Dear readers, In order to strengthen and promote research and policies tackling social and economic inequalities throughout societies, LIS has launched a quarterly newsletter Inequality Matters. This newsletter will present state-of-the-art research, give policy recommendations, and visualise the richness of the LIS/LWS micro databases. Our news feeds will cover the most recent LIS micro data releases and revisions, our user’s additions to our working papers series, and news from our two offices located in Luxembourg and New York. This first issue honours the work of Sir Tony Atkinson, whose loss we still mourn at LIS. Andrea Brandolini exemplifies the huge relevance of Tony’s academic contribution, moving ahead research on inequality. Tony’s modest personality, his wise council as president of LIS, and his distinct academic contribution will be sincerely missed, but remembered for plenty of decades to come. This issue’s research brief by David Natali and Emmanuele Pavolini concentrates on presenting some core findings of the PROWELFARE project by the European Social Observatory (OSE); among the project’s goals was the exploration and evaluation of cross-national differences of occupational welfare provision in the dimensions of occupational pensions and unemployment protection. Future efforts might particularly pick up on the standardisation of data collection and documentation of occupational welfare programmes. For our Highlights section we compiled a selection of articles showing the multi- faceted information available in the LIS/LWS databases. Enjoy reading! Jörg Neugschwender, Editor Inequality Matters 1 Inequality and economics: Tony Atkinson’s enduring lessons by Andrea Brandolini 3 Occupational welfare in Europe: why we need to study it more than in the past in order to understand social inequalities by David Natali & Emmanuele Pavolini Working Papers & Publications 5 Focus on ‘The Political Economy of Compensatory Redistribution’ by Jonas Pontusson & David Weisstanner 5 Recent LIS/LWS working papers – publications Data News 6 Data releases and revisions 6 Data release schedule News, Events and Updates 12 Interactive METadata Information System (METIS) 12 François Bourguignon has been named President of LIS Board 12 Visiting scholars at LIS 12 LIS/LWS User Conference 2017 / LIS Summer Workshop 2017 Highlights 7 Is redistribution in South Korea really so small? by Teresa Munzi 8 Occupational pensions – data evidence of gender gaps by Jörg Neugschwender 9 West-East regional disparities in Slovakia by Heba Omar 10 How do consumers discount future? Evidence from the Luxembourg Wealth Study by Walid Merouani Contents www.lisdatacenter.org/newsletter Inequality Matters, LIS Newsletter, Issue No. 1 (March 2017) Interested in contributing to the Inequality Matters policy/research briefs? Please contact us: Jörg Neugschwender, Editor - [email protected] Inequality Matters LIS Newsletter, Issue No. 1 (March 2017)

Welcome message from author
This document is posted to help you gain knowledge. Please leave a comment to let me know what you think about it! Share it to your friends and learn new things together.
Transcript
Dear readers,
In order to strengthen and promote research and policies tackling social and
economic inequalities throughout societies, LIS has launched a quarterly newsletter
Inequality Matters. This newsletter will present state-of-the-art research, give policy
recommendations, and visualise the richness of the LIS/LWS micro databases. Our
news feeds will cover the most recent LIS micro data releases and revisions, our
user’s additions to our working papers series, and news from our two offices
located in Luxembourg and New York.
This first issue honours the work of Sir Tony Atkinson, whose loss we still mourn at LIS.
Andrea Brandolini exemplifies the huge relevance of Tony’s academic contribution,
moving ahead research on inequality. Tony’s modest personality, his wise council as
president of LIS, and his distinct academic contribution will be sincerely missed, but
remembered for plenty of decades to come.
This issue’s research brief by David Natali and Emmanuele Pavolini concentrates on
presenting some core findings of the PROWELFARE project by the European Social
Observatory (OSE); among the project’s goals was the exploration and evaluation of
cross-national differences of occupational welfare provision in the dimensions of
occupational pensions and unemployment protection. Future efforts might
particularly pick up on the standardisation of data collection and documentation of
occupational welfare programmes.
For our Highlights section we compiled a selection of articles showing the multi-
faceted information available in the LIS/LWS databases.
Enjoy reading! Jörg Neugschwender, Editor
Inequality Matters
1 Inequality and economics: Tony Atkinson’s enduring lessons by Andrea Brandolini
3 Occupational welfare in Europe: why we need to study it more than in the past in order to understand social inequalities by David Natali & Emmanuele Pavolini
Working Papers & Publications
5 Focus on ‘The Political Economy of Compensatory Redistribution’ by Jonas Pontusson & David Weisstanner
5 Recent LIS/LWS working papers – publications
Data News
6 Data releases and revisions
6 Data release schedule
News, Events and Updates
12 Interactive METadata Information System (METIS)
12 François Bourguignon has been named President of LIS Board
12 Visiting scholars at LIS
12 LIS/LWS User Conference 2017 / LIS Summer Workshop 2017
Highlights
7 Is redistribution in South Korea really so small?
by Teresa Munzi
8 Occupational pensions – data evidence of gender gaps
by Jörg Neugschwender
9 West-East regional disparities in Slovakia by Heba Omar
10 How do consumers discount future? Evidence from the
Luxembourg Wealth Study by Walid Merouani
Contents
www.lisdatacenter.org/newsletter Inequality Matters, LIS Newsletter, Issue No. 1 (March 2017) Interested in contributing to the Inequality Matters policy/research briefs? Please contact us: Jörg Neugschwender, Editor - [email protected]
Inequality Matters
LIS Newsletter, Issue No. 1 (March 2017)

Inequality Matters LIS Newsletter, Issue No. 1 ______________________________________________________________________________________________________________________________________________________________________________________________________________________________________________________________________
____________________________
1
“I am not sure that I will be able to finish [a book he was writing on
measuring global poverty, building on Atkinson (2017)], but it is quite
interesting to read all the different country studies for places that I
scarcely knew existed (like the Solomon Islands!). I keep an atlas on
my desk! I am very impressed with the overall quality of the work
being produced in statistical offices around the world, and feel that
there is a lot of scope for mutual learning.”
This is an excerpt from the last email that I received from Tony Atkin-
son, a few weeks before his premature death on 1 January 2017 from
multiple myeloma, an incurable disease diagnosed three years earlier.
These words are telling of Tony’s personality. They well illustrate the
insatiable intellectual curiosity that brought him to explore archives
to find and understand the data he needed, but also to develop a
wide-ranging and deep knowledge of the economics literature. They
show his profound respect for craftsmanship – be that of the official
statisticians of the Solomon Islands or the carpenter who had fixed
his bookshelves. They reveal a supreme commitment to research,
which not even his illness could restrain.
The modern theory of inequality measurement
Tony is universally celebrated for his outstanding contributions to the
measurement of poverty and inequality, in theory and in practice.
There is no doubt that his 1970 paper radically changed the way that
economists deal with these problems and laid the foundations of the
modern theory of inequality measurement. Developing an idea
originated by Hugh Dalton (1920), Tony viewed income inequality as
the loss of social welfare associated with an uneven distribution of
incomes. This focus on social welfare allowed him to derive three
important results.
The first is that it is sometimes possible to rank one income
distribution as less, or more, unequal than another by only agreeing
on a few regularity properties of the social welfare function and on
the “Pigou-Dalton principle of transfers”, which states that total
welfare is increased by a mean-preserving transfer of income from a
richer person to an (otherwise identical) poorer person. This can be
easily checked by simply verifying that the Lorenz curves for the two
distributions do not cross.3
But the ensuing ordering is only partial, as the Lorenz curves may
cross: other restrictions could be imposed on the social welfare
function, but eventually it might be necessary to specify a single
function. This leads to the second result: any social welfare function
can be converted into an (in)equality index and vice versa. This map-
ping helps to uncover the collective preferences underlying, implicitly
or explicitly, an inequality index but also to derive new indices.
The third result is the development of a class of indices that makes
explicit different views concerning distributional justice by
introducing a parameter that captures the degree of inequality
aversion assumed in the measurement.
Amartya Sen (1997: 114) attributes to this article primary
responsibility for “the revival of a basically utilitarian perspective in
evaluating inequality” that “proved to be a very productive move” –
although there is nothing inherently utilitarian in Tony’s formulation
(Atkinson 1983: 5).
Tony’s insights have been enormously influential in stimulating
innovative research on the axiomatic derivation of indices, the
criteria for ordinal comparisons and the multidimensional
measurement of inequality and poverty (for example, Jenkins 2017). 4
All these topics remain active research fields (Atkinson and
Bourguignon 2000, 2015; Atkinson and Brandolini 2015).
Taking data seriously
Advancing the measurement of inequality and poverty is not only a
matter of theory. It is also important to pay proper attention to the
data used: their characteristics and fitness-for-purpose – and their
limitations whenever they are only a proxy of the ideal theoretical
notion. The scrupulous attention to data quality permeates Tony’s
research. Throughout his life, Tony scrutinised original sources and
perused footnotes and appendices to understand what the data
really measure, to assess how they compare to alternative sources,
to improve existing statistics or to estimate new ones.
There are plenty of examples: the evaluation of the quality of income
data collected in the UK’s Family Expenditure Survey (Atkinson and
Micklewright 1983); the extensive and thoroughly documented
evidence collected in volumes about wealth distribution in the UK
(Atkinson and Harrison 1978), income distribution in Eastern Europe
under Communism (Atkinson and Micklewright 1992), earnings
distribution in OECD countries (Atkinson 2008); the construction of
statistics on top incomes undertaken with Thomas Piketty and co-
authors; the continuous advice offered to international endeavours
such as the Luxembourg Income Study and the European Union
Statistics on Income and Living Conditions.
Tony’s concern for data issues represents a warning to researchers
that the comparability of data is a prerequisite for reliable
conclusions (Atkinson and Brandolini 2001). This point is central in
the report of the Commission on Global Poverty, where he outlined
the criteria for monitoring global poverty that will guide the World
Bank in the coming years (Atkinson 2017). The consideration for
statistical production gained him the respect of professional
statisticians, as testified by the influence of the Atkinson Review on
the measurement of government output (Atkinson 2005a) and by his
appointment as member of the European Statistical Governance
Advisory Board.
Inequality analysis as the basis for policy
Theoretical and practical progress in inequality measurement was
never conceived by Tony as an end in itself. It constituted the
precondition for analysis of the causes of inequality and policies that
may reduce it.
The review of the historical experience of advanced countries led
Tony to conclude that income inequality moves erratically, tracing a
sequence of episodes rather than well-defined long-term trends
(Atkinson 1997). Tony had an inclination to shy away from mono-
causal explanations and the search for a great unifying theory, an
attitude that probably distinguishes his work from that of Piketty.
The driving factors often emphasised in the academic and public
debate – technological progress, globalisation, demographic changes
– cannot be separated from specific national factors, such as the
choices made by governments on taxation and social protection.
Tony has long argued that it is not inevitable that globalisation and
Inequality Matters
Inequality and economics: Tony Atkinson’s enduring lessons1
Andrea Brandolini2, Bank of Italy
Inequality Matters LIS Newsletter, Issue No. 1 ______________________________________________________________________________________________________________________________________________________________________________________________________________________________________________________________________
____________________________
2
technological progress raise inequality: governments retain room for
manoeuvre to counter these trends (Atkinson 1999).
Throughout his life, from his first book, Poverty in Britain and the
Reform of Social Security (1969a), written when he was just 25, to his
last, Inequality: What Can Be Done? (2015), written when disease
had already hit him, Tony translated economic analysis into policy
actions.
The latter book – which, in many ways, is his intellectual testament –
describes a package of concrete measures to reduce inequality that
embraces all fields of government action: from public investments to
policies for innovation; from the guarantee of a minimum return for
small investors’ savings to policies for redistributing income and
wealth. People may disagree with specific proposals – Tony typically
concluded when presenting the book – but if they hold that
inequality is a problem, then they have a duty to advance realistic
alternative proposals.
This exposes the ultimate goal of Tony’s research. Economics is a tool
for understanding the world and taking informed decisions on
policies; but economists must strive to communicate their results
beyond the narrow circles of decision-makers, making them
accessible for public discussion.
Significantly, he gave his book on the pros and cons of basic income
the title of Public Economics in Action (1995). And for over 30 years
he was involved in constructing tax-and-benefit micro-simulation
models, first for the UK (Atkinson and Sutherland 1988), then for the
European Union (Atkinson 2005b).
From the outset, he saw these models as tools that could be applied
by policy-makers, journalists and the general public: “It is essential
that the methods used in the analysis should be fully explicit, and the
availability of micro-computer programs of the kind produced by [us]
is intended to encourage better informed debate about these
important issues” (Atkinson et al 1983: 74).
In his Presidential Address to the European Economic Association, he
lamented that economists were lagging behind in communication
and compared unfavourably with researchers from other disciplines:
“It is noteworthy that Hawking in A Brief History of Time almost
entirely eschews equations but has some 35 diagrams in his 200
pages” (Atkinson 1990: 245). 5
Beyond inequality: a classical economist
It would be reductive to confine Tony’s excellence to a single, narrow
field, however fundamental. Tony was an economist in the classical
sense. He never conceived the study of inequality as a separate
branch of economics and he was keen to maintain inequality as an
integral part of the economists’ agenda. His ethical commitment to
understanding and providing tools for fighting economic injustice
was intimately related to his economic vision.
Tony had a deep appreciation for general equilibrium theory but was
fully aware of its severe limitations in interpreting the real world. I
remember him making this point in his advanced lectures in
microeconomics at the LSE: “There has been a widely-held view in
micro-economics that generality is the supreme virtue and that
highly structured models are to be avoided as only suitable for the
construction of counter-examples. Once we leave perfect
competition, however, it may not be possible to make progress in
this way, and we may have to specify more of the structure” (Atkinson
1987: 70). 6
It is more difficult to assume away distributive considerations as
irrelevant when one moves from the abstract general equilibrium
assumed by mainstream macroeconomic models to a more complex
and realistic framework with imperfections, externalities and
multiple equilibria.
Citing Tony’s lecture notes again: “The provision of micro-
foundations for macro-economics has been a major part of the
theoretical research agenda, but ... the aggregate functions may have
different properties from those at the individual level. One cannot
simply posit that the macro-economy behaves like some
‘representative’ individual. It is indeed optimistic to suppose that we
could derive properties of the aggregate demand functions without
specifying anything about the distribution of tastes and income
across the population” (Atkinson 1987: 27).
Tony was especially concerned with the design and role of taxation,
social protection and the welfare state. His Lectures on Public
Economics (1980), written with Joseph Stiglitz, have represented the
advanced textbook for generations of postgraduate students. Yet, his
two first academic articles were in macroeconomics.
One stressed that research on growth models was overlooking the
speed of convergence to the long-run equilibrium, despite this being
a significant prediction of the models: “If we throw away information
about the time dimension, we are reducing still further our limited
understanding of the relationship between these models and the real
world” (Atkinson 1969b: 137).
The other suggested that technical progress does not apply across
the board, as usually postulated, but specifically to particular
techniques of production; hence, technical development is localised
and history matters (Atkinson and Stiglitz 1969). Daron Acemoglu
recently noted that this idea “was ahead of its time in emphasising
localised and biased new technologies and challenging the orthodoxy
in the modelling of technological change” (2015: 456).
The two 1969 articles show salient features of Tony’s future
research: the effort to work out all the implications of theoretical
models; a willingness to explore analytical solutions different from
the received one; and awareness of the limits of models. “Economists
are too often prisoners within the theoretical walls they have
erected”, he recently wrote discussing austerity policies, “and fail to
see that important considerations are missing” (Atkinson 2014: 84).
Had the profession listened more to him, today we would perhaps be
less worried about rising inequalities and the risk they pose for our
societies.
1 Published on VoxEU.org on 27 February 2017
(http://www.voxeu.org/article/inequality-and-economics-tony-atkinson-s-
enduring-lessons)
2 I thank Giorgio Gobbi, Stephen Jenkins, Marco Magnani, John Micklewright,
Luisa Minghetti and Alfonso Rosolia for very helpful comments on this
overview of his work. The views expressed here are mine and do not
necessarily reflect those of the Bank of Italy or the Eurosystem.
3 The Lorenz curve shows the proportion of total income received by successive
proportionate groups cumulated from the bottom.
4 Tony’s 1970 paper is among the most cited articles published in leading
economics journals between 1970 and 2002 (Kim et al 2006: Table 2).
5 Tony’s interest in graphical representation culminated in the Chartbook of
Economic Inequality, which he realised with Salvatore Morelli and Max
Roser, where a chart for each of the 25 countries considered shows how
different dimensions of economic inequality have changed over time.
6 Tony’s lecture notes for the advanced course in microeconomics held at the
LSE in the fall of 1987 were handed out to students but bore the warning
that they had not been checked and should not be quoted or cited. Here, I
am consciously infringing that requirement.
Inequality Matters LIS Newsletter, Issue No. 1 ______________________________________________________________________________________________________________________________________________________________________________________________________________________________________________________________________
____________________________
3
What is occupational welfare and why it is important while studying
social outcomes?
Around sixty years ago Richard Titmuss invited to take a broader view
on complex mechanisms of welfare provision (Titmuss 1958). He
developed the idea that, alongside ‘social’ welfare (social benefits
and services provided by the State), ‘fiscal’ welfare (tax incentives for
individuals and firms to help them provide welfare) and
‘occupational’ welfare (benefits and services provided by social
partners) are important sources of protection. While some seminal
works focused on occupational welfare (OW) in the 1970s and the
1980s, such type of welfare provision has been in recent years a
relatively neglected area in welfare state studies.
OW is in fact a very delicate but increasingly important area of
research. In the following we list the main reasons why we need to
study OW, and why it is so difficult to do so, especially in a
comparative perspective. There are at least three good reasons for
an analysis of OW in greater depth. First, from an empirical point of
view, the level of spending and the number of workers covered by
these programmes show its key and, in many countries, growing role.
Secondly, OW is important for understanding recent trends in
industrial relations, with welfare provision and workers’ social rights
being one of the central issues tackled by social partners. Last but not
least, OW is relevant for the ongoing transformations in the welfare
state and its impact on social inequalities. Some of the more recent
trends in the welfare state – benefit cutbacks, programme revisions,
decentralisation, etc. – cannot be assessed in isolation from what
happens to OW. Furthermore, OW plays an important role in terms
of redistribution and inequalities. OW programmes may lead under
certain circumstances to increased dualisation and widen socio-
occupational inequalities among workers and their families.
Yet the study of OW entails some methodological problems. The first
problem is related to the lack of a clear and universally accepted
definition of OW. In particular, the concept is ambiguous if seen in
the context of the contemporary welfare literature. Some scholars
conceptualise OW with reference to the coverage model of statutory
schemes rather than to the nature of the providers. Both public
(social welfare in Titmuss) and supplementary schemes are thus
occupational when they are based on employment. Secondly, we still
lack a classification of OW in Europe. Thirdly, data collection has
proved extremely difficult, especially in comparative terms. Important
questions have to be addressed, especially for survey data.
Some recent progress on the analysis of OW and its impact on
inequalities
The EU funded research project – Unemployment and Pensions
Protection in Europe: The changing role of the Social Partners,
PROWELFARE – has aimed at providing in-depth evidence of
occupational schemes in the field of pensions and unemployment
programmes in nine EU countries while addressing the problems
mentioned above.
In the project we have defined OW as the sum of benefits and
services provided by social partners – employers and trade unions (by
themselves or with the participation of others) – to employees over
and beyond state benefits, on the basis of an employment contract.
References
Acemoglu, D. (2015), ‘Localized and Biased Technologies: Atkinson and Stiglitz’s New View, Induced Innovations, and Directed Technological Change’, Economic Journal 125: 443-57.
Atkinson, A.B. (1969a), Poverty in Britain and the Reform of Social Security, Cambridge University Press.
Atkinson, A.B. (1969b), ‘The Timescale of Economic Models: How Long is the Long Run?’, Review of Economic Studies 36: 137-52.
Atkinson, A.B. (1970), ‘On the Measurement of Inequality’, Journal of Economic Theory 2: 244-63.
Atkinson, A.B. (1983), Social Justice and Public Policy, Harvester-Wheatsheaf.
Atkinson, A.B. (1987), ‘M.Sc. Micro-Economics’, mimeo, London School of Economics.
Atkinson, A.B. (1990), ‘Public Economics and the Economic Public’, European Economic Review 34(2-3): 225-48.
Atkinson, A.B. (1995), Public Economics in Action: The Basic Income/Flat Tax Proposal, Oxford University Press.
Atkinson, A.B. (1997), ‘Bringing Income Distribution in from the Cold’, Economic Journal 107: 297-321.
Atkinson, A.B. (1999), ‘Is Rising Income Inequality Inevitable? A Critique of the Transatlantic Consensus’, Third WIDER Annual Lecture (https://www.wider.unu.edu/publication/rising-income-inequality-inevitable-1).
Atkinson, A.B. (2005a), Measurement of Government Output and Productivity for the National Accounts, Palgrave Macmillan.
Atkinson, A.B. (2005b), ‘EUROMOD and the Development of EU Social Policy’, EUROMOD Working Paper No. EM1/05.
Atkinson, A.B. (2008), The Changing Distribution of Earnings in OECD Countries, Oxford University Press.
Atkinson, A.B. (2014), Public Economics in an Age of Austerity, Routledge.
Atkinson, A.B. (2015), Inequality: What Can Be Done?, Harvard University Press.
Atkinson, A.B. (2017), Monitoring Global Poverty: Report of the Commission on Global Poverty, World Bank.
Atkinson, A.B., and F. Bourguignon (eds) (2000), Handbook of Income Distribution Volume 1, North Holland.
Atkinson, A.B., and F. Bourguignon (eds) (2015), Handbook of Income Distribution Volume 2, North Holland.
Atkinson, A.B., and A. Brandolini (2001), ‘Promise and Pitfalls in the Use of “Secondary” Data-sets: Income Inequality in OECD Countries’, Journal of Economic Literature 39: 771-99.
Atkinson, A.B., and A. Brandolini (2015), ‘Unveiling the Ethics behind Inequality Measurement: Dalton’s Contribution to Economics’, Economic Journal, 125: 209-20.
Atkinson, A.B., and A.J. Harrison, (1978), Distribution of Personal Wealth in Britain, Cambridge University Press.
Atkinson, A.B., M.A. King and H. Sutherland (1983), ‘The Analysis of Personal Taxation and Social Security’, National Institute Economic Review 106: 63-74.
Atkinson, A.B., and J. Micklewright (1983), ‘On the Reliability of Income Data in the Family Expenditure Survey 1970-1977’, Journal of the Royal Statistical Society Series A 146 Part 1: 33-61.
Atkinson, A.B., and J. Micklewright (1992), Economic Transformation in Eastern Europe and the Distribution of Income, Cambridge University Press.
Atkinson, A.B., and J.E. Stiglitz (1969), ‘A New View of Technological Change’, Economic Journal 79: 573-78.
Atkinson, A.B., and J.E. Stiglitz (1980), Lectures on Public Economics, McGraw-Hill; updated edition: Princeton University Press, 2015.
Atkinson, A.B., and H. Sutherland (eds) (1988), Tax-Benefit Models, STICERD Occasional Paper, London School of Economics.
Dalton, H. (1920), ‘The Measurement of the Inequality of Incomes’, Economic Journal 30: 348-61.
Jenkins, S.P. (2017), ‘Anthony B. Atkinson (1944-)’, in R. Cord (ed.), The Palgrave Companion to Cambridge Economics 1151-74, Palgrave Macmillan.
Kim, E.H., A. Morse and L. Zingales (2006), ‘What has Mattered to Economics since 1970’, Journal of Economic Perspectives 20: 189-202.
Sen, A.K. (1997), On Economic Inequality, expanded edition with a substantial annex by J.E. Foster and A.K. Sen, Clarendon Press.
Occupational welfare in Europe: why we need to study it more
than in the past in order to understand social inequalities
David Natali, S. Anna School of Advanced
Studies of Pisa and European Social Observatory
Emmanuele Pavolini, University of Macerata
Inequality Matters LIS Newsletter, Issue No. 1 ______________________________________________________________________________________________________________________________________________________________________________________________________________________________________________________________________
____________________________
4
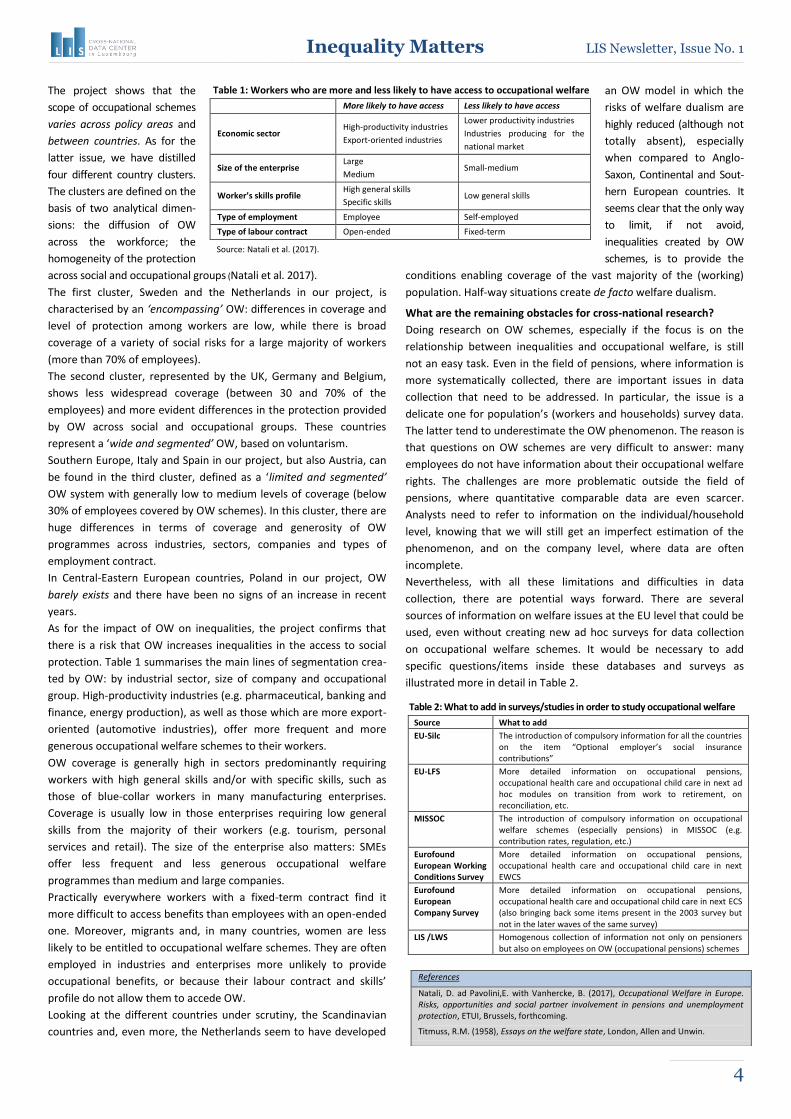
The project shows that the
scope of occupational schemes
varies across policy areas and
between countries. As for the
latter issue, we have distilled
four different country clusters.
The clusters are defined on the
basis of two analytical dimen-
sions: the diffusion of OW
across the workforce; the
homogeneity of the protection
across social and occupational groups (Natali et al. 2017).
The first cluster, Sweden and the Netherlands in our project, is
characterised by an ‘encompassing’ OW: differences in coverage and
level of protection among workers are low, while there is broad
coverage of a variety of social risks for a large majority of workers
(more than 70% of employees).
The second cluster, represented by the UK, Germany and Belgium,
shows less widespread coverage (between 30 and 70% of the
employees) and more evident differences in the protection provided
by OW across social and occupational groups. These countries
represent a ‘wide and segmented’ OW, based on voluntarism.
Southern Europe, Italy and Spain in our project, but also Austria, can
be found in the third cluster, defined as a ‘limited and segmented’
OW system with generally low to medium levels of coverage (below
30% of employees covered by OW schemes). In this cluster, there are
huge differences in terms of coverage and generosity of OW
programmes across industries, sectors, companies and types of
employment contract.
In Central-Eastern European countries, Poland in our project, OW
barely exists and there have been no signs of an increase in recent
years.
As for the impact of OW on inequalities, the project confirms that
there is a risk that OW increases inequalities in the access to social
protection. Table 1 summarises the main lines of segmentation crea-
ted by OW: by industrial sector, size of company and occupational
group. High-productivity industries (e.g. pharmaceutical, banking and
finance, energy production), as well as those which are more export-
oriented (automotive industries), offer more frequent and more
generous occupational welfare schemes to their workers.
OW coverage is generally high in sectors predominantly requiring
workers with high general skills and/or with specific skills, such as
those of blue-collar workers in many manufacturing enterprises.
Coverage is usually low in those enterprises requiring low general
skills from the majority of their workers (e.g. tourism, personal
services and retail). The size of the enterprise also matters: SMEs
offer less frequent and less generous occupational welfare
programmes than medium and large companies.
Practically everywhere workers with a fixed-term contract find it
more difficult to access benefits than employees with an open-ended
one. Moreover, migrants and, in many countries, women are less
likely to be entitled to occupational welfare schemes. They are often
employed in industries and enterprises more unlikely to provide
occupational benefits, or because their labour contract and skills’
profile do not allow them to accede OW.
Looking at the different countries under scrutiny, the Scandinavian
countries and, even more, the Netherlands seem to have developed
an OW model in which the
risks of welfare dualism are
highly reduced (although not
totally absent), especially
when compared to Anglo-
Saxon, Continental and Sout-
hern European countries. It
seems clear that the only way
to limit, if not avoid,
inequalities created by OW
schemes, is to provide the
conditions enabling coverage of the vast majority of the (working)
population. Half-way situations create de facto welfare dualism.
What are the remaining obstacles for cross-national research?
Doing research on OW schemes, especially if the focus is on the
relationship between inequalities and occupational welfare, is still
not an easy task. Even in the field of pensions, where information is
more systematically collected, there are important issues in data
collection that need to be addressed. In particular, the issue is a
delicate one for population’s (workers and households) survey data.
The latter tend to underestimate the OW phenomenon. The reason is
that questions on OW schemes are very difficult to answer: many
employees do not have information about their occupational welfare
rights. The challenges are more problematic outside the field of
pensions, where quantitative comparable data are even scarcer.
Analysts need to refer to information on the individual/household
level, knowing that we will still get an imperfect estimation of the
phenomenon, and on the company level, where data are often
incomplete.
Nevertheless, with all these limitations and difficulties in data
collection, there are potential ways forward. There are several
sources of information on welfare issues at the EU level that could be
used, even without creating new ad hoc surveys for data collection
on occupational welfare schemes. It would be necessary to add
specific questions/items inside these databases and surveys as
illustrated more in detail in Table 2.
References
Natali, D. ad Pavolini,E. with Vanhercke, B. (2017), Occupational Welfare in Europe. Risks, opportunities and social partner involvement in pensions and unemployment protection, ETUI, Brussels, forthcoming.
Titmuss, R.M. (1958), Essays on the welfare state, London, Allen and Unwin.
Table 1: Workers who are more and less likely to have access to occupational welfare
More likely to have access Less likely to have access
Economic sector High-productivity industries
Export-oriented industries
Lower productivity industries
Industries producing for the
national market
Size of the enterprise Large
Medium Small-medium
Worker’s skills profile High general skills
Specific skills Low general skills
Type of employment Employee Self-employed
Type of labour contract Open-ended Fixed-term
Source: Natali et al. (2017).
Table 2: What to add in surveys/studies in order to study occupational welfare
Source What to add
EU-Silc The introduction of compulsory information for all the countries on the item “Optional employer’s social insurance contributions”
EU-LFS More detailed information on occupational pensions, occupational health care and occupational child care in next ad hoc modules on transition from work to retirement, on reconciliation, etc.
MISSOC The introduction of compulsory information on occupational welfare schemes (especially pensions) in MISSOC (e.g. contribution rates, regulation, etc.)
Eurofound European Working Conditions Survey
More detailed information on occupational pensions, occupational health care and occupational child care in next EWCS
Eurofound European Company Survey
More detailed information on occupational pensions, occupational health care and occupational child care in next ECS (also bringing back some items present in the 2003 survey but not in the later waves of the same survey)
LIS /LWS Homogenous collection of information not only on pensioners but also on employees on OW (occupational pensions) schemes
Inequality Matters LIS Newsletter, Issue No. 1 ______________________________________________________________________________________________________________________________________________________________________________________________________________________________________________________________________
____________________________
5
LIS working papers series
LIS working papers series - No. 685
Are Parents More Likely to Be Unemployed? A Study of Nine Western
Democracies
by Richard Stjärnfäldt
LIS working papers series - No. 686
Anatomy of Income Inequality in the United States: 1979-2013 by Aboozar Hadavand
LIS working papers series - No. 687
Single-Parent Families and In-Work Poverty by Rense Nieuwenhuis and Laurie C. Maldonado
published (forthcoming) in Handbook of Research on in-Work Poverty,
edited by Henning Lohmann and Ive Marx. Edward Elgar: 2017.
LIS working papers series - No. 688
The Specificity of Human Capital Investment under Agent
Heterogeneity and Market Frictions: Theory and Empirics by Tomáš Jagelka
LIS working papers series - No. 689
Are Recent Generations Catching Up or Falling Behind? Trends in
Inter-Generational Inequality by Michael Freedman
LIS working papers series - No. 690
The Inequality We Want: How Much Is Too Much? by Alice Krozer
published: Krozer, A. 2015: The Inequality We Want: How Much Is
Too Much? Journal of International Commerce, Economics and Policy,
October 2015, Vol. 06, No. 03.
LIS working papers series - No. 691 Different Faces of Inequality across Asia: Decomposition of Income
Gaps across Demographic Groups by Vladimir Hlasny
LIS working papers series - No. 692 American Exceptionalism in Market Income Inequality: An Analysis
Based on Microdata from the Luxembourg Income Study (LIS)
Database by Janet C. Gornick, Branko Milanovic, and Nathaniel Johnson
______________________________________________________________
LWS working papers series
LWS working papers series - No. 23
Who is Eager to Save for Retirement – the Cross-Country Evidence
by Anna Kaliciak, Radoslav Kurach, Walid Merouani
Working Papers & Publications
Focus on ‘The Political Economy of Compensatory Redistribution’
by Jonas Pontusson (University of Geneva) & David Weisstanner (University of Bern)
LIS Working Paper, No. 684
This paper explores common trends in income inequality and redistribution across OECD countries from the late 1980s to 2013. We draw
attention to recessions and, more generally, to macroeconomic conditions as a source of inequality. Unemployment has different
implications for low-end and high-end inequality. Poverty rates and overall market inequality rise along with unemployment during
economic downturns, while top income shares rise during growth periods.
Redistribution through the tax-transfer system partly compensates increases in market inequality during downturns. However, we show
that in most countries compensatory redistribution was less extensive in the Great Recession than in the recession of the early 1990s. The
decline of compensatory redistribution reflects policy choices that were made in the growth period between 1994 and 2007. Our
explanation of these policy choices emphasises weakening support for redistribution among electorally pivotal middle-income citizens.
Since the 1990s, unemployment and poverty risks have become increasingly concentrated among workers with low education. Less
worried about falling into poverty, middle-income citizens have become more permissive of cuts in unemployment insurance generosity
and income assistance to the poor.
The more unequal distribution of economic insecurity has been facilitated by deregulatory labor market reforms. Apart from reductions
in replacement rates and the duration of unemployment benefits, the expansion of more precarious forms of employment reduces
compensatory redistribution during downturns because temporary employees do not have the same access to unemployment benefits as
permanent employees. The growing concentration of economic risks among low-educated workers poses an obstacle to the formation of
a pro-redistribution coalition of lower and middle income groups.
Inequality Matters LIS Newsletter, Issue No. 1 ______________________________________________________________________________________________________________________________________________________________________________________________________________________________________________________________________
____________________________
6
LIS is happy to announce the release of seven additional micro data
sets to the Luxembourg Income Study (LIS) Database. While
harmonising the new LIS waves for each country, several revisions of
earlier released datasets have been carried out.
Austria
Three new datasets from Austria, AT07 (Wave VII), AT10 (Wave VIII)
and AT13 (Wave IX) have been added. The datasets are based on the
2008, 2011 and 2014 waves of the Survey of Income and Living
Conditions (SILC) carried out by Statistic Austria.
Slovakia
One new dataset from Slovakia, SK13 (Wave IX) has been added. The
dataset is from the 2014 wave of the Survey on Income and Living
Conditions (SILC) carried out by the Statistical Office of the Slovak
Republic (ŠÚ SR).
Switzerland
Three new datasets from Switzerland, CH07 (Wave VII), CH10 (Wave
VIII) and CH13 (Wave IX) have been added. The datasets are based on
the 2008, 2011 and 2014 waves of the Survey of Income and Living
Conditions (SILC) carried out by the Swiss Federal Statistical Office.
The following datasets have been revised:
- Austria: AT04, AT00, AT97 and AT94.
- Czech Republic: CZ13, CZ10, CZ07, CZ04 and CZ96.
- Slovakia: SK10, SK07, SK04, SK96 and SK92.
- Switzerland: CH04, CH02, CH00 and CH92.
Summer
2017 Fall
2017 Winter
2017/18
LIS Database Australia AU14
Chile CL15/13/09/06/03/00/95/90
Guatemala GT14
Iceland IS13
South Africa ZA15
Tunisia TN14
LWS Database Australia AU14
Canada CA99
Germany DE02/07/12
Greece GR14
Italy IT95/00/04/08
Slovakia SK10/14
Slovenia SI14
South Africa ZA15
Sweden SE02/05
United Kingdom UK13
Data News
_________________________________________________________________________________________________________________________________________________________________________
Data releases – Luxembourg Income Study (LIS)
_________________________________________________________________________________________________________________________________________________________________________
Data revisions – Luxembourg Income Study (LIS)
_________________________________________________________________________________________________________________________________________________________________________
Data release schedule
LIS country coverage
Inequality Matters LIS Newsletter, Issue No. 1 ______________________________________________________________________________________________________________________________________________________________________________________________________________________________________________________________________
____________________________
7
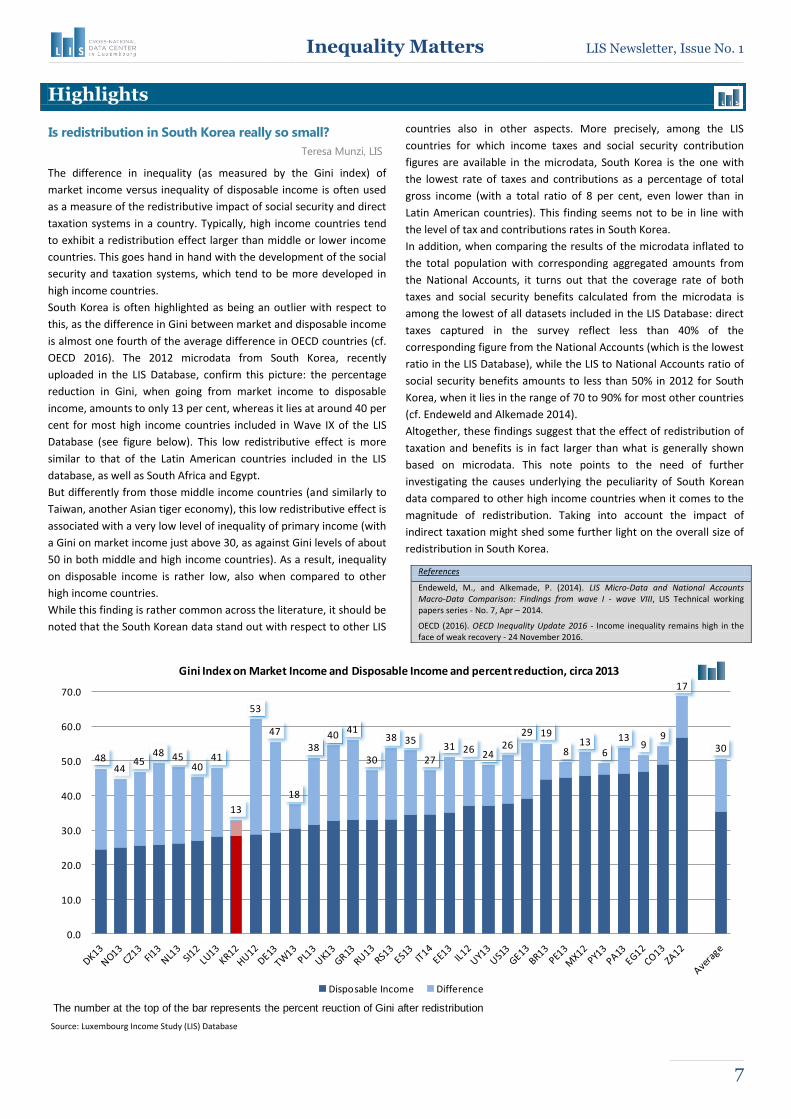
The difference in inequality (as measured by the Gini index) of
market income versus inequality of disposable income is often used
as a measure of the redistributive impact of social security and direct
taxation systems in a country. Typically, high income countries tend
to exhibit a redistribution effect larger than middle or lower income
countries. This goes hand in hand with the development of the social
security and taxation systems, which tend to be more developed in
high income countries.
South Korea is often highlighted as being an outlier with respect to
this, as the difference in Gini between market and disposable income
is almost one fourth of the average difference in OECD countries (cf.
OECD 2016). The 2012 microdata from South Korea, recently
uploaded in the LIS Database, confirm this picture: the percentage
reduction in Gini, when going from market income to disposable
income, amounts to only 13 per cent, whereas it lies at around 40 per
cent for most high income countries included in Wave IX of the LIS
Database (see figure below). This low redistributive effect is more
similar to that of the Latin American countries included in the LIS
database, as well as South Africa and Egypt.
But differently from those middle income countries (and similarly to
Taiwan, another Asian tiger economy), this low redistributive effect is
associated with a very low level of inequality of primary income (with
a Gini on market income just above 30, as against Gini levels of about
50 in both middle and high income countries). As a result, inequality
on disposable income is rather low, also when compared to other
high income countries.
While this finding is rather common across the literature, it should be
noted that the South Korean data stand out with respect to other LIS
countries also in other aspects. More precisely, among the LIS
countries for which income taxes and social security contribution
figures are available in the microdata, South Korea is the one with
the lowest rate of taxes and contributions as a percentage of total
gross income (with a total ratio of 8 per cent, even lower than in
Latin American countries). This finding seems not to be in line with
the level of tax and contributions rates in South Korea.
In addition, when comparing the results of the microdata inflated to
the total population with corresponding aggregated amounts from
the National Accounts, it turns out that the coverage rate of both
taxes and social security benefits calculated from the microdata is
among the lowest of all datasets included in the LIS Database: direct
taxes captured in the survey reflect less than 40% of the
corresponding figure from the National Accounts (which is the lowest
ratio in the LIS Database), while the LIS to National Accounts ratio of
social security benefits amounts to less than 50% in 2012 for South
Korea, when it lies in the range of 70 to 90% for most other countries
(cf. Endeweld and Alkemade 2014).
Altogether, these findings suggest that the effect of redistribution of
taxation and benefits is in fact larger than what is generally shown
based on microdata. This note points to the need of further
investigating the causes underlying the peculiarity of South Korean
data compared to other high income countries when it comes to the
magnitude of redistribution. Taking into account the impact of
indirect taxation might shed some further light on the overall size of
redistribution in South Korea.
Highlights
References
Endeweld, M., and Alkemade, P. (2014). LIS Micro-Data and National Accounts Macro-Data Comparison: Findings from wave I - wave VIII, LIS Technical working papers series - No. 7, Apr – 2014.
OECD (2016). OECD Inequality Update 2016 - Income inequality remains high in the face of weak recovery - 24 November 2016.
Is redistribution in South Korea really so small?
Teresa Munzi, LIS
Source: Luxembourg Income Study (LIS) Database The number at the top of the bar represents the percent reuction of Gini after redistribution
4844
4548 45
4041
13
53
47
18
3840
41
30
38 35
2731 26 24
2629 19
813
6
139
9
17
30
0.0
10.0
20.0
30.0
40.0
50.0
60.0
70.0
Gini Index on Market Income and Disposable Income and percent reduction, circa 2013
Disposable Income Difference

Inequality Matters LIS Newsletter, Issue No. 1 ______________________________________________________________________________________________________________________________________________________________________________________________________________________________________________________________________
____________________________
8
Nowadays, in many societies pension entitlements are built up from
various schemes that are regulated and administered by the state
(first pillar), employers and trade unions (second pillar), and/or
financial institutes (third pillar). Researchers in the field have
systematically analysed the development of multipillar pension
systems and the variety of institutional arrangements between the
policy actors over time (Arza and Kohli 2008; Ebbinghaus 2011; Natali
et al. 2017). Building on national country case studies, in comparative
contributions the scholars grouped together countries with similar
institutional approaches in order to better contrast the main
pathways and implications for the redistributive outcomes of such
systems.
Besides the common analytical approaches of pension pillars and
income tiers, two main archetypes of pension systems have been
conceptualised: Bismarckian social security systems were founded
mostly on one main public system that secure the elderly against
poverty (first tier of income) and maintain the living standard (second
tier of income). In contrast to the Bismarckian approach, in
Beveridgean systems the state restricted its role mostly to protect
the elderly against poverty. Additionally, the state might be involved
in joint regulation with employers and trade unions setting up
complementary pension schemes. Alternatively, the state might
increase incentives to take up personal pension plans with financial
institutes through favourable tax treatment and subsidised
contributions. Typically Beveridgean systems are also classified as
multipillar systems.
Ebbinghaus and Gronwald (2011) analysed the main pathways of
pension system development. In Bismarckian systems, occupational
(second-pillar) and personal (third pillar) pensions have been typically
crowded out, as the contribution-based pension income by the state
already served to maintain the living standard. It is particularly the
multipillar pension systems which crowd in a variety of alternative
solutions that may even partly or fully substitute the public system.
Following up on the policy brief by Natali and Pavolini in this
newsletter issue, this article will try to shed some more light on the
relevance of occupational pensions in the pension income mix
around the world.
Occupational welfare solutions set the scope for various outcomes:
How employers and employees share contributions to occupational
pension plans. Whether or not, individuals in case of job change can
transfer their rights to the new employer. But also whether or not,
individuals are allowed to cancel their accumulated rights from
occupational welfare at any point in time during their working career.
In contrast to this, personal pensions with financial institutes might
protect two very distinct groups, the ones earning above income
ceilings, and the ones who do not have sufficiently access to
occupational pensions respectively for whom personal pensions are
more suitable than employer-based solutions. Therefore, it is
important that during the data collection phase a clear distinction in
the income sources public vs. occupational vs. personal pensions
respectively nature and type of current pension savings contracts is
made.
In general, the Luxembourg Income Study (LIS) Database tries to
distinguish between various pension income sources/LIS variables:
employment-related public pensions,
old-age/disability/survivors universal pensions,
old-age/disability/survivors assistance pensions,
occupational pensions,
voluntary individual pensions.
For various LIS datasets from the early 2010s a split in all three
pension income sources public vs. occupational vs. personal is
available. The presented graph concentrates on the relevance of
occupational pensions in the pension income mix and its cross-
national variation. The numbers below the graph show the weighted
percentage of elderly persons (here defined as persons aged 65 or
older) receiving occupational pension income. In order to focus on
the pension income mix of retirees and to reduce the influence of
partial pensions in the pension income mix, for the presented income
Occupational pensions – data evidence of gender gaps
Jörg Neugschwender, LIS
Source: Luxembourg Income Study (LIS) Database
Inequality Matters LIS Newsletter, Issue No. 1 ______________________________________________________________________________________________________________________________________________________________________________________________________________________________________________________________________
____________________________
9
shares, the sample of the elderly (65 and older) has been further
restricted to those elderly, whose individual pension income is the
main income source (pension income larger than 50 % of total
individual labour income). Further breakdowns by three income
groups and by gender offer additional insights in the spread of
occupational pension income and its redistributive impact among the
elderly in current societies.
Among the analysed economies, in the Bismarckian countries such as
Luxembourg, Italy, Greece, and mostly in Germany, occupational
pensions are barely contributing to the pension income mix.
Although Germany and the United States show a similar pattern in
recipient rates, occupational pensions are relatively more important
in the United States due to the lower generosity of the public
earnings-related pension system. In general, in the Beveridgean
pension systems of Ireland, the United Kingdom, and the
Netherlands, there is a strong variation of relevance of occupational
pension in the income mix across the income groups. As occupational
pensions, particularly for high-skilled workers, function at the same
time as fringe benefits, a comparatively higher relevance of
occupational pensions in the upper end of the income distribution
could be expected.
The separate analyses by gender reveal in most of the countries a
strong gender gap. Ireland shows the highest difference between
men and women regarding the spread of occupational pensions
among the elderly population. The gender divide is also particularly
high in the Netherlands, where women due to a high relevance of
part-time employment careers collect substantially less contribution-
based entitlements; furthermore, the public residence-based pension
income is intertwined with the payment from occupational systems.
Note that the various Finnish occupation-based pension schemes are
a hybrid between public and occupational pensions, as they are
legislated by tripartite agreements; for this overview the various
Finnish contribution-based pension schemes have been reclassified
from public to occupational pensions.
References
Arza, C., and Kohli, M. (eds.) (2008a). Pension Reform in Europe. Politics, Policies and Outcomes. London/New York: Routledge.
Ebbinghaus, B. (ed.) (2011a). The Varieties of Pension Governance: Pension Privatization in Europe. Oxford: Oxford University Press.
Ebbinghaus, B., and Gronwald, M. (2011). ‘The Changing Public Private Pension Mix in Europe: From Path Dependence to Path Departure’, in B. Ebbinghaus (ed.), The Varieties of Pension Governance: Pension Privatization in Europe. Oxford: Oxford University Press, 23-53.
Natali, D. and Pavolini, E. with Vanhercke, B. (2017), Occupational Welfare in Europe. Risks, opportunities and social partner involvement in pensions and unemployment protection, ETUI, Brussels, forthcoming.
The phenomenon of regional disparities is prominent and has been
well-captured across different Central and Eastern European regions,
and Slovakia is no exception to that. Römisch (2003) argued that
Prague cannot be considered a representative in terms of economic
growth, infrastructure and employment rates for the rest of the
Czech Republic regions “…it is not wise to take the old town of
Prague as pars pro toto for the rest of the city or even the country…”,
and from the literature, we can certainly deduce that West Slovakia
is booming while the East is still lagging behind (Uramová and Kožiak
2008). This article will shed light on the evolution of West-East
regional disparities in Slovakia during the period 2004 – 2013 using
the LIS Database.
Slovakia is divided into four main regions, namely (from the West to
the East); Bratislava (capital city), Západné Slovensko (Western
Slovakia), Stredné Slovensko (Central Slovakia), and Východné
Slovensko (Eastern Slovakia). The West-East regional disparities are
captured in many forms, such as GDP per capita, employment, and
poverty indicators (OECD, 2013). Causes of such disparities can be
summarised as follows (Demmou et al. 2015; Römisch 2003):
1. Low job creation in the Eastern and Central regions of the
country, and insufficient labour mobility to the West.
2. The regions are not equally equipped with growth factors, and
by time these factors are used differently (both in terms of
amount and intensity).
3. Decreases in the production and employment of heavy
industries (coal, mining, chemistry and others).
4. Changes in the market dynamics after the fall of the iron
curtain revealed that some regions were in poor competitive
shape.
This article further investigates the role of employment as an
underlying stimulus of regional disparity in Slovakia. In the following,
three variables of the LIS Database are used to provide further
exploration of the phenomenon1:
Employed (emp): Indicator of any employment activity in the
current period.
Disposable Household Income (dhi): Total monetary and non-
monetary current income net of income taxes and social
security contributions (annual).
Labour Household Income (hil): Monetary payments and value
of non-monetary goods and services received from dependent
employment, as well as profits/losses and value of goods for
own consumption from self-employment (annual).
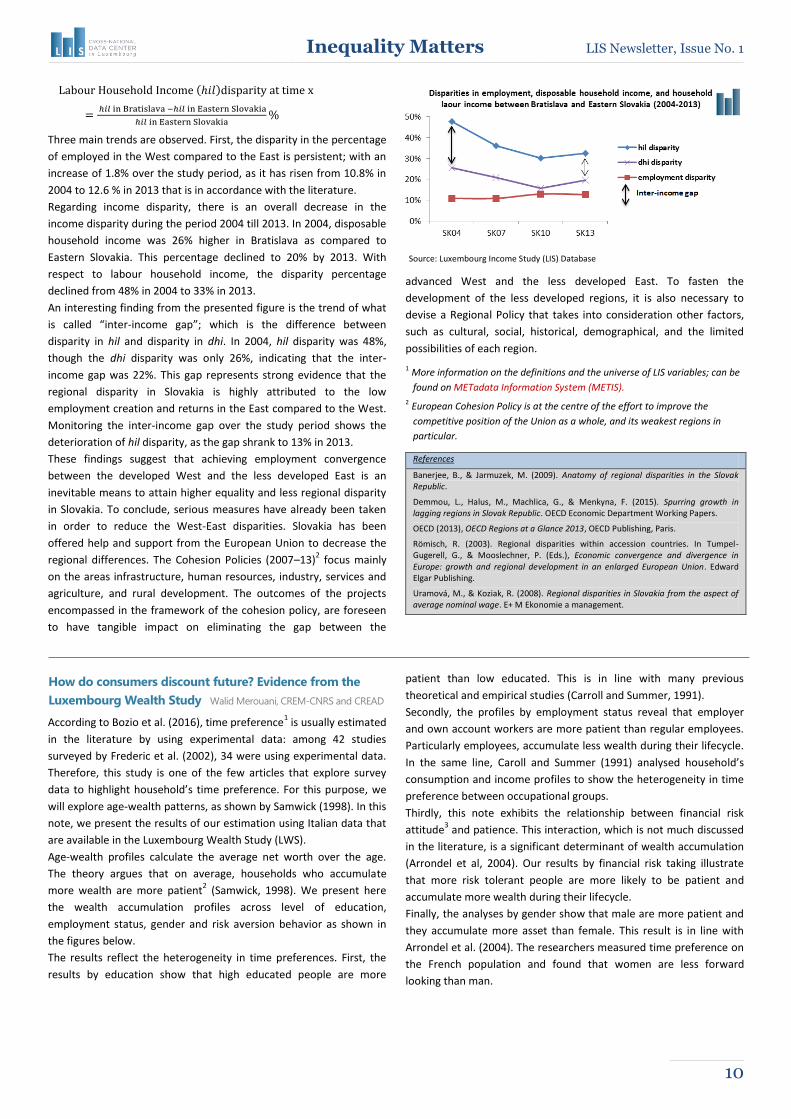
The figure below shows the evolution of regional disparities in terms
of employment, disposable household income, and labour household
income in the period of 2004-2013, between the developed capital
Bratislava in the West and the least developed region Východné
Slovensko (Eastern Slovakia). The figure displays the disparities as
percentage differences; the regional employment disparity is
measured as the difference in the percentage of employed in
Bratislava and Eastern Slovakia.
Employment disparity at time x = % of employed in Bratislava
- % of employed in Eastern Slovakia
The income disparity (for both dhi and hil) is measured as the
percentage of income increase in the Bratislava region, with
reference to the Eastern region.
( )
West-East regional disparities in Slovakia
Heba Omar, LIS
Inequality Matters LIS Newsletter, Issue No. 1 ______________________________________________________________________________________________________________________________________________________________________________________________________________________________________________________________________
____________________________
10
( )
Three main trends are observed. First, the disparity in the percentage
of employed in the West compared to the East is persistent; with an
increase of 1.8% over the study period, as it has risen from 10.8% in
2004 to 12.6 % in 2013 that is in accordance with the literature.
Regarding income disparity, there is an overall decrease in the
income disparity during the period 2004 till 2013. In 2004, disposable
household income was 26% higher in Bratislava as compared to
Eastern Slovakia. This percentage declined to 20% by 2013. With
respect to labour household income, the disparity percentage
declined from 48% in 2004 to 33% in 2013.
An interesting finding from the presented figure is the trend of what
is called “inter-income gap”; which is the difference between
disparity in hil and disparity in dhi. In 2004, hil disparity was 48%,
though the dhi disparity was only 26%, indicating that the inter-
income gap was 22%. This gap represents strong evidence that the
regional disparity in Slovakia is highly attributed to the low
employment creation and returns in the East compared to the West.
Monitoring the inter-income gap over the study period shows the
deterioration of hil disparity, as the gap shrank to 13% in 2013.
These findings suggest that achieving employment convergence
between the developed West and the less developed East is an
inevitable means to attain higher equality and less regional disparity
in Slovakia. To conclude, serious measures have already been taken
in order to reduce the West-East disparities. Slovakia has been
offered help and support from the European Union to decrease the
regional differences. The Cohesion Policies (2007–13)2 focus mainly
on the areas infrastructure, human resources, industry, services and
agriculture, and rural development. The outcomes of the projects
encompassed in the framework of the cohesion policy, are foreseen
to have tangible impact on eliminating the gap between the
advanced West and the less developed East. To fasten the
development of the less developed regions, it is also necessary to
devise a Regional Policy that takes into consideration other factors,
such as cultural, social, historical, demographical, and the limited
possibilities of each region.
1 More information on the definitions and the universe of LIS variables; can be
found on METadata Information System (METIS).
2 European Cohesion Policy is at the centre of the effort to improve the
competitive position of the Union as a whole, and its weakest regions in
particular.
References
Banerjee, B., & Jarmuzek, M. (2009). Anatomy of regional disparities in the Slovak Republic.
Demmou, L., Halus, M., Machlica, G., & Menkyna, F. (2015). Spurring growth in lagging regions in Slovak Republic. OECD Economic Department Working Papers.
OECD (2013), OECD Regions at a Glance 2013, OECD Publishing, Paris.
Römisch, R. (2003). Regional disparities within accession countries. In Tumpel-Gugerell, G., & Mooslechner, P. (Eds.), Economic convergence and divergence in Europe: growth and regional development in an enlarged European Union. Edward Elgar Publishing.
Uramová, M., & Koziak, R. (2008). Regional disparities in Slovakia from the aspect of average nominal wage. E+ M Ekonomie a management.
According to Bozio et al. (2016), time preference1 is usually estimated
in the literature by using experimental data: among 42 studies
surveyed by Frederic et al. (2002), 34 were using experimental data.
Therefore, this study is one of the few articles that explore survey
data to highlight household’s time preference. For this purpose, we
will explore age-wealth patterns, as shown by Samwick (1998). In this
note, we present the results of our estimation using Italian data that
are available in the Luxembourg Wealth Study (LWS).
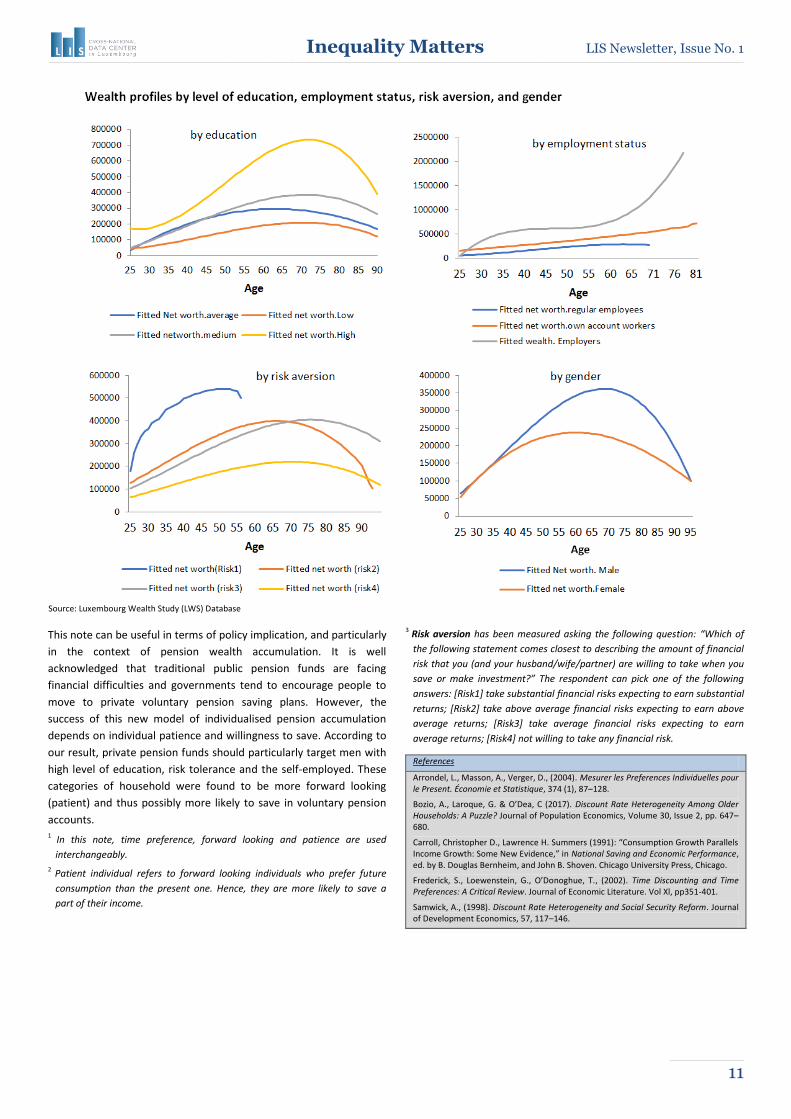
Age-wealth profiles calculate the average net worth over the age.
The theory argues that on average, households who accumulate
more wealth are more patient2 (Samwick, 1998). We present here
the wealth accumulation profiles across level of education,
employment status, gender and risk aversion behavior as shown in
the figures below.
The results reflect the heterogeneity in time preferences. First, the
results by education show that high educated people are more
patient than low educated. This is in line with many previous
theoretical and empirical studies (Carroll and Summer, 1991).
Secondly, the profiles by employment status reveal that employer
and own account workers are more patient than regular employees.
Particularly employees, accumulate less wealth during their lifecycle.
In the same line, Caroll and Summer (1991) analysed household’s
consumption and income profiles to show the heterogeneity in time
preference between occupational groups.
Thirdly, this note exhibits the relationship between financial risk
attitude3 and patience. This interaction, which is not much discussed
in the literature, is a significant determinant of wealth accumulation
(Arrondel et al, 2004). Our results by financial risk taking illustrate
that more risk tolerant people are more likely to be patient and
accumulate more wealth during their lifecycle.
Finally, the analyses by gender show that male are more patient and
they accumulate more asset than female. This result is in line with
Arrondel et al. (2004). The researchers measured time preference on
the French population and found that women are less forward
looking than man.
How do consumers discount future? Evidence from the
Luxembourg Wealth Study Walid Merouani, CREM-CNRS and CREAD
Source: Luxembourg Income Study (LIS) Database
Inequality Matters LIS Newsletter, Issue No. 1 ______________________________________________________________________________________________________________________________________________________________________________________________________________________________________________________________________
____________________________
11
This note can be useful in terms of policy implication, and particularly
in the context of pension wealth accumulation. It is well
acknowledged that traditional public pension funds are facing
financial difficulties and governments tend to encourage people to
move to private voluntary pension saving plans. However, the
success of this new model of individualised pension accumulation
depends on individual patience and willingness to save. According to
our result, private pension funds should particularly target men with
high level of education, risk tolerance and the self-employed. These
categories of household were found to be more forward looking
(patient) and thus possibly more likely to save in voluntary pension
accounts. 1 In this note, time preference, forward looking and patience are used
interchangeably.
2 Patient individual refers to forward looking individuals who prefer future
consumption than the present one. Hence, they are more likely to save a
part of their income.
3 Risk aversion has been measured asking the following question: “Which of
the following statement comes closest to describing the amount of financial
risk that you (and your husband/wife/partner) are willing to take when you
save or make investment?” The respondent can pick one of the following
answers: [Risk1] take substantial financial risks expecting to earn substantial
returns; [Risk2] take above average financial risks expecting to earn above
average returns; [Risk3] take average financial risks expecting to earn
average returns; [Risk4] not willing to take any financial risk.
References
Arrondel, L., Masson, A., Verger, D., (2004). Mesurer les Preferences Individuelles pour le Present. Économie et Statistique, 374 (1), 87–128.
Bozio, A., Laroque, G. & O’Dea, C (2017). Discount Rate Heterogeneity Among Older Households: A Puzzle? Journal of Population Economics, Volume 30, Issue 2, pp. 647–680.
Carroll, Christopher D., Lawrence H. Summers (1991): “Consumption Growth Parallels Income Growth: Some New Evidence,” in National Saving and Economic Performance, ed. by B. Douglas Bernheim, and John B. Shoven. Chicago University Press, Chicago.
Frederick, S., Loewenstein, G., O’Donoghue, T., (2002). Time Discounting and Time Preferences: A Critical Review. Journal of Economic Literature. Vol Xl, pp351-401.
Samwick, A., (1998). Discount Rate Heterogeneity and Social Security Reform. Journal of Development Economics, 57, 117–146.
Source: Luxembourg Wealth Study (LWS) Database
Inequality Matters LIS Newsletter, Issue No. 1 ______________________________________________________________________________________________________________________________________________________________________________________________________________________________________________________________________
____________________________
12
LIS is delighted to announce the launch of the LIS METadata
Information System (METIS), a powerful search tool that documents
the structure and content of the LIS and LWS databases. METIS
capitalises on exciting new technologies and on the strengths of the
LIS/LWS microdata, thus better enabling and promoting the highest
quality social science research. It provides immediate access to our
comprehensive documentation, without the need for scrolling
through hundreds of documents.
The new web interface allows our users to create customised queries
that can be also exported to Microsoft Excel. The main functionality
of METIS is the crossed compare screen, where variable-specific or
dataset-specific codebooks for several datasets can be retrieved, at
the same time. We strongly encourage our data users to consult
METIS and the rich documentation that it contains. For further
instructions please see our webpage.
LIS is pleased to announce that François Bourguignon has been
named President of the Board of LIS: Cross-National Data Center in
Luxembourg.
François Bourguignon is a well-recognised economist working on
income distribution, inequality and poverty, redistribution, and
economic development. He is a former Chief Economist and Senior
Vice President of the World Bank (2003-2007), professor and former
director at the Paris School of Economics, and former professor at
the ‘Ecole des Hautes Etudes en Sciences Politiques’.
François held a number of advisory positions and has received
several honors, most recently the Chevalier de l’Ordre National de la
Légion d’Honneur, France (2010), the Médaille d’honneur de la Santé
et des Affaires Sociales, France (2012), and the Juan Luis Londono
Prize, Lacea, Bogota-Colombia (2012).
In January, we were welcoming two scholars who worked onsite with
the LIS/LWS data; namely Walid Merouani and Justyna Wilk who
among many others before applied through the InGRID project.
Walid Merouani is an Associate Researcher at the Research Center of
Economy and Management in Université Caen Normandie in France,
and permanent Researcher at Centre de Recherche en Economie
Appliquée pour le Développement-CREAD in Algeria. During his
second visit at LIS, Walid was using the LWS Database to study how
people consume during their life cycle by using life cycle theory. In
this regard, he compares age-consumption, age-income, and age-net
worth among many countries. He aims to analyse household
behaviour according to many household characteristics (socio
economic characteristics, risk aversion, and inter-temporal choices).
Justyna Wilk works as Associate Professor at the Adam Mickiewicz
University in Poznan, Poland. During her second visit at LIS, Justyna
was working with the LIS Database to study cross-national
inequalities of social inclusion across Europe after the financial and
economic crisis. She applies a spatio-temporal study to compare the
regional disproportions to examine the progress in the social
inclusion process, and she is also interested to examine the spatial
relations over four LIS Waves.
News, Events and Updates
Interactive METadata Information System (METIS)
François Bourguignon has been named President of
LIS Board
Visiting scholars at LIS
Editor: Jörg Neugschwender Layout and Design: Heba Omar & Jörg Neugschwender
The views and opinions set out in this newsletter are those of the author(s) and do not necessarily reflect the official opinion of LIS and its Boards.
2017 LIS Introductory Summer Workshop
Luxembourg, 18-22 June 2017
The LIS Summer Workshop will be held at the University of Luxembourg,
Belval Campus, Esch-sur-Alzette, the Grand Duchy of Luxembourg. The
workshop format will contain a mixture of lectures taught in English and
lab sessions explained in Stata. Participants will be introduced to the LIS
and LWS databases, concepts and analytic measures of income and
wealth, and some research conducted with the LIS/LWS data. The
successful completion of the workshop will enable the participants to work
independently with LIS’ remote access system.
Applicants are expected to be versed in descriptive and inferential
statistics, have working knowledge of Stata as well as basic programming
skills with Stata or any other statistical software (R, SAS, SPSS).
Researchers and doctoral students from various social science disciplines
are invited to apply.
For more information please visit our webpage.
Applications should be submitted online by March 26, 2017.
LIS/LWS Users Conference
Luxembourg, 27-28 April 2017
LIS has been providing data on income and wealth for comparative research since 1983. Over the years, our databases: Luxembourg Income Study (LIS) and Luxembourg Wealth Study (LWS) have made possible hundreds of publications, including many articles in top journals. This long lasting activity would have not been possible without our users. In order to strengthen this community, LIS organises the first LIS/LWS Users Conference, giving researchers the opportunity to present papers based on our databases.
Papers from economics to political sciences, sociology and social policy were selected by a Scientific Committee that included: Louis Chauvel (University of Luxembourg), Daniele Checchi (University of Milano & LIS), Conchita D’Ambrosio (University of Luxembourg), Janet Gornick (The City University of New York & LIS), Aline Muller (LISER), Carmen Petrovici (LIS), Eva Sierminska (LISER), and Philippe Van Kerm (LISER).
The papers reflect the diversity of topics that can be studied using our databases, from inequality and poverty to labour market participation, from saving patterns to class composition.
You are welcomed to register to attend the conference via our website where you can also find the full programme:
www.lisdatacenter.org/news-and-events/lislws-user-conference-2017/
Related Documents