ERSTE Foundation Fellowship for Social Research Labour Market and Employment in Central and Eastern Europe 2013–2014 Inequality in Total Returns to Work in Ukraine: Taking a Closer Look at Workplace (Dis)Amenities Olena Nizalova

Inequality in Total Returns to Work in Ukraine: Taking a Closer Look at Workplace (Dis)Amenities
Jul 24, 2016
By Olena Nizalova. ERSTE Foundation Fellowship for Social Research: Labour Market and Employment in Central and Eastern Europe 2013–2014 http://www.erstestiftung.org/social-research
Welcome message from author
This document is posted to help you gain knowledge. Please leave a comment to let me know what you think about it! Share it to your friends and learn new things together.
Transcript

ERSTE FoundationFellowship for Social Research
Labour Market and Employment in Central and Eastern Europe
2013–2014
Inequality in Total Returns to Work in Ukraine: Taking a Closer Look at Workplace (Dis)AmenitiesOlena Nizalova

INEQUALITY IN TOTAL RETURNS TO
WORK IN UKRAINE: TAKING A CLOSER
LOOK ATWORKPLACE (DIS)AMENITIES!
Preliminary draft do not quote without Author’s permission
Olena Nizalova †
Kyiv School of Economics/ University of Kent/ IZA
N117 Cornwallis Building
Canterbury, CT2 7NF, UK
Tel.: 44.1227.824966
E-mail: [email protected]
May 20, 2014
Keywords: workplace injuries, disamenities, amenities, non-wage benefits, multidi-
mensional inequality, non-parametric
JEL Classification Numbers: J81, D63, C14
Manuscript contains: 8585 words, 13 figures, 5 tables
!This project has been financially supported by the ERSTE Foundation through the 2013 Fellowship forSocial Research.
†The author is thankful to Nataliia Shapoval, Vadym Bizyaev, and Vladyslav Petrov for excellent researchassistance. A special gratitude goes to Tom Coupe for access to the ULFS data, and Elena Korosteleva forfruitful discussions.
1

Abstract
This paper examines the importance of non-monetary dimensions of work in stud-ies of overall compensation inequality. Relying on the methodological advances in thefield of multidimensional inequality and using the representative sample of Ukrainianindustrial establishments over the period from 1994 to 2004, we show that the focuson monetary compensation is too narrow. It ignores significant dynamics of inequalityin workplaces. Analysis of such workplace conditions as risk of on the job injury,various benefits/amenities, and insecurities with wage payments, shows that the in-equalities in these conditions do exacerbate inequalities in hourly wages. Workers inestablishments paying highest hourly wages have enjoyed relatively greater reductionsin the total workplace injury burden, greater retention of various benefits/ amenities,and relatively larger increases in wage payment security (decreased wage arrears),compared to the workers in the lowest paying establishments. These findings presentan important lesson for further research on inequality inasmuch as a narrow focus onwages actually disguise the growing inequality in overall returns to work, as well asconsiderable implications for the development of social policies.
2

1 Introduction
More than two decades after the collapse of the Soviet Union, public opinion polls
in the New Independent States show that people are unhappy about the state of affairs
with political and economic life. These are the same people who, inspired by Western
democracies in political realm and superiority of the capitalistic system in the economic
domain, voted for independence. For example, in Ukraine 90% of the population voted for
independence in the national referendum in December 1991. Tired of corruption, life in
scarcity and deficit, and attracted by the abundance and opportunities, which the Western
model offered, people entrusted their lives to the hands of newly formed governments with
the hope that this will bring a better life if not for themselves, then for their children. For
example, according to the Times Mirror Center survey in the spring of 1991, 72% percent
of Ukrainians supported the change to democratic rule and 54% showed approval for the
movement towards market economy (Pew Research Center, 2011). Twenty years later,
according to the same source, only 35% of Ukrainians approve multi-party system and
only 34% – market economy. About 95% of Ukrainians think, politicians have benefited a
great deal or a fair amount from the changes since 1991, and 76% say this about business
owners. Only 11% believe that ordinary people have benefited from the change. A great
part of the disillusionment may be explained by the increasing inequality in both existing
conditions and opportunities.
As Stiglitz (2013) points out, an increasing inequality creates considerable tensions in
the society, which may lead to civil movements and attempts by people to correct what
went wrong in their countries. The most recent history has provided a number of examples
starting fromGermany in first half of the 20th century and the Arab spring a short while ago.
Since the previous year the protests around the world1 have demonstrated the increasing
anger of the public and the feeling that inequality has gone too far. The World Economic
Forums Global Risk Report rated inequality as one of the top global risks of 20132. Even
the IMF and the Economist agree on this matter3. Adjustments to rising inequality may1http://occupywallst.org/2http://www.weforum.org/issues/global-risks3http://www.economist.com/node/21564413, http://blog-imfdirect.imf.org/2011/04/08/inequality-and-
growth/
3
be applied through a more progressive tax system. But some policy makers argue that
the alleviation of tax burden from the rich would eventually lead to the creation of more
jobs for everyone (so-called “trickle-down” economics). Yet, a lengthy period of persistent
growth in inequality combined with the movement towards a less progressive tax system in
the USA and other developed countries, and at the same time worsening of the well-being
of the majority of population, has shown that the “trickle-down” simply does not work
(Stiglitz, 2013). Moreover, more and more evidence is suggesting that inequality harms the
society in many dimensions, which have been out of focus of the economists before. Simple
country level comparisons show that countries with higher disparity between the top and
bottom quartiles of the income distribution have higher rates of mental illness, drug use,
and homicide; a larger proportion of their population is imprisoned and obese; children in
these countries are much more likely to drop-out from high school, less likely to experience
upward socio-economic mobility, and have, in general, lower level of well-being; the level
of trust is also lower in these unequal countries (Wilkinson & Pickett, 2010). At the macro
level, inequality has also been shown to impede sustainable growth (Ostry & Berg, 2011).
The literature on income inequality has flourished in the first decade of the 21st century
with considerable attention being paid to the methodological aspects of the measurement,
decomposition and analysis of the underlying causes of the phenomenon. It should be
noted, that researchers’ focus has also shifted towards documenting and studying more
carefully various non-monetary characteristics of individual and household well-being,
from housing conditions and health status to social exclusion. Scholars of social exclusion
usually conceptualize it either as the lack of participation in social institutions (Paugam &
Russell, 2000; Chakravarty & D’Ambrosio, 2006), or as the denial or non-realization of
rights of citizenship (Room, 1995), or the increase in distance among population groups
(Akerlof, 1997). Few works have explored the issue of income/wage inequality in Ukraine
and Russia (Ganguli & Terrell, 2006; Galbraith et al., 2004; Gorodnichenko et al., 2010;
Lokshin & Ravallion, 2005), and found that, if anything, the change in inequality after
1995 has been quite modest. But does the measure used in the earlier studies reflect the
true inequality levels in the society? Is there anything important missing from the picture?
This paper tries to address this question and explore whether the non-monetary dimensions
4

of work can explain the growing tensions in the society where the changes in income/wage
inequality have been quite modest. The study of non-monetary working conditions is im-
portant for several reasons.
First, work is central to people’s lives not only because major share of the household
income in most countries comes from earnings (Guerriero, 2012), but also because indi-
viduals spend a considerable part of their time at work. Thus, as Rosen (1986) points out,
the conditions in which people work do matter and they constitute part of the total com-
pensation to work individuals obtain. Rosen’s (1986) theory shows that riskier jobs have to
be compensated by higher wages, while more pleasant working conditions can be obtained
at the expense of lower wages. Taking Rosen’s theory a step further, Hamermesh (1999)
shows that the increasing wage inequality may lead to a situation when high wage earners
would opt for safer working environment by giving up part of their ever-growing wage,
while low-wage earners may, in fact, choose riskier jobs to secure somewhat higher earn-
ings, as the price of risk increases. Therefore, empirically, the observed persistent increase
of the earnings inequality can be either mitigated or exacerbated by the trends in the non-
wage compensation. Thus, rising earnings inequality can inappropriately reflect the true
level of the total inequality in the labor market. Moreover, there is some evidence that even
in the absence of the relationship between working conditions and individual wages, like
in the Finnish labor market, adverse working conditions substantially increase the level of
job dissatisfaction and the perception of unfairness of pay at the workplace (Bockerman &
Ilmakunnas, 2006).
Second, the importance of this direction of research is further highlighted by the devel-
opment of the ILO “Decent work agenda”. One of its aims is to promote both inclusion
and productivity by ensuring that women and men enjoy working conditions, which satisfy
several criteria. They are safe, allow adequate free time and rest, take into account family
and social values, provide for reasonable compensation in case of lost or reduced income,
and permit access to adequate healthcare 4.
Third, inequality in working conditions, and in particular workplace injuries, may di-
rectly translate into income and wealth inequality, and, indirectly, affect inequality in future4http://www.ilo.org/global/about-the-ilo/decent-work-agenda/lang–en/index.htm
5
generations. For example, Marquis & Manning (1999) find that in the USA worker’s com-
pensation in case of on-the-job injury replaces only 32 to 41 percent of 10-year pretax
losses. These large losses lead injured workers to borrow money, sell their cars, move to
less expensive housing or even sell a home (another venue for the impact on children’s
future outcomes), draw down their savings, and so on (Keogh et al., 2000). These losses
are not compensated by the increased involvement of injured workers into household pro-
duction. In fact, 40 percent of injured workers reduce their household work by 1 or more
days and 11 percent report that they no longer could do housework. Moreover, a substan-
tial number of injured workers require care during recovery - increasing time demands on
other family members (Hensler et al., 1991). Moreover, if low wage earners are work-
ing during inconvenient hours, are more bound to shift type of employment, experience
greater insecurity in wage payments and greater risks of on-the-job injury, while having
fewer possibilities for training, health care, and less access to childcare facilities, this may
jeopardize opportunities for their children as well. This type of employment would mean
that people are in general more likely to be tired, less healthy and more likely to become
disabled, making it less likely that their children would get proper educational and health
investments and, thus, reinforce the inequality in the future.
Finally, as one of the few works on transition countries (Senik, 2009) shows, the most
important reference group for people in transition countries are former school mates and
colleagues and that the most important negative welfare impact comes from the deterio-
ration of one’s own standard of living and from under-performing relative to these two
reference groups. Therefore, inequality in workplaces concerns one of these two important
reference groups. If this is true for the monetary dimension, this may be relevant for a
non-monetary job characteristics as well. This is in contrast to Western European countries
where the comparison with family members and “others”, but not the colleagues, hurts
most and prompts a demand for income redistribution (Clark & Senik, 2010).
This paper investigates whether the inequality in non-monetary workplace conditions
exacerbates the inequality in monetary compensation in Ukraine. It contributes to the liter-
ature in several ways. First of all, it expands the inequality literature by taking the method-
ology developed in the area of mutli-dimensional inequality and health inequity and apply-
6
ing it to the study of non-monetary aspects of jobs – workplace amenities and disamenities.
Second, it represents the first attempt to measure the inequality in workplace (dis)amenities
in one of the FSU countries and compares its time dynamics to that of monetary work com-
pensation. Third, and most importantly, it documents the degree of an unequal shift away
from work-centered provision of social services – the phenomenon which has not been
addressed by the state in the social policy reforms. Furthermore, it highlights the impor-
tance of the development of the multi-dimensional measure of inequality in total returns to
work addressing two important peculiarities of the setting under consideration – the need
to combine the measures of both amenities and disamenities and the fact that for some of
the indicators data contains a considerable number of zeros.
Establishment level data from the Ukrainian Labour Flexibility Survey for the period
1994-2004 is used in the analysis. The available measures of workplace risks include the
following: incidence of injuries, average duration of injuries, total number of workdays
lost due to injury. In addition, various other job amenities and disamenities are considered,
such as number of working shifts, housing subsidies, prevalence of wage arrears, provision
of rest houses, paid health services, and others.
The analysis shows that establishments, which pay higher wages, tend to provide safer
and, in general, better working conditions than establishments, which pay lower wages.
In addition, the latter are much more likely to experience difficulties with the payment
of wages and have higher percentage of workers with severe (more than 3 months) wage
arrears. A further distributive analysis has shown that the burden of workplace injuries,
measured as total work days lost due to injuries per 100 Full Time Equivalent (FTE) em-
ployees, over time has shifted from being concentrated in the top part of the wage distribu-
tion to the lowest part. Moreover, the distribution of employer-provided benefits has also
changed from being almost equally spread across the wage distribution to being more con-
centrated in the upper part. And this result is not driven by any one particular amenity –
it is observed across the whole range of indicators. Similarly, wage arrears’ concentration
has changed from being almost equally distributed across all wage levels to being more
concentrated among lower paying establishments. The non-parametric regression results
go in line with the other approaches – wages tend to be positively associated with ameni-
7
ties, negatively with wage arrears, and the relationship between wages and total injuries is
virtually non-existent. Analysis of distributional shifts in the establishment characteristics
over corresponding period shows significant changes only with respect to the firm size and
export status, and some sectoral shifts.
The remainder of the paper is structured as follows. Section 2 is devoted to the literature
review followed by the theoretical considerations in Section 3. Data description is provided
in Section 4. Section 5 presents the results. Section 6 is devoted to the discussion of policy
implications followed by the conclusions.
2 Related Literature
From the economic perspective, inequality is simply the difference between individuals
or groups of individuals or populations in the distribution of assets, wealth, income, or any
other measure of well-being. This paper focuses on inequality in returns to work taking
into account the fact that they consist not only from monetary compensation but also from
various amenities and disamenities. This is important because the workers spend a consid-
erable amount of time at work; and the working conditions, and workers satisfaction with
them, may have serious consequences for his/her future physical and emotional health and,
as a result, future well-being. Since the literature on inequality in workplace conditions is
quite scarce, this review will focus more broadly on the wage inequality literature and the
developments in the measurements of multiple inequality as most relevant for the chosen
empirical strategy.
The literature on wage inequality has mostly been preoccupied with the factors, which
have contributed to the increase in wage inequality at the end of the 20th century. This
literature has been quite rich, but sometimes contradictory. For example, Levy & Murnane
(1992) and Goos & Manning (2007) argue that wage inequality growth has been caused
by skill-biased technology developments: e.g. the invention of computers had eliminated
many middle-income routine jobs and made the upper-tail wage inequality grow faster (Au-
tor et al., 2003). In line with these studies, Autor et al. (2008) show that the information
technology exacerbated polarization in wage distribution at the expense of middle class.
8

However, Card & DiNardo (2002) find only weak evidence of skilled-biased technology
to be responsible for inequality growth of 1980-1990s. According to them and other au-
thors (Bound & Johnson, 1992; Viscusi & Aldy, 2003), the transformation of economic
institutions could have also contributed to the observed phenomenon. Effects of global-
ization, trade liberalization and immigration have been considered by Borjas et al. (1997).
Trade liberalization, on the one hand, shapes the industrial composition of the economy
and, therefore, defines how intensively the country uses labor-capital factors of production
and, hence, influences demand for different types of skills. On the other hand, globaliza-
tion may create the inflow of the labor of either high, or low skills. Interestingly, exogenous
determinants of various skills migration have been shown (Borjas et al., 1996) to be insuf-
ficiently influential to account for more than a small proportion of the overall increase in
wage inequality.
Another part of the literature considers changes in the wage distribution due to underly-
ing changes in the distribution of population groups (Autor et al., 2003; Goos & Manning,
2007; Autor et al., 2008). Autor et al. (2008) use time series models in order to disentangle
demand-side, supply-side and institutional factors in their impact on educational wage dif-
ferentials and overall wage inequality. They find that the increased inequality in wages in
the USA over the period 1963-2005 is in line with the skill-biased technical change hypoth-
esis – information technology complements highly educated workers engaged in abstract
tasks, substitutes for moderately educated workers performing routine tasks, and has less
impact on low-skilled workers performing manual tasks.
Although, the wage data is readily available in many countries, earlier research have
shown, albeit not always persuasively with respect to all job characteristics (Brown, 1980;
Biddle & Zarkin, 1988; Rosen, 1986; Viscusi, 2004; Quintana-Domeque, 2011), that work-
ers may be compensated for (dis)amenities on the job by higher (lower) wages. And, thus,
ignoring these aspects of workplaces, may result in misleading conclusions. Therefore, a
more comprehensive measure of total returns to work maybe warranted in the studies of
inequality in labor markets.
Some authors in the past looked at the overall job satisfaction (Hamermesh, 2001; Clark
& Oswald, 1996) as a measure of total returns to work. Yet, this measure has been criticized
9
as the workers’ job satisfaction is influenced by the opinion of the peers and by the expec-
tations the worker formed prior to joining the job. Thus, the distribution of job satisfaction
may not necessarily reflect the distribution of total returns to work. Other authors have tried
to quantify total returns to work by attaching monetary value to various benefits provided
by employers, such as leave benefits, pension payments and health insurance. These stud-
ies find that in the United States the inequality in these measures of total compensation has
been growing faster than the inequality in wages (Pierce, 2001; Chung, 2003). However,
there exists a considerable number of job characteristics, which are not easily quantifiable
in monetary terms. So, the only strategy for a researcher is to investigate the dynamics
of each of the available job characteristics and reach the conclusion based on the overall
evidence.
Hamermesh (1999) follows this route and explores whether the rising wage inequality
overstates or understates the true extent of the change in overall inequality in returns to
work by considering the non-wage aspects of work which are difficult to quantify. Extend-
ing Rosen’s (1986) Theory of Equalizing Wage Differentials, he finds empirical evidence
that the increasing wage inequality over the period from 1979 to 1995 in the USA have
coincided with the declining relative risk in high wage industries and a relative increase in
the likelihood of disamenity of night/evening work in low-wage industries.
Similar to the literature on returns to work, the literature on overall household in-
come/expenditure inequality has long suffered from narrow focus on monetary dimension.
Although justified by data availability and methodological developments at the time, schol-
ars in development economics have realized the multidimensional nature of inequality and
poverty and expanded the necessary methodology. Sen’s (1985; 1992) calls for alternative
approaches targeting the inequality of capabilities to achieve valuable functionings that
make up our lives, and more generally, our freedom to promote objectives we have reasons
to value, got methodological and empirical attention.
An expanding literature on multidimensional inequality indices has gradually followed
in the coming years (Maasoumi, 1986; Maasoumi & Jeong, 1985; Maasoumi & Nickels-
burg, 1988; Tsui, 1995; Koshevoy & Mosler, 1996, 1997). The information from multi-
variate distribution has been converted into real-value measurement both through welfarist
10

(Maasoumi, 1986) and nonwelfarist (Tsui, 1995, 1999) approaches. Conventional measures
of inequality have also been adapted for the multivariate case: Lorenz curve and Lorenz or-
der gave birth to multivariate generalizations – Lorenz zonotope (Koshevoy, 1995), Lorenz
zonoid and Lorenz surface (Koshevoy & Mosler, 1996). Gini indexes have also been ex-
tended to multivariate case (Koshevoy & Mosler, 1997). With the growing attention to
health inequities in relation to socioeconomic status of individuals, the analogues of the
regular instruments for measuring socioeconomic inequality appeared also in the health
field (Wagstaff et al., 1991; Kakwani & Bank, 1980).
This paper contributes to the inequality literature in several dimensions. First, it im-
proves on the previous literature on inequalities in workplace (dis)amenities by relying on
a firm-level (in contrast to industry-level) data set which describes a wide range of job
characteristics. Second, it applies the distributional analysis apparatus developed for the
study of multidimensional inequality in a new setting of workplace (dis)amenities. Finally,
it studies the inequality in overall returns to work in one of the Former Socialists countries,
where the population sentiments towards equality are still high and the danger of growing
inequality in any dimension should not be underestimated, and where changes in wages and
workplace conditions have been caused by major institutional changes, not the changes of
underlying population/establishments characteristics.
3 Theoretical Background and Empirical Strategy
This paper refers to the standard compensating wage differentials theory developed by
Rosen (1986) and further explored with respect to the dynamics of wage inequality by
Hamermesh (1999). Comparing a low-wage earner to a high-wage earner who face a dif-
ferential exogenous change in full earnings, Hamermesh (1999) arrives at the conclusion
that we may observe an increasing inequality in workplace amenities between these work-
ers for the following reasons. The increase in the real wage observed throughout low-wage
and high-wage sectors has two effects – income and substitution. As amenity is assumed
to be a normal good, income effect of increasing wages ensures that workers consume less
of disamenity (more of amenity). But the “rising return to accepting risk generates a price
11

[substitution] effect that leads him/her [low-wage worker] to accept more of the disamenity
[less of the amenity]” (Hamermesh, 1999, p.1090, p.1089).
The overall effect of the increased real wages will depend on the relative size of the
two effects – income and substitution – as they are of opposite directions. Since the wage
growth for high-wage earners has been disproportionately greater than that for low-wage
earners, Hamermesh (1999) argue that the income effect would dominate for the former
while the latter will observe dominating substitution effect. As a result, a compression of
differences in risks between the two groups of workers will be observed with a correspond-
ing increased dispersion in the wage distribution. Or, as Hamermesh (1999, p.1090) states,
those workers whose earnings are falling (rising) relative to those of the average worker
will also find their burden of the disamenity rising (falling) relative to that of the average
worker, provided that the degree of relative risk aversion is not decreasing in full earnings.
For the purpose of this study, all that is required is an exogenous shock generating changing
differentials in earnings and in distribution of amenities. This seems to be a very reasonable
assumption for Ukraine as during the considered period labor market changes had mostly
been driven by political will, not by changing workers preferences and characteristics.
To investigate whether the dynamics of inequality in workplace (dis)amenities exac-
erbates or mitigates the wage inequality, two approaches are taken. First is the graphical
analysis similar to that of Hamermesh (1999) and the second is the distributive analysis
following the multi-dimensional inequality literature.
To analyze the distribution of wages and workplace amenities and disamenities, first all
of the establishments in the sample are ranked according to the level of hourly wages paid
to regular workers. Then the characteristics and the wage level of the average establishment
in the first quartile of the wage distribution are determined. Then the difference between
log wage of a particular establishment and that of the average lowest quartile establishment
is obtained for each of the establishments in the 2nd, 3rd, and 4th quartiles. Concerning the
other job characteristics, the ratio is taken between the actual measure of the characteristic
and the average establishment in the 1st quartile. The averages of these ratios and their
time dynamics are then depicted on the graphs for further visual analysis.
While the quartile analysis is somewhat informative, the distributive analysis offers
12
wider opportunities of exploring the associations between movements of monetary and
non-monetary aspects of returns to work depending on the place of the establishment in
the wage distribution. This part makes use of the Distributive Analysis STATA Package
(DASP) (Araar & Duclos, 2007) to:
• Study time dynamics of the Lorenz curve and the concentration curves for three
dimensions of work: total workplace injury burden, amenities score, and prevalence
of wage arrears;
• Estimate the corresponding concentration indices to see whether the situation is sig-
nificantly different from the 45 ! line, and explore overtime dynamics;
• Estimate the differences between the concentration coefficients over time and analyze
the timing of the change.
In addition, the paper offers a non-parametric lowess smoothing to analyze whether
there has been a change overtime in the joint movement of wages and the three non-wage
dimensions of work considered in this paper, as well as an attempt to construct a hybrid
index by estimating multidimensional inequality indices (Araar, 2009) for wages and other
non-monetary job characteristics and analyze its time dynamics. The analysis is followed
by the discussion of possible reasons behind the changes in inequality and corresponding
policy implications.
4 Data Description
Ideally, the question of inequality in total returns to work is to be studied using a
matched employer-employee data to allow controlling for workers preferences and job
characteristics. This data is not available for Ukraine. But this study does represent an
improvement over Hamermesh (1999) in terms of data use as it relies on the establishment
level information from the Ukrainian Labor Flexibility Surveys for the years 1994, 1996,
1999, 2002, 2004 initiated by the International Labour Organization. This data set is the
only longitudinal survey of Ukrainian industrial establishments, which provides compre-
hensive information on the average characteristics of the firms and workplaces, including
13
wages, workforce, injuries, working time, shifts, and other amenities. It should be pointed
out that the data was available also for the year 2000, but the measures of wages in this
year were totally off reasonable pattern and it has been decided to drop this year from the
analysis. This issue is discussed later in the Results section.
The ULFS started in 1994 as part of the collaboration of the ILOwith the State Statistics
Office of Ukraine surveying a random sample of industrial establishments in six regions
of Ukraine: Kyiv City, Kyiv Region, Donetsk, Kharkiv, Lviv and Mykolyiv. By 1999,
the survey covered all the regions of Ukraine, thus, providing an unbalance sample of
industrial establishments for research analysis. As in other flexibility surveys conducted by
ILO, ULFS is based on the interviews with senior managers and two questionnaires, one
completed by the establishment, the other administered orally in discussion with managers,
often accompanied by senior staff (Standing & Zsoldos, 2001).
The ULFS provides a number of measures for earnings, including separately for em-
ployees, regular and non-regular workers. As workers are the ones who are more likely to
be exposed to the risk of injury on the job, this paper relies on the measures of earnings
for regular workers. So, earnings in each establishment in each year are computed as the
sum of full-time equivalent average monthly earnings, overtime pay, and bonuses for estab-
lishments, where a positive number of working hours in the past month has been reported.
However, the analysis relies on the hourly wage rate calculated from the above-described
measure and the total number of hours (including overtime) in the previous week multi-
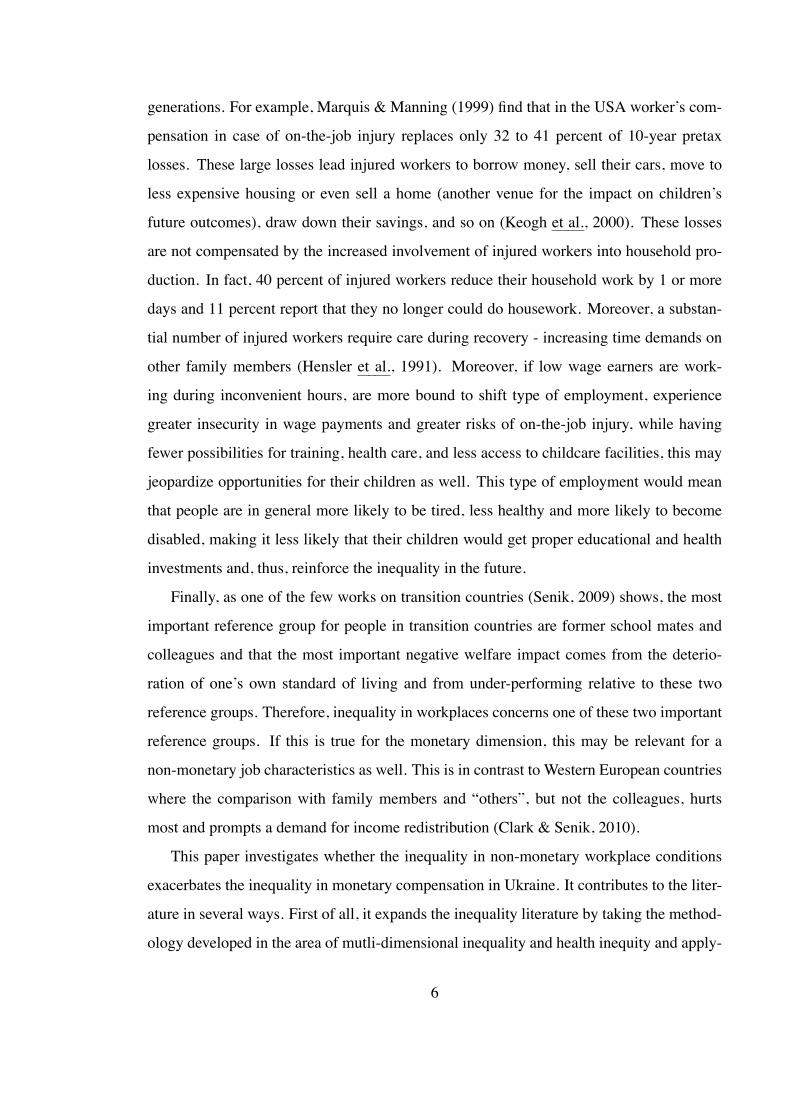
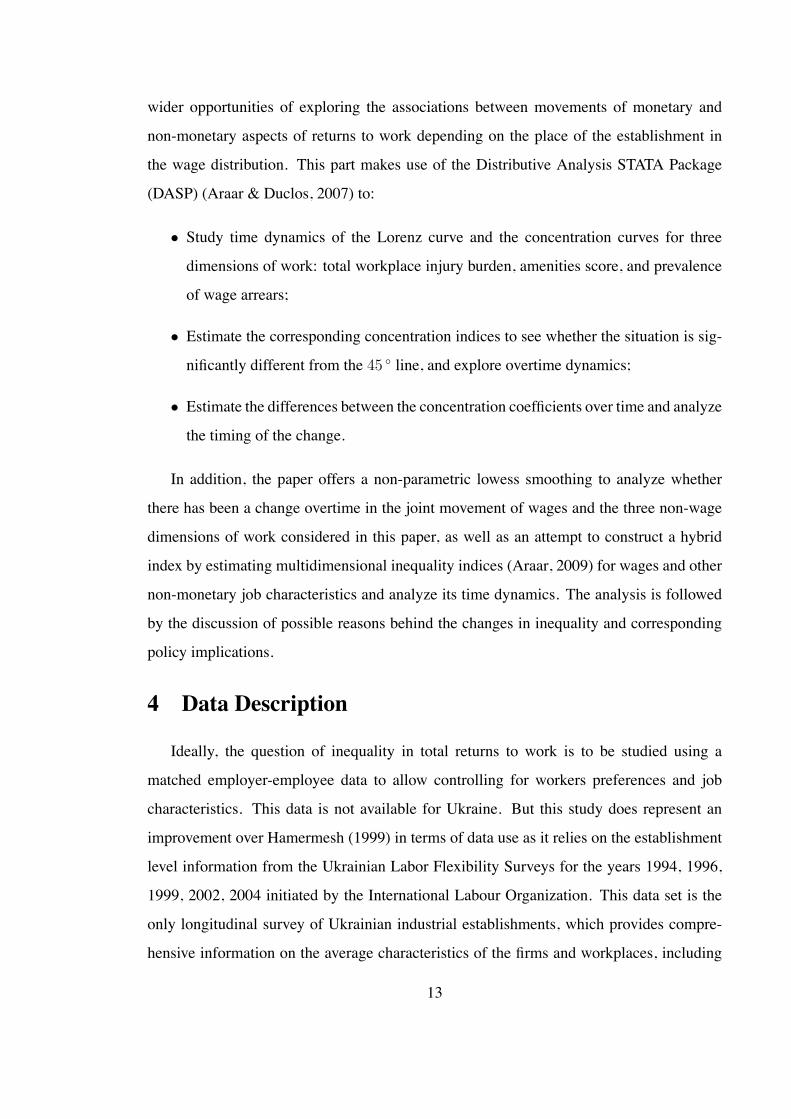
plied by four. Figure 2 offers a comparison of the average monthly wage as reported in
the ULFS (weighed by the number of workers) and various measures of monthly wages as
derived from the National Statistics.5 Although it is difficult to find a comparative measure
and the data overlaps only for a couple of years, it is obvious that the growing trend is
similar. Yet, one should be careful as the composition of industry groups in the National
Statistics does not correspond to those in the ULFS. For example, highest paying industry
sector – energy production and supply – is combined with water supply, which is bringing
the average down considerably. At the same time, the overall industry measure contains5Accessed at http://ukrstat.org/uk/operativ/operativ2006/gdn/prc rik/prc rik u/dszpPD u2005.html on
May 19, 2014.
14
mining, which is not part of the ULFS, and the composition of the “other” group is not
clear.
Concerning the measures of (dis)amenities, the main variables of interest are: (i) INC
– number of work related accidents per 100 Full-time equivalent workers, (ii) DUR – the
average duration of injury in workdays, and (iii) TOTINJ – the total number of days lost due
to lost-workday injuries per 100 FTE workers. These three measures and other workplace
(dis)amenities are presented in Table 1 along with the corresponding summary statistics by
year.
5 Empirical Findings
5.1 Graphical Analysis
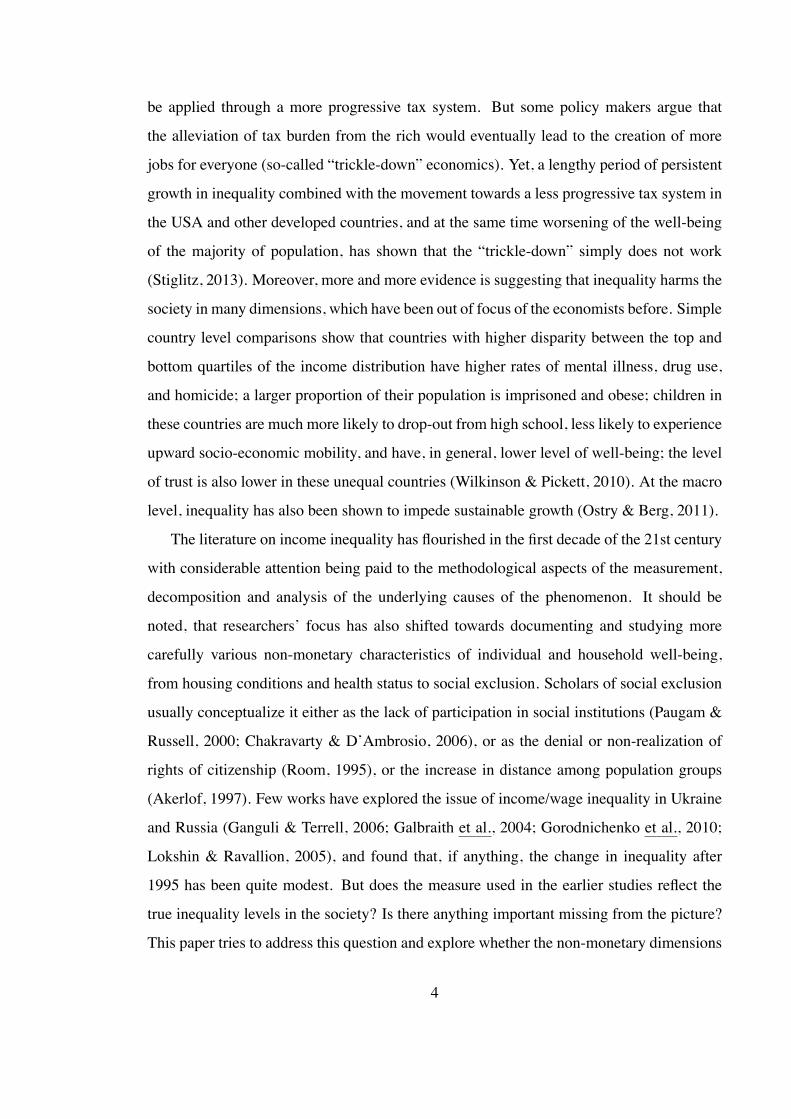
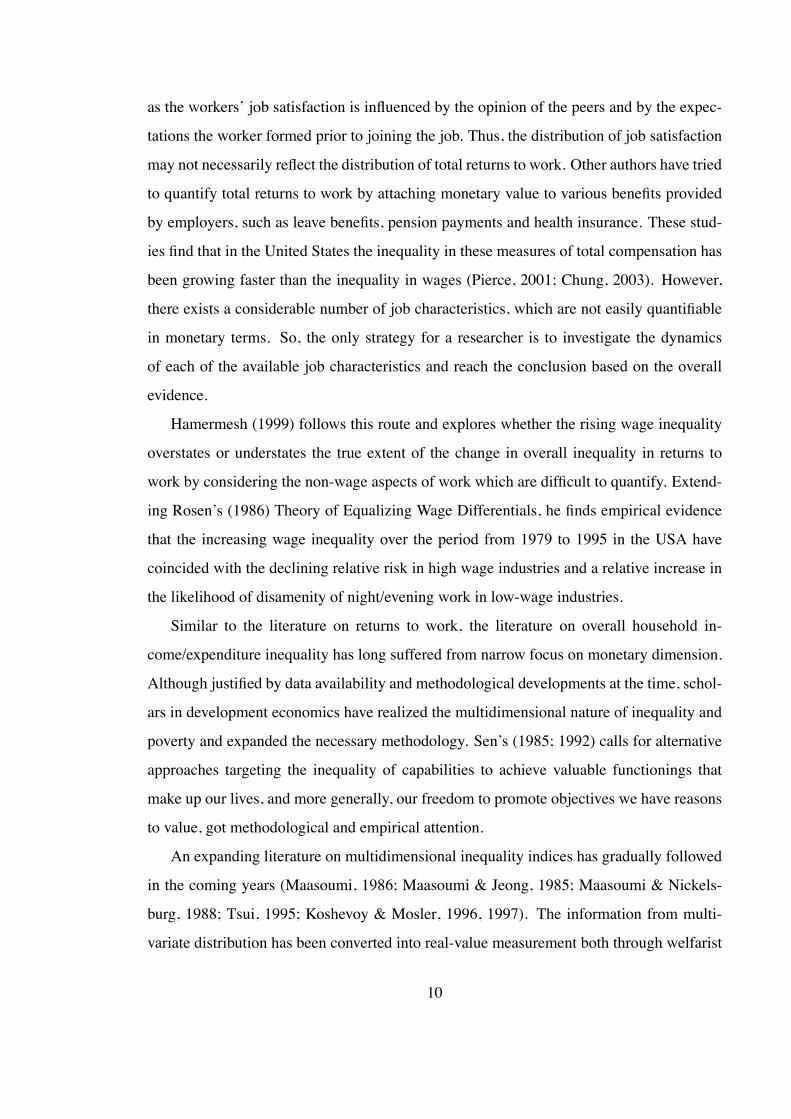
Figure 1 offers a first glance into the overall dynamics of real wages and workplace
accidents. As could be seen, the real wage grows from USD 50 (UAH 90) per month in
1996 to about USD 100 (UAH 525) in 2004 and USD 316 (UAH 2517) in 2011. At the
same time the number of Work accidents per 1000 Employees decreases from 4.5 to 1.9 in
2004 and 1.1 in 2011, while the same dynamics in fatal workplace accidents is 0.12, 0.09,
0.06. However, the question in this paper is not in the changes to the mean, but how these
general trends reflect upon different parts of wage distribution.
To understand the evolution of inequality in earnings over the considered period, a
simple measure of standard deviation of the logarithm of hourly wages weighted by the
size of the workforce at each establishment is calculated. The second row in Figure 1
presents the time paths of both wage dispersion from the raw wage data and from the
residual wage after controlling for regional effects. As the two lines show, most of the
dispersion in 1990s is due to the regional wage inequality. Controlling for the latter, the
variance of hourly wages is on the decrease from 1994 to 2002, but then starts increasing
afterward. The last graph in the second row shows the average differences in log hourly
wages between the 2nd, 3rd, and 4th quartiles and the mean of the 1st quartile. Following the
story with the dynamics of standard deviation, the differences among quartiles are stable
before the year 2002 and then increase substantially.
15

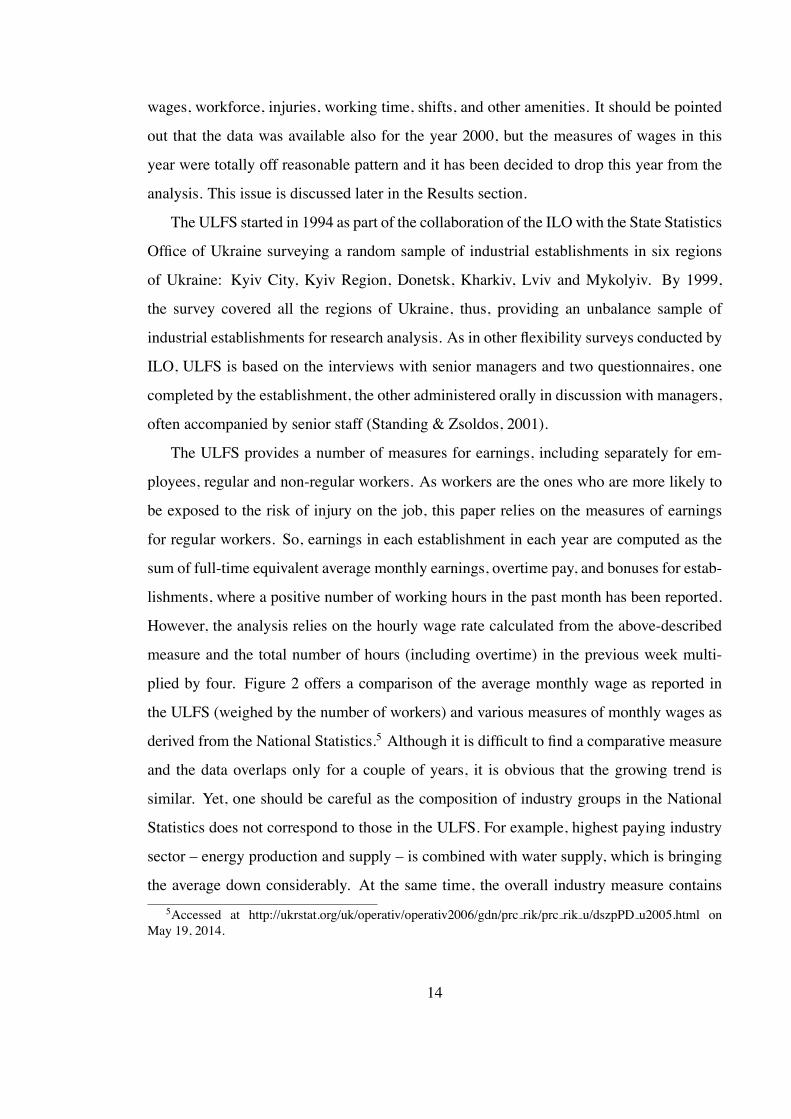
The main question of this paper is whether this relatively stable wage inequality has
been exacerbated or mitigated by corresponding changes in inequality in workplace (dis)
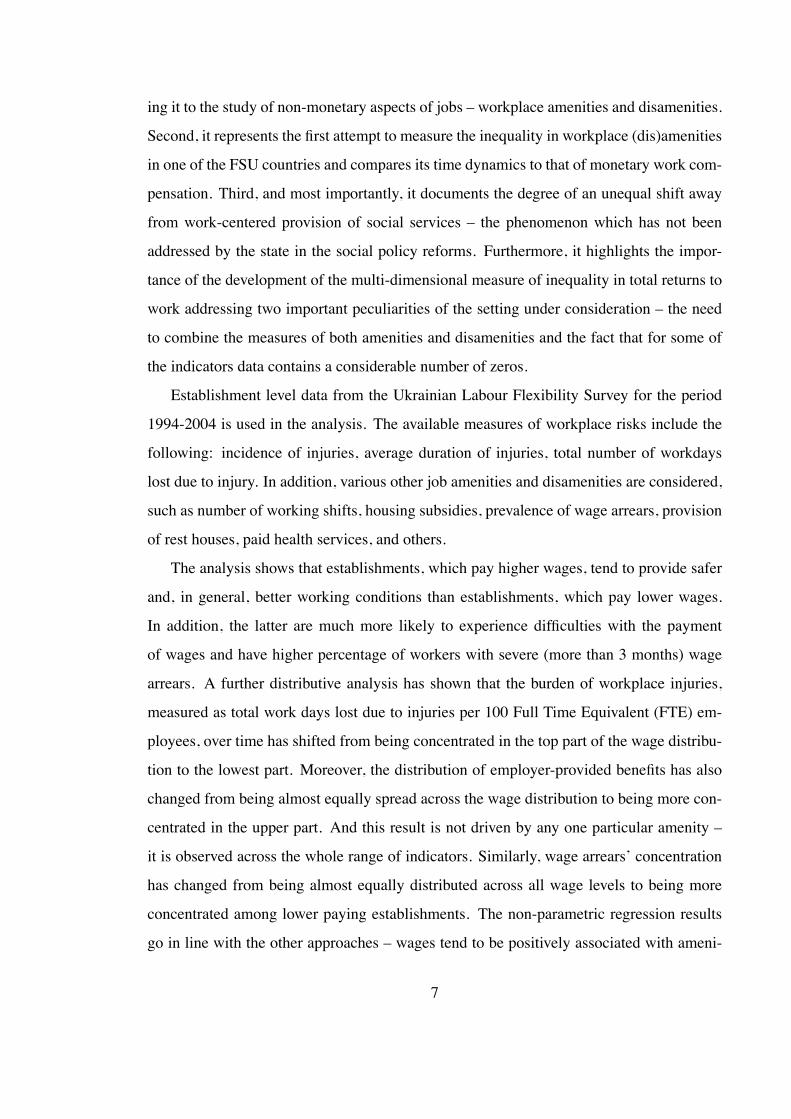
amenities. Figure 3 illustrates three measures of workplace accidents in the first row. In
accordance with the Theory of Equalizing Wage Differentials, the number of accidents is
relatively higher in 2nd, 3rd, and 4th quartiles compared to the 1st. Similarly, the number
of lost men-days per injury has been increasing in relative terms up to year 2002, and in
2004 dropped to almost the same severity for the 2nd quartile, 50% greater losses for the
3rd quartile and 70% for the 4th quartile. The total burden of workplace injuries, however,
has shown some volatility in the close proximity to the y = 1 line, with a jump observed
for the 4th quartile. This means that in terms of the overall burden of workplace accidents
the establishments in different spectrum of wage distribution do not differ. This can partly
be connected to the greater availability of the Safety Committees at the establishments in
highest quartiles of the wage distribution. Thus, the jobs maybe in general riskier in the
higher quartiles of the wage distribution, but better safety measures make the consequences
of accidents less severe, and thus lessen the amount of lost men-days.
The similar comparison of the number of shifts per day, shows that the number of shifts
is consistently higher in the 2nd, 3rd, and 4th quartiles compared to the 1st one, but it has
been on the decline for the 4th quartile from year 1999, and for the other two from year
2002. One may think that the highest wage earners are working longer hours and thus their
hourly wage may be higher. Last graph in Figure 3 shows that hours are the same across the
whole distribution and across time. And, if anything, top paying establishments had regular
workers working 10% fewer hours compared to the lowest paying ones in years 1994 and
1999.
Another feature of the transition period in Ukraine and other FSU countries was the
irregularity of payments, or wage arrears. Therefore, Figure 3 offers graphical analysis of
several relevant measures available in the survey. First of all, as could be seen from the
first row of the Figure, while at the beginning of the period all of the establishments had
similar likelihood of having difficulty with paying wages to their workers, the situation
changed already in 1995 for the establishments in 3rd and 4th quartiles, with those in the
2nd quartile joining the trend in 2002. Overall, by 2004, establishments in the 2nd quartile
16
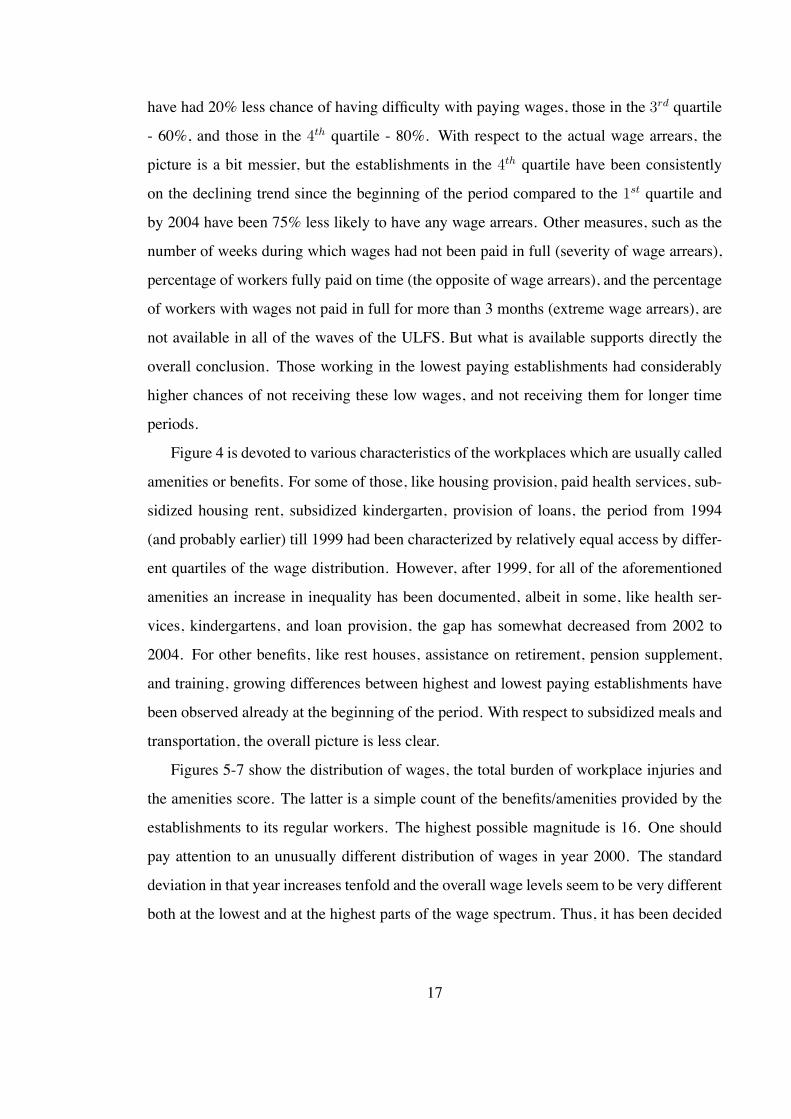
have had 20% less chance of having difficulty with paying wages, those in the 3rd quartile
- 60%, and those in the 4th quartile - 80%. With respect to the actual wage arrears, the
picture is a bit messier, but the establishments in the 4th quartile have been consistently
on the declining trend since the beginning of the period compared to the 1st quartile and
by 2004 have been 75% less likely to have any wage arrears. Other measures, such as the
number of weeks during which wages had not been paid in full (severity of wage arrears),
percentage of workers fully paid on time (the opposite of wage arrears), and the percentage
of workers with wages not paid in full for more than 3 months (extreme wage arrears), are
not available in all of the waves of the ULFS. But what is available supports directly the
overall conclusion. Those working in the lowest paying establishments had considerably
higher chances of not receiving these low wages, and not receiving them for longer time
periods.
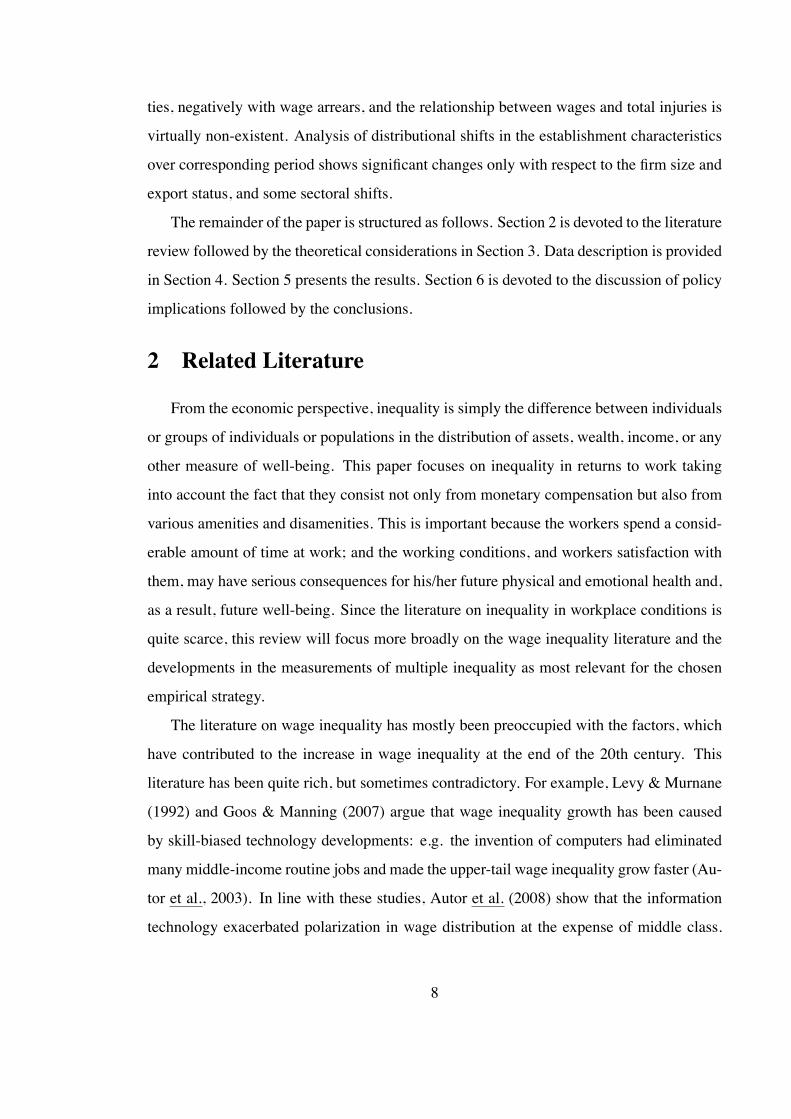
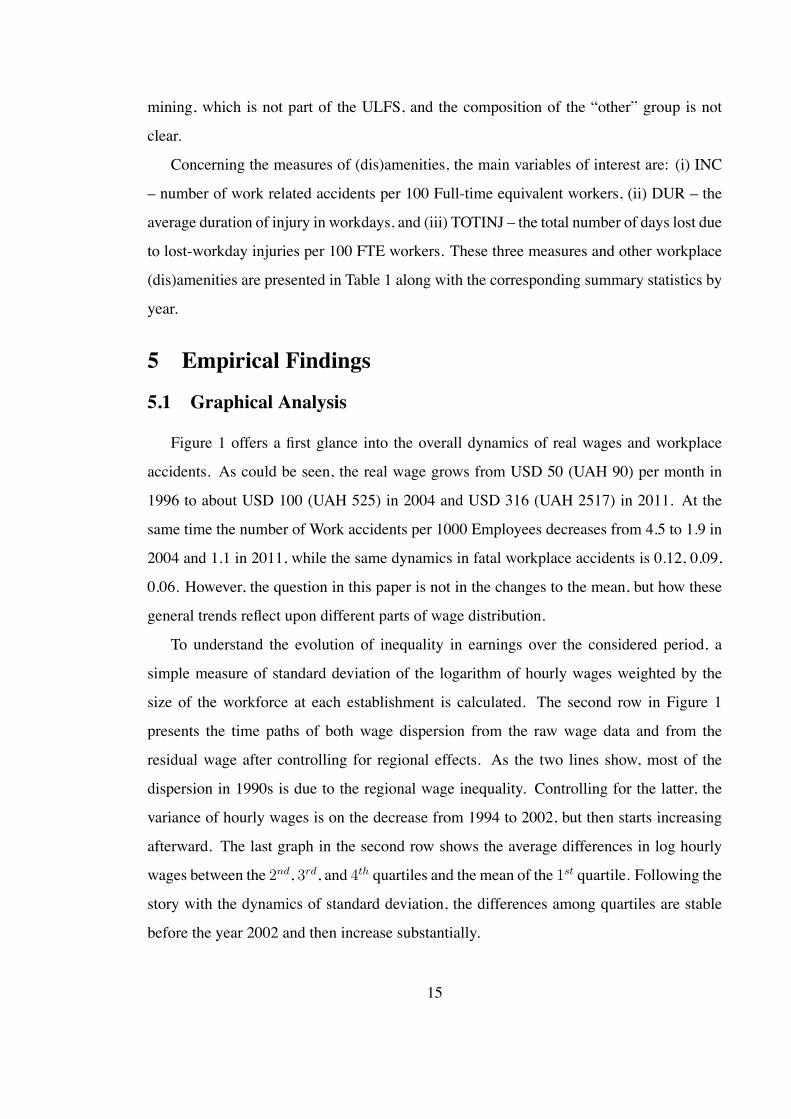
Figure 4 is devoted to various characteristics of the workplaces which are usually called
amenities or benefits. For some of those, like housing provision, paid health services, sub-
sidized housing rent, subsidized kindergarten, provision of loans, the period from 1994
(and probably earlier) till 1999 had been characterized by relatively equal access by differ-
ent quartiles of the wage distribution. However, after 1999, for all of the aforementioned
amenities an increase in inequality has been documented, albeit in some, like health ser-
vices, kindergartens, and loan provision, the gap has somewhat decreased from 2002 to
2004. For other benefits, like rest houses, assistance on retirement, pension supplement,
and training, growing differences between highest and lowest paying establishments have
been observed already at the beginning of the period. With respect to subsidized meals and
transportation, the overall picture is less clear.
Figures 5-7 show the distribution of wages, the total burden of workplace injuries and
the amenities score. The latter is a simple count of the benefits/amenities provided by the
establishments to its regular workers. The highest possible magnitude is 16. One should
pay attention to an unusually different distribution of wages in year 2000. The standard
deviation in that year increases tenfold and the overall wage levels seem to be very different
both at the lowest and at the highest parts of the wage spectrum. Thus, it has been decided
17

to exclude this year from further analysis.6
The total burden of workplace accidents in Figure 6 is only available starting from year
1995, and is top-coded at 10 per 100 FTE workers. Following the overall national trend,
the distribution of total injuries has shifted towards zero with majority of establishments
in 2004 not having any men-days lost from workplace injuries. Concerning the workplace
amenities/benefits (Figure 7), it is clear that over the considered period there has been a
significant decline in their numbers with the distribution in 1994 having quite fat right-
hand tail, while the one in 2004 resembles a normal distribution.
5.2 Lorenz/Concentration Curves
Figure 8 in general reflects the earlier graphical comparisons across quartiles - there has
been no significant change in the wage inequality from 1994 to 2004. It seems that all the
major changes in wage inequality occurred before this period, and the change must have
been rather rapid, if we take for granted the relatively compressed distribution of wages in
the Soviet Union.
But wages constitute only part of the total returns to work. And, indeed, the following
figures show that other workplace characteristics have continued to change over the period.
As Figure 9 shows, at the beginning of the period the total burden of workplace injuries
had been mostly concentrated among the establishments paying the highest wages. The
concentration of the total burden has been decreasing at the top spectrum of wages and
increasing at the bottom. And in 2004, the concentration curve flips over the 45 ! line,
meaning that starting from that year most of the overall total injury burden is shifted to the
establishments paying lowest wages.
The third dimension has been compressed to one linear measure of the simple amenities
count for the sake of simplicity in further distributional analysis. As concentration curves
for the period in Figure 10 show, in 1994 they had been equally allocated across wage dis-6The changes in the labor legislation and tax codes have been analyzed. However, it seemed unlikely
that any of those could have resulted in such a short-lived increase in dispersion of wages, while no similarchanges observed in either total injuries or the amenities score. An inquiry has been sent to the responsibleoffice in the ILO to understand possible faults in the data collection during this particular year, but before aclear explanation is found for such a drastic change in the wage distribution, this year could not be used inthe analysis.
18

tribution. However, starting from 1995, and more noticeable from 1999, the concentration
shifts towards right-hand part of the wage distribution with some clear signs of inequality
started being observed.
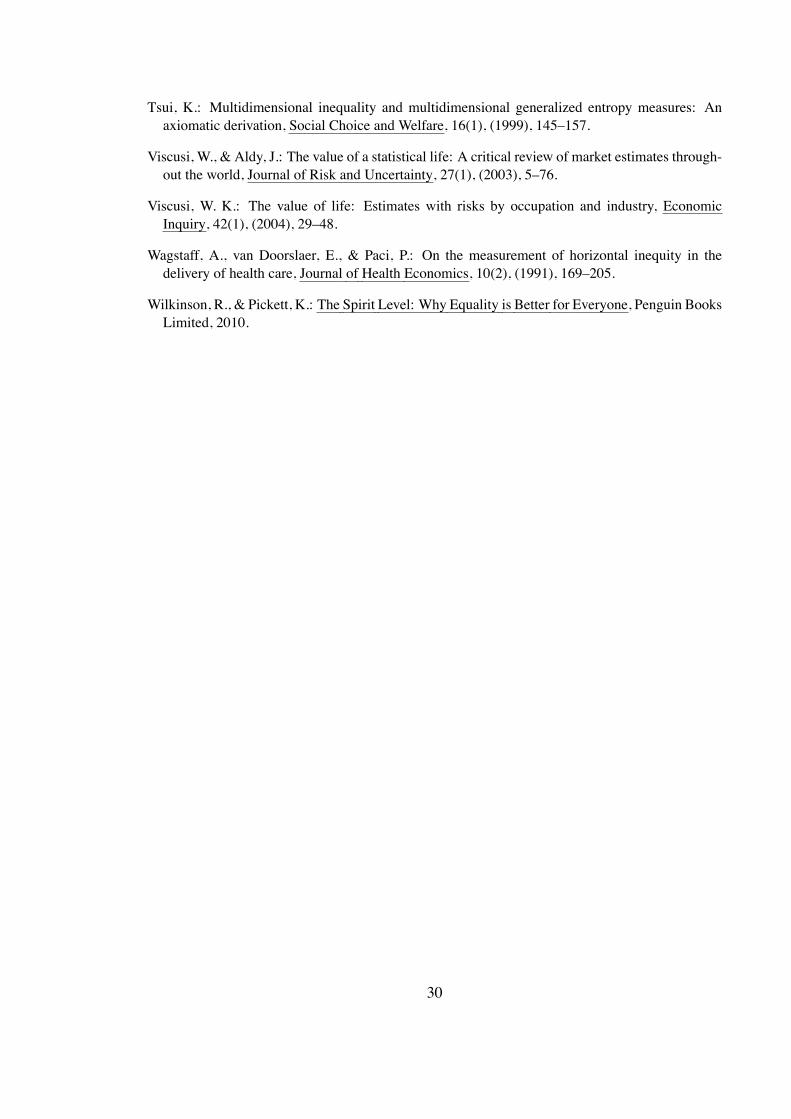
Finally, wage arrears in 1994 are concentrated among the lowest and middle parts of
the wage distribution. In 1995 they become almost equally distributed. However, by the
end of the observed period they become highly concentrated in the lowest part of the wage
distribution (Figure 11).
5.3 Time Dynamics in Lorenz/Concentration Indices andHybridMul-tidimensional Inequality Index
Table 2 mirrors the graphical distributional analysis described in the previous subsec-
tion with standard errors attached to the concentration indices. It is clear from this table
that the differences from the 45 ! line are in all cases, but one (wage arrears in year 1999),
statistically significant at 5% level and less.
Although, one gets a general idea of how the inequality in workplaces changed over
the considered period from both graphical analysis and the comparison of concentration
indices, it is worth testing whether these changes have been statistically significant. At
the moment, there is no ready to use test of statistical dominance of the multidimensional
measure of inequality. Therefore, this paper will compare the concentration indices for
the three non-wage dimensions one-by-one. As Column (1) in Panel B Table 2 shows, in
both, total injury burden and wage arrears, from 1995 to 2004 there has been a significant
re-shifting of the concentration from highest paying establishments to lowest paying estab-
lishments. At the same time, there has been an increases in the concentration of amenities
score among high paying establishments, albeit the magnitude of the shift is much smaller
compared to the other two dimensions. The remaining three columns are presented to show
the rate of change and its timing. For example, the observed change in the concentration
for total injury burden occurred first between years 1995 and 1999, with little change be-
tween 1999 and 2002, and with an overwhelming change between years 2002 and 2004.
The wage arrears concentration had not changed till year 1999, but then the changes of the
same magnitude happened over the two remaining sub-periods. Contrary to the disameni-
19

ties, changes in the amenities score concentration have been gradual, almost of the same
size across the three considered sub-periods.
5.4 Non-Parametric Estimations
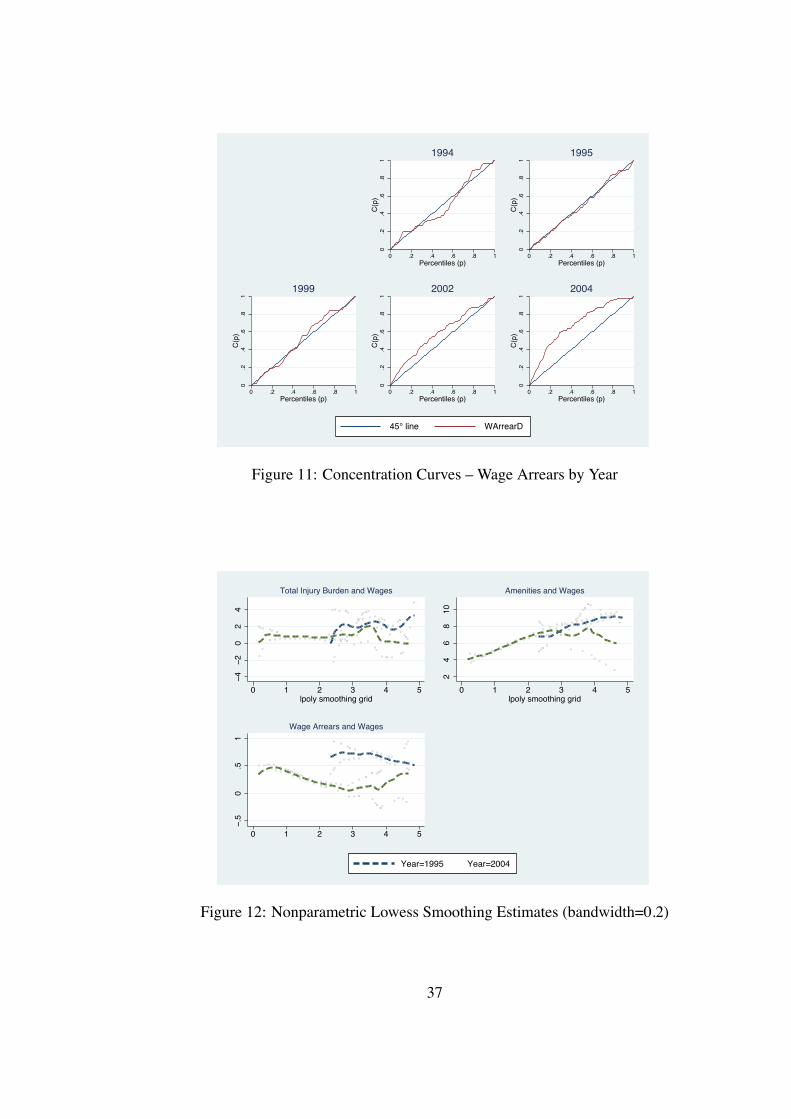
Presented above graphical and distributive analysis is supplemented by the non-parametric
estimation presented in Figure 12 with bandwidth of 0.2. 7 The graphs depict estimates
from the lowess smoothing with bandwidth 0.2, only for two years, 1995 and 2004. The
idea here is to see whether the relationship between wages and various other dimensions
of workplace has changed at the end of the considered period compared to the beginning.
The first graph shows that, compared to 1995 when the relationship was quite different in
different parts of the wage distribution, in 2004 there is clearly no relation between wages
and total injury burden – it is the same across all wage levels. This cannot be said though
for other dimensions. Amenities score and wages are obviously positively related, with
the only difference between 1995 and 2004 being the downward shift in the overall ameni-
ties score, and a negative relationship at very high wage levels. The opposite is true for
the wage arrears – wages are negatively related to this characteristic up to a log wage of
3 (approximately 20 UAH), and then turn to positive relationship. One should be careful
though with putting much confidence into both too low and too high wages when consid-
ering the nonparametric estimates, given that the number of observations at both ends is
much smaller and may be driven by outliers.
5.5 Individual Amenities Dynamics
To better understand the underlying nature of the distributional change in amenities,
they have been analyzed individually. Table 4 summarizes the corresponding results while
Appendix B offers graphical analysis. The first two columns in the table show concentra-
tion indices for the years 1995 and 2004 correspondingly. The significance levels indicate
whether certain amenities are distributed significantly differently from the equal distribu-
tion. The last column shows the difference in the concentration indices over time and the7The bandwidth of 0.2 was chosen to follow the data more closely. However, other bandwidths were tried
with higher levels resulting in smoother curves but similar overall relationship.
20

significance levels here indicate whether the temporal change has been statistically signifi-
cant.
As can be seen, in 1995 none of the amenities, but the supplement pension, exhibit
inequalities, which is understandable given the Soviet egalitarian approach. However, by
year 2004 all of the amenities, except for the provision of free or subsidized meals, are
unequally distributed, with establishments at the higher end of the wage distribution being
more likely to provide various kinds of amenities. Albeit, one should remember that the
time dynamics reflects rather an unequal decline in the provision of amenities, than an
expansion of them, as the overall generosity of the non-monetary compensation has been
decreasing in the economy. As Column (3) shows the inequality has increased along all of
the dimensions, except provision of meals and supplement pensions. The former remained
equally distributed, while the latter remained highly unequal.
In a word, the evidence suggests that there has been no single driver behind the signifi-
cant change in the inequality in workplace amenities. Rather this inequality has been rising
across all dimensions. However, for two out of the twelve amenities available in the data,
the increase has not been statistically significant.
5.6 Associated Dynamics in Firms’ Characteristics
Since over the studied period Ukrainian economy has experienced considerable struc-
tural changes, one may be interested in knowing whether the changes in total returns to
work have been accompanied by prominent distributional changes in firms’ characteris-
tics. Appendix A provides a summary of the available firms’ characteristics and industrial
structure of the sample in 1995 and 2004 across wage quartiles. Table 5 shows the concen-
tration indices for various available firms’ characteristics and the corresponding temporal
change similarly to Table 4. In terms of the firms’ characteristics, at the beginning of the
period, only the monopoly status 8 and the share of female workers seem to be distributed
unequally. The latter, is more prevalent among lower paying firms, as would be expected.
In terms of the industrial composition, firms in the Energy sector in 1995 tend to be paying8This question is an indicator whether the manager who is being questioned thinks that the firm enjoys
any kind of monopoly power.
21
higher wages, while those in Engineering and Wood and Paper are at the lower end of the
wage distribution.
The situation changes somewhat by year 2004. Yet, the difference in the distributions
is statistically significant only in terms of the firm size and its export status - larger firms,
as well as those engaged in exports, are observed in the upper part of the wage distribution.
Likewise, the change in the industrial structure is only statistically significant for the Energy
sector, becoming more equally spread across the wage distribution, and the Light industry
and the Food Processing industry with firms concentrating more at the lower end of the
spectrum.
In spite of all the shortcomings, generally speaking, there seems to be very little ev-
idence that such a massive change in the distribution of non-monetary job characteristics
has been due to a change in characteristics of the firms represented in the sample.
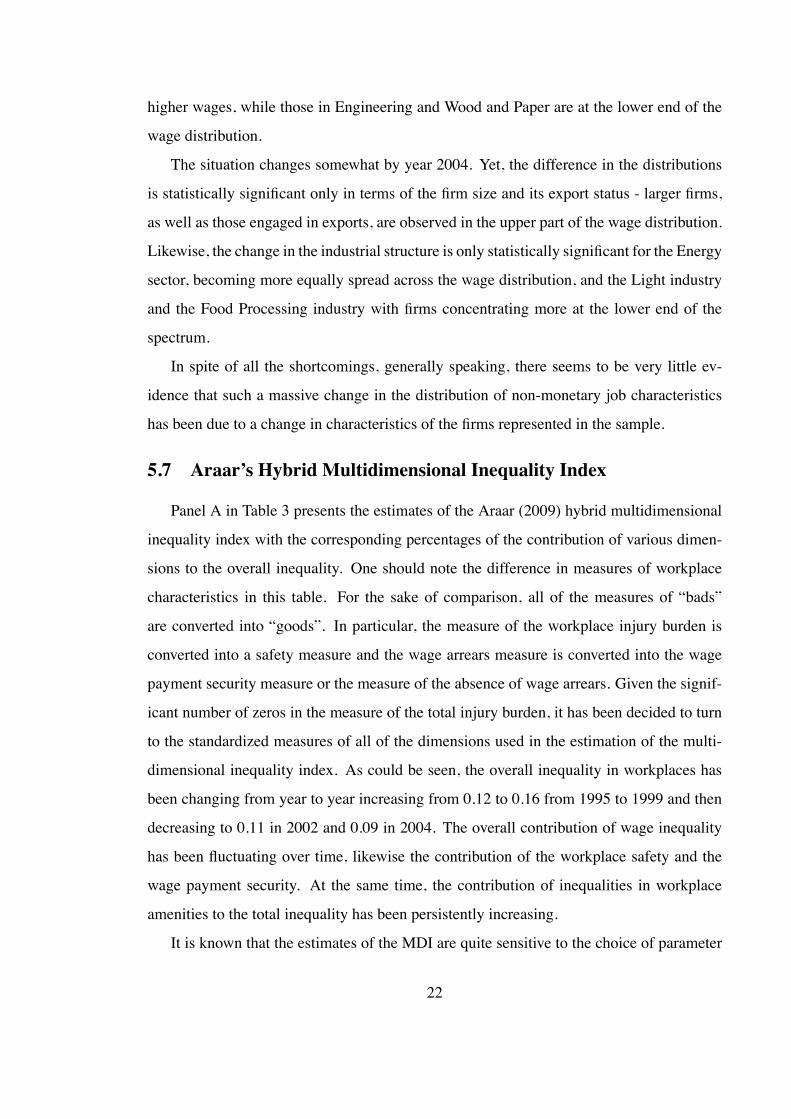
5.7 Araar’s Hybrid Multidimensional Inequality Index
Panel A in Table 3 presents the estimates of the Araar (2009) hybrid multidimensional
inequality index with the corresponding percentages of the contribution of various dimen-
sions to the overall inequality. One should note the difference in measures of workplace
characteristics in this table. For the sake of comparison, all of the measures of “bads”
are converted into “goods”. In particular, the measure of the workplace injury burden is
converted into a safety measure and the wage arrears measure is converted into the wage
payment security measure or the measure of the absence of wage arrears. Given the signif-
icant number of zeros in the measure of the total injury burden, it has been decided to turn
to the standardized measures of all of the dimensions used in the estimation of the multi-
dimensional inequality index. As could be seen, the overall inequality in workplaces has
been changing from year to year increasing from 0.12 to 0.16 from 1995 to 1999 and then
decreasing to 0.11 in 2002 and 0.09 in 2004. The overall contribution of wage inequality
has been fluctuating over time, likewise the contribution of the workplace safety and the
wage payment security. At the same time, the contribution of inequalities in workplace
amenities to the total inequality has been persistently increasing.
It is known that the estimates of the MDI are quite sensitive to the choice of parameter
22
!. Panel B of Table 3 provides the results of the sensitivity test by setting the parameter !
to different values. As could be seen, the estimated results differ considerably for ! = 0
and ! = 0.1. However, they follow the same pattern for any ! = 0.5 or above. In fact,
this range represents the most applicable range for the case under consideration. Araar
(2009) states that the nature of the components determine the size of this parameter. If the
component k is a perfect substitute of the other set of components, it is appropriate to set
the !k to zero. In contrast, if the component is a perfect complement, which seems to be
the case for some of the dimensions considered here, then !k will converge to one. Setting
! = 0.5 probably leads to the underestimation of the degree of multidimensional inequality
if all of the components are perfect complements.
In spite of the robust evidence on the decrease in overall inequality in returns to work
over time, Araar (2009) warns against relying on the hybrid multidimensional inequality
index when there is an increase in inequality in one of the components and a decrease in
the other. Technically defined, the case of Ukraine is of such nature. Moreover, the whole
construct of the multidimensional index of inequality should be reconsidered to better tailor
the case of total returns to work. Other transformations of the total injury burden and
the wage arrears measure have been tested, and the results turned out to be non robust.
More theoretical and methodological research into the nature of the considered problem
is required to arrive at the proper multidimensional index. Therefore, in this instance, it
is recommended to consider the changes in inequality dimension by dimension, what has
been done in this paper earlier.
To summarize, the above analysis shows that the inequality in wages, although re-
mained relatively stable over considered period from 1994 to 2004, has been exacerbated
by the increasing inequality in workplace risks, wage payment security (i.e. wage arrears),
and amenities.
6 Discussion and Policy Recommendations
After gaining its independence in 1992 Ukrainian society moved away from state-
owned economy to its own version of market economy characterized by high levels of
23

corruption and a formation of a very pecuniary phenomenon of criminalized oligarchy cul-
minating into a massive social unrest in the winter of 2013-2014. In the process very little
attention has been given to the overall well-being of the majority of the population. Leav-
ing aside the reasons of such neglect, be they due to the genuine lack of resources or bold
robbery of the public funds, it materialized into an appalling state of affairs in all aspects of
social life, without exceptions. Ukraine is in the midst of a severe population health crisis
contributing to a rapid population decline. Widespread poverty is aggravated by deteriorat-
ing conditions of housing. Many cities are facing the collapse of the utilities infrastructure
due to the 20-years poor maintenance and lack of renovation. Lack of childcare infrastruc-
ture is mentioned by people as one of the top three reasons for not having children. Absence
of quality social care for elderly and those with long-term conditions is contributing to the
lowest life expectancy in Europe. And the list can be continued.
This study provides persuading evidence that Ukraine has moved from the model where
social support has been provided primarily through the individual’s workplace, but the state
failed to pick up important social responsibilities. The results clearly show that the wage
inequality, although somewhat declining from 1999 to 2004, is exacerbated by a significant
and ever increasing inequality in workplace amenities, such as provision of subsidized
childcare and health care, housing, recreation, loans, training, transportation, and assistance
on retirement. Greater decline in provision of all these amenities among the lowest paid
workers coupled with the inability of the state to offer corresponding public alternatives
deepens the divide in well-being among various population groups.
Although little can be done to address the causes of such dynamics in the distribution
of non-monetary aspects of work, except for, probably, tighter regulation of the workplace
safety and timely wage payments, knowledge of these trends is helpful in designing and
reforming the overall social policy in the country. For example, four aspects are worth
prioritizing in social policy reform - provision of housing, health care, kindergartens, as
well as training opportunities. The first two would clearly lead to the improvement of the
situation with health inequalities, while the latter would be instrumental in improving the
productivity of the workforce immediately, through alleviating the childcare burden, and in
the long-run by improving educational outcomes and upgrading the skill level. All of the
24
discussed possible routes would lead to the improvement of the quality of human capital,
and, thus, greater economic growth opportunities.
7 Conclusions
This study investigated the distribution of workplace characteristics, both amenities and
disamenities, as pertaining to jobs at different levels of wage distribution. Analysis of the
data on Ukrainian firms over the period from 1994 to 2004 shows that establishments which
pay high wages tend to provide safer and in general better working conditions than estab-
lishments, which pay lower wages. In addition, establishments within the lowest quartile
of the wage distribution are much more likely to experience difficulties with the payment
of wages and have higher percentage of workers with severe (more than 3 months) wage
arrears.
Further distributional analysis has confirmed the graphical analysis. The burden of
workplace injuries, measured as total work days lost due to injuries per 100 Full Time
Equivalent (FTE) employees, has shifted from being concentrated in the top part of the
wage distribution to the lowest part. Furthermore, the distribution of employer-provided
benefits has also changed from being almost equal across wage distribution to more favor-
able towards upper part of the wage distribution, albeit the overtime effect here has been
modest. The dynamics of wage arrears goes the same direction – from being almost equally
distributed across all wage levels in 1995 to showing increased concentration among lowest
paying establishments in 2004. The non-parametric regression results go in line with the
other approaches – wages tend to be positively associated with amenities, negatively with
wage arrears, and the relationship between wages and total injuries is negative for the very
top of the wage distribution.
Overall, the findings in the current paper suggest that although the wage differentials
in Ukrainian industries have remained relatively stable over the period from 1994 to 2004,
the inequality continued its growth in other dimensions. Although, the overall level of
risk has been falling over the period, it has fallen disproportionately more in high paying
establishments compared to the low paying establishments. Similarly, while the overall
25

level of workplace amenities has been falling, it has fallen disproportionately more among
low paying establishments, and this pattern is uniform across all the individual amenities.
Moreover, the decrease in the likelihood of having wage arrears has been disproportionately
smaller among establishments paying lowest wages.
Preliminary exploration into the causes underlying the documented distributional change,
suggests that there are very limited changes in the underlying firms’ characteristics and in
the industrial structure of the sample. So, there is a significant move of the large firms and
firms engaged in exporting towards the upper end of the wage spectrum. Likewise, a shift
of the firms in the Energy sector away from the upper end of the wage distribution, and the
firms in the Light and the Food Processing industries towards the lower end of the wage
distribution.
Although further research on causes of growth in multidimensional inequality in returns
to work is required, this study provides two important lessons for research community and
policy makers. First of all, it highlights the importance of multi-dimensional approach
to the labor market returns, as a focus on monetary compensation only may significantly
underestimate the true inequality in the society. Second, it draws attention to the need
of developing counter measures by the government when workplace-centered provision
of social service is moving towards market economy and liberalization. By prioritizing
measures to facilitate provision of affordable housing, health care, kindergartens, as well
as training opportunities, the government could mitigate the increasing inequalities. This
would allow avoiding significant tensions and conflicts in the society, which is an important
pre-requisite for ongoing sustainable development.
26

ReferencesAkerlof, G. A.: Social distance and social decisions, Econometrica, 65(5), (1997), 1005–1028.
Araar, A.: The hybrid multidimensional index of inequality, Cahiers de recherche 0945, CIRPEE,2009.
Araar, A., & Duclos, J.-Y.: Dasp: Stata modules for distributive analysis, Statistical Software Com-ponents, Boston College Department of Economics, 2007.
Autor, D., Levy, F., & Murnane, R.: The skill content of recent technological change: An empiricalexploration, Quarterly Journal of Economics, 118(4), (2003), 1279–1333.
Autor, D. H., Katz, L. F., & Kearney, M. S.: Trends in US wage inequality: Revising the revisionists,Review of Economics Studies, 90(2), (2008), 300–323.
Biddle, J. E., & Zarkin, G. A.: Worker preferences and market compensation for job risk, TheReview of Economics and Statistics, 70(4), (1988), 660–67.
Bockerman, P., & Ilmakunnas, P.: Do job disamenities raise wages or ruin job satisfaction?,International Journal of Manpower, 27(3), (2006), 290–302.
Borjas, G., Freeman, R., & Katz, L.: Searching for the effect of immigration on the labor market,American Economic Review, 86(2), (1996), 246–251, 108th Annual Meeting of the American-Economic-Association, SAN FRANCISCO, CA, JAN 05-07, 1996.
Borjas, G., Freeman, R., & Katz, L.: How much do immigration and trade affect labor marketoutcomes?, Brookings papers on economic activity, Brookings Institution, 1997, 63rd Conferenceof the Brookings-Panel on Economic Activity, WASHINGTON, DC, MAR 27-28, 1997.
Bound, J., & Johnson, G.: Changes in the Structure of Wages in the 1980s - An Evaluation ofAlternative Explanations, American Economic Review, 82(3), (1992), 371–392.
Brown, C.: Equalizing Differences in the Labor Market, Quarterly Journal of Economics, 94(1),(1980), 113–134.
Card, D., & DiNardo, J.: Skill-biased technological change and rising wage inequality: Some prob-lems and puzzles, Journal of Labor Economics, 20(4), (2002), 733–783.
Chakravarty, S. R., & D’Ambrosio, C.: The measurement of social exclusion, Review of Incomeand Wealth, 52(3), (2006), 377–398.
Chung, W.: Fringe benefits and inequality in the labor market, Economic Inquiry, 41(3), (2003),517–529.
Clark, A., & Oswald, A.: Satisfaction and comparison income, Journal of Public Economics, 61(3),(1996), 359–381.
27

Clark, A., & Senik, C.: Who compares to whom? the anatomy of income comparisons in europe,Economic Journal, 120(544), (2010), 573–594.
Galbraith, J. K., Krytynskaia, L., & Wang, Q.: The experience of rising inequality in russia andchina during the transition, European Journal of Comparative Economics, 1(1), (2004), 87–106.
Ganguli, I., & Terrell, K.: Institutions, markets and men’s and women’s wage inequality: Evidencefrom ukraine, Journal of Comparative Economics, 34(2), (2006), 200–227.
Goos, M., & Manning, A.: Lousy and lovely jobs: The rising polarization of work in Britain,Review of Economics and Statistics, 89(1), (2007), 118–133.
Gorodnichenko, Y., Peter, K. S., & Stolyarov, D.: Inequality and volatility moderation in russia: Ev-idence from micro-level panel data on consumption and income, Review of Economic Dynamics,13(1), (2010), 209–237.
Guerriero, M.: The Labour Share of Income around the World. Evidence from a Panel Dataset,2012, working Paper.
Hamermesh, D.: Changing inequality in markets for workplace amenities,Quarterly Journal of Economics, 114(4), (1999), 1085–1123.
Hamermesh, D.: The changing distribution of job satisfaction, Journal of Human Resources, 36(1),(2001), 1–30.
Hensler, D. R., Marquis, M. S., Abrahamse, A., Berry, S. H., Ebener, P. A., Lewis, E., Lind, E.,MacCoun, R. J., Manning, W. G., Rogowski, J., & Vaiana, M. E.: Compensation for accidentalinjuries in the united states, RAND Corporation Report Series R3999, Santa Monica, CA: RANDCorporation, 1991.
Kakwani, N., & Bank, W.: Income inequality and poverty: methods of estimation and policyapplications, A World Bank Publication, Published for the World Bank [by] Oxford UniversityPress, 1980.
Keogh, J. P., Nuwayhid, I., Gordon, J. L., & Gucer, P. W.: The impact of occupational injury oninjured worker and family: outcomes of upper extremity cumulative trauma disorders in marylandworkers, American journal of industrial medicine, 38(5), (2000), 498–506, research Support, U.S.Gov’t, P.H.S.
Koshevoy, G.: Multivariate Lorenz Majorization, Social Choice and Welfare, 12(1), (1995), 93–102.
Koshevoy, G., & Mosler, K.: The Lorenz zonoid of a multivariate distribution,Journal of the American Statistical Association, 91(434), (1996), 873–882.
Koshevoy, G., & Mosler, K.: Multivariate gini indices, Journal of Multivariate Analysis, 60(2),(1997), 252–276.
Levy, F., & Murnane, R.: United States Earnings Levels and Earnings Inequality - A Review ofRecent Trends and Proposed Explanations, Journal of Economic Literature, 30(3), (1992), 1333–1381.
28

Lokshin, M., & Ravallion, M.: Rich and powerful?: Subjective power and welfare in russia, Journalof Economic Behavior & Organization, 56(2), (2005), 141–172.
Maasoumi, E.: The Measurement and Decomposition of Multidimensional Inequality,Econometrica, 54(4), (1986), 991–997.
Maasoumi, E., & Jeong, J.: The Trend and the Measurement of World Inequality over ExtendedPeriods of Accounting, Economics Letters, 19(3), (1985), 295–301.
Maasoumi, E., & Nickelsburg, G.: Multivariate Measures ofWell-Being and an Analysis of Inequal-ity in the Michigan Data, Journal of Business & Economic Statistics, 6(3), (1988), 327–334.
Marquis, M. S., &Manning, W. G.: Lifetime costs and compensation for injuries, Inquiry : a journalof medical care organization, provision and financing, 36(3), (1999), 244–254, research Support,Non-U.S. Gov’t.
Ostry, J. D., & Berg, A.: Inequality and unsustainable growth: Two sides of the same coin?, IMFStaff Discussion Notes 11/08, International Monetary Fund, 2011.
Paugam, S., & Russell, H.: The effects of employment precarity and unemployment on social iso-lation, in D. Gallie, & S. Paugam (Eds.), Welfare Regimes and the Experience of Unemploymentin Europe, (pp. 243–264), OUP Oxford, 2000.
Pew Research Center, P.: Confidence in Democracy and Capitalism Wanes in Former Soviet Union,2011, accessed on October 10, 2013.
Pierce, B.: Compensation inequality, Quarterly Journal of Economics, 116(4), (2001), 1493–1525.
Quintana-Domeque, C.: Preferences, Comparative Advantage, and Compensating Wage Differen-tials for Job Routinization, Oxford Bulletin of Economics and Statistics, 73(2), (2011), 207–229.
Room, G.: Beyond the Threshold: The Measurement and Analysis of Social Exclusion, AcademicTexts Series, Policy Press, 1995.
Rosen, S.: The theory of equalizing differences, in O. Ashenfelter, R. Layard, P. Layard, & D. Card(Eds.), Handbook of Labor Economics, v. 2, chap. 12, (pp. 641–692), North-Holland, 1986.
Sen, A.: Commodities and Capabilities, Elsevier, Oxford, 1985.
Sen, A.: Inequality Reexamined, Harvard U.P. and Oxford U.P., 1992.
Senik, C.: Direct evidence on income comparisons and their welfare effects, Journal of EconomicBehavior & Organization, 72(1), (2009), 408–424.
Standing, G., & Zsoldos, L.: Worker insecurities in the ukrainian industry: The 2000 ulfs, Workingpaper, ILO, 2001.
Stiglitz, J.: The Price of Inequality, W W Norton & Company Incorporated, 2013.
Tsui, K.: Multidimensional Generalizations of the Relative and Absolute Inequality Indexes - theAtkinson-Kom-Sen Approach, Journal of Economic Theory, 67(1), (1995), 251–265.
29
Tsui, K.: Multidimensional inequality and multidimensional generalized entropy measures: Anaxiomatic derivation, Social Choice and Welfare, 16(1), (1999), 145–157.
Viscusi, W., & Aldy, J.: The value of a statistical life: A critical review of market estimates through-out the world, Journal of Risk and Uncertainty, 27(1), (2003), 5–76.
Viscusi, W. K.: The value of life: Estimates with risks by occupation and industry, EconomicInquiry, 42(1), (2004), 29–48.
Wagstaff, A., van Doorslaer, E., & Paci, P.: On the measurement of horizontal inequity in thedelivery of health care, Journal of Health Economics, 10(2), (1991), 169–205.
Wilkinson, R., & Pickett, K.: The Spirit Level: Why Equality is Better for Everyone, Penguin BooksLimited, 2010.
30

500
1000
1500
2000
2500
3000
1990 1995 2000 2005 2010
Real Monthly Wage
12
34
5
1990 1995 2000 2005 2010
Work Accidents
.06
.08
.1.1
2
1990 1995 2000 2005 2010
Fatal Work Accidents
05
1015
20
1994 1996 1998 2000 2002 2004
SD Log(Wage)
.35
.4.4
5.5
.55
1994 1996 1998 2000 2002 2004
SD Adj Log(Wage)
.4.6
.81
1.2
1.4
1994 1996 1998 2000 2002 2004
Qrt2 Qrt3
Qrt4
Relative Wage by Quartiles
Figure 1: Wages and Accidents (first row - from national statistics, second row - estimatesfrom ULFS)
010
0020
0030
0040
0050
00
1990 1995 2000 2005 2010
Derzhkomstat, overall Derzhkomstat, industryULFS Derzhkomstat, processing industryDerzhkomstat, Energy−gas−water
Monthly Real Wage, 2012 UAH
Figure 2: Monthly Wage Dynamics According to Different Data SourcesSource: National Statistics.
31

12
34
56
1994 1996 1998 2000 2002 2004
accidents
11.
52
2.5
3
1994 1996 1998 2000 2002 2004
duration
.51
1.5
22.
5
1994 1996 1998 2000 2002 2004
total_injuries1
1.1
1.2
1.3
1.4
1994 1996 1998 2000 2002 2004
safety_committee1
1.2
1.4
1.6
1.8
1994 1996 1998 2000 2002 2004
shifts
.85
.9.9
51
1.05
1994 1996 1998 2000 2002 2004
hours
.2.4
.6.8
11.
2
1994 1996 1998 2000 2002 2004
paying_difficulties
0.5
11.
5
1994 1996 1998 2000 2002 2004
wage_arrears
.4.6
.81
1.2
1994 1996 1998 2000 2002 2004
wage_arrears_weeks
1.2
1.4
1.6
1.8
1994 1996 1998 2000 2002 2004
workers_fully_paid
0.5
11.
5
1994 1996 1998 2000 2002 2004
workers_extreme_arr
Qrt2 Qrt3Qrt4
Figure 3: Workplace Risks and Disamenities by Quartiles
32

11.
52
2.5
1994 1996 1998 2000 2002 2004
house
.51
1.5
22.
5
1994 1996 1998 2000 2002 2004
resthouse
02
46
8
1994 1996 1998 2000 2002 2004
health0
24
68
10
1994 1996 1998 2000 2002 2004
rent0
510
15
1994 1996 1998 2000 2002 2004
kindergarten
.51
1.5
2
1994 1996 1998 2000 2002 2004
meals
.91
1.1
1.2
1.3
1.4
1994 1996 1998 2000 2002 2004
loan
.51
1.5
22.
53
1994 1996 1998 2000 2002 2004
free_loans
.81
1.2
1.4
1.6
1.8
1994 1996 1998 2000 2002 2004
assistance_on_retirement
01
23
45
1994 1996 1998 2000 2002 2004
pension_supplement
.51
1.5
2
1994 1996 1998 2000 2002 2004
training
01
23
4
1994 1996 1998 2000 2002 2004
transportation
Qrt2 Qrt3Qrt4
Figure 4: Workplace Amenities by Quartiles
33

0.5
11.
50
.51
1.5
0 2 4 6 0 2 4 6 0 2 4 6
1994 1995 1999
2000 2002 2004
Den
sity
Hourly wageGraphs by year
Figure 5: Distribution of Adjusted Wages by Year
01
23
40
12
34
0 5 10 0 5 10 0 5 10
1994 1995 1999
2000 2002 2004
Den
sity
TOTINJ1Graphs by year
Figure 6: Distribution of Total Injury Burden by Year
34

0.2
.4.6
.80
.2.4
.6.8
0 5 10 15 0 5 10 15 0 5 10 15
1994 1995 1999
2000 2002 2004
Den
sity
Number of AmenitiesGraphs by year
Figure 7: Distribution of Amenities Score by Year
0.2
.4.6
.81
L(p)
0 .2 .4 .6 .8 1Percentiles (p)
1994
0.2
.4.6
.81
L(p)
0 .2 .4 .6 .8 1Percentiles (p)
1995
0.2
.4.6
.81
L(p)
0 .2 .4 .6 .8 1Percentiles (p)
1999
0.2
.4.6
.81
L(p)
0 .2 .4 .6 .8 1Percentiles (p)
2002
0.2
.4.6
.81
L(p)
0 .2 .4 .6 .8 1Percentiles (p)
2004
45° line wagehat
Figure 8: Lorenz Curves – Wages by Year
35

0.2
.4.6
.81
C(p
)
0 .2 .4 .6 .8 1Percentiles (p)
1995
0.2
.4.6
.81
C(p
)
0 .2 .4 .6 .8 1Percentiles (p)
1999
0.2
.4.6
.81
C(p
)
0 .2 .4 .6 .8 1Percentiles (p)
2002
0.2
.4.6
.81
C(p
)
0 .2 .4 .6 .8 1Percentiles (p)
2004
45° line TOTINJ
Figure 9: Concentration Curves – Total Injury Burden by Year
0.2
.4.6
.81
C(p
)
0 .2 .4 .6 .8 1Percentiles (p)
1994
0.2
.4.6
.81
C(p
)
0 .2 .4 .6 .8 1Percentiles (p)
1995
0.2
.4.6
.81
C(p
)
0 .2 .4 .6 .8 1Percentiles (p)
1999
0.2
.4.6
.81
C(p
)
0 .2 .4 .6 .8 1Percentiles (p)
2002
0.2
.4.6
.81
C(p
)
0 .2 .4 .6 .8 1Percentiles (p)
2004
45° line amenities
Figure 10: Concentration Curves – Amenities Scores by Year
36
0.2
.4.6
.81
C(p
)
0 .2 .4 .6 .8 1Percentiles (p)
1994
0.2
.4.6
.81
C(p
)
0 .2 .4 .6 .8 1Percentiles (p)
1995
0.2
.4.6
.81
C(p
)
0 .2 .4 .6 .8 1Percentiles (p)
1999
0.2
.4.6
.81
C(p
)
0 .2 .4 .6 .8 1Percentiles (p)
2002
0.2
.4.6
.81
C(p
)
0 .2 .4 .6 .8 1Percentiles (p)
2004
45° line WArrearD
Figure 11: Concentration Curves – Wage Arrears by Year
−4−2
02
4
0 1 2 3 4 5lpoly smoothing grid
Total Injury Burden and Wages
24
68
10
0 1 2 3 4 5lpoly smoothing grid
Amenities and Wages
−.5
0.5
1
0 1 2 3 4 5
Wage Arrears and Wages
Year=1995 Year=2004
Figure 12: Nonparametric Lowess Smoothing Estimates (bandwidth=0.2)
37

Table 1: Summary Statistics1995 1999 2000 2002 2004
Wages 3.57 8.86 44.29 15.32 13.71[1.74] [2.45] [58.3] [5.62] [12.13]
Incidence of Injuries per 100 FTE 1.04 0.81 0.59 0.61 0.40[2.75] [2.09] [1.58] [1.42] [0.86]
Duration per Injury 3.10 3.80 3.35 3.16 1.73[3.23] [7.02] [4.85] [2.63] [3.66]
Total Injury Burden per 100 FTE 3.32 2.96 1.99 1.99 0.58(Incidence*Duration) [7.99] [6.72] [4.57] [4.05] [2.17]Number of shifts per day 2.15 2.28 2.13 2.17 2.17
[0.95] [1.27] [1.00] [0.95] [0.93]Total working hours 33.72 33.20 33.92 35.85 36.97
[6.85] [6.25] [6.82] [5.66] [4.9]Amenities Score 9.49 7.61 7.84 7.66 7.40
[2.50] [2.56] [2.85] [2.67] [2.74]Difficulty paying wages 0.71 0.76 0.63 0.43 0.20Wage Arrears 0.42 0.39 0.27 0.28 0.15% workers fully paid 45.77 73.72 81.98
[47.39] [42.43] [37.5]% workers with wage arrears ¿3 months 71.37 35.64 4.82
[34.57] [41.16] [18.97]Weeks of wage arrears 2.03 16.70 3.60
[2.44] [18.18] [7.71]Housing provision 0.86 0.71 0.64 0.52 0.38Rent subsidy 0.25 0.09 0.14 0.11 0.07Rest houses 0.74 0.75 0.70 0.68 0.70Paid health expenditures 0.38 0.29 0.32 0.38 0.33Kindergarden subsisdies 0.42 0.30 0.36 0.33 0.21Loans 0.88 0.77 0.82 0.84 0.85Interest Free Loans 0.36 0.20 0.27 0.30 0.35Assistance on retirement 0.88 0.65 0.63 0.65 0.65Supplement pension 0.07 0.08 0.08 0.14 0.12Training 0.82 0.59 0.63 0.63 0.62Meals 0.51 0.31 0.32 0.28 0.29Transportation 0.24 0.28 0.26 0.19 0.22
No observations 507 660 773 1327 1945
38

Table 2: Estimated Gini/Concentration Indices and Their Time Dynamics1995 1999 2002 2004A. Concentration Indices
Wages 0.1750** 0.1424** 0.1275** 0.1526**(0.0000) (0.0093) (0.0054) (0.0055)
Total Injury Burden 0.4085** 0.2402* 0.2172** -0.1587*(0.0000) (0.0920) (0.0486) (0.0573)
Amenities Score 0.0094** 0.0313** 0.0537** 0.0823**(0.0000) (0.0117) (0.0117) (0.0132)
Wage Arrears 0.0025** -0.0327 -0.1759** -0.3715**(0.0000) (0.0522) (0.0466) (0.0502)
B. Comparing Concentration Indices Over Time1995-2004 1995-1999 1999-2002 2004-2002
Total Injury Burden -0.5916** -0.1927* -0.0229 -0.3760**(0.0573) (0.0920) (0.1040) (0.0751)
Amenities Score 0.0734** 0.0225* 0.0224 0.0286+(0.0132) (0.0117) (0.0165) (0.0176)
Wage Arrears -0.3802** -0.0414 -0.1432* -0.1956**(0.0502) (0.0522) (0.0700) (0.0685)
Note: ! ! p < 0.01, !p < 0.05,+p < 0.1.
Table 3: Estimates of the Hybrid Multidimensional Inequality Index1995 1999 2002 2004
A. Multidimensional Inequality Estimates ($ lambda=0.5$)Total (MDI) 0.1215 0.1562 0.1081 0.0891Relative contribution of:Wages 9.57% 40.63% 13.98% 22.15%Total Safety Level 3.48% 0.93% 6.12% 0.76%Amenities Score 26.65% 31.15% 37.34% 50.29%Absence of Wage Arrears 60.31% 27.29% 42.56% 26.80%
B. Multidimensional Inequality Estimates - Robustness checkTotal (MDI) ($ lambda=0.0$) 0.0912 0.1142 0.0599 0.0672Total (MDI) ($ lambda=0.1$) 0.0973 0.1224 0.0693 0.0716Total (MDI) ($ lambda=0.5$) 0.1215 0.1562 0.1081 0.0891Total (MDI) ($ lambda=0.9$) 0.1457 0.1901 0.1468 0.1066Total (MDI) ($ lambda=1.0$) 0.1517 0.1985 0.1564 0.1110
Note: ! ! p < 0.01, !p < 0.05,+p < 0.1.
39
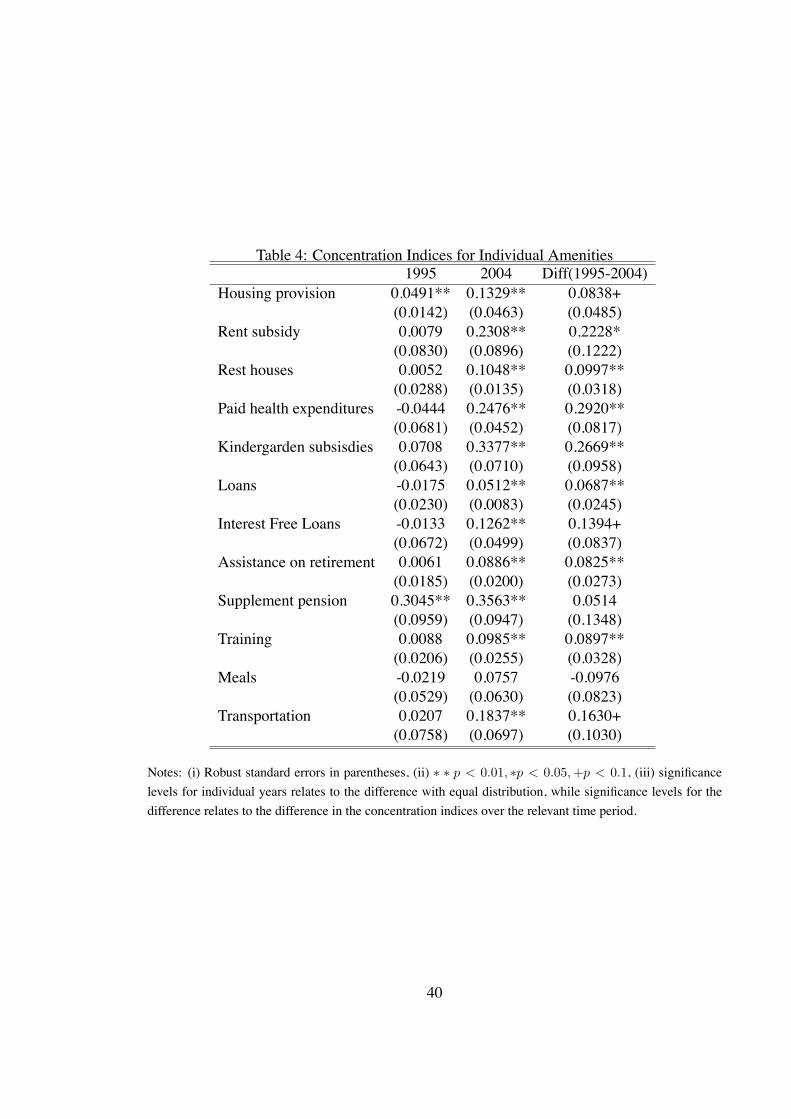
Table 4: Concentration Indices for Individual Amenities1995 2004 Diff(1995-2004)
Housing provision 0.0491** 0.1329** 0.0838+(0.0142) (0.0463) (0.0485)
Rent subsidy 0.0079 0.2308** 0.2228*(0.0830) (0.0896) (0.1222)
Rest houses 0.0052 0.1048** 0.0997**(0.0288) (0.0135) (0.0318)
Paid health expenditures -0.0444 0.2476** 0.2920**(0.0681) (0.0452) (0.0817)
Kindergarden subsisdies 0.0708 0.3377** 0.2669**(0.0643) (0.0710) (0.0958)
Loans -0.0175 0.0512** 0.0687**(0.0230) (0.0083) (0.0245)
Interest Free Loans -0.0133 0.1262** 0.1394+(0.0672) (0.0499) (0.0837)
Assistance on retirement 0.0061 0.0886** 0.0825**(0.0185) (0.0200) (0.0273)
Supplement pension 0.3045** 0.3563** 0.0514(0.0959) (0.0947) (0.1348)
Training 0.0088 0.0985** 0.0897**(0.0206) (0.0255) (0.0328)
Meals -0.0219 0.0757 -0.0976(0.0529) (0.0630) (0.0823)
Transportation 0.0207 0.1837** 0.1630+(0.0758) (0.0697) (0.1030)
Notes: (i) Robust standard errors in parentheses, (ii) ! ! p < 0.01, !p < 0.05,+p < 0.1, (iii) significancelevels for individual years relates to the difference with equal distribution, while significance levels for thedifference relates to the difference in the concentration indices over the relevant time period.
40
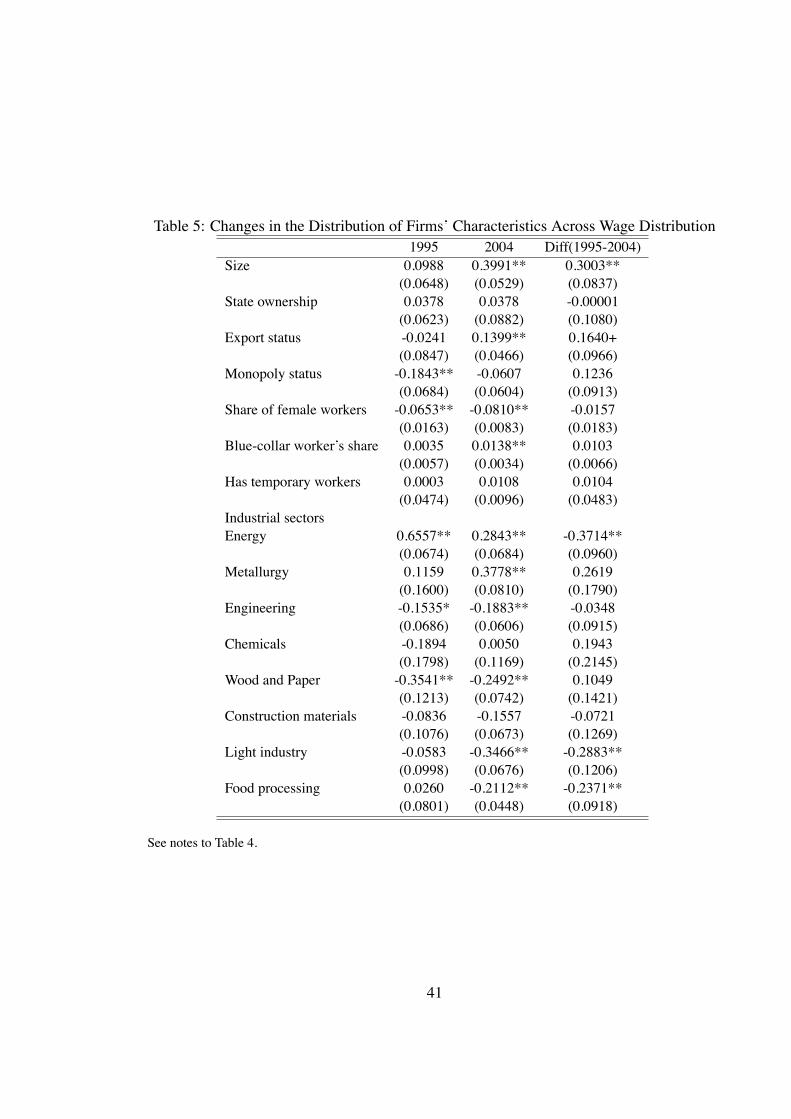
Table 5: Changes in the Distribution of Firms’ Characteristics Across Wage Distribution1995 2004 Diff(1995-2004)
Size 0.0988 0.3991** 0.3003**(0.0648) (0.0529) (0.0837)
State ownership 0.0378 0.0378 -0.00001(0.0623) (0.0882) (0.1080)
Export status -0.0241 0.1399** 0.1640+(0.0847) (0.0466) (0.0966)
Monopoly status -0.1843** -0.0607 0.1236(0.0684) (0.0604) (0.0913)
Share of female workers -0.0653** -0.0810** -0.0157(0.0163) (0.0083) (0.0183)
Blue-collar worker’s share 0.0035 0.0138** 0.0103(0.0057) (0.0034) (0.0066)
Has temporary workers 0.0003 0.0108 0.0104(0.0474) (0.0096) (0.0483)
Industrial sectorsEnergy 0.6557** 0.2843** -0.3714**
(0.0674) (0.0684) (0.0960)Metallurgy 0.1159 0.3778** 0.2619
(0.1600) (0.0810) (0.1790)Engineering -0.1535* -0.1883** -0.0348
(0.0686) (0.0606) (0.0915)Chemicals -0.1894 0.0050 0.1943
(0.1798) (0.1169) (0.2145)Wood and Paper -0.3541** -0.2492** 0.1049
(0.1213) (0.0742) (0.1421)Construction materials -0.0836 -0.1557 -0.0721
(0.1076) (0.0673) (0.1269)Light industry -0.0583 -0.3466** -0.2883**
(0.0998) (0.0676) (0.1206)Food processing 0.0260 -0.2112** -0.2371**
(0.0801) (0.0448) (0.0918)
See notes to Table 4.
41
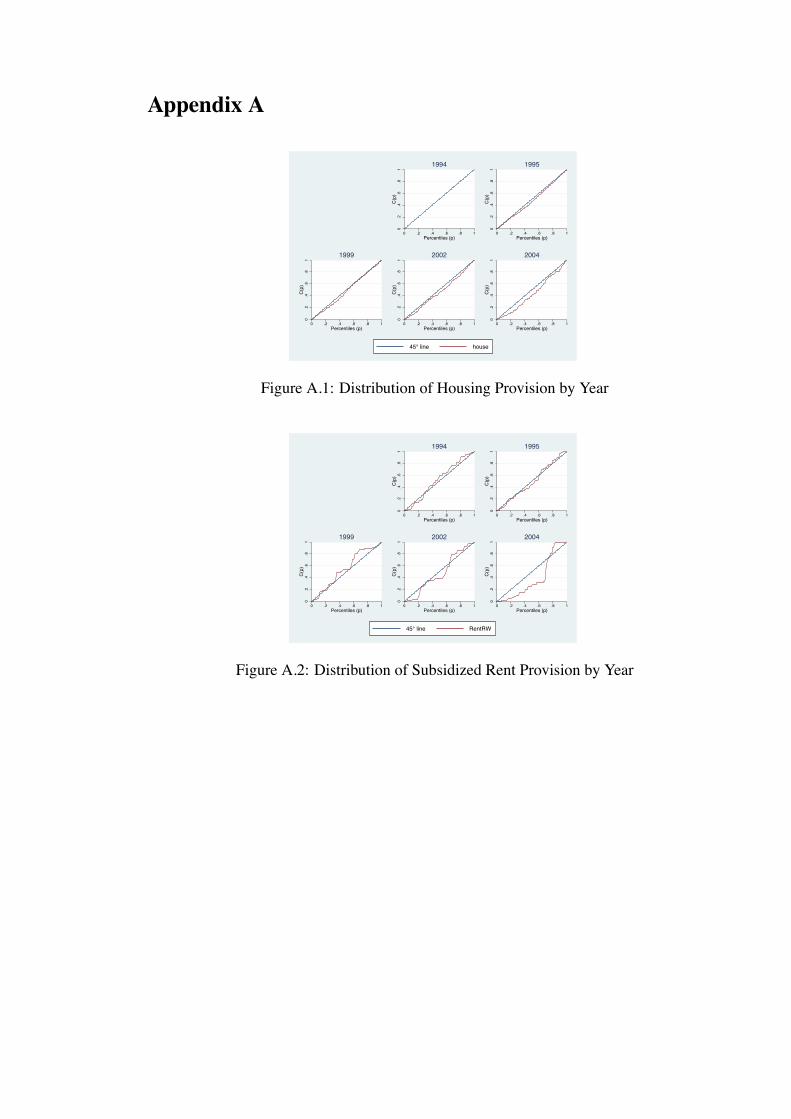
Appendix A
0.2
.4.6
.81
C(p
)
0 .2 .4 .6 .8 1Percentiles (p)
1994
0.2
.4.6
.81
C(p
)
0 .2 .4 .6 .8 1Percentiles (p)
1995
0.2
.4.6
.81
C(p
)
0 .2 .4 .6 .8 1Percentiles (p)
1999
0.2
.4.6
.81
C(p
)
0 .2 .4 .6 .8 1Percentiles (p)
2002
0.2
.4.6
.81
C(p
)
0 .2 .4 .6 .8 1Percentiles (p)
2004
45° line house
Figure A.1: Distribution of Housing Provision by Year0
.2.4
.6.8
1C
(p)
0 .2 .4 .6 .8 1Percentiles (p)
1994
0.2
.4.6
.81
C(p
)
0 .2 .4 .6 .8 1Percentiles (p)
1995
0.2
.4.6
.81
C(p
)
0 .2 .4 .6 .8 1Percentiles (p)
1999
0.2
.4.6
.81
C(p
)
0 .2 .4 .6 .8 1Percentiles (p)
2002
0.2
.4.6
.81
C(p
)
0 .2 .4 .6 .8 1Percentiles (p)
2004
45° line RentRW
Figure A.2: Distribution of Subsidized Rent Provision by Year
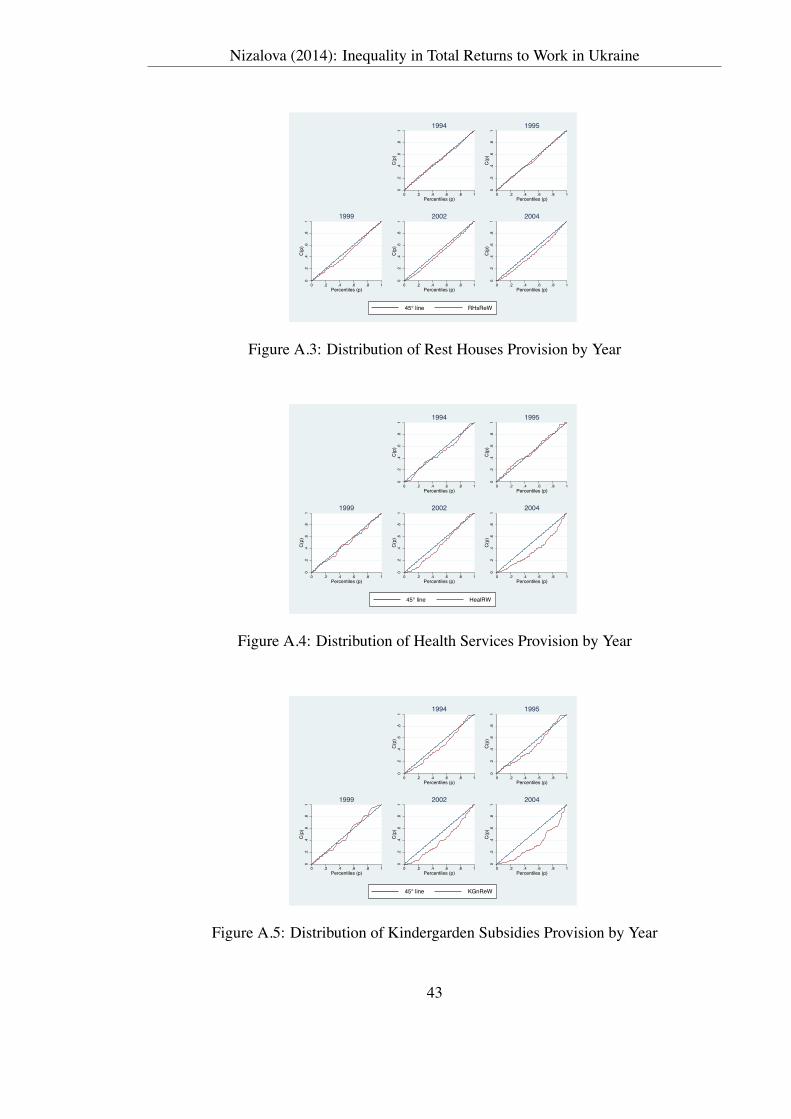
Nizalova (2014): Inequality in Total Returns to Work in Ukraine
0.2
.4.6
.81
C(p
)
0 .2 .4 .6 .8 1Percentiles (p)
1994
0.2
.4.6
.81
C(p
)
0 .2 .4 .6 .8 1Percentiles (p)
1995
0.2
.4.6
.81
C(p
)
0 .2 .4 .6 .8 1Percentiles (p)
1999
0.2
.4.6
.81
C(p
)
0 .2 .4 .6 .8 1Percentiles (p)
2002
0.2
.4.6
.81
C(p
)
0 .2 .4 .6 .8 1Percentiles (p)
2004
45° line RHsReW
Figure A.3: Distribution of Rest Houses Provision by Year
0.2
.4.6
.81
C(p
)
0 .2 .4 .6 .8 1Percentiles (p)
1994
0.2
.4.6
.81
C(p
)0 .2 .4 .6 .8 1
Percentiles (p)
1995
0.2
.4.6
.81
C(p
)
0 .2 .4 .6 .8 1Percentiles (p)
1999
0.2
.4.6
.81
C(p
)
0 .2 .4 .6 .8 1Percentiles (p)
2002
0.2
.4.6
.81
C(p
)
0 .2 .4 .6 .8 1Percentiles (p)
2004
45° line HealRW
Figure A.4: Distribution of Health Services Provision by Year
0.2
.4.6
.81
C(p
)
0 .2 .4 .6 .8 1Percentiles (p)
1994
0.2
.4.6
.81
C(p
)
0 .2 .4 .6 .8 1Percentiles (p)
1995
0.2
.4.6
.81
C(p
)
0 .2 .4 .6 .8 1Percentiles (p)
1999
0.2
.4.6
.81
C(p
)
0 .2 .4 .6 .8 1Percentiles (p)
2002
0.2
.4.6
.81
C(p
)
0 .2 .4 .6 .8 1Percentiles (p)
2004
45° line KGnReW
Figure A.5: Distribution of Kindergarden Subsidies Provision by Year
43

Nizalova (2014): Inequality in Total Returns to Work in Ukraine
0.2
.4.6
.81
C(p
)
0 .2 .4 .6 .8 1Percentiles (p)
1994
0.2
.4.6
.81
C(p
)
0 .2 .4 .6 .8 1Percentiles (p)
1995
0.2
.4.6
.81
C(p
)
0 .2 .4 .6 .8 1Percentiles (p)
1999
0.2
.4.6
.81
C(p
)
0 .2 .4 .6 .8 1Percentiles (p)
2002
0.2
.4.6
.81
C(p
)
0 .2 .4 .6 .8 1Percentiles (p)
2004
45° line LoanRW
Figure A.6: Distribution of Loan Provision by Year
0.2
.4.6
.81
C(p
)
0 .2 .4 .6 .8 1Percentiles (p)
1994
0.2
.4.6
.81
C(p
)0 .2 .4 .6 .8 1
Percentiles (p)
1995
0.2
.4.6
.81
C(p
)
0 .2 .4 .6 .8 1Percentiles (p)
1999
0.2
.4.6
.81
C(p
)
0 .2 .4 .6 .8 1Percentiles (p)
2002
0.2
.4.6
.81
C(p
)
0 .2 .4 .6 .8 1Percentiles (p)
2004
45° line FLnReW
Figure A.7: Distribution of Interest-free Loan Provision by Year
0.2
.4.6
.81
C(p
)
0 .2 .4 .6 .8 1Percentiles (p)
1994
0.2
.4.6
.81
C(p
)
0 .2 .4 .6 .8 1Percentiles (p)
1995
0.2
.4.6
.81
C(p
)
0 .2 .4 .6 .8 1Percentiles (p)
1999
0.2
.4.6
.81
C(p
)
0 .2 .4 .6 .8 1Percentiles (p)
2002
0.2
.4.6
.81
C(p
)
0 .2 .4 .6 .8 1Percentiles (p)
2004
45° line RAsReW
Figure A.8: Distribution of Assistance on Retirement Provision by Year
44
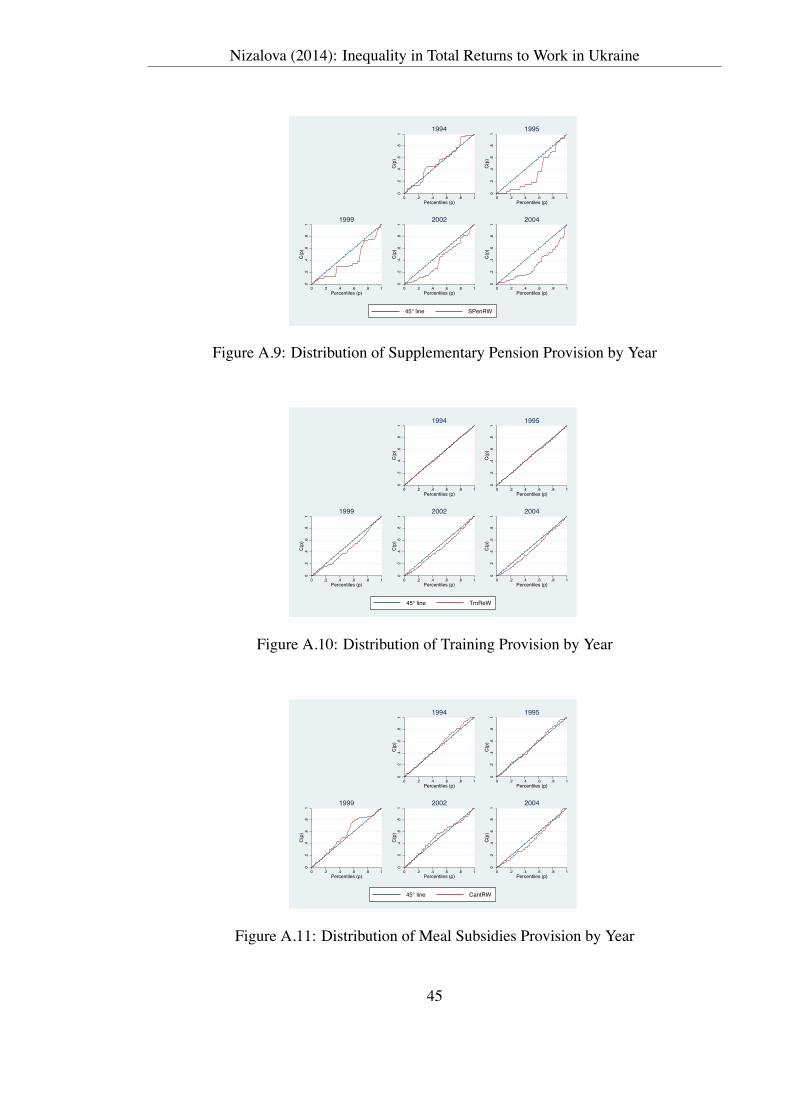
Nizalova (2014): Inequality in Total Returns to Work in Ukraine
0.2
.4.6
.81
C(p
)
0 .2 .4 .6 .8 1Percentiles (p)
1994
0.2
.4.6
.81
C(p
)
0 .2 .4 .6 .8 1Percentiles (p)
1995
0.2
.4.6
.81
C(p
)
0 .2 .4 .6 .8 1Percentiles (p)
1999
0.2
.4.6
.81
C(p
)
0 .2 .4 .6 .8 1Percentiles (p)
2002
0.2
.4.6
.81
C(p
)
0 .2 .4 .6 .8 1Percentiles (p)
2004
45° line SPenRW
Figure A.9: Distribution of Supplementary Pension Provision by Year
0.2
.4.6
.81
C(p
)
0 .2 .4 .6 .8 1Percentiles (p)
1994
0.2
.4.6
.81
C(p
)0 .2 .4 .6 .8 1
Percentiles (p)
1995
0.2
.4.6
.81
C(p
)
0 .2 .4 .6 .8 1Percentiles (p)
1999
0.2
.4.6
.81
C(p
)
0 .2 .4 .6 .8 1Percentiles (p)
2002
0.2
.4.6
.81
C(p
)
0 .2 .4 .6 .8 1Percentiles (p)
2004
45° line TrnReW
Figure A.10: Distribution of Training Provision by Year
0.2
.4.6
.81
C(p
)
0 .2 .4 .6 .8 1Percentiles (p)
1994
0.2
.4.6
.81
C(p
)
0 .2 .4 .6 .8 1Percentiles (p)
1995
0.2
.4.6
.81
C(p
)
0 .2 .4 .6 .8 1Percentiles (p)
1999
0.2
.4.6
.81
C(p
)
0 .2 .4 .6 .8 1Percentiles (p)
2002
0.2
.4.6
.81
C(p
)
0 .2 .4 .6 .8 1Percentiles (p)
2004
45° line CantRW
Figure A.11: Distribution of Meal Subsidies Provision by Year
45
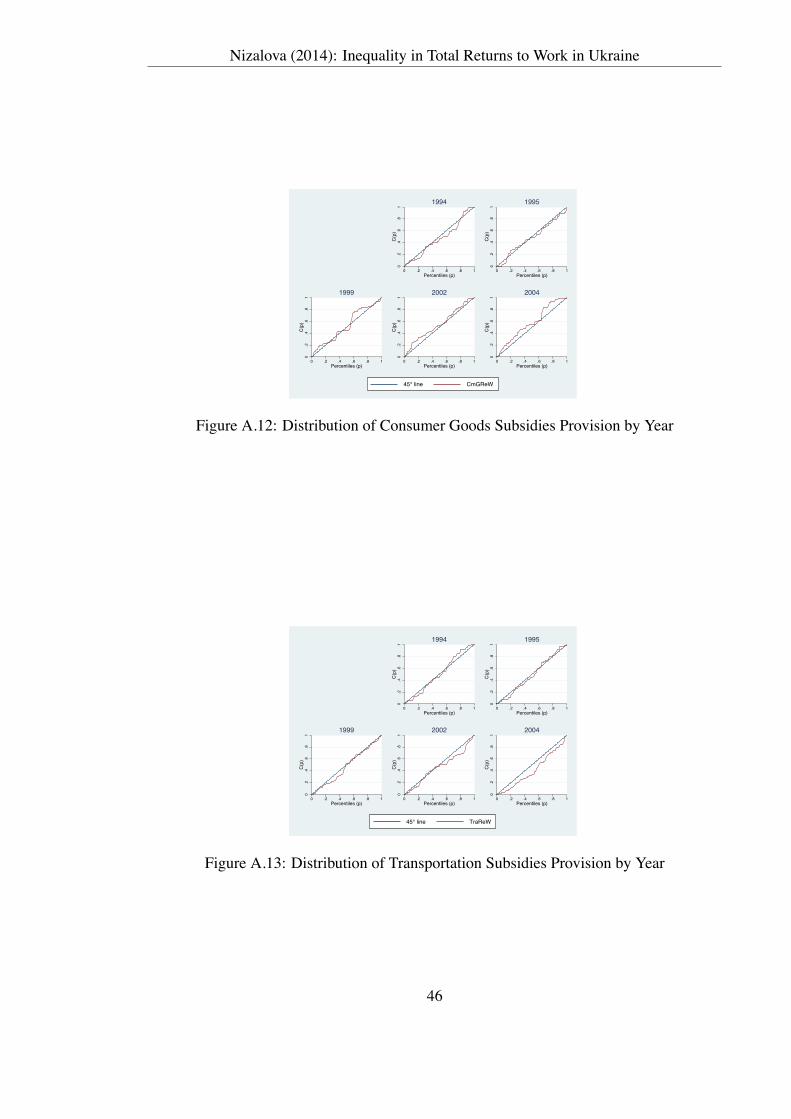
Nizalova (2014): Inequality in Total Returns to Work in Ukraine
0.2
.4.6
.81
C(p
)
0 .2 .4 .6 .8 1Percentiles (p)
1994
0.2
.4.6
.81
C(p
)
0 .2 .4 .6 .8 1Percentiles (p)
1995
0.2
.4.6
.81
C(p
)
0 .2 .4 .6 .8 1Percentiles (p)
1999
0.2
.4.6
.81
C(p
)
0 .2 .4 .6 .8 1Percentiles (p)
2002
0.2
.4.6
.81
C(p
)
0 .2 .4 .6 .8 1Percentiles (p)
2004
45° line CmGReW
Figure A.12: Distribution of Consumer Goods Subsidies Provision by Year
0.2
.4.6
.81
C(p
)
0 .2 .4 .6 .8 1Percentiles (p)
1994
0.2
.4.6
.81
C(p
)
0 .2 .4 .6 .8 1Percentiles (p)
1995
0.2
.4.6
.81
C(p
)
0 .2 .4 .6 .8 1Percentiles (p)
1999
0.2
.4.6
.81
C(p
)
0 .2 .4 .6 .8 1Percentiles (p)
2002
0.2
.4.6
.81
C(p
)
0 .2 .4 .6 .8 1Percentiles (p)
2004
45° line TraReW
Figure A.13: Distribution of Transportation Subsidies Provision by Year
46

Appendix B
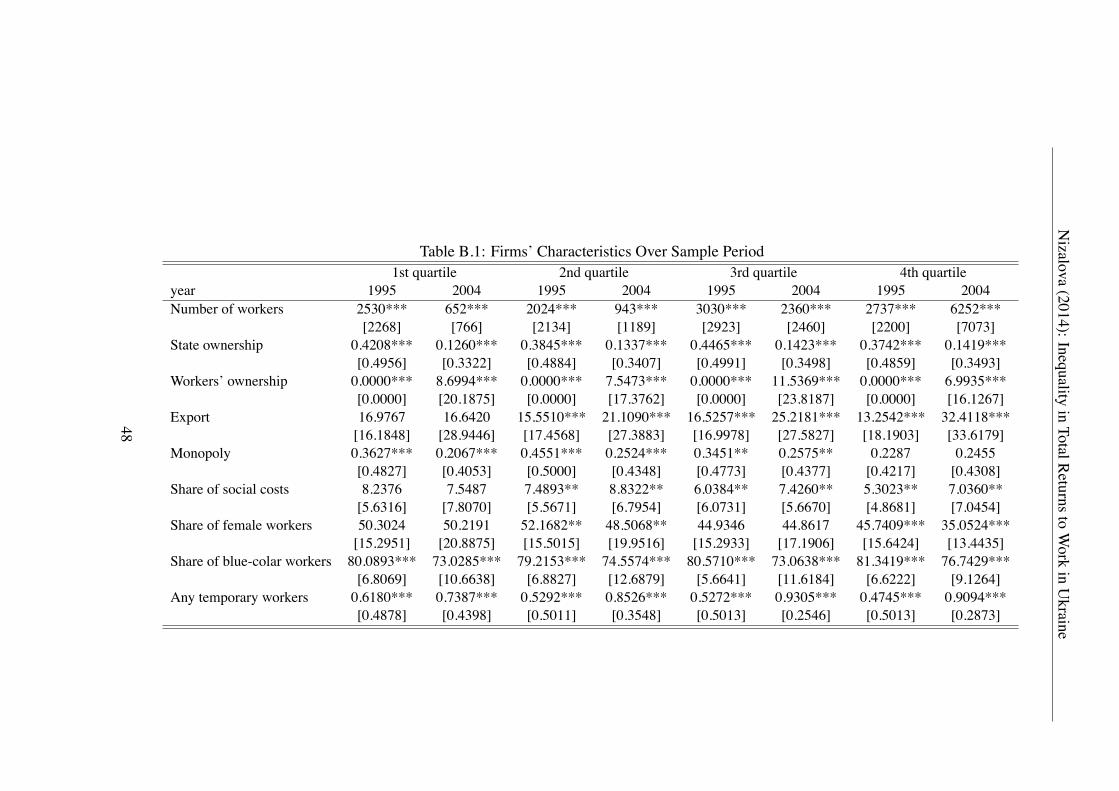
Nizalova
(2014):InequalityinTotalReturnsto
Work
inUkraine
Table B.1: Firms’ Characteristics Over Sample Period1st quartile 2nd quartile 3rd quartile 4th quartile
year 1995 2004 1995 2004 1995 2004 1995 2004Number of workers 2530*** 652*** 2024*** 943*** 3030*** 2360*** 2737*** 6252***
[2268] [766] [2134] [1189] [2923] [2460] [2200] [7073]State ownership 0.4208*** 0.1260*** 0.3845*** 0.1337*** 0.4465*** 0.1423*** 0.3742*** 0.1419***
[0.4956] [0.3322] [0.4884] [0.3407] [0.4991] [0.3498] [0.4859] [0.3493]Workers’ ownership 0.0000*** 8.6994*** 0.0000*** 7.5473*** 0.0000*** 11.5369*** 0.0000*** 6.9935***
[0.0000] [20.1875] [0.0000] [17.3762] [0.0000] [23.8187] [0.0000] [16.1267]Export 16.9767 16.6420 15.5510*** 21.1090*** 16.5257*** 25.2181*** 13.2542*** 32.4118***
[16.1848] [28.9446] [17.4568] [27.3883] [16.9978] [27.5827] [18.1903] [33.6179]Monopoly 0.3627*** 0.2067*** 0.4551*** 0.2524*** 0.3451** 0.2575** 0.2287 0.2455
[0.4827] [0.4053] [0.5000] [0.4348] [0.4773] [0.4377] [0.4217] [0.4308]Share of social costs 8.2376 7.5487 7.4893** 8.8322** 6.0384** 7.4260** 5.3023** 7.0360**
[5.6316] [7.8070] [5.5671] [6.7954] [6.0731] [5.6670] [4.8681] [7.0454]Share of female workers 50.3024 50.2191 52.1682** 48.5068** 44.9346 44.8617 45.7409*** 35.0524***
[15.2951] [20.8875] [15.5015] [19.9516] [15.2933] [17.1906] [15.6424] [13.4435]Share of blue-colar workers 80.0893*** 73.0285*** 79.2153*** 74.5574*** 80.5710*** 73.0638*** 81.3419*** 76.7429***
[6.8069] [10.6638] [6.8827] [12.6879] [5.6641] [11.6184] [6.6222] [9.1264]Any temporary workers 0.6180*** 0.7387*** 0.5292*** 0.8526*** 0.5272*** 0.9305*** 0.4745*** 0.9094***
[0.4878] [0.4398] [0.5011] [0.3548] [0.5013] [0.2546] [0.5013] [0.2873]
48

Nizalova
(2014):InequalityinTotalReturnsto
Work
inUkraine
Table B.2: Industrial Structure Over Sample Period1st quartile 2nd quartile 3rd quartile 4th quartile
year 1995 2004 1995 2004 1995 2004 1995 2004indsec==metals 0.0939*** 0.0201*** 0.0581 0.0528 0.2884*** 0.1461*** 0.0705*** 0.2968***
[0.2928] [0.1405] [0.2348] [0.2238] [0.4548] [0.3536] [0.2570] [0.4573]indsec==engineering 0.4512*** 0.2381*** 0.4467** 0.3496** 0.3303 0.2995 0.3274*** 0.1667***
[0.4996] [0.4264] [0.4991] [0.4773] [0.4722] [0.4585] [0.4712] [0.3731]indsec==chemicals 0.1290 0.1684 0.1847*** 0.0430*** 0.0674 0.0842 0.0895 0.1065
[0.3365] [0.3746] [0.3896] [0.2032] [0.2517] [0.2779] [0.2866] [0.3089]indsec==wood & paper 0.1194 0.0885 0.0299 0.0458 0.0264 0.0497 0.0228 0.0220
[0.3255] [0.2843] [0.1709] [0.2092] [0.1608] [0.2176] [0.1497] [0.1469]indsec==building mat. 0.0469 0.0447 0.0733 0.0593 0.0612 0.0445 0.0295 0.0351
[0.2122] [0.2067] [0.2616] [0.2363] [0.2406] [0.2065] [0.1699] [0.1842]indsec==light ind. 0.0631*** 0.1963*** 0.1121** 0.1759** 0.0777 0.0756 0.1154*** 0.0312***
[0.2441] [0.3976] [0.3167] [0.3812] [0.2688] [0.2646] [0.3208] [0.1741]indsec==food proc. 0.0910*** 0.2240*** 0.0939*** 0.2214*** 0.0868** 0.1623** 0.1289 0.0851
[0.2888] [0.4173] [0.2928] [0.4156] [0.2827] [0.3691] [0.3364] [0.2793]indsec==other 0.0024* 0.0188* 0.0001** 0.0216** 0.0022 0.0142 0.0258 0.0195
[0.0492] [0.1360] [0.0102] [0.1456] [0.0470] [0.1184] [0.1592] [0.1385]
49
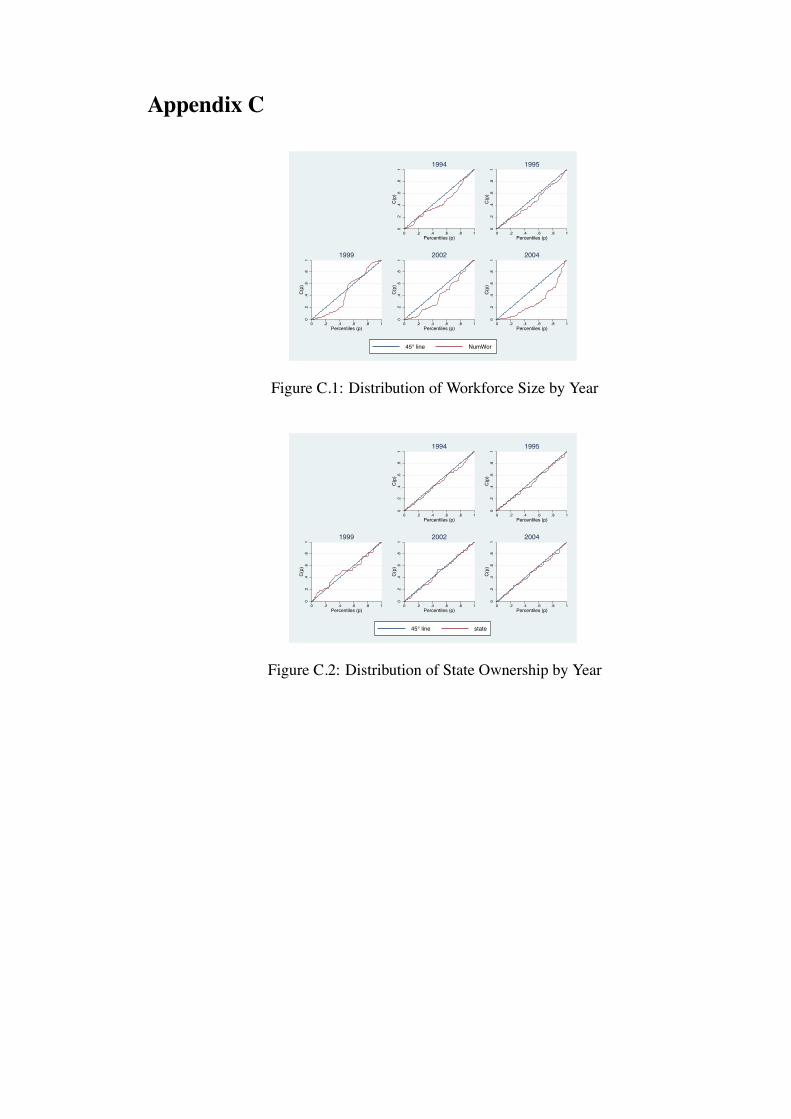
Appendix C
0.2
.4.6
.81
C(p
)
0 .2 .4 .6 .8 1Percentiles (p)
1994
0.2
.4.6
.81
C(p
)
0 .2 .4 .6 .8 1Percentiles (p)
1995
0.2
.4.6
.81
C(p
)
0 .2 .4 .6 .8 1Percentiles (p)
1999
0.2
.4.6
.81
C(p
)
0 .2 .4 .6 .8 1Percentiles (p)
2002
0.2
.4.6
.81
C(p
)
0 .2 .4 .6 .8 1Percentiles (p)
2004
45° line NumWor
Figure C.1: Distribution of Workforce Size by Year0
.2.4
.6.8
1C
(p)
0 .2 .4 .6 .8 1Percentiles (p)
1994
0.2
.4.6
.81
C(p
)
0 .2 .4 .6 .8 1Percentiles (p)
1995
0.2
.4.6
.81
C(p
)
0 .2 .4 .6 .8 1Percentiles (p)
1999
0.2
.4.6
.81
C(p
)
0 .2 .4 .6 .8 1Percentiles (p)
2002
0.2
.4.6
.81
C(p
)
0 .2 .4 .6 .8 1Percentiles (p)
2004
45° line state
Figure C.2: Distribution of State Ownership by Year

Nizalova (2014): Inequality in Total Returns to Work in Ukraine
0.2
.4.6
.81
C(p
)
0 .2 .4 .6 .8 1Percentiles (p)
1994
0.2
.4.6
.81
C(p
)
0 .2 .4 .6 .8 1Percentiles (p)
1995
0.2
.4.6
.81
C(p
)
0 .2 .4 .6 .8 1Percentiles (p)
1999
0.2
.4.6
.81
C(p
)
0 .2 .4 .6 .8 1Percentiles (p)
2002
0.2
.4.6
.81
C(p
)
0 .2 .4 .6 .8 1Percentiles (p)
2004
45° line export
Figure C.3: Distribution of Export Status by Year
0.2
.4.6
.81
C(p
)
0 .2 .4 .6 .8 1Percentiles (p)
1994
0.2
.4.6
.81
C(p
)0 .2 .4 .6 .8 1
Percentiles (p)
1995
0.2
.4.6
.81
C(p
)
0 .2 .4 .6 .8 1Percentiles (p)
1999
0.2
.4.6
.81
C(p
)
0 .2 .4 .6 .8 1Percentiles (p)
2002
0.2
.4.6
.81
C(p
)
0 .2 .4 .6 .8 1Percentiles (p)
2004
45° line fem_sh
Figure C.4: Distribution of Share of Females by Year
0.2
.4.6
.81
C(p
)
0 .2 .4 .6 .8 1Percentiles (p)
1994
0.2
.4.6
.81
C(p
)
0 .2 .4 .6 .8 1Percentiles (p)
1995
0.2
.4.6
.81
C(p
)
0 .2 .4 .6 .8 1Percentiles (p)
1999
0.2
.4.6
.81
C(p
)
0 .2 .4 .6 .8 1Percentiles (p)
2002
0.2
.4.6
.81
C(p
)
0 .2 .4 .6 .8 1Percentiles (p)
2004
45° line dumsector1
Figure C.5: Distribution of Energy Sector by Year
51
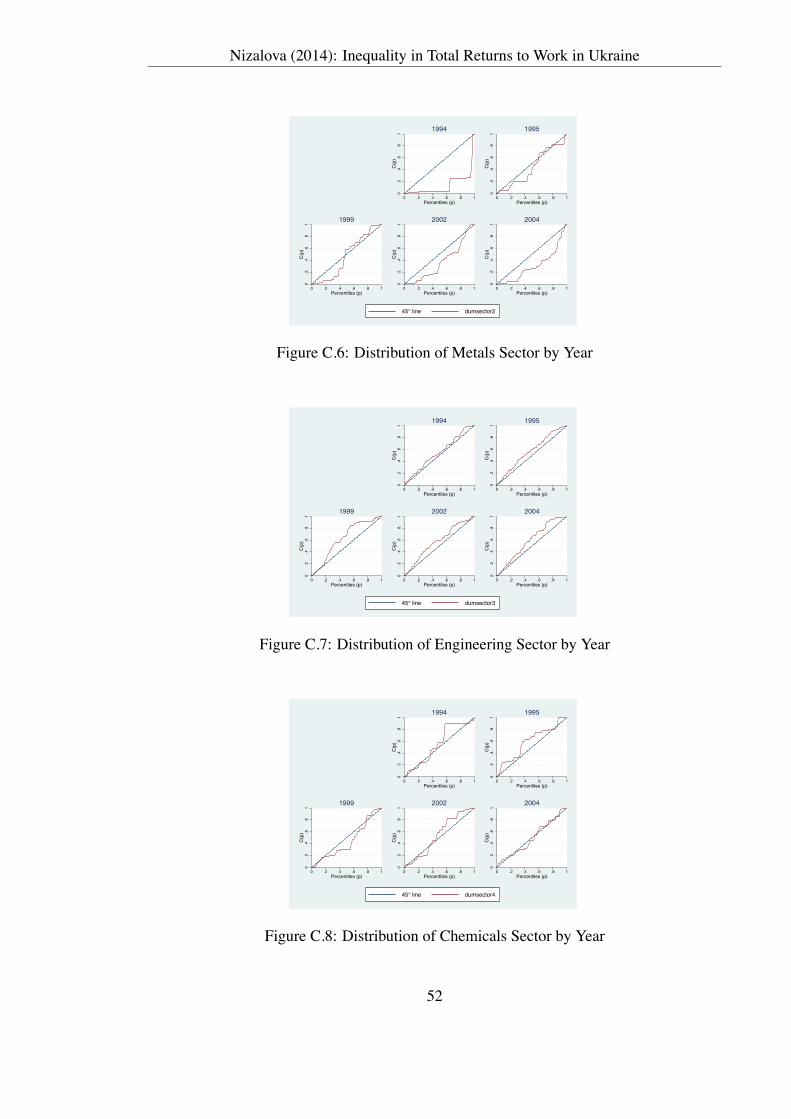
Nizalova (2014): Inequality in Total Returns to Work in Ukraine
0.2
.4.6
.81
C(p
)
0 .2 .4 .6 .8 1Percentiles (p)
1994
0.2
.4.6
.81
C(p
)
0 .2 .4 .6 .8 1Percentiles (p)
1995
0.2
.4.6
.81
C(p
)
0 .2 .4 .6 .8 1Percentiles (p)
1999
0.2
.4.6
.81
C(p
)
0 .2 .4 .6 .8 1Percentiles (p)
2002
0.2
.4.6
.81
C(p
)
0 .2 .4 .6 .8 1Percentiles (p)
2004
45° line dumsector2
Figure C.6: Distribution of Metals Sector by Year
0.2
.4.6
.81
C(p
)
0 .2 .4 .6 .8 1Percentiles (p)
1994
0.2
.4.6
.81
C(p
)0 .2 .4 .6 .8 1
Percentiles (p)
1995
0.2
.4.6
.81
C(p
)
0 .2 .4 .6 .8 1Percentiles (p)
1999
0.2
.4.6
.81
C(p
)
0 .2 .4 .6 .8 1Percentiles (p)
2002
0.2
.4.6
.81
C(p
)
0 .2 .4 .6 .8 1Percentiles (p)
2004
45° line dumsector3
Figure C.7: Distribution of Engineering Sector by Year
0.2
.4.6
.81
C(p
)
0 .2 .4 .6 .8 1Percentiles (p)
1994
0.2
.4.6
.81
C(p
)
0 .2 .4 .6 .8 1Percentiles (p)
1995
0.2
.4.6
.81
C(p
)
0 .2 .4 .6 .8 1Percentiles (p)
1999
0.2
.4.6
.81
C(p
)
0 .2 .4 .6 .8 1Percentiles (p)
2002
0.2
.4.6
.81
C(p
)
0 .2 .4 .6 .8 1Percentiles (p)
2004
45° line dumsector4
Figure C.8: Distribution of Chemicals Sector by Year
52
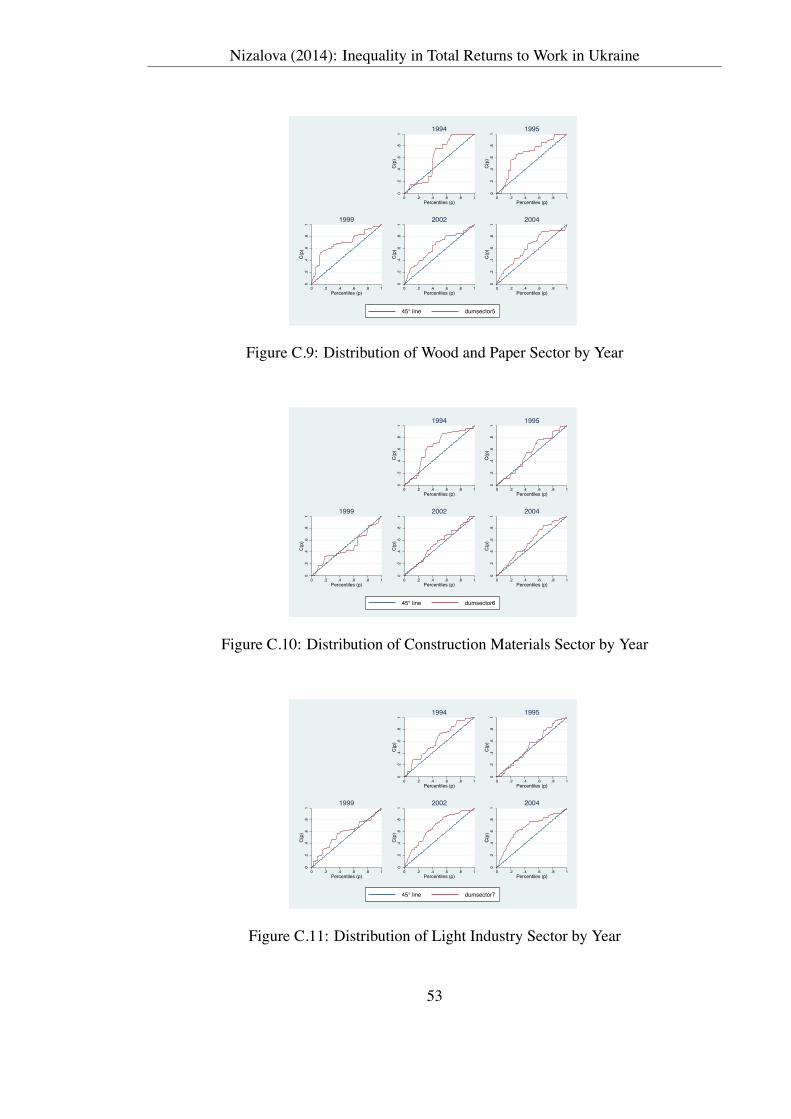
Nizalova (2014): Inequality in Total Returns to Work in Ukraine
0.2
.4.6
.81
C(p
)
0 .2 .4 .6 .8 1Percentiles (p)
1994
0.2
.4.6
.81
C(p
)
0 .2 .4 .6 .8 1Percentiles (p)
1995
0.2
.4.6
.81
C(p
)
0 .2 .4 .6 .8 1Percentiles (p)
1999
0.2
.4.6
.81
C(p
)
0 .2 .4 .6 .8 1Percentiles (p)
2002
0.2
.4.6
.81
C(p
)
0 .2 .4 .6 .8 1Percentiles (p)
2004
45° line dumsector5
Figure C.9: Distribution of Wood and Paper Sector by Year
0.2
.4.6
.81
C(p
)
0 .2 .4 .6 .8 1Percentiles (p)
1994
0.2
.4.6
.81
C(p
)0 .2 .4 .6 .8 1
Percentiles (p)
1995
0.2
.4.6
.81
C(p
)
0 .2 .4 .6 .8 1Percentiles (p)
1999
0.2
.4.6
.81
C(p
)
0 .2 .4 .6 .8 1Percentiles (p)
2002
0.2
.4.6
.81
C(p
)
0 .2 .4 .6 .8 1Percentiles (p)
2004
45° line dumsector6
Figure C.10: Distribution of Construction Materials Sector by Year
0.2
.4.6
.81
C(p
)
0 .2 .4 .6 .8 1Percentiles (p)
1994
0.2
.4.6
.81
C(p
)
0 .2 .4 .6 .8 1Percentiles (p)
1995
0.2
.4.6
.81
C(p
)
0 .2 .4 .6 .8 1Percentiles (p)
1999
0.2
.4.6
.81
C(p
)
0 .2 .4 .6 .8 1Percentiles (p)
2002
0.2
.4.6
.81
C(p
)
0 .2 .4 .6 .8 1Percentiles (p)
2004
45° line dumsector7
Figure C.11: Distribution of Light Industry Sector by Year
53

Nizalova (2014): Inequality in Total Returns to Work in Ukraine
0.2
.4.6
.81
C(p
)
0 .2 .4 .6 .8 1Percentiles (p)
1994
0.2
.4.6
.81
C(p
)0 .2 .4 .6 .8 1
Percentiles (p)
1995
0.2
.4.6
.81
C(p
)
0 .2 .4 .6 .8 1Percentiles (p)
1999
0.2
.4.6
.81
C(p
)
0 .2 .4 .6 .8 1Percentiles (p)
2002
0.2
.4.6
.81
C(p
)
0 .2 .4 .6 .8 1Percentiles (p)
2004
45° line dumsector8
Figure C.12: Distribution of Food Processing Sector by Year
54
Related Documents