Inequalities in lung cancer mortality by the educational level in 10 European populations Johan P. Mackenbach a, *, Martijn Huisman a , Otto Andersen b , Matthias Bopp c , Jens-Kristian Borgan d , Carme Borrell e , Giuseppe Costa f , Patrick Deboosere g , Angela Donkin h , Sylvie Gadeyne g , Christoph Minder i , Enrique Regidor j , Teresa Spadea k , Tapani Valkonen l , Anton E. Kunst a a Department of Public Health, Erasmus MC, University Medical Center Rotterdam, PO Box 1738 3000 DR Rotterdam, The Netherlands b Statistics Denmark, Copenhagen, Denmark c Institut fu ¨r Sozial und Pra ¨ventivmedizin, Universita ¨t Zu ¨rich, Zu ¨rich, Switzerland d Division for Health Statistics, Statistics Norway, Oslo, Norway e Agency of Public Health of Barcelona, Barcelona, Spain f Department of Public Health, University of Turin, Turin, Italy g Interface Demography, Centrum voor Sociologie—VUB, Brussels, Belgium h Health and Care Division, Office for National Statistics, London, UK i University of Bern, Dept. of Social and Preventive Medicine, Bern, Switzerland j Department of Preventive Medicine and Public Health, Universidad Complutense de Madrid, Madrid, Spain k Azienda Sanitaria Locale 5 Piemonte, Servizio di Epidemiologia, Grugliasco (To), Italy l Department of Sociology, University of Helsinki, Helsinki, Finland Received 22 April 2003; received in revised form 12 September 2003; accepted 28 October 2003 Abstract Previous studies have shown that due to differences in the progression of the smoking epidemic European countries differ in the direction and size of socioeconomic variations in smoking prevalence. We studied differences in the direction and size of inequalities in lung cancer mortality by the educational level of subjects in 10 European populations during the 1990’s. We obtained long- itudinal mortality data by cause of death, age, sex and educational level for 4 Northern European populations (England/Wales, Norway, Denmark, Finland), 3 continental European populations (Belgium, Switzerland, Austria), and 3 Southern European populations (Barcelona, Madrid, Turin). Age- and sex-specific mortality rates by educational level were calculated, as well as the age- and sex-specific mortality rate ratios. Patterns of educational inequalities in lung cancer mortality suggest that England/Wales, Norway, Denmark, Finland and Belgium are the farthest advanced in terms of the progression of the smoking epidemic: these populations have consistently higher lung cancer mortality rates among the less educated in all age-groups in men, including the oldest men, and in all age-groups in women up to those aged 60–69 years. Madrid appears to be less advanced, with less educated men in the oldest age-group and less educated women in all age-groups still benefiting from lower lung cancer mortality rates. Switzerland, Austria, Turin and Barcelona occupy intermediate positions. The lung cancer mortality data suggest that inequalities in smoking contribute substantially to the educational differences in total mortality among men in all populations, except Madrid. Among women, these contributions are probably substantial in the Northern European countries and in Belgium, but only small in Switzerland, Austria, Turin and Barcelona, and negative in Madrid. In many European countries, policies and interventions that reduce smoking in less educated groups should be one of the main priorities to tackle socioeconomic inequalities in mortality. In some countries, particularly in Southern Europe, it may not be too late to prevent women in less educated groups from taking up the smoking habit, thereby avoiding large inequalities in mortality in the future in these countries. # 2003 Elsevier Ltd. All rights reserved. Keywords: Lung cancer; Mortality; Socioeconomic factors; Education; International; Smoking 0959-8049/$ - see front matter # 2003 Elsevier Ltd. All rights reserved. doi:10.1016/j.ejca.2003.10.018 European Journal of Cancer 40 (2004) 126–135 www.ejconline.com * Corresponding author. Tel.: +31-10-408-7714; fax: +31-10-408-9455. E-mail address: [email protected] (J.P. Mackenbach).

Welcome message from author
This document is posted to help you gain knowledge. Please leave a comment to let me know what you think about it! Share it to your friends and learn new things together.
Transcript
Inequalities in lung cancer mortality by the educational levelin 10 European populations
Johan P. Mackenbacha,*, Martijn Huismana, Otto Andersenb, Matthias Boppc,Jens-Kristian Borgand, Carme Borrelle, Giuseppe Costaf, Patrick Deboosereg,
Angela Donkinh, Sylvie Gadeyneg, Christoph Minderi, Enrique Regidorj, Teresa Spadeak,Tapani Valkonenl, Anton E. Kunsta
aDepartment of Public Health, Erasmus MC, University Medical Center Rotterdam, PO Box 1738 3000 DR Rotterdam, The NetherlandsbStatistics Denmark, Copenhagen, Denmark
cInstitut fur Sozial und Praventivmedizin, Universitat Zurich, Zurich, SwitzerlanddDivision for Health Statistics, Statistics Norway, Oslo, Norway
eAgency of Public Health of Barcelona, Barcelona, SpainfDepartment of Public Health, University of Turin, Turin, Italy
gInterface Demography, Centrum voor Sociologie—VUB, Brussels, BelgiumhHealth and Care Division, Office for National Statistics, London, UK
iUniversity of Bern, Dept. of Social and Preventive Medicine, Bern, SwitzerlandjDepartment of Preventive Medicine and Public Health, Universidad Complutense de Madrid, Madrid, Spain
kAzienda Sanitaria Locale 5 Piemonte, Servizio di Epidemiologia, Grugliasco (To), ItalylDepartment of Sociology, University of Helsinki, Helsinki, Finland
Received 22 April 2003; received in revised form 12 September 2003; accepted 28 October 2003
Abstract
Previous studies have shown that due to differences in the progression of the smoking epidemic European countries differ in thedirection and size of socioeconomic variations in smoking prevalence. We studied differences in the direction and size of inequalities
in lung cancer mortality by the educational level of subjects in 10 European populations during the 1990’s. We obtained long-itudinal mortality data by cause of death, age, sex and educational level for 4 Northern European populations (England/Wales,Norway, Denmark, Finland), 3 continental European populations (Belgium, Switzerland, Austria), and 3 Southern European
populations (Barcelona, Madrid, Turin). Age- and sex-specific mortality rates by educational level were calculated, as well as theage- and sex-specific mortality rate ratios. Patterns of educational inequalities in lung cancer mortality suggest that England/Wales,Norway, Denmark, Finland and Belgium are the farthest advanced in terms of the progression of the smoking epidemic: thesepopulations have consistently higher lung cancer mortality rates among the less educated in all age-groups in men, including the
oldest men, and in all age-groups in women up to those aged 60–69 years. Madrid appears to be less advanced, with less educatedmen in the oldest age-group and less educated women in all age-groups still benefiting from lower lung cancer mortality rates.Switzerland, Austria, Turin and Barcelona occupy intermediate positions. The lung cancer mortality data suggest that inequalities
in smoking contribute substantially to the educational differences in total mortality among men in all populations, except Madrid.Among women, these contributions are probably substantial in the Northern European countries and in Belgium, but only small inSwitzerland, Austria, Turin and Barcelona, and negative in Madrid. In many European countries, policies and interventions that
reduce smoking in less educated groups should be one of the main priorities to tackle socioeconomic inequalities in mortality. Insome countries, particularly in Southern Europe, it may not be too late to prevent women in less educated groups from taking upthe smoking habit, thereby avoiding large inequalities in mortality in the future in these countries.
# 2003 Elsevier Ltd. All rights reserved.
Keywords: Lung cancer; Mortality; Socioeconomic factors; Education; International; Smoking
0959-8049/$ - see front matter # 2003 Elsevier Ltd. All rights reserved.
doi:10.1016/j.ejca.2003.10.018
European Journal of Cancer 40 (2004) 126–135
www.ejconline.com
* Corresponding author. Tel.: +31-10-408-7714; fax: +31-10-408-9455.
E-mail address: [email protected] (J.P. Mackenbach).
1. Introduction
The habit of smoking usually spreads through popu-lations like an epidemic with four stages. In stage 1,smoking is an exceptional behaviour and mainly a habitof men and people in higher socioeconomic groups. Instage 2, smoking becomes more common. Rates amongmen peak at 50%–80% and are equal among socio-economic groups or higher among higher socio-economic groups. In women, these patterns usually lag10–20 years behind those of men. Smoking is firstadopted by women from higher socioeconomic groups.In stage 3, prevalence rates among men decrease toapproximately 40% since many men stop smoking,especially those who are better off. Women reach theirpeak rate (35%–45%) during this stage, and at the endof this stage their rates also start to decline. In stage 4,prevalence rates keep declining slowly for both men andwomen, and smoking becomes progressively more ahabit of the lower socioeconomic groups. As a result,during the smoking epidemic, there is a reversal froma positive to a negative association between socio-economic status and smoking [1].
Different countries are in different stages of thesmoking epidemic, as shown by international-compara-tive studies of smoking prevalence rates by age, sex andsocioeconomic status [2,3]. A previous study which weconducted, and which used data from surveys under-taken around 1990 in 12 Western European countries,found positive associations between education andsmoking (implying a higher smoking prevalence in moreeducated groups) among men and women of all ages inPortugal, among younger and older women in Spain,and among older women in Italy and France. This sug-gested that countries in Southern Europe were still instage 2 (Portugal) or at the beginning of stage 3 (Spain,Italy, France) of the smoking epidemic. On the otherhand, we found negative associations between educationand smoking among men and women of all ages inGreat Britain, Norway, Sweden and the Netherlands. InWest Germany, negative associations were found onlyfor men and younger women, while in Finland, negativeassociations were limited to men. This suggested thatcountries in Northern Europe were already in stage 4(Great Britain, Norway, Sweden, the Netherlands) or atthe end of stage 3 (West Germany, Finland) [4].
We now report on a study of socioeconomic inequal-ities in lung cancer mortality in 10 European countriesduring the 1990’s. Socioeconomic variations in lungcancer incidence and mortality have been reported for anumber of European countries, including Italy [5], theNetherlands [6,7], Spain [8,9], Sweden [10], Switzerland[11,12], and the United Kingdom [13,14]. However, asystematic analysis of variations between countries inthe size and pattern of socioeconomic inequalities inlung cancer mortality has not yet been performed. Such
a systematic analysis may shed further light on, first, theprogression of the smoking epidemic and, second, the rolesmoking plays in socioeconomic inequalities in totalmortality.
Lung cancer mortality rates reflect the exposure ofpopulations to smoking over previous decades, and in asense summarise that exposure and form a useful com-plement to survey data, which are not as widely avail-able for comparisons between countries. We willtherefore use the socioeconomic patterning of lung can-cer mortality to make inferences about the stage of thesmoking epidemic that countries find themselves in. Wewill also use the lung cancer mortality rates by socio-economic group to obtain an indication of differences inthe role of smoking in generating socioeconomicinequalities in total mortality in different populations.Smoking accounts for a considerable proportion ofpremature deaths in developed countries, partly throughits effect on lung cancer (for which aetiological fractionsare in the order of 90% or more), partly through itseffect on other causes of death (for which aetiologicalfractions are mostly smaller, but absolute numbers ofsmoking-induced deaths may be larger) [15]. Previousstudies have indicated that smoking accounts for aconsiderable part of the excess mortality in lowersocioeconomic groups, at least in some countries [16–18]. However, it is likely that the role of smoking differsbetween countries that are in a different stage of thesmoking epidemic. As Peto and colleagues have shown,one can use lung cancer rates in national populations toindirectly estimate the contribution of smoking to pre-mature mortality in these populations [19,20], and,similarly, lung cancer rates in different socioeconomicgroups can be used to indicate the contribution ofsmoking to socioeconomic variations in total mortality.
Thus, the aims of our study were: (1) to describesocioeconomic inequalities in lung cancer mortality indifferent European populations; (2) to make inferencesabout the staging of the smoking epidemic in differentEuropean populations; (3) to make inferences about thecontribution of smoking to socioeconomic inequalitiesin total mortality in different European populations.
2. Data and methods
2.1. Data
Table 1 presents a summary description of the dataused in this study. We obtained data from sevennational, one regional (Madrid) and two city-wide(Turin and Barcelona) registrations of mortality, allcollected according to a longitudinal design in whichpersons enumerated during a census in the (early) 1990’swere followed-up for various periods of time. Moststudies covered the entire national, regional or local
J.P. Mackenbach et al. / European Journal of Cancer 40 (2004) 126–135 127
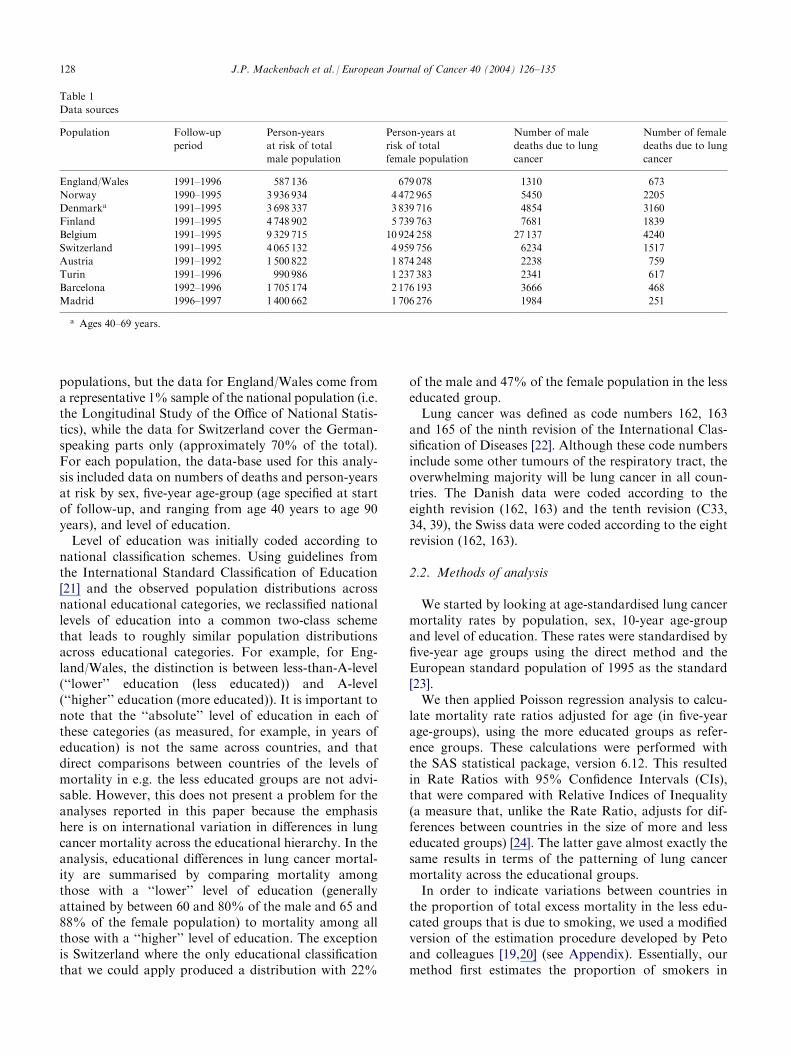
populations, but the data for England/Wales come froma representative 1% sample of the national population (i.e.the Longitudinal Study of the Office of National Statis-tics), while the data for Switzerland cover the German-speaking parts only (approximately 70% of the total).For each population, the data-base used for this analy-sis included data on numbers of deaths and person-yearsat risk by sex, five-year age-group (age specified at startof follow-up, and ranging from age 40 years to age 90years), and level of education.
Level of education was initially coded according tonational classification schemes. Using guidelines fromthe International Standard Classification of Education[21] and the observed population distributions acrossnational educational categories, we reclassified nationallevels of education into a common two-class schemethat leads to roughly similar population distributionsacross educational categories. For example, for Eng-land/Wales, the distinction is between less-than-A-level(‘‘lower’’ education (less educated)) and A-level(‘‘higher’’ education (more educated)). It is important tonote that the ‘‘absolute’’ level of education in each ofthese categories (as measured, for example, in years ofeducation) is not the same across countries, and thatdirect comparisons between countries of the levels ofmortality in e.g. the less educated groups are not advi-sable. However, this does not present a problem for theanalyses reported in this paper because the emphasishere is on international variation in differences in lungcancer mortality across the educational hierarchy. In theanalysis, educational differences in lung cancer mortal-ity are summarised by comparing mortality amongthose with a ‘‘lower’’ level of education (generallyattained by between 60 and 80% of the male and 65 and88% of the female population) to mortality among allthose with a ‘‘higher’’ level of education. The exceptionis Switzerland where the only educational classificationthat we could apply produced a distribution with 22%
of the male and 47% of the female population in the lesseducated group.
Lung cancer was defined as code numbers 162, 163and 165 of the ninth revision of the International Clas-sification of Diseases [22]. Although these code numbersinclude some other tumours of the respiratory tract, theoverwhelming majority will be lung cancer in all coun-tries. The Danish data were coded according to theeighth revision (162, 163) and the tenth revision (C33,34, 39), the Swiss data were coded according to the eightrevision (162, 163).
2.2. Methods of analysis
We started by looking at age-standardised lung cancermortality rates by population, sex, 10-year age-groupand level of education. These rates were standardised byfive-year age groups using the direct method and theEuropean standard population of 1995 as the standard[23].
We then applied Poisson regression analysis to calcu-late mortality rate ratios adjusted for age (in five-yearage-groups), using the more educated groups as refer-ence groups. These calculations were performed withthe SAS statistical package, version 6.12. This resultedin Rate Ratios with 95% Confidence Intervals (CIs),that were compared with Relative Indices of Inequality(a measure that, unlike the Rate Ratio, adjusts for dif-ferences between countries in the size of more and lesseducated groups) [24]. The latter gave almost exactly thesame results in terms of the patterning of lung cancermortality across the educational groups.
In order to indicate variations between countries inthe proportion of total excess mortality in the less edu-cated groups that is due to smoking, we used a modifiedversion of the estimation procedure developed by Petoand colleagues [19,20] (see Appendix). Essentially, ourmethod first estimates the proportion of smokers in
Table 1
Data sources
Population
Follow-upperiod
Person-years
at risk of total
male population
Person-years at
risk of total
female population
Number of male
deaths due to lung
cancer
Number of female
deaths due to lung
cancer
England/Wales
1991–1996 587 136 679 078 1310 673Norway
1990–1995 3 936 934 4 472 965 5450 2205Denmarka
1991–1995 3 698 337 3 839 716 4854 3160Finland
1991–1995 4 748 902 5 739 763 7681 1839Belgium
1991–1995 9 329 715 10 924 258 27 137 4240Switzerland
1991–1995 4 065 132 4 959 756 6234 1517Austria
1991–1992 1 500 822 1 874 248 2238 759Turin
1991–1996 990 986 1 237 383 2341 617Barcelona
1992–1996 1 705 174 2 176 193 3666 468Madrid
1996–1997 1 400 662 1 706 276 1984 251a Ages 40–69 years.
128 J.P. Mackenbach et al. / European Journal of Cancer 40 (2004) 126–135
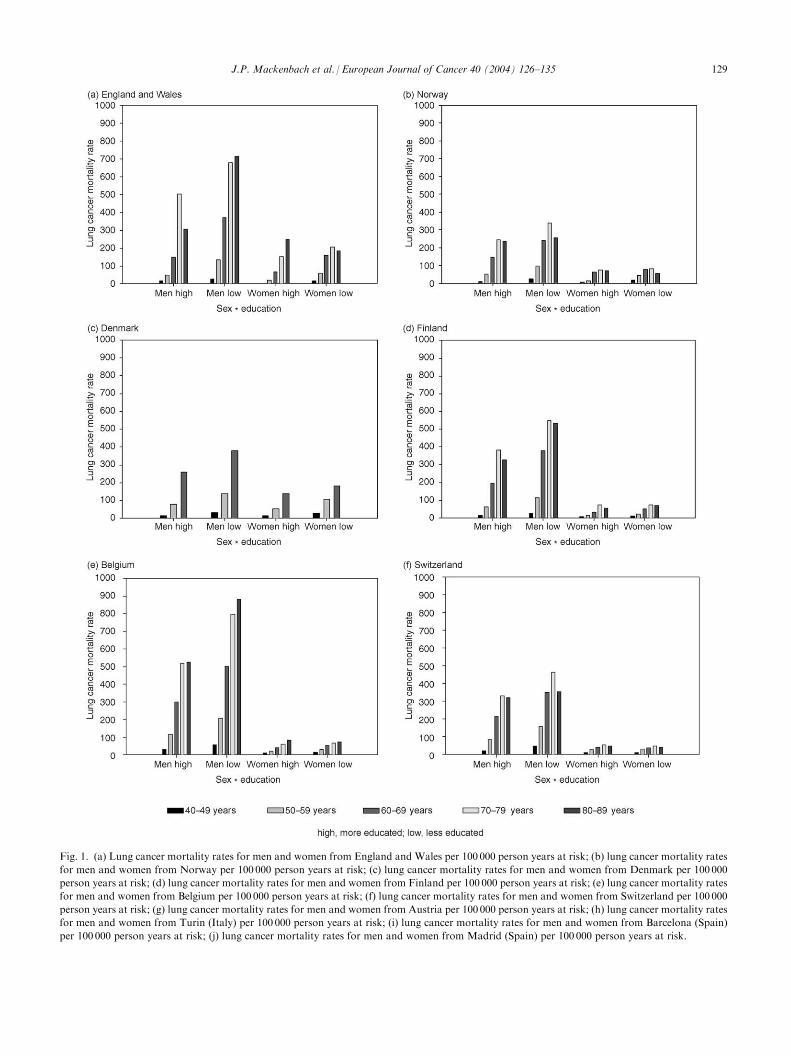
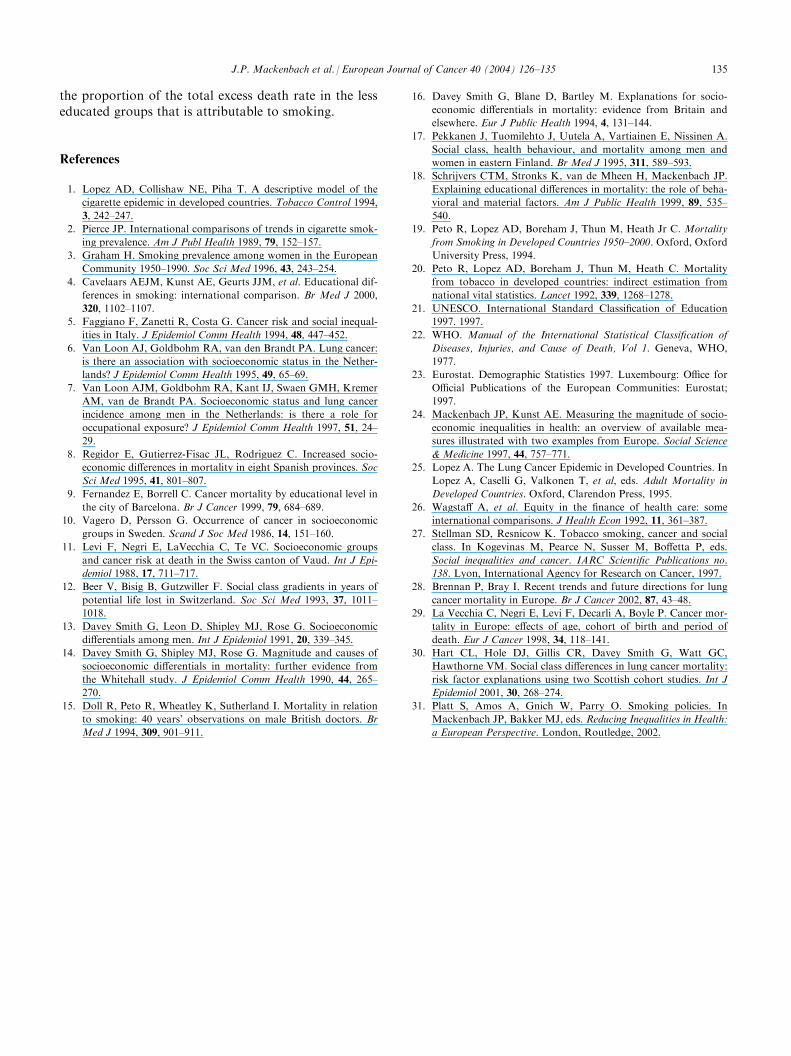
Fig. 1. (a) Lung cancer mortality rates for men and women from England and Wales per 100 000 person years at risk; (b) lung cancer mortality rates
for men and women from Norway per 100 000 person years at risk; (c) lung cancer mortality rates for men and women from Denmark per 100 000
person years at risk; (d) lung cancer mortality rates for men and women from Finland per 100 000 person years at risk; (e) lung cancer mortality rates
for men and women from Belgium per 100 000 person years at risk; (f) lung cancer mortality rates for men and women from Switzerland per 100 000
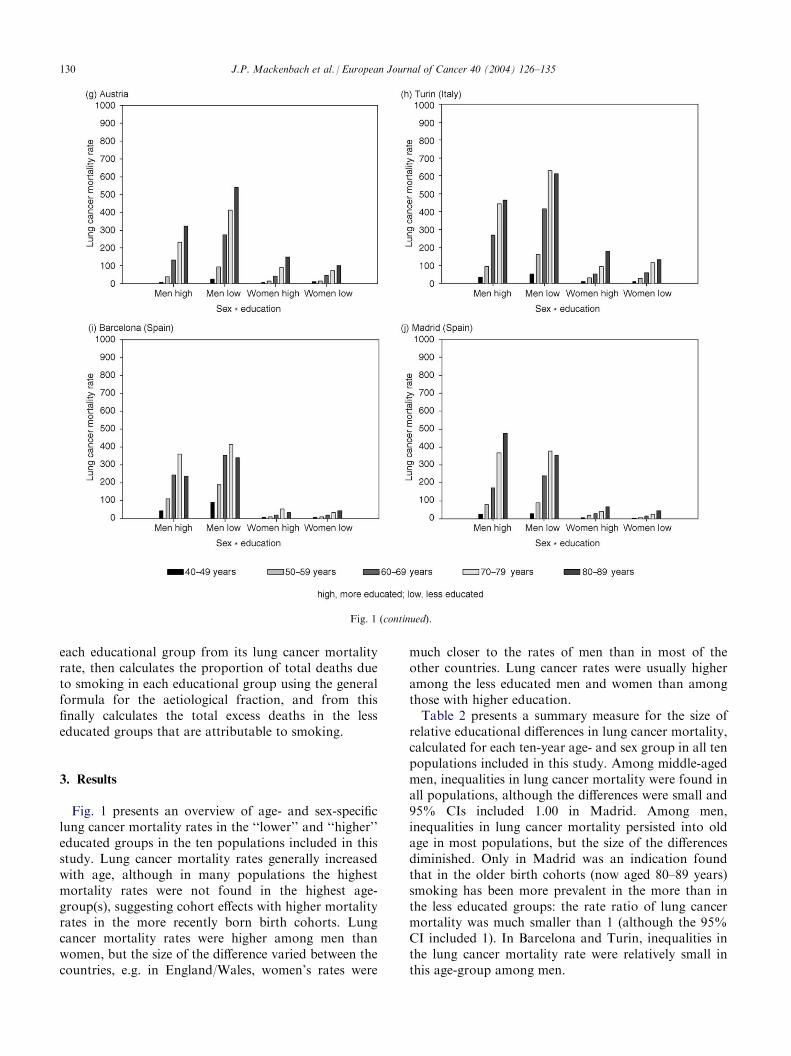
person years at risk; (g) lung cancer mortality rates for men and women from Austria per 100 000 person years at risk; (h) lung cancer mortality rates
for men and women from Turin (Italy) per 100 000 person years at risk; (i) lung cancer mortality rates for men and women from Barcelona (Spain)
per 100 000 person years at risk; (j) lung cancer mortality rates for men and women from Madrid (Spain) per 100 000 person years at risk.
J.P. Mackenbach et al. / European Journal of Cancer 40 (2004) 126–135 129
each educational group from its lung cancer mortalityrate, then calculates the proportion of total deaths dueto smoking in each educational group using the generalformula for the aetiological fraction, and from thisfinally calculates the total excess deaths in the lesseducated groups that are attributable to smoking.
3. Results
Fig. 1 presents an overview of age- and sex-specificlung cancer mortality rates in the ‘‘lower’’ and ‘‘higher’’educated groups in the ten populations included in thisstudy. Lung cancer mortality rates generally increasedwith age, although in many populations the highestmortality rates were not found in the highest age-group(s), suggesting cohort effects with higher mortalityrates in the more recently born birth cohorts. Lungcancer mortality rates were higher among men thanwomen, but the size of the difference varied between thecountries, e.g. in England/Wales, women’s rates were
much closer to the rates of men than in most of theother countries. Lung cancer rates were usually higheramong the less educated men and women than amongthose with higher education.
Table 2 presents a summary measure for the size ofrelative educational differences in lung cancer mortality,calculated for each ten-year age- and sex group in all tenpopulations included in this study. Among middle-agedmen, inequalities in lung cancer mortality were found inall populations, although the differences were small and95% CIs included 1.00 in Madrid. Among men,inequalities in lung cancer mortality persisted into oldage in most populations, but the size of the differencesdiminished. Only in Madrid was an indication foundthat in the older birth cohorts (now aged 80–89 years)smoking has been more prevalent in the more than inthe less educated groups: the rate ratio of lung cancermortality was much smaller than 1 (although the 95%CI included 1). In Barcelona and Turin, inequalities inthe lung cancer mortality rate were relatively small inthis age-group among men.
Fig. 1 (continued).
130 J.P. Mackenbach et al. / European Journal of Cancer 40 (2004) 126–135
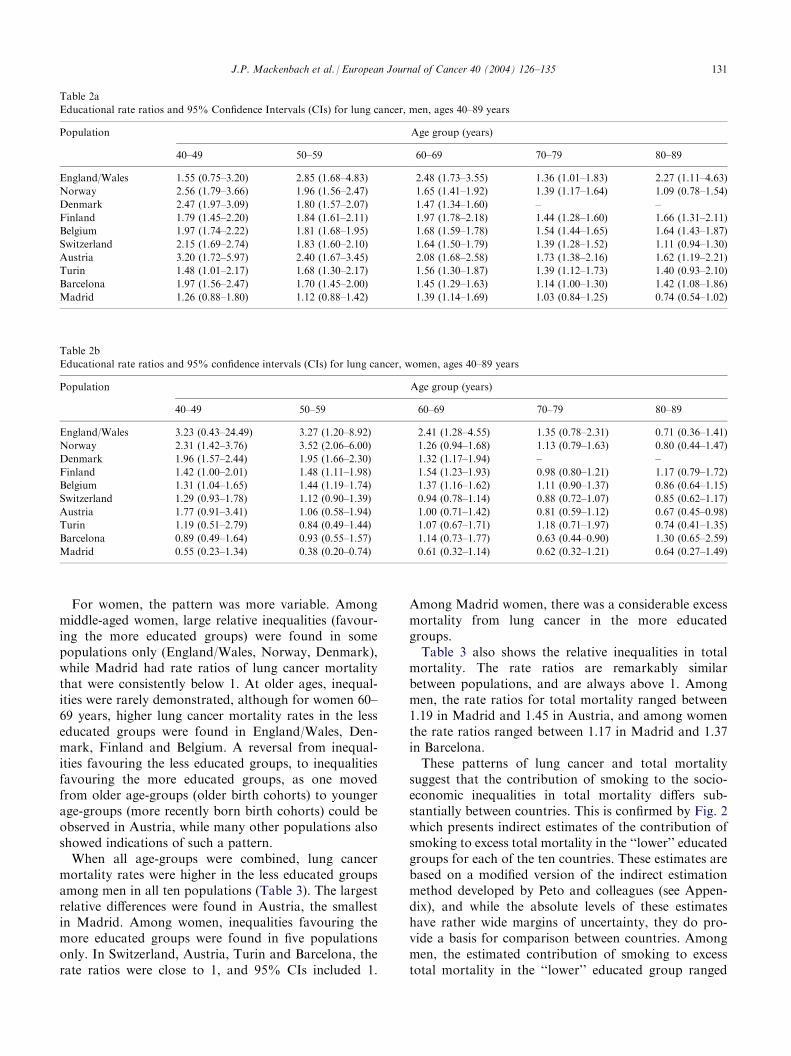
For women, the pattern was more variable. Amongmiddle-aged women, large relative inequalities (favour-ing the more educated groups) were found in somepopulations only (England/Wales, Norway, Denmark),while Madrid had rate ratios of lung cancer mortalitythat were consistently below 1. At older ages, inequal-ities were rarely demonstrated, although for women 60–69 years, higher lung cancer mortality rates in the lesseducated groups were found in England/Wales, Den-mark, Finland and Belgium. A reversal from inequal-ities favouring the less educated groups, to inequalitiesfavouring the more educated groups, as one movedfrom older age-groups (older birth cohorts) to youngerage-groups (more recently born birth cohorts) could beobserved in Austria, while many other populations alsoshowed indications of such a pattern.
When all age-groups were combined, lung cancermortality rates were higher in the less educated groupsamong men in all ten populations (Table 3). The largestrelative differences were found in Austria, the smallestin Madrid. Among women, inequalities favouring themore educated groups were found in five populationsonly. In Switzerland, Austria, Turin and Barcelona, therate ratios were close to 1, and 95% CIs included 1.
Among Madrid women, there was a considerable excessmortality from lung cancer in the more educatedgroups.
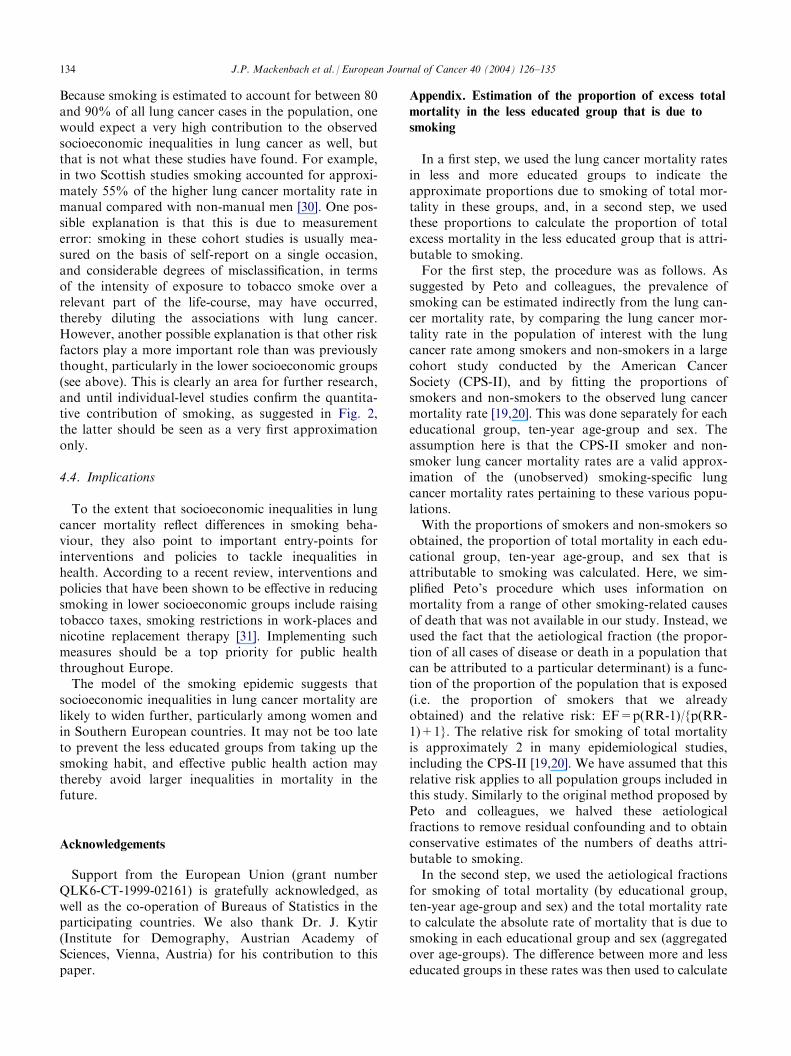
Table 3 also shows the relative inequalities in totalmortality. The rate ratios are remarkably similarbetween populations, and are always above 1. Amongmen, the rate ratios for total mortality ranged between1.19 in Madrid and 1.45 in Austria, and among womenthe rate ratios ranged between 1.17 in Madrid and 1.37in Barcelona.
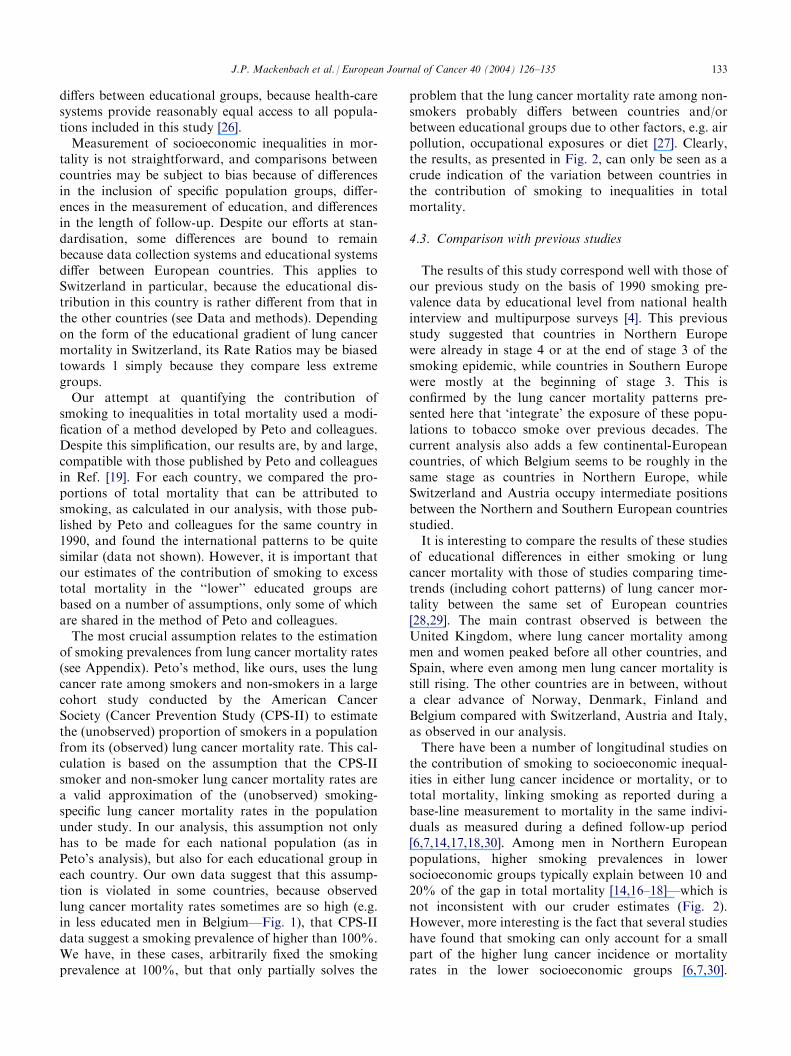
These patterns of lung cancer and total mortalitysuggest that the contribution of smoking to the socio-economic inequalities in total mortality differs sub-stantially between countries. This is confirmed by Fig. 2which presents indirect estimates of the contribution ofsmoking to excess total mortality in the ‘‘lower’’ educatedgroups for each of the ten countries. These estimates arebased on a modified version of the indirect estimationmethod developed by Peto and colleagues (see Appen-dix), and while the absolute levels of these estimateshave rather wide margins of uncertainty, they do pro-vide a basis for comparison between countries. Amongmen, the estimated contribution of smoking to excesstotal mortality in the ‘‘lower’’ educated group ranged
Table 2b
Educational rate ratios and 95% confidence intervals (CIs) for lung cancer, women, ages 40–89 years
Population
Age group (years)40–49
50–59 60–69 70–79 80–89England/Wales
3.23 (0.43–24.49) 3.27 (1.20–8.92) 2.41 (1.28–4.55) 1.35 (0.78–2.31) 0.71 (0.36–1.41)Norway
2.31 (1.42–3.76) 3.52 (2.06–6.00) 1.26 (0.94–1.68) 1.13 (0.79–1.63) 0.80 (0.44–1.47)Denmark
1.96 (1.57–2.44) 1.95 (1.66–2.30) 1.32 (1.17–1.94) – –Finland
1.42 (1.00–2.01) 1.48 (1.11–1.98) 1.54 (1.23–1.93) 0.98 (0.80–1.21) 1.17 (0.79–1.72)Belgium
1.31 (1.04–1.65) 1.44 (1.19–1.74) 1.37 (1.16–1.62) 1.11 (0.90–1.37) 0.86 (0.64–1.15)Switzerland
1.29 (0.93–1.78) 1.12 (0.90–1.39) 0.94 (0.78–1.14) 0.88 (0.72–1.07) 0.85 (0.62–1.17)Austria
1.77 (0.91–3.41) 1.06 (0.58–1.94) 1.00 (0.71–1.42) 0.81 (0.59–1.12) 0.67 (0.45–0.98)Turin
1.19 (0.51–2.79) 0.84 (0.49–1.44) 1.07 (0.67–1.71) 1.18 (0.71–1.97) 0.74 (0.41–1.35)Barcelona
0.89 (0.49–1.64) 0.93 (0.55–1.57) 1.14 (0.73–1.77) 0.63 (0.44–0.90) 1.30 (0.65–2.59)Madrid
0.55 (0.23–1.34) 0.38 (0.20–0.74) 0.61 (0.32–1.14) 0.62 (0.32–1.21) 0.64 (0.27–1.49)Table 2a
Educational rate ratios and 95% Confidence Intervals (CIs) for lung cancer, men, ages 40–89 years
Population
Age group (years)40–49
50–59 60–69 70–79 80–89England/Wales
1.55 (0.75–3.20) 2.85 (1.68–4.83) 2.48 (1.73–3.55) 1.36 (1.01–1.83) 2.27 (1.11–4.63)Norway
2.56 (1.79–3.66) 1.96 (1.56–2.47) 1.65 (1.41–1.92) 1.39 (1.17–1.64) 1.09 (0.78–1.54)Denmark
2.47 (1.97–3.09) 1.80 (1.57–2.07) 1.47 (1.34–1.60) – –Finland
1.79 (1.45–2.20) 1.84 (1.61–2.11) 1.97 (1.78–2.18) 1.44 (1.28–1.60) 1.66 (1.31–2.11)Belgium
1.97 (1.74–2.22) 1.81 (1.68–1.95) 1.68 (1.59–1.78) 1.54 (1.44–1.65) 1.64 (1.43–1.87)Switzerland
2.15 (1.69–2.74) 1.83 (1.60–2.10) 1.64 (1.50–1.79) 1.39 (1.28–1.52) 1.11 (0.94–1.30)Austria
3.20 (1.72–5.97) 2.40 (1.67–3.45) 2.08 (1.68–2.58) 1.73 (1.38–2.16) 1.62 (1.19–2.21)Turin
1.48 (1.01–2.17) 1.68 (1.30–2.17) 1.56 (1.30–1.87) 1.39 (1.12–1.73) 1.40 (0.93–2.10)Barcelona
1.97 (1.56–2.47) 1.70 (1.45–2.00) 1.45 (1.29–1.63) 1.14 (1.00–1.30) 1.42 (1.08–1.86)Madrid
1.26 (0.88–1.80) 1.12 (0.88–1.42) 1.39 (1.14–1.69) 1.03 (0.84–1.25) 0.74 (0.54–1.02)J.P. Mackenbach et al. / European Journal of Cancer 40 (2004) 126–135 131
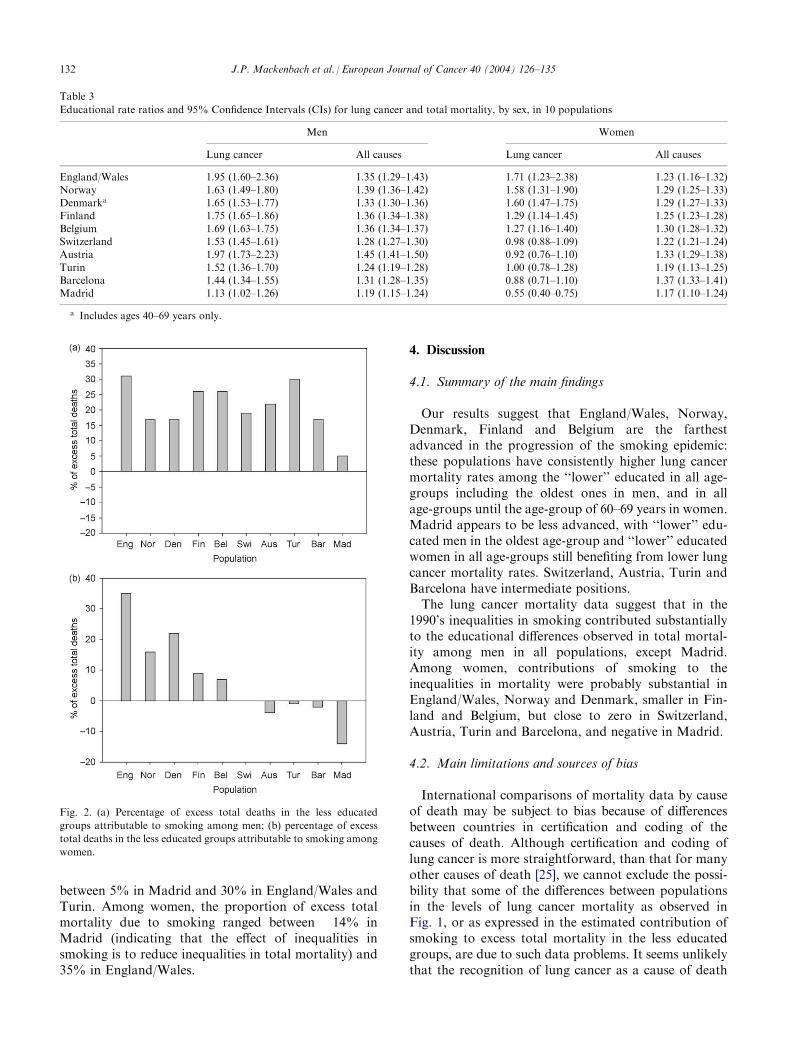
between 5% in Madrid and 30% in England/Wales andTurin. Among women, the proportion of excess totalmortality due to smoking ranged between �14% inMadrid (indicating that the effect of inequalities insmoking is to reduce inequalities in total mortality) and35% in England/Wales.
4. Discussion
4.1. Summary of the main findings
Our results suggest that England/Wales, Norway,Denmark, Finland and Belgium are the farthestadvanced in the progression of the smoking epidemic:these populations have consistently higher lung cancermortality rates among the ‘‘lower’’ educated in all age-groups including the oldest ones in men, and in allage-groups until the age-group of 60–69 years in women.Madrid appears to be less advanced, with ‘‘lower’’ edu-cated men in the oldest age-group and ‘‘lower’’ educatedwomen in all age-groups still benefiting from lower lungcancer mortality rates. Switzerland, Austria, Turin andBarcelona have intermediate positions.
The lung cancer mortality data suggest that in the1990’s inequalities in smoking contributed substantiallyto the educational differences observed in total mortal-ity among men in all populations, except Madrid.Among women, contributions of smoking to theinequalities in mortality were probably substantial inEngland/Wales, Norway and Denmark, smaller in Fin-land and Belgium, but close to zero in Switzerland,Austria, Turin and Barcelona, and negative in Madrid.
4.2. Main limitations and sources of bias
International comparisons of mortality data by causeof death may be subject to bias because of differencesbetween countries in certification and coding of thecauses of death. Although certification and coding oflung cancer is more straightforward, than that for manyother causes of death [25], we cannot exclude the possi-bility that some of the differences between populationsin the levels of lung cancer mortality as observed inFig. 1, or as expressed in the estimated contribution ofsmoking to excess total mortality in the less educatedgroups, are due to such data problems. It seems unlikelythat the recognition of lung cancer as a cause of death
Table 3
Educational rate ratios and 95% Confidence Intervals (CIs) for lung cancer and total mortality, by sex, in 10 populations
Men
WomenLung cancer
All causes Lung cancer All causesEngland/Wales
1.95 (1.60–2.36) 1.35 (1.29–1.43) 1.71 (1.23–2.38) 1.23 (1.16–1.32)Norway
1.63 (1.49–1.80) 1.39 (1.36–1.42) 1.58 (1.31–1.90) 1.29 (1.25–1.33) Denmarka 1.65 (1.53–1.77) 1.33 (1.30–1.36) 1.60 (1.47–1.75) 1.29 (1.27–1.33) Finland 1.75 (1.65–1.86) 1.36 (1.34–1.38) 1.29 (1.14–1.45) 1.25 (1.23–1.28)Belgium
1.69 (1.63–1.75) 1.36 (1.34–1.37) 1.27 (1.16–1.40) 1.30 (1.28–1.32) Switzerland 1.53 (1.45–1.61) 1.28 (1.27–1.30) 0.98 (0.88–1.09) 1.22 (1.21–1.24) Austria 1.97 (1.73–2.23) 1.45 (1.41–1.50) 0.92 (0.76–1.10) 1.33 (1.29–1.38)Turin
1.52 (1.36–1.70) 1.24 (1.19–1.28) 1.00 (0.78–1.28) 1.19 (1.13–1.25) Barcelona 1.44 (1.34–1.55) 1.31 (1.28–1.35) 0.88 (0.71–1.10) 1.37 (1.33–1.41) Madrid 1.13 (1.02–1.26) 1.19 (1.15–1.24) 0.55 (0.40–0.75) 1.17 (1.10–1.24)a Includes ages 40–69 years only.
Fig. 2. (a) Percentage of excess total deaths in the less educated
groups attributable to smoking among men; (b) percentage of excess
total deaths in the less educated groups attributable to smoking among
women.
132 J.P. Mackenbach et al. / European Journal of Cancer 40 (2004) 126–135
differs between educational groups, because health-caresystems provide reasonably equal access to all popula-tions included in this study [26].
Measurement of socioeconomic inequalities in mor-tality is not straightforward, and comparisons betweencountries may be subject to bias because of differencesin the inclusion of specific population groups, differ-ences in the measurement of education, and differencesin the length of follow-up. Despite our efforts at stan-dardisation, some differences are bound to remainbecause data collection systems and educational systemsdiffer between European countries. This applies toSwitzerland in particular, because the educational dis-tribution in this country is rather different from that inthe other countries (see Data and methods). Dependingon the form of the educational gradient of lung cancermortality in Switzerland, its Rate Ratios may be biasedtowards 1 simply because they compare less extremegroups.
Our attempt at quantifying the contribution ofsmoking to inequalities in total mortality used a modi-fication of a method developed by Peto and colleagues.Despite this simplification, our results are, by and large,compatible with those published by Peto and colleaguesin Ref. [19]. For each country, we compared the pro-portions of total mortality that can be attributed tosmoking, as calculated in our analysis, with those pub-lished by Peto and colleagues for the same country in1990, and found the international patterns to be quitesimilar (data not shown). However, it is important thatour estimates of the contribution of smoking to excesstotal mortality in the ‘‘lower’’ educated groups arebased on a number of assumptions, only some of whichare shared in the method of Peto and colleagues.
The most crucial assumption relates to the estimationof smoking prevalences from lung cancer mortality rates(see Appendix). Peto’s method, like ours, uses the lungcancer rate among smokers and non-smokers in a largecohort study conducted by the American CancerSociety (Cancer Prevention Study (CPS-II) to estimatethe (unobserved) proportion of smokers in a populationfrom its (observed) lung cancer mortality rate. This cal-culation is based on the assumption that the CPS-IIsmoker and non-smoker lung cancer mortality rates area valid approximation of the (unobserved) smoking-specific lung cancer mortality rates in the populationunder study. In our analysis, this assumption not onlyhas to be made for each national population (as inPeto’s analysis), but also for each educational group ineach country. Our own data suggest that this assump-tion is violated in some countries, because observedlung cancer mortality rates sometimes are so high (e.g.in less educated men in Belgium—Fig. 1), that CPS-IIdata suggest a smoking prevalence of higher than 100%.We have, in these cases, arbitrarily fixed the smokingprevalence at 100%, but that only partially solves the
problem that the lung cancer mortality rate among non-smokers probably differs between countries and/orbetween educational groups due to other factors, e.g. airpollution, occupational exposures or diet [27]. Clearly,the results, as presented in Fig. 2, can only be seen as acrude indication of the variation between countries inthe contribution of smoking to inequalities in totalmortality.
4.3. Comparison with previous studies
The results of this study correspond well with those ofour previous study on the basis of 1990 smoking pre-valence data by educational level from national healthinterview and multipurpose surveys [4]. This previousstudy suggested that countries in Northern Europewere already in stage 4 or at the end of stage 3 of thesmoking epidemic, while countries in Southern Europewere mostly at the beginning of stage 3. This isconfirmed by the lung cancer mortality patterns pre-sented here that ‘integrate’ the exposure of these popu-lations to tobacco smoke over previous decades. Thecurrent analysis also adds a few continental-Europeancountries, of which Belgium seems to be roughly in thesame stage as countries in Northern Europe, whileSwitzerland and Austria occupy intermediate positionsbetween the Northern and Southern European countriesstudied.
It is interesting to compare the results of these studiesof educational differences in either smoking or lungcancer mortality with those of studies comparing time-trends (including cohort patterns) of lung cancer mor-tality between the same set of European countries[28,29]. The main contrast observed is between theUnited Kingdom, where lung cancer mortality amongmen and women peaked before all other countries, andSpain, where even among men lung cancer mortality isstill rising. The other countries are in between, withouta clear advance of Norway, Denmark, Finland andBelgium compared with Switzerland, Austria and Italy,as observed in our analysis.
There have been a number of longitudinal studies onthe contribution of smoking to socioeconomic inequal-ities in either lung cancer incidence or mortality, or tototal mortality, linking smoking as reported during abase-line measurement to mortality in the same indivi-duals as measured during a defined follow-up period[6,7,14,17,18,30]. Among men in Northern Europeanpopulations, higher smoking prevalences in lowersocioeconomic groups typically explain between 10 and20% of the gap in total mortality [14,16–18]—which isnot inconsistent with our cruder estimates (Fig. 2).However, more interesting is the fact that several studieshave found that smoking can only account for a smallpart of the higher lung cancer incidence or mortalityrates in the lower socioeconomic groups [6,7,30].
J.P. Mackenbach et al. / European Journal of Cancer 40 (2004) 126–135 133
Because smoking is estimated to account for between 80and 90% of all lung cancer cases in the population, onewould expect a very high contribution to the observedsocioeconomic inequalities in lung cancer as well, butthat is not what these studies have found. For example,in two Scottish studies smoking accounted for approxi-mately 55% of the higher lung cancer mortality rate inmanual compared with non-manual men [30]. One pos-sible explanation is that this is due to measurementerror: smoking in these cohort studies is usually mea-sured on the basis of self-report on a single occasion,and considerable degrees of misclassification, in termsof the intensity of exposure to tobacco smoke over arelevant part of the life-course, may have occurred,thereby diluting the associations with lung cancer.However, another possible explanation is that other riskfactors play a more important role than was previouslythought, particularly in the lower socioeconomic groups(see above). This is clearly an area for further research,and until individual-level studies confirm the quantita-tive contribution of smoking, as suggested in Fig. 2,the latter should be seen as a very first approximationonly.
4.4. Implications
To the extent that socioeconomic inequalities in lungcancer mortality reflect differences in smoking beha-viour, they also point to important entry-points forinterventions and policies to tackle inequalities inhealth. According to a recent review, interventions andpolicies that have been shown to be effective in reducingsmoking in lower socioeconomic groups include raisingtobacco taxes, smoking restrictions in work-places andnicotine replacement therapy [31]. Implementing suchmeasures should be a top priority for public healththroughout Europe.
The model of the smoking epidemic suggests thatsocioeconomic inequalities in lung cancer mortality arelikely to widen further, particularly among women andin Southern European countries. It may not be too lateto prevent the less educated groups from taking up thesmoking habit, and effective public health action maythereby avoid larger inequalities in mortality in thefuture.
Acknowledgements
Support from the European Union (grant numberQLK6-CT-1999-02161) is gratefully acknowledged, aswell as the co-operation of Bureaus of Statistics in theparticipating countries. We also thank Dr. J. Kytir(Institute for Demography, Austrian Academy ofSciences, Vienna, Austria) for his contribution to thispaper.
Appendix. Estimation of the proportion of excess total
mortality in the less educated group that is due to
smoking
In a first step, we used the lung cancer mortality ratesin less and more educated groups to indicate theapproximate proportions due to smoking of total mor-tality in these groups, and, in a second step, we usedthese proportions to calculate the proportion of totalexcess mortality in the less educated group that is attri-butable to smoking.
For the first step, the procedure was as follows. Assuggested by Peto and colleagues, the prevalence ofsmoking can be estimated indirectly from the lung can-cer mortality rate, by comparing the lung cancer mor-tality rate in the population of interest with the lungcancer rate among smokers and non-smokers in a largecohort study conducted by the American CancerSociety (CPS-II), and by fitting the proportions ofsmokers and non-smokers to the observed lung cancermortality rate [19,20]. This was done separately for eacheducational group, ten-year age-group and sex. Theassumption here is that the CPS-II smoker and non-smoker lung cancer mortality rates are a valid approx-imation of the (unobserved) smoking-specific lungcancer mortality rates pertaining to these various popu-lations.
With the proportions of smokers and non-smokers soobtained, the proportion of total mortality in each edu-cational group, ten-year age-group, and sex that isattributable to smoking was calculated. Here, we sim-plified Peto’s procedure which uses information onmortality from a range of other smoking-related causesof death that was not available in our study. Instead, weused the fact that the aetiological fraction (the propor-tion of all cases of disease or death in a population thatcan be attributed to a particular determinant) is a func-tion of the proportion of the population that is exposed(i.e. the proportion of smokers that we alreadyobtained) and the relative risk: EF=p(RR-1)/{p(RR-1)+1}. The relative risk for smoking of total mortalityis approximately 2 in many epidemiological studies,including the CPS-II [19,20]. We have assumed that thisrelative risk applies to all population groups included inthis study. Similarly to the original method proposed byPeto and colleagues, we halved these aetiologicalfractions to remove residual confounding and to obtainconservative estimates of the numbers of deaths attri-butable to smoking.
In the second step, we used the aetiological fractionsfor smoking of total mortality (by educational group,ten-year age-group and sex) and the total mortality rateto calculate the absolute rate of mortality that is due tosmoking in each educational group and sex (aggregatedover age-groups). The difference between more and lesseducated groups in these rates was then used to calculate
134 J.P. Mackenbach et al. / European Journal of Cancer 40 (2004) 126–135
the proportion of the total excess death rate in the lesseducated groups that is attributable to smoking.
References
1. Lopez AD, Collishaw NE, Piha T. A descriptive model of the
cigarette epidemic in developed countries. Tobacco Control 1994,
3, 242–247.
2. Pierce JP. International comparisons of trends in cigarette smok-
ing prevalence. Am J Publ Health 1989, 79, 152–157.
3. Graham H. Smoking prevalence among women in the European
Community 1950–1990. Soc Sci Med 1996, 43, 243–254.
4. Cavelaars AEJM, Kunst AE, Geurts JJM, et al. Educational dif-
ferences in smoking: international comparison. Br Med J 2000,
320, 1102–1107.
5. Faggiano F, Zanetti R, Costa G. Cancer risk and social inequal-
ities in Italy. J Epidemiol Comm Health 1994, 48, 447–452.
6. Van Loon AJ, Goldbohm RA, van den Brandt PA. Lung cancer:
is there an association with socioeconomic status in the Nether-
lands? J Epidemiol Comm Health 1995, 49, 65–69.
7. Van Loon AJM, Goldbohm RA, Kant IJ, Swaen GMH, Kremer
AM, van de Brandt PA. Socioeconomic status and lung cancer
incidence among men in the Netherlands: is there a role for
occupational exposure? J Epidemiol Comm Health 1997, 51, 24–
29.
8. Regidor E, Gutierrez-Fisac JL, Rodriguez C. Increased socio-
economic differences in mortality in eight Spanish provinces. Soc
Sci Med 1995, 41, 801–807.
9. Fernandez E, Borrell C. Cancer mortality by educational level in
the city of Barcelona. Br J Cancer 1999, 79, 684–689.
10. Vagero D, Persson G. Occurrence of cancer in socioeconomic
groups in Sweden. Scand J Soc Med 1986, 14, 151–160.
11. Levi F, Negri E, LaVecchia C, Te VC. Socioeconomic groups
and cancer risk at death in the Swiss canton of Vaud. Int J Epi-
demiol 1988, 17, 711–717.
12. Beer V, Bisig B, Gutzwiller F. Social class gradients in years of
potential life lost in Switzerland. Soc Sci Med 1993, 37, 1011–
1018.
13. Davey Smith G, Leon D, Shipley MJ, Rose G. Socioeconomic
differentials among men. Int J Epidemiol 1991, 20, 339–345.
14. Davey Smith G, Shipley MJ, Rose G. Magnitude and causes of
socioeconomic differentials in mortality: further evidence from
the Whitehall study. J Epidemiol Comm Health 1990, 44, 265–
270.
15. Doll R, Peto R, Wheatley K, Sutherland I. Mortality in relation
to smoking: 40 years’ observations on male British doctors. Br
Med J 1994, 309, 901–911.
16. Davey Smith G, Blane D, Bartley M. Explanations for socio-
economic differentials in mortality: evidence from Britain and
elsewhere. Eur J Public Health 1994, 4, 131–144.
17. Pekkanen J, Tuomilehto J, Uutela A, Vartiainen E, Nissinen A.
Social class, health behaviour, and mortality among men and
women in eastern Finland. Br Med J 1995, 311, 589–593.
18. Schrijvers CTM, Stronks K, van de Mheen H, Mackenbach JP.
Explaining educational differences in mortality: the role of beha-
vioral and material factors. Am J Public Health 1999, 89, 535–
540.
19. Peto R, Lopez AD, Boreham J, Thun M, Heath Jr C. Mortality
from Smoking in Developed Countries 1950–2000. Oxford, Oxford
University Press, 1994.
20. Peto R, Lopez AD, Boreham J, Thun M, Heath C. Mortality
from tobacco in developed countries: indirect estimation from
national vital statistics. Lancet 1992, 339, 1268–1278.
21. UNESCO. International Standard Classification of Education
1997. 1997.
22. WHO. Manual of the International Statistical Classification of
Diseases, Injuries, and Cause of Death, Vol 1. Geneva, WHO,
1977.
23. Eurostat. Demographic Statistics 1997. Luxembourg: Office for
Official Publications of the European Communities: Eurostat;
1997.
24. Mackenbach JP, Kunst AE. Measuring the magnitude of socio-
economic inequalities in health: an overview of available mea-
sures illustrated with two examples from Europe. Social Science
& Medicine 1997, 44, 757–771.
25. Lopez A. The Lung Cancer Epidemic in Developed Countries. In
Lopez A, Caselli G, Valkonen T, et al, eds. Adult Mortality in
Developed Countries. Oxford, Clarendon Press, 1995.
26. Wagstaff A, et al. Equity in the finance of health care: some
international comparisons. J Health Econ 1992, 11, 361–387.
27. Stellman SD, Resnicow K. Tobacco smoking, cancer and social
class. In Kogevinas M, Pearce N, Susser M, Boffetta P, eds.
Social inequalities and cancer. IARC Scientific Publications no.
138. Lyon, International Agency for Research on Cancer, 1997.
28. Brennan P, Bray I. Recent trends and future directions for lung
cancer mortality in Europe. Br J Cancer 2002, 87, 43–48.
29. La Vecchia C, Negri E, Levi F, Decarli A, Boyle P. Cancer mor-
tality in Europe: effects of age, cohort of birth and period of
death. Eur J Cancer 1998, 34, 118–141.
30. Hart CL, Hole DJ, Gillis CR, Davey Smith G, Watt GC,
Hawthorne VM. Social class differences in lung cancer mortality:
risk factor explanations using two Scottish cohort studies. Int J
Epidemiol 2001, 30, 268–274.
31. Platt S, Amos A, Gnich W, Parry O. Smoking policies. In
Mackenbach JP, Bakker MJ, eds. Reducing Inequalities in Health:
a European Perspective. London, Routledge, 2002.
J.P. Mackenbach et al. / European Journal of Cancer 40 (2004) 126–135 135
Related Documents