Ine qualitie s, Employme nt and Income Conve rge nce in Europe : Evidence from Regional Data James K. Galbraith Lyndon B. Johnson School of Public Affairs The University of Texas at Austin Austin, Texas [email protected] Jose Enrique Garcilazo Organization for Economic Cooperation and Development Paris, France [email protected] September 21, 2008 University of Texas Inequality Project UTIP Working Paper No. 52 Abstract: This paper explores the relationship between pay inequality and unemployment rates for 187 European Regions from 1984-2003. We measure inequality within the regions -- between 16 industrial sectors in each region -- and also between the regions: thus the inequality measures are nested. Our model of unemployment employs a panel structure that permits us to separate regional, national and continental influences on European unemployment. This allows us to test whether a tradeoff exists between cohesion and competitiveness. We find no evidence of this tradeoff; instead lower pay inequality is generally associated with a lower regional unemployment rate. We find strong country effects lowering unemployment (relative to the model) in relatively smaller countries such as Ireland, Austria, Portugal and the Netherlands; on the other hand unemployment is high, relative to the model, in Spain and Poland. Time effects reveal the effects of European macro- enviro nment on regio nal unemp lo yment. We find an employment penalty associated with the Maastricht Treaty (1992) and its implementation of around four percentage points, lasting until 1998, when a general reduction in unemployment appears to coincide with the arrival of the Euro. Unfortunately, the pattern is again reversed in 2000, coinciding with the implementation of the Lisbon Treaty.

Welcome message from author
This document is posted to help you gain knowledge. Please leave a comment to let me know what you think about it! Share it to your friends and learn new things together.
Transcript

Inequalities, Employment and Income Convergence in Europe:
Evidence from Regional Data
James K. GalbraithLyndon B. Johnson School of Public Affairs
The University of Texas at AustinAustin, Texas
Jose Enrique GarcilazoOrganization for Economic Cooperation and Development
Paris, [email protected]
September 21, 2008
University of Texas Inequality Project
UTIP Working Paper No. 52
Abstract:
This paper explores the relationship between pay inequality and unemployment rates for 187 European Regions from 1984-2003. We measure inequality within the regions --between 16 industrial sectors in each region -- and also between the regions: thus the inequality measures are nested. Our model of unemployment employs a panel structure that permits us to separate regional, national and continental influences on European unemployment. This allows us to test whether a tradeoff exists between cohesion and competitiveness. We find no evidence of this tradeoff; instead lower pay inequality is generally associated with a lower regional unemployment rate. We find strong country effects lowering unemployment (relative to the model) in relatively smaller countries such asIreland, Austria, Portugal and the Netherlands; on the other hand unemployment is high, relative to the model, in Spain and Poland. Time effects reveal the effects of European macro-environment on regional unemployment. We find an employment penalty associated with the Maastricht Treaty (1992) and its implementation of around four percentage points, lasting until 1998, when a general reduction in unemployment appears to coincide with the arrival of the Euro. Unfortunately, the pattern is again reversed in 2000, coinciding with the implementation of the Lisbon Treaty.

Introduction
The achievement of territorial and social cohesion is a well known statutory objective
embedded into the preambles of the European Union Treaty -- from the original Treaty of
Rome in 1957 onward -- and enforced the European Commission mainly through regional
policies. Reducing inequalities is high in the Commission’s policy agenda especially after the
accession of new members has amplified the inequalities of Europe by mere virtue of their
lower income levels. Achieving cohesion is a clearly-stated (Objective 1) and actively-
pursued objective of the Structural Funds; yet the introduction of the Lisbon Treaty and its
emphasis on competitiveness (Objectives 2 and 3) seems to run counter to the achievement of
cohesion. At least, so it is often argued. This paper finds no evidence of such a tradeoff.
Instead, we argue that both objectives -- cohesion and competitiveness -- can coexist. And not
only that, our evidence suggests that cohesion is a useful and even perhaps a necessary
condition for enhanced efficiency in Europe’s labor markets.
Section One presents measures of wage inequality within regions and between them
for approximately 187 NUTS 2 regional observations. The former is a measure of social
cohesion, while the latter a measure of territorial cohesion. This section combines both
measures and finds a striking pattern: the wealthy regions are markedly less unequal than the
poorer regions.
Section Two explores causal mechanisms between pay inequality and unemployment
in regional labor markets. Here we re-test a regional model of unemployment proposed by
Galbraith and Garcilazo (2004) using new observations and updating a substantial part of the
original data. The model tests the impact of four variables on regional unemployment rates:
growth, demographic structure, relative wealth and inequality. Furthermore, the model is a
two-way fixed effects specification, which allows us to estimate the effects of national labor
market institutions -- through country-effects -- and of European supranational policies --
through time-effects -- on regional unemployment rates. Section Three discusses policy
implications.
1. Measuring Inequality Between and Within European Regions
The European Commission (EC) defines economic and social cohesion as: “…an
expression of solidarity between the Member States and regions of the European Union
(EU)…” The aim of cohesion is to “… balance development throughout the EU, reduce

structural disparities between regions and promote equal opportunities for all” (Europe
Glossary1).
This policy objective -- the reduction of territorial disparities – is not new in the
European model of integration. It has been embedded into the preambles of the European
Union Treaty since the beginning, from the original Treaty of Rome in 1957, to the Single
European Act (SEA) (Article 130a) and more recently in the proposed Constitutional Treaty
(Article III-220).
The EC purses this objective through a Cohesion Policy, assigning financial resources
to eligible regions according to three objectives: the convergence objective (Objective 1), the
regional competitiveness and employment objective (Objectives 2 and 3) and the territorial
cooperation objective. The effectiveness of these instruments in achieving these objectives --
especially Objective 1 where the bulk of resources are allocated -- has generated an ongoing
debate, whose terms depend on how to define and measure cohesion and consequently
inequality. Literature measuring inequality in the EU falls into two broad categories: the first
concerned with territorial or economic cohesion, and the second with social cohesion.
The measurement of territorial cohesion focuses on movements in GDP per capita
over time among European countries and regions. Studies of this kind find convergence in
per capita income between EU countries during 1980-2005, but divergence between regions
within countries (Sapir et al., 2003). Inequality within counties accounts for roughly half of
total EU inequality in the early 1980s, but rises to about two-thirds by the mid-1990s (Puga,
2002; Neven and Gouyette, 1995). The test to determine these facts is a sigma convergence2
or beta convergence3 test in per capita income levels as proposed by Sala i Martín (1996).
The measurement of social cohesion focuses on interpersonal income inequality. At
the European level, Morrisson and Murtin (2003) estimate a measure of income inequality for
1970, 1980, 1990, 1995, and 1998, and Beblo and Knaus (2001) estimate a single measure of
European inequality for 1995. Morrisson and Murtin find that inequality within countries first
1 http://europa.eu/scadplus/glossary/economic_social_cohesion_en.htm2 The testing for sigma-convergence is based on standard deviation of the cross-section series. An alternative way is to use the coefficient of variation.3 The beta-convergence test is obtained by a regression analysis. The per capita income of a chosen period of time is estimated as a function of the initial level of per capita income. It is specified through the following
equation: ( ) ( ) ititiiit uXYYYT +++= *log*log*1 00 gba , where a is a constant term, itY the real per capita
income of country i at time t, 0iY the initial per capita income, itX a set of structural exogenous variables
influencing the growth of per capita income, T the time in which the dynamics of convergence is measured, and
itu the stochastic error.

falls from 1970 to 1980, and then returns to the 1970s level by the late 1990s, while inequality
across countries falls by half between 1970 and 1998 with a particularly sharp decrease
starting in the 1980s. At the national level this literature is rich, drawing data from two main
surveys: the Luxembourg Income Study (LIS) and the European Community Household Panel
(ECHP). Both surveys, although comparable at the national level, have very limited coverage
at the regional level.
Our approach departs from both lines of literatures and instead combines both
measures, territorial and social cohesion, into a single additive metric, using Theil’s T statistic
and its property of decomposability. Furthermore our inequality measures depart from the
traditional focus on household income inequality and instead focus on interpersonal pay
inequality, which is suitable for issues related to labor market outcomes and economic
competitiveness. Therefore we no longer depend on surveys and instead make use of payroll
data which carry several advantages:
The first advantage is that we can construct comparable measures of inequality at the
level of the region. Given that time series data for payroll are available for the last two
decades, we can also trace movements of inequality over this time period.
A second advantage is that the method allows us to measure inequality at multiple
hierarchical levels. Theil’s T statistic, which we construct within each region as a measure of
inequality between economic sectors within that region, allows us to combine measures of
inequality within and between regions to achieve a measure of the movement of inequality at
the European level. Therefore we can determine (for example) whether richer or poorer
regions (relative to the European average) tend to be more or less unequal internally. This
allows us to understand the interrelation between territorial and social cohesion.
Finally our measures of inequality are easy to update at a low cost. Survey studies are
very expensive projects, a fact that limits the availably of observations across countries and
time. The high cost is also an impediment to producing observations at the regional level.
The payroll measures, on the other hand, are very inexpensive to obtain and to keep-up-to-
date. However Eurostat’s recent decision to discontinue publishing employment data for 16
sectors within each region raises some concern as to whether our project will continue to be
feasible into the future.

Inequality Within and Between European Regions
One of the attractive features of Theil’ s T statistic is its property of decomposability.
As long as a distribution of income and a distribution of individuals are grouped into mutually
exclusive and completely exhaustive (MECE) groups, overall inequality can be broken down
into a between-groups component and a within-groups component. The technique is founded
on the original work of Henri Theil (1972). Formal expressions of our method are
documented by Conceição and Galbraith (2000) and in Conceição et al. (2001).
The data source needed to compute Theil’ s T statistic is payroll data (employment and
wages) published by Eurostat and disaggregated into 16 industrial sectors (Appendix 1) at the
NUTS Levels 0 (country), 1, 2, and 3. As unit of analysis we selected NUTS level 2 (when
available4) to remain consistent with the European Commission and their decision to assign
financial support at this level. Coverage at level 3 is also scarce in some geographical areas.
Our first measure of inequality, at the regional level, is the within-regions between-
sectors Theil’ s T statistic. It measures inequality within each region, between economic
sectors categorized by NACE Rev. 1.1 for each region. All regions have the same grouping
structure,5 enabling us to compare observations consistently with one other and over time.
The between-sectors within-regions component of Theil’ s T statistic is expressed as:
÷÷ø
öççè
æ÷÷ø
öççè
æ= å
= j
ijn
i j
ijij
Y
Y
Y
YPT log
1
" j (1)
where ÷÷ø
öççè
æ=
j
iji P
PP
jT is the between-sectors within-region component of Theil's T statistic for the thj
region. 'iP is the share of employment of the thi sector of the thj region to the total
employment of the thj region, where ijP is the number of individuals employed in the thi
sector of the thj region.
4 Germany is the only country for which data are not available at level 2.5 All regions are partitioned into the same sixteen sectors (NACE for 1983-1994 and NACE Rev. 1.1 for 1995-2003).

Coverage for the within-regions between-sectors component of Theil's T statistic in
Eurostat’ s Regio database covers the years (1983-1994) in the database ESA-79 and (1995-
2003) in ESA-95. The number of observations varies each year according to available payroll
data, ranging from 45 to 90 administrative regions in ESA-79 and from 191 to 214 in ESA-95
with maximum coverage in 1998.
There are a total of 1204 regional observations from 1995 to 2000. The lowest value
(0.0044) occurs in Thüringen (deg), Germany, in 1995 while the highest (0.269) in
Severozapaden (bg 11), Bulgaria, in 1999. Figure 1 displays the values of the within-regions
between-sectors component of Theil’ s T statistic for the year with maximum coverage, 1998.
Figure 1. Within-Regions Between-Sectors Theil’ s T Statistic, 1998
At the European wide level, we present a measure of European-wide inequality
statistic that divides Europe into a set of regions. It contains two components: the between-
regions component and the within-regions component. The between-regions component
measures inequality between all the European regions, and the within regions component
measures inequality within the regions (weighted by the relative income of the regions)
between their corresponding economic industries.
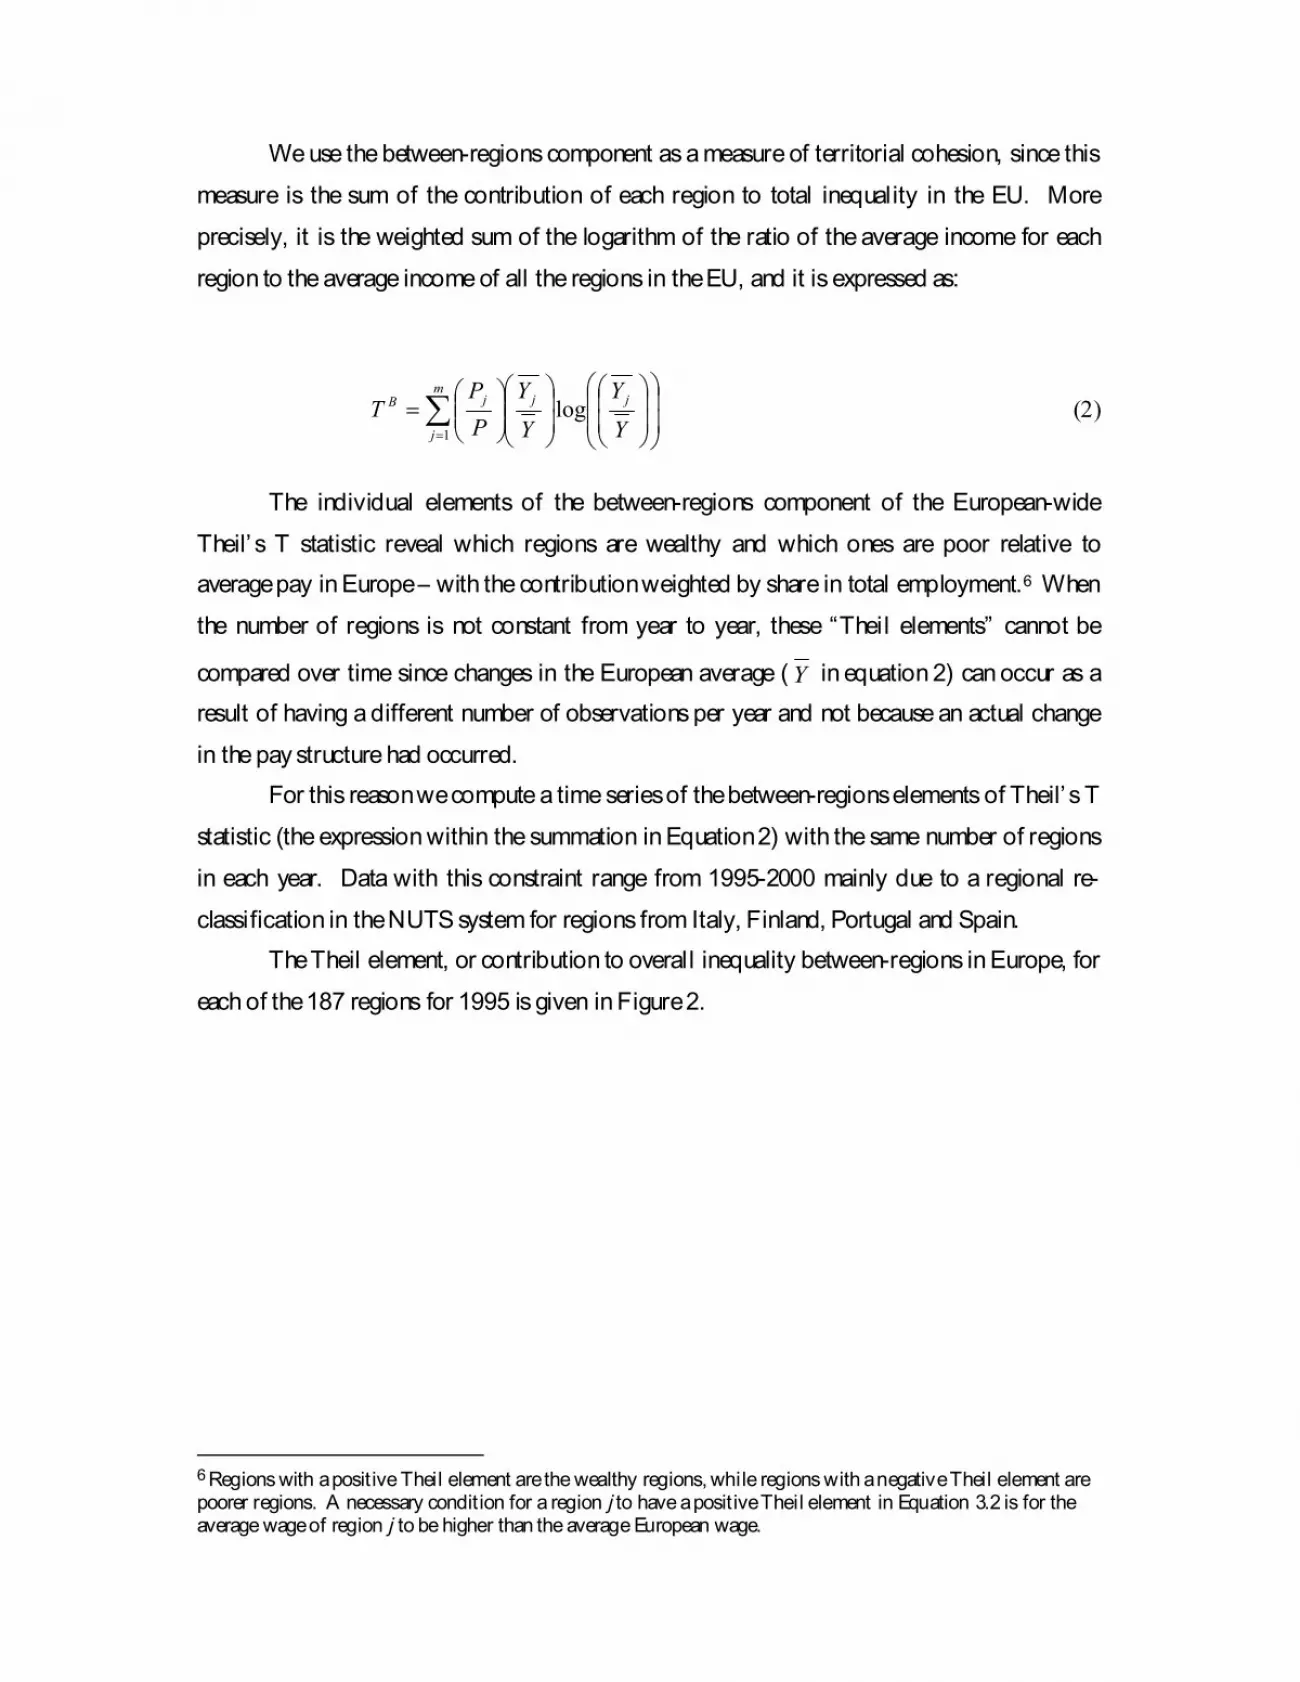
We use the between-regions component as a measure of territorial cohesion, since this
measure is the sum of the contribution of each region to total inequality in the EU. More
precisely, it is the weighted sum of the logarithm of the ratio of the average income for each
region to the average income of all the regions in the EU, and it is expressed as:
å= ÷
÷
ø
ö
çç
è
æ
÷÷ø
öççè
æ÷÷ø
öççè
æ÷÷ø
öççè
æ=
m
j
jjjB
Y
Y
Y
Y
P
PT
1
log (2)
The individual elements of the between-regions component of the European-wide
Theil’ s T statistic reveal which regions are wealthy and which ones are poor relative to
average pay in Europe– with the contribution weighted by share in total employment.6 When
the number of regions is not constant from year to year, these “Theil elements” cannot be
compared over time since changes in the European average ( Y in equation 2) can occur as a
result of having a different number of observations per year and not because an actual change
in the pay structure had occurred.
For this reason we compute a time series of the between-regions elements of Theil’ s T
statistic (the expression within the summation in Equation 2) with the same number of regions
in each year. Data with this constraint range from 1995-2000 mainly due to a regional re-
classification in the NUTS system for regions from Italy, Finland, Portugal and Spain.
TheTheil element, or contribution to overall inequality between-regions in Europe, for
each of the 187 regions for 1995 is given in Figure 2.
6 Regions with a positive Theil element are the wealthy regions, while regions with a negative Theil element are poorer regions. A necessary condition for a region j to have a positive Theil element in Equation 3.2 is for the average wage of region j to be higher than the average European wage.

Figure 2. Regional Contribution to the European-wide Theil’s T Statistic, 1995
In 1995, regions from Germany were contributing heavily to inequality “from above,”
while most regions from the Czech Republic, Slovakia, Spain, Portugal, Ireland, England, and
some regions of Italy and Greece were contributing to European inequality from below the
average. The metropolitan regions: London (Inner and Outer), Île-de-France (Paris), Berlin,
and Stockholm as expected exhibit higher wage levels than their neighboring regions. It is
worth noting that the low standing of the UK at this moment reflected the weakness, at the
time, of sterling: our measures are not PPP-adjusted and it would not be appropriate to do so,
since the metric of competitiveness is related to profitability measured in nominal terms. In
1995 relative wages in Britain were low, and would have seemed low to a corporation
comparing industrial location sites in, say, Manchester and Hamburg.
By fixing the legend values to a base year (1995) and graphing the Theil components
of the same regions in subsequent years, one can observe which regions have gained and
which ones have lost relative to 1995. Figure 3 displays the Theil elements for the year 2000.
Of particular interest is the extent of inter-regional convergence that evidently occurred

during this short period. Relative to 1995, the gaps between Germany and Britain, in
particular are noticeably smaller than they were, a fact documented in Galbraith and Garcilazo
(2005). Exchange rate changes, once again, are no doubt responsible for a considerable
amount of this inter-regional convergence.
Figure 3. Regional Contribution to the European-wide Theil’s T Statistic, 2000
As previously noted, the between-regions component measures trends in territorial
cohesion, while the within-regions between-sectors Theil’s T statistic reveals the degree of
interpersonal pay-inequality within regions, a measure of social cohesion. Although both
dimensions are interesting on their own, if combined together they reveal a very interesting
pattern. This is given by Figure 47: wealthy regions (contributing to inequality from above the
average) have strikingly lower levels of inequality within them. These include Germany,
France, and the Scandinavian countries. On the other hand, poorer regions such as Spain,
7 This figure displays a three dimensional graph (created by Arcview, version 9, with the 3-D extension), representing the between–regions component (territorial cohesion) by the color scheme (consistent with the legends used in the Figures 2-3), and the within–regions component (social cohesion) by the height of each region
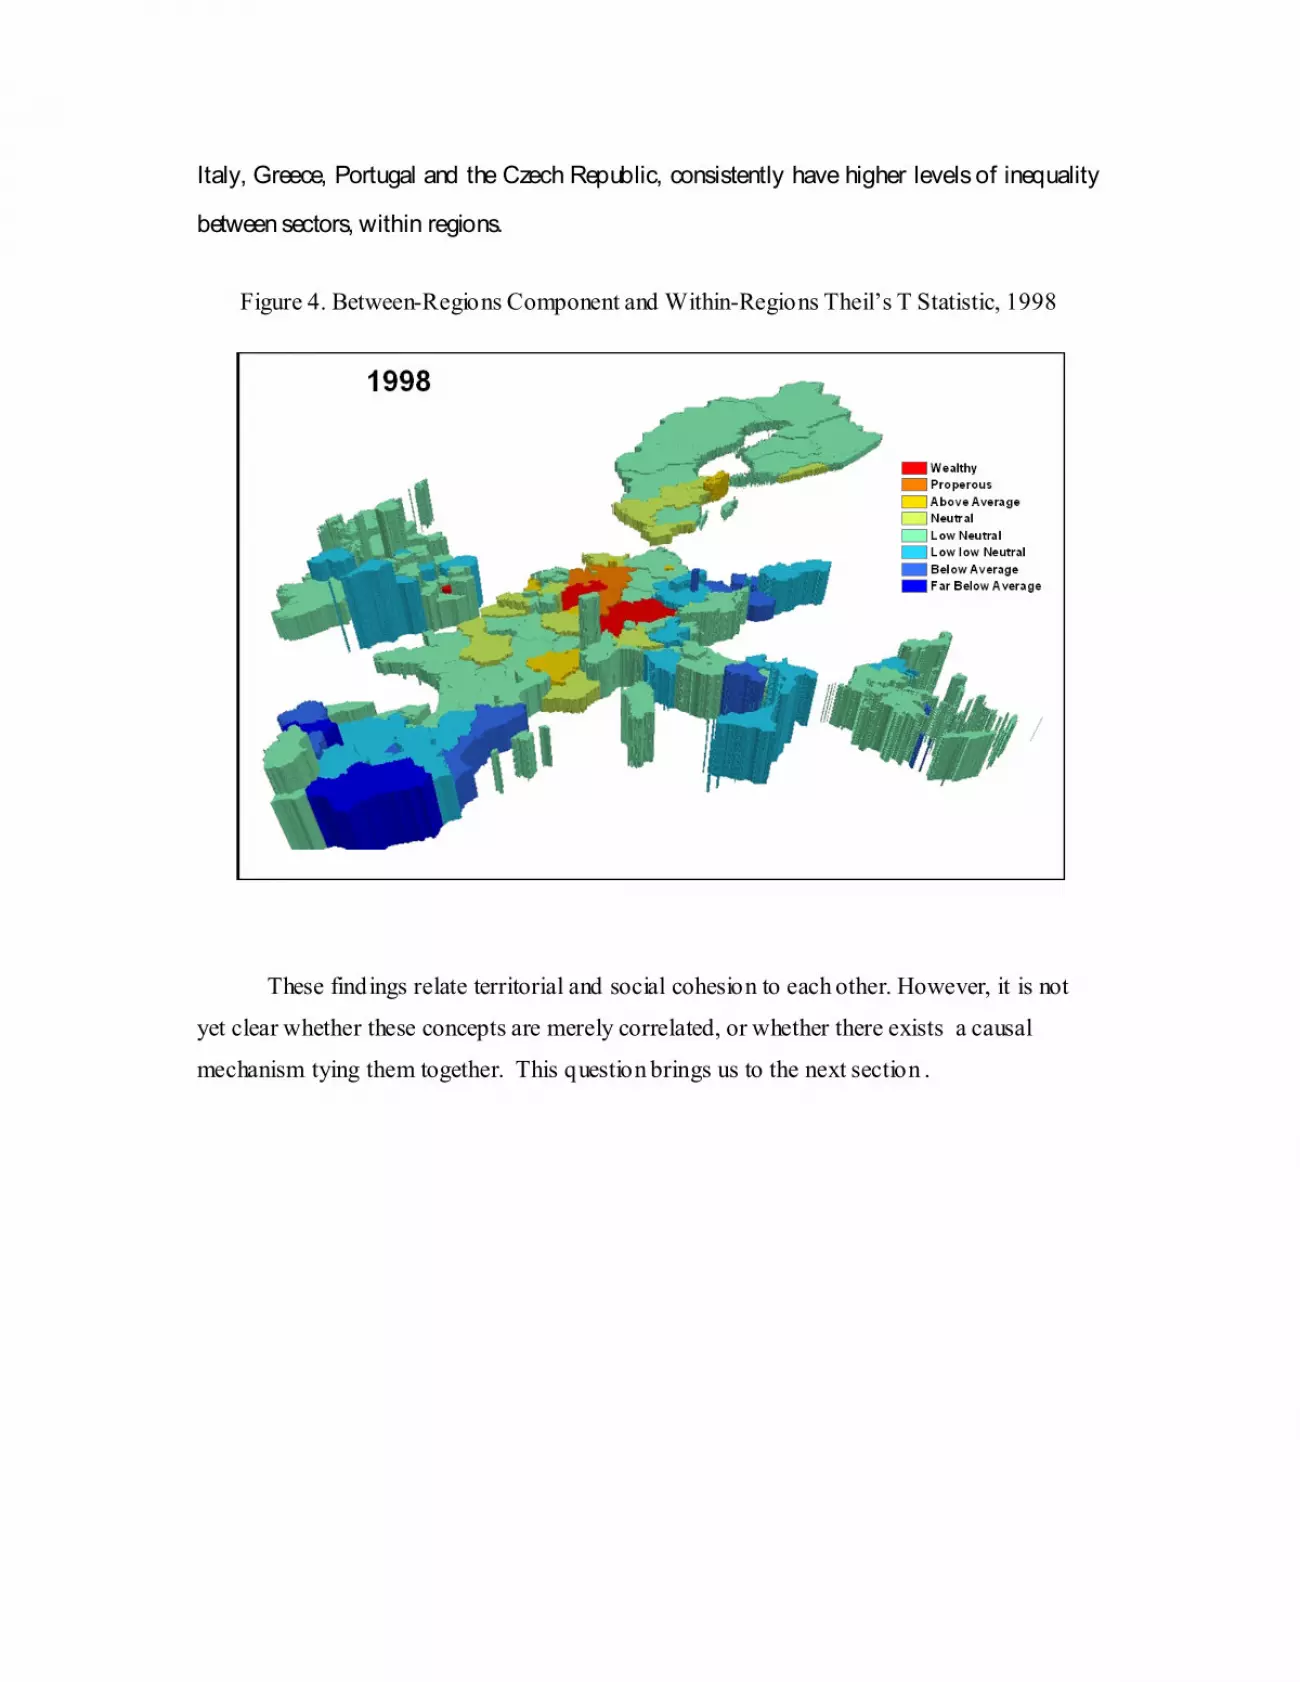
Italy, Greece, Portugal and the Czech Republic, consistently have higher levels of inequality
between sectors, within regions.
Figure 4. Between-Regions Component and Within-Regions Theil’s T Statistic, 1998
These findings relate territorial and social cohesion to each other. However, it is not
yet clear whether these concepts are merely correlated, or whether there exists a causal
mechanism tying them together. This question brings us to the next section .

2. A Regional Model of Unemployment
This section explores the relationship between social cohesion and competitiveness.
We measure social cohesion by inequality in the regional pay structure, and competitiveness
by a region’s capacity to employ its labor force or, differently said, to reduce unemployment
rates. We test a regional model of unemployment proposed by Galbraith and Garcilazo
(2004) with a substantial update of the data and inclusion of new observations. This allows us
to (1) test the relationship between pay inequality and unemployment, (2) estimate the effects
of national-related factors such as national labor market institutions or the informal economy
and (3) estimate the effects of supranational factors such as pan European policies, on
regional unemployment rates with a larger data sample as used in Galbraith and Garcilazo
(2004), and more up-to-date data -- up to 2003.
The model proposed by Galbraith and Garcilazo (2004) identifies two supply and two
demand variables that influence variation in regional unemployment rates. We use the same
model specification. The supply variables are the relative size of the population of young
workers and a measure of the inequality of the wage structure; and the demand variables are
the strength of economic growth at any given time and the average wage rate of the region
relative to the average for Europe as a whole.
Theoretical Arguments for a Regional Model of Unemployment
Ex ante we expect both demand variables to reduce unemployment rates and both
supply variables to augment them.
We expect our first supply variable, growth of GDP, to reduce regional unemployment
mainly through the dynamics in the construction and investment sectors. Strong regional
economic activity creates jobs. When the growth rate of the economy decreases, firms start to
decrease their investments and to reduce labor demand. The introduction of this variable is
captures the effects of business cycleson regional rates of unemployment.
The effect of our second demand variable is equally simple: we expect richer regions
to offer more jobs, particularly more on-the-books jobs, both in the public and private sectors.
But it is interesting to note that the effect of this variable is contingent on a larger proposition:
that the European economy is, in fact, integrated. Our “wealth” measure is relative to the
European average. In a world of mutually insulated local or national labor markets – the

world that still governs most economic models—the relative income of countries should have
no effect on their internal unemployment rates, since each market would clear separately. The
finding of any effect for a Europe-wide wealth variable is thus a significant confirmation of
European interconnectedness. We project a negative effect: greater wealth leads to less
unemployment, on grounds that are in line with common sense but counter to “standard”
economic logic. Such logic would, of course, predict that in an integrated market, there
would be greater labor demand in the cheaper regions.
With regard to our supply variables, we expect a higher proportion of youth in the
population to increase regional unemployment. This stems from the straightforward fact that
young people face the burden of transitioning to the work force and are thus hard to employ
and to keep employed.
Finally we expect pay inequality and unemployment rates to be positively related. This
expectation, also counter to “standard” economic logic, is based on theoretical arguments
already presented by Galbraith and Garcilazo (2004), which we condense next.
Simon Kuznets (1955) proposed the idea that economic development first increases
and then subsequently decreases inequality, producing an inverted U curve of inequality as a
function of the level of income. Although the Kuznets hypothesis was built to explain the
evolution during the transitional period from agriculture to industry in now-industrialized
lands, Harris and Todaro (1970) developed a model of unemployment capturing these
characteristics, in a paper aimed mainly at development economists. In their model, workers
migrate from a low-marginal-product rural sector to cities where minimum wages are
imposed, and accept a high probability of sustained unemployment in exchange for a low
probability of getting one of those jobs and enjoying the resulting rise in income. The
equilibrium condition is that the expected value of the gain be just equal to cost incurred in
leaving rural employment, and this condition entails substantial equilibrium unemployment.
From this, a positive relationship between urban/rural pay inequality and equilibrium
unemployment emerges.
Galbraith (1998) extended these arguments into modern advanced societies, arguing
that there existss an elite group of knowledge and finance workers, a core of manufacturing

workers, and a large reservoir of workers in the services, and that wage-setting in these three
classes behaves very differently. In the knowledge and finance sector, wages are protected by
barriers of entry, such as academic credentials and technical expertise; in the manufacturing
sector, workers enjoy a wage premium where wages fluctuate with the performance of the
firm, and in the service sector they are typically determined by socially mandated minimum
wages.
So long as the differential between service wages and manufacturing wages is fairly
small, or if it is possible to search for better jobs while working, services workers will not
abandon current employment to seek for better. But on the other hand, if there are large
differentials and obstacles to on-the-job search, they will do so. In that event, unemployment
will rise as inequality rises.
This logic applies with special force to young workers who have not entered the labor
market and do not possess technical expertise. Young workers know that the transition from
being a low skilled worker to becoming a high skilled worker is problematic, and thus have an
incentive to avoid being labeled as low-skilled. So long as they have an outside option, such
as staying in school or living with their parents, they will avoid entering the labor force when
only low-paid jobs are available. This process – delayed employment – occurs until higher
paid jobs become available in labor markets, or equivalently when wage inequality increases.
At that point, some will become employed while others will not, thus increasing the
unemployment rate in the presence of high inequality.
Finally Rehn and Meidner (1951) developed further theoretical arguments supporting
a positive relationship between wage inequality and unemployment. The Rehn-Meidner
model was based on what they called a solidarity wage policy. This policy exerts pressure on
firm profits and as a result shuts down low productivity companies. This pressure along with
the restraint of high wages expands the production and employment of more productive
companies and sectors, creating new jobs, greater wealth, and lower rates of unemployment.
In sum, the regional model depends on four regional factors: pay inequality (+), the
youth proportion in the population (+), economic growth rate (-) and relative wages (-). To
these we add country and time-specific fixed effects.

Model Specification and Data Sources
Our regions are classified according to NUTS level 2 except for the regions of
Germany and United Kingdom where data are only available at NUTS level 1. A list of
regions is included in the appendix (Appendix 2). Data are mainly taken from Eurostat’ s
REGIO data base (http://www.eu-datashop.de) and from the OECD’s Regional Database.
The dependent variable and three independent variables (proportion of youth
population and growth rates of GDP, and wealth of regions) are directly available with a
minor calculation from the REGIO accounts published by Eurostat: the youth population is
obtained by dividing the number of people under 24 years of age by the total population in
each region, growth rates of GDP is obtained by computing the annual change in regional
GDP per capita. We compute relative income of regions by calculating a region’s average pay
(total compensation/total employees) relative to the European average as a whole. The value
of this variable varies above and below 1, with the value of 1 if the region has the same
average wage as Europe.
Our measure of inequality is constructed through the between-sectors within-regions
Theil’ s T statistic (equation 1). The raw data used in this measure are compensation of
employees (e2rem95) and employment (e2empl95) for 187 regional entities among sixteen
major economic sectors. Given that Eurostat no longer publishes employment regional data
for 16 sectors in recent years, we used employment data from the OECD’s Regional Database
for 158 sectors for regions in Spain, France, Italy, Ireland, Austria, Portugal, Finland, Czech
Republic, Hungary and Poland. In the remaining regions to obtain comparability we
aggregated sectors (a) agriculture, hunting and forestry and (b) fishing into one sector for all
observations from 1995-2003.
Finally data for unemployment rates are disaggregated by gender and by age. Our
data coverage expands the original sample used in Galbraith and Garcilazo (2004) by adding
8 The OECD ‘s industrial classif ication is the same as Eurostat except sectors (a) agriculture, hunting and forestry and (b) f ishing are aggregated into one.

approximately 400 new observations (the years 2001-2003 for all regions and 31 regions from
Poland, the Czech Republic and Hungary) to the sample and it re-computes approximately
500 observation of pay-inequality from a different data source (the OECD Regional Database)
using 15 instead of 16 industrial sectors. Our sample covers two decades (1984-2003) with a
total of 18349 observations.
The regression model is a reduced form, two-way fixed-effects panel specified as
follows:
UN = a +B1Theil +B2 RelWage + B3 GDPG + B4 PopUn24 + Di Country + DjTime (3)
where:
UN = Regional unemployment rate
Theil = Pay inequality across sectors for each region
RelWage = Average regional wages relative to the European average
GDPG = Growth rate of GDP at the regional level
PopUn24 = proportion of the regional population under 24 years of age
Country = Dummy to capture fixed country effects
Time = Dummy to capture fixed time effects
Table 1 presents coefficient estimates and their corresponding p-values for five
dependent variables reflecting estimates for the whole population and its component parts:
men, women, older and younger workers (ages greater or less than 25 years).
9 This number includes the total number of regions where data for all four independent variables and the dependent variables are available.
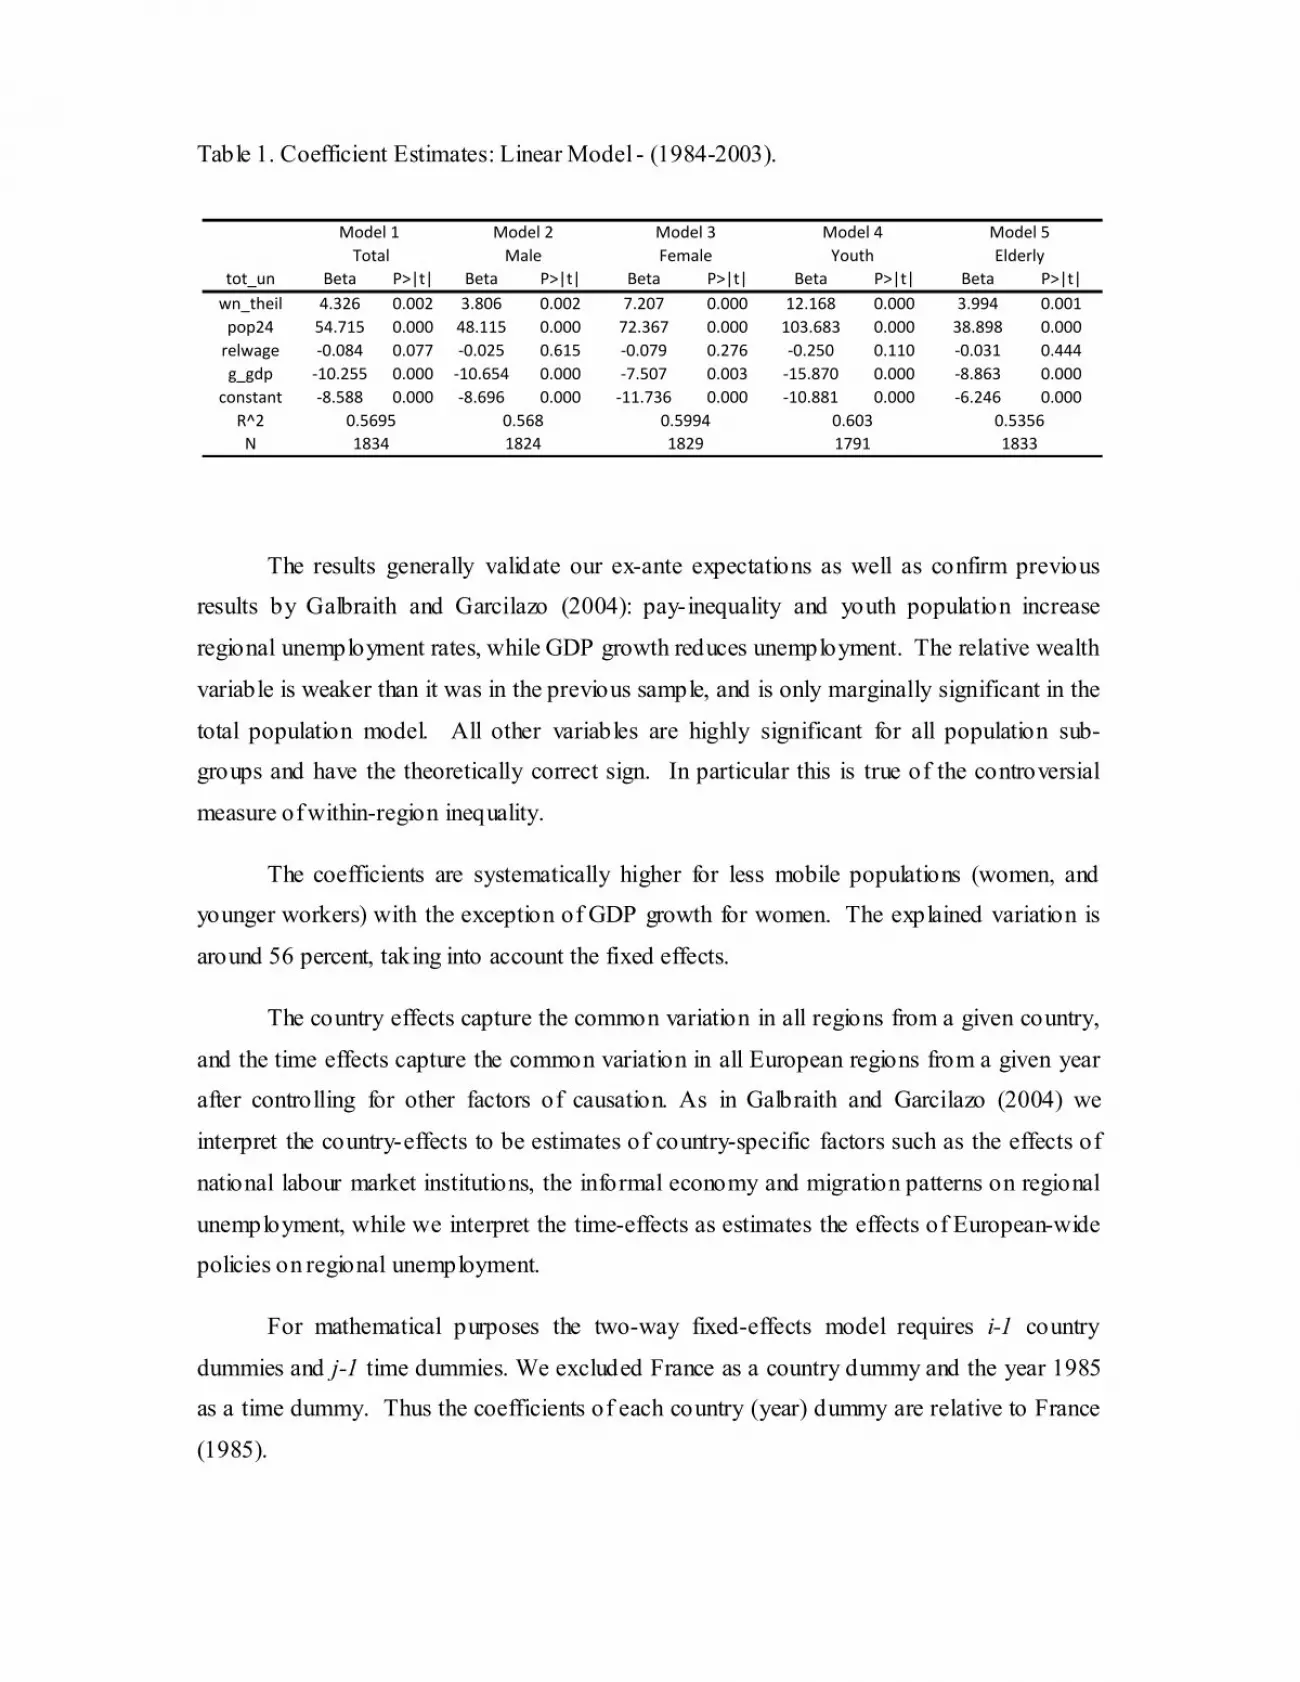
Table 1. Coefficient Estimates: Linear Model - (1984-2003).
The results generally validate our ex-ante expectations as well as confirm previous
results by Galbraith and Garcilazo (2004): pay-inequality and youth population increase
regional unemployment rates, while GDP growth reduces unemployment. The relative wealth
variable is weaker than it was in the previous sample, and is only marginally significant in the
total population model. All other variables are highly significant for all population sub-
groups and have the theoretically correct sign. In particular this is true of the controversial
measure of within-region inequality.
The coefficients are systematically higher for less mobile populations (women, and
younger workers) with the exception of GDP growth for women. The explained variation is
around 56 percent, taking into account the fixed effects.
The country effects capture the common variation in all regions from a given country,
and the time effects capture the common variation in all European regions from a given year
after controlling for other factors of causation. As in Galbraith and Garcilazo (2004) we
interpret the country-effects to be estimates of country-specific factors such as the effects of
national labour market institutions, the informal economy and migration patterns on regional
unemployment, while we interpret the time-effects as estimates the effects of European-wide
policies on regional unemployment.
For mathematical purposes the two-way fixed-effects model requires i-1 country
dummies and j-1 time dummies. We excluded France as a country dummy and the year 1985
as a time dummy. Thus the coefficients of each country (year) dummy are relative to France
(1985).
tot_un Beta P>|t| Beta P>|t| Beta P>|t| Beta P>|t| Beta P>|t|wn_theil 4.326 0.002 3.806 0.002 7.207 0.000 12.168 0.000 3.994 0.001
pop24 54.715 0.000 48.115 0.000 72.367 0.000 103.683 0.000 38.898 0.000relwage -0.084 0.077 -0.025 0.615 -0.079 0.276 -0.250 0.110 -0.031 0.444g_gdp -10.255 0.000 -10.654 0.000 -7.507 0.003 -15.870 0.000 -8.863 0.000
constant -8.588 0.000 -8.696 0.000 -11.736 0.000 -10.881 0.000 -6.246 0.000R^2
N 1834 1824 1829 1791 1833
Model 1 Model 2 Model 3 Model 4 Model 5ElderlyMale
0.5695 0.568 0.5994 0.603 0.5356
Total Female Youth

Figure 5 graphs the national dummies for the benchmark model (Model 1 with total
unemployment). The country fixed effects are statistically significant in all countries except
in Hungary, the Czech Republic, Sweden, Greece and Belgium. Their magnitude is relatively
unimportant in the United Kingdom, the Czech Republic, Sweden, Greece and Belgium when
France is used as baseline observation with plus or minus two percent as a threshold. Spain,
Poland, Finland and Germany have higher unemployment than one would expect, while
Ireland, Austria, Portugal, the Netherlands and Greece have lower unemployment than
otherwise expected.
Figure 5. Country Fixed Effects in European Unemployment
*Statistically insignificant at ten percent significant level
We believe that the lower-than-expected unemployment rates in Ireland and Austria
are due to strategic wage-setting. These are small countries with strong collective wage
bargaining, who have a consistent pattern of setting wages in tradeable goods sectors (and
only those) at a significant discount to their larger neighbour (Galbraith and Garcilazo, 2004).
They thus offer themselves as attractive targets for industrial location, and are able to generate
domestic full employment at the expense of the UK in Ireland’s case and Germany for the
case of Austria. Ireland also benefited from a large IT boom but the effect of this should be
largely captured by the growth rate variable.
-10.000
-8.000
-6.000
-4.000
-2.000
0.000
2.000
4.000
6.000
8.000
ie at pt nl hu* uk cz* se* gr* be* it de fi pl es

The lower-than-expected level of measured unemployment in Portugal might be due to
the existence of a large emigrant population, which disappear from the local labour force and
therefore from local unemployment data.
Contrary to the findings in Galbraith and Garcilazo (2004), the country effects for the
UK do not appear large, in fact as additional years were added to the sample they became
non-existent. This would tend to reduce the force of arguments that the UK’s deregulated
(“Anglo-Saxon”) labor market has conferred special advantages on that country. Country
effects for other large European countries, notably Germany and Italy, are statistically
significant but small, and do not account for a large share of total variance in the model. They
also differ only a little from that of Sweden, suggesting that there are not large institutional
differences across Europe, except those already captured by differences in inequality and
population structure. This either poses a challenge to the “varieties of capitalism” approach to
the explanation of unemployment, or suggests that our inequality measure may be a good
instrument for capturing the critical difference between varieties of capitalism.
Unemployment in Spain remains higher than expected, as also found in our previous
estimates. This might be due to the notoriously large cash economy in Spain. Several authors
have assigned the blame to “wage rigidity” in Spanish labor markets, as argued by Bentolila
and Jimeno (1998), Bover et al. (2000), (Montuenga et al. ( 2003) and Bentolila and Jimeno,
(2002). We, however, doubt that interpretation, as we have already accounted in our model
for the effect of pay inequality, a good measure, in our view, of rigidity as usually conceived.
The high country-effects for Poland, on the other hand, might be in some part a statistical
artifact. Recent estimates by the Polish government10 calculate there are approximately one
million Polish immigrants in the UK still registered as unemployed in their home country.
The time effects measure common variation in all regions during a given year. We
interpret these effects as showing the consequences of policies and shocks on the European
scale. The effects obtained are, broadly speaking, consistent with the results obtained in
Galbraith and Garcilazo (2004), although the magnitude of the 1994 peak in our present study
is one percentage point lower and effects in 1997 one percentage point higher (Figure 6).
This trend reveals an employment penalty associated with the Maastricht Treaty (1992) and
its implementation, through 1998, of around 4 percentage points. The arrival of the Euro in
1999 appears to have a positive effect on unemployment, especially for youth workers. This
10 http://www.euractiv.com/en/mobility/poland-unemployment-statistics-artif icially-boosted/article-159526

positive trend is reversed in the year 2000 coinciding with the implementation of the Lisbon
Treaty.
Figure 6. Time Fixed Effects in European Unemployment
3. Conclusions and Policy Implications
The European Commission’s main objective in the area of cohesion has been the reduction of regional disparities across the EU territory so as to achieve balanceddevelopment that promotes equal opportunities for all citizens of Europe. Our results find that achieving cohesion within European regions also to be important for development purposes, at least in order to attain full employment.
The relationship we find between wealth and inequality, along with the positive impact of pay inequality on unemployment in our regressions, suggests that promoting cohesion in the structure of pay in lagging regions could lead to a catching-up process leading to territorial cohesion. These findings go counter to the common view that Europe needs more pay inequality (“flexibility”) rather than less, but it is consistent with the Rehn-Meidner model that underlay much of the successful development strategy of Scandinavia in the postwar era.
-6.000
-4.000
-2.000
0.000
2.000
4.000
6.000
Un
em
plo
ymen
t
Years
Total Male Female <25 Yrs >25 Yrs
Single European Act
Maastrich Treaty
Euro
Lisbon Treaty
Policies that promote cohesion in lagging regions include raising minimum wages, targeting industrial development policies in poor areas, active labor market polices for the unemployed, policies to improve workers’ skills such as on-the-job training, adult education,and assistance programs for people at the bottom. Measures that promote interregional coherence could (and we believe should) be expanded from the construction and infrastructure projects that currently dominate the regional funds to include payments to individuals, particularly to top up pensions and the minimum wage, on the models of continental Social Security and the Earned Income Tax Credit of the United States. Galbraith (2006) provides an in-depth discussion.
The larger effects of inequality on youth unemployment suggest that measures toprovide jobs for young workers could ameliorate youth unemployment, still chronic in many European regions, so long as such programs did not involve stigmatizing their participants as otherwise unemployable. However, expanding university enrollments is perhaps the proven effective route to reducing youth unemployment, since it largely reclassifies the unemployed as “students,” avoiding stigma while giving young people a chance to grow out of theirproblem. Time heals, as they say.
Citations
Belbo, Miriam, and Tomas Knaus. "Measuring Income Inequality in Euroland." Review of Income and Wealth 47.3 (2001).
Bentolila, S., and F. Jimeno. "Regional Unemployment Persistence." Labour Economics 5 (1998): 25-51.
Bentolila, Samuel, and Juan F. Jimeno. "Spanish Unemployment: The End of the Wild Ride?" CESifo working paper No. 940, 2002. Vol. Category 4: Labour Markets.
Bover, Olympia, Pilar Garcia-Perea, and Pedro Portugal. "Iberian Labour Markets Why Spain and Portugal Are OECD Outliers." Economic Policy 15.31 (2000): 381-428.
Conceição, P., and J. Galbraith. "Constructing Long and Dense Time Series of Inequality Using the Theil Statistic." Eastern Economic Journal 26.1 (2000): 61-74.
Conceição, P., J. K. Galbraith, and P. Bradford. "The Theil Index in Sequences of Nested and Hierarchical Grouping Structures: Implications for the Measurement of Inequality through Time, with Data Aggregated at Different Levels of Industrial Classification." Eastern Economic Journal 27.4 (2001): 491-514.
Galbraith, J., and E. Garcilazo. “Pay Inequality in Europe 1995-2000: Convergence Between Countries and Stability Inside", European Journal of Comparative Economics, 2.2 (2005):139-175.
Galbraith, J., and E. Garcilazo. "Unemployment Inequality and the Policy of Europe." Banca Nazionale del Lavoro Quarterly Review LVII.228 (2004): 3-28.
Galbraith, James K. “Maastricht 2042 and the Fate of Europe: Toward Convergence and Full Employment.” Levy Economics Institute Public Policy Brief, No. 87, November 2006. Published separately by the Friedrich Ebert Stiftung, International Policy Analysis Unit, March 2007.
Galbraith, James K. Created Unequal: The Crisis in American Pay. New York: Free Press, 1998.
Harris, J. R., and M. P. Todaro. "Migration Unemployment and Development: A Two-Sector Analysis." The American Economic Review 60.1 (1970): 126-42.
Kuznets, S. "Economic Growth and Income Inequality." American Economic Review 65.1 (1955): 1-28.
Martin, Sala i. "The Classical Approach to Convergence Analysis." The Economic Journal106.437 (1996): 1019-36.
Meidner, R., and G. Rehn. "Fackföreningrsrörelsen Och Den Fulla Sysselsättningen." LO.Stockholm (1951).
Montuenga, V., I. Garcia-Mainar, and M. Fernandez. "Wage Flexiblity: Evidence from Five EU Countries Based on the Wage Curve." Economics Letters78.2 (2003): 169-74.
Morrisson, C., and F Murtin. Inequality among Europeans (1970-2000): European Commission, 2003.
Neven, D., and C. Gouyette. "Regional Convergence in the European Community." Journal of Common Market Studies33 (1995): 47-65.
Sapir, Andre, et al. An Agenda for a Growing Europe. Brussels: Oxford University Press, 2003.
Puga, Diego. "European Regional Policies in Light of Recent Location Theories." Journal of Economic Geography 2.4 (2002): 373-406.

Appendix 1 -- Sectorization used to Calculate Regional Inequality
Sectors by NACE-CLIO (1984-1994) Sectors by NACE (1995-2000)
B06-Fuel and power products A-Agriculture, hunting and forestry
B13-Ferrous and non-ferrous ores and metals,r*** B-Fi shing
B15-Non-metallic minerals and mineral products C-Mining and quarrying
B17-Chemical products D-Manufacturing
B24-Metal products, machinery, equipment and^ E-Electricity, gas and water supply
B28-Transport equipment F-Construction
B36-Food, beverages, tobacco G-Wholesale and retail trade; repair of*
B42-Textiles and clothing, leather and footwear H-Hotel s and restaurants
B47-Paper and printing products I-Transport, storage and communication
B50-Products of various industries J-Financial intermediation
B53-Building and construction K-Real estate, renting and business activities
B58-Recovery, repair, trade, lodging and^^ L-Public administration and defence; ss**
B60-Transport and communication services M-Education
B69-Services of credit and insurance institutions N-Health and social work
B74Other market services 0-Oth. Comm.., social, personal service act.
B86Non-market services P-Private households with employed persons
* motor vehicles, motorcycles and personal and household goods** com pulsory social security*** other than radioactive^ electrical goods^^ catering services

Appendix 2 – European Regions used in Sample
be1 Région Bruxelles-capitale es3 Com. de Madrid ite4 Lazio se08 Övre Norrlandbe21 Antwerpen es41 Castilla y León itf1 Abruzzo se09 Småland med öarnabe22 Limburg (B) es42 Castilla-la Mancha itf2 Molise se0a Västsverigebe23 Oost-Vlaanderen es43 Extremadura itf3 Campania ukc North Eastbe24 Vlaams Brabant es51 Cataluña itf4 Puglia ukd North West be25 West-Vlaanderen es52 Com. Valenciana itf5 Basilicata uke Yorkshire & Humberbe31 Brabant Wallon es53 Illes Balears itf6 Calabria ukf East Midlandsbe32 Hainaut es61 Andalucia itg1 Sicilia ukg West Midlandsbe33 Liège es62 Murcia itg2 Sardegna ukh Easternbe34 Luxembourg (B) es63 Ceuta y Melilla (ES) nl11 Groningen uki Londonbe35 Namur es7 Canarias (ES) nl12 Friesland ukj South Eastde1 Baden-Württemberg fr1 Île de France nl13 Drenthe ukk South Westde2 Bayern fr21 Champagne-Ardenne nl21 Overijssel ukl Walesde3 Berlin fr22 Picardie nl22 Gelderland ukm Scotlandde4 Brandenburg fr23 Haute-Normandie nl23 Flevoland ukn Northern Irelandde5 Bremen fr24 Centre nl31 Utrecht cz01 Prahade6 Hamburg fr25 Basse-Normandie nl32 Noord-Holland cz02 Strední Cechyde7 Hessen fr26 Bourgogne nl33 Zuid-Holland cz03 Jihozápadde8 Mecklenburg-Vorpommern fr3 Nord - Pas-de-Calais nl34 Zeeland cz04 Severozápadde9 Niedersachsen fr41 Lorraine nl41 Noord-Brabant cz05 Severovýchoddea Nordrhein-Westfalen fr42 Alsace at11 Burgenland cz06 Jihovýchoddeb Rheinland-Pfalz fr43 Franche-Comté at12 Niederösterreich cz07 Strední Moravadec Saarland fr51 Pays de la Loire at13 Vienna cz08 Moravskoslezskoded Sachsen fr52 Bretagne at21 Kärnten pl11 Lódzkiedee Sachsen-Anhalt fr53 Poitou-Charentes at22 Steiermark pl12 Mazowieckiedef Schleswig-Holstein fr61 Aquitaine at31 Oberösterreich pl21 Malopolskiedeg Thüringen fr62 Midi-Pyrénées at32 Salzburg pl22 Slaskiegr11 Anatoliki Mak. &Thraki fr63 Limousin at33 Tirol pl31 Lubelskiegr12 Kentriki Makedonia fr71 Rhône-Alpes at34 Vorarlberg pl32 Podkarpackiegr13 Dytiki Makedonia fr72 Auvergne nl42 Limburg (NL) pl33 Swietokrzyskiegr14 Thessalia fr81 Languedoc-Roussillon pt11 Norte pl34 Podlaskiegr21 Ipeiros fr82 Pr.-Alpes-Côte d'Azur pt15 Algarve pl41 Wielkopolskiegr22 Ionia Nisia fr83 Corse pt16 Centro (PT) pl42 Zachodniopomorskiegr23 Dytiki Ellada ie01 Border, Mid. & Western pt17 Lisboa pl43 Lubuskiegr24 Sterea Ellada ie02 Southern and Eastern pt18 Alentejo pl51 Dolnoslaskiegr25 Peloponnisos itc1 Piemonte pt20 R. A. dos Açores (PT) pl52 Opolskiegr3 Attiki itc2 Valle d'Aosta pt30 R.A. da Madeira (PT) pl61 Kujawsko-Pomorskiegr41 Voreio Aigaio itc3 Liguria fi13 Itä-Suomi pl62 Warminsko-Mazurskiegr42 Notio Aigaio itc4 Lombardia fi18 Etelä-Suomi pl63 Pomorskiegr43 Kriti itd1 Pr. A Bolzano-Bozen fi19 Länsi-Suomi hu10 Közép-Magyarországes11 Galicia itd2 Pr. A Trento fi1a Pohjois-Suomi hu21 Közép-Dunántúles12 Principado de Asturias itd3 Veneto fi20 Åland hu22 Nyugat-Dunántúles13 Cantabria itd4 Friuli-Venezia Giulia se01 Stockholm hu23 Dél-Dunántúles21 Pais Vasco itd5 Emilia-Romagna se02 Östra Mellansverige hu31 Észak-Magyarországes22 Comunidad de Navarra ite1 Toscana se04 Sydsverige hu32 Észak-Alföldes23 La Rioja ite2 Umbria se06 Norra Mellansverige hu33 Dél-Alföldes24 Aragón ite3 Marche se07 Mellersta Norrland
Related Documents

![Research Article Harnack Inequalities: An Introduction · 2017. 8. 25. · Harnack inequalities and Harnack convergence theorems. Only three years after [2]is published Poincar´e](https://static.cupdf.com/doc/110x72/610fd8c14cb1643500092498/research-article-harnack-inequalities-an-introduction-2017-8-25-harnack-inequalities.jpg)