Inequalities Audit Ards and North Down Borough Council This document is available in a range of formats on request. Please contact us with your requirements.

Welcome message from author
This document is posted to help you gain knowledge. Please leave a comment to let me know what you think about it! Share it to your friends and learn new things together.
Transcript

Inequalities Audit
Ards and North Down Borough Council
This document is available in a range of formats on request. Please contact us with
your requirements.

Contents
Section 1 – Background ............................................................................................. 3
Section 2 – The Council, it’s role, functions and policies ............................................ 4
Section 3 – Methodology ............................................................................................ 7
Section 4 – Evidence used to identify Key Inequalities and develop Action Plan ....... 9
Section 5 – Development of Equality Action Plan ...................................................... 9
Section 6 - Consultation ........................................................................................... 10
Section 7 – Further information and alternative formats ........................................... 10
Section 8 – Publication ............................................................................................. 11
Section 9 – Monitoring and Review .......................................................................... 11
Appendix A Templates of Inequalities Identified…………………………………………12
Appendix B Local Statistics on Ards and North Down Borough areas…………….34

Section 1 – Background
Section 75 of the Northern Ireland Act 1998 requires Ards and North Down Borough
Council (the Council), or whatsoever that body is named, when carrying out its work,
to have due regard to the need to promote equality of opportunity between nine
categories of persons, namely:
• between persons of different religious belief, political opinion, racial group,
age, marital status or sexual orientation;
• between men and women generally;
• between persons with a disability and persons without; and
• between persons with dependants and persons without.
The Council must also have regard to the desirability of promoting good relations
between persons of different religious belief, political opinion or racial group.
Whilst much good work has been achieved in promoting equality of opportunity and
good relations, there still remain persistent inequalities within our society.
In April 2010 the Equality Commission for Northern Ireland (ECNI) published its
revised ‘Guide to the S75 Statutory Duties for Public Authorities.’ Within the guide
the ECNI recommended that public authorities should undertake an audit of
inequalities by systematically reviewing and analysing its service functions, and how
these relate to the promotion of equality and good relations. Having identified any
inequalities it was recommended that public authorities should set out specific
actions to address these in an action plan attached to the public authorities Equality
Scheme.
The Council has, in so far as possible before 1st April 2015, undertaken these
recommendations and conducted an audit of inequalities. This audit has enabled the
Council to identify potential functional areas for further or better discharge of Section
75 duties and will further mainstream equality of opportunity and good relations into
its service delivery.
The purpose of this report is to detail how the Council conducted its audit of
inequalities, and to identify some of the key inequalities which emerged.

Section 2 –District Profile and the Council
District Profile
The district area, situated on the north east coast of County Down, is home to a population of 157,000 people (approximately 8.6% of the population of Northern Ireland) and is expanding. However, it should be noted that migration into the area has fallen since June 2013.
The area is bounded by the shores of Belfast Lough to the north and the Irish Sea to the east. Strangford Lough, with its reputed 365 islands, provides the coast to most of the west of the District and creates the Ards Peninsula to its east. The area is renowned for beautiful, natural scenic landscape and rich historical interest with Strangford Lough designated as an Area of Outstanding Natural Beauty, Special Scientific Interest and Marine Nature Reserve.
The special environment of Strangford Lough with its unique habitat for birds and sanctuary for wildlife has created the optimum location for Exploris in Portaferry, Northern Irelands only Aquarium and the Wildfowl and Wetlands Centre at Castle Espie.
The area is made up of a mix of urban areas and rural settlements. The two principal towns are Bangor (60,000) and Newtownards (28,000), followed by Holywood, Comber and Donaghadee in terms of size. All of these settlements are located in the north of the District, whilst the remainder of the population live mainly in 12 smaller villages. The uneven spatial distribution means that 80% of people live in the northern 25% of the District.
The primary challenge facing the new Council from a social perspective is the ageing population and the subsequent impact this has upon the health of those living in the area and thus the range of services they require.
Council engage with a broad range of residents, employers, visitors to and within the Borough. Council has a broad range of tourist attractions and seasonal events and works with employers across the Borough in supporting and developing employment with a range of initiatives and grant support.
Since 2001 there has been 6.6% decrease in the number of people under the age of 16, while there has been marked increase of 40% in the number of people aged over 65 years. It is also interesting to note from age profile information from NINIS that there are a higher percentage of residents over the age of 40 than the Northern Ireland average, yet a lower percentage under the age of 40 years.
The new Council recognises the rich history and vibrant culture of the District area and is committed to building a new and even better future for all the people who live, work, visit and wish to invest in this very special place.

The Council
Ards and North Down Borough Council took on its full powers from 1st April 2015 and has been formed by the merger of North Down Borough Council and Ards Borough Council as part of the Review of Public Administration and Local Government Reform Programme. The Council will have an annual operating budget of approximately £50 million and a workforce of almost 1,000 people delivering a range of services to local residents. The roles and functions, of the Council fall within three types; Direct, Representative and Consultative and include the following examples: • the direct provision of a number of services and facilities,
• the promotion of the arts, tourism, community and economic development,
• the regulation and licensing of certain activities relating to environmental health,
consumer protection and public safety,
• a representative role on a number of bodies and boards including Education and
Health,
• a consultative role in relation to functions conducted by other Government bodies
and agencies on issues such as planning, water, roads and housing.
• an advocacy role for the people of the District
In the performance of the above roles the Council carries out functions in the
following areas: (This is not an exhaustive list)
• the provision and maintenance of facilities for recreational, social and cultural
activities including leisure centres, community centres, parks, open spaces, sports
and playgrounds and places of entertainment
• street cleansing
• waste collection and disposal
• the provision of burial grounds
• the provision of grant aid to support the Arts, community development, good
relations and the promotion of tourism and economic development
• the administration and regulation of certain matters relating to the environment,
public health and public safety including building control, food safety, statutory
nuisance, dangerous buildings, air pollution, noise pollution, dog control, consumer
protection and health and safety
• the licensing and regulation of street trading, places of entertainment, amusement
centres, sex establishments, society lotteries, cinemas and petroleum stations
• the making of bye-laws and regulation of same
• A wide range of powers and duties placed on the Council by statute.
Powers agreed by the Executive that will transfer to the Council from April 2015
include:

Planning
Local development plan functions
Development control and enforcement
Authority to Spot List to enable Councils to add a building to the statutory list on a temporary basis, subject to ratification by the DOE
Authority to draw up local lists of buildings that are of architectural and/or historic interest
Roads
• Off street parking (except Park and Ride)
Urban regeneration and community development
• Functions associated with physical development (e.g. environmental
improvement schemes)
• Area based regeneration (such as Neighbourhood Renewal)
• Some community development programmes for the voluntary and community
sectors
Local Economic Development
Range of Business and Enterprise Schemes Neighbourhood Renewal funding relating to enterprise initiatives
Local Tourism
• Providing business support including business start up advice along with
training and delivery of customer care schemes
• Providing advice to developers on tourism policies and related issues
General Power of Competence
Section 79 of the Local Government Act (Northern Ireland) 2014 provides Councils with the General Power of Competence. This power enables the Council, in broad terms, to act with similar freedom to an individual, unless there is a law to prevent it from doing so. It provides the Council with the ability to act in its own interest and to develop innovative approaches to addressing issues in its area.
As well as:
• Some elements of the delivery of the EU Rural Development Programme;
• Local water recreational facilities;
• Local sports to give greater involvement of local government in local sports
decisions
• Donaghadee Harbour
• Community Planning
To enable the Council to provide the above services and perform its other functions,
the Council must levy an annual rate and has the power to:-
• acquire and dispose of land;
• borrow money;
• employ staff;
• procure goods and services.
Section 3 – Methodology
The process of scoping of the audit of inequalities began with the development of
Ards and North Down Borough Council’s Equality Scheme, completion of a gap
analysis of service provision in both legacy Council areas and a subsequent scoping
exercise carried out across each Council.
This Audit has reviewed the existing Council functions through the perspective of the
management and organisational structure and directorates:
It was identified that a number of Council functions are regulated and statute based,
and therefore have a lesser potential impact for better discharge of the Section 75
duties. However, these will require to be screened for both the impact or potential
impact on equality of opportunity and good relations.

Chief Executives Office Theme 1 Production of Corporate Plan and related Council strategies Indicators Corporate Planning development process Screening for equality of opportunity and good relations across the
organisation Provision of accessible and relevant information
Directorate: Finance and Performance Theme 1 Budget setting Indicators Identifying budget changes
Identify changes to service delivery Theme 2 Performance Management and Improvement Indicators Development of relevant SMART Performance Indicators Business Plans to include promotion of equality of opportunity and
good relations across the organisation
Directorate: Organisational Development and Administration Theme 1 Corporate practices Indicators Accessibility to services Borough identity Theme 2 Employee profile Indicators Employee composition Employee policies Theme 3 Promotion of a welcoming environment Indicators Display and collection of memorabilia Corporate recognition to individuals and organisations
Directorate: Environment Theme 1 Provision of Council facilities and services Indicators Location and opening times Range of programmes Theme 2 Pricing Policies Indicators Concessionary arrangements Price variations across Council Theme 3 Waste Management Indicators Service provision Access to relevant and timely information
Directorate: Community & Well Being Theme 1 Participation in sport and leisure Indicators Location of facilities and services Range of programmes and times Theme 2 Good Relations Strategy Indicators Impact on employees Impact on residents Theme 3 Provision of community facilities and services Indicators Promotion of facilities and services Seasonal provision

Directorate: Regeneration, Development and Planning Theme 1 Local Development Plan Indicators Impact on residents Impact on services Theme 2 Tourism Strategy Provision of events Provision of Tourism Information Centres Theme 3 Economic Development Plan Impact on Borough Provision of Grant funding
Section 4 – Evidence used to identify Key Inequalities and develop Action Plan
The Council has gathered and utilised a breadth of knowledge, research and raw
data to identify key inequalities and to develop its action plan from both North Down
Borough Council and Ards Borough Council.
Using the template previously agreed by all Councils, a review and comparison of
the Council services was undertaken, and possible inequalities identified. These
templates are included at Appendix A.
Local statistics on the Ards and North Down Borough Council are included at
Appendix B.
This document sets out the key inequalities identified from the research and audit of
inequalities of the two merged Councils. This document is not an exhaustive list of
equality and good relation issues, but rather provides a summary of the key findings
and main themes which have emerged in recent years and have been identified as
the Council services merge and take on new responsibilities.
The Council recognises that the information and research available is continually
changing, and with this in mind the Council is committed to reviewing the latest
research available, as well as keeping its own Section 75 monitoring data up to date.
This document will be used by the Council not only for identifying key inequalities for
its action plan, but also for informing equality screening and equality impact
assessment. In addition the document will be a valuable resource for both Council
employees and Elected Members.
Section 5 – Development of Equality Action Plan
The actions within the Council’s action plan are designed to mainstream equality of
opportunity and good relations throughout its service units and functions. Some

actions are relevant to all Council services whilst others may be individual to a
particular service. Some actions have emerged due to the merging of the Councils
and exist as a result of individual practices, population need and demographics,
whilst some are attributed to the new transferring powers and responsibilities.
Councils Action measures will be implemented through the framework of the
Council’s Equality Scheme.
In developing its action plan consideration has been given to what inequalities can
be addressed through the exercise of its functions and available resources. The
action plan sets out the desired outcomes the Council seeks to achieve, with related
performance indicators and timescales.
It is important to note that the action plan is flexible, and will be adapted to suit
changing circumstances and needs. The action plan will be reviewed at least
annually to identify any inequalities that require to be addressed in the incoming
period.
The Council’s action plan is included as an appendix to the Council’s Equality
Scheme.
Section 6 - Consultation This draft document is available for comment from members of the public, Council
officers, the Equality Commission for Northern Ireland and Elected Members.
Section 7 – Further information and alternative formats
This document can be made available in alternative formats including:
- Paper Copy
- Large Print
- Easy Read
- Audio CD / MP3
- Braille
- Computer Disk
- Other languages where English is not the first language
If you require more information on the audit of inequalities and emerging themes, or
require a copy of this document in an alternative format please contact the Council’s
Policy Officer. Contact details are provided below:
Shirley Poxon
Town Hall, The Castle,
Bangor
BT20 4BT
Tel: 0300 013 3333
07718 159 275 sms text only
E-mail:
Fax: 028 9127 1370
Section 8 – Publication
The Council’s Inequalities Audit will inform the Council’s Action Plan which will be
appended to the Ards and North Down Borough Council Equality Scheme and will be
included in all publications as stated in the Equality Scheme.
The inequalities audit will be available for reference should any individual wish to
read it.
Section 9 – Monitoring and Review
The Audit of Inequalities will be regularly reviewed. The Action Plan will be monitored
at least annually with an update provided to Council Members and the Equality
Commission and posted on Councils website with the Council’s Annual Progress
Report on Section 75.
Responsibility for monitoring and review of the Action Plan will rest with the Councils
relevant officers in association with the identified business areas.

Appendix A – Inequalities Identified
Chief Executives Office
Theme 1 – Production of Corporate Plan and related Council strategies
Indicators Data sources Associated measures
Questions to Aid Completion Findings Identified as an Action
Corporate Planning development process
Workshops with officers and Elected members Corporate Plans of existing Councils Current corporate practices in each Council Corporate identity of Council
Departmental strategies Expectations of Council services Availability and accessibility of resources
What is the Vision of the new Council? What are the core values of the new Council?
Work on the Corporate Plan for the new Council on going. Findings are reviewed during the process and at its conclusion Identification of adverse and potential adverse impact on any Section 75 dimension
Engage with officers and Elected Members to develop Corporate Plan Review existing Corporate Plans and determine core values of new Council Consult with user groups
Screening for equality of opportunity and good relations across the organisation
Internal consultations held with employees Internal Equality Screening Group External Consultation Panel
Staff consultation events Screening of Corporate Plan by Internal officer group Consultative
How many events were held? Were attendance monitored in relation to Section 75 dimensions? How many/ what type of S75 related issues were raised? Mitigating factors relating to S75 issues
Corporate Plan to be reviewed by Internal Equality Screening Group to ensure compliance with Equality Scheme Further screening to

13
Panel Challenge Workshops
identified? Number and type of Section 75 complaints and enquiries received previously by both Councils
Policies are reviewed to mitigate against adverse and potential adverse impact
be carried out by External Equality Screening Group Findings from Staff Consultation
Provision of accessible and relevant information
Current policy Range of information provided Range of information proposed to be provided Requests from residents and service users for alternative formats Website design
Commitment to Disability and age related communications in Corporate Plan
Is this commitment clearly stated in Plan? Does the Council have a Diversity Champion? Is the Council implementing a Disability Action Plan?
Work on the Council Communication Policy for the new Council on going. Findings are reviewed during the process and at its conclusion
Ensure commitment is included in Corporate Plan Appointment of Diversity Champions within the Council Completion and implementation of a Disability Action Plan

14
Identifying
budget
changes
Estimates
process
Performance
indicators per
section
Budget reports
Explanation to
variations in
budget
Requests to
changes to
service provision
Did the service operate within budget?
What service increases/ reductions have
been identified
Budget over
spends
Budget
underspends
Proposed
changes to
service
provision with
rational and any
relevant
legislation
requirements
Screen all proposed
budget increases
and decreases
Identify
changes to
service
delivery
Complaints and
comments
received
Changes to
legislation
Changes to
operating
procedures
What was basis
for comment or
complaint
Who will benefit
from changes
Who identified
best practice
changes
Were the comments/ complaints valid
Were any possible changes identified?
Would changes incur additional or
reduced spending?
Outcome of
estimates
meetings
Relevant
legislation
Changes to
working
practices
Review policy or
service delivery
where appropriate
and screen revised
policy
Directorate : Finance & Performance
Theme 1 – Budget Setting
Indicators Data sources Associated measures
Questions to Aid Completion Findings Identified as an Action

15
identified for best
practice
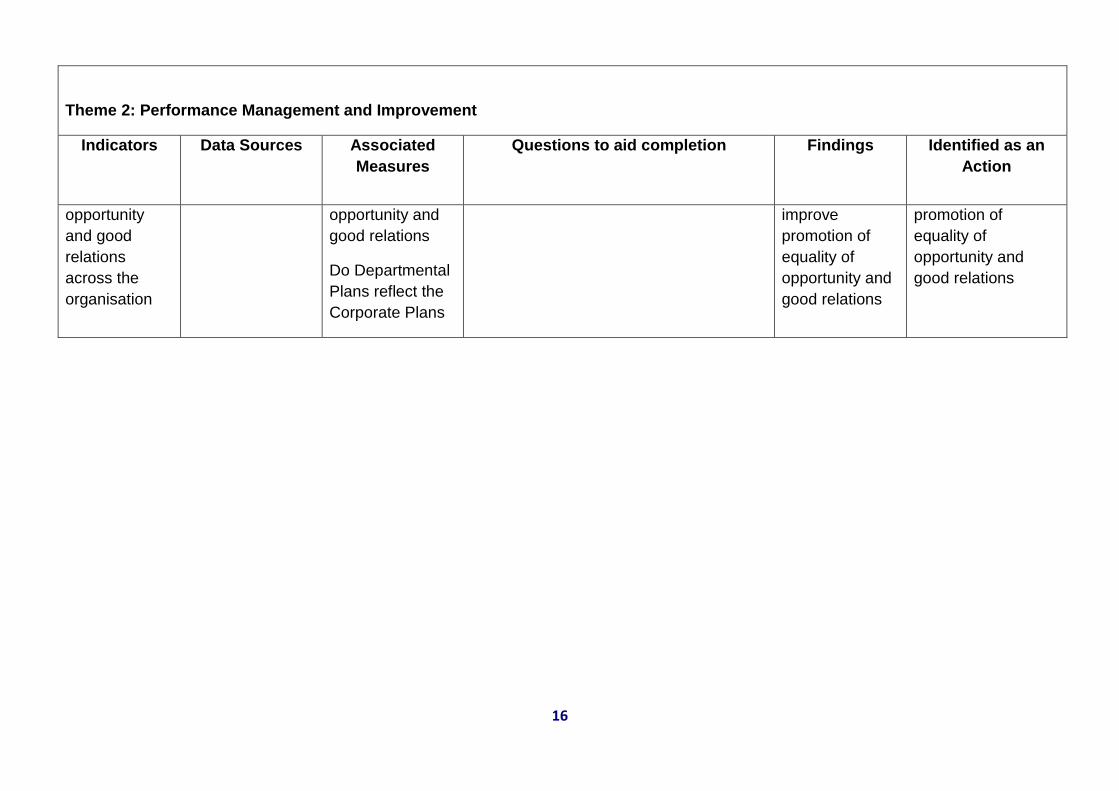
Theme 2: Performance Management and Improvement
Indicators Data Sources Associated
Measures
Questions to aid completion Findings
Identified as an
Action
Development
of relevant
SMART
Performance
Indicators
Performance
Management
Strategy
Statutory
performance
management
indicators
Local agreed
performance
management
indicators
Statutory
requirements
Relevant
indicators that
include Section
75
What indicators have been identified?
What data is required to complete these
indicators?
What indicators
reflect Section
75 compliance
What indicators
are not meeting
their targets
Ensure KPI’s
include promotion of
equality of
opportunity and
good relations
where relevant
Business
Plans to
include
promotion of
equality of
Corporate Plan
Departmental
Plans
Does the
Corporate Plan
address Section
75 promotion of
equality of
How do the Corporate Plan and
Departmental Plans address Section 75
promotion of equality of opportunity and
good relations
Actions
identified across
the organisation
and within
departments to
To ensure all plans
include a
demonstrable and
measurable
commitment to the
16
Theme 2: Performance Management and Improvement
Indicators Data Sources Associated
Measures
Questions to aid completion Findings
Identified as an
Action
opportunity
and good
relations
across the
organisation
opportunity and
good relations
Do Departmental
Plans reflect the
Corporate Plans
improve
promotion of
equality of
opportunity and
good relations
promotion of
equality of
opportunity and
good relations

17
Directorate: Organisational Development and Administration
THEME 1: Corporate practices
Indicators Data Sources Associated
Measures
Questions to
aid completion
Findings
Identified as an Action
Accessibility to
services
List of all services
Council policy on
service provision
Local Government Act
What is
provided?
What is
accessible?
What services
do Council have
to provide
What services
have Council
chosen to
provide?
How service is currently
provided
Identified gaps in service
provision
Ensure information on
Council services is timely
and accessible to users
and potential users in a
suitable format
Borough identity District / Borough
Demographics
Census
Profile of District What are the
Statistics broken
down over the
S75 categories?
Statistics are detailed in
Appendix 2
Council will review and
update its programme of
services delivery and
provision of services and
facilities in line with
existing annual review
practices.
THEME 2: Employee Profile

18
Indicators Data Sources Associated
Measures
Questions to
aid completion
Findings
Identified as an Action
Employee
composition
Employee Profile Article 55 Profile of
existing
employees
Profile of
applicants
What are the statistics
broken down over the S75
categories for which data is
collated?
Finding will be made
available 1st June 2015.
Employee
Policies
Range of all agreed
Council policies
Outstanding
policies
Identified
adverse or
potential policies
Are policies
available to
employees and
potential
employees
Can policies be
accessed by all
employees
Policies are being agreed for
all employees and potential
employees
To continue to update
and review policies and
inform employees
To ensure all policies are
screened and the
outcome consulted upon
with employees and
Trade Unions
THEME 3: Promotion of a Welcoming Environment
Indicators Data Sources Associated
Measures
Questions to
aid completion
Findings
Identified as an Action

19
Display and
collection of
memorabilia
Current practices in all
Council facilities
Use of Council facilities
Council policy on
service provision in
Council facilities
Audit of all
Council services
and facilities and
displays
What image do
these displays
portray of the
Council
What is the
purpose of
displays
Some buildings and facilities
have some displays that may
not be considered welcoming
to the diverse population
who use or wish to use the
facility.
Audit all facilities for their
use and range of visitors
and employees
Audit displays and
memorabilia
Provide context for
display where
appropriate
Work to ensure all
buildings and facilities
provide a welcoming
environment
Corporate
recognition to
individuals and
organisations
Corporate policy on
range of recognitions
available
Cost of each award
Audit existing
Council awards
for Freedom of
the Borough
Audit all
individuals and
organisations
who have
received
recognitions in
legacy Councils
Who/ what work
do Council want
to publicly
recognise
Who do Council
want to
recognise in a
less formal
manner
What is the
purpose of this
policy
Criteria to be agreed for
entitlement to Freedom of
the Borough
Criteria to be invited to a
Mayoral function
What awards will Council
provide to
residents/members of the
public/businesses/employees
Write and screen generic
policy for each agreed
category of recognition

20
Directorate: Environment
THEME 1: Provision of Council Facilities and Services
Indicators Data Sources Associated
Measures
Questions to aid
completion
Findings
Identified as an Action
Location and
opening times
EQIA’s
Website/leaflets
KPI’s
DisabledGo audit
Audit of all Council
facilities
Council customer care
reports
Accessibility of
facilities
Opening hours
Range of
activities
available
Arrangements to
rent/hire facilities
Where are the
facilities
Are they easily
accessible
How do people
know about them
Are the range of
activities/opening
times made
available
Are the
arrangements to
use the facilities
made available
GIS data provides
access and location
information
Variations in
opening times
Variation of demand
for range of facilities
Variation in activities
currently available
Council policy in
responding to
customer comments
and complaints
Hiring policy
Ensure all premises are
audited for disability access
to DisabledGo standards
Consider wifi availability
Update website information
regularly with relevant
information
Review opening times aand
service demand and usage
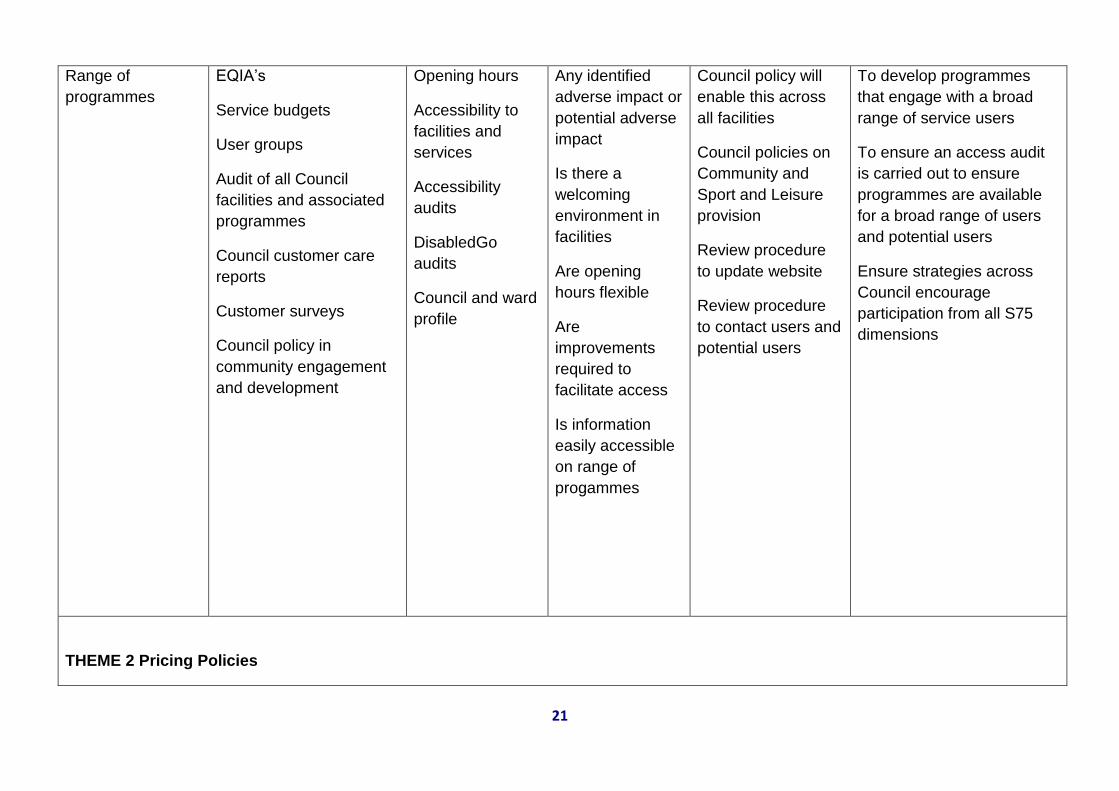
21
Range of
programmes
EQIA’s
Service budgets
User groups
Audit of all Council
facilities and associated
programmes
Council customer care
reports
Customer surveys
Council policy in
community engagement
and development
Opening hours
Accessibility to
facilities and
services
Accessibility
audits
DisabledGo
audits
Council and ward
profile
Any identified
adverse impact or
potential adverse
impact
Is there a
welcoming
environment in
facilities
Are opening
hours flexible
Are
improvements
required to
facilitate access
Is information
easily accessible
on range of
progammes
Council policy will
enable this across
all facilities
Council policies on
Community and
Sport and Leisure
provision
Review procedure
to update website
Review procedure
to contact users and
potential users
To develop programmes
that engage with a broad
range of service users
To ensure an access audit
is carried out to ensure
programmes are available
for a broad range of users
and potential users
Ensure strategies across
Council encourage
participation from all S75
dimensions
THEME 2 Pricing Policies

22
Indicators Data Sources Associated
Measures
Questions to aid
completion
Findings
Identified as an Action
Concessionary
arrangements
Legacy Council policies for all services Revised pricing policy
Complaints Accessibility to services/facilities Statutory provision requirements What is the purpose of offering concessionary rates
Why were these rates/ranges selected Why are concessionary rates offered Is evidence to access concessionary rates required
Screening outcome of new policy Other council policies
Review all comments and complaints received at least twice annually
Price variations
across Council
Directorate and service unit definitions for concessionary rates Relevant S75 data on service users
Purpose of concessionary rates offered by Council Variations across Council to access concessionary rates What concessionary rates were available in legacy Councils
Are concessionary rates mean tested? How are concessionary rates advertised?
Development of harmonised pricing policy is on going See screening form of 16th December 2014
Record all enquiries about concessionary rates Review at least annually Harmonise policy across Council Establish concessionary pricing eligibility criteria

23
THEME 3 Waste Management
Indicators Data Sources Associated
Measures
Questions to aid
completion
Findings
Identified as an Action
Service Provision Location of all facilities
and services
Complaints and service
comments
Accessibility
Availability of information
Recycling data
Records of range and
take up of all services
Range of concessionary
rates available
KPI’s
What is available
where within the
Borough
Recording
mechanism for
complaints and
comments
Accessibility
audits
KPI’s
Take up of
recycling
initiatives
Take up of
concessionary
rates
Are there areas
that have a lower
take up?
What was the
nature of
complaints and
comments
Have all areas
been audited for
disability
What are we
measuring?
Are
concessionary
rates available
and do residents
know of them?
Website and leaflets
identify availability
of alternative
formats
Population profile
for each Council
ward and take up
Demand/take up
varies across
Council
Information regularly
updated and made
available
Work to ensure equity of
provision across Borough
with facilities available to
meet demand
Ensure information is readily
available and up to date and
timely
Ensure alternative formats
are available and
deliverable
Review take up of
concessionary rates
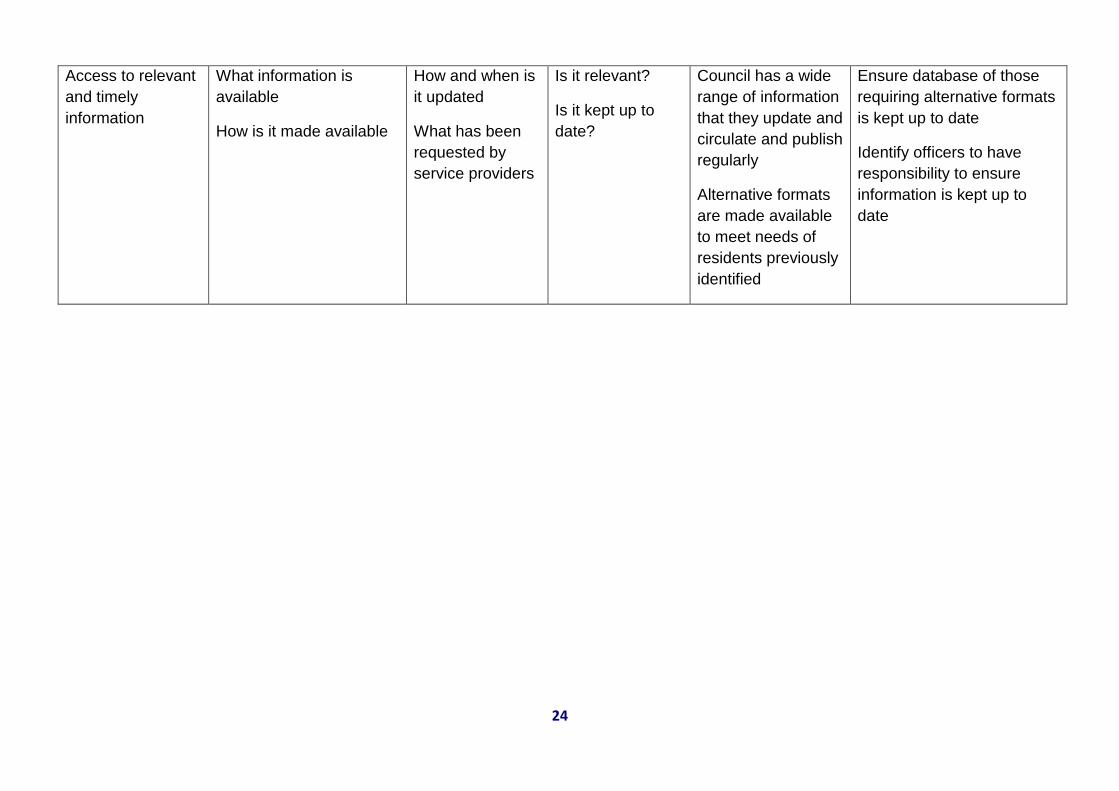
24
Access to relevant
and timely
information
What information is
available
How is it made available
How and when is
it updated
What has been
requested by
service providers
Is it relevant?
Is it kept up to
date?
Council has a wide
range of information
that they update and
circulate and publish
regularly
Alternative formats
are made available
to meet needs of
residents previously
identified
Ensure database of those
requiring alternative formats
is kept up to date
Identify officers to have
responsibility to ensure
information is kept up to
date

25
Directorate: Community & Wellbeing
THEME 1: Participation in Sport & Leisure
Indicators Data Sources Associated
Measures
Questions to aid
completion
Findings Identified as an Action
Location of
Facilities &
Services
EQIA’s Website/Leaflets GIS information
Accessibility of facilities Opening hours Range of activities available Arrangements to rent/hire/access facilities and services DisabledGo audit information
Where are the facilities Are they easily accessible How do people know about them? Are the range of activities/opening times made available Are the arrangements to use these facilities/services made available?
GIS data Audit of Council facilities and services Capital Projects programme Sport Development programme Range of services and facilities currently available Community Development Strategy Hiring policy Criteria to take a class
Ensure all facilities and services are audited for disability access Identify by GIS where all facilities are located Ensure each facility provides a welcoming atmosphere

26
Range of
Programmes &
Times
EQIA’s
Website/Leaflets
Ward area data on
population
Programmes available
and take up
Councils policy
on participation
and engagement
Sports
Development
programme and
strategy
KPI’s
Are there areas of
over provision
and under
provision based
on data
How does
Council currently
promote
participation in
sport and leisure?
Information readily
available
Information updated
regularly
Council strategy to
promote
participation
Ensure all section 75
dimensions are provided for
across the Borough
Develop policy to ensure
requests to participate and
under representations are
addressed
THEME 2 : Good Relations Strategy
Indicators Data Sources Associated
Measures
Questions to aid
completion
Findings
Identified as an Action
Impact on
Employees
Good Relations Strategy
Training records for
employees
Adoption of Good
Relations
Strategy
Identified training
needs
KPI’s
Has the Strategy
been formally
adopted by
Council?
Development of the
Good Relations
Strategy is ongoing
and will be reviewed
and ratified when
complete
Adoption of Good Relations
Strategy

27
Impact on
Residents
Good Relations Strategy
Database of community
groups Council engage
with
KPI’s
Adoption of Good
Relations
Strategy
Audit those with
whom Council
work and any
gaps in service
provision
Has the Strategy
been formally
adopted by
Council?
Development of the
Good Relations
Strategy is ongoing
and will be reviewed
and ratified when
complete
Adoption of Good Relations
Strategy
THEME 3 : Provision of Community Facilities & Services
Indicators Data Sources Associated
Measures
Questions to aid
completion
Findings
Identified as an Action
28
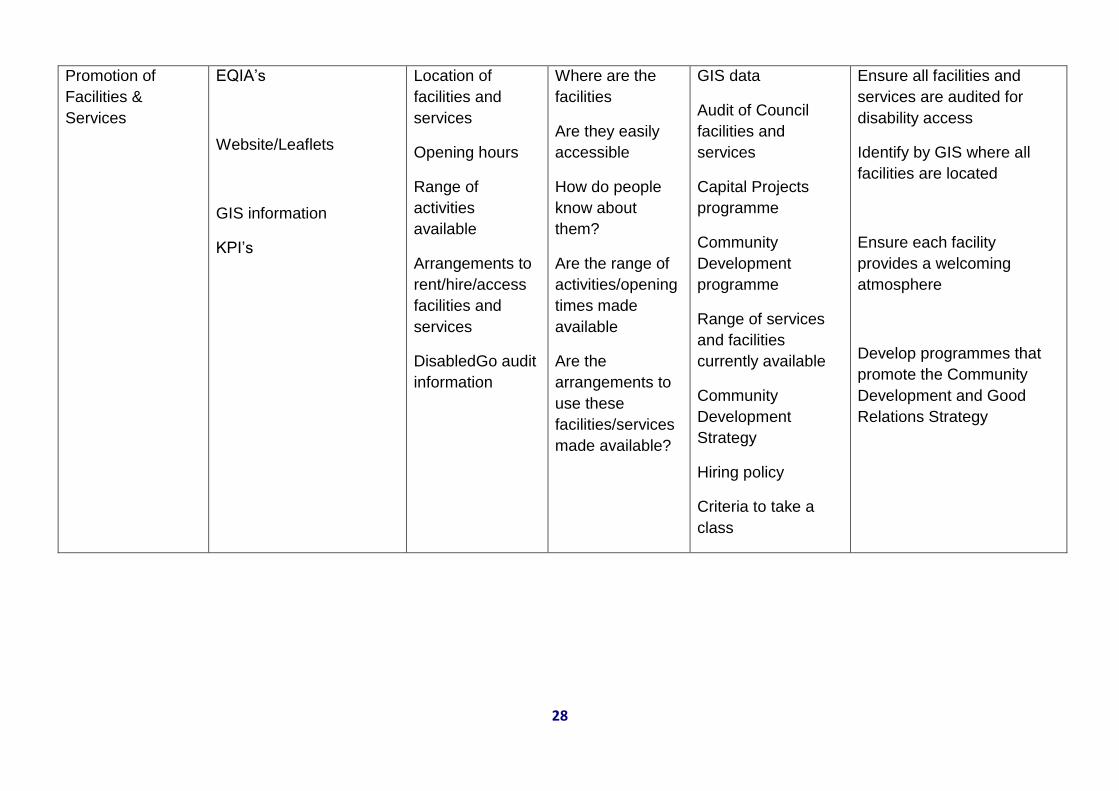
Promotion of
Facilities &
Services
EQIA’s
Website/Leaflets
GIS information
KPI’s
Location of
facilities and
services
Opening hours
Range of
activities
available
Arrangements to
rent/hire/access
facilities and
services
DisabledGo audit
information
Where are the
facilities
Are they easily
accessible
How do people
know about
them?
Are the range of
activities/opening
times made
available
Are the
arrangements to
use these
facilities/services
made available?
GIS data
Audit of Council
facilities and
services
Capital Projects
programme
Community
Development
programme
Range of services
and facilities
currently available
Community
Development
Strategy
Hiring policy
Criteria to take a
class
Ensure all facilities and
services are audited for
disability access
Identify by GIS where all
facilities are located
Ensure each facility
provides a welcoming
atmosphere
Develop programmes that
promote the Community
Development and Good
Relations Strategy

29
Seasonal
Provision
Current practices in each
Council area
Council policy
Location of
facilities and
services
What seasonal
services can be
provided
Location of
seasonal demand
Purpose of
seasonal
provision
What services
have been
provided?
What is the take
up and where?
Range of
activities that
have been made
available
Arrangements to
access facilities
and services in
seasonal
provision
DisabledGo audit
information
Demand varies
across Council
Age and location of
facilities and
premises are main
service
consideration for
provision of services
decisions
Develop appropriate
seasonal provision across
the Borough
Address needs and ensure
appropriate to age/location
and strategies of Council

30
Directorate: Regeneration, Development & Planning
THEME 1: Local Development Plan
Indicators Data Sources Associated
Measures
Questions to aid
completion
Findings
Identified as an Action
Impact on
Residents
Local Development Plan
NINIS Borough statistics
KPI’s
How does
Council
anticipate growth
being managed
and developed
with all stake
holders
How can Council
coordinate with
stakeholders in a
meaningful way
Need to integrate
local knowledge
and best practice of
legacy Councils
and facilitate
consultations
Ensure consultation is
managed to ensure all
Section 75 dimensions are
included to identify needs
Impact on
Services
Local Development Plan
Local Economic Plans
Database on services
provided within the
Borough
KPI’s
How does
Council
anticipate growth
being managed
and developed
with all stake
holders
How can Council
coordinate with
stakeholders in a
meaningful way
Development and
consultation on an
Economic
Development Plan
Ensure consultation is
managed to ensure all
Section 75 dimensions are
considered to enable their
needs to be identified
THEME 2: Tourism Strategy

31
Indicators Data Sources Associated
Measures
Questions to aid
completion
Findings
Identified as an Action
Provision of
Events
Tourism strategy
Data on all events in last
2 years and proposed
events for current and
next 2 year period
Cost of events
Spend from events
Disability audits of
events
KPI’s
Council policy on
provision of
events
Expectations of
and comments
received from
events
What does Council
want to gain from
events
Who are they aimed at
Where are they
provided
When are they
provided
Are attendances
meeting the
anticipated
attendances
Council wide
programme aimed
at a broad range of
residents and
visitors and
potential visitors
Council opportunity
to engage with
range of
businesses
Audit all event for disability
access including
information
Audit events to record
anticipated attendance of
target attendees in relation
to Section 75 categories
Ensure grants that
promote events are S75
compliant

32
Provision of
Tourist
Information
Centres
Tourism strategy
Location on centres
Opening arrangements
for centres
Council policy
DisabledGo audit
Who does
Council intend to
engage with
through these
hubs?
Opening hours in
seasonal
provision
What services
are available
Are the hubs being
utilised to their
potential
What services do they
provide
What is the profile of
users?
Council provision is
changing to meet
changing demands
Seasonal provision
ensures efficiency
of provision
Audit service users and
identify range of services
provided and services
requested but not provided
Audit all premises and
information available to
ensure it meets demand
on the hub
THEME 3: Economic Development Plan
Indicators Data Sources Associated
Measures
Questions to aid
completion
Findings
Identified as an Action
Impact on
Borough
Economic Development
Strategy
Data on economic
profile of the Borough
KPI’s
Role of Council
in provision of
economic
development
Does Council engage
with a broad range of
economic activities
Does Council provide
accessible information
in a range of
formats/locations/times
to their clients?
Council engages
with economic
providers and
develop
programmes to
assist in meeting
their needs
Ensure the development
of all programmes are
accessible to all users and
potential users

33
Provision of Grant
Funding
Economic Development
Strategy
Data on economic
profile of the Borough
Range of grants
available to and from
Council
KPI’s
Range of grants
and criteria to
apply
What economic
profile does
Borough aim to
support
What are grants
available to Council
and from where?
What grants can
Council make
available to users?
Grant criteria
ensures all
applicants adhere
to all relevant
legislation
Ensure grant criteria is
S75 compliant
Council to ensure
availability of grants is
advertised as widely as
possible and alternative
formats are available for
all to whom it is
appropriate

34
Appendix B - Ards and North Down Statistics
Religious belief profile of Ards and North Down Borough Council
Source - NISRA Statistics 2011
Population
Number No. Catholic
% Catholic
No. Main Protestant Churches*
% Main Protestant Churches*
No. Other Christian
% Other Christian
No. Other religions
% Other religions
No religion
% religion
Religion not stated
% Religion not stated
N.I. 1,810,863 738,033 40.76 648,175 35.8 104,380 5.76 14,859
0.82 183,164
10.11 122,252 6.75
Ards and North Down
157,015 17,065 10.87 74,709 47.58 13,030 8.30 1584 1.00 30,007
19.11 9380 5.97
*Presbyterian Church in Ireland
Church of Ireland
Methodist Church in Ireland
**Other Christian (including Christian related)
***Other religions

35
RESULTS OF LOCAL GOVERNMENT ELECTION
MAY 2014
PARTY Number of Councillors elected
Democratic Unionist Party 17 Councillors
Ulster Unionist Party 9 Councillors
Alliance Party 7 Councillors
Green Party 3 Councillors
Social Democratic and
Labour Party 1 Councillor
Traditional Unionist Voice 1 Councillor
Independent 2 Councillors
Eligible Electorate 112,077
Total Votes polled 47,161
Turnout (%) 42.08

36
Ethnic Groups in Northern Ireland
Source – NI Census 2011
RACE Northern
Ireland total
Ards and North Down
Borough Council
No %
All persons 1,810,863 157015
White 1778449 154695 98.52
Chinese 6303 567 0.36
Irish Traveller 1301 22 0.01
Indian 6198 292 0.19
Pakistani 1091 94 0.06
Bangladeshi 540 177 0.11
Other Asian 4998 322 0.21
Black
Caribbean
372 52 0.03
Black African 2345 140 0.09
Black other 899 80 0.05
Mixed 6014 557 0.35

37
Age Profile of North Down Borough Council
Source – NI Census 2011
Northern
Ireland
Total
Ards and
NDBC
Usual
residents
%
NI total
population
%
Borough
population
0-15 yrs 354,703 29,780 1.65 18.96
16-39 618,452 44,997 2.49 28.65
40-64 573,988 54,550 3.01 34.74
65-84 232,324 24,236 1.34 15.43
85+ 31,396 3,502 0.2 2.22
Total 1,810,863 157,015
SOME INTERESTING FACTS
NI (Source: Registrar General NI Annual Report 2010)
The age structure of NI’s population continues to grow older due to a long period of below replacement level of fertility (In
western countries a total period fertility rate of about 2.1 is required to maintain long-term population levels) and increasing
life expectancy

38
Over the past thirty years, lower fertility levels have resulted in a decrease in the number of children aged 0-15 years (15%
decrease). In contrast, the number of people aged 16 to 64 has increased by 28%; and the older population (aged 65 and
over) have increased by 44%.
In June 2010, 29,700 people or around 1.7% of the population were aged 85 years and over. Within the population aged 85
and over, women significantly outnumber men at 70% of this population group.
Local Council statistics in 2011
Newry & Mourne was the Local Government District with the highest proportion of children aged 0-15 among its population
(23.9%), while North Down had the lowest proportion (18.3%).
In 2010, North Down Local Government District had the highest proportion of older people aged 65 and over (18.2%)) and
Derry Local Government District had the lowest proportion (11.6%).
39
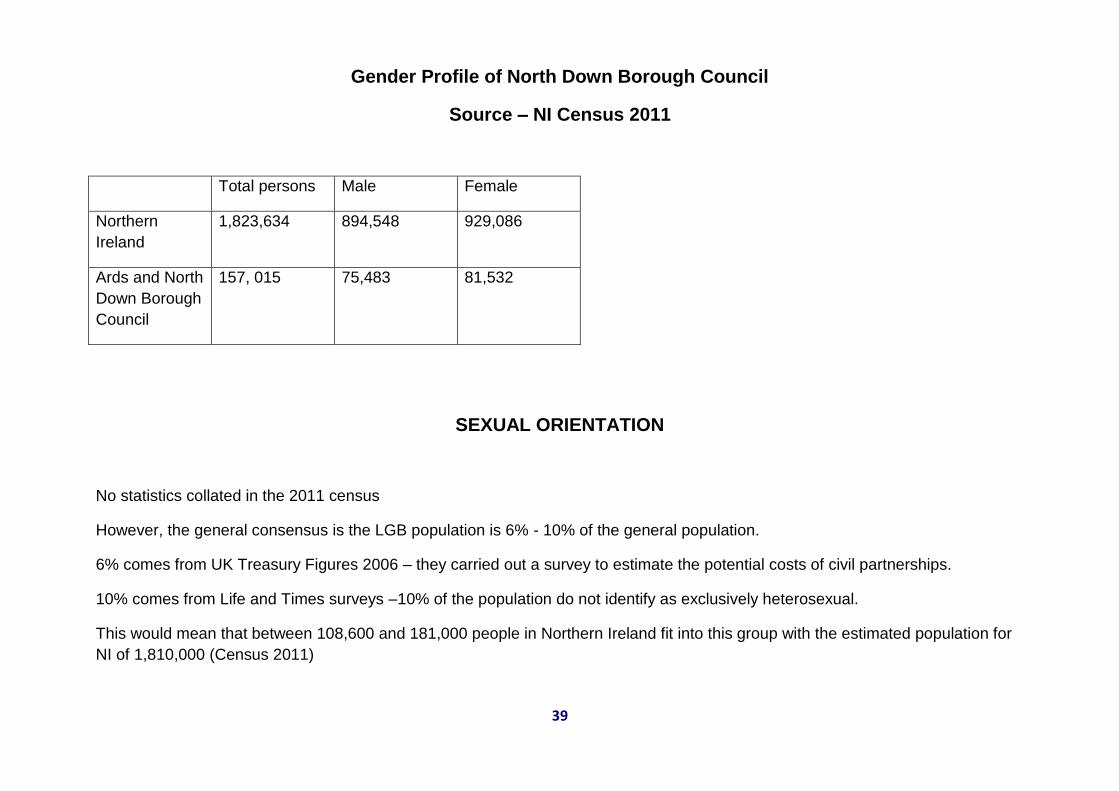
Gender Profile of North Down Borough Council
Source – NI Census 2011
Total persons Male Female
Northern
Ireland
1,823,634 894,548 929,086
Ards and North
Down Borough
Council
157, 015 75,483 81,532
SEXUAL ORIENTATION
No statistics collated in the 2011 census
However, the general consensus is the LGB population is 6% - 10% of the general population.
6% comes from UK Treasury Figures 2006 – they carried out a survey to estimate the potential costs of civil partnerships.
10% comes from Life and Times surveys –10% of the population do not identify as exclusively heterosexual.
This would mean that between 108,600 and 181,000 people in Northern Ireland fit into this group with the estimated population for
NI of 1,810,000 (Census 2011)

40
Marital Status of North Down Borough Council
Source – NI Census
All usual
residents
Single Married In a
regist
ered
same-
sex
civil
partne
rship
Separat
ed or
divorced
or
formerly
in a
same-
sex civil
partners
hip
which is
now
legally
dissolve
d
Wido
wed
or
survivi
ng
partne
r from
a
same-
sex
civil
partne
rship
Single Married In a
registe
red
same-
sex
civil
partner
ship:
Separate
d or
divorced
or
formerly
in a
same-sex
civil
partnershi
p which is
now
legally
dissolved
Widowed or
surviving
partner from a
same-sex civil
partnership
TOTALS: All aged 16+ years %: All aged 16+ years
Northern
Ireland 1,431,540 517,393 680,831 1,243
134,985
97,08
8 36.14 47.56 0.09
9.43 6.78
Ards and
North
Down
BC
127,235 36,816 68,017 123
12,917 9,362 28.93 53.47 0.09
10.15 7.36

41
DISABILITY
SOME INTERESTING FACTS
6% of children aged 15 and under have a disability or long standing limiting illness.
44% of adults with a disability or long standing limiting illness are retired.
29% of individuals with a disability or long standing limiting illness source the majority of their income from wages and
salaries (including self-employed income).
26% of adult informal carers provide between 20 and 50 hours of care per week.
18% of adult informal carers provide varying hours of care in excess of 50 hours per week.
32% of informal carers are caring for a spouse/civil partner or cohabitee.
34% of informal carers are providing care for relatives that are non-household members.
40% of adult informal carers are also in full time or part time employment. A further 4% are self-employed.
77% of those receiving care are attended to at least once a day, with 37% receiving care continuously.
37% of those receiving care stated Retirement pension (state and other) as their main source of income; 24% from
employment (including self-employment); 7% from disability benefits and 29% from other benefits.
42
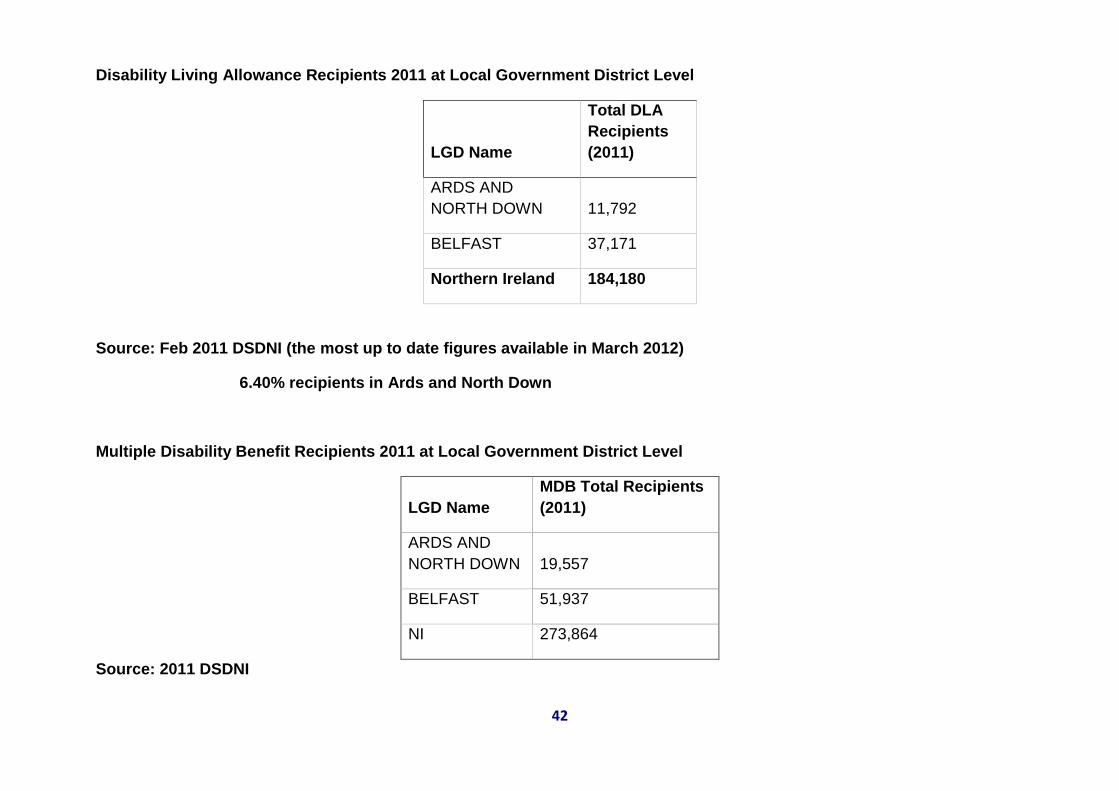
Disability Living Allowance Recipients 2011 at Local Government District Level
LGD Name
Total DLA
Recipients
(2011)
ARDS AND
NORTH DOWN 11,792
BELFAST 37,171
Northern Ireland 184,180
Source: Feb 2011 DSDNI (the most up to date figures available in March 2012)
6.40% recipients in Ards and North Down
Multiple Disability Benefit Recipients 2011 at Local Government District Level
LGD Name
MDB Total Recipients
(2011)
ARDS AND
NORTH DOWN 19,557
BELFAST 51,937
NI 273,864
Source: 2011 DSDNI

43
7.14% recipients in Ards and North Down
Severe Disablement Allowance Recipients 2011 at Local Government District
LGD Name
Total SDA Recipients
(2011)
ARDS AND
NORTH DOWN 657
BELFAST 1656
NI 10041
Source: DSD 2011
6.54% recipients in Ards and North Down

44
HOUSEHOLDS WITH/WITHOUT DEPENDENTS
SOME INTERESTING FACTS
(Source: Family Resources Survey 2009/2010 (Published November 2011)
Newry & Mourne Local Government District has the highest average household size of 2.9 persons compared to the NI
average of 2.5.
Larne & Moyle has the highest percentage of households with one or more adults over pension age (42%), compared to
Dungannon and Banbridge which have the lowest (23%).
Derry has the highest percentage of households with children (42%), with the lowest being Ballymena (25%). The NI
average is 34%.
The Local Government District with the highest proportion of lone parent benefit units is Derry (12%) closely followed by
Belfast and Limavady (11%).
Ballymena has the highest proportion of benefit units where all adults are in full time work (41%).
Households in Derry receive the highest percentage of income from non-disability social security benefits (15%), compared
to the NI average of 7%.

45
HOUSEHOLDS WITH/WITHOUT DEPENDENTS
Percentage of households
Ards and North Down
Belfast Northern Ireland
1 person 25 34 26
2 persons 35 32 34
3 persons 15 18 16
4 persons 17 11 15
5 or more persons 9 6 10
Average number of persons per household
2.55 2.2 2.5
Households without children Ards and North Down
Belfast Northern Ireland
One adult
adult male over pension age 2.5 4 3
adult female over pension age 9 10 9
adult male under pension age 7 12 8
adult female under pension age
5 8 5
Two adults
both over pension age 10 8 9
one over pension age 4 2 4
both under pension age 18.5 16 17
Three or more adults 22 9 10

46
Households with children Ards and North Down
Belfast Northern Ireland
One adult with children 4.5 11 7
Two adults 6.5 7 7
One child 10 7 9
Two children 3.5 3 5
Three children or more adults with children
7 4 6
Ards and North Down
Belfast Northern Ireland
All households without children 78 69 66
All households with children 31.5 31 34
Households with one or more adults over pension age
29 28 30
Households with one or more disabled adults under pension age
14.5 17 19
Households with one or more unemployed adults under pension age
3.5 5 5
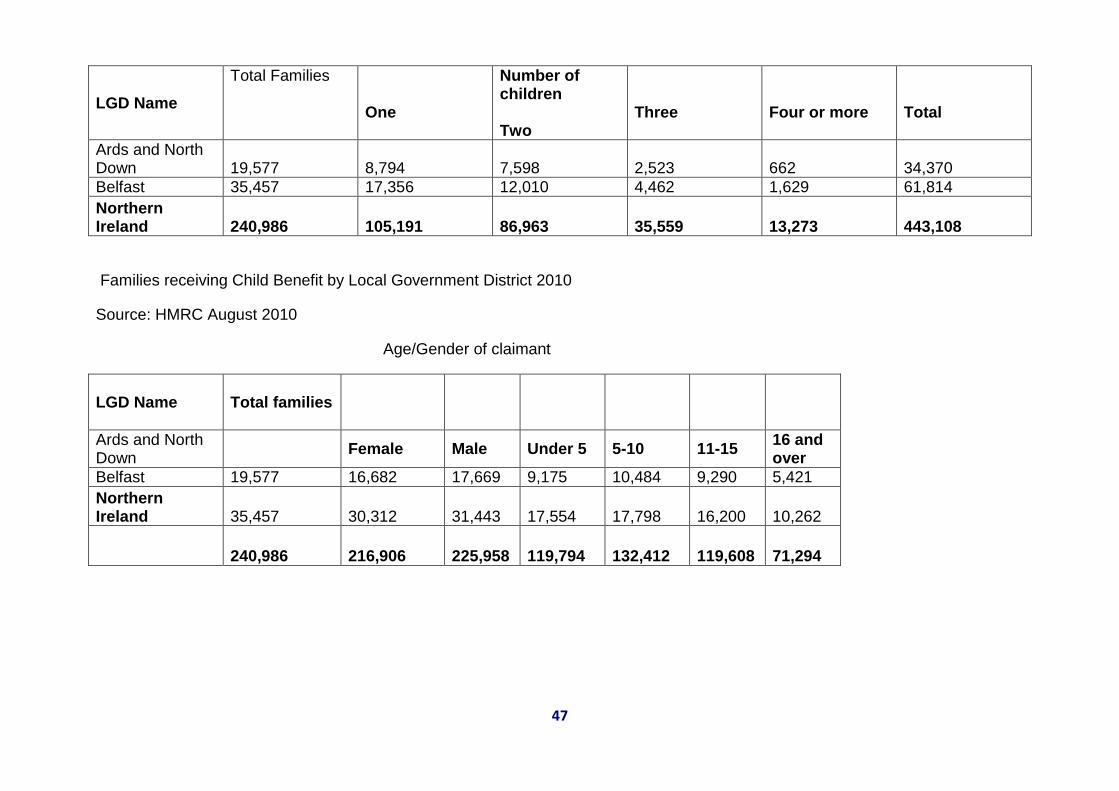
Families receiving Child Benefit by Local Government District 2010
Source: HMRC August 2010
47
LGD Name
Total Families
One
Number of children Two
Three
Four or more
Total
Ards and North Down 19,577 8,794 7,598 2,523 662 34,370
Belfast 35,457 17,356 12,010 4,462 1,629 61,814
Northern Ireland 240,986 105,191 86,963 35,559 13,273 443,108
Families receiving Child Benefit by Local Government District 2010
Source: HMRC August 2010
Age/Gender of claimant
LGD Name Total families
Ards and North Down
Female Male Under 5 5-10 11-15 16 and over
Belfast 19,577 16,682 17,669 9,175 10,484 9,290 5,421
Northern Ireland 35,457 30,312 31,443 17,554 17,798 16,200 10,262
240,986 216,906 225,958 119,794 132,412 119,608 71,294
Related Documents