Industry/FDA/Academia Safety Graphics Working Group Introduction and Overview FDA/QSPI Biostatistics, Statistical FDA/QSPI Biostatistics, Statistical Programming, Programming, and Data Management Summit and Data Management Summit March 8, 2012 March 8, 2012 FDA White Oak Campus FDA White Oak Campus

Industry/FDA/Academia Safety Graphics Working Group Introduction and Overview FDA/QSPI Biostatistics, Statistical Programming, and Data Management Summit.
Dec 15, 2015
Welcome message from author
This document is posted to help you gain knowledge. Please leave a comment to let me know what you think about it! Share it to your friends and learn new things together.
Transcript

Industry/FDA/Academia Safety Graphics Working Group
Introduction and Overview
FDA/QSPI Biostatistics, Statistical Programming, FDA/QSPI Biostatistics, Statistical Programming, and Data Management Summitand Data Management Summit
March 8, 2012March 8, 2012FDA White Oak Campus FDA White Oak Campus

Motivation
Tables: most presentations of safety data convey information in tables
often difficult to understand, especially when data are complex
volume and complexity of presentations complicate regulatory review
may obscure important relationships
Graphical displays: more effective and more efficient
communicate critical safety information
facilitate rapid integration and dissemination of new information

Where is the signal?

Example: Understanding the Trend
Tabular Summary of Systolic Blood Pressure Over Time:
Active Drug Control Drug
Visit N Mean
SD 95% CI N Mean SD 95% CI
1 112 118.1 1.3 (115.9, 120.3) 113 119.1 1.2 (117.0, 121.2)
2 112 122.7 1.4 (120.4, 125.0) 112 119.1 1.1 (117.0, 121.2)
3 111 125.6 1.0 (123.6, 127.6) 110 114.4 1.2 (112.3, 116.5)
4 110 133.1 1.2 (131.0, 135.2) 108 124.2 1.4 (121.9, 126.5)
5 110 136.7 1.2 (134.6, 138.8) 108 123.8 1.2 (121.7, 125.9)
6 108 134.2 1.1 (132.1, 136.3) 108 114.9 1.1 (112.8, 117.0)
7 106 131.0 1.2 (128.9, 133.1) 104 120.1 1.2 (118.0, 122.2)
8 105 126.2 1.3 (124.0, 128.4) 103 121.6 1.2 (119.5, 123.7)
9 104 124.3 1.2 (122.2, 126.4) 100 118.6 1.1 (116.5, 120.7)
10 102 125.1 1.2 (123.0, 127.2) 100 117.7 1.3 (115.5, 119.9)
4

Example: Understanding the Trend
5Visit NumberSys
tolic
Blo
od P
ress
ure
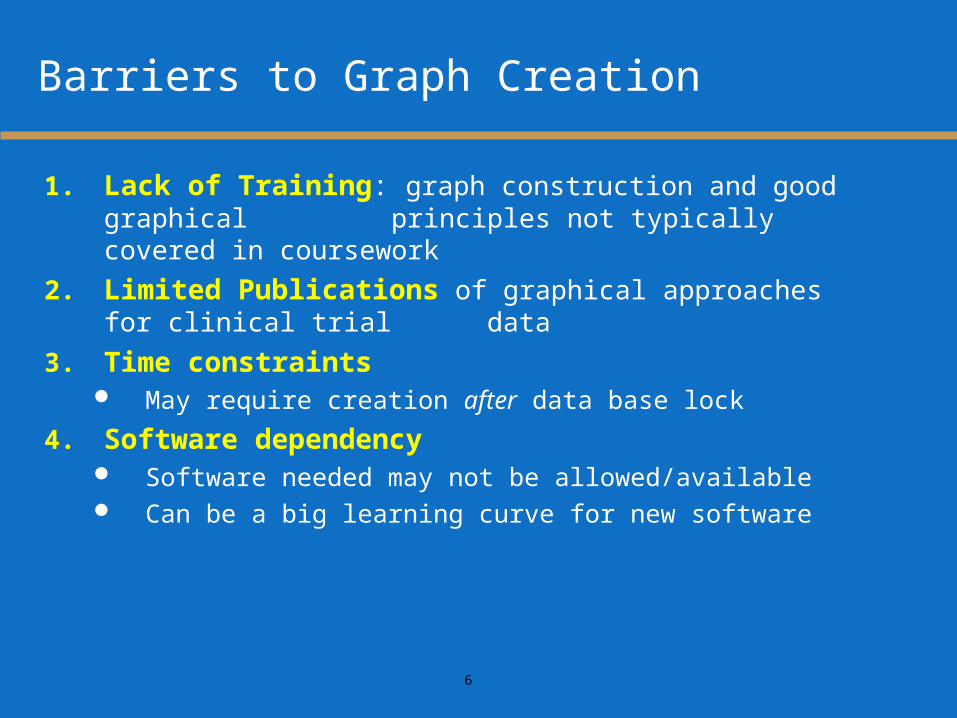
Barriers to Graph Creation
1. Lack of Training: graph construction and good graphical principles not typically covered in coursework
2. Limited Publications of graphical approaches for clinical trial data
3. Time constraints May require creation after data base lock
4. Software dependency Software needed may not be allowed/available Can be a big learning curve for new software
6

FDA/Industry/Academia Working Group
Formed: Fall 2009Membership
Regulatory (17 members): FDA Industry (14 members): Pfizer, GSK, Johnson and
Johnson, Novartis, Eli Lilly, Merck, Sanofi-Aventis, Roche, Amgen, Actelion
Academia (2 members): Vanderbilt, UC-Davis
7

Members of the FDA/Industry/Academia Safety Graphics Working Group
Regulatory: Mat Soukup, George Rochester, Antonio Paredes, Chuck Cooper, Eric Frimpong, Hao Zhu, Janelle Charles, Jeff Summers, Joyce Korvick, Leslie Kenna, Mark Walderhaug, Pravin Jadjav, Richard Forshee, Robert Fiorentino, Suzanne Demko, Ted Guo, Yaning Wang,
Industry: Brenda Crowe, Ken Koury, Andreas Brueckner, Andreas Krause, Fabrice Bancken, Larry Gould, Liping Huang, Mac Gordon, Matthew Gribbin, Navdeep Boparai, Qi Jiang, Rich Anziano, Susan Duke, Sylvia Engelen,
Academia: Frank Harrell, Mary Banach
Co-leads are in bold font
8

Project Vision and Objectives
Enhance understanding of safety information obtained from clinical trials Facilitate and promote development and use of effective graphical displays Communicate critical safety information effectively and efficiently
Create a scientific forum discussion, development, and recommendation of graphics based on good scientific principles and best practices
Identify applications useful for regulatory review
Provide a palette of statistical graphics publicly-available repository includes data sets and programming code encourages interactions among the user community
Engage stakeholders through outreach activities promotion and dissemination of methods and best practices sharing experiences and effective examples
9

Working Group Structure
Focus: • Identify important clinical questions for safety reporting and signal
detection• Develop appropriate graphical displays
Four Subgroups: Leaders:
1. ECG/Vitals Rich Anziano
2. General Adverse Events Liping Huang and Qi Jiang*
3. Labs/Liver Mac Gordon
4. General Principles Susan Duke**
* Previously led by Stephine Keeton and Janelle Charles
** Previously led by Rich Forshee and Fabrice Bancken
10

Addressing the Barriers
Lack of Training: Develop materials to help scientists select the right graph; outreach through presentations
Limited Publications: Materials presented in a public forum
Time Constraints: Standard set of views reduces time to develop graphics; can be planned upfront
Software Dependency: Code to create graphics will be publicly available; examples are included from multiple software packages
11

Distribution of Content
Information is becoming publicly available at CTSpedia (www.ctspedia.org)
CTSpedia is an online collection of best practices, tools, educational materials, and other items about biostatistics, ethics, and research design.
Site is constantly updated/changed to help users.
12
Related Documents