December 2017 Industry Survey on Underground Storage Tank System Damage Related to Corrosion from Ethanol and Biodiesel Fuels Prepared for Florida Department of Environmental Protection Prepared by Department of Environmental Engineering Sciences The Bill Hinkley Center for Solid and Hazardous Waste Management Engineering School of Sustainable Infrastructure and Environment University of Florida Timothy Townsend, Principal Investigator Nicole Robey, Graduate Research Assistant Malak Anshassi, Graduate Research Assistant John Schert, Executive Director (HCSHWM) Wester Henderson III, Research Coordinator III (HCSHWM)

Welcome message from author
This document is posted to help you gain knowledge. Please leave a comment to let me know what you think about it! Share it to your friends and learn new things together.
Transcript

December 2017
Industry Survey on Underground Storage Tank System Damage Related to Corrosion
from Ethanol and Biodiesel Fuels
Prepared for
Florida Department of Environmental Protection
Prepared by
Department of Environmental Engineering Sciences
The Bill Hinkley Center for Solid and Hazardous Waste Management
Engineering School of Sustainable Infrastructure and Environment
University of Florida
Timothy Townsend, Principal Investigator
Nicole Robey, Graduate Research Assistant
Malak Anshassi, Graduate Research Assistant
John Schert, Executive Director (HCSHWM)
Wester Henderson III, Research Coordinator III (HCSHWM)
2
TABLE OF CONTENTS
Executive Summary 1 1.0 Introduction 2 2.0 Survey Methodology 3
2.1 Survey Administration 3 2.2 Quality Assurance 3 2.3 Survey Results Normalization 3 2.4 Survey Response Analysis 3
3.0 Survey Results 5 4.0 Discharge Damage Assessment 7 5.0 Economic Assessment 8
5.1 Corrosion-Related Expenditures in Last Five Years 8 5.2 Estimated Repair Costs Based on Contractor Survey 8 5.3 Estimated Annual Maintenance Costs 9
Appendix 10

1
EXECUTIVE SUMMARY
The University of Florida’s (UF) Department of Environmental Engineering Sciences and the Hinkley Center for Solid and Hazardous Waste aided the Florida Department of Environmental Protection (DEP) by constructing and executing a request for information regarding the potential damage to underground petroleum systems by ethanol or biodiesel. Two surveys were created, one for the tank specialty contractors and service providers and the other for the owners of the underground storage tank (UST) systems. A total of 28 questions for each survey were created with assistance from DEP. The survey was administrated through an online platform until August 31, 2017, and the corresponding results were obtained via extraction from the online platform. The results of both surveys provided information on the magnitude and type of equipment experiencing corrosion, cost estimates regarding repair and replacement, and other detailed information regarding UST. This report summarizes the results of all 28 questions for each of the surveys and provides a sample of each survey. The survey did illustrate that some owners have experienced corrosion or other problems associated with ethanol or biodiesel necessitating repairs. Thirty-six percent of survey respondents reported observing corrosion, corresponding to 90 percent of tanks reflected by survey responses experiencing corrosion-related issues. An inspection of discharge report forms submitted by tank owners found an average of three corrosion-related discharges per year from 2009-2017, indicating that corrosion is not the primary cause of discharge incidents. The approximate universe of tanks in the state is 22,000, meaning that corrosion-related discharge affects about 0.015 percent of all tanks. Analysis of survey results regarding costs and expenditures provides an estimate for the monetary value of repairs, replacements and preventative maintenance due to ethanol and biodiesel, and these results can be extrapolated to estimate statewide costs and expenditures. The economic analysis determined that statewide, UST owners have spent between $18,000,000 and $83,000,000 on ethanol- or biodiesel-related repairs in the last five years. Contractor responses suggest that the average cost for repairs to several UST system components may be well above typical annual per-tank expenditures, so these major repairs are not being done very often by tank owners. Additionally, contractors surveyed indicated that a typical annual preventative maintenance budget to control and prevent corrosion would be between $700 and $2,000 per tank annually, or between $15,400,000 and $44,000,000 statewide.

2

3
1.0 INTRODUCTION
The University of Florida’s (UF) Department of Environmental Engineering Sciences and the Hinkley Center for Solid and Hazardous Waste aided the Florida Department of Environmental Protection (DEP) by constructing and executing a request for information regarding the potential damage to underground petroleum systems by ethanol or biodiesel. This project aimed to gather information from industry professionals regarding reported issues associated with underground tanks storing biodiesel and fuels containing ethanol.
The two sets of surveys were developed and administered, and the results are summarized in this document. The first survey targeted the owners of underground storage tank (UST) systems to identify any damage or potential damage to UST systems caused by ethanol or biodiesel fuels and associated total repair costs. The second survey targeted UST contractors to identify techniques and costs associated with replacement, repair and prevention associated with the issues identified above. Both surveys were developed with input from DEP and industry organizations to verify the survey questions’ appropriateness and ensure that questions were not at risk to be misconstrued.
A discharge assessment was conducted to identify the number of discharges due to corrosion, and the number of tanks reporting discharge due to corrosion, compared to the total number of discharge cases and tanks. Historic discharge reports were provided by DEP for 2009-2017.
An economic analysis was performed on the cost-related survey questions to determine a per-tank and statewide estimate for current UST owner expenditures, average cost for repairs of UST system components, and estimate a typical annual preventative maintenance budget (again, per-tank and for all of Florida).

4
2.0 SURVEY METHODOLOGY 2.1 SURVEY ADMINISTRATION
This survey project was initiated by DEP in response to a legislative request for information regarding ethanol- and biodiesel-related impacts to Florida’s petroleum storage infrastructure. The survey questions were written by DEP in collaboration with UF and industry representatives, converted to an online survey format, and a link to the survey was distributed via email and traditional mail by DEP to 548 Pollutant Storage System Contractors (PSSC) license holders (Contractor Survey) and 3,533 UST owners (Owner Survey). Hard copies of the survey were also distributed. The survey was “live” for approximately 30 days. Additional questions for the contractor respondents were asked in a telephone follow-up survey. Copies of the online and telephone surveys are included in Appendix A.
2.2 QUALITY ASSURANCE
Data from the online survey platform was imported into an electronic spreadsheet program for analysis. Each response was assigned a response number, for quality assurance and to allow for further correlative analysis if necessary. Responses were separated by question (maintaining their associated response numbers), and blank or invalid responses were identified and removed, resulting in a total number of valid responses for each question, used to calculate response rates and for data analysis. Questions 1-5 required responses in order for the survey to be accepted, so their respective response rates were all 100 percent. Numerical responses were considered invalid if they indicated percentages that added up to more than 100 percent. The results from the quality assurance review are found in Appendix E.
2.3 SURVEY RESULTS NORMALIZATION
Each response in the Owner Survey is associated with an Owner Identification Number, and respondents provided the number of facilities and the number of tanks associated with that Owner Identification Number. Survey responses were weighted according to the number of tanks reported by the respondent in Question 5. Questions 1-5 were for identification purposes and therefore did not require normalization. Of the remaining questions, all but one (Question 26) were weighted by multiplying individual responses by the number of tanks associated with that respondent. For Question 26, which asks respondents to estimate costs, the opposite approach was employed – responses were divided by the number of tanks to provide a per-tank cost estimate. The Tank Specialty Contractors and Service Providers Survey results did not undergo normalization.
2.4 SURVEY RESPONSES ANALYSIS
For multiple choice questions which allow for only one answer selection, the total number of each answer choice selected was divided by the total number of valid responses for that question, giving percentages which total 100 percent. For “Check all that apply” multiple choice questions, both the number of each selection and each possible combination of selections was determined and divided by the total number of valid responses for a result given as a percentage. The percentage for each answer choice will not necessarily add up to 100 percent, while the percentages for each possible combination of answer choices will.

5
Several of the survey questions asked respondents to provide a number between 0 and 100 (a percentage) for an array of equipment parts and their respective conditions. In these cases, valid numerical responses were averaged and reported for each component. Other questions asked the respondent to indicate, for each of a series of components, whether they have been repaired or replaced in the last five years and, if so, how many were replaced. For these, the number of “positive responses” was determined by counting the number of responses which indicated at least one of the choices (repair or replace). Then, the quantity of repaired or replaced parts input by the respondent is divided by that number of positive responses to determine the average number of repaired or replaced parts per positive response.
6
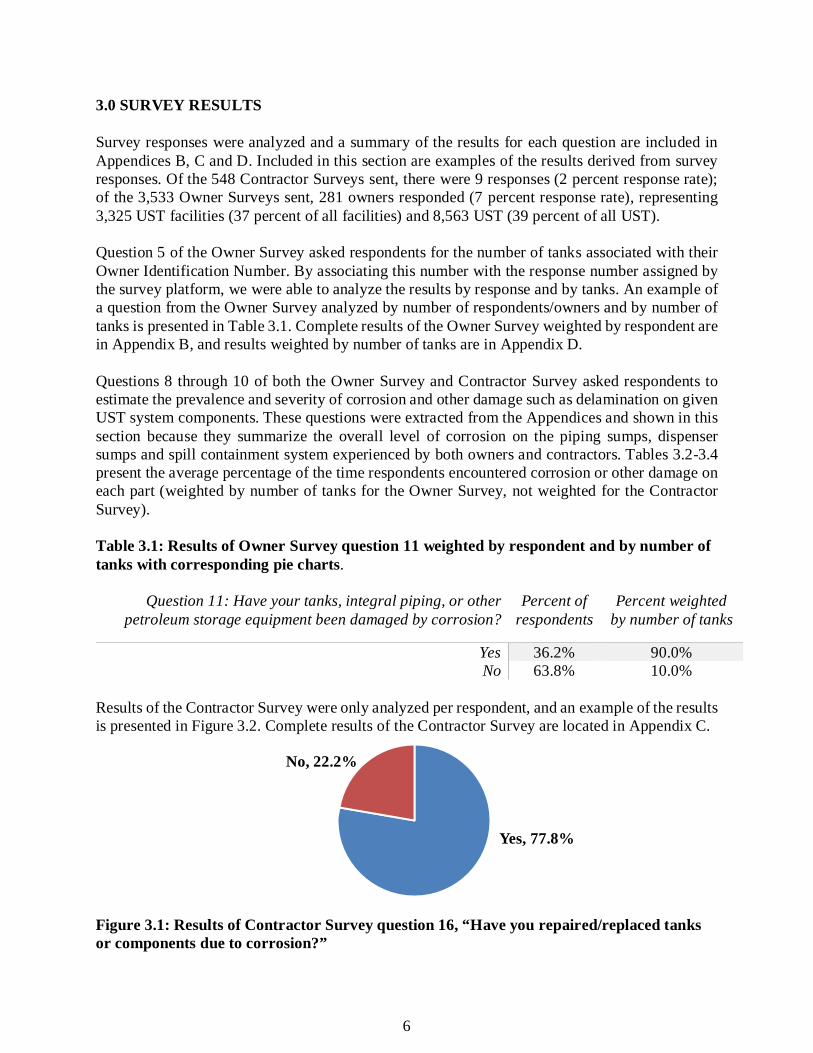
3.0 SURVEY RESULTS
Survey responses were analyzed and a summary of the results for each question are included in Appendices B, C and D. Included in this section are examples of the results derived from survey responses. Of the 548 Contractor Surveys sent, there were 9 responses (2 percent response rate); of the 3,533 Owner Surveys sent, 281 owners responded (7 percent response rate), representing 3,325 UST facilities (37 percent of all facilities) and 8,563 UST (39 percent of all UST).
Question 5 of the Owner Survey asked respondents for the number of tanks associated with their Owner Identification Number. By associating this number with the response number assigned by the survey platform, we were able to analyze the results by response and by tanks. An example of a question from the Owner Survey analyzed by number of respondents/owners and by number of tanks is presented in Table 3.1. Complete results of the Owner Survey weighted by respondent are in Appendix B, and results weighted by number of tanks are in Appendix D.
Questions 8 through 10 of both the Owner Survey and Contractor Survey asked respondents to estimate the prevalence and severity of corrosion and other damage such as delamination on given UST system components. These questions were extracted from the Appendices and shown in this section because they summarize the overall level of corrosion on the piping sumps, dispenser sumps and spill containment system experienced by both owners and contractors. Tables 3.2-3.4 present the average percentage of the time respondents encountered corrosion or other damage on each part (weighted by number of tanks for the Owner Survey, not weighted for the Contractor Survey).
Table 3.1: Results of Owner Survey question 11 weighted by respondent and by number of tanks with corresponding pie charts.
Question 11: Have your tanks, integral piping, or other petroleum storage equipment been damaged by corrosion?
Percent of respondents
Percent weighted by number of tanks
Yes 36.2% 90.0% No 63.8% 10.0%
Results of the Contractor Survey were only analyzed per respondent, and an example of the results is presented in Figure 3.2. Complete results of the Contractor Survey are located in Appendix C.
Figure 3.1: Results of Contractor Survey question 16, “Have you repaired/replaced tanks or components due to corrosion?”
Yes, 77.8%
No, 22.2%

7
Table 3.2. Summary of results of question 8 of the Owner Survey and Contractor Survey, segregated by tank system component regarding the piping sump. The “% Corrosion” is the sum of the average “Minimal Corrosion,” “Moderate Corrosion” and “Severe Corrosion” responses, or 100 percent minus the average “No Corrosion” response. Note: Owner Survey responses are weighted by number of tanks and for both surveys respondents were given an answer choice of “Other” and asked to specify another part; those results are not included here.
Piping Sump (% Corrosion) Piping Piping
fittings Release
detection probes
Boot fittings
Sump walls
Submersible turbine pump
Owner 38.9% 83.5% 89.6% 75.3% 48.8% 91.4% Contractor 76.7% 90.0% 78.0% 77.0% 68.3% 86.3%
Table 3.3. Summary of results of questions 9 of the Owner Survey and Contractor Survey, segregated by tank system component regarding the dispenser sump. The “% Corrosion” is the sum of the average “Minimal Corrosion,” “Moderate Corrosion” and “Severe Corrosion” responses, or 100 percent minus the average “No Corrosion” response. Note: Owner Survey responses are weighted by number of tanks and for both surveys respondents were given an answer choice of “Other” and asked to specify another part; those results are not included here.
Dispenser Sump (% Corrosion) Piping Piping
fittings Release
detection probes
Boot fittings
Sump walls
Submersible turbine pump
Owner 20.6% 69.9% 70.9% 71.5% 32.1% 60.4% Contractor 49.3% 65.0% 75.0% 62.0% 48.0% 100%
Table 3.4. Summary of results of question 10 of the Owner Survey and Contractor Survey, segregated by tank system component regarding the spill containment system. The “% Corrosion” is the sum of the average “Minimal Corrosion,” “Moderate Corrosion” and “Severe Corrosion” responses, or 100 percent minus the average “No Corrosion” response. Note: Owner Survey responses are weighted by number of tanks and for both surveys respondents were given an answer choice of “Other” and asked to specify another part; those results are not included here.
Spill Containment System (% Corrosion) Fill cap Drop tube Walls/base
of spill bucket
Interstitial Monitoring
Device
Tanks
Owner 42.1% 75.2% 75.5% 61.5% 78.7% Contractor 52.5% 43.7% 50.0% 57.0% 76.3%
8
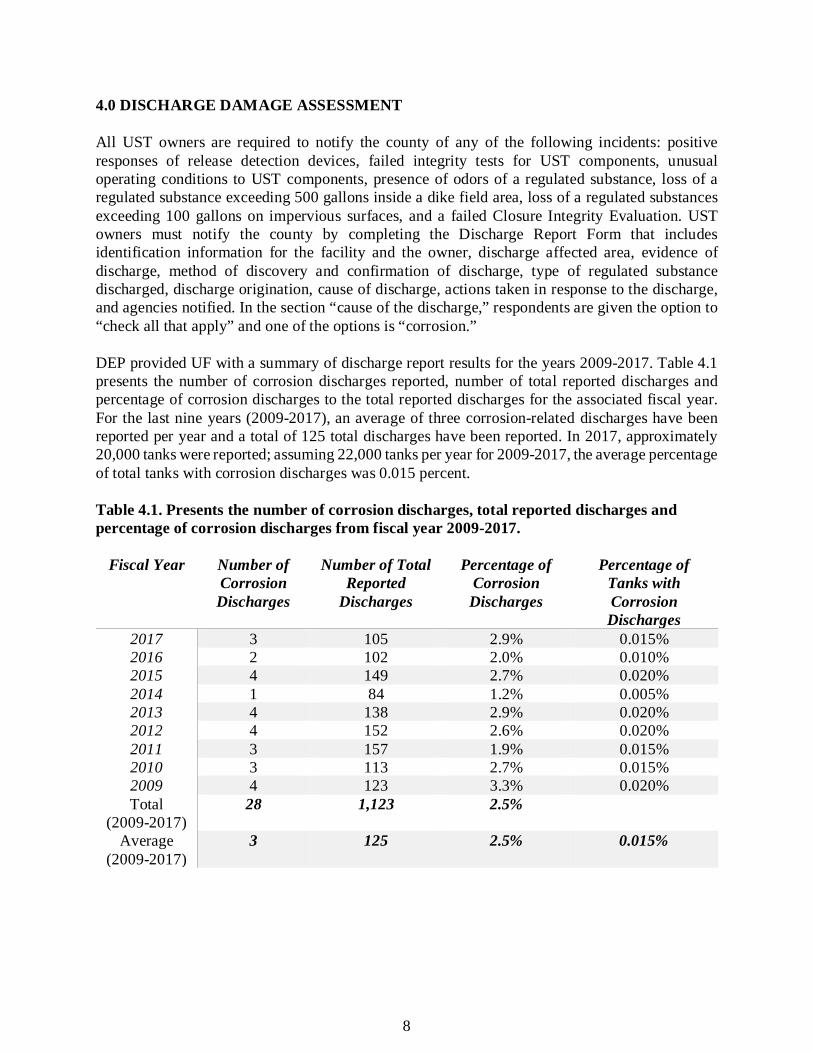
4.0 DISCHARGE DAMAGE ASSESSMENT
All UST owners are required to notify the county of any of the following incidents: positive responses of release detection devices, failed integrity tests for UST components, unusual operating conditions to UST components, presence of odors of a regulated substance, loss of a regulated substance exceeding 500 gallons inside a dike field area, loss of a regulated substances exceeding 100 gallons on impervious surfaces, and a failed Closure Integrity Evaluation. UST owners must notify the county by completing the Discharge Report Form that includes identification information for the facility and the owner, discharge affected area, evidence of discharge, method of discovery and confirmation of discharge, type of regulated substance discharged, discharge origination, cause of discharge, actions taken in response to the discharge, and agencies notified. In the section “cause of the discharge,” respondents are given the option to “check all that apply” and one of the options is “corrosion.”
DEP provided UF with a summary of discharge report results for the years 2009-2017. Table 4.1 presents the number of corrosion discharges reported, number of total reported discharges and percentage of corrosion discharges to the total reported discharges for the associated fiscal year. For the last nine years (2009-2017), an average of three corrosion-related discharges have been reported per year and a total of 125 total discharges have been reported. In 2017, approximately 20,000 tanks were reported; assuming 22,000 tanks per year for 2009-2017, the average percentage of total tanks with corrosion discharges was 0.015 percent.
Table 4.1. Presents the number of corrosion discharges, total reported discharges and percentage of corrosion discharges from fiscal year 2009-2017.
Fiscal Year Number of Corrosion Discharges
Number of Total Reported
Discharges
Percentage of Corrosion Discharges
Percentage of Tanks with Corrosion Discharges
2017 3 105 2.9% 0.015% 2016 2 102 2.0% 0.010% 2015 4 149 2.7% 0.020% 2014 1 84 1.2% 0.005% 2013 4 138 2.9% 0.020% 2012 4 152 2.6% 0.020% 2011 3 157 1.9% 0.015% 2010 3 113 2.7% 0.015% 2009 4 123 3.3% 0.020% Total
(2009-2017) 28 1,123 2.5%
Average (2009-2017)
3 125 2.5% 0.015%
9
5.0 ECONOMIC ASSESSMENT
Both the owners and contractors were asked questions regarding expenses incurred by ethanol- and biodiesel-related damages. Results of these survey questions were analyzed to determine current expenditures, typical repair costs and preventative maintenance costs. A complete analysis of these economic questions is included in Appendix F.
5.1 CORROSION-RELATED EXPENDITURES IN LAST FIVE YEARS
Responses to questions 5 and 27 of the Owner Survey were analyzed to estimate total ethanol- and biodiesel-related expenditures over the last five years on both a per-tank basis and statewide, assuming approximately 22,000 underground storage tanks in Florida. Question 27 asked respondents how much they have spent due to damage caused by ethanol or biodiesel in the last five years, and gives five monetary ranges as answer choices. In order to determine a numerical average for the results, each range was assigned a high-, mid- and low-range estimate. Additionally, the results of question 27 were interpreted in two ways to account for some uncertainty in the responses, giving a total of six possible results which ranged from approximately $830 to $3,800 per tank over five years or $18,000,000 to $83,000,000 total across the state (again, over five years).
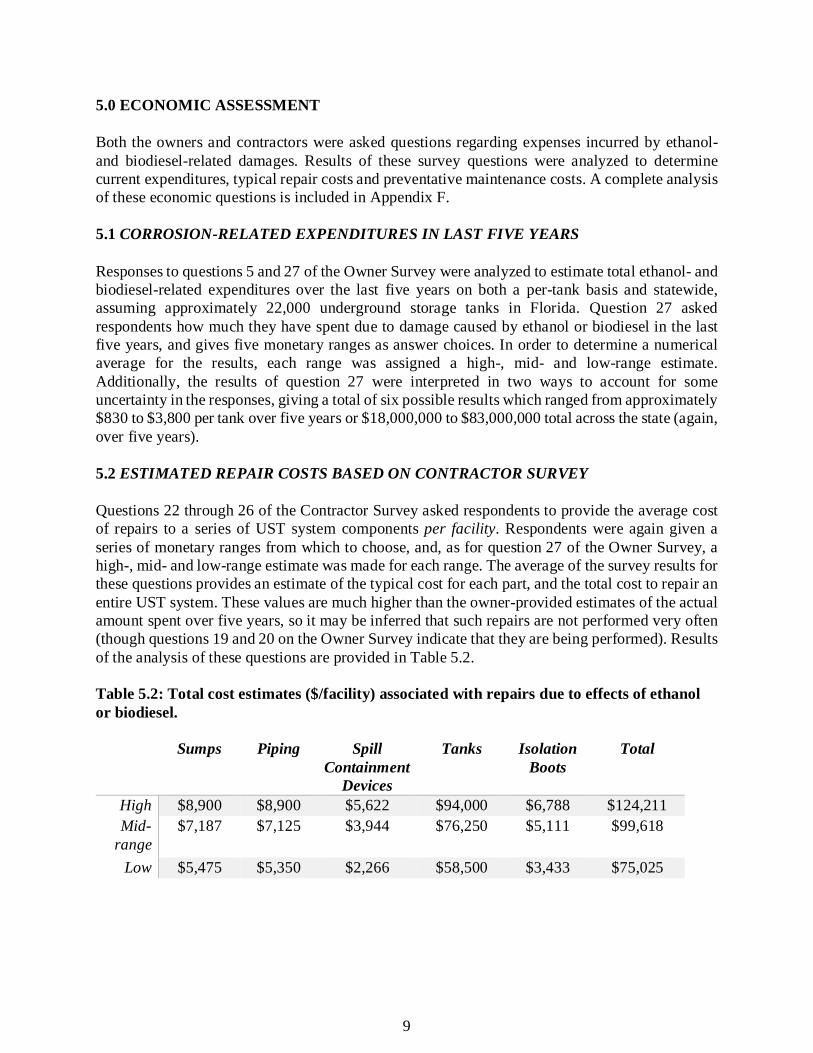
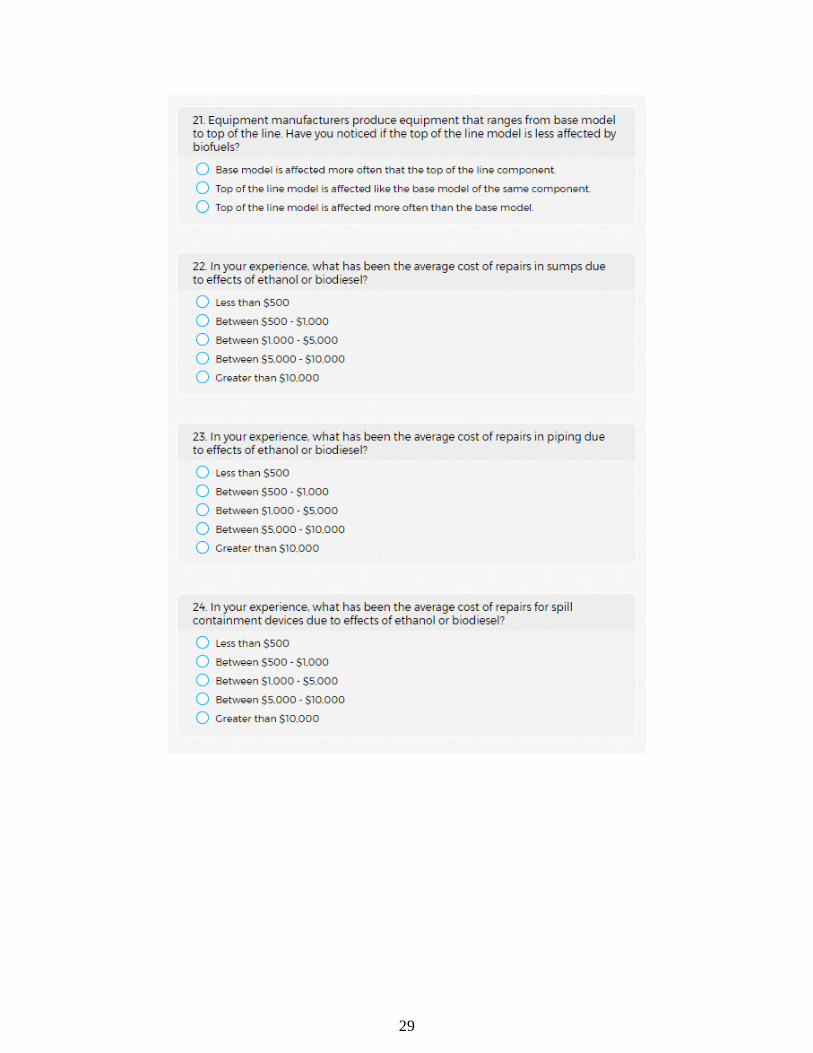
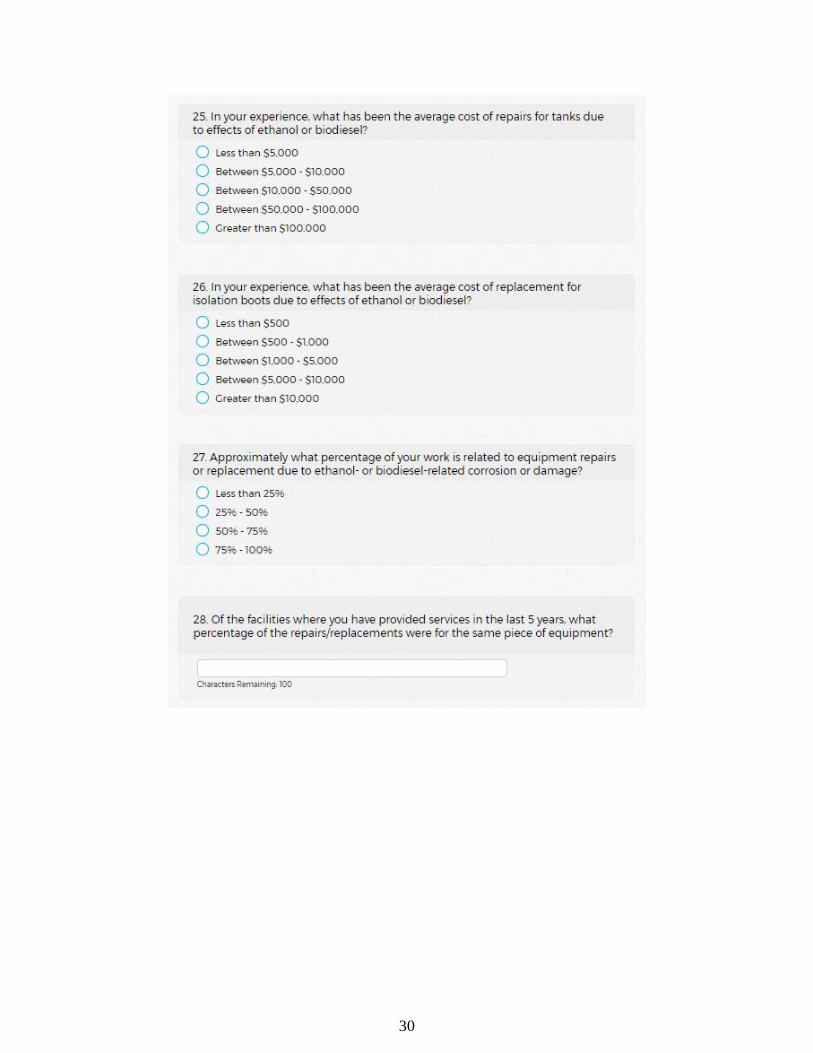
5.2 ESTIMATED REPAIR COSTS BASED ON CONTRACTOR SURVEY
Questions 22 through 26 of the Contractor Survey asked respondents to provide the average cost of repairs to a series of UST system components per facility. Respondents were again given a series of monetary ranges from which to choose, and, as for question 27 of the Owner Survey, a high-, mid- and low-range estimate was made for each range. The average of the survey results for these questions provides an estimate of the typical cost for each part, and the total cost to repair an entire UST system. These values are much higher than the owner-provided estimates of the actual amount spent over five years, so it may be inferred that such repairs are not performed very often (though questions 19 and 20 on the Owner Survey indicate that they are being performed). Results of the analysis of these questions are provided in Table 5.2. Table 5.2: Total cost estimates ($/facility) associated with repairs due to effects of ethanol or biodiesel.
Sumps Piping Spill Containment
Devices
Tanks Isolation Boots
Total
High $8,900 $8,900 $5,622 $94,000 $6,788 $124,211 Mid-
range $7,187 $7,125 $3,944 $76,250 $5,111
$99,618
Low $5,475 $5,350 $2,266 $58,500 $3,433 $75,025

10
5.3 ESTIMATED ANNUAL MAINTENANCE COSTS
A follow-up telephone survey was conducted with the nine respondents from the original Contractor Survey. They were asked to estimate an appropriate per-tank annual budget for preventative maintenance (defined as work performed to prevent corrosion or repair damage caused by corrosion). Responses were provided by three of the nine contractors contacted. Responses ranged from $700 to $2,000, averaging $1,050 annually. By multiplying this per-tank cost by 22,000 (the number of tanks in Florida) we can estimate the annual cost of a statewide preventative maintenance plan. The cost to fund preventative maintenance on a statewide level could range from a low estimate of $15,400,000 to a high estimate of $44,000,000. The results are provided in Table 5.3.
Table 5.3: Average typical annual preventative maintenance budget per tank system.
Estimate Level Average annual preventative maintenance cost per tank (Contractors follow-up)
Statewide annual preventative maintenance plan cost (Contractors follow-up)
High $2,000 $44,000,000 Mid-range $1,050 $23,100,000
Low $700 $15,400,000

11
APPENDIX
Appendix A: Survey Samples
11 A1. Owners of Underground Storage Tank System
11 A2. Tank Specialty Contractors and Service Providers
21 A3. Tank Specialty Contractors and Service Providers Additional Questions
30 Appendix B: Owners of Underground Storage Tank Systems Results Weighted by Tanks 31 Appendix C: Tank Specialty Contractors and Service Providers Results
69 Appendix D: Owners of Underground Storage Tank Systems Results Weighted by
Response 100
Appendix E: Quality Assurance Results 131 Appendix F: Economic Assessment Results 133 F1. Corrosion-Related Expenditures in Last Five Years 133 F2. Estimated Repair Costs Based on Contractor Survey 135 F3. Estimated Annual Maintenance Costs 136

12
APPENDIX A: SURVEY SAMPLES A1. Owners of Underground Storage Tank System
13

14
15
16
17
18
19
20
21

22
A2. Tank Specialty Contractors and Service Providers
23

24

25

26

27

28
29
30
31
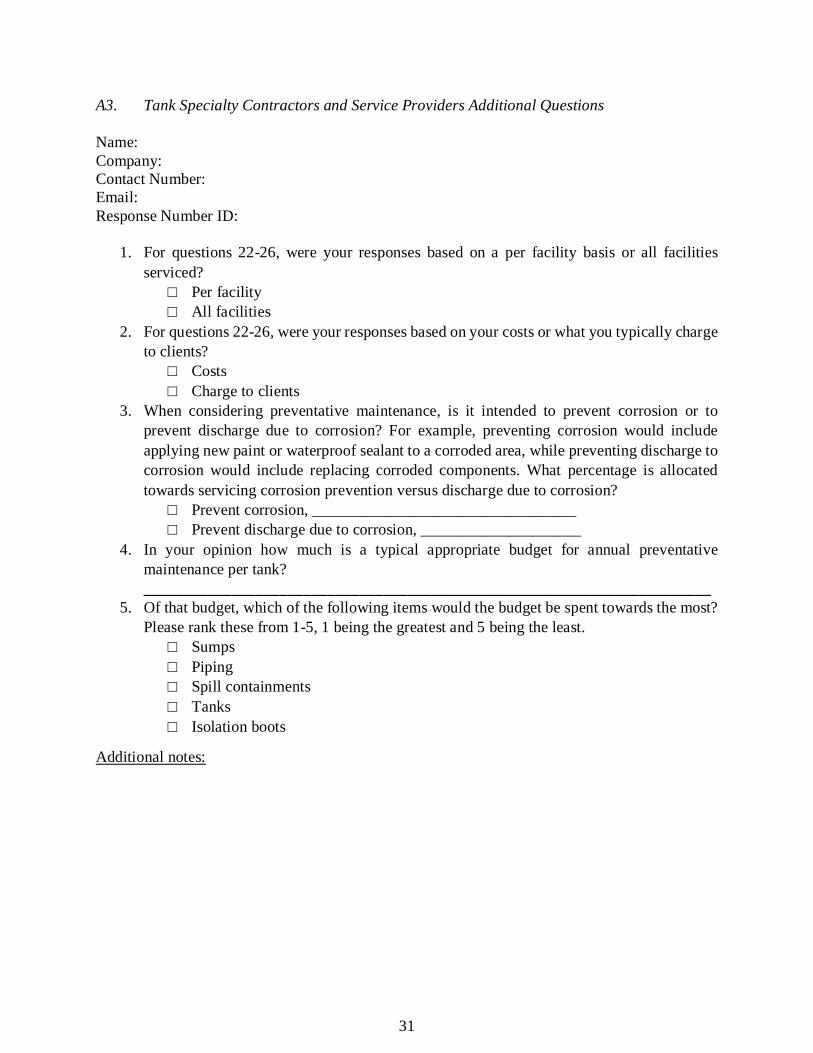
A3. Tank Specialty Contractors and Service Providers Additional Questions
Name: Company: Contact Number: Email: Response Number ID:
1. For questions 22-26, were your responses based on a per facility basis or all facilities serviced?
□ Per facility □ All facilities
2. For questions 22-26, were your responses based on your costs or what you typically charge to clients?
□ Costs □ Charge to clients
3. When considering preventative maintenance, is it intended to prevent corrosion or to prevent discharge due to corrosion? For example, preventing corrosion would include applying new paint or waterproof sealant to a corroded area, while preventing discharge to corrosion would include replacing corroded components. What percentage is allocated towards servicing corrosion prevention versus discharge due to corrosion?
□ Prevent corrosion, _________________________________ □ Prevent discharge due to corrosion, ____________________
4. In your opinion how much is a typical appropriate budget for annual preventative maintenance per tank? _______________________________________________________________________
5. Of that budget, which of the following items would the budget be spent towards the most? Please rank these from 1-5, 1 being the greatest and 5 being the least.
□ Sumps □ Piping □ Spill containments □ Tanks □ Isolation boots
Additional notes:
32
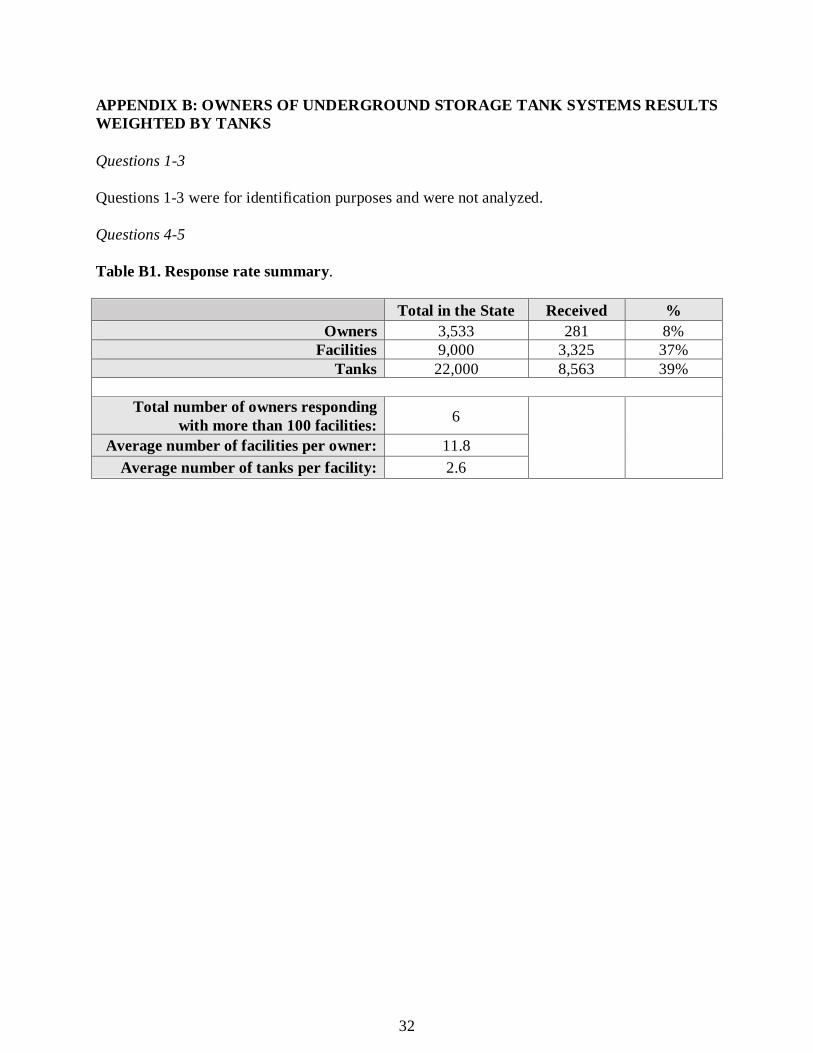
APPENDIX B: OWNERS OF UNDERGROUND STORAGE TANK SYSTEMS RESULTS WEIGHTED BY TANKS
Questions 1-3
Questions 1-3 were for identification purposes and were not analyzed.
Questions 4-5
Table B1. Response rate summary.
Total in the State Received % Owners 3,533 281 8%
Facilities 9,000 3,325 37% Tanks 22,000 8,563 39%
Total number of owners responding
with more than 100 facilities: 6
Average number of facilities per owner: 11.8 Average number of tanks per facility: 2.6
33
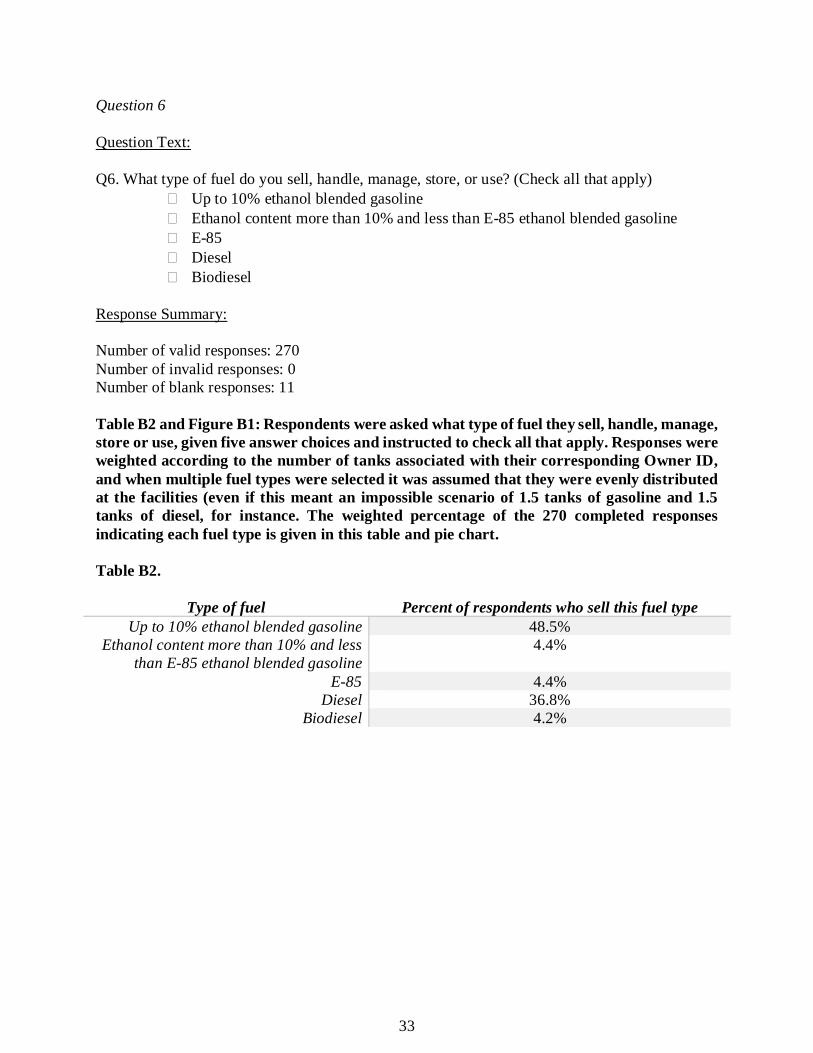
Question 6
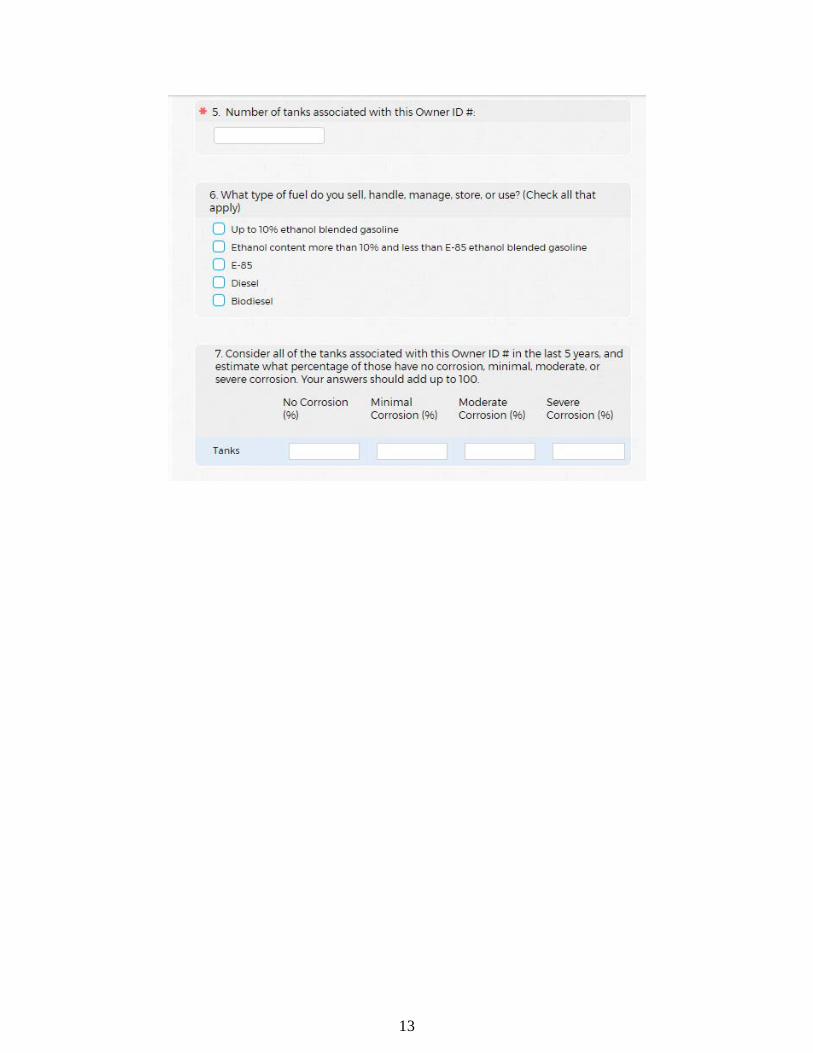
Question Text:
Q6. What type of fuel do you sell, handle, manage, store, or use? (Check all that apply) � Up to 10% ethanol blended gasoline � Ethanol content more than 10% and less than E-85 ethanol blended gasoline � E-85 � Diesel � Biodiesel
Response Summary:
Number of valid responses: 270 Number of invalid responses: 0 Number of blank responses: 11 Table B2 and Figure B1: Respondents were asked what type of fuel they sell, handle, manage, store or use, given five answer choices and instructed to check all that apply. Responses were weighted according to the number of tanks associated with their corresponding Owner ID, and when multiple fuel types were selected it was assumed that they were evenly distributed at the facilities (even if this meant an impossible scenario of 1.5 tanks of gasoline and 1.5 tanks of diesel, for instance. The weighted percentage of the 270 completed responses indicating each fuel type is given in this table and pie chart. Table B2.
Type of fuel Percent of respondents who sell this fuel type Up to 10% ethanol blended gasoline 48.5%
Ethanol content more than 10% and less than E-85 ethanol blended gasoline
4.4%
E-85 4.4% Diesel 36.8%
Biodiesel 4.2%

34
Figure B1.
Up to 10% ethanol blended gasoline, 48.50%
Ethanol content more than 10% and less than E-85
ethanol blended
gasoline, 4.40%
E-85, 4.40%
Diesel, 36.80%
Biodiesel, 4.20%
35
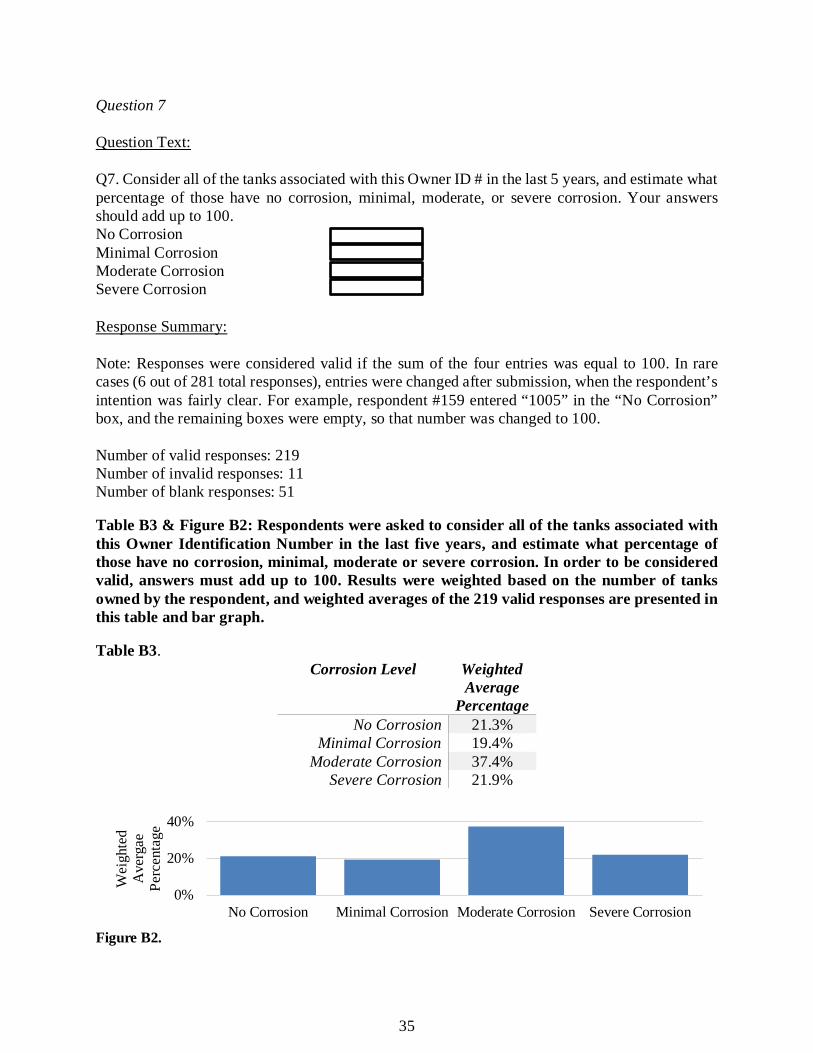
Question 7
Question Text:
Q7. Consider all of the tanks associated with this Owner ID # in the last 5 years, and estimate what percentage of those have no corrosion, minimal, moderate, or severe corrosion. Your answers should add up to 100. No Corrosion Minimal Corrosion Moderate Corrosion Severe Corrosion
Response Summary:
Note: Responses were considered valid if the sum of the four entries was equal to 100. In rare cases (6 out of 281 total responses), entries were changed after submission, when the respondent’s intention was fairly clear. For example, respondent #159 entered “1005” in the “No Corrosion” box, and the remaining boxes were empty, so that number was changed to 100. Number of valid responses: 219 Number of invalid responses: 11 Number of blank responses: 51 Table B3 & Figure B2: Respondents were asked to consider all of the tanks associated with this Owner Identification Number in the last five years, and estimate what percentage of those have no corrosion, minimal, moderate or severe corrosion. In order to be considered valid, answers must add up to 100. Results were weighted based on the number of tanks owned by the respondent, and weighted averages of the 219 valid responses are presented in this table and bar graph. Table B3.
Corrosion Level Weighted Average
Percentage No Corrosion 21.3%
Minimal Corrosion 19.4% Moderate Corrosion 37.4%
Severe Corrosion 21.9%
Figure B2.
0%
20%
40%
No Corrosion Minimal Corrosion Moderate Corrosion Severe Corrosion
Wei
ghte
d A
verg
ae
Perc
enta
ge

36
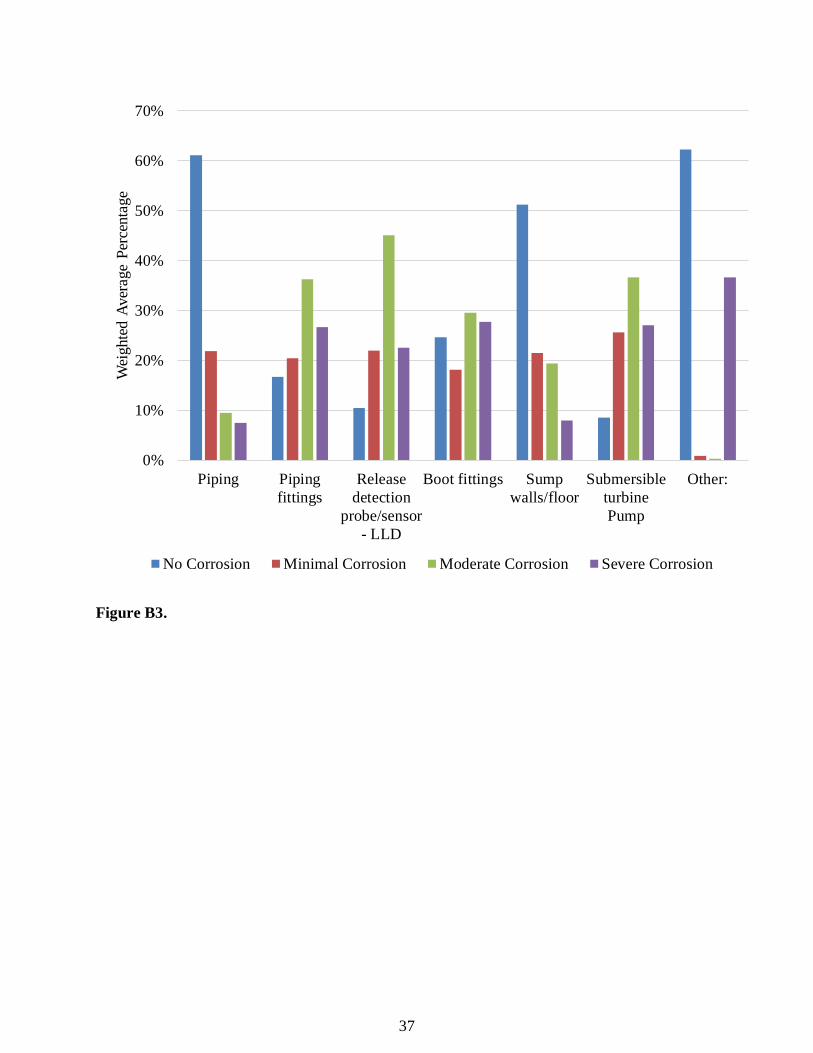
Question 8
Question Text:
Q8. When you have checked inside your piping sump(s), have you noticed corrosion on any of the following components? Consider all of the facilities associated with this Owner ID # in the last 5 years, and estimate what percentage of those have no corrosion, minimal, moderate, or severe corrosion for each piping sump component. Your answers for each component should add up to 100.
Response Summary:
Note: Responses were considered valid if the sum of the four entries was equal to 100. Average corrosion levels were calculated using only valid responses. Table B4 & Figure B3: Respondents were asked if they have noticed corrosion on any of an assortment of piping sump components at facilities associated with their Owner Identification Number in the last five years, and to estimate what percentage of those have no corrosion, minimal, moderate or severe corrosion for each component. In order to be considered valid, answers for each component must add up to 100. The number of valid, invalid and blank responses, as well as the average of the valid responses for each component, are presented in this table. Results were weighted based on the number of tanks owned by the respondent, and weighted averages of the valid responses for each component are presented in this table and bar graph. Table B4.
Piping Piping fittings
Release detection
probe/sensor - LLD
Boot fittings
Sump walls/floor
Submersible turbine Pump
Other:
Number of valid
responses
190 211 202 208 199 216 7
Number of invalid
responses
75 55 65 59 69 54 270
Number of blank
responses
16 15 14 14 13 11 4
Corrosion Level
% % % % % % %
No Corrosion 61.1 16.7 10.4 24.7 51.2 8.6 62.3 Minimal
Corrosion 21.9 20.4 22.0 18.1 21.5 25.6 0.8
Moderate Corrosion
9.5 36.2 45.1 29.5 19.4 36.7 0.2
Severe Corrosion
7.5 26.6 22.5 27.7 7.9 27.0 36.7
37
Figure B3.
0%
10%
20%
30%
40%
50%
60%
70%
Piping Pipingfittings
Releasedetection
probe/sensor- LLD
Boot fittings Sumpwalls/floor
SubmersibleturbinePump
Other:
Wei
ghte
d Av
erag
e Pe
rcen
tage
No Corrosion Minimal Corrosion Moderate Corrosion Severe Corrosion
38
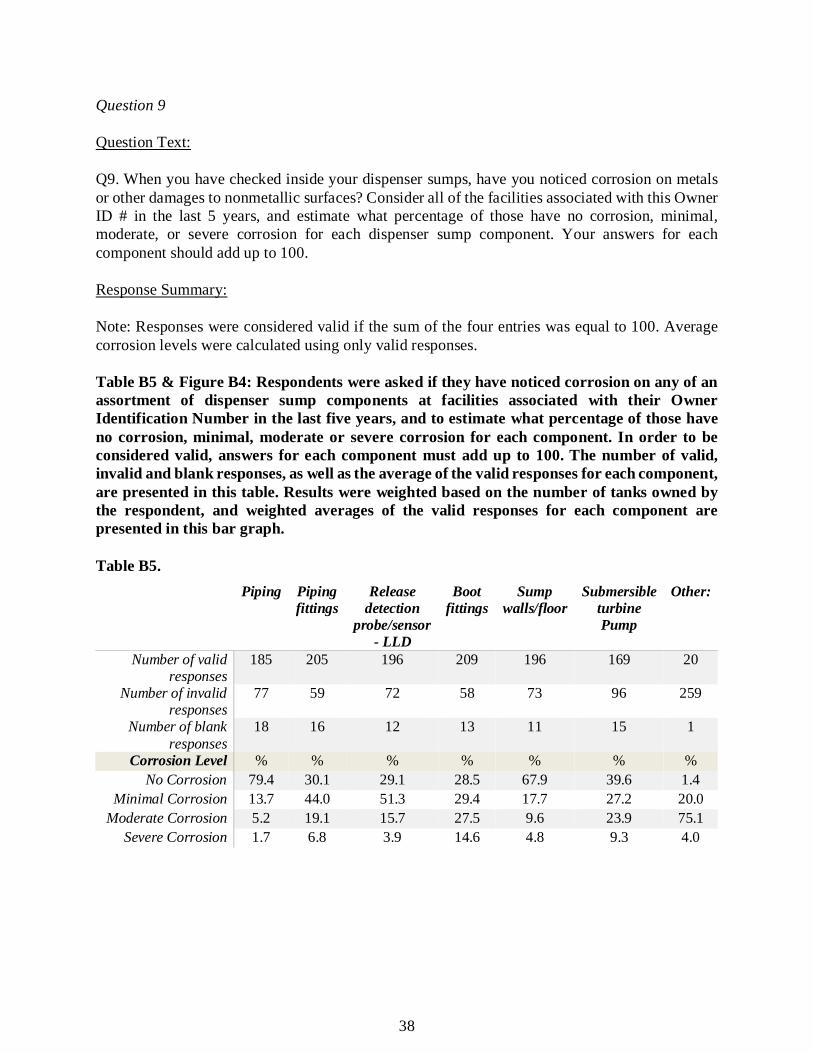
Question 9
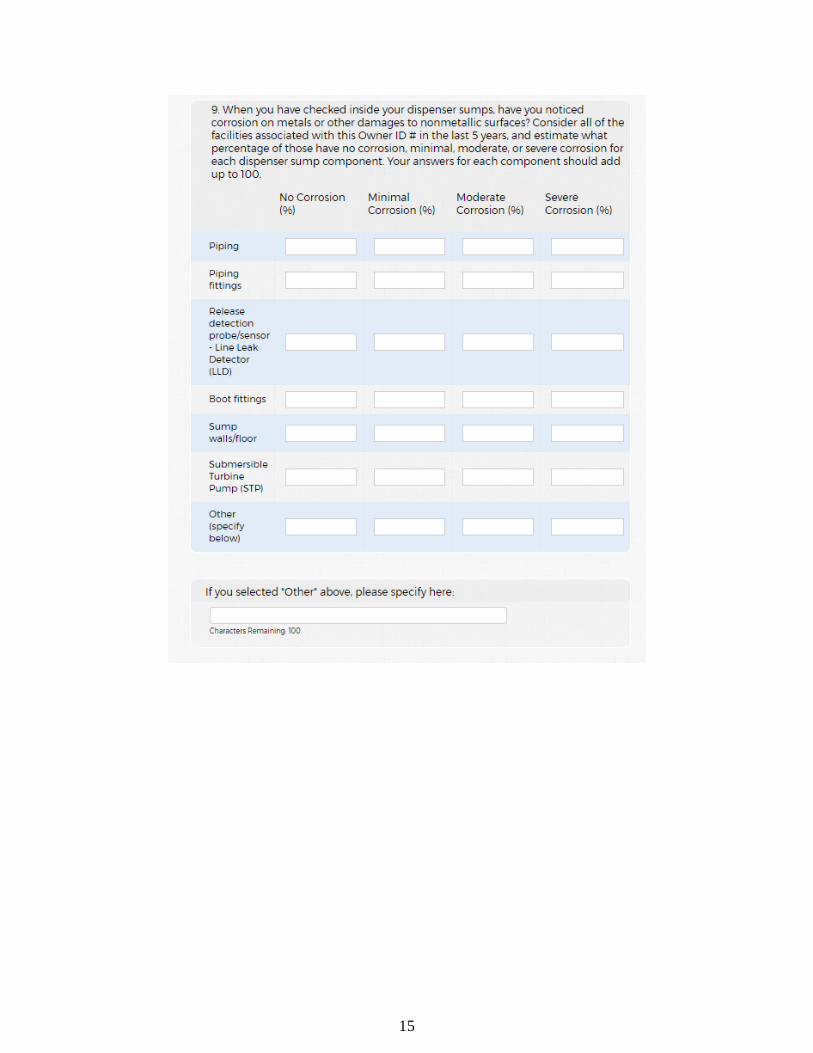
Question Text:
Q9. When you have checked inside your dispenser sumps, have you noticed corrosion on metals or other damages to nonmetallic surfaces? Consider all of the facilities associated with this Owner ID # in the last 5 years, and estimate what percentage of those have no corrosion, minimal, moderate, or severe corrosion for each dispenser sump component. Your answers for each component should add up to 100.
Response Summary:
Note: Responses were considered valid if the sum of the four entries was equal to 100. Average corrosion levels were calculated using only valid responses.
Table B5 & Figure B4: Respondents were asked if they have noticed corrosion on any of an assortment of dispenser sump components at facilities associated with their Owner Identification Number in the last five years, and to estimate what percentage of those have no corrosion, minimal, moderate or severe corrosion for each component. In order to be considered valid, answers for each component must add up to 100. The number of valid, invalid and blank responses, as well as the average of the valid responses for each component, are presented in this table. Results were weighted based on the number of tanks owned by the respondent, and weighted averages of the valid responses for each component are presented in this bar graph.
Table B5.
Piping Piping fittings
Release detection
probe/sensor - LLD
Boot fittings
Sump walls/floor
Submersible turbine Pump
Other:
Number of valid responses
185 205 196 209 196 169 20
Number of invalid responses
77 59 72 58 73 96 259
Number of blank responses
18 16 12 13 11 15 1
Corrosion Level % % % % % % % No Corrosion 79.4 30.1 29.1 28.5 67.9 39.6 1.4
Minimal Corrosion 13.7 44.0 51.3 29.4 17.7 27.2 20.0 Moderate Corrosion 5.2 19.1 15.7 27.5 9.6 23.9 75.1
Severe Corrosion 1.7 6.8 3.9 14.6 4.8 9.3 4.0

39
Figure B4.
0%
10%
20%
30%
40%
50%
60%
70%
80%
90%
Piping Pipingfittings
Releasedetection
probe/sensor- LLD
Boot fittings Sumpwalls/floor
SubmersibleturbinePump
Other:
Wei
ghte
d A
vera
ge
Perc
enta
ge
No Corrosion Minimal Corrosion Moderate Corrosion Severe Corrosion

40
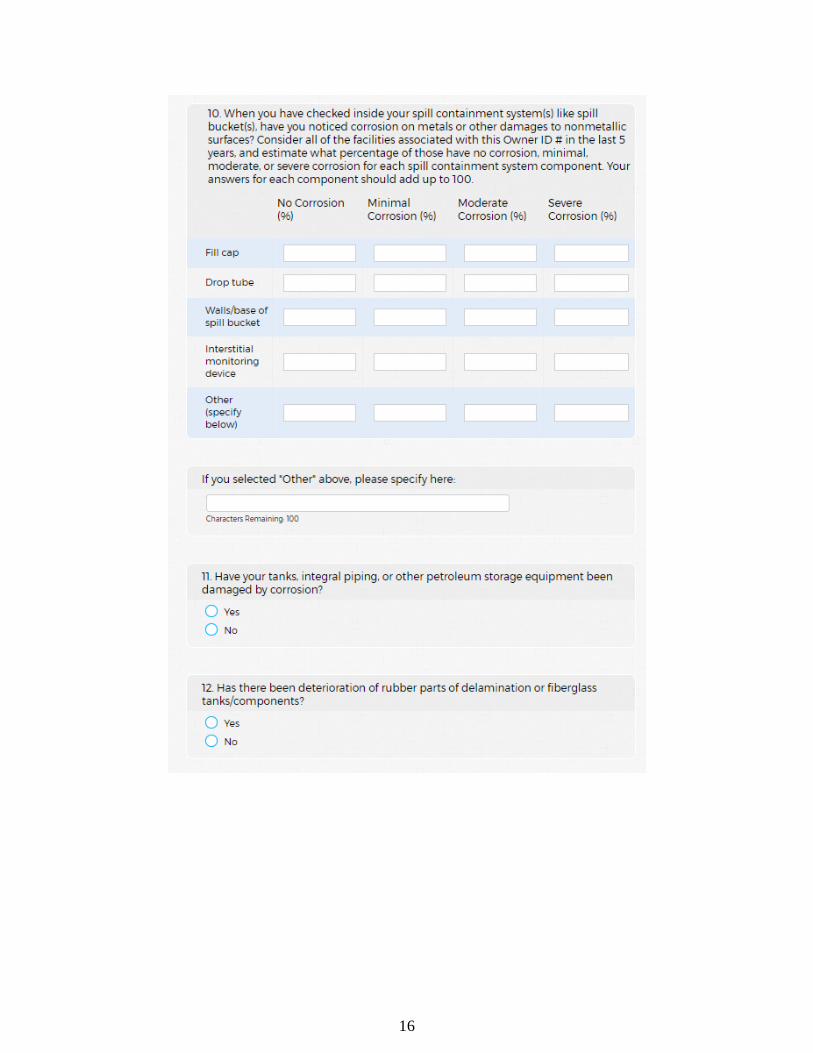
Question 10
Question Text:
Q10. When you have checked inside your spill containment system(s) like spill bucket(s), have you noticed corrosion on metals or other damages to nonmetallic surfaces? Consider all of the facilities associated with this Owner ID # in the last 5 years, and estimate what percentage of those have no corrosion, minimal, moderate, or severe corrosion for each spill containment system component. Your answers for each component should add up to 100.
Response Summary:
Note: Responses were considered valid if the sum of the four entries was equal to 100. Average corrosion levels were calculated using only valid responses. Table B6 & Figure B5: Respondents were asked if they have noticed corrosion on any of an assortment of spill containment system components at facilities associated with their Owner Identification Number in the last five years, and to estimate what percentage of those have no corrosion, minimal, moderate or severe corrosion for each component. In order to be considered valid, answers for each component must add up to 100. The number of valid, invalid and blank responses, as well as the average of the valid responses for each component, are presented in this table. Results were weighted based on the number of tanks owned by the respondent, and weighted averages of the valid responses for each component are presented in this bar graph. Table B6.
Fill cap Drop tube Walls/base of spill bucket
Interstitial monitoring device
Other:
Number of valid responses
205 198 204 200 21
Number of invalid responses
65 71 63 72 260
Number of blank responses
11 12 14 9 0
Corrosion Level % % % % % No Corrosion 57.9 24.8 24.5 38.5 0.8
Minimal Corrosion
19.8 49.4 44.1 51.6 7.7
Moderate Corrosion
13.1 16.3 21.8 8.2 81.4
Severe Corrosion 9.1 9.5 9.6 1.7 10.1
41
Figure B5.
0%
10%
20%
30%
40%
50%
60%
70%
80%
90%
Fill cap Drop tube Walls/base ofspill bucket
Interstitialmonitoring
device
Other:
Wei
ghte
d Av
erag
e Pe
rcen
tage
s
No Corrosion Minimal Corrosion Moderate Corrosion Severe Corrosion
42
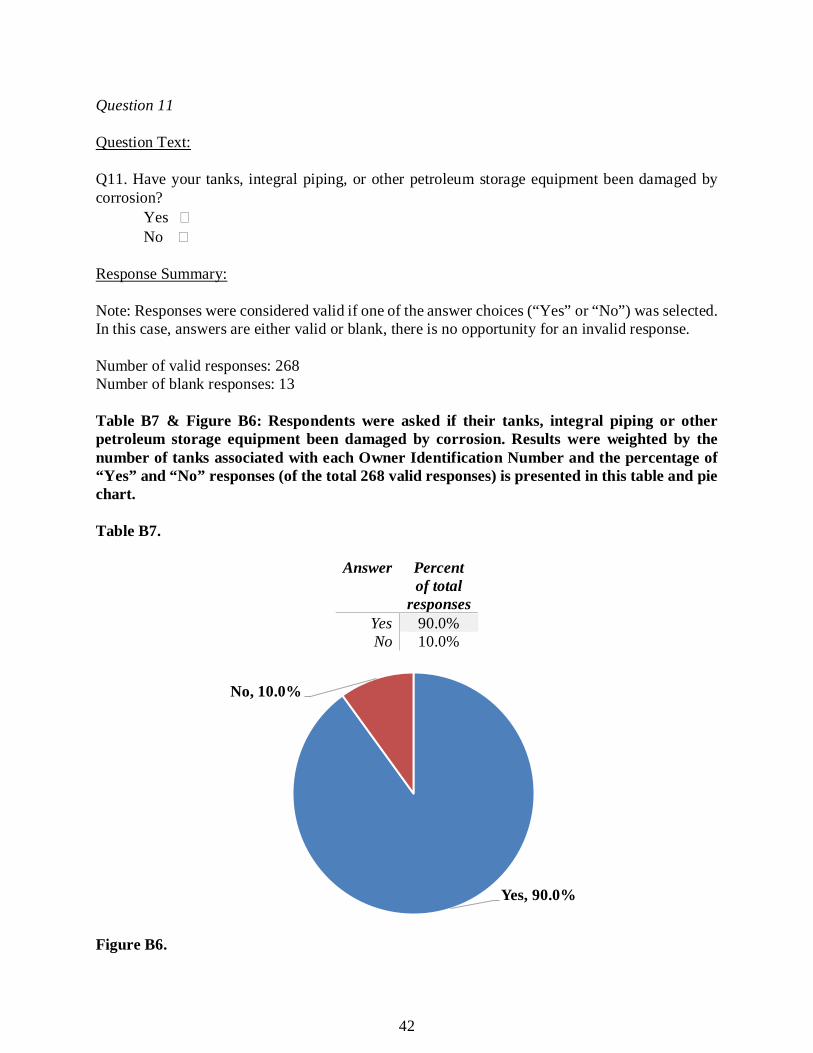
Question 11
Question Text:
Q11. Have your tanks, integral piping, or other petroleum storage equipment been damaged by corrosion?
Yes � No �
Response Summary:
Note: Responses were considered valid if one of the answer choices (“Yes” or “No”) was selected. In this case, answers are either valid or blank, there is no opportunity for an invalid response. Number of valid responses: 268 Number of blank responses: 13 Table B7 & Figure B6: Respondents were asked if their tanks, integral piping or other petroleum storage equipment been damaged by corrosion. Results were weighted by the number of tanks associated with each Owner Identification Number and the percentage of “Yes” and “No” responses (of the total 268 valid responses) is presented in this table and pie chart. Table B7.
Answer Percent of total
responses Yes 90.0% No 10.0%
Figure B6.
Yes, 90.0%
No, 10.0%
43
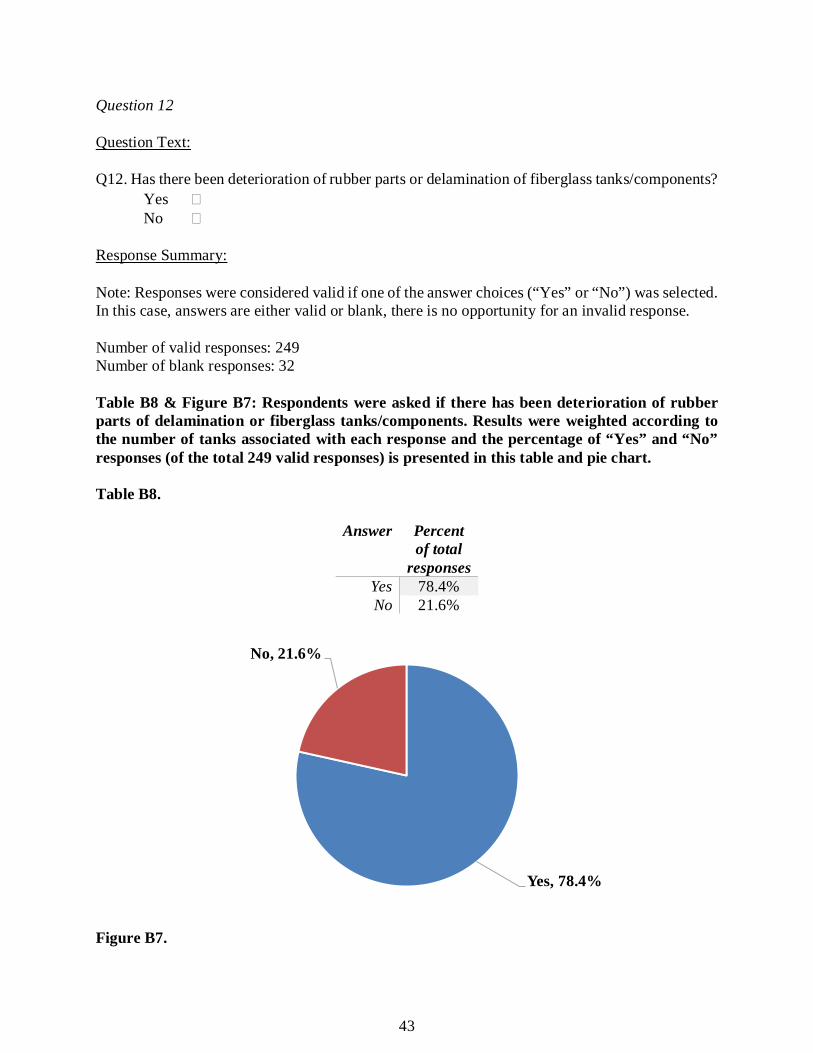
Question 12
Question Text:
Q12. Has there been deterioration of rubber parts or delamination of fiberglass tanks/components? Yes � No �
Response Summary:
Note: Responses were considered valid if one of the answer choices (“Yes” or “No”) was selected. In this case, answers are either valid or blank, there is no opportunity for an invalid response. Number of valid responses: 249 Number of blank responses: 32 Table B8 & Figure B7: Respondents were asked if there has been deterioration of rubber parts of delamination or fiberglass tanks/components. Results were weighted according to the number of tanks associated with each response and the percentage of “Yes” and “No” responses (of the total 249 valid responses) is presented in this table and pie chart. Table B8.
Answer Percent of total
responses Yes 78.4% No 21.6%
Figure B7.
Yes, 78.4%
No, 21.6%

44
Question 13
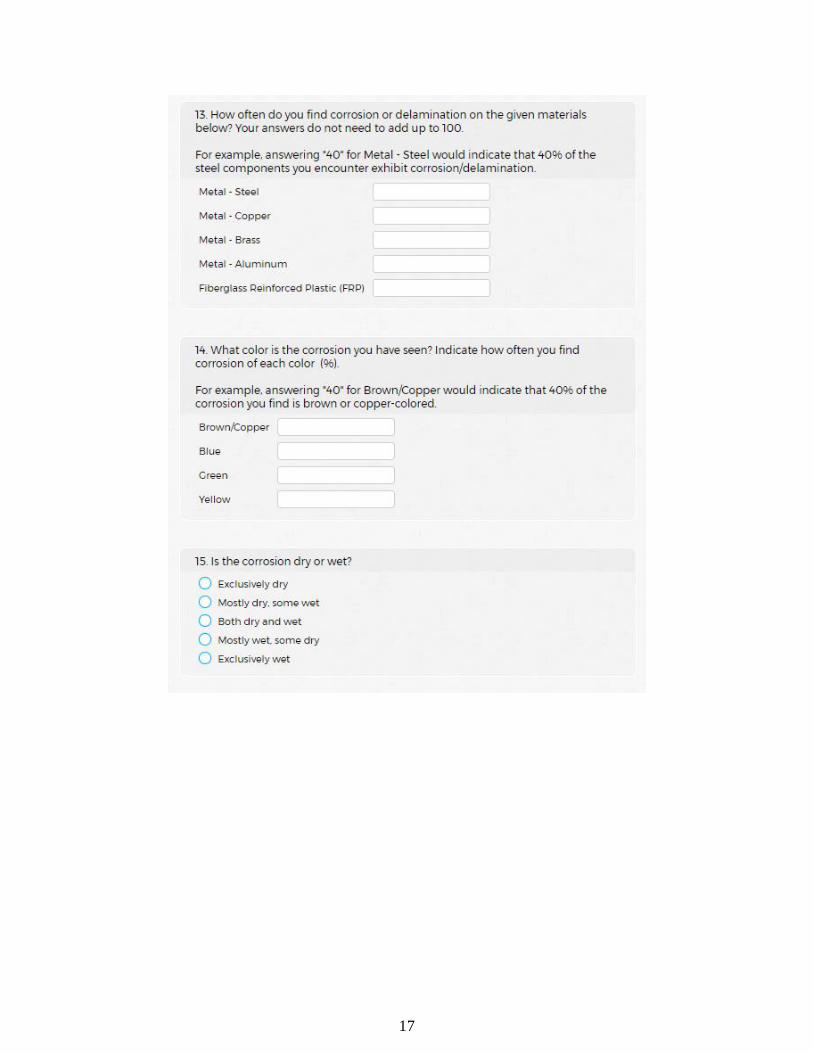
Question Text:
Q13. How often do you find corrosion or delamination on the given materials below? Your answers do not need to add up to 100. Steel Copper Brass Aluminum Fiber-Reinforced Plastic (FRP)
Response Summary:
Note: Responses were considered valid if any text was input, even if it was a zero. Responses would be considered invalid if an individual number greater than 100 was input, however, there were no instances of that happening. Number of valid responses: 218 Number of invalid responses: 0 Number of blank responses: 63 Table B9 & Figure B8: Respondents were asked how often they find corrosion or delamination on steel, copper, brass, aluminum and fiberglass-reinforced plastic. Results were weighted according to the number of tanks associated with each response and the average of the 218 valid responses for each material are presented in this table and bar graph. Table B9.
Answer Average percentage response
Steel 69.1% Copper 50.2%
Brass 16.6% Aluminum 11.2%
FRP 2.8%
Figure B8.
0%20%40%60%80%
Steel Copper Brass Aluminum FRP
Wei
ghte
d A
vera
ge
Perc
enta
ge
45
Question 14
Question Text:
Q14. What color is the corrosion you have seen? Indicate how often you find corrosion of each color (%).
Brown/Copper Blue Green Yellow
Response Summary:
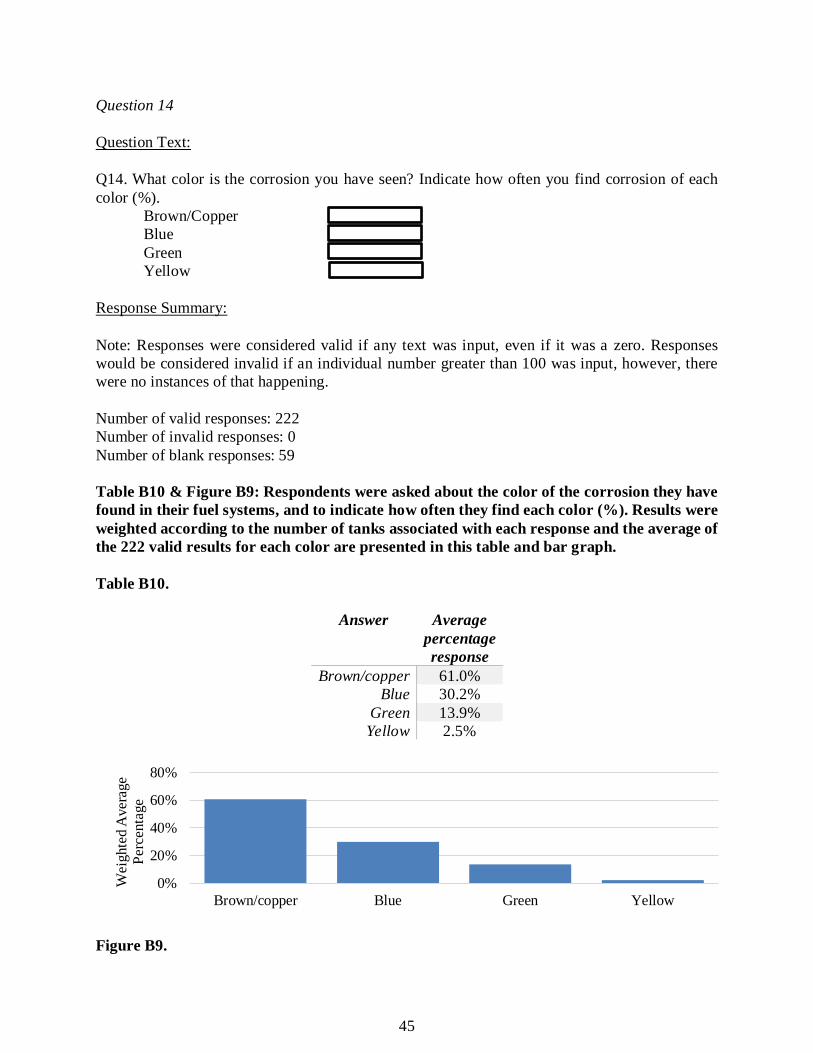
Note: Responses were considered valid if any text was input, even if it was a zero. Responses would be considered invalid if an individual number greater than 100 was input, however, there were no instances of that happening. Number of valid responses: 222 Number of invalid responses: 0 Number of blank responses: 59 Table B10 & Figure B9: Respondents were asked about the color of the corrosion they have found in their fuel systems, and to indicate how often they find each color (%). Results were weighted according to the number of tanks associated with each response and the average of the 222 valid results for each color are presented in this table and bar graph. Table B10.
Answer Average percentage response
Brown/copper 61.0% Blue 30.2%
Green 13.9% Yellow 2.5%
Figure B9.
0%
20%
40%
60%
80%
Brown/copper Blue Green Yellow
Wei
ghte
d A
vera
ge
Perc
enta
ge
46
Question 15
Question Text:
Q15. Is the corrosion dry or wet? Exclusively dry � Mostly dry, some wet � Both dry and wet � Mostly wet, some dry � Exclusively wet �
Response Summary:
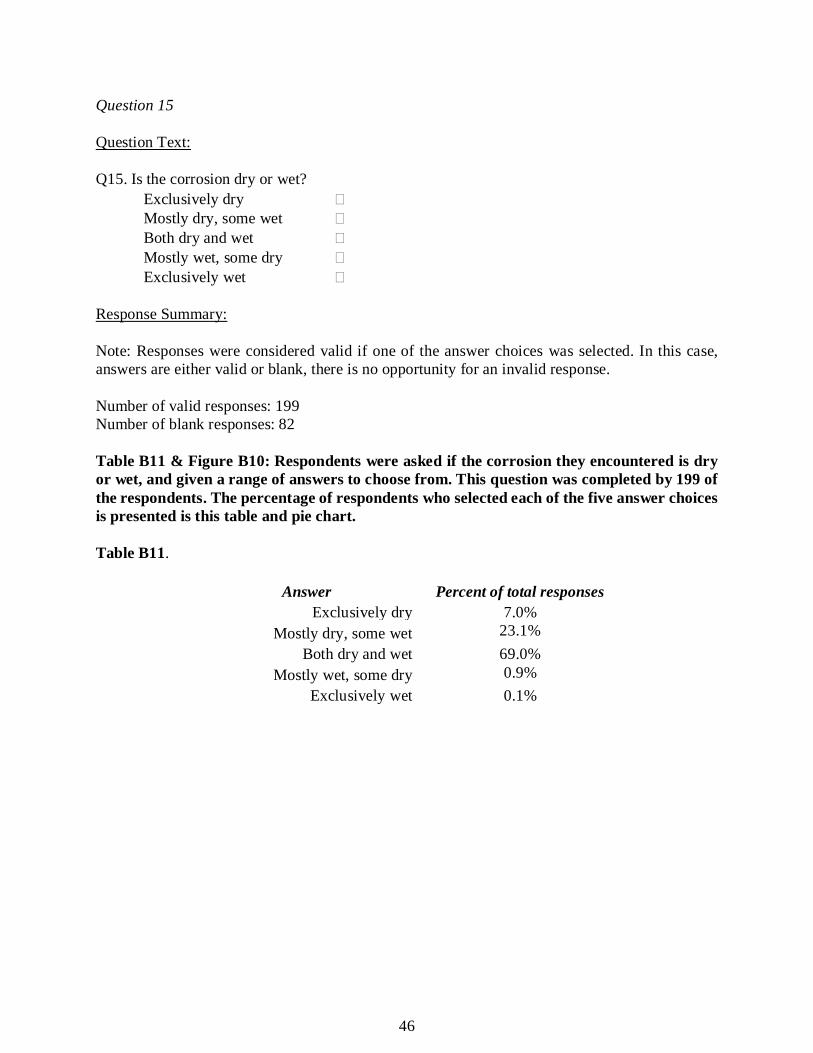
Note: Responses were considered valid if one of the answer choices was selected. In this case, answers are either valid or blank, there is no opportunity for an invalid response. Number of valid responses: 199 Number of blank responses: 82 Table B11 & Figure B10: Respondents were asked if the corrosion they encountered is dry or wet, and given a range of answers to choose from. This question was completed by 199 of the respondents. The percentage of respondents who selected each of the five answer choices is presented is this table and pie chart. Table B11.
Answer Percent of total responses Exclusively dry 7.0%
Mostly dry, some wet 23.1% Both dry and wet 69.0%
Mostly wet, some dry 0.9% Exclusively wet 0.1%

47
Figure B10.
Exclusively dry, 7.0%
Mostly dry, some wet, 23.1%
Both dry and wet, 69.0%
Mostly wet, some dry, 0.9%
Exclusively wet, 0.1%
48
Question 16
Question Text:
Q16. In Fiberglass Reinforced Plastic (FRP) equipment, how often have you noticed the following types of damage? Your answers do not need to add up to 100.
Cracks Blisters Delamination Other
Response Summary:
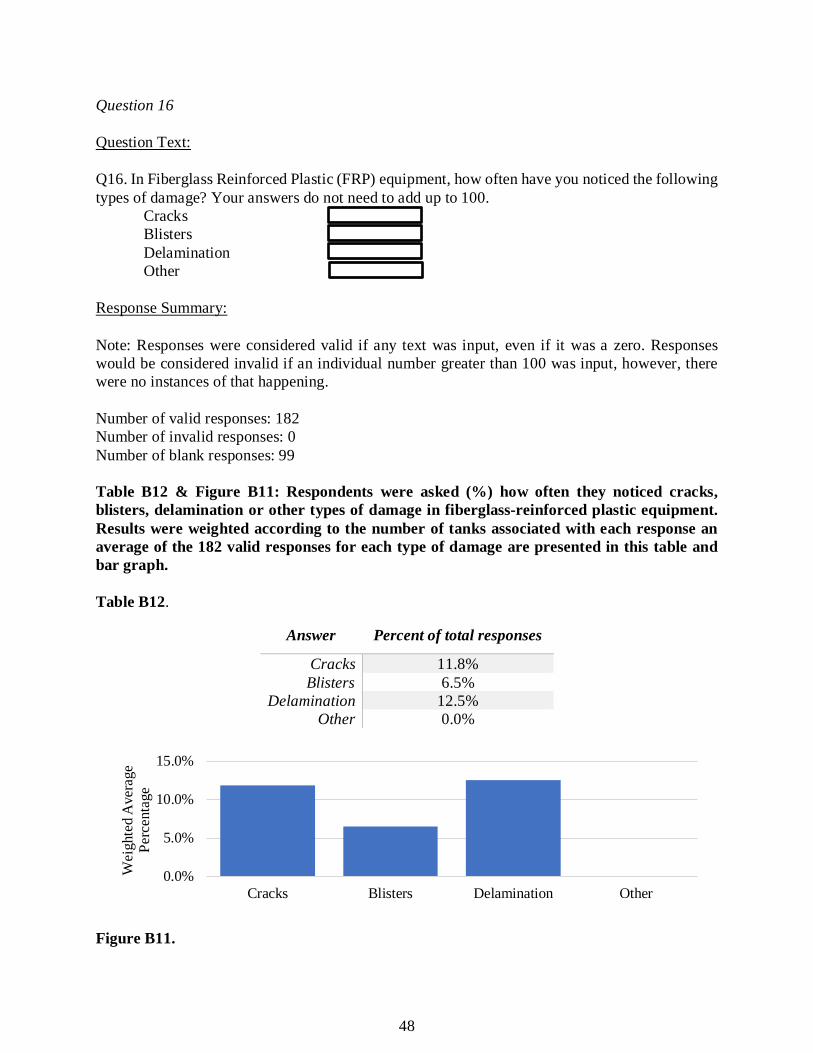
Note: Responses were considered valid if any text was input, even if it was a zero. Responses would be considered invalid if an individual number greater than 100 was input, however, there were no instances of that happening. Number of valid responses: 182 Number of invalid responses: 0 Number of blank responses: 99 Table B12 & Figure B11: Respondents were asked (%) how often they noticed cracks, blisters, delamination or other types of damage in fiberglass-reinforced plastic equipment. Results were weighted according to the number of tanks associated with each response an average of the 182 valid responses for each type of damage are presented in this table and bar graph. Table B12.
Answer Percent of total responses
Cracks 11.8% Blisters 6.5%
Delamination 12.5% Other 0.0%
Figure B11.
0.0%
5.0%
10.0%
15.0%
Cracks Blisters Delamination Other
Wei
ghte
d A
vera
ge
Perc
enta
ge
49
Question 17
Question Text:
Q17. How often do you visually inspect inside your piping sumps, dispenser sumps, spill buckets and other equipment?
Twice per month � Monthly � Every 2 months � Every 6 months � Utilize sensors � Other �
Response Summary:
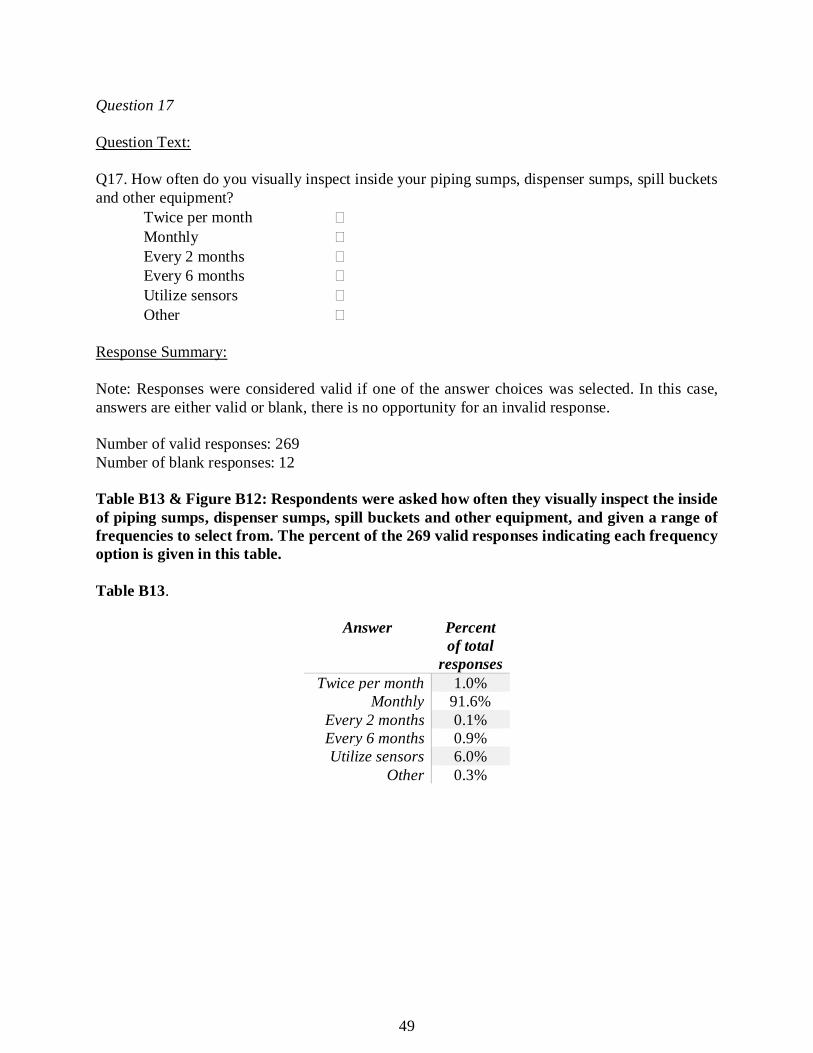
Note: Responses were considered valid if one of the answer choices was selected. In this case, answers are either valid or blank, there is no opportunity for an invalid response. Number of valid responses: 269 Number of blank responses: 12 Table B13 & Figure B12: Respondents were asked how often they visually inspect the inside of piping sumps, dispenser sumps, spill buckets and other equipment, and given a range of frequencies to select from. The percent of the 269 valid responses indicating each frequency option is given in this table. Table B13.
Answer Percent of total
responses Twice per month 1.0%
Monthly 91.6% Every 2 months 0.1% Every 6 months 0.9% Utilize sensors 6.0%
Other 0.3%

50
Figure B12.
Twice per month, 1.0%
Monthly, 91.6%
Every 2 months, 0.1%
Every 6 months, 0.9%
Utilize sensors, 6.0%
Other, 0.3%

51
Question 18
Question Text:
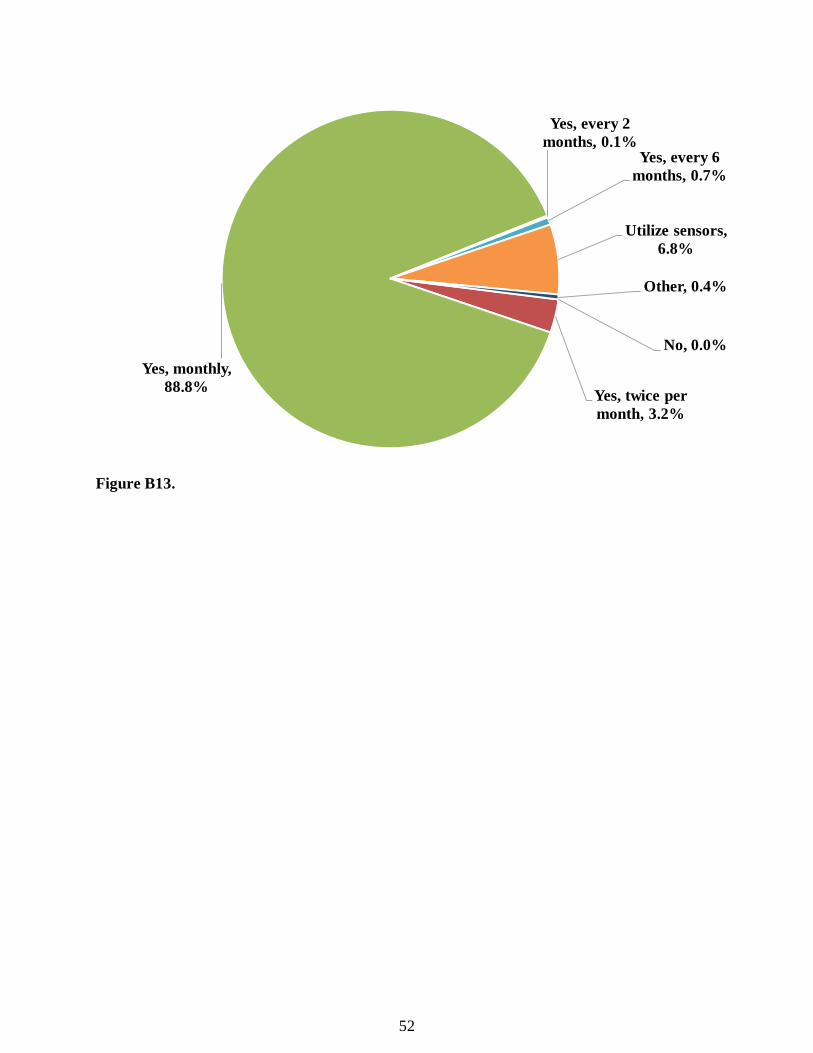
Q18. Do you visually check for water in your sumps? If so, how often? No � Yes, twice per month � Yes, monthly � Yes, every 2 months � Yes, every 6 months � Utilize sensors � Other �
Response Summary:
Note: Responses were considered valid if one of the answer choices was selected. In this case, answers are either valid or blank, there is no opportunity for an invalid response. Number of valid responses: 269 Number of blank responses: 12 Table B14 & Figure B13: Respondents were asked if they visually check for water in their sumps, and, if so, given a range of frequencies to select from. The percent of the 269 valid responses indicating each frequency option is given in this table. Table B14.
Answer Percent of total responses No 0.0%
Yes, twice per month 3.2% Yes, monthly 88.8%
Yes, every 2 months 0.1% Yes, every 6 months 0.7%
Utilize sensors 6.8% Other 0.4%
52
Figure B13.
No, 0.0%
Yes, twice per month, 3.2%
Yes, monthly, 88.8%
Yes, every 2 months, 0.1%
Yes, every 6 months, 0.7%
Utilize sensors, 6.8%
Other, 0.4%
53
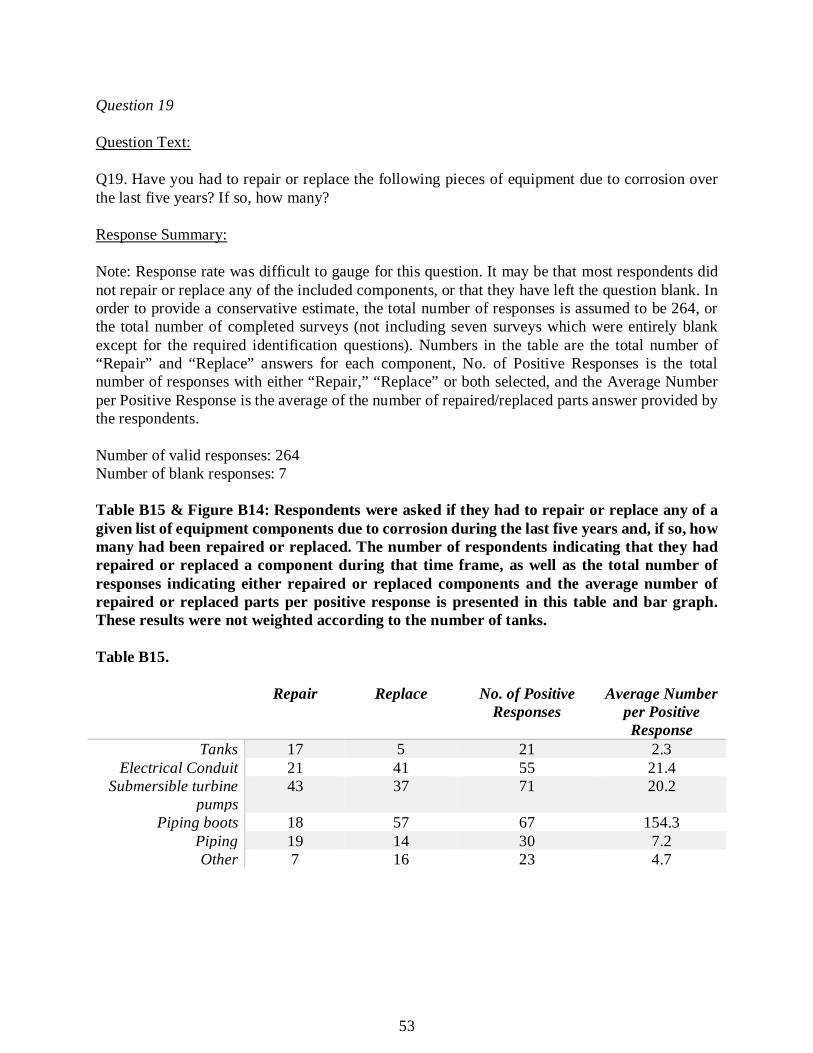
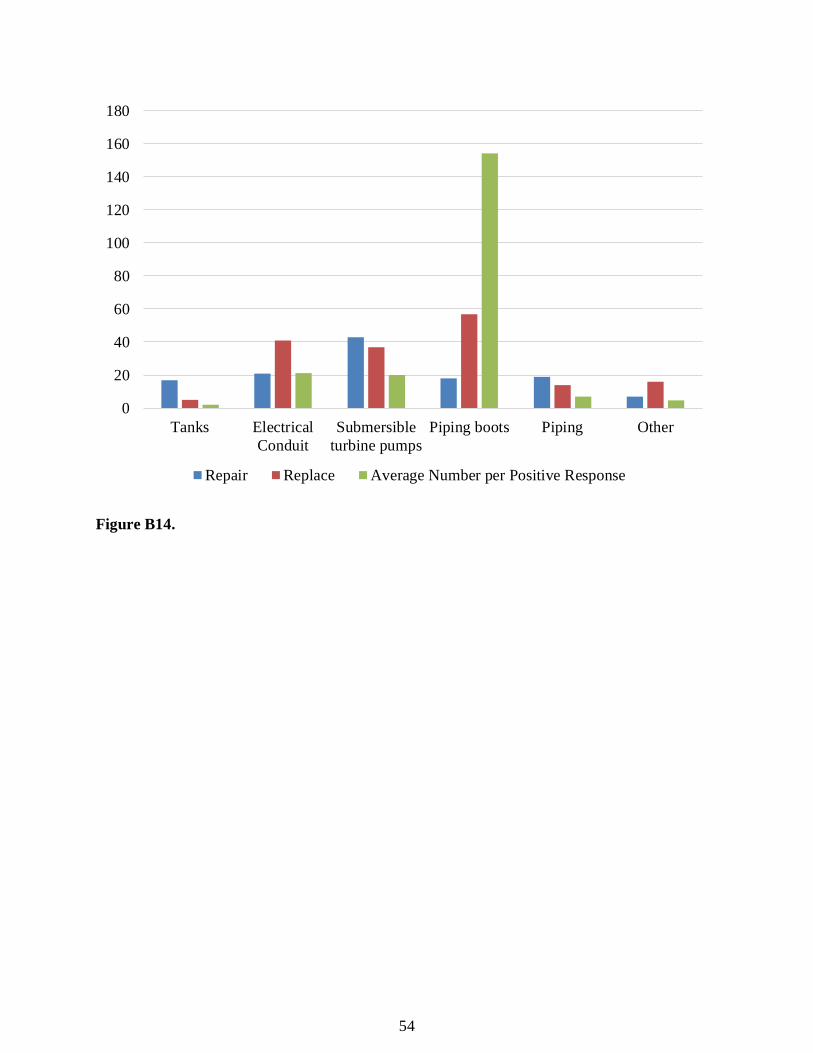
Question 19
Question Text:
Q19. Have you had to repair or replace the following pieces of equipment due to corrosion over the last five years? If so, how many?
Response Summary:
Note: Response rate was difficult to gauge for this question. It may be that most respondents did not repair or replace any of the included components, or that they have left the question blank. In order to provide a conservative estimate, the total number of responses is assumed to be 264, or the total number of completed surveys (not including seven surveys which were entirely blank except for the required identification questions). Numbers in the table are the total number of “Repair” and “Replace” answers for each component, No. of Positive Responses is the total number of responses with either “Repair,” “Replace” or both selected, and the Average Number per Positive Response is the average of the number of repaired/replaced parts answer provided by the respondents. Number of valid responses: 264 Number of blank responses: 7 Table B15 & Figure B14: Respondents were asked if they had to repair or replace any of a given list of equipment components due to corrosion during the last five years and, if so, how many had been repaired or replaced. The number of respondents indicating that they had repaired or replaced a component during that time frame, as well as the total number of responses indicating either repaired or replaced components and the average number of repaired or replaced parts per positive response is presented in this table and bar graph. These results were not weighted according to the number of tanks. Table B15.
Repair Replace No. of Positive Responses
Average Number per Positive Response
Tanks 17 5 21 2.3 Electrical Conduit 21 41 55 21.4
Submersible turbine pumps
43 37 71 20.2
Piping boots 18 57 67 154.3 Piping 19 14 30 7.2 Other 7 16 23 4.7
54
Figure B14.
0
20
40
60
80
100
120
140
160
180
Tanks ElectricalConduit
Submersibleturbine pumps
Piping boots Piping Other
Repair Replace Average Number per Positive Response
55
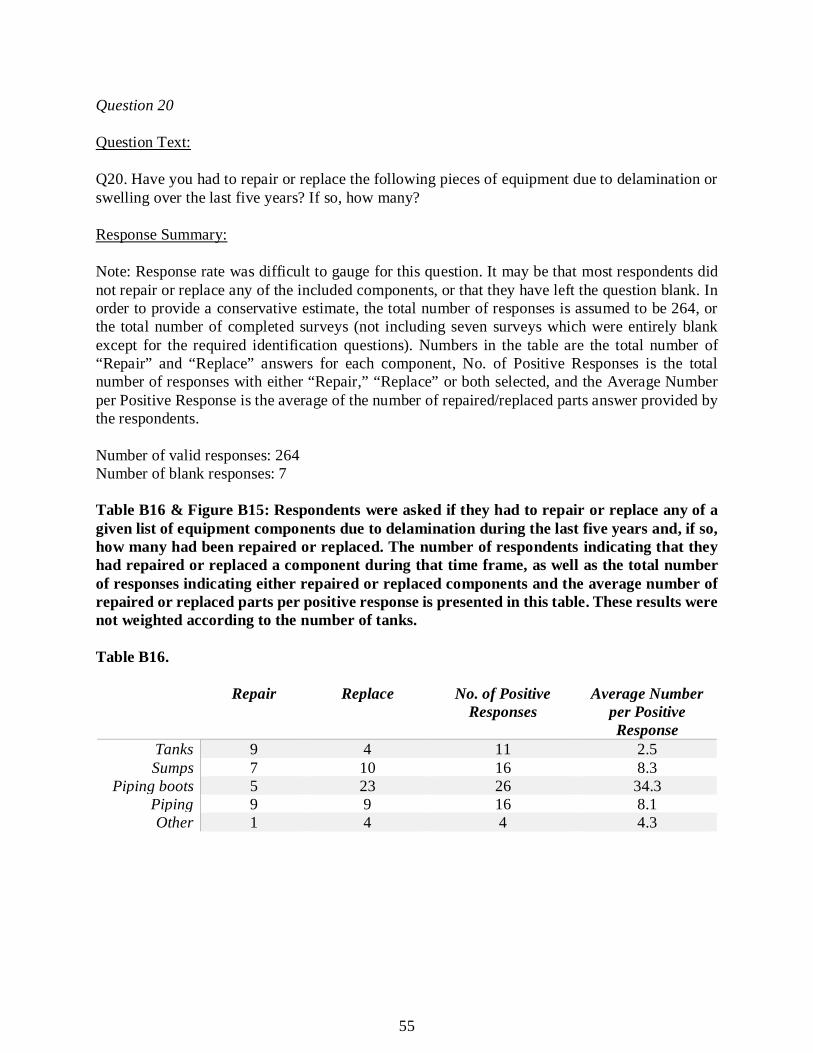
Question 20
Question Text:
Q20. Have you had to repair or replace the following pieces of equipment due to delamination or swelling over the last five years? If so, how many?
Response Summary:
Note: Response rate was difficult to gauge for this question. It may be that most respondents did not repair or replace any of the included components, or that they have left the question blank. In order to provide a conservative estimate, the total number of responses is assumed to be 264, or the total number of completed surveys (not including seven surveys which were entirely blank except for the required identification questions). Numbers in the table are the total number of “Repair” and “Replace” answers for each component, No. of Positive Responses is the total number of responses with either “Repair,” “Replace” or both selected, and the Average Number per Positive Response is the average of the number of repaired/replaced parts answer provided by the respondents. Number of valid responses: 264 Number of blank responses: 7 Table B16 & Figure B15: Respondents were asked if they had to repair or replace any of a given list of equipment components due to delamination during the last five years and, if so, how many had been repaired or replaced. The number of respondents indicating that they had repaired or replaced a component during that time frame, as well as the total number of responses indicating either repaired or replaced components and the average number of repaired or replaced parts per positive response is presented in this table. These results were not weighted according to the number of tanks. Table B16.
Repair Replace No. of Positive Responses
Average Number per Positive Response
Tanks 9 4 11 2.5 Sumps 7 10 16 8.3
Piping boots 5 23 26 34.3 Piping 9 9 16 8.1 Other 1 4 4 4.3

56
Figure B15.
0
5
10
15
20
25
30
35
40
Tanks Sumps Piping boots Piping Other
Repair Replace Average Number per Positive Response
57
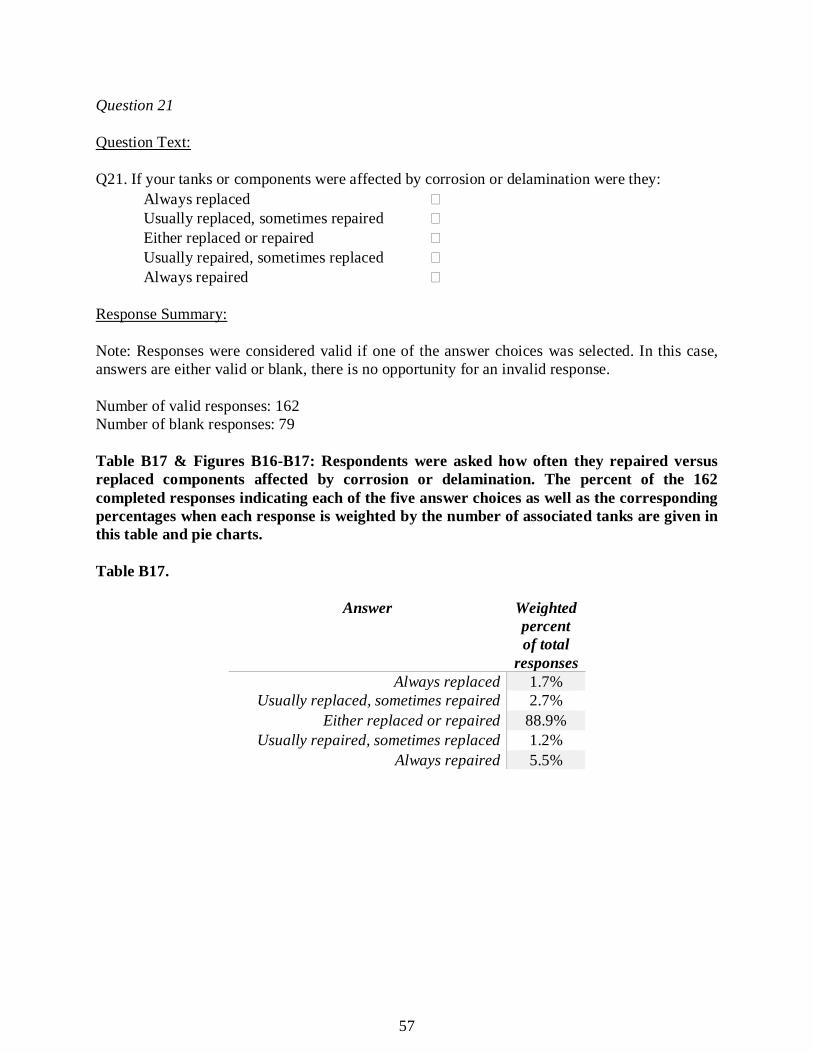
Question 21
Question Text:
Q21. If your tanks or components were affected by corrosion or delamination were they: Always replaced � Usually replaced, sometimes repaired � Either replaced or repaired � Usually repaired, sometimes replaced � Always repaired �
Response Summary:
Note: Responses were considered valid if one of the answer choices was selected. In this case, answers are either valid or blank, there is no opportunity for an invalid response. Number of valid responses: 162 Number of blank responses: 79 Table B17 & Figures B16-B17: Respondents were asked how often they repaired versus replaced components affected by corrosion or delamination. The percent of the 162 completed responses indicating each of the five answer choices as well as the corresponding percentages when each response is weighted by the number of associated tanks are given in this table and pie charts. Table B17.
Answer Weighted percent of total
responses Always replaced 1.7%
Usually replaced, sometimes repaired 2.7% Either replaced or repaired 88.9%
Usually repaired, sometimes replaced 1.2% Always repaired 5.5%

58
Figure B16.
Figure B17.
Always replaced, 27.2%
Usually replaced, sometimes
repaired, 9.9%Either replaced or repaired, 42.0%
Usually repaired, sometimes
replaced, 8.0%
Always repaired, 13.0%
Always replaced, 1.7%
Usually replaced,
sometimes repaired, 2.7%
Either replaced or
repaired, 88.9%
Usually repaired,
sometimes replaced, 1.2%
Always repaired, 5.5%
59
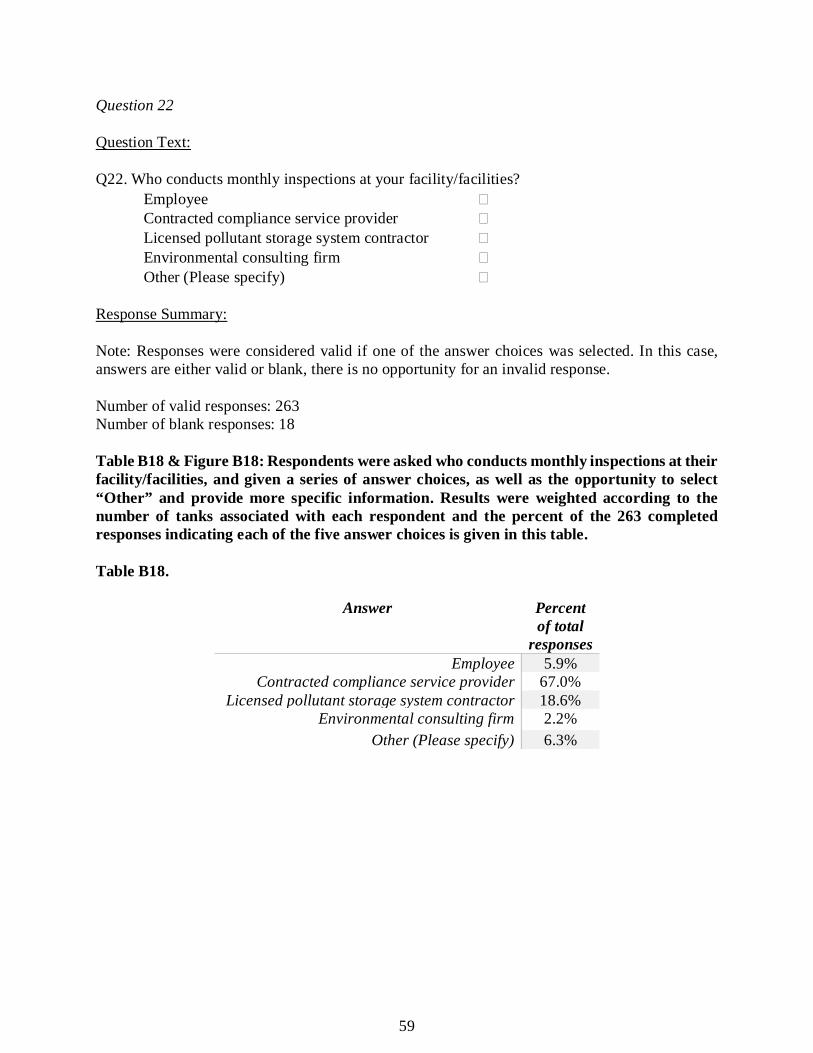
Question 22
Question Text:
Q22. Who conducts monthly inspections at your facility/facilities? Employee � Contracted compliance service provider � Licensed pollutant storage system contractor � Environmental consulting firm � Other (Please specify) �
Response Summary:
Note: Responses were considered valid if one of the answer choices was selected. In this case, answers are either valid or blank, there is no opportunity for an invalid response. Number of valid responses: 263 Number of blank responses: 18 Table B18 & Figure B18: Respondents were asked who conducts monthly inspections at their facility/facilities, and given a series of answer choices, as well as the opportunity to select “Other” and provide more specific information. Results were weighted according to the number of tanks associated with each respondent and the percent of the 263 completed responses indicating each of the five answer choices is given in this table. Table B18.
Answer Percent of total
responses Employee 5.9%
Contracted compliance service provider 67.0% Licensed pollutant storage system contractor 18.6%
Environmental consulting firm 2.2% Other (Please specify) 6.3%
60
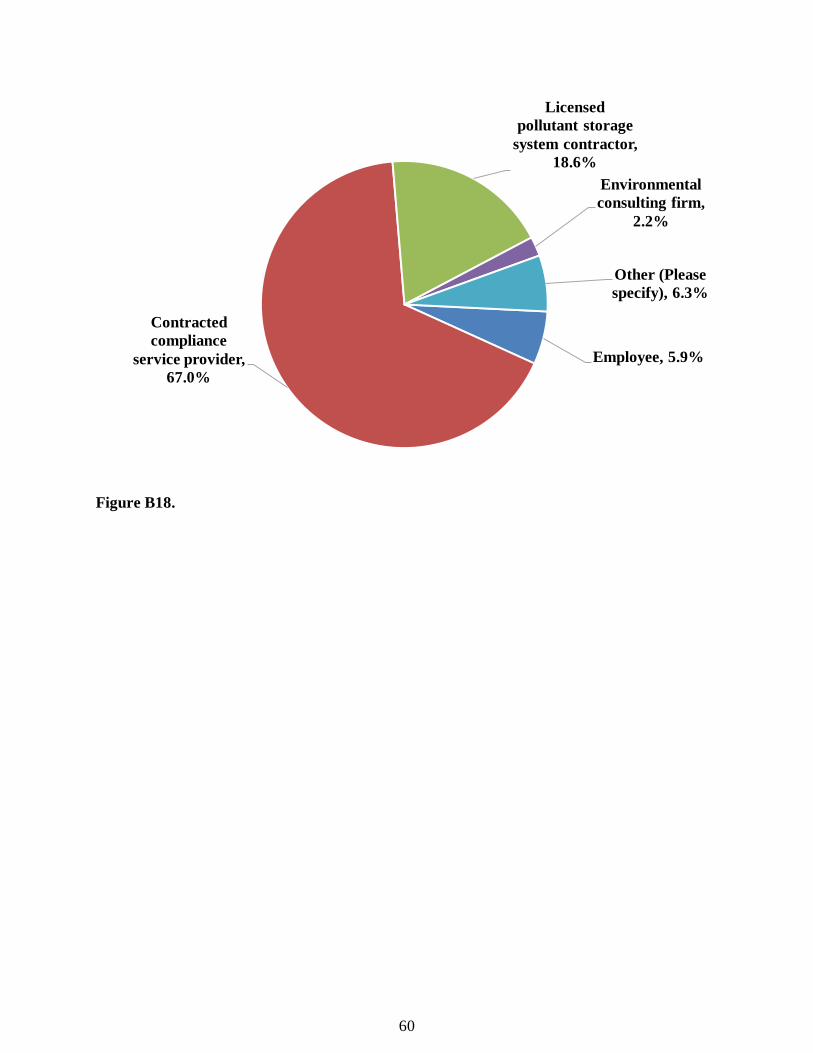
Figure B18.
Employee, 5.9%
Contracted compliance
service provider, 67.0%
Licensed pollutant storage
system contractor, 18.6%
Environmental consulting firm,
2.2%
Other (Please specify), 6.3%
61
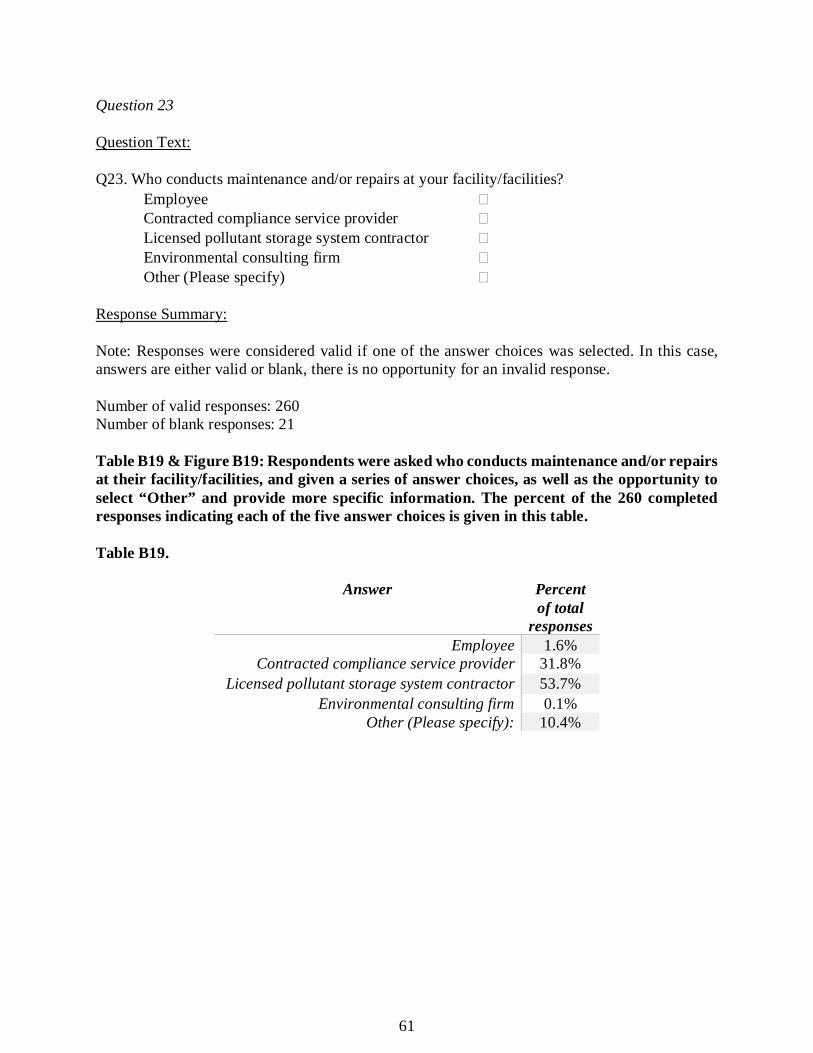
Question 23
Question Text:
Q23. Who conducts maintenance and/or repairs at your facility/facilities? Employee � Contracted compliance service provider � Licensed pollutant storage system contractor � Environmental consulting firm � Other (Please specify) �
Response Summary:
Note: Responses were considered valid if one of the answer choices was selected. In this case, answers are either valid or blank, there is no opportunity for an invalid response. Number of valid responses: 260 Number of blank responses: 21 Table B19 & Figure B19: Respondents were asked who conducts maintenance and/or repairs at their facility/facilities, and given a series of answer choices, as well as the opportunity to select “Other” and provide more specific information. The percent of the 260 completed responses indicating each of the five answer choices is given in this table. Table B19.
Answer Percent of total
responses Employee 1.6%
Contracted compliance service provider 31.8% Licensed pollutant storage system contractor 53.7%
Environmental consulting firm 0.1% Other (Please specify): 10.4%
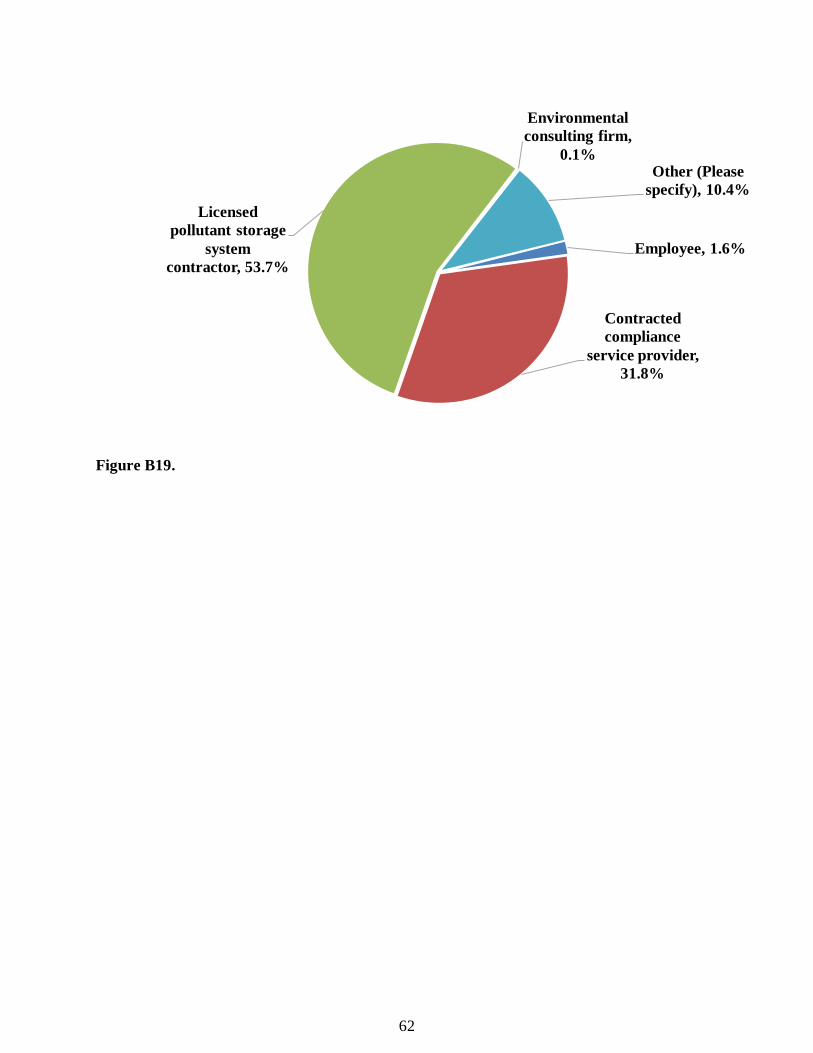
62
Figure B19.
Employee, 1.6%
Contracted compliance
service provider, 31.8%
Licensed pollutant storage
system contractor, 53.7%
Environmental consulting firm,
0.1%Other (Please
specify), 10.4%
63
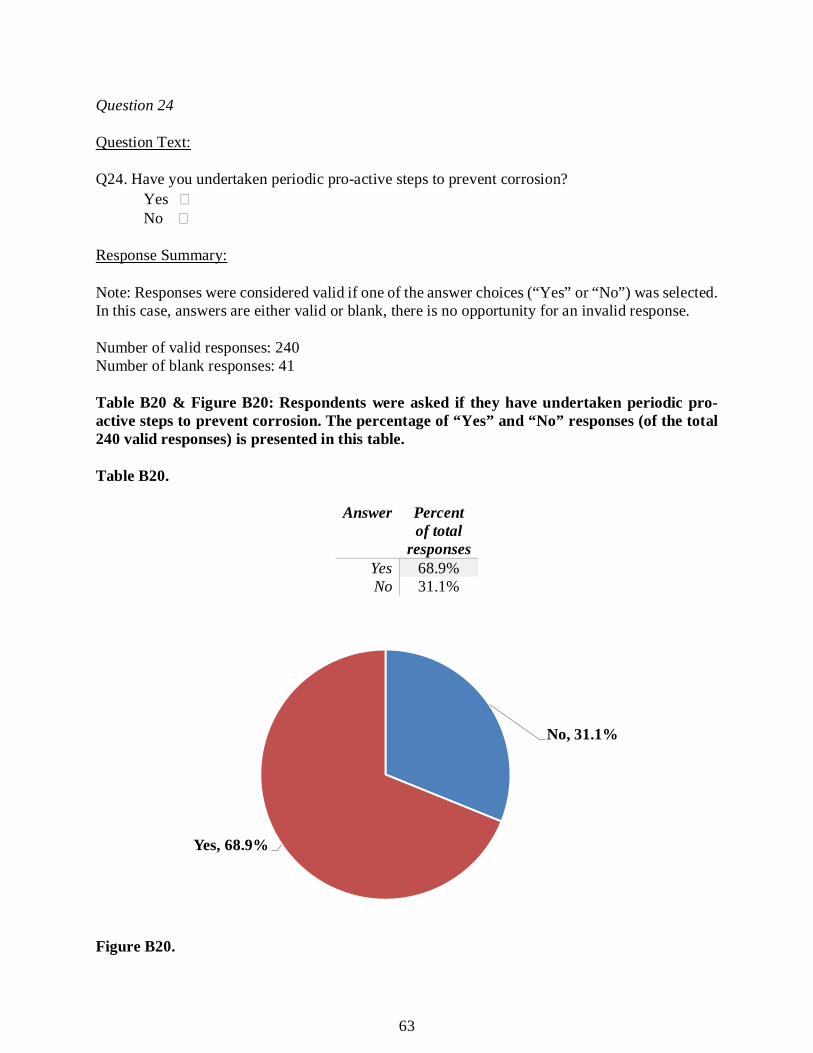
Question 24
Question Text:
Q24. Have you undertaken periodic pro-active steps to prevent corrosion? Yes � No �
Response Summary:
Note: Responses were considered valid if one of the answer choices (“Yes” or “No”) was selected. In this case, answers are either valid or blank, there is no opportunity for an invalid response. Number of valid responses: 240 Number of blank responses: 41 Table B20 & Figure B20: Respondents were asked if they have undertaken periodic pro-active steps to prevent corrosion. The percentage of “Yes” and “No” responses (of the total 240 valid responses) is presented in this table. Table B20.
Answer Percent of total
responses Yes 68.9% No 31.1%
Figure B20.
No, 31.1%
Yes, 68.9%
64
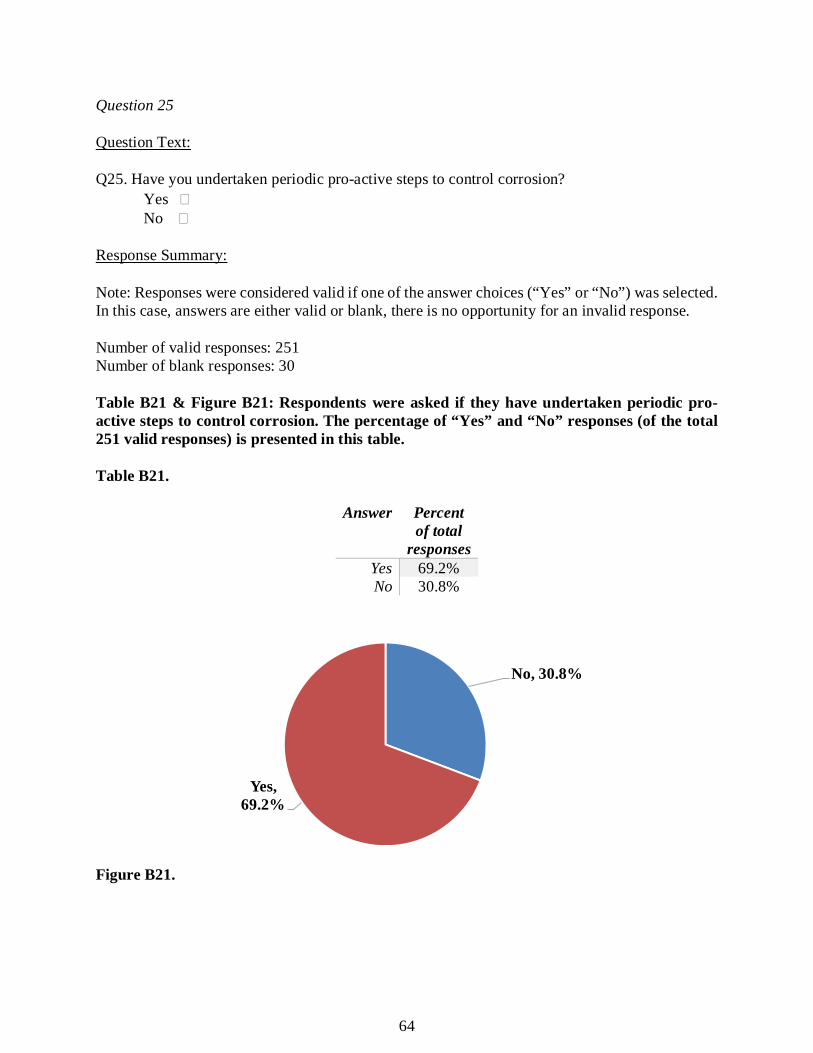
Question 25
Question Text:
Q25. Have you undertaken periodic pro-active steps to control corrosion? Yes � No �
Response Summary:
Note: Responses were considered valid if one of the answer choices (“Yes” or “No”) was selected. In this case, answers are either valid or blank, there is no opportunity for an invalid response. Number of valid responses: 251 Number of blank responses: 30 Table B21 & Figure B21: Respondents were asked if they have undertaken periodic pro-active steps to control corrosion. The percentage of “Yes” and “No” responses (of the total 251 valid responses) is presented in this table. Table B21.
Answer Percent of total
responses Yes 69.2% No 30.8%
Figure B21.
No, 30.8%
Yes, 69.2%

65
Question 26
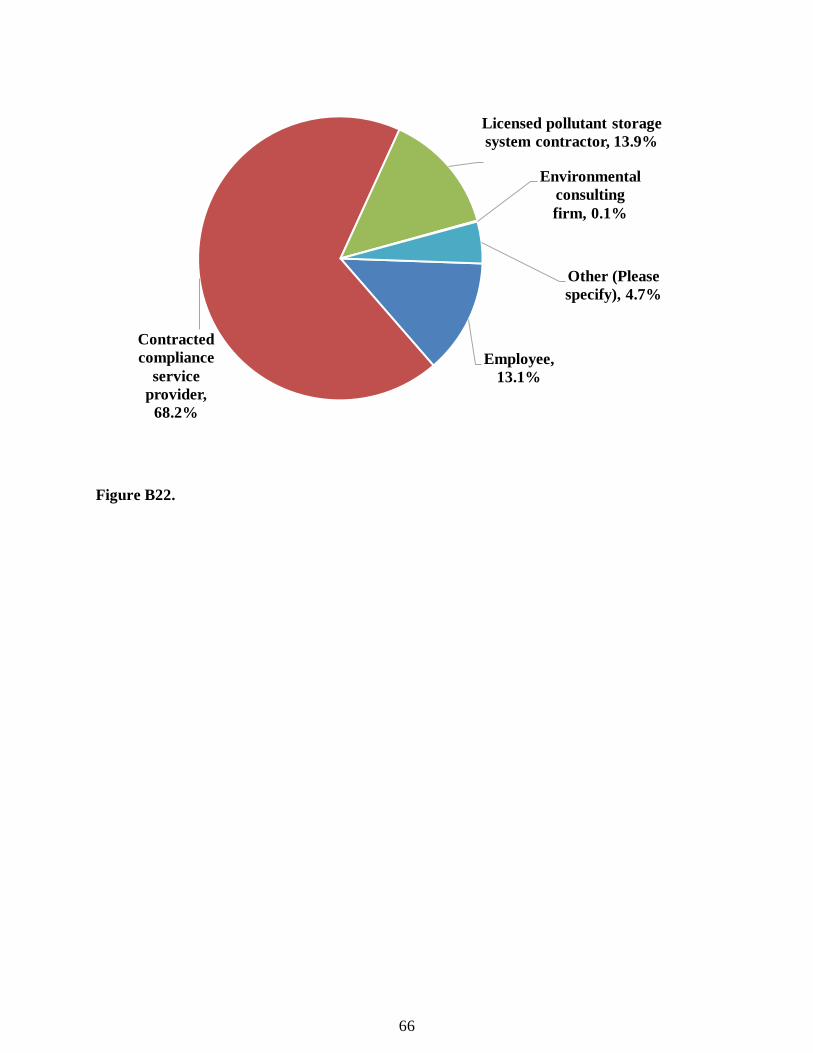
Question Text:
Q26. Who conducts corrosion control maintenance at your facility/facilities? Employee � Contracted compliance service provider � Licensed pollutant storage system contractor � Environmental consulting firm � Other (Please specify) �
Response Summary:
Note: Responses were considered valid if one of the answer choices was selected. In this case, answers are either valid or blank, there is no opportunity for an invalid response. Number of valid responses: 239 Number of blank responses: 42 Table B22 & Figure B22: Respondents were asked who conducts corrosion control maintenance at their facility/facilities, and given a series of answer choices, as well as the opportunity to select “Other” and provide more specific information. Results are weighted according to the number of tanks associated with each respondent and the percent of the 239 completed responses indicating each of the five answer choices is given in this table. Table B22.
Answer Percent of total
responses Employee 13.1%
Contracted compliance service provider 68.2% Licensed pollutant storage system contractor 13.9%
Environmental consulting firm 0.1% Other (Please specify): 4.7%
66
Figure B22.
Employee, 13.1%
Contracted compliance
service provider,
68.2%
Licensed pollutant storage system contractor, 13.9%
Environmental consulting firm, 0.1%
Other (Please specify), 4.7%

67
Question 27
Question Text:
Q27. What has been the cost of repairs because of ethanol or biodiesel on all your tank systems in the last 5 years?
Less than $15,000 � Between $15,000 - $150,000 � Between $150,000 - $250,000 � Between $250,000 - $500,000 � Greater than $500,000 �
Response Summary:
Note: Responses were considered valid if one of the answer choices was selected. In this case, answers are either valid or blank, there is no opportunity for an invalid response. Number of valid responses: 204 Number of blank responses: 78 Table B23 & Figure B23: Respondents were asked to provide the cost of repairs because of ethanol- or biodiesel-related damages on all of their tank systems in the last five years, and given a series of monetary ranges to choose from. The percentage of the 204 valid responses indicating each range are given in this table. Because the responses suggest that the respondents were considering all tank systems associated with their Owner Identification Number, results were not weighted according to number of tanks. Table B23.
Answer Percent of total
responses Less than $15,000 69.1%
Between $15,000 - $150,000 21.6% Between $150,000 - $250,000 2.5% Between $250,000 - $500,000 2.9%
Greater than $500,000 3.9%
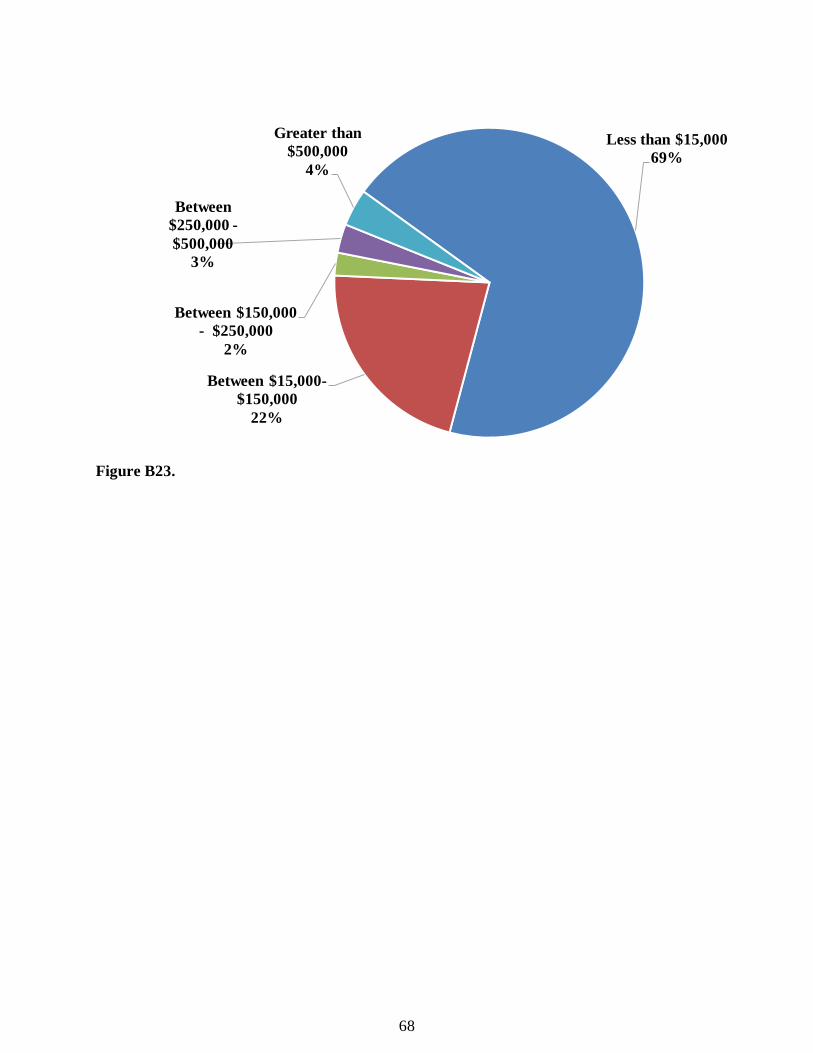
68
Figure B23.
Less than $15,00069%
Between $15,000-$150,000
22%
Between $150,000 - $250,000
2%
Between $250,000 -$500,000
3%
Greater than $500,000
4%

69
Question 28
Question Text:
Q28. Has your facility installed dispensers or other components with funding under the Biofuels Infrastructure Partnership from the Florida Department of Agriculture?
Yes � No �
Response Summary:
Note: Responses were considered valid if one of the answer choices (“Yes” or “No”) was selected. In this case, answers are either valid or blank, there is no opportunity for an invalid response. Number of valid responses: 251 Number of blank responses: 30 Table B26 & Figure B24: Respondents were asked if they installed dispensers or other components with funding provided under the Biofuels Infrastructure Partnership from the Florida Department of Agriculture and Consumer Services. The percentage of “Yes” and “No” responses (of the total 251 valid responses) is presented in this table and pie chart. Table B26.
Answer Percent of total responses
Yes 1.3% No 98.7%
Figure B24.
Yes, 1.3%
No, 98.7%

70
APPENDIX C: TANK SPECIALTY CONTRACTORS AND SERVICE PROVIDERS RESULTS
Question 1-3
The questions 1-3 were for identification purposes and were not analyzed.
Question 4
Question Text:
Q4. How many petroleum storage facilities have you provided services for in the last 5 years? � Fewer than 25 � 25 to 100 � More than 100
Response Summary:
Responses were considered valid if one of the answer choices was selected. In this case, answers are either valid or blank, there is no opportunity for an invalid response. Number of valid responses: 9 Number of blank responses: 0 Table C1 & Figure C1: Respondents were asked how many petroleum storage facilities they provided services for in the last five years, and given three answer choices with ranges from less than 25 to more than 100 facilities. The percentage of the nine completed responses for each answer choice is given in this table/pie chart. Table C1.
Number of Facilities Percent of respondents Fewer than 25 0%
25 to 100 22% More than 100 78%
Figure C1.
Fewer than 25, 0%
25 to 100, 22%
More than 100, 78%

71
Question 5
Question Text:
Q5. How long have you had your PSSC license? � Fewer than 5 years � 5 to 10 years � More than 10 years
Response Summary:
Responses were considered valid if one of the answer choices was selected. In this case, answers are either valid or blank, there is no opportunity for an invalid response. Number of valid responses: 9 Number of blank responses: 0 Table C2: Respondents were asked how long they have had their PSSC license and given three answer choices with ranges from less than 5 to more than 10 years. The percentage of the nine completed responses for each answer choice is given in this table.
Number of Facilities Percent of respondents Fewer than 5 0% 5 to 10 years 0%
More than 10 years 100%

72
Question 6
Question Text:
Q6. If you have been a PSSC greater than 10 years, have you noticed an increase in the amount of corrosion damage in underground storage systems?
� Yes � No � N/A (PSSC less than 10 years)
Response Summary:
Responses were considered valid if one of the answer choices was selected. In this case, answers are either valid or blank, there is no opportunity for an invalid response. Number of valid responses: 8 Number of blank responses: 1 Table C3: Respondents were asked (if they have been a PSSC more than 10 years) if they have noticed an increase in the amount of corrosion damage in underground storage systems. The percentage of “Yes,” “No” and “N/A (PSSC less than 10 years)” responses (of the total eight valid responses) is presented in this table.
Number of Facilities Percent of respondents Yes 100% No <1%
N/A (PSSC less than 10 years) <1%

73
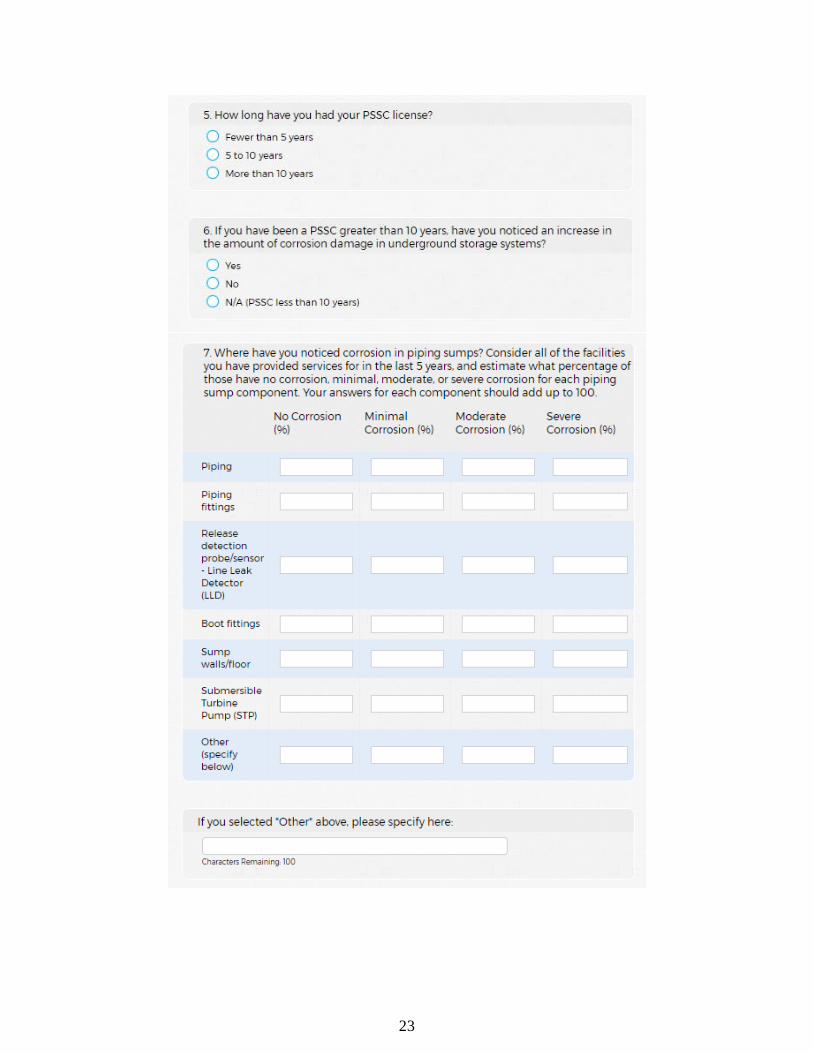
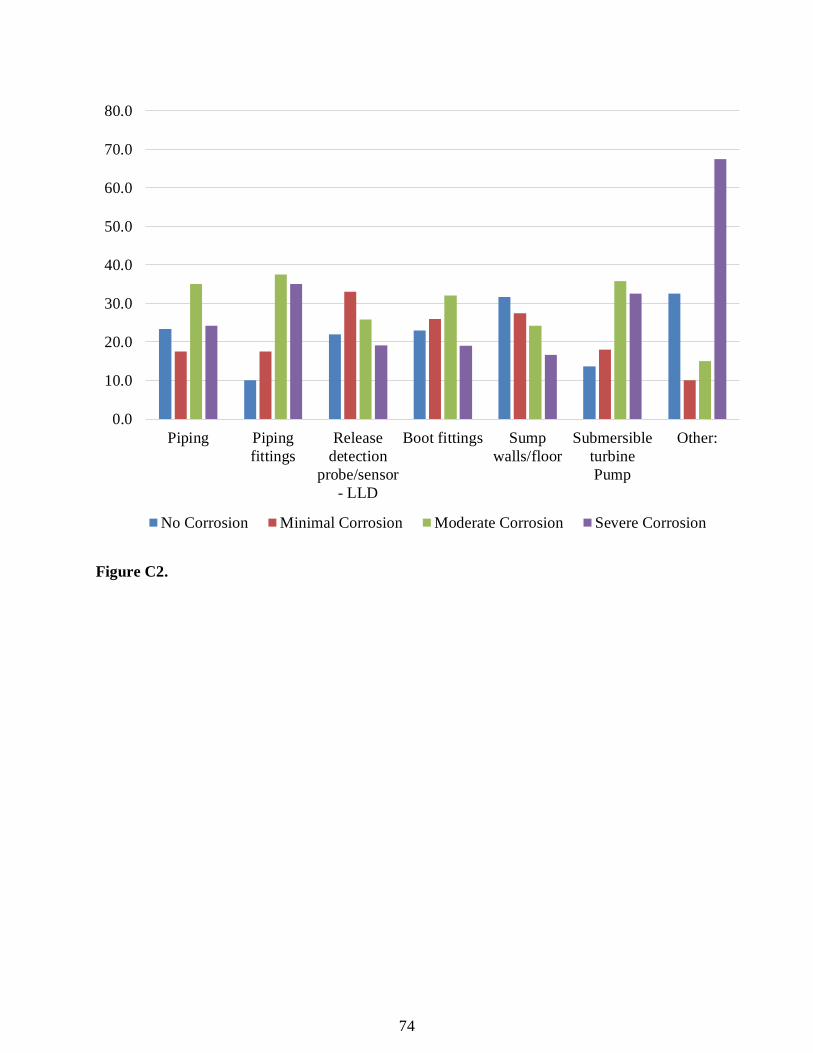
Question 7
Question Text:
Q7. Where have you noticed corrosion in piping sumps? Consider all of the facilities you have provided services for in the last 5 years, and estimate what percentage of those have no corrosion, minimal, moderate, or severe corrosion for each piping sump component. Your answers for each component should add up to 100.
Response Summary:
Note: Responses were considered valid if the sum of the four entries was equal to 100. Average corrosion levels were calculated using only valid responses. Table C4 & Figure C2: Respondents were asked if they have noticed corrosion on any of an assortment of piping sump components at facilities they had provided service for in the last five years, and to estimate what percentage of those have no corrosion, minimal, moderate, or severe corrosion for each component. In order to be considered valid, answers for each component must add up to 100. The number of valid, invalid and blank responses, as well as the average of the valid responses for each component are presented in this table/bar graph. Table C4.
Piping Piping fittings
Release detection
probe/sensor - LLD
Boot fittings
Sump walls/floor
Submersible turbine Pump
Other:
Number of valid
responses
6 6 6 5 6 6 2
Number of invalid
responses
2 3 2 3 0 3 1
Number of blank
responses
1 0 1 1 3 0 6
Corrosion Level
% % % % % % %
No Corrosion
23.3 10.0 22.0 23.0 31.7 13.7 32.5
Minimal Corrosion
17.5 17.5 33.0 26.0 27.5 18.0 10.0
Moderate Corrosion
35.0 37.5 25.8 32.0 24.2 35.8 15.0
Severe Corrosion
24.2 35.0 19.2 19.0 16.7 32.5 67.5
74
Figure C2.
0.0
10.0
20.0
30.0
40.0
50.0
60.0
70.0
80.0
Piping Pipingfittings
Releasedetection
probe/sensor- LLD
Boot fittings Sumpwalls/floor
SubmersibleturbinePump
Other:
No Corrosion Minimal Corrosion Moderate Corrosion Severe Corrosion
75
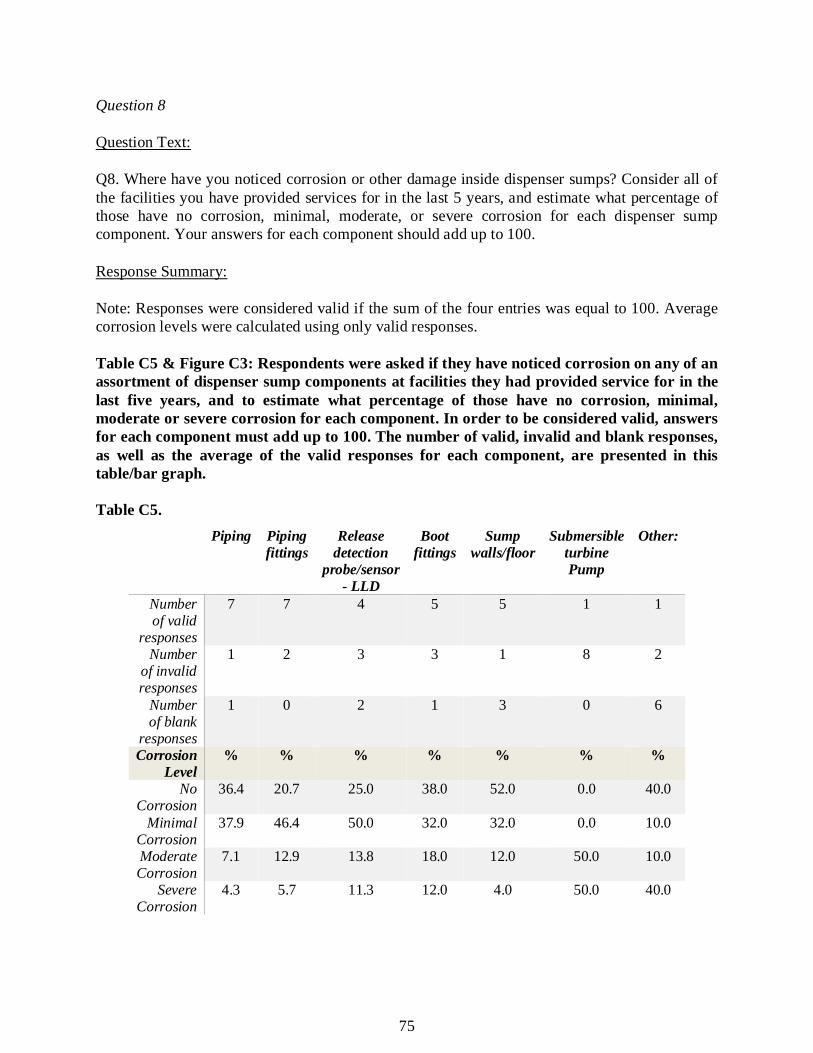
Question 8
Question Text:
Q8. Where have you noticed corrosion or other damage inside dispenser sumps? Consider all of the facilities you have provided services for in the last 5 years, and estimate what percentage of those have no corrosion, minimal, moderate, or severe corrosion for each dispenser sump component. Your answers for each component should add up to 100.
Response Summary:
Note: Responses were considered valid if the sum of the four entries was equal to 100. Average corrosion levels were calculated using only valid responses. Table C5 & Figure C3: Respondents were asked if they have noticed corrosion on any of an assortment of dispenser sump components at facilities they had provided service for in the last five years, and to estimate what percentage of those have no corrosion, minimal, moderate or severe corrosion for each component. In order to be considered valid, answers for each component must add up to 100. The number of valid, invalid and blank responses, as well as the average of the valid responses for each component, are presented in this table/bar graph. Table C5.
Piping Piping fittings
Release detection
probe/sensor - LLD
Boot fittings
Sump walls/floor
Submersible turbine Pump
Other:
Number of valid
responses
7 7 4 5 5 1 1
Number of invalid responses
1 2 3 3 1 8 2
Number of blank
responses
1 0 2 1 3 0 6
Corrosion Level
% % % % % % %
No Corrosion
36.4 20.7 25.0 38.0 52.0 0.0 40.0
Minimal Corrosion
37.9 46.4 50.0 32.0 32.0 0.0 10.0
Moderate Corrosion
7.1 12.9 13.8 18.0 12.0 50.0 10.0
Severe Corrosion
4.3 5.7 11.3 12.0 4.0 50.0 40.0

76
Figure C3.
0
10
20
30
40
50
60
Piping Pipingfittings
Releasedetection
probe/sensor- LLD
Boot fittings Sumpwalls/floor
SubmersibleturbinePump
Other:
No Corrosion Minimal Corrosion Moderate Corrosion Severe Corrosion

77
Question 9
Question Text:
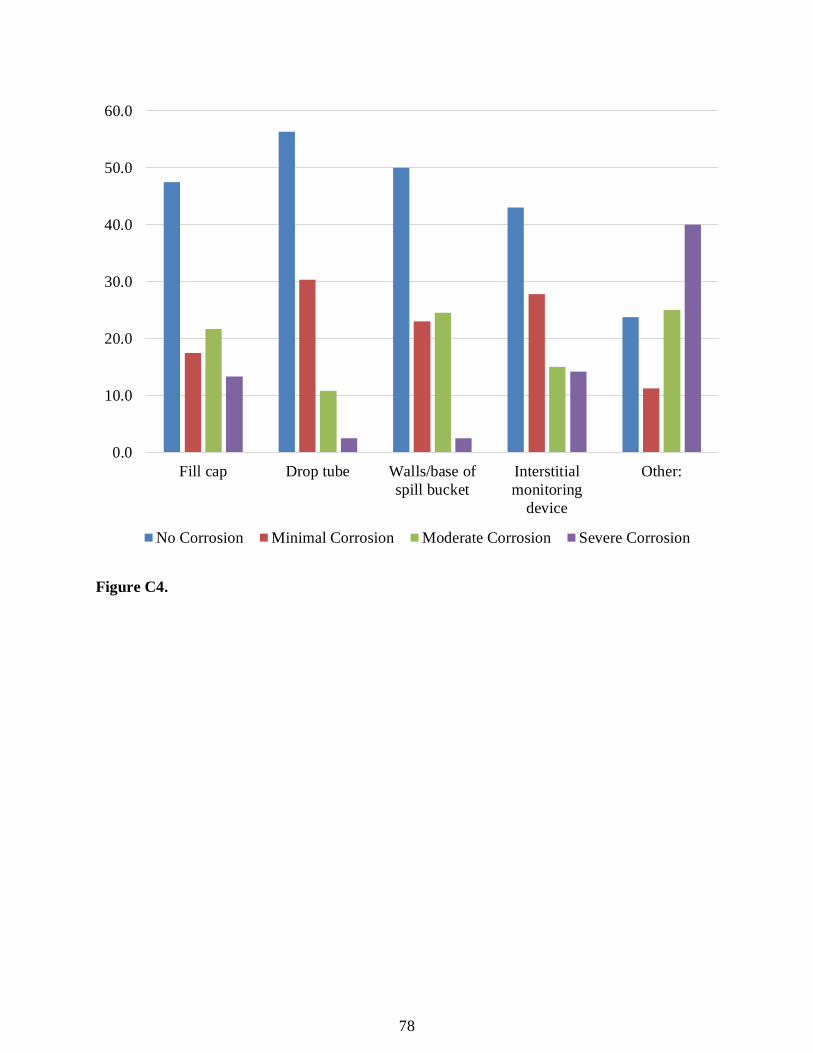
Q9. Where have you noticed corrosion or other damage inside spill containment systems like spill buckets? Consider all of the facilities you have provided services for in the last 5 years, and estimate what percentage of those have no corrosion, minimal, moderate, or severe corrosion for each spill containment system component. Your answers for each component should add up to 100.
Response Summary:
Note: Responses were considered valid if the sum of the four entries was equal to 100. Average corrosion levels were calculated using only valid responses. Table C6 & Figure C4: Respondents were asked if they have noticed corrosion on any of an assortment of spill containment system components at facilities they had provided service for in the last five years, and to estimate what percentage of those have no corrosion, minimal, moderate or severe corrosion for each component. In order to be considered valid, answers for each component must add up to 100. The number of valid, invalid and blank responses, as well as the average of the valid responses for each component, are presented in this table/bar graph. Table C6.
Fill cap
Drop tube
Walls/base of spill bucket
Interstitial monitoring
device
Other:
Number of valid responses 6 6 6 6 4 Number of invalid responses 3 3 3 2 1
Number of blank responses 0 0 0 1 4 Corrosion Level % % % % %
No Corrosion 47.5 56.3 50.0 43.0 23.8 Minimal Corrosion 17.5 30.3 23.0 27.8 11.3
Moderate Corrosion 21.7 10.8 24.5 15.0 25.0 Severe Corrosion 13.3 2.5 2.5 14.2 40.0
78
Figure C4.
0.0
10.0
20.0
30.0
40.0
50.0
60.0
Fill cap Drop tube Walls/base ofspill bucket
Interstitialmonitoring
device
Other:
No Corrosion Minimal Corrosion Moderate Corrosion Severe Corrosion
79
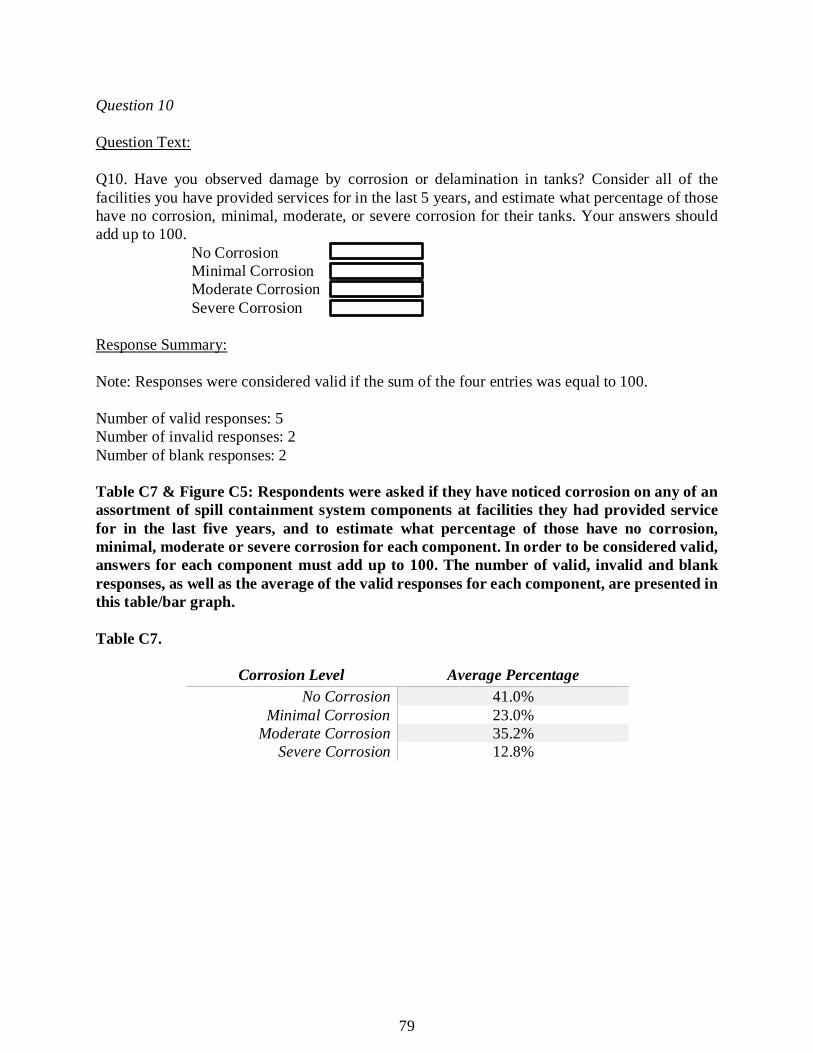
Question 10
Question Text:
Q10. Have you observed damage by corrosion or delamination in tanks? Consider all of the facilities you have provided services for in the last 5 years, and estimate what percentage of those have no corrosion, minimal, moderate, or severe corrosion for their tanks. Your answers should add up to 100.
No Corrosion Minimal Corrosion Moderate Corrosion Severe Corrosion
Response Summary:
Note: Responses were considered valid if the sum of the four entries was equal to 100. Number of valid responses: 5 Number of invalid responses: 2 Number of blank responses: 2 Table C7 & Figure C5: Respondents were asked if they have noticed corrosion on any of an assortment of spill containment system components at facilities they had provided service for in the last five years, and to estimate what percentage of those have no corrosion, minimal, moderate or severe corrosion for each component. In order to be considered valid, answers for each component must add up to 100. The number of valid, invalid and blank responses, as well as the average of the valid responses for each component, are presented in this table/bar graph. Table C7.
Corrosion Level Average Percentage No Corrosion 41.0%
Minimal Corrosion 23.0% Moderate Corrosion 35.2%
Severe Corrosion 12.8%

80
Figure C5.
0
10
20
30
40
50
No Corrosion Minimal Corrosion Moderate Corrosion Severe Corrosion

81
Question 11
Question Text:
Q11. How often do you find corrosion or delamination on the given materials below? Your answers do not need to add up to 100. Steel Copper Brass Aluminum Fiber-Reinforced Plastic (FRP)
Response Summary:
Note: Responses were considered valid if any text was input, even if it was a zero. Responses would be considered invalid if an individual number greater than 100 was input, however, there were no instances of that happening. Number of valid responses: 8 Number of invalid responses: 0 Number of blank responses: 1 Table C8 & Figure C6: Respondents were asked how often they find corrosion or delamination on steel, copper, brass, aluminum and fiberglass-reinforced plastic. An average of the eight valid responses for each material are presented in this table. Table C8.
Answer Percent of total responses Steel 70.6%
Copper 27.5% Brass 23.1%
Aluminum 17.8% FRP 8.8%
Figure C6.
020406080
Steel Copper Brass Aluminum FRP
82
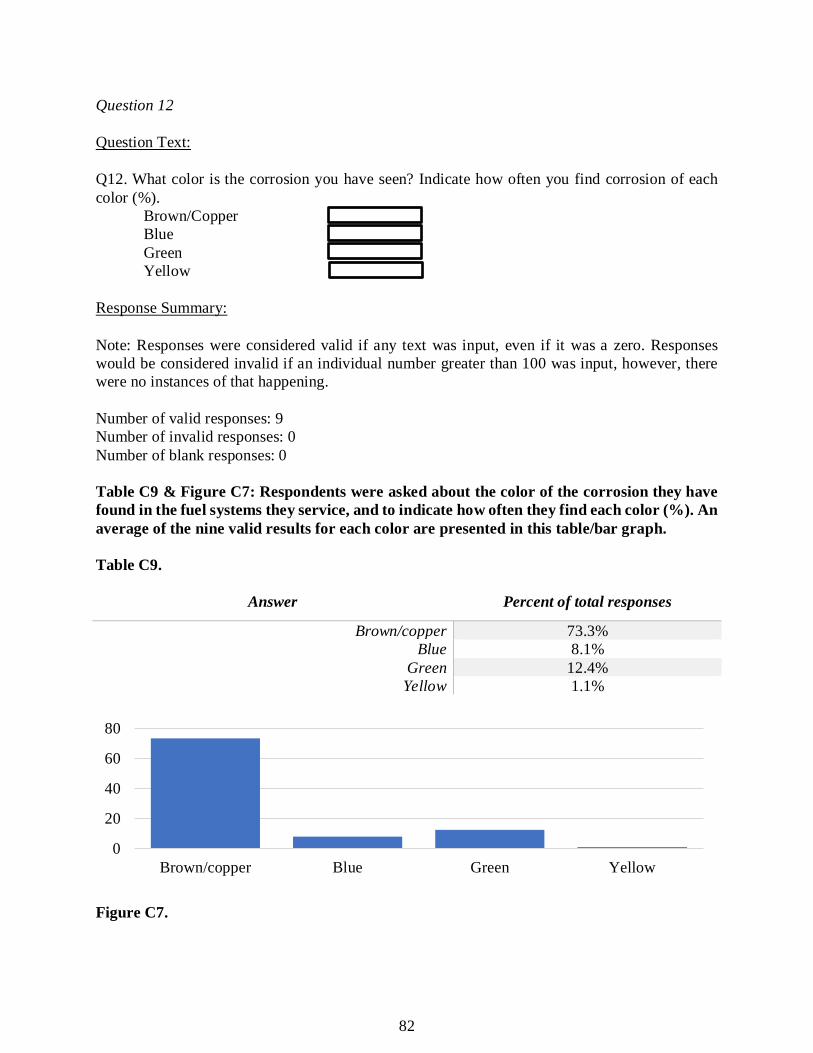
Question 12
Question Text:
Q12. What color is the corrosion you have seen? Indicate how often you find corrosion of each color (%).
Brown/Copper Blue Green Yellow
Response Summary:
Note: Responses were considered valid if any text was input, even if it was a zero. Responses would be considered invalid if an individual number greater than 100 was input, however, there were no instances of that happening. Number of valid responses: 9 Number of invalid responses: 0 Number of blank responses: 0 Table C9 & Figure C7: Respondents were asked about the color of the corrosion they have found in the fuel systems they service, and to indicate how often they find each color (%). An average of the nine valid results for each color are presented in this table/bar graph. Table C9.
Answer Percent of total responses
Brown/copper 73.3% Blue 8.1%
Green 12.4% Yellow 1.1%
Figure C7.
0
20
40
60
80
Brown/copper Blue Green Yellow
83
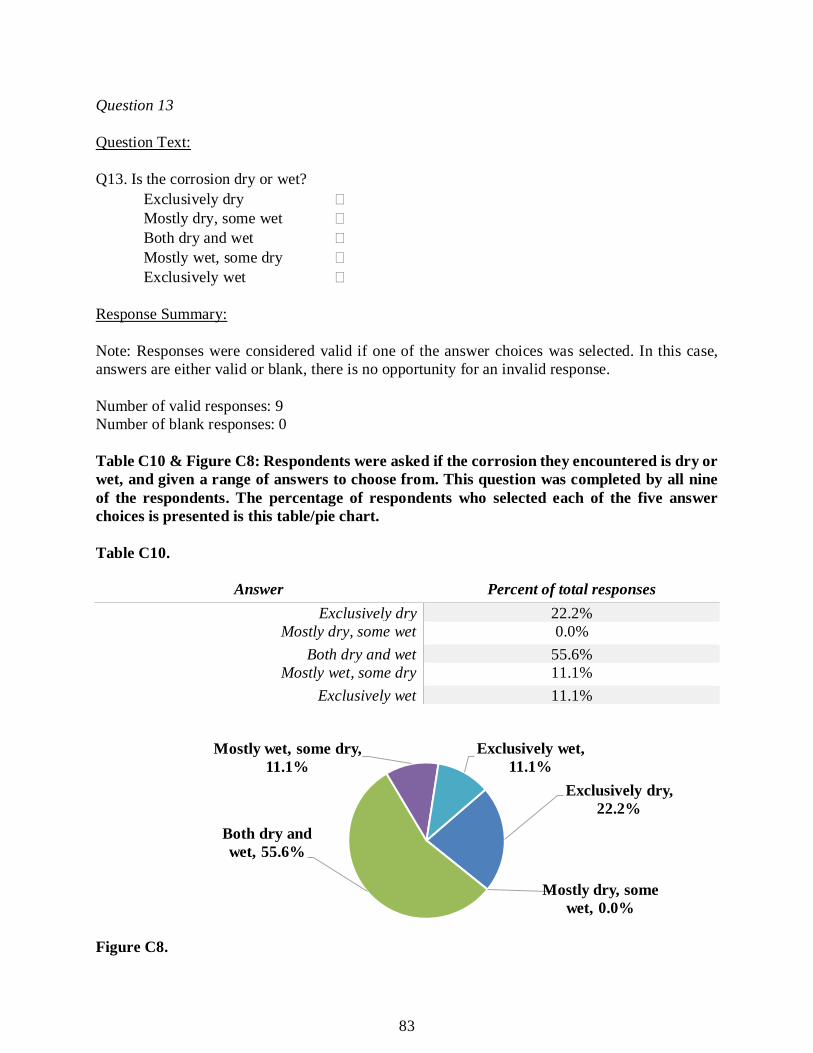
Question 13
Question Text:
Q13. Is the corrosion dry or wet? Exclusively dry � Mostly dry, some wet � Both dry and wet � Mostly wet, some dry � Exclusively wet �
Response Summary:
Note: Responses were considered valid if one of the answer choices was selected. In this case, answers are either valid or blank, there is no opportunity for an invalid response. Number of valid responses: 9 Number of blank responses: 0 Table C10 & Figure C8: Respondents were asked if the corrosion they encountered is dry or wet, and given a range of answers to choose from. This question was completed by all nine of the respondents. The percentage of respondents who selected each of the five answer choices is presented is this table/pie chart. Table C10.
Answer Percent of total responses Exclusively dry 22.2%
Mostly dry, some wet 0.0% Both dry and wet 55.6%
Mostly wet, some dry 11.1% Exclusively wet 11.1%
Figure C8.
Exclusively dry, 22.2%
Mostly dry, some wet, 0.0%
Both dry and wet, 55.6%
Mostly wet, some dry, 11.1%
Exclusively wet, 11.1%
84
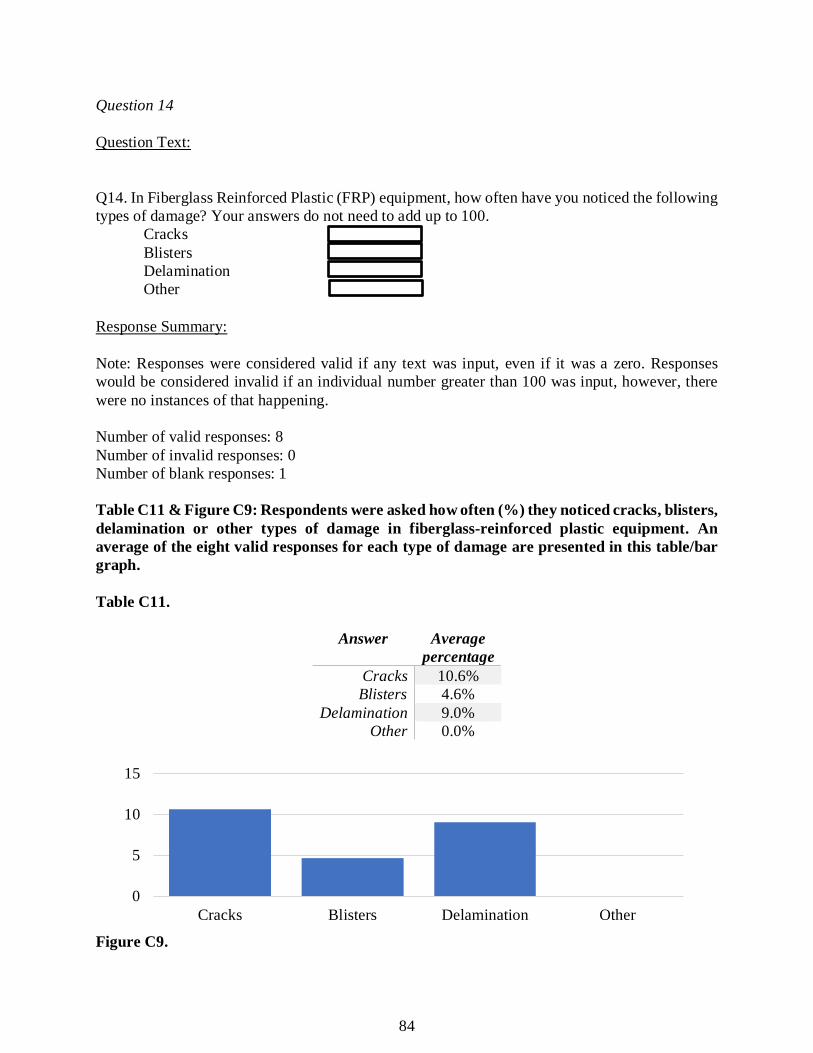
Question 14
Question Text:
Q14. In Fiberglass Reinforced Plastic (FRP) equipment, how often have you noticed the following types of damage? Your answers do not need to add up to 100.
Cracks Blisters Delamination Other
Response Summary:
Note: Responses were considered valid if any text was input, even if it was a zero. Responses would be considered invalid if an individual number greater than 100 was input, however, there were no instances of that happening. Number of valid responses: 8 Number of invalid responses: 0 Number of blank responses: 1 Table C11 & Figure C9: Respondents were asked how often (%) they noticed cracks, blisters, delamination or other types of damage in fiberglass-reinforced plastic equipment. An average of the eight valid responses for each type of damage are presented in this table/bar graph. Table C11.
Answer Average percentage
Cracks 10.6% Blisters 4.6%
Delamination 9.0% Other 0.0%
Figure C9.
0
5
10
15
Cracks Blisters Delamination Other
85
Question 15
Question Text:
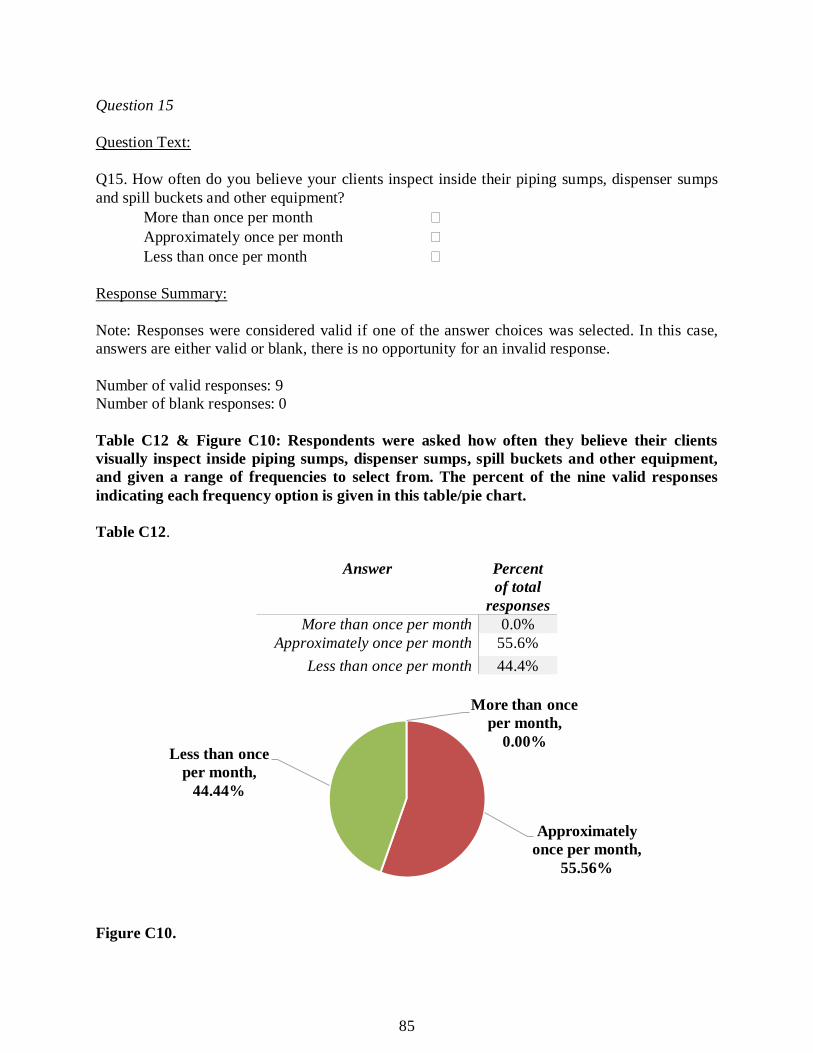
Q15. How often do you believe your clients inspect inside their piping sumps, dispenser sumps and spill buckets and other equipment?
More than once per month � Approximately once per month � Less than once per month �
Response Summary:
Note: Responses were considered valid if one of the answer choices was selected. In this case, answers are either valid or blank, there is no opportunity for an invalid response. Number of valid responses: 9 Number of blank responses: 0 Table C12 & Figure C10: Respondents were asked how often they believe their clients visually inspect inside piping sumps, dispenser sumps, spill buckets and other equipment, and given a range of frequencies to select from. The percent of the nine valid responses indicating each frequency option is given in this table/pie chart. Table C12.
Answer Percent of total
responses More than once per month 0.0%
Approximately once per month 55.6% Less than once per month 44.4%
Figure C10.
More than once per month,
0.00%
Approximately once per month,
55.56%
Less than once per month,
44.44%
86
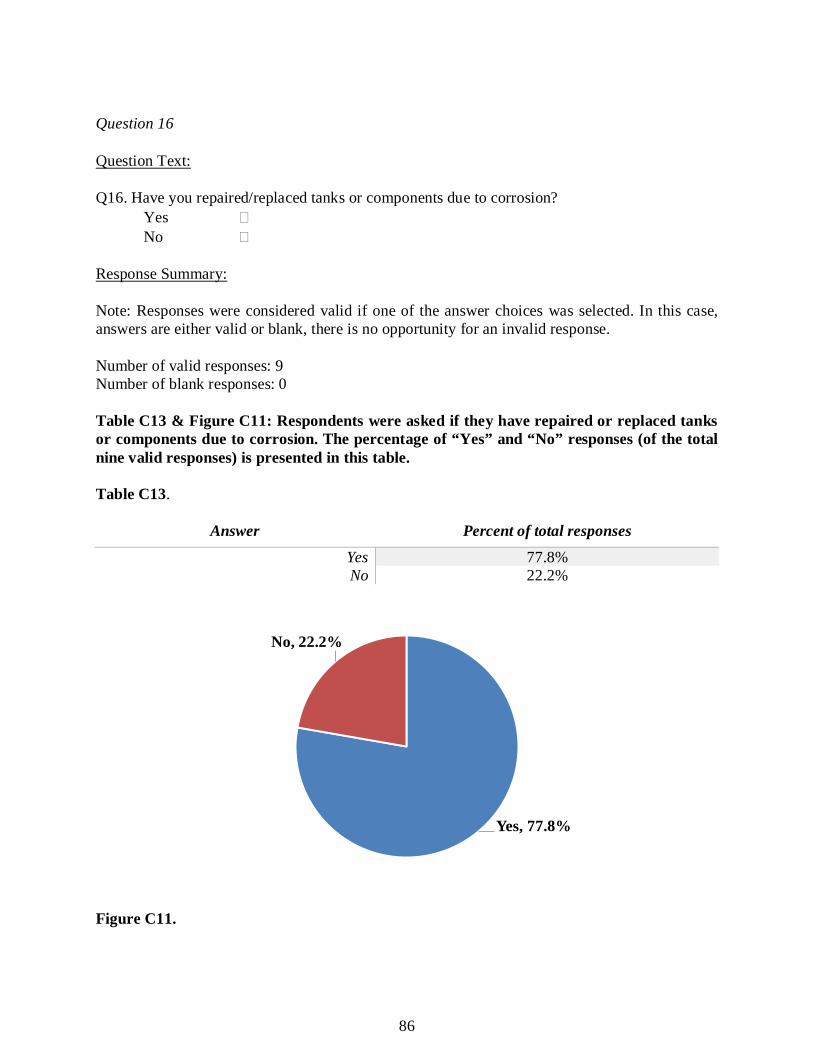
Question 16
Question Text:
Q16. Have you repaired/replaced tanks or components due to corrosion? Yes � No �
Response Summary:
Note: Responses were considered valid if one of the answer choices was selected. In this case, answers are either valid or blank, there is no opportunity for an invalid response. Number of valid responses: 9 Number of blank responses: 0 Table C13 & Figure C11: Respondents were asked if they have repaired or replaced tanks or components due to corrosion. The percentage of “Yes” and “No” responses (of the total nine valid responses) is presented in this table. Table C13.
Answer Percent of total responses
Yes 77.8% No 22.2%
Figure C11.
Yes, 77.8%
No, 22.2%
87
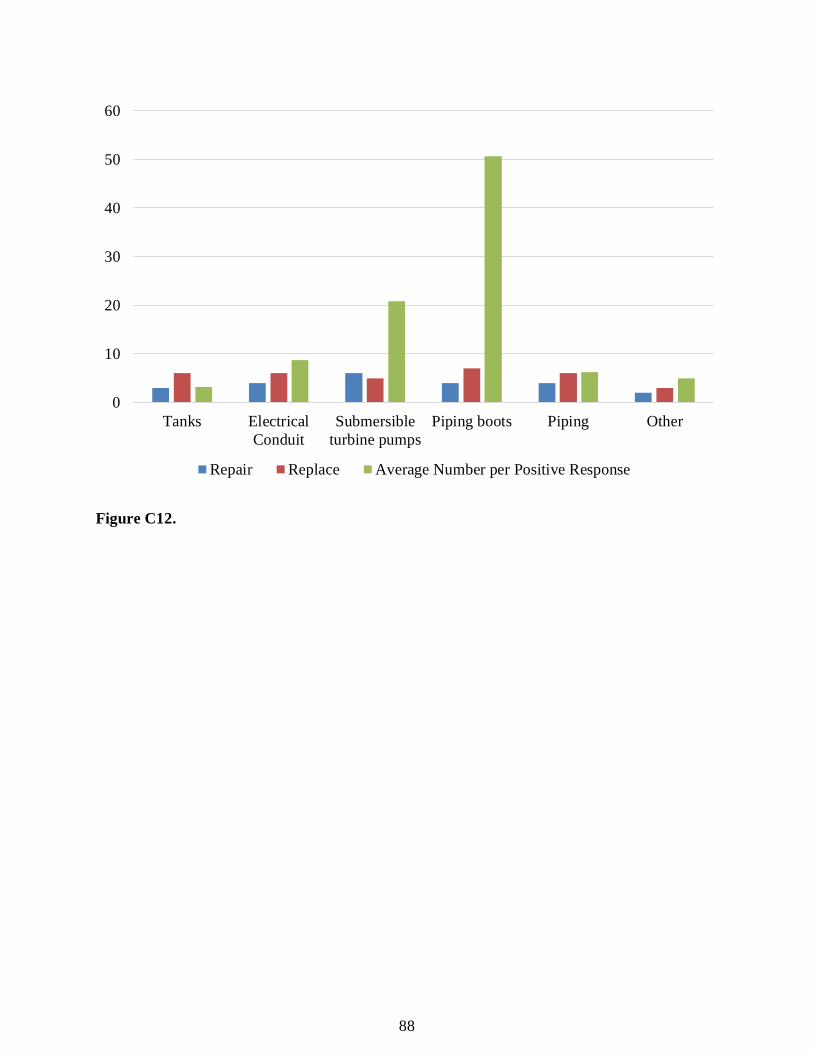
Question 17
Question Text:
Q17. Have you had to repair or replace the following pieces of equipment due to corrosion over the last five years? If so, how many?
Repair Replace # Tanks
Electrical Conduit Submersible turbine pumps
Piping boots Piping Other
Response Summary:
Note: Response rate was difficult to gauge for this question. It may be that most respondents did not repair or replace any of the included components, or that they have left the question blank. In order to provide a conservative estimate, the total number of responses is assumed to be nine, or the total number of completed surveys. Numbers in the table are the total number of “Repair” and “Replace” answers for each component, No. of Positive Responses is the total number of responses with either “Repair,” “Replace” or both selected, and the Average Number per Positive Response is the average of the number of repaired/replaced parts answer provided by the respondents. Number of valid responses: 9 Number of blank responses: 0 Table C14 & Figure C12: Respondents were asked if they had to repair or replace any of a given list of equipment components due to corrosion during the last five years and, if so, how many had been repaired or replaced. The number of respondents indicating that they had repaired or replaced a component during that time frame, as well as the total number of responses indicating either repaired or replaced components and the average number of repaired or replaced parts per positive response is presented in this table. Table C14.
Repair Replace No. of Positive
Responses
Average Number per Positive Response
Tanks 3 6 7 3.1 Electrical Conduit 4 6 8 8.8
Submersible turbine pumps 6 5 9 20.8 Piping boots 4 7 8 50.6
Piping 4 6 7 6.3 Other 2 3 7 5.0
88
Figure C12.
0
10
20
30
40
50
60
Tanks ElectricalConduit
Submersibleturbine pumps
Piping boots Piping Other
Repair Replace Average Number per Positive Response

89
Question 18
Question Text:
Q18. Have you had to repair or replace the following pieces of equipment due to delamination or swelling over the last five years? If so, how many?
Repair Replace # Tanks
Sumps Piping boots
Piping Other
Response Summary:
Note: Response rate was difficult to gauge for this question. It may be that most respondents did not repair or replace any of the included components, or that they have left the question blank. In order to provide a conservative estimate, the total number of responses is assumed to be nine, or the total number of completed surveys. Numbers in the table are the total number of “Repair” and “Replace” answers for each component, No. of Positive Responses is the total number of responses with either “Repair,” “Replace” or both selected, and the Average Number per Positive Response is the average of the number of repaired/replaced parts answer provided by the respondents. Number of valid responses: 9 Number of blank responses: 0 Table C15 & Figure C13: Respondents were asked if they had to repair or replace any of a given list of equipment components due to delamination or swelling during the last five years and, if so, how many had been repaired or replaced. The number of respondents indicating that they had repaired or replaced a component during that time frame, as well as the total number of responses indicating either repaired or replaced components and the average number of repaired or replaced parts per positive response are presented in this table. Table C15.
Repair Replace No. of Positive Responses
Average Number per Positive Response
Tanks 2 1 2 4.0 Sumps 1 4 5 9.6
Piping boots 1 5 6 135.8 Piping 2 3 15 7.5 Other 0 1 1 15.0

90
Figure C13.
0
20
40
60
80
100
120
140
160
Tanks Sumps Piping boots Piping Other
Repair Replace Average Number per Positive Response

91
Question 19
Question Text:
Q19. At facilities where corrosion or delamination required replacement or repair, in your opinion, was the equipment properly maintained (sumps emptied of water and debris when needed, etc.) prior to requiring replacement?
All were maintained properly � More than half were maintained properly � A few were maintained properly � None of the facilities were maintained properly �
Response Summary:
Note: Responses were considered valid if one of the answer choices was selected. In this case, answers are either valid or blank, there is no opportunity for an invalid response. Number of valid responses: 9 Number of blank responses: 0 Table C16 & Figure C14: Respondents were asked, at facilities where corrosion or delamination required replacement or repair, if in their opinion the equipment was properly maintained prior to requiring repair/replacement, and given a range of selections indicating that all, more than or less than half, or none of the facilities were properly maintained. The percentage of the nine responses for each answer choice are presented in this table/pie chart. Table C16.
Answer Percent of total
responses All were maintained properly 44.4%
More than half were maintained properly 33.3% A few were maintained properly 22.2%
None of the facilities were maintained properly 0.0%
Figure C14.
All were maintained
properly, 44.4%More than half
were maintained properly, 33.3%
A few were maintained
properly, 22.2%
None of the facilities were maintained properly, 0.0%
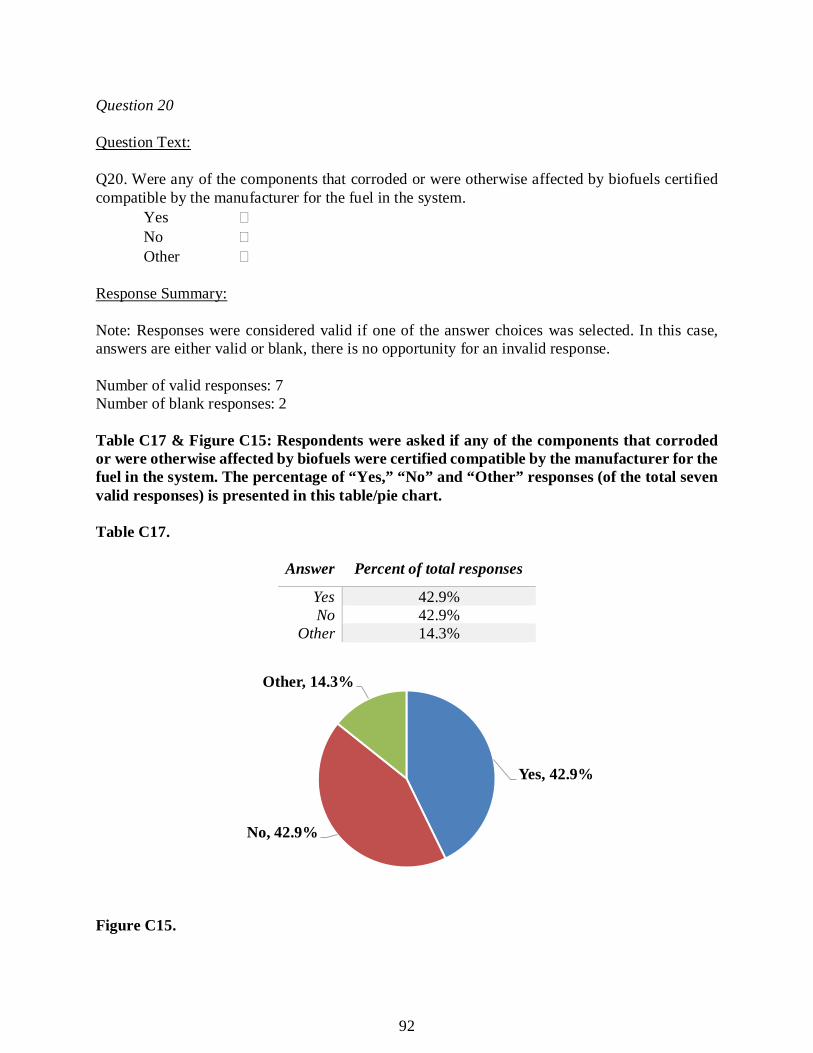
92
Question 20
Question Text:
Q20. Were any of the components that corroded or were otherwise affected by biofuels certified compatible by the manufacturer for the fuel in the system.
Yes � No � Other �
Response Summary:
Note: Responses were considered valid if one of the answer choices was selected. In this case, answers are either valid or blank, there is no opportunity for an invalid response. Number of valid responses: 7 Number of blank responses: 2 Table C17 & Figure C15: Respondents were asked if any of the components that corroded or were otherwise affected by biofuels were certified compatible by the manufacturer for the fuel in the system. The percentage of “Yes,” “No” and “Other” responses (of the total seven valid responses) is presented in this table/pie chart. Table C17.
Answer Percent of total responses
Yes 42.9% No 42.9%
Other 14.3%
Figure C15.
Yes, 42.9%
No, 42.9%
Other, 14.3%
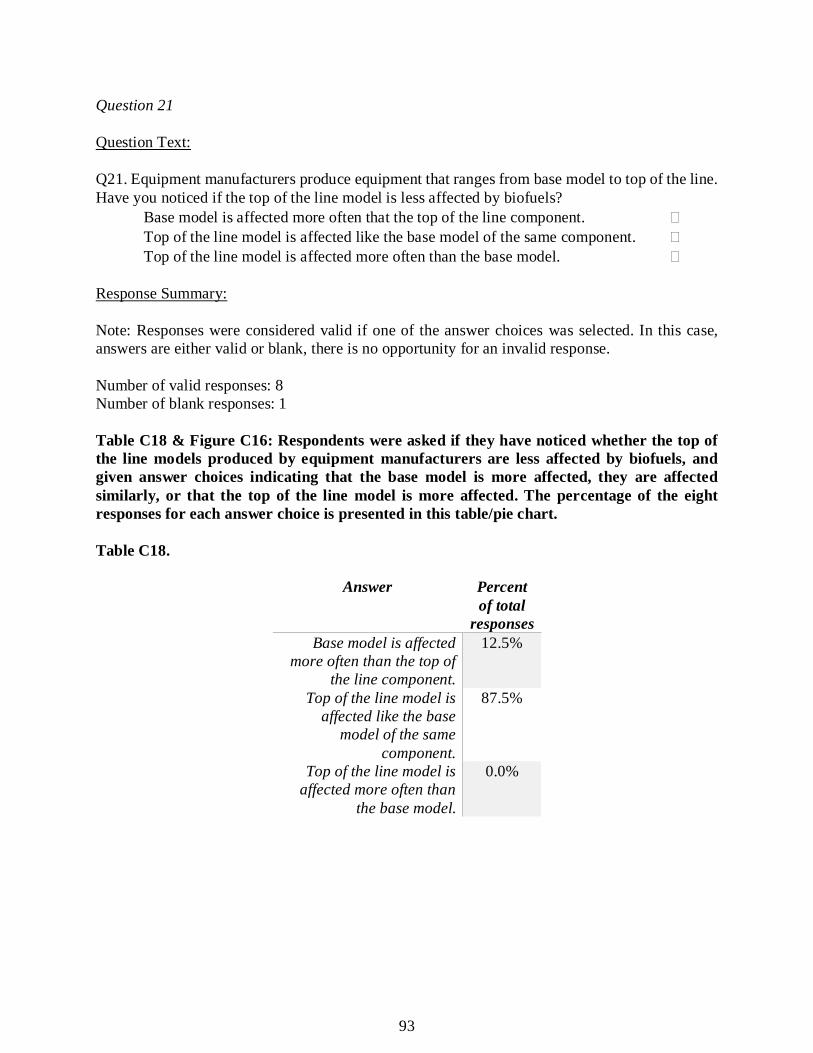
93
Question 21
Question Text:
Q21. Equipment manufacturers produce equipment that ranges from base model to top of the line. Have you noticed if the top of the line model is less affected by biofuels? Base model is affected more often that the top of the line component. � Top of the line model is affected like the base model of the same component. � Top of the line model is affected more often than the base model. �
Response Summary:
Note: Responses were considered valid if one of the answer choices was selected. In this case, answers are either valid or blank, there is no opportunity for an invalid response. Number of valid responses: 8 Number of blank responses: 1 Table C18 & Figure C16: Respondents were asked if they have noticed whether the top of the line models produced by equipment manufacturers are less affected by biofuels, and given answer choices indicating that the base model is more affected, they are affected similarly, or that the top of the line model is more affected. The percentage of the eight responses for each answer choice is presented in this table/pie chart. Table C18.
Answer Percent of total
responses Base model is affected
more often than the top of the line component.
12.5%
Top of the line model is affected like the base
model of the same component.
87.5%
Top of the line model is affected more often than
the base model.
0.0%

94
Figure C16.
Base model is affected more often that the top of the line component.,
12.5%
Top of the line model is affected like the base model of the same component., 87.5%
Top of the line model is affected more often than the base
model., 0.0%
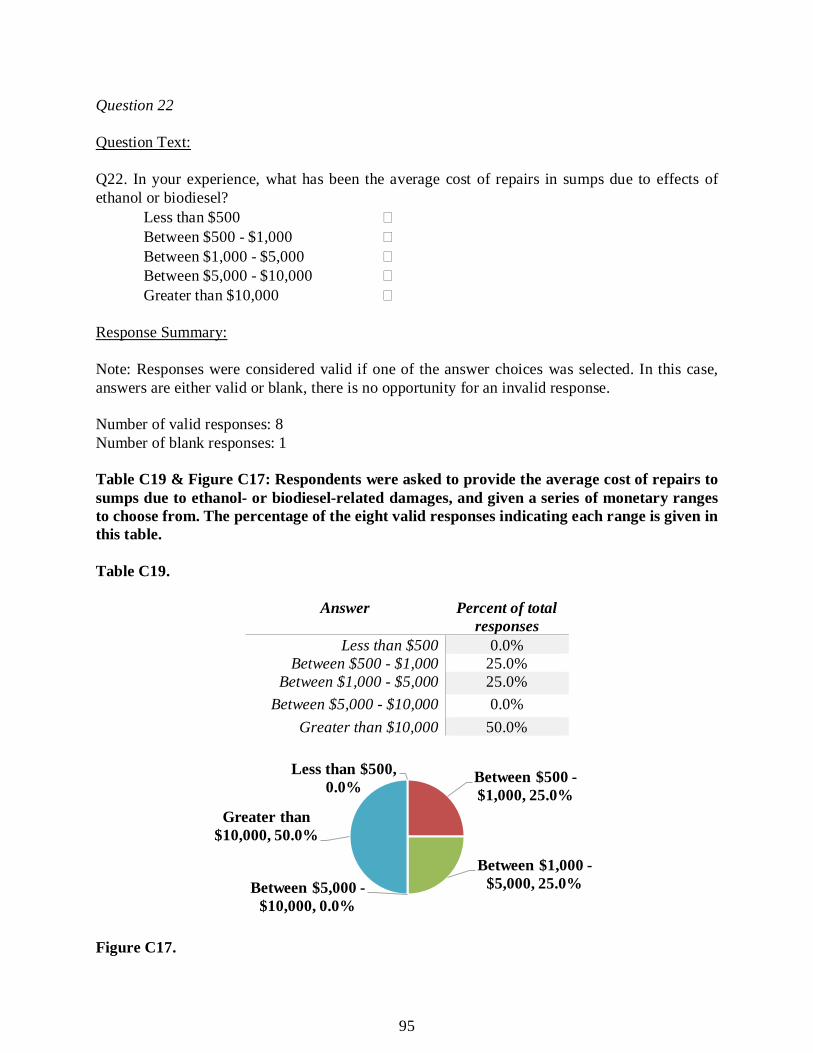
95
Question 22
Question Text:
Q22. In your experience, what has been the average cost of repairs in sumps due to effects of ethanol or biodiesel?
Less than $500 � Between $500 - $1,000 � Between $1,000 - $5,000 � Between $5,000 - $10,000 � Greater than $10,000 �
Response Summary:
Note: Responses were considered valid if one of the answer choices was selected. In this case, answers are either valid or blank, there is no opportunity for an invalid response. Number of valid responses: 8 Number of blank responses: 1 Table C19 & Figure C17: Respondents were asked to provide the average cost of repairs to sumps due to ethanol- or biodiesel-related damages, and given a series of monetary ranges to choose from. The percentage of the eight valid responses indicating each range is given in this table. Table C19.
Answer Percent of total responses
Less than $500 0.0% Between $500 - $1,000 25.0%
Between $1,000 - $5,000 25.0% Between $5,000 - $10,000 0.0%
Greater than $10,000 50.0%
Figure C17.
Less than $500, 0.0% Between $500 -
$1,000, 25.0%
Between $1,000 -$5,000, 25.0%Between $5,000 -
$10,000, 0.0%
Greater than $10,000, 50.0%
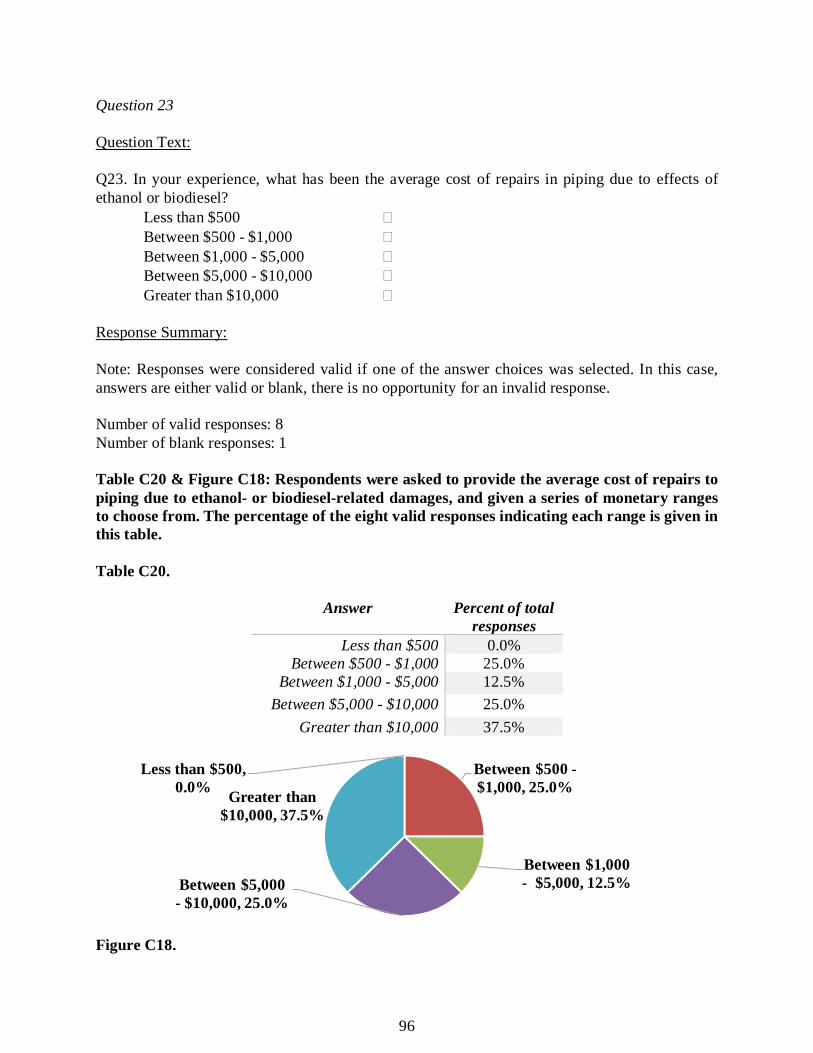
96
Question 23
Question Text:
Q23. In your experience, what has been the average cost of repairs in piping due to effects of ethanol or biodiesel?
Less than $500 � Between $500 - $1,000 � Between $1,000 - $5,000 � Between $5,000 - $10,000 � Greater than $10,000 �
Response Summary:
Note: Responses were considered valid if one of the answer choices was selected. In this case, answers are either valid or blank, there is no opportunity for an invalid response. Number of valid responses: 8 Number of blank responses: 1 Table C20 & Figure C18: Respondents were asked to provide the average cost of repairs to piping due to ethanol- or biodiesel-related damages, and given a series of monetary ranges to choose from. The percentage of the eight valid responses indicating each range is given in this table. Table C20.
Answer Percent of total responses
Less than $500 0.0% Between $500 - $1,000 25.0%
Between $1,000 - $5,000 12.5% Between $5,000 - $10,000 25.0%
Greater than $10,000 37.5%
Figure C18.
Less than $500, 0.0%
Between $500 -$1,000, 25.0%
Between $1,000 - $5,000, 12.5%Between $5,000
- $10,000, 25.0%
Greater than $10,000, 37.5%

97
Question 24
Question Text:
Q24. In your experience, what has been the average cost of repairs for spill containment devices due to effects of ethanol or biodiesel?
Less than $500 � Between $500 - $1,000 � Between $1,000 - $5,000 � Between $5,000 - $10,000 � Greater than $10,000 �
Response Summary:
Note: Responses were considered valid if one of the answer choices was selected. In this case, answers are either valid or blank, there is no opportunity for an invalid response. Number of valid responses: 9 Number of blank responses: 0 Table C21 & Figure C19: Respondents were asked to provide the average cost of repairs to spill containment devices due to ethanol- or biodiesel-related damages, and given a series of monetary ranges to choose from. The percentage of the nine valid responses indicating each range is given in this table. Table C21.
Answer Percent of total responses Less than $500 11.1%
Between $500 - $1,000 11.1% Between $1,000 - $5,000 44.4%
Between $5,000 - $10,000 33.3% Greater than $10,000 0.0%
Figure C19.
Less than $500, 11.1% Between $500 -
$1,000, 11.1%
Between $1,000 -$5,000, 44.4%
Between $5,000 -$10,000, 33.3%
Greater than $10,000, 0.0%
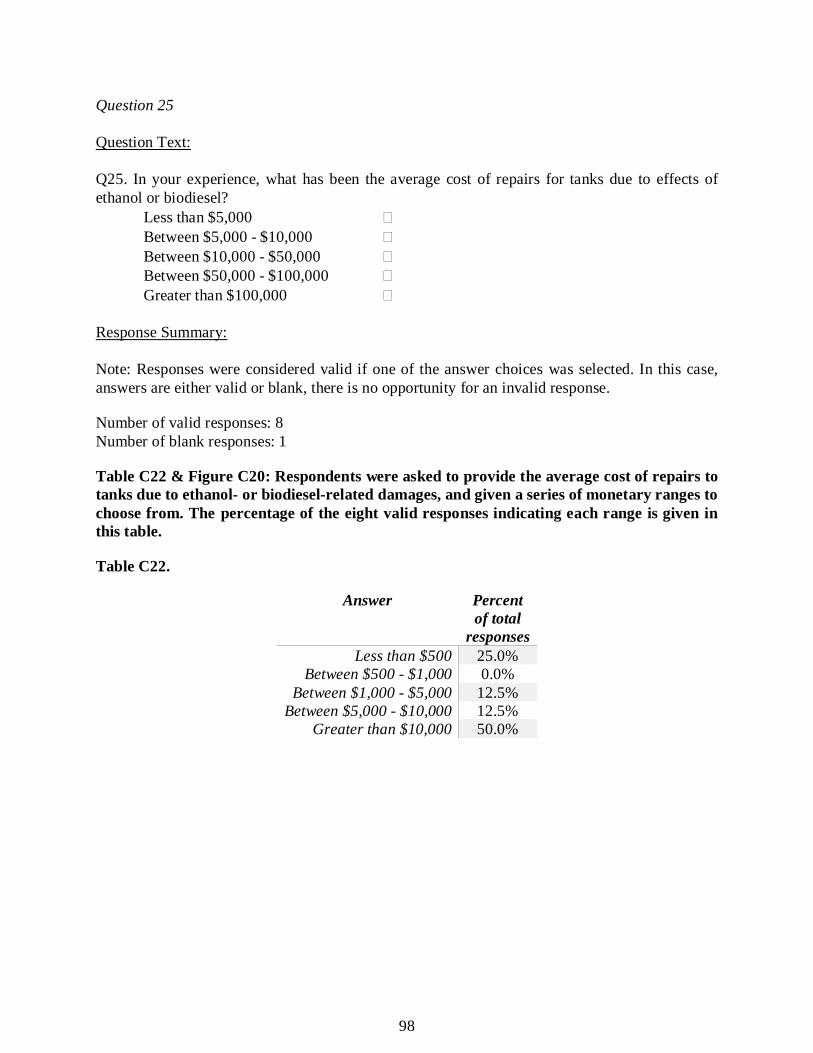
98
Question 25
Question Text:
Q25. In your experience, what has been the average cost of repairs for tanks due to effects of ethanol or biodiesel?
Less than $5,000 � Between $5,000 - $10,000 � Between $10,000 - $50,000 � Between $50,000 - $100,000 � Greater than $100,000 �
Response Summary:
Note: Responses were considered valid if one of the answer choices was selected. In this case, answers are either valid or blank, there is no opportunity for an invalid response. Number of valid responses: 8 Number of blank responses: 1 Table C22 & Figure C20: Respondents were asked to provide the average cost of repairs to tanks due to ethanol- or biodiesel-related damages, and given a series of monetary ranges to choose from. The percentage of the eight valid responses indicating each range is given in this table. Table C22.
Answer Percent of total
responses Less than $500 25.0%
Between $500 - $1,000 0.0% Between $1,000 - $5,000 12.5%
Between $5,000 - $10,000 12.5% Greater than $10,000 50.0%

99
Figure C20.
Less than $5,000, 25.0%
Between $5,000-$10,000, 0.0%
Between $10,000 - $50,000,
12.5%Between $50,000 - $100,000,
12.5%
Greater than $100,000, 50.0%

100
Question 26
Question Text:
Q26. In your experience, what has been the average cost of replacement for isolation boots due to effects of ethanol or biodiesel?
Less than $500 � Between $500 - $1,000 � Between $1,000 - $5,000 � Between $5,000 - $10,000 � Greater than $10,000 �
Response Summary:
Note: Responses were considered valid if one of the answer choices was selected. In this case, answers are either valid or blank, there is no opportunity for an invalid response. Number of valid responses: 9 Number of blank responses: 0 Table C23 & Figure C21: Respondents were asked to provide the average cost of repairs to isolation boots due to ethanol- or biodiesel-related damages, and given a series of monetary ranges to choose from. The percentage of the nine valid responses indicating each range is given in this table. Table C23.
Answer Percent of total responses Less than $500 0.0%
Between $500 - $1,000 22.2% Between $1,000 - $5,000 44.4%
Between $5,000 - $10,000 11.1% Greater than $10,000 22.2%
Figure C21.
Less than $500, 0.0%
Between $500 -$1,000, 22.2%
Between $1,000 -$5,000, 44.4%
Between $5,000 -$10,000, 11.1%
Greater than $10,000, 22.2%

101
Question 27
Question Text:
Q27. Approximately what percentage of your work is related to equipment repairs or replacement due to ethanol- or biodiesel-related corrosion or damage?
Less than 25% � 25% - 50% � 50% - 75% � 75% - 100% �
Response Summary:
Note: Responses were considered valid if one of the answer choices was selected. In this case, answers are either valid or blank, there is no opportunity for an invalid response. Number of valid responses: 9 Number of blank responses: 0 Table C24 & Figure C22: Respondents were asked to estimate what percentage of their work is related to equipment repairs or replacement due to ethanol- or biodiesel-related corrosion or damage, and given four choices indicating a range of percentages, from less than 25 percent to 100 percent. The percentage of the nine responses for each selection is presented in this table. Table C24.
Answer Percent of total responses
Less than 25% 77.8% 25% - 50% 22.2% 50% - 75% 0.0%
75% - 100% 0.0%
Figure C22.
Less than 25%, 77.80%
25% - 50%, 22.20%
50% - 75%, 0.00%
75% - 100%, 0.00%

102
Question 28
Question Text:
Q28. Of the facilities where you have provided services in the last 5 years, what percentage of the repairs/replacements were for the same piece of equipment?
Response Summary:
Note: Responses were considered valid if any number between 0 and 100 was submitted in the answer box. A number greater than 100 would be considered an invalid response, but that did not occur in any of the responses. Number of valid responses: 7 Number of invalid responses: 0 Number of blank responses: 2
Average (%) 21.7%

103
APPENDIX D: OWNERS OF UNDERGROUND STORAGE TANK SYSTEMS RESULTS WEIGHTED BY RESPONSE
Question 1-3
The questions 1-3 were not analyzed.
Question 4-5
Table D1. Response rate summary.
Total in the State Received % Owners 4,100 281 7%
Facilities 9,000 3,325 37% Tanks 20,000 8,563 43%
Total number of owners responding
with more than 100 facilities: 6
Average number of facilities per owner: 11.8 Average number of tanks per facility: 2.6
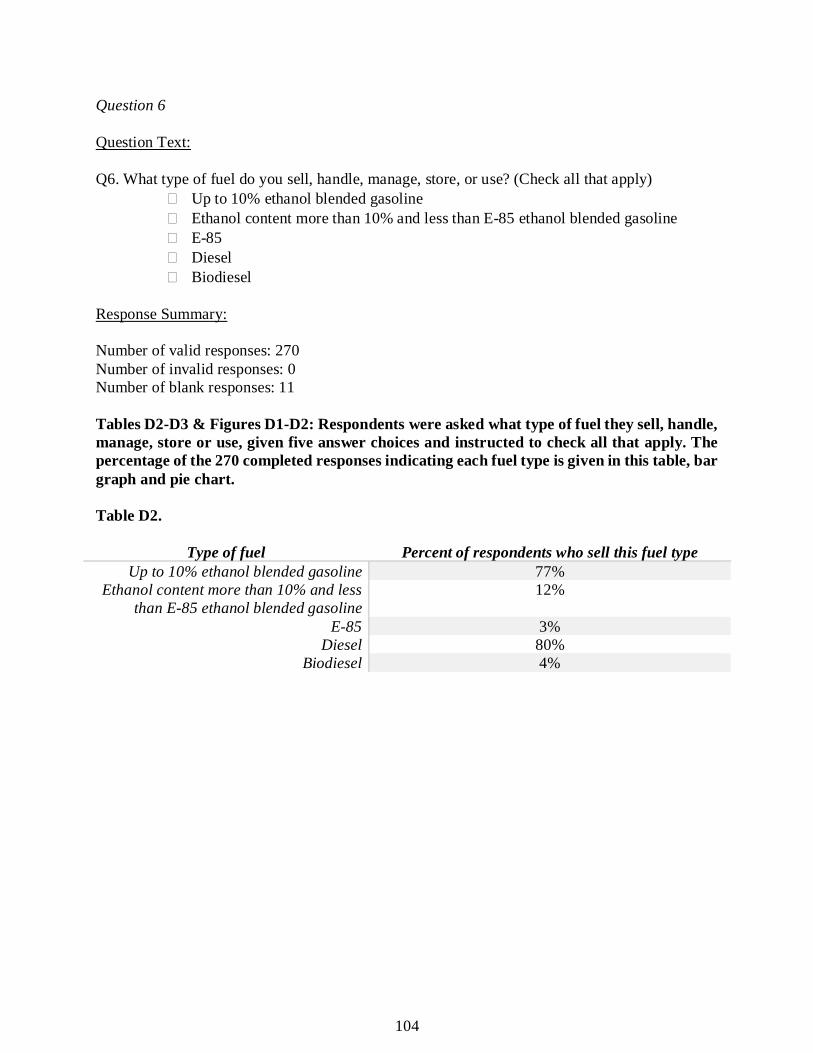
104
Question 6
Question Text:
Q6. What type of fuel do you sell, handle, manage, store, or use? (Check all that apply) � Up to 10% ethanol blended gasoline � Ethanol content more than 10% and less than E-85 ethanol blended gasoline � E-85 � Diesel � Biodiesel
Response Summary:
Number of valid responses: 270 Number of invalid responses: 0 Number of blank responses: 11 Tables D2-D3 & Figures D1-D2: Respondents were asked what type of fuel they sell, handle, manage, store or use, given five answer choices and instructed to check all that apply. The percentage of the 270 completed responses indicating each fuel type is given in this table, bar graph and pie chart. Table D2.
Type of fuel Percent of respondents who sell this fuel type Up to 10% ethanol blended gasoline 77%
Ethanol content more than 10% and less than E-85 ethanol blended gasoline
12%
E-85 3% Diesel 80%
Biodiesel 4%

105
Table D3.
Type of fuel combination Number of fuel types Count %
Up to 10% ethanol blended gasoline
1 44 16.3%
Ethanol content more than 10% and less than E-85 ethanol
blended gasoline
1 2 0.7%
Diesel 1 58 21.5% Biodiesel 1 1 0.4%
Up to 10% ethanol blended gasoline & Ethanol content
more than 10% and less than E-85 ethanol blended gasoline
2 3 1.1%
Up to 10% ethanol blended gasoline & Diesel
2 124 45.9%
Up to 10% ethanol blended gasoline & Biodiesel
2 2 0.7%
Diesel & Biodiesel 2 1 0.4% Up to 10% ethanol blended
gasoline, Ethanol content more than 10% and less than E-85
ethanol blended gasoline & E-85
3 2 0.7%
Up to 10% ethanol blended gasoline, Ethanol content more
than 10% and less than E-85 ethanol blended gasoline &
Diesel
3 21 7.8%
Up to 10% ethanol blended gasoline, E-85 & Diesel
3 3 1.1%
Up to 10% ethanol blended gasoline, Diesel & Biodiesel
3 5 1.9%
Up to 10% ethanol blended gasoline, Ethanol content more
than 10% and less than E-85 ethanol blended gasoline, E-85
& Diesel
4 1 0.4%
Up to 10% ethanol blended gasoline, Ethanol content more
than 10% and less than E-85 ethanol blended gasoline, E-85,
Diesel & Biodiesel
5 3 1.1%
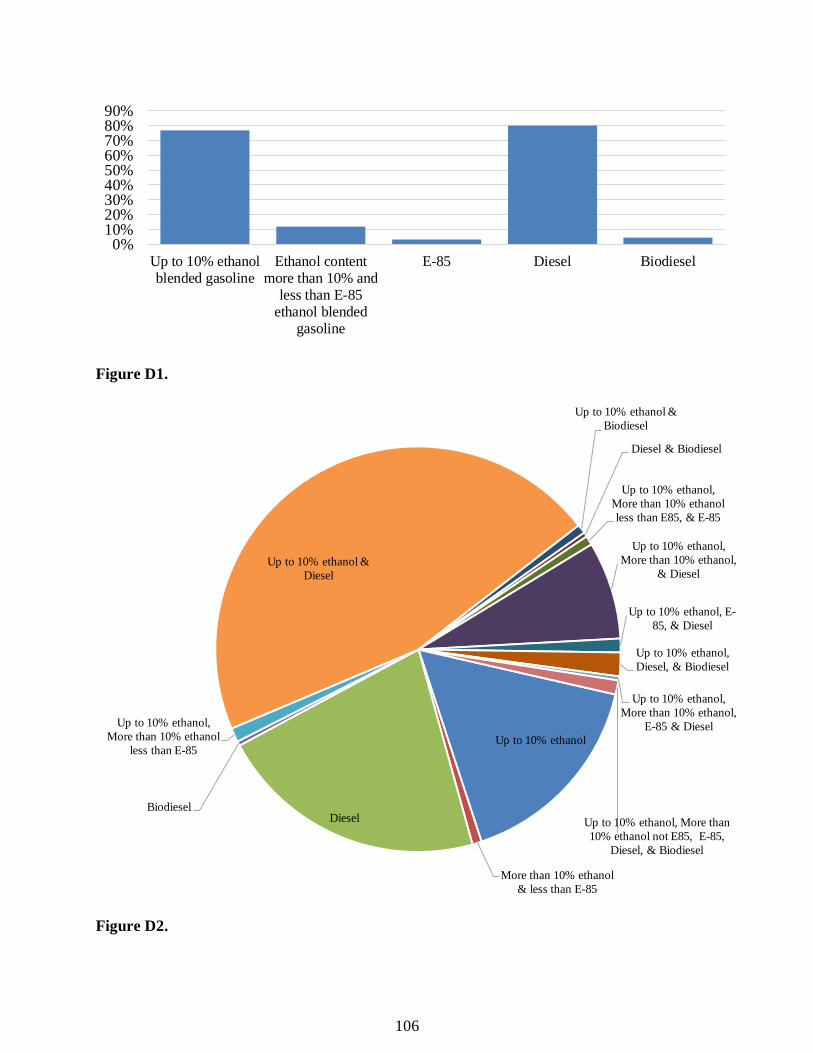
106
Figure D1.
Figure D2.
0%10%20%30%40%50%60%70%80%90%
Up to 10% ethanolblended gasoline
Ethanol contentmore than 10% and
less than E-85ethanol blended
gasoline
E-85 Diesel Biodiesel
Up to 10% ethanol
More than 10% ethanol & less than E-85
DieselBiodiesel
Up to 10% ethanol, More than 10% ethanol
less than E-85
Up to 10% ethanol & Diesel
Up to 10% ethanol & Biodiesel
Diesel & Biodiesel
Up to 10% ethanol, More than 10% ethanol less than E85, & E-85
Up to 10% ethanol, More than 10% ethanol,
& Diesel
Up to 10% ethanol, E-85, & Diesel
Up to 10% ethanol, Diesel, & Biodiesel
Up to 10% ethanol, More than 10% ethanol,
E-85 & Diesel
Up to 10% ethanol, More than 10% ethanol not E85, E-85,
Diesel, & Biodiesel

107
Question 7
Question Text:
Q7. Consider all of the tanks associated with this Owner ID # in the last 5 years, and estimate what percentage of those have no corrosion, minimal, moderate, or severe corrosion. Your answers should add up to 100. No Corrosion Minimal Corrosion Moderate Corrosion Severe Corrosion
Response Summary:
Note: Responses were considered valid if the sum of the four entries was equal to 100. In rare cases (6 out of 281 total responses), entries were changed after submission, when the respondent’s intention was fairly clear. For example, respondent #159 entered “1005” in the “No Corrosion” box, and the remaining boxes were empty, so that number was changed to 100. Number of valid responses: 219 Number of invalid responses: 11 Number of blank responses: 51 Table D4 & Figure D3: Respondents were asked to consider all of the tanks associated with this Owner Identification Number in the last 5 years, and estimate what percentage of those have no corrosion, minimal, moderate or severe corrosion. In order to be considered valid, answers must add up to 100. Averages of the 219 valid responses are presented in this table and bar graph. Table D4.
Corrosion Level Average Percentage
No Corrosion 55.51% Minimal Corrosion 22.33%
Moderate Corrosion 15.94% Severe Corrosion 6.22%
Figure D3.
0%
20%
40%
60%
No Corrosion Minimal Corrosion Moderate Corrosion Severe Corrosion

108
Question 8
Question Text:
Q8. When you have checked inside your piping sump(s), have you noticed corrosion on any of the following components? Consider all of the facilities associated with this Owner ID # in the last 5 years, and estimate what percentage of those have no corrosion, minimal, moderate, or severe corrosion for each piping sump component. Your answers for each component should add up to 100.
Response Summary:
Note: Responses were considered valid if the sum of the four entries was equal to 100. Average corrosion levels were calculated using only valid responses. Table D5 & Figure D4: Respondents were asked if they have noticed corrosion on any of an assortment of piping sump components at facilities associated with their Owner Identification Number in the last 5 years, and to estimate what percentage of those have no corrosion, minimal, moderate or severe corrosion for each component. In order to be considered valid, answers for each component must add up to 100. The number of valid, invalid and blank responses, as well as the average of the valid responses for each component are presented in this table. Averages of the valid responses for each component are presented in this bar graph. Table D5.
Piping Piping fittings
Release detection
probe/sensor - LLD
Boot fittings
Sump walls/floor
Submersible turbine Pump
Other:
Number of valid responses
190 211 202 208 199 216 7
Number of invalid responses
75 55 65 59 69 54 270
Number of blank responses
16 15 14 14 13 11 4
Corrosion Level % % % % % % % No Corrosion 64.2 54.4 57.3 58.6 63.6 48.0 64.2
Minimal Corrosion
24.5 24.0 19.8 18.2 22.9 17.9 19.1
Moderate Corrosion
8.1 16.0 15.3 10.1 10.1 11.9 2.4
Severe Corrosion 3.3 5.5 7.6 13.1 3.4 22.2 14.3
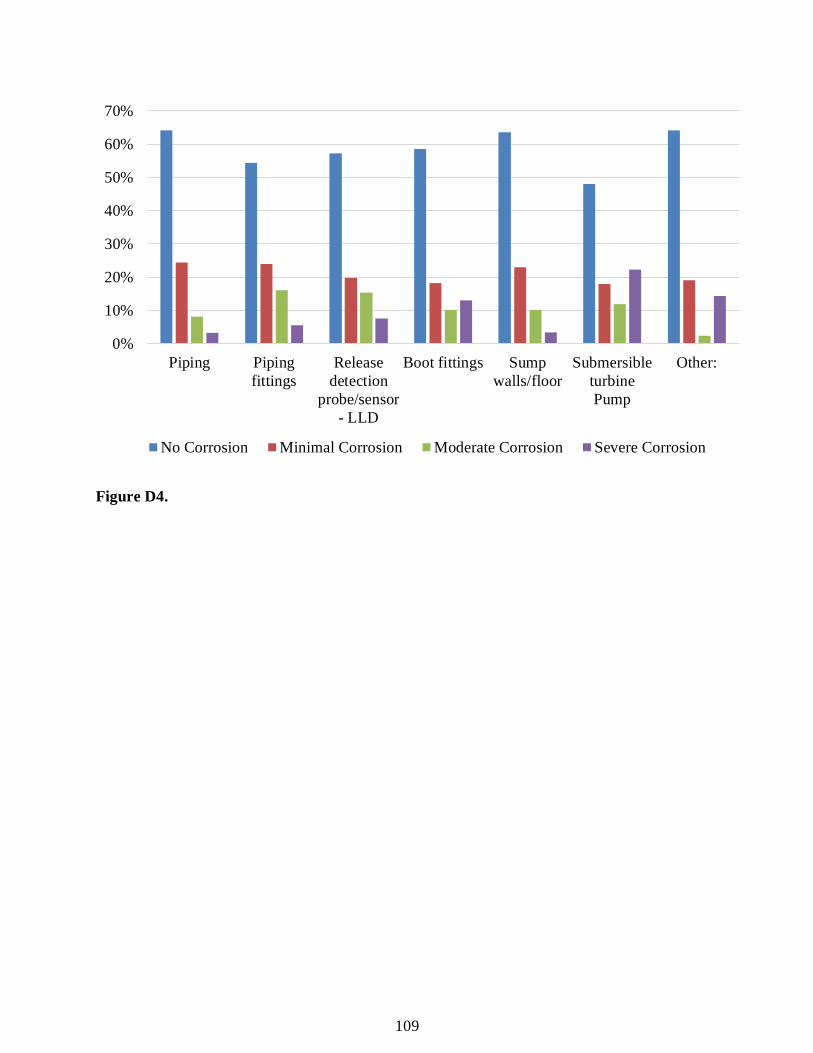
109
Figure D4.
0%
10%
20%
30%
40%
50%
60%
70%
Piping Pipingfittings
Releasedetection
probe/sensor- LLD
Boot fittings Sumpwalls/floor
SubmersibleturbinePump
Other:
No Corrosion Minimal Corrosion Moderate Corrosion Severe Corrosion
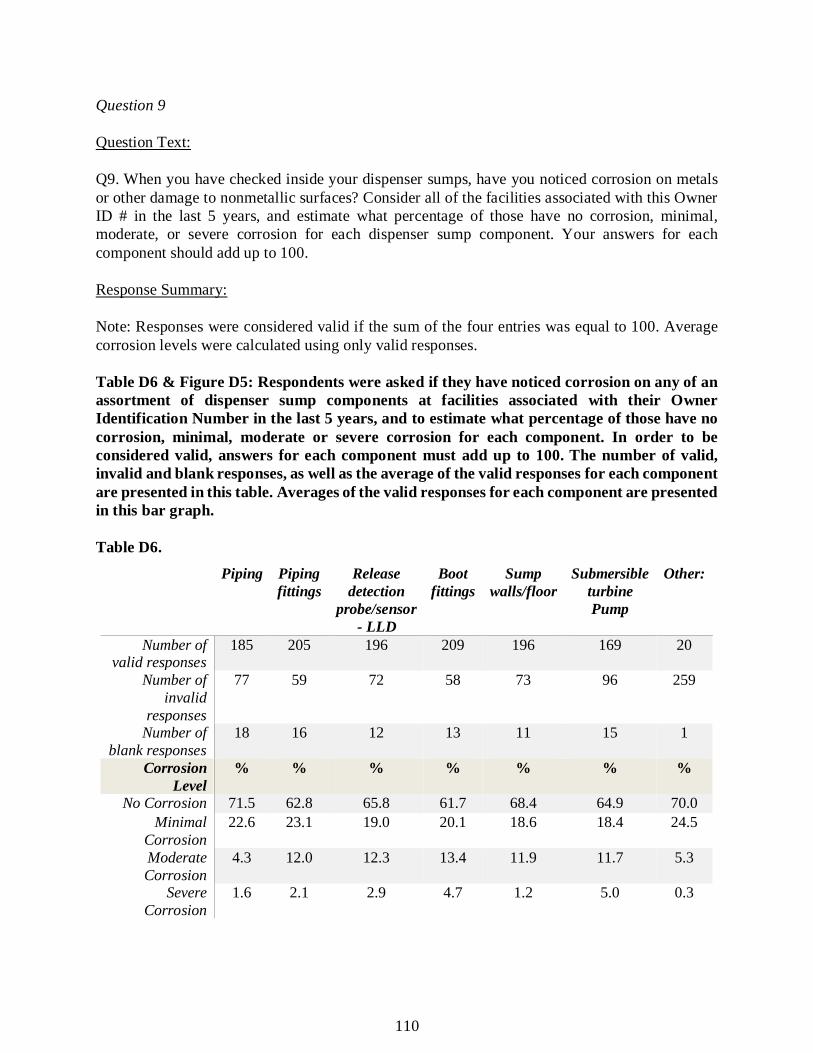
110
Question 9
Question Text:
Q9. When you have checked inside your dispenser sumps, have you noticed corrosion on metals or other damage to nonmetallic surfaces? Consider all of the facilities associated with this Owner ID # in the last 5 years, and estimate what percentage of those have no corrosion, minimal, moderate, or severe corrosion for each dispenser sump component. Your answers for each component should add up to 100.
Response Summary:
Note: Responses were considered valid if the sum of the four entries was equal to 100. Average corrosion levels were calculated using only valid responses.
Table D6 & Figure D5: Respondents were asked if they have noticed corrosion on any of an assortment of dispenser sump components at facilities associated with their Owner Identification Number in the last 5 years, and to estimate what percentage of those have no corrosion, minimal, moderate or severe corrosion for each component. In order to be considered valid, answers for each component must add up to 100. The number of valid, invalid and blank responses, as well as the average of the valid responses for each component are presented in this table. Averages of the valid responses for each component are presented in this bar graph.
Table D6.
Piping Piping fittings
Release detection
probe/sensor - LLD
Boot fittings
Sump walls/floor
Submersible turbine Pump
Other:
Number of valid responses
185 205 196 209 196 169 20
Number of invalid
responses
77 59 72 58 73 96 259
Number of blank responses
18 16 12 13 11 15 1
Corrosion Level
% % % % % % %
No Corrosion 71.5 62.8 65.8 61.7 68.4 64.9 70.0 Minimal
Corrosion 22.6 23.1 19.0 20.1 18.6 18.4 24.5
Moderate Corrosion
4.3 12.0 12.3 13.4 11.9 11.7 5.3
Severe Corrosion
1.6 2.1 2.9 4.7 1.2 5.0 0.3

111
Figure D5.
0%10%20%30%40%50%60%70%80%
Piping Pipingfittings
Releasedetection
probe/sensor- LLD
Boot fittings Sumpwalls/floor
SubmersibleturbinePump
Other:
No Corrosion Minimal Corrosion Moderate Corrosion Severe Corrosion

112
Question 10
Question Text:
Q10. When you have checked inside your spill containment system(s) like spill bucket(s), have you noticed corrosion on metals or other damage to nonmetallic surfaces? Consider all of the facilities associated with this Owner ID # in the last 5 years, and estimate what percentage of those have no corrosion, minimal, moderate, or severe corrosion for each spill containment system component. Your answers for each component should add up to 100.
Response Summary:
Note: Responses were considered valid if the sum of the four entries was equal to 100. Average corrosion levels were calculated using only valid responses. Table D7 & Figure D6: Respondents were asked if they have noticed corrosion on any of an assortment of spill containment system components at facilities associated with their Owner Identification Number in the last 5 years, and to estimate what percentage of those have no corrosion, minimal, moderate, or severe corrosion for each component. In order to be considered valid, answers for each component must add up to 100. The number of valid, invalid and blank responses, as well as the average of the valid responses for each component are presented in this table. Averages of the valid responses for each component are presented in this bar graph. Table D7.
Fill cap Drop tube
Walls/base of spill bucket
Interstitial monitoring device
Other:
Number of valid responses
205 198 204 200 21
Number of invalid
responses
65 71 63 72 260
Number of blank responses
11 12 14 9 0
Corrosion Level % % % % % No Corrosion 65.6 66.5 64.4 67.2 47.6
Minimal Corrosion
19.1 19.1 21.6 20.8 28.8
Moderate Corrosion
10.6 8.7 11.7 10.5 16.9
Severe Corrosion
4.7 5.7 2.3 1.4 6.7
113
Figure D6.
0%10%20%30%40%50%60%70%80%
Fill cap Drop tube Walls/base ofspill bucket
Interstitialmonitoring
device
Other:
No Corrosion Minimal Corrosion Moderate Corrosion Severe Corrosion
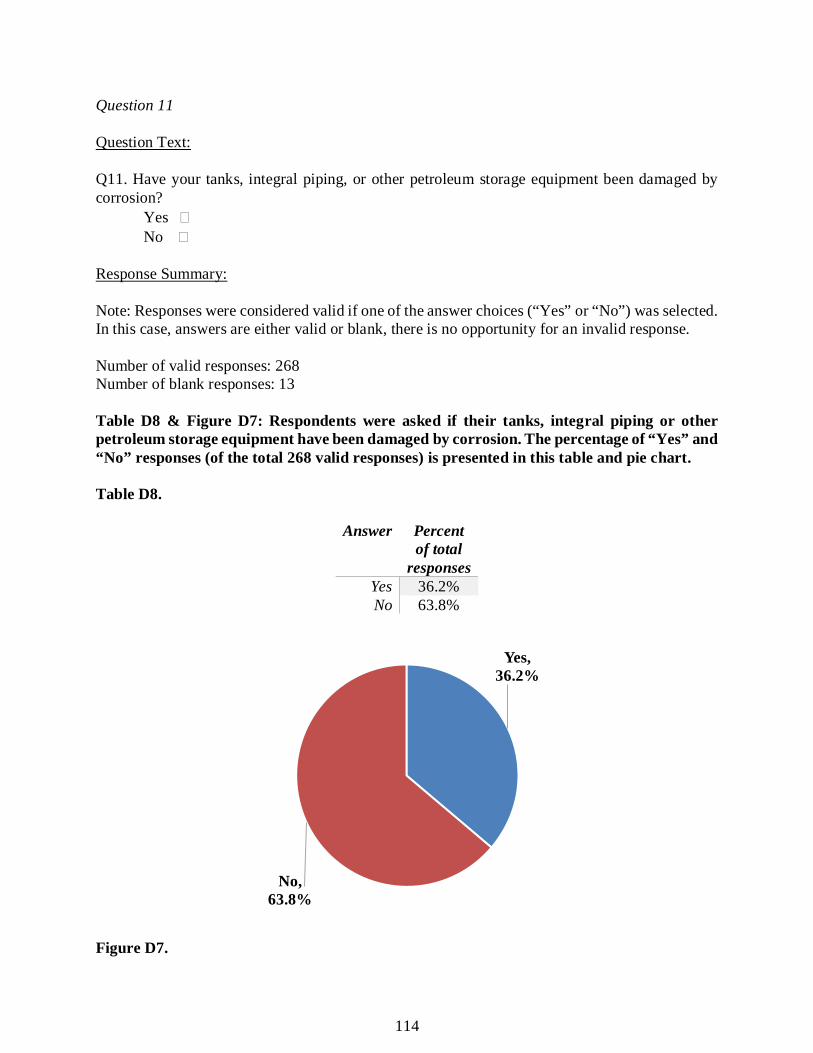
114
Question 11
Question Text:
Q11. Have your tanks, integral piping, or other petroleum storage equipment been damaged by corrosion?
Yes � No �
Response Summary:
Note: Responses were considered valid if one of the answer choices (“Yes” or “No”) was selected. In this case, answers are either valid or blank, there is no opportunity for an invalid response. Number of valid responses: 268 Number of blank responses: 13 Table D8 & Figure D7: Respondents were asked if their tanks, integral piping or other petroleum storage equipment have been damaged by corrosion. The percentage of “Yes” and “No” responses (of the total 268 valid responses) is presented in this table and pie chart. Table D8.
Answer Percent of total
responses Yes 36.2% No 63.8%
Figure D7.
Yes, 36.2%
No, 63.8%

115
Question 12
Question Text:
Q12. Has there been deterioration of rubber parts of delamination or fiberglass tanks/components? Yes � No �
Response Summary:
Note: Responses were considered valid if one of the answer choices (“Yes” or “No”) was selected. In this case, answers are either valid or blank, there is no opportunity for an invalid response. Number of valid responses: 249 Number of blank responses: 32 Table D9 & Figure D8: Respondents were asked if there has been deterioration of rubber parts of delamination or fiberglass tanks/components. The percentage of “Yes” and “No” responses (of the total 249 valid responses) is presented in this table and pie chart. Table D9.
Answer Percent of total
responses Yes 32.5% No 67.5%
Figure D8.
Yes, 32.5%
No, 67.5%
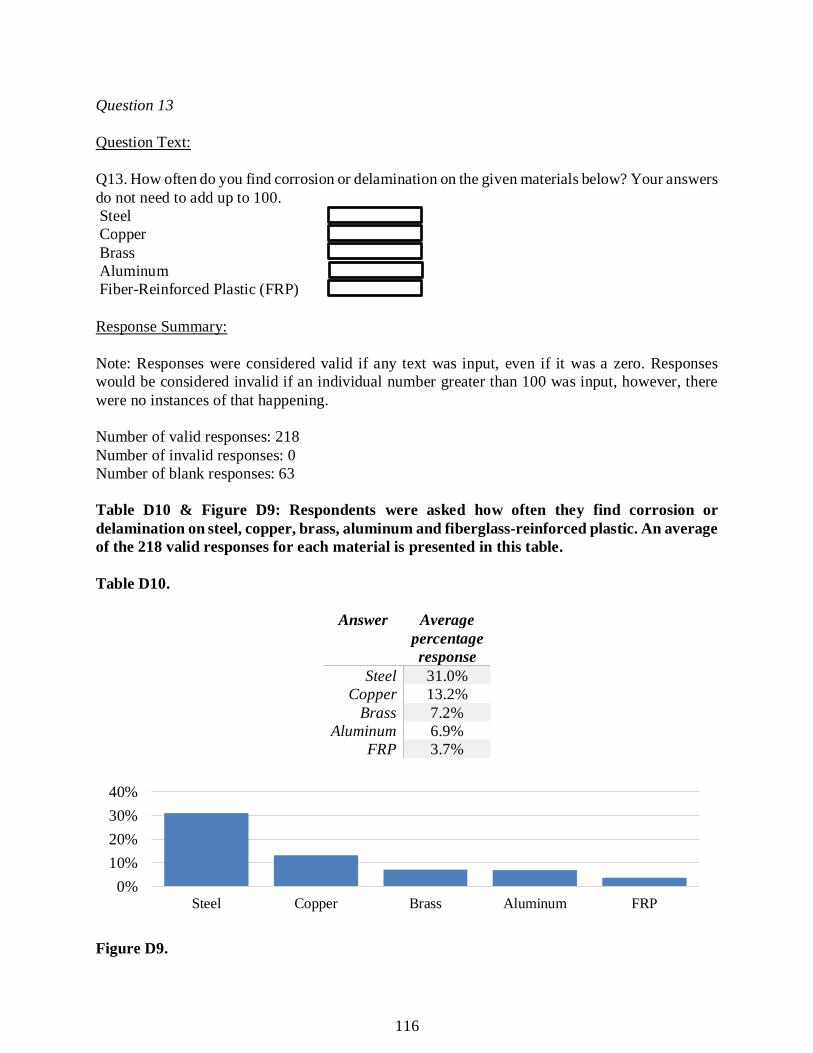
116
Question 13
Question Text:
Q13. How often do you find corrosion or delamination on the given materials below? Your answers do not need to add up to 100. Steel Copper Brass Aluminum Fiber-Reinforced Plastic (FRP)
Response Summary:
Note: Responses were considered valid if any text was input, even if it was a zero. Responses would be considered invalid if an individual number greater than 100 was input, however, there were no instances of that happening. Number of valid responses: 218 Number of invalid responses: 0 Number of blank responses: 63 Table D10 & Figure D9: Respondents were asked how often they find corrosion or delamination on steel, copper, brass, aluminum and fiberglass-reinforced plastic. An average of the 218 valid responses for each material is presented in this table. Table D10.
Answer Average percentage response
Steel 31.0% Copper 13.2%
Brass 7.2% Aluminum 6.9%
FRP 3.7%
Figure D9.
0%10%20%30%40%
Steel Copper Brass Aluminum FRP
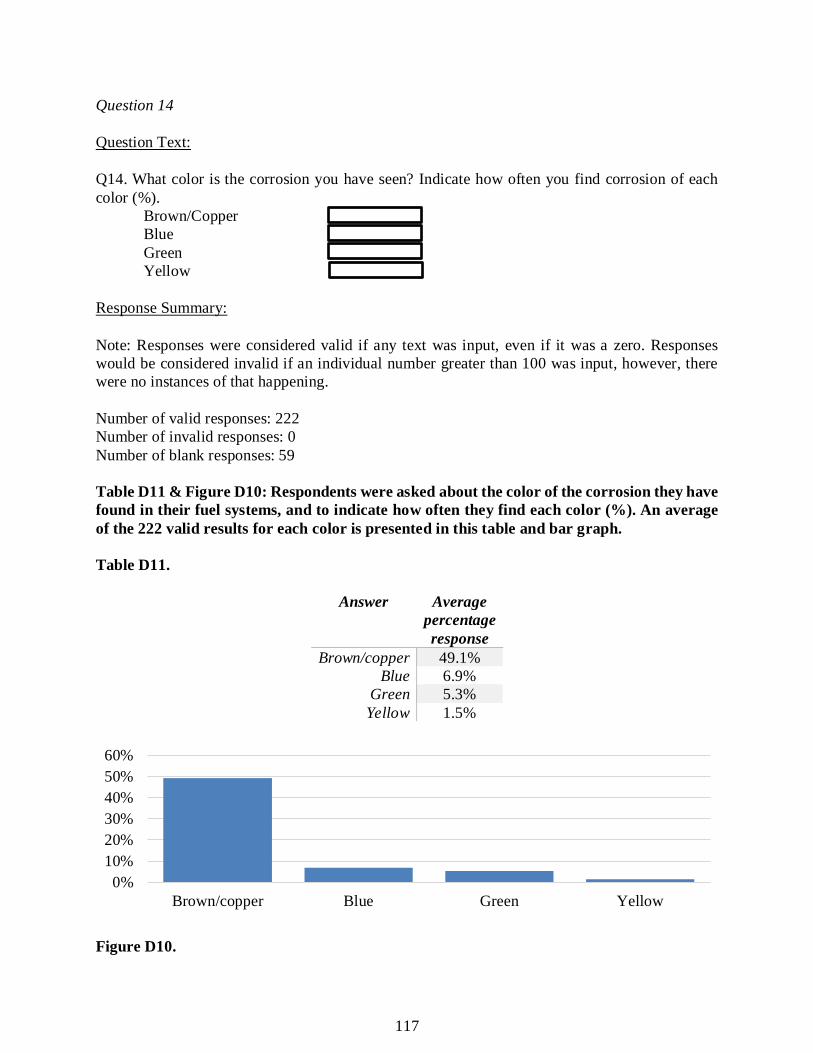
117
Question 14
Question Text:
Q14. What color is the corrosion you have seen? Indicate how often you find corrosion of each color (%).
Brown/Copper Blue Green Yellow
Response Summary:
Note: Responses were considered valid if any text was input, even if it was a zero. Responses would be considered invalid if an individual number greater than 100 was input, however, there were no instances of that happening. Number of valid responses: 222 Number of invalid responses: 0 Number of blank responses: 59 Table D11 & Figure D10: Respondents were asked about the color of the corrosion they have found in their fuel systems, and to indicate how often they find each color (%). An average of the 222 valid results for each color is presented in this table and bar graph. Table D11.
Answer Average percentage response
Brown/copper 49.1% Blue 6.9%
Green 5.3% Yellow 1.5%
Figure D10.
0%10%20%30%40%50%60%
Brown/copper Blue Green Yellow
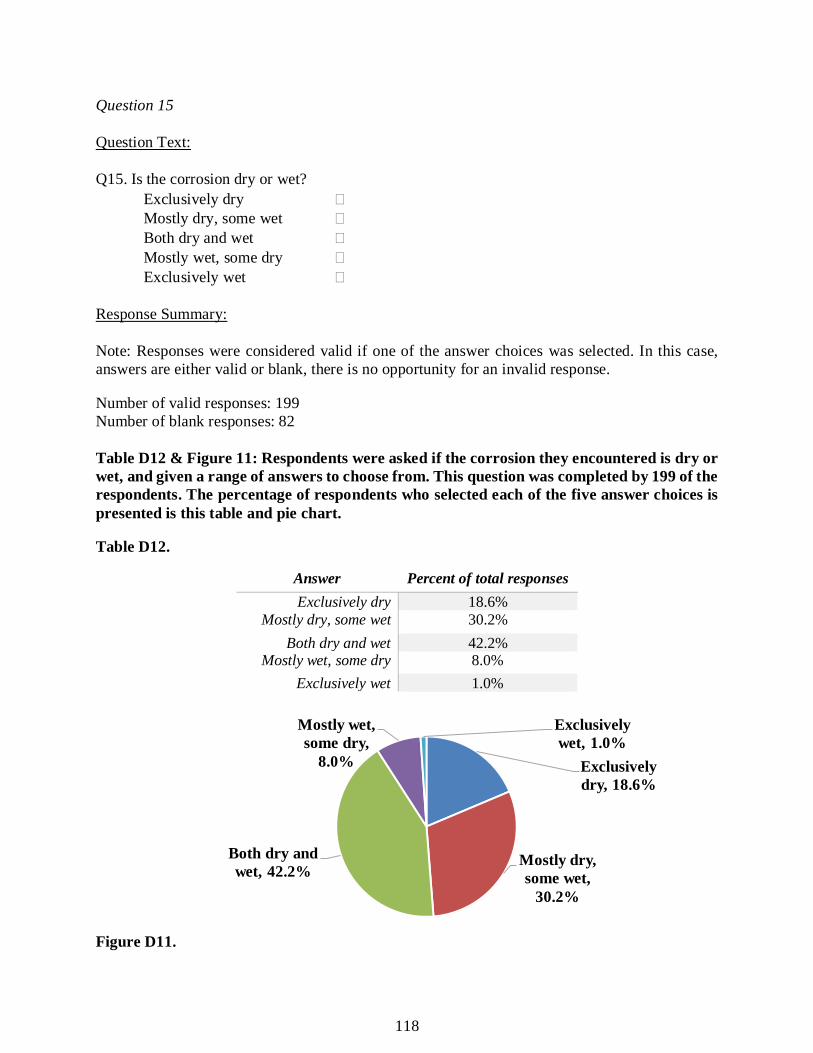
118
Question 15
Question Text:
Q15. Is the corrosion dry or wet? Exclusively dry � Mostly dry, some wet � Both dry and wet � Mostly wet, some dry � Exclusively wet �
Response Summary:
Note: Responses were considered valid if one of the answer choices was selected. In this case, answers are either valid or blank, there is no opportunity for an invalid response. Number of valid responses: 199 Number of blank responses: 82 Table D12 & Figure 11: Respondents were asked if the corrosion they encountered is dry or wet, and given a range of answers to choose from. This question was completed by 199 of the respondents. The percentage of respondents who selected each of the five answer choices is presented is this table and pie chart. Table D12.
Answer Percent of total responses Exclusively dry 18.6%
Mostly dry, some wet 30.2% Both dry and wet 42.2%
Mostly wet, some dry 8.0% Exclusively wet 1.0%
Figure D11.
Exclusively dry, 18.6%
Mostly dry, some wet,
30.2%
Both dry and wet, 42.2%
Mostly wet, some dry,
8.0%
Exclusively wet, 1.0%
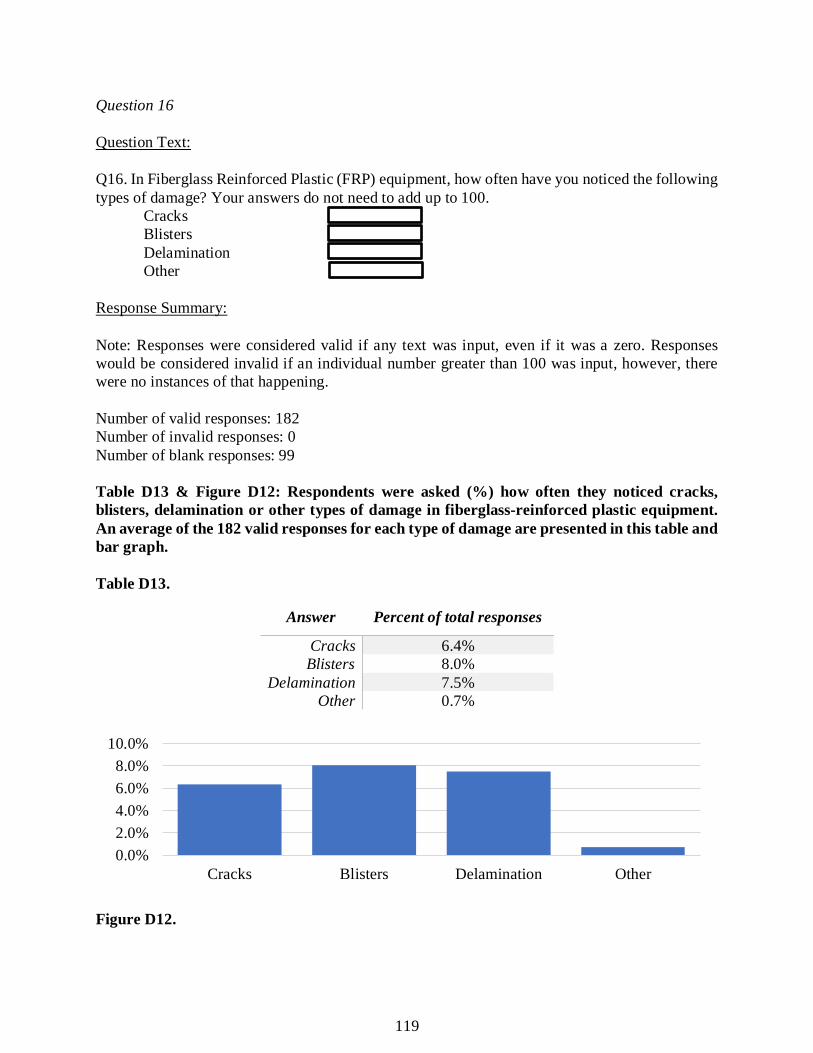
119
Question 16
Question Text:
Q16. In Fiberglass Reinforced Plastic (FRP) equipment, how often have you noticed the following types of damage? Your answers do not need to add up to 100.
Cracks Blisters Delamination Other
Response Summary:
Note: Responses were considered valid if any text was input, even if it was a zero. Responses would be considered invalid if an individual number greater than 100 was input, however, there were no instances of that happening. Number of valid responses: 182 Number of invalid responses: 0 Number of blank responses: 99 Table D13 & Figure D12: Respondents were asked (%) how often they noticed cracks, blisters, delamination or other types of damage in fiberglass-reinforced plastic equipment. An average of the 182 valid responses for each type of damage are presented in this table and bar graph. Table D13.
Answer Percent of total responses
Cracks 6.4% Blisters 8.0%
Delamination 7.5% Other 0.7%
Figure D12.
0.0%2.0%4.0%6.0%8.0%
10.0%
Cracks Blisters Delamination Other

120
Question 17
Question Text:
Q17. How often do you visually inspect inside your piping sumps, dispenser sumps, spill buckets and other equipment?
Twice per month � Monthly � Every 2 months � Every 6 months � Utilize sensors � Other �
Response Summary: Note: Responses were considered valid if one of the answer choices was selected. In this case, answers are either valid or blank, there is no opportunity for an invalid response. Number of valid responses: 269 Number of blank responses: 12 Table D14 & Figure D13: Respondents were asked how often they visually inspect inside piping sumps, dispenser sumps, spill buckets and other equipment, and given a range of frequencies to select from. The percent of the 269 valid responses indicating each frequency option is given in this table. Table D14.
Answer Percent of total responses
Twice per month 4.8% Monthly 84.4%
Every 2 months 1.9% Every 6 months 3.3% Utilize sensors 2.6%
Other 3.0%
Figure D13.
Twice per month, 4.8%
Monthly, 84.4%
Every 2 months, 1.9%
Every 6 months, 3.3%
Utilize sensors, 2.6%
Other, 3.0%
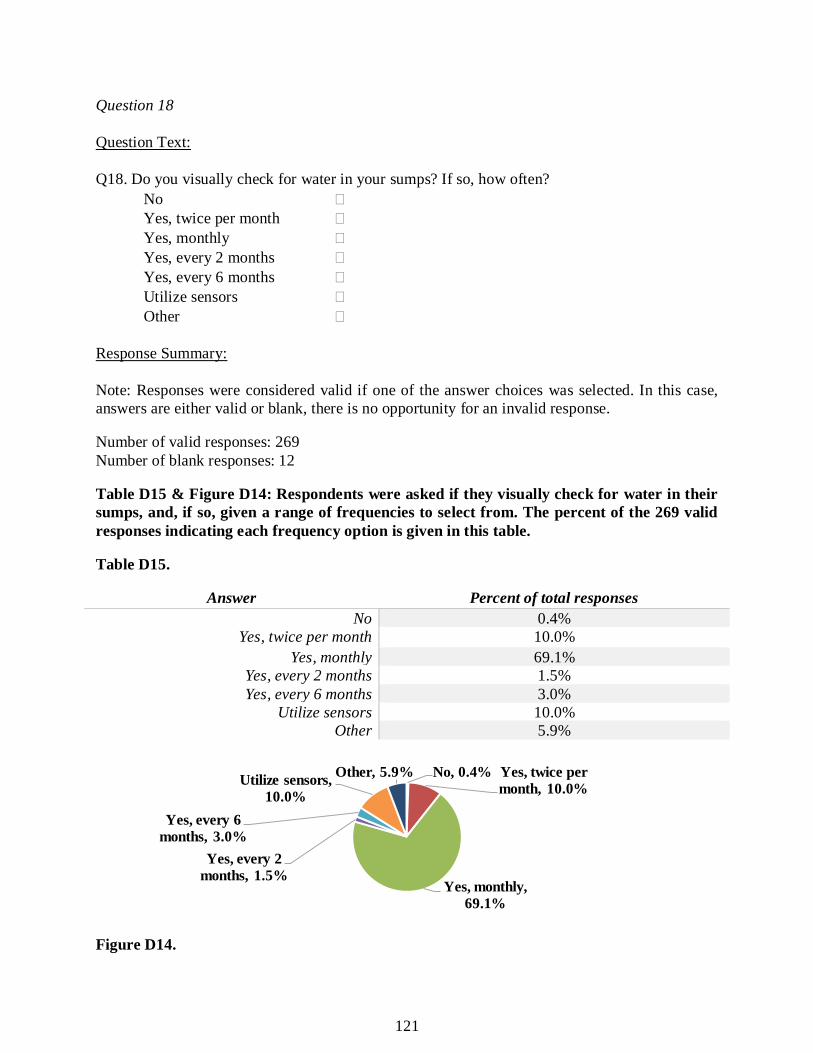
121
Question 18
Question Text:
Q18. Do you visually check for water in your sumps? If so, how often? No � Yes, twice per month � Yes, monthly � Yes, every 2 months � Yes, every 6 months � Utilize sensors � Other �
Response Summary:
Note: Responses were considered valid if one of the answer choices was selected. In this case, answers are either valid or blank, there is no opportunity for an invalid response. Number of valid responses: 269 Number of blank responses: 12 Table D15 & Figure D14: Respondents were asked if they visually check for water in their sumps, and, if so, given a range of frequencies to select from. The percent of the 269 valid responses indicating each frequency option is given in this table. Table D15.
Answer Percent of total responses No 0.4%
Yes, twice per month 10.0% Yes, monthly 69.1%
Yes, every 2 months 1.5% Yes, every 6 months 3.0%
Utilize sensors 10.0% Other 5.9%
Figure D14.
No, 0.4% Yes, twice per month, 10.0%
Yes, monthly, 69.1%
Yes, every 2 months, 1.5%
Yes, every 6 months, 3.0%
Utilize sensors, 10.0%
Other, 5.9%

122
Question 19
Question Text:
Q19. Have you had to repair or replace the following pieces of equipment due to corrosion over the last five years? If so, how many?
Response Summary:
Note: Response rate was difficult to gauge for this question. It may be that most respondents did not repair or replace any of the included components, or that they have left the question blank. In order to provide a conservative estimate, the total number of responses is assumed to be 264, or the total number of completed surveys (not including seven surveys which were entirely blank except for the required identification questions). Numbers in the table are the total number of “Repair” and “Replace” answers for each component, No. of Positive Responses is the total number of responses with either “Repair,” “Replace” or both selected, and the Average Number per Positive Response is the average of the number of repaired/replaced parts answer provided by the respondents. Number of valid responses: 264 Number of blank responses: 7 Table D16 & Figure D15: Respondents were asked if they had to repair or replace any of a given list of equipment components due to corrosion during the last five years and, if so, how many had been repaired or replaced. The number of respondents indicating that they had repaired or replaced a component during that time frame, as well as the total number of responses indicating either repaired or replaced components and the average number of repaired or replaced parts per positive response is presented in this table and bar graph. Table D16.
Repair Replace No. of Positive Responses
Average Number per Positive Response
Tanks 17 5 21 2.3 Electrical Conduit 21 41 55 21.4
Submersible turbine pumps
43 37 71 20.2
Piping boots 18 57 67 154.3 Piping 19 14 30 7.2 Other 7 16 23 4.7
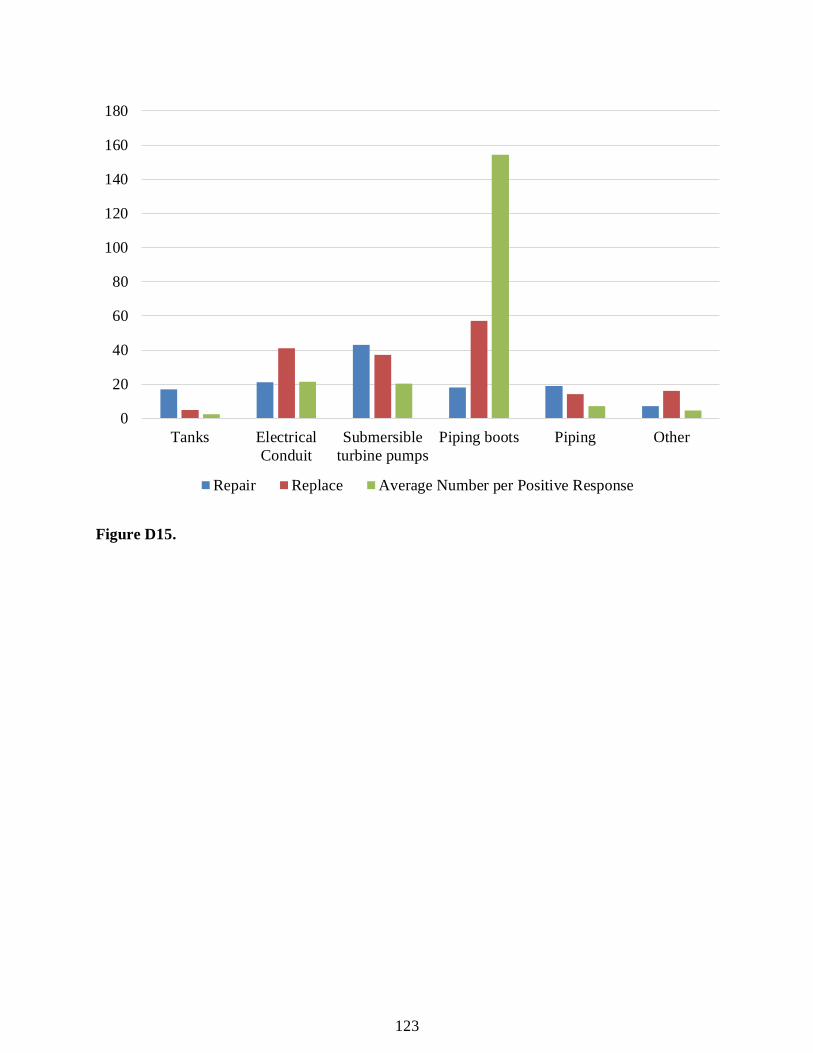
123
Figure D15.
0
20
40
60
80
100
120
140
160
180
Tanks ElectricalConduit
Submersibleturbine pumps
Piping boots Piping Other
Repair Replace Average Number per Positive Response
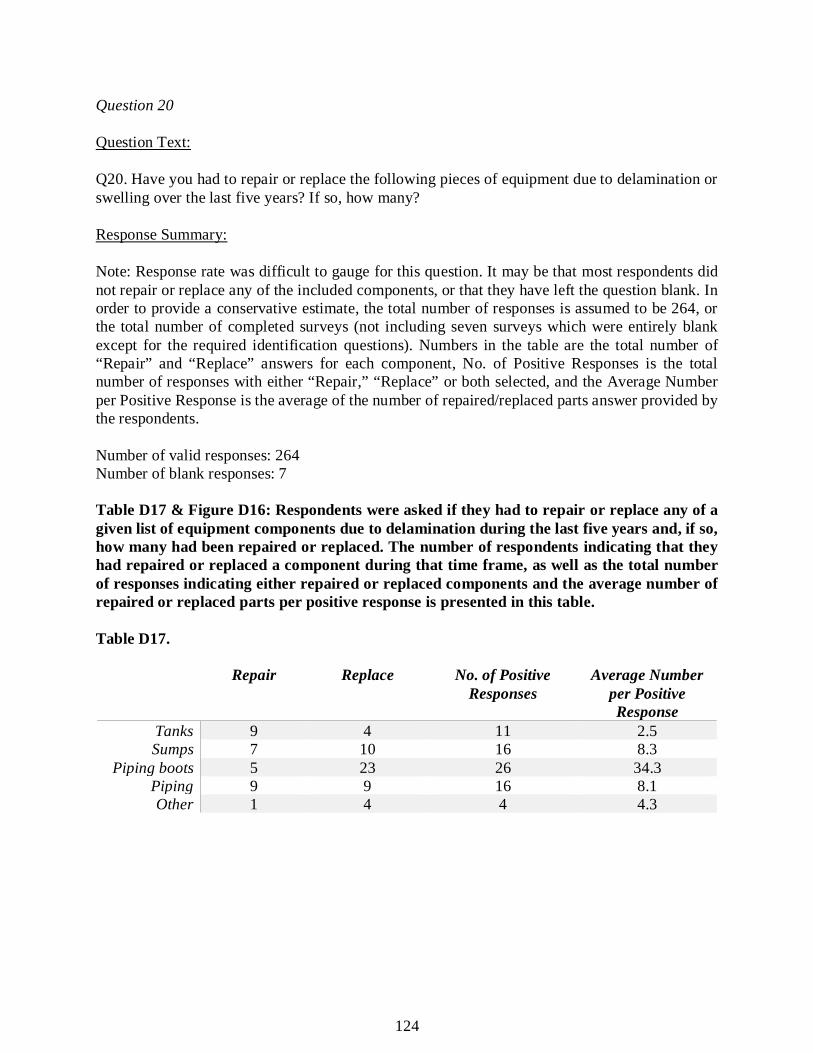
124
Question 20
Question Text:
Q20. Have you had to repair or replace the following pieces of equipment due to delamination or swelling over the last five years? If so, how many?
Response Summary:
Note: Response rate was difficult to gauge for this question. It may be that most respondents did not repair or replace any of the included components, or that they have left the question blank. In order to provide a conservative estimate, the total number of responses is assumed to be 264, or the total number of completed surveys (not including seven surveys which were entirely blank except for the required identification questions). Numbers in the table are the total number of “Repair” and “Replace” answers for each component, No. of Positive Responses is the total number of responses with either “Repair,” “Replace” or both selected, and the Average Number per Positive Response is the average of the number of repaired/replaced parts answer provided by the respondents. Number of valid responses: 264 Number of blank responses: 7 Table D17 & Figure D16: Respondents were asked if they had to repair or replace any of a given list of equipment components due to delamination during the last five years and, if so, how many had been repaired or replaced. The number of respondents indicating that they had repaired or replaced a component during that time frame, as well as the total number of responses indicating either repaired or replaced components and the average number of repaired or replaced parts per positive response is presented in this table. Table D17.
Repair Replace No. of Positive Responses
Average Number per Positive Response
Tanks 9 4 11 2.5 Sumps 7 10 16 8.3
Piping boots 5 23 26 34.3 Piping 9 9 16 8.1 Other 1 4 4 4.3

125
Figure D16.
0
5
10
15
20
25
30
35
40
Tanks Sumps Piping boots Piping Other
Repair Replace Average Number per Positive Response
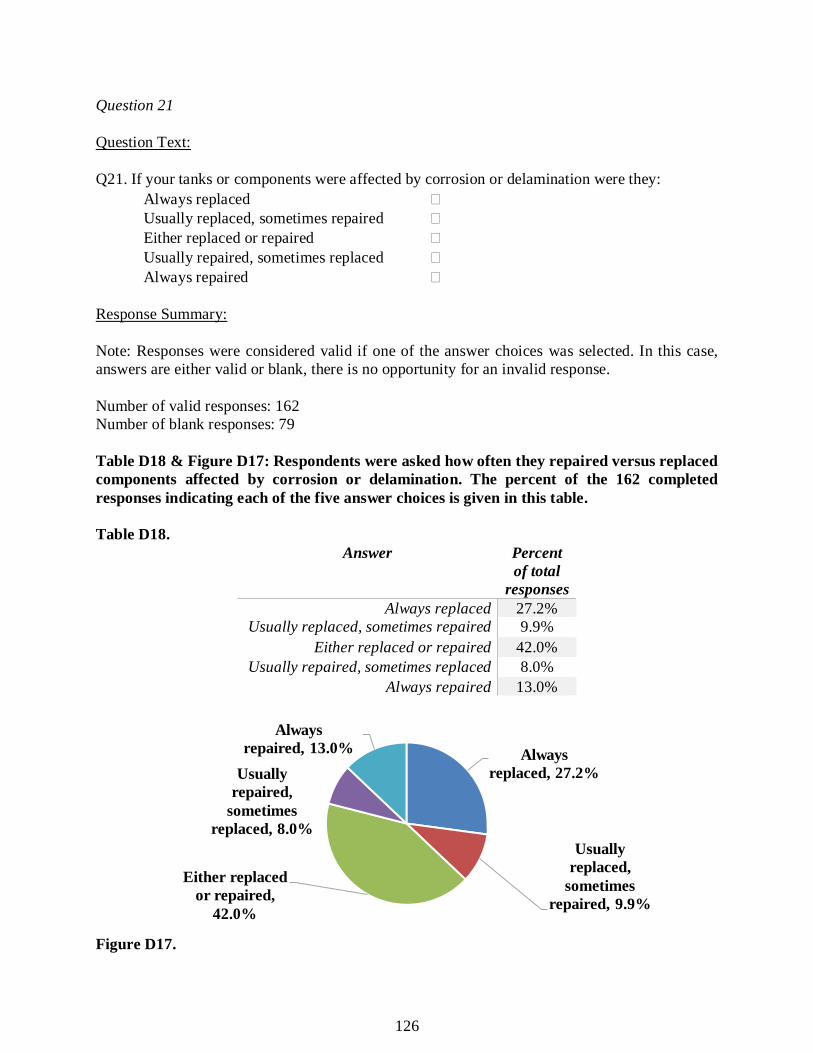
126
Question 21
Question Text:
Q21. If your tanks or components were affected by corrosion or delamination were they: Always replaced � Usually replaced, sometimes repaired � Either replaced or repaired � Usually repaired, sometimes replaced � Always repaired �
Response Summary:
Note: Responses were considered valid if one of the answer choices was selected. In this case, answers are either valid or blank, there is no opportunity for an invalid response. Number of valid responses: 162 Number of blank responses: 79 Table D18 & Figure D17: Respondents were asked how often they repaired versus replaced components affected by corrosion or delamination. The percent of the 162 completed responses indicating each of the five answer choices is given in this table. Table D18.
Answer Percent of total
responses Always replaced 27.2%
Usually replaced, sometimes repaired 9.9% Either replaced or repaired 42.0%
Usually repaired, sometimes replaced 8.0% Always repaired 13.0%
Figure D17.
Always replaced, 27.2%
Usually replaced,
sometimes repaired, 9.9%
Either replaced or repaired,
42.0%
Usually repaired,
sometimes replaced, 8.0%
Always repaired, 13.0%

127
Question 22
Question Text:
Q22. Who conducts monthly inspections at your facility/facilities? Employee � Contracted compliance service provider � Licensed pollutant storage system contractor � Environmental consulting firm � Other (Please specify) �
Response Summary:
Note: Responses were considered valid if one of the answer choices was selected. In this case, answers are either valid or blank, there is no opportunity for an invalid response. Number of valid responses: 263 Number of blank responses: 18 Table D19 & Figure D18: Respondents were asked who conducts monthly inspections at their facility/facilities, and given a series of answer choices, as well as the opportunity to select “Other” and provide more specific information. The percent of the 263 completed responses indicating each of the five answer choices is given in this table. Table D19.
Answer Percent of total responses Employee 43.7%
Contracted compliance service provider 33.1% Licensed pollutant storage system contractor 11.8%
Environmental consulting firm 4.2% Other (Please specify) 7.2%
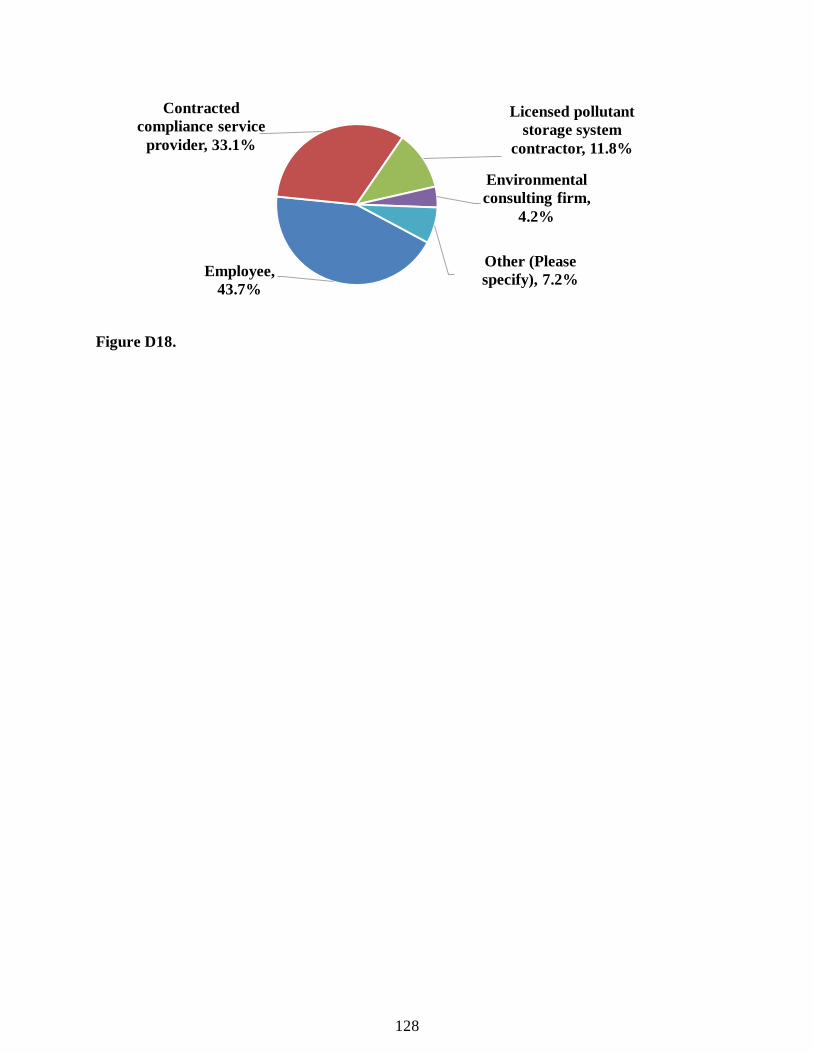
128
Figure D18.
Employee, 43.7%
Contracted compliance service
provider, 33.1%
Licensed pollutant storage system
contractor, 11.8%
Environmental consulting firm,
4.2%
Other (Please specify), 7.2%

129
Question 23
Question Text:
Q23. Who conducts maintenance and/or repairs at your facility/facilities? Employee � Contracted compliance service provider � Licensed pollutant storage system contractor � Environmental consulting firm � Other (Please specify) �
Response Summary:
Note: Responses were considered valid if one of the answer choices was selected. In this case, answers are either valid or blank, there is no opportunity for an invalid response. Number of valid responses: 260 Number of blank responses: 21 Table D20 & Figure D19: Respondents were asked who conducts maintenance and/or repairs at their facility/facilities, and given a series of answer choices, as well as the opportunity to select “Other” and provide more specific information. The percent of the 260 completed responses indicating each of the five answer choices is given in this table. Table D20.
Answer Percent of total responses Employee 7.3%
Contracted compliance service provider 54.2% Licensed pollutant storage system contractor 32.3%
Environmental consulting firm 1.9% Other (Please specify): 4.2%
Figure D19.
Employee, 7.3%
Contracted compliance service provider, 54.2%
Licensed pollutant storage system
contractor, 32.3%
Environmental consulting firm, 1.9%
Other (Please specify), 4.2%
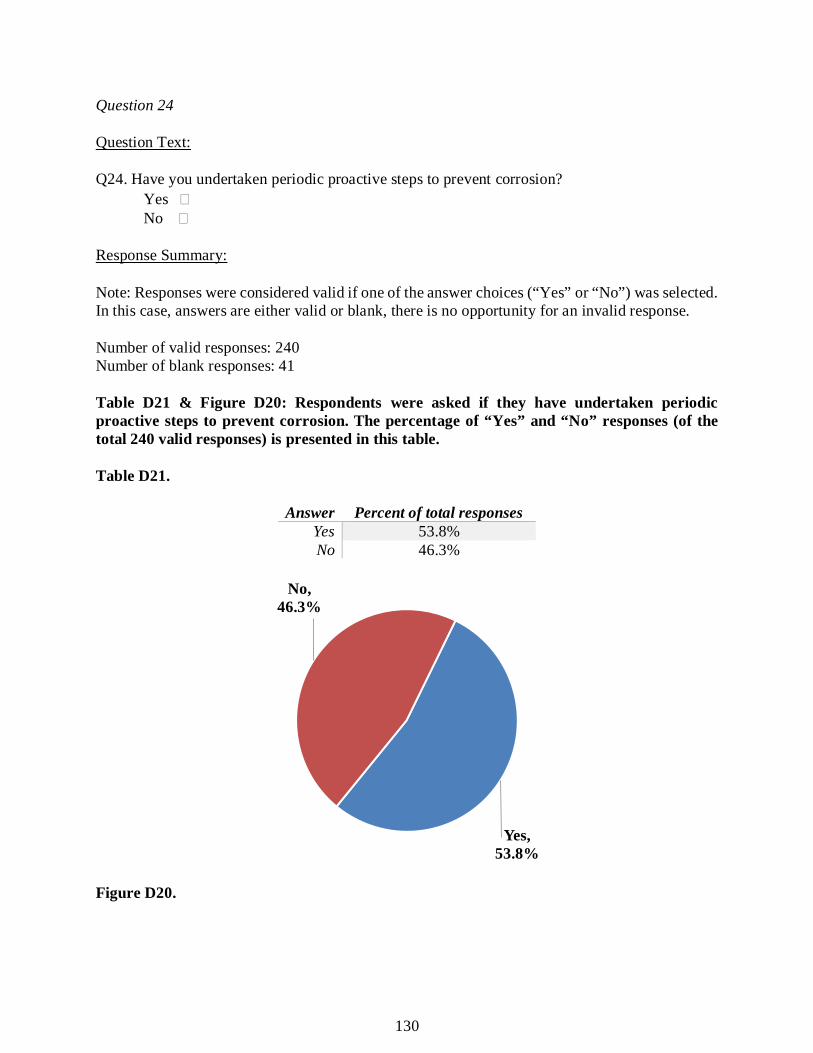
130
Question 24
Question Text:
Q24. Have you undertaken periodic proactive steps to prevent corrosion? Yes � No �
Response Summary:
Note: Responses were considered valid if one of the answer choices (“Yes” or “No”) was selected. In this case, answers are either valid or blank, there is no opportunity for an invalid response. Number of valid responses: 240 Number of blank responses: 41 Table D21 & Figure D20: Respondents were asked if they have undertaken periodic proactive steps to prevent corrosion. The percentage of “Yes” and “No” responses (of the total 240 valid responses) is presented in this table. Table D21.
Answer Percent of total responses Yes 53.8% No 46.3%
Figure D20.
Yes, 53.8%
No, 46.3%
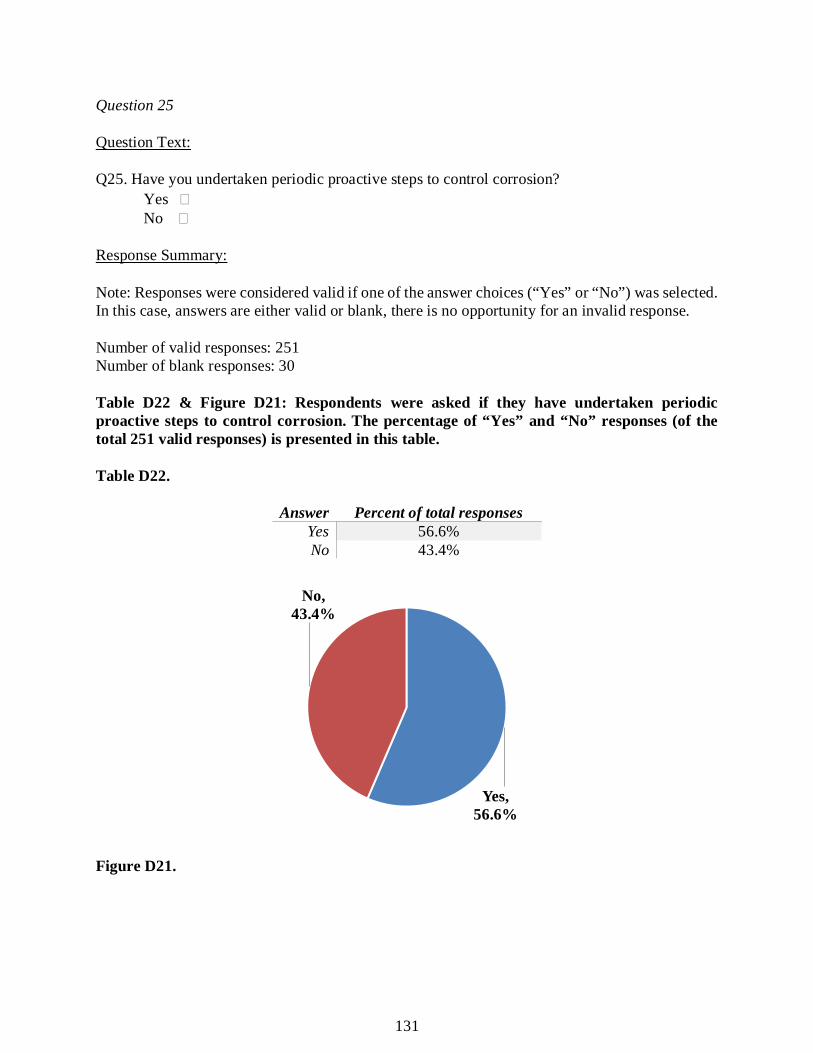
131
Question 25
Question Text:
Q25. Have you undertaken periodic proactive steps to control corrosion? Yes � No �
Response Summary:
Note: Responses were considered valid if one of the answer choices (“Yes” or “No”) was selected. In this case, answers are either valid or blank, there is no opportunity for an invalid response. Number of valid responses: 251 Number of blank responses: 30 Table D22 & Figure D21: Respondents were asked if they have undertaken periodic proactive steps to control corrosion. The percentage of “Yes” and “No” responses (of the total 251 valid responses) is presented in this table. Table D22.
Answer Percent of total responses Yes 56.6% No 43.4%
Figure D21.
Yes, 56.6%
No, 43.4%
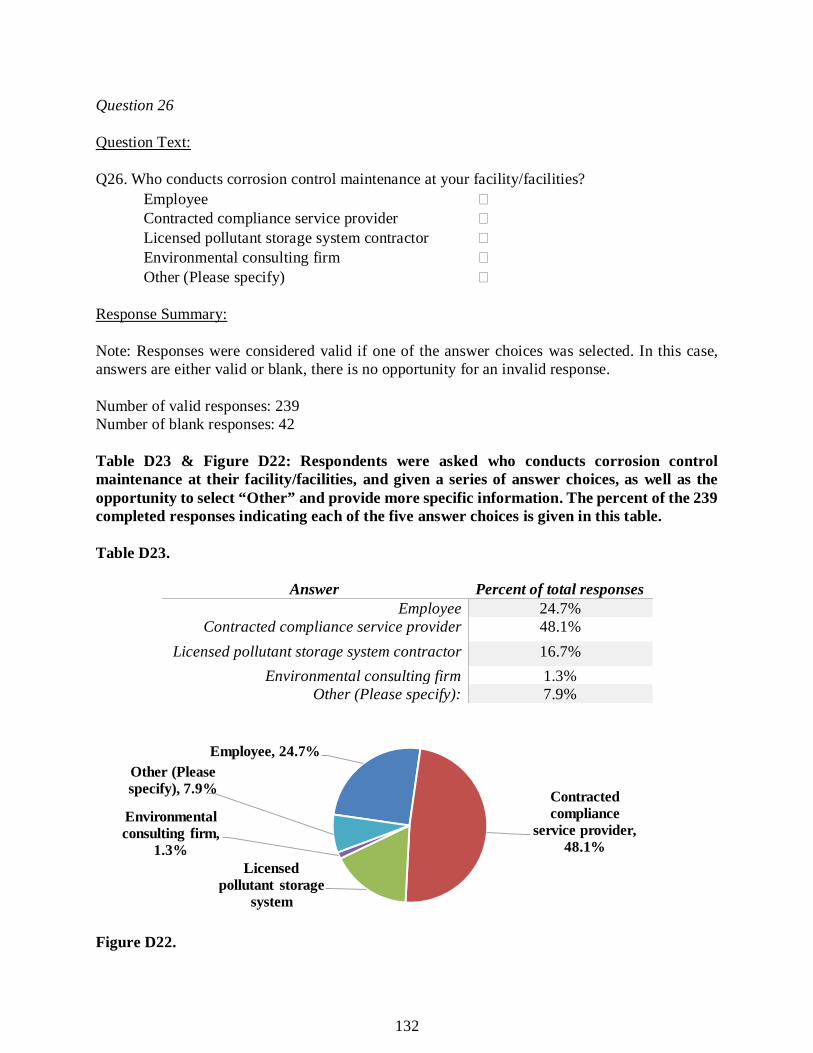
132
Question 26
Question Text:
Q26. Who conducts corrosion control maintenance at your facility/facilities? Employee � Contracted compliance service provider � Licensed pollutant storage system contractor � Environmental consulting firm � Other (Please specify) �
Response Summary:
Note: Responses were considered valid if one of the answer choices was selected. In this case, answers are either valid or blank, there is no opportunity for an invalid response. Number of valid responses: 239 Number of blank responses: 42 Table D23 & Figure D22: Respondents were asked who conducts corrosion control maintenance at their facility/facilities, and given a series of answer choices, as well as the opportunity to select “Other” and provide more specific information. The percent of the 239 completed responses indicating each of the five answer choices is given in this table. Table D23.
Answer Percent of total responses Employee 24.7%
Contracted compliance service provider 48.1% Licensed pollutant storage system contractor 16.7%
Environmental consulting firm 1.3% Other (Please specify): 7.9%
Figure D22.
Employee, 24.7%
Contracted compliance
service provider, 48.1%
Licensed pollutant storage
system t t
Environmental consulting firm,
1.3%
Other (Please specify), 7.9%
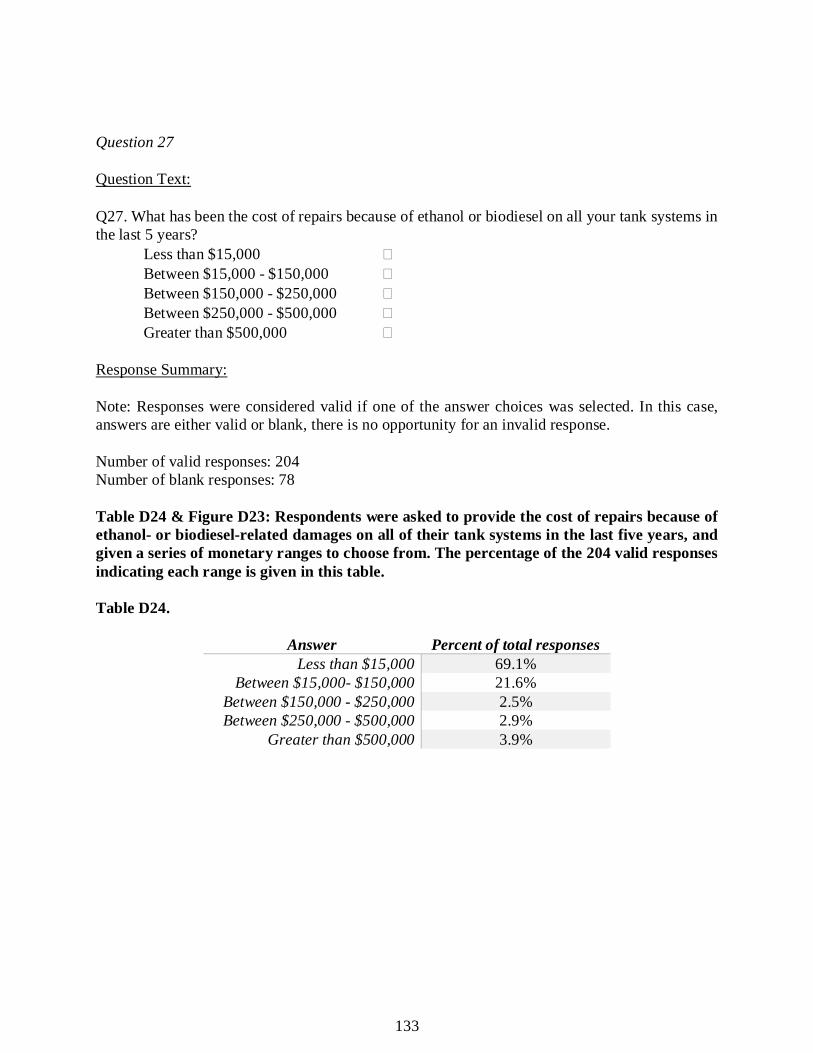
133
Question 27
Question Text:
Q27. What has been the cost of repairs because of ethanol or biodiesel on all your tank systems in the last 5 years?
Less than $15,000 � Between $15,000 - $150,000 � Between $150,000 - $250,000 � Between $250,000 - $500,000 � Greater than $500,000 �
Response Summary:
Note: Responses were considered valid if one of the answer choices was selected. In this case, answers are either valid or blank, there is no opportunity for an invalid response. Number of valid responses: 204 Number of blank responses: 78 Table D24 & Figure D23: Respondents were asked to provide the cost of repairs because of ethanol- or biodiesel-related damages on all of their tank systems in the last five years, and given a series of monetary ranges to choose from. The percentage of the 204 valid responses indicating each range is given in this table. Table D24.
Answer Percent of total responses Less than $15,000 69.1%
Between $15,000- $150,000 21.6% Between $150,000 - $250,000 2.5% Between $250,000 - $500,000 2.9%
Greater than $500,000 3.9%

134
Figure D23.
Less than $15,00069%
Between $15,000- $150,00022%
Between $150,000 -$250,000…
Between $250,000 - $500,000
3%Greater than $500,000
4%

135
Question 28
Question Text:
Q28. Has your facility installed dispensers or other components with funding under the Biofuels Infrastructure Partnership from the Florida Department of Agriculture?
Yes � No �
Response Summary:
Note: Responses were considered valid if one of the answer choices (“Yes” or “No”) was selected. In this case, answers are either valid or blank, there is no opportunity for an invalid response. Number of valid responses: 251 Number of blank responses: 30 Table D25 & Figure D24: Respondents were asked if they installed dispensers or other components with funding provided under the Biofuels Infrastructure Partnership from the Florida Department of Agriculture and Consumer Services. The percentage of “Yes” and “No” responses (of the total 251 valid responses) is presented in this table and pie chart. Table D25.
Answer Percent of total responses
Yes 1.1% No 98.9%
Figure D24.
Yes, 1.1%
No, 98.9%
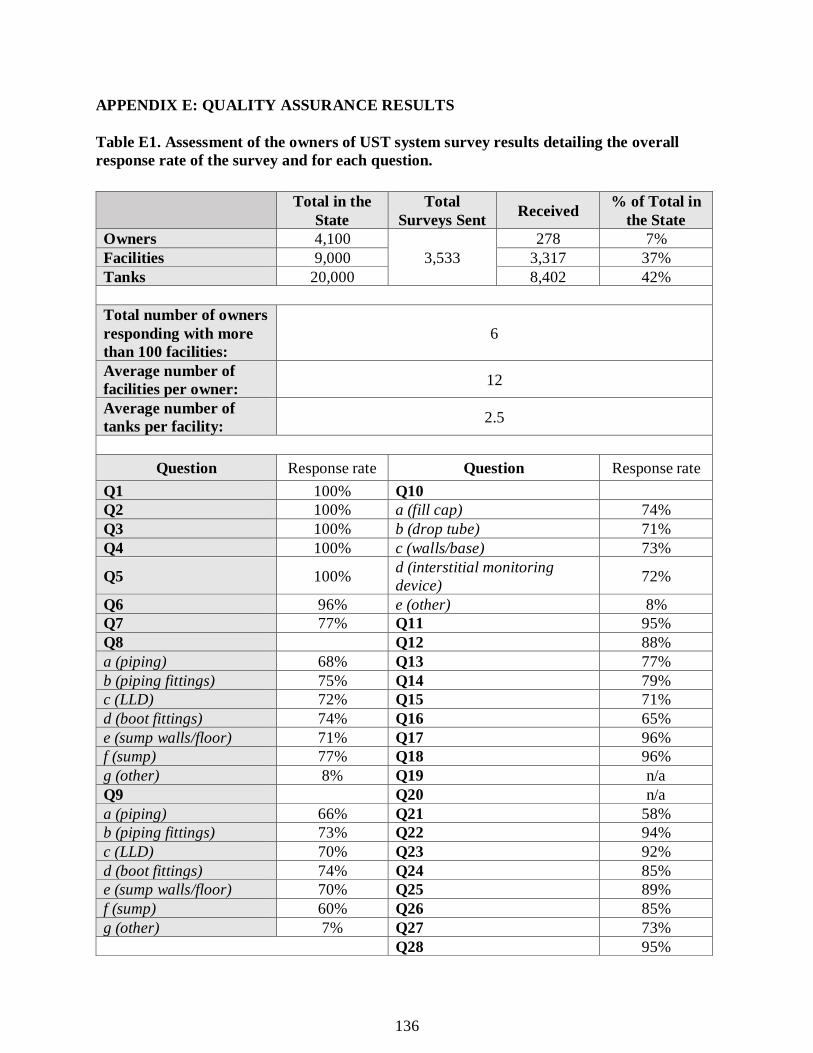
136
APPENDIX E: QUALITY ASSURANCE RESULTS Table E1. Assessment of the owners of UST system survey results detailing the overall response rate of the survey and for each question.
Total in the State
Total Surveys Sent Received % of Total in
the State Owners 4,100
3,533 278 7%
Facilities 9,000 3,317 37% Tanks 20,000 8,402 42% Total number of owners responding with more than 100 facilities:
6
Average number of facilities per owner: 12
Average number of tanks per facility: 2.5
Question Response rate Question Response rate
Q1 100% Q10 Q2 100% a (fill cap) 74% Q3 100% b (drop tube) 71% Q4 100% c (walls/base) 73%
Q5 100% d (interstitial monitoring device) 72%
Q6 96% e (other) 8% Q7 77% Q11 95% Q8 Q12 88% a (piping) 68% Q13 77% b (piping fittings) 75% Q14 79% c (LLD) 72% Q15 71% d (boot fittings) 74% Q16 65% e (sump walls/floor) 71% Q17 96% f (sump) 77% Q18 96% g (other) 8% Q19 n/a Q9 Q20 n/a a (piping) 66% Q21 58% b (piping fittings) 73% Q22 94% c (LLD) 70% Q23 92% d (boot fittings) 74% Q24 85% e (sump walls/floor) 70% Q25 89% f (sump) 60% Q26 85% g (other) 7% Q27 73%
Q28 95%
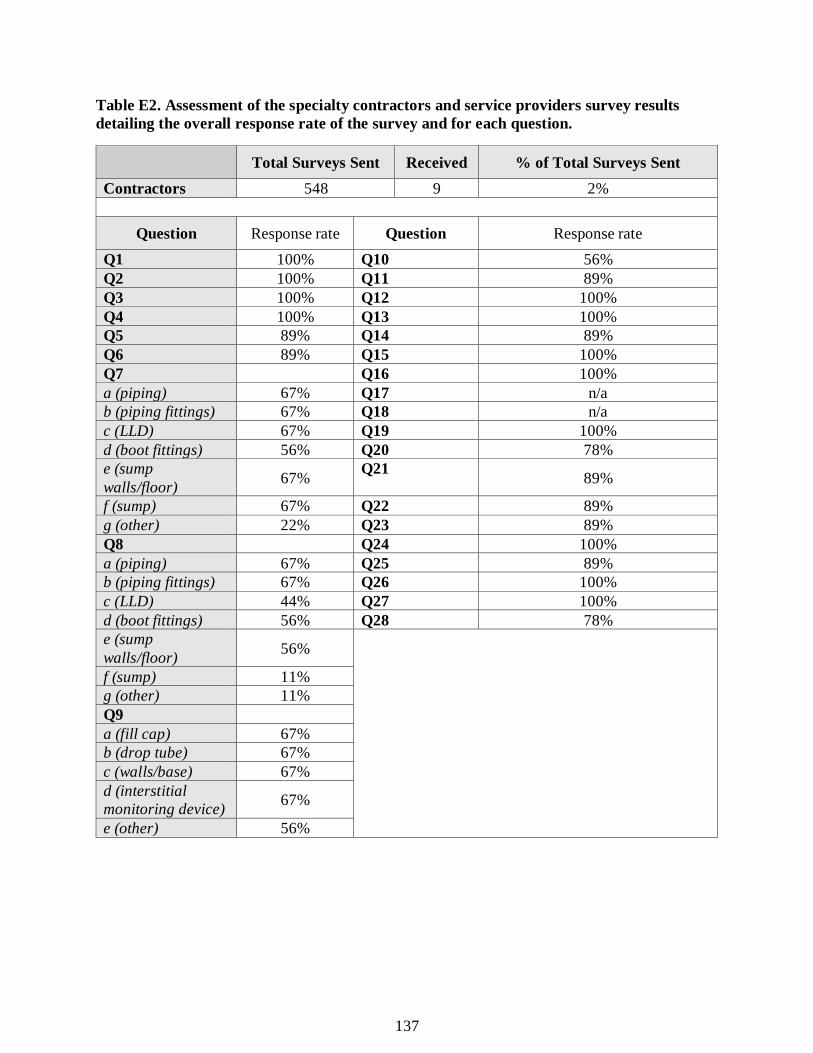
137
Table E2. Assessment of the specialty contractors and service providers survey results detailing the overall response rate of the survey and for each question.
Total Surveys Sent Received % of Total Surveys Sent Contractors 548 9 2%
Question Response rate Question Response rate
Q1 100% Q10 56% Q2 100% Q11 89% Q3 100% Q12 100% Q4 100% Q13 100% Q5 89% Q14 89% Q6 89% Q15 100% Q7 Q16 100% a (piping) 67% Q17 n/a b (piping fittings) 67% Q18 n/a c (LLD) 67% Q19 100% d (boot fittings) 56% Q20 78% e (sump walls/floor) 67% Q21 89%
f (sump) 67% Q22 89% g (other) 22% Q23 89% Q8 Q24 100% a (piping) 67% Q25 89% b (piping fittings) 67% Q26 100% c (LLD) 44% Q27 100% d (boot fittings) 56% Q28 78% e (sump walls/floor) 56%
f (sump) 11% g (other) 11% Q9 a (fill cap) 67% b (drop tube) 67% c (walls/base) 67% d (interstitial monitoring device) 67%
e (other) 56%

138
APPENDIX F: ECONOMIC ASSESSMENT RESULTS The survey results were used to make estimates on several different economic outcomes: (1) the total value spent by facility owners on ethanol- or biodiesel-related repairs in the last five years, (2) the average cost of repairs to a tank system resulting from ethanol- or biodiesel-related repairs, and (3) the annual cost of preventative maintenance. F1. Corrosion-Related Expenditures in Last Five Years Question 27 of the Owner Survey asked respondents to estimate the total amount owners spent on ethanol- or biodiesel-related repairs in the last five years. The answers provided are assumed to represent the total amount of money spent on all of their tanks in the five years. Respondents were given five monetary ranges from which to choose. For computational purposes, a high, mid-range and low estimate value were assigned to each range. These assigned values are found in Table F1. Table F1: High, Mid-range and Low assumed values for the monetary ranges given as answer choices for Question 27 of the Owner Survey.
Range Less than
$15,000
Between $15,000- $150,000
Between $150,000
- $250,000
Between $250,000
- $500,000
Greater than
$500,000
High $14,000 $149,000 $249,000 $499,000 $750,000 Mid-
range $7,500 $82,500 $200,000 $375,000 $675,000
Low $1,000 $16,000 $151,000 $251,000 $501,000 By adding the assigned numerical values for every response, we determine high-, middle- and low-range estimates for the total amount spent by the survey respondents. Respondents who did not provide any numerical range were assumed to have not spent anything on ethanol- or biodiesel-related repairs in the last five years. Table F2 presents these results. Table F2. Total amount owners responding to survey spent on ethanol- or biodiesel-related repairs in the last five years. Calculations based on results from Owner Survey question 27 and the assumed monetary values in Table F1.
Total amount spent by survey
respondents High $18,620,000
Mid-range $13,255,000 Low $7,098,000
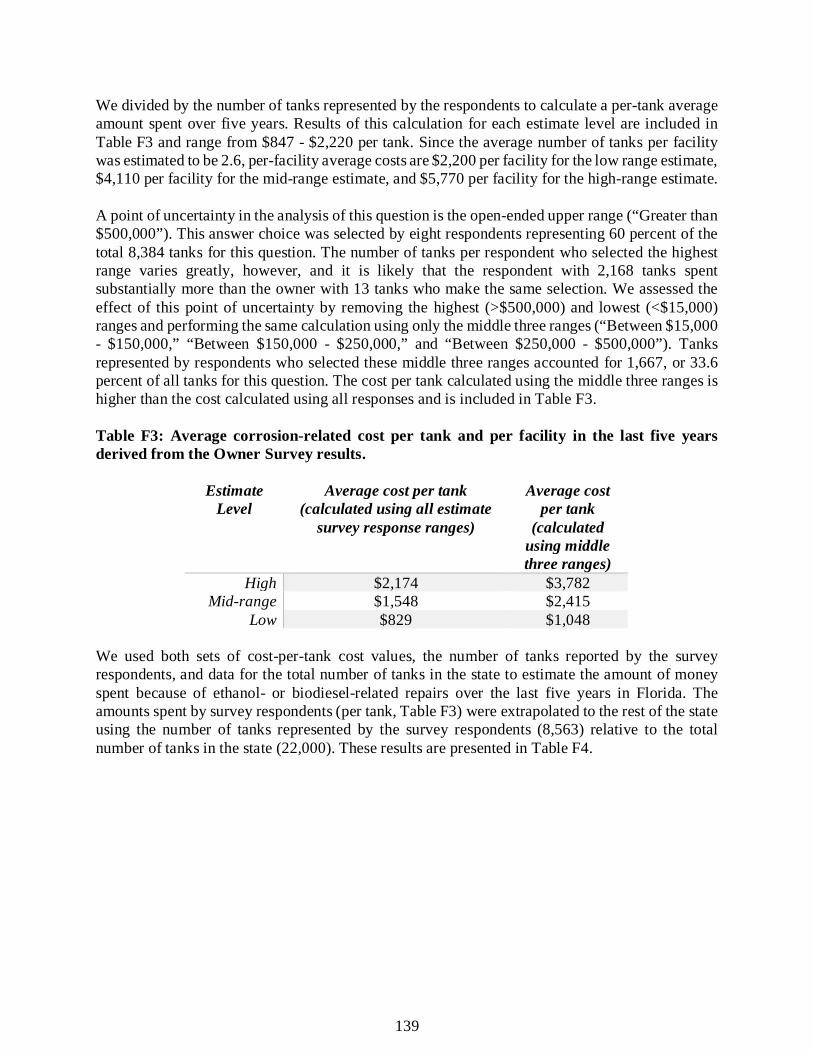
139
We divided by the number of tanks represented by the respondents to calculate a per-tank average amount spent over five years. Results of this calculation for each estimate level are included in Table F3 and range from $847 - $2,220 per tank. Since the average number of tanks per facility was estimated to be 2.6, per-facility average costs are $2,200 per facility for the low range estimate, $4,110 per facility for the mid-range estimate, and $5,770 per facility for the high-range estimate. A point of uncertainty in the analysis of this question is the open-ended upper range (“Greater than $500,000”). This answer choice was selected by eight respondents representing 60 percent of the total 8,384 tanks for this question. The number of tanks per respondent who selected the highest range varies greatly, however, and it is likely that the respondent with 2,168 tanks spent substantially more than the owner with 13 tanks who make the same selection. We assessed the effect of this point of uncertainty by removing the highest (>$500,000) and lowest (<$15,000) ranges and performing the same calculation using only the middle three ranges (“Between $15,000 - $150,000,” “Between $150,000 - $250,000,” and “Between $250,000 - $500,000”). Tanks represented by respondents who selected these middle three ranges accounted for 1,667, or 33.6 percent of all tanks for this question. The cost per tank calculated using the middle three ranges is higher than the cost calculated using all responses and is included in Table F3. Table F3: Average corrosion-related cost per tank and per facility in the last five years derived from the Owner Survey results. We used both sets of cost-per-tank cost values, the number of tanks reported by the survey respondents, and data for the total number of tanks in the state to estimate the amount of money spent because of ethanol- or biodiesel-related repairs over the last five years in Florida. The amounts spent by survey respondents (per tank, Table F3) were extrapolated to the rest of the state using the number of tanks represented by the survey respondents (8,563) relative to the total number of tanks in the state (22,000). These results are presented in Table F4.
Estimate Level
Average cost per tank (calculated using all estimate
survey response ranges)
Average cost per tank
(calculated using middle three ranges)
High $2,174 $3,782 Mid-range $1,548 $2,415
Low $829 $1,048

140
Table F4: Total amount spent in the last five years by survey respondents on ethanol- and biodiesel-related issues, as well as an estimated statewide expenditure. A high, mid-range and low estimate was computed for each. Per-tank repair costs are included for both cost-per-tank estimates from Table F2.
Total amount spent in last five years by survey respondents
(calculated using all survey response
ranges)
Statewide estimate of amount spent for all tanks in Florida
(calculated using all survey response
ranges)
Total amount spent in last five years by survey respondents (calculated using
middle three survey response ranges)
Statewide estimate of amount spent for all tanks in Florida (calculated using
middle three estimate survey
response ranges) High $18,620,000 $47,838,374 $32,384,300 $83,201,420 Mid-
range $13,255,000 $34,054,654 $20,677,400 $53,124,330
Low $7,098,000 $18,236,132 $8,970,600 $23,047,250 Following the methodology described above, the survey results suggest that facility owners in Florida spent between $18 million and $83 million on ethanol- or biodiesel-related repairs in the last five years. F2. Estimated Repair Costs Based on Contractor Survey The Contractor Survey asked respondents to estimate the average cost of repairs for a selection of five UST system components due to the effects of ethanol or biodiesel (sumps, piping, spill containment devices, tanks, isolation boots). Respondents were provided a choice of five monetary ranges from which to make a selection. As with Question 27 of the Owner Survey, high, mid-range and low assumed values were estimated. The responses were assumed to represent an average per-facility cost. A weighted average cost for each component was calculated using the percentage of respondents selecting each answer choice and the assumed (high, mid-range and low) values. For example, the survey results for contractor Question 25 (related to repairs to tanks) are presented in Table F5. For middle-range estimates, the average per-facility cost was calculated as:
𝑋𝑋�𝑀𝑀𝑀𝑀𝑀𝑀 = (0.25𝑥𝑥$2,500) + (0.0𝑥𝑥$7,500) + (0.125𝑥𝑥$30,000) + (0.125𝑥𝑥$75,000)+ (0.50𝑥𝑥$125,000)
which results in a per-facility cost for tank repair of $76,250.
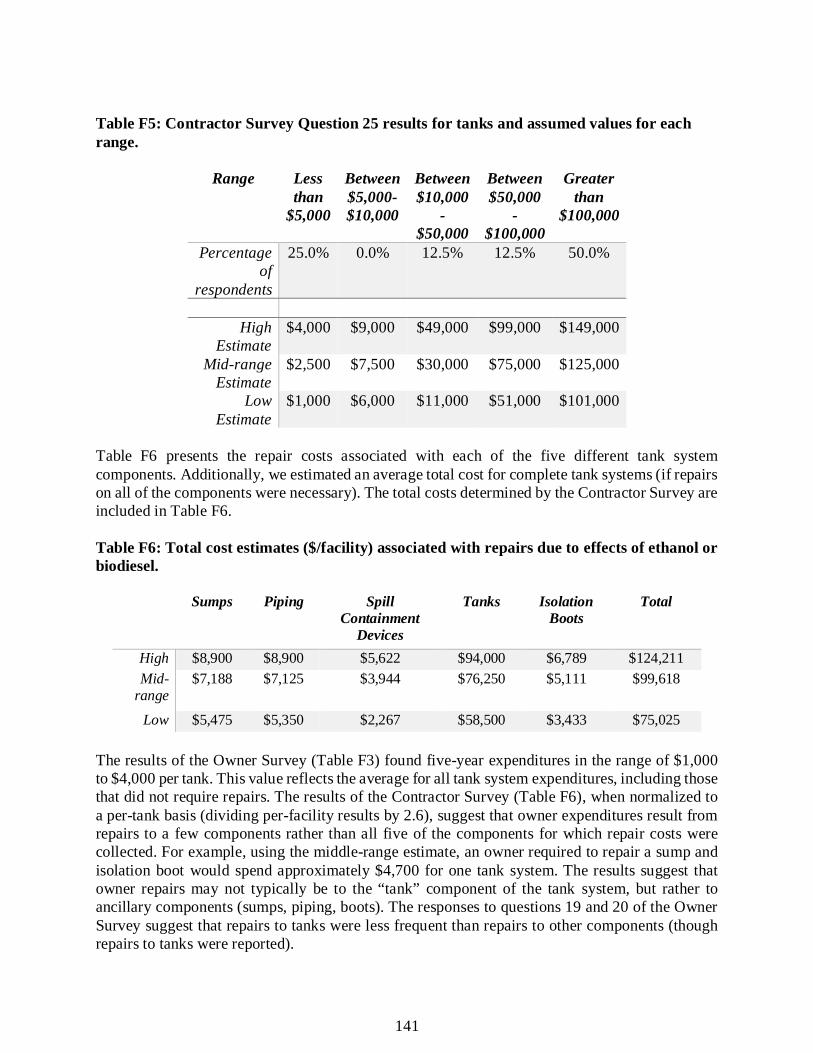
141
Table F5: Contractor Survey Question 25 results for tanks and assumed values for each range.
Range Less than
$5,000
Between $5,000- $10,000
Between $10,000
- $50,000
Between $50,000
- $100,000
Greater than
$100,000
Percentage of
respondents
25.0% 0.0% 12.5% 12.5% 50.0%
High
Estimate $4,000 $9,000 $49,000 $99,000 $149,000
Mid-range Estimate
$2,500 $7,500 $30,000 $75,000 $125,000
Low Estimate
$1,000 $6,000 $11,000 $51,000 $101,000
Table F6 presents the repair costs associated with each of the five different tank system components. Additionally, we estimated an average total cost for complete tank systems (if repairs on all of the components were necessary). The total costs determined by the Contractor Survey are included in Table F6. Table F6: Total cost estimates ($/facility) associated with repairs due to effects of ethanol or biodiesel.
Sumps Piping Spill Containment
Devices
Tanks Isolation Boots
Total
High $8,900 $8,900 $5,622 $94,000 $6,789 $124,211 Mid-
range $7,188 $7,125 $3,944 $76,250 $5,111
$99,618
Low $5,475 $5,350 $2,267 $58,500 $3,433 $75,025 The results of the Owner Survey (Table F3) found five-year expenditures in the range of $1,000 to $4,000 per tank. This value reflects the average for all tank system expenditures, including those that did not require repairs. The results of the Contractor Survey (Table F6), when normalized to a per-tank basis (dividing per-facility results by 2.6), suggest that owner expenditures result from repairs to a few components rather than all five of the components for which repair costs were collected. For example, using the middle-range estimate, an owner required to repair a sump and isolation boot would spend approximately $4,700 for one tank system. The results suggest that owner repairs may not typically be to the “tank” component of the tank system, but rather to ancillary components (sumps, piping, boots). The responses to questions 19 and 20 of the Owner Survey suggest that repairs to tanks were less frequent than repairs to other components (though repairs to tanks were reported).
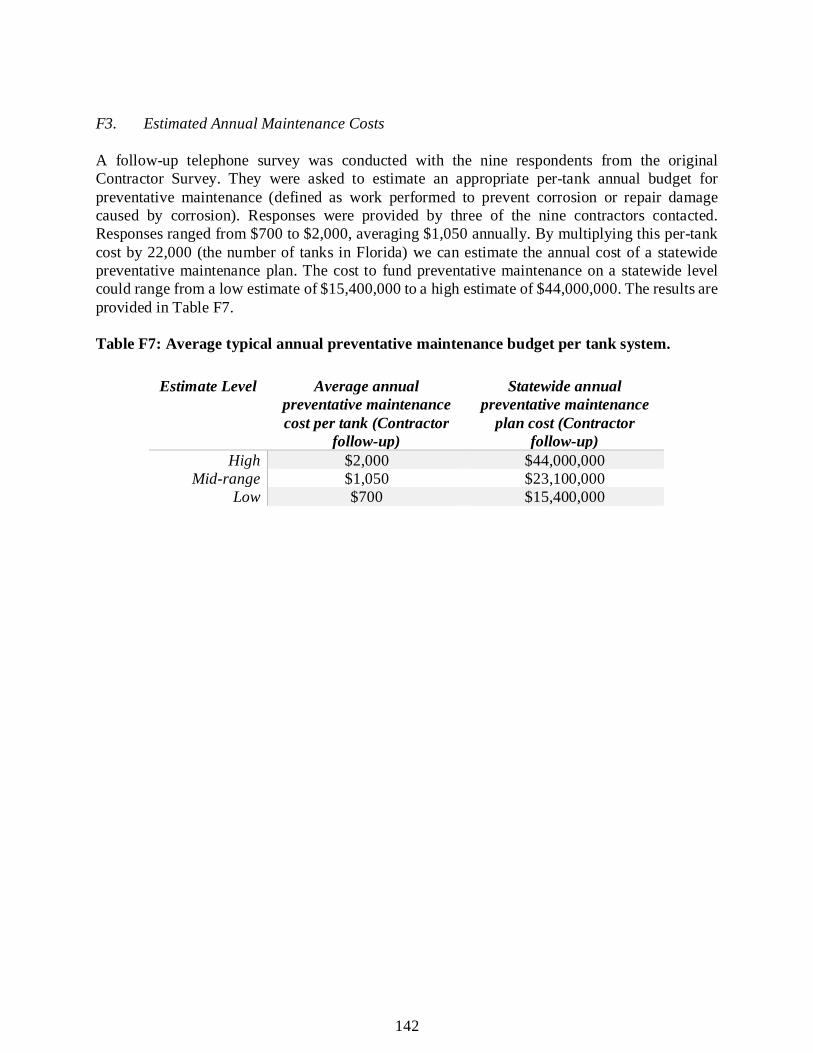
142
F3. Estimated Annual Maintenance Costs A follow-up telephone survey was conducted with the nine respondents from the original Contractor Survey. They were asked to estimate an appropriate per-tank annual budget for preventative maintenance (defined as work performed to prevent corrosion or repair damage caused by corrosion). Responses were provided by three of the nine contractors contacted. Responses ranged from $700 to $2,000, averaging $1,050 annually. By multiplying this per-tank cost by 22,000 (the number of tanks in Florida) we can estimate the annual cost of a statewide preventative maintenance plan. The cost to fund preventative maintenance on a statewide level could range from a low estimate of $15,400,000 to a high estimate of $44,000,000. The results are provided in Table F7. Table F7: Average typical annual preventative maintenance budget per tank system.
Estimate Level Average annual
preventative maintenance cost per tank (Contractor
follow-up)
Statewide annual preventative maintenance
plan cost (Contractor follow-up)
High $2,000 $44,000,000 Mid-range $1,050 $23,100,000
Low $700 $15,400,000
Related Documents


