1 | Page Industry Performance Review Report of PPAC: July, 2016 www.ppac.org.in INDUSTRY SALES REVIEW July 2016

Welcome message from author
This document is posted to help you gain knowledge. Please leave a comment to let me know what you think about it! Share it to your friends and learn new things together.
Transcript

1 | P a g e Industry Performance Review Report of PPAC: July, 2016 www.ppac.org.in
INDUSTRY SALES REVIEW
July 2016
2 | P a g e Industry Performance Review Report of PPAC: July, 2016 www.ppac.org.in
This report analyses the trend of consumption of petroleum products in the
country during the month of July, 2016. Data on product-wise monthly
consumption of petroleum products for July, 2016 is uploaded on PPAC website
(www.ppac.org.in).
1.0 CONSUMPTION :
The growth (%) in consumption of petroleum products, category-wise, for the
month of July, 2016 is given in Table-1.
Table-1: Petroleum Products Consumption (Quantity in TMT)
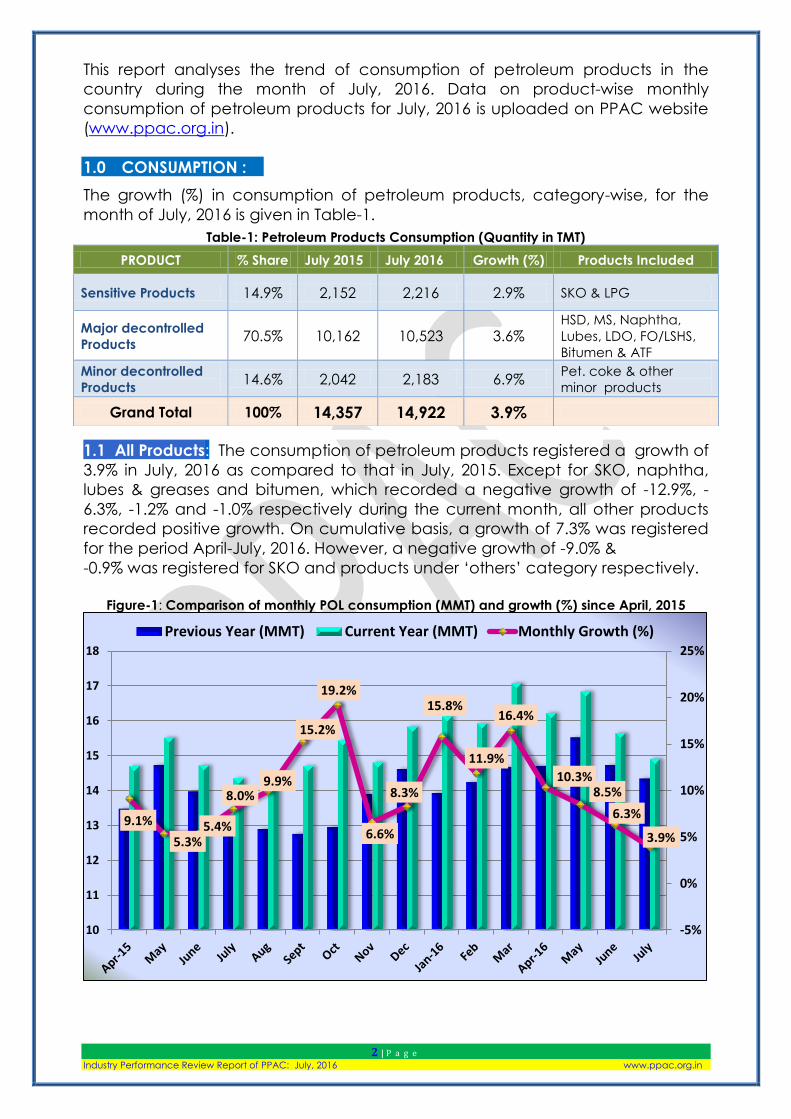
1.1 All Products: The consumption of petroleum products registered a growth of
3.9% in July, 2016 as compared to that in July, 2015. Except for SKO, naphtha,
lubes & greases and bitumen, which recorded a negative growth of -12.9%, -
6.3%, -1.2% and -1.0% respectively during the current month, all other products
recorded positive growth. On cumulative basis, a growth of 7.3% was registered
for the period April-July, 2016. However, a negative growth of -9.0% &
-0.9% was registered for SKO and products under ‘others’ category respectively.
Figure-1: Comparison of monthly POL consumption (MMT) and growth (%) since April, 2015
9.1%
5.3% 5.4%
8.0% 9.9%
15.2%
19.2%
6.6%
8.3%
15.8%
11.9%
16.4%
10.3% 8.5%
6.3%
3.9%
-5%
0%
5%
10%
15%
20%
25%
10
11
12
13
14
15
16
17
18
Previous Year (MMT) Current Year (MMT) Monthly Growth (%)
PRODUCT % Share July 2015 July 2016 Growth (%) Products Included
Sensitive Products 14.9% 2,152 2,216 2.9% SKO & LPG
Major decontrolled
Products 70.5% 10,162 10,523 3.6%
HSD, MS, Naphtha,
Lubes, LDO, FO/LSHS,
Bitumen & ATF
Minor decontrolled
Products 14.6% 2,042 2,183 6.9%
Pet. coke & other
minor products
Grand Total 100% 14,357 14,922 3.9%
3 | P a g e Industry Performance Review Report of PPAC: July, 2016 www.ppac.org.in
The Nikkei India Services PMI rose to 51.9 in July, 2016 from 50.3 in June, 2016.
Business sentiment increased and there was increase in both output and new
work. Manufacturing PMI also increased from 51.7 to 51.8. India’s manufacturing
and infrastructure sectors are on a recovery path, as suggested by the PMI data.
With growth of manufacturing production also quickening, the seasonally
adjusted Nikkei India Composite PMI Output Index climbed to a three month
high of 52.4 in July, 2016 (June, 2016 was 51.1)
The month of June 2016 had recorded a high growth in coal output, cement
production, fertilizer production, refinery production and steel output with
expansion in electricity production. India’s manufacturing economy seemed to
be reviving and with lower prices paid for fuel and some other commodities,
average input costs dropped for service providers in July, 2016. Expansion in PMI
Index in July, 2016 indicates growth in manufacturing and services continued.
Low oil prices have created a favourable environment for the economy and the
outlook for consumption of petroleum products.
PPAC analyzes the sales recorded by the Industry on the basis of the data
available. Data on direct private imports received from DGCIS, which are
added to the final sales reported by oil companies for estimation of
consumption figures, are available up to May, 2016 and private imports data for
the months of June and July, 2016 are projected based on June, 2015 to May,
2016 figures.
Detailed product-wise analysis of growth for July, 2016 is given in the
following sections:
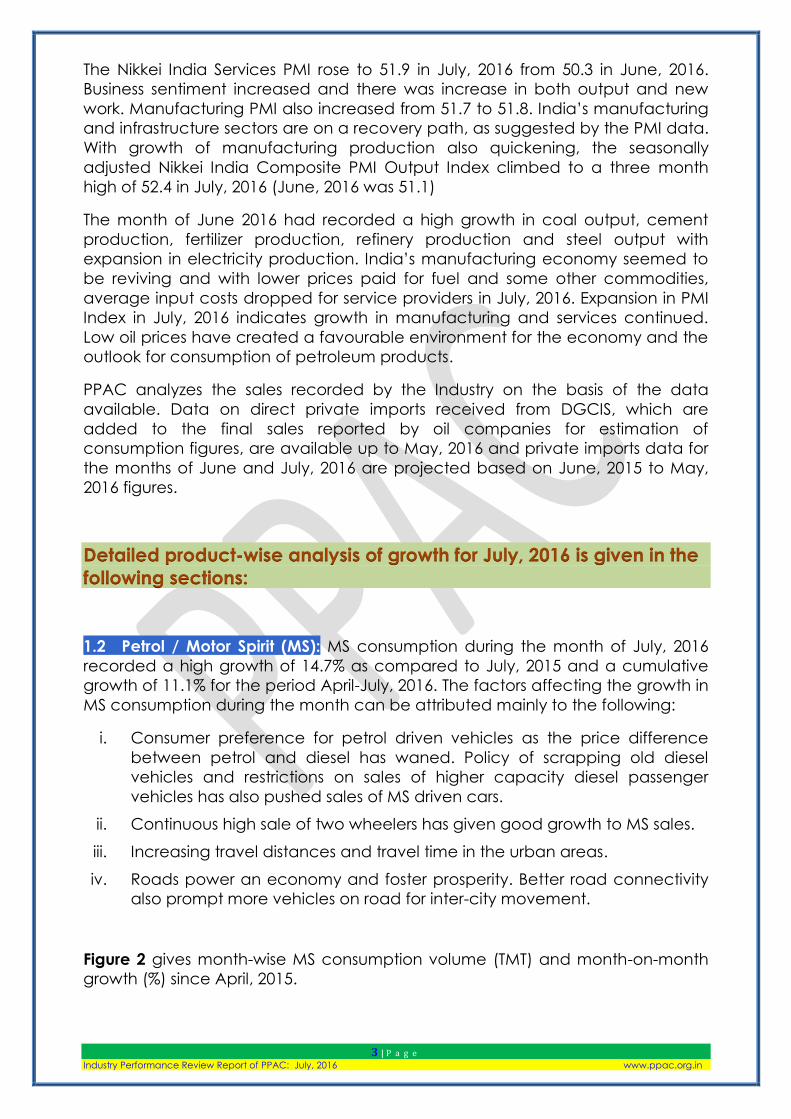
1.2 Petrol / Motor Spirit (MS): MS consumption during the month of July, 2016
recorded a high growth of 14.7% as compared to July, 2015 and a cumulative
growth of 11.1% for the period April-July, 2016. The factors affecting the growth in
MS consumption during the month can be attributed mainly to the following:
i. Consumer preference for petrol driven vehicles as the price difference
between petrol and diesel has waned. Policy of scrapping old diesel
vehicles and restrictions on sales of higher capacity diesel passenger
vehicles has also pushed sales of MS driven cars.
ii. Continuous high sale of two wheelers has given good growth to MS sales.
iii. Increasing travel distances and travel time in the urban areas.
iv. Roads power an economy and foster prosperity. Better road connectivity
also prompt more vehicles on road for inter-city movement.
Figure 2 gives month-wise MS consumption volume (TMT) and month-on-month
growth (%) since April, 2015.
4 | P a g e Industry Performance Review Report of PPAC: July, 2016 www.ppac.org.in
Figure-2: Month wise MS consumption (TMT) and growth (%) since April, 2015
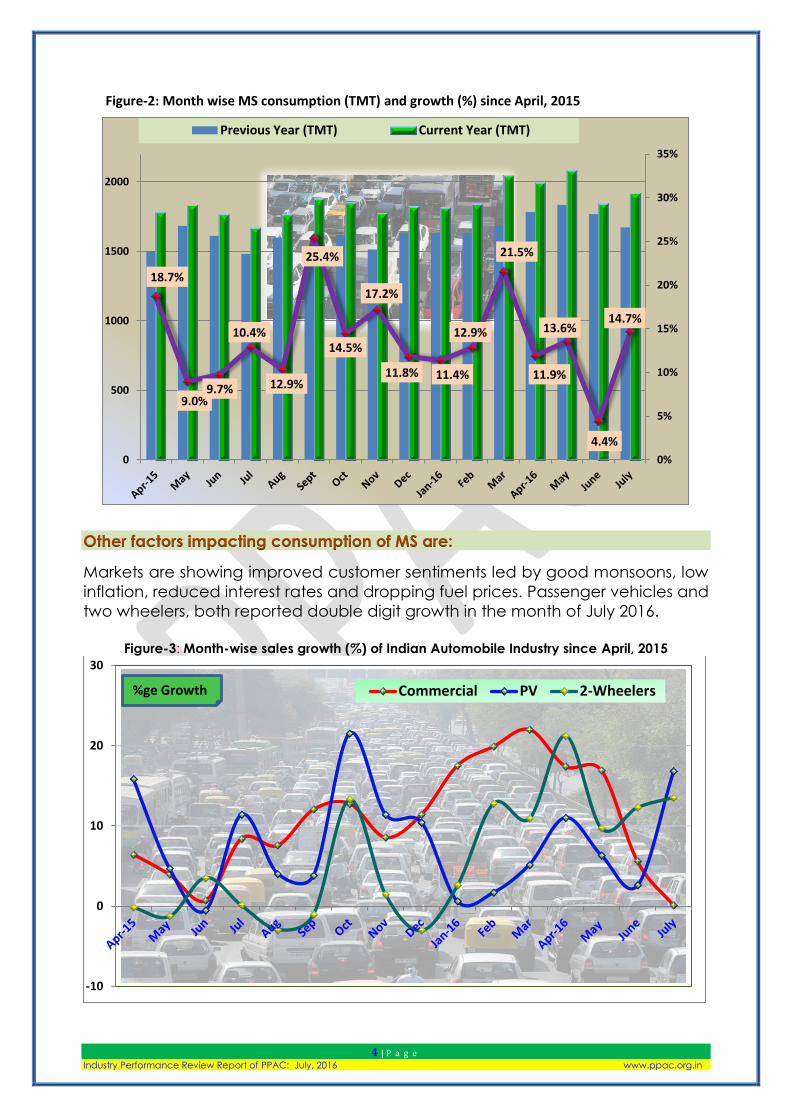
Other factors impacting consumption of MS are:
Markets are showing improved customer sentiments led by good monsoons, low
inflation, reduced interest rates and dropping fuel prices. Passenger vehicles and
two wheelers, both reported double digit growth in the month of July 2016.
Figure-3: Month-wise sales growth (%) of Indian Automobile Industry since April, 2015
18.7%
9.0% 9.7% 12.9%
10.4%
25.4%
14.5%
17.2%
11.8% 11.4%
12.9%
21.5%
11.9%
13.6%
4.4%
14.7%
0%
5%
10%
15%
20%
25%
30%
35%
0
500
1000
1500
2000
Previous Year (TMT) Current Year (TMT)
-10
0
10
20
30
Commercial PV 2-Wheelers%ge Growth
5 | P a g e Industry Performance Review Report of PPAC: July, 2016 www.ppac.org.in
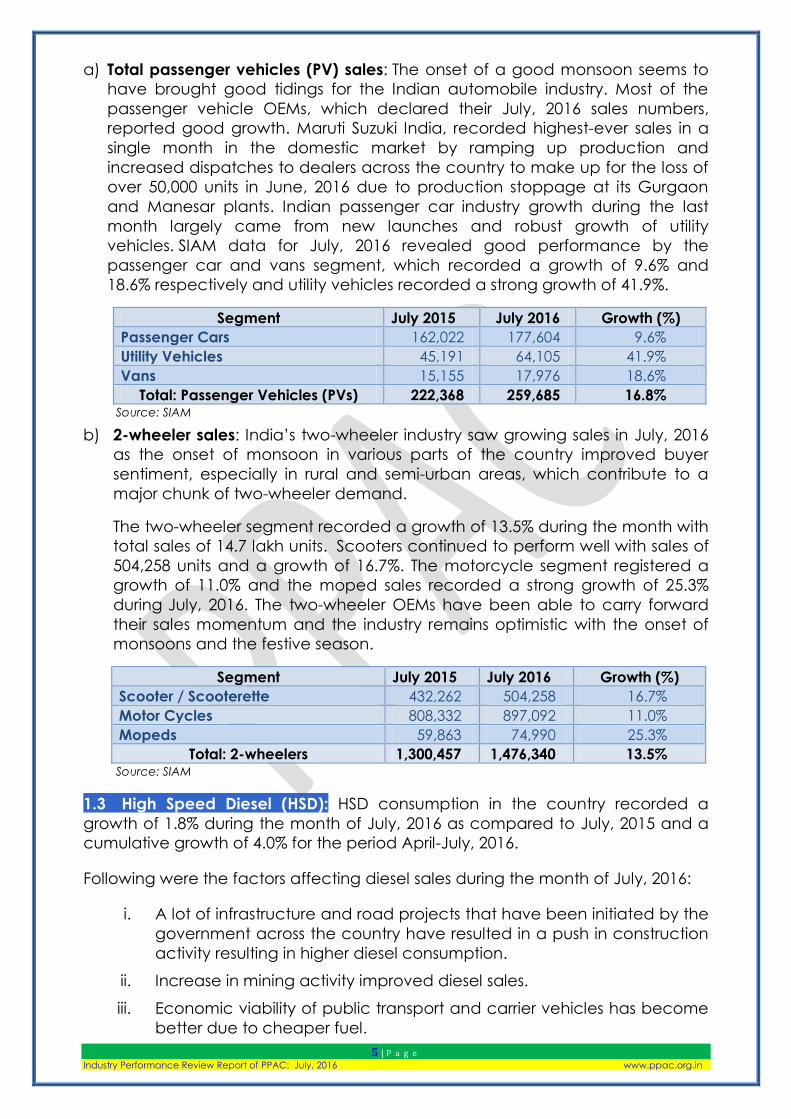
a) Total passenger vehicles (PV) sales: The onset of a good monsoon seems to
have brought good tidings for the Indian automobile industry. Most of the
passenger vehicle OEMs, which declared their July, 2016 sales numbers,
reported good growth. Maruti Suzuki India, recorded highest-ever sales in a
single month in the domestic market by ramping up production and
increased dispatches to dealers across the country to make up for the loss of
over 50,000 units in June, 2016 due to production stoppage at its Gurgaon
and Manesar plants. Indian passenger car industry growth during the last
month largely came from new launches and robust growth of utility
vehicles. SIAM data for July, 2016 revealed good performance by the
passenger car and vans segment, which recorded a growth of 9.6% and
18.6% respectively and utility vehicles recorded a strong growth of 41.9%.
Segment July 2015 July 2016 Growth (%)
Passenger Cars 162,022 177,604 9.6%
Utility Vehicles 45,191 64,105 41.9%
Vans 15,155 17,976 18.6%
Total: Passenger Vehicles (PVs) 222,368 259,685 16.8% Source: SIAM
b) 2-wheeler sales: India’s two-wheeler industry saw growing sales in July, 2016
as the onset of monsoon in various parts of the country improved buyer
sentiment, especially in rural and semi-urban areas, which contribute to a
major chunk of two-wheeler demand.
The two-wheeler segment recorded a growth of 13.5% during the month with
total sales of 14.7 lakh units. Scooters continued to perform well with sales of
504,258 units and a growth of 16.7%. The motorcycle segment registered a
growth of 11.0% and the moped sales recorded a strong growth of 25.3%
during July, 2016. The two-wheeler OEMs have been able to carry forward
their sales momentum and the industry remains optimistic with the onset of
monsoons and the festive season.
Segment July 2015 July 2016 Growth (%)
Scooter / Scooterette 432,262 504,258 16.7%
Motor Cycles 808,332 897,092 11.0%
Mopeds 59,863 74,990 25.3%
Total: 2-wheelers 1,300,457 1,476,340 13.5% Source: SIAM
1.3 High Speed Diesel (HSD): HSD consumption in the country recorded a
growth of 1.8% during the month of July, 2016 as compared to July, 2015 and a
cumulative growth of 4.0% for the period April-July, 2016.
Following were the factors affecting diesel sales during the month of July, 2016:
i. A lot of infrastructure and road projects that have been initiated by the
government across the country have resulted in a push in construction
activity resulting in higher diesel consumption.
ii. Increase in mining activity improved diesel sales.
iii. Economic viability of public transport and carrier vehicles has become
better due to cheaper fuel.

6 | P a g e Industry Performance Review Report of PPAC: July, 2016 www.ppac.org.in
iv. Price decrease apprehension affected the upliftment of product and
prompted dealer to limit indents towards the end of the month.
v. Good monsoons affected the road transport movement, construction
activity and reduced usage of diesel by farmers who used pumps for
electricity and water fields in the absence of rain.
Figure-4: Month-wise HSD consumption (TMT) and growth (%) since April , 2015
Other factors affecting diesel consumption are discussed below:
a) Commercial vehicles (CV) sales: The overall CV sector posted a near flat
growth of 0.1% in July, 2016. With the monsoon underway, there was an uptick
in rural India for small commercial vehicles. Medium and heavy commercial
vehicles (M&HCVs) recorded a de-growth of -7.6 % during the month of July,
2016 mainly due to falling truck rentals in trunk routes.
Light Commercial Vehicle (LCV) sales registered a growth of 6.3% during the
month of July, 2016. Improving economy of the country and overall recovery
due to improved industry and infrastructure is also driving the LCV sales
growth.
Segment July 2015 July 2016 Growth (%)
M&HCVs 23,061 21,307 -7.6%
LCVs 28,734 30,546 6.3%
Total: Commercial Vehicles 51,795 51,853 0.1% Source: SIAM
b) Port traffic: There has been a growth of 2.7% in port traffic for the month of
July, 2016. The growth in port traffic and cargos handled at most of the
major ports during July, 2016 is mainly due to increase in port traffic at ports
except at Kolkata, Ennore, Chennai, Chidambarnar, Cochin, Mumbai and
JNPT.
9.3%
-0.6%
2.5%
-0.6%
6.0%
20.1%
16.4%
1.6%
5.5%
8.0%
10.7% 15.1%
4.3% 8.1%
1.5%
1.8%
-5%
0%
5%
10%
15%
20%
25%
0
1000
2000
3000
4000
5000
6000
7000
8000
Previous Year (TMT) Current Year (TMT) Monthly Growth (%)

7 | P a g e Industry Performance Review Report of PPAC: July, 2016 www.ppac.org.in
Table-2 below gives the port-wise performance during the month of July, 2016.
The growth in traffic during the period April-July,2016 has been contributed
mostly by iron ore (124.8%), other liquids (1.25%), POL products (2.95%), and
others (8.85%) while there has been a drop in finished fertilizer (-9.49%) and raw
fertilizer(-11.36%). High growth in iron ore traffic is due to resumption of iron ore
mining activities in Karnataka, Goa and Odisha.
Table-2: Traffic handled at major ports in July, 2016
TRAFFIC HANDLED AT MAJOR PORTS (TMT)
PORTS July 2015 July 2016 Growth (%)
KOLKATA + HALDIA 4,525 4,110 -9.17%
PARADIP 6,086 8,056 32.37%
VISAKHAPATNAM 5,142 5,299 3.05%
KAMARAJAR (ENNORE) 3,059 2,384 -22.07%
CHENNAI 4,422 4,272 -3.39%
V.O. CHIDAMBARANAR 3,599 3,465 -3.72%
COCHIN 1,881 1,763 -6.27%
NEW MANGALORE 2,885 3,097 7.35%
MORMUGAO 1,224 1,492 21.90%
MUMBAI 5,334 4,979 -6.66%
JNPT 5,664 5,019 -11.39%
KANDLA 8,543 9,820 14.95%
TOTAL: 52,364 53,756 2.66% Source: IPA
c) Power situation improves: The power deficit position for the month of July,
2016 is given in Table-3. The power deficit position improved from -2.1% in July,
2015 to -0.4% during July, 2016. The shortage during the month improved for
all regions. The deficits continue mainly in the states of Jammu & Kashmir,
Assam and Uttar Pradesh. The improved power position in July, 2016 may
have led to reduced usage of diesel for back-up power generation.
Table-3: Power deficit: Region-wise position for July, 2016 (% deficit)
States
July 2016 (P) July 2015
Requirement
(MU)
Available
(MU)
Deficit Deficit
(%) MU (%)
North 32,887 32,615 -273 -0.8% -5.1%
West 26,978 26,965 -13 0% -0.4%
South 23,950 23,950 0 0% -0.5%
East 11,703 11,692 -11 -0.1% -0.6%
North-East 1,306 1,260 -46 -3.5% -5.1%
Total 96,824 96,482 -342 -0.4% -2.1%
Source: Central Electricity Authority (CEA)

8 | P a g e Industry Performance Review Report of PPAC: July, 2016 www.ppac.org.in
• Seasonal rainfall scenario: In July, 2016, rainfall was 7% above average, a
sharp improvement from the deficit of 16% last year. Barring Western India,
coastal Karnataka, Andhra Pradesh and Kerala, all other regions in the
country received normal to excess rainfall during the month. This augurs well
for the growth of crops in the Rabi season and crop planting has surpassed
last year's level by 6.3% to touch 800 million hectares. Among the various
crops planted so far, the area under pulses has expanded. Higher than
normal rainfall is expected to reduce the need for diesel by irrigation pumps
and diesel powered generators. Heavy rains also impede road construction
and other infrastructure related activities which is reflected in diesel
consumption of July, 2016.
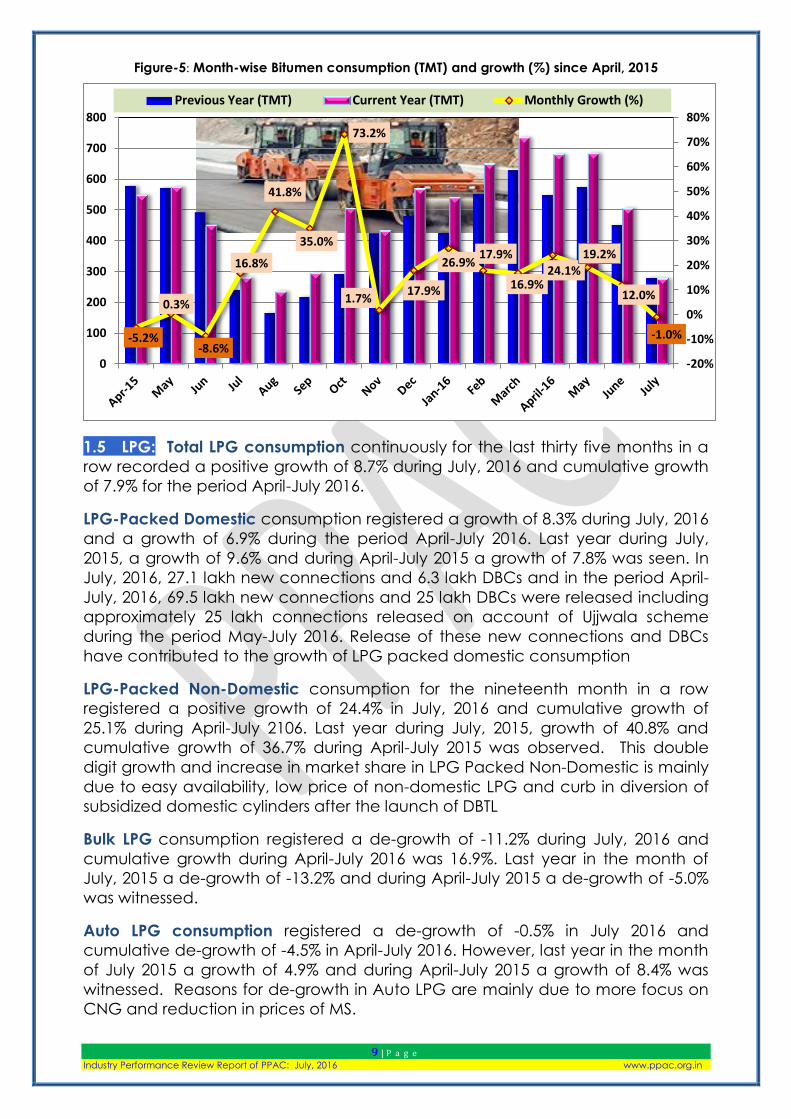
1.4 Bitumen: After twelve months of high growth, bitumen consumption
registered a de-growth of -1.0% during the month of July, 2016 and a cumulative
growth of 15.9% for the period April- July, 2016. The government has kept the
development of roads at a high priority through various programmes like the
National Highways Development Project (NHDP), Special Accelerated Road
Development Programme in North East (SARDP-NE), Left Wing Extremism (LWE)
and Pradhan Mantri Gramin Sadak Yojana (PMGSY), however, heavy rains
impede construction work and bitumen consumption was therefore affected
during the month due to monsoons.
Figure-5 gives the month wise bitumen consumption and growth since April,
2015.
9 | P a g e Industry Performance Review Report of PPAC: July, 2016 www.ppac.org.in
Figure-5: Month-wise Bitumen consumption (TMT) and growth (%) since April, 2015
1.5 LPG: Total LPG consumption continuously for the last thirty five months in a
row recorded a positive growth of 8.7% during July, 2016 and cumulative growth
of 7.9% for the period April-July 2016.
LPG-Packed Domestic consumption registered a growth of 8.3% during July, 2016
and a growth of 6.9% during the period April-July 2016. Last year during July,
2015, a growth of 9.6% and during April-July 2015 a growth of 7.8% was seen. In
July, 2016, 27.1 lakh new connections and 6.3 lakh DBCs and in the period April-
July, 2016, 69.5 lakh new connections and 25 lakh DBCs were released including
approximately 25 lakh connections released on account of Ujjwala scheme
during the period May-July 2016. Release of these new connections and DBCs
have contributed to the growth of LPG packed domestic consumption
LPG-Packed Non-Domestic consumption for the nineteenth month in a row
registered a positive growth of 24.4% in July, 2016 and cumulative growth of
25.1% during April-July 2106. Last year during July, 2015, growth of 40.8% and
cumulative growth of 36.7% during April-July 2015 was observed. This double
digit growth and increase in market share in LPG Packed Non-Domestic is mainly
due to easy availability, low price of non-domestic LPG and curb in diversion of
subsidized domestic cylinders after the launch of DBTL
Bulk LPG consumption registered a de-growth of -11.2% during July, 2016 and
cumulative growth during April-July 2016 was 16.9%. Last year in the month of
July, 2015 a de-growth of -13.2% and during April-July 2015 a de-growth of -5.0%
was witnessed.
Auto LPG consumption registered a de-growth of -0.5% in July 2016 and
cumulative de-growth of -4.5% in April-July 2016. However, last year in the month
of July 2015 a growth of 4.9% and during April-July 2015 a growth of 8.4% was
witnessed. Reasons for de-growth in Auto LPG are mainly due to more focus on
CNG and reduction in prices of MS.
-5.2%
0.3%
-8.6%
16.8%
41.8%
35.0%
73.2%
1.7% 17.9%
26.9% 17.9%
16.9% 24.1%
19.2%
12.0%
-1.0%
-20%
-10%
0%
10%
20%
30%
40%
50%
60%
70%
80%
0
100
200
300
400
500
600
700
800
Previous Year (TMT) Current Year (TMT) Monthly Growth (%)

10 | P a g e Industry Performance Review Report of PPAC: July, 2016 www.ppac.org.in
Figure-6: Month-wise LPG consumption (TMT) and growth (%) since April, 2015
1.6 Naphtha: consumption recorded a de-growth of -6.3% during the month of
July, 2016 and a cumulative growth of 0.8% for the period April- July, 2016. Low
demand of naphtha by the petrochemical industry (particularly polymers and
plastics) has driven down the growth. As the economy and the demand for
manufacturing grow, the demand for plastics also grows and so does the
demand for naphtha.
1.7 ATF During July, 2016 the growth in consumption of ATF was 11.1% and a
cumulative growth of 12.3% was observed for the period April-July, 2016. Air
traffic in India continued its upward journey growing at a phenomenal pace,
helped by cheaper fares. Domestic airlines carried 85.08 lakh (8.5 million)
passengers during July 2016, 25.8% more than 67.62 lakh (6.7 million) flown in July,
2015. The Ministry of Civil Aviation (MoCA) has come out with an integrated civil
aviation policy with the central idea of making regional air connectivity a reality.
The key objective of the policy is to take flying to the masses by making it
affordable and convenient along with establishing an integrated eco-system
that will lead to significant growth of the sector in the longer term. On
cumulative basis, a growth of 22.4% was registered in the number of passengers
carried by airlines in the period April-July, 2016 as compared to the period
April-July, 2015.
9.7%
5.2% 10.0%
10.8%
7.6%
4.2%
12.6%
3.1%
6.8%
4.5%
15.5%
14.2%
7.5%
6.8%
8.4% 8.7%
-10%
-5%
0%
5%
10%
15%
20%
0
200
400
600
800
1000
1200
1400
1600
1800
Previous Year (TMT) Current Year (TMT) Monthly Growth (%)

11 | P a g e Industry Performance Review Report of PPAC: July, 2016 www.ppac.org.in
Figure-7: Month-wise ATF consumption (TMT) and growth (%) since April, 2015
1.8 FO/LSHS: FO and LSHS consumption registered a growth of 6.5% during July,
2016 and a cumulative growth of 18.4% for the period April-July, 2016. The
growth is mainly due to increased consumption of FO in power, petrochemical,
steel and general trade sectors. The consumption of LSHS has reduced due to
shift to natural gas by major customers like fertilizer industries.
1.9 PETCOKE: Pet-coke consumption registered a growth of 6.8% during July,
2016 and a cumulative growth of 23.3% during April-July, 2016. Multi-fuel cement
plants and aluminum industries use pet-coke for their production and fall in
prices of petroleum products makes it very lucrative to use.
1.10 LDO: LDO consumption recorded a growth of 2.2% in the month of July,
2016 and a cumulative growth of 13.1 % for April-July, 2016. LDO month wise
demand fluctuates depending on its requirement at power plants for boiler
restart as it trips. LDO is also extensively used in various types of furnaces and any
fluctuation in manufacturing activities lead to fluctuation in its consumption.
*******
4.3% 4.0%
8.5%
6.8% 4.8%
4.5%
11.4%
16.4%
13.0%
7.1%
15.0%
8.8%
12.7%
14.0%
11.2%
11.1%
0%
2%
4%
6%
8%
10%
12%
14%
16%
18%
20%
150
200
250
300
350
400
450
500
550
600
Previous Year (MMT) Current Year (MMT) Monthly Growth (%)

12 | P a g e Industry Performance Review Report of PPAC: July, 2016 www.ppac.org.in
Industry Sales Trend Analysis (Provisional) : April-July 2016
('000 MT)
Product
July April-July
2015-16 2016-17 Growth
(%) 2015-16 2016-17
Growth
(%)
(A) Sensitive Products
SKO 576.4 502.2 -12.9 2287.8 2081.7 -9.0
LPG 1575.9 1713.5 8.7 6036.2 6511.1 7.9
Sub Total 2152.3 2215.7 2.9 8324.0 8592.8 3.2
(B) Major Decontrolled Product
Naphtha 1174.1 1099.9 -6.3 4382.4 4415.8 0.8
MS 1671.7 1917.7 14.7 7056.6 7841.6 11.1
HSD 5704.8 5809.4 1.8 24917.5 25921.0 4.0
Lubes+Greases 260.8 257.6 -1.2 1057.3 1098.2 3.9
LDO 34.6 35.4 2.2 125.7 142.2 13.1
FO/LSHS 536.0 570.8 6.5 2064.2 2445.0 18.4
Bitumen 280.4 277.5 -1.0 1853.3 2147.3 15.9
ATF 499.7 555.0 11.1 1982.8 2226.1 12.3
Sub Total 10162.1 10523.3 3.6 43439.8 46237.2 6.4
Sub - Total
(A) + (B) 12314.4 12739.0 3.4 51763.8 54830.0 5.9
(C) Minor Decontrolled Products
Pet Coke 1553.5 1658.9 6.8 5496.5 6779.8 23.3
Others 489.0 524.0 7.2 2071.9 2052.6 -0.9
Sub Total 2042.4 2182.9 6.9 7568.4 8832.4 16.7
Total 14356.8 14921.9 3.9 59332.2 63662.4 7.3
Related Documents