Industry Report on Women Indian Wear Retail in India 28 th March 2022 2022

Welcome message from author
This document is posted to help you gain knowledge. Please leave a comment to let me know what you think about it! Share it to your friends and learn new things together.
Transcript
Technopak Advisors Pvt. Ltd.| Confidential
s
Industry Report on Women Indian Wear Retail in India 28th March 2022
2022
2
2
Contents
1. Overview of the Indian Economy
2. Apparel Industry in India
3. Women Apparel Industry and Women Indian Wear Overview
4. Competitive Landscape of Women Indian Wear Apparel
5. Key Trends and success factors Enabling Growth of Women Indian Wear Industry
6. Operational & Financial Benchmarking
7. Consumer Survey
3
3
1. Overview of Indian Economy
India GDP and GDP Growth
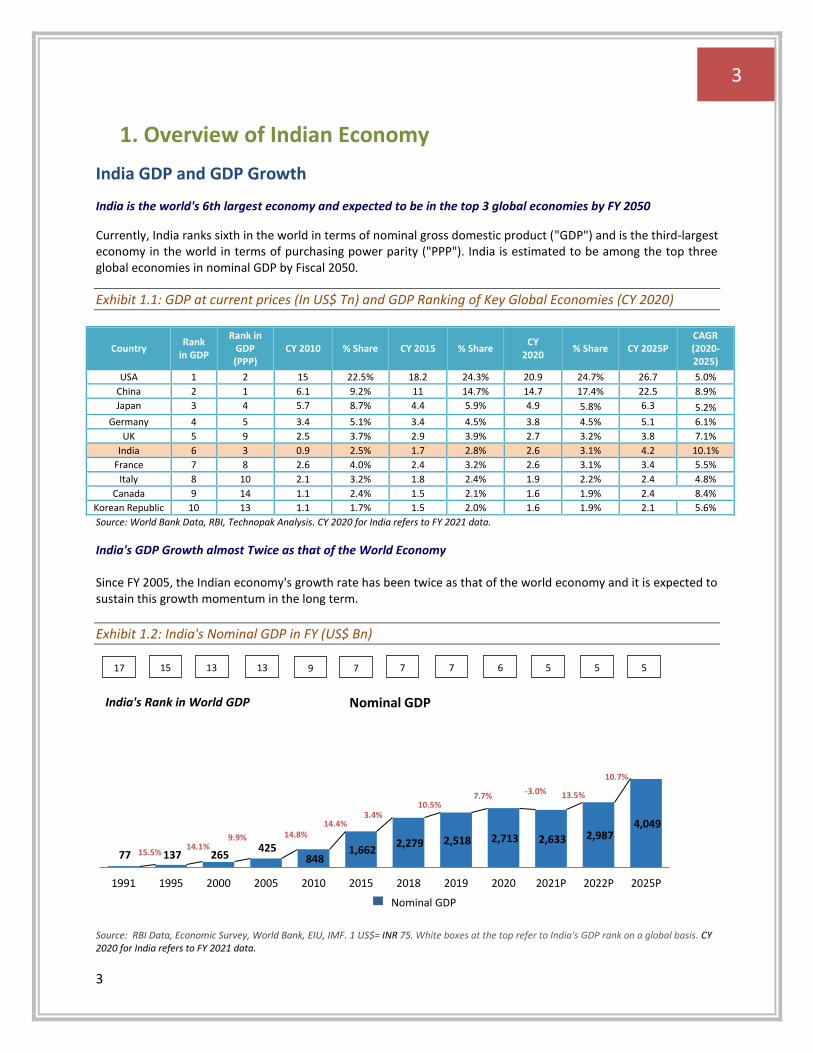
India is the world's 6th largest economy and expected to be in the top 3 global economies by FY 2050
Currently, India ranks sixth in the world in terms of nominal gross domestic product ("GDP") and is the third-largest economy in the world in terms of purchasing power parity ("PPP"). India is estimated to be among the top three global economies in nominal GDP by Fiscal 2050.
Exhibit 1.1: GDP at current prices (In US$ Tn) and GDP Ranking of Key Global Economies (CY 2020)
Country Rank
in GDP
Rank in GDP (PPP)
CY 2010 % Share CY 2015 % Share CY
2020 % Share CY 2025P
CAGR (2020-2025)
USA 1 2 15 22.5% 18.2 24.3% 20.9 24.7% 26.7 5.0%
China 2 1 6.1 9.2% 11 14.7% 14.7 17.4% 22.5 8.9%
Japan 3 4 5.7 8.7% 4.4 5.9% 4.9 5.8% 6.3 5.2%
Germany 4 5 3.4 5.1% 3.4 4.5% 3.8 4.5% 5.1 6.1%
UK 5 9 2.5 3.7% 2.9 3.9% 2.7 3.2% 3.8 7.1%
India 6 3 0.9 2.5% 1.7 2.8% 2.6 3.1% 4.2 10.1%
France 7 8 2.6 4.0% 2.4 3.2% 2.6 3.1% 3.4 5.5%
Italy 8 10 2.1 3.2% 1.8 2.4% 1.9 2.2% 2.4 4.8%
Canada 9 14 1.1 2.4% 1.5 2.1% 1.6 1.9% 2.4 8.4%
Korean Republic 10 13 1.1 1.7% 1.5 2.0% 1.6 1.9% 2.1 5.6%
Source: World Bank Data, RBI, Technopak Analysis. CY 2020 for India refers to FY 2021 data.
India's GDP Growth almost Twice as that of the World Economy Since FY 2005, the Indian economy's growth rate has been twice as that of the world economy and it is expected to sustain this growth momentum in the long term.
Exhibit 1.2: India's Nominal GDP in FY (US$ Bn)
Source: RBI Data, Economic Survey, World Bank, EIU, IMF. 1 US$= INR 75. White boxes at the top refer to India's GDP rank on a global basis. CY 2020 for India refers to FY 2021 data.
77 137 265 425
848 1,662
2,279 2,518 2,713 2,633 2,987 4,049
1991 1995 2000 2005 2010 2015 2018 2019 2020 2021P 2022P 2025P
Nominal GDPIndia's Rank in World GDP
Nominal GDP
17
13.5%
10.7%
15 13 13 9 7 7 7 6 5 5 5
15.5% 14.1%
9.9% 14.8% 14.4%
3.4% 10.5%
7.7% -3.0%
4
4
Private Final Consumption
High share of domestic consumption in Private Final Consumption Expenditure
India's share of domestic consumption, measured as private final consumption expenditure, in its GDP was ~60.5% in FY 2020. This private consumption expenditure comprises both goods (food, lifestyle, home, pharmacy etc.) and services (food services, education, healthcare etc.). In comparison, China's domestic consumption share to GDP in CY 2019 was 36.8%. High share of private consumption to GDP has the advantage of insulating India from volatility in the global economy. The annual growth rate for FY 1991-2005 was ~13% and this increased to ~14% for FY 2005-2019. While in the short term, consumption will suffer a setback, it is expected to reach to ~US$ 2.27 Tn by FY 2025, growing at ~8% CAGR over the period of 5 years. This sustainable growth is expected to increase the Private Final Consumption Expenditure of Indians, leading to a growth in the Indian retail and Service industry.
Key Growth Drivers
India's medium to long term growth and its positive impact on private consumption will be determined by inter-play of demographics, urbanization, and policy reforms. The per capita income of India has been showing an increasing trend since 2012; and growing at a healthy CAGR of approximately 10%, the per capita income reached ₹1,48,808 in CY 2019. Given the impact of COVID-19, it decreased to ₹1,42,073 in CY 2020. However, it is expected to bounce
back to ₹1,64,137 in CY 2021 and continue its growth journey at a CAGR of 10.3% between CY 2021 and CY 2025.
Demographic Profile of India
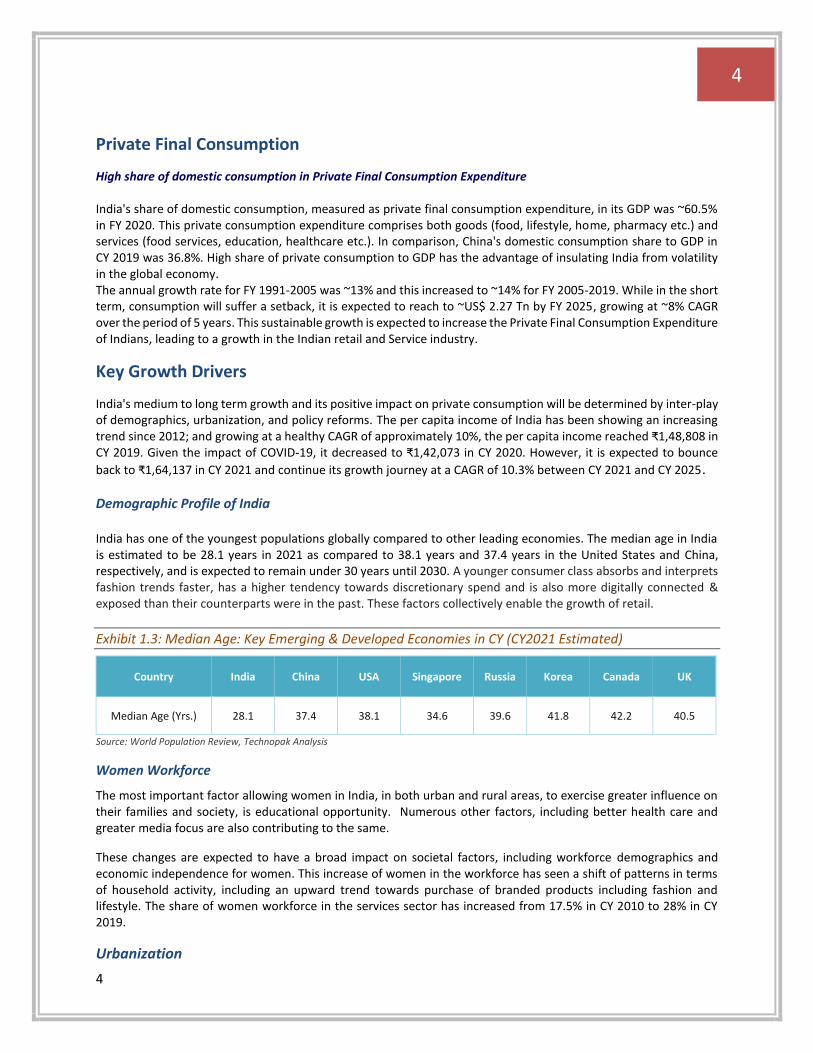
India has one of the youngest populations globally compared to other leading economies. The median age in India is estimated to be 28.1 years in 2021 as compared to 38.1 years and 37.4 years in the United States and China, respectively, and is expected to remain under 30 years until 2030. A younger consumer class absorbs and interprets fashion trends faster, has a higher tendency towards discretionary spend and is also more digitally connected & exposed than their counterparts were in the past. These factors collectively enable the growth of retail.
Exhibit 1.3: Median Age: Key Emerging & Developed Economies in CY (CY2021 Estimated)
Country India China USA Singapore Russia Korea Canada UK
Median Age (Yrs.) 28.1 37.4 38.1 34.6 39.6 41.8 42.2 40.5
Source: World Population Review, Technopak Analysis
Women Workforce
The most important factor allowing women in India, in both urban and rural areas, to exercise greater influence on their families and society, is educational opportunity. Numerous other factors, including better health care and greater media focus are also contributing to the same.
These changes are expected to have a broad impact on societal factors, including workforce demographics and economic independence for women. This increase of women in the workforce has seen a shift of patterns in terms of household activity, including an upward trend towards purchase of branded products including fashion and lifestyle. The share of women workforce in the services sector has increased from 17.5% in CY 2010 to 28% in CY 2019.
Urbanization
5
5
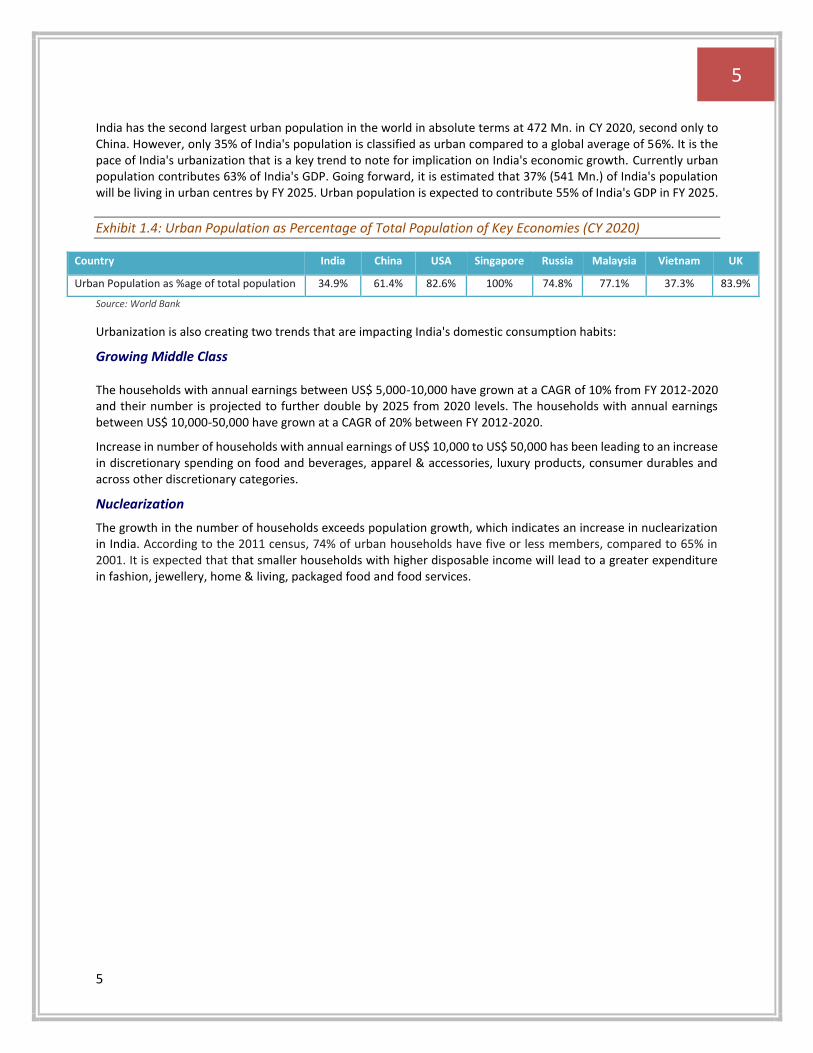
India has the second largest urban population in the world in absolute terms at 472 Mn. in CY 2020, second only to China. However, only 35% of India's population is classified as urban compared to a global average of 56%. It is the pace of India's urbanization that is a key trend to note for implication on India's economic growth. Currently urban population contributes 63% of India's GDP. Going forward, it is estimated that 37% (541 Mn.) of India's population will be living in urban centres by FY 2025. Urban population is expected to contribute 55% of India's GDP in FY 2025.
Exhibit 1.4: Urban Population as Percentage of Total Population of Key Economies (CY 2020)
Country India China USA Singapore Russia Malaysia Vietnam UK
Urban Population as %age of total population 34.9% 61.4% 82.6% 100% 74.8% 77.1% 37.3% 83.9%
Source: World Bank
Urbanization is also creating two trends that are impacting India's domestic consumption habits:
Growing Middle Class The households with annual earnings between US$ 5,000-10,000 have grown at a CAGR of 10% from FY 2012-2020 and their number is projected to further double by 2025 from 2020 levels. The households with annual earnings between US$ 10,000-50,000 have grown at a CAGR of 20% between FY 2012-2020.
Increase in number of households with annual earnings of US$ 10,000 to US$ 50,000 has been leading to an increase in discretionary spending on food and beverages, apparel & accessories, luxury products, consumer durables and across other discretionary categories.
Nuclearization
The growth in the number of households exceeds population growth, which indicates an increase in nuclearization in India. According to the 2011 census, 74% of urban households have five or less members, compared to 65% in 2001. It is expected that that smaller households with higher disposable income will lead to a greater expenditure in fashion, jewellery, home & living, packaged food and food services.
6
6
2. Apparel Industry in India
Retail Market in India
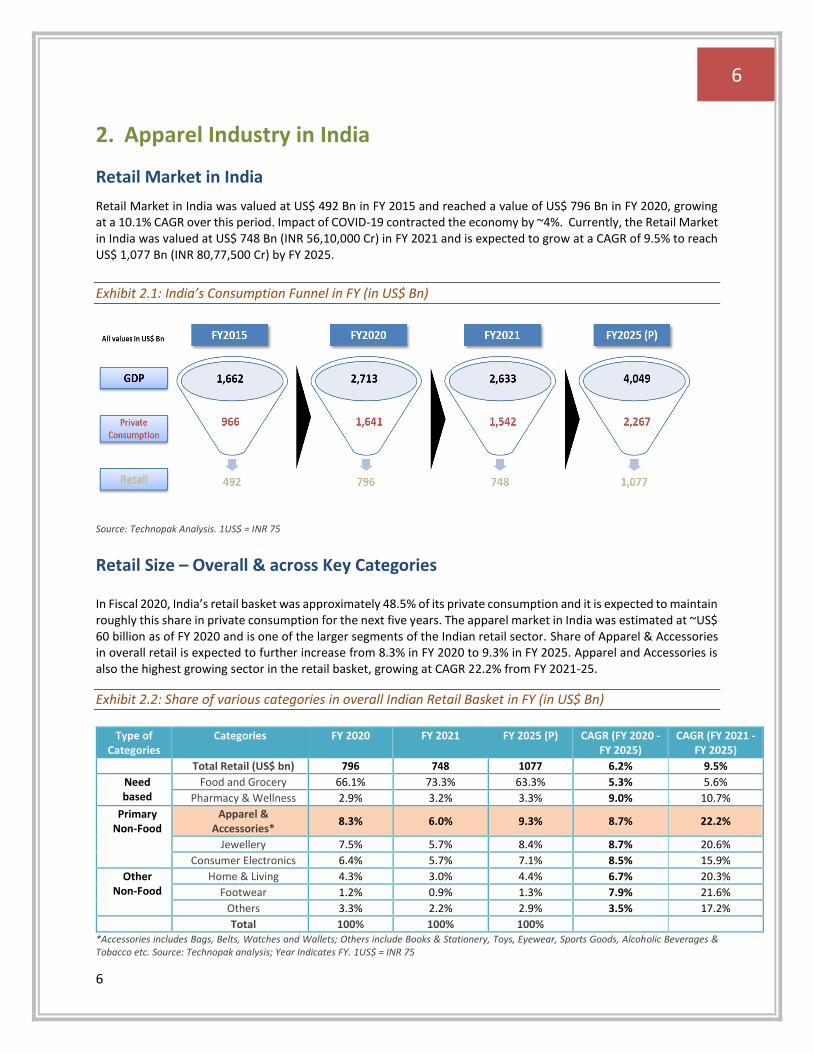
Retail Market in India was valued at US$ 492 Bn in FY 2015 and reached a value of US$ 796 Bn in FY 2020, growing at a 10.1% CAGR over this period. Impact of COVID-19 contracted the economy by ~4%. Currently, the Retail Market in India was valued at US$ 748 Bn (INR 56,10,000 Cr) in FY 2021 and is expected to grow at a CAGR of 9.5% to reach US$ 1,077 Bn (INR 80,77,500 Cr) by FY 2025.
Exhibit 2.1: India’s Consumption Funnel in FY (in US$ Bn)
Source: Technopak Analysis. 1US$ = INR 75
Retail Size – Overall & across Key Categories In Fiscal 2020, India’s retail basket was approximately 48.5% of its private consumption and it is expected to maintain roughly this share in private consumption for the next five years. The apparel market in India was estimated at ~US$ 60 billion as of FY 2020 and is one of the larger segments of the Indian retail sector. Share of Apparel & Accessories in overall retail is expected to further increase from 8.3% in FY 2020 to 9.3% in FY 2025. Apparel and Accessories is also the highest growing sector in the retail basket, growing at CAGR 22.2% from FY 2021-25.
Exhibit 2.2: Share of various categories in overall Indian Retail Basket in FY (in US$ Bn)
Type of Categories
Categories FY 2020 FY 2021 FY 2025 (P) CAGR (FY 2020 -FY 2025)
CAGR (FY 2021 -FY 2025)
Total Retail (US$ bn) 796 748 1077 6.2% 9.5%
Need based
Food and Grocery 66.1% 73.3% 63.3% 5.3% 5.6%
Pharmacy & Wellness 2.9% 3.2% 3.3% 9.0% 10.7%
Primary Non-Food
Apparel & Accessories*
8.3% 6.0% 9.3% 8.7% 22.2%
Jewellery 7.5% 5.7% 8.4% 8.7% 20.6%
Consumer Electronics 6.4% 5.7% 7.1% 8.5% 15.9%
Other Non-Food
Home & Living 4.3% 3.0% 4.4% 6.7% 20.3%
Footwear 1.2% 0.9% 1.3% 7.9% 21.6%
Others 3.3% 2.2% 2.9% 3.5% 17.2%
Total 100% 100% 100% *Accessories includes Bags, Belts, Watches and Wallets; Others include Books & Stationery, Toys, Eyewear, Sports Goods, Alcoholic Beverages & Tobacco etc. Source: Technopak analysis; Year Indicates FY. 1US$ = INR 75
7
7
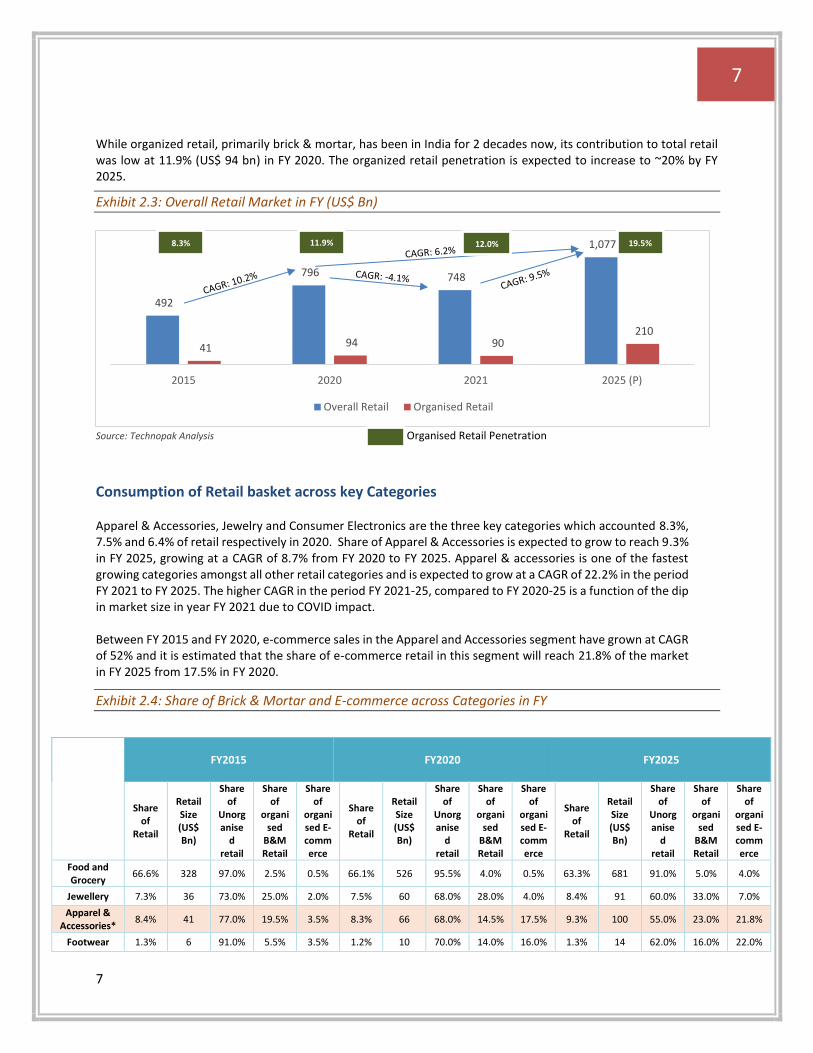
While organized retail, primarily brick & mortar, has been in India for 2 decades now, its contribution to total retail was low at 11.9% (US$ 94 bn) in FY 2020. The organized retail penetration is expected to increase to ~20% by FY 2025.
Exhibit 2.3: Overall Retail Market in FY (US$ Bn)
Source: Technopak Analysis Organised Retail Penetration
Consumption of Retail basket across key Categories Apparel & Accessories, Jewelry and Consumer Electronics are the three key categories which accounted 8.3%, 7.5% and 6.4% of retail respectively in 2020. Share of Apparel & Accessories is expected to grow to reach 9.3% in FY 2025, growing at a CAGR of 8.7% from FY 2020 to FY 2025. Apparel & accessories is one of the fastest growing categories amongst all other retail categories and is expected to grow at a CAGR of 22.2% in the period FY 2021 to FY 2025. The higher CAGR in the period FY 2021-25, compared to FY 2020-25 is a function of the dip in market size in year FY 2021 due to COVID impact. Between FY 2015 and FY 2020, e-commerce sales in the Apparel and Accessories segment have grown at CAGR of 52% and it is estimated that the share of e-commerce retail in this segment will reach 21.8% of the market in FY 2025 from 17.5% in FY 2020.
Exhibit 2.4: Share of Brick & Mortar and E-commerce across Categories in FY
FY2015 FY2020 FY2025
Share of
Retail
Retail Size (US$ Bn)
Share of
Unorganise
d retail
Share of
organised
B&M Retail
Share of
organised E-commerce
Share of
Retail
Retail Size (US$ Bn)
Share of
Unorganise
d retail
Share of
organised
B&M Retail
Share of
organised E-commerce
Share of
Retail
Retail Size (US$ Bn)
Share of
Unorganise
d retail
Share of
organised
B&M Retail
Share of
organised E-commerce
Food and Grocery
66.6% 328 97.0% 2.5% 0.5% 66.1% 526 95.5% 4.0% 0.5% 63.3% 681 91.0% 5.0% 4.0%
Jewellery 7.3% 36 73.0% 25.0% 2.0% 7.5% 60 68.0% 28.0% 4.0% 8.4% 91 60.0% 33.0% 7.0%
Apparel & Accessories*
8.4% 41 77.0% 19.5% 3.5% 8.3% 66 68.0% 14.5% 17.5% 9.3% 100 55.0% 23.0% 21.8%
Footwear 1.3% 6 91.0% 5.5% 3.5% 1.2% 10 70.0% 14.0% 16.0% 1.3% 14 62.0% 16.0% 22.0%
492
796 748
1,077
41 94 90 210
2015 2020 2021 2025 (P)
Overall Retail Organised Retail
% of Organized B&M Retail
8.3% 11.9% 19.5%
% Of Organized B&M Retail
12.0%
8
8
Pharmacy & Wellness
3.0% 15 95.0% 4.5% 0.5% 2.9% 23 90.0% 7.8% 2.2% 3.3% 36 80.4% 11.2% 8.4%
Consumer Electronics
5.9% 29 74.0% 16.5% 9.5% 6.4% 51 68.0% 4.7% 27.3% 7.1% 77 55.0% 9.0% 36.0%
Home & Living
4.5% 22 91.0% 7.6% 1.4% 4.3% 34 85.0% 7.7% 7.3% 4.4% 47 70.0% 11.0% 19.0%
Others 3.0% 15 89.0% 10.4% 0.6% 3.3% 26 86.0% 5.3% 8.7% 2.9% 31 78.0% 11.0% 11.0%
Total 100.0
% 492 91.7% 7.1% 1.2% 100% 796 88.1% 7.2% 4.7% 100% 1077 80.4% 10.0% 9.6%
*Accessories include Bags, Belts, Wallets & Watches. Source: Technopak Analysis. 1US$ = INR 75
Overall, the e-commerce market in India has witnessed an accelerated growth and is expected to reach 9.6% (US$ 103 Bn) of the total retail market by FY 2025 from its share of 4.7% in FY 2020 (US$ 37 billion) at a growth rate of ~23% CAGR.
Evolution of Organized Apparel Retail Segment in India
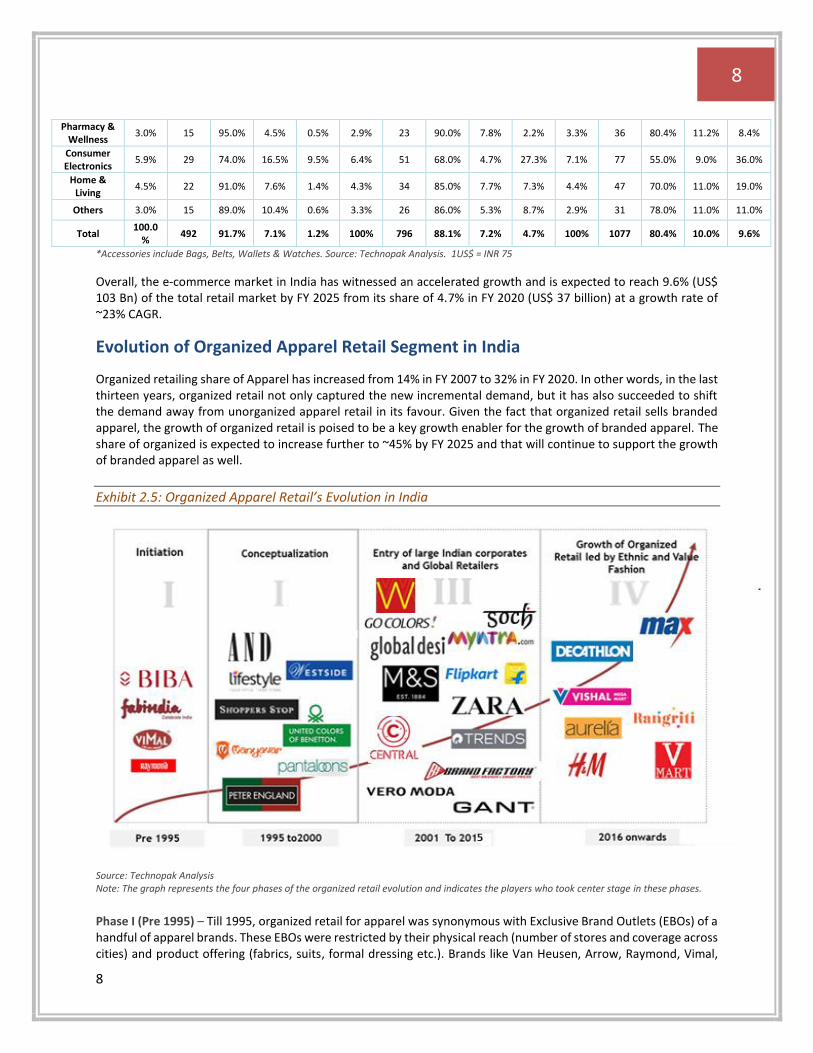
Organized retailing share of Apparel has increased from 14% in FY 2007 to 32% in FY 2020. In other words, in the last thirteen years, organized retail not only captured the new incremental demand, but it has also succeeded to shift the demand away from unorganized apparel retail in its favour. Given the fact that organized retail sells branded apparel, the growth of organized retail is poised to be a key growth enabler for the growth of branded apparel. The share of organized is expected to increase further to ~45% by FY 2025 and that will continue to support the growth of branded apparel as well.
Exhibit 2.5: Organized Apparel Retail’s Evolution in India
Source: Technopak Analysis Note: The graph represents the four phases of the organized retail evolution and indicates the players who took center stage in these phases.
Phase I (Pre 1995) – Till 1995, organized retail for apparel was synonymous with Exclusive Brand Outlets (EBOs) of a handful of apparel brands. These EBOs were restricted by their physical reach (number of stores and coverage across cities) and product offering (fabrics, suits, formal dressing etc.). Brands like Van Heusen, Arrow, Raymond, Vimal,
9
9
and Bombay Dyeing signified organized apparel retailing. Indian Wear focused Brands such as Biba and Fabindia entered the organised retail sector and became category creators in the segment.
Phase II (1995 – 2000) – Shoppers Stop started the first large format multi-brand outlet in the mid-nineties that triggered the expansion of multi brand retail for apparel and other retailing categories. Around the same time, Westside and Lifestyle also started their private brand led large format stores. Indian apparel fashion brands like Biba and Fabindia also initiated the expansion of their stores beyond their places of origin. Biba was the first women Indian wear brand to partner with a Large Format Store (Shoppers Stop). They further partnered with Pantaloons to expand their retail footprint. Hence, Biba has been a part of the four largest retail formats (Shoppers Stop, Lifestyle, Central and Pantaloons). This period also saw the entry of Benetton into India. These developments expanded the product offerings for the consumer and aspects around product design, sourcing and supply chain became key focus areas for organized retailers. This period also marked the entry of global sportswear brands like Nike that introduced the Indian market to Athleisure as an extension of footwear.
Phase III (2001 – 2015)– This phase was marked by the bifurcation of apparel retailing into specialized groups viz. Indian, Casual, Sportswear, Daily wear, Denimwear etc. Existing players expanded their physical retail presence through exclusive brand outlets like Biba and Fabindia in Indian fashion and Shopper’s Stop & Westside in LFS. This phase also witnessed increase in competitive intensity with the entry of more players. For instance, brands like W, Soch were launched in Indian apparel. Western wear brands like Zara and Marks & Spencer entered India during the same period. General Merchandise retailers like Future Group (Central, Brand Factory, fbb) and Lifestyle expanded their private brand offering into Apparel fashion. This period also witnessed the emergence of brand aggregator model for international brands into India with players like Arvind Brands and Reliance Brands becoming major India partners for many international apparel fashion brands. This phase has also witnessed rapid growth of E-commerce. Online emerged as a key organized retailer channel for apparel in India with the scale up of players like Myntra+Flipkart and Amazon. Online and offline channels proved to co-exist and jointly grow the organized retail pie. Product differentiation of organized apparel retailers also became sharper on price points (value fashion, mid to premium and premium plus offering) and on product attributes (fusion, prints, fabric, look).
Phase IV (2016 onwards) – The current phase represents distinct segmentation of channels of organized retail for Apparel. This phase also represents emergence of category leaders in respective groups of Western (formal and casual), Indian, and Athleisure etc. Value fashion retailer such as fbb, Max Fashion, Vmart are working towards bridging the price gap in the branded apparel market by offering quality products at affordable prices. Exclusive Brands Outlets (EBOs) have emerged as a core channel for most national apparel retailers irrespective of the category (type of apparel sold) or fashion (Indian or western) play. This phase also saw the entry of existing leading players into value-mid segment, like Biba launching Rangriti and TCNS launching Aurelia. LFSs have also grown their footprints with the expansion of Central, Brand Factory, Shoppers Stop, Reliance Trends, Westside, Decathlon and Pantaloons in towns beyond Metros and Tier I cities and are important growth drivers for organized apparel retailing.
Digitization in India: An Enabler to Retail Increasing Omni-channel approach by Retailers - ‘Omnichannel’ approach improves customer service by providing multiple communication options. The back-end integration of channels also allows for more flexibility, as the customer can switch between channels throughout an interaction. Hence more flexibility is achieved through back-end integration of channels and provides for a seamless experience for consumers.
Retailers and brands are prioritising the listing of products across online and offline channels including EBOs, MBOs, LFSs, E-commerce marketplaces and verticals. Retailing in India is witnessing scale up of many multiple category single brand stores such as Biba, Fabindia, Zara, H&M, Marks & Spencer etc. providing customers with a wide assortment and options, across many categories under a single roof.
Digital Penetration is a Key Growth Driver for Organized Retail
10
10
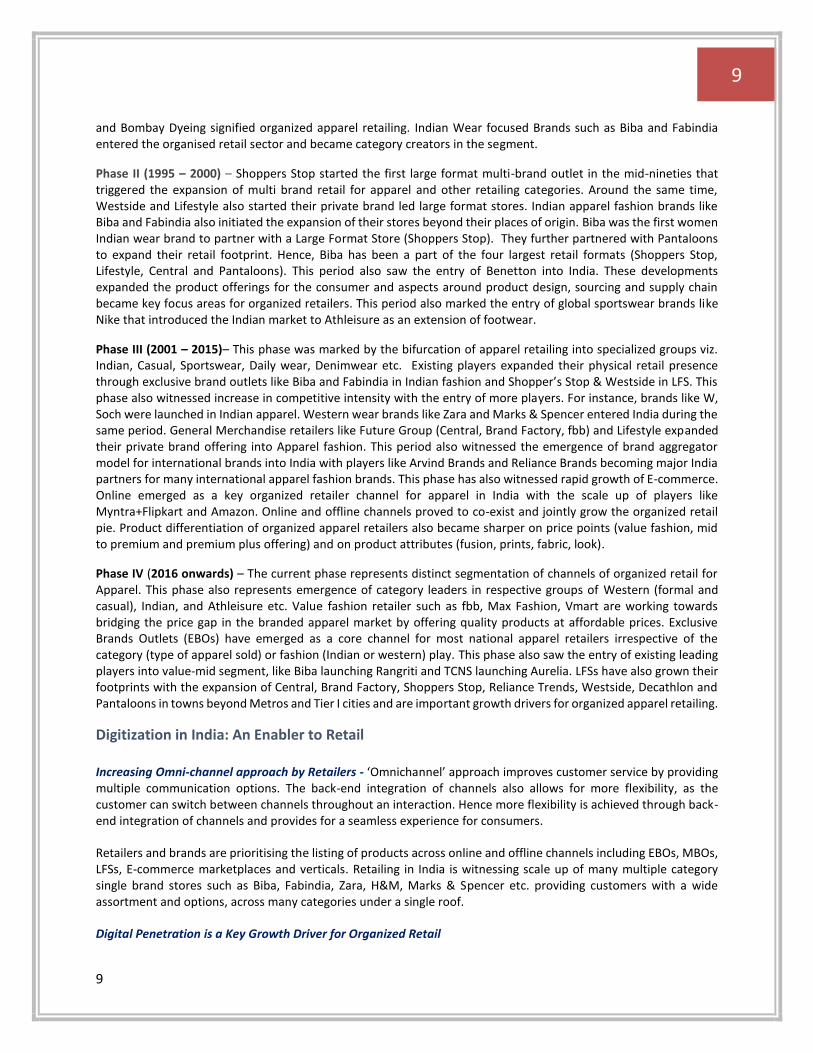
India has also witnessed growth in internet penetration and mobile connectivity resulting in increased online presence of the Indian population directly resulting in a boom in e-commerce activities. Option of payment across various methods whether card, cash, wallets, and e-commerce transaction security has led to increasing trust in these payment systems. The option of easy returns at e-commerce portals has led to trial of products and services. Although household spending declined during the pandemic in FY2021, it is expected to recover quicker and witness much higher growth in FY2022.
Exhibit 2.6: Growth of Digital Penetration in India in CY
2010 2015 2020 2025 CAGR CAGR
2015-20 2020-25
Internet Users (Mn) 72 350 662 900-1000 14% 6-8%
Mobile internet Users as a share of Total Internet Users (%) 34% 45% 73% 82% - -
Mobile Internet Users (Mn) 24 159 480 730- 820 25% 9-11%
Source: Secondary Research, Technopak Analysis
Online Retail of Apparel Apparel has traditionally been a category which was dependent on trial for size and touch-feel of the fabric to assess and make the purchase decision. However, it saw an increase in ecommerce uptake during COVID and led to a change in consumer behavior and there was an increase in adoption of online channels for apparel purchase. Companies and consumers alike adapted to this change and there was use of various mediums like Apps, Websites, and Social Commerce channels like WhatsApp, Video-shopping from home etc. Companies also accelerated their online adoption plans, and use of AI and softwares, which would enable virtual try-ons. While online penetration is relatively lower for women’s wear as compared to men’s wear in India, the demographics appear promising and an increase in sales through online channels is expected by 2025. The share of online retail in the apparel segment grew from ~4% in FY 2015 to ~18% in FY 2020 and is expected to reach ~22% by FY 2025. Generation Z and Millennials as the driving force for Digitization Millennials and Generation Z are the key driving forces for digitization in India, with the latter now entering the workforce, and both these generation segments being active adopters of technology and digital media. As of CY 2021, there are about ~375 million Generation Z and ~335 million Millennials in India.
OTT consumption The rise and acceptability of alternate streaming and OTT platforms tapped into the market vacated by Indian multiplexes during COVID. Independent film producers and established film production houses are increasingly taking on this medium by creating content exclusively for OTT platforms. Advertisement and acceptability also led to a significant rise in the number of paid subscribers and the number of subscriptions, increasing from 11 million to 29 million and 21 million to 53 million from 2019 to 2020 respectively.
Spend on Digital marketing The Indian Advertisement market was expected valued at INR 89,600 Cr. In FY 2021 with digital marketing being the cornerstone of growth. Digital advertisements are expected to show rapid growth of ~29% CAGR over the period of FY 2020-FY 2025, contributing to ~27% of total advertisement spend in India in FY2020. It is expected that by FY 2025, Digital advertisement would contribute ~43% of the overall advertising Market.
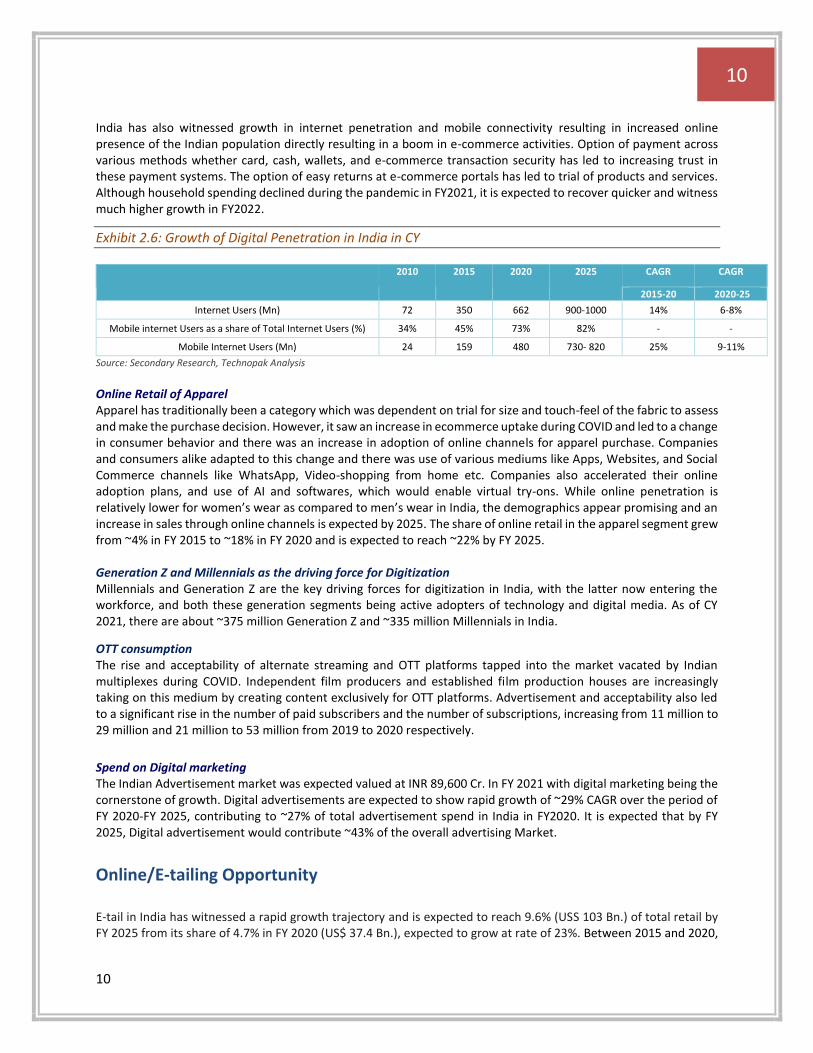
Online/E-tailing Opportunity E-tail in India has witnessed a rapid growth trajectory and is expected to reach 9.6% (USS 103 Bn.) of total retail by FY 2025 from its share of 4.7% in FY 2020 (US$ 37.4 Bn.), expected to grow at rate of 23%. Between 2015 and 2020,
11
11
the e-commerce sales have grown at CAGR of 44%. In 2012, the e-tail pie was INR 4,500 Cr (US$ ~0.6 Bn) and that was limited to key categories of Electronics, Books, Stationery, and Music which catered to nearly 50% of the pie.
Exhibit 2.7: Growth of E-retail in India in FY 2015, FY 2020, FY 2021, FY 2025P (in US$ Bn)
Source: Technopak Analysis
Retailers across categories are moving towards online channel to expand their offerings, in an attempt to have a place in the ‘Omni-channel Ecosystem’ where all channels of retail are essential to reach the consumers. The lines between offline and online retailing are blurring gradually, whereby consumers connect with brands through any medium of their preference. A purchase made by a consumer is often a mix of various mediums. E.g., A consumer searches online and reads reviews about a product before making a purchase decision, then goes to an offline store to look and experience the product, and the eventual purchase could be through either of the channels. This makes presence across mediums essential for retailers to connect with the consumer at every touch point.
Acceleration in Online retail due to COVID 19
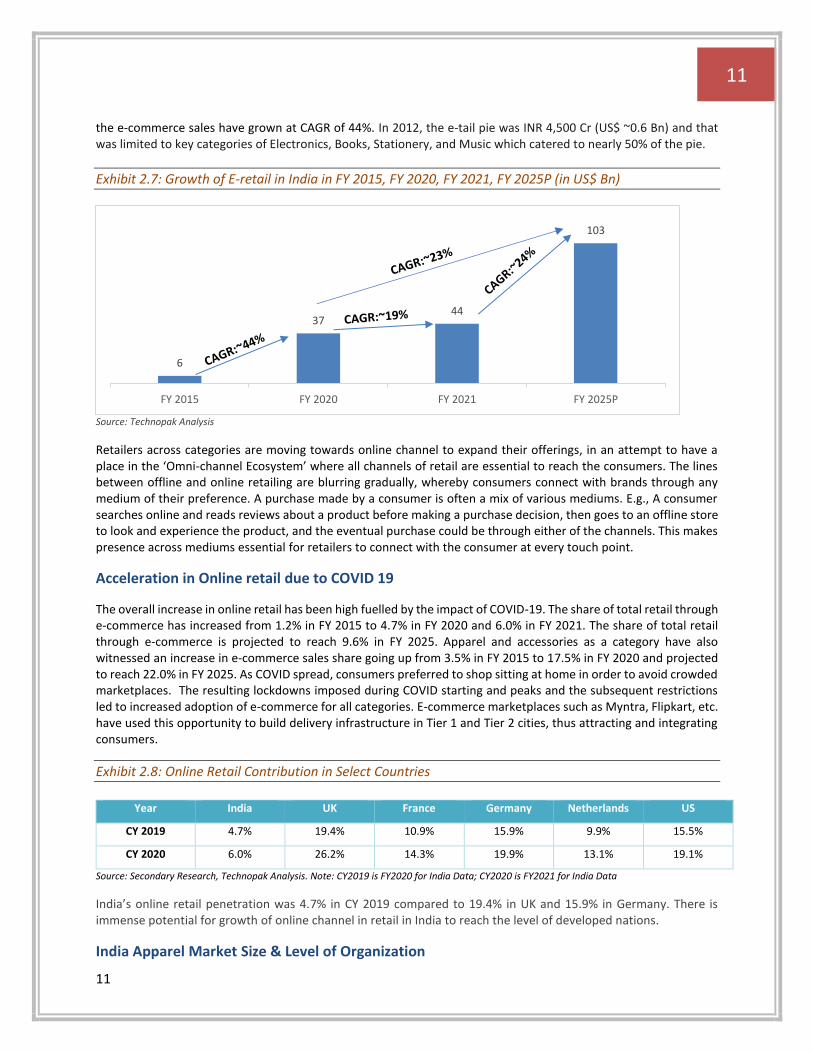
The overall increase in online retail has been high fuelled by the impact of COVID-19. The share of total retail through e-commerce has increased from 1.2% in FY 2015 to 4.7% in FY 2020 and 6.0% in FY 2021. The share of total retail through e-commerce is projected to reach 9.6% in FY 2025. Apparel and accessories as a category have also witnessed an increase in e-commerce sales share going up from 3.5% in FY 2015 to 17.5% in FY 2020 and projected to reach 22.0% in FY 2025. As COVID spread, consumers preferred to shop sitting at home in order to avoid crowded marketplaces. The resulting lockdowns imposed during COVID starting and peaks and the subsequent restrictions led to increased adoption of e-commerce for all categories. E-commerce marketplaces such as Myntra, Flipkart, etc. have used this opportunity to build delivery infrastructure in Tier 1 and Tier 2 cities, thus attracting and integrating consumers.
Exhibit 2.8: Online Retail Contribution in Select Countries
Year India UK France Germany Netherlands US
CY 2019 4.7% 19.4% 10.9% 15.9% 9.9% 15.5%
CY 2020 6.0% 26.2% 14.3% 19.9% 13.1% 19.1%
Source: Secondary Research, Technopak Analysis. Note: CY2019 is FY2020 for India Data; CY2020 is FY2021 for India Data
India’s online retail penetration was 4.7% in CY 2019 compared to 19.4% in UK and 15.9% in Germany. There is immense potential for growth of online channel in retail in India to reach the level of developed nations.
India Apparel Market Size & Level of Organization
6
3744
103
FY 2015 FY 2020 FY 2021 FY 2025P
12
12
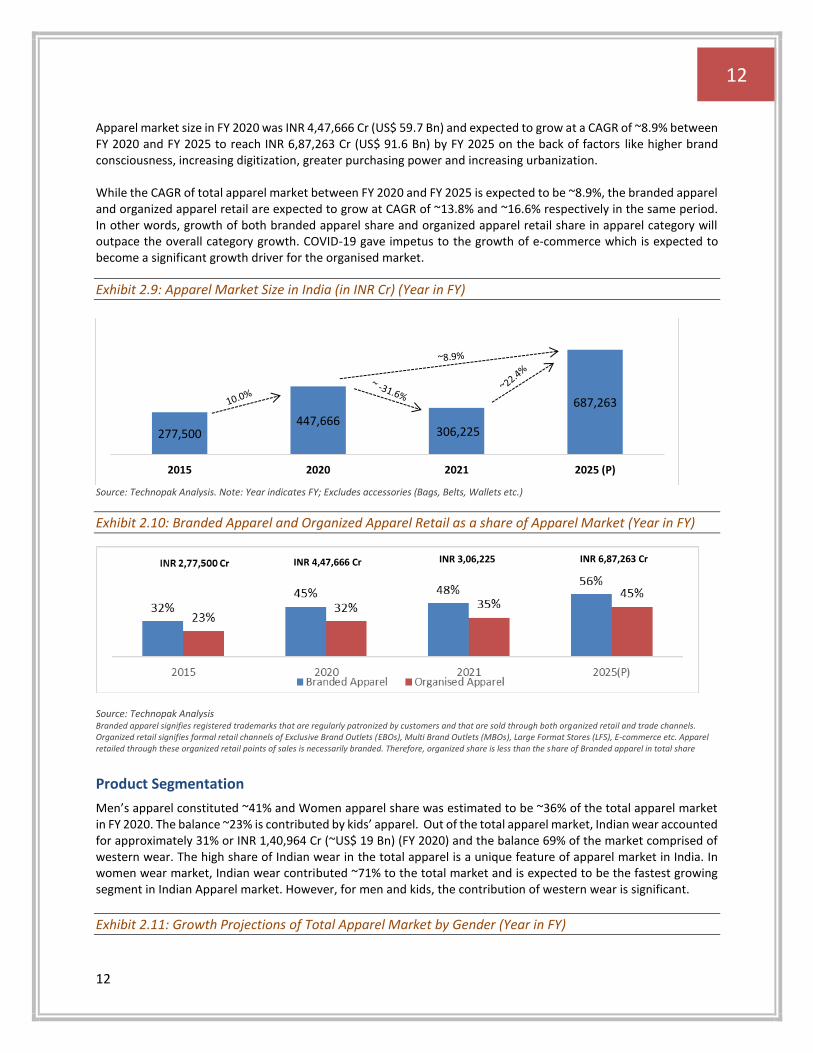
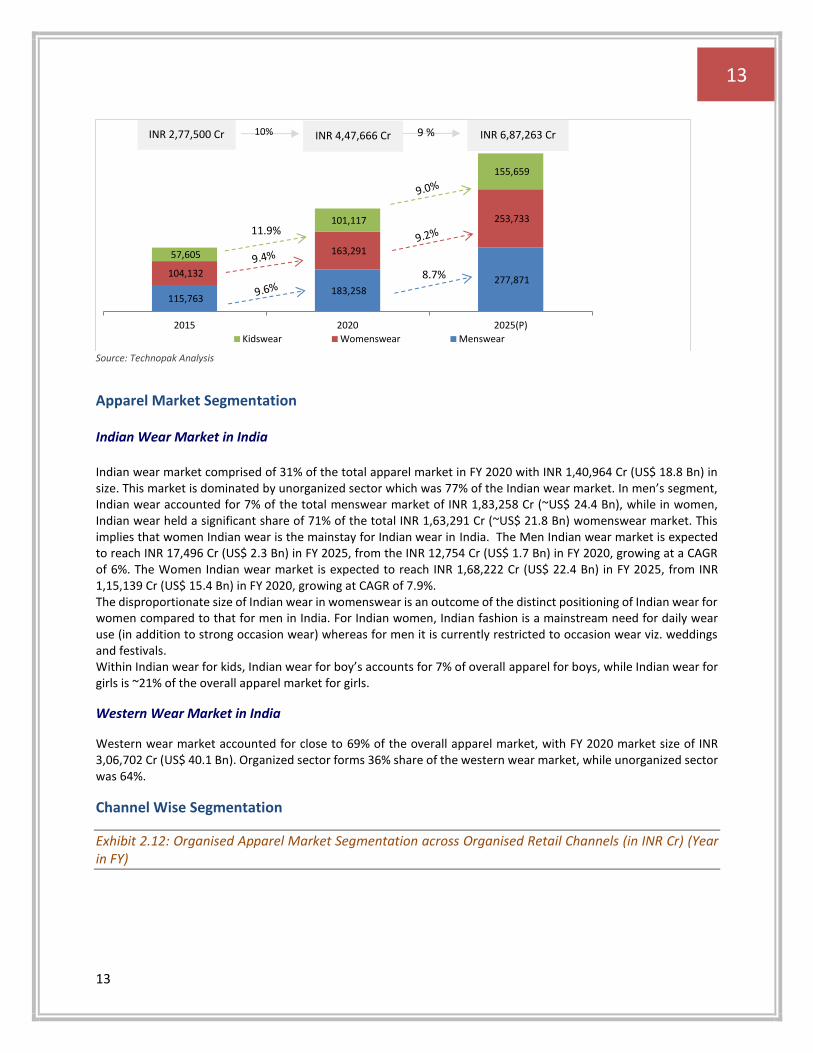
Apparel market size in FY 2020 was INR 4,47,666 Cr (US$ 59.7 Bn) and expected to grow at a CAGR of ~8.9% between FY 2020 and FY 2025 to reach INR 6,87,263 Cr (US$ 91.6 Bn) by FY 2025 on the back of factors like higher brand consciousness, increasing digitization, greater purchasing power and increasing urbanization. While the CAGR of total apparel market between FY 2020 and FY 2025 is expected to be ~8.9%, the branded apparel and organized apparel retail are expected to grow at CAGR of ~13.8% and ~16.6% respectively in the same period. In other words, growth of both branded apparel share and organized apparel retail share in apparel category will outpace the overall category growth. COVID-19 gave impetus to the growth of e-commerce which is expected to become a significant growth driver for the organised market.
Exhibit 2.9: Apparel Market Size in India (in INR Cr) (Year in FY)
Source: Technopak Analysis. Note: Year indicates FY; Excludes accessories (Bags, Belts, Wallets etc.)
Exhibit 2.10: Branded Apparel and Organized Apparel Retail as a share of Apparel Market (Year in FY)
Source: Technopak Analysis Branded apparel signifies registered trademarks that are regularly patronized by customers and that are sold through both organized retail and trade channels. Organized retail signifies formal retail channels of Exclusive Brand Outlets (EBOs), Multi Brand Outlets (MBOs), Large Format Stores (LFS), E-commerce etc. Apparel retailed through these organized retail points of sales is necessarily branded. Therefore, organized share is less than the share of Branded apparel in total share
Product Segmentation
Men’s apparel constituted ~41% and Women apparel share was estimated to be ~36% of the total apparel market in FY 2020. The balance ~23% is contributed by kids’ apparel. Out of the total apparel market, Indian wear accounted for approximately 31% or INR 1,40,964 Cr (~US$ 19 Bn) (FY 2020) and the balance 69% of the market comprised of western wear. The high share of Indian wear in the total apparel is a unique feature of apparel market in India. In women wear market, Indian wear contributed ~71% to the total market and is expected to be the fastest growing segment in Indian Apparel market. However, for men and kids, the contribution of western wear is significant.
Exhibit 2.11: Growth Projections of Total Apparel Market by Gender (Year in FY)
277,500447,666
306,225
687,263
2015 2020 2021 2025 (P)
INR 4,47,666 Cr INR 6,87,263 Cr INR 3,06,225
13
13
Source: Technopak Analysis
Apparel Market Segmentation Indian Wear Market in India Indian wear market comprised of 31% of the total apparel market in FY 2020 with INR 1,40,964 Cr (US$ 18.8 Bn) in size. This market is dominated by unorganized sector which was 77% of the Indian wear market. In men’s segment, Indian wear accounted for 7% of the total menswear market of INR 1,83,258 Cr (~US$ 24.4 Bn), while in women, Indian wear held a significant share of 71% of the total INR 1,63,291 Cr (~US$ 21.8 Bn) womenswear market. This implies that women Indian wear is the mainstay for Indian wear in India. The Men Indian wear market is expected to reach INR 17,496 Cr (US$ 2.3 Bn) in FY 2025, from the INR 12,754 Cr (US$ 1.7 Bn) in FY 2020, growing at a CAGR of 6%. The Women Indian wear market is expected to reach INR 1,68,222 Cr (US$ 22.4 Bn) in FY 2025, from INR 1,15,139 Cr (US$ 15.4 Bn) in FY 2020, growing at CAGR of 7.9%. The disproportionate size of Indian wear in womenswear is an outcome of the distinct positioning of Indian wear for women compared to that for men in India. For Indian women, Indian fashion is a mainstream need for daily wear use (in addition to strong occasion wear) whereas for men it is currently restricted to occasion wear viz. weddings and festivals. Within Indian wear for kids, Indian wear for boy’s accounts for 7% of overall apparel for boys, while Indian wear for girls is ~21% of the overall apparel market for girls.
Western Wear Market in India
Western wear market accounted for close to 69% of the overall apparel market, with FY 2020 market size of INR 3,06,702 Cr (US$ 40.1 Bn). Organized sector forms 36% share of the western wear market, while unorganized sector was 64%.
Channel Wise Segmentation
Exhibit 2.12: Organised Apparel Market Segmentation across Organised Retail Channels (in INR Cr) (Year in FY)
115,763 183,258
277,871 104,132
163,291
253,733
57,605
101,117
155,659
2015 2020 2025(P)
Kidswear Womenswear Menswear
10% 9 %
11.9%
8.7%
INR 4,47,666 Cr INR 6,87,263 Cr INR 2,77,500 Cr
14
14
Source: Technopak Analysis
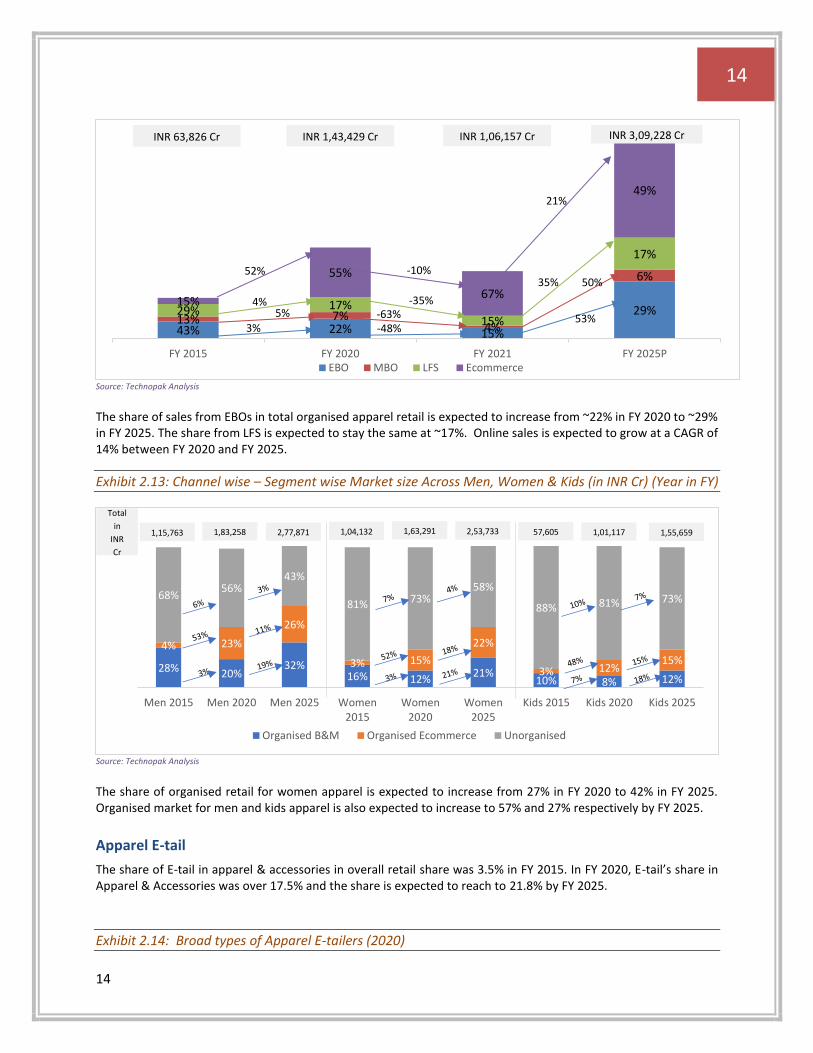
The share of sales from EBOs in total organised apparel retail is expected to increase from ~22% in FY 2020 to ~29% in FY 2025. The share from LFS is expected to stay the same at ~17%. Online sales is expected to grow at a CAGR of 14% between FY 2020 and FY 2025.
Exhibit 2.13: Channel wise – Segment wise Market size Across Men, Women & Kids (in INR Cr) (Year in FY)
Source: Technopak Analysis
The share of organised retail for women apparel is expected to increase from 27% in FY 2020 to 42% in FY 2025. Organised market for men and kids apparel is also expected to increase to 57% and 27% respectively by FY 2025.
Apparel E-tail
The share of E-tail in apparel & accessories in overall retail share was 3.5% in FY 2015. In FY 2020, E-tail’s share in Apparel & Accessories was over 17.5% and the share is expected to reach to 21.8% by FY 2025.
Exhibit 2.14: Broad types of Apparel E-tailers (2020)
43% 22% 15%
29%13% 7%
4%
6%
29% 17%15%
17%
15%
55%
67%
49%
FY 2015 FY 2020 FY 2021 FY 2025PEBO MBO LFS Ecommerce
INR 63,826 Cr INR 1,43,429 Cr INR 1,06,157 Cr INR 3,09,228 Cr
52%
4%5%
3%
-10%
-35%-63%-48%
53%
50%35%
21%
28% 20%32%
16% 12%21%
10% 8% 12%
4% 23%
26%
3% 15%
22%
3% 12%15%
68%56%
43%
81% 73%58%
88% 81% 73%
Men 2015 Men 2020 Men 2025 Women2015
Women2020
Women2025
Kids 2015 Kids 2020 Kids 2025
Organised B&M Organised Ecommerce Unorganised
Total
in
INR
Cr
1,15,763 1,04,1322,77,8711,83,258 57,6052,53,7331,63,291 1,55,6591,01,117
15
15
Source: Technopak Analysis
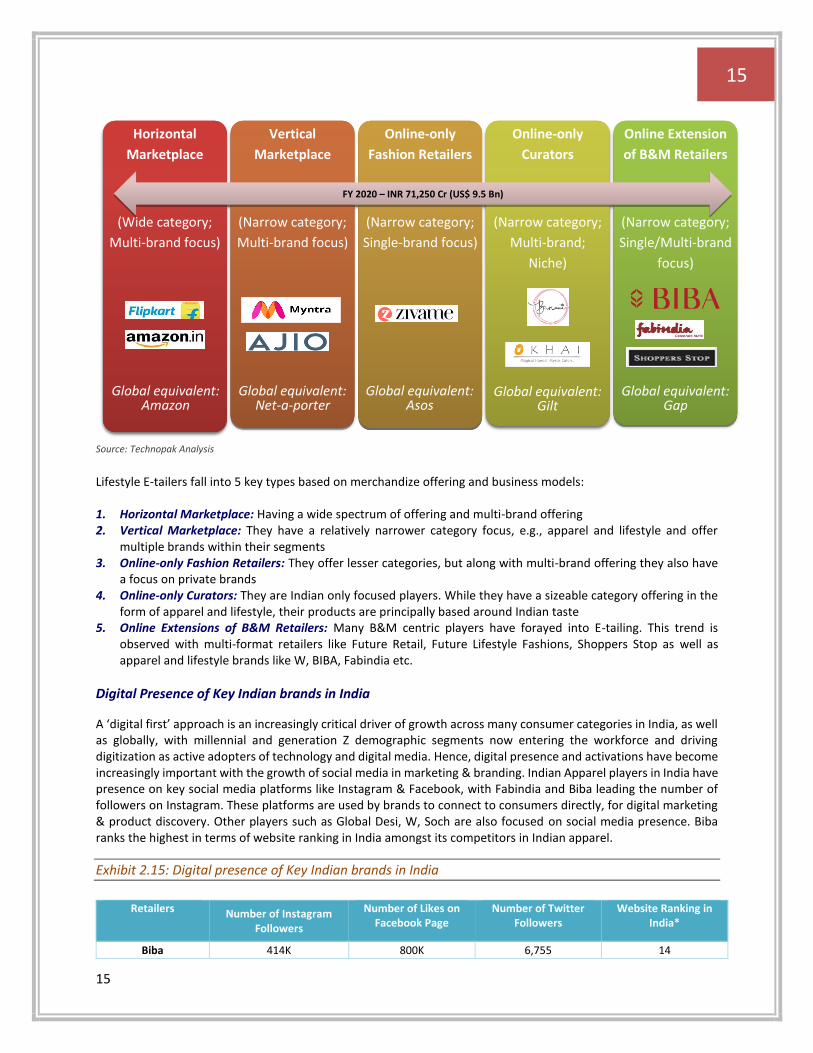
Lifestyle E-tailers fall into 5 key types based on merchandize offering and business models: 1. Horizontal Marketplace: Having a wide spectrum of offering and multi-brand offering 2. Vertical Marketplace: They have a relatively narrower category focus, e.g., apparel and lifestyle and offer
multiple brands within their segments 3. Online-only Fashion Retailers: They offer lesser categories, but along with multi-brand offering they also have
a focus on private brands 4. Online-only Curators: They are Indian only focused players. While they have a sizeable category offering in the
form of apparel and lifestyle, their products are principally based around Indian taste 5. Online Extensions of B&M Retailers: Many B&M centric players have forayed into E-tailing. This trend is
observed with multi-format retailers like Future Retail, Future Lifestyle Fashions, Shoppers Stop as well as apparel and lifestyle brands like W, BIBA, Fabindia etc.
Digital Presence of Key Indian brands in India
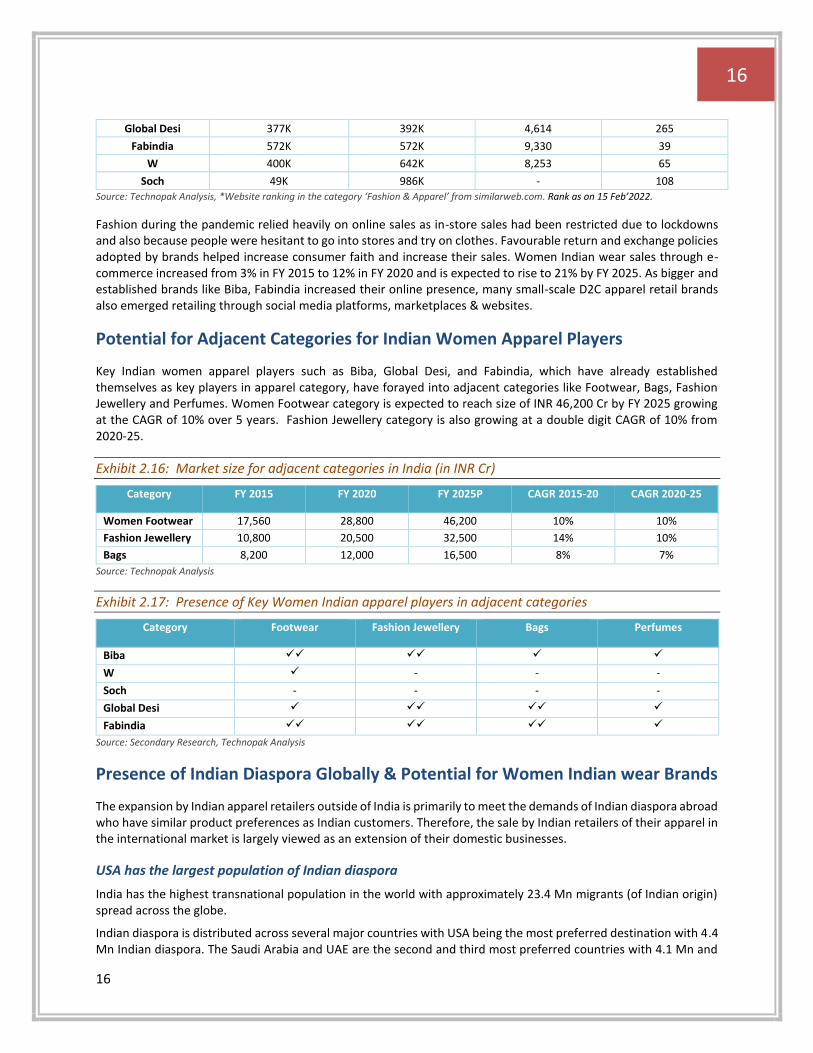
A ‘digital first’ approach is an increasingly critical driver of growth across many consumer categories in India, as well as globally, with millennial and generation Z demographic segments now entering the workforce and driving digitization as active adopters of technology and digital media. Hence, digital presence and activations have become increasingly important with the growth of social media in marketing & branding. Indian Apparel players in India have presence on key social media platforms like Instagram & Facebook, with Fabindia and Biba leading the number of followers on Instagram. These platforms are used by brands to connect to consumers directly, for digital marketing & product discovery. Other players such as Global Desi, W, Soch are also focused on social media presence. Biba ranks the highest in terms of website ranking in India amongst its competitors in Indian apparel.
Exhibit 2.15: Digital presence of Key Indian brands in India
Retailers Number of Instagram
Followers
Number of Likes on Facebook Page
Number of Twitter Followers
Website Ranking in India*
Biba 414K 800K 6,755 14
Horizontal
Marketplace
(Wide category;
Multi-brand focus)
Vertical
Marketplace
(Narrow category;
Multi-brand focus)
Online-only
Fashion Retailers
(Narrow category;
Single-brand focus)
Online-only
Curators
(Narrow category;
Multi-brand;
Niche)
Online Extension
of B&M Retailers
(Narrow category;
Single/Multi-brand
focus)
Global equivalent: Amazon
Global equivalent: Net-a-porter
Global equivalent: Asos
Global equivalent: Gilt
Global equivalent: Gap
FY 2020 - US$ 9.5 Bn
Horizontal
Marketplace
(Wide category;
Multi-brand focus)
Vertical
Marketplace
(Narrow category;
Multi-brand focus)
Online-only
Fashion Retailers
(Narrow category;
Single-brand focus)
Online-only
Curators
(Narrow category;
Multi-brand;
Niche)
Online Extension
of B&M Retailers
(Narrow category;
Single/Multi-brand
focus)
Global equivalent: Amazon
Global equivalent: Net-a-porter
Global equivalent: Asos
Global equivalent: Gilt
Global equivalent: Gap
FY 2020 – INR 71,250 Cr (US$ 9.5 Bn)
16
16
Global Desi 377K 392K 4,614 265
Fabindia 572K 572K 9,330 39
W 400K 642K 8,253 65
Soch 49K 986K - 108
Source: Technopak Analysis, *Website ranking in the category ‘Fashion & Apparel’ from similarweb.com. Rank as on 15 Feb’2022.
Fashion during the pandemic relied heavily on online sales as in-store sales had been restricted due to lockdowns and also because people were hesitant to go into stores and try on clothes. Favourable return and exchange policies adopted by brands helped increase consumer faith and increase their sales. Women Indian wear sales through e-commerce increased from 3% in FY 2015 to 12% in FY 2020 and is expected to rise to 21% by FY 2025. As bigger and established brands like Biba, Fabindia increased their online presence, many small-scale D2C apparel retail brands also emerged retailing through social media platforms, marketplaces & websites.
Potential for Adjacent Categories for Indian Women Apparel Players
Key Indian women apparel players such as Biba, Global Desi, and Fabindia, which have already established themselves as key players in apparel category, have forayed into adjacent categories like Footwear, Bags, Fashion Jewellery and Perfumes. Women Footwear category is expected to reach size of INR 46,200 Cr by FY 2025 growing at the CAGR of 10% over 5 years. Fashion Jewellery category is also growing at a double digit CAGR of 10% from 2020-25.
Exhibit 2.16: Market size for adjacent categories in India (in INR Cr)
Category FY 2015 FY 2020 FY 2025P CAGR 2015-20 CAGR 2020-25
Women Footwear 17,560 28,800 46,200 10% 10%
Fashion Jewellery 10,800 20,500 32,500 14% 10%
Bags 8,200 12,000 16,500 8% 7%
Source: Technopak Analysis
Exhibit 2.17: Presence of Key Women Indian apparel players in adjacent categories
Category Footwear Fashion Jewellery Bags Perfumes
Biba ✓✓ ✓✓ ✓ ✓
W ✓ - - -
Soch - - - -
Global Desi ✓ ✓✓ ✓✓ ✓
Fabindia ✓✓ ✓✓ ✓✓ ✓
Source: Secondary Research, Technopak Analysis
Presence of Indian Diaspora Globally & Potential for Women Indian wear Brands
The expansion by Indian apparel retailers outside of India is primarily to meet the demands of Indian diaspora abroad who have similar product preferences as Indian customers. Therefore, the sale by Indian retailers of their apparel in the international market is largely viewed as an extension of their domestic businesses.
USA has the largest population of Indian diaspora
India has the highest transnational population in the world with approximately 23.4 Mn migrants (of Indian origin) spread across the globe.
Indian diaspora is distributed across several major countries with USA being the most preferred destination with 4.4 Mn Indian diaspora. The Saudi Arabia and UAE are the second and third most preferred countries with 4.1 Mn and
17
17
3.8 Mn Indian diasporas respectively. The total addressable population i.e relevant population (excluding students, low and semi-skilled workers etc.) for apparel is 9.2 Mn (out of 23.4 Mn). Middle- and high-income groups are the key target consumers for Indian wear brands.
Presence of Indian diaspora across the global, and primarily in North America, Asia Pacific and Africa presents an opportunity for Indian wear brands to expand international presence in these regions. Players like Biba (2 stores in Canada, 2 stores in Dubai and 1 store in Nepal), Fabindia, W and Manyavar also have physical store presence outside India. Biba and W also have their websites specific to Canada & Mauritius respectively. Key players also sell through international marketplaces like amazon.com, amazon.uk, amazon.ae etc.
3. Women Apparel Industry and Women Indian Wear Overview
Women Apparel Market in India
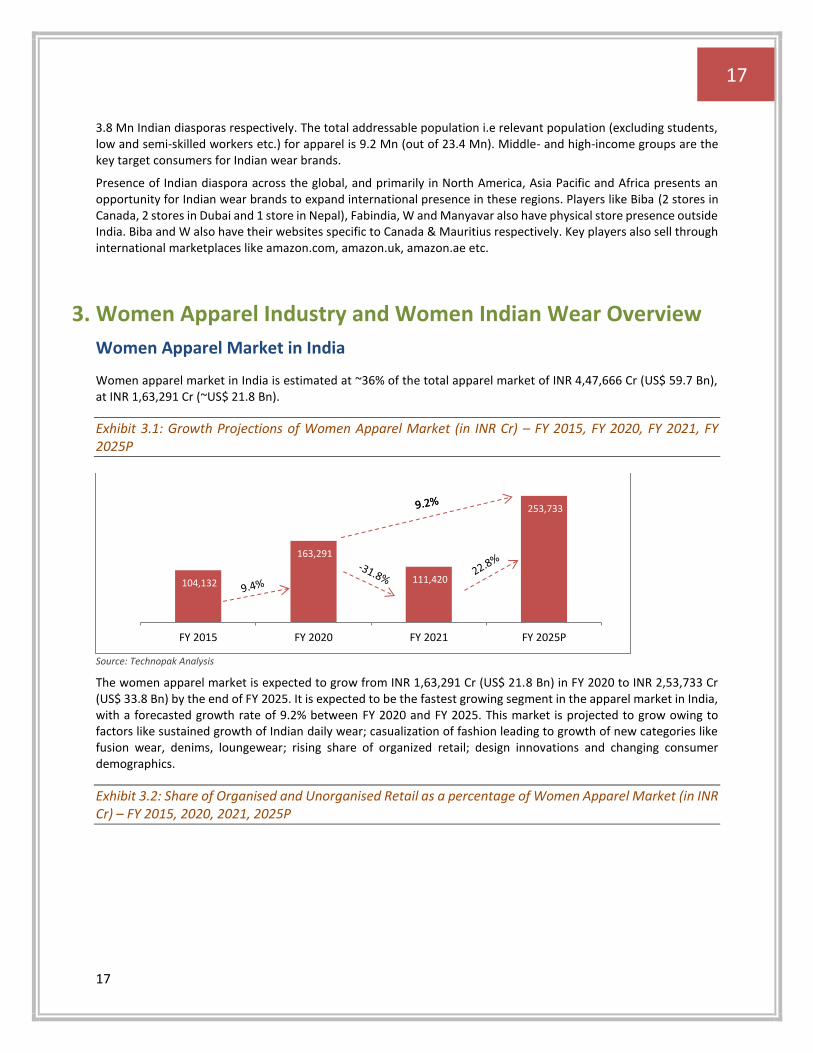
Women apparel market in India is estimated at ~36% of the total apparel market of INR 4,47,666 Cr (US$ 59.7 Bn), at INR 1,63,291 Cr (~US$ 21.8 Bn).
Exhibit 3.1: Growth Projections of Women Apparel Market (in INR Cr) – FY 2015, FY 2020, FY 2021, FY 2025P
Source: Technopak Analysis
The women apparel market is expected to grow from INR 1,63,291 Cr (US$ 21.8 Bn) in FY 2020 to INR 2,53,733 Cr (US$ 33.8 Bn) by the end of FY 2025. It is expected to be the fastest growing segment in the apparel market in India, with a forecasted growth rate of 9.2% between FY 2020 and FY 2025. This market is projected to grow owing to factors like sustained growth of Indian daily wear; casualization of fashion leading to growth of new categories like fusion wear, denims, loungewear; rising share of organized retail; design innovations and changing consumer demographics.
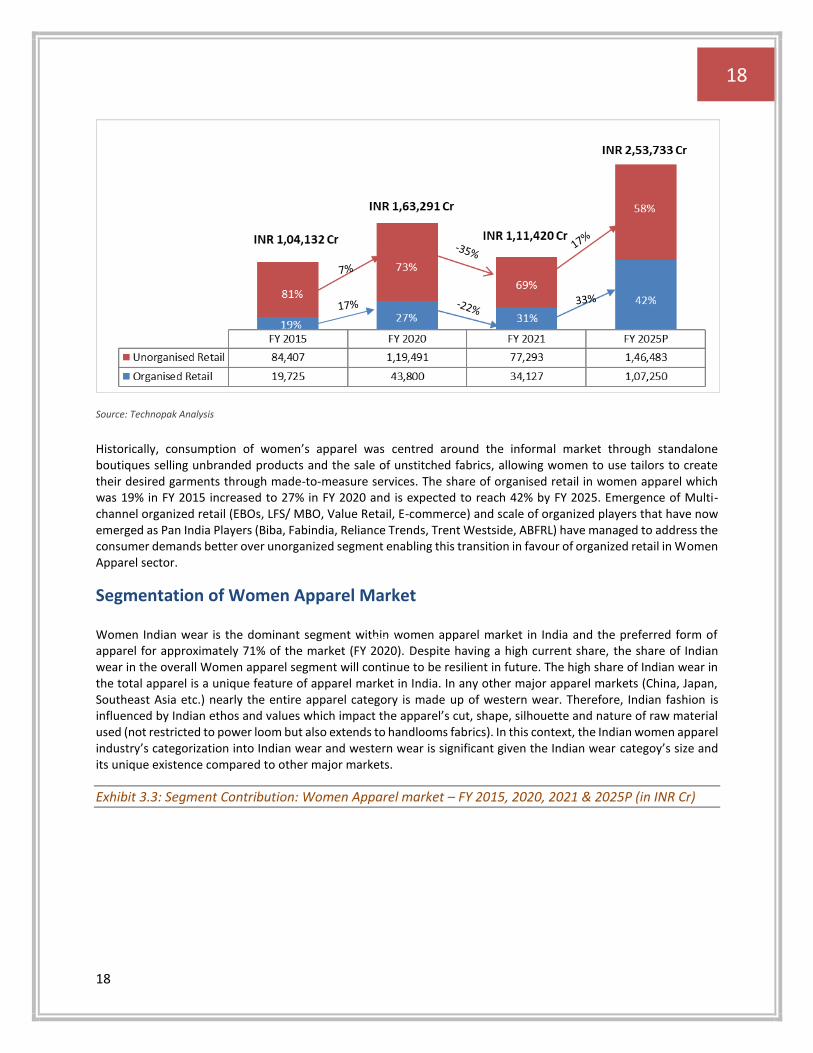
Exhibit 3.2: Share of Organised and Unorganised Retail as a percentage of Women Apparel Market (in INR Cr) – FY 2015, 2020, 2021, 2025P
104,132
163,291
111,420
253,733
FY 2015 FY 2020 FY 2021 FY 2025P
18
18
Source: Technopak Analysis
Historically, consumption of women’s apparel was centred around the informal market through standalone boutiques selling unbranded products and the sale of unstitched fabrics, allowing women to use tailors to create their desired garments through made-to-measure services. The share of organised retail in women apparel which was 19% in FY 2015 increased to 27% in FY 2020 and is expected to reach 42% by FY 2025. Emergence of Multi-channel organized retail (EBOs, LFS/ MBO, Value Retail, E-commerce) and scale of organized players that have now emerged as Pan India Players (Biba, Fabindia, Reliance Trends, Trent Westside, ABFRL) have managed to address the consumer demands better over unorganized segment enabling this transition in favour of organized retail in Women Apparel sector.
Segmentation of Women Apparel Market
Women Indian wear is the dominant segment within women apparel market in India and the preferred form of apparel for approximately 71% of the market (FY 2020). Despite having a high current share, the share of Indian wear in the overall Women apparel segment will continue to be resilient in future. The high share of Indian wear in the total apparel is a unique feature of apparel market in India. In any other major apparel markets (China, Japan, Southeast Asia etc.) nearly the entire apparel category is made up of western wear. Therefore, Indian fashion is influenced by Indian ethos and values which impact the apparel’s cut, shape, silhouette and nature of raw material used (not restricted to power loom but also extends to handlooms fabrics). In this context, the Indian women apparel industry’s categorization into Indian wear and western wear is significant given the Indian wear categoy’s size and its unique existence compared to other major markets.
Exhibit 3.3: Segment Contribution: Women Apparel market – FY 2015, 2020, 2021 & 2025P (in INR Cr)
(27%) (27%)
19
19
Source: Technopak Analysis. Western Wear (excluding Innerwear & Activewear) includes Tops/shirts, T-shirts, Denim, Formal Jackets, Sleepwear, Trousers/skirts, Winterwear & clothing accessories
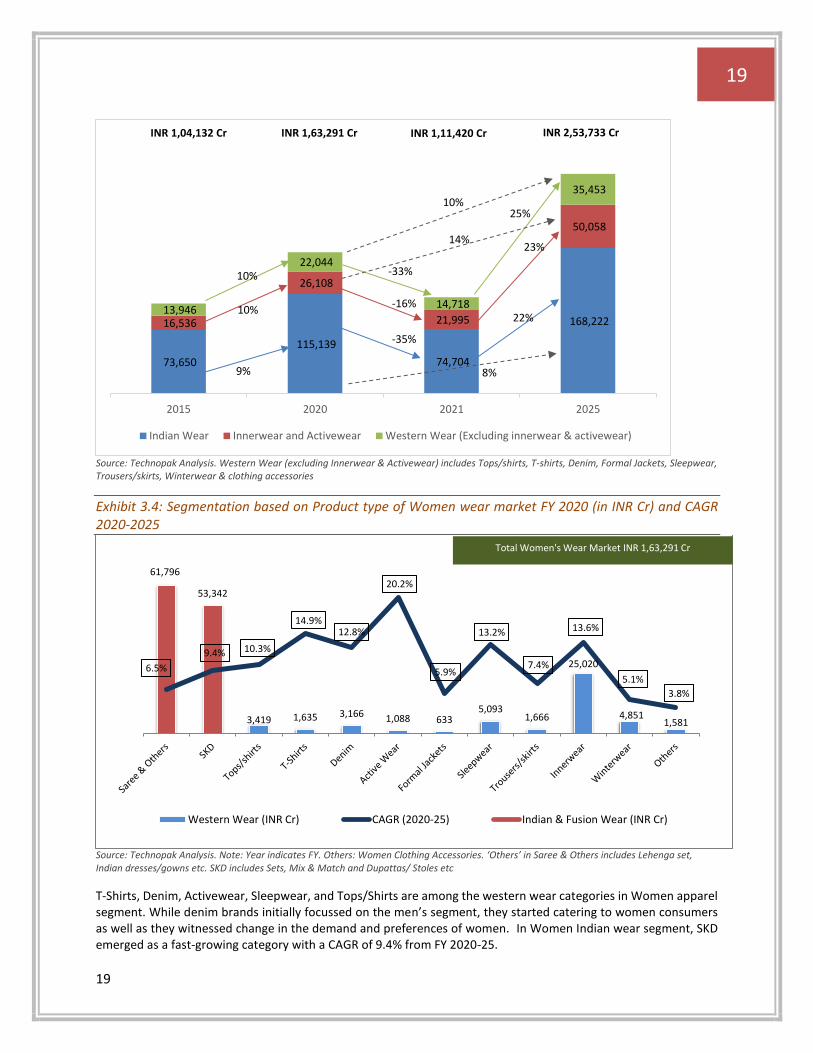
Exhibit 3.4: Segmentation based on Product type of Women wear market FY 2020 (in INR Cr) and CAGR 2020-2025
Source: Technopak Analysis. Note: Year indicates FY. Others: Women Clothing Accessories. ‘Others’ in Saree & Others includes Lehenga set, Indian dresses/gowns etc. SKD includes Sets, Mix & Match and Dupattas/ Stoles etc
T-Shirts, Denim, Activewear, Sleepwear, and Tops/Shirts are among the western wear categories in Women apparel segment. While denim brands initially focussed on the men’s segment, they started catering to women consumers as well as they witnessed change in the demand and preferences of women. In Women Indian wear segment, SKD emerged as a fast-growing category with a CAGR of 9.4% from FY 2020-25.
73,650
115,139
74,704
168,222 16,536
26,108
21,995
50,058
13,946
22,044
14,718
35,453
2015 2020 2021 2025
Indian Wear Innerwear and Activewear Western Wear (Excluding innerwear & activewear)
INR 1,04,132 Cr
61,796
53,342
3,419 1,635 3,166 1,088 6335,093
1,666
25,020
4,8511,581
6.5%
9.4%
14.9%
10.3%
12.8% 13.6%
20.2%
5.9%
13.2%
7.4%
5.1%
3.8%
Western Wear (INR Cr) CAGR (2020-25) Indian & Fusion Wear (INR Cr)
Total Women's Wear Market INR 1,63,291 Cr
INR 1,63,291 Cr INR 1,11,420 Cr INR 2,53,733 Cr
9%
10%
10% -33%
-16%
-35%
25%
23%
22%
10%
14%
8%
20
20
Women Apparel Brands across Price Segments
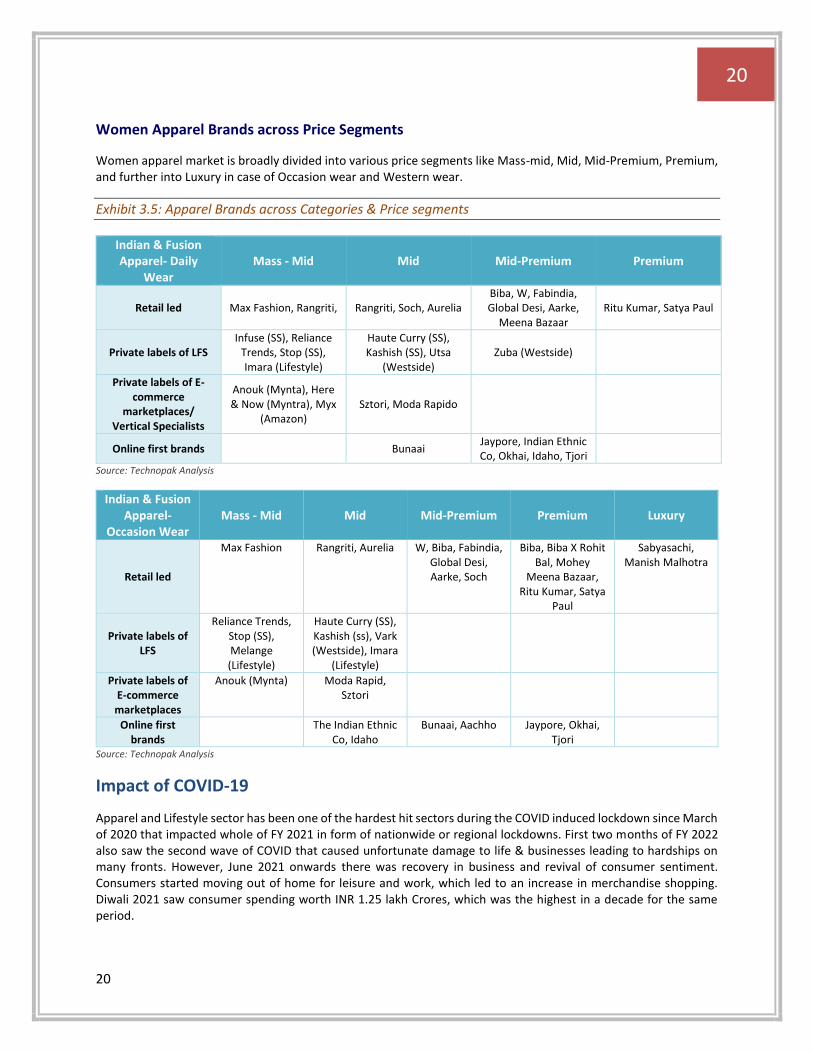
Women apparel market is broadly divided into various price segments like Mass-mid, Mid, Mid-Premium, Premium, and further into Luxury in case of Occasion wear and Western wear.
Exhibit 3.5: Apparel Brands across Categories & Price segments
Indian & Fusion Apparel- Daily
Wear Mass - Mid Mid Mid-Premium Premium
Retail led Max Fashion, Rangriti, Rangriti, Soch, Aurelia Biba, W, Fabindia, Global Desi, Aarke,
Meena Bazaar Ritu Kumar, Satya Paul
Private labels of LFS Infuse (SS), Reliance
Trends, Stop (SS), Imara (Lifestyle)
Haute Curry (SS), Kashish (SS), Utsa
(Westside) Zuba (Westside)
Private labels of E-commerce
marketplaces/ Vertical Specialists
Anouk (Mynta), Here & Now (Myntra), Myx
(Amazon) Sztori, Moda Rapido
Online first brands Bunaai Jaypore, Indian Ethnic Co, Okhai, Idaho, Tjori
Source: Technopak Analysis
Indian & Fusion Apparel-
Occasion Wear Mass - Mid Mid Mid-Premium Premium Luxury
Retail led
Max Fashion Rangriti, Aurelia W, Biba, Fabindia, Global Desi, Aarke, Soch
Biba, Biba X Rohit Bal, Mohey
Meena Bazaar, Ritu Kumar, Satya
Paul
Sabyasachi, Manish Malhotra
Private labels of LFS
Reliance Trends, Stop (SS), Melange (Lifestyle)
Haute Curry (SS), Kashish (ss), Vark (Westside), Imara
(Lifestyle)
Private labels of E-commerce marketplaces
Anouk (Mynta) Moda Rapid, Sztori
Online first brands
The Indian Ethnic
Co, Idaho Bunaai, Aachho Jaypore, Okhai,
Tjori
Source: Technopak Analysis
Impact of COVID-19
Apparel and Lifestyle sector has been one of the hardest hit sectors during the COVID induced lockdown since March of 2020 that impacted whole of FY 2021 in form of nationwide or regional lockdowns. First two months of FY 2022 also saw the second wave of COVID that caused unfortunate damage to life & businesses leading to hardships on many fronts. However, June 2021 onwards there was recovery in business and revival of consumer sentiment. Consumers started moving out of home for leisure and work, which led to an increase in merchandise shopping. Diwali 2021 saw consumer spending worth INR 1.25 lakh Crores, which was the highest in a decade for the same period.
21
21
Brands and consumers alike have adapted to the changes due to COVID, while business cycles come back to normalcy. E-commerce saw a major boost with consumers taking it as a means of ordering merchandise both across need and aspiration-based categories. COVID-19 gave impetus to the growth of e-commerce that is expected to become a significant growth driver for the organised market. The women apparel industry saw a decrease in formal wear due to COVID-19, but also witnessed increase sales of casual wear driven by work from home and awareness towards wellness due to the pandemic, and hence active wear gained traction during this period. The sleepwear, loungewear and athleisure categories saw rise in sales, along with fusion wear that works as both formal/ smart casual and comfort wear. Marks & Spencer’s and Shoppers Stop added a separate section offering loungewear. Online majors like Amazon India and Myntra expanded offerings for comfort-wear. Indian Wear brand Biba launched its range of sleepwear and loungewear to cater to the consumers seeking comfort wear mixed with smart casuals, along with more offerings in comfortable fusion wear such as kurtas, palazzos, pants etc.
Women Indian Wear Market
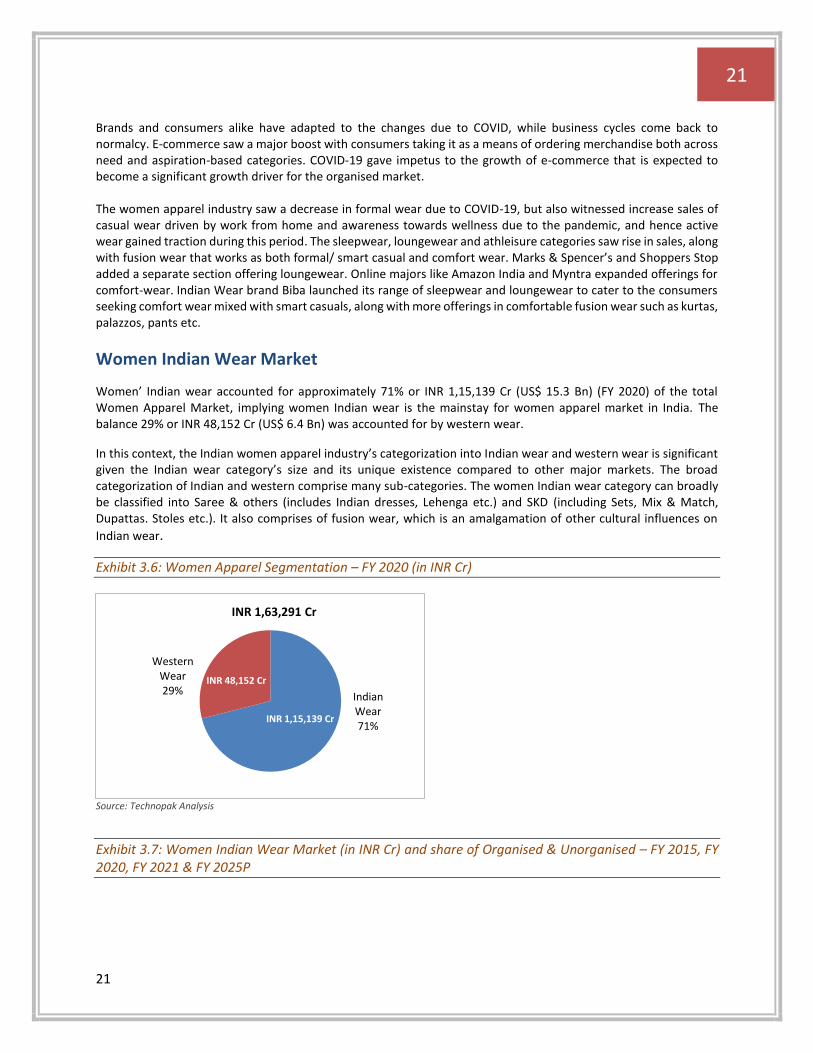
Women’ Indian wear accounted for approximately 71% or INR 1,15,139 Cr (US$ 15.3 Bn) (FY 2020) of the total Women Apparel Market, implying women Indian wear is the mainstay for women apparel market in India. The balance 29% or INR 48,152 Cr (US$ 6.4 Bn) was accounted for by western wear.
In this context, the Indian women apparel industry’s categorization into Indian wear and western wear is significant given the Indian wear category’s size and its unique existence compared to other major markets. The broad categorization of Indian and western comprise many sub-categories. The women Indian wear category can broadly be classified into Saree & others (includes Indian dresses, Lehenga etc.) and SKD (including Sets, Mix & Match, Dupattas. Stoles etc.). It also comprises of fusion wear, which is an amalgamation of other cultural influences on
Indian wear.
Exhibit 3.6: Women Apparel Segmentation – FY 2020 (in INR Cr)
Source: Technopak Analysis
Exhibit 3.7: Women Indian Wear Market (in INR Cr) and share of Organised & Unorganised – FY 2015, FY 2020, FY 2021 & FY 2025P
Indian Wear71%
Western Wear29%
INR 1,15,139 Cr
INR 48,152 Cr
INR 1,63,291 Cr
22
22
Source: Technopak Analysis
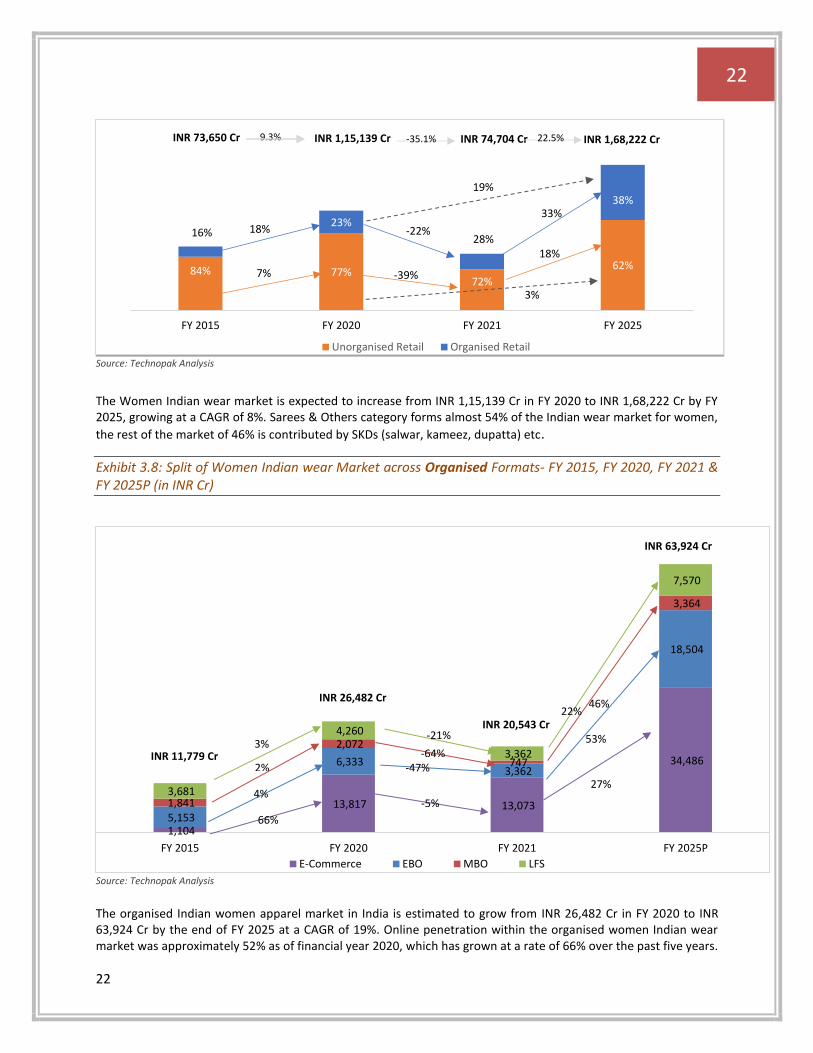
The Women Indian wear market is expected to increase from INR 1,15,139 Cr in FY 2020 to INR 1,68,222 Cr by FY 2025, growing at a CAGR of 8%. Sarees & Others category forms almost 54% of the Indian wear market for women,
the rest of the market of 46% is contributed by SKDs (salwar, kameez, dupatta) etc.
Exhibit 3.8: Split of Women Indian wear Market across Organised Formats- FY 2015, FY 2020, FY 2021 & FY 2025P (in INR Cr)
Source: Technopak Analysis
The organised Indian women apparel market in India is estimated to grow from INR 26,482 Cr in FY 2020 to INR 63,924 Cr by the end of FY 2025 at a CAGR of 19%. Online penetration within the organised women Indian wear market was approximately 52% as of financial year 2020, which has grown at a rate of 66% over the past five years.
84% 77%72%
62%
16%23%
28%
38%
FY 2015 FY 2020 FY 2021 FY 2025
Unorganised Retail Organised Retail
INR 73,650 Cr INR 1,15,139 Cr INR 1,68,222 Cr INR 74,704 Cr
18%
7%
-22%
-39%
18%
33%
9.3% -35.1% 22.5%
3%
19%
1,104
13,817 13,073
34,486
5,153
6,333 3,362
18,504
1,841
2,072
747
3,364
3,681
4,260
3,362
7,570
FY 2015 FY 2020 FY 2021 FY 2025P
E-Commerce EBO MBO LFS
INR 11,779 Cr
INR 26,482 Cr
INR 63,924 Cr
INR 20,543 Cr
66%
4%
2%
3%
-5%
27%
-47%
53% -64%
46%
-21%
22%
23
23
These dynamics are advantageous for players like Biba given their strong digital presence. Brand focus on digital activation is expected to be a growth enabler for the online channel.
Exhibit 3.9: Representative players - EBOs, MBOS, LFS and Online
EBO MBO LFS E-commerce/Online
Biba Vama Reliance Trends Amazon
Aurelia Chunmun Westside Flipkart
W Kapsons Lifestyle Myntra
Fabindia Lulu Vishal Nykaa Fashion Source: Technopak Analysis
Product segmentation of Women Indian Wear Market
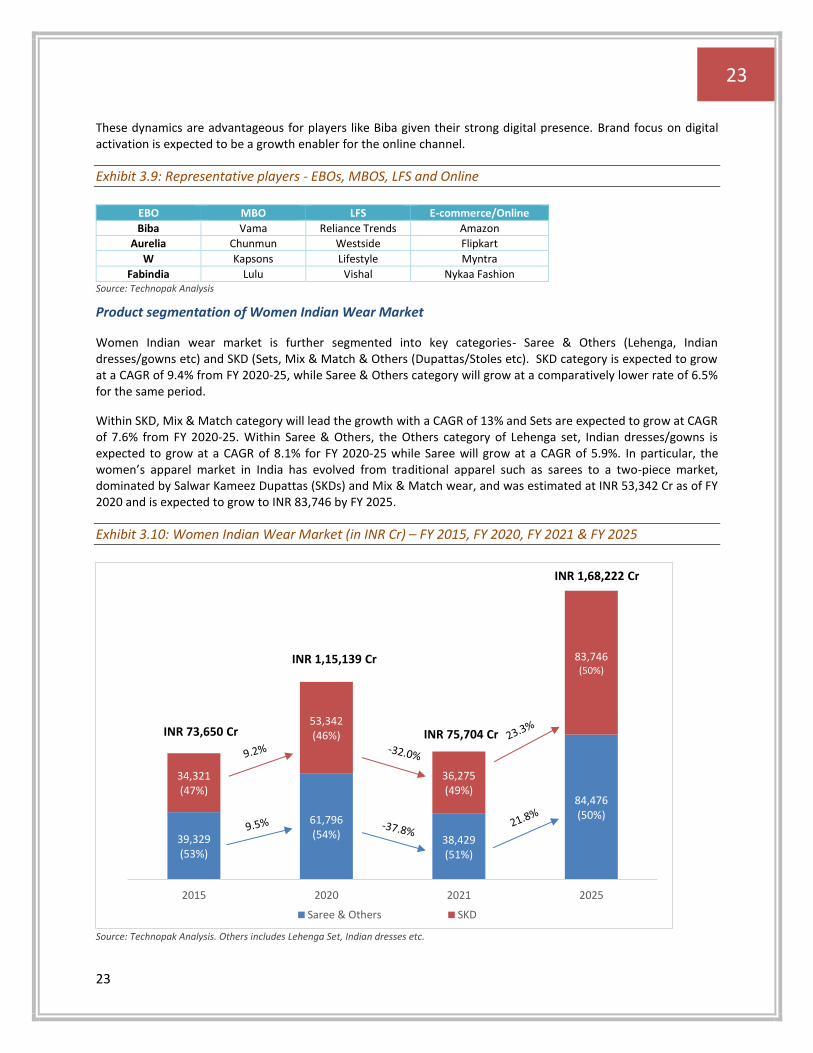
Women Indian wear market is further segmented into key categories- Saree & Others (Lehenga, Indian dresses/gowns etc) and SKD (Sets, Mix & Match & Others (Dupattas/Stoles etc). SKD category is expected to grow at a CAGR of 9.4% from FY 2020-25, while Saree & Others category will grow at a comparatively lower rate of 6.5% for the same period.
Within SKD, Mix & Match category will lead the growth with a CAGR of 13% and Sets are expected to grow at CAGR of 7.6% from FY 2020-25. Within Saree & Others, the Others category of Lehenga set, Indian dresses/gowns is expected to grow at a CAGR of 8.1% for FY 2020-25 while Saree will grow at a CAGR of 5.9%. In particular, the women’s apparel market in India has evolved from traditional apparel such as sarees to a two-piece market, dominated by Salwar Kameez Dupattas (SKDs) and Mix & Match wear, and was estimated at INR 53,342 Cr as of FY 2020 and is expected to grow to INR 83,746 by FY 2025.
Exhibit 3.10: Women Indian Wear Market (in INR Cr) – FY 2015, FY 2020, FY 2021 & FY 2025
Source: Technopak Analysis. Others includes Lehenga Set, Indian dresses etc.
39,329(53%)
61,796(54%) 38,429
(51%)
84,476(50%)
34,321(47%)
53,342(46%)
36,275(49%)
83,746(50%)
2015 2020 2021 2025
Saree & Others SKD
INR 73,650 Cr
INR 1,68,222 Cr
INR 1,15,139 Cr
INR 75,704 Cr
24
24
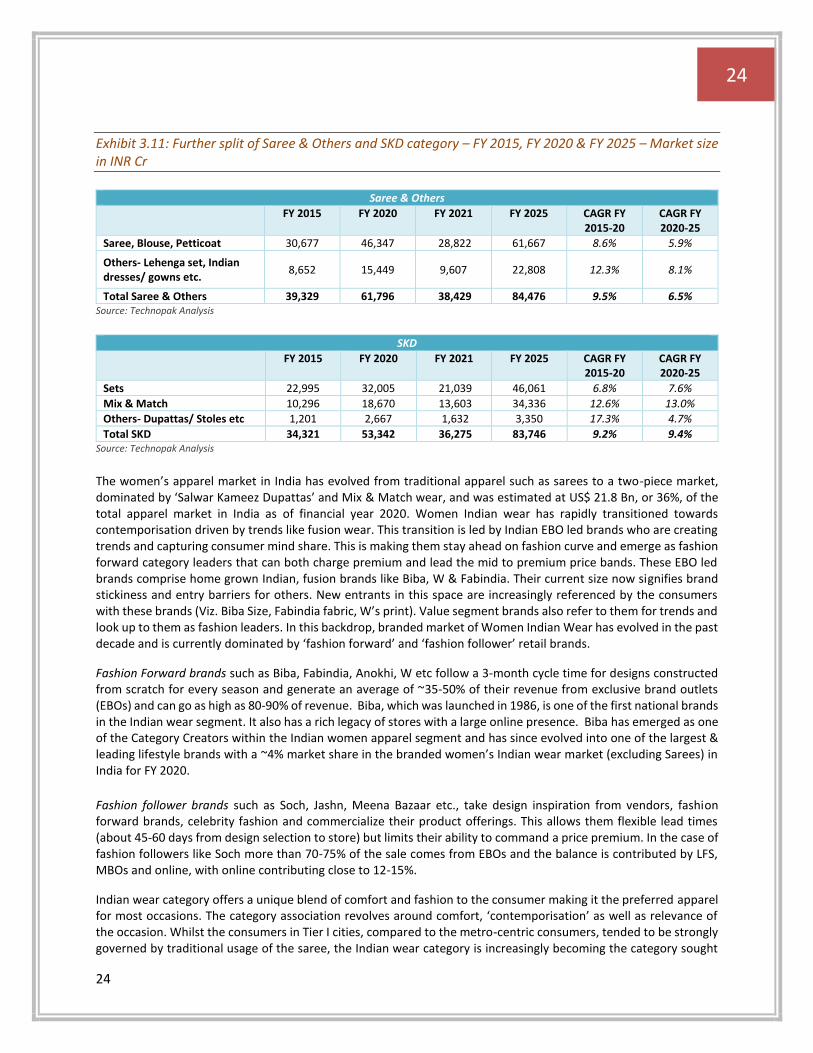
Exhibit 3.11: Further split of Saree & Others and SKD category – FY 2015, FY 2020 & FY 2025 – Market size in INR Cr
Saree & Others
FY 2015 FY 2020 FY 2021 FY 2025 CAGR FY 2015-20
CAGR FY 2020-25
Saree, Blouse, Petticoat 30,677 46,347 28,822 61,667 8.6% 5.9%
Others- Lehenga set, Indian dresses/ gowns etc.
8,652 15,449 9,607 22,808 12.3% 8.1%
Total Saree & Others 39,329 61,796 38,429 84,476 9.5% 6.5% Source: Technopak Analysis
SKD
FY 2015 FY 2020 FY 2021 FY 2025 CAGR FY 2015-20
CAGR FY 2020-25
Sets 22,995 32,005 21,039 46,061 6.8% 7.6%
Mix & Match 10,296 18,670 13,603 34,336 12.6% 13.0%
Others- Dupattas/ Stoles etc 1,201 2,667 1,632 3,350 17.3% 4.7%
Total SKD 34,321 53,342 36,275 83,746 9.2% 9.4% Source: Technopak Analysis
The women’s apparel market in India has evolved from traditional apparel such as sarees to a two-piece market, dominated by ‘Salwar Kameez Dupattas’ and Mix & Match wear, and was estimated at US$ 21.8 Bn, or 36%, of the total apparel market in India as of financial year 2020. Women Indian wear has rapidly transitioned towards contemporisation driven by trends like fusion wear. This transition is led by Indian EBO led brands who are creating trends and capturing consumer mind share. This is making them stay ahead on fashion curve and emerge as fashion forward category leaders that can both charge premium and lead the mid to premium price bands. These EBO led brands comprise home grown Indian, fusion brands like Biba, W & Fabindia. Their current size now signifies brand stickiness and entry barriers for others. New entrants in this space are increasingly referenced by the consumers with these brands (Viz. Biba Size, Fabindia fabric, W’s print). Value segment brands also refer to them for trends and look up to them as fashion leaders. In this backdrop, branded market of Women Indian Wear has evolved in the past decade and is currently dominated by ‘fashion forward’ and ‘fashion follower’ retail brands.
Fashion Forward brands such as Biba, Fabindia, Anokhi, W etc follow a 3-month cycle time for designs constructed from scratch for every season and generate an average of ~35-50% of their revenue from exclusive brand outlets (EBOs) and can go as high as 80-90% of revenue. Biba, which was launched in 1986, is one of the first national brands in the Indian wear segment. It also has a rich legacy of stores with a large online presence. Biba has emerged as one of the Category Creators within the Indian women apparel segment and has since evolved into one of the largest & leading lifestyle brands with a ~4% market share in the branded women’s Indian wear market (excluding Sarees) in India for FY 2020.
Fashion follower brands such as Soch, Jashn, Meena Bazaar etc., take design inspiration from vendors, fashion forward brands, celebrity fashion and commercialize their product offerings. This allows them flexible lead times (about 45-60 days from design selection to store) but limits their ability to command a price premium. In the case of fashion followers like Soch more than 70-75% of the sale comes from EBOs and the balance is contributed by LFS, MBOs and online, with online contributing close to 12-15%.
Indian wear category offers a unique blend of comfort and fashion to the consumer making it the preferred apparel for most occasions. The category association revolves around comfort, ‘contemporisation’ as well as relevance of the occasion. Whilst the consumers in Tier I cities, compared to the metro-centric consumers, tended to be strongly governed by traditional usage of the saree, the Indian wear category is increasingly becoming the category sought
25
25
for as it offers both conformity and style. Indian women wear in the form of Kurtas, Mix & Match, Saree, Indian dresses etc has found a universal appeal across states as these categories are being worn by women across the country. With increased online presence and social media marketing, consumers across have become aware of, and have adopted various Indian & Fusion wear apparel like Kurtas, sets, palazzos, dhoti, Indian jackets, saree etc.
Indian apparel fashion is uniquely an India focused opportunity and one that provides a natural and sustainable advantage to homegrown players to seize it. This advantage is reflected in structure of the Indian wear category that comprises of home-grown brands in leading positions.
Kids Apparel Market
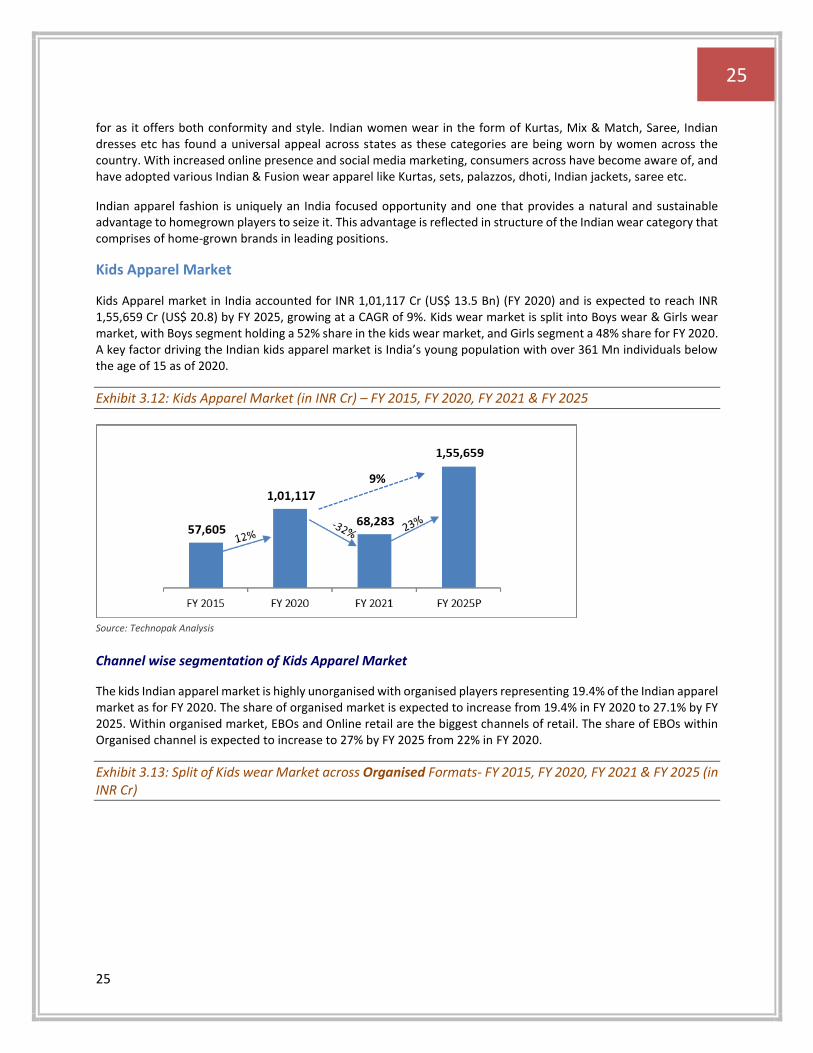
Kids Apparel market in India accounted for INR 1,01,117 Cr (US$ 13.5 Bn) (FY 2020) and is expected to reach INR 1,55,659 Cr (US$ 20.8) by FY 2025, growing at a CAGR of 9%. Kids wear market is split into Boys wear & Girls wear market, with Boys segment holding a 52% share in the kids wear market, and Girls segment a 48% share for FY 2020. A key factor driving the Indian kids apparel market is India’s young population with over 361 Mn individuals below the age of 15 as of 2020.
Exhibit 3.12: Kids Apparel Market (in INR Cr) – FY 2015, FY 2020, FY 2021 & FY 2025
Source: Technopak Analysis
Channel wise segmentation of Kids Apparel Market
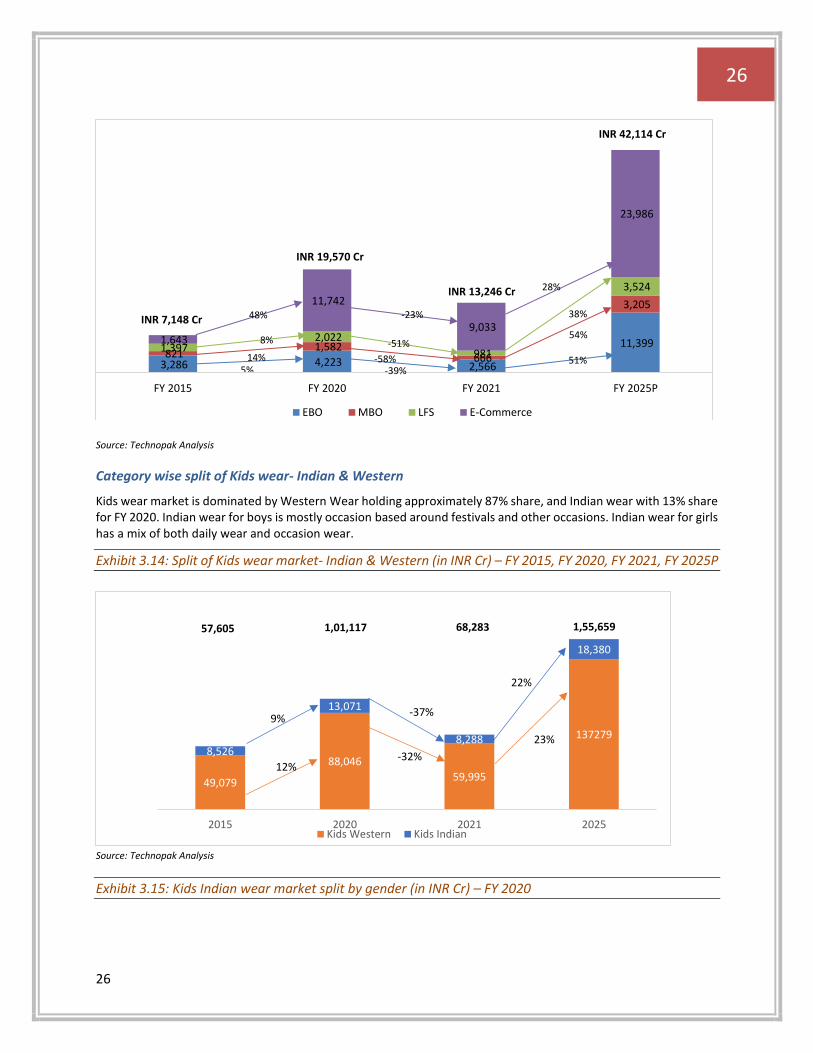
The kids Indian apparel market is highly unorganised with organised players representing 19.4% of the Indian apparel market as for FY 2020. The share of organised market is expected to increase from 19.4% in FY 2020 to 27.1% by FY 2025. Within organised market, EBOs and Online retail are the biggest channels of retail. The share of EBOs within Organised channel is expected to increase to 27% by FY 2025 from 22% in FY 2020.
Exhibit 3.13: Split of Kids wear Market across Organised Formats- FY 2015, FY 2020, FY 2021 & FY 2025 (in INR Cr)
9%
26
26
Source: Technopak Analysis
Category wise split of Kids wear- Indian & Western
Kids wear market is dominated by Western Wear holding approximately 87% share, and Indian wear with 13% share for FY 2020. Indian wear for boys is mostly occasion based around festivals and other occasions. Indian wear for girls has a mix of both daily wear and occasion wear.
Exhibit 3.14: Split of Kids wear market- Indian & Western (in INR Cr) – FY 2015, FY 2020, FY 2021, FY 2025P
Source: Technopak Analysis
Exhibit 3.15: Kids Indian wear market split by gender (in INR Cr) – FY 2020
3,286 4,223 2,566
11,399 821
1,582 666
3,205
1,397 2,022
981
3,524
1,643
11,742
9,033
23,986
FY 2015 FY 2020 FY 2021 FY 2025P
EBO MBO LFS E-Commerce
INR 7,148 Cr
INR 19,570 Cr
INR 42,114 Cr
INR 13,246 Cr
5%14%
8%
48%
-39%-58%
-51%
-23%
51%
54%
38%
28%
49,079
88,046
59,995
137279
8,526
13,071
8,288
18,380
2015 2020 2021 2025Kids Western Kids Indian
57,605 1,01,117 68,283 1,55,659
9%
12%
-37%
-32%
22%
23%
27
27
Source: Technopak Analysis
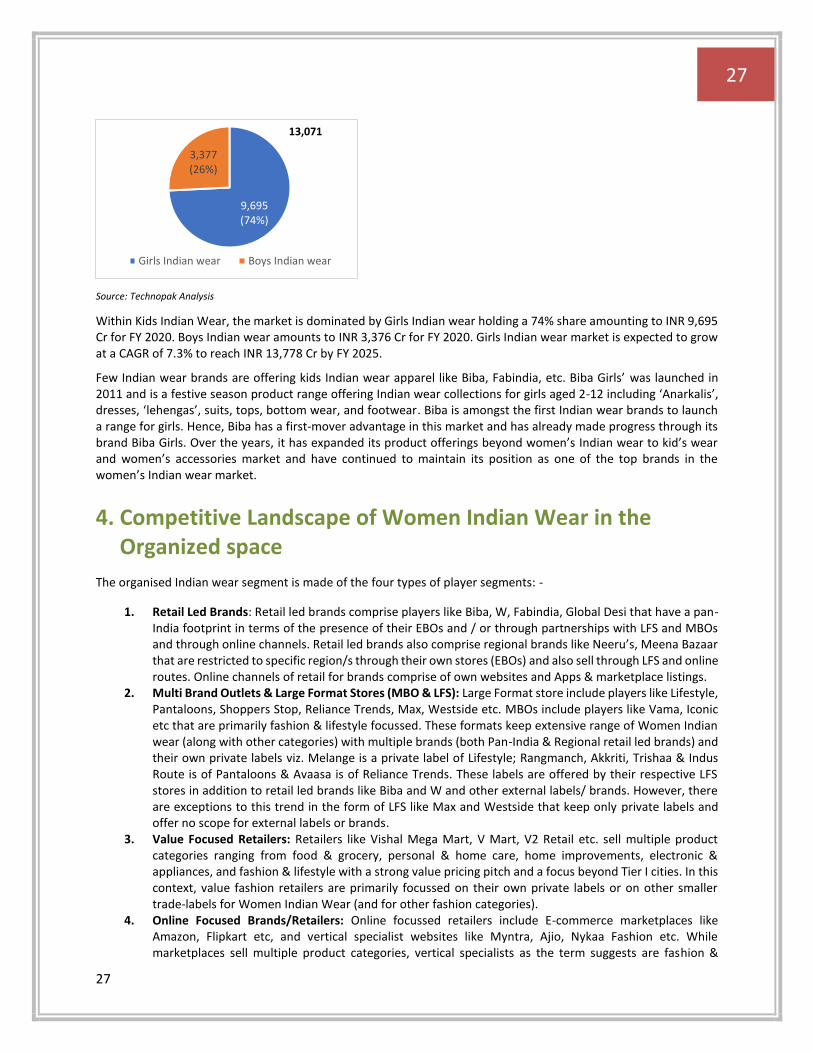
Within Kids Indian Wear, the market is dominated by Girls Indian wear holding a 74% share amounting to INR 9,695 Cr for FY 2020. Boys Indian wear amounts to INR 3,376 Cr for FY 2020. Girls Indian wear market is expected to grow at a CAGR of 7.3% to reach INR 13,778 Cr by FY 2025.
Few Indian wear brands are offering kids Indian wear apparel like Biba, Fabindia, etc. Biba Girls’ was launched in 2011 and is a festive season product range offering Indian wear collections for girls aged 2-12 including ‘Anarkalis’, dresses, ‘lehengas’, suits, tops, bottom wear, and footwear. Biba is amongst the first Indian wear brands to launch a range for girls. Hence, Biba has a first-mover advantage in this market and has already made progress through its brand Biba Girls. Over the years, it has expanded its product offerings beyond women’s Indian wear to kid’s wear and women’s accessories market and have continued to maintain its position as one of the top brands in the women’s Indian wear market.
4. Competitive Landscape of Women Indian Wear in the Organized space
The organised Indian wear segment is made of the four types of player segments: -
1. Retail Led Brands: Retail led brands comprise players like Biba, W, Fabindia, Global Desi that have a pan-India footprint in terms of the presence of their EBOs and / or through partnerships with LFS and MBOs and through online channels. Retail led brands also comprise regional brands like Neeru’s, Meena Bazaar that are restricted to specific region/s through their own stores (EBOs) and also sell through LFS and online routes. Online channels of retail for brands comprise of own websites and Apps & marketplace listings.
2. Multi Brand Outlets & Large Format Stores (MBO & LFS): Large Format store include players like Lifestyle, Pantaloons, Shoppers Stop, Reliance Trends, Max, Westside etc. MBOs include players like Vama, Iconic etc that are primarily fashion & lifestyle focussed. These formats keep extensive range of Women Indian wear (along with other categories) with multiple brands (both Pan-India & Regional retail led brands) and their own private labels viz. Melange is a private label of Lifestyle; Rangmanch, Akkriti, Trishaa & Indus Route is of Pantaloons & Avaasa is of Reliance Trends. These labels are offered by their respective LFS stores in addition to retail led brands like Biba and W and other external labels/ brands. However, there are exceptions to this trend in the form of LFS like Max and Westside that keep only private labels and offer no scope for external labels or brands.
3. Value Focused Retailers: Retailers like Vishal Mega Mart, V Mart, V2 Retail etc. sell multiple product categories ranging from food & grocery, personal & home care, home improvements, electronic & appliances, and fashion & lifestyle with a strong value pricing pitch and a focus beyond Tier I cities. In this context, value fashion retailers are primarily focussed on their own private labels or on other smaller trade-labels for Women Indian Wear (and for other fashion categories).
4. Online Focused Brands/Retailers: Online focussed retailers include E-commerce marketplaces like Amazon, Flipkart etc, and vertical specialist websites like Myntra, Ajio, Nykaa Fashion etc. While marketplaces sell multiple product categories, vertical specialists as the term suggests are fashion &
9,695 (74%)
3,377 (26%)
Girls Indian wear Boys Indian wear
13,071
28
28
lifestyle focussed. However, both retail types offer various brands, for eg. retail led brands, smaller brands/labels, private labels (like Myx for Amazon, and Anouk for Myntra). There is also an emerging third group of ‘online focussed/online-first’ Women Indian wear brands that are only or primarily available online. Brands such as Jaypore, Pinklay, Okhai are examples of such online focussed/online-first brands.
EBO led retail brands emerge as fashion forward choice on products in the online channel: Various National and regional brands have adopted online channel for their sales as digital enablement paves way for the growth of an Omni-Channel retailing ecosystem. Having said that, the product differentiation on designs of Women Indian apparel is led by retail led brands selling online. There are a few pure play online vertical specialists with focus on women Indian wear. While leading online fashion portals and marketplaces have invested in private label development of western product categories, they also offer limited range of Women Indian Wear.
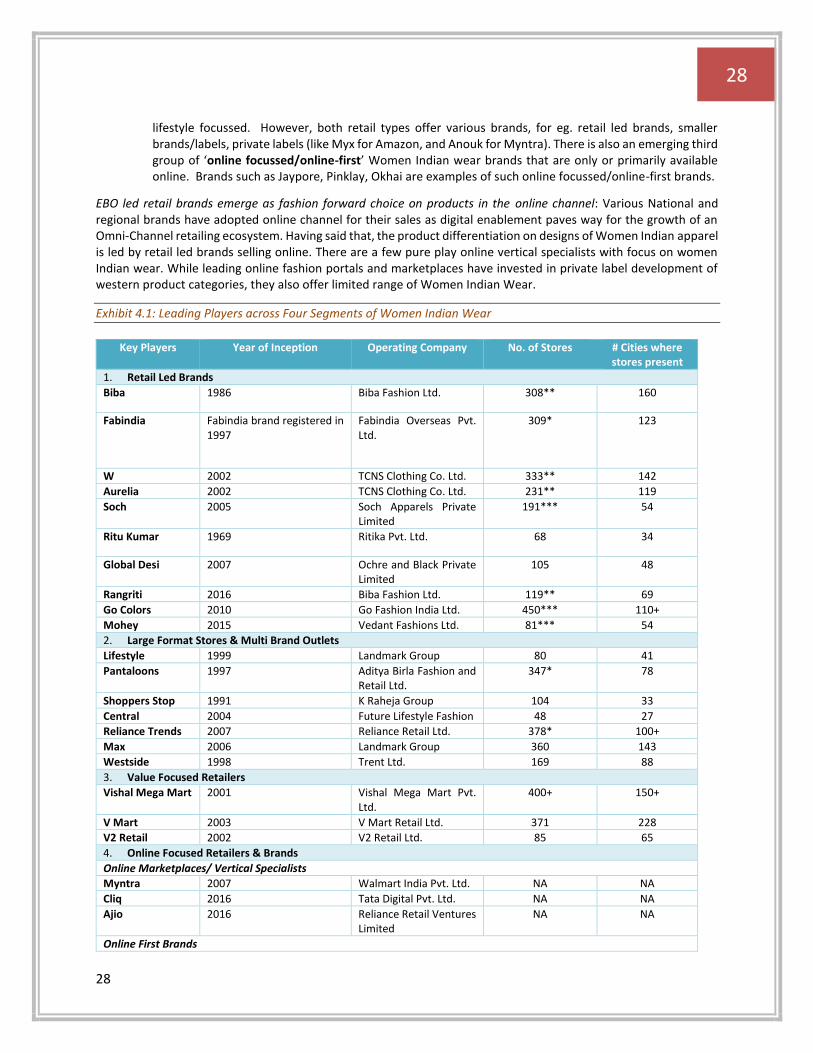
Exhibit 4.1: Leading Players across Four Segments of Women Indian Wear
Key Players Year of Inception Operating Company No. of Stores # Cities where stores present
1. Retail Led Brands
Biba 1986 Biba Fashion Ltd. 308** 160
Fabindia Fabindia brand registered in 1997
Fabindia Overseas Pvt. Ltd.
309* 123
W 2002 TCNS Clothing Co. Ltd. 333** 142
Aurelia 2002 TCNS Clothing Co. Ltd. 231** 119
Soch 2005 Soch Apparels Private Limited
191*** 54
Ritu Kumar 1969 Ritika Pvt. Ltd. 68 34
Global Desi 2007 Ochre and Black Private Limited
105 48
Rangriti 2016 Biba Fashion Ltd. 119** 69
Go Colors 2010 Go Fashion India Ltd. 450*** 110+
Mohey 2015 Vedant Fashions Ltd. 81*** 54
2. Large Format Stores & Multi Brand Outlets
Lifestyle 1999 Landmark Group 80 41
Pantaloons 1997 Aditya Birla Fashion and Retail Ltd.
347* 78
Shoppers Stop 1991 K Raheja Group 104 33
Central 2004 Future Lifestyle Fashion 48 27
Reliance Trends 2007 Reliance Retail Ltd. 378* 100+
Max 2006 Landmark Group 360 143
Westside 1998 Trent Ltd. 169 88
3. Value Focused Retailers
Vishal Mega Mart 2001 Vishal Mega Mart Pvt. Ltd.
400+ 150+
V Mart 2003 V Mart Retail Ltd. 371 228
V2 Retail 2002 V2 Retail Ltd. 85 65
4. Online Focused Retailers & Brands
Online Marketplaces/ Vertical Specialists
Myntra 2007 Walmart India Pvt. Ltd. NA NA
Cliq 2016 Tata Digital Pvt. Ltd. NA NA
Ajio 2016 Reliance Retail Ventures Limited
NA NA
Online First Brands
29
29
Jaypore 2012 Jaypore E-commerce Pvt. Ltd.
3 2
Okhai 2015 Okhai Enterprises Pvt. Ltd.
NA NA
Pinklay 2015 Pinklay Retail Pvt. Ltd. NA NA Source: Company Websites, Secondary Research. Store counts as of Jan 2022. * Indicates store count as of Sept 2021. **Indicates stores counts on Dec 2021. ***indicates store count as of June’ 2021.
Women Indian Wear Offerings across Player Groups
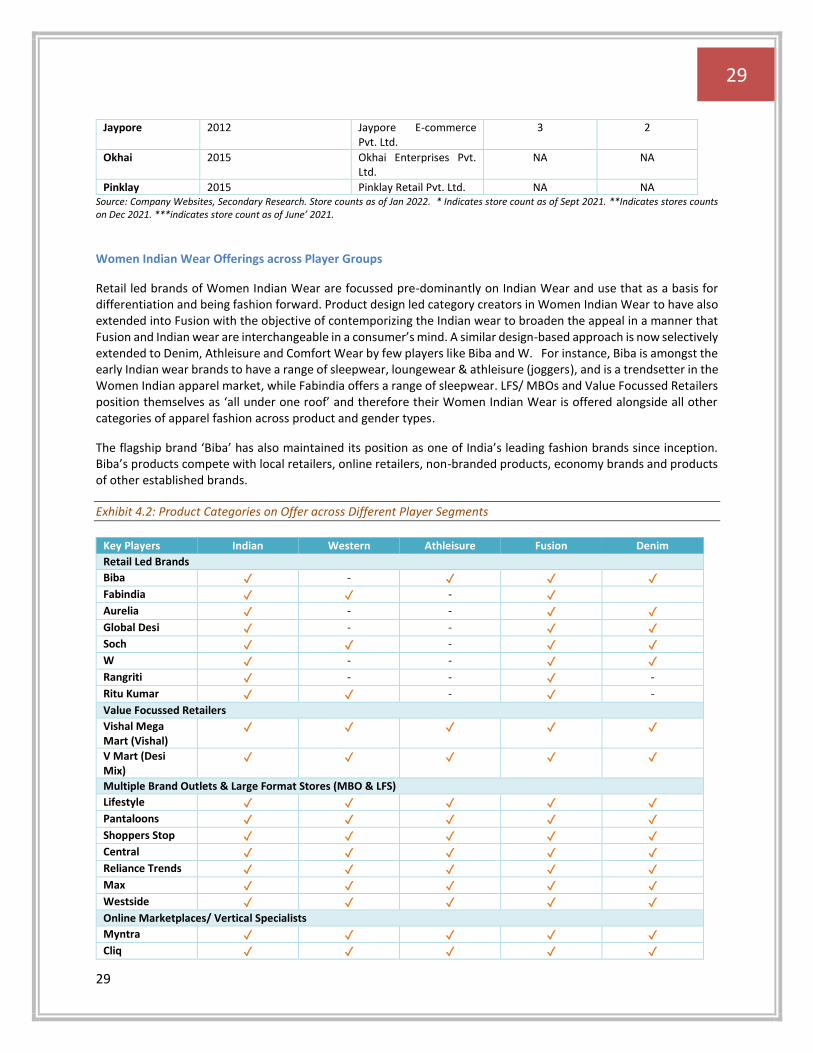
Retail led brands of Women Indian Wear are focussed pre-dominantly on Indian Wear and use that as a basis for differentiation and being fashion forward. Product design led category creators in Women Indian Wear to have also extended into Fusion with the objective of contemporizing the Indian wear to broaden the appeal in a manner that Fusion and Indian wear are interchangeable in a consumer’s mind. A similar design-based approach is now selectively extended to Denim, Athleisure and Comfort Wear by few players like Biba and W. For instance, Biba is amongst the early Indian wear brands to have a range of sleepwear, loungewear & athleisure (joggers), and is a trendsetter in the Women Indian apparel market, while Fabindia offers a range of sleepwear. LFS/ MBOs and Value Focussed Retailers position themselves as ‘all under one roof’ and therefore their Women Indian Wear is offered alongside all other categories of apparel fashion across product and gender types.
The flagship brand ‘Biba’ has also maintained its position as one of India’s leading fashion brands since inception. Biba’s products compete with local retailers, online retailers, non-branded products, economy brands and products of other established brands.
Exhibit 4.2: Product Categories on Offer across Different Player Segments
Key Players Indian Western Athleisure Fusion Denim
Retail Led Brands
Biba ✓ - ✓ ✓ ✓
Fabindia ✓ ✓ - ✓
Aurelia ✓ - - ✓ ✓
Global Desi ✓ - - ✓ ✓
Soch ✓ ✓ - ✓ ✓
W ✓ - - ✓ ✓
Rangriti ✓ - - ✓ -
Ritu Kumar ✓ ✓ - ✓ -
Value Focussed Retailers
Vishal Mega Mart (Vishal)
✓ ✓ ✓ ✓ ✓
V Mart (Desi Mix)
✓ ✓ ✓ ✓ ✓
Multiple Brand Outlets & Large Format Stores (MBO & LFS)
Lifestyle ✓ ✓ ✓ ✓ ✓
Pantaloons ✓ ✓ ✓ ✓ ✓
Shoppers Stop ✓ ✓ ✓ ✓ ✓
Central ✓ ✓ ✓ ✓ ✓
Reliance Trends ✓ ✓ ✓ ✓ ✓
Max ✓ ✓ ✓ ✓ ✓
Westside ✓ ✓ ✓ ✓ ✓
Online Marketplaces/ Vertical Specialists
Myntra ✓ ✓ ✓ ✓ ✓
Cliq ✓ ✓ ✓ ✓ ✓
30
30
Ajio ✓ ✓ ✓ ✓ ✓
Online Focused Brands
Jaypore ✓ - - ✓ -
Okhai ✓ - - ✓ -
Pinklay ✓ - - ✓ - Source: Company Websites, Secondary Research
SKD (Salwar Kurta & Dupatta) & SK (Salwar & Kurta) Sets, Tops, Bottoms, Indian Dresses, Dupattas are synonymous with Indian wear offering and are offered by all players that offer Women Indian Wear. The design play within this can range from daily wear to occasion wear or from traditional to fusion, dependent on an individual brand’s overall pitch and positioning in the market.
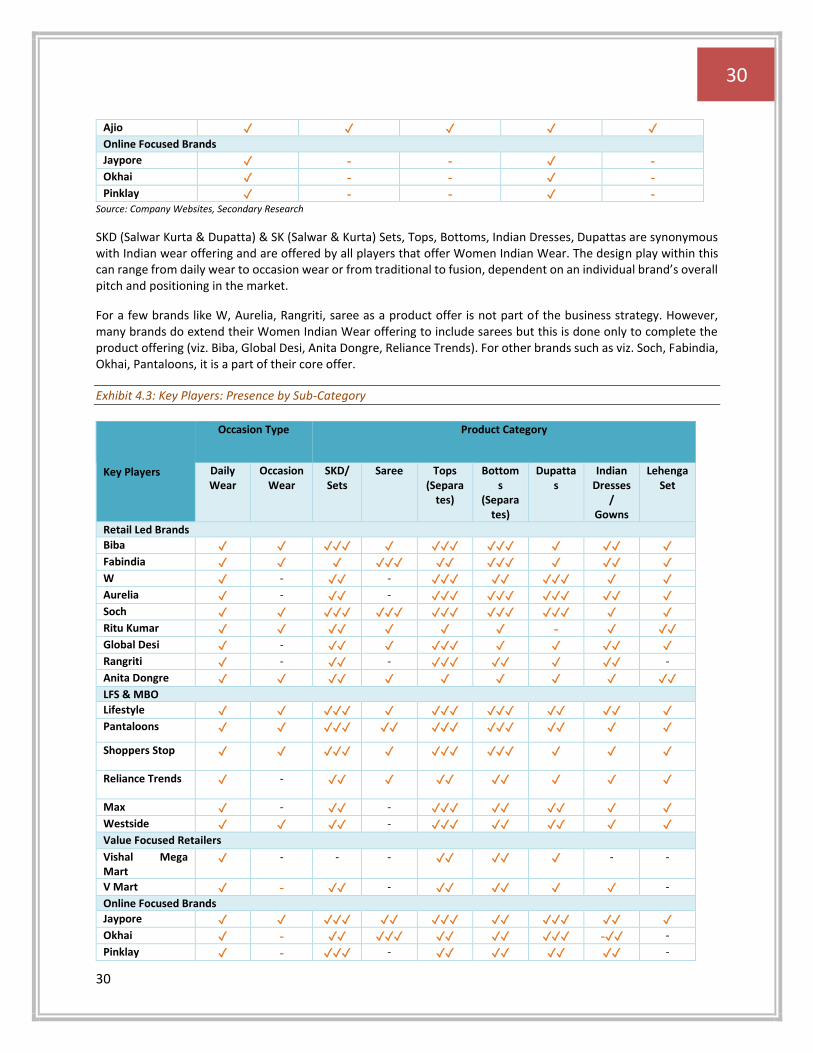
For a few brands like W, Aurelia, Rangriti, saree as a product offer is not part of the business strategy. However, many brands do extend their Women Indian Wear offering to include sarees but this is done only to complete the product offering (viz. Biba, Global Desi, Anita Dongre, Reliance Trends). For other brands such as viz. Soch, Fabindia, Okhai, Pantaloons, it is a part of their core offer.
Exhibit 4.3: Key Players: Presence by Sub-Category
Key Players
Occasion Type Product Category
Daily Wear
Occasion Wear
SKD/ Sets
Saree Tops (Separa
tes)
Bottoms
(Separates)
Dupattas
Indian Dresses
/ Gowns
Lehenga Set
Retail Led Brands
Biba ✓ ✓ ✓✓✓ ✓ ✓✓✓ ✓✓✓ ✓ ✓✓ ✓
Fabindia ✓ ✓ ✓ ✓✓✓ ✓✓ ✓✓✓ ✓ ✓✓ ✓
W ✓ - ✓✓ - ✓✓✓ ✓✓ ✓✓✓ ✓ ✓
Aurelia ✓ - ✓✓ - ✓✓✓ ✓✓✓ ✓✓✓ ✓✓ ✓
Soch ✓ ✓ ✓✓✓ ✓✓✓ ✓✓✓ ✓✓✓ ✓✓✓ ✓ ✓
Ritu Kumar ✓ ✓ ✓✓ ✓ ✓ ✓ - ✓ ✓✓
Global Desi ✓ - ✓✓ ✓ ✓✓✓ ✓ ✓ ✓✓ ✓
Rangriti ✓ - ✓✓ - ✓✓✓ ✓✓ ✓ ✓✓ -
Anita Dongre ✓ ✓ ✓✓ ✓ ✓ ✓ ✓ ✓ ✓✓
LFS & MBO
Lifestyle ✓ ✓ ✓✓✓ ✓ ✓✓✓ ✓✓✓ ✓✓ ✓✓ ✓
Pantaloons ✓ ✓ ✓✓✓ ✓✓ ✓✓✓ ✓✓✓ ✓✓ ✓ ✓
Shoppers Stop ✓ ✓ ✓✓✓ ✓ ✓✓✓ ✓✓✓ ✓ ✓ ✓
Reliance Trends ✓ - ✓✓ ✓ ✓✓ ✓✓ ✓ ✓ ✓
Max ✓ - ✓✓ - ✓✓✓ ✓✓ ✓✓ ✓ ✓
Westside ✓ ✓ ✓✓ - ✓✓✓ ✓✓ ✓✓ ✓ ✓
Value Focused Retailers
Vishal Mega Mart
✓ - - - ✓✓ ✓✓ ✓ - -
V Mart ✓ - ✓✓ - ✓✓ ✓✓ ✓ ✓ -
Online Focused Brands
Jaypore ✓ ✓ ✓✓✓ ✓✓ ✓✓✓ ✓✓ ✓✓✓ ✓✓ ✓
Okhai ✓ - ✓✓ ✓✓✓ ✓✓ ✓✓ ✓✓✓ -✓✓ -
Pinklay ✓ - ✓✓✓ - ✓✓ ✓✓ ✓✓ ✓✓ -
31
31
Source: Company Websites, Secondary Research. ✓ Ticks in Occasion type signify presence. No. of ticks in Product category signify intensity of presence basis SKU range.
The acceptance of Women Indian Wear as an apparel of choice for daily wear purposes has been a key growth driver for this category in the last decade. This is reflected in the rising share of daily wear in the overall Women Indian Wear sales. The organized players’ ability to contemporize and make products with high quotient of functionality, comfort and affordable prices is what has led to their individual growth trajectory and driven share away from occasion wear to daily wear. Therefore, within all leading brands in Women Indian Wear segment, the product offering is skewed towards Daily Wear. For many brands like Biba; Fabindia; Lifestyle; Myntra, Occasion Wear offers an incremental opportunity for further expansion and deeper penetration. It will enable them to offer occasion wear to consumers that already buy daily wear from them.
Product Offerings across Player Groups
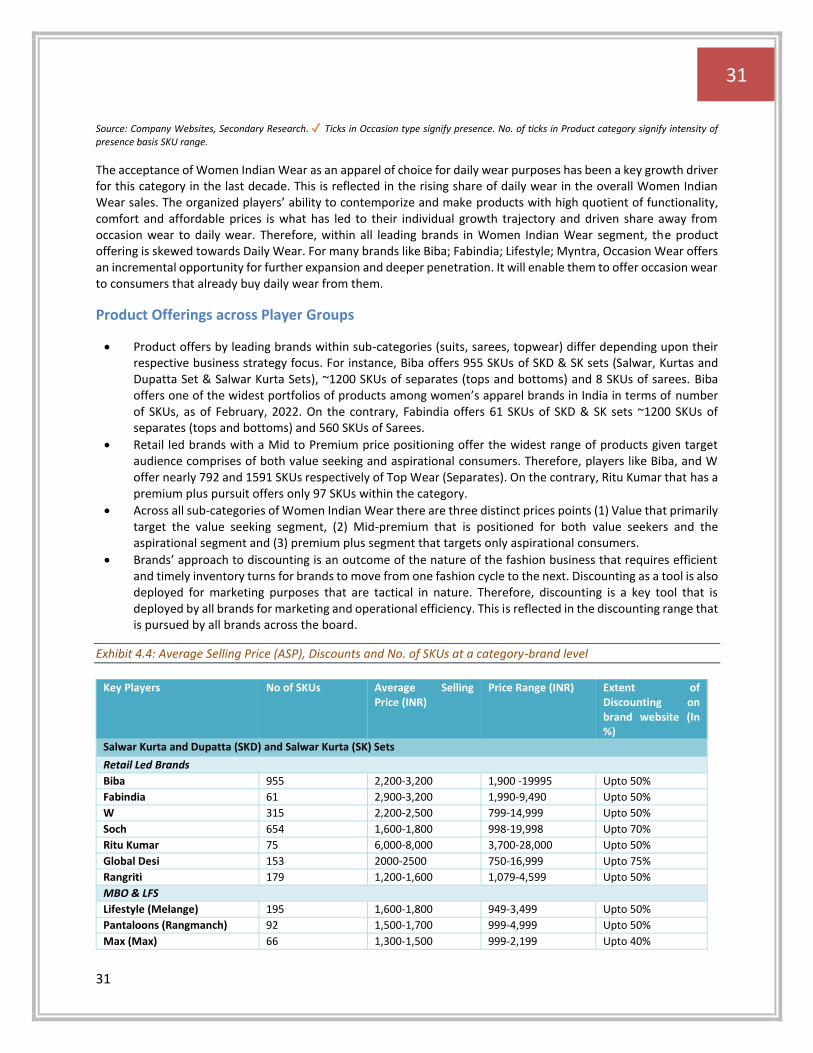
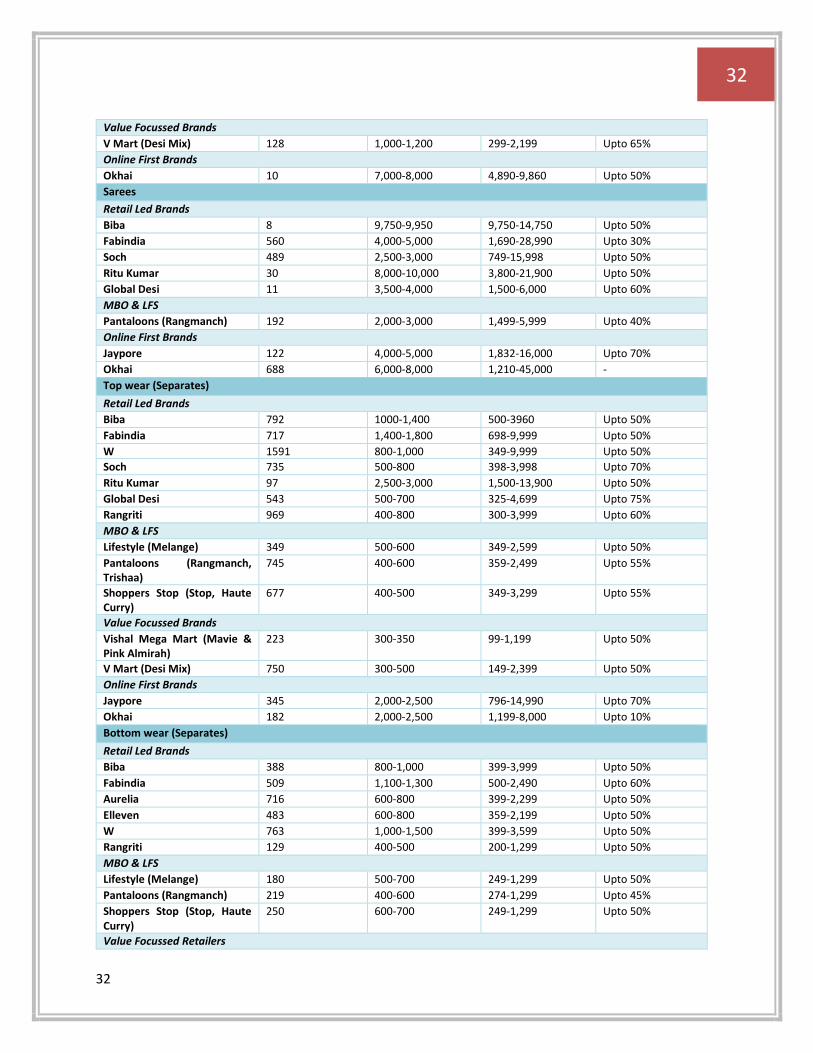
• Product offers by leading brands within sub-categories (suits, sarees, topwear) differ depending upon their respective business strategy focus. For instance, Biba offers 955 SKUs of SKD & SK sets (Salwar, Kurtas and Dupatta Set & Salwar Kurta Sets), ~1200 SKUs of separates (tops and bottoms) and 8 SKUs of sarees. Biba offers one of the widest portfolios of products among women’s apparel brands in India in terms of number of SKUs, as of February, 2022. On the contrary, Fabindia offers 61 SKUs of SKD & SK sets ~1200 SKUs of separates (tops and bottoms) and 560 SKUs of Sarees.
• Retail led brands with a Mid to Premium price positioning offer the widest range of products given target audience comprises of both value seeking and aspirational consumers. Therefore, players like Biba, and W offer nearly 792 and 1591 SKUs respectively of Top Wear (Separates). On the contrary, Ritu Kumar that has a premium plus pursuit offers only 97 SKUs within the category.
• Across all sub-categories of Women Indian Wear there are three distinct prices points (1) Value that primarily target the value seeking segment, (2) Mid-premium that is positioned for both value seekers and the aspirational segment and (3) premium plus segment that targets only aspirational consumers.
• Brands’ approach to discounting is an outcome of the nature of the fashion business that requires efficient and timely inventory turns for brands to move from one fashion cycle to the next. Discounting as a tool is also deployed for marketing purposes that are tactical in nature. Therefore, discounting is a key tool that is deployed by all brands for marketing and operational efficiency. This is reflected in the discounting range that is pursued by all brands across the board.
Exhibit 4.4: Average Selling Price (ASP), Discounts and No. of SKUs at a category-brand level
Key Players No of SKUs Average Selling Price (INR)
Price Range (INR) Extent of Discounting on brand website (In %)
Salwar Kurta and Dupatta (SKD) and Salwar Kurta (SK) Sets
Retail Led Brands
Biba 955 2,200-3,200 1,900 -19995 Upto 50%
Fabindia 61 2,900-3,200 1,990-9,490 Upto 50%
W 315 2,200-2,500 799-14,999 Upto 50%
Soch 654 1,600-1,800 998-19,998 Upto 70%
Ritu Kumar 75 6,000-8,000 3,700-28,000 Upto 50%
Global Desi 153 2000-2500 750-16,999 Upto 75%
Rangriti 179 1,200-1,600 1,079-4,599 Upto 50%
MBO & LFS
Lifestyle (Melange) 195 1,600-1,800 949-3,499 Upto 50%
Pantaloons (Rangmanch) 92 1,500-1,700 999-4,999 Upto 50%
Max (Max) 66 1,300-1,500 999-2,199 Upto 40%
32
32
Value Focussed Brands
V Mart (Desi Mix) 128 1,000-1,200 299-2,199 Upto 65%
Online First Brands
Okhai 10 7,000-8,000 4,890-9,860 Upto 50%
Sarees
Retail Led Brands
Biba 8 9,750-9,950 9,750-14,750 Upto 50%
Fabindia 560 4,000-5,000 1,690-28,990 Upto 30%
Soch 489 2,500-3,000 749-15,998 Upto 50%
Ritu Kumar 30 8,000-10,000 3,800-21,900 Upto 50%
Global Desi 11 3,500-4,000 1,500-6,000 Upto 60%
MBO & LFS
Pantaloons (Rangmanch) 192 2,000-3,000 1,499-5,999 Upto 40%
Online First Brands
Jaypore 122 4,000-5,000 1,832-16,000 Upto 70%
Okhai 688 6,000-8,000 1,210-45,000 -
Top wear (Separates)
Retail Led Brands
Biba 792 1000-1,400 500-3960 Upto 50%
Fabindia 717 1,400-1,800 698-9,999 Upto 50%
W 1591 800-1,000 349-9,999 Upto 50%
Soch 735 500-800 398-3,998 Upto 70%
Ritu Kumar 97 2,500-3,000 1,500-13,900 Upto 50%
Global Desi 543 500-700 325-4,699 Upto 75%
Rangriti 969 400-800 300-3,999 Upto 60%
MBO & LFS
Lifestyle (Melange) 349 500-600 349-2,599 Upto 50%
Pantaloons (Rangmanch, Trishaa)
745 400-600 359-2,499 Upto 55%
Shoppers Stop (Stop, Haute Curry)
677 400-500 349-3,299 Upto 55%
Value Focussed Brands
Vishal Mega Mart (Mavie & Pink Almirah)
223 300-350 99-1,199 Upto 50%
V Mart (Desi Mix) 750 300-500 149-2,399 Upto 50%
Online First Brands
Jaypore 345 2,000-2,500 796-14,990 Upto 70%
Okhai 182 2,000-2,500 1,199-8,000 Upto 10%
Bottom wear (Separates)
Retail Led Brands
Biba 388 800-1,000 399-3,999 Upto 50%
Fabindia 509 1,100-1,300 500-2,490 Upto 60%
Aurelia 716 600-800 399-2,299 Upto 50%
Elleven 483 600-800 359-2,199 Upto 50%
W 763 1,000-1,500 399-3,599 Upto 50%
Rangriti 129 400-500 200-1,299 Upto 50%
MBO & LFS
Lifestyle (Melange) 180 500-700 249-1,299 Upto 50%
Pantaloons (Rangmanch) 219 400-600 274-1,299 Upto 45%
Shoppers Stop (Stop, Haute Curry)
250 600-700 249-1,299 Upto 50%
Value Focussed Retailers
33
33
Vishal Mega Mart (Mavie & Pink Almirah)
114 200-300 99-349 Upto 50%
V Mart (Desi Mix) 351 300-500 99-899 Upto 50%
Lehenga Set
Retail Led Brands
Biba 23 3,998-4,498 2,498-14,360 Upto 50%
Fabindia 6 3,000-4,500 2,994-4,990 Upto 40%
Soch 88 4,000-5,000 3,499-19,998 Upto 50%
MBO or LFS
Pantaloons (Akkriti, Rangmanch)
23 1,500-2,000 1,049-3,499 Upto 35%
Reliance Trends (Avaasa) 9 1,700-2,000 1,679-2,999 Upto 30%
Indian Dresses/ Gowns
Retail Led Brands
Biba 112 2,000-2,200 1,079-3,799 Upto 50%
Fabindia 175 2,000-2,500 792-4,999 Upto 55%
W 297 2,000-2,500 799-14,999 Upto 70%
Soch 79 1,500-2,000 749-3,374 Upto 250%
Rangriti 199 1,200-1,400 450-2,999 Upto 50%
MBO or LFS
Pantaloons (Akkriti, Rangmanch)
161 1,000-1,200 539-3,999 Upto 55%
Shoppers Stop (Haute Curry) 103 800-1,000 499-1,499 Upto 50%
Online First Brands
Jaypore 20 1,500-2,000 945-3,590 Upto 60%
Okhai 145 2,000-2,500 925-11,550 Upto 15%
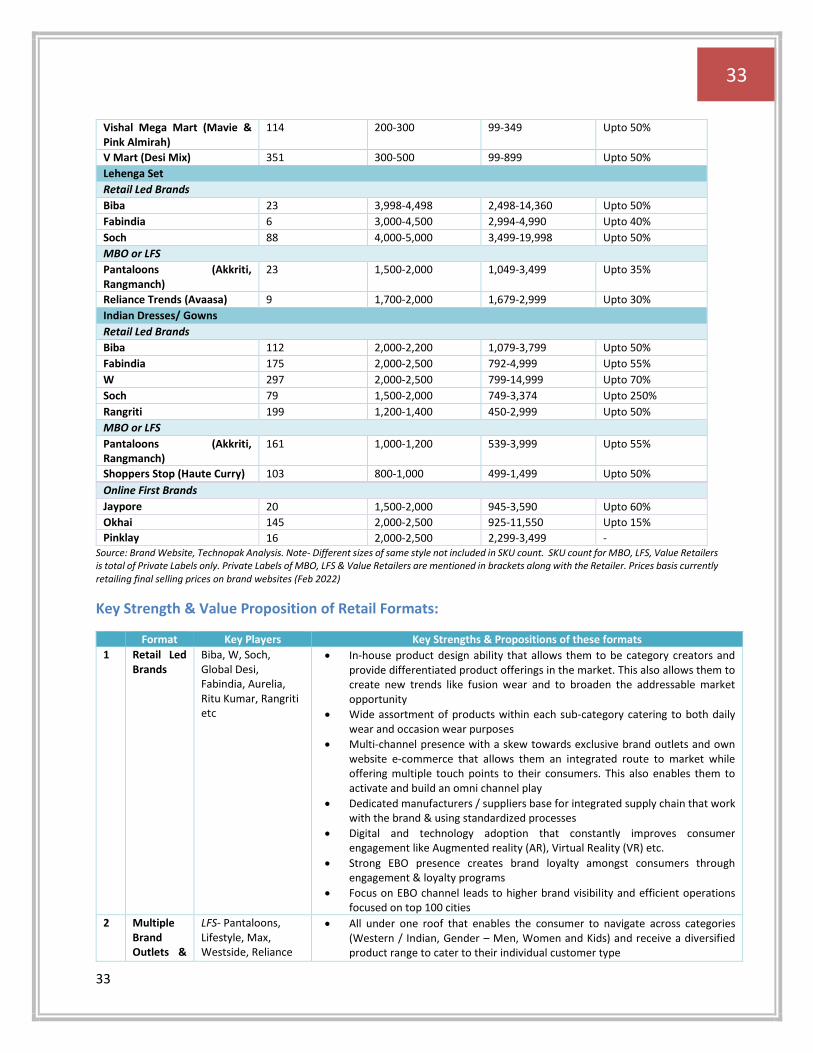
Pinklay 16 2,000-2,500 2,299-3,499 - Source: Brand Website, Technopak Analysis. Note- Different sizes of same style not included in SKU count. SKU count for MBO, LFS, Value Retailers is total of Private Labels only. Private Labels of MBO, LFS & Value Retailers are mentioned in brackets along with the Retailer. Prices basis currently retailing final selling prices on brand websites (Feb 2022)
Key Strength & Value Proposition of Retail Formats:
Format Key Players Key Strengths & Propositions of these formats
1 Retail Led Brands
Biba, W, Soch, Global Desi, Fabindia, Aurelia, Ritu Kumar, Rangriti etc
• In-house product design ability that allows them to be category creators and provide differentiated product offerings in the market. This also allows them to create new trends like fusion wear and to broaden the addressable market opportunity
• Wide assortment of products within each sub-category catering to both daily wear and occasion wear purposes
• Multi-channel presence with a skew towards exclusive brand outlets and own website e-commerce that allows them an integrated route to market while offering multiple touch points to their consumers. This also enables them to activate and build an omni channel play
• Dedicated manufacturers / suppliers base for integrated supply chain that work with the brand & using standardized processes
• Digital and technology adoption that constantly improves consumer engagement like Augmented reality (AR), Virtual Reality (VR) etc.
• Strong EBO presence creates brand loyalty amongst consumers through engagement & loyalty programs
• Focus on EBO channel leads to higher brand visibility and efficient operations focused on top 100 cities
2 Multiple Brand Outlets &
LFS- Pantaloons, Lifestyle, Max, Westside, Reliance
• All under one roof that enables the consumer to navigate across categories (Western / Indian, Gender – Men, Women and Kids) and receive a diversified product range to cater to their individual customer type
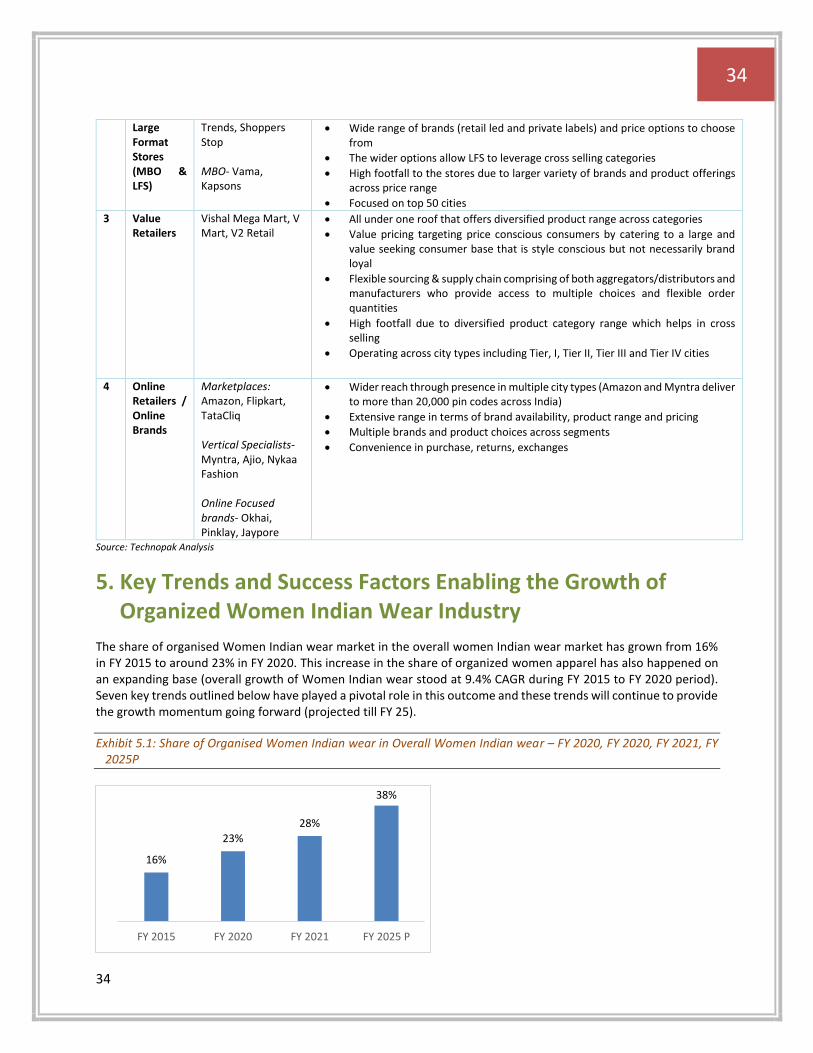
34
34
Large Format Stores (MBO & LFS)
Trends, Shoppers Stop MBO- Vama, Kapsons
• Wide range of brands (retail led and private labels) and price options to choose from
• The wider options allow LFS to leverage cross selling categories
• High footfall to the stores due to larger variety of brands and product offerings across price range
• Focused on top 50 cities
3 Value Retailers
Vishal Mega Mart, V Mart, V2 Retail
• All under one roof that offers diversified product range across categories
• Value pricing targeting price conscious consumers by catering to a large and value seeking consumer base that is style conscious but not necessarily brand loyal
• Flexible sourcing & supply chain comprising of both aggregators/distributors and manufacturers who provide access to multiple choices and flexible order quantities
• High footfall due to diversified product category range which helps in cross selling
• Operating across city types including Tier, I, Tier II, Tier III and Tier IV cities
4 Online Retailers / Online Brands
Marketplaces: Amazon, Flipkart, TataCliq Vertical Specialists- Myntra, Ajio, Nykaa Fashion Online Focused brands- Okhai, Pinklay, Jaypore
• Wider reach through presence in multiple city types (Amazon and Myntra deliver to more than 20,000 pin codes across India)
• Extensive range in terms of brand availability, product range and pricing
• Multiple brands and product choices across segments
• Convenience in purchase, returns, exchanges
Source: Technopak Analysis
5. Key Trends and Success Factors Enabling the Growth of Organized Women Indian Wear Industry
The share of organised Women Indian wear market in the overall women Indian wear market has grown from 16% in FY 2015 to around 23% in FY 2020. This increase in the share of organized women apparel has also happened on an expanding base (overall growth of Women Indian wear stood at 9.4% CAGR during FY 2015 to FY 2020 period). Seven key trends outlined below have played a pivotal role in this outcome and these trends will continue to provide the growth momentum going forward (projected till FY 25).
Exhibit 5.1: Share of Organised Women Indian wear in Overall Women Indian wear – FY 2020, FY 2020, FY 2021, FY 2025P
16%
23%
28%
38%
FY 2015 FY 2020 FY 2021 FY 2025 P
35
35
Source: Technopak Analysis
Key Trends and Success Factors enabling the growth of Organized Women Indian wear Industry
1. Consumer Demographics
The median age of India estimated to be 28.1 years for CY 2021, has had a profoundly positive implication on many merchandise and service consumption categories including Indian wear. This advantage of age makes the Indian consuming class more open to experimentation without preconditions. These factors enable them to absorb and interpret trends faster than before. India’s demographic composition that is young is also more literate and digitally connected & exposed than their counterparts were in the past. This is manifested in the growth of internet habitual consumers and rise of online shopping. 2. Heterogeneous Wardrobe of Indian Women
Heterogeneous wardrobe has been a unique feature of the Indian woman consumers that stands out in the business of fashion globally. Consumer research on Indian women wear has always shown ownership of both western wear and Indian wear apparel by Indian women. While the extent of ownership of each type may vary, the ownership of both Indian wear and western wear has been a unique feature of the Indian Women wear market. For instance, in other markets (viz. Japan, China), consumers replaced their traditional attires with western wear for daily wear purposes or restricted their use to specific occasions. However, Indian women have continued to own and use Indian wear for daily and occasion wear, while not holding them back from owning western wear (viz. Denims). This unique behaviour (partly a positive outcome of demographic profile like age as stated in point 1) has enabled the growth and rise of Indian wear industry, particularly the organised segment. 3. Growth of Fusion Wear
Fusion wear implies an amalgamated apparel or any other lifestyle product that imbibes sensibilities of both International and Indian wear design sensibilities. It may mean a print or a combination of colours that is in vogue globally and to use such a print on a kurta. It may also mean alterations in a kurta with a silhouette that gives it global appeal. For instance, Palazzos and leggings from the Indian wear segment have emerged as a piece of clothing that women pair with both Indian and western tops.
Such innovations in designs, primarily undertaken by organised Indian Wear players have played a key role in contemporizing the Indian wear segment and made it desirable for the Indian consumer. While traditional Indian prints are being used on modern outfits, the style of Indian clothing is being altered to make it more comfortable and modern viz. dhoti pants along with short or long kurtas which is being worn by Indian women. Retail led brands in India have managed to lead this trend by being at the forefront of product development, trend setting and brand stickiness with customers. This is an important factor to consider because it implies that the consumers’ aspirations (young Indian women) were understood, and Indian wear was re-imagined by organised Indian wear players to cater it. Brands like Biba for instance launched modernised ‘saree kurta’, gowns and casual wear section.
Exhibit 5.2: Fusion Wear on Offer by Various Brands
Format Brand Fusion Wear
Category Apparel within Fusion Wear
EBOs
Biba ✓ Dresses, Tunic Pants Sets, Dhoti Pant sets, Choga, 3-piece sets (including bottomwear, topwear and capes), etc.
Fabindia ✓ Pants & Palazzos, Tunics, Dresses, Skirts, etc.
W ✓ Dresses, Jumpsuits, Palazzos, etc.
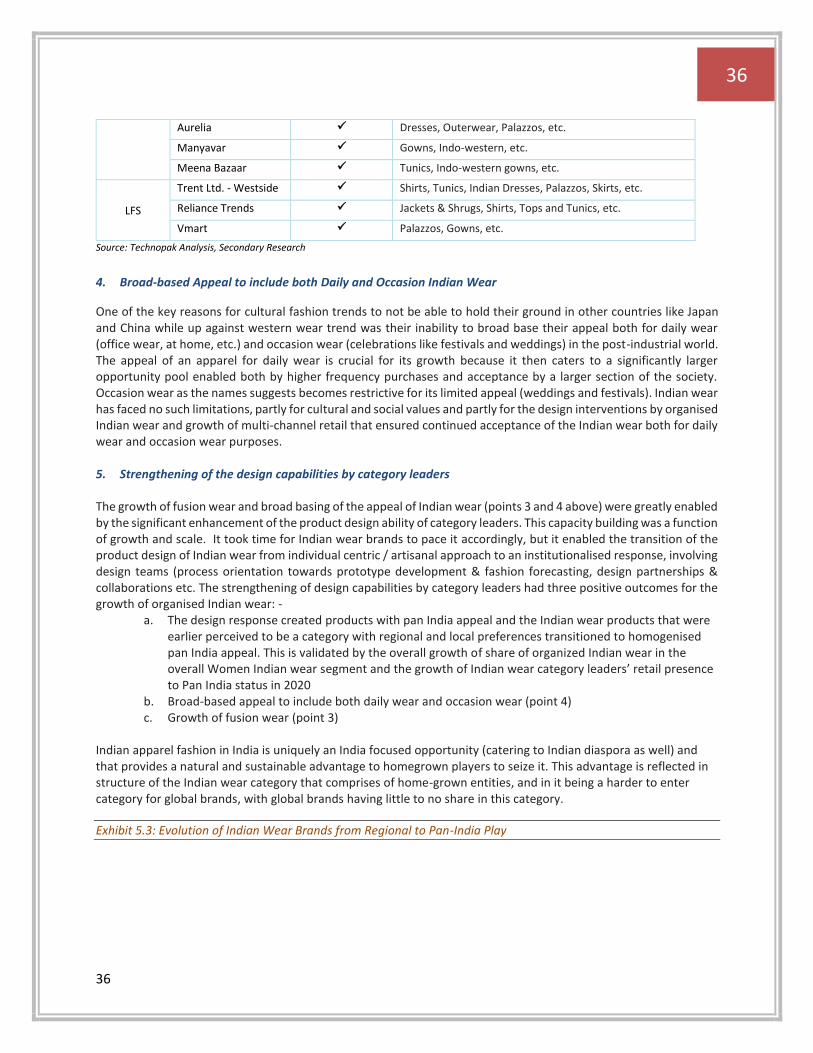
36
36
Aurelia ✓ Dresses, Outerwear, Palazzos, etc.
Manyavar ✓ Gowns, Indo-western, etc.
Meena Bazaar ✓ Tunics, Indo-western gowns, etc.
LFS
Trent Ltd. - Westside ✓ Shirts, Tunics, Indian Dresses, Palazzos, Skirts, etc.
Reliance Trends ✓ Jackets & Shrugs, Shirts, Tops and Tunics, etc.
Vmart ✓ Palazzos, Gowns, etc.
Source: Technopak Analysis, Secondary Research
4. Broad-based Appeal to include both Daily and Occasion Indian Wear
One of the key reasons for cultural fashion trends to not be able to hold their ground in other countries like Japan and China while up against western wear trend was their inability to broad base their appeal both for daily wear (office wear, at home, etc.) and occasion wear (celebrations like festivals and weddings) in the post-industrial world. The appeal of an apparel for daily wear is crucial for its growth because it then caters to a significantly larger opportunity pool enabled both by higher frequency purchases and acceptance by a larger section of the society. Occasion wear as the names suggests becomes restrictive for its limited appeal (weddings and festivals). Indian wear has faced no such limitations, partly for cultural and social values and partly for the design interventions by organised Indian wear and growth of multi-channel retail that ensured continued acceptance of the Indian wear both for daily wear and occasion wear purposes. 5. Strengthening of the design capabilities by category leaders
The growth of fusion wear and broad basing of the appeal of Indian wear (points 3 and 4 above) were greatly enabled by the significant enhancement of the product design ability of category leaders. This capacity building was a function of growth and scale. It took time for Indian wear brands to pace it accordingly, but it enabled the transition of the product design of Indian wear from individual centric / artisanal approach to an institutionalised response, involving design teams (process orientation towards prototype development & fashion forecasting, design partnerships & collaborations etc. The strengthening of design capabilities by category leaders had three positive outcomes for the growth of organised Indian wear: -
a. The design response created products with pan India appeal and the Indian wear products that were earlier perceived to be a category with regional and local preferences transitioned to homogenised pan India appeal. This is validated by the overall growth of share of organized Indian wear in the overall Women Indian wear segment and the growth of Indian wear category leaders’ retail presence to Pan India status in 2020
b. Broad-based appeal to include both daily wear and occasion wear (point 4) c. Growth of fusion wear (point 3)
Indian apparel fashion in India is uniquely an India focused opportunity (catering to Indian diaspora as well) and that provides a natural and sustainable advantage to homegrown players to seize it. This advantage is reflected in structure of the Indian wear category that comprises of home-grown entities, and in it being a harder to enter category for global brands, with global brands having little to no share in this category.
Exhibit 5.3: Evolution of Indian Wear Brands from Regional to Pan-India Play
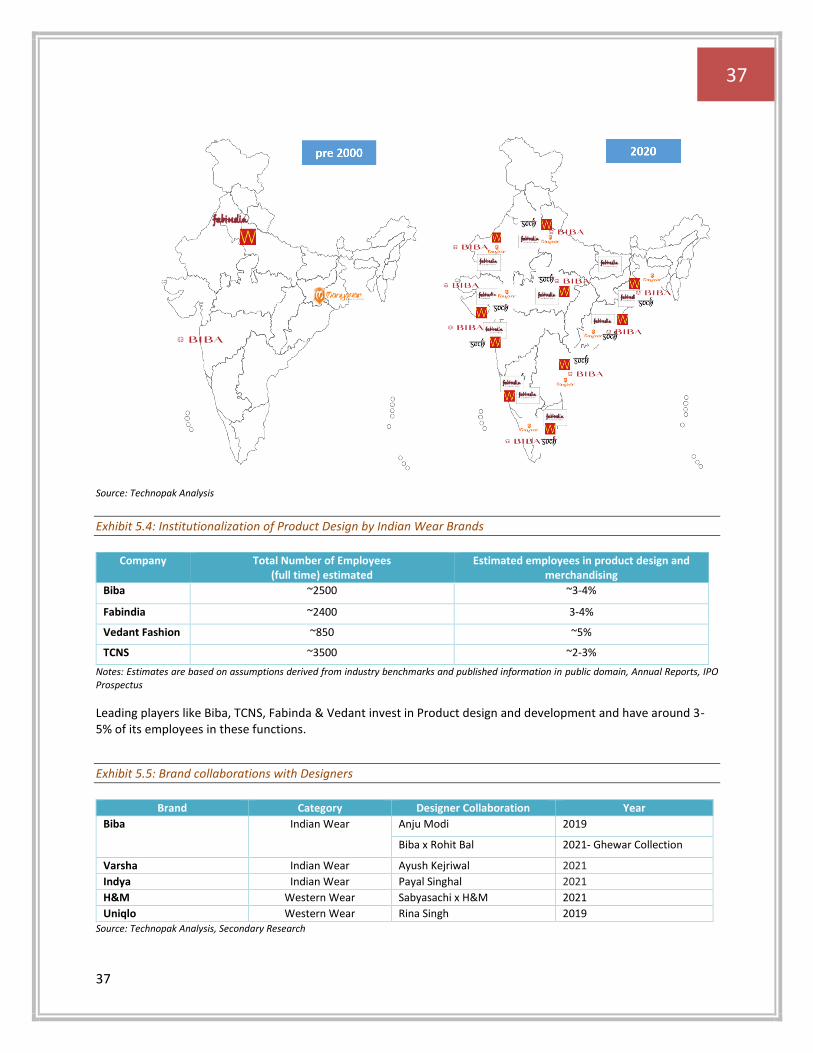
37
37
Source: Technopak Analysis
Exhibit 5.4: Institutionalization of Product Design by Indian Wear Brands
Company Total Number of Employees
(full time) estimated Estimated employees in product design and
merchandising
Biba ~2500 ~3-4%
Fabindia ~2400 3-4%
Vedant Fashion ~850 ~5%
TCNS ~3500 ~2-3%
Notes: Estimates are based on assumptions derived from industry benchmarks and published information in public domain, Annual Reports, IPO Prospectus
Leading players like Biba, TCNS, Fabinda & Vedant invest in Product design and development and have around 3-5% of its employees in these functions.
Exhibit 5.5: Brand collaborations with Designers
Brand Category Designer Collaboration Year
Biba Indian Wear Anju Modi 2019
Biba x Rohit Bal 2021- Ghewar Collection
Varsha Indian Wear Ayush Kejriwal 2021
Indya Indian Wear Payal Singhal 2021
H&M Western Wear Sabyasachi x H&M 2021
Uniqlo Western Wear Rina Singh 2019 Source: Technopak Analysis, Secondary Research
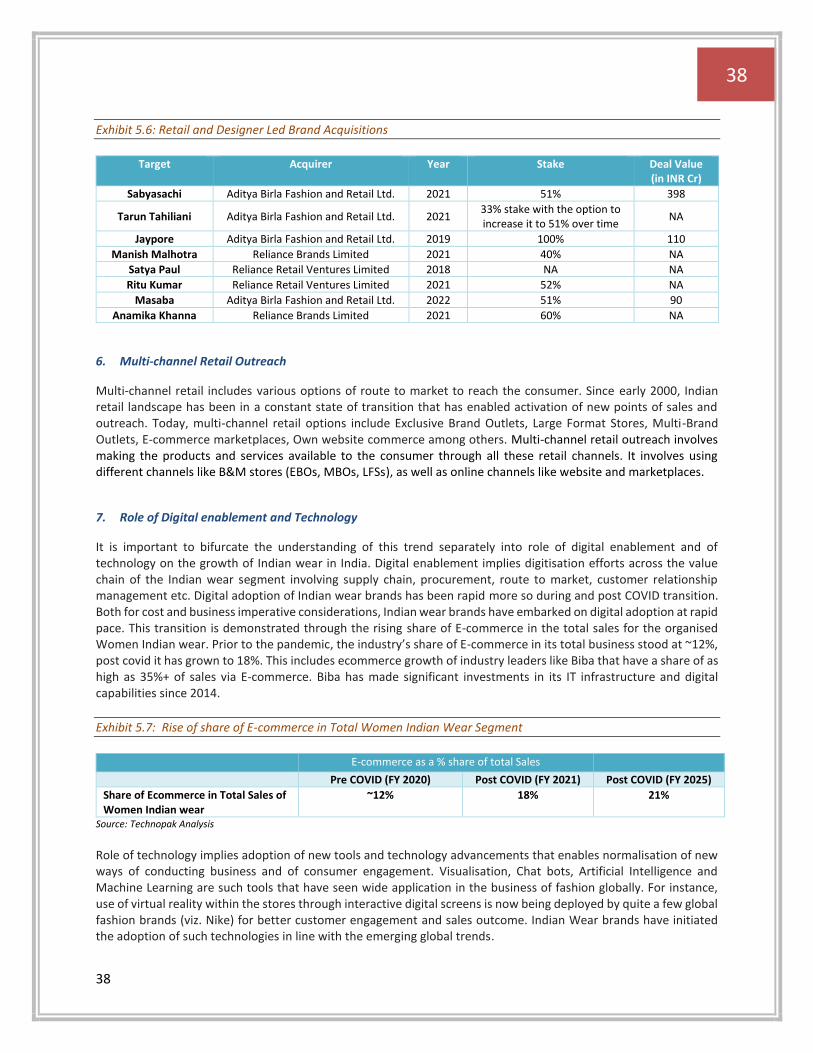
38
38
Exhibit 5.6: Retail and Designer Led Brand Acquisitions
Target Acquirer Year Stake Deal Value
(in INR Cr)
Sabyasachi Aditya Birla Fashion and Retail Ltd. 2021 51% 398
Tarun Tahiliani Aditya Birla Fashion and Retail Ltd. 2021 33% stake with the option to increase it to 51% over time
NA
Jaypore Aditya Birla Fashion and Retail Ltd. 2019 100% 110
Manish Malhotra Reliance Brands Limited 2021 40% NA
Satya Paul Reliance Retail Ventures Limited 2018 NA NA
Ritu Kumar Reliance Retail Ventures Limited 2021 52% NA
Masaba Aditya Birla Fashion and Retail Ltd. 2022 51% 90
Anamika Khanna Reliance Brands Limited 2021 60% NA
6. Multi-channel Retail Outreach
Multi-channel retail includes various options of route to market to reach the consumer. Since early 2000, Indian retail landscape has been in a constant state of transition that has enabled activation of new points of sales and outreach. Today, multi-channel retail options include Exclusive Brand Outlets, Large Format Stores, Multi-Brand Outlets, E-commerce marketplaces, Own website commerce among others. Multi-channel retail outreach involves making the products and services available to the consumer through all these retail channels. It involves using different channels like B&M stores (EBOs, MBOs, LFSs), as well as online channels like website and marketplaces.
7. Role of Digital enablement and Technology
It is important to bifurcate the understanding of this trend separately into role of digital enablement and of technology on the growth of Indian wear in India. Digital enablement implies digitisation efforts across the value chain of the Indian wear segment involving supply chain, procurement, route to market, customer relationship management etc. Digital adoption of Indian wear brands has been rapid more so during and post COVID transition. Both for cost and business imperative considerations, Indian wear brands have embarked on digital adoption at rapid pace. This transition is demonstrated through the rising share of E-commerce in the total sales for the organised Women Indian wear. Prior to the pandemic, the industry’s share of E-commerce in its total business stood at ~12%, post covid it has grown to 18%. This includes ecommerce growth of industry leaders like Biba that have a share of as high as 35%+ of sales via E-commerce. Biba has made significant investments in its IT infrastructure and digital capabilities since 2014.
Exhibit 5.7: Rise of share of E-commerce in Total Women Indian Wear Segment
E-commerce as a % share of total Sales
Pre COVID (FY 2020) Post COVID (FY 2021) Post COVID (FY 2025)
Share of Ecommerce in Total Sales of Women Indian wear
~12% 18% 21%
Source: Technopak Analysis
Role of technology implies adoption of new tools and technology advancements that enables normalisation of new ways of conducting business and of consumer engagement. Visualisation, Chat bots, Artificial Intelligence and Machine Learning are such tools that have seen wide application in the business of fashion globally. For instance, use of virtual reality within the stores through interactive digital screens is now being deployed by quite a few global fashion brands (viz. Nike) for better customer engagement and sales outcome. Indian Wear brands have initiated the adoption of such technologies in line with the emerging global trends.
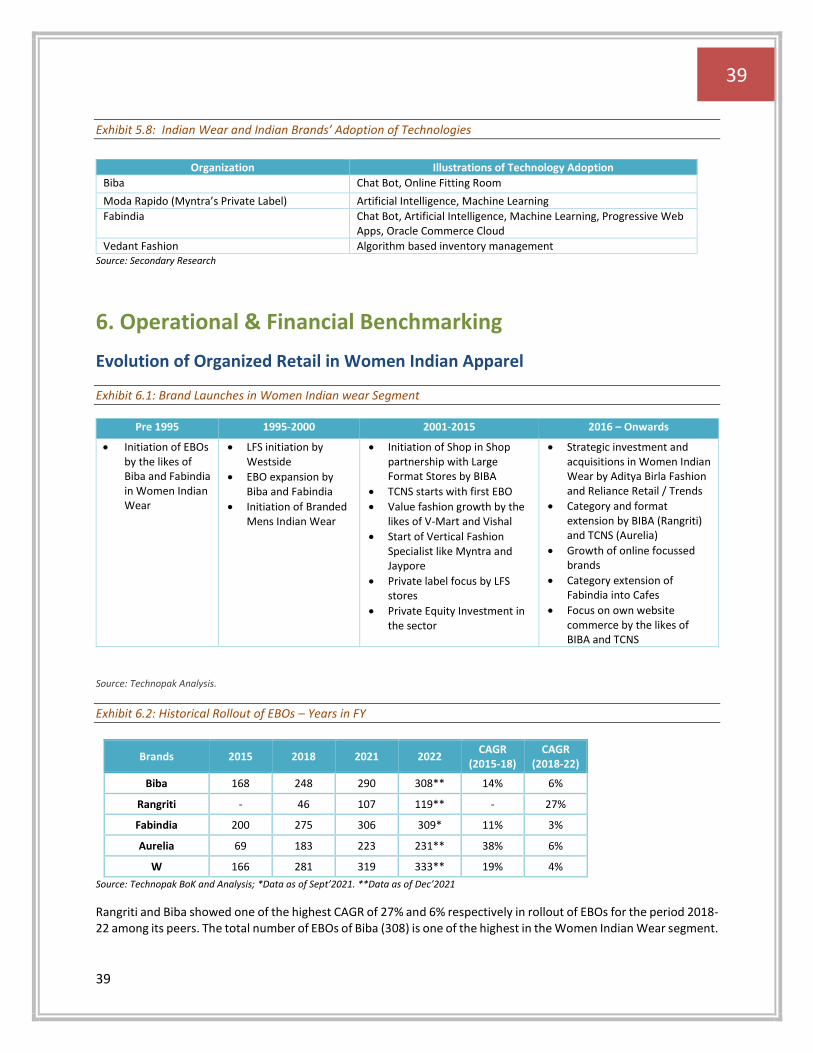
39
39
Exhibit 5.8: Indian Wear and Indian Brands’ Adoption of Technologies
Organization Illustrations of Technology Adoption
Biba Chat Bot, Online Fitting Room
Moda Rapido (Myntra’s Private Label) Artificial Intelligence, Machine Learning
Fabindia Chat Bot, Artificial Intelligence, Machine Learning, Progressive Web Apps, Oracle Commerce Cloud
Vedant Fashion Algorithm based inventory management Source: Secondary Research
6. Operational & Financial Benchmarking
Evolution of Organized Retail in Women Indian Apparel
Exhibit 6.1: Brand Launches in Women Indian wear Segment
Pre 1995 1995-2000 2001-2015 2016 – Onwards
• Initiation of EBOs by the likes of Biba and Fabindia in Women Indian Wear
• LFS initiation by Westside
• EBO expansion by Biba and Fabindia
• Initiation of Branded Mens Indian Wear
• Initiation of Shop in Shop partnership with Large Format Stores by BIBA
• TCNS starts with first EBO
• Value fashion growth by the likes of V-Mart and Vishal
• Start of Vertical Fashion Specialist like Myntra and Jaypore
• Private label focus by LFS stores
• Private Equity Investment in the sector
• Strategic investment and acquisitions in Women Indian Wear by Aditya Birla Fashion and Reliance Retail / Trends
• Category and format extension by BIBA (Rangriti) and TCNS (Aurelia)
• Growth of online focussed brands
• Category extension of Fabindia into Cafes
• Focus on own website commerce by the likes of BIBA and TCNS
Source: Technopak Analysis.
Exhibit 6.2: Historical Rollout of EBOs – Years in FY
Brands 2015 2018 2021 2022 CAGR
(2015-18) CAGR
(2018-22)
Biba 168 248 290 308** 14% 6%
Rangriti - 46 107 119** - 27%
Fabindia 200 275 306 309* 11% 3%
Aurelia 69 183 223 231** 38% 6%
W 166 281 319 333** 19% 4%
Source: Technopak BoK and Analysis; *Data as of Sept’2021. **Data as of Dec’2021
Rangriti and Biba showed one of the highest CAGR of 27% and 6% respectively in rollout of EBOs for the period 2018-22 among its peers. The total number of EBOs of Biba (308) is one of the highest in the Women Indian Wear segment.
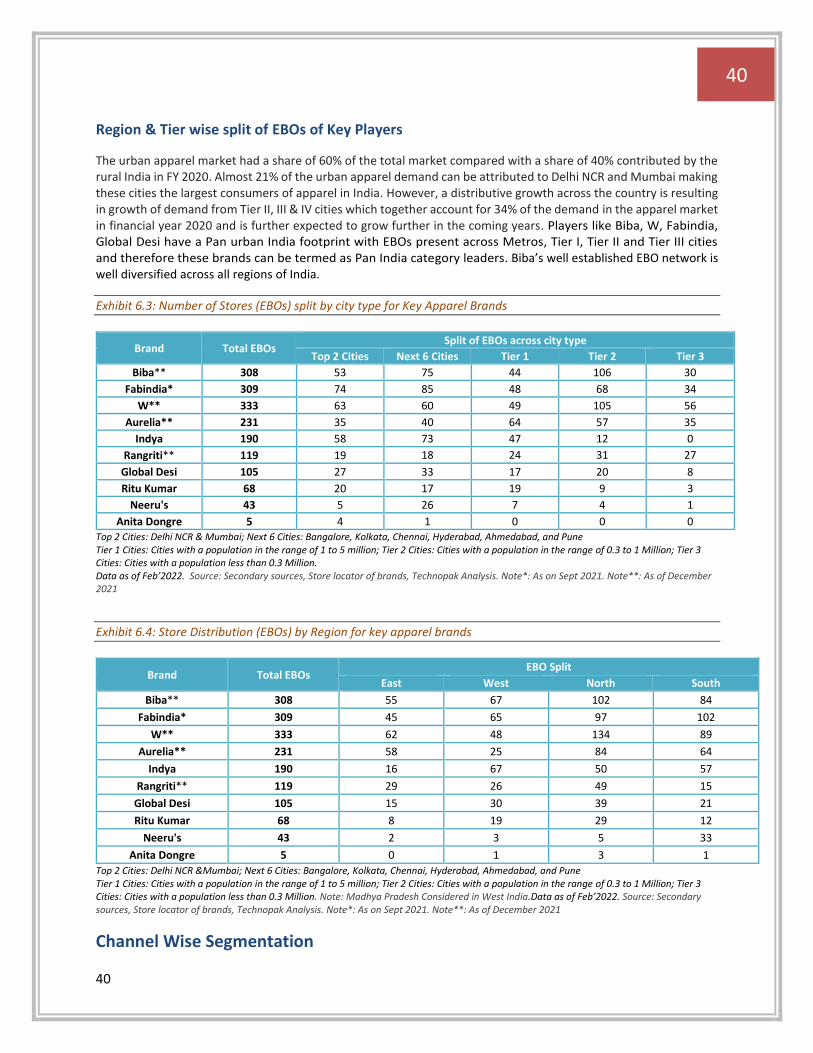
40
40
Region & Tier wise split of EBOs of Key Players
The urban apparel market had a share of 60% of the total market compared with a share of 40% contributed by the rural India in FY 2020. Almost 21% of the urban apparel demand can be attributed to Delhi NCR and Mumbai making these cities the largest consumers of apparel in India. However, a distributive growth across the country is resulting in growth of demand from Tier II, III & IV cities which together account for 34% of the demand in the apparel market in financial year 2020 and is further expected to grow further in the coming years. Players like Biba, W, Fabindia, Global Desi have a Pan urban India footprint with EBOs present across Metros, Tier I, Tier II and Tier III cities and therefore these brands can be termed as Pan India category leaders. Biba’s well established EBO network is well diversified across all regions of India.
Exhibit 6.3: Number of Stores (EBOs) split by city type for Key Apparel Brands
Brand Total EBOs Split of EBOs across city type
Top 2 Cities Next 6 Cities Tier 1 Tier 2 Tier 3
Biba** 308 53 75 44 106 30
Fabindia* 309 74 85 48 68 34
W** 333 63 60 49 105 56
Aurelia** 231 35 40 64 57 35
Indya 190 58 73 47 12 0
Rangriti** 119 19 18 24 31 27
Global Desi 105 27 33 17 20 8
Ritu Kumar 68 20 17 19 9 3
Neeru's 43 5 26 7 4 1
Anita Dongre 5 4 1 0 0 0 Top 2 Cities: Delhi NCR & Mumbai; Next 6 Cities: Bangalore, Kolkata, Chennai, Hyderabad, Ahmedabad, and Pune Tier 1 Cities: Cities with a population in the range of 1 to 5 million; Tier 2 Cities: Cities with a population in the range of 0.3 to 1 Million; Tier 3 Cities: Cities with a population less than 0.3 Million. Data as of Feb’2022. Source: Secondary sources, Store locator of brands, Technopak Analysis. Note*: As on Sept 2021. Note**: As of December 2021
Exhibit 6.4: Store Distribution (EBOs) by Region for key apparel brands
Brand Total EBOs EBO Split
East West North South
Biba** 308 55 67 102 84
Fabindia* 309 45 65 97 102
W** 333 62 48 134 89
Aurelia** 231 58 25 84 64
Indya 190 16 67 50 57
Rangriti** 119 29 26 49 15
Global Desi 105 15 30 39 21
Ritu Kumar 68 8 19 29 12
Neeru's 43 2 3 5 33
Anita Dongre 5 0 1 3 1
Top 2 Cities: Delhi NCR &Mumbai; Next 6 Cities: Bangalore, Kolkata, Chennai, Hyderabad, Ahmedabad, and Pune Tier 1 Cities: Cities with a population in the range of 1 to 5 million; Tier 2 Cities: Cities with a population in the range of 0.3 to 1 Million; Tier 3 Cities: Cities with a population less than 0.3 Million. Note: Madhya Pradesh Considered in West India.Data as of Feb’2022. Source: Secondary sources, Store locator of brands, Technopak Analysis. Note*: As on Sept 2021. Note**: As of December 2021
Channel Wise Segmentation
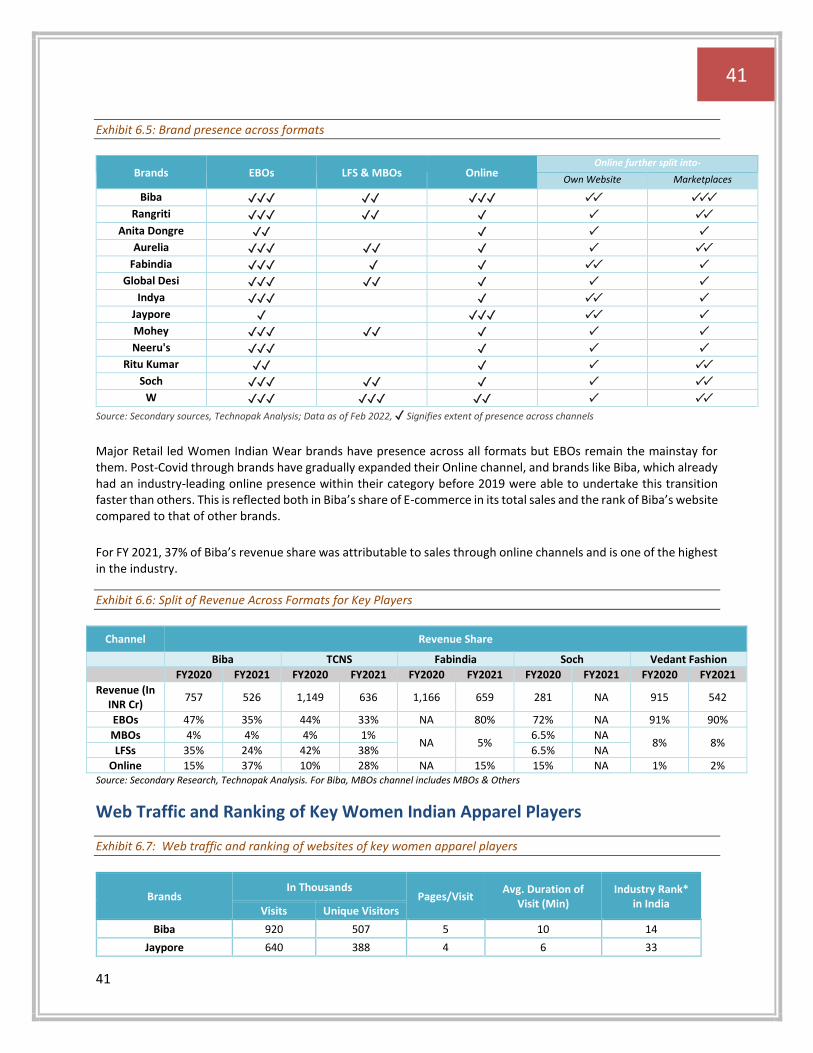
41
41
Exhibit 6.5: Brand presence across formats
Brands EBOs LFS & MBOs Online Online further split into-
Own Website Marketplaces
Biba ✓✓✓ ✓✓ ✓✓✓ ✓✓ ✓✓✓
Rangriti ✓✓✓ ✓✓ ✓ ✓ ✓✓
Anita Dongre ✓✓ ✓ ✓ ✓
Aurelia ✓✓✓ ✓✓ ✓ ✓ ✓✓
Fabindia ✓✓✓ ✓ ✓ ✓✓ ✓
Global Desi ✓✓✓ ✓✓ ✓ ✓ ✓
Indya ✓✓✓ ✓ ✓✓ ✓
Jaypore ✓ ✓✓✓ ✓✓ ✓
Mohey ✓✓✓ ✓✓ ✓ ✓ ✓
Neeru's ✓✓✓ ✓ ✓ ✓
Ritu Kumar ✓✓ ✓ ✓ ✓✓
Soch ✓✓✓ ✓✓ ✓ ✓ ✓✓
W ✓✓✓ ✓✓✓ ✓✓ ✓ ✓✓
Source: Secondary sources, Technopak Analysis; Data as of Feb 2022, ✓ Signifies extent of presence across channels
Major Retail led Women Indian Wear brands have presence across all formats but EBOs remain the mainstay for them. Post-Covid through brands have gradually expanded their Online channel, and brands like Biba, which already had an industry-leading online presence within their category before 2019 were able to undertake this transition faster than others. This is reflected both in Biba’s share of E-commerce in its total sales and the rank of Biba’s website compared to that of other brands.
For FY 2021, 37% of Biba’s revenue share was attributable to sales through online channels and is one of the highest in the industry.
Exhibit 6.6: Split of Revenue Across Formats for Key Players
Channel Revenue Share
Biba TCNS Fabindia Soch Vedant Fashion
FY2020 FY2021 FY2020 FY2021 FY2020 FY2021 FY2020 FY2021 FY2020 FY2021
Revenue (In INR Cr)
757 526 1,149 636 1,166 659 281 NA 915 542
EBOs 47% 35% 44% 33% NA 80% 72% NA 91% 90%
MBOs 4% 4% 4% 1% NA 5%
6.5% NA 8% 8%
LFSs 35% 24% 42% 38% 6.5% NA
Online 15% 37% 10% 28% NA 15% 15% NA 1% 2% Source: Secondary Research, Technopak Analysis. For Biba, MBOs channel includes MBOs & Others
Web Traffic and Ranking of Key Women Indian Apparel Players
Exhibit 6.7: Web traffic and ranking of websites of key women apparel players
Brands In Thousands
Pages/Visit Avg. Duration of
Visit (Min) Industry Rank*
in India Visits Unique Visitors
Biba 920 507 5 10 14
Jaypore 640 388 4 6 33
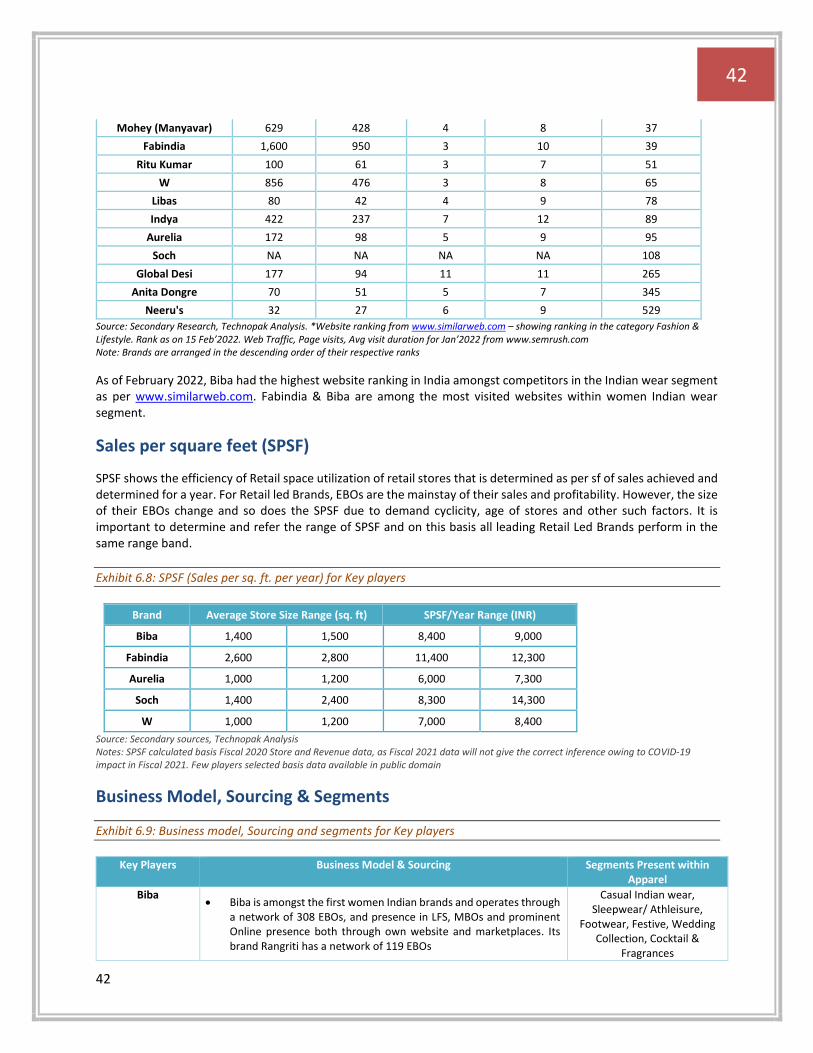
42
42
Mohey (Manyavar) 629 428 4 8 37
Fabindia 1,600 950 3 10 39
Ritu Kumar 100 61 3 7 51
W 856 476 3 8 65
Libas 80 42 4 9 78
Indya 422 237 7 12 89
Aurelia 172 98 5 9 95
Soch NA NA NA NA 108
Global Desi 177 94 11 11 265
Anita Dongre 70 51 5 7 345
Neeru's 32 27 6 9 529
Source: Secondary Research, Technopak Analysis. *Website ranking from www.similarweb.com – showing ranking in the category Fashion & Lifestyle. Rank as on 15 Feb’2022. Web Traffic, Page visits, Avg visit duration for Jan’2022 from www.semrush.com Note: Brands are arranged in the descending order of their respective ranks
As of February 2022, Biba had the highest website ranking in India amongst competitors in the Indian wear segment as per www.similarweb.com. Fabindia & Biba are among the most visited websites within women Indian wear segment.
Sales per square feet (SPSF)
SPSF shows the efficiency of Retail space utilization of retail stores that is determined as per sf of sales achieved and determined for a year. For Retail led Brands, EBOs are the mainstay of their sales and profitability. However, the size of their EBOs change and so does the SPSF due to demand cyclicity, age of stores and other such factors. It is important to determine and refer the range of SPSF and on this basis all leading Retail Led Brands perform in the same range band.
Exhibit 6.8: SPSF (Sales per sq. ft. per year) for Key players
Brand Average Store Size Range (sq. ft) SPSF/Year Range (INR)
Biba 1,400 1,500 8,400 9,000
Fabindia 2,600 2,800 11,400 12,300
Aurelia 1,000 1,200 6,000 7,300
Soch 1,400 2,400 8,300 14,300
W 1,000 1,200 7,000 8,400
Source: Secondary sources, Technopak Analysis Notes: SPSF calculated basis Fiscal 2020 Store and Revenue data, as Fiscal 2021 data will not give the correct inference owing to COVID-19 impact in Fiscal 2021. Few players selected basis data available in public domain
Business Model, Sourcing & Segments
Exhibit 6.9: Business model, Sourcing and segments for Key players
Key Players Business Model & Sourcing Segments Present within Apparel
Biba • Biba is amongst the first women Indian brands and operates through
a network of 308 EBOs, and presence in LFS, MBOs and prominent Online presence both through own website and marketplaces. Its brand Rangriti has a network of 119 EBOs
Casual Indian wear, Sleepwear/ Athleisure,
Footwear, Festive, Wedding Collection, Cocktail &
Fragrances
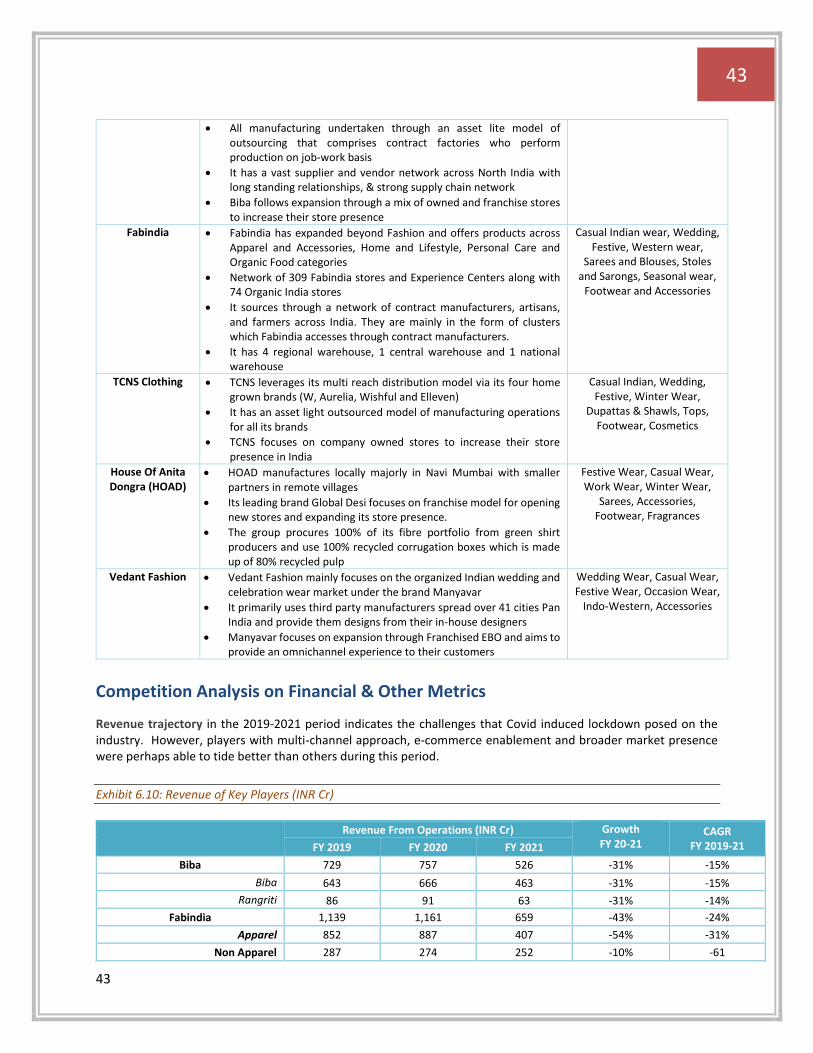
43
43
• All manufacturing undertaken through an asset lite model of outsourcing that comprises contract factories who perform production on job-work basis
• It has a vast supplier and vendor network across North India with long standing relationships, & strong supply chain network
• Biba follows expansion through a mix of owned and franchise stores to increase their store presence
Fabindia • Fabindia has expanded beyond Fashion and offers products across Apparel and Accessories, Home and Lifestyle, Personal Care and Organic Food categories
• Network of 309 Fabindia stores and Experience Centers along with 74 Organic India stores
• It sources through a network of contract manufacturers, artisans, and farmers across India. They are mainly in the form of clusters which Fabindia accesses through contract manufacturers.
• It has 4 regional warehouse, 1 central warehouse and 1 national warehouse
Casual Indian wear, Wedding, Festive, Western wear,
Sarees and Blouses, Stoles and Sarongs, Seasonal wear,
Footwear and Accessories
TCNS Clothing • TCNS leverages its multi reach distribution model via its four home grown brands (W, Aurelia, Wishful and Elleven)
• It has an asset light outsourced model of manufacturing operations for all its brands
• TCNS focuses on company owned stores to increase their store presence in India
Casual Indian, Wedding, Festive, Winter Wear,
Dupattas & Shawls, Tops, Footwear, Cosmetics
House Of Anita Dongra (HOAD)
• HOAD manufactures locally majorly in Navi Mumbai with smaller partners in remote villages
• Its leading brand Global Desi focuses on franchise model for opening new stores and expanding its store presence.
• The group procures 100% of its fibre portfolio from green shirt producers and use 100% recycled corrugation boxes which is made up of 80% recycled pulp
Festive Wear, Casual Wear, Work Wear, Winter Wear,
Sarees, Accessories, Footwear, Fragrances
Vedant Fashion • Vedant Fashion mainly focuses on the organized Indian wedding and celebration wear market under the brand Manyavar
• It primarily uses third party manufacturers spread over 41 cities Pan India and provide them designs from their in-house designers
• Manyavar focuses on expansion through Franchised EBO and aims to provide an omnichannel experience to their customers
Wedding Wear, Casual Wear, Festive Wear, Occasion Wear,
Indo-Western, Accessories
Competition Analysis on Financial & Other Metrics
Revenue trajectory in the 2019-2021 period indicates the challenges that Covid induced lockdown posed on the industry. However, players with multi-channel approach, e-commerce enablement and broader market presence were perhaps able to tide better than others during this period.
Exhibit 6.10: Revenue of Key Players (INR Cr)
Revenue From Operations (INR Cr) Growth FY 20-21
CAGR FY 2019-21 FY 2019 FY 2020 FY 2021
Biba 729 757 526 -31% -15%
Biba 643 666 463 -31% -15%
Rangriti 86 91 63 -31% -14%
Fabindia 1,139 1,161 659 -43% -24%
Apparel 852 887 407 -54% -31%
Non Apparel 287 274 252 -10% -61
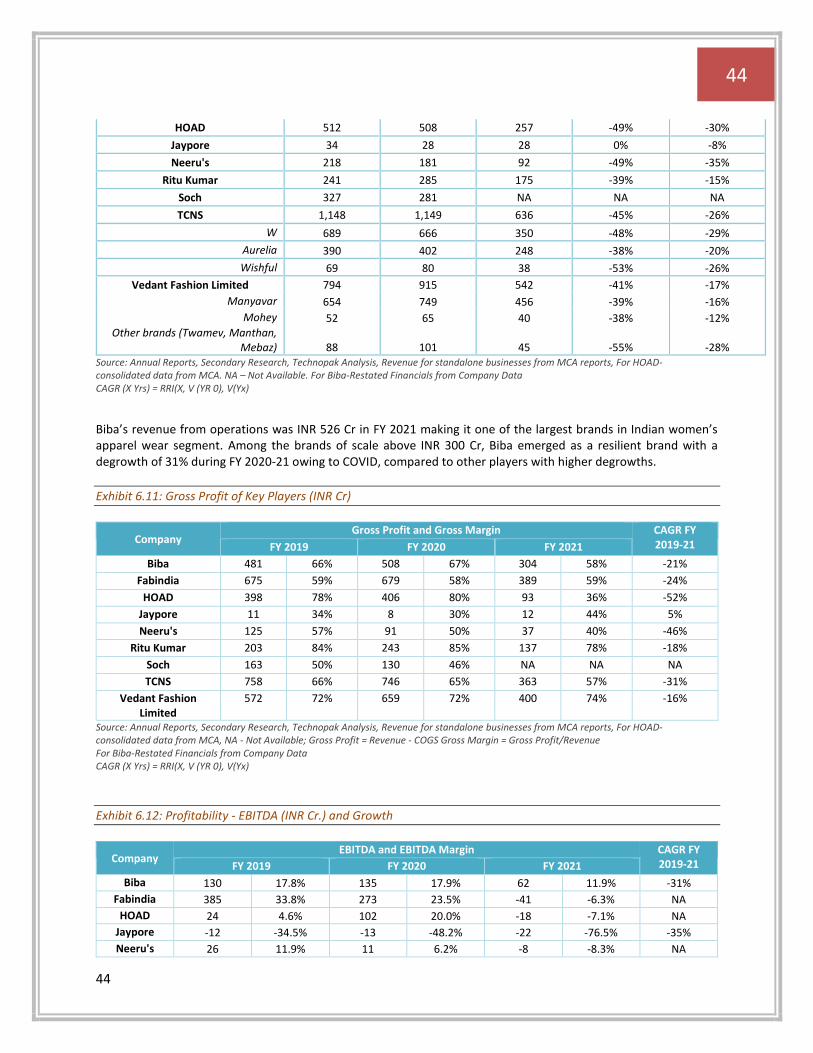
44
44
HOAD 512 508 257 -49% -30%
Jaypore 34 28 28 0% -8%
Neeru's 218 181 92 -49% -35%
Ritu Kumar 241 285 175 -39% -15%
Soch 327 281 NA NA NA
TCNS 1,148 1,149 636 -45% -26%
W 689 666 350 -48% -29%
Aurelia 390 402 248 -38% -20%
Wishful 69 80 38 -53% -26%
Vedant Fashion Limited 794 915 542 -41% -17%
Manyavar 654 749 456 -39% -16%
Mohey 52 65 40 -38% -12% Other brands (Twamev, Manthan,
Mebaz) 88 101 45 -55% -28% Source: Annual Reports, Secondary Research, Technopak Analysis, Revenue for standalone businesses from MCA reports, For HOAD- consolidated data from MCA. NA – Not Available. For Biba-Restated Financials from Company Data CAGR (X Yrs) = RRI(X, V (YR 0), V(Yx)
Biba’s revenue from operations was INR 526 Cr in FY 2021 making it one of the largest brands in Indian women’s apparel wear segment. Among the brands of scale above INR 300 Cr, Biba emerged as a resilient brand with a degrowth of 31% during FY 2020-21 owing to COVID, compared to other players with higher degrowths.
Exhibit 6.11: Gross Profit of Key Players (INR Cr)
Company Gross Profit and Gross Margin CAGR FY
2019-21 FY 2019 FY 2020 FY 2021
Biba 481 66% 508 67% 304 58% -21%
Fabindia 675 59% 679 58% 389 59% -24%
HOAD 398 78% 406 80% 93 36% -52%
Jaypore 11 34% 8 30% 12 44% 5%
Neeru's 125 57% 91 50% 37 40% -46%
Ritu Kumar 203 84% 243 85% 137 78% -18%
Soch 163 50% 130 46% NA NA NA
TCNS 758 66% 746 65% 363 57% -31%
Vedant Fashion Limited
572 72% 659 72% 400 74% -16%
Source: Annual Reports, Secondary Research, Technopak Analysis, Revenue for standalone businesses from MCA reports, For HOAD- consolidated data from MCA, NA - Not Available; Gross Profit = Revenue - COGS Gross Margin = Gross Profit/Revenue For Biba-Restated Financials from Company Data CAGR (X Yrs) = RRI(X, V (YR 0), V(Yx)
Exhibit 6.12: Profitability - EBITDA (INR Cr.) and Growth
Company EBITDA and EBITDA Margin CAGR FY
2019-21 FY 2019 FY 2020 FY 2021
Biba 130 17.8% 135 17.9% 62 11.9% -31%
Fabindia 385 33.8% 273 23.5% -41 -6.3% NA
HOAD 24 4.6% 102 20.0% -18 -7.1% NA
Jaypore -12 -34.5% -13 -48.2% -22 -76.5% -35%
Neeru's 26 11.9% 11 6.2% -8 -8.3% NA
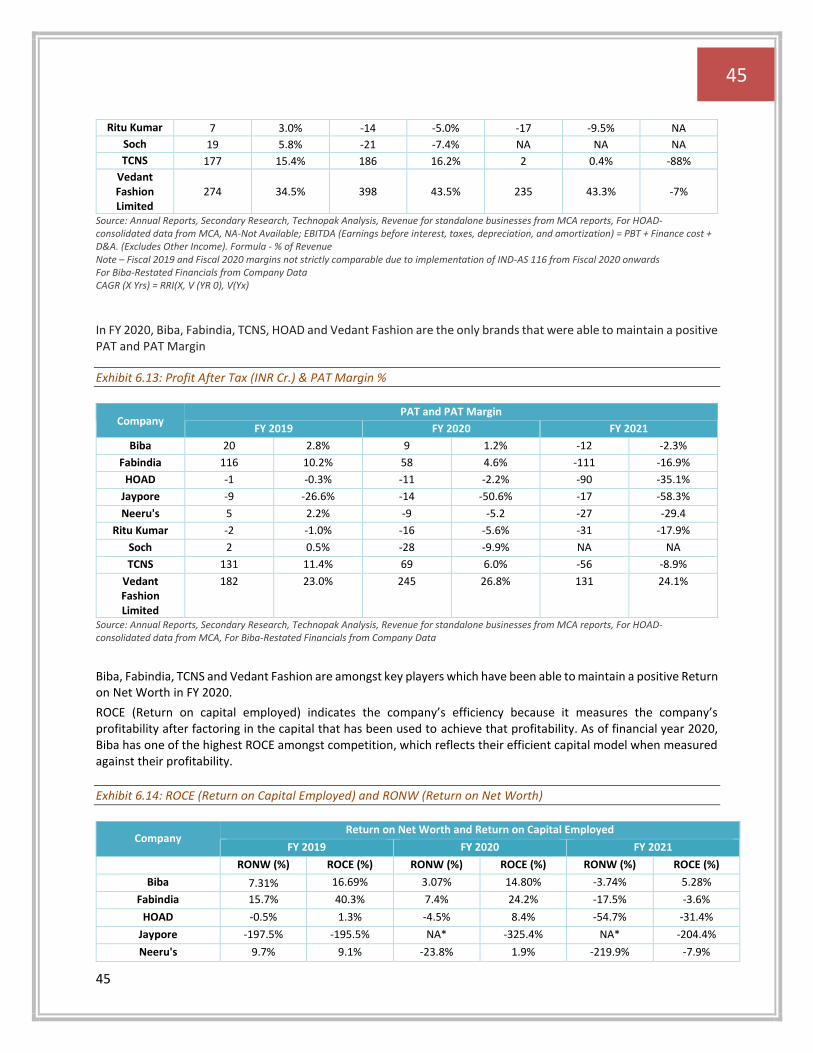
45
45
Ritu Kumar 7 3.0% -14 -5.0% -17 -9.5% NA
Soch 19 5.8% -21 -7.4% NA NA NA
TCNS 177 15.4% 186 16.2% 2 0.4% -88%
Vedant Fashion Limited
274 34.5% 398 43.5% 235 43.3% -7%
Source: Annual Reports, Secondary Research, Technopak Analysis, Revenue for standalone businesses from MCA reports, For HOAD- consolidated data from MCA, NA-Not Available; EBITDA (Earnings before interest, taxes, depreciation, and amortization) = PBT + Finance cost + D&A. (Excludes Other Income). Formula - % of Revenue Note – Fiscal 2019 and Fiscal 2020 margins not strictly comparable due to implementation of IND-AS 116 from Fiscal 2020 onwards For Biba-Restated Financials from Company Data CAGR (X Yrs) = RRI(X, V (YR 0), V(Yx)
In FY 2020, Biba, Fabindia, TCNS, HOAD and Vedant Fashion are the only brands that were able to maintain a positive PAT and PAT Margin
Exhibit 6.13: Profit After Tax (INR Cr.) & PAT Margin %
Company PAT and PAT Margin
FY 2019 FY 2020 FY 2021
Biba 20 2.8% 9 1.2% -12 -2.3%
Fabindia 116 10.2% 58 4.6% -111 -16.9%
HOAD -1 -0.3% -11 -2.2% -90 -35.1%
Jaypore -9 -26.6% -14 -50.6% -17 -58.3%
Neeru's 5 2.2% -9 -5.2 -27 -29.4
Ritu Kumar -2 -1.0% -16 -5.6% -31 -17.9%
Soch 2 0.5% -28 -9.9% NA NA
TCNS 131 11.4% 69 6.0% -56 -8.9%
Vedant Fashion Limited
182 23.0% 245 26.8% 131 24.1%
Source: Annual Reports, Secondary Research, Technopak Analysis, Revenue for standalone businesses from MCA reports, For HOAD- consolidated data from MCA, For Biba-Restated Financials from Company Data
Biba, Fabindia, TCNS and Vedant Fashion are amongst key players which have been able to maintain a positive Return on Net Worth in FY 2020.
ROCE (Return on capital employed) indicates the company’s efficiency because it measures the company’s profitability after factoring in the capital that has been used to achieve that profitability. As of financial year 2020, Biba has one of the highest ROCE amongst competition, which reflects their efficient capital model when measured against their profitability.
Exhibit 6.14: ROCE (Return on Capital Employed) and RONW (Return on Net Worth)
Company Return on Net Worth and Return on Capital Employed
FY 2019 FY 2020 FY 2021
RONW (%) ROCE (%) RONW (%) ROCE (%) RONW (%) ROCE (%)
Biba 7.31% 16.69% 3.07% 14.80% -3.74% 5.28%
Fabindia 15.7% 40.3% 7.4% 24.2% -17.5% -3.6%
HOAD -0.5% 1.3% -4.5% 8.4% -54.7% -31.4%
Jaypore -197.5% -195.5% NA* -325.4% NA* -204.4%
Neeru's 9.7% 9.1% -23.8% 1.9% -219.9% -7.9%
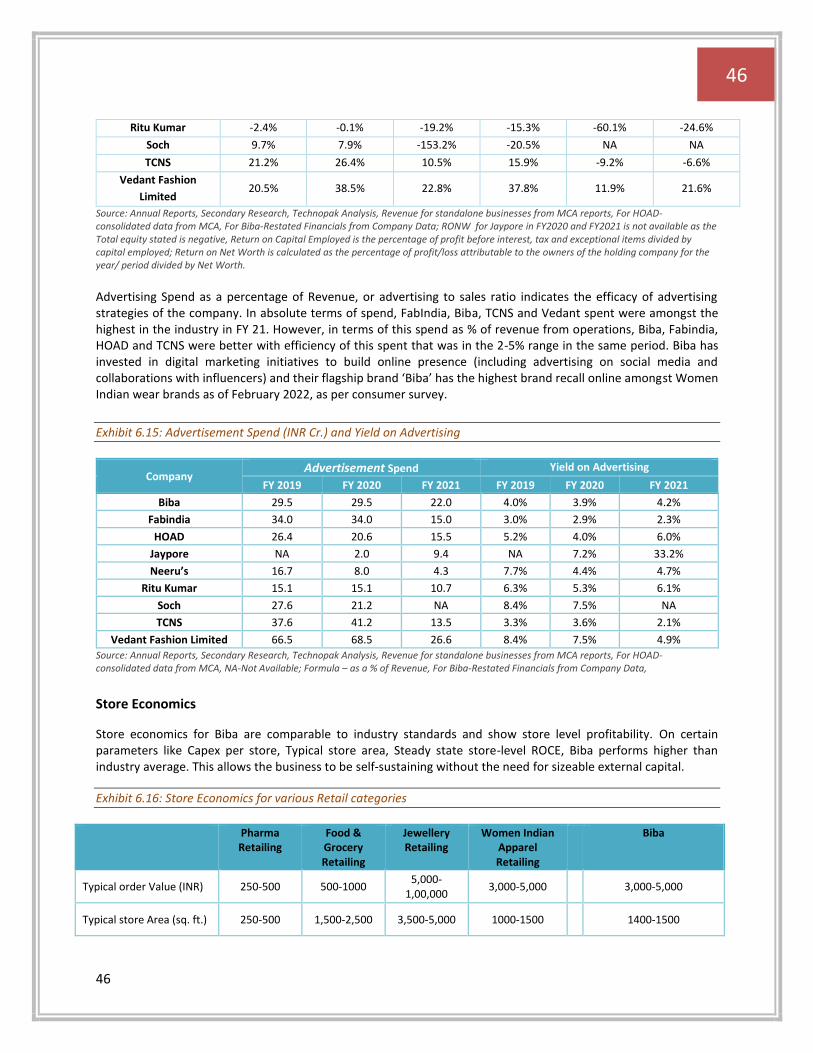
46
46
Ritu Kumar -2.4% -0.1% -19.2% -15.3% -60.1% -24.6%
Soch 9.7% 7.9% -153.2% -20.5% NA NA
TCNS 21.2% 26.4% 10.5% 15.9% -9.2% -6.6%
Vedant Fashion
Limited 20.5% 38.5% 22.8% 37.8% 11.9% 21.6%
Source: Annual Reports, Secondary Research, Technopak Analysis, Revenue for standalone businesses from MCA reports, For HOAD- consolidated data from MCA, For Biba-Restated Financials from Company Data; RONW for Jaypore in FY2020 and FY2021 is not available as the Total equity stated is negative, Return on Capital Employed is the percentage of profit before interest, tax and exceptional items divided by capital employed; Return on Net Worth is calculated as the percentage of profit/loss attributable to the owners of the holding company for the year/ period divided by Net Worth.
Advertising Spend as a percentage of Revenue, or advertising to sales ratio indicates the efficacy of advertising strategies of the company. In absolute terms of spend, FabIndia, Biba, TCNS and Vedant spent were amongst the highest in the industry in FY 21. However, in terms of this spend as % of revenue from operations, Biba, Fabindia, HOAD and TCNS were better with efficiency of this spent that was in the 2-5% range in the same period. Biba has invested in digital marketing initiatives to build online presence (including advertising on social media and collaborations with influencers) and their flagship brand ‘Biba’ has the highest brand recall online amongst Women Indian wear brands as of February 2022, as per consumer survey.
Exhibit 6.15: Advertisement Spend (INR Cr.) and Yield on Advertising
Company Advertisement Spend Yield on Advertising
FY 2019 FY 2020 FY 2021 FY 2019 FY 2020 FY 2021
Biba 29.5 29.5 22.0 4.0% 3.9% 4.2%
Fabindia 34.0 34.0 15.0 3.0% 2.9% 2.3%
HOAD 26.4 20.6 15.5 5.2% 4.0% 6.0%
Jaypore NA 2.0 9.4 NA 7.2% 33.2%
Neeru’s 16.7 8.0 4.3 7.7% 4.4% 4.7%
Ritu Kumar 15.1 15.1 10.7 6.3% 5.3% 6.1%
Soch 27.6 21.2 NA 8.4% 7.5% NA
TCNS 37.6 41.2 13.5 3.3% 3.6% 2.1%
Vedant Fashion Limited 66.5 68.5 26.6 8.4% 7.5% 4.9%
Source: Annual Reports, Secondary Research, Technopak Analysis, Revenue for standalone businesses from MCA reports, For HOAD- consolidated data from MCA, NA-Not Available; Formula – as a % of Revenue, For Biba-Restated Financials from Company Data,
Store Economics
Store economics for Biba are comparable to industry standards and show store level profitability. On certain parameters like Capex per store, Typical store area, Steady state store-level ROCE, Biba performs higher than industry average. This allows the business to be self-sustaining without the need for sizeable external capital.
Exhibit 6.16: Store Economics for various Retail categories
Pharma Retailing
Food & Grocery Retailing
Jewellery Retailing
Women Indian Apparel Retailing
Biba
Typical order Value (INR) 250-500 500-1000 5,000-
1,00,000 3,000-5,000 3,000-5,000
Typical store Area (sq. ft.) 250-500 1,500-2,500 3,500-5,000 1000-1500 1400-1500
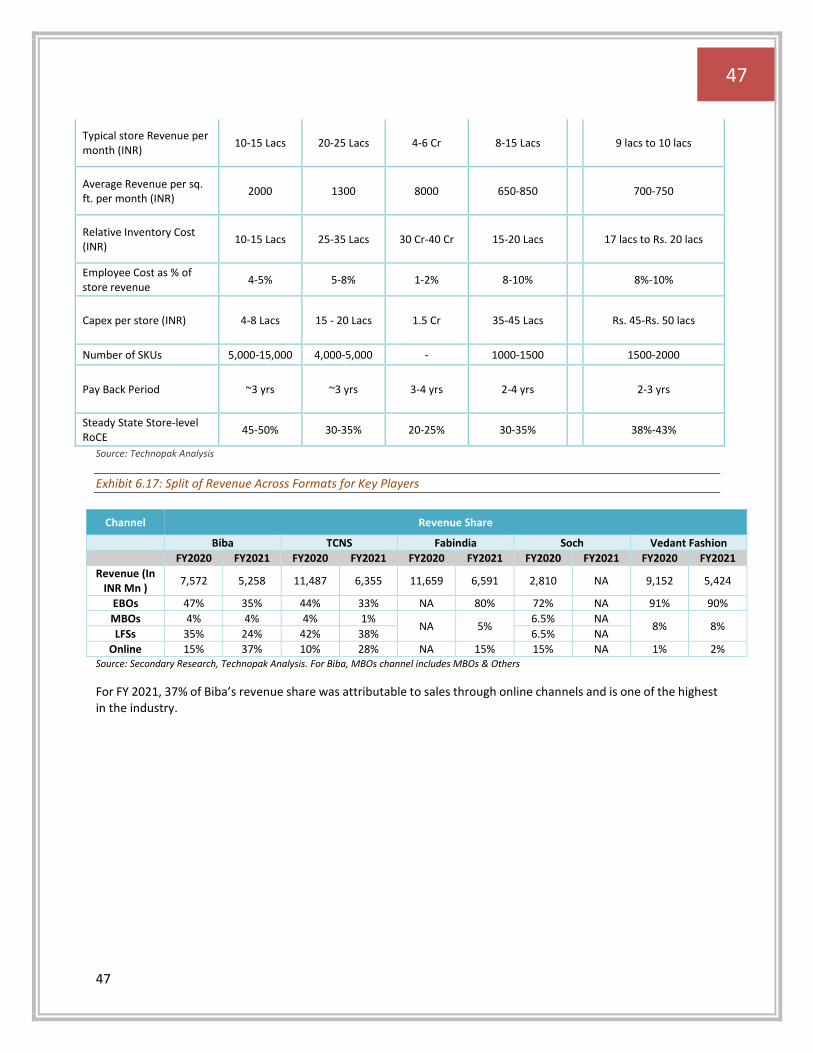
47
47
Typical store Revenue per month (INR)
10-15 Lacs 20-25 Lacs 4-6 Cr 8-15 Lacs
9 lacs to 10 lacs
Average Revenue per sq. ft. per month (INR)
2000 1300 8000 650-850 700-750
Relative Inventory Cost (INR)
10-15 Lacs 25-35 Lacs 30 Cr-40 Cr 15-20 Lacs 17 lacs to Rs. 20 lacs
Employee Cost as % of store revenue
4-5% 5-8% 1-2% 8-10% 8%-10%
Capex per store (INR) 4-8 Lacs 15 - 20 Lacs 1.5 Cr 35-45 Lacs Rs. 45-Rs. 50 lacs
Number of SKUs 5,000-15,000 4,000-5,000 - 1000-1500 1500-2000
Pay Back Period ~3 yrs ~3 yrs 3-4 yrs 2-4 yrs 2-3 yrs
Steady State Store-level RoCE
45-50% 30-35% 20-25% 30-35% 38%-43%
Source: Technopak Analysis
Exhibit 6.17: Split of Revenue Across Formats for Key Players
Channel Revenue Share
Biba TCNS Fabindia Soch Vedant Fashion
FY2020 FY2021 FY2020 FY2021 FY2020 FY2021 FY2020 FY2021 FY2020 FY2021
Revenue (In INR Mn )
7,572 5,258 11,487 6,355 11,659 6,591 2,810 NA 9,152 5,424
EBOs 47% 35% 44% 33% NA 80% 72% NA 91% 90%
MBOs 4% 4% 4% 1% NA 5%
6.5% NA 8% 8%
LFSs 35% 24% 42% 38% 6.5% NA
Online 15% 37% 10% 28% NA 15% 15% NA 1% 2% Source: Secondary Research, Technopak Analysis. For Biba, MBOs channel includes MBOs & Others
For FY 2021, 37% of Biba’s revenue share was attributable to sales through online channels and is one of the highest in the industry.
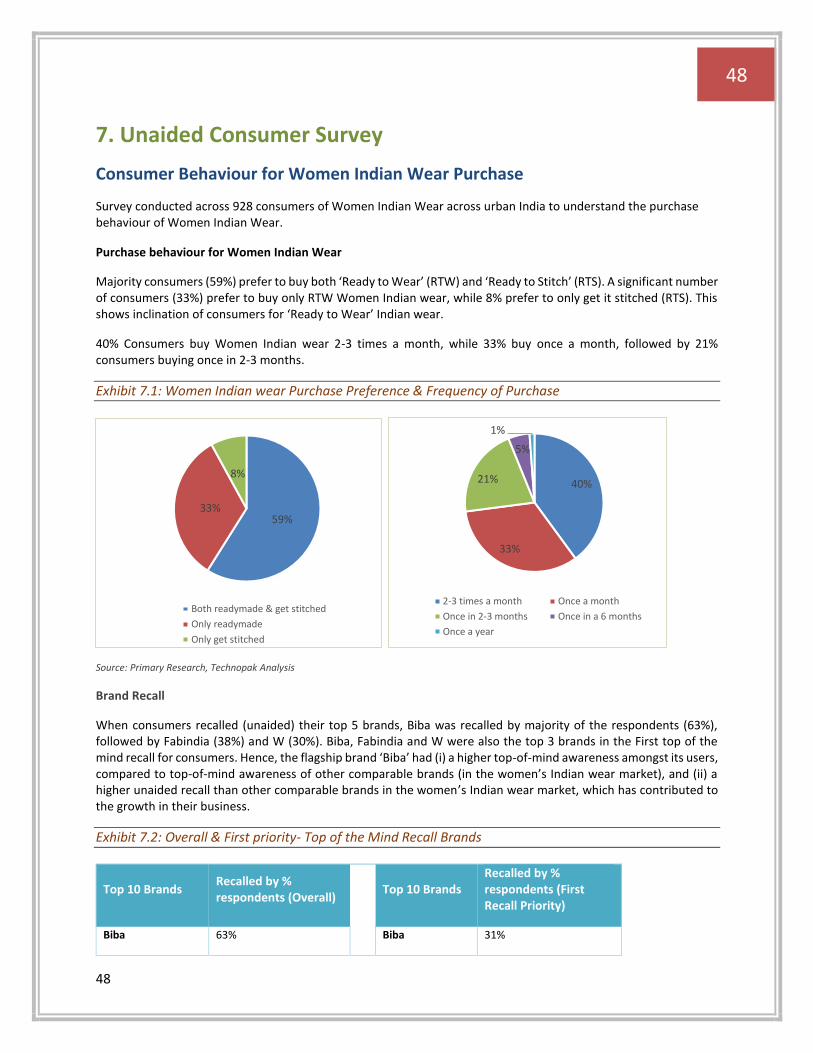
48
48
7. Unaided Consumer Survey
Consumer Behaviour for Women Indian Wear Purchase
Survey conducted across 928 consumers of Women Indian Wear across urban India to understand the purchase behaviour of Women Indian Wear. Purchase behaviour for Women Indian Wear
Majority consumers (59%) prefer to buy both ‘Ready to Wear’ (RTW) and ‘Ready to Stitch’ (RTS). A significant number of consumers (33%) prefer to buy only RTW Women Indian wear, while 8% prefer to only get it stitched (RTS). This shows inclination of consumers for ‘Ready to Wear’ Indian wear.
40% Consumers buy Women Indian wear 2-3 times a month, while 33% buy once a month, followed by 21% consumers buying once in 2-3 months.
Exhibit 7.1: Women Indian wear Purchase Preference & Frequency of Purchase
Source: Primary Research, Technopak Analysis
Brand Recall
When consumers recalled (unaided) their top 5 brands, Biba was recalled by majority of the respondents (63%), followed by Fabindia (38%) and W (30%). Biba, Fabindia and W were also the top 3 brands in the First top of the mind recall for consumers. Hence, the flagship brand ‘Biba’ had (i) a higher top-of-mind awareness amongst its users, compared to top-of-mind awareness of other comparable brands (in the women’s Indian wear market), and (ii) a higher unaided recall than other comparable brands in the women’s Indian wear market, which has contributed to the growth in their business.
Exhibit 7.2: Overall & First priority- Top of the Mind Recall Brands
Top 10 Brands Recalled by % respondents (Overall)
Top 10 Brands
Recalled by % respondents (First Recall Priority)
Biba 63% Biba 31%
59%33%
8%
Both readymade & get stitched
Only readymade
Only get stitched
40%
33%
21%
5%
1%
2-3 times a month Once a month
Once in 2-3 months Once in a 6 months
Once a year
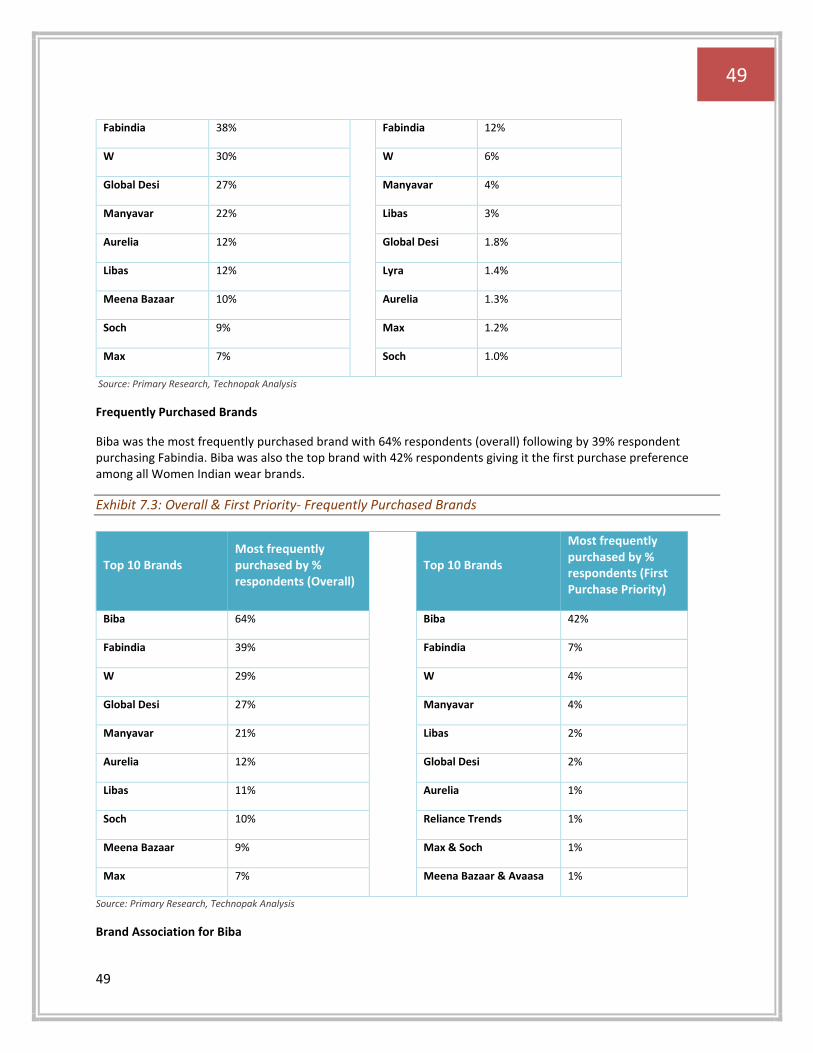
49
49
Fabindia 38% Fabindia 12%
W 30% W 6%
Global Desi 27% Manyavar 4%
Manyavar 22% Libas 3%
Aurelia 12% Global Desi 1.8%
Libas 12% Lyra 1.4%
Meena Bazaar 10% Aurelia 1.3%
Soch 9% Max 1.2%
Max 7% Soch 1.0%
Source: Primary Research, Technopak Analysis
Frequently Purchased Brands
Biba was the most frequently purchased brand with 64% respondents (overall) following by 39% respondent purchasing Fabindia. Biba was also the top brand with 42% respondents giving it the first purchase preference among all Women Indian wear brands.
Exhibit 7.3: Overall & First Priority- Frequently Purchased Brands
Top 10 Brands
Most frequently purchased by % respondents (Overall)
Top 10 Brands
Most frequently purchased by % respondents (First Purchase Priority)
Biba 64% Biba 42%
Fabindia 39% Fabindia 7%
W 29% W 4%
Global Desi 27% Manyavar 4%
Manyavar 21% Libas 2%
Aurelia 12% Global Desi 2%
Libas 11% Aurelia 1%
Soch 10% Reliance Trends 1%
Meena Bazaar 9% Max & Soch 1%
Max 7% Meena Bazaar & Avaasa 1%
Source: Primary Research, Technopak Analysis
Brand Association for Biba
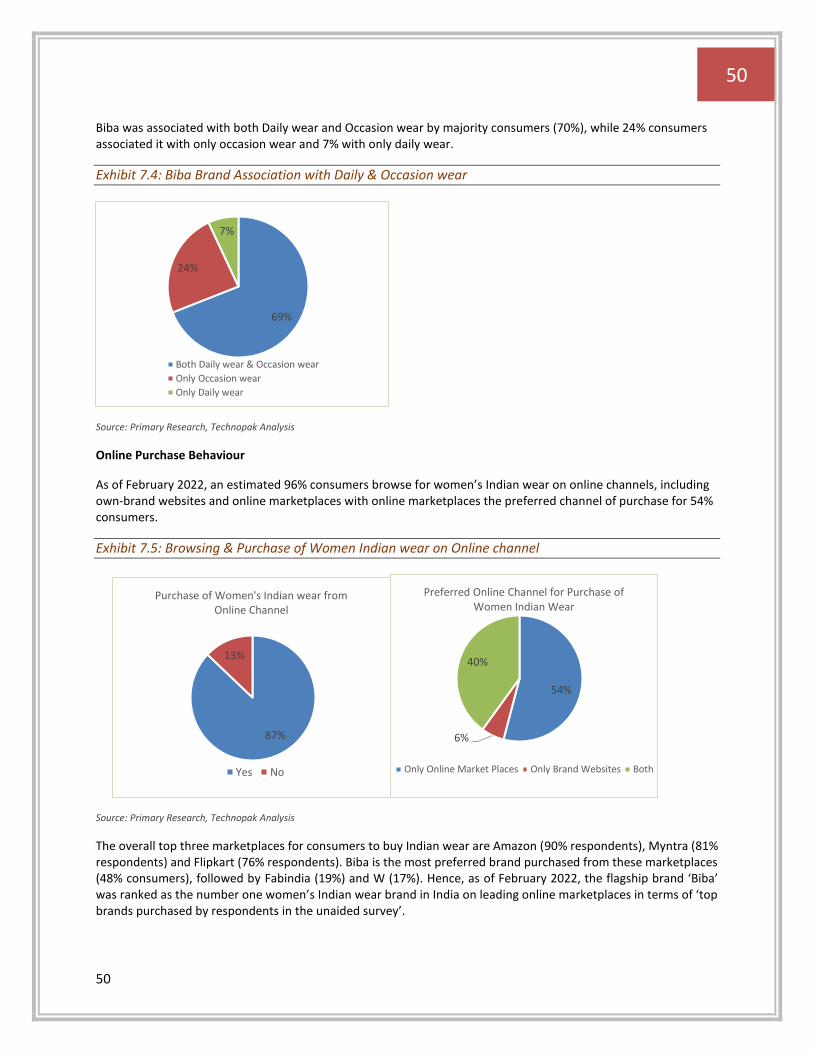
50
50
Biba was associated with both Daily wear and Occasion wear by majority consumers (70%), while 24% consumers associated it with only occasion wear and 7% with only daily wear.
Exhibit 7.4: Biba Brand Association with Daily & Occasion wear
Source: Primary Research, Technopak Analysis
Online Purchase Behaviour
As of February 2022, an estimated 96% consumers browse for women’s Indian wear on online channels, including own-brand websites and online marketplaces with online marketplaces the preferred channel of purchase for 54% consumers.
Exhibit 7.5: Browsing & Purchase of Women Indian wear on Online channel
Source: Primary Research, Technopak Analysis
The overall top three marketplaces for consumers to buy Indian wear are Amazon (90% respondents), Myntra (81% respondents) and Flipkart (76% respondents). Biba is the most preferred brand purchased from these marketplaces (48% consumers), followed by Fabindia (19%) and W (17%). Hence, as of February 2022, the flagship brand ‘Biba’ was ranked as the number one women’s Indian wear brand in India on leading online marketplaces in terms of ‘top brands purchased by respondents in the unaided survey’.
69%
24%
7%
Both Daily wear & Occasion wear
Only Occasion wear
Only Daily wear
87%
13%
Purchase of Women's Indian wear from Online Channel
Yes No
54%
6%
40%
Preferred Online Channel for Purchase of Women Indian Wear
Only Online Market Places Only Brand Websites Both
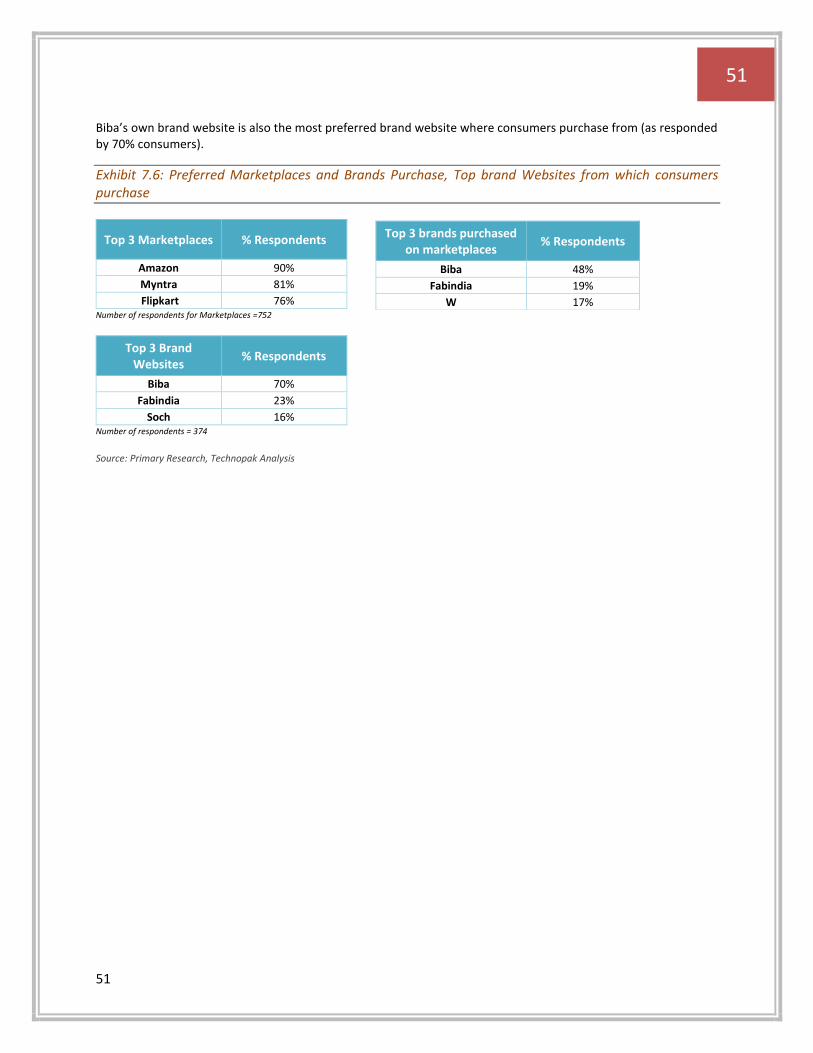
51
51
Biba’s own brand website is also the most preferred brand website where consumers purchase from (as responded by 70% consumers).
Exhibit 7.6: Preferred Marketplaces and Brands Purchase, Top brand Websites from which consumers purchase
Top 3 Marketplaces % Respondents
Amazon 90%
Myntra 81%
Flipkart 76% Number of respondents for Marketplaces =752
Top 3 Brand Websites
% Respondents
Biba 70%
Fabindia 23%
Soch 16% Number of respondents = 374
Source: Primary Research, Technopak Analysis
Top 3 brands purchased on marketplaces
% Respondents
Biba 48%
Fabindia 19%
W 17%
52
52
Disclaimer
• This information package is distributed by Technopak Advisors Private Limited (hereinafter
“Technopak”) on a strictly private and confidential and on ‘need to know’ basis exclusively to
the intended recipient. This information package and the information and projections contained
herein may not be disclosed, reproduced or used in whole or in part for any purpose or
furnished to any other person(s). The person(s) who is/are in possession of this information
package or may come in possession at a later day hereby undertake(s) to observe the
restrictions contained herein.
• Only leading players are profiled and benchmarked for the purpose of the report and does not
necessarily cover all types of players.
• The information contained herein is of a general nature and is not intended to address the facts
and figures of any particular individual or entity. The content provided here treats the subjects
covered here in condensed form. It is intended to provide a general guide to the subject matter
and should not be relied on as a basis for business decisions. No one should act upon such
information without taking appropriate additional professional advice and/or thorough
examination of the particular situation. Technopak and its directors , employees, agents and
consultants shall have no liability (including liability to any person by reason of negligence or
negligent misstatement) for any statements, opinions, information or matters (expressed or
implied) arising out of, contained in or derived from, or of any omissions from the information
package and any liability whatsoever for any direct, indirect, consequential or other loss arising
from any use of this information package and/or further communication in relation to this
information package.
53
53
Authors of the Report
Ankur Bisen
Senior Partner & Head of Retail
Madhulika Tiwari
Partner
Priyanka Abrol
Manager
Meghna Mishra
Associate
Kushal Madke
Associate
Ravindra Negi
Senior Associate
www.technopak.com
Technopak Advisors Pvt. Ltd.
Lemon Tree Hotel (Corporate Park)
5A and 5B, 5th Floor, Block A,
Village Ullhawas, Tehsil Wazirabad,
Sector 60, Gurgaon-122011
T : +91.124.454 1111 I [email protected]
Corporate Identification Number: U74140DL1994PTC61818
Related Documents