Except as otherwise provided in this document, certain facts, statistics and dates presented in this section have been derived, in part, from various official government sources as well as industry reports prepared by independent industry consultants, PAL and CALI. We believe that the sources of such information are appropriate sources for such information and we have taken reasonable care in extracting and reproducing such information. We have no reason to believe that such information is false or misleading in any material respect or that any fact has been omitted that would render such information false or misleading in any material respect. The information has not been independently verified by us, any of our or their respective directors, officers, representatives or other affiliates or any other party involved and no representation is given as to its accuracy. We have engaged PAL to prepare the report for use in whole or in part in this document. We paid PAL a total of GBP75,000 ( C = 89,748) in fees for the preparation and updating of its report. We obtained permission from CALI to refer to, quote and excerpt its report in this document. CALI has certified that the membership of Mr. Sean Ma in CALI did not affect the impartiality of its report. PET RESIN BUSINESS Introduction M&G operates primarily within the PET resin production industry. PET is a versatile plastic polymer produced by reacting PTA with MEG in the presence of catalysts and heat. The following chart highlights PET resin production and downstream manufacturing: Source: Polyester Analysis Ltd. THIS WEB PROOF INFORMATION PACK IS IN DRAFT FORM. The information contained in it is incomplete and is subject to change. This Web Proof Information Pack must be read in conjunction with the section headed “Warning” on the cover of this Web Proof Information Pack. INDUSTRY OVERVIEW — 58 —

Welcome message from author
This document is posted to help you gain knowledge. Please leave a comment to let me know what you think about it! Share it to your friends and learn new things together.
Transcript
Except as otherwise provided in this document, certain facts, statistics and dates presented inthis section have been derived, in part, from various official government sources as well as industryreports prepared by independent industry consultants, PAL and CALI. We believe that the sourcesof such information are appropriate sources for such information and we have taken reasonablecare in extracting and reproducing such information. We have no reason to believe that suchinformation is false or misleading in any material respect or that any fact has been omitted thatwould render such information false or misleading in any material respect. The information has notbeen independently verified by us, any of our or their respective directors, officers, representativesor other affiliates or any other party involved and no representation is given as to its accuracy. Wehave engaged PAL to prepare the report for use in whole or in part in this document. We paid PALa total of GBP75,000 ( C= 89,748) in fees for the preparation and updating of its report. We obtainedpermission from CALI to refer to, quote and excerpt its report in this document. CALI has certifiedthat the membership of Mr. Sean Ma in CALI did not affect the impartiality of its report.
PET RESIN BUSINESS
Introduction
M&G operates primarily within the PET resin production industry. PET is a versatile plasticpolymer produced by reacting PTA with MEG in the presence of catalysts and heat. The followingchart highlights PET resin production and downstream manufacturing:
Source: Polyester Analysis Ltd.
THIS WEB PROOF INFORMATION PACK IS IN DRAFT FORM. The information contained init is incomplete and is subject to change. This Web Proof Information Pack must be read inconjunction with the section headed “Warning” on the cover of this Web Proof Information Pack.
INDUSTRY OVERVIEW
— 58 —
The PET market has grown significantly in recent years and is forecast by PAL to grow at an
estimated CAGR of 7.5% from 2012 to 2017 due to the technical advantages of PET as a packaging
material compared to alternatives such as glass, paper and metal. PET also maintains advantages in
versatility and packaging and freight costs and has a relatively small carbon footprint. It is also
expected to benefit from the development of new end-use applications.
Principal applications
PET is principally used for packaging. Traditional uses for PET include the manufacturing of
bottles for carbonated beverages, water, isotonic energy drinks, vegetable oils and other beverages and
PET sheet molded into clam shells for food packaging, as well as numerous non-food applications.More recent uses include packaging for hot-fill drinks, custom foods and oxygen-sensitive food anddrinks, such as beer, wine, juice and baby food.
Unlike the typical commodity chemical industry where products manufactured by all suppliershave the same formulation and are fungible, the general properties of standard PET have beenprogressively improved by some (but not all) producers in order to develop specific formulations—orPET grades—suitable for specific applications. Product innovation is therefore very important in thisindustry.
The main PET applications are:
• Carbonated soft drinks: PET for carbonated soft drinks (“CSD”) use is the most commongrade in the market and most resins are suitable for this application. Demand for CSDscontinues to grow in developing countries, but there is slower growth in more matureeconomies as consumers turn to “healthier” beverages, such as flavored waters.
• Water: PET resin for water bottles contains less acetaldehyde than CSD grade becauseacetaldehyde affects the taste of water. This is a general commodity product and one of thefastest growing demand areas, especially in developing countries. Though consumption hasslowed in some of the more mature economies, commodity purified water is growing as analternative to branded, higher-cost mineral water.
• Sheet: PET sheet has a lower intrinsic viscosity than CSD and water grade PET, making itmore malleable for use in clam shells and film packaging for baked goods, fresh fruit andvegetables, meat and fish and other non-food uses.
• Custom food: PET is used for custom food packaging where its properties provide amarketing advantage, such as allowing brand owners to create unique package shapes,sizes, colors and profiles. Packaging applications for this grade include edible oils, sauces,spreads, bottled fruits and vegetables, peanut butter, wine, spirits, cider, coffee and otherbeverages.
• Hot-fill: Packaging applications for this grade include juice drinks, health and sportsdrinks, ready-to-drink tea, milk products, soups and baby foods.
THIS WEB PROOF INFORMATION PACK IS IN DRAFT FORM. The information contained init is incomplete and is subject to change. This Web Proof Information Pack must be read inconjunction with the section headed “Warning” on the cover of this Web Proof Information Pack.
INDUSTRY OVERVIEW
— 59 —
• Barrier: Historically, packaging for refrigerated fresh fruit and vegetable juices, food, beerand other oxygen- or carbon dioxide-sensitive drinks was either aluminum-metallized TetraPak cartons, glass bottles or metal cans, which provided the necessary barrier properties toensure the required shelf life. However, barrier-grade PET has been gradually replacingsuch packaging materials for these end uses because it offers durable, light, transparent andresealable packaging. One promising application for barrier-grade PET is packaging forbeer, which is still at an early stage of commercialization. M&G has successfullycommercialized fully formulated monolayer barrier resins, while other PET producersmainly use less efficient coatings, or more expensive multilayer solutions. This has thepotential to be a large market—possibly millions of tons of PET—if PET’s key advantagescan be leveraged to substitute cans and glass. According to PAL, M&G is the only PETproducer that can deliver barrier-grade PET immediately usable by clients with traditionalconversion equipment and without the need for clients to employ additives.
• Non-food: PET resin is used to make containers for pharmaceuticals, personal care goods,household cleaning fluids, detergents and disinfectants, as well as packaging for tools,batteries, sports equipment and toys. Another fast developing application for PET is thereplacement of nylon fibers in carpets, especially in the United States, due to its lower cost,longevity and stain resistance.
In addition, there are environmentally sustainable PET resin formulations, such as post-consumerresin (“PCR”)-grade and bio-grade PET, which can be used for the same end-use applications as virginPET.
• PCR-grade PET: PET resin derived from post-consumer recycling. According to PAL,M&G is currently the only PET producer of chemically recycled PCR-grade PET in theAmericas. Its technology enables it to chemically break down recycled PET into itscomponent parts, PTA and MEG, which are then used to produce virgin PET. Others recyclePET mechanically by mixing it with virgin PET in a ratio of one part recycled PET to nineparts virgin PET. The resulting PET is a lower quality product than chemically recycledPET.
• Bio-grade PET: PET resin produced from raw materials derived from biomass. Accordingto PAL, M&G is the only PET producer with exclusive and proprietary access to secondgeneration bio-technology to produce PET raw materials from biomass, a technology whichit plans to implement in its new facilities in China (see “Business — Key Businesses —PET Division — Projects Under Construction — China bio-MEG Project”).
Demand for PET resin
General description of global demand for PET resin
According to PAL, over the last 10 years, annual global virgin PET resin demand grew by nearly9.5 mMT, from 9.1 mMT in 2002 to 18.6 mMT in 2012, representing a CAGR of 7.4%. From 2007to 2012, PET resin demand grew at a CAGR of 5.4%, which was below the historical average, in partdue to the global financial crisis, the increased use of recycled material and light-weighting, or thereduced use of plastic in packaging for both cost savings and environmental sustainability reasons.However, even at the peak of the financial crisis, when several industries had negative growth, PETdemand still had positive (although reduced) growth, in part because the PET industry is more closelylinked to, and more closely resembles in its demand profile, the consumer food industry than otherchemical and petrochemical industries.
THIS WEB PROOF INFORMATION PACK IS IN DRAFT FORM. The information contained init is incomplete and is subject to change. This Web Proof Information Pack must be read inconjunction with the section headed “Warning” on the cover of this Web Proof Information Pack.
INDUSTRY OVERVIEW
— 60 —
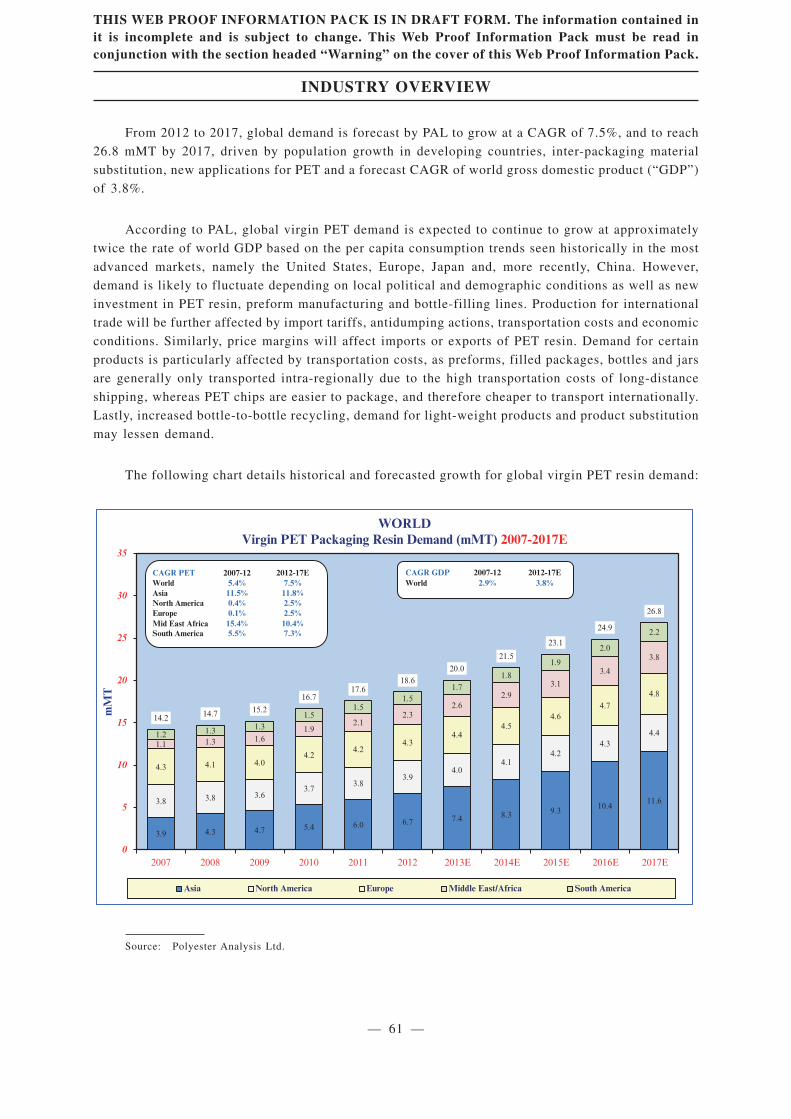
From 2012 to 2017, global demand is forecast by PAL to grow at a CAGR of 7.5%, and to reach
26.8 mMT by 2017, driven by population growth in developing countries, inter-packaging material
substitution, new applications for PET and a forecast CAGR of world gross domestic product (“GDP”)
of 3.8%.
According to PAL, global virgin PET demand is expected to continue to grow at approximately
twice the rate of world GDP based on the per capita consumption trends seen historically in the most
advanced markets, namely the United States, Europe, Japan and, more recently, China. However,
demand is likely to fluctuate depending on local political and demographic conditions as well as new
investment in PET resin, preform manufacturing and bottle-filling lines. Production for international
trade will be further affected by import tariffs, antidumping actions, transportation costs and economic
conditions. Similarly, price margins will affect imports or exports of PET resin. Demand for certain
products is particularly affected by transportation costs, as preforms, filled packages, bottles and jars
are generally only transported intra-regionally due to the high transportation costs of long-distance
shipping, whereas PET chips are easier to package, and therefore cheaper to transport internationally.
Lastly, increased bottle-to-bottle recycling, demand for light-weight products and product substitution
may lessen demand.
The following chart details historical and forecasted growth for global virgin PET resin demand:
3.9 4.3 4.7 5.4 6.0 6.7 7.4 8.3 9.3 10.411.63.8 3.8 3.6
3.73.8
3.94.0
4.14.2
4.34.4
4.3 4.1 4.04.2
4.24.3
4.44.5
4.64.7
4.8
1.1 1.3 1.61.9
2.12.3
2.62.9
3.1
3.4
3.8
1.2 1.3 1.31.5
1.51.5
1.7
1.8
1.9
2.0
2.2
14.2 14.7 15.2
16.717.6
18.620.0
21.5
23.1
24.9
26.8
0
5
10
15
20
25
30
35
Asia North America Europe Middle East/Africa South America
WORLDVirgin PET Packaging Resin Demand (mMT) 2007-2017E
mM
T
CAGR GDPWorld 2.9% 3.8%
2007-12 2012-17ECAGR PETWorldAsiaNorth America EuropeMid East AfricaSouth America
2007-125.4%11.5%0.4%0.1%15.4%
7.5%2012-17E
11.8%2.5%2.5%
7.3%10.4%
5.5%
2007 2008 2009 2010 2011 2012 2013E 2014E 2015E 2016E 2017E
Source: Polyester Analysis Ltd.
THIS WEB PROOF INFORMATION PACK IS IN DRAFT FORM. The information contained init is incomplete and is subject to change. This Web Proof Information Pack must be read inconjunction with the section headed “Warning” on the cover of this Web Proof Information Pack.
INDUSTRY OVERVIEW
— 61 —
Principal drivers of global demand for PET resin
Population growth
In 2012, the global population was estimated to be 7.1 billion and is expected to reach 7.6 billionby 2017, representing a 13.6% increase compared to 2007. Population growth drives increasedconsumption of packaged goods, which in turn drives increased demand for PET. Significant expectedpopulation growth in Asia, South America and the Middle East and Africa makes these areaspotentially high growth markets for PET.
Global per capita GDP
As a country’s GDP grows, and the country’s population becomes wealthier, consumption tendsto increase. In mature markets such as the United States, Europe and Japan, PET demand is expectedto grow at, or below, GDP growth for mainstream end uses unless there is a paradigm shift in demand,which would require new PET uses or the replacement of steel, glass, aluminum and other packaging.In contrast, in less mature markets, such as Mexico, South America, China and India, PET demand isexpected to grow at rates above GDP growth with increased per capita consumption.
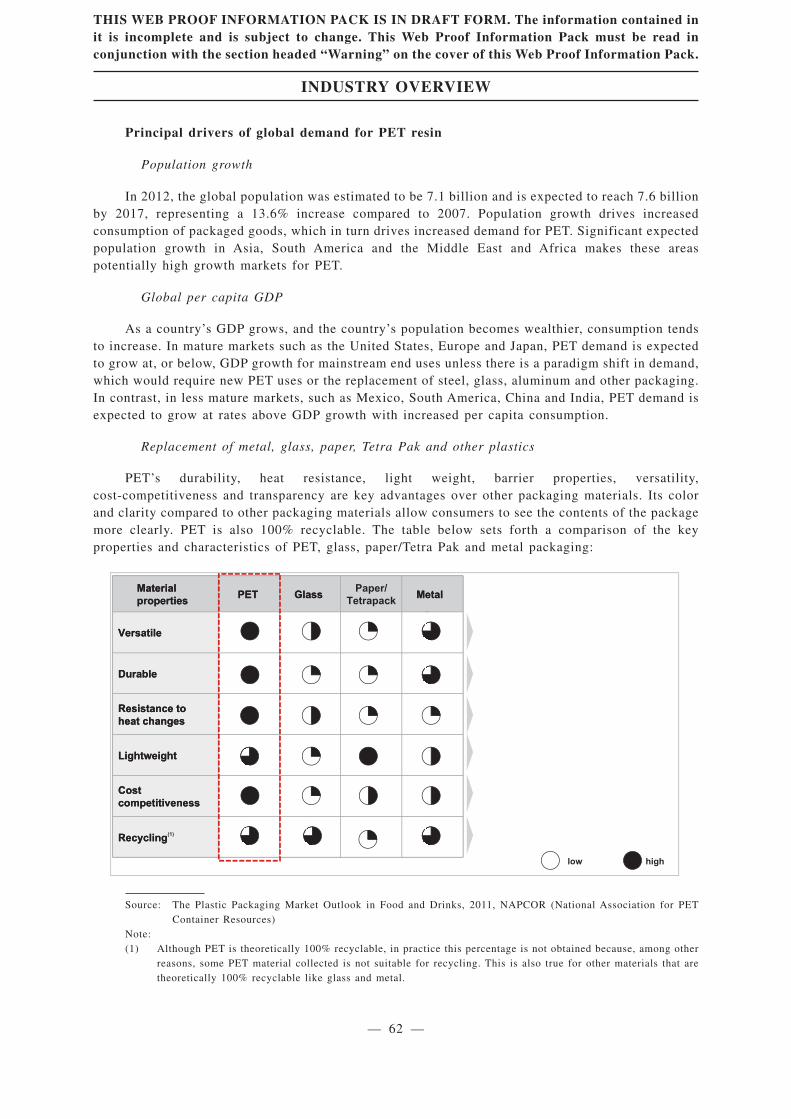
Replacement of metal, glass, paper, Tetra Pak and other plastics
PET’s durability, heat resistance, light weight, barrier properties, versatility,cost-competitiveness and transparency are key advantages over other packaging materials. Its colorand clarity compared to other packaging materials allow consumers to see the contents of the packagemore clearly. PET is also 100% recyclable. The table below sets forth a comparison of the keyproperties and characteristics of PET, glass, paper/Tetra Pak and metal packaging:
Material properties
PET Glass Metal
Versatile
Durable
Resistance to heat changes
Lightweight
Cost competitiveness
Recycling
Material properties
PET GlassPaper/
TetrapackMetal
Versatile
Durable
Resistance to heat changes
Lightweight
Cost competitiveness
Recycling(1)
2555%%%
highlow
222555%%%
2555%%%
222555%%%
222555%%%
222555%%%
Source: The Plastic Packaging Market Outlook in Food and Drinks, 2011, NAPCOR (National Association for PETContainer Resources)
Note:(1) Although PET is theoretically 100% recyclable, in practice this percentage is not obtained because, among other
reasons, some PET material collected is not suitable for recycling. This is also true for other materials that aretheoretically 100% recyclable like glass and metal.
THIS WEB PROOF INFORMATION PACK IS IN DRAFT FORM. The information contained init is incomplete and is subject to change. This Web Proof Information Pack must be read inconjunction with the section headed “Warning” on the cover of this Web Proof Information Pack.
INDUSTRY OVERVIEW
— 62 —
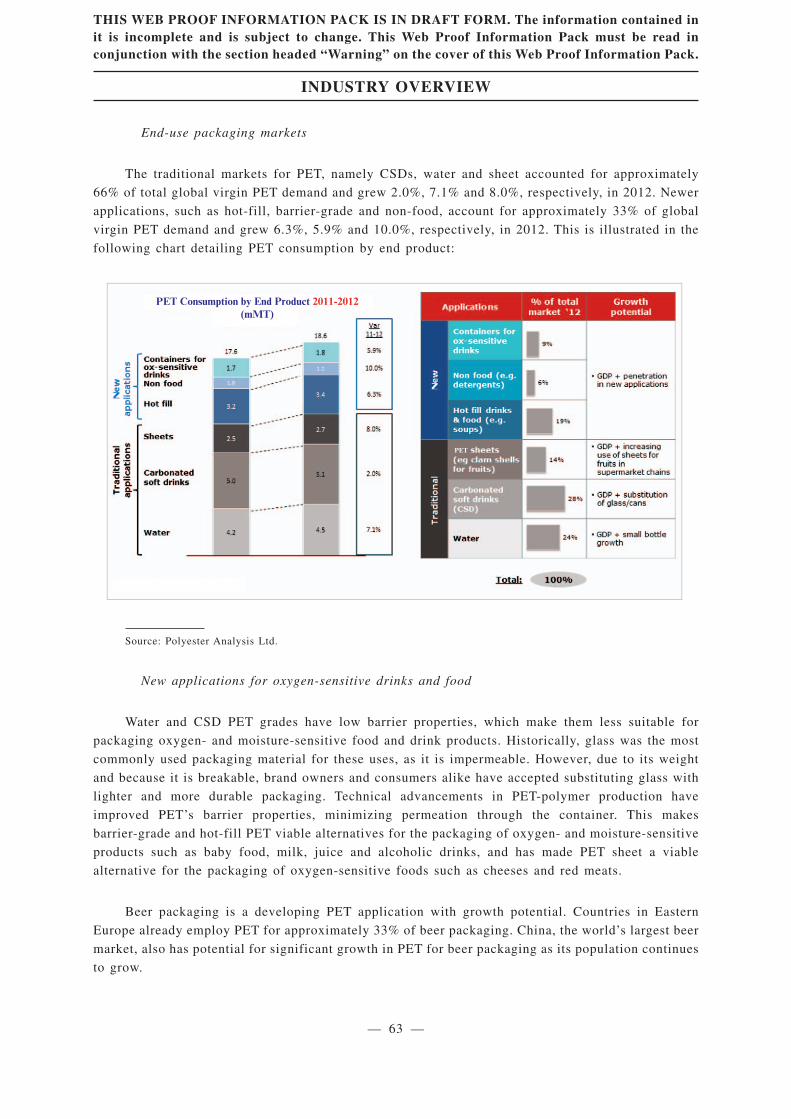
End-use packaging markets
The traditional markets for PET, namely CSDs, water and sheet accounted for approximately
66% of total global virgin PET demand and grew 2.0%, 7.1% and 8.0%, respectively, in 2012. Newer
applications, such as hot-fill, barrier-grade and non-food, account for approximately 33% of global
virgin PET demand and grew 6.3%, 5.9% and 10.0%, respectively, in 2012. This is illustrated in the
following chart detailing PET consumption by end product:
PET Consumption by End Product 2011-2012(mMT)
PET
Source: Polyester Analysis Ltd.
New applications for oxygen-sensitive drinks and food
Water and CSD PET grades have low barrier properties, which make them less suitable for
packaging oxygen- and moisture-sensitive food and drink products. Historically, glass was the most
commonly used packaging material for these uses, as it is impermeable. However, due to its weight
and because it is breakable, brand owners and consumers alike have accepted substituting glass with
lighter and more durable packaging. Technical advancements in PET-polymer production have
improved PET’s barrier properties, minimizing permeation through the container. This makes
barrier-grade and hot-fill PET viable alternatives for the packaging of oxygen- and moisture-sensitive
products such as baby food, milk, juice and alcoholic drinks, and has made PET sheet a viable
alternative for the packaging of oxygen-sensitive foods such as cheeses and red meats.
Beer packaging is a developing PET application with growth potential. Countries in Eastern
Europe already employ PET for approximately 33% of beer packaging. China, the world’s largest beer
market, also has potential for significant growth in PET for beer packaging as its population continues
to grow.
THIS WEB PROOF INFORMATION PACK IS IN DRAFT FORM. The information contained init is incomplete and is subject to change. This Web Proof Information Pack must be read inconjunction with the section headed “Warning” on the cover of this Web Proof Information Pack.
INDUSTRY OVERVIEW
— 63 —
Threats to the global virgin PET market
Bottle-to-bottle recycling
The production of new PET bottles from used, recycled PET bottles rather than from virgin PET
resin could cause demand for virgin PET to decline in some countries. Currently, this process is not
widespread (approximately 1.0 mMT globally, representing 5% of the total market) for several
reasons: the lack of an effective infrastructure for the collection of used PET material; the high cost
of collection and transportation to recycling centers; the need to sort and process the material
collected by the color of the resin; the higher market price of recycled as compared to virgin PET; and
the risk that customers will perceive recycled PET to be of lower quality because of a risk of
impurities. Most recycled PET is produced by blending PCR that has been mechanically washed and
cut into flakes or chips with virgin PET.
Recyclability is one of the important advantages of PET compared to other materials and, in
theory, all PET is recyclable, even if for the most part in textile rather than bottle applications. In fact,
there is a large demand for recycled PET for fiber production where quality is less critical, particularly
in China, which imports approximately 3.0 mMT of waste PET annually, mostly in the form of flakes
and crushed bales of PET bottles. Because recycled PET fiber has a production and price advantage
over virgin PET fiber, the fiber production industry is able to take advantage of an increasing supply
of recyclable PET bottles.
Light-weighting
Light-weighting is the reduced use of plastic in packaging. Ten years ago, production of a 0.5
liter water bottle required approximately 25 grams of PET. Today, it averages below 10 grams with
the lightest approximately 8.4 grams. These technological advancements have been driven by, and
have allowed manufacturers to counteract, the rising cost of crude oil and corresponding PET price
increases. Brand owners are also able to use light-weighting in response to criticism over packaging
waste and other environmental concerns. PAL has estimated that much of the optimization in
packaging has already taken place (as there are structural limits to further reductions, including the
need to maintain rigidity for ease of use by customers and for safety in transportation and storage),
although modest further weight reductions may be seen in mature markets.
Product substitution
According to PAL, although there is little likelihood of reverse substitution by aluminum, Tetra
Pak or competitor plastics, various other materials could become substitutes to PET given the right
conditions.
THIS WEB PROOF INFORMATION PACK IS IN DRAFT FORM. The information contained init is incomplete and is subject to change. This Web Proof Information Pack must be read inconjunction with the section headed “Warning” on the cover of this Web Proof Information Pack.
INDUSTRY OVERVIEW
— 64 —
Supply of virgin PET resin
Competitive landscape
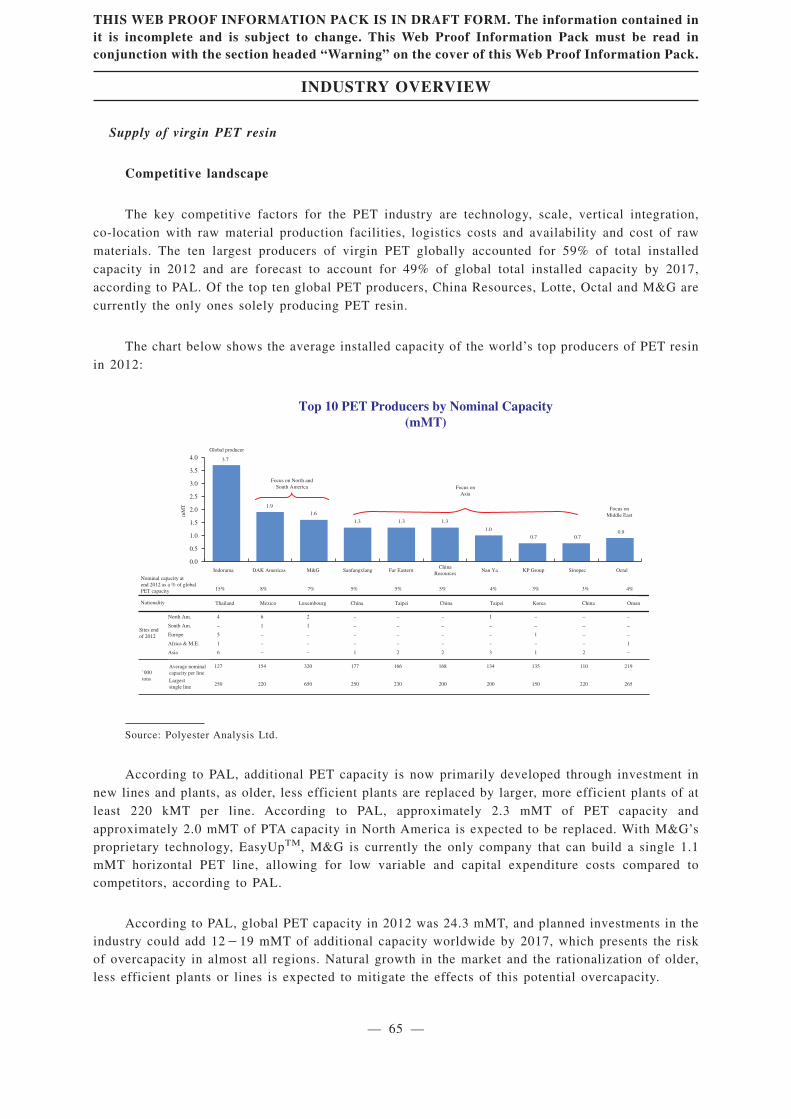
The key competitive factors for the PET industry are technology, scale, vertical integration,co-location with raw material production facilities, logistics costs and availability and cost of rawmaterials. The ten largest producers of virgin PET globally accounted for 59% of total installedcapacity in 2012 and are forecast to account for 49% of global total installed capacity by 2017,according to PAL. Of the top ten global PET producers, China Resources, Lotte, Octal and M&G arecurrently the only ones solely producing PET resin.
The chart below shows the average installed capacity of the world’s top producers of PET resinin 2012:
0.0
0.5
1.0
1.5
2.0
2.5
3.0
3.5
4.0 3.7
6
1
–
–
–
154
220
2
1
–
–
–
320
650
–
–
–
–
1
177
250
–
–
–
–
2
166
230
–
–
–
–
2
168
200
1
–
–
–
3
134
200
–
–
1
–
1
135
150
–
–
–
–
2
110
220
–
–
–
1
–
219
265
4
–
5
1
6
127
250
1.9
1.6
1.3 1.3 1.3
1.0
0.7 0.70.9
15% 8% 7% 5% 5% 5% 4% 3% 3% 4%
Top 10 PET Producers by Nominal Capacity(mMT)
mM
T
Thailand Mexico Luxembourg China Taipei China Taipei Korea China Oman
Nominal capacity at
end 2012 as a % of global
PET capacity
Nationality
Average nominal
capacity per line
Largest
single line
Sites end
of 2012
’000
tons
Indorama
Focus on
Asia
Focus on
Middle East
Focus on North and
South America
Global producer
DAK Americas M&G Sanfangxlang Far Eastern Nan Ya KP Group Sinopec OctalChina
Resources
North Am.
South Am.
Europe
Africa & M.E.
Asia
Source: Polyester Analysis Ltd.
According to PAL, additional PET capacity is now primarily developed through investment innew lines and plants, as older, less efficient plants are replaced by larger, more efficient plants of atleast 220 kMT per line. According to PAL, approximately 2.3 mMT of PET capacity andapproximately 2.0 mMT of PTA capacity in North America is expected to be replaced. With M&G’sproprietary technology, EasyUpTM, M&G is currently the only company that can build a single 1.1mMT horizontal PET line, allowing for low variable and capital expenditure costs compared tocompetitors, according to PAL.
According to PAL, global PET capacity in 2012 was 24.3 mMT, and planned investments in theindustry could add 12�19 mMT of additional capacity worldwide by 2017, which presents the riskof overcapacity in almost all regions. Natural growth in the market and the rationalization of older,less efficient plants or lines is expected to mitigate the effects of this potential overcapacity.
THIS WEB PROOF INFORMATION PACK IS IN DRAFT FORM. The information contained init is incomplete and is subject to change. This Web Proof Information Pack must be read inconjunction with the section headed “Warning” on the cover of this Web Proof Information Pack.
INDUSTRY OVERVIEW
— 65 —
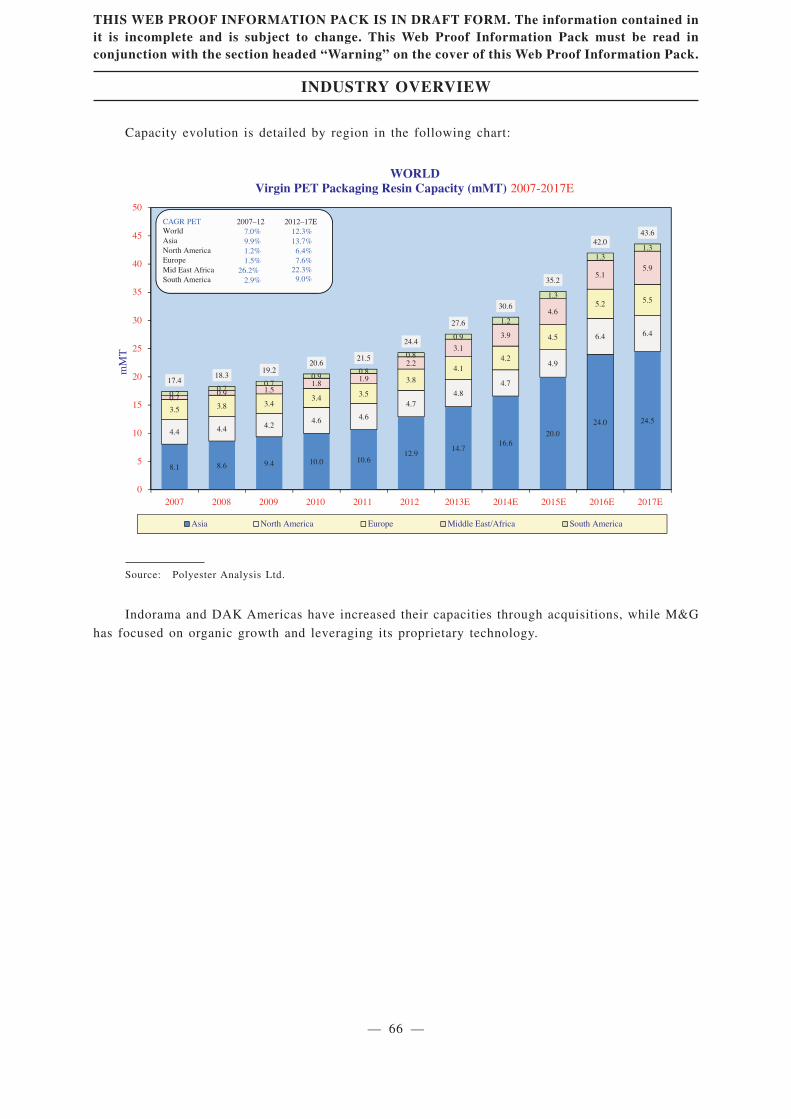
Capacity evolution is detailed by region in the following chart:
8.1 8.6 9.4 10.0 10.612.9
14.716.6
20.0
24.0 24.5
4.4 4.4 4.24.6 4.6
4.74.8
4.7
4.9
6.4 6.4
3.5 3.8 3.43.4 3.5
3.8
4.14.2
4.5
5.2 5.5
0.70.9 1.5
1.81.9
2.2
3.1
3.9
4.6
5.15.9
0.70.7
0.70.9
0.8
0.8
0.9
1.2
1.3
1.31.3
17.418.3
19.220.6
21.5
24.4
27.6
30.6
35.2
42.043.6
0
5
10
15
20
25
30
35
40
45
50
7.0%9.9%1.2%1.5%
26.2%2.9%
12.3%13.7%
6.4%7.6%
22.3%9.0%
WORLDVirgin PET Packaging Resin Capacity (mMT) 2007-2017E
mM
T
CAGR PETWorldAsiaNorth America EuropeMid East AfricaSouth America
2007–12 2012–17E
2007 2008 2009 2010 2011 2012 2013E 2014E 2015E 2016E 2017E
Asia North America Europe Middle East/Africa South America
Source: Polyester Analysis Ltd.
Indorama and DAK Americas have increased their capacities through acquisitions, while M&G
has focused on organic growth and leveraging its proprietary technology.
THIS WEB PROOF INFORMATION PACK IS IN DRAFT FORM. The information contained init is incomplete and is subject to change. This Web Proof Information Pack must be read inconjunction with the section headed “Warning” on the cover of this Web Proof Information Pack.
INDUSTRY OVERVIEW
— 66 —
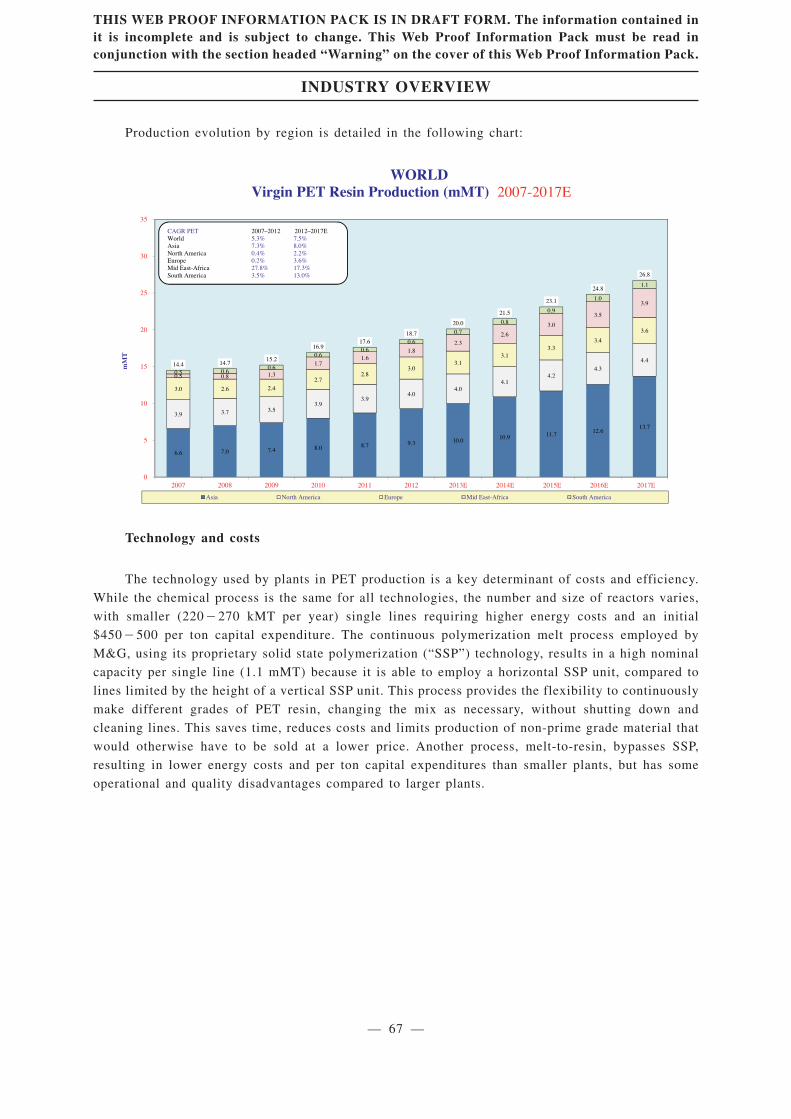
Production evolution by region is detailed in the following chart:
6.6 7.0 7.4 8.0 8.7 9.3 10.0 10.9 11.7 12.6 13.7
3.9 3.7 3.5 3.9
3.9 4.0
4.0 4.1
4.2 4.3
4.4
3.0 2.6 2.4 2.7
2.8 3.0
3.1 3.1
3.3 3.4
3.6
0.5 0.8 1.3
1.7 1.6
1.8 2.3
2.6
3.0
3.5
3.9
0.5 0.6 0.6
0.6 0.6
0.6
0.7
0.8
0.9
1.0
1.1
14.4 14.7 15.2
16.9 17.6
18.7
20.0
21.5
23.1
24.8
26.8
0
5
10
15
20
25
30
35
2007 2008 2009 2010 2011 2012 2013E 2014E 2015E 2016E 2017E
Asia North America Europe Mid East-Africa South America
mM
T
CAGR PET 2007–2012 2012–2017EWorld 5.3% 7.5%Asia 7.3% 8.0%North America 0.4% 2.2%Europe 0.2% 3.6%Mid East-Africa 27.8% 17.3%South America 3.5% 13.0%
WORLDVirgin PET Resin Production (mMT) 2007-2017E
Technology and costs
The technology used by plants in PET production is a key determinant of costs and efficiency.
While the chemical process is the same for all technologies, the number and size of reactors varies,
with smaller (220�270 kMT per year) single lines requiring higher energy costs and an initial
$450�500 per ton capital expenditure. The continuous polymerization melt process employed by
M&G, using its proprietary solid state polymerization (“SSP”) technology, results in a high nominal
capacity per single line (1.1 mMT) because it is able to employ a horizontal SSP unit, compared to
lines limited by the height of a vertical SSP unit. This process provides the flexibility to continuously
make different grades of PET resin, changing the mix as necessary, without shutting down and
cleaning lines. This saves time, reduces costs and limits production of non-prime grade material that
would otherwise have to be sold at a lower price. Another process, melt-to-resin, bypasses SSP,
resulting in lower energy costs and per ton capital expenditures than smaller plants, but has some
operational and quality disadvantages compared to larger plants.
THIS WEB PROOF INFORMATION PACK IS IN DRAFT FORM. The information contained init is incomplete and is subject to change. This Web Proof Information Pack must be read inconjunction with the section headed “Warning” on the cover of this Web Proof Information Pack.
INDUSTRY OVERVIEW
— 67 —
Benefits of integration in the polyester value chain
The price of PET resin is determined primarily by market dynamics and is influenced by the price
of crude oil. Therefore, in order to be consistently profitable, producers must manage production costs
and formulate a cost-effective sales strategy. Co-location and integration of raw material production
is an important way of reducing costs and its benefits include the following:
• Logistics costs savings: The proximity of PX, MEG and PTA to PET manufacturing
facilities reduces or, in the case of co-located plants, eliminates the cost of packaging,
freight, shipping and delivery of PX to PTA plants and PTA and MEG to PET plants.
• Energy optimization: Integration of raw material production optimizes energy resources in
a PTA/PET factory, as energy generated in the manufacture of PTA can be used in the
production of PET.
• Raw material supply: Co-locating PTA and PET plants ensures a stable supply of, and
consistent quality in, raw materials for the PET or fiber facility, reducing the risk of
delivery delays or volatility in spot raw material prices.
• Profit optimization: Co-locating PTA and PET or polyester fiber plants captures added
profit from another part of the value chain, while eliminating marketing and sales costs and
customer credit. Typically, both PET and PTA plants achieve a higher capacity utilization
than a merchant PTA seller.
THIS WEB PROOF INFORMATION PACK IS IN DRAFT FORM. The information contained init is incomplete and is subject to change. This Web Proof Information Pack must be read inconjunction with the section headed “Warning” on the cover of this Web Proof Information Pack.
INDUSTRY OVERVIEW
— 68 —
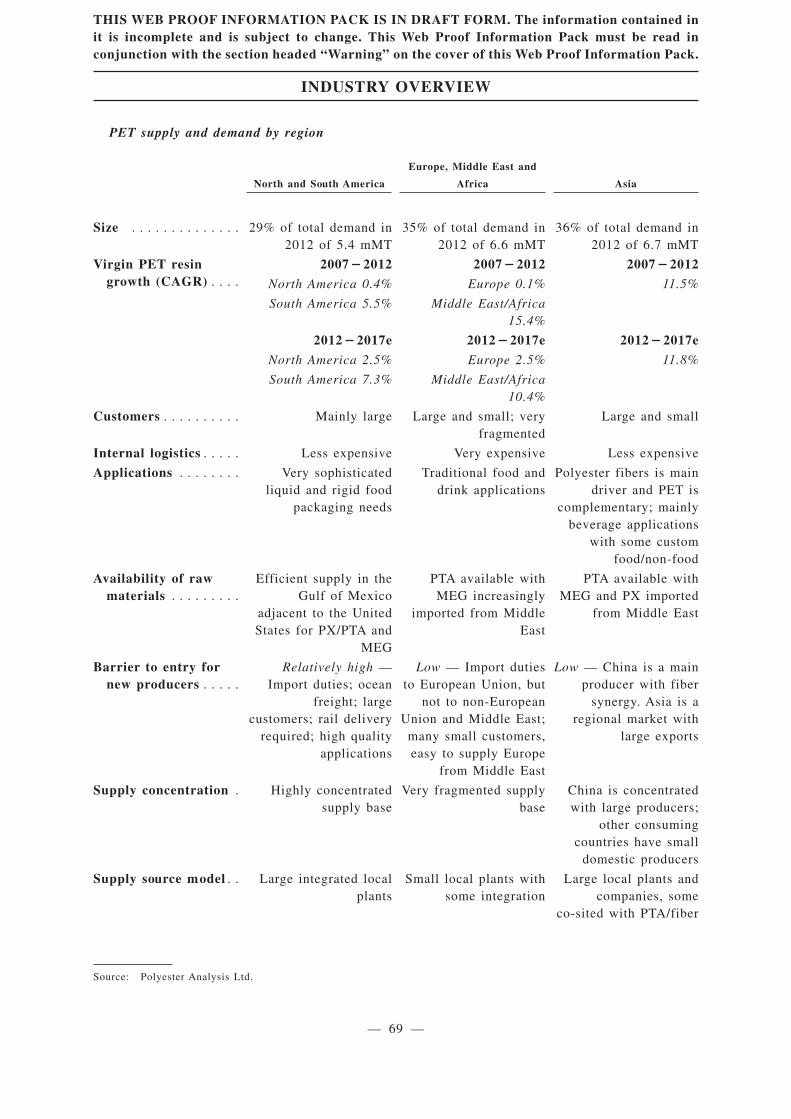
PET supply and demand by region
North and South America
Europe, Middle East and
Africa Asia
Size . . . . . . . . . . . . . . 29% of total demand in2012 of 5.4 mMT
35% of total demand in2012 of 6.6 mMT
36% of total demand in2012 of 6.7 mMT
Virgin PET resingrowth (CAGR) . . . .
2007�2012 2007�2012 2007�2012
North America 0.4% Europe 0.1% 11.5%
South America 5.5% Middle East/Africa15.4%
2012�2017e 2012�2017e 2012�2017e
North America 2.5% Europe 2.5% 11.8%
South America 7.3% Middle East/Africa10.4%
Customers . . . . . . . . . . Mainly large Large and small; veryfragmented
Large and small
Internal logistics . . . . . Less expensive Very expensive Less expensive
Applications . . . . . . . . Very sophisticatedliquid and rigid food
packaging needs
Traditional food anddrink applications
Polyester fibers is maindriver and PET is
complementary; mainlybeverage applications
with some customfood/non-food
Availability of rawmaterials . . . . . . . . .
Efficient supply in theGulf of Mexico
adjacent to the UnitedStates for PX/PTA and
MEG
PTA available withMEG increasingly
imported from MiddleEast
PTA available withMEG and PX imported
from Middle East
Barrier to entry fornew producers . . . . .
Relatively high —Import duties; ocean
freight; largecustomers; rail delivery
required; high qualityapplications
Low — Import dutiesto European Union, but
not to non-EuropeanUnion and Middle East;
many small customers,easy to supply Europe
from Middle East
Low — China is a mainproducer with fiber
synergy. Asia is aregional market with
large exports
Supply concentration . Highly concentratedsupply base
Very fragmented supplybase
China is concentratedwith large producers;
other consumingcountries have small
domestic producers
Supply source model . . Large integrated localplants
Small local plants withsome integration
Large local plants andcompanies, some
co-sited with PTA/fiber
Source: Polyester Analysis Ltd.
THIS WEB PROOF INFORMATION PACK IS IN DRAFT FORM. The information contained init is incomplete and is subject to change. This Web Proof Information Pack must be read inconjunction with the section headed “Warning” on the cover of this Web Proof Information Pack.
INDUSTRY OVERVIEW
— 69 —
North America
North America has been at the forefront of packaging innovation and development and is now
a mature market in traditional growth areas, with potential for barrier resins to take market shares in
new applications.
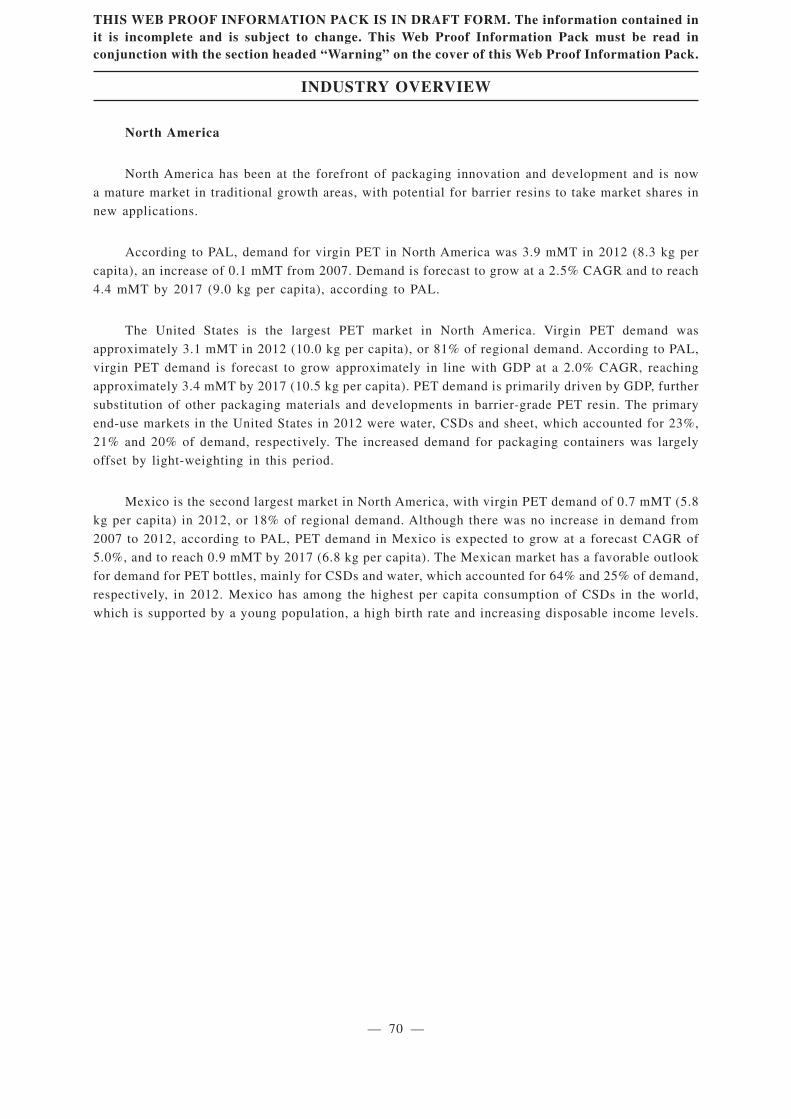
According to PAL, demand for virgin PET in North America was 3.9 mMT in 2012 (8.3 kg per
capita), an increase of 0.1 mMT from 2007. Demand is forecast to grow at a 2.5% CAGR and to reach
4.4 mMT by 2017 (9.0 kg per capita), according to PAL.
The United States is the largest PET market in North America. Virgin PET demand was
approximately 3.1 mMT in 2012 (10.0 kg per capita), or 81% of regional demand. According to PAL,
virgin PET demand is forecast to grow approximately in line with GDP at a 2.0% CAGR, reaching
approximately 3.4 mMT by 2017 (10.5 kg per capita). PET demand is primarily driven by GDP, further
substitution of other packaging materials and developments in barrier-grade PET resin. The primary
end-use markets in the United States in 2012 were water, CSDs and sheet, which accounted for 23%,
21% and 20% of demand, respectively. The increased demand for packaging containers was largely
offset by light-weighting in this period.
Mexico is the second largest market in North America, with virgin PET demand of 0.7 mMT (5.8
kg per capita) in 2012, or 18% of regional demand. Although there was no increase in demand from
2007 to 2012, according to PAL, PET demand in Mexico is expected to grow at a forecast CAGR of
5.0%, and to reach 0.9 mMT by 2017 (6.8 kg per capita). The Mexican market has a favorable outlook
for demand for PET bottles, mainly for CSDs and water, which accounted for 64% and 25% of demand,
respectively, in 2012. Mexico has among the highest per capita consumption of CSDs in the world,
which is supported by a young population, a high birth rate and increasing disposable income levels.
THIS WEB PROOF INFORMATION PACK IS IN DRAFT FORM. The information contained init is incomplete and is subject to change. This Web Proof Information Pack must be read inconjunction with the section headed “Warning” on the cover of this Web Proof Information Pack.
INDUSTRY OVERVIEW
— 70 —
3.0 3.0 2.8 2.9 3.0 3.1 3.2 3.2 3.3 3.3 3.4
0.7 0.70.7 0.7 0.7
0.7 0.7 0.8 0.8 0.9 0.90.1 0.1
0.1 0.1 0.10.1 0.1 0.1 0.1 0.1 0.1
3.8 3.83.6 3.7 3.8
3.9 4.0 4.1 4.2 4.3 4.4
0
1
2
3
4
5
6
7
mM
T
USA Mexico Canada
NORTH AMERICAVirgin PET Packaging Resin Demand (mMT) 2007-2017E
CAGR 2007-12 0.4%Canada -0% Mexico 0.1% USA 0.5%
CAGR 2012-17E 2.5%Canada 2.0% Mexico 5.0% USA 2.0%
2007 2008 2009 2010 2011 2012 2013E 2014E 2015E 2016E 2017E
Source: Polyester Analysis Ltd.
Production and demand in North America is currently near equilibrium, with exports and importslargely offsetting each other. Supply is mostly concentrated in three producers, with DAK, Indoramaand M&G accounting for 87% of capacity. Imports face high barriers to entry due to the import dutiesapplicable to most Asian countries. In addition, reliance on rail transportation, which can beexpensive, makes container imports less practical on the East Coast of the United States. This leadsto relatively low pressure on prices, except on the West Coast of the United States where freight costsfor transportation from East Coast PET factories and ocean freight costs from Asia are comparable.
In the last five years, PET plants in seven locations throughout North America have been shutdown or converted to other uses. Despite those shutdowns and conversions, investments at other sitesresulted in a net increase in capacity of 230 kMT. According to PAL, 1.0 mMT of PET capacity in theAmericas may be idled; for example, in 2013, DAK Americas announced the planned closure of alloperations at its site in Cape Fear, North Carolina, USA.
South America
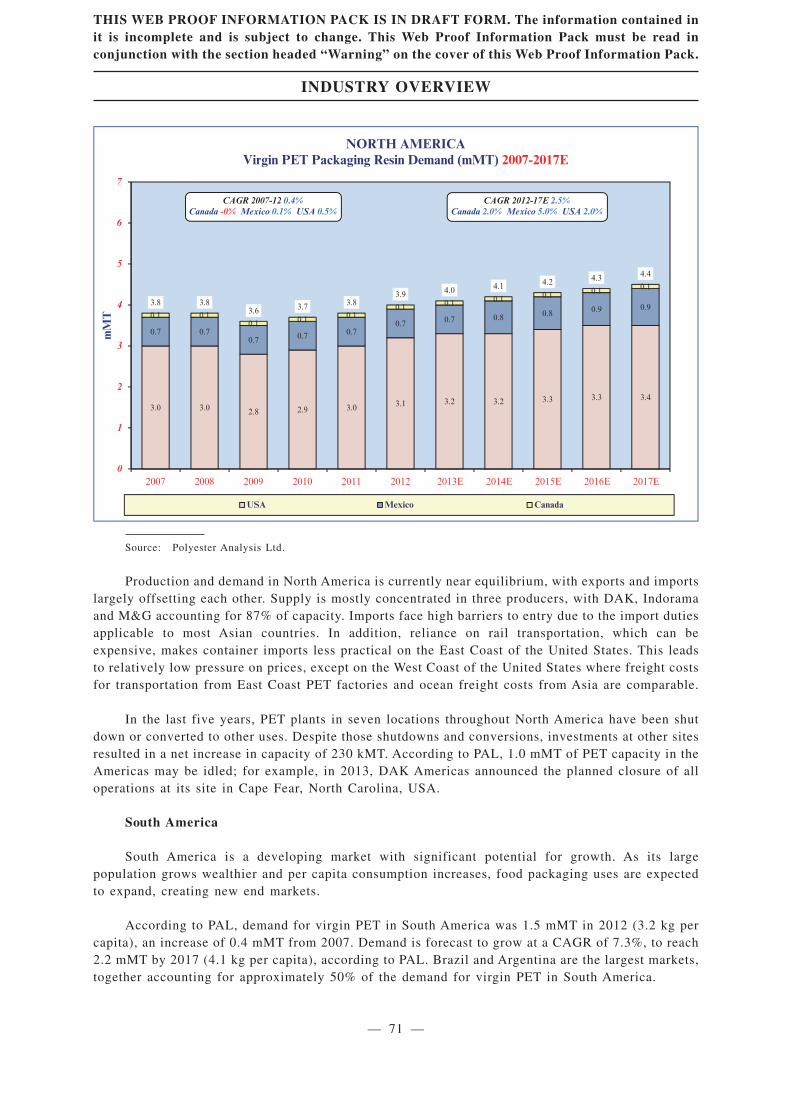
South America is a developing market with significant potential for growth. As its largepopulation grows wealthier and per capita consumption increases, food packaging uses are expectedto expand, creating new end markets.
According to PAL, demand for virgin PET in South America was 1.5 mMT in 2012 (3.2 kg percapita), an increase of 0.4 mMT from 2007. Demand is forecast to grow at a CAGR of 7.3%, to reach2.2 mMT by 2017 (4.1 kg per capita), according to PAL. Brazil and Argentina are the largest markets,together accounting for approximately 50% of the demand for virgin PET in South America.
THIS WEB PROOF INFORMATION PACK IS IN DRAFT FORM. The information contained init is incomplete and is subject to change. This Web Proof Information Pack must be read inconjunction with the section headed “Warning” on the cover of this Web Proof Information Pack.
INDUSTRY OVERVIEW
— 71 —
0.4 0.5 0.4 0.5 0.5 0.5 0.5 0.6 0.6 0.7 0.7
0.20.2 0.2
0.2 0.2 0.20.2 0.2 0.3
0.30.3
0.10.1 0.1
0.1 0.1 0.10.1
0.1 0.10.2
0.1
0.10.1 0.1
0.1 0.1 0.10.1
0.1 0.10.2
0.2
0.10.1 0.1
0.1 0.1 0.10.1
0.1 0.10.1
0.1
0.10.1 0.1
0.1 0.1 0.10.1
0.1 0.1
0.10.2
0.10.1 0.1
0.1 0.1 0.10.1
0.1 0.1
0.10.1
0.20.2 0.2
0.3 0.3 0.30.3
0.40.4
0.40.5
1.21.3 1.3
1.5 1.5 1.5
1.71.8
1.9
2.0
2.2
0
1
2
3
Brazil Argentina Venezuela Peru Uruguay Colombia Chile Others
mM
T
SOUTH AMERICAVirgin PET Packaging Resin Demand (mMT) 2007-2017E
2007 2008 2009 2010 2011 2012 2013E 2014E 2015E 2016E 2017E
CAGR 2007-12 5.5% p.a. CAGR 2012-17E 7.3% p.a.
Source: Polyester Analysis Ltd.
According to PAL, demand for virgin PET in Brazil was 0.5 mMT in 2012 (2.5 kg per capita),
or 33% of regional demand. Actual demand was higher after factoring in preform (precursor of the
final container) imports. A significant increase in demand is expected from 2012 to 2017, with a
forecast CAGR of 8.2%, compared to a CAGR of 4.6% from 2007 to 2012, driven primarily by demand
for CSDs, which accounted for 61% of demand in 2012. Other end uses, including barrier-grade PET
for beer packaging, are expected to show higher growth and expanded market share in the next five
years.
Supply in South America is highly concentrated in two major producers: DAK Americas, which
is focused on the Argentinean market, and M&G, with its focus on the Brazilian and Venezuelan
markets. A third supplier, Petroquímica Suape, is expected to enter the market by 2014. High initial
set-up costs and capital expenditures required to enter the market creates a high barrier to entry, but
PET imports from Asia drive local prices down. Companies based in Brazil benefit from government
incentives for local production, an advantage not available to companies in other South American
countries.
In the last five years, the closure of three smaller PET plants was offset by the opening of a 650
kMT plant in Suape, Brazil by M&G, resulting in a net increase in capacity of 110 kMT.
THIS WEB PROOF INFORMATION PACK IS IN DRAFT FORM. The information contained init is incomplete and is subject to change. This Web Proof Information Pack must be read inconjunction with the section headed “Warning” on the cover of this Web Proof Information Pack.
INDUSTRY OVERVIEW
— 72 —
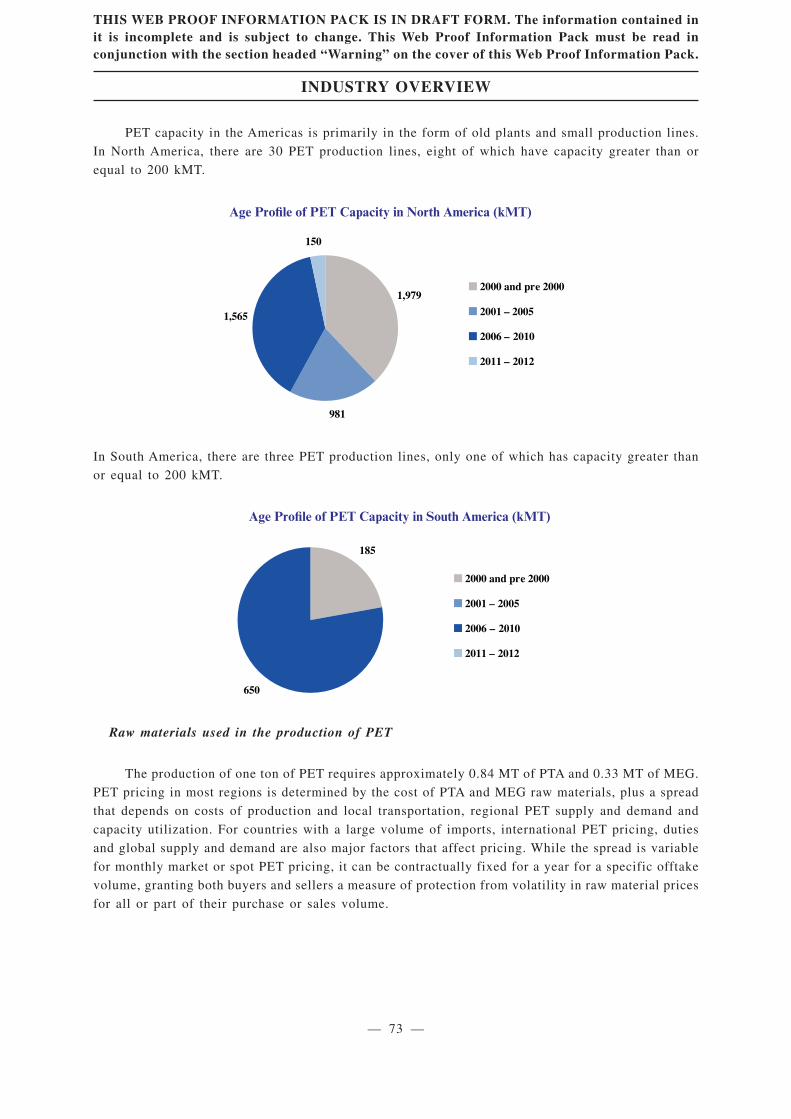
PET capacity in the Americas is primarily in the form of old plants and small production lines.
In North America, there are 30 PET production lines, eight of which have capacity greater than or
equal to 200 kMT.
1,979
981
1,565
150
2000 and pre 2000
2001 – 2005
2006 – 2010
2011 – 2012
Age Profile of PET Capacity in North America (kMT)
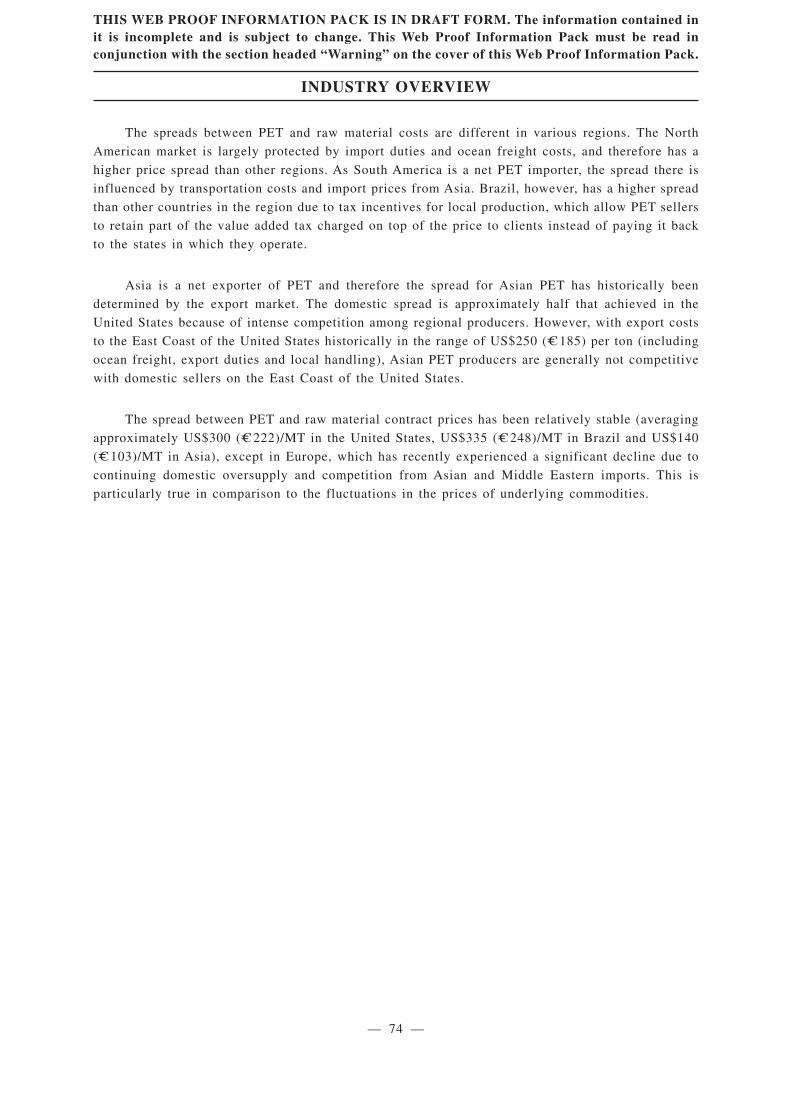
In South America, there are three PET production lines, only one of which has capacity greater than
or equal to 200 kMT.
185
650
2000 and pre 2000
2001 – 2005
2006 – 2010
2011 – 2012
Age Profile of PET Capacity in South America (kMT)
Raw materials used in the production of PET
The production of one ton of PET requires approximately 0.84 MT of PTA and 0.33 MT of MEG.
PET pricing in most regions is determined by the cost of PTA and MEG raw materials, plus a spread
that depends on costs of production and local transportation, regional PET supply and demand and
capacity utilization. For countries with a large volume of imports, international PET pricing, duties
and global supply and demand are also major factors that affect pricing. While the spread is variable
for monthly market or spot PET pricing, it can be contractually fixed for a year for a specific offtake
volume, granting both buyers and sellers a measure of protection from volatility in raw material prices
for all or part of their purchase or sales volume.
THIS WEB PROOF INFORMATION PACK IS IN DRAFT FORM. The information contained init is incomplete and is subject to change. This Web Proof Information Pack must be read inconjunction with the section headed “Warning” on the cover of this Web Proof Information Pack.
INDUSTRY OVERVIEW
— 73 —
The spreads between PET and raw material costs are different in various regions. The North
American market is largely protected by import duties and ocean freight costs, and therefore has a
higher price spread than other regions. As South America is a net PET importer, the spread there is
influenced by transportation costs and import prices from Asia. Brazil, however, has a higher spread
than other countries in the region due to tax incentives for local production, which allow PET sellers
to retain part of the value added tax charged on top of the price to clients instead of paying it back
to the states in which they operate.
Asia is a net exporter of PET and therefore the spread for Asian PET has historically been
determined by the export market. The domestic spread is approximately half that achieved in the
United States because of intense competition among regional producers. However, with export costs
to the East Coast of the United States historically in the range of US$250 ( C= 185) per ton (including
ocean freight, export duties and local handling), Asian PET producers are generally not competitive
with domestic sellers on the East Coast of the United States.
The spread between PET and raw material contract prices has been relatively stable (averaging
approximately US$300 ( C= 222)/MT in the United States, US$335 ( C= 248)/MT in Brazil and US$140
( C= 103)/MT in Asia), except in Europe, which has recently experienced a significant decline due to
continuing domestic oversupply and competition from Asian and Middle Eastern imports. This is
particularly true in comparison to the fluctuations in the prices of underlying commodities.
THIS WEB PROOF INFORMATION PACK IS IN DRAFT FORM. The information contained init is incomplete and is subject to change. This Web Proof Information Pack must be read inconjunction with the section headed “Warning” on the cover of this Web Proof Information Pack.
INDUSTRY OVERVIEW
— 74 —
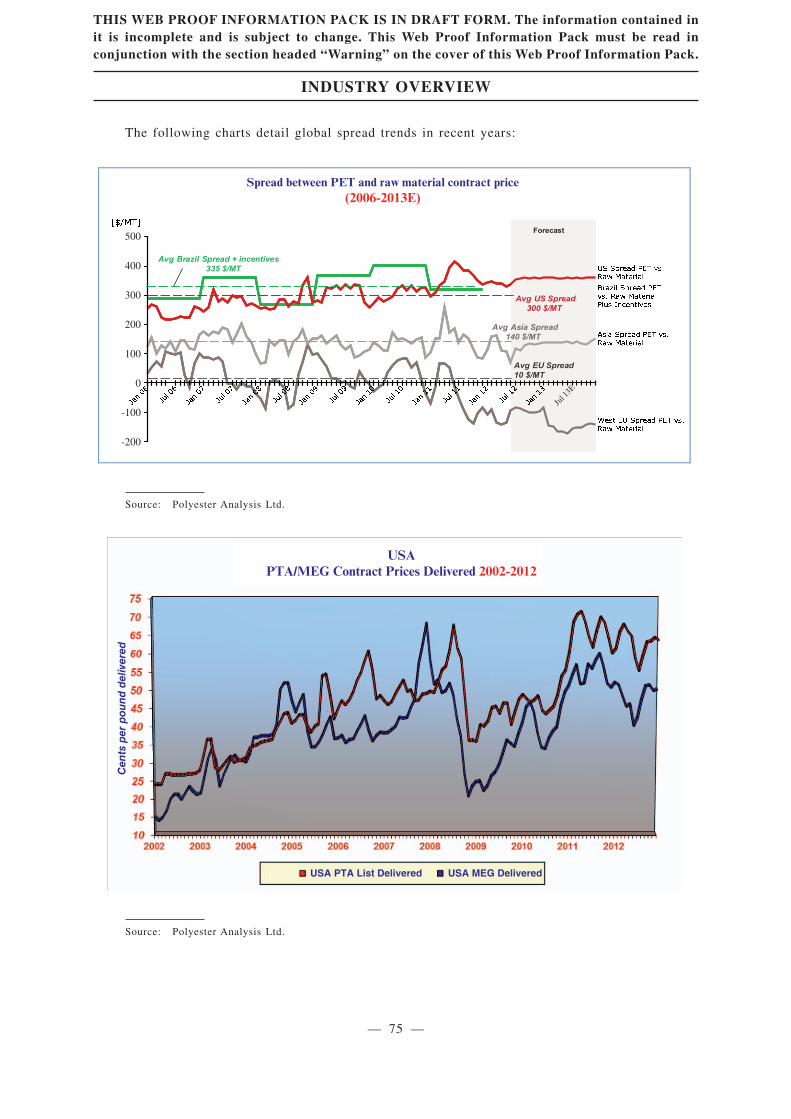
The following charts detail global spread trends in recent years:
500
400
300
200
100
0
-100
-200
Spread between PET and raw material contract price(2006-2013E)
Forecast
Avg US Spread 300 $/MT
Avg Asia Spread 140 $/MT
Avg EU Spread 10 $/MT
Avg Brazil Spread + incentives335 $/MT
Jul 1
3E
Source: Polyester Analysis Ltd.
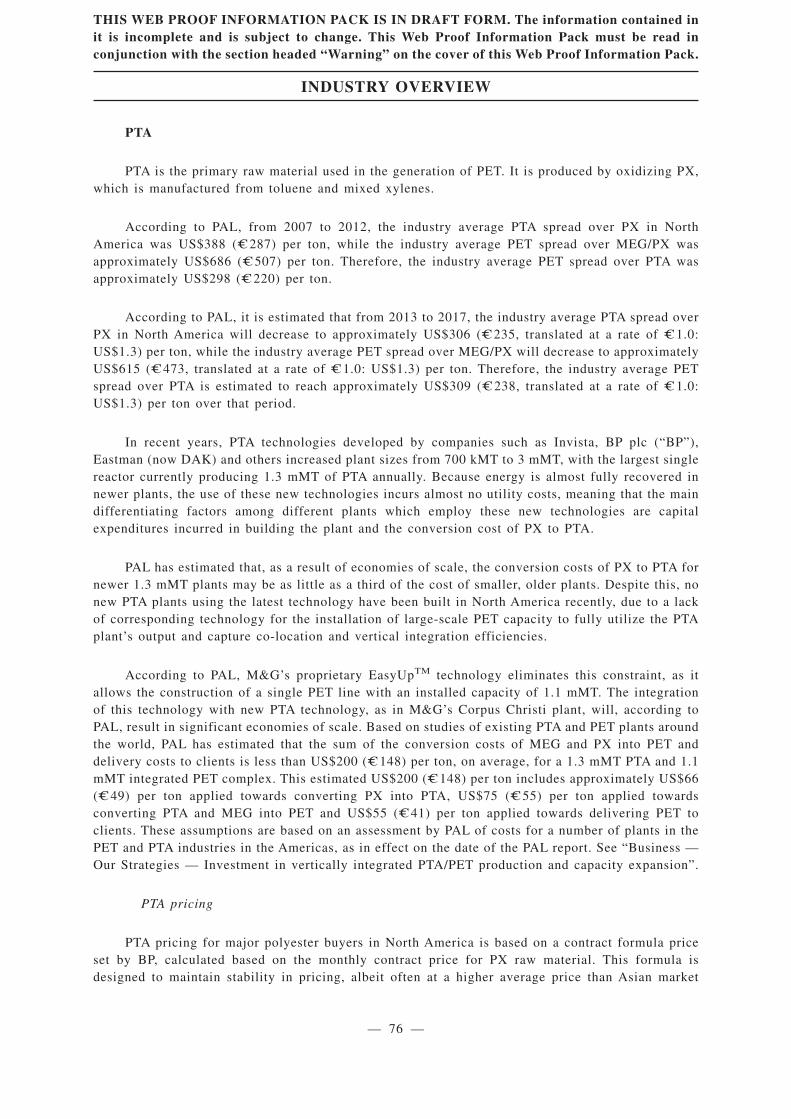
USAPTA/MEG Contract Prices Delivered 2002-2012
Cen
ts p
er p
ou
nd
del
iver
ed
USA MEG DeliveredUSA PTA List Delivered
Source: Polyester Analysis Ltd.
THIS WEB PROOF INFORMATION PACK IS IN DRAFT FORM. The information contained init is incomplete and is subject to change. This Web Proof Information Pack must be read inconjunction with the section headed “Warning” on the cover of this Web Proof Information Pack.
INDUSTRY OVERVIEW
— 75 —
PTA
PTA is the primary raw material used in the generation of PET. It is produced by oxidizing PX,which is manufactured from toluene and mixed xylenes.
According to PAL, from 2007 to 2012, the industry average PTA spread over PX in NorthAmerica was US$388 ( C= 287) per ton, while the industry average PET spread over MEG/PX wasapproximately US$686 ( C= 507) per ton. Therefore, the industry average PET spread over PTA wasapproximately US$298 ( C= 220) per ton.
According to PAL, it is estimated that from 2013 to 2017, the industry average PTA spread overPX in North America will decrease to approximately US$306 ( C= 235, translated at a rate of C= 1.0:US$1.3) per ton, while the industry average PET spread over MEG/PX will decrease to approximatelyUS$615 ( C= 473, translated at a rate of C= 1.0: US$1.3) per ton. Therefore, the industry average PETspread over PTA is estimated to reach approximately US$309 ( C= 238, translated at a rate of C= 1.0:US$1.3) per ton over that period.
In recent years, PTA technologies developed by companies such as Invista, BP plc (“BP”),Eastman (now DAK) and others increased plant sizes from 700 kMT to 3 mMT, with the largest singlereactor currently producing 1.3 mMT of PTA annually. Because energy is almost fully recovered innewer plants, the use of these new technologies incurs almost no utility costs, meaning that the maindifferentiating factors among different plants which employ these new technologies are capitalexpenditures incurred in building the plant and the conversion cost of PX to PTA.
PAL has estimated that, as a result of economies of scale, the conversion costs of PX to PTA fornewer 1.3 mMT plants may be as little as a third of the cost of smaller, older plants. Despite this, nonew PTA plants using the latest technology have been built in North America recently, due to a lackof corresponding technology for the installation of large-scale PET capacity to fully utilize the PTAplant’s output and capture co-location and vertical integration efficiencies.
According to PAL, M&G’s proprietary EasyUpTM technology eliminates this constraint, as itallows the construction of a single PET line with an installed capacity of 1.1 mMT. The integrationof this technology with new PTA technology, as in M&G’s Corpus Christi plant, will, according toPAL, result in significant economies of scale. Based on studies of existing PTA and PET plants aroundthe world, PAL has estimated that the sum of the conversion costs of MEG and PX into PET anddelivery costs to clients is less than US$200 ( C= 148) per ton, on average, for a 1.3 mMT PTA and 1.1mMT integrated PET complex. This estimated US$200 ( C= 148) per ton includes approximately US$66( C= 49) per ton applied towards converting PX into PTA, US$75 ( C= 55) per ton applied towardsconverting PTA and MEG into PET and US$55 ( C= 41) per ton applied towards delivering PET toclients. These assumptions are based on an assessment by PAL of costs for a number of plants in thePET and PTA industries in the Americas, as in effect on the date of the PAL report. See “Business —Our Strategies — Investment in vertically integrated PTA/PET production and capacity expansion”.
PTA pricing
PTA pricing for major polyester buyers in North America is based on a contract formula priceset by BP, calculated based on the monthly contract price for PX raw material. This formula isdesigned to maintain stability in pricing, albeit often at a higher average price than Asian market
THIS WEB PROOF INFORMATION PACK IS IN DRAFT FORM. The information contained init is incomplete and is subject to change. This Web Proof Information Pack must be read inconjunction with the section headed “Warning” on the cover of this Web Proof Information Pack.
INDUSTRY OVERVIEW
— 76 —
pricing. The BP formula is a cost-plus formula commonly used in the industry and published by anumber of industry sources, such as PAL, PCI, Tecnon OrbiChem and IHS Inc. BP and others haveprovided discounts and selective price support for customers over the years and react to structuralmarket trends in Asia in order to benefit the United States polyester export business.
In South America, import prices into Brazil from North America are typically based on PX pricesin the United States, plus conversion cost, sea freight and profit. Import prices from Asia includefreight and shipping costs.
PTA supply and demand
According to PAL, global PTA capacity increased from 42.7 mMT in 2007 to 60.6 mMT in 2012at a CAGR of 7.2%, and is forecast to increase to 107.8 mMT by 2017 at a CAGR of 12.2%. GlobalPTA demand increased from 37.1 mMT in 2007 to 50.0 mMT in 2012 at a CAGR of 6.1%, and isforecast to increase at a CAGR of 7.8% from 2012 to 2017 to reach 72.7 mMT, primarily driven bygrowth in the Asian polyester fiber market and demand for PET and film.
According to PAL, capacity and demand for PTA in North America are forecast to grow from 6.0mMT and 4.3 mMT, respectively, in 2012 to 7.0 mMT and 5.1 mMT, respectively, by 2017. GrupoPetrotemex/Alpek is currently the largest producer, with 2.8 mMT of capacity, while BP has 2.4 mMT,Cepsa 675 kMT and Eastman 240 kMT.
In South America, capacity and demand for PTA are forecast to grow from nil and 650 kMT,respectively, in 2012, to 0.8 mMT and 1.2 mMT, respectively, by 2017.
MEG
MEG is normally produced from naphtha, gas oil or liquefied petroleum gas. MEG can also beproduced from biomass. However, chemical companies in China are currently developing newercatalysts that are expected to enable polyester-grade MEG to be made from coal, using dimethyloxalate and methanol-to-olefins processes. The cost of production of MEG in China is estimated to beUS$600�800 ( C= 443 � 591) per ton and depends on feedstock and processing costs, but with marketprices at over US$1,000 ( C= 739) per ton, most technologies are economically viable compared toimporting material from Asia, the Middle East or North America.
The cost of producing MEG from biomass depends on the cost of biomass. First generationbiomass (i.e. food) is expensive because of the high alternative food use value and would driveproduction costs to the upper end of the traditional range. However, according to PAL, if the cost ofbiomass can be contained (including yield and logistics) in a range of US$200�250 ( C= 154 �192,translated at a rate of C= 1.0: US$1.3) per ton by employing second generation biomass technologies,bio-MEG production costs could fall 20�30% below the lower end of the traditional range, beingapproximately US$420�480 ( C= 323�369, translated at a rate of C= 1.0: US$1.3) per ton.
MEG pricing
The price of MEG is determined by supply and demand and the cost of ethylene, which in turnis largely driven by oil and natural gas prices.
THIS WEB PROOF INFORMATION PACK IS IN DRAFT FORM. The information contained init is incomplete and is subject to change. This Web Proof Information Pack must be read inconjunction with the section headed “Warning” on the cover of this Web Proof Information Pack.
INDUSTRY OVERVIEW
— 77 —
In the Americas, the MEG contract price for major polyester buyers is related to Asian market
pricing. In Asia, Sabic, MEGlobal and Shell make a public nomination each month for their contract
volumes so customers may open letters of credit. The actual net market price is then determined by
the average monthly Asia spot price, plus or minus a premium or discount. The historical spread for
conventional MEG is calculated from spot market prices for both ethylene and MEG, using a formula
based on the MEG price and subtracting 0.6 times the ethylene price. Integrated ethylene/MEG
producers have a higher margin since they have no logistics costs associated with ethylene sourcing.
PAL’s forecast of a US$300�400 ( C= 231�308, translated at a rate of C= 1.0: US$1.3) per ton spread
for conventional chemical MEG is supplemented by a bio-MEG premium1, which was as high as
US$500 ( C= 370) per ton in 2012 but it is likely to plateau as more capacity is installed. According to
PAL, from 2013 to 2017, a bio-MEG premium of approximately US$200�300 ( C= 154�231, translated
at a rate of C= 1.0: US$1.3) per ton is estimated over the spread for conventional chemical MEG.
MEG Supply and Demand
According to PAL, global MEG capacity is forecast to increase at a CAGR of 15.6% in
2012�2017, from 28.0 mMT to 57.8 mMT, while demand is forecast to increase at a CAGR of 7.0%
during the same period, primarily driven by growth in the Asian polyester fiber market and demand
for PET and film.
In 2012, MEG capacity in North America was 4.0 mMT, whereas demand was estimated at 3.0
mMT, according to PAL. Capacity and demand are forecast to grow to almost 6.8 mMT and 3.2 mMT,
respectively, by 2017.
Capacity in South America was only 415 kMT in 2012 according to PAL, whereas demand was
approximately 380 kMT, with Oxiteno in Brazil and Pralca in Venezuela the only producers. PAL
forecasts capacity and demand for MEG to grow to 1.0 mMT and 0.6 mMT, respectively, by 2017, as
domestic polyester production is expected to substitute imported PET, fibers and textiles.
BIO-PET AND BIO-MEG
The limitations of the Earth’s resources, the environmental impact of oil-based plastics
production and increasing consumer concerns about packaging waste are driving the rapid growth in
demand for sustainable polyester, not only among food and beverage brand owners, such as
Coca-Cola, Pepsi, Danone and Heinz, but also among other brand owners using polyester in fiber and
tire-cord applications, such as Nike and Ford.
1 This is the additional price (compared to oil and gas-based MEG) that brand-owners (such as Coca-Cola and Pepsi) arewilling to pay in order to provide environmental sustainability for consumers. Typically brand-owners receive importantbenefits (such as higher market share) from being able to provide consumers with environmental sustainability that morethan compensate the premium they pay to suppliers of environmentally sustainable packaging materials.
THIS WEB PROOF INFORMATION PACK IS IN DRAFT FORM. The information contained init is incomplete and is subject to change. This Web Proof Information Pack must be read inconjunction with the section headed “Warning” on the cover of this Web Proof Information Pack.
INDUSTRY OVERVIEW
— 78 —
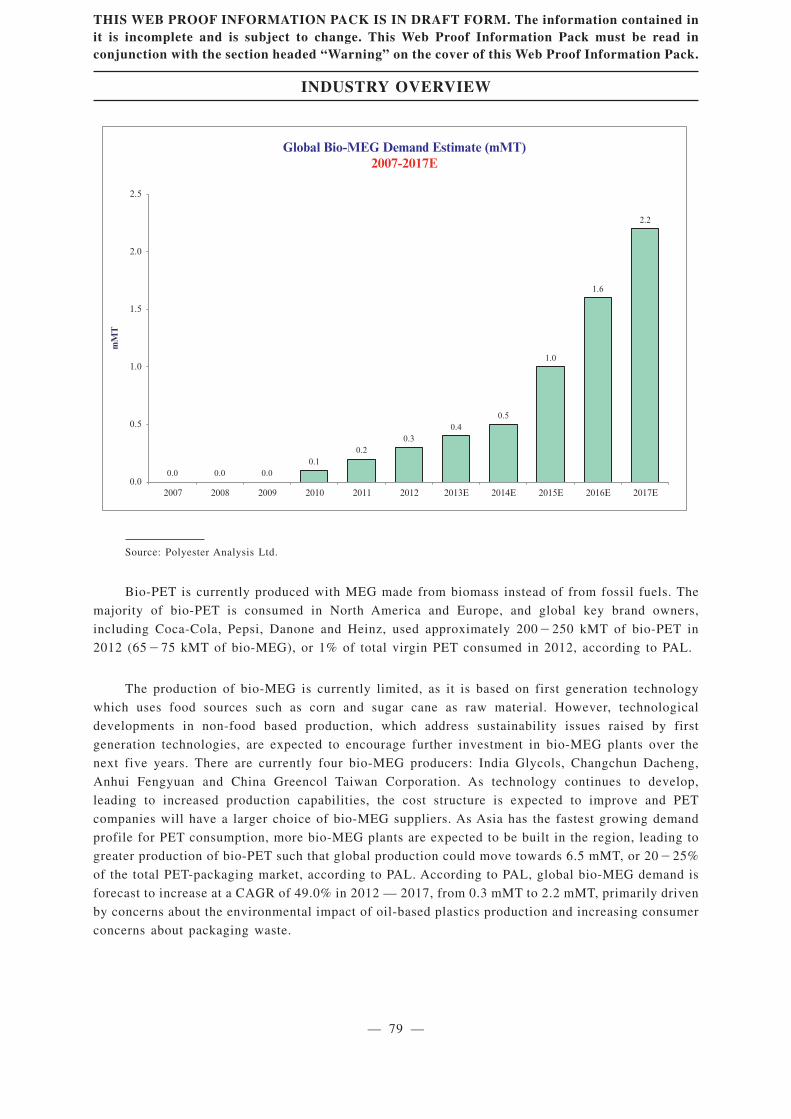
0.0 0.0 0.00.1
0.20.3
0.40.5
1.0
1.6
2.2
0.0
0.5
1.0
1.5
2.0
2.5
mM
T
Global Bio-MEG Demand Estimate (mMT)2007-2017E
2007 2008 2009 2010 2011 2012 2013E 2014E 2015E 2016E 2017E
Source: Polyester Analysis Ltd.
Bio-PET is currently produced with MEG made from biomass instead of from fossil fuels. The
majority of bio-PET is consumed in North America and Europe, and global key brand owners,
including Coca-Cola, Pepsi, Danone and Heinz, used approximately 200�250 kMT of bio-PET in
2012 (65�75 kMT of bio-MEG), or 1% of total virgin PET consumed in 2012, according to PAL.
The production of bio-MEG is currently limited, as it is based on first generation technology
which uses food sources such as corn and sugar cane as raw material. However, technological
developments in non-food based production, which address sustainability issues raised by first
generation technologies, are expected to encourage further investment in bio-MEG plants over the
next five years. There are currently four bio-MEG producers: India Glycols, Changchun Dacheng,
Anhui Fengyuan and China Greencol Taiwan Corporation. As technology continues to develop,
leading to increased production capabilities, the cost structure is expected to improve and PET
companies will have a larger choice of bio-MEG suppliers. As Asia has the fastest growing demand
profile for PET consumption, more bio-MEG plants are expected to be built in the region, leading to
greater production of bio-PET such that global production could move towards 6.5 mMT, or 20�25%
of the total PET-packaging market, according to PAL. According to PAL, global bio-MEG demand is
forecast to increase at a CAGR of 49.0% in 2012 — 2017, from 0.3 mMT to 2.2 mMT, primarily driven
by concerns about the environmental impact of oil-based plastics production and increasing consumer
concerns about packaging waste.
THIS WEB PROOF INFORMATION PACK IS IN DRAFT FORM. The information contained init is incomplete and is subject to change. This Web Proof Information Pack must be read inconjunction with the section headed “Warning” on the cover of this Web Proof Information Pack.
INDUSTRY OVERVIEW
— 79 —
In June 2012, as part of their increased focus on packaging sustainability, Coca-Cola, Ford,Heinz, Nike and Procter & Gamble formed the “PET Technology Collaborative”, which is a strategicworking group focused on leveraging the participating companies’ research and development effortsin order to accelerate the development and use of 100% bio-based PET material and fiber in theirproducts. Coca-Cola’s stated intent to source 100% of its PET requirements for its “PlantBottle” frombio-raw materials by 2020 could alone require an estimated 2.5 mMT of bio-MEG.
According to PAL, the total number of new bio-MEG plants is expected to approach 25 by 2017,with a typical capacity of up to 100 kMT.
CONTRACTING AND ENGINEERING
M&G’s Engineering division provides technological development and research and engineeringservices for the construction of plants for the bio-fuel, chemicals, energy, environmental,petrochemical, polyester and fiber industries. M&G’s Engineering division primarily constructspolyester-chain plants and small- to medium-sized LNG plants in China.
Polyester chain
In the next five years, according to PAL, increasing demand for products in the polyester chain(PET, PTA, MEG and fiber) is expected to lead to an expansion in production and a consequent needfor new, more efficient plants throughout the value chain. This is expected to come partly at theexpense of older, less efficient units. Globally, PAL forecasts, new PET, PTA and polyester fibercapacity is expected to increase at a CAGR of approximately 12.4%, 12.2% and 7.1%, respectively,from 2012 to 2017.
With projected increases in PET, PTA and fiber production capacity, PAL also expects thedemand for construction of new plants to remain relatively high, at approximately 35�45 new plantseach year, based on a unit size of 250 kMT per PET line, 1 mMT per PTA line and 200 kMT per fiberline.
The primary companies providing plant construction services in the polyester industry areChemtex, Uhde Inventa-Fischer and the Chinese companies CTIEI and Huitong Chemical, which havelimited market share outside of China and historically have not had the ability to build individual lineslarger than approximately 250 kMT.
Small- and medium-sized LNG plants in China
Demand for LNG and LNG production plants
China is currently the second largest producer and consumer of energy in the world. This demandfor energy has been a key driver of the growth in production and consumption of natural gas in Chinain the past 10 years, which has grown at an average yearly rate of 13% and 16%, respectively,according to CALI. In the past seven years, Chinese natural gas production nearly doubled, reaching102.5 billion Nm3 in 2011, while consumption has nearly tripled to 130.7 billion Nm3, making Chinaone of the largest natural gas consumers in the world in 2011.
THIS WEB PROOF INFORMATION PACK IS IN DRAFT FORM. The information contained init is incomplete and is subject to change. This Web Proof Information Pack must be read inconjunction with the section headed “Warning” on the cover of this Web Proof Information Pack.
INDUSTRY OVERVIEW
— 80 —
This high growth rate is expected to continue in the future, with CALI predicting that Chinesenatural gas demand will increase by 12% every year over the next fifteen years. CALI expects thatdemand for LNG will increase at a faster rate than supply, with forecasts for LNG production anddemand of 185 billion Nm3 and 260 billion Nm3, respectively, in 2015.
The growth in demand for natural gas has driven the construction of medium- and small-scaleLNG plants in China in order to alleviate the pressures on local natural gas supplies, city gas supplypeak-shaving and the utilization of oilfield associated gas, marginal gas and coalbed methane, whichhave not been exploited due to lack of storage capacity and the costs of transporting natural gas longdistances to the market. The construction of medium- and small-scale LNG plants in China is intendedgenerally to allow the more remote regions of China to access natural gas. In addition, such plantsoccupy less land and require lower capital expenditure and less construction time. Chinese nationalenergy strategy has further driven the construction of LNG production facilities, as coal-miningregions of the country have begun using LNG as fuel.
Chinese imports of LNG, driven by high domestic demand, have grown at a CAGR of 45.0%,from 3.3 mMT in 2008 to 14.7 mMT in 2012, according to CALI. In addition, large petroleumcompanies such as China National Offshore Oil Corporation and China National PetroleumCorporation have built several LNG terminals for the importation of LNG.
The Chinese government has implemented policies to foster the development of the natural gasindustry with the objective of making natural gas 10% of energy use in China by 2030. This emphasison the development of LNG in China has also led to the development of upstream and downstreamindustries such as LNG-fueled ships and vehicles, low-temperature storage facilities and a network ofLNG filling stations.
In May 2012, China had over thirty medium- and small-scale LNG plants in operation, with totalcapacity of nearly 2.6 mMT per year, and over forty new LNG plants currently under construction.CALI estimates that the total capacity of domestic Chinese LNG plants will reach 7.5 mMT per yearby 2015.
Competitive landscape
Among the technology suppliers and contractors available in the Chinese small- andmedium-sized LNG plant market, the Black & Veatch PRICO� liquefaction technology supplied byM&G has been the most extensively applied due to its reliability, broad adaptability and costeffectiveness. According to CALI, approximately 33% of the total current Chinese LNG industryliquefaction capacity, and 36% of that currently under construction in August 2012, implements thistechnology.
COMMISSIONED REPORT FROM PAL
We commissioned PAL, an independent advisor to participants in the industries in which weoperate in strategic and commercial planning, feasibility and financial studies, due diligence supportand competitive and market analysis, to conduct an analysis of, and to report on, the PET industry andthe plant construction and engineering business. PAL is a global, commercial consultancy specializingin the PET packaging resin and polyester fiber industry value chain. The report by PAL has beenprepared independent of our influence. We paid PAL GBP75,000 ( C= 89,748) for the commissionedreport, and we consider that such fees reflect market rates.
THIS WEB PROOF INFORMATION PACK IS IN DRAFT FORM. The information contained init is incomplete and is subject to change. This Web Proof Information Pack must be read inconjunction with the section headed “Warning” on the cover of this Web Proof Information Pack.
INDUSTRY OVERVIEW
— 81 —
Investors should note that PAL was engaged to prepare a market study report, for use in whole
or in part in this document and we obtained permission from CALI to refer to, quote and extract
information from its report for use in this document. PAL prepared its report based on its in-house
databases, independent third party reports, publicly available data from government or industry
publications and data provided by us. Where necessary, PAL contacted companies operating in the
industry and other industry experts to gather and analyze information about markets, prices and other
relevant information. Although the information contained in the PAL report and CALI report has been
obtained from sources believed by PAL and CALI to be reliable, certain information from government
or industry publications is unavoidably subject to assumptions and estimates made by third parties and
such information has not been independently verified by PAL or CALI. The information contained in
the PAL report and CALI report are also subject to assumptions that no significant economic
depression or financial crisis, global political or environmental events or technical revolution in the
PET industry and the plant construction and engineering business would take place or be fulfilled in
the next five years. The information extracted from the PAL report and CALI report reflects an
estimate of the market conditions based on PAL’s and CALI’s research and analysis at the time of
preparation of the PAL report and CALI report. The information extracted from the PAL report and
CALI report should not be viewed as a basis for investments provided by PAL and CALI and
references to the PAL report and CALI report should not be considered as their opinion as to the value
of any security or the advisability of investing in our Company. In no event will PAL or CALI be liable
for indirect, special, punitive or consequential damages of any kind or nature whatsoever, suffered by
the other party.
PAL and CALI have provided part of the statistical and graphical information contained in this
Industry Overview section. PAL and CALI have advised that (i) some information in their databases
is derived from estimates from industry sources or subjective judgments and (ii) the information in the
databases of other data collection agencies may differ from the information in PAL’s and CALI’s
databases.
Investors should also note that no independent verification has been carried out on any facts or
statistics that are directly or indirectly derived from official government and non-official sources. We
believe that the sources of the information in this section are appropriate sources for such information
and have taken reasonable care in extracting and reproducing such information. We have no reason to
believe that such information is false or misleading or that any part has been omitted that would render
such information false or misleading. We, any other persons or parties involved make no
representation as to the accuracy of the information from official government and non-official sources,
which may not be consistent with other information compiled within or outside the PRC. Accordingly,
the official government and non-official sources contained herein may not be accurate and should not
be unduly relied upon.
THIS WEB PROOF INFORMATION PACK IS IN DRAFT FORM. The information contained init is incomplete and is subject to change. This Web Proof Information Pack must be read inconjunction with the section headed “Warning” on the cover of this Web Proof Information Pack.
INDUSTRY OVERVIEW
— 82 —
Related Documents