Industry Cluster Analysis Industry Cluster Analysis Project Overview Project Overview Wande Reweta Colorado Department of Labor and Employment

Welcome message from author
This document is posted to help you gain knowledge. Please leave a comment to let me know what you think about it! Share it to your friends and learn new things together.
Transcript

Industry Cluster Analysis Industry Cluster Analysis Project OverviewProject Overview
Wande Reweta
Colorado Department of Labor and Employment

Industry Cluster Analysis
• What are Industry Clusters?• Groupings of firms, involving various industries, that
have mutual affinity or reliance
• Three critical conceptual dimensions• Linkage
• Interdependence between businesses/industries/sectors
• Stage of development
• Clusters may be existing, emerging, or potential
• Geography

Linkage
• The heart of cluster analysis
• May be formal or informal
• Sources• common value (e.g. production, market) chains
• similar labor skill requirements
• shared or similar technologies
• or knowledge and/or innovation exchange
• Choice of study linkage determined, at least in part, from policy goals.

Stage of Development• Offers different cluster types for study focus,
depending on goals• Existing stage
• Existing clusters are those that have reached a critical mass in size and/or diversity of operation
• Existing clusters may be expanding or contracting at any given point in time
• Emerging• Emerging clusters are likely to achieve critical mass, given
current trends
• Potential• Potential clusters are those with potential, but uncertain
growth environment and possibly have only a few related industries

Geography
• Clusters must be identified by more than locality
• Regional concentration versus global dispersion
• Cross boundary linkages
• Study order:
Linkage/economic logic Geographic concentrations

Required Resources and ToolsFor This Study
• Resources• Benchmark Input-Output Accounts of the U.S.
• Staffing Patterns Matrix
• Industry X Industry Transactions Matrix
• Reference Literature
• Analytical Tools• IMPLAN
• Programmable statistical software (SPSS)
• Excel spreadsheets

Work Components
Report
Data
Software
Analyst Knowledge & Skills
References

General Flow of Work
Policymakers
Policy Goals
ClusterDefinition
Value-addedI-O
EmploymentSkills
Growth Rates
Basic Data Composition
State Data Analysis
National/State Cluster Synthesis
Sub-state Data Analysis
CompositeReport
GenerationBenchmark I-O Accounts of U.S.
Transactions Accounts IMPLAN
Mathematical Methods
Previous Studies, Texts,
& Consultation
SWOT Analysis
SeparateReport

The Report
• Basic information rather than more encompassing analysis
• Cluster Identification
• Industry Information• Employment
• Wages
• Occupation employment
• Regional Comparison

Goals versus Reality
• Identification of Colorado industry clusters
• Analysis of clusters• Employment• Wages• Value Added or Tax Revenue• Export Value
• Comparison with National clusters
• Cluster state evaluation• Mature• Emerging• Potential
• Regional comparison• Denver• Rural region (NWRR)
• Identification of Colorado industry clusters
• Analysis of clusters• Employment
• Wages
• Occupation Employment
• Regional comparison (reduced)

The Clusters
• Aerospace• Agricultural and Resource
Production• Construction• Consumer Products• Dairy Products• Electronic Components and
Devices• Fabricated Materials• Ferrous Metal and Mineral
Mining• Food Processing and Packaging• Gas and Oil Refining and
Related Products
• Gas and Oil Well Maintenance and Repair
• General Manufacturing• Leather and Animal Products• Logging and Wood Products• Meat Production• Motor Vehicles and Parts
Manufacturing and Repair• Non-ferrous Metal Mining• Non-metallic Mineral Products• Pharmaceuticals• Plastics and Allied Chemicals• Public Utilities
Selected Highlights of State Data
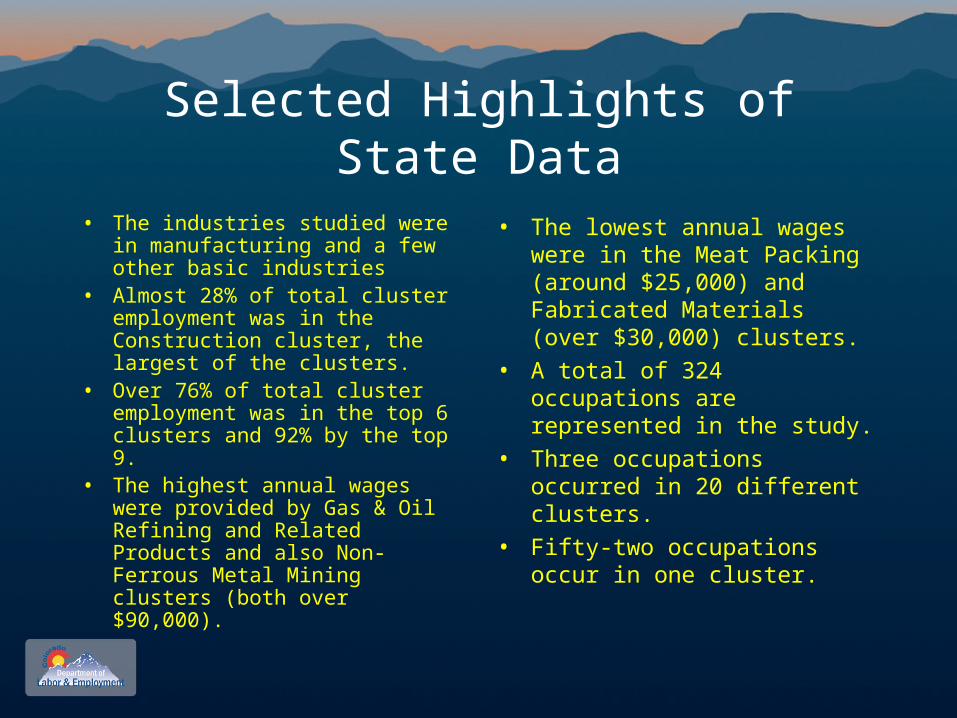
• The industries studied were in manufacturing and a few other basic industries
• Almost 28% of total cluster employment was in the Construction cluster, the largest of the clusters.
• Over 76% of total cluster employment was in the top 6 clusters and 92% by the top 9.
• The highest annual wages were provided by Gas & Oil Refining and Related Products and also Non-Ferrous Metal Mining clusters (both over $90,000).
• The lowest annual wages were in the Meat Packing (around $25,000) and Fabricated Materials (over $30,000) clusters.
• A total of 324 occupations are represented in the study.
• Three occupations occurred in 20 different clusters.
• Fifty-two occupations occur in one cluster.

Cluster Employment
-
20,000
40,000
60,000
80,000
100,000
120,000
140,000
160,000
180,000
200,000
Co
nst
ruct
ion
Pu
blic
Util
itie
s
Ge
ne
ral M
an
ufa
ctu
rin
g
Ae
rosp
ace
Ele
ctri
c C
om
po
ne
nts
an
d D
evi
ces
No
n-M
eta
llic
Min
era
l Pro
du
cts
Ag
ricu
ltura
l an
d R
eso
urc
e P
rod
uct
ion
Co
nsu
me
r P
rod
uct
s
Fa
bri
cate
d M
ate
ria
ls
Ga
s a
nd
Oil
Re
finin
g a
nd
Re
late
d P
rod
uct
s
Ga
s a
nd
Oil
We
ll M
ain
tan
en
ce a
nd
Re
pa
ir
Pla
stic
s a
nd
Alli
ed
Ch
em
ica
ls
Fe
rro
us
Me
tal a
nd
Min
era
l Min
ing
Mo
tor
Ve
hic
les
an
d P
art
s M
an
ufa
ctu
rin
g a
nd
Re
pa
ir
Me
at P
rod
uct
ion
Ph
arm
ace
utic
als
Fo
od
Pro
cess
ing
an
d P
ack
ag
ing
Da
iry
Pro
du
cts
No
n-F
err
ou
s M
eta
l Min
ing
Le
ath
er
an
d A
nim
al P
rod
uct
s
Lo
gg
ing
an
d W
oo
d P
rod
uct
s
Em
plo
ym
en
t
$0
$10,000
$20,000
$30,000
$40,000
$50,000
$60,000
$70,000
$80,000
$90,000
$100,000
Wag
e
Employment
2001 Average Wages

Colorado Cluster Wages Ranges
Wage Ranges for the Top 10 Clusters by Employment$
10
0,6
30
$2
13
,84
8
$1
06
,22
9
$7
3,5
22
$2
13
,84
8
$8
3,1
29
$4
3,7
99
$6
0,5
19
$4
1,6
49
$4
4,6
53
$2
4,8
03
$1
4,8
78
$1
5,7
40
$1
5,7
40
$1
,34
8
$1
5,6
74
$2
8,5
78
$8
,29
1
$1
4,8
78
$2
,24
5
$5
6,6
84
$5
4,6
31
$5
1,3
25
$4
2,1
49
$3
9,7
10
$3
9,2
92
$3
5,5
45
$2
9,0
58
$2
8,8
62
$2
1,7
29
$0
$50,000
$100,000
$150,000
$200,000
$250,000
Ele
ctr
Cm
pn
& D
vc
Av
gW
ag
e
Ae
ros
pa
ce
Av
g W
ag
e
Pu
b U
tilit
ies
Av
g W
ag
e
Cn
sm
r P
rd A
vg
Wa
ge
Ge
ne
ral C
om
po
ne
nts
Av
gW
ag
e
No
n-M
eta
llic
Min
era
lsP
rod
uc
ts A
vg
Wa
ge
Co
ns
tru
cti
on
Av
g W
ag
e
Me
at
Prd
n A
vg
Wa
ge
Fa
br
Mtr
ls A
vg
Wa
ge
Ag
r &
Rs
rc P
rdn
& D
istr
Av
g W
ag
e
Maximum Wage Minimum Wage Average Wage

Occupations Occurring in Ten or More Clusters
20 20 20
19 19 19
18 18 18
17 17
16 16 16
15 15
14 14
13 13 13 13 13 13
12 12
11 11 11 11 11
10 10 10 10 10 10 10
0
5
10
15
20
25
Ge
ne
ral a
nd
Op
era
tio
ns M
an
ag
ers
Bo
okke
ep
ing
,
Acco
un
tin
g,
an
d
Fir
st-
Lin
e
Su
pe
rvis
ors
/Ma
na
ge
rs
Off
ice
Cle
rks,
Ge
ne
ral
Ind
ustr
ial P
rod
uctio
n
Ma
na
ge
rs
Fir
st-
Lin
e
Su
pe
rvis
ors
/Ma
na
ge
rs
Se
cre
tari
es,
Exce
pt
Le
ga
l, M
ed
ica
l, a
nd
Fin
an
cia
l M
an
ag
ers
Pro
du
ctio
n,
Pla
nn
ing
,
an
d E
xp
ed
itin
g C
lerk
s
Sto
ck C
lerk
s a
nd
Ord
er
Fille
rs
Exe
cu
tive
Se
cre
tari
es
an
d A
dm
inis
tra
tive
Pu
rch
asin
g A
ge
nts
,
Exce
pt
Wh
ole
sa
le,
Bu
sin
ess O
pe
ratio
ns
Sp
ecia
lists
, A
ll O
the
r
Me
ch
an
ica
l E
ng
ine
ers
Re
ce
ptio
nis
ts a
nd
Info
rma
tio
n C
lerk
s
Ind
ustr
ial T
ruck a
nd
Tra
cto
r O
pe
rato
rs
We
lde
rs,
Cu
tte
rs,
So
lde
rers
, a
nd
Bra
ze
rs
Ma
ch
inis
ts
He
lpe
rs--
Pro
du
ctio
n
Wo
rke
rs
Cluster Repeats

Occupation Wage Comparison by Region (Occupations Occurring in at least 15 Clusters)
$0.00
$10.00
$20.00
$30.00
$40.00
$50.00
$60.00
Gen
eral
and
Ope
ratio
ns M
anag
ers
Acc
ount
ants
and
Aud
itors
Boo
kkee
ping
,A
ccou
ntin
g, a
ndA
uditi
ng C
lerk
sS
ales
Rep
rese
ntat
ives
,W
hole
sale
and
Mai
nten
ance
and
Rep
air
Wor
kers
,G
ener
alF
irst-
Line
Sup
ervi
sors
/Man
ager
sof
Pro
duct
ion
and
Indu
stria
l Pro
duct
ion
Man
ager
s
Shi
ppin
g, R
ecei
ving
,an
d T
raffi
c C
lerk
s
Offi
ce C
lerk
s, G
ener
al
Firs
t-Li
neS
uper
viso
rs/M
anag
ers
of O
ffice
and
Tru
ck D
river
s, L
ight
or
Del
iver
y S
ervi
ces
Jani
tors
and
Cle
aner
s,E
xcep
t Mai
ds a
ndH
ouse
keep
ing
Sec
reta
ries,
Exc
ept
Lega
l, M
edic
al, a
ndE
xecu
tive
Labo
rers
and
Fre
ight
,S
tock
, and
Mat
eria
lM
over
s, H
and
Fin
anci
al M
anag
ers
Tru
ck D
river
s, H
eavy
and
Tra
ctor
-Tra
iler
Co
un
t o
r W
ag
e
Entry Hourly Wage CO Entry Hourly Wage DM Entry Hourly Wage NWRR
Experienced Hourly Wage CO Experienced Hourly Wage DM Experienced Hourly Wage NWRR

Projected Occupation Growth2000-2010
24,7
70
20,2
90
19,9
40
18,7
30
18,2
30
15,4
70
14,8
50
14,1
40
13,5
00
12,8
30
12,8
20
12,0
00
11,3
20
10,6
70
9,59
0
9,36
0
8,66
0
8,43
0
8,24
0
8,00
0
2.9%
13.7%
5.7%
3.2%
12.4%
3.0% 3.1%
4.5%
6.1%
7.1%7.9%
12.5%
3.1%
4.9% 4.6%
6.4%
2.5%3.5%
2.2%2.8%
0
5,000
10,000
15,000
20,000
25,000
30,000
Ret
ail S
ales
pers
ons
Com
pute
r S
uppo
rt S
peci
alis
ts
Cus
tom
er S
ervi
ce R
epre
sent
ativ
es
Offi
ce C
lerk
s, G
ener
al
Com
pute
r S
oftw
are
Eng
inee
rs, A
pplic
atio
ns
Cas
hier
s
Wai
ters
and
Wai
tres
ses
Com
bine
d F
ood
Pre
para
tion
and
Ser
ving
Wor
kers
,In
clud
ing
Fas
t Foo
d
Car
pent
ers
Con
stru
ctio
n La
bore
rs
Com
pute
r S
yste
ms
Ana
lyst
s
Com
pute
r S
oftw
are
Eng
inee
rs, S
yste
ms
Sof
twar
e
Gen
eral
and
Ope
ratio
ns M
anag
ers
Sal
es a
nd R
elat
ed W
orke
rs, A
ll O
ther
Firs
t-Li
ne S
uper
viso
rs/M
anag
ers
of C
onst
ruct
ion
Tra
des
and
Ext
ract
ion
Wor
kers
Sec
urity
Gua
rds
Jani
tors
and
Cle
aner
s, E
xcep
t Mai
ds a
nd H
ouse
keep
ing
Cle
aner
s
Tru
ck D
river
s, H
eavy
and
Tra
ctor
-Tra
iler
Boo
kkee
ping
, Acc
ount
ing,
and
Aud
iting
Cle
rks
Labo
rers
and
Fre
ight
, Sto
ck, a
nd M
ater
ial M
over
s, H
and
Ab
solu
te G
row
th
0.0%
2.0%
4.0%
6.0%
8.0%
10.0%
12.0%
14.0%
16.0%
Per
cen
tag
e G
row
ht
Review of Selected Features
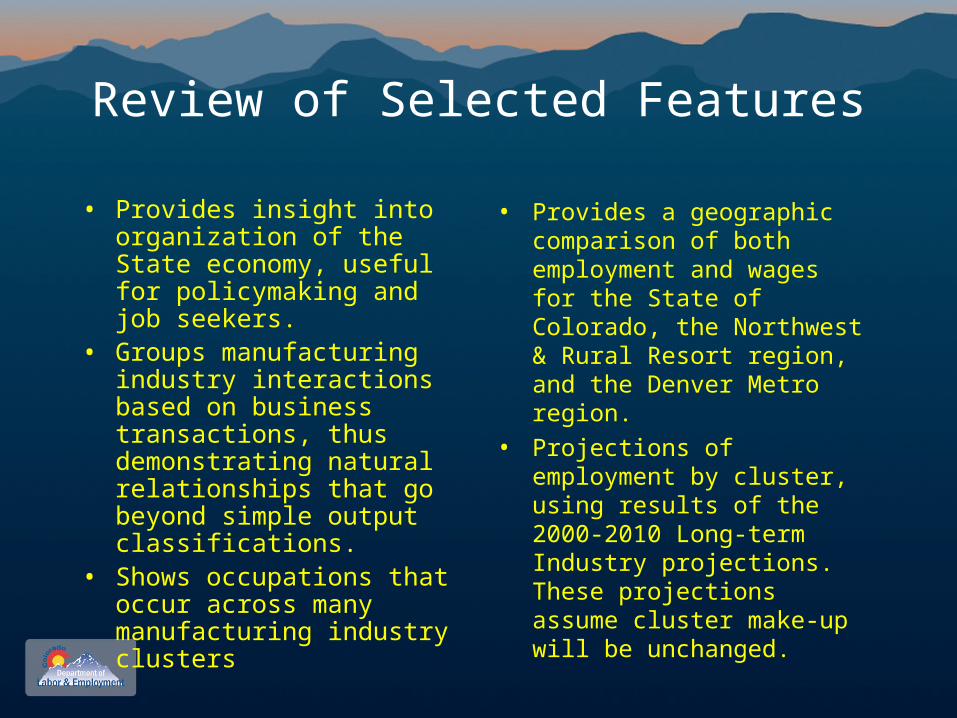
• Provides insight into organization of the State economy, useful for policymaking and job seekers.
• Groups manufacturing industry interactions based on business transactions, thus demonstrating natural relationships that go beyond simple output classifications.
• Shows occupations that occur across many manufacturing industry clusters
• Provides a geographic comparison of both employment and wages for the State of Colorado, the Northwest & Rural Resort region, and the Denver Metro region.
• Projections of employment by cluster, using results of the 2000-2010 Long-term Industry projections. These projections assume cluster make-up will be unchanged.

Some Limitations
• Not a dynamic representation of the economy.• Study’s method is not the only way of analyzing
clusters.• Should be used with other materials for career analysis.• Does not differentiate between emerging, mature, and
declining clusters.• Study does not signify career path development
advantages.• Some analysis distortion possible due to the use of
different employment data years in different segment of the study.

Top Occurring Occupations
SOC Occupational Title Clusters Average Hourly WageState Denver Metro Northwest & Rural
Resort11-1011 General and Operations Managers 20 $39.50 $42.66 $35.56 13-2011 Accountants and Auditors 20 $26.41 $27.67 $26.24 43-3031 Bookkeeping, Accounting, and Auditing Clerks 20 $14.42 $15.24 $15.07 41-4012 Sales Representatives, Wholesale and Manufacturing,
Except Technical and Scientific Products 19 $24.19 $25.43 $21.37 51-1011 First-Line Supervisors/Managers of Production and
Operating Workers 19 $22.14 $22.44 $22.22 49-9042 Maintenance and Repair Workers, General 19 $14.62 $15.35 $15.71 43-9061 Office Clerks, General 18 $12.37 $12.96 $11.92 43-5071 Shipping, Receiving, and Traffic Clerks 18 $12.20 $12.54 $13.53 11-3051 Industrial Production Managers 18 $34.21 $34.94 $33.36 53-3033 Truck Drivers, Light or Delivery Services 17 $13.45 $13.47 $14.64 43-1011 First-Line Supervisors/Managers of Office and
Administrative Support Workers 17 $20.96 $22.17 $20.18 53-7062 Laborers and Freight, Stock, and Material
Movers, Hand 16 $10.80 $11.27 $11.72 43-6014 Secretaries, Except Legal, Medical, and Executive 16 $13.32 $14.47 $12.72 37-2011 Janitors & Cleaners, Except Maids & Hskpg. Cleaners 16 $9.53 $9.74 $10.77 11-3031 Financial Managers 15 $38.17 $40.26 $34.36 53-3032 Truck Drivers, Heavy and Tractor-Trailer 15 $16.03 $16.89 $17.44 43-5061 Production, Planning, and Expediting Clerks 14 $17.42 $18.17 $20.17 49-1011 First-Line Supervisors/Managers of Mechanics,
Installers, and Repairers 14 $24.64 $26.16 $25.96 43-5081 Stock Clerks and Order Fillers 13 $11.97 $12.41 $12.58 43-4051 Customer Service Representatives 13 $13.51 $14.26 $14.05 43-6011 Executive Secretaries and Administrative Assistants 13 $17.69 $18.22 $17.72 11-9199 Managers, All Other 13 $34.99 $36.71 $26.60 13-1023 Purchasing Agents, Except Wholesale, Retail,
and Farm Products 13 $23.47 $24.11 $21.24
Related Documents