sensors Article Industry 4.0 Lean Shopfloor Management Characterization Using EEG Sensors and Deep Learning Daniel Schmidt 1,2, * , , Javier Villalba Diez 1,3,4, * ,† , Joaquín Ordieres-Meré 1 , Roman Gevers 2 , Joerg Schwiep 2 and Martin Molina 4 1 Department of Business Intelligence, Escuela Técnica Superior de Ingenieros Industriales, Universidad Politécnica de Madrid, 28006 Madrid, Spain; [email protected] 2 Matthews International GmbH, Gutenbergstraße 1-3, 48691 Vreden, Germany; [email protected] (R.G.); [email protected] (J.S.) 3 Hochschule Heilbronn, Fakultät Management und Vertrieb, Campus Schwäbisch Hall, 74523 Schwäbisch Hall, Germany 4 Department of Artificial Intelligence, Escuela Técnica Superior de Ingenieros Informáticos, Universidad Politécnica de Madrid, 28660 Boadilla del Monte, Madrid, Spain; [email protected] * Correspondence: [email protected] (D.S.); [email protected] (J.V.D.) † These authors contributed equally to the work. Received: 30 April 2020; Accepted: 12 May 2020; Published: 18 May 2020 Abstract: Achieving the shift towards Industry 4.0 is only feasible through the active integration of the shopfloor into the transformation process. Several shopfloor management (SM) systems can aid this conversion. They form two major factions. The first includes methodologies such as Balanced Scorecard (BSC). A defining feature is rigid structures to fixate on pre-defined goals. Other SM strategies instead concentrate on continuous improvement by giving directions. An example of this group is the “HOSHIN KANRI TREE” (HKT). One way of analyzing the dissimilarities, the advantages and disadvantages of these groups, is to examine the neurological patterns of workers as they are applying these. This paper aims to achieve this evaluation through non-invasive electroencephalography (EEG) sensors, which capture the electrical activity of the brain. A deep learning (DL) soft sensor is used to classify the recorded data with an accuracy of 96.5%. Through this result and an analysis using the correlations of the EEG signals, it has been possible to detect relevant characteristics and differences in the brain’s activity. In conclusion, these findings are expected to help assess SM systems and give guidance to Industry 4.0 leaders. Keywords: EEG sensors; manufacturing systems; shopfloor management; machine learning; deep learning 1. Introduction The concept of Industry 4.0 tries to tackle many of the forthcoming challenges that get faced by business leaders in the 21st century [1,2]. Some may see it as focused on technological solutions for higher automation enabled by digitalization and the resulting possibilities [3]. Yet the full potential is only achievable through the holistic perspective of a sociotechnical system [4,5]. This stands in stark contrast to the extreme technical view of Computer Integrated Manufacturing (CIM) [6]. In the sociotechnical system, the technology and the workers are both viewed as interconnected parts. Because of this, placing a prime focus on the complex interaction between these two groups is necessary [7]. This presupposes that organizations will change old structures and adapt to the approaching demands [8]. The challenge presented here, which is closely linked to the research Sensors 2020, 20, 2860; doi:10.3390/s20102860 www.mdpi.com/journal/sensors

Welcome message from author
This document is posted to help you gain knowledge. Please leave a comment to let me know what you think about it! Share it to your friends and learn new things together.
Transcript

sensors
Article
Industry 4.0 Lean Shopfloor ManagementCharacterization Using EEG Sensors andDeep Learning
Daniel Schmidt 1,2,*, , Javier Villalba Diez 1,3,4,*,† , Joaquín Ordieres-Meré 1 , Roman Gevers 2,Joerg Schwiep 2 and Martin Molina 4
1 Department of Business Intelligence, Escuela Técnica Superior de Ingenieros Industriales,Universidad Politécnica de Madrid, 28006 Madrid, Spain; [email protected]
2 Matthews International GmbH, Gutenbergstraße 1-3, 48691 Vreden, Germany;[email protected] (R.G.); [email protected] (J.S.)
3 Hochschule Heilbronn, Fakultät Management und Vertrieb, Campus Schwäbisch Hall,74523 Schwäbisch Hall, Germany
4 Department of Artificial Intelligence, Escuela Técnica Superior de Ingenieros Informáticos,Universidad Politécnica de Madrid, 28660 Boadilla del Monte, Madrid, Spain; [email protected]
* Correspondence: [email protected] (D.S.); [email protected] (J.V.D.)† These authors contributed equally to the work.
Received: 30 April 2020; Accepted: 12 May 2020; Published: 18 May 2020�����������������
Abstract: Achieving the shift towards Industry 4.0 is only feasible through the active integration ofthe shopfloor into the transformation process. Several shopfloor management (SM) systems can aidthis conversion. They form two major factions. The first includes methodologies such as BalancedScorecard (BSC). A defining feature is rigid structures to fixate on pre-defined goals. Other SMstrategies instead concentrate on continuous improvement by giving directions. An exampleof this group is the “HOSHIN KANRI TREE” (HKT). One way of analyzing the dissimilarities,the advantages and disadvantages of these groups, is to examine the neurological patterns ofworkers as they are applying these. This paper aims to achieve this evaluation through non-invasiveelectroencephalography (EEG) sensors, which capture the electrical activity of the brain. A deeplearning (DL) soft sensor is used to classify the recorded data with an accuracy of 96.5%. Through thisresult and an analysis using the correlations of the EEG signals, it has been possible to detect relevantcharacteristics and differences in the brain’s activity. In conclusion, these findings are expected tohelp assess SM systems and give guidance to Industry 4.0 leaders.
Keywords: EEG sensors; manufacturing systems; shopfloor management; machine learning;deep learning
1. Introduction
The concept of Industry 4.0 tries to tackle many of the forthcoming challenges that get faced bybusiness leaders in the 21st century [1,2]. Some may see it as focused on technological solutions forhigher automation enabled by digitalization and the resulting possibilities [3]. Yet the full potentialis only achievable through the holistic perspective of a sociotechnical system [4,5]. This standsin stark contrast to the extreme technical view of Computer Integrated Manufacturing (CIM) [6].In the sociotechnical system, the technology and the workers are both viewed as interconnectedparts. Because of this, placing a prime focus on the complex interaction between these two groupsis necessary [7]. This presupposes that organizations will change old structures and adapt to theapproaching demands [8]. The challenge presented here, which is closely linked to the research
Sensors 2020, 20, 2860; doi:10.3390/s20102860 www.mdpi.com/journal/sensors

Sensors 2020, 20, 2860 2 of 25
question, is whether artificial intelligence is capable of providing future leaders with the tools necessaryto understand the complex dynamics that occur in these Industry 4.0 environments.
The purpose of this work is to provide Industry 4.0 leaders with a better understanding of LeanShopfloor Management (SM) methods through artificial intelligence techniques applied to informationcollected from portable devices that provide an electroencephalographic (EEG) signal. For this theinitial hypothesis is that deep learning (DL) algorithms are capable of characterizing and discerningbetween different types of behavior, once the EEG signal has been properly treated. This is shownin the graphical abstract of the paper depicted in Figure 1. More specifically, the work aims to offerinsights into the two major categories of SM systems. This is done through the study of the neurologicalactivity of process owners and their leaders performing either method. Non-invasive EEG sensorscapture the electrical activity of the brain. A DL soft sensor is used to categorize the data. If thehypothesis is correct, then this would confirm that distinct contrasts in the brain activity during theconduction of the different SM systems exist. Furthermore, the correlations of the sensor channels arecompared. These correspond to brain regions and show existing differences.
Figure 1. Graphical Abstract.

Sensors 2020, 20, 2860 3 of 25
In the following the structure of the paper is described. Section 2 provides a background tothe lean SM methodologies which presents fundamental preliminary concepts to the comprehensiveunderstanding of the presented content in the following sections of this work. Section 3 provides theneurophysiological background in the context of SM, necessary to understand the EEG classificationperformed by the DL algorithms. Section 4 demonstrates the used materials and methods. The resultsattained are discussed in Section 5 and the implications in section 6 should be able to help judgedisparate SM systems and give guidance to Industry 4.0 leaders.
2. Background
In order to achieve this goal, following points have received close attention. These and the rest ofthis section are, apart from the further description of the paper, taken from the conference paper TheHOSHIN KANRI TREE. Cross-Plant Lean Shopfloor Management [9].
The points are:
• the need to sustainably empower the workforce (Learning Factory) (LF) as indicated byNarkhede et al. [10],
• the need to develop an autonomous and intelligent process management (PM) (Smart Factory)(SF) as presented by Lee et al. [11],
• the need to cope with increasing complexity of value-stream networks (VSN) as researched bySchuh et al. [12],
• the necessary paradigm shift towards strategic alignment as pointed out by Covey [13].
In the context of LF and SF, empowerment can be understood as a systematic way of learning thatenables continuous improvement in an autonomous, intelligent, self-organized, and systematic manner.Coleman [14] defines empowerment as “the act of enhancing, supporting or not obstructing another’sability to bring about outcomes that he or she seeks.” An “autonomous” management method ought tobe able to function without a centralized controlling force by empowering all organizational elements.An “intelligent” management method ought to sustainably empower all organizational individuals toalign and grow in the direction where value comes from for the organization.
A powerful paradigm to empower organizations focuses on value creation has flourished in thelast two decades as lean management (LM). LM has been declared to be the industrial paradigm ofthe 21st century by Shah and Ward [15]. It is believed that the problems that LM endeavors to solve,the non-value adding activities, are embedded within processes, and therefore the response-ableprocess owners (PO) that manage them are in charge of eliminating the non-value adding activitieswithin them. Thus, the task set by LM is mainly a process management task and not a problem-solvingone. Each individual of the organization is understood to be a PO, who is acting on his or her processon the shop floor.
This also enhances the need to act autonomously to make fast and flexible adjustments.Nonetheless, it is necessary to be aligned in the same direction (HOSHIN) by the strategic goalsof the organizations. This leads to the fact that a balancing act between empowerment and alignmenttowards strategic goals is needed. According to Frow et al. [16] this makes multiple controls necessary.HOSHIN KANRI (HK) (management by giving direction) is a comprehensive management systemthat enables such alignment of complex systems as shown by Jolayemi [17].
Many of these points are in the general focus of SM. The term “shopfloor” has been usedby western scholars, de Leeuw and van der Berg [18], to refer to processes close to productionor distribution, excluding purposely strategic processes. In this sense, SM can be understood asa management system that can enhance shopfloor performance. The term “shopfloor” is used byJapanese scholars, Suzaki [19], in a broader sense, understanding “shopfloor” or “gemba” as the place,physical or virtual, where the value stream (VS) is performed. The definition of VS that Womack andJones [20] gives is a “sequence of activities required to design, produce, and provide a specific good orservice, and along which information, materials, and worth flows.”

Sensors 2020, 20, 2860 4 of 25
Because of the before mentioned challenges, efficient SM systems will be essential in thetransformation process towards Industry 4.0 [21]. Thus, it is of chief benefit to rate these options.Earlier papers have focused on the implementation effects of case studies [22–25] or used theoreticalconsiderations [26]. A big detriment is the enormous effort to measure the direct influence of themanagement strategies. For a comparison, similar starting positions are necessary. Only then are theoutcomes contrastable. The many influencing factors make it challenging to get meaningful resultsfrom only a few comparisons. So, alternative concepts that produce more comparable findings areof immense value. Examining the brain activity during the practice of the SM methods opens upunique possibilities.
Earlier research demonstrates that significant neurological variations of a PO using differentLM techniques such as KATA and (CPD)nA exist [27]. The aimed added value through this paperis manifold. Instead of only looking at the brain activity of the PO, this research further takes intoaccount the interaction with his supervisor (in the following “leader”) by recording the EEG data ofboth. It also concentrates on the differences of various SM systems. LM and SM have a large overlap,as SM uses many LM methods and tools. The primary distinction is that SM focuses on the aspectsof leading and empowering people on the shopfloor [28], the place where the value creation occurs.Furthermore, an alternative way of pre-processing the EEG data for the DL soft sensor is implemented.
3. Literature Review
Much is still unknown about how the brain functions and above all the human brain. Despite this,many remarkable discoveries of the recent years promote the understanding [29,30]. These findingscan help Industry 4.0 leaders in distinct ways. They make it easier to understand which factors aremost important to foster progress on the shopfloor. This is attributed to the circumstance that thecrucial component in the advancement of a company continues to be using the full potential of theemployees [31].
The essential element for continuous improvement through the workers is the ability to forminternal goals and to pursue these. In this context, the prefrontal cortex (PFC) has been identified asthe most important region of the brain that contributes to this [32]. It is the center for cognitive controland makes it possible to act flexible to the outer world. For automatic “hardwired” behaviors, it doesn’tplay any significant role. This leads to the conclusion that substantial activity in the PFC should beexpected and seems to be a requirement for POs practicing an SM system.
Another critical factor is the cooperation between workers to achieve improvements.Understanding the mental state of others is a prerequisite. In this context, there is sound evidence thatnot only the PFC plays a significant task. Likewise, the left and right temporoparietal junctions (TPJ)are indispensable. Though the roles they play seem to differ. While the left appears to be involvedin strategic planning of choices concerning humans [33], the right plays a pivotal role in empathy,sympathy and perception [34,35].
Next to the PFC, the right TPJ additionally seems to play an important role for attentionshifting [36]. This is a fundamental aspect in an Industry 4.0 setting, as every part of a manufacturingprocess is intertwined with other processes. These need to be put into consideration during any changeprocess. Hence it is necessary to be capable of moving the mental focus.
To analyze the differences between SM systems, two distinct groups can be identified by focusingon the goal achievement that lays at the core of each management system.
1. Focus on pre-defined goals
Through pre-defined goals, the focus is set on finding ways to achieve these. This is done throughspecific key figures, that in the best case give a balanced view on the different achievements orKPIs [37–39].
2. Continuous improvement by giving directions

Sensors 2020, 20, 2860 5 of 25
This group of SM systems only provides a direction (HOSHIN) of improvement. A pre-definedgoal is not set. Through this, improvements are approached in a more agile form and can beadapted along the road [40–43].
To narrow down the further analysis, one example was chosen for each of the two categories. TheBalanced Scorecard (BSC) [44] as a representation of SM systems with pre-defined goals and the HoshinKanri TREE (HKT) representing the focus on continuous improvement by giving directions [45].
1. Balanced Scorecard is a SM system first described by Kaplan et al. [44] in 1992. The prime goal is toenable a balanced view on the driving measures of a business. This works by showing a handfulof measurements that allow managers to interpret the complex interactions. Every measurementreceives a specific target to motivate the employees to achieve this state. This is in contrast tomore traditional approaches. A focus was only set on a few financial performance numbers.These only give a very short-sighted glance on the actual competitiveness of a company.
One example of a balanced scorecard implementation is visible in Figure 2a showing the measuresof Safety, Quality, Delivery and Value (SQDV). There are many variants in circulation such asSafety, Quality, Delivery and Customer (SQDC) or Quality, Delivery, Inventory, and Productivity(QDIP) that can also show the priorities of a company by including or excluding specific categoriessuch as Environment or Safety.
Neely describes the standard way of using BSC [46] through the following steps:
I Check the current performance. See how the development is progressing.II Communicate performance. Bring everyone to the same understanding of the
current state.III Confirm priorities. Align the actions needed to improve the performance.IV Compel progress. Systematically achieve better performances.
The prime aim is to measure and communicate the achievements towards predeterminedgoals [47]. Niven summarizes balanced scorecard as a conversation tool, a measurement systemand a strategic management system [48].
2. HKT [45] in contrast is an example of a SM system that focuses on continuous improvementwithout pre-defined goals. A key feature is the standardization of communication between POsin organizations using the (CPD)nA framework. Based on this, a feedback empowerment loop isimplemented which makes it possible to build a sustainable process development.
An implementation of the HKT can be seen in Figure 2b. The standard procedure encompassesthe following steps as described by Villalba-Diez [49]:
I Evaluating progress. Every PO checks if an improvement has been made to his or herKPI and places either a red or green magnet on his (CPD)nA.
II Reporting progress. Only when the KPI receives a red magnet, does the progress need tobe announced. The others can choose.
III (CPD)nA. Every reporting PO ought to follow the (CPD)nA behavioral pattern.IV Shopfloor visit. One of the (CPD)nAs improvement is checked on site by the
complete team.
As shown in Figure 2, a visual representation of both types of SM systems displays the maindifferences between them: BSC is basically depicting a set of key performance indicators as timeseries, and the HKT is representing a continuous improvement focused communication networkbetween POs.

Sensors 2020, 20, 2860 6 of 25
Figure 2. Shopfloor management systems. (a) SQDV (Safety,Quality,Delivery andValue) board atMatthews International GmbH, Vreden, Germany as an example of a balanced scorecard managementsystem [44]. (b) Hoshin Kanri TREE [45] at Matthews International GmbH, Vreden, Germany. Processowner names are blurred out for privacy reasons.

Sensors 2020, 20, 2860 7 of 25
To analyze these, an experimental setup using EEG recordings can be implemented. Depending onthe results to be achieved with the EEG data, distinct methods of investigation are possible. A limiteduse case is the manual inspection for abnormalities in the EEG data, which can take a long time andpresumes at least a basic level of domain knowledge [50]. The frequency analysis has been a morepopular method that allows a wider range of applications [51–53].
Two distinct techniques are used in this research. These are the correlation function and a DLsoft sensor.
1. Correlation Function
The correlation function has found many use cases. It makes it feasible to classify EEG data [54],identify risk levels for developing schizophrenia [55], detect epileptic stages [56] or to classifyEEG Motor imagery [57].
With it, it is possible to determine the similarities between two signals and many applicationfields use it. In image processing it is for example used for template matching [58] or local imageregistration [59]. In geology for the location of earthquakes [60].
The cross-correlation function works by sliding one signal along the other, calculating the productbetween the signals and finding the best fit [61]. Therefore, it is possible to work with time-shiftedsignals with the cross-correlation function.
2. Deep Learning
In the last years DL has become a popular technique for analyzing EEG data and has been used torecognize emotions [62,63], detect Parkinson’s [64] and Alzheimer’s [65] disease, epileptic seizureprediction [66], the detection and diagnosis of seizures [67] or to decode and visualize the EEGdata [68].
An enormous advantage is that it can handle the complex EEG data with no prior domainknowledge, which allows a wider audience to work with this data. The neural network does thisby learning the parameters to detect features from examples [69]. This has made it a popular choicefor many other fields such as computer vision [70], audio processing [71] or bioinformatics [72].The key challenge often hindering the further progress with neural networks is the limited dataavailable. This is a prerequisite to represent a high range of input and parameters.
Our research aims to expand this approach on the characterization of complex LM shopfloormanagement associated behavioral patterns in an Industry 4.0 environment. In order to achieve this,this study outlines the following four research hypotheses (H) and their related LM interpretationshown in Table 1. Furthermore, as these hypotheses are based on neurophysiological expert knowledge,management needs to be provided with tools that allow a proper discernment of which behavior isfollowed, based only on the data. For this reason, a DL-based soft sensor is developed that is able toperform this task. The aim is to examine these with the mentioned methods.

Sensors 2020, 20, 2860 8 of 25
Table 1. Hypotheses regarding the correlations of the recorded electroencephalography (EEG)-data.
# Hypothesis Interpretation
H1
The brain patterns of the leaders are expected to showstrong correlations between the prefrontal-cortex andthe occipital-cortex.This causes high correlations between the sensorsFp1-Fp2-F3-Fz-F4 and O1-Oz-O2.
This result can be expected, as the leaders arelistening for the majority of the time.
H2
In contrast to H1, the brain patterns of the processowners are expected to show significant correlationswithin the prefrontal-cortex and the occipital-cortex.This could be seen in strong correlations within thesensor groups Fp1-Fp2-F3-Fz-F4 and O1-Oz-O2.
This result can be expected, as the process ownerspeaks for the majority of the time.
H3
Besides H2, all subjects are expected to show a highcorrelation of the prefrontal-cortex.This causes high correlations for the sensorsFp1-Fp2-F3-Fz-F4.
This could be understood in that way,that the conducted tasks are all executivebehavioural patterns.
H4
The brain patterns of HKT practitioners are expected toshow a strong correlation between the prefrontal-cortexand the TPJ.This could be seen by high correlations between thesensors Fp1-Fp2-F3-Fz-F4 and T7-T8 as well as P3-P4.
The interpretation is that HKT is a goal-oriented,context-independent SM problem-solvingbehavioral pattern.
H5
Compared to HKT, the brain patterns of BSCpractitioners are expected to show a weak correlationbetween the prefrontal-cortex and the TPJ.This could be seen by low correlations between thesensors Fp1-Fp2-F3-Fz-F4 and T7-T8 and P3-P4.
This could be understood in that way, thatBSC is a goal-oriented, context-dependent SMproblem-solving behavioral pattern.
4. Materials and Methods
To test the hypotheses, a case study can provide meaningful first impressions if these are valid.Still it is necessary to note that a single study cannot give clear-cut proof. In the following thescope of the research is established Section 4.1, the population and sampling is specified Section 4.2,the data collection is further described Section 4.3, as well as the data pre-processing Section 4.4,the standardization procedure Section 4.5 and the data analysis Section 4.6.
4.1. Scope Establishment
For this study, the EEG data from a PO and his supervisor performing a BSC and a HKTimplementation are recorded. All the recordings take place at one corporation. This is an automobilemanufacturing facility based in Japan, where LM/SM methodologies were systematically implementedand accompanied by one author of this paper. The organization of the company can be seen throughthe HOSHIN KANRI FOREST STRUCTURE in Figure 3.
Figure 3. Part of the HOSHIN KANRI FOREST STRUCTURE [73].

Sensors 2020, 20, 2860 9 of 25
4.2. Specifications of Population and Sampling
For this paper, data was collected from 14 subject pairs comprising a PO and his supervisor.The age range is between 20 and 60 years with a mean age of 40 years. As far as possible it was madesure that no significant neurological variations between the subjects should be expected. The subjectswere male and had no history of any neurological or psychiatric disorder. Neither was any on chronicmedication. All participants were left-hemisphere-dominant persons. Only between the PO and theleader differences could be possible that result from different levels of SM experience. Still, these arenot expected to produce significant distinctions for the EEG recordings.
4.3. Data Collection
To record the EEG data, following 16 channels were chosen as standardized by the AmericanElectroencephalographic Society [74]:
[‘Fp1’, ‘Fp2’, ‘F4’, ‘Fz’, ‘F3’, ‘T7’, ‘C3’, ‘Cz’, ‘C4’, ‘T8’, ‘P4’, ‘Pz’, ‘P3’, ‘O1’, ‘Oz’, ‘O2’]Through the regulated names, the respective locations on the head during the recording are
defined. These can also be seen in Figure 4.
Figure 4. The 16 channels with standardized nomenclature that were recorded and the correspondingbrain regions.
The used EEG sensor can be seen in Figure 5a,b and has these specifications [27]:
• Sampling method: Sequential sampling. Single ADC.• Sampling rate: 128 samples per second (2048 Hz internal).• Resolution: 14 bits 1 least significant beat = 0.51 µV (16 bit ADC, 2 bits instrumental noise floor
discarded), or 16 bits.• Bandwidth: 0.2–43 Hz, digital notch filters at 50 Hz.• Filtering: Built in digital 5th order Sinc filter.• Dynamic range (input referred): 8400 µV.• Coupling mode: AC coupled.
60 s were recorded and the hair of all subjects was cut to <1 mm to receive the best possible qualityof the data.

Sensors 2020, 20, 2860 10 of 25
Figure 5. Data Collection. (a) EEG Low Cost Portable Sensor; (b) EEG Low Cost Portable Sensor; (c) 5 sof the recorded EEG-data for the HKT leader Subject 1; (d) 5 s of the recorded EEG-data for the BSCleader Subject 1.
4.4. Data Pre-Processing
After recording the EEG data, it needs to be pre-processed to improve the signal-to-noise ratio.This is done in multiple steps and has been achieved with Fieldtrip [75]. An open access toolboxfor pre-processing and analyzing EEG data in MATLAB. A high-pass filter is used to cut out the DCcomponent of the signals, as large drifts were observed in the data. Also, a hardware embeddedlow-pass filter is used to remove frequencies above 50 Hz. Although it can be possible that gammawaves have an even higher frequency [76], those are usually the result of artifacts during the recording.
In the last step, the data is normalized to the range of −10 to 10, allowing the greatest level ofanonymity for the probands. This doesn’t remove any essential information for the further analysis,as relative differences between subjects are not relevant for this study.
4.5. Standardization Procedure
For every recording, a pair of process owner and his leader are examined. For the first 10 s of therecordings, the leader talks, and the PO listens. In the remaining 50 s, the process owner presents hisresults. In this time, the leader observes. This is in contrast to the earlier study [27], where only theprocess owner of the LM system was recorded without speaking.

Sensors 2020, 20, 2860 11 of 25
During the recording, the pair of PO and leader sit in a room with 50 dBA artificially created noise.This noise level is akin to that of a fridge and makes it possible to have comparable background noises.
4.6. Data Analysis
In the following section of this paper the developed soft sensor is further described.This encompasses the experimental setup Section 4.6.1 of the used hardware and software as well asthe DL based analysis Section 4.6.3.
4.6.1. Experimental Setup
The training and testing of the neural network and the pre-processing has been performed usingfollowing hardware:
• CPU (Central Processing Unit): Intel(R) Xeon(R) Gold 6154 CPU @ 3.00GHz• GPU (Graphics Processing Unit): NVIDIA Quadro P4000• RAM (Random-access Memory): 192GB DDR4
The source code for the data pre-processing, the training, and testing of the neural network isavailable under Open Access Repository and was created with Jupyter Notebook Version 5.7.0.
4.6.2. Correlation Function
For this paper the Pearson correlation is calculated which returns a value between −1 for a highnegative correlation, 0 for no interrelationship, and +1 for a strong positive correlation [77].
4.6.3. Deep Learning
After the recording and pre-processing of the EEG-data, further steps have to be taken to train theneural network.
1. Data Segmentation
At first the pre-processed time-dependent EEG data is split into 0.5 s long segments. It is possibleto work with shorter or longer segments such as 1 s [27,78], but 0.5 s was chosen because shorterlengths would decrease the amount of information of a data point and longer lengths woulddecrease the amount of data points that can be used for training.
2. Image generation
Through the MNE library [79,80], these time segments are transformed into topographic maps,as shown in Figure 6. The topographic map displays the activity in the brain, using distinct colortones for the different strengths. To show the brain activity for the complete brain and not just themeasured points, the points in between the sensors are interpolated, creating a topographic mapfor the complete brain. Using more sensors would increase the accuracy of the interpolated area.
In the example Figure 6 four topographic maps are visible. These show the average brain activityin the first 0.5 s for the four different categories.
The values of the 0.5 s segments stretch to the smallest and largest value, displaying the relativedifferences on the brain using the jet color map as shown in Figure 6e. This was chosen as thefull range of colors is used and the color range does not need to be optimized for the humanperception as this color range is not intuitive for a human [81]. The lowest values are shown as adark blue, which turn to a green and then to a dark red with the highest value.
The images have a size of 360 × 360 × 3 pixel. A different size could have been chosen. Smallerimages could decrease the accuracy and larger images would increase the training time.

Sensors 2020, 20, 2860 12 of 25
(e)
Figure 6. Topographic maps for the first 0.5 s of the four different categories. Each topographic map wasgenerated from one subject. (a) HKT process owner. (b) Hoshin Kanri TREE (HKT) leader. (c) BalancedScorecard (BSC) process owner. (d) BSC leader. (e) Colormap Jet used for the topographic maps.
3. Deep Learning Architecture
With these generated images, a neural network can be trained. In this paper a convolutionalneural network [82] is used. It has shown astonishing results within the realm of imageclassification [83–85] and is by far the most adopted neural network for physiological signal dataprocessing while also showing excellent results [86]. By using it, a manual feature engineeringis unnecessary. In the training phase, the neural network finds the most important features.These become more complex in each convolutional layer.
Still, some specifications are set manually. These form the architecture. The coarse architectureof the used neural network can be seen in Figure 7, the exact composition and the code inthe Open Access Repository. Parameters that are set include among others the number andthe type of layers and the optimizer for the training of the neural network. Here we havechosen the Adam optimizer for the training of the network which stands for adaptive momentestimation [87]. The network architecture comprises four repeated layer groups consisting ofa convolution, followed by a rectified linear unit (ReLU) activation and a max pooling layer.After this, the network is flattened and a regular, deeply connected neural network layer follows.To reduce the chance of over-fitting a dropout layer with a ratio of 0.2 is added. The networkends with four outputs that go through the Softmax function to display the probability of thefour examined categories.
While statistical ways exist to help select some parameters [88,89] and few have become unofficialstandards, no clear-cut way to know the best beforehand exist yet. Thus, it is an iterative processof finding the ideal specifications for the architecture by starting with a simple design and seeingwhich changes improve the results. The final optimal layout therefore depends on multiplefactors. More complex features that have to be found in general increase the number of layersneeded [90]. But these can also be limited because the training data wouldn’t be sufficient forthe increasing number of weights or a limit is reached solely because the hardware requirementscan’t be met.

Sensors 2020, 20, 2860 13 of 25
Figure 7. Deep Learning architecture for the classification of the EEG-data.
5. Results and Discussion
This section presents the obtained results using the recorded EEG-data. It comprises two majorparts. Through the analysis of the EEG-data with the help of the correlation function, and throughthe analysis of the EEG-data with the help of the DL soft sensor. The real-world implications of thesefindings follow in Section 6.

Sensors 2020, 20, 2860 14 of 25
5.1. Results and Discussion of the Correlation Function
The correlation function can verify the hypotheses presented in Table 1. In the following, theresults for each hypothesis are examined.
1. Corresponding to H1
A subject that is listening shows strong correlations between the prefrontal-cortex and theoccipital cortex. For the recordings this would mean that a high correlation between the sensorsFp1-F3-Fp2-F4-Fz and O1-Oz-O2 can be found.
This can clearly be seen in the Figures 8 and 9. The leaders for both HKT and BSC show a strongcorrelation between the prefrontal-cortex and the occipital cortex with values ranging between0.52 and 0.71 for the HKT leader and values between 0.32 and 0.61 for the BSC leader.
2. Corresponding to H2
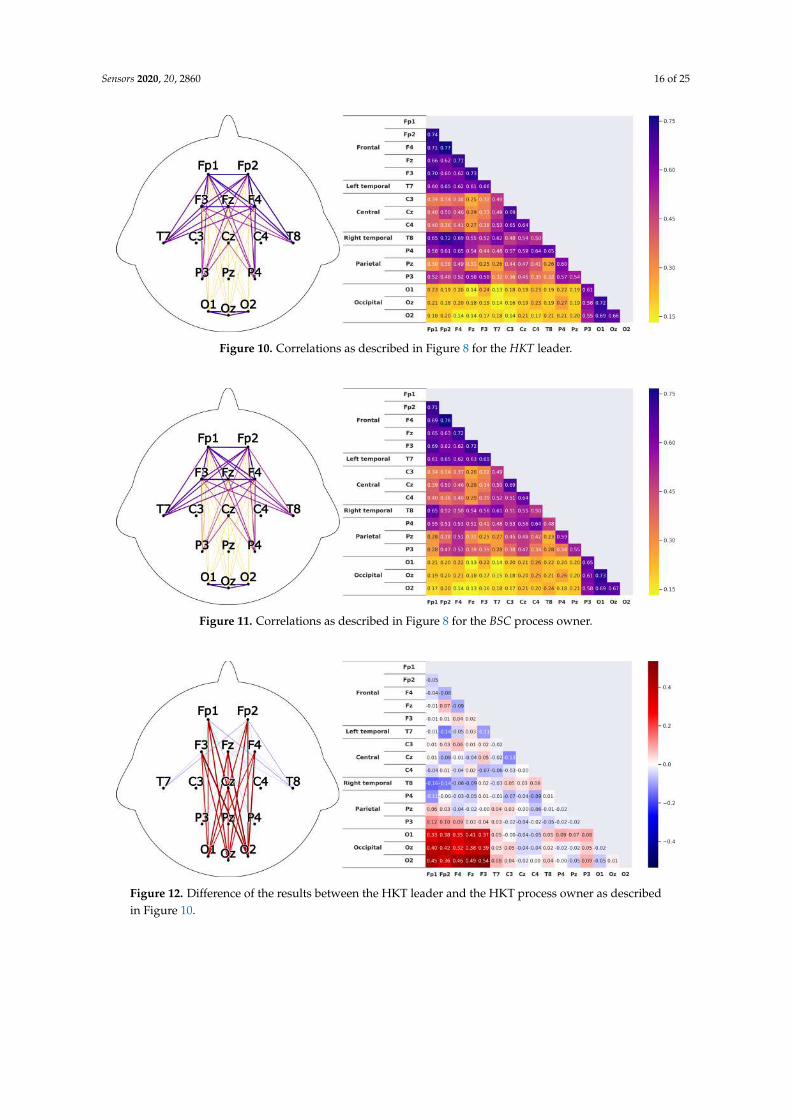
A subject that is listening shows significant correlations within the prefrontal-cortex and theoccipital cortex. This would be seen in the recordings through high correlations within the sensorgroups Fp1-F3-Fp2-F4-Fz and O1-Oz-O2.
This is confirmed in Figures 10 and 11. Both HKT and BSC process owner show high correlationswithin the sensor groups but not between the sensor groups. The values for the frontal sensorgroup are in the range from 0.6 to 0.74 for the HKT process owner and 0.62 to 0.76 for the BSCprocess owner. For the occipital group, the values range between 0.55 and 0.72 for the HKTprocess owner and 0.58 to 0.73 for the BSC process owner. The values between the frontal andoccipital sensor groups only reach up to 0.23 for both HKT PO and BSC PO.
A clear difference between the leaders and process owners can be seen in Figures 12 and 13,where the biggest differences are the connections between the frontal and occipital group.
3. Corresponding to H3
To confirm an executive behavioural pattern in the neurological activity, a strong correlation inthe PFC should be found. For the recordings this would mean that a high correlation between thesensors Fp1-F3-Fp2-F4-Fz should be expected in all four examined categories.
This is confirmed in Figures 9 and 10 showing very high correlations within the frontal sensorgroup. The minimum value for the weakest correlation of the four subject groups still reaching0.6, which can already be considered a strong correlation.
4. Corresponding to H4
To conclude hypothesis 4, it is anticipated that strong correlations can be found between the PFCand the TPJ for HKT practitioners.
In the EEG recordings this would be confirmed, if strong correlations between the sensorsFp1-F3-Fp2-F4-Fz and T7-T8, as well as P3-P4 can be found.
This can be seen in Figures 8 and 10. Values range between 0.52 to 0.72 for the HKT processowner and 0.46 to 0.64 for the HKT leader.
5. Corresponding to H5
To conclude hypothesis 5, it is anticipated that only weak correlations can be found between theprefrontal-cortex and the TPJ for BSC practitioners.
In the EEG recordings this would be confirmed, if weak correlations between the sensorsFp1-F3-Fp2-F4-Fz and T7-T8 as well as P3-P4 can be found.
The results for this hypothesis aren’t as clear-cut as the previous. Although clearly lowercorrelations such as 0.28 for the correlation Fp1_P3 of the BSC PO can be found, Fp1_T8 for

Sensors 2020, 20, 2860 15 of 25
the same category also shows a correlation of 0.65 in Figure 11. What can clearly be seen inthe comparison of the BSC PO and the HKT PO in Figure 14, is that a handful of the expectedcorrelations of the BSC PO show a significantly lower value compared to the HKT PO. These arethe correlations Fp1_P3, Fp2_T8, F4_T8, Fz_P3, and F3_P3, that on average show a correlationwith 0.2 less. This could mean that the right TPJ is less active for the BSC PO. Which in turnwould signify that the BSC PO shows weaker activity in the brain region responsible for empathyor more general for the ability to switch between perspectives.
The difference between the HKT leader and BSC leader in Figure 15 shows similar results asbetween HKT PO and BSC PO. This means that the right TPJ is also more active for the HKTleader than for the BSC leader, which would again mean that also the leader of the BSC showsless activity in the brain region linked to the ability to switch between perspectives.
Figure 8. Average correlations of the EEG sensors for the HKT process owner displayed in two differinglayouts. On the left through connecting lines. The strength is visible through the color and the thicknessof the line. Only the correlations concerning the 5 hypotheses are shown to have a clearer view. On theright, the correlation matrix for all EEG sensors is displayed.
Figure 9. Correlations as described in Figure 8 for the BSC leader.
Sensors 2020, 20, 2860 16 of 25
Figure 10. Correlations as described in Figure 8 for the HKT leader.
Figure 11. Correlations as described in Figure 8 for the BSC process owner.
Figure 12. Difference of the results between the HKT leader and the HKT process owner as describedin Figure 10.

Sensors 2020, 20, 2860 17 of 25
Figure 13. Difference of the results between the BSC leader and the BSC process owner as described inFigure 10.
Figure 14. Difference of the results between the HKT process owner and the BSC process owner asdescribed in Figure 10. Colorscale maximum and minimum are set to the +maximum and -maximumabsolute value of the examined differences.
Figure 15. Difference of the results between the HKT leader and the BSC leader as described inFigure 10.

Sensors 2020, 20, 2860 18 of 25
5.2. Results and Discussion of Deep Learning Soft Sensor
With the help of the DL soft sensor, a classification rate accuracy of 96.5% was able to be achieved.This proves that an automatic classification of the EEG data without the need of any domain knowledgeis possible. Furthermore, it reveals that the differences of the neurological activity of the subjectspracticing either SM system are significant enough to make this achievable.
To train the DNN, the recorded EEG data was split into three parts. The training, validation, andtesting set. The set size ratio depends on the amount of data, as the test and validation data should besufficient to check the validity. While big data cases with millions of examples allow for splits of 99.5%training data, 0.25% validation data and 0.25% test data, cases with examples in the range of 10,000need a bigger split for the test and validation data [91]. For smaller data collections the standard is a80%, 10% and 10% split. By keeping all of the time slices of a subject pair in one split, it can be assuredthat the DNN does not learn specifics from the particular pass. Therefore, a split of 10/14 ≈ 72%,2/14 ≈ 14% and 2/14 ≈ 14% was chosen. With 0.5 s slices this equates to 4800 images for the trainingset, 960 images for the validation set and 960 images for the test set. Though it would be possibleto perform a k-fold cross-validation, this was not chosen, as the data set is big enough for a simpletrain/test/validation split and it would increase the training time significantly.
After training the DNN with the training data in multiple epochs (Figure 16), the validation datacan be used to tune the hyperparameters of the DNN without exposing the test data to the DNN. Onlyat the very end, when no further changes to the DNN are being done, can the testing data be used toevaluate its effectiveness. A common method is to use the results of a confusion matrix [92]. These areusually separated into the categories True Negative, False Negative, True Positive and False Positive.As this is a multiclass categorization, it makes sense to have a True and False version for each of thefour categories.
Figure 16. Results for the training of the deep learning (DL) network. (a) Training and validation lossof the trained DL network. (b) Training and validation accuracy of the trained DL network.

Sensors 2020, 20, 2860 19 of 25
1. True HKT PO stands for the EEG data of POs practicing the HKT system, that has correctly beenclassified as a PO practicing HKT.
2. False HKT PO stands for all other EEG data, that has falsely been classified as a HKT PO.3. True HKT Leader stands for the EEG data of Leaders practicing the HKT system, that has correctly
been classified as a leader practicing HKT.4. False HKT Leader stands for all other EEG data, that has falsely been classified as a HKT Leader.5. True BSC PO stands for the EEG data of POs practicing the BSC system, that has correctly been
classified as a PO practicing BSC.6. False BSC PO stands for all other EEG data, that has falsely been classified as a BSC PO.7. True BSC Leader stands for the EEG data of Leaders practicing the BSC system, that has correctly
been classified as a leader practicing BSC.8. False BSC Leader stands for all other EEG data, that has falsely been classified as a BSC Leader.
The results from the confusion matrix can be seen in Figure 17. With these values, further valuesfor the evaluation of the model can be computed. The accuracy of the DNN can be calculated bydividing the sum of the True cases through the sum of all cases: (THKTPO + THKTL + TBSCPO +
TBSCL)/(THKTPO + THKTL + TBSCPO + TBSCL + FHKTPO + FHKTL + FBSCPO + FBSCL).In this study 96.5% has been achieved, which is extremely high, as EEG data usually has a poorsignal-to-noise ratio and significant differences between subjects should be expected [93]. Otherstudies using EEG data and DL for the classification of brain data have also shown positive results.Though it is difficult to compare the applied classification algorithms, as there are few public datasets that are consistently used to evaluate the effectiveness of these. Next to CNN, Recurrent NeuralNetworks (RNN)/Long-short Term Memory (LSTM) implementations have been used extensively.Depending on the classification type, accuracies up to 100% could be achieved [86].
Figure 17. Multi-label confusion matrix (n = 960) without normalization for the four categories thathave been used to train the neural network.
6. Management Conclusions and Future Steps
This paper uses a multidisciplinary approach to find ways that can help Industry 4.0 leadersguide the shopfloor. As it forms the center of the value-creation a specific focus needs to be laid on it.Through wide-ranging fields such as neuroscience, machine learning and management science, it hasbeen possible to discover various interesting aspects that support interpreting the thinking processesduring the practice of SM systems. It requires to be noted that these are just starting points that need

Sensors 2020, 20, 2860 20 of 25
to be confirmed in further studies. The understanding of the brain regions functions is ongoing andthe ability of the regions are not limited to one specific function. The interplay is even more complexand sometimes allows for a wide range of explanations.
Still, following interpretations can be drawn from the achieved results:
• The studied SM systems both cause large correlations within the PFC for the PO and the leader.This indicates that both systems and both PO and leader show brain activity that can be consideredgoal-oriented, which is the core requirement for any kind of improvement.
• Both BSC and HKT show a solid correlation between the PFC and the left TPJ. The left TPJamongst other functions plays an important role in the strategic planning concerning other people.The difference between BSC and HKT is negligible, but the difference between PO and leadershow interesting patterns. Both correlations T7_Fp2 and T7_F3 show noticeable stronger resultsfor the PO. This arises from the different focuses of PO and leader.
• The HKT PO shows substantial correlations of the PFC to the right TPJ. This is especially noticeablein comparison to the results of the BSC participants. The direction-focused approach seems toenable a wider view, allowing diverse positions to be taken into perspective. This is a crucialcharacteristic for an Industry 4.0 setting where conflicting information needs to be taken intoconsideration to find optimal improvements that not only shift the focus but ensure sustainableimprovements [94]. The HKT leader shows significantly weaker results in this aspect.
• The SM system BSC on the contrary demonstrates weak correlations for the right TPJ to thePFC for both PO and leader, while the leader also shows significantly weaker correlations. Thereduced correlations of the PFC to the right TPJ indicate that the contemplated perspectives arerestricted and the focus on pre-defined goals limits the aspects that are taken into considerationto receive a goal.
Although the results can be described as preliminary, due in part to the relatively small samplespace, if confirmed, the conclusions of this study could have profound implications in the world ofWestern management. The fundamental reason for this assertion lies basically in the fact that practicallythe entire corporate culture of operational management is based on the achievement of objectives. In abusiness environment in which the complexity of processes is constantly increasing, managementmodels that favour a holistic understanding of this reality. Studies such as the one presented, which isclearly multidisciplinary, present, with the help of artificial intelligence, the differences between typesof management and the effects that management could be having on POs in a quantitative way.
The classification results of the EEG-data emphasize that significant and distinct differences in thebrain activity of the examined leadership patterns exist and can be learned by a DNN. Furthermore,the implemented classifier allows for different usages. As the classification can be done in real time,direct feedback can be given. This could, for example, be used during the training of an SM system.An employee with an EEG-device connected to the trained DNN could receive valuable feedback todifferentiate the systems and better understand the thinking patterns.
A comparison of the subjects would be of high interest in order to know how far these resultsare valid for all subjects and which differences can expected. In this way possible differences betweenexperience, age and gender could be examined and it would be possible to see if alterations in thegroup size could possibly change the results. Due to compliance rules of the organization this wasnot possible.
Future research could test the influence of the cultural background and how experience in LM/SMchanges the subjects brain patterns. It could also be of interest to examine the influence of the subjectspeaking on the results.
Author Contributions: Conceptualization, D.S. and J.V.D.; Data curation, D.S. and J.V.D.; Formal analysis, D.S.and J.V.D.; Funding acquisition, J.V.D.; Investigation, D.S.; Methodology, D.S. and J.V.D.; Project administration,J.O.-M., R.G. and J.S.; Resources, D.S.; Software, D.S.; Supervision, D.S. and J.V.D.; Validation, J.V.D. andM.M.; Visualization, D.S. and J.V.D.; Writing—original draft, D.S.; Writing—review & editing, J.V.D. and J.O.-M.All authors have read and agreed to the published version of the manuscript.

Sensors 2020, 20, 2860 21 of 25
Funding: This research received no external funding.
Acknowledgments: This research was partially supported by Hochschule Heilbronn, Fakultät Managementund Vertrieb, Campus Schwäbisch Hall, 74523, Schwäbisch Hall, Germany. We thank Dr. Tomas Sterkenburghfrom Matthews Europe GmbH, for his unconditional support. The second and third authors want to thank theSpanish Agency for Research for the support provided throughout the research project RTI2018-094614-B-I00(SMASHING).
Conflicts of Interest: The authors declare no conflict of interest.
Abbreviations
The following abbreviations are used in this manuscript:
BSC Balanced Scorecard(CPD)nA Check-Plan-Do-...-ActdBA Decibel A-weightingDL Deep LearningDNN Deep Neural NetworkEEG ElectroencephalographyHK HOSHIN KANRIHKT HOSHIN KANRI TREEKPI Key Performance IndicatorLM Lean ManagementPDCA Plan-Do-Check-ActPFC Prefrontal CortexPO Process OwnerSM Shopfloor ManagementTPJ Temporoparietal junctionVS Value Stream
References
1. Lasi, H.; Fettke, P.; Kemper, H.G.; Feld, T.; Hoffmann, M. Industry 4.0. Bus. Inf. Syst. Eng. 2014, 6, 239–242.2. Rüßmann, M.; Lorenz, M.; Gerbert, P.; Waldner, M.; Justus, J.; Engel, P.; Harnisch, M. Industry 4.0: The future
of productivity and growth in manufacturing industries. Boston Consult. Group 2015, 9, 54–89.3. Gilchrist, A. Industry 4.0: The Industrial Internet of Things; Apress: New York, NY, USA, 2016.4. Imran, F.; Kantola, J. Review of industry 4.0 in the light of sociotechnical system theory and competence-based
view: A future research agenda for the evolute approach. In Proceedings of the International Conference onApplied Human Factors and Ergonomics; Springer: Berlin/Heidelberg, Germany, 2018; pp. 118–128.
5. Kopp, R.; Howaldt, J.; Schultze, J. Why Industry 4.0 needs Workplace Innovation: A critical look at theGerman debate on advanced manufacturing. Eur. J. Workplace Innov. 2016, 2, doi:10.46364/ejwi.v2i1.373.
6. Vaidya, S.; Ambad, P.; Bhosle, S. Industry 4.0—A glimpse. Procedia Manuf. 2018, 20, 233–238.7. Baxter, G.; Sommerville, I. Socio-technical systems: From design methods to systems engineering.
Interact. Comput. 2011, 23, 4–17.8. Kagermann, H. Change through digitization—Value creation in the age of Industry 4.0. In Management of
Permanent Change; Springer: Berlin/Heidelberg, Germany, 2015; pp. 23–45.9. Diez, J.V.; Ordieres-Mere, J.; Nuber, G. The hoshin kanri tree. Cross-plant lean shopfloor management.
Procedia CIRP 2015, 32, 150–155.10. Narkhede, B.; Nehete, R.; Mahajan, S. Exploring Linkages between Manufacturing Functions, Operations
Priorities and Plant Performance in Manufacturing Smes in Mumbai. Int. J. Qual. Res. 2012, 6, 9–22.11. Lee, J.; Bagheri, B.; Kao, H.A. Recent advances and trends of cyber-physical systems and big data analytics
in industrial informatics. In Proceedings of the International Conference on Industrial Informatics (INDIN),Porto Alegre, Brazil, 27–30 July 2014; pp. 1–6.
12. Schuh, G.; Potente, T.; Varandani, R.M.; Schmitz, T. Methodology for the assessment of structural complexityin global production networks. Procedia CIRP 2013, 7, 67–72.
13. Covey, S.R. The 8th Habit: From Effectiveness to Greatness; Simon and Schuster: New York, NY, USA, 2013.

Sensors 2020, 20, 2860 22 of 25
14. Coleman, P.T. Implicit Theories of Organizational Power and Priming Effects on Managerial Power-SharingDecisions: An Experimental Study 1. J. Appl. Soc. Psychol. 2004, 34, 297–321.
15. Shah, R.; Ward, P.T. Defining and developing measures of lean production. J. Oper. Manag. 2007, 25, 785–805.16. Frow, N.; Marginson, D.; Ogden, S. “Continuous” budgeting: Reconciling budget flexibility with budgetary
control. Account. Organ. Soc. 2010, 35, 444–461.17. Jolayemi, J.K. Hoshin kanri and hoshin process: A review and literature survey. Total. Qual. Manag. 2008,
19, 295–320.18. de Leeuw, S.; van den Berg, J.P. Improving operational performance by influencing shopfloor behavior via
performance management practices. J. Oper. Manag. 2011, 29, 224–235.19. Suzaki, K. New Shop Floor Management: Empowering People for Continuous Improvement; Simon and Schuster:
New York, NY, USA, 1993.20. Womack, J.P.; Jones, D.T. Lean Thinking: Banish Waste and Create Wealth in Your Corporation, 2nd ed.; Simon &
Schuster: New York, NY, USA, 2003.21. Hertle, C.; Siedelhofer, C.; Metternich, J.; Abele, E. The next generation shop floor management—How to
continuously develop competencies in manufacturing environments. In Proceedings of the 23rd InternationalConference on Production Research, Manila, Philippines, 1–4 August 2015.
22. Davis, S.; Albright, T. An investigation of the effect of balanced scorecard implementation on financialperformance. Manag. Account. Res. 2004, 15, 135–153.
23. Speckbacher, G.; Bischof, J.; Pfeiffer, T. A descriptive analysis on the implementation of balanced scorecardsin German-speaking countries. Manag. Account. Res. 2003, 14, 361–388.
24. Doran, M.S.; Haddad, K.; Chow, C.W. Maximizing the success of balanced scorecard implementation in thehospitality industry. Int. J. Hosp. Tour. Adm. 2002, 3, 33–58.
25. Schuster, B.; Herrmann, F. Analyse, Beurteilung und Entwicklung eines Umsetzungskonzeptes zurOptimierung des Warengruppenmanagements im Einkauf der Krones AG. AKWI 2017, 5, 14.
26. Mooraj, S.; Oyon, D.; Hostettler, D. The balanced scorecard: A necessary good or an unnecessary evil?Eur. Manag. J. 1999, 17, 481–491.
27. Villalba-Diez, J.; Zheng, X.; Schmidt, D.; Molina, M. Characterization of Industry 4.0 Lean ManagementProblem-Solving Behavioral Patterns Using EEG Sensors and Deep Learning. Sensors 2019, 19, 2841.
28. Kudernatsch, D. Eine Lean-Kultur im Unternehmen verankern. wissensmanagement 2013, 3, 48–49.29. Fox, M.D.; Snyder, A.Z.; Vincent, J.L.; Corbetta, M.; Van Essen, D.C.; Raichle, M.E. The human brain is
intrinsically organized into dynamic, anticorrelated functional networks. Proc. Natl. Acad. Sci. USA 2005,102, 9673–9678.
30. Buckner, R.L.; Andrews-Hanna, J.R.; Schacter, D.L. The brain’s default network: Anatomy, function, andrelevance to disease. In Annals of the New York Academy of Sciences: Volume 1124. The Year in CognitiveNeuroscience 2008; Blackwell Publishing: Hoboken, NJ, USA, 2008.
31. Gabcanová, I. The employees—The most important asset in the organizations. HUm. Resour. Manag. Ergon.2011, 5, 30–33.
32. Miller, E.K.; Cohen, J.D. An integrative theory of prefrontal cortex function. Annu. Rev. Neurosci. 2001,24, 167–202.
33. Samson, D.; Apperly, I.A.; Chiavarino, C.; Humphreys, G.W. Left temporoparietal junction is necessary forrepresenting someone else’s belief. Nat. Neurosci. 2004, 7, 499–500.
34. Saxe, R.; Wexler, A. Making sense of another mind: The role of the right temporo-parietal junction.Neuropsychologia 2005, 43, 1391–1399.
35. Ogawa, A.; Kameda, T. Dissociable roles of left and right temporoparietal junction in strategic competitiveinteraction. Soc. Cogn. Affect. Neurosci. 2019, 14, 1037–1048.
36. Krall, S.C.; Rottschy, C.; Oberwelland, E.; Bzdok, D.; Fox, P.T.; Eickhoff, S.B.; Fink, G.R.; Konrad, K. The roleof the right temporoparietal junction in attention and social interaction as revealed by ALE meta-analysis.Brain Struct. Funct. 2015, 220, 587–604.
37. Kaplan, R.S.; Norton, D.P. Linking the balanced scorecard to strategy. Calif. Manag. Rev. 1996, 39, 53–79.38. Figge, F.; Hahn, T.; Schaltegger, S.; Wagner, M. The sustainability balanced scorecard–linking sustainability
management to business strategy. Bus. Strategy Environ. 2002, 11, 269–284.39. Kaplan, R.S.; Norton, D.P. Transforming the balanced scorecard from performance measurement to strategic
management: Part II. Account. Horizons 2001, 15, 147–160.

Sensors 2020, 20, 2860 23 of 25
40. Villalba-Diez, J.; Ordieres-Mere, J. Improving manufacturing operational performance by standardizingprocess management. Trans. Eng. Manag. 2015, 62, 351–360.
41. Imai, M. Gemba Kaizen: A Commonsense Approach to a Continuous Improvement Strategy, 2nd ed.; McGraw-HillProfessional: New York, NY, USA, 2012.
42. Baba, F. Study on stable facility conservation activities based on PDCA cycle. Yokohama Int. Soc. Sci. Res.2012, 17, 2–10.
43. Center, J.M.A.M. PDCA Starting from C Works Faster! Japan Management Association Management Center:Tokyo, Japan, 2013.
44. Kaplan, R.S.; Norton, D.P. The Balanced Scorecard: Measures that Drive Performance. Harv. Bus. Rev. 1992,70, 71–79.
45. Villalba-Diez, J. The Hoshin Kanri Forest: Lean Strategic Organizational Design, 1st ed; Productivity Press:New York, USA, 2017, doi:10.1201/9781315155814.
46. Neely, A.D. Measuring Business Performance; Profile Books: London, UK, 1998.47. Hines, T. Supply Chain Strategies: Customer Driven and Customer Focused; Taylor & Francis: Abingdon, UK, 2004.48. Niven, P.R. Balanced Scorecard: Step-by-Step for Government and Nonprofit Agencies; John Wiley & Sons:
Hoboken, NJ, USA, 2008.49. Díez, J.V. Hoshin Kanri Forest: Lean Strategic Organizational Design. Ph.D. Thesis, Universidad Politécnica
de Madrid, Madrid, Spain, 2016.50. Krumholz, A.; Wiebe, S.; Gronseth, G.; Shinnar, S.; Levisohn, P.; Ting, T.; Hopp, J.; Shafer, P.; Morris, H.;
Seiden, L.; et al. Practice Parameter: Evaluating an apparent unprovoked first seizure in adults (anevidence-based review):[RETIRED]: Report of the Quality Standards Subcommittee of the AmericanAcademy of Neurology and the American Epilepsy Society. Neurology 2007, 69, 1996–2007.
51. Nuwer, M.R. Quantitative EEG: II. Frequency analysis and topographic mapping in clinical settings.J. Clin. Neurophysiol. 1988, 5, 45–85.
52. Neufeld, M.; Blumen, S.; Aitkin, I.; Parmet, Y.; Korczyn, A. EEG frequency analysis in demented andnondemented parkinsonian patients. Dement. Geriatr. Cogn. Disord. 1994, 5, 23–28.
53. Coben, L.A.; Danziger, W.L.; Berg, L. Frequency analysis of the resting awake EEG in mild senile dementiaof Alzheimer type. Electroencephalogr. Clin. Neurophysiol. 1983, 55, 372–380.
54. Chandaka, S.; Chatterjee, A.; Munshi, S. Cross-correlation aided support vector machine classifier forclassification of EEG signals. Expert Syst. Appl. 2009, 36, 1329–1336.
55. Panischev, O.Y.; Demin, S.; Kaplan, A.Y.; Varaksina, N.Y. Use of cross-correlation analysis of EEG signals fordetecting risk level for development of schizophrenia. Biomed. Eng. 2013, 47, 153–156.
56. Poulos, M.; Georgiacodis, F.; Chrissikopoulos, V.; Evagelou, A. Diagnostic test for the discrimination betweeninterictal epileptic and non-epileptic pathological EEG events using auto–cross-correlation methods. Am. J.Electroneurodiagn. Technol. 2003, 43, 228–240.
57. Krishna, D.H.; Pasha, I.; Savithri, T.S. Classification of EEG motor imagery multi class signals based on crosscorrelation. Procedia Comput. Sci. 2016, 85, 490–495.
58. Briechle, K.; Hanebeck, U.D. Template matching using fast normalized cross correlation. In Proceedings ofthe Optical Pattern Recognition XII. International Society for Optics and Photonics, Orlando, FL, USA, 16–20April 2001; Volume 4387, pp. 95–102.
59. Avants, B.B.; Epstein, C.L.; Grossman, M.; Gee, J.C. Symmetric diffeomorphic image registration withcross-correlation: evaluating automated labeling of elderly and neurodegenerative brain. Med Image Anal.2008, 12, 26–41.
60. Shearer, P.M. Improving local earthquake locations using the L1 norm and waveform cross correlation:Application to the Whittier Narrows, California, aftershock sequence. J. Geophys. Res. Solid Earth 1997,102, 8269–8283.
61. Bracewell, R. Fourier Analysis and Imaging; Springer: Boston, MA, USA, 2012.62. Jirayucharoensak, S.; Pan-Ngum, S.; Israsena, P. EEG-based emotion recognition using deep learning
network with principal component based covariate shift adaptation. Sci. World J. 2014, 2014.63. Zheng, W.L.; Zhu, J.Y.; Peng, Y.; Lu, B.L. EEG-based emotion classification using deep belief networks.
In Proceedings of the 2014 IEEE International Conference on Multimedia and Expo (ICME), Chengdu, China,14–18 July 2014; pp. 1–6.

Sensors 2020, 20, 2860 24 of 25
64. Oh, S.L.; Hagiwara, Y.; Raghavendra, U.; Yuvaraj, R.; Arunkumar, N.; Murugappan, M.; Acharya, U.R.A deep learning approach for Parkinson’s disease diagnosis from EEG signals. Neural Comput. Appl. 2018,1–7.
65. Ortiz, A.; Munilla, J.; Gorriz, J.M.; Ramirez, J. Ensembles of deep learning architectures for the early diagnosisof the Alzheimer’s disease. Int. J. Neural Syst. 2016, 26, 1650025.
66. Hosseini, M.P.; Soltanian-Zadeh, H.; Elisevich, K.; Pompili, D. Cloud-based deep learning of big eeg data forepileptic seizure prediction. In Proceedings of the 2016 IEEE Global Conference on Signal and InformationProcessing (GlobalSIP), Washington, DC, USA, 7–9 December 2016; pp. 1151–1155.
67. Acharya, U.R.; Oh, S.L.; Hagiwara, Y.; Tan, J.H.; Adeli, H. Deep convolutional neural network for theautomated detection and diagnosis of seizure using EEG signals. Comput. Biol. Med. 2018, 100, 270–278.
68. Schirrmeister, R.T.; Springenberg, J.T.; Fiederer, L.D.J.; Glasstetter, M.; Eggensperger, K.; Tangermann, M.;Hutter, F.; Burgard, W.; Ball, T. Deep learning with convolutional neural networks for EEG decoding andvisualization. Hum. Brain Mapp. 2017, 38, 5391–5420.
69. Francois, C. Deep Learning with Python; Manning Publications: Shelter Island, NY, USA, 2017.70. Voulodimos, A.; Doulamis, N.; Doulamis, A.; Protopapadakis, E. Deep learning for computer vision: A brief
review. Comput. Intell. Neurosci. 2018, 2018, 7068349.71. Lee, H.; Pham, P.; Largman, Y.; Ng, A.Y. Unsupervised feature learning for audio classification using
convolutional deep belief networks. In Proceedings of the Advances in Neural Information ProcessingSystems, Vancouver, BC, Canada, 7–10 December 2009; pp. 1096–1104.
72. Min, S.; Lee, B.; Yoon, S. Deep learning in bioinformatics. Brief. Bioinform. 2017, 18, 851–869.73. Villalba-Diez, J. The Lean Brain Theory. Complex Networked Lean Strategic Organizational Design; CRC Press,
Taylor and Francis Group LLC: Boca Raton, FL, USA, 2017.74. American Electroencephalographic Society Guidelines in Electroencephalography, Evoked Potentials, and
Polysomnography. J. Clin. Neurophysiol. 1994, 11, 1–147.75. Oostenveld, R.; Fries, P.; Maris, E.; Schoffelen, J.M. FieldTrip: Open Source Software for Advanced
Analysis of MEG, EEG, and Invasive Electrophysiological Data. Comput. Intell. Neurosci. 2011, 2011, 9,doi:10.1155/2011/156869.
76. Henry, J.C. Electroencephalography: basic principles, clinical applications, and related fields. Neurology2006, 67, 2092–2092.
77. Adler, J.; Parmryd, I. Quantifying colocalization by correlation: the Pearson correlation coefficient is superiorto the Mander’s overlap coefficient. Cytom. Part A 2010, 77, 733–742.
78. Längkvist, M.; Karlsson, L.; Loutfi, A. Sleep stage classification using unsupervised feature learning.Adv. Artif. Neural Syst. 2012, 2012, 5.
79. Gramfort, A.; Luessi, M.; Larson, E.; Engemann, D.A.; Strohmeier, D.; Brodbeck, C.; Goj, R.; Jas, M.; Brooks, T.;Parkkonen, L.; et al. MEG and EEG data analysis with MNE-Python. Front. Neurosci. 2013, 7, 267.
80. Gramfort, A.; Luessi, M.; Larson, E.; Engemann, D.A.; Strohmeier, D.; Brodbeck, C.; Parkkonen, L.;Hämäläinen, M.S. MNE software for processing MEG and EEG data. Neuroimage 2014, 86, 446–460.
81. Nuñez, J.R.; Anderton, C.R.; Renslow, R.S. Optimizing colormaps with consideration for color visiondeficiency to enable accurate interpretation of scientific data. PLoS ONE 2018, 13, e0199239.
82. LeCun, Y.; Bottou, L.; Bengio, Y.; Haffner, P. Gradient-based learning applied to document recognition.Proc. IEEE 1998, 86, 2278–2324.
83. Krizhevsky, A.; Sutskever, I.; Hinton, G.E. Imagenet classification with deep convolutional neural networks.In Proceedings of the Advances in Neural Information Processing Systems, Lake Tahoe, NV, USA, 3–6December 2012; pp. 1097–1105.
84. Zeiler, M.D.; Fergus, R. Visualizing and understanding convolutional networks. In Proceedings of the EuropeanConference on Computer Vision; Springer: Berlin/Heidelberg, Germany, 2014; pp. 818–833.
85. He, K.; Zhang, X.; Ren, S.; Sun, J. Deep residual learning for image recognition. In Proceedings of the IEEEConference on Computer Vision and Pattern Recognition, Las Vegas, NV, USA, 27–30 June 2016; pp. 770–778.
86. Rim, B.; Sung, N.J.; Min, S.; Hong, M. Deep Learning in Physiological Signal Data: A Survey. Sensors 2020,20, 969.
87. Kingma, D.P.; Ba, J. Adam: A method for stochastic optimization. arXiv 2014, arXiv:1412.6980.88. Ripley, B.D. Statistical ideas for selecting network architectures. In Neural Networks: Artificial Intelligence and
Industrial Applications; Springer: Berlin/Heidelberg, Germany, 1995; pp. 183–190.

Sensors 2020, 20, 2860 25 of 25
89. Tishby, N.; Zaslavsky, N. Deep learning and the information bottleneck principle. In Proceedings of the 2015IEEE Information Theory Workshop (ITW), Jerusalem, Israel, 26 April–1 May 2015; pp. 1–5.
90. Güçlü, U.; van Gerven, M.A. Deep neural networks reveal a gradient in the complexity of neuralrepresentations across the ventral stream. J. Neurosci. 2015, 35, 10005–10014.
91. Ng, A. Train/Dev/Test sets. 2019. Available online: https://www.coursera.org/lecture/deep-neural-network/train-dev-test-sets-cxG1s ( accessed on 8 November 2019).
92. Alpaydin, E. Introduction to Machine Learning; Adaptive computation and machine learning; MIT Press:Cambridge, MA, USA, 2004.
93. Stober, S.; Sternin, A.; Owen, A.M.; Grahn, J.A. Deep feature learning for EEG recordings. arXiv 2015,arXiv:1511.04306.
94. Villalba-Diez, J.; Ordieres-Meré, J.; Chudzick, H.; López-Rojo, P. NEMAWASHI: Attaining value streamalignment within complex organizational networks. Procedia CIRP 2015, 37, 134–139.
© 2020 by the authors. Licensee MDPI, Basel, Switzerland. This article is an open accessarticle distributed under the terms and conditions of the Creative Commons Attribution(CC BY) license (http://creativecommons.org/licenses/by/4.0/).
Related Documents