venezueia IndustrialSector Report March 15, 1991 Brazil, Peru and Venezuela Energy and Induistry Division Country Department I Latin America and theCaribbean Region FOR OFFICIALUSEONLY o ~ ~ ~ ~ ~ ~ ~ ~ ~ ~ ~ ~ ~ ~ ~ ~ ~~~ 3 .. o' '3 u~~~~~~~~~~~~~~~~~~~~~~ > j ) 5 < ' O \~~~~~ - - . ~ ~ ~ ~ ~ ~ ~ ~ . .3 . . 3 t ' ' ' ' ' 7 ' ' ' ' t '' ' ;" '0'3'" -V. CU'' ' ' ''* D ~ ~ ~ '3 .- - y 0 ~ ~ ~ ~ ~ ~ t ,_ ~ ~~~~~~~ O '3 '3 . U 3\ 3 _ *~~~~~~~~~~~~~~~~~~~ '3 Document ofthe YWrld Bank << .~~~~~~~~~~~- ". , _ ' , 4 o~~~~~~~~~~~~~~~~~1 ' . 3 This documnent has a restriicted distribution anci may beused by recipients . , only hn the perfomrnance oftheir official duties. Its contents 'may nototerwise be disclosed without World Bank authorization.. ^ - ' : Public Disclosure Authorized Public Disclosure Authorized Public Disclosure Authorized Public Disclosure Authorized Public Disclosure Authorized Public Disclosure Authorized Public Disclosure Authorized Public Disclosure Authorized

Welcome message from author
This document is posted to help you gain knowledge. Please leave a comment to let me know what you think about it! Share it to your friends and learn new things together.
Transcript
venezueiaIndustrial Sector Report
March 15, 1991
Brazil, Peru and Venezuela Energy and Induistry DivisionCountry Department ILatin America and the Caribbean Region
FOR OFFICIAL USE ONLY
o ~ ~ ~ ~ ~ ~ ~ ~ ~ ~ ~ ~ ~ ~ ~ ~ ~~~ 3 .. o' '3
u~~~~~~~~~~~~~~~~~~~~~~ > j ) 5 < ' O
\~~~~~ - -
. ~ ~ ~ ~ ~ ~ ~ ~ . .3 . . 3
t ' ' ' ' ' 7 ' ' ' ' t '' ' ;" '0'3'" -V.
CU'' ' ' ''*
D ~ ~ ~ '3 .- - y
0 ~ ~ ~ ~ ~ ~ t
,_ ~ ~~~~~~~ O
'3 '3 . U
3\ 3 _
*~~~~~~~~~~~~~~~~~~~ '3
Document of the YWrld Bank <<.~~~~~~~~~~~- ". ,
_ ' , 4 o~~~~~~~~~~~~~~~~~1 ' . 3
This documnent has a restriicted distribution anci may be used by recipients . ,only hn the perfomrnance of their official duties. Its contents 'may not oterwisebe disclosed without World Bank authorization.. ^ - ' :
Pub
lic D
iscl
osur
e A
utho
rized
Pub
lic D
iscl
osur
e A
utho
rized
Pub
lic D
iscl
osur
e A
utho
rized
Pub
lic D
iscl
osur
e A
utho
rized
Pub
lic D
iscl
osur
e A
utho
rized
Pub
lic D
iscl
osur
e A
utho
rized
Pub
lic D
iscl
osur
e A
utho
rized
Pub
lic D
iscl
osur
e A
utho
rized
CURRENCY EOUIVALENTS
Currency Unit = Bolivar (Bs)US$1 = 48.75 Bs
(As of September 26, 1990)
ACRONYMS
LCASA - Aluminio del Caroni, S.A. (State-owned aluminum company)HV - Banco Central de Venezuela (Central bank)ADAFE - Compaiifa An6nima de Administraci6n y Fomento El6ctrico (State-owned electric
company)NTV - Compafifa An6nima Venezolana de Tel6fonos (State-owned telephone company)AVN - CompafiMa An6nima Venezolana de Navegaci6n (State-owned shipping line)DRPOINDUSTRIA - Small and Medium Industry Development CorporationK]D - Completely-knocked-down assembly unitNC - Central North Coastal RegionR - Concentration RatioVG - Corporaci6n Venezolana de GuayanaFl - Direct Foreign InvestmentPZ - Export Processing Zone[NEXPO - Export Financing FundIV - Fondo de Inversiones de Venezuela (Venezuelan Investment Fund)DNCAFE - Fondo de Caf6 (Coffee buying and exporting board)3)NCREI - Fondo de Credito Industrial (Government industrial development fund)DNTUR - Fondo de Turismo (Government tourism development fund)DP - Gross Domestic Product4CE - Instituto Nacional de Cooperaci6n Educativa (Government training institute)iP - Instituto Nacional de Puertos (Government ports institute)[BOR - London Inter-Bank Offer RateIC - Newly Industrialized CountryTB - Non-tariff BarrierCEI - Oficina Central die Estadfstica e Informatica (Statistical agency)EQUIVEN - Petroqufmica de Venezuela (State-owned chemical producer)DVSA - Petr6leos de Venezuela, S.A. (State petroleum producer)VP - Precio de Venta al Pdblico (Maximum retail price)ECADI - Oficina del iogimen de Cambios Diferenciales (Office of the differential exchange rate)IPI - Registro de Informaci6n de Proyectos Industriales (Industrial investment registry)[DOR - Siderurgica del Orinoco (State-owned steel company)[EX - Superintendencia de Inversiones Extranjeras (Superintendent of foreign investment)[VENSA - Sidertrgica Venezolana, S.A. (Private steel company)DE's - State-Owned EnterprisesENALUM - Industrias Venezolanas de Aluminio (State-owned aluminum company)IASA - Venezolana Internacional de Aviaci6n (State-owned international airline)
FOR OMCIAL USE ONLY
TABLE OF CONTENTS
LIST OF TABLES .............................................. - iv-
LIST OF FIGURES .............................................. - vi -
EXECUTIVE SUMMARY.... vii
1. INTRODUCTION ............................................ [11
2. INDUSTRIAL POLICY: THE 1980'S AND THE REFORM ............... . 7]
2.1 Trade Policy ................... .[-.-.-.*............ 81
2.1.1 Import Restrictions ..................................... [ 81
2.1.1.1 Foreign Exchange Controls [ 812.1.1.2 Non-tariff Barriers [1412.1.1.3 Tariffs [1912.1.1.4 Import Restrictions: Combined Effects [ 2012.1.1.5 Reform of the Import Regime [ 25 ]
2.1.2 Export Incentives ..................................... [25 ]
2.2 Public Enterprises ......................................... [27]
2.2.1 Distribution of Ownership ................................ [30]2.2.2 Policy Instruments .[.................................... 3012.2.3 Domestic Market Practices ....... [....................... 32]2.2.4 Impact on the Industrial Private Sector ........................ [ 33]2.2.5 Recent Policy Changes .................................. [ 34 12.2.6 Recommendations ..................................... [ 35 1
2.3 Other Instruments of Industrial Policy ........................... [36]
2.3.1 Price Controls . 3612.3.2 Financial Incentives ................... *.l 37 12.3.3 Tax Policy .[ 38]2.3.4 Production Subsidies .[ 39]
3. POLICIES AND PERFORMANCE IN THE MANUFACTURING SECTOR ..... 41
3.1 Overview of the Manufacturing Sector: Structure. Behavior. Performance .. 41
3.1.1 Structure of the Manufacturing Sector ........................ 41
3.1.1.1 Share of Manufacturing in GDP 41
This document has a restricted distribution and may be used by recipients only in the performanceof their official duties. Its contents may not otherwise be disclosed without World Bank authorization.
- ii -
3.1.1.2 Composition of Output 1433.1.1.3 Size and Location of Manufacturing Plants [ 4413.1.1.4 Concentration of Production 1 47 1
3.1.2 Market Structure and Behavior ............................. [53 1
3.1.2.1 Concentration and Price-Cost Margir,s [ 54 13.1.2.2 Price-Cost Margins, Concentration, Import Competition and Export
Orientation [55 1
3.1.3 Performance ........................................ [57 1
3.1.3.1 Growth in Manufacturing Value-Added [57 13.1.3.2 Labor Productivity [59 13.1.3.3 Productivity of Investment [61]3.1.3.4 Composition of Exports and Export Performance l61 ]3.1.3.5 Capacity Utilization [66 1
3.1.4 Ass,jssment ......................................... [67 1
3.2 Labor in the Manufacturing Sector: Policies and Evidence .............. [ 67 J
3.3 Foreign Investme,i .in the Manufacturing Sectr .[ 73 ]
3.3.1 Regulation of Direct Foreign Investment ....................... [ 74 j3.3.2 Sectoral Pattern of Foreign Investment ........................ [ 75 J3.3.3 Characteristics of Foreign and Domestic Firms ................... [76]
4. AGENDA FOR THE 1990'S . . . 791
4.1 Trade Reform: Next Steps ............... [80]
4.1.1 Exchange R ........ [............................... [814.1.2 Uniform Treatment of Sectors ............................. 814.1.3 Licenses ........................................... [82]4.1.4 Tariffs ............................................ 82]4.1.5 Exemptions ......................................... [83 ]4.1.6 Exports and Export Subsidies .............................. 83]4.1.7 Export Processing Zones ................................. 84 14.1.8 Export Credit and Export Credit Insurance ..................... [854.1.9 Public Services ....................................... [851
4.2 Role of the Development Ministry ............ .. ................ 86 1
4.2.1 Investment Climate .................................... [86 1
4.2.1.1 Investment Promotion [87 1
- iii-
4.2.2 promotion of CompetitiQn ................................ 1891
4.2.2.1 Antitrust Legislation [901
4.2.3 InfQmatigiad Research ................................ 1941
APPENDIX 1 .. ................................................ ( 95 1
BIBLIOGRAPHY ............................................... 1011
- iv -
LIST OF TABLES
Table 1.1: Structure of Production and Domestic Absorption, 1971-88 ................... 21Table 1.2: Structure of Production--International Comparisons, 1965-87 ... .............. 3 1Table 1.3: Per Capita Manufactured Exports' 1980, 1987 .......................... [5 Table 1.4: International Comparisons of Productivity ............................. [6]
Table 2.1: Foreign Exchange Sales and Exchange Rates, 1984-87 ..................... 9Table 2.2: Imports by Type ar. ' Exchange Rates, 1981-88 ......................... [10]Table 2.3: Percentage of 1986 Imports at Free Market Rate ........................ 12 ]Table 2.4: Benefits to Merchandise Importers from the Preferential Exchange Rate, 1984-
87 .[. 14]Table 2.5A: Import Restrictions and Average Tariffs by Sector and Stage of Processing,
1989 ................................................... [16]Table 2.5B: Import Restrictions and Averaga Tariffs by Sector and Stage of Processing,
1990 . .................................................. [16]Table 2.6A: Import Restrictions and Average Tariffs by Manufacturing Subsector, 1989 ... ..... 17 1Table 2.6B: Import Restrictions and Average Tariffs by Manufacturing Subsector, 1990 ........ [17 ]Table 2.7A: Production Coverage of NTB's by Manufacturing Subsector, 1989 .... ......... 18 ]Table 2.7B: Production Coverage of NTB's by Manufacturing Subsector, 1990 .... ......... [18 ]Table 2.9: Manufacturing Value Added by State and Private Firms .................... [ 311
Table 3.1: Manufacturing as a Percentage of GDP, 1968 and 1987 ..................... [ 42]Table 3.2: Share of Manufacturing Output by End Use ........................... [ 43]Table 3.3: Share of Manufacturing Value-added by Subsector, 1985 ................... [ 441Table 3.4: Distribution of Plants by Size, 1975-1988 ............................ [45]Table 3.5: Comparison of Plant Sizes, 1984 ....... ................ .......... [ 45]Table 3.6: Distribution of Manufacturing Plants by State, 1975-88 .................... - 46 lTable 3.7: Concentration of Production, 1975 and 1988 ........................... [48]Table 3.8: Industrial Concentration by Four-Digit CIIU, 1975-88 ..................... [49]Table 3.9: Concentration of Production: International Comparisons ................... t]Table 3.10: Distribution of Plants by Age, 1975-1988 ............................ [53 Table 3.11: Price-Cost Margins by Degree of Concentration ........................ 54]Table 3.12: Correlation Coefficients for Selected Variables ................ [-. 56]Table 3.13: Growth Rates of Manufacturing Value-Added by Subsector, 1975-88 .... ......... [ 57]Table 3.14: Labor Productivity Growth, 1975-1988 .............................. [ 59]Table 3.15: Gross Investment as a Percentage of Value-Added, 1976-88 ................. [ 60]Table 3.16: Composition of Manufactured Exports, 1981-88 ........................ [61]Table 3.17: Types of Manufactured Exports, 1981-1988 ........................... [ 63 ]Table 3.18: Value of Exports, 1975-87 ...................................... [ 641Table 3.19: Export Orientation by Subsector .................................. [ 65]Table 3.20: Capacity Utilization, 1984-88 ....................-.- ... [ 66]Table 3.21: Factors Affecting Capacity Utilization, 1984-88 ......................... [ 66]Table 3.22: Wage and Non-wage Benefits, 1989 ................................ [ 68]Table 3.23A: Share of Non-Wage Costs in Total Labor Costs ......................... [70]Table 3.23B: Comparison of Non-Wage Costs/Salaries by Plant Size .................... [70]Table 3.24: Indices of Real Wage and Non-Wage Payments, 1985-1988 ................. [71]Table 3.25: Non-wage Costs: International Comparisons .......................... [ 72]Table 3.26: Total Earnings as a Percentage of Value-Added: International Comparisons ... .... [ 72]
- v -
Table 3.27: Changes in Regulation of Foreign Investment under Decree 727 ............... [74 lTable 3.28: Sectoral Patterns of Foreign Ownership, 1976-88 ..... ................... 76 ]Table 3.29: Behavior of Plants with 5% or More Foreign Participation and Plants with 100%
Domestic Participation, 1976-88 .................................. [77]Table 3.30: Sectoral Comparison of Foreign and Domestic Firms in 1988 ................ [78 ]
Table A.2. 1: Distribution of Sales (Excluding Petroleum) by State, 1975-88 ................ 95 ]Table A.2.2: Price-Cost Margins By Sector .................................... [ 96 ]Table A.2.3: Intemational Comparison of Price-Cost Margir.s, ' 985 .................... [ 97 ]Table A.2.4: Growth of Manufacturing Value-Added .............................. [ 98 ]Table A.2.5: International Comparisons of Export Orientation, 1985 .................... [ 99 lTable A.2.6: Employment by Manufacturing Subsector, 1975-1988 .................... [100 ]
- vi
I,s OF FIGURES
Box 1: Arbitrage Gains betwe,en Venezuelan and U. S. Financial Markets at Parallel Exchange Rates, 1984-89 ~ ................................................... [ 4]
Figure 2.1: Price and Output Under Official and Free Market Exchange Rates . ..... ........ 1 20 1Figure 2.2: Price and Output with Import Quotas. ............................... [ 22 ]Figure 2.3: Price and Output with Import Quotas On Outputs and Inputs ..... ............ [ 23 1
Box 2: A Boom in Nontraditional Exports? . 28 1
Figure 3.1: Share of Manufacturing in GDP, 1987; International Comparisons. [42 1Figure 3.2: Real Investment in Manufacturing, 1976-88. [ 58 lFigure 3.3: Non-Traditional Exports and the Real Effective Exchange Rate. [ 62 1
This' reprtisaed onwrk by :A-nnk: .Irisn .ol ... d.cnslat,Lntrt1et Lr~ h...(o.nsult. , ..M . .. . ..... i . . p,.ng ..n . . p .
h1gh-quality u in stein
EXECUTIVE SUMMARY
1. Introduction
1. Between 1974 and 1982 Venezuela enjoyed windfall oil revenues equal to about two years'GOP and supplemented these resources with foreign borrowing. The Government sought to diversify theindustrial base, reserving for itself the "strategic sectors" or "basic industries"--principally aluminum,steel, and energy. Private investors were encouraged to develop activities which would substitute forimports and which were' downstream from the basic industries. Import substitution was encouraged byprotection through tariffs and licenses, by directed credit, and by investment controls.
2. When oil prices dropped in the 1980s, the bolfvar became overvalued, but it could not bemaintained. In 1983 the bolfvar was devalued and a multiple exchange rate system was introduced.Exchange controls, which were changed frequently, ad.-d more discretionary incentives. Price controlswere applied throughout the economy. Many private exports were prohibited, and the anti-export biasdiscouraged most others.
3. The result was an uncoordinated, inefficient system characterized by contradiction,redundancy, and discretion. Through most of the 1980s, the government controlled every aspect of afirm's decisions: input prices and quantities, output prices, investments, employment conditions andmarket access. Venezuelans found the most profitable investment opportunities were outside the country.The petroleum windfalls had favored Venezuela, but the Government's economic policies encouragedhigher consumption and lower private investment, productivity, and GDP.
2. Ind4ustrial Policy: the 1980s and the Reform
4. Industrial policy in the 1980s concentrated power in government ministries and supplantedmarket-based tests of efficiency. Policy may have been based on benevolent intentions of maintainingwages and aiding poorer consumers, but the result was unnecessary costs and inefficiencies which werepassed on to labor in unemployment and to consumers in higher prices, lower quality, poorer service,and a reduced range of products.
2.1 Trade Policy
5. The most potent instruments of industrial policy during the 1980s were administered throughtrade policy: exchange allocations, import licenses and delegations, tariff exonerations, and exportincentives. Even with large export subsidies, the import controls created a regime in which the industrialsector had little incentive to compete in international markets.
6. 2.1. 1 Import Restrictions. To import most items into Venezuela, it was necessary to obtainan import permit from the Development or the Agricultural Ministry which would be granted only ifdomestic producers did not object. Licenses protected an estimated 50 percent of the manufacturingsector. Tariffs were prohibitive, but exonerations were commonly given if there was no domesticproduction. Tariff exonerations were worth about three percent of GDP annually.
7. Importers applied for foreign exchange at the official rate. Ten percent of imports enteredat the free market rate, which averaged 110 percent above the official rate. This large differential wasa heavy barrier to imports which made the right to exchange at the official rate a valuable benefit.
- viii -
Benefits .o merchandise importers--awarded with little control or accountability--were equal to betweenfive and 20 percent of GDP annually.
8. The combined impacts of these programs were large, but it is impossible to determine fromtheory how the benefits were divided among importers, workers, producers, and consumers. It has beencompletely reformed with the goal of applying licenses and prohibitions to protect no more than fivepercent of domestic p ouction, placing all tariffs in the range of ten to twenty percent by 1993, andmaintaining a unified, floating exchange rate.
9. 2.1.2 Export Incentives. Exporters were required to surrender their foreign exchange at theofficial rate but were offered three principal incentives: a currency retention scheme; an export subsidy;and preferential credit. The incentives favored low value-added exports. They were changed fre(iuentlyand without much prior notice so that exporters were reluctant to plan on them. Currency retention, atits peak in 1966, paid an estimated 2.8 percent of GDP for exJEorts which were about two percent ofGDP. The export subsidy averaged .3 percent of GDP (and 18 percent of the fob price of the exportswhich received it) and the value of export credit was probably less that .01 percent of GDP.
10. Currency retention was eliminated in 1987 and under the reform program the export subsidywas fixed at 30 percent of fob price for one year and reduced in stages to 15 percent and five percent.The high export subsidy, coupled with the free market exchange rate and the domestic recession led toan increase of nontraditional e:xports from $1.87 billion in 1988 to $2.79 billion in 1989. However, bylooking at changes in unit values of expoits, it is estimated that half the apparent increase can beac.ounted for by the change from a regime which rewarded und-r-invoicing to one which rewarded over-invo:cing: Either 1988 exports were higher than reported or 1989 exports were lower, or both.
2.2 Public Enterprises
i1. State-owned enterprises (SOEs) produced 26 percen' of GDP in 1988. While petroleumaccounted for most production SOE also produced nine percent of goods and 18 percent of services. TheSOEs are concentrated in resource-based, export-oriented activities and in services. Their businesspractices vis-a-vis the private sector have reflected their monopolistic positions and resulted in transfersfrom private to public firms and in high-cost, unreliable goods and services. The Government's reformprogram--especially restructuring and privatization of major SOEs and trade and price liberalization--islikely to improve quality and services, but additional measures could be taken to increase SOEs' exposureto market forces.
2.3 Other Instruments of Industrial Policy
12. 2.3.1 Price Controls. In theory, every price was subject to Government controls, but theDevelopment Ministry regulated carefully the prices of 43 "basic necessities" and another 86 "priority"goods and services. The price controls caused occasional serious shortages and encouraged illegalexports. Under the reform program, controls were eliminated on all but 17 items.
13. 2.3.2 Financial Incentives. The Government channelled credit on favorable terms throughspecialized institutions. The total value of the subsidies to industry was relatively small, and directedcredit is being reduced under the financial sector reform program.
- ix -
14. 2.3.3 Tax Policy. Corporate tax rates are telatively high, but there are extensive exemptionswhich reduce the tax base, encourage evasion, distort resource allocation and, because they are sowidespread, lose much of their force. The tax system is being reformed in consultation with the IMF.
15. 2.3.4 Production Subsidies. Direct subsidies were used for food production and distribution:fertilizers, animal feed, powdered milk, corn meal, and coffee. The subsidies were not large as apercentage of GDP, but were large relative to the industries they affected. Subsidies have been retainedonly for fertilizer and powdered milk.
3. Policies and Performance in the Manufacturing Sector
16. Manufacturing output grew at an average rate of 3.9 percent between 1975 and 1988 due tolarge public investments, import protection, and targeted incentives. The cost of the industrial policiesof the 1970s and 1980s is reflected in reduced productivity, low capacity utilization, and the failure ofVenezuelan firms to compete effectively in international markets.
3.1 Overview of the Manufacturing Sector: Structure, Behavior, Performance
17. 3.1. I Structure of the Manufacturing Sector. The share of industry in GDP was 38 percentin 1987, while the share of manufacturing was 20 percent. Although manufacturing increased from12 percent of GDP in 1968, it is lower than in other countries at comparable stages of development.
1 8. In comparison with NIC's or Latin American countries as a group, Venezuelan manufacturingis specialized in basic industries. The share of value-added in basic industries is higher while the sharein textiles and capital goods is lower. Half of manufacturing is chemicals, petro-chemicals, steel andaluminum. This pattern reflects the government's policy of developing sectors in which it believesVenezuela has a comparative advantage.
19. Location. Industrial development centered in the central-northern-coastal (CNC) region wherethe largest markets were located. Apart from proximity to markets and access to better communicationand transportation, the CNC region benefitted from subsidized infrastructure and access to the centralgovernment which grants industrial in_entives. Location policies adopted in the .9- have not had aclear effect in moving production out of the Caracas area. Although restrictions on plant location led tosome movement out of Caracas, most plants seem to have moved to the surrounding areas. A mnoreefficient approach would be to set prices for utilities and housing services which reflect regionaldifferentials in costs and demand.
20. Plant Concentration. In 1975, 58 percent of all sectors had concentration ratios of 50 percentor greater. In 1988, 47 percent of consumer goods sectors had concentration ratios of 50 percent orgreater and, for producer goods sectors, the comparable figure was 59 percent. The greater concentrationin producer goods--which include heavy industry and capital goods--reflects a number of factors. Thetechnology for these sectors is more likely to be characterized by increasing returns to scale, leading tomore concentrated production. However, a number of producer goods sectors were also rserved forpublic firms, reinforcing the concentration in those sectors. Although the manufacturing sector has highconcentration, production levels in some sectors are below efficient scales. In the automotive industry,there are 15 assemblers in a market which fell from 163,000 units in 1982 to 26,000 units in 1989. Since
x -
production should be at least 100,000 units to exploit economies of scale, auto assemnbly cannot beefficient by international standards without exports.
21. Industrial policies have contributed to concentration. Restrict.ons on entry into key sectors,investment licenses, and exchange allocations have benefitted incumbents and reduced competition.Concentration does not necessarily reduce economic welfare, particularly where it permits the exploitationof economies of scale. Both in concentrated domestic markets and the contrasting case of fragmentedproduction, pressure from imports can either provide competition or the necessary impetus towardsconsolidation of production. Complementary domestic regulatory measures, however, may be necessary.Consolidation of production cannot occur without relatively easy exit and bankrupt%;y policies.
22. 3.1.2 Market Structure and Behavior. Concentration affected firms' pricing. There is asignificant, positive relation between one measure of concentration and price-cost margins during 1975-88. Import competition, which could be the chief element of market discipline in a small economy, doesnot seem to have affected firms' behavior. Investment in manufacturiig has declined, as indicated by theaverage age of plants. Finally, export share is positively correlated with both import penetration andconcentration and is negatively correlated with protectiou.
23. The correlation between exports and concentration suggests that economies of scale (as insteel) have been important for exporting firms. Any future anti-trust provisions which seek to maximizedomestic competition must take into account the importance of economies of scale both for efficientoutput levels in the domestic market and for export expansion. One approach is to foster importcompetition to control market power. A complementary solution is to create an environment moreconducive to export activity which would allow economies of scale and simultaneously increase thenumber of firms. These solutions--mp!icit in the Government's trade reforms-are in fact one: a firmcapable of competing domestically against imports should also be capable of export rivalry abroad.
24. 3.1.3 Performance. The period 1975-88 was characterized by inefficient growth of output.Large investments, financed by oil revenues, were directed to steel, aluminum, and petrochemicals.Manufacturing growth, which averaged eight percent during the late 197Cs, fell below two percent in themid-1980s. Inefficiency is evident in low growth of labor productivity or--in sectors dominated by publicenterprises--declines in the rates of output per worker. Other signs of inefficiency include high ratios ofinvestment to value-added in public enterprises, low rates of capacity utilization, and the manufacturingsector's inability to compete internationally.
3.2 Labor in the Manufacturing Sector: Policies and Evidence
25. In the 1970s and 1980s, the government introduced measures to increase wages and non-wagebenefits. The evidence suggests that, although non-wage costs increased as a share of total labor coststo the employer, real wages fell between 1975 and 1988.
26. Changes in real earnings between 1975 and 1988 have differed between public and privateplants. Real remuneration stayed almost constant in sectors with-. a predominance of private enterprises.In petroleum, steel, and aluminum, however, real remuneration declined by one percent annually. Thissuggests that real earnings outside of these sectors remained essentially constant over 1975-88. Laborproductivity declined by more than four percent annually in sectors dominated by public enterprises, butincreased in other sectors. It appears that declining real wages in aluminum, petroleum, and steel reflectdeclining productivity, although the rate of productivity decline exceeds the loss in real earnings.
- xi -
27. International comparisons suggest that the share of labor costs in value-added in Venezuelais relatively high. High labor costs, in combination with low rates of labor productivity growth, may betwo factors which account for the drop in real earnings over 1975-88.
3.3 Foreign Investment in the Manufacturing Sector
28. Direct foreign investment (DFI) has been small in the manufacturing sector. Restrictions wereimposed on sectors open to DFI, on profit repatriation, on re-investment, and on tax rates. Theserestrictions were reformed in February 1990. Only petroleum, media, professional services, publicsafety, and banks are reserved for national firms and, except for petroleum production and iron ore, allsectors previously opened to mixed firms are open to foreign firms.
29. Very few plants have any foreign ownership. In 1988, 94 percent of plants were domesticallyowned, three percent were "mixed," and two percent were "foreign." The pattern of limited foreignparticipation held--although less strongly--among large firms: For firms with more than 100 employeesin 1988, 85 percent were 100 percent domestically owned. Foreign ownership is narrowly concentratedin a few large establishments and mixed enterprises. In 1988 three sectors (metal products andmachinery, chemicals, and food processing) accounted for almost three-quarters of foreign ownership.
30. Labor productivity (output per employee) is greater in plants with foreign participation, andthe differential has been widening. Another distinguishing feature of firms with foreign participation isthat their shares of imports as a percentage of intermediates and of exports as a percent of sales are higherthan domestic firms'. The superior productivity and export performance of plants with foreignparticipation suggests that recent reforms, which open the economy to greater foreign participation, mayhave beneficial effects on performance.
4. Agenda for the 1990s
31. The Venezuelan Government has abandoned the instruments it used to control the industrialsector in the 1980s, and is eliminating other discretionary industrial incentives. The economy is beingopened to foreign investment; taxes are being reformed; and privatization, public enterprise restructuring,and financial sector reform programs are being introduced. The thrust of these reforms is to reduce theGovernment's role in the economy and to give greater prominence to market-based incentives anddecisions. For the industrial sector, the outstanding items on the policy agenda are the continuation ofthe trade policy reforms and implementation of a domestic policy regime supportive of internalcompetition. The role of the Development Ministry in support of these reforms lies in promotingcompetition, fostering efficient investment, and providing and supporting information, research, andanalysis to advance the broad interests of the industrial sector in economic policy-making.
4.1 Trade Reform: Next Steps
32. The trade reform has replaced the system of uncontrolled, ad hoc protection and costly exportsubsidies with a system which--when it is fully implemented in 1993--will use effective exchange ratemanagement in place of directed programs aimed at import substitution or export promotion. Moderatetariffs-between ten percent and 20 percent--would offer additional protection for domestic economicactivities, and the Government's intention is to provide comparable levels of effective protection to allsectors to encourage efficient resource allocation. Licenses would provide further protection to no more
- xii -
than five percent of domestic manufacturing. This protection through licenses and tariffs would leavea residual anti-export bias which would be accepted as a cost to the economy. Export subsidies wouldbe eliminated.
33. 4.1. 1 Exchange Rate. The most important single element of the trade reform program hasbeen unifying and floating the exchange rate. Exchange rate management will encourage an efficientallocation of resources between the traded goods sector (importables and exportables) and the nontradedsector. In the future it will be necessary to manage the exchange rate to accommodate unexpectedchanges in petroleum prices. The Government is studying an oil stabilization fund to absorb revenueswhen prices are high and to utilize them when prices are low. Exchange rate management will benecessary to allow investors and producers to form reliable expectations of future exchange rates.
34. 4.1.2 Uniform Treatment of Sectors. One of the cornerstones of the adjustment program hasbeen to re-orient the economy based on transparent, broadly applicable general principles rather than theprevious array of industry-specific rules and standards. With the notable exception of agriculture (whichis currently being addressed) the Government has, to date, maintained an admirable degree of uniformityof treatment among sectors. Tnis is an important element of the program, both politically-to showimpartiality, and economically--to allow market forces, rather than bureaucratic or political judgements,to reveal the activities which are most robust.
35. 4.1.3 Licenses. As the Government approaches its medium-term goal of reducing licensesand prohibitions to protect no more than five percent of manufacturing, it will have to consider longer-term objectives. It should look at a longer-term goal of eliminating all licenses and prohibitions. Withtariffs, internal prices move with world prices, separated only by the percentage of the tariff rate. Tothe extent that the Government wishes to exempt some sectors from the forces of the adjustment program(expressed in Venezuela by the five percent target for licenses and prohibitions), it would be preferableto grant them through fixed-term (one-to-three years) tariff protection slightly (five-to-ten percent) abovethe ceiling for other sectors.
36. 4.1.4 Tariffs. The most important tariff reductions are yet to come. At each step, a greaterproportion of the domestic economy will be subject to foreign competition. Manufacturers which areunchallenged by imports with a 50 percent tariff will find greater competition at 20 percent.
37. As the Government approaches its medium-term target of a ten-to-twenty percent tariff range,it should consider its longer-term goals. It may wish to examine a longer-term goal of a unified tariffat a rate between five and ten percent or lower. The ten-to-twenty percent range could leave higheffective protection for activities of low value-added. Further, it would mean that Venezuelan consumerswould be paying prices 20 percent above world levels for many items, and it would continue to encourageinvestment in low value-added, inwardly-oriented industries. If Venezuelan industries are to becompetitive in world markets, they must also be competitive at home, and the surest way ofaccomplishing that would be to eliminate tariff protection so that investment would be directed to thoseactivities where Venezuela would be most competitive.
38. 4.1.5 Exemptions. Discretionary tariff exonerations have been eliminated except for someassembly operations. There also are exemptions, established in law, for some entities such as state-ownedenterprises, universities, and the central government. The remaining discretionary exemptions should beeliminated, and legislation should be introduced to abolish statutory exemptions.
- xiii -
39. 4.1.6 Expors and Exort Subsidies. Over the years, the role of export subsidies has beenforgotten and the Government had to fend off many spurious claims for exporters' right to the subsidy.The subsidy initially compensated exporters who, under the multiple exchange rate regime, were requiredto surrender their foreign exchange to the Central Bank at the official rate. With the unification andfloating of the exchange rate, the subsidy no longer served that purpose, and the Government was correctin reducing it and in its plans to eliminate it as soon as an effective duty and indirect tax rebate schemeis available to exporters.
40. 4.1.7 Export Processing Zones. There is interest within Venezuela in establishing exportprocessing zones (EPZ's). These zones are economic enclaves within which manufacturing for exportoccurs under virtual free trade conditions by exempting exporters from some administrative procedures,customs duties, and perhaps other taxes and/or labor laws. These are not an effecdive solution to long-term problems of efficient resource allocation, and will be less attractive in Venezuela as the trade reformlowers tariffs and other obstacles to international trade. While the Government should not discourageprivate development of EPZ's, it should avoid any programs which would subsidize them.
41. 4.1.8 Export Credit and EWport Credit Insurance. FINEXPO has offered credit at subsidizedrates to a limited number of exporters. There is no justification for these subsidies and they encouragemany distortions in the industrial incentives. Exporters should pay market rates for credit. TheGovernment should encourage the development of private markets which could provide suitableinstruments for export credit and insurance.
42. Exporters have sought subsidies for an export credit insurance scheme which would allowthem to export to risky clients in countries with poor credit records without bearing the political and/orcommercial risk of default. The Government should not subsidize such programs without a carefulanalysis to establish that the benefits would exceed the costs and risks. The records of most officialexport credit insurance agencies in other countries are poor. As long as there are no laws which preventprivate insurers from offering export credit insurance in Venezuela, the fact that it is not offered or is"too costly" most likely indicates that the exports involved would be too risky and should not beundertaken.
43. 4.1.9 Public Services. It is widely argued that the private sector has adjusted to the tradereforms and that the public sector has not. Entrepreneurs point to a long list of state-owned enterprisesand government services which are costly and inefficient: products of the basic industries,communications, electricity, water, shipping, ports, and customs administration. The Government hasbegun a program of restructuring and privatization which will address these concerns, but the programis a year-and-a-half behind the trade reforms. The correct policy response is not, as some haveadvocated, to offset these cost penalties with subsidies but, as the Government's restructuring andprivatization is designed to do, to eliminate them at the source. It is incumbent on the Government toplace its industrial sector in a more competitive position by eliminating government-imposed obstacles.The appropriate governmental role in promoting industrial competitiveness and exports lies in placingproducers in the most advantageous competitive positions through efficient services and infrastructure.
4.2 Role of the Development Ministry
44. The Development Ministry has been restructured to adopt a role compatible with an outward-oriented economy. The Ministry has four institutional objectives: (a) Increased productivity, productquality, and service; (b) Increased foreign investment and access to technology; (c) Increased capacity
- xiv -
to monitor industrial performance; and (d) Stronger analytical bases to formulate policy and to identifypublic sector obstacles to competitiveness. The responsibilities the Ministry must undertake can begrouped into three categories: those which make the country internationally competitive and maintaina favorable investment climate; those which maintain and promote competition within the domesticmarket; and those which collect, analyze, and disseminate information in support of the other two.
45. 4.2.1 Investnent Climate. The general economic health and political stability in a country,along with resources and markets, are the primary determinants of industrial investment. In this regard,the Government's reform program has eliminated many of the impediments to industrial investment, bothdomestic and foreign. There are areas where further policy changes would enhance Venezuela'sinternational competitiveness:
* Tax Reform. Tax rates on corporate profits are higher in Venezuela (50 percent) than they are in othercountries which compete for investment. Legislation to reform the entire tax system is pending but,until it is passed, investors will defer decisions in cases where this would make a difference.
* Labor Legislation. Labor laws intrude heavily into employee and managerial freedom to negotiateterms and conditions of employment. They impose requirements which make Venezuelan labor lesscompetitive with other nations.
* Training and Education. The quality of the labor force is as important to investors as the price. TheNational Training Institute (INCE) and the public education system need to implement programs whichwill more efficiently prepare Venezuelan labor for employment in modern industrial occupations.
* Technology. Technology transfers have been inhibited by policies which discouraged foreigninvestment and by import restrictions on capital goods. These policies have been reformed, and theDevelopment Ministry should ensure that no other government policies--such as outdated patent laws-will inhibit introduction of state-of-the-art technology in Venezuela.
* Investment Promotion. Venezuela has much to offer, and this is becoming more widely recognizedinternationally. Effective investment promotion, in conjunction with the private sector, may acceleratesome decisions.
46. 4.2.2 Promotion of Competition. In a small economy like Venezuela's, the principal sourceof competition is the world market, and the Development Ministry is responsible for continuing the tariffreform. It is also important to maintain a competitive environment in nontraded goods. Reforms of somelaws and regulations can contribute to a more competitive economy:
* Patents and Copyrights. Venezuela's laws of intellectual property rights have been criticized fordiscouraging research and innovation and deterring foreign investors from introducing advancedtechnology. Legislation has been drafted to increase protection of intellectual property rights inVenezuela, and the Development Ministry should take an active role in advocating appropriate changes;
* Product Standards. Weights and Measures. The Development Ministry, in setting standards, shouldlook abroad toward international norms which would maximize domestic competition. This would beof the greatest benefit to consumers, who would have wider selection, and to domestic producers who,by adapting to international norms, would be able to compete in larger markets.
- xv -
* Maximum Retail Price. The consumer protection law requires-among other things--that manufacturersset a maximum retail price (precio de venta al pablico, PVP). It is not clear under what conditionsthe PVP protects consumers, and the requirement should be replaced with a provision which makesthe PVP optional.
* Financial Sector Reform. An efficient financial sector facilitates resource mobilization and allocation.The financial sector reform should encourage internal competition, however, the Development Ministryshould study with other affected Ministries the feasibility of greater foreign ownership of commercialbanks.
* Bankruptcy. An important element of vigorous competition is exit by firms which are unable tocompete. This frees resources to move to more dynamic, expanding activities and leads to a stronger,more competitive economy. The Development Ministry should ensure that bankruptcy regulations andprocedures are consistent with best international practice.
* Antitrust Legislation. The strongest form of consumer protection would come from vigorous,competitive markets. As tariffs are reduced, international competition will reduce the prices of tradedgoods and drive producers' prices toward international levels. For domestic distribution and for othernontraded goods, it may be desirable to rely on antitrust legislation to enforce competitive norms andbehavior.
47. 4.2.3 Information and Research. The Development Ministry should undertake a systematicinventory of the economic information and systems available in Venezuela and in other countries andshould develop recommendations to improve the quality and availability of reliable data, and ensure thatthey are gathered and disseminated in a cost-effective fashion. Without such data it is impossible tomeasure the effects of any policy, much less to approximate the effects of alternative policies. In thisregard, the Development Ministry should continue to give priority to computerizing its own records andmaking these available to researchers who would be interested in measuring the effects of the policies andeconomic decisions made during the 1980s. The Ministry itself does not have sufficient resources toanalyze these data, but they would be of interest to an international body of scholars seeking tounderstand and measure the effects of Venezuelan industrial policy during the 1980s.
March 13. 19919:11 am
1. INTRODUCIION
1.1 Between 1958 and 1972 Venezuela's non-oil GDP grew an average of 6.8 percent per year.Manufacturing (excluding oil refining) was the fastest growing sector, at a rate of 7.8 percent. Thisresulted from foreign investment and import substitution which reduced the share of imports in privateconsumption from 30 percent at the end of the 1950s to three percent in 1970. In the 1970s and early1980s, the Government was awash in oil revenues. Bourginon (1989) estimates the windfall during 1974-78 averaged a 20 percent increase annually above what GDP would have been without the boom, and,during 1979-82, 27 percent of GDP. Over the nine years, the windfall totalled approximately two years'GDP. These resources were supplemented by foreign borrowing, and Venezuela's external debt wentfrom $1.5 billion in 1975 to $38.2 billion in 1983. The $36.7 billion increase in debt is equal to aboutone-half of the 1988 GDP.
1.2 The Government sought to diversify the industrial base, reserving for itself investment in "strategicsectors" or "basic industries"-principally aluminum, steel, and energy. Large public investments weremade through the Venezuelan Investment Fund (Fondo de Inversiones de Venezuela, FIV) and theVenezuelan Corporation of Guayana (Corporacion Venezolana de Guayana, CVG). Direct foreigninvestment was discouraged or prohibited, and private investors were encouraged to invest--generally--indomestic activities which would substitute for imports and-specifically-in activities downstream fromthe basic industries. This import substitution was encouraged by protection through tariffs and licenses,by directed credit at below-market rates, and by controls on investments.
1.3 When oil prices dropped in the 1980s, the bolfvar became overvalued, but it could not bemaintained. In 1983, following a series of currency crises and losses of foreign exchange reserves, thebolfvar was devalued and a multiple exchange rate system was introduced. Exchange controls, whichwere changed frequently, introduced a new layer o. discretionary incentives. Price guidelines andcontrols were applied throughout the economy. Some exports were prohibited, and the industrialincentives discouraged most others. It was widely felt that the role of industry was to satisfy the localmarket and that only if there was a "surplus," could it be exported.
1.4 The layers upon layers of intervention produced an uncoordinated, inefficient system characterizedby contradiction, redundancy, and discretion. Through most of the 1980s, the industrial sector operatedin an environment in which government controlled every aspect of a firm's decisions: input prices andquantities, output prices, investments, and market access. Bourginon (1989, p. 322) has characterizedthis period as "... a dramatic failure of economic policy under complex yet seemingly exceptionallyfavorable conditions. Nothing appears to have been gained from the windfalls in terms of non-oil GDP*during 1973-82. Consumption has been the only winner."
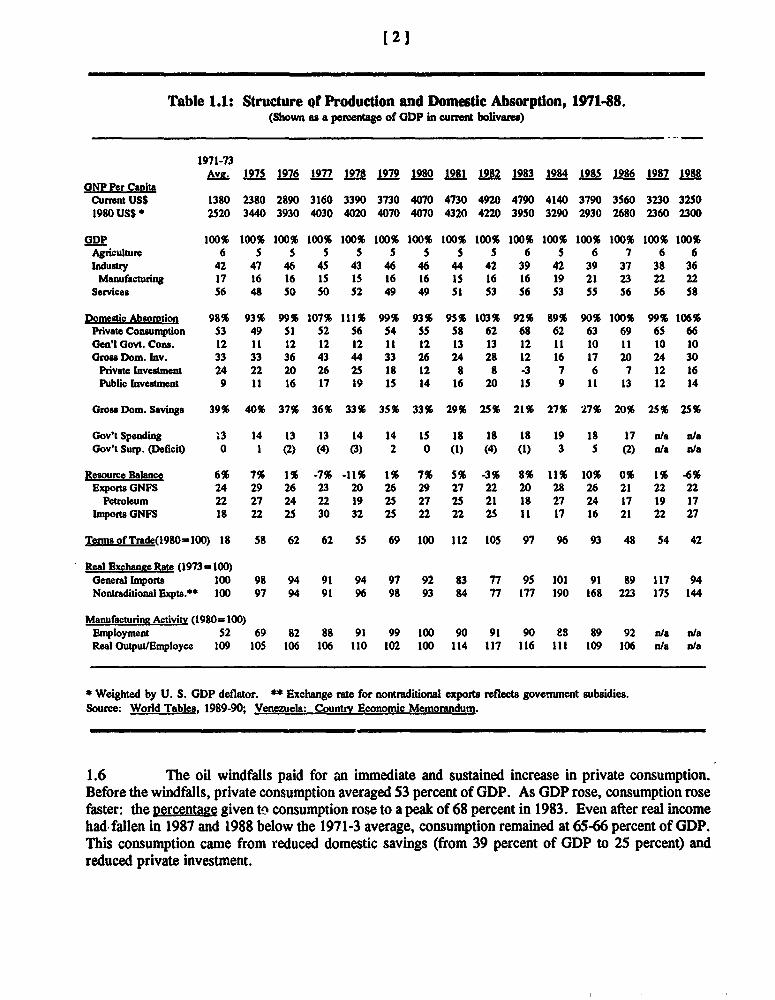
1.5 Table 1. 1 shows the structure of production and domestic absorption during this period. RealGNP per capita (exDressed in 1980 US$), which was relatively stable during 1976-83, rose and fell withthe terms of trade. In 1988 it was only 53 percent of its 1981 peak, and about 10 percent below the1971-73 average. Expressed in constant US$, all sectors declined, but measured in 1980 bolivares, onlythe non-manufacturing industrial sector declined: agriculture grew at an annual rate of 4.3 percent,manufacturing at 3.8 percent, and services at 1.8 percent between 1981 and 1988 (cf. World Tables.1989-90).
[2)
Table 1.1: Structure Qf Production and Domestic Absorption, 1971488.(Shown as a percertage of GDP in curnt bolivares)
1971-73Ave. 1975 1976 1977 1978 1979 1980 1981 1 1983 1984 1985 1986 1987 198R
ONP Per CapitaCumnt USS 1380 2380 2890 3160 3390 3730 4070 4730 4920 4790 4140 3790 3560 3230 32S01980 USS * 2520 3440 3930 4030 4020 4070 4070 4320 4220 3950 3290 2930 2680 2360 2300
GDP 100% 100% 100% 100% 100% 100% 100% 100% 100% 100% 100% 100% 100% 100% 100%Agrculture 6 5 S 5 5 5 5 5 S 6 5 6 7 6 6Indusry 42 47 46 45 43 46 46 44 42 39 42 39 37 38 36
Manufacturing 17 16 16 IS IS 16 16 15 16 16 19 21 23 22 22Services 56 48 50 50 52 49 49 51 53 56 53 55 56 56 58
Domesic Absorption 98% 93% 99% 107% 111% 99% 93% 9S% 103% 92% 89% 90% 100% 99% 106%Private Consumption 53 49 S1 52 S6 S4 SS 58 62 68 62 63 69 6S 66Gen'lGovt.Cons. 12 11 12 12 12 11 12 13 13 12 11 10 11 10 10Gross Dom. Inv. 33 33 36 43 44 33 26 24 28 12 16 17 20 24 30
Private Investment 24 22 20 26 25 18 12 8 8 -3 7 6 7 12 16Public Investment 9 11 16 17 19 IS 14 16 20 15 9 11 13 12 14
Gross Dom. Savings 39% 40% 37% 36% 33% 3S% 33% 29% 25% 21% 27% 27% 20% 2S% 25%
Gov't Spending .3 14 13 13 14 14 IS 18 18 18 19 18 17 n/a rJaGov't Surp. (Deficit) 0 1 (2) (4) (3) 2 0 (1) (4) (1) 3 5 (2) n/a n/a
Resource Balance 6% 7% 1% -7% -11% 1% 7% 5% -3% 8% 11% 10% 0% 1% -6%Exports GNFS 24 29 26 23 20 26 29 27 22 20 28 26 21 22 22
Petroleum 22 27 24 22 19 25 27 25 21 18 27 24 17 19 17ImportsGNFS 18 22 25 30 32 25 22 22 25 11 17 16 21 22 27
TermsofTrade(1980=100) 18 58 62 62 S5 69 100 112 105 97 96 93 48 54 42
Real Exchanee Rate (1973 = 100)General lmpotts 100 98 94 91 94 97 92 83 77 95 101 91 89 117 94Nontraditional Expts.** 100 97 94 91 96 98 93 84 77 177 190 168 223 17S 144
Manufacturing Activity (1980= 100)Employment 52 69 82 88 91 99 100 90 91 90 88 89 92 n/a n/aReal Output/Employee 109 10S 106 106 110 102 100 114 117 116 111 109 106 n/a n/a
* Weighted by U. S. GDP deflator. *# Exchange rate for nontraditional exports reflects government subsidies.Source: World Tables, 1989-90; Venezuela: Country Economic Memorandum.
1.6 The oil windfalls paid for an immediate and sustained increase in private consumption.Before the windfalls, private consumption averaged 53 percent of GDP. As GDP rose, consumption rosefaster: the percentage given to consumption rose to a peak of 68 percent in 1983. Even after real incomehad fallen in 1987 and 1988 below the 1971-3 average, consumption remained at 65-66 percent of GDP.This consumption came from reduced domestic savings (from 39 percent of GDP to 25 percent) andreduced private investment.
(3J
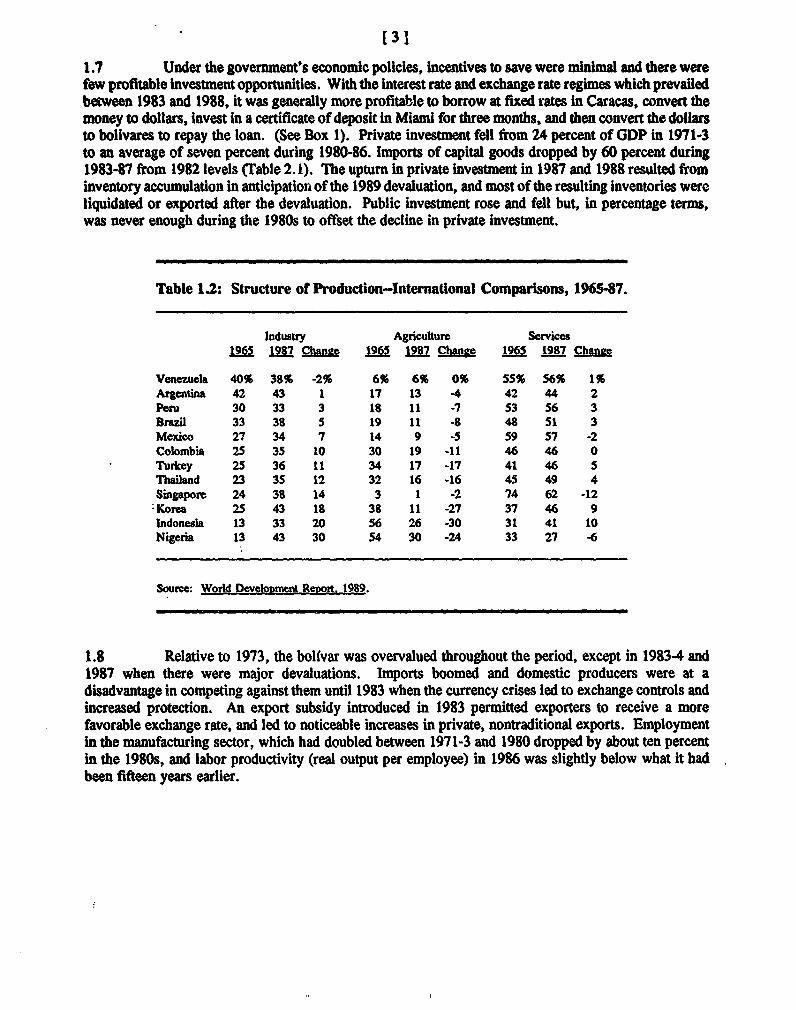
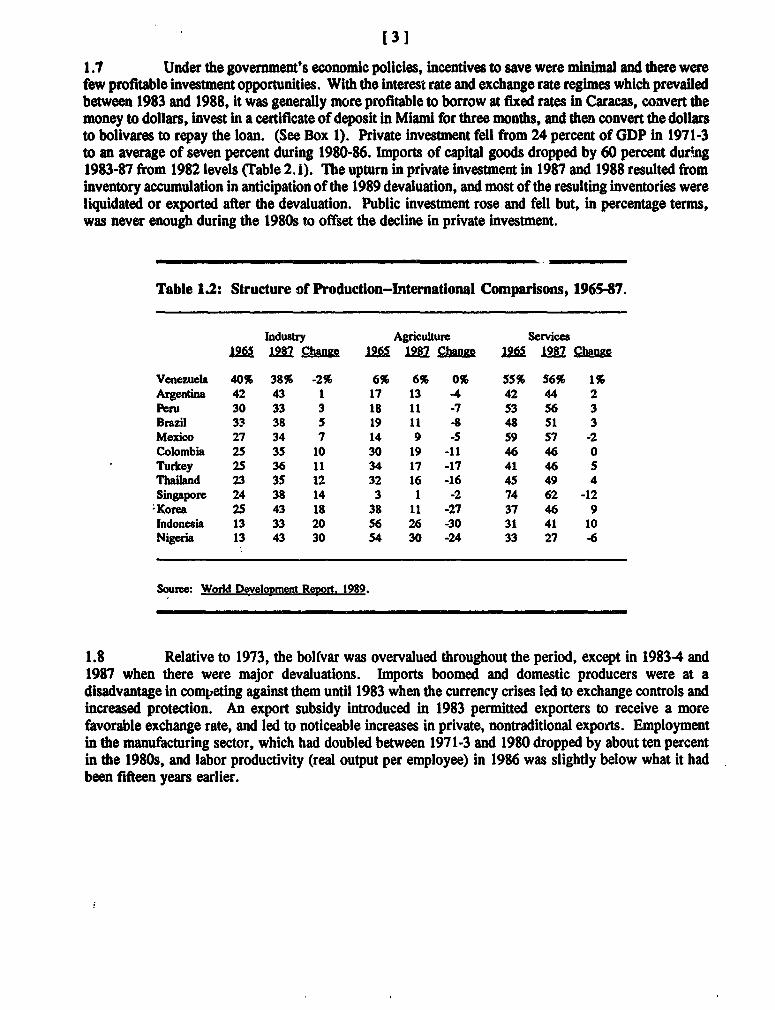
1.7 Under the government's economic policies, incentives to save were minimal and there werefew profitable investment opportunities. With the interest rate and exchange rate regimes which prevailedbetween 1983 and 1988, it was generally more profitable to borrow at fixed rates in Caracas, convert themoney to dollars, invest in a certificate of deposit in Miami for three months, and then convert the dollarsto bolivares to repay the loan. (See Box 1). Private investment fell from 24 percent of GDP in 1971-3to an average of seven percent during 1980-86. Imports of capital goods dropped by 60 percent during1983-87 from 1982 levels (Table 2.1). The upturn in private investment in 1987 and 1988 resulted frominventory accumulation in anticipation of the 1989 devaluation, and most of the resulting inventories wereliquidated or exported after the devaluation. Public investment rose and fell but, in percentage terms,was never enough during the 1980s to offset the decline in private investment.
Table 1.2: Structure of Production-International Compasons, 1965-87.
Industry Agriculture Services1965 1987 Chanc 1965 1987 Changee 1 1987 Chanc
Venezuela 40% 38% -2% 6% 6% 0% 55% 56% 1%Argentina 42 43 1 17 13 -4 42 44 2Peru 30 33 3 18 11 -7 53 56 3Brazil 33 38 5 19 11 -8 48 51 3Mexico 27 34 7 14 9 -5 59 57 -2Colombia 25 35 10 30 19 -11 46 46 0Turkey 25 36 11 34 17 -17 41 46 5Thailand 23 35 12 32 16 -16 45 49 4Singapore 24 38 14 3 1 -2 74 62 -12Korea 25 43 18 38 11 -27 37 46 9Indonesia 13 33 20 56 26 -30 31 41 10Nigeria 13 43 30 54 30 -24 33 27 -6
Soure: World Development Reron. 1989.
1.8 Relative to 1973, the bolfvar was overvalued throughout the period, except in 19834 and1987 when there were major devaluations. Imports boomed and domestic producers were at adisadvantage in competing against them until 1983 when the currency crises led to exchange controls andincreased protection. An export subsidy introduced in 1983 permitted exporters to receive a morefavorable exchange rate, and led to noticeable increases in private, nontraditional exports. Employmentin the manufacturing sector, which had doubled between 1971-3 and 1980 dropped by about ten percentin the 1980s, and labor productivity (real output per employee) in 1986 was slightly below what it hadbeen fifteen years earlier.
[31
1.7 Under the government's economic policies, incentives to save were minimal and there werefew profitable investment opportunities. With the interest rate and exchange rate regimes which prevailedbetween 1983 and 1988, it was generally more profitable to borrow at fixed rates in Caracas, convert themoney to dollars, invest in a certificate of deposit in Miami for three months, and then convert the dollarsto bolivares to repay the loan. (See Box 1). Private investment fell from 24 percent of GDP in 1971-3to an average of seven percent during 1980-86. Imports of capital goods dropped by 60 percent dur.ng1983-87 from 1982 levels (Table 2.1). The upturn in private investment in 1987 and 1988 resulted frominventory accumulation in anticipation of the 1989 devaluation, and most of the resulting inventories wereliquidated or exported after the devaluation. Public investment rose and fell but, in percentage terms,was never enough during the 1980s to offset the decline in private investment.
Table 12: Structure of Production-International Comparisons, 1965487.
Industry Agriculturm Services196S 1987 Chanze 1965 1987 Chane 1965 1987 Change
Venezuela 40% 38% -2% 6% 6% 0% 55% 56% 1%Argentina 42 43 1 17 13 -4 42 44 2Peru 30 33 3 18 11 -7 53 56 3Brazil 33 38 5 19 11 -8 48 51 3Mexico 27 34 7 14 9 -5 59 57 -2Colombia 25 35 10 30 19 -11 46 46 0Turkey 25 36 11 34 17 -17 41 46 5Thailand 23 35 12 32 16 -16 45 49 4Singapore 24 38 14 3 1 -2 74 62 -12
'Korea 25 43 18 38 11 -27 37 46 9Indonesia 13 33 20 56 26 -30 31 41 10Nigeria 13 43 30 54 30 -24 33 27 -6
Souce: World Development Report. 1989.
1.8 Relative to 1973, the bolfvar was overvalued throughout the period, except in 19834 and1987 when there were major devaluations. Imports boomed and domestic producers were at adisadvantage in competing against them until 1983 when the currency crises led to exchange controls andincreased protection. An export subsidy introduced in 1983 permitted exporters to receive a morefavorable exchange rate, and led to noticeable increases in private, nontraditional exports. Employmentin the manufacturing sector, which had doubled between 1971-3 and 1980 dropped by about ten percentin the 1980s, and labor productivity (real output per employee) in 1986 was slightly below what it hadbeen fifteen years earlier.
l 5 ]
1.9 Venezuela's recent industrial performance compares unfavorably to other nations'.Table 1.2 shows the structure of production of ten developing countries in 1965 and in 1987. In 1965,Venezuela and Argentina were the most industrialized. However, Venezuela's industrial sector declinedduring the period while tne other nations became more industrialized. The Latin economies generallytrailed the non-Latin nations in this sample, but Venezuela's decline in industrial output from 40 percentto 38 percent of GDP is in sharp contrast to all the other nations. It should also be noted thatVenezuela's agricultural sector, already a small percentage of GDP in 1965, was the only one not tocontract over the period. This reflects the heavy agricultural subsidies during the Lusinchi Administration(estimated elsewhere (World Bank 1988a) to be as high as two percent of CDP) which restored theagricultural sector from five percent of GDP in 1975-82 to six-to-seven percent during 1985-88.
Table 1.3: Per Capita Manufactured Exports: 1980, 1987.(Shown in 1987 USS)
Growth Growth1980 1987 Rate 1980 1987 Rate
Peru $53 $23 -11% Brazil $88 $83 -1%Chile 55 36 -6 Mexico 43 119 16Colombia 43 37 -2 Turkey 24 131 27Venezuela 30 48 7 Malaysia 245 428 8Argentina 82 54 -6 Korea 565 1035 9Thailand 55 80 6 Singapore 5966 7876 4
Source: World Bank Staff calculations based on World Develooment ReMort. 1989.
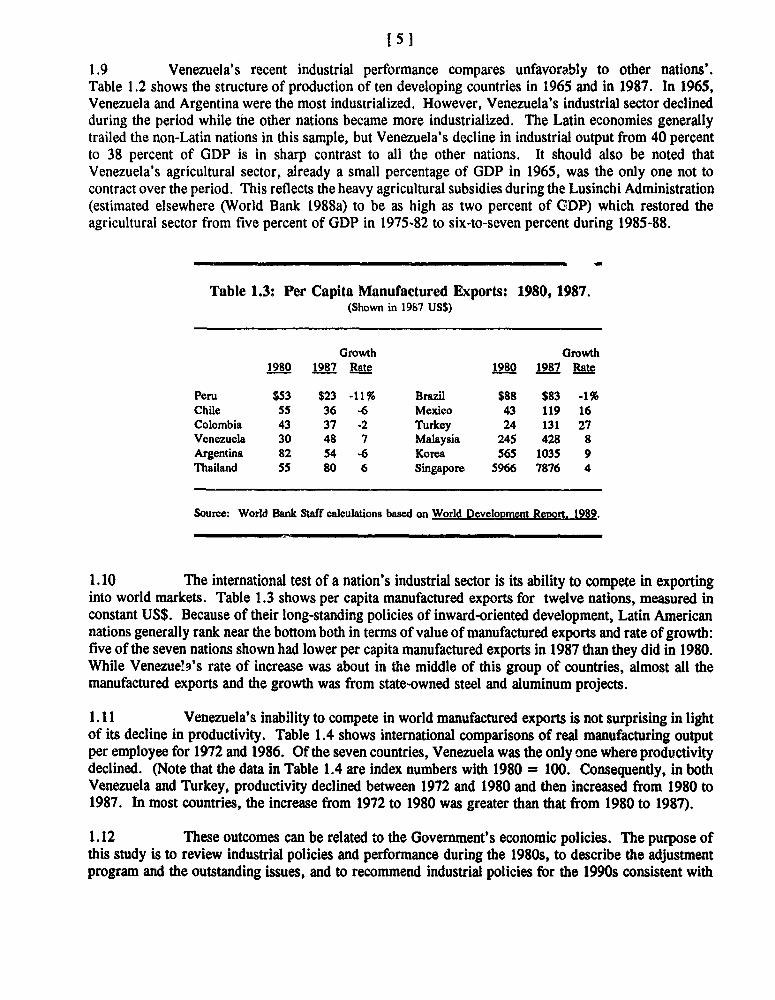
1.10 The international test of a nation's industrial sector is its ability to compete in exportinginto world markets. Table 1.3 shows per capita manufactured exports for twelve nations, measured inconstant US$. Because of their long-standing policies of inward-oriented development, Latin Americannations generally rank near the bottom both in terms of value of manufactured exports and rate of growth:five of the seven nations shown had lower per capita manufactured exports in 1987 than they did in 1980.While Venezue!a.'s rate of increase was about in the middle of this group of countries, almost all themanufactured exports and the growth was from state-owned steel and aluminum projects.
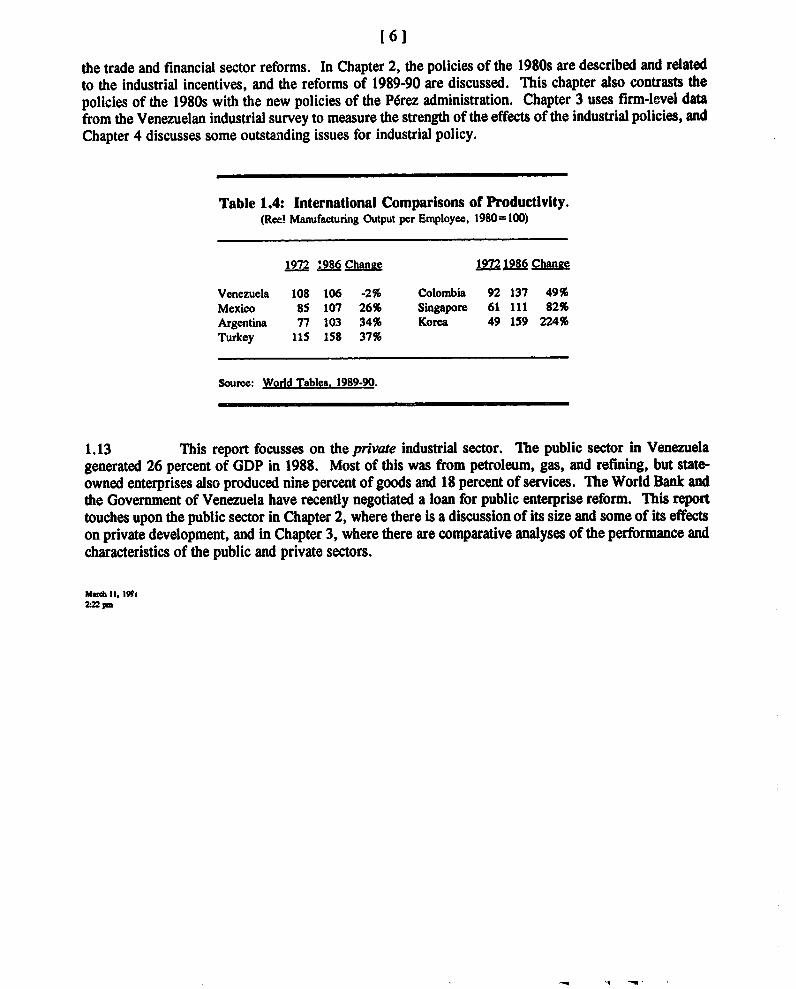
1.11 Venezuela's inability to compete in world manufactured exports is not surprising in lightof its decline in productivity. Table 1.4 shows international comparisons of real manufacturing outputper employee for 1972 and 1986. Of the seven countries, Venezuela was the only one where productivitydeclined. (Note that the data in Table 1.4 are index numbers with 1980 = 100. Consequently, in bothVenezuela and Turkey, productivity declined between 1972 and 1980 and then increased from 1980 to1987. In most countries, the increase from 1972 to 1980 was greater than that from 1980 to 1987).
1.12 These outcomes can be related to the Government's economic policies. The purpose ofthis study is to review industrial policies and performance during the 1980s, to describe the adjustmentprogram and the outstanding issues, and to recommend industrial policies for the 1990s consistent with
[61
the trade and financial sector reforms. In Chapter 2, the policies of the 1980s are described and relatedto the industrial incentives, and the reforms of 1989-90 are discussed. This chapter also contrasts thepolicies of the 1980s with the new policies of the PNrez administration. Chapter 3 uses firm-level datafrom the Venezuelan industrial survey to measure the strength of the effects of the industrial policies, andChapter 4 discusses some outstanlding issues for industrial policy.
Table 1.4: International Comparisons of Productivity.(Rcea! Manufacturing Output per Employee, 1980= 100)
1972 :986 Chanec 1972 1986 Chance
Venezuela 108 106 -2% Colombia 92 137 49%Mexico 85 107 26% Singapore 61 111 82%Argentina 77 103 34% Korea 49 159 224%Turkey 115 158 37%
Source: World Tables. 1989-90.
1.13 This report focusses on the private industrial sector. T'he public sector in Venezuelagenerated 26 percent of GDP in 1988. Most of this was from petroleum, gas, and refining, but state-owned enterprises also produced nine percent of goods and 18 percent of services. The World Bank andthe Govermment of Venezuela have recently negotiated a loan for public enterprise reform. This reporttouches upon the public sector in Chapter 2, where there is a discussion of its size and some of its effectson private development, and in Chapter 3, where there are comparative analyses of the performance andcharacteristics of the public and private sectors.
Matc 11. 199&PMl
2. INDUSTRIAL POLICY: THE 1980S AND THE REFORm
2.1 During the 1980s-particularly after the introduction of the multiple exchange rate systemin February 1983--the Venezuelan Government managed industrial policy through a comprehensive,uncoordinated series of ad hoc instruments which were orimarily intended to achieve objectives other thanefficient industrial development. Entrepreneurial discretion was sharply restricted and firms' successdepended more on bureaucratic whim than on a market test of efficiency of production or distribution.Government limited managerial prerogatives in significant ways:
* The prices and quantities of imported inputs were contz^?'ed by licenses, tariffs (which could bereduced upon application), government import monopolies, and foreign exchange allocations.Government allowed domestic producers to prevent importation of competing merchandise.Domestically produced inputs were subject to price controls. Labor costs and terms of employmentwere controlled by distorting labor laws.
* Output prices were regulated and foreign competition was restrained bv import prohibitions, licenses,and foreign exchange allocations.
* Investments to expand production or to enter new markets were regulated. Government permits gaveinvestors concessional credit, imported inputs, and preferential foreign exchange. Investments incertain geographic regions were discouraged.
e Exports were discouraged and permits were necessary. Exporters received the official--rather thanthe free market-exchange rate, but were eligible for an offsetting subsidy plus preferential credit.The incentive regime and rates were frequently changed and exporters were unable to predictaccurately their export receipts more than a few weeks in advance.
2.2 There was a benevolent intention and an internal logic-albeit, misguided-to the policies.The multiple exchange rate system was meant to protect consumers, permitting preferential rates for"essential" items such as food, clothing, medicines, or inputs into their production. The import controlsand tariff exonerations were meant to protect employment and production, ensuring that there weresufficient imported inputs and an absence of foreign competition to keep industry employed. With noforeign competition, price controls were intended to protect consumers against monopolistic pricing.Further, the price controls were thought to be necessary to ensure that the benefits of the preferentialforeign exchange would be passed on to consumers. However, where items were being subsidized, itwas necessary to prohibit their exportation so that only Venezuelan residents would benefit. Finally, withinvestors entitled to concessional credit and other subsidies to capital, investment controls would ensurethat there would not be too much investment.
2.3 These policies, though well-intended, built distortions upon distortions and increasinglysubstituted governmental discretion and judgement for market-based transactions. For the policies to havebeen efficiently administered, they would have demanded information and analytical resources which arebeyond the reach of any government. There is no example of a government which has efficientlyadministered such policies, and many examples of governments which have failed.
2.4 The concentration of power in governmental ministries left wide discretion and in some casesfostered corruption. Businessmen found the most profitable use of their time to be seeking privileges (or
[ 8 ]
preventing their competitors from receiving concessions), and visitors to economic ministries commonlyfound queues of well-dressed executives waiting outside offices for hearings on applications for someprivilege which officials were empowered to grant. While these policies were meant to serve theVenezuelan consumer, they imposed additional business costs on the industrial sector which were passedon to labor, in the form of unemployment, and to consumers in higher prices, lower product quality,poorer service, and a reduced range of goods and services.
2.1 Trgde Policy
2.5 The principal and most pot-nt instruments of industrial policy during the 1980s wereadministered through international trade policy--exchange allocations, import licenses and delegations,tariff exonerations, and export incentives. Despite large export subsidies, the import controls created ananti-export bias and the industrial sector had little incentive to compete in international markets.
2.1.1 Import Restrictions
2.6 For someone to import most items into Venezuela, he had first to obtain an import permit(a license or a delegation) from the Development or the Agricultural Ministry. This would be grantedonly if domestic producers did not object. Since tariffs were prohibitive, he had to apply for anexoneration which would reduce the tariff to a reasonable level. Then, he had to apply to an agency ofthe Finance Miristry for foreign exchange at one of the preferential rates.
2.1.1.1 Foreign Exchange Controls
2.7 From 1973 to February 1983, Venezuela maintained a fixed exchange rate of 4.3 bolivaresto the US$. The bolfvar became incroasingly overvalued (see the real exchange rate indices inTable 1.1), and in early 1983 there were a series of currency crises which were resolved by introducingthe multiple exchange rate system which was maintained through early 1989. Initially, the rate of 4.3Bs./US$ was retained for the petroleum sector, "essential" imports, Pid foreign debt service. An"official" rate of 6.0 applied to most commercial transactions, and a free market rate (which variedbetween 7.5 and 17.0 during the first year) applied to nontraditional exports, tourism, and capital. Theofficial rate was raised to 7.5 in March, 1984, and subsequently to 14.5 in December, 1986, and therewere numerous movements of items among categories. At one point, there was the 4.3 rate for foreigndebt, a 6.0 preferential rate, the 7.5 official rate, and the free market rate. Over 1984-88 the free rateranged from 60 percent to 200 percent above the official rate, averaging 110 percent (see Box 1). InFebruary, 1989, the multiple exchange rates were unified and the exchange rate was floated.
2.8 Table 2.1 shows the foreign exchange sales by the Central Bank at the various rates during1984-87. It also shows the average exchange rates for sales and for purchases. Collins (1988) pointsout that the multiple exchange rate system altered relative prices, effectively taxing some transactions andsubsidizing others. In 1986, for example, the average purchase rate was 8.5 and the average sales ratewas. 8.7 so that sales of dollars were subsidized by purchases (predominately petroleum exports).However, not all sales were subsidized. The 7 percent of sales which received the preferential rate of4.3 (debt repayment) were subsidized by about 50 percent, those sales at the official rate of 7.5 weresubsidized by 12 percent, and sales at the free rate (averaging 19.7) were taxed at 130 percent. Over thefour years, the Central Bank's sales of foreign exchange exceeded purchases and there was a net reductionof $2.1 billion of international reserves.

191
Table 2.1: Foreign Exchange Sales and Exchange Rates, 1984-87.(Billions of USS)
Rate(Bs./US$) 1984 1985 1986 1987
4.3 $5.0 (31%) $1.6 (11%) $1.0 ( 7%) $ .8 ( 5%)6.0 2.4 (15%) 1.4 ( 9%)7.5 7.1 (45%) 10.0 (70%) 11.7 (81%) 6.8 (41%)8.7 1.0 ( 6%)
14.5 7.1 (43%)Free Mkt 1.5 ( 9%) 1. (10%) 1.7 (12%) .7 (4%)TOTAL $16.0 $14.3 $14.4 $16.3
Averaze RatesFree Market Sales 13.4 14.0 19.7 27.0All Sales 6.8 7.7 8.7 11.2All Purchases 6.1 6.5 8.5 11.9
Source: BCV.
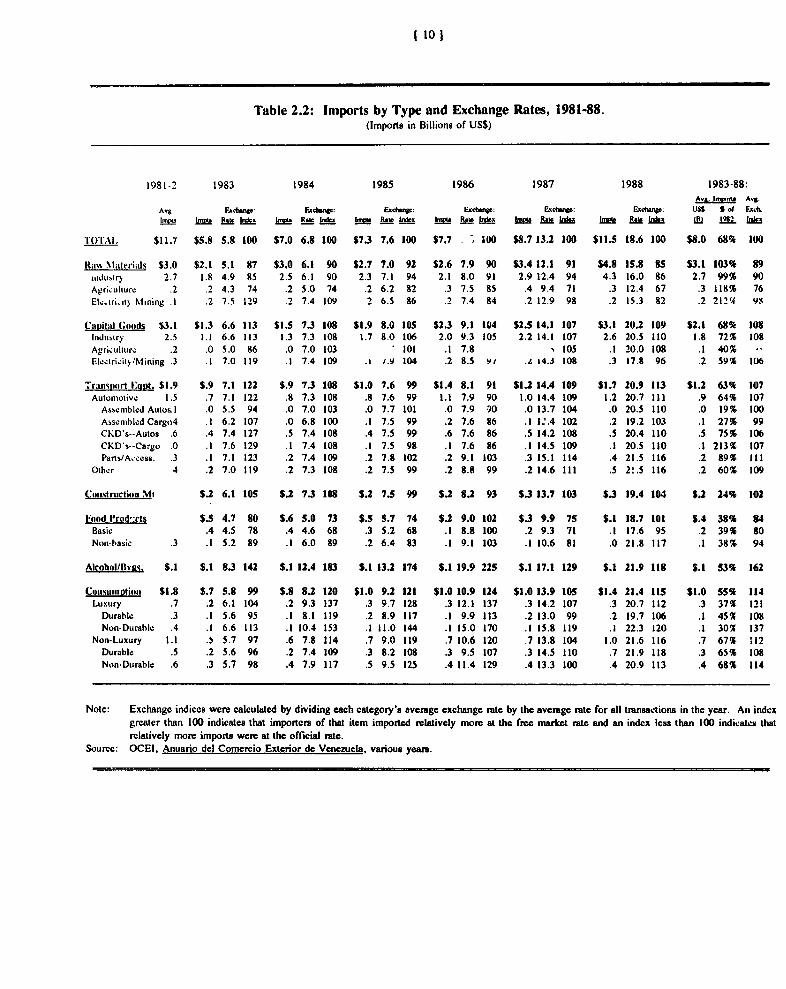
2.9 Merchandise imports accounted for about half of the C>ntral Bank's foreign exchange salesbetween 1984 and 1987. Table 2.2 shows the average exchange rate which applied to each category ofmerchandise imports each year during 1983-88, together with imports in US$. For each category, anexchange rate index was calculated by dividing its average exchange rate by the average for all importsin the year. An index above 100 indicates that the average exchange rate effectively taxed importers ofthat class of goods in order to subsidize importers of goods with indices below 100. This tax/subsidyis in addition to any subsidy provided generally for sales of dollars by taxing the purchase of dollars.The last three columns show for 1983-88: average import levels; average import levels as a percentageof 1981-82 imports; and the (unweighted) average of the six ai'nual exchange indices. Table 2.2 revealsmuch about the distortions which the exchange regime imposed on the industrial sector during the 1980s.
2.10 Merchandise imports peaked in 1981-82. Imports declined by 50 percent in 1983, thenincreased gradually through 1987. There was a relatively large increase in 1988, made up mostly of rawmaterials (up 40 percent), capital goods (up 24 percent), transportation equipment (up 41 percent), andconsumer durables (up 100 percent) in anticipation of the devaluation of 1989. Over 1983-88, importsaveraged 68 percent of the 1981-82 level.
2.11 The structure of imports in Table 2.2 reflects the intensification of the import substitutionunder the industrial policies of the 1980s. While imports during 1983-88 were only 68 percent of 191-82 levels, raw materials actually increased (103 percent), capital goods were relativelyunaffected(68 percent) while final goods were below 68 percent: food (38 percent), alcoholic beverages(53 percent), and consumption goods (55 percent). The category of transportation equipment illustratesmost clearly the import substitution bias, with assembled units cut sharply while materials for the
I to I
Tuble 2.2: Imports by Type and Exchange Rates, 1981-88.(Imports in Billions of USS)
1981-2 1983 1984 1985 1986 1987 1988 1983-88:A.&. kw,rt. A.g.
AVg F.Adwng Fxdw.p: Etxedbu: Exduo: Exdu: USS S of F.ci.In48 bnpu Rateh c Indhiex hm- Rate h Ridncx Ima FtR e Index blots Rat 1ex IIYCXI Rawc tndcx 1 142 W¢dx
ilOTrAl. $11.7 $5.8 5.8 100 S7.0 6.8 100 57.3 7.6 100 57.7 - 100 $8.7 13.2 100 $11.5 18.6 100 $8.0 680k 100
Ran MhideriaIs $3.0 $2.1 5.1 87 S3.0 6.1 90 $2.7 7.0 92 $2.6 7.9 90 53.4 12.1 91 $4.8 15.8 85 53.1 103% 89inidtilir 2.7 1.8 4.9 85 2.5 6.1 90 2.3 7.1 94 2.1 8.0 91 2.9 12.4 94 4.3 16.0 86 2.7 99% 90Agriculturc .2 .2 4.3 74 .2 5.0 74 .2 6.2 82 .3 7.5 85 .4 9.4 71 .3 12.4 67 .3 118% 76EK.tri,it) Nianing .1 .2 7.5 129 .2 7.4 109 2 6.5 86 .2 7.4 84 .2 12.9 98 .2 15.3 82 .2 2124 98
C:naital (oods $3.1 $1.3 6.6 113 $1.5 7.3 108 $3.9 8.0 lOS $2.3 9.1 104 $2.5 14.1 107 $3.1 20.2 109 52.1 68% 108Induibtry 2.5 1.1 6.6 113 1.3 7.3 108 1.7 8.0 106 2.0 9.3 105 2.2 14.1 107 2.6 20.5 110 1.8 72% 108Agriculture .2 .0 5.0 86 .0 7.0 103 101 .1 7.8 s 105 .1 20.0 108 .1 40%ElcctriJiq/Mining .3 .1 7.0 119 .1 7.4 109 . i.Y/ 104 .2 8.5 9# .L 14.3 108 .3 17.8 96 .2 59% 106
Tr.msnwort IlnDt. $1.9 S.9 7.1 122 5.9 7.3 108 $1.0 7.6 99 $1.4 8.1 91 $1.2 14.4 109 $1.7 20.9 113 53.2 63% 107Automilotive 3.5 .7 7.1 122 .8 7.3 108 .8 7.6 99 1.1 7.9 90 1.0 14.4 109 1.2 20.7 III .9 64% 107
Assnb1ed Autos I .0 5.5 94 .0 7.0 103 .0 7.7 101 .0 7.9 *30 .0 13.7 104 .0 20.5 110 .0 19% 100Asscmb1cd Cargo4 .1 6.2 107 .0 6.8 100 .1 7.5 99 .2 7.6 86 .1 1.'.4 102 .2 19.2 103 .1 27% 99CKD's--Autos .6 .4 7.4 127 .5 7.4 108 .4 7.5 99 .6 7.6 86 .5 14.2 108 .5 20.4 110 .5 75% 106CKD's--Cargo .0 .1 7.6 129 .1 7.4 108 .1 7.5 98 .1 7.6 86 .1 14.5 109 .1 20.5 110 .1 213% 107Parts/Access. .3 .1 7.1 123 .2 7.4 109 .2 7.8 102 .2 9.1 103 .3 15.1 114 .4 21.5 116 .2 89% III
Other 4 .2 7.0 119 .2 7.3 108 .2 7.5 99 .2 8.8 99 .2 14.6 III .5 2!.5 116 .2 60% 109
Cowstruction.Mi 5.2 6.1 10S 5.2 7.3 108 5.2 7.5 99 5.2 8.2 93 5.3 13.7 103 S.3 19.4 104 5.2 24% 102
Food Prod':cts 5.5 4.7 80 5.6 S.0 73 S.5 5.7 74 5.2 9.0 102 5.3 9.9 75 5.1 18.7 101 5.4 38% 84Basic .4 4.5 78 .4 4.6 68 .3 5.2 68 .1 8.8 100 .2 9.3 71 .1 17.6 95 .2 39% 80Non-basic .3 .1 5.2 89 .1 6.0 89 .2 6.4 83 .1 9.1 103 .1 10.6 81 .0 21.8 117 .1 38% 94
Alcohol/Bvgc. 5.1 5.1 8.3 142 5.1 12.4 183 5.1 13.2 174 5.1 19.9 225 $.1 17.1 129 5.1 21.9 138 5.1 53% 162
Comistalilotioal $3.8 5.7 5.8 99 5.8 8.2 120 $1.0 9.2 121 51.0 10.9 124 53.0 13.9 105 $1.4 21.4 115 $3.0 55% 114Luxury .7 .2 6.1 104 .2 9.3 137 .3 9.7 128 .3 12.1 137 .3 14.2 107 .3 20.7 112 .3 37% 121
Durable .3 .1 5.6 95 .1 8.1 119 .2 8.9 117 .1 9.9 113 .2 13.0 99 .2 19.7 106 .1 45% 108Non-Durable .4 .1 6.6 113 .1 10.4 153 .1 11.0 144 .1 15.0 170 .1 135.8 119 .1 22.3 120 .1 30% 137
Non-Luxury 1.1 .S 5.7 97 .6 7.8 114 .7 9.0 119 .7 10.6 120 .7 13.8 104 1.0 21.6 116 .7 67% 312Durable .5 .2 5.6 96 .2 7.4 109 .3 8.2 108 .3 9.5 107 .3 14.5 110 .7 21.9 118 .3 65% 108Non-Durable .6 .3 5.7 98 .4 7.9 117 .5 9.5 123 .4 11.4 129 .4 13.3 100 .4 20.9 113 .4 68% 114
Note: Exchange indices were calculated by dividing each category's average exchange rate by the average rate for all transactions in the year. An indcxgreater than 100 indicates that importers of that item imponted relatively more at the free market rate and an index lcss than 100 indicates thatrelatively more imports were at the official rate.
Source: OCEI, Anuario del Comercio Exterior de Venezuela, various years.
[11l
assembly industry rose absolutely or, at least, relative to the decline in imports: assembled autos were19 percent of 1981-82 levels and assembled cargo vehicles were 27 percent, while automobile CKD kitswere 75 percent and cargo vehicle CKD's were 213 percent. Motor vehicle sales were 163,000 units in1982, and fell 25 percent to an average of 122,000 units over 1983-88.'
2.12 Over 1983-88, the relatively most heavily subsidized commodities through the exchange ratewere foods and raw materials. By contrast, the most heavily taxed were consumer goods--particularly"luxuries"--and alcoholic beveiages. Capital goods and transportation equipment were taxed aboutequally. This pattern of taxing consumption goods and subsidizing inputs could increase the protectionfor domestic production. The Foreign Trade Institute estimated that the average domestic value addedin Venezuela was 65 percent. For a good with 65 percent domestic content, an 11 percent subsidy toinputs together with a 14 percent tax on outputs would, by itself, lead to effective protection of27 percent. However, the foreign exchange system effectively imposed a tax on importers ofconsumption goods which averaged between 8 percent (durables) and 37 percent (non-durable luxurygoods) so that effective protection rates would be in the range of 18 percent to 64 percent. Effectiveprotection would also vary with the level of domestic value added. In the case of goods where the valueadded is 35 percent, effective protection on consumer goods would be higher: in the range of 23 percentto 106 percent. Consequently, the exchange system distorted prices, conferring the greatest benefits onproducers of low value-added, non-durable luxuries such as cosmetics and toiletries. Alcoholic beveragesenjoyed particularly large nominal protection-as high as 125 percent in 1986-through the exchange rate.
2.13 In the case of agriculture, it would appear that protection through the exchange regime waslower than that provided to industry. Agricultural inputs were more favored through the exchange rate.However, since food imports also entered at favorable rates, effective protection was lower and, in cases,could even have been nega.ive. For example, in 1984 (1985), agricultural inputs entered at an averageexchange rate of 5.0 Bs./US$ (6.2), while "basic" foods entered at 4.6 (5.2).
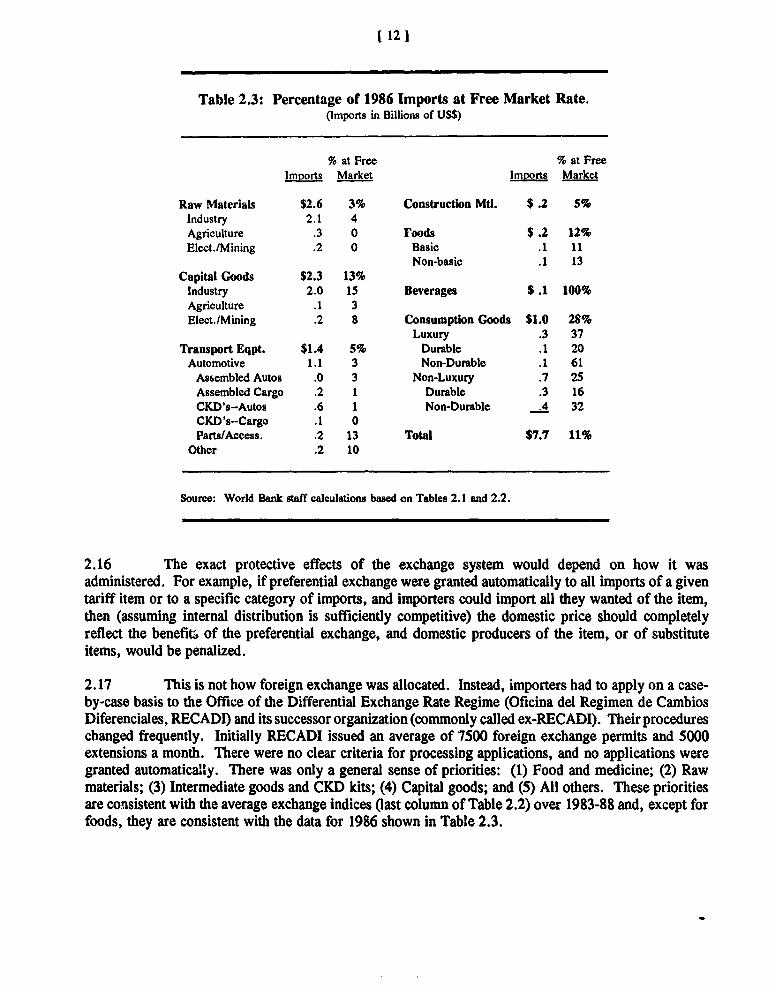
2.14 In 1986 all merchandise imports entered either at the official rate of 7.5 Bs./US$ or at thefree market rate which varied between 14.9 and 27.1 Bs./US$, with an average for the year for alltransactions of 19.7. Assuming that all import categories paid about the same average free rate, it ispossible to infer from Table 2.2 the percentage of each type of merchandise which was imported at thefree market rate in 1986. These percentages are shown in Table 2.3. (In other years imports enteredat multiple official rates and we cannot reproduce these calculations with existing data.)
2.15 For most categories of merchandise, sufficient foreign exchange was available at the officialrate so that importers resorted to the free market only occasionally. However, alcoholic beveragesentered exclusively at the free rate and nearly 30 percent of consumer goods imports had to use the freemarket. Capital goods for industry, parts and accessories for transportation equipment, and non-basicfoods also had above-average use of the free market rate. The system promoted the consumption (anddiscouraged the production) of the subsidized goods while discouraging the consumption (promoting theproduction) of the taxed goods. Since the purpose of the preferential exchange rates was to assist thepoor, the system's incentives were perverse: they encouraged the consumption and discouraged theproduction of "essential" commodities-food and pharmaceuticals.
'Under the adjuatment program, CKCD kits were removed from the official exchange mte (14.5 Bs./USS) and paid the freemarket rate (35-40 Bs./US$). Sales fell to 26,000 units in 1989.
[ 121
Table 2.3: Percentage of 1986 Imports at Free Market Rate.(Imports in Billions of USS)
% at Free % at FreeImports Market Imnorts Market
Raw Materials $2.6 3% Construction Mtl. $ .2 5%Industry 2.1 4Agriculture .3 0 Foods $ .2 12%Elect./Mining .2 0 Basic .1 11
Non-basic .1 13Capital Goods $2.3 13%
Industry 2.0 15 Beverages $ .1 100%Agriculture .1 3Elect./Mining .2 8 Consumption Goods $1.0 28%
Luxury .3 37Transport Eqpt. $1.4 5% Durable .1 20
Automotive 1.1 3 Non-Durable .1 61Assembled Autos .0 3 Non-Luxury .7 25Assembled Cargo .2 1 Durable .3 16CKD's-Autos .6 1 Non-Durable .4 32CKD's-Cargo .1 0Parts/Access. .2 13 Total $7.7 11%
Other .2 10
Source: World Bank staff calculations based on Tables 2.1 and 2.2.
2.16 The exact protective effects of the exchange system would depend on how it wasadministered. For example, if preferential exchange were granted automatically to all imports of a giventariff item or to a specific category of imports, and importers could import all they wanted of the item,then (assuming internal distribution is sufficiently competitive) the domestic price should completelyreflect the benefits. of the preferential exchange, and domestic producers of the item, or of substituteitems, would be penalized.
2.17 This is not how foreign exchange was allocated. Instead, importers had to apply on a case-by-case basis to the Office of the Differential Exchange Rate Regime (Oficina del Regimen de CambiosDiferenciales, RECADI) and its successor organization (commonly called ex-RECADI). Theirprocedureschanged frequently. Initially RECADI issued an average of 7500 foreign exchange permits and 5000extensions a month. There were no clear criteria for processing applications, and no applications weregranted automatically. There was only a general sense of priorities: (1) Food and medicine; (2) Rawmaterials; (3) Intermediate goods and CKD kits; (4) Capital goods; and (5) All others. These prioritiesare consistent with the average exchange indices Oast column of Table 2.2) over 1983-88 and, except forfoods, they are consistent with the data for 1986 shown in Table 2.3.
[ 13 1
2.18 With excess demand and no clear criteria or guidelines, RECADI resorted to delays andexcessive formality to allocate foreign exchange. Applications with erasures or white-out were returnedwithout being read, but only after a six- or eight-week delay. One application was returned because thebank submitting it had applied a rubber stamp, perfectly legible, two inches to the left of where it shouldhave been stamped. The application was retyped, restamped, resubmitted, and subsequently approved,but with an additional two months' delay. Where there is excess demand, it is possible to satisfyeveryone--eventually-if they wait long enough. Delays at RECADI typically extended to six months.In December 1986, RECADI announced that all applications which had not been approved had to beresubmitted. Importers who had waited as long as nine months had to begin anew their wait for foreignexchange.
2.19 RECADI was replaced by an agency, so similar in personnel and policies that it was called"ex-RECADI," which sought to administer firm-specific foreign exchange budgets. In theory, each firmhad an annual budget and requests for withdrawals would be automatic. Budget requests were submittedthrough trade associations, promoting the cartelization of industries. The requests were about double theavailable exchange--$6 billion in 1987. There were no clear criteria for choosing among enterprises andbudgets tended to be allocated according to the previous year's import levels, thereby reducing internalcompetition and serving as a barrier to entry. Ex-RECADI did not operate automatically, although delayswere reduced. This regime encouraged and rewarded cheating and corruption.
2.20 Enormous economic power was vested in RECADI and ex-RECADI. An importer deniedexchange at the official or preferential rate had to purchase free market dollars. The spread between theofficial and the free market rates averaged 112 percent (see Box 1 in Chapter 1). Some domesticmanufacturers said they didn't care whether the Development Ministry granted import licenses or tariffexonerations. They would rely on RECADI to refuse importers preferential dollars for their products-comparable to an import tariff which averaged 112 percent. On the other side, importers seekingexchange at the official rates were looking at a benefit equal to 112 percent of the exchange theyreceived.
2.21 Table 2.4 contains estimates of the benefits for merchandise importers which were giventhrough the preferential exchange system during 1984-87. There are separate estimates of the benefitsfor all merchandise imports and for "discretionary" merchandise imports--those categories whereRECADI exercised greater discretion among exchange rates as evidenced by 10 percent or more of theimports entering at the free market exchange rate in 1986 (see Table 2.3). The benefits were calculatedby multiplying the imports (measured in US$) times the difference between the average exchange rateand the average free market rate in the year. The benefits are expressed as a percentage of GDP. Thesecalculations overestimate the benefits actually received because many of the imports, if they had to paythe free market rate, would not have taken place. Further, if there had been a unified exchange rate, itlikely would have been lower than the average free market rate which prevailed. (When the exchangerates were unified in February 1989, the unified rate was 36 Bs./US$-between the official rate of 14.5and the free market rate of 39).
2.22 Notwithstanding these caveats, the magnitude of the benefits was large. For all merchandiseimports, the benefits averaged nearly 15 percent of GDP and for the imports where RECADI exerted thegreatest discretion, benefits averaged six percent of GDP. While the Government's goal was to reduceprices to consumers, the benefits may have gone to importers, to distributors, or to domestic producers.For any given imported item, the market price may be determined by the exchange rate, whether thelicense was a binding constraint, whether the tariff was exonerated, or whether the price control was
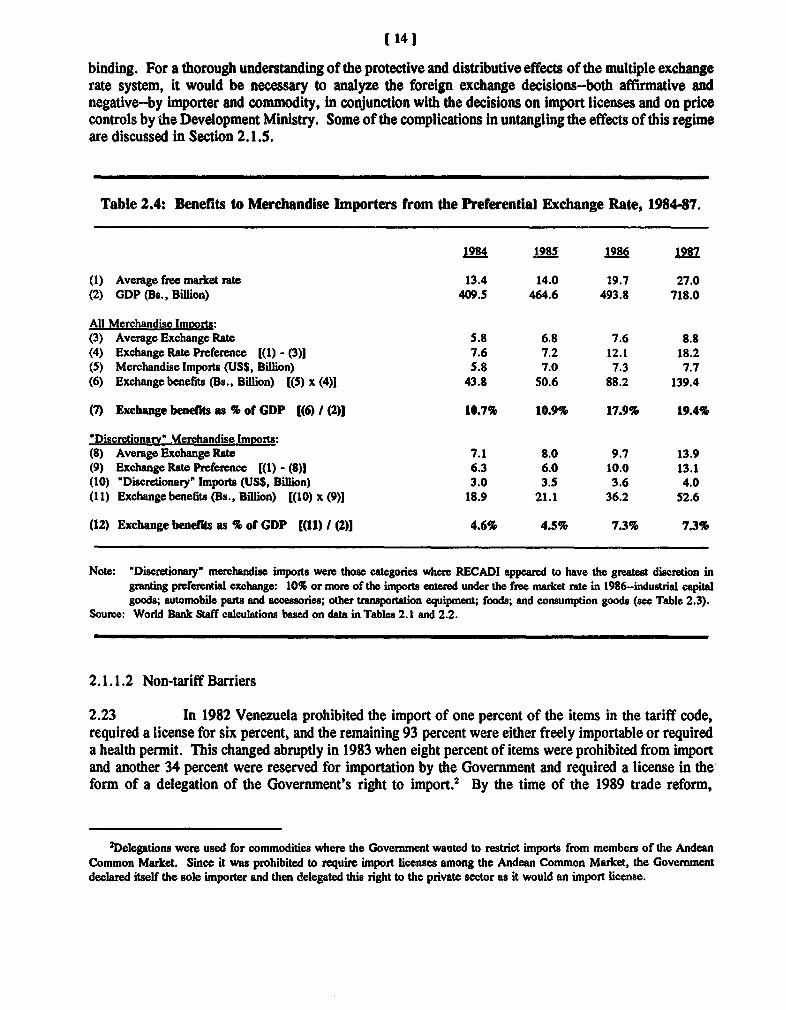
[ 14 1
binding. For a thorough understanding of the protective and distributive effects of the multiple exchangerate system, it would be necessary to analyze the foreign exchange decisions-both affirmative andnegative-by importer and commodity, in conjunction with the decisions on import licenses and on pricecontrols by the Development Ministry. Some of the complications in untangling the effects of this regimeare discussed in Section 2.1.5.
Table 2.4: Benerits to Merchandise Importers from the Preferential Exchange Rate, 198447.
1984 1985 1986 1987
(1) Average free market rate 13.4 14.0 19.7 27.0(2) GDP (Be., BiUion) 409.5 464.6 493.8 718.0
All Merchandise Im2orts:(3) Average Exchange Rate 5.8 6.8 7.6 8.8(4) Exchange Rate Preference [(1) - (3)1 7.6 7.2 12.1 18.2(5) Merchandise Imports (USS, Billion) 5.8 7.0 7.3 7.7(6) Exchange benefits (Bs., Billion) [(5) x (4)1 43.8 50.6 88.2 139.4
(7) Excbange benefits as % of GDP (6) (2)1 10.7% 10.9% 17.9% 19.4%
'Discretionary' Merchandise Imports:(8) Average Exchange Rate 7.1 8.0 9.7 13.9(9) Exchange Rate Preference [(1) - (8)1 6.3 6.0 10.0 13.1(10) 'Discretionary' Imports (USS, Billion) 3.0 3.5 3.6 4.0(11) Exchangebenefits (Bs., BiUion) [(10) x (9)] 18.9 21.1 36.2 52.6
(12) Exchange benefits as % of GDP [(I1) / (2)1 4.6% 4.5% 7.3% 7.3%
Note: "Discretionary" merchandise imports were those categories where RECADI appeared to have the greatest discretion ingranting preferential exchange: 10% or more of the imports entered under the free market rate in 1986-industrial capitalgoods; automobile parts and accessories; other transpoaion equipment; foods; and consumption goods (see Table 2.3).
Source: World Bank Staff calculations based on data in Tables 2.1 and 2.2.
2.1.1.2 Non-tariff Barriers
2.23 In 1982 Venezuela prohibited the import of one percent of the items in the tariff code,required a license for six percent, and the remaining 93 percent were either freely importable or requireda health permit. This changed abruptly in 1983 when eight percent of items were prohibited from importand another 34 percent were reserved for importation by the Government and required a license in theform of a delegation of the Govermment's right to import.2 By the time of the 1989 trade reform,
'Delegations were used for commodities where the Government wanted to restrict imports from members of the AndeanCommon Market. Since it was prohibited to require import licenses among the Andean Common Market, the Governmentdeclared itself the sole importer and then delegated this right to the private sector as it would an import license.
[ 1s)
11 percent of all tariff items were prohibited from import and 29 percent required licenses or delegations(see Table 2.5A).
2.24 Depending on the item, import permits were granted by the Development Ministry (formost items), the Finance Ministry, or the Agriculture Ministry. Importers were required to applyseparately for each import order, and the Development Ministry received 71,000 applications during1985, of which 48,000 were denied and 23,000 approved. There were no written criteria, but authoritiessought generally to protect domestic industries, encourage employment and increase capacity utilization,ensure the production of "priority" goods and "necessities," and to prevent importation of "luxuries."
2.25 Importers often had to give the Development Ministry a 'letter of no objection" from theproducers' association stating that the domestic industry was unable to produce the items in the quantitywhich would be imported. The import licenses the Development Ministry issued generally exceeded theforeign exchange budget the Finance Ministry administered so that, effectively, both ministriesadministered industrial policy. The system of import permits was also used to establish state enterprisesin steel, aluminum, and petrochemicals as de facto import monopolies. For example, only the state-owned steel company, SIDOR, could import steel regardless of whether it produced competing items.
2.26 Protection of manufacturing from imports by licenses varied greatly among stages ofprocessing and-within manufacturing-by subsectors. Table 2.5A shows that import licenses were usedmost heavily for processed foods, consumer goods, transport equipment, and finished industrial goods.They were applied least to semi-processed inputs and capital equipment. Table 2.6A shows the widevariation in application of NTBs among subsectors. For agro-industry, only nine percent of import itemswere freely importable while for chemicals, petroleum and coal, 77 percent could be imported withoutrestriction by non-tariff barriers.
2.27 The measure of protection provided by import restrictions is not so much in the numberor percentage of items which are protected as it is in the value of domestic production which is protected.If non-tariff barriers are applied only against imported goods where there is no domestic production (e.g.,to prohibit "luxury" imports), it has far different economic implications than if they are applied onlyagainst goods which compete against domestic producers. Since the NTBs in Venezuela have been usedfor protection, we would expect to find them applied most heavily in items where there is domesticproduction and least heavily where there is not.
2.28 To approximate the domestic production covered by NTBs, an index was developed byweighting 1987 production levels (at the four-digit ISIC level) by the percentage of tariff items, undereach classification, produced in each sector. These numbers, aggregated to the two-digit ISIC level, areshown in Table 2.7A. They yield an index which shows that before the 1989 reforms, 17 percent ofdomestic manufacturing was protected by import prohibitions, 33 percent by licenses, six percent requireda health permit,3 and 43 percent was free of NTBs. Combining this index with the unweighted incidenceof import restrictions (Table 2.6A), we see that the ten percent of tariff items which were prohibitedrepresented an imputed 17 percent of domestic production, the 29 percent which required a license were36 percent of domestic production, and the three percent requiring a health permit were
sThere are instances where health permits have been used with the same restrictive effects as licenses or prohibitions,however it is unknown how widely this may have occurred in Venezuela.
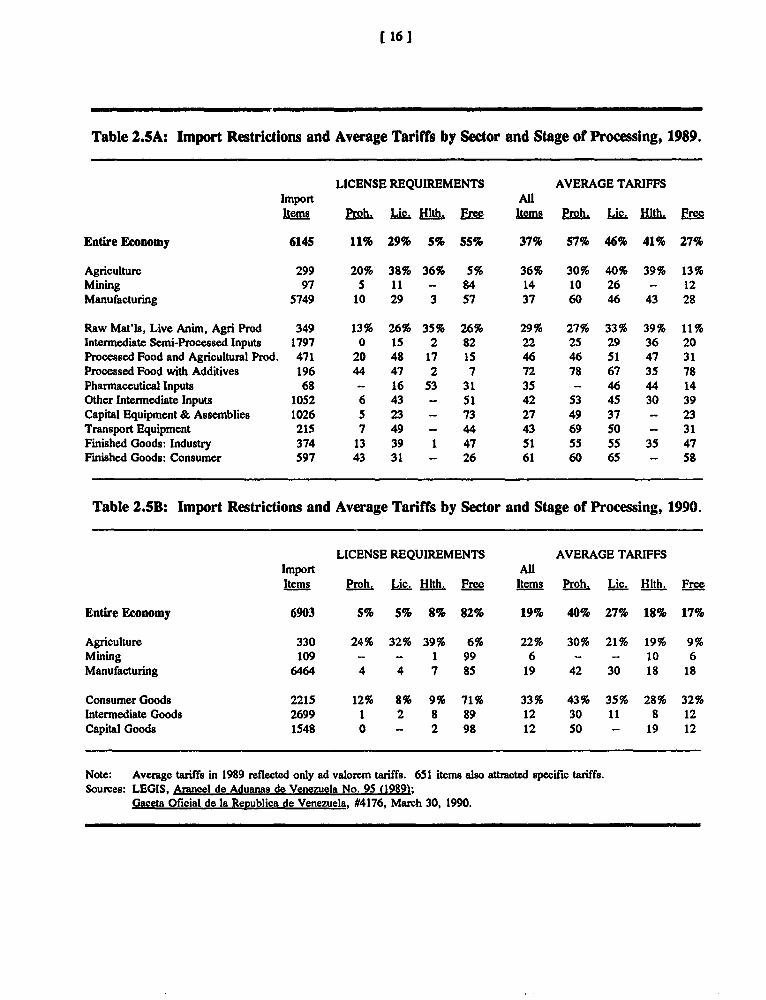
[ 161
Table 2.5A: Import Restrictions and Average Tariffs by Sector and Stage of Processing, 1989.
LICENSE REQUIREMENTS AVERAGE TARIFFSImport Allitems Proh. Hlth, F Items Pro Lic. Hlth. F
Entire Economy 6145 11% 29% 5% 55% 37% 57% 46% 41% 27%
Agriculture 299 20% 38% 36% 5% 36% 30% 40% 39% 13%Mining 97 5 11 - 84 14 10 26 - 12Manufacturing 5749 10 29 3 57 37 60 46 43 28
Raw Mat'ls, Live Anim, Agri Prod 349 13% 26% 35% 26% 29% 27% 33% 39% 11%Intermediate Semi-Processed Inputs 1797 0 15 2 82 22 25 29 36 20Processed Food and Agricultural Prod. 471 20 48 17 15 46 46 51 47 31Processed Food with Additives 196 44 47 2 7 72 78 67 35 78Pharmaceutical Inputs 68 - 16 53 31 35 - 46 44 14Other Intermediate Inputs 1052 6 43 - 51 42 53 45 30 39Capital Equipment & Assemblies 1026 5 23 - 73 27 49 37 - 23Transport Equipment 215 7 49 - 44 43 69 50 - 31Finished Goods: Industry 374 13 39 1 47 51 55 55 35 47Finished Goods: Consumer 597 43 31 - 26 61 60 65 - 58
Table 2.5B: Imnort Restrictions and Average Tariffs by Sector and Stage of Processing, 1990.
LICENSE REQUIREMENTS AVERAGE TARIFFSImport AllItems Proh. Lic Hith. Free Items Proh. Lic. H lth. Free
Entire Economy 6903 5% 5% 8% 82% 19% 40% 27% 18% 17%
Agriculture 330 24% 32% 39% 6% 22% 30% 21% 19% 9%Mining 109 - - 1 99 6 - - 10 6Manufacturing 6464 4 4 7 85 19 42 30 18 18
Consumer Goods 2215 12% 8% 9% 71% 33% 43% 35% 28% 32%Intermediate Goods 2699 1 2 8 89 12 30 11 8 12Capital Goods 1548 0 - 2 98 12 50 - 19 12
Note: Average tarffs in 1989 reflected only ad valorem tariffs. 651 items also attracted specific tariffs.Sources: LEGIS, Arancel de Aduanas de Venezuela No. 95 (1989);
Gaceta Oficial de la Regublica de Venezuela, #4176, March 30, 1990.
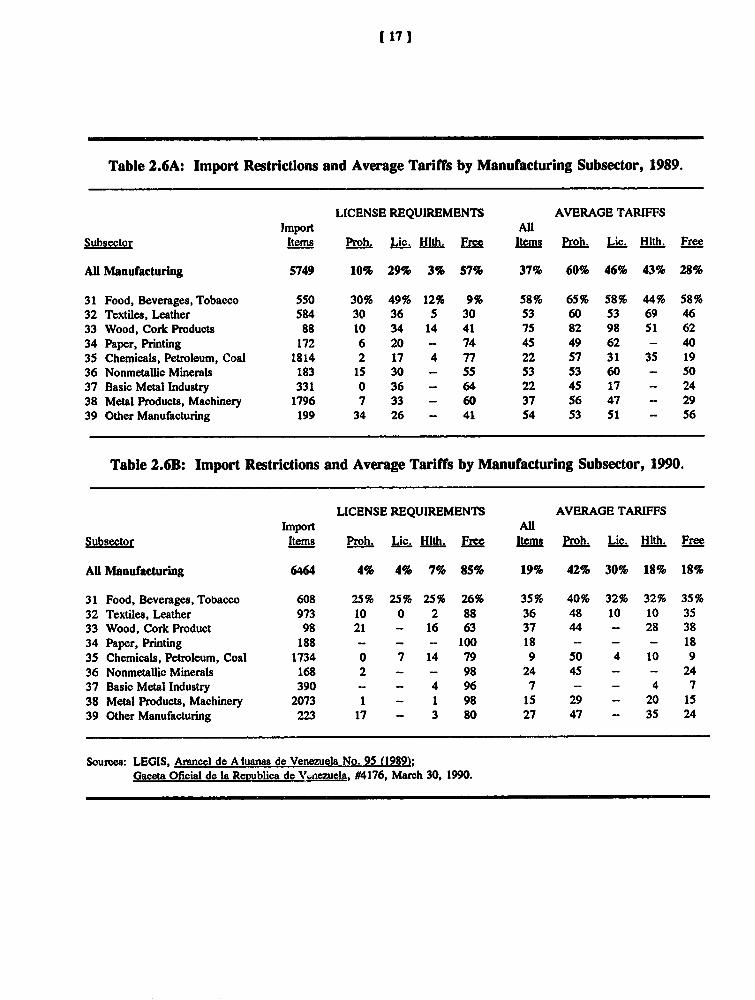
(17 1
Table 2.6A: Import Restrictions and Average Tariffs by Manufacturing Subsector, 1989.
LICENSE REQUIREMENTS AVERAGE TARIFFSImport AR
Subsector Items Proh. Lic. Hlth. Free Items Proh. Lic. Hith. Free
All Manufacturing 5749 10% 29% 3% 57% 37% 60% 46% 43% 28%
31 Food, Beverages, Tobacco 550 30% 49% 12% 9% 58% 65% 58% 44% 58%32 Textiles, Leather 584 30 36 5 30 53 60 53 69 4633 Wood, Cork Products 88 10 34 14 41 75 82 98 51 6234 Paper, Printing 172 6 20 - 74 45 49 62 - 4035 Chemicals, Petroleum, Coal 1814 2 17 4 77 22 57 31 35 1936 Nonmetallic Minerals 183 15 30 - 55 53 53 60 - 5037 Basic Metal Industry 331 0 36 - 64 22 45 17 - 2438 Metal Products, Machinery 1796 7 33 - 60 37 56 47 - 2939 Other Manufacturing 199 34 26 - 41 54 53 51 - 56
Table 2.6B: Import Restrictions and Average Tariffs by Manufacturing Subsector, 1990.
LICENSE REQUIREMENTS AVERAGE TARIFFSImport All
Subsector Items Proh. Lic. Hlth. Free Items Proh. Lic. Hlth. Free
AU Manufacturing 6464 4% 4% 7% 85% 19% 42% 30% 18% 18%
31 Food, Beverages, Tobacco 608 25% 25% 25% 26% 35% 40% 32% 32% 35%32 Textiles, Leather 973 10 0 2 88 36 48 10 10 3533 Wood, Cork Product 98 21 - 16 63 37 44 - 28 3834 Paper, Printing 188 - - - 100 18 - - - 1835 Chemicals, Petroleum, Coal 1734 0 7 14 79 9 50 4 10 936 Nonmetallic Minerals 168 2 - - 98 24 45 - - 2437 Basic Metal Industry 390 - - 4 96 7 - - 4 738 Metal Products, Machinery 2073 1 - 1 98 15 29 - 20 1539 Other Manufacturing 223 17 - 3 80 27 47 - 35 24
Sources: LEGIS, Arancel de Aluanas de Venezuela No. 95 (1989);Gaceta Oficial de la Revublica de V'nezuela, #4176, March 30, 1990.
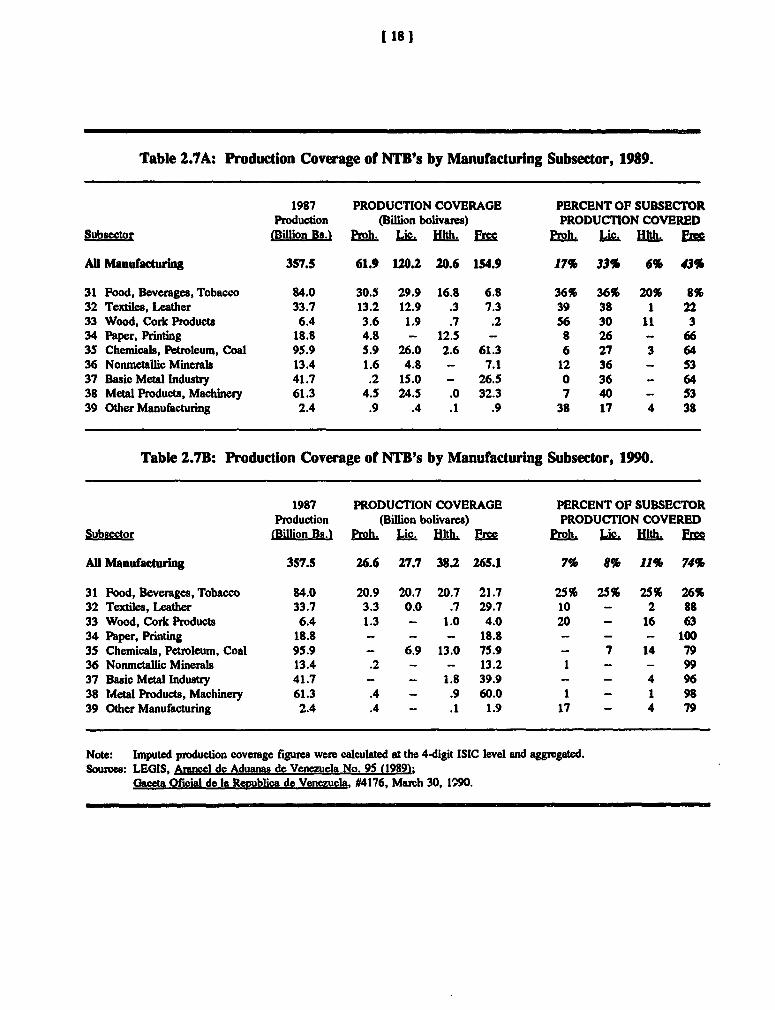
[18 1
Table 2.7A: Production Coverage of NTB's by Manufacturing Subsector, 1989.
1987 PRODUCTION COVERAGE PERCENT OF SUBSECTORProduction (Bilion bolivares) PRODUCTION COVERED
Subsector (Billion Bs.1 Proh. Lie, HIlt Fee Pmh, LiL l F
All Manufacturing 357.5 61.9 120.2 20.6 154.9 17% 33% 6% 43%
31 Food, Beverages, Tobacco 84.0 30.5 29.9 16.8 6.8 36% 36% 20% 8%32 Textiles, Leather 33.7 13.2 12.9 .3 7.3 39 38 1 2233 Wood, Cork Produec 6.4 3.6 1.9 .7 .2 56 30 11 334 Paper, Printing 18.8 4.8 - 12.5 - 8 26 - 6635 Chemicals, Petroleum, Coal 95.9 5.9 26.0 2.6 61.3 6 27 3 6436 Nomnetallic Minerals 13.4 1.6 4.8 - 7.1 12 36 - 5337 Basic Metal industry 41.7 .2 15.0 - 26.5 0 36 - 6438 Metal Products, Machinery 61.3 4.5 24.5 .0 32.3 7 40 - 5339 Other Manufacturing 2.4 .9 .4 .1 .9 38 17 4 38
Table 2.7B: Production Coverage of NTB's by Manufacturing Subsector, 1990.
1987 PRODUCTION COVERAGE PERCENT OF SUBSECTORProduction (Billion bolivares) PRODUCTION COVERED
Subsector (Billion Bs.) Proh Lie. Hlth Free Proh Lie. Hlth. Fre
AH Manufacturing 357.5 26.6 27.7 38.2 265.1 7% 8% 11% 74%
31 Food, Beverages, Tobacco 84.0 20.9 20.7 20.7 21.7 25% 25% 25% 26%32 Textiles, Leather 33.7 3.3 0.0 .7 29.7 10 - 2 8833 Wood, Cork Products 6.4 1.3 - 1.0 4.0 20 - 16 6334 Paper, Printing 18.8 - - - 18.8 - - - 10035 Chemicals, Petroleum, Coal 95.9 - 6.9 13.0 75.9 - 7 14 7936 Nonmetallic Minerals 13.4 .2 - - 13.2 1 - - 9937 Basic Metal Industry 41.7 - - 1.8 39.9 - - 4 9638 Metal Products, Machinery 61.3 .4 - .9 60.0 1 - 1 9839 Other Manufacturing 2.4 .4 - .1 1.9 17 - 4 79
Note: Imputed production coverage figures were calculated at the 4-digit ISIC level and aggregated.Souces: LEGIS, Amncel de Aduanas do Venezuela No. 95 (19891;
Gaceta Oficial de la Republica de Venezuela, #4176, March 30, 1990.
[ 19 1
six percent of production. The 57 percent of tariff items which were free of NTB's corresponded to43 percent of domestic production. The subsector in which this effect was most dramatic was ISIC 33,wood and cork products, where ten percent of the import items were prohibited, but they represented56 percent of the production.
2.1.1.3 Tariffs
2.29 Before the trade reforms of 1989, there were 41 tariff rates with a maximum of135 percent. Tariffs had been established over the years on a case-by-case basis without guidelines forsetting the rates. The dispersion was great: About a sixth of the items attracted tariffs below one percentand a fifth had tariffs over 80 percent. In addition to ad valorem tariffs, 854 items also attracted specificduties so that effective rates were as high as 940 percent. Average tariff rates by sector and stage ofprocessing had the cascading pattern (high for final goods, low for inputs and capital goods) typical ofimport substitution (Table 2.5A). Tariff rates were higher for items restricted by NTB's than for thosefreely importable. There were also large differences in average tariffs among the manufacturingsubsectors (Table 2.6A).
2.30 Protection was provided by licenses and exchange allocations since tariffs, while high,were routinely reduced. In 1984-85, importers on average paid only 28 percent of the statutory tariffrates after 72 percent was exonerated. An importer could apply to the Development or AgriculturalMinistry for an exoneration which, upon ministerial recommendation, would be granted by the FinanceMinistry. Exonerations were generally given where there was no domestic production of an item. TheDevelopment Ministry processed over 7,000 applications-each with supporting documentation up to one-half inch thick-annually and determined favorably in about 80 percent of the cases.
2.31 Once it was determined that an importer could receive an exoneration, further discretionwas applied in assigning a tariff rate. In 1985, tariffs after exoneration were set at 17 rates between0 percent and 50 percent, though most rates (about 85 percent) were either 1 percent, 5 percent, or10 percent. Rates varied not only among import items but also among importers. For example fororganic synthetic coloring materials the tariff was 60 percent plus 13 Bs./K in 1985. There were 175exonerations, 76 to 10 percent, 81 to 5 percent, and 18 to 1 percent. There were not always clearguidelines for determining the rate, although at one time the Development Ministry was applying higherrates to commercial importers than to direct importers on the theory that the commercial importer wasmaking a profit from his customers but the direct importer was reducing the costs of his inputs. Thismay have increased the costs of imported inputs for those who bought materials through commercialdistributors-essentially smaller businesses who could not import directly in large lots.
2.32 Actual tariff collections averaged about 10 percent of import values (and about 1.2 percentof GDP) in 1984-85. Exonerations were about two-and-a-half times as great as tariff receipts. In 1984exonerations were 12.2 billion bolivares and in 1985 they were 14.5 billion-respectively 2.9 percent and3.2 percent of GDP. Tariffs represent about four to five percent of government receipts. The effect ofthe exonerations is to reduce Government revenues, but the exonerations were not coordinated withoverall fiscal policy.
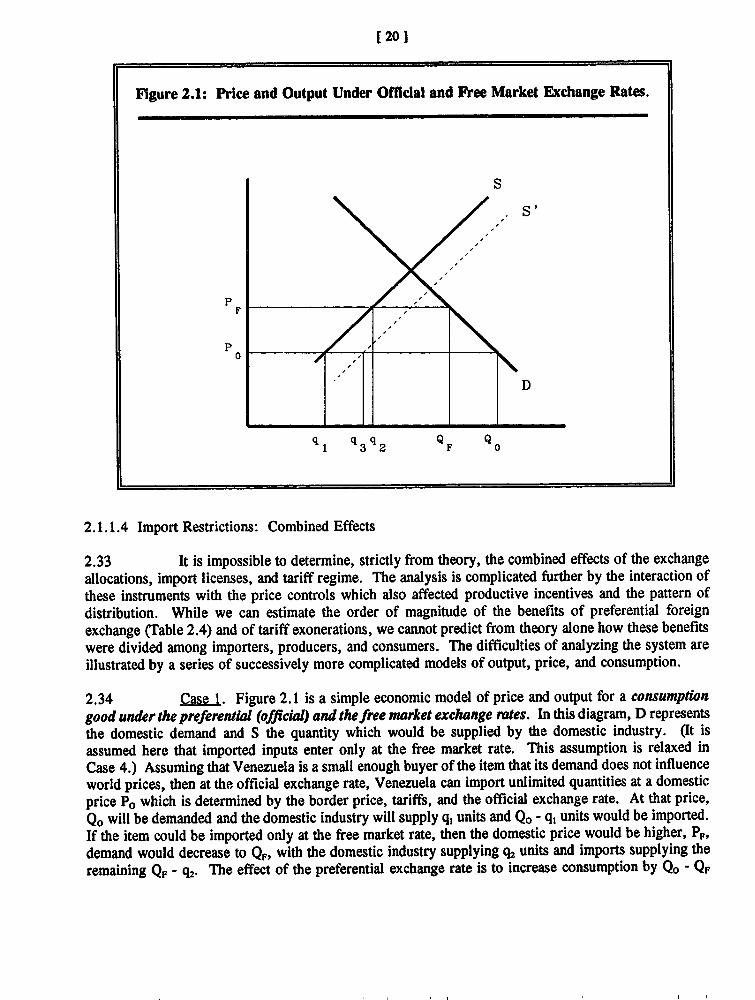
[201
Figure 2.1: Price and Output Under OMdal and Free Market Exchange Rates.
S
PoX IF
0
D
qI q3q 2 QF Q1 3 2 F 0
2.1.1.4 Import Restrictions: Combined Effects
2.33 It is impossible to determine, strictly from theory, the combined effects of the exchangeallocations, import licenses, and tariff regime. The analysis is complicated further by the interaction ofthese instruments with the price controls which also affected productive incentives and the pattern ofdistribution. While we can estimate the order of magnitude of the benefits of preferential foreignexchange (Table 2.4) and of tariff exonerations, we cannot predict from theory alone how these benefitswere divided among importers, producers, and consumers. The difficulties of analyzing the system areillustrated by a series of successively more complicated models of output, price, and consumption.
2.34 Case 1. Figure 2.1 is a simple economic model of price and output for a consumptiongood under the preferentital (official) and the free market exchange rates. In this diagram, D representsthe domestic demand and S the quantity which would be supplied by the domestic industry. (It isassumed here that imported inputs enter only at the free market rate. This assumption is relaxed inCase 4.) Assuming that Venezuela is a small enough buyer of the item that its demand does not influenceworld prices, then at the official exchange rate, Venezuela can import unlimited quantities at a domesticprice PO which is determined by the border price, tariffs, and the official exchange rate. At that price,QO will be demanded and the domestic industry will supply q, units and QO - q1 units would be imported.If the item could be imported only at the free market rate, then the domestic price would be higher, P.,demand would decrease to QF, with the domestic industry supplying q2 units and imports supplying theremaining QF - q 2 . The effect of the preferential exchange rate is to increase consumption by Qo - QF
[21 1
units, to reduce domestic production by qc, - q1, and to increase imports by the sum of the changes, (QO -
QF) + (q2 - ql).
2.35 It should be noted here (and below) that tariffs and tariff exonerations function within amarket the same as preferential foreign exchange. A tariff selectively increases the exchange rate for thegood in question, and an exoneration is analogous to receiving a preferential exchange rate. The effectson output, prices, and distribution will be the same as those deduced from looking at preferential and freemarket exchange rates. Tariffs and exonerations, taken in combination with the preferential and officialrates, determine the vertical distance between PF and PO in Figures 2.1 and 2.2.
2.36 Case 2. Consider the case where preferentialforeign exchange is ratoned and there isnot enough to import at the preferential rate the QO - q, units that are demanded. If the foreign exchangeallocation permits importation of less than QF - q2, then the domestic supply will be insufficient to satisfydemand at any price below PF. Some items will be imported at the parallel rate, and the market pricewill be PF (If the exchange budget permits imports of an intermediate quantity between QO - q, and QF -
q2, then no units will be imported at the free rate and the market price will be determined by the domesticsupply curve and will be greater than PO but less than PF.) Those who receive the preferential exchangewill import at PO and enjoy profits equal to PF - PO, the difference between their import price and themarket price. If price controls are used to hold prices below PF to reduce importers' profits and pass thebenefits of the preferential foreign exchange on to consumers, then imports would not take place at thefree market rate, domestic supply would not expand, and there would be shortages. Where foreignexchange is rationed and insufficient items are imported to satisfy the market at she preferential price,then market forces will drive up the price of all units. In Venezuela, there were few items for whichpreferential exchange was automatically granted. Only raw materials, transportation equipment, andconstruction equipment had 95 percent or more of their imports enter at the official rate in 1986(Table 2.3).
2.37 Ca-se . If there were unlimited preferentialforeign exchange forthe consumption goodand its inputs, then domestic production costs would be reduced and the domestic supply curve wouldshift to the right, to S', as domestic producers would supply a greater quantity at each price. The priceof the commodity would remain at PO--determined by the world price and the exchange rate-and demandwould be unchanged at QO. Domestic output would rise from qc to q%. Whether the domestic outputwould be as great as it would in the case where the free market exchange rate led to the higher domesticprice, PF, is an empirical question which would be determined by the import content of the item and therelative cost advantage which Venezuela would have in the other factors of production. This arrangementexpands domestic output to a more efficient level, correcting a distortion in Case 1 where the outputentered at a preferencial rate while the inputs entered at the free rate.
2.38 Case 4. Where preferential exchange is available without limit for impolted inputs butrationed for the consumption good, the domestic market price would rise, as in Case 2, to a levelbetween PF and PO, depending upon how much preferential exchange were granted. Domestic outputwould expand beyond q3 and domestic suppliers-as well as the importers who were awarded thepreferential foreign exchange-would realize greater profits at the higher prices.
2.39 C . In the previous cases we ignored import licenses. Cases 14 are accurate modelswhere licenses either are not required or they are given in sufficient number as not to be a bindingconstraint. If we revise Case 1 to assume that irnpoit licenses are binding and preferential foreign
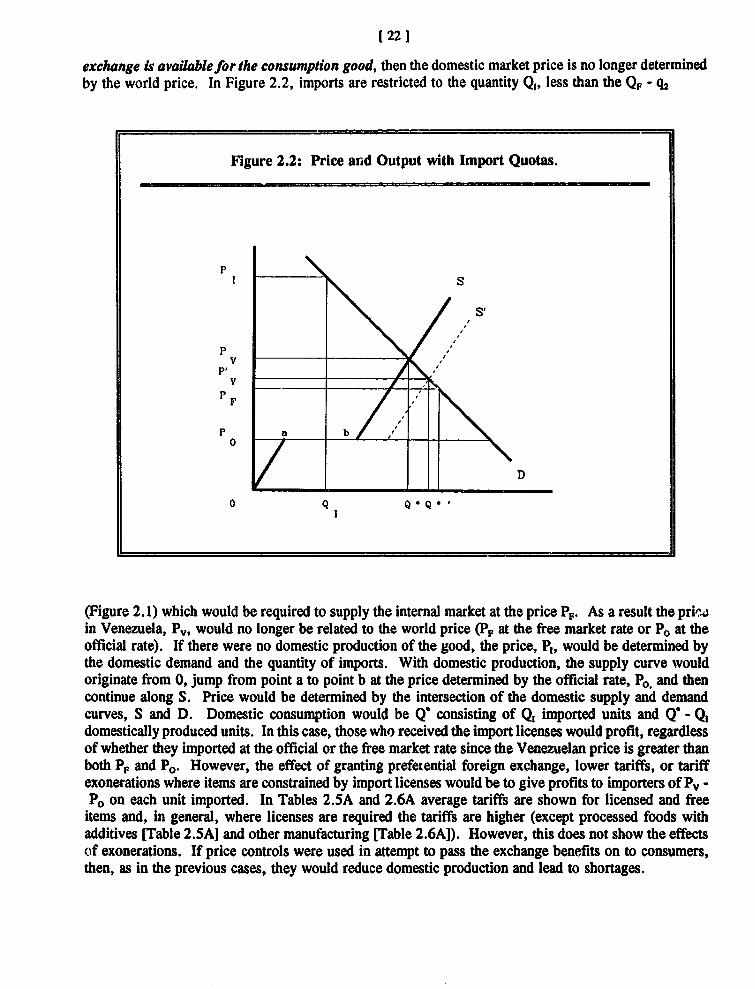
1 22 1
exchange is availablefor the consumption good, then the domestic market price is no longer determinedby the world price. In Figure 2.2, imports are restricted to the quantity Q,, less than the Qp - q2
Figure 2.2: Price and Output with Import Quotas.
P
SI
PI
-F
D
(Figure 2.1) which would be required to supply the internal market at the price P.. As a result the pric4in Venezuela, Pv, would no longer be related to the world price (PF at the free market rate or PO at theofficial rate). If there were no domestic production of the good, the price, P,, would be determined bythe domestic demand and the quantity of imports. With domestic production, the supply curve wouldoriginate from 0, jump from point a to point b at the price determined by the official rate, PO and thencontinue along S. Price would be determined by the intersection of the domestic supply and demandcurves, S and D. Domestic consumption would be Q consisting of Q, imported units and Q - Q,domestically produced units. In this case, those who received the import licenses would profit, regardlessof whether they imported at the official or the free market rate since the Venezuelan price is greater thanboth P. and PO. However, the effect of granting prefezential foreign exchange, lower tariffs, or tariffexonerations where items are constrained by import licenses would be to give profits to importers of Pv -PO on each unit imported. In Tables 2.5A and 2.6A average tariffs are shown for licensed and freeitems and, in general, where licenses are required the tariffs are higher (except processed foods withadditives [Table 2.5AJ and other manufacturing [Table 2.6A]). However, this does not show the effectsof exonerations. If price controls were used in attempt to pass the exchange benefits on to consumers,then, as in the previous cases, they would reduce domestic production and lead to shortages.
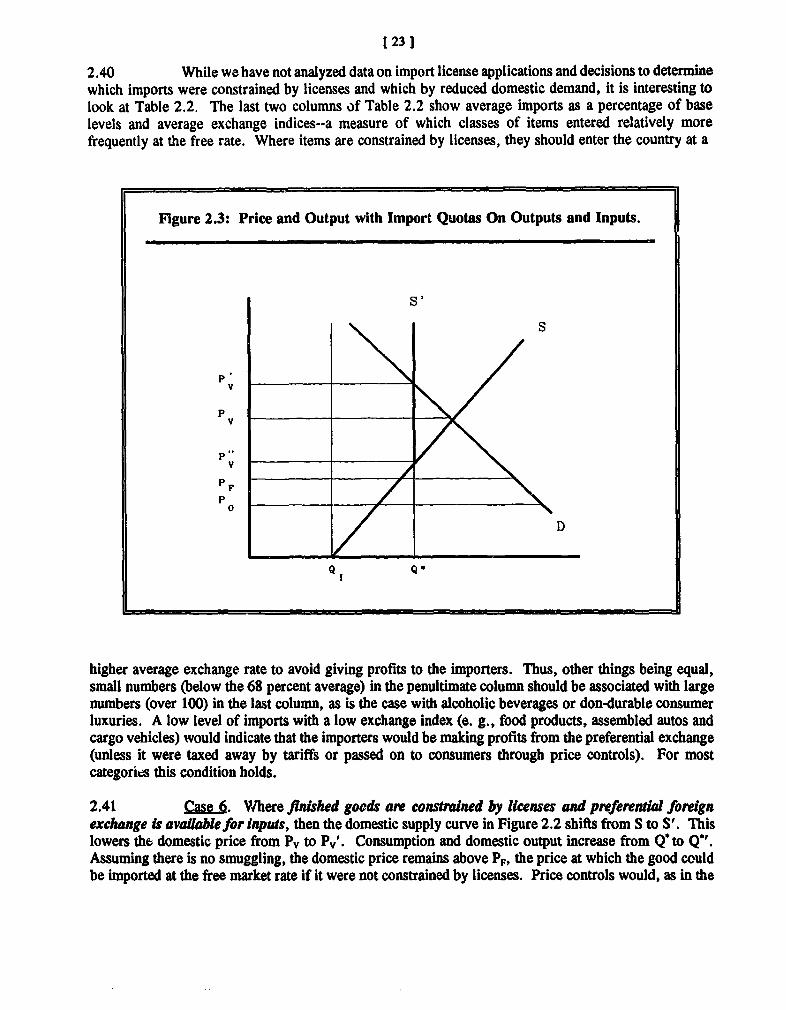
l 23 1
2.40 While we have not analyzed data on import license applications and decisions to determinewhich imports were constrained by licenses and which by reduced domestic demand, it is interesting tolook at Table 2.2. The last two columns of Table 2.2 show average imports as a percentage of baselevels and average exchange indices--a measure of which classes of items entered relatively morefrequently at the free rate. Where items are constrained by licenses, they should enter the country at a
Figure 2.3: Price and Output with Import Quotas On Outputs and Inputs.
., .~~S
s'
v
Po
P'
p~~Q Q
V
- ~ ~~ ___.___,_
0
D
Q Q
higher average exchange rate to avoid giving profits to the importers. Thus, other things being equal,small numbers (below the 68 percent average) in the penultimate column should be associated with largenumbers (over 100) in the last column, as is the case with alcoholic beverages or don-durable consumerluxuries. A low level of imports with a low exchange index (e. g., food products, assembled autos andcargo vehicles) would indicate that the importers would be making profits from the preferential exchange(unless it were taxed away by tariffs or passed on to consumers through price controls). For mostcategories this condition holds.
2.41 Case 6. Vlhere finished goods are constrained by licenses and preferential foreignexchange is available for inputs, then the domestic supply curve in Figure 2.2 shifts from S to S'. Thislowers the domestic price from Pv to Pv'. Consumption and domestic output increase from Q to Q*'.Assuming there is no smuggling, the domestic price remains above PF, the price at which the good couldbe imported at the free market rate if it were not constrained by licenses. Price controls would, as in the
[24 1
other cases, be counterproductive, and the additional output, Q' - Q', would be inefficient in the sensethat the cost of the domestic production is greater than the cost of importing the same number of itemswhen inputs and outputs are valued at the free market rate. Nonetheless, it could, by reducing thedomestic price, redistribute the benefits of the import licenses away from importers toward consumers.
2.42 Case 7. If finished gocds and inputs are constrained by licenses, then the domesticsupply curve has a kink as shown in Figure 2.3. This often occurred in Venezuela, as when plants wereforced to shut down for lack of imported inputs. Because of the constraint on inputs, domestic supplycannot expand beyond Q - Q,, and the domestic market-clearing price would rise from Pv to Pv'. Atany price below Pv' there would be shortages. However, the cost of production would be only Pv", sothat producers would earn excess profits of Pv' - Pv'. Price controls to redistribute the profits toconsumers would create shortages if prices were set below Pv'. Any concessions such as preferentialexchange or tariff exonerations either to the importers of the inputs or the final goods would also createexcess profits for the importers.
2.43 Case S. Throughout the first seven cases we have assumed there is an upward-slopingsupply curve: that as prices rise more product would be supplied. While the first seven cases areaccurate models of some products and some industries where there is competition among domestic firms,if an industry is a monopoly or an effective cartel, then producers will attempt to set their output levelsso that marginal cost equals not price but marginal revenue. At higher prices there could be loweroutput. This may be a more accurate model of Venezuelan industry during the 1980s since manyindustrial policies were administered to encourage collusion among competitors and to promote cartels:
• The reliance on import licenses and prohibitions as the principal instrument of industrial protectionexempted an estimated 50 percent of domestic manufacturing from international competition. In somesectors, the percentage was much higher (Table 2.7A): 72 percent in agro-industry, 78 percent intextiles, 86 percent in wood and cork products. In some items, state enterprises were allowed tocontrol imports of related products.
* RECADI asked firms to submit requests for foreign exchange budgets through their tradeassociations. Budgets were generally based on historic import levels, and prevented firms fromcompeting aggressively for market share.
* The Development Ministry relied on producers' associations to issue a "letter of no objection" beforegiving an import license.
* Import licenses and exonerations were awarded only where the Development Ministry judged thatdemand for an item was beyond domestic "capacity." But capacity is not fixed: the essence of anupward-sloping supply curve is that as prices rise-even in the short run-output can be expanded withexisting capacity. The linkage between price and output was missing from these calculations so thatthe Development Ministry abetted the domestic producers in setting their own prices.
* The price controls--established at levels which would maintain the profitability of the least efficientfirm in an industry-assisted other producers in fixing prices above their costs of production.
2.44 In these cases, the outcomes would not depend so much on the instruments which wereapplied but upon a bargaining or a political process. An astute, skilled, and well-informed DevelopmentM;nistry, working closely with RECADI might well have been able to manipulate economic incentives
f 25]
to foster efficient production and to achieve distributive objectives. However, there are many ways inwhich industrialists could have taken advantage of the fragmented decision-making, manipulation of data,and opportunities for corruption to receive excess profits.
2.45 Assessment. We have seen seven well-articulated cases and, finally, some complicationswhich demonstrate that under reasonable assumptions it is impossible to predict the outcome--in termsof prices, output, and distribution--of the interactions among trade policy instruments. There were over6000 items in, Venezuela's tariff code, and it would be possible to assign each item to one of theforegoing cases. Most likely, most of the important items would fall into either cases 6, 7, or 8 wherethe effects would be an empirical rather than a theoretical determination. In such cases, it would benearly impossible for Government officials to determine or to control the level of protection or the rateof profits. There would be no incentive for entrepreneurs to invest in plant and equipment given that itwould be impossible to predict the returns to investment and that resources would be better spent in tryingto influence Ministerial decisions of the allocation of import licenses or foreign exchange allocations.Similarly, if an entrepreneur were to invest to reduce costs, then he could expect to see cost savingspassed to the consumer through price controls. While the system was well-intended, it was socomplicated it is impossible for economists or government officials to tell what was going on just fromtheory or whether it achieved its stated purposes. What is shown unambiguously in Chapter 3 is that itwas associated with reduced productivity and a general decline in output and employment. It was asystem demanding difficult, time-consuming, inter-ministerial coordination and which would have beenbeyond the capacity of most governments to administer effectively and efficiently.
2.1.1.5 Reform of the Import Regime
2.46 The Government has begun a phased reform of the import regime. The most importantsingle measure was the unification and floating of the exchange rate. The reform of import licenses andtariffs is contrasted with the earlier trade regime in Tables 2.5-2.8. Import prohibitions and licenses havebeen sharply reduced and today protect less than 15 percent of domestic production (Fable 2.7B). Themedium-term goal is to reduce this to five percent. The greatest incidence of prohibitions and licensesremains in agro-industry, but these may be relaxed as the agricultural trade reform begins. The tariffcode has been restructured for the manufacturing sector with the intention of affording each line ofproduction roughly equal levels of effective protection. The average tariff rate has already been reducedfrom 37 to 19 percent (Table 2.5), with consumer goods-at 33 percent-continuing to attract the highestaverage rate. The maximum tariff is 50 percent and the Government's goal is to place all tariffs withinthe range of 10 to 20 percent by 1993.
2.1.2 E;xport Incentives
2.47 To offset the strong anti-export bias inherent in the import regime and the overvaluedexchange rate, the Government offered three significant export incentives: the bono de exportaci6n, asubsidy to non-traditional exporters, paid as a percentage of their export receipts; a currency retentionscheme; and subsidized credit for exporters through FINEXPO. The bulk of export subsidies (e. g.,60 percent of the bonos de exportacidn) went to state-owned enterprises-which generate most of thenontraditional exports (65 percent of exports qualifying for the bonos de exportaci6n).
0 Export subsidy. About 80 percent of non-traditional exports qualify for the export subsidy (bono deexportaci6n), a negotiable bond applicable toward any federal tax. The subsidy is paid to the exporteras a percentage of the f. o. b. value of exports, and the value of the bond is exempt from taxation.
[ 25 1
to foster efficient production and to achieve distributive objectives. However, there are many ways inwhich industrialists could have taken advantage of the fragmented decision-making, manipulation of data,and opportunities for corruption to receive excess profits.
2.45 Assessment. We have seen seven well-articulated cases and, finally, some complicationswhich demonstrate that under reasonable assumptions it is impossible to predict the outcome--in termsof prices, output, and distribution--of the interactions among trade policy instruments. There were over6000 items in Venezuela's tariff code, and it would be possible to assign each item to one of theforegoing cases. Most likely, most of the important items would fall into either cases 6, 7, or 8 wherethe effects would be an empirical rather than a theoretical determination. In such cases, it would benearly impossible for Government officials to determine or to control the level of protection or the rateof profits. There would be no incentive for entrepreneurs to invest in plant and equipment given that itwould be impossible to predict the returns to investment and that resources would be better spent in tryingto influence Ministerial decisions of the allocation of import licenses or foreign exchange allocations.Similarly, if an entrepreneur were to invest to reduce costs, then he could expect to see cost savingspassed to the consumer through price controls. While the system was well-intended, it was socomplicated it is impossible for economists or goverrinent officials to tell what was going on just fromtheory or whether it achieved its stated purposes. What is shown unambiguously in Chapter 3 is that itwas associated with reduced productivity and a general decline in output and employment. It was asystem demanding difficult, time-consuming, inter-ministerial coordination and which would have beenbeyond the capacity of most governments to administer effectively and efficiently.
2.1.1.5 Reform of the Import Regime
2.46 The Government has begun a phased reform of the import regime. The most importantsingle measure was the unification and floating of the exchange rate. The reform of import licenses andtariffs is contrasted with the earlier trade regime in Tables 2.5-2.8. Import prohibitions and licenses havebeen sharply reduced and today protect less than 15 percent of domestic production (Table 2.7B). Themedium-term goal is to reduce this to five percent. The greatest incidence of prohibitions and licensesremains in agro-industry, but these may be relaxed as the agricultural trade reform begins. The tariffcode has been restructured for the manufacturing sector with the intention of affording each line ofproduction roughly equal levels of effective protection. The average tariff rate has already been reducedfrom 37 to 19 percent (Table 2.5), with consumer goods-at 33 percent-continuing to attract the highestaverage rate. The maximum tariff is 50 perce'it and the Government's goal is to place all tariffs withinthe range of 10 to 20 percent by 1993.
2.1.2 Export Incentives
2.47 To offset the strong anti-export bias inherent in the import regime and the overvaluedexchange rate, the Government offered three significant export incentives: the bono de exportaci6n, asubsidy to non-traditional exporters, paid as a percentage of their export receipts; a currency retentionscheme; and subsidized credit for exporters through FINEXPO. The bulk of export subsidies (e. g.,60 percent of the bonos de exportaci6n) went to state-owned enterprises-which generate most of thenontraditional exports (65 percent of exports qualifying for the bonos de exportacion).
* Export subsidy. About 80 percent of non-traditional exports qualify for the export subsidy (bono deexportacion), a negotiable bond applicable toward any federal tax. The subsidy is paid to the exporteras a percentage of the f. o. b. value of exports, and the value of the bond is exempt from taxation.
[ 27 1
of subsidy would have been less than .01 percent of GDP. Reform of these credit subsidies will beincluded within the Government's overall financial sector program.
2.48 A temporary admissions scheme has existed for several years under which exporters couldimport inputs duty-free, but few exporters took advantage of it because of the delays and paperwork andbecause using it precluded exporters from receiving the higher benefits of the bono de exportaci6n. Thisscheme was improved in February, 1990, and it is widely used. There is no duty-drawback scheme, butthe Government is working with consultants to design one.
2.49 Assessment. The export subsidies introduced new economic distortions, encouraging lowvalue-added exports over high value-added, encouraging exports which were inefficient and should nothave taken place. The incentive regime was changed frequently and without notice, and exporters werereluctant to rely on them. Under these conditions they did not stimulate extra, efficient exports, but gavewindfall gains to exports which would have taken place anyway. Subsidies to state-owned enterpriseswere merely ways of transferring resources from one government pocket to another. In the case ofVIASA, the subsidies one year were greater than the net profits, giving an inaccurate picture of theairline's efficiency. Nogues (1989) found that, aside from Brazil, Latin American experiences withexport subsidies were disappointing. They did not achieve their objectives of increasing or diversifyingexports on a sustained basis and they fostered widespread corruption.
2.50 Many people point to the large, apparent increase in exports in 1989 as justification forcontinuing the export subsidy. While nontraditional exports reported by OCEI increased 50% from $1.87billion in 1988 to $2.79 billion in 1989, nearly half of the apparent increase was a result of the changein trade regime from one which encouraged under-invoicing to one which rewarded over-invoicing (seeBox 2). That is, either 1988 exports were higher than $1.87 or 1989 exports were lower than $2.79billion, or some combination of the two. Further, the decrease in Venezuelan consumption, the highcosts of carrying inventories, and the free market exchange rate all contributed to increased exports. Therole of exports and export subsidies in the reform program is discussed in Section 4.1.6.
2.2 Public Enterprises
2.51 Aside from trade policy, the largest government intervention in the industrial sector wasdirect ownership. This section describes the magnitude of state ownership of productive activity and itseffects on the private sector. Section 2.2.1 describes the distribution of the state owned industrialenterprises and section 2.2.2 refers to the policy instruments influencing industrial firms' economicdecisions. Section 2.2.3 describes SOEs' market practices, and their impact on private industry isdescribed in section 2.2.4. Recent policy changes are described in section 2.2.5. Policyrecommendations are offered in section 2.2.6.
2.52 State-owned enterprises are concentrated in resource-based, export-oriented activities andin services. In many cases, they are the only domestic producer and, before the reforms in 1989, theycontrolled imports of competing products. Their business practices vis-a-vis the private sector reflecttheir monopolistic position and result in transfers from private to public firms. The new economicenvironment is likely to improve quality and service. The main recommendation is to pursue theGovernment's medium-term program of privatization and other measures to increase private participationand competition and to ensure that all SOEs, while remaining publicly owned, are exposed to fullcompetition and market forces.
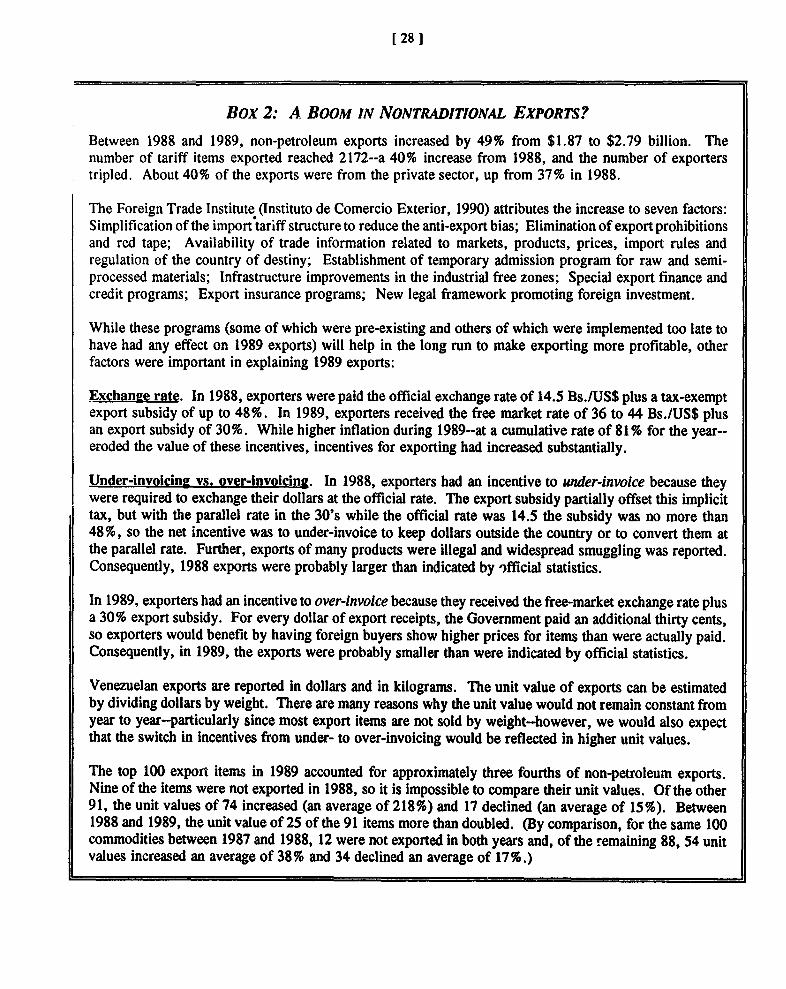
[ 28 1
Box 2: A BOOM IN NONTRADITiONAL EXPORTS?
Between 1988 and 1989, non-petroleum exports increased by 49% from $1.87 to $2.79 billion. Thenumber of tariff items exported reached 2172--a 40% increase from 1988, and the number of exporterstripled. About 40% of the exports were from the private sector, up from 37% in 1988.
The Foreign Trade Institute (Instituto de Comercio Exterior, 1990) attributes the increase to seven factors:Simplification of the import tariff structure to reduce the anti-export bias; Elimination of export prohibitionsand red tape; Availability of trade information related to markets, products, prices, import rules andregulation of the country of destiny; Establishment of temporary admission program for raw and semi-processed materials; Infrastructure improvements in the industrial free zones; Special export finance andcredit programs; Export insurance programs; New legal framework promoting foreign investment.
While these programs (some of which were pre-existing and others of which were implemented too late tohave had any effect on 1989 exports) will help in the long run to make exporting more profitable, otherfactors were important in explaining 1989 exports:
Exchange rate. In 1988, exporters were paid the official exchange rate of 14.5 Bs./US$ plus a tax-exemptexport subsidy of up to 48%. In 1989, exporters received the free market rate of 36 to 44 Bs./US$ plusan export subsidy of 30%. While higher inflation during 1989-at a cumulative rate of 81% for the year-eroded the value of these incentives, incentives for exporting had increased substantially.
Under-invoicing vs. over-invoicing. In 1988, exporters had an incentive to under-invoice because theywere required to exchange their dollars at the official rate. The export subsidy partially offset this implicittax, but with the parallel rate in the 30's while the official rate was 14.5 the subsidy was no more than48%, so the net incentive was to under-invoice to keep dollars outside the country or to convert them atthe parallel rate. Further, exports of many products were illegal and widespread smuggling was reported.Consequently, 1988 exports were probably larger than indicated by 'fficial statistics.
In 1989, exporters had an incentive to over-invoice because they received the free-market exchange rate plusa 30% export subsidy. For every dollar of export receipts, the Government paid an additional thirty cents,so exporters would benefit by having foreign buyers show higher prices for items than were actually paid.Consequently, in 1989, the exports were probably smaller than were indicated by official statistics.
Venezuelan exports are reported in dollars and in kilograms. The unit value of exports can be estimatedby dividing dollars by weight. There are many reasons why the unit value would not remain constant fromyear to year-particularly since most export items are not sold by weight-however, we would also expectthat the switch in incentives from under- to over-invoicing would be reflected in higher unit values.
The top 100 export items in 1989 accounted for approximately three fourths of non-petroleum exports.Nine of the items were not exported in 1988, so it is impossible to compare their unit values. Of the other91, the unit values of 74 increased (an average of 218%) and 17 declined (an average of 15%). Between1988 and 1989, the unit value of 25 of the 91 items more than doubled. (By comparison, for the same 100commodities between 1987 and 1988, 12 were not exported in both years and, of the remaining 88, 54 unitvalues increased an average of 38% and 34 declined an average of 17%.)
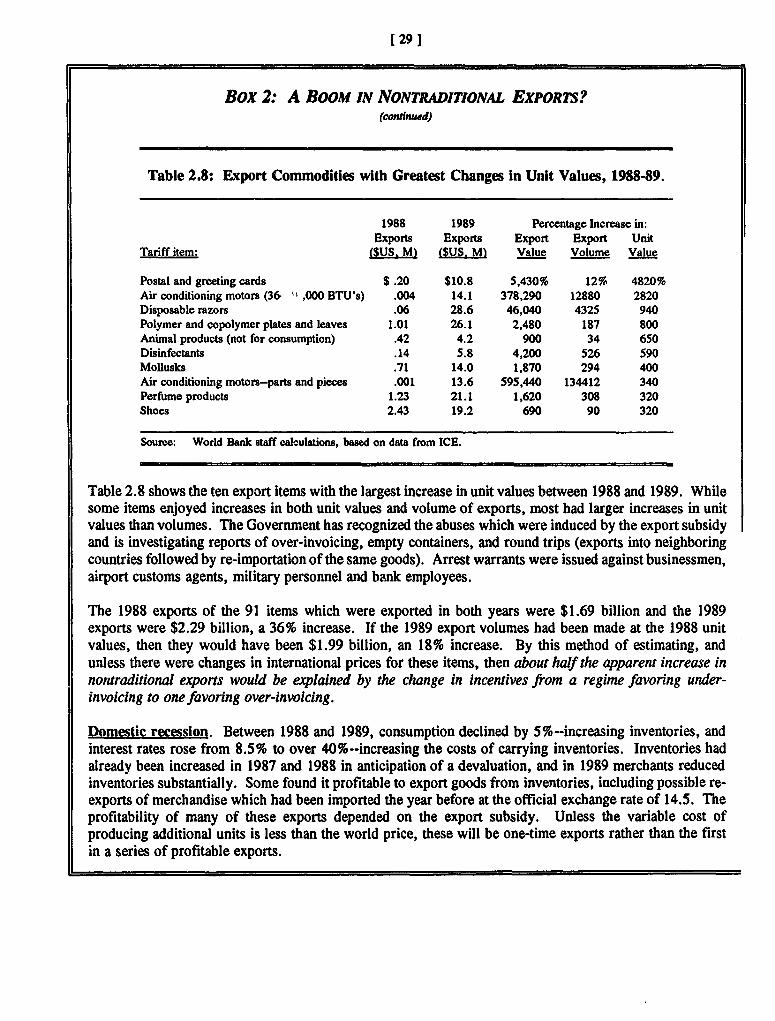
[29
Box 2: A BOOM IN NONTRADITIONAL EXPORTS?(continwud)
Table 2.8: Export Commodities with Greatest Changes in Unit Values, 1988-89.
1988 1989 Percentage Increase in:Exports Exports Export Export Unit
Tariff item: ($US. M) ($US. M) Value Volume Value
Postal and greeting cards $ .20 $10.8 5,430% 12% 4820%
Air conditioning motors (36. ;. 000 BTU's) .004 14.1 378,290 12880 2820
Disposable razors .06 28.6 46,040 4325 940
Polymer and copolymer plates and leaves 1.01 26.1 2,480 187 800
Animal products (not for consumption) .42 4.2 900 34 650
Disinfectants .14 5.8 4,200 526 590
Mollusks .71 14.0 1,870 294 400
Air conditioning motors-parts and pieces .001 13.6 595,440 134412 340
Perfume products 1.23 21.1 1,620 308 320
Shoes 2.43 19.2 690 90 320
Source: World Bank staff calculations, based on data from ICE.
Table 2.8 shows the ten export items with the largest increase in unit values between 1988 and 1989. While
some items enjoyed increases in both unit values and volume of exports, most had larger increases in unit
values than volumes. The Government has recognized the abuses which were induced by the export subsidy
and is investigating reports of over-invoicing, empty containers, and round trips (exports into neighboring
countries followed by re-importation of the same goods). Arrest warrants were issued against businessmen,
airport customs agents, military personnel and bank employees.
The 1988 exports of the 91 items which were exported in both years were $1.69 billion and the 1989
exports were $2.29 billion, a 36% increase. If the 1989 export volumes had been made at the 1988 unit
values, then they would have been $1.99 billion, an 18% increase. By this method of estimating, and
unless there were changes in international prices for these items, then about half the apparent increase innontraditional exports would be explained by the change in incentives from a regime favoring under-invoicing to one favoring over-invoicing.
Domestic recession. Between 1988 and 1989, consumption declined by 5%-increasing inventories, and
interest rates rose from 8.5% to over 40%--increasing the costs of carrying inventories. Inventories had
already been increased in 1987 and 1988 in anticipation of a devaluation, and in 1989 merchants reduced
inventories substantially. Some found it profitable to export goods from inventories, including possible re-
exports of merchandise which had been imported the year before at the official exchange rate of 14.5. The
profitability of many of these exports depended on the export subsidy. Unless the variable cost of
producing additional units is less than the world price, these will be one-time exports rather than the first
in a series of profitable exports.
1 30]
2.2.1 Distribution of Ownership
2.53 The importance of publicly-owned industries-and the rents accruing to the public sectorfrom these activities-rose with world petroleum prices in 1973; with the nationalization of foreign oilcompanies in 1976; and since the mid-1970s w:th the growth of petrochemicals, steel, aluminum, andchemicals production. Bourginon (1989, p. 300) estimates that 19 percent of the resources derived fromthe oil boom were directed to public investments in those areas.
2.54 Excluding petroleum refining, SOEs accounted for five and 18 percent of industrial valueadded in 1970 and 1986, respectively. When petroleum refining is included the corresponding figuresare four percent and 42 percent (see Table 2.9). Preliminary data for 1987 show public firmsconcentrated in nonferrous metals (largely aluminum), where the public sector accounts for 91 percentof domestic value added; iron and steel, where it accounts for 62 percent; and chemical and petrochemicalproducts. SOEs (without private participation) also extract the basic material inputs for those industries:crude oil, iron ore, and bauxite.
2.55 The Government prohibited private investment in some subsectors. Following thenationalization of the foreign petroleum companies in 1976, petrochemicals were reserved forPEQUIVEN, the affiliate of Petr6leos de Venezuela, S. A. (PDVSA) the petroleum producer and refiner.Recently, however, petrochemical firms have been established with the participation of domestic privateand foreign capital, with PEQUIVEN's share between 11 percent and 75 percent.
2.56 In the aluminum-related activities, minority foreign participation is present in the aluminaand primary aluminum firms. These are run by the goverrment-owned Corporaci6n Venezolana deGuayana (CVG). Domestic private interests are present in the aluminum manufacturing activities only.
2.57 In the steel sector the Government has a moilopoly in the production of flat steel atSIDOR, a CVG-managed firm; it shares the production of non-flat steels mostly with the privately-ownedSIVENSA; and there is domestic private investment in the downstream steel industry.
2.58 Basic industries' output and their key material inputs are sold domestically andinternationally. Of manufactured exports in 1987-excluding petroleum refining-aluminum accountedfor 34 percent; steel, 21 percent; and chemicals, seven percent. As a proportion of 1987 production,exports accounted for 52 percent in aluminum, 43 percent in chemicals, and 17 percent in steel. Incontrast, private industries like garments, shoes, food processing, and consumer durables are mostlyoriented toward the domestic market. In 1987 the proportion of export to domestic production wasone percent for nondurable consumer goods (31-32).
2.59 Some service subsectors like telecommunications, shipping and port handling, and postalservices are dominated by SOEs. While not industrial SOEs, these activities are major obstacles toprivate sector development and trade expansion.
2.2.2 Policy Instruments
2.60 Resource allocation in industry has been influenced through direct controls, trade,financial and fiscal instruments. No estimates are available of the relative importance of differentinstruments on private firms' economic decisions; however, the use of commercial policy, and the roleof the industrial SOEs in its implementation, appear to be critical.
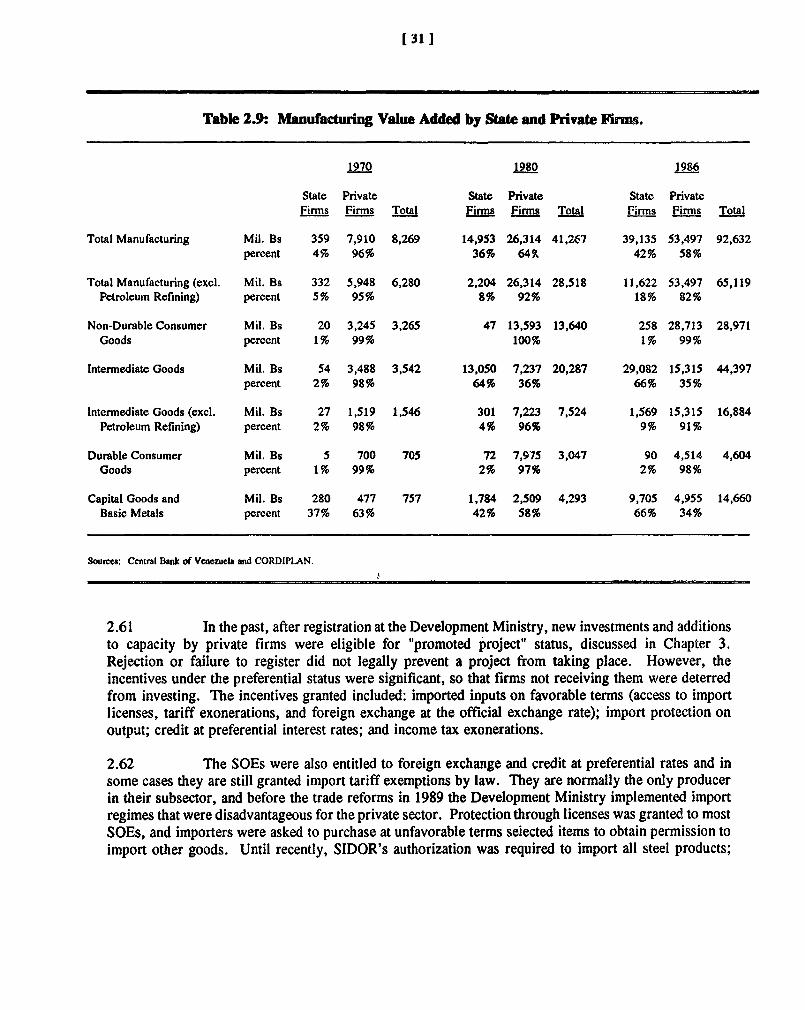
1 311
Table 2.9: Manufacturing Value Added by State and Private linus.
1970 1980 1986
State Private State Private State PrivateFirms Firms Total Firms Firms Total F.rms Firms Total
Total Manufacturing Mil. Bs 359 7,910 8,269 14,953 26,314 41,267 39,135 53,497 92,632percent 4% 96% 36% 649. 42% 58%
Total Manufacturing (excl. Mil. Bs 332 5,948 6,280 2,204 26,314 28,518 11,622 53,497 65,119Petroleum Refining) percent 5% 95% 8% 92% 18% 82%
Non-Durable Consumer Mil. Bs 20 3,245 3,265 47 13,593 13,640 258 28,713 28,971Goods percent 1% 99% 100% 1% 99%
Intermediate Goods Mil. Bs 54 3,488 3,542 13,050 7,237 20,287 29,082 15,315 44,397percent 2% 98% 64% 36% 66% 35%
Intermediate Goods (excl. Mil. Bs 27 1,519 1,546 301 7,223 7,524 1,569 15,315 16,884Petroleum Refining) percent 2% 98% 4% 96% 9% 91%
Durable Consumer Mil. Bs 5 700 705 72 7,975 3,047 90 4,514 4,604Goods percent 1% 99% 2% 97% 2% 98%
Capital Goods and Mil. Bs 280 477 757 1,784 2,509 4,293 9,705 4,955 14,660Basic Metals percent 37% 63% 42% 58% 66% 34%
Sources: Central Bank of Venezaela and CORDIPLAN.
2.61 In the past, after registration at the Development Ministry, new investments and additionsto capacity by private firms were eligible for "promoted project" status, discussed in Chapter 3.Rejection or failure to register did not legally prevent a project from taking place. However, theincentives under the preferential status were significant, so that firms not receiving them were deterredfrom investing. The incentives granted included: imported inputs on favorable terms (access to importlicenses, tariff exonerations, and foreign exchange at the official exchange rate); import protection onoutput; credit at preferential interest rates; and income tax exonerations.
2.62 The SOEs were also entitled to foreign exchange and credit at preferential rates and insome cases they are still granted import tariff exemptions by law. They are normally the only producerin their subsector, and before the trade reforms in 1989 the Development Ministry implemented importregimes that were disadvantageous for the private sector. Protection through licenses was granted to mostSOEs, and importers were asked to purchase at unfavorable terms selected items to obtain permission toimport other goods. Until recently, SIDOR's authorization was required to import all steel products;
t 32 ]
2.63 In addition, Government linancial support to SOEs--both directly through budgetarytransfers and indirectly through FIV loans and equity participation and government guaranteed borrowing--allowed many SOEs to survive and expand in the absence of financial/market discipline. TheGovernment and FIV channel roughly $1 billion annually in transfers to SOEs, much of it to service debt.Generally, such financial support has been provided without economic and financial justification, clearobjectives, or financial accountability.
2.2.3 Domestic Market Practices
2.64 The SOEs' market behavior is explained--among other factors--by: a) institutionalarrangements; b) market position as the only supplier in their subsector (through production and importcontrols); c) other economic polkiies. Interviews with private executives found several concerns aboutSOEs' practices. We did not determine how frequent or widespread the problems are, but they increasecosts within Venezuelan industry and reduce international competitiveness.
2.65 Delivery. Untimely delivery is a common complaint. VENALUM and (less so)ALCASA sell a significant part of Lheir output under long-term international contracts, and only residuallyin the domestic market. The consensus among buyers is that the SOEs find the domestic market lessprofitable and this is reflected in their delivery practices. In fact, in the past, ALCASA and VENALUMwere required to sell primary aluminum at a discount domestically (with the output allocated amongprivate firms based on installed capacity); and most private orders are not sufficiently large to beprofitable. Although the domestic price of primary aluminum has been raised to about the fob exportprice, the domestic market is still less profitable than foreign markets because of the export subsidy(30 percent of fob export price in April 1990, but only 5 percent in September 1990).
2.66 SIDOR's customers also expressed concerns about unreliable deliveries. Operations atSIDOR are characterized by: a) a large output mix (more than 17,000 products); b) highly centralizeddecision making; and c) apparently granting delivery priority to other SOEs, SIDOR's joint-ventures withthe private sector (like Fior de Venezuela), and "preferred customers".
2.67 In contrast, PEQUIVEN's delivery practices are said to be acceptable. Hypotheses forthe different behavior between this firm and the CVG affiliates: a) PEQUIVEN is part of PDVSA, abetter managed and world-integrated conglomerate; b) PEQUIVEN's production of critical inputs to thedownstream industry, like propylene and ethylene, is all for the domestic markets; c) PEQUIVEN ismore directly involved in downstream activities, through joint-ventures with the private sector, than theCVG firms.
2.68 Payments. While most SOEs are said to have no commitment to delivery .iming, itappears to be their common practice to collect in advance for private orders. In contrast, private firmshave had difficulties collecting from some SOEs. Recently, the SOEs have accumulated large arrearsamong themselves, and also vis-a-vis the private sector.
2.69 Ouality control. Quality control is a problem in public and private firms. Theseproblems are exacerbated where firms are exempt from competitive pressures. The problems reflect inlack of commitment to product specification and in low product durability.
2.70 Price/Ouota arrangements. Until recently, the domestic price of aluminum was muchlower than the fob export price, and the domestic distribution of primary aluminum by CVG was based
(33 1
on installed capacity in the downstream firms. This quota system is probably not binding now whensignificant excess capacity prevails among domestic aluminum manufacturers. At the time of this writing,FERROMINERA, the CVG-run iron ore supplier, charges a higher price to SIVENSA than to SIDOR(a schedule of price increases is in effect to raise the domestic price to all users to the fob export price);while some CVG companies sell among themselves on a cost-recovery basis with no reference to fobexport prices (FESLVEN to SIDOR for example).
2.71 Services gift. With respect to services, the major concerns by all firms interviewedare unreliability, cost, and insufficiency of Government-supplied services. In particular, communications(telephones), transport (international shipping), ports, and electricity.
2.2.4 Impact on the Industrial Private Sector
2.72 Through their pricing policies and product and service quality, the SOEs affect privateprofitability and international competitiveness. In the past, firms benefitted from the low prices at whichSOEs sold most of their products domestically. However, as part of the pricing and trade reforms,underway since early 1989, prices are being raised while the SOEs' poor quality and service stillundermine private activity.
2.73 Untimely delivery makes inventory management costly through unmatched items, costlyoverstocks, and lack of imports as a backup. More than one firm reported having temporarily suspendedproduction due to lack of supplies. To guarantee deliveries, private resources were used to lobbyexecutives from the SOEs. And before the trade reform, commissions were paid to the SOEs for importauthorizations. Through those fees the SOEs effectively determined the domestic price of imports.Moreover, to obtain import authorizations the private firms were required to buy unneeded items fromthe SOEs and sell them within the domestic market.
2.74 The allocation system based on installed capacity followed by the CVG firms supplyingprimary aluminum might have resulted in over-capacity among private aluminum users. (They producemostly for export markets as do the SOEs.) As of end 1989, most primary aluminum producers weremuch below capacity. This is partly because the domestic price of primary aluminum increased towardthe fob export price reducing profitability, and domestic demand declined with the recession. Moreover,in spite of a higher exchange rate than in previous years and the 30 percent export subsidy, exports didnot increase enough to compensate for the reduced domestic demand. This might be the result of thecountervailing duties that apply to Venezuelan exports of aluminum products in the U.S. (See U.S.Department of Commerce, International Trade Administration, C-307-702.) Recently, a U. S. courtnullified unfair trade findings against Venezuelan aluminum manufacturers, revoking the countervailingduties imposed in 1988.
2.75 Some private firms have facilities to compensate for the deficiencies of public services.SIVENSA maintains a communications system; one of the cement companies has an electric powerfacility; and most cement companies operate their own ports under government concessions. Telephonelines are limited. The next new line in Barquisimento is not expected for years. At the current lowprices, telephone calls, FAX, and other electronic data transferring operations overload the telephonesystem. Inefficiencies at the ports are likely to reduce the export competitiveness, increase the landedcost of imports, and serve as a barrier to trade.
[ 34 1
2.76 On the positive side, one firm indicated that the CVG firms play a major role in thedevelopment of basic infrastructurn k, the Guayana region, promoting the establishment of private firmsin the area. SIVENSA is believed to have flourished under the import protection and inefficiency allowedto SIDOR. And several firms believe that having joint-ventures with the SOEs in the downstreamindustry has improved their bargaining power in most of their productive operations. This is mostlythrough better delivery service and access to information.
2.2.5 Recent Policy Changes
2.77 The pricing and trade reforms changed significantly the economic environment faced bySOEs. Moreover, the Government is restructuring and privatizing the SOEs.
2.78 Domestic prices of primary aluminum, steel, and petrochemical products have been raisedto reflect their opportunity cost. And iron ore prices to all users will be at export opportunity cost in thenear future; a schedule of price increases is in effect between Ferrominera and SIDOR. The CVG pricesof bauxite and alumina for dome3tic use take international quotations as a reference. The CVG used toallocate primary aluminum among domestic manufactures according to installed capacity. This systemis probably not binding now when significant excess capacity exists and CVG is able to charge exportopportunity costs.
2.79 The import monopolies granted the SOEs have been eliminated and imports are providingcompetition to the state monopolies. Venezuela's accession to the GATT on September 1, 1990 hasreduced fears of policy reversals among some entrepreneurs.
2.80 To redefine the role of the public sector and ensure that it will be more strategic,selective, and transparent, an overall government strategy specifying the role of the public sector isneeded. To this end, the Government recently invited 21 national institutions to a major review of theroles of the public and private sectors in the production of goods and services.
2.81 A restructuring and privatization program was started with the objectives of: (a) reducingthe dominance of the public sector; (b) improving the competitive environment for the private sector;(c) increasing the efficiency of and rationalizing pricing policy in public enterprises; (d) promotingclarity, transparency, and accountability in the relationship between the Central Government and thepublic enterprises; and (e) laying a base for stronger public finances over the medium and longer term.The reform in the first two years will focus on restructuring about 11 priority public enterprises, theprivatization of about 100 more, and establishment of transparent institutional relationships between thecentral Government and remaining public enterprises.
2.82 The interministerial committee for privatization identified about 100 firms to be privatizedin the medium term. These include three banks, 17 hotels, two airlines, and the telecommunicationscompany. The FIV, used in the past to channel public funds to the SOEs, is being restructured to be theimplementing agency, and at least five firms have been brought to the point of sale. Eight major SOEshave been selected for restructuring, including the public ports. Restructuring of the ports involvesliquidating the current ports agency (Instituto Nacional de Puertos, INP), granting concessions to privateoperators, and establishing a new regulatory regime. Finally, the new regulation on foreign investment(Decree 727, see Section 3.3.1) increased significantly the opportunities for foreign ownership.
(35 1
2.83 The overall reform program and the recent changes in the role of the FIV and publicenterprise management are increasing the transparency of the economic environment and reducing theprivileges and protection to the SOEs. As foreign competition increases and SOEs are forced to showacceptable financial results to attract private financing, better output quality and delivery services arelikely from all industrial firms.
2.2.6 Recommendations
2.84 This section supports the Government's medium-term agc.ida for restructuring andprivatization. To the extent that privatization will ba done gradually, additional policy changes that wouldincrease private participation in SOEs, and market discipline on the SOEs are outlined here.
2.85 The privatization and restructuring plans for the SOEs should be publicly announced atan early date. Petrochemical and chemical executives complain about not knowing PEQUIVEN's plans;and the discussion on the "hydrocarbons law" is delaying private decisions in related activities.
2.86 In response to the trade reforms, the private firms are changing their product lineskeeping only those where they are more competitive and adding new ones. Moreover, joint-ventures withthe SOEs have been very advantageous to the overall activities of firms like SIVENSA and Corimon; inthe transition, these arrangements might be critical for both private and public firms. In the transitionto privatization: ALCASA should consider increased private participation in producing primaryaluminum, and encouraging private development of other activities; PEQUIVEN shoul[ consider privateparticipation in basic products like ethylene and propylene and the feasibility of reducing its downstreamactivities; and SIDOR could concentrate in certain groups of products, and decentralize the productionand management of small orders (such as selling bottle tops to Polar).
2.87 Full implementation of the trade reforms-including elimination of import tariffexemptions for SOEs, and the export subsidy-will increase the pressure on all firms to be internationallycompetitive. As domestic prices are raised to international levels, and the export subsidy is eliminated,the bias in favor of foreign customers will be reduced. Imports are likely to improve inventorymanagement and increase pressure on the SOEs to improve quality and delivery. Moreover, the privatesector is likely to get better payment terms through suppliers' credits than the current policy by SOEs.
2.88 Uniform pricing between domestic and foreign markets is essential. Differentiated pricesencourage unwillingness to supply the domestic market, poor quality and specifications, need of privatefirms to lobby SOEs' managers, etc. Moreover, transfer prices on a cost recovery basis--rather than amarket-price basis--between SOEs foster waste and discrimination against private firms.
2.89 Government financial support to SOEs should be phased out and SOEs should be requiredto be financially self-sufficient in their operations and be able to finance their investments from internally-generated funds and commercial financing (private equity and non-guaranteed borrowings). In the past,commercial banks have been reluctant to lend to SOEs without a Government guarantee due to countryrisk and the financial situation of particular SOEs. However, it is expected that an increasing numberof SOEs will attract non-guaranteed financing as a result of sustained macroeconomic reforms and theGovernment's efforts to restructure problem enterprises.
2.90 The experience of the recent past, as well as cross-country evidence (see, e. g., Krueger1990), suggest that needed policy changes are more difficult to implement when public ownership is
[36 1
present. This is partly the result of political pressures. Therefore, there is a case for acceleratingmedium-term objectives. During the transition the firms that would remain publicly owned should beclosely monitored.
2.3 Other InstrMments of Industrial Policy4
2.91 The Government also influenced the allocation of resources through direct interventionsto control the prices of virtually every item produced in the country, through subsidies for selected foodproducts, through directed credit, and through a wide range of tax exonerations and credits. These weregenerally uncoordinated, and it is impossible to estimate their combined magnitude, incidence, and effecton resource allocation with existing data.
2.92 The one vehicle which could have been used to coordinate industrial incentives was theRegistro de Informaci6n de Proyectos Industriales (RIPI) maintained since 1974 by the DevelopmentMinistry. The RIPI was an instrument to direct investment to selected sectors. Approval of a projectwas necessary for certain incentives (fiscal benefits, trade and foreign exchange preferences, financial).These incentives were large and rejection by the Development Ministry virtually precluded investment.Application for the RIPI was costly and time-consuming. The Development Ministry generally used theregistry to favor import substitution, to direct investment away from the Caracas area, and to preventexpansion in industries where there was thought to be adequate capacity. While the RIPI could have beenan instrument for coordinating the diverse benefits to industrial projects, programs which depended onRIPI status were administered independently and total benefits were uncontrolled.
2.93 Under the Government's reform program, the RIPI has been converted into a registrywhich is used only for information. The Development Ministry does not exercise discretion in listingprojects on the registry, and listing does not convey any special benefits to investors.
2.3.1 Price Controls
2.94 Price controls were established in August 1974. During the 1980s, the Government hadreasons-based on other policy-induced distortions-for controlling prices. With large sectors protectedagainst foreign competition by import licenses, price controls could, if effectively applied, reduce thepotential for monopoly profits. Further, with preferential foreign exchange intended to assist the poor,price controls could be used to ensure that the benefits weren't captured by importers. Less legitimately,price controls were intended to reduce inflation.
2.95 The system of price controls was changed from t.me to time and, in principle, every pricein Venezuela was controlled by the Development Ministry. By the time of the reforms, the controls wereadministered by dividing goods into three classes:
* Regulated gggb. 43 basic necessities (common food and household items-pharmaceuticals, medicalservices, electricity, urban and intercity transportation) whose prices could not be changed without
'This section is largely based upon World Bank (1988a) and draws upon chapters written by Kris Hallberg, Eduardo Bitran,and Charles McClure.
[ 37 1
approval by the Costs, Prices, and Salaries Commission which included government, producers'associations and labor representatives.
* Controlled goods. 86 priority goods and services including food and household products, motorvehicles, and some production inputs whose prices could not be changed without approval of theDevelopment Ministry.
* Superised goods. For all other goods, the Development Ministry had to be informed thirty daysbefore a price increase. If the Ministry did not object, the increase could be introduced.
2.96 We do not have data to determine whether the controls achieved the objective ofproviding food to the poor. There are data which show that the prices of regulated and controlled goodsrose less quickly than the others. However, there were serious shortages of several items--rice, edibleoils, milk, corn, and meat--as producers refused to produce and retailers refused to sell at controlledprices. Illegal exports were a common way of avoiding price controls. And some shortages wereavoided by loopholes: chickens could be sold at a higher price in parts than whole; tuna in small canswas controlled but in large cans was not; products were withdrawn from the market or modified; tie-insales were used to force consumers to buy uncontrolled items with the controlled items. All these effectswere felt more harshly by poor consumers who had fewer alternatives or means to purchase substitutes.
2.97 With regards to protecting consumers in imperfectly competitive markets, the system mayhave been harmful by encouraging collusion among producers as they negotiated price increases with theDevelopment Ministry. Certainly, for traded goods, a more nearly uniform level of import competitionwould have been a more efficient system to ensure competitive pricing. The Government recognized thisin its reform program and controls were retained for only 17 items.
2.3.2 Financial Incentives
2.98 The Government influenced the cost of credit to industry by channelling resources onfavorable terms through specialized institutions or second-tier lending through commercial banks. TheFondo de Credito Industrial (FONCREI) finances large- and medium-scale private firms and theCorporaci6n de Desarrollo de la Pequefha y Mediana Industria (CORPOINDUSTRIA) finances privatesmall- and medium-scale enterprise. The Fondo de Inversiones de Venezuela (FIV) lends mainly topublic sector enterprises, and FONTUR lends for tourism. In June, 1987, FONCREI andCORPOINDUSTRIA accounted for about 1 percent of total banking system credit.
2.99 FONCREI financed fixed investment and working capital through financial intermediaries.The amount and terms of loans were made by the FONCREI Administrative Board with agro-industryand import substitution being priority activities. Other criteria were use of locally produced inputs, netcontribution to foreigni exchange, and employment generation. In 1988, interest rates were 11 percent-13 percent at a time when commercial lending rates regulated at 13.7 percent, but extra fees andcompensating balances brought them effectively to 20 - 22 percent.
2.100 Relative to the trade subsidies, the credit subsidies were small. FONCREI ha' 2,255million bolivares credit outstanding in the June, 1988. With an interest rate subsidy of 7 - 11 percent,the total subsidy in FONCREI credit amounted to about 160 - 250 million bolivares, or .02 -.03 percentof 1988 GNP of 896 billion bolivares. CORPOINDUSTRIA had outstanding only about one-third as
[ 38 1
much credit as FONCREI, although it offered slightly deeper subsidies with lending rates rangingbetween four and 10.5 percent in 1988.
2.101 These two are among the four most important government development financeinstitutions (the others being the Export Financing Fund and the Agricultural Credit Fund). They bothhave a significant mismatch between the average interesnt rate in the loan portfolio and their cost offunds. FOCREI's cost of funds is approximately 24% while the average return on its loan portolio is10%. A large part of its loans are at fixed rates. CORPOINDUSTRIA, mostly a first-tier institution,has weak loan supervision and its procedures for loan recovery ard poor.
2.102 The Government has begun reforms to liberalize financial policy, to reduce its direct rolein intermediation, and to strengthen the competitiveness and financial condition of intermediaries. In themedium-term, it will simplify the rates offered by government-owned development finance institutionsby establishing two preferential rates at levels substantially above current levels, and will consolidate atleast five funds into two new second-tier credit institutions.
2.103 A further factor influencing credit allocation in the 1970s and 1980s was the VenezuelanInvestment Fund (FX V) which channeled petroleum revenue into state-owned industrial projects. The F1Vwas established in the mid-1970s with the intention of creating a strong financial entity that wouldallocate, in an independent and technically-sound fashion. an earmarked portion of the petroleum surplus(5% of the Government's oil and natural gas income). Given that the Govermment's development strategyduring the 1970s focussed on public sector development of basic industries, the FIV's Lole consistedmainly of financing power, steel, aluminum, mining, ports, and shipping projects. Initially, the financingwas generally provided in bolivares-denominated long-term loans. However, when some enterprisesshowed signs of financial distress in the 1980s, most of the FIV's loans were converted into equity. Byend-1988, 95% of its public enterprise loan portfolio (75% of its assets) were non-income generatingequity (totalling Bs. 126 billiou or roughly $2.5 billion at current exchange rates). In addition, the FIVcontinued to provide roughly $500 million annually in transfers to its SOE holdings, often to assist withservicing foreign debt.
2.104 By 1989, this practice was no longer sustainable. Consequently, a major element of themacrecopomic adjustment program has been the reorganization of the FIV. In late 1989, the Govermnentdecided in principle that the FIV would withdraw from direct lending and investments and refocus itsactivities towards privatization as the implementing agency for the Government's PrivatizationCommission. Legislation has been submitted to Congress revising the FIV's role and authorizing itsphased withdrawal from direct lending and investment (after meeting its existing obligations) during thenext five years.
2.3.3 Tax Policy
2.105 Venezuela's level of taxation-measured by the ratio of tax revenue to GDP-iscomparable to other developing countries with similar levels of income, but the structure is different.Venezuela relies relatively more heavily on company income taxes Qargely on the petroleum sector) thanother LDCs and much less on individual income taxes, indirect taxes on consumption, taxes oninternational trade, and payroll taxes. This is true despite a broad systen of exemptions, exonerations,and investment incentives that reduce substantially the tax burden on selected industries. Theseprovisions, together with widespread evasion which is possible because of poor administration, mean thatrelatively high statutory tax rates are required to maintain the present revenue yield. Data are not
[39 1
available to estimate the magnitude of the various incentives. While collections from the non-petroleumcorporate sector are relatively lower than in other countries even though tax rates are high, it isimpossible to determine whether this is because the incentives are so great or evasion is so widespread.
2.106 The major defect in the corporate income tax is the wide range of exonerations andinvestment tax credits. Incentives exist for agriculture, pollution control, construction, fishing, mining,tourism, transportation, regional development, exports, and a range of financial activities. Between 20and 100 percent of income in certain activities is tax-free. Interest on loans for favored investments anddividends paid from income earned in agriculture and some construction are tax-exempt. Investmentsin some sectors are eligible for credits against tax of 15 percent of the investment-25 percent forproducers of capital goods. These preferences reduce the tax base, create opportunities for evasion,distort resource allocation and, because they are so widespread, lose much of their force.
2.107 Venezuela applies progressive tax rates to corporate profits-15 percent, 35 percent, and50 percent. This is believed to have contributed to fragmentation of corporations. Further, the top rateis above that applied in many countries which would compete against Venezuela for investment and placesthe country at a disadvantage. Elimination of exonerations would allow reduction of the top rate to acompetitive level without reducing tax revenues.
2.108 The Government has acknowledged many of these defects in the tax system and issubmitting legislation-in consultation with the IMF-to improve it. Improvements would include lowercorporate tax rates and introduction of a value added tax. The Government is also using technicalassistance from international consultants to improve tax administration, including reform of the customsservice to facilitate trade.
2.3.4 Production Subsidies
2.109 Direct subsidies to producers-a generally less distorting incentive than trade, fiscal, orfinancial policies-were not widespread. The subsidies were related to food production and distributionand were intended to assist the poor. While the subsidies were not as large a percentage of GDP as thetrade distortions, they were large relative to the size of the markets they affected. They distorted resourceallocation and were an inefficient method of transferring resources to the poor.
* Feltilizers. PEQUIVEN produced fertilizers which were distributed by PALMAVEN to farmers at50 percent of production cost in 1984, with the Government paying the rest. The subsidy went from411 million Bs. in 1984 to 3192 million Bs. in 1988 (about .4 percent of GDP). The increase wasexplained by a 120 percent increase in production and a rise in general costs from Bs. 678 to Bs.2413. The low domestic price of fertilizer led to increased demand which was beyond PEQUIVEN'scapacity, and fertilizer imports (at the preferential exchange rate) went from virtually nothing in 1983to US$180 million in 1988.
* Concentrated Animal Feed. The Government introduced this subsidy-equal to 30 percent of theproducer price-on feed for dairy cattle, in 1987, when its cost was 952 million Bs. (.1 percent ofGDP). (The feed also benefitted from preferential exchange rates for sorghum, soybeans, and wheatwastes, estimated to be Bs. 1600 million per year.) The subsidy had a perverse effect of discouragingranchers from their normal practice of growing a portion of their feed requirements since they wouldnot benefit from the subsidies.
[401
* Powdered Milk. Two grades of powdered milk were sold in 1988: inexpensive at Bs. 14 per kiloand commercial at Bs. 31.5 per kilo. Both were subsidized. The total subsidy was Bs. 2460 millionin 1988 (about .3 percent of GDP). The milk is a blend of domestic and imported powdered milk andthere is an exchange rate subsidy for the imported milk of Bs. 1330 million.
* Pre-cooked Corn Meal. The subsidy on harina pan was Bs. 2 per kilo (one-third of the retail price)in 1987. The cost of the subsidy was Bs. 800 million, .1 percent of GDP.
* Coffee. In 1987 a subsidy was introduced on the purchase of coffee beans for processing and saleto the domestic market, and totaled Bs. 720 million in the 1987-88 season. FONCAFE has amonopoly on the export of coffee beans and also fixes producer prices. About 15 percent of the cropwas exported (10 percent within the export quotas and 5 percent off-quota). FONCAFE received Bs.195 million in export subsidies in 1988. The price of coffee to the processing industry was equal to40 percent of the average price to producers.
2.110 These subsidies were not directed toward the poor, but enriched all consumers-withoutregard to their income--in proportion to the amount they consumed. The subsidies fostered widespreadsmuggling out of the country, particularly of fertilizers. A distributor of harinapan said that when hevisited three U. S. cities he found only product which had been packaged for sale in Venezuela, producedunder Government subsidy. Under the Government's reform program, all subsidies-except for powderedmilk and fertilizer-were abolished.
Matds 11, 1991:2:26 pn
3. POLICIES AND PERFORMANCE IN THE MANUFACTURING SECTOR
3.1 Growth of the manufacturing sector, which averaged 3.9 percent between 1975 and 1988,was achieved with large public investments, import protection, and targeted incentives. This chapterexamines the consequences of industrial and trade policies as they affected the structure of manufacturing,behavior of firms, and performance (Section 3.1). The cost of the industrial policies of the 1970s and1980 is reflected in reduced productivity, low capacity utilization, and the failure of Venezuelan firmsto compete in international markets. The role of the labor force and labor legislation is explored inSection 3.2, and the impact of foreign investment on manufacturing is examined in Section 3.3.
3.2 The primary data for this chapter are the Venezuelan industrial survey (Enquesta Industrial)for 1975-88 (except 1980)1 which is conducted by the national statistical bureau (Oficina Central deEstadistica e Informatica, OCEI), an autonomous government agency. The survey covers all plants inthe formal sector with more than 50 workers, as well as a large sample of smaller plants. The surveyranges from a low of 3,955 plants in 1982 to a high of 6,044 in 1978. OCEI also calculates the sampleweights attached to the smaller plants, which permits aggregation of output and other variables to estimatethe total value for all manufacturing. Unless indicated otherwise, totals in this paper represent allmanufacturing output, aggregated from the OCEI sample using the survey weights. We have notattempted to verify independently the accuracy of the data. Although, by law, respondents are guaranteedanonymity in responding to the survey, it is unclear whether there are (real or perceived) incentives tomisrepresent information.
3.1 Overview of the Manufacturing Sector: Structure. Behavior, Performance
3.3 This section is an overview of the structure of manufacturing, the behavior of enterprises,and their performance. Section 3.1.1 examines the composition and share of manufacturing in GDP,regional distribution, and concentration over 1975-88. Section 3.1.2 examines enterprise behavior andrelates behavior to the structure of the sector. Section 3.1.3 describes the performance of the sector,including growth of manufacturing value-added, productivity, capacity utilization and export orientation.
3.1.1 Structure of the Manufacturing Sector
3.1.1.1 Share of Manufacturing in GDP
3.4 Manufacturing in Venezuela has been small compared to total industrial output because ofthe dominance of crude oil. The share of industry in GDP was 38 percent in 1987, while the share ofmanufacturing was 20 percent (Table 3.1). Although manufacturing increased from 12 percent of GDPin 1968, it is lower than in other countries at comparable stages of development. Manufacturing was28 percent and 25 percent of GDP for Brazil and the Philippines in 1987, yet per capita GNP wassignificantly lower than in Venezuela. Figure 3.1 shows the relationship between manufacturing and percapita GNP in eleven countries. Venezuela's relatively low share of manufacturing output for its incomelevel is similar to other oil-producing countries.
'The industrial survey is not taken in census years (1970, 1980,...). The most recent survey (1989) was not available inMarch, 1990.
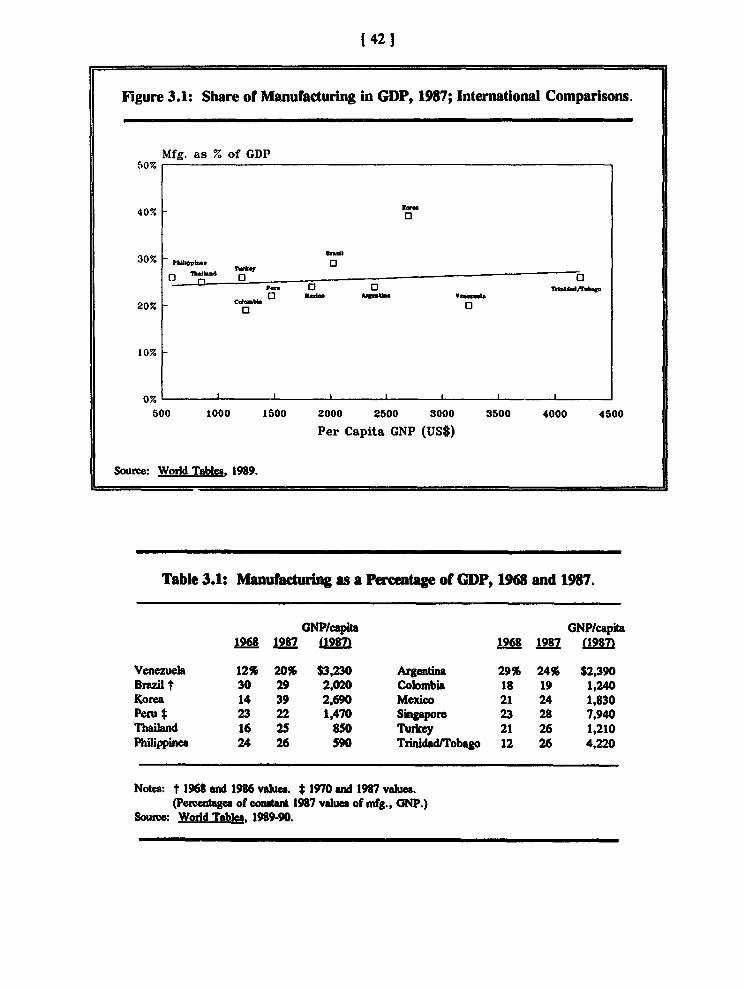
42]
Figure 3.1: Share of Manufacturing in GDP, 1987; International Comparisons.
Mfg. as % of GDP50%
40% -
30% -, .o0
20% o 0
10% _
0% I I I
500 1000 L500 2000 2500 3000 3500 4000 4500
Per Capita GNP (US$)
Soure: Word Tables, 1989.
Table 3.1: Manufacturing as a Percentage of GDP, 1968 and 1987.
GNP/capita GNP/capita1968 1987 L12D 1968 1987 L187l
Venezuel 12% 20% $3,230 Argentina 29% 24% $2,390Brzil t 30 29 2,020 Colombia 18 19 1,240Korea 14 39 2,690 Mexico 21 24 1,830Peru t 23 22 1,470 Singapore 23 28 7,940Thailand 16 25 850 Turkey 21 26 1,210Philippines 24 26 590 Trinidad/Tobago 12 26 4,220
Nota: t 1968 and 1986 values. t 1970 and 1987 values.(Pecntages of contait 1987 values of mfg., GNP.)
Source: W orabld 1989-90.
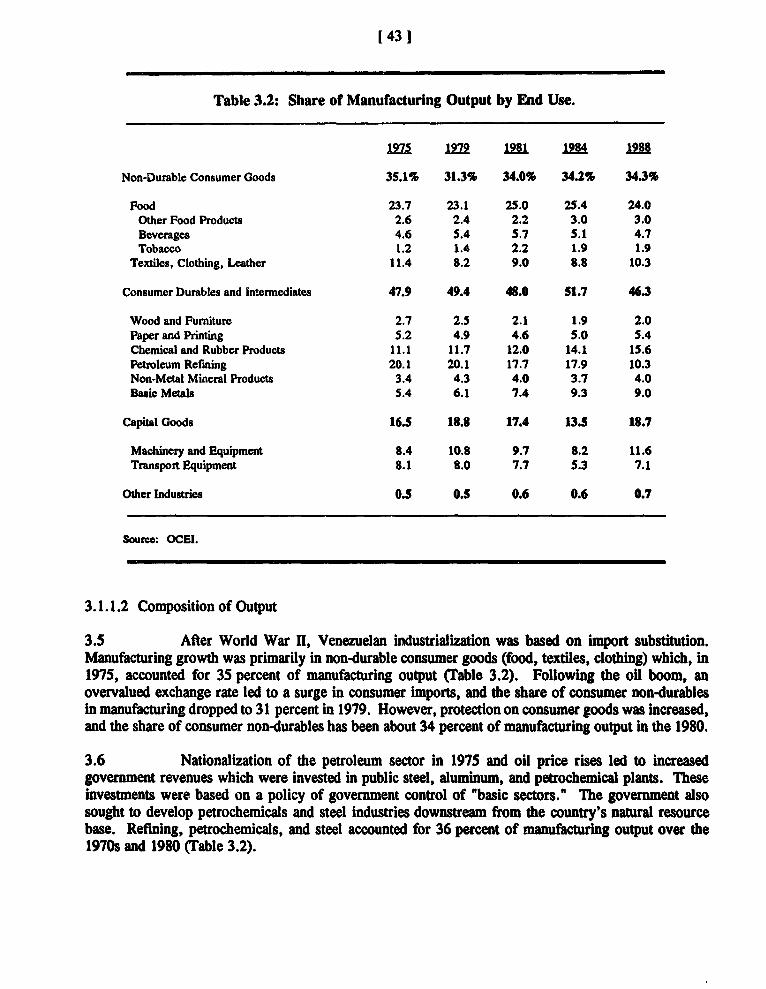
[43 1
Table 3.2: Share of Manufacturing Output by End Use.
1975 1979 1981 18 19
Non-Durable Consumer Goods 35.1% 31.3% 34.0% 34.2% 34.3%
Food 23.7 23.1 25.0 25.4 24.0Other Food Products 2.6 2.4 2.2 3.0 3.0Beverages 4.6 5.4 5.7 5.1 4.7Tobacco 1.2 1.4 2.2 1.9 1.9
Textiles, Clothing, Leather 11.4 8.2 9.0 8.8 10.3
Consumer Durables and Intermediates 47.9 49.4 48.0 51.7 46.3
Wood and Furniture 2.7 2.5 2.1 1.9 2.0Paper and Printing 5.2 4.9 4.6 5.0 5.4Chemical and Rubber Products 11.1 11.7 12.0 14.1 15.6Petroleum Refining 20.1 20.1 17.7 17.9 10.3Non-Metal Mineral Products 3.4 4.3 4.0 3.7 4.0Basic Metals 5.4 6.1 7.4 9.3 9.0
Capital Goods 16.5 18.8 17.4 13.5 18.7
Machinery and Equipment 8.4 10.8 9.7 8.2 11.6Transport Equipment 8.1 8.0 7.7 5.3 7.1
Other Industries 0.5 0.5 0.6 0.6 0.7
Source: OCEI.
3.1.1.2 Composition of Output
3.5 After World War n, Venezuelan industrialization was based on import substitution.Manufacturing growth was primarily in non-durable consumer goods (food, textiles, clothing) which, in1975, accounted for 35 percent of manufacturing output (Table 3.2). Following the oil boom, anovervalued exchange rate led to a surge in consumer imports, and the share of consumer non-durablesin manufacturing dropped to 31 percent in 1979. However, protection on consumer goods was increased,and the share of consumer non-durables has been about 34 percent of manufacturing output in the 1980.
3.6 Nationalization of the petroleum sector in 1975 and oil price rises led to increasedgovernment revenues which were invested in public steel, aluminum, and petrochemical plants. Theseinvestments were based on a policy of government control of "basic sectors." The government alsosought to develop petrochemicals and steel industries downstream from the country's natural resourcebase. Refining, petrochemicals, and steel accounted for 36 percent of manufacturing output over the1970s and 1980 (Crable 3.2).
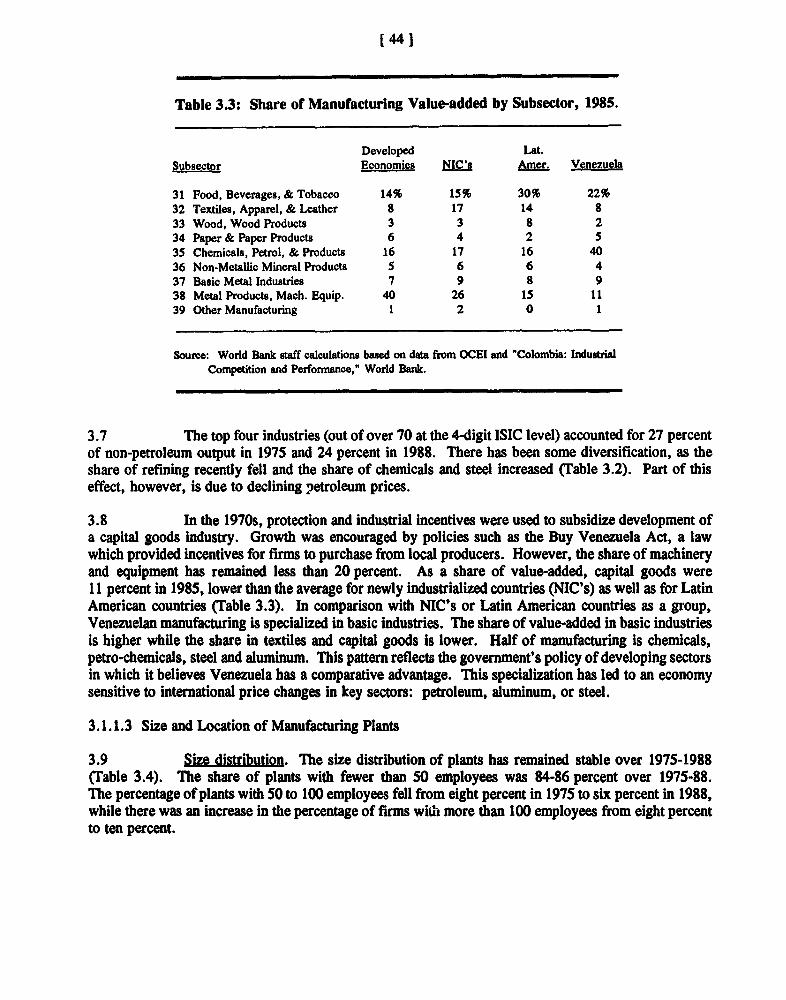
[441
Table 3.3: Share of Manufacturing Value-added by Subsector, 1985.
Developed Lat.Subsector Economies NIC's Amer. Venezuela
31 Food, Beverages, & Tobacco 14% 15% 30% 22%32 Textiles, Apparel, & Leather 8 17 14 833 Wood, Wood Products 3 3 8 234 Paper & Paper Products 6 4 2 535 Chemicals, Petrol, & Products 16 17 16 4036 Non-Metallic Mineral Products 5 6 6 437 Basic Metal Industries 7 9 8 938 Metal Products, Mach. Equip. 40 26 1S 1139 Other Manufacturing 1 2 0 1
Source: World Bank staff calculations based on data from OCEI and "Colombia: IndustrialCompetition and Performance," World Bank.
3.7 The top four industries (out of over 70 at the 4-digit ISIC level) accounted for 27 percentof non-petroleum output in 1975 and 24 percent in 1988. There has been some diversification, as theshare of refining recently fell and the share of chemicals and steel increased (Table 3.2). Part of thiseffect, however, is due to declining petroleum prices.
3.8 In the 1970s, protection and industrial incentives were used to subsidize development ofa capital goods industry. Growth was encouraged by policies such as the Buy Venezuela Act, a lawwhich provided incentives for firms to purchase from local producers. However, the share of machineryand equipment has remained less than 20 percent. As a share of value-added, capital goods were11 percent in 1985, lower than the average for newly industrialized countries (NIC's) as well as for LatinAmerican countries (Table 3.3). In comparison with NIC's or Latin American countries as a group,Venezuelan manufacturing is specialized in basic industries. The share of value-added in basic industriesis higher while the share in textiles and capital goods is lower. Half of manufacturing is chemicals,petro-chemicals, steel and aluminum. This pattern reflects the government's policy of developing sectorsin which it believes Venezuela has a comparative advantage. This specialization has led to an economysensitive to international price changes in key sectors: petroleum, aluminum, or steel.
3.1.1.3 Size and Location of Manufacturing Plants
3.9 Size distribution. The size distribution of plants has remained stable over 1975-1988(Table 3.4). The share of plants with fewer than 50 employees was 84-86 percent over 1975-88.The percentage of plants with 50 to 100 employees fell from eight percent in 1975 to six percent in 1988,while there was an increase in the percentage of firms with more than 100 employees from eight percentto ten percent.
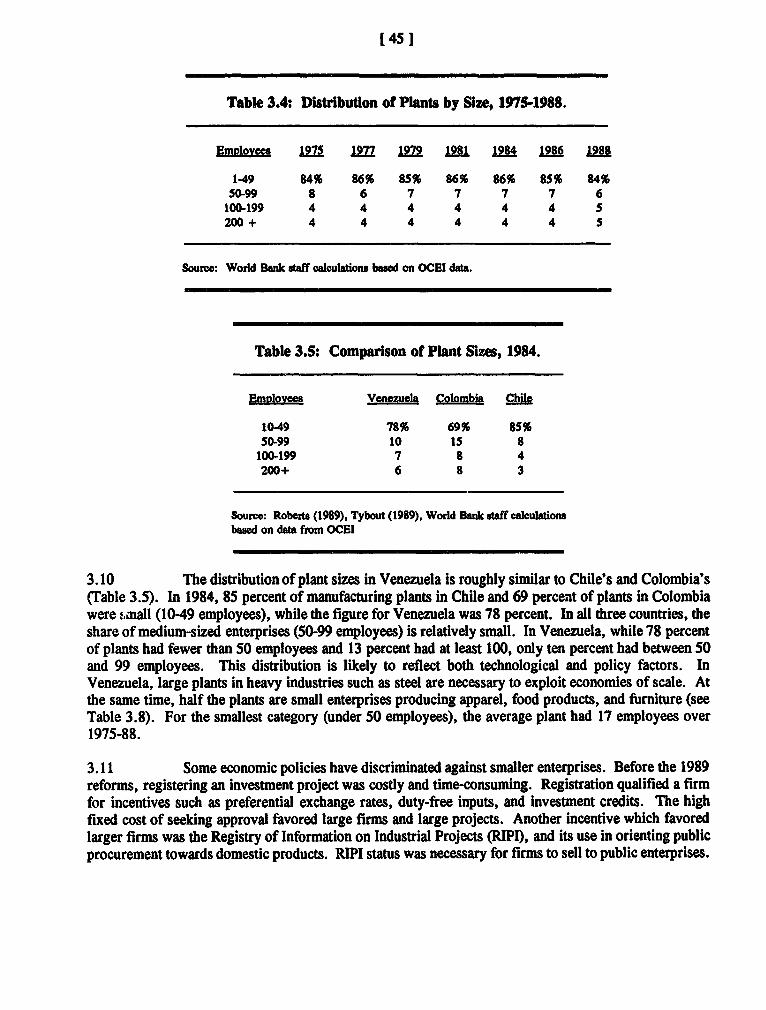
[ 45 1
Table 3.4: Distributlon of Plants by Size, 1975-1988.
Emolm 197 1977 1979 181 U 12M 1986 81
1-49 84% 86% 85% 86% 86% 85% 84%50-99 8 6 7 7 7 7 6
100-199 4 4 4 4 4 4 5200 + 4 4 4 4 4 4 5
Soure: World Bank staff calculations basd on OCEI data.
Table 3.5: Comparison of Plant Sizes, 1984.
Eplovees Venezuela Colombia Chile
10-49 78% 69% 85%50-99 10 1S 8
100-199 7 8 4200+ 6 8 3
Source: Roberts (1989), Tybout (1989), World Bank staff alculationsbased on data from OCEI
3.10 The distribution of plant sizes in Venezuela is roughly similar to Chile's and Colombia's(Table 3.5). In 1984, 85 percent of manufacturing plants in Chile and 69 percent of plants in Colombiawere &;nall (10-49 employees), while the figure for Venezuela was 78 percent. In all three countries, theshare of medium-sized enterprises (50-99 employees) is relatively small. In Venezuela, while 78 percentof plants had fewer than 50 employees and 13 percent had at least 100, only ten percent had between 50and 99 employees. This distribution is likely to reflect both technological and policy factors. InVenezuela, large plants in heavy industries such as steel are necessary to exploit economies of scale. Atthe same time, half the plants are small enterprises producing apparel, food products, and furniture (seeTable 3.8). For the smallest category (under 50 employees), the average plant had 17 employees over1975-88.
3.11 Some economic policies have discriminated against smaller enterprises. Before the 1989reforms, registering an investment project was costly and time-consuming. Registration qualified a firmfor incentives such as preferential exchange rates, duty-free inputs, and investment credits. The highfixed cost of seeking approval favored large firms and large projects. Another incentive which favoredlarger firms was the Registry of Information on Industrial Projects (RIPI), and its use in orienting publicprocurement towards domestic products. RIPI status was necessary for firms to sell to public enterprises.
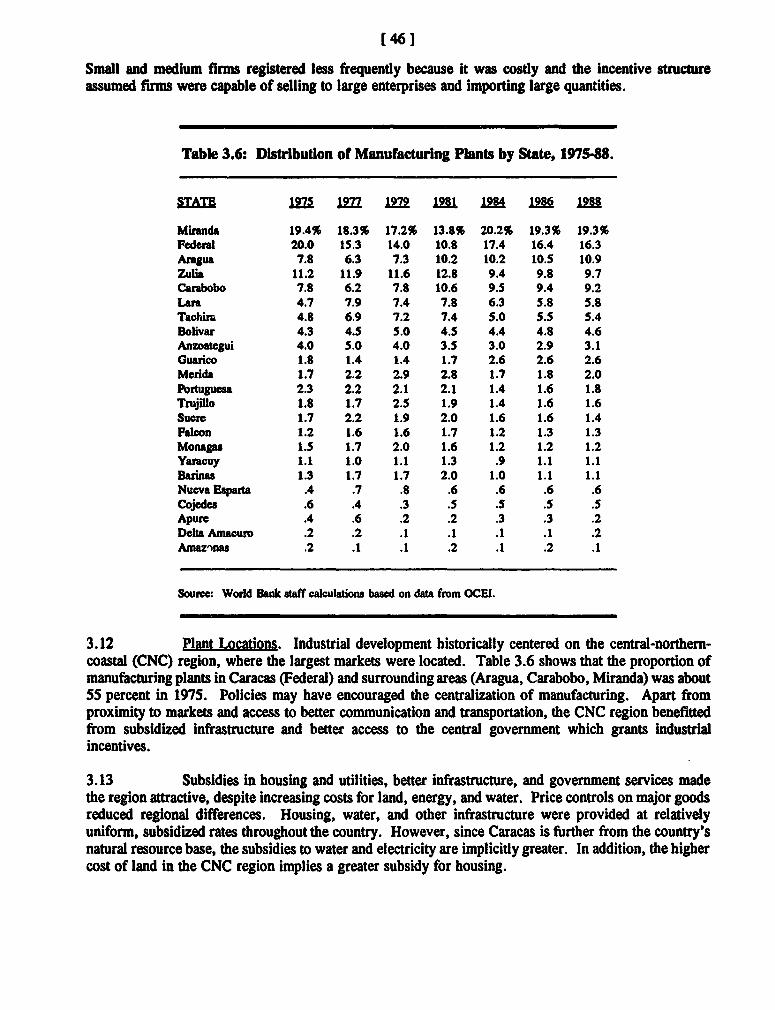
[461
Small and medium firms registered less frequently because it was costly and the incentive structureassumed firms were capable of selling to large enterprises and importing large quantities.
Table 3.6: Distribution of Manufacturing Plants by State, 1975488.
STATE e 17 19 1979 19,81 1984 1986 1988
Miranda 19.4% 18.3% 17.2% 13.8% 20.2% 19.3% 19.3%Federal 20.0 15.3 14.0 10.8 17.4 16.4 16.3Aragua 7.8 6.3 7.3 10.2 10.2 10.5 10.9Zulia 11.2 11.9 11.6 12.8 9.4 9.8 9.7Cambobo 7.8 6.2 7.8 10.6 9.5 9.4 9.2La= 4.7 7.9 7.4 7.8 6.3 5.8 5.8Tachira 4.8 6.9 7.2 7.4 5.0 5.5 5.4Bolivar 4.3 4.5 5.0 4.5 4.4 4.8 4.6Anzoategui 4.0 5.0 4.0 3.5 3.0 2.9 3.1Guarico 1.8 1.4 1.4 1.7 2.6 2.6 2.6Merida 1.7 2.2 2.9 2.8 1.7 1.8 2.0Portuguasa 2.3 2.2 2.1 2.1 1.4 1.6 1.8Trujillo 1.8 1.7 2.5 1.9 1.4 1.6 1.6Sucre 1.7 2.2 1.9 2.0 1.6 1.6 1.4Falcon 1.2 1.6 1.6 1.7 1.2 1.3 1.3Monags 1.5 1.7 2.0 1.6 1.2 1.2 1.2Yaracuy 1.1 1.0 1.1 1.3 .9 1.1 1.1Barinas 1.3 1.7 1.7 2.0 1.0 1.1 1.1Nueva sparta .4 .7 .8 .6 .6 .6 .6Cojedes .6 .4 .3 .5 .5 .5 .5Apure .4 .6 .2 .2 .3 .3 .2Delta nAacuro .2 .2 .1 .1 .1 .1 .2Amaz)nas .2 .1 .1 .2 .1 .2 .1
Soure: Wodd Bank staff calculations based on data from OCEI.
3.12 Plant Locations. Industrial development historically centered on the central-northern-coastal (CNC) region, where the largest markets were located. Table 3.6 shows that the proportion ofmanufacturing plants in Caracas (Federal) and surrounding areas (Aragua, Carabobo, Miranda) was about55 percent in 1975. Policies may have encouraged the centralization of manufacturing. Apart fromproximity to markets and access to better communication and transportation, the CNC region benefittedfrom subsidized infrastructure and better access to the central government which grants industrialincentives.
3.13 Subsidies in housing and utilities, better infrastructure, and government services madethe region attractive, despite increasing costs for land, energy, and water. Price controls on major goodsreduced regional differences. Housing, water, and other infrastructure were provided at relativelyuniform, subsidized rates throughout the country. However, since Caracas is further from the country'snatural resource base, the subsidies to water and electricity are implicidy greater. In addition, the highercost of land in the CNC region implies a greater subsidy for housing.
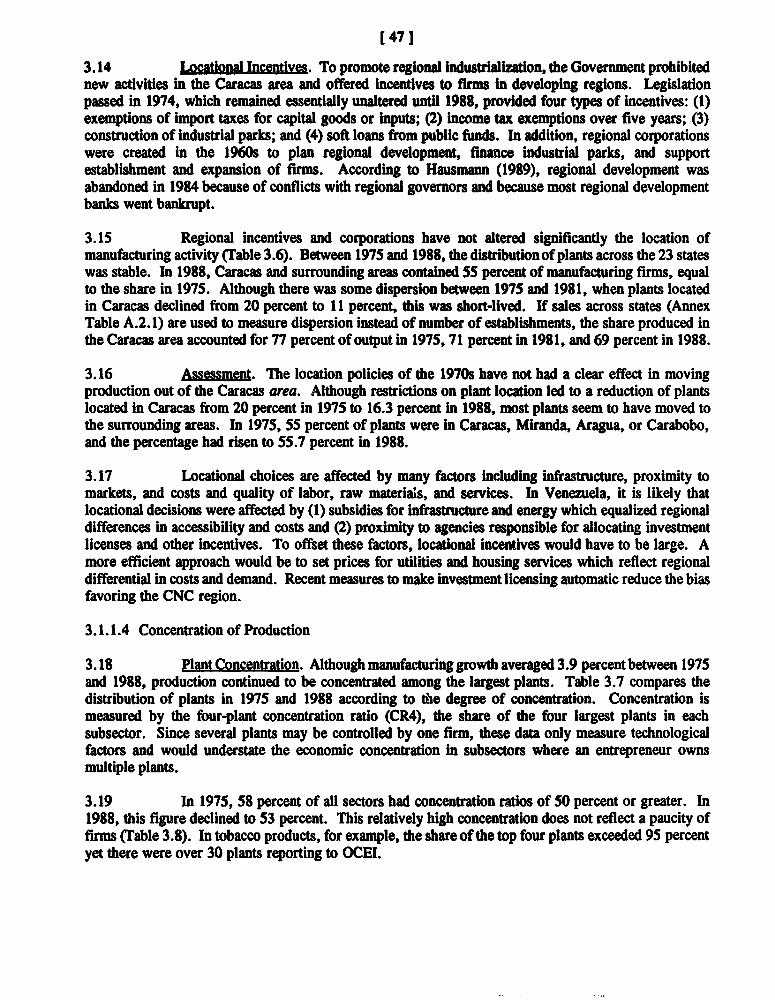
[471
3.14 Locational Incentie. To promote regional industrialization, the Government prohibitednew activities in the Caracas area and offered incentives to firms in developing regions. Legislationpassed in 1974, which remained essentially unaltered until 1988, provided four types of incentives: (1)exemptions of import taxes for capital goods or inputs; (2) income tax exemptions over five years; (3)construction of industrial parks; and (4) soft loans from public funds. In addition, regional corporationswere created in the 1960s to plan regional development, finance industrial parks, and supportestablishment and expansion of firms. According to Hausmann (1989), regional development wasabandoned in 1984 because of conflicts with regional governors and because most regional developmentbanks went bankrupt.
3.15 Regional incendves and corporations have not altered significantly the location ofmanufacturing activity (Table 3.6). Between 1975 and 1988, the distribudon of plants across the 23 stateswas stable. In 1988, Caracas and surrounding areas contained 55 percent of manufacturing firms, equalto the share in 1975. Although there was some dispersion between 1975 and 1981, when plants locatedin Caracas declined from 20 percent to 11 percent, this was short-lived. If sales across states (AnnexTable A.2. 1) are used to measure dispersion instead of number of establishments, the share produced inthe Caracas area accounted for 77 percent of output in 1975, 71 percent in 1981, and 69 percent in 1988.
3.16 Assessment. The location policies of the 1970s have not had a clear effect in movingproduction out of the Caracas area. Although restrictions on plant location led to a reduction of plantslocated in Caracas from 20 percent in 1975 to 16.3 percent in 1988, most plants seem to have moved tothe surrounding areas. In 1975, 55 percent of plants were in Caracas, Miranda, Aragua, or Carabobo,and the percentage had risen to 55.7 percent in 1988.
3.17 Locational choices are affected by many factors including infrastructure, proximity tomarkets, and costs and quality of labor, raw materia;s, and services. In Venezuela, it is likely thatlocational decisions were affected by (1) subsidies for infrastructure and energy which equalized regionaldifferences in accessibility and costs and (2) proximity to agencies responsible for allocating investmentlicenses and other incentives. To offset these factors, locational incentives would have to be large. Amore efficient approach would be to set prices for utilities and housing services which reflect regionaldifferential in costs and demand. Recent measures to make investment licensing automatic reduce the biasfavoring the CNC region.
3.1.1.4 Concentration of Production
3.18 Plant Concentration. Although manufacturing growth averaged 3.9 percent between 1975and 1988, production continued to be concentrated among the largest plants. Table 3.7 compares thedistribution of plants in 1975 and 1988 according to the degree of concentration. Concentration ismeasured by the four-plant concentration ratio (CR4), the share of the four largest plants in eachsubsector. Since several plants may be controlled by one firm, these data only measure technologicalfactors and would understate the economic concentration in subsectors where an entrepreneur ownsmultiple plants.
3.19 In 1975, 58 percent of all sectors had concentration ratios of 50 percent or greater. In1988, this figure declined to 53 percent. This relatively high concentration does not reflect a paucity offirms (able 3.8). In tobacco products, for example, the share of the top four plants exceeded 95 percentyet there were over 30 plants reporting to OCEI.
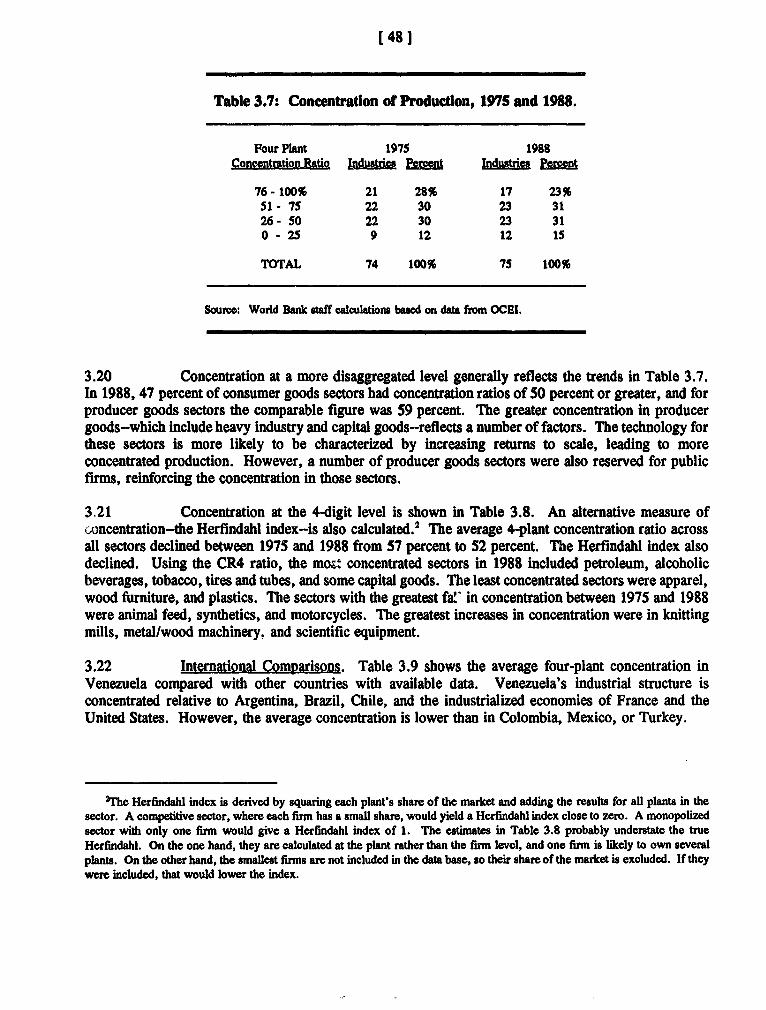
[48 l
Table 3.7: Concentratlon of Productlon, 1975 and 1988.
Four Plant 1975 1988Concentration Ratio Ind a Pf n Industrisa Pcrcnt
76- 100% 21 28% 17 23%51- 75 22 30 23 3126- 50 22 30 23 310 - 25 9 12 12 1S
TOTAL 74 100% 75 100%
Source: World Bank staff calculations based on data from OCEI.
3.20 Concentration at a more disaggregated level generally reflects the trends in Table 3.7.In 1988, 47 percent of consumer goods sectors had concentration ratios of 50 percent or greater, and forproducer goods sectors the comparable figure was 59 percent. The greater concentration in producergoods-which include heavy industry and capital goods-reflects a number of factors. The technology forthese sectors is more likely to be characterized by increasing returns to scale, leading to moreconcentrated production. However, a number of producer goods sectors were also reserved for publicfirms, reinforcing the concentration in those sectors.
3.21 Concentration at the 4-digit level is shown in Table 3.8. An alternative measure ofconcentration-the Herfindahl index-is also calculated.2 The average 4plant concentration ratio acrossall sectors declined between 1975 and 1988 from 57 percent to 52 percent. The Herfindahl index alsodeclined. Using the CR4 ratio, the most concentrated sectors in 1988 included petroleum, alcoholicbeverages, tobacco, tires and tubes, and some capital goods. The least concentrated sectors were apparel,wood furniture, and plastics. The sectors with the greatest fa'' in concentration between 1975 and 1988were animal feed, synthetics, and motorcycles. The greatest increases in concentration were in knittingmills, metal/wood machinery. and scientific equipment.
3.22 International Comparisons. Table 3.9 shows the average four-plant concentration inVenezuela compared with other countries with available data. Venezuela's industrial structure isconcentrated relative to Argentina, Brazil, Chile, and the industrialized economies of France and theUnited States. However, the average concentration is lower than in Colombia, Mexico, or Turkey.
2 The Herfindahl index is derived by squaring each plant's share of the market and adding the results for all plants in thesector. A competitive sector, where each firm has a small share, would yield a Herfindahl index close to zero. A monopolizedsector with only one firm would give a Herfindahl index of 1. The estimates in Table 3.8 probably understate the trueHerfindahl. On the one hand, they are calculated at the plant rather than the firm level, and one firm is likely to own severalplants. On the other hand, the smallest firms are not included in the data base, so their share of the market is excluded. If theywere included, that would lower the index.
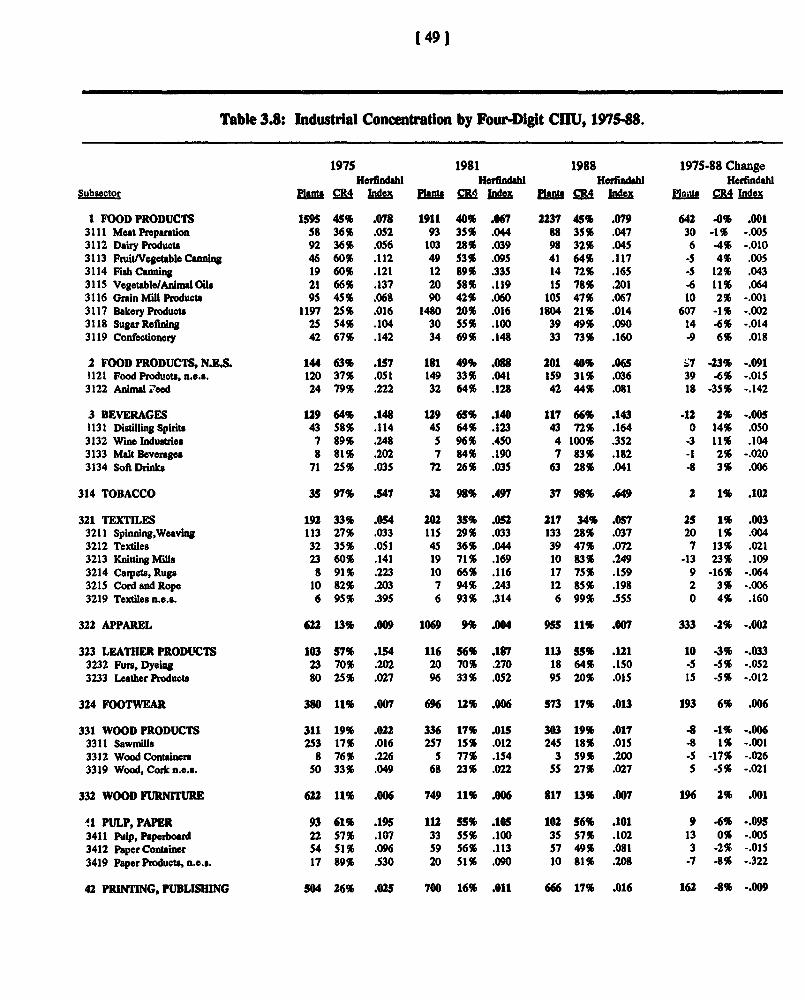
(491
Table 3.8: Industrial Concentration by Four-Digit CIIU, 1975-88.
197S 1981 1988 1975-88 ChangeHerfindahl HerfindHhl Herfindahl HefHindahi
Subsector bnd C Ine fk_ CR4 Inail MM Ml PWatst CR4 Index
I FOOD PRODUCTS 1595 45% .078 1911 40% .067 2237 45% .079 642 .0% .0013111 Meat Preparation 58 36% .052 93 35% .044 88 35% .047 30 -1% -.0053112 Dairy Products 92 36% .056 103 28% .039 98 32% .045 6 4% -.0103113 Fruit/VegetableCanning 46 60% .112 49 53% .095 41 64% .117 -5 4% .0053114 Fish Cnnng 19 60% .121 12 89% .335 14 72% .165 -5 12% .0433115 Vegetable/Anim Oils 21 66% .137 20 58% .119 15 78% .201 -6 11% .0643116 Grain Mifl Poductr 95 45% .068 90 42% .060 105 47% .067 10 2% -.0013117 BakeryProducts 1197 25% .016 1480 20% .016 1804 21% .014 607 -1% -.0023118 SugarRefining 25 54% .104 30 55% .100 39 49% .090 14 -6% -.0143119 Confectionery 42 67% .142 34 69% .148 33 73% .160 -9 6% .018
.2 FOOD PRODUCTS, N.E.S. 144 63% .157 181 499D .088 201 40% .065 S7 -23% -.0913121 Food Products, n.e.s. 120 37% .051 149 33% .041 159 31% .036 39 -6% -.0153122 Animsl 'eed 24 79% .222 32 64% .128 42 44% .081 18 -35% -.142
.3 BEVERAGES 1.9 64% .148 129 65% .140 117 66% .143 -12 2% -.0051131 Distilling Spirits 43 58% .114 45 64% .123 43 72% .164 0 14% .0503132 Wine Industriea 7 89% .248 5 96% .450 4 100% .352 -3 11% .1043133 Malt Beverages 8 81% .202 7 84% .190 7 83% .182 .1 2% -.0203134 Soft Drinks 71 25% .035 72 26% .035 63 28% .041 -8 3% .006
314 TOBACCO 35 97% .547 32 98% .497 37 98% .649 2 1% .102
321 TEXTILES 192 33% .054 202 35% .052 217 34% .057 2S 1% .0033211 Spinnig,Weaving 113 27% .033 115 29% .033 133 28% .037 20 1% .0043212 Textiles 32 35% .051 45 36% .044 39 47% .072 7 13% .0213213 Knitting Mils 23 60% .141 19 71% .169 10 83% .249 -13 23% .1093214 Carpeta,Rugs 8 91% .223 10 66% .116 17 75% .159 9 -16% -.0643215 Cord and Rope 10 82% .203 7 94% .243 12 85% .198 2 3% -.0063219 Textiles n.e.s. 6 95% .395 6 93% .314 6 99% .555 0 4% .160
322 APPAREL 622 13% .009 1069 9% .004 955 11% .007 333 -2% -.002
323 LEATHER PRODUICTS 103 57% .154 116 56% .187 113 55% .121 10 -3% -.0333232 Furs, Dyeing 23 70% .202 20 70% .270 18 64% .150 -5 -5% -.0523233 Leather Products 80 25% .027 96 33% .052 95 20% .015 15 -5% -.012
324 FOOTWEAR 380 11% .007 696 12% .006 573 17% .013 193 6% .006
331 WOOD PRODUCTS 311 19% .022 336 17% .015 303 19% .017 -8 -1% -.0063311 SawmiLls 253 17% .016 257 15% .012 245 18% .015 -8 1% -.0013312 Wood Containen 8 76% .226 5 77% .154 3 59% .200 -S -17% -.0263319 Wood,Corkn.e.s. 50 33% .049 68 23% .022 55 27% .027 5 -5% -.021
332 WOOD FURNITURE 622 11% .006 749 11% .006 817 13% .007 196 2% .001
'1 PULP,PAPER 93 61% .195 112 55% .105 102 56% .101 9 -6% -.09S3411 Pulp, Paperboard 22 57% .107 33 55% .100 35 S7% .102 13 0% -.0053412 PaperConainer 54 51% .096 59 56% .113 57 49% .081 3 -2% -.0153419 PaperProducts,n.e.s. 17 89% .530 20 51% .090 10 81% .208 -7 -8% -.322
42 PRINTING, PUBLISHING 504 26% .025 700 16% .011 666 17% .016 162 8% -.009
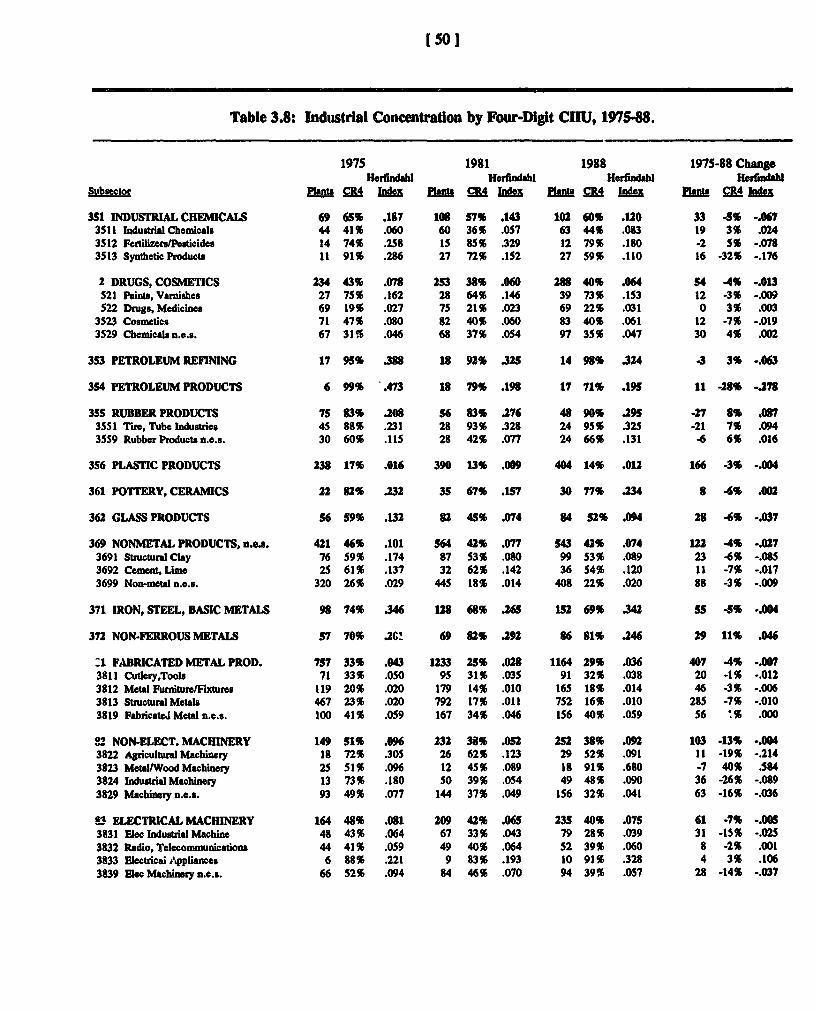
[t501
Table 3.8: IndustrIal Concentration by Four-Digit CIIU, 197548.
1975 1981 1988 1975-88 ChangeHerfindahl Herfindab Herfindshl Herdinihe
Subsector Pl1t 11140 aEnla nb& WIndex R ma B Index fl'ls CR4 IWe
351 INDUSTRIAL CEMICALS 69 65% .187 106 57% .143 102 60% .120 33 -5% -.0673511 Industrial Chemicals 44 41% .060 60 36% .057 63 44% .083 19 3% .024
3512 Feutilizers/Pesticides 14 74% .258 15 85% .329 12 79% .180 -2 5% -.078
3513 SyntheticPrducts 11 91% .286 27 72% .152 27 59% .110 16 -32% -.176
2 DRUGS, COSMETICS 234 43% .078 253 38% .060 288 40% .064 54 -4% -.013521 Pints, Vanishes 27 75% .162 28 64% .146 39 73% .153 12 -3% -.009
522 Drugs, Medicines 69 19% .027 75 21% .023 69 22% .031 0 3% .003
3523 Cosmetics 71 47% .080 82 40% .060 83 40% .061 12 -7% -.019
3529 Chemicals n.e.s. 67 31% .046 68 37% .054 97 35% .047 30 4% .002
353 PETROLEUM REFINIG 17 95% 388 18 92% 325 14 98% 324 -3 3% -.063
354 PETROLEUM PRODUCTS 6 99% .473 18 79% .198 17 71% .1V 11 -28% -.278
355 RUBBER PRODUCTS 75 83% .208 56 83% .276 48 90% .295 -27 8% .087
3551 Tre, Tube Industries 45 88% .231 28 93% .328 24 95% .325 -21 7% .094
3559 RubberProducts n.e.s. 30 60% .11S 28 42% .077 24 66% .131 -6 6% .016
356 PLASrIC PRODUCTS 238 17% .016 390 13% .009 404 14% .012 166 -3% -.004
361 POTrERY, CERAMICS 22 82% .232 35 67% .157 30 77% .234 8 -6% .002
362 GLASS PRODUCTS 56 59% .132 82 45% .074 84 52% .094 28 -6% -.037
369 NONMETAL PRODUCTS, n.es. 421 46% .101 S64 42% .077 543 42% .074 122 -4% -.027
3691 StrucuralClay 76 59% .174 87 53% .080 99 53% .089 23 -6% -.085
3692 Cement,Lime 2S 61% .137 32 62% .142 36 54% .120 11 -7% -.017
3699 Non-mel n.e.s. 320 26% .029 445 18% .014 408 22% .020 88 -3% -.009
371 IRON, STEEL, BASIC METALS 98 74% 346 128 68% .265 152 69% .342 5S -5% -.004
372 NON-FERROUS METALS 57 70% .2C' 69 82% .292 86 81% .246 29 11% .046
-1 FABRICATED METAL PROD. 757 33% .043 1233 25% .028 1164 29% .036 407 -4% -.007
3811 Cutlery,Tools 71 33% .050 95 31% .03S 91 32% .038 20 -1% -.012
3812 Metal Furniture/Fixtures 119 20% .020 179 14% .010 165 18% .014 46 -3% -.006
3813 Structural Metals 467 23% .020 792 17% .011 752 16% .010 285 -7% -.010
3819 Fabricated Metal n.e.s. 100 41% .059 167 34% .046 156 40% .059 56 *% .000
82 NON-ELECT. MACHINERY 149 51% .096 232 38% .052 252 38% .092 103 -13% -.004
3822 Agriculural Machinery 18 72% .305 26 62% .123 29 52% .091 11 -19% -.214
3823 Metal/WoodMachinery 25 51% .096 12 45% .089 18 91% .680 -7 40% .584
3824 Indurl Machinery 13 73% .180 50 39% .054 49 48% .090 36 -26% -.089
3829 Machinery n.e.s. 93 49% .077 144 37% .049 156 32% .041 63 -16% -.036
83 ELECTRICAL MACHlINERY 164 48% .081 209 42% .065 235 40% .07S 61 -7% -.005
3831 Elec Induddal Machine 48 43% .064 67 33% .043 79 28% .039 31 -15% -.025
3832 Radio, Telecommunications 44 41% .059 49 40% .064 52 39% .060 8 -2% .001
3833 Electrica Appliances 6 88% .221 9 83% .193 10 91% .328 4 3% .106
3839 Elec Machinery n.e.s. 66 52% .094 84 46% .070 94 39% .057 28 -14% -.037
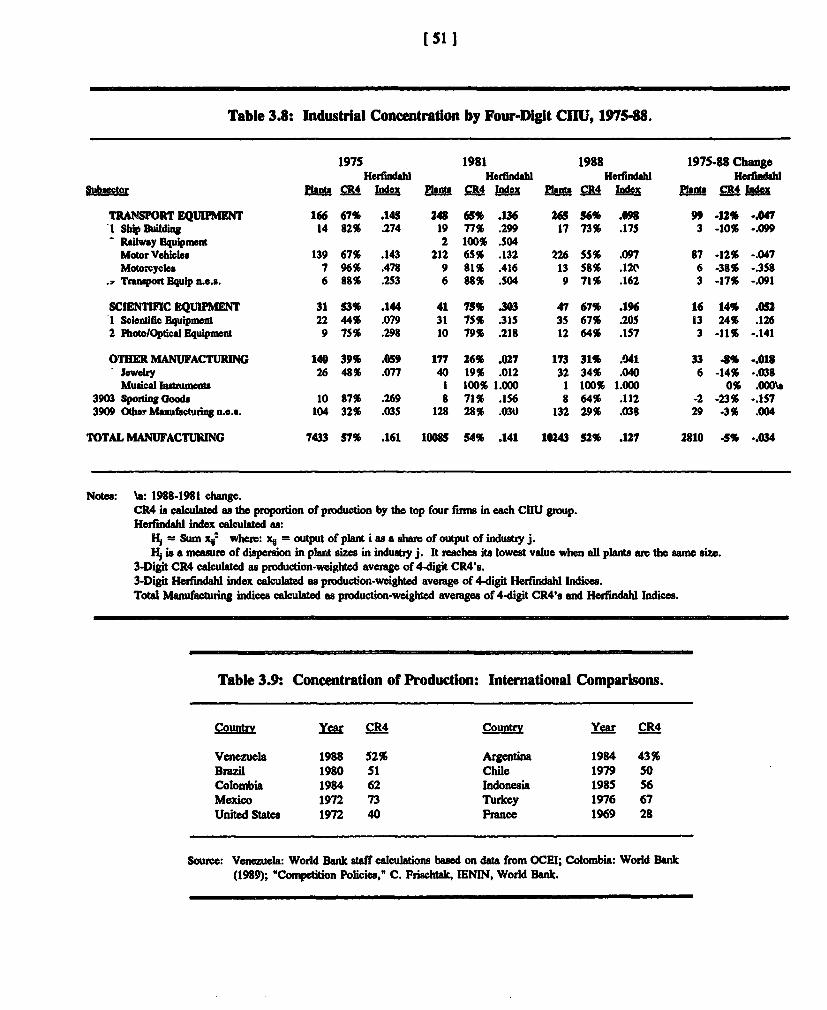
[51J
Table 3.8: Industrial Concentration by Four-Digit CIIU, 197548.
1975 1981 1988 1975-88 ChangeHerf Herfindab Herfind Herfindah
Subctor &lab CR4 Ignde Pbn M4 Index Plbnt CR4 lfidx OA CRainde
TRANSPORT EQUIPMENT 166 67% .145 248 65% .136 265 56% .098 99 -12% -.047-I Ship Building 14 82% .274 19 77% .299 17 73% .175 3 -10% -.099-Ralway Equipmnet 2 100% .504
Motor Vehicle 139 67% .143 212 65% .132 226 55% .097 87 -12% -.047Motorcycles 7 96% .478 9 81% .416 13 58% .12e 6 -38% -.3S8
. Transport Equipn.e.s. 6 88% .2S3 6 88% .504 9 71% .162 3 -17% -.091
SCIENTIFIC EQUIPMENT 31 53% .144 41 75% .303 47 67% .196 16 14% .052-I Scientific Equipmenlt 22 44% .079 31 75% .31S 35 67% .205 13 24% .1262 Photo/OpticalEquipnent 9 7S% .298 10 79% .218 12 64% .157 3 -11% -.141
OTHER MANUFACTURING 140 39% .059 177 26% .027 173 31% .041 33 -8% -.018leweky 26 48% .077 40 19% .012 32 34% .040 6 -14% -.038Musical Insuments 1 100% 1.000 1 100% 1.000 0% .000\
3903 SporingGoods 10 87% .269 8 71% .156 8 64% .112 -2 -23% -.1573909 Other Manufacturing n.e... 104 32% .035 128 28% .030 132 29% .038 29 -3% .004
TOTAL MANUFACTURING 7433 57% .161 10085 54% .141 10t43 52% .127 2810 -5% -.034
Notes: ia: 1988-1981 change.CR4 is calculated as the proportion of production by the top four firms in each CIIU group.Hefuridahi index calculated as:
i = Sum x, where: xt = output of plant i as a share of output of industry j.H; is a mnasure of dispersion in plart sizes in industy j. It reachas its lowest value when all plants are the same size.
3-Digit CR4 calculated as production-weighted average of 4-digit CR4's.3-Digit Herfindah index calculated as production-weighted average of 4-digit Herfindahl Indices.Total Manufactuang indices calculated an production-weighted averages of 4-digit CR4's and Hcrfindahi Indices.
Table 3.9: Concentration of Production: International Comparisons.
Countrv Year CR4 Countr Year CR4
Venezuela 1988 S2% Argentina 1984 43%Brazil 1980 51 Chile 1979 50Colombia 1984 62 Indonesia 1985 S6Mexico 1972 73 Turkey 1976 67United States 1972 40 France 1969 28
Source: Venezula: World Bank staff calculations based on data from OCEI; Colombia: World Bank(1989); 'Competition Policies," C. Frischtak, MENIN, World Bank.
[52 1
3.23 Another interesting comparison is with Japan where, in 1963, 19 percent of the industrialsectors had four-plant concentration ratios greater than 60 percent, compared to more than 40 percent ofVenezuelan sectors in 1988. While only 11 percent of Venezuelan sectors had concentration less than20 percent in 1988, in Japan in 1963 one-third of the sectors were in this category. The lower Japaneseconcentration in 1963 was possible because of the size of the domestic market and the large share ofexports of many industries.
3.24 Fragmentation of Production. Although the manufacturing sector has high concentration,production levels in some sectors are below efficient scales. In the automotive industry, there are 15assemblers in a market which peaked at 163,000 units in 1982 and fell to 26,000 units in 1989. Sinceproduction should be at least 100,000 units to exploit economies of scale, auto assembly cannot beefficient by international standards without exports. The sector's profits derived from a ban on importsand preferential exchange rates for inputs until 1989. Legislation in 1985 attempted to rationalizeproduction through: (1) prohibiting entrants; (2) restricting new models; (3) imposing minimum productionlevels; and (4) raising the percentage of domestically produced components in assembled vehicles. Thisapproach further reduced competition in a market already protected from import rivalry, limited theflexibility to respond to changing demand conditions, raised production costs, and further reducedinternational competitiveness by mandating domestic content rules.
3.25 As part of the 1989 trade reform, quotas were removed on models produced inVenezuela, and import prohibitions were replaced by an 80 percent tariff, which has been reduced to50 percent and will be reduced in line with the tariff reforms. Models not produced in Venezuela willbe subjected to luxury taxes of 70 percent above the base tariff. As an interim protective measure, thegovernment continued to grant tariff exonerations on CKD kits. To allow effective competition withimports, the government should minimize domestic content regulations and allow free entry and exit inthe sector. Although free entry in a protected environment can lead to plants with suboptimal levels ofproduction, free entry in conjunction with import competition would act to rationalize the sector.
3.26 Assessment. Concentration and plant size in Venezuela are likely to reflect a combinationof factors including (1) technological requirements of industries; (2) size of domestic markets; (3) theeconomy's general inward orientation; (4) policies to restrict entry; and (5) lack of an anti-trustmechanism to regulate market structure or behavior. In reference to (1), Naim (1984) suggests that onefactor leading to concentrated markets is the large-scale requirements of the imported technology in mostindustries. In regard to (2) both Naim (1984) and Meller (1978) noted the importance of small domesticmarkets in determining concentration in Latin America. Meller (1978) found that concentration wasinversely related to market size. However, economies of scale could be achieved in small domesticmarkets through expanded export production. The anti-export bias, in conjunction with small domesticmarkets, have jointly limited the scope for entry and expansion.
3.27 Industrial policies have also contributed to concentration. Restrictions on private entryinto key sectors such as aluminum and steel are one factor which explains the higher concentration inproducer goods sectors. Investment licenses, which gave special incentives, were not awarded to firmsin sectors with "adequate" supply. In addition, exchange allocations and other benefi:3 were generallyawarded on the basis of output, protecting the share of incumbents. Finally, as pointed out by Naim(1984), the combination of few firms and easy credit made it more attractive for firms to acquire existingplants than build new ones. Unfortunately, since the data from OCEI are at the plant- and not at thefirm-level, it is not possible to measure the effects of mergers on market share and concentration. Thelack of an anti-trust mechanism for regulating behavior encourages concentration of ownership.
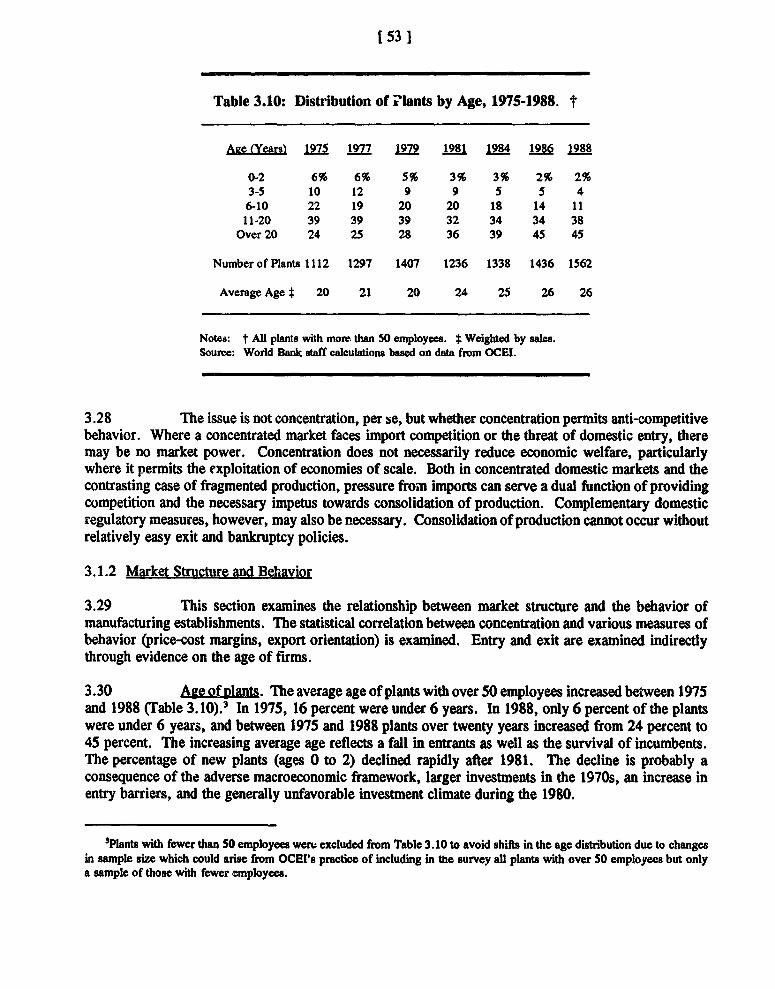
1 53 1
Table 3.10: Distribution of ?'lants by Age, 1975-1988. t
Aee (Years) 1975 1977 1979 1981 1984 1986 1988
0-2 6% 6% 5% 3% 3% 2% 2%3-5 10 12 9 9 5 5 46-10 22 19 20 20 18 14 1111-20 39 39 39 32 34 34 38
Over 20 24 25 28 36 39 45 45
Number of Plants 1112 1297 1407 1236 1338 1436 1562
Average Age t 20 21 20 24 25 26 26
Notes: t AU plants with more than 50 employees. t Weighted by sales.Source: World Bank staff calculations based on data from OCEI.
3.28 The issue is not concentration, per se, but whether concentration permits anti-competitivebehavior. Where a concentrated market faces import competition or the threat of domestic entry, theremay be no market power. Concentration does not necessarily reduce economic welfare, particularlywhere it permits the exploitation of economies of scale. Both in concentrated domestic markets and thecontrasting case of fragmented production, pressure from imports can serve a dual function of providingcompetition and the necessary impetus towards consolidation of production. Complementary domesticregulatory measures, however, may also be necessary. Consolidation of production cannot occur withoutrelatively easy exit and bankruptcy policies.
3.1.2 Market Structure and Behavior
3.29 This section examines the relationship between market structure and the behavior ofmanufacturing establishments. The statistical correlation between concentration and various measures ofbehavior (price-cost margins, export orientation) is examined. Entry and exit are examined indirectlythrough evidence on the age of firms.
3.30 Age of plan. The average age of plants with over 50 employees increased between 1975and 1988 (Table 3.10).3 In 1975, 16 percent were under 6 years. In 1988, only 6 percent of the plantswere under 6 years, and between 1975 and 1988 plants over twenty years increased from 24 percent to45 percent. The increasing average age reflects a fall in entrants as well as the survival of incumbents.The percentage of new plants (ages 0 to 2) declined rapidly after 1981. The decline is probably aconsequence of the adverse macroeconomic framework, larger investments in the 1970s, an increase inentry barriers, and the generally unfavorable investment climate during the 1980.
'Plants with fewer than 50 employees weru excluded from Table 3.10 to avoid shifts in the age distribution due to changesin sample size which could arise from OCEI's practice of including in the survey all plants with over 50 employees but onlya sample of those with fewer employees.
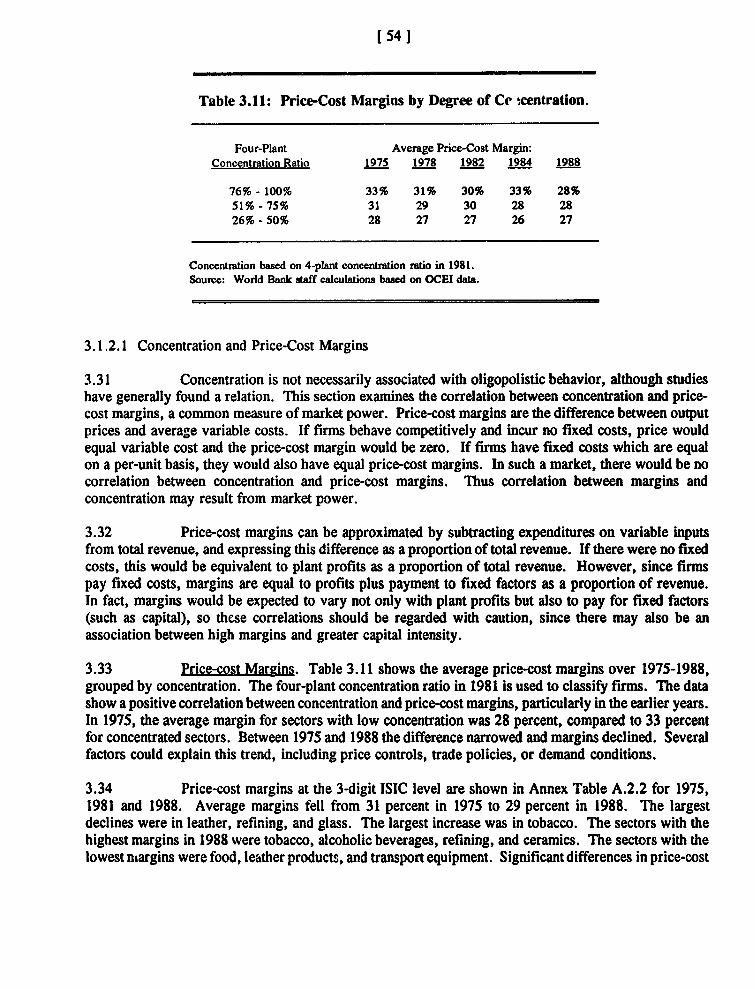
[54 1
Table 3.11: Price-Cost Margins by Degree of Ce *centration.
Four-Plant Average Price-Cost Margin:Concentration Ratio 1975 1978 1982 1984 1988
76% - 100% 33% 31% 30% 33% 28%51% - 75% 31 29 30 28 2826% - 50% 28 27 27 26 27
Concentmation based on 4-plant concentration ratio in 1981.Source: World Bank staff calculations based on OCEI data.
3.1.2.1 Concentration and Price-Cost Margins
3.31 Concentration is not necessarily associated with oligopolistic behavior, although studieshave generally found a relation. This section examines the correlation between concentration and price-cost margins, a common measure of market power. Price-cost margins are the difference between outputprices and average variable costs. If firms behave competitively and incur no fixed costs, price wouldequal variable cost and the price-cost margin would be zero. If firms have fixed costs which are equalon a per-unit basis, they would also have equal price-cost margins. In such a market, there would be nocorrelation between concentration and price-cost margins. Thus correlation between margins andconcentration may result from market power.
3.32 Price-cost margins can be approximated by subtracting expenditures on variable inputsfrom total revenue, and expressing this difference as a proportion of total revenue. If there were no fixedcosts, this would be equivalent to plant profits as a proportion of total revenue. However, since firmspay fixed costs, margins are equal to profits plus payment to fixed factors as a proportion of revenue.In fact, margins would be expected to vary not only with plant profits but also to pay for fixed factors(such as capital), so these correlations should be regarded with caution, since there may also be anassociation between high margins and greater capital intensity.
3.33 Price-cost Margins. Table 3.11 shows the average price-cost margins over 1975-1988,grouped by concentration. The four-plant concentration ratio in 1981 is used to classify firms. The datashow a positive correlation between concentration and price-cost margins, particularly in the earlier years.In 1975, the average margin for sectors with low concentration was 28 percent, compared to 33 percentfor concentrated sectors. Between 1975 and 1988 the difference narrowed and margins declined. Severalfactors could explain this trend, including price controls, trade policies, or demand conditions.
3.34 Price-cost margins at the 3-digit ISIC level are shown in Annex Table A.2.2 for 1975,1981 and 1988. Average margins fell from 31 percent in 1975 to 29 percent in 1988. The largestdeclines were in leather, refining, and glass. The largest increase was in tobacco. The sectors with thehighest margins in 1988 were tobacco, alcoholic beverages, refining, and ceramics. The sectors with thelowest niargins were food, leather products, and transport equipment. Significant differences in price-cost
[55 I
margins have persisted. In 1975, as in 1988, tobacco, alcoholic beverages, and refining had the highestmargins.
3.35 Annex Table A.2.3 compares price-ost margins in Venezuela in 1985 with margins inChile and Colombia. On average, Venezuelan margins were slightly lower than in Chile and 50 percenthigher than in Colombia, but these differences could result from many factors. Venezuelan margins weresignificantly higher for beverages, tobacco, refining, ceramics, and nonelectric machinery. Margins werelower for scientific equipment, wood, printing and glass products.
3.1.2.2 Price-Cost Margins, Concentration, Import Competition and Export Orientation
3.36 This section discusses the statistical correlation between price-cost margins, concentration,import competition, and export orientation. A perfect positive correlation between two variables wouldequal 1; no correlation yields a coefficient close to zero. A negative correlation between two variableswould give a value between 0 and -1. These correlations should be treated with caution, since it is notpossible to determine the direction of causation between two variables, nor whether the correlation isactually caused by some third factor. Further, concentration and margins are functions of each other sothere may be bias in the estimates.
3.37 The top half of Table 3.12 reports the correlation coefficients for concentration (as measuredby the Herfindahl index), price-cost margins, import penetration and export shares. The correlation in1975 and 1986 between concentration and margins is +.50, and is statistically significant at the95 percent level. In addition, correlation rose between 1975 and 1986. Not only do concentratedindustries have higher price-cost margins, but the relationship strengthened over time.
3.38 If imports are a competitive force, we would expect a negative correlation between importsand margins. Although the correlation is negative for both years, it is not statistically significant.Imports may not have been sufficiently high to discipline manufacturers since, by government policy, theywere allowed only with the consent of local producers of competing products. Another possibdlity is thatwe cannot separate the (negative) impact of imports on margins from the (positive) impact of margins onimports. High margins may attract imports and reverse or dampen the negative correlation if trade policypermits.
3.39 Table 3.12 also shows the correlation between exports, measured as a percentage of sales,and other variables. The correlation between export shares and import penetration was statisticallysignificant in both 1975 and 1986. This may reflect the importance either of imported inputs forexporters or of import competition to stimulate internationally competitive production. Further researchwould be necessary to identify the direction of causation. Table 3.12 also shows that the correlationbetween concentration and export share was significant in 1986 (but not in 1975).
3.40 The bottom half of Table 3.12 sbows the correlation between import restrictions andconcentration, margins, and export shares in 1988. The only significant (negative) correlation is betweenexport shares and import restrictions. Since export orientation and import penetration are significantlycorrelated, it is not surprising that the correlation between export shares and restrictions is negative.
3.41 Assessme. Concentration affected fims' pricing behavior. There is a significant, positiverelation between one measure of concentration and price-cost margins margins during 1975-88. Importcompetition, which could be the chief element of market discipline in a small economy, does not seem
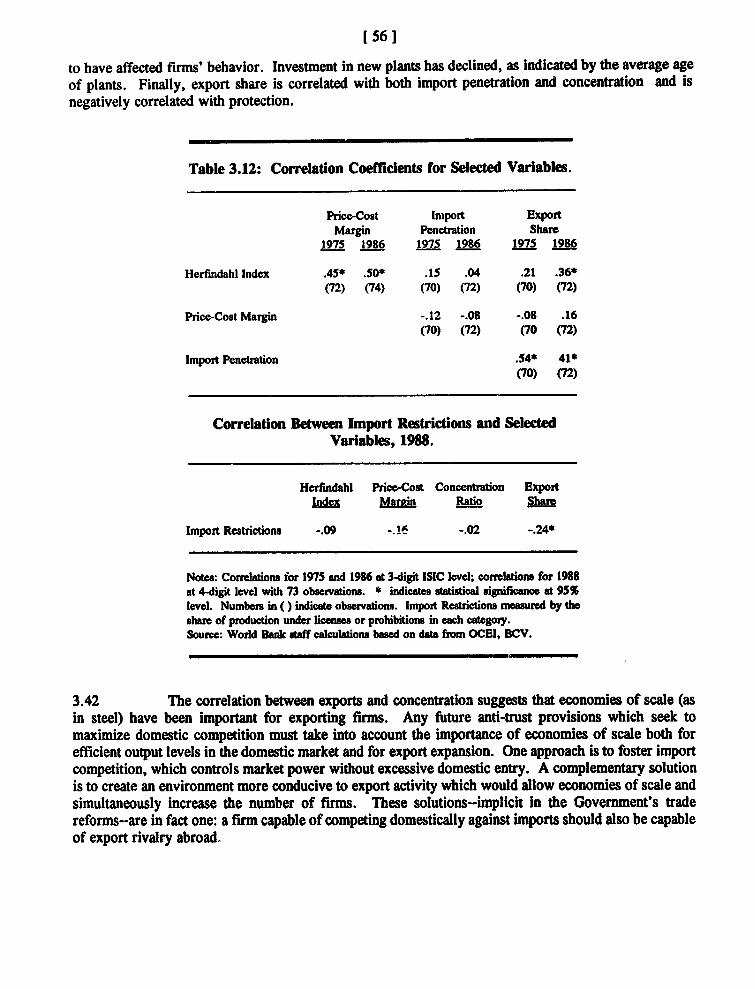
[561
to have affected firms' behavior. Investment in new plants has declined, as indicated by the average ageof plants. Finally, export share is correlated with both import penetration and concentration and isnegatively correlated with protection.
Table 3.12: Correlation CoeMdents for Selected Variables.
Price-Cost Import ExportMargin Penetration Share
1975 1986 1975 1986 1975 1986
Herfindahl Index .45* .50* .15 .04 .21 .36*(72) (74) (70) (72) (70) (72)
Price-Cost Margin -.12 -.08 -.08 .16(70) (72) (70 (72)
Import Penetration .54* 41*(70) (72)
Correlation Between Import Restrictions and SelectedVariables, 1988.
Herfindahl PriceCost Concentration ExportIndc Marain Ratio Share
Import Restrictions -.09 -1A -.02 -.24*
Notes: Correlations for 1975 and 1986 at 3-digit ISIC level; correlations for 1988at 4-digit level with 73 obsevations. * indicates statistical significance at 95%level. Numbers in ( ) indicate observations. Import Restrictions meawred by theshae of production under licenses or prohibitions in each category.Source: World Bank saff calculations based on data from OCEI, BCV.
3.42 The correlation between exports and concentration suggests that economies of scale (asin steel) have been important for exporting firms. Any future anti-trust provisions which seek tomaximize domestic competition must take into account the importance of economies of scale both forefficient output levels in the domestic market and for export expansion. One approach is to foster importcompetition, which controls market power without excessive domestic entry. A complementary solutionis to create an environment more conducive to export activity which would allow economies of scale andsimultaneously increase the number of firms. These solutions-implicit in the Government's tradereforms-are in fact one: a firm capable of competing domestically against imports should also be capableof export rivalry abroad.
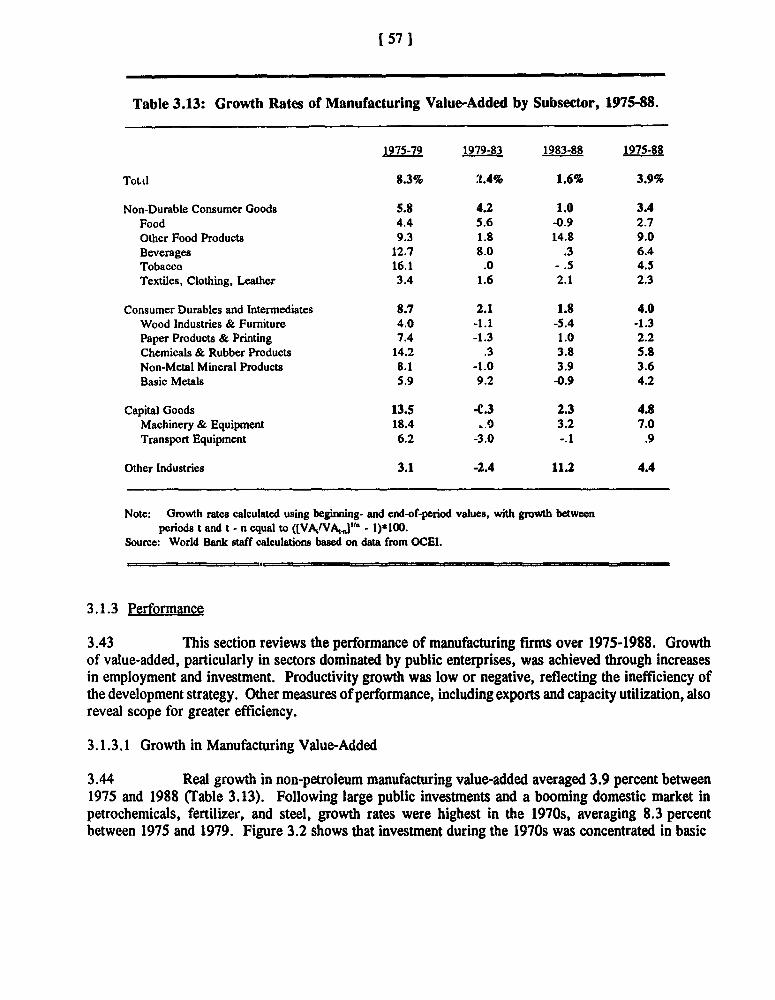
(57 1
Table 3.13: Growth Rates of Manufacturing Value-Added by Subsector, 1975-88.
1975-79 1979-83 1983-88 1975-88
Tot.tl 8.3% 'L.4% 1.6% 3.9%
Non-Durable Consumer Goods 5.8 4.2 1.0 3.4Food 4.4 5.6 -0.9 2.7Other Food Products 9.3 1.8 14.8 9.0Beverages 12.7 8.0 .3 6.4Tobacco 16.1 .0 - .5 4.5Textiles, Clothing, Leather 3.4 1.6 2.1 2.3
Consumer Durables and Intermnediates 8.7 2.1 1.8 4.0Wood Industries & Furniture 4.0 -1.1 -5.4 -1.3Paper Products & Printing 7.4 -1.3 1.0 2.2Chemicals & Rubber Products 14.2 .3 3.8 5.8Non-Metal Mineral Products 8.1 -1.0 3.9 3.6Basic Metals 5.9 9.2 -0.9 4.2
Capital Goods 13.5 -C.3 2.3 4.8Machinery & Equipment 18.4 .0 3.2 7.0Transport Equipment 6.2 -3.0 -.1 .9
Other Industries 3.1 -2.4 11.2 4.4
Note: Growth rates calculated using beginning- and end-of-period values, with growth betweenperiods t and t - n equal to ([VA,1VA,j" - 1)*100.
Source: World Bank staff calculations based on data from OCEI.
3.1.3 Performance
3.43 This section reviews the performance of manufacturing firms over 1975-1988. Growthof value-added, particularly in sectors dominated by public enterprises, was achieved through increasesin employment and investment. Productivity growth was low or negative, reflecting the inefficiency ofthe development strategy. Other measures of performance, including exports and capacity utilization, alsoreveal scope for greater efficiency.
3.1.3.1 Growth in Manufacturing Value-Added
3.44 Real growth in non-petroleum manufacturing value-added averaged 3.9 percent between1975 and 1988 (Table 3.13). Following large public investments and a booming domestic market inpetrochemicals, fertilizer, and steel, growth rates were highest in the 1970s, averaging 8.3 percentbetween 1975 and 1979. Figure 3.2 shows that investment during the 1970s was concentrated in basic
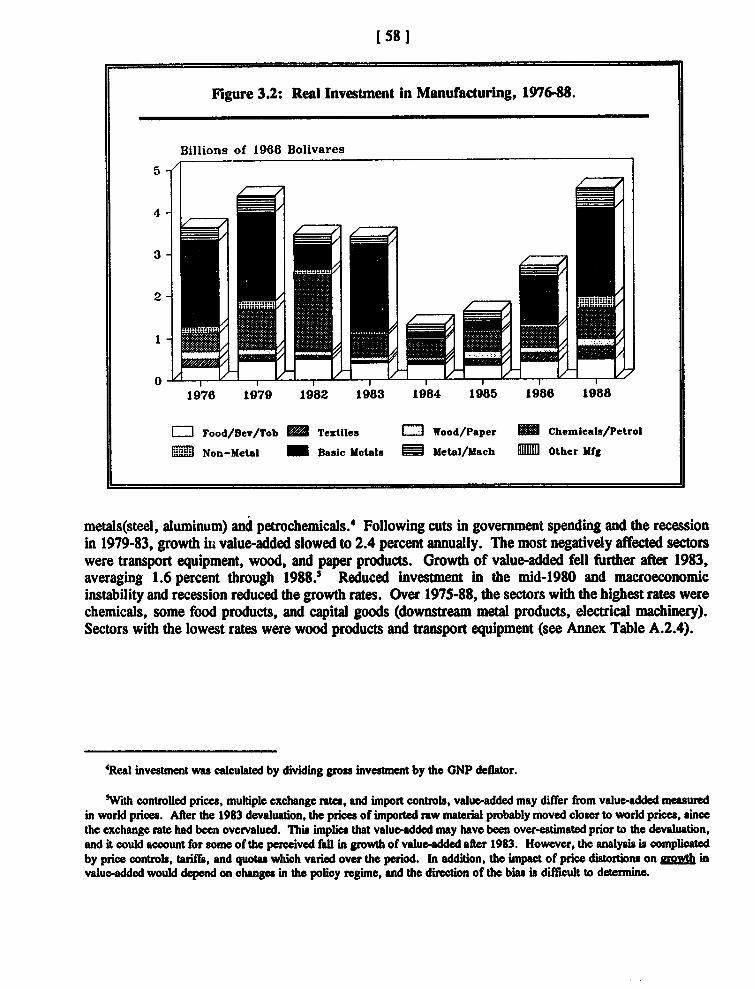
[581
Fligure 3.2: Real Investment in Manufacturing, 197688.
Billions of 1968 Bolivares
5
4-
3
2-
0 1978 19179 19182 1983 1984 1985 1986 1988
LiFood/Bev/Tob = Textiles LiWood/Paper Chemnicala/Petrol
IlNon-Metal 1 D asic Metals Metal/Mach 1Ul1Other Mfg
metals(steel, aluminum) and petrochemicals.' Following cuts in government spending and the recessionin 1979-83, growth in value-added slowed to 2.4 percent annually. The most negatively affected sectorswere transport equipment, wood, and paper products. Growth of value-added fell further after 1983,averaging 1.6 percent through 1988.1 Reduced investment in the mid-1980 and macroeconomicinstability and recession reduced the growth rates. Over 1975-88, the sectors with the highest rates werechemicals, some food products, and capital goods (downstream metal products, electrical machinery).Sectors with the lowest rates were wood products and transport equipment (see Annex Table A.2.4).
'Real investment was caculate by dividing gross investment by the GNP deflator.
'With controlled prices, multiple exchange rates, and impoit controls, value-added may differ from value-added measuredin world prices. After the 1983 devaluation, the prices of impofted raw material probably moved closer to world prices, sincethe exchange rate had been overvalued. Thin implies that value-added may have been over-estimated prior to the devaluation,and it could account for some of the perceived fall in growth of value-added after 1983. However, the analysis is complicatedby price controls, tariffs, and quotas which varied over the period. In addition, the impact of price diatortions on growh invalue-dded would depend on changes in the policy regimne, and the direcion of the bias is difficult to determine.
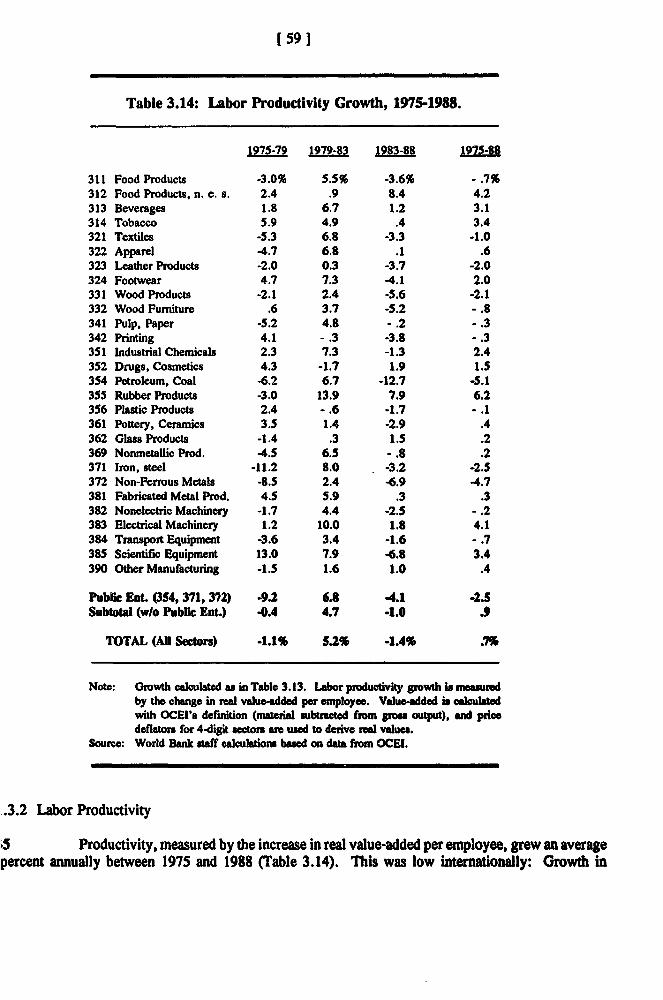
1 59 1
Table 3.14: Labor Productivity Growth, 1975-1988.
1975-79 1979-83 1983-88 1975-88
311 Food Products -3.0% 5.5% -3.6% - .7%312 Food Products, n. c. s. 2.4 .9 8.4 4.2313 Beverages 1.8 6.7 1.2 3.1314 Tobacco 5.9 4.9 .4 3.4321 Textiles -5.3 6.8 -3.3 -1.0322 Apparel -4.7 6.8 .1 .6323 Leather Products -2.0 0.3 -3.7 -2.0324 Footwear 4.7 7.3 -4.1 2.0331 Wood Products -2.1 2.4 -5.6 -2.1332 Wood Furniture .6 3.7 -5.2 - .8341 Pulp, Paper -5.2 4.8 .2 - .3342 Printing 4.1 - .3 -3.8 - .3351 Industrial Chemicals 2.3 7.3 -1.3 2.4352 Drugs, Cosmetics 4.3 -1.7 1.9 1.5354 Petroleum, Coal -6.2 6.7 -12.7 -5.1355 Rubber Products -3.0 13.9 7.9 6.2356 Plastic Products 2.4 - .6 -1.7 - .1361 Pottery, Ceramics 3.5 1.4 -2.9 .4362 Glass Products -1.4 .3 1.5 .2369 Nonmetallic Prod. -4.5 6.5 - .8 .2371 Iron, steel -11.2 8.0 -3.2 -2.5372 Non-Ferrous Metals -8.5 2.4 -6.9 -4.7381 Fabricated Metal Prod. 4.5 5.9 .3 .3382 Nonelectric Machinery -1.7 4.4 -2.5 - .2383 Electrical Machinery 1.2 10.0 1.8 4.1384 Transport Equipment -3.6 3.4 -1.6 - .7385 Scientific Equipment 13.0 7.9 -6.8 3.4390 Other Manufacturing -1.5 1.6 1.0 .4
Publc Eot. (354, 371, 372) -9.2 6.8 4.1 -2.5Subtotal (w/o Publi Ent.) 0.4 4.7 -1.0 .9
TOTAL (Al Sectors) -1.1% 5.2% -1.4% .7%
Note: Growth calulated as in Table 3.13. Labor productivity grwth is meuredby the change in real value-added per employee. Value-added is calculaedwith OCEI's definiton (mntrial wbutcted fiwn gtos output), ad pricedeflator for 4-digit sectors are ued to derive ea values.
Soure: World Bank saff calculations based on data fromn OCEI.
.3.2 Labor Productivity
5 Productivity, measured by the increase in real value-added per employee, grew an averagepercent annually between 1975 and 1988 (Table 3.14). Ihis was low internationally: Growth in
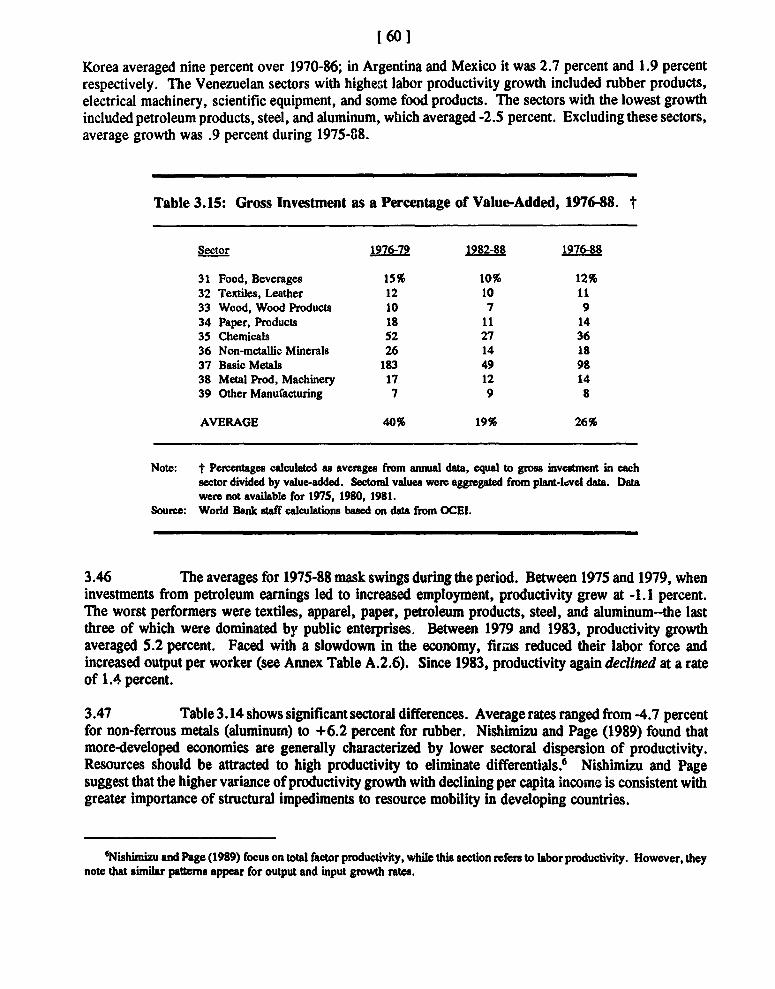
1601
Korea averaged nine percent over 1970-86; in Argentina and Mexico it was 2.7 percent and 1.9 percentrespectively. The Venezuelan sectors with higheGt labor productivity growth included rubber products,electrical machinery, scientific equipment, and some food products. The sectors with the lowest growthincluded petroleum products, steel, and aluminum, which averaged -2.5 percent. Excluding these sectors,average growth was .9 percent during 1975-88.
Table 3.15: Gross Investment as a Percentage of Value-Added, 1976-88. t
Sector 1976-79 1982-88 1976-88
31 Food, Beverages 15% 10% 12%32 Textiles, Leather 12 10 1133 Wood, Wood Products 10 7 934 Paper, Products 18 11 1435 Chemicals 52 27 3636 Non-metallic Minerals 26 14 1837 Basic Metals 183 49 9838 Metal Prod, Machinery 17 12 1439 Other Manufacturing 7 9 8
AVERAGE 40% 19% 26%
Note: t Pecmentages calculated as averages from anmnal data, equal to gross investment in eachsector divided by value-added. Sectoral values were aggregated from plant-lvvl data. Datawere not available for 1975, 1980, 1981.
Soure: World Bank saff calculations based on data from OCEI.
3.46 The averages for 1975-88 mask swings during the period. Between 1975 and 1979, wheninvestments from petroleum earnings led to increased employment, productivity grew at -1.1 percent.The worst performers were textiles, apparel, paper, petroleum products, steel, and aluminum-the lastthree of which were dominated bv public enterprises. Between 1979 and 1983, productivity growthaveraged 5.2 percent. Faced with a slowdown in the economy, firims reduced their labor force andincreased output per worker (see Annex Table A.2.6). Since 1983, productivity again declined at a rateof 1.4 percent.
3.47 Table 3.14 shows significant sectoral differences. Average rates ranged from -4.7 percentfor non-ferrous metals (aluminurn) to +6.2 percent for rubber. Nishimizu and Page (1989) found thatmore-developed economies are generally characterized by lower sectoral dispersion of productivity.Resources should be attracted to high productivity to eliminate differentials.6 Nishimizu and Pagesuggest that the higher variance of productivity growth with declining per capita income is consistent withgreater importance of structural impediments to resource mobility in developing countries.
6Nishimizu and Page (1989) focus on total factor productivity, while this section refers to labor productivity. However, theynote that similar patterns appear for output and input growth rates.
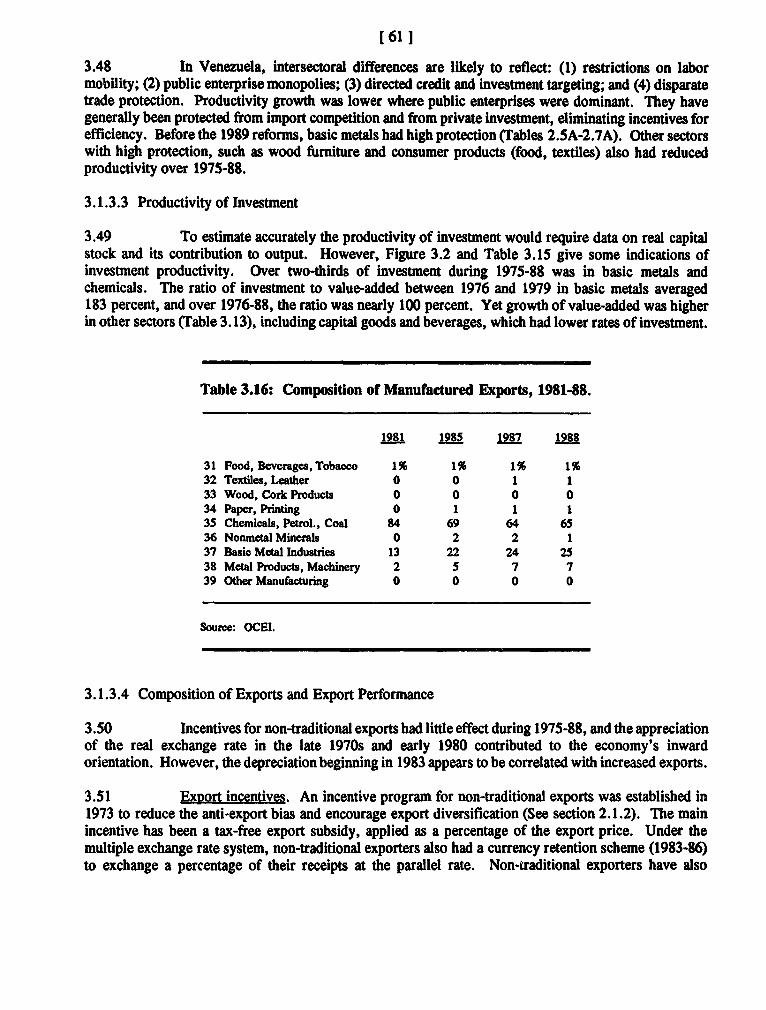
[ 611
3.48 In Venezuela, intersectoral differences are likely to reflect: (1) restrictions on labormobility; (2) public enterprise monopolies; (3) directed credit and investment targeting; and (4) disparatetrade protection. Productivity growth was lower where public enterprises were dominant. They havegenerally been protected from import competition and from private investment, eliminating incentives forefficiency. Before the 1989 reforms, basic metals had high protection (Tables 2.5A-2.7A). Other sectorswith high protection, such as wood furniture and consumer products (food, textiles) also had reducedproductivity over 1975-88.
3.1.3.3 Productivity of Investment
3.49 To estimate accurately the productivity of investment would require data on real capitalstock and its contribution to output. However, Figure 3.2 and Table 3.15 give some indications ofinvestment productivity. Over two-thirds of investment during 1975-88 was in basic metals andchemicals. The ratio of investment to value-added between 1976 and 1979 in basic metals averaged183 percent, and over 1976-88, the ratio was nearly 100 percent. Yet growth of value-added was higherin other sectors (Table 3.13), including capital goods and beverages, which had lower rates of investment.
Table 3.16: Composition of Manufactured Exports, 1981-88.
1981 1985 1987 1988
31 Food, Bverages,Tobacco 1% 1% 1% 1%32 Textiles, Leather 0 0 1 133 Wood, Cork Products 0 0 0 034 Paper, Printing 0 1 1 135 Chemicals, Petrol., Coal 84 69 64 6536 Nonmetal Minerals 0 2 2 137 Basic Metal Industries 13 22 24 2538 Metal Products, Machinery 2 5 7 739 Other Manufacturing 0 0 0 0
Source: OCEI.
3.1.3.4 Composition of Exports and Export Performance
3.50 Incentives for non-traditional exports had little effect during 1975-88, and the appreciationof the real exchange rate in the late 1970s and early 1980 contributed to the economy's inwardorientation. However, the depreciation beginning in 1983 appears to be correlated with increased exports.
3.51 Export incentives. An incentive program for non-traditional exports was established in1973 to reduce the anti-export bias and encourage export diversification (See section 2.1.2). The mainincentive has been a tax-free export subsidy, applied as a percentage of the export price. Under themultiple exchange rate system, non-traditional exporters also had a currency retention scheme (1983-86)to exchange a percentage of their receipts at the parallel rate. Non-traditional exporters have also
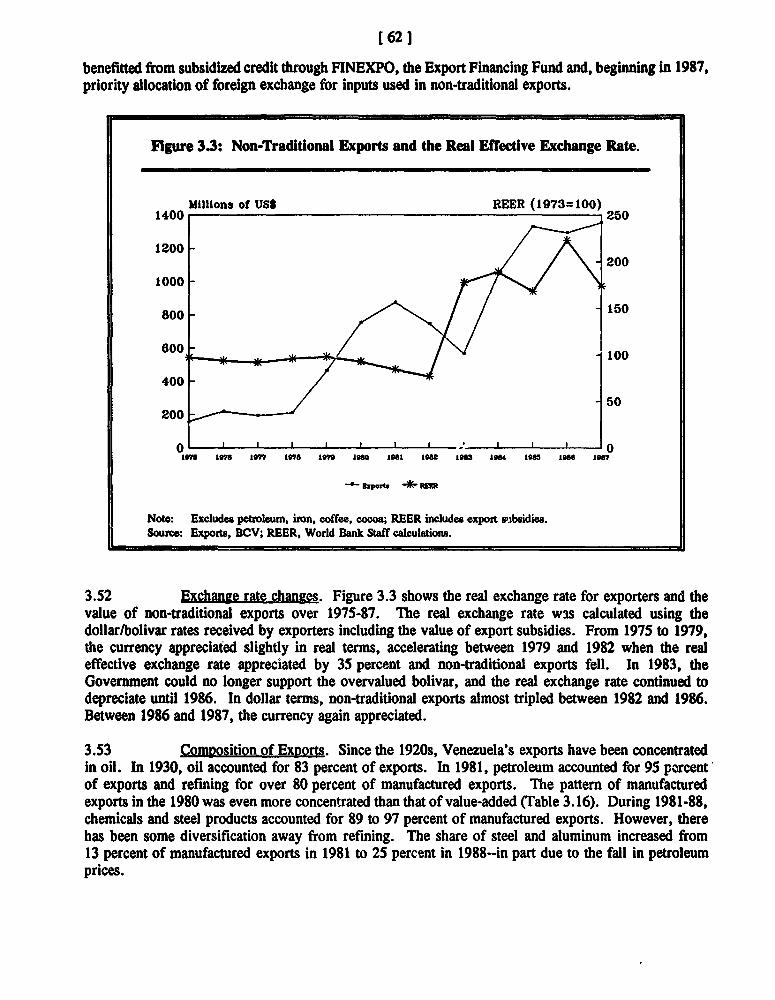
[62 1
benefitted from subsidized credit through FINEXPO, the Export Financing Fund and, beginning in 1987,priority allocation of foreign exchange for inputs used in non-traditional exports.
Figure 3.3: Non-Traditional Exports and the Real Effectlve Exchange Rate.
Millions of USS REER (1973=100)1400 -
1200_ < 2 00
1000
80°0 - 1/50lo
1975 8 976 177 1078 107 1980 101 108 10 1t" 185 10 10987
: -xpowa -* RER
Note: Excludes petrolcum, iron, coffee, cocoa; REER includes export sibsidies.Source: Export., BCV; REER, World Bank Staff cdcultons.
3.52 Exchange rate changes. Figure 3.3 shows the real exchange rate for exporters and thevalue of non-traditional exports over 1975-87. The real exchange rate w3s calculated using thedollar/bolivar rates received by exporters including the value of export subsidies. From 1975 to 1979,the currency appreciated slightly in real terms, accelerating between 1979 and 1982 when the realeffective exchange rate appreciated by 35 percent and non-traditional exports fell. In 1983, theGovernment could no longer support the overvalued bolivar, and the real exchange rate continued todepreciate until 1986. In dollar terms, non-traditional exports almost tripled between 1982 and 1986.Between 1986 and 1987, the currency again appreciated.
3.53 Composition of Exports. Since the 1920s, Venezuela's exports have been concentratedin oil. In 1930, oil accounted for 83 percent of exports. In 1981, petroleum accounted for 95 percentof exports and refining for over 80 percent of manufactured exports. The pattern of manufacturedexports in the 1980 was even more concentrated than that of value-added (Table 3.16). During 1981-88,chemicals and steel products accounted for 89 to 97 percent of manufactured exports. However, therehas been some diversification away from refining. The share of steel and aluminum increased from13 percent of manufactured exports in 1981 to 25 percent in 1988--in part due to the fall in petroleumprices.
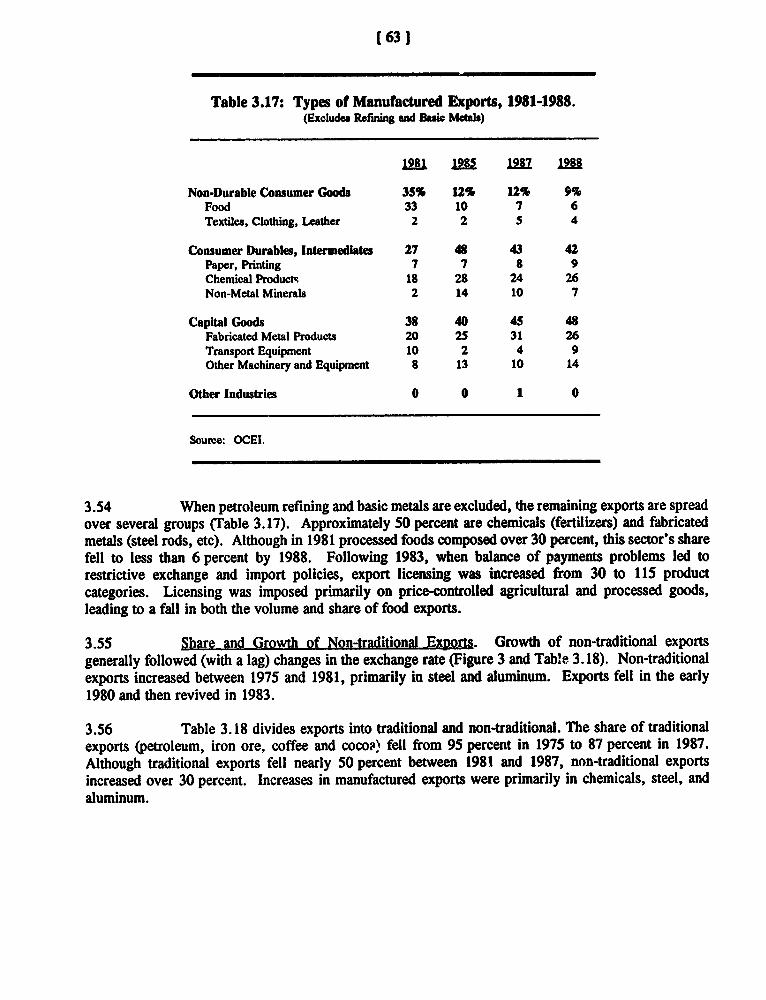
(631
Table 3.17: Types of Manufactured Exports, 1981-1988.(Excludes Refining and Basic Metals)
1981 nu8 1987 1988
Non-Durable Consumer Goods 35% 12% 12% 9%Food 33 10 7 6Textiles, Clothing, Leather 2 2 5 4
Consumer Durables, Intermediates 27 48 43 42Paper, Printing 7 7 8 9Chemical Products 18 28 24 26Non-Metal Minerals 2 14 10 7
Capital Goods 38 40 45 48Fabricated Metal Products 20 25 31 26Transport Equipment 10 2 4 9Other Machinery and Equipment 8 13 10 14
Other Industries 0 0 1 0
Source: OCEI.
3.54 When petroleum refining and basic metals are excluded, the remaining exports are spreadover several groups (Table 3.17). Approximately 50 percent are chemicals (fertilizers) and fabricatedmetals (steel rods, etc). Although in 1981 processed foods composed over 30 percent, this sector's sharefell to less than 6 percent by 1988. Following 1983, when balance of payments problems led torestrictive exchange and import policies, export licensing was increased from 30 to 115 productcategories. Licensing was imposed primarily on price-controlled agricultural and processed goods,leading to a fall in both the volume and share of food exports.
3.55 Share and Growth of Non-traditional Exports. Growth of non-traditional exportsgenerally followed (with a lag) changes in the exchange rate (Figure 3 and Table 3.18). Non-traditionalexports increased between 1975 and 1981, primarily in steel and aluminum. Exports fell in the early1980 and then revived in 1983.
3.56 Table 3.18 divides exports into traditional and non-traditional. The share of traditionalexports (petroleum, iron ore, coffee and cocoa' fell from 95 percent in 1975 to 87 percent in 1987.Although traditional exports fell nearly 50 percent between 1981 and 1987, non-traditional exportsincreased over 30 percent. Increases in manufactured exports were primarily in chemicals, steel, andaluminum.
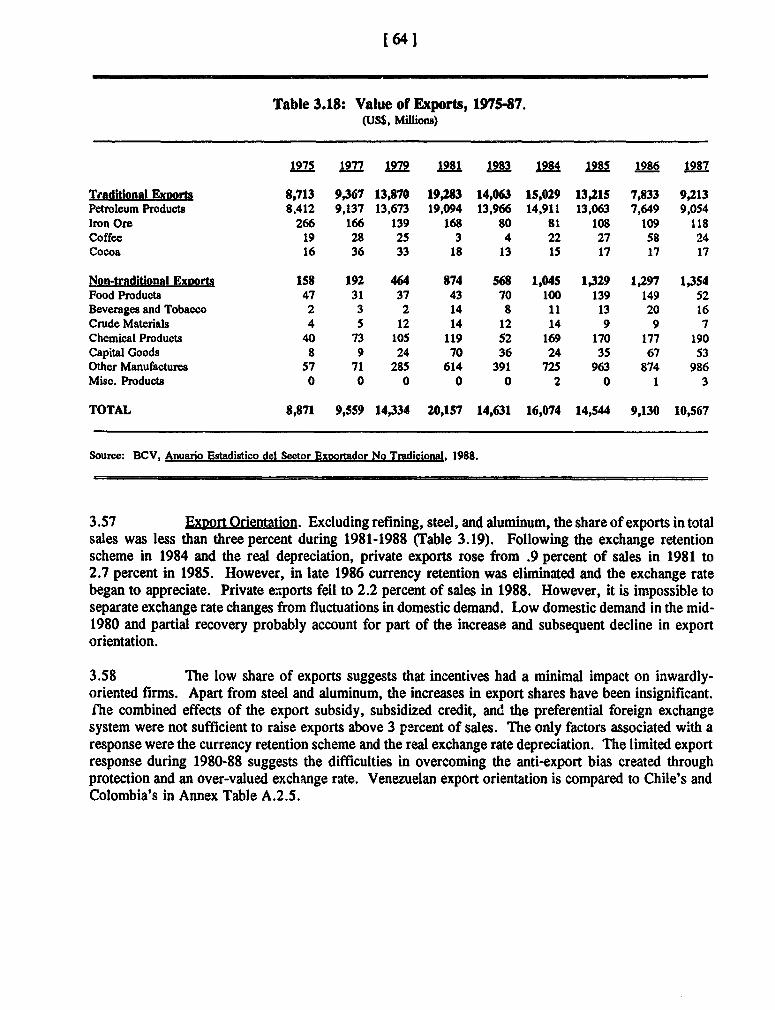
[641
Table 3.18: Value of Exports, 1975-87.(USS, Millions)
1975 1977 1979 1981 1983 1984 1985 1986 1987
Traditional ExDortS 8,713 9,367 13,870 19,283 14,063 15,029 13,215 7,833 9,213Petroleum Products 8,412 9,137 13,673 19,094 13,966 14,911 13,063 7,649 9,054Iron Ore 266 166 139 168 80 81 108 109 118Coffee 19 28 25 3 4 22 27 58 24Cocoa 16 36 33 18 13 15 17 17 17
Non-traditional Exports 158 192 464 874 568 1,045 1,329 1,297 1,354Food Products 47 31 37 43 70 100 139 149 52Beverages and Tobacco 2 3 2 14 8 11 13 20 16Crude Materials 4 5 12 14 12 14 9 9 7Chemical Products 40 73 105 119 52 169 170 177 190Capital Goods 8 9 24 70 36 24 35 67 53Other Manufactures 57 71 285 614 391 725 963 874 986Misc. Products 0 0 0 0 0 2 0 1 3
TOTAL 8,871 9,559 14,334 20,157 14,631 16,074 14,544 9,130 10,567
Source: BCV, Anuario Estadistico del Sector Exoortador No Tradicional, 1988.
3.57 Export Orientation. Excluding refining, steel, and aluminum, the share of exports in totalsales was less than three percent during 1981-1988 (Table 3.19). Following the exchange retentionscheme in 1984 and the real depreciation, private exports rose from .9 percent of sales in 1981 to2.7 percent in 1985. However, in late 1986 currency retention was eliminated and the exchange ratebegan to appreciate. Private exports fell to 2.2 percent of sales in 1988. However, it is impossible toseparate exchange rate changes from fluctuations in domestic demand. Low domestic demand in the mid-1980 and partial recovery probably account for part of the increase and subsequent decline in exportorientation.
3.58 The low share of exports suggests that incentives had a minimal impact on inwardly-oriented firms. Apart from steel and aluminum, the increases in export shares have been insignificant.The combined effects of the export subsidy, subsidized credit, and the preferential foreign exchangesystem were not sufficient to raise exports above 3 percent of sales. The only factors associated with aresponse were the currency retention scheme and the real exchange rate depreciation. The limited exportresponse during 1980-88 suggests the difficulties in overcoming the anti-export bias created throughprotection and an over-valued exchange rate. Venezuelan export orientation is compared to Chile's andColombia's in Annex Table A.2.5.
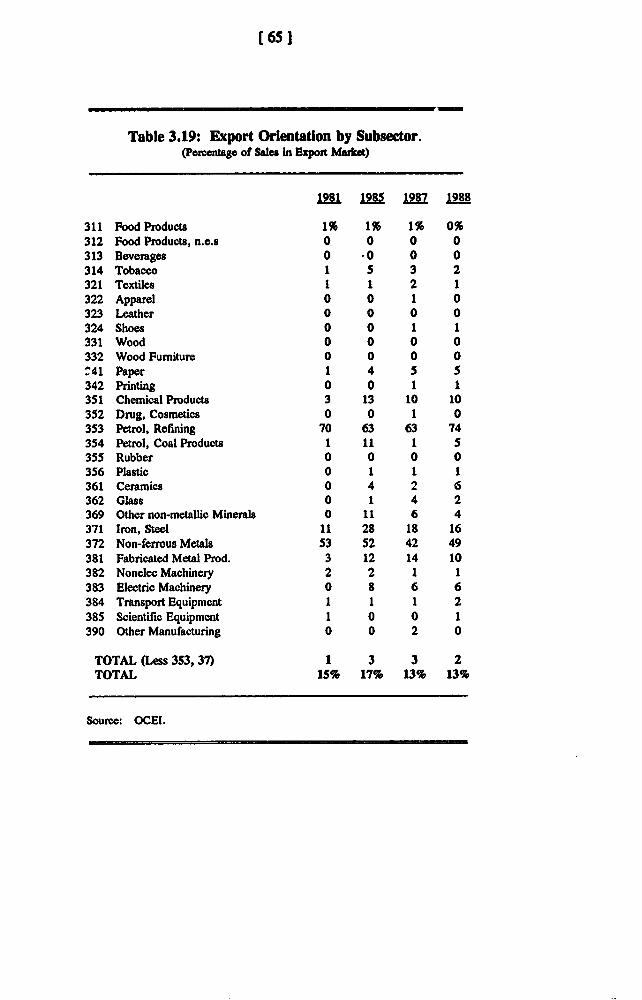
[651
Table 3.19: Export Orientation by Subsector.(Percentage of Sales in Expoit Market)
I2I 198S 1987 1988
311 Food Products 1% 1% 1% 0%312 Food Products, n.e.s 0 0 0 0313 Beverages 0 *0 0 0314 Tobacco 1 5 3 2321 Textiles 1 1 2 1322 Apparel 0 0 1 0323 Leather 0 0 0 0324 Shoes 0 0 1 1331 Wood 0 0 0 0332 Wood Furniture 0 0 0 0341 Paper 1 4 5 5342 Printing 0 0 1 1351 Chemical Products 3 13 10 10352 Drug, Cosmetics 0 0 1 0353 Petrol, Refining 70 63 63 74354 Petrol, Coal Products 1 11 1 5355 Rubber 0 0 0 0356 Plastic 0 1 1 1361 Ceramics 0 4 2 6362 Glass 0 1 4 2369 Other non-metallic Minerals 0 11 6 4371 Iron, Steel 11 28 18 16372 Non-ferrous Metals 53 52 42 49381 Fabricated Metal Prod. 3 12 14 10382 Nonelec Machinery 2 2 1 1383 Electric Machinery 0 8 6 6384 Transport Equipment 1 1 1 2385 Scientific Equipment 1 0 0 1390 Other Manufacturing 0 0 2 0
TOTAL (Less 3S3, 37) 1 3 3 2TOTAL 15% 17% 13% 13%
Source: OCEI.
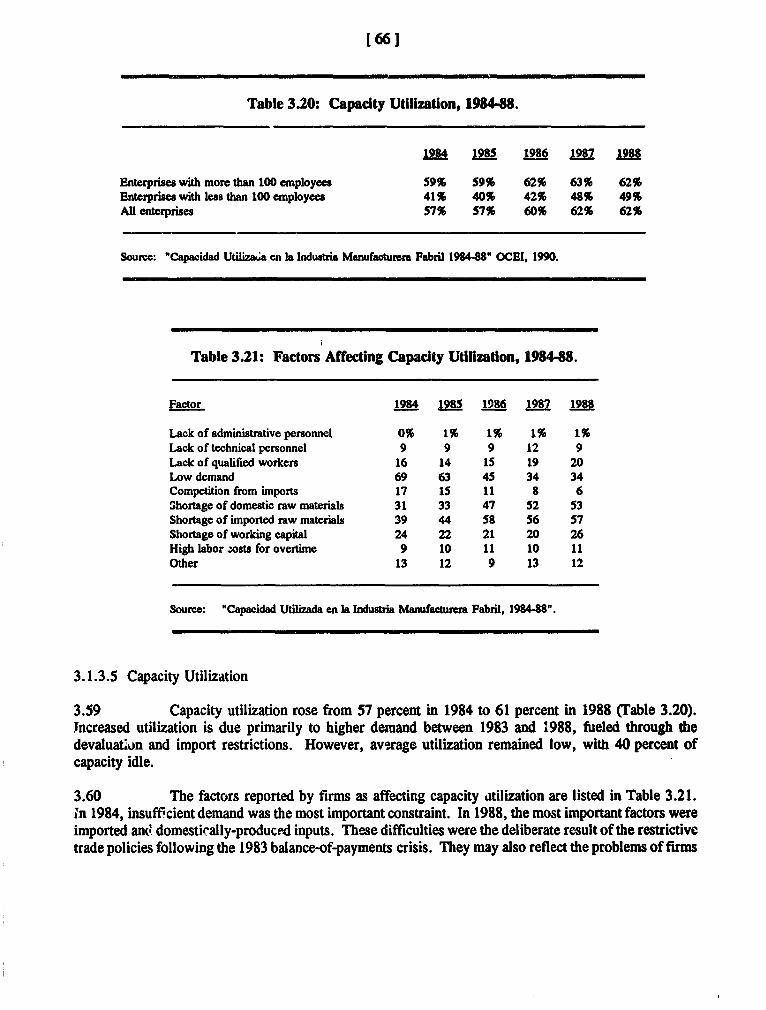
[66J
Table 3.20: Capadty Utilization, 198488.
1984 198 1986 1987 1988
Enterprie8 with more than 100 employees 59% 59% 62% 63% 62%Enterprises with less than 100 employees 41% 40% 42% 48% 49%All enterprises 57% 57% 60% 62% 62%
Source: "Capacidad Utliza a en la Industria Manufacturera Fabril 1984-88" OCEI, 1990.
Table 3.21: Factors Affecting Capacity Utilization, 198488.
Factor 194 1985 1986 1987 1988
Lack of administrative personnel 0% 1% 1% 1% 1%Lack of technical personnel 9 9 9 12 9Lack of qualified workers 16 14 IS 19 20Low demand 69 63 45 34 34Competition from imports 17 1S 11 8 6Shortage of domestic raw materials 31 33 47 52 53Shortage of imported raw materials 39 44 58 56 57Shortage of working capital 24 22 21 20 26High labor zosts for overtime 9 10 11 10 11Other 13 12 9 13 12
Source: "Capacidad Utilizada en la Industria Manufactumem Fabril, 198488".
3.1.3.5 Capacity Utilization
3.59 Capacity utilization rose from 57 percent in 1984 to 61 percent in 1988 (Table 3.20).Jncreased utilization is due primarily to higher demand between 1983 and 1988, fueled through thedevaluation and import restrictions. However, average utilization remained low, with 40 percent ofcapacity idle.
3.60 The factors reported by firms as affecting capacity utilization are listed in Table 3.21.In 1984, insufficient demand was the most important constraint. In 1988, the most important factors wereimported anC' domestically-produced inputs. These difficulties were the deliberate result of the restrictivetrade policies following the 1983 balance-of-payments crisis. They may also reflect the problems of firms
[67 1
which obtain inputs from state-owned enterprises. The two other important factors which reducedcapacity utilization in 1988 were low demand and working capital.
3.1.4 Assessmn
3.61 Section 3.1 has examined the structure and performance of the manufacturing sector andfound that 1975-88 was characterized by inefficient growth of output. Large investments, financed byoil revenues, were directed to steel, aluminum, and petrochemicals. Manu,acturing growth, whichaveraged eight percent during the late 1970s, fell below two percent in the mid 1980s. Inefficiency isevident in low growth of labor productivity or-in sectors dominated by p',blic enterprises-declines inthe rates of output per worker. Other signs of inefficiency include high ratios of investment to value-added in public enterprises, low rates of capacity utilization, and the manufacturing sector's inability tocompete internationally.
3.62 Industrial and trade policies discouraged competition and contributed to the sector'sstructure, behavior, and performance. Private investment was prohibited in sectors reserved to the publicenterprises. Industrial incentives were selectively granted with the goal of discouraging competition bydenying them in sectors where supply was perceived adequate by government officials. Despite outputgrowth and significant numbers of firms, the concentration of output in several large plants continued inthe 1970s and 1980. Import protection via tariffs, quotas, and exchange allocations further limitedcompetition. There was a significant relationship between concentration and price-cost margins, butimport penetration-again, by government policy-was not sufficient to discipline these margins acrosssectors. An overvalued exchange rate and significant import protection led to an environment where,excluding oil and steel, less than three percent of sales were in export markets.
3.2 Labor in the Manufacturing Sector: Policies and Evidence
3.63 This section descibes the Venezuelan labor laws and policies and presents data on wagesand non-wage costs. In the 1970s and 1980, the government introduced measures to increase wages andnon-wage benefits. The evidence suggests that although non-wage costs increased as a share of total laborcosts to the employer, real wages fell between 1975 and 1988. This section concludes with a discussionof proposed labor legislation.
3.64 Labor Policies: An Overview. Statutory wage and non-wage costs are listed inTable 3.22. In addition to payments for overtime and ;iolidays, the most important non-wage costs are:
(1) Profit-sharing bonuses equal to ten percent of a company's liquid profits, up to a maximum of twomonths' salary per employee. These bonuses are mandated for all firms of a certain size.
(2) Severance pay (cesanda) for workers fired without just cause, which doubles the standard pension(antiguedad) to departing workers. The combined payments are equal to one month's pay for eachyear worked, based on the last month's salary.
(3) A contribution of two percent of wages and salaries, as well as .5 percent of the ten percent nrofitbonus, to the National Training Institute, INCE.
(4) Social security payments by the employer (seven percent of wage bill) and employee (four percent)covering retirement, maternity, disability, sick leave, marriage payments, and burial expenses.
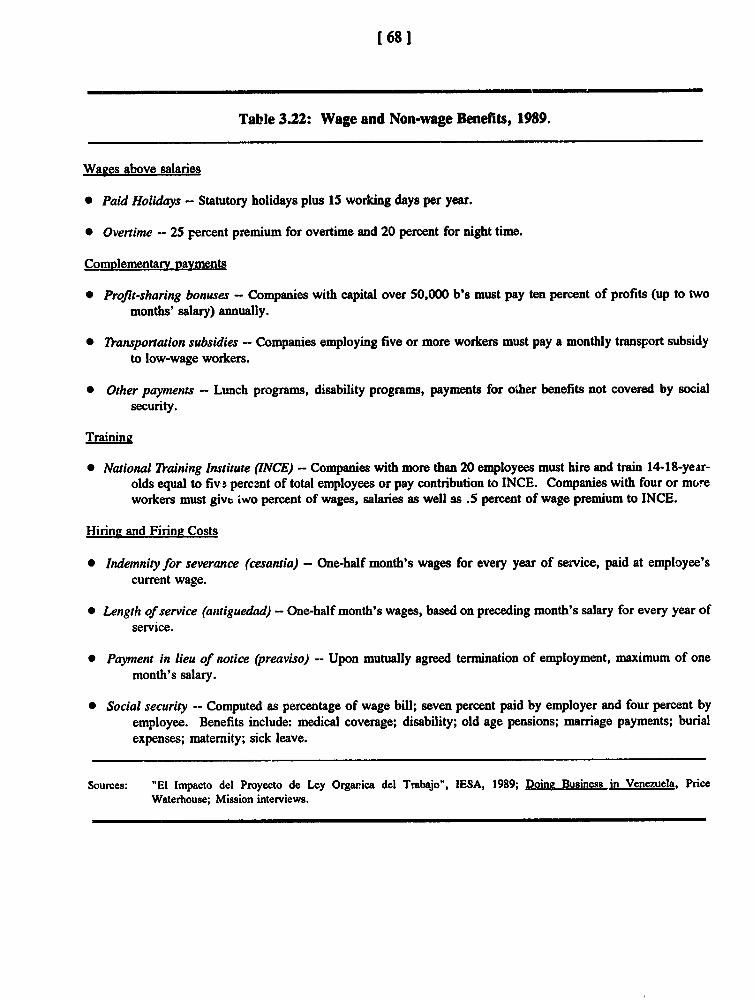
[681
Table 3.22: Wage and Non-wage Benefits, 1989.
Wages above salaries
* Paid Holidays - Statutory holidays plus 15 working days per year.
* Overtime -- 25 percent premium for overtime and 20 percent for night time.
Complementarv payments
* Profit-sharing bonuses -- Companies with capital over 50,000 b's must pay ten percent of profits (up to twomonths' salary) annually.
* Transportation subsidies - Companies employing five or more workers must pay a monthly transport subsidyto low-wage workers.
v Other payments - Lunch programs, disability programs, payments for other benefits not covered by socialsecurity.
Training
* National Training Institute (INCE) - Companies with more than 20 employees must hire and train 14-18-year-olds equal to fivb percant of total employees or pay contribution to INCE. Companies with four or moreworkers must givt ivwo percent of wages, salaries as well as .5 percent of wage premium to INCE.
Hiring and Firine Costs
* Indemnity for severance (cesantia) - One-half month's wages for every year of service, paid at employee'scurrent wage.
* Length of service (antiguedad) -- One-half month's wages, based on preceding month's salary for every year ofservice.
* Payment in lieu of notice (preaviso) -- Upon mutually agreed termination of employment, maximum of onemonth's salary.
* Social security -- Computed as percentage of wage bill; seven percent paid by employer and four percent byemployee. Benefits include: medical coverage; disability; old age pensions; marriage payments; burialexpenses; matemity; sick leave.
Sources: "El Impacto del Proyecto de Ley Orgarica del Trabajo", IESA, 1989; Doing Business in Venezuela, PriceWaterhouse; Mission interviews.
[69 1
3.65 The law regulating severance payments provides double the usual severance payment if aworker is laid off without a 'just cause". An employer must either submit a request to a tripartitecommittee (with representatives from the Labor Ministry, labor unions, and business) to determine if adismissal is justified or make the severance payment The committee is slow in processing applicationsand most employers prefer to pay the double indemnity rather than submit requests to the Committee.
3.66 Since severance payments are based on the last month's wages, they are indexed for inflationand for merit increases. Employers are concerned by the uncertainty these payments impose in aninflationary environment. Employers also complain that the double indemnity law encourages workersto leave to collect the indemnity. The law conveys a perverse incentive in that workers receive greaterbenefits for being fired than for resigning so workers are encouraged to provoke their dismissal. At thesame time, the law discourages employers from keeping employees over a long period.
3.67 Firms provide substantial non-wage benefits and may also offer schooling or transportation,often in conjunction with labor contracts. Wage and non-wage costs are documented below. Since thedata are taken from enterprise surveys, it iv only possible to quantify non-wage costs, as opposed tobenefits. Not all costs to employers are perceived by employees as benefits. For example, the paymentto INCE for training is a cost which does not benefit the employees in whose name it is paid.
3.68 Trends in Non-wage Costs. Social benefits mandated through labor legislation increasedthe share of non-wage costs over 1975-88 (Table 3.23A). For skilled workers, the ratio of non-wagecosts to salaries increased from 58 percent to 95 percent; for unskilled workers, from 52 percent to84 percent. As a share of total labor costs, salaries declined from 64-66 percent to 51-54 percent. Thesteepest increases in non-wage costs occurred between 1984 and 1988. Between 1975 and 1984, non-wage costs rose from 34-36 percent of labor costs to 38-39 percent. During 1984-88, however, non-wagecosts increased to nearly 50 percent of the total.
3.69 Table 3.23B shows non-wage costs/salaries by size of plant. Plants with over 50 employeesgenerally paid higher non-wage costs than smaller plants. The difference in non-wage costs for skilledand non-skilled workers was also less significant for large plants. For large plants, the ratio of non-wagecosts to salaries for skilled and unskilled workers in 1988 was 97 percent and 87 percent respectively.For small plants, the ratio of non-wage costs to salaries was 59 percent and 52 percent for skilled andunskilled workers respectively. Although the share of non-wage costs was lower for small plants, theincrease in non-wage costs was the highest for unskilled workers in small plants.
3.70 Changes in the Real Wage. The increase in non-wage costs has been accompanied by a fallin the real wage. Table 3.24 shows changes in both real wages and real remuneration, defined as the sumof wages and non-wage costs. Real wages declined significantly for both skilled and unskilled workers.Using the GDP deflator, real wages declined by 2.8 percent annually for skilled workers and 1.6 percentfor unskilled workers. Using the CPI deflator, real wages declined by 3.2 percent annually for skilledworkers and 1.9 percent for unskilled workers.
3.71 If both wage and non-wage costs are included in total remuneration, Table 3.24 shows asmaller decline in real labor costs over 1975-88. The index for skilled workers, expressed in real termsusing the GDP deflator, declined from 1.10 in 1975 to .95 in 1988-a decline in real wages of one percentper year. For unskilled workers, however, real remuneration remained almost constant. If the CPI isused to deflate wages, the decline in real remuneration appears greater. For skilled workers, realremuneration declined at 1.6 percent per year; for unskilled workers, the rate was .5 percent per year.
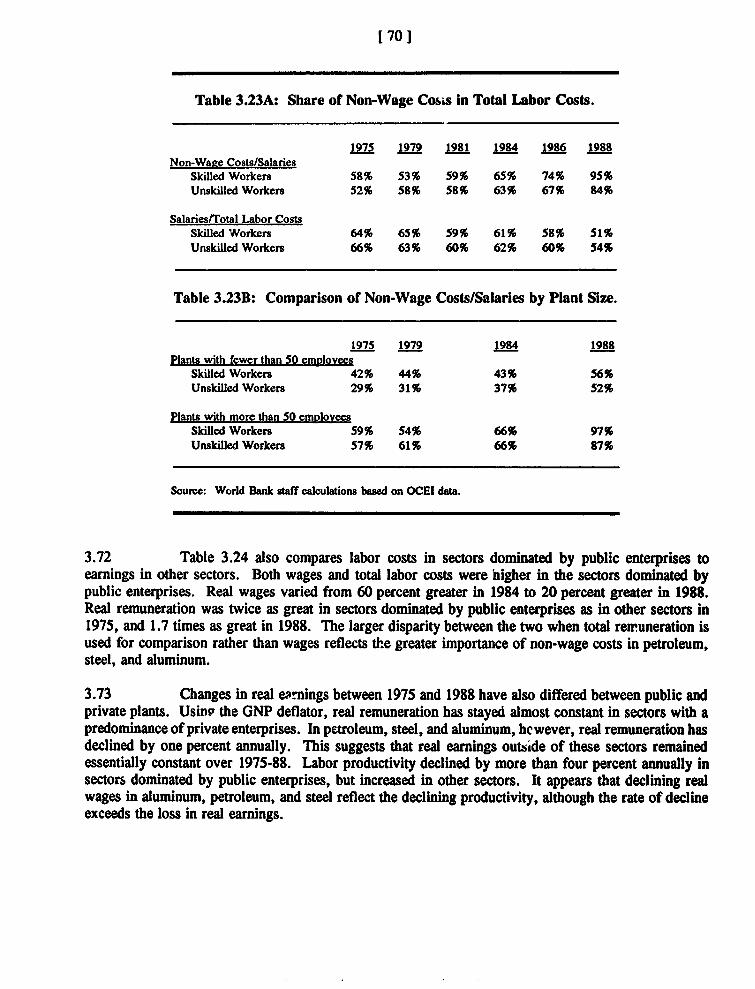
1 70 1
Table 3.23A: Share of Non-Wage Cos s in Total Labor Costs.
1975 1979 1981 1984 1986 1988Non-Waee Costs/Salaries
Skilled Workers 58% 53% 59% 65% 74% 95%Unskilled Workers 52% 58% 58% 63% 67% 84%
Salaries/Total Labor CostsSkilled WVorkers 64% 65% 59% 61% 58% 51%Unskilled Workers 66% 63% 60% 62% 60% 54%
Table 3.23B: Comparison of Non-Wage Costs/Salaries by Plant Size.
1975 1979 1984 1988Plants with fewer than 50 emplovees
Skilled Workers 42% 44% 43% 56%Unskilled Workers 29% 31% 37% 52%
Plants with more than 50 emploveesSkilled Workers 59% 54% 66% 97%Unskilled Workers 57% 61% 66% 87%
Source: World Bank staff calculations based on OCEI data.
3.72 Table 3.24 also compares labor costs in sectors dominated by public enterprises toearnings in other sectors. Both wages and total labor costs were higher in the sectors dominated bypublic enterprises. Real wages varied from 60 percent greater in 1984 to 20 percent greater in 1988.Real remuneration was twice as great in sectors dominated by public enterprises as in other sectors in1975, and 1.7 times as great in 1988. The larger disparity between the two when total remuneration isused for comparison rather than wages reflects the greater importance of non-wage costs in petroleum,steel, and aluminum.
3.73 Changes in real earnings between 1975 and 1988 have also differed between public andprivate plants. Usin' the GNP deflator, real remuneration has stayed almost constant in sectors with apredominance of private enterprises. In petroleum, steel, and aluminum, hewever, real remuneration hasdeclined by one percent annually. This suggests that real earnings outside of these sectors remainedessentially constant over 1975-88. Labor productivity declined by more than four percent annually insectors dominated by public enterprises, but increased in other sectors. It appears that declining realwages in aluminum, petroleum, and steel reflect the declining productivity, although the rate of declineexceeds the loss in real earnings.
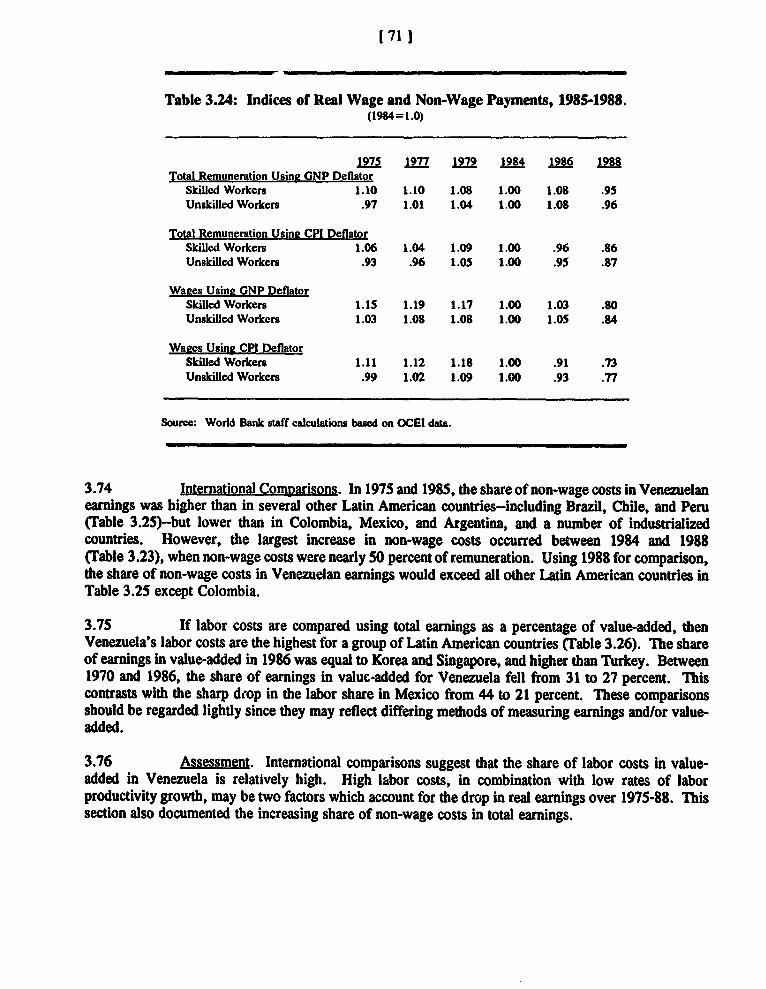
[71 1
Table 3.24: Indices of Real Wage and Non-Wage Payments, 1985-1988.(1984=1.0)
1975 1977 1979 1984 1986 1988Total Remuneration Usine GNP Deflator
Skilled Workers 1.10 1.10 1.08 1.00 1.08 .95Unskilled Workers .97 1.01 1.04 1.00 1.08 .96
Total Remuneration Usine CPI DeflatorSkilled Workers 1.06 1.04 1.09 1.00 .96 .86Unskilled Workers .93 .96 1.05 1.00 .95 .87
Waees Using GNP DeflatorSkilled Workers 1.15 1.19 1.17 1.00 1.03 .80Unskilled Workers 1.03 1.08 1.08 1.00 1.05 .84
Wages Using CPI DeflatorSkilled Workers 1.11 1.12 1.18 1.00 .91 .73Unskilled Workers .99 1.02 1.09 1.00 .93 .77
Source: World Bank staff calculations baed on OCEI data.
3.74 International Comparisons. In 1975 and 1985, the share of non-wage costs in Venezuelanearnings was higher than in several other Latin American countries-including Brazil, Chile, and Peru(rable 3.25)-but lower than in Colombia, Mexico, and Argentina, and a number of industrializedcountries. However, the largest increase in non-wage costs occurred between 1984 and 1988(Table 3.23), when non-wage costs were nearly 50 percent of remuneration. Using 1988 for comparison,the share of non-wage costs in Venezuelan earnings would exceed all other Latin American countries inTable 3.25 except Colombia.
3.75 If labor costs are compared using total earnings as a percentage of value-added, thenVenezuela's labor costs are the highest for a group of Latin American countries (Table 3.26). The shareof earnings in value-added in 1986 was equal to Korea and Singapore, and higher than Turkey. Between1970 and 1986, the share of earnings in value-added for Venezuela fell from 31 to 27 percent. Thiscontrasts with the sharp drop in the labor share in Mexico from 44 to 21 percent. These comparisonsshould be regarded lightly since they may reflect differing methods of measuring earnings and/or value-added.
3.76 Assessment. International comparisons suggest that the share of labor costs in value-added in Venezuela is relatively high. High labor costs, in combination with low rates of laborproductivity growth, may be two factors which account for the drop in real earnings over 1975-88. Thissection also documented the increasing share of non-wage costs in total earnings.
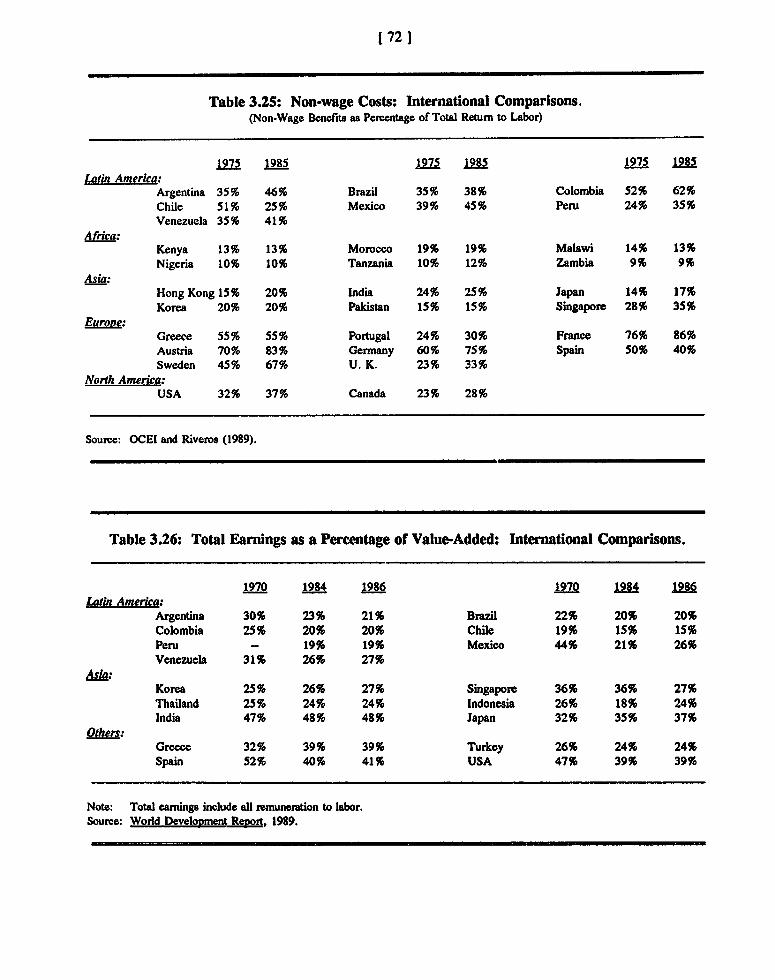
1 72 1
Table 3.25: Non-wage Costs: International Comparisons.(Non-Wage Benefits as Permentage of Total Retum to Labor)
1975 1985 1975 1985 1975 1985Latin America:
Argentina 35% 46% Brazil 35% 38% Colombia 52% 62%Chile 51% 25% Mexico 39% 45% Peru 24% 35%Venezuela 35% 41%
Africa:Kenya 13% 13% Morocco 19% 19% Malawi 14% 13%Nigeria 10% 10% Tanzania 10% 12% Zambia 9% 9%
Asia:Hong Kong 15% 20% India 24% 25% Japan 14% 17%Korea 20% 20% Pakistan 15% 15% Singapore 28% 35%
Eurone:Greece 55% 55% Portugal 24% 30% France 76% 86%Austria 70% 83% Germany 60% 75% Spain 50% 40%Sweden 45% 67% U. K. 23% 33%
North Amerka:USA 32% 37% Canada 23% 28%
Source: OCEI and Riveros (1989).
Table 3.26: Total Earnings as a Percentage of Value-Added: International Comparisons.
1970 1984 1986 1970 1984 1986Latin America:
Argentina 30% 23% 21% Brazil 22% 20% 20%Colombia 25% 20% 20% Chile 19% 15% 15%Peru - 19% 19% Mexico 44% 21% 26%Venezuela 31% 26% 27%
A=:.Korea 25% 26% 27% Singapore 36% 36% 27%Thailand 25% 24% 24% Indonesia 26% 18% 24%India 47% 48% 48% Japan 32% 35% 37%
Others:Greece 32% 39% 39% Turkey 26% 24% 24%Spain 52% 40% 41% USA 47% 39% 39%
Note: Total carmings include all remuneration to labor.Source: World Develooment Report, 1989.
1 73 1
3.77 The changing composition of labor costs. T'he Venezuelan Government should evaluatethe effects and efficiency of labor laws which so strongly proscribe the form and amount of wages.Several factors suggest that new, less rest,-ctive laws could increase employment and reduce labor costswithout reducing employee benefits.
3.78 First, employees would generally rather have cash wages than benefits with an equivalentcost to the employer. If employers and employees had the choice of raising wages and reducing non-wage payments, the current mix might be changed. Second, although real labor costs to employers haveremained roughly constant, a significant percentage of non-wage costs do not benefit a firm's employees.While the costs may be for legitimate social programs, it is questionable whether the best method offunding them is with a tax on wages. Third, rising non-wage costs may have increased labor turnoverand reduced employment stability for recently hired employees. One study found that the majority ofworkers had less than five years' seniority, and only 18 percent had more than ten years with theircompany. Many firms resort to short-term employment and they are encouraged to use more capital-intensive production techniques. Contracting services external to firms have been used to reduce laborcosts and improve flexibility. Finally, severance benefits may inhibit worker mobility, particularly foremployees with seniority, thereby making industrial restructuring more difficult.
3.79 Proposed legislation. The inefficiency of non-wage payments is critical in light ofproposed labor legislation which has the following principal components:
(1) Profit sharing would increase from ten percent or a maximum of two months' salary to 15 percentof company profits or a maximum of four months' salary.
(2) Vacation would be increased from 15 days per year to an additional day for each year of seniority,to a maximum of 15 additional days.
(3) Severance payments would be granted regardless of cause and doubled to one month for each yearof service, based on the previous month's wage. Profit-sharing benefits would be included in thebase for calculating severance payments.
(4) Productivity increases must be compensated by wage increases.
3.80 The proposed changes would be likely to accelerate the share of non-wage costs in total costsand to raise the cost of employment in the formal sector. Further research should be undertaken on theexpected effects of the proposed labor legislation.
3.3 Foreign Investment in the Manufacturing Sector
3.81 Direct foreign investment (DFI) has been small in the manufacturing sector. However,reforms initiated in 1986 and extended in 1990 permit a more efficient use of foreign investment. Thissection (1) describes the regulatory environment for DFI prior to the recent changes and contrasts it tothe present system; (2) uses firm-level data to describe the structure of foreign investment over 1976-88;and (3) compares the behavior of domestic and partially-foreign-owned firms with respect to productivity,wage, import use, and export orientation. Differences in behavior allow projection of the potential effectsof recent reforms which permit increased foreign participation.
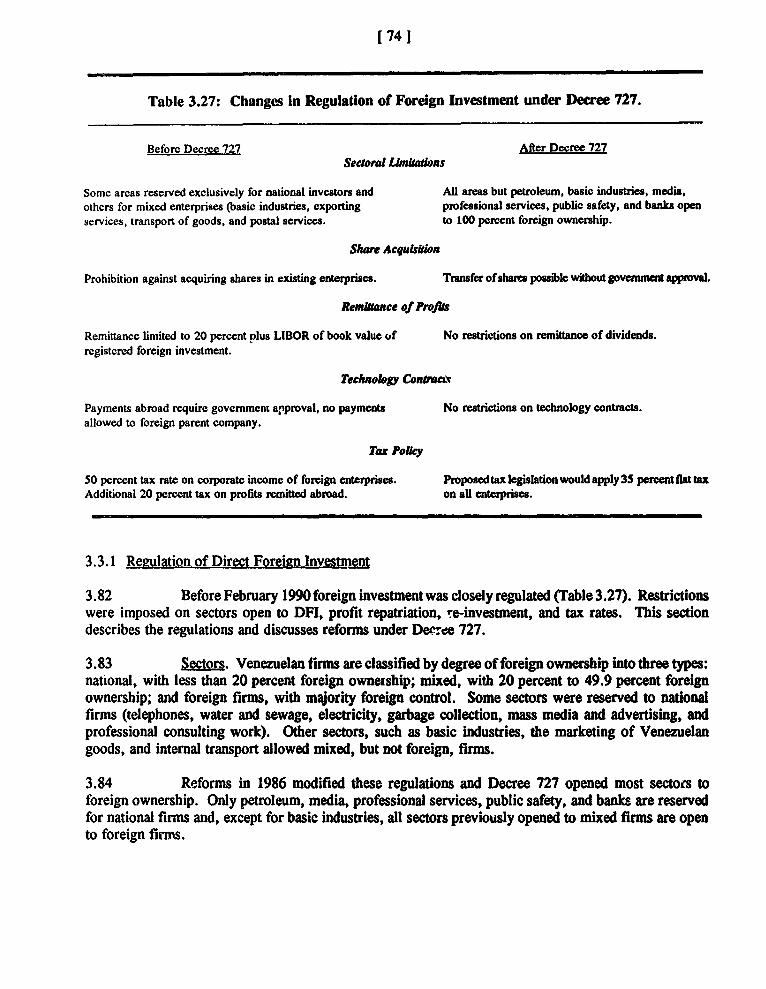
[74 1
Table 3.27: Changes in Regulation of Foreign Investment under Decree 727.
Before Decree 727 After Decree 727Sectoral Lmiations
Some areas reserved exclusively for national investors and All areas but petroleum, basic industries, media,others for mixed enterprises (basic industries, exporting professional services, public safety, and banks openservices, transport of goods, and postal services. to 100 percent foreign ownership.
Share Acquisition
Prohibition against acquiring shares in existing enterprises. Transfer of shares possible without govenmcnt approval.
Remince of Profit
Remittance limited to 20 percent nius LIBOR of book value of No restrictions on remittance of dividends.registered foreign investment.
Technology Contraccq
Payments abroad require government approval, no payments No restrictions on technology contracts.allowed to foreign parent company.
Tax PoUcy
50 percent tax rate on corporate income of foreign enterprises. Proposedtaxlegislationwouldapply3S pereritflattaxAdditional 20 percent tax on profits remitted abroad. on al' enterprises.
3.3.1 Regulation of Direct Foreign Investment
3.82 Before February 1990 foreign investment was closely regulated (Table 3.27). Restrictionswere imposed on sectors open to DFI, profit repatriation, re-investment, and tax rates. This sectiondescribes the regulations and discusses reforms under Decree 727.
3.83 Sectors. Venezuelan firms are classified by degree of foreign ownership into three types:national, with less than 20 percent foreign ownership; mixed, with 20 percent to 49.9 percent foreignownership; and foreign firms, with majority foreign control. Some sectors were reserved to nationalfirms (telephones, water and sewage, electricity, garbage collection, mass media and advertising, andprofessional consulting work). Other sectors, such as basic industries, the marketing of Venezuelangoods, and internal transport allowed mixed, but not foreign, firms.
3.84 Reforms in 1986 modified these regulations and Decree 727 opened most sectors toforeign ownership. Only petroleum, media, professional services, public safety, and banks are reservedfor national firms and, except for basic industries, all sectors previously opened to mixed firms are opento foreign finms.
1175 1
3.85 Investment and profit regulation. The Superintendencia de Inversiones Extranjeras (SIEX)regulates foreign investment and, before Decree 727, held substantial discretion. Profit remittances werelimited to 20 percent (plus LIBOR) of the investment (based on book value) which was consideredinsufficient by most investors. Since purchase of equity in existing firms was prohibited, foreigninvestment could only be in the form of direct investment registered with SIEX. SIEX was more thana registry however, as it set the value of the investment for profit repatriation. Payments by a firm forits foreign parent's technology were prohibited, and contracts that called for royalty or patent paymentsneeded SIEX approval. When Decree 727 eliminated the restriction on repatriation, it also eliminatedsecondary concerns, such as the valuation of the investment. Bureaucratic discretion has been eliminatedfrom the registry and SIEX can only reject foreign investments which do not comply with the sectoralrestrictions.
3.86 Other regulations. Foreign firms faced higher tax rates on corporate income-50 percentversus 35 percent for domestic firms. This is being addressed in pending tax legislation. Also, theregulation of foreign investment contained restrictive provisions disallowing exclusive use andconfidentiality of trade secrets clauses in joint ventures. These restrictions are being negotiated as partof agreements on property rights. Foreign firms were obligated to buy bolivares at the official exchangerate rather than the free market rate, but were permitted to repatriate profits at the official rate. This waseliminated when the exchange rates were unified.
3.3.2 Sectoral Pattern of Foreign Investment
3.87 OCEI's industrial census gives the percentage of subscribed capital owned by domesticinvestors. Very few plants have any foreign ownership. In 1976, 93 percent of plants were 100 percentdomestically owned, two percent were "mixed," and three percent "foreign." This continued to 1988,with 94 percent of plants domestically owned, three percent "mixed," and two percent "foreign.' Thepattern of limited foreign participation held-although less strongly-among large plants: For plants withmore than 100 employees in 1988, 85 percent were 100 percent domestically owned.
3.88 Foreign ownership was three percent in 1976 and in 1988. However, because foreign-owned plants tend to be larger, the unweighted average understates the magnitude of foreign participation.In Table 3.28 foreign ownership is weighted by fixed assets and by employment. In terms of fixedassets, foreign ownership rose from nine to eleven percent between 1976 and 1988, whereas in terms ofemployment, foreign participation declined from eleven to eight percent.
3.89 International comparisons of foreign ownership are difficult, as data are usually notcomparable. Dunning and Cantwell (1982) estimated the ratio of foreign capital to GDP for 1982, andfound Venezuela slightly below the Latin American average, at ten percent compared to the average of11.5 percent.
3.90 Foreign ownership is narrowly concentrated in a few large foreign establishments andmixed enterprises. In 1988 three (metal products and machinery, chemicals, and food processitig) of thenine two-digit sectors accounted for almost three quarters of foreign ownership. If each plant's value offoreign assets is calculated as the plant's fixed assets times the percentage of capital not held by domesticowners, in 1988 the five plants with greatest foreign ownership accounted for 35 percent of foreign-owned assets, and the top ten accounted for 44 percent. Since some firms operate more than one plant,firm-level concentration may be higher.
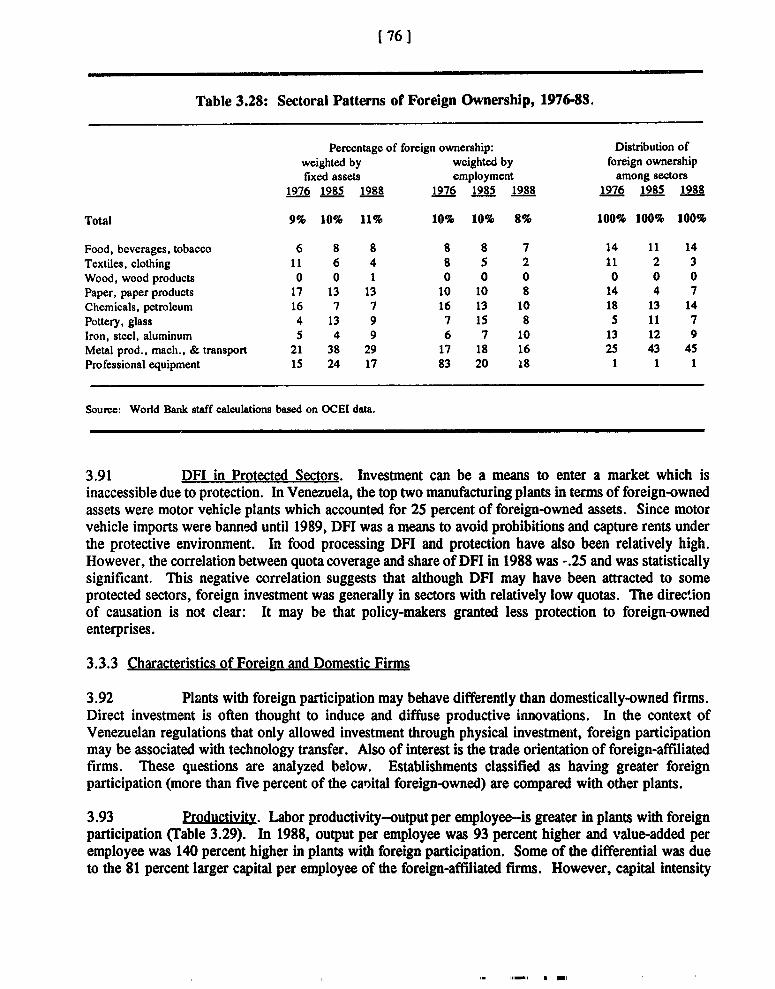
1 76 1
Table 3.28: Sectoral Patterns of Foreign Ownership, 1976-88.
Percentage of foreign ownership: Distribution ofweighted by weighted by foreign ownershipftxed assets employment among sectors
1976 1985 1988 1976 1985 1988 1976 1985 1988
Total 9% 10% 11% 10% 10% 8% 100% 100% 100%
Food, beverages, tobacco 6 8 8 8 8 7 14 11 14Textiles, clothing 11 6 4 8 5 2 11 2 3Wood, wood products 0 0 1 0 0 0 0 0 0Paper, paper products 17 13 13 10 10 8 14 4 7Chemicals, petroleum 16 7 7 16 13 10 18 13 14Pottery, glass 4 13 9 7 1S 8 5 11 7Iron, steel, aluminum 5 4 9 6 7 10 13 12 9Metal prod., mach., & transport 21 38 29 17 18 16 25 43 45Professional equipment 15 24 17 83 20 18 1 1 1
Source: World Bank staff calculations based on OCEI data.
3.91 DFI in Protected Sectors. Investment can be a means to enter a market which isinaccessible due to protection. In Venezuela, the top two manufacturing plants in terms of foreign-ownedassets were motor vehicle plants which accounted for 25 percent of foreign-owned assets. Since motorvehicle imports were banned until 1989, DFI was a means to avoid prohibitions and capture rents underthe protective environment. In food processing DFI and protection have also been relatively high.However, the correlation between quota coverage and share of DFI in 1988 was -.25 and was statisticallysignificant. This negative correlation suggests that although DFI may have been attracted to someprotected sectors, foreign investment was generally in sectors with relatively low quotas. The directionof causation is not clear: It may be that policy-makers granted less protection to foreign-ownedenterprises.
3.3.3 Characteristics of Foreign and Domestic Firms
3.92 Plants with foreign participation may behave differently than domestically-owned firms.Direct investment is often thought to induce and diffuse productive innovations. In the context ofVenezuelan regulations that only allowed investment through physical investment, foreign participationmay be associated with technology transfer. Also of interest is the trade orientation of foreign-affiliatedfirms. These questions are analyzed below. Establishments classified as having greater foreignparticipation (more than five percent of the canital foreign-owned) are compared with other plants.
3.93 Productivity. Labor productivity-output per employee-is greater in plants with foreignparticipation (Table 3.29). In 1988, output per employee was 93 percent higher and value-added peremployee was 140 percent higher in plants with foreign participation. Some of the differential was dueto the 81 percent larger capital per employee of the foreign-affiliated firms. However, capital intensity
I'-'. * l
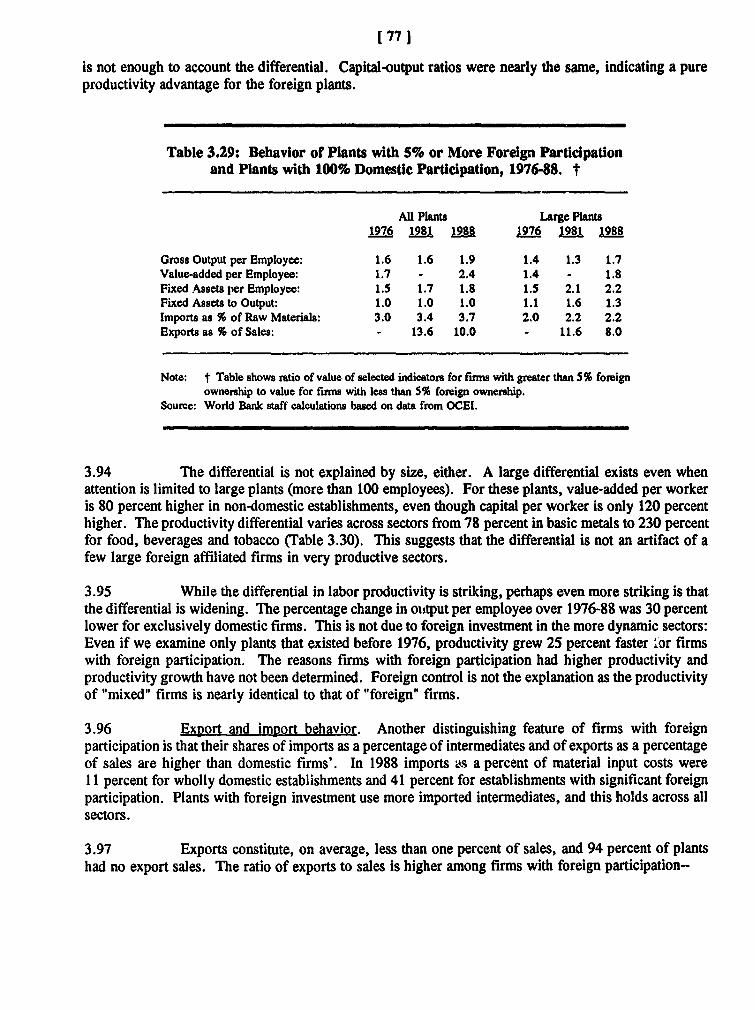
[ 77 l
is not enough to account the differential. Capital-output ratios were nearly the same, indicating a pureproductivity advantage for the foreign plants.
Table 3.29: Behavior of Plants with 5% or More Foreign Participationand Plants with 100% Domestic Participation, 1976-88. t
All Plants Large Plants1976 1981 1988 1976 1981 1988
Gross Output per Employee: 1.6 1.6 1.9 1.4 1.3 1.7Value-added per Employee: 1.7 - 2.4 1.4 - 1.8Fixed Assets per Employee: 1.5 1.7 1.8 1.5 2.1 2.2Fixed Assets to Output: 1.0 1.0 1.0 1.1 1.6 1.3Imports as % of Raw Materials: 3.0 3.4 3.7 2.0 2.2 2.2Exports as % of Sales: - 13.6 10.0 - 11.6 8.0
Note: t Table shows ratio of value of selected indicators for firms with greatr than 5% foreignownership to value for firms with less than 5% foreign ownership.
Source: World Bank staft calculations based on data from OCEI.
3.94 The differential is not explained by size, either. A large differential exists even whenattention is limited to large plants (more than 100 employees). For these plants, value-added per workeris 80 percent higher in non-domestic establishments, even though capital per worker is only 120 percenthigher. The productivity differential varies across sectors from 78 percent in basic metals to 230 percentfor food, beverages and tobacco (Table 3.30). This suggests that the differential is not an artifact of afew large foreign affiliated firms in very productive sectors.
3.95 While the differential in labor productivity is striking, perhaps even more striking is thatthe differential is widening. The percentage change in ouitput per employee over 1976-88 was 30 percentlower for exclusively domestic firms. This is not due to foreign investment in the more dynamic sectors:Even if we examine only plants that existed before 1976, productivity grew 25 percent faster "or firmswith foreign participation. The reasons firms with foreign participation had higher productivity andproductivity growth have not been determined. Foreign control is not the explanation as the productivityof "mixed" firms is nearly identical to that of "foreign" firms.
3.96 Export and import behavior. Another distinguishing feature of firms with foreignparticipation is that their shares of imports as a percentage of intermediates and of exports as a percentageof sales are higher than domestic firms'. In 1988 imports as a percent of material input costs wereI 1 percent for wholly domestic establishments and 41 percent for establishments with significant foreignparticipation. Plants with foreign investment use more imported intermediates, and this holds across allsectors.
3.97 Exports constitute, on average, less than one percent of sales, and 94 percent of plantshad no export sales. The ratio of exports to sales is higher among firms with foreign participation-
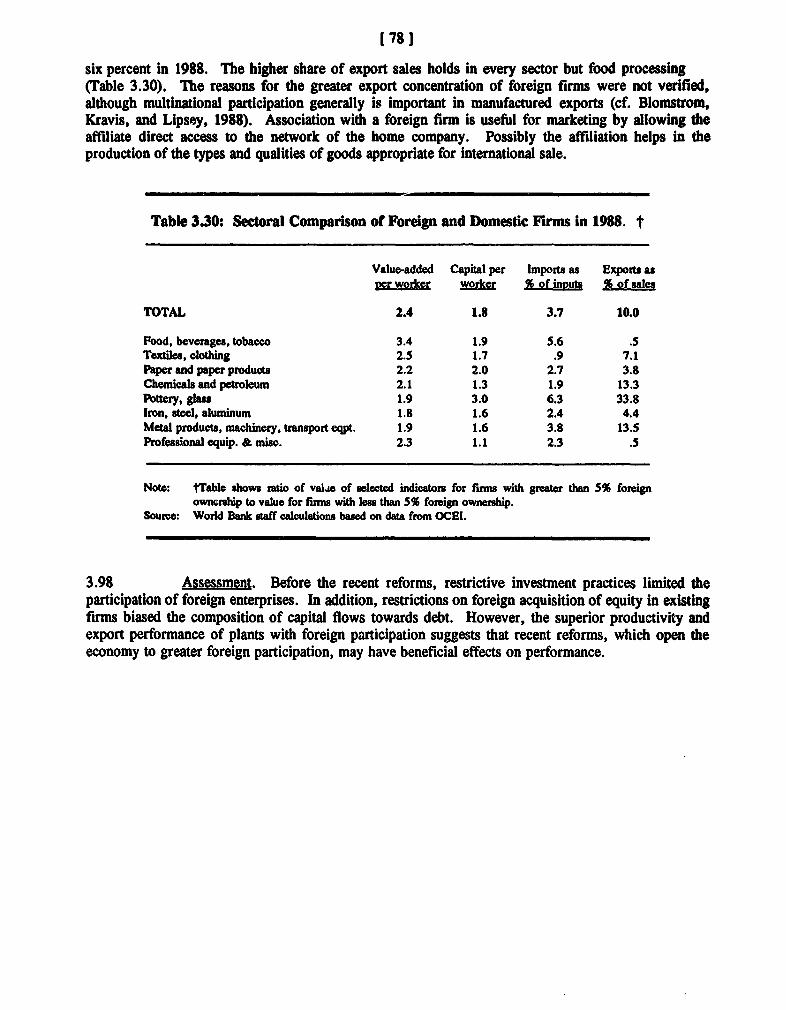
[78 1
six percent in 1988. The higher share of export sales holds in every sector but food processing(Table 3.30). The reasons for the greater export concentration of foreign firms were not verified,although multinational participation generally is important in manufactured exports (cf. Blomstrom,Kravis, and Lipsey, 1988). Association with a foreign firm is useful for marketing by allowing theaffiliate direct access to the network of the home company. Possibly the affiliation helps in theproduction of the types and qualities of goods appropriate for international sale.
Table 3.30: Sectoral Comparison of Foreign and Domestic Firms In 1988. t
Value-added Capital per Imports as Exports asper worker wo % of inlUts % of ales
TOTAL 2.4 1.8 3.7 10.0
Food, beverages, tobacco 3.4 1.9 5.6 .5Textiles, clothing 2.5 1.7 .9 7.1Paper and paper products 2.2 2.0 2.7 3.8Chemicals and petroleum 2.1 1.3 1.9 13.3Pottery, glass 1.9 3.0 6.3 33.8kron, steel, aluminum 1.8 1.6 2.4 4.4Metal products, machinery, transport eqpt. 1.9 1.6 3.8 13.5Professional equip. & misc. 2.3 1.1 2.3 .5
Note: tTable hows ratio of valje of selected indicators for fims with greater than 5% foreignownership to value for fimns with less than 5% foreign ownership.
Source: World Bank saff calculations based on data from OCEI.
3.98 Assessment. Before the recent reforms, restrictive investment practices limited theparticipation of foreign enterprises. In addition, restrictions on foreign acquisition of equity in existingfirms biased the composition of capital flows towards debt. However, the superior productivity andexport performance of plants with foreign participation suggests that recent reforms, which open theeconomy to greater foreign participation, may have beneficial effects on performance.
4. AGENDA FOR THE 199Os
4.1 Venezuela in the 1980s engaged in a mamsive goverrment intervention in the economiclife of the nation. The programs the government administered, discussed in Chapter 2, involvedenormous, discretionary benefits which were given without coordination or adequate accountability:preferential exchange rates with benefits between five and 19 percent of GDP between 1984 and 1987(Table 2.4); a currencv retention scheme for exporters equal to about 2.8 percent of GDP for exportswhich were only 2.0 percent of GDP (Section 2.1.2). The system was so complex it is impossible todetermine its beneficiaries from a priori theory. These programs led to distortions and widespreadcorruption. The industrial sector's record during the 1980s (Chapter 3) is a story of weak growth,declining productivity, low capacity utilization, and reduced investment.
4.2 Venezuela's approach to economic management did not differ from many other nations'.Krueger (1990, p. 9) described the pervasive theory of economic development as: "Government should... undertake activities that would compensate for 'market failures.' These were regarded as being somuch more extreme in developing countries as to make their economies different not only in degree butin kdnd from industrial countries. Market failures were thought to result from 'structural rigidities,'which were defined as a lack of responsiveness to price signals. It was therefore concluded thatgovernments should take a leading role in the allocation of investment, control the 'commanding heights'of the economy, and otherwise intervene to compensate for market failures."
4.3 Throughout the world, governments are redefining their roles in response to their policyfailures. "The collective optimism of the nationalist era has given way to a sullen and embitteredrecognition that the sacrifices of the many have created disproportionate opportunities for a few. Howdo policy choices, ostensibly made for the public good, become the basis for private aggrandizement?By what process does a vision of the public good erode?" (Bates 1981, p. 6).
4.4 The Venezuelan Government has abandoned the instruments it used to control theindustrial sector in the 1980s, and is eliminating other discretionary industrial incentives. The economyis being opened to foreign investment; taxes are being reformed; and privatization, public enterpriserestructuring, and financial sector reform programs are being introduced. The thrust of these reformsis to reduce the Government's role in the economy and to give greater prominence to market-basedincentives and decisions.
4.5 Venezuelan industrialists report a renewed optimism and confidence in the futureprofitability of their firms. Entrepreneurial attention has been refocussed from ;leading for governmentalrelief toward the fundamentals of business management. They have begun some investment programsto compete in an open economy, but they point to a long agenda of unresolved problems-all related togovernment policies or services: ports (INP), shipping (CAVN), tele-communications (CANTV),electricity, and inputs from state-owned enterprises (e. g., aluminum, steel, petroleum products). Actionshere have not kept pace with the reforms which have been forced on the private sector.
4.6 The program is a year-and-a-half old. Much has been accomplished quickly, but thechanges are far from finished. Most changes have been made by Presidential o' Ministerial decree andcould be reversed as easily and quickly as they were introduced. Their tenure will depend on a newunderstanding in Venezuela about the limits of government and markets. The Venezuelan Govermnentof the 1980s neglected the legitimate functions of government-provision of public goods and
1801
infrastructure, education and training, public health, modern systems of welfare maintenance, equitableand effilient tax collection and administration-and intervened ini areas where the government wasunqualified-control of imports, prices, and hivestment.
4.7 The policy failures of the 1980s ha/e been widely recognized. In the 1990s thegovernment must restructure, keeping in mind its economic objectives, the range of instruments availableto achieve them, and the limits of government expertise and competence. Trere are many functionswhich government simply cannot perform at any reasonable cost. The problem is acute in Venezuelawhere governmental salaries are too low to attract a sufficient number of well-qualified professionals toadminister programs requiring extensive professional manpower.
4.8 The Development Ministry has been a leader within the Venezuelan government in itsinternal reforms and restructuring to implement the new policies. Its accomplishments to date have beenimpressive and offer promise that the reform will realign the boundaries between governmentalresponsibilities and market-based decisions to encouicage a more efficient allocation of resources andhigher rates of economic growth.
4.9 For the industrial sector, the outstanding items on the policy agenda are the continuationof the trade policy reforms and implementation of a domestic policy regime supportive of internalcompetition. Solid foundations hase been laid for both of these actions with the reforms to date.However, difficult steps lie ahead for the Government to allow the industrial sector to achieve its potentialto generate income and employment through effective competition in international and domestic markets.In Section 4.1 we discuss outstanding issues in the trade reform and recommend principles to guide thereforms to their conclusion. In Section 4.2 we discuss the role Af the Development Ministry in thedomestic market, focusing on three important tasks: promoting c.mpetition; fostering investment; andinformation, research, and analysis to advance the broad interests of the industrial sector in economicpolicy-making.
4.1 Trade Reeorm: Next Steps
4.10 The trade reform has replaced the system of uncontrolled, ad hoc protection and costlyexport subsidies with a system which-when it is fully implemented in 1993-will use effective exchangerate management in place of directed programs aimed at import substitution or export promotion.Moderate tariffs-between ten and 20 percent-would provide additional protection for domestic economicactivities, and the Csvernment's intention is to give comparable levels of effective protection to all sectorsin order to encourage efficient resource allocation. Licenses would provide further protection to no morethan five percent of domestic manufacturing. This protection through licenses and tariffs would leave4 residual anti-export bias which would be accepted as a cost to Venezuelan consumers. Export subsidieswvould be eliminated.
4.11 In the initial phases of the trade reform, the Government has coordinated the programamong affected Ministries and with the private sector. It has conscientiously implemented the programunder a tight schedule, with limited resources, and consistent with the principles of treating all economicactivities equally. Many crucial steps and decisions remain as the Government moves toward its medium-term goals for trade policy in 1993. Not all of the elements necessary to the success of the trade reformprogram are within the direct control of any single Ministry, and it will be important to continue to workwithin the Cabinet and other decision-making bodies to advance the policies which will contribute to theprogram's success.
[811
4.1.1 Exgbang Rate
4.12 The most important single element of the trade reform program has been unifying andfloating the exchange rate. In the future, it will be necessary to manage the exchange rate to avoid themistakes of the 1980s in the face of unexpected changes in petroleum prices. The Government isstudying the feasibility of an oil stabilization fund whereby 3xcess oil revenues would be absorbed intoa special reserve when prices are unusually high to be utilized when they are unusually low.
4.13 Exchange rate management wIll encourage an efficient allocation of resources betweenthe traded goods sector (importables and exportables) and the nontraded sector. Investors naed a ciearunderstanding of the Government's exchange rate policies and an ability to formulate reliable expectationsof future exchange rates. This is a fundamental determinant of investment in the tradable goods sector.
4.14 Under an exchange regime which accommodates petroleum price shocks, the exchangerate reveals the relative values of domestically produced and imported goods. Venezuela will alwaysenjoy foreign exchange inflows from its petroleum exports and these resources should be used to importthose items which Venezuela produces least efficiently. Policies or programs which would "conserveforeign exchange" (through import substitution) or "promote exports" (through subsidies or otherconcessions) would be misguided government interventions which would lead to inefficient consumptionand production. If the exchange rate were not properly managed, there may be a rationale for suchprograms, but it is questionable whether a government which cannot manage an exchange rate effectivelycould manage a more complicated program of taxes and subsidies. Certainly the Venezuelan re.;ord ofthe 1980s is not encouraging.
4.1.2 Uniform Treatment of Sectors
4.15 One of the cornerstones of the adjustment program has been to re-orient the economybased on transparent, broadly applicable principles rather than the previous array of industry-specific rulesand standards. With the notable exception of agriculture (which is currently being addressed) theGovernment has, to date, maintained an admirable degree of uniformity of treatment among economicsectors. This is an important element of the program, both politically-to show impartiality, andeconomically-to allow market forces, rather than bureaucratic or political decisions, to reveal theactivities which are most robust.
4.16 Where sectors are not treated uniformly, resources may be driven out of unfavoredactivities and toward the favored, instead of toward more efficient alternatives. The costs of adjustmentwould be borne more heavily by the efficient sectors and less heavily by the inefficient-exactly theopposite of what should occur. Within Venezuela, there are many industrialists who support theadjustment program whole-heartedly, and many others who support it "except as it applies to my ownsector, which is really different form the rest and merits special treatment because .... " The Governmentshould continue to resist the mounting pressures to grant industry-specific concessions.
4.17 Adjustment will succeed only if resources are released from inefficient activities to movetoward more efficient ones. Government concessions which would retain employees in inefficient linesof production will undermine the program by not making those workers available for other employment.Where firms complain that they will be put out of business, it should be recognized that this is one ofthe necessary consequences of adjustment. If these are efficient, productive enterprises, then they willbe financially reorganized under new or existing owners and production will continue. If they are not
(82 1
efficient then they will close forever. Workers will find new employment and what can be salvage4 ofthe factories will be. The failure of the activity signified that domestic production costs more than itsvalue added at world prices. Only by moving productive resources out of such activities and toward theirinternational comparative advantage can the economy's adjustment succeed. These old, inefficientpatterns of allocation precipitated the crisis which led to the adjustment program, and they are exactlirwhat adjustmneni seeks to change.
4.1.3 Licenses
4.18 The remaining licenses and prohibitions are concentrated in Subsector 31, food, beveragesand tobacco (Table 2.7B). Most of these licenses were retained pending resolution of the agriculturaltrade reform, and can be eliminated in conjunction with it. If those licenses and prohibitions werereplaced by tariff protection, then the index of production coverage would drop from 15 percent of themanufacturing sector to 4.7 percent-within the Government's target for coverage at the end of the reformprogram.
4.19 The other class of items for which prohibitions were retained were 'luxury goods' suchas specialty food items. A more efficient strategy would be to eliminate these restrictions and to useexcise taxes which woulu apply uniformly both to domestic and to imported luxury goods. Withprohibitions, uncontrolled protection is provided to domestic producers of luxury goods or theirsubstitutes. The producers thereby earn supra-normal profits and, in the lovg-run, investment would beattracted away from more efficient alternatives to produce the protected luxury goods.
4.20 The final point here is that the Government should consider a longer-term goal ofeliminating all licenses and prohibitions. With tariffs, internal prices will move with border prices,separated only by the percentage of the tariff rate. Licenses have the undesirable feature of divorcinginternal prices from world prices (see Section 2.1.1.4). Productive resources are not allocated accordingto underlying global economic forces, but the whim of government policy makers. To the extent that thegovernment wishes to exempt some sectors from the forces of the adjustment program (expressed inVenezuela by the five percent target for licenses and prohibitions), it would be preferable to grant directproduction subsidies or fixed-term (one or two years) tariff protection slightly (five to ten percent) abovethe ceiling for other sectors.
4.1.4 Tariffs
4.21 The maximum tariff has been reduced, in two steps, from 135 percent to 80 percent to50 percent. However, the most difficult tariff reductions are yet to come. At each stage of tariffreductions, a greater proportion of the domestic economy is subjected to foreign competition.Manufacturers which are unchallenged by imports with a 50 percent tariff rate will fini greatercompetition as tariffs fall to 20 percent. The political pressures to postpone or cancel subsequent stagesini the reform will increase at each successive round of tariff reductions.
4.22 In resisting these pressures, policy-makers should point out the benefits which accrue toVenezuelans-bunefits which will be greater than (though perhaps not as visible as) the costs. Consumerswill pay lower prices. With tariff reductions, and effective exchange rate management, there should bea compensating devaluation of the exchange rate which would afford broad protection uniformly to alldomestic manufacturing as well as a greater incentive for export-oriented activii.es. The effect shouldbe to draw resources into traded goods sectors and out of non-traded goods, strengthening the Venezuelan
[ 83 1
economy and increasing its competitiveness in domestic and international markets. Two key elementshere are the importance of effective exchange rate management as well as adoption of policies which willencourage resources, particularly labor, to exit from uneconomic industries and move toward moreefficient and competitive activities.
4.23 As the Government &.proaches its medium-term target of a ten to 20 percent tariff range,it should consider a longer-term goal of a unified tariff at a rate between five and ten percent. The tento 20 percent range leaves high effective protection for activities of low value-added (60 percent effectiveprotection for a good with 20 percent domestic content, which might be found in assembly industries).Further, it would mean that Venezuelan consumers would pay prices 20 percent above world levels formany items, and it would continue to encourage investment in low value-added, inwardly-orientedindustries. If Venezuelan industries are to be competitive in wor!d markets, they must also becompetitive at home, and the surest way of accomplishing that would be to eliminate tariff protection sothat investment would be directed to those activities where Venezuela would be most competitive.
4.24 Finally, it should be kept in mind that to the extent the Government may consider activepromotion of selected economic activities, direct production subsidies would always be more efficientinstruments than trade interventions. Trade interventions distort both production and consumptiondecisions whereas productions subsidies distort only production decisions. "ome believe that productionsubsidies are too costly because they show up in the budget whereas trade interventions do not.However, the trade intervention-with the double distortion will always be more costly, so it follows thatif budget subsidies are too costly, trade interventions should not even be contemplated.
4.1.5 Exemptions
4.25 Discretionary tariff exonerations have been eliminated. However, there remainexemptions, established by law, for some entities such as state-owned enterprises, universities, and thecentral government. The Development Ministry does not know all the entities which are entitled toexemptions, but it has estimated that they affected less than three percent of imports in 1988.
4.26 Legislation should be introduced to eliminate these exemptions. Where the exemptionsare offered to domestic enterprises, they allow an unfair commercial advantage. The exemptions areleakages in the system of protection-allowing foreign producers preferential treatment for somecustomers-which should be eliminated. The decision to grant protection to domestic manufacturers isa policy decision that consumers of an item should bear the cost of developing that activity and that theforeign manufacturer should not enjoy a price advantage. To exempt some consumers from thatprotection places a greater burden on others.
4.1.6 Exports and Export Subsidies
4.27 The bono de exportacldn was introduced to compensate exporters for requiring them tosurrender their foreign exchange at the official rate. While this was an inferior way of solving theoriginal problem, it was a legitimate way. Over the years, the role of export subsidies has been lost andthe Government had to fend off many spurious claims for exporters' right to receive the subsidy. Withthe unification and floating of the exchange rate, the subsidy no longer served a legitimate purpose, andthe Government was correct in reducing the subsidy and in its plans to eliminate it as soon as an effectiveduty and indirect tax rebate scheme is available to exporters.
[841
4.28 Many people point to the large, apparent increase in exports in 1989 (and subsequentdecline as the subsidy has been reduced) as justification to re-introduce the subsidy. While nontraditionalexports reported by OCEI increased by 50 percent from $2 billion to $3 billion, nearly half of theapparent increase was a result of the change in trade regime from one which encouraged under-invoicingto one which rewarded over-invoicing (see Box 2). That is, either 1988 exports were higher than $2billion or 1989 exports were lower than $3 billion, or some combination of the two. Further, thedecrease in Venezuelan consumption, the high costs of carrying inventories, and the free-market exchangerate all contributed to increased exports.
4.29 It is also important to emphasize that the purpose of trade reform is not to increase norto diversify exports. Trade reform changes the pattern and level of economic activity and, as aconsequence of increased efficiency, each of the following is affected: specific commodities importedand exported; total imports and total exports; value added to exports; and the balance of payments. Thesechar jes are the results of increased efficiency and are not goals in and of themselves. Greater exportsor export diversification are only desirable wbere they consist of exports in which the country has acomparative advantage and, under the present exchange regime, any export which requires a subsidy tobe profitable is one in which the country has no comparative advantage. If the subsidy is used toencourage exports, it would be a drain on the Venezuelan economy in the sense that the cost of producingthe item for export would be greater than the receipts. Government policy should continue to discouragethis type of expurt.
4.30 A final point. What is required for the adjustment program is new investment ininternationally competitive industries or to increase the efficiency of existing firms. The export subsidy,while it may encourage exports from existing inventories or even export production from existingcapacity, is not an efficient method to encourage new investment in export-oriented industries.Investment is based on the underlying fundamentals of international supply and demand, aad exportsubsidies-which may be changed capriciously or countervailed in export markets-are not factored intoinvestment decisions. And since they cannot be counted on in estimating the profitability of aninvestment, they would only provide windfall economic gains to exports which would take place anyway.
4.1.7 Export Processing Zones
4.31 There is interest within Venezuela in establishing export processing zones (EPZ's). Thesezones are economic enclaves within which manufacturing for export occurs under virtual free tradeconditions by exempting exporters from some administrative procedures, customs duties, and perhapsother taxes and/or labor !dws. In theory, the country would enjoy gains through employment, foreignexchange earnings, and technology transfer.
4.32 These are not an effective solution to long-term problems of efficient resource allocation,and will be less attractive in Venezuela as the trade reform lowers tariffs and other obstacles tointernational trade. They have a mixed record, and Warr (1989) points out several drawbacks. Hefound, after examining the experience in Korea, Malaysia, and the Philippines that "When the domesticeconomy is distorted, the EPZ confers limited welfare gains. Nevertheless, EPZ's are far from the'engines of development' that some countries had initially hoped they would become." (p. 86). Anyproposals should be carefully scrutinized and the Government should avoid providing any subsidiesthrough infrastructure, credit, or tax concessions which would benefit investors at the expense of theVenezuelan taxpayer. Fees should be structured so that all costs would be fully recovered.
[ 85 1
4.1.8 Export Credit and Expurt Credit Insurance
4.33 In the areas of export credi. and credit insurance, the Government should encourage thedevelopment of private markets which could provide suitable instruments. FINEXPO has offered creditat subsidized rates to a limited number of exporters. There is no justification for these subsidies and theyencourage many distortions in the industrial incentives (see, e. g. Fitzgerald and Monson, 1989).Exporters should pay market rates for credit.
4.34 Exporters have sought government subsidies for an export credit insurance scheme whichwould allow them to export to risky clients in countries with poor credit records (e. g., Guyana,Nicaragua), without bearing the risk of default. The government should not subsidize such programswithout a careful analysis to establish that the benefits would exceed the costs and risks. The records ofmost export credit insurance agencies are poor. More than half the agencies which are members of theBerne Union are running losses which will have to be repaid by the taxpayers of the exporting nation.
4.35 Insurance is an industry demanding a high degree of technical expertise and where theprivate sector is generally more efficient than government agencies-including insurance for political andcommercial risks. The government can assume large, uncontrolled liabilities in the name of its citizens:The U. S. taxpayers are paying an estimated $500 billion-about ten percent of GNP-for its FederalHome Loan Bank Board's failure to charge adequate rates to insure against failures in the savings andloan industry.
4.36 In theory, there could be conditions of market failure or imperfect information whichwould warrant government subsidies for export credit insurance. However, careful empirical analysiswould be necessary to show that those conditions are met in Venezuela. Further, even if such conditionsshould be met, the most efficient form of intervention is unlikely to be government provision of theinsurance. As long as there are no laws which prevent private irnsurers from offering export creditinsurance in Venezuela, then the fact that it is not offered or is too costly most likely indicates that theexports involved would be too risky and should not be undertaken.
4.1.9 Public Services
4.37 It is widely believed that the private sector has adjusted to the trade reforms and that thepublic sector has not. Entrepreneurs point to a long list of state-owned enterprises and governmentservices which are costly and inefficient: products of the basic industries, communications, electricity,water, shipping, ports, and customs administration. The Government has begun a program ofrestructuring and privatization which will address these concerns, but the program is a year-and-a-halfbehind the trade reforms.
4.38 Some have estimated that the goods and services provided direcdy by the Governmentor by state-owned enterprises place Venezuelans at disadvantages of ten to 25 percent in exporting. Wedo not have independent estimates to verify the magnitude of these distortions. However, to the extentthat the goverrment taxes the industrial sector and consumers to underwrite inefficiencies in shipping,infrastructure, communications, or other basic services, the Venezuelan economy will be uncompetitivein traded goods. These inefficiencies are costs associated with Government policies, but they are realcosts of importing and exporting. As long as the government continues to require exporters andimporters to bear them, they will direct resources away from the production of tradable goods and towardnontradables. This, however, is a more efficient allocation in a society which delivers traded goods so
[861
inefficiently. The correct policy response is not, as some have advocated, to o7fset these cost penaltieswith subsidies but, as the Government's restructuring and privatization is designe1 to do, to eliminatethem at the source. It is incumbent on the Government to place its industrial park in a more competitiveposition by eliminating government-imposed obstacles and costs.
4.2 Role of the Deve ^ment Ministry
4.39 The Development Ministry has been restructured-to tne approval of the private sector-and is adopting a role compatible with a more outward-oriented economy. The Ministry has identifiedfour specific institutional objectives: (a) Increased productivity, product quality, and service; (b)Increased foreign investment and access to technology; (c) Increased capacity to monitor industrialperformance in Venezuela and overseas; and (d) Stronger analytical basis to formulate policy and toidentify public sector bottlenecks to international competitiveness. The responsibilities which the Ministrymust undertake can be grouped into three broad-and not necessarily mutually exclusive-categories:those which make the country internationally competitive and maintain a favorable investment climate;those which maintain and promote competition within the domestic market; and those which collect,analyze, or disseminate information in support of the other two. These topics are discussed in this sectionalong with more detailed discussions of issues surrounding promotion of foreign investment and antitrustlegislation-topics on which the World Bank has provided technical assistance to Venezuela.
4.2.1 Investment Climate
4.40 The general economic health and political stability in a country, along with resources andmarkets, are the primary determinants of the climate for industrial investment. In this regard, theGovernment's reform program has restored the attractiveness of Venezuela for investors-both domesticand foreign. The decline of private investment from 24 percent of GDP in 1971-73 to an average ofsix percent of GDP during 1981-86 (Cable 1.1) should be reversed. The most important measure toencourage this reversal will be continuation of the reform program-particularly in the reform of stateenterprises, public services, and infrastructure-and extension of the trade reforms. However, Venezuela,even with its rich base of natural resources and a favorable policy regime, will still compete forinvestment with other countries which are implementing policy reforms. There are areas where furtherpolicy changes would enhance Venezuela's international competitiveness:
* Tax Reform. Tax rates on corporate profits are higher in Venezuela (50 percent) than in many othercountries (Section 2.3.3). Legislation to reform the tax system (broadening the base and loweringrates) and to reduce the maximum rate for corporate profits to 35 percent, has been submitted toCongress but, until it is passed, investors will defer decisions in cases where this would make adifference.
* LV QLegishn. Labor laws intrude heavily into employee and managerial freedom to negotiateterms and conditions of employment. Labor legislation can be an instrument to ensure that labor isallocated efficiently to increase productivity and employment. Where it is used instead as a "socialsafety net" for purposes of maintaining or redistributing income, it will distort labor market decisionsand reduce employment. While income maintenance and social welfare are legitimate objectives ofsocial policy, labor laws are usually inefficient ways to achieve those ends. Existing legislationimposes requirements which make Venezuelan labor less competitive with other nations'.
[87 1
There are many drafts of legislation under consideration (Section 3.2). While some of these reformscould reduce the problems which add unnecessary costs and discourage employment in the formalsector, other drafts would make Venezuela even less competitive. Until laws are revised to restoremarket freedoms, while protecting legitimate worker rights, Venezuela will operate at a handicap.Less investment will be attracted and that which is attracted will be more capital intensive and createless employment.
* Training and Education. The quality of the labor force is as important to investors as the price. TheNational Training Institute (INCE) and the public education system needs to implement programswhich will more efficiently piepare Venezuelan labor for employment in modern industrialoccupations. The Government is implementing programs to address shortcomings in both area.
* Technology. Technolugy transfers have been inhibited by policies which discouraged foreigninvestment and by import restrictions on capital goods. These policies have been reformed, and theDevelopment Ministry should ensure that no other government policies-such as patent laws-willcontinue to inhibit introduction of state-of-the-art technology in Venezuela.
4.41 These policies serve many purposes besides fostering investment, and are beyond thelimited responsibility of one Ministry. However, an appropriate role for the Development Ministryshould ensure that no decision is taken on them without the Executive's being fully aware of theimplications, with the Ministry acting as the advocate for those policies which will foste. investment,growth, and development.
4.2.1.1 Investment Promotion
4.42 The change in economic incentives under the reform program creates opportunities forprofitable investment in export-oriented and efficient import substitution activities in 'enezuela. The newincentives, coupled with new foreign investment regulations, will attract foreign investorm. Success ofthe reform program would be reinforced by early investment to take advantage of these opportunities.The Government is seeking methods to promote these opportunities domestically and internationally. Toavoid wasting resources and manpower, investment promotion must be carefully tailored to Venezuela'ssituation in light of current international practices. (See Wells and Wint, 1990).
4.43 It is often assumed that investment promotion-which has some aspects of a public goodin that it is not always easy to identify the beneficiaries and to charge them directly-is a legitimategovernmental function. In fact, there are identifiable beneficiaries of foreign investment, and promotionis in their interest: chambers of commerce, banks, labor groups, potential suppliers, owners ofcomplementary lines of production, or domestic investors seeking foreign partners. Many of these groupsare already promoting investment. Further, even if there is an additional benefit which would justifygovernment support, it may be that the activity would best be provided by private interests enjoyingpartial or complete financial support from the government. The first decision, then, must be whetherinvestment promotion would most efficiently be implemented by a public, a private, or a mixedinstitution. This decision must also be influenced by the types of personnel required to staff the agency.Government salary limits discourage well-trained professionals from pursuing a government career, soattention must be paid to ensuring that the organization can be effectively administered.
4.44 Investment promotion is a long-term activity which would be more successful with stable,predictable fiuding. The necessary funding can be estimated relative to the experiences of other countries
[ 88 1
and the tasks and strategies the sponsors adopt. Typically such agencies may employ staffs of five to 35people with annual budgets of roughly $300,000 to $4 million. One activity which the agency mustdecide is whether to establish and maintain overseas offices. The experience of other countries in thisarea has been mixed and, ultimately, it is an empirical question of projecting the costs and the benefits.
4.45 The organization design must be related to concrete measures of performance andaccomplishment which are r,ecessary both to demonstrate effectiveness to sponsors and for managementto measure and improve its own effectiveness. Alternative performance measures include: number ofinvestor inquiries, frequency of promotional presentations, amount of investment attracted, number ofjobs created, etc. In choosing among measures, it is important to distinguish between input measures(hours worked, trips taken, etc.) and output measures (employment created, dollars of new investment).While the former are easier to measure and control than the latter, they give little indication of theorganization's effectiveness and no justification for expanding or even continuing the program.
4.46 The agency must find a suitable mix of promotional techniques. These may be "imagebuilding"--to improve potential investors' understanding of programs and opportunities; "investmentservicing" --to assist existing investors; or "investment generating" -to attract and service new investment.Most countries employ all techniques but emphasize one ahead of the others, shifting emphasis over timeas strategies have evolved.
4.47 Given the agency's budget, it must concentrate resources in areas and sectors with thegreatest potential yield--as measured by the performance targets. The agency must strike a balancebetween promoting in sectors capable of attracting investment on their own (and where !he agency's workwould have no marginal contribution) and sectors in which investment may be inherently unprofitable andunsuitable. Here promotion, if it were successful, would actually be costly to the investor, the country,or both. The same considerations apply to selecting foreign countries where prcomnotion would be mostsuccessful. However, it would be impossible for an agency such as this to predict trends and to identifya country's comparative advantage-particularly when economic incentives are changing so sharply underthe Government's reform program-and the agency should not concentrate its resources too narrowly inan attempt to second-guess the market.
4.48 Finally, the agency will need an appropriate information system. Investment promotiontakes time to realize results. From initial contacts to a favorable investment decision demands that theagency keep careful records of activities and information and that it maintain timetables to ensure thatfollow-up actions are completed. Computerization of appropriate information, tracking, and managementsystems would be desirable.
4.49 Essential to the success of these activities is a sound reform program which ensuresfavorable investment conditions. Foreign and domestic investors alike are interested in the underlyingeconomic fundamentals: tax and labor laws, the fiscal deficit, exchange rate policy, inflation rates, costsand quality of local services. No investment promotion agency can convince investors to put resourcesinto an economy which is inherently unprofitable. Conversely, investors are continually on the searchfor profitable opportunities and stand to gain as much from investment as the host country. If theconditions are sufficiently attractive, investment will come, and the promotion agency can only hope tomake it come more rapidly.
[ 891
4.2.2 Promotion of Competition
4.50 In a small economy like Venezuela's, the principal source of competition is the worldmarket, and the Development Ministry will maintain a responsibility for continuing the tariff reform.However, In nontraded goods, different conditions are necessary to maintain a competitive environment.The Ministry will be responsible for policies of patents and copyrights, product standards, weights andmeasures, consumer piotection, and antitrust.
* Patents and Copyrights. Venezuela's laws of intellectual property rights have been criticized for notprotecting pharmaceuticals or chemicals, for their limited terms (five to ten years compared to theinternational norm of 17-20 years), for discouraging domestic research and innovation, and fordeterring investors from introducing advanced technology (which would not be adequately protected).This has been a contentious issue because the lack of patent protection has enabled domesticpharmaceutical and chemical manufacturers to enjoy the benefit of foreign innovation without payingroyalties. Legislation has been drafted to increase protection of intellectual property rights inVenezuela, and the Development Ministry should take an active role in identifying and advocatingappropriate changes in the law.
* Product Standards. Weights and Measures. These topics relate to establishing and enforcing the rulesof an environment in which competitors are on an equal footing. The most problematic area is insetting product standards. Local manufacturers wili press to enforce standards and definitions whichwould place foreign producers at a competitive disadvantage. The Development Ministry, in rulingon appropriate standards, should look abroad toward international norms which would maximizedomestic competition. This would be of the greatest benefit to consumers who would have greaterselection and to domestic producers who, by adapting to international norms would be able to competein world markets.
* Financial Sector. An efficient financial system is essential to match borrowers and lenders in orderto facilitate savings and investment and permit an efficient allocation of resources. The Government'sfinancial sector reforms should reduce the policy-induced obstacles to mobilizing resources forindustrial development. Liberalizing interest rates should increase the supply of credit available toqualified borrowers. Measures to reduce the subsidy in interest rates and rationalize the developmentfinancial institutions will ensure that credit is available at lower rates for most economic purposes.Foreign competition in the financial sector should promote the introduction of modern banking andfinancial practices and instruments and reduce the spreads charged by financial intermediaries, to thebenefit of both borrowers and lenders.
The Development Ministry should monitor these reforms to ensure that they will encourage a morecompetitive environment and avoid the mistakes of the 1980s. In particular, it should, with otherresponsible Ministries and the Central Bank, evaluate the feasibility and benefits of openingcommercial banking to greater foreign ownership. Under the financial reform program, legislation willbe introduced to permit 20% foreign ownership of commercial banks, with the National Executivegiven discretion to increase it to 30%. It is likely that the national interest would be served byincreasing these limits.
* Maximum Retail Price. The consumer protection law requires--among other things-that manufacturersset a maximum retail price (precio de venta at piblico, PVP). Retailers may sell merchandise for lessthan the PVP (and often do), but they may not sell it for more.
[90]
It is not clear under what conditions the PVP protects consumers. If the distribution system iscompetit. e, then it would fix a retail price no higher than necessary to return a normal profit-presumably the same price that a manufacturer would wish to set. If distribution is not competitive,then distributors could dictate the retail price to the manufacturer, but they would dictate the sameprice that they could charge using their market power. If there is a problem due to imperfectcompetition, it could not be remedied through the PVP-antitrust legislation woula be necessary.
The PVP could be costly to retailers in times of unanticipated inflation if it prevents them fromreceiving an adequate profit margin. It is costly to mannfacturers who must purchase new packagingmaterials each time their costs increase. In both cases, the costs would be passed on to consumers.The requirement that manufacturers mark a PVP on their product should be replaced with a provisionwhich allows them to fix a PVP if they wish.
v Banknrutgy. An important element of vigorous market competition is the exit of firms which are nolonger competitive. This frees human and enital resources to move to more dynamic, expandingactivities and leads to a stronger, more competitive economy. The Development Ministry shouldensure that bankruptcy regulations and procedures are consistent with best international practice tofacilitate and encourage efficient resource reallocation.
d Reforming the FIV. The state owned enterprises have been at a competitive advantage vis-a-vis theprivate sector because of the benefits provided through the FIV. The Government has introdsucedlegislation to change the role of the FIV, involving a phased withdrawal from direct lending andinvestment in SOEs (after meeting current obligations) and refocussing its activity towards privatization(as the implementing agency for the Government's privatization program). At the same time, theGovernment is taking steps to reduce direct budgetary transfers to SOEs. The phasing out of FIV andGovernment financial support for SOEs will help to ensure greater financial discipline on SOEs andpermit more robust competition between private and public companies
4.51 The strongest form of consumer protection would come from vigorous, competitivemarkets. As tariffs are reduced, international competition will lower the prices of traded goods and driveproducers' prices toward international levels. For domestic distribution and for other nontraded goods,it may be desirable to rely on antitrst legislation to enforce competitive norms and behavior.
4.2.2.1 Antitrust Legislation
4.52 Goals and Policies. Venezuela has no antitrust law. In the 1980s, the DevelopmentMinistry was able to control virtually every aspect of entrepreneurial discretion, but in today's market-oriented economy, antitrust could be a valuable part of the legal framework. Properly conceived andexecuted, it could promote competition, inhibit collusion, and discourage or p.event monopoly in orderto encourage greater efficiency, improved uses of resources, superior performance, and lower prices.
4.53 There are at least three possible goals of antitrust policy and they may be mutuallyincompatible. First, antitrust could be focused on promoting an efficient and competitive market system.Second, antitrust could have a more populist orientation. and be focused on preventing the developmentof large enterprises or agglomerations of capital and wealth, regardless of the consequences for efficiencyand competition. Third, antitrust could focus on ensuring 'fairness" in the marketplace. If largerent&prises are more efficient and can compete in a superior manner in the marketplace, a populist policythat prevents their development will conflict with the first goal. If the pursuit of efficiency causes an
[91]
enterprise to treat some customers or suppliers in a disparate fashion and to discrimnnate among them,a policy that emphasizes fairness would conflict with the first goal.
4.54 Advocates of antitvust have often failed to distinguish the three goals and have notrecognized these incompatibilities and the importance of informed selection among them. The choiceamong policy goals is ultimately a political decision, but economic efficiency is an important goal ofmany Venezuelan econcmic policies, and it is assumed here that the promotion of efficiency andcompetition is the primary goal of antitrust policy as well.
4.55 In a market the size of Venezuela's the most important instrument of economic efficiencyis an open international trade and investment regime so that foreign producers can compete with localenterprises that would otherwise exercise power in domestic markets. An open trade and investmentregime, however, is not a complete substitute for an antitrust policy: First, competition from abroadcannot occur instantly. Second, traded goods must be distribu' d domestically, which means that non-traded domestic distribution services are a potential impediment to competition from abroad. And third,import competition from abroad may be ineffective or non-existent for goods that bave a high ratio oftransportation costs to values (e.g., cement, metal ores) or that are perishable (e.g., fresh fruits andvegetables, fresh dairy products) and for most services, which are inherently non-traded.'
4.56 Services are important. Though much attention is focused on manufacturing, the outputof services exceeds manufacturing output in most economies. For Venezuela, in 1986 manufacturing(excluding refining) accounted for 16 percent of GDP. By contrast, wholesale and retail distributionaccounted for 12 percent of GDP, transportation and communications for 13 percent, financial servicesfor 17 percent, construction for four percent, and other (persoaal) services, five percent. The total ofthese services was approximately 50 percent of GDP, or over three times the contribution ofmanufacturing.
4.57 There are, however, risks to an antitrust policy as well. An overzealous, poorly focused,or poorly administered policy could impede economic efficiency and harm growth and development. Thiscould arise a number of ways: Entrepreneurs may not expand into iew markets or new fields if they fearantitrust prosecution; they may be inhibited from developing efficient distribution or supplierarrangements or relationships because of misguided antitrust policiLs that might protect distributors orsuppliers; or they avoid investments because of erratic antitrust enforcement. Accordingly, theGovernment must not only develop good, effectively administered antitrust policies, but also avoid thepitfalls of poor policies.
4.58 Though antitrust, when properly carried out, is distinctly pro-consumer, it should beconsidered and administered separately from other consumer protection laws. Most consumer protectionfocuses on fraud, standards, health, and safety. These are not inherently related to monopoly orcompetition, but to deficiencies in information about the goods or services. Their solutions, and theenforcement, are different from antitrust and are best handled by differnt laws and administration.
'For non-taded goods and for some sevices, foreign invesment may provide competition. This is likely to be true forfinancial services, professional services, transportation, and largscale constuction; it is Iss likely to be tme for wholesaleand retail ditibution srvices, personal svices, and small-scale conuction.
[92 1
4.59 Antitrust should also be separated from anti-dumping. There is a surface similaritybetween one strand of antitrust, "predatory" pricing by a dominant firm, and dumping: Both involveclaims that sellers are pricing beiow "cost." But *.e remainder of antitrust has iittle connection withdumping. Further, dumping involves claims against foreign producers and international negotiations andtreaties. The methods of investigation and evidentiary burdens often differ. Finally, if predatory pricingis a problem, it arises because a firm is trying to create or buttress a monopolistic position. By contrast,it is rare that claims of monopoly have any empirical validity in dumping; rather, the major complaintis usually that foreign governments are subsidizing their exporters or otherm ise causing goods to floodthe domestic market. The enforcement of anti-dumping statutes, because it means protection for domesticproducers and higher domestic prices, is almost always anti-competitive and against the interests ofconsumers.
4.60 Some General Principles. Antitrust is a set of policies that are pro-competition and pro-efficiency. In many instances, competition and efficiency are mutually consistent. Where markets arecompetitive, prices in the long run are likely to reflect the costs of production (including a normal,competitive profit on the capital invested), and consumer demands will be satisfied through an efficientallocation of resources. Competitive pressures will motivate entrepreneurs to find new methods andtechnologies to reduce their costs and to develop new or improved products and services that better meetconsumer demands. Conversely, a monopolist (or a group of competitors that coordinates its actions tobehave like a monopolist) will tend to restrict output and maintain prices above costs (earning monopolyprofits), thereby inducing an inefficient satisfaction of consumer demands. Further, the monopolist doesnot fear the pressures of competitors and thus does not have that spur to improving efficiency,discovering new methods or technologies, or developing superior products.
4.61 Competition and efficiency conflict where the efficiency advantages to large scaleproduction extend over the entire range of output encompassed by the market. These economies of scalecan arise in core production activities (e.g., chemical production; beer brewing; electricity generation)or in ancillary services and distribution (e.g., chemical sales; beer delivery and distribution; retailelectricity service) or both. This is a natural monopoly. Any effort strictly to prevent a monopoly wouldentail a loss of efficiency, since multiple firms would have higher costs than the single (larger) enterprise.And any such effort would probably be unsustainable, since a larger firm in this market could alwayscharge lower prices (while earning an adequate profit) than a smaller firm.
4.62 Greater overall efficiency does not automatically accompany larger output. For manytechnologies, processes and services, the difficulties of maraging a large-scale enterprise and ofresponding quickly to changing demands outweigh the technical advantages that might accompany largervolumes. In such situations, large-scale enterprises are likely to be Id efficient than smaller firms.Accordingly, the relative efficiency of small- and large-scale enterprises is always an empirical questionthat can only be answered for the specific market circumstances.
4.63 A system of price and/or profit regulation is one way to treat a natural monopoly that isoften chosen in the area of public utilities (e.g., electricity distribution, local telephone service). Likeconsumer protection and anti-dumping, such formal eonomic regulation has a different conceptualframework and is best kept administratively separate from antitrust.
4.64 Antitrust can still encourage competition in the presence of natural monopoly (whetherregulated or not). By discouraging practices that raise barriers to entry or raise the costs of rivals,antitrust can limit a natural monopoly's market power. Further, if the economies of scale are exhaustedat, say, one-half or one-third the market, a few firms can operate efficiently. Antitrust can encouragecompetition and efficiency in this structure ("oligopoly"), by preventing collusion.
[93 1
4.65 Efforts to provide detailed checks on abuses of market power are fraught with difficulties.The danger is that efficient, competitive behavior will be discouraged. For example, if a dominant firmresponds to a competitive challenge by cutting its prices, this price-cutting may be interpreted aspredatuir behavior; but it could also be normal, aggressive competition. should this response bediscouraged? If a firm thatt is dominant in one market chooses to enter a new market by offering lowerprices in that new market, this pattern of charging different prices to different customers ("pricediscrimination") is often treated as an unfair or anti-competitive practice; but the firm's entrv into the newmarket is clearly pro-competitive. Should this be discouraged? Overly-zealous restrictions could becomea protective screen for inefficient rivals rather than encouraging competition and efficiency.
4.66 Finally, there is an area of arrangements between suppliers and customers termed "verticalrestraints," that sometimes appear to impede competition and have often been targets of antitrust. Thesearrangements encompass instances, for example, where a supplier (e.g., a manufacturer) restricts theareas where distributors may sell, the types of customers to which they may sell, the services they mustprovide, the items they must carry, and/or their retail prices. A manufacture. may insist that distributorshandle its products exclusively; or a distributor may insist that the manufacturer deal exclusively with itand not sell through rivals. Finally, a manufacturer may insist that certain goods or services be "tied"to the sale of its primary products.
4.67 Such vertical restraints have a similarity to price-fixing, output restrictions, or marketallocations when done by competitors. And, in some instances, these restraints cover a collusivearrangement among competitors, at the distributor or the manufacturer level; or they may be an effortto raise barriers to entry or the costs of production (or distribution) by rivals. On the other hand, theserestraints, imposed by the manufacturer, are often means of dealing with "free-rider" problems or otherinefficiencies. For example, a frequent practice is to assign sales territories to separate distributors. Eachdistributor can focus its advertising and promotion on its territory and without fearing that otherdiatributors would benefit from its efforts. Such restraints are usually pro-competitive because theyennance a manufacturer's ability to compete with its rivals by offering a distribution method that itbelieves to be superior. Equivalently, it is achieving through a contractual arrangement what it mightotherwise achieve through vertical integration and distributing through its own facilities and employees.
4.68 Instruments. Antitrust encompasses a wide range of business practices and arrangementsthat could require scrutiny. It is possible to implement a minimalist framework or, depending on legaland administrative capabilities and choices among policy goals, to expand that framework. It would bepossible to have a bare-bones antitrust policy that focused exclusively on price-fixing and other restrictivepractices among competitors. This is where the social harm is clearest and where the need to consideroffsetting efficiencies is negligible.
4.69 Beyond this, it would be possible to add layers to: prevent practices that raise barriersto entry or raise costs to rivals; prevent mergers or joint ventures that would create or enhance marketpower; prevent predatory practices or other abuses of a dominant firm's power; break up existingmonopolies by divesting facilities. These layers require increasingly complex considerations of offsettingefficiencies and of the trade-offs between the social harms from the peo sible exercise of market powerand the social gains from the possible efficiencies; they would run greater risks of inhibiting efficiencyand competition itself; and, in any event, they would require a larger and more sophisticated enforcementagency.
1941
4.2.3 Jnfim aUa Rd.mh
4.70 Tbe Government has not been an active producer, disseminator, sponsor, nor user ofresearch and infbrmation. As a result, policy decisions and laws have often been based on goodintentions' - hasty generalizations. This report has shown many examples of why good intentions arenot sufficient to choose among policy alternatives. Policy in the 1990s should be informed by reliable,timely inwrmation which has been carefidly analyzed to elevate and inform the policy debate and to avoidfuture mistakes.
4.71 The Development Ministry should undertake a systematic inventory of the economicinformation and systems available in Venezuela and in other countries and should developrecommendaJons to improve the quality and availability of reliable data, and ensure that they are gatheredand disseminated in a cost-effective fashion. Without such data it is impossible to measure the effectsof any policy, much less to approximate the effects of alternative policies. In this regard, theDevelopment Ministry should continue to give priority to computerizing its own records and making theseavailable to researchers who would be interested in measuring the effects of the policies and economicdecisions made during the 1980s. The Ministry itself does not have sufficient resources to analyze thesedata, but they would be of interest to an international body of scholars interested in understanding theeffects of Venezuelan industrial policy during the 1980s.
4.72 With reliable, timely data, the Government can undertake or sponsor suitable policyanalyses. The Development Ministry should encourage research in support of legislation and regulationswhich would lead to a more attractive investment climate and more competitive markets. The Ministryshould continue to increase its ability to undertake sophisticated analyses which can provide a morereliable basis for policy decisions on the agenda outlined in this chapter. In the interim it can encourageeconomic research directly through consultants and indirecdy through providing information and a forumfor economic debate.
4.73 The level of economic discourse in Venezuela is low relative to its economicsophistication. For example, there are no journals of economics where scholars can debate economicgoals, policies, and their consequences. Economic ideas are largely debated in the popular press or ina few specialized periodicals. While the Goverment would not be a suitable body to sponsor such ajournal, it could consider making a direct grant to an appropriate academic institution to underwrite anexperimental fiveyear publication.
Fcbngr 12, 1W4:52 5
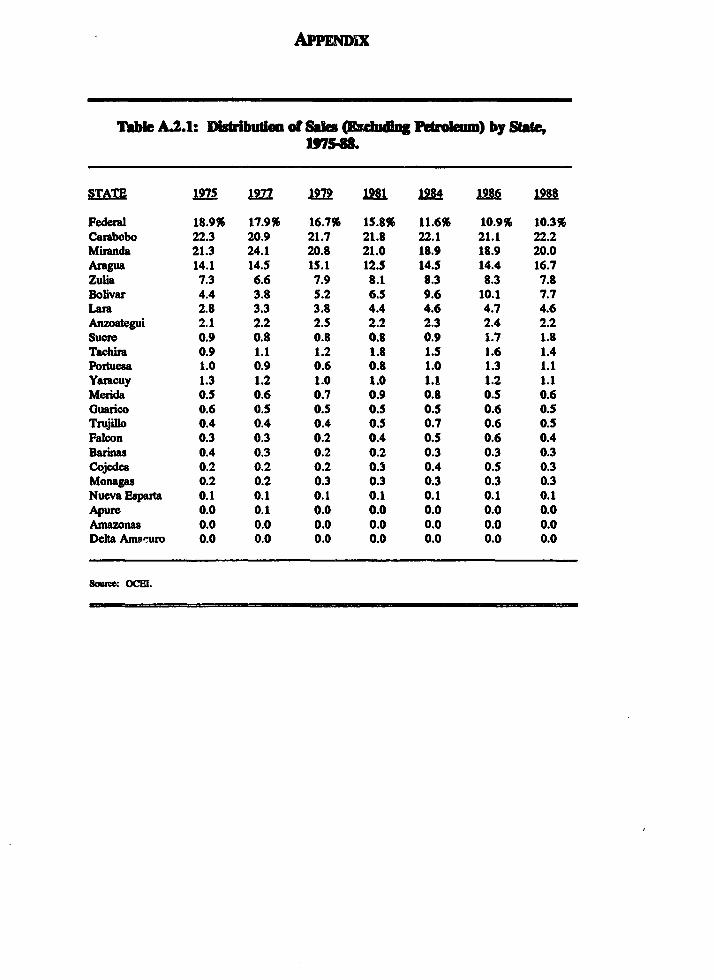
APPENDiX
Tabb A.2.1: Diuribudom of S1 (ERrbu_n Pmem) by State,1,7548.
SOTe ~197S 1977 1979 1211 94 1986 1988
Federal 18.9% 17.9% 16.7% 15.8% 11.6% 10.9% 10.3%Carabobo 22.3 20.9 21.7 21.8 22.1 21.1 22.2Miranda 21.3 24.1 20.8 21.0 18.9 18.9 20.0Aragua 14.1 14.5 1S.1 12.S 14.5 14.4 16.7Zulia 7.3 6.6 7.9 8.1 8.3 8.3 7.8Bolivar 4.4 3.8 5.2 6.S 9.6 10.1 7.7Lam 2.8 3.3 3.8 4.4 4.6 4.7 4.6Anzoategui 2.1 2.2 2.5 2.2 2.3 2.4 2.2Suer 0.9 0.8 0.8 0.8 0.9 1.7 1.8Tachira 0.9 1.1 1.2 1.8 1.5 1.6 1.4Portuesa 1.0 0.9 0.6 0.8 1.0 1.3 1.1Yaracuy 1.3 1.2 1.0 1.0 1.1 1.2 1.1Merida O.S 0.6 0.7 0.9 0.8 O.S 0.6Guarico 0.6 O.S O.S O.S O.S 0.6 O.STrujiUlo 0.4 0.4 0.4 0.5 0.7 0.6 0.5Falcon 0.3 0.3 0.2 0.4 O.S 0.6 0.4Barinas 0.4 0.3 0.2 0.2 0.3 0.3 0.3Cojedes 0.2 0.2 0.2 0.3 0.4 O.S 0.3Monagas 0.2 0.2 0.3 0.3 0.3 0.3 0.3Nueva Esparta 0.1 0.1 0.1 0.1 0.1 0.1 0.1Apure 0.0 0.1 0.0 0.0 0.0 0.0 0.0Amazonas 0.0 0.0 0.0 0.0 0.0 0.0 0.0Delta Amw-uro 0.0 0.0 0.0 0.0 0.0 0.0 0.0
-B.c ocEI.
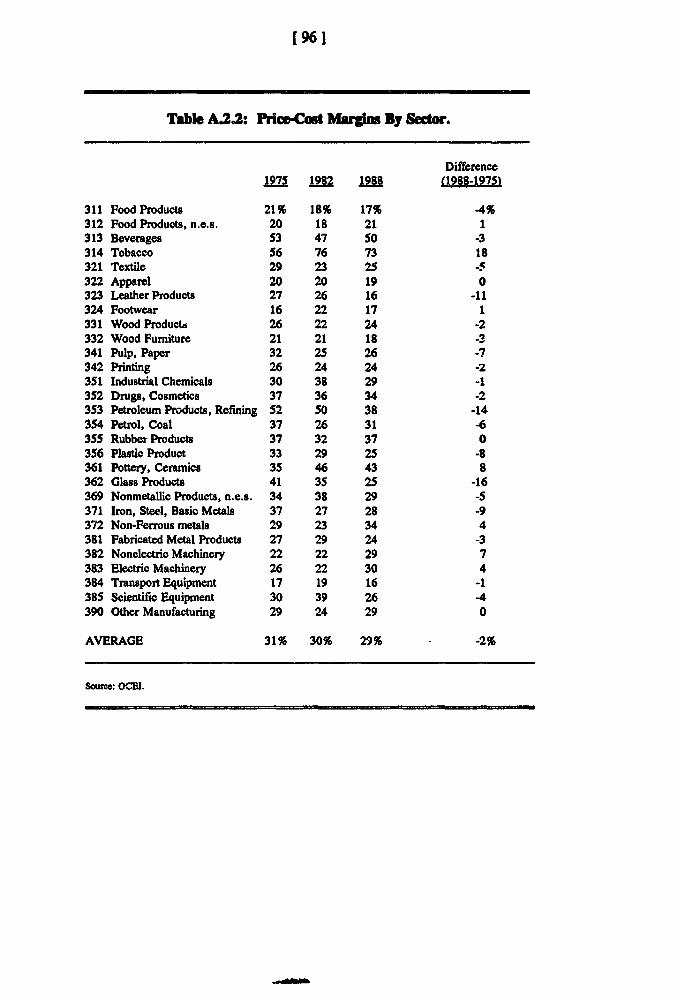
[961
Tabl. A.22: Prie-.Cost MNrxgh By Sector.
Difference1975 192S 19I8 (1988-197S1
311 Food Products 21% 18% 17% -4%312 Food Products, n.e.s. 20 18 21 1313 Beverages 53 47 S0 -3314 Tobacco 56 76 73 18321 Textile 29 23 25 -5322 Apparel 20 20 19 0323 Leather Products 27 26 16 -11324 Footwear 16 22 17 1331 Wood Productd 26 22 24 -2332 Wood Pumiture 21 21 18 -3341 Pulp, Paper 32 25 26 -7342 Printing 26 24 24 -z351 Industrial Chemicals 30 38 29 -13S2 Drugs, Cosmetics 37 36 34 -2353 Petroleum Products, Refining 52 S0 38 -14354 Petrol, Coal 37 26 31 -6355 Rubber Products 37 32 37 0356 Plastic Product 33 29 25 -8361 Pottery, Ceramics 35 46 43 8362 Glass Products 41 35 25 -16369 Nonmetallic Products, n.e.s. 34 38 29 -5371 Iron, Steel, Basic Metals 37 27 28 -9372 Non-Ferrous metals 29 23 34 4381 Fabricated Metal Products 27 29 24 -3382 Nonelectric Machinery 22 22 29 7383 Electric Machinery 26 22 30 4384 Transport Equipment 17 19 16 -1385 Scientific Equipment 30 39 26 -4390 Other Manufacturing 29 24 29 0
AVERAGE 31% 30% 29% -2%
Sa: OCE.
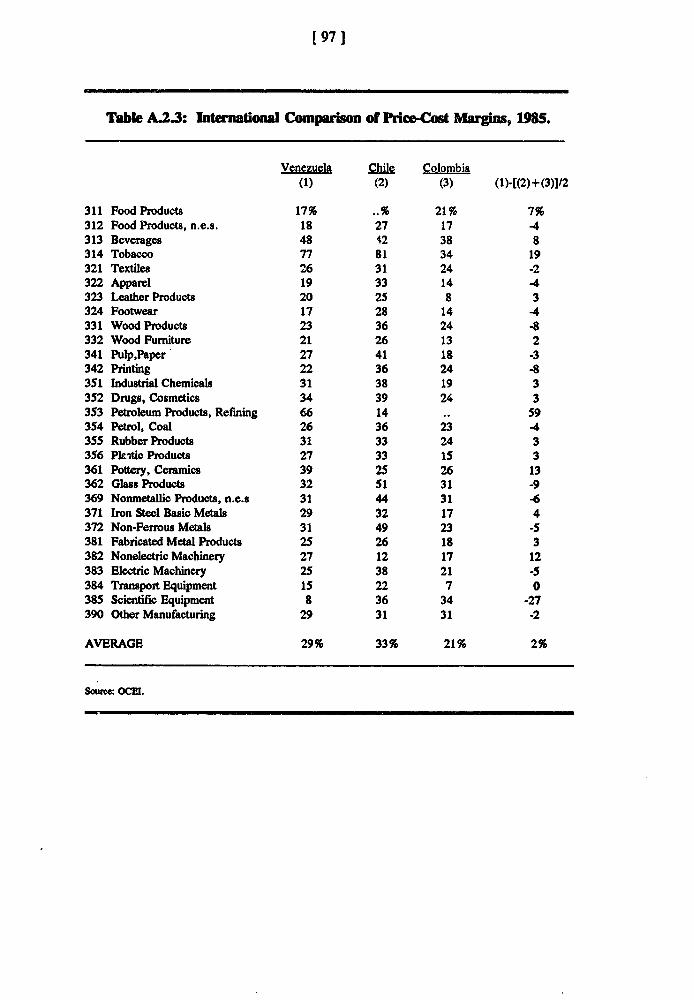
[97 1
Table A.23: International Comparison of Price-Cost Margins, M85.
Venezuela Chle Colombia(1) (2) (3) (1)-[(2)+(3)]12
311 Food Products 17% ..% 21% 7%312 Food Products, n.e.s. 18 27 17 -4313 Beverages 48 42 38 8314 Tobacco 77 81 34 19321 Textiles 26 31 24 -2322 Apparel 19 33 14 -4323 Leather Products 20 25 8 3324 Footwear 17 28 14 -4331 Wood Products 23 36 24 -8332 Wood Furniture 21 26 13 2341 Pulp,Paper 27 41 18 -3342 Printing 22 36 24 -8351 Industrial Chemicals 31 38 19 3352 Drugs, Cosmetics 34 39 24 3353 Petroleum Products, Refining 66 14 59354 Petrol, Coal 26 36 23 -4355 Rubber Products 31 33 24 3356 Plastic Products 27 33 1S 3361 Pottery, Ceramics 39 25 26 13362 Glass Products 32 51 31 -9369 Nonmetallic Products, n.e.s 31 44 31 -6371 Iron Steel Basic Metals 29 32 17 4372 Non-Ferrous Metals 31 49 23 -S381 Fabricated Metal Products 25 26 18 3382 Nonelectric Machinery 27 12 17 12383 Electric Machinery 25 38 21 -5384 Transport Equipment 15 22 7 0385 Scientific Equipment 8 36 34 -27390 Other Manufacturing 29 31 31 -2
AVERAGE 29% 33% 21% 2%
Sou: OCI.
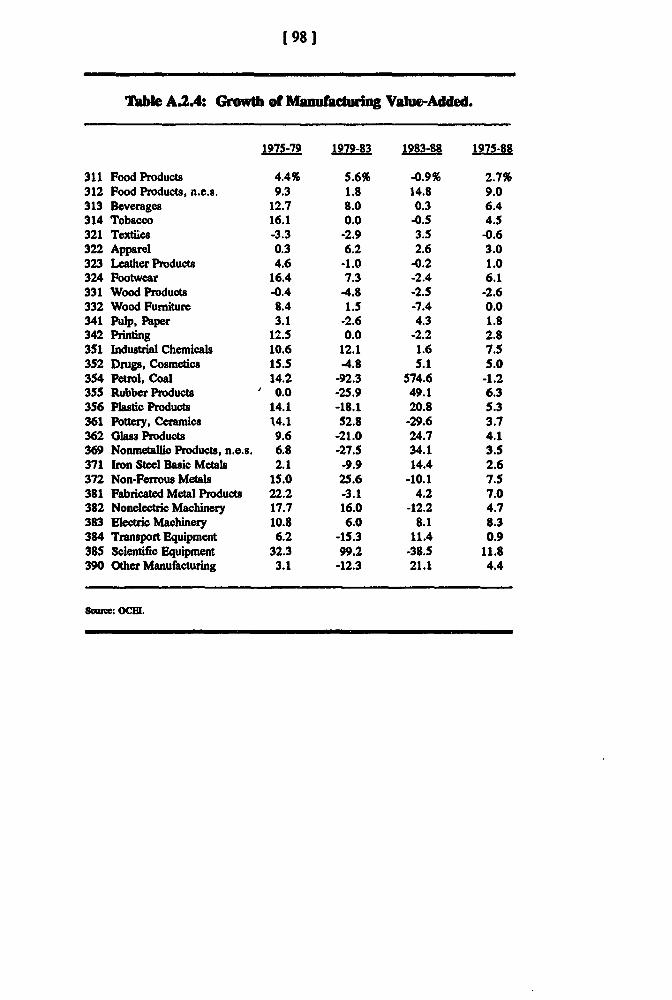
[98]
Table A.2.4: Growth of nufacturing Value-Added.
1975-79 1979-83 1983-88 1975-88
311 Food Products 4.4% 5.6% -0.9% 2.7%312 Food Products, n.e.s. 9.3 1.8 14.8 9.0313 Beverages 12.7 8.0 0.3 6.4314 Tobacco 16.1 0.0 -0.5 4.5321 Textiles -3.3 -2.9 3.5 -0.6322 Apparel 0.3 6.2 2.6 3.0323 Leather Products 4.6 -1.0 -0.2 1.0324 Footwear 16.4 7.3 -2.4 6.1331 Wood Products -0.4 -4.8 -2.5 -2.6332 Wood Purniture 8.4 1.5 -7.4 0.0341 Pulp, Paper 3.1 -2.6 4.3 1.8342 Printing 12.5 0.0 -2.2 2.8351 Industrial Chemicals 10.6 12.1 1.6 7.5352 Drugs, Cosmetics 15.5 -4.8 5.1 5.0354 Petrol, Coal 14.2 -92.3 574.6 -1.2355 Rubber Products ' 0.0 -25.9 49.1 6.3356 Pastic Products 14.1 -18.1 20.8 5.3361 Pottery, Ceramics 14.1 52.8 -29.6 3.7362 Glas Products 9.6 -21.0 24.7 4.1369 Nonmetalic Products, n.e.s. 6.8 -27.5 34.1 3.5371 Iron Steel Basic Metals 2.1 -9.9 14.4 2.6372 Non-Ferrous Metals 15.0 25.6 -10.1 7.5381 Fabricated Metal Products 22.2 -3.1 4.2 7.0382 Nonelectric Machinery 17.7 16.0 -12.2 4.7383 Electric Machinery 10.8 6.0 8.1 8.3384 Transport Equipment 6.2 -15.3 11.4 0.9385 Scientific Equipment 32.3 99.2 -38.5 11.8390 Other Manufacturing 3.1 -12.3 21.1 4.4
Sk: OCEZ.
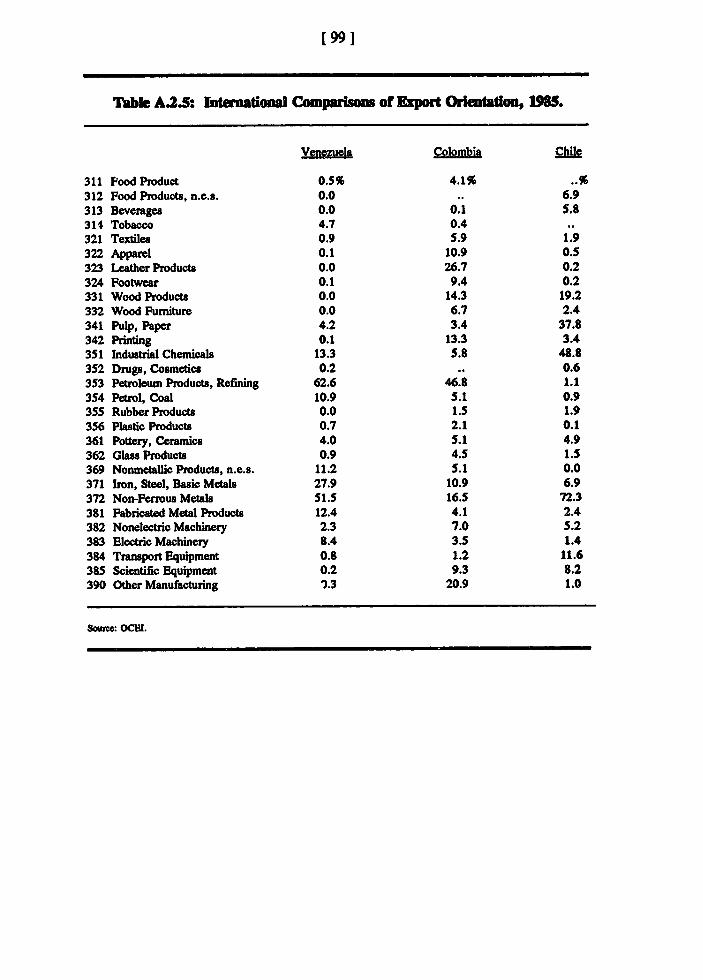
[99 1
Table A±5: Intuaoa o o of Export Orientadon, 19.
Venezela Colombia hl
311 Food Product 0.5% 4.1%312 Food Products, n.e.s. 0.0 .. 6.9313 Beverages 0.0 0.1 5.8314 Tobacco 4.7 0.4321 Textiles 0.9 S.9 1.9322 Apparel 0.1 10.9 0.5323 Leather Products 0.0 26.7 0.2324 Footwear 0.1 9.4 0.2331 Wood Products 0.0 14.3 19.2332 Wood Fumiture 0.0 6.7 2.4341 Pulp, Paper 4.2 3.4 37.8342 Printing 0.1 13.3 3.4351 Industrial Chemicals 13.3 5.8 48.8352 Drugs, Cosmetics 0.2 .. 0.6353 Petroleum Products, Refining 62.6 46.8 1.1354 Petrol, Coal 10.9 5.1 0.9355 Rubber Products 0.0 1.5 1.9356 Plastic Products 0.7 2.1 0.1361 Pottery, Ceramics 4.0 5.1 4.9362 Glass Products 0.9 4.5 1.5369 Nonmetallic Products, n.e.s. 11.2 5.1 0.0371 Iron, Steel, Basic Metals 27.9 10.9 6.9372 Non-Ferrous Metabs 51.5 16.5 72.3381 Fabricated Metal Products 12.4 4.1 2.4382 Nonelectric Machinery 2.3 7.0 5.2383 Electric Machinery 8.4 3.5 1.4384 Transport Equipment 0.8 1.2 11.6385 Scientific Equipment 0.2 9.3 8.2390 Other Manufacturing 0.3 20.9 1.0
SacC: oceW.
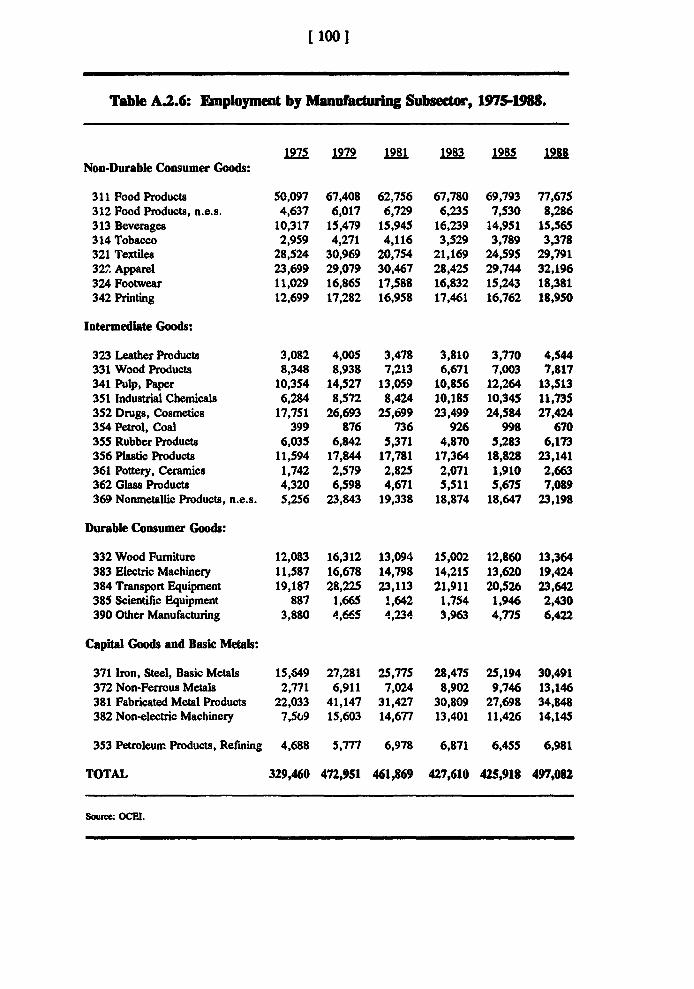
[1001
Table A.2.6: Employment by Manufacuring Subsector, 1975-1988.
1975 1979 1981 1983 1985 198Non-Durable Consumer Goods:
311 Food Products 50,097 67,408 62,756 67,780 69,793 77,675312 Food Products, n.e.s. 4,637 6,017 6,729 6,235 7,530 8,286313 Beverages 10,317 15,479 15,945 16,239 14,951 15,565314 Tobacco 2,959 4,271 4,116 3,529 3,789 3,378321 Textiles 28,524 30,969 20,754 21,169 24,595 29,79132, Apparel 23,699 29,079 30,467 28,425 29,744 32,196324 Footwear 11,029 16,865 17,588 16,832 15,243 18,381342 Printing 12,699 17,282 16,958 17,461 16,762 18,950
Intermediate Goods:
323 Leather Products 3,082 4,005 3,478 3,810 3,770 4,544331 Wood Products 8,348 8,938 7,213 6,671 7,003 7,817341 Pulp, Paper 10,354 14,527 13,059 10,856 12,264 13,513351 Industrial Chemicals 6,284 8,572 8,424 10,185 10,345 11,735352 Drugs, Cosmetics 17,751 26,693 25,699 23,499 24,584 27,424354 Petrol, Coal 399 876 736 926 998 670355 Rubber Products 6,035 6,842 5,371 4,870 5,283 6,173356 Plastic Products 11,594 17,844 17,781 17,364 18,828 23,141361 Pottery, Ceramics 1,742 2,579 2,825 2,071 1,910 2,663362 Glass Products 4,320 6,598 4,671 5,511 5,675 7,089369 Nonmetallic Products, n.e.s. 5,256 23,843 19,338 18,874 18,647 23,198
Durable Consumer Goods:
332 Wood Furniture 12,083 16,312 13,094 15,002 12,860 13,364383 Electric Machinery 11,587 16,678 14,798 14,215 13,620 19,424384 Transport Equipment 19,187 28,225 23,113 21,911 20,526 23,642385 Scientific Equipment 887 1,665 1,642 1,754 1,946 2,430390 Other Manufacturing 3,880 4,665 4,234 3,963 4,775 6,422
Capital Goods and Basic Metals:
371 Iron, Steel, Basic Metals 15,649 27,281 25,775 28,475 25,194 30,491372 Non-Ferrous Metals 2,771 6,911 7,024 8,902 9,746 13,146381 Fabricated Metal Products 22,033 41,147 31,427 30,809 27,698 34,848382 Non-electric Machinery 7,509 15,603 14,677 13,401 11,426 14,145
353 Petroleunm Products, Refining 4,688 5,777 6,978 6,871 6,4SS 6,981
TOTAL 329,460 472,9S1 461,869 427,610 42S,918 497,082
SourCm OCEI.
BIBLIOGRAPHY
Bates, Robert H. (1981) Markets and States in Tropical Africa. Berkeley: University of CaliforniaPress.
Balassa, Bela (ed.) (1989) Subsidies and Countervailing Measures: Critical Issues for the UruguayRound. Washington: World Bank Discussion Paper number 55.
Blomstrom, Magnus, Irving Kravis and Robert Lipsey (1988) "Multinational Firms and ManufacturedExports from Developing Countries", NBER Working Paper 2493.
Bourguignon, Francois (1988) "Venezuela: Absorption without Growth." In Gelb and Associates(1988).
Collins, Susan M. (1988) "Multiple Exchange Rates, Capital Controls, and Commercial Policy." InDornbusch and Helmers (1988).
Corden, W. M. (1984) "Booming Sector and Dutch Disease Economics: Survey and Consolidation."Oxford Economic Papers, pp. 359-80.
Dornbusch, Rudiger and F. Leslie C. H. Helmers (1988) The OpenEconomy. Oxford: OxfordUniversity Press.
Dunning, John and John Cantwell (1985) IRM Directory of Statistics of International Investment andProduction.
Fitzgerald, Bruce, and Terry Monson (1989) "Preferential Credit and Insurance as Means to PromoteExports." World Bank Research Observer. January, pp. 89-114.
Gelb, Alan and Associates (1988) Oil Windfalls: Blessing or Curse? Oxford: Oxford UniversityPress.
Instituto de Comercio Exterior (1990) Venezuela for Export: More than Just Oil. Caracas: processed.
Krueger, Anne 0. (1990) "Government Failures in Development," Journal of Economic Perspectives,Summer, pp. 9-23.
Meller, Patricio (1978) "The Pattern of Industrial Concentration in Latin America", in The Journal ofIndustrial Economics, Sept.
Naim, Moises, (1988) "La Empresa Privada en Venezuela: Que Pasa Cuando se Crece en Medio de laRiqueza y la Confusi6n?", in Naim (1988).
Naim, Moises and Ramon Pinango (1988) El Caso Venezuela: Una Ilusi6n de Armonia. Caracas:IESA.
[ 102 1
Nishimizu, Mieko, and John M. Page, Jr. (1989) "Economic Policies and Productivity Change inIndustry: An International Comparison." Washington: World Bank, processed.
Nogues, Julio (1989) "The Experience of Latin America with Export Subsidies." in Balassa (1989).
O'Brien, Peter (1988) The Automobile Industry in the Developing Countries: Risks and Opportunitiesin the 1990's. London: Economist Intelligence Unit.
Roberts, Mark (1989) "The Structure of Production in Colombian Manufacturing Industries 1977-1985." State College, Penn.: Pennsylvania State University, processed.
Tybout, James (1989) "Entry, Exit, Competition and Productivity in the Chilean Industrial Sector."Washington: World Bank, CECTP, processed.
Warr, Peter G. (1989) "Export Processing Zones: The Economics of Enclave Manufactring." MEWorld Bank Research Observer, January, 1989, pp. 65-88.
Wells, Louis T. and Alvin G. Wint (1990) Marketing a Country: Promotion as a Tool for AttractingForeign Investment. Washington, D. C.: International Finance Corporation and MultilateralInvestment Guarantee Agency.
World Bank (1988) Country Economic Report on Venezuela: Policy Choices and Economic Growth.Washington: Report No. 6711-VE, v. 1 and v. 2.
World Bank (1988a) Policy Options for Venezuela. Washington: photocopied.
World Bank (1989) Colombia: Industrial Competition and Performance. Washington: Report No.7921-CO.
OiAob 10 19WO90SW P

MAP SECTION
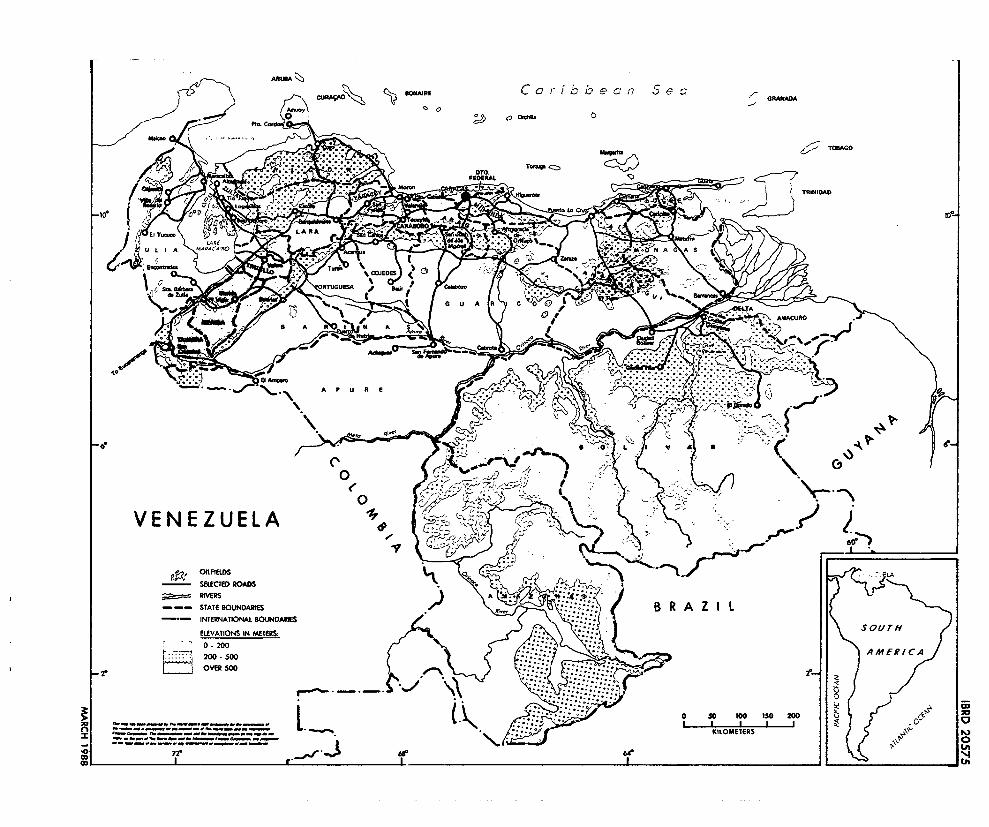
ELEATON IN M' -E R
- -INTERNATIONAL BOUNDARIES V -'.
0-200 ~ AtM
F -° < 01Dsov20 - 50
I ~ ~~~~~ I2 ' - (PTtOTi5
Related Documents