Industrial-scale proteomics: From liters of plasma to chemically synthesized proteins Keith Rose 1 * , Lydie Bougueleret 1 * , Thierry Baussant 1 , Günter Böhm 1 , Paolo Botti 1 , Jacques Colinge 1 , Isabelle Cusin 1 , Hubert Gaertner 1 , Anne Gleizes 1 , Manfred Heller 1 , Silvia Jimenez 1 , Andrew Johnson 1 , Martin Kussmann 1 , Laure Menin 1 , Christoph Menzel 1 , Frederic Ranno 1 , Patricia Rodriguez-Tomé 1 , John Rogers 1 , Cedric Saudrais 1 , Matteo Villain 1 , Diana Wetmore 1 , Amos Bairoch 1, 2 and Denis Hochstrasser 1, 3 1 GeneProt, Geneva, Switzerland 2 Swiss Institute of Bioinformatics, CMU, Geneva, Switzerland 3 University Hospital of Geneva, Geneva, Switzerland Human blood plasma is a useful source of proteins associated with both health and disease. Analysis of human blood plasma is a challenge due to the large number of peptides and pro- teins present and the very wide range of concentrations. In order to identify as many proteins as possible for subsequent comparative studies, we developed an industrial-scale (2.5 liter) approach involving sample pooling for the analysis of smaller proteins (M r generally , ca. 40 000 and some fragments of very large proteins). Plasma from healthy males was depleted of abundant proteins (albumin and IgG), then smaller proteins and polypeptides were sepa- rated into 12 960 fractions by chromatographic techniques. Analysis of proteins and polypep- tides was performed by mass spectrometry prior to and after enzymatic digestion. Thousands of peptide identifications were made, permitting the identification of 502 different proteins and polypeptides from a single pool, 405 of which are listed here. The numbers refer to chromato- graphically separable polypeptide entities present prior to digestion. Combining results from studies with other plasma pools we have identified over 700 different proteins and polypep- tides in plasma. Relatively low abundance proteins such as leptin and ghrelin and peptides such as bradykinin, all invisible to two-dimensional gel technology, were clearly identified. Proteins of interest were synthesized by chemical methods for bioassays. We believe that this is the first time that the small proteins in human blood plasma have been separated and analyzed so extensively. Keywords: Industrial-scale / Mass spectrometry / Plasma Received 11/11/03 Revised 16/12/03 Accepted 22/12/03 Proteomics 2004, 4, 2125–2150 2125 1 Introduction The present article describes an industrial-scale ap- proach (comprehensive as far as possible) [1] to the anal- ysis of small proteins and polypeptides present in human blood plasma. Plasma is interesting for the following rea- sons: it contains many active proteins and telltale traces of diseases from many tissues; it may be obtained in fairly large quantities relatively noninvasively from both patients and control subjects (contrast tissue, which is often diffi- cult to obtain in large amounts from controls); blood, plasma or serum are used quite generally for exisiting clinical tests; many of the cells responsible for the protein content of plasma are not found in the blood, which may limit a genomic approach; it is via the plasma that most therapeutic agents reach their targets, and finally it is a fluid and therefore may be pooled (much more difficult to achieve with tissue) in order to obtain a large and repre- sentative sample for analysis. Nonetheless, analysis of the plasma proteome is challenging [1, 2] in view of the Correspondence: Keith Rose, Ph.D., GeneProt, 2 rue Pré-de-la- Fontaine, CP125, CH-1217 Meyrin 2, Switzerland E-mail: [email protected] Fax: 141-22-719-39-70 Abbreviation: LIMS, laboratory information management sys- tem * These authors contributed equally. 2004 WILEY-VCH Verlag GmbH & Co. KGaA, Weinheim www.proteomics-journal.de DOI 10.1002/pmic.200300718

Welcome message from author
This document is posted to help you gain knowledge. Please leave a comment to let me know what you think about it! Share it to your friends and learn new things together.
Transcript

Industrial-scale proteomics: From liters of plasma tochemically synthesized proteins
Keith Rose1*, Lydie Bougueleret1*, Thierry Baussant1, Günter Böhm1, Paolo Botti1,Jacques Colinge1, Isabelle Cusin1, Hubert Gaertner1, Anne Gleizes1, Manfred Heller1,Silvia Jimenez1, Andrew Johnson1, Martin Kussmann1, Laure Menin1,Christoph Menzel1, Frederic Ranno1, Patricia Rodriguez-Tomé1, John Rogers1,Cedric Saudrais1, Matteo Villain1, Diana Wetmore1, Amos Bairoch1, 2
and Denis Hochstrasser1, 3
1GeneProt, Geneva, Switzerland2Swiss Institute of Bioinformatics, CMU, Geneva, Switzerland3University Hospital of Geneva, Geneva, Switzerland
Human blood plasma is a useful source of proteins associated with both health and disease.Analysis of human blood plasma is a challenge due to the large number of peptides and pro-teins present and the very wide range of concentrations. In order to identify as many proteinsas possible for subsequent comparative studies, we developed an industrial-scale (2.5 liter)approach involving sample pooling for the analysis of smaller proteins (Mr generally , ca.40 000 and some fragments of very large proteins). Plasma from healthy males was depletedof abundant proteins (albumin and IgG), then smaller proteins and polypeptides were sepa-rated into 12 960 fractions by chromatographic techniques. Analysis of proteins and polypep-tides was performed by mass spectrometry prior to and after enzymatic digestion. Thousandsof peptide identifications were made, permitting the identification of 502 different proteins andpolypeptides from a single pool, 405 of which are listed here. The numbers refer to chromato-graphically separable polypeptide entities present prior to digestion. Combining results fromstudies with other plasma pools we have identified over 700 different proteins and polypep-tides in plasma. Relatively low abundance proteins such as leptin and ghrelin and peptidessuch as bradykinin, all invisible to two-dimensional gel technology, were clearly identified.Proteins of interest were synthesized by chemical methods for bioassays. We believe thatthis is the first time that the small proteins in human blood plasma have been separated andanalyzed so extensively.
Keywords: Industrial-scale / Mass spectrometry / Plasma
Received 11/11/03Revised 16/12/03Accepted 22/12/03
Proteomics 2004, 4, 2125–2150 2125
1 Introduction
The present article describes an industrial-scale ap-proach (comprehensive as far as possible) [1] to the anal-ysis of small proteins and polypeptides present in humanblood plasma. Plasma is interesting for the following rea-sons: it contains many active proteins and telltale tracesof diseases from many tissues; it may be obtained in fairly
large quantities relatively noninvasively from both patientsand control subjects (contrast tissue, which is often diffi-cult to obtain in large amounts from controls); blood,plasma or serum are used quite generally for exisitingclinical tests; many of the cells responsible for the proteincontent of plasma are not found in the blood, which maylimit a genomic approach; it is via the plasma that mosttherapeutic agents reach their targets, and finally it is afluid and therefore may be pooled (much more difficult toachieve with tissue) in order to obtain a large and repre-sentative sample for analysis. Nonetheless, analysis ofthe plasma proteome is challenging [1, 2] in view of the
Correspondence: Keith Rose, Ph.D., GeneProt, 2 rue Pré-de-la-Fontaine, CP125, CH-1217 Meyrin 2, SwitzerlandE-mail: [email protected]: 141-22-719-39-70
Abbreviation: LIMS, laboratory information management sys-tem * These authors contributed equally.
2004 WILEY-VCH Verlag GmbH & Co. KGaA, Weinheim www.proteomics-journal.de
DOI 10.1002/pmic.200300718

2126 K. Rose et al. Proteomics 2004, 4, 2125–2150
large numbers of proteins expected to be present and thewide dynamic range of protein and polypeptide concen-trations, known to span at least 11 to 12 orders of magni-tude (albumin vs. TNF, Fig. 1).
Figure 1. Abundance and dynamic range of plasma pro-teins. Plasma concentrations of some known proteins areshown in a log-log relationship with the number of proteinspecies expected at the various concentration ranges.Adapted from [1]. The 100 or so most abundant proteinsrepresent the “tip of the iceberg”, labeled common in theFigure. The less abundant proteins are represented by thearea region of interest.
In order to identify and characterize proteins and poly-peptides present at very low concentrations, it is neces-sary to start with a large sample volume to ensure theirpresence in sufficient quantities. This stems from thesensitivity requirements of mass spectrometers whichare used for rapid and sensitive analysis of proteins. If100 fmol (not an unreasonable amount) of protein isrequired for successful separation, digestion and massspectrometric identification, then a protein concentrationof at least 1 nM is required with a sample size of 100 mL.This required minimum concentration falls to 100 fM ifone liter of sample is available.
Although this is a question of simple arithmetic, it is notalways appreciated. Of course, these are minimum con-centrations which may not actually be reached with thecited sample volumes since extensive separation cannotbe performed quantitatively, but it is important to appreci-ate the utility of larger sample sizes when comprehensiveproteomics is attempted. In this article we outline ourapproach for the analysis of smaller proteins (Mr , ca.40 000) present in 2.5 liter samples of pooled humanplasma and present some preliminary results. We havecarried out several separate large scale analyses (500 mLand above), including comparative studies, and believethis is the first time that such an extensive separationand study of the small proteins present in human plasmaor serum has been reported.
2 Materials and methods
2.1 Initial sample handling
A laboratory information management system (LIMS) wasdeveloped and employed to track plasma samples fromthe point of blood collection, to track fractions and fractionhandling throughout the extensive separation process,and to monitor laboratory instruments and record datagenerated. Blood (100–450mL) was obtained from healthymales using standard veinous puncture procedures in amedical center (Duke University, Durham, NC, USA) set-ting after informed written consent. Samples were bar-coded and plasma was prepared by centrifugation andremoval of white cells on filters, Sepacell RZ-2000 non-woven (Baxter, Asahi, Japian), according to the manufac-turer’s instructions. Times, temperaturesandcentrifugationconditions and subsequent procedures were rigorouslycontrolled to ensure similar treatment of all samples. Pro-tease inhibitor (Complete; Roche Molecular Biochemicals,Indianapolis, IN, USA) was added according to the manu-facturer’s instructions and mixed gently to ensure disso-lution. Plasma samples were then frozen and stored at2807C. After careful consideration of medical history andclinical chemistry parameters, major portions of 53 sam-ples were pooled. Portions from each individual (10 mL)were retained unpooled for individual small-scale studies.From this pool (total volume 6 L) 2.5 L was used for analysisof the smaller proteins and polypeptides. The separationsteps are summarized in Table 1.
Table 1. Separation steps for the small proteins of 2.5 Lof plasma or serum
1. Depletion of abundant proteins (albumin and immuno-globulins): 53 g remain.
2. Gel filtration and reverse phase capture: 1.5 g remain(ca. 91%).
3. Cation exchange chromatography (CEX): 18 fractionsof 15–280 mg (ca. 95%).
4. Reduction and alkylation.5. 1st reverse phase dimension (RP1): 30 fractions/CEX
fraction (ca. 98%).6. Concentration in vacuum centrifuge.7. 2nd reverse phase dimension (RP2): 24 fractions/RP1
fraction, online LC-MS.8. Automated liquid handling and sample preparation
of the 12 960 fractions from step 7: MALDI MS,digestion, MALDI and LC-MS/MS of digests.
Protein recovery (, 20 kDa) is given where available inparentheses. It is expressed as the % of eluted proteinover protein injected. Both values were determined bysize exclusion HPLC (using BSA as a standard, see Sec-tion 2.2).
2004 WILEY-VCH Verlag GmbH & Co. KGaA, Weinheim www.proteomics-journal.de

Proteomics 2004, 4, 2125–2150 Industrial-scale proteomics 2127
2.2 Depletion and gel filtration
Portions of frozen pooled plasma (125 mL) were thawedand filtered through 0.45 mm sterile filters in a sterile hood.Filtrate was applied to a tandem column combinationconsisting of 300 mL albumin affinity resin (column 5 cmID, 15 cm length, laboratory prototype gel based on apeptidic compound linked to an agarose matrix; Amers-ham Biosciences, Uppsala, Sweden) and 100 mL ProteinG Sepharose Fast Flow (5 cm ID, 5 cm length; AmershamBiosciences). Columns were equilibrated and washedwith 50 mM PO4 buffer, pH 7.1, 0.15 M NaCl. A flow rateof 5 mL/min was used. The nonretained (flow-through)fraction (350 mL) was frozen until the second step. Twentyruns were performed. Protein content in the flow-throughfraction was determined by analytical size exclusionHPLC using BSA as a standard. The 20 flow-through frac-tions were applied in turn to gel filtration chromatography.Each portion was thawed and filtered through a 0.45 mmsterile filter in a sterile hood. Filtrate was injected on twoin-line gel filtration columns: 269.5 L Superdex 75 (each14 cm ID, 62 cm length; Amersham Biosciences). Thetandem columns were equilibrated and then eluted at arate of 40 mL/min with 50 mM PO4 buffer pH 7.4, 0.1 M
NaCl, 8 M urea. Hydrophobic impurities in the buffer wereretained on a reverse phase precolumn upstream of theinjector (150 mL PLRPS; Polymer Labs, Amherst, MA,USA). During the elution of low Mr proteins (nominally ,
20 kDa based on analytical SDS-PAGE) the effluent wasswitched to an in-line reverse phase capture column(50 mL PLRPS, 100 Å; Polymer Labs). The three-wayvalve controlling effluent switching to the PLRPS columnwas activated when the absorbance at 280 nm fell to33 mAU after elution of the large proteins. The cut-offvalue was established during preliminary experimentsusing SDS-PAGE to monitor the eluate. After washingthe PLRPS capture column, low Mr proteins and peptideswere eluted with one column volume of 0.1% TFA, 80%CH3CN in water. Each eluted portion was frozen untilfurther use. The 20650 mL eluates were then thawed,pooled (1 L) and distributed into 7 polypropylene contain-ers (143 mL each). Containers were kept at 2207C.
2.3 Ion exchange chromatography
The seven portions were thawed in turn and mixed withan equal volume of cation exchange buffer A (glycine/HCl 50 mM, pH 2.7, urea 8 M). Each sample was injectedonto a 100 mL Source 15S column (35 mm ID, 100 mmlength; Amersham Biosciences) equilibrated and washedwith buffer A. A flow rate of 10 mL/min was used. Proteinsand peptides were eluted with step gradients from 100%buffer A to 100% buffer B (i.e. buffer A containing 1 M
NaCl): 3 column volumes 7.5% buffer B (75 mM NaCl);3 column volumes 10% buffer B (100 mM NaCl); 3 columnvolumes 17.5% buffer B (175 mM NaCl); 2 columnvolumes 22.5% buffer B (225 mM NaCl); 2 columnvolumes 27.5% buffer B (275 mM NaCl); 2 columnvolumes 100% buffer B (1 M NaCl). After seven runs, frac-tions were pooled in order to obtain 18 final fractions.Fractions were kept at 2207C until further use.
2.4 Reduction/alkylation and 1st RP HPLCfractionation
After adjusting the pH to 8.5 with concentrated Tris-HCl,each of the 18 cation exchange fractions was reducedwith dithioerythritol ((DTE) 30 mM, 3 h at 377C) and alkylat-ed with iodoacetamide (120 mM, 1 h 257C in the dark). Thelatter reaction was stopped with the addition of DTE(30 mM) followed by acidification (0.1% TFA). Fractionswere then injected at a rate of 10 mL/min on an UptispherC8 column (5 mm, 300 Å, 21 mm ID, 150 mm length; Inter-chim, Montlucon, France). The C8 column was equili-brated and washed with 0.1% TFA in water (solution A).Proteins and peptides were eluted at a rate of 20 mL/minwith a biphasic gradient from 100% A to 100% B (0.1%TFA, 80% CH3CN in water) over 60 min. Thirty fractionsof 40 mL were collected. Based on the measured OD ofeach fraction at 280 nm, aliquots of similar protein con-tent were created for each fraction. Aliquots were frozenand kept for further use. One aliquot per fraction wasdried with a Speed Vac (Savant Holbrook, NY, USA) afteraddition of 500 mL 10% glycerol in water to preventexcess drying. Dried fractions were kept at 2207C untilneeded.
2.5 2nd RP HPLC fractionation
Dried samples from the previous step (see Section 2.4)were resuspended in 1 mL of solution A (0.03% TFA inwater) and injected on a LCMS C4 column (5 micrometers,300 Å, 4.6 mm ID, 150 mm length; Vydac Hesperia, CA,USA). The column was equilibrated and washed at a rateof 0.8 mL/min with solution A. Proteins and peptides wereeluted with a biphasic gradient adapted to the elutionposition of the fraction in the 1st RP dimension. Sixteendifferent gradients were used with a CH3CN concentra-tion range from 5% below to 5% above the elution con-centration used in the 1st RP1 dimension. However, forproteins eluted in the first dimension with a CH3CN con-centration equal to or greater than 30% CH3CN, the start-ing elution conditions for the second dimension gradientwere set at the first dimension elution concentrationminus 30%. Twenty-four eluted fractions were collected in
2004 WILEY-VCH Verlag GmbH & Co. KGaA, Weinheim www.proteomics-journal.de

2128 K. Rose et al. Proteomics 2004, 4, 2125–2150
deep-well plates using optimized collection configura-tions designed for optimal SpeedVac concentration andfurther robotic treatment.
2.6 MS
ESI-MS data were collected online during the 2nd RP di-mension by splitting 2.5% of the effluent to a mass spec-trometer (Esquire 3000; Bruker Daltonics Bremen, Ger-many). Aliquots of the 12 960 final fractions of undigestedproteins were mixed with MALDI matrices, and spottedwith automated spotting devices (MAP II/8; Bruker Dal-tonics) on MALDI plates (Anchor type; Bruker Daltonics)together with mass calibration standards and sensitivitystandards. Two different MALDI matrices were employed:sinapinic acid (SA), and a-cyano-4-hydroxycinnamic acid(HCCA). MALDI spectra were obtained using BrukerReflex III machines. Spectra were systematically acquiredunder three sets of conditions: low and medium massranges with HCCA in reflector mode, and high mass rangewith SA in linear mode. The bulk of each sample in the96-well plates was concentrated from 0.8 mL to about50 mL per well in the vacuum centrifuge. Samples werethen diluted to about 200 mL, reconcentrated to about50 mL per well, and stored at 47C. Proteins were thendigested by re-buffering, adding trypsin to the wells, seal-ing and incubating the plates at 377C for 12 h, followedby quenching (addition of formic acid to bring the pH to2.0). The amount of trypsin added to the wells was basedon the OD at 280 nm recorded for each particular fraction.This ensured an optimal use of trypsin and completedigestion of the most concentrated fractions. MALDIanalysis was performed as described above except thatonly the HCCA matrix was used. The major portion ofeach digest was analyzed by capillary LC-ESI-MS/MS(Esquire 3000 ion trap machines; Bruker Daltonics) at arate of 2 mL/min. For this, each of 40 Bruker Esquire 3000mass spectrometers was fitted with a pair of Waters Alli-ance chromatographs (Waters, Milford, MA, USA) througha low dead volume switching valve in order to maximizethroughput of the mass spectrometers. While one chro-matograph was equilibrating and injecting, the other waseluting components into the mass spectrometer. Theroles were then reversed automatically. Machines werecontrolled using HyStar software (Bruker Daltonics).
2.7 Bioinformatics
Raw data were processed online on an acquisition PC,then data were collected by the LIMS, backed up, andpeak lists were transferred to the Supercomputer (1420Compaq/HP Alpha processors) for processing. Identifica-tion against six different databanks was performed using
commercial algorithms in early experiments, and thenwith a new search engine [5]. Integrated identificationresults were then transferred to an Oracle DataBase, to-gether with the related relevant LIMS information (fractionnumber and position in the experimental process). Auto-matic procedures were put in place to filter out false posi-tive peptide identifications after careful validation byannotators. Manual identification of protein and or frag-ments of proteins was then done by the annotators. Auto-matic annotation is kept in the database as well as man-ual annotation when required.
2.8 Chemical synthesis
Proteins of interest were then synthesized by chemicalmethods [7–9], including Native Chemical Ligation. Finaloxidative refolding was performed by standard methods[10, 11] based on results of trial experiments involvingdilution or dialysis to remove denaturant while increasingthe proportion of oxidized glutathione in a buffered mix-ture of oxidized and reduced forms of glutathione.Masses of all fragments and of final products were veri-fied by MS and were within 0.5 amu of calculated values.Synthesized proteins were then submitted to a variety ofin vitro and in vivo assays.
3 Results and discussion
3.1 Preseparation
Portions of plasma from 53 healthy male volunteers werepooled in order to dilute phenotypic differences and toprovide a large pool volume. Great care was taken toensure that sample collection and processing (includingtimes, temperatures, centrifugation etc.) was as similaras possible for all of the samples. A volume of 2.5 L ofsuch a pool was used for the analysis of the smallerproteins described here. Unpooled portions (ca. 10 mL)of individual samples were retained for further studies.The separation scheme, shown in Table 1, starts with adepletion step to reduce the concentrations of the mostabundant proteins. It is necessary to remove abundantlarger proteins as these interfere with the subsequentchromatographic procedures [2, 3]. We used a tandemcolumn combination which adsorbs serum albumin andimmunoglobulins (Fig. 2A).
Other groups have used immobilized Cibacron blue orimmobilized antibodies for this purpose [2, 4] and suchcolumns are available from Amersham, ABI (Foster City,CA, USA) and Agilent (Palo Alto, CA, USA). The advan-tage of the albumin binding medium which we used wasits specificity. Besides albumin, the column adsorbed at
2004 WILEY-VCH Verlag GmbH & Co. KGaA, Weinheim www.proteomics-journal.de

Proteomics 2004, 4, 2125–2150 Industrial-scale proteomics 2129
Figure 2. Chromatographic separations. (A) Depletion of albumin and IgG. The earlier peak is nonretained and the second(doublet) is obtained during regeneration. One-twentieth of the 2.5 L sample (125 mL) was loaded per run. (B) Gel filtrationof depleted plasma (125 mL equivalent). Effluent between arrows was diverted to RP capture. (C) Cation exchange chro-matography with fractions shown. Seven such runs were performed.
least 20 polypeptides identified as albumin fragmentsafter reduction, alkylation, 2-DE and MS. This depletionstep greatly simplified the subsequent analysis of smallproteins. Small quantities of very hydrophobic proteins(apolipoproteins) were also captured by the depletionmedia. These proteins were all clearly identified in theflow-through fraction also. Detailed results obtained withthe albumin binding medium will be reported elsewhere.From 2.5 L pooled plasma we obtained approximately53 g of protein depleted in albumin and immunoglobulins.
Gel filtration (Fig. 2B) was then performed. Approximately1.5 g of small proteins of which approximately 1.3 g wasof Mr , 20 000, as determined by analytical gel filtrationHPLC monitored at 210 nm and using BSA as a standard(data not shown), was obtained. These small proteins andpolypeptides were separated (Table 1) into 12 960 frac-tions by a combination of cation exchange chromatogra-phy (Fig. 2C, 18 fractions), a first RP HPLC dimension(30 fractions from each of the ion exchange fractions;Fig. 3 top panel), and a second HPLC procedure (24 frac-
2004 WILEY-VCH Verlag GmbH & Co. KGaA, Weinheim www.proteomics-journal.de

2130 K. Rose et al. Proteomics 2004, 4, 2125–2150
Figure 3. (A) 1st RP dimension (RP1) for ion exchange fraction 4. (B) 2nd RP dimension (RP2) for 9 consecutive RP1 fractions(10–18) of the RP1 run shown in the upper panel. Examples of the second-dimension RP chromatogram obtained from nineconsecutive fractions (10–18) from the first-dimension RP run of ion exchange fraction 4 are shown. While the complexity ofthese fractions is very evident, the consecutive chromatograms are very different, testifying to the separating power of thefirst dimension.
tions from each of the fractions from the first HPLCseparation). Many (8533) of these final fractions weresubsequently found not to contain an identifiable protein,994 fractions contained a single identifiable protein, andthe richest fraction contained 21 identifiable proteins.These final fractions were analyzed online by LC-ESI-MSand offline by MALDI-TOF MS, to obtain mass determina-tion of intact species where possible. Of the 8533 emptyfractions, 5892 arrived empty in the database becausethere was no successful automatic identification, eitherbecause there was no triggered MS/MS spectrum or be-cause the quality was below our threshold. This tended tooccur for the earliest (1–5) and latest (18–24) RP2 frac-
tions of each run. The remaining 2641 of the 8533 emptyfractions were emptied after annotation since the hitswere of insufficient quality.
3.2 MS
As mentioned above, ESI-MS data of the intact proteinswere acquired online during the second RP dimension.Small aliquots of collected fractions were prepared forMALDI-TOF MS using liquid handlers. After being con-centrated in a vacuum centrifuge the proteins weredigested and optical density values of the fractions were
2004 WILEY-VCH Verlag GmbH & Co. KGaA, Weinheim www.proteomics-journal.de

Proteomics 2004, 4, 2125–2150 Industrial-scale proteomics 2131
used to automatically adjust the amount of enzyme (tryp-sin) which was added for the digestion step. Fragmentsproduced by digestion were analyzed by MALDI-TOFMS in reflectron mode to obtain peptide mass fingerprintinformation, and also by LC-ESI-MS and MS/MS. MS/MSanalysis was initiated automatically in a data-dependentfashion based on MS data acquired during the same run.Figure 4 shows an example of how all this information isused.
Figure 4. Sequence coverage of small inducible cytokineA14. Italic bold type indicates coverage by ESI-MS;underlined sequence indicates coverage by MALDI MS.A total coverage of 82% was obtained.
From Fig. 4, the close correspondence of the intactmasses found (8903.0 by ESI, 8904.3 by MALDI) with themass calculated for the entire reduced and carboxamido-methylated cytokine (8905.99) allows us to deduce thatthis protein was processed as expected (removal of thesignal sequence) and that the cysteine residues were
alkylated properly by our procedures. A coverage of82% was obtained when combining MALDI and ESIdata. Figure 5 shows that even with 12 960 fractions it isnot possible to separate all the proteins present. Theexcellent signal-to-noise ratio obtained for the relativelylow abundance protein leptin is also shown.
3.3 Bioinformatics
More than 1.5 million MS/MS spectra were generated and330 000 of these used for manual testing and validationof the algorithms developed for automated identifica-tions. Preliminary interpretations of MS/MS spectra wereperformed using commercial algorithms. Later, MS/MSspectra were interpreted using a new identification engine(Olav) which has been previously described [5]. Theengine accessed a set of six different databases contain-ing either protein sequence data (Swiss-Prot), publicEST or Genomic sequence data, and commercial Patentdatabases. Post-processing was performed to enhancethe quality of the scoring of each identification. An inte-gration step was then used to check the consistency ofthe global identification across the different databasesused. Annotation (automatic and manual) was performed
Figure 5. MALDI mass spectrum of a tryptic digest of one of the 12 960 fractions, shown to contain atleast two proteins: leptin and apolipoprotein A II.
2004 WILEY-VCH Verlag GmbH & Co. KGaA, Weinheim www.proteomics-journal.de

2132 K. Rose et al. Proteomics 2004, 4, 2125–2150
on the validated identifications to emphasize importantfeatures and further characterize the observed proteinsor fragments of proteins.
3.4 Proteins identified
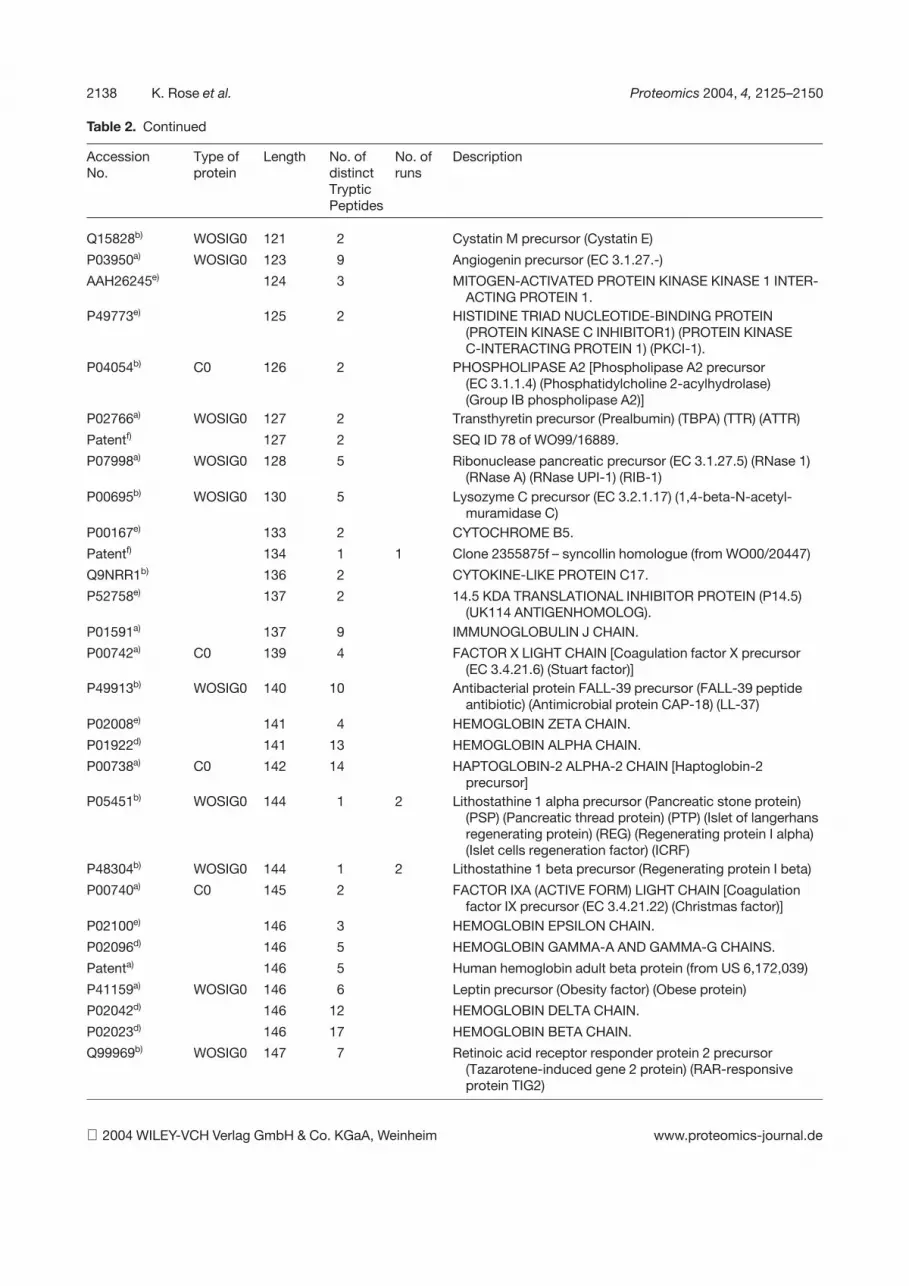
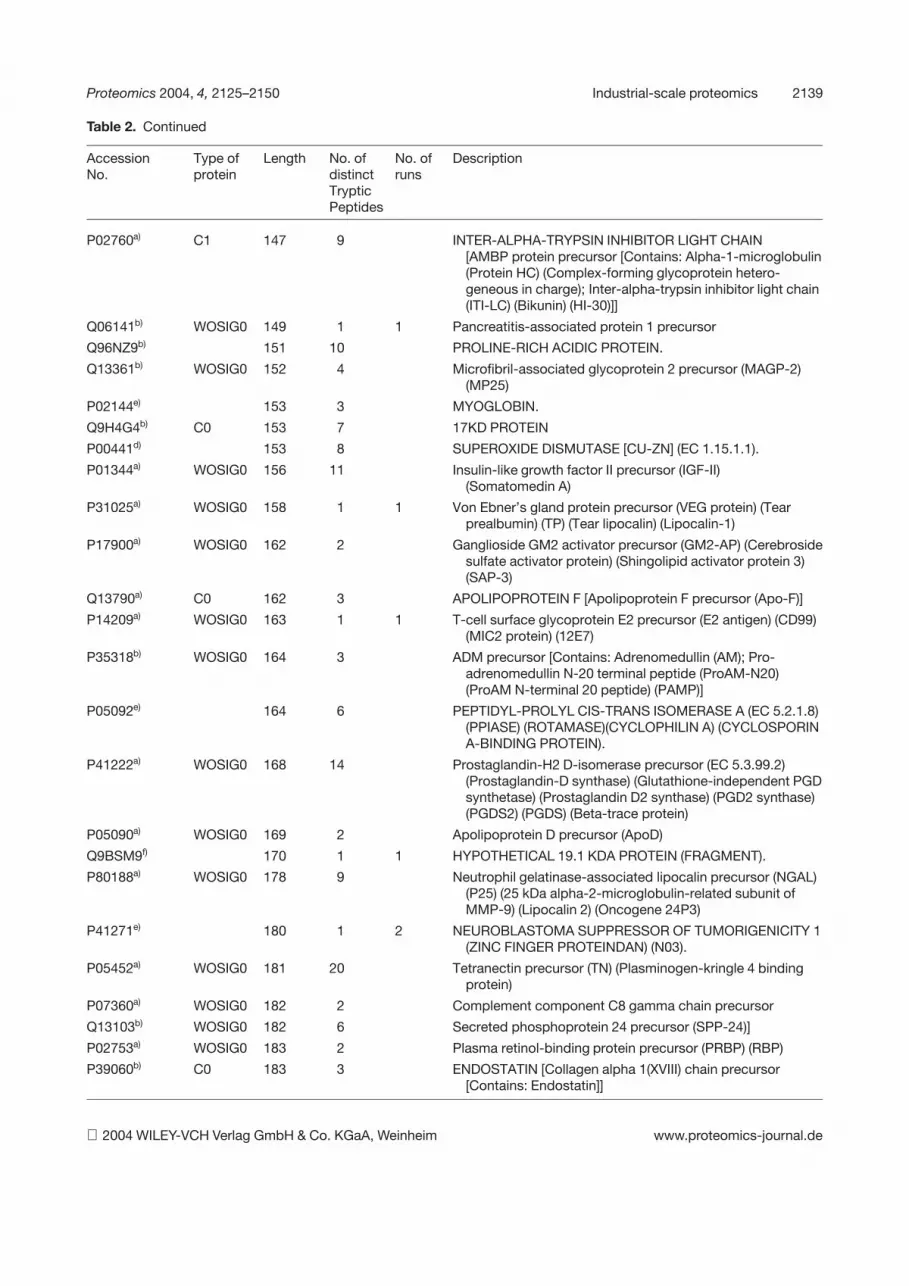
In total 405 nonredundant proteins (defined as chroma-tographically separable polypeptide entities) were defini-tively identified (Table 2) in a process involving a singleplasma pool from healthy males. By separable poly-peptide entities we refer to known fragments of a geneproduct. For example, several forms of the serine pro-tease inhibitor Kazal-type 5 precursor are known to circu-late as separate fragments of the gene product Q9NQ38.Another example concerns polypeptide chains from thesame gene product which become chromatographicallyseparable after denaturation, reduction and alkylation,such as plasma kallikrein heavy and light chains PO3952.In addition, in some cases, MS coverage permitted theexistence of new fragments to be proposed, for examplewhen identified tryptic fragments were localized exclu-sively towards the N-terminus or C-terminus of a longprotein. Such cases brought the overall number of sepa-rable entities from 405 to 502. Furthermore, about onehundred peptides were identified from areas of the ge-nome where no proteins have previously been predicted,although a possible mechanism for their production hasbeen reported [6]. By combining results of similar analy-ses from other plasma pools, we have identified a total of
over 700 different proteins in human plasma from males.Additional proteins have been identified in plasma orserum from female donors. This is a far greater numberof nonredundant small proteins than has been found inprevious smaller-scale studies of the small proteins ofplasma or serum, described in the patent literature orreported in the scientific literature. While a large numberof identified proteins (490) have been cited recently in aninteresting article where LC-MS/MS of peptides wasemployed [3], in our opinion, when the list of identifiedserum proteins is restricted using the same criteria as weused (only classical tryptic peptides included, with nomore than one missed cleavage), this number is reducedto about 164 of the more common proteins in line withFig. 1. The first 100–200 most abundant proteins arerelatively easy to identify. The identification of the lessabundant proteins requires a larger scale approach suchas the one described here.
We show details of 405 of the 502 identified proteins inTable 2. After further study, details on the other proteinswill be published elsewhere. Of the 405 proteins shownin Table 2, 210 are known to be secreted and plasmatic,76 are secreted but not known to be plasmatic, 2 are notknown to be secreted, 15 are cellular leakage proteinsknown to be found in plasma, 41 are probably cellularleakage proteins but have not been reported as presentin plasma, and 61 are unclassified. This list includes lowabundance proteins such as leptin, and low abundancepeptides such as bradykinin. While the gel filtration step
Table 2. List of 405 of the 502 nonredundant proteins found in a single 2.5 L pool of human blood plasma from healthymales
AccessionNo.
Type ofprotein
Length No. ofdistinctTrypticPeptides
No. ofruns
Description
AC005187 7 1 1 Homo sapiens chromosome 4 clone B153K6 map 4q25
AC015987 7 1 1 Homo sapiens chromosome 7 clone RP11-207O19
NT_010498.5 7 1 7 Homo sapiens chromosome 16 working draft sequencesegment
Patentf) 8 1 1 Translation of Sequence 49 from patent US 6476195
NT_033985 9 1 1 Homo sapiens chromosome 10 genomic contig
P01042a) P0 9 1 22 BRADYKININ [Kininogen precursor (Alpha-2-thiol proteinaseinhibitor) [Contains: Bradykinin]]
AC087832 10 1 1 Homo sapiens chromosome 15 clone RP11-64I7 map15q21.3
N93909f) 10 1 1 EST from Soares_multiple_sclerosis_2NbHMSP
2004 WILEY-VCH Verlag GmbH & Co. KGaA, Weinheim www.proteomics-journal.de

Proteomics 2004, 4, 2125–2150 Industrial-scale proteomics 2133
Table 2. Continued
AccessionNo.
Type ofprotein
Length No. ofdistinctTrypticPeptides
No. ofruns
Description
Patentf) 10 1 1 Human gene 1 encoded secreted protein HPJBK03(SEQ ID NO:73 from WO02/18435)
P01019a) P0 10 1 2 ANGIOTENSIN I [Angiotensinogen precursor [Contains:Angiotensin I; Angiotensin II]]
NT_009755 10 1 59 Homo sapiens chromosome 12 genomic contig
NT_077569 12 1 1 Homo sapiens chromosome 10 genomic contig
AL157778 12 1 2 Human DNA sequence from clone RP11-485F13 onchromosome Xq21.2-22.2
Patentf) 13 1 2 Protein #8450 (SEQ ID NO: 28221 from WO01/57274)
P02675a) P0 14 1 2 FIBRINOPEPTIDE B [Fibrinogen beta chain precursor[Contains: Fibrinopeptide B]]
Patentf) 15 1 1 DNA encoding novel human diagnostic protein #5890
AX320486 15 1 1 Translation of Sequence 109 from Patent WO0168858
P02671a) P0 16 1 25 FIBRINOPEPTIDE A [Fibrinogen alpha/alpha-E chainprecursor [Contains: Fibrinopeptide A]]
P01024a) P5 17 2 C3F FRAGMENT [Complement C3 precursor [Contains: C3aanaphylatoxin]]
P02765a) C1 27 2 ALPHA-2-HS-GLYCOPROTEIN, CHAIN B [Alpha-2-HS-glycoprotein precursor (Fetuin-A) (Alpha-2-Z-globulin)(Ba-alpha-2-glycoprotein)]
P11479a) C2 29 7 NEUTROPHIL DEFENSIN 2 (HP-2) [Neutrophil defensins 1, 2and 3 precursor (HNP) (Defensin, alpha 1)]
P81605b) P0 30 1 2 SURVIVAL-PROMOTING PEPTIDE [Dermcidin precursor(Preproteolysin) [Contains: Survival-promoting peptide;DCD-1]]
P11479a) C1 30 6 NEUTROPHIL DEFENSIN 1 (HP-1) [Neutrophil defensins 1, 2and 3 precursor (HNP) (Defensin, alpha 1)]
Q09753a) C0 36 1 1 BETA-DEFENSIN 1 [Beta-defensin 1 precursor (BD-1)(hBD-1) (Defensin, beta 1)]
Patenta) 40 2 Amino acid sequence of an alpha-2HS-glycoproteinconnecting sequence (from WO00/60943)
Q969E1a) C0 40 2 LIVER-EXPRESSED ANTIMICROBIAL PEPTIDE 2[Liver-expressed antimicrobial peptide 2 precursor]
Patentf) 41 1 1 Human polypeptide SEQ ID NO 18812 from WO01/64835
P07711a) C1 42 2 CATHEPSIN L LIGHT CHAIN [Cathepsin L precursor (EC3.4.22.15) (Major excreted protein) (MEP)]
P01253e) 43 4 THYMOSIN BETA-4 (FX) [CONTAINS: HEMATOPOIETICSYSTEM REGULATORYPEPTIDE; SERASPENIDE].
P04004a) P0 44 2 SOMATOMEDIN B [Vitronectin precursor (Serum spreadingfactor) (S-protein) (V75) [Contains: Vitronectin V65 subunit;Vitronectin V10 subunit; Somatomedin B]]
P81534b) WOSIG0 45 1 3 Beta-defensin 3 precursor (BD-3) (hBD-3) (Defensin likeprotein)
P81605b) P1 47 1 2 DCD-1 [Dermcidin precursor (Preproteolysin) [Contains:Survival-promoting peptide; DCD-1]]
2004 WILEY-VCH Verlag GmbH & Co. KGaA, Weinheim www.proteomics-journal.de

2134 K. Rose et al. Proteomics 2004, 4, 2125–2150
Table 2. Continued
AccessionNo.
Type ofprotein
Length No. ofdistinctTrypticPeptides
No. ofruns
Description
P10645b) P4 48 1 1 PANCREASTATIN [Chromogranin A precursor (CGA)(Pituitary secretory protein I) (SP-I) [Contains: Vasostatin I;Vasostatin II; EA-92; ES-43; Pancreastatin; SS-18; WA-8;WE-14; LF-19; AL-11; GV-19; GR-44; ER-37]]
Q9NQ38a) P0 55 1 1 HEMOFILTRATE PEPTIDE HF6478 [Serine protease inhibitorKazal-type 5 precursor (Lympho-epithelial Kazal-typerelated inhibitor) (LEKTI) [Contains: Hemofiltrate peptideHF6478; Hemofiltrate peptide HF7665]]
P28799b) P0 56 2 GRANULIN 3 [Granulins precursor (Acrogranin) [Contains:Paragranulin; Granulin 1 (Granulin G); Granulin 2(Granulin F); Granulin 3 (Granulin B); Granulin 4 (Granulin A);Granulin 5 (Granulin C); Granulin 6 (Granulin D); Granulin 7(Granulin E)]]
P28799b) P1 56 2 GRANULIN 4 [Granulins precursor (Acrogranin) [Contains:Paragranulin; Granulin 1 (Granulin G); Granulin 2(Granulin F); Granulin 3 (Granulin B); Granulin 4 (Granulin A);Granulin 5 (Granulin C); Granulin 6 (Granulin D); Granulin 7(Granulin E)]]
P00995b) WOSIG0 56 3 Pancreatic secretory trypsin inhibitor precursor (Tumor-associated trypsin inhibitor) (TATI) (Serine protease inhibi-tor Kazal-type 1)
P02654a) WOSIG0 57 11 Apolipoprotein C-I precursor (Apo-CI)
P58062b) WOSIG0 66 1 1 Esophagus cancer-related gene-2 protein precursor(ECRG-2)
P01344a) C0 67 6 INSULIN-LIKE GROWTH FACTOR II [Insulin-like growthfactor II precursor (IGF-II) (Somatomedin A)]
Q9NQ38a) P1 68 2 HEMOFILTRATE PEPTIDE HF7665 [Serine protease inhibitorKazal-type 5 precursor (Lympho-epithelial Kazal-typerelated inhibitor) (LEKTI) [Contains: Hemofiltrate peptideHF6478; Hemofiltrate peptide HF7665]]
P02776a) WOSIG0 70 5 Platelet factor 4 precursor (PF-4) (Oncostatin A) (Iroplact)
P01343a) C0 70 6 INSULIN-LIKE GROWTH FACTOR IA [Insulin-like growthfactor IA precursor (IGF-IA) (Somatomedin C)]
P05019a) C0 70 6 INSULIN-LIKE GROWTH FACTOR IB [Insulin-like growthfactor IB precursor (IGF-IB) (Somatomedin C)]
Q16627a) WOSIG0 74 4 Small inducible cytokine A14 precursor (ChemokineCC-1/CC-3) (HCC-1/HCC-3) (NCC-2)
Q01523b) WOSIG0 75 2 Defensin 5 precursor (Defensin, alpha 5)
P11479a) WOSIG0 75 5 Neutrophil defensins 1, 2 and 3 precursor (HNP) (Defensin,alpha 1)
P02735a) C0 76 5 AMYLOID PROTEIN A [Serum amyloid A protein precursor(SAA) [Contains: Amyloid protein A (Amyloid fibrilprotein AA)]]
P02248e) 76 8 UBIQUITIN.
P08493b) C0 77 2 MATRIX GLA-PROTEIN [Matrix Gla-protein precursor (MGP)]
P01024a) P0 77 5 C3A ANAPHYLATOXIN [Complement C3 precursor[Contains: C3a anaphylatoxin]]
2004 WILEY-VCH Verlag GmbH & Co. KGaA, Weinheim www.proteomics-journal.de

Proteomics 2004, 4, 2125–2150 Industrial-scale proteomics 2135
Table 2. Continued
AccessionNo.
Type ofprotein
Length No. ofdistinctTrypticPeptides
No. ofruns
Description
Patenta) 77 5 Sequence of human apolipoprotein (from JP63237795)
P13987a) C0 77 6 CD59 GLYCOPROTEIN [CD59 glycoprotein precursor(Membrane attack complex inhibition factor) (MACIF)(MAC-inhibitory protein) (MAC-IP) (MEM43 antigen)(Protectin) (Membrane inhibitor of reactive lysis) (MIRL)(20 kDa homologous restriction factor) (HRF-20) (HRF20)(1F5 antigen)]
P01028a) P0 77 12 C4A ANAPHYLATOXIN [Complement C4 precursor[Contains: C4A anaphylatoxin]]
P00747a) P0 78 7 ACTIVATION PEPTIDE [Plasminogen precursor (EC 3.4.21.7)[Contains: Angiostatin]]
P02656a) WOSIG0 79 10 Apolipoprotein C-III precursor (Apo-CIII)
P02655a) WOSIG0 79 12 Apolipoprotein C-II precursor (Apo-CII)
P04004a) C1 80 5 VITRONECTIN V10 SUBUNIT [Vitronectin precursor (Serumspreading factor) (S-protein) (V75) [Contains: VitronectinV65 subunit; Vitronectin V10 subunit; Somatomedin B]]
Q01524b) WOSIG0 81 2 Defensin 6 precursor (Defensin, alpha 6)
P02775a) C1 81 7 BETA-THROMBOGLOBULIN [Platelet basic protein precur-sor (PBP) [Contains: Connective-tissue activating peptideIII (CTAP-III); Low-affinity platelet factor IV (LA-PF4);Beta-thromboglobulin (Beta-TG); Neutrophil-activatingpeptide 2 (NAP–2)]]
P07602b) C4 82 1 1 SAPOSIN D [Proactivator polypeptide precursor [Contains:Saposin A (Protein A); Saposin B (Sphingolipid activatorprotein 1) (SAP-1) (Cerebroside sulfate activator) (CSAct)(Dispersin) (Sulfatide/GM1 activator); Saposin C (Co-beta-glucosidase) (A1 activator) (Glucosylceramidase activator)(Sphingolipid activator protein 2) (SAP-2); Saposin D(Protein C) (Component C)]]
P55000a) WOSIG0 82 1 5 Secreted Ly-6/uPAR related protein 1 precursor (SLURP-1)(ARS component B) (ARS(Component B)-81/S)(Anti-neoplastic urinary protein) (ANUP)
P02652a) WOSIG0 82 11 Apolipoprotein A-II precursor (Apo-AII) (ApoA-II)
P00737a) C0 83 8 HAPTOGLOBIN-1 ALPHA-1 CHAIN [Haptoglobin-1precursor]
P02775a) C0 85 7 LA-PF4 / CTAP-III [Platelet basic protein precursor (PBP)[Contains: Connective-tissue activating peptide III (CTAP-III); Low-affinity platelet factor IV (LA-PF4); Beta-thrombo-globulin (Beta-TG); Neutrophil-activating peptide 2 (NAP-2)]]
Patentf) 86 1 1 Human reproductive system related antigen SEQ ID NO:5057 from WO01/55320
P07108e) 86 4 ACYL-COA-BINDING PROTEIN (ACBP) (DIAZEPAMBINDING INHIBITOR) (DBI)(ENDOZEPINE) (EP).
Q9BZ98e) 90 1 1 TRANSCRIPT Y 12.
P06703e) 90 4 CALCYCLIN (PROLACTIN RECEPTOR ASSOCIATED PRO-TEIN) (PRA) (GROWTHFACTOR-INDUCIBLE PROTEIN2A9) (S100 CALCIUM-BINDING PROTEIN A6) (MLN 4).
2004 WILEY-VCH Verlag GmbH & Co. KGaA, Weinheim www.proteomics-journal.de

2136 K. Rose et al. Proteomics 2004, 4, 2125–2150
Table 2. Continued
AccessionNo.
Type ofprotein
Length No. ofdistinctTrypticPeptides
No. ofruns
Description
Q16663a) WOSIG0 92 1 3 Small inducible cytokine A15 precursor (Macrophage in-flammatory protein 5) (MIP-5) (Chemokine CC-2) (HCC-2)(NCC-3) (MIP-1 delta) (Leukotactin-1) (LKN-1) (Mrp-2b)
P10645b) P2 92 4 EA-92 [Chromogranin A precursor (CGA) (Pituitary secretoryprotein I) (SP-I) [Contains: Vasostatin I; Vasostatin II; EA-92;ES-43; Pancreastatin; SS-18; WA-8; WE-14; LF-19; AL-11;GV-19; GR-44; ER-37]]
P05109d) 93 5 CALGRANULIN A (MIGRATION INHIBITORY FACTOR-RE-LATED PROTEIN 8) (MRP-8)(CYSTIC FIBROSIS ANTIGEN)(CFAG) (P8) (LEUKOCYTE L1 COMPLEX LIGHTCHAIN)(S100 CALCIUM-BINDING PROTEIN A8).
P08118a) WOSIG0 94 1 1 Prostate secreted seminal plasma protein precursor (PSP-94)(Beta-microseminoprotein) (Seminal plasma beta-inhibin)(Immunoglobulin binding factor) (IGBF) (Prostate secretoryprotein PSP94) (PN44)
P01178a) P1 94 3 NEUROPHYSIN 1 [Oxytocin-neurophysin 1 precursor(OT-NPI) [Contains: Oxytocin (Ocytocin); Neurophysin 1]]
Patentf) 95 1 1 Human immune/haematopoietic antigen SEQ ID NO:18694from WO01/57182
P04433a) WOSIG0 95 3 Ig kappa chain V-III region VG precursor (Fragment)
P19957b) WOSIG0 95 6 Elafin precursor (Elastase-specific inhibitor) (ESI)(Skin-derived antileukoproteinase) (SKALP)
P04434a) WOSIG0 96 1 2 Ig kappa chain V-III region VH precursor (Fragment)
P01621a) WOSIG0 96 3 Ig kappa chain V-III region NG9 precursor (Fragment)
P04211a) WOSIG0 97 1 1 Ig lambda chain V region 4A precursor
Patentf) 97 1 1 Human PRO polypeptide sequence #234 (from WO01/68848)
O15467a) WOSIG0 97 8 Small inducible cytokine A16 precursor (IL-10-induciblechemokine) (Chemokine LEC) (Liver-expressed chemokine)(Monotactin-1) (MTN-1) (Chemokine CC-4) (HCC-4)(NCC-4) (Lymphocyte and monocyte chemoattractant)(LMC) (LCC-1)
P01764a) WOSIG0 98 3 Ig heavy chain V-III region VH26 precursor
Patentf) 99 4 Human angiogenesis-associated protein PRO826(SEQ ID NO:158 from WO00/53753)
P01884a) WOSIG0 99 7 Beta-2-microglobulin precursor
P06312a) WOSIG0 101 2 Ig kappa chain V-IV region precursor (Fragment)
P55056a) WOSIG0 101 12 Apolipoprotein C-IV precursor (Apo-CIV)
Q9NZD4d) 102 6 EDRF (ERYTHROID DIFFERENTIATION RELATED FACTOR).
Patentf) 103 1 1 Human cancer associated protein sequence (SEQ IDNO:1435 from WO00/55350)
P27469c) 103 1 2 PUTATIVE LYMPHOCYTE G0/G1 SWITCH PROTEIN 2.
P02735a) WOSIG0 104 10 Serum amyloid A protein precursor (SAA) [Contains: Amyloidprotein A (Amyloid fibril protein AA)]
O95178e) 105 1 3 NADH-UBIQUINONE OXIDOREDUCTASE AGGG SUBUNIT,MITOCHONDRIAL PRECURSOR(EC 1.6.5.3) (EC 1.6.99.3)(COMPLEX I-AGGG) (CI-AGGG).
2004 WILEY-VCH Verlag GmbH & Co. KGaA, Weinheim www.proteomics-journal.de

Proteomics 2004, 4, 2125–2150 Industrial-scale proteomics 2137
Table 2. Continued
AccessionNo.
Type ofprotein
Length No. ofdistinctTrypticPeptides
No. ofruns
Description
P01842a) 105 11 IG LAMBDA CHAIN C REGIONS.
P01715a) 106 1 1 IG LAMBDA CHAIN V-IV REGION BAU.
P01834a) 106 7 IG KAPPA CHAIN C REGION.
P01717a) 107 1 1 IG LAMBDA CHAIN V-IV REGION HIL.
P20071e) 107 1 1 FK506-BINDING PROTEIN (FKBP-12) (PEPTIDYL-PROLYLCIS-TRANS ISOMERASE) (EC 5.2.1.8) (PPIASE)(ROTAMASE) (IMMUNOPHILIN FKBP12).
P04432a) WOSIG0 107 1 7 Ig kappa chain V-I region Daudi precursor
P01597a) 108 1 1 IG KAPPA CHAIN V-I REGION DEE.
P01619a) 108 1 2 IG KAPPA CHAIN V-III REGION B6.
P01599a) 108 2 IG KAPPA CHAIN V-I REGION GAL.
Q9UL85a) 109 2 MYOSIN-REACTIVE IMMUNOGLOBULIN KAPPA CHAINVARIABLE REGION(FRAGMENT).
P18136a) WOSIG0 109 4 Ig kappa chain V-III region HIC precursor
P01620a) 109 5 IG KAPPA CHAIN V-III REGION SIE.
P04216b) C0 111 2 THY-1 MEMBRANE GLYCOPROTEIN [Thy-1 membraneglycoprotein precursor (Thy-1 antigen) (CDw90)(CD90 antigen)]
O00585a) WOSIG0 111 3 Small inducible cytokine A21 precursor (Beta chemokineexodus-2) (6Ckine) (Secondary lymphoid-tissue chemo-kine) (SLC)
P80748f) 111 3 IG LAMBDA CHAIN V-III REGION LOI.
P01700a) 112 1 2 IG LAMBDA CHAIN V-I REGION HA.
P01616a) 112 1 3 IG KAPPA CHAIN V-II REGION MIL.
P01137b) C0 112 2 TRANSFORMING GROWTH FACTOR BETA 1 [Transforminggrowth factor beta 1 precursor (TGF-beta 1)]
P35542a) WOSIG0 112 13 Serum amyloid A-4 protein precursor (Constitutively ex-pressed serum amyloid A protein) (C-SAA)
P06310a) WOSIG0 113 2 Ig kappa chain V-II region RPMI 6410 precursor
P06309a) WOSIG0 113 3 Ig kappa chain V-II region GM607 precursor (Fragment)
O75368e) 114 5 SH3 DOMAIN-BINDING GLUTAMIC ACID-RICH-LIKEPROTEIN.
P06702d) 114 10 CALGRANULIN B (MIGRATION INHIBITORY FACTOR-RELATED PROTEIN 14)(MRP-14) (P14) (LEUKOCYTE L1COMPLEX HEAVY CHAIN) (S100 CALCIUM-BINDINGPROTEIN A9).
Q96JD0f) 116 2 AMYLOID LAMBDA 6 LIGHT CHAIN VARIABLE REGIONSAR (FRAGMENT).
Q96PF6a) 116 2 KAPPA 1 LIGHT CHAIN VARIABLE REGION (FRAGMENT).
P12273b) WOSIG0 118 5 Prolactin-inducible protein precursor (Secretory actin-bindingprotein) (SABP) (GROSS cystic disease fluid protein 15)(GCDFP-15) (GP17)
P01777a) 119 1 3 IG HEAVY CHAIN V-III REGION TEI.
P01034a) WOSIG0 120 14 Cystatin C precursor (Neuroendocrine basic polypeptide)(Gamma-trace) (Post-gamma-globulin)
2004 WILEY-VCH Verlag GmbH & Co. KGaA, Weinheim www.proteomics-journal.de
2138 K. Rose et al. Proteomics 2004, 4, 2125–2150
Table 2. Continued
AccessionNo.
Type ofprotein
Length No. ofdistinctTrypticPeptides
No. ofruns
Description
Q15828b) WOSIG0 121 2 Cystatin M precursor (Cystatin E)
P03950a) WOSIG0 123 9 Angiogenin precursor (EC 3.1.27.-)
AAH26245e) 124 3 MITOGEN-ACTIVATED PROTEIN KINASE KINASE 1 INTER-ACTING PROTEIN 1.
P49773e) 125 2 HISTIDINE TRIAD NUCLEOTIDE-BINDING PROTEIN(PROTEIN KINASE C INHIBITOR1) (PROTEIN KINASEC-INTERACTING PROTEIN 1) (PKCI-1).
P04054b) C0 126 2 PHOSPHOLIPASE A2 [Phospholipase A2 precursor(EC 3.1.1.4) (Phosphatidylcholine 2-acylhydrolase)(Group IB phospholipase A2)]
P02766a) WOSIG0 127 2 Transthyretin precursor (Prealbumin) (TBPA) (TTR) (ATTR)
Patentf) 127 2 SEQ ID 78 of WO99/16889.
P07998a) WOSIG0 128 5 Ribonuclease pancreatic precursor (EC 3.1.27.5) (RNase 1)(RNase A) (RNase UPI-1) (RIB-1)
P00695b) WOSIG0 130 5 Lysozyme C precursor (EC 3.2.1.17) (1,4-beta-N-acetyl-muramidase C)
P00167e) 133 2 CYTOCHROME B5.
Patentf) 134 1 1 Clone 2355875f – syncollin homologue (from WO00/20447)
Q9NRR1b) 136 2 CYTOKINE-LIKE PROTEIN C17.
P52758e) 137 2 14.5 KDA TRANSLATIONAL INHIBITOR PROTEIN (P14.5)(UK114 ANTIGENHOMOLOG).
P01591a) 137 9 IMMUNOGLOBULIN J CHAIN.
P00742a) C0 139 4 FACTOR X LIGHT CHAIN [Coagulation factor X precursor(EC 3.4.21.6) (Stuart factor)]
P49913b) WOSIG0 140 10 Antibacterial protein FALL-39 precursor (FALL-39 peptideantibiotic) (Antimicrobial protein CAP-18) (LL-37)
P02008e) 141 4 HEMOGLOBIN ZETA CHAIN.
P01922d) 141 13 HEMOGLOBIN ALPHA CHAIN.
P00738a) C0 142 14 HAPTOGLOBIN-2 ALPHA-2 CHAIN [Haptoglobin-2precursor]
P05451b) WOSIG0 144 1 2 Lithostathine 1 alpha precursor (Pancreatic stone protein)(PSP) (Pancreatic thread protein) (PTP) (Islet of langerhansregenerating protein) (REG) (Regenerating protein I alpha)(Islet cells regeneration factor) (ICRF)
P48304b) WOSIG0 144 1 2 Lithostathine 1 beta precursor (Regenerating protein I beta)
P00740a) C0 145 2 FACTOR IXA (ACTIVE FORM) LIGHT CHAIN [Coagulationfactor IX precursor (EC 3.4.21.22) (Christmas factor)]
P02100e) 146 3 HEMOGLOBIN EPSILON CHAIN.
P02096d) 146 5 HEMOGLOBIN GAMMA-A AND GAMMA-G CHAINS.
Patenta) 146 5 Human hemoglobin adult beta protein (from US 6,172,039)
P41159a) WOSIG0 146 6 Leptin precursor (Obesity factor) (Obese protein)
P02042d) 146 12 HEMOGLOBIN DELTA CHAIN.
P02023d) 146 17 HEMOGLOBIN BETA CHAIN.
Q99969b) WOSIG0 147 7 Retinoic acid receptor responder protein 2 precursor(Tazarotene-induced gene 2 protein) (RAR-responsiveprotein TIG2)
2004 WILEY-VCH Verlag GmbH & Co. KGaA, Weinheim www.proteomics-journal.de
Proteomics 2004, 4, 2125–2150 Industrial-scale proteomics 2139
Table 2. Continued
AccessionNo.
Type ofprotein
Length No. ofdistinctTrypticPeptides
No. ofruns
Description
P02760a) C1 147 9 INTER-ALPHA-TRYPSIN INHIBITOR LIGHT CHAIN[AMBP protein precursor [Contains: Alpha-1-microglobulin(Protein HC) (Complex-forming glycoprotein hetero-geneous in charge); Inter-alpha-trypsin inhibitor light chain(ITI-LC) (Bikunin) (HI-30)]]
Q06141b) WOSIG0 149 1 1 Pancreatitis-associated protein 1 precursor
Q96NZ9b) 151 10 PROLINE-RICH ACIDIC PROTEIN.
Q13361b) WOSIG0 152 4 Microfibril-associated glycoprotein 2 precursor (MAGP-2)(MP25)
P02144e) 153 3 MYOGLOBIN.
Q9H4G4b) C0 153 7 17KD PROTEIN
P00441d) 153 8 SUPEROXIDE DISMUTASE [CU-ZN] (EC 1.15.1.1).
P01344a) WOSIG0 156 11 Insulin-like growth factor II precursor (IGF-II)(Somatomedin A)
P31025a) WOSIG0 158 1 1 Von Ebner’s gland protein precursor (VEG protein) (Tearprealbumin) (TP) (Tear lipocalin) (Lipocalin-1)
P17900a) WOSIG0 162 2 Ganglioside GM2 activator precursor (GM2-AP) (Cerebrosidesulfate activator protein) (Shingolipid activator protein 3)(SAP-3)
Q13790a) C0 162 3 APOLIPOPROTEIN F [Apolipoprotein F precursor (Apo-F)]
P14209a) WOSIG0 163 1 1 T-cell surface glycoprotein E2 precursor (E2 antigen) (CD99)(MIC2 protein) (12E7)
P35318b) WOSIG0 164 3 ADM precursor [Contains: Adrenomedullin (AM); Pro-adrenomedullin N-20 terminal peptide (ProAM-N20)(ProAM N-terminal 20 peptide) (PAMP)]
P05092e) 164 6 PEPTIDYL-PROLYL CIS-TRANS ISOMERASE A (EC 5.2.1.8)(PPIASE) (ROTAMASE)(CYCLOPHILIN A) (CYCLOSPORINA-BINDING PROTEIN).
P41222a) WOSIG0 168 14 Prostaglandin-H2 D-isomerase precursor (EC 5.3.99.2)(Prostaglandin-D synthase) (Glutathione-independent PGDsynthetase) (Prostaglandin D2 synthase) (PGD2 synthase)(PGDS2) (PGDS) (Beta-trace protein)
P05090a) WOSIG0 169 2 Apolipoprotein D precursor (ApoD)
Q9BSM9f) 170 1 1 HYPOTHETICAL 19.1 KDA PROTEIN (FRAGMENT).
P80188a) WOSIG0 178 9 Neutrophil gelatinase-associated lipocalin precursor (NGAL)(P25) (25 kDa alpha-2-microglobulin-related subunit ofMMP-9) (Lipocalin 2) (Oncogene 24P3)
P41271e) 180 1 2 NEUROBLASTOMA SUPPRESSOR OF TUMORIGENICITY 1(ZINC FINGER PROTEINDAN) (N03).
P05452a) WOSIG0 181 20 Tetranectin precursor (TN) (Plasminogen-kringle 4 bindingprotein)
P07360a) WOSIG0 182 2 Complement component C8 gamma chain precursor
Q13103b) WOSIG0 182 6 Secreted phosphoprotein 24 precursor (SPP-24)]
P02753a) WOSIG0 183 2 Plasma retinol-binding protein precursor (PRBP) (RBP)
P39060b) C0 183 3 ENDOSTATIN [Collagen alpha 1(XVIII) chain precursor[Contains: Endostatin]]
2004 WILEY-VCH Verlag GmbH & Co. KGaA, Weinheim www.proteomics-journal.de

2140 K. Rose et al. Proteomics 2004, 4, 2125–2150
Table 2. Continued
AccessionNo.
Type ofprotein
Length No. ofdistinctTrypticPeptides
No. ofruns
Description
P19652a) WOSIG0 183 17 Alpha-1-acid glycoprotein 2 precursor (AGP 2)(Orosomucoid 2) (OMD 2)
P02763a) WOSIG0 183 19 Alpha-1-acid glycoprotein 1 precursor (AGP 1)(Orosomucoid 1) (OMD 1)
P01033a) WOSIG0 184 6 Metalloproteinase inhibitor 1 precursor (TIMP-1)(Erythroid potentiating activity) (EPA) (Tissue inhibitorof metalloproteinases) (Fibroblast collagenase inhibitor)(Collagenase inhibitor)
P02760a) C0 184 11 ALPHA-1-MICROGLOBULIN [AMBP protein precursor[Contains: Alpha-1-microglobulin (Protein HC) (Complex-forming glycoprotein heterogeneous in charge); Inter-alpha-trypsin inhibitor light chain (ITI-LC) (Bikunin) (HI-30)]]
P30086e) 186 4 PHOSPHATIDYLETHANOLAMINE-BINDING PROTEIN(PEBP) (NEUROPOLYPEPTIDE H3)(HIPPOCAMPALCHOLINERGIC NEUROSTIMULATING PEPTIDE) (HCNP)(RAF KINASEINHIBITOR PROTEIN) (RKIP).
O95445a) 188 10 APOLIPOPROTEIN M (APOM) (G3A) (HSPC336).
P16035a) WOSIG0 194 14 Metalloproteinase inhibitor 2 precursor (TIMP-2) (Tissueinhibitor of metalloproteinases-2) (CSC-21K)
P32119e) 198 7 PEROXIREDOXIN 2 (THIOREDOXIN PEROXIDASE 1)(THIOREDOXIN-DEPENDENTPEROXIDE REDUCTASE 1)(THIOL-SPECIFIC ANTIOXIDANT PROTEIN) (TSA) (PRP)(NATURAL KILLER CELL ENHANCING FACTOR B) (NKEF-B).
Q9NS71e) 199 2 CA11 PROTEIN.
P02743a) WOSIG0 204 3 Serum amyloid P-component precursor (SAP) (9.5S alpha-1-glycoprotein)
P30043d) 205 6 FLAVIN REDUCTASE (EC 1.6.99.1) (FR) (NADPH-DEPEND-ENT DIAPHORASE)(NADPH-FLAVIN REDUCTASE) (FLR)(BILIVERDIN REDUCTASE B) (EC 1.3.1.24)(BVR-B)(BILIVERDIN-IX BETA-REDUCTASE) (GREEN HEMEBINDING PROTEIN)(GHBP).
P10909a) C0 205 9 BETA-CHAIN [Clusterin precursor (Complement-associatedprotein SP-40,40) (Complement cytolysis inhibitor) (CLI)(NA1 and NA2) (Apolipoprotein J) (Apo-J) (TRPM-2)]
P01024a) P1 206 2 C3C FRAGMENT [Complement C3 precursor [Contains:C3a anaphylatoxin]]
P22352a) WOSIG0 206 12 Plasma glutathione peroxidase precursor (EC 1.11.1.9)(GSHPX-P)
P09211d) 209 1 1 GLUTATHIONE S-TRANSFERASE P (EC 2.5.1.18) (GSTCLASS-PI) (GSTP1-1).
Q9HAT0e) 212 1 15 ROPPORIN.
P24592a) WOSIG0 216 10 Insulin-like growth factor binding protein 6 precursor(IGFBP-6) (IBP-6) (IGF-binding protein 6)
O00466b) WOSIG0 220 1 3 K12 protein precursor
Q9UNN8b) WOSIG0 221 3 Endothelial protein C receptor precursor (Endothelial cellprotein C receptor) (Activated protein C receptor)(APC receptor)
2004 WILEY-VCH Verlag GmbH & Co. KGaA, Weinheim www.proteomics-journal.de

Proteomics 2004, 4, 2125–2150 Industrial-scale proteomics 2141
Table 2. Continued
AccessionNo.
Type ofprotein
Length No. ofdistinctTrypticPeptides
No. ofruns
Description
P16562b) WOSIG0 222 2 Testis-specific protein TPX-1 precursor (Cysteine-richsecretory protein-2) (Crisp-2)
P10909a) C1 222 4 ALPHA-CHAIN [Clusterin precursor (Complement-associat-ed protein SP-40,40) (Complement cytolysis inhibitor) (CLI)(NA1 and NA2) (Apolipoprotein J) (Apo-J) (TRPM-2)]
Q92876b) C0 223 2 KALLIKREIN 6 [Kallikrein 6 precursor (EC 3.4.21.-) (ProteaseM) (Neurosin) (Zyme) (SP59)]
P06681a) C0 223 7 COMPLEMENT C2B FRAGMENT [Complement C2 precursor(EC 3.4.21.43) (C3/C5 convertase)]
P54108a) WOSIG0 225 2 Cysteine-rich secretory protein-3 precursor (CRISP-3)(SGP28 protein)
Q96S96b) 227 6 PHOSPHATIDYLETHANOLAMINE BINDING PROTEIN.
Q92520b) 227 8 PROTEIN GS3786.
P00746a) C0 228 13 COMPLEMENT FACTOR D [Complement factor Dprecursor (EC 3.4.21.46) (C3 convertase activator)(Properdin factor D) (Adipsin)]
P00747a) C2 230 3 PLASMIN LIGHT CHAIN B [Plasminogen precursor(EC 3.4.21.7) [Contains: Angiostatin]]
Q07985e) 231 1 1 FILAMIN (FRAGMENT).
O00584b) WOSIG0 232 4 RIBONUCLEASE 6 PRECURSOR
Q96I69f) 233 4 UNKNOWN (PROTEIN FOR MGC:12849).
AAH22823a) 233 5 HYPOTHETICAL 24.9 KDA PROTEIN.
P00746a) WOSIG0 233 7 Complement factor D precursor (EC 3.4.21.46) (C3 conver-tase activator) (Properdin factor D) (Adipsin)
AAH28090a) 234 4 HYPOTHETICAL 24.8 KDA PROTEIN.
P00751a) C0 234 6 BA FRAGMENT [Complement factor B precursor (EC3.4.21.47) (C3/C5 convertase) (Properdin factor B)(Glycine-rich beta glycoprotein) (GBG) (PBF2)]
Q96E61f) 236 6 UNKNOWN (PROTEIN FOR MGC:17259).
P22692a) WOSIG0 237 13 Insulin-like growth factor binding protein 4 precursor(IGFBP-4) (IBP-4) (IGF-binding protein 4)
Patentf) 238 4 Anti-rhesus D recombinant antibody D7C2 light chain (fromFR2724182)
AAH22362a) 239 8 HYPOTHETICAL 26.2 KDA PROTEIN.
P78417e) 241 2 GLUTATHIONE TRANSFERASE OMEGA 1 (EC 2.5.1.18)(GSTO 1-1).
Patentf) 241 5 Human immune response protein HIRP1 (from WO01/68696)
P00748a) C3 243 3 BETA-FACTOR XIIA PART 2 [Coagulation factor XII precursor(EC 3.4.21.38) (Hageman factor) (HAF)]
Patenta) 243 3 Human apo A-I protein (from WO02/40501)
P02647a) C0 243 37 APOLIPOPROTEIN A-I [Apolipoprotein A-I precursor(Apo-AI)]
P05156a) C1 244 6 COMPLEMENT FACTOR I LIGHT CHAIN [Complement factorI precursor (EC 3.4.21.45) (C3B/C4B inactivator)]
P00738a) C1 245 20 HAPTOGLOBIN-2 BETA CHAIN [Haptoglobin-2 precursor]
2004 WILEY-VCH Verlag GmbH & Co. KGaA, Weinheim www.proteomics-journal.de

2142 K. Rose et al. Proteomics 2004, 4, 2125–2150
Table 2. Continued
AccessionNo.
Type ofprotein
Length No. ofdistinctTrypticPeptides
No. ofruns
Description
P03952a) C1 248 7 PLASMA KALLIKREIN LIGHT CHAIN [Plasma kallikreinprecursor (EC 3.4.21.34) (Plasma prekallikrein) (Kininogenin)(Fletcher factor)]
P00938d) 248 10 TRIOSEPHOSPHATE ISOMERASE (EC 5.3.1.1) (TIM).
P17931e) 249 1 1 GALECTIN-3 (GALACTOSE-SPECIFIC LECTIN 3) (MAC-2ANTIGEN) (IGE-BINDINGPROTEIN) (35 KDA LECTIN)(CARBOHYDRATE BINDING PROTEIN 35) (CBP35)(LAMININ-BINDING PROTEIN) (LECTIN L-29) (L-31)(GALACTOSIDE-BINDINGPROTEIN) (GALBP).
P02647a) WOSIG0 249 24 Apolipoprotein A-I precursor (Apo-AI)
O76076b) 250 1 1 CONNECTIVE TISSUE GROWTH FACTOR-LIKE PROTEINPRECURSOR (BA445H22.2)(WNT1 INDUCIBLE SIGNAL-ING PATHWAY PROTEIN 2).
Patentf) 250 3 Novel human diagnostic protein #19294 (SEQ ID No 49662from WO01/75067)
P24593a) WOSIG0 252 11 Insulin-like growth factor binding protein 5 precursor(IGFBP-5) (IBP-5) (IGF-binding protein 5)
P36980a) WOSIG0 252 21 Complement factor H-related protein 2 precursor (FHR-2)(H factor-like protein 2) (H factor-like 3) (DDESK59)
P01042a) C1 255 1 22 KININOGEN LIGHT CHAIN [Kininogen precursor (Alpha-2-thiol proteinase inhibitor) [Contains: Bradykinin]]
P00734a) C2 259 1 138 THROMBIN HEAVY CHAIN (B) [Prothrombin precursor(EC 3.4.21.5) (Coagulation factor II)]
P00915d) 260 14 CARBONIC ANHYDRASE I (EC 4.2.1.1) (CARBONATEDEHYDRATASE I) (CA-I).
P17936a) WOSIG0 264 19 Insulin-like growth factor binding protein 3 precursor(IGFBP-3) (IBP-3) (IGF-binding protein 3)
Q9Y287b) 266 3 INTEGRAL MEMBRANE PROTEIN 2B (TRANSMEMBRANEPROTEIN BRI) [CONTAINS:ABRI/ADAN AMYLOIDPEPTIDE].
Q9BTZ2d) 278 1 3 PEROXISOMAL SHORT-CHAIN ALCOHOL DEHYDROGE-NASE.
O75636a) WOSIG0 278 4 Ficolin 3 precursor (Collagen/fibrinogen domain-containingprotein 3) (Collagen/fibrinogen domain-containing lectin 3P35) (Hakata antigen)
P25311a) WOSIG0 278 27 Zinc-alpha-2-glycoprotein precursor (Zn-alpha-2-glyco-protein) (Zn-alpha-2-GP)
Q9NRN8e) 281 1 1 DC8.
Q16270a) 282 7 PROSTACYCLIN-STIMULATING FACTOR (INSULIN-LIKEGROWTH FACTOR BINDINGPROTEIN 7).
Q9HAL8f) 286 1 1 HYPOTHETICAL 32.2 KDA PROTEIN.
Q15485a) WOSIG0 288 1 1 Ficolin 2 precursor (Collagen/fibrinogen domain-containingprotein 2) (Ficolin-B) (Ficolin B) (Serum lectin P35) (EBP-37)(Hucolin) (L-Ficolin)
P18065a) WOSIG0 289 15 Insulin-like growth factor binding protein 2 precursor(IGFBP-2) (IBP-2) (IGF-binding protein 2)
2004 WILEY-VCH Verlag GmbH & Co. KGaA, Weinheim www.proteomics-journal.de

Proteomics 2004, 4, 2125–2150 Industrial-scale proteomics 2143
Table 2. Continued
AccessionNo.
Type ofprotein
Length No. ofdistinctTrypticPeptides
No. ofruns
Description
P01028a) C2 291 6 COMPLEMENT C4, GAMMA CHAIN [Complement C4precursor [Contains: C4A anaphylatoxin]]
P02748a) C1 294 4 COMPLEMENT COMPONENT C9B [Complement compo-nent C9 precursor]
CAD13492f) 296 1 4 BA351K23.5 (NOVEL PROTEIN) (FRAGMENT).
P10451b) WOSIG0 298 1 1 Osteopontin precursor (Bone sialoprotein 1) (Urinary stoneprotein) (Secreted phosphoprotein 1) (SPP-1)(Nephropontin) (Uropontin)
Patentf) 298 1 1 Human polypeptide, SEQ ID NO: 3169 from EP1130094
Patentf) 299 20 Mature human apolipoprotein E (apoE) isoprotein, apoE3(from WO01/77136)
P01024a) P4 302 3 C3D FRAGMENT [Complement C3 precursor [Contains:C3a anaphylatoxin]]
P48052b) C0 305 1 1 CARBOXYPEPTIDASE A2 [Carboxypeptidase A2 precursor(EC 3.4.17.15)]
Q9BRJ2e) 306 1 1 MITOCHONDRIAL 39S RIBOSOMAL PROTEIN L45(MRP-L45).
P11082e) 309 1 3 SERINE/THREONINE PROTEIN PHOSPHATASE 2ACATALYTIC SUBUNIT, BETAISOFORM (EC 3.1.3.16)(PP2A-BETA).
Q03591a) WOSIG0 312 18 Complement factor H-related protein 1 precursor (FHR-1)(H factor-like protein 1) (H-factor like 1) (H36)
P29279a) WOSIG0 323 4 Connective tissue growth factor precursor (Hypertrophicchondrocyte-specific protein 24)
P02749a) WOSIG0 326 22 Beta-2-glycoprotein I precursor (Apolipoprotein H) (Apo-H)(B2GPI) (Beta(2)GPI) (Activated protein C-binding protein)(APC inhibitor)
O43866a) WOSIG0 328 17 CD5 antigen-like precursor (SP-alpha) (CT-2) (IgM-associated peptide)
P00737a) WOSIG0 329 16 Haptoglobin-1 precursor
P00739a) WOSIG0 329 16 Haptoglobin-related protein precursor
P01857a) 330 4 IG GAMMA-1 CHAIN C REGION.
P37837d) 337 1 2 TRANSALDOLASE (EC 2.2.1.2).
P50213e) C0 339 2 ISOCITRATE DEHYDROGENASE [NAD] SUBUNIT ALPHA[Isocitrate dehydrogenase [NAD] subunit alpha, mito-chondrial precursor (EC 1.1.1.41) (Isocitric dehydrogenase)(NAD+-specific ICDH)]
P01877a) 340 14 IG ALPHA-2 CHAIN C REGION.
Q01459b) WOSIG0 347 11 Di-N-acetylchitobiase precursor (EC 3.2.1.-)
P01024a) P2 349 14 C3DG FRAGMENT [Complement C3 precursor [Contains:C3a anaphylatoxin]]
P02765a) WOSIG0 349 14 Alpha-2-HS-glycoprotein precursor (Fetuin-A) (Alpha-2-Z-globulin) (Ba-alpha-2-glycoprotein)
O14793a) WOSIG0 352 2 Growth/differentiation factor 8 precursor (GDF-8) (Myostatin)
P01876a) 353 17 IG ALPHA-1 CHAIN C REGION.
2004 WILEY-VCH Verlag GmbH & Co. KGaA, Weinheim www.proteomics-journal.de

2144 K. Rose et al. Proteomics 2004, 4, 2125–2150
Table 2. Continued
AccessionNo.
Type ofprotein
Length No. ofdistinctTrypticPeptides
No. ofruns
Description
P27169a) 354 8 SERUM PARAOXONASE/ARYLESTERASE 1 (EC 3.1.1.2)(EC 3.1.8.1) (PON 1)(SERUM ARYLDIAKYL-PHOSPHATASE 1) (A-ESTERASE 1) (AROMATICESTERASE 1)(K-45).
Q00796e) 356 1 4 SORBITOL DEHYDROGENASE (EC 1.1.1.14) (L-IDITOL 2-DEHYDROGENASE).
P49908a) WOSIG0 362 2 Selenoprotein P precursor (SeP)
P01042a) C0 362 7 KININOGEN HEAVY CHAIN [Kininogen precursor (Alpha-2-thiol proteinase inhibitor) [Contains: Bradykinin]]
Q96B73e) 370 2 SIMILAR TO RIKEN CDNA 2310034C04 GENE.
O14791a) WOSIG0 371 3 Apolipoprotein L1 precursor (Apolipoprotein L-I) (Apolipo-protein L) (ApoL-I) (Apo-L) (ApoL)
P03952a) C0 371 6 PLASMA KALLIKREIN HEAVY CHAIN [Plasma kallikreinprecursor (EC 3.4.21.34) (Plasma prekallikrein)(Kininogenin) (Fletcher factor)]
P02570d) C0 374 7 ACTIN, CYTOPLASMIC 1 [Actin, cytoplasmic 1 (Beta-actin)]
O95885f) 376 1 2 HYPOTHETICAL 42.6 KDA PROTEIN (FRAGMENT).
P06727a) WOSIG0 376 28 Apolipoprotein A-IV precursor (Apo-AIV)
P04004a) C0 379 10 VITRONECTIN V65 SUBUNIT [Vitronectin precursor (Serumspreading factor) (S-protein) (V75) [Contains: VitronectinV65 subunit; Vitronectin V10 subunit; Somatomedin B]]
P01880a) 383 2 IG DELTA CHAIN C REGION.
Patentf) 384 6 Human novel protein #335 (from WO01/55437)
Q9UP60a) 384 7 SNC73 PROTEIN.
P05154a) WOSIG0 387 10 Plasma serine protease inhibitor precursor (PCI) (Protein Cinhibitor) (Plasminogen activator inhibitor-3) (PAI3)(Acrosomal serine protease inhibitor)
P00738a) WOSIG0 388 2 Haptoglobin-2 precursor
Q13508b) 389 3 ECTO-ADP-RIBOSYLTRANSFERASE 3 PRECURSOR(EC 2.4.2.31) (NAD(P)(+)–ARGININE ADP-RIBOSYL-TRANSFERASE 3) (MONO(ADP-RIBOSYL)TRANSFERASE 3).
P04220a) 391 9 IG MU HEAVY CHAIN DISEASE PROTEIN (BOT).
Q9NWZ7f) 394 1 4 CDNA FLJ20515 FIS, CLONE KAT09889.
P07339b) WOSIG0 394 3 Cathepsin D precursor (EC 3.4.23.5)
P01009a) WOSIG0 394 44 Alpha-1-antitrypsin precursor (Alpha-1 protease inhibitor)(Alpha-1-antiproteinase) (PRO0684/PRO2209)
P05543a) WOSIG0 395 4 Thyroxine-binding globulin precursor (T4-binding globulin)
P20848b) WOSIG0 399 1 1 Alpha-1-antitrypsin-related protein precursor
P01011a) WOSIG0 400 4 Alpha-1-antichymotrypsin precursor (ACT)
P36955a) WOSIG0 403 14 Pigment epithelium-derived factor precursor (PEDF) (EPC-1)
P29622a) WOSIG0 407 2 Kallistatin precursor (Kallikrein inhibitor) (Protease inhibitor 4)
O94864e) 414 1 1 KIAA0764 PROTEIN (ADENOCARCINOMA ANTIGEN ART1).
P25490e) 414 1 2 TRANSCRIPTIONAL REPRESSOR PROTEIN YY1 (YIN ANDYANG 1) (YY-1) (DELTATRANSCRIPTION FACTOR) (NF-E1).
2004 WILEY-VCH Verlag GmbH & Co. KGaA, Weinheim www.proteomics-journal.de

Proteomics 2004, 4, 2125–2150 Industrial-scale proteomics 2145
Table 2. Continued
AccessionNo.
Type ofprotein
Length No. ofdistinctTrypticPeptides
No. ofruns
Description
Q9UK55b) WOSIG0 423 5 Protein Z-dependent protease inhibitor precursor(PZ-dependent protease inhibitor) (PZI)
P01042a) VS0 427 16 SPLICE ISOFORM LMW OF Kininogen precursor (Alpha-2-thiol proteinase inhibitor) [Contains: Bradykinin].
P02679a) WOSIG0 427 18 Fibrinogen gamma chain precursor
O00187b) C0 429 11 MANNAN-BINDING LECTIN SERINE PROTEASE 2A CHAIN [Mannan-binding lectin serine protease 2precursor (EC 3.4.21.-) (Mannose-binding proteinassociated serine protease 2) (MASP-2) (MBL-associatedserine protease 2)]
Patenta) 432 2 Mature protein sequence of antithrombin III (ATIII) (fromWO98/36085)
P01008a) WOSIG0 432 27 Antithrombin-III precursor (ATIII) (PRO0309)
P02790a) WOSIG0 439 28 Hemopexin precursor (Beta-1B-glycoprotein)
Patentf) 440 4 Amino acid sequence of human polypeptide PRO1411(from WO00/77037)
Q13231b) WOSIG0 445 1 6 Chitotriosidase precursor
P00736a) C0 446 3 COMPLEMENT C1R HEAVY CHAIN [Complement C1rcomponent precursor (EC 3.4.21.41)]
P02675a) C0 447 34 FIBRINOGEN BETA CHAIN [Fibrinogen beta chain precursor[Contains: Fibrinopeptide B]]
Q9BU40b) 450 6 Neuralin precursor (Ventroptin)
P01019a) WOSIG0 452 9 Angiotensinogen precursor [Contains: Angiotensin I;Angiotensin II]
P08697a) C0 452 15 ALPHA-2-ANTIPLASMIN [Alpha-2-antiplasmin precursor(Alpha-2-plasmin inhibitor) (Alpha-2-PI) (Alpha-2-AP)]
Patentf) 453 2 Human protein SEQ ID NO 1155 from WO01/57190
P01871a) 454 14 IG MU CHAIN C REGION.
P02774a) WOSIG0 458 28 Vitamin D-binding protein precursor (DBP) (Group-specificcomponent) (GC-globulin) (VDB)
P04004a) WOSIG0 459 8 Vitronectin precursor (Serum spreading factor) (S-protein)(V75) [Contains: Vitronectin V65 subunit; Vitronectin V10subunit; Somatomedin B]
P02675a) WOSIG0 461 34 Fibrinogen beta chain precursor [Contains: Fibrinopeptide B]
Q96AR3f) 463 2 HYPOTHETICAL 50.6 KDA PROTEIN.
Q96HJ4f) 464 1 2 HYPOTHETICAL 54.3 KDA PROTEIN.
O95841b) WOSIG0 468 3 ANGIOPOIETIN Y1 (DJ595C2.2) (ANGIOPOIETIN-RELATEDPROTEIN 1 PRECURSOR)
O15204b) 470 4 DISINTEGRIN-PROTEASE.
Q13228e) 472 2 SELENIUM-BINDING PROTEIN 1.
O43278b) WOSIG0 478 1 1 Kunitz-type protease inhibitor 1 precursor (Hepatocytegrowth factor activator inhibitor type 1) (HAI-1)
P05155a) WOSIG0 478 13 Plasma protease C1 inhibitor precursor (C1 Inh) (C1Inh)
P05546a) WOSIG0 480 10 Heparin cofactor II precursor (HC-II) (Protease inhibitorleuserpin 2) (HLS2)
2004 WILEY-VCH Verlag GmbH & Co. KGaA, Weinheim www.proteomics-journal.de

2146 K. Rose et al. Proteomics 2004, 4, 2125–2150
Table 2. Continued
AccessionNo.
Type ofprotein
Length No. ofdistinctTrypticPeptides
No. ofruns
Description
P00747a) C1 483 4 PLASMIN SHORT FORM OF CHAIN A [Plasminogenprecursor (EC 3.4.21.7) [Contains: Angiostatin]]
Patentf) 493 7 Human polypeptide (SEQ ID NO: 2764 from EP1130094)
P04217a) 495 17 ALPHA-1B-GLYCOPROTEIN.
Q9BRV0f), *) 500 8 HYPOTHETICAL 54.2 KDA PROTEIN.
P51956e) 506 1 1 SERINE/THREONINE-PROTEIN KINASE NEK3 (EC 2.7.1.-)(NIMA-RELATEDPROTEIN KINASE 3) (HSPK 36)(FRAGMENT).
P04196a), *) WOSIG0 507 22 Histidine-rich glycoprotein precursor (Histidine-proline richglycoprotein) (HPRG)
Q96LA5b) 508 1 1 FC RECEPTOR-LIKE PROTEIN 2.
Q9NQ76b) WOSIG0 508 6 Extracellular matrix protein 1 precursor (Secretory compo-nent P85)
BAB86362f) 524 1 1 FOUR-TRANSMEMBRANE PROTEIN ASSOCIATING WITHDISHEVELLED.
Patentf), *) 532 4 Novel human secreted protein #3710 (from WO01/79449)
P07358a) C0 537 2 COMPLEMENT COMPONENT C8 BETA CHAIN[Complement component C8 beta chain precursor]
O15079e) 538 1 1 KIAA0374 (SYNTAPHILIN) (BA314N13.1.1).
Q86SQ4f) 541 1 1 G protein-coupled receptor 126.
Q9NWZ5e) 548 1 4 CDNA FLJ20517 FIS, CLONE KAT10235.
Q08397b) WOSIG0 549 1 1 Lysyl oxidase homolog 1 precursor (EC 1.4.3.-)(Lysyl oxidase-like protein 1) (LOL)
P07357a) C0 554 6 COMPLEMENT COMPONENT C8 ALPHA CHAIN[Complement component C8 alpha chain precursor]
Q96PD5b), *) WOSIG0 555 21 Peptidoglycan recognition protein L precursor
P00747a), *) C0 561 7 PLASMIN HEAVY CHAIN A [Plasminogen precursor(EC 3.4.21.7) [Contains: Angiostatin]]
P50281b) WOSIG0 562 3 Matrix metalloproteinase-14 precursor (EC 3.4.24.-)(MMP-14) (Membrane-type matrix metalloproteinase 1)(MT-MMP 1) (MTMMP1) (Membrane-type-1 matrixmetalloproteinase) (MT1-MMP) (MT1MMP) (MMP-X1)
P28799b), *) WOSIG0 576 4 Granulins precursor (Acrogranin) Contains: Paragranulin;Granulin 1 (Granulin G); Granulin 2 (Granulin F); Granulin 3(Granulin B); Granulin 4 (Granulin A); Granulin 5 (Granulin C);Granulin 6 (Granulin D); Granulin 7 (Granulin E)
Patentf) 578 5 Human membrane or secretory protein clone PSEC0052(SEQ ID 46 from EP1067182)
P35858a), *) WOSIG0 578 6 Insulin-like growth factor binding protein complex acid labilechain precursor (ALS)
P43652a), *) WOSIG0 578 10 Afamin precursor (Alpha-albumin) (Alpha-Alb)
Q96MH9f) 579 1 1 CDNA FLJ32351 FIS, CLONE PROST2007317, HIGHLYSIMILAR TO RATTUSNORVEGICUS ZINC FINGERPROTEIN RIN ZF MRNA.
P00734a) C0 579 19 PROTHROMBIN [Prothrombin precursor (EC 3.4.21.5)(Coagulation factor II)]
2004 WILEY-VCH Verlag GmbH & Co. KGaA, Weinheim www.proteomics-journal.de

Proteomics 2004, 4, 2125–2150 Industrial-scale proteomics 2147
Table 2. Continued
AccessionNo.
Type ofprotein
Length No. ofdistinctTrypticPeptides
No. ofruns
Description
P02768a), *) C0 585 39 SERUM ALBUMIN [Serum albumin precursor]
Q9NZI5e) 618 1 10 LBP-32.
Patentf) 631 1 1 Novel human diagnostic protein #2309 (SEQ ID No 32677from WO01/75067)
Q14624a) C0 633 3 70 KDA INTER-ALPHA-TRYPSIN INHIBITOR HEAVY CHAINH4 [Inter-alpha-trypsin inhibitor heavy chain H4 precursor(ITI heavy chain H4) (Inter-alpha-trypsin inhibitor family heavychain-related protein) (IHRP) (Plasma kallikrein sensitiveglycoprotein 120) (PK-120) (GP120) [Contains: GP57]]
O15350e) 636 1 1 TUMOR PROTEIN P73 (P53-LIKE TRANSCRIPTIONFACTOR) (P53-RELATEDPROTEIN).
AAH24178f) 643 1 4 HYPOTHETICAL 73.3 KDA PROTEIN.
P19827a) C0 645 1 2 INTER-ALPHA-TRYPSIN INHIBITOR HEAVY CHAIN H1[Inter-alpha-trypsin inhibitor heavy chain H1 precursor(ITI heavy chain H1) (Inter-alpha-trypsin inhibitor complexcomponent III) (Serum-derived hyaluronan-associatedprotein) (SHAP)]
P01024a), *) C0 645 36 COMPLEMENT C3, BETA CHAIN [Complement C3 precursor[Contains: C3a anaphylatoxin]]
P19823a) C0 648 2 INTER-ALPHA-TRYPSIN INHIBITOR HEAVY CHAIN H2[Inter-alpha-trypsin inhibitor heavy chain H2 precursor(ITI heavy chain H2) (Inter-alpha-trypsin inhibitor complexcomponent II) (Serum-derived hyaluronan-associatedprotein) (SHAP)]
P01031a) C0 655 2 COMPLEMENT C5 BETA CHAIN [Complement C5 precursor[Contains: C5a anaphylatoxin]]
P01028a) C0 656 19 COMPLEMENT C4, BETA CHAIN [Complement C4 precursor[Contains: C4A anaphylatoxin]]
P05060b), *) WOSIG0 657 1 1 Secretogranin I precursor (SGI) (Chromogranin B) (CgB)[Contains: GAWK peptide; CCB peptide]
P09871a), *) WOSIG0 673 9 Complement C1s component precursor (EC 3.4.21.42)(C1 esterase)
P23142b), *) WOSIG0 674 2 Fibulin-1 precursor
Q96PQ8a), *) 679 4 FACTOR VII ACTIVE SITE MUTANT IMMUNOCONJUGATE.
P02787a), *) WOSIG0 679 72 Serotransferrin precursor (Siderophilin) (Beta-1-metal bindingglobulin)
P55290b) WOSIG0 691 4 Cadherin-13 precursor (Truncated-cadherin) (T-cadherin)(T-cad) (Heart-cadherin) (H-cadherin) (P105)
Q92902e) 700 1 1 HERMANSKY-PUDLAK SYNDROME PROTEIN.
P00751a), *) WOSIG0 739 10 Complement factor B precursor (EC 3.4.21.47) (C3/C5convertase) (Properdin factor B) (Glycine-rich beta glyco-protein) (GBG) (PBF2)
P05067a) WOSIG0 753 1 1 Alzheimer’s disease amyloid A4 protein precursor (Proteasenexin-II) (PN-II) (APPI) [Contains: Beta-amyloid protein(Beta-APP) (A-beta)]
2004 WILEY-VCH Verlag GmbH & Co. KGaA, Weinheim www.proteomics-journal.de

2148 K. Rose et al. Proteomics 2004, 4, 2125–2150
Table 2. Continued
AccessionNo.
Type ofprotein
Length No. ofdistinctTrypticPeptides
No. ofruns
Description
P06396a) WOSIG0 755 2 Gelsolin precursor, plasma (Actin-depolymerizing factor)(ADF) (Brevin) (AGEL)
AAH28395f) 757 1 1 SEC15 (S. CEREVISIAE)-LIKE.
P18564a) WOSIG0 767 2 Integrin beta-6 precursor
P01028a), *) C1 767 20 COMPLEMENT C4, ALPHA CHAIN [Complement C4precursor [Contains: C4A anaphylatoxin]]
BAB91138f) 775 1 3 CLCP1.
Patentf), *) 792 1 1 Novel human diagnostic protein #7270 (SEQ ID No 37638from WO01/75067)
Q9HCB6b) 807 1 1 VSGP/F-SPONDIN.
Q96JY4f) 811 1 1 CDNA FLJ14897 FIS, CLONE PLACE1004743, WEAKLYSIMILAR TO PROBABLEN-END-RECOGNIZING PROTEIN(FRAGMENT).
P02671a), *) C0 831 1 25 FIBRINOGEN ALPHA-E CHAIN [Fibrinogen alpha/alpha-Echain precursor [Contains: Fibrinopeptide A]]
Patenta), *) 847 13 AlphaE subunit of human fibrinogen (from WO00/09562)
Q08554b) WOSIG0 865 9 Desmocollin 1A/1B precursor (Desmosomal glycoprotein 2/3)(DG2/DG3)
Q14574b) WOSIG0 869 5 Desmocollin 3 precursor (Desmocollin 4) (HT-CP)
P19022b) WOSIG0 883 7 Neural-cadherin precursor (N-cadherin) (Cadherin-2)
P13671a) WOSIG0 913 7 Complement component C6 precursor
Q9H8L6c) 949 3 PLACE1003493 PROTEIN.
P01024a), *) C1 992 10 COMPLEMENT C3, ALPHA CHAIN [Complement C3precursor [Contains: C3a anaphylatoxin]]
P54198e) 1017 1 25 HIRA PROTEIN (TUP1 LIKE ENHANCER OF SPLITPROTEIN 1).
P05023e) C0 1018 1 2 SODIUM/POTASSIUM-TRANSPORTING ATPASE ALPHA-1CHAIN [Sodium/potassium-transporting ATPase alpha-1chain precursor (EC 3.6.3.9) (Sodium pump 1)(Na+/K+ ATPase 1)]
Q9NQ38a) WOSIG0 1042 2 Serine protease inhibitor Kazal-type 5 precursor(Lympho-epithelial Kazal-type related inhibitor) (LEKTI)[Contains: Hemofiltrate peptide HF6478; Hemofiltratepeptide HF7665]
P00450a) WOSIG0 1046 17 Ceruloplasmin precursor (EC 1.16.3.1) (Ferroxidase)
O95135f) 1051 1 1 ATAXIN-2-LIKE PROTEIN A2LP.
P42702b) WOSIG0 1053 1 1 Leukemia inhibitory factor receptor precursor (LIF-R)
Q14212a) WOSIG0 1067 1 1 Complement receptor type 2 precursor (Cr2) (ComplementC3d receptor) (Epstein-Barr virus receptor) (EBV receptor)(CD21 antigen).
Patentf) 1196 1 2 Novel human diagnostic protein #28734 (SEQ ID No 59102from WO01/75067)
P08603a), *) WOSIG0 1213 44 Complement factor H precursor (H factor 1)
2004 WILEY-VCH Verlag GmbH & Co. KGaA, Weinheim www.proteomics-journal.de

Proteomics 2004, 4, 2125–2150 Industrial-scale proteomics 2149
Table 2. Continued
AccessionNo.
Type ofprotein
Length No. ofdistinctTrypticPeptides
No. ofruns
Description
P78311f) 1224 1 1 MRNA, COMPLETE CDS, CLONE:RES4-22A,.
P22064b), *) WOSIG0 1374 3 Latent transforming growth factor beta binding protein 1precursor (Transforming growth factor beta-1 bindingprotein 1) (TGF-beta1-BP-1)
Q9BX49f) 1404 6 BG174L6.2 (MSF: MEGAKARYOCYTE STIMULATINGFACTOR ).
P28827b), *) WOSIG0 1432 4 Protein-tyrosine phosphatase mu precursor (EC 3.1.3.48)(R-PTP-mu)
AAL84159f) 1445 1 4 CD109.
P01023a), *) WOSIG0 1451 32 Alpha-2-macroglobulin precursor (Alpha-2-M)
O00508b) 1587 2 LATENT TGF-BETA BINDING PROTEIN-4.
Patentf) 1679 3 Human GPCR related protein NOV37c (from WO02/79398)
Q9P1Z9f) 1680 1 1 KIAA1529 PROTEIN (FRAGMENT).
Q14767b) 1821 3 LATENT TRANSFORMING GROWTH FACTOR-BETA-BINDING PROTEIN-2 (LTBP-2).
P10586b) WOSIG0 1881 2 LAR protein precursor (Leukocyte antigen related)(EC 3.1.3.48)
P02751a) WOSIG0 2355 11 Fibronectin precursor (FN) (Cold-insoluble globulin) (CIG)
P12111b), *) WOSIG0 3151 5 Collagen alpha 3(VI) chain precursor
P98160b) WOSIG0 4370 4 Basement membrane-specific heparan sulfate proteoglycancore protein precursor (HSPG) (Perlecan) (PLC)
Accession numbers and descriptions are from Swiss-Prot and TrEMBL when the protein is found there. WOSIGO (withoutsignal peptide) is the mature form of the peptide. C0,1,2 . . . are chains as described in Swiss-Prot. An accurate descriptionis given in the description column. P0,1,2 . . . are peptides as described in Swiss-Prot (see description column).a) Known to be secreted and plasmaticb) Secreted but not known to be plasmaticc) Not known to be secretedd) Cellular leakage proteins known to be found in plasmae) Probably cellular leakage proteins but have not been reported as present in plasmaf) unclassified; * indicates protein identified in the ion exchange column regeneration fraction.Length refers to the number of amino acid residues in the identified protein. Number of distinct tryptic peptides refers toidentified different classical tryptic peptides (no more than one missed cleavage allowed, no nontryptic cleavages). Forproteins identified by a single peptide, number of runs refers to the number of separate (independent) RP2 runs (fractions)in which the protein was identified.
led to identification of a majority of small proteins, frag-ments of some very large proteins were identified, manyof which (those carrying an asterisk in Table 2) were elutedduring regeneration of the ion exchange column (fraction18 in Fig. 2C). We identified 115 proteins through a singlepeptide (generally identified in multiple fractions, seerelevant column in Table 2), 143 through 2–5 peptides,77 through 6–10 peptides and 70 through more than 10peptides.
3.5 Chemical protein synthesis
Proteins found to be of interest (e.g. new and secreted)are being synthesized chemically and studied. Bioactivity,such as enzymic activity, has already been demonstratedfor some of the proteins identified. Refolding has beensuccessful with proteins possessing 8 disulfide bonds.The largest proteins synthesized and refolded so far havemore than 160 residues (Fig. 6). This is not the limit of
2004 WILEY-VCH Verlag GmbH & Co. KGaA, Weinheim www.proteomics-journal.de

2150 K. Rose et al. Proteomics 2004, 4, 2125–2150
Figure 6. Chemically synthesized 18 kDa protein assembled from 4 fragments. RP HPLC analysis of fully reduced protein(upper left panel), and after refolding (elutes earlier, lower left panel). ESI MS analysis (right panels) of refolded protein,which gave up 8 protons (4 disulfide bonds formed). The deduced mass is correct to within one amu.
the chemical method employed [7]. Purities assessed byHPLC and MS are in excess of 95% and yields of 5–40 mg,depending on length, are obtained. The nonbiological originof the chemically synthesized proteins avoided the risk ofcontamination by viruses, prions or endotoxins which canexhibit biological effects in small animal studies.
4 Concluding remarks
A procedure for the automated industrial-scale (2.5 L) anal-ysis of human plasma has been described, and hundredsof small proteins reported. By comparing two large pools,one from diseased and one from carefully matched controlsubjects, differences even in low abundance proteins maybe detected (data not shown). Once such proteins havebeen identified, high-throughput assays may be developedand used in follow-up validation studies involving the pre-served unpooled aliquots from individual donors. Sincecompletion of the work described here, we have upgradedour mass spectrometric instrumentation to the Esquire30001 model, and studied sample volumes of 500 mLand of 10 mL of serum or plasma. Preliminary results indi-cate that more than 250 nonredundant small proteinscan be identified from a 10 mL sample of plasma.
5 References
[1] Rose, K., in: Cooper, D. N. (Ed.),Nature Encyclopedia of theHuman Genome, Macmillan Publishers, London, England2003, Vol. 3, pp.435–439.
[2] Anderson, N. L., Anderson, N. G., Mol. Cell. Proteomics2002, 1, 845–867.
[3] Adkins, J. N., Varnum, S. M., Auberry, K. J., Moore, R. J. etal., Mol. Cell. Proteomics 2002, 1, 947–955.
[4] Wang, Y. Y., Cheng, P., Chan, D. W., Proteomics 2003, 3,243–248.
[5] Colinge, J., Masselot, A., Giron, M., Dessingy, T., Magnin, J.,Proteomics 2003, 3, 1454–1463.
[6] Schwab, S. R., Li, K. C., Kang, C., Shastri, N., Science 2003,301, 1367–1371.
[7] Dawson, P. E., Kent, S. B., Annu. Rev. Biochem. 2000, 69,923–960.
[8] Low, D. W., Hill, M. G., Carrasco, M. R., Kent, S. B., Botti, P.,Proc. Natl. Acad. Sci. USA 2001, 98, 6554–6559.
[9] Villain, M., Vizzavona, J., Gaertner, H., in: Lebel, M.,Houghten, R. A. (Eds.), Peptides: The Wave of the Future.Proceedings of the 17th American Peptide Symposium,Kluwer Academic Publishers, Dordrecht, The Netherlands2001, pp.107–108.
[10] De Bernadez Clark, E., Schwartz, E., Rudolph, R., Meth.Enzymol. 1999, 309, 217–236.
[11] Armstrong, N., de Lancastre, A., Gouaux, E., Protein Sci.1999, 8, 1475–1483.
2004 WILEY-VCH Verlag GmbH & Co. KGaA, Weinheim www.proteomics-journal.de
Related Documents