Industrial Pretreatment Program Chapter 5 Local Limits Evaluation Updated December 2020

Welcome message from author
This document is posted to help you gain knowledge. Please leave a comment to let me know what you think about it! Share it to your friends and learn new things together.
Transcript
Industrial Pretreatment Program
Chapter 5
Local Limits Evaluation
Updated
December 2020
Industrial Pretreatment Program
Training Log
Chapter 605 Local Limits Evaluation
My signature below certifies that I have been trained to perform the functions described in the referenced procedure and that I am familiar with the procedure and the attachments referenced herein.
Print Name Signature Date Trainer
LOCAL LIMITS EVALUATION ....................................................................................................................................... 1
EXECUTIVE SUMMARY ........................................................................................................................................... 1
INTRODUCTION ..................................................................................................................................................... 4
The Need for Local Limits .................................................................................................................................. 4
Facility Description ............................................................................................................................................ 4
Industrial Dischargers ........................................................................................................................................ 5
Pollutants of Concern ........................................................................................................................................ 5
METHODOLOGY ..................................................................................................................................................... 7
Flow and Loading Data ...................................................................................................................................... 7
Water Quality Criteria........................................................................................................................................ 7
Process Inhibition Criteria ................................................................................................................................. 8
Sludge (Biosolids) Protection ............................................................................................................................. 8
Allowable Headworks Loading Calculations ........................................................................................................ 10
Acute Water Quality Criteria ........................................................................................................................... 10
Chronic Water Quality Criteria ........................................................................................................................ 10
Human Health Water Quality Criteria ............................................................................................................. 11
Process Inhibition – Activated Sludge ............................................................................................................. 11
Process Inhibition – Nitrification ..................................................................................................................... 12
Sludge Protection ............................................................................................................................................ 12
Maximum Allowable Headworks Loading ....................................................................................................... 13
Maximum Allowable Industrial Loading .............................................................................................................. 15
Allocation of Local Limits ................................................................................................................................. 15
Recommenced Action ...................................................................................................................................... 16
Summary .......................................................................................................................................................... 16
CONVENTIONAL POLLUTANTS ............................................................................................................................. 17
Oil and Grease/pH ........................................................................................................................................... 17
605 Local Limits Evaluation 01 December 2020 Page 1 of 17
LOCAL LIMITS EVALUATION
EXECUTIVE SUMMARY
The City of Tifton has a revised NPDES Permit (No. GA0047480) effective December 1, 2017 for the operation of the Tifton New River Water Pollution Control Plant. Part III, Section A.2.c of this permit requires the City of Tifton to conduct an evaluation of the industrial discharge limits included in the Sewer Use Ordinance to determine if any revision of these limits is warranted. This technical evaluation has been prepared to document the need for and development of revised local limits in compliance with this requirement.
The local limits are intended to control and regulate the discharge of pollutants to a publicly owned treatment works (POTW) that may:
Pass through the POTW's treatment system and result in a violation of effluent limitations or receiving water standards
Interfere with the biological treatment processes, such that regulatory compliance is impacted Contaminate the POTWs sludge, impacting the beneficial reuse of Biosolids Endanger POTW worker health and safety Interfere with the POTW's collection or treatment works, such that regulatory compliance or
operating costs are significantly affected
The Office of Wastewater Management of the U.S. Environmental Protection Agency (EPA) has issued a guidance document, the Local Limits Development Guidance Manual (EPA 833-R-04-002A, July 2004) also known as the 2004 Manual, that is used as the basis for this evaluation. In general, this document outlines the following steps:
1. Determine the pollutants of concern 2. Gather relevant information
a. Water quality limits, sludge quality limits b. Process inhibition levels c. Process removal efficiency d. Domestic or background loadings
3. Determine the allowable headworks loading at the WPCP 4. Determine the allowable industrial loading to the WPCP 5. Allocate the loading to safety factor, existing industries, and future needs 6. Address acceptance, approval and implementation of revised limits.
The 2004 Manual identifies fifteen pollutants as national pollutants of concern (POC). All of these are addressed in this update along with oil and grease, and pH. Most of the POCs are metals and are addressed as non-conventional pollutants. BOD, TSS, and nitrogen are addressed as conventional pollutants based on the POTWs design capability to remove these pollutants. Oil and Grease and pH are addressed with a primary focus on protection of the POTW collection system.
605 Local Limits Evaluation 01 December 2020 Page 2 of 17
Water quality criteria are based on EPD water quality standards and sludge quality limits are based on EPA “clean sludge” standards. Process inhibition levels and process removals rates of non-conventional pollutants of concern are taken from the 2004 Manual. Background loadings are based on recent sampling of plant influent at facilities in the southeast with no industrial contribution.
For each of the six protection criteria, two for process protection, three for water quality protection and one for sludge quality protection, an allowable headworks loading is determined for each pollutant. The lowest of these six loadings is selected as the maximum allowable headworks loading.
Some pollutants are anticipated to be present in domestic discharges. To determine how much of the maximum allowable headworks loading(MAHL) may be allocated to industry, the amount that is in domestic or not-controllable sources must first be subtracted. The remaining balance, less a safety factor and any allowance for future needs is available to be allocated to industrial sources. This mass is then allocated on a uniform concentration basis to all existing permitted industries and recently identified industries that will soon be permitted.
All of the incoming waste enters the facility through the preliminary treatment facilities, or headworks, and the headworks loading is set at this point. The MAHL for the treatment works must account for pollutants entering the facility from the incoming sewer system.
The MAHL arrives at the plant from several sources. Per EPA standards, the portion of each pollutant MAHL that can be allocated to industrial users is termed the maximum allowable industrial loading (MAIL). The MAIL is equal to the total MAHL, less the loading contributed by uncontrolled sources (LUNC) within the collection system including domestic, commercial and infiltration and inflow (I&I), and less an amount held in reserve as a safety factor (SF).
The recommended local limits for the Tifton are based on a uniform allocation of the industrial loading across the industrial flow base, which consists of the known industrial users. Since all pollutants of concern are not discharged at this uniform concentration level, some allocations are possible beyond the uniform limit. The City of Tifton will consider mass based allocations of these pollutants up to the mass levels determined by allocation of the above formula while still achieving their goal to meet the MAHL to protect the treatment processes, stream and sludge and where possible minimize the impact on local industry.
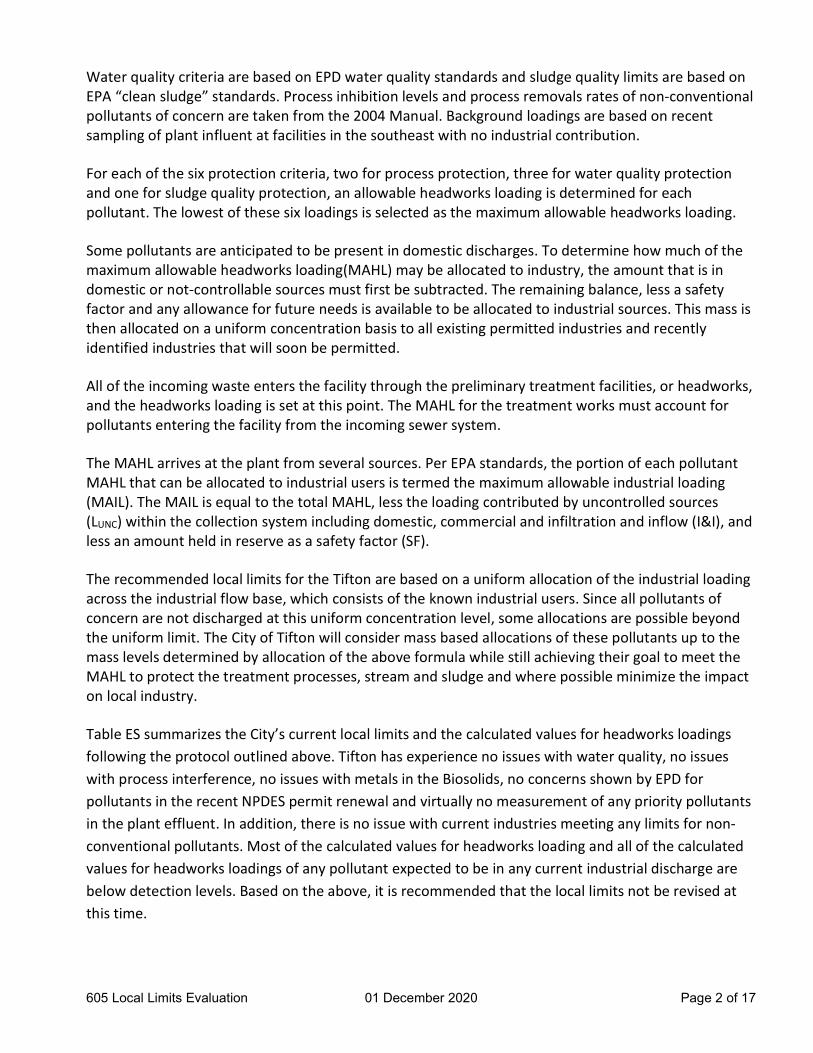
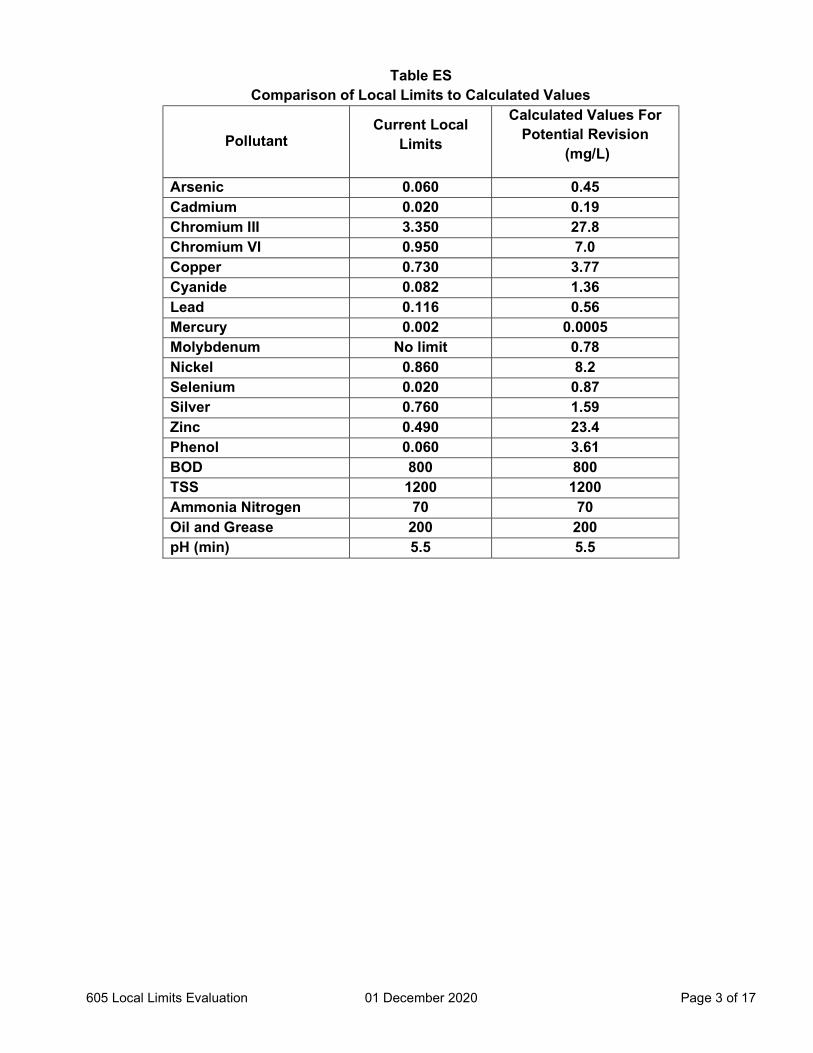
Table ES summarizes the City’s current local limits and the calculated values for headworks loadings following the protocol outlined above. Tifton has experience no issues with water quality, no issues with process interference, no issues with metals in the Biosolids, no concerns shown by EPD for pollutants in the recent NPDES permit renewal and virtually no measurement of any priority pollutants in the plant effluent. In addition, there is no issue with current industries meeting any limits for non-conventional pollutants. Most of the calculated values for headworks loading and all of the calculated values for headworks loadings of any pollutant expected to be in any current industrial discharge are below detection levels. Based on the above, it is recommended that the local limits not be revised at this time.
605 Local Limits Evaluation 01 December 2020 Page 3 of 17
Table ES Comparison of Local Limits to Calculated Values
Pollutant Current Local
Limits
Calculated Values For Potential Revision
(mg/L)
Arsenic 0.060 0.45 Cadmium 0.020 0.19 Chromium III 3.350 27.8 Chromium VI 0.950 7.0 Copper 0.730 3.77 Cyanide 0.082 1.36 Lead 0.116 0.56 Mercury 0.002 0.0005 Molybdenum No limit 0.78 Nickel 0.860 8.2 Selenium 0.020 0.87 Silver 0.760 1.59 Zinc 0.490 23.4 Phenol 0.060 3.61 BOD 800 800 TSS 1200 1200 Ammonia Nitrogen 70 70 Oil and Grease 200 200 pH (min) 5.5 5.5
605 Local Limits Evaluation 01 December 2020 Page 4 of 17
INTRODUCTION
The Need for Local Limits
Publically Owned Treatment Works (POTWs) are responsible for limiting, where necessary, the character and volume of pollutants being discharged into their wastewater treatment system in order to protect the treatment facility against pass through and interference, adverse water quality impacts on the receiving stream, adverse sludge quality impacts, and worker health and safety problems. In addition, the POTW must control the quantity of conventional pollutants that it is designed to treat to levels that the system can process and still operate within permit limits.
POTWs control the discharge of toxic pollutants by non-domestic sources to their wastewater treatment facility through the development and implementation of Pretreatment Standards, called local limits. The recommended procedures for evaluating and deriving local limits are described in Local Limits Development Guidance, U.S. EPA, 2004 (2004 Manual).
Industrial sources that may discharge non-conventional pollutants or significant quantities of conventional pollutants that may interfere with the operation of the WPCP are regulated by the City of Tifton by the issuance of Industrial User Permits that regulate the quality and nature of the discharge and requirements for the industry to monitor the discharge and report the results to the City of Tifton.
The National Pollutant Discharge Elimination System (NPDES) Permit No. GA0047480 (effective December 1, 2017) issued to the City of Tifton by the Georgia Environmental Protection Division contained the requirement that the City conduct a technically based headworks loading evaluation to determine the need to revise the limits contained in the Tifton Sewer Use Ordinance.
This document serves to meet the requirements for a review of the local limits and technical evaluation of the need to revise the limits contained in the Sewer Use Ordinance.
Facility Description
The Tifton sanitary sewer collection system conveys flow from the City of Tifton to the New River WPCP located on Old Brookfield Road. The Tifton sanitary sewer system serves the residents, businesses and industry located in all of the City of Tifton. Wastewater gravity flows to the plant from the City of Tifton collection system.
The New River WPCP has been designed to provide enhanced secondary treatment including ammonia removal in the extended aeration facility. The WPCP has a design capacity of 8.0 mgd and treated an average of 5.69 mgd in 2018 with an influent BOD of 110 mg/L and influent TSS of 143 mg/L. The plant flow includes about 0.043 mgd from all industrial sources.
The preliminary treatment consists of influent pumping, a mechanical bar screen and grit removal. Screened incoming wastewater and RAS flow to the aeration system. The biological system consists of two oxidation ditch type aeration basin with diffused aeration and mechanical mixing and three final clarifiers. Final treatment includes chlorine disinfection, dechlorination and post aeration. discharge to the New River.

605 Local Limits Evaluation 01 December 2020 Page 5 of 17
Sludge removed from the aeration system is pumped to the aerobic digester. Sludge from the digester flows to the gravity thickener and the thickened sludge is pumped to the sludge holding tank and is then transferred via pipeline to the dedicated land application site where it is surface applied at agronomic rates..
Industrial Dischargers
The City of Tifton has identified five industries that are subject to the permitting requirements of the Tifton Sewer Use Ordinance. One is a categorical industry permitted at the more restrictive local permit levels and the others are non-categorical industries. These industries are shown in the following Table.
Table 1 Industrial Contributors
Industry Name Average Flow (mgd) NAICS Code TC Transcontinental 0.020 322220 Triest Ag Group 0.0017 325320 Tifton Extrusions 0.015 331318; 332812 Heatcraft 0.0049 333415 First Products LLC 0.001 333111
Pollutants of Concern
The purpose of developing local limits is to prevent interference of POTW treatment operations, protect worker health and safety, prevent pass-through of conventional and toxic pollutants, prevent adverse impacts a sludge quality, and maintain discharge permit and regulatory compliance. This is accomplished by identifying which pollutants of concern (POCs) need to be controlled to meet these goals and to meet Federal, State, and local requirements. The EPA has identified 15 pollutants that it considers potential POCs. These include; Arsenic, Cadmium, Chromium, Copper, Cyanide, Lead, Mercury, Nickel, Silver, Zinc, Ammonia, BOD, Molybdenum, Selenium and Total Suspended Solids.
In addition to the EPA's list of national pollutants, additional potential POCs were identified that may adversely impact compliance with effluent limitations, environmental standards and regulatory requirements, protection of the POTW, collection system and workers. Additional POCs, oil and grease has been included based on the impact on the operation of the collection system.
Other pollutants measured in priority pollutant scans of the industrial discharges and the POTW influent and effluent were measured in quantities that are less than one percent of the allowable instream water quality and were determined to not need consideration at this time as pollutants of concern for developing local limits. Some pollutants may still be regulated under categorical standards.
The pollutants of concern are listed below:
605 Local Limits Evaluation 01 December 2020 Page 6 of 17
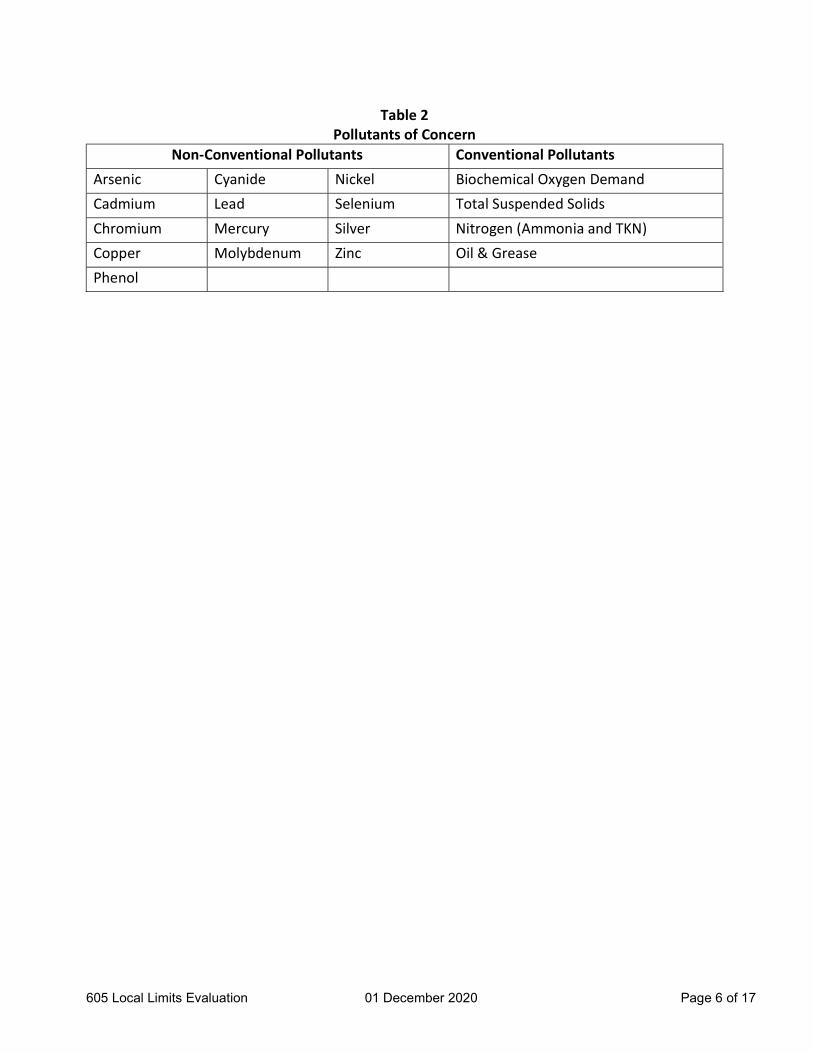
Table 2 Pollutants of Concern
Non-Conventional Pollutants Conventional Pollutants
Arsenic Cyanide Nickel Biochemical Oxygen Demand
Cadmium Lead Selenium Total Suspended Solids
Chromium Mercury Silver Nitrogen (Ammonia and TKN)
Copper Molybdenum Zinc Oil & Grease
Phenol
605 Local Limits Evaluation 01 December 2020 Page 7 of 17
METHODOLOGY
The general methodology used to calculate local limits is described in the EPA Local Limits Development Guidance Manual (2004). Local limits are dependent on the plant flow and the stream flow. The higher the plant flow in relation to the stream, the more potential there is for the plant discharge to impact the stream. The plant and stream flows will determine the discharge limits for a pollutant, then the ability of the plant to remove that pollutant will determine how much can be introduced at the headworks of the plant. Conservative pollutants, such as metals, are not altered in the plant; therefore, whatever quantity is removed to prevent it entering the receiving stream will accumulate in the sludge produced by the plant. This quantity must also be considered in setting local limits to protect the beneficial use of the sludge. As another consideration, these pollutants are also toxic to the biological processes in the facility and the concentration at which pollutants may impact the plant must also be part of the consideration. Each of these criterions are discussed in more detail below and examples of each calculation are included in the next section.
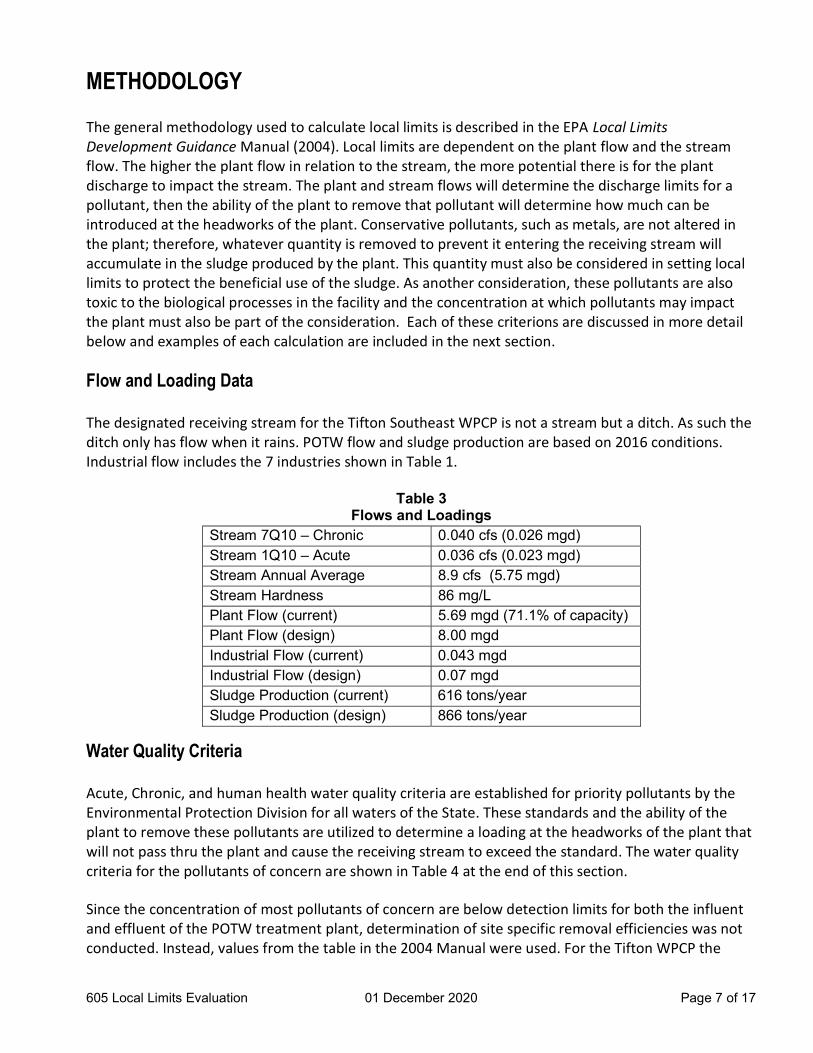
Flow and Loading Data
The designated receiving stream for the Tifton Southeast WPCP is not a stream but a ditch. As such the ditch only has flow when it rains. POTW flow and sludge production are based on 2016 conditions. Industrial flow includes the 7 industries shown in Table 1.
Table 3 Flows and Loadings
Stream 7Q10 – Chronic 0.040 cfs (0.026 mgd) Stream 1Q10 – Acute 0.036 cfs (0.023 mgd) Stream Annual Average 8.9 cfs (5.75 mgd) Stream Hardness 86 mg/L Plant Flow (current) 5.69 mgd (71.1% of capacity) Plant Flow (design) 8.00 mgd Industrial Flow (current) 0.043 mgd Industrial Flow (design) 0.07 mgd Sludge Production (current) 616 tons/year Sludge Production (design) 866 tons/year
Water Quality Criteria
Acute, Chronic, and human health water quality criteria are established for priority pollutants by the Environmental Protection Division for all waters of the State. These standards and the ability of the plant to remove these pollutants are utilized to determine a loading at the headworks of the plant that will not pass thru the plant and cause the receiving stream to exceed the standard. The water quality criteria for the pollutants of concern are shown in Table 4 at the end of this section.
Since the concentration of most pollutants of concern are below detection limits for both the influent and effluent of the POTW treatment plant, determination of site specific removal efficiencies was not conducted. Instead, values from the table in the 2004 Manual were used. For the Tifton WPCP the
605 Local Limits Evaluation 01 December 2020 Page 8 of 17
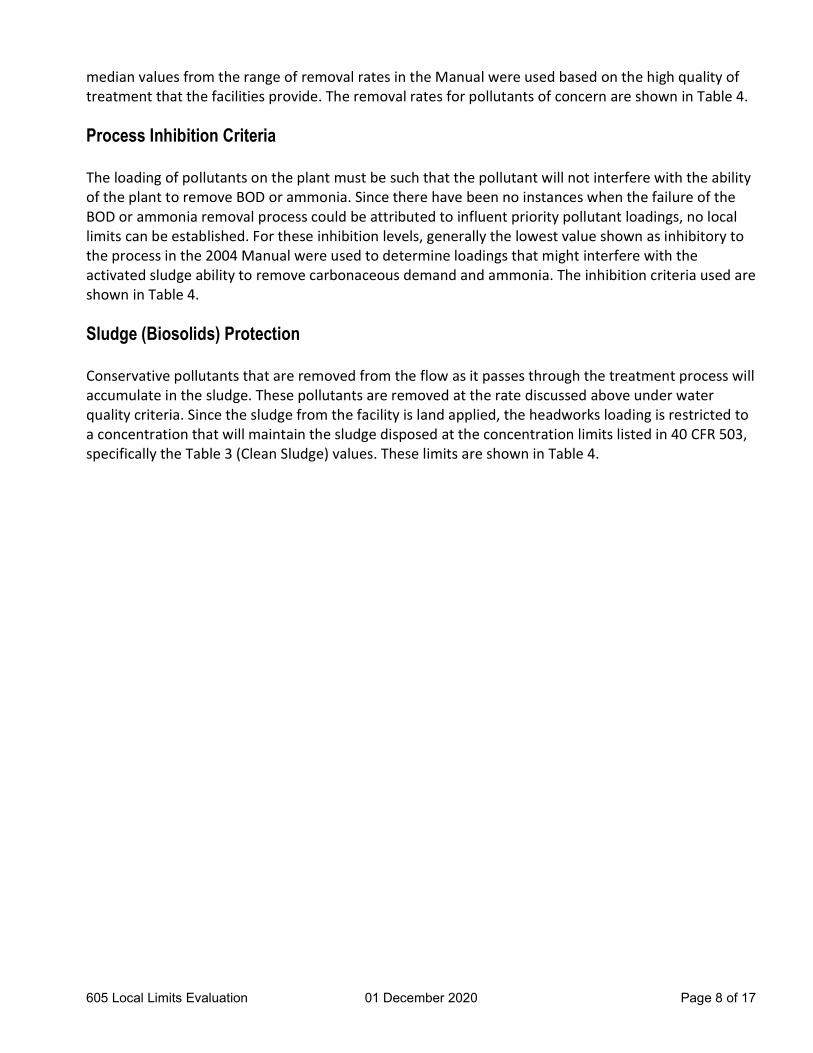
median values from the range of removal rates in the Manual were used based on the high quality of treatment that the facilities provide. The removal rates for pollutants of concern are shown in Table 4.
Process Inhibition Criteria
The loading of pollutants on the plant must be such that the pollutant will not interfere with the ability of the plant to remove BOD or ammonia. Since there have been no instances when the failure of the BOD or ammonia removal process could be attributed to influent priority pollutant loadings, no local limits can be established. For these inhibition levels, generally the lowest value shown as inhibitory to the process in the 2004 Manual were used to determine loadings that might interfere with the activated sludge ability to remove carbonaceous demand and ammonia. The inhibition criteria used are shown in Table 4.
Sludge (Biosolids) Protection
Conservative pollutants that are removed from the flow as it passes through the treatment process will accumulate in the sludge. These pollutants are removed at the rate discussed above under water quality criteria. Since the sludge from the facility is land applied, the headworks loading is restricted to a concentration that will maintain the sludge disposed at the concentration limits listed in 40 CFR 503, specifically the Table 3 (Clean Sludge) values. These limits are shown in Table 4.
605 Local Limits Evaluation 01 December 2020 Page 9 of 17
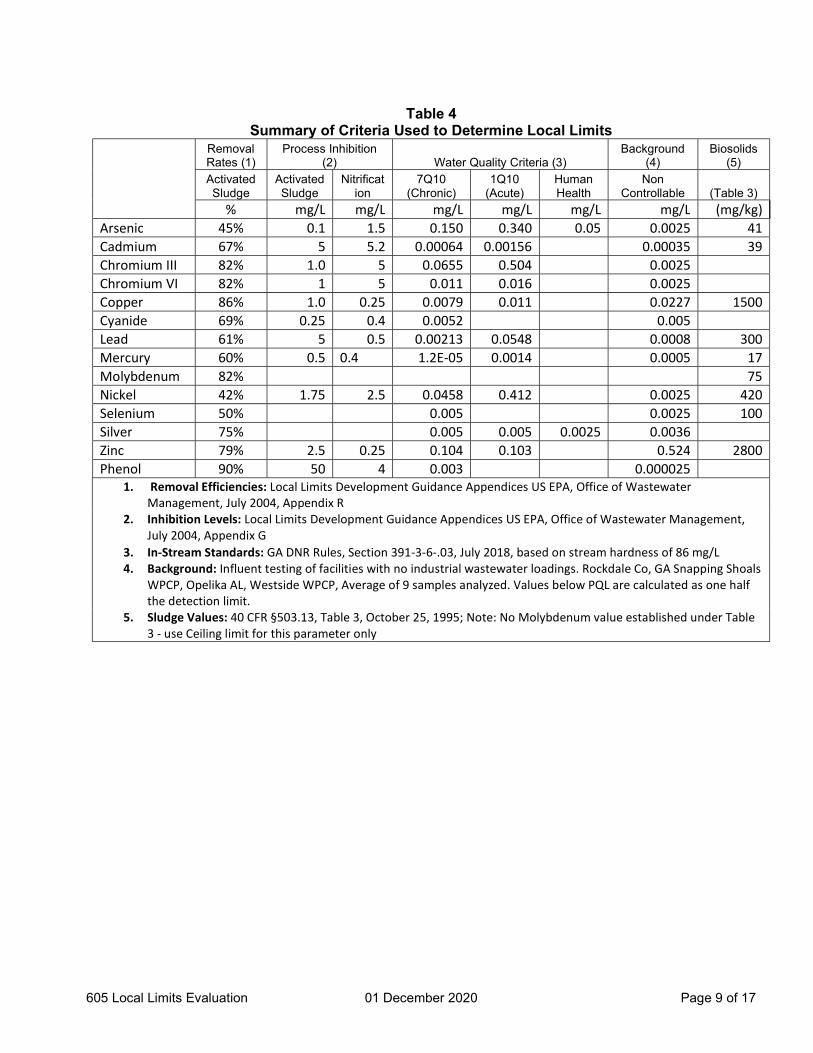
Table 4 Summary of Criteria Used to Determine Local Limits
Removal Rates (1)
Process Inhibition (2) Water Quality Criteria (3)
Background (4)
Biosolids (5)
Activated Sludge
Activated Sludge
Nitrification
7Q10 (Chronic)
1Q10 (Acute)
Human Health
Non Controllable (Table 3)
% mg/L mg/L mg/L mg/L mg/L mg/L (mg/kg) Arsenic 45% 0.1 1.5 0.150 0.340 0.05 0.0025 41 Cadmium 67% 5 5.2 0.00064 0.00156 0.00035 39 Chromium III 82% 1.0 5 0.0655 0.504 0.0025 Chromium VI 82% 1 5 0.011 0.016 0.0025 Copper 86% 1.0 0.25 0.0079 0.011 0.0227 1500 Cyanide 69% 0.25 0.4 0.0052 0.005 Lead 61% 5 0.5 0.00213 0.0548 0.0008 300 Mercury 60% 0.5 0.4 1.2E-05 0.0014 0.0005 17 Molybdenum 82% 75 Nickel 42% 1.75 2.5 0.0458 0.412 0.0025 420 Selenium 50% 0.005 0.0025 100 Silver 75% 0.005 0.005 0.0025 0.0036 Zinc 79% 2.5 0.25 0.104 0.103 0.524 2800 Phenol 90% 50 4 0.003 0.000025
1. Removal Efficiencies: Local Limits Development Guidance Appendices US EPA, Office of Wastewater Management, July 2004, Appendix R
2. Inhibition Levels: Local Limits Development Guidance Appendices US EPA, Office of Wastewater Management, July 2004, Appendix G
3. In-Stream Standards: GA DNR Rules, Section 391-3-6-.03, July 2018, based on stream hardness of 86 mg/L 4. Background: Influent testing of facilities with no industrial wastewater loadings. Rockdale Co, GA Snapping Shoals
WPCP, Opelika AL, Westside WPCP, Average of 9 samples analyzed. Values below PQL are calculated as one half the detection limit.
5. Sludge Values: 40 CFR §503.13, Table 3, October 25, 1995; Note: No Molybdenum value established under Table 3 - use Ceiling limit for this parameter only
605 Local Limits Evaluation 01 December 2020 Page 10 of 17
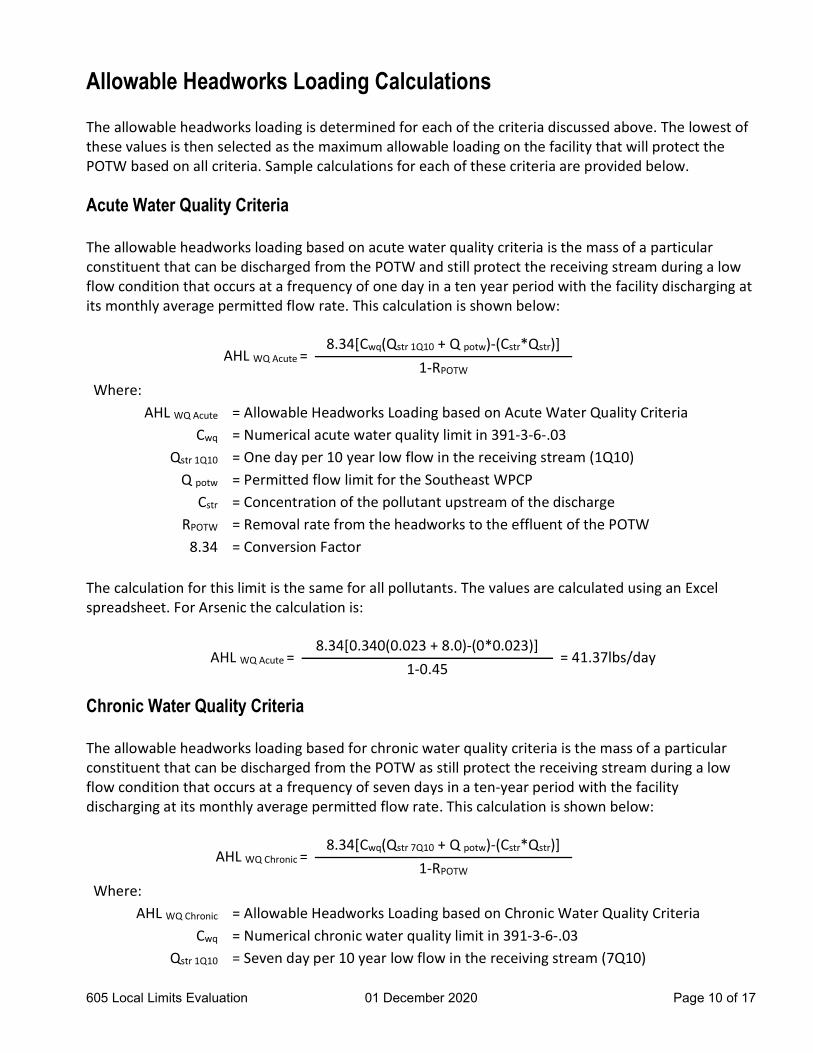
Allowable Headworks Loading Calculations
The allowable headworks loading is determined for each of the criteria discussed above. The lowest of these values is then selected as the maximum allowable loading on the facility that will protect the POTW based on all criteria. Sample calculations for each of these criteria are provided below.
Acute Water Quality Criteria
The allowable headworks loading based on acute water quality criteria is the mass of a particular constituent that can be discharged from the POTW and still protect the receiving stream during a low flow condition that occurs at a frequency of one day in a ten year period with the facility discharging at its monthly average permitted flow rate. This calculation is shown below:
AHL WQ Acute = 8.34[Cwq(Qstr 1Q10 + Q potw)-(Cstr*Qstr)]
1-RPOTW Where:
AHL WQ Acute = Allowable Headworks Loading based on Acute Water Quality Criteria Cwq = Numerical acute water quality limit in 391-3-6-.03
Qstr 1Q10 = One day per 10 year low flow in the receiving stream (1Q10) Q potw = Permitted flow limit for the Southeast WPCP
Cstr = Concentration of the pollutant upstream of the discharge RPOTW = Removal rate from the headworks to the effluent of the POTW
8.34 = Conversion Factor
The calculation for this limit is the same for all pollutants. The values are calculated using an Excel spreadsheet. For Arsenic the calculation is:
AHL WQ Acute = 8.34[0.340(0.023 + 8.0)-(0*0.023)]
= 41.37lbs/day 1-0.45
Chronic Water Quality Criteria
The allowable headworks loading based for chronic water quality criteria is the mass of a particular constituent that can be discharged from the POTW as still protect the receiving stream during a low flow condition that occurs at a frequency of seven days in a ten-year period with the facility discharging at its monthly average permitted flow rate. This calculation is shown below:
AHL WQ Chronic = 8.34[Cwq(Qstr 7Q10 + Q potw)-(Cstr*Qstr)]
1-RPOTW Where:
AHL WQ Chronic = Allowable Headworks Loading based on Chronic Water Quality Criteria Cwq = Numerical chronic water quality limit in 391-3-6-.03
Qstr 1Q10 = Seven day per 10 year low flow in the receiving stream (7Q10)
605 Local Limits Evaluation 01 December 2020 Page 11 of 17
Q potw = Permitted flow limit for the Southeast WPCP Cstr = Concentration of the pollutant upstream of the discharge
RPOTW = Removal rate from the headworks to the effluent of the POTW 8.34 = Conversion Factor
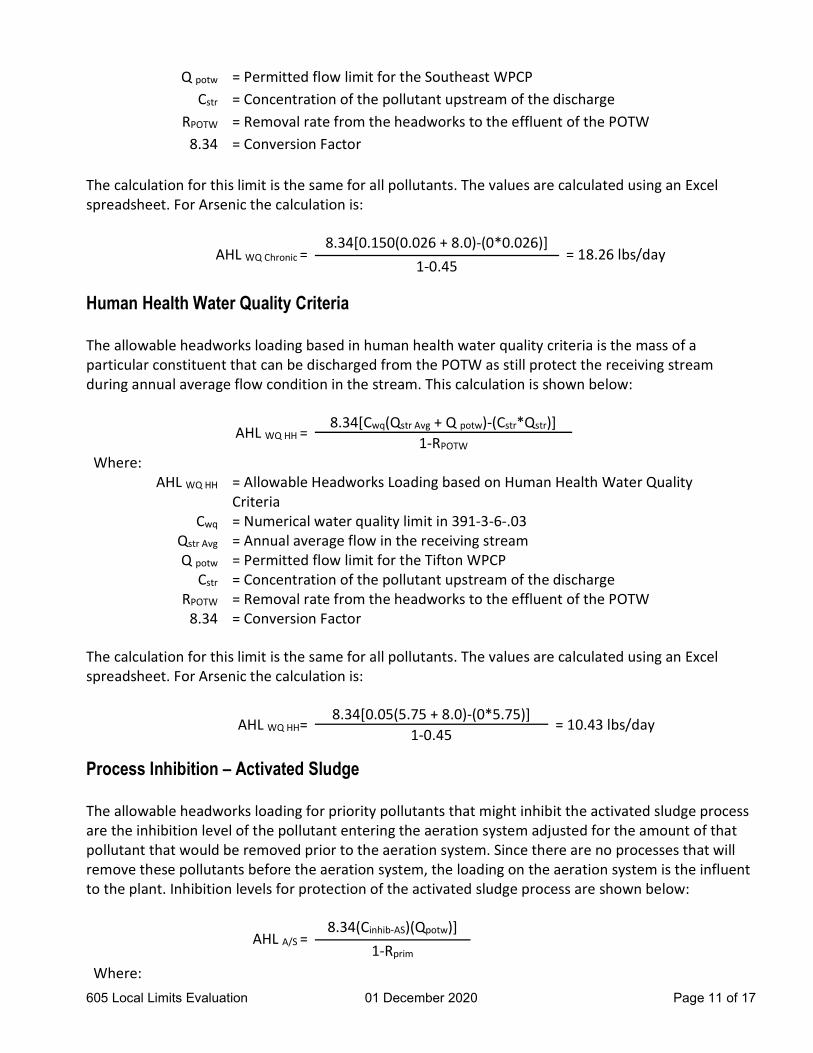
The calculation for this limit is the same for all pollutants. The values are calculated using an Excel spreadsheet. For Arsenic the calculation is:
AHL WQ Chronic = 8.34[0.150(0.026 + 8.0)-(0*0.026)]
= 18.26 lbs/day 1-0.45
Human Health Water Quality Criteria
The allowable headworks loading based in human health water quality criteria is the mass of a particular constituent that can be discharged from the POTW as still protect the receiving stream during annual average flow condition in the stream. This calculation is shown below:
AHL WQ HH = 8.34[Cwq(Qstr Avg + Q potw)-(Cstr*Qstr)]
1-RPOTW Where:
AHL WQ HH = Allowable Headworks Loading based on Human Health Water Quality Criteria
Cwq = Numerical water quality limit in 391-3-6-.03 Qstr Avg = Annual average flow in the receiving stream Q potw = Permitted flow limit for the Tifton WPCP
Cstr = Concentration of the pollutant upstream of the discharge RPOTW = Removal rate from the headworks to the effluent of the POTW
8.34 = Conversion Factor
The calculation for this limit is the same for all pollutants. The values are calculated using an Excel spreadsheet. For Arsenic the calculation is:
AHL WQ HH= 8.34[0.05(5.75 + 8.0)-(0*5.75)]
= 10.43 lbs/day 1-0.45
Process Inhibition – Activated Sludge
The allowable headworks loading for priority pollutants that might inhibit the activated sludge process are the inhibition level of the pollutant entering the aeration system adjusted for the amount of that pollutant that would be removed prior to the aeration system. Since there are no processes that will remove these pollutants before the aeration system, the loading on the aeration system is the influent to the plant. Inhibition levels for protection of the activated sludge process are shown below:
AHL A/S = 8.34(Cinhib-AS)(Qpotw)]
1-Rprim Where:
605 Local Limits Evaluation 01 December 2020 Page 12 of 17
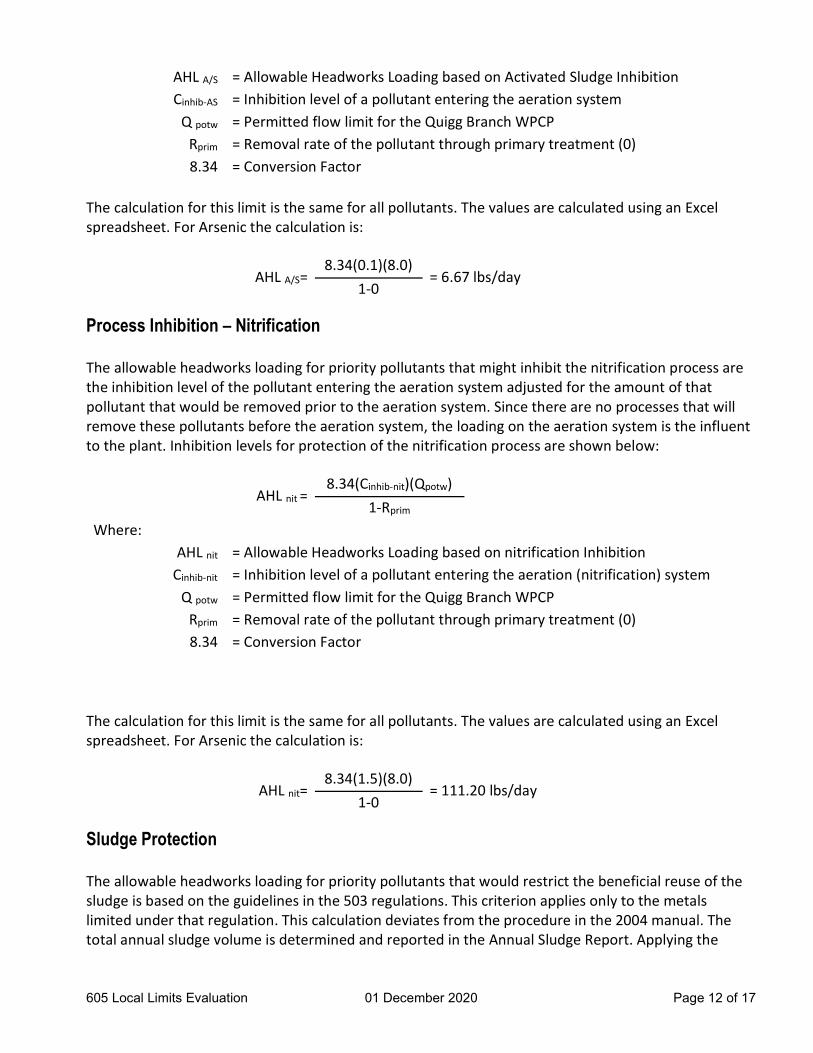
AHL A/S = Allowable Headworks Loading based on Activated Sludge Inhibition Cinhib-AS = Inhibition level of a pollutant entering the aeration system
Q potw = Permitted flow limit for the Quigg Branch WPCP Rprim = Removal rate of the pollutant through primary treatment (0) 8.34 = Conversion Factor
The calculation for this limit is the same for all pollutants. The values are calculated using an Excel spreadsheet. For Arsenic the calculation is:
AHL A/S= 8.34(0.1)(8.0)
= 6.67 lbs/day 1-0
Process Inhibition – Nitrification
The allowable headworks loading for priority pollutants that might inhibit the nitrification process are the inhibition level of the pollutant entering the aeration system adjusted for the amount of that pollutant that would be removed prior to the aeration system. Since there are no processes that will remove these pollutants before the aeration system, the loading on the aeration system is the influent to the plant. Inhibition levels for protection of the nitrification process are shown below:
AHL nit = 8.34(Cinhib-nit)(Qpotw)
1-Rprim Where:
AHL nit = Allowable Headworks Loading based on nitrification Inhibition Cinhib-nit = Inhibition level of a pollutant entering the aeration (nitrification) system
Q potw = Permitted flow limit for the Quigg Branch WPCP Rprim = Removal rate of the pollutant through primary treatment (0) 8.34 = Conversion Factor
The calculation for this limit is the same for all pollutants. The values are calculated using an Excel spreadsheet. For Arsenic the calculation is:
AHL nit= 8.34(1.5)(8.0)
= 111.20 lbs/day 1-0
Sludge Protection
The allowable headworks loading for priority pollutants that would restrict the beneficial reuse of the sludge is based on the guidelines in the 503 regulations. This criterion applies only to the metals limited under that regulation. This calculation deviates from the procedure in the 2004 manual. The total annual sludge volume is determined and reported in the Annual Sludge Report. Applying the
605 Local Limits Evaluation 01 December 2020 Page 13 of 17
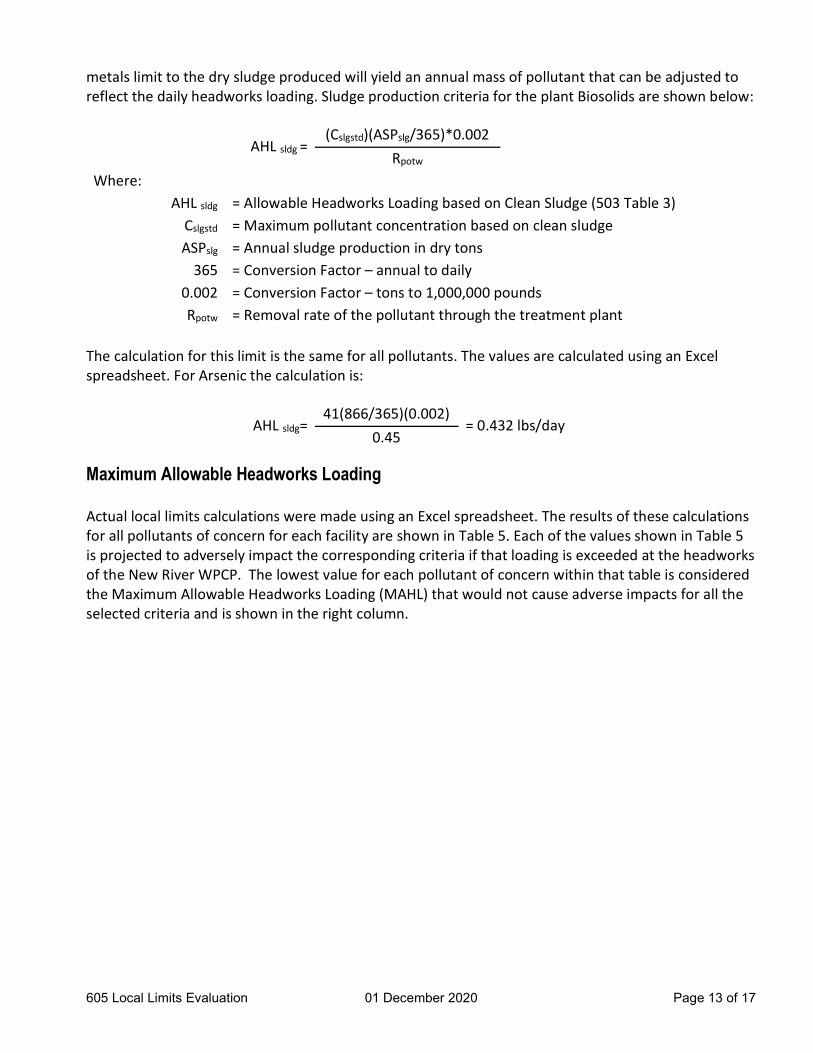
metals limit to the dry sludge produced will yield an annual mass of pollutant that can be adjusted to reflect the daily headworks loading. Sludge production criteria for the plant Biosolids are shown below:
AHL sldg = (Cslgstd)(ASPslg/365)*0.002
Rpotw Where:
AHL sldg = Allowable Headworks Loading based on Clean Sludge (503 Table 3) Cslgstd = Maximum pollutant concentration based on clean sludge ASPslg = Annual sludge production in dry tons
365 = Conversion Factor – annual to daily 0.002 = Conversion Factor – tons to 1,000,000 pounds Rpotw = Removal rate of the pollutant through the treatment plant
The calculation for this limit is the same for all pollutants. The values are calculated using an Excel spreadsheet. For Arsenic the calculation is:
AHL sldg= 41(866/365)(0.002)
= 0.432 lbs/day 0.45
Maximum Allowable Headworks Loading
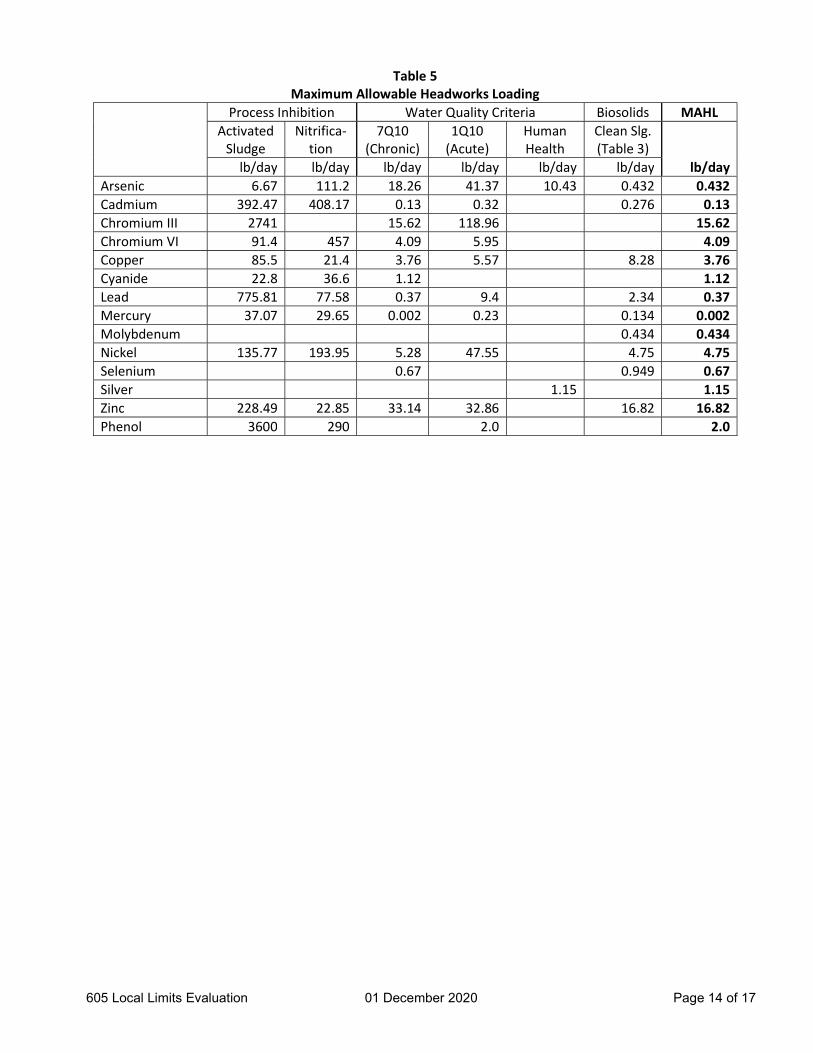
Actual local limits calculations were made using an Excel spreadsheet. The results of these calculations for all pollutants of concern for each facility are shown in Table 5. Each of the values shown in Table 5 is projected to adversely impact the corresponding criteria if that loading is exceeded at the headworks of the New River WPCP. The lowest value for each pollutant of concern within that table is considered the Maximum Allowable Headworks Loading (MAHL) that would not cause adverse impacts for all the selected criteria and is shown in the right column.
605 Local Limits Evaluation 01 December 2020 Page 14 of 17
Table 5 Maximum Allowable Headworks Loading
Process Inhibition Water Quality Criteria Biosolids MAHL
Activated
Sludge Nitrifica-
tion 7Q10
(Chronic) 1Q10
(Acute) Human Health
Clean Slg. (Table 3)
lb/day lb/day lb/day lb/day lb/day lb/day lb/day Arsenic 6.67 111.2 18.26 41.37 10.43 0.432 0.432 Cadmium 392.47 408.17 0.13 0.32 0.276 0.13 Chromium III 2741 15.62 118.96 15.62 Chromium VI 91.4 457 4.09 5.95 4.09 Copper 85.5 21.4 3.76 5.57 8.28 3.76 Cyanide 22.8 36.6 1.12 1.12 Lead 775.81 77.58 0.37 9.4 2.34 0.37 Mercury 37.07 29.65 0.002 0.23 0.134 0.002 Molybdenum 0.434 0.434 Nickel 135.77 193.95 5.28 47.55 4.75 4.75 Selenium 0.67 0.949 0.67 Silver 1.15 1.15 Zinc 228.49 22.85 33.14 32.86 16.82 16.82 Phenol 3600 290 2.0 2.0
605 Local Limits Evaluation 01 December 2020 Page 15 of 17
Maximum Allowable Industrial Loading
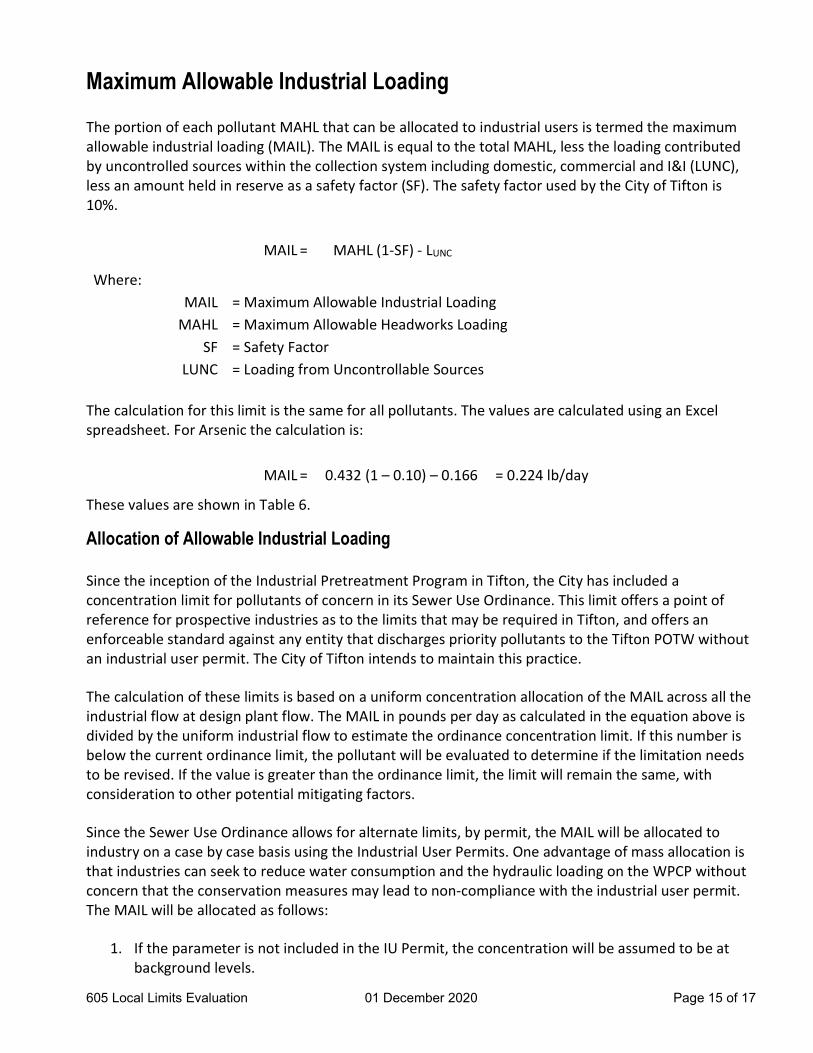
The portion of each pollutant MAHL that can be allocated to industrial users is termed the maximum allowable industrial loading (MAIL). The MAIL is equal to the total MAHL, less the loading contributed by uncontrolled sources within the collection system including domestic, commercial and I&I (LUNC), less an amount held in reserve as a safety factor (SF). The safety factor used by the City of Tifton is 10%.
MAIL = MAHL (1-SF) - LUNC
Where: MAIL = Maximum Allowable Industrial Loading
MAHL = Maximum Allowable Headworks Loading SF = Safety Factor
LUNC = Loading from Uncontrollable Sources
The calculation for this limit is the same for all pollutants. The values are calculated using an Excel spreadsheet. For Arsenic the calculation is:
MAIL = 0.432 (1 – 0.10) – 0.166 = 0.224 lb/day
These values are shown in Table 6.
Allocation of Allowable Industrial Loading
Since the inception of the Industrial Pretreatment Program in Tifton, the City has included a concentration limit for pollutants of concern in its Sewer Use Ordinance. This limit offers a point of reference for prospective industries as to the limits that may be required in Tifton, and offers an enforceable standard against any entity that discharges priority pollutants to the Tifton POTW without an industrial user permit. The City of Tifton intends to maintain this practice.
The calculation of these limits is based on a uniform concentration allocation of the MAIL across all the industrial flow at design plant flow. The MAIL in pounds per day as calculated in the equation above is divided by the uniform industrial flow to estimate the ordinance concentration limit. If this number is below the current ordinance limit, the pollutant will be evaluated to determine if the limitation needs to be revised. If the value is greater than the ordinance limit, the limit will remain the same, with consideration to other potential mitigating factors.
Since the Sewer Use Ordinance allows for alternate limits, by permit, the MAIL will be allocated to industry on a case by case basis using the Industrial User Permits. One advantage of mass allocation is that industries can seek to reduce water consumption and the hydraulic loading on the WPCP without concern that the conservation measures may lead to non-compliance with the industrial user permit. The MAIL will be allocated as follows:
1. If the parameter is not included in the IU Permit, the concentration will be assumed to be at background levels.
605 Local Limits Evaluation 01 December 2020 Page 16 of 17
2. If the parameter is included in the IU Permit, the mass allocation will be defined in that permit (either directly as a mass limit, or as defined by the flow and concentration.)
3. In the case of either 1 or 2, the mass of the pollutant will be deducted from the MAIL on a worksheet contained in the same Excel spreadsheet used in all the calculations listed in this document.
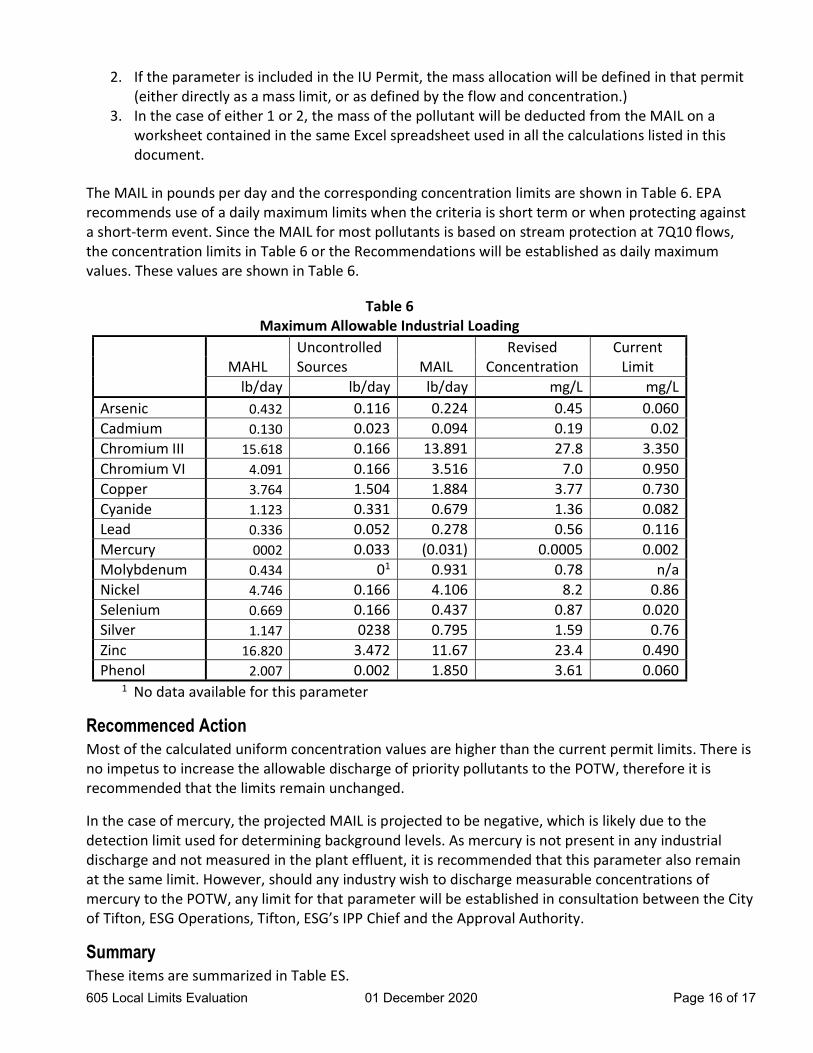
The MAIL in pounds per day and the corresponding concentration limits are shown in Table 6. EPA recommends use of a daily maximum limits when the criteria is short term or when protecting against a short-term event. Since the MAIL for most pollutants is based on stream protection at 7Q10 flows, the concentration limits in Table 6 or the Recommendations will be established as daily maximum values. These values are shown in Table 6.
Table 6 Maximum Allowable Industrial Loading
Uncontrolled Revised Current MAHL Sources MAIL Concentration Limit lb/day lb/day lb/day mg/L mg/L Arsenic 0.432 0.116 0.224 0.45 0.060 Cadmium 0.130 0.023 0.094 0.19 0.02 Chromium III 15.618 0.166 13.891 27.8 3.350 Chromium VI 4.091 0.166 3.516 7.0 0.950 Copper 3.764 1.504 1.884 3.77 0.730 Cyanide 1.123 0.331 0.679 1.36 0.082 Lead 0.336 0.052 0.278 0.56 0.116 Mercury 0002 0.033 (0.031) 0.0005 0.002 Molybdenum 0.434 01 0.931 0.78 n/a Nickel 4.746 0.166 4.106 8.2 0.86 Selenium 0.669 0.166 0.437 0.87 0.020 Silver 1.147 0238 0.795 1.59 0.76 Zinc 16.820 3.472 11.67 23.4 0.490 Phenol 2.007 0.002 1.850 3.61 0.060
1 No data available for this parameter
Recommenced Action Most of the calculated uniform concentration values are higher than the current permit limits. There is no impetus to increase the allowable discharge of priority pollutants to the POTW, therefore it is recommended that the limits remain unchanged.
In the case of mercury, the projected MAIL is projected to be negative, which is likely due to the detection limit used for determining background levels. As mercury is not present in any industrial discharge and not measured in the plant effluent, it is recommended that this parameter also remain at the same limit. However, should any industry wish to discharge measurable concentrations of mercury to the POTW, any limit for that parameter will be established in consultation between the City of Tifton, ESG Operations, Tifton, ESG’s IPP Chief and the Approval Authority.
Summary These items are summarized in Table ES.
605 Local Limits Evaluation 01 December 2020 Page 17 of 17
CONVENTIONAL POLLUTANTS
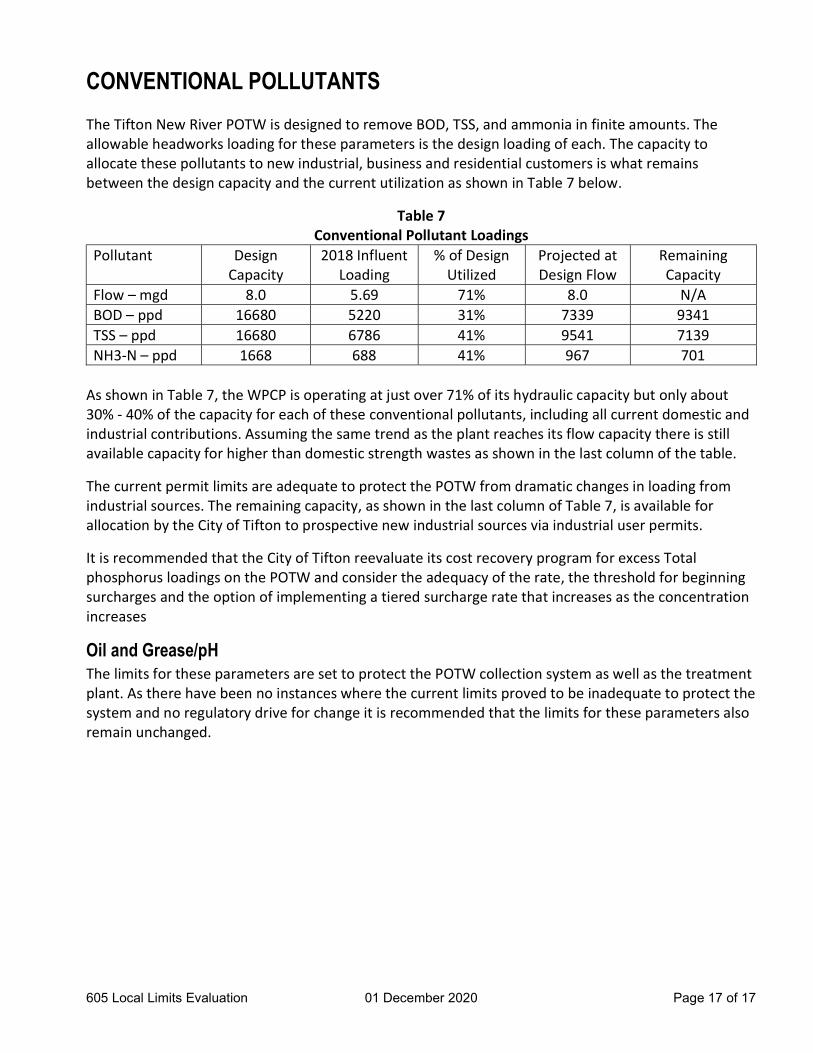
The Tifton New River POTW is designed to remove BOD, TSS, and ammonia in finite amounts. The allowable headworks loading for these parameters is the design loading of each. The capacity to allocate these pollutants to new industrial, business and residential customers is what remains between the design capacity and the current utilization as shown in Table 7 below.
Table 7 Conventional Pollutant Loadings
Pollutant Design Capacity
2018 Influent Loading
% of Design Utilized
Projected at Design Flow
Remaining Capacity
Flow – mgd 8.0 5.69 71% 8.0 N/A BOD – ppd 16680 5220 31% 7339 9341 TSS – ppd 16680 6786 41% 9541 7139 NH3-N – ppd 1668 688 41% 967 701
As shown in Table 7, the WPCP is operating at just over 71% of its hydraulic capacity but only about 30% - 40% of the capacity for each of these conventional pollutants, including all current domestic and industrial contributions. Assuming the same trend as the plant reaches its flow capacity there is still available capacity for higher than domestic strength wastes as shown in the last column of the table.
The current permit limits are adequate to protect the POTW from dramatic changes in loading from industrial sources. The remaining capacity, as shown in the last column of Table 7, is available for allocation by the City of Tifton to prospective new industrial sources via industrial user permits.
It is recommended that the City of Tifton reevaluate its cost recovery program for excess Total phosphorus loadings on the POTW and consider the adequacy of the rate, the threshold for beginning surcharges and the option of implementing a tiered surcharge rate that increases as the concentration increases
Oil and Grease/pH The limits for these parameters are set to protect the POTW collection system as well as the treatment plant. As there have been no instances where the current limits proved to be inadequate to protect the system and no regulatory drive for change it is recommended that the limits for these parameters also remain unchanged.
Related Documents


![Discharge and Industrial Pretreatment Regulations · 13/02/2008 · – An Industrial User subject to a Categorical Pretreatment Standard or Categorical Standard. H. [City or County]](https://static.cupdf.com/doc/110x72/6017b10c29f77d33e06d695b/discharge-and-industrial-pretreatment-regulations-13022008-a-an-industrial.jpg)