A publication of ABO’s Technical Standards Committee Industrial Algae Measurements September 2015 | Version 7.0 © 2015 Algae Biomass Organization

Welcome message from author
This document is posted to help you gain knowledge. Please leave a comment to let me know what you think about it! Share it to your friends and learn new things together.
Transcript
A publication of ABO’s Technical Standards Committee
Industrial Algae Measurements September 2015 | Version 7.0
© 2015 Algae Biomass Organization

Algae Biomass Organization | 2Algae Biomass Organization | 1
About the Algae Biomass Organization
StaffExecutive Director – Matthew CarrGeneral Counsel – Andrew Braff, Wilson Sonsini Goodrich & RosatiAdministrative Coordinator – Barb ScheevelAdministrative Assistant – Nancy ByrneWebsite Manager – Riley Dempsey
Board of DirectorsChair – Martin Sabarsky, CellanaVice Chair – Jacques Beaudry-Losique, Algenol BiofuelsSecretary – Tom Byrne, Byrne & CompanyMark Allen, Accelergy CorporationJohn Benemann, MicroBio EngineeringTim Burns, BioProcess Algae Al DarzinsLaurel Harmon, LanzaTechDavid Hazlebeck, Global Algae InnovationsTom Jensen, Joule UnlimitedMichael Lakeman, The Boeing CompanyJames Levine, Sapphire EnergyMargaret McCormick, Matrix GeneticsGreg Mitchell, Scripps Institution of OceanographyJoel Murdock, FedEx ExpressEmilie SlabyTim Zenk, Algenol Biofuels
Founded in 2008, the Algae Biomass Organization (ABO) is a non-profit organization whose mission is to promote the development of viable commercial markets for renewable and sustainable products derived from algae. Our membership is comprised of people, companies, and organizations across the value chain. More information about the ABO, including membership, costs, benefits, members and their affiliations, is available at our website: www.algaebiomass.org.
The Technical Standards Committee is dedicated to the following functions:• Developing and advocating algal industry standards and best practices • Liaising with ABO members, other standards organizations and government • Facilitating information flow between industry stakeholders • Reviewing ABO technical positions and recommendations
For more information, please see: http://www.algaebiomass.org
CommitteesEvents CommitteeChair – Greg Mitchell, Scripps Institution of Oceanography Program Chair – Al Darzins
Member Development CommitteeJacques Beaudry-Losique, Algenol BiofuelsMartin Sabarsky, Cellana
Bylaw & Governance CommitteeChair – Mark Allen, Accelergy Corporation
Technical Standards CommitteeChair – Lieve Laurens, National Renewable Energy LaboratoryCo-Chair – Keith Cooksey, Environmental Biotechnology Consultants
Director Recruitment CommitteeChair – Michael Lakeman, The Boeing CompanyCo-Chair – Joel Murdock, FedEx Express
Peer Review CommiteeCo-Chair – Keith Cooksey, Environmental Biotechnology Consultants Co-Chair – John Benemann, MicroBio Engineering
Executive Policy CouncilChair – Tim Zenk, Algenol Biofuels
About IAM 7.0This document, released in October 2015, reviews a set of minimum descriptive parameters and metrics required to fully characterize the economic, sustainability, and environmental inputs and outputs of an aquatic biomass processing operation. Voluntary adoption of a uniform common language and methodology will accelerate and allow the industry to grow.
The IAM 7.0 is dedicated to Mary Rosenthal (1958 - 2014) who, as first Executive Director of the ABO, championed the development of technical standards in our still nascent industry. When ABO started it was no more than a small group of like-minded engineers, entrepreneurs, and scientists who saw the need to have an organization promoting the use of algal biomass and the growth of an algae industry to produce it. Mary helped champion the Technical Standards Committee into what it is today. She understood why developing Standards and formally distributing elemental information is critical to spawning any industry. Mary was a charming and engaging contributor to the efforts of the committee and together with her, the Committee spent time in the trenches fighting for this work and we owe her gratitude for paving the way to help us get where we are today.
ABO Technical Standards Committee Authors
Page 2Page 3 Page 5 Page 12Page 18Page 21Page 25Page 27Page 29Page 35
Table of ContentsAbout the IAM 7.0 DocumentExecutive Summary Chapter 1: State of the Art Algal Product and Operations Measurements Chapter 2: Life Cycle and Techno-Economic Analysis for the Uniform Definition of Algal OperationsChapter 3: Regulations and Policy on Algal Production Operations Chapter 4: Use of Wastewater in Algal Cultivation Chapter 5: Regulatory and Process Considerations for Marketing Algal-Based Food, Feed, and SupplementsChapter 6: Regulatory Considerations and Standards for Algal Biofuels Chapter 7: Open and Closed Algal Cultivation SystemsABO 2015 Corporate Members
Dr. Lieve M. L. Laurens, Committee chair, Senior research scientist, National Renewable Energy Laboratory, Golden, CO, USA, Contact: [email protected]
Dr. Keith E. Cooksey, Deputy committee chair, Environmental biotechnology consultant, Professor emeritus, Montana State University, Bozeman, MT, USA
Jim Sears, Co-founder Visual Exploration LLC, former ABO committee chair and CTO, A2BE Carbon Capture LLC, Boulder, CO, USA
Dr. Mark Edwards, Professor, Arizona State University Morrison School of Agribusiness and Resource Management, Vice president at Algae Biosciences Inc
Dr. Tryg Lundquist, Associate professor, Department of Civil and Environmental Engineering, California Polytechnic State University, San Luis Obispo, CA, USA
Dr. Craig Behnke, Vice president at Sapphire Energy, San Diego, CA, USA
Dr. Niko Schultz, Corporate research and technology development, SCHOTT, Mainz, Germany
Steve Howell, President and founder of MARC-IV, Chairman of the ASTM task force on biodiesel standards, Kearney, MO, USA
Gina Clapper, Technical specialist, AOCS, American Oil Chemists’ Society, Urbana, IL, USA
Dr. Robert Gardner, Assistant professor, Department of Bioproducts and Biosystems Engineering, University of Minnesota, Morris, MN, USA
Emilie Slaby, Independent consultant, Minneapolis, MN, USA
Dr. Jose Olivares, Division leader Biosciences Division, Los Alamos National Laboratory, Los Alamos, USA
Dr. Robert McCormick, Principal engineer, Fuels Performance, National Renewable Energy Laboratory, Golden, CO, USA
Dr. Rose Ann Cattolico, Professor of Algal Biology, University of Washington
Contributing Authors and ReviewersRyan Davis, National Renewable Energy Laboratory; Dr. Jason Quinn, Utah State University; Amha Belay, Earthrise Nutritionals; Greg Sower, ENVIRON IntI.; William Hiscox, WSU Pullman; Don Scott, National Biodiesel Board; Ron Pate, Sandia National Labs; James Collett, Pacific Northwest National Laboratory; Mark Allen, Accelergy Corporation; David Glass, Joule Unlimited
SupportFunding for editing, typesetting, and printing was provided by FedEx through a donation to the Algae Foundation and SCHOTT. Dr. Liesbeth Aerts is acknowledged as the editor and citation manager of this version of the document. Graphic design was provided by ClearVision Design, Minneapolis, MN.
Algae Biomass Organization | 4Algae Biomass Organization | 3
Executive Summary The goal of this document is to provide an overview of the current state of the art of measurements or metrics, as well as policy and regulatory environments that are pertinent to the development and growth of a successful algal industry. The descriptive parameters listed in this document are designed to provide the industry and academic groups with a common language and direct and objective parameters for the evaluation of technologies currently on track to be commercialized. The methodologies, metrics, and discussions in this document continue to equally encompass autotrophic, heterotrophic, open pond, photobioreactor, and open water production, as well as harvest and conversion processes for microalgae, macroalgae, and cyanobacteria, and are aimed at being process and pathway agnostic.Industrial Algae Measurements version 7.0 is a collaborative effort representing contributions of over 30 universities, private companies, and national laboratories over the past seven years. This fully updated October 2015 version offers detailed recommendations on measurement methodologies for use across the industry and roadmaps of the regulatory environments surrounding different facets of the industry. This 2015 Industrial Algae Measurements (IAM 7.0) supersedes the 2013 Industrial Algae Measurements (IAM 6.0) and previous Minimum Descriptive Language documents or MDLs that the Technical Standards Committee has published from 2010 through 2012. Overall, the industry guidance contained in IAM 7.0 has been broadened in scope, with increased depth and a new chapter layout for content.ABO’s “Green Box” approach discussed below, describes the industry’s environmental, economic, and carbon footprint via quantifying the inputs and outputs of an installation. These input/output measurements systematically allow for economic projections (through techno-economic analyses) and sustainability calculations (through life cycle assessments). Inputs include the carbon, water, energy, and
nutrients required by the algae, as well as land requirements, process consumables, and human resources required by the infrastructure. Green Box outputs include the different classes of algal products as well as industrial waste emissions including gas, liquid, and solid discharges. Together, the measured inputs and outputs generically carve out the total economic and environmental footprint of any algal operation. Identifying this total footprint will become increasingly central in the funding, regulatory, and sustainability review of an expanding algae industry, and will ultimately come to define the commercial viability of specific ventures.In the content that follows, we present the metrics and language of algal measurements to provide a guide to the regulatory environment and other considerations applicable to the algae industry.
•Chapter 1 State-of-the-art-algal product and operations measurements discusses methodologies for assessing productivity at the cellular level, along with the detailed composition of the products. In this version of the document, we include a discussion of available standard procedures for feedstock and product characterization that have been made available through standards agencies such as ASTM, AOAC, and AOCS.
•Chapter 2 Life cycle and techno- economic analysis for the uniform definition of algal operations gives a rudimentary understanding of life cycle analyses specifically applicable to the algae industry and increasingly important in the funding and government support of programs.
•Chapter 3 Regulations and policy on algal production operations reviews and summarizes regulatory and permitting processes applicable to algae farming, and provides a framework overview of the siting approval process.
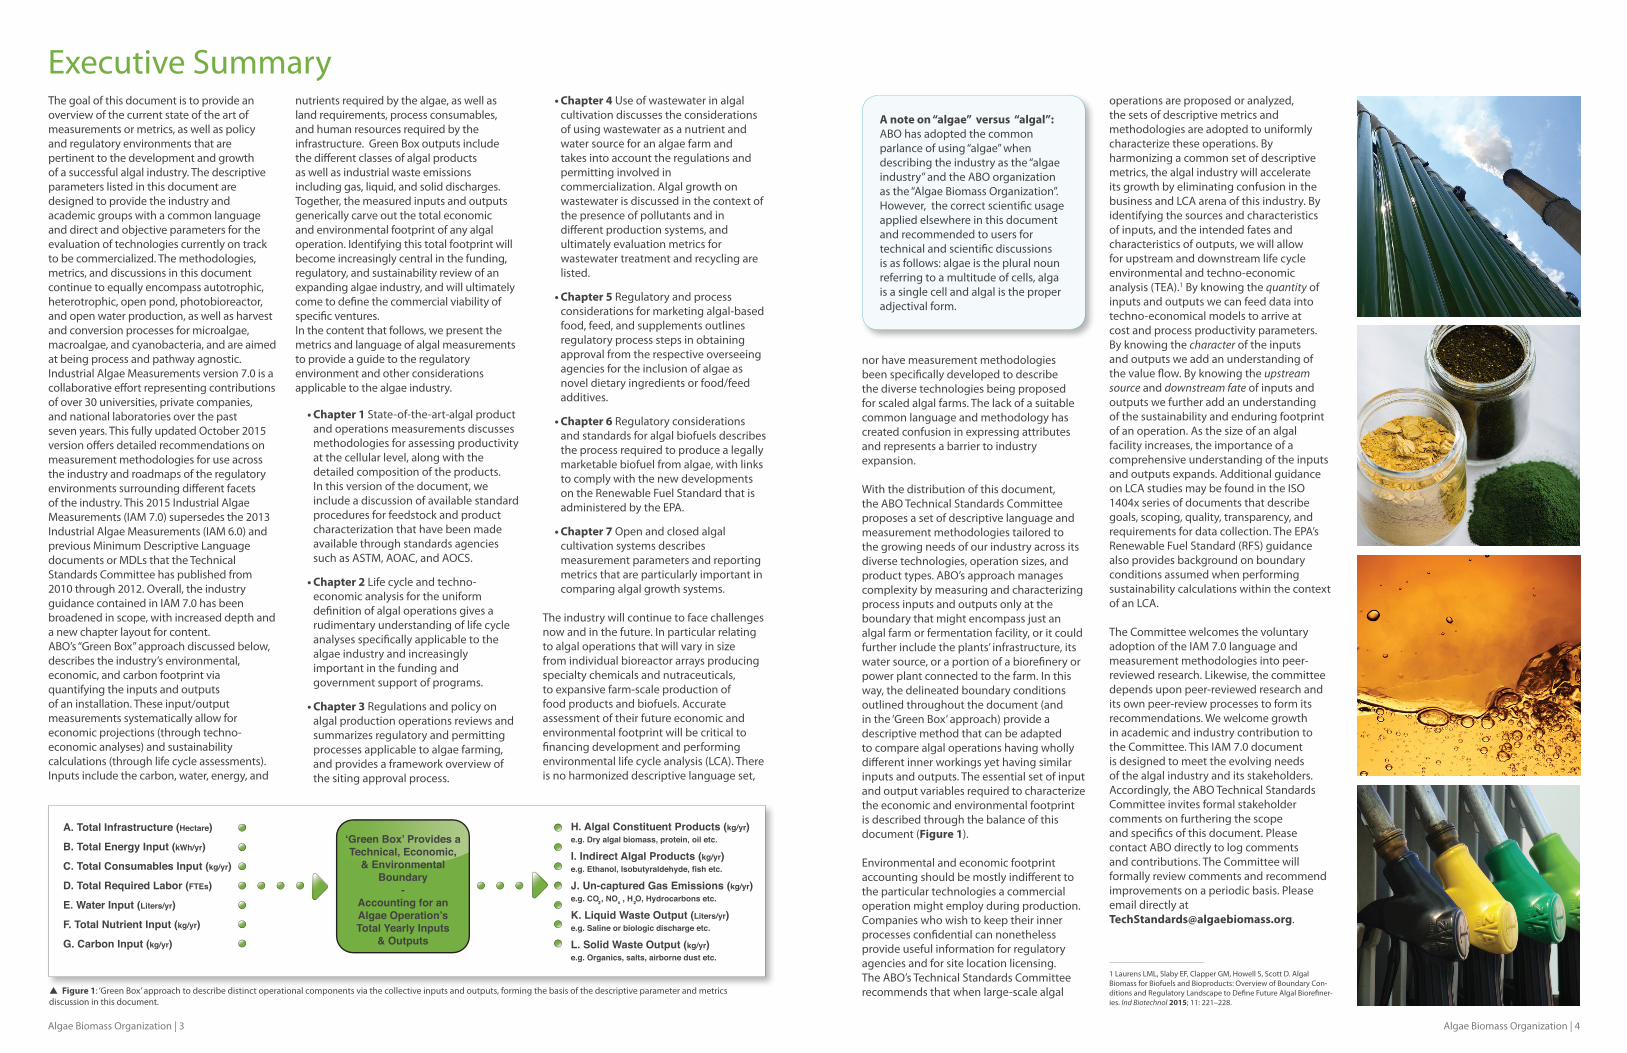
p Figure 1: ‘Green Box’ approach to describe distinct operational components via the collective inputs and outputs, forming the basis of the descriptive parameter and metrics discussion in this document.
A. Total Infrastructure (Hectare)
B. Total Energy Input (kWh/yr)
C. Total Consumables Input (kg/yr)
D. Total Required Labor (FTEs)
E. Water Input (Liters/yr)
F. Total Nutrient Input (kg/yr)
G. Carbon Input (kg/yr)
H. Algal Constituent Products (kg/yr)e.g. Dry algal biomass, protein, oil etc.
I. Indirect Algal Products (kg/yr)e.g. Ethanol, Isobutyraldehyde, fish etc.
J. Un-captured Gas Emissions (kg/yr)e.g. CO , NOx , H O, Hydrocarbons etc.
K. Liquid Waste Output (Liters/yr)e.g. Saline or biologic discharge etc.
L. Solid Waste Output (kg/yr)e.g. Organics, salts, airborne dust etc.
2 2
‘Green Box’ Provides aTechnical, Economic,
& EnvironmentalBoundary
-Accounting for anAlgae Operation’sTotal Yearly Inputs
& Outputs
A note on “algae” versus “algal”: ABO has adopted the common parlance of using “algae” when describing the industry as the “algae industry” and the ABO organization as the “Algae Biomass Organization”. However, the correct scientific usage applied elsewhere in this document and recommended to users for technical and scientific discussions is as follows: algae is the plural noun referring to a multitude of cells, alga is a single cell and algal is the proper adjectival form.
•Chapter 4 Use of wastewater in algal cultivation discusses the considerations of using wastewater as a nutrient and water source for an algae farm and takes into account the regulations and permitting involved in commercialization. Algal growth on wastewater is discussed in the context of the presence of pollutants and in different production systems, and ultimately evaluation metrics for wastewater treatment and recycling are listed.
•Chapter 5 Regulatory and process considerations for marketing algal-based food, feed, and supplements outlines regulatory process steps in obtaining approval from the respective overseeing agencies for the inclusion of algae as novel dietary ingredients or food/feed additives.
•Chapter 6 Regulatory considerations and standards for algal biofuels describes the process required to produce a legally marketable biofuel from algae, with links to comply with the new developments on the Renewable Fuel Standard that is administered by the EPA.
•Chapter 7 Open and closed algal cultivation systems describes measurement parameters and reporting metrics that are particularly important in comparing algal growth systems.
The industry will continue to face challenges now and in the future. In particular relating to algal operations that will vary in size from individual bioreactor arrays producing specialty chemicals and nutraceuticals, to expansive farm-scale production of food products and biofuels. Accurate assessment of their future economic and environmental footprint will be critical to financing development and performing environmental life cycle analysis (LCA). There is no harmonized descriptive language set,
nor have measurement methodologies been specifically developed to describe the diverse technologies being proposed for scaled algal farms. The lack of a suitable common language and methodology has created confusion in expressing attributes and represents a barrier to industry expansion.
With the distribution of this document, the ABO Technical Standards Committee proposes a set of descriptive language and measurement methodologies tailored to the growing needs of our industry across its diverse technologies, operation sizes, and product types. ABO’s approach manages complexity by measuring and characterizing process inputs and outputs only at the boundary that might encompass just an algal farm or fermentation facility, or it could further include the plants’ infrastructure, its water source, or a portion of a biorefinery or power plant connected to the farm. In this way, the delineated boundary conditions outlined throughout the document (and in the ‘Green Box’ approach) provide a descriptive method that can be adapted to compare algal operations having wholly different inner workings yet having similar inputs and outputs. The essential set of input and output variables required to characterize the economic and environmental footprint is described through the balance of this document (Figure 1).
Environmental and economic footprint accounting should be mostly indifferent to the particular technologies a commercial operation might employ during production. Companies who wish to keep their inner processes confidential can nonetheless provide useful information for regulatory agencies and for site location licensing. The ABO’s Technical Standards Committee recommends that when large-scale algal
operations are proposed or analyzed, the sets of descriptive metrics and methodologies are adopted to uniformly characterize these operations. By harmonizing a common set of descriptive metrics, the algal industry will accelerate its growth by eliminating confusion in the business and LCA arena of this industry. By identifying the sources and characteristics of inputs, and the intended fates and characteristics of outputs, we will allow for upstream and downstream life cycle environmental and techno-economic analysis (TEA).1 By knowing the quantity of inputs and outputs we can feed data into techno-economical models to arrive at cost and process productivity parameters. By knowing the character of the inputs and outputs we add an understanding of the value flow. By knowing the upstream source and downstream fate of inputs and outputs we further add an understanding of the sustainability and enduring footprint of an operation. As the size of an algal facility increases, the importance of a comprehensive understanding of the inputs and outputs expands. Additional guidance on LCA studies may be found in the ISO 1404x series of documents that describe goals, scoping, quality, transparency, and requirements for data collection. The EPA’s Renewable Fuel Standard (RFS) guidance also provides background on boundary conditions assumed when performing sustainability calculations within the context of an LCA.
The Committee welcomes the voluntary adoption of the IAM 7.0 language and measurement methodologies into peer-reviewed research. Likewise, the committee depends upon peer-reviewed research and its own peer-review processes to form its recommendations. We welcome growth in academic and industry contribution to the Committee. This IAM 7.0 document is designed to meet the evolving needs of the algal industry and its stakeholders. Accordingly, the ABO Technical Standards Committee invites formal stakeholder comments on furthering the scope and specifics of this document. Please contact ABO directly to log comments and contributions. The Committee will formally review comments and recommend improvements on a periodic basis. Please email directly at [email protected].
1 Laurens LML, Slaby EF, Clapper GM, Howell S, Scott D. Algal Biomass for Biofuels and Bioproducts: Overview of Boundary Con-ditions and Regulatory Landscape to Define Future Algal Biorefiner-ies. Ind Biotechnol 2015; 11: 221–228.
Algae Biomass Organization | 6Algae Biomass Organization | 5
In order to establish long-term cultivation and biorefinery operational trials, different stakeholders need to harmonize their data inputs towards a more uniform description and testing of algal biomass and products. We encourage an open dialogue on the adoption of a set of descriptive parameters to help eliminate confusion, and accelerate growth of the algal industry. We believe that standardization across an industry cannot be enforced, rather will have to be encouraged, and will ultimately happen through consensus among a group of stakeholders.
Possibly one of the most pressing and fundamental areas of standardization is in the measurement of algal productivity, the denominator in any description of algal yield, and of the constituents that give it market value. The composition of biomass forms a crucial point in any algal bio-production process, and there is an effort to suggest universally accepted analytical methods that would allow researchers and industry members to compare processes and track individual components, including lipids, proteins, carbohydrates, and ash. We discuss the current challenges for the application of these methods in the algal industry and recommend measurement practices that are based on a review of existing methods.
Trade and testing organizations will have to work together to define the required biomass, oil, and other product properties, and encourage the use of select test methods for the analysis of algal biomass composition. The applicability of test methods currently in use (American Society for Testing and Materials, ASTM; Association of Official Analytical Communities, AOAC; and American Oil Chemists’ Society, AOCS) should be evaluated using reference material in the context of comprehensive interlaboratory studies. For example, culture health parameters which are known to be important in the industry and for objective assessment of reactor and culture performance can be found on the ASTM website.1 Whole cell dry weight, cell number, biomass productivity Biomass productivity in cultivation systems depends on both the cell number and the dry weight. Thus, it is not useful to derive a highly sensitive measurement for cell content, such as cellular protein/cell, when
1 ASTM. Water Testing Standards. http://www.astm.org/Standards/water-testing-standards.html (accessed Aug 2015).
that figure will be divided by a parameter that has lower statistical confidence. Sampling frequency and sample size will also influence the ratio. For this reason, an accurate measurement of sample volume and representative sampling are essential as well. A standard method that is routinely used throughout the water and wastewater industry is the ASTM D5907 method, which provides a detailed assessment of filterable matter (or dissolved solids) in a water environment (Table 1.1). The implementation of an existing standard method and adoption throughout the industry could help set the stage for like-for-like comparisons between different cultivation systems and reports on the performance of reactors.
Dry weight can be assessed by “primary measurements”, in which the desired component is separated and weighed directly, or by “indirect measurements”, such as cell counting or fluorescence, where the measured quantity is calibrated to the actual mass and used as an analog. Indirect measurements are very useful because of their typical speed and sensitivity when calibrated. It is the aim of the Technical Standards Committee to provide relatively easy and inexpensive primary measurement methods that are useful across a variety of algae and different types of aquatic biomass. Although other methods exist, the ones mentioned in this document have been tested and confirmed by many laboratories. Where possible, the described methods include their respective advantages and disadvantages. Carbon content measurements The carbon content of the biomass is often one of the primary measurements to determine the energetic value of the biomass and to provide information on the efficiency of carbon conversion in a cultivation system. Carbon is assimilated by either photosynthesis in autotrophic algal cultivation systems, or from an organic carbon source such as sugar in heterotrophic fermentations. Carbon utilization and measurements Inorganic carbon (CO2) is the primary nutrient required for sustainable algal cultivation. However, CO2 is dissolved in an aqueous system and forms a weak acid-base buffer system according to Eqn. 1:
where H2CO*3 includes CO2 (aq) and H2CO3.
The relative amount of the dissolved inorganic carbon (DIC) species in the above equilibrium depends on the pH of the system.2 Therefore, bicarbonate (HCO -
3) is the dominant inorganic species in the pH where most microalgae thrive (i.e., between pH 6.5 and 10). However, the pH of an algal culture is manipulated by N-assimilation and the amount of photosynthesis activity,2-4 and these metabolic events can cause the dissolved CO2 and HCO -
3 concentrations to be displaced far from equilibrium.5 By consequence, microalgae have developed carbon concentrating mechanisms (CCMs) to increase the carbon flux to ribulose-1,5-bisphosphate carboxylase/oxygenase (RuBisCo), which catalyzes the first step in carbon fixation.6 Microalgal CCMs employ a number of carbonic anhydrases and bicarbonate transport proteins that effectively and reversibly shuttle inorganic carbon, in the forms of HCO -
3 and CO2, across the periplasmic membrane, through the cytosol, into the chloroplast, and convert it to CO2 in the direct vicinity of RuBisCo in the pyrenoid. This is an effective strategy to maintain high levels of carbon in the cell and avoid loss of CO2 by passive diffusion across the cell membrane.
Microalgae will grow at atmospheric concentrations of inorganic CO2 (~400 ppm); however, biomass productivity can be improved by supplementing the media with additional inorganic carbon. It is often cited that this additional carbon source could come from industrial waste such as coal-fired power, cement production, or plant flue
2 Markou G, Vandamme D, Muylaert K. Microalgal and cyanobacterial cultivation: the supply of nutrients. Water Res 2014; 65: 186–202.
3 Eustance E, Gardner RD, Moll KM, Menicucci J, Gerlach R, Peyton BM. Growth, nitrogen utilization and biodiesel potential for two chlorophytes grown on ammonium, nitrate or urea. J Appl Phycol 2013; 25: 1663–1677.
4 Shiraiwa Y, Goyal A, Tolbert NE. Alkalization of the Medium by Unicellular Green Algae during Uptake Dissolved Inorganic Carbon. Plant Cell Physiol 1993; 34: 649–657.
5 Nedbal L, Cervený J, Keren N, Kaplan A. Experimental validation of a nonequilibrium model of CO₂ fluxes between gas, liquid medium, and algae in a flat-panel photobioreactor. J Ind Microbiol Biotechnol 2010; 37: 1319–26.
6 Giordano M, Beardall J, Raven JA. CO₂ concentrating mechanisms in algae: mechanisms, environmental modulation, and evolution. Annu Rev Plant Biol 2005; 56: 99–131.
gas.7,8 However, CO2 solubility is dependent on the temperature, total pressure, and concentration of total dissolved solids, and in shallow depths a fraction of supplied CO2 gas could escape into the atmosphere.9,10 The efficiency of CO2 dissolution into aqueous solutions is dependent on the deviation of chemical conditions from equilibrium, the contact time (e.g., aqueous depth), and the contact surface area (e.g., bubble parameters).5,11-13
An alternative approach to using gaseous CO2 directly in algal cultures is to use solutions with high non-carbonate alkalinity (e.g., high hydroxyl ion concentration and high pH) to absorb CO2 and convert it to solid phase bicarbonate salts (e.g., NaHCO3, KHCO3, and NH4HCO3). The main concerns with using bicarbonate salts are a higher cost than gaseous CO2 and strain selection for microalgae that can tolerate high pH and ionic strength.2 However, the solubility and application efficiency is much higher when bicarbonate salts are used as supplemental DIC, as compared to gaseous CO2, and contamination from microorganisms is reduced due to the high ionic strength of the media. Furthermore, depending on the concentration and timing of the culture amendments, bicarbonate supplementing can increase both growth and lipid accumulation.13-15 A related source of DIC is anaerobic digestion wastewater, where organic carbon has been converted to methane and CO2. The latter will have dissolved into the wastewater stream,
7 Collet P, Hélias A, Lardon L, Ras M, Goy R-A, Steyer J-P. Life-cycle assessment of microalgae culture coupled to biogas production. Bioresour Technol 2011; 102: 207–14.
8 Sheehan J, Dunahay T, Benemann J, Roessler P. A Look Back at the U.S. Department of Energy’s Aquatic Species Program: Biodiesel from Algae. Natl. Renew. Energy Lab. Goldon, CO. 1998. http://www.nrel.gov/biomass/pdfs/24190.pdf (accessed Aug 2015).
9 Benemann JR. Utilization of carbon dioxide from fossil fuel-burning power plants with biological systems. Energy Convers Manag 1993; 34: 999–1004.
10 Milne JL, Cameron effrey C, Page LE, Benson SM, Pakrasi HB. Perspectives on Biofuels: Potential Benefits and Possible Pitfalls. American Chemical Society: Washington, DC, 2012 http://dx.doi.org/10.1021/bk-2012-1116.ch007 (accessed Aug 2015).
11 Danckwerts PV, Kennedy AM. The kinetics of absorption of carbon dioxide into neutral and alkaline solutions. Chem Eng Sci 1958; 8: 201–215.
12 Putt R, Singh M, Chinnasamy S, Das KC. An efficient system for carbonation of high-rate algae pond water to enhance CO₂ mass transfer. Bioresour Technol 2011; 102: 3240–5.
13 Lohman EJ, Gardner RD, Pedersen T, Peyton BM, Cooksey KE, Gerlach R. Optimized inorganic carbon regime for enhanced growth and lipid accumulation in Chlorella vulgaris. Biotechnol Biofuels 2015; 8: 82.
14 Gardner RD, Cooksey KE, Mus F, Macur R, Moll K, Eustance E et al. Use of sodium bicarbonate to stimulate triacylglycerol accumulation in the chlorophyte Scenedesmus sp. and the diatom Phaeodactylum tricornutum. J Appl Phycol 2012; 24: 1311–1320.
15 White DA, Pagarette A, Rooks P, Ali ST. The effect of sodium bicarbonate supplementation on growth and biochemical composition of marine microalgae cultures. J Appl Phycol 2012; 25: 153–165.
establishing a bicarbonate-carbonate buffer with elevated DIC concentrations.2
Inorganic carbon measurementsCarbon dioxide and other gases consisting of dissimilar atoms absorb infrared radiation at unique and discrete wavelengths. Thus, the most common technique for measuring gaseous CO2 is to use infrared spectroscopy. Total inorganic carbon (or DIC) is typically measured by acidification of the sample driving the carbonate equilibrium to CO2, which is then sparged from the solution using oxygen or inert gas, and trapped for quantification. Quantification can be done using infrared spectroscopy, gas chromatography, or by coulometry. Current state-of-the art gaseous CO2 measurements are done using off-gas sensors employing infrared technology, which has become relatively inexpensive. Furthermore, current state-of-the-art DIC measurements are performed by filtering a sample (0.45 µm or smaller) and analyzing it using a total carbon analyzer. A portion of a filtered sample is combusted under high temperature using a heavy metal catalyst, thereby converting the total organic and inorganic components to CO2. The resulting CO2 gas is then moved across an infrared sensor using a carrier gas and quantified by comparison to known concentrations of organic and inorganic standards. A second analysis must be done on the sample, and the sample must be acidified and sparged with oxygen (or another inert gas) to remove all of the DIC, and then reanalyzed by combustion. Thus, total carbon content and the dissolved organic carbon (DOC) content are measured, and the latter is subtracted from the former to discern the total DIC. Some dual chamber carbon analyzers consist of both a heated chamber and an acidic sparging chamber, which can be configured to measure total DIC in only one step.
A CO2 electrode can be used to measure dissolved CO2 in a system. Basically, a CO2 permeable membrane allows the electrode solution to equilibrate with the surrounding aqueous environment and the resulting pH is measured. In order to measure the total DIC concentration, the sample must be acidified to drive the dissolved carbon species to CO2. The disadvantages of using a CO2 electrode include membrane fouling from algal cultures and potential electrode interferences with volatile weak acids (e.g.,
NO2-, HSO -
3 , acetic acid, and formic acid). Organic carbon measurement of the biomass A variety of C analyzers are available, along with standard procedures (e.g. ASTM D4129) to measure total organic carbon in aqueous samples. Solid phase CHN analyzers will measure total carbon on a dried filter or a dried pellet. However, primary methods are needed to calibrate to the cell weight of each algal species. While this method is accurate even for small sample sizes if the calibration is accurate, its disadvantages are that it is an indirect measurement requiring expensive equipment, and additionally, the C/N ratio in algal cells changes with time of day and growth conditions, complicating the interpretation of the results.
Compositional analysis of algal biomass, lipids, carbohydrates, and protein Characterization of algal biomass consists of the accurate measurement of lipids, proteins, and carbohydrates as the major constituents of all biomass samples. The degree to which these are characterized depends primarily on the information required and different methods provide different information. Algal lipids vs. extractable oils vs. fuel fractionThe detailed composition and molecular profile of lipids is required for reporting on oil quality and biomass valorization and will be highly influential when targeting particular bioproduct markets, for example for biodiesel or green diesel.16-19 Not all lipids can be considered equally valuable for fuel or even food or feed applications. The lipid composition, with respect to polar (phospho- and glycolipids) and non-polar (triglycerides and sterols) lipids and the respective impurities found in each fraction, is highly dependent on the origin and type of biomass. Autotrophically grown algae are rich in polar lipids, waxes, sterols, and pigments, whereas heterotrophic cultivation will yield triglyceride-rich oil similar to plant-derived oils, but often with very different
16 Haas MJ, Wagner K. Simplifying biodiesel production: The direct or in situ transesterification of algal biomass. Eur J Lipid Sci Technol 2011; 113: 1219–1229.
17 Davis RE, Fishman DB, Frank ED, Johnson MC, Jones SB, Kinchin CM et al. Integrated evaluation of cost, emissions, and resource potential for algal biofuels at the national scale. Environ Sci Technol 2014; 48: 6035–42.
18 Knothe G. A technical evaluation of biodiesel from vegetable oils vs. algae. Will algae-derived biodiesel perform? Green Chem 2011; 13: 3048.
19 Knothe G. Biodiesel and renewable diesel: A comparison. Prog Energy Combust Sci 2010; 36: 364–373.
Chapter 1: State-of-the-Art algal Product and Operations Measurements
!"! (!") + !!! !!!≈!.! !!!"!∗
!!!≈!.! !"#!! + !! !!!≈!".! !"!!! + 2!!
Algae Biomass Organization | 8Algae Biomass Organization | 7
fatty-acid profiles.20,21
Traditionally, lipids have been measured gravimetrically after solvent extraction. The completeness of extraction and composition depends on the biochemistry of the alga and the recent physiological conditions experienced by the organism, as well as the compatibility of the solvent polarity with the lipid molecule polarity and the extraction conditions used, resulting in inconsistent lipid yields.22-25 Inevitably, the extractable oil fraction will contain non-fuel components (e.g., chlorophyll, other pigments, proteins, and soluble carbohydrates). Thus, it may be necessary to assess its fuel fraction (i.e., fatty acid content) by transesterification followed by quantification of the fatty acid methyl esters (FAMEs). Due to the large number of variables, it is difficult to standardize an extraction-based lipid quantification procedure. There are two extraction systems currently in use across algal biomass analytical laboratories: conventional Soxhlet extractor systems or the more recently developed pressurized fluid extraction systems (as in the commercially available Accelerated Solvent Extractor, Thermo Scientific, Massachusetts, USA).
As an alternative to extraction there is a growing emphasis on the quantification of lipids through a direct (or in situ) transesterification of whole algal biomass. The process consists of either a two-step alkaline and subsequent acid hydrolysis of the biomass,26,27 or a single-step acid
20 Li MH, Robinson EH, Tucker CS, Manning BB, Khoo L. Effects of dried algae Schizochytrium sp., a rich source of docosahexaenoic acid, on growth, fatty acid composition, and sensory quality of channel catfish Ictalurus punctatus. Aquaculture 2009; 292: 232–236.
21 Pyle DJ, Garcia R a, Wen Z. Producing docosahexaenoic acid (DHA)-rich algae from biodiesel-derived crude glycerol: effects of impurities on DHA production and algal biomass composition. J Agric Food Chem 2008; 56: 3933–9.
22 Guckert JB, Cooksey KE, Jackson LL. Lipid sovent systems are not equivalent for analysis of lipid classes in the microeukaryotic green alga, Chlorella. J Microbiol Methods 1988; 8: 139–149.
23 Iverson SJ, Lang SL, Cooper MH. Comparison of the Bligh and Dyer and Folch methods for total lipid determination in a broad range of marine tissue. Lipids 2001; 36: 1283–7.
24 Laurens L, Quinn M, Van Wychen S, Templeton D, Wolfrum EJ. Accurate and reliable quantification of total microalgal fuel potential as fatty acid methyl esters by in situ transesterification. Anal Bioanal Chem 2012; 403: 167–178.
25 Bigogno C, Khozin-Goldberg I, Boussiba S, Vonshak A, Cohen Z. Lipid and fatty acid composition of the green oleaginous alga Parietochloris incisa, the richest plant source of arachidonic acid. Phytochemistry 2002; 60: 497–503.
26 Griffiths MJ, van Hille RP, Harrison STL. Selection of Direct Transesterification as the Preferred Method for Assay of Fatty Acid Content of Microalgae. Lipids 2010; 45: 1053–1060.
27 AOAC. Analysis of Fatty Acids. In: Official Method 991.39. 1995
catalysis,24,28,29 followed by the methylation of the fatty acids to FAME and quantification by gas chromatography (GC). These procedures have been demonstrated to be robust across species and their efficacy is less dependent on the parameters listed above that influence lipid extraction. However, if the relative composition of intact lipids is required (e.g., polar versus neutral lipid content), an extraction process may be the only way to isolate intact lipids from the rest of the biomass, with the utilization of advanced instrumentation, such as liquid chromatography for the characterization of the lipid molecular profile. Several reports in the literature and AOAC (Association of Official Analytical Communities) official methods suggest in situ transesterification as the lipid quantification procedure of choice for algal biomass (Table 1.1).24,26–29 Quality attributes and considerations for algal oilsTrading rules and important quality attributes of existing vegetable-derived oils and fats are based on a combination of key attributes common to naturally occurring triglycerides, making up the majority of the vegetable-derived oils and fats, or other important characteristics for the use of these oils. The algae industry will need to provide a list of the necessary properties and attributes of algal oils, allowing them to be easily compared to already approved oils and fats. While it is premature at this time to develop specific standards or trading rules of algal oils, those for existing oils and fats can serve as a useful guide for the attributes and specific values of algal oils that will be demanded by customers (Table 1.1).
Traditional oils and fats are often derived from vegetable oil feedstocks and are generally characterized by application (edible or industrial applications), by their source (plant, animal, algal, etc.), and then by various industry terms, which generally describe their quality or purity (crude, refined, or refined and bleached) or their end use (technical grade, feed grade, etc.). In particular the end use will often determine the list of properties and quality targets that need to be met. These oils consist mostly of triglycerides and have a premium on properties important to their end use (color, cold properties, heat stress properties),
28 Bigelow NW, Hardin WR, Barker JP, Ryken SA, Macrae AC, Cat-tolico RA. A Comprehensive GC-MS Sub-Microscale Assay for Fatty Acids and its Applications. J Am Oil Chem Soc 2011; 88: 1329–1338.
29 Lohman EJ, Gardner RD, Halverson L, Macur RE, Peyton BM, Gerlach R. An efficient and scalable extraction and quantification method for algal derived biofuel. J Microbiol Methods 2013; 94: 235–244.
minor compounds that can affect flavor or texture (impurities, unsaponifiable matter; i.e. non-fatty-acid-containing lipids, such as sterols, pigments, and hydrocarbons), properties that may affect shelf life (moisture, storage stability), and overall purity of the triglyceride oil (i.e., low level of free fatty acids). Some of these oils or fats are marketed as detergents, lubricants, or as other industrial or cosmetic applications. These markets capitalize on the properties that are already present for edible purposes, and typically add or emphasize one or several properties that are important for the particular industrial application.
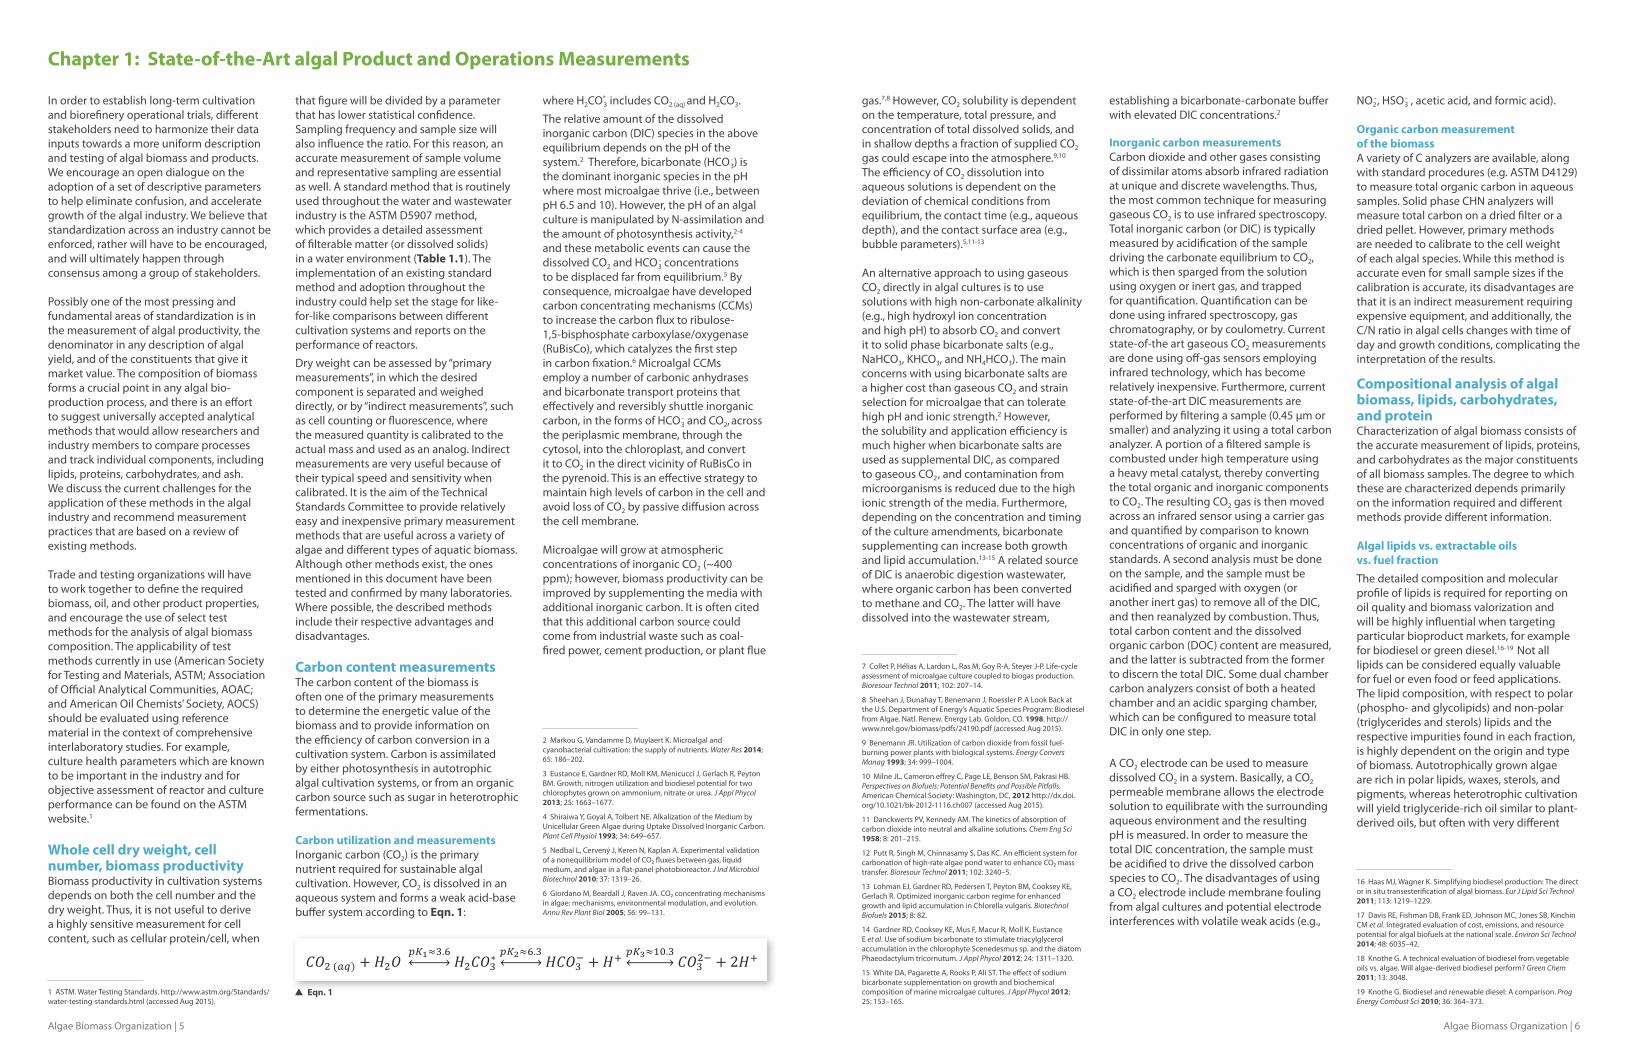
Inedible oils are commonly used for animal feed rations, biodiesel, and other industrial applications. These generally require only low-grade oil or fat and there tends to be less concern with oil color, some impurities, and free fatty acid levels. On the other hand, some other properties become more important, such as viscosity, energy content (BTU), and low levels of poly-unsaturated fatty acids to enhance storage stability. High-throughput measurement of lipids in algae In addition to the procedures listed above, there has been an emphasis to accelerate the quantification of lipids. Often, researchers need to tailor the analysis to the screening of thousands of individual strains for bioprospection or metabolic engineering projects. These high-throughput methodologies are based on hydrophobic (lipophilic) fluorescent dyes, such as Nile Red29,30 and BODIPY.31,32 As these dyes are soluble in a lipid or hydrophobic environment, the fluorescence intensity increases proportionally with the lipid content and this principle has been used extensively in the screening for high lipid-producing cells (Figure 1.2). Note that BODIPY staining may not be a substitute for Nile Red in semi-quantitative fluorescence measurements of total lipids, as the dye does not exhibit a Stokes wavelength shift when binding to hydrophobic areas of an algal cell, such as neutral lipids. Furthermore, although fluorescent dyes are a powerful and potentially high-throughput approach for screening lipid-producing cells, caution has to be taken with the quantitative
30 Cooksey KE, Guckert JB, Williams SA, Callis PR. Fluorometric determination of the neutral lipid content of microalgal cells using Nile Red. J Microbiol Methods 1987; 6: 333–345.
31 Govender T, Ramanna L, Rawat I, Bux F. BODIPY staining, an alternative to the Nile Red fluorescence method for the evaluation of intracellular lipids in microalgae. Bioresour Technol 2012; 114: 507–11.
32 Cooper MS, Hardin WR, Petersen TW, Cattolico RA. Visualizing ‘green oil’ in live algal cells. J Biosci Bioeng 2010; 109: 198–201.
interpretation of fluorescence results from both BODIPY and Nile Red Dyes, due to the possibility of inconsistent dye-uptake between different algal species.
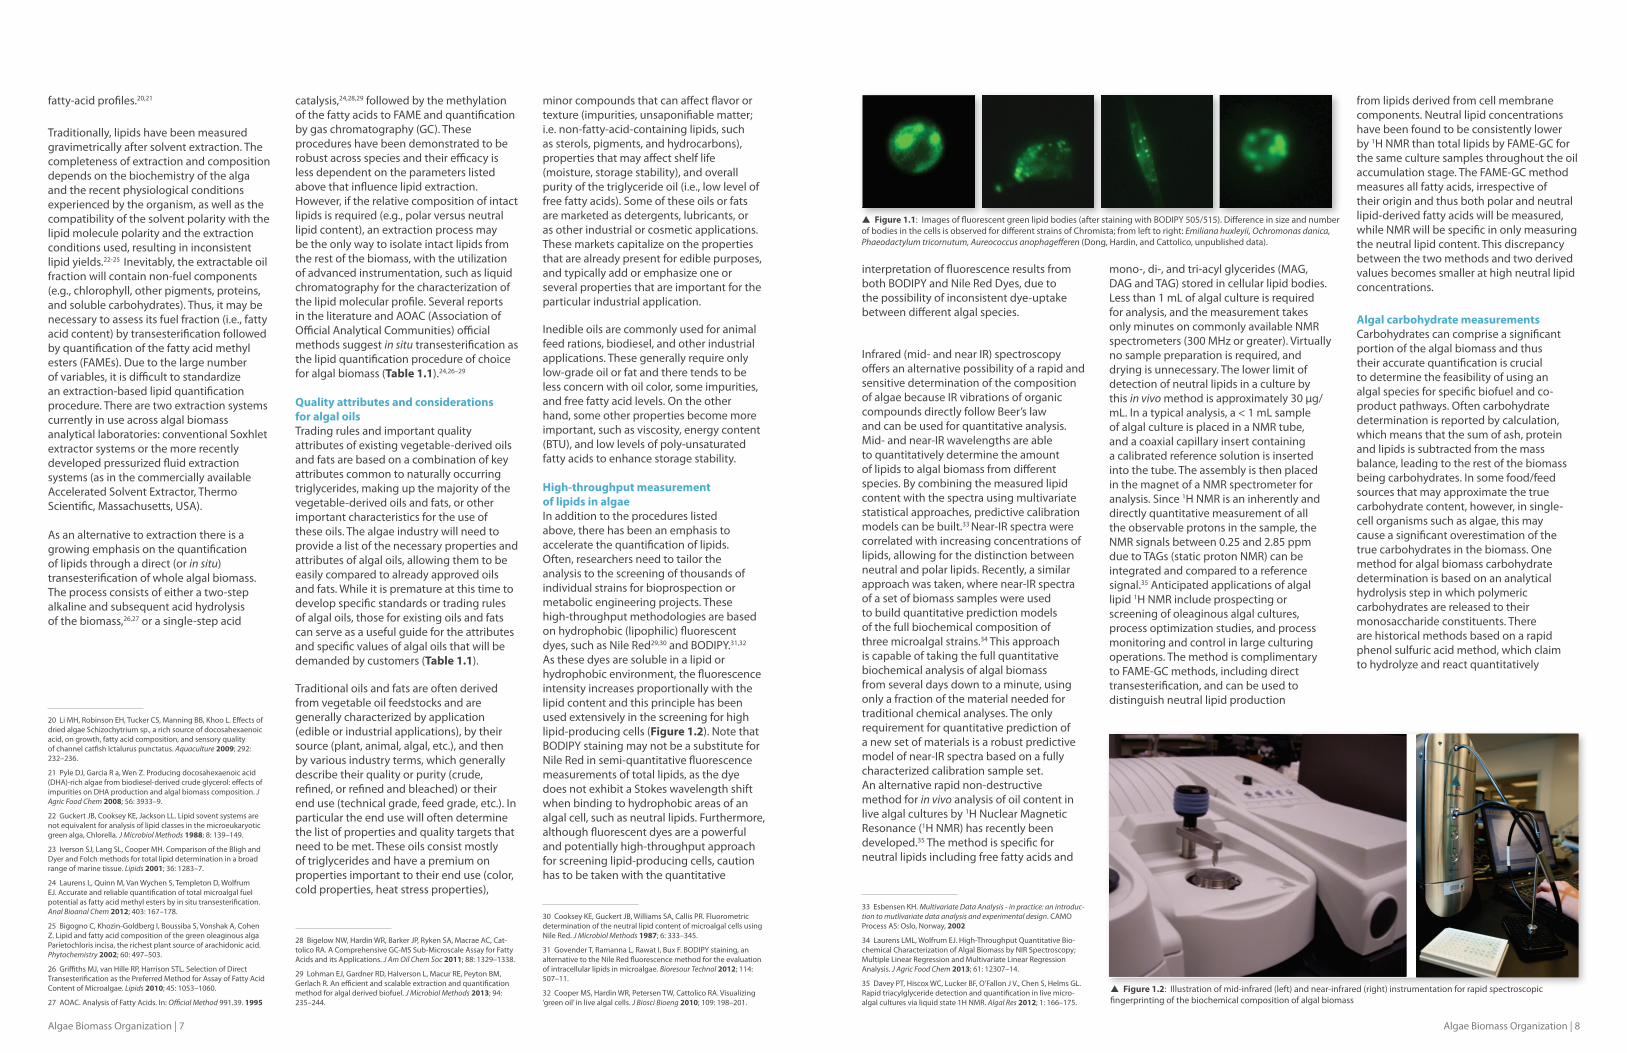
Infrared (mid- and near IR) spectroscopy offers an alternative possibility of a rapid and sensitive determination of the composition of algae because IR vibrations of organic compounds directly follow Beer’s law and can be used for quantitative analysis. Mid- and near-IR wavelengths are able to quantitatively determine the amount of lipids to algal biomass from different species. By combining the measured lipid content with the spectra using multivariate statistical approaches, predictive calibration models can be built.33 Near-IR spectra were correlated with increasing concentrations of lipids, allowing for the distinction between neutral and polar lipids. Recently, a similar approach was taken, where near-IR spectra of a set of biomass samples were used to build quantitative prediction models of the full biochemical composition of three microalgal strains.34 This approach is capable of taking the full quantitative biochemical analysis of algal biomass from several days down to a minute, using only a fraction of the material needed for traditional chemical analyses. The only requirement for quantitative prediction of a new set of materials is a robust predictive model of near-IR spectra based on a fully characterized calibration sample set. An alternative rapid non-destructive method for in vivo analysis of oil content in live algal cultures by 1H Nuclear Magnetic Resonance (1H NMR) has recently been developed.35 The method is specific for neutral lipids including free fatty acids and
33 Esbensen KH. Multivariate Data Analysis - in practice: an introduc-tion to mutlivariate data analysis and experimental design. CAMO Process AS: Oslo, Norway, 2002
34 Laurens LML, Wolfrum EJ. High-Throughput Quantitative Bio-chemical Characterization of Algal Biomass by NIR Spectroscopy; Multiple Linear Regression and Multivariate Linear Regression Analysis. J Agric Food Chem 2013; 61: 12307–14.
35 Davey PT, Hiscox WC, Lucker BF, O’Fallon J V., Chen S, Helms GL. Rapid triacylglyceride detection and quantification in live micro-algal cultures via liquid state 1H NMR. Algal Res 2012; 1: 166–175.
mono-, di-, and tri-acyl glycerides (MAG, DAG and TAG) stored in cellular lipid bodies. Less than 1 mL of algal culture is required for analysis, and the measurement takes only minutes on commonly available NMR spectrometers (300 MHz or greater). Virtually no sample preparation is required, and drying is unnecessary. The lower limit of detection of neutral lipids in a culture by this in vivo method is approximately 30 µg/mL. In a typical analysis, a < 1 mL sample of algal culture is placed in a NMR tube, and a coaxial capillary insert containing a calibrated reference solution is inserted into the tube. The assembly is then placed in the magnet of a NMR spectrometer for analysis. Since 1H NMR is an inherently and directly quantitative measurement of all the observable protons in the sample, the NMR signals between 0.25 and 2.85 ppm due to TAGs (static proton NMR) can be integrated and compared to a reference signal.35 Anticipated applications of algal lipid 1H NMR include prospecting or screening of oleaginous algal cultures, process optimization studies, and process monitoring and control in large culturing operations. The method is complimentary to FAME-GC methods, including direct transesterification, and can be used to distinguish neutral lipid production
from lipids derived from cell membrane components. Neutral lipid concentrations have been found to be consistently lower by 1H NMR than total lipids by FAME-GC for the same culture samples throughout the oil accumulation stage. The FAME-GC method measures all fatty acids, irrespective of their origin and thus both polar and neutral lipid-derived fatty acids will be measured, while NMR will be specific in only measuring the neutral lipid content. This discrepancy between the two methods and two derived values becomes smaller at high neutral lipid concentrations.
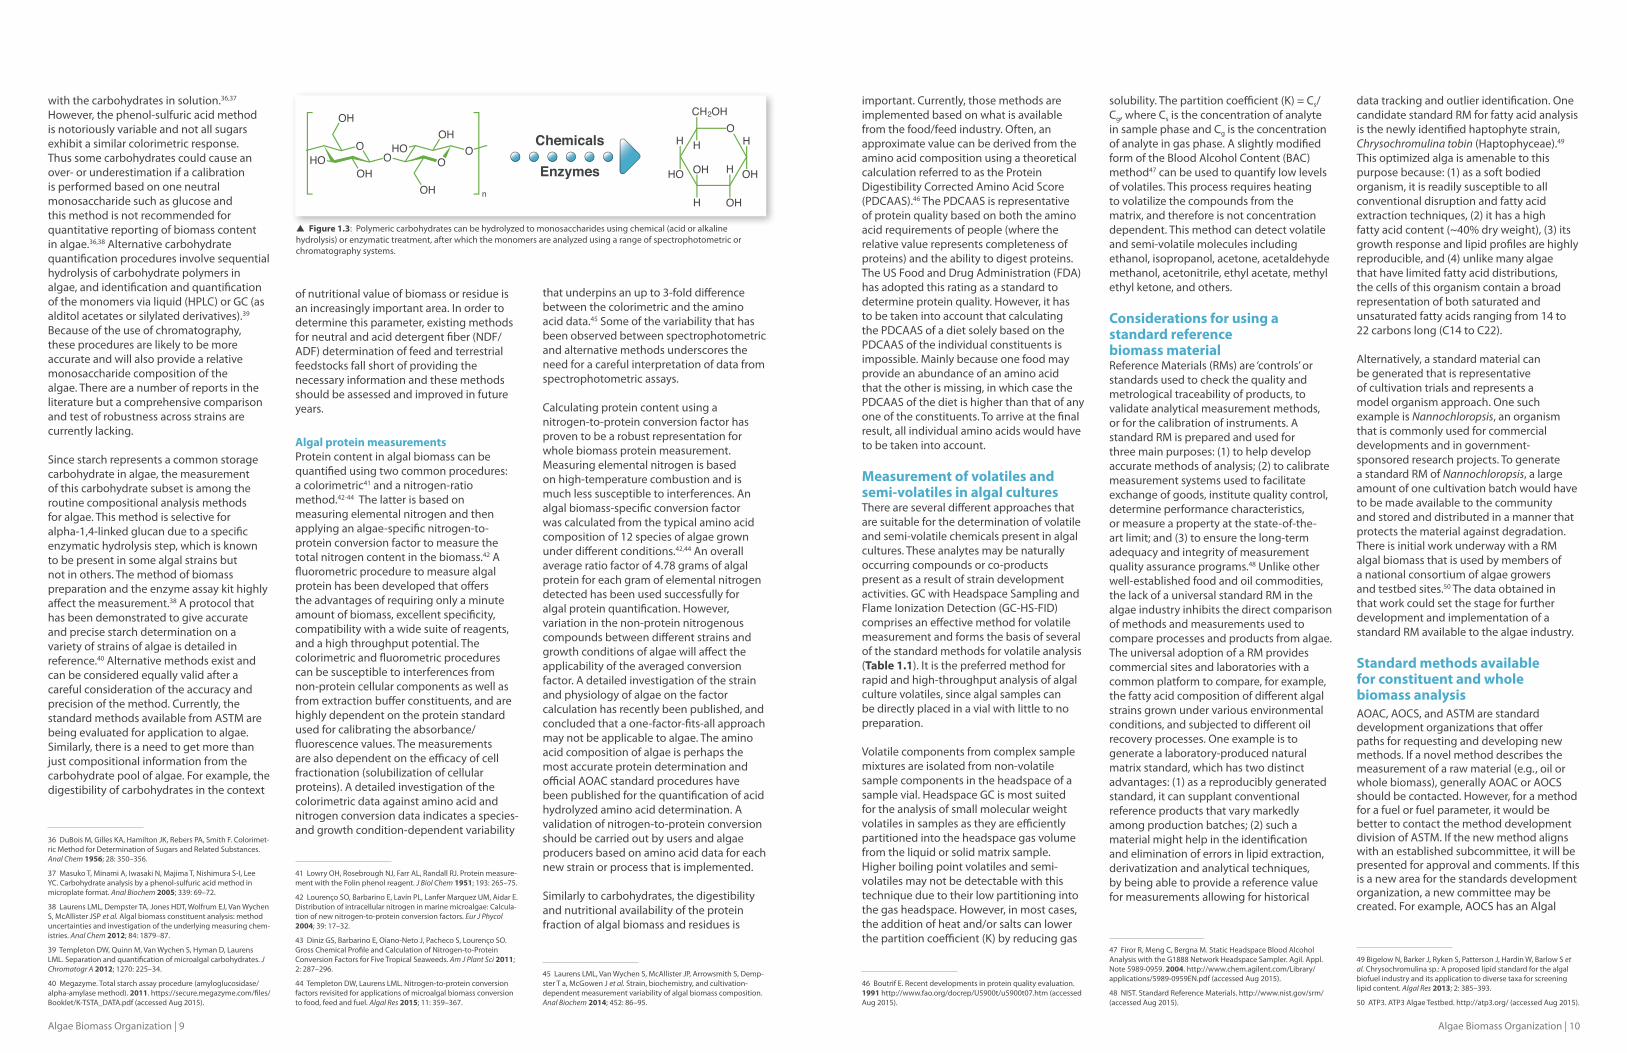
Algal carbohydrate measurementsCarbohydrates can comprise a significant portion of the algal biomass and thus their accurate quantification is crucial to determine the feasibility of using an algal species for specific biofuel and co-product pathways. Often carbohydrate determination is reported by calculation, which means that the sum of ash, protein and lipids is subtracted from the mass balance, leading to the rest of the biomass being carbohydrates. In some food/feed sources that may approximate the true carbohydrate content, however, in single-cell organisms such as algae, this may cause a significant overestimation of the true carbohydrates in the biomass. One method for algal biomass carbohydrate determination is based on an analytical hydrolysis step in which polymeric carbohydrates are released to their monosaccharide constituents. There are historical methods based on a rapid phenol sulfuric acid method, which claim to hydrolyze and react quantitatively
Algae Biomass Organization | 10Algae Biomass Organization | 9
with the carbohydrates in solution.36,37 However, the phenol-sulfuric acid method is notoriously variable and not all sugars exhibit a similar colorimetric response. Thus some carbohydrates could cause an over- or underestimation if a calibration is performed based on one neutral monosaccharide such as glucose and this method is not recommended for quantitative reporting of biomass content in algae.36,38 Alternative carbohydrate quantification procedures involve sequential hydrolysis of carbohydrate polymers in algae, and identification and quantification of the monomers via liquid (HPLC) or GC (as alditol acetates or silylated derivatives).39 Because of the use of chromatography, these procedures are likely to be more accurate and will also provide a relative monosaccharide composition of the algae. There are a number of reports in the literature but a comprehensive comparison and test of robustness across strains are currently lacking.
Since starch represents a common storage carbohydrate in algae, the measurement of this carbohydrate subset is among the routine compositional analysis methods for algae. This method is selective for alpha-1,4-linked glucan due to a specific enzymatic hydrolysis step, which is known to be present in some algal strains but not in others. The method of biomass preparation and the enzyme assay kit highly affect the measurement.38 A protocol that has been demonstrated to give accurate and precise starch determination on a variety of strains of algae is detailed in reference.40 Alternative methods exist and can be considered equally valid after a careful consideration of the accuracy and precision of the method. Currently, the standard methods available from ASTM are being evaluated for application to algae. Similarly, there is a need to get more than just compositional information from the carbohydrate pool of algae. For example, the digestibility of carbohydrates in the context
36 DuBois M, Gilles KA, Hamilton JK, Rebers PA, Smith F. Colorimet-ric Method for Determination of Sugars and Related Substances. Anal Chem 1956; 28: 350–356.
37 Masuko T, Minami A, Iwasaki N, Majima T, Nishimura S-I, Lee YC. Carbohydrate analysis by a phenol-sulfuric acid method in microplate format. Anal Biochem 2005; 339: 69–72.
38 Laurens LML, Dempster TA, Jones HDT, Wolfrum EJ, Van Wychen S, McAllister JSP et al. Algal biomass constituent analysis: method uncertainties and investigation of the underlying measuring chem-istries. Anal Chem 2012; 84: 1879–87.
39 Templeton DW, Quinn M, Van Wychen S, Hyman D, Laurens LML. Separation and quantification of microalgal carbohydrates. J Chromatogr A 2012; 1270: 225–34.
40 Megazyme. Total starch assay procedure (amyloglucosidase/alpha-amylase method). 2011. https://secure.megazyme.com/files/Booklet/K-TSTA_DATA.pdf (accessed Aug 2015).
of nutritional value of biomass or residue is an increasingly important area. In order to determine this parameter, existing methods for neutral and acid detergent fiber (NDF/ADF) determination of feed and terrestrial feedstocks fall short of providing the necessary information and these methods should be assessed and improved in future years.
Algal protein measurementsProtein content in algal biomass can be quantified using two common procedures: a colorimetric41 and a nitrogen-ratio method.42-44 The latter is based on measuring elemental nitrogen and then applying an algae-specific nitrogen-to-protein conversion factor to measure the total nitrogen content in the biomass.42 A fluorometric procedure to measure algal protein has been developed that offers the advantages of requiring only a minute amount of biomass, excellent specificity, compatibility with a wide suite of reagents, and a high throughput potential. The colorimetric and fluorometric procedures can be susceptible to interferences from non-protein cellular components as well as from extraction buffer constituents, and are highly dependent on the protein standard used for calibrating the absorbance/fluorescence values. The measurements are also dependent on the efficacy of cell fractionation (solubilization of cellular proteins). A detailed investigation of the colorimetric data against amino acid and nitrogen conversion data indicates a species- and growth condition-dependent variability
41 Lowry OH, Rosebrough NJ, Farr AL, Randall RJ. Protein measure-ment with the Folin phenol reagent. J Biol Chem 1951; 193: 265–75.
42 Lourenço SO, Barbarino E, Lavín PL, Lanfer Marquez UM, Aidar E. Distribution of intracellular nitrogen in marine microalgae: Calcula-tion of new nitrogen-to-protein conversion factors. Eur J Phycol 2004; 39: 17–32.
43 Diniz GS, Barbarino E, Oiano-Neto J, Pacheco S, Lourenço SO. Gross Chemical Profile and Calculation of Nitrogen-to-Protein Conversion Factors for Five Tropical Seaweeds. Am J Plant Sci 2011; 2: 287–296.
44 Templeton DW, Laurens LML. Nitrogen-to-protein conversion factors revisited for applications of microalgal biomass conversion to food, feed and fuel. Algal Res 2015; 11: 359–367.
that underpins an up to 3-fold difference between the colorimetric and the amino acid data.45 Some of the variability that has been observed between spectrophotometric and alternative methods underscores the need for a careful interpretation of data from spectrophotometric assays.
Calculating protein content using a nitrogen-to-protein conversion factor has proven to be a robust representation for whole biomass protein measurement. Measuring elemental nitrogen is based on high-temperature combustion and is much less susceptible to interferences. An algal biomass-specific conversion factor was calculated from the typical amino acid composition of 12 species of algae grown under different conditions.42,44 An overall average ratio factor of 4.78 grams of algal protein for each gram of elemental nitrogen detected has been used successfully for algal protein quantification. However, variation in the non-protein nitrogenous compounds between different strains and growth conditions of algae will affect the applicability of the averaged conversion factor. A detailed investigation of the strain and physiology of algae on the factor calculation has recently been published, and concluded that a one-factor-fits-all approach may not be applicable to algae. The amino acid composition of algae is perhaps the most accurate protein determination and official AOAC standard procedures have been published for the quantification of acid hydrolyzed amino acid determination. A validation of nitrogen-to-protein conversion should be carried out by users and algae producers based on amino acid data for each new strain or process that is implemented.
Similarly to carbohydrates, the digestibility and nutritional availability of the protein fraction of algal biomass and residues is
45 Laurens LML, Van Wychen S, McAllister JP, Arrowsmith S, Demp-ster T a, McGowen J et al. Strain, biochemistry, and cultivation-dependent measurement variability of algal biomass composition. Anal Biochem 2014; 452: 86–95.
important. Currently, those methods are implemented based on what is available from the food/feed industry. Often, an approximate value can be derived from the amino acid composition using a theoretical calculation referred to as the Protein Digestibility Corrected Amino Acid Score (PDCAAS).46 The PDCAAS is representative of protein quality based on both the amino acid requirements of people (where the relative value represents completeness of proteins) and the ability to digest proteins. The US Food and Drug Administration (FDA) has adopted this rating as a standard to determine protein quality. However, it has to be taken into account that calculating the PDCAAS of a diet solely based on the PDCAAS of the individual constituents is impossible. Mainly because one food may provide an abundance of an amino acid that the other is missing, in which case the PDCAAS of the diet is higher than that of any one of the constituents. To arrive at the final result, all individual amino acids would have to be taken into account. Measurement of volatiles and semi-volatiles in algal culturesThere are several different approaches that are suitable for the determination of volatile and semi-volatile chemicals present in algal cultures. These analytes may be naturally occurring compounds or co-products present as a result of strain development activities. GC with Headspace Sampling and Flame Ionization Detection (GC-HS-FID) comprises an effective method for volatile measurement and forms the basis of several of the standard methods for volatile analysis (Table 1.1). It is the preferred method for rapid and high-throughput analysis of algal culture volatiles, since algal samples can be directly placed in a vial with little to no preparation.
Volatile components from complex sample mixtures are isolated from non-volatile sample components in the headspace of a sample vial. Headspace GC is most suited for the analysis of small molecular weight volatiles in samples as they are efficiently partitioned into the headspace gas volume from the liquid or solid matrix sample. Higher boiling point volatiles and semi-volatiles may not be detectable with this technique due to their low partitioning into the gas headspace. However, in most cases, the addition of heat and/or salts can lower the partition coefficient (K) by reducing gas
46 Boutrif E. Recent developments in protein quality evaluation. 1991 http://www.fao.org/docrep/U5900t/u5900t07.htm (accessed Aug 2015).
solubility. The partition coefficient (K) = Cs/Cg, where Cs is the concentration of analyte in sample phase and Cg is the concentration of analyte in gas phase. A slightly modified form of the Blood Alcohol Content (BAC) method47 can be used to quantify low levels of volatiles. This process requires heating to volatilize the compounds from the matrix, and therefore is not concentration dependent. This method can detect volatile and semi-volatile molecules including ethanol, isopropanol, acetone, acetaldehyde methanol, acetonitrile, ethyl acetate, methyl ethyl ketone, and others. Considerations for using a standard reference biomass material Reference Materials (RMs) are ‘controls’ or standards used to check the quality and metrological traceability of products, to validate analytical measurement methods, or for the calibration of instruments. A standard RM is prepared and used for three main purposes: (1) to help develop accurate methods of analysis; (2) to calibrate measurement systems used to facilitate exchange of goods, institute quality control, determine performance characteristics, or measure a property at the state-of-the-art limit; and (3) to ensure the long-term adequacy and integrity of measurement quality assurance programs.48 Unlike other well-established food and oil commodities, the lack of a universal standard RM in the algae industry inhibits the direct comparison of methods and measurements used to compare processes and products from algae. The universal adoption of a RM provides commercial sites and laboratories with a common platform to compare, for example, the fatty acid composition of different algal strains grown under various environmental conditions, and subjected to different oil recovery processes. One example is to generate a laboratory-produced natural matrix standard, which has two distinct advantages: (1) as a reproducibly generated standard, it can supplant conventional reference products that vary markedly among production batches; (2) such a material might help in the identification and elimination of errors in lipid extraction, derivatization and analytical techniques, by being able to provide a reference value for measurements allowing for historical
47 Firor R, Meng C, Bergna M. Static Headspace Blood Alcohol Analysis with the G1888 Network Headspace Sampler. Agil. Appl. Note 5989-0959. 2004. http://www.chem.agilent.com/Library/applications/5989-0959EN.pdf (accessed Aug 2015).
48 NIST. Standard Reference Materials. http://www.nist.gov/srm/ (accessed Aug 2015).
data tracking and outlier identification. One candidate standard RM for fatty acid analysis is the newly identified haptophyte strain, Chrysochromulina tobin (Haptophyceae).49 This optimized alga is amenable to this purpose because: (1) as a soft bodied organism, it is readily susceptible to all conventional disruption and fatty acid extraction techniques, (2) it has a high fatty acid content (~40% dry weight), (3) its growth response and lipid profiles are highly reproducible, and (4) unlike many algae that have limited fatty acid distributions, the cells of this organism contain a broad representation of both saturated and unsaturated fatty acids ranging from 14 to 22 carbons long (C14 to C22).
Alternatively, a standard material can be generated that is representative of cultivation trials and represents a model organism approach. One such example is Nannochloropsis, an organism that is commonly used for commercial developments and in government-sponsored research projects. To generate a standard RM of Nannochloropsis, a large amount of one cultivation batch would have to be made available to the community and stored and distributed in a manner that protects the material against degradation. There is initial work underway with a RM algal biomass that is used by members of a national consortium of algae growers and testbed sites.50 The data obtained in that work could set the stage for further development and implementation of a standard RM available to the algae industry. Standard methods available for constituent and whole biomass analysisAOAC, AOCS, and ASTM are standard development organizations that offer paths for requesting and developing new methods. If a novel method describes the measurement of a raw material (e.g., oil or whole biomass), generally AOAC or AOCS should be contacted. However, for a method for a fuel or fuel parameter, it would be better to contact the method development division of ASTM. If the new method aligns with an established subcommittee, it will be presented for approval and comments. If this is a new area for the standards development organization, a new committee may be created. For example, AOCS has an Algal
49 Bigelow N, Barker J, Ryken S, Patterson J, Hardin W, Barlow S et al. Chrysochromulina sp.: A proposed lipid standard for the algal biofuel industry and its application to diverse taxa for screening lipid content. Algal Res 2013; 2: 385–393.
50 ATP3. ATP3 Algae Testbed. http://atp3.org/ (accessed Aug 2015).
OH
OHOH
OH
OH
OHOH
OH
H
H
H H
CH OH
Chemicals
Enzymes
2
HOHO
HOOO O
O
n
Algae Biomass Organization | 12Algae Biomass Organization | 11
Products Expert Panel that is currently planning a collaborative study for discovery in late 2015 on several analyses. Once there is consensus that a method should be studied, there are set procedures to follow for a collaborative study with the aim of determining the precision and accuracy of the method.
Various trade groups already publish trading standards, guidelines, or quality targets for
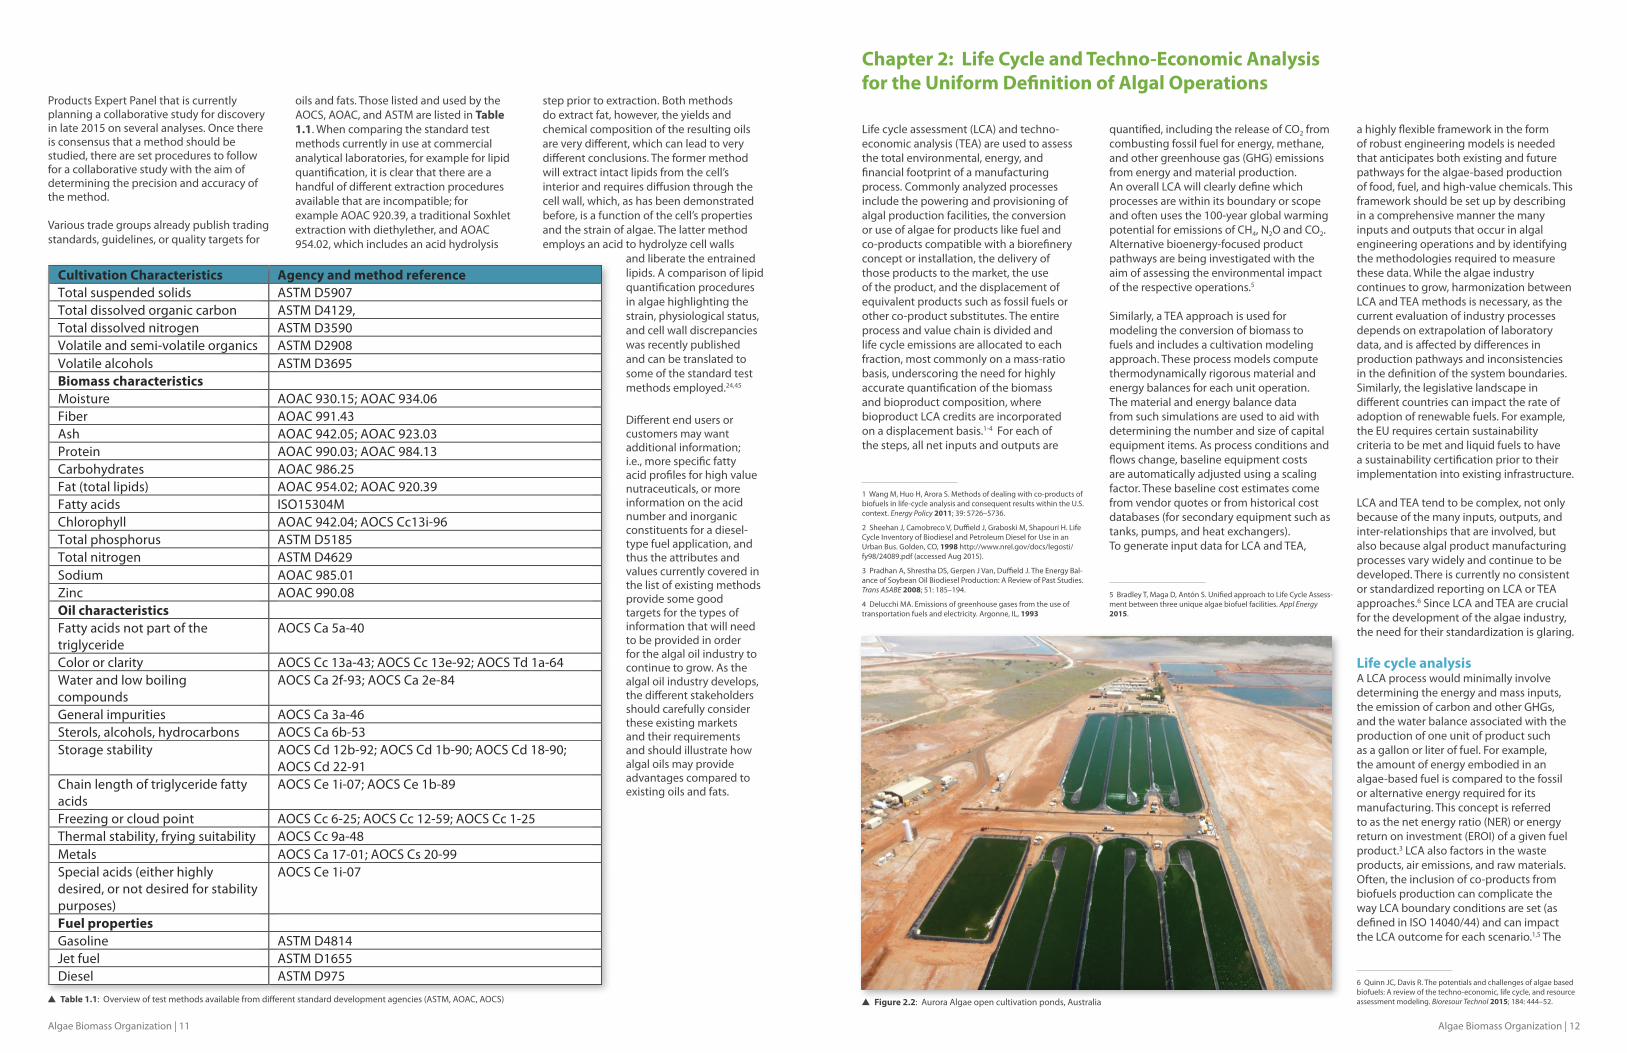
oils and fats. Those listed and used by the AOCS, AOAC, and ASTM are listed in Table 1.1. When comparing the standard test methods currently in use at commercial analytical laboratories, for example for lipid quantification, it is clear that there are a handful of different extraction procedures available that are incompatible; for example AOAC 920.39, a traditional Soxhlet extraction with diethylether, and AOAC 954.02, which includes an acid hydrolysis
step prior to extraction. Both methods do extract fat, however, the yields and chemical composition of the resulting oils are very different, which can lead to very different conclusions. The former method will extract intact lipids from the cell’s interior and requires diffusion through the cell wall, which, as has been demonstrated before, is a function of the cell’s properties and the strain of algae. The latter method employs an acid to hydrolyze cell walls
and liberate the entrained lipids. A comparison of lipid quantification procedures in algae highlighting the strain, physiological status, and cell wall discrepancies was recently published and can be translated to some of the standard test methods employed.24,45
Different end users or customers may want additional information; i.e., more specific fatty acid profiles for high value nutraceuticals, or more information on the acid number and inorganic constituents for a diesel-type fuel application, and thus the attributes and values currently covered in the list of existing methods provide some good targets for the types of information that will need to be provided in order for the algal oil industry to continue to grow. As the algal oil industry develops, the different stakeholders should carefully consider these existing markets and their requirements and should illustrate how algal oils may provide advantages compared to existing oils and fats.
Life cycle assessment (LCA) and techno-economic analysis (TEA) are used to assess the total environmental, energy, and financial footprint of a manufacturing process. Commonly analyzed processes include the powering and provisioning of algal production facilities, the conversion or use of algae for products like fuel and co-products compatible with a biorefinery concept or installation, the delivery of those products to the market, the use of the product, and the displacement of equivalent products such as fossil fuels or other co-product substitutes. The entire process and value chain is divided and life cycle emissions are allocated to each fraction, most commonly on a mass-ratio basis, underscoring the need for highly accurate quantification of the biomass and bioproduct composition, where bioproduct LCA credits are incorporated on a displacement basis.1-4 For each of the steps, all net inputs and outputs are
1 Wang M, Huo H, Arora S. Methods of dealing with co-products of biofuels in life-cycle analysis and consequent results within the U.S. context. Energy Policy 2011; 39: 5726–5736.
2 Sheehan J, Camobreco V, Duffield J, Graboski M, Shapouri H. Life Cycle Inventory of Biodiesel and Petroleum Diesel for Use in an Urban Bus. Golden, CO, 1998 http://www.nrel.gov/docs/legosti/fy98/24089.pdf (accessed Aug 2015).
3 Pradhan A, Shrestha DS, Gerpen J Van, Duffield J. The Energy Bal-ance of Soybean Oil Biodiesel Production: A Review of Past Studies. Trans ASABE 2008; 51: 185–194.
4 Delucchi MA. Emissions of greenhouse gases from the use of transportation fuels and electricity. Argonne, IL, 1993
Chapter 2: Life Cycle and Techno-Economic Analysis for the Uniform Definition of Algal Operations
quantified, including the release of CO2 from combusting fossil fuel for energy, methane, and other greenhouse gas (GHG) emissions from energy and material production. An overall LCA will clearly define which processes are within its boundary or scope and often uses the 100-year global warming potential for emissions of CH4, N2O and CO2. Alternative bioenergy-focused product pathways are being investigated with the aim of assessing the environmental impact of the respective operations.5 Similarly, a TEA approach is used for modeling the conversion of biomass to fuels and includes a cultivation modeling approach. These process models compute thermodynamically rigorous material and energy balances for each unit operation. The material and energy balance data from such simulations are used to aid with determining the number and size of capital equipment items. As process conditions and flows change, baseline equipment costs are automatically adjusted using a scaling factor. These baseline cost estimates come from vendor quotes or from historical cost databases (for secondary equipment such as tanks, pumps, and heat exchangers). To generate input data for LCA and TEA,
5 Bradley T, Maga D, Antón S. Unified approach to Life Cycle Assess-ment between three unique algae biofuel facilities. Appl Energy 2015.
a highly flexible framework in the form of robust engineering models is needed that anticipates both existing and future pathways for the algae-based production of food, fuel, and high-value chemicals. This framework should be set up by describing in a comprehensive manner the many inputs and outputs that occur in algal engineering operations and by identifying the methodologies required to measure these data. While the algae industry continues to grow, harmonization between LCA and TEA methods is necessary, as the current evaluation of industry processes depends on extrapolation of laboratory data, and is affected by differences in production pathways and inconsistencies in the definition of the system boundaries. Similarly, the legislative landscape in different countries can impact the rate of adoption of renewable fuels. For example, the EU requires certain sustainability criteria to be met and liquid fuels to have a sustainability certification prior to their implementation into existing infrastructure.
LCA and TEA tend to be complex, not only because of the many inputs, outputs, and inter-relationships that are involved, but also because algal product manufacturing processes vary widely and continue to be developed. There is currently no consistent or standardized reporting on LCA or TEA approaches.6 Since LCA and TEA are crucial for the development of the algae industry, the need for their standardization is glaring. Life cycle analysisA LCA process would minimally involve determining the energy and mass inputs, the emission of carbon and other GHGs, and the water balance associated with the production of one unit of product such as a gallon or liter of fuel. For example, the amount of energy embodied in an algae-based fuel is compared to the fossil or alternative energy required for its manufacturing. This concept is referred to as the net energy ratio (NER) or energy return on investment (EROI) of a given fuel product.3 LCA also factors in the waste products, air emissions, and raw materials. Often, the inclusion of co-products from biofuels production can complicate the way LCA boundary conditions are set (as defined in ISO 14040/44) and can impact the LCA outcome for each scenario.1,5 The
6 Quinn JC, Davis R. The potentials and challenges of algae based biofuels: A review of the techno-economic, life cycle, and resource assessment modeling. Bioresour Technol 2015; 184: 444–52.
Cultivation Characteristics Agency and method reference Total suspended solids ASTM D5907 Total dissolved organic carbon ASTM D4129, Total dissolved nitrogen ASTM D3590 Volatile and semi-volatile organics ASTM D2908 Volatile alcohols ASTM D3695 Biomass characteristics Moisture AOAC 930.15; AOAC 934.06 Fiber AOAC 991.43 Ash AOAC 942.05; AOAC 923.03 Protein AOAC 990.03; AOAC 984.13 Carbohydrates AOAC 986.25 Fat (total lipids) AOAC 954.02; AOAC 920.39 Fatty acids ISO15304M Chlorophyll AOAC 942.04; AOCS Cc13i-96 Total phosphorus ASTM D5185 Total nitrogen ASTM D4629 Sodium AOAC 985.01 Zinc AOAC 990.08 Oil characteristics Fatty acids not part of the triglyceride
AOCS Ca 5a-40
Color or clarity AOCS Cc 13a-43; AOCS Cc 13e-92; AOCS Td 1a-64 Water and low boiling compounds
AOCS Ca 2f-93; AOCS Ca 2e-84
General impurities AOCS Ca 3a-46 Sterols, alcohols, hydrocarbons AOCS Ca 6b-53 Storage stability AOCS Cd 12b-92; AOCS Cd 1b-90; AOCS Cd 18-90;
AOCS Cd 22-91 Chain length of triglyceride fatty acids
AOCS Ce 1i-07; AOCS Ce 1b-89
Freezing or cloud point AOCS Cc 6-25; AOCS Cc 12-59; AOCS Cc 1-25 Thermal stability, frying suitability AOCS Cc 9a-48 Metals AOCS Ca 17-01; AOCS Cs 20-99 Special acids (either highly desired, or not desired for stability purposes)
AOCS Ce 1i-07
Fuel properties Gasoline ASTM D4814 Jet fuel ASTM D1655 Diesel ASTM D975
Algae Biomass Organization | 14Algae Biomass Organization | 13
impact of each individual co-product and process scenario should be considered separately and reported in a consistent manner. A LCA may assist in determining eligibility for government incentive programs, evaluating the environmental impact of farm operations, projecting economic performance, or performing a resource assessment (RA). The latter is used to calculate the total amount of fuel or other product that can be manufactured using a specific process given the amount of input resources available within a specific area, or alternatively, to inform the LCA of the need to bring resources to the cultivation facility from remote locations.7,8 In all cases, the importance of uniform approaches to these analyses is increasing as the algae industry seeks to rapidly develop, finance, and build out its operations. The standardized GREET LCA tool developed by Argonne National Laboratories has been adapted to over 100 feedstock-to-fuel pathways, yet it continues to require adaptation to accommodate the diversity of algae-based fuels.9-11
In the US, the Energy Independence and Security Act of 2007 (EISA) included the national Renewable Fuel Standard (RFS)12 with the purpose of diversifying fuel alternatives and increasing the contribution from renewable fuels. EISA defines four categories of renewable fuel with minimum GHG reduction thresholds as a key requirement for each category. EISA requires 20% GHG reduction for any renewable fuel facility constructed after 2007, 50% reduction for advanced biofuel, 50% reduction for biomass-based diesel, and 60% reduction for cellulosic biofuel. All of these are measured against the 2005 average petroleum baseline. Having achieved significant success through 2014, the majority of growth remaining in the program is to be fulfilled by advanced
7 Venteris ER, Skaggs RL, Coleman AM, Wigmosta MS. A GIS cost model to assess the availability of freshwater, seawater, and saline groundwater for algal biofuel production in the United States. Environ Sci Technol 2013; 47: 4840–9.
8 Venteris ER, McBride RC, Coleman AM, Skaggs RL, Wigmosta MS. Siting algae cultivation facilities for biofuel production in the United States: trade-offs between growth rate, site constructability, water availability, and infrastructure. Environ Sci Technol 2014; 48: 3559–66.
9 Woertz IC, Benemann JR, Du N, Unnasch S, Mendola D, Mitchell BG et al. Life Cycle GHG Emissions from Microalgal Biodiesel - A CA-GREET Model. Environ Sci Technol 2014; 48: 6060–8.
10 Davis RE, Fishman DB, Frank ED, Johnson MC, Jones SB, Kinchin CM et al. Integrated evaluation of cost, emissions, and resource potential for algal biofuels at the national scale. Environ Sci Technol 2014; 48: 6035–42.
11 Frank ED, Han J, Palou-Rivera I, Elgowainy A, Wang MQ. User Manual for Algae Life-Cycle Analysis with GREET: Version 0.0. 2011 https://greet.es.anl.gov/files/algae-life-cycle-manual (accessed Aug 2015).
12 USEPA. Renewable Fuel Standard (RFS). http://www.epa.gov/otaq/fuels/renewablefuels/index.htm (accessed Aug 2015).
biofuels, which include biomass-based diesel and cellulosic biofuel. Implementation of the RFS requires the EPA to estimate the life cycle GHG emissions for renewable fuels to determine eligibility in the prescribed categories. EISA defines life cycle GHG emissions as “the aggregate quantity of GHG emissions (including direct emissions and significant indirect emissions such as those from land use changes), related to the full fuel life cycle, including all stages of fuel and feedstock production and distribution, from feedstock generation or extraction through the distribution and delivery and use of the finished fuel to the ultimate consumer, where the mass values for all GHGs are adjusted to account for their relative global warming potential.”13
LCA can include other resource inputs and impacts besides energy and GHGs. In particular, LCA can be used to compare environmental and human health impacts between renewable and conventional products. These impact categories can include potential effects with regard to acidification, eutrophication, air pollution, ozone depletion, smog formation, ecotoxicity, human toxicity, and fossil fuel depletion. Recently, a set of 16 indicators has been included in the assessment of algal fuels.14 It has been suggested that water is an important resource to be considered by LCA. However, the consistent framing of the use of water remains a complex challenge. Water itself is a renewable resource, but the ways in which it is used for different energy strategies are not directly comparable. For instance, underground injection of water for hydraulic fracturing and emulsification with fracking fluids has a much different environmental implication than the use of water to produce electricity via hydroelectric power or cooling water for thermoelectric generation. These applications are all very different from the transpiration of water by organisms during biomass production or its recycling during biomass processing. The impact of water use also varies dramatically by region, and therefore, a universal or even national framework is rarely appropriate. There is no compliance threshold or inclusion of water in LCAs required by EISA. Instead, following EISA enactment, the EPA and the National Academies of Sciences with the National Research Council (NRC) have completed qualitative assessment of water impact of renewable fuels complying with
13 USEPA. Lifecycle Analysis of Greenhouse Gas Emissions from Renewable Fuels. EPA-420-F-10-006. 2010. http://www.epa.gov/OMS/renewablefuels/420f10006.pdf (accessed Aug 2015).
14 Efroymson RA, Dale VH. Environmental indicators for sustain-able production of algal biofuels. Ecol Indic 2015; 49: 1–13.
the RFS. The goal of this work was to assess and avoid potential negative environmental impacts of the RFS.15 Again, as commercial algal facilities are being developed, this may need follow-up to ensure that previous assumptions still hold true. Sustainability considerations for algal cultivationDuring algal production and processing operations, gaseous, liquid, and solid emissions can include indirect and direct GHG emissions associated with the production of input energy and materials as well as their consumption during operations. This includes water evaporation, effluent waters with entrained organic and inorganic materials not otherwise suitable for recycled use within the operation, solid biomass residue fractions not included in algal constituent products or indirect products, and solid inorganic, organic, and biological particulates that can become airborne emissions or liquid effluent suspensions.14 Techno-economic and life cycle analysis for example pathways To assist in realizing the goals of increasing bioenergy production from algae, a number of techno-economic evaluations have been developed for both biological and thermochemical pathways for converting algal biomass to fuels. These conceptual evaluations of example processes, termed “design cases”, provide a detailed basis for understanding the potential of various conversion technologies and help identify technical barriers where research and development could potentially lead to significant cost improvements. Consistent assumptions for items such as plant lifetimes, rates of return, and other factors are used in all design cases so the various conversion pathways may be assessed on a comparative basis. To highlight examples of pathways for production of fuels from algae, we chose to focus on (1) a lipid extraction, (2) a hydrothermal conversion of whole algal biomass, and (3) a volatile biofuel product (e.g., ethanol) pathway. These pathways have been adopted by the US Department of Energy as baseline cases for technology and process optimization towards future design cases that improve the cost basis for production of fuels as shown through full TEA and LCA and with comparative sustainability assessment reports available
15 NRC. Sustainable Development of Algal Biofuels. The National Academies Press: Washington D.C, 2012
in the peer-reviewed literature. We selected these pathways here as examples only, of well-documented reports covering both the engineering and thermodynamic modeling assumptions. It is worth mentioning that the TEA referenced here are based on “nth-plant” economics. The key assumption implied by nth-plant economics is that our analysis does not describe a pioneer plant; instead, it assumes several plants using the same technology have already been built and are operating. In other words, it reflects a mature future in which a successful industry of n plants has been established. Because the techno-economic model is primarily a tool for studying new process technologies or integration schemes in order to comment on their comparative economic impact, nth-plant analysis avoids artificial inflation of project costs associated with risk financing, longer start-ups, equipment overdesign, and
other costs associated with first-of-a-kind or pioneer plants, lest these overshadow the real economic impact of research advances in conversion or process integration. It should be emphasized, however, that a large number of the assumptions included in the economic assessments carry a degree of uncertainty and are subject to refinement.
Algal lipid extraction and upgrading Conversion pathways focused around the extraction and upgrading of algal lipids, are referred to as ‘Algal Lipid Extraction
16 Doran JW, Jones AJ. Methods for assessing soil quality. Soil Science Society of America Inc., 1996
17 Buchanan TJ, Somers WP. Discharge measurements at gaging stations. In: U.S. Geological Survey, Techniques of Water-Resources Investigations. 1969
18 Rice EW, Baird RB, Eaton AD, Ciesceri LS. Standard Methods for the Examination of Water and Wastewater. In: American Public Health Association. American Public Health Association, 2012, p 724
19 Hambrook Berkman JA, Canova MG. Algal biomass indicators. In: U.S. Geological Survey Techniques of Water-Resources Investigations, Book 9. 2007
and Upgrading’ (ALU) pathways. They are often less destructive than comparative thermochemical avenues and thus allow for the utilization and development of additional non-lipid co-products.20-22 One example of an ALU approach is based on a biochemical processing strategy to selectively recover and convert certain algal biomass components to fuels, namely carbohydrates to ethanol and lipids to a renewable diesel blendstock (RDB) product.23,24 The overarching process design converts algal biomass, delivered from upstream cultivation and dewatering, to ethanol, RDB, and minor co-products, using dilute-acid pretreatment, fermentation, lipid extraction, and hydrotreatment. Additional areas, e.g., anaerobic digestion of spent algal residues, combined heat and power generation, and utilities are also included in the design, and so are detailed material and energy balances and capital and operating costs for this baseline process. This case study techno-economic model provides a production cost for the fuel products that can be used to gauge the technology potential and to quantify critical cost drivers. In brief, the process can be described as follows: whole algal biomass, grown autotrophically in open pond systems, is utilized at a dewatered paste concentration of 20% directly into a biomass-pretreatment process, followed by aqueous-phase fermentation of sugars liberated after pretreatment to ethanol, and finally hexane solvent extraction to separate the neutral lipid-rich oil from the biomass. The solvent is separated from the oil and recycled. The lipid-extracted residual biomass is sent to anaerobic digestion. The anaerobic digestion of the spent biomass provides methane for process heat, and recycles CO2, nitrogen, and phosphorous to the algal cultivation ponds. The digestate (‘sludge’ solids) product from anaerobic digestion is sold as a fertilizer co-product. The raw oil is upgraded to finished fuels
20 Davis R, Fishman D, Frank ED, Wigmosta MS. Renewable Diesel from Algal Lipids: An Integrated Baseline for Cost, Emissions, and Resource Potential from a Harmonized Model. Golden, CO, 2012
21 Lohman EJ, Gardner RD, Halverson L, Macur RE, Peyton BM, Gerlach R. An efficient and scalable extraction and quantification method for algal derived biofuel. J Microbiol Methods 2013; 94: 235–244.
22 Halim R, Danquah MK, Webley P a. Extraction of oil from micro-algae for biodiesel production: A review. Biotechnol Adv 2012; 30: 709–32.
23 Davis R, Kinchin CM, Markham J, Tan ECD, Laurens LML, Sexton D et al. Process Design and Economics for the Conversion of Algal Biomass to Biofuels: Algal Biomass Fractionation to Lipid- and Carbohydrate-Derived Fuel Products. Golden, CO, 2014
24 Laurens LML, Nagle NJ, Davis R, Sweeney N, Van Wychen S, Low-ell A et al. Acid-catalyzed algal biomass pretreatment for integrated lipid and carbohydrate-based biofuels production. Green Chem 2015; 1145.
Category Indicator Unit Reference or data collection
Soil quality Bulk density g/cm3 16
Water quantity Peak storm flow L/s 17
Minimum base flow L/s
Water consumption (incorporates base flow)
Feedstock production: m3/ha/day or m3/ton biomass produced
Calculated from flow measurements
Biorefinery: m3/day or m3/GJ fuel produced
Reported total water withdrawn used as proxy
Nutrient utilization Total N, P, K, trace metal lost through liquid, solid, and gaseous media
Concentration: mg/L; export: kg/ha/yr; kgnutrient/kgbiomass
18
Water quality in consumption and discharge water
Salinity Conductivity (no unit)
18
Greenhouse gases CO2 equivalent emissions (CO2 and N2O)
kg CO2 eq/GJ Spreadsheet models (e.g. GREET11)
Biodiversity Presence of taxa of special concern Presence/absence Various methods exist
Habitat of taxa of special concern ha Various methods exist
Abundance of released algae number/L Initially calculated from known biomass in culture and estimated release rate or estimated using genetic markers
Air quality
Tropospheric ozone ppb Combination of sources and methods necessary, from example EPA mobile source observation database
Carbon monoxide ppm
Total particulate matter less than 2.5 µm diameter (PM2.5)
µg/m3
Total particulate matter less than 10 μm diameter (PM10)
μg/m3
Productivity Primary productivity or yield g/(m2 x day) Combination of sources and dependent on harvesting and recovery operations 19
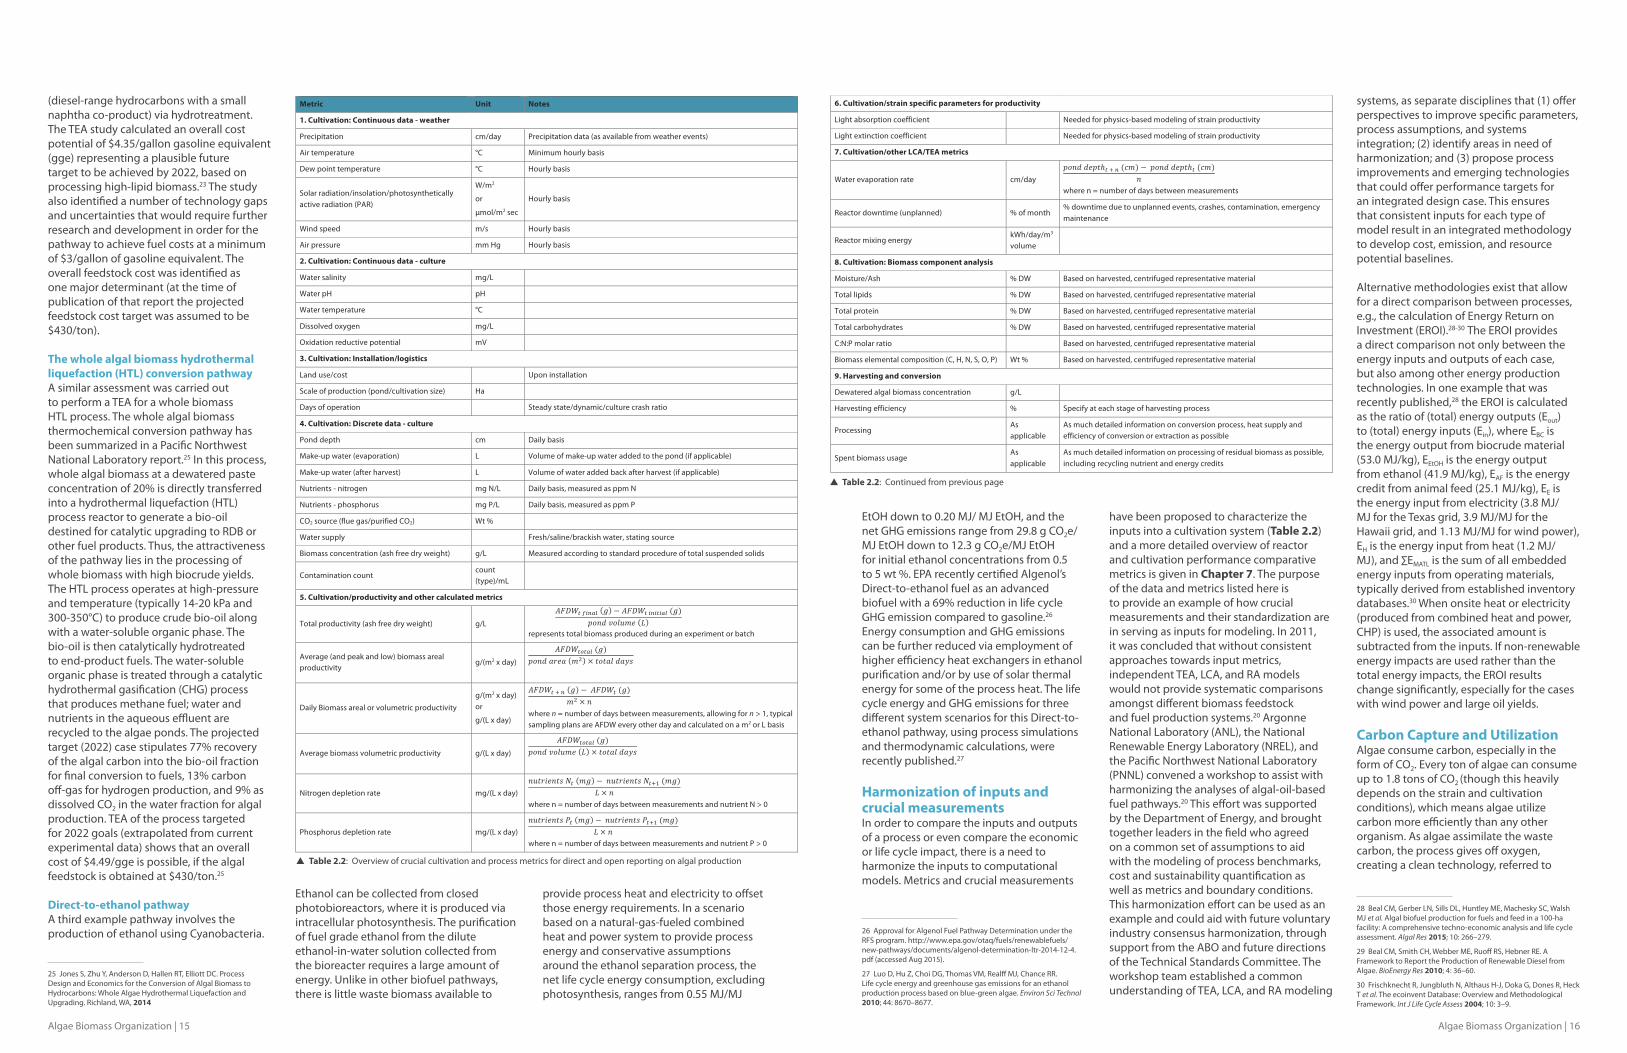
Algae Biomass Organization | 16Algae Biomass Organization | 15
(diesel-range hydrocarbons with a small naphtha co-product) via hydrotreatment. The TEA study calculated an overall cost potential of $4.35/gallon gasoline equivalent (gge) representing a plausible future target to be achieved by 2022, based on processing high-lipid biomass.23 The study also identified a number of technology gaps and uncertainties that would require further research and development in order for the pathway to achieve fuel costs at a minimum of $3/gallon of gasoline equivalent. The overall feedstock cost was identified as one major determinant (at the time of publication of that report the projected feedstock cost target was assumed to be $430/ton). The whole algal biomass hydrothermal liquefaction (HTL) conversion pathwayA similar assessment was carried out to perform a TEA for a whole biomass HTL process. The whole algal biomass thermochemical conversion pathway has been summarized in a Pacific Northwest National Laboratory report.25 In this process, whole algal biomass at a dewatered paste concentration of 20% is directly transferred into a hydrothermal liquefaction (HTL) process reactor to generate a bio-oil destined for catalytic upgrading to RDB or other fuel products. Thus, the attractiveness of the pathway lies in the processing of whole biomass with high biocrude yields. The HTL process operates at high-pressure and temperature (typically 14-20 kPa and 300-350°C) to produce crude bio-oil along with a water-soluble organic phase. The bio-oil is then catalytically hydrotreated to end-product fuels. The water-soluble organic phase is treated through a catalytic hydrothermal gasification (CHG) process that produces methane fuel; water and nutrients in the aqueous effluent are recycled to the algae ponds. The projected target (2022) case stipulates 77% recovery of the algal carbon into the bio-oil fraction for final conversion to fuels, 13% carbon off-gas for hydrogen production, and 9% as dissolved CO2 in the water fraction for algal production. TEA of the process targeted for 2022 goals (extrapolated from current experimental data) shows that an overall cost of $4.49/gge is possible, if the algal feedstock is obtained at $430/ton.25 Direct-to-ethanol pathwayA third example pathway involves the production of ethanol using Cyanobacteria.
25 Jones S, Zhu Y, Anderson D, Hallen RT, Elliott DC. Process Design and Economics for the Conversion of Algal Biomass to Hydrocarbons: Whole Algae Hydrothermal Liquefaction and Upgrading. Richland, WA, 2014
Ethanol can be collected from closed photobioreactors, where it is produced via intracellular photosynthesis. The purification of fuel grade ethanol from the dilute ethanol-in-water solution collected from the bioreacter requires a large amount of energy. Unlike in other biofuel pathways, there is little waste biomass available to
provide process heat and electricity to offset those energy requirements. In a scenario based on a natural-gas-fueled combined heat and power system to provide process energy and conservative assumptions around the ethanol separation process, the net life cycle energy consumption, excluding photosynthesis, ranges from 0.55 MJ/MJ
EtOH down to 0.20 MJ/ MJ EtOH, and the net GHG emissions range from 29.8 g CO2e/MJ EtOH down to 12.3 g CO2e/MJ EtOH for initial ethanol concentrations from 0.5 to 5 wt %. EPA recently certified Algenol’s Direct-to-ethanol fuel as an advanced biofuel with a 69% reduction in life cycle GHG emission compared to gasoline.26 Energy consumption and GHG emissions can be further reduced via employment of higher efficiency heat exchangers in ethanol purification and/or by use of solar thermal energy for some of the process heat. The life cycle energy and GHG emissions for three different system scenarios for this Direct-to-ethanol pathway, using process simulations and thermodynamic calculations, were recently published.27 Harmonization of inputs and crucial measurements In order to compare the inputs and outputs of a process or even compare the economic or life cycle impact, there is a need to harmonize the inputs to computational models. Metrics and crucial measurements
26 Approval for Algenol Fuel Pathway Determination under the RFS program. http://www.epa.gov/otaq/fuels/renewablefuels/new-pathways/documents/algenol-determination-ltr-2014-12-4.pdf (accessed Aug 2015).
27 Luo D, Hu Z, Choi DG, Thomas VM, Realff MJ, Chance RR. Life cycle energy and greenhouse gas emissions for an ethanol production process based on blue-green algae. Environ Sci Technol 2010; 44: 8670–8677.
have been proposed to characterize the inputs into a cultivation system (Table 2.2) and a more detailed overview of reactor and cultivation performance comparative metrics is given in Chapter 7. The purpose of the data and metrics listed here is to provide an example of how crucial measurements and their standardization are in serving as inputs for modeling. In 2011, it was concluded that without consistent approaches towards input metrics, independent TEA, LCA, and RA models would not provide systematic comparisons amongst different biomass feedstock and fuel production systems.20 Argonne National Laboratory (ANL), the National Renewable Energy Laboratory (NREL), and the Pacific Northwest National Laboratory (PNNL) convened a workshop to assist with harmonizing the analyses of algal-oil-based fuel pathways.20 This effort was supported by the Department of Energy, and brought together leaders in the field who agreed on a common set of assumptions to aid with the modeling of process benchmarks, cost and sustainability quantification as well as metrics and boundary conditions. This harmonization effort can be used as an example and could aid with future voluntary industry consensus harmonization, through support from the ABO and future directions of the Technical Standards Committee. The workshop team established a common understanding of TEA, LCA, and RA modeling
systems, as separate disciplines that (1) offer perspectives to improve specific parameters, process assumptions, and systems integration; (2) identify areas in need of harmonization; and (3) propose process improvements and emerging technologies that could offer performance targets for an integrated design case. This ensures that consistent inputs for each type of model result in an integrated methodology to develop cost, emission, and resource potential baselines. Alternative methodologies exist that allow for a direct comparison between processes, e.g., the calculation of Energy Return on Investment (EROI).28-30 The EROI provides a direct comparison not only between the energy inputs and outputs of each case, but also among other energy production technologies. In one example that was recently published,28 the EROI is calculated as the ratio of (total) energy outputs (Eout) to (total) energy inputs (Ein), where EBC is the energy output from biocrude material (53.0 MJ/kg), EEtOH is the energy output from ethanol (41.9 MJ/kg), EAF is the energy credit from animal feed (25.1 MJ/kg), EE is the energy input from electricity (3.8 MJ/MJ for the Texas grid, 3.9 MJ/MJ for the Hawaii grid, and 1.13 MJ/MJ for wind power), EH is the energy input from heat (1.2 MJ/MJ), and ∑EMATL is the sum of all embedded energy inputs from operating materials, typically derived from established inventory databases.30 When onsite heat or electricity (produced from combined heat and power, CHP) is used, the associated amount is subtracted from the inputs. If non-renewable energy impacts are used rather than the total energy impacts, the EROI results change significantly, especially for the cases with wind power and large oil yields. Carbon Capture and Utilization Algae consume carbon, especially in the form of CO2. Every ton of algae can consume up to 1.8 tons of CO2 (though this heavily depends on the strain and cultivation conditions), which means algae utilize carbon more efficiently than any other organism. As algae assimilate the waste carbon, the process gives off oxygen, creating a clean technology, referred to
28 Beal CM, Gerber LN, Sills DL, Huntley ME, Machesky SC, Walsh MJ et al. Algal biofuel production for fuels and feed in a 100-ha facility: A comprehensive techno-economic analysis and life cycle assessment. Algal Res 2015; 10: 266–279.
29 Beal CM, Smith CH, Webber ME, Ruoff RS, Hebner RE. A Framework to Report the Production of Renewable Diesel from Algae. BioEnergy Res 2010; 4: 36–60.
30 Frischknecht R, Jungbluth N, Althaus H-J, Doka G, Dones R, Heck T et al. The ecoinvent Database: Overview and Methodological Framework. Int J Life Cycle Assess 2004; 10: 3–9.
Metric Unit Notes
1. Cultivation: Continuous data - weather
Precipitation cm/day Precipitation data (as available from weather events)
Air temperature °C Minimum hourly basis
Dew point temperature °C Hourly basis
Solar radiation/insolation/photosynthetically active radiation (PAR)
W/m2
or
µmol/m2 sec
Hourly basis
Wind speed m/s Hourly basis
Air pressure mm Hg Hourly basis
2. Cultivation: Continuous data - culture
Water salinity mg/L
Water pH pH
Water temperature °C
Dissolved oxygen mg/L
Oxidation reductive potential mV
3. Cultivation: Installation/logistics
Land use/cost
Upon installation
Scale of production (pond/cultivation size) Ha
Days of operation Steady state/dynamic/culture crash ratio
4. Cultivation: Discrete data - culture
Pond depth cm Daily basis
Make-up water (evaporation) L Volume of make-up water added to the pond (if applicable)
Make-up water (after harvest) L Volume of water added back after harvest (if applicable)
Nutrients - nitrogen mg N/L Daily basis, measured as ppm N
Nutrients - phosphorus mg P/L Daily basis, measured as ppm P
CO2 source (flue gas/purified CO2) Wt %
Water supply Fresh/saline/brackish water, stating source
Biomass concentration (ash free dry weight) g/L Measured according to standard procedure of total suspended solids
Contamination count count (type)/mL
5. Cultivation/productivity and other calculated metrics
Total productivity (ash free dry weight) g/L
!"#$! !"#$% ! − !"#$! !"!#!$% (!)!"#$ !"#$%& !
represents total biomass produced during an experiment or batch
Average (and peak and low) biomass areal productivity
g/(m2 x day)
!"#$!"!#$ (!)!"#$ !"#! !! × !"!#$ !"#$
Daily Biomass areal or volumetric productivity
g/(m2 x day) or
g/(L x day)
!"#$! ! ! ! − !"#$! (!)!! × !
where n = number of days between measurements, allowing for n > 1, typical sampling plans are AFDW every other day and calculated on a m2 or L basis
Average biomass volumetric productivity g/(L x day)
!"#$!"!#$ (!)!"#$ !"#$%& ! × !"!#$ !"#$
Nitrogen depletion rate mg/(L x day)
!"#$%&!#' !! !" − !"#$%&!#' !!!! (!")! × !
where n = number of days between measurements and nutrient N > 0
Phosphorus depletion rate mg/(L x day) !"#$%&!#' !! !" − !"#$%&!#' !!!! (!")
! × !
where n = number of days between measurements and nutrient P > 0
6. Cultivation/strain specific parameters for productivity
Light absorption coefficient
Needed for physics-based modeling of strain productivity
Light extinction coefficient
Needed for physics-based modeling of strain productivity
7. Cultivation/other LCA/TEA metrics
Water evaporation rate cm/day
!"#$ !"#$ℎ! ! ! (!") − !"#$ !"#$ℎ! (!")!
where n = number of days between measurements
Reactor downtime (unplanned) % of month % downtime due to unplanned events, crashes, contamination, emergency maintenance
Reactor mixing energy kWh/day/m3 volume
8. Cultivation: Biomass component analysis
Moisture/Ash % DW Based on harvested, centrifuged representative material
Total lipids % DW Based on harvested, centrifuged representative material
Total protein % DW Based on harvested, centrifuged representative material
Total carbohydrates % DW Based on harvested, centrifuged representative material
C:N:P molar ratio
Based on harvested, centrifuged representative material
Biomass elemental composition (C, H, N, S, O, P) Wt % Based on harvested, centrifuged representative material
9. Harvesting and conversion
Dewatered algal biomass concentration g/L
Harvesting efficiency % Specify at each stage of harvesting process
Processing As applicable
As much detailed information on conversion process, heat supply and efficiency of conversion or extraction as possible
Spent biomass usage As applicable
As much detailed information on processing of residual biomass as possible, including recycling nutrient and energy credits
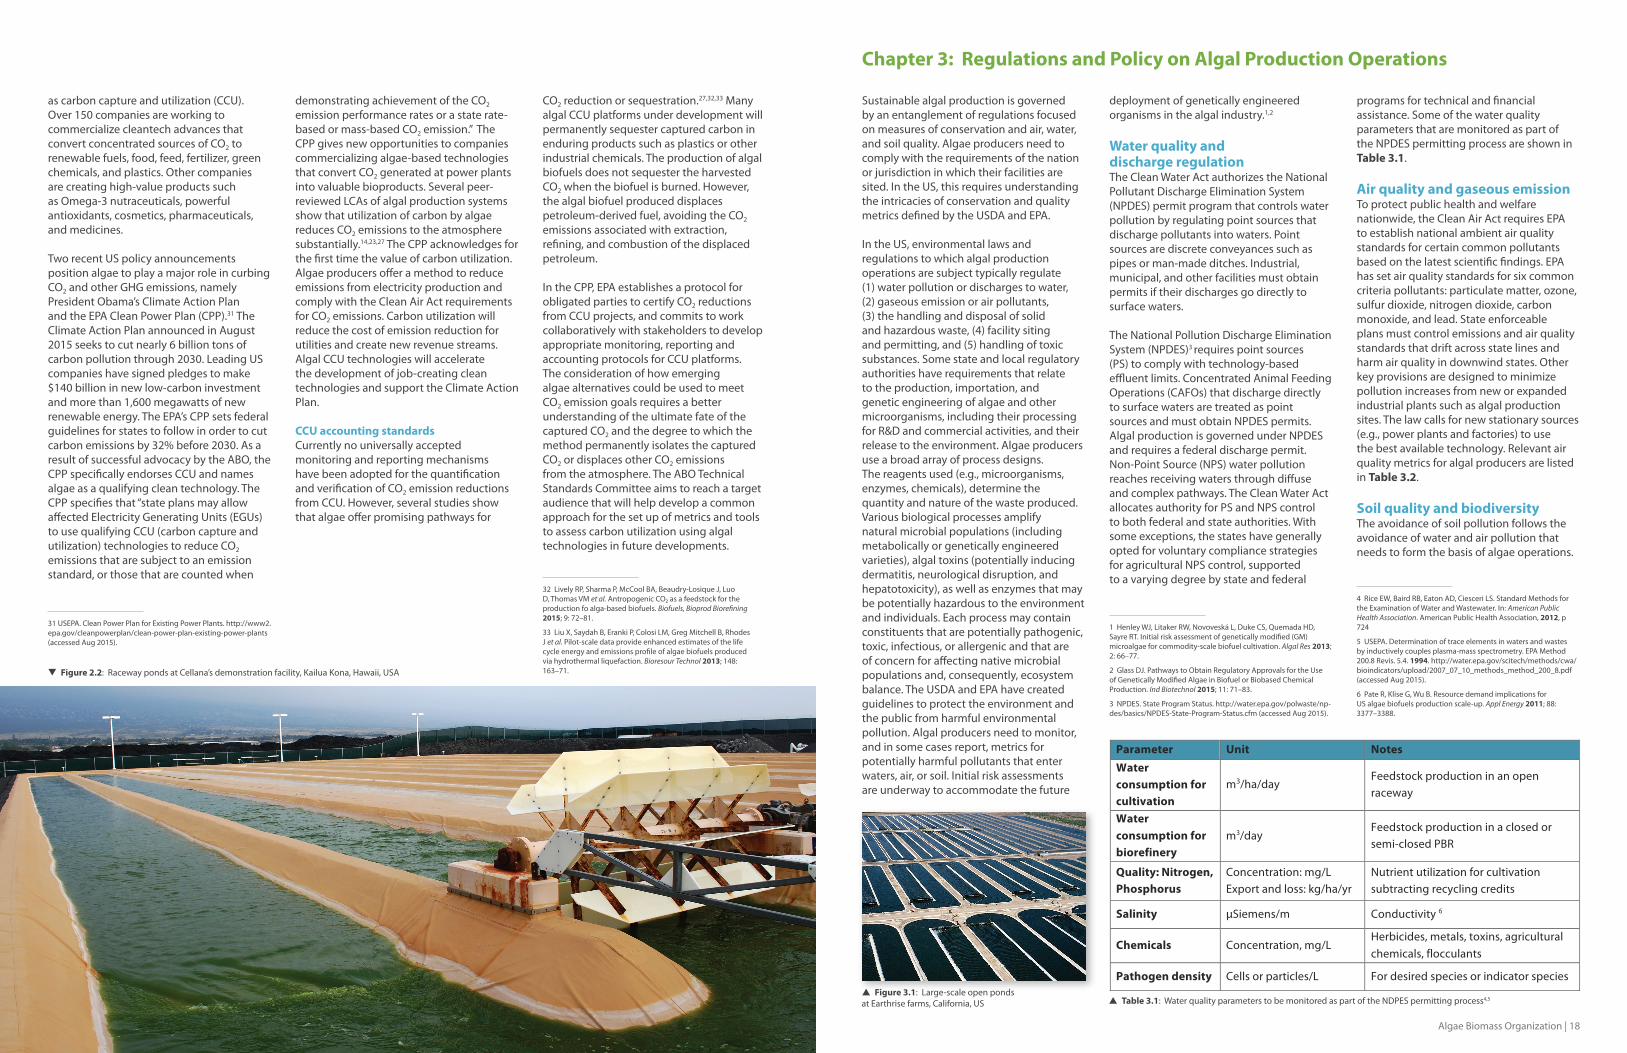
Algae Biomass Organization | 18Algae Biomass Organization | 17
as carbon capture and utilization (CCU). Over 150 companies are working to commercialize cleantech advances that convert concentrated sources of CO2 to renewable fuels, food, feed, fertilizer, green chemicals, and plastics. Other companies are creating high-value products such as Omega-3 nutraceuticals, powerful antioxidants, cosmetics, pharmaceuticals, and medicines.
Two recent US policy announcements position algae to play a major role in curbing CO2 and other GHG emissions, namely President Obama’s Climate Action Plan and the EPA Clean Power Plan (CPP).31 The Climate Action Plan announced in August 2015 seeks to cut nearly 6 billion tons of carbon pollution through 2030. Leading US companies have signed pledges to make $140 billion in new low-carbon investment and more than 1,600 megawatts of new renewable energy. The EPA’s CPP sets federal guidelines for states to follow in order to cut carbon emissions by 32% before 2030. As a result of successful advocacy by the ABO, the CPP specifically endorses CCU and names algae as a qualifying clean technology. The CPP specifies that “state plans may allow affected Electricity Generating Units (EGUs) to use qualifying CCU (carbon capture and utilization) technologies to reduce CO2 emissions that are subject to an emission standard, or those that are counted when
31 USEPA. Clean Power Plan for Existing Power Plants. http://www2.epa.gov/cleanpowerplan/clean-power-plan-existing-power-plants (accessed Aug 2015).
demonstrating achievement of the CO2 emission performance rates or a state rate-based or mass-based CO2 emission.” The CPP gives new opportunities to companies commercializing algae-based technologies that convert CO2 generated at power plants into valuable bioproducts. Several peer-reviewed LCAs of algal production systems show that utilization of carbon by algae reduces CO2 emissions to the atmosphere substantially.14,23,27 The CPP acknowledges for the first time the value of carbon utilization. Algae producers offer a method to reduce emissions from electricity production and comply with the Clean Air Act requirements for CO2 emissions. Carbon utilization will reduce the cost of emission reduction for utilities and create new revenue streams. Algal CCU technologies will accelerate the development of job-creating clean technologies and support the Climate Action Plan. CCU accounting standardsCurrently no universally accepted monitoring and reporting mechanisms have been adopted for the quantification and verification of CO2 emission reductions from CCU. However, several studies show that algae offer promising pathways for
CO2 reduction or sequestration.27,32,33 Many algal CCU platforms under development will permanently sequester captured carbon in enduring products such as plastics or other industrial chemicals. The production of algal biofuels does not sequester the harvested CO2 when the biofuel is burned. However, the algal biofuel produced displaces petroleum-derived fuel, avoiding the CO2 emissions associated with extraction, refining, and combustion of the displaced petroleum.
In the CPP, EPA establishes a protocol for obligated parties to certify CO2 reductions from CCU projects, and commits to work collaboratively with stakeholders to develop appropriate monitoring, reporting and accounting protocols for CCU platforms. The consideration of how emerging algae alternatives could be used to meet CO2 emission goals requires a better understanding of the ultimate fate of the captured CO2 and the degree to which the method permanently isolates the captured CO2 or displaces other CO2 emissions from the atmosphere. The ABO Technical Standards Committee aims to reach a target audience that will help develop a common approach for the set up of metrics and tools to assess carbon utilization using algal technologies in future developments.
32 Lively RP, Sharma P, McCool BA, Beaudry-Losique J, Luo D, Thomas VM et al. Antropogenic CO₂ as a feedstock for the production fo alga-based biofuels. Biofuels, Bioprod Biorefining 2015; 9: 72–81.
33 Liu X, Saydah B, Eranki P, Colosi LM, Greg Mitchell B, Rhodes J et al. Pilot-scale data provide enhanced estimates of the life cycle energy and emissions profile of algae biofuels produced via hydrothermal liquefaction. Bioresour Technol 2013; 148: 163–71.
Chapter 3: Regulations and Policy on Algal Production Operations
Sustainable algal production is governed by an entanglement of regulations focused on measures of conservation and air, water, and soil quality. Algae producers need to comply with the requirements of the nation or jurisdiction in which their facilities are sited. In the US, this requires understanding the intricacies of conservation and quality metrics defined by the USDA and EPA.
In the US, environmental laws and regulations to which algal production operations are subject typically regulate (1) water pollution or discharges to water, (2) gaseous emission or air pollutants, (3) the handling and disposal of solid and hazardous waste, (4) facility siting and permitting, and (5) handling of toxic substances. Some state and local regulatory authorities have requirements that relate to the production, importation, and genetic engineering of algae and other microorganisms, including their processing for R&D and commercial activities, and their release to the environment. Algae producers use a broad array of process designs. The reagents used (e.g., microorganisms, enzymes, chemicals), determine the quantity and nature of the waste produced. Various biological processes amplify natural microbial populations (including metabolically or genetically engineered varieties), algal toxins (potentially inducing dermatitis, neurological disruption, and hepatotoxicity), as well as enzymes that may be potentially hazardous to the environment and individuals. Each process may contain constituents that are potentially pathogenic, toxic, infectious, or allergenic and that are of concern for affecting native microbial populations and, consequently, ecosystem balance. The USDA and EPA have created guidelines to protect the environment and the public from harmful environmental pollution. Algal producers need to monitor, and in some cases report, metrics for potentially harmful pollutants that enter waters, air, or soil. Initial risk assessments are underway to accommodate the future
deployment of genetically engineered organisms in the algal industry.1,2 Water quality and discharge regulation The Clean Water Act authorizes the National Pollutant Discharge Elimination System (NPDES) permit program that controls water pollution by regulating point sources that discharge pollutants into waters. Point sources are discrete conveyances such as pipes or man-made ditches. Industrial, municipal, and other facilities must obtain permits if their discharges go directly to surface waters.
The National Pollution Discharge Elimination System (NPDES)3 requires point sources (PS) to comply with technology-based effluent limits. Concentrated Animal Feeding Operations (CAFOs) that discharge directly to surface waters are treated as point sources and must obtain NPDES permits. Algal production is governed under NPDES and requires a federal discharge permit. Non-Point Source (NPS) water pollution reaches receiving waters through diffuse and complex pathways. The Clean Water Act allocates authority for PS and NPS control to both federal and state authorities. With some exceptions, the states have generally opted for voluntary compliance strategies for agricultural NPS control, supported to a varying degree by state and federal
1 Henley WJ, Litaker RW, Novoveská L, Duke CS, Quemada HD, Sayre RT. Initial risk assessment of genetically modified (GM) microalgae for commodity-scale biofuel cultivation. Algal Res 2013; 2: 66–77.
2 Glass DJ. Pathways to Obtain Regulatory Approvals for the Use of Genetically Modified Algae in Biofuel or Biobased Chemical Production. Ind Biotechnol 2015; 11: 71–83.
3 NPDES. State Program Status. http://water.epa.gov/polwaste/np-des/basics/NPDES-State-Program-Status.cfm (accessed Aug 2015).
programs for technical and financial assistance. Some of the water quality parameters that are monitored as part of the NPDES permitting process are shown in Table 3.1.
Air quality and gaseous emission To protect public health and welfare nationwide, the Clean Air Act requires EPA to establish national ambient air quality standards for certain common pollutants based on the latest scientific findings. EPA has set air quality standards for six common criteria pollutants: particulate matter, ozone, sulfur dioxide, nitrogen dioxide, carbon monoxide, and lead. State enforceable plans must control emissions and air quality standards that drift across state lines and harm air quality in downwind states. Other key provisions are designed to minimize pollution increases from new or expanded industrial plants such as algal production sites. The law calls for new stationary sources (e.g., power plants and factories) to use the best available technology. Relevant air quality metrics for algal producers are listed in Table 3.2.
Soil quality and biodiversity The avoidance of soil pollution follows the avoidance of water and air pollution that needs to form the basis of algae operations.
4 Rice EW, Baird RB, Eaton AD, Ciesceri LS. Standard Methods for the Examination of Water and Wastewater. In: American Public Health Association. American Public Health Association, 2012, p 724
5 USEPA. Determination of trace elements in waters and wastes by inductively couples plasma-mass spectrometry. EPA Method 200.8 Revis. 5.4. 1994. http://water.epa.gov/scitech/methods/cwa/bioindicators/upload/2007_07_10_methods_method_200_8.pdf (accessed Aug 2015).
6 Pate R, Klise G, Wu B. Resource demand implications for US algae biofuels production scale-up. Appl Energy 2011; 88: 3377–3388.
Parameter Unit Notes Water consumption for cultivation
m3/ha/day Feedstock production in an open raceway
Water consumption for biorefinery
m3/day Feedstock production in a closed or semi-closed PBR
Quality: Nitrogen, Phosphorus
Concentration: mg/L Export and loss: kg/ha/yr
Nutrient utilization for cultivation subtracting recycling credits
Salinity µSiemens/m Conductivity 6
Chemicals Concentration, mg/L Herbicides, metals, toxins, agricultural chemicals, flocculants
Pathogen density Cells or particles/L For desired species or indicator species
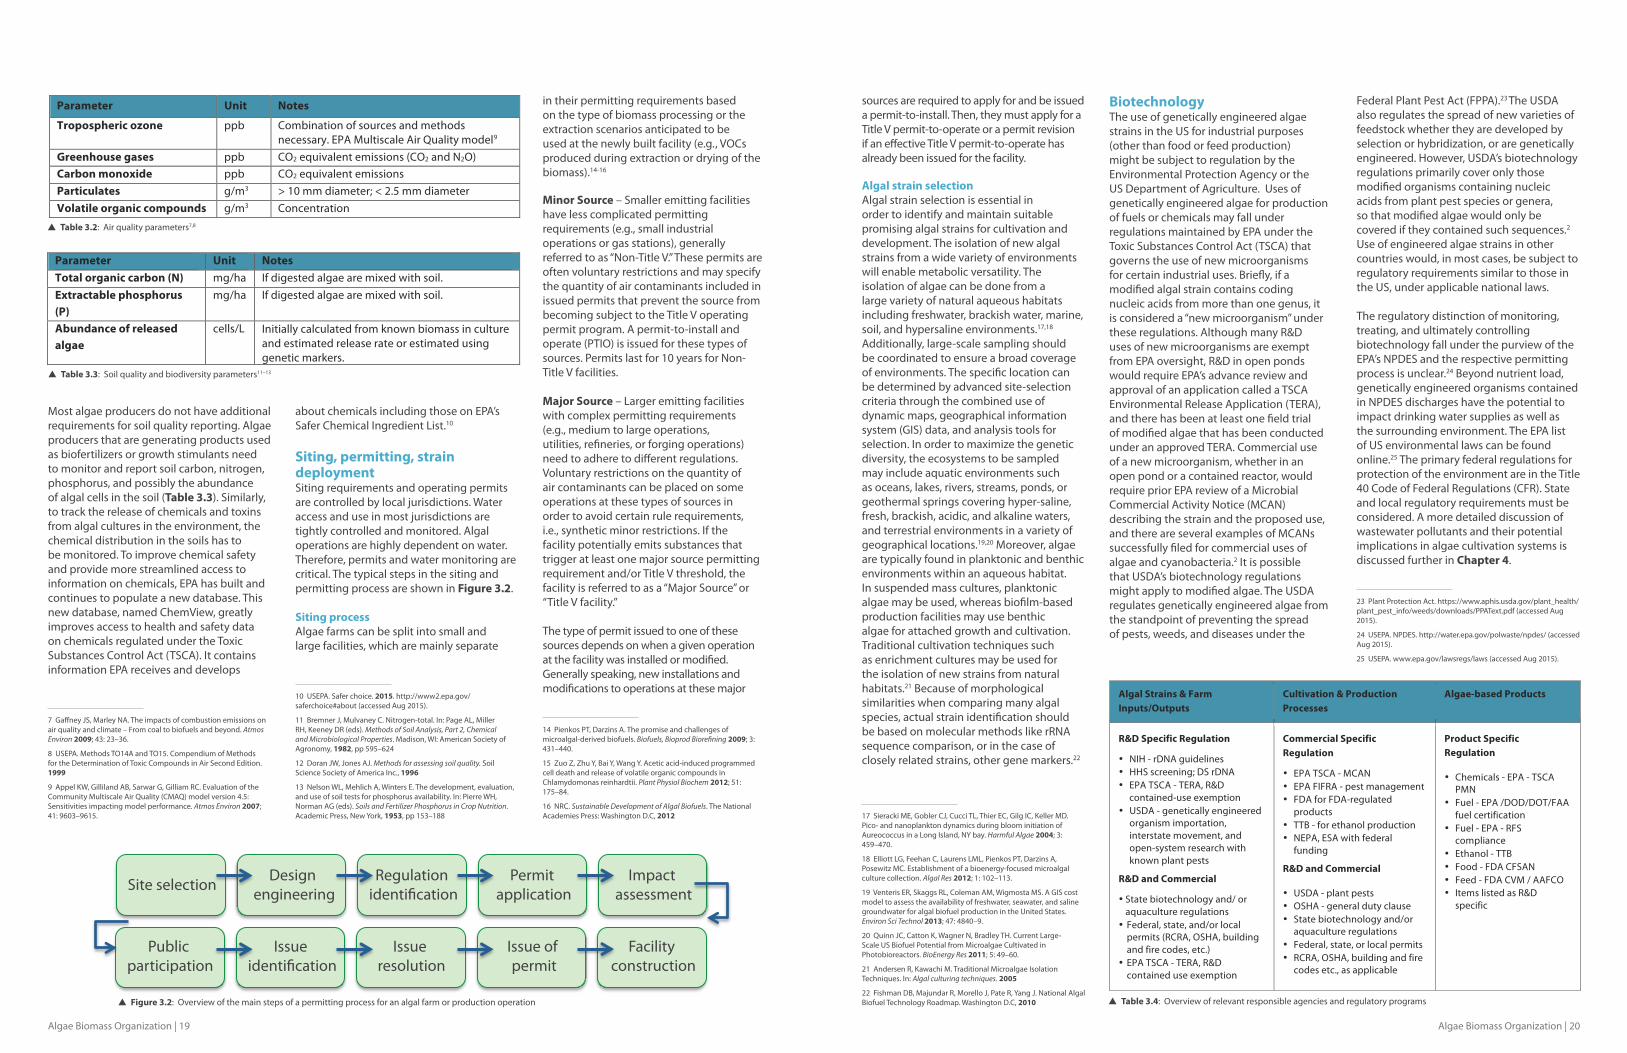
Algae Biomass Organization | 20Algae Biomass Organization | 19
Most algae producers do not have additional requirements for soil quality reporting. Algae producers that are generating products used as biofertilizers or growth stimulants need to monitor and report soil carbon, nitrogen, phosphorus, and possibly the abundance of algal cells in the soil (Table 3.3). Similarly, to track the release of chemicals and toxins from algal cultures in the environment, the chemical distribution in the soils has to be monitored. To improve chemical safety and provide more streamlined access to information on chemicals, EPA has built and continues to populate a new database. This new database, named ChemView, greatly improves access to health and safety data on chemicals regulated under the Toxic Substances Control Act (TSCA). It contains information EPA receives and develops
7 Gaffney JS, Marley NA. The impacts of combustion emissions on air quality and climate – From coal to biofuels and beyond. Atmos Environ 2009; 43: 23–36.
8 USEPA. Methods TO14A and TO15. Compendium of Methods for the Determination of Toxic Compounds in Air Second Edition. 1999
9 Appel KW, Gilliland AB, Sarwar G, Gilliam RC. Evaluation of the Community Multiscale Air Quality (CMAQ) model version 4.5: Sensitivities impacting model performance. Atmos Environ 2007; 41: 9603–9615.
about chemicals including those on EPA’s Safer Chemical Ingredient List.10
Siting, permitting, strain deployment Siting requirements and operating permits are controlled by local jurisdictions. Water access and use in most jurisdictions are tightly controlled and monitored. Algal operations are highly dependent on water. Therefore, permits and water monitoring are critical. The typical steps in the siting and permitting process are shown in Figure 3.2.
Siting process Algae farms can be split into small and large facilities, which are mainly separate
10 USEPA. Safer choice. 2015. http://www2.epa.gov/saferchoice#about (accessed Aug 2015).
11 Bremner J, Mulvaney C. Nitrogen-total. In: Page AL, Miller RH, Keeney DR (eds). Methods of Soil Analysis, Part 2, Chemical and Microbiological Properties. Madison, WI: American Society of Agronomy, 1982, pp 595–624
12 Doran JW, Jones AJ. Methods for assessing soil quality. Soil Science Society of America Inc., 1996
13 Nelson WL, Mehlich A, Winters E. The development, evaluation, and use of soil tests for phosphorus availability. In: Pierre WH, Norman AG (eds). Soils and Fertilizer Phosphorus in Crop Nutrition. Academic Press, New York, 1953, pp 153–188
in their permitting requirements based on the type of biomass processing or the extraction scenarios anticipated to be used at the newly built facility (e.g., VOCs produced during extraction or drying of the biomass).14-16
Minor Source – Smaller emitting facilities have less complicated permitting requirements (e.g., small industrial operations or gas stations), generally referred to as “Non-Title V.” These permits are often voluntary restrictions and may specify the quantity of air contaminants included in issued permits that prevent the source from becoming subject to the Title V operating permit program. A permit-to-install and operate (PTIO) is issued for these types of sources. Permits last for 10 years for Non-Title V facilities. Major Source – Larger emitting facilities with complex permitting requirements (e.g., medium to large operations, utilities, refineries, or forging operations) need to adhere to different regulations. Voluntary restrictions on the quantity of air contaminants can be placed on some operations at these types of sources in order to avoid certain rule requirements, i.e., synthetic minor restrictions. If the facility potentially emits substances that trigger at least one major source permitting requirement and/or Title V threshold, the facility is referred to as a “Major Source” or “Title V facility.”
The type of permit issued to one of these sources depends on when a given operation at the facility was installed or modified. Generally speaking, new installations and modifications to operations at these major
14 Pienkos PT, Darzins A. The promise and challenges of microalgal-derived biofuels. Biofuels, Bioprod Biorefining 2009; 3: 431–440.
15 Zuo Z, Zhu Y, Bai Y, Wang Y. Acetic acid-induced programmed cell death and release of volatile organic compounds in Chlamydomonas reinhardtii. Plant Physiol Biochem 2012; 51: 175–84.
16 NRC. Sustainable Development of Algal Biofuels. The National Academies Press: Washington D.C, 2012
sources are required to apply for and be issued a permit-to-install. Then, they must apply for a Title V permit-to-operate or a permit revision if an effective Title V permit-to-operate has already been issued for the facility.
Algal strain selection Algal strain selection is essential in order to identify and maintain suitable promising algal strains for cultivation and development. The isolation of new algal strains from a wide variety of environments will enable metabolic versatility. The isolation of algae can be done from a large variety of natural aqueous habitats including freshwater, brackish water, marine, soil, and hypersaline environments.17,18 Additionally, large-scale sampling should be coordinated to ensure a broad coverage of environments. The specific location can be determined by advanced site-selection criteria through the combined use of dynamic maps, geographical information system (GIS) data, and analysis tools for selection. In order to maximize the genetic diversity, the ecosystems to be sampled may include aquatic environments such as oceans, lakes, rivers, streams, ponds, or geothermal springs covering hyper-saline, fresh, brackish, acidic, and alkaline waters, and terrestrial environments in a variety of geographical locations.19,20 Moreover, algae are typically found in planktonic and benthic environments within an aqueous habitat. In suspended mass cultures, planktonic algae may be used, whereas biofilm-based production facilities may use benthic algae for attached growth and cultivation. Traditional cultivation techniques such as enrichment cultures may be used for the isolation of new strains from natural habitats.21 Because of morphological similarities when comparing many algal species, actual strain identification should be based on molecular methods like rRNA sequence comparison, or in the case of closely related strains, other gene markers.22
17 Sieracki ME, Gobler CJ, Cucci TL, Thier EC, Gilg IC, Keller MD. Pico- and nanoplankton dynamics during bloom initiation of Aureococcus in a Long Island, NY bay. Harmful Algae 2004; 3: 459–470.
18 Elliott LG, Feehan C, Laurens LML, Pienkos PT, Darzins A, Posewitz MC. Establishment of a bioenergy-focused microalgal culture collection. Algal Res 2012; 1: 102–113.
19 Venteris ER, Skaggs RL, Coleman AM, Wigmosta MS. A GIS cost model to assess the availability of freshwater, seawater, and saline groundwater for algal biofuel production in the United States. Environ Sci Technol 2013; 47: 4840–9.
20 Quinn JC, Catton K, Wagner N, Bradley TH. Current Large-Scale US Biofuel Potential from Microalgae Cultivated in Photobioreactors. BioEnergy Res 2011; 5: 49–60.
21 Andersen R, Kawachi M. Traditional Microalgae Isolation Techniques. In: Algal culturing techniques. 2005
22 Fishman DB, Majundar R, Morello J, Pate R, Yang J. National Algal Biofuel Technology Roadmap. Washington D.C, 2010
BiotechnologyThe use of genetically engineered algae strains in the US for industrial purposes (other than food or feed production) might be subject to regulation by the Environmental Protection Agency or the US Department of Agriculture. Uses of genetically engineered algae for production of fuels or chemicals may fall under regulations maintained by EPA under the Toxic Substances Control Act (TSCA) that governs the use of new microorganisms for certain industrial uses. Briefly, if a modified algal strain contains coding nucleic acids from more than one genus, it is considered a “new microorganism” under these regulations. Although many R&D uses of new microorganisms are exempt from EPA oversight, R&D in open ponds would require EPA’s advance review and approval of an application called a TSCA Environmental Release Application (TERA), and there has been at least one field trial of modified algae that has been conducted under an approved TERA. Commercial use of a new microorganism, whether in an open pond or a contained reactor, would require prior EPA review of a Microbial Commercial Activity Notice (MCAN) describing the strain and the proposed use, and there are several examples of MCANs successfully filed for commercial uses of algae and cyanobacteria.2 It is possible that USDA’s biotechnology regulations might apply to modified algae. The USDA regulates genetically engineered algae from the standpoint of preventing the spread of pests, weeds, and diseases under the
Federal Plant Pest Act (FPPA).23 The USDA also regulates the spread of new varieties of feedstock whether they are developed by selection or hybridization, or are genetically engineered. However, USDA’s biotechnology regulations primarily cover only those modified organisms containing nucleic acids from plant pest species or genera, so that modified algae would only be covered if they contained such sequences.2 Use of engineered algae strains in other countries would, in most cases, be subject to regulatory requirements similar to those in the US, under applicable national laws.
The regulatory distinction of monitoring, treating, and ultimately controlling biotechnology fall under the purview of the EPA’s NPDES and the respective permitting process is unclear.24 Beyond nutrient load, genetically engineered organisms contained in NPDES discharges have the potential to impact drinking water supplies as well as the surrounding environment. The EPA list of US environmental laws can be found online.25 The primary federal regulations for protection of the environment are in the Title 40 Code of Federal Regulations (CFR). State and local regulatory requirements must be considered. A more detailed discussion of wastewater pollutants and their potential implications in algae cultivation systems is discussed further in Chapter 4.
23 Plant Protection Act. https://www.aphis.usda.gov/plant_health/plant_pest_info/weeds/downloads/PPAText.pdf (accessed Aug 2015).
24 USEPA. NPDES. http://water.epa.gov/polwaste/npdes/ (accessed Aug 2015).
25 USEPA. www.epa.gov/lawsregs/laws (accessed Aug 2015).
Parameter Unit Notes
Tropospheric ozone ppb Combination of sources and methods necessary. EPA Multiscale Air Quality model9
Greenhouse gases ppb CO2 equivalent emissions (CO2 and N2O) Carbon monoxide ppb CO2 equivalent emissions Particulates g/m3 > 10 mm diameter; < 2.5 mm diameter Volatile organic compounds g/m3 Concentration
Parameter Unit Notes Total organic carbon (N) mg/ha If digested algae are mixed with soil. Extractable phosphorus (P)
mg/ha If digested algae are mixed with soil.
Abundance of released algae
cells/L Initially calculated from known biomass in culture and estimated release rate or estimated using genetic markers.
+
H/.-(J,#-.%4(#02(L./2.O&'1.%4(=;*+%2/&0%'1*+/5+#/&)+-/))"$&/'+5/))/7#+$;*+%2/&0%'1*+/5+7%$*.+%'0+%&.+-/))"$&/'+$;%$+'**0#+$/+5/.4+ $;*+(%#&#+/5+%),%*+/-*.%$&/'#9+_/#$+%),%*+-./0"1*.#+0/+'/$+;%2*+%00&$&/'%)+.*8"&.*4*'$#+5/.+#/&)+8"%)&$3+.*-/.$&',9+:),%*+-./0"1*.#+$;%$+%.*+,*'*.%$&',+-./0"1$#+"#*0+%#+(&/5*.$&)&G*.#+/.+,./7$;+#$&4")%'$#+'**0+$/+4/'&$/.+%'0+.*-/.$+#/&)+1%.(/'6+'&$./,*'6+-;/#-;/."#6+%'0+-/##&()3+$;*+%("'0%'1*+/5+%),%)+1*))#+&'+$;*+#/&)+BK#L-&( )6)D9+!&4&)%.)36+$/+$.%1O+$;*+.*)*%#*+/5+1;*4&1%)#+%'0+$/J&'#+5./4+%),%)+1")$".*#+&'+$;*+*'2&./'4*'$6+$;*+1;*4&1%)#+0&#$.&("$&/'+&'+$;*+#/&)#+;%#+$/+(*+4/'&$/.*09+=/+&4-./2*+1;*4&1%)+#%5*$3+%'0+-./2&0*+4/.*+#$.*%4)&'*0+%11*##+$/+&'5/.4%$&/'+/'+ 1;*4&1%)#6+ @A:+ ;%#+ ("&)$+ %'0+ 1/'$&'"*#+ $/+ -/-")%$*+ %+ '*7+ 0%$%(%#*9+ =;&#+ '*7+ 0%$%(%#*6+'%4*0+ P;*4M&*76+ ,.*%$)3+ &4-./2*#+ %11*##+ $/+ ;*%)$;+ %'0+ #%5*$3+ 0%$%+ /'+ 1;*4&1%)#+ .*,")%$*0+"'0*.+ $;*+ =/J&1+ !"(#$%'1*#+ P/'$./)+ :1$+ B=!P:D9+ N$+ 1/'$%&'#+ &'5/.4%$&/'+ @A:+ .*1*&2*#+ %'0+0*2*)/-#+%(/"$+1;*4&1%)#+&'1)"0&',+$;/#*+/'+@A:f#+!%5*.+P;*4&1%)+N',.*0&*'$+Y&#$9Cc+
+
K#L-&()6)V+!/&)+8"%)&$3+%'0+(&/0&2*.#&$3+-%.%4*$*.#CCgCF+
G0.%( N/%&1(K/%#-(/'+#0.3(3#'L/0(VNW(( 4 ,W;%+ N5+0&,*#$*0+%),%*+%.*+4&J*0+7&$;+#/&)9+CT%'#3%#L-&($"/1$"/',1(VMW( 4 ,W;%+ N5+0&,*#$*0+%),%*+%.*+4&J*0+7&$;+#/&)9+;L,02#03&(/D('&-&2(#-+#&( 1*))#WY++ N'&$&%))3+1%)1")%$*0+5./4+O'/7'+(&/4%##+&'+1")$".*+%'0+
*#$&4%$*0+.*)*%#*+.%$*+/.+*#$&4%$*0+"#&',+,*'*$&1+4%.O*.#9++
H.%.0+F($&'E.%%.0+F(1%'#.0(2&$-/4E&0%(!&$&',+.*8"&.*4*'$#+ %'0+ /-*.%$&',+ -*.4&$#+%.*+1/'$./))*0 +(3+ )/1%)+ <".�&1$&/'#9+Q %$*.+%11*##+%'0+"#*+&'+4/#$+<".�&1$&/'#+%.*+$&,;$)3+1/'$./))*0+%'0+4/'&$/.*09+:),%) +/-*.%$&/'#+%.*+;&,;)3+0*-*'0*'$+/'+ 7%$*.9+=;*.*5/.*6+-*.4&$#+%'0+7%$*.+4/'&$/.&',+%.*+1.&$&1%)9+=;*+$3-&1%)+#$*-#+&'+$;*+#&$&',+%'0+-*.4&$$&',+-./1*##+%.*+#;/7'+&'+5.+,'&()6Q9++
Site selection Design engineering
Regulation identi�cation
Permit application
Impact assessment
Public participation
Issue identi�cation
Issue resolution
Issue of permit
Facility construction
p Figure 3.2: Overview of the main steps of a permitting process for an algal farm or production operation
Algal Strains & Farm Inputs/Outputs
Cultivation & Production Processes
Algae-based Products
R&D Specific Regulation
• NIH - rDNA guidelines • HHS screening; DS rDNA • EPA TSCA - TERA, R&D
contained-use exemption • USDA - genetically engineered
organism importation, interstate movement, and open-system research with known plant pests
R&D and Commercial
• State biotechnology and/ or aquaculture regulations
• Federal, state, and/or local permits (RCRA, OSHA, building and fire codes, etc.)
• EPA TSCA - TERA, R&D contained use exemption
Commercial Specific Regulation
• EPA TSCA - MCAN • EPA FIFRA - pest management • FDA for FDA-regulated
products • TTB - for ethanol production • NEPA, ESA with federal
funding
R&D and Commercial
• USDA - plant pests • OSHA - general duty clause • State biotechnology and/or
aquaculture regulations • Federal, state, or local permits • RCRA, OSHA, building and fire
codes etc., as applicable
Product Specific Regulation
• Chemicals - EPA - TSCA PMN
• Fuel - EPA /DOD/DOT/FAA fuel certification
• Fuel - EPA - RFS compliance
• Ethanol - TTB • Food - FDA CFSAN • Feed - FDA CVM / AAFCO • Items listed as R&D
specific
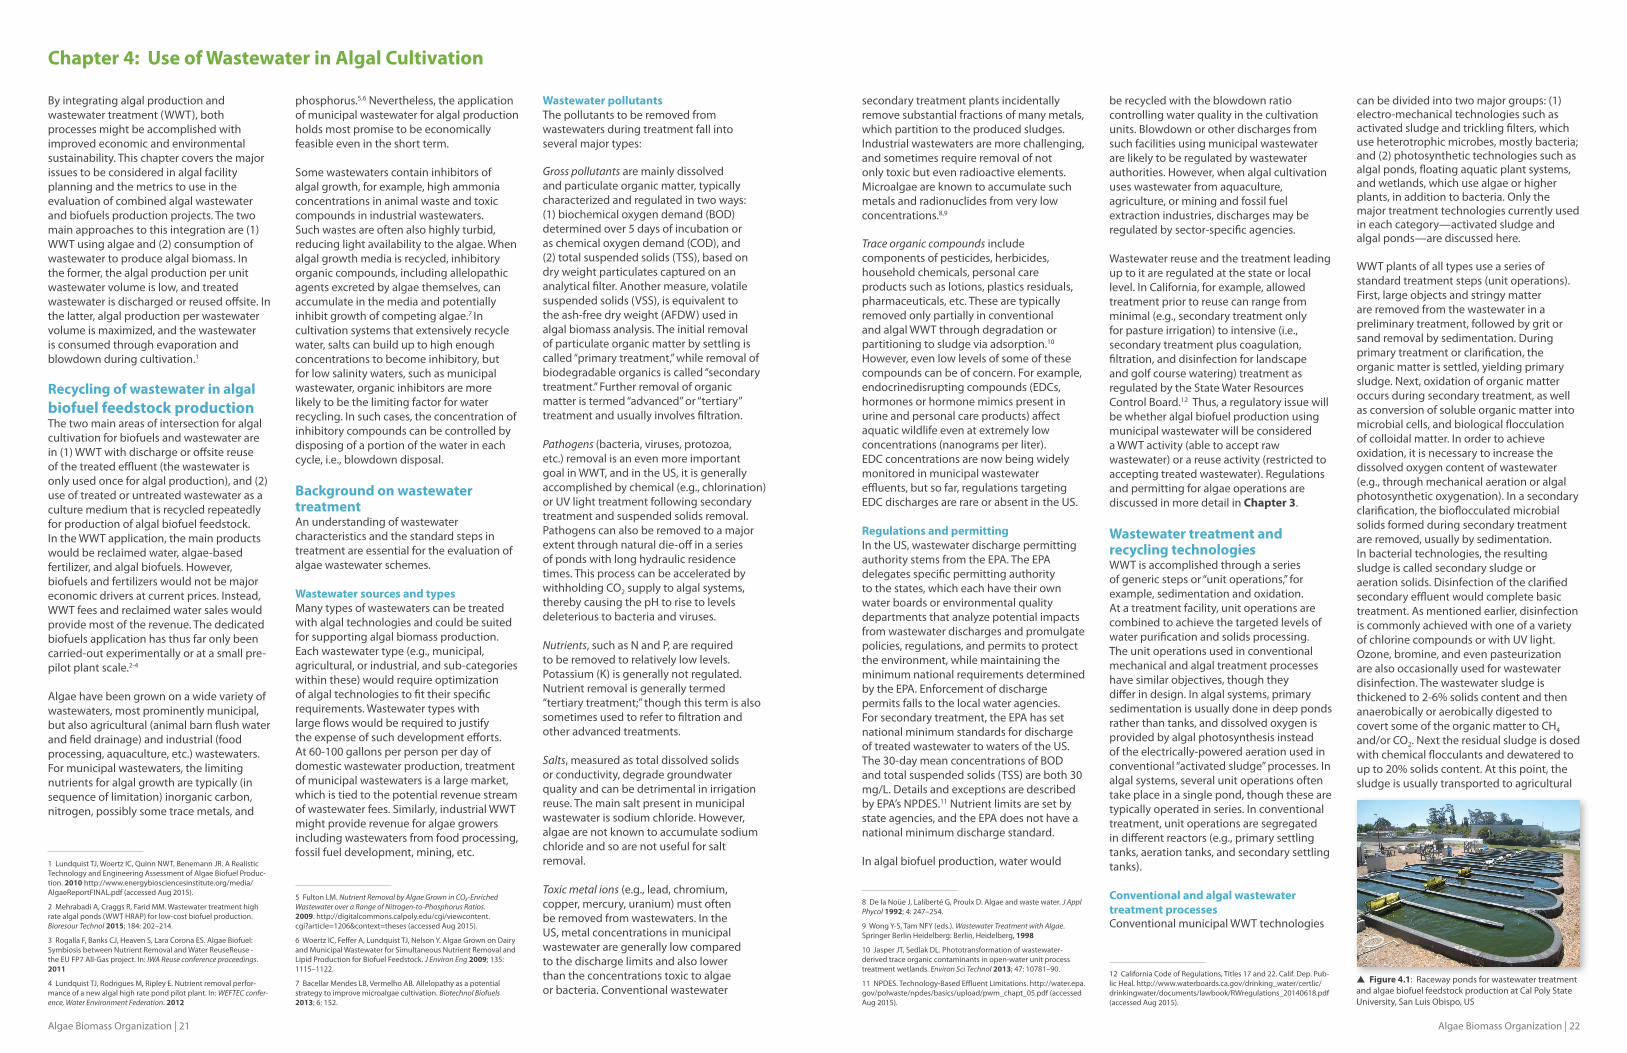
Algae Biomass Organization | 22Algae Biomass Organization | 21
Chapter 4: Use of Wastewater in Algal Cultivation
By integrating algal production and wastewater treatment (WWT), both processes might be accomplished with improved economic and environmental sustainability. This chapter covers the major issues to be considered in algal facility planning and the metrics to use in the evaluation of combined algal wastewater and biofuels production projects. The two main approaches to this integration are (1) WWT using algae and (2) consumption of wastewater to produce algal biomass. In the former, the algal production per unit wastewater volume is low, and treated wastewater is discharged or reused offsite. In the latter, algal production per wastewater volume is maximized, and the wastewater is consumed through evaporation and blowdown during cultivation.1
Recycling of wastewater in algal biofuel feedstock productionThe two main areas of intersection for algal cultivation for biofuels and wastewater are in (1) WWT with discharge or offsite reuse of the treated effluent (the wastewater is only used once for algal production), and (2) use of treated or untreated wastewater as a culture medium that is recycled repeatedly for production of algal biofuel feedstock. In the WWT application, the main products would be reclaimed water, algae-based fertilizer, and algal biofuels. However, biofuels and fertilizers would not be major economic drivers at current prices. Instead, WWT fees and reclaimed water sales would provide most of the revenue. The dedicated biofuels application has thus far only been carried-out experimentally or at a small pre-pilot plant scale.2-4
Algae have been grown on a wide variety of wastewaters, most prominently municipal, but also agricultural (animal barn flush water and field drainage) and industrial (food processing, aquaculture, etc.) wastewaters. For municipal wastewaters, the limiting nutrients for algal growth are typically (in sequence of limitation) inorganic carbon, nitrogen, possibly some trace metals, and
1 Lundquist TJ, Woertz IC, Quinn NWT, Benemann JR. A Realistic Technology and Engineering Assessment of Algae Biofuel Produc-tion. 2010 http://www.energybiosciencesinstitute.org/media/AlgaeReportFINAL.pdf (accessed Aug 2015).
2 Mehrabadi A, Craggs R, Farid MM. Wastewater treatment high rate algal ponds (WWT HRAP) for low-cost biofuel production. Bioresour Technol 2015; 184: 202–214.
3 Rogalla F, Banks CJ, Heaven S, Lara Corona ES. Algae Biofuel: Symbiosis between Nutrient Removal and Water ReuseReuse - the EU FP7 All-Gas project. In: IWA Reuse conference proceedings. 2011
4 Lundquist TJ, Rodrigues M, Ripley E. Nutrient removal perfor-mance of a new algal high rate pond pilot plant. In: WEFTEC confer-ence, Water Environment Federation. 2012
phosphorus.5,6 Nevertheless, the application of municipal wastewater for algal production holds most promise to be economically feasible even in the short term.
Some wastewaters contain inhibitors of algal growth, for example, high ammonia concentrations in animal waste and toxic compounds in industrial wastewaters. Such wastes are often also highly turbid, reducing light availability to the algae. When algal growth media is recycled, inhibitory organic compounds, including allelopathic agents excreted by algae themselves, can accumulate in the media and potentially inhibit growth of competing algae.7 In cultivation systems that extensively recycle water, salts can build up to high enough concentrations to become inhibitory, but for low salinity waters, such as municipal wastewater, organic inhibitors are more likely to be the limiting factor for water recycling. In such cases, the concentration of inhibitory compounds can be controlled by disposing of a portion of the water in each cycle, i.e., blowdown disposal. Background on wastewater treatmentAn understanding of wastewater characteristics and the standard steps in treatment are essential for the evaluation of algae wastewater schemes. Wastewater sources and types Many types of wastewaters can be treated with algal technologies and could be suited for supporting algal biomass production. Each wastewater type (e.g., municipal, agricultural, or industrial, and sub-categories within these) would require optimization of algal technologies to fit their specific requirements. Wastewater types with large flows would be required to justify the expense of such development efforts. At 60-100 gallons per person per day of domestic wastewater production, treatment of municipal wastewaters is a large market, which is tied to the potential revenue stream of wastewater fees. Similarly, industrial WWT might provide revenue for algae growers including wastewaters from food processing, fossil fuel development, mining, etc.
5 Fulton LM. Nutrient Removal by Algae Grown in CO₂-Enriched Wastewater over a Range of Nitrogen-to-Phosphorus Ratios. 2009. http://digitalcommons.calpoly.edu/cgi/viewcontent.cgi?article=1206&context=theses (accessed Aug 2015).
6 Woertz IC, Feffer A, Lundquist TJ, Nelson Y. Algae Grown on Dairy and Municipal Wastewater for Simultaneous Nutrient Removal and Lipid Production for Biofuel Feedstock. J Environ Eng 2009; 135: 1115–1122.
7 Bacellar Mendes LB, Vermelho AB. Allelopathy as a potential strategy to improve microalgae cultivation. Biotechnol Biofuels 2013; 6: 152.
Wastewater pollutants The pollutants to be removed from wastewaters during treatment fall into several major types:
Gross pollutants are mainly dissolved and particulate organic matter, typically characterized and regulated in two ways: (1) biochemical oxygen demand (BOD) determined over 5 days of incubation or as chemical oxygen demand (COD), and (2) total suspended solids (TSS), based on dry weight particulates captured on an analytical filter. Another measure, volatile suspended solids (VSS), is equivalent to the ash-free dry weight (AFDW) used in algal biomass analysis. The initial removal of particulate organic matter by settling is called “primary treatment,” while removal of biodegradable organics is called “secondary treatment.” Further removal of organic matter is termed “advanced” or “tertiary” treatment and usually involves filtration.
Pathogens (bacteria, viruses, protozoa, etc.) removal is an even more important goal in WWT, and in the US, it is generally accomplished by chemical (e.g., chlorination) or UV light treatment following secondary treatment and suspended solids removal. Pathogens can also be removed to a major extent through natural die-off in a series of ponds with long hydraulic residence times. This process can be accelerated by withholding CO2 supply to algal systems, thereby causing the pH to rise to levels deleterious to bacteria and viruses.
Nutrients, such as N and P, are required to be removed to relatively low levels. Potassium (K) is generally not regulated. Nutrient removal is generally termed “tertiary treatment;” though this term is also sometimes used to refer to filtration and other advanced treatments.
Salts, measured as total dissolved solids or conductivity, degrade groundwater quality and can be detrimental in irrigation reuse. The main salt present in municipal wastewater is sodium chloride. However, algae are not known to accumulate sodium chloride and so are not useful for salt removal.
Toxic metal ions (e.g., lead, chromium, copper, mercury, uranium) must often be removed from wastewaters. In the US, metal concentrations in municipal wastewater are generally low compared to the discharge limits and also lower than the concentrations toxic to algae or bacteria. Conventional wastewater
secondary treatment plants incidentally remove substantial fractions of many metals, which partition to the produced sludges. Industrial wastewaters are more challenging, and sometimes require removal of not only toxic but even radioactive elements. Microalgae are known to accumulate such metals and radionuclides from very low concentrations.8,9
Trace organic compounds include components of pesticides, herbicides, household chemicals, personal care products such as lotions, plastics residuals, pharmaceuticals, etc. These are typically removed only partially in conventional and algal WWT through degradation or partitioning to sludge via adsorption.10 However, even low levels of some of these compounds can be of concern. For example, endocrinedisrupting compounds (EDCs, hormones or hormone mimics present in urine and personal care products) affect aquatic wildlife even at extremely low concentrations (nanograms per liter). EDC concentrations are now being widely monitored in municipal wastewater effluents, but so far, regulations targeting EDC discharges are rare or absent in the US. Regulations and permittingIn the US, wastewater discharge permitting authority stems from the EPA. The EPA delegates specific permitting authority to the states, which each have their own water boards or environmental quality departments that analyze potential impacts from wastewater discharges and promulgate policies, regulations, and permits to protect the environment, while maintaining the minimum national requirements determined by the EPA. Enforcement of discharge permits falls to the local water agencies. For secondary treatment, the EPA has set national minimum standards for discharge of treated wastewater to waters of the US. The 30-day mean concentrations of BOD and total suspended solids (TSS) are both 30 mg/L. Details and exceptions are described by EPA’s NPDES.11 Nutrient limits are set by state agencies, and the EPA does not have a national minimum discharge standard.
In algal biofuel production, water would
8 De la Noüe J, Laliberté G, Proulx D. Algae and waste water. J Appl Phycol 1992; 4: 247–254.
9 Wong Y-S, Tam NFY (eds.). Wastewater Treatment with Algae. Springer Berlin Heidelberg: Berlin, Heidelberg, 1998
10 Jasper JT, Sedlak DL. Phototransformation of wastewater-derived trace organic contaminants in open-water unit process treatment wetlands. Environ Sci Technol 2013; 47: 10781–90.
11 NPDES. Technology-Based Effluent Limitations. http://water.epa.gov/polwaste/npdes/basics/upload/pwm_chapt_05.pdf (accessed Aug 2015).
be recycled with the blowdown ratio controlling water quality in the cultivation units. Blowdown or other discharges from such facilities using municipal wastewater are likely to be regulated by wastewater authorities. However, when algal cultivation uses wastewater from aquaculture, agriculture, or mining and fossil fuel extraction industries, discharges may be regulated by sector-specific agencies.
Wastewater reuse and the treatment leading up to it are regulated at the state or local level. In California, for example, allowed treatment prior to reuse can range from minimal (e.g., secondary treatment only for pasture irrigation) to intensive (i.e., secondary treatment plus coagulation, filtration, and disinfection for landscape and golf course watering) treatment as regulated by the State Water Resources Control Board.12 Thus, a regulatory issue will be whether algal biofuel production using municipal wastewater will be considered a WWT activity (able to accept raw wastewater) or a reuse activity (restricted to accepting treated wastewater). Regulations and permitting for algae operations are discussed in more detail in Chapter 3. Wastewater treatment and recycling technologiesWWT is accomplished through a series of generic steps or “unit operations,” for example, sedimentation and oxidation. At a treatment facility, unit operations are combined to achieve the targeted levels of water purification and solids processing. The unit operations used in conventional mechanical and algal treatment processes have similar objectives, though they differ in design. In algal systems, primary sedimentation is usually done in deep ponds rather than tanks, and dissolved oxygen is provided by algal photosynthesis instead of the electrically-powered aeration used in conventional “activated sludge” processes. In algal systems, several unit operations often take place in a single pond, though these are typically operated in series. In conventional treatment, unit operations are segregated in different reactors (e.g., primary settling tanks, aeration tanks, and secondary settling tanks). Conventional and algal wastewater treatment processesConventional municipal WWT technologies
12 California Code of Regulations, Titles 17 and 22. Calif. Dep. Pub-lic Heal. http://www.waterboards.ca.gov/drinking_water/certlic/drinkingwater/documents/lawbook/RWregulations_20140618.pdf (accessed Aug 2015).
can be divided into two major groups: (1) electro-mechanical technologies such as activated sludge and trickling filters, which use heterotrophic microbes, mostly bacteria; and (2) photosynthetic technologies such as algal ponds, floating aquatic plant systems, and wetlands, which use algae or higher plants, in addition to bacteria. Only the major treatment technologies currently used in each category—activated sludge and algal ponds—are discussed here.
WWT plants of all types use a series of standard treatment steps (unit operations). First, large objects and stringy matter are removed from the wastewater in a preliminary treatment, followed by grit or sand removal by sedimentation. During primary treatment or clarification, the organic matter is settled, yielding primary sludge. Next, oxidation of organic matter occurs during secondary treatment, as well as conversion of soluble organic matter into microbial cells, and biological flocculation of colloidal matter. In order to achieve oxidation, it is necessary to increase the dissolved oxygen content of wastewater (e.g., through mechanical aeration or algal photosynthetic oxygenation). In a secondary clarification, the bioflocculated microbial solids formed during secondary treatment are removed, usually by sedimentation. In bacterial technologies, the resulting sludge is called secondary sludge or aeration solids. Disinfection of the clarified secondary effluent would complete basic treatment. As mentioned earlier, disinfection is commonly achieved with one of a variety of chlorine compounds or with UV light. Ozone, bromine, and even pasteurization are also occasionally used for wastewater disinfection. The wastewater sludge is thickened to 2-6% solids content and then anaerobically or aerobically digested to covert some of the organic matter to CH4 and/or CO2. Next the residual sludge is dosed with chemical flocculants and dewatered to up to 20% solids content. At this point, the sludge is usually transported to agricultural
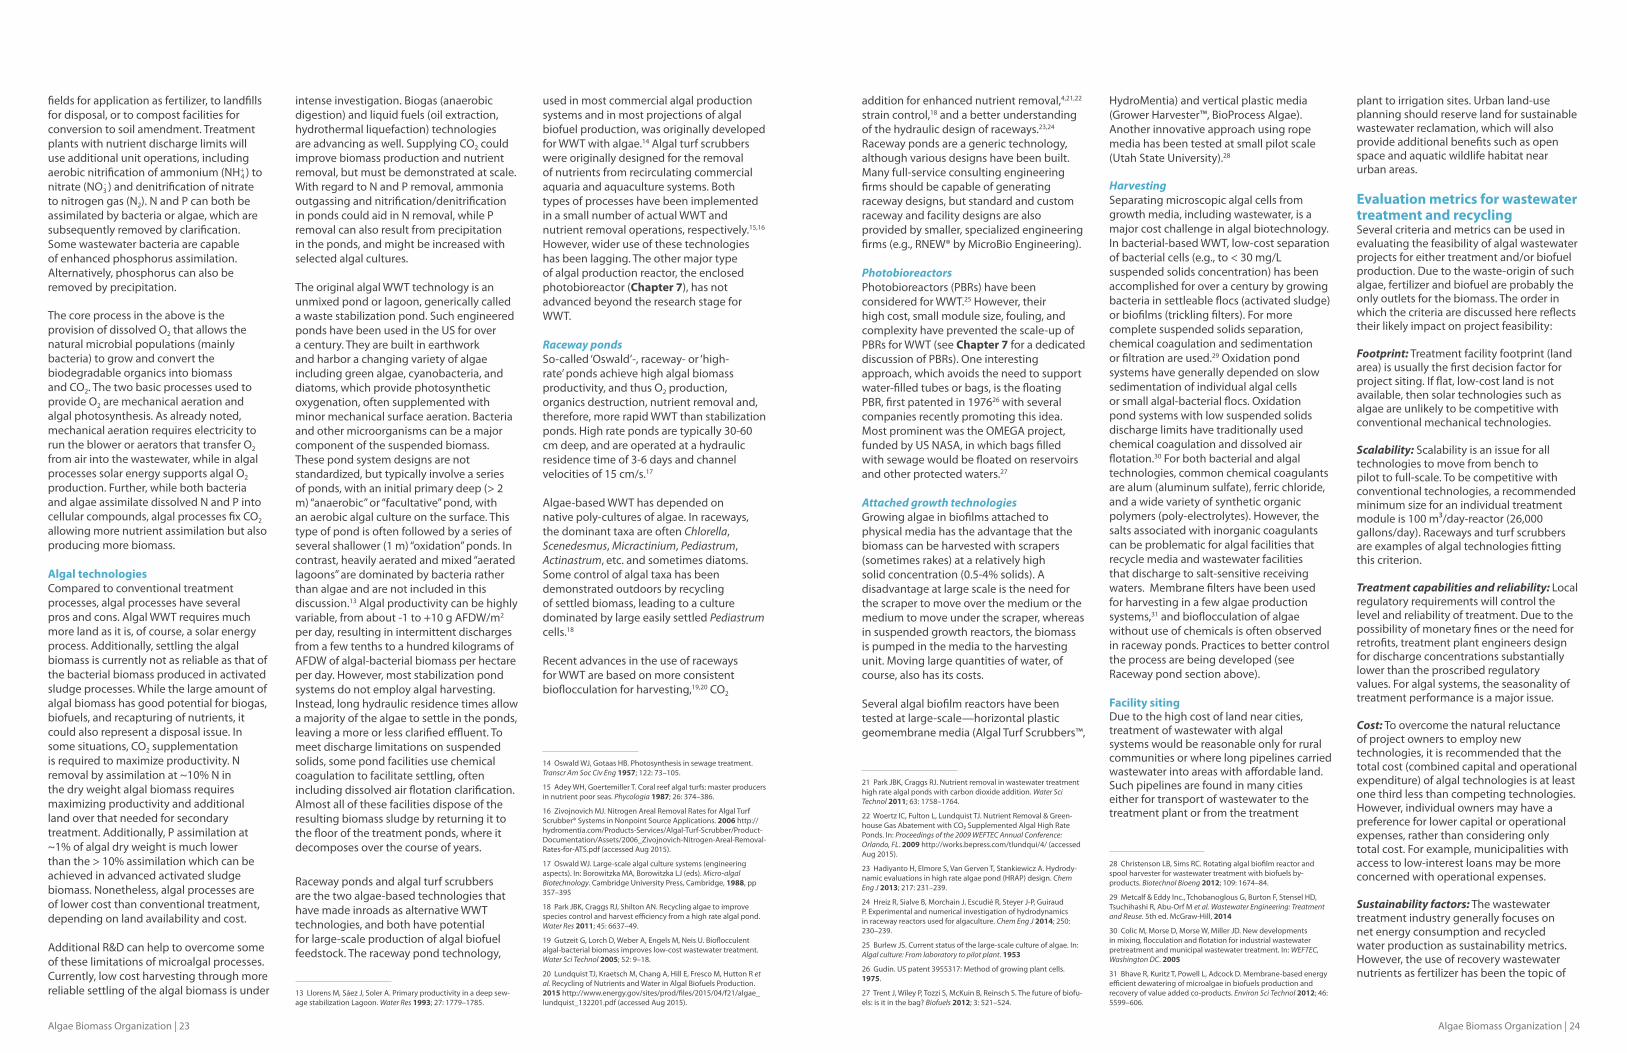
Algae Biomass Organization | 24Algae Biomass Organization | 23
fields for application as fertilizer, to landfills for disposal, or to compost facilities for conversion to soil amendment. Treatment plants with nutrient discharge limits will use additional unit operations, including aerobic nitrification of ammonium (NH+
4 ) to nitrate (NO -
3 ) and denitrification of nitrate to nitrogen gas (N2). N and P can both be assimilated by bacteria or algae, which are subsequently removed by clarification. Some wastewater bacteria are capable of enhanced phosphorus assimilation. Alternatively, phosphorus can also be removed by precipitation.
The core process in the above is the provision of dissolved O2 that allows the natural microbial populations (mainly bacteria) to grow and convert the biodegradable organics into biomass and CO2. The two basic processes used to provide O2 are mechanical aeration and algal photosynthesis. As already noted, mechanical aeration requires electricity to run the blower or aerators that transfer O2 from air into the wastewater, while in algal processes solar energy supports algal O2 production. Further, while both bacteria and algae assimilate dissolved N and P into cellular compounds, algal processes fix CO2 allowing more nutrient assimilation but also producing more biomass. Algal technologiesCompared to conventional treatment processes, algal processes have several pros and cons. Algal WWT requires much more land as it is, of course, a solar energy process. Additionally, settling the algal biomass is currently not as reliable as that of the bacterial biomass produced in activated sludge processes. While the large amount of algal biomass has good potential for biogas, biofuels, and recapturing of nutrients, it could also represent a disposal issue. In some situations, CO2 supplementation is required to maximize productivity. N removal by assimilation at ~10% N in the dry weight algal biomass requires maximizing productivity and additional land over that needed for secondary treatment. Additionally, P assimilation at ~1% of algal dry weight is much lower than the > 10% assimilation which can be achieved in advanced activated sludge biomass. Nonetheless, algal processes are of lower cost than conventional treatment, depending on land availability and cost.
Additional R&D can help to overcome some of these limitations of microalgal processes. Currently, low cost harvesting through more reliable settling of the algal biomass is under
intense investigation. Biogas (anaerobic digestion) and liquid fuels (oil extraction, hydrothermal liquefaction) technologies are advancing as well. Supplying CO2 could improve biomass production and nutrient removal, but must be demonstrated at scale. With regard to N and P removal, ammonia outgassing and nitrification/denitrification in ponds could aid in N removal, while P removal can also result from precipitation in the ponds, and might be increased with selected algal cultures. The original algal WWT technology is an unmixed pond or lagoon, generically called a waste stabilization pond. Such engineered ponds have been used in the US for over a century. They are built in earthwork and harbor a changing variety of algae including green algae, cyanobacteria, and diatoms, which provide photosynthetic oxygenation, often supplemented with minor mechanical surface aeration. Bacteria and other microorganisms can be a major component of the suspended biomass. These pond system designs are not standardized, but typically involve a series of ponds, with an initial primary deep (> 2 m) “anaerobic” or “facultative” pond, with an aerobic algal culture on the surface. This type of pond is often followed by a series of several shallower (1 m) “oxidation” ponds. In contrast, heavily aerated and mixed “aerated lagoons” are dominated by bacteria rather than algae and are not included in this discussion.13 Algal productivity can be highly variable, from about -1 to +10 g AFDW/m2 per day, resulting in intermittent discharges from a few tenths to a hundred kilograms of AFDW of algal-bacterial biomass per hectare per day. However, most stabilization pond systems do not employ algal harvesting. Instead, long hydraulic residence times allow a majority of the algae to settle in the ponds, leaving a more or less clarified effluent. To meet discharge limitations on suspended solids, some pond facilities use chemical coagulation to facilitate settling, often including dissolved air flotation clarification. Almost all of these facilities dispose of the resulting biomass sludge by returning it to the floor of the treatment ponds, where it decomposes over the course of years.
Raceway ponds and algal turf scrubbers are the two algae-based technologies that have made inroads as alternative WWT technologies, and both have potential for large-scale production of algal biofuel feedstock. The raceway pond technology,
13 Llorens M, Sáez J, Soler A. Primary productivity in a deep sew-age stabilization Lagoon. Water Res 1993; 27: 1779–1785.
used in most commercial algal production systems and in most projections of algal biofuel production, was originally developed for WWT with algae.14 Algal turf scrubbers were originally designed for the removal of nutrients from recirculating commercial aquaria and aquaculture systems. Both types of processes have been implemented in a small number of actual WWT and nutrient removal operations, respectively.15,16 However, wider use of these technologies has been lagging. The other major type of algal production reactor, the enclosed photobioreactor (Chapter 7), has not advanced beyond the research stage for WWT. Raceway pondsSo-called ‘Oswald’-, raceway- or ‘high-rate’ ponds achieve high algal biomass productivity, and thus O2 production, organics destruction, nutrient removal and, therefore, more rapid WWT than stabilization ponds. High rate ponds are typically 30-60 cm deep, and are operated at a hydraulic residence time of 3-6 days and channel velocities of 15 cm/s.17
Algae-based WWT has depended on native poly-cultures of algae. In raceways, the dominant taxa are often Chlorella, Scenedesmus, Micractinium, Pediastrum, Actinastrum, etc. and sometimes diatoms. Some control of algal taxa has been demonstrated outdoors by recycling of settled biomass, leading to a culture dominated by large easily settled Pediastrum cells.18
Recent advances in the use of raceways for WWT are based on more consistent bioflocculation for harvesting,19,20 CO2
14 Oswald WJ, Gotaas HB. Photosynthesis in sewage treatment. Transcr Am Soc Civ Eng 1957; 122: 73–105.
15 Adey WH, Goertemiller T. Coral reef algal turfs: master producers in nutrient poor seas. Phycologia 1987; 26: 374–386.
16 Zivojnovich MJ. Nitrogen Areal Removal Rates for Algal Turf Scrubber® Systems in Nonpoint Source Applications. 2006 http://hydromentia.com/Products-Services/Algal-Turf-Scrubber/Product-Documentation/Assets/2006_Zivojnovich-Nitrogen-Areal-Removal-Rates-for-ATS.pdf (accessed Aug 2015).
17 Oswald WJ. Large-scale algal culture systems (engineering aspects). In: Borowitzka MA, Borowitzka LJ (eds). Micro-algal Biotechnology. Cambridge University Press, Cambridge, 1988, pp 357–395
18 Park JBK, Craggs RJ, Shilton AN. Recycling algae to improve species control and harvest efficiency from a high rate algal pond. Water Res 2011; 45: 6637–49.
19 Gutzeit G, Lorch D, Weber A, Engels M, Neis U. Bioflocculent algal-bacterial biomass improves low-cost wastewater treatment. Water Sci Technol 2005; 52: 9–18.
20 Lundquist TJ, Kraetsch M, Chang A, Hill E, Fresco M, Hutton R et al. Recycling of Nutrients and Water in Algal Biofuels Production. 2015 http://www.energy.gov/sites/prod/files/2015/04/f21/algae_lundquist_132201.pdf (accessed Aug 2015).
addition for enhanced nutrient removal,4,21,22 strain control,18 and a better understanding of the hydraulic design of raceways.23,24 Raceway ponds are a generic technology, although various designs have been built. Many full-service consulting engineering firms should be capable of generating raceway designs, but standard and custom raceway and facility designs are also provided by smaller, specialized engineering firms (e.g., RNEW® by MicroBio Engineering). PhotobioreactorsPhotobioreactors (PBRs) have been considered for WWT.25 However, their high cost, small module size, fouling, and complexity have prevented the scale-up of PBRs for WWT (see Chapter 7 for a dedicated discussion of PBRs). One interesting approach, which avoids the need to support water-filled tubes or bags, is the floating PBR, first patented in 197626 with several companies recently promoting this idea. Most prominent was the OMEGA project, funded by US NASA, in which bags filled with sewage would be floated on reservoirs and other protected waters.27 Attached growth technologiesGrowing algae in biofilms attached to physical media has the advantage that the biomass can be harvested with scrapers (sometimes rakes) at a relatively high solid concentration (0.5-4% solids). A disadvantage at large scale is the need for the scraper to move over the medium or the medium to move under the scraper, whereas in suspended growth reactors, the biomass is pumped in the media to the harvesting unit. Moving large quantities of water, of course, also has its costs.
Several algal biofilm reactors have been tested at large-scale—horizontal plastic geomembrane media (Algal Turf Scrubbers™,
21 Park JBK, Craggs RJ. Nutrient removal in wastewater treatment high rate algal ponds with carbon dioxide addition. Water Sci Technol 2011; 63: 1758–1764.
22 Woertz IC, Fulton L, Lundquist TJ. Nutrient Removal & Green-house Gas Abatement with CO₂ Supplemented Algal High Rate Ponds. In: Proceedings of the 2009 WEFTEC Annual Conference: Orlando, FL. 2009 http://works.bepress.com/tlundqui/4/ (accessed Aug 2015).
23 Hadiyanto H, Elmore S, Van Gerven T, Stankiewicz A. Hydrody-namic evaluations in high rate algae pond (HRAP) design. Chem Eng J 2013; 217: 231–239.
24 Hreiz R, Sialve B, Morchain J, Escudié R, Steyer J-P, Guiraud P. Experimental and numerical investigation of hydrodynamics in raceway reactors used for algaculture. Chem Eng J 2014; 250: 230–239.
25 Burlew JS. Current status of the large-scale culture of algae. In: Algal culture: From laboratory to pilot plant. 1953
26 Gudin. US patent 3955317: Method of growing plant cells. 1975.
27 Trent J, Wiley P, Tozzi S, McKuin B, Reinsch S. The future of biofu-els: is it in the bag? Biofuels 2012; 3: 521–524.
HydroMentia) and vertical plastic media (Grower Harvester™, BioProcess Algae). Another innovative approach using rope media has been tested at small pilot scale (Utah State University).28
HarvestingSeparating microscopic algal cells from growth media, including wastewater, is a major cost challenge in algal biotechnology. In bacterial-based WWT, low-cost separation of bacterial cells (e.g., to < 30 mg/L suspended solids concentration) has been accomplished for over a century by growing bacteria in settleable flocs (activated sludge) or biofilms (trickling filters). For more complete suspended solids separation, chemical coagulation and sedimentation or filtration are used.29 Oxidation pond systems have generally depended on slow sedimentation of individual algal cells or small algal-bacterial flocs. Oxidation pond systems with low suspended solids discharge limits have traditionally used chemical coagulation and dissolved air flotation.30 For both bacterial and algal technologies, common chemical coagulants are alum (aluminum sulfate), ferric chloride, and a wide variety of synthetic organic polymers (poly-electrolytes). However, the salts associated with inorganic coagulants can be problematic for algal facilities that recycle media and wastewater facilities that discharge to salt-sensitive receiving waters. Membrane filters have been used for harvesting in a few algae production systems,31 and bioflocculation of algae without use of chemicals is often observed in raceway ponds. Practices to better control the process are being developed (see Raceway pond section above). Facility sitingDue to the high cost of land near cities, treatment of wastewater with algal systems would be reasonable only for rural communities or where long pipelines carried wastewater into areas with affordable land. Such pipelines are found in many cities either for transport of wastewater to the treatment plant or from the treatment
28 Christenson LB, Sims RC. Rotating algal biofilm reactor and spool harvester for wastewater treatment with biofuels by-products. Biotechnol Bioeng 2012; 109: 1674–84.
29 Metcalf & Eddy Inc., Tchobanoglous G, Burton F, Stensel HD, Tsuchihashi R, Abu-Orf M et al. Wastewater Engineering: Treatment and Reuse. 5th ed. McGraw-Hill, 2014
30 Colic M, Morse D, Morse W, Miller JD. New developments in mixing, flocculation and flotation for industrial wastewater pretreatment and municipal wastewater treatment. In: WEFTEC, Washington DC. 2005
31 Bhave R, Kuritz T, Powell L, Adcock D. Membrane-based energy efficient dewatering of microalgae in biofuels production and recovery of value added co-products. Environ Sci Technol 2012; 46: 5599–606.
plant to irrigation sites. Urban land-use planning should reserve land for sustainable wastewater reclamation, which will also provide additional benefits such as open space and aquatic wildlife habitat near urban areas. Evaluation metrics for wastewater treatment and recycling Several criteria and metrics can be used in evaluating the feasibility of algal wastewater projects for either treatment and/or biofuel production. Due to the waste-origin of such algae, fertilizer and biofuel are probably the only outlets for the biomass. The order in which the criteria are discussed here reflects their likely impact on project feasibility:
Footprint: Treatment facility footprint (land area) is usually the first decision factor for project siting. If flat, low-cost land is not available, then solar technologies such as algae are unlikely to be competitive with conventional mechanical technologies.
Scalability: Scalability is an issue for all technologies to move from bench to pilot to full-scale. To be competitive with conventional technologies, a recommended minimum size for an individual treatment module is 100 m³/day-reactor (26,000 gallons/day). Raceways and turf scrubbers are examples of algal technologies fitting this criterion.
Treatment capabilities and reliability: Local regulatory requirements will control the level and reliability of treatment. Due to the possibility of monetary fines or the need for retrofits, treatment plant engineers design for discharge concentrations substantially lower than the proscribed regulatory values. For algal systems, the seasonality of treatment performance is a major issue.
Cost: To overcome the natural reluctance of project owners to employ new technologies, it is recommended that the total cost (combined capital and operational expenditure) of algal technologies is at least one third less than competing technologies. However, individual owners may have a preference for lower capital or operational expenses, rather than considering only total cost. For example, municipalities with access to low-interest loans may be more concerned with operational expenses.
Sustainability factors: The wastewater treatment industry generally focuses on net energy consumption and recycled water production as sustainability metrics. However, the use of recovery wastewater nutrients as fertilizer has been the topic of
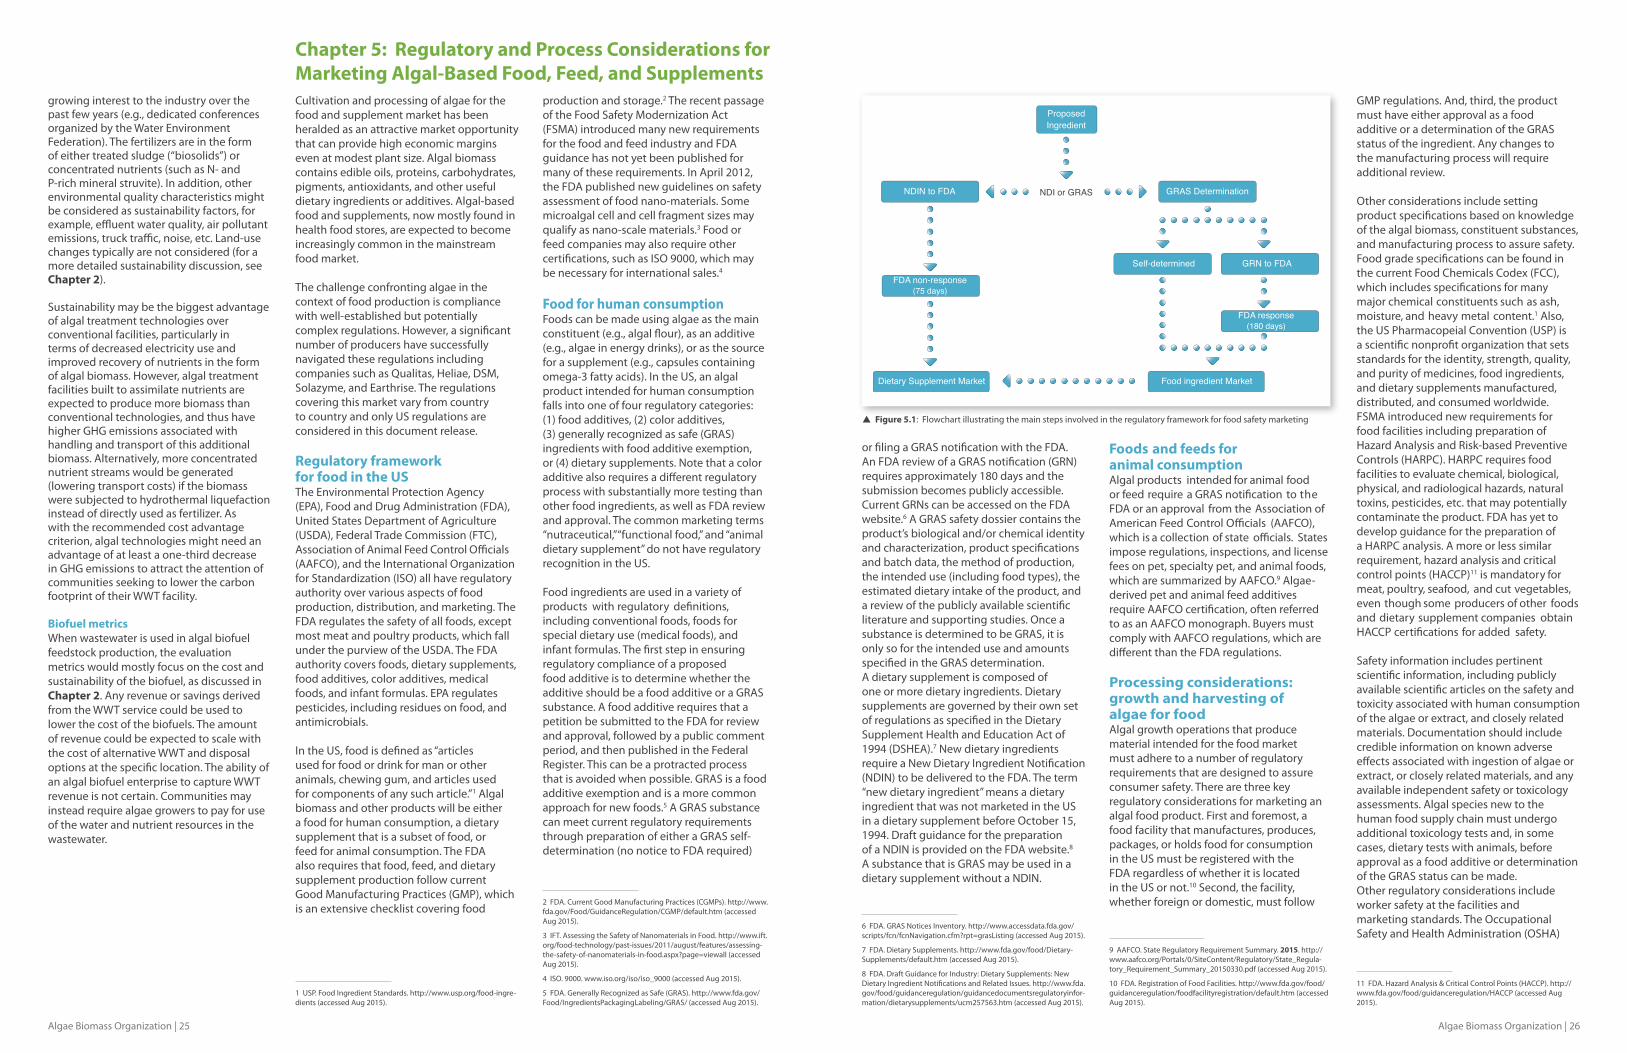
Algae Biomass Organization | 26Algae Biomass Organization | 25
growing interest to the industry over the past few years (e.g., dedicated conferences organized by the Water Environment Federation). The fertilizers are in the form of either treated sludge (“biosolids”) or concentrated nutrients (such as N- and P-rich mineral struvite). In addition, other environmental quality characteristics might be considered as sustainability factors, for example, effluent water quality, air pollutant emissions, truck traffic, noise, etc. Land-use changes typically are not considered (for a more detailed sustainability discussion, see Chapter 2).
Sustainability may be the biggest advantage of algal treatment technologies over conventional facilities, particularly in terms of decreased electricity use and improved recovery of nutrients in the form of algal biomass. However, algal treatment facilities built to assimilate nutrients are expected to produce more biomass than conventional technologies, and thus have higher GHG emissions associated with handling and transport of this additional biomass. Alternatively, more concentrated nutrient streams would be generated (lowering transport costs) if the biomass were subjected to hydrothermal liquefaction instead of directly used as fertilizer. As with the recommended cost advantage criterion, algal technologies might need an advantage of at least a one-third decrease in GHG emissions to attract the attention of communities seeking to lower the carbon footprint of their WWT facility.
Biofuel metricsWhen wastewater is used in algal biofuel feedstock production, the evaluation metrics would mostly focus on the cost and sustainability of the biofuel, as discussed in Chapter 2. Any revenue or savings derived from the WWT service could be used to lower the cost of the biofuels. The amount of revenue could be expected to scale with the cost of alternative WWT and disposal options at the specific location. The ability of an algal biofuel enterprise to capture WWT revenue is not certain. Communities may instead require algae growers to pay for use of the water and nutrient resources in the wastewater.
Chapter 5: Regulatory and Process Considerations for Marketing Algal-Based Food, Feed, and SupplementsCultivation and processing of algae for the food and supplement market has been heralded as an attractive market opportunity that can provide high economic margins even at modest plant size. Algal biomass contains edible oils, proteins, carbohydrates, pigments, antioxidants, and other useful dietary ingredients or additives. Algal-based food and supplements, now mostly found in health food stores, are expected to become increasingly common in the mainstream food market. The challenge confronting algae in the context of food production is compliance with well-established but potentially complex regulations. However, a significant number of producers have successfully navigated these regulations including companies such as Qualitas, Heliae, DSM, Solazyme, and Earthrise. The regulations covering this market vary from country to country and only US regulations are considered in this document release.
Regulatory framework for food in the US The Environmental Protection Agency (EPA), Food and Drug Administration (FDA), United States Department of Agriculture (USDA), Federal Trade Commission (FTC), Association of Animal Feed Control Officials (AAFCO), and the International Organization for Standardization (ISO) all have regulatory authority over various aspects of food production, distribution, and marketing. The FDA regulates the safety of all foods, except most meat and poultry products, which fall under the purview of the USDA. The FDA authority covers foods, dietary supplements, food additives, color additives, medical foods, and infant formulas. EPA regulates pesticides, including residues on food, and antimicrobials.
In the US, food is defined as “articles used for food or drink for man or other animals, chewing gum, and articles used for components of any such article.”1 Algal biomass and other products will be either a food for human consumption, a dietary supplement that is a subset of food, or feed for animal consumption. The FDA also requires that food, feed, and dietary supplement production follow current Good Manufacturing Practices (GMP), which is an extensive checklist covering food
1 USP. Food Ingredient Standards. http://www.usp.org/food-ingre-dients (accessed Aug 2015).
production and storage.2 The recent passage of the Food Safety Modernization Act (FSMA) introduced many new requirements for the food and feed industry and FDA guidance has not yet been published for many of these requirements. In April 2012, the FDA published new guidelines on safety assessment of food nano-materials. Some microalgal cell and cell fragment sizes may qualify as nano-scale materials.3 Food or feed companies may also require other certifications, such as ISO 9000, which may be necessary for international sales.4 Food for human consumptionFoods can be made using algae as the main constituent (e.g., algal flour), as an additive (e.g., algae in energy drinks), or as the source for a supplement (e.g., capsules containing omega-3 fatty acids). In the US, an algal product intended for human consumption falls into one of four regulatory categories: (1) food additives, (2) color additives, (3) generally recognized as safe (GRAS) ingredients with food additive exemption, or (4) dietary supplements. Note that a color additive also requires a different regulatory process with substantially more testing than other food ingredients, as well as FDA review and approval. The common marketing terms “nutraceutical,”“functional food,” and “animal dietary supplement” do not have regulatory recognition in the US.
Food ingredients are used in a variety of products with regulatory definitions, including conventional foods, foods for special dietary use (medical foods), and infant formulas. The first step in ensuring regulatory compliance of a proposed food additive is to determine whether the additive should be a food additive or a GRAS substance. A food additive requires that a petition be submitted to the FDA for review and approval, followed by a public comment period, and then published in the Federal Register. This can be a protracted process that is avoided when possible. GRAS is a food additive exemption and is a more common approach for new foods.5 A GRAS substance can meet current regulatory requirements through preparation of either a GRAS self-determination (no notice to FDA required)
2 FDA. Current Good Manufacturing Practices (CGMPs). http://www.fda.gov/Food/GuidanceRegulation/CGMP/default.htm (accessed Aug 2015).
3 IFT. Assessing the Safety of Nanomaterials in Food. http://www.ift.org/food-technology/past-issues/2011/august/features/assessing-the-safety-of-nanomaterials-in-food.aspx?page=viewall (accessed Aug 2015).
4 ISO. 9000. www.iso.org/iso/iso_9000 (accessed Aug 2015).
5 FDA. Generally Recognized as Safe (GRAS). http://www.fda.gov/Food/IngredientsPackagingLabeling/GRAS/ (accessed Aug 2015).
or filing a GRAS notification with the FDA. An FDA review of a GRAS notification (GRN) requires approximately 180 days and the submission becomes publicly accessible. Current GRNs can be accessed on the FDA website.6 A GRAS safety dossier contains the product’s biological and/or chemical identity and characterization, product specifications and batch data, the method of production, the intended use (including food types), the estimated dietary intake of the product, and a review of the publicly available scientific literature and supporting studies. Once a substance is determined to be GRAS, it is only so for the intended use and amounts specified in the GRAS determination.A dietary supplement is composed of one or more dietary ingredients. Dietary supplements are governed by their own set of regulations as specified in the Dietary Supplement Health and Education Act of 1994 (DSHEA).7 New dietary ingredients require a New Dietary Ingredient Notification (NDIN) to be delivered to the FDA. The term “new dietary ingredient” means a dietary ingredient that was not marketed in the US in a dietary supplement before October 15, 1994. Draft guidance for the preparation of a NDIN is provided on the FDA website.8
A substance that is GRAS may be used in a dietary supplement without a NDIN.
6 FDA. GRAS Notices Inventory. http://www.accessdata.fda.gov/scripts/fcn/fcnNavigation.cfm?rpt=grasListing (accessed Aug 2015).
7 FDA. Dietary Supplements. http://www.fda.gov/food/Dietary-Supplements/default.htm (accessed Aug 2015).
8 FDA. Draft Guidance for Industry: Dietary Supplements: New Dietary Ingredient Notifications and Related Issues. http://www.fda.gov/food/guidanceregulation/guidancedocumentsregulatoryinfor-mation/dietarysupplements/ucm257563.htm (accessed Aug 2015).
Foods and feeds for animal consumptionAlgal products intended for animal food or feed require a GRAS notification to the FDA or an approval from the Association of American Feed Control Officials (AAFCO), which is a collection of state officials. States impose regulations, inspections, and license fees on pet, specialty pet, and animal foods, which are summarized by AAFCO.9 Algae-derived pet and animal feed additives require AAFCO certification, often referred to as an AAFCO monograph. Buyers must comply with AAFCO regulations, which are different than the FDA regulations.
Processing considerations: growth and harvesting of algae for food Algal growth operations that produce material intended for the food market must adhere to a number of regulatory requirements that are designed to assure consumer safety. There are three key regulatory considerations for marketing an algal food product. First and foremost, a food facility that manufactures, produces, packages, or holds food for consumption in the US must be registered with the FDA regardless of whether it is located in the US or not.10 Second, the facility, whether foreign or domestic, must follow
9 AAFCO. State Regulatory Requirement Summary. 2015. http://www.aafco.org/Portals/0/SiteContent/Regulatory/State_Regula-tory_Requirement_Summary_20150330.pdf (accessed Aug 2015).
10 FDA. Registration of Food Facilities. http://www.fda.gov/food/guidanceregulation/foodfacilityregistration/default.htm (accessed Aug 2015).
GMP regulations. And, third, the product must have either approval as a food additive or a determination of the GRAS status of the ingredient. Any changes to the manufacturing process will require additional review.
Other considerations include setting product specifications based on knowledge of the algal biomass, constituent substances, and manufacturing process to assure safety. Food grade specifications can be found in the current Food Chemicals Codex (FCC), which includes specifications for many major chemical constituents such as ash, moisture, and heavy metal content.1 Also, the US Pharmacopeial Convention (USP) is a scientific nonprofit organization that sets standards for the identity, strength, quality, and purity of medicines, food ingredients, and dietary supplements manufactured, distributed, and consumed worldwide. FSMA introduced new requirements for food facilities including preparation of Hazard Analysis and Risk-based Preventive Controls (HARPC). HARPC requires food facilities to evaluate chemical, biological, physical, and radiological hazards, natural toxins, pesticides, etc. that may potentially contaminate the product. FDA has yet to develop guidance for the preparation of a HARPC analysis. A more or less similar requirement, hazard analysis and critical control points (HACCP)11 is mandatory for meat, poultry, seafood, and cut vegetables, even though some producers of other foods and dietary supplement companies obtain HACCP certifications for added safety.
Safety information includes pertinent scientific information, including publicly available scientific articles on the safety and toxicity associated with human consumption of the algae or extract, and closely related materials. Documentation should include credible information on known adverse effects associated with ingestion of algae or extract, or closely related materials, and any available independent safety or toxicology assessments. Algal species new to the human food supply chain must undergo additional toxicology tests and, in some cases, dietary tests with animals, before approval as a food additive or determination of the GRAS status can be made.Other regulatory considerations include worker safety at the facilities and marketing standards. The Occupational Safety and Health Administration (OSHA)
11 FDA. Hazard Analysis & Critical Control Points (HACCP). http://www.fda.gov/food/guidanceregulation/HACCP (accessed Aug 2015).
ProposedIngredient
NDI or GRASNDIN to FDA
FDA non-response(75 days)
Dietary Supplement Market Food ingredient Market
GRAS Determination
Self-determined GRN to FDA
FDA response(180 days)
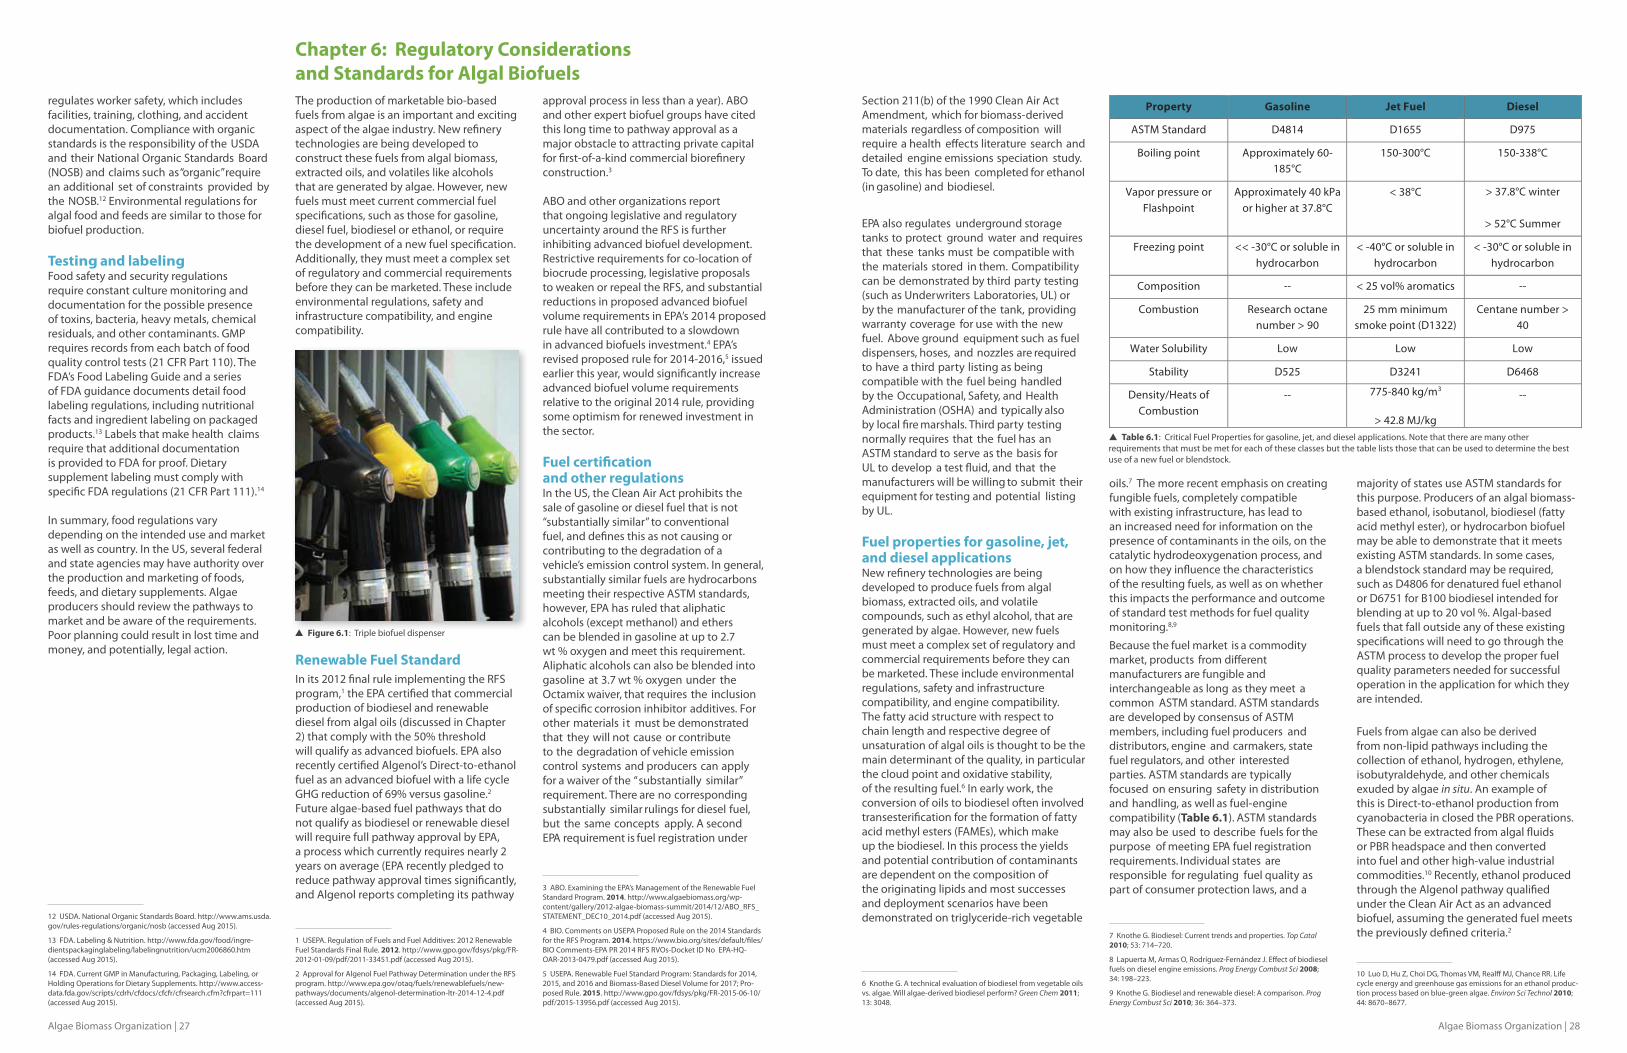
Algae Biomass Organization | 28Algae Biomass Organization | 27
regulates worker safety, which includes facilities, training, clothing, and accident documentation. Compliance with organic standards is the responsibility of the USDA and their National Organic Standards Board (NOSB) and claims such as “organic” require an additional set of constraints provided by the NOSB.12 Environmental regulations for algal food and feeds are similar to those for biofuel production. Testing and labelingFood safety and security regulations require constant culture monitoring and documentation for the possible presence of toxins, bacteria, heavy metals, chemical residuals, and other contaminants. GMP requires records from each batch of food quality control tests (21 CFR Part 110). The FDA’s Food Labeling Guide and a series of FDA guidance documents detail food labeling regulations, including nutritional facts and ingredient labeling on packaged products.13 Labels that make health claims require that additional documentation is provided to FDA for proof. Dietary supplement labeling must comply with specific FDA regulations (21 CFR Part 111).14 In summary, food regulations vary depending on the intended use and market as well as country. In the US, several federal and state agencies may have authority over the production and marketing of foods, feeds, and dietary supplements. Algae producers should review the pathways to market and be aware of the requirements. Poor planning could result in lost time and money, and potentially, legal action.
12 USDA. National Organic Standards Board. http://www.ams.usda.gov/rules-regulations/organic/nosb (accessed Aug 2015).
13 FDA. Labeling & Nutrition. http://www.fda.gov/food/ingre-dientspackaginglabeling/labelingnutrition/ucm2006860.htm (accessed Aug 2015).
14 FDA. Current GMP in Manufacturing, Packaging, Labeling, or Holding Operations for Dietary Supplements. http://www.access-data.fda.gov/scripts/cdrh/cfdocs/cfcfr/cfrsearch.cfm?cfrpart=111 (accessed Aug 2015).
The production of marketable bio-based fuels from algae is an important and exciting aspect of the algae industry. New refinery technologies are being developed to construct these fuels from algal biomass, extracted oils, and volatiles like alcohols that are generated by algae. However, new fuels must meet current commercial fuel specifications, such as those for gasoline, diesel fuel, biodiesel or ethanol, or require the development of a new fuel specification. Additionally, they must meet a complex set of regulatory and commercial requirements before they can be marketed. These include environmental regulations, safety and infrastructure compatibility, and engine compatibility.
Renewable Fuel StandardIn its 2012 final rule implementing the RFS program,1 the EPA certified that commercial production of biodiesel and renewable diesel from algal oils (discussed in Chapter 2) that comply with the 50% threshold will qualify as advanced biofuels. EPA also recently certified Algenol’s Direct-to-ethanol fuel as an advanced biofuel with a life cycle GHG reduction of 69% versus gasoline.2 Future algae-based fuel pathways that do not qualify as biodiesel or renewable diesel will require full pathway approval by EPA, a process which currently requires nearly 2 years on average (EPA recently pledged to reduce pathway approval times significantly, and Algenol reports completing its pathway
1 USEPA. Regulation of Fuels and Fuel Additives: 2012 Renewable Fuel Standards Final Rule. 2012. http://www.gpo.gov/fdsys/pkg/FR-2012-01-09/pdf/2011-33451.pdf (accessed Aug 2015).
2 Approval for Algenol Fuel Pathway Determination under the RFS program. http://www.epa.gov/otaq/fuels/renewablefuels/new-pathways/documents/algenol-determination-ltr-2014-12-4.pdf (accessed Aug 2015).
approval process in less than a year). ABO and other expert biofuel groups have cited this long time to pathway approval as a major obstacle to attracting private capital for first-of-a-kind commercial biorefinery construction.3
ABO and other organizations report that ongoing legislative and regulatory uncertainty around the RFS is further inhibiting advanced biofuel development. Restrictive requirements for co-location of biocrude processing, legislative proposals to weaken or repeal the RFS, and substantial reductions in proposed advanced biofuel volume requirements in EPA’s 2014 proposed rule have all contributed to a slowdown in advanced biofuels investment.4 EPA’s revised proposed rule for 2014-2016,5 issued earlier this year, would significantly increase advanced biofuel volume requirements relative to the original 2014 rule, providing some optimism for renewed investment in the sector. Fuel certification and other regulations In the US, the Clean Air Act prohibits the sale of gasoline or diesel fuel that is not “substantially similar” to conventional fuel, and defines this as not causing or contributing to the degradation of a vehicle’s emission control system. In general, substantially similar fuels are hydrocarbons meeting their respective ASTM standards, however, EPA has ruled that aliphatic alcohols (except methanol) and ethers can be blended in gasoline at up to 2.7 wt % oxygen and meet this requirement. Aliphatic alcohols can also be blended into gasoline at 3.7 wt % oxygen under the Octamix waiver, that requires the inclusion of specific corrosion inhibitor additives. For other materials it must be demonstrated that they will not cause or contribute to the degradation of vehicle emission control systems and producers can apply for a waiver of the “substantially similar” requirement. There are no corresponding substantially similar rulings for diesel fuel, but the same concepts apply. A second EPA requirement is fuel registration under
3 ABO. Examining the EPA’s Management of the Renewable Fuel Standard Program. 2014. http://www.algaebiomass.org/wp-content/gallery/2012-algae-biomass-summit/2014/12/ABO_RFS_STATEMENT_DEC10_2014.pdf (accessed Aug 2015).
4 BIO. Comments on USEPA Proposed Rule on the 2014 Standards for the RFS Program. 2014. https://www.bio.org/sites/default/files/BIO Comments-EPA PR 2014 RFS RVOs-Docket ID No EPA-HQ-OAR-2013-0479.pdf (accessed Aug 2015).
5 USEPA. Renewable Fuel Standard Program: Standards for 2014, 2015, and 2016 and Biomass-Based Diesel Volume for 2017; Pro-posed Rule. 2015. http://www.gpo.gov/fdsys/pkg/FR-2015-06-10/pdf/2015-13956.pdf (accessed Aug 2015).
Chapter 6: Regulatory Considerations and Standards for Algal Biofuels
Section 211(b) of the 1990 Clean Air Act Amendment, which for biomass-derived materials regardless of composition will require a health effects literature search and detailed engine emissions speciation study. To date, this has been completed for ethanol (in gasoline) and biodiesel.
EPA also regulates underground storage tanks to protect ground water and requires that these tanks must be compatible with the materials stored in them. Compatibility can be demonstrated by third party testing (such as Underwriters Laboratories, UL) or by the manufacturer of the tank, providing warranty coverage for use with the new fuel. Above ground equipment such as fuel dispensers, hoses, and nozzles are required to have a third party listing as being compatible with the fuel being handled by the Occupational, Safety, and Health Administration (OSHA) and typically also by local fire marshals. Third party testing normally requires that the fuel has an ASTM standard to serve as the basis for UL to develop a test fluid, and that the manufacturers will be willing to submit their equipment for testing and potential listing by UL. Fuel properties for gasoline, jet, and diesel applicationsNew refinery technologies are being developed to produce fuels from algal biomass, extracted oils, and volatile compounds, such as ethyl alcohol, that are generated by algae. However, new fuels must meet a complex set of regulatory and commercial requirements before they can be marketed. These include environmental regulations, safety and infrastructure compatibility, and engine compatibility. The fatty acid structure with respect to chain length and respective degree of unsaturation of algal oils is thought to be the main determinant of the quality, in particular the cloud point and oxidative stability, of the resulting fuel.6 In early work, the conversion of oils to biodiesel often involved transesterification for the formation of fatty acid methyl esters (FAMEs), which make up the biodiesel. In this process the yields and potential contribution of contaminants are dependent on the composition of the originating lipids and most successes and deployment scenarios have been demonstrated on triglyceride-rich vegetable
6 Knothe G. A technical evaluation of biodiesel from vegetable oils vs. algae. Will algae-derived biodiesel perform? Green Chem 2011; 13: 3048.
oils.7 The more recent emphasis on creating fungible fuels, completely compatible with existing infrastructure, has lead to an increased need for information on the presence of contaminants in the oils, on the catalytic hydrodeoxygenation process, and on how they influence the characteristics of the resulting fuels, as well as on whether this impacts the performance and outcome of standard test methods for fuel quality monitoring.8,9
Because the fuel market is a commodity market, products from different manufacturers are fungible and interchangeable as long as they meet a common ASTM standard. ASTM standards are developed by consensus of ASTM members, including fuel producers and distributors, engine and carmakers, state fuel regulators, and other interested parties. ASTM standards are typically focused on ensuring safety in distribution and handling, as well as fuel-engine compatibility (Table 6.1). ASTM standards may also be used to describe fuels for the purpose of meeting EPA fuel registration requirements. Individual states are responsible for regulating fuel quality as part of consumer protection laws, and a
7 Knothe G. Biodiesel: Current trends and properties. Top Catal 2010; 53: 714–720.
8 Lapuerta M, Armas O, Rodríguez-Fernández J. Effect of biodiesel fuels on diesel engine emissions. Prog Energy Combust Sci 2008; 34: 198–223.
9 Knothe G. Biodiesel and renewable diesel: A comparison. Prog Energy Combust Sci 2010; 36: 364–373.
majority of states use ASTM standards for this purpose. Producers of an algal biomass-based ethanol, isobutanol, biodiesel (fatty acid methyl ester), or hydrocarbon biofuel may be able to demonstrate that it meets existing ASTM standards. In some cases, a blendstock standard may be required, such as D4806 for denatured fuel ethanol or D6751 for B100 biodiesel intended for blending at up to 20 vol %. Algal-based fuels that fall outside any of these existing specifications will need to go through the ASTM process to develop the proper fuel quality parameters needed for successful operation in the application for which they are intended.
Fuels from algae can also be derived from non-lipid pathways including the collection of ethanol, hydrogen, ethylene, isobutyraldehyde, and other chemicals exuded by algae in situ. An example of this is Direct-to-ethanol production from cyanobacteria in closed the PBR operations. These can be extracted from algal fluids or PBR headspace and then converted into fuel and other high-value industrial commodities.10 Recently, ethanol produced through the Algenol pathway qualified under the Clean Air Act as an advanced biofuel, assuming the generated fuel meets the previously defined criteria.2
10 Luo D, Hu Z, Choi DG, Thomas VM, Realff MJ, Chance RR. Life cycle energy and greenhouse gas emissions for an ethanol produc-tion process based on blue-green algae. Environ Sci Technol 2010; 44: 8670–8677.
Property Gasoline Jet Fuel Diesel
ASTM Standard D4814 D1655 D975
Boiling point Approximately 60-185°C
150-300°C 150-338°C
Vapor pressure or Flashpoint
Approximately 40 kPa or higher at 37.8°C
< 38°C > 37.8°C winter
> 52°C Summer
Freezing point << -30°C or soluble in hydrocarbon
< -40°C or soluble in hydrocarbon
< -30°C or soluble in hydrocarbon
Composition -- < 25 vol% aromatics --
Combustion Research octane number > 90
25 mm minimum smoke point (D1322)
Centane number > 40
Water Solubility Low Low Low
Stability D525 D3241 D6468
Density/Heats of Combustion
-- 775-840 kg/m3
> 42.8 MJ/kg
--
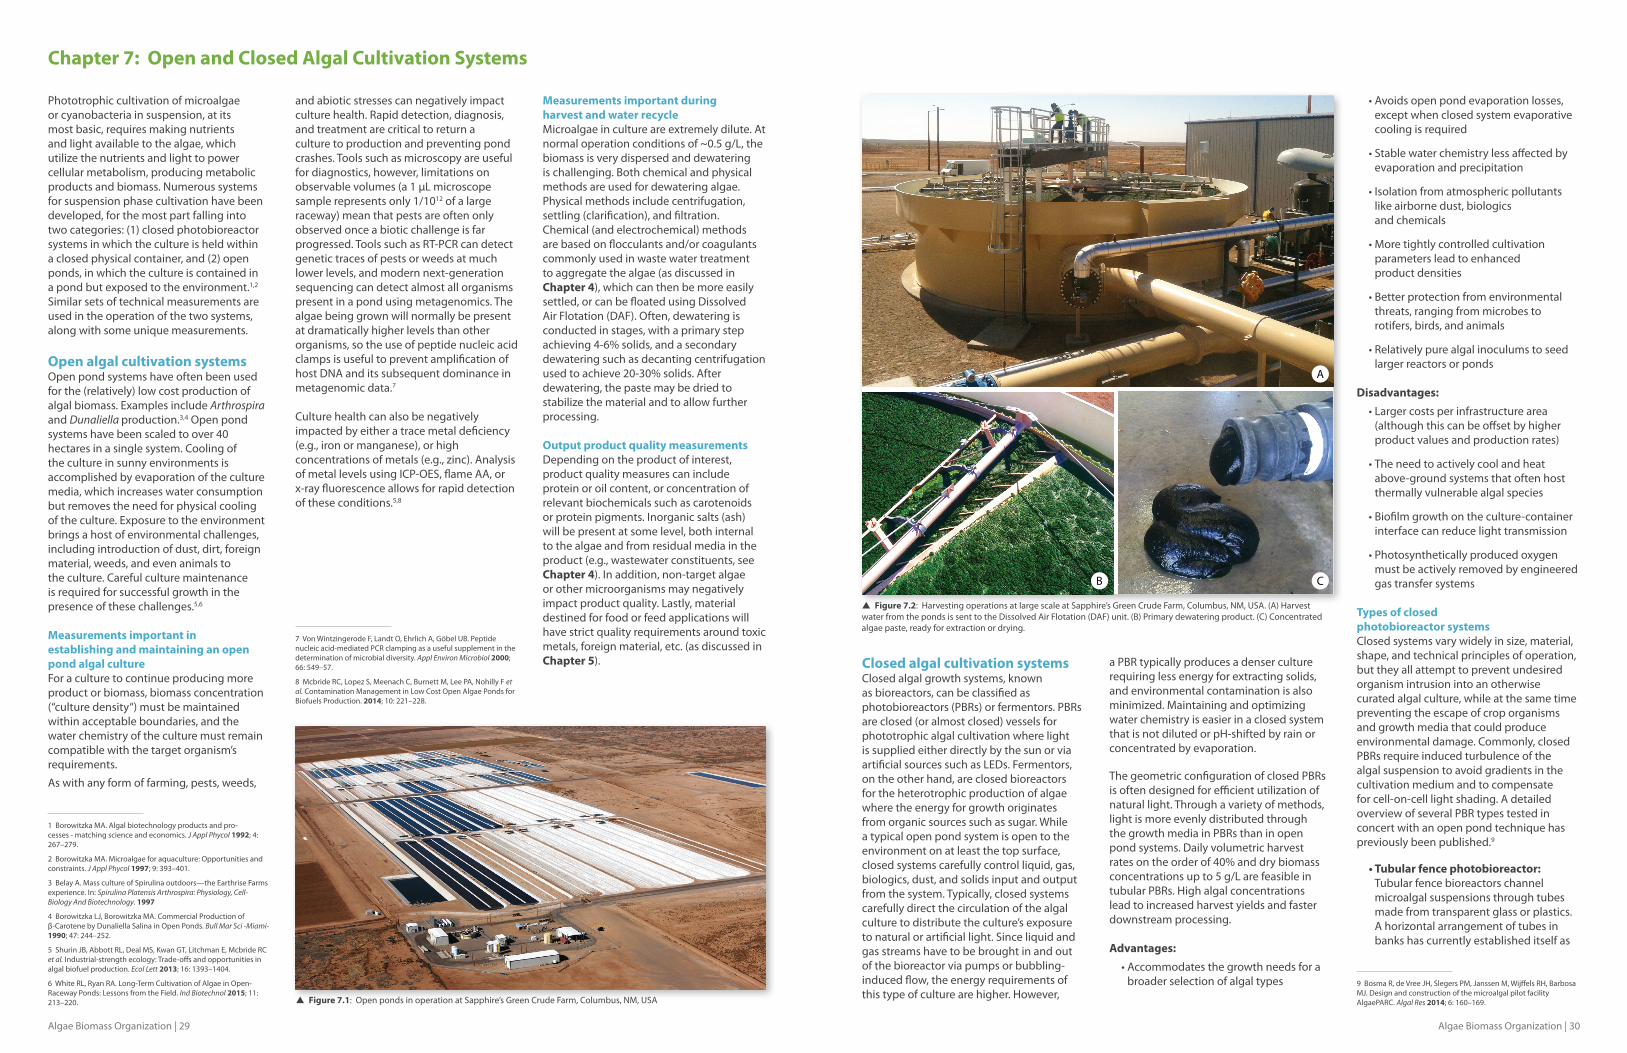
Algae Biomass Organization | 30Algae Biomass Organization | 29
Phototrophic cultivation of microalgae or cyanobacteria in suspension, at its most basic, requires making nutrients and light available to the algae, which utilize the nutrients and light to power cellular metabolism, producing metabolic products and biomass. Numerous systems for suspension phase cultivation have been developed, for the most part falling into two categories: (1) closed photobioreactor systems in which the culture is held within a closed physical container, and (2) open ponds, in which the culture is contained in a pond but exposed to the environment.1,2 Similar sets of technical measurements are used in the operation of the two systems, along with some unique measurements. Open algal cultivation systems Open pond systems have often been used for the (relatively) low cost production of algal biomass. Examples include Arthrospira and Dunaliella production.3,4 Open pond systems have been scaled to over 40 hectares in a single system. Cooling of the culture in sunny environments is accomplished by evaporation of the culture media, which increases water consumption but removes the need for physical cooling of the culture. Exposure to the environment brings a host of environmental challenges, including introduction of dust, dirt, foreign material, weeds, and even animals to the culture. Careful culture maintenance is required for successful growth in the presence of these challenges.5,6 Measurements important in establishing and maintaining an open pond algal culture For a culture to continue producing more product or biomass, biomass concentration (“culture density“) must be maintained within acceptable boundaries, and the water chemistry of the culture must remain compatible with the target organism’s requirements.
As with any form of farming, pests, weeds,
1 Borowitzka MA. Algal biotechnology products and pro-cesses - matching science and economics. J Appl Phycol 1992; 4: 267–279.
2 Borowitzka MA. Microalgae for aquaculture: Opportunities and constraints. J Appl Phycol 1997; 9: 393–401.
3 Belay A. Mass culture of Spirulina outdoors—the Earthrise Farms experience. In: Spirulina Platensis Arthrospira: Physiology, Cell-Biology And Biotechnology. 1997
4 Borowitzka LJ, Borowitzka MA. Commercial Production of β-Carotene by Dunaliella Salina in Open Ponds. Bull Mar Sci -Miami- 1990; 47: 244–252.
5 Shurin JB, Abbott RL, Deal MS, Kwan GT, Litchman E, Mcbride RC et al. Industrial-strength ecology: Trade-offs and opportunities in algal biofuel production. Ecol Lett 2013; 16: 1393–1404.
6 White RL, Ryan RA. Long-Term Cultivation of Algae in Open-Raceway Ponds: Lessons from the Field. Ind Biotechnol 2015; 11: 213–220.
and abiotic stresses can negatively impact culture health. Rapid detection, diagnosis, and treatment are critical to return a culture to production and preventing pond crashes. Tools such as microscopy are useful for diagnostics, however, limitations on observable volumes (a 1 μL microscope sample represents only 1/1012 of a large raceway) mean that pests are often only observed once a biotic challenge is far progressed. Tools such as RT-PCR can detect genetic traces of pests or weeds at much lower levels, and modern next-generation sequencing can detect almost all organisms present in a pond using metagenomics. The algae being grown will normally be present at dramatically higher levels than other organisms, so the use of peptide nucleic acid clamps is useful to prevent amplification of host DNA and its subsequent dominance in metagenomic data.7
Culture health can also be negatively impacted by either a trace metal deficiency (e.g., iron or manganese), or high concentrations of metals (e.g., zinc). Analysis of metal levels using ICP-OES, flame AA, or x-ray fluorescence allows for rapid detection of these conditions.5,8
7 Von Wintzingerode F, Landt O, Ehrlich A, Göbel UB. Peptide nucleic acid-mediated PCR clamping as a useful supplement in the determination of microbial diversity. Appl Environ Microbiol 2000; 66: 549–57.
8 Mcbride RC, Lopez S, Meenach C, Burnett M, Lee PA, Nohilly F et al. Contamination Management in Low Cost Open Algae Ponds for Biofuels Production. 2014; 10: 221–228.
Measurements important during harvest and water recycle Microalgae in culture are extremely dilute. At normal operation conditions of ~0.5 g/L, the biomass is very dispersed and dewatering is challenging. Both chemical and physical methods are used for dewatering algae. Physical methods include centrifugation, settling (clarification), and filtration. Chemical (and electrochemical) methods are based on flocculants and/or coagulants commonly used in waste water treatment to aggregate the algae (as discussed in Chapter 4), which can then be more easily settled, or can be floated using Dissolved Air Flotation (DAF). Often, dewatering is conducted in stages, with a primary step achieving 4-6% solids, and a secondary dewatering such as decanting centrifugation used to achieve 20-30% solids. After dewatering, the paste may be dried to stabilize the material and to allow further processing. Output product quality measurements Depending on the product of interest, product quality measures can include protein or oil content, or concentration of relevant biochemicals such as carotenoids or protein pigments. Inorganic salts (ash) will be present at some level, both internal to the algae and from residual media in the product (e.g., wastewater constituents, see Chapter 4). In addition, non-target algae or other microorganisms may negatively impact product quality. Lastly, material destined for food or feed applications will have strict quality requirements around toxic metals, foreign material, etc. (as discussed in Chapter 5).
Closed algal cultivation systems Closed algal growth systems, known as bioreactors, can be classified as photobioreactors (PBRs) or fermentors. PBRs are closed (or almost closed) vessels for phototrophic algal cultivation where light is supplied either directly by the sun or via artificial sources such as LEDs. Fermentors, on the other hand, are closed bioreactors for the heterotrophic production of algae where the energy for growth originates from organic sources such as sugar. While a typical open pond system is open to the environment on at least the top surface, closed systems carefully control liquid, gas, biologics, dust, and solids input and output from the system. Typically, closed systems carefully direct the circulation of the algal culture to distribute the culture’s exposure to natural or artificial light. Since liquid and gas streams have to be brought in and out of the bioreactor via pumps or bubbling-induced flow, the energy requirements of this type of culture are higher. However,
a PBR typically produces a denser culture requiring less energy for extracting solids, and environmental contamination is also minimized. Maintaining and optimizing water chemistry is easier in a closed system that is not diluted or pH-shifted by rain or concentrated by evaporation.
The geometric configuration of closed PBRs is often designed for efficient utilization of natural light. Through a variety of methods, light is more evenly distributed through the growth media in PBRs than in open pond systems. Daily volumetric harvest rates on the order of 40% and dry biomass concentrations up to 5 g/L are feasible in tubular PBRs. High algal concentrations lead to increased harvest yields and faster downstream processing. Advantages:
•Accommodates the growth needs for a broader selection of algal types
•Avoids open pond evaporation losses, except when closed system evaporative cooling is required
•Stable water chemistry less affected by evaporation and precipitation
•Isolation from atmospheric pollutants like airborne dust, biologics and chemicals
•More tightly controlled cultivation parameters lead to enhanced product densities
•Better protection from environmental threats, ranging from microbes to rotifers, birds, and animals
•Relatively pure algal inoculums to seed larger reactors or ponds
Disadvantages:
•Larger costs per infrastructure area (although this can be offset by higher product values and production rates)
•The need to actively cool and heat above-ground systems that often host thermally vulnerable algal species
•Biofilm growth on the culture-container interface can reduce light transmission
•Photosyntheticallyproducedoxygen must be actively removed by engineered gas transfer systems
Types of closed photobioreactor systemsClosed systems vary widely in size, material, shape, and technical principles of operation, but they all attempt to prevent undesired organism intrusion into an otherwise curated algal culture, while at the same time preventing the escape of crop organisms and growth media that could produce environmental damage. Commonly, closed PBRs require induced turbulence of the algal suspension to avoid gradients in the cultivation medium and to compensate for cell-on-cell light shading. A detailed overview of several PBR types tested in concert with an open pond technique has previously been published.9
•Tubular fence photobioreactor: Tubular fence bioreactors channel microalgal suspensions through tubes made from transparent glass or plastics. A horizontal arrangement of tubes in banks has currently established itself as
9 Bosma R, de Vree JH, Slegers PM, Janssen M, Wijffels RH, Barbosa MJ. Design and construction of the microalgal pilot facility AlgaePARC. Algal Res 2014; 6: 160–169.
Chapter 7: Open and Closed Algal Cultivation Systems
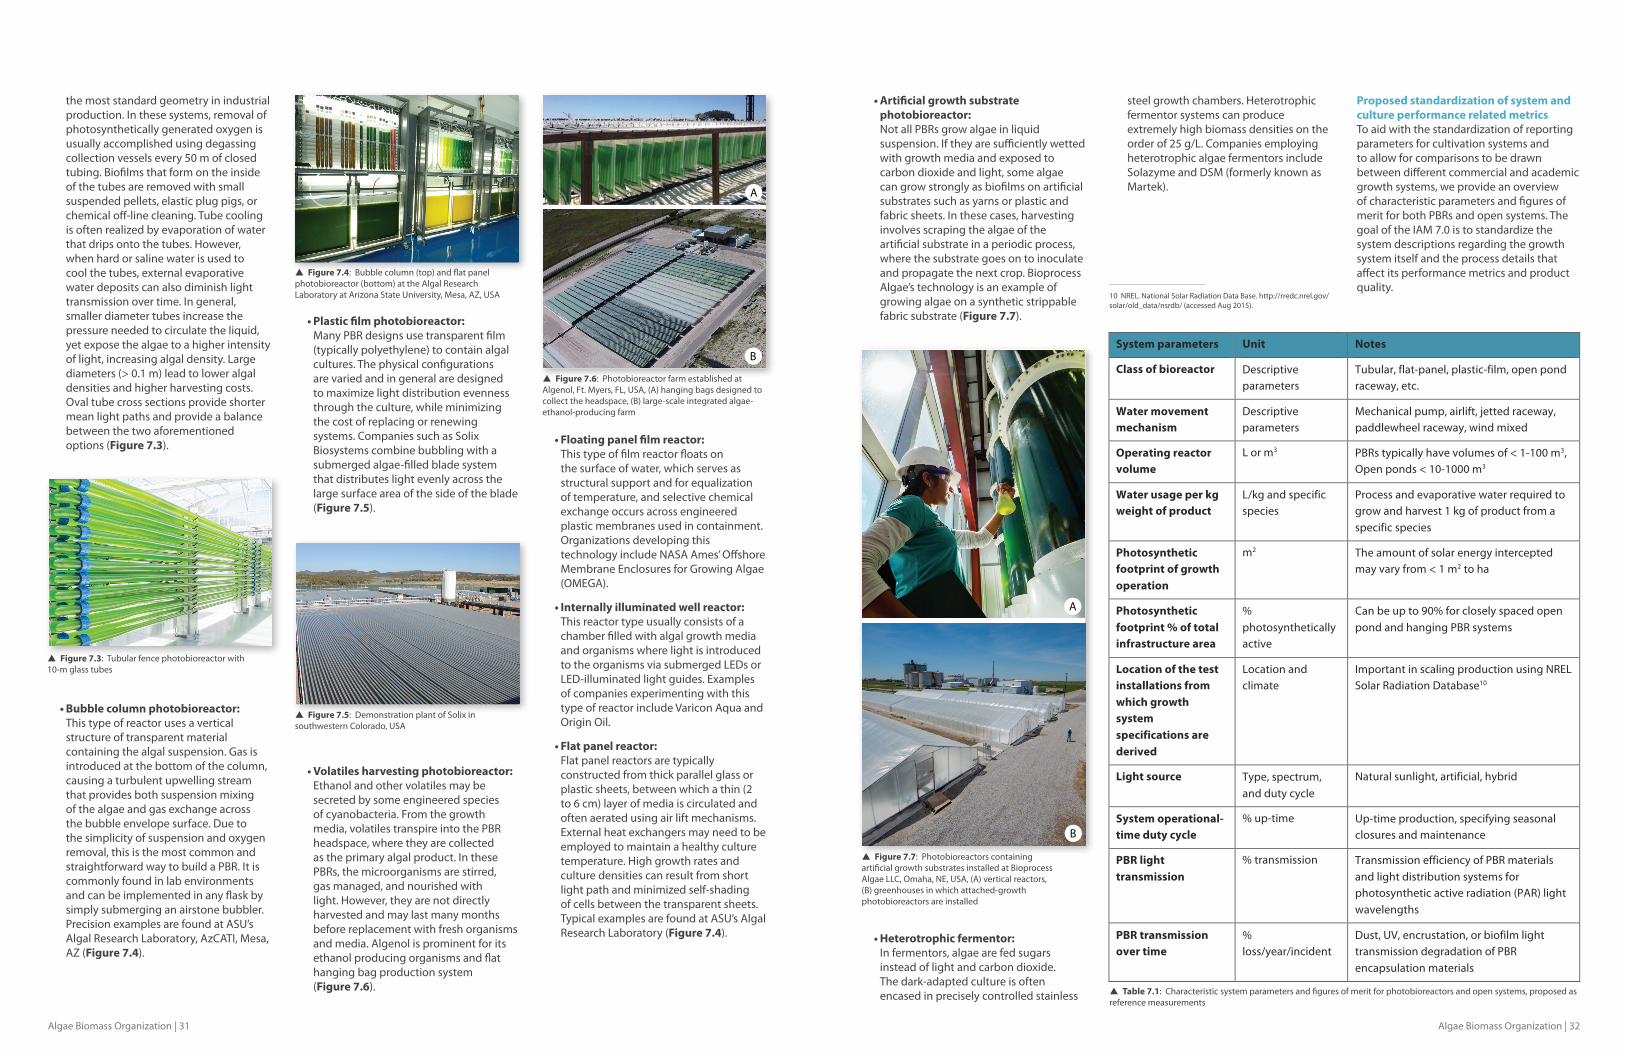
Algae Biomass Organization | 32Algae Biomass Organization | 31
System parameters Unit Notes
Class of bioreactor Descriptive parameters
Tubular, flat-panel, plastic-film, open pond raceway, etc.
Water movement mechanism
Descriptive parameters
Mechanical pump, airlift, jetted raceway, paddlewheel raceway, wind mixed
Operating reactor volume
L or m3 PBRs typically have volumes of < 1-100 m3, Open ponds < 10-1000 m3
Water usage per kg weight of product
L/kg and specific species
Process and evaporative water required to grow and harvest 1 kg of product from a specific species
Photosynthetic footprint of growth operation
m2 The amount of solar energy intercepted may vary from < 1 m2 to ha
Photosynthetic footprint % of total infrastructure area
% photosynthetically active
Can be up to 90% for closely spaced open pond and hanging PBR systems
Location of the test installations from which growth system specifications are derived
Location and climate
Important in scaling production using NREL Solar Radiation Database10
Light source Type, spectrum, and duty cycle
Natural sunlight, artificial, hybrid
System operational-time duty cycle
% up-time Up-time production, specifying seasonal closures and maintenance
PBR light transmission
% transmission Transmission efficiency of PBR materials and light distribution systems for photosynthetic active radiation (PAR) light wavelengths
PBR transmission over time
% loss/year/incident
Dust, UV, encrustation, or biofilm light transmission degradation of PBR encapsulation materials
the most standard geometry in industrial production. In these systems, removal of photosynthetically generated oxygen is usually accomplished using degassing collection vessels every 50 m of closed tubing. Biofilms that form on the inside of the tubes are removed with small suspended pellets, elastic plug pigs, or chemical off-line cleaning. Tube cooling is often realized by evaporation of water that drips onto the tubes. However, when hard or saline water is used to cool the tubes, external evaporative water deposits can also diminish light transmission over time. In general, smaller diameter tubes increase the pressure needed to circulate the liquid, yet expose the algae to a higher intensity of light, increasing algal density. Large diameters (> 0.1 m) lead to lower algal densities and higher harvesting costs. Oval tube cross sections provide shorter mean light paths and provide a balance between the two aforementioned options (Figure 7.3).
•Bubble column photobioreactor: This type of reactor uses a vertical structure of transparent material containing the algal suspension. Gas is introduced at the bottom of the column, causing a turbulent upwelling stream that provides both suspension mixing of the algae and gas exchange across the bubble envelope surface. Due to the simplicity of suspension and oxygen removal, this is the most common and straightforward way to build a PBR. It is commonly found in lab environments and can be implemented in any flask by simply submerging an airstone bubbler. Precision examples are found at ASU’s Algal Research Laboratory, AzCATI, Mesa, AZ (Figure 7.4).
•Plastic film photobioreactor: Many PBR designs use transparent film (typically polyethylene) to contain algal cultures. The physical configurations are varied and in general are designed to maximize light distribution evenness through the culture, while minimizing the cost of replacing or renewing systems. Companies such as Solix Biosystems combine bubbling with a submerged algae-filled blade system that distributes light evenly across the large surface area of the side of the blade (Figure 7.5).
•Volatiles harvesting photobioreactor: Ethanol and other volatiles may be secreted by some engineered species of cyanobacteria. From the growth media, volatiles transpire into the PBR headspace, where they are collected as the primary algal product. In these PBRs, the microorganisms are stirred, gas managed, and nourished with light. However, they are not directly harvested and may last many months before replacement with fresh organisms and media. Algenol is prominent for its ethanol producing organisms and flat hanging bag production system (Figure 7.6).
•Floating panel film reactor: This type of film reactor floats on the surface of water, which serves as structural support and for equalization of temperature, and selective chemical exchange occurs across engineered plastic membranes used in containment. Organizations developing this technology include NASA Ames’ Offshore Membrane Enclosures for Growing Algae (OMEGA).
•Internally illuminated well reactor: This reactor type usually consists of a chamber filled with algal growth media and organisms where light is introduced to the organisms via submerged LEDs or LED-illuminated light guides. Examples of companies experimenting with this type of reactor include Varicon Aqua and Origin Oil.
•Flat panel reactor: Flat panel reactors are typically constructed from thick parallel glass or plastic sheets, between which a thin (2 to 6 cm) layer of media is circulated and often aerated using air lift mechanisms. External heat exchangers may need to be employed to maintain a healthy culture temperature. High growth rates and culture densities can result from short light path and minimized self-shading of cells between the transparent sheets. Typical examples are found at ASU’s Algal Research Laboratory (Figure 7.4).
•Artificial growth substrate photobioreactor: Not all PBRs grow algae in liquid suspension. If they are sufficiently wetted with growth media and exposed to carbon dioxide and light, some algae can grow strongly as biofilms on artificial substrates such as yarns or plastic and fabric sheets. In these cases, harvesting involves scraping the algae of the artificial substrate in a periodic process, where the substrate goes on to inoculate and propagate the next crop. Bioprocess Algae’s technology is an example of growing algae on a synthetic strippable fabric substrate (Figure 7.7).
•Heterotrophic fermentor: In fermentors, algae are fed sugars instead of light and carbon dioxide. The dark-adapted culture is often encased in precisely controlled stainless
steel growth chambers. Heterotrophic fermentor systems can produce extremely high biomass densities on the order of 25 g/L. Companies employing heterotrophic algae fermentors include Solazyme and DSM (formerly known as Martek).
10 NREL. National Solar Radiation Data Base. http://rredc.nrel.gov/solar/old_data/nsrdb/ (accessed Aug 2015).
Proposed standardization of system and culture performance related metrics To aid with the standardization of reporting parameters for cultivation systems and to allow for comparisons to be drawn between different commercial and academic growth systems, we provide an overview of characteristic parameters and figures of merit for both PBRs and open systems. The goal of the IAM 7.0 is to standardize the system descriptions regarding the growth system itself and the process details that affect its performance metrics and product quality.
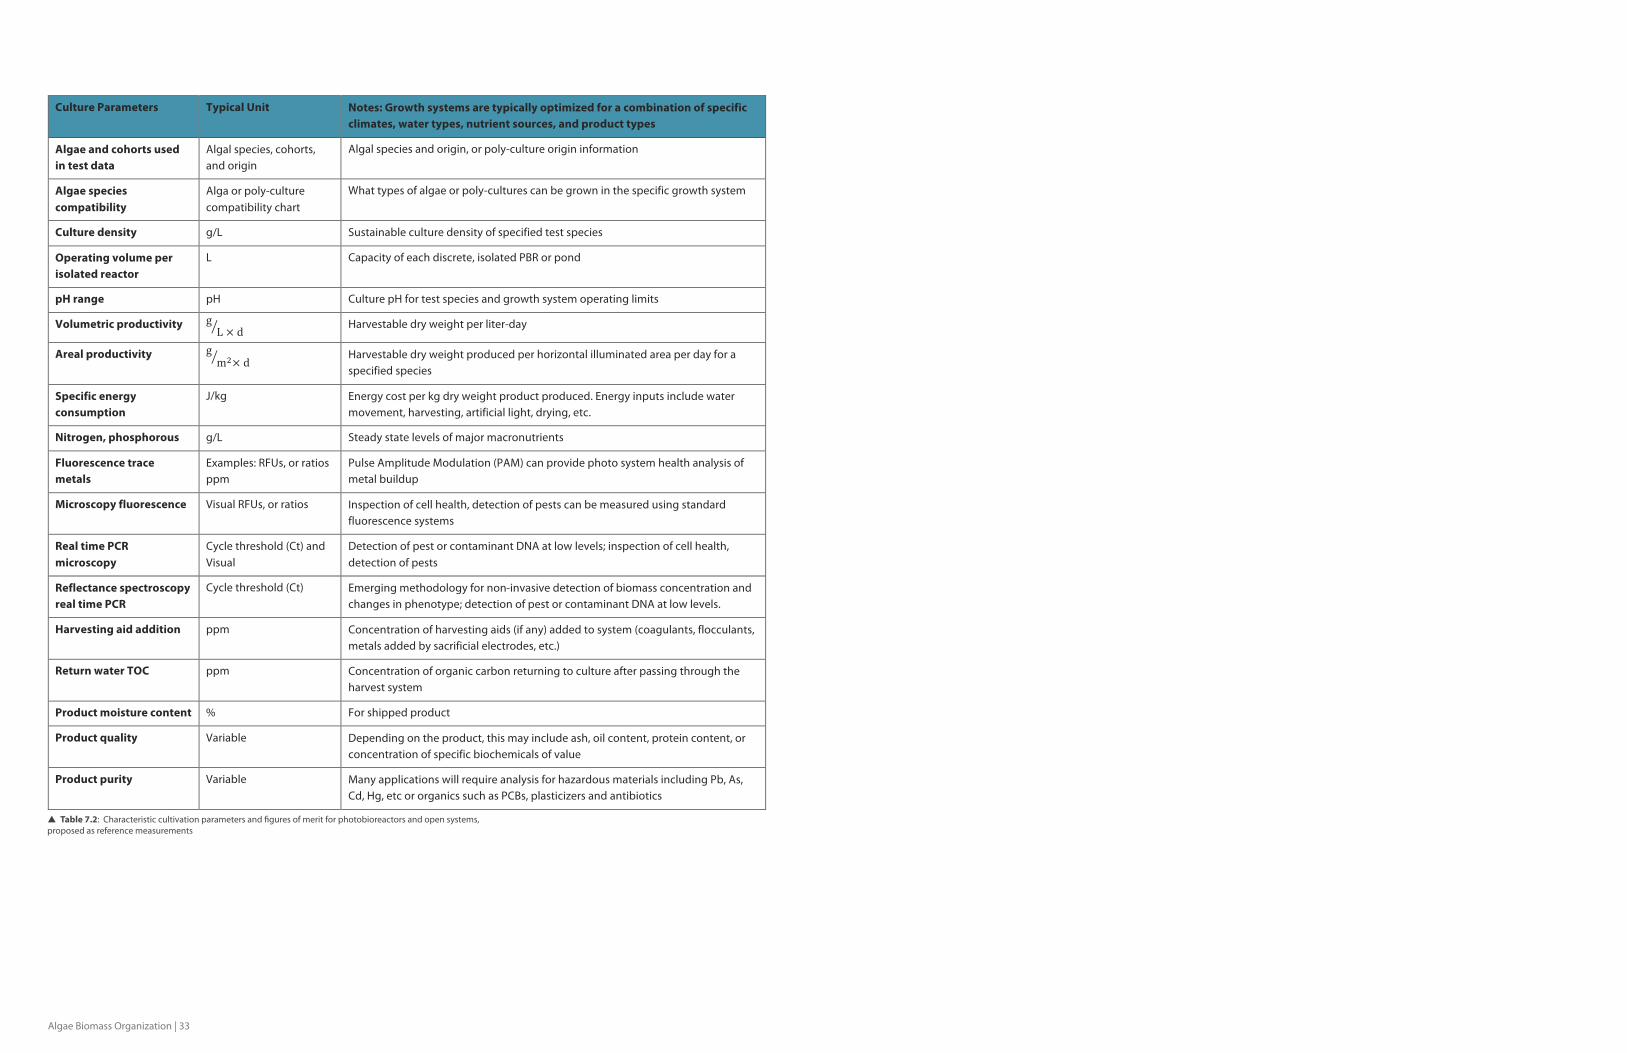
Algae Biomass Organization | 33
Culture Parameters Typical Unit Notes: Growth systems are typically optimized for a combination of specific climates, water types, nutrient sources, and product types
Algae and cohorts used in test data
Algal species, cohorts, and origin
Algal species and origin, or poly-culture origin information
Algae species compatibility
Alga or poly-culture compatibility chart
What types of algae or poly-cultures can be grown in the specific growth system
Culture density g/L Sustainable culture density of specified test species
Operating volume per isolated reactor
L Capacity of each discrete, isolated PBR or pond
pH range pH Culture pH for test species and growth system operating limits
Volumetric productivity gL × d Harvestable dry weight per liter-day
Areal productivity gm!× d Harvestable dry weight produced per horizontal illuminated area per day for a
specified species
Specific energy consumption
J/kg Energy cost per kg dry weight product produced. Energy inputs include water movement, harvesting, artificial light, drying, etc.
Nitrogen, phosphorous g/L Steady state levels of major macronutrients
Fluorescence trace metals
Examples: RFUs, or ratios ppm
Pulse Amplitude Modulation (PAM) can provide photo system health analysis of metal buildup
Microscopy fluorescence Visual RFUs, or ratios Inspection of cell health, detection of pests can be measured using standard fluorescence systems
Real time PCR microscopy
Cycle threshold (Ct) and Visual
Detection of pest or contaminant DNA at low levels; inspection of cell health, detection of pests
Reflectance spectroscopy real time PCR
Cycle threshold (Ct) Emerging methodology for non-invasive detection of biomass concentration and changes in phenotype; detection of pest or contaminant DNA at low levels.
Harvesting aid addition ppm Concentration of harvesting aids (if any) added to system (coagulants, flocculants, metals added by sacrificial electrodes, etc.)
Return water TOC ppm Concentration of organic carbon returning to culture after passing through the harvest system
Product moisture content % For shipped product
Product quality Variable Depending on the product, this may include ash, oil content, protein content, or concentration of specific biochemicals of value
Product purity Variable Many applications will require analysis for hazardous materials including Pb, As, Cd, Hg, etc or organics such as PCBs, plasticizers and antibiotics
Supporting Organizations
Applied Chemical TechnologyATP3Aurora Algae, Inc.NCMA - Bigelow Laboratory for Ocean SciencesCleanTECH San DiegoColorado Lining InternationalCommercial Algae ManagementDiversified Technologies, Inc.DSMDuke Energy CorporationEarthrise Nutritionals LLCElnusa Daya KreatifEvodos B.V.FedEx Express
Gas Technology InstituteGeneral AtomicsGeorg Fischer LLCGICON Grossman Ingenieur Consult GmbHGlobal Algae InnovationsHY-TEK Bio, LLCJAIICKimberly-ClarkLinde AGMicroBio Engineering, IncMuradel Pty LtdNeste OpenAlgaeParker Hannifin Renewable Resources
PRANA S.r.l.Qualitas HealthRenewable Algal EnergySABICSCHOTT North America, Inc.Synthetic Genomics IncT2eEnergy, LLCTASA (Tecnológica de Alimentos S.A.)Texas A&M AgriLife ResearchThe Scoular CompanyUniversity of Kentucky - Center for Applied Energy Research
Gold
Members | 2015
Corporate
Platinum
National Laboratories
American Oil Chemists’ SocietyBiotechnology Industry Organization
European Algae Biomass AssociationNational Biodiesel Board
Phycological Society of America
Los Alamos National LaboratoryNational Renewable Energy Laboratory
Oak Ridge National LaboratorywPacific Northwest National Laboratory
Sandia National Laboratory
Diamond
T2 Energy
Related Documents