63 Induction Sintering of %3 Cu Contented Iron Based Powder Metal Parts Uğur ÇAVDAR Department of Mechanical Engineering, Celal Bayar University Muradiye Campus, PO Box: 45140 Manisa, TURKEY Tel: 90-236-241-2144-45 (Inner :279) Fax: +90 236 2142143 E-mail: [email protected] Enver ATİK Department of Mechanical Engineering, Celal Bayar University Muradiye Campus, PO Box: 45140 Manisa, TURKEY Tel: 90-236-241-2144-45 (Inner :279) Fax: +90 236 2142143 E-mail: [email protected] Abstract In this study; iron powder metals were sintered with induction heating process. Sintering process has been achieved with an induction generator that has 12 kW power supply and 30 kHz frequency. ASC10029 grade iron powder was mixed with copper with a ratio of %3 and zinc stearat with a ratio of %0.8 of iron mass by weight. Several duration in the range of 1, 2 and 3 minutes was studied during induction sintering. Transverse rupture strength, hardness and microstructural investigations were done. Obtained mechanical properties and microstructures were compared with traditionally sintered samples. At the end of the induction sintering process for a period of 3 minutes, the maximum stress values that were obtained from traditionally oven-sintered samples for a period of 30 minutes are reached. Keywords: Induction, Sintering, Iron based powder, Induction sintering, Copper Powder 1. Introduction The sintering is a modification process which causes significantly an increase in resistance and recovery of the properties by supplying to interlink bits(German, R.M., 1984)(German, R.M., 2007). The sintering process is generally performed in the sintering furnaces. The sintering furnace controls the heat and the time during the sintering loop. Additionally, it maintains the atmosphere and controls the heat treatment which provides the disposal of the lubricant and bindings. The sintering process is done in batch furnaces and continuous furnaces(German, R.M., 1984)(German, R.M., 2007). The sintering process of an iron-based powder metal sample in a traditional furnace is performed at 1120°C in 30 minutes. The reason of performing the induction sintering is decreasing 30 minute-sintering duration to a shorter period. Based on the literature sintering by induction was patented in 1988 in the USA under the name of “Induction sintering process and apparatus”(United States Patent, 1988). The most significant studies done on sintering by induction after that date have been done under the name of high frequency induction heat sintering which are called HFIHS. Parallel to our study, M. Nakamura et al. (Nakamura, M., 2003) took out the patent of rapid sintering of iron and steel by induction heat under hydrogen and nitrogen gases in 2003. 1.1 HFIHS (High Frequency Induction Heat Sintering) HFIHS method is a method of rapid sintering like SPS (Spark Plasma Sintering) method. As compared to SPS, HFIHS is a new method of sintering (Kim, H.C., Kim, D.K., Woo, K.D., Ko, I.Y., Shon, I.J. 2007). This method is generally applied to ceramics, composites and bio materials. For example; are used in materials such as WC-Co (Kim, H.C., Oh, D.Y., Shon, I.J., 2004), uranium oxide (UO)(Yang, J.H., Kim, Y.W. , Kim, J.H., Kim, D.J. , Kang, K.W., Rhee, Y.W., Kim, K.S., Song, K.W., 2008) , composite like WC-Ni, Fe, Co(Shon, I.J., Jeong, I.K., Ko, I.Y., Doh, J.M., Woo, K.D., 2007)(Kim, H.C., Shon, I. J., Munir, Z. A., 2006), WC-Mo 2 C (Kim, H.C., Park, H.K., Jeong, I.K., Ko, I.Y., Shon, I.J., 2007), WC-TiC (Kim, H.C. , Kim, D.K. , Woo, K.D., Ko, I.Y., Shon I.J., 2007), WC-8%Co(Kim, H.C., Jeong, I.K., Shon, I.J., Ko, I.Y. , Doh, J.M., 2006), 8YSZ-Fe 2 O 3 (Shon, I.J., Jeong, I. K., Park, J.H., Kim, B.R., Lee, K.T., 2007), TiB 2 -WB 2 (Shibuya, M., Ohanagi M., 2007), NbSi 2 -Si 3 N 4 (Park, H.K., Shon, I.J., Yoon, J.K., Doh, J.M., Ko, I.Y.,

Welcome message from author
This document is posted to help you gain knowledge. Please leave a comment to let me know what you think about it! Share it to your friends and learn new things together.
Transcript
Modern Applied Science March, 2010
63
Induction Sintering of %3 Cu Contented Iron Based Powder Metal Parts
Uğur ÇAVDAR Department of Mechanical Engineering, Celal Bayar University
Muradiye Campus, PO Box: 45140 Manisa, TURKEY Tel: 90-236-241-2144-45 (Inner :279) Fax: +90 236 2142143 E-mail: [email protected]
Enver ATİK
Department of Mechanical Engineering, Celal Bayar University Muradiye Campus, PO Box: 45140 Manisa, TURKEY
Tel: 90-236-241-2144-45 (Inner :279) Fax: +90 236 2142143 E-mail: [email protected]
Abstract In this study; iron powder metals were sintered with induction heating process. Sintering process has been achieved with an induction generator that has 12 kW power supply and 30 kHz frequency. ASC10029 grade iron powder was mixed with copper with a ratio of %3 and zinc stearat with a ratio of %0.8 of iron mass by weight. Several duration in the range of 1, 2 and 3 minutes was studied during induction sintering. Transverse rupture strength, hardness and microstructural investigations were done. Obtained mechanical properties and microstructures were compared with traditionally sintered samples. At the end of the induction sintering process for a period of 3 minutes, the maximum stress values that were obtained from traditionally oven-sintered samples for a period of 30 minutes are reached. Keywords: Induction, Sintering, Iron based powder, Induction sintering, Copper Powder 1. Introduction The sintering is a modification process which causes significantly an increase in resistance and recovery of the properties by supplying to interlink bits(German, R.M., 1984)(German, R.M., 2007). The sintering process is generally performed in the sintering furnaces. The sintering furnace controls the heat and the time during the sintering loop. Additionally, it maintains the atmosphere and controls the heat treatment which provides the disposal of the lubricant and bindings. The sintering process is done in batch furnaces and continuous furnaces(German, R.M., 1984)(German, R.M., 2007). The sintering process of an iron-based powder metal sample in a traditional furnace is performed at 1120°C in 30 minutes. The reason of performing the induction sintering is decreasing 30 minute-sintering duration to a shorter period. Based on the literature sintering by induction was patented in 1988 in the USA under the name of “Induction sintering process and apparatus”(United States Patent, 1988). The most significant studies done on sintering by induction after that date have been done under the name of high frequency induction heat sintering which are called HFIHS. Parallel to our study, M. Nakamura et al. (Nakamura, M., 2003) took out the patent of rapid sintering of iron and steel by induction heat under hydrogen and nitrogen gases in 2003. 1.1 HFIHS (High Frequency Induction Heat Sintering) HFIHS method is a method of rapid sintering like SPS (Spark Plasma Sintering) method. As compared to SPS, HFIHS is a new method of sintering (Kim, H.C., Kim, D.K., Woo, K.D., Ko, I.Y., Shon, I.J. 2007). This method is generally applied to ceramics, composites and bio materials. For example; are used in materials such as WC-Co (Kim, H.C., Oh, D.Y., Shon, I.J., 2004), uranium oxide (UO)(Yang, J.H., Kim, Y.W. , Kim, J.H., Kim, D.J. , Kang, K.W., Rhee, Y.W., Kim, K.S., Song, K.W., 2008) , composite like WC-Ni, Fe, Co(Shon, I.J., Jeong, I.K., Ko, I.Y., Doh, J.M., Woo, K.D., 2007)(Kim, H.C., Shon, I. J., Munir, Z. A., 2006), WC-Mo2C (Kim, H.C., Park, H.K., Jeong, I.K., Ko, I.Y., Shon, I.J., 2007), WC-TiC (Kim, H.C. , Kim, D.K. , Woo, K.D., Ko, I.Y., Shon I.J., 2007), WC-8%Co(Kim, H.C., Jeong, I.K., Shon, I.J., Ko, I.Y. , Doh, J.M., 2006), 8YSZ-Fe2O3(Shon, I.J., Jeong, I. K., Park, J.H., Kim, B.R., Lee, K.T., 2007), TiB2-WB2 (Shibuya, M., Ohanagi M., 2007), NbSi2-Si3N4 (Park, H.K., Shon, I.J., Yoon, J.K., Doh, J.M., Ko, I.Y.,
Vol. 4, No. 3 Modern Applied Science
64
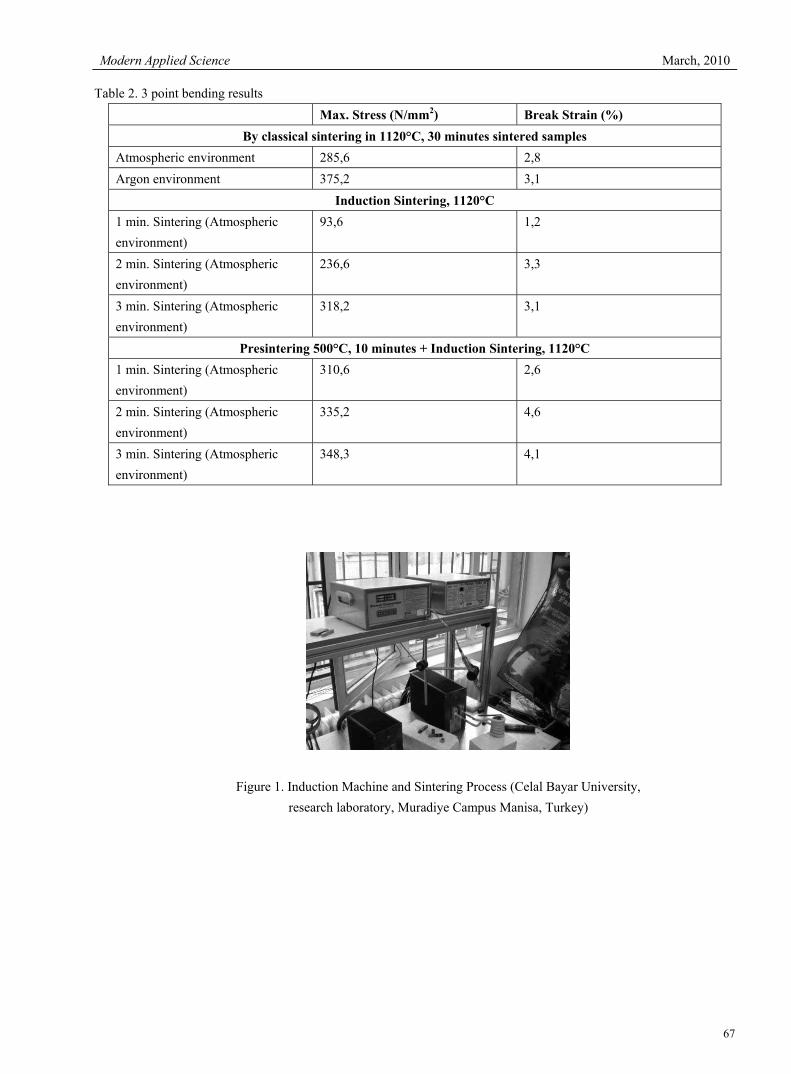
Munir Z.A., 2008), bio ceramics like Hydroxyapatite (Hap) (Khalil, K.A., Kim, S.W., Darmaraj, N., Kim, K.W., Kim, H.Y., 2007) and Al2O3-(ZrO2+3%Y2O3) (Khalil, K.A., Kim, S.W., 2007). When the powders which are generally placed between Al2O3 double axis blocks in the plate are pressed as double axis, they are sintered by high frequency induction coil. Cavdar et al. studied iron and iron based powder metals for sintering samples with medium frequency induction sintering (Cavdar, U., Atik, E., 2008)( Cavdar, U., Atik, E., 2008)( Cavdar, U., Atik, E., 2008). In our study, which differs from the previous studies, medium frequency was used. Moreover, the sintering process was done after the powder metal pieces are pressed, not during the pressing process. 2. Materials and Method The samples used in tests were produced by weight of ratio as %3 copper and iron powder. Zinc stearate as the ratio %0.8 by weight was used as the lubricant. Zinc stearate powder vanishes during the sintering process, zinc stearate functions only as a lubricant during the pressing. The iron powder used in the tests was called ASC10029 which was produced by Hougenas (The characteristics are shown in Table 1). All of these three were mixed in 25 cycle / min. for 20 minutes to have a homogeneous mixture. The samples were sized 10x10x55 mm and they weighed 37 gr. The powder metal samples were produced by pressing in 600MPa pressure with one axis press. A group of pressed metal powder samples were sintered in a traditional sintering furnace, some parts of these were sintered in argon gas environment, another part in atmosphere environment. The other group was sintered by a 2 kW 30 kHz induction generator in the atmosphere environment. The sintering temperature was 1120°C during the traditional sintering process. The sintering process performed in conventional furnaces was finished in 30 minutes. Two different kinds of induction sintering processes were applied to the same sort of samples. The first sintering process lasted for 1, 2 and 3 minutes in induction sintering. Second sintering process was started with pre-sintering in a traditional sintering furnace at 500°C for 10 minutes and then samples were sintered at 1, 2 and 3 minutes with an induction sintering generator. The heat of the sample was set as 1120°C by an infrared pyrometer during the induction sintering process. The induction appliance and the sintering progress made by it which is shown in Figure 1. Transverse rupture strength (TRS) tests were performed in Autograph Shimadzu AG-IS 100 kN, a universal test appliance used for comparing the sintered samples via traditional sintering process and sintered samples via induction sintering. 3. Results and Discussion The results of transverse rupture strength experiments presented the average of at least 3 samples. The results are shown in Table 2. The break stretching of the samples sintered by induction for 3 minutes were nearly the same as of the samples sintered for 30 minutes by traditional sintering ovens. The SEM pictures of the samples were taken from the broken surfaces which were formed as the result of transverse rupture strength tests. SEM pictures are only the pictures of the samples which were sintered in 1, 2 and 3 minutes by induction sintering. In the SEM pictures, it is shown that the samples which were sintered for 3 minutes are sintered better than the ones that were sintered for 1 and 2 minutes. In the pictures of the broken surfaces of the samples, it is seen that the sintered powder forms neck shapes. These shapes are the proof of sintering. The breaking took place at these points. 4. Conclusion Induction sintering is completed in a shorter period compared to conventional sintering. Maximum stress and break strain values accomplished in 3 minutes via induction sintering are accomplished in 30 minutes via conventional sintering. Induction sintering is illustrated in SEM views. The best sintering process occurs in 3 minutes which is seen from broken surface views. If pre-heating and atmosphere controls are made in sintering when high mechanic features can be obtained. In addition to this sample surfaces can have been high quality. Energy consumption is lower in induction sintering. Bobbin designing and using which is suitable to component shape and dimensions is important in induction sintering. Specıal Thanks To Prof. Dr. Cevdet Meriç ([email protected]) and Prof. Dr. Haldun KARACA ([email protected]) for their academic helps, to Toz Metal Inc. (http://www.tozmetal.com/english.htm), Aytaç Ataç ([email protected]) for their help as the provider of the metal powders.
Modern Applied Science March, 2010
65
References Cavdar, U., Atik, E. (2008). “Induction sintering of %3 cu contented iron based powder metal parts”5th International Powder Metallurgy Conference Turkey, TOBB University, Ankara/Turkey, 8-12 October 2008. Cavdar, U., Atik, E. (2008). “Iron based powder bushings sintering via induction generator” in Turkish, 5th International Powder Metallurgy Conference Turkey, TOBB University, Ankara/Turkey, 8-12 October 2008. Cavdar, U., Atik, E. (2008). “Sintering with induction”, International Powder metal Congress & Exhibition, Rostengarten congress center, Euro PM2008, Mannheim/Germany, September 29th - 1st October, Vol.3, p.p: 33-38. Cavdar, U., Atik, E. (2008). “The effects of powders size in Induction sintering”, in Turkish, 12. International Materials Symposium, October 15-17 2008, Pamukkale University Congress & Cultural Center, Denizli, Turkey, vol.2 p.p: 1286-1290. German, R.M. (1984). “Powder Metallurgy Science”, MPIF, USA, 1984, p.p: 7. German, R.M. (2007). Translator editors: S. Sarıtaş, M. Türker, N. Durlu, “Toz Metalürjisi ve Parçalıklı Malzemeler İşlemleri” TTMD, Ankara, Türkiye, 2007. http://www.hoganas.com/ Khalil, K.A., Kim, S.W., Darmaraj, N., Kim, K.W., Kim, H.Y. (2007). “Novel mechanism to improve toughness of the hyroxyapatite bio ceramics using high-frequency induction heat sintering”, Elsevier, Journal of Materials Processing Technology 187-188 (2007) 417-420. Khalil, K.A., Kim, S.W. (2006). “Mechanical wet-milling and subsequent consolidation of ultra-fine Al2O3-(ZrO2+Y2O3) bio ceramics by using high-frequency induction heat sintering”, Science Press, Trans. Nonferrous Met. Soc. China 17(2007), accepted 13 September 2006, p.p:21-26. Kim, H.C. , Kim, D.K. , Woo, K.D., Ko, I.Y., Shon I.J. (2007). “Consolidation of binderless WC-TiC by high frequency induction heating sintering”, Elsevier, International Journal of Refractory Maters & Hard Materials 26 (2008), Republic of Korea, accepted 18 January 2007, p.p: 48-54. Kim, H.C., Jeong, I.K., Shon, I.J., Ko, I.Y. , Doh, J.M. (2007). “ Fabrication of WC-8wt.%Co hard materials by two rapid sintering processes” Elsevier, International Journal of Refractory Metals & Hard Materials 25 (2007), Republic of Korea, accepted 4 September 2006, p.p: 336-340. Kim, H.C., Kim, D.K., Woo, K.D., Ko, I.Y., Shon, I.J. (2007). “Consolidation of binderless WC-TiC by high frequency induction heating sintering”, Elsevier, International Journal of Refractory Maters & Hard Materials 26 (2008), Republic of Korea, accepted 18 January 2007, p.p: 48-54. Kim, H.C., Oh, D.Y., Shon, I.J. (2004). “Sintering of nanophase WC - 15 vol. %Co hard metals by rapid sintering process”, Elsevier, Refractory Metals & Hard Materials 22(2004), South Korea, accepted 22 june 2004, p.p: 197-203. Kim, H.C., Park, H.K., Jeong, I.K., Ko, I.Y., Shon, I.J. (2008). “Sintering of binderless WC-Mo2C hard materials by rapid sintering process”, Elsevier, Ceramic International Vol. 34, Issue 6, August 2008, Republic of Korea, accepted 27 march 2007, p.p:1419-1423. Kim, H.C., Shon, I. J., Munir, Z. A. (2006). “Rapid sintering of ultra - fine WC - 10 wt % Co by high - frequency induction heating”, Elsevier, International Journal of Refractory metals & Hard Materials 24 (2006), accepted 5 July 2005, p.p: 427-431. Nakamura, M. (2003). “Iron and steel – rapid sintering of steels by induction heating in hydrogen-nitrogen”, I. Japan Soc., Patents, Metal-powder.net, March 2003, MPR, p. 33. Park, H.K., Shon, I.J., Yoon, J.K., Doh, J.M., Ko, I.Y., Munir Z.A. (2007). “ Simultaneous synthesis and consolidation of nanostructured NbSi2-Si3N4 composite from mechanically activated powders by high frequency induction-heated combustion” Elsevier, Journal of Alloys and Compounds 461 (2008), Available online 25 June 2007, p.p:560-564. Shibuya, M., Ohanagi M. (2007). “Effect of nickel boride additive on simultaneous densification and phase decomposition of TiB2-WB2 solid solutions by pressure less sintering using induction heating”, Elsevier, Journal of the European Ceramic Society 27 (2007), Japan, accepted 6 May 2006, p.p: 301-306. Shon, I.J., Jeong, I. K., Park, J.H., Kim, B.R., Lee, K.T. (2007). “ Effect of Fe2O3 addition on consolidation and properties of 8 mol% yttria- stabilized zirconia by high-frequency induction heated sintering (HFIHS)”, Elsevier, Ceramics International Vol. 35, Issue 1, January 2009, accepted 6 November 2007, p.p: 363-368. Shon, I.J., Jeong, I.K., Ko, I.Y., Doh, J.M., Woo, K.D. (2007). “ Sintering behavior and mechanical properties of WC-10Co, WC-10Ni and WC10Fe hard materials produced by high-frequency induction heated sintering” Elsevier, Ceramic International vol. 35, n:1, Republic of Korea, accepted 3 November 2007, p.p: 339-344.
Vol. 4, No. 3 Modern Applied Science
66
United States Patent, Patent Number: 4,720,615. Inventor: Jerry R. Dunn, Boaz, Ala; Assignee: Tocco, Inc., Boaz, Ala; Appl. No: 770,768; Date of patent: Jan.19.1988, USA. Yang, J.H., Kim, Y.W. , Kim, J.H., Kim, D.J. , Kang, K.W., Rhee, Y.W., Kim, K.S., Song, K.W. (2008). “ Pressure less rapid sintering of UO2 assisted by high frequency induction heating process“, The American Ceramic Society, 91 [10], 2008, p.p: 3202-3206.
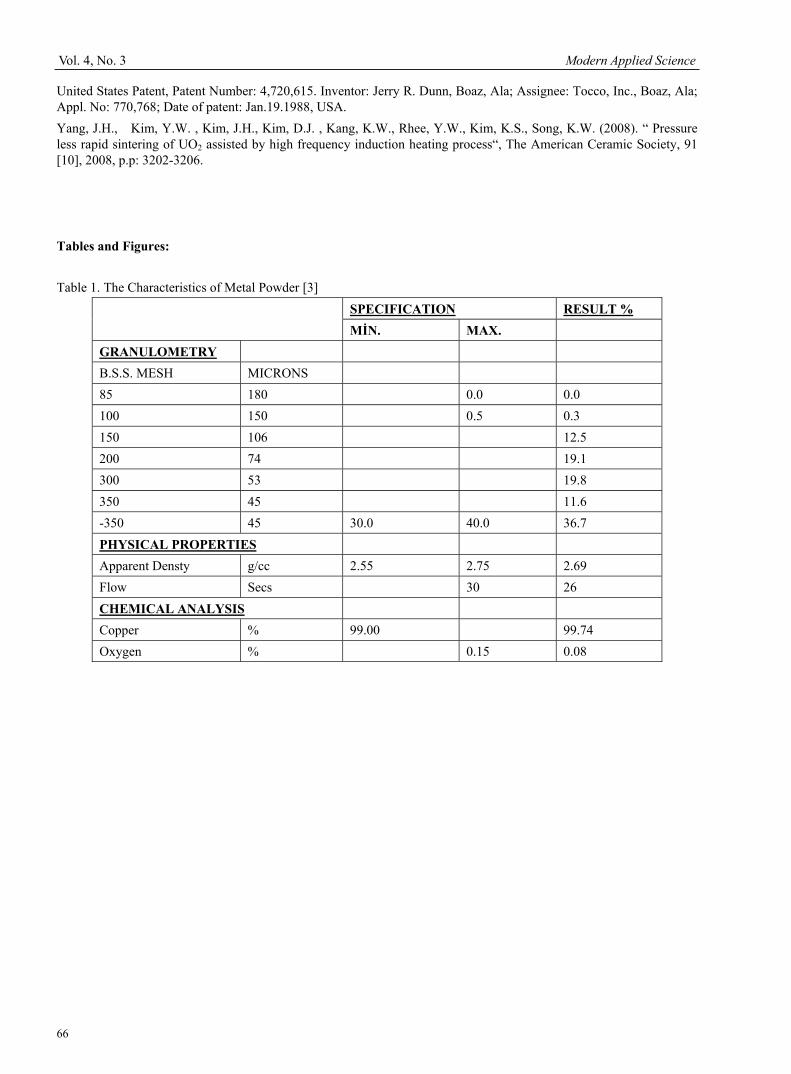
Tables and Figures: Table 1. The Characteristics of Metal Powder [3]
SPECIFICATION RESULT % MİN. MAX.
GRANULOMETRY B.S.S. MESH MICRONS 85 180 0.0 0.0 100 150 0.5 0.3 150 106 12.5 200 74 19.1 300 53 19.8 350 45 11.6 -350 45 30.0 40.0 36.7 PHYSICAL PROPERTIES Apparent Densty g/cc 2.55 2.75 2.69 Flow Secs 30 26 CHEMICAL ANALYSIS Copper % 99.00 99.74 Oxygen % 0.15 0.08
Modern Applied Science March, 2010
67
Table 2. 3 point bending results Max. Stress (N/mm2) Break Strain (%)
By classical sintering in 1120°C, 30 minutes sintered samples Atmospheric environment 285,6 2,8 Argon environment 375,2 3,1
Induction Sintering, 1120°C 1 min. Sintering (Atmospheric environment)
93,6 1,2
2 min. Sintering (Atmospheric environment)
236,6 3,3
3 min. Sintering (Atmospheric environment)
318,2 3,1
Presintering 500°C, 10 minutes + Induction Sintering, 1120°C 1 min. Sintering (Atmospheric environment)
310,6 2,6
2 min. Sintering (Atmospheric environment)
335,2 4,6
3 min. Sintering (Atmospheric environment)
348,3 4,1
Figure 1. Induction Machine and Sintering Process (Celal Bayar University, research laboratory, Muradiye Campus Manisa, Turkey)
Vol. 4, No. 3 Modern Applied Science
68
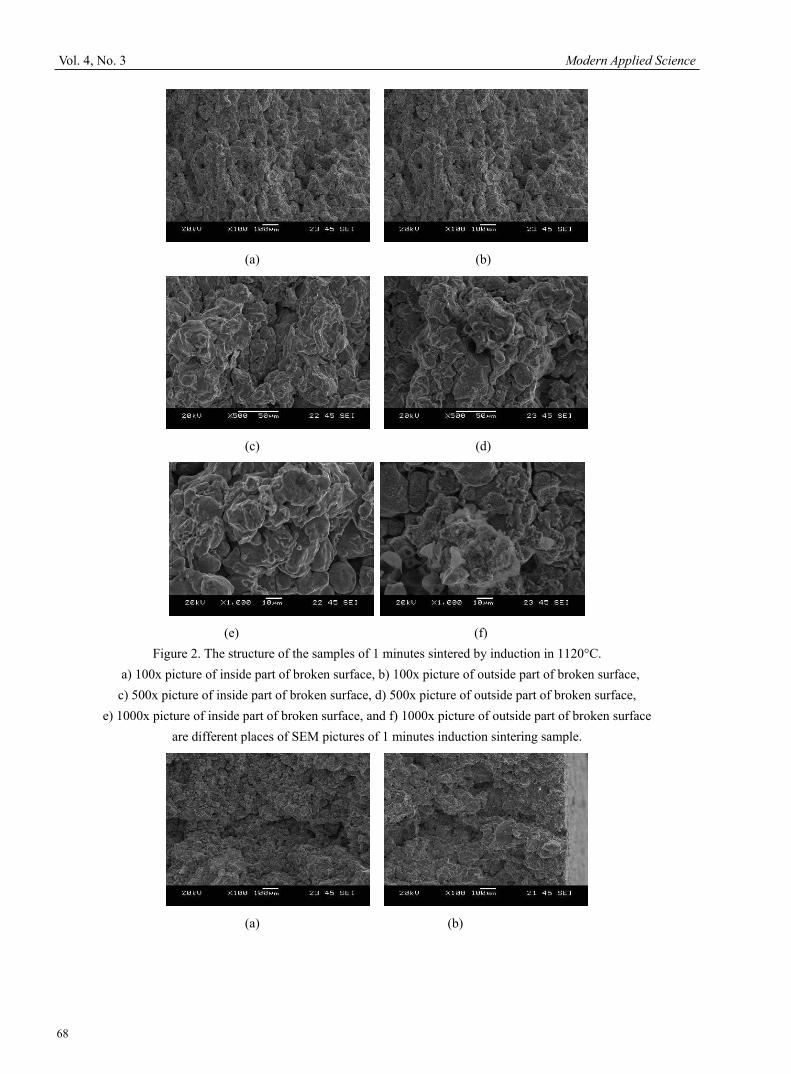
(a) (b)
(c) (d)
(e) (f)
Figure 2. The structure of the samples of 1 minutes sintered by induction in 1120°C. a) 100x picture of inside part of broken surface, b) 100x picture of outside part of broken surface, c) 500x picture of inside part of broken surface, d) 500x picture of outside part of broken surface,
e) 1000x picture of inside part of broken surface, and f) 1000x picture of outside part of broken surface are different places of SEM pictures of 1 minutes induction sintering sample.
(a) (b)
Modern Applied Science March, 2010
69
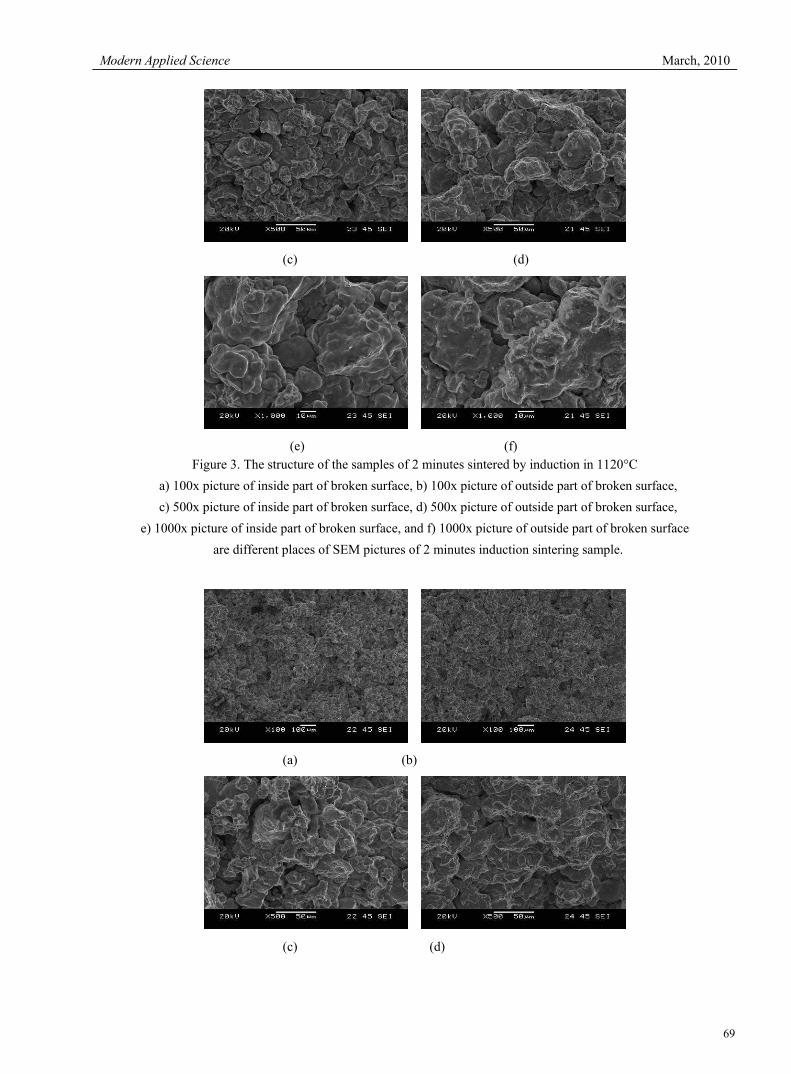
(c) (d)
(e) (f)
Figure 3. The structure of the samples of 2 minutes sintered by induction in 1120°C a) 100x picture of inside part of broken surface, b) 100x picture of outside part of broken surface, c) 500x picture of inside part of broken surface, d) 500x picture of outside part of broken surface,
e) 1000x picture of inside part of broken surface, and f) 1000x picture of outside part of broken surface are different places of SEM pictures of 2 minutes induction sintering sample.
(a) (b)
(c) (d)
Vol. 4, No. 3 Modern Applied Science
70
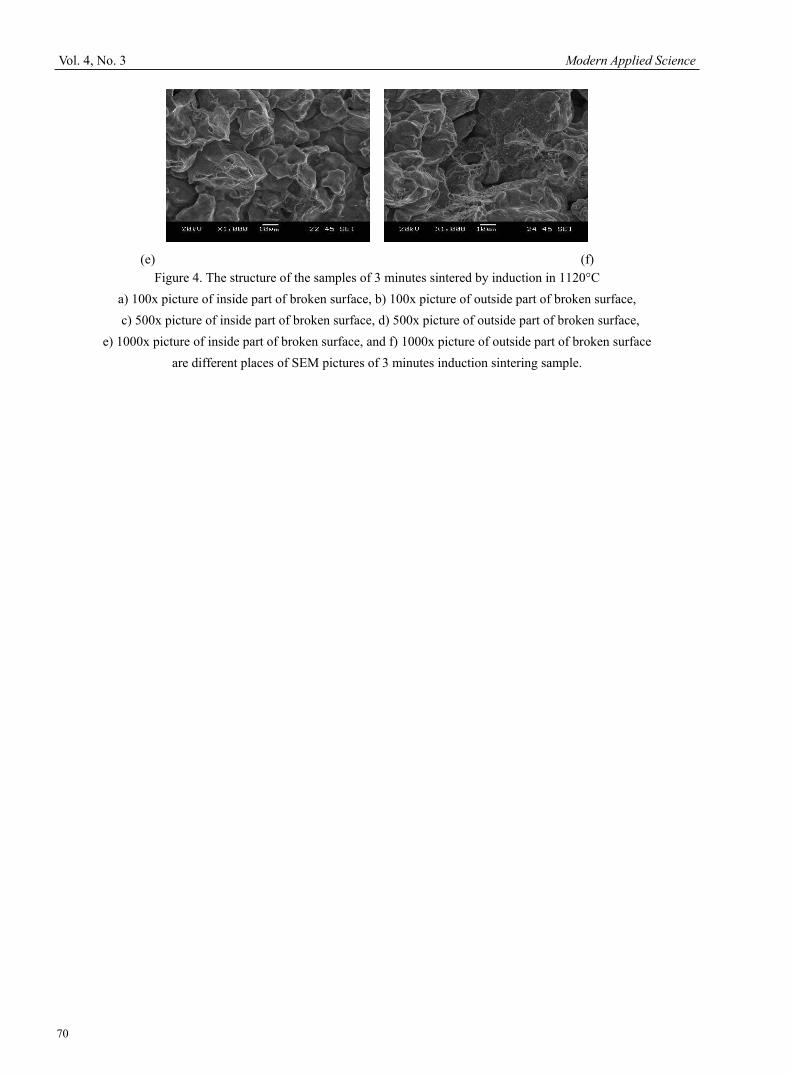
(e) (f)
Figure 4. The structure of the samples of 3 minutes sintered by induction in 1120°C a) 100x picture of inside part of broken surface, b) 100x picture of outside part of broken surface, c) 500x picture of inside part of broken surface, d) 500x picture of outside part of broken surface,
e) 1000x picture of inside part of broken surface, and f) 1000x picture of outside part of broken surface are different places of SEM pictures of 3 minutes induction sintering sample.
Modern Applied Science March, 2010
71
Comparison of Two Different Yarn Evenness Test Methods Dairong Zhang & Ling Cheng
College of Textiles, Tianjin Polytechnic University, Tianjin 300160, China E-mail: [email protected]
Abstract The evenness of yarn is an important index of quality control of textiles, so the researches about the yarn evenness test method have been the hotspot in the textile measurement for recent years. In this article, two main yarn evenness testing methods including the Uster method and the CTT (Constant Tension Transport) method which are important in the present textile industry are compared and studied. Though comparing and analyzing the testing principles of two methods, adopting the method of statistical analysis to correlatively analyze the testing data obtaining from two different testing measures, the method of CTT can more visually and exactly describe the appearance quality of yarns. Keywords: Yarn evenness, CTT, Uster, Value of CV The evenness of yarn is one of main indexes to measure the quality of yearns. The unevenness of yarns will deteriorate the mightiness of yarns, and increase the end breakage rate in the spinning, and the increase of the end breakage rate will directly limit the speed of the machines and reduce the productivity. In addition, the unevenness of yarns will seriously influence the appearance quality of textiles. The usual yarn evenness testing methods mainly include the length measurement and weight measurement method, the visual measurement method and the Uster evenness tester method. Because of large computation, the length measurement and weight measurement method is only used in the research works requiring higher nicety or adjusting and measuring unevenness instruments, and it is rarely adopted in general tests. Because the visual measurement method is quick and convenient, and it can comprehensively evaluate the appearance quality of yarns, and it is a very usual method in productions, but it has many deficiencies such as large man-made factor influences, random character, non-objectivity and bad repetition character, and its testing results are hard to be reserved. So the application range of above two testing methods will be narrower and narrower, and they will be finally replaced by other testing methods. The Uster evenness tester can get rid of the influence of man-made factors to the testing results, and it can quickly and objectively measure the unevenness of yarns, so it is applied widely. However, as viewed from its testing principle, it still has certain deficiencies. First, the Uster CV value of yarn evenness can only denote the unevenness degree of yarns, but can not reflect the uneven structure of yarns. Second, the Uster CV value of yarn evenness only considers the average of the unevenness degree of yarns, and can not reflect the uneven waves with different characters on yarns, i.e. it ignores the discrete character of yarn unevenness. But these uneven waves of yarns would largely influence the unevenness of cloth cover. Third, when measuring blended yarns, because both the properties of fiber materials and the dielectric coefficients are different, and if the blended evenness of fibers in yarns is bad, the capacitance will change, which will influence the CV values. If above factors can not be controlled effectively, the nicety of the testing result of yarn unevenness will be influenced. Fourth, the nicety of testing values will be impacted by the testing conditions (the atmosphere state, the historical reversion condition of samples, the time of humidifying treatment) (Lu, 2008). At present, with the development of the computer and the image processing technology, people begin to utilize the computer visual technology to evaluate the appearance quality of yarns, and obtained large achievements. For example, combining with the technologies of optics and computer image processing, scientists can acquire images of yarns by the knowledge of applied mathematics such as the wavelet analysis, and implement image processing by pre-compiled computer software to obtain the fineness unevenness of yarns and the blending ratio of hairiness, the unevenness rate of blended yarns and other quality indexes (Wang, 1999, P.101-103). And the CTT yarn performance tester made by American Lawson-Hemphill Company to evaluate the comprehensive performance of yarns is the most representative one. This machine adopts advanced CCD digital imaging technology to test the appearance quality of yarns, such as the diameter of yarns, the appearance and outline changes of yarns, the faults of yarns and the hairiness. Because it adopted completely different testing principle, it is valuable to study and discuss the similarities and differences about the appearance quality of yarns. The experiment method will be used to compare two testing methods including Uster and CTT, and both differences and relationship will be analyzed, which can be used as references to more objectively evaluate the appearance quality of yarns.
Vol. 4, No. 3 Modern Applied Science
72
1. Comparison of the testing principles of two methods 1.1 Testing principle of the Uster yarn evenness tester The Uster yarn evenness tester is the instrument developed by Switzerland Uster Company, and it is used to test the evenness of yarns, and there are many types and kinds. This evenness tester uses the capacitance conversion principle to translate the non-electric yarn section change into the electric singles representing the change of section. The testing part is composed by the capacitors with two parallel metal plates. Because the dielectric coefficient of the fiber materials exceeds the dielectric coefficient of air, when the sample of yarn enters into the capacitor with certain speed, the capacitance of the polar plate will increase, and the change of the capacitance is related with the actual volume of the yarns in the polar plates. Supposed that the polar plates with experiment materials is a capacitor composed by multi-layer mediums, when the yarns enters, the relative change of the capacitance of the capacitor is
0
111 ( 1)
CC
ε
ελ
Δ −=
+ −
Where, C0 is the capacitance of the parallel plate capacitor before the yarns enter, ε is the dielectric coefficient of the
sample, λ=dD
is the fullness of the capacitor, d is the depth of the sample, and D is the space between polar plates.
The dielectric coefficient of the sample ε changes with the humidity of the materials, and when the fullness λ is small, the relationship between the capacitance relative change and the dielectric coefficient of the sample is not
obvious, so when ε »1 and λ «1, the relative change of capacitance 0
CCΔ
=λ . Under this condition, the relative
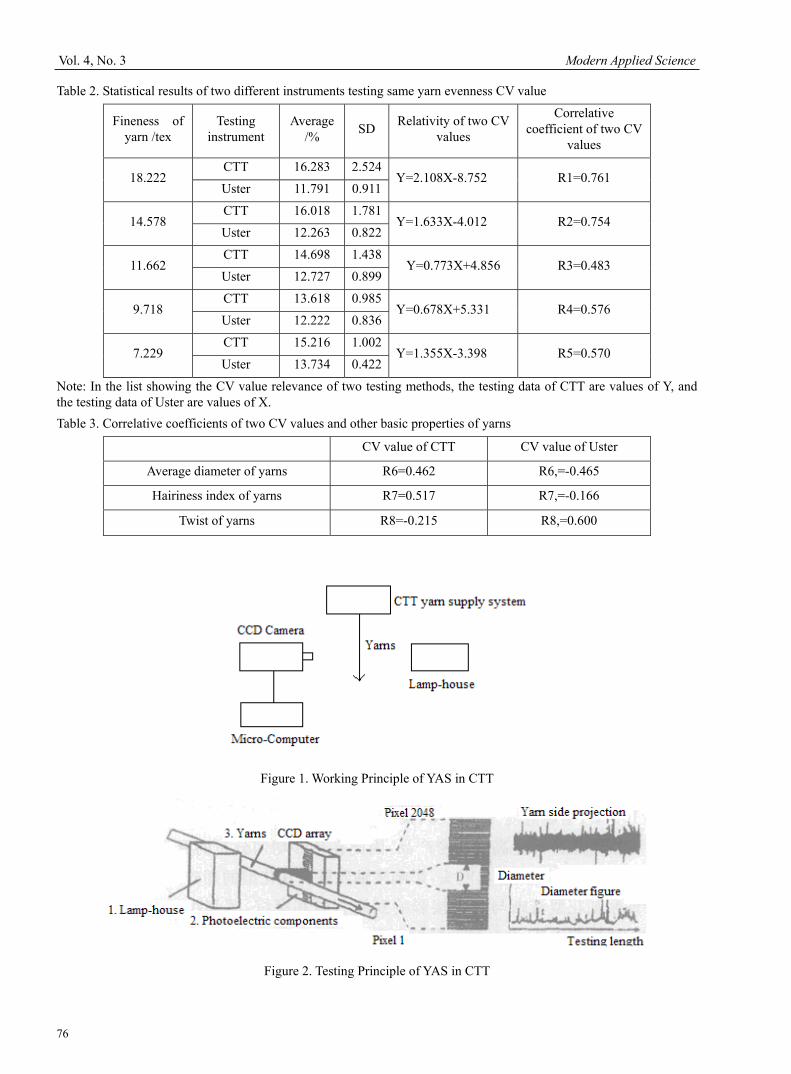
change of capacitance is not correlative with the dielectric coefficient of the sample, and the testing result shows that the signals is positive proportional with the volume or weight of the samples in the polar plates. When the fullness exceeds 20%, the linear relationship between the capacitance relative change and the dielectric coefficient will be destroyed, and it will impacted by the humidity. When the Uster evenness tester is used, to ensure the linear relationship between the capacitance relative change and the dielectric coefficient, the fullness should be small as possible, but too small fullness will impact the sensitivity of the testing. Therefore, multiple measurement troughs are designed in the Uster evenness tester for yearns with different thicknesses, and the regulation should be strictly followed when using it. The measurement result of the capacitance method only represents the total volume or weight of the yarns within the length of polar plate, not the change of the thicknesses of the yarns in the polar plate. The length of the capacitance polar plate will influence the measurement results of the period unevenness and random unevenness, and when the polar plate of 8mm and the average length of fibers exceed 25mm, the influences can be ignored. The electric field distribution of the polar plate capacitor is very complex, and the shielding protection loop will produce the distribution capacitance to make the electric lines to present non-parallel distribution, and the reverse region of the electric lines exists, so the yarns must be passed in proper regions, and the measurement values will be stable. Because of the anisotropy of textile fibers, the capacitance change is related with the weight of the yarns, and impacted by the section formation and structure, so the formation of yarns should be unchangeable when testing (Zhang, 2005, P. 1-3). In a word, the Uster evenness tester is to measure the average value of the volumes or weights of a segment of yarns in the measurement area. 1.2 Testing principle of CTT CTT yarn performance tester is made by the American Lawson-Hemphill Company, and it can measure various performances of yarns under dynamic conditions. The Yarn Analysis System (YAS) in the instrument can comprehensively test and analyze the indexes of appearance quality of yarns. The YAS is composed by the host computer of CTT, the accessory set of yarn appearance quality test, and a set of corresponding data processing software. Figure 1 is the working principle of YAS, and it includes the linear scanning camera, the illumination system, the CTT yarn supply system of constant tension and the computer which is used for the data acquirement and data processing. Yarns passes a digital camera by the normal testing speed of 100m/min, and the digital system is composed by CDD cameras with higher distinguish-ability (3.5 ×10⁻³mm), and the yarn diameter of 0.55 will be measured exactly, and the blur images will not exist in the yarns moving with high speed. Though the data processing of computer, relative data of yarn appearance will be generated, and the testing principle is seen in Figure 2, where, the beam of the lamp-house shoots to the photoelectric component 2, and the yarn 3 in movement will form a shadow in the photoelectric component 2, and the light quantity accepted by the photoelectric component and the current quantity in the electric circuit will change with the fineness of yarns, and the fluctuation of the current will be amplified by the amplifier and recorded. The testing result of the CTT yarn testing system will not be impacted by the relative humidity, the color, and
Modern Applied Science March, 2010
73
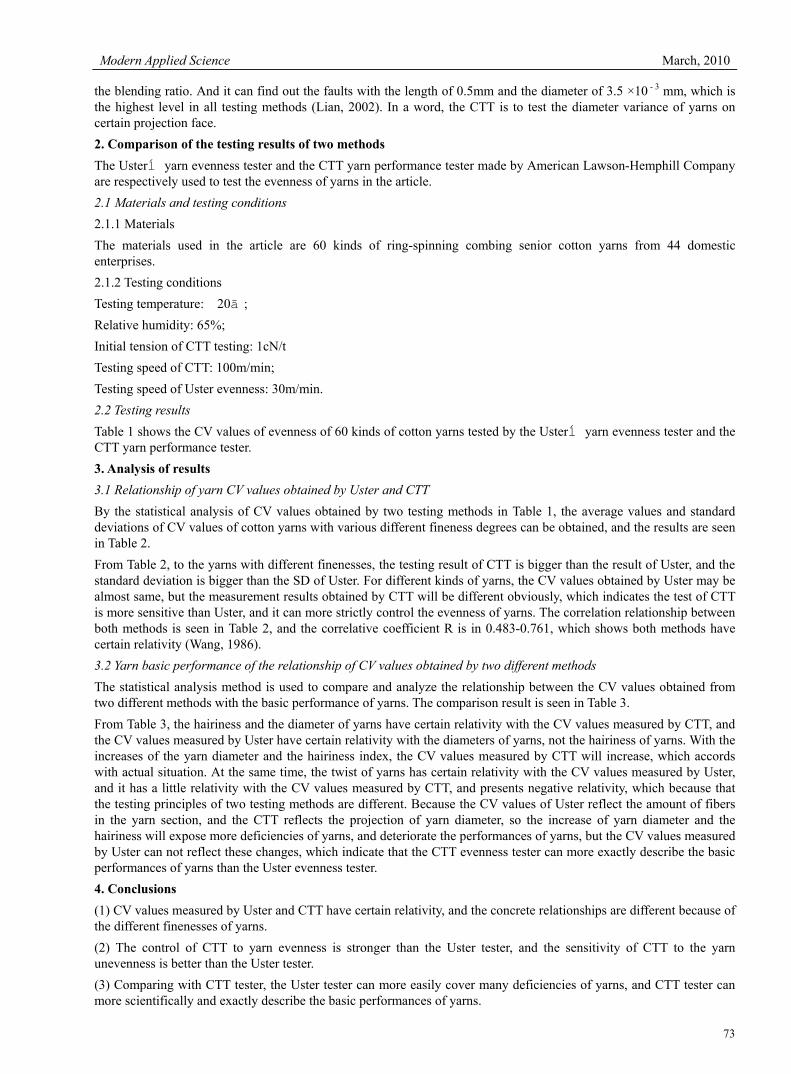
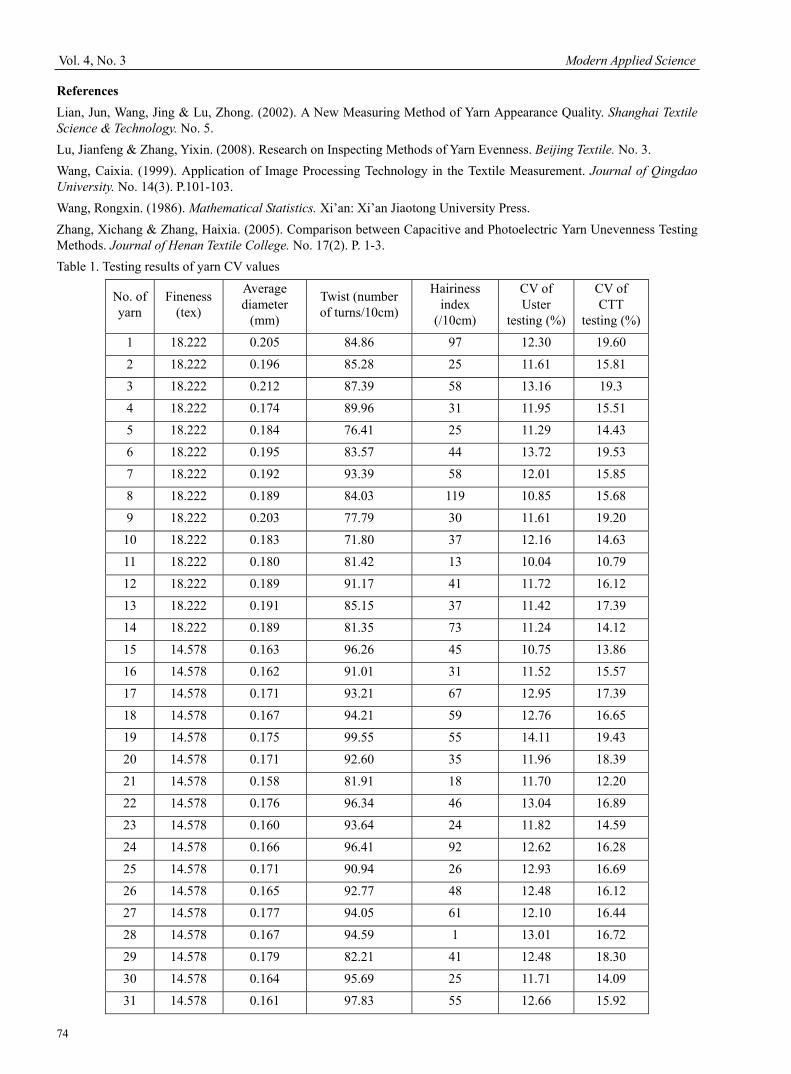
the blending ratio. And it can find out the faults with the length of 0.5mm and the diameter of 3.5 ×10 - 3 mm, which is the highest level in all testing methods (Lian, 2002). In a word, the CTT is to test the diameter variance of yarns on certain projection face. 2. Comparison of the testing results of two methods The Uster yarn evenness tester and the CTT yarn performance tester made byⅡ American Lawson-Hemphill Company are respectively used to test the evenness of yarns in the article. 2.1 Materials and testing conditions 2.1.1 Materials The materials used in the article are 60 kinds of ring-spinning combing senior cotton yarns from 44 domestic enterprises. 2.1.2 Testing conditions Testing temperature: 20 ;℃ Relative humidity: 65%; Initial tension of CTT testing: 1cN/t Testing speed of CTT: 100m/min; Testing speed of Uster evenness: 30m/min. 2.2 Testing results Table 1 shows the CV values of evenness of 60 kinds of cotton yarns tested by the Uster yarn evenness tester and the ⅡCTT yarn performance tester. 3. Analysis of results 3.1 Relationship of yarn CV values obtained by Uster and CTT By the statistical analysis of CV values obtained by two testing methods in Table 1, the average values and standard deviations of CV values of cotton yarns with various different fineness degrees can be obtained, and the results are seen in Table 2. From Table 2, to the yarns with different finenesses, the testing result of CTT is bigger than the result of Uster, and the standard deviation is bigger than the SD of Uster. For different kinds of yarns, the CV values obtained by Uster may be almost same, but the measurement results obtained by CTT will be different obviously, which indicates the test of CTT is more sensitive than Uster, and it can more strictly control the evenness of yarns. The correlation relationship between both methods is seen in Table 2, and the correlative coefficient R is in 0.483-0.761, which shows both methods have certain relativity (Wang, 1986). 3.2 Yarn basic performance of the relationship of CV values obtained by two different methods The statistical analysis method is used to compare and analyze the relationship between the CV values obtained from two different methods with the basic performance of yarns. The comparison result is seen in Table 3. From Table 3, the hairiness and the diameter of yarns have certain relativity with the CV values measured by CTT, and the CV values measured by Uster have certain relativity with the diameters of yarns, not the hairiness of yarns. With the increases of the yarn diameter and the hairiness index, the CV values measured by CTT will increase, which accords with actual situation. At the same time, the twist of yarns has certain relativity with the CV values measured by Uster, and it has a little relativity with the CV values measured by CTT, and presents negative relativity, which because that the testing principles of two testing methods are different. Because the CV values of Uster reflect the amount of fibers in the yarn section, and the CTT reflects the projection of yarn diameter, so the increase of yarn diameter and the hairiness will expose more deficiencies of yarns, and deteriorate the performances of yarns, but the CV values measured by Uster can not reflect these changes, which indicate that the CTT evenness tester can more exactly describe the basic performances of yarns than the Uster evenness tester. 4. Conclusions (1) CV values measured by Uster and CTT have certain relativity, and the concrete relationships are different because of the different finenesses of yarns. (2) The control of CTT to yarn evenness is stronger than the Uster tester, and the sensitivity of CTT to the yarn unevenness is better than the Uster tester. (3) Comparing with CTT tester, the Uster tester can more easily cover many deficiencies of yarns, and CTT tester can more scientifically and exactly describe the basic performances of yarns.
Vol. 4, No. 3 Modern Applied Science
74
References Lian, Jun, Wang, Jing & Lu, Zhong. (2002). A New Measuring Method of Yarn Appearance Quality. Shanghai Textile Science & Technology. No. 5. Lu, Jianfeng & Zhang, Yixin. (2008). Research on Inspecting Methods of Yarn Evenness. Beijing Textile. No. 3. Wang, Caixia. (1999). Application of Image Processing Technology in the Textile Measurement. Journal of Qingdao University. No. 14(3). P.101-103. Wang, Rongxin. (1986). Mathematical Statistics. Xi’an: Xi’an Jiaotong University Press. Zhang, Xichang & Zhang, Haixia. (2005). Comparison between Capacitive and Photoelectric Yarn Unevenness Testing Methods. Journal of Henan Textile College. No. 17(2). P. 1-3. Table 1. Testing results of yarn CV values
No. of yarn
Fineness (tex)
Average diameter
(mm)
Twist (number of turns/10cm)
Hairiness index
(/10cm)
CV of Uster
testing (%)
CV of CTT
testing (%)
1 18.222 0.205 84.86 97 12.30 19.60
2 18.222 0.196 85.28 25 11.61 15.81
3 18.222 0.212 87.39 58 13.16 19.3
4 18.222 0.174 89.96 31 11.95 15.51
5 18.222 0.184 76.41 25 11.29 14.43
6 18.222 0.195 83.57 44 13.72 19.53
7 18.222 0.192 93.39 58 12.01 15.85
8 18.222 0.189 84.03 119 10.85 15.68
9 18.222 0.203 77.79 30 11.61 19.20
10 18.222 0.183 71.80 37 12.16 14.63
11 18.222 0.180 81.42 13 10.04 10.79
12 18.222 0.189 91.17 41 11.72 16.12
13 18.222 0.191 85.15 37 11.42 17.39
14 18.222 0.189 81.35 73 11.24 14.12
15 14.578 0.163 96.26 45 10.75 13.86
16 14.578 0.162 91.01 31 11.52 15.57
17 14.578 0.171 93.21 67 12.95 17.39
18 14.578 0.167 94.21 59 12.76 16.65
19 14.578 0.175 99.55 55 14.11 19.43
20 14.578 0.171 92.60 35 11.96 18.39
21 14.578 0.158 81.91 18 11.70 12.20
22 14.578 0.176 96.34 46 13.04 16.89
23 14.578 0.160 93.64 24 11.82 14.59
24 14.578 0.166 96.41 92 12.62 16.28
25 14.578 0.171 90.94 26 12.93 16.69
26 14.578 0.165 92.77 48 12.48 16.12
27 14.578 0.177 94.05 61 12.10 16.44
28 14.578 0.167 94.59 1 13.01 16.72
29 14.578 0.179 82.21 41 12.48 18.30
30 14.578 0.164 95.69 25 11.71 14.09
31 14.578 0.161 97.83 55 12.66 15.92
Modern Applied Science March, 2010
75
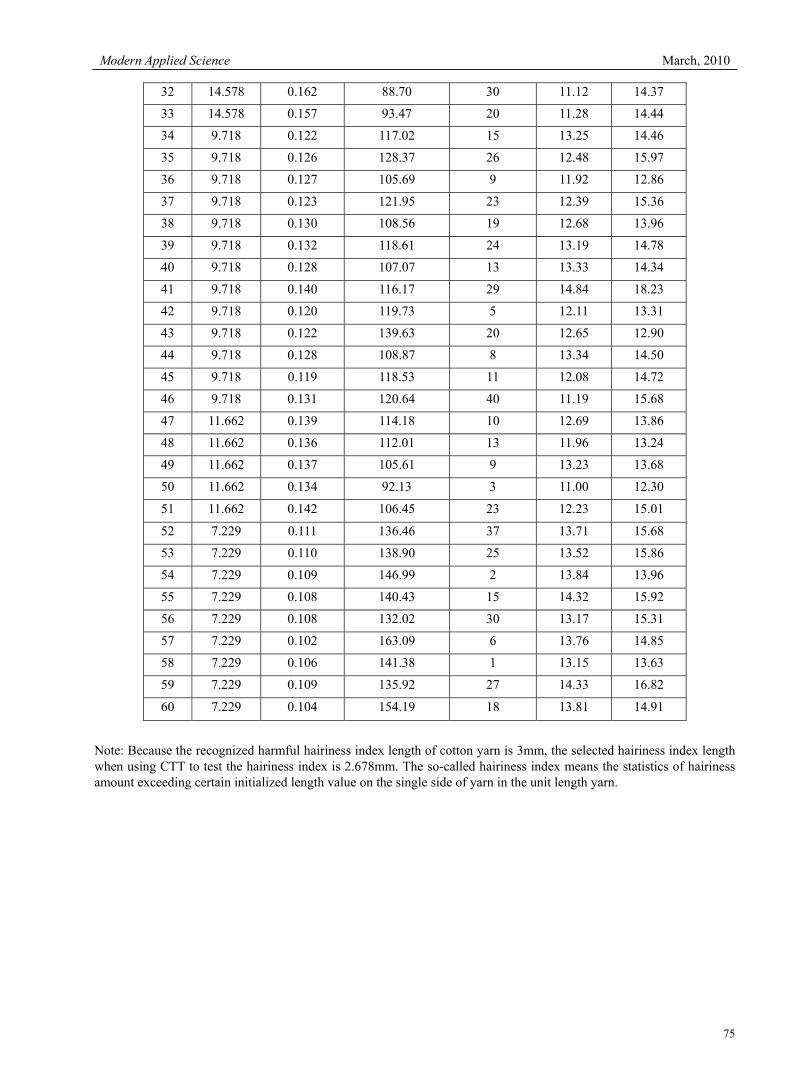
32 14.578 0.162 88.70 30 11.12 14.37
33 14.578 0.157 93.47 20 11.28 14.44
34 9.718 0.122 117.02 15 13.25 14.46
35 9.718 0.126 128.37 26 12.48 15.97
36 9.718 0.127 105.69 9 11.92 12.86
37 9.718 0.123 121.95 23 12.39 15.36
38 9.718 0.130 108.56 19 12.68 13.96
39 9.718 0.132 118.61 24 13.19 14.78
40 9.718 0.128 107.07 13 13.33 14.34
41 9.718 0.140 116.17 29 14.84 18.23
42 9.718 0.120 119.73 5 12.11 13.31
43 9.718 0.122 139.63 20 12.65 12.90
44 9.718 0.128 108.87 8 13.34 14.50
45 9.718 0.119 118.53 11 12.08 14.72
46 9.718 0.131 120.64 40 11.19 15.68
47 11.662 0.139 114.18 10 12.69 13.86
48 11.662 0.136 112.01 13 11.96 13.24
49 11.662 0.137 105.61 9 13.23 13.68
50 11.662 0.134 92.13 3 11.00 12.30
51 11.662 0.142 106.45 23 12.23 15.01
52 7.229 0.111 136.46 37 13.71 15.68
53 7.229 0.110 138.90 25 13.52 15.86
54 7.229 0.109 146.99 2 13.84 13.96
55 7.229 0.108 140.43 15 14.32 15.92
56 7.229 0.108 132.02 30 13.17 15.31
57 7.229 0.102 163.09 6 13.76 14.85
58 7.229 0.106 141.38 1 13.15 13.63
59 7.229 0.109 135.92 27 14.33 16.82
60 7.229 0.104 154.19 18 13.81 14.91
Note: Because the recognized harmful hairiness index length of cotton yarn is 3mm, the selected hairiness index length when using CTT to test the hairiness index is 2.678mm. The so-called hairiness index means the statistics of hairiness amount exceeding certain initialized length value on the single side of yarn in the unit length yarn.
Vol. 4, No. 3 Modern Applied Science
76
Table 2. Statistical results of two different instruments testing same yarn evenness CV value
Fineness of yarn /tex
Testing instrument
Average /% SD Relativity of two CV
values
Correlative coefficient of two CV
values
18.222 CTT 16.283 2.524
Y=2.108X-8.752 R1=0.761 Uster 11.791 0.911
14.578 CTT 16.018 1.781
Y=1.633X-4.012 R2=0.754 Uster 12.263 0.822
11.662 CTT 14.698 1.438
Y=0.773X+4.856 R3=0.483 Uster 12.727 0.899
9.718 CTT 13.618 0.985
Y=0.678X+5.331 R4=0.576 Uster 12.222 0.836
7.229 CTT 15.216 1.002
Y=1.355X-3.398 R5=0.570 Uster 13.734 0.422
Note: In the list showing the CV value relevance of two testing methods, the testing data of CTT are values of Y, and the testing data of Uster are values of X. Table 3. Correlative coefficients of two CV values and other basic properties of yarns
CV value of CTT CV value of Uster
Average diameter of yarns R6=0.462 R6,=-0.465
Hairiness index of yarns R7=0.517 R7,=-0.166
Twist of yarns R8=-0.215 R8,=0.600
Figure 1. Working Principle of YAS in CTT
Figure 2. Testing Principle of YAS in CTT
Modern Applied Science March, 2010
77
Application of Artificial Neural Networks for Emission Modelling of Biodiesels for a C.I Engine under Varying Operating Conditions
R.Manjunatha Assistant Executive Engineer, Irrigation Department, GBC Division Guntakal, A.P, India
Tel: 91-94-4052-2877 E-mail: [email protected]
P. Badari Narayana Assistant Professor, Department of Mechanical Engineering
Sreenidhi Institute of Science and Technology (SNIST), Hyderabad, A.P, India Tel: 91-94-4188-9441 E-mail:[email protected]
K. Hema Chandra Reddy
JNTU College of Engineering, JNTUA, Pulivendula, A.P, India E-mail: [email protected]
Abstract The technical analysis conducted in this study deals with the modelling of diesel engine exhaust emissions using artificial neural networks. Objective of this study is to understand the effectiveness of various biodiesel fuel properties and engine operating conditions on diesel engine combustion towards the formation of exhaust emissions. The experimental investigations have been carried out on a single cylinder Direct Injection (DI) combustion ignition (CI) engine using blends of biodiesel methyl esters from Pongamia, Jatropha and Neem oils. The performance parameters such as brake power (BP), brake thermal efficiency (BTE), brake specific fuel consumption (BSFC), volumetric efficiency, exhaust gas temperature (EGT) were measured along with regulated and unregulated exhaust emissions of CO, HC and NOx. An Artificial neural network (ANN) was developed based on the available experimental data. Multi layer perceptron neural network was used for nonlinear mapping between input and output parameters of ANN. Biodiesel blend percentage, calorific value, density, Cetane number of each biodiesel blend and operating load were used as inputs to train the neural network. The exhaust gas emissions - NOx, CO and HC are predicted for the new fuel and its blends. Different activation functions and several rules were used to train and validate the normalized data pattern and an acceptable percentage error was achieved by Levenberg-Marquardt design optimization algorithm. The results showed that training through back propagation was sufficient enough in predicting the engine emissions. It was found that R (Regression Coefficient) values were 0.99, 0.95 and 0.99 for NOx, CO and HC emissions, respectively. Therefore, the developed model can be used as a diagnostic tool for estimating the emissions of biodiesels and their blends under varying operating conditions. Keywords: Artificial neural network, Biodiesel, Engine Performance, Exhaust Emissions 1. Introduction Biodiesel is favorably viewed as a potential green alternative fuel and can improve the economic growth of the country in the form of employment in regional & rural areas. Biodiesel fuel refers to a non-petroleum-based fuel consisting of short chain alkyl (methyl or ethyl) esters, typically made by transesterification of vegetable oils or animal fats, which can be used (alone, or blended with conventional petroleum diesel) in unmodified diesel-engine vehicles. Though there are some positive environmental impacts of the use of biodiesels in diesel engines, there is a need to analyze their exhaust emissions for the benefit of human health and other environmental concerns. Making and burning of biodiesel inside the diesel engines as fuel, contributes to atmospheric carbon dioxide, sulphur dioxide, NOx, smoke and particulate matter emissions to a smaller extent than burning the conventional diesel. The estimation of biodiesel emissions is a non-linear complex problem due to variations in chemical and thermodynamic properties of biodiesels that affect the combustion process. Many researchers have carried out experiments to evaluate diesel engine exhaust emissions for various biodiesel blends. Carrying out the experiments which involve the measurement of emissions of
Vol. 4, No. 3 Modern Applied Science
78
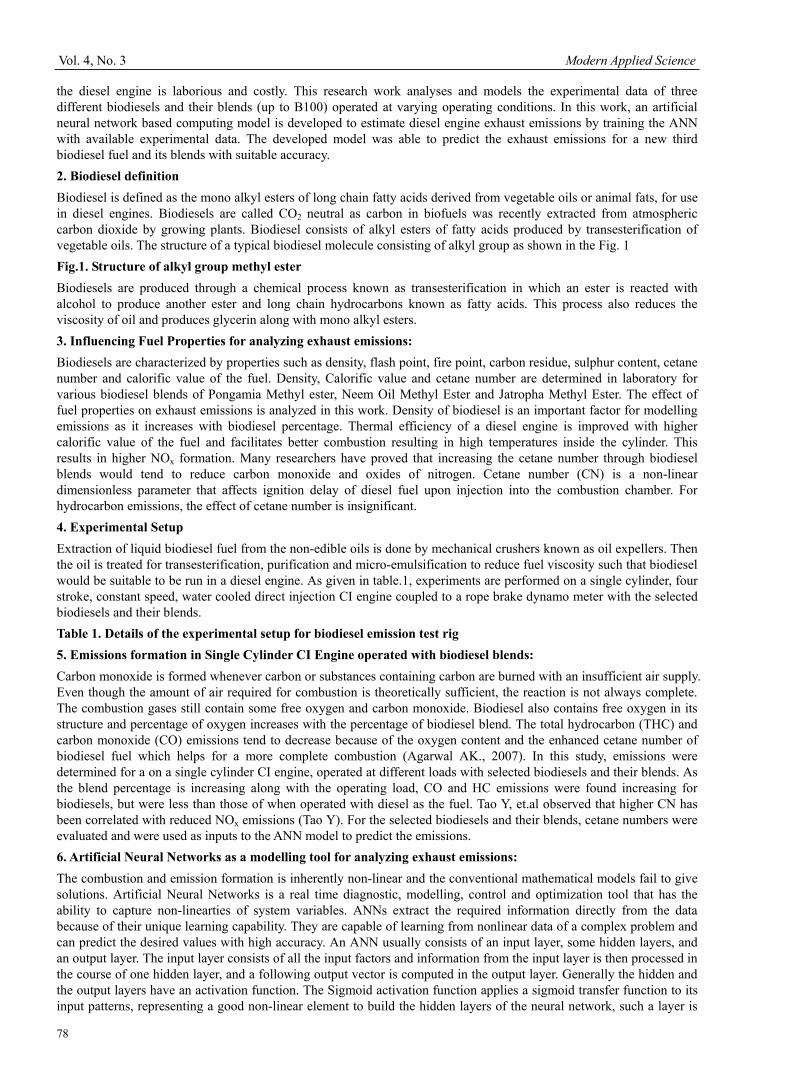
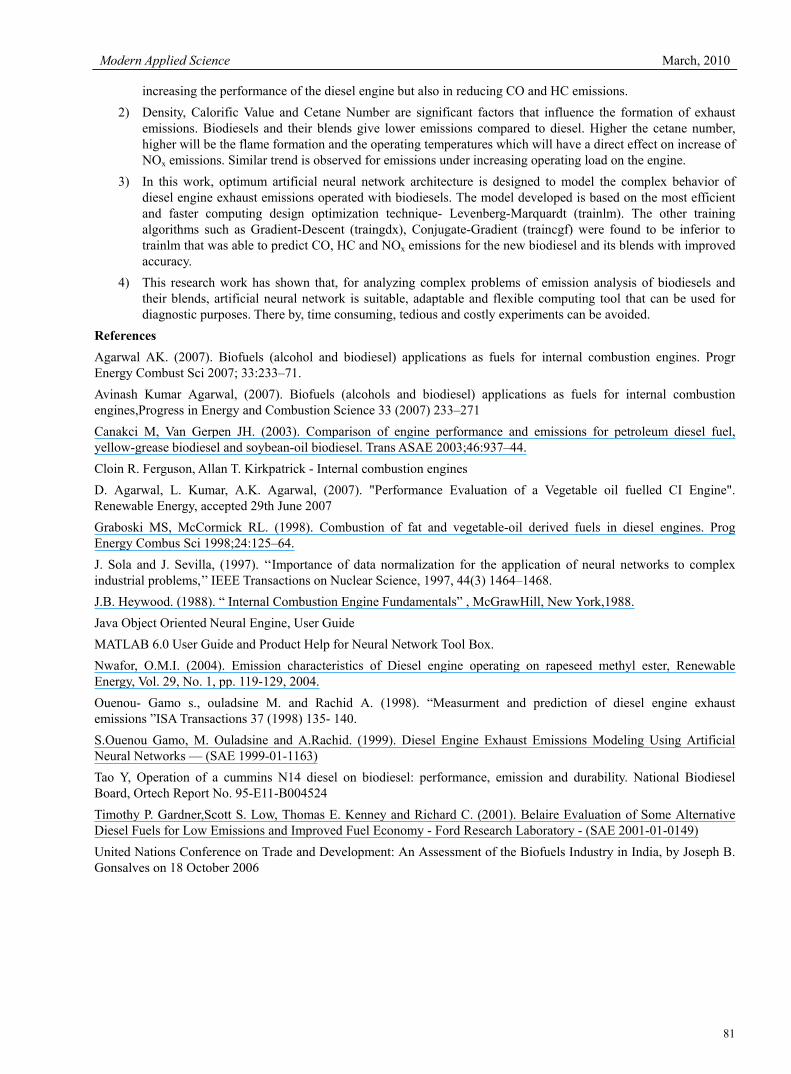
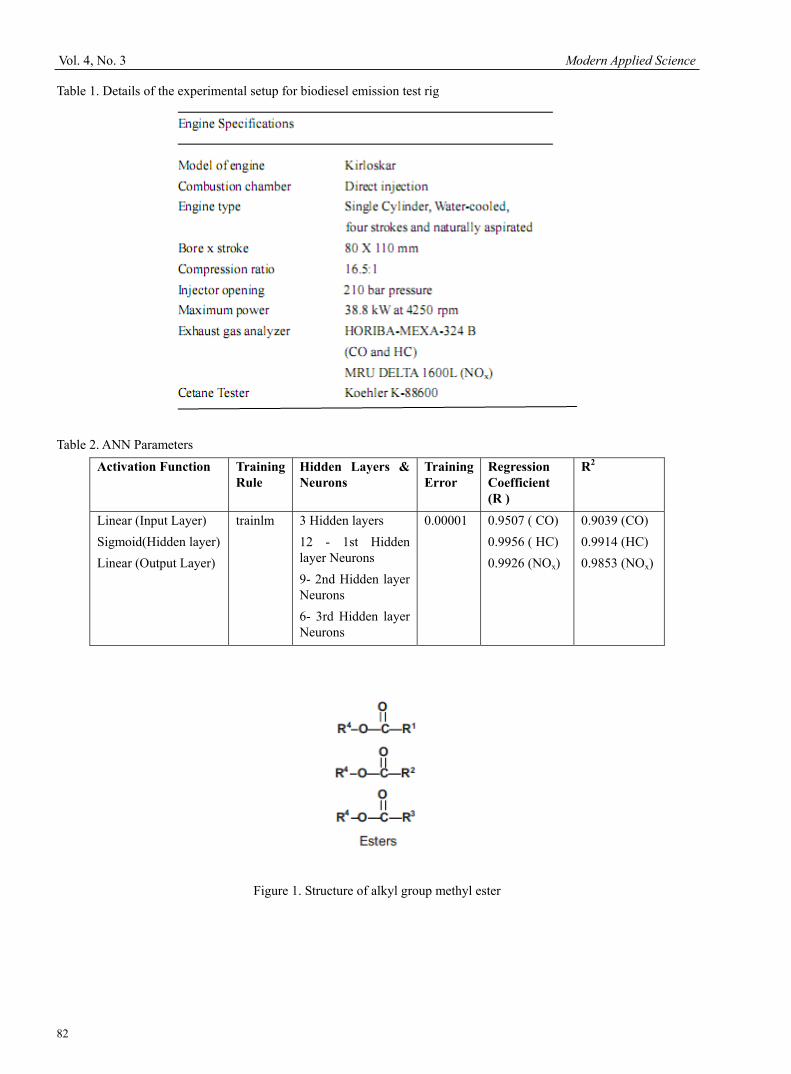
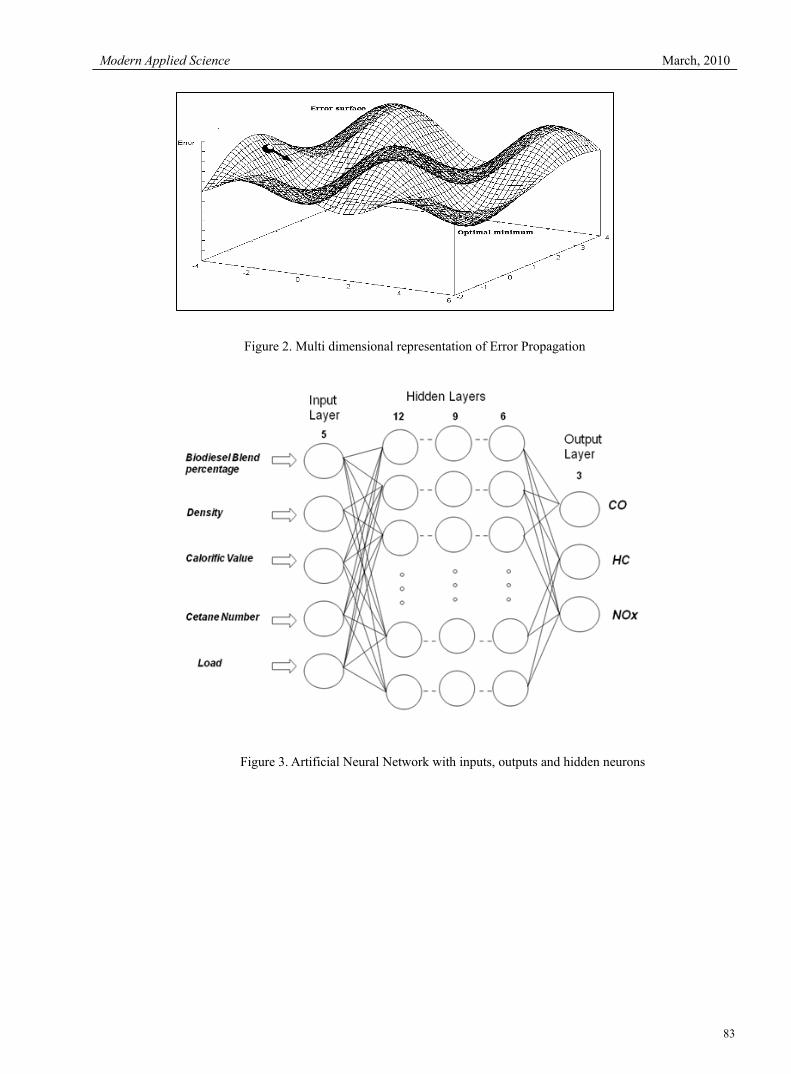
the diesel engine is laborious and costly. This research work analyses and models the experimental data of three different biodiesels and their blends (up to B100) operated at varying operating conditions. In this work, an artificial neural network based computing model is developed to estimate diesel engine exhaust emissions by training the ANN with available experimental data. The developed model was able to predict the exhaust emissions for a new third biodiesel fuel and its blends with suitable accuracy. 2. Biodiesel definition Biodiesel is defined as the mono alkyl esters of long chain fatty acids derived from vegetable oils or animal fats, for use in diesel engines. Biodiesels are called CO2 neutral as carbon in biofuels was recently extracted from atmospheric carbon dioxide by growing plants. Biodiesel consists of alkyl esters of fatty acids produced by transesterification of vegetable oils. The structure of a typical biodiesel molecule consisting of alkyl group as shown in the Fig. 1 Fig.1. Structure of alkyl group methyl ester Biodiesels are produced through a chemical process known as transesterification in which an ester is reacted with alcohol to produce another ester and long chain hydrocarbons known as fatty acids. This process also reduces the viscosity of oil and produces glycerin along with mono alkyl esters. 3. Influencing Fuel Properties for analyzing exhaust emissions: Biodiesels are characterized by properties such as density, flash point, fire point, carbon residue, sulphur content, cetane number and calorific value of the fuel. Density, Calorific value and cetane number are determined in laboratory for various biodiesel blends of Pongamia Methyl ester, Neem Oil Methyl Ester and Jatropha Methyl Ester. The effect of fuel properties on exhaust emissions is analyzed in this work. Density of biodiesel is an important factor for modelling emissions as it increases with biodiesel percentage. Thermal efficiency of a diesel engine is improved with higher calorific value of the fuel and facilitates better combustion resulting in high temperatures inside the cylinder. This results in higher NOx formation. Many researchers have proved that increasing the cetane number through biodiesel blends would tend to reduce carbon monoxide and oxides of nitrogen. Cetane number (CN) is a non-linear dimensionless parameter that affects ignition delay of diesel fuel upon injection into the combustion chamber. For hydrocarbon emissions, the effect of cetane number is insignificant. 4. Experimental Setup Extraction of liquid biodiesel fuel from the non-edible oils is done by mechanical crushers known as oil expellers. Then the oil is treated for transesterification, purification and micro-emulsification to reduce fuel viscosity such that biodiesel would be suitable to be run in a diesel engine. As given in table.1, experiments are performed on a single cylinder, four stroke, constant speed, water cooled direct injection CI engine coupled to a rope brake dynamo meter with the selected biodiesels and their blends. Table 1. Details of the experimental setup for biodiesel emission test rig 5. Emissions formation in Single Cylinder CI Engine operated with biodiesel blends: Carbon monoxide is formed whenever carbon or substances containing carbon are burned with an insufficient air supply. Even though the amount of air required for combustion is theoretically sufficient, the reaction is not always complete. The combustion gases still contain some free oxygen and carbon monoxide. Biodiesel also contains free oxygen in its structure and percentage of oxygen increases with the percentage of biodiesel blend. The total hydrocarbon (THC) and carbon monoxide (CO) emissions tend to decrease because of the oxygen content and the enhanced cetane number of biodiesel fuel which helps for a more complete combustion (Agarwal AK., 2007). In this study, emissions were determined for a on a single cylinder CI engine, operated at different loads with selected biodiesels and their blends. As the blend percentage is increasing along with the operating load, CO and HC emissions were found increasing for biodiesels, but were less than those of when operated with diesel as the fuel. Tao Y, et.al observed that higher CN has been correlated with reduced NOx emissions (Tao Y). For the selected biodiesels and their blends, cetane numbers were evaluated and were used as inputs to the ANN model to predict the emissions. 6. Artificial Neural Networks as a modelling tool for analyzing exhaust emissions: The combustion and emission formation is inherently non-linear and the conventional mathematical models fail to give solutions. Artificial Neural Networks is a real time diagnostic, modelling, control and optimization tool that has the ability to capture non-linearties of system variables. ANNs extract the required information directly from the data because of their unique learning capability. They are capable of learning from nonlinear data of a complex problem and can predict the desired values with high accuracy. An ANN usually consists of an input layer, some hidden layers, and an output layer. The input layer consists of all the input factors and information from the input layer is then processed in the course of one hidden layer, and a following output vector is computed in the output layer. Generally the hidden and the output layers have an activation function. The Sigmoid activation function applies a sigmoid transfer function to its input patterns, representing a good non-linear element to build the hidden layers of the neural network, such a layer is
Modern Applied Science March, 2010
79
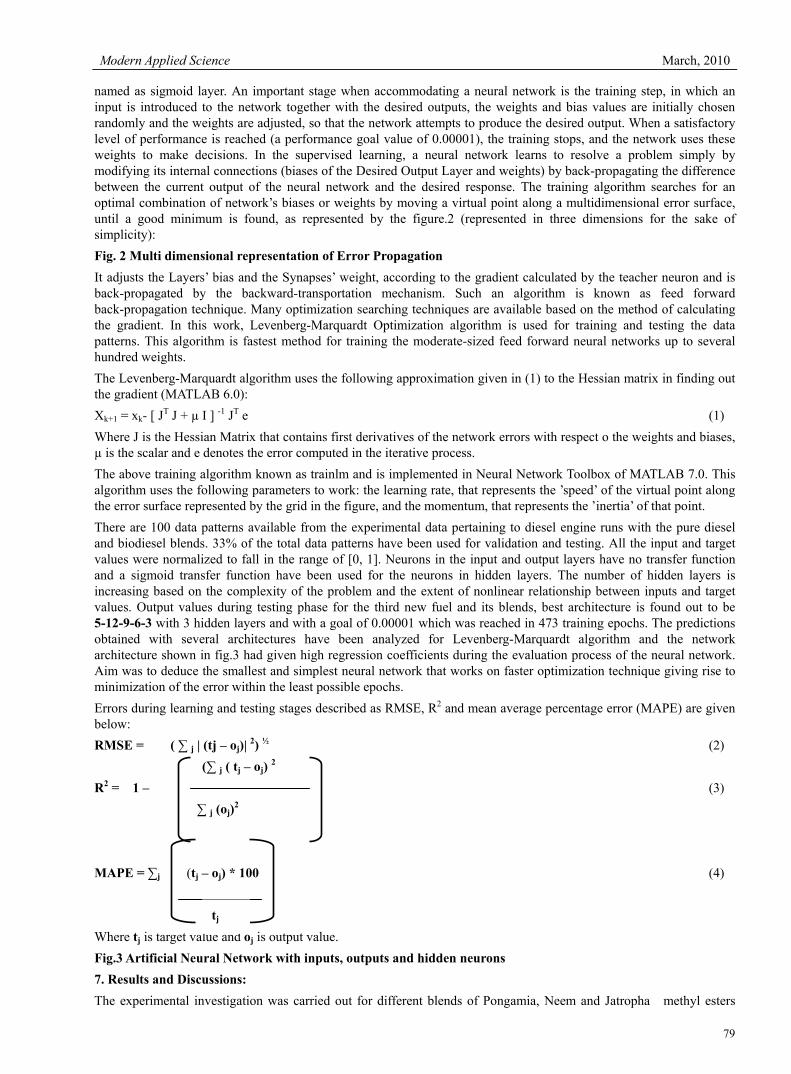
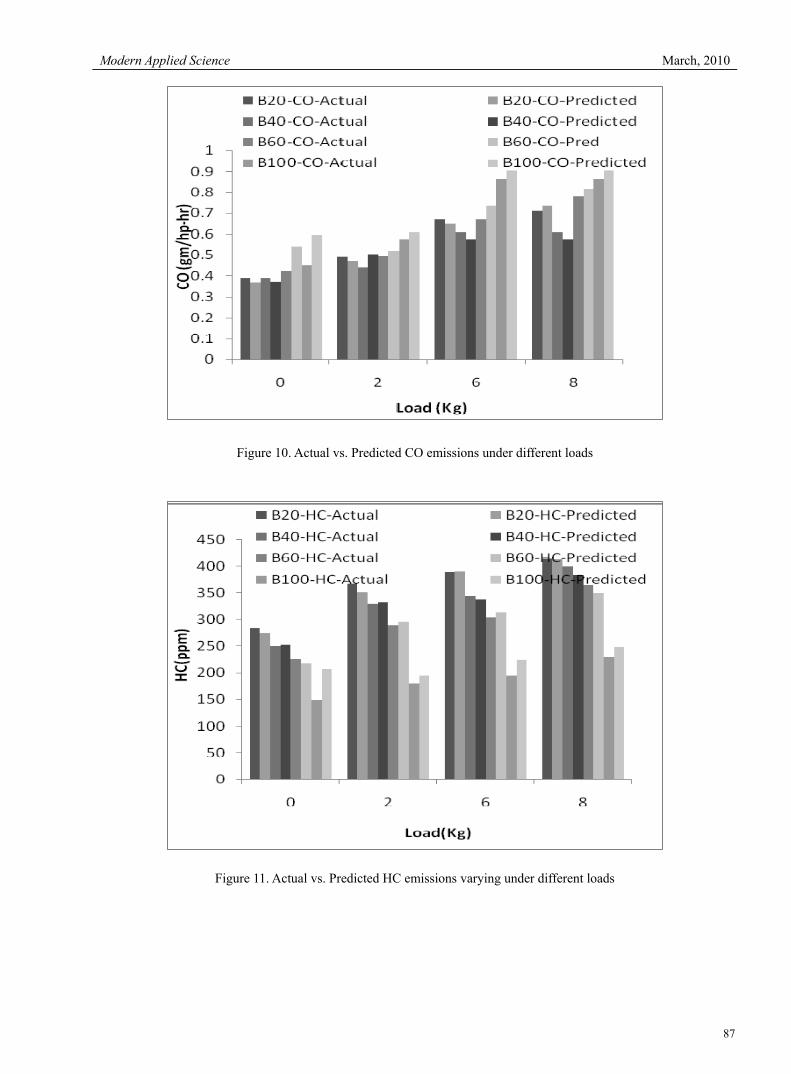
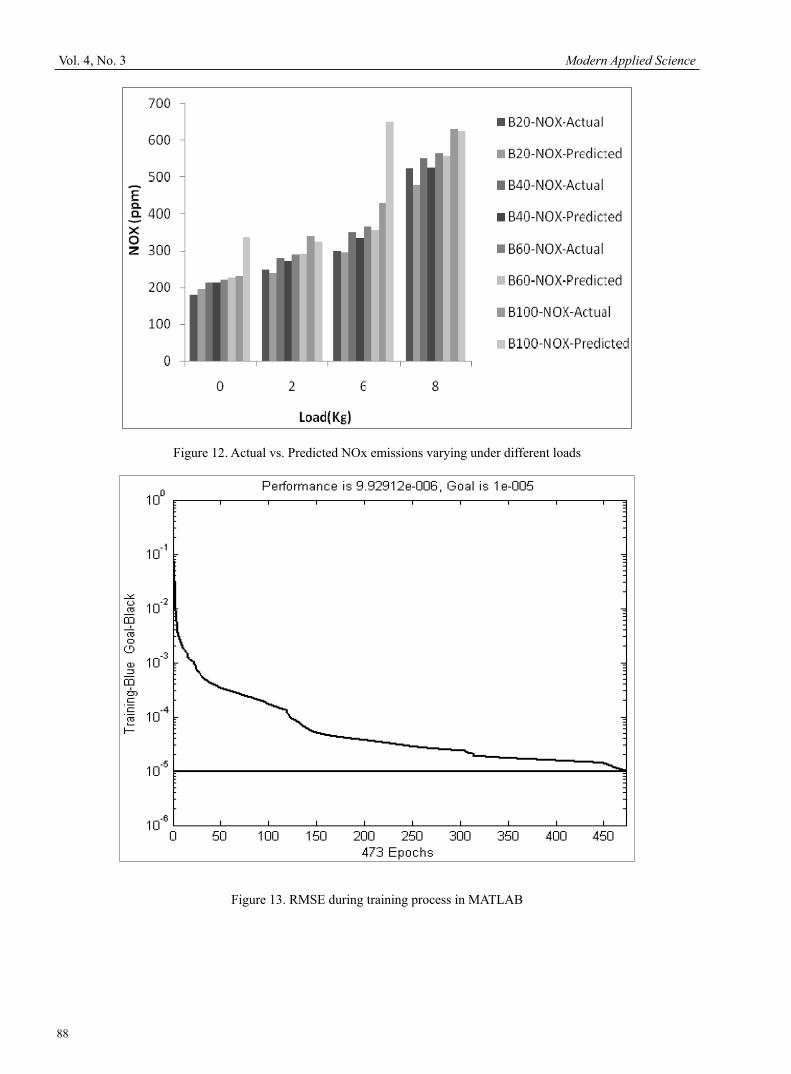
named as sigmoid layer. An important stage when accommodating a neural network is the training step, in which an input is introduced to the network together with the desired outputs, the weights and bias values are initially chosen randomly and the weights are adjusted, so that the network attempts to produce the desired output. When a satisfactory level of performance is reached (a performance goal value of 0.00001), the training stops, and the network uses these weights to make decisions. In the supervised learning, a neural network learns to resolve a problem simply by modifying its internal connections (biases of the Desired Output Layer and weights) by back-propagating the difference between the current output of the neural network and the desired response. The training algorithm searches for an optimal combination of network’s biases or weights by moving a virtual point along a multidimensional error surface, until a good minimum is found, as represented by the figure.2 (represented in three dimensions for the sake of simplicity): Fig. 2 Multi dimensional representation of Error Propagation It adjusts the Layers’ bias and the Synapses’ weight, according to the gradient calculated by the teacher neuron and is back-propagated by the backward-transportation mechanism. Such an algorithm is known as feed forward back-propagation technique. Many optimization searching techniques are available based on the method of calculating the gradient. In this work, Levenberg-Marquardt Optimization algorithm is used for training and testing the data patterns. This algorithm is fastest method for training the moderate-sized feed forward neural networks up to several hundred weights. The Levenberg-Marquardt algorithm uses the following approximation given in (1) to the Hessian matrix in finding out the gradient (MATLAB 6.0): Xk+1 = xk- [ JT J + µ I ] -1 JT e (1) Where J is the Hessian Matrix that contains first derivatives of the network errors with respect o the weights and biases, µ is the scalar and e denotes the error computed in the iterative process. The above training algorithm known as trainlm and is implemented in Neural Network Toolbox of MATLAB 7.0. This algorithm uses the following parameters to work: the learning rate, that represents the ’speed’ of the virtual point along the error surface represented by the grid in the figure, and the momentum, that represents the ’inertia’ of that point. There are 100 data patterns available from the experimental data pertaining to diesel engine runs with the pure diesel and biodiesel blends. 33% of the total data patterns have been used for validation and testing. All the input and target values were normalized to fall in the range of [0, 1]. Neurons in the input and output layers have no transfer function and a sigmoid transfer function have been used for the neurons in hidden layers. The number of hidden layers is increasing based on the complexity of the problem and the extent of nonlinear relationship between inputs and target values. Output values during testing phase for the third new fuel and its blends, best architecture is found out to be 5-12-9-6-3 with 3 hidden layers and with a goal of 0.00001 which was reached in 473 training epochs. The predictions obtained with several architectures have been analyzed for Levenberg-Marquardt algorithm and the network architecture shown in fig.3 had given high regression coefficients during the evaluation process of the neural network. Aim was to deduce the smallest and simplest neural network that works on faster optimization technique giving rise to minimization of the error within the least possible epochs. Errors during learning and testing stages described as RMSE, R2 and mean average percentage error (MAPE) are given below: RMSE = ( ∑ j | (tj – oj)| 2) ½ (2) (∑ j ( tj – oj) 2 R2 = 1 – (3) ∑ j (oj)2 MAPE = ∑j (tj – oj) * 100 (4) Where tj is target value and oj is output value. Fig.3 Artificial Neural Network with inputs, outputs and hidden neurons 7. Results and Discussions: The experimental investigation was carried out for different blends of Pongamia, Neem and Jatropha methyl esters
tj
Vol. 4, No. 3 Modern Applied Science
80
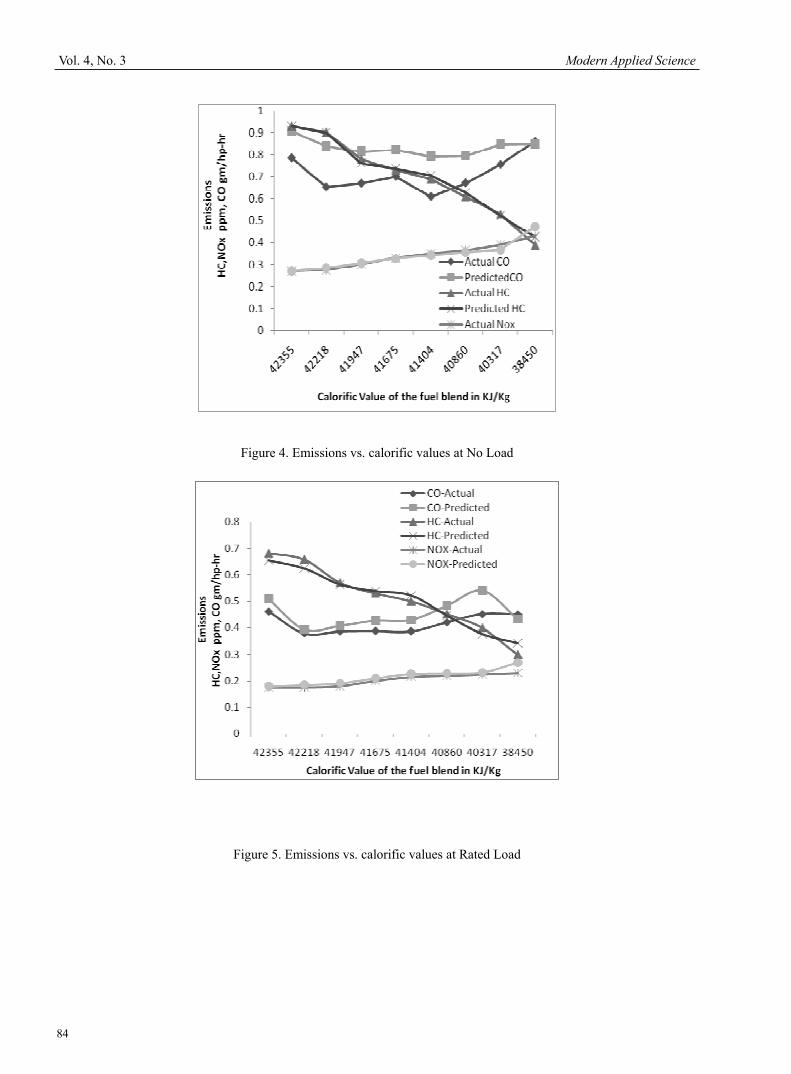
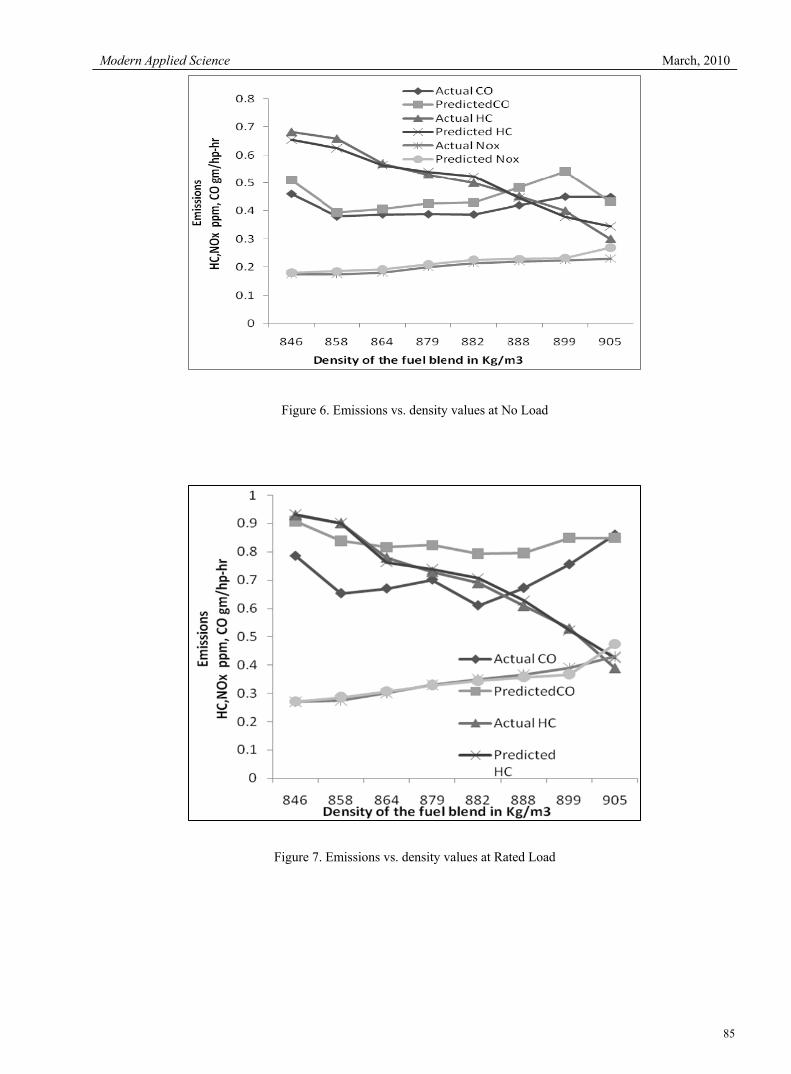
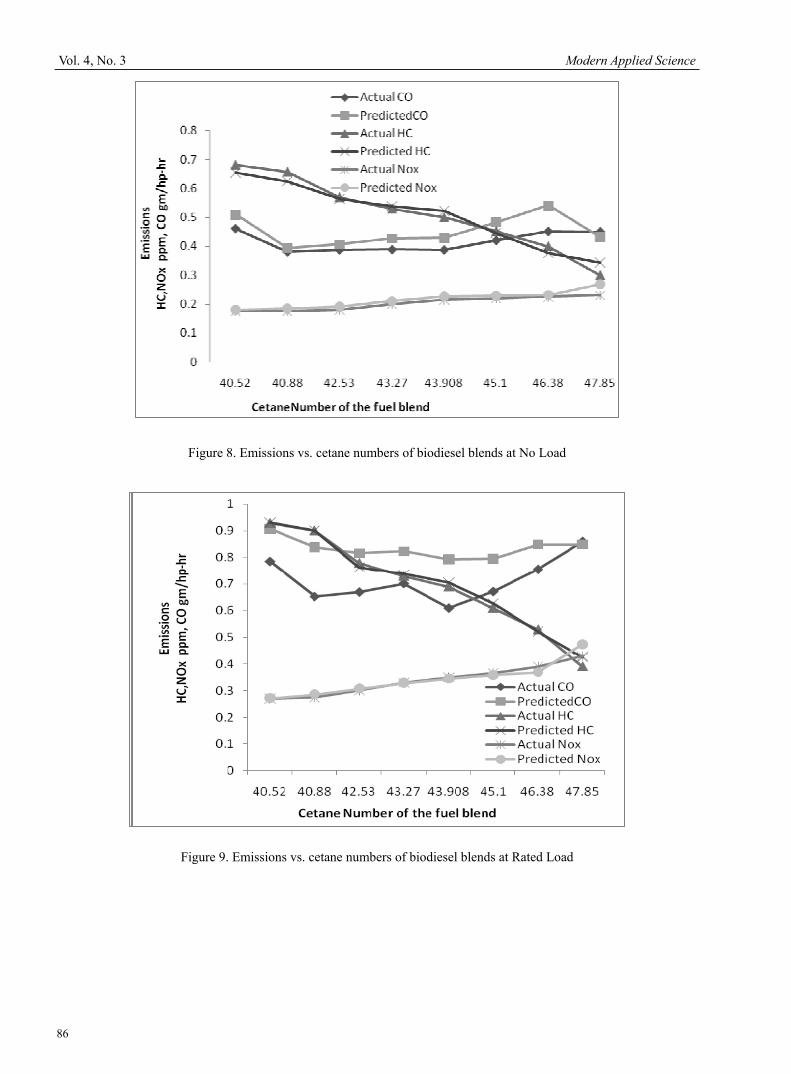
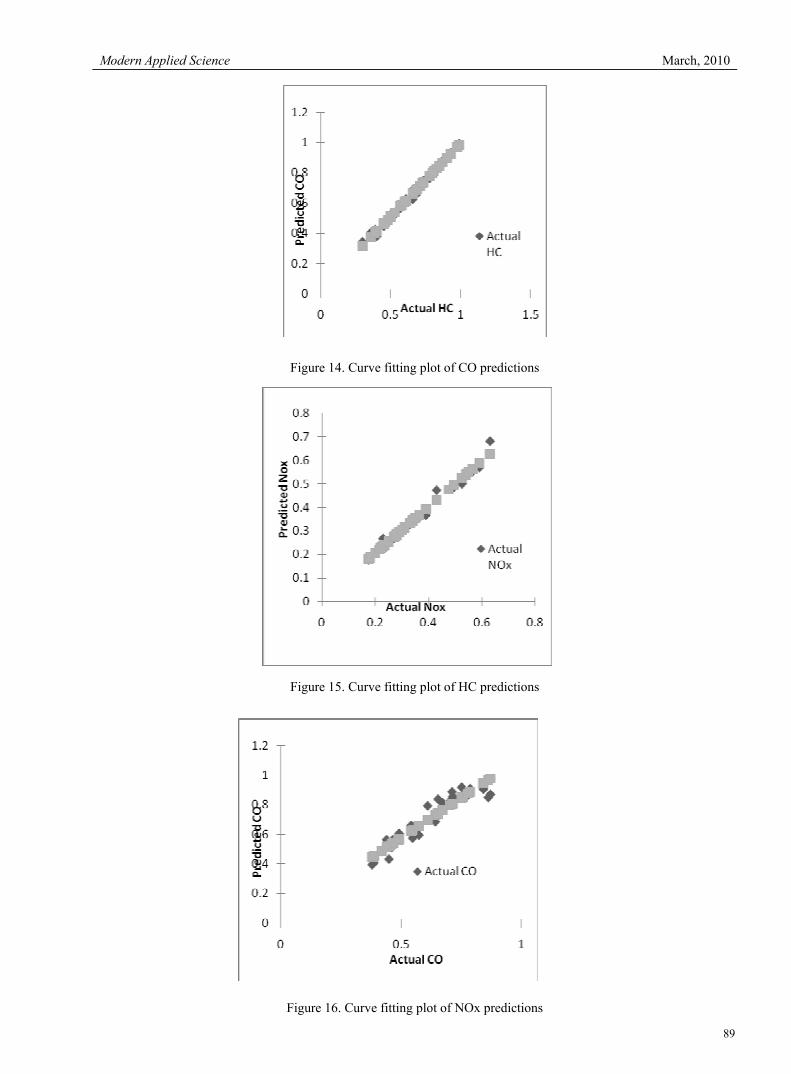
(biodiesel) , the emissions were evaluated and compared with diesel. This paper gives the result of ANN based predictions of emissions for the new biodiesels and its blends. A regression analysis is carried out to evaluate the performance of the adapted neural network model. 7.1 Fuel Properties: Transesterification of the biodiesel oils has reduced the viscosity by greater extent and hence the biodiesel has been used in diesel engine test rig without making any modifications to the engine. Calorific value of the biodiesel blends decrease with the blend percentage of biodiesel but is comparable with diesel. Cetane number and density of the biodiesel blends are increasing with the increase in the percentage of biodiesel blend. Biodiesels and their blends have higher cetane numbers higher than diesel resulting in better ignition advance for the engine. Biodiesels contain more oxygen percentage by weight, more density than diesel and subsequently more amount of fuel can be injected resulting in reduced emissions. The influence of properties of the biodiesel blends on exhaust emissions along with the predicted values by ANN is shown in fig 4, 5, 6,7,8,9. Fig. 4 Emissions vs. calorific values at No Load Fig. 5 Emissions vs. calorific values at Rated Load Fig. 6 Emissions vs. densities of biodiesel blends at No Load Fig. 7 Emissions vs. densities of biodiesel blends at Rated Load Fig. 8 Emissions vs. cetane numbers of biodiesel blends at No Load Fig. 9 Emissions vs. cetane numbers of biodiesel blends at Rated Load 7.2 Effect of Load with biodiesel blends percentage on emissions: At 75% of full load, CO and HC emissions of biodiesel blends are lower than those of diesel by nearly 60%. But NOx emissions are higher in case of biodiesels due to increased temperature because of the higher cetane numbers giving rise to efficient combustion when the blend percentage is increasing. Effect of load on diesel engine exhaust emissions operated with biodiesel blends is shown in fig 10, 11 and 12. Fig. 10 Actual vs. Predicted CO emissions varying under different loads Fig. 11 Actual vs. Predicted HC emissions varying under different loads Fig. 12 Actual vs. Predicted NOx emissions varying under different loads 7.3 Neural Network Performance Parameters: Various training algorithms such as Gradient-Descent (traingdx), Conjugate-Gradient (traincgf) were used to obtain predictions for the desired emissions. During experience, it was found out that the optimum neural network architecture would be possible with Levenberg-Marquardt algorithm as shown below that has given improved regression coefficients. The goal for the training was set to 0.00001 and it took 473 epochs for achieving it as shown in table 2. A satisfactory performance was observed with the given number of neurons in the hidden layers for the selected neural network algorithm. Table 2. ANN parameters Fig. 13 RMSE during training process in MATLAB 7.4 Performance evaluation of the developed ANN using Regression Analysis: Regression statistics output characterizes the goodness of the neural network model adapted as a whole. The regression analysis carried out to relate the actual and predicted data has shown that there is a high correlation between actual experimental values and predicted values. Regression Coefficient (R) which indicates the amount of variation of actual and predicted values for NOx, CO and HC was found out to be 0.99, 0.95 and 0.99 respectively. It implies that the model has succeeded in the prediction of diesel engine exhaust emissions. The lower value of R, R2 for CO emissions may be due to incomplete combustion or any unseen variations in working conditions. Noise in the experimental data is captured by ANN and has given reduced regression value for CO. It was also observed that the curve fitting plot for each of the predicted emissions of Jatropha oil, most of the MAPE values are less than 15%. Figs 14 to Fig 16 are the residual and curve fitting graphs for all the predictions. 8. Conclusion Following are the conclusions based on the experimental results and their simulation using artificial neural networks to predict the emission characteristics of a new biodiesel and its blends operated at different load conditions on a single cylinder diesel engine.
1) Biodiesel properties are similar to diesel fuel. Transesterification of biodiesel methyl esters helps not only in
Modern Applied Science March, 2010
81
increasing the performance of the diesel engine but also in reducing CO and HC emissions. 2) Density, Calorific Value and Cetane Number are significant factors that influence the formation of exhaust
emissions. Biodiesels and their blends give lower emissions compared to diesel. Higher the cetane number, higher will be the flame formation and the operating temperatures which will have a direct effect on increase of NOx emissions. Similar trend is observed for emissions under increasing operating load on the engine.
3) In this work, optimum artificial neural network architecture is designed to model the complex behavior of diesel engine exhaust emissions operated with biodiesels. The model developed is based on the most efficient and faster computing design optimization technique- Levenberg-Marquardt (trainlm). The other training algorithms such as Gradient-Descent (traingdx), Conjugate-Gradient (traincgf) were found to be inferior to trainlm that was able to predict CO, HC and NOx emissions for the new biodiesel and its blends with improved accuracy.
4) This research work has shown that, for analyzing complex problems of emission analysis of biodiesels and their blends, artificial neural network is suitable, adaptable and flexible computing tool that can be used for diagnostic purposes. There by, time consuming, tedious and costly experiments can be avoided.
References Agarwal AK. (2007). Biofuels (alcohol and biodiesel) applications as fuels for internal combustion engines. Progr Energy Combust Sci 2007; 33:233–71. Avinash Kumar Agarwal, (2007). Biofuels (alcohols and biodiesel) applications as fuels for internal combustion engines,Progress in Energy and Combustion Science 33 (2007) 233–271 Canakci M, Van Gerpen JH. (2003). Comparison of engine performance and emissions for petroleum diesel fuel, yellow-grease biodiesel and soybean-oil biodiesel. Trans ASAE 2003;46:937–44. Cloin R. Ferguson, Allan T. Kirkpatrick - Internal combustion engines D. Agarwal, L. Kumar, A.K. Agarwal, (2007). "Performance Evaluation of a Vegetable oil fuelled CI Engine". Renewable Energy, accepted 29th June 2007 Graboski MS, McCormick RL. (1998). Combustion of fat and vegetable-oil derived fuels in diesel engines. Prog Energy Combus Sci 1998;24:125–64. J. Sola and J. Sevilla, (1997). ‘‘Importance of data normalization for the application of neural networks to complex industrial problems,’’ IEEE Transactions on Nuclear Science, 1997, 44(3) 1464–1468. J.B. Heywood. (1988). “ Internal Combustion Engine Fundamentals” , McGrawHill, New York,1988. Java Object Oriented Neural Engine, User Guide MATLAB 6.0 User Guide and Product Help for Neural Network Tool Box. Nwafor, O.M.I. (2004). Emission characteristics of Diesel engine operating on rapeseed methyl ester, Renewable Energy, Vol. 29, No. 1, pp. 119-129, 2004. Ouenou- Gamo s., ouladsine M. and Rachid A. (1998). “Measurment and prediction of diesel engine exhaust emissions ”ISA Transactions 37 (1998) 135- 140. S.Ouenou Gamo, M. Ouladsine and A.Rachid. (1999). Diesel Engine Exhaust Emissions Modeling Using Artificial Neural Networks –– (SAE 1999-01-1163) Tao Y, Operation of a cummins N14 diesel on biodiesel: performance, emission and durability. National Biodiesel Board, Ortech Report No. 95-E11-B004524 Timothy P. Gardner,Scott S. Low, Thomas E. Kenney and Richard C. (2001). Belaire Evaluation of Some Alternative Diesel Fuels for Low Emissions and Improved Fuel Economy - Ford Research Laboratory - (SAE 2001-01-0149) United Nations Conference on Trade and Development: An Assessment of the Biofuels Industry in India, by Joseph B. Gonsalves on 18 October 2006
Vol. 4, No. 3 Modern Applied Science
82
Table 1. Details of the experimental setup for biodiesel emission test rig
Table 2. ANN Parameters
Activation Function Training Rule
Hidden Layers & Neurons
Training Error
Regression Coefficient (R )
R2
Linear (Input Layer) Sigmoid(Hidden layer) Linear (Output Layer)
trainlm 3 Hidden layers 12 - 1st Hidden layer Neurons 9- 2nd Hidden layer Neurons 6- 3rd Hidden layer Neurons
0.00001 0.9507 ( CO) 0.9956 ( HC) 0.9926 (NOx)
0.9039 (CO) 0.9914 (HC) 0.9853 (NOx)
Figure 1. Structure of alkyl group methyl ester
Modern Applied Science March, 2010
83
Figure 2. Multi dimensional representation of Error Propagation
Figure 3. Artificial Neural Network with inputs, outputs and hidden neurons
Vol. 4, No. 3 Modern Applied Science
84
Figure 4. Emissions vs. calorific values at No Load
Figure 5. Emissions vs. calorific values at Rated Load
Modern Applied Science March, 2010
85
Figure 6. Emissions vs. density values at No Load
Figure 7. Emissions vs. density values at Rated Load
Vol. 4, No. 3 Modern Applied Science
86
Figure 8. Emissions vs. cetane numbers of biodiesel blends at No Load
Figure 9. Emissions vs. cetane numbers of biodiesel blends at Rated Load
Modern Applied Science March, 2010
87
Figure 10. Actual vs. Predicted CO emissions under different loads
Figure 11. Actual vs. Predicted HC emissions varying under different loads
Vol. 4, No. 3 Modern Applied Science
88
Figure 12. Actual vs. Predicted NOx emissions varying under different loads
Figure 13. RMSE during training process in MATLAB
Modern Applied Science March, 2010
89
Figure 14. Curve fitting plot of CO predictions
Figure 15. Curve fitting plot of HC predictions
Figure 16. Curve fitting plot of NOx predictions
Vol. 4, No. 3 Modern Applied Science
90
Optimal Solutions of Production Inventory Control Problem
Zhiguang Zhang Department of Mathematics, Dezhou University
Dezhou 253023, China E-mail: [email protected]
Abstract This paper studies a production inventory problem, which has deteriorating items and dynamic costs. The corresponding optimal solutions are derived respectively by optimal control theory. Keywords: Optimal control, Pontryagin maximum principle, Lagrangian method of multipliers 1. Introduction That the study of inventory problems dates back to 1915, by Harris, was quite natural for the inventory problem to be among the first selected for mathematical analysis. He established the simple but famous EOQ (Economic Order Quantity) formula. The EOQ models assume a constant demand rate and are solved using classical optimization tools. The dynamic counterparts, the GEOQ models, assume a time varying demand rate. They are solved using either classical optimization or optimal control theory. S.Axsäter (1985) solved the problem using optimal control theory, which is suited to find optimal ways to control a dynamic system. During the recent decades, more and more inventory models (Chang et al.2001, Teng et al.2005, Silver et al.1985) were researched and solved by optimal control theory (Y. Salama 2000, E. Khemlnitsky2003). In this paper, we study a new production inventory control problem. First, the costs in our model are general functions of time; Second, the on-hand inventory deteriorates and the deterioration rate is a general function of time; Third, the demand rate is a general function of time too. To construct the objective function of the problem, we assume that there are an inventory goal level, a production goal rate, and a deterioration goal rate and penalties that are incurred when the inventory level, the production rate, and the deterioration rate deviate from their respective goals. In this paper, we consider both continuous and periodic-review policies. For both models, we utilize optimal control theory to obtain an optimal control policy. The rest of the paper is organized as follows. All the notations are stated in section 2. Section 3 describes the continuous-review model, which is solved by applying pontryagin maximum principle. In section 4, we build and solve periodic-review model, and give the optimal solution using Lagrange multiplier method. 2. Notations and Assumptions 2.1 notations T : length of the planning horizon; r : constant nonnegative discount rate;
0I : initial inventory level; ( )h t : holding penalty cost rate at time t ; ( )K t : production penalty cost rate at time t ;
( )I t : inventory level at time t ; ( )P t : production rate at time t ; ( )D t : demand rate at time t ; ( )d t : deterioration rate at time t ; ( )I t : inventory goal level at time t , it is a safety stock that the company wants to keep on hand;
( )P t : production goal rate at time t , it is the most efficient rate desired by the company.
Modern Applied Science March, 2010
91
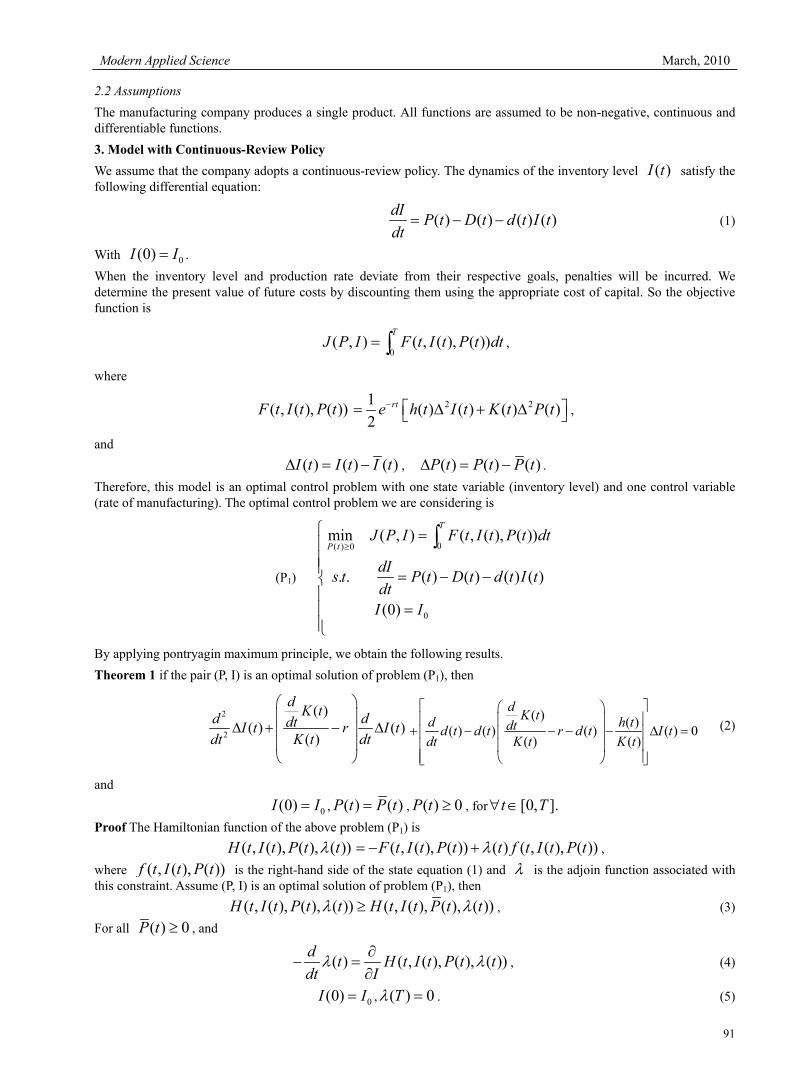
2.2 Assumptions The manufacturing company produces a single product. All functions are assumed to be non-negative, continuous and differentiable functions. 3. Model with Continuous-Review Policy We assume that the company adopts a continuous-review policy. The dynamics of the inventory level ( )I t satisfy the following differential equation:
( ) ( ) ( ) ( )dI P t D t d t I tdt
= − − (1)
With 0(0)I I= . When the inventory level and production rate deviate from their respective goals, penalties will be incurred. We determine the present value of future costs by discounting them using the appropriate cost of capital. So the objective function is
0( , ) ( , ( ), ( ))
TJ P I F t I t P t dt= ∫ ,
where
( , ( ), ( ))F t I t P t 2 21 ( ) ( ) ( ) ( )2
rte h t I t K t P t− ⎡ ⎤= Δ + Δ⎣ ⎦ ,
and ( ) ( ) ( )I t I t I tΔ = − , ( ) ( ) ( )P t P t P tΔ = − .
Therefore, this model is an optimal control problem with one state variable (inventory level) and one control variable (rate of manufacturing). The optimal control problem we are considering is
(P1)
0( ) 0
0
min ( , ) ( , ( ), ( ))
. . ( ) ( ) ( ) ( )
(0)
T
P tJ P I F t I t P t dt
dIs t P t D t d t I tdt
I I
≥
⎧ =⎪⎪⎪ = − −⎨⎪
=⎪⎪⎩
∫
By applying pontryagin maximum principle, we obtain the following results. Theorem 1 if the pair (P, I) is an optimal solution of problem (P1), then
2
2
( )( ) ( )
( )
d K td ddtI t r I tdt K t dt
⎛ ⎞⎜ ⎟
Δ + − Δ⎜ ⎟⎜ ⎟⎝ ⎠
( ) ( )( ) ( ) ( ) ( ) 0( ) ( )
d K td h tdtd t d t r d t I tdt K t K t
⎡ ⎤⎛ ⎞⎢ ⎥⎜ ⎟
+ − − − − Δ =⎢ ⎥⎜ ⎟⎢ ⎥⎜ ⎟⎢ ⎥⎝ ⎠⎣ ⎦
(2)
and
0(0)I I= , ( ) ( )P t P t= , ( ) 0P t ≥ , for [0, ].t T∀ ∈ Proof The Hamiltonian function of the above problem (P1) is
( , ( ), ( ), ( ))H t I t P t tλ ( , ( ), ( )) ( ) ( , ( ), ( ))F t I t P t t f t I t P tλ= − + , where ( , ( ), ( ))f t I t P t is the right-hand side of the state equation (1) and λ is the adjoin function associated with this constraint. Assume (P, I) is an optimal solution of problem (P1), then
( , ( ), ( ), ( )) ( , ( ), ( ), ( ))H t I t P t t H t I t P t tλ λ≥ , (3) For all ( ) 0P t ≥ , and
( ) ( , ( ), ( ), ( ))d t H t I t P t tdt Iλ λ∂
− =∂
, (4)
0(0)I I= , ( ) 0Tλ = . (5)
Vol. 4, No. 3 Modern Applied Science
92
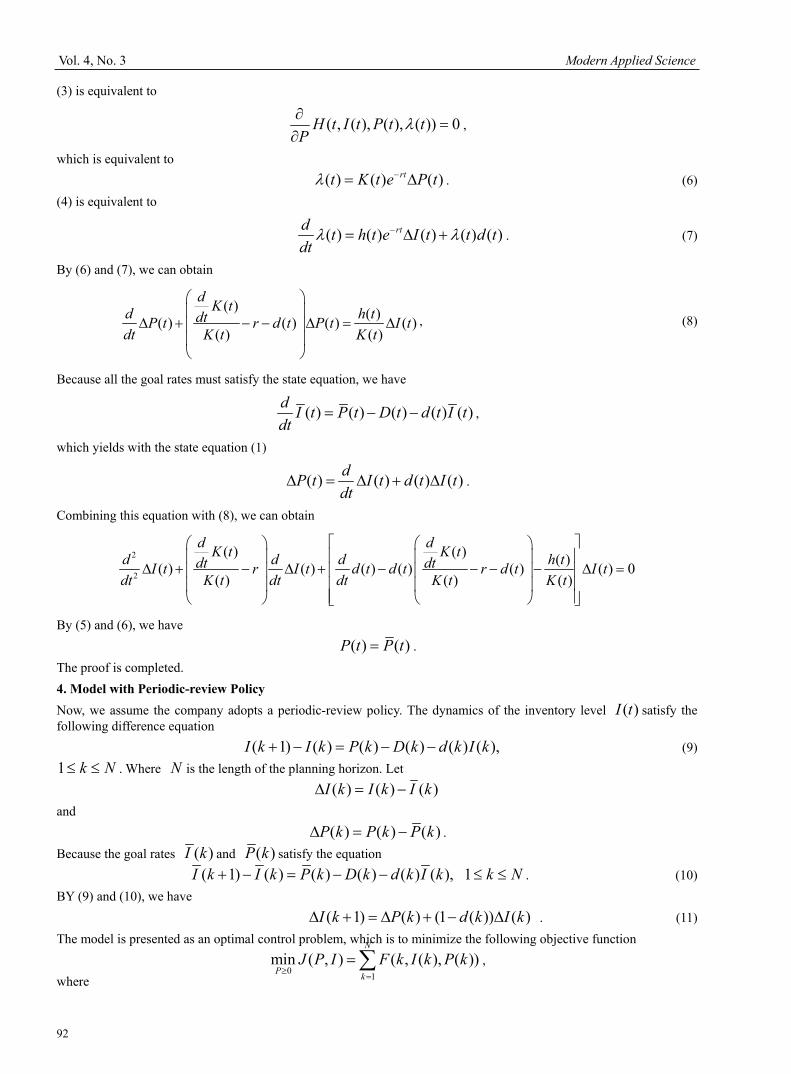
(3) is equivalent to
( , ( ), ( ), ( )) 0H t I t P t tP
λ∂=
∂,
which is equivalent to ( ) ( ) ( )rtt K t e P tλ −= Δ . (6)
(4) is equivalent to
( ) ( ) ( ) ( ) ( )rtd t h t e I t t d tdtλ λ−= Δ + . (7)
By (6) and (7), we can obtain
( ) ( )( ) ( ) ( ) ( )( ) ( )
d K td h tdtP t r d t P t I tdt K t K t
⎛ ⎞⎜ ⎟
Δ + − − Δ = Δ⎜ ⎟⎜ ⎟⎝ ⎠
, (8)
Because all the goal rates must satisfy the state equation, we have
( ) ( ) ( ) ( ) ( )d I t P t D t d t I tdt
= − − ,
which yields with the state equation (1)
( ) ( ) ( ) ( )dP t I t d t I tdt
Δ = Δ + Δ .
Combining this equation with (8), we can obtain
2
2
( ) ( ) ( )( ) ( ) ( ) ( ) ( ) ( ) 0( ) ( ) ( )
d dK t K td d d h tdt dtI t r I t d t d t r d t I tdt K t dt dt K t K t
⎡ ⎤⎛ ⎞ ⎛ ⎞⎢ ⎥⎜ ⎟ ⎜ ⎟
Δ + − Δ + − − − − Δ =⎢ ⎥⎜ ⎟ ⎜ ⎟⎢ ⎥⎜ ⎟ ⎜ ⎟⎢ ⎥⎝ ⎠ ⎝ ⎠⎣ ⎦
By (5) and (6), we have ( ) ( )P t P t= .
The proof is completed. 4. Model with Periodic-review Policy Now, we assume the company adopts a periodic-review policy. The dynamics of the inventory level ( )I t satisfy the following difference equation
( 1) ( ) ( ) ( ) ( ) ( ),I k I k P k D k d k I k+ − = − − (9) 1 k N≤ ≤ . Where N is the length of the planning horizon. Let
( ) ( ) ( )I k I k I kΔ = − and
( ) ( ) ( )P k P k P kΔ = − . Because the goal rates ( )I k and ( )P k satisfy the equation
( 1) ( ) ( ) ( ) ( ) ( ),I k I k P k D k d k I k+ − = − − 1 k N≤ ≤ . (10) BY (9) and (10), we have
( 1) ( ) (1 ( )) ( )I k P k d k I kΔ + = Δ + − Δ . (11) The model is presented as an optimal control problem, which is to minimize the following objective function
0 1min ( , ) ( , ( ), ( ))
N
P kJ P I F k I k P k
≥=
= ∑ , where
Modern Applied Science March, 2010
93
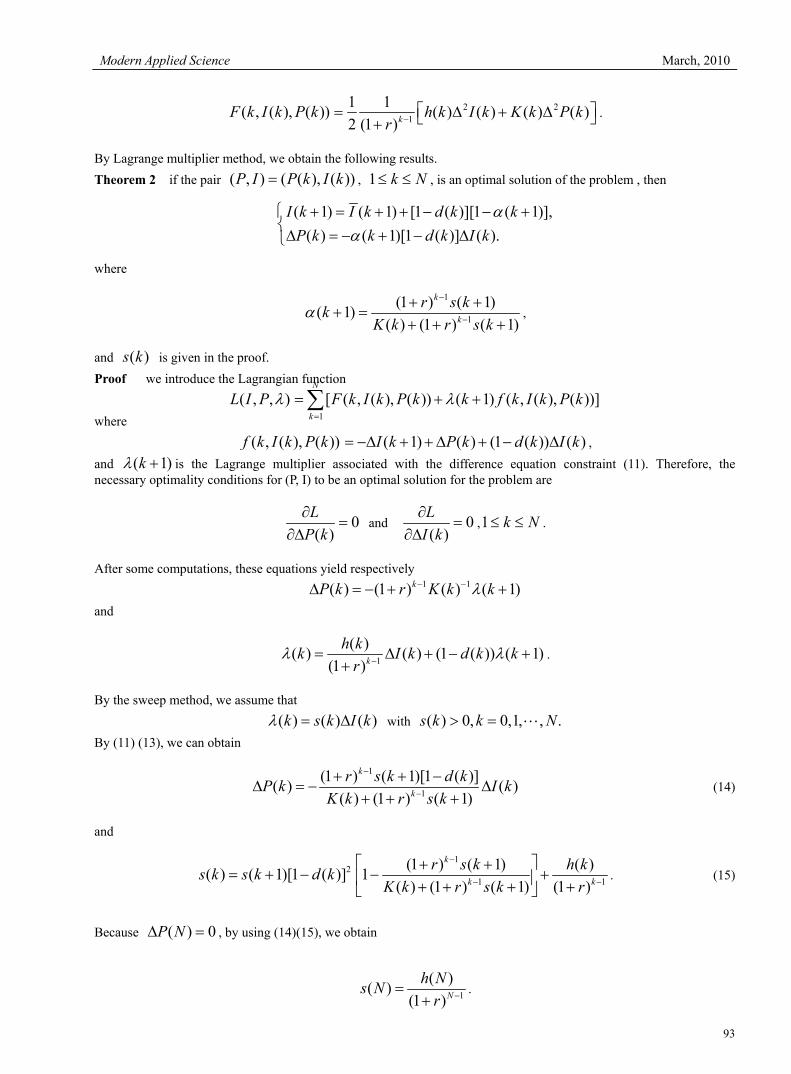
( , ( ), ( ))F k I k P k 2 21
1 1 ( ) ( ) ( ) ( )2 (1 )k h k I k K k P k
r −⎡ ⎤= Δ + Δ⎣ ⎦+
.
By Lagrange multiplier method, we obtain the following results. Theorem 2 if the pair ( , ) ( ( ), ( ))P I P k I k= , 1 k N≤ ≤ , is an optimal solution of the problem , then
( 1) ( 1) [1 ( )][1 ( 1)],( ) ( 1)[1 ( )] ( ).
I k I k d k kP k k d k I k
αα
⎧ + = + + − − +⎨Δ = − + − Δ⎩
where
1
1
(1 ) ( 1)( 1)( ) (1 ) ( 1)
k
k
r s kkK k r s k
α−
−
+ ++ =
+ + +,
and ( )s k is given in the proof. Proof we introduce the Lagrangian function
( , , )L I P λ1
[ ( , ( ), ( )) ( 1) ( , ( ), ( ))]N
k
F k I k P k k f k I k P kλ=
= + +∑ where
( , ( ), ( ))f k I k P k ( 1) ( ) (1 ( )) ( )I k P k d k I k= −Δ + + Δ + − Δ , and ( 1)kλ + is the Lagrange multiplier associated with the difference equation constraint (11). Therefore, the necessary optimality conditions for (P, I) to be an optimal solution for the problem are
0( )
LP k∂
=∂Δ
and 0( )LI k∂
=∂Δ
,1 k N≤ ≤ .
After some computations, these equations yield respectively 1 1( ) (1 ) ( ) ( 1)kP k r K k kλ− −Δ = − + +
and
1
( )( ) ( ) (1 ( )) ( 1)(1 )k
h kk I k d k kr
λ λ−= Δ + − ++
.
By the sweep method, we assume that ( ) ( ) ( )k s k I kλ = Δ with ( ) 0, 0,1, , .s k k N> = L
By (11) (13), we can obtain
1
1
(1 ) ( 1)[1 ( )]( ) ( )( ) (1 ) ( 1)
k
k
r s k d kP k I kK k r s k
−
−
+ + −Δ = − Δ
+ + + (14)
and
2( ) ( 1)[1 ( )]s k s k d k= + −1
1 1
(1 ) ( 1) ( )1( ) (1 ) ( 1) (1 )
k
k k
r s k h kK k r s k r
−
− −
⎡ ⎤+ +− +⎢ ⎥+ + + +⎣ ⎦
. (15)
Because ( ) 0P NΔ = , by using (14)(15), we obtain
1
( )( )(1 )N
h Ns Nr −=
+.
Vol. 4, No. 3 Modern Applied Science
94
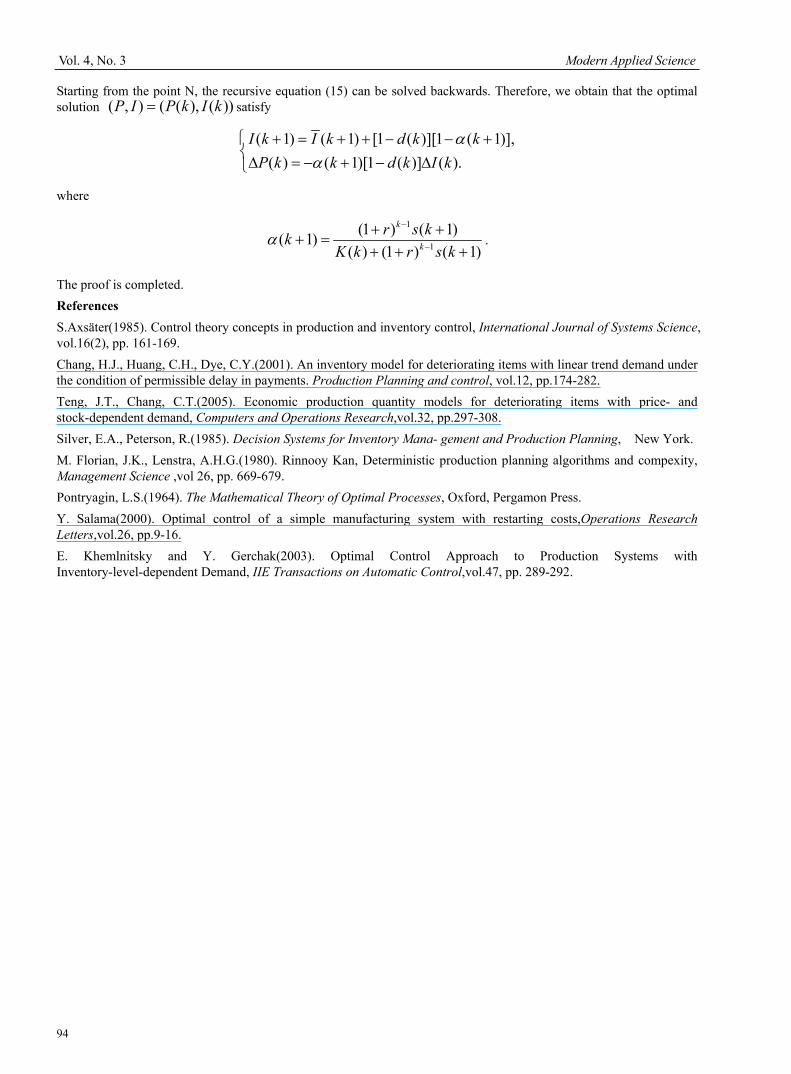
Starting from the point N, the recursive equation (15) can be solved backwards. Therefore, we obtain that the optimal solution ( , ) ( ( ), ( ))P I P k I k= satisfy
( 1) ( 1) [1 ( )][1 ( 1)],( ) ( 1)[1 ( )] ( ).
I k I k d k kP k k d k I k
αα
⎧ + = + + − − +⎨Δ = − + − Δ⎩
where
1
1
(1 ) ( 1)( 1)( ) (1 ) ( 1)
k
k
r s kkK k r s k
α−
−
+ ++ =
+ + +.
The proof is completed. References S.Axsäter(1985). Control theory concepts in production and inventory control, International Journal of Systems Science, vol.16(2), pp. 161-169. Chang, H.J., Huang, C.H., Dye, C.Y.(2001). An inventory model for deteriorating items with linear trend demand under the condition of permissible delay in payments. Production Planning and control, vol.12, pp.174-282. Teng, J.T., Chang, C.T.(2005). Economic production quantity models for deteriorating items with price- and stock-dependent demand, Computers and Operations Research,vol.32, pp.297-308. Silver, E.A., Peterson, R.(1985). Decision Systems for Inventory Mana- gement and Production Planning, New York. M. Florian, J.K., Lenstra, A.H.G.(1980). Rinnooy Kan, Deterministic production planning algorithms and compexity, Management Science ,vol 26, pp. 669-679. Pontryagin, L.S.(1964). The Mathematical Theory of Optimal Processes, Oxford, Pergamon Press. Y. Salama(2000). Optimal control of a simple manufacturing system with restarting costs,Operations Research Letters,vol.26, pp.9-16. E. Khemlnitsky and Y. Gerchak(2003). Optimal Control Approach to Production Systems with Inventory-level-dependent Demand, IIE Transactions on Automatic Control,vol.47, pp. 289-292.
Modern Applied Science March, 2010
95
The Study of X-Ray Fluorescence Spectrum of Potsherd in New Stone Age in Zhaotong
Kunli Fu Physics Department, Zhaotong Teacher’s College
Huancheng East Road, Yunnan 657000, China E-mail: [email protected]
Changfen Ding
Bureau of Cultural Relics of Zhaotong City Yunnan 657000, China
Qiao Lu & Delan Wu
Physics Department, Zhaotong Teacher’s College Yunnan 657000, China
Bocheng He
The First Middle School of Zhaoyang Yunnan 657000, China
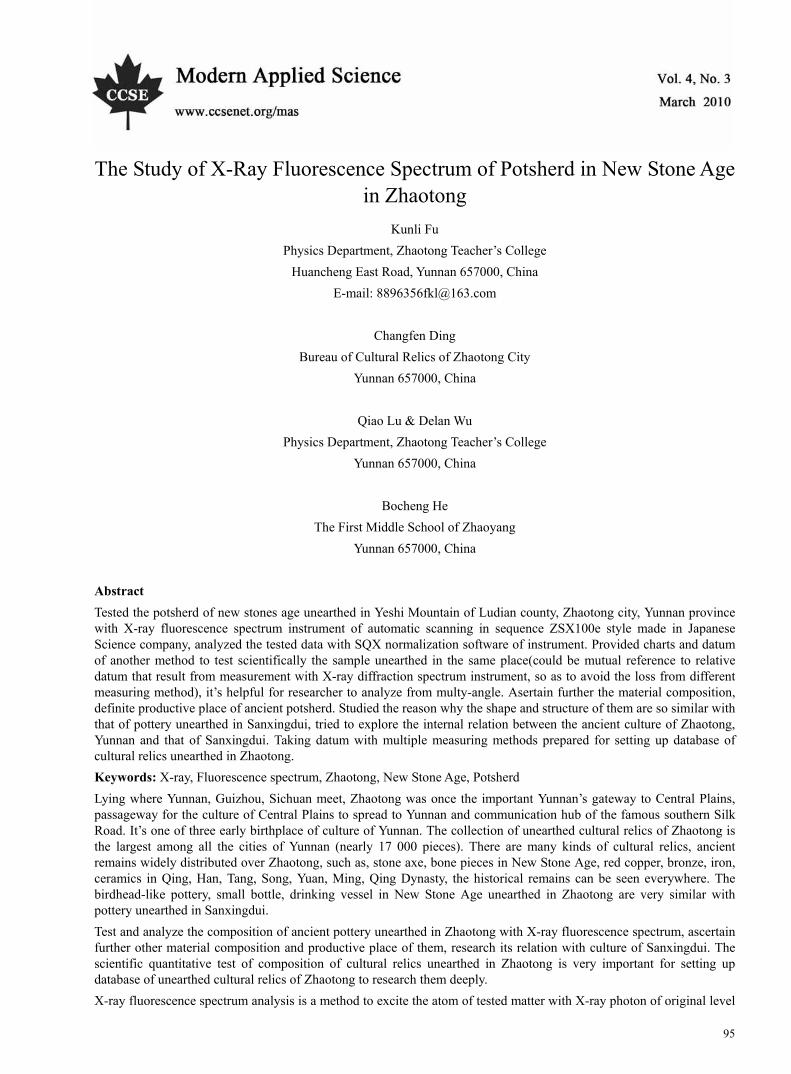
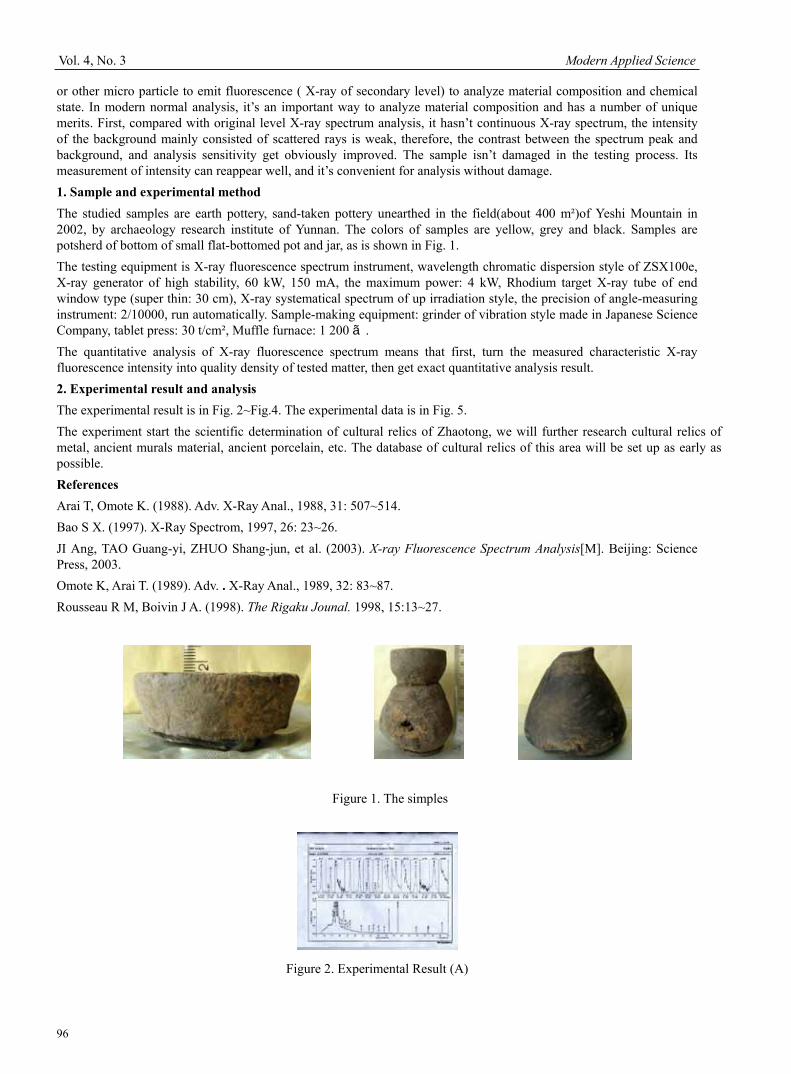
Abstract Tested the potsherd of new stones age unearthed in Yeshi Mountain of Ludian county, Zhaotong city, Yunnan province with X-ray fluorescence spectrum instrument of automatic scanning in sequence ZSX100e style made in Japanese Science company, analyzed the tested data with SQX normalization software of instrument. Provided charts and datum of another method to test scientifically the sample unearthed in the same place(could be mutual reference to relative datum that result from measurement with X-ray diffraction spectrum instrument, so as to avoid the loss from different measuring method), it’s helpful for researcher to analyze from multy-angle. Asertain further the material composition, definite productive place of ancient potsherd. Studied the reason why the shape and structure of them are so similar with that of pottery unearthed in Sanxingdui, tried to explore the internal relation between the ancient culture of Zhaotong, Yunnan and that of Sanxingdui. Taking datum with multiple measuring methods prepared for setting up database of cultural relics unearthed in Zhaotong. Keywords: X-ray, Fluorescence spectrum, Zhaotong, New Stone Age, Potsherd Lying where Yunnan, Guizhou, Sichuan meet, Zhaotong was once the important Yunnan’s gateway to Central Plains, passageway for the culture of Central Plains to spread to Yunnan and communication hub of the famous southern Silk Road. It’s one of three early birthplace of culture of Yunnan. The collection of unearthed cultural relics of Zhaotong is the largest among all the cities of Yunnan (nearly 17 000 pieces). There are many kinds of cultural relics, ancient remains widely distributed over Zhaotong, such as, stone axe, bone pieces in New Stone Age, red copper, bronze, iron, ceramics in Qing, Han, Tang, Song, Yuan, Ming, Qing Dynasty, the historical remains can be seen everywhere. The birdhead-like pottery, small bottle, drinking vessel in New Stone Age unearthed in Zhaotong are very similar with pottery unearthed in Sanxingdui. Test and analyze the composition of ancient pottery unearthed in Zhaotong with X-ray fluorescence spectrum, ascertain further other material composition and productive place of them, research its relation with culture of Sanxingdui. The scientific quantitative test of composition of cultural relics unearthed in Zhaotong is very important for setting up database of unearthed cultural relics of Zhaotong to research them deeply. X-ray fluorescence spectrum analysis is a method to excite the atom of tested matter with X-ray photon of original level
Vol. 4, No. 3 Modern Applied Science
96
or other micro particle to emit fluorescence ( X-ray of secondary level) to analyze material composition and chemical state. In modern normal analysis, it’s an important way to analyze material composition and has a number of unique merits. First, compared with original level X-ray spectrum analysis, it hasn’t continuous X-ray spectrum, the intensity of the background mainly consisted of scattered rays is weak, therefore, the contrast between the spectrum peak and background, and analysis sensitivity get obviously improved. The sample isn’t damaged in the testing process. Its measurement of intensity can reappear well, and it’s convenient for analysis without damage. 1. Sample and experimental method The studied samples are earth pottery, sand-taken pottery unearthed in the field(about 400 m²)of Yeshi Mountain in 2002, by archaeology research institute of Yunnan. The colors of samples are yellow, grey and black. Samples are potsherd of bottom of small flat-bottomed pot and jar, as is shown in Fig. 1. The testing equipment is X-ray fluorescence spectrum instrument, wavelength chromatic dispersion style of ZSX100e, X-ray generator of high stability, 60 kW, 150 mA, the maximum power: 4 kW, Rhodium target X-ray tube of end window type (super thin: 30 cm), X-ray systematical spectrum of up irradiation style, the precision of angle-measuring instrument: 2/10000, run automatically. Sample-making equipment: grinder of vibration style made in Japanese Science Company, tablet press: 30 t/cm², Muffle furnace: 1 200 ℃. The quantitative analysis of X-ray fluorescence spectrum means that first, turn the measured characteristic X-ray fluorescence intensity into quality density of tested matter, then get exact quantitative analysis result. 2. Experimental result and analysis The experimental result is in Fig. 2~Fig.4. The experimental data is in Fig. 5. The experiment start the scientific determination of cultural relics of Zhaotong, we will further research cultural relics of metal, ancient murals material, ancient porcelain, etc. The database of cultural relics of this area will be set up as early as possible. References Arai T, Omote K. (1988). Adv. X-Ray Anal., 1988, 31: 507~514. Bao S X. (1997). X-Ray Spectrom, 1997, 26: 23~26. JI Ang, TAO Guang-yi, ZHUO Shang-jun, et al. (2003). X-ray Fluorescence Spectrum Analysis[M]. Beijing: Science Press, 2003. Omote K, Arai T. (1989). Adv. . X-Ray Anal., 1989, 32: 83~87. Rousseau R M, Boivin J A. (1998). The Rigaku Jounal. 1998, 15:13~27.
Figure 1. The simples
Figure 2. Experimental Result (A)
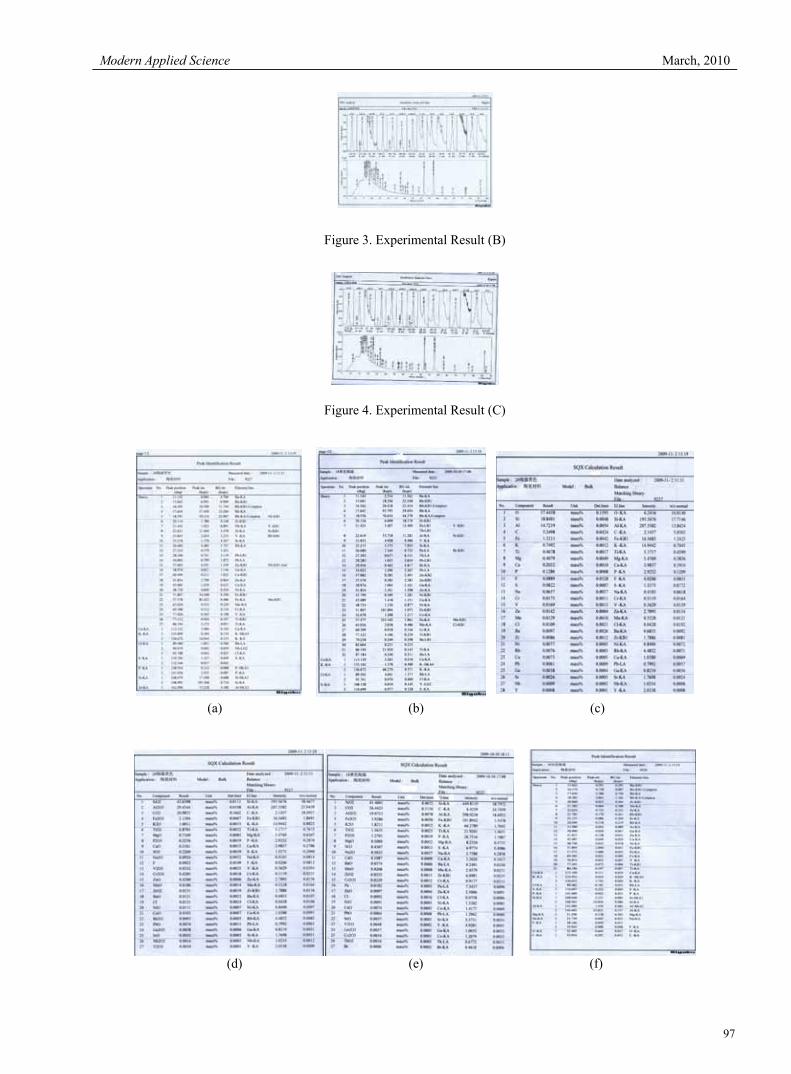
Modern Applied Science March, 2010
97
Figure 3. Experimental Result (B)
Figure 4. Experimental Result (C)
(a) (b) (c)
(d) (e) (f)
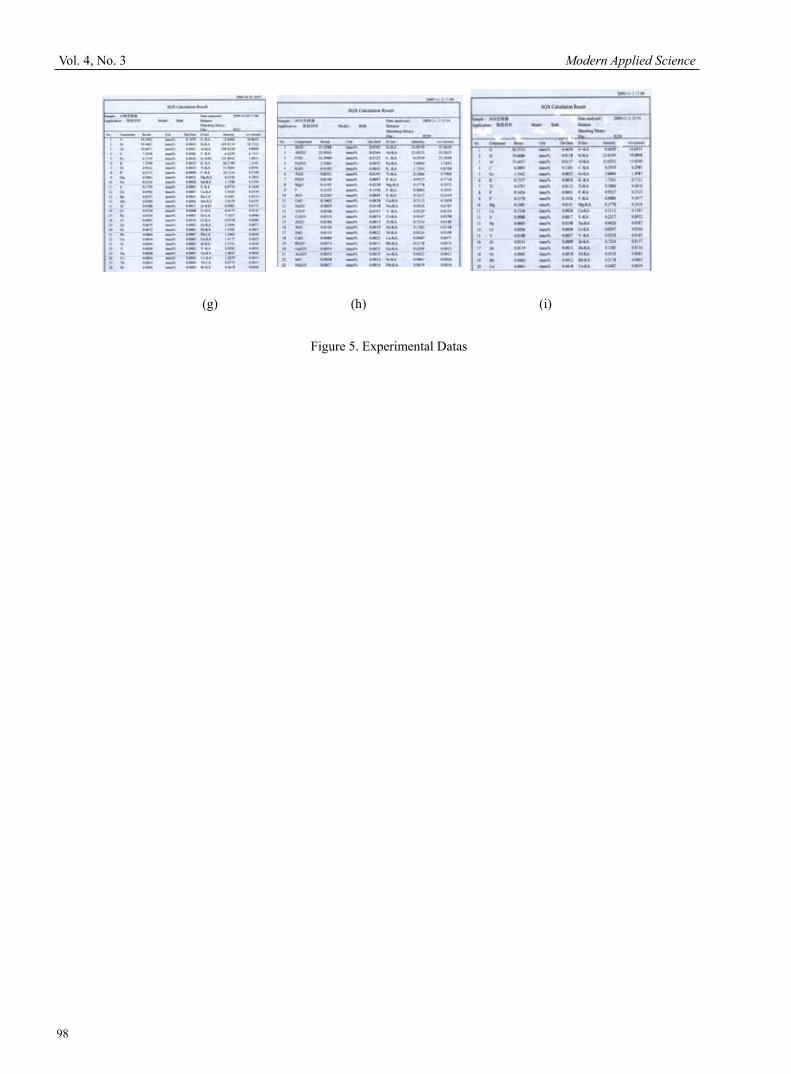
Vol. 4, No. 3 Modern Applied Science
98
(g) (h) (i)
Figure 5. Experimental Datas
Modern Applied Science March, 2010
99
Development of Multi-Purpose Nonwoven Filter Medium for Automobile
Binghui Wang (Corresponding author) School of Textile, Tianjin Polytechnic University
63# Chenglin Road, Hedong District, Tianjin 300160, China Tel: 86-22-2451-4516 E-mail: [email protected]
Abstract With Dacron and fiber as the raw materials, the filter medium is prepared by punching and calendering the sandwich structure which is composed of the carded fiber nets reinforced with Dacron. This filter medium is used to filter oil, water and air. The experiment results indicate that this filter medium is comparable to the British and German products of the same type, and has an excellent effect on filtering impurities, water and oil. The product not only broadens the application fields of filter media, but also has a positive significance in increasing the social and economic benefits of enterprises. Keywords: Filter medium, Punch, Process, Filtration efficiency Preface Filtration is a process of separating insoluble solid particles out of gases or liquids, such as gas-solid filtration and liquid-solid filtration (Tian, Caihong et al, 2006, p. 35-38). Although having already had a history of decades abroad, the development of filter medium in China is relatively late. A full range of filter media has been successfully developed since the last decade in China. However, there are few reports on the investigations of multi-purpose filter media capable of filtering oil, water and air that are applied on diesel locomotives and diesel vehicles (Qu, Cailian et al, 2006, p. 60-62). The research on multi-purpose filter media plays an important role in promoting the development of automobile manufacturing industry and prolonging the service life of locomotives. The multi-purpose filter medium, a necessary component for oil-filtration system of diesel locomotives and vehicles, is an easily consumed product, and has a relatively short replacement cycle. At present, it has relied heavily on imports, and spent a large amount of foreign currency. For example, we import 500,000 multi-purpose filter media in all with 40 US dollars (RMB 280) for each every year, that is to say, we spend 20 million US dollars on it annually. Therefore, the research and development of multi-purpose filter media has been an urgent issue to be solved in automobile manufacturing industry, and remarkably decreased the expense of foreign currency. This multi-purpose filter medium is prepared by punching and calendaring the sandwich structure which is composed of the carded fiber nets reinforced with Dacron. It is comparable to the foreign products of the same type. 1. Preparation of multi-purpose filter medium for automobile 1.1 Selection of fiber The studied fiber medium is used for automotive oil filtration. Dacron fiber has advantages of high strength, low thermal deformation rate, no water absorption, excellent durability and perfect processing property (Wang, Xu et al, 2006, p. 16-18). Therefore, this fiber medium is prepared with Dacron fiber of 9 D×75 mm as the main raw material, and reinforced with Dacron cloth for further improving its stability and uniformity. 1.2 Production process This fiber medium is manufactured on the self-made special production lines. Its process flow diagram is shown in figure 1. After mechanically opening, card the fiber for two times to form a fiber web, which is then punched for the first time with a six-needle array of 91 mm length at a punch frequency of 60 times/s, punch depth of 19 mm, and step length of 13.33 mm per punching. Feed a roll of fiber web, together with 120 g/m2 Dacron cloth, into the cross lapper, and punch for the second time with a six-needle array of 81 mm length at a punch frequency of 80 times/s, punch depth of 11 mm, and step length of 10 mm per punching. Cut this fiber roll into two rolls of the same width along the middle line, then punch them for the third time with a six-needle array of 81 mm length at a punch frequency of 120 times/s, punch depth
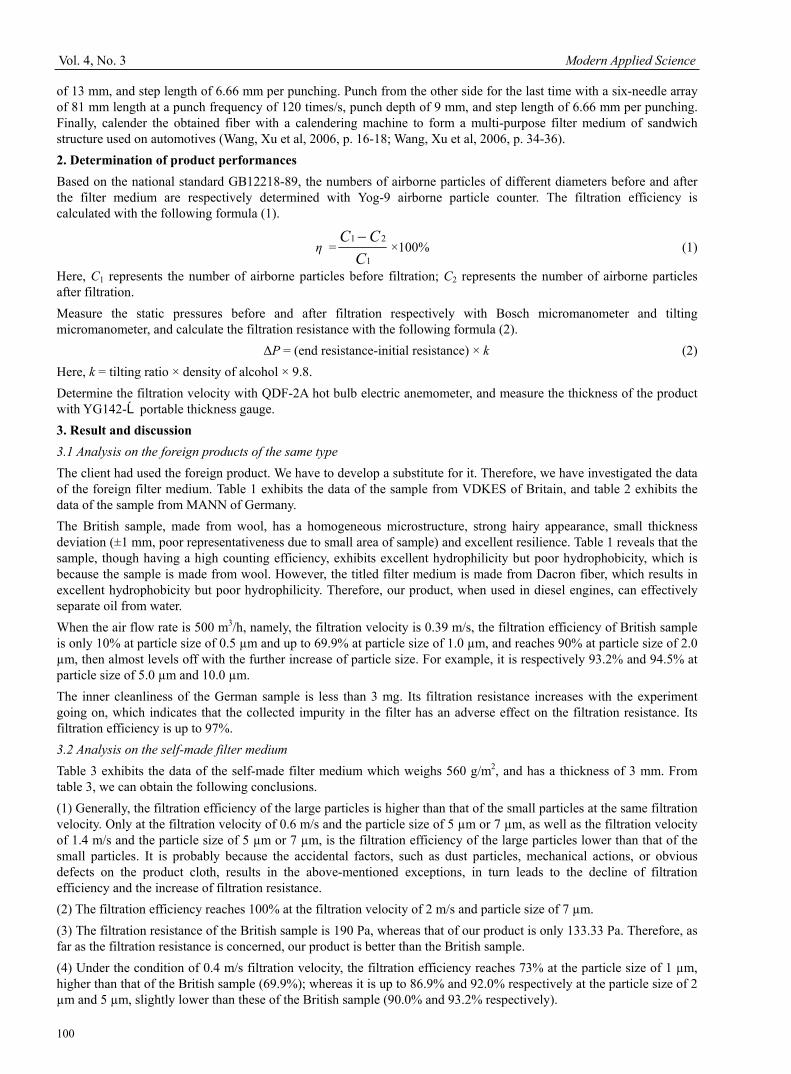
Vol. 4, No. 3 Modern Applied Science
100
of 13 mm, and step length of 6.66 mm per punching. Punch from the other side for the last time with a six-needle array of 81 mm length at a punch frequency of 120 times/s, punch depth of 9 mm, and step length of 6.66 mm per punching. Finally, calender the obtained fiber with a calendering machine to form a multi-purpose filter medium of sandwich structure used on automotives (Wang, Xu et al, 2006, p. 16-18; Wang, Xu et al, 2006, p. 34-36). 2. Determination of product performances Based on the national standard GB12218-89, the numbers of airborne particles of different diameters before and after the filter medium are respectively determined with Yog-9 airborne particle counter. The filtration efficiency is calculated with the following formula (1).
η =1
21
CCC −
×100% (1)
Here, C1 represents the number of airborne particles before filtration; C2 represents the number of airborne particles after filtration. Measure the static pressures before and after filtration respectively with Bosch micromanometer and tilting micromanometer, and calculate the filtration resistance with the following formula (2).
ΔP = (end resistance-initial resistance) × k (2) Here, k = tilting ratio × density of alcohol × 9.8. Determine the filtration velocity with QDF-2A hot bulb electric anemometer, and measure the thickness of the product with YG142-Ⅱportable thickness gauge. 3. Result and discussion 3.1 Analysis on the foreign products of the same type The client had used the foreign product. We have to develop a substitute for it. Therefore, we have investigated the data of the foreign filter medium. Table 1 exhibits the data of the sample from VDKES of Britain, and table 2 exhibits the data of the sample from MANN of Germany. The British sample, made from wool, has a homogeneous microstructure, strong hairy appearance, small thickness deviation (±1 mm, poor representativeness due to small area of sample) and excellent resilience. Table 1 reveals that the sample, though having a high counting efficiency, exhibits excellent hydrophilicity but poor hydrophobicity, which is because the sample is made from wool. However, the titled filter medium is made from Dacron fiber, which results in excellent hydrophobicity but poor hydrophilicity. Therefore, our product, when used in diesel engines, can effectively separate oil from water. When the air flow rate is 500 m3/h, namely, the filtration velocity is 0.39 m/s, the filtration efficiency of British sample is only 10% at particle size of 0.5 µm and up to 69.9% at particle size of 1.0 µm, and reaches 90% at particle size of 2.0 µm, then almost levels off with the further increase of particle size. For example, it is respectively 93.2% and 94.5% at particle size of 5.0 µm and 10.0 µm. The inner cleanliness of the German sample is less than 3 mg. Its filtration resistance increases with the experiment going on, which indicates that the collected impurity in the filter has an adverse effect on the filtration resistance. Its filtration efficiency is up to 97%. 3.2 Analysis on the self-made filter medium Table 3 exhibits the data of the self-made filter medium which weighs 560 g/m2, and has a thickness of 3 mm. From table 3, we can obtain the following conclusions. (1) Generally, the filtration efficiency of the large particles is higher than that of the small particles at the same filtration velocity. Only at the filtration velocity of 0.6 m/s and the particle size of 5 µm or 7 µm, as well as the filtration velocity of 1.4 m/s and the particle size of 5 µm or 7 µm, is the filtration efficiency of the large particles lower than that of the small particles. It is probably because the accidental factors, such as dust particles, mechanical actions, or obvious defects on the product cloth, results in the above-mentioned exceptions, in turn leads to the decline of filtration efficiency and the increase of filtration resistance. (2) The filtration efficiency reaches 100% at the filtration velocity of 2 m/s and particle size of 7 µm. (3) The filtration resistance of the British sample is 190 Pa, whereas that of our product is only 133.33 Pa. Therefore, as far as the filtration resistance is concerned, our product is better than the British sample. (4) Under the condition of 0.4 m/s filtration velocity, the filtration efficiency reaches 73% at the particle size of 1 µm, higher than that of the British sample (69.9%); whereas it is up to 86.9% and 92.0% respectively at the particle size of 2 µm and 5 µm, slightly lower than these of the British sample (90.0% and 93.2% respectively).
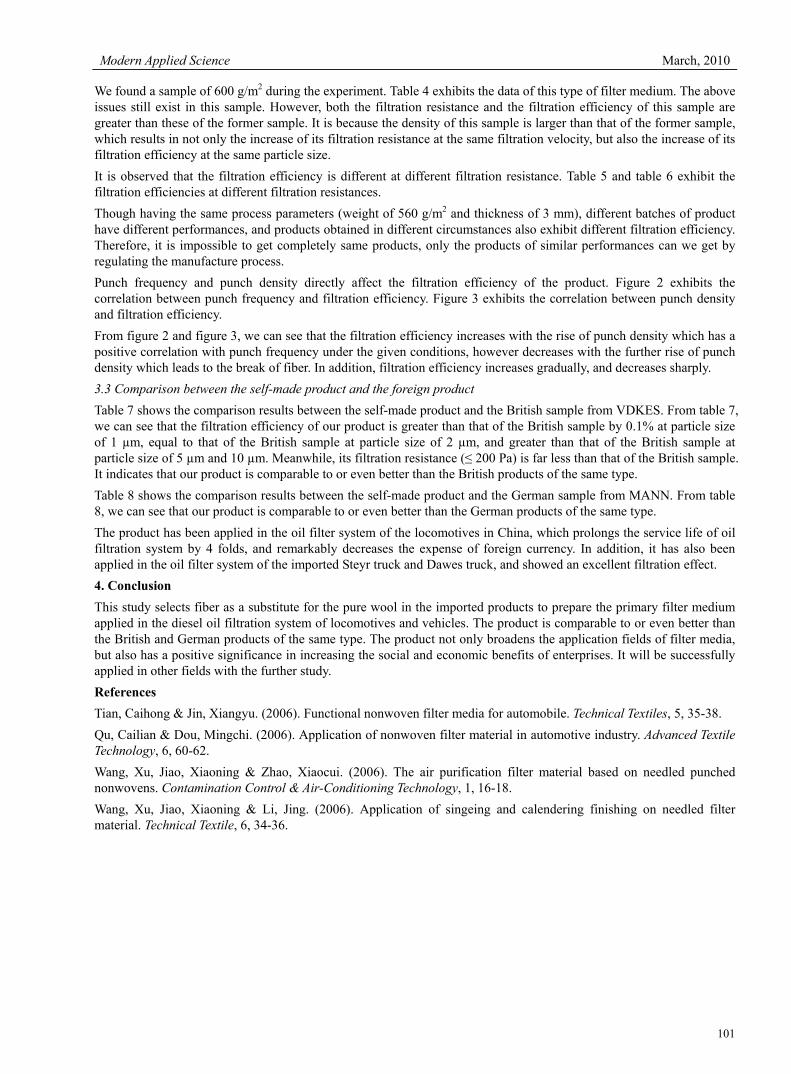
Modern Applied Science March, 2010
101
We found a sample of 600 g/m2 during the experiment. Table 4 exhibits the data of this type of filter medium. The above issues still exist in this sample. However, both the filtration resistance and the filtration efficiency of this sample are greater than these of the former sample. It is because the density of this sample is larger than that of the former sample, which results in not only the increase of its filtration resistance at the same filtration velocity, but also the increase of its filtration efficiency at the same particle size. It is observed that the filtration efficiency is different at different filtration resistance. Table 5 and table 6 exhibit the filtration efficiencies at different filtration resistances. Though having the same process parameters (weight of 560 g/m2 and thickness of 3 mm), different batches of product have different performances, and products obtained in different circumstances also exhibit different filtration efficiency. Therefore, it is impossible to get completely same products, only the products of similar performances can we get by regulating the manufacture process. Punch frequency and punch density directly affect the filtration efficiency of the product. Figure 2 exhibits the correlation between punch frequency and filtration efficiency. Figure 3 exhibits the correlation between punch density and filtration efficiency. From figure 2 and figure 3, we can see that the filtration efficiency increases with the rise of punch density which has a positive correlation with punch frequency under the given conditions, however decreases with the further rise of punch density which leads to the break of fiber. In addition, filtration efficiency increases gradually, and decreases sharply. 3.3 Comparison between the self-made product and the foreign product Table 7 shows the comparison results between the self-made product and the British sample from VDKES. From table 7, we can see that the filtration efficiency of our product is greater than that of the British sample by 0.1% at particle size of 1 µm, equal to that of the British sample at particle size of 2 µm, and greater than that of the British sample at particle size of 5 µm and 10 µm. Meanwhile, its filtration resistance (≤ 200 Pa) is far less than that of the British sample. It indicates that our product is comparable to or even better than the British products of the same type. Table 8 shows the comparison results between the self-made product and the German sample from MANN. From table 8, we can see that our product is comparable to or even better than the German products of the same type. The product has been applied in the oil filter system of the locomotives in China, which prolongs the service life of oil filtration system by 4 folds, and remarkably decreases the expense of foreign currency. In addition, it has also been applied in the oil filter system of the imported Steyr truck and Dawes truck, and showed an excellent filtration effect. 4. Conclusion This study selects fiber as a substitute for the pure wool in the imported products to prepare the primary filter medium applied in the diesel oil filtration system of locomotives and vehicles. The product is comparable to or even better than the British and German products of the same type. The product not only broadens the application fields of filter media, but also has a positive significance in increasing the social and economic benefits of enterprises. It will be successfully applied in other fields with the further study. References Tian, Caihong & Jin, Xiangyu. (2006). Functional nonwoven filter media for automobile. Technical Textiles, 5, 35-38. Qu, Cailian & Dou, Mingchi. (2006). Application of nonwoven filter material in automotive industry. Advanced Textile Technology, 6, 60-62. Wang, Xu, Jiao, Xiaoning & Zhao, Xiaocui. (2006). The air purification filter material based on needled punched nonwovens. Contamination Control & Air-Conditioning Technology, 1, 16-18. Wang, Xu, Jiao, Xiaoning & Li, Jing. (2006). Application of singeing and calendering finishing on needled filter material. Technical Textile, 6, 34-36.
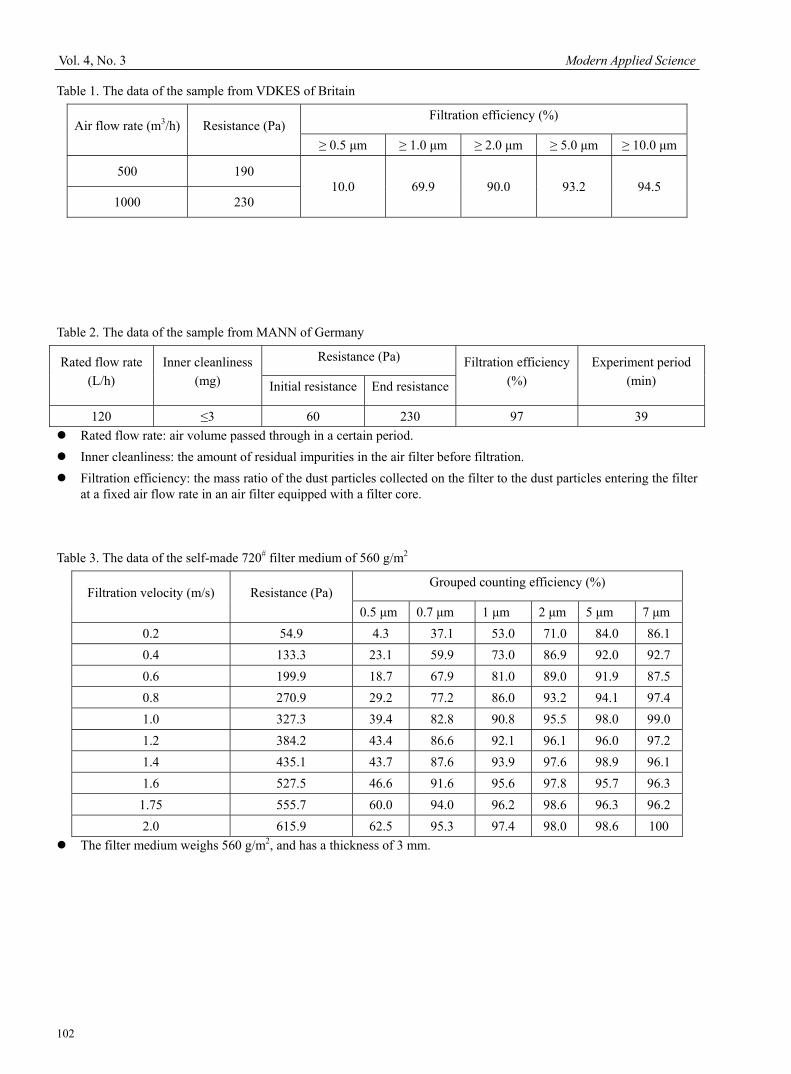
Vol. 4, No. 3 Modern Applied Science
102
Table 1. The data of the sample from VDKES of Britain
Air flow rate (m3/h) Resistance (Pa) Filtration efficiency (%)
≥ 0.5 μm ≥ 1.0 μm ≥ 2.0 μm ≥ 5.0 μm ≥ 10.0 μm
500 190 10.0 69.9 90.0 93.2 94.5
1000 230
Table 2. The data of the sample from MANN of Germany
Rated flow rate (L/h)
Inner cleanliness (mg)
Resistance (Pa) Filtration efficiency (%)
Experiment period (min) Initial resistance End resistance
120 ≤3 60 230 97 39 Rated flow rate: air volume passed through in a certain period. Inner cleanliness: the amount of residual impurities in the air filter before filtration. Filtration efficiency: the mass ratio of the dust particles collected on the filter to the dust particles entering the filter
at a fixed air flow rate in an air filter equipped with a filter core. Table 3. The data of the self-made 720# filter medium of 560 g/m2
Filtration velocity (m/s) Resistance (Pa) Grouped counting efficiency (%)
0.5 μm 0.7 μm 1 μm 2 μm 5 μm 7 μm 0.2 54.9 4.3 37.1 53.0 71.0 84.0 86.10.4 133.3 23.1 59.9 73.0 86.9 92.0 92.70.6 199.9 18.7 67.9 81.0 89.0 91.9 87.50.8 270.9 29.2 77.2 86.0 93.2 94.1 97.41.0 327.3 39.4 82.8 90.8 95.5 98.0 99.01.2 384.2 43.4 86.6 92.1 96.1 96.0 97.21.4 435.1 43.7 87.6 93.9 97.6 98.9 96.11.6 527.5 46.6 91.6 95.6 97.8 95.7 96.3
1.75 555.7 60.0 94.0 96.2 98.6 96.3 96.22.0 615.9 62.5 95.3 97.4 98.0 98.6 100
The filter medium weighs 560 g/m2, and has a thickness of 3 mm.
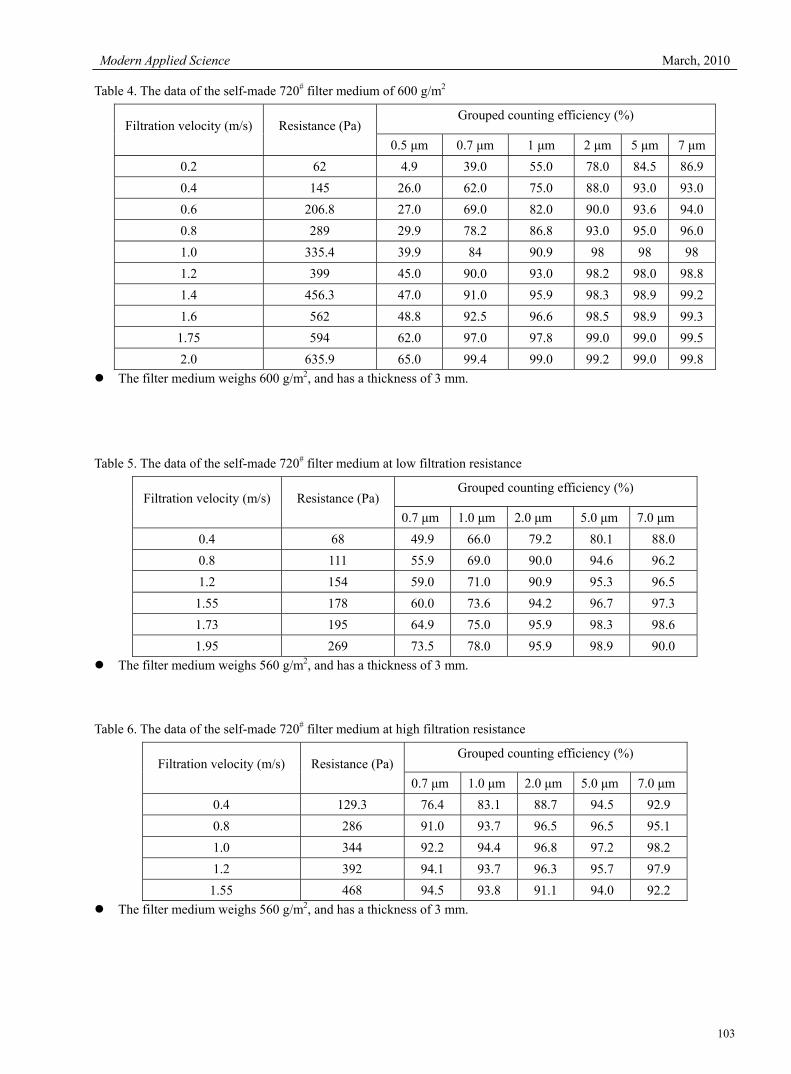
Modern Applied Science March, 2010
103
Table 4. The data of the self-made 720# filter medium of 600 g/m2
Filtration velocity (m/s) Resistance (Pa) Grouped counting efficiency (%)
0.5 μm 0.7 μm 1 μm 2 μm 5 μm 7 μm0.2 62 4.9 39.0 55.0 78.0 84.5 86.90.4 145 26.0 62.0 75.0 88.0 93.0 93.00.6 206.8 27.0 69.0 82.0 90.0 93.6 94.00.8 289 29.9 78.2 86.8 93.0 95.0 96.01.0 335.4 39.9 84 90.9 98 98 98 1.2 399 45.0 90.0 93.0 98.2 98.0 98.81.4 456.3 47.0 91.0 95.9 98.3 98.9 99.21.6 562 48.8 92.5 96.6 98.5 98.9 99.3
1.75 594 62.0 97.0 97.8 99.0 99.0 99.52.0 635.9 65.0 99.4 99.0 99.2 99.0 99.8
The filter medium weighs 600 g/m2, and has a thickness of 3 mm. Table 5. The data of the self-made 720# filter medium at low filtration resistance
Filtration velocity (m/s) Resistance (Pa) Grouped counting efficiency (%)
0.7 μm 1.0 μm 2.0 μm 5.0 μm 7.0 μm 0.4 68 49.9 66.0 79.2 80.1 88.0 0.8 111 55.9 69.0 90.0 94.6 96.2 1.2 154 59.0 71.0 90.9 95.3 96.5
1.55 178 60.0 73.6 94.2 96.7 97.3 1.73 195 64.9 75.0 95.9 98.3 98.6 1.95 269 73.5 78.0 95.9 98.9 90.0
The filter medium weighs 560 g/m2, and has a thickness of 3 mm. Table 6. The data of the self-made 720# filter medium at high filtration resistance
Filtration velocity (m/s) Resistance (Pa)Grouped counting efficiency (%)
0.7 μm 1.0 μm 2.0 μm 5.0 μm 7.0 μm0.4 129.3 76.4 83.1 88.7 94.5 92.9 0.8 286 91.0 93.7 96.5 96.5 95.1 1.0 344 92.2 94.4 96.8 97.2 98.2 1.2 392 94.1 93.7 96.3 95.7 97.9
1.55 468 94.5 93.8 91.1 94.0 92.2 The filter medium weighs 560 g/m2, and has a thickness of 3 mm.
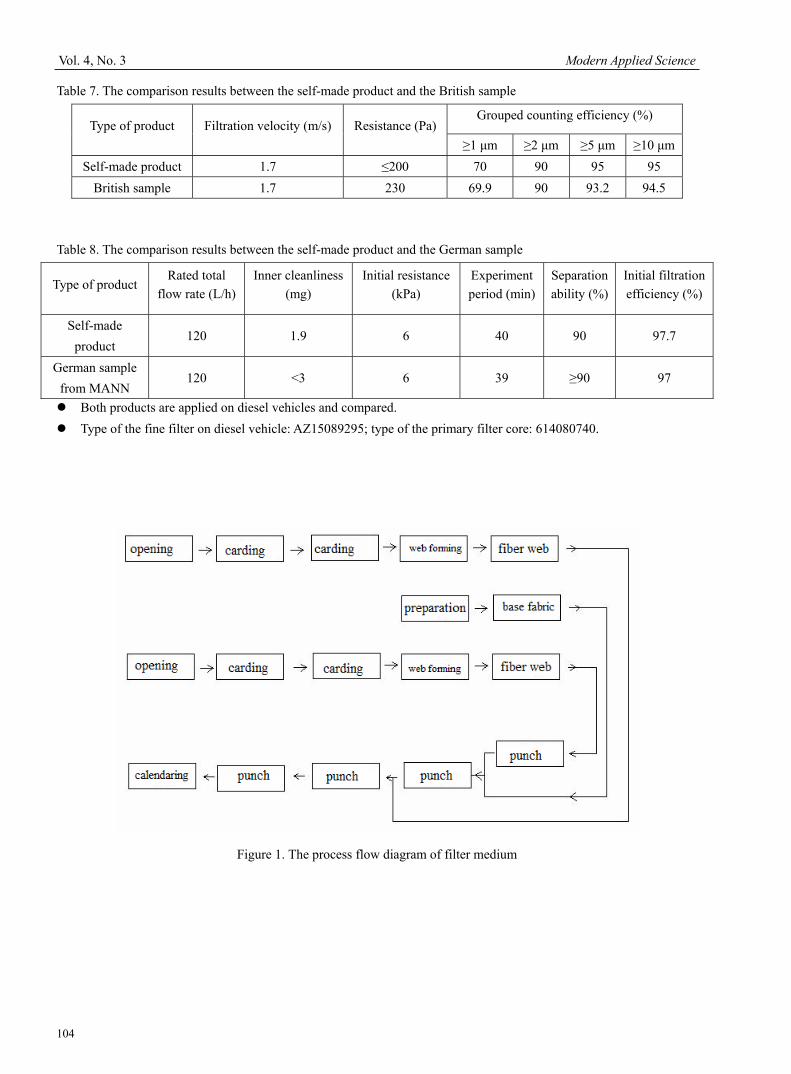
Vol. 4, No. 3 Modern Applied Science
104
Table 7. The comparison results between the self-made product and the British sample
Type of product Filtration velocity (m/s) Resistance (Pa)Grouped counting efficiency (%)
≥1 μm ≥2 μm ≥5 μm ≥10 μmSelf-made product 1.7 ≤200 70 90 95 95
British sample 1.7 230 69.9 90 93.2 94.5 Table 8. The comparison results between the self-made product and the German sample
Type of product Rated total
flow rate (L/h)Inner cleanliness
(mg) Initial resistance
(kPa) Experiment period (min)
Separation ability (%)
Initial filtration efficiency (%)
Self-made product
120 1.9 6 40 90 97.7
German sample from MANN
120 <3 6 39 ≥90 97
Both products are applied on diesel vehicles and compared. Type of the fine filter on diesel vehicle: AZ15089295; type of the primary filter core: 614080740.
Figure 1. The process flow diagram of filter medium
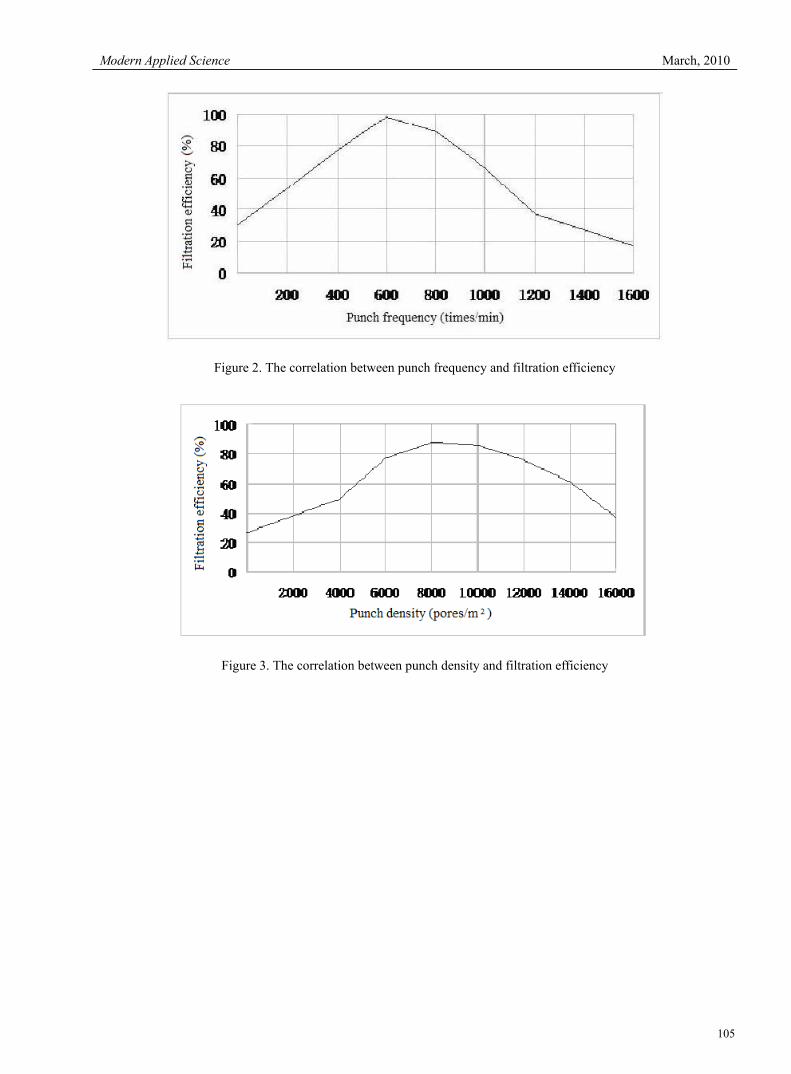
Modern Applied Science March, 2010
105
Figure 2. The correlation between punch frequency and filtration efficiency
Figure 3. The correlation between punch density and filtration efficiency
Vol. 4, No. 3 Modern Applied Science
106
Bohr Theory in the Atomic Physics
Haiyan Li Department of Physics, Dezhou University, Dezhou 253023, China
Tel: 86-534-8985-879 E-mail: [email protected] Abstract Bohr Theory is one important stage in the development of the theory of atomic physics, and it has achieved great achievements when dealing with the problem of hydrogen atom and H-like ion, and it is on the important status in the teaching of atomic physics. Combining with teaching experiences, the historical background of Bohr Theory, three fundamental hypotheses of Bohr Theory, and the deduction and limitations of Bohr Theory are respectively introduced in this article. Keywords: Bohr Theory, Quantization, Quantum mechanics 1. Historical background of Bohr Theory At the beginning of 1900, Rutherford proposed the famous atomic nuclear-mode structure which was testified by the big angle α-particle scattering experiment, but this model was acutely conflicted with the classical electromagnetic theory. On the one hand, this conflict is represented by that according to the classical electromagnetic theory, the electrons in the hydrogen atom will emit energies by the mode of electromagnetic wave when running around the nucleus which will finally induce the orbit radius smaller and smaller until it drops into the nucleus, and induce the collapse of atom, and that breaches the fact that the atom is quite stable. On the other hand, because the speed that the electron runs around the nucleus continuously change, so the wavelength of the atomic radiation will correspondingly continually change, and the spectrum emitted by the atom should be continuous spectrum, which is also conflicted with the fact that the atomic spectrum is the line spectrum in the experiment. To explain the experiment law of the hydrogen atom spectrum and overcome and the difficulties in the Rutherford atomic nuclear-model structure, Bohr who was only 28 years old bravely introduced the concept of quantum, which was proposed by Planck in 1900 and developed by Einstein in 1905, into the atom, and continually published three articles with tremendous meaning, i.e. well-known “The Great Trilogy” about the atom theory, which is a milestone in the modern physics. Bohr Theory created the new age of the atom physics, and it explained the spectrum feature of hydrogen atom which could not been explained in 30 years. 2. “The Great trilogy” of Bohr Theory 2.1 Hypothesis of stationary state Bohr applied the nuclear-model structure model but breached the limitation of classical physics, and supposed the electron in the atom could only run on some special allowed orbit, and here, though the electron did the accelerated motion around the nucleus, it could not radiate the electromagnetic energy, so it would not drop into the nucleus because of the energy consumption, and be in the stable state. These states are called the stationary state of the atom. The stationary state energy of the atom only takes some discrete values E1, E2, E3, E4…, and these stationary state energies are called the energy level, and the orbit run by the electron when the atom is in the stationary state is called as the stationary state orbit. 2.2 Condition of frequency Bohr made the analogy of the Planck’s energy quanta hypothesis and Einstein’s photons hypothesis, and according to the energy conversation law, the change of atom energy equaled to the energy that it emitted and absorbed photons. Bohr thought that when the atom transited between two stationary states, the absorbed or emitted radiation frequency γ was exclusive, and the relationship between the energy difference and the frequency γ in two stationary states was
mnmn EEhEE >=− ,ν (1) Here, Bohr introduced the Planck constant into the domain of atom. The so-called stationary sate is the non-substantive movement which only happens among stationary states.

Modern Applied Science March, 2010
107
2.3 Quantization of angular momentum According to the correspondence principle, Bohr thought of the quantization of corresponding orbit from the quantization of energy, and deduced the quantization of the angular momentum of orbit. He thought that only the orbit movement angular momentum of the out-nuclear electron L would satisfy
π2hnmvrL == (n is the quantum number, 1, 2, 3…),
the movement was stable, which is the selection rule to confirm the stationary state. 3. Deduction of Bohr Theory 3.1 Quantization of orbit radius Suppose the out-nuclear electron in the hydrogen atom runs around the nucleus on certain orbit, and here the Coulomb force serves as the centripetal force
2
2
0
2
41
re
rvm
πε= (2)
Introduce the quantization condition of angular momentum and eliminate v
2
202
mehnr
πε
= (3)
and suppose 2
20
1 meha
πε
= (4)
so, 12anr = , which indicates that the electron orbit radius allowed in the hydrogen atom can only take a series of
discrete values, not continual values. 3.2 Quantization of energy The hydrogen atom energy is composed by the kinetic energy and the potential energy of the electron. Suppose the potential energy is 0 when ∞=r , the energy of the hydrogen atom is
reEn 24
1 2
0πε−=
Introduce the formula (3) into the formula (2)
and, 22
0
2
2 81
hme
nEn ε
= (5)
So the energy of the hydrogen atom is quantitative.
When n is large, the relatively change variables of the orbit radius and the orbit energy respectively are nrr 2≈
Δ and
nEE
n
n 2≈Δ
, so the orbit radius and the orbit energy can be regarded as continually changing when n is large. When n
is very small, the electric orbit, the orbit radius and the orbit energy have no meanings in the quantum mechanics. 3.3 Rydberg constant
Introduce the formula (5) into the formula (1), and compare with the Rydberg formula ⎟⎠⎞
⎜⎝⎛ −= 22
11~nm
Rν ,
so ( ) ch
meR 3
24
204
2 ππε
= .
In 1914, Bohr considered that the difference between the computation value and the experiment value of Rydberg constant exceeded the experimental error, and he thought that the electron should run around the center of mass in the mutual function with the nuclear electron. According to the disposal of double-body problem, the Ryderg constant can
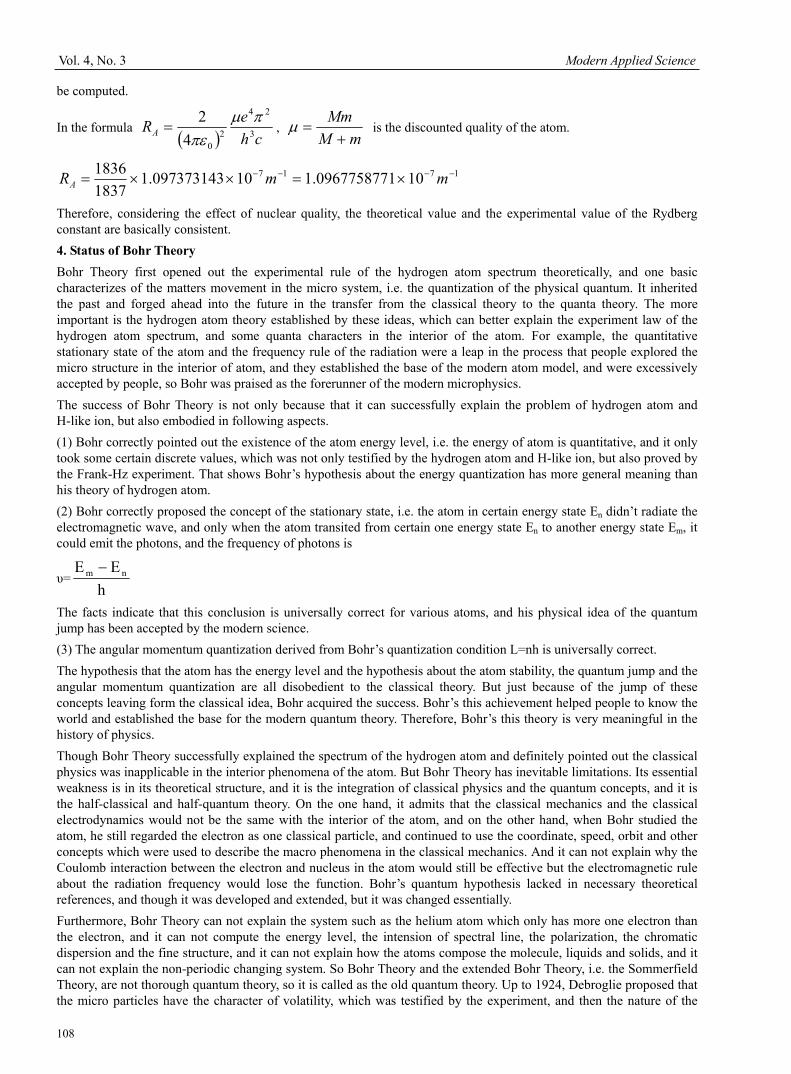
Vol. 4, No. 3 Modern Applied Science
108
be computed.
In the formula ( ) ch
eRA 3
24
204
2 πμπε
= , mM
Mm+
=μ is the discounted quality of the atom.
1717 100967758771.110097373143.118371836 −−−− ×=××= mmRA
Therefore, considering the effect of nuclear quality, the theoretical value and the experimental value of the Rydberg constant are basically consistent. 4. Status of Bohr Theory Bohr Theory first opened out the experimental rule of the hydrogen atom spectrum theoretically, and one basic characterizes of the matters movement in the micro system, i.e. the quantization of the physical quantum. It inherited the past and forged ahead into the future in the transfer from the classical theory to the quanta theory. The more important is the hydrogen atom theory established by these ideas, which can better explain the experiment law of the hydrogen atom spectrum, and some quanta characters in the interior of the atom. For example, the quantitative stationary state of the atom and the frequency rule of the radiation were a leap in the process that people explored the micro structure in the interior of atom, and they established the base of the modern atom model, and were excessively accepted by people, so Bohr was praised as the forerunner of the modern microphysics. The success of Bohr Theory is not only because that it can successfully explain the problem of hydrogen atom and H-like ion, but also embodied in following aspects. (1) Bohr correctly pointed out the existence of the atom energy level, i.e. the energy of atom is quantitative, and it only took some certain discrete values, which was not only testified by the hydrogen atom and H-like ion, but also proved by the Frank-Hz experiment. That shows Bohr’s hypothesis about the energy quantization has more general meaning than his theory of hydrogen atom. (2) Bohr correctly proposed the concept of the stationary state, i.e. the atom in certain energy state En didn’t radiate the electromagnetic wave, and only when the atom transited from certain one energy state En to another energy state Em, it could emit the photons, and the frequency of photons is
υ=h
EE nm −
The facts indicate that this conclusion is universally correct for various atoms, and his physical idea of the quantum jump has been accepted by the modern science. (3) The angular momentum quantization derived from Bohr’s quantization condition L=nh is universally correct. The hypothesis that the atom has the energy level and the hypothesis about the atom stability, the quantum jump and the angular momentum quantization are all disobedient to the classical theory. But just because of the jump of these concepts leaving form the classical idea, Bohr acquired the success. Bohr’s this achievement helped people to know the world and established the base for the modern quantum theory. Therefore, Bohr’s this theory is very meaningful in the history of physics. Though Bohr Theory successfully explained the spectrum of the hydrogen atom and definitely pointed out the classical physics was inapplicable in the interior phenomena of the atom. But Bohr Theory has inevitable limitations. Its essential weakness is in its theoretical structure, and it is the integration of classical physics and the quantum concepts, and it is the half-classical and half-quantum theory. On the one hand, it admits that the classical mechanics and the classical electrodynamics would not be the same with the interior of the atom, and on the other hand, when Bohr studied the atom, he still regarded the electron as one classical particle, and continued to use the coordinate, speed, orbit and other concepts which were used to describe the macro phenomena in the classical mechanics. And it can not explain why the Coulomb interaction between the electron and nucleus in the atom would still be effective but the electromagnetic rule about the radiation frequency would lose the function. Bohr’s quantum hypothesis lacked in necessary theoretical references, and though it was developed and extended, but it was changed essentially. Furthermore, Bohr Theory can not explain the system such as the helium atom which only has more one electron than the electron, and it can not compute the energy level, the intension of spectral line, the polarization, the chromatic dispersion and the fine structure, and it can not explain how the atoms compose the molecule, liquids and solids, and it can not explain the non-periodic changing system. So Bohr Theory and the extended Bohr Theory, i.e. the Sommerfield Theory, are not thorough quantum theory, so it is called as the old quantum theory. Up to 1924, Debroglie proposed that the micro particles have the character of volatility, which was testified by the experiment, and then the nature of the
Modern Applied Science March, 2010
109
micro particles was further known. The quantum mechanics based on that is the new quantum mechanics, hence the perfect theory about the atom phenomena formed. Still, Bohr Theory inherits the past and forges ahead into the future in the atom physics even in the modern physics. Just as someone visualized that “like a bridge, one end of the Bohr Theory is based on the classical concepts, and its another end leads people to the quantum world.” Both its limitations and its advantages should be clearly realized, which could help researches to complete the transition form the classical concepts to the quantum concepts. References Chu, Shenglin. (1994). Atomic Physics. Beijing: China Higher Education Press. Pei, Yongwei, Ji, Yanshen & Song, Yali. (2004). More Discussion on the Establishment Process of Bohr Theory. Journal of Shenyang University. No.8. Sun, Chunfeng & Zheng, Dongmei. (2004). Compared Research of Bohr Theory: In Memory of the Born of Bohr Theory for 90 Anniversaries. Physics and Engineering. No.14 (1). Wang, Fushan. (1986). Research on History of Modern Physics. Shanghai: Fudan University Press. Yu, Shenqi, Long, Chunhua & Liu, Huaxiang. (1990). Atomic Physics. Changchun: Northeast Normal University Press. Zhou, Shaosen, Fan, Cheng & Zhou, Jing. (1984). Atomic Physics. Shanghai: East China Normal University Press.
Vol. 4, No. 3 Modern Applied Science
110
Control on Pore Structure and Strength of Tubular Carbon
Membrane by Introducing Additives
Lijie Liu (Corresponding author) College of Environment and Chemical Engineering, Tianjin Polytechnic University
Tianjin 300160, China &
Key Laboratory of Hollow Fiber Membrane Material & Membrane Process Ministry of Education
Tianjin Polytechnic University, Tianjin 300160, China E-mail: [email protected]
Yong Tan
College of Environment and Chemical Engineering, Tianjin Polytechnic University Tianjin 300160, China
E-mail: [email protected]
Abstract The pore structure and strength of carbon membrane are controlled by introducing different additives into raw materials. It is indicated that sesbania powder has an obvious effect on the pore structure of carbon membrane, and the obtained pores have the maximum diameter of 0.723 µm, average diameter of 0.319 µm and minimum diameter of 0.241 µm, respectively; whereas, medium temperature pitch has an obvious effect on the strength of carbon membrane, and increases the linear pressure and flexural strength to 13.68 N/mm and 19.80 MPa, respectively. Keywords: Tabular carbon membrane, Petroleum coke, Additive, Pore size, Strength Preface Carbon membrane, a new inorganic separation membrane that has developed since the mid-1980s, is composed of carbon materials. In recent years, with more and more research in this field, carbon membrane has been industrialized in France, and China has made a remarkable progress in its research and development (Ash R et al, 1967, p. 434-454; Ash R et al, 1968, p. 407-425; Wang, Tonghua et al, 2000, p. 6-11; Wang, Shuseng et al, 1995, p. 90-95; Wei, Wei et al, 2004, p. 5-8). With petroleum coke as the main material, this paper has prepared a carbon membrane by altering the type and dose of the additives, and investigated the effects of additives on the performances of tabular carbon membrane. 1. Experiment 1.1 Raw materials Main raw material: petroleum coke, from Tianjin Tongxiang Carbon Factory. Its performance indexes are listed in table 1. 1.2 Preparation of carbon membrane Evenly blend petroleum coke of a given particle size with additive and binder at a certain ratio, knead in water until the mixture becomes a loose mud, and force it out at a certain pressure from an extruder to obtain a tabular original membrane of internal diameter 8.5 mm and wall thickness 1.45 mm. Dry the original membrane in air, and heat in nitrogen medium to obtain a tabular carbon membrane.
Modern Applied Science March, 2010
111
1.3 Characterization of carbon membrane At room temperature, measure the diameter and diameter distribution of pore by the bubble method with isopropanol as wetting agent and nitrogen as permeation gas, then calculate the average diameter and diameter distribution of pore of carbon membrane according to the method reported by Wei et al (2004, p. 20-23). The strength of tabular carbon membrane is characterized by the maximum linear pressure measured with KC-2A digital strength tester, and the maximum flexural strength measured with SK2 digital anti-rupture tester. 2. Results and discussions 2.1 Particle size distribution and structure of petroleum coke The particle size distribution of petroleum coke after 2 hours of ball milling is shown in table 2. Figure 1 and figure 2 exhibit the SEM image and the particle size distribution of petroleum coke after 2 hours of ball milling, respectively. The average diameter of petroleum coke [D (v, 0.5)] is 46.49 µm. The SEM image indicates an obvious difference in the particle size; however, the large particles and small particles make up only a very small portion. 2.2 Effect of additive on pore size of carbon membrane Figure 3 exhibits the SEM images of carbon membranes containing different additives. From figure 3, we can see that the surface of additive-contained carbon membrane is smoother than that of additive-free carbon membrane; the carbon membranes containing phenolic resin or sesbania powder appear obvious pores on the surface; however, the carbon membranes containing iron powder or starch appear cracks, but no pores, on the surface; particularly, the pores on the medium temperature pitch-contained carbon membrane are smaller than those on the additive-free membrane, it’s probably because the uncombined small particles inside the pore fall off and aggregate with the rise of pressure during measurement of pore size, in turn lead to the decrease of pore size. Table 3 reveals the pore size of additive-contained carbon membrane. It indicates that except medium temperature pitch, the average and minimum pore sizes of the other four additive-contained membranes are larger than those of the additive-free membrane. For example, the average and minimum pore sizes of sesbania powder-contained membrane increase from 0.214 μm and 0.167 μm to 0.319 μm and 0.241 μm, respectively. However, those of medium temperature pitch-contained membrane decrease from 0.214 μm and 0.174 μm to 0.167 μm and 0.136 μm, respectively. As to the maximum pore size, the additive-contained membranes, except for iron powder (0.482 μm), are larger than the additive-free membrane. For example, the maximum pore sizes of carbon membranes containing phenolic resin or sesbania powder are up to 0.723 μm. Figure 4 exhibits the pore size distribution of additive-contained carbon membranes. It demonstrates that the pore size of tabular carbon membrane is mainly in the range between the minimum and the average, which contributes about 70 percent of the total. 2.3 Effect of additive on strength of carbon membrane 2.3.1 Effect of additive on linear pressure of carbon membrane Table 4 reveals the effect of additive on the linear pressure of carbon membrane. It demonstrates that the linear pressures of carbon membranes containing medium temperature pitch or starch are higher than that of original carbon membrane, and increase from previous 8.58 N to 13.68 N and 9.85 N, respectively. However, the linear pressures of carbon membranes containing iron powder, phenolic resin or sesbania powder decrease to 7.19 N, 7.66 N and 4.40 N, respectively. It is concluded that medium temperature pitch has the most positive effect on the increase of linear pressure of carbon membrane; the increase of linear pressure resulted from medium temperature pitch is almost two times of that from iron powder or phenolic resin, and three times of that from sesbania powder. 2.3.2 Effect of additive on flexural strength of carbon membrane Table 5 reveals the effect of additive on the flexural strength of carbon membrane. It demonstrates that the flexural strength of carbon membranes containing iron powder or sesbania powder are lower than that of original carbon membrane, and decrease from previous 9.32 MPa to 7.87 MPa and 7.63 MPa, respectively. However, the flexural strength of carbon membranes containing medium temperature pitch, phenolic resin or starch increase from previous 9.32 MPa to 19.80 MPa, 10.19 MPa and 10.62 MPa, respectively. Therefore, it is still the medium temperature pitch that has the most positive effect on the increase of flexural strength of carbon membrane, which increases more than two times. 3. Conclusion (1) Among the above-mentioned additives, sesbania powder has the most positive effect on the increase of pore size of the tabular carbon membrane, and causes the maximum, average and minimum pore sizes to increase from previous 0.482 μm, 0.214 μm and 0.167 μm to 0.723 μm, 0.319 μm and 0.241 μm, respectively. However, medium temperature
Vol. 4, No. 3 Modern Applied Science
112
pitch causes the average and minimum pore sizes of carbon membrane to decrease to 0.174 μm and 0.136 μm, respectively. (2) Among the above-mentioned additives, medium temperature pitch has the most positive effect on the increase of strength of the tabular carbon membrane, and causes the linear pressure and flexural strength to increase from previous 8.58 N and 9.32 MPa to 13.68 N and 19.80 MPa, respectively. However, the linear pressure and flexural strength of sesbania powder-contained carbon membrane decrease to 4.40 N and 7.63 MPa, respectively. (3) Based on the above conclusions, we have tried to introduce the mixture of sesbania powder and medium temperature pitch into the tabular carbon membrane. As a result, both the pore size and the strength of the obtained carbon membrane increase. References Ash R, Baker R W & Barer R W. (1967). Sorption and surface flow in graphitized carbon membranes (Ⅰ): the steady state. Proc. Roy. Soc., 299, 434-454. Ash R, Baker R W & Barer R W. (1968). Sorption and surface flow in graphitized carbon membranes (Ⅰ): Time-lag and blind pore character. Proc. Roy. Soc., 304, 407-425. Wang, Tonghua, Wei, Wei, Liu, Suqin, You, Longbo & Cai, Tianxi. (2000). The study on tubular porous carbon membrane. New Carbon Materials, 15(1), 6-11. Wang, Shusen, Zeng, Meiyun & Wang, Zhizhong. (1995). The study on morphology of molecular sieve carbon membranes. Journal of Beijing Polytechnic University, 4, 90-95. Wei, Wei, Qin, Guotong & Hou, Shengde. (2004). Carbon membrane and its application in environmental protection. Techniques and Equipment for Environmental Pollution Control, 5(7), 5-8. Wei, Yun & Li, Zhongquan. (2004). Simplified analysis method of determining pore sizes of porous materials by bubbling test. Powder Metallurgy Industry, 14(6), 20-23. Table 1. The performance indexes of petroleum coke
Total water content 0.85%
Ash content 0.44%
True density 0.9399 g/cm3
Volatile content 9.88%
Particle size Adjustable according to the requirements of experiment
Table 2. The particle size distribution of petroleum coke
Ball-milling time Average diameter (µm)
D (v, 0.1) D (v, 0.5) D (v, 0.9) 2 h 35.70 46.69 61.55
Modern Applied Science March, 2010
113
Table 3. The pore size of additive-contained carbon membrane
Additives rmax (μm) rave (μm) rmin (μm)
No additive 0.482 0.214 0.167
Iron powder 0.482 0.299 0.207
Medium temperature pitch 0.543 0.174 0.136
Phenolic resin 0.723 0.282 0.241
Sesbania powder 0.723 0.319 0.241
Starch 0.543 0.299 0.197
Table 4. The effect of additive on the linear pressure of carbon membrane
Additives Strength (N) Average
strength (N) Diameter
(mm) Average linear pressure (N)
No additive 62.8 69.1 64.3 65.40 7.62 8.58
Iron powder 58.4 58.5 53.1 56.67 7.88 7.19
Medium temperature pitch 104.2 104.6 105.5 104.77 7.66 13.68
Phenolic resin 61.9 58.6 57.0 59.17 7.72 7.66
Sesbania powder 35.5 31.8 30.7 32.67 7.42 4.40
Starch 74.9 72.8 73.9 73.87 7.50 9.85
Table 5. The effect of additive on the flexural strength of carbon membrane
Additives Strength (N) Average
strength (N) Diameter
(mm) Average flexural strength (MPa)
No additive 67 74 72 71.00 7.62 9.32
Iron powder 62 54 70 62.00 7.88 7.87
Medium temperature pitch 125 152 178 151.67 7.66 19.80
Phenolic resin 70 72 94 78.67 7.72 10.19
Sesbania powder 54 62 54 32.67 7.42 7.63
Starch 82 82 75 79.67 7.50 10.62
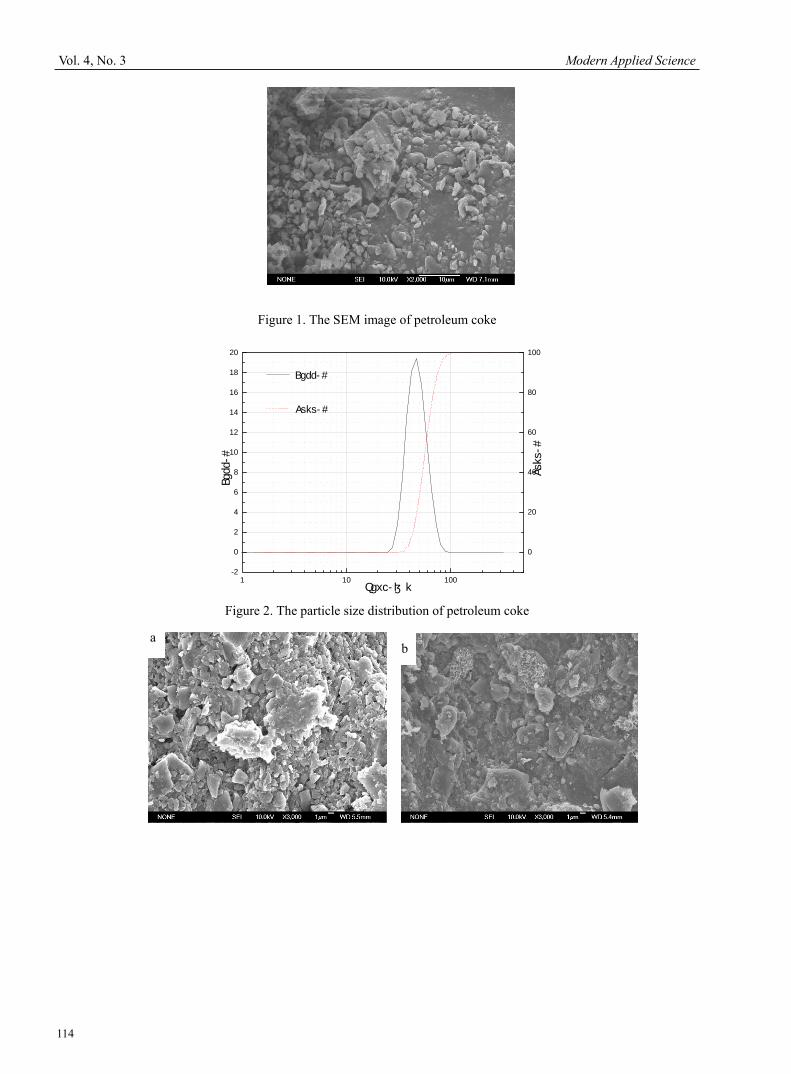
Vol. 4, No. 3 Modern Applied Science
114
Figure 1. The SEM image of petroleum coke
1 10 100-2
0
2
4
6
8
10
12
14
16
18
20
Diff/%
Cumu/%
Diff/%
Size/μm
0
20
40
60
80
100
Cumu/%
Figure 2. The particle size distribution of petroleum coke
a b
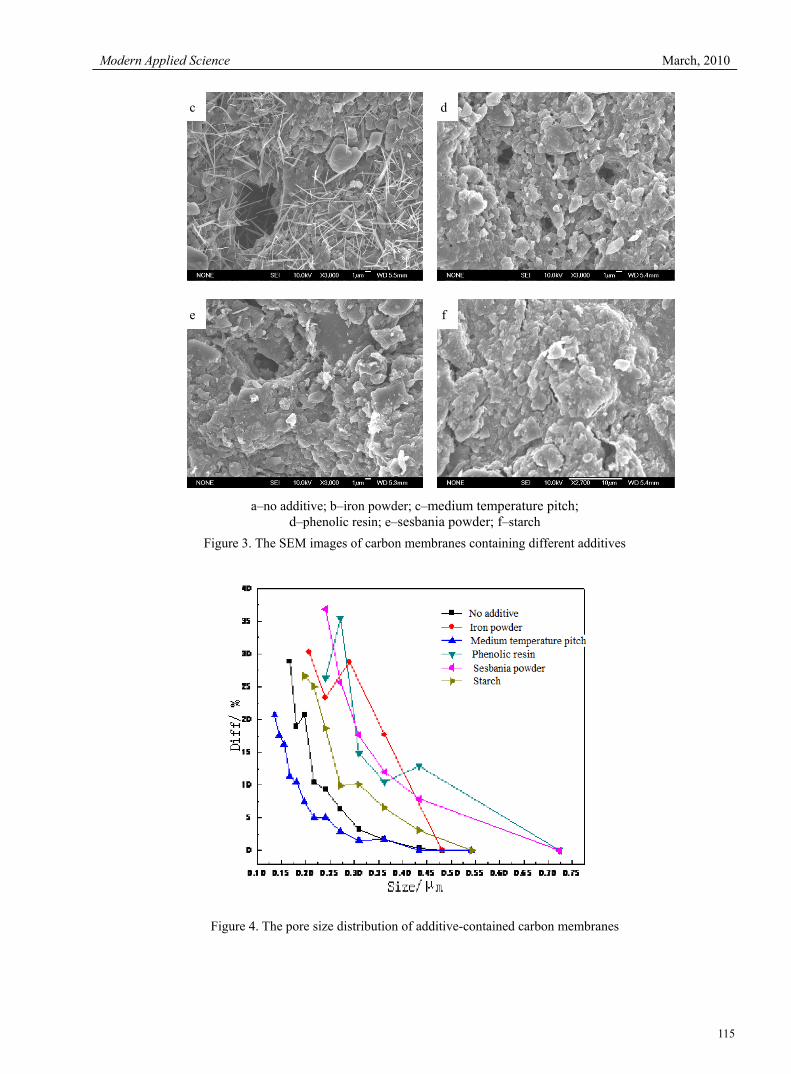
Modern Applied Science March, 2010
115
a–no additive; b–iron powder; c–medium temperature pitch;
d–phenolic resin; e–sesbania powder; f–starch Figure 3. The SEM images of carbon membranes containing different additives
Figure 4. The pore size distribution of additive-contained carbon membranes
c d
e f

Call for Manuscripts
Modern Applied Science is a peer-reviewed journal, published by Canadian Center of Science and Education. The journal publishes research papers in the fields of chemistry, environmental sciences, management and economics, physics, mathematics and statistics, geology, engineering, computer and information sciences, and biology. The journal is published in both printed and online versions. The online version is free access and download.
We are seeking submissions for forthcoming issues. The paper should be written in professional English. The length of 3000-8000 words is preferred. All manuscripts should be prepared in MS-Word format, and submitted online, or sent to: [email protected]
Paper Selection and Publication Process
a). Upon receipt of paper submission, the Editor sends an E-mail of confirmation to the corresponding author within 1-3 working days. If you fail to receive this confirmation, your submission/e-mail may be missed. Please contact the Editor in time for that.
b). Peer review. We use single-blind system for peer-review; the reviewers' identities remain anonymous to authors. The paper will be peer-reviewed by three experts; one is an editorial staff and the other two are external reviewers. The review process may take 2-3 weeks.
c). Notification of the result of review by E-mail.
d). The authors revise paper and pay publication fee.
e). After publication, the corresponding author will receive two copies of printed journals, free of charge.
f). E-journal in PDF is available on the journal’s webpage, free of charge for download.
Requirements and Copyrights
Submission of an article implies that the work described has not been published previously (except in the form of an abstract or as part of a published lecture or academic thesis), that it is not under consideration for publication elsewhere, that its publication is approved by all authors and tacitly or explicitly by the responsible authorities where the work was carried out, and that, if accepted, it will not be published elsewhere in the same form, in English or in any other languages, without the written consent of the Publisher. The Editors reserve the right to edit or otherwise alter all contributions, but authors will receive proofs for approval before publication.
Copyrights for articles published in CCSE journals are retained by the authors, with first publication rights granted to the journal. The journal/publisher is not responsible for subsequent uses of the work. It is the author's responsibility to bring an infringement action if so desired by the author.
More Information
E-mail: [email protected]
Website: www.ccsenet.org/mas
Paper Submission Guide: www.ccsenet.org/submission
Recruitment for Reviewers: www.ccsenet.org/reviewer.html

Related Documents