FACULTY OF ENGINEERING AND SUSTAINABLE DEVELOPMENT . Indoor and Outdoor Evaluation of Campus RSS Performance Qian Li & Xintong Zhang June 2011 Bachelor’s Thesis in Electronics Bachelor’s Program in Electronics Examiner: Dr. José Chilo Supervisor: Sathyaveer Prasad

Welcome message from author
This document is posted to help you gain knowledge. Please leave a comment to let me know what you think about it! Share it to your friends and learn new things together.
Transcript
FACULTY OF ENGINEERING AND SUSTAINABLE DEVELOPMENT .
Indoor and Outdoor Evaluation of Campus RSS
Performance
Qian Li & Xintong Zhang
June 2011
Bachelor’s Thesis in Electronics
Bachelor’s Program in Electronics
Examiner: Dr. José Chilo
Supervisor: Sathyaveer Prasad


Qian Li & Xintong Zhang Indoor and Outdoor Evaluation of Campus RSS Performance
i
Abstract
The focus of this thesis work is to evaluate the RSS (Received Signal Strength) Performance
of the University of Gävle (HiG) based on IEEE 802.11 standards both indoor and outdoor.
Authors investigated the issues of deploying access points for wireless local area networks in
the library-2nd
floor, building 99-4th
floor and outdoor university campus. By using the
program VisiWave Site Survey, Global Position System (GPS) and RSS sensor to analysis the
received signal strength, throughput and radio map. The influence of the building material and
distance for the signal strength and the throughput are done by investigating indoor
environment. The results of investigation suggest that most parts of library-2nd
floor and
building 99-4th
floor possess at least a good RSS performance. However, minority parts of
these places have a poor RSS performance, and the new resolution of Access Points’ (AP)
deployment for these poor-RSS-performance parts is provided. For the outdoor campus part,
the RSS in the area which near the walls of building is satisfactory (Received Signal Strength
Indication (RSSI) between -79.8 dBm and -57 dBm), however in the centre of outdoor
campus the RSS is poor. Thus, the evaluation of APs deployment in HiG is achieved.
Key words: Evaluation, IEEE 802.11, WLAN, Access point, RSSI, RSS, Throughput, Radio
map.
Qian Li & Xintong Zhang Indoor and Outdoor Evaluation of Campus RSS Performance
ii
Acknowledgements
The authors would like to thank Sathyaveer Prasad as a professional supervisor for providing
effective ideas, suggestions. Furthermore, the authors would like to thank Dr. Jose Chilo,
Niklas Rothpfeffer for providing the RSS sensor and our friend Yuhang Sun for providing
GPS sensor. Moreover, the authors would also like to thank IT-Support for providing the
maps of access points of the University of Gävle.
Qian Li & Xintong Zhang Indoor and Outdoor Evaluation of Campus RSS Performance
iii
Abbreviations
WLAN Wireless Local Area Network
RF Radio Frequency
WAP Wireless Access Point
IEEE Institute of Electrical and Electronics Engineers
RSS Received Signal Strength
GPS Global Position System
Wi-Fi Wireless Fidelity
NIC Network Interface Card
LAN Local Area Network
MAC Medium Access control
PHY Physics
AP Access Point
CSMA/CA Carrier-Sense Multiple Access with Collision Avoidance
OFDM Orthogonal Frequency-Division Multiplexing
DSSS Direct-Sequence Spread Spectrum
PC Personal Computer
SNR Signal-to-Noise Ratio
HiG University of Gävle
BSS Basic Service Set
SAT Station
PDA Personal Digital Assistant
SSID Service Set Identifier
RSSI Received Signal Strength Indication

Qian Li & Xintong Zhang Indoor and Outdoor Evaluation of Campus RSS Performance
iv
Table of contents
Abstract ................................................................................................................................................... i
Acknowledgements ................................................................................................................................ ii
Abbreviations ........................................................................................................................................ iii
Chapter 1 Introduction ......................................................................................................................... 1
1.1 Background....................................................................................................................... 1
1.2 Objectives of Thesis ......................................................................................................... 1
Chapter 2 Theory .................................................................................................................................. 3
2.1 802.11 Standard ................................................................................................................ 3
2.1.1 IEEE 802.11 MAC Layer ................................................................................................. 4
2.1.2 IEEE 802.11 PHY Layer .................................................................................................. 4
2.2 RSS and Throughput ........................................................................................................ 5
2.2.1 RSS ................................................................................................................................... 6
2.2.2 Throughput ....................................................................................................................... 6
2.3 Radio Map ........................................................................................................................ 6
2.4 Some Indoor Factors Impact Wi-Fi Signal Propagation................................................... 7
2.5 Overlapping ...................................................................................................................... 9
Chapter 3 Measurement Method and Results .................................................................................. 11
3.1 Method ............................................................................................................................ 11
3.1.1 Equipments ..................................................................................................................... 11
3.1.2 Site Survey...................................................................................................................... 13
3.1.3 RSS and Throughput Survey .......................................................................................... 22
3.2 Results ............................................................................................................................ 23
3.2.1 Result of Library-2nd
Floor Part ...................................................................................... 23
3.2.2 Result of Building 99-4th Floor Part ............................................................................... 26
3.2.3 Result of Outdoor Campus Part ...................................................................................... 27
3.2.4 Result of RSS and Throughput Survey........................................................................... 29
Qian Li & Xintong Zhang Indoor and Outdoor Evaluation of Campus RSS Performance
v
Chapter 4 Discussion ........................................................................................................................... 32
4.1 Recommendations for a Better RSS Performance of Library-2nd
Floor Part .................. 32
4.2 Recommendations for a Better RSS Performance of Building 99-2nd
Floor Part ........... 34
4.3 Recommendation for a Better RSS Performance for Outdoor Campus Part .................. 36
Chapter 5 Conclusions ........................................................................................................................ 38
References ............................................................................................................................................ 39
Appendix A ......................................................................................................................................... A1
Appendix B ........................................................................................................................................... B1

Qian Li & Xintong Zhang Indoor and Outdoor Evaluation of Campus RSS Performance
1
Chapter 1
Introduction
1.1 Background
Increasing numbers of students are using their own laptop to study in university. To keep up
with increasing demand, the performance of wireless networks must continue to increase.
WLANs (Wireless Local Area Networks) are becoming more and more popular in computer
networks and they play an important role in communications systems. It makes
communication systems more flexible and more mobile which is the essential network
services while wired network is proved unfeasible. In computer network systems, wireless
access point (WAP) is an important equipment to build the WLAN. Wireless access points are
devices that allow wireless devices to connect to a wired network and transmit data between
wired networks and wireless devices.
WLAN based on 802.11 standards is the most widely used in computer networks. It is
developed by the IEEE (Institute of Electrical and Electronics Engineers) and offers a firm
basis for high performance WLANs. In this thesis work, the evaluation of the wireless
network in the University of Gävle has been carried out. The aim is to show students where
the signal is strongest in the university campus by designing a radio map and performing
some tests such as throughput. Radio maps lead to cost saving location services and illustrate
the signal strength so it is important to make an estimated radio map since it is real-time and
more universal.
1.2 Objectives of Thesis
In this thesis work, the authors will evaluate the WLAN performance at the University of
Gävle campus both indoors and outdoors. The evaluation is done by:
1. Using Visiwave Site Survey software (to obtain the radio map), Chanalyzer Pro software
(to obtain the RSS) and Bandwidth Meter Online Speed Test Software (to obtain the
throughput).

Qian Li & Xintong Zhang Indoor and Outdoor Evaluation of Campus RSS Performance
2
2. Measuring RSS (Received Signal Strength) by using RSS sensor according to IEEE 802.11
standard. GPS also have been utilized for positioning.
3. Designing a Radio Map based on the measurement data.

Qian Li & Xintong Zhang Indoor and Outdoor Evaluation of Campus RSS Performance
3
Chapter 2
Theory
This is the theory part which concerning some compulsory information that we need
comprehend to support their research. Including 802.11 standard, radio map, some
environmental factors that can influence Wi-Fi (Wireless Fidelity) signal propagation, signal
overlapping and basic antenna theory.
2.1 802.11 Standard
Before 1998, the only way to connect a WLAN is to install a proprietary hardware for both
access point and terminal, this limit other devices to connect to this wireless network. In
response IEEE sets a standard for WLAN connection which is IEEE 802.11 [1].
IEEE sets a standard for WLAN communication, consequently, it permits every device with
wireless NIC (Network Interface Card) to connect public wireless or even Internet resource,
and roam within the WLAN signal covered area [2]. Figure 1 indicates the connection of each
components of wireless network.
Figure 1: A wireless network connection.
To accomplish this project, authors need to understand basic logical architecture of wireless
LAN. Especially in wireless LAN Functions part, which includes two different layers :
Medium Access Control (MAC) layer and Physics (PHY) layer. Each layer possesses distinct

Qian Li & Xintong Zhang Indoor and Outdoor Evaluation of Campus RSS Performance
4
functions to hold a wireless network operation normally, and it is described in detail in
sections 2.1.1 and 2.1.2.
2.1.1 IEEE 802.11 MAC Layer
MAC (Medium Access Control) is data link function of a radio-based wireless LAN. This
enables a couple of terminals to share a carrier which transmits data at the same time. In
another words, it could be a protocol similar to Ethernet [1].
Although, MAC is a protocol that permits different terminals share a carrier, it still need to
avoid data transmit collision. For instance, if there are two terminals utilizing a same AP
(Access point) to receive data, it could not make AP transmit data to two terminals at the
same time (by reason of the time is extremely short, therefore, we cannot realize that when we
connected to a Wi-Fi).
2.1.2 IEEE 802.11 PHY Layer
PHY layer has three functions [1]:
Determining the state of medium
To transmit data
To receive data
Nowadays, IEEE 802.11 b, g and n standards are primarily utilized in wireless LAN, Table 1
indicates some details for different 802.11 standards respectively.
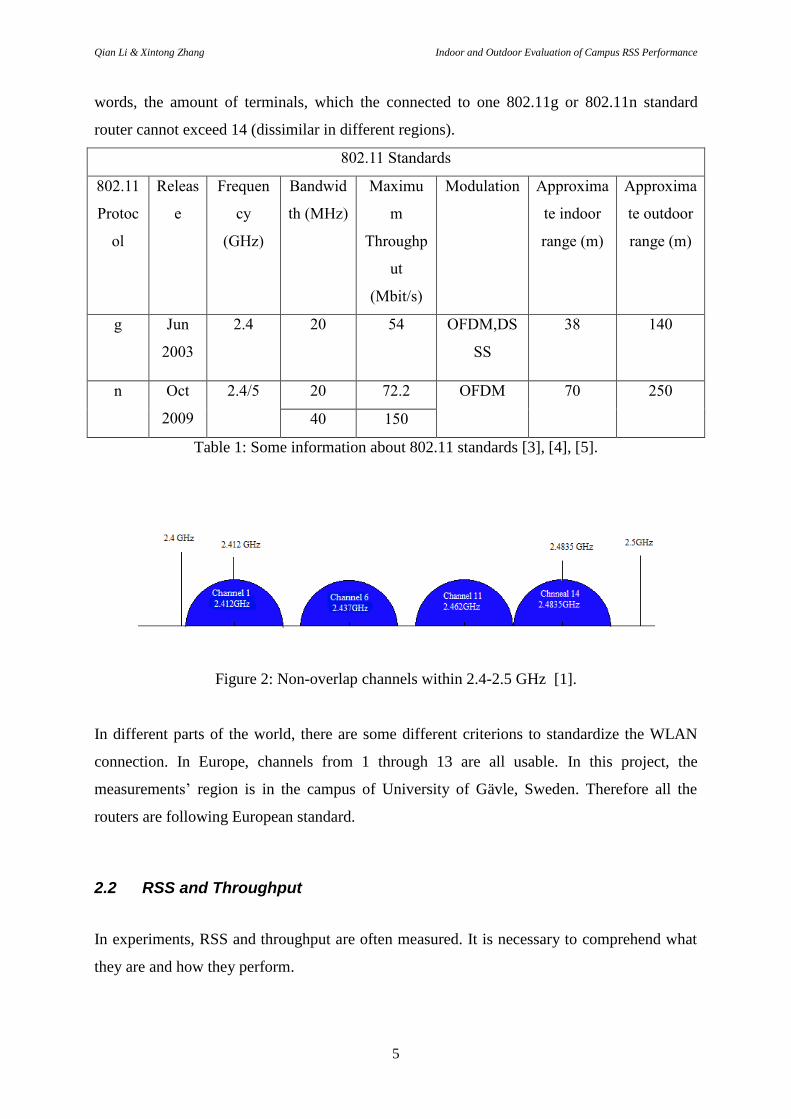
All the 802.11 n/g standard APs contain distinct channels. Each channel possesses 22 MHz
bandwidth, start from 2.412 GHz. Certainly, they are all between 2.4-2.5 GHz, which has
been illustrated in Figure 2 explicitly. Furthermore, the overlapping between different
channels is unavoidable. Each channel is able to connect to one mobile device with wireless
NIC. When terminal connecting to AP, AP deploying a channel to terminal automatically in
random. Precondition is that, there must be at least one idle channel. What authors must refer
to is, all the 802.11 g/ n standard routers contain a maximum number of 14 channels, in other
Qian Li & Xintong Zhang Indoor and Outdoor Evaluation of Campus RSS Performance
5
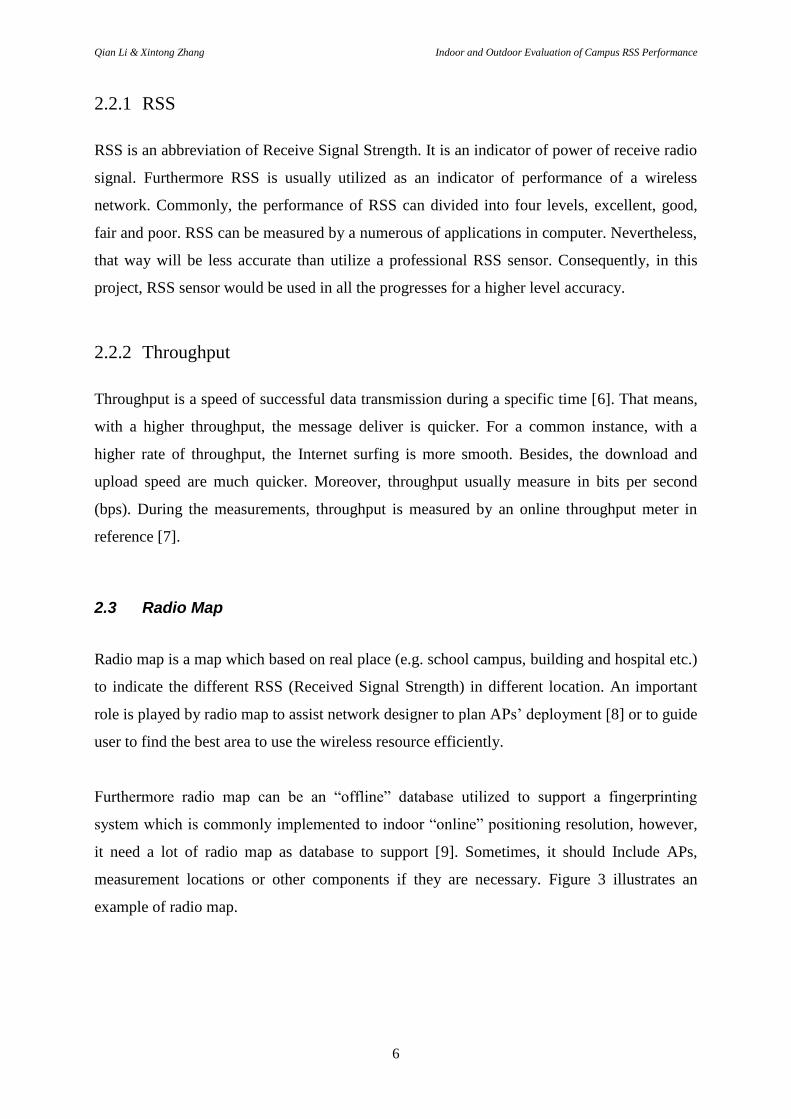
words, the amount of terminals, which the connected to one 802.11g or 802.11n standard
router cannot exceed 14 (dissimilar in different regions).
802.11 Standards
802.11
Protoc
ol
Releas
e
Frequen
cy
(GHz)
Bandwid
th (MHz)
Maximu
m
Throughp
ut
(Mbit/s)
Modulation Approxima
te indoor
range (m)
Approxima
te outdoor
range (m)
g Jun
2003
2.4 20 54 OFDM,DS
SS
38 140
n Oct
2009
2.4/5 20 72.2 OFDM 70 250
40 150
Table 1: Some information about 802.11 standards [3], [4], [5].
Figure 2: Non-overlap channels within 2.4-2.5 GHz [1].
In different parts of the world, there are some different criterions to standardize the WLAN
connection. In Europe, channels from 1 through 13 are all usable. In this project, the
measurements’ region is in the campus of University of Gävle, Sweden. Therefore all the
routers are following European standard.
2.2 RSS and Throughput
In experiments, RSS and throughput are often measured. It is necessary to comprehend what
they are and how they perform.
Qian Li & Xintong Zhang Indoor and Outdoor Evaluation of Campus RSS Performance
6
2.2.1 RSS
RSS is an abbreviation of Receive Signal Strength. It is an indicator of power of receive radio
signal. Furthermore RSS is usually utilized as an indicator of performance of a wireless
network. Commonly, the performance of RSS can divided into four levels, excellent, good,
fair and poor. RSS can be measured by a numerous of applications in computer. Nevertheless,
that way will be less accurate than utilize a professional RSS sensor. Consequently, in this
project, RSS sensor would be used in all the progresses for a higher level accuracy.
2.2.2 Throughput
Throughput is a speed of successful data transmission during a specific time [6]. That means,
with a higher throughput, the message deliver is quicker. For a common instance, with a
higher rate of throughput, the Internet surfing is more smooth. Besides, the download and
upload speed are much quicker. Moreover, throughput usually measure in bits per second
(bps). During the measurements, throughput is measured by an online throughput meter in
reference [7].
2.3 Radio Map
Radio map is a map which based on real place (e.g. school campus, building and hospital etc.)
to indicate the different RSS (Received Signal Strength) in different location. An important
role is played by radio map to assist network designer to plan APs’ deployment [8] or to guide
user to find the best area to use the wireless resource efficiently.
Furthermore radio map can be an “offline” database utilized to support a fingerprinting
system which is commonly implemented to indoor “online” positioning resolution, however,
it need a lot of radio map as database to support [9]. Sometimes, it should Include APs,
measurement locations or other components if they are necessary. Figure 3 illustrates an
example of radio map.

Qian Li & Xintong Zhang Indoor and Outdoor Evaluation of Campus RSS Performance
7
Figure 3: An example of radio map different color stands for different RSS.
2.4 Some Indoor Factors Impact Wi-Fi Signal Propagation
When the Wi-Fi signal is generated by APs, and then transmitted to terminals, some indoor
factors would influence signal’s propagation, such as building materials. It includes distance
from APs to PCs, obstacles between APs and PCs and building structures’ Reflection [10]
[11]. By the reason of all the measurements and experiments processes of project are done in
indoor and outdoor of HiG campus. Consequently, authors hereby provide some brief
information concerning indoor factors impact Wi-Fi signal propagation.
It is evident that, with the distance between from APs to PCs being extended, RSS would be
more weaken. This is called path loss, furthermore, it is also based on transmit power level,
receiver sensitivity and signal-to-noise ratio (SNR).
Nevertheless, the range between APs and PCs is the key, RSS declines exponentially as the
range increases, in a vicinity of 20dB every 100 feet (30.48 meters) [1].
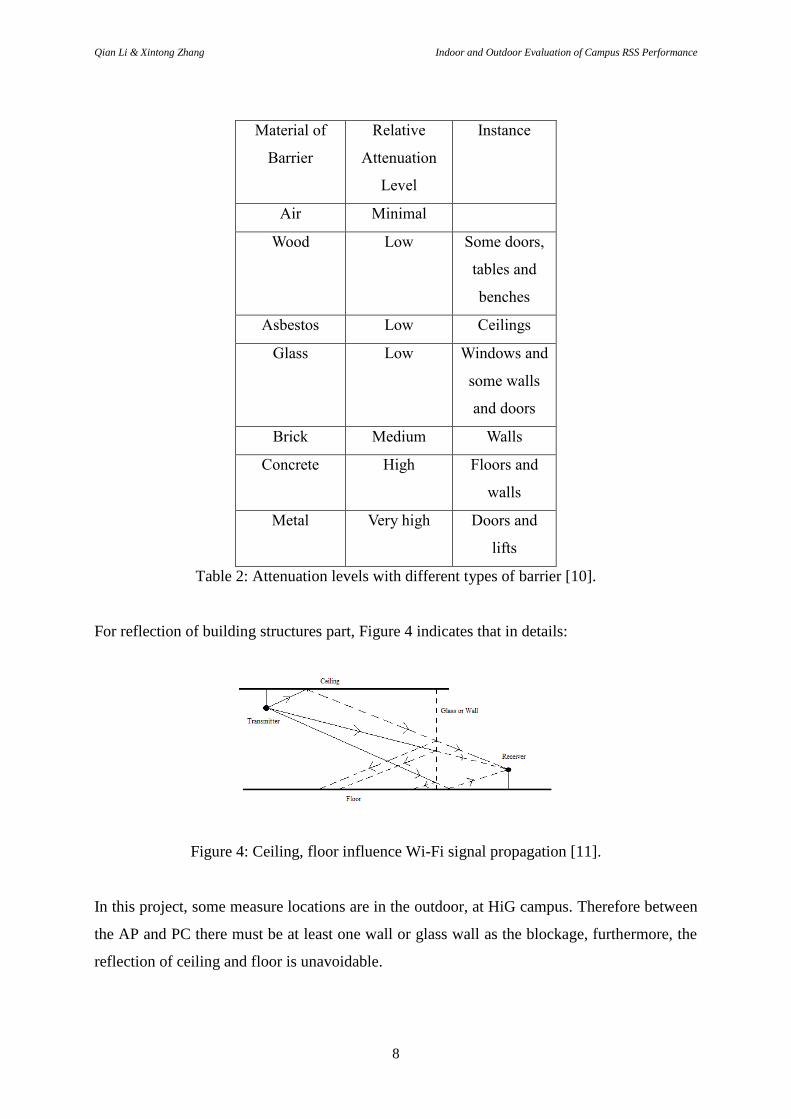
With the signal propagating, some blockages between transmitter and receiver are difficult to
avoid. However dissimilar type of barriers’ material possesses dissimilar level of attenuation
Table 2 illustrates that.
Qian Li & Xintong Zhang Indoor and Outdoor Evaluation of Campus RSS Performance
8
Material of
Barrier
Relative
Attenuation
Level
Instance
Air Minimal
Wood Low Some doors,
tables and
benches
Asbestos Low Ceilings
Glass Low Windows and
some walls
and doors
Brick Medium Walls
Concrete High Floors and
walls
Metal Very high Doors and
lifts
Table 2: Attenuation levels with different types of barrier [10].
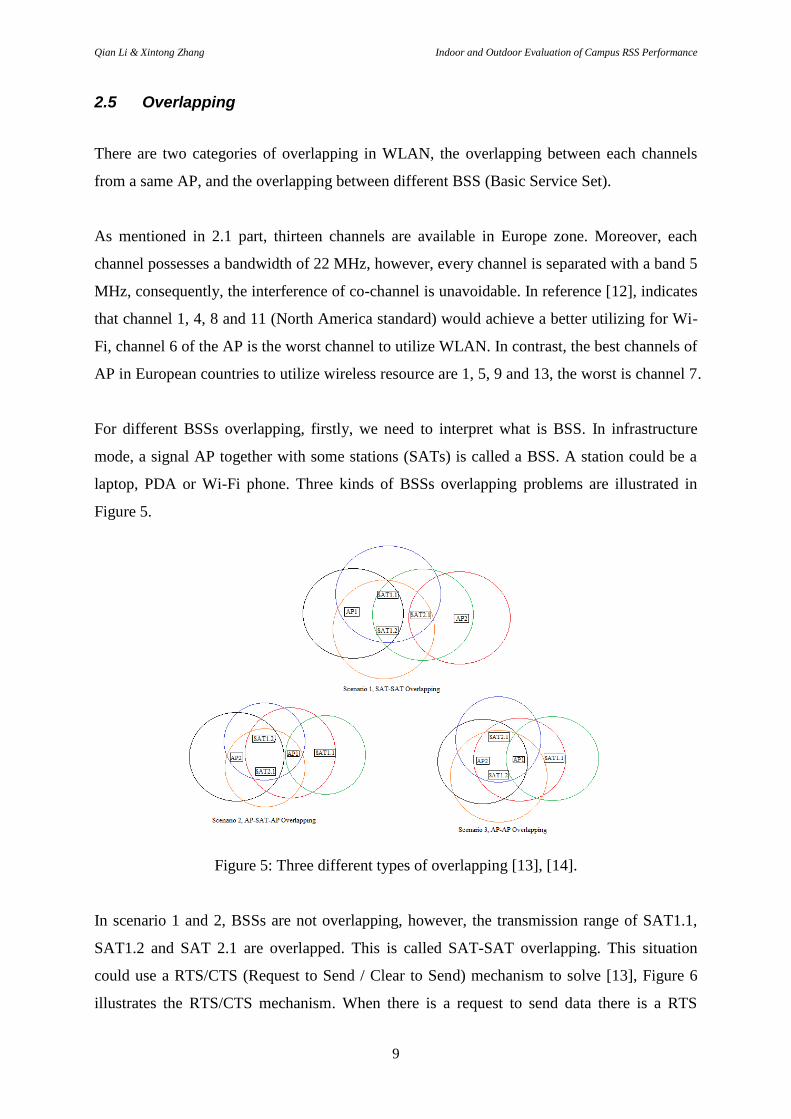
For reflection of building structures part, Figure 4 indicates that in details:
Figure 4: Ceiling, floor influence Wi-Fi signal propagation [11].
In this project, some measure locations are in the outdoor, at HiG campus. Therefore between
the AP and PC there must be at least one wall or glass wall as the blockage, furthermore, the
reflection of ceiling and floor is unavoidable.
Qian Li & Xintong Zhang Indoor and Outdoor Evaluation of Campus RSS Performance
9
2.5 Overlapping
There are two categories of overlapping in WLAN, the overlapping between each channels
from a same AP, and the overlapping between different BSS (Basic Service Set).
As mentioned in 2.1 part, thirteen channels are available in Europe zone. Moreover, each
channel possesses a bandwidth of 22 MHz, however, every channel is separated with a band 5
MHz, consequently, the interference of co-channel is unavoidable. In reference [12], indicates
that channel 1, 4, 8 and 11 (North America standard) would achieve a better utilizing for Wi-
Fi, channel 6 of the AP is the worst channel to utilize WLAN. In contrast, the best channels of
AP in European countries to utilize wireless resource are 1, 5, 9 and 13, the worst is channel 7.
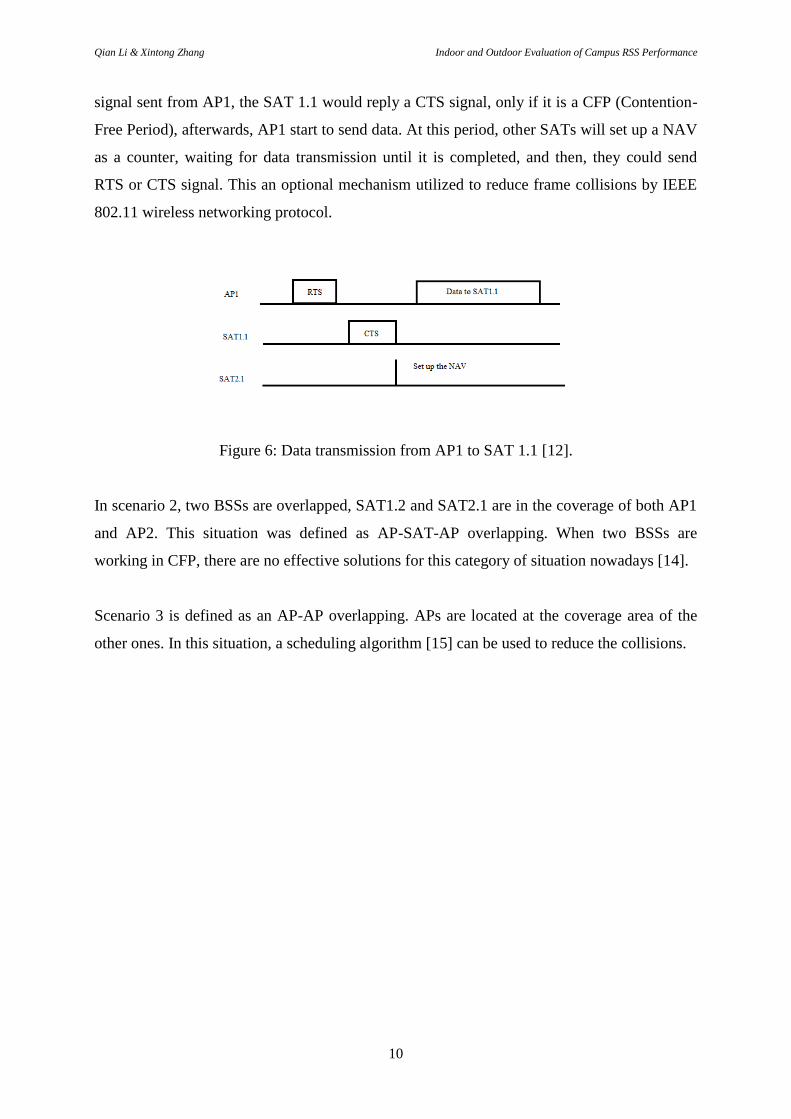
For different BSSs overlapping, firstly, we need to interpret what is BSS. In infrastructure
mode, a signal AP together with some stations (SATs) is called a BSS. A station could be a
laptop, PDA or Wi-Fi phone. Three kinds of BSSs overlapping problems are illustrated in
Figure 5.
Figure 5: Three different types of overlapping [13], [14].
In scenario 1 and 2, BSSs are not overlapping, however, the transmission range of SAT1.1,
SAT1.2 and SAT 2.1 are overlapped. This is called SAT-SAT overlapping. This situation
could use a RTS/CTS (Request to Send / Clear to Send) mechanism to solve [13], Figure 6
illustrates the RTS/CTS mechanism. When there is a request to send data there is a RTS
Qian Li & Xintong Zhang Indoor and Outdoor Evaluation of Campus RSS Performance
10
signal sent from AP1, the SAT 1.1 would reply a CTS signal, only if it is a CFP (Contention-
Free Period), afterwards, AP1 start to send data. At this period, other SATs will set up a NAV
as a counter, waiting for data transmission until it is completed, and then, they could send
RTS or CTS signal. This an optional mechanism utilized to reduce frame collisions by IEEE
802.11 wireless networking protocol.
Figure 6: Data transmission from AP1 to SAT 1.1 [12].
In scenario 2, two BSSs are overlapped, SAT1.2 and SAT2.1 are in the coverage of both AP1
and AP2. This situation was defined as AP-SAT-AP overlapping. When two BSSs are
working in CFP, there are no effective solutions for this category of situation nowadays [14].
Scenario 3 is defined as an AP-AP overlapping. APs are located at the coverage area of the
other ones. In this situation, a scheduling algorithm [15] can be used to reduce the collisions.

Qian Li & Xintong Zhang Indoor and Outdoor Evaluation of Campus RSS Performance
11
Chapter 3
Measurement Method and Results
3.1 Method
Site survey is a method to survey Wi-Fi signal strength place by place within its coverage area.
In this chapter, the authors commence measurement by using this method. Library (Floor 2nd
),
Building 99 (Floor 4th
), and outdoor Campus of Gävle University, Some spot of these parts
are selected to be measured the RSS and throughput. Furthermore, a program named
VisiWave Site Survey is commonly used in all the measurement processes for site survey,
another program is to design a radio map name VisiWave Site Survey Report is used as well
(Appendix A will indicate how to utilize both of these Programs). Moreover, the RSS of
distinct areas covered by APs with SSID (Service Set Identifier) of HiG are surveyed,
sometimes, may with the different MAC address and Channels (only channels 1, 6, 11 are
available in Gävle University), details will be indicates in Appendix B.
During the measurements, the RSS of different scenarios are measured. Therefore the sensor
is essential. Furthermore, the program named Chanalyzer Pro is utilized to measure RSS.
3.1.1 Equipments
3.1.1.1 Software
1. VisiWave Site Survey program.
2. VisiWave Site Survey Report program.
3. Chanalyzer Pro program.
4. XiRRUS Wi-Fi Monitor
5. Bandwidth Meter Online Speed Test program.
3.1.1.2 Hardware
In measurements, authors utilize a laptop move path which wireless resource is primarily used.
Qian Li & Xintong Zhang Indoor and Outdoor Evaluation of Campus RSS Performance
12
Metrical laptop:
Hewlett-Packard, Compaq, model: Presario CQ61 with Microsoft Windows 7 Home Premium
operation system (SP1) (64 bit), and Atheros AR9285 802.11 b/g/n Wi-Fi Adapter.
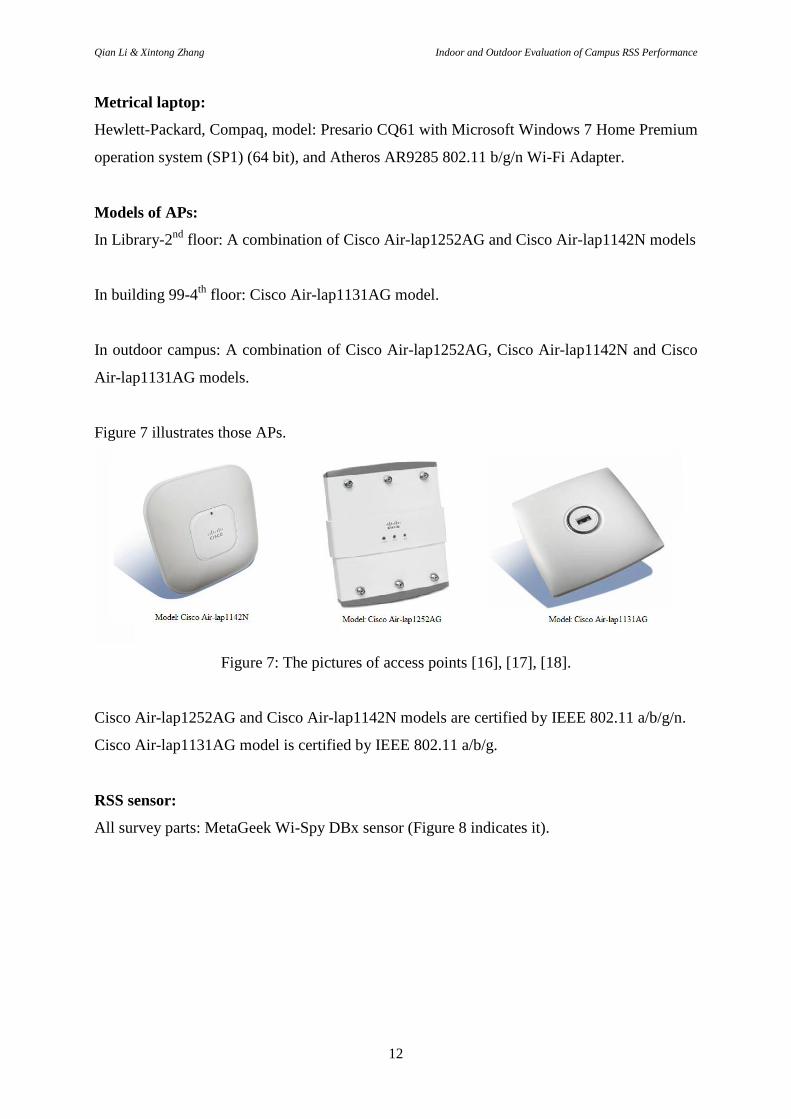
Models of APs:
In Library-2nd
floor: A combination of Cisco Air-lap1252AG and Cisco Air-lap1142N models
In building 99-4th
floor: Cisco Air-lap1131AG model.
In outdoor campus: A combination of Cisco Air-lap1252AG, Cisco Air-lap1142N and Cisco
Air-lap1131AG models.
Figure 7 illustrates those APs.
Figure 7: The pictures of access points [16], [17], [18].
Cisco Air-lap1252AG and Cisco Air-lap1142N models are certified by IEEE 802.11 a/b/g/n.
Cisco Air-lap1131AG model is certified by IEEE 802.11 a/b/g.
RSS sensor:
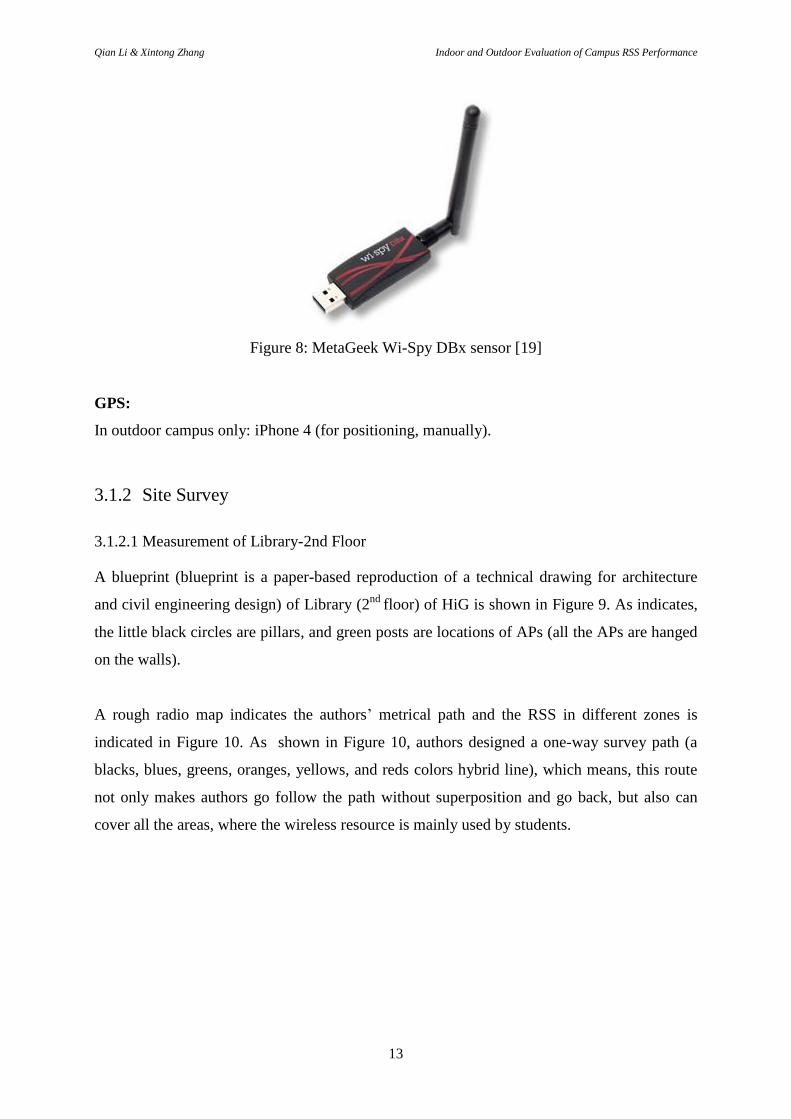
All survey parts: MetaGeek Wi-Spy DBx sensor (Figure 8 indicates it).
Qian Li & Xintong Zhang Indoor and Outdoor Evaluation of Campus RSS Performance
13
Figure 8: MetaGeek Wi-Spy DBx sensor [19]
GPS:
In outdoor campus only: iPhone 4 (for positioning, manually).
3.1.2 Site Survey
3.1.2.1 Measurement of Library-2nd Floor
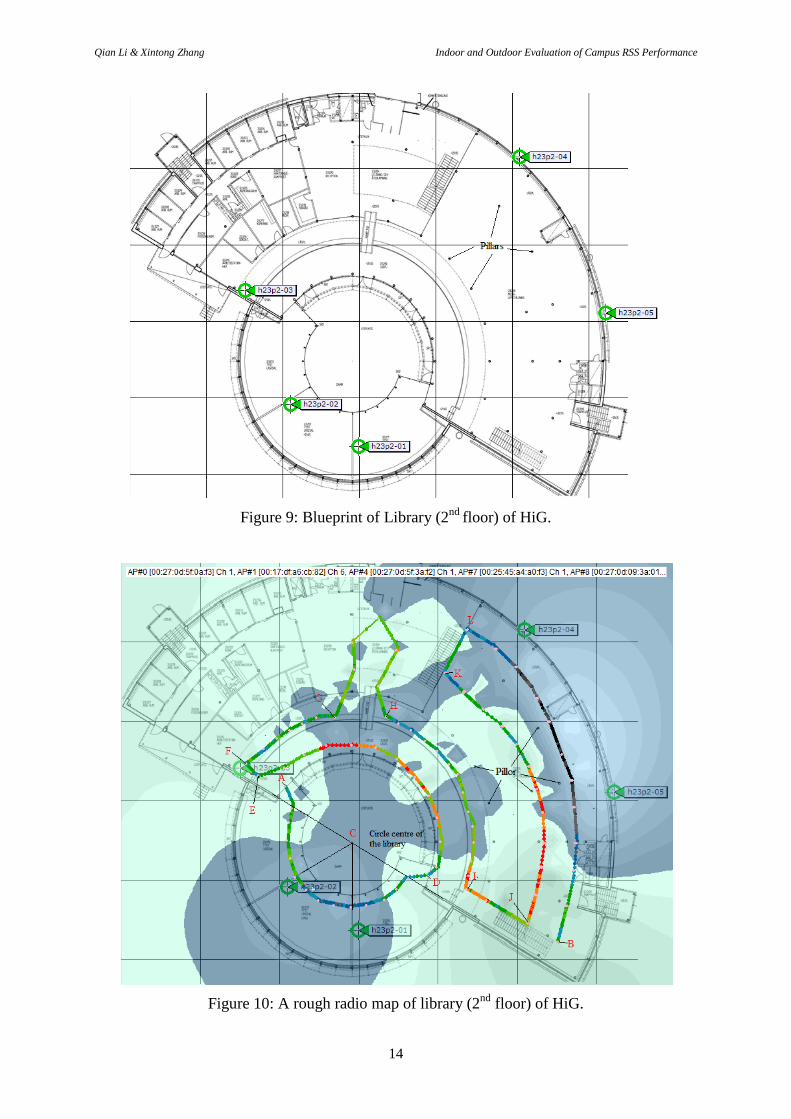
A blueprint (blueprint is a paper-based reproduction of a technical drawing for architecture
and civil engineering design) of Library (2nd
floor) of HiG is shown in Figure 9. As indicates,
the little black circles are pillars, and green posts are locations of APs (all the APs are hanged
on the walls).
A rough radio map indicates the authors’ metrical path and the RSS in different zones is
indicated in Figure 10. As shown in Figure 10, authors designed a one-way survey path (a
blacks, blues, greens, oranges, yellows, and reds colors hybrid line), which means, this route
not only makes authors go follow the path without superposition and go back, but also can
cover all the areas, where the wireless resource is mainly used by students.
Qian Li & Xintong Zhang Indoor and Outdoor Evaluation of Campus RSS Performance
14
Figure 9: Blueprint of Library (2nd
floor) of HiG.
Figure 10: A rough radio map of library (2nd
floor) of HiG.
Qian Li & Xintong Zhang Indoor and Outdoor Evaluation of Campus RSS Performance
15
In Figure 10, spot A is the start point which authors start to move and measure, likewise, spot
B is end point, C is library circle centre, Meanwhile, for pink spots are stop and mark location.
Dark blue area and light green area are illustrated in Figure 10, which dark blue area stands
for stronger RSS area, conversely, light green area stands for weaker RSS area. Furthermore,
the route of survey by authors is indicated in Figure 10 (as mentioned, a blacks, blues, greens,
oranges, yellows, and reds colors hybrid line). Dissimilar colors of different parts of line in
Figure 10 indicate RSS from strongest to weakest fellow an order: blacks, blues, greens,
oranges, yellows, and reds [20].
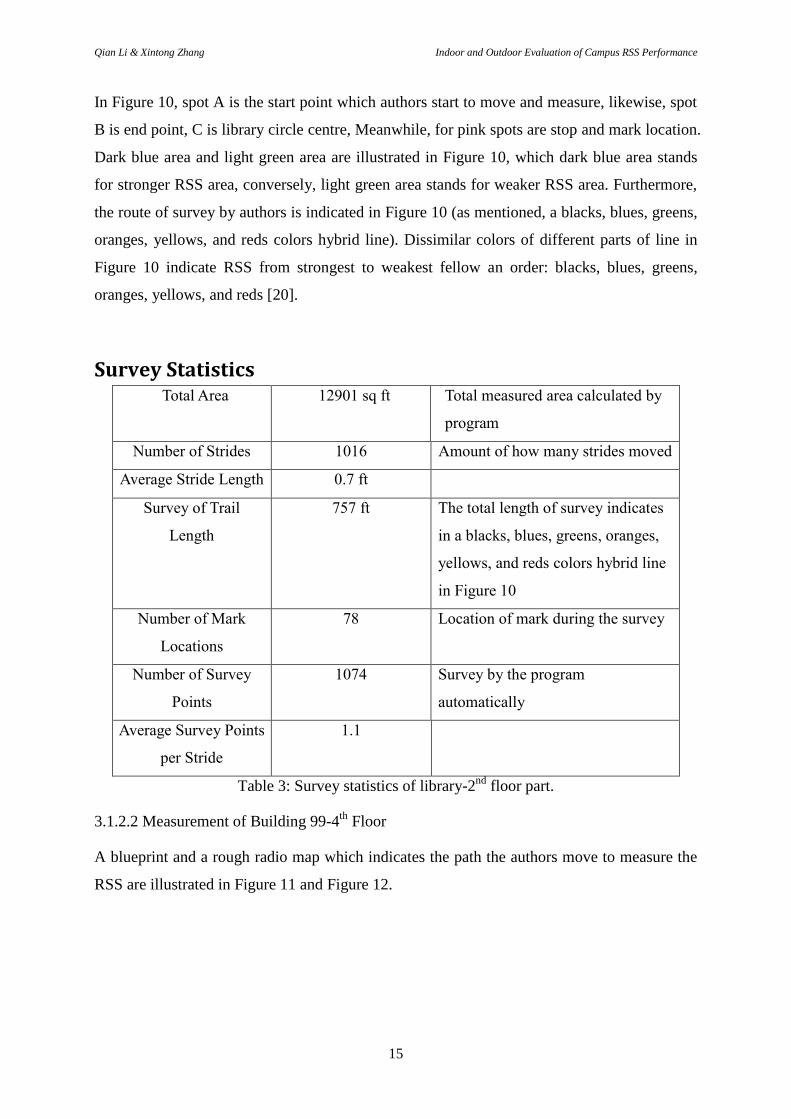
Survey Statistics Total Area 12901 sq ft Total measured area calculated by
program
Number of Strides 1016 Amount of how many strides moved
Average Stride Length 0.7 ft
Survey of Trail
Length
757 ft The total length of survey indicates
in a blacks, blues, greens, oranges,
yellows, and reds colors hybrid line
in Figure 10
Number of Mark
Locations
78 Location of mark during the survey
Number of Survey
Points
1074 Survey by the program
automatically
Average Survey Points
per Stride
1.1
Table 3: Survey statistics of library-2nd
floor part.
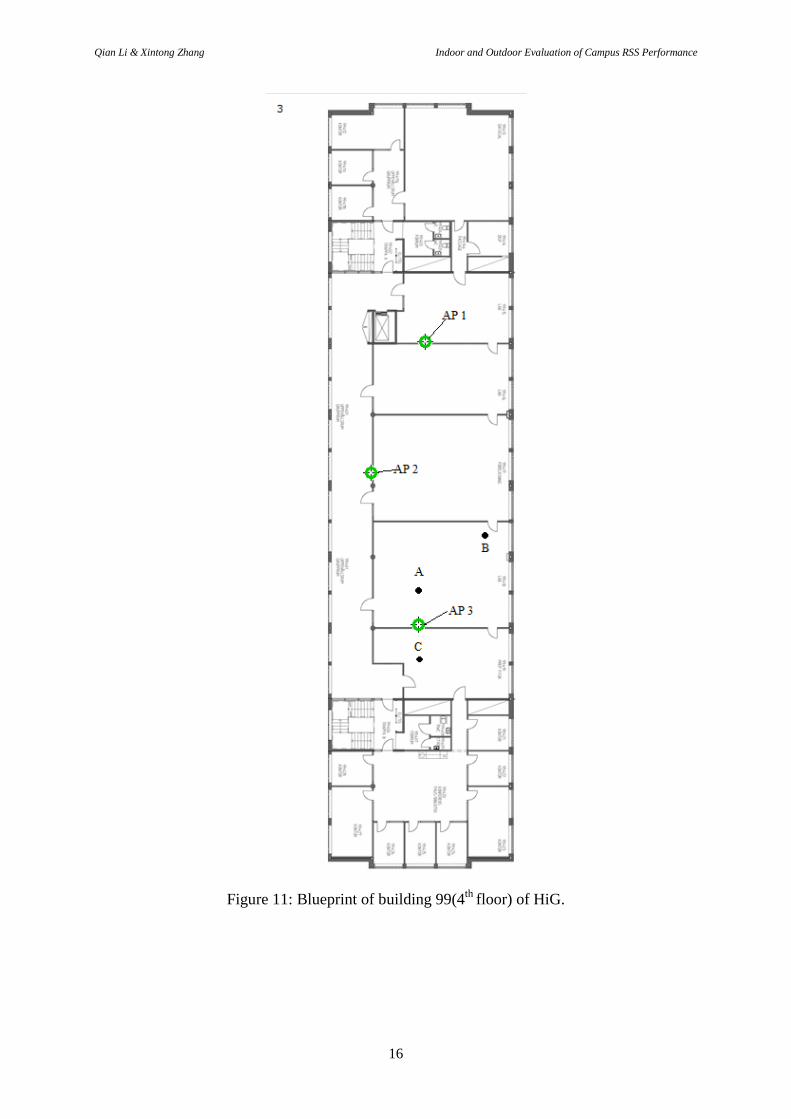
3.1.2.2 Measurement of Building 99-4th
Floor
A blueprint and a rough radio map which indicates the path the authors move to measure the
RSS are illustrated in Figure 11 and Figure 12.
Qian Li & Xintong Zhang Indoor and Outdoor Evaluation of Campus RSS Performance
16
Figure 11: Blueprint of building 99(4th
floor) of HiG.
Qian Li & Xintong Zhang Indoor and Outdoor Evaluation of Campus RSS Performance
17
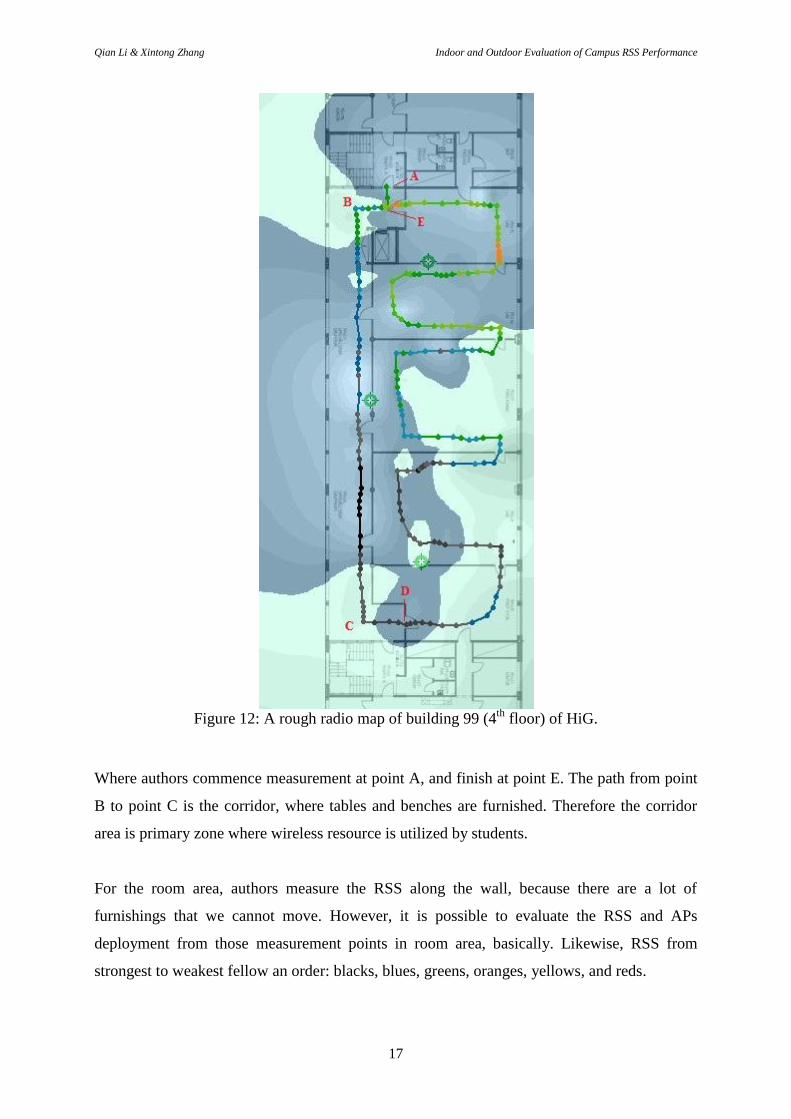
Figure 12: A rough radio map of building 99 (4
th floor) of HiG.
Where authors commence measurement at point A, and finish at point E. The path from point
B to point C is the corridor, where tables and benches are furnished. Therefore the corridor
area is primary zone where wireless resource is utilized by students.
For the room area, authors measure the RSS along the wall, because there are a lot of
furnishings that we cannot move. However, it is possible to evaluate the RSS and APs
deployment from those measurement points in room area, basically. Likewise, RSS from
strongest to weakest fellow an order: blacks, blues, greens, oranges, yellows, and reds.
Qian Li & Xintong Zhang Indoor and Outdoor Evaluation of Campus RSS Performance
18
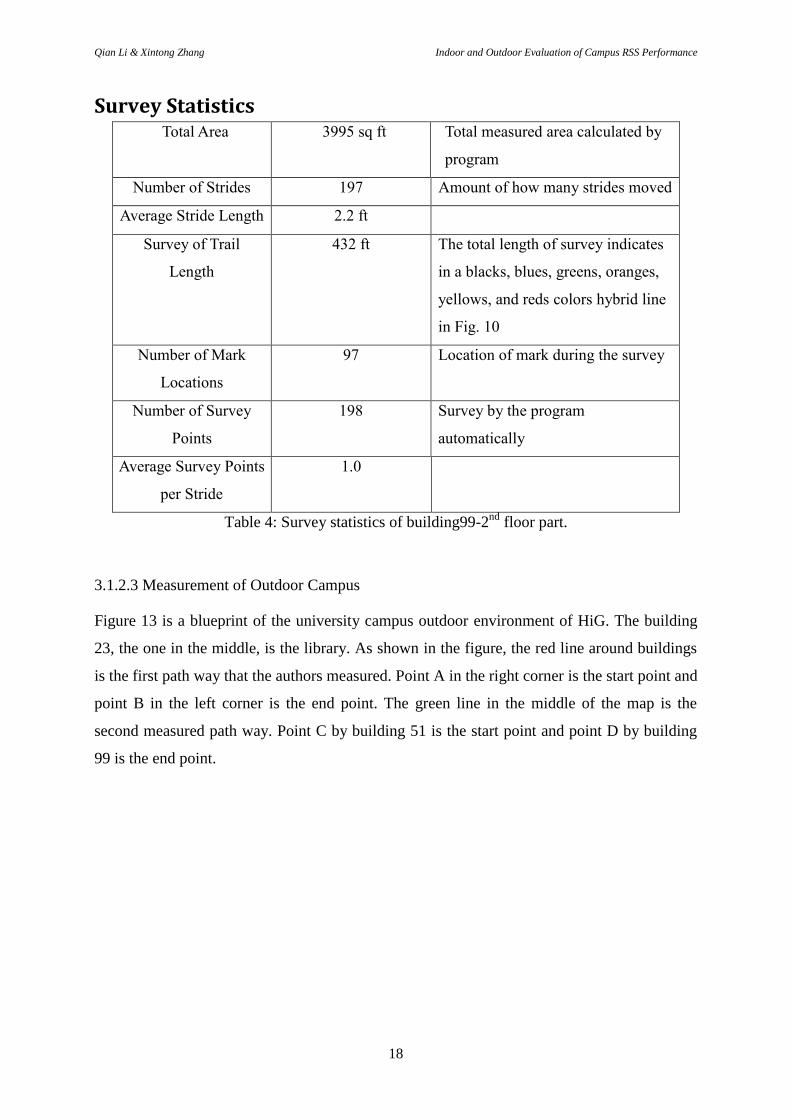
Survey Statistics Total Area 3995 sq ft Total measured area calculated by
program
Number of Strides 197 Amount of how many strides moved
Average Stride Length 2.2 ft
Survey of Trail
Length
432 ft The total length of survey indicates
in a blacks, blues, greens, oranges,
yellows, and reds colors hybrid line
in Fig. 10
Number of Mark
Locations
97 Location of mark during the survey
Number of Survey
Points
198 Survey by the program
automatically
Average Survey Points
per Stride
1.0
Table 4: Survey statistics of building99-2nd
floor part.
3.1.2.3 Measurement of Outdoor Campus
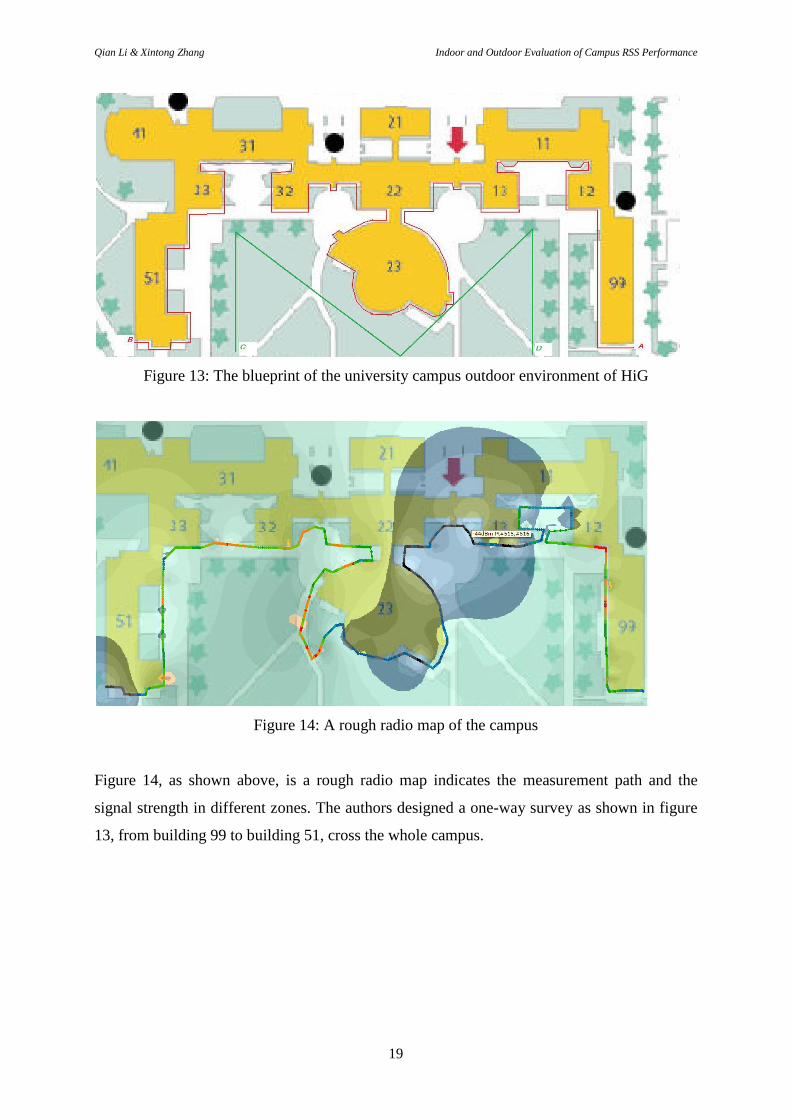
Figure 13 is a blueprint of the university campus outdoor environment of HiG. The building
23, the one in the middle, is the library. As shown in the figure, the red line around buildings
is the first path way that the authors measured. Point A in the right corner is the start point and
point B in the left corner is the end point. The green line in the middle of the map is the
second measured path way. Point C by building 51 is the start point and point D by building
99 is the end point.
Qian Li & Xintong Zhang Indoor and Outdoor Evaluation of Campus RSS Performance
19
Figure 13: The blueprint of the university campus outdoor environment of HiG
Figure 14: A rough radio map of the campus
Figure 14, as shown above, is a rough radio map indicates the measurement path and the
signal strength in different zones. The authors designed a one-way survey as shown in figure
13, from building 99 to building 51, cross the whole campus.

Qian Li & Xintong Zhang Indoor and Outdoor Evaluation of Campus RSS Performance
20
Figure 15: A rough radio map of the campus (different part)
Figure 15 shows the second path way of the measurement where is further away from
buildings. The authors designed a “M” shape path to measure to make sure that the route not
only makes authors go follow the path without superposition and go back, but also can cover
all the areas.
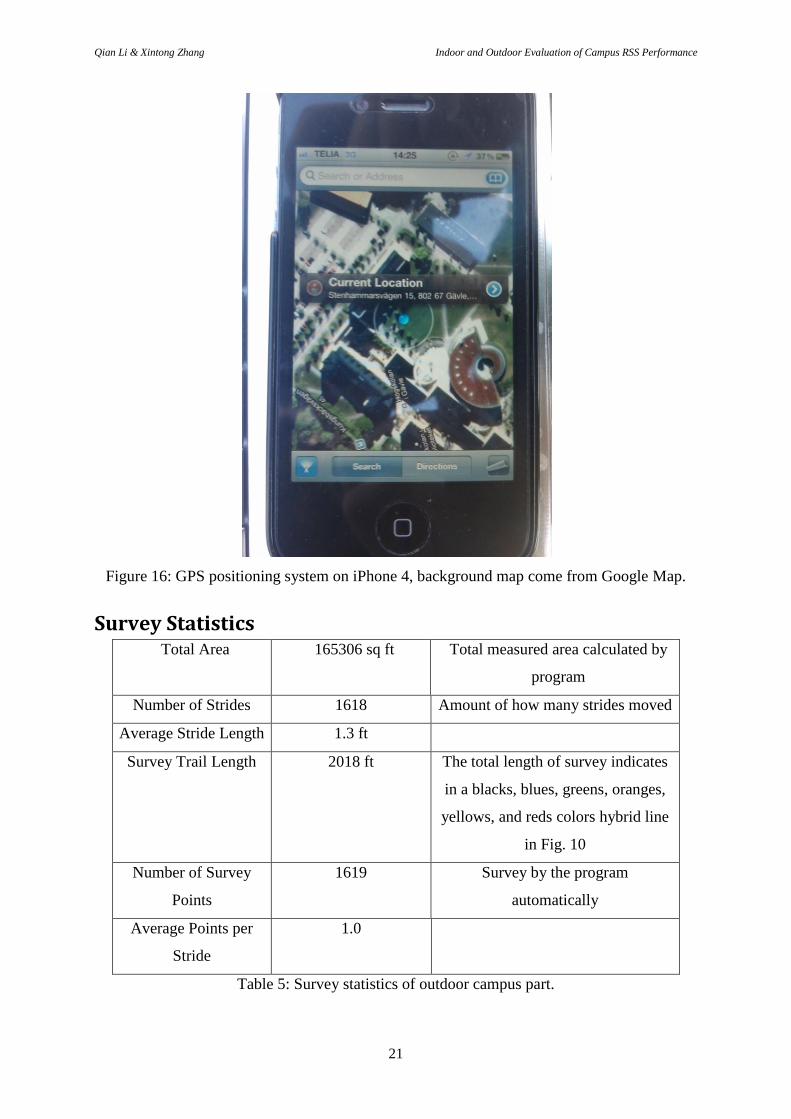
Both path ways are measured with the program VisiWave Site Survey and GPS sensor. Figure
16 shows a part of the located point in the campus by the GPS sensor.
Qian Li & Xintong Zhang Indoor and Outdoor Evaluation of Campus RSS Performance
21
Figure 16: GPS positioning system on iPhone 4, background map come from Google Map.
Survey Statistics Total Area 165306 sq ft Total measured area calculated by
program
Number of Strides 1618 Amount of how many strides moved
Average Stride Length 1.3 ft
Survey Trail Length 2018 ft The total length of survey indicates
in a blacks, blues, greens, oranges,
yellows, and reds colors hybrid line
in Fig. 10
Number of Survey
Points
1619 Survey by the program
automatically
Average Points per
Stride
1.0
Table 5: Survey statistics of outdoor campus part.
Qian Li & Xintong Zhang Indoor and Outdoor Evaluation of Campus RSS Performance
22
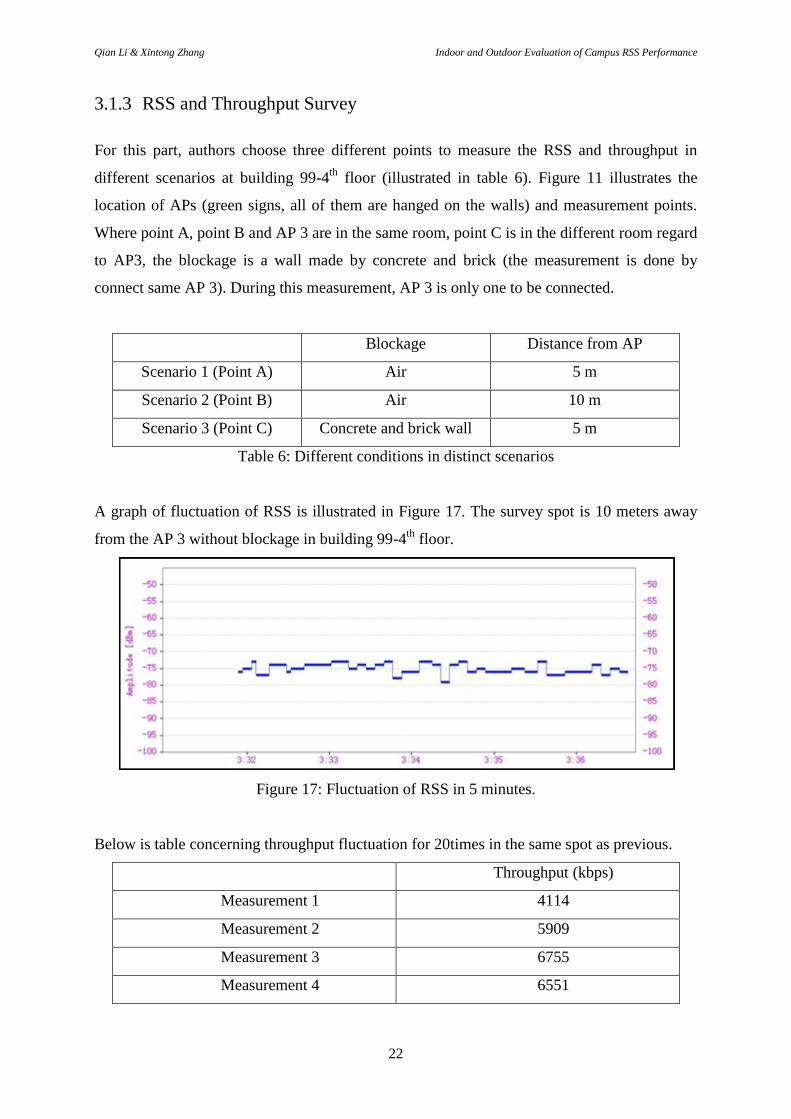
3.1.3 RSS and Throughput Survey
For this part, authors choose three different points to measure the RSS and throughput in
different scenarios at building 99-4th
floor (illustrated in table 6). Figure 11 illustrates the
location of APs (green signs, all of them are hanged on the walls) and measurement points.
Where point A, point B and AP 3 are in the same room, point C is in the different room regard
to AP3, the blockage is a wall made by concrete and brick (the measurement is done by
connect same AP 3). During this measurement, AP 3 is only one to be connected.
Blockage Distance from AP
Scenario 1 (Point A) Air 5 m
Scenario 2 (Point B) Air 10 m
Scenario 3 (Point C) Concrete and brick wall 5 m
Table 6: Different conditions in distinct scenarios
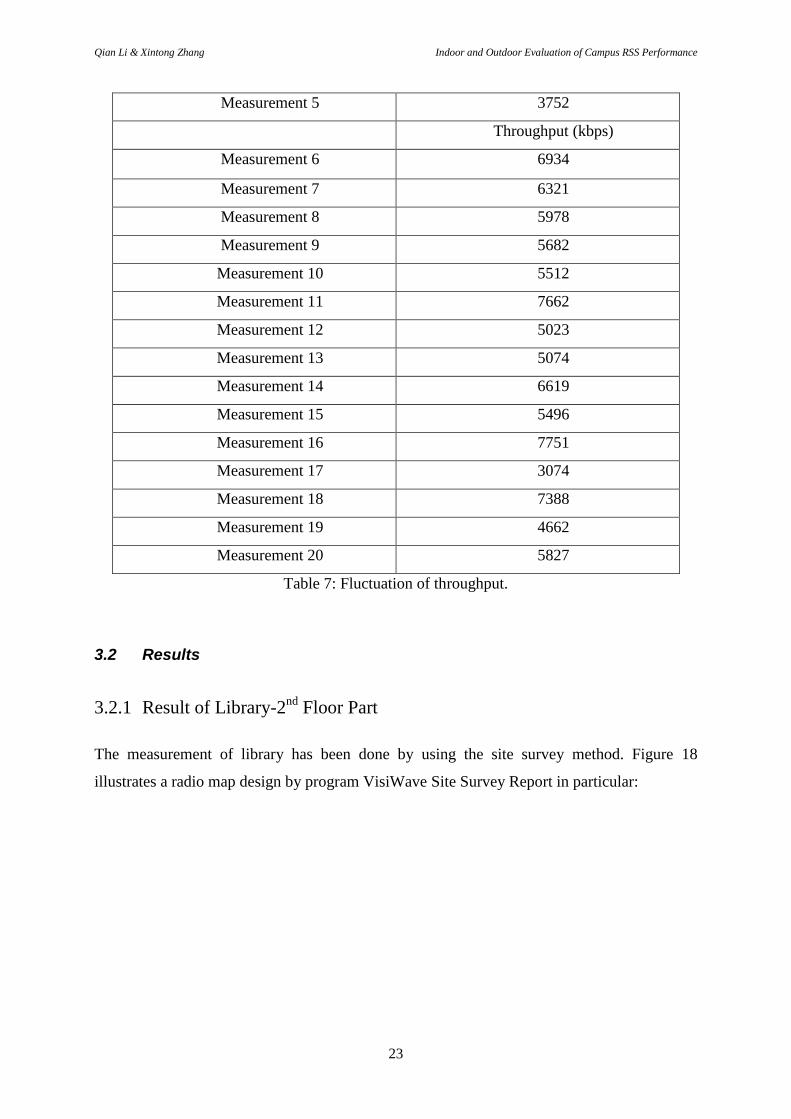
A graph of fluctuation of RSS is illustrated in Figure 17. The survey spot is 10 meters away
from the AP 3 without blockage in building 99-4th
floor.
Figure 17: Fluctuation of RSS in 5 minutes.
Below is table concerning throughput fluctuation for 20times in the same spot as previous.
Throughput (kbps)
Measurement 1 4114
Measurement 2 5909
Measurement 3 6755
Measurement 4 6551
Qian Li & Xintong Zhang Indoor and Outdoor Evaluation of Campus RSS Performance
23
Measurement 5 3752
Throughput (kbps)
Measurement 6 6934
Measurement 7 6321
Measurement 8 5978
Measurement 9 5682
Measurement 10 5512
Measurement 11 7662
Measurement 12 5023
Measurement 13 5074
Measurement 14 6619
Measurement 15 5496
Measurement 16 7751
Measurement 17 3074
Measurement 18 7388
Measurement 19 4662
Measurement 20 5827
Table 7: Fluctuation of throughput.
3.2 Results
3.2.1 Result of Library-2nd
Floor Part
The measurement of library has been done by using the site survey method. Figure 18
illustrates a radio map design by program VisiWave Site Survey Report in particular:

Qian Li & Xintong Zhang Indoor and Outdoor Evaluation of Campus RSS Performance
24
Figure 18: A specific radio map generated by VisiWave Site Survey Report Program
Firstly, Authors will indicate the main area where the students primarily utilize the Internet
resource for studying, as shown in Figure 19:
Qian Li & Xintong Zhang Indoor and Outdoor Evaluation of Campus RSS Performance
25
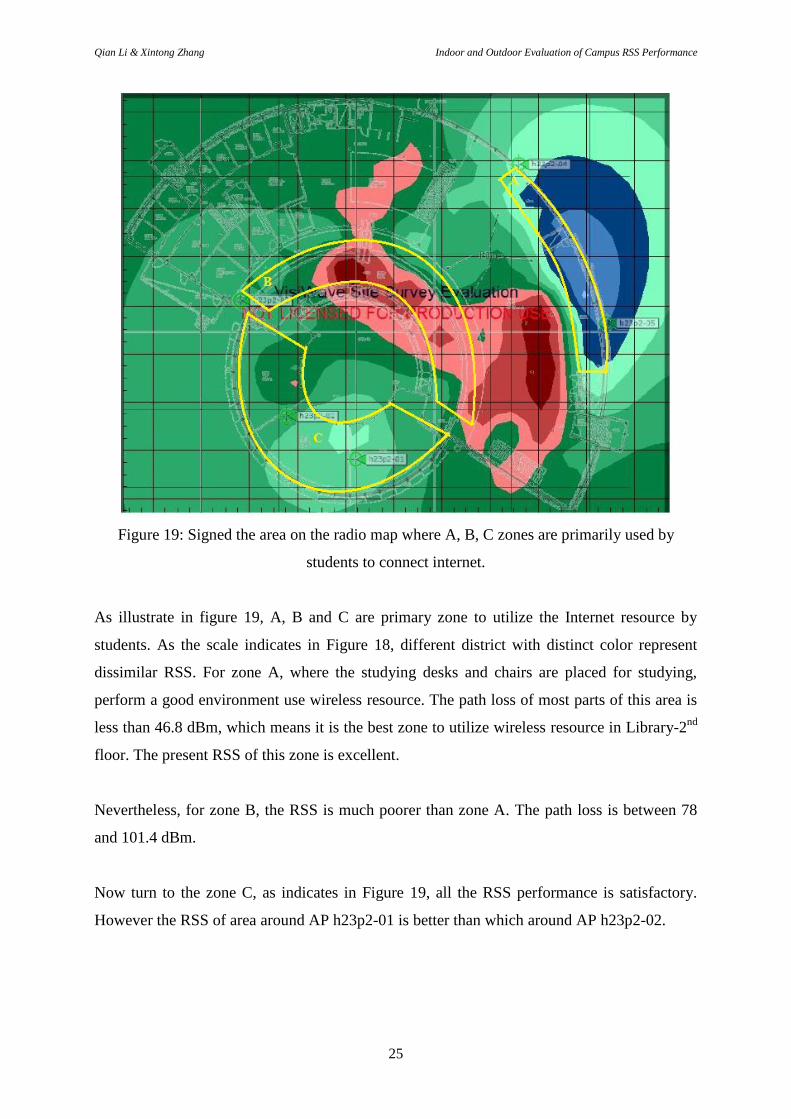
Figure 19: Signed the area on the radio map where A, B, C zones are primarily used by
students to connect internet.
As illustrate in figure 19, A, B and C are primary zone to utilize the Internet resource by
students. As the scale indicates in Figure 18, different district with distinct color represent
dissimilar RSS. For zone A, where the studying desks and chairs are placed for studying,
perform a good environment use wireless resource. The path loss of most parts of this area is
less than 46.8 dBm, which means it is the best zone to utilize wireless resource in Library-2nd
floor. The present RSS of this zone is excellent.
Nevertheless, for zone B, the RSS is much poorer than zone A. The path loss is between 78
and 101.4 dBm.
Now turn to the zone C, as indicates in Figure 19, all the RSS performance is satisfactory.
However the RSS of area around AP h23p2-01 is better than which around AP h23p2-02.
Qian Li & Xintong Zhang Indoor and Outdoor Evaluation of Campus RSS Performance
26
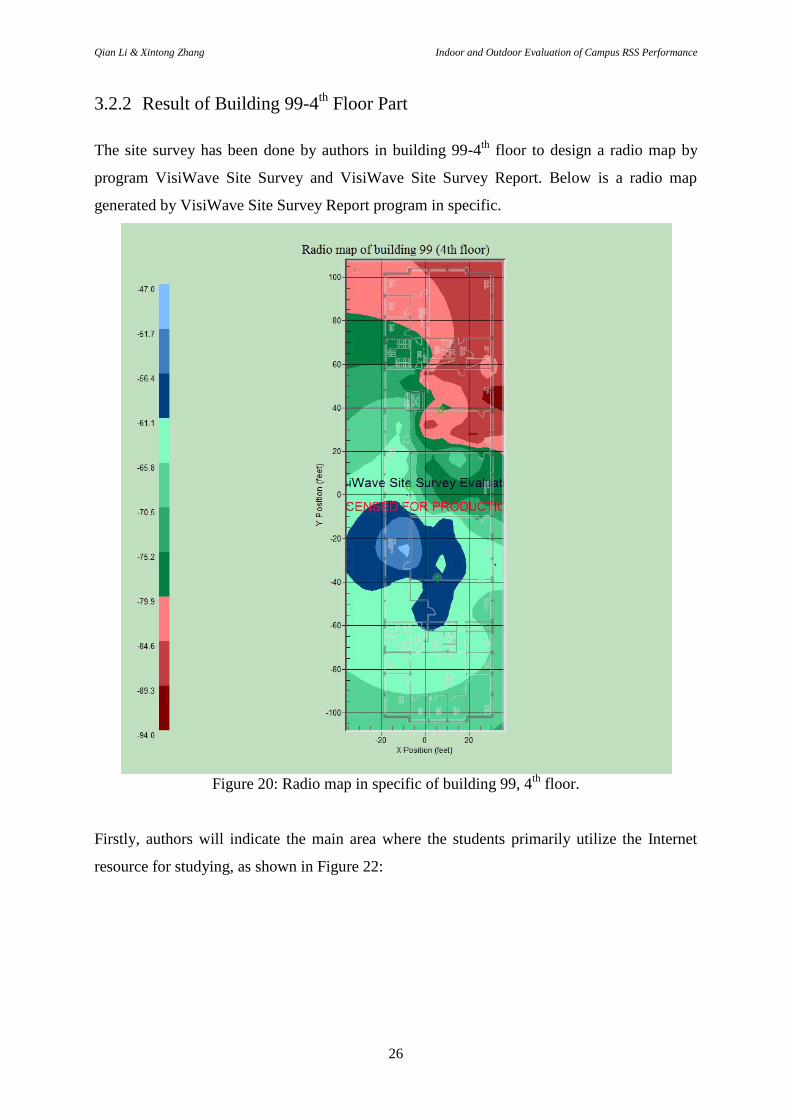
3.2.2 Result of Building 99-4th
Floor Part
The site survey has been done by authors in building 99-4th
floor to design a radio map by
program VisiWave Site Survey and VisiWave Site Survey Report. Below is a radio map
generated by VisiWave Site Survey Report program in specific.
Figure 20: Radio map in specific of building 99, 4
th floor.
Firstly, authors will indicate the main area where the students primarily utilize the Internet
resource for studying, as shown in Figure 22:
Qian Li & Xintong Zhang Indoor and Outdoor Evaluation of Campus RSS Performance
27
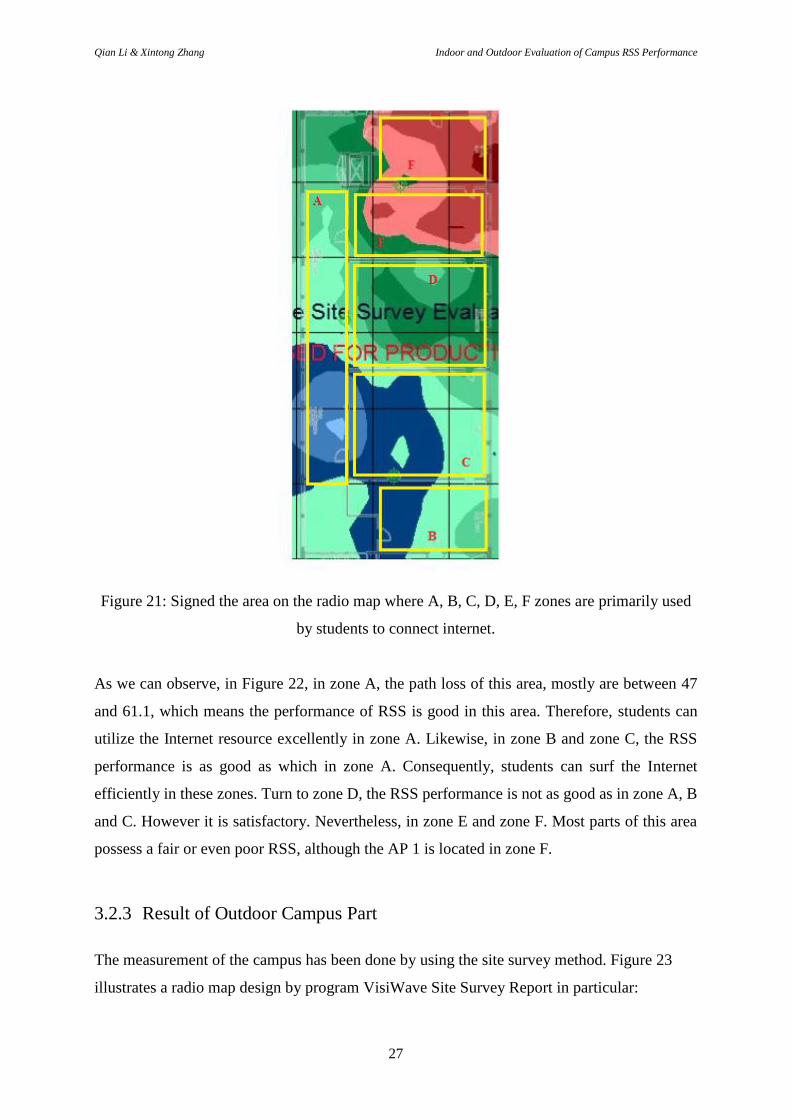
Figure 21: Signed the area on the radio map where A, B, C, D, E, F zones are primarily used
by students to connect internet.
As we can observe, in Figure 22, in zone A, the path loss of this area, mostly are between 47
and 61.1, which means the performance of RSS is good in this area. Therefore, students can
utilize the Internet resource excellently in zone A. Likewise, in zone B and zone C, the RSS
performance is as good as which in zone A. Consequently, students can surf the Internet
efficiently in these zones. Turn to zone D, the RSS performance is not as good as in zone A, B
and C. However it is satisfactory. Nevertheless, in zone E and zone F. Most parts of this area
possess a fair or even poor RSS, although the AP 1 is located in zone F.
3.2.3 Result of Outdoor Campus Part
The measurement of the campus has been done by using the site survey method. Figure 23
illustrates a radio map design by program VisiWave Site Survey Report in particular:
Qian Li & Xintong Zhang Indoor and Outdoor Evaluation of Campus RSS Performance
28
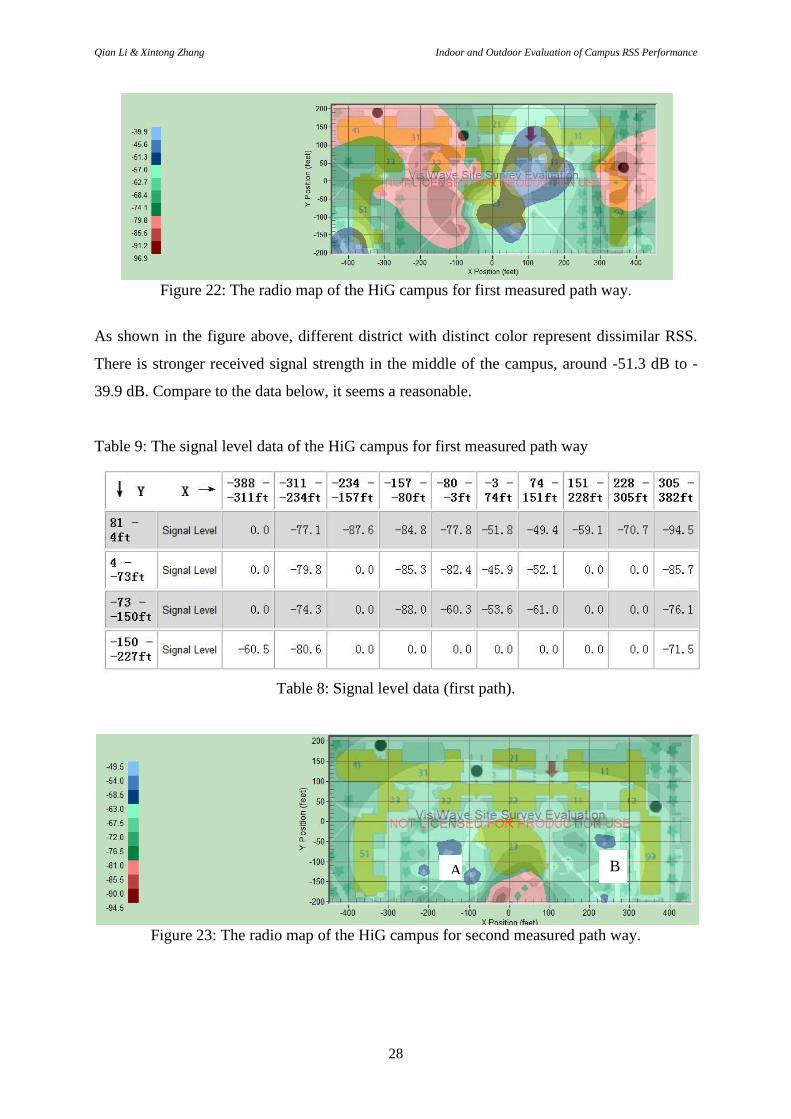
Figure 22: The radio map of the HiG campus for first measured path way.
As shown in the figure above, different district with distinct color represent dissimilar RSS.
There is stronger received signal strength in the middle of the campus, around -51.3 dB to -
39.9 dB. Compare to the data below, it seems a reasonable.
Table 9: The signal level data of the HiG campus for first measured path way
Table 8: Signal level data (first path).
Figure 23: The radio map of the HiG campus for second measured path way.
A B
Qian Li & Xintong Zhang Indoor and Outdoor Evaluation of Campus RSS Performance
29
As shown in the figure above, the signal is stronger around A and B between -58.5 dB to -
49.5 dB. The signal of the second measured path way is weaker than the first measured path
way is because that the measured area is further away from APs. The distance has effect to the
signal strength.
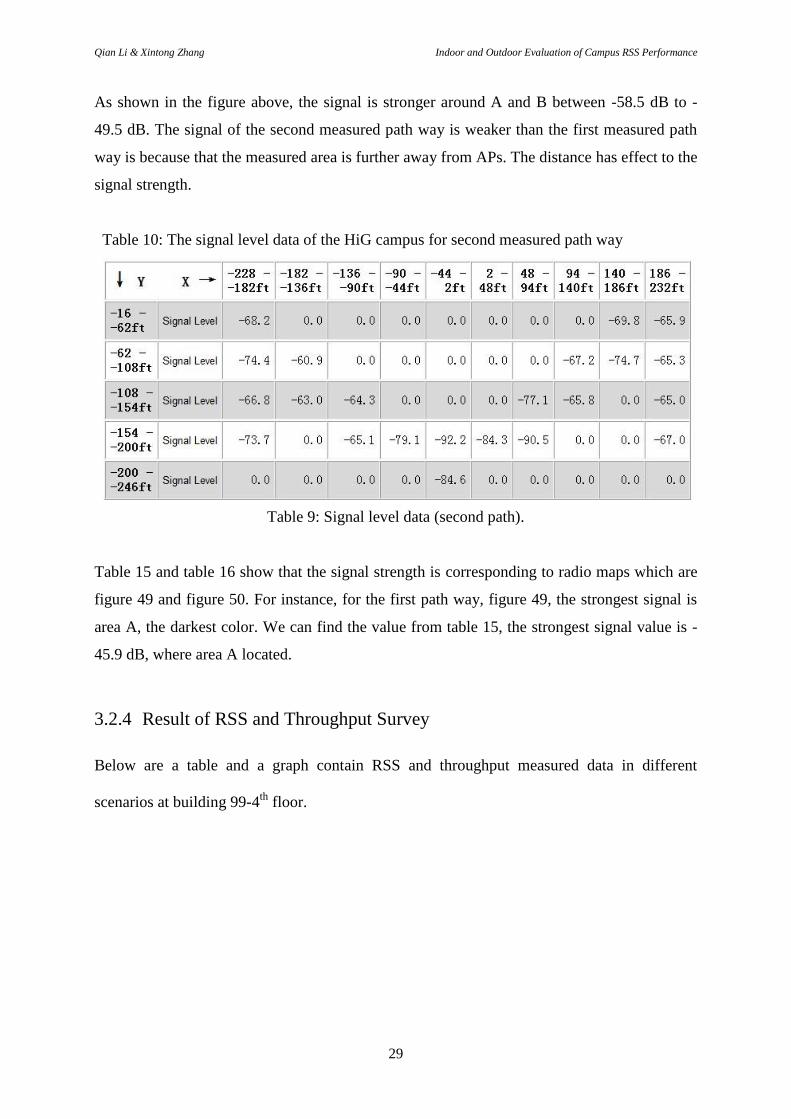
Table 10: The signal level data of the HiG campus for second measured path way
Table 9: Signal level data (second path).
Table 15 and table 16 show that the signal strength is corresponding to radio maps which are
figure 49 and figure 50. For instance, for the first path way, figure 49, the strongest signal is
area A, the darkest color. We can find the value from table 15, the strongest signal value is -
45.9 dB, where area A located.
3.2.4 Result of RSS and Throughput Survey
Below are a table and a graph contain RSS and throughput measured data in different
scenarios at building 99-4th
floor.

Qian Li & Xintong Zhang Indoor and Outdoor Evaluation of Campus RSS Performance
30
Throughput (kbps) RSS
Scenario 1
Minimum 4124
94% Average 6129.2
Maximum 7507
Scenario 2
Minimum 3074
78% Average 5804.2
Maximum 7751
Scenario 3
Minimum 4387
69% Average 6250.1
Maximum 8006
Table 10: Measure data in distinct scenarios.
Figure 24: Graph data of throughput in distinct scenarios

Qian Li & Xintong Zhang Indoor and Outdoor Evaluation of Campus RSS Performance
31
As we can see from the graph, the scenario 1 is the most stable one of throughput, with the
span of 3383 kbps. Furthermore, the average throughput is 6129.2 is the middle one of three
scenarios.
In scenario 2, its span of throughput is wider than any other two scenarios. Furthermore, its
maximum throughput is higher than scenario 1. Perhaps, it is because of it is further from the
AP 3, therefore, it is exist a higher probability to acquire the signal of reflection by the wall.
However, in scenario 3, the minimum, average and maximum values of throughput are higher
than whichever another two scenarios, that very surprisingly. In our opinion, it is because, in
scenario 3, during the measurement, authors are in another room relative to AP 3,
nevertheless, in the measurement room, there are a lot of furnishings, moreover, there are not
exist any blockage between the AP 3 and measurement point (except the wall). Consequently,
authors consider that there must be a lot of reflections plus of furnishings, so that the average
throughput is higher that scenario 1.
Turn to the RSS part. The performances of RSS in distinct scenarios are such different. The
average RSS of three scenarios are follow the order: scenario 1, scenario 2 and scenario 3,
with 94%, 78% and 69% measured by program XiRRUS Wi-Fi Monitor. The fluctuation of
scenario 1 is bigger than other scenarios. In our opinion, it is because, in scenario 1, the
authors are very close to the AP 3, the RSS sensor is extremely sensitive, so that the
fluctuations are very clear.
Qian Li & Xintong Zhang Indoor and Outdoor Evaluation of Campus RSS Performance
32
Chapter 4
Discussion
In this section we will provide some recommendations to improve the RSS performance in
some zones where the RSS performance is unsatisfactory from our measurements.
4.1 Recommendations for a Better RSS Performance of Library-2nd Floor
Part
By reason of the present RSS of zone A is excellent, therefore, it is not necessary to change of
deployment of AP h23p2-04 and AP h23p2-05.
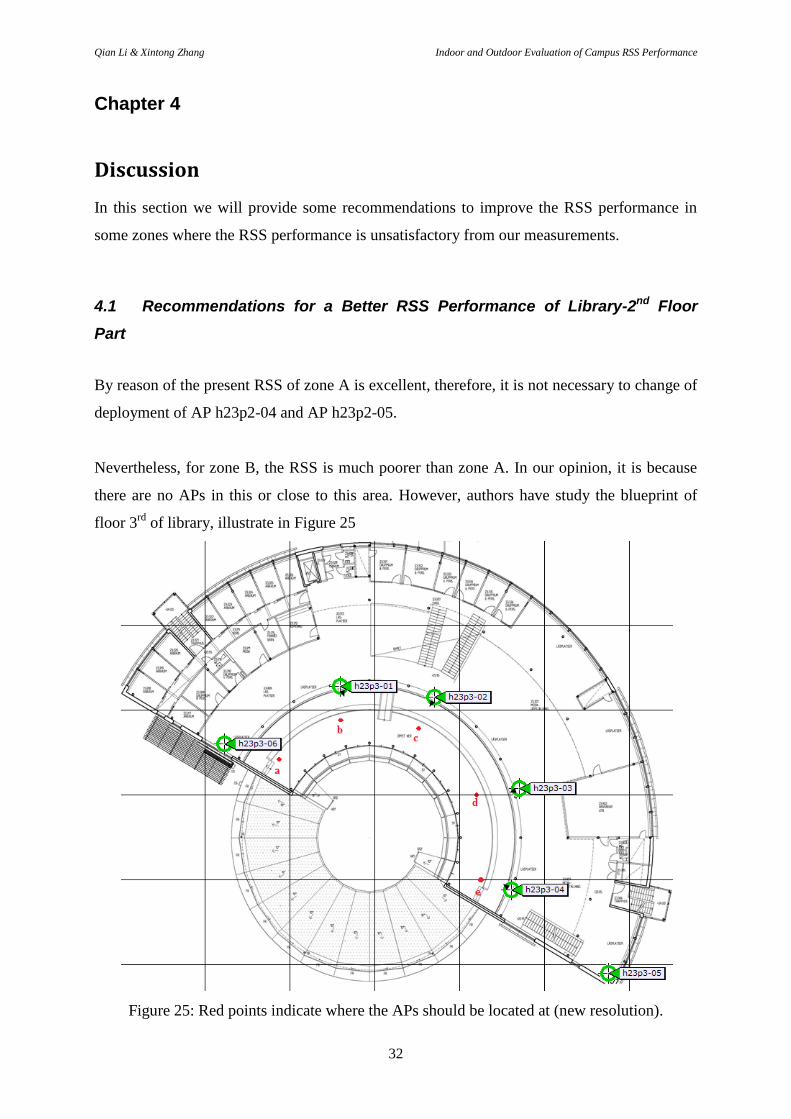
Nevertheless, for zone B, the RSS is much poorer than zone A. In our opinion, it is because
there are no APs in this or close to this area. However, authors have study the blueprint of
floor 3rd
of library, illustrate in Figure 25
Figure 25: Red points indicate where the APs should be located at (new resolution).
Qian Li & Xintong Zhang Indoor and Outdoor Evaluation of Campus RSS Performance
33
In the blueprint, AP: h23p3-01, h23p3-02, h23p3-03, h23p3-04, h23p3-06, are located close
to B zone correspond to blueprint of floor 2nd
. However, authors went the 3rd
floor of library,
and did not find where are APs are located in the real world. Nevertheless, authors realized
that, in case, if network designer deploys the APs on spots a, b, c, d, and e at the ceiling of
library, this issue may solve weak RSS in zone B of Library floor 2nd
, furthermore, the RSS of
this zone in 3rd
floor will perform excellent as well. One thing what readers should note is that,
most Wi-Fi protocol utilized in library is 802.11g, which data can be found in Table 1, its
approximate indoor transmission range 38 m. However, distance between the ceiling and
ground of floor 2nd
of library does not exceed 38 m, moreover, there is no blockage between
ceiling and ground. Therefore, the network performance will be good both at 2nd
floor and 3rd
floor in zone B of library if terminals connect APs which hanged on the ceiling of library.
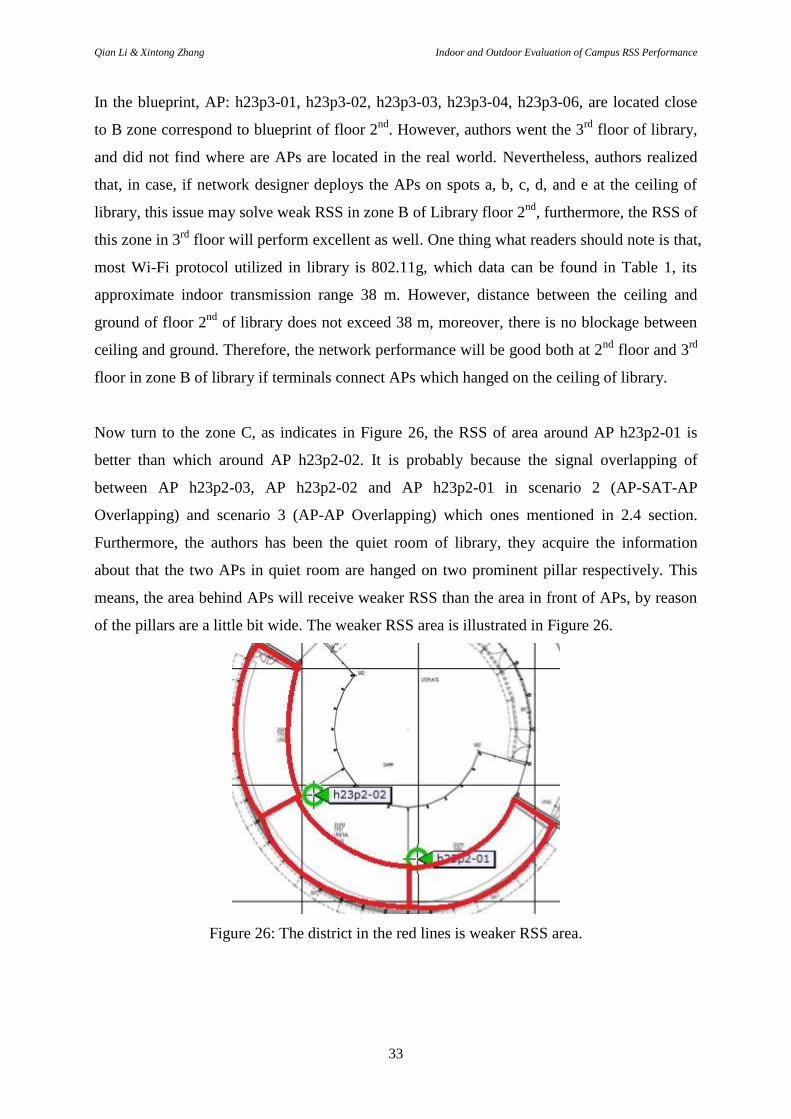
Now turn to the zone C, as indicates in Figure 26, the RSS of area around AP h23p2-01 is
better than which around AP h23p2-02. It is probably because the signal overlapping of
between AP h23p2-03, AP h23p2-02 and AP h23p2-01 in scenario 2 (AP-SAT-AP
Overlapping) and scenario 3 (AP-AP Overlapping) which ones mentioned in 2.4 section.
Furthermore, the authors has been the quiet room of library, they acquire the information
about that the two APs in quiet room are hanged on two prominent pillar respectively. This
means, the area behind APs will receive weaker RSS than the area in front of APs, by reason
of the pillars are a little bit wide. The weaker RSS area is illustrated in Figure 26.
Figure 26: The district in the red lines is weaker RSS area.

Qian Li & Xintong Zhang Indoor and Outdoor Evaluation of Campus RSS Performance
34
Through the discussion and evaluating, our solution of the quiet room is illustrated in Figure
27.
Figure 27: Blue points indicate where the APs should be located at (new resolution).
In this case, most parts in quiet room of library will be in the coverage area of APs. So
students could use wireless resource efficiently.
Consequently, our final AP deployment solution for whole library floor 2nd
is keep location of
AP h23p2-04 and AP h23p2-05 fixed, and change some APs placement to where indicated in
Figure 25 and Figure 27.
4.2 Recommendations for a Better RSS Performance of Building 99-2nd Floor
Part
The only poor RSS area is at Zone E and Zone F. From the analysis of authors, we think it is
by reason of in the 3rd
floor of building 99, there is an AP in the same place as AP 1.
Although, they are in the different floors, there must some overlapping or attenuation of
signal transmitted by two APs. For instance, like scenario 2 in 2.5 part of this report.
Consequently, we have two resolutions to improve the performance of RSS in zone E and
zone F.
Qian Li & Xintong Zhang Indoor and Outdoor Evaluation of Campus RSS Performance
35
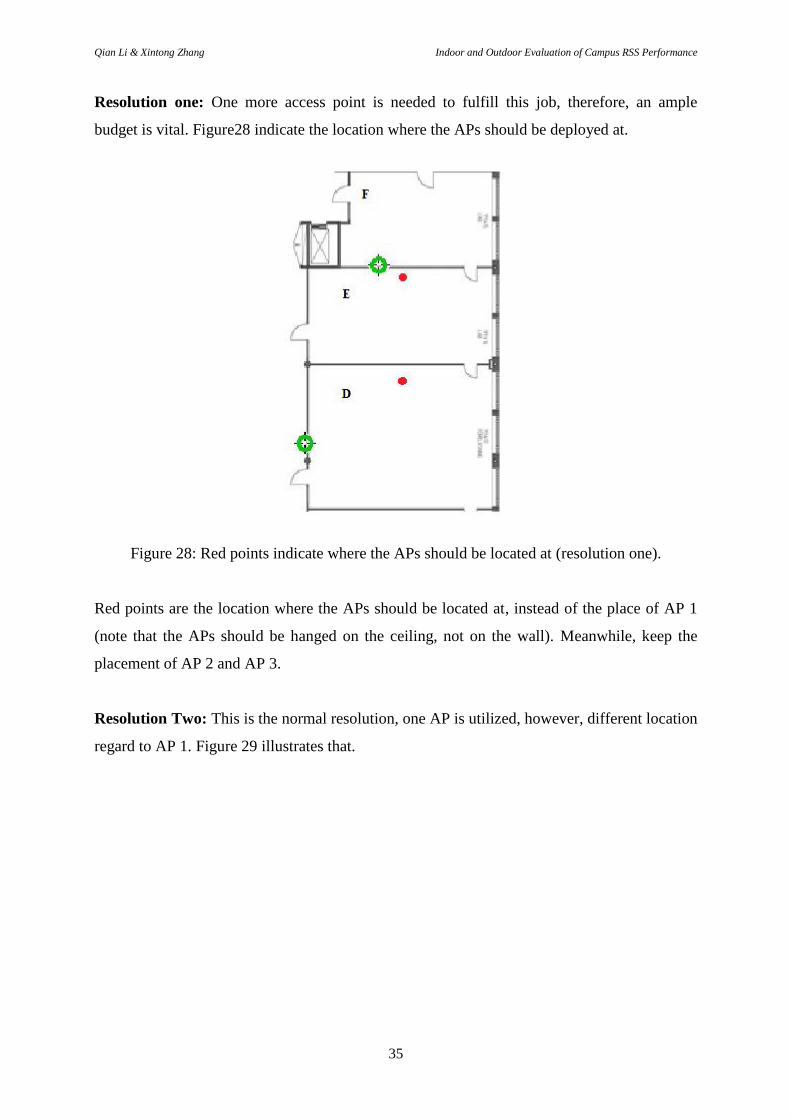
Resolution one: One more access point is needed to fulfill this job, therefore, an ample
budget is vital. Figure28 indicate the location where the APs should be deployed at.
Figure 28: Red points indicate where the APs should be located at (resolution one).
Red points are the location where the APs should be located at, instead of the place of AP 1
(note that the APs should be hanged on the ceiling, not on the wall). Meanwhile, keep the
placement of AP 2 and AP 3.
Resolution Two: This is the normal resolution, one AP is utilized, however, different location
regard to AP 1. Figure 29 illustrates that.

Qian Li & Xintong Zhang Indoor and Outdoor Evaluation of Campus RSS Performance
36
Figure 29: Red point indicates where the AP should be located at (resolution two).
Red point is the location where the AP should be located at, instead of the place of AP 1 (note
that the AP should be hanged on the ceiling, not on the wall). Likewise, keep the placement of
AP 2 and AP 3.
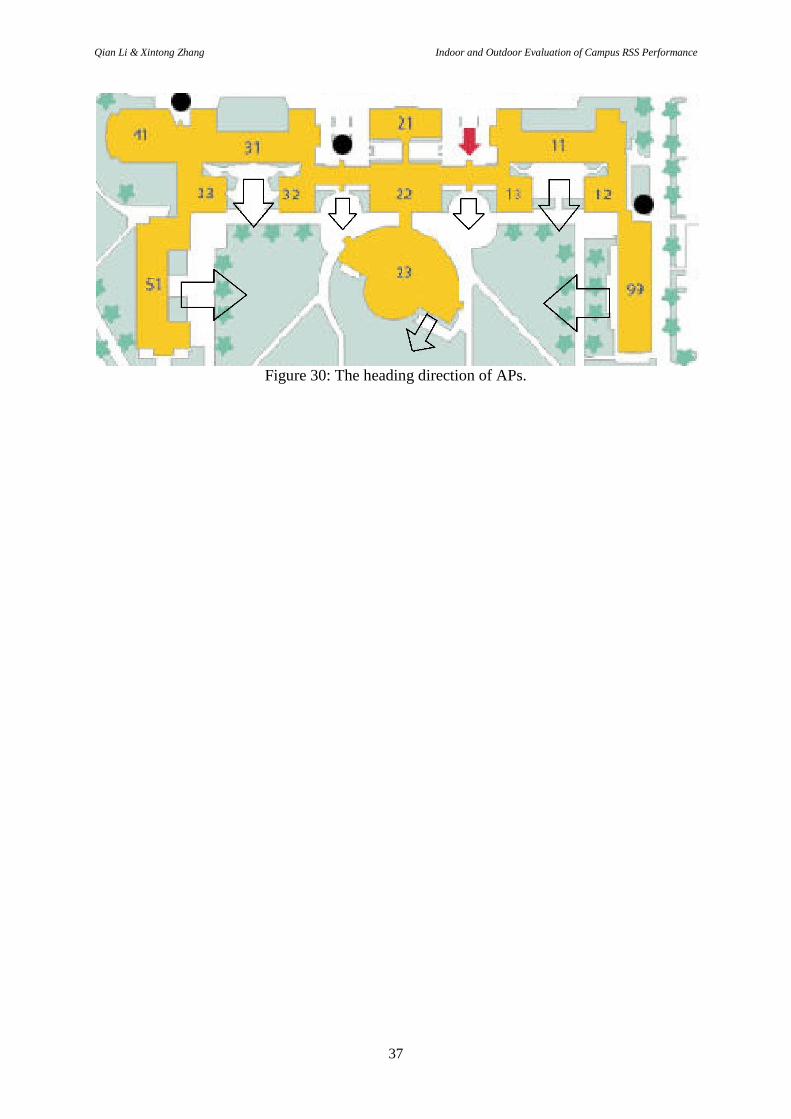
4.3 Recommendation for a Better RSS Performance for Outdoor Campus
Part
In outdoor campus part, students utilize the wireless resource rarely. Nevertheless, there are
some benches near the buildings of HiG, students could connect to APs and surf internet
basically. However, near the building 31 and North part of building 99, the RSS performance
is not satisfactory, likewise in the Southeast part of Library, the RSS performance is not good
either. We recommend that, locating APs head to inside outdoor campus area (shown in
Figure 30), thus, the RSS performance will be good near the building.
Qian Li & Xintong Zhang Indoor and Outdoor Evaluation of Campus RSS Performance
37
Figure 30: The heading direction of APs.
Qian Li & Xintong Zhang Indoor and Outdoor Evaluation of Campus RSS Performance
38
Chapter 5
Conclusions
The results of investigation suggest that most parts of library-2nd
floor and building 99-4th
floor possess at least a good RSS performance. However, minority parts of these places have
a poor RSS performance, and the new resolutions of Access Points’ (AP) deployment for
these poor-RSS-performance parts are provided. For the outdoor campus part, the RSS in the
area which near the walls of building is satisfactory (RSSI between -79.8 dBm and -57 dBm),
however in the center of outdoor campus the RSS is poor.
For present APs deployment, following the radio map as illustrated in 3.2 section. We believe
that you will have a good guidance for utilizing the wireless resource in library-2nd
floor,
building 99-4th
floor and outdoor campus parts. However, on condition that, if the University
follows the recommendations in Chapter 4, we convinced that students will have an at least
satisfactory RSS performance in library-2nd
floor, building 99-4th
floor and outdoor campus
parts (near the buildings).
Future work of this project is to evaluate the RSS performance in a more advanced, accurate
simpler and systemic way. We simulate that, the measurement tool is a RSS detector which
can detect if there exist 802.11 standard wireless signal and RSS, Furthermore, it is extremely
portable. Before the measurements, some important spots should be signed both on the map
and real world (note that the measurement spots must be enough intensive). During the
measurements, each spot should be tested at least 5times in our opinion. Afterwards, data
should be analyzed, so that the network designer could achieve information that where the
RSS is strong or weakness. Then combine theories and realities to adjust the deployment of
APs. Thus, the RSS performance will be perfect in the test place.

Qian Li & Xintong Zhang Indoor and Outdoor Evaluation of Campus RSS Performance
39
References
[1] J. Geier, Wireless LANs Implementing High Performance IEEE 802.11 Network,
Second Edition, 201 West 103rd
St. (2002), Indianapolis, Indiana, 46290 USA, Sams
Publishing.
[2] J.E. Goldman, Local Area Networks A Client/Server Approach, Published
simultaneously in Canada, John Wiley &Sons (1997), Inc Publishing
[3] J.S. Beasley, G.M. Miller, Modern Electronic Communication, ninth edition, Upper
Saddle River, NJ 07458, USA (2008), Pearspm Prentice Hall Publishing.
[4] http://grouper.ieee.org/groups/802/11/Reports/802.11_Timelines.htm, Last trieved
2011-04-08.
[5] http://www.wi-fi.org/register.php?file=wp_Wi-Fi_CERTIFIED_n_Industry.pdf,
(Register required). Wi-Fi Alliance, Last retrieved 2011-04-08.
[6] http://www.birds-eye.net/definition/r/rssi-receive_signal_strength_indicator.shtml, Last
retrieved 2011-4-25.
[7] http://reviews.cnet.com/internet-speed-test/, Last retrieved 2011-04-25
[8] Z. Xiang, H. Zhang, J. Huang, S. Song, K.C. Almeeroth, A Hidden Environment Model
for Constructing Indoor Radio Maps, Sixth IEEE International Symposium, World of
Wireless Mobile and Multimedia Networks, 2005 (WoWMoM 2005), June 2005.
[9] A. Arya, P. Godlewski, P. Mellé, A Hierarchical Clustering Technique for Radio Map
Compression in Location Fingerprinting Systems, 2010 IEEE 71st Vehicular
Technology Conference (VTC 2010-Spring), May 2010.
[10] G. Kbar and W. Mansoor, TESTING THE PERFORMANCE OF WIRELESS LAN, IEEE
2005 Asia-Pacific Conference on communications, Perth, Western Australia, December
2005, pp. 493-496.W.-K. Chen, Linear Networks and Systems (Book style). Belmont,
CA: Wadsworth, 1993, pp. 123–135.
[11] Z. Sun, W. Zhang, Y. Xie and H. Kishida, Analysis of Environmental Factors for a
WLAN Location System using an Estimated Radio Map, 2010 12th IEEE International
Conference on Communication Technology (ICCT), January 2011, pp. 946-949.
[12] A. G. Forte, H. Schulzrinne, Deployment Guidelines for Highly Congested IEEE
802.11b/g Networks, 16th IEEE Workshop on Local and Metropolitan Area Networks,
2008 (LANMAN 2008), September 2008, pp. 1-6.
Qian Li & Xintong Zhang Indoor and Outdoor Evaluation of Campus RSS Performance
40
[13] G. Cervelló, S. Choi, Protecting QoS-Enabled BSSs in Situations of Overlapping BSSs
in IEEE 802.11 WLAN, IEEE 802.11-00/108, May 2000.
[14] Y. Fang, D. Gu, A. B. McDonald, J. Zhang, A Two-level Carrier Sensing Mechanism
For Overlapping BSS Problem in WLAN, The 14th IEEE Workshop on, Local and
Metropolitan Area Networks, 2005 (LANMAN 2005), September 2005, pp. 1-6.
[15] S. Choi, S. Mangold, J. Habetha, and C. Ngo, Coexistence and Interworking of IEEE
802.11a and Etsi Bran Hiperlan/2 In Multihop Scenarios, IEEE workshop on wireless
local area networks, September 2001.
[16] Cisco Aironet 1140 Series Access Point datasheet.
[17] Cisco Aironet 1250 Series Access Point datasheet.
[18] Cisco Aironet 1130AG Series Access Point datasheet.
[19] http://www.metageek.net/products/wi-spy/, Last retrieved 2011-05-17.
[20] H. N. Mahmoud, Site Surveying in Home, Office and Laboratory Environment,
Bachelor thesis (2010), Gävle University, Gävle, Sweden.
Qian Li & Xintong Zhang Indoor and Outdoor Evaluation of Campus RSS Performance
A1
Appendix A
How to use VisiWave Site Survey and VisiWave Site Survey Report programs
During all the measurements, Programs VisiWave Site Survey and VisiWave Site Survey
Report are utilized to do the site survey. In this appendix, authors will show how to use them.
Program VisiWave Site Survey
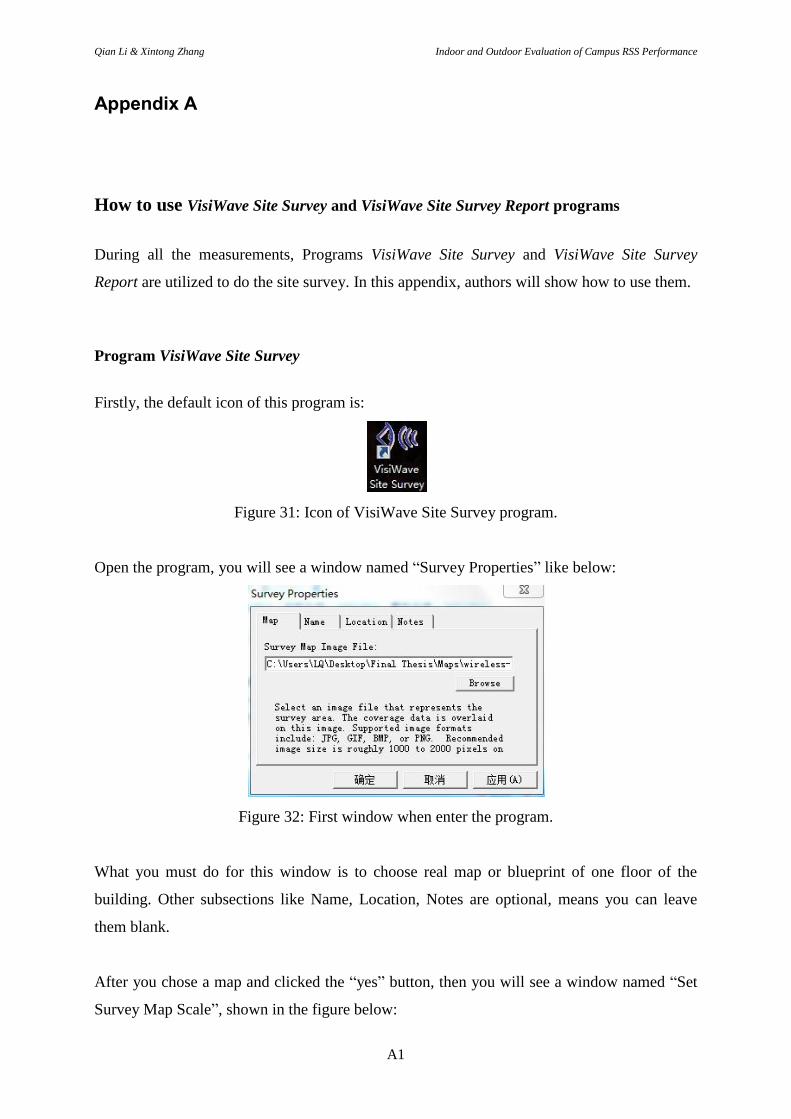
Firstly, the default icon of this program is:
Figure 31: Icon of VisiWave Site Survey program.
Open the program, you will see a window named “Survey Properties” like below:
Figure 32: First window when enter the program.
What you must do for this window is to choose real map or blueprint of one floor of the
building. Other subsections like Name, Location, Notes are optional, means you can leave
them blank.
After you chose a map and clicked the “yes” button, then you will see a window named “Set
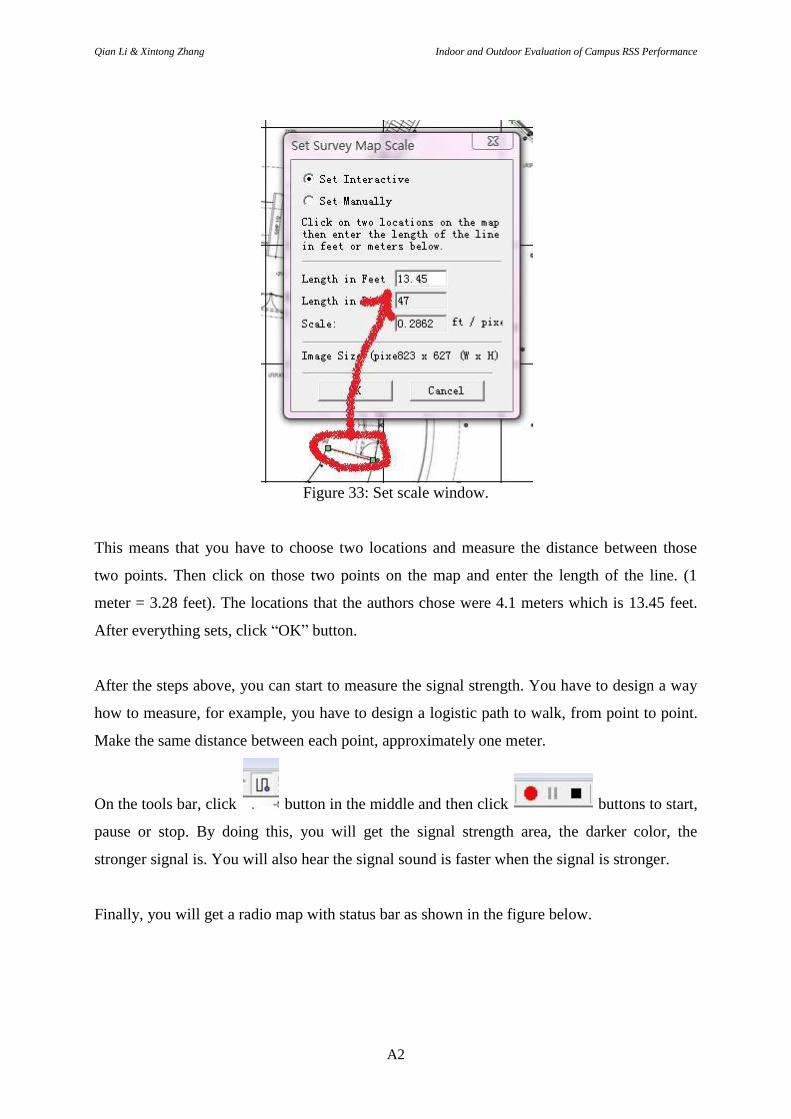
Survey Map Scale”, shown in the figure below:
Qian Li & Xintong Zhang Indoor and Outdoor Evaluation of Campus RSS Performance
A2
Figure 33: Set scale window.
This means that you have to choose two locations and measure the distance between those
two points. Then click on those two points on the map and enter the length of the line. (1
meter = 3.28 feet). The locations that the authors chose were 4.1 meters which is 13.45 feet.
After everything sets, click “OK” button.
After the steps above, you can start to measure the signal strength. You have to design a way
how to measure, for example, you have to design a logistic path to walk, from point to point.
Make the same distance between each point, approximately one meter.
On the tools bar, click button in the middle and then click buttons to start,
pause or stop. By doing this, you will get the signal strength area, the darker color, the
stronger signal is. You will also hear the signal sound is faster when the signal is stronger.
Finally, you will get a radio map with status bar as shown in the figure below.

Qian Li & Xintong Zhang Indoor and Outdoor Evaluation of Campus RSS Performance
A3
Figure 34. The radio map in the HIG library, second floor.
VisiWave Site Survey Report Program
This program helps us to analysis the results.
Figure35: Icon VisiWave Site Survey Report Program
After open the program, you have to browse the radio map file and the real map into the
program. You will see the main screen shown in the figure below:
Qian Li & Xintong Zhang Indoor and Outdoor Evaluation of Campus RSS Performance
A4
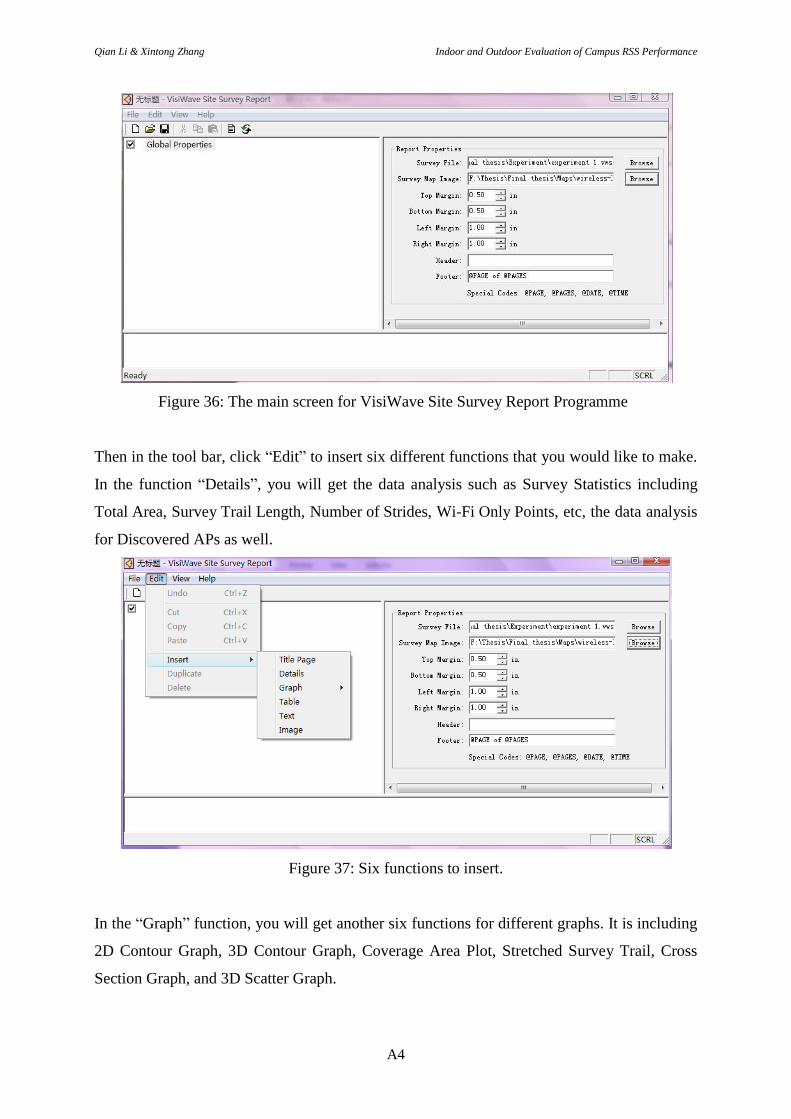
Figure 36: The main screen for VisiWave Site Survey Report Programme
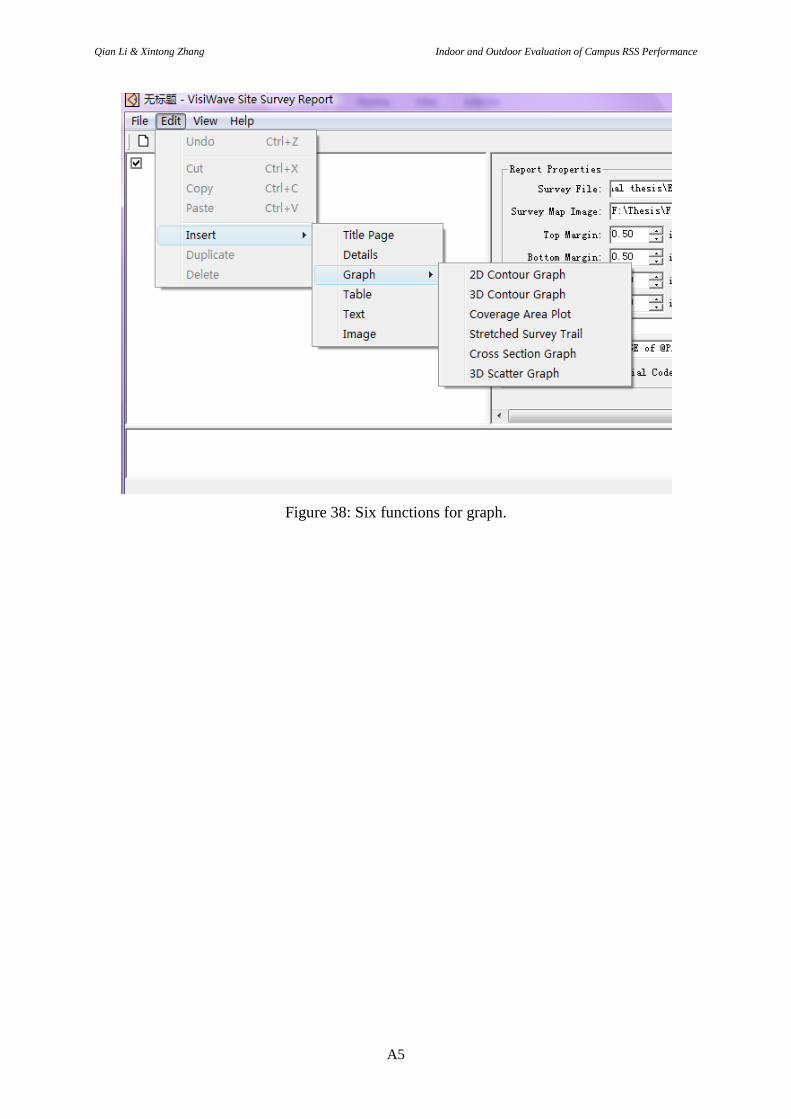
Then in the tool bar, click “Edit” to insert six different functions that you would like to make.
In the function “Details”, you will get the data analysis such as Survey Statistics including
Total Area, Survey Trail Length, Number of Strides, Wi-Fi Only Points, etc, the data analysis
for Discovered APs as well.
Figure 37: Six functions to insert.
In the “Graph” function, you will get another six functions for different graphs. It is including
2D Contour Graph, 3D Contour Graph, Coverage Area Plot, Stretched Survey Trail, Cross
Section Graph, and 3D Scatter Graph.
Qian Li & Xintong Zhang Indoor and Outdoor Evaluation of Campus RSS Performance
A5
Figure 38: Six functions for graph.

Qian Li & Xintong Zhang Indoor and Outdoor Evaluation of Campus RSS Performance
B1
Appendix B
Discovered APs in HIG (only SSID is hig are listed). Where infra stands for infrastructure
mode networks.
Table 11 indicates the discovered APs in library, 2nd
floor of HIG (SSID is hig only):
MAC Ch Security Mode
00:27:0d:5f:0a:f3 1 Clear Infra
00:17:df:a6:cb:82 6 Clear Infra
00:27:0d:5f:3a:f2 1 Clear Infra
00:25:45:a4:a0:f3 1 Clear Infra
00:27:0d:09:3a:01 1 Clear Infra
00:27:0d:09:3a:d1 11 Clear Infra
00:17:df:a6:db:03 11 Clear Infra
00:17:df:a6:da:f3 1 Clear Infra
00:17:df:a6:da:b2 11 Clear Infra
00:27:0d:5f:0d:93 11 Clear Infra
00:27:0d:09:49:f2 6 Clear Infra
00:17:df:a6:d1:d2 6 Clear Infra
00:27:0d:09:39:03 6 Clear Infra
00:1d:a2:c9:73:a0 6 Clear Infra
00:1e:13:1a:bd:90 11 Clear Infra
00:1e:13:1b:00:c0 1 Clear Infra
00:1d:a2:c9:7a:b0 11 Clear Infra
00:27:0d:5f:0a:f3 ? Clear Infra
00:27:0d:5f:60:e1 1 Clear Infra
00:17:df:a6:d2:43 6 Clear Infra
00:27:0d:5f:3a:f2 ? Clear Infra
00:27:0d:5f:0e:61 1 Clear Infra
00:1e:13:6c:d2:f3 11 Clear Infra
00:17:df:a6:c2:b0 6 Clear Infra
Table 11: Discovered APs in library, 2nd
floor of HIG (SSID is hig only).
Qian Li & Xintong Zhang Indoor and Outdoor Evaluation of Campus RSS Performance
B2
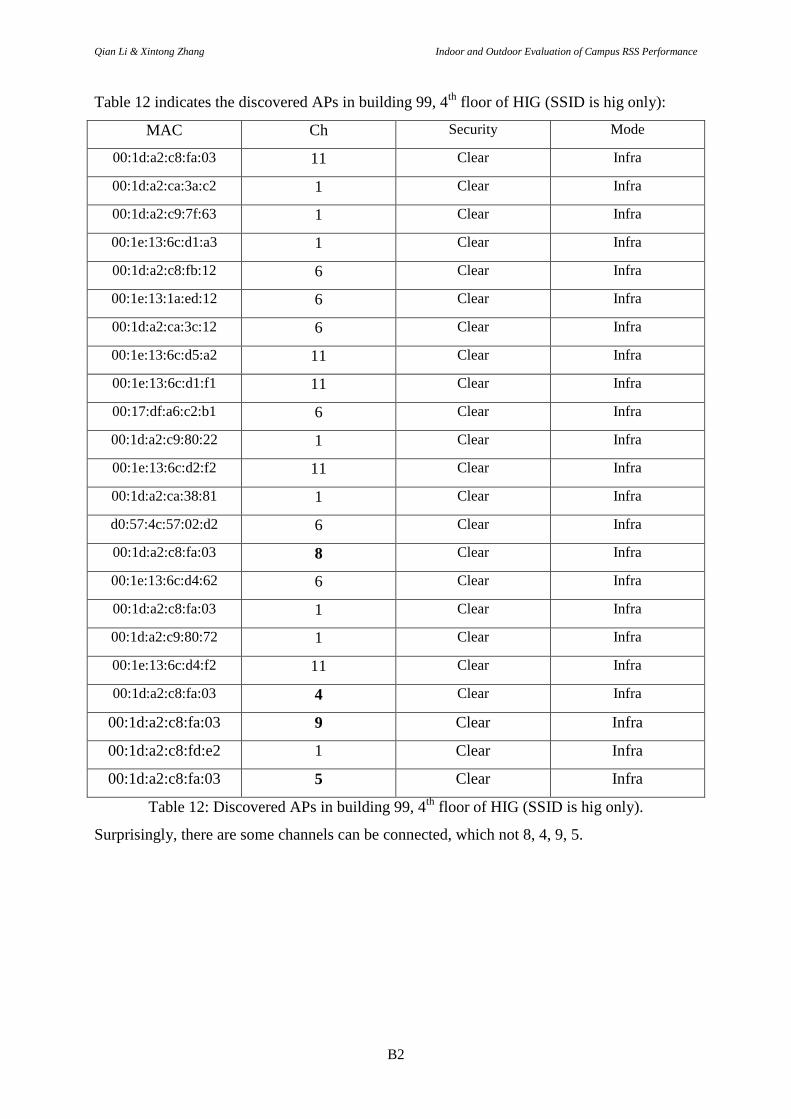
Table 12 indicates the discovered APs in building 99, 4th
floor of HIG (SSID is hig only):
MAC Ch Security Mode
00:1d:a2:c8:fa:03 11 Clear Infra
00:1d:a2:ca:3a:c2 1 Clear Infra
00:1d:a2:c9:7f:63 1 Clear Infra
00:1e:13:6c:d1:a3 1 Clear Infra
00:1d:a2:c8:fb:12 6 Clear Infra
00:1e:13:1a:ed:12 6 Clear Infra
00:1d:a2:ca:3c:12 6 Clear Infra
00:1e:13:6c:d5:a2 11 Clear Infra
00:1e:13:6c:d1:f1 11 Clear Infra
00:17:df:a6:c2:b1 6 Clear Infra
00:1d:a2:c9:80:22 1 Clear Infra
00:1e:13:6c:d2:f2 11 Clear Infra
00:1d:a2:ca:38:81 1 Clear Infra
d0:57:4c:57:02:d2 6 Clear Infra
00:1d:a2:c8:fa:03 8 Clear Infra
00:1e:13:6c:d4:62 6 Clear Infra
00:1d:a2:c8:fa:03 1 Clear Infra
00:1d:a2:c9:80:72 1 Clear Infra
00:1e:13:6c:d4:f2 11 Clear Infra
00:1d:a2:c8:fa:03 4 Clear Infra
00:1d:a2:c8:fa:03 9 Clear Infra
00:1d:a2:c8:fd:e2 1 Clear Infra
00:1d:a2:c8:fa:03 5 Clear Infra
Table 12: Discovered APs in building 99, 4th
floor of HIG (SSID is hig only).
Surprisingly, there are some channels can be connected, which not 8, 4, 9, 5.
Qian Li & Xintong Zhang Indoor and Outdoor Evaluation of Campus RSS Performance
B3
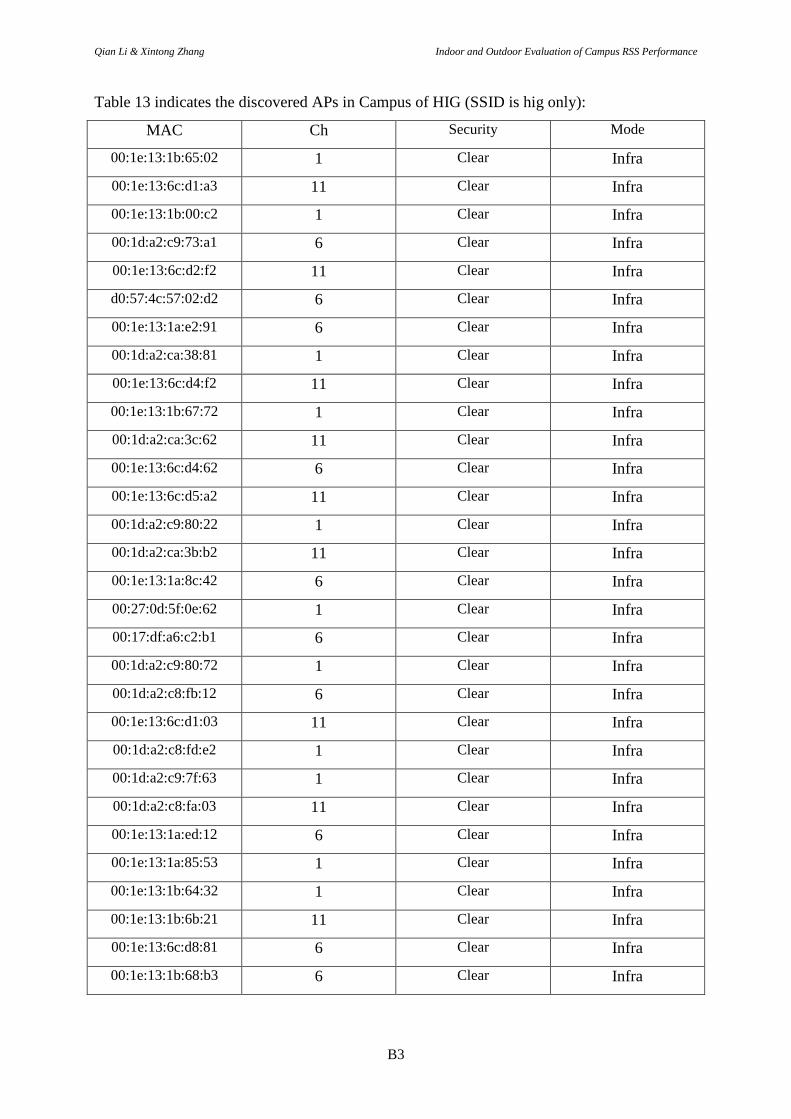
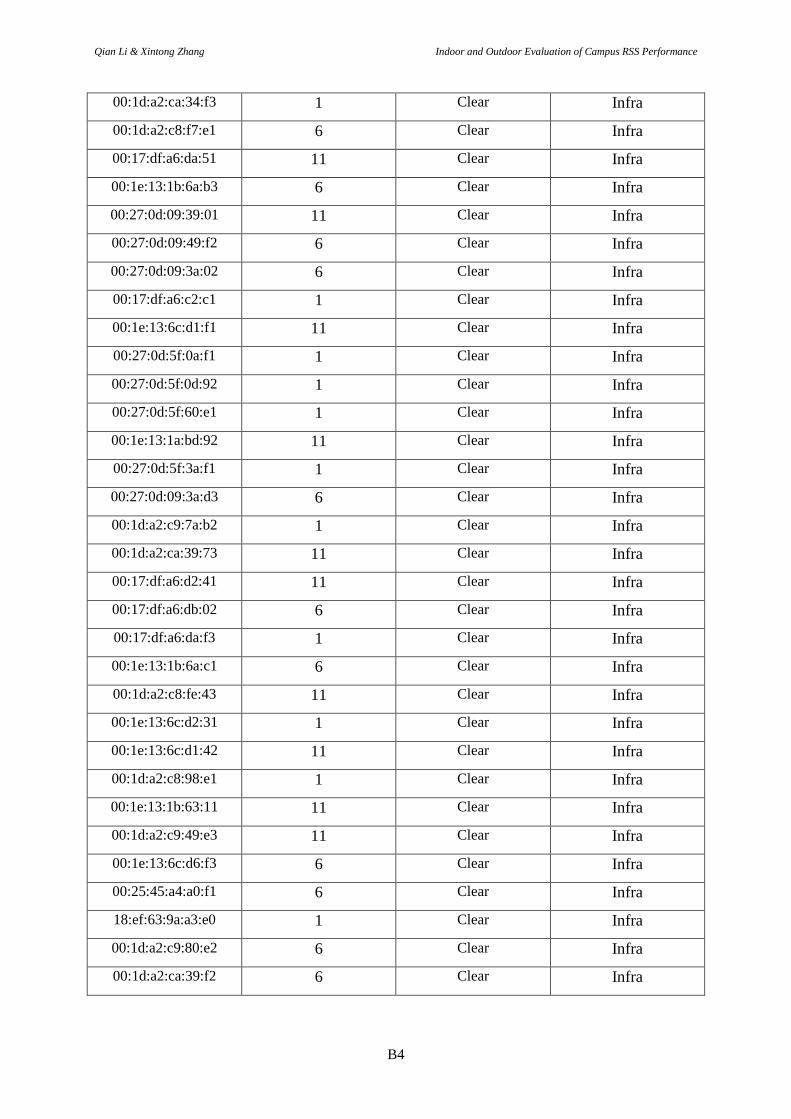
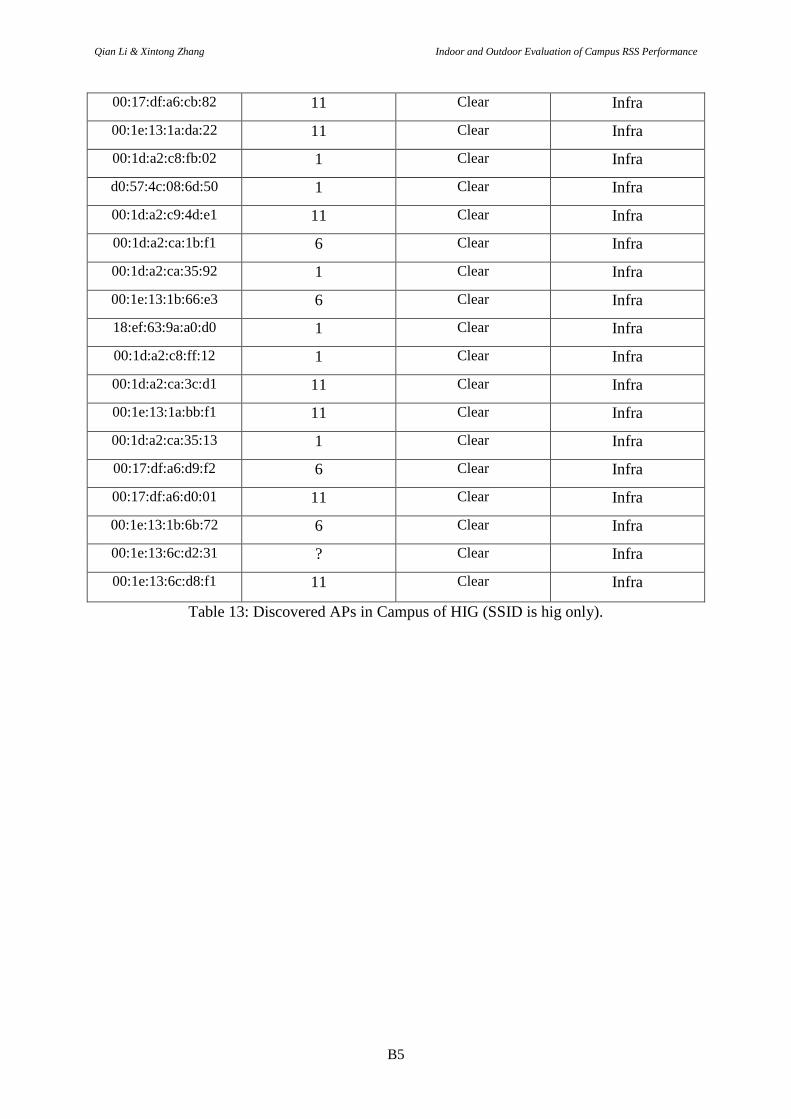
Table 13 indicates the discovered APs in Campus of HIG (SSID is hig only):
MAC Ch Security Mode
00:1e:13:1b:65:02 1 Clear Infra
00:1e:13:6c:d1:a3 11 Clear Infra
00:1e:13:1b:00:c2 1 Clear Infra
00:1d:a2:c9:73:a1 6 Clear Infra
00:1e:13:6c:d2:f2 11 Clear Infra
d0:57:4c:57:02:d2 6 Clear Infra
00:1e:13:1a:e2:91 6 Clear Infra
00:1d:a2:ca:38:81 1 Clear Infra
00:1e:13:6c:d4:f2 11 Clear Infra
00:1e:13:1b:67:72 1 Clear Infra
00:1d:a2:ca:3c:62 11 Clear Infra
00:1e:13:6c:d4:62 6 Clear Infra
00:1e:13:6c:d5:a2 11 Clear Infra
00:1d:a2:c9:80:22 1 Clear Infra
00:1d:a2:ca:3b:b2 11 Clear Infra
00:1e:13:1a:8c:42 6 Clear Infra
00:27:0d:5f:0e:62 1 Clear Infra
00:17:df:a6:c2:b1 6 Clear Infra
00:1d:a2:c9:80:72 1 Clear Infra
00:1d:a2:c8:fb:12 6 Clear Infra
00:1e:13:6c:d1:03 11 Clear Infra
00:1d:a2:c8:fd:e2 1 Clear Infra
00:1d:a2:c9:7f:63 1 Clear Infra
00:1d:a2:c8:fa:03 11 Clear Infra
00:1e:13:1a:ed:12 6 Clear Infra
00:1e:13:1a:85:53 1 Clear Infra
00:1e:13:1b:64:32 1 Clear Infra
00:1e:13:1b:6b:21 11 Clear Infra
00:1e:13:6c:d8:81 6 Clear Infra
00:1e:13:1b:68:b3 6 Clear Infra
Qian Li & Xintong Zhang Indoor and Outdoor Evaluation of Campus RSS Performance
B4
00:1d:a2:ca:34:f3 1 Clear Infra
00:1d:a2:c8:f7:e1 6 Clear Infra
00:17:df:a6:da:51 11 Clear Infra
00:1e:13:1b:6a:b3 6 Clear Infra
00:27:0d:09:39:01 11 Clear Infra
00:27:0d:09:49:f2 6 Clear Infra
00:27:0d:09:3a:02 6 Clear Infra
00:17:df:a6:c2:c1 1 Clear Infra
00:1e:13:6c:d1:f1 11 Clear Infra
00:27:0d:5f:0a:f1 1 Clear Infra
00:27:0d:5f:0d:92 1 Clear Infra
00:27:0d:5f:60:e1 1 Clear Infra
00:1e:13:1a:bd:92 11 Clear Infra
00:27:0d:5f:3a:f1 1 Clear Infra
00:27:0d:09:3a:d3 6 Clear Infra
00:1d:a2:c9:7a:b2 1 Clear Infra
00:1d:a2:ca:39:73 11 Clear Infra
00:17:df:a6:d2:41 11 Clear Infra
00:17:df:a6:db:02 6 Clear Infra
00:17:df:a6:da:f3 1 Clear Infra
00:1e:13:1b:6a:c1 6 Clear Infra
00:1d:a2:c8:fe:43 11 Clear Infra
00:1e:13:6c:d2:31 1 Clear Infra
00:1e:13:6c:d1:42 11 Clear Infra
00:1d:a2:c8:98:e1 1 Clear Infra
00:1e:13:1b:63:11 11 Clear Infra
00:1d:a2:c9:49:e3 11 Clear Infra
00:1e:13:6c:d6:f3 6 Clear Infra
00:25:45:a4:a0:f1 6 Clear Infra
18:ef:63:9a:a3:e0 1 Clear Infra
00:1d:a2:c9:80:e2 6 Clear Infra
00:1d:a2:ca:39:f2 6 Clear Infra
Qian Li & Xintong Zhang Indoor and Outdoor Evaluation of Campus RSS Performance
B5
00:17:df:a6:cb:82 11 Clear Infra
00:1e:13:1a:da:22 11 Clear Infra
00:1d:a2:c8:fb:02 1 Clear Infra
d0:57:4c:08:6d:50 1 Clear Infra
00:1d:a2:c9:4d:e1 11 Clear Infra
00:1d:a2:ca:1b:f1 6 Clear Infra
00:1d:a2:ca:35:92 1 Clear Infra
00:1e:13:1b:66:e3 6 Clear Infra
18:ef:63:9a:a0:d0 1 Clear Infra
00:1d:a2:c8:ff:12 1 Clear Infra
00:1d:a2:ca:3c:d1 11 Clear Infra
00:1e:13:1a:bb:f1 11 Clear Infra
00:1d:a2:ca:35:13 1 Clear Infra
00:17:df:a6:d9:f2 6 Clear Infra
00:17:df:a6:d0:01 11 Clear Infra
00:1e:13:1b:6b:72 6 Clear Infra
00:1e:13:6c:d2:31 ? Clear Infra
00:1e:13:6c:d8:f1 11 Clear Infra
Table 13: Discovered APs in Campus of HIG (SSID is hig only).
Related Documents