Indonesia’s Economic Projections for 2014 and Electricity Condition in Indonesia Aviliani 17 Januari 2014

Welcome message from author
This document is posted to help you gain knowledge. Please leave a comment to let me know what you think about it! Share it to your friends and learn new things together.
Transcript

Indonesia’s Economic Projections for 2014 and Electricity Condition in
Indonesia
Aviliani
17 Januari 2014

2
3

4
Toward 2014: SWOT Analysis of Indonesia
Strengths Weaknesses
Indonesia’s population that reaches 250 million people with income levels that tend to increase is a very high domestic market potential Indonesia’s economy is relatively stable in spite of the global economic shocks. Practice of democracy in Indonesia has been relatively conducive. Banking performance is relatively solid. Major banks in Indonesia are considered to be resilient against global economic shocks.
Opportunities
Current account deficit is expected to continue in 2014, due to weak exports and high imports, especially oil and gas import. Corruption remains a major problem in Indonesia. This issue has the potential to be politicized prior to the 2014 general election, which can heat up the condition. Indonesia's economic dependence on commodities leads to volatility in global commodity prices and this has a significant effect on export performance and economic growth.
Threats
Activities of pre-election and election in 2014 are predicted to increase domestic economic activities. According to the analysis of various experts, the election has the potential to increase community revolving funds up to Rp 50 trillion for various activities including infrastructure development. The
general election is expected to contribute as much as 0.2% to the economic growth (Bank Indonesia). Inflationary pressures in 2013 are estimated to have subsided in 2014. This will increase the public purchasing power. With high returns and huge market, Indonesia is still seen as an attractive investment destination in the eyes of investors. World commodity prices are expected to gradually improve in 2014. There is the potential for capital inflows to developing countries if Japanese financial stimulus continues.
High uncertainty ahead of the election. This will encourage investors to put the brakes on investments, both direct investments in the form of foreign investment (PMA) or domestic investment (PMDN) and portfolio investments (wait and see). Although the potential for political unrest is relatively low, such potential remains to exist. Potential outflows (capital outflow of hot money) due to the tapering off of U.S. financial stimulus persist in 2014 (around the end of the first quarter of 2014). The rising prices of many industrial basic components (basic electricity rate, provincial minimum wage/UMP, district minimum wage/UMK) has the potential to undermine investment interest in Indonesia 4 Source: Kiryanto, 2013

5
5 5

6
• The national economy still relies on household consumption in the midst of inflation surge.
• Government consumption is not moving much due to its hampered realization.
• Investments will tend to slow down due to the emergence of risks in external sector and poor investment climate
• Exports slightly improve (especially to the US and Europe), which are expected to move into other countries, especially the ASEAN countries, China, Japan, and India.
• Imports are still high but potentially decrease if the exchange rate does not strengthen.
• In businesses, the growth of non-tradable sectors is still dominating.
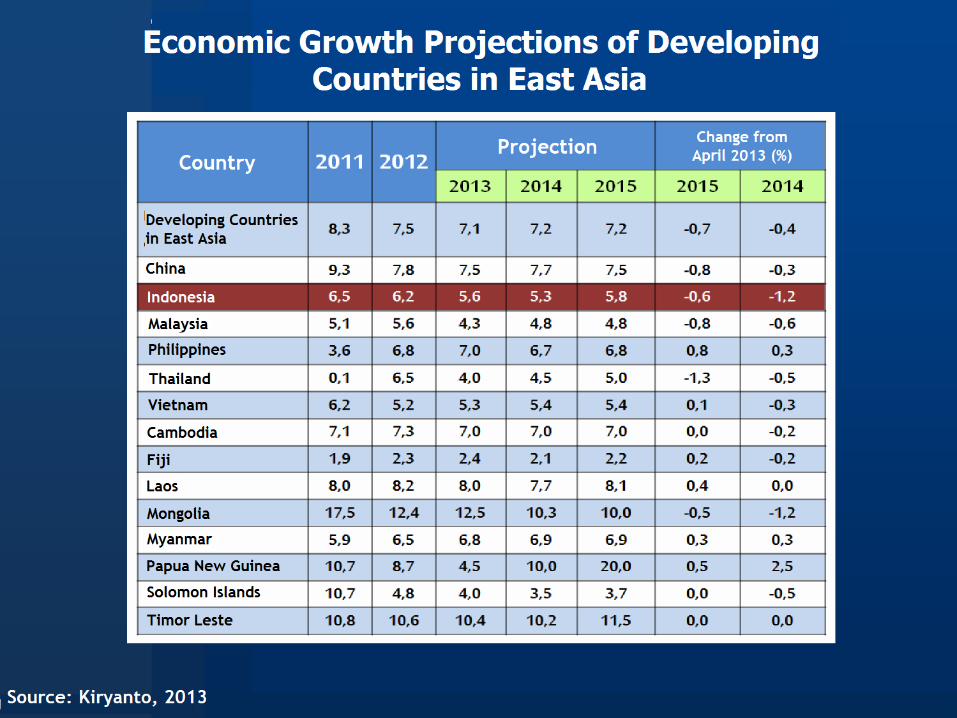
a. State revenues are set at Rp1.662,5 trillion. Tax revenues are still dominating at around Rp1 .310.2 trillion. International tax revenues are expected to decline due to the ongoing slowdown in exports.
b. State expenditures are planned to amount to Rp1.816,7 trillion, leading to a deficit of Rp154,2 trillion (1,49% of GDP).
7
Summary of the 2013 State Budget and the 2014 Draft State Budget
2013
Revised
2014
Draft
Change
(yoy)
State
Budget
State
Budget
A. State Revenues and Grants 1.502,0 1.662,5 10,69
I. Domestic Revenues 1.497,5 1.161,1 (22,47)
1. Tax Revenues 1.148,4 1310,2 14,09
2. Non-Tax Revenues 349,2 350,9 0,50
II. Grants 4,5 1,4 (68,78)
B. State Expenditures 1.726,2 1.816,7 5,24
I. Central Government 1.196,8 1.230,3 2,80
1. Ministries/Agencies 622,0 612,7 (1,50)
2. Non-Ministries/Agencies 574,8 617,7 7,46
II. Transfers to Local Governments 529,4 586,4 10,77
1. Balancing Fund 445,5 481,8 8,14
2. Special Autonomy Funds and Adjustments 83,8 104,6 24,77
C. Primary Balance (111,7) (34,7) (68,93)
D. Budget Surplus/Deficit (A-B) (224,2) (154,2) (31,22)
% of GDP (2,38) (1,49) (37,39)
E. Financing 224,2 154,2 (31,22)
I. Domestic Financing 241,1 173,2 (28,15)
II. Foreign Financing (nett) (16,9) (19,00) 12,63
Financing Surplus/(Deficit) 0,0 0 -
8
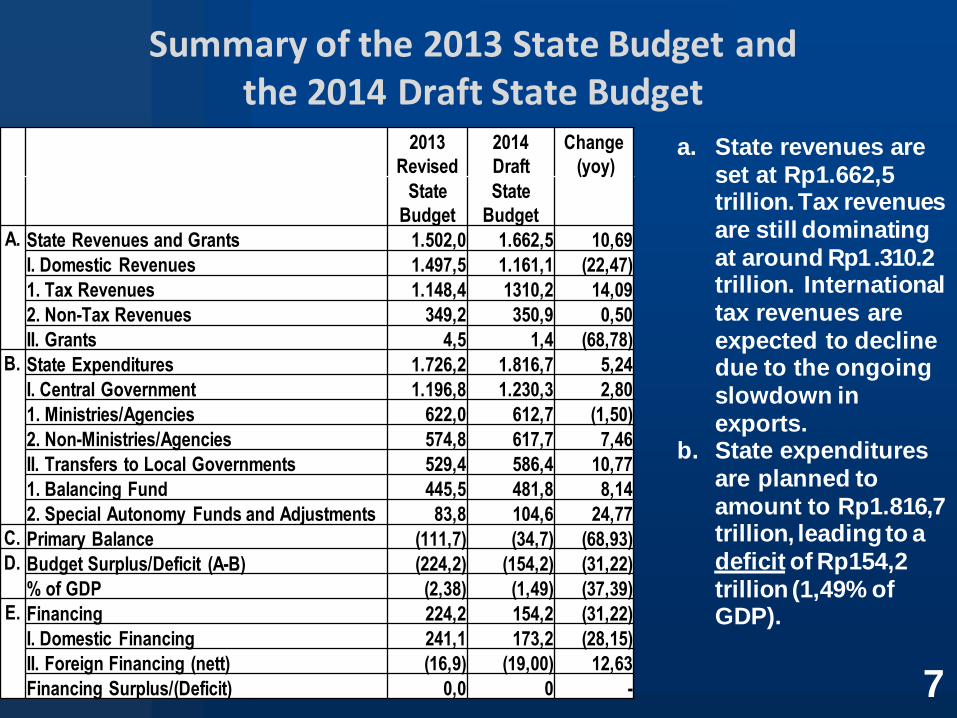
Growth of Central Government Expenditures 2013-2014
Personnel expenditures actually rise more sharply in the 2014 Draft State Budget, reaching up to 18,76 percent. Capital expenditures only rise by 6.85 percent.
2013 2014 Growth
Revised % % Draft % % (yoy)
State Budget GDP Total State Budget GDP Total
Employee Expenditures 233 2,5 19,47 276,7 2,7 22,49 18,76
Goods Expenditures 206,5 2,2 17,25 203,7 2 16,56 -1,36
Capital Expenditures 192,6 2 16,09 205,8 2 16,73 6,85
Interest Payment on Debt 112,5 1,2 9,40 119,5 1,2 9,71 6,22
Subsidies 348,1 3,7 29,09 336,2 3,2 27,33 -3,42
Grant Expenditures 2,3 0 0,19 3,5 0 0,28 52,17
Social Aids 82,5 0,9 6,89 55,9 0,5 4,54 -32,24
Other Expenditures 19,3 0,2 1,61 28,9 0,3 2,35 49,74
Total 1196,8 12,7 1230,2 11,9 2,790,775,401
Source: Ministry of Finance, 2013, re-processed .

Improvement of Indonesia’s
Competitiveness
9
9

Perbaikan Daya Saing
Indonesia
10 10

11
The Role of Energy Sector in Economy
SUSTAINABLE NATIONAL DEVELOPMENT
ECONOMIC DEVELOPMENT
GROWTH DRIVERS
CREATING A CHAIN OF EFFECTS
SOURCES OF ENERGY AND
INDUSTRIAL RAW MATERIALS
SOURCES OF STATE
REVENUES
ENERGY SECTOR Current approach:
People’s welfare 11
(Pro Poor - Pro Job - Pro Growth)
Past approach:
Maximizing state revenues
11
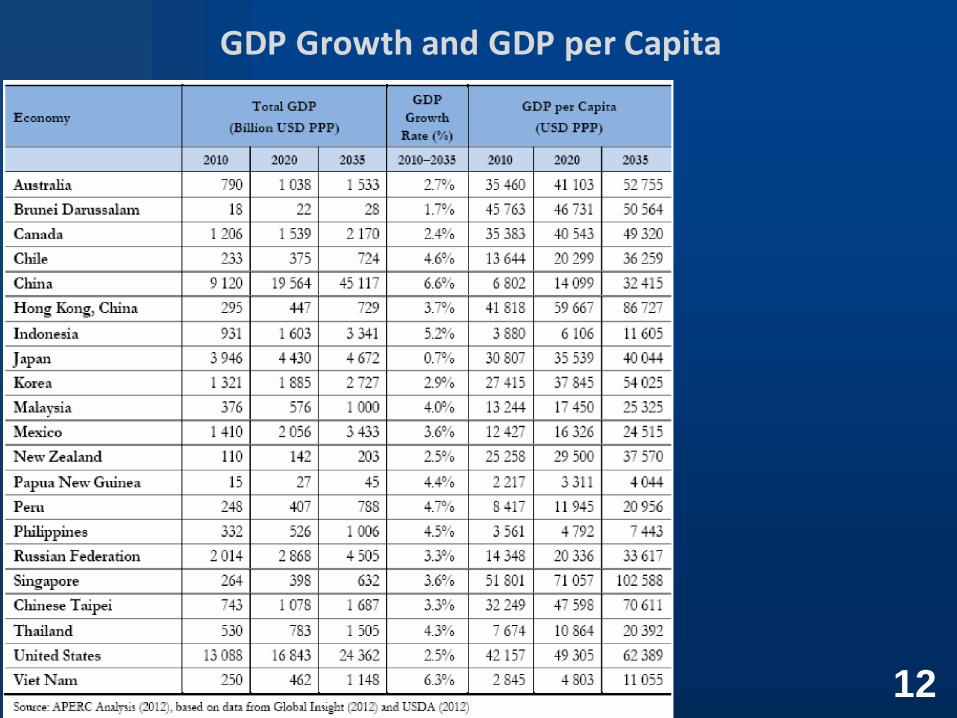
GDP Growth and GDP per Capita
12

Final Energy Consumption in Asia Pacific
Until 2035, final energy consumption in Asia Pacific is
projected to still be dominated by oil (36 percent), followed by
electricity (25 percent) and gas (17 percent). The use of coal
(10 per cent) and other types is still very low. 13

Final Energy Consumption in Asia Pacific by Sector
In 2035, the industrial sector is the major consumer of energy
consumption in Asia Pacific, followed by domestic transportation.
Such a format is not much different from the previous periods.
14

Energy Intensity by Individual Country
Russia, Canada, and Venezuela reached the highest rank, followed
by Thailand and Indonesia.
15
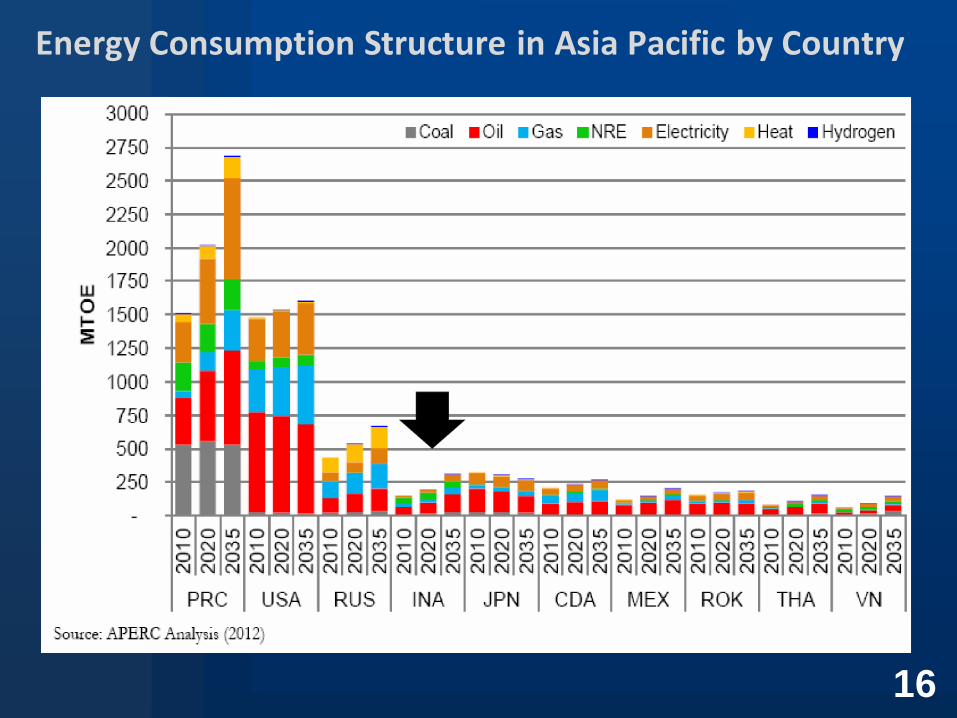
Energy Consumption Structure in Asia Pacific by Country
16
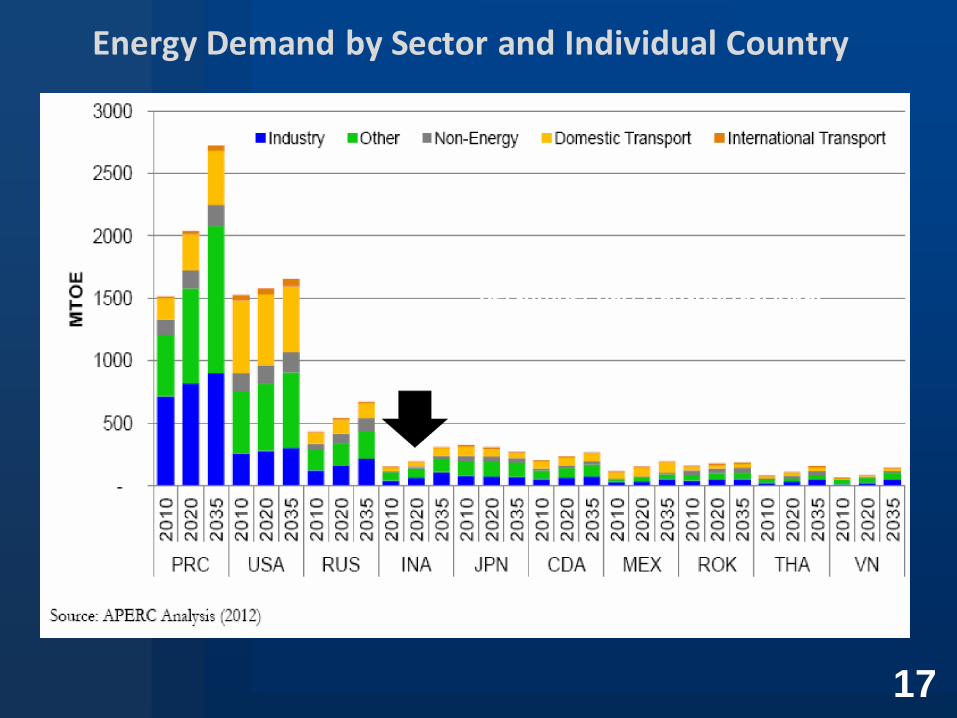
Energy Demand by Sector and Individual Country
17

Number of Vehicles per 100 Inhabitants
18

Electricity Demand Projection by Country
19
Throughout 2009-2035, The growth of electricity deman in Indonesia is 5,5 percent; the highest level after Vietnam (6,4 percent).

Electricity Ratio by Country
20
Indonesia has the lowest electricity ratio compared to other countries, which is only 67,2 percent. Countries with electricity ratio of 100 percent are Australia, Canada, Hong Kong, Japan, Korea, New Zealand, Russia, Singapore, Taipei and the US.
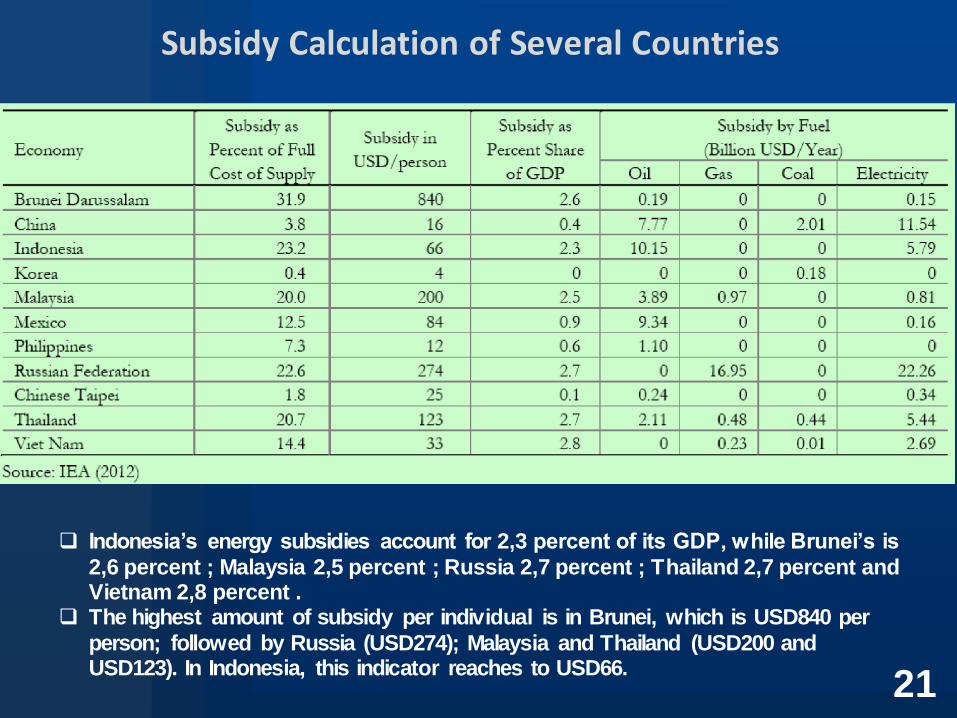
Subsidy Calculation of Several Countries
21
Indonesia’s energy subsidies account for 2,3 percent of its GDP, while Brunei’s is
2,6 percent ; Malaysia 2,5 percent ; Russia 2,7 percent ; Thailand 2,7 percent and Vietnam 2,8 percent .
The highest amount of subsidy per individual is in Brunei, which is USD840 per
person; followed by Russia (USD274); Malaysia and Thailand (USD200 and USD123). In Indonesia, this indicator reaches to USD66.
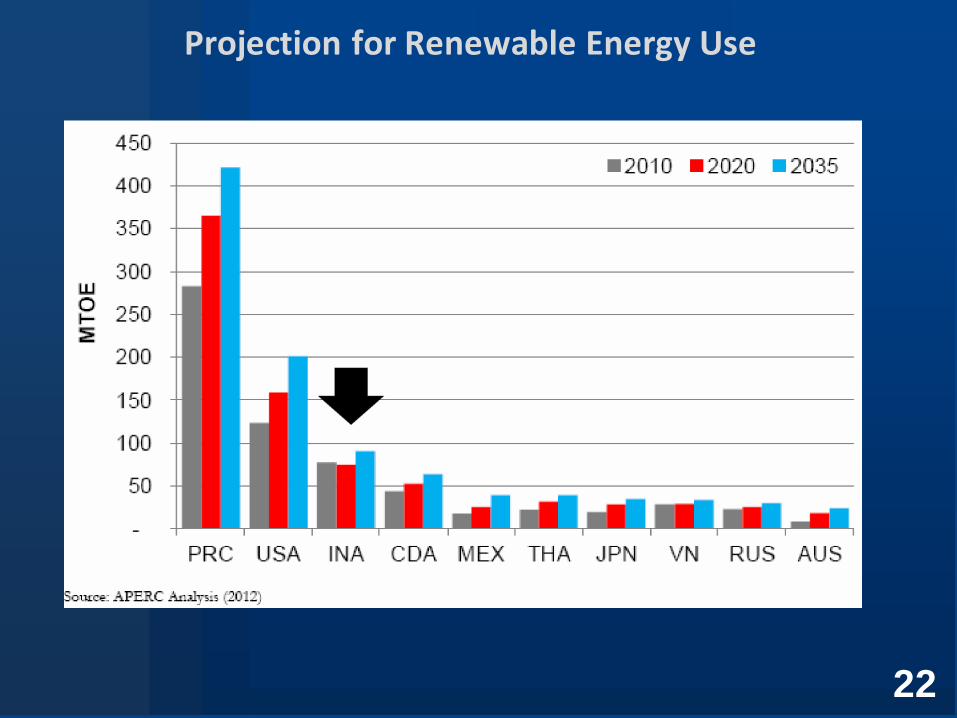
Projection for Renewable Energy Use
22
Pressure for the Fulfillment of Energy Needs
23
The study of Energy Management Indonesia (2010) explained that there is a significant relationship between the fulfillment of energy needs and economic growth. In 2010, energy elasticity in Indonesia reached a level of 1,84. This means that in order to encourage an economic growth of 1 percent, it is necessary for energy supply to rise up to 1,84 percent.
Such condition describes that to reach an average economic growth of 7
percent per year requires an average energy supply of 14 percent a year. The same elasticity in other countries show lower numbers. Energy elasticity in
Malaysia amounts to 1,69 percent; Thailand 1,16 percent; Singapore 1,1 percent; and Japan 0,1 percent.
In some European countries, the figures for energy elasticity are even negative.
That is, when the economy grows, the rate of energy consumption decreases. It suggests that the efforts of energy conservation and diversification are running very well.
Availability of National Energy
24
Indonesia has currently become a net oil importer, although it still has enough reserve of gas for the next 50 years.
Therefore it is necessary to make a change in the energy policy from the current condition, which emphasizes on the sale of energy to obtain foreign exchange and State Budget revenues, to the fullf illment of national energy .
It is necessary to compile a comprehensive energy balance along with economic growth targets (we currently do not have energy balance yet).
It is necessary to change the energy policy from the fulfillment of
foreign exchange target toward national energy security that will ensure the availability of energy nationally.
This policy should also be supported by the provision of incentives for renewable energy that is environmentally friendly as well as the securing of energy for the future. This also reduces energy dependence on other countries

National Primary Energy Resources
Relatively ‘Abundant’
Source: Kurtubi, 2012
If Managed Properly: Indonesia should be free from the threat of energy crisis. These natural wealth of Fossil/Hydrocarbon Energy can even become a powerful source of funding for the National Development.
25
Petroleum (billion barrels)
Natural Gas (TSCF)
Coal (billion tons)
Coal Bed Methane/CBM (TSCF)
Shale Gas (TSCF)
NON-RENEWABLE ENERGY
RESOURCES RESERVES PRODUCTION
RESERVES/PRODUCTION
RATIO (YEAR) *)
RESOURCES/RESERVES RATIO (%)
*) Dengan asumsi tidak ada penemuan cadangan baru: Assuming there is no discovery of new reserves **) Termasuk Blok Cepu: Including Cepu Block Sumber: DITJEN EBTKE-2011 : Source: Directorate General of New, Renewable Energy and Energy Conservation (NREEC/EBTKE) - 2011

National Primary Energy Mix Target 2025
26
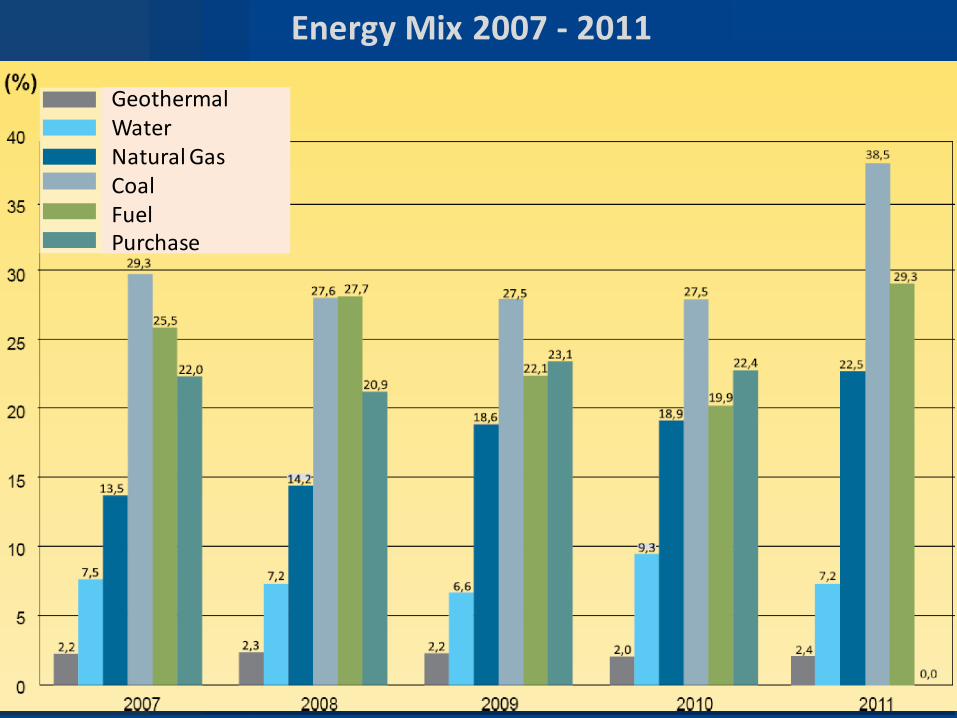
Energy Mix 2007 - 2011
24
Geothermal Water Natural Gas Coal Fuel Purchase

Energy Policy Development 1981 1987 1991 1998 2003
General Policies General Policies General Policies General Policies "National Energy in Energy in Energy in Energy in Energy Policy"
Main Policies Main Policies Policies 1. Intensification 1. Intensification 1. Intensification 1. Diversification 1. Intensification 2. Diversification 2. Diversification 2. Diversification 2. Intensification 2. Diversification 3. Conservation 3. Conservation 3. Conservation 3. Conservation 3. Conservation 4. Indexation 4. Energy Prices 5. Environment Supporting Policies Supporting Policies Supporting Policies Supporting Policies Supporting Policies 1. Research and 1. Energy Industries 1. Energy Industries 1. Investments 1. Infrastructures Development 2. Investment 2. Investment 2. Incentives & 2. Determination of 2. Energy Industries Climate Climate Disincentives economic price 3. Investment 3. Energy Prices 3. Energy Prices 3. Standardization & mechanism Climate Certification 3. Protection of the 4. Infrastructure poor
Final Utilization Policies Final Utilization Policies Final Utilization Policies Development 4. Environment 1. Industries 1. Industries 1. Industries 5. Human Resource 5. Government and 2. Transportation 2. Transportation 2. Transportation Quality Improvement Private Sector 3. Households 3. Households 3. Households 6. Information System Partnership 7. Research and 6. Community Development Empowerment 8. Institutions 7. Research & 9. Management Development and Education & Training 8. Coordination for energy mix optimization
28

Measuring the Role of Electricity in Economy
29
Elasticity of Infrastructure Development on Economic Growth (10 percent Growth Stock)
*The higher the elasticity, the more crucial it is
Location Telecommu
nication Electricity Road Water Port Irrigation
National
Java-Bali
Sumber: Studi LPEM-UI (Dampak Pembangunan Infrastruktur terhadap Pertumbuhan Ekonomi), 2005 : Source: A Study by the Research Institute for Economy and Community, University of Indonesia / LPEM-UI (Impacts of Infrastructure Development on Economic Growth), 2005

Electrification Ratio Target
30
No. PROVINCE 2012 2017 2022 2027 2035 1 Aceh 89,79 97,24 99,99 100,00 100,00
2 North Sumatera 87,01 95,85 99,99 100,00 100,00 3 West Sumatera 80,19 92,44 99,99 100,00 100,00 4 Riau 79,09 91,89 99,99 100,00 100,00 5 Riau Islands *) 91,68 98,19 99,99 100,00 100,00 6 South Sumatera 74,83 88,96 99,99 100,00 100,00
7 Jambi 78,17 91,43 99,99 100,00 100,00 8 Bengkulu 73,23 89,76 99,99 100,00 100,00 9 Lampung 72,88 94,04 99,99 100,00 100,00
10 Bangka Belitung Islands 83,39 88,79 99,99 100,00 100,00
11 Bali 71,56 87,35 100,00 100,00 100,00 12 East Java 74,98 100,00 100,00 100,00 100,00 13 Central Java 80,74 88,97 100,00 100,00 100,00
14 Special Region of Yogyakarta 77,96 92,95 100,00 100,00 100,00 15 West Java 72,77 91,56 100,00 100,00 100,00 16 Banten 69,53 90,07 100,00 100,00 100,00
17 Special Capital Region of Jakarta 99,99 88,36 100,00 100,00 100,00 18 East Kalimantan 64,02 86,28 99,99 100,00 100,00 19 South Kalimantan 77,70 86,95 99,99 100,00 100,00 20 Central Kalimantan 69,20 91,20 99,99 100,00 100,00
21 West Kalimantan 67,87 84,36 99,99 100,00 100,00 22 North Sulawesi 75,68 87,69 95,91 98,18 100,00 23 Central Sulawesi 66,60 80,29 99,99 100,00 100,00 24 Gorontalo 55,88 83,15 95,91 98,18 100,00 25 South Sulawesi 76,86 84,98 99,99 100,00 100,00
26 Southeast Sulawesi 57,90 90,78 99,99 100,00 100,00 27 West Sulawesi 65,26 78,80 95,91 98,18 100,00 28 West Nusa Tenggara 54,77 74,74 91,82 96,36 100,00 29 East Nusa Tenggara 44,49 69,60 91,82 96,36 100,00 30 Maluku 72,01 83,36 91,82 96,36 100,00 31 North Maluku 71,68 83,19 91,82 96,36 100,00 32 Papua and West Papua 40,84 67,77 91,82 96,36 100,00
Indonesia 75,30 86,37 99,33 99,69 100,00
*) Electrification ratio is high because it includes the Batam area.

31
Electricity Elasticity Projections for 2010-2019
PLN explained that after 2014, the total elasticity in Indonesia is predicted to decline as more and more consumers are using electrical equipment with more efficient technologies, especially in the industrial, business and public sectors.
Electrification Ratio Projections
Meanwhile electrification ratio reaches 90.9 percent in 2019, rising from 66,1 percent in 2010.
Source: General Plan of Electricity Supply, 2010-2019
31

Targeted Electricity Growth & Electrification Ratio
32
Electricity Demand, Growth Rate and Electrification Ratio Forecasts
o Electrification ratio in 2015 is expected to increase to 79,5 percent with focus on spurring electricity growth in the eastern Indonesia region.
Source: Electrical Power Supply Business Plan (RUPTL) 2010-2019 , State Electricity Company (PLN)
Details
Java-Bali
East Indonesian West Indonesian
East Indonesian
West Indonesian
Java-Bali
Java-Bali
East Indonesian
West Indonesian
Electricity Supply Electricity Supply Growth (%)Growth (%)
Electrification Ratio (%)

Electricity and Decomposition of Inflation
33
Government-arranged inflation throughout 2006-2012 was relatively low; only in 2008 did it break through a level of 15.99% due to the rise in fuel prices.
Source: Processed from Statistics Indonesia (Badan Pusat Statistik)
Electricity Demand, Growth Rate and Electrification Ratio Forecasts
Consumer Price Index (CPI) Inflation
Core Inflation
Volatile
Government-arranged
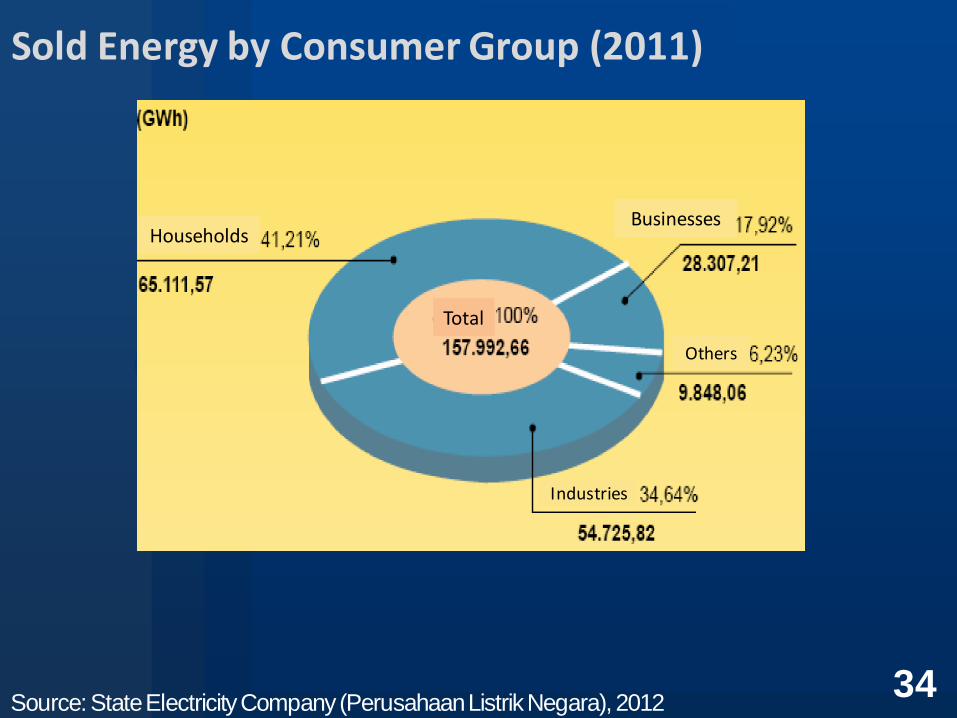
Sold Energy by Consumer Group (2011)
34 Source: State Electricity Company (Perusahaan Listrik Negara), 2012
Households Businesses
Others
Industries
Total

Number of Consumers per Consumer Group
35
Average Growth Rate of Consumers per Year (%)
Year Household Industry Business Social Government Public Road Lighting Total Office Building
Type of Consumer
Household
Industries
Businesses
Others
Total Until the end of 1999

Comparison of Installed Capacity and Population
36

Energy Mix 2007 - 2011
37

Purposes of Electricity Subsidies
38
Some of the purposes of electricity subsidies are as follows:
Electricity subsidies are allocated because the average
price of electricity is lower than the basic supply cost of
electricity for the categories with such rates.
Electricity subsidies are also allocated in order to support
electricity supply for industrial, commercial , public service
sectors. The provision of electricity subsidies is expected to ensure
investment programs and facility/infrastructure rehabilitation in electricity supply

Government Efforts to Reduce the Basic Supply Cost
39
The Government and the State Electricity Company (PLN) are taking several steps to reduce the basic supply cost of electricity, which are as follows:
Network loss reduction program Diversification of primary energy in power plants by optimizing
the use of gas, geothermal, coal, biodiesel, and the replacement of high speed diesel (HSD) to marine fuel oil (MFO).
Increased use of coal, utilization of biofuels and geothermal. From the internal side of the government is also seeking to
improve PT PLN in order to avoid liquidity and funding difficulties. The government undertakes this measure by providing an operating margin of 7 percent to PLN.

Development of Electricity Subsidy Realization
40
Throughout 2007-2012, the realization of electricity subsidy expenditure in nominal terms increased by Rp31,9 trillion (with average increase of 14.5 percent per year). The number includes 0.8 percent of GDP.
Several factors that influence the realization are:
increase in the basic supply cost for electricity as an impact of the dominating use of fuel in the national power generation system;
changes in exchange rates and ICP; and
Increased sale of electricity that had reached 167,2 terawatt hour (TWh) in 2012, compared to the sale of electricity in 2007 which amounted to 119,0 TWh
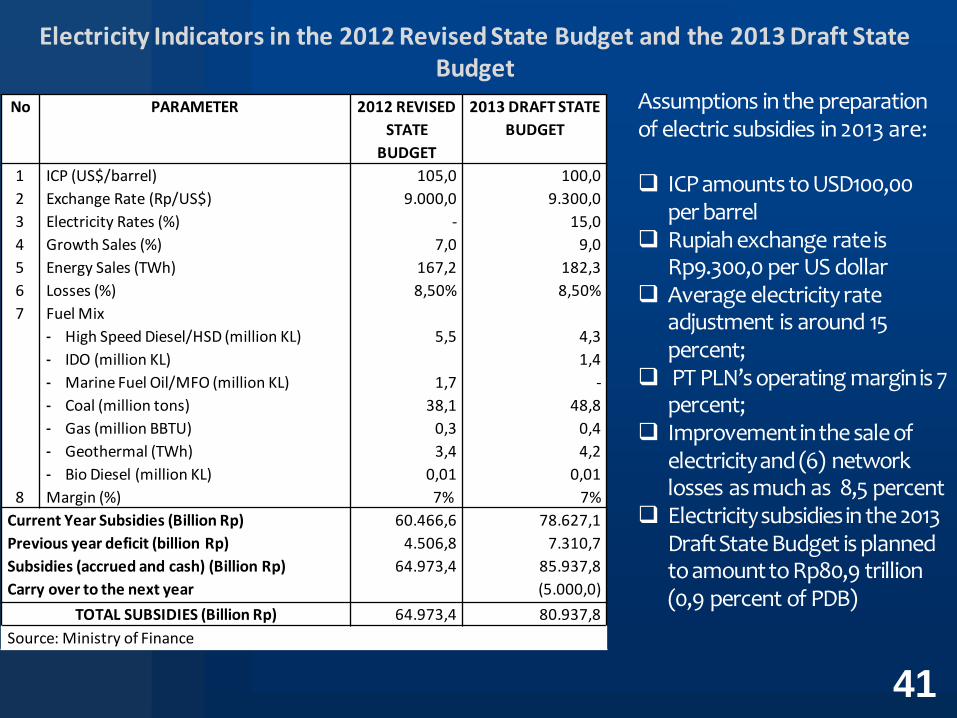
Electricity Indicators in the 2012 Revised State Budget and the 2013 Draft State Budget
41
Assumptions in the preparation of electric subsidies in 2013 are: ICP amounts to USD100,00
per barrel Rupiah exchange rate is
Rp9.300,0 per US dollar Average electricity rate
adjustment is around 15 percent;
PT PLN’s operating margin is 7 percent;
Improvement in the sale of electricity and (6) network losses as much as 8,5 percent
Electricity subsidies in the 2013 Draft State Budget is planned to amount to Rp80,9 trillion (0,9 percent of PDB)
No PARAMETER 2012 REVISED
STATE
BUDGET
2013 DRAFT STATE
BUDGET
1
2
3
4
5
6
7
8
ICP (US$/barrel)
Exchange Rate (Rp/US$)
Electricity Rates (%)
Growth Sales (%)
Energy Sales (TWh)
Losses (%)
Fuel Mix
- High Speed Diesel/HSD (million KL)
- IDO (million KL)
- Marine Fuel Oil/MFO (million KL)
- Coal (million tons)
- Gas (million BBTU)
- Geothermal (TWh)
- Bio Diesel (million KL)
Margin (%)
105,0
9.000,0
-
7,0
167,2
8,50%
5,5
1,7
38,1
0,3
3,4
0,01
7%
100,0
9.300,0
15,0
9,0
182,3
8,50%
4,3
1,4
-
48,8
0,4
4,2
0,01
7%
Current Year Subsidies (Billion Rp)
Previous year deficit (billion Rp)
Subsidies (accrued and cash) (Billion Rp)
Carry over to the next year
60.466,6
4.506,8
64.973,4
78.627,1
7.310,7
85.937,8
(5.000,0)
TOTAL SUBSIDIES (Billion Rp) 64.973,4 80.937,8
Source: Ministry of Finance

Development of National Electricity Indicators
42
No. PARAMETER 2007 2008 2009 2010 2011 2012 REVISED
STATE BUDGET
1 ICP (US$/barrel) 78,0 96,8 61,5 79,4 111,5 105,0
2 Exchange Rate (Rp/US$) 9.419,0 10.950,0 10.408,0 9.087,0 8.776,0 9.000,0
3 Electricity Rates (%) - - - 10 - -
4 Growth Sales (%) 5,7 3,8 4,3 9,4 4,1 7,0
5 Energy Sales (TWh) 119,0 124,3 134,9 145,7 151,7 167,2
6 Losses (%) 11,11 10,45 9,96 9,74 9,44 8,50%
7 Fuel Mix
- High Speed Diesel/HSD
(million KL)
7,9 8,1 6,3 6,9 8,0 5,5
- IDO (million KL) 0,01 0,03 0,01 0,01 0,01 -
- Marine Fuel Oil/MFO
(million KL)
2,8 3,2 3,3 2,43 2,5 1,7
- Coal (million tons) 21,5 21,0 21,6 23,96 29,1 38,1
- Gas (million BBTU) 0,2 0,2 0,3 0,28 0,3 0,3
- Geothermal (TWh) 3,2 3,4 3,5 3,40 3,4 3,4
- Bio Diesel (million KL) - - - - - 0,01
8 Margin (%) - - 5% 8% 8% 7%
Current Year Subsidies (Billion Rp) 33.073,5 80.395,6 45.139,3 53.601,6 92.867,0 60.466,6
Previous year deficit (billion Rp) - 3.510,9 4.407,1 4.000,0 4.580,5 4.506,8
Subsidies (accrued and cash) (Billion
Rp)
33.073,5 83.906,5 49.546,5 57.601,6 97.447,5 64.973,4
Carry over to the next year - - - - (7.000,0) C
TOTAL SUBSIDIES (Billion Rp) 33.073,5 83.906,5 49.546,5 57.601,6 90.447,5 64.973,4
Source: Ministry of Finance
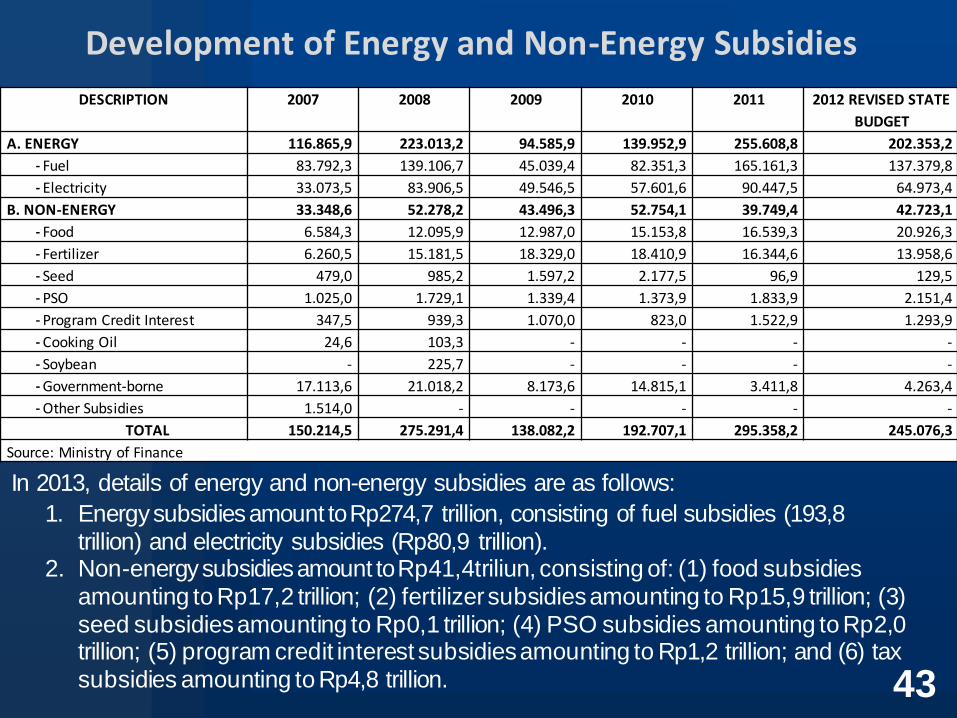
Development of Energy and Non-Energy Subsidies
43
In 2013, details of energy and non-energy subsidies are as follows:
1. Energy subsidies amount to Rp274,7 trillion, consisting of fuel subsidies (193,8 trillion) and electricity subsidies (Rp80,9 trillion).
2. Non-energy subsidies amount to Rp41,4triliun, consisting of: (1) food subsidies amounting to Rp17,2 trillion; (2) fertilizer subsidies amounting to Rp15,9 trillion; (3) seed subsidies amounting to Rp0,1 trillion; (4) PSO subsidies amounting to Rp2,0 trillion; (5) program credit interest subsidies amounting to Rp1,2 trillion; and (6) tax subsidies amounting to Rp4,8 trillion.
DESCRIPTION 2007 2008 2009 2010 2011 2012 REVISED STATE
BUDGET
A. ENERGY 116.865,9 223.013,2 94.585,9 139.952,9 255.608,8 202.353,2
- Fuel 83.792,3 139.106,7 45.039,4 82.351,3 165.161,3 137.379,8
- Electricity 33.073,5 83.906,5 49.546,5 57.601,6 90.447,5 64.973,4
B. NON-ENERGY 33.348,6 52.278,2 43.496,3 52.754,1 39.749,4 42.723,1
- Food 6.584,3 12.095,9 12.987,0 15.153,8 16.539,3 20.926,3
- Fertilizer 6.260,5 15.181,5 18.329,0 18.410,9 16.344,6 13.958,6
- Seed 479,0 985,2 1.597,2 2.177,5 96,9 129,5
- PSO 1.025,0 1.729,1 1.339,4 1.373,9 1.833,9 2.151,4
- Program Credit Interest 347,5 939,3 1.070,0 823,0 1.522,9 1.293,9
- Cooking Oil 24,6 103,3 - - - -
- Soybean - 225,7 - - - -
- Government-borne 17.113,6 21.018,2 8.173,6 14.815,1 3.411,8 4.263,4
- Other Subsidies 1.514,0 - - - - -
TOTAL 150.214,5 275.291,4 138.082,2 192.707,1 295.358,2 245.076,3
Source: Ministry of Finance

Development of Government Guarantee Fund Allocation
44
Government Guarantee Obligations in 2012-2013 (Billion Rupiahs)
Guarantee 2008 2009 2010 2011 2012
1. Acceleration of Coal-powered Electric Generator
Development by PT PLN (Persero)
283,0 1.000,0 1.000,0 889,0 623,3
2. Acceleration of Drinking Water Supply by PDAM - - 50,0 15,0 10,0
Total 283,0 1.000,0 1.050,0 904,0 633,3
Source: Ministry of Finance
Guarantee Activity Basis of Regulation 2012 Revised
State Budget
2013 Draft
State Budget
1. PT. PLN (Persero) Acceleration of Coal-powered Electric
Generator Development for First Phase
10.000 MW Project
Presidential Regulation
Number 86 of 2006
623,3 611,2
2. PDAM Drinking Water Supply Acceleration
Project
Presidential Regulation
Number 29 of 2009
10,0 35,0
3. Public Private Partnership in
Infrastructure Development
Central Java steam-powered electric
generator
Presidential Regulation
Number 78 of 2010
0,0 59,8
Total 633,3 706,0
Source: Ministry of Finance
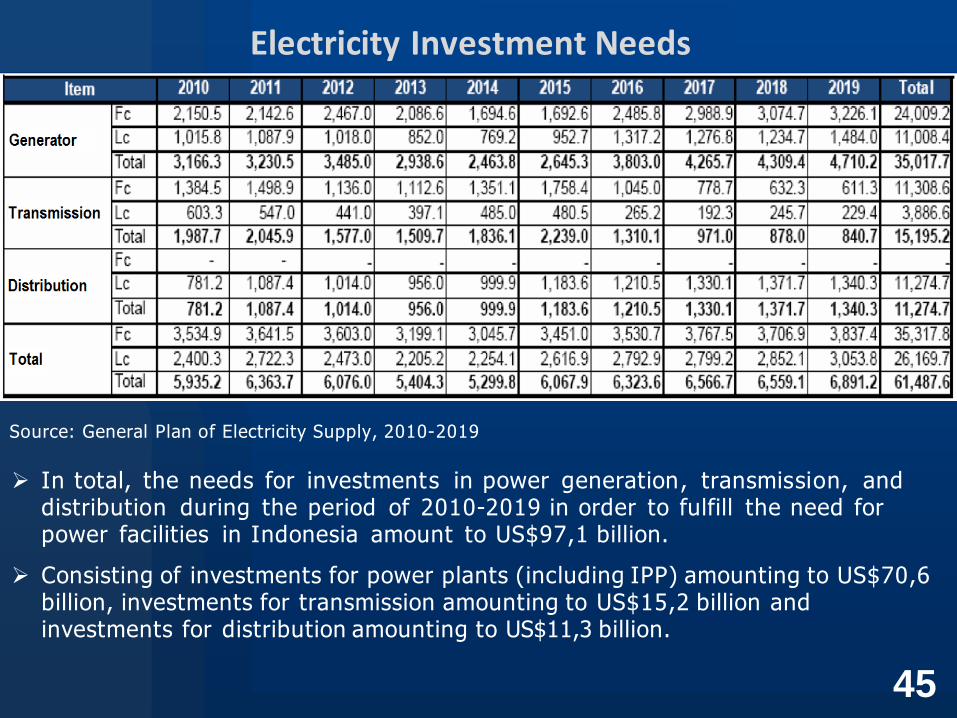
Electricity Investment Needs
45
Source: General Plan of Electricity Supply, 2010-2019
In total, the needs for investments in power generation, transmission, and distribution during the period of 2010-2019 in order to fulfill the need for power facilities in Indonesia amount to US$97,1 billion.
Consisting of investments for power plants (including IPP) amounting to US$70,6 billion, investments for transmission amounting to US$15,2 billion and investments for distribution amounting to US$11,3 billion.

Realization of Domestic Investments in Paper Industry
46
Realization of Foreign Direct Investments in Paper Industry

Electricity Investment Models in Other Countries
47
1. Government Monopoly Model
1. The Government produces electricity and sells it to the public (households, businesses, and other sectors). The government carries out public service
obligations.
2. The Government usually provides subsidies since the electricity is sold below its
economic price.
2. Private Sector Involment Model (Private Public Partnership)
1. A study by the International Energy Agency (2003) concluded that it is necessary to reduce government monopoly in the supply of electricity
(involving the private sector). This has been implemented by OECD countries.
2. In addition to the reason of limited government funds, effectiveness and efficiency
also play a role as influencing factors.
3. The requirement is that it needs to be supported by a conducive investment climate.
4. Nevertheless, the Government must set a maximum price (price floor) to protect the consumers.
5. The Government must require the transfer of technology

Electricity Investment Models in Other Countries
48
3. Alternative Model (exchange)
For example, in order to be able to invest in a particular sector, an investor is required to make an investment in electricity (at least capital deposit).
Incentives can be given for both fiscal and non-fiscal.

Appendices

Study of Effects of Electricity Rate Increase on Inflation
50
A study conducted by Pri Agung and Komaidi (2010) describes the effects of the increase in basic electricity rate on inflation through the cost of production.
Source: Pri Agung and Komaidi, 2010
This study concludes that Basic Electricity Rate increases of 10 percent, 15
percent and 20 percent would raise production cost by 2,13 percent; 3,19
percent; and 4,25 percent, respectively.
Such condition explains that the effort to obtain the same profit (before Basic Electricity Rate increase) would be responded by raising the product selling price by at least 2,13 percent; 3,19 percent; and 4,25 percent, respectively.
No Sector Portion of Electricity
Cost of the Total Cost
(%)
Additional Production Cost
Basic Electricity Rate
10%
Basic Electricity
Rate 15%
Basic Electricity Rate
20%
1 Textile 8.78 0.88% 1.32% 1.76%
2 Electronic goods, communications, and
equipment
11.20 1.12% 1.68% 2.24%
3 Cosmetic goods 13.23 1.32% 1.98% 2.65%
4 Metal household and office furniture 16.49 1.65% 2.47% 3.30%
5 Ready-made garment 19.10 1.91% 2.87% 3.82%
6 Wooden, bamboo, and rattan household
furniture
24.38 2.44% 3.66% 4.88%
7 Individual and household services 26.57 2.66% 3.99% 5.31%
8 Knitted goods 27.18 2.72% 4.08% 5.44%
9 Railway transport services 29.21 2.92% 4.38% 5.84%
10 Footwear 36.55 3.66% 5.48% 7.31%
Average 2.13% 3.19% 4.25%

Basic Electricity Rate Increase and Inflation
51
Referring to the results of the same study, an increase in basic electricity rate at a range between 10 percent to 20 percent will cause a rise in inflat ion. However, the effects will be different, depending on the model used. The study explains that electricity basic rate increase between 10 percent to 20 percent through the FSAM model (assuming that consumption of electricity as well as goods and services will decrease if the basic electric ity rate increases) will cause inflat ion to rise at a range between 0,63 percent to 0,70 percent.
Meanwhile, if using the WAP model (assuming that there is no shift in consumption pattern), an increase in basic electric ity rate at a range between 10 percent to 20 percent will cause a rise in inflat ion of about 0,68 percent to 1,36 percent.

Basic Electricity Rate Increase and Manpower
52
The increase in basic electricity rate will in turn cut down manpower. Referring to the research by Pri Agung and Komaidi (2010), the increase in basic electricity rate at a range between 10 percent to 20 percent will lead to a decline in industrial electricity consumption by 6.7 percent to 13.40 percent.
In terms of manpower condition, basic electricity rate increase at a level of 10 percent to 20 percent will lead to a cut-down on the use of manpower by 1,17 percent to 2,35 percent.

Thank You
Related Documents