Indonesian NDC: State and Progress of Implementation of Mitigation Rizaldi Boer HP: +62811117660, email: [email protected] Centre for Climate Risk and Opportunity Management in South East Asia and Pacific (CCROM SEAP) Bogor Agriculture University

Welcome message from author
This document is posted to help you gain knowledge. Please leave a comment to let me know what you think about it! Share it to your friends and learn new things together.
Transcript

Indonesian NDC: State and Progress of Implementation
of MitigationRizaldi Boer
HP: +62811117660, email: [email protected] for Climate Risk and Opportunity Management in South East
Asia and Pacific (CCROM SEAP)Bogor Agriculture University

INDONESIAN POSITION IN GLOBAL EMISSION
• Indonesia fall under country group with 3rd largest emitter countries along with Japan, Canada, Australia, Germany, Republic of Congo
• Indonesia ratify the Paris Agreement through Act number 16/2016.
• Emission reduction target by 2030 is 29% of the BAU unconditionally and up to 41% conditionally
Source : UNFCCC (status 3 August 2017)

Target NDC Indonesia
Emission reduction target will reached mainly through 2
sectors: Land use, Land use change and forestry: 60%; and
Energy sector: 38%

• From I(NDC) the contribution of Indonesia to Global Emission Reduction Target under conditional will be about 7-8% (about 60% of this will be from LULUCF sector)
• Globally, contribution of LULUCF will be about 24% of the global emission reduction target
INDONESIAN CONTRIBUTION TO GLOBAL Source: Grassi et al. (2017)
3.8 (2.2-4.5)24% (14-29%) of
emission reduction in
(I)NDC
69.9
54.1
15.8
Emission at reference point
(base year or BAU
Emission reduction relative to the reference
point
Conditional (I)NDC LULUCF Contribution to
emission reduction in (I)NDC
Emiss
ion
or e
miss
ion
redu
ctio
n (G
tCO
2e)
All Sectors
75
70
65
60
55
50
45
40

MITIGATION ACTIONS TO MEET THE
NDC EMISSION
REDUCTION TARGET
ENERGY• Efficiency in final energy consumption
(75-100 % implemented)• Application of clean coal technology in
power plant (75 % implemented)• Electricity generation using renewable
sources (22.5% of energy mix)• Use of biofuel in transportation sector
(90-100 % implemented)• Additional gas distribution lines (100 %)• Additional compressed natural gas fuel
stations (100%)
LAND USE CHANGE AND FORESTRY• Reducing deforestation down to 0,45 ha-
0,25 Mha/year)*• Applying SFM principle (Mandatory for
RIL)*.• Land rehabilitation reached 12 million ha
by 2030 about 800,000 ha/year with survival rate of 90% .
• Peat restoration 2 million ha by 2030 with

Main action is to reduce emission from deforestation and peat land
60%78%
Moving away from forest and peatland for agriculture
development
CM1: unconditional CM2: Conditional

PROGRESS Detail mapping of REDD and non-REDD area by island and by province
on peat and non-peat lands Consolidation and coordination across sectors to follow up the NDC
commitment Policy discussion with high level policy makers to follow up the NDC
commitment Development of Governance Structure for National Agency for
Environmental Funding Management (BPDLH) that include climate finance (Drafting the Government Regulation and President Regulation on BPDLH) and also financing for REDD+
Review of regulation related to REDD+ and finalization of Minister of Environment and Forest Regulation on REDD+ implementation
Development guidance for sub-national (provincial government such as FREL/FRL, MRV protocol) for REDD and Forestry NDC
National Registry System (SRN) One data and one map policy ~ one GHG Inventory Data Policy

I. DEVELOPMENT OF OWNERSHIP AND COMMITMENT • Government, private,
community, financial agencies
II. CAPACITY DEVELOPMENT• Institutional and human
capacity in elaborating NDC, GHGI, MRV, SRN, NDC implementation)
III. ENABLING CONDITION• Issuance of supporting
Policies and regulations (Act Number 16/2016, PP 46/2016, Financing Instrument etc)
IV. DEVELOPMENT OF COMMUNICATION FRAMEWORK• Coordination and
synergy across sectors and region and actors
V. ONE GHGI DATA POLICY• SIGN-SMART • SRN & verification
system): mitigation, adaptation, financing
VI. DEVELOPMENT OF POLICY, PLAN & PROGRAM
• Mainstreaming CCM, CCA into RPJMD and resource mobilization
VII. DEVELOPMENT OF NDC GUIDELINE • Guideline for planning,
implementing, MRVingand reviewing NDC for governments & private
II. NDC IMPLEMENTATION• Based on policy, plan
and program (KRP) -BAPPENAS
• Coordinated by MoEF in term of ERT achievement
IX. NDC MONITORING & EVALUATION• Monitoring progress• Review for adjustment
of Emission reduction target
GHG Inventory in the implementation of NDC (MoEF, 2017)
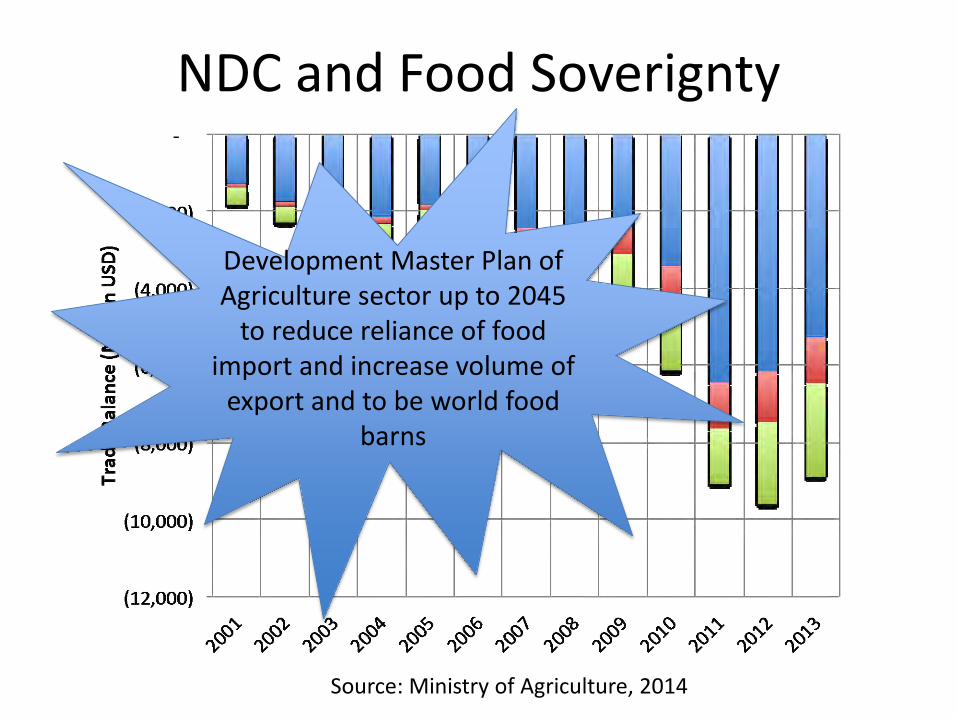
NDC and Food Soverignty
Source: Ministry of Agriculture, 2014
Development Master Plan of Agriculture sector up to 2045
to reduce reliance of food import and increase volume of
export and to be world food barns

Agriculture development
• Growth of alm oil plantation 0.571 million ha/year, while other relative constant except for cacao
• Palm oil is the main contribution to national GDP: 70% of national earning from agriculture plantation commodity export
• Production target of CPO:
– 2020: 40 Mton– 2030: 60 Mton– 2050: 160 Mton
Source: MoEF, 2016

Food Balanced in NDC
In NDC Volume of food import continue to increase until 2030 (assumption growth rate of crop productivity
follows historical trend and government target
Source: MoEF (2016)
Others Maize vegetables fruits sugar

Food Production Surplus
Source: MoEF (2016)
Surplus of production for some commodities tend to increase, and production surplus for CPO nearly meet government target, i.e. 60 million ton CPO
Rice Cassava Industrial Palm Oilcrops

Development of alternative scenarios for NDC toward food sovereignty
• There is a possibility to develop alternative scenario to NDC that can reduce reliance on food import and potential to reduce the emission further beyond 2030 and become net sink by 2050
• Mitigation rate should be more intensified than that NDC
• Crops productivity improvement and planting intensity should be further increase from the those of NDC scenarios and production target for CPO in 2050 should revisited and reduce to about half of the initial target
Source: Boer et al. 2017

Key mitigation actions in NDC and Alternative scenario (DD)
• Rate of mitigation actions should be increased particularly in peatlandrestoration and management as well as land rehabilitation. Additional investment 2.5 billion USD (until 2030)
Mitigation Actions (000 HA)
Year Scenarios Peat Restoration
Peat Water manage-
ment
Land rehabili-
tation

Crop Productivity Improvement (Boer et al., 2017)
Commodities Current Yield1 Yield Target DD (2050)
Attainable Yield
t/haRice in Java 5.80 6.50 8.80Rice outside Java 4.20 5.60 5.57Upland rice 3.04 3.50 5.00Maize 4.40 7.00 10.60Cassava 20.22 35.00 40.00Sugarcane (cane bar) 47.89 80.00 100.00Palm oil (CPO) 4.02 9.00 10.00Vegetables3
- Red Chilli- Red Onion
8.379.57
11.1312.72
11.6512.23
Other Industrial crops3
- Rubber- Coffee- Cacao- Tea
0.940.700.421.19
1.551.160.701.90
1.902.002.002.00
About 14 million ha of agriculture land located in forest area

Planting Intensity Improvement
Sumber: Boer et al., 2017)

Palm Oil Production
Sumber: Boer et al. 2017
Meeting NDC target of transportation

Land Demand for Development under NDC and Alternative Scenario
Source: Boer et al. 2017
Area of Convertible Production Forest in 2013: 15.52 million ha meaning that forest area allocated for the development is
enough until 2050
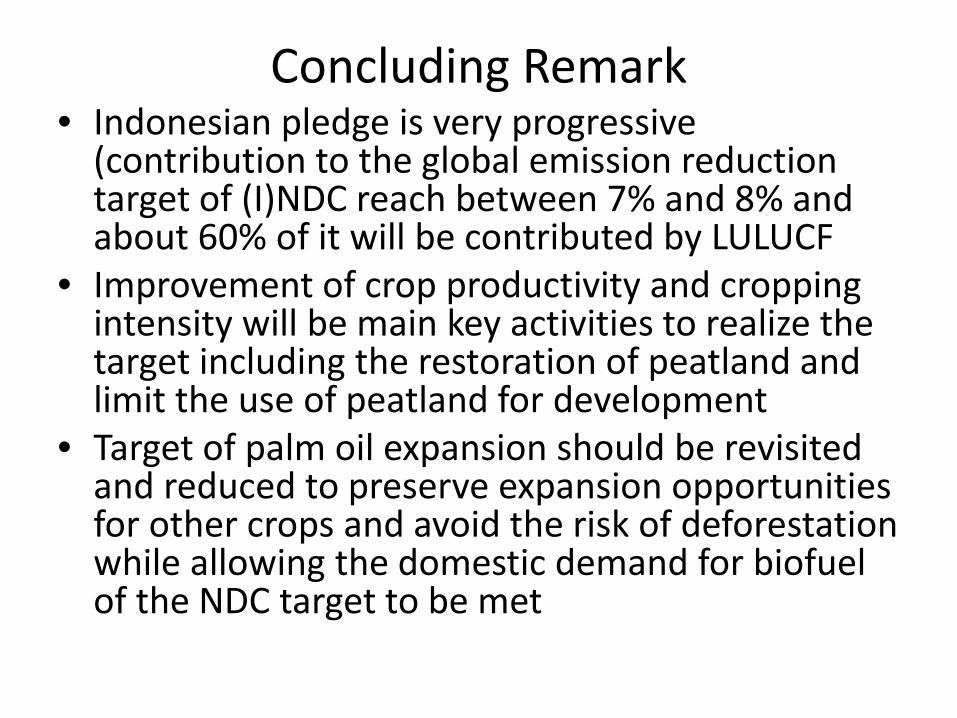
Concluding Remark• Indonesian pledge is very progressive
(contribution to the global emission reduction target of (I)NDC reach between 7% and 8% and about 60% of it will be contributed by LULUCF
• Improvement of crop productivity and cropping intensity will be main key activities to realize the target including the restoration of peatland and limit the use of peatland for development
• Target of palm oil expansion should be revisited and reduced to preserve expansion opportunities for other crops and avoid the risk of deforestation while allowing the domestic demand for biofuel of the NDC target to be met
Related Documents