Indonesia: Strategy for Manufacturing Competitiveness Vol. II. Main report Shafiq Dhanani United Nations Industrial Development Organization (UNIDO) UNDP/UNIDO Project No. NC/INS/99/004 Jakarta November 2000

Welcome message from author
This document is posted to help you gain knowledge. Please leave a comment to let me know what you think about it! Share it to your friends and learn new things together.
Transcript
Indonesia: Strategy for
Manufacturing Competitiveness
Vol. II. Main report
Shafiq Dhanani United Nations Industrial Development Organization (UNIDO) UNDP/UNIDO Project No. NC/INS/99/004 Jakarta November 2000
ii
Forward This policy study was implemented by UNIDO in close cooperation with the Ministry of Industry and Trade. It was funded by UNDP under project NC/INS/004 entitled Policy Support for Industrial Recovery, and in the framework of the inter-sectoral United Nations Support Facility for Indonesian Recovery (UNSFIR). In developing the approach to the study, UNIDO concentrated on analyzing structural strengths and weaknesses in the industrial sector, reviewing trends in manufacturing production and trade before, during and after the crisis. Most of the analysis has been conducted at the level of industrial sub-sectors, although the data collected and analyzed allow for issues to be investigated at a greater level of detail. The findings and recommendations are intended to help establish a strategic framework for industrial promotion policies and strategies, which the Ministry of Industry and Trade may wish take up with the private sector and other government departments, in order to strengthen Indonesia’s competitive position over the medium to longer term. This is all the more crucial and timely as the Indonesian economy and the manufacturing sector emerge from the crisis and face the challenges of liberalization and globalization. The study is focused on the real side of the industrial economy. Intentionally, it does not deal with corporate debt restructuring, trade policy reform, corporate governance and a host of other industry related policy issues, which are being addressed by other national or international institutions. This is for two reasons. First, were this project to deal with these issues, it would mainly duplicate efforts carried out elsewhere. Second, because of the overwhelming emphasis, in both policy and public discussion, on the problems specifically emerging from the financial crisis, there is a concern that the basic industrialization and trade development agenda is loosing focus. The project attempts to contribute to regaining that focus. We sincerely hope that the findings and recommendations contained herein will be of interest to the Ministry of Trade and Industry, and stand ready to provide clarifications or support the elaboration of the strategic and policy measures contained in this submission1.
Philippe R. Scholtes Industrial Policies and Research
UNIDO Vienna Project Manager
Syed Asif Hasnain Representative UNIDO Jakarta
1 The project analysis and findings were undertaken by Dr. Shafiq Dhanani, UNIDO Consultant, with extensive support from UNIDO headquarters in Vienna and the UNIDO office in Jakarta.
iii
_________________ This document has not been edited. This study was prepared by Dr. Shafiq Dhanani, Consultant for UNIDO. The designations employed and the presentation of material in this document do not imply the expression of any opinion whatsoever on the part of the Secretariat of the United Nations Industrial Development Organization concerning the legal status of any country, city or area, or of its authorities, or concerning the delimitation of its frontiers or boundaries, or regarding its economic system or degree of development. Designations such as ‘developed’, ‘industrialized’ and ‘developing’ are intended for statistical convenience and do not necessarily express a judgement about the stage reached by a particular country or area in the development process. The opinions, figures and estimates contained in this study are the responsibility of the author and should not necessarily be considered as reflecting the views or carry the endorsement of the United Nations Industrial Organization (UNIDO), nor do they officially commit UNIDO to any particular course of action. Mention of company names and commercial products does not imply the endorsement of UNIDO.

iv
v
EXECUTIVE SUMMARY Indonesia’s competitiveness declined in the second half of the 1990s relative to other countries in Southeast and South Asia, three to four years before the crisis. After spectacular growth of nearly 30% per annum in the early 1990s, export earnings slowed down to just 7% p.a., while those of the four major products (plywood, textile, garments and footwear) stagnated during 1993-97. Following the onset of the 1997 financial crisis, the drastic devaluation of the rupiah (now worth only a quarter of its pre-crisis value) did not galvanize non-oil manufactured exports. The now much lower labour costs in dollar terms have yet to restore Indonesia’s competitiveness. Before the crisis, Indonesian manufacturers were already facing the prospect of a more difficult environment due to globalization of manufacturing production and liberalization (WTO, AFTA, expiration of Multi-Fibre Agreement and of guaranteed textile export quotas). The financial crisis, and the ensuing IMF-led restructuring programme, has greatly increased pressure on Indonesia to rapidly liberalize its domestic market, leading to the flooding of the domestic market of imported goods ranging from textiles and sandals, to motorcycles, hand tractors and consumer electronics. At a time when the domestic manufacturing sector has been greatly weakened by corporate indebtedness and inward foreign direct investment flows have virtually dried up, due in part to serious competition from equally reform-oriented countries, Indonesia now faces the real threat of de-industrialization. A review of Indonesia’s pattern of industrialization indicates that the factors contributing to Indonesia’s lack of competitiveness both before and after the financial crisis are essentially the same, namely: 1. The emergence of lower-cost competitors in Indonesia’s traditional export products and
markets leading to lower international prices, particularly of textile, garments and footwear.
2. The inability of Indonesian producers to reduce production costs to match those of their competitors in China and other countries due to their heavy reliance on imported inputs.
3. Indonesia’s continued reliance on a small number of exports (plywood, textile, garments, footwear and electronics) and a small number of markets (USA, Japan, Singapore).
4. Unlike China and India, Indonesia possesses a very small capital goods industry, and relied entirely on imported equipment and machinery.
5. Absence of technological deepening in production and exports: while low technology, labour-intensive industries, and to some extent resource-based food, paper and wood industries expanded rapidly, this was not accompanied by the development of medium and higher technology industries.
6. The manufacture of consumer electronics, whose exports have picked up since the onset of the crisis, is an extreme example of essentially an assembly operation: some 90% of components were imported, assembled using low wages mainly in Batam, and re-exported.
Underlying Indonesia’s declining relative competitiveness is due to the failure to develop supplier and support industries, to diversify its manufacturing base, and to achieve technological deepening of its manufacturing sector. This in turn was due to the following: 1. Absence of an effective industrial technology support system, or more accurately,
manufacturing capability support system, such as a network of productivity centres and
vi
technical institutes to assist domestic manufacturers to produce technologically more sophisticated products such as chemicals, and motor vehicle and electronic components.
2. Lack of interest on the part of Indonesian conglomerates and foreign manufacturers in developing a supplier or vendor network, partly due to the prevailing trade regime, and partly due to their business strategies.
3. Relatively weak human resources, particularly the ability to reverse-engineer and adapt foreign technology to domestic markets, products and scales of production.
4. Absence of a strategic vision of where Indonesia wanted to be in terms of industrialization (role and types of industry, self-sufficiency and competitiveness, shifting from labour and resource-based industries to knowledge-based industry, etc.), to provide broad signals to investors and guide government policies.
5. Absence of a formal government-business forum where issues of competitiveness could be addressed and resolved.
Just as the import-substitution strategy of the 1960s and 1970s gave way to an export-oriented strategy in the 1980s and 1990s, the changing international environment calls for more creative and innovative strategies which rely on closer public-private partnerships. However, the role of government in industrial development, while necessary, should change from that in the past, as the regulatory or dirigiste approach becomes increasingly incompatible with the current free-trade era. The government should redefine industrial strategy as the attainment of a common public-private vision of industrialization, and the basic implementation mechanisms as shared public-private efforts. In close collaboration and formal partnership with the private sector, the government should formulate and implement policies at three levels: 1. Industry-wide policies will aim at reducing country costs and enhancing the transaction
efficiency for business, including the necessary macroeconomic, regulatory and business environment, the physical infrastructure, and the educated and skilled labour force under which manufacturing firms can invest and grow.
2. At the sub-sectoral level, the government can support strategic initiatives and promotional activities in priorities industries, including trade an market diversification policies, industrial transformation programme, industrial diversification and deepening, and strengthening industry associations.
3. At the firm level, the government will aim to increase the manufacturing capabilities in a non-discriminatory manner in selected industries, including the adoption of total quality and productivity programmes, technological upgrading, and investment in plant and industrial skills, using a network of private-sector led productivity centres, technical institutes and industrial extension services. The latter are particularly important for moving small and medium-scale industries into higher-skill market niches.
To provide employment and raise living standards of the entire population, Indonesia needs to maintain the pace of industrial development and to redress past weaknesses. Even in the context of liberalized investment and trade flows, public policy can go a long way towards influencing the nature and direction of industrialization, without resorting to distortive pricing policies or firm-specific incentives. Public-private partnerships in the formulation and implementation of industrial strategy can provide the necessary framework for the coordinated action of various government agencies involved in industrial development.
vii
Contents 1. MAIN ISSUES AND POLICY RECOMMENDATIONS ……………………………. 1 1.1. Main Issues..........................................................................................................................2 1.2 Structural Weaknesses..........................................................................................................4 1.3. Organizational Weaknesses.................................................................................................9 1.4. Implications for Industrial Strategy and Policy.................................................................13 2. BEYOND SHALLOW, EXPORT-LED INDUSTRIALIZATION ………………… 25 1. Introduction ..........................................................................................................................26 2. Industrial Development Policy, 1965-2000 .........................................................................27 3. Structural and Organizational Weaknesses ..........................................................................30 4. Emerging Challenges and Implications................................................................................40 5. Conclusion............................................................................................................................48 References ................................................................................................................................44 3. FOREIGN DIRECT INVESTMENT IN INDONESIAN MANUFACTURING ….. 53 3.1. Introduction .......................................................................................................................54 3.2. Importance of FDI in Indonesian Manufacturing .............................................................56 3.3. Impact on Domestic Economy ..........................................................................................62 3.4. Policy Implications............................................................................................................70 5. Conclusion............................................................................................................................72 References ................................................................................................................................74 Annex 3.1: FDI inflows and outflows.....................................................................................76 Annex 3.2: Tables ....................................................................................................................78 4. INDONESIA’S INDUSTRIAL DEVELOPMENT COMPARED …………………. 83 4.1. Manufacturing Performance..............................................................................................84 4.2. Trade Performance ............................................................................................................92 4.3. Summary ...........................................................................................................................99 Annex 4.1: Tables ..................................................................................................................101 5. PATTERNS OF MANUFACTURING DEVELOPMENT, 1975-1998 …………… 109 5.1 Growth and Structural change..........................................................................................110 5.2 Production Structure and Performance ............................................................................119 5.3 Manufacturing Employment ............................................................................................133 5.4 Conclusion........................................................................................................................135 Annex 5.1: Tables ..................................................................................................................138 6. MANUFACTURING TRADE AND BALANCE OF PAYMENTS ………………. 165 6.1 Export Performance..........................................................................................................166 6.2 Imports .............................................................................................................................175 6.3 Trade Balance...................................................................................................................177 6.4 conclusion.........................................................................................................................182 Annex 6.1: Tables and Figures...............................................................................................185
viii
7. POST-CRISIS CHALLENGES AND PRIORITIES ……………………………….. 193 7.1 From Economic Crisis to Recovery .................................................................................194 7.2 Small and Medium-scale Industries .................................................................................203 7.3 Regional Dimensions of Industrialization........................................................................212 7.4 Industrial Skills Development..........................................................................................217 Annex 7.1: Vocational Training in MOM's Training Centres ..............................................227 Annex 7.2: Tables ………………………………………………………………………… 231 APPENDICES …………………………………………………………………………… 235 ANNEX A: LIST OF PERSONS CONSULTED ..............................................................236 1. Government........................................................................................................................236 2. International Agencies........................................................................................................239 3. Industry Associations .........................................................................................................240 4. Universities, Research Institutes and Consultants..............................................................242 5. Companies..........................................................................................................................243 APPENDIX B. LIST OF PARTICIPANTS IN SEMINAR & PRESENTATIONS ......244 1. Ministry of Industry and Trade ..........................................................................................244 2. National Economic Council (DEN) ...................................................................................246 3. Office of the Deputy for Economic Affairs, Coordinating Minister for Economy............247 4. UNDP Office in Jakarta .....................................................................................................248 5. Coordinating Minister for Economy and Finance (EKUIN)..............................................249 6. National Chamber of Commerce and Industry (KADIN)..................................................250 7. Inter-ministerial officials Related to Industry & Trade......................................................251 8. University of Indonesia Seminar on Economic Recovery .................................................253 9. Presentation to Minister and Director-Generals of MOIT .................................................254 10. UNIDO/National Chamber of Commerce and Industry (KADIN) Workshop …….…. 250

ix
1
1. Main Issues and Policy Recommendations 1.1. MAIN ISSUES...................................................................................................................2
1.2 STRUCTURAL WEAKNESSES......................................................................................4 1.2.1 Reliance on a limited number of export products and markets.........................................4 1.2.2 Import dependence ............................................................................................................5 1.2.3 No technological deepening of manufacturing production and exports ...........................6 1.2.4 Underdeveloped capital goods sector................................................................................7 1.2.5 Limited net revenue generated by the oil and gas sector ..................................................8 1.2.6 Regional concentration......................................................................................................8 1.2.7 Low-productivity small and medium scale industries.......................................................8
1.3 ORGANIZATIONAL WEAKNESSES ...........................................................................9 1.3.1 Weak industrial technology development .........................................................................9 1.3.2 Moderate benefits of FDI to date ....................................................................................10 1.3.3 Weak human resource development ...............................................................................11 1.3.4 Market concentration.......................................................................................................12 1.3.5 Fragmented responsibility for industrial promotion and policy......................................12 1.3.6 Relatively narrow focus of industry associations............................................................12
1.4 IMPLICATIONS FOR INDUSTRIAL STRATEGY AND POLICY.........................13 1.4.1 White Paper on Industrial Competitiveness ....................................................................14 1.4.2 Industry-wide Policies.....................................................................................................16 1.4.3 Sub-sectoral Policies .......................................................................................................19 1.4.4 Firm-centred policies.......................................................................................................21
2
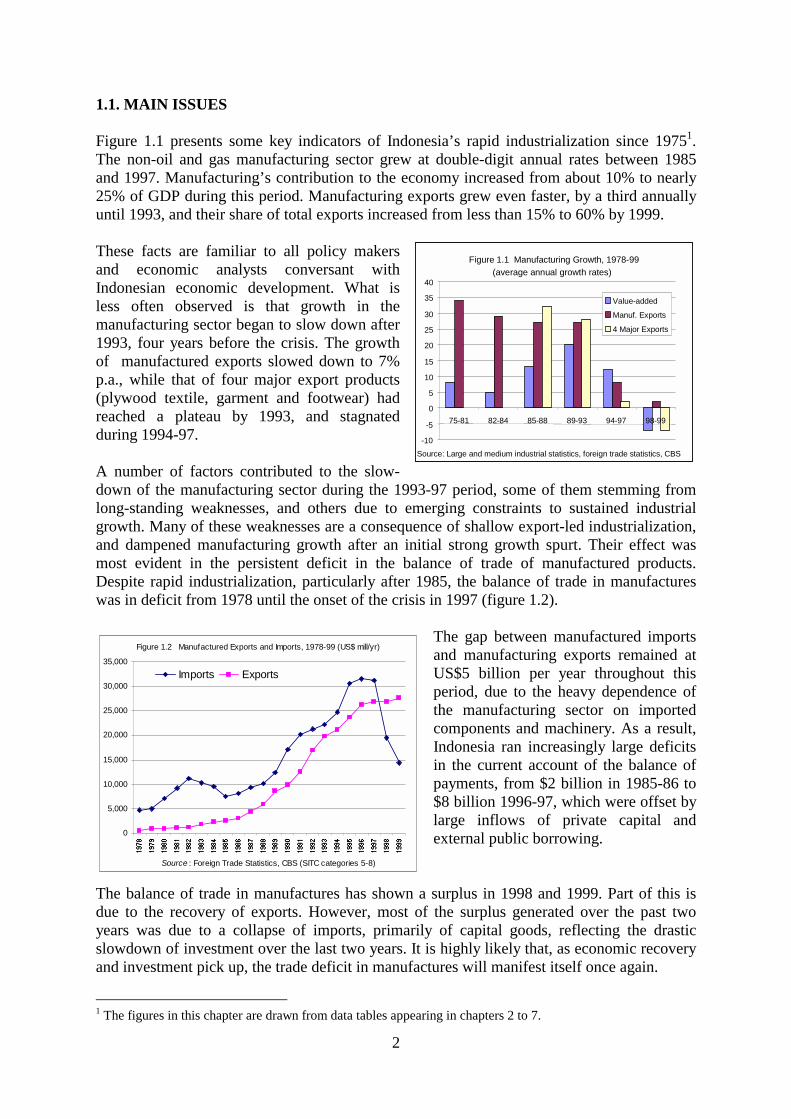
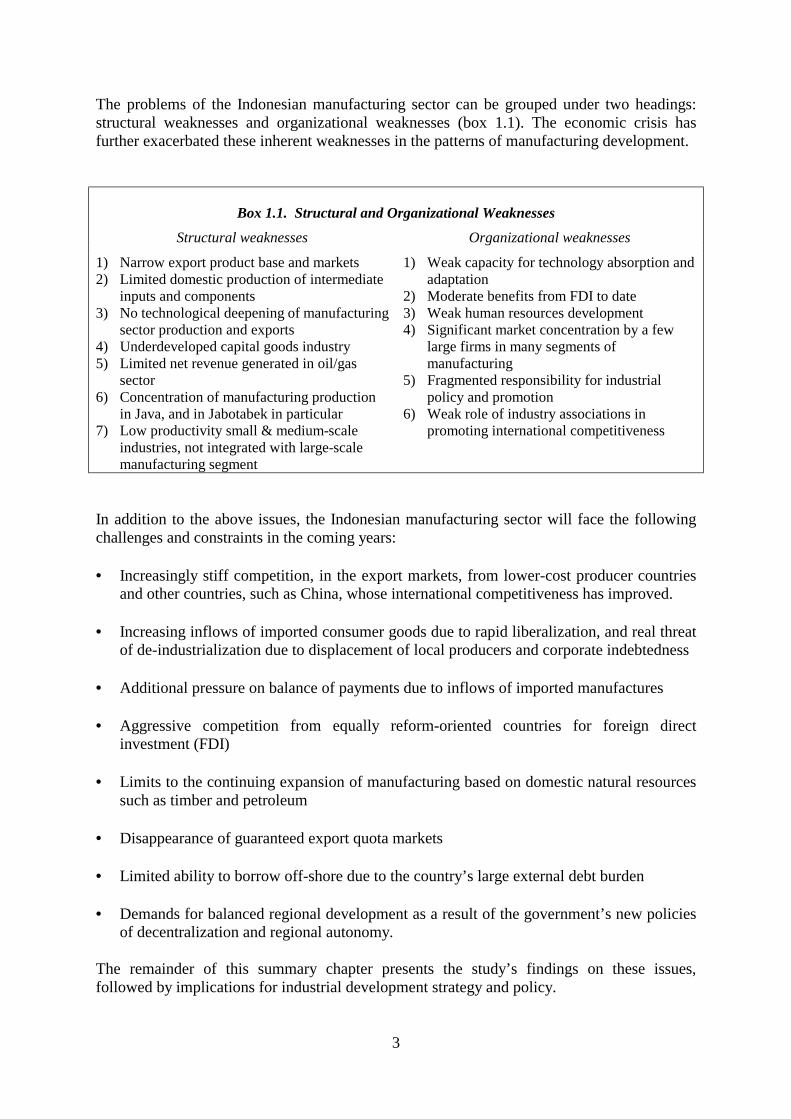
1.1. MAIN ISSUES Figure 1.1 presents some key indicators of Indonesia’s rapid industrialization since 19751. The non-oil and gas manufacturing sector grew at double-digit annual rates between 1985 and 1997. Manufacturing’s contribution to the economy increased from about 10% to nearly 25% of GDP during this period. Manufacturing exports grew even faster, by a third annually until 1993, and their share of total exports increased from less than 15% to 60% by 1999. These facts are familiar to all policy makers and economic analysts conversant with Indonesian economic development. What is less often observed is that growth in the manufacturing sector began to slow down after 1993, four years before the crisis. The growth of manufactured exports slowed down to 7% p.a., while that of four major export products (plywood textile, garment and footwear) had reached a plateau by 1993, and stagnated during 1994-97. A number of factors contributed to the slow-down of the manufacturing sector during the 1993-97 period, some of them stemming from long-standing weaknesses, and others due to emerging constraints to sustained industrial growth. Many of these weaknesses are a consequence of shallow export-led industrialization, and dampened manufacturing growth after an initial strong growth spurt. Their effect was most evident in the persistent deficit in the balance of trade of manufactured products. Despite rapid industrialization, particularly after 1985, the balance of trade in manufactures was in deficit from 1978 until the onset of the crisis in 1997 (figure 1.2).
The gap between manufactured imports and manufacturing exports remained at US$5 billion per year throughout this period, due to the heavy dependence of the manufacturing sector on imported components and machinery. As a result, Indonesia ran increasingly large deficits in the current account of the balance of payments, from $2 billion in 1985-86 to $8 billion 1996-97, which were offset by large inflows of private capital and external public borrowing.
The balance of trade in manufactures has shown a surplus in 1998 and 1999. Part of this is due to the recovery of exports. However, most of the surplus generated over the past two years was due to a collapse of imports, primarily of capital goods, reflecting the drastic slowdown of investment over the last two years. It is highly likely that, as economic recovery and investment pick up, the trade deficit in manufactures will manifest itself once again.
1 The figures in this chapter are drawn from data tables appearing in chapters 2 to 7.
Figure 1.1 Manufacturing Growth, 1978-99(average annual growth rates)
-10
-5
0
5
10
15
20
25
30
35
40
75-81 82-84 85-88 89-93 94-97 98-99
Source: Large and medium industrial statistics, foreign trade statistics, CBS
Value-added
Manuf. Exports
4 Major Exports
Figure 1.2 Manufactured Exports and Imports, 1978-99 (US$ mill/yr)
0
5,000
10,000
15,000
20,000
25,000
30,000
35,000
Source : Foreign Trade Statistics, CBS (SITC categories 5-8)
Imports Exports
3
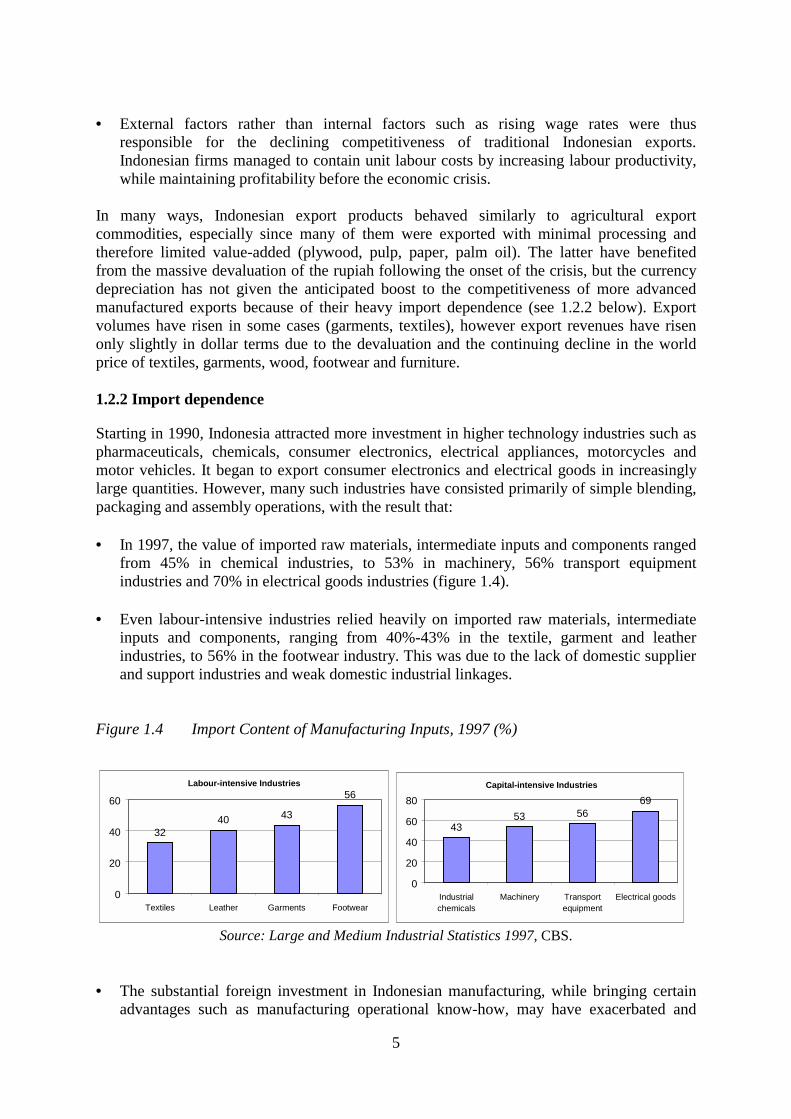
The problems of the Indonesian manufacturing sector can be grouped under two headings: structural weaknesses and organizational weaknesses (box 1.1). The economic crisis has further exacerbated these inherent weaknesses in the patterns of manufacturing development.
Box 1.1. Structural and Organizational Weaknesses
Structural weaknesses Organizational weaknesses
1) Narrow export product base and markets 2) Limited domestic production of intermediate
inputs and components 3) No technological deepening of manufacturing
sector production and exports 4) Underdeveloped capital goods industry 5) Limited net revenue generated in oil/gas
sector 6) Concentration of manufacturing production
in Java, and in Jabotabek in particular 7) Low productivity small & medium-scale
industries, not integrated with large-scale manufacturing segment
1) Weak capacity for technology absorption and adaptation
2) Moderate benefits from FDI to date 3) Weak human resources development 4) Significant market concentration by a few
large firms in many segments of manufacturing
5) Fragmented responsibility for industrial policy and promotion
6) Weak role of industry associations in promoting international competitiveness
In addition to the above issues, the Indonesian manufacturing sector will face the following challenges and constraints in the coming years: • Increasingly stiff competition, in the export markets, from lower-cost producer countries
and other countries, such as China, whose international competitiveness has improved. • Increasing inflows of imported consumer goods due to rapid liberalization, and real threat
of de-industrialization due to displacement of local producers and corporate indebtedness • Additional pressure on balance of payments due to inflows of imported manufactures • Aggressive competition from equally reform-oriented countries for foreign direct
investment (FDI) • Limits to the continuing expansion of manufacturing based on domestic natural resources
such as timber and petroleum • Disappearance of guaranteed export quota markets • Limited ability to borrow off-shore due to the country’s large external debt burden • Demands for balanced regional development as a result of the government’s new policies
of decentralization and regional autonomy. The remainder of this summary chapter presents the study’s findings on these issues, followed by implications for industrial development strategy and policy.

4
1.2 STRUCTURAL WEAKNESSES Indonesia’s success in industrialization was due to macroeconomic stability, export-oriented policy, trade reform, investment licensing deregulation, periodic currency devaluations and investments in infrastructure and basic education. All these policy measures attained investment-driven manufacturing growth rates which were amongst the highest experienced by any country over the last couple of decades. However the rapidity of industrialization led to a relatively shallow industrial structure. 1.2.1 Reliance on a limited number of export products and markets
Manufacturing development relied to a great extent on the rapid expansion of exports in which Indonesia had comparative advantage in terms of plentiful, fairly good quality labour and/or natural resources. However, exports were highly concentrated in terms of both products and markets (figure 1.3). Figure 1.3 Export Product and Market Concentration, 1998
Source: Foreign Trade Statistics 1998, CBS • Five products accounted for nearly half of manufactured exports (plywood, textiles,
garments, electronics and footwear. Market access for two of these, textiles and garments, was dependent on non-tariff barriers to countries abiding by the Multi-fibre Agreement (MFA), while the domestic supply of timber has reached its limit of sustainability.
• Three countries accounted for nearly half of total and manufactured exports (US, Japan
and Singapore), while one country, the US, absorbed nearly half of the total exports of garments and footwear.
• Ten products provided 80% of all the country’s manufactured export revenues. Exports
were thus highly vulnerable to the changing fortunes of these few products in limited markets.
• More importantly, many of the labour-intensive exports selected by Indonesia have
suffered from a secular decline in world prices due to intense international competition, particularly from China and other low-cost Asian producers, from Eastern Europe in the West European market, and from Latin America for the North American market. Indonesian exports also exhibited inelastic demand in industrialized country markets.
% Share of 5 Major Products, 1998in Total Manuf. Exports ($22.5 billion)
12%
11%
6%
12%5%
54%
P lywood Textiles Electronics G arm ents Footwear O thers
% Export Share of three Largest Countries, 1998, All Exports ($49 billion)
14
19
12
55
USA Japan Singapore Oth. Countries
5
• External factors rather than internal factors such as rising wage rates were thus
responsible for the declining competitiveness of traditional Indonesian exports. Indonesian firms managed to contain unit labour costs by increasing labour productivity, while maintaining profitability before the economic crisis.
In many ways, Indonesian export products behaved similarly to agricultural export commodities, especially since many of them were exported with minimal processing and therefore limited value-added (plywood, pulp, paper, palm oil). The latter have benefited from the massive devaluation of the rupiah following the onset of the crisis, but the currency depreciation has not given the anticipated boost to the competitiveness of more advanced manufactured exports because of their heavy import dependence (see 1.2.2 below). Export volumes have risen in some cases (garments, textiles), however export revenues have risen only slightly in dollar terms due to the devaluation and the continuing decline in the world price of textiles, garments, wood, footwear and furniture. 1.2.2 Import dependence
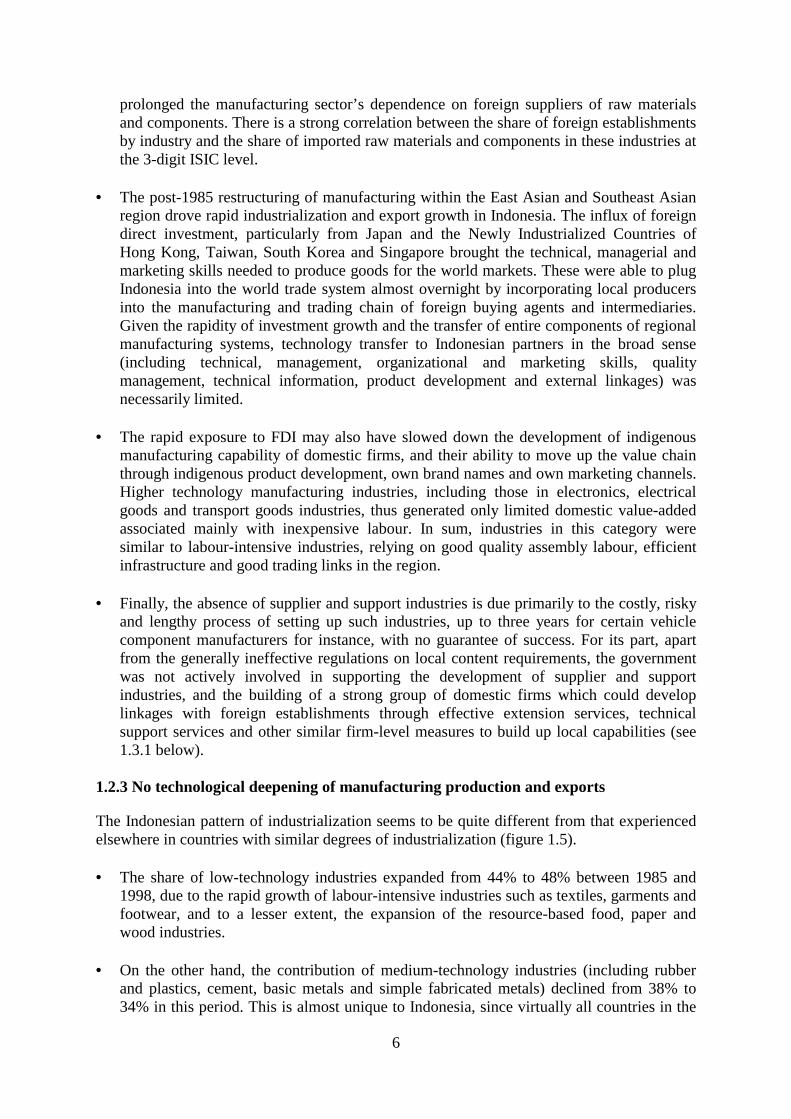
Starting in 1990, Indonesia attracted more investment in higher technology industries such as pharmaceuticals, chemicals, consumer electronics, electrical appliances, motorcycles and motor vehicles. It began to export consumer electronics and electrical goods in increasingly large quantities. However, many such industries have consisted primarily of simple blending, packaging and assembly operations, with the result that: • In 1997, the value of imported raw materials, intermediate inputs and components ranged
from 45% in chemical industries, to 53% in machinery, 56% transport equipment industries and 70% in electrical goods industries (figure 1.4).
• Even labour-intensive industries relied heavily on imported raw materials, intermediate
inputs and components, ranging from 40%-43% in the textile, garment and leather industries, to 56% in the footwear industry. This was due to the lack of domestic supplier and support industries and weak domestic industrial linkages.
Figure 1.4 Import Content of Manufacturing Inputs, 1997 (%)
Source: Large and Medium Industrial Statistics 1997, CBS. • The substantial foreign investment in Indonesian manufacturing, while bringing certain
advantages such as manufacturing operational know-how, may have exacerbated and
Capital-intensive Industries
4353 56
69
0
20
40
60
80
Industrialchemicals
Machinery Transportequipment
Electrical goods
Labour-intensive Industries
3240 43
56
0
20
40
60
Textiles Leather Garments Footwear
6
prolonged the manufacturing sector’s dependence on foreign suppliers of raw materials and components. There is a strong correlation between the share of foreign establishments by industry and the share of imported raw materials and components in these industries at the 3-digit ISIC level.
• The post-1985 restructuring of manufacturing within the East Asian and Southeast Asian
region drove rapid industrialization and export growth in Indonesia. The influx of foreign direct investment, particularly from Japan and the Newly Industrialized Countries of Hong Kong, Taiwan, South Korea and Singapore brought the technical, managerial and marketing skills needed to produce goods for the world markets. These were able to plug Indonesia into the world trade system almost overnight by incorporating local producers into the manufacturing and trading chain of foreign buying agents and intermediaries. Given the rapidity of investment growth and the transfer of entire components of regional manufacturing systems, technology transfer to Indonesian partners in the broad sense (including technical, management, organizational and marketing skills, quality management, technical information, product development and external linkages) was necessarily limited.
• The rapid exposure to FDI may also have slowed down the development of indigenous
manufacturing capability of domestic firms, and their ability to move up the value chain through indigenous product development, own brand names and own marketing channels. Higher technology manufacturing industries, including those in electronics, electrical goods and transport goods industries, thus generated only limited domestic value-added associated mainly with inexpensive labour. In sum, industries in this category were similar to labour-intensive industries, relying on good quality assembly labour, efficient infrastructure and good trading links in the region.
• Finally, the absence of supplier and support industries is due primarily to the costly, risky
and lengthy process of setting up such industries, up to three years for certain vehicle component manufacturers for instance, with no guarantee of success. For its part, apart from the generally ineffective regulations on local content requirements, the government was not actively involved in supporting the development of supplier and support industries, and the building of a strong group of domestic firms which could develop linkages with foreign establishments through effective extension services, technical support services and other similar firm-level measures to build up local capabilities (see 1.3.1 below).
1.2.3 No technological deepening of manufacturing production and exports
The Indonesian pattern of industrialization seems to be quite different from that experienced elsewhere in countries with similar degrees of industrialization (figure 1.5). • The share of low-technology industries expanded from 44% to 48% between 1985 and
1998, due to the rapid growth of labour-intensive industries such as textiles, garments and footwear, and to a lesser extent, the expansion of the resource-based food, paper and wood industries.
• On the other hand, the contribution of medium-technology industries (including rubber
and plastics, cement, basic metals and simple fabricated metals) declined from 38% to 34% in this period. This is almost unique to Indonesia, since virtually all countries in the
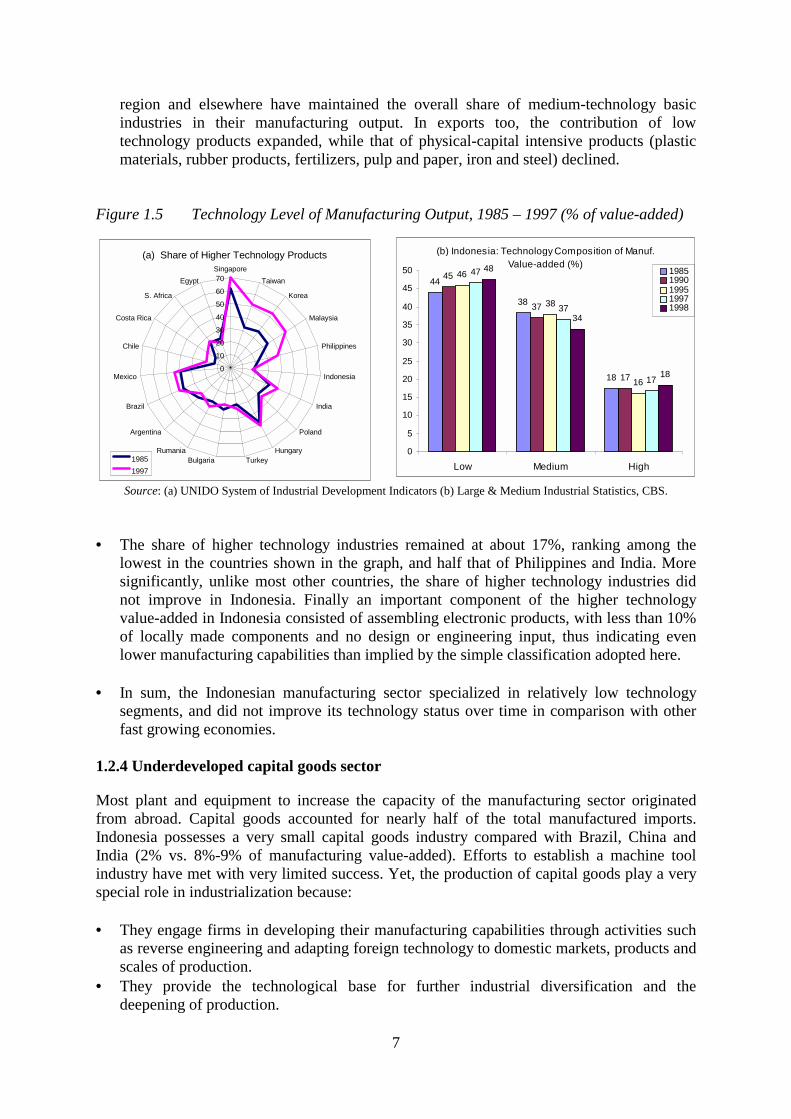
7
region and elsewhere have maintained the overall share of medium-technology basic industries in their manufacturing output. In exports too, the contribution of low technology products expanded, while that of physical-capital intensive products (plastic materials, rubber products, fertilizers, pulp and paper, iron and steel) declined.
Figure 1.5 Technology Level of Manufacturing Output, 1985 – 1997 (% of value-added)
Source: (a) UNIDO System of Industrial Development Indicators (b) Large & Medium Industrial Statistics, CBS. • The share of higher technology industries remained at about 17%, ranking among the
lowest in the countries shown in the graph, and half that of Philippines and India. More significantly, unlike most other countries, the share of higher technology industries did not improve in Indonesia. Finally an important component of the higher technology value-added in Indonesia consisted of assembling electronic products, with less than 10% of locally made components and no design or engineering input, thus indicating even lower manufacturing capabilities than implied by the simple classification adopted here.
• In sum, the Indonesian manufacturing sector specialized in relatively low technology
segments, and did not improve its technology status over time in comparison with other fast growing economies.
1.2.4 Underdeveloped capital goods sector
Most plant and equipment to increase the capacity of the manufacturing sector originated from abroad. Capital goods accounted for nearly half of the total manufactured imports. Indonesia possesses a very small capital goods industry compared with Brazil, China and India (2% vs. 8%-9% of manufacturing value-added). Efforts to establish a machine tool industry have met with very limited success. Yet, the production of capital goods play a very special role in industrialization because: • They engage firms in developing their manufacturing capabilities through activities such
as reverse engineering and adapting foreign technology to domestic markets, products and scales of production.
• They provide the technological base for further industrial diversification and the deepening of production.
(a) Share of Higher Technology Products
0
10
20
3040
50
6070
SingaporeTaiwan
Korea
Malaysia
Philippines
Indonesia
India
Poland
HungaryTurkeyBulgaria
Rumania
Argentina
Brazil
Mexico
Chile
Costa Rica
S. Africa
Egypt
19851997
(b) Indonesia: Technology Composition of Manuf. Value-added (%)
44
38
18
45
37
17
46
38
16
47
37
17
48
34
18
0
5
10
15
20
25
30
35
40
45
50
Low Medium High
19851990199519971998
8
1.2.5 Limited net revenue generated by the oil and gas sector
The large oil and gas sector generated relatively limited surplus. In 1996-97 for instance, total exports of $13 billion were to a large extent offset by imports oil products amounting to $5 billion and oil-related services of another $4 billion, leaving a surplus of just $4-5 billion or 35% of gross revenues. In fact, Indonesia ran an overall deficit in services both in the oil and gas sector and in other services. 1.2.6 Regional concentration
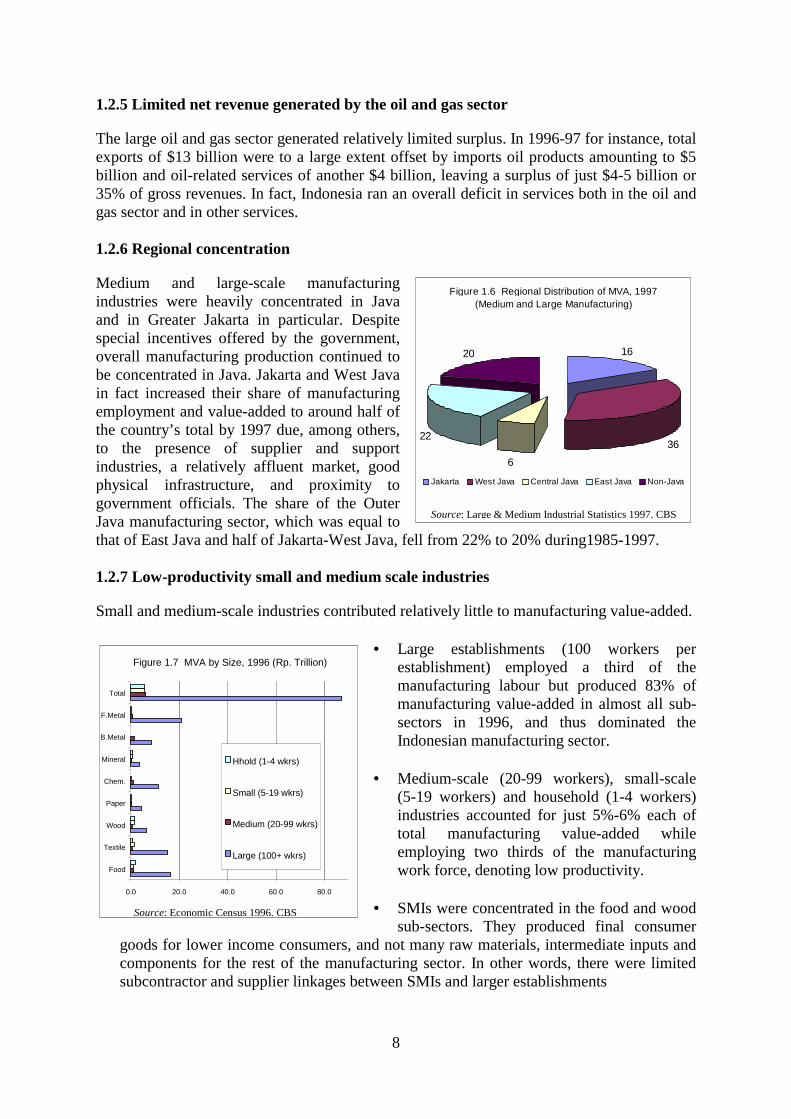
Medium and large-scale manufacturing industries were heavily concentrated in Java and in Greater Jakarta in particular. Despite special incentives offered by the government, overall manufacturing production continued to be concentrated in Java. Jakarta and West Java in fact increased their share of manufacturing employment and value-added to around half of the country’s total by 1997 due, among others, to the presence of supplier and support industries, a relatively affluent market, good physical infrastructure, and proximity to government officials. The share of the Outer Java manufacturing sector, which was equal to that of East Java and half of Jakarta-West Java, fell 1.2.7 Low-productivity small and medium scale
Small and medium-scale industries contributed rela
• LargestamanmansectIndo
• Med
(5-1indutotalempwor
• SMI
sub-goods for lower income consumers, and not mcomponents for the rest of the manufacturing subcontractor and supplier linkages between SM
Figure 1.6 Regional Distribution of MVA, 1997 (Medium and Large Manufacturing)
16
366
22
20
Jakarta West Java Central Java East Java Non-Java
S
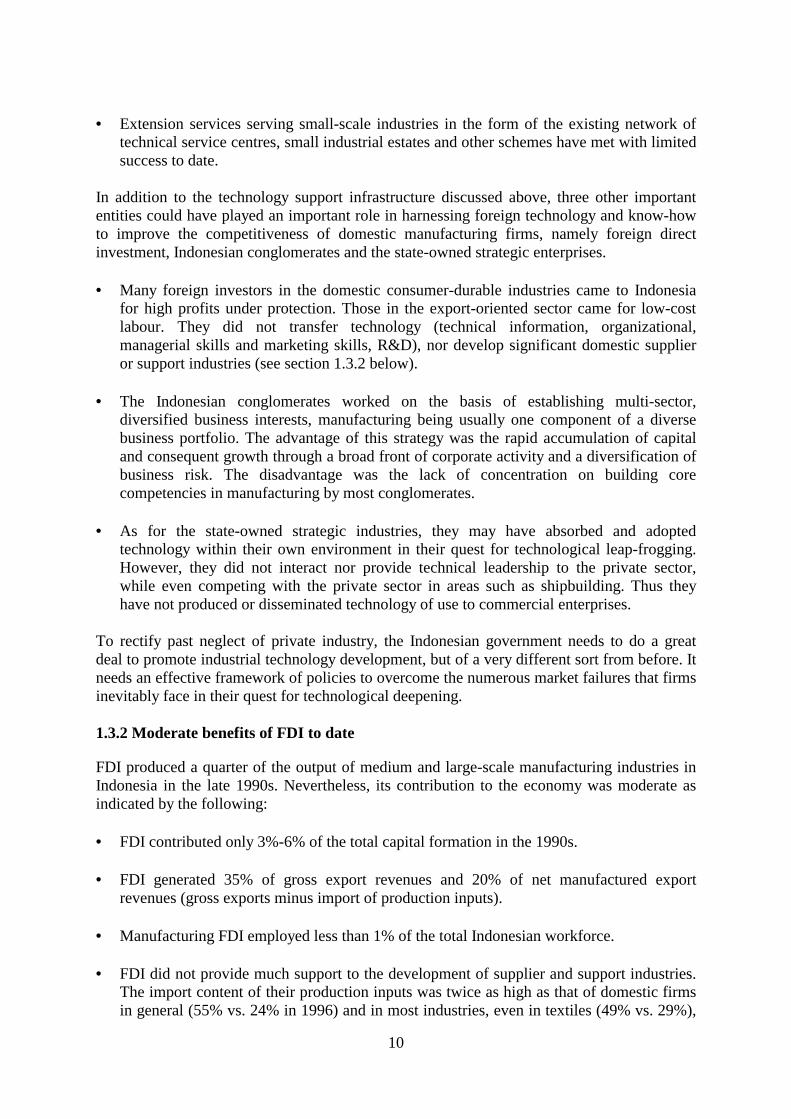
Figure 1.7 MVA by Size, 1996 (Rp. Trillion)
0.0 20.0 40.0 60.0 80.0
Food
Textile
Wood
Paper
Chem.
Mineral
B.Metal
F.Metal
Total
Hhold (1-4 wkrs)
Small (5-19 wkrs)
Medium (20-99 wkrs)
Large (100+ wkrs)
S
Source: Large & Medium Industrial Statistics 1997, CB
from 22% to 20% during1985-1997.
industries
tively little to manufacturing value-added.
e establishments (100 workers per blishment) employed a third of the ufacturing labour but produced 83% of ufacturing value-added in almost all sub-ors in 1996, and thus dominated the nesian manufacturing sector.
ium-scale (20-99 workers), small-scale 9 workers) and household (1-4 workers) stries accounted for just 5%-6% each of manufacturing value-added while loying two thirds of the manufacturing k force, denoting low productivity.
s were concentrated in the food and wood
Source: Economic Census 1996, CB sectors. They produced final consumer any raw materials, intermediate inputs and sector. In other words, there were limited Is and larger establishments
9
1.3 ORGANIZATIONAL WEAKNESSES Recognizing the need to step up efforts to develop human resources and industrial technology the government, over the past twenty years, has made available substantial resources of its own as well as through loans from international agencies, to address weaknesses in these two areas. However, government interventions have not succeeded in improving the situation to date. The nature, extent and patterns of problems remain much the same as before, due mainly to the government’s own limited capacity in implementing development projects in these areas, project overload (leading to dissipation of scarce administrative and managerial capacity), as well as the misallocation of resources in non-priority areas. 1.3.1 Weak industrial technology development
Indonesian firms have not been able to draw on technical information and other support services provided by the country’s industrial technology development infrastructure to upgrade their manufacturing capabilities due mainly to the following reasons: • The existing infrastructure consists almost entirely of government-operated R&D and
technical institutes. Unlike in other Asian countries, there is virtually no private provision of manufacturing capability support services.
• The state-owned R&D institutes (under the Agency for Assessment of Technology BPPT
and the Indonesian Institute of Science LIPI) have catered mainly to the needs of state-owned strategic industries. Efforts to encourage them to carry out research of more relevance to private firms, with government financial support, have not borne fruit
• The Ministry of Industry and Trade (MOIT) sectoral research institutes, regional testing
laboratories and industrial research and testing centres, due to poor funding and weak management structure, have not provided relevant services to manufacturing firms
• Public technology information services operated by BPPT and MOIT are not kept up-to-
date and are rarely used by private firms. SMIs have even lower access to these. • Metrology, standards, testing and quality assurance (MSTQ) services do not meet the
modern needs of Indonesian manufacturing for a variety of reasons, including the absence of a set of industrial standards, lack of international accreditation of laboratories, obsolete national laboratory equipment and poorly trained staff, lack of international recognition of many national standards, lack of awareness and demand for such services on the part of the manufacturing firms themselves, and poor or inadequate services by existing providers, forcing many exporters to routinely use laboratories abroad.
• Indonesia does not have productivity centres to improve the productivity, product quality,
delivery and manufacturing methods of manufacturing firms. • Industry associations have not played any role as yet in upgrading the manufacturing
capabilities of their members. • Government finance for public institutions has been inadequate, particularly in
comparison with neighbouring countries, though existing resources could have been used with greater effectiveness.
10
• Extension services serving small-scale industries in the form of the existing network of
technical service centres, small industrial estates and other schemes have met with limited success to date.
In addition to the technology support infrastructure discussed above, three other important entities could have played an important role in harnessing foreign technology and know-how to improve the competitiveness of domestic manufacturing firms, namely foreign direct investment, Indonesian conglomerates and the state-owned strategic enterprises. • Many foreign investors in the domestic consumer-durable industries came to Indonesia
for high profits under protection. Those in the export-oriented sector came for low-cost labour. They did not transfer technology (technical information, organizational, managerial skills and marketing skills, R&D), nor develop significant domestic supplier or support industries (see section 1.3.2 below).
• The Indonesian conglomerates worked on the basis of establishing multi-sector,
diversified business interests, manufacturing being usually one component of a diverse business portfolio. The advantage of this strategy was the rapid accumulation of capital and consequent growth through a broad front of corporate activity and a diversification of business risk. The disadvantage was the lack of concentration on building core competencies in manufacturing by most conglomerates.
• As for the state-owned strategic industries, they may have absorbed and adopted
technology within their own environment in their quest for technological leap-frogging. However, they did not interact nor provide technical leadership to the private sector, while even competing with the private sector in areas such as shipbuilding. Thus they have not produced or disseminated technology of use to commercial enterprises.
To rectify past neglect of private industry, the Indonesian government needs to do a great deal to promote industrial technology development, but of a very different sort from before. It needs an effective framework of policies to overcome the numerous market failures that firms inevitably face in their quest for technological deepening. 1.3.2 Moderate benefits of FDI to date
FDI produced a quarter of the output of medium and large-scale manufacturing industries in Indonesia in the late 1990s. Nevertheless, its contribution to the economy was moderate as indicated by the following: • FDI contributed only 3%-6% of the total capital formation in the 1990s. • FDI generated 35% of gross export revenues and 20% of net manufactured export
revenues (gross exports minus import of production inputs). • Manufacturing FDI employed less than 1% of the total Indonesian workforce. • FDI did not provide much support to the development of supplier and support industries.
The import content of their production inputs was twice as high as that of domestic firms in general (55% vs. 24% in 1996) and in most industries, even in textiles (49% vs. 29%),
11
garments (57% vs. 25%), footwear (66% vs. 41%) and electronic components (92% vs. 65%).
• The transfer of technology from foreign to domestic establishments has been rather
moderate in Indonesia as indicated by: (i) lack of progress in the development of domestic supplier and support industries during the 1990s noted above; (ii) lack of technological deepening and diversification in the industrial structure of the country in the 1985-1990 period; (iii) no evidence that foreign establishments in the labour-intensive export-oriented industries undertook more training of their workers then domestic firms; and (iv), weak external linkages of domestic firms, as they continued to rely on foreign buying agents and intermediaries to procure their inputs as well as to market their final products on the world markets, and no linkages with R&D institutions.
• FDI is likely to have generated moderate tax revenues in the 1990s. • FDI had an adverse impact on the balance of payment. The remitted profits and other
investment income earned on accumulated FDI in Indonesia were larger than new FDI inflows throughout the 1985-1999 period. In the 1998-99 period in particular, in the absence of new FDI inflow, the net outflow of foreign exchange due to FDI was particularly large, reaching $8 billion per year. Furthermore, FDI contributed to the persistent deficit in manufacturing goods due to its larger propensity to import production inputs from abroad.
Domestic firms continued to account for the bulk of manufacturing production, employment and export earnings. Rather than lead economic growth, it is the latter and the size of the domestic market, as well as the initial export success of domestic firms (created in part by the country’s relatively open trading environment) which appear to have attracted most FDI. 1.3.3 Weak human resource development
The current education and training system does not meet the needs of industry: • The general secondary education school system relies on rote learning, and does not
develop adequate mastery of basic literacy, basic numeracy, and thinking and creative skills. School leavers are thus not equipped with the knowledge and skills required for a more complex and diversified manufacturing sector, and cannot fully benefit from in-plant training.
• The senior secondary technical vocational schools, two thirds of it in the private sector,
are poorly equipped and staffed, and do not impart sufficient practical knowledge. As the result, the labour market does not differentiate between general and vocational senior secondary school leavers, paying them the same wage and allocating them the same jobs in industry.
• Post-secondary vocational technical education is provided primarily by the government
and not the private sector. The changes in technology and product mix taking place in the economy have not been substantial enough to bring about corresponding market changes in the demand and therefore the supply of the required training from the private sector.
12
• At the higher education level, science and engineering institutions produce poor quality graduates who are unable to work independently, and who have inadequate general skills in problem solving, analyzing technical problems, teamwork, technical report writing and oral presentation.
• As for in-plant training, the majority of firms find it unnecessary to train their workforce
due to the dominance of simple processes in their plants. Those that do, mostly in the higher-technology category, have not done it systematically or extensively.
1.3.4 Market concentration
High levels of concentration were found across large segments of manufacturing, potentially stifling domestic competition. The four leading establishments firms produced more than 75% of the total output in more than half of the 300 industrial branches. In fact these four largest establishments accounted for virtually all the production in more than a quarter of all industrial branches. The average unweighted four-firm concentration ratio (CR4) remained above 70% during 1990-1997, while the weighed CR4 was 55% in 1996. 1.3.5 Fragmented responsibility for industrial promotion and policy
Due to the complexity of the industrial sector, various aspects of industrial policy and promotion are shared among ten government departments. • Taking sectoral ministries first, beside the Ministry of Industry and Trade, the
Departments of Agriculture and Health are respectively in charge of selected agro-processing and pharmaceutical industries, while the Ministry of Cooperatives and Small-scale Enterprises is responsible for small-scale industries, and the Ministry of Mines and Energy was fully responsible for oil and gas production and refineries. The central Ministries of Finance, Investment and State-owned Enterprises respectively handled taxation matters, investment policy and licensing and state-owned enterprises.
• The National Development Planning Board is responsible for planning and resource
allocation, as well as approving and monitoring all industrial projects funded by bilateral, multilateral and national agencies. The Board for Science and Technology is charged with developing and disseminating technology.
• Since the onset of the crisis, the Indonesian Bank Restructuring Agency (IBRA) owns a
large number of manufacturing establishments and appoints its officials on the board of directors of companies pledged as collateral by banks.
Due to the shared responsibility at the central level, and the increasingly important role played by provisional and district offices of the Ministry of Trade in the wake of regional autonomy, there is a need for more strategic and tightly coordinated industrial policy and promotion. 1.3.6 Relatively narrow focus of industry associations
Interactions between government officials and the existing industry associations have been mostly limited to taxation and regulations. They have not often taken the form of meaningful public-private dialogue and collaboration in the following important areas:
13
• Investment and trade promotion strategy • Industrial and export diversification • Productivity enhancement and mastery of product and process technology • International competitiveness • Skills development The analytical capacity of most industry associations needs to be upgraded to enable them to contribute effective arguments and ideas related to industrial development and increasing competitiveness, especially needed in the face of regional and global liberalization. 1.4 IMPLICATIONS FOR INDUSTRIAL STRATEGY AND POLICY The above findings suggest that a strategic realignment in industrial policy is required to regain the momentum of industrialization of the early 1990s, to maintain market share in the world as well as to successfully compete against increasingly cheaper imported manufactures. Indonesia cannot indefinitely continue to rely on a narrow range of labour-intensive and resource-based products such as plywood, textiles, garments and footwear to spearhead manufacturing development as in the past. Indonesia faces the challenges of channelling domestic investment resources, attracting more foreign direct investment and directing more technology and other support infrastructure to successfully transform its industrial sector into a more diverse, deeper and technologically more reliant sector which can effective compete in the global market. On the other hand, now that production, sourcing and distribution have all become globalized, it has the opportunity to attract the kind of FDI that increases the technological and industrial competitiveness of the Indonesian manufacturing sector. There is no doubt that an overall industrial strategy to transform the manufacturing sector should be designed in the context of open, deregulated and increasingly liberalized markets, and in the context of transparent and competitive pricing in all transactions between government agencies and private sector firms. However, while trade reforms and transparency are necessary to address the immediate, short-term constraints of the manufacturing sector, they are not sufficient by themselves for the next stage of industrial development. In other words, progress will not naturally evolve in the context of Indonesia’s present endowments and policy framework, nor in the international context of fierce competition in the globalized market place. As markets liberalize, and investment becomes ever more mobile, the determinants of industrial development will increasingly shift from trade, tariff and price-dependent strategies of nations to the business strategies of firms. In other words, the focus of competition will move from nations to firms. Indonesia’s tariff and licensing-driven trade and industry strategy must give way to one which strengthens the competitiveness of firms and which spans the patterns of investment, innovation, industrial organization and structure. Ideally, the process of economic liberalization should be a gradual and controlled process of opening up, accompanied by a strategy of industrial restructuring and upgrading in collaboration with the private sector.
14
In sum, just as the import-substitution strategy of the 1960s and 1970s gave way to an export-oriented strategy in the 1980s and 1990s, the changing international environment calls for more creative and innovative strategies which rely on closer public-private partnerships, as the regulatory or dirigiste approach becomes increasingly incompatible with the current free-trade era. However, it should be stressed that the role of government in industrial development, while necessary, should change from that in the past. The government should redefine industrial strategy as the attainment of a common public-private vision of industrialization, and the basic implementation mechanisms as shared public-private efforts. A suggested set of objectives is presented in box 1.2 below, as a seven-point agenda to achieve industrial transformation.
Box 1.2 Seven-point Industrial Transformation Agenda 1. Improve the overall balance of trade in manufacturing, not just in terms of increasing exports 2. Diversify the export base and diversify export markets 3. Diversify and deepen the industrial base 4. Identify and promote regional potentials, and promote industrialization outside Java 5. Increase the knowledge and skills of the manufacturing work force at all levels 6. Develop manufacturing capability of indigenous firms in order to move up the value chain 7. Promote industrial linkages between SMIs and larger establishments and integrate them for
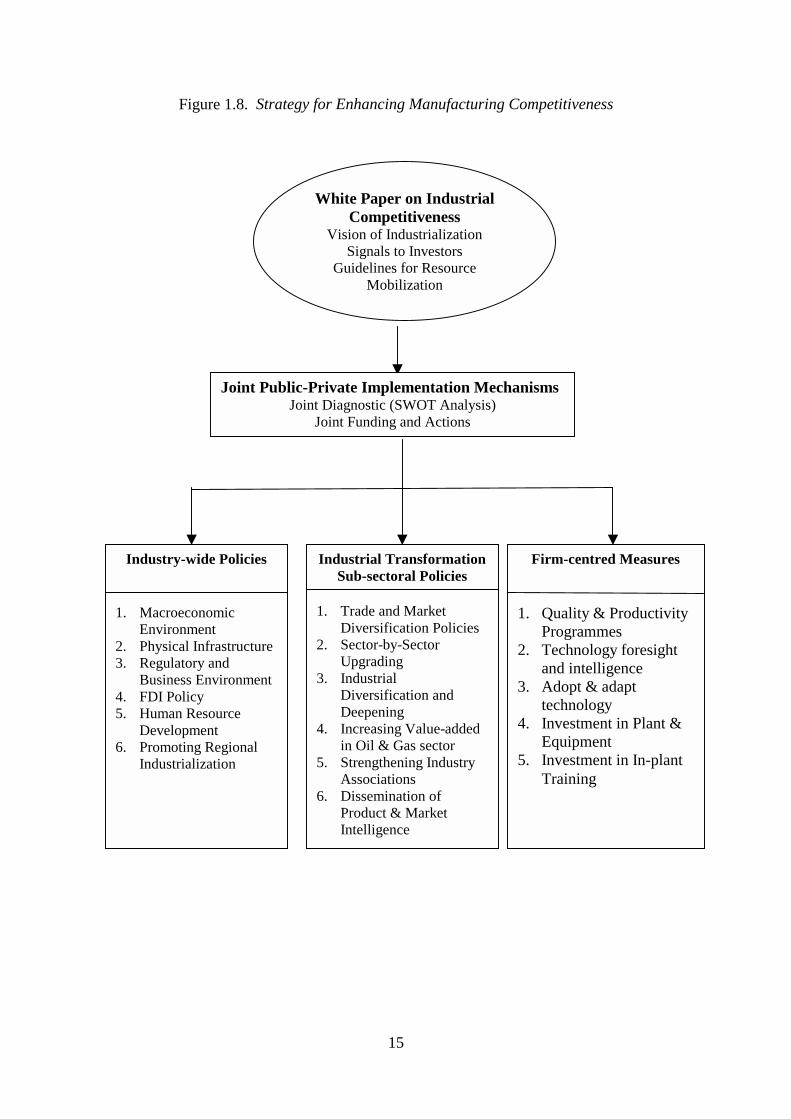
mutual benefit In close collaboration and formal partnership with the private sector, the government should formulate and implement policies at three levels (figure 1.8). Industry-wide policies will aim at reducing country costs and enhancing the transaction efficiency for business, including the necessary macroeconomic, regulatory and business environment, the physical infrastructure, and the educated and skilled labour force under which manufacturing firms can invest and grow. At the sub-sectoral level, the government can support the development of strategic initiatives and promotional activities in priorities industries. And at the firm level, the government will aim to increase the manufacturing capabilities of local enterprises. This new approach to industrial strategy is elaborated further below. 1.4.1 White Paper on Industrial Competitiveness
At the outset, the government and the private sector should jointly produce a joint public-private sector long-term vision of where Indonesia wants to be in terms of industrialization (what types of products it would like to produce and export, and what other types of goods it should continue to import), to provide broad signals to investors, and to develop guidelines for public-private resource mobilization. This collaborative process is by itself very important to reach a common vision, which can be articulated in a joint public-private White Paper on Industrial Competitiveness. Under the co-sponsorship of the Coordinating Ministry for Economy, Finance and Industry, the Ministry of Industry and Trade, the National Economic Council and the National Business Development Council, the paper should be formulated by a joint inter-ministerial group and representatives of the private sector, research institutes and international organizations.
15
Figure 1.8. Strategy for Enhancing Manufacturing Competitiveness
White Paper on Industrial Competitiveness
Vision of Industrialization Signals to Investors
Guidelines for Resource Mobilization
Industry-wide Policies 1. Macroeconomic
Environment 2. Physical Infrastructure 3. Regulatory and
Business Environment 4. FDI Policy 5. Human Resource
Development 6. Promoting Regional
Industrialization
Industrial Transformation Sub-sectoral Policies
1. Trade and Market
Diversification Policies 2. Sector-by-Sector
Upgrading 3. Industrial
Diversification and Deepening
4. Increasing Value-added in Oil & Gas sector
5. Strengthening Industry Associations
6. Dissemination of Product & Market Intelligence
Firm-centred Measures 1. Quality & Productivity
Programmes 2. Technology foresight
and intelligence 3. Adopt & adapt
technology 4. Investment in Plant &
Equipment 5. Investment in In-plant
Training
Joint Public-Private Implementation Mechanisms Joint Diagnostic (SWOT Analysis)
Joint Funding and Actions
16
The White Paper should identify a number of priority industries and export products which the government and the private sector can jointly promote, without however prejudicing other industries. It should contain the following: • A realistic assessment of the competitive potential of various sectors. • A promotional programme focused on priority areas, since government resources for
industrial promotion are limited. Intervening in a large number of unrelated activities will risk diffusion and failure.
• A common strategic vision of industrialization for all central government departments
concerned with implementing various aspects of industrial policies, as well as all provincial and district authorities, which will become increasingly involved in regional industrial development. Unlike policy guidelines and objectives contained in the GBHN and PROPENAS, the strategic vision should be expressed in sufficiently concrete terms, and with clearly laid-out priorities, to provide an overall operational framework for medium-term industrial development.
• A coherent strategy for industrial technology development and the development of the
manufacturing capabilities of private firms. An industrial strategy, which can elicit desirable responses from the largely private manufacturing sector in a free-trade environment, will necessarily be more complex to formulate and implement. Nevertheless, the private sector may welcome the opportunity to contribute to a common overall strategic vision as to the desirable directions of manufacturing development in the medium and long term. Critical to this is the need to initiate and maintain close public-private dialogue. The government can accelerate the process of industrial transformation and the establishment of a more competitive industrial sector by sending signals and switching government resources to build critical endowments in support of priority private sector needs. 1.4.2 Industry-wide Policies
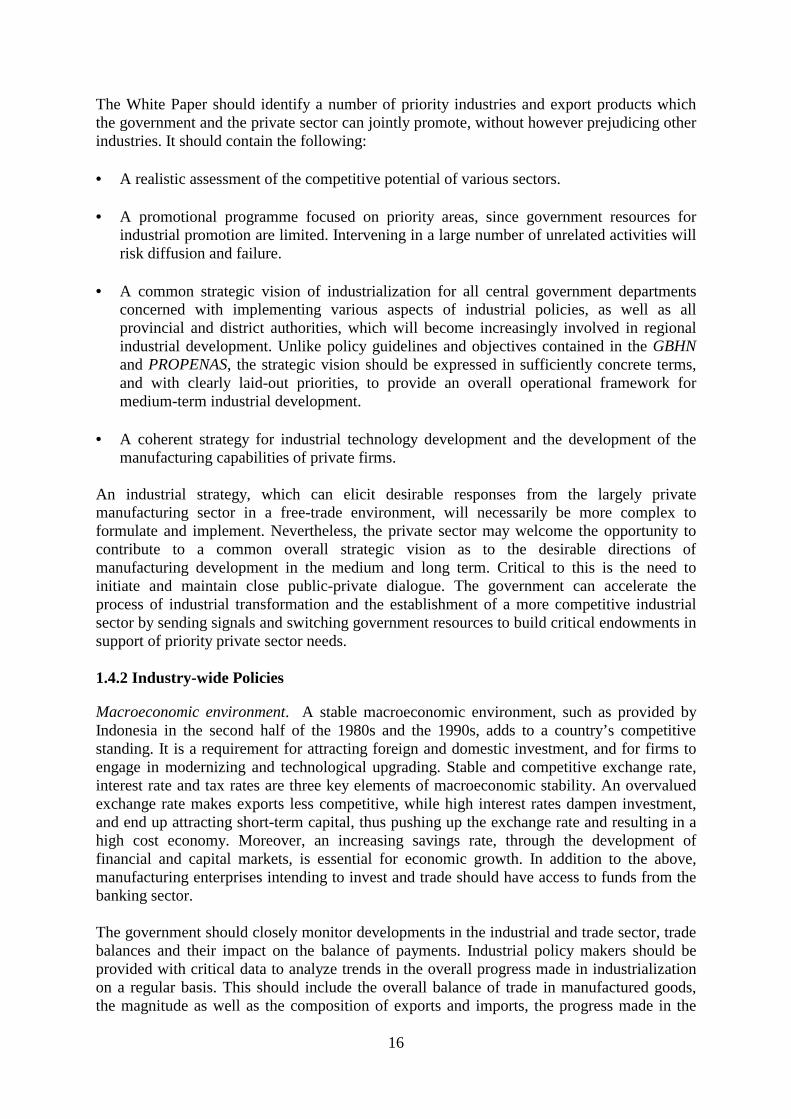
Macroeconomic environment. A stable macroeconomic environment, such as provided by Indonesia in the second half of the 1980s and the 1990s, adds to a country’s competitive standing. It is a requirement for attracting foreign and domestic investment, and for firms to engage in modernizing and technological upgrading. Stable and competitive exchange rate, interest rate and tax rates are three key elements of macroeconomic stability. An overvalued exchange rate makes exports less competitive, while high interest rates dampen investment, and end up attracting short-term capital, thus pushing up the exchange rate and resulting in a high cost economy. Moreover, an increasing savings rate, through the development of financial and capital markets, is essential for economic growth. In addition to the above, manufacturing enterprises intending to invest and trade should have access to funds from the banking sector. The government should closely monitor developments in the industrial and trade sector, trade balances and their impact on the balance of payments. Industrial policy makers should be provided with critical data to analyze trends in the overall progress made in industrialization on a regular basis. This should include the overall balance of trade in manufactured goods, the magnitude as well as the composition of exports and imports, the progress made in the
17
implementation of the public-private investment programme, the progress made in diversifying export products and markets, the unit prices of key exports, and the balance of trade in the oil and gas sector. Physical infrastructure. Good quality transport, telecommunications and power are the three most important components of physical infrastructure sought after by investors, and these were important factors in Indonesia’s success in attracting both domestic and foreign investments in the manufacturing sector. It is important for government to consult the private sector as the requirements and location of necessary additional infrastructural investments. In addition, the private sector involvement in the provision of telecommunications and power should be encouraged through the establishment of a supportive regulatory framework for private investment, and the commercialization and privatization of existing transport, telecommunications and energy generation assets. Adequate transport facilities and economical freight costs and port charges are important, however time and reliability are increasingly dominant factors in the production of higher-value goods. The availability of efficient traditional (telephone, facsimile) and new (internet) telecommunication services will enable manufacturers to take advantage of globalization and regionalization trends in location, as well as allowing clients to request rapid response to inquiries and orders through electronic commerce. Regulatory and business environment. The regulatory and business environment in an important element of country costs, and is often cited as the major impediment in facing foreign investors in Indonesia. The government should hold regular consultations with the private sector to listen to their concerns, to identify the most serious bottlenecks in these areas, and to provide an undertaking to rectify them in a given period of time. The judicial system and the rules and institutions that affect FDI, including contract enforcement, bankruptcy law, and competition policy regulations and enforcement are recognized factors in attracting and retaining investors, and of country competitiveness. Effective anti-dumping legislation, institutions and enforcement should also receive priority to protect manufacturing enterprises from unfair competition. To lower transaction costs, the government should be unrelenting in its efforts to reduce unnecessary administrative and bureaucratic procedures to speed up the investment approval process, as well as to simplify tax and customs systems for existing enterprises. Unnecessary labour regulations, such as rigid salary schedules for expatriate workers according to occupation and nationality, should be abolished. FDI policy. In addition to investment in physical infrastructure, education and training, and in the improvement of the regulatory and business environment, the following measures are specifically required to attract foreign direct investment: • Provide clearer, unambiguous and better information to potential investors to establish a
distinct image for Indonesia or to alter their negative perception. Since effective promotional efforts are highly skill-intensive and can be expensive, they should be: • Focussed • Professionally prepared • Responsive to investor needs and concerns
18
• Improve the implementation of the one-stop investment approval process at the national and regional levels
• Support local capabilities and develop a group of strong domestic firms which can offer
business linkage opportunities with foreign partners • Use FDI as vehicle for the development of new industries and for maximizing technology
transfer. The government should target investment promotion to match technology-based medium-scale foreign companies with suitable domestic partners to promote technology-based international partnerships in such areas as capital goods, component manufactured and high technology.
Human resource development. The current secondary education system is more suited to producing school leavers for the repetitive nature of shop floor manufacturing processes currently in use in many export-oriented labour-intensive industries. As the country moves up the technology ladder and begins to produce more complex products in greater volumes such as capital goods and advanced chemicals, manufacturers will require workers able to use judgement and other thinking skills in the operation of advanced manufacturing processes and in the maintenance and repair of complex automated production equipment. • The industry associations and the Ministry of Industry and Trade (representing the users
of educated and trained manpower) and the Ministries of Education and Manpower (representing the producers of skills and knowledge) should establish a forum to continually identify the problems and agree on improvements to develop the skills, knowledge and attitudes required by the increasingly knowledge-based industry at the secondary general school, secondary vocational school, post-secondary vocational technical and tertiary education (university and diploma) levels.
• The private sector should be encouraged to establish and operate demand-driven technical
training centres through financial and other incentives, under a very carefully designed industry-managed, and government supported, quality control and accreditation system.
Promoting regional potentials and regional industrialization. The strong impetus given by the present government to decentralization and regional autonomy will provide the provinces a new and powerful channel to build their manufacturing base by formulating policies to attract both domestic and foreign manufacturing investment. While this process will create many new opportunities, the competition for scarce investment funds between provinces will at the same time raise new challenges to make optimum use of available investment funds. The provincial governments will need to intensify cooperation among them to avoid being played one against the other by potential domestic and foreign investors. In addition, central government’s role will be crucial to coordinate their individual industrial policies to achieve maximum benefits from their relative comparative advantages and local resources. Pro-active central government policies and guidelines will be necessary to achieve effective cooperation and coordination between the provincial government in the following areas: • Identification of regional potential, specializations and priorities taking into account
economies of scale

19
• Creation of industrial clusters and provision of relevant information regarding business opportunities.
• Adherence to common minimum national standards regarding labour conditions and
environment. • Harmonization of investment incentives, particularly concerning tax holidays and other
fiscal incentives. 1.4.3 Sub-sectoral Policies
Non-discriminatory policies such as those outlined above have gained favour over those with a sub-sector or industry focus. They require less detailed information and less implementation capacity on the part of government agencies, while averting the risk that policy makers would pursue capacity creation in irrelevant industries. However, the practice of policy implementation has shown that many policies need to sub-sector specific for the following reasons: • Trade and commercial policies, beyond an initial thrust towards trade liberalization and
reform with universal rules, need to be formulated according to the specific needs of different industries, for instance to deter anti-dumping and unauthorized subsidies, as well as offering temporary relief when necessary
• Export promotion programmes often involve industry associations are usually sub-sector
specific • Industrial restructuring programmes and cluster support policies are industry-specific • Some sub-sectors are characterized by significant market failures, externalities or
technological economies of scale, calling for targeted support for capacity creation • Government-private sector networks are generally organized around sub-sector issues • Sub-sector policies are a natural response to addressing issues of competitiveness Trade and market diversification policies. Exports must continue to grow, not only to provide valuable foreign exchange, but to speed up industrial transformation, reap externalities and master international best practice, which all come from competing and trading in international markets. Exports are also necessary to maintain balance of payment viability, in view of the country’s large external debt. Indonesia’s share in world markets is still small, and the scope for expansion still substantial. • A joint public-private comprehensive assessment of past export diversification policies
and measures, and why they have not succeeded • Export promotion efforts should be more focussed and better targeted at a small number
of selected products and countries with high potential. This should be undertaken on the following basis:
20
• Joint public-private selection of export products and markets, taking into account positive price trends.
• Export products should be selected in terms of net export benefits (gross export earnings minus imported inputs).
• Existing mechanisms for providing trade financing are still cumbersome and should be
greatly improved. Industrial transformation programme. An industrial transformation agenda should consist of the following steps: • Stocktaking, industry-by-industry: Analyze strengths and weaknesses (SWOT analysis)
in various industries, to reach public-private consensus on medium-term objectives for sub-sector development.
• Operational programme: Industry associations and other public-private sector
representatives to define initiatives to enhance the competitiveness of all the firms in priority sector, and prepare initial cost estimates (bottom-up approach).
• Resource mobilization plan: Identify sources of funding for industry-specific operational
programmes, and agree on cost-sharing arrangements between private (domestic and foreign) sector, public sector and overseas development funds.
• Implementation plan: Develop procedures and mechanisms for implementing the
industry-specific operational programmes for industrial transformation, and for monitoring and evaluating the programmes.
Industrial diversification and deepening. The broadening of the manufactured base should be achieved through accelerated development in four areas: • Establishment of supplier and support industries to produce intermediate inputs and
components including in the chemical, consumer electronics, electrical appliance and motorcycle and motor vehicle industries (backward linkages).
• Promotion of downstream industries to increase value-added in exports (forward
linkages). • Production of basic machine tools and other industrial equipment. The production of
capital goods and components should be promoted both domestically and for FDI due their special role in the manufacturing learning process and technological mastery
• Expansion of medium-technology industries (plastics, paper products, rubber, iron and
steel, non-mineral metallic products, and iron and steel). Past government efforts in deepening and diversifying the industrial base, for instance in establishing a component industry for motor vehicle manufacturing and a machine tool industry, have not succeeded. The factors responsible for this lack of success should evaluated, on the basis of which new policies and strategies should be designed. Furthermore, it should also take into account the inherited structure and organization of the manufacturing
21
sector such as size and location, which have evolved due to historical as well as technological indivisibility reasons, and build upon this to promote core competencies and improve competitiveness. Increasing value-added in the oil and gas sector. The oil and gas sector is characterized large trade imbalances as well as substantial discontinuities in the value-chain of petrochemical products. Domestic value-added should be increased and import dependence reduced by: • Increasing the domestic production capacity of refineries and petrochemical feedstock • Encouraging domestic firms to supply services to the oil and gas sector including freight,
insurance, exploration and other related services Strengthening industry associations. The government and the private sector should work together to strengthen private sector industry associations, particularly in the areas of: • Competitiveness analysis • Dissemination of international best practice (industrial organization, management, quality
management, manufacturing techniques) • Establishment and operation of industry-level and customer-oriented productivity centres • Joint management and operation of existing government-owned technical centres, with
eventual transfer of ownership in the future Dissemination of product and market intelligence. The industry associations, with assistance from government, can provide a very useful service to domestic and foreign entrepreneurs who wish to invest in the production of inputs or final products for both the domestic as well as export markets. Product-based information would include: • Market prospects both at home and abroad, price trends and quality requirements • Information referral services of prospective clients and machinery and equipment
suppliers • Estimates of investment costs and sources of investment funding • Guidance in negotiating contracts with foreign investors and equipment suppliers 1.4.4 Firm-centred policies
The government should encourage indigenous firms to develop their manufacturing capability by acquiring and apply technology in its broad sense, including skills (technical, managerial, industrial organization and marketing), technical information, manufacturing techniques, quality management, product development, and external linkages to enhance their competitiveness. Firm-level policies aim at encouraging producers towards best-practice standards in the following areas in particular:
22
• Adoption of total quality and productivity programmes • Technological upgrading • Investment in plant and industrial skills • Moving small and medium-scale industries into specialized, high skill market niches Total quality and productivity programmes. The application of continuous improvement, minimum waste of energy, materials and time, zero defects and other aspects of quality can greatly reduce production inefficiencies and enhance the competitiveness of firms. To reach companies, productivity centres and technical institutes and centres should be in a position to provide effective and competent extension services. In addition to expanding the existing programmes of on-the-job transfer of production know-how by technical experts from Japan and elsewhere, additional incentives can also be provided to companies to finance specialized consultant services. Technological upgrading. While quality and productivity programmes are a prerequisite for most Indonesian firms at their current level of development, their productivity gains will eventually be exhausted. Firms will then need to compete on the basis of product differentiation and innovation, as well as cost and quality. Firms will need to build the capacity to undertake product adaptation and development by upgrading their technology in the following way: • Domestic firms and affiliates of foreign firms need not aim to innovate at world frontiers,
but should be encouraged to adapt and assimilate new technologies and create new products on the basis of existing technologies. For example, the government and the private sector can jointly present awards of excellence to particularly innovative firms to give them public and international recognition.
• Firms should be encouraged, through the dissemination of relevant information, to
acquire arms’ length technology through technology licensing, technology transfer agreement, reverse engineering and adaptation to build their own capabilities.
Investment in equipment and training. The Government should consider tax and other incentives for upgrading of plant and equipment, and of workers and managers through in-plant technical and management training. Increasing the productivity of small and medium industries (SMIs). A mature industrial structure is characterized by small and medium-scale industries moving into highly specialized market niches where high levels of skills are often required. The major challenge and opportunity facing SMIs is therefore to become integrated in the overall manufacturing sector as suppliers of raw materials, intermediate inputs and components to other establishments, both small and large. The following measures could be undertaken to develop sub-contracting arrangements and SMIs in general:
23
• Provide incentives for assemblers to identify potential suppliers for components, and to provide technical assistance to them to develop their capabilities, including the development of a vendor improvement and certification programme.
• Encourage local design and engineering capabilities to produce components based on
client specifications, and the ability to reverse engineer products or create original designs on the basis of agreed specifications.
• Intensify interaction between the government technology support institutions and the
private sector, through joint management of such institutions with industry associations. • Deliver a private-sector led active outreach programme to SMIs through productivity
centres, with qualified and motivated teams visiting the industries, offering free diagnosis and putting together packages of technology, training and finance.
• Undertake a thorough evaluation of all existing schemes and redirect viable schemes to
private sector providers. • Rationalize the SMI credit programmes based on the evaluation of the effectiveness and
performance of the numerous existing credit schemes, and improve access to market-based finance.
• Study and seek to adapt successful SMI programmes in other countries such as Hong
Kong and Taiwan. The latter has provided extensive technical and managerial assistance by matching SMIs in need of services with appropriate consultants in the private sector, and has therefore managed to contract out most of its services to the private sector instead of government agencies.
• Promote business to business electronic commerce (B2B). • Promote medium-scale technology-based FDI partnerships between foreign and local
SMIs. • Improve the contracting and legal environment to encourage assemblers and principals to
establish a close and durable relationship with suppliers, and establish a competent commercial court system.
Finally, the availability of a comprehensive industrial strategy document will provide the necessary framework for the coordinated action of various government agencies involved in industrial development. In addition however, policy reform and investment in one area will need to be coordinated with changes in other areas to derive maximum benefits through mutually reinforcing feedbacks. So one agency may need to provide strong leadership and coordination in all matters of medium-term industrial development strategy.
___________________

24

25
2. Beyond Shallow, Export-led Industrialization1
2.1 INTRODUCTION............................................................................................................26 2.2 INDUSTRIAL DEVELOPMENT POLICY, 1965-2000...............................................27 2.3 STRUCTURAL AND ORGANIZATIONAL WEAKNESSES ...................................30 2.3.1 Deficit in Manufacturing Trade.......................................................................................30 2.3.2 Limited Export Products and Markets ............................................................................31 2.3.3 Import Dependence .........................................................................................................32 2.3.4 Lack of Industrial Depth .................................................................................................32 2.3.5 Limited net revenue in Oil and Gas Sector .....................................................................33 2.3.6 Reduced Employment Generation ..................................................................................33 2.3.7 Regional Concentration...................................................................................................34 2.3.8 Low-productivity Small and Medium-scale Industries...................................................34 2.3.8 Limited Upgrading of Firms’ Manufacturing Capabilities .............................................34 2.3.8 Moderate Benefits of Foreign Direct Investment............................................................36 2.3.9 Weak human resource development ...............................................................................38 2.3.10 Market concentration.....................................................................................................38 2.3.11 Fragmented responsibility for industrial promotion and policy....................................39 2.3.12 Relatively narrow focus of industry associations..........................................................39
2.4 EMERGING CHALLENGES AND IMPLICATIONS ...............................................40 2.4.1 Emerging Challenges ......................................................................................................40 2.4.2 Policy Implications..........................................................................................................41
2.5 CONCLUSION.................................................................................................................48 REFERENCES.......................................................................................................................51
1 An earlier version of this chapter will appear in Chowdury A. and Islam I. Editors, Beyond the East Asian Crisis: The Path to Innovation and Economic Growth, Cheltenham: Edward Elgar, forthcoming, early 2001.
26
2.1 INTRODUCTION
Export orientation can lead to rapid industrialization and higher living standards, as forcefully demonstrated by the experience of the Newly Industrialized Countries (NICs) in the past three decades. Among the usual advantages of export-orientation are foreign exchange earnings (provided manufacturing is not overly dependent on imported inputs and foreign capital), exposure of domestic firms to international competition, and consequent increase in their efficiency, transfer of technology, the fuller utilization of resources in which the country has comparative advantage, particularly natural resources and labour, and employment generation. There are nevertheless several disadvantages, as well as inherent limitations, which have to be addressed in the course of export-led industrialization. First, an open economy highly dependent on a few markets for its exports is likely to be quite vulnerable to external shocks such as price changes in imported inputs and exports, and movement in exchange rates, largely outside its control. Second, other lower-costs producers can rapidly erode the comparative advantage of low-wage production. Third, the more successful a country is in the export of manufactured goods, the more likely it is going to face import barriers or reach its quota limits. Fourth, changes in technology such as robotization and computer-controlled manufacturing can significantly reduce the competitive advantage of labour-intensive methods of production, while computer-aided inventory systems and lean production processes often require component manufacturers to be located nearby. Finally, a growing balance of trade surplus is likely to put upward pressure on exchange rates. Following a sharp decline in oil revenues and increasing balance of payment difficulties in 1982, the Indonesian government adopted an export-led industrialization strategy, with the emphasis on private-sector led growth and the promotion of resource-based and labour-intensive export products. This contrasted with the previous import-substitution strategy pursued since the mid-1970s, which focused on public investment in state-owned industries in steel, chemical, cement, fertilizer and other basic industries. Growth in the manufacturing sector accelerated in the 1985-1988 period, and was particularly rapid in the period 1989-1992. However, the growth of the manufacturing sector and of manufacturing exports slowed down noticeably in the subsequent period 1993-1997, four years before the crisis. This chapter argues that the observed slow-down was primarily a consequence of shallow, export-led industrialization. As a result, the country reaped only some of the advantages associated with export-oriented industrialization while suffering most of the disadvantages of such a strategy noted above. Following a review of industrial policy since the mid 1960s in section 2, section 3 reviews some of the major structural as well as institutional weaknesses which marked the actual pattern of industrial development in Indonesia, and which eventually dampened manufactured growth. These include a continuously high dependence on imported raw materials and components, low value-added generated in resource-based and labour-intensive industries, a virtually non-existent capital goods sector, limited range in export products and markets, singular specialization in labour-intensive but inelastic manufactured products combined with fierce international competition in the export markets from lower cost producers, low productivity small and medium industries, high market concentration in many segments of industry, weak human resources, weak technology support system, and weak manufacturing capabilities of domestic firms.
27
Section 4 discusses how the economic crisis begun in mid-1997, as well as the emerging challenges of liberalization and globalization will further exacerbate these inherent weaknesses in the patterns of manufacturing development. To regain the momentum of the early 1990s and to take industrialization to its next stage of broader and technologically more resilient development, this section suggests the adoption a comprehensive industrial strategy to be implemented at three levels. At the firm level, the government should aim to increase the manufacturing capabilities of local enterprises. At the sub-sectoral level, the government should support the development of strategic initiatives and promotional activities in priorities industries, as well as the technological upgrading of key industries such as capital goods and vehicle and electronic and electrical components. And finally at the sectoral level, industry-wide policies should aim at reducing country costs and enhancing the transaction efficiency for business, including the necessary macroeconomic, regulatory and business environment, the physical infrastructure, and the educated and skilled labour force under which manufacturing firms can invest and grow. Section 5 of the chapter concludes that, just as the import-substitution strategy of the 1960s and 1970s gave way to an export-oriented strategy in the 1980s and 1990s, the full benefits of the export-led strategy as well as the changing international environment calls for more creative and innovative strategies which rely on closer public-private partnerships. While a liberal environment is necessary, the full benefits of an export-oriented strategy will not accrue automatically. The government must play a more active and complementary role to the market, but different from that in the past. It should not only get prices right and continue to improve the business environment and physical and human resources, but also implement concrete and practical public-private measures to directly improve the competitiveness of manufacturing firms in Indonesia. 2.2 INDUSTRIAL DEVELOPMENT POLICY, 1965-2000
Indonesian industrial development policy, after President Soeharto came to power in 1965, can be divided into three broad phases. The first period, between 1965 and 1975, was characterized by an open-door economic strategy, aimed at producing maximum economic growth and relying heavily on investment by international corporate capital. Having inherited a debt-ridden and chaotic economy, the government was desperate to renegotiate debts and attract foreign investment. Following government guarantees to foreign investors, this period witnessed the re-entry of foreign capital, short-term foreign loans in the form of import credits to finance extensive commodity imports in the late 1960s so crucial to bring rampant inflation under control, and long-term foreign loans to rehabilitate infrastructure (Robison, 1986:138). The second period 1975-81, buoyed by high oil prices and substantial state revenues, saw the resurgence of economic nationalism in which the state played a more active role in financing, protecting and subsidizing domestic capital and in direct investment. In addition, the stated policy was the creation of a national heavy industrial capacity, based on major resource projects in steel, natural gas, oil refining and aluminium, and on import-substitution. Japan, eager to penetrate the previously US-dominated energy and resource sectors, provided finance outside the normal channels of IGGI finance to build basic industries. Manufacturing growth averaged 8% p.a. between 1975 and 1981 (table 2.1).
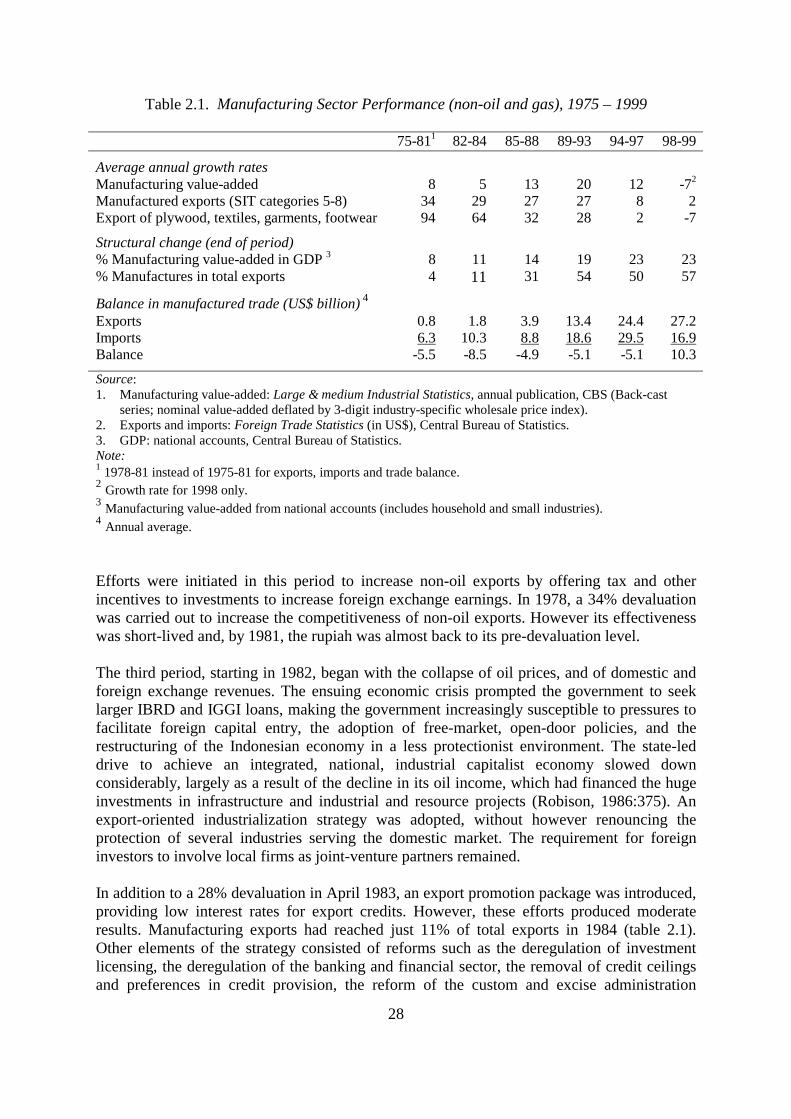
28
Table 2.1. Manufacturing Sector Performance (non-oil and gas), 1975 – 1999 75-811 82-84 85-88 89-93 94-97 98-99
Average annual growth rates Manufacturing value-added 8 5 13 20 12 -72 Manufactured exports (SIT categories 5-8) 34 29 27 27 8 2 Export of plywood, textiles, garments, footwear 94 64 32 28 2 -7
Structural change (end of period) % Manufacturing value-added in GDP 3 8 11 14 19 23 23 % Manufactures in total exports 4 11 31 54 50 57
Balance in manufactured trade (US$ billion) 4 Exports 0.8 1.8 3.9 13.4 24.4 27.2 Imports 6.3 10.3 8.8 18.6 29.5 16.9 Balance -5.5 -8.5 -4.9 -5.1 -5.1 10.3
Source: 1. Manufacturing value-added: Large & medium Industrial Statistics, annual publication, CBS (Back-cast
series; nominal value-added deflated by 3-digit industry-specific wholesale price index). 2. Exports and imports: Foreign Trade Statistics (in US$), Central Bureau of Statistics. 3. GDP: national accounts, Central Bureau of Statistics. Note: 1 1978-81 instead of 1975-81 for exports, imports and trade balance. 2 Growth rate for 1998 only. 3 Manufacturing value-added from national accounts (includes household and small industries). 4 Annual average. Efforts were initiated in this period to increase non-oil exports by offering tax and other incentives to investments to increase foreign exchange earnings. In 1978, a 34% devaluation was carried out to increase the competitiveness of non-oil exports. However its effectiveness was short-lived and, by 1981, the rupiah was almost back to its pre-devaluation level. The third period, starting in 1982, began with the collapse of oil prices, and of domestic and foreign exchange revenues. The ensuing economic crisis prompted the government to seek larger IBRD and IGGI loans, making the government increasingly susceptible to pressures to facilitate foreign capital entry, the adoption of free-market, open-door policies, and the restructuring of the Indonesian economy in a less protectionist environment. The state-led drive to achieve an integrated, national, industrial capitalist economy slowed down considerably, largely as a result of the decline in its oil income, which had financed the huge investments in infrastructure and industrial and resource projects (Robison, 1986:375). An export-oriented industrialization strategy was adopted, without however renouncing the protection of several industries serving the domestic market. The requirement for foreign investors to involve local firms as joint-venture partners remained. In addition to a 28% devaluation in April 1983, an export promotion package was introduced, providing low interest rates for export credits. However, these efforts produced moderate results. Manufacturing exports had reached just 11% of total exports in 1984 (table 2.1). Other elements of the strategy consisted of reforms such as the deregulation of investment licensing, the deregulation of the banking and financial sector, the removal of credit ceilings and preferences in credit provision, the reform of the custom and excise administration
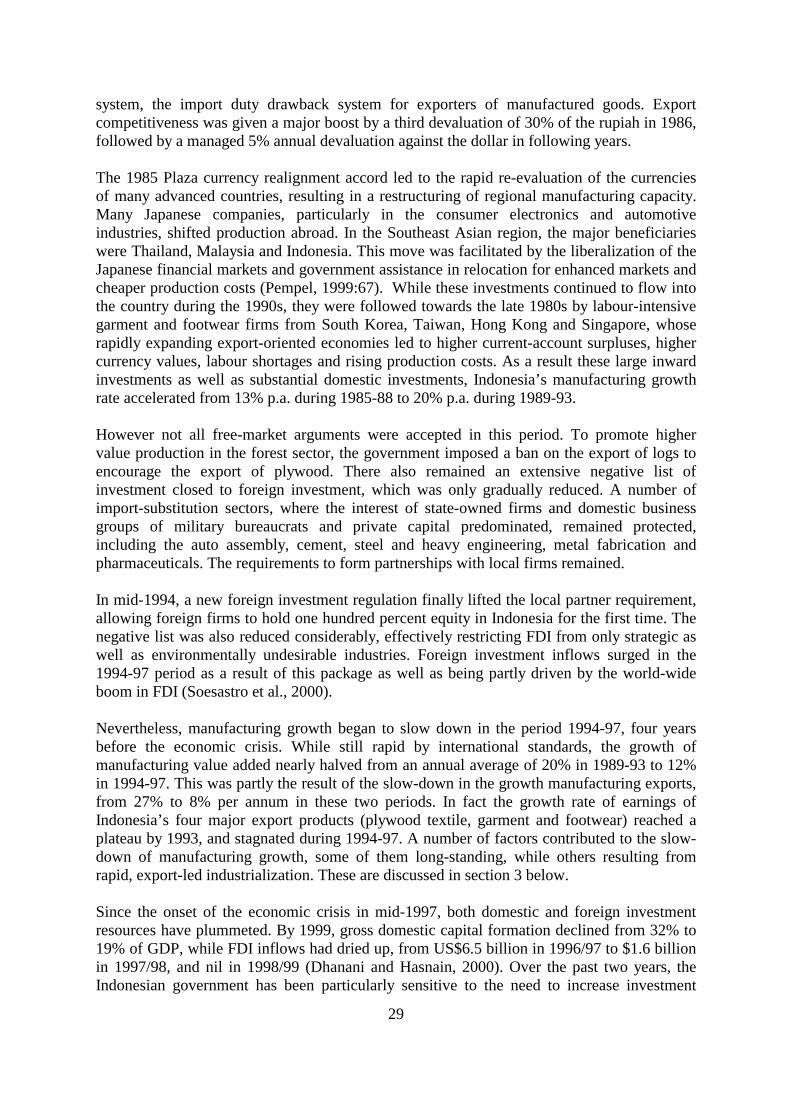
29
system, the import duty drawback system for exporters of manufactured goods. Export competitiveness was given a major boost by a third devaluation of 30% of the rupiah in 1986, followed by a managed 5% annual devaluation against the dollar in following years. The 1985 Plaza currency realignment accord led to the rapid re-evaluation of the currencies of many advanced countries, resulting in a restructuring of regional manufacturing capacity. Many Japanese companies, particularly in the consumer electronics and automotive industries, shifted production abroad. In the Southeast Asian region, the major beneficiaries were Thailand, Malaysia and Indonesia. This move was facilitated by the liberalization of the Japanese financial markets and government assistance in relocation for enhanced markets and cheaper production costs (Pempel, 1999:67). While these investments continued to flow into the country during the 1990s, they were followed towards the late 1980s by labour-intensive garment and footwear firms from South Korea, Taiwan, Hong Kong and Singapore, whose rapidly expanding export-oriented economies led to higher current-account surpluses, higher currency values, labour shortages and rising production costs. As a result these large inward investments as well as substantial domestic investments, Indonesia’s manufacturing growth rate accelerated from 13% p.a. during 1985-88 to 20% p.a. during 1989-93. However not all free-market arguments were accepted in this period. To promote higher value production in the forest sector, the government imposed a ban on the export of logs to encourage the export of plywood. There also remained an extensive negative list of investment closed to foreign investment, which was only gradually reduced. A number of import-substitution sectors, where the interest of state-owned firms and domestic business groups of military bureaucrats and private capital predominated, remained protected, including the auto assembly, cement, steel and heavy engineering, metal fabrication and pharmaceuticals. The requirements to form partnerships with local firms remained. In mid-1994, a new foreign investment regulation finally lifted the local partner requirement, allowing foreign firms to hold one hundred percent equity in Indonesia for the first time. The negative list was also reduced considerably, effectively restricting FDI from only strategic as well as environmentally undesirable industries. Foreign investment inflows surged in the 1994-97 period as a result of this package as well as being partly driven by the world-wide boom in FDI (Soesastro et al., 2000). Nevertheless, manufacturing growth began to slow down in the period 1994-97, four years before the economic crisis. While still rapid by international standards, the growth of manufacturing value added nearly halved from an annual average of 20% in 1989-93 to 12% in 1994-97. This was partly the result of the slow-down in the growth manufacturing exports, from 27% to 8% per annum in these two periods. In fact the growth rate of earnings of Indonesia’s four major export products (plywood textile, garment and footwear) reached a plateau by 1993, and stagnated during 1994-97. A number of factors contributed to the slow-down of manufacturing growth, some of them long-standing, while others resulting from rapid, export-led industrialization. These are discussed in section 3 below. Since the onset of the economic crisis in mid-1997, both domestic and foreign investment resources have plummeted. By 1999, gross domestic capital formation declined from 32% to 19% of GDP, while FDI inflows had dried up, from US$6.5 billion in 1996/97 to $1.6 billion in 1997/98, and nil in 1998/99 (Dhanani and Hasnain, 2000). Over the past two years, the Indonesian government has been particularly sensitive to the need to increase investment
30
resources, and has embarked on an intensive promotional campaign to woo foreign investors back into the country. In fact, as far as official pronouncements are concerned, industrial policy has been equated with re-establishing investor confidence to attract FDI in the manufacturing sector. A 1998 regulation focused on simplifying approval and licensing procedures, and reducing the negative list of industries closed to FDI (Soesastro et al., 2000). Otherwise, the authorities were pre-occupied with resolving the substantial debt problems of domestic corporations and the financial restructuring of large manufacturing firms, under the tutelage of the Indonesian Bank Restructuring Agency. As part of the its recovery programme with the International Monetary Fund, Indonesia has reaffirmed its commitment to trade liberalization, and to agreements made under the Asian Free Trade Association and World Trade Organization rules. Notwithstanding a sharp drop in manufacturing production (-7% and 2% growth rates in 1998 and 1999) and the weak predicament of most manufacturing firms, the government pressed ahead with tariff reductions and the removal of non-tariff barriers. As a consequence, Indonesia may have possessed one of the most liberalized economies in Southeast Asia by 2000. Finally, a new investment regulation of June 2000 imposed certain restrictions on foreign investment, such as the need to establish a joint venture with a local partner and limited equity ownership. However, such conditions applied mainly to sectors outside manufacturing such as media, energy, ports, transport, trade and restaurants (Jakarta Post, 7 August 2000). As in the past, restrictions affected environmentally damaging or strategic industries such as in sawmills and certain types of chemicals. 2.3 STRUCTURAL AND ORGANIZATIONAL WEAKNESSES
While the government assiduously promoted export-oriented industrialization since 1985, neither the government nor the private sector accompany this drive with the necessary measures to diversify export products and markets, to deepen and diversity the manufacturing base, and to enhance the competitiveness of Indonesian firms. The absence of these measures to compensate for known market failures in building up manufacturing capability such as inadequate information, high risks and long and expensive learning process (Lall, 1993 and Lall, 1995), and the sheer rapidity of industrialization, led to a relatively shallow industrial structure, while the promised foreign exchange earnings failed to materialize. A number of other structural problems emerged. The oil and gas sector generated only limited net revenues. Low productivity plagued the small and medium-scale industries, while significant market concentration by a few large firms prevailed in large segments of manufacturing. Manufacturing production remained concentrated in Java, and in Greater Jakarta in particular. The capacity to absorb, adapt and developing process and product technology as well as human resources remained weak. Finally little effective institutional support from government departments as well as from industry associations were available to manufacturing firms. 2.3.1 Deficit in Manufacturing Trade The overall fragility of industrial development in Indonesia is most apparent in the persistent deficit in the balance of trade of manufactured products. Despite rapid industrialization, particularly after 1985, the balance of trade in manufactures was in deficit from 1978 until the
31
onset of the crisis in 1997. The gap between manufactured imports and manufacturing exports remained at US$5 billion per year throughout this period (table 2.1 and figure 1.2). As a result, Indonesia ran increasingly large deficits in the current account of the balance of payments, from $2 billion in 1985-86 to $8 billion 1996-97, which were offset by large inflows of private capital and external public borrowing. More recently, the balance of trade in manufactures has shown a surplus in 1998 and 1999. While part of this is due to the recovery of exports, most of the surplus generated over the past two years was due to a collapse of imports, primarily of capital goods, reflecting the drastic slowdown in investment over the last two years. It is highly likely that, as the economy and investments recover, the trade deficit in manufactures will reappear. It remains to be seen whether this will be offset by a capital account surplus as in the past. 2.3.2 Limited Export Products and Markets Manufacturing development relied to a great extent on the rapid expansion of exports in which Indonesia had comparative advantage in terms of plentiful, fairly good quality labour, good infrastructure, and natural resources. However, exports were highly concentrated in terms of both products and markets. Thus, five products account for half of exports (plywood, textiles, garments, footwear and electronics, see figure 1.3). Market access for two of these, textiles and garments, was dependent on non-tariff barriers to countries abiding by the Multi-fibre Agreement (MFA), while the domestic supply of timber has reached its limit of sustainability. Furthermore, three countries account for over half of exports (US, Japan and Singapore), while one country, the US, absorbed nearly half of the total exports of garments and footwear. Ten products provided 80% of all the country’s manufactured export revenues. Exports were thus highly vulnerable to the changing fortunes of these few products in limited markets. More importantly, many of the labour-intensive exports selected by Indonesia have suffered from a secular decline in world prices due to intense international competition, particularly from China, Latin America and other low-cost producers in the North American market, and from Eastern Europe in the West European market. Indonesian labour-intensive exports also faced a relatively inelastic demand in industrialized country markets. External factors rather than internal factors such as rising wage rates were thus responsible for the declining competitiveness of traditional Indonesian exports. Indonesian firms managed to contain unit labour costs by increasing labour productivity, and also maintained profitability before the economic crisis. In many ways, Indonesian export products behaved similarly to agricultural export commodities, especially since many of them were exported with minimal processing and therefore limited value-added (plywood, pulp, paper, palm oil). The latter have benefited from the massive devaluation of the rupiah following the onset of the crisis, but the currency depreciation has not given the anticipated boost to the competitiveness of more advanced manufactured exports because of their heavy import dependence (see 2.2.2 below). Export volumes have risen in some cases (garments, textiles), however export revenues have risen only slightly in dollar terms due to the devaluation and the continuing decline in the world price of textiles, garments, wood, footwear and furniture.
32
2.3.3 Import Dependence The manufacturing sector was heavily dependent on imported components and machinery. Many industries have consisted primarily of simple blending, packaging and assembly operations, with the result that in 1997, the value of imported raw materials, intermediate inputs and components ranged from 45% in chemical industries, to 53% in machinery, 56% transport equipment industries and 70% in electrical goods industries (figure 2). Even labour-intensive industries relied heavily on imported raw materials, intermediate inputs and components, ranging from 40%-43% in the textile, garment and leather industries, to 56% in the footwear industry. Moreover, this extent of import dependence changed little during the course of the 1990s. The development of the capacity of domestic supplier and support industries is a demanding task because firms face high risks and a lengthy and costly learning process. Market failures in this respect suggest the need for the government to assist domestic firms in building up their manufacturing capacity. However the types of government interventions adopted, including regulations controlling local content requirements for the motor vehicle industry, have met with little success (Aswicahyono et al., 2000). As for capital goods, most plant and equipment originated from abroad. Capital goods accounted for nearly half of the total manufactured imports. Unlike China and India, the capital goods industry is very small in Indonesia (2% versus 9% of manufacturing value-added in China and India). Efforts to establish a machine tool industry, as well as a motor vehicle component industry, have also met with very limited success (Braadbart, 1996). Yet, the production of capital goods and intermediate components play a very special role in industrialization because they engage firms in developing their manufacturing capabilities through activities such as reverse engineering and adapting foreign technology to domestic markets, products and scales of production. They also provide the technological base for further industrial diversification and the deepening of production. 2.3.4 Lack of Industrial Depth The pattern of Indonesian industrialization differed from that of other countries with similar degrees of industrialization. Between 1985 and 1997, the contribution of higher technology industries to manufacturing value-added did not increase, while the production of low-technology industries expanded, mainly at the expense of medium-technology industries (figures 1.5 and 2.1). The increase in the share of low technology industries was due to the rapid growth of labour-intensive industries such as textiles, garments and footwear, and to a lesser extent to the expansion of the resource-based food, paper and wood industries. In contrast to the decline of the share of medium-technology industries in Indonesia (including rubber and plastic industries, fertilizer, cement, basic metals and simple fabricated metal industry), virtually all countries in the region and elsewhere have maintained the share of medium-technology industries in their manufacturing output. Similarly, the contribution of physical-capital intensive products to total exports also declined during this period.
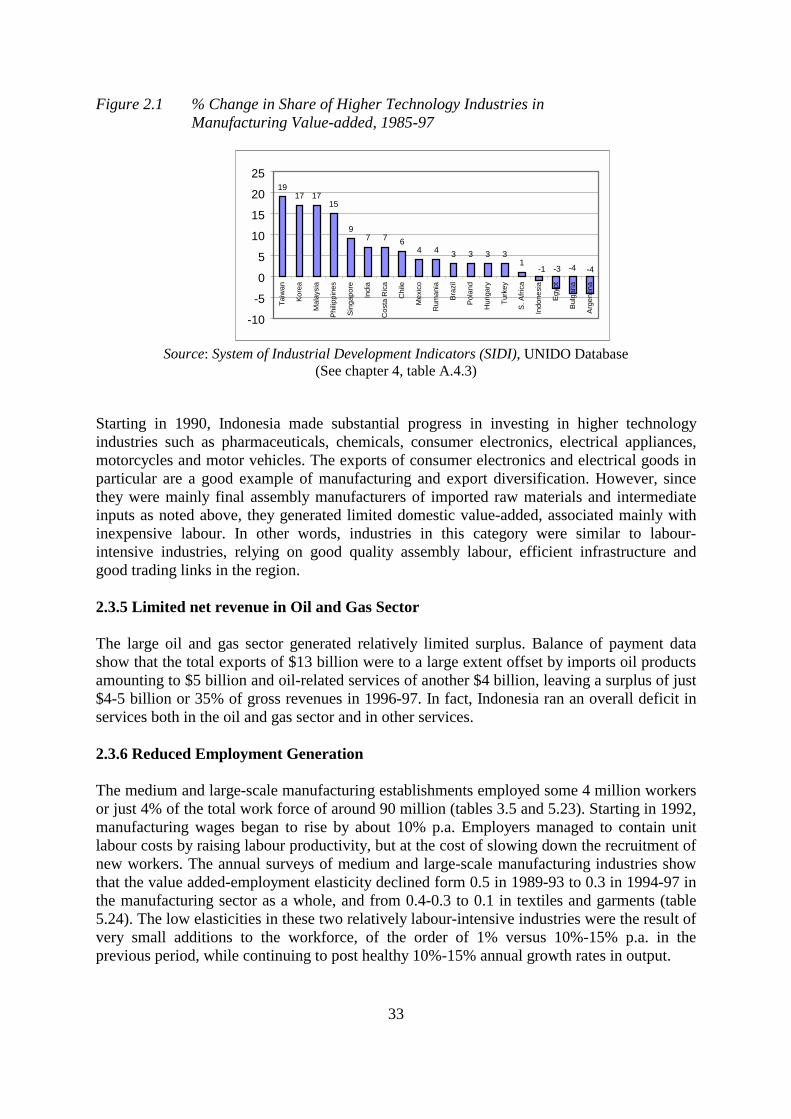
33
Figure 2.1 % Change in Share of Higher Technology Industries in Manufacturing Value-added, 1985-97
Source: System of Industrial Development Indicators (SIDI), UNIDO Database (See chapter 4, table A.4.3)
Starting in 1990, Indonesia made substantial progress in investing in higher technology industries such as pharmaceuticals, chemicals, consumer electronics, electrical appliances, motorcycles and motor vehicles. The exports of consumer electronics and electrical goods in particular are a good example of manufacturing and export diversification. However, since they were mainly final assembly manufacturers of imported raw materials and intermediate inputs as noted above, they generated limited domestic value-added, associated mainly with inexpensive labour. In other words, industries in this category were similar to labour-intensive industries, relying on good quality assembly labour, efficient infrastructure and good trading links in the region. 2.3.5 Limited net revenue in Oil and Gas Sector The large oil and gas sector generated relatively limited surplus. Balance of payment data show that the total exports of $13 billion were to a large extent offset by imports oil products amounting to $5 billion and oil-related services of another $4 billion, leaving a surplus of just $4-5 billion or 35% of gross revenues in 1996-97. In fact, Indonesia ran an overall deficit in services both in the oil and gas sector and in other services. 2.3.6 Reduced Employment Generation The medium and large-scale manufacturing establishments employed some 4 million workers or just 4% of the total work force of around 90 million (tables 3.5 and 5.23). Starting in 1992, manufacturing wages began to rise by about 10% p.a. Employers managed to contain unit labour costs by raising labour productivity, but at the cost of slowing down the recruitment of new workers. The annual surveys of medium and large-scale manufacturing industries show that the value added-employment elasticity declined form 0.5 in 1989-93 to 0.3 in 1994-97 in the manufacturing sector as a whole, and from 0.4-0.3 to 0.1 in textiles and garments (table 5.24). The low elasticities in these two relatively labour-intensive industries were the result of very small additions to the workforce, of the order of 1% versus 10%-15% p.a. in the previous period, while continuing to post healthy 10%-15% annual growth rates in output.
1917 17
15
97 7 6
4 4 3 3 3 31
-1 -3 -4 -4
-10
-5
0
5
10
15
20
25
Taiw
an
Kore
a
Mal
aysi
a
Philip
pine
s
Sing
apor
e
Indi
a
Cos
ta R
ica
Chi
le
Mex
ico
Rum
ania
Braz
il
Pola
nd
Hun
gary
Turk
ey
S. A
frica
Indo
nesi
a
Egyp
t
Bulg
aria
Arge
ntin
a
2.3.7 Regional Concentration Medium and large-scale manufacturing industries were heavily concentrated in Java and in Greater Jakarta in particular (figure 1.6). Despite special incentives offered by the government, overall manufacturing production continued to be concentrated in Java. Jakarta and West Java in fact increased their share of manufacturing employment and value-added to around half of the country’s total by 1997 (role of market, infrastructure, proximity to government officials). The share of the Outer Java manufacturing sector, of equal size at that of East Java and about half the size of Jakarta-West Java, declined from 22% to 20% between 1985 and 1997. 2.3.8 Low-productivity Small and Medium-scale Industries Small and medium-scale industries contributed relatively little to manufacturing value-added. Large establishments (500 workers/establishment) employed a third of the manufacturing labour but produced 80% of manufacturing value-added in almost all sub-sectors, and thus dominated the Indonesian manufacturing sector (figure 1.7). Medium-scale (20-99 workers), small-scale (5-19 workers) and household (1-4 workers) industries accounted for just 5%-6% each of total manufacturing value-added while employing two thirds of the manufacturing work force, denoting low productivity. S
1996, CB34
SMIs were concentrated in the food and wood sub-sectors. They produced final consumer goods for lower income consumers, and not many raw materials, intermediate inputs and components for the rest of the manufacturing sector. In other words, there were limited subcontractor and supplier linkages between SMIs and larger establishments 2.3.8 Limited Upgrading of Firms’ Manufacturing Capabilities Manufacturing capability refers to the firms’ ability to acquire and apply not just manufacturing technology in the traditional sense (production techniques, and product design and development), but also new management and industrial organizational techniques, including marketing and quality control management. It also refers to their ability to benefit from technical support institutions, from external linkages with other domestic and foreign enterprises for product and equipment information and for technology licensing, and from other general information flows between economic agents, to enhance their competitiveness and produce at best-practice standards. Manufacturing capability therefore entails important structural changes at the individual firm level. This whole complex is referred to as ‘manufacturing capability’ here rather than the narrower ‘technological capability’. Recent assessments indicate that Indonesian firms have not been able to draw on technical information and other support services provided by the country’s industrial technology development infrastructure to upgrade their manufacturing capabilities due mainly to the following reasons (Thee 1998, Lall 1998, Mans 1996 and Lall and Rao 1995). The existing infrastructure consists almost entirely of government-operated R&D and technical institutes. Moreover, only about 5% of their personnel work on manufacturing problems (Lall, 1998:154). Except from some private testing facilities in West Java, there is virtually no private provision of manufacturing capability support services. In other Asian countries, private providers, with government financial support, are increasingly common.
35
The R&D institutes operated by the Agency for Assessment and Application of Technology (BPPT) and the Indonesian institute of Science (LIPI) have catered mainly to the needs of state-owned strategic industries. Their internal management and procedures face bureaucratic constraints. Recent efforts to encourage them to carry out research of more relevance to private firms, with government financial support, have not borne fruit, and most projects were initiated by the institutes themselves rather than demand-driven. The MOIT sectoral research institutes, regional testing laboratories and industrial research and testing centres are involved mainly in product testing and certification and training. Due to poor funding and weak management structure, their equipment is outmoded and their staff poorly trained, paid and motivated. They are in no position to provide relevant services to manufacturing firms. Here too, efforts to turn them into service providers to private firms have not succeeded due mainly to their rigid government structure and culture, and bureaucratic constraints including not authorized to charge for their services and become financially self-sufficient. Public technology information services operated by BPPT and MOIT are not kept up-to-date and are rarely used by firms. SMIs have even lower access to these. Metrology, standards, testing and quality assurance (MSTQ) services do not meet the modern needs of Indonesian manufacturing for a variety of reasons, including the absence of a set of industrial standards, lack of international accreditation of laboratories, obsolete national laboratory equipment and poorly trained staff, lack of international recognition of many national standards, lack of awareness and demand for such services on the part of the manufacturing firms themselves, and poor or inadequate services by existing providers, forcing many exporters to routinely use laboratories abroad. Indonesia does not have productivity centres to improve the productivity, product quality, delivery and manufacturing methods of manufacturing firms. Firms can become more competitive, not by developing new products, but by employing current best manufacturing practices, including plant layout, inventory control, improving machine reliability, reducing scrap rates and eliminating production bottlenecks. Services include the provision of technological support and training in quality control systems, just-in-time management, flexible manufacturing, computer-aided design and access to free technical information such as technical journals, trade fairs and equipment manufacturer directories. Productivity centres in other Southeast Asian countries have been able to provide comprehensive information services to firms on sources of technology, saving the heavy costs in searching for and importing the best technologies. Industry associations have not played any role as yet in upgrading the manufacturing capabilities of their members. Government finance for the above institutions has been inadequate, particularly in comparison with neighbouring countries, though existing resources could have been used with greater effectiveness. Extension services serving small-scale industries in the form of the existing network of technical service centres, small industrial estates and other schemes have met with limited success to date.
36
In addition to the technology support infrastructure discussed above, three other important entities could have played an important role in harnessing foreign technology and know-how to improve the competitiveness of domestic manufacturing firms, namely foreign direct investment, Indonesian conglomerates and the state-owned strategic enterprises. Many foreign investors in the domestic consumer-durable industries came to Indonesia for high profits under protection (World Bank, 1994). Those in the export-oriented sector came for low-cost labour. As noted earlier, they did not transfer technology (technical information, organizational, managerial skills and marketing skills, R&D), nor develop significant domestic supplier or support industries. Foreign firms have been reluctant to deepen their local technological activities for a variety of reasons which are explored in more detailed later (see chapter 3). The Indonesian conglomerates worked on the basis of establishing multi-sector, diversified business interests, manufacturing being usually one component of a diverse business portfolio. The advantage of this strategy was the rapid accumulation of capital and consequent growth through a broad front of corporate activity and a diversification of business risk. The disadvantage was the lack of concentration on building core competencies in manufacturing by most conglomerates. As for the state-owned strategic industries, they may have absorbed and adopted technology within their own environment in their quest for technological leap-frogging. However, they did not interact nor provide technical leadership to the private sector, while even competing with the private sector in areas such as ship-building. Thus they have not produced or disseminated technology of use to commercial enterprises. Due to the past narrow focus on the state-owned strategic industries as the main agents for technological transformation, including the aim of increasing the local physical and technological content of their operations, and due to a narrow science and technology approach, the government was not fully aware of the nature and extent of problem in raising the capabilities of manufacturing firms at large. To rectify past neglect of private industry, the Indonesian government needs to do a great deal to promote industrial technology development, but of a very different sort from before. It needs an effective framework of policies to overcome the numerous market failures that firms inevitably face in their quest for technological deepening. Since the substantial donor and government resources ploughed into this government-operated infrastructure in the past have yet to make them actively serve industry and to change their bureaucratic culture, resources should be re-directed to supporting private sector-led productivity centres and technical institutes, which can also supply relevant and up-to-date MSTQ support to conform to strict standards and performance requirements of export markets. 2.3.8 Moderate Benefits of Foreign Direct Investment Despite the much heralded success in attracting foreign investment to Indonesia, the manufacturing sector enjoyed rather limited benefits from FDI in terms of exports, employment, tax revenues, linkages with the rest of the manufacturing sector, and technology transfer in the 1990s. FDI amounted to just 3%-6% of total capital formation (table 3.1, Lall

37
1998), though most of this was directed at the manufacturing sector. The persistent gap in production efficiency, labour productivity and higher wages between foreign and domestic firms further suggests minimal adoption of best manufacturing practices by the latter. Foreign firms may even have prolonged the manufacturing sector’s dependence on foreign suppliers of raw materials and components. Foreign establishments accounted for about 25% of medium and large-scale manufacturing production, and 35% of total manufactured exports in 1996 (table 3.2). However, because foreign establishments also imported more than half of their inputs, their net export earnings were lower than for domestic firms as a proportion of total production (8% versus 12%). Even these limited foreign exchange earnings may have been offset by the outflows of repatriated profits, royalties and fees. Moreover, due to their higher capital intensity, foreign establishments employed just 15% of the manufacturing work force, and less than one percent of the total Indonesian workforce. Thus domestic firms continued to account for the bulk of manufacturing production, employment and export earnings. Foreign establishments did not develop linkages with domestic firms, nor promote industrial diversification and technological deepening. They operated rather like enclave industries, establishing fewer linkages with the rest of the manufacturing sector than their domestic counterparts. While the latter bought only a quarter of their inputs from abroad, foreign establishments imported 55% of their inputs in most sub-sectors, even in relatively simple industries such as garments and footwear. This proportion in fact rose to 60% following the onset of the crisis. In higher-technology industries such as medicines, machinery, electronic and vehicle components, foreign establishments bought around 90% of their inputs from abroad and transformed them into components and finished products, using inexpensive Indonesian labour and good infrastructure, for the domestic and export markets. That higher linkages were possible in many of these industries is indicated by the significantly higher local content of inputs procured by domestic establishments in similar industries. The extent and quality of technology transfer from FDI to domestic firms and to the domestic economy is more difficult to assess. The lack of progress in four indicators used in the above study - difference over time in production efficiency, trends in the development of domestic supplier and support industries, training, and growth of external linkages – suggest that, though foreign establishments are likely to have shared their technology with their joint-venture partners, particularly with respect to production organization and quality management, they had only a limited impact in the upgrading of technology of domestic firms at large. As noted, the post-1985 restructuring of manufacturing within the East Asian and Southeast Asian region drove industrialization and export growth in Indonesia. The influx of foreign direct investment, particularly from Japan and the Newly Industrialized Countries of Taiwan, South Korea and Singapore brought the technical, managerial and marketing skills needed to produce goods for the world markets. These were able to plug Indonesia into the world trade system almost overnight by incorporating local producers into the manufacturing and trading chain of foreign buying agents and intermediaries. Given the rapidity of investment growth and the transfer of entire components of regional manufacturing systems, technology transfer to Indonesian partners in the broad sense (including technical, management, organizational and marketing skills, quality management, technical information, product development and external linkages) was necessarily limited. Perhaps the rapid exposure to FDI may also have
38
slowed down the development of indigenous manufacturing capability of domestic firms, and their ability to move up the value chain through indigenous product development, own brand names and own marketing channels. 2.3.9 Weak human resource development Several assessments of the Indonesian education and training system at the primary, secondary, vocational and professional levels indicate that it does not meet the needs of industry. School leavers and graduates are thus not equipped with the knowledge and skills required for a more complex and diversified manufacturing sector, and are thus unlikely to fully benefit from in-plant training. At the primary and secondary school levels, surveys of student competencies and other diagnostic surveys consistently reveal that schools rely on rote learning and do not develop adequate mastery of basic literacy, basic numeracy, and thinking and creative skills (see for instance Sweeting, 1997 and Blazely, 1999 for primary schools, and Blazely et al., 1996, Sadtono et al., 1996 and Somerset, 1996 for secondary schools). At the vocational level, the senior secondary technical vocational schools, mostly in the private sector, are poorly equipped and staffed, and do not impart sufficient practical knowledge. As a result, the labour market does not differentiate between general and vocational senior secondary school leavers, paying them the same wage and allocating them the same jobs in industry (Dhanani, 1995). Post-secondary vocational technical education is provided primarily by the government, under the Ministry of Manpower and the Ministry of Industry, and not the private sector. The changes in technology and product mix taking place in an economy have not been substantial enough to bring about corresponding market changes in the demand and therefore the supply of the required training from the private sector (Dhanani, 1995). At the higher education level, employer surveys show that science and engineering institutions are producing poor quality graduates, unable to work independently, and with inadequate general skills in problem solving, technical problem analysis, teamwork, technical report writing and oral presentation skills. As a result, many employers have to provide training in these basic skills to graduates upon recruitment (Dhanani and Sweeting, 1994). As for in-plant training, the majority of firms do not undertake on-the-job training because they find it unnecessary due to the dominance of simple processes in their plants. Those that do, mostly in the higher-technology category, do not do it extensively or systematically (Dhanani 1992). 2.3.10 Market concentration High levels of concentration were found across large segments of manufacturing, potentially stifling domestic competition. The four leading establishments firms produced more than 75% of the total output in more than half of the 300 industrial branches. In fact these four largest establishments accounted for virtually all the production in more than a quarter of all industrial branches. The average unweighted four-firm concentration ratio (CR4) remained above 70% during 1990-1997, while the weighed CR4 was 55% in 1996.
39
As expected, some of the largest CR4 ratios occurred in capital-intensive industries such as pulp (90%), industrial papers (92%), single fertilizers (82%), compound fertilizers (100%), tyres (87%), glass sheets (90%), cement (66%), basic iron and steel (87%), electronics (65%), motor vehicles (93%) and motorcycles (99%). However they were also high in other industries such as wheat flour mills (100%), cigarettes (96%), pharmaceutical products (97%) and soaps and toothpaste (73%, CBS 2000). Foreign firms were important players in many of these industries. 2.3.11 Fragmented responsibility for industrial promotion and policy Due to the complexity of the industrial sector, various aspects of industrial policy and promotion are shared among ten government departments. Taking sectoral agencies first, beside the Ministry of Industry and Trade, the Departments of Agriculture and Health are respectively in charge of selected agro-processing and pharmaceutical industries, while the Ministry of Cooperatives and Small-scale Enterprises is responsible for small-scale industries, and the Ministry of Mines and Energy for oil and gas production and refineries. Next, all tariff changes and VAT matters are handled by the Ministry of Finance, while the State Ministry for Investment and State-owned Enterprises is responsible for the formulation of investment policies, the approval of foreign direct investment, and for managing all the state-owned enterprises. The National Development Planning Board is responsible for planning and resource allocation, as well as approving and monitoring all industrial projects funded by bilateral, multilateral and national agencies. The Board for Science and Technology is charged with developing technology. Since the onset of the crisis, the Indonesian Bank Restructuring Agency (IBRA) owns a large number of manufacturing establishments and appoints its officials on the board of directors of companies pledged as collateral by banks. Due to the shared responsibility at the central level, and the increasingly important role played by provisional and district offices of the Ministry of Trade in the wake of regional autonomy, there is a need for more strategic and tightly coordinated industrial policy and promotion. 2.3.12 Relatively narrow focus of industry associations Interactions between government officials and the existing industry associations have been mostly limited to taxation and regulations. They have not often taken the form of meaningful public-private dialogue and collaboration in important areas such as investment and trade promotion strategy, industrial and export diversification, productivity enhancement and mastery of product and process technology, international competitiveness and skills development. The analytical capacity of most industry associations needs to be upgraded to enable them to contribute effective arguments and ideas related to industrial development and increasing competitiveness, especially needed in the face of regional and global liberalization.
40
2.4 EMERGING CHALLENGES AND IMPLICATIONS
2.4.1 Emerging Challenges In addition to the numerous existing weaknesses outlined above, the manufacturing sector will face a number of new challenges and constraints in the coming years due to the globalization of world manufacturing and serious competition from emerging exporters both in the export and domestic markets. These include the increasingly stiff competition, in the export markets, from lower-cost producer countries, and the real threat of de-industrialization due to rapid import liberalization and corporate indebtedness. Additional pressure will be felt on the balance of payments due to inflows of imported manufactures, while at the same time, aggressive competition from equally reform-oriented countries will reduce foreign direct investment funds. There will be little scope for continuing the expansion of manufacturing based on domestic natural resources such as timber and petroleum, since their limits may have already been reached. Guaranteed export quota markets will disappear with the trade liberalization, while the country’s large external debt burden will constrain its ability to borrow offshore due to the country’s. Growing demands for regional autonomy and decentralization will bring the problems associated with achieving balanced regional development to the fore. The above findings suggest that a strategic realignment in industrial policy is required to regain the momentum of industrialization of the early 1990s, both to maintain market share in the world as well as to successfully compete against increasingly cheaper imported manufactures. Indonesia cannot indefinitely continue to rely on a narrow range of labour-intensive and resource-based products such as plywood, textiles, garments and footwear to spearhead manufacturing development as in the past. Indonesia faces the challenges of channelling domestic investment resources, attracting more foreign direct investment and directing more technology and other support infrastructure to successfully transform its industrial sector. On the other hand, now that production, sourcing and distribution have all become globalized, it has the opportunity to attract the kind of FDI that increases the technological and industrial competitiveness of the Indonesian manufacturing sector. As markets liberalize, and investment becomes ever more mobile, the determinants of industrial development will increasingly shift from trade, tariff and price-dependent strategies of nations to the business strategies of firms. In other words, the focus of competition will move from nations to firms. Indonesia’s price-dependent trade and industry strategy must give way to an industrial strategy which strengthens the competitiveness of firms and which spans the patterns of investment, innovation, industrial organization and structure. There may thus be little alternative but to design an overall industrial strategy to transform the manufacturing sector in the context of open, deregulated and increasingly liberalized markets (Rodrik, 1997), and in the context of transparent and competitive pricing in all transactions between government agencies and private sector firms. Ideally however, the process of economic liberalization should be a gradual and controlled process of opening up, which should be accompanied by a strategy of industrial restructuring and upgrading in collaboration with the private sector. Furthermore, while trade reforms and transparency are necessary to address the immediate, short-term constraints of the manufacturing sector, they are not sufficient by themselves for
41
the next stage of industrial development. In other words, progress will not naturally evolve in the context of Indonesia’s present endowments and policy framework, nor in the international context of fierce competition in the globalized market place. A reassessment of the effectiveness of industrial policy in Indonesia has concluded that industrial policy played a crucial role in the development success of Indonesian manufacturing since the mid-1960s. The neo-liberal interpretation, that industrial policy was incoherent, subject to rent-seeking and irrelevant to Indonesia, may oversimplify the policy objective of creating a strong, integrated, diversified and outward-oriented industrial economy, which the state achieved in part due to the development of an effective government-business partnership (Rock, 1999). In sum, just as the import-substitution strategy of the 1960s and 1970s gave way to an export-oriented strategy in the 1980s and 1990s, the changing international environment calls for more creative and innovative strategies which rely on closer public-private partnerships, as the regulatory or dirigiste approach becomes increasingly incompatible with the current free-trade era. However, the role of government in industrial development, while necessary, need to change from that in the past. The government should redefine industrial strategy as the attainment of a common public-private vision of industrialization, and the basic implementation mechanisms as shared public-private efforts (Sercovich, 1999). It should also be more selective, and intervene in areas where it can be most effective (Rodrik, 1995). 2.4.2 Policy Implications In close collaboration and formal partnership with the private sector, the government should formulate and implement policies at three levels (Sercovich, 1999). Industry-wide policies should aim at reducing country costs and enhancing the transaction efficiency for business, including the necessary macroeconomic, regulatory and business environment, the physical infrastructure, and the educated and skilled labour force under which manufacturing firms can invest and grow. At the sub-sectoral level, the government can support the development of strategic initiatives and promotional activities in priorities industries. And at the firm level, the government will aim to increase the manufacturing capabilities of local enterprises. This new approach to industrial strategy is elaborated further below. a) Vision of Industrialization At the outset, the government and the private sector should jointly produce a joint public-private sector long-term vision of where Indonesia wants to be in terms of industrialization (what types of products it would like to produce and export, and what other types of goods it should continue to import), to provide broad signals to investors, and to develop guidelines for public-private resource mobilization. This collaborative process is by itself very important to reach a common vision, which can be articulated in a joint public-private strategy on industrial competitiveness. The strategy should identify a number of priority industries and export products which the government and the private sector can jointly promote, without however prejudicing other industries. It should contain a realistic assessment of the competitive potential of various sectors and, since government resources for industrial promotion are limited, a promotional strategy focused on priority areas. Intervening in a large number of unrelated activities will risk diffusion and failure. A common strategic vision of industrialization will also assist in coordinating the efforts of the central government departments concerned with implementing various aspects of industrial policies, as well as all
42
provincial and district authorities, which will become increasingly involved in regional industrial development. An industrial strategy, which can elicit desirable responses from the largely private manufacturing sector in a free-trade environment, will necessarily be more complex to formulate and implement. Nevertheless, the private sector may welcome the opportunity to contribute to a common overall strategic vision as to the desirable directions of manufacturing development in the medium and long term. Critical to this is the need to initiate and maintain close public-private dialogue. The government can accelerate the process of industrial transformation and the establishment of a more competitive industrial sector by sending signals and switching government resources to build critical endowments in support of priority private sector needs. b) Industry-wide Policies to Reduce Country Costs Macroeconomic environment. A stable macroeconomic environment, such as provided by Indonesia in the second half of the 1980s and the 1990s, adds to a country’s competitive standing. It is a requirement for attracting foreign and domestic investment, and for firms to engage in modernizing and technological upgrading. Stable and competitive exchange rate, interest rate and tax rates are three key elements of macroeconomic stability. An overvalued exchange rate makes exports less competitive, while high interest rates dampen investment, and end up attracting short-term capital, thus pushing up the exchange rate and resulting in a high cost economy. Moreover, savings rate should be increased through the development of financial and capital markets. In addition to the above, manufacturing enterprises intending to invest and trade should have access to funds from the banking sector. Physical infrastructure. Good quality transport, telecommunications and power are the three most important components of physical infrastructure sought after by investors (Rodrik, 1995), and these were important factors in Indonesia’s success in attracting both domestic and foreign investments in the manufacturing sector. It is important for government to consult the private sector as the requirements and location of necessary additional infrastructural investments. The private sector involvement in the provision of telecommunications and power should be encouraged through the establishment of a supportive regulatory framework for private investment, and the commercialization and privatization of existing transport, telecommunications and energy generation assets. Adequate transport facilities and economical freight costs and port charges are important, however time and reliability are increasingly dominant factors in the production of higher-value goods. The availability of efficient traditional (telephone, facsimile) and new (internet) telecommunication services will enable manufacturers to take advantage of globalization and regionalization trends in location, as well as allowing clients to request rapid response to inquiries and orders through electronic commerce. Regulatory and business environment. The regulatory and business environment in an important element of country costs, and is often cited as the major impediment in facing foreign investors in Indonesia. The government should hold regular consultations with the private sector to listen to their concerns, to identify the most serious bottlenecks in these areas, and to provide an undertaking to rectify them in a given period of time.
43
The judicial system and the rules and institutions that affect FDI, including contract enforcement, bankruptcy law, and competition policy regulations and enforcement are recognized factors in attracting and retaining investors, and of country competitiveness. Effective anti-dumping legislation, institutions and enforcement should also receive priority to protect manufacturing enterprises from unfair competition. To lower transaction costs, the government should be unrelenting in its efforts to reduce unnecessary administrative and bureaucratic procedures to speed up the investment approval process, as well as to simplify tax and customs systems for existing enterprises. Unnecessary labour regulations, such as rigid salary schedules for expatriate workers according to occupation and nationality, should be abolished. FDI policy. In addition to investment in physical infrastructure, education and training, and in the improvement of the regulatory and business environment, the following measures are specifically required to attract foreign direct investment. First of all, experience in other countries indicate that incentives play a relatively minor role in a good promotion programme, since long-term investors are not susceptible to short-term inducements (UNCTAD, 1999). In view of the limited benefits of FDI accruing to Indonesia in the past, the government should dispense with preferential measures such as tax breaks and holidays, financial incentives, accelerated depreciation and various duty exemptions, which tilt the level playing field in favour of FDI and discriminate against domestic investors, who after all produce most of the output, employment, exports and foreign exchange. Second, it is more important for investment promotion agencies to strive to discover the special needs of TNCs and other foreign firms, and then to take steps to cater to them. Effective promotion should be mounted to establish a distinct image or to alter the perception of potential investors by providing more and better information. However, such promotional efforts are highly skill-intensive and can be expensive, and they need to be undertaken carefully to maximize their impact. Third, despite the institution of a one-stop approval process, investors still have to obtain additional licenses from other government agencies (Soesastro et al., 2000). The impending decentralization and the future relationship between the central and local administrations has further heightened their concerns, thus necessitating clear and simplified regulations. The government can strengthen the opportunities for domestic firms to do business with foreign firms by building up local capabilities and a strong group of domestic firms which can develop linkages with foreign establishments (see section d below). Fourth, FDI should be used as a vehicle for the development of new industries and for maximizing technology development. Due to lack of information, high transaction costs and high risks involved, the government can undertake the crucial role of targeted investment promotion to reach out and put technology-based medium-scale foreign companies in touch with suitable domestic partners to promote technology-based supplier industries in such areas as capital goods, component manufactured and high technology. Human resource development. The current secondary education system is more suited to producing school leavers for the repetitive nature of shop floor manufacturing processes currently in use in many export-oriented labour-intensive industries. As the country moves up the technology ladder and begins to produce more complex products in greater volumes such as capital goods and advanced chemicals, manufacturers will require workers able to use
44
judgement and other thinking skills in the operation of advanced manufacturing processes and in the maintenance and repair of complex automated production equipment. The industry associations and the Ministry of Industry and Trade (representing the users of educated and trained manpower) and the Ministries of Education and Manpower (representing the producers of skills and knowledge) should establish a forum to continually identify the problems and agree on improvements to develop the skills, knowledge and attitudes required by the increasingly knowledge-based industry at the secondary general school, secondary vocational school, post-secondary vocational technical and tertiary education (university and diploma) levels. The private sector should be encouraged to establish and operate demand-driven technical training centres through financial and other incentives, under carefully designed industry initiatives, supported and coordinated by government, for quality control and accreditation systems (Manning, 1998). Institutional reform. The ministries responsible for industrial policy need to change their role from regulators to facilitators and promoters. The impending decentralization of many central functions provides an ideal opportunity to streamline central institutions to make them more effective. In order to achieve this new more demanding role, they need to undertake policy analysis, establish a formal government-business council, and regularly consult with business. It should strengthen some of its institutions such as customs and investment board, while transferring its current involvement in research and development, product testing and certification, and skills development to the private sector, perhaps managed by industry associations. Promoting regional potentials and regional industrialization. The strong impetus given by the present government to decentralization and regional autonomy will provide the provinces a new and powerful channel to build their manufacturing base by formulating policies to attract both domestic and foreign manufacturing investment. While this process will create many new opportunities, the competition for scarce investment funds between provinces will at the same time raise new challenges to make optimum use of available investment funds. The provincial governments will need to intensify cooperation among them to avoid being played one against the other by potential domestic and foreign investors. In addition, central government’s role will be crucial to coordinate their individual industrial policies to achieve maximum benefits from their relative comparative advantages and local resources. Pro-active central government policies and guidelines will be necessary to achieve effective cooperation and coordination between the provincial government in the areas of Identification of regional potential, specializations and priorities taking into account economies of scale; the creation of industrial clusters and provision of relevant information regarding business opportunities; the adherence to common minimum national standards regarding labour conditions and environment; and the harmonization of investment incentives, particularly concerning tax holidays and other fiscal incentives. c) Sub-sectoral Policies Non-discriminatory policies such as those outlined above have gained favour over those with a sub-sector or industry focus. They require less detailed information and less implementation capacity on the part of government agencies, while averting the risk that policy makers would pursue capacity creation in non-competitive industries. However, the practice of policy
45
implementation has shown that many policies need to address sub-sector issues. Trade and commercial policies, beyond an initial thrust towards trade liberalization and reform with universal rules, need to be formulated according to the specific needs of different industries, for instance to deter anti-dumping and unauthorized subsidies, as well as offering temporary relief when necessary. Export promotion programmes often involve industry associations are usually sub-sector specific. Industrial restructuring programmes and cluster support policies are industry-specific. Some sub-sectors are characterized by significant market failures, externalities or technological economies of scale, calling for targeted support for capacity creation. Government-private sector networks are generally organized around sub-sector issues. Sub-sector policies are a natural response to addressing issues of competitiveness. However, when specific sectors are selected for promotion, an appropriate industrial strategy is one that acts selectively. It should identify a narrow group of industries and set out transparent policies to promote them, as well as clear-cut guidelines against which their success can be evaluated (Rodrik, 1995). Trade and market diversification policies. Exports must continue to grow, not only to provide valuable foreign exchange, but to speed up industrial transformation, reap externalities and master international best practice, which all come from competing and trading in international markets. Exports are also necessary to maintain balance of payment viability, in view of the country’s large external debt. Indonesia’s share in world markets is still small, and the scope for expansion still substantial. Exports should be rapidly diversified, in terms of both products and markets. The selection of export products and markets to promote should be made jointly with the private sector, and could target other labour-intensive products (e.g. food products), more processed export products (e.g. secondary wood and paper processing, processed foods) and higher value-added products. Export promotion policies should be made in terms of net benefits, i.e., taking into account export earnings and the need to import inputs. Promotion policies should carefully study price trends, and avoid promoting products likely to face a decline in world prices due to competition and low demand. Biased government policies and regulations against exports should be identified through frequent government-private sector consultations, and eliminated. Existing mechanisms for providing trade financing and inputs at world prices are still cumbersome and should be greatly improved. Trade promotion efforts must be accelerated with existing trading partners (e.g., US, Europe, Japan) as well as with new countries (Middle East, Latin America, South Asia and Africa). Industrial transformation programme. The industrial transformation programme should begin with stocktaking, industry-by-industry: analyze strengths and weaknesses (SWOT analysis) in various industries, to reach public-private consensus on medium-term objectives for sub-sector development. This should be followed by the design of an implementation programme, consisting of project ideas of common interest to all the firms in priority sectors should be requested from industry associations and other public and private sector representatives, and initial cost estimates prepared (bottom-up approach). Resource mobilization should follow, by identifying sources of funding for the industry-specific operational programmes, and agree on cost-sharing arrangements between private (domestic and foreign) sector, public sector and overseas development funds. Finally an implementation plan should be drawn, to develop procedures and mechanisms for implementing the industry-
46
specific operational programmes for industrial transformation, and for monitoring and evaluating the programmes. Industrial diversification and deepening. The broadening of the manufactured base should be achieved through the establishment of supplier and support industries to produce intermediate inputs and components including in the chemical, consumer electronics, electrical appliance and motorcycle and motor vehicle industries (backward linkages), the promotion of downstream industries to increase value-added in exports (forward linkages), the production of basic machine tools and other industrial equipment. The production of capital goods and components should be promoted both domestically and for FDI due their special role in the manufacturing learning process and technological mastery, and the expansion of medium-technology industries (plastics, paper products, rubber, iron and steel, non-mineral metallic products, and iron and steel). Past government efforts in deepening and diversifying the industrial base, for instance in establishing a component industry for motor vehicle manufacturing and a machine tool industry, have not succeeded (Aswichahyono et al., 2000 and Braadbaart, 1996). The factors responsible for this lack of success should evaluated, on the basis of which new policies and strategies should be designed. Furthermore, it should also take into account the inherited structure and organization of the manufacturing sector such as size and location, which have evolved due to historical as well as technological indivisibility reasons, and build upon this to promote core competencies and improve competitiveness. Increasing value-added in the oil and gas sector. The oil and gas sector is characterized large trade imbalances as well as substantial discontinuities in the value-chain of petrochemical products. Domestic value-added should be increased and import dependence reduced by increasing the domestic production capacity of refineries and petrochemical feedstock, and encouraging domestic firms to supply services to the oil and gas sector including freight, insurance, exploration and other related services Strengthening industry associations. The government and the private sector should work together to strengthen private sector industry associations, particularly in the areas of competitiveness analysis, the dissemination of international best practice (industrial organization, management, quality management, manufacturing techniques), the establishment and operation of industry-level and customer-oriented productivity centres, and the joint management and operation of existing government-owned technical centres, with eventual transfer of ownership in the future. Dissemination of product and market intelligence. The industry associations, with assistance from government, can provide a very useful service to domestic and foreign entrepreneurs who wish to invest in the production of inputs or final products for both the domestic as well as export markets. Product-based information would include the market prospects both at home and abroad, price trends and quality requirements, information referral services of prospective clients and machinery and equipment suppliers, estimates of investment costs and sources of investment funding, and guidance in negotiating contracts with foreign investors and equipment suppliers.
47
d) Firm-centred policies to develop manufacturing capability The government should encourage indigenous firms to develop their manufacturing capability by acquiring and apply technology in its broad sense, including skills (technical, managerial, industrial organization and marketing), technical information, manufacturing techniques, quality management, product development, and external linkages to enhance their competitiveness. Firm-level policies aim at encouraging producers towards best-practice standards in the following areas in particular: adoption of total quality and productivity programmes, technological upgrading, and investment in plant and industrial skills. Total quality and productivity programmes. The application of continuous improvement, minimum waste of energy, materials and time, zero defects and other aspects of quality can greatly reduce production inefficiencies and enhance the competitiveness of firms. To reach companies, productivity centres and technical institutes and centres should be in a position to provide effective and competent extension services. In addition to expanding the existing programmes of on-the-job transfer of production know-how by technical experts from Japan and elsewhere, additional incentives can also be provided to companies to finance specialized consultant services. Technological upgrading. While quality and productivity programmes are a prerequisite for most Indonesian firms at their current level of development, their productivity gains will eventually be exhausted. Firms will then need to compete on the basis of product differentiation and innovation, as well as cost and quality. Firms will need to build the capacity to undertake product adaptation and development by upgrading their technology. For instance, domestic firms and affiliates of foreign firms need not aim to innovate at world frontiers, but should be encouraged to adapt and assimilate new technologies and create new products on the basis of existing technologies. For example, the government and the private sector can jointly present awards of excellence to particularly innovative firms to give them public and international recognition. Firms should also be encouraged, through the dissemination of relevant information, to acquire arms’ length technology through technology licensing, technology transfer agreement, reverse engineering and adaptation to build their own capabilities. Investment in equipment and training. The Government should consider tax and other incentives for upgrading plant and equipment, and the skills of workers and managers through in-plant technical and management training. Increasing the productivity of small and medium industries (SMIs). A mature industrial structure is characterized by small and medium-scale industries moving into highly specialized market niches where high levels of skills are often required. The major challenge and opportunity facing SMIs is therefore to become integrated in the overall manufacturing sector as suppliers of raw materials, intermediate inputs and components to other establishments, both small and large. A number of measures can be undertaken to develop sub-contracting arrangements and SMIs in general. Assemblers could be provided with incentives to identify potential suppliers for components, and to provide technical assistance to them to develop their capabilities, including the development of a vendor improvement and certification programme. Local design and engineering capabilities can be encouraged to produce components based on client
48
specifications, and the ability to reverse engineer products or create original designs on the basis of agreed specifications. Government technology support institutions should be jointly managed with industry associations. An aggressive, private-led outreach programme for SMIs should be provided by productivity centres, with qualified and motivated teams visiting the industries, offering free diagnosis and putting together packages of technology, training and finance. In order to learn from past mistakes, a thorough evaluation of all existing schemes should be made, and viable schemes should be redirected to private sector providers. Indonesia can benefit from intensive and adaptation of successful SMI programmes in other countries such as Hong Kong and Taiwan. The latter has provided extensive technical and managerial assistance by matching SMIs in need of services with appropriate consultants in the private sector, and has therefore managed to contract out most of its services to the private sector instead of government agencies. As for credit, the existing SMI credit programmes should be rationalized based on the evaluation of their effectiveness and performance, to improve SMI access to market-based finance. Business to business electronic commerce (B2B) should be encouraged, and medium-scale technology-based FDI partnerships between foreign and local SMIs should be promoted. Finally, the contracting and legal environment should be improved to encourage assemblers and principals to establish a close and durable relationship with suppliers, and establish a competent commercial court system. 2.5 CONCLUSION
Indonesia’s rapid industrialization and export growth since the mid-1980s were driven by the post-1985 restructuring of manufacturing within the East Asian and Southeast Asian region. The influx of foreign direct investment, particularly from Japan and the Newly Industrialized Countries of South Korea, Taiwan, Singapore and Hong Kong brought the technical, managerial and marketing skills needed to produce goods for the world markets. These were able to plug Indonesia into the world trade system almost overnight by incorporating local producers into the manufacturing and trading chain of foreign buying agents and intermediaries. Progress was particularly rapid in the period 1989-1992. However, the growth of the manufacturing sector and of manufacturing exports slowed down considerably in the subsequent period 1993-1997, four years before the crisis. This chapter argues that the marked slow-down observed in the Indonesian manufacturing sector and manufactured exports during 1993-97 was a consequence of shallow, export-led industrialization. As a result, the country reaped only some of the advantages associated with export-oriented industrialization while suffering many of its disadvantages. The actual pattern of industrial development in Indonesia was marked by a number of structural as well as institutional weaknesses, which dampened manufactured growth. These included a continuously high dependence on imported raw materials and components, low value-added generated in resource-based industries (e.g., palm oil, wood, paper, oil and gas), a virtually non-existent capital goods sector, limited range in export products and markets, singular specialization in labour-intensive but inelastic manufactured products combined with fierce international competition in the export markets from lower cost producers, low productivity
49
small and medium industries, high market concentration in many segments of industry, weak human resources, weak technology support system, and weak manufacturing capabilities of domestic firms. Given the nature and extent of import dependence and low value-added in the industrial sector, Indonesia ran a persistent deficit in manufacturing goods ($5 billion per year) and an increasingly large deficit in the current account of the balance of payments ($2 billion to $8 billion) in the 1985-6 to 1996-97 period, which were offset by large inflows of private capital and external public borrowing. Following the onset of the economic crisis in mid-1997, a massive devaluation of the rupiah took place. However, the constraints identified above prevented the manufacturing sector from reaping its benefits. Furthermore, as the economy recovers, the import dependence of the manufacturing sector is likely to once again produce a deficit in the balance of trade of manufactures. Now however, the constrained borrowing capacity of the public and private sectors, which will confront the country over the next four or five years, will prevent the restoration of external payment balances maintained before the crisis. On the domestic front, in view of current trade liberalization and the above mentioned weaknesses, international competition as well as firm indebtedness, and ensuing rapid inflow of manufactured goods already observed, ranging from shoes, to garments, motorcycles and motor vehicles, Indonesia is facing a real threat of de-industrialization. The chapter concludes that, just as the import-substitution strategy of the 1970s gave way to an export-oriented strategy in the 1980s and 1990s, a new strategy is required for the 2000s, which combines the benefits of trade liberalization, export-orientation and that of building the manufacturing capabilities of domestic firms, to enhance their competitiveness and resilience in the export as well as domestic markets. To take full advantage of the export-led strategy as well as the changing international environment, dominated by globalized manufacturing production and trade liberalization, will however call for more creative and innovative measures which rely on closer public-private partnerships. While a liberal environment is necessary, this should be done carefully and gradually lest it results in unwarranted de-industrialization. Since domestic firms have to undergo an arduous and risky process of learning to catch up with best international technological and business practices, a path fraught with market failures, liberalization alone will not ensure their competitiveness. The chapter calls for a changing role for government, firmly grounded on a private-public compact and complementary to the market, to facilitate the necessary learning process. The dramatic increase in industrial investment, manufacturing output and exports since the mid-1980s would suggest that Indonesia possessed a fairly articulated and developed industrial structure. The evidence presented here suggests that this was not the case. Despite the relatively large size of Indonesia’s industrial economy, the industrial structure is characterized by significant weaknesses, and international competitive threats pose the risks of de-industrialization and wiping out the gains experienced in the past decade and a half of rapid growth. Already three years before the crisis, there were tendencies towards dampened growth in manufacturing exports, due mainly to increased competitive pressures from other emerging economies across the limited range of products and in the few markets which Indonesian industry managed to penetrate. The inability of Indonesian firms to deepen their technological base or to move beyond the assembly-stage of manufacturing contributed to persistent deficits in balance of trade, caused largely by imported inputs and capital goods.
50
Following the spectacular growth of export-led manufacturing in the early 1990s, some slow-down was expected, since the manufacturing sector could not continue to grow at over 20% p.a. indefinitely. Nevertheless, the rapid deterioration in export revenues in the four years before the economic crisis of mid-1997, and the consequent halving of the growth rate of the manufacturing sector, took many by surprise. Also the pre-conditions for investment-driven growth were beginning to change. The regional restructuring of manufacturing capacities in the mid-1980s resulted in a massive flow of investments by Japanese, South Korean, Taiwanese, Hong Kong and Singaporean firms to what were then the three or four most open and labour-abundant ASEAN economies. By the early 1990s however, the investment liberalization process had become fairly widespread across Asia, with some of the newly liberalized economies offering equivalent if not higher productivity-wage rate ratios, and comparable investment incentives. The economic crisis hit Indonesia amidst growing competitive threats both in the investment and product markets. More recently, exports have recovered, and a current account surplus was posted in 1998 and 1999. However the export boom in manufactures has been caused by a (delayed) response to favourable prices resulting from the massively depreciated rupiah, and the trade surpluses are due to a collapse of imports rather than a change in the pattern of shallow export-led industrialization. When growth resumes, there is little to suggest that the balance of trade will not display its recurrent deficit. Only this time, there will be constrained opportunities for offsetting current account deficits through a positive capital account, given the large private and public debt overhang resulting from the collapse of 1997. The threats of stagnation or de-industrialization also pose significant political challenges. It was observed that most of Indonesia’s industrial capacities are located in people-abundant but resource-poor Java, which, consequently, would have the most to loose from a process of de-industrialization. By contrast, the devaluation of the rupiah has caused an increase of economic advantage in relatively sparsely populated but resource-abundant islands. A probable shift in economic weight among the constituent provinces has implications for regional balances within the country as well as the pattern of revenue-sharing implied by the recent moves towards decentralization adopted by the Government in the post-Soeharto era. The chapter argues that there is little choice but to maintain the pace of industrial development and to redress past weaknesses. Even in the context of liberalized investment and trade flows, public policy can go a long way towards influencing the nature and direction of industrialization, without resorting to distortive pricing policies or firm-specific incentives. Public-private partnerships in the formulation and implementation of industrial strategy could provide the necessary framework for the coordinated action of various government agencies involved in industrial development. In addition, policy makers and institutions will need to be insulated from lobbying for special favours from interest groups. However, to guard against bureaucratic authoritarianism, technocratic independence would need to be accompanied by public accountability. Whether these initiatives can be realized and implemented with the imagination required remains to be seen, as the government struggles to cope with the numerous economic and political reforms that occupy its policy agenda.
51
REFERENCES
Aswicahyono H., Basri M.C. and Hill H. (2000), How not to Industrialize: Indonesia’s Automotive Industry. Bulletin of Indonesian Economic Studies, (36)1.
Blazely L., Samami M., Rahayu Y.S. and Purwati R. (1996), Junior Secondary Education
Science: Diagnostic Survey. Jakarta: Technical Report No.10, Directorate of Secondary Education-World Bank Junior Secondary Education Project.
Blazely L. (1999), Review of Primary School Science Curriculum. Jakarta: Curriculum
Development Centre-British Council Curriculum Capacity Project. Braadbaart O. (1996), Machine Tools and the Indonesian Engineering Subsector:
Consumption Trends and Localization Efforts. BIES, (32)2. CBS. (2000), Large and Medium Manufacturing Indicator 1998. Jakarta: CBS. Dhanani S. (1992), Indonesian Manufacturing Employment and Training: Major Findings of
the 1992 Enterprise Surveys. Jakarta: technical reports 1, 2and 3 (West Java, East Java and North Sumatra), Regional Manpower Planning and Training Project, Bappenas Bureau of Manpower-World Bank Professional Human Resources Development loan 3134-IND.
Dhanani S. (1995), Indonesia: Public Vocational Training Centres in the Ministry of
Manpower. Jakarta: World Bank Consultant report, EA3PH. Dhanani S. and E. Sweeting (1995), Employment, Remuneration and Training of Technical
Graduates in Indonesia: Findings of a 1994 Tracer Study. Jakarta: Technical report, Regional Manpower Planning and Training Project, Bappenas Bureau of Manpower-World Bank Professional Human Resources Development loan 3134-IND.
Lall S. (1993), Policies for Building Technological Capabilities. Asian Development Review,
(11) 2. Lall S. (1995), Government and Industrialization: The Role of Policy Interventions. Global
Forum on Industry: Perspectives for 2000 and Beyond. New Delhi: United Nations Industrial Organization.
Lall S. (1998), Technology Policies in Indonesia. In Hall H. and K.W. Thee Editors (1998),
Indonesia’s Technological Challenge. Singapore: Institute of Southeast Asian Studies. Lall S. and K. Rao (1995), Indonesia: Sustaining Manufactured Export Growth, volume 1,
Main report, Jakarta, August. Manning C. (1998), Technology and Human Resources: Are Supply-side Constraints Holding
Indonesia Back, In Hall H. and K.W. Thee Editors (1998), Indonesia’s Technological Challenge. Singapore: Institute of Southeast Asian Studies.
Mans D. (1996), Indonesia: Industrial Technology Development for a Competitive Edge,
World Bank Discussion Paper Series No. 4, EAP Country Department III, Washington.
52
Pempel T.J. (1999), Regional Ups, Regional Downs. In Pempel T.J. Editor, The Politics of
the Asian Economic Crisis. Ithaca and London: Cornell University Press. Robison R. (1986), Indonesia: The Rise of Capital. Sidney: Allen and Unwin in association
with Asian Studies Association Rodrik D. (1997), Trade Liberalization, Competitiveness and Industrial Policy: Major
Conceptual Issues. In UNIDO, Policies for Competition and Competitiveness: The Case for Industry in Turkey Globalization Gone Too Far? Vienna: General Studies Series, United Nations Industrial Development Organization.
Rodrik D. (1997), Has Globalization Gone Too Far? Washington: Institute for International
Economics. Rock M.T. (1999), Reassessing the Effectiveness of Industrial Policy in Indonesia: Can the
Neoliberals be Wrong? World Development, (27)4. Sadtono E., Handayani and M. O’Reilly (1996), Junior Secondary Education: English
Diagnostic Survey with Recommendations for In-Service Training Programme for SLTP Teachers. Jakarta: Technical Report No.8a, Directorate of Secondary Education-World Bank Junior Secondary Education Project.
Sercovich, F. et al. (1999), Competition and the World Economy. Cheltenham: Edward
Elgar, in association with the United Nations Industrial Development Organization. Soesastro, M.H, K.W. Thee and W. Chandra (2000), Foreign and Domestic Direct
Investment in Indonesia since the Early 1990s. Jakarta: mimeo. Somerset A. (1996), Junior Secondary Education Mathematics: Diagnostic Survey of Basic
Number Skills. Jakarta: Technical Report No.12, Directorate of Secondary Education-World Bank Junior Secondary Education Project.
Sweeting E. (1997), The Three R’s: Their Assessment and Development in PEQIP Schools.
Jakarta: Technical Report No.17, Directorate-General of Primary and Secondary Education-World Bank Junior Secondary Education Project.
Thee K.W. (1994), Technological Capabilities and Indonesia’s Manufactured Exports.
Technical report to UNCTAD. Thee K. W. (1998), Determinants of Indonesia’s Industrial Technology Development. In Hall
H. and K.W. Thee Editors, Indonesia’s Technological Challenge. Singapore: Institute of Southeast Asian Studies.
UNCTAD. (1999), World Investment Report: Overview. New York and Geneva: United
Nations Conference for Trade and Development, United Nations. World Bank (1993), Indonesia: Industrial Policy: Shifting into High Gear. Washington:
Report No. 12153-IND.
53
3. Foreign Direct Investment in Indonesian Manufacturing 3.1. INTRODUCTION...........................................................................................................54 3.2. IMPORTANCE OF FDI IN INDONESIAN MANUFACTURING...........................56 3.2.1 Capital Formation............................................................................................................56 3.2.2 FDI Contribution to Manufacturing Production and Exports .........................................58 3.2.3 Manufacturing FDI Contribution to Employment ..........................................................60
3.3. IMPACT ON DOMESTIC ECONOMY ......................................................................62 3.3.1 Development of Supplier and Support Industries ...........................................................62 3.3.2 Transfer and Diffusion of Technology............................................................................64 3.3.3 Macroeconomic Effects...................................................................................................67
3.4. POLICY IMPLICATIONS ............................................................................................70 3.5. CONCLUSION................................................................................................................72 REFERENCES.......................................................................................................................74 ANNEX 3.1: FDI INFLOWS AND OUTFLOWS..............................................................76 ANNEX 3.2: TABLES ...........................................................................................................78
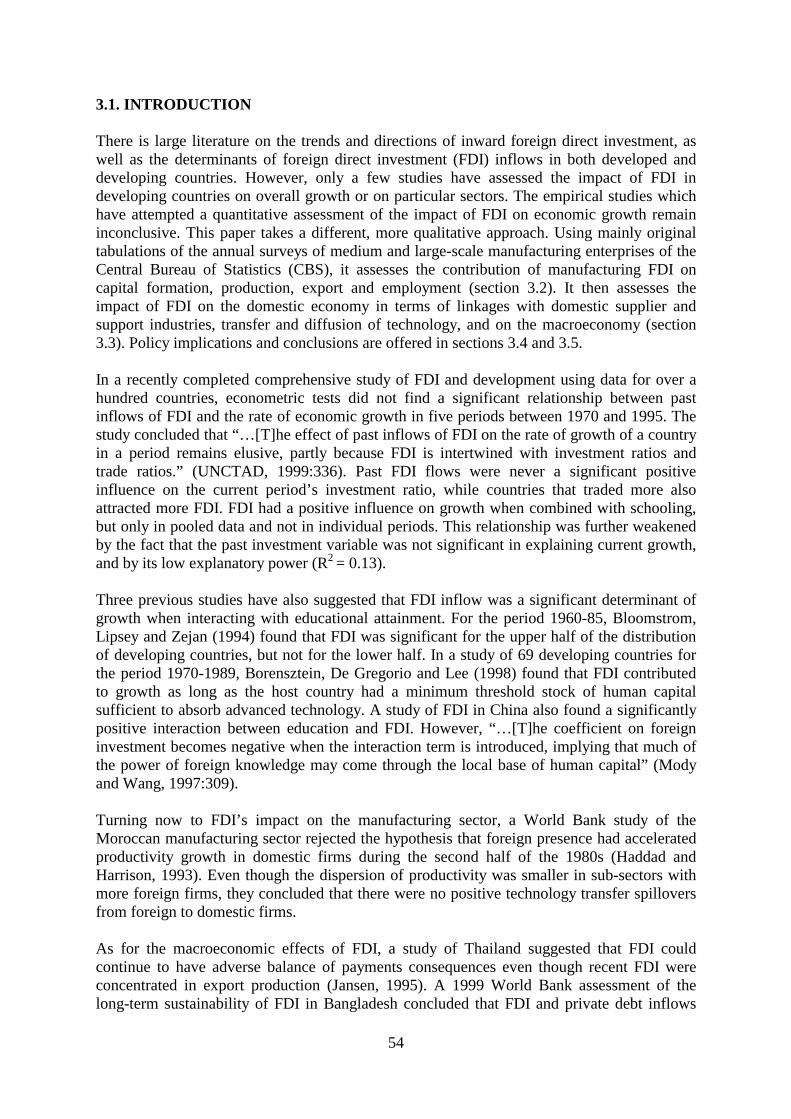
54
3.1. INTRODUCTION There is large literature on the trends and directions of inward foreign direct investment, as well as the determinants of foreign direct investment (FDI) inflows in both developed and developing countries. However, only a few studies have assessed the impact of FDI in developing countries on overall growth or on particular sectors. The empirical studies which have attempted a quantitative assessment of the impact of FDI on economic growth remain inconclusive. This paper takes a different, more qualitative approach. Using mainly original tabulations of the annual surveys of medium and large-scale manufacturing enterprises of the Central Bureau of Statistics (CBS), it assesses the contribution of manufacturing FDI on capital formation, production, export and employment (section 3.2). It then assesses the impact of FDI on the domestic economy in terms of linkages with domestic supplier and support industries, transfer and diffusion of technology, and on the macroeconomy (section 3.3). Policy implications and conclusions are offered in sections 3.4 and 3.5. In a recently completed comprehensive study of FDI and development using data for over a hundred countries, econometric tests did not find a significant relationship between past inflows of FDI and the rate of economic growth in five periods between 1970 and 1995. The study concluded that “…[T]he effect of past inflows of FDI on the rate of growth of a country in a period remains elusive, partly because FDI is intertwined with investment ratios and trade ratios.” (UNCTAD, 1999:336). Past FDI flows were never a significant positive influence on the current period’s investment ratio, while countries that traded more also attracted more FDI. FDI had a positive influence on growth when combined with schooling, but only in pooled data and not in individual periods. This relationship was further weakened by the fact that the past investment variable was not significant in explaining current growth, and by its low explanatory power (R2 = 0.13). Three previous studies have also suggested that FDI inflow was a significant determinant of growth when interacting with educational attainment. For the period 1960-85, Bloomstrom, Lipsey and Zejan (1994) found that FDI was significant for the upper half of the distribution of developing countries, but not for the lower half. In a study of 69 developing countries for the period 1970-1989, Borensztein, De Gregorio and Lee (1998) found that FDI contributed to growth as long as the host country had a minimum threshold stock of human capital sufficient to absorb advanced technology. A study of FDI in China also found a significantly positive interaction between education and FDI. However, “…[T]he coefficient on foreign investment becomes negative when the interaction term is introduced, implying that much of the power of foreign knowledge may come through the local base of human capital” (Mody and Wang, 1997:309). Turning now to FDI’s impact on the manufacturing sector, a World Bank study of the Moroccan manufacturing sector rejected the hypothesis that foreign presence had accelerated productivity growth in domestic firms during the second half of the 1980s (Haddad and Harrison, 1993). Even though the dispersion of productivity was smaller in sub-sectors with more foreign firms, they concluded that there were no positive technology transfer spillovers from foreign to domestic firms. As for the macroeconomic effects of FDI, a study of Thailand suggested that FDI could continue to have adverse balance of payments consequences even though recent FDI were concentrated in export production (Jansen, 1995). A 1999 World Bank assessment of the long-term sustainability of FDI in Bangladesh concluded that FDI and private debt inflows
55
had not helped in augmenting foreign exchange reserves so far and were not expected to do so for the next ten years. It calculated that higher inflows would lead to higher outflows in the medium to long-term. Growing repayment obligations thus presented the prospects of negative transfers in the future, and posed major challenges to generate additional foreign exchange (World Bank, 1999:19). Nevertheless, most developing countries now compete to attract FDI in the belief that it will significantly contribute to economic development. They often provide subsidies and special incentives in the hope that the total benefits will exceed the total costs of attracting FDI, pointing to the following potential benefits. Foreign firms can raise the level of capital formation, promote exports and generate foreign exchange. They can provide a much needed market for domestic supplier and support industries and, in the process, transfer technology, increase industrial linkages and stimulate industry as a whole, while providing direct and indirect employment. They can disseminate best practices through the demonstration of higher production efficiencies, labour standards, wages and environmental protection. In addition, competition between foreign and domestic firms in a market dominated by a few large local firms can improve the competitiveness and efficiency of domestic firms. In practice, the economic effects of FDI are almost impossible to measure with precision. Each foreign investment provides a complex package of firm-level attributes in varying quantities and quality, which are difficult to separate and quantify. The most prized proprietary assets of transnational companies (TNCs) include technology (and their ability to adapt it to local conditions), brand equity, product development, specialized skills, the ability to organize and integrate production across countries, the ability to establish marketing networks. These attributes can be copied or reproduced by others, but the cost of doing so can be prohibitive, and so are the risks associated with the development of competitive branded products, particularly in developing countries and where advanced technologies are involved. TNCs also provide non-proprietary assets including finance, capital goods and intermediate inputs, which are usually obtained from the market, but to which they have privileged access. Prior to the crisis, Indonesia was quite successful in attracting FDI, of the order of US$ 4 billion a year in the mid-1990s, and ranked among the top twelve recipients of FDI inflows among developing and transition economies in the first half of the 1990s (UNIDO, 1997). The 1985 Plaza currency realignment accord led to the rapid realignment of industrialized country currencies, resulting in a restructuring of regional manufacturing capacity. Many Japanese companies, particularly in the consumer electronics and automotive industries, shifted production to Indonesia and other Southeast Asian countries, a move facilitated by the liberalization of the Japanese financial markets and government assistance in relocation for enhanced markets and cheaper production costs (Pempel, 1999:67). While Japanese investments continued into the 1990s, they were joined towards the late 1980s by labour-intensive garment and footwear firms from Korea, Taiwan, Hong Kong and Singapore, whose rapidly expanding export-oriented economies led to higher current-account surpluses, higher currency values, labour shortages and rising production costs. However, since the onset of the economic crisis in mid-1997, both domestic and foreign investment resources have plummeted. By 1999, gross domestic capital formation declined from 32% to 19% of GDP, while FDI inflows had dried up, from US$6.5 billion in 1996/97 to $1.6 billion in 1997/98, and nil in 1998/99. Over the past two years, the Indonesian government has been particularly sensitive to the need to increase investment resources, and has embarked on an intensive campaign to woo foreign investors back into the country. It is

56
therefore important and timely to assess the impact of FDI in the Indonesian manufacturing sector in the 1990s, and review its prospects in the increasingly liberalized and globalized setting of the 2000s, particularly in the context of increased merger and acquisition activity by transnational companies (TNCs) in the aftermath of the East Asian economic crisis. 3.2. IMPORTANCE OF FDI IN INDONESIAN MANUFACTURING 3.2.1 Capital Formation
FDI in the Overall Economy Though the government collects and publishes data on investment approvals by sector and country of origin, there is no reliable data on investments realized by foreign firms in Indonesia. Balance of payment data however provide estimates of annual foreign direct investment in the whole economy. According to this, FDI was a relatively minor, though growing, player in the overall capital formation of Indonesia, accounting for 3% and 6% of total gross investment in the second half of the 1980s and first half of the 1990s (table 3.1). Nevertheless, foreign capital played a much more important role in the manufacturing sector than in the overall economy, since foreign firms accounted for about a quarter of manufacturing output. Table 3.1 Average FDI Inflows in East and Southeast Asia, 1987-97 ($ million/year) 1987-92 1993-97 Inward FDI as % of gross fixed
capital formation (annual average) 1987-92 1993-97
Hong Kong 1,886 4,518 9.9 10.2 Indonesia 999 3,865 2.7 6.1 Korea 907 1,668 1.1 1.1 Malaysia 2,387 4,742 18.1 14.1 Singapore 3,674 3,865 32.2 27.0 Taiwan 1,127 1,593 3.3 2.8 Thailand 1,656 2,261 5.6 3.8 Source: World Investment Report 1999, UNCTAD, United Nations, 1999 (annex table B.1 pp. 479-480 and annex table B.5, pp 509-510.). Note: All sectors including manufacturing. The relatively low level of FDI in total capital formation is similar to that of Korea and Taiwan, which have emphasized minimal levels of reliance on foreign investment. In contrast to Indonesia’s policy of attracting FDI, these two countries have used infant industry protection, local content rules, FDI restrictions and technology promotion in the form of externalized technology transfer (Lall, 1998). At the other extreme, Singapore and Malaysia were much more FDI-intensive (27% and 14% of gross domestic investment in 1993-97 respectively). These two countries have promoted FDI through extensive targeting in FDI selection and technology development process.

57
Actual FDI inflows to all countries may be much smaller than the above figures suggest. FDI comprises three components: equity, reinvested earnings and other capital. Figures available for some thirty developing countries indicate that equity typically formed about 60% of the total, while reinvested earnings and other capital formed about 20% each in the mid-1990s (UNCTAD, 1999:8). Since reinvested earnings are domestic savings in reality and not an infusion of fresh capital from abroad (Vernon, 1999), the supply of foreign resources may be 20% less than published FDI figures in these countries. Unfortunately similarly disaggregated FDI data is not available for Indonesia. “Other capital” consisted of inter-company loans covering initial and subsequent transactions with affiliated enterprises. According to the balance of payment statistics produced by the IMF, other capital accounted for about 50% of total FDI in Indonesia in the period 1990-97 (see annex table A.1), and some of these funds may have been used for short-term financing rather than investment. Finally, FDI also includes funds for mergers and acquisitions (M&As). Since these represent a change in ownership of existing assets, particularly related to privatization, they do not contribute to capital formation. On the other hand, to the extent that foreign affiliates finance some of their investment from the domestic capital market, FDI inflows would underestimate their total investment expenditure. There is evidence that Japanese TNCs in ASEAN countries raised up to 40% of their total financing from bonds issued by foreign affiliates and loans, including from Japanese institutions in host countries (UNCTAD, 1999:159). From the point of view of the size of investment by foreign affiliates, the source of funding does not matter. However, their use of domestic rather international financial resources raises the possibility of competition for investment funds and crowding out of domestic companies in the financial market. Apart from its direct contribution to capital formation, FDI may also influence investment by domestic firms and by other foreign affiliates. If domestic firms give up on investment projects to avoid the prospect of competing against more efficient and established foreign competitors, and if they do not invest in alternative activities, there will be crowding out of investment as a whole. In contrast, crowding in will occur if FDI stimulates new investment in downstream or upstream production. However, empirical evidence on this issue in developing countries remains inconclusive. An econometric exercise based on 39 countries and over 1970-96 shows that neutral effects dominated while the number of crowding out and crowding in cases were equal (UNCTAD, 1999:173). On the other hand, an IMF study based on 69 countries over 1970-89 study found that FDI from developed countries stimulated domestic investment (Borensztein et al., 1998). Though there are several methodological problems in such estimates, neutral effects may have prevailed in countries such as Indonesia, where foreign establishments remained essentially assemblers with relatively few linkages to the rest of the economy (see section 3 below). FDI in Indonesian Manufacturing Before 1985, many foreign firms took advantage of high tariff and non-tariff barriers to set up import-substitution industries in Indonesia, such as textiles and motor vehicles. After liberalization in 1985, new foreign firms entered mainly export-oriented and labour-intensive industries. Following the lifting of restrictions on full foreign ownership in 1994 and mandatory divestment rules on one hand, and sustained rapid economic growth on the other, new foreign firms increasingly entered the domestically oriented consumer durable industries. FDI also accelerated in the second half of the 1990s: more than 250 new foreign establishments were added in 1996-97 alone, the year before the economic crisis, or equal to
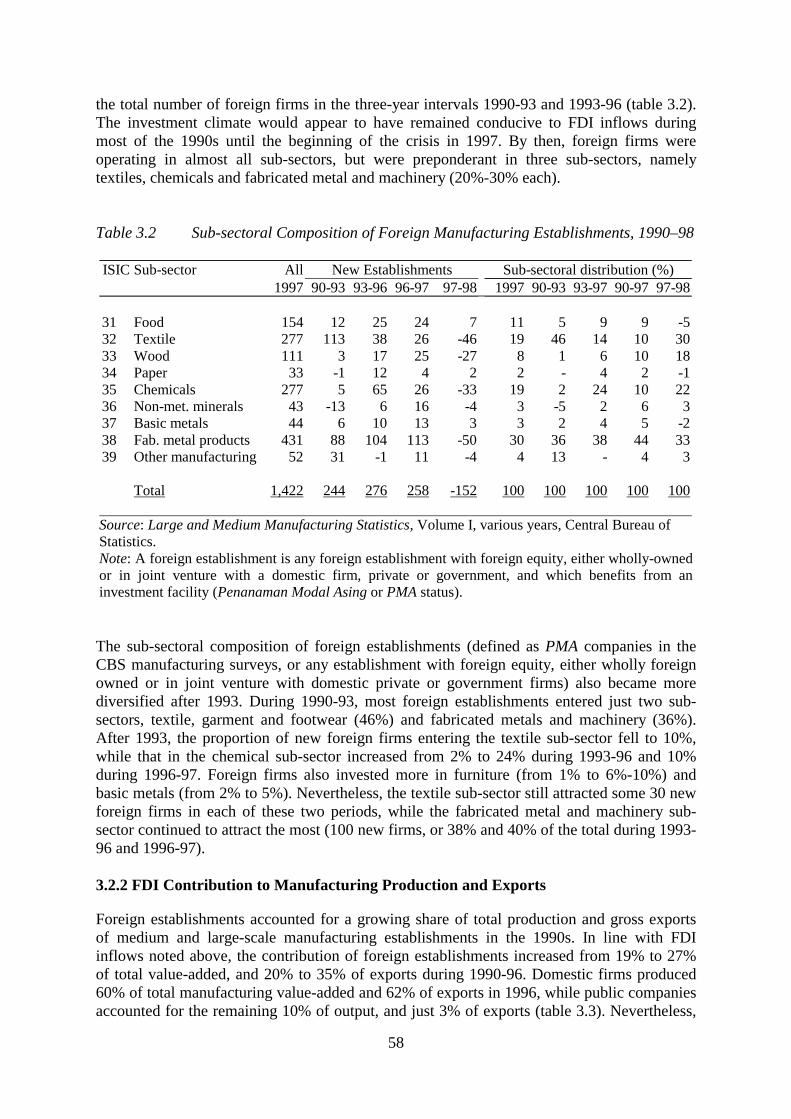
58
the total number of foreign firms in the three-year intervals 1990-93 and 1993-96 (table 3.2). The investment climate would appear to have remained conducive to FDI inflows during most of the 1990s until the beginning of the crisis in 1997. By then, foreign firms were operating in almost all sub-sectors, but were preponderant in three sub-sectors, namely textiles, chemicals and fabricated metal and machinery (20%-30% each). Table 3.2 Sub-sectoral Composition of Foreign Manufacturing Establishments, 1990–98 ISIC Sub-sector All New Establishments Sub-sectoral distribution (%)
1997 90-93 93-96 96-97 97-98 1997 90-93 93-97 90-97 97-98
31 Food 154 12 25 24 7 11 5 9 9 -5 32 Textile 277 113 38 26 -46 19 46 14 10 30 33 Wood 111 3 17 25 -27 8 1 6 10 18 34 Paper 33 -1 12 4 2 2 - 4 2 -1 35 Chemicals 277 5 65 26 -33 19 2 24 10 22 36 Non-met. minerals 43 -13 6 16 -4 3 -5 2 6 3 37 Basic metals 44 6 10 13 3 3 2 4 5 -2 38 Fab. metal products 431 88 104 113 -50 30 36 38 44 33 39 Other manufacturing 52 31 -1 11 -4 4 13 - 4 3
Total 1,422 244 276 258 -152 100 100 100 100 100
Source: Large and Medium Manufacturing Statistics, Volume I, various years, Central Bureau of Statistics. Note: A foreign establishment is any foreign establishment with foreign equity, either wholly-owned or in joint venture with a domestic firm, private or government, and which benefits from an investment facility (Penanaman Modal Asing or PMA status). The sub-sectoral composition of foreign establishments (defined as PMA companies in the CBS manufacturing surveys, or any establishment with foreign equity, either wholly foreign owned or in joint venture with domestic private or government firms) also became more diversified after 1993. During 1990-93, most foreign establishments entered just two sub-sectors, textile, garment and footwear (46%) and fabricated metals and machinery (36%). After 1993, the proportion of new foreign firms entering the textile sub-sector fell to 10%, while that in the chemical sub-sector increased from 2% to 24% during 1993-96 and 10% during 1996-97. Foreign firms also invested more in furniture (from 1% to 6%-10%) and basic metals (from 2% to 5%). Nevertheless, the textile sub-sector still attracted some 30 new foreign firms in each of these two periods, while the fabricated metal and machinery sub-sector continued to attract the most (100 new firms, or 38% and 40% of the total during 1993-96 and 1996-97). 3.2.2 FDI Contribution to Manufacturing Production and Exports
Foreign establishments accounted for a growing share of total production and gross exports of medium and large-scale manufacturing establishments in the 1990s. In line with FDI inflows noted above, the contribution of foreign establishments increased from 19% to 27% of total value-added, and 20% to 35% of exports during 1990-96. Domestic firms produced 60% of total manufacturing value-added and 62% of exports in 1996, while public companies accounted for the remaining 10% of output, and just 3% of exports (table 3.3). Nevertheless,
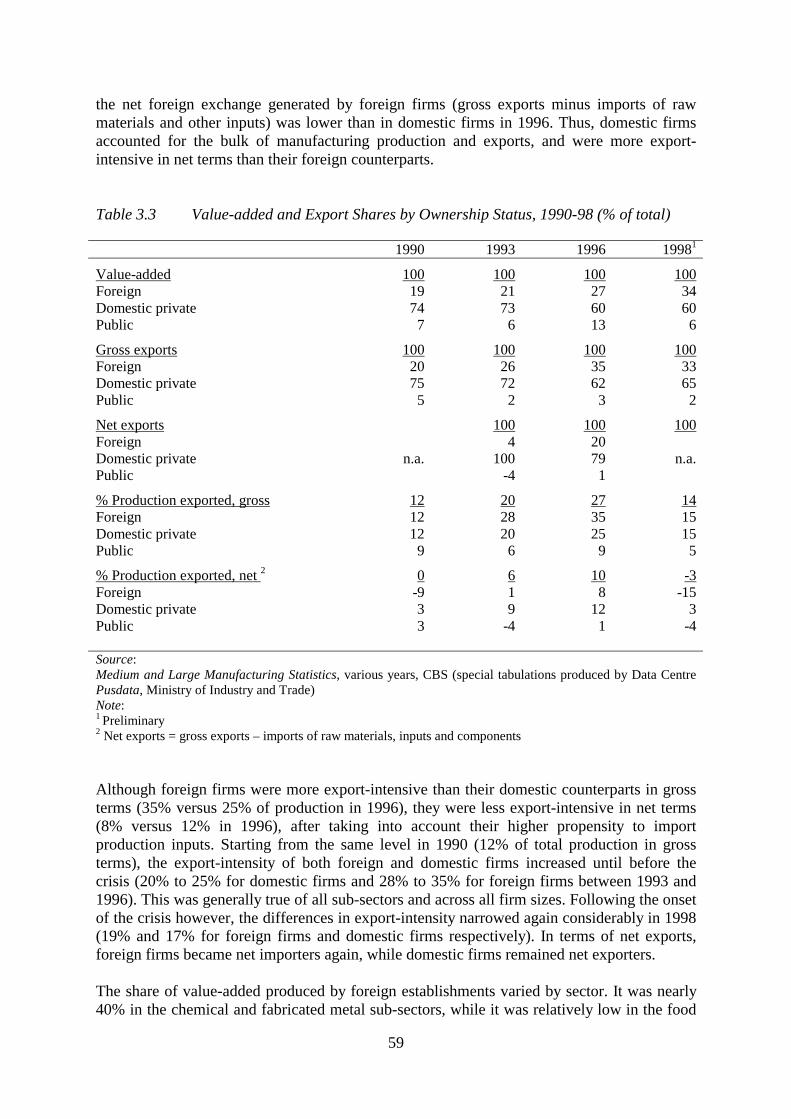
59
the net foreign exchange generated by foreign firms (gross exports minus imports of raw materials and other inputs) was lower than in domestic firms in 1996. Thus, domestic firms accounted for the bulk of manufacturing production and exports, and were more export-intensive in net terms than their foreign counterparts. Table 3.3 Value-added and Export Shares by Ownership Status, 1990-98 (% of total) 1990 1993 1996 19981
Value-added 100 100 100 100 Foreign 19 21 27 34 Domestic private 74 73 60 60 Public 7 6 13 6
Gross exports 100 100 100 100 Foreign 20 26 35 33 Domestic private 75 72 62 65 Public 5 2 3 2
Net exports 100 100 100 Foreign 4 20 Domestic private n.a. 100 79 n.a. Public -4 1
% Production exported, gross 12 20 27 14 Foreign 12 28 35 15 Domestic private 12 20 25 15 Public 9 6 9 5
% Production exported, net 2 0 6 10 -3 Foreign -9 1 8 -15 Domestic private 3 9 12 3 Public 3 -4 1 -4 Source: Medium and Large Manufacturing Statistics, various years, CBS (special tabulations produced by Data Centre Pusdata, Ministry of Industry and Trade) Note: 1 Preliminary 2 Net exports = gross exports – imports of raw materials, inputs and components Although foreign firms were more export-intensive than their domestic counterparts in gross terms (35% versus 25% of production in 1996), they were less export-intensive in net terms (8% versus 12% in 1996), after taking into account their higher propensity to import production inputs. Starting from the same level in 1990 (12% of total production in gross terms), the export-intensity of both foreign and domestic firms increased until before the crisis (20% to 25% for domestic firms and 28% to 35% for foreign firms between 1993 and 1996). This was generally true of all sub-sectors and across all firm sizes. Following the onset of the crisis however, the differences in export-intensity narrowed again considerably in 1998 (19% and 17% for foreign firms and domestic firms respectively). In terms of net exports, foreign firms became net importers again, while domestic firms remained net exporters. The share of value-added produced by foreign establishments varied by sector. It was nearly 40% in the chemical and fabricated metal sub-sectors, while it was relatively low in the food
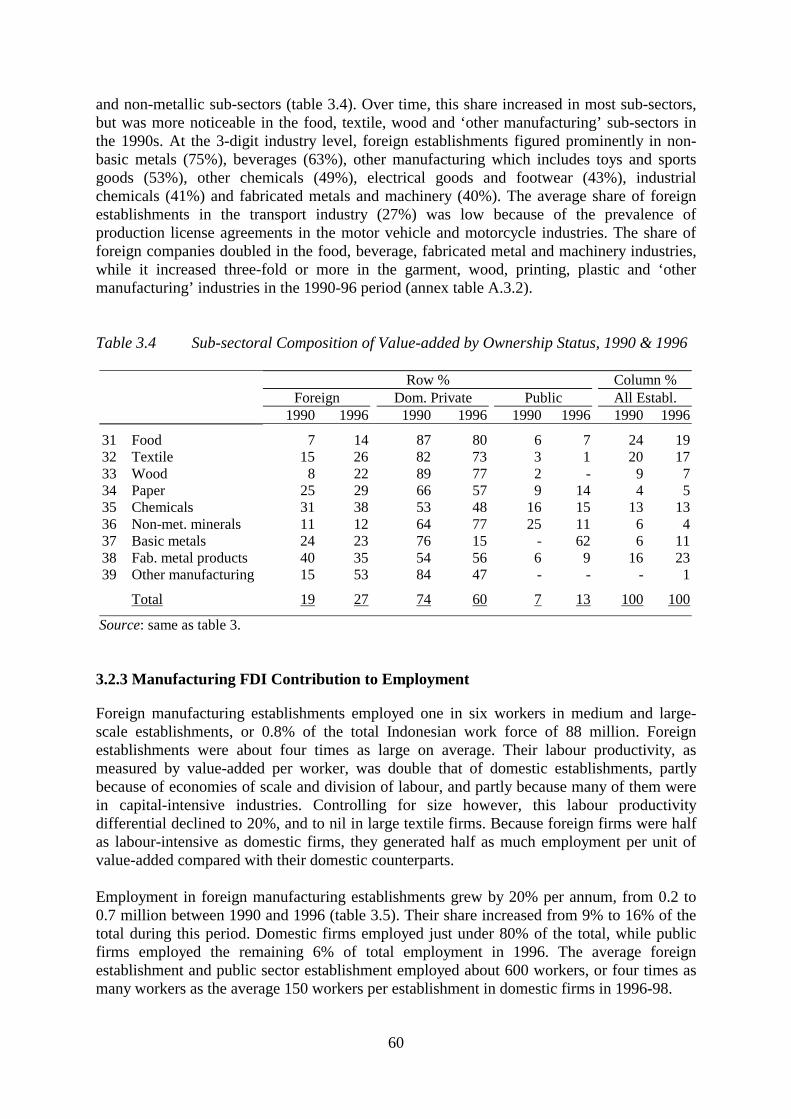
60
and non-metallic sub-sectors (table 3.4). Over time, this share increased in most sub-sectors, but was more noticeable in the food, textile, wood and ‘other manufacturing’ sub-sectors in the 1990s. At the 3-digit industry level, foreign establishments figured prominently in non-basic metals (75%), beverages (63%), other manufacturing which includes toys and sports goods (53%), other chemicals (49%), electrical goods and footwear (43%), industrial chemicals (41%) and fabricated metals and machinery (40%). The average share of foreign establishments in the transport industry (27%) was low because of the prevalence of production license agreements in the motor vehicle and motorcycle industries. The share of foreign companies doubled in the food, beverage, fabricated metal and machinery industries, while it increased three-fold or more in the garment, wood, printing, plastic and ‘other manufacturing’ industries in the 1990-96 period (annex table A.3.2). Table 3.4 Sub-sectoral Composition of Value-added by Ownership Status, 1990 & 1996
Row % Column % Foreign Dom. Private Public All Establ. 1990 1996 1990 1996 1990 1996 1990 1996
31 Food 7 14 87 80 6 7 24 19 32 Textile 15 26 82 73 3 1 20 17 33 Wood 8 22 89 77 2 - 9 7 34 Paper 25 29 66 57 9 14 4 5 35 Chemicals 31 38 53 48 16 15 13 13 36 Non-met. minerals 11 12 64 77 25 11 6 4 37 Basic metals 24 23 76 15 - 62 6 11 38 Fab. metal products 40 35 54 56 6 9 16 23 39 Other manufacturing 15 53 84 47 - - - 1
Total 19 27 74 60 7 13 100 100
Source: same as table 3. 3.2.3 Manufacturing FDI Contribution to Employment
Foreign manufacturing establishments employed one in six workers in medium and large-scale establishments, or 0.8% of the total Indonesian work force of 88 million. Foreign establishments were about four times as large on average. Their labour productivity, as measured by value-added per worker, was double that of domestic establishments, partly because of economies of scale and division of labour, and partly because many of them were in capital-intensive industries. Controlling for size however, this labour productivity differential declined to 20%, and to nil in large textile firms. Because foreign firms were half as labour-intensive as domestic firms, they generated half as much employment per unit of value-added compared with their domestic counterparts. Employment in foreign manufacturing establishments grew by 20% per annum, from 0.2 to 0.7 million between 1990 and 1996 (table 3.5). Their share increased from 9% to 16% of the total during this period. Domestic firms employed just under 80% of the total, while public firms employed the remaining 6% of total employment in 1996. The average foreign establishment and public sector establishment employed about 600 workers, or four times as many workers as the average 150 workers per establishment in domestic firms in 1996-98.
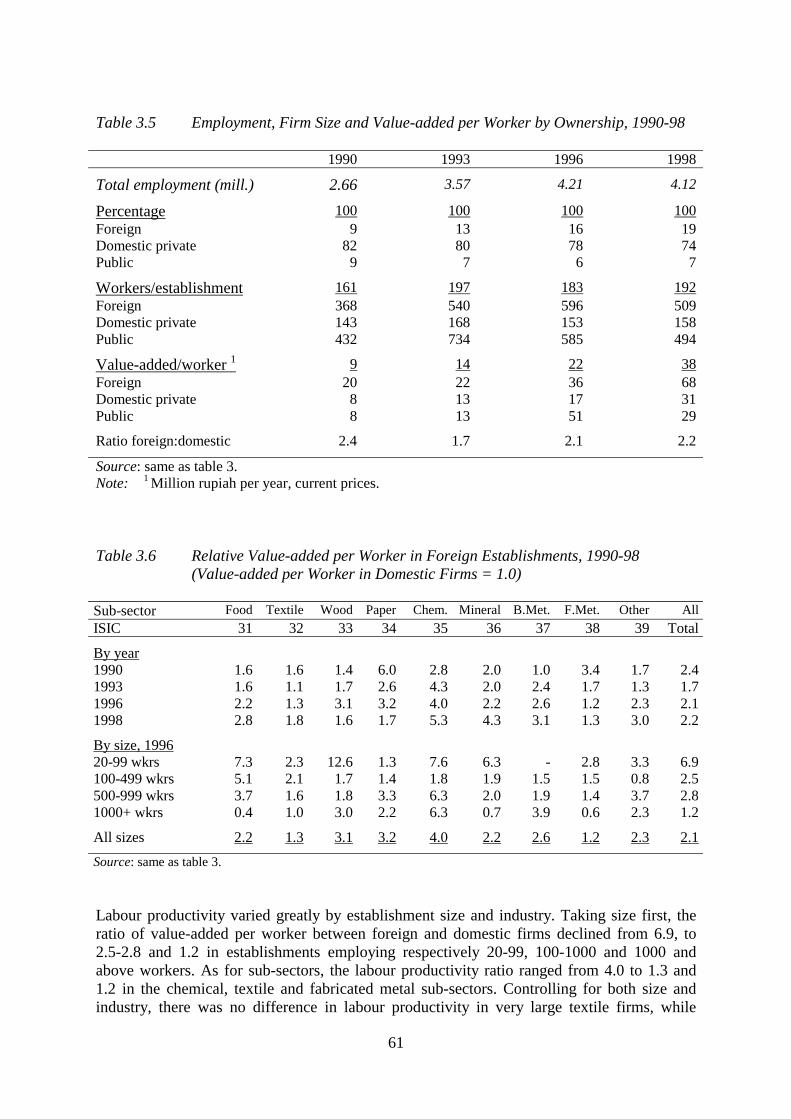
61
Table 3.5 Employment, Firm Size and Value-added per Worker by Ownership, 1990-98
1990 1993 1996 1998
Total employment (mill.) 2.66 3.57 4.21 4.12
Percentage 100 100 100 100 Foreign 9 13 16 19 Domestic private 82 80 78 74 Public 9 7 6 7
Workers/establishment 161 197 183 192 Foreign 368 540 596 509 Domestic private 143 168 153 158 Public 432 734 585 494
Value-added/worker 1 9 14 22 38 Foreign 20 22 36 68 Domestic private 8 13 17 31 Public 8 13 51 29
Ratio foreign:domestic 2.4 1.7 2.1 2.2
Source: same as table 3. Note: 1 Million rupiah per year, current prices. Table 3.6 Relative Value-added per Worker in Foreign Establishments, 1990-98
(Value-added per Worker in Domestic Firms = 1.0) Sub-sector Food Textile Wood Paper Chem. Mineral B.Met. F.Met. Other All ISIC 31 32 33 34 35 36 37 38 39 Total
By year 1990 1.6 1.6 1.4 6.0 2.8 2.0 1.0 3.4 1.7 2.4 1993 1.6 1.1 1.7 2.6 4.3 2.0 2.4 1.7 1.3 1.7 1996 2.2 1.3 3.1 3.2 4.0 2.2 2.6 1.2 2.3 2.1 1998 2.8 1.8 1.6 1.7 5.3 4.3 3.1 1.3 3.0 2.2
By size, 1996 20-99 wkrs 7.3 2.3 12.6 1.3 7.6 6.3 - 2.8 3.3 6.9 100-499 wkrs 5.1 2.1 1.7 1.4 1.8 1.9 1.5 1.5 0.8 2.5 500-999 wkrs 3.7 1.6 1.8 3.3 6.3 2.0 1.9 1.4 3.7 2.8 1000+ wkrs 0.4 1.0 3.0 2.2 6.3 0.7 3.9 0.6 2.3 1.2
All sizes 2.2 1.3 3.1 3.2 4.0 2.2 2.6 1.2 2.3 2.1 Source: same as table 3. Labour productivity varied greatly by establishment size and industry. Taking size first, the ratio of value-added per worker between foreign and domestic firms declined from 6.9, to 2.5-2.8 and 1.2 in establishments employing respectively 20-99, 100-1000 and 1000 and above workers. As for sub-sectors, the labour productivity ratio ranged from 4.0 to 1.3 and 1.2 in the chemical, textile and fabricated metal sub-sectors. Controlling for both size and industry, there was no difference in labour productivity in very large textile firms, while
62
labour productivity was higher in very large domestic firms in several sub-sectors such as food, non-metallic minerals and fabricated metals. Thus, higher average labour productivity in foreign and public establishments in the manufacturing sector as a whole cannot be necessarily equated with higher efficiency of labour. 3.3. IMPACT ON DOMESTIC ECONOMY 3.3.1 Development of Supplier and Support Industries
FDI had a moderate impact on the development of supplier and support industries in Indonesia, since foreign firms bought more than half of their inputs from abroad, while the opposite was true of domestic establishments. Before the crisis, foreign establishments procured 55% of their raw materials, inputs and components from abroad, compared with 24% for domestic firms (figure 3.1). Moreover, this pattern did not change in the course of the 1990s. Following the onset of the crisis, foreign procurement in fact increased to 57% in the case of foreign firms, while declining to 23% for domestic firms. The higher propensity of foreign buyers to locate their suppliers abroad was evident in all industries. The imported input content of foreign establishments was higher than domestic establishments in all industries, whether relatively low technology industries, such as textile (49% vs. 29%), garment (57% vs. 25%) and footwear industries (66% vs. 41%), or higher technology ones, such as electronic component (92% vs. 83%), motorcycle component (67% vs. 52%) and motor vehicle component (92% vs. 87%) industries (figure 3.1). While the imported input content of foreign establishments in the textile, garment and footwear industries declined between 1993 and 1996 (a trend which was however reversed after the onset of the crisis), no similar improvement could be seen in higher-technology industries, with the exception of the electrical appliance and motorcycle component industries. Thus the imported input content of the chemical industries, drugs and medicines, machinery, electronic components and vehicle components remained unchanged. The small decline in the imported input content observed in the consumer electronics and communication equipment industries was easily compensated by the rise in the imported input contents of electronic components from 88% to 92% during 1993-96. A similar situation prevailed in the motor vehicle assembly industry. Its import content in foreign firms declined from 81% to 69% during 1993-98. However, the local content policy in the motor vehicle industry was easily defeated by assemblers purchasing locally assembled components whose sub-components were in turn practically all imported.
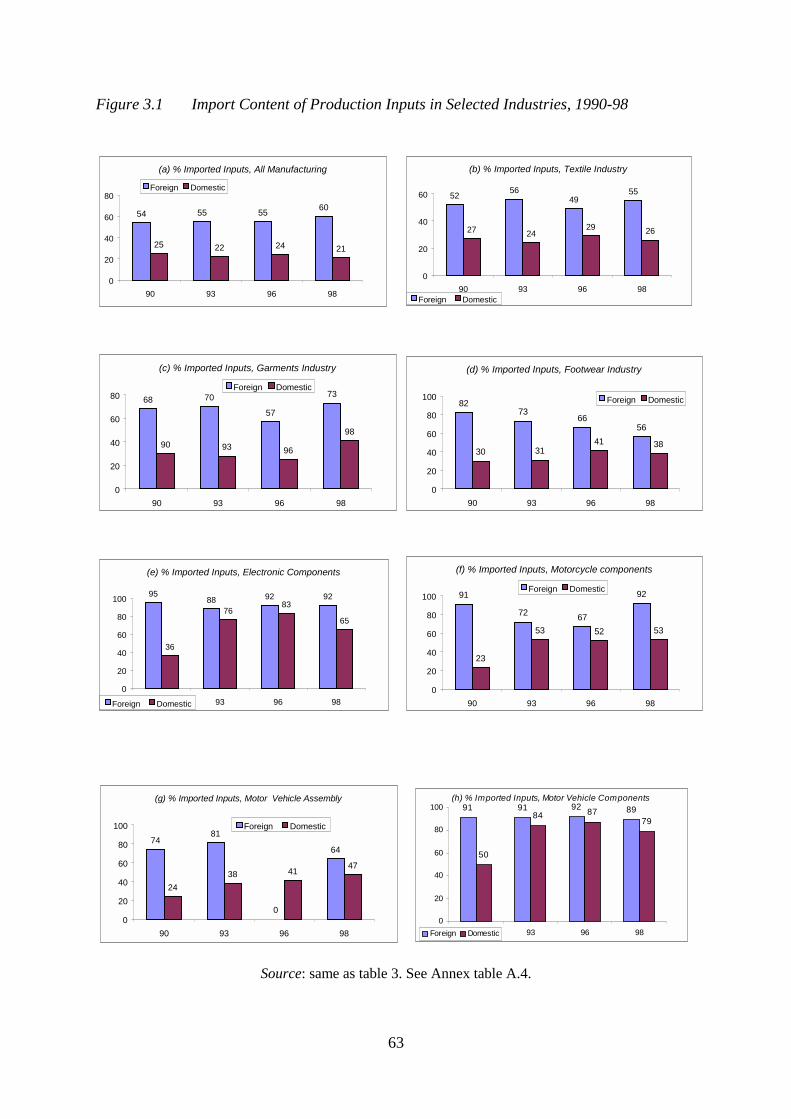
63
Figure 3.1 Import Content of Production Inputs in Selected Industries, 1990-98
Source: same as table 3. See Annex table A.4.
(a) % Imported Inputs, All Manufacturing
54 55 55 60
25 22 24 21
0
20
40
60
80
90 93 96 98
Foreign Domestic
(b) % Imported Inputs, Textile Industry
52 5649
55
27 2429 26
0
20
40
60
90 93 96 98Foreign Domestic
(c) % Imported Inputs, Garments Industry
68 70
57
73
90 93 96
98
0
20
40
60
80
90 93 96 98
Foreign Domestic
(d) % Imported Inputs, Footwear Industry
8273
6656
30 3141 38
0
20
40
60
80
100
90 93 96 98
Foreign Domestic
(e) % Imported Inputs, Electronic Components
9588 92 92
36
7683
65
0
20
40
60
80
100
90 93 96 98Foreign Domestic
(f) % Imported Inputs, Motorcycle components
91
72 67
92
23
53 52 53
0
20
40
60
80
100
90 93 96 98
Foreign Domestic
(g) % Imported Inputs, Motor Vehicle Assembly
7481
0
64
2438 41 47
0
20
40
60
80
100
90 93 96 98
Foreign Domestic
(h) % Imported Inputs, Motor Vehicle Components91 91 92 89
50
84 8779
0
20
40
60
80
100
90 93 96 98Foreign Domestic
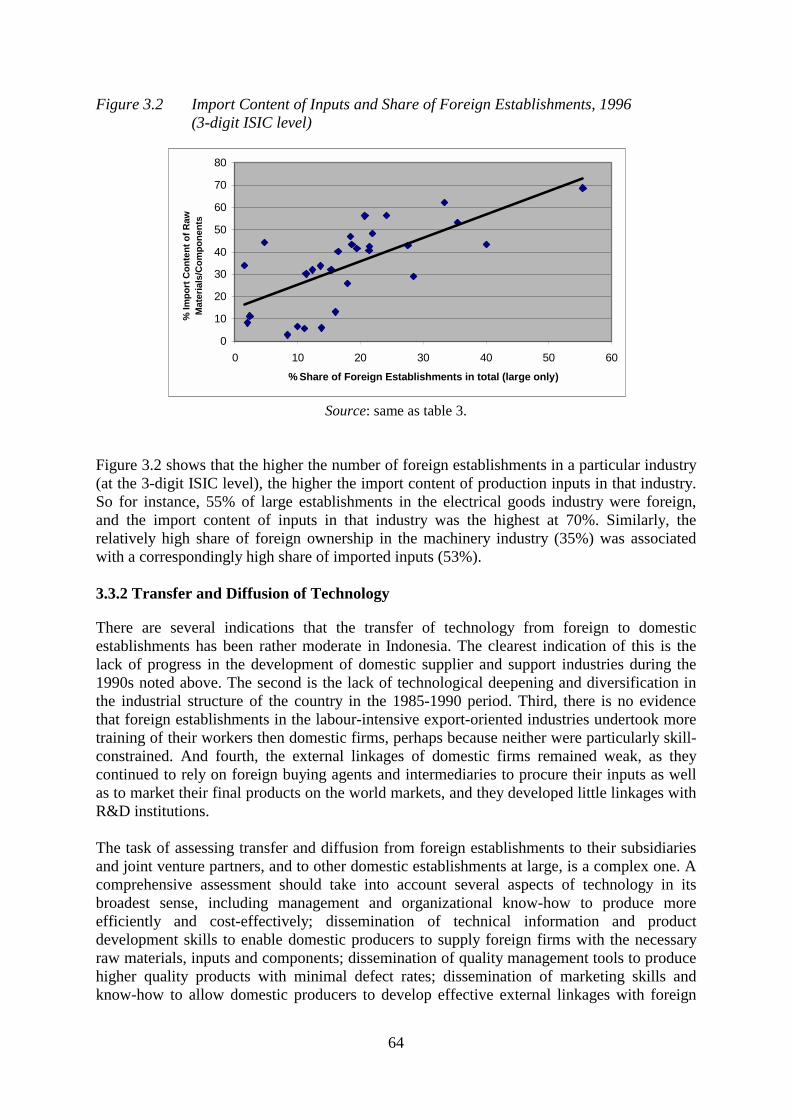
64
Figure 3.2 Import Content of Inputs and Share of Foreign Establishments, 1996 (3-digit ISIC level)
Source: same as table 3. Figure 3.2 shows that the higher the number of foreign establishments in a particular industry (at the 3-digit ISIC level), the higher the import content of production inputs in that industry. So for instance, 55% of large establishments in the electrical goods industry were foreign, and the import content of inputs in that industry was the highest at 70%. Similarly, the relatively high share of foreign ownership in the machinery industry (35%) was associated with a correspondingly high share of imported inputs (53%). 3.3.2 Transfer and Diffusion of Technology
There are several indications that the transfer of technology from foreign to domestic establishments has been rather moderate in Indonesia. The clearest indication of this is the lack of progress in the development of domestic supplier and support industries during the 1990s noted above. The second is the lack of technological deepening and diversification in the industrial structure of the country in the 1985-1990 period. Third, there is no evidence that foreign establishments in the labour-intensive export-oriented industries undertook more training of their workers then domestic firms, perhaps because neither were particularly skill-constrained. And fourth, the external linkages of domestic firms remained weak, as they continued to rely on foreign buying agents and intermediaries to procure their inputs as well as to market their final products on the world markets, and they developed little linkages with R&D institutions. The task of assessing transfer and diffusion from foreign establishments to their subsidiaries and joint venture partners, and to other domestic establishments at large, is a complex one. A comprehensive assessment should take into account several aspects of technology in its broadest sense, including management and organizational know-how to produce more efficiently and cost-effectively; dissemination of technical information and product development skills to enable domestic producers to supply foreign firms with the necessary raw materials, inputs and components; dissemination of quality management tools to produce higher quality products with minimal defect rates; dissemination of marketing skills and know-how to allow domestic producers to develop effective external linkages with foreign
0
10
20
30
40
50
60
70
80
0 10 20 30 40 50 60% Share of Foreign Establishments in total (large only)
% Im
port
Con
tent
of R
aw
Mat
eria
ls/C
ompo
nent
s
65
buyers and suppliers as well as technology suppliers; and dissemination of product design know-how to allow domestic producers to create new products. Though dissemination of product design know-how implies innovating at world technological frontiers and may therefore come at a much later stage, all the other skills mentioned above are necessary to deepen and diversify the industrial base, and to develop the production capabilities to improve the competitiveness of domestic manufacturing firms. Also, while most of the above transfers imply deliberate efforts on the part of foreign establishments to transfer technology to domestic partners, the latter can also greatly benefit from demonstration effects in a variety of ways, including adopting production technologies and organization methods observed in foreign firms, ordering identical or similar production equipment, buying from the same suppliers and recruiting some of their employees. Both deliberate technology transfers and spillovers are difficult to measure however. Four possible indicators are used to assess technology transfer in Indonesia here: development of supplier and supporting industries, technological deepening of the industrial structure, technical, production and management skills development, and increasing external linkages. These are briefly examined in turn below. First, the extent to which foreign establishments have shifted their procurement of raw materials, inputs and components from foreign to domestic suppliers over time, would signal a growing ability by domestic establishments to supply inputs competitively and at the required quality standards. A gradual decline in the imported input content of foreign establishments did take place to some extent in the textile sub-sector, and in particular segments of higher-technology industries such as electrical appliances and motorcycle components before the crisis. However these trends was reversed after the onset of the crisis. In contrast, the imported input content of foreign establishments in most higher-technology industries including chemicals, drugs and medicines, machinery, electronics and vehicle components, remained unchanged. Having located their assembly operations here, foreign establishments have thus shown only a moderate interest in developing domestic supplier and support industries during most of the 1990s. Second, the ability to increase the production and export of medium and higher technology products signals the rising technological capability of a country. There was little indication of technological deepening and diversification of the Indonesian industrial structure in the 1985-1998 period, a trend at odds with that of similar countries in Asia and elsewhere. The domination of low-technology labour-intensive industries (including textile, garments, footwear, wood and paper) is to be expected in a low labour-cost economy. Nevertheless, their share rose from 44% to 48% of total manufacturing value-added (figure 3.3a), reflecting the emphasis on labour-intensive exports, mainly at the expense of medium-technology industries (including gas and oil refinery, petrochemical, rubber, plastic, cement and iron and steel), which declined from 38% to 34%. The share of higher-technology industries (including the chemical, machinery, consumer electronics and components, electrical goods and vehicle industries and parts) remained unchanged at 18% of the total. Indonesia’s production of higher technology products ranked among the lowest in the world, and was only half that of Philippines, India, Mexico and Brazil (figure 3.3b). In spite of the rapid growth of consumer electronics and electrical goods industries, the share of higher-technology industries stagnated in Indonesia, while expanding rapidly in most countries, usually at the expense of low technology industries. The production of capital goods, a

66
further sign of the technological maturity of an economy, was also rather limited (2% versus 8%-9% in India, China and Brazil, see figure 3.4). The rapidly growing countries of East and Southeast Asia as well as Latin American countries preserved the contribution of medium-technology industries in the overall mix, while Eastern European countries increased this contribution in overall manufacturing value-added. Figure 3.3 Technology level of Industrial Output, 1998-97 (% of Value-added)
Source: 1. UNIDO (1999), Measure for Measure: Building UNIDO’s System of Industrial Development Indicators
(SIDI), Vienna (classification based on R&D expenditure in 10 OECD countries). 2. Data for Indonesia: same as table 3. Note: Industrial value-added includes oil and gas. Low-technology industries:
Food, drinks and tobacco (31), textile, garments & leather (32) , wood and products (33), and paper and products (34)
Medium-technology industries:
Rubber and plastic products (355, 356), non-metallic minerals (36), basic metals (37), metal products (381), and other manufacturing (390)
High-technology industries:
Chemicals (351, 352), metal products, machinery and transport equipment (38 except 381)
Figure 3.4 Share of Machinery Production in Manufacturing Value-added, 1997
(% of Value-added, (ISIC Category 382)
Source: same as figure 3.
26
19
9 9 8 8 7 6 42 2
05
1015202530
Singap
re
Hunga
ry
Poland
Brazil
India
Korea
Malays
ia
South
Africa
Turkey
Indon
esia
Philipp
ines
(a) Technology Composition of Manuf. Output
44
38
18
45
37
17
46
38
16
47
37
17
48
34
18
0
5
10
15
20
25
30
35
40
45
50
Low Medium High
19851990199519971998
(b) % Share of Higher Technology Products
010203040506070
SingaporeTaiwan
Korea
Malaysia
Philippines
Indonesia
India
Poland
HungaryTurkeyBulgaria
Rumania
Argentina
Brazil
Mexico
Chile
Costa Rica
S. AfricaEgypt
19851997
67
A third indicator of technology transfer is the training imparted by foreign and domestic firms to their workforce. According to firm-level surveys undertaken in the early 1990s, the amount of training undertaken by firms varied considerably by sub-sector and by establishment size. Larger firms, whether domestic or foreign, undertook more training of their workers than smaller firms, particularly when producing higher technology goods such as transport equipment for the domestic market (World Bank 1991, Dhanani 1992). On the other hand, firms producing labour-intensive goods for the world market were less likely to offer skills upgrading to their workers, perhaps because they did not need higher level skills. Since foreign establishments were typically very large (1000 workers and above), and almost half of them produce consumer durables, they appear to provide more training than their generally smaller domestic counterparts. Unfortunately, the available evidence on firm-level training is not sufficiently disaggregated to ascertain whether foreign firms of the same size and in the same industry as their domestic counterparts did in fact undertake more training. A fourth indicator of technology transfer is the growth of external linkages of domestic firms in product marketing and procurement of inputs from abroad, and with R&D institutes. Though there is no systematic information on this subject, Indonesian manufacturers are believed to rely mainly on foreign buying agents and intermediaries to procure their inputs as well as to market their final products on the world markets. Indonesian trading firms have not yet built a sizeable network of international trading houses to market Indonesian products. As for linkages with research and development institutes, export-oriented textile, garments and electronic firms rarely interacted with the science and technology institutes, because they were unaware of their R&D capabilities or believed that the latter’s activities were irrelevant to their specific needs. In some cases firms were not convinced that the researchers had the necessary understanding of the technological needs of the firms they were supposed to advise (Thee and Pangestu, 1994 and Thee, 1998). The limited degree of transfer and diffusion of technology from foreign to domestic establishments at large described above should not really come as surprise. Most technology flows take place between parent companies and their affiliates and, being commercially oriented, firms have little incentive to transfer knowledge and supporting innovations in subsidiary companies beyond what is needed for the production process or product at hand, much less to domestic firms at large. Developing countries should thus not expect their technological base to be transformed just by opening their doors to FDI. In addition, deficiencies in technology learning and transfer, due to inadequate human capital and local capabilities, can further hinder this process. The best way to raise technological linkages between foreign and domestic firms is therefore to raise the capabilities of potential suppliers through strong technology support services and in partnership with foreign firms. 3.3.3 Macroeconomic Effects
Balance of payments Net FDI inflows to Indonesia increased substantially from US$0.3 billion to $6 billion per year between 1985 and 1996, particularly between 1994 and 1996 when they nearly trebled from $2 billion to $6 billion, one year before the crisis (annex 3.1, figure A.3.1). At the same time, significant FDI-related outflows occurred in the form of profit remittance, interest payments on past investment loans, and payment for business services, including royalties and license and management fees. Due to the lack of detailed statistics in the public domain, it is difficult to estimate the net impact of FDI on the overall balance of payments. Nevertheless, the available published data, discussed in more detail in annex 3.1, suggest that
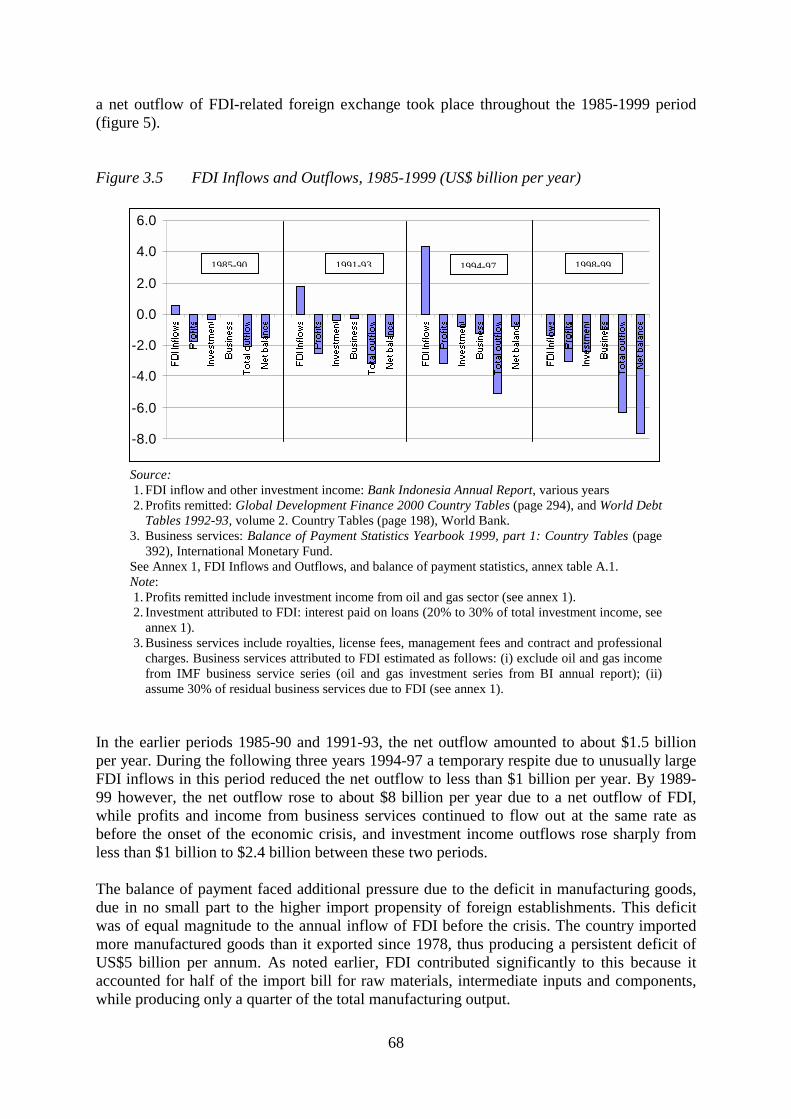
68
a net outflow of FDI-related foreign exchange took place throughout the 1985-1999 period (figure 5). Figure 3.5 FDI Inflows and Outflows, 1985-1999 (US$ billion per year)
Source: 1. FDI inflow and other investment income: Bank Indonesia Annual Report, various years 2. Profits remitted: Global Development Finance 2000 Country Tables (page 294), and World Debt
Tables 1992-93, volume 2. Country Tables (page 198), World Bank. 3. Business services: Balance of Payment Statistics Yearbook 1999, part 1: Country Tables (page
392), International Monetary Fund. See Annex 1, FDI Inflows and Outflows, and balance of payment statistics, annex table A.1. Note: 1. Profits remitted include investment income from oil and gas sector (see annex 1). 2. Investment attributed to FDI: interest paid on loans (20% to 30% of total investment income, see
annex 1). 3. Business services include royalties, license fees, management fees and contract and professional
charges. Business services attributed to FDI estimated as follows: (i) exclude oil and gas income from IMF business service series (oil and gas investment series from BI annual report); (ii) assume 30% of residual business services due to FDI (see annex 1).
In the earlier periods 1985-90 and 1991-93, the net outflow amounted to about $1.5 billion per year. During the following three years 1994-97 a temporary respite due to unusually large FDI inflows in this period reduced the net outflow to less than $1 billion per year. By 1989-99 however, the net outflow rose to about $8 billion per year due to a net outflow of FDI, while profits and income from business services continued to flow out at the same rate as before the onset of the economic crisis, and investment income outflows rose sharply from less than $1 billion to $2.4 billion between these two periods. The balance of payment faced additional pressure due to the deficit in manufacturing goods, due in no small part to the higher import propensity of foreign establishments. This deficit was of equal magnitude to the annual inflow of FDI before the crisis. The country imported more manufactured goods than it exported since 1978, thus producing a persistent deficit of US$5 billion per annum. As noted earlier, FDI contributed significantly to this because it accounted for half of the import bill for raw materials, intermediate inputs and components, while producing only a quarter of the total manufacturing output.
-8.0
-6.0
-4.0
-2.0
0.0
2.0
4.0
6.0
1985-90 1991-93 1994-97 1998-99
69
The adverse impact of FDI on the balance of payment is not unexpected. By definition, if all profits are repatriated, the direct effect of an FDI project is more adverse on the balance of payments than in an identical project financed from national resources. There would be little point in investing in a project that did not yield more income than the cost of its investment during the life of the project. Nevertheless the large imbalance between foreign exchange inflows and outflows attributable to FDI raises the question of long-term sustainability and future foreign exchange liabilities. Furthermore, the high investment income for payment of inter-company loans indicates that FDI is a more expensive source of foreign finance than alternative sources. The rates of profit of foreign firms in Asia in the 1980s and 1990s (20%-30%) exceeded the rate of interest on sovereign loans and other types of international loans (6%-9%, UNCTAD, 1999:164). From this point of view, it would be preferable for domestic firms to carry out the same projects if they were able to do so without additional costs to acquire technology, skills or market access, or if they had the possibility to enter into more favourable licensing agreements with foreign firms. Taxes Import and export tariffs are a major source of tax revenues in a country with an underdeveloped administrative structure to collect income taxes such as Indonesia. Though tax revenue data by ownership status is not available, foreign manufacturing establishments are unlikely to have contributed much to the country’s tax revenues because they were routinely offered tax holidays and exemptions, exporters were exempt from import duties and VAT, and firms could offset most of the taxes they eventually had to pay through accelerated depreciation allowances on plant and equipment. A wide array of tax facilities were available to foreign and domestic investors, including the following (Capital Investment Coordinating Board, 1999): • Exemption of import duties and value-added tax on machinery and equipment. • Exemption of import duties on raw materials and intermediate inputs for the first two
years. Export-oriented firms and firms located in “integrated economic development zones” benefited from the additional facilities as follows: • Refund of import duties and surcharges on all inputs. • Accelerated depreciation and amortization, e.g., five years on permanent buildings. • Compensation for operating losses for a period of ten years. • A 50% reduction on income tax payable on dividends. • Income tax deductible import of all capital goods, and on raw materials for one year of
production. • Income tax deductible benefits-in-kind to employees. • Exemptions on value-added tax and luxury taxes on imports of capital goods,
intermediate inputs and services from domestic and foreign sources. Furthermore, all companies located in Eastern Indonesia benefited from the following incentives: • A 50% reduction in land and building taxes for eight years. • An opportunity to compensate for losses for eight years.
70
Finally, a large number of transactions take place between foreign affiliates and their parent firms. Foreign firms thus have considerable freedom in fixing prices of goods and services in internal transactions which, in contrast to transactions with other firms, are not transparent and cannot be checked easily. Foreign firms can use such transfer pricing to their own advantage, affecting the amount of profit reported to tax authorities in the host country. Thus, according to the IMF balance of payment statistics, dividends and distributed branch profits fell from $1.5 billion in 1993 to $0.6-$1.0 billion in the high growth period between 1994 and 1996 (see annex table A.3.1). The above exemptions, facilities and likelihood of transfer pricing would suggest that foreign investors in the manufacturing sector ended up paying little tax. To avoid charges of discrimination, domestic companies were gradually granted the same exemptions and facilities, with the result that neither contributed much to the country’s tax base. Moreover, by lowering the price of machinery and equipment relative to labour, the government may have inadvertently influenced the choice of techniques adopted by manufacturing establishments, and may have encouraged them to automate certain auxiliary processes which could have been undertaken manually. 3.4. POLICY IMPLICATIONS Though Indonesia appears to have benefited only modestly from FDI in the 1990s, this does not mean that FDI entry should in any way be restricted. This, in any case, may no longer be an option in an increasingly liberalizing and globalizing world economy, and in view of the conditionalities of the crisis recovery programmes of the IMF and World Bank. Furthermore, without TNCs, domestic firms may not be able to enter those export markets where product differentiation and internationally integrated production processes are required. FDI can have a positive impact on the economy in fostering new, higher value-added activities to produce goods that can compete in an open setting. An important benefit of FDI is to inject new technologies and competition that lead to the exit of inefficient enterprises and the increased efficiency of others. FDI should be viewed in a realistic perspective. Foreign firms cannot substitute for domestic effort, and can only provide access to tangible and intangible assets and catalyze domestic investment and capabilities. In some circumstances, FDI can hinder the performance of domestic enterprises, and required therefore the government to implement policies and measures to maximize the positive contribution that FDI can make to development, while minimizing any negative effects it may have. The government may wish to consider ten policy measures in this regard. First, experience in other countries has shown that incentives play a relatively minor role in a good promotion programme, since long-term investors are not susceptible to short-term inducements (UNCTAD, 1999). The government should dispense with preferential incentives such as tax breaks and holidays, financial incentives, accelerated depreciation and various duty exemptions which can tilt the level playing field in favour of foreign firms. Scarce resources currently used to subsidize FDI and domestic investment should be redirected at creating human capital and developing the capabilities of domestic enterprises, both of which are known to attract long-term FDI.
71
Second, foreign firms, especially TNCs, will shift their mobile assets across the globe to match them with the best immobile assets of host countries. The ability to provide the best immobile assets thus becomes a critical aspect of FDI policy. These include a world-class infrastructure, skilled labour, innovation capacity, and the agglomeration of efficient suppliers, support institutions and services. Low-cost labour remains a source of competitive advantage, but its importance is diminishing. Moreover, it does not provide a base for sustainable growth, since rising wages will erode the edge they provide. Third, effective promotional efforts are required to establish a distinct image or to alter the perception of potential investors by providing more and better information. However, such promotional drives are highly skill-intensive and can be expensive, and thus need to be undertaken carefully to maximize its impact. Investment promotion agencies should strive to discover the special needs of TNCs and other foreign firms, and then take steps to cater to them. Fourth, public-private partnerships can be formed to strengthen the opportunities for domestic firms to crowd in after the entry of FDI by building up local capabilities and a strong group of domestic firms which can develop linkages with foreign establishments through extension services, technical support services and other similar firm-level measures. The development impact of FDI depends on the extent to which TNCs dynamically upgrade their technology and skills transfer and raise local capabilities and linkages. TNCs may simply exploit the existing advantages of a host economy and then move on as those advantages, such as low-cost labour, erode, particularly when the main activity is low-technology assembly. Fifth, the more competitive and outward-oriented the trade regime, the more dynamic will be the upgrading process. In addition, policies regarding the operations of TNCs, including local content requirements, incentives for local training and R&D and dissemination of technologies, when used as part of a coherent strategy and when local firms are given adequate technical support, can be quite beneficial. However, upgrading of local capabilities involve extra costs, and TNCs will not necessarily undertake them unless it is cost-effective and suits their long-term objectives. In the absence of rising skills, it would be too costly for TNCs to import advanced technologies and complex, linkage-intensive operations. An important measure is therefore to address the weaknesses of the local education, training and technology system by improving education quality at all levels and. At the higher education level in particular, efforts to strengthen two or three existing technology institutes should be intensified, aimed at reaching international standards similar to the renowned Indian Institutes of Technology. Sixth, FDI should be used as a vehicle for the development of new industries and for maximizing technology development. Due to lack of information, high transaction costs and high risks involved, the government can undertake the crucial role of targeted investment promotion to stimulate technology-based medium-scale foreign companies to cooperate with suitable domestic partners to promote technology-based supplier industries in such areas as capital goods, component manufacture and other high technology industries. Seventh, the government ought to be aware of some risks involved in mergers and acquisitions by TNCs, including the privatization of state owned enterprises, particularly since the onset of the economic crisis. While some of these entail a simple change of ownership, some take-overs can lead to asset stripping, and large FDI inflows can turn into similar outflows when investments are liquidated, giving rise to exchange rate volatility as
72
well as discouraging productive investment. Other take-overs can result in scaling-down of research and development activities, while others still can result in the reduction of competitors and anti-competitive effects. Merger and acquisitions can yield economic benefits when investors make a long-term commitment to the acquired firms and invest in upgrading and restructuring its technology and management, or in modernizing privatized utilities such as telecommunications and power. Foreign firms can also prevent viable assets of local firms from being wiped out in financially distressed countries. It is thus important to monitor mergers and acquisitions, and TNCs in general, and to institute effective competition policies including placing limits on them when TNCs run the risk of dominating an industry. Eighth, the government should continue its efforts to lower transaction costs and reduce unnecessary administrative and bureaucratic procedures to speed up the investment approval process, as well as to simplify tax and customs systems. Despite various deregulation measures taken up by government in the past, including the institution of a one-stop approval process, these issues still ranked highest in the list of concerns of investors to Indonesia in 1990 and in 1997 (see for instance Japanese External Trade Organization, 1997). While the one-stop approval process entrusted to the National Investment Board has in the past always necessitated additional licenses issued by other government agencies, the impending decentralization and the future relationship between the central and local administrations has further heightened their concerns (Soesastro et al., 2000). Ninth, the provinces must avoid an incentive race to raise financial incentives, reduce taxes or lower labour and environmental standards in their eagerness to attract FDI. The provincial governments should intensify cooperation among them to avoid being played one against the other by potential domestic and foreign investors. In addition, the central government’s role will be crucial in coordinating their individual industrial policies to achieve maximum benefits from their relative comparative advantages and local resources. It should start by identifying regional potentials, specializations and priorities taking into account economies of scale, and plan the creation of industrial clusters and the provision of relevant information regarding business opportunities. It should also prepare common minimum national standards regarding labour conditions and the environment, and harmonize investment incentives, particularly concerning tax holidays and other fiscal incentives. And tenth, the restoration of stability and security need to be addressed to attract FDI back into the country, including modifying the current image of a country prone to labour strikes in foreign mining and manufacturing establishments. These factors, as well as the prompt restructuring of the corporate debt problem, are of course also of crucial importance for domestic and particularly Sino-Indonesian sources of capital in the manufacturing sector, which can in turn attract FDI in new joint-venture enterprises. 3.5. CONCLUSION FDI produced a quarter of the output of medium and large-scale manufacturing industries in Indonesia in the late 1990s. Nevertheless, its contribution was moderate in total capital formation (3%-6% of the total), generating net export revenues (20% of total manufactured exports), creating manufacturing employment (less than 1% of total employment), developing supplier and support industries (60%-70% of inputs in garments, footwear and drugs industries purchased abroad, this proportion rising to over 90% in machinery, electronics, motorcycle and motor vehicle component industries), transferring technology, and generating

73
tax revenues in the 1990s. Thus domestic firms continued to account for the bulk of manufacturing production, employment and export earnings. Rather than lead economic growth, it is the latter and the size of the domestic market, as well as the initial export success of domestic firms (created in part by the country’s relatively open trading environment) which appear to have attracted most FDI. FDI had an adverse impact on the balance of payment. The remitted profits and other investment income earned on accumulated FDI in Indonesia were larger than new FDI inflows throughout the 1985-1999 period. In the 1998-99 period in particular, in the absence of new FDI inflow, the net outflow of foreign exchange due to FDI was particularly large, reaching $8 billion per year. Furthermore, FDI contributed to the persistent deficit in manufacturing goods due to its larger propensity to import production inputs from abroad. Given FDI’s moderate impact to date, and the rather weak link between FDI and economic growth in developing countries in recent empirical studies, Indonesia needs to view FDI in a realistic perspective. Foreign firms cannot substitute for domestic effort and, in some circumstances, may even hinder the performance of domestic enterprises. Therefore the government needs to maximize the positive contribution that FDI can make to development, while minimizing any negative effects it may have. It may wish to consider ten policy implications in this regard: 1. Since long-term investors are not susceptible to short-term inducements, eliminate
differential tax incentives used to attract FDI; use scarce resources which currently subsidize FDI and domestic investment to create human capital and develop the capabilities of domestic enterprises, both of which are known to attract long-term FDI.
2. Provide a world-class infrastructure, skilled labour, innovation capacity, and the
agglomeration of efficient suppliers, support institutions and services. 3. Undertake effective and skilled promotional efforts to establish a distinct image or to alter
the perception of potential investors by providing more and better information. 4. Public-private partnerships to strengthen opportunities for domestic firms to crowd in
after the entry of FDI by building up local capabilities and a strong group of domestic firms to develop linkages with foreign establishments through extension services, technical support services and other firm-level measures.
5. Address the weaknesses of the local education, training and technology system by
improving education quality at all levels and; at the higher education level in particular, strengthen two or three existing technology institutes, aimed at reaching international standards similar to the renowned Indian Institutes of Technology.
6. Target investment promotion to stimulate technology-based medium-scale foreign
companies to collaborate with suitable domestic partners to promote technology-based supplier industries in such areas as capital goods, component manufactured and emerging high technology industries.
7. Monitor mergers and acquisitions, and TNCs in general, and institute effective
competition policies including placing limits on TNCs when they run the risk of dominating an industry.
74
8. Lower transaction costs and reduce unnecessary administrative and bureaucratic
procedures to speed up the investment approval process, as well as to simplify tax and customs systems.
9. Avoid an incentive race between provinces to raise financial incentives, reduce taxes or
lower labour and environmental standards in their eagerness to attract FDI, while prepare common minimum national standards regarding labour conditions and the environment, and harmonization of investment incentives, particularly concerning tax holidays and other fiscal incentives.
10. Restore stability and security in the country to attract not only FDI but also domestic
investment, including Sino-Indonesian capital as joint-venture partners, and address the current image of a country prone to labour strikes in foreign mining and manufacturing establishments.
Managing FDI policy effectively in the context of a broader competitiveness strategy is a demanding task. A passive approach is unlikely to be sufficient because of market failures and deficiencies in existing institutions. It may not attract sufficient FDI, extract all the potential benefits that FDI offers (as the experience of Indonesia in the 1990s has shown) or induce TNCs to operate by best-practice standards. To ensure that FDI is sustained even when existing advantages such as low-cost labour run out, and that it enters new higher-value activities, requires policy intervention both to target investors and to raise the quality of local factors aimed at competitiveness. Formulating and implementing an effective strategy, not just to attract but to benefit from FDI, requires above all a development vision, coherence and coordination. REFERENCES Bloomstrom M., Lipsey R.E. and Zejan M. 1994. What Explains Developing Country
Growth? NBER working paper No.W4132. Cambridge, MA: National Bureau of Economic Research.
Borensztein E., De Gregorio J. and Lee J.W. 1998. How Does Foreign Direct Investment
Affect Economic Growth? Journal of International Economics 45(1) 115-135. Capital Investment Coordinating Board. 1999. Doing Business: section 1. Website
www.bkpm.go.id. Dhanani S. 1992. Indonesian Manufacturing Employment and Training: Major Findings of
the 1992 Enterprise Surveys. Regional Manpower Planning and Training Project (RMPT) reports No. 1, 2 and 3 (West Java, East Java and North Sumatra). Jakarta: Bappenas Bureau of Manpower-World Bank Professional Human Resources Development loan 3134-IND.
Jansen K. 1995. The Macroeconomic Effects of Direct Foreign Investment: The Case of
Thailand. World Development 23(2) pp. 193-210.
75
Lall S. 1998. Technology Policies in Indonesia. In H. Hill and K.W. Thee (Editors) Indonesia’s Technological Challenge. Singapore: Institute of Southeast Asian Studies.
Mody A. and Wang F.Y. 1997. Explaining Industrial Growth in Coastal China: Economic
Reforms… and What Else? World Bank Economic Review 11(2), pp. 293-325. Pempel, T.J. 1999. Regional Ups, Regional Downs. In Pempel T.J. (Editor) The Politics of
the Asian Economic Crisis. Ithaca and London: Cornell University Press. Soesastro, M.H, Thee K.W. and Chandra W. 2000. Foreign and Domestic Direct Investment
in Indonesia since the Early 1990s. Jakarta: mimeo. Thee K.W. and Pangestu M. 1994. Technological Capabilities and Indonesia’s Manufacturing
Exports. In D. Ernst, T. Ganiatsos and L. Mytelka (Editors) Technological Capabilities and Export Success in Asia. London and New York: Routledge for the United Nations (UNCTAD).
Thee K.W. 1998. Determinants of Indonesia’s Industrial Technology Development. In H. Hill
and K.W. Thee Editors, Indonesia’s Technological Challenge. Singapore: Institute of Southeast Asian Studies.
UNIDO. 1997. Industrial Development: Global Report 1997. Oxford: Oxford University
Press for the United Nations Industrial Development Organization. UNCTAD. 1999. World Investment Report 1999: Foreign Direct Investment and the
Challenge of Development. New York and Geneva: United Nations. Vernon, R. 1999. Review. World Investment Report 1997: Transnational Corporations,
Market Structure and Competition Policy. Economic Development and Cultural Change 47(2).
World Bank. 1991. Indonesia: Employment and Training. Foundations for Industrialization
in the 1990s. Report No. 9350-IND. Washington. World Bank. 1999. Foreign Direct Investment in Bangladesh: Issues of Long-run
Sustainability. Dhaka: mimeo.
76
ANNEX 3.1: FDI INFLOWS AND OUTFLOWS Data Sources Statistics on FDI-related inflows and outflows are available from three sources: the annual report and the monthly financial statistics of Bank Indonesia (BI), the Indonesian central bank in charge of producing balance of payments statistics, the annual IMF balance of payment statistics country tables, and the World Bank global development finance country tables, previously known as world debt tables. The IMF and the World Bank tables are based on custom-made forms submitted to BI, while the published BI tables are aggregated tables based on disaggregated unpublished internal statistics. Apart from the latter, which are not in the public domain, none of the published sources provide an adequate picture of FDI inflows and outflows. There are also definitional differences between the three sources and between different time periods, making direct comparisons across sources and time period hazardous. For instance, remitted profits (dividends and distributed branch profits) include the oil and gas sector in the World Bank tables, but not in the BI tables and the IMF tables, at least after 1993 when IMF introduced a new reporting and publication format. Outflows from oil and gas sector are classified under investment income by BI, and under business services by IMF after 1993. The following provides further information on the major FDI-related inflow and outflow items. Net FDI inflows (inward FDI). These include two types of funds, equity and other capital, the latter consisting of loans from the parent companies, banks and other financial institutions. Systematic data on these loans are only available since a presidential instruction was issued in 1998 in the aftermath of the crisis, requiring all FDI companies to report their loan acquisitions on a quarterly basis. Data on equity capital inflows is not collected on a regular basis. In a survey carried out in the early 1990s, these flows were estimated to account for about 30% of total FDI inflows (equity plus incoming loans). So this figure is currently used to estimate annual equity flows. In 1999 for instance, incoming loans amounted to $2.6 billion, so equity capital was estimated at $1.1 billion, or 30% of the total inflows of $3.7 billion. However, debt repayment amounted to some $6 billion in that year, so the net FDI inflow was calculated at - $2.3 billion. It should be noted that net FDI inflow does not include outward FDI made by Indonesian companies abroad. Profits remitted. Since the World Bank tables appear to offer the most complete data on profits remitted, including investment income from the oil and gas sector, their series is used for the present purpose. Net other investment income (non oil-gas). Net other investment income consisted of interest payments, minus interest received, on loans contracted by BI, domestic banks, domestic companies, state-owned enterprises, the government and FDI companies. Net investment income in non-oil and gas sectors increased from $2 billion to $7 billion between 1985 and 1997. The interest paid out on behalf of FDI companies alone rose from $1 billion in 1996 and 1997, to $2.3-2.4 billion in 1998 and 1997, or about 20%-30% of the total net investment income. Business services. Business services figures are only published by the IMF. They included royalties and license fees, financial services contract and professional charges, construction services, and, more crucially, outflows of the oil and gas industry. Business service outflows
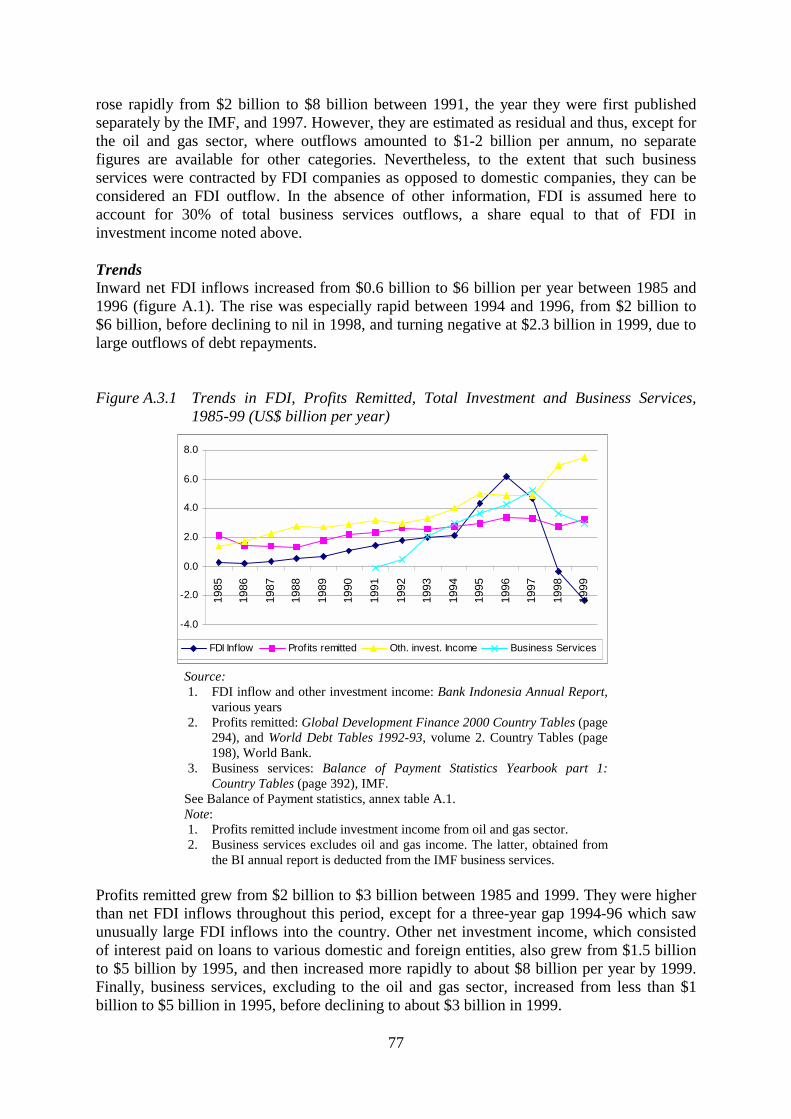
77
rose rapidly from $2 billion to $8 billion between 1991, the year they were first published separately by the IMF, and 1997. However, they are estimated as residual and thus, except for the oil and gas sector, where outflows amounted to $1-2 billion per annum, no separate figures are available for other categories. Nevertheless, to the extent that such business services were contracted by FDI companies as opposed to domestic companies, they can be considered an FDI outflow. In the absence of other information, FDI is assumed here to account for 30% of total business services outflows, a share equal to that of FDI in investment income noted above. Trends Inward net FDI inflows increased from $0.6 billion to $6 billion per year between 1985 and 1996 (figure A.1). The rise was especially rapid between 1994 and 1996, from $2 billion to $6 billion, before declining to nil in 1998, and turning negative at $2.3 billion in 1999, due to large outflows of debt repayments. Figure A.3.1 Trends in FDI, Profits Remitted, Total Investment and Business Services,
1985-99 (US$ billion per year)
Source: 1. FDI inflow and other investment income: Bank Indonesia Annual Report,
various years 2. Profits remitted: Global Development Finance 2000 Country Tables (page
294), and World Debt Tables 1992-93, volume 2. Country Tables (page 198), World Bank.
3. Business services: Balance of Payment Statistics Yearbook part 1: Country Tables (page 392), IMF.
See Balance of Payment statistics, annex table A.1. Note: 1. Profits remitted include investment income from oil and gas sector. 2. Business services excludes oil and gas income. The latter, obtained from
the BI annual report is deducted from the IMF business services. Profits remitted grew from $2 billion to $3 billion between 1985 and 1999. They were higher than net FDI inflows throughout this period, except for a three-year gap 1994-96 which saw unusually large FDI inflows into the country. Other net investment income, which consisted of interest paid on loans to various domestic and foreign entities, also grew from $1.5 billion to $5 billion by 1995, and then increased more rapidly to about $8 billion per year by 1999. Finally, business services, excluding to the oil and gas sector, increased from less than $1 billion to $5 billion in 1995, before declining to about $3 billion in 1999.
-4.0
-2.0
0.0
2.0
4.0
6.0
8.0
1985
1986
1987
1988
1989
1990
1991
1992
1993
1994
1995
1996
1997
1998
1999
FDI Inflow Profits remitted Oth. invest. Income Business Services
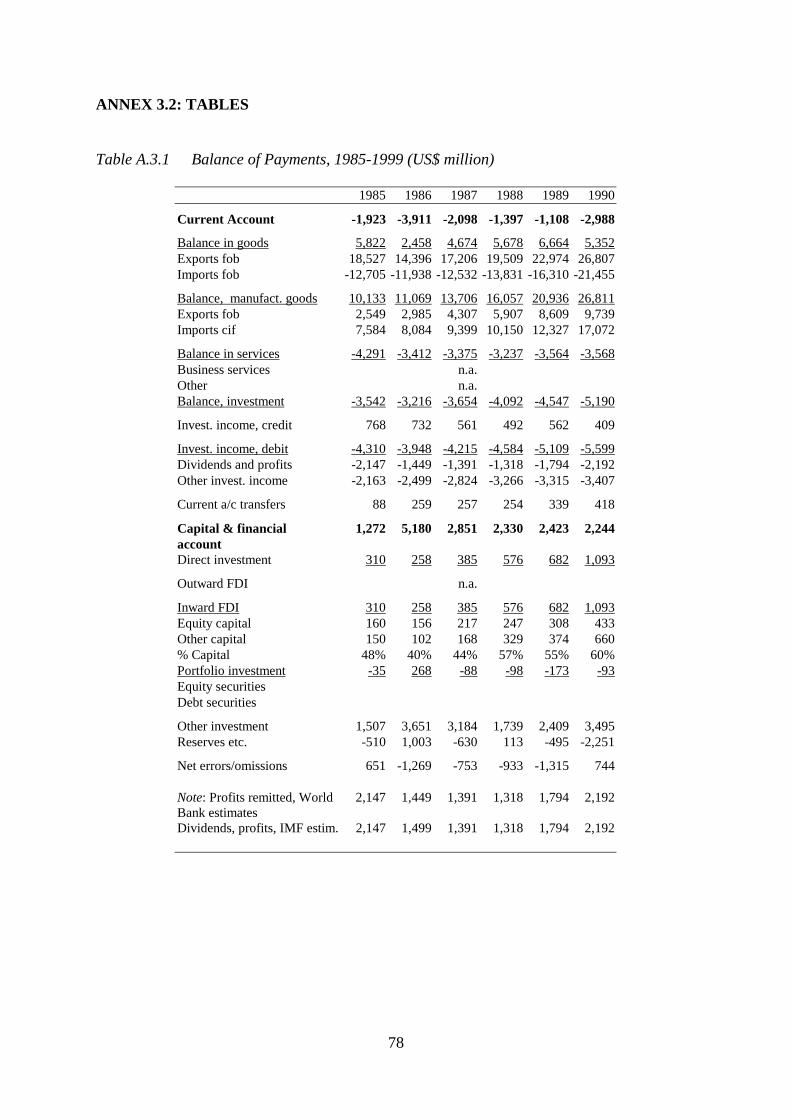
78
ANNEX 3.2: TABLES Table A.3.1 Balance of Payments, 1985-1999 (US$ million)
1985 1986 1987 1988 1989 1990
Current Account -1,923 -3,911 -2,098 -1,397 -1,108 -2,988
Balance in goods 5,822 2,458 4,674 5,678 6,664 5,352 Exports fob 18,527 14,396 17,206 19,509 22,974 26,807 Imports fob -12,705 -11,938 -12,532 -13,831 -16,310 -21,455
Balance, manufact. goods 10,133 11,069 13,706 16,057 20,936 26,811 Exports fob 2,549 2,985 4,307 5,907 8,609 9,739 Imports cif 7,584 8,084 9,399 10,150 12,327 17,072
Balance in services -4,291 -3,412 -3,375 -3,237 -3,564 -3,568 Business services n.a. Other n.a. Balance, investment -3,542 -3,216 -3,654 -4,092 -4,547 -5,190
Invest. income, credit 768 732 561 492 562 409
Invest. income, debit -4,310 -3,948 -4,215 -4,584 -5,109 -5,599 Dividends and profits -2,147 -1,449 -1,391 -1,318 -1,794 -2,192 Other invest. income -2,163 -2,499 -2,824 -3,266 -3,315 -3,407
Current a/c transfers 88 259 257 254 339 418
Capital & financial 1,272 5,180 2,851 2,330 2,423 2,244 account Direct investment 310 258 385 576 682 1,093
Outward FDI n.a.
Inward FDI 310 258 385 576 682 1,093 Equity capital 160 156 217 247 308 433 Other capital 150 102 168 329 374 660 % Capital 48% 40% 44% 57% 55% 60% Portfolio investment -35 268 -88 -98 -173 -93 Equity securities Debt securities
Other investment 1,507 3,651 3,184 1,739 2,409 3,495 Reserves etc. -510 1,003 -630 113 -495 -2,251
Net errors/omissions 651 -1,269 -753 -933 -1,315 744
Note: Profits remitted, World Bank estimates
2,147 1,449 1,391 1,318 1,794 2,192
Dividends, profits, IMF estim. 2,147 1,499 1,391 1,318 1,794 2,192
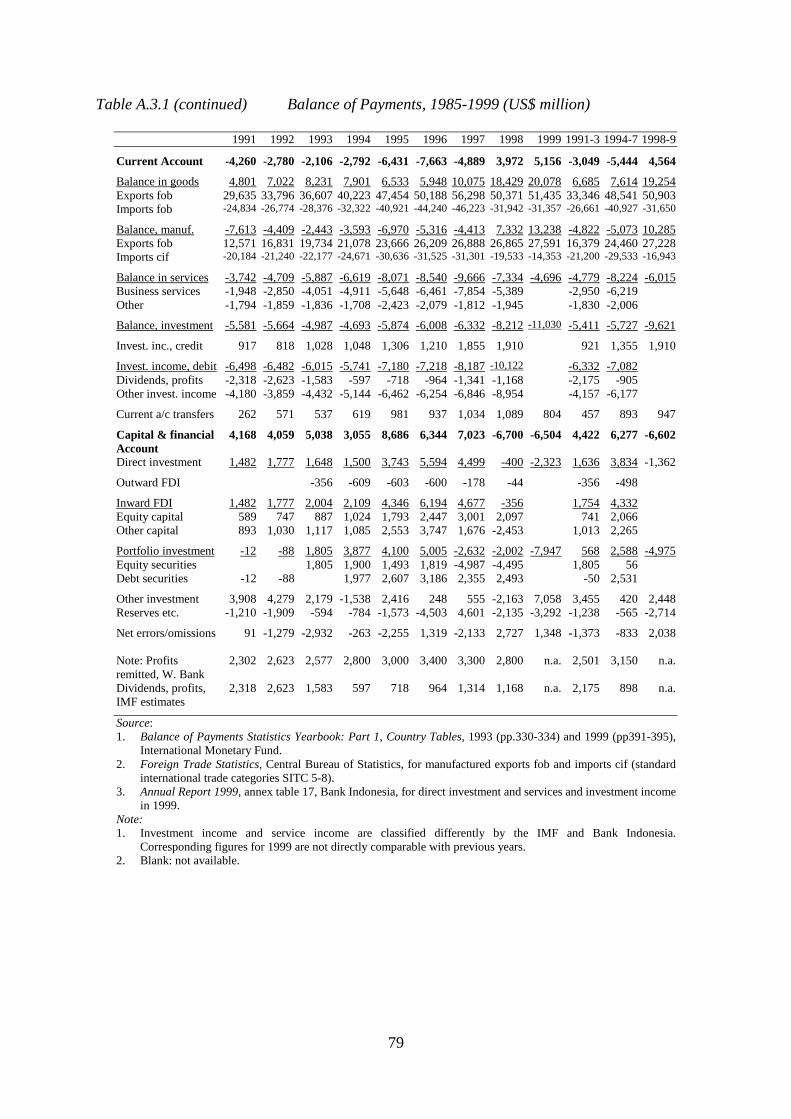
79
Table A.3.1 (continued) Balance of Payments, 1985-1999 (US$ million)
1991 1992 1993 1994 1995 1996 1997 1998 1999 1991-3 1994-7 1998-9
Current Account -4,260 -2,780 -2,106 -2,792 -6,431 -7,663 -4,889 3,972 5,156 -3,049 -5,444 4,564
Balance in goods 4,801 7,022 8,231 7,901 6,533 5,948 10,075 18,429 20,078 6,685 7,614 19,254 Exports fob 29,635 33,796 36,607 40,223 47,454 50,188 56,298 50,371 51,435 33,346 48,541 50,903 Imports fob -24,834 -26,774 -28,376 -32,322 -40,921 -44,240 -46,223 -31,942 -31,357 -26,661 -40,927 -31,650
Balance, manuf. -7,613 -4,409 -2,443 -3,593 -6,970 -5,316 -4,413 7,332 13,238 -4,822 -5,073 10,285 Exports fob 12,571 16,831 19,734 21,078 23,666 26,209 26,888 26,865 27,591 16,379 24,460 27,228 Imports cif -20,184 -21,240 -22,177 -24,671 -30,636 -31,525 -31,301 -19,533 -14,353 -21,200 -29,533 -16,943
Balance in services -3,742 -4,709 -5,887 -6,619 -8,071 -8,540 -9,666 -7,334 -4,696 -4,779 -8,224 -6,015 Business services -1,948 -2,850 -4,051 -4,911 -5,648 -6,461 -7,854 -5,389 -2,950 -6,219 Other -1,794 -1,859 -1,836 -1,708 -2,423 -2,079 -1,812 -1,945 -1,830 -2,006
Balance, investment -5,581 -5,664 -4,987 -4,693 -5,874 -6,008 -6,332 -8,212 -11,030 -5,411 -5,727 -9,621
Invest. inc., credit 917 818 1,028 1,048 1,306 1,210 1,855 1,910 921 1,355 1,910
Invest. income, debit -6,498 -6,482 -6,015 -5,741 -7,180 -7,218 -8,187 -10,122 -6,332 -7,082 Dividends, profits -2,318 -2,623 -1,583 -597 -718 -964 -1,341 -1,168 -2,175 -905 Other invest. income -4,180 -3,859 -4,432 -5,144 -6,462 -6,254 -6,846 -8,954 -4,157 -6,177
Current a/c transfers 262 571 537 619 981 937 1,034 1,089 804 457 893 947
Capital & financial 4,168 4,059 5,038 3,055 8,686 6,344 7,023 -6,700 -6,504 4,422 6,277 -6,602 Account Direct investment 1,482 1,777 1,648 1,500 3,743 5,594 4,499 -400 -2,323 1,636 3,834 -1,362
Outward FDI -356 -609 -603 -600 -178 -44 -356 -498
Inward FDI 1,482 1,777 2,004 2,109 4,346 6,194 4,677 -356 1,754 4,332 Equity capital 589 747 887 1,024 1,793 2,447 3,001 2,097 741 2,066 Other capital 893 1,030 1,117 1,085 2,553 3,747 1,676 -2,453 1,013 2,265
Portfolio investment -12 -88 1,805 3,877 4,100 5,005 -2,632 -2,002 -7,947 568 2,588 -4,975 Equity securities 1,805 1,900 1,493 1,819 -4,987 -4,495 1,805 56 Debt securities -12 -88 1,977 2,607 3,186 2,355 2,493 -50 2,531
Other investment 3,908 4,279 2,179 -1,538 2,416 248 555 -2,163 7,058 3,455 420 2,448 Reserves etc. -1,210 -1,909 -594 -784 -1,573 -4,503 4,601 -2,135 -3,292 -1,238 -565 -2,714
Net errors/omissions 91 -1,279 -2,932 -263 -2,255 1,319 -2,133 2,727 1,348 -1,373 -833 2,038 Note: Profits remitted, W. Bank
2,302 2,623 2,577 2,800 3,000 3,400 3,300 2,800 n.a. 2,501 3,150 n.a.
Dividends, profits, IMF estimates
2,318 2,623 1,583 597 718 964 1,314 1,168 n.a. 2,175 898 n.a.
Source: 1. Balance of Payments Statistics Yearbook: Part 1, Country Tables, 1993 (pp.330-334) and 1999 (pp391-395),
International Monetary Fund. 2. Foreign Trade Statistics, Central Bureau of Statistics, for manufactured exports fob and imports cif (standard
international trade categories SITC 5-8). 3. Annual Report 1999, annex table 17, Bank Indonesia, for direct investment and services and investment income
in 1999. Note: 1. Investment income and service income are classified differently by the IMF and Bank Indonesia.
Corresponding figures for 1999 are not directly comparable with previous years. 2. Blank: not available.
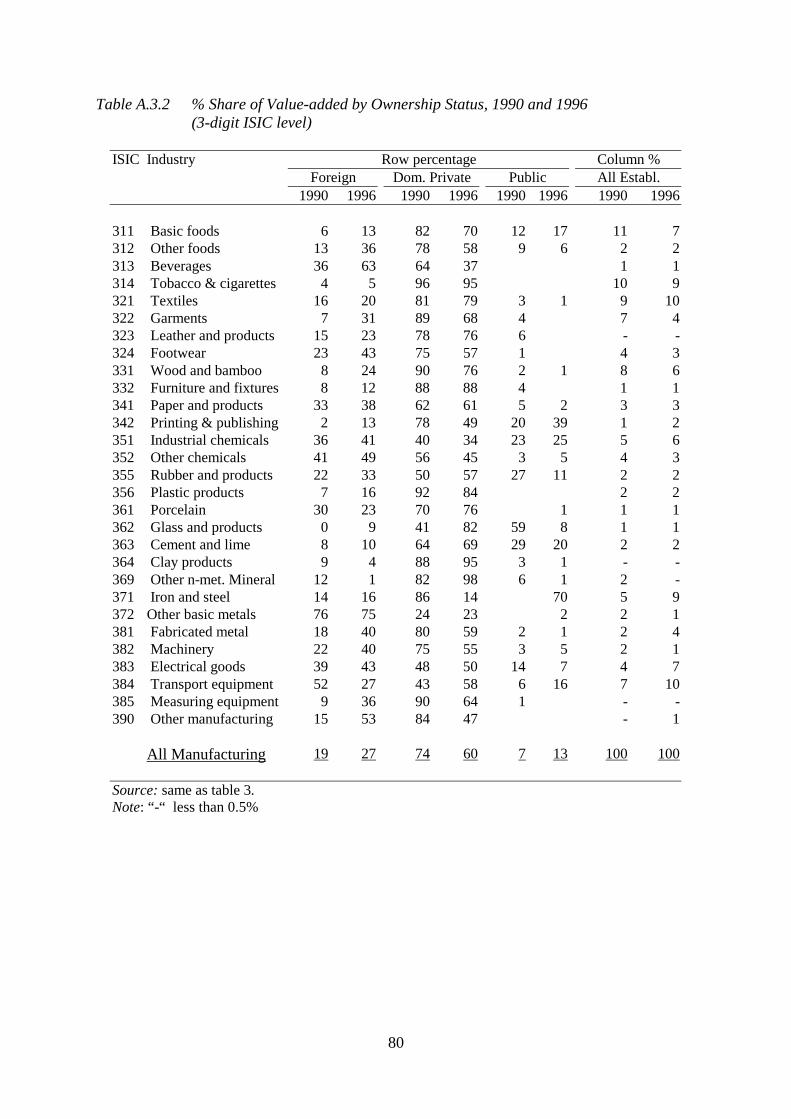
80
Table A.3.2 % Share of Value-added by Ownership Status, 1990 and 1996 (3-digit ISIC level)
ISIC Industry Row percentage Column % Foreign Dom. Private Public All Establ. 1990 1996 1990 1996 1990 1996 1990 1996 311 Basic foods 6 13 82 70 12 17 11 7 312 Other foods 13 36 78 58 9 6 2 2 313 Beverages 36 63 64 37 1 1 314 Tobacco & cigarettes 4 5 96 95 10 9 321 Textiles 16 20 81 79 3 1 9 10 322 Garments 7 31 89 68 4 7 4 323 Leather and products 15 23 78 76 6 - - 324 Footwear 23 43 75 57 1 4 3 331 Wood and bamboo 8 24 90 76 2 1 8 6 332 Furniture and fixtures 8 12 88 88 4 1 1 341 Paper and products 33 38 62 61 5 2 3 3 342 Printing & publishing 2 13 78 49 20 39 1 2 351 Industrial chemicals 36 41 40 34 23 25 5 6 352 Other chemicals 41 49 56 45 3 5 4 3 355 Rubber and products 22 33 50 57 27 11 2 2 356 Plastic products 7 16 92 84 2 2 361 Porcelain 30 23 70 76 1 1 1 362 Glass and products 0 9 41 82 59 8 1 1 363 Cement and lime 8 10 64 69 29 20 2 2 364 Clay products 9 4 88 95 3 1 - - 369 Other n-met. Mineral 12 1 82 98 6 1 2 - 371 Iron and steel 14 16 86 14 70 5 9 372 Other basic metals 76 75 24 23 2 2 1 381 Fabricated metal 18 40 80 59 2 1 2 4 382 Machinery 22 40 75 55 3 5 2 1 383 Electrical goods 39 43 48 50 14 7 4 7 384 Transport equipment 52 27 43 58 6 16 7 10 385 Measuring equipment 9 36 90 64 1 - - 390 Other manufacturing 15 53 84 47 - 1 All Manufacturing 19 27 74 60 7 13 100 100 Source: same as table 3. Note: “-“ less than 0.5%
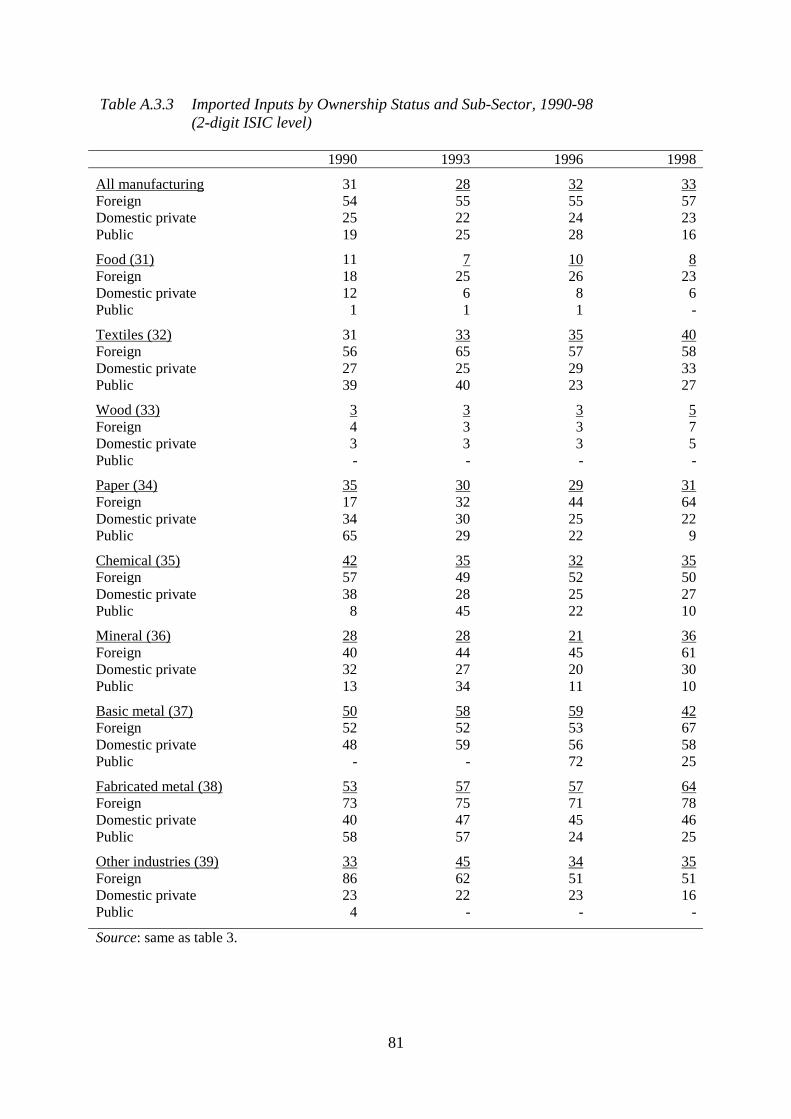
81
Table A.3.3 Imported Inputs by Ownership Status and Sub-Sector, 1990-98 (2-digit ISIC level)
1990 1993 1996 1998
All manufacturing 31 28 32 33 Foreign 54 55 55 57 Domestic private 25 22 24 23 Public 19 25 28 16
Food (31) 11 7 10 8 Foreign 18 25 26 23 Domestic private 12 6 8 6 Public 1 1 1 -
Textiles (32) 31 33 35 40 Foreign 56 65 57 58 Domestic private 27 25 29 33 Public 39 40 23 27
Wood (33) 3 3 3 5 Foreign 4 3 3 7 Domestic private 3 3 3 5 Public - - - -
Paper (34) 35 30 29 31 Foreign 17 32 44 64 Domestic private 34 30 25 22 Public 65 29 22 9
Chemical (35) 42 35 32 35 Foreign 57 49 52 50 Domestic private 38 28 25 27 Public 8 45 22 10
Mineral (36) 28 28 21 36 Foreign 40 44 45 61 Domestic private 32 27 20 30 Public 13 34 11 10
Basic metal (37) 50 58 59 42 Foreign 52 52 53 67 Domestic private 48 59 56 58 Public - - 72 25
Fabricated metal (38) 53 57 57 64 Foreign 73 75 71 78 Domestic private 40 47 45 46 Public 58 57 24 25
Other industries (39) 33 45 34 35 Foreign 86 62 51 51 Domestic private 23 22 23 16 Public 4 - - -
Source: same as table 3.
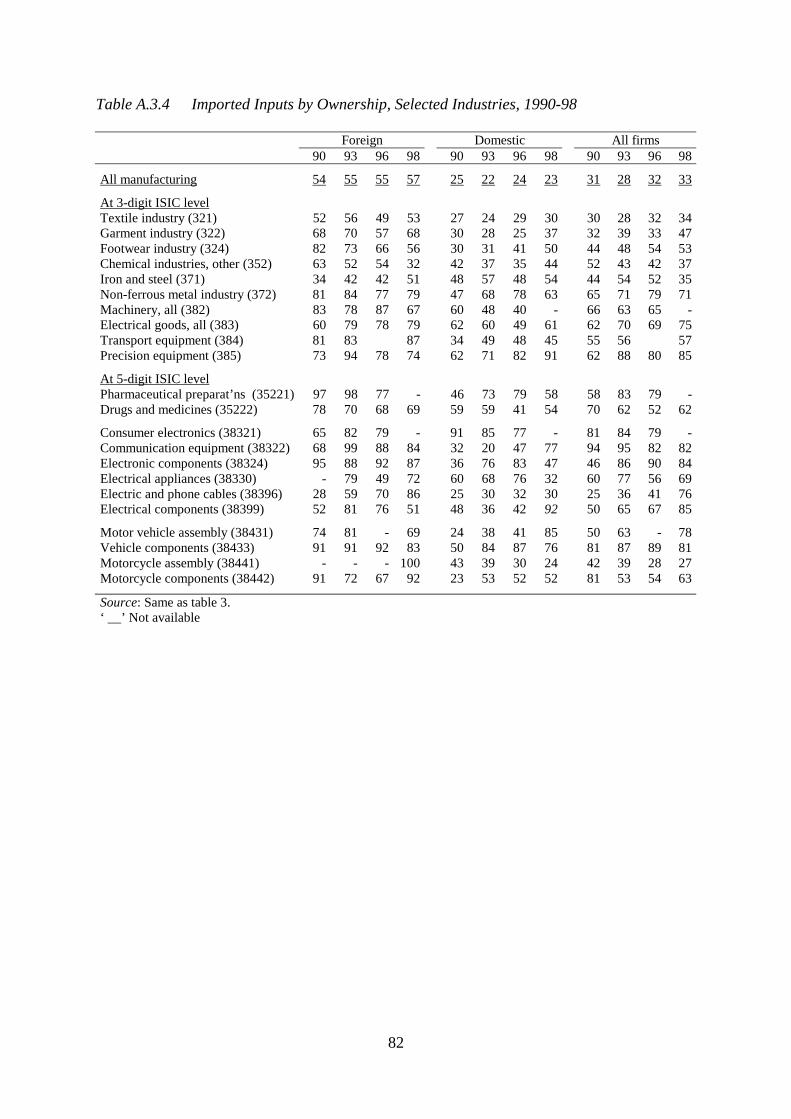
82
Table A.3.4 Imported Inputs by Ownership, Selected Industries, 1990-98 Foreign Domestic All firms 90 93 96 98 90 93 96 98 90 93 96 98
All manufacturing 54 55 55 57 25 22 24 23 31 28 32 33
At 3-digit ISIC level Textile industry (321) 52 56 49 53 27 24 29 30 30 28 32 34 Garment industry (322) 68 70 57 68 30 28 25 37 32 39 33 47 Footwear industry (324) 82 73 66 56 30 31 41 50 44 48 54 53 Chemical industries, other (352) 63 52 54 32 42 37 35 44 52 43 42 37 Iron and steel (371) 34 42 42 51 48 57 48 54 44 54 52 35 Non-ferrous metal industry (372) 81 84 77 79 47 68 78 63 65 71 79 71 Machinery, all (382) 83 78 87 67 60 48 40 - 66 63 65 - Electrical goods, all (383) 60 79 78 79 62 60 49 61 62 70 69 75 Transport equipment (384) 81 83 87 34 49 48 45 55 56 57 Precision equipment (385) 73 94 78 74 62 71 82 91 62 88 80 85
At 5-digit ISIC level Pharmaceutical preparat’ns (35221) 97 98 77 - 46 73 79 58 58 83 79 - Drugs and medicines (35222) 78 70 68 69 59 59 41 54 70 62 52 62
Consumer electronics (38321) 65 82 79 - 91 85 77 - 81 84 79 - Communication equipment (38322) 68 99 88 84 32 20 47 77 94 95 82 82 Electronic components (38324) 95 88 92 87 36 76 83 47 46 86 90 84 Electrical appliances (38330) - 79 49 72 60 68 76 32 60 77 56 69 Electric and phone cables (38396) 28 59 70 86 25 30 32 30 25 36 41 76 Electrical components (38399) 52 81 76 51 48 36 42 92 50 65 67 85
Motor vehicle assembly (38431) 74 81 - 69 24 38 41 85 50 63 - 78 Vehicle components (38433) 91 91 92 83 50 84 87 76 81 87 89 81 Motorcycle assembly (38441) - - - 100 43 39 30 24 42 39 28 27 Motorcycle components (38442) 91 72 67 92 23 53 52 52 81 53 54 63
Source: Same as table 3. ‘ __’ Not available
83
4. Indonesia’s Industrial Development Performance Compared1
4.1. MANUFACTURING PERFORMANCE......................................................................84 4.1.1 Manufacturing Level, Productivity and Output Share ....................................................84 4.1.2 Growth and Structural Change........................................................................................87 4.1.3 Technology Level of Manufactured Products.................................................................89
4.2 TRADE PERFORMANCE .............................................................................................92 4.2.1 Manufactured Export Level and Share............................................................................92 4.2.2 Export Growth and Structural Change ............................................................................95 4.2.3 Revealed Comparative Advantage ..................................................................................97
4.3 SUMMARY.......................................................................................................................99
ANNEX TABLES.................................................................................................................101
1 This chapter is based on data contained in Measure by Measure: Building UNIDO’s System for Industrial Development Indicators (SIDI), Vienna, 1999. The author is grateful to Helmut Forstner for sharing his interim report, for clarifying the methodologies used, and for providing additional and updated indicators from the UNIDO database.
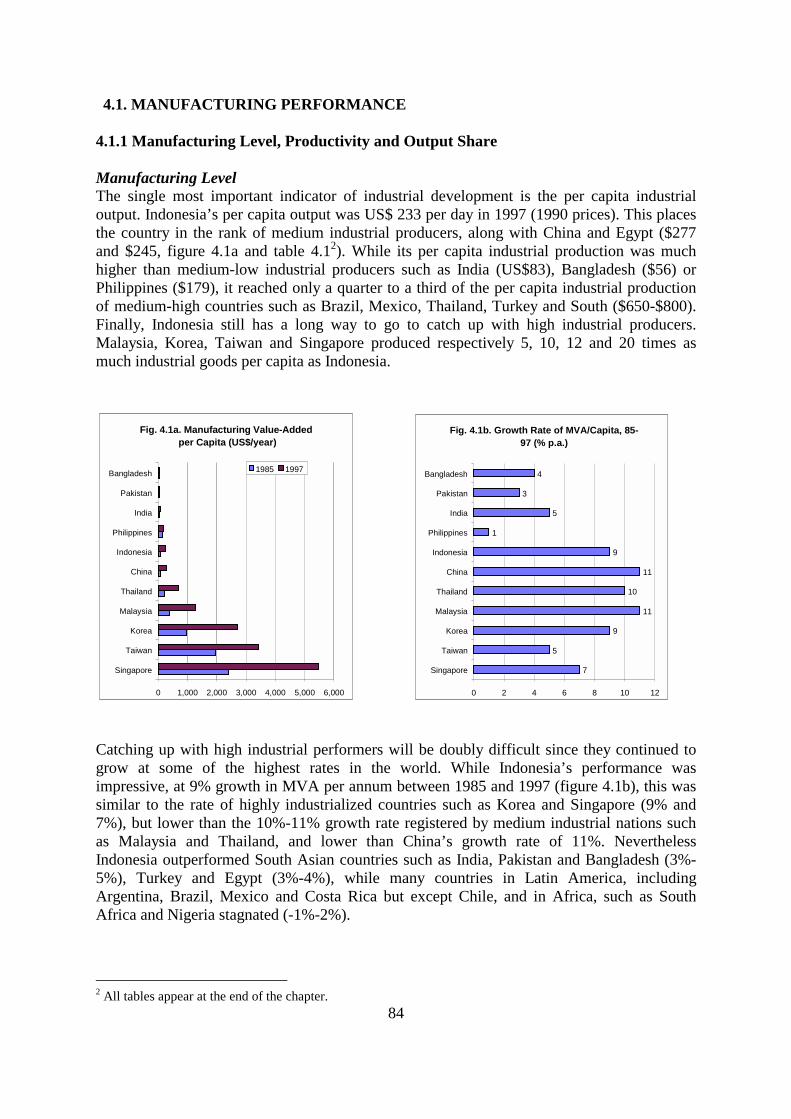
84
4.1. MANUFACTURING PERFORMANCE
4.1.1 Manufacturing Level, Productivity and Output Share Manufacturing Level The single most important indicator of industrial development is the per capita industrial output. Indonesia’s per capita output was US$ 233 per day in 1997 (1990 prices). This places the country in the rank of medium industrial producers, along with China and Egypt ($277 and $245, figure 4.1a and table 4.12). While its per capita industrial production was much higher than medium-low industrial producers such as India (US$83), Bangladesh ($56) or Philippines ($179), it reached only a quarter to a third of the per capita industrial production of medium-high countries such as Brazil, Mexico, Thailand, Turkey and South ($650-$800). Finally, Indonesia still has a long way to go to catch up with high industrial producers. Malaysia, Korea, Taiwan and Singapore produced respectively 5, 10, 12 and 20 times as much industrial goods per capita as Indonesia.
Catching up with high industrial performers will be doubly difficult since they continued to grow at some of the highest rates in the world. While Indonesia’s performance was impressive, at 9% growth in MVA per annum between 1985 and 1997 (figure 4.1b), this was similar to the rate of highly industrialized countries such as Korea and Singapore (9% and 7%), but lower than the 10%-11% growth rate registered by medium industrial nations such as Malaysia and Thailand, and lower than China’s growth rate of 11%. Nevertheless Indonesia outperformed South Asian countries such as India, Pakistan and Bangladesh (3%-5%), Turkey and Egypt (3%-4%), while many countries in Latin America, including Argentina, Brazil, Mexico and Costa Rica but except Chile, and in Africa, such as South Africa and Nigeria stagnated (-1%-2%).
2 All tables appear at the end of the chapter.
Fig. 4.1a. Manufacturing Value-Added per Capita (US$/year)
0 1,000 2,000 3,000 4,000 5,000 6,000
Singapore
Taiwan
Korea
Malaysia
Thailand
China
Indonesia
Philippines
India
Pakistan
Bangladesh 1985 1997
Fig. 4.1b. Growth Rate of MVA/Capita, 85-97 (% p.a.)
7
5
9
11
10
11
9
1
5
3
4
0 2 4 6 8 10 12
Singapore
Taiwan
Korea
Malaysia
Thailand
China
Indonesia
Philippines
India
Pakistan
Bangladesh
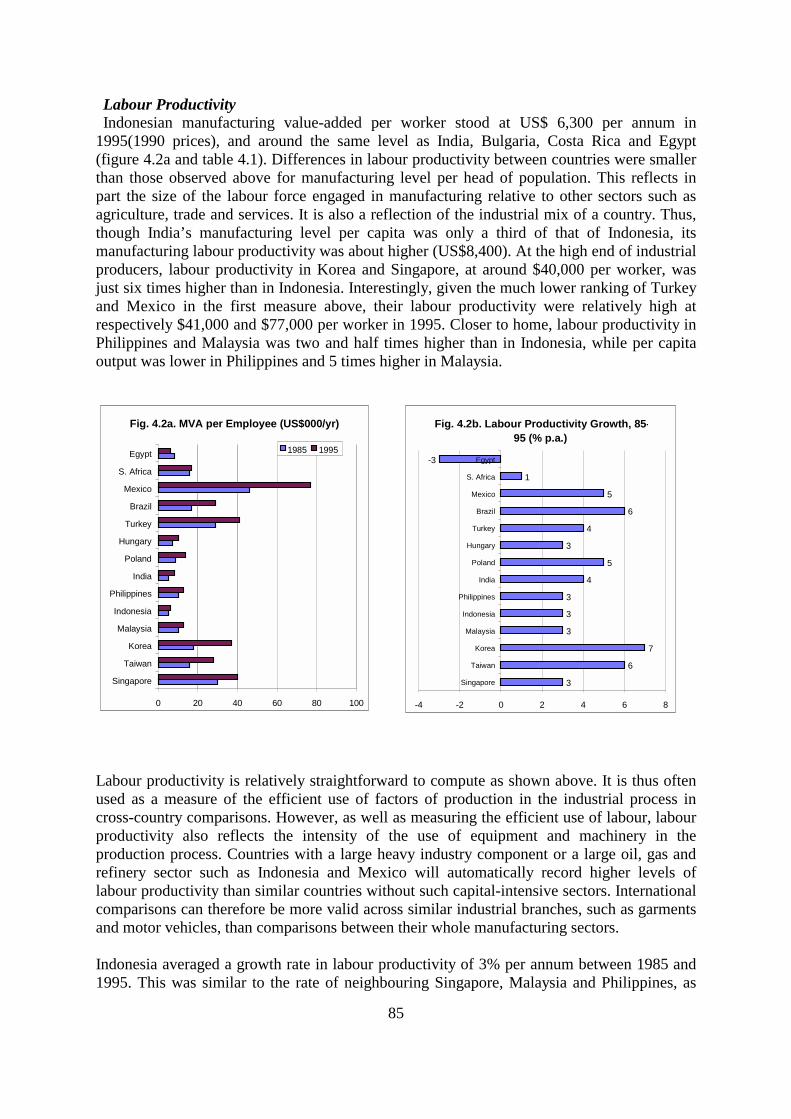
85
Labour Productivity Indonesian manufacturing value-added per worker stood at US$ 6,300 per annum in
1995(1990 prices), and around the same level as India, Bulgaria, Costa Rica and Egypt (figure 4.2a and table 4.1). Differences in labour productivity between countries were smaller than those observed above for manufacturing level per head of population. This reflects in part the size of the labour force engaged in manufacturing relative to other sectors such as agriculture, trade and services. It is also a reflection of the industrial mix of a country. Thus, though India’s manufacturing level per capita was only a third of that of Indonesia, its manufacturing labour productivity was about higher (US$8,400). At the high end of industrial producers, labour productivity in Korea and Singapore, at around $40,000 per worker, was just six times higher than in Indonesia. Interestingly, given the much lower ranking of Turkey and Mexico in the first measure above, their labour productivity were relatively high at respectively $41,000 and $77,000 per worker in 1995. Closer to home, labour productivity in Philippines and Malaysia was two and half times higher than in Indonesia, while per capita output was lower in Philippines and 5 times higher in Malaysia.
Labour productivity is relatively straightforward to compute as shown above. It is thus often used as a measure of the efficient use of factors of production in the industrial process in cross-country comparisons. However, as well as measuring the efficient use of labour, labour productivity also reflects the intensity of the use of equipment and machinery in the production process. Countries with a large heavy industry component or a large oil, gas and refinery sector such as Indonesia and Mexico will automatically record higher levels of labour productivity than similar countries without such capital-intensive sectors. International comparisons can therefore be more valid across similar industrial branches, such as garments and motor vehicles, than comparisons between their whole manufacturing sectors. Indonesia averaged a growth rate in labour productivity of 3% per annum between 1985 and 1995. This was similar to the rate of neighbouring Singapore, Malaysia and Philippines, as
Fig. 4.2a. MVA per Employee (US$000/yr)
0 20 40 60 80 100
Singapore
Taiwan
Korea
Malaysia
Indonesia
Philippines
India
Poland
Hungary
Turkey
Brazil
Mexico
S. Africa
Egypt 1985 1995
Fig. 4.2b. Labour Productivity Growth, 85-95 (% p.a.)
3
6
7
3
3
3
4
5
3
4
6
5
1
-3
-4 -2 0 2 4 6 8
Singapore
Taiwan
Korea
Malaysia
Indonesia
Philippines
India
Poland
Hungary
Turkey
Brazil
Mexico
S. Africa
Egypt
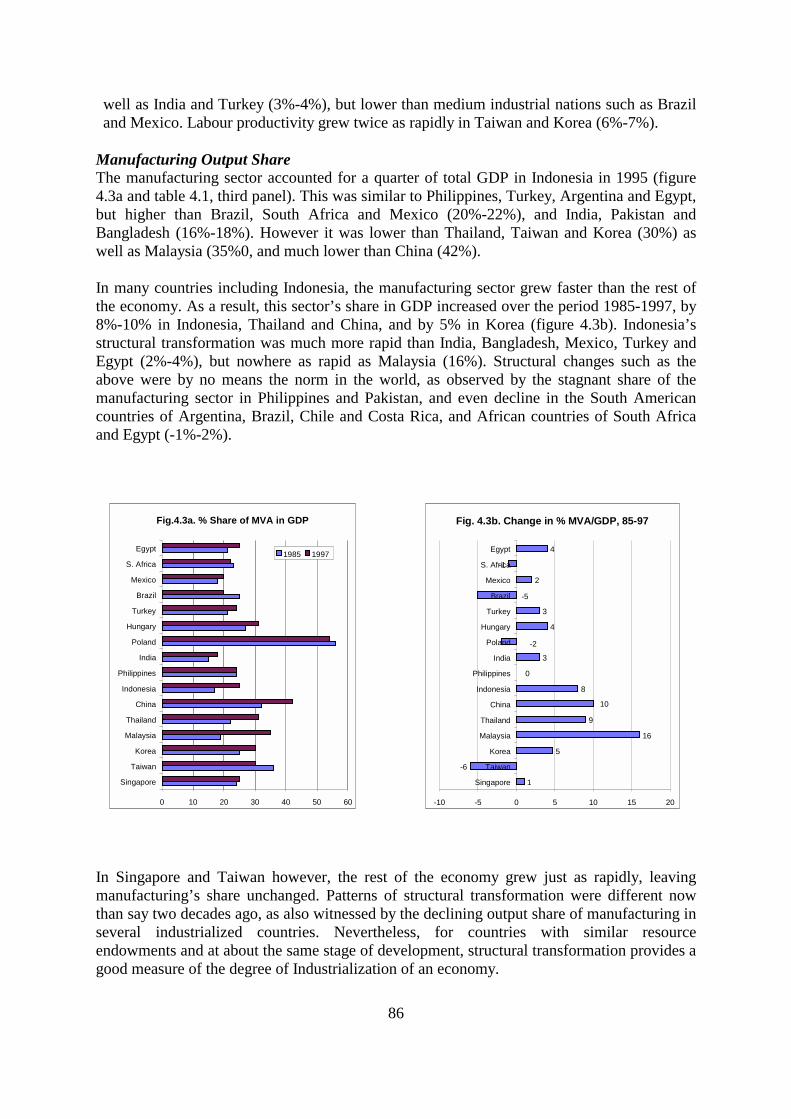
86
well as India and Turkey (3%-4%), but lower than medium industrial nations such as Brazil and Mexico. Labour productivity grew twice as rapidly in Taiwan and Korea (6%-7%).
Manufacturing Output Share The manufacturing sector accounted for a quarter of total GDP in Indonesia in 1995 (figure 4.3a and table 4.1, third panel). This was similar to Philippines, Turkey, Argentina and Egypt, but higher than Brazil, South Africa and Mexico (20%-22%), and India, Pakistan and Bangladesh (16%-18%). However it was lower than Thailand, Taiwan and Korea (30%) as well as Malaysia (35%0, and much lower than China (42%). In many countries including Indonesia, the manufacturing sector grew faster than the rest of the economy. As a result, this sector’s share in GDP increased over the period 1985-1997, by 8%-10% in Indonesia, Thailand and China, and by 5% in Korea (figure 4.3b). Indonesia’s structural transformation was much more rapid than India, Bangladesh, Mexico, Turkey and Egypt (2%-4%), but nowhere as rapid as Malaysia (16%). Structural changes such as the above were by no means the norm in the world, as observed by the stagnant share of the manufacturing sector in Philippines and Pakistan, and even decline in the South American countries of Argentina, Brazil, Chile and Costa Rica, and African countries of South Africa and Egypt (-1%-2%).
In Singapore and Taiwan however, the rest of the economy grew just as rapidly, leaving manufacturing’s share unchanged. Patterns of structural transformation were different now than say two decades ago, as also witnessed by the declining output share of manufacturing in several industrialized countries. Nevertheless, for countries with similar resource endowments and at about the same stage of development, structural transformation provides a good measure of the degree of Industrialization of an economy.
Fig.4.3a. % Share of MVA in GDP
0 10 20 30 40 50 60
Singapore
Taiwan
Korea
Malaysia
Thailand
China
Indonesia
Philippines
India
Poland
Hungary
Turkey
Brazil
Mexico
S. Africa
Egypt1985 1997
Fig. 4.3b. Change in % MVA/GDP, 85-97
1
-6
5
16
9
8
3
4
3
2
-1
4
-5
0
10
-2
-10 -5 0 5 10 15 20
Singapore
Taiwan
Korea
Malaysia
Thailand
China
Indonesia
Philippines
India
Poland
Hungary
Turkey
Brazil
Mexico
S. Africa
Egypt
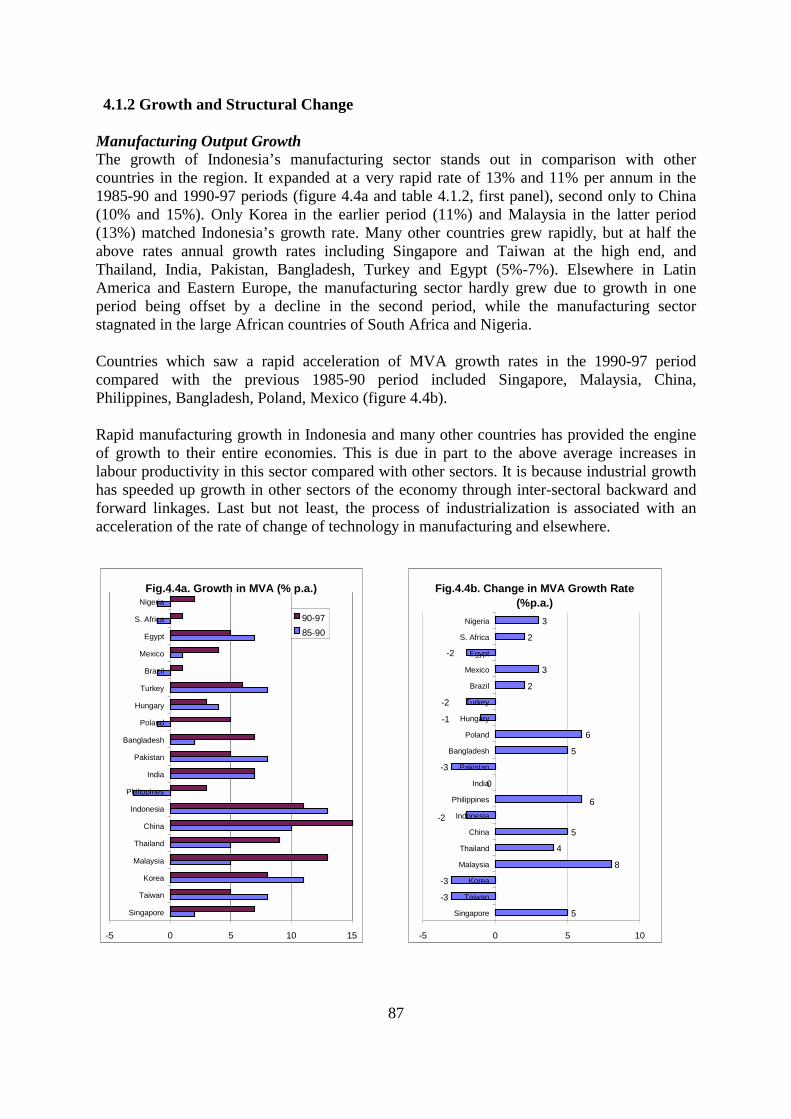
87
4.1.2 Growth and Structural Change
Manufacturing Output Growth The growth of Indonesia’s manufacturing sector stands out in comparison with other countries in the region. It expanded at a very rapid rate of 13% and 11% per annum in the 1985-90 and 1990-97 periods (figure 4.4a and table 4.1.2, first panel), second only to China (10% and 15%). Only Korea in the earlier period (11%) and Malaysia in the latter period (13%) matched Indonesia’s growth rate. Many other countries grew rapidly, but at half the above rates annual growth rates including Singapore and Taiwan at the high end, and Thailand, India, Pakistan, Bangladesh, Turkey and Egypt (5%-7%). Elsewhere in Latin America and Eastern Europe, the manufacturing sector hardly grew due to growth in one period being offset by a decline in the second period, while the manufacturing sector stagnated in the large African countries of South Africa and Nigeria. Countries which saw a rapid acceleration of MVA growth rates in the 1990-97 period compared with the previous 1985-90 period included Singapore, Malaysia, China, Philippines, Bangladesh, Poland, Mexico (figure 4.4b). Rapid manufacturing growth in Indonesia and many other countries has provided the engine of growth to their entire economies. This is due in part to the above average increases in labour productivity in this sector compared with other sectors. It is because industrial growth has speeded up growth in other sectors of the economy through inter-sectoral backward and forward linkages. Last but not least, the process of industrialization is associated with an acceleration of the rate of change of technology in manufacturing and elsewhere.
Fig.4.4b. Change in MVA Growth Rate (%p.a.)
5
-3
-3
8
4
5
0
-3
5
6
2
3
2
3
6
-2
-1
-2
-2
-5 0 5 10
Singapore
Taiwan
Korea
Malaysia
Thailand
China
Indonesia
Philippines
India
Pakistan
Bangladesh
Poland
Hungary
Turkey
Brazil
Mexico
Egypt
S. Africa
Nigeria
Fig.4.4a. Growth in MVA (% p.a.)
-5 0 5 10 15
Singapore
Taiwan
Korea
Malaysia
Thailand
China
Indonesia
Philippines
India
Pakistan
Bangladesh
Poland
Hungary
Turkey
Brazil
Mexico
Egypt
S. Africa
Nigeria
90-9785-90
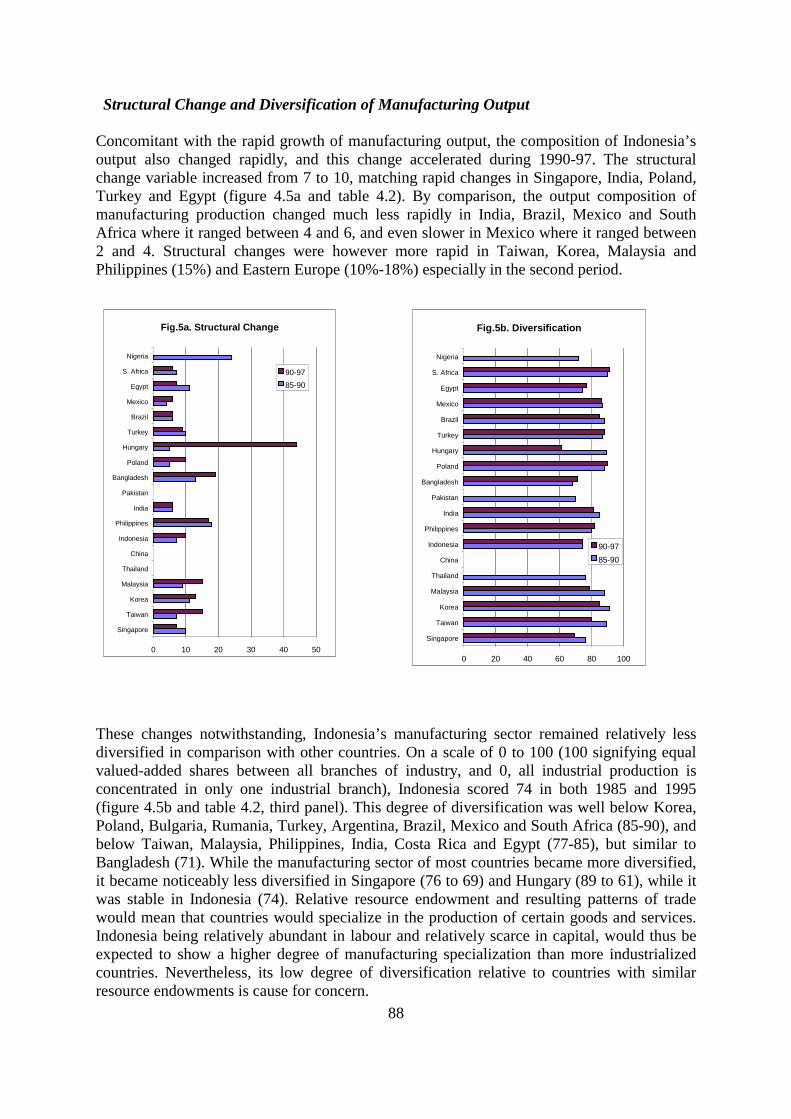
88
Structural Change and Diversification of Manufacturing Output
Concomitant with the rapid growth of manufacturing output, the composition of Indonesia’s output also changed rapidly, and this change accelerated during 1990-97. The structural change variable increased from 7 to 10, matching rapid changes in Singapore, India, Poland, Turkey and Egypt (figure 4.5a and table 4.2). By comparison, the output composition of manufacturing production changed much less rapidly in India, Brazil, Mexico and South Africa where it ranged between 4 and 6, and even slower in Mexico where it ranged between 2 and 4. Structural changes were however more rapid in Taiwan, Korea, Malaysia and Philippines (15%) and Eastern Europe (10%-18%) especially in the second period.
These changes notwithstanding, Indonesia’s manufacturing sector remained relatively less diversified in comparison with other countries. On a scale of 0 to 100 (100 signifying equal valued-added shares between all branches of industry, and 0, all industrial production is concentrated in only one industrial branch), Indonesia scored 74 in both 1985 and 1995 (figure 4.5b and table 4.2, third panel). This degree of diversification was well below Korea, Poland, Bulgaria, Rumania, Turkey, Argentina, Brazil, Mexico and South Africa (85-90), and below Taiwan, Malaysia, Philippines, India, Costa Rica and Egypt (77-85), but similar to Bangladesh (71). While the manufacturing sector of most countries became more diversified, it became noticeably less diversified in Singapore (76 to 69) and Hungary (89 to 61), while it was stable in Indonesia (74). Relative resource endowment and resulting patterns of trade would mean that countries would specialize in the production of certain goods and services. Indonesia being relatively abundant in labour and relatively scarce in capital, would thus be expected to show a higher degree of manufacturing specialization than more industrialized countries. Nevertheless, its low degree of diversification relative to countries with similar resource endowments is cause for concern.
Fig.5a. Structural Change
0 10 20 30 40 50
Singapore
Taiwan
Korea
Malaysia
Thailand
China
Indonesia
Philippines
India
Pakistan
Bangladesh
Poland
Hungary
Turkey
Brazil
Mexico
Egypt
S. Africa
Nigeria
90-9785-90
Fig.5b. Diversification
0 20 40 60 80 100
Singapore
Taiwan
Korea
Malaysia
Thailand
China
Indonesia
Philippines
India
Pakistan
Bangladesh
Poland
Hungary
Turkey
Brazil
Mexico
Egypt
S. Africa
Nigeria
90-9785-90
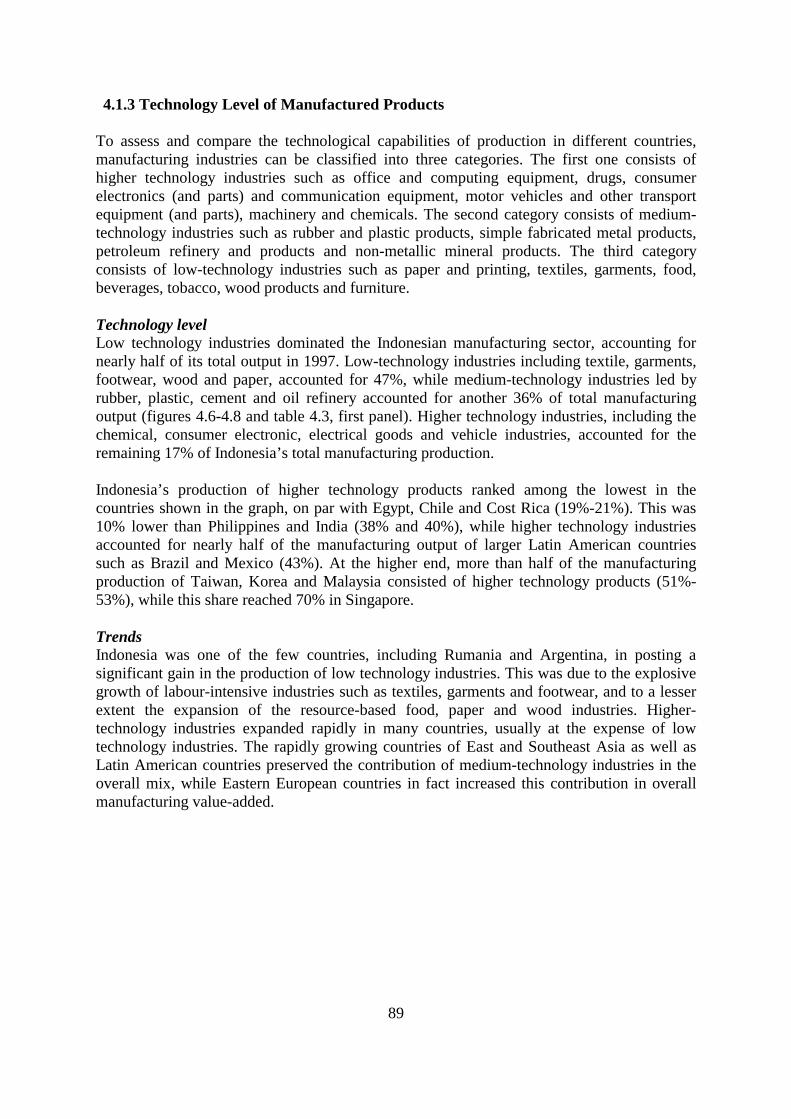
89
4.1.3 Technology Level of Manufactured Products
To assess and compare the technological capabilities of production in different countries, manufacturing industries can be classified into three categories. The first one consists of higher technology industries such as office and computing equipment, drugs, consumer electronics (and parts) and communication equipment, motor vehicles and other transport equipment (and parts), machinery and chemicals. The second category consists of medium-technology industries such as rubber and plastic products, simple fabricated metal products, petroleum refinery and products and non-metallic mineral products. The third category consists of low-technology industries such as paper and printing, textiles, garments, food, beverages, tobacco, wood products and furniture. Technology level Low technology industries dominated the Indonesian manufacturing sector, accounting for nearly half of its total output in 1997. Low-technology industries including textile, garments, footwear, wood and paper, accounted for 47%, while medium-technology industries led by rubber, plastic, cement and oil refinery accounted for another 36% of total manufacturing output (figures 4.6-4.8 and table 4.3, first panel). Higher technology industries, including the chemical, consumer electronic, electrical goods and vehicle industries, accounted for the remaining 17% of Indonesia’s total manufacturing production. Indonesia’s production of higher technology products ranked among the lowest in the countries shown in the graph, on par with Egypt, Chile and Cost Rica (19%-21%). This was 10% lower than Philippines and India (38% and 40%), while higher technology industries accounted for nearly half of the manufacturing output of larger Latin American countries such as Brazil and Mexico (43%). At the higher end, more than half of the manufacturing production of Taiwan, Korea and Malaysia consisted of higher technology products (51%-53%), while this share reached 70% in Singapore. Trends Indonesia was one of the few countries, including Rumania and Argentina, in posting a significant gain in the production of low technology industries. This was due to the explosive growth of labour-intensive industries such as textiles, garments and footwear, and to a lesser extent the expansion of the resource-based food, paper and wood industries. Higher-technology industries expanded rapidly in many countries, usually at the expense of low technology industries. The rapidly growing countries of East and Southeast Asia as well as Latin American countries preserved the contribution of medium-technology industries in the overall mix, while Eastern European countries in fact increased this contribution in overall manufacturing value-added.
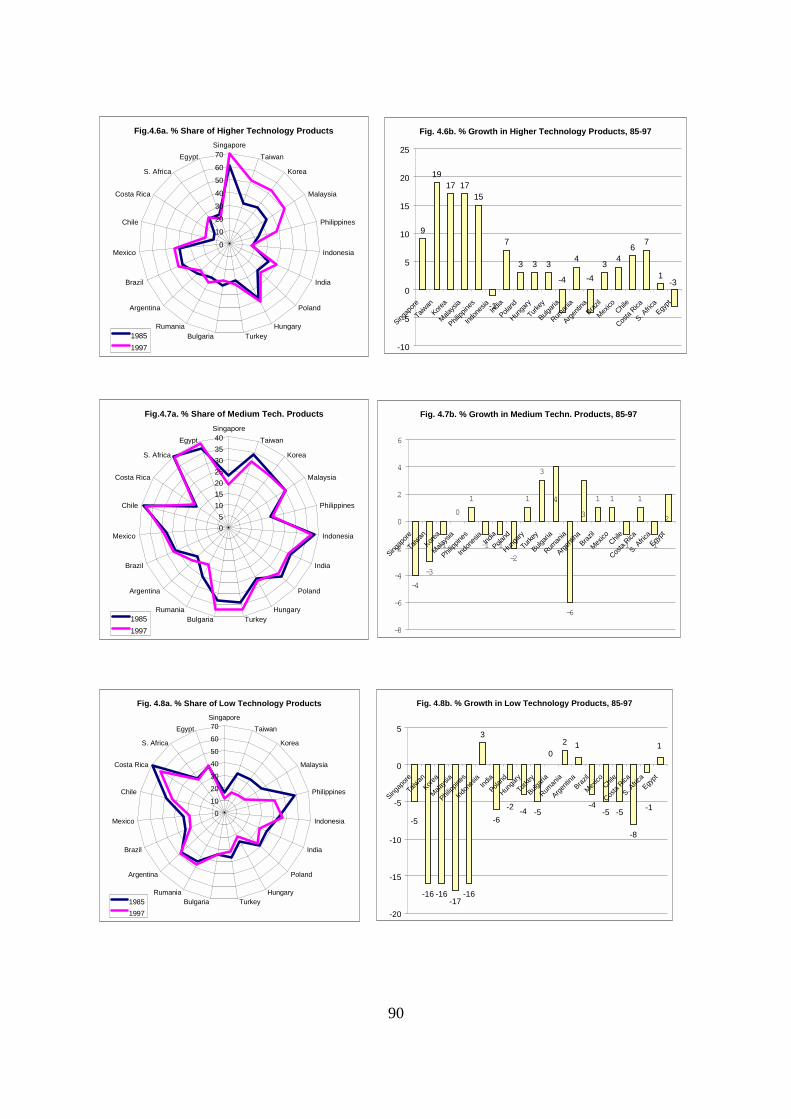
90
Fig.4.6a. % Share of Higher Technology Products
0
1020
30
40
5060
70Singapore
Taiwan
Korea
Malaysia
Philippines
Indonesia
India
Poland
HungaryTurkeyBulgaria
Rumania
Argentina
Brazil
Mexico
Chile
Costa Rica
S. Africa
Egypt
19851997
Fig. 4.6b. % Growth in Higher Technology Products, 85-97
9
1917 17
15
-1
7
3 3 3 4 3 46 7
1-4 -4 -3
-10
-5
0
5
10
15
20
25
Singap
ore
Taiwan
Korea
Malays
ia
Philipp
ines
Indon
esia
India
Poland
Hunga
ry
Turkey
Bulgari
a
Ruman
ia
Argenti
naBraz
il
Mexico Chil
e
Costa
Rica
S. Afric
aEgy
pt
Fig.4.7a. % Share of Medium Tech. Products
05
10152025303540
SingaporeTaiwan
Korea
Malaysia
Philippines
Indonesia
India
Poland
HungaryTurkeyBulgaria
Rumania
Argentina
Brazil
Mexico
Chile
Costa Rica
S. Africa
Egypt
19851997
Fig. 4.7b. % Growth in Medium Techn. Products, 85-97
-4
-3
-1
0
1
-1 -1
-2
1
3
-6
1 1
-1
1
-1
4
3 2
-8
-6
-4
-2
0
2
4
6
Singap
ore
Taiwan
Korea
Malays
ia
Philipp
ines
Indon
esia
India
Poland
Hunga
ry
Turkey
Bulgari
a
Ruman
ia
Argenti
naBraz
il
Mexico Chil
e
Costa
Rica
S. Afric
aEgy
pt
Fig. 4.8a. % Share of Low Technology Products
0
10
20
30
40
50
60
70Singapore
Taiwan
Korea
Malaysia
Philippines
Indonesia
India
Poland
HungaryTurkeyBulgaria
Rumania
Argentina
Brazil
Mexico
Chile
Costa Rica
S. Africa
Egypt
19851997
Fig. 4.8b. % Growth in Low Technology Products, 85-97
-16 -16-17
-16
3
-6-5
2
-4-5 -5
-8
110
-4 -1-2
-5
-20
-15
-10
-5
0
5
Singap
ore
Taiwan
Korea
Malays
ia
Philipp
ines
Indon
esia
India
Poland
Hunga
ry
Turkey
Bulgari
a
Ruman
ia
Argenti
naBraz
il
Mexico
Chile
Costa
Rica
S. Afric
aEgy
pt
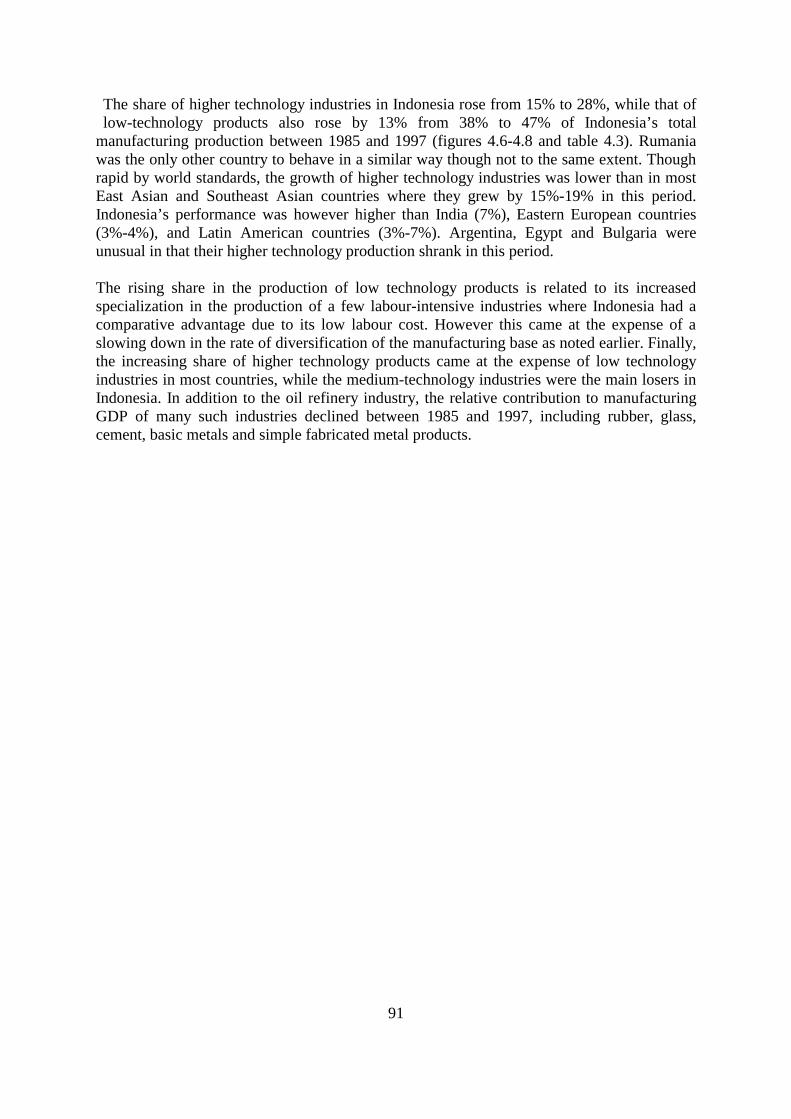
91
The share of higher technology industries in Indonesia rose from 15% to 28%, while that of low-technology products also rose by 13% from 38% to 47% of Indonesia’s total
manufacturing production between 1985 and 1997 (figures 4.6-4.8 and table 4.3). Rumania was the only other country to behave in a similar way though not to the same extent. Though rapid by world standards, the growth of higher technology industries was lower than in most East Asian and Southeast Asian countries where they grew by 15%-19% in this period. Indonesia’s performance was however higher than India (7%), Eastern European countries (3%-4%), and Latin American countries (3%-7%). Argentina, Egypt and Bulgaria were unusual in that their higher technology production shrank in this period. The rising share in the production of low technology products is related to its increased specialization in the production of a few labour-intensive industries where Indonesia had a comparative advantage due to its low labour cost. However this came at the expense of a slowing down in the rate of diversification of the manufacturing base as noted earlier. Finally, the increasing share of higher technology products came at the expense of low technology industries in most countries, while the medium-technology industries were the main losers in Indonesia. In addition to the oil refinery industry, the relative contribution to manufacturing GDP of many such industries declined between 1985 and 1997, including rubber, glass, cement, basic metals and simple fabricated metal products.

92
4.2 TRADE PERFORMANCE
4.2.1 Manufactured Export Level and Share Manufactured Export Level Indonesia’s manufactured exports amounted to $132 per $1000 of GDP, or 13% of GDP, in 1995 (figure 4.9a and table 4.2, first panel). This degree of export orientation, similar to that of Philippines and Pakistan, was however lower than that of China ($173). In relation to high performers, it was only half of that achieved by Korea ($267), Thailand ($267) and Mexico ($221), a fifth of that of Malaysia ($611) and one eight of Singapore ($1,088). Nevertheless Indonesia’s degree of export orientation was substantially higher than countries outside East and Southeast Asian such as India ($69), Bangladesh ($77), Turkey ($95), Argentina ($28), Brazil ($35), Chile ($33), South Africa ($91) and Egypt ($21).
The level and patterns of industrial production on one hand and trade on the other both reflect the level and structure of industrial activity in a country, and the performance of different countries’ industrial sectors in an increasingly open trading environment. Starting from a low base of just $31 in 1995, Indonesia’s manufactured exports grew by 15% per annum, surpassing the growth rates achieved by other export-oriented Malaysia, Thailand and Philippines (11%-13%), and also other countries such as India, Pakistan and Bangladesh (7%-9%). In this respect, only Mexico (17%) and Egypt (15%) matched Indonesia’s export growth performance.
Fig. 4.9a. Manufactured Exports per $1000 GDP ($)
0 200 400 600 800 1000 1200
Singapore
Korea
Malaysia
Thailand
China
Indonesia
Philippines
India
Pakistan
Bangladesh
Poland
Hungary
Turkey
Brazil
Mexico
South Africa
Egypt 19971985
Fig. 4.9b. % Change in Manufactured Exports/$1000 GDP 1985-97
4
13
12
0
11
8
7
9
3
2
3
-3
17
0
15
-1
-5 0 5 10 15 20
Singapore
Korea
Malaysia
Thailand
China
Indonesia
Philippines
India
Pakistan
Bangladesh
Poland
Hungary
Turkey
Brazil
Mexico
South Africa
Egypt
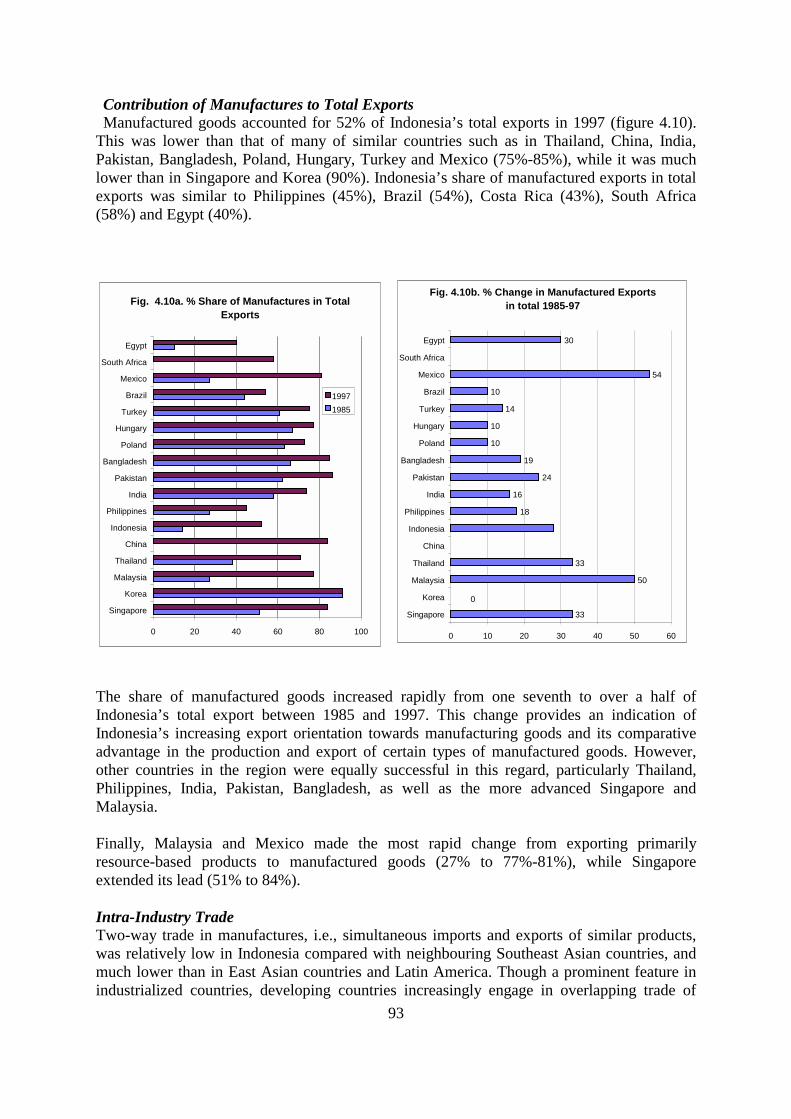
93
Contribution of Manufactures to Total Exports Manufactured goods accounted for 52% of Indonesia’s total exports in 1997 (figure 4.10).
This was lower than that of many of similar countries such as in Thailand, China, India, Pakistan, Bangladesh, Poland, Hungary, Turkey and Mexico (75%-85%), while it was much lower than in Singapore and Korea (90%). Indonesia’s share of manufactured exports in total exports was similar to Philippines (45%), Brazil (54%), Costa Rica (43%), South Africa (58%) and Egypt (40%).
The share of manufactured goods increased rapidly from one seventh to over a half of Indonesia’s total export between 1985 and 1997. This change provides an indication of Indonesia’s increasing export orientation towards manufacturing goods and its comparative advantage in the production and export of certain types of manufactured goods. However, other countries in the region were equally successful in this regard, particularly Thailand, Philippines, India, Pakistan, Bangladesh, as well as the more advanced Singapore and Malaysia. Finally, Malaysia and Mexico made the most rapid change from exporting primarily resource-based products to manufactured goods (27% to 77%-81%), while Singapore extended its lead (51% to 84%). Intra-Industry Trade Two-way trade in manufactures, i.e., simultaneous imports and exports of similar products, was relatively low in Indonesia compared with neighbouring Southeast Asian countries, and much lower than in East Asian countries and Latin America. Though a prominent feature in industrialized countries, developing countries increasingly engage in overlapping trade of
Fig. 4.10a. % Share of Manufactures in Total Exports
0 20 40 60 80 100
Singapore
Korea
Malaysia
Thailand
China
Indonesia
Philippines
India
Pakistan
Bangladesh
Poland
Hungary
Turkey
Brazil
Mexico
South Africa
Egypt
19971985
Fig. 4.10b. % Change in Manufactured Exports in total 1985-97
33
50
33
18
16
24
19
10
10
14
10
54
30
0
0 10 20 30 40 50 60
Singapore
Korea
Malaysia
Thailand
China
Indonesia
Philippines
India
Pakistan
Bangladesh
Poland
Hungary
Turkey
Brazil
Mexico
South Africa
Egypt
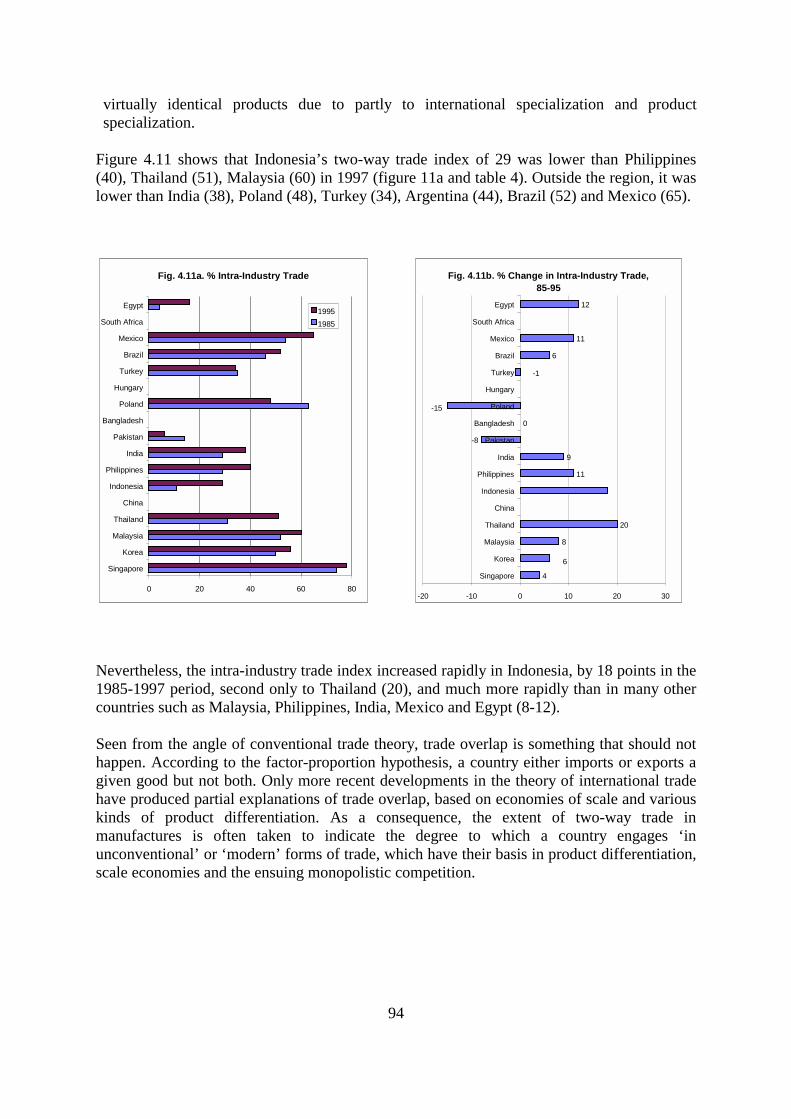
94
virtually identical products due to partly to international specialization and product specialization.
Figure 4.11 shows that Indonesia’s two-way trade index of 29 was lower than Philippines (40), Thailand (51), Malaysia (60) in 1997 (figure 11a and table 4). Outside the region, it was lower than India (38), Poland (48), Turkey (34), Argentina (44), Brazil (52) and Mexico (65).
Nevertheless, the intra-industry trade index increased rapidly in Indonesia, by 18 points in the 1985-1997 period, second only to Thailand (20), and much more rapidly than in many other countries such as Malaysia, Philippines, India, Mexico and Egypt (8-12). Seen from the angle of conventional trade theory, trade overlap is something that should not happen. According to the factor-proportion hypothesis, a country either imports or exports a given good but not both. Only more recent developments in the theory of international trade have produced partial explanations of trade overlap, based on economies of scale and various kinds of product differentiation. As a consequence, the extent of two-way trade in manufactures is often taken to indicate the degree to which a country engages ‘in unconventional’ or ‘modern’ forms of trade, which have their basis in product differentiation, scale economies and the ensuing monopolistic competition.
Fig. 4.11a. % Intra-Industry Trade
0 20 40 60 80
Singapore
Korea
Malaysia
Thailand
China
Indonesia
Philippines
India
Pakistan
Bangladesh
Poland
Hungary
Turkey
Brazil
Mexico
South Africa
Egypt19951985
Fig. 4.11b. % Change in Intra-Industry Trade, 85-95
4
8
20
11
9
-8
0
6
11
12
6
-15
-1
-20 -10 0 10 20 30
Singapore
Korea
Malaysia
Thailand
China
Indonesia
Philippines
India
Pakistan
Bangladesh
Poland
Hungary
Turkey
Brazil
Mexico
South Africa
Egypt
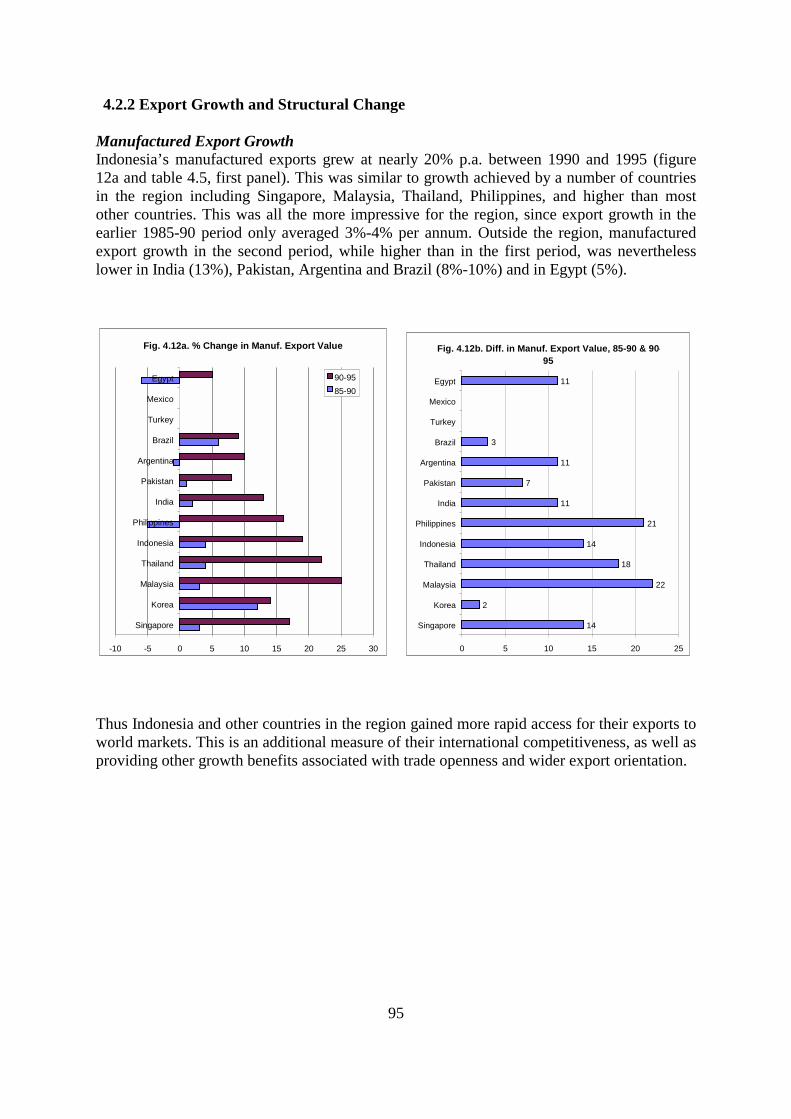
95
4.2.2 Export Growth and Structural Change
Manufactured Export Growth Indonesia’s manufactured exports grew at nearly 20% p.a. between 1990 and 1995 (figure 12a and table 4.5, first panel). This was similar to growth achieved by a number of countries in the region including Singapore, Malaysia, Thailand, Philippines, and higher than most other countries. This was all the more impressive for the region, since export growth in the earlier 1985-90 period only averaged 3%-4% per annum. Outside the region, manufactured export growth in the second period, while higher than in the first period, was nevertheless lower in India (13%), Pakistan, Argentina and Brazil (8%-10%) and in Egypt (5%).
Thus Indonesia and other countries in the region gained more rapid access for their exports to world markets. This is an additional measure of their international competitiveness, as well as providing other growth benefits associated with trade openness and wider export orientation.
Fig. 4.12a. % Change in Manuf. Export Value
-10 -5 0 5 10 15 20 25 30
Singapore
Korea
Malaysia
Thailand
Indonesia
Philippines
India
Pakistan
Argentina
Brazil
Turkey
Mexico
Egypt 90-9585-90
Fig. 4.12b. Diff. in Manuf. Export Value, 85-90 & 90-95
14
2
22
18
14
21
11
7
11
3
11
0 5 10 15 20 25
Singapore
Korea
Malaysia
Thailand
Indonesia
Philippines
India
Pakistan
Argentina
Brazil
Turkey
Mexico
Egypt
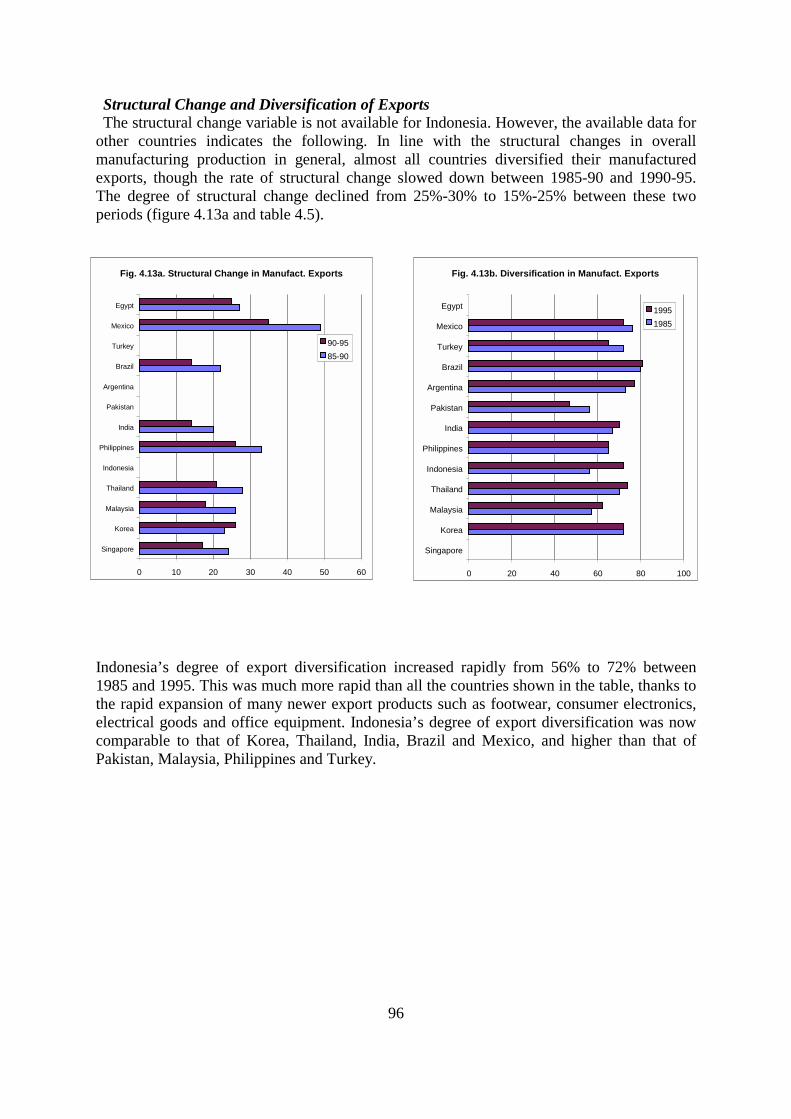
96
Structural Change and Diversification of Exports The structural change variable is not available for Indonesia. However, the available data for
other countries indicates the following. In line with the structural changes in overall manufacturing production in general, almost all countries diversified their manufactured exports, though the rate of structural change slowed down between 1985-90 and 1990-95. The degree of structural change declined from 25%-30% to 15%-25% between these two periods (figure 4.13a and table 4.5).
Indonesia’s degree of export diversification increased rapidly from 56% to 72% between 1985 and 1995. This was much more rapid than all the countries shown in the table, thanks to the rapid expansion of many newer export products such as footwear, consumer electronics, electrical goods and office equipment. Indonesia’s degree of export diversification was now comparable to that of Korea, Thailand, India, Brazil and Mexico, and higher than that of Pakistan, Malaysia, Philippines and Turkey.
Fig. 4.13a. Structural Change in Manufact. Exports
0 10 20 30 40 50 60
Singapore
Korea
Malaysia
Thailand
Indonesia
Philippines
India
Pakistan
Argentina
Brazil
Turkey
Mexico
Egypt
90-9585-90
Fig. 4.13b. Diversification in Manufact. Exports
0 20 40 60 80 100
Singapore
Korea
Malaysia
Thailand
Indonesia
Philippines
India
Pakistan
Argentina
Brazil
Turkey
Mexico
Egypt 19951985
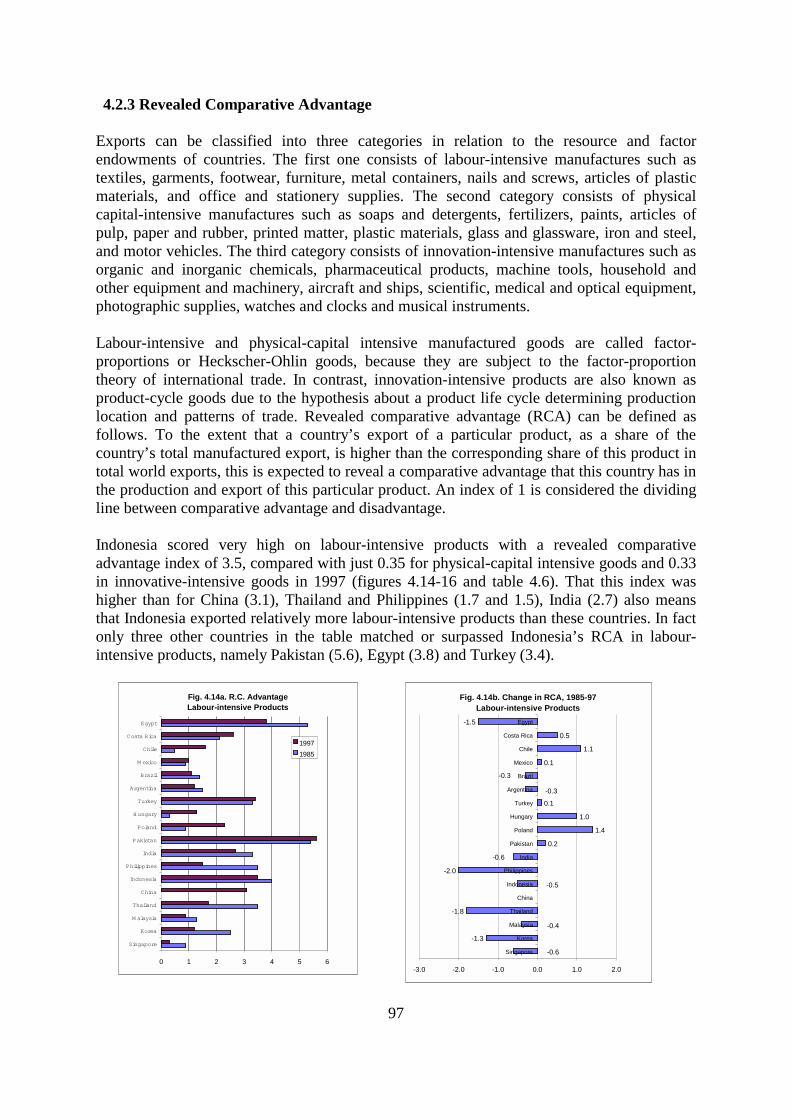
97
4.2.3 Revealed Comparative Advantage
Exports can be classified into three categories in relation to the resource and factor endowments of countries. The first one consists of labour-intensive manufactures such as textiles, garments, footwear, furniture, metal containers, nails and screws, articles of plastic materials, and office and stationery supplies. The second category consists of physical capital-intensive manufactures such as soaps and detergents, fertilizers, paints, articles of pulp, paper and rubber, printed matter, plastic materials, glass and glassware, iron and steel, and motor vehicles. The third category consists of innovation-intensive manufactures such as organic and inorganic chemicals, pharmaceutical products, machine tools, household and other equipment and machinery, aircraft and ships, scientific, medical and optical equipment, photographic supplies, watches and clocks and musical instruments. Labour-intensive and physical-capital intensive manufactured goods are called factor-proportions or Heckscher-Ohlin goods, because they are subject to the factor-proportion theory of international trade. In contrast, innovation-intensive products are also known as product-cycle goods due to the hypothesis about a product life cycle determining production location and patterns of trade. Revealed comparative advantage (RCA) can be defined as follows. To the extent that a country’s export of a particular product, as a share of the country’s total manufactured export, is higher than the corresponding share of this product in total world exports, this is expected to reveal a comparative advantage that this country has in the production and export of this particular product. An index of 1 is considered the dividing line between comparative advantage and disadvantage. Indonesia scored very high on labour-intensive products with a revealed comparative advantage index of 3.5, compared with just 0.35 for physical-capital intensive goods and 0.33 in innovative-intensive goods in 1997 (figures 4.14-16 and table 4.6). That this index was higher than for China (3.1), Thailand and Philippines (1.7 and 1.5), India (2.7) also means that Indonesia exported relatively more labour-intensive products than these countries. In fact only three other countries in the table matched or surpassed Indonesia’s RCA in labour-intensive products, namely Pakistan (5.6), Egypt (3.8) and Turkey (3.4).
Fig. 4.14a. R.C. AdvantageLabour-intensive Products
0 1 2 3 4 5 6
Singapore
Korea
M alaysia
Thailand
China
Indonesia
Philippines
India
Pakistan
Poland
Hungary
Turkey
Argentina
Brazil
M exico
Chile
Costa Rica
Egypt
19971985
Fig. 4.14b. Change in RCA, 1985-97Labour-intensive Products
-1.3
-1.8
-2.0
0.2
1.4
1.0
0.1
0.1
1.1
0.5
-1.5
-0.5
-0.6
-0.3
-0.3
-0.4
-0.6
-3.0 -2.0 -1.0 0.0 1.0 2.0
Singapore
Korea
Malaysia
Thailand
China
Indonesia
Philippines
India
Pakistan
Poland
Hungary
Turkey
Argentina
Brazil
Mexico
Chile
Costa Rica
Egypt
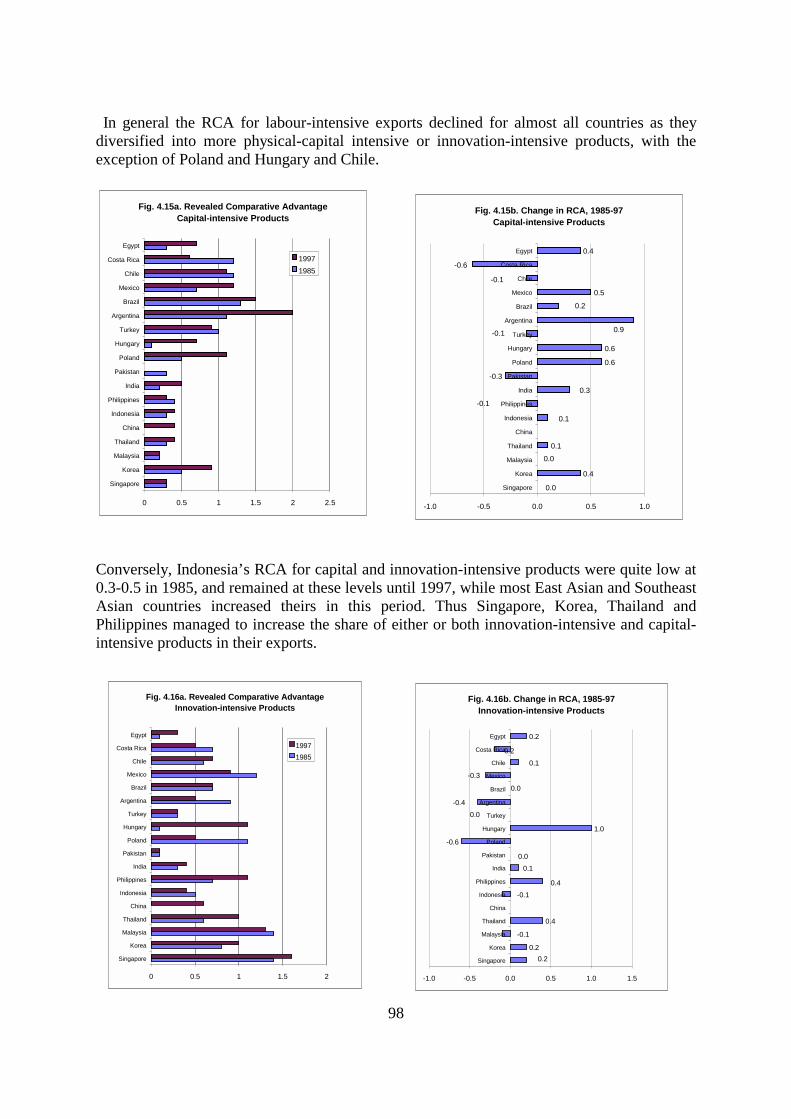
98
In general the RCA for labour-intensive exports declined for almost all countries as they
diversified into more physical-capital intensive or innovation-intensive products, with the exception of Poland and Hungary and Chile.
Conversely, Indonesia’s RCA for capital and innovation-intensive products were quite low at 0.3-0.5 in 1985, and remained at these levels until 1997, while most East Asian and Southeast Asian countries increased theirs in this period. Thus Singapore, Korea, Thailand and Philippines managed to increase the share of either or both innovation-intensive and capital-intensive products in their exports.
Fig. 4.15a. Revealed Comparative AdvantageCapital-intensive Products
0 0.5 1 1.5 2 2.5
Singapore
Korea
Malaysia
Thailand
China
Indonesia
Philippines
India
Pakistan
Poland
Hungary
Turkey
Argentina
Brazil
Mexico
Chile
Costa Rica
Egypt
19971985
Fig. 4.15b. Change in RCA, 1985-97Capital-intensive Products
0.4
0.1
-0.3
0.6
0.6
0.5
0.4
0.9
0.2
0.3
0.1
0.0
-0.1
-0.1
-0.6
-0.1
0.0
-1.0 -0.5 0.0 0.5 1.0
Singapore
Korea
Malaysia
Thailand
China
Indonesia
Philippines
India
Pakistan
Poland
Hungary
Turkey
Argentina
Brazil
Mexico
Chile
Costa Rica
Egypt
Fig. 4.16a. Revealed Comparative AdvantageInnovation-intensive Products
0 0.5 1 1.5 2
Singapore
Korea
Malaysia
Thailand
China
Indonesia
Philippines
India
Pakistan
Poland
Hungary
Turkey
Argentina
Brazil
Mexico
Chile
Costa Rica
Egypt
19971985
Fig. 4.16b. Change in RCA, 1985-97Innovation-intensive Products
0.2
0.4
-0.6
1.0
0.2
0.4
-0.20.1
0.0
0.2
-0.1
0.1
0.0
-0.4
-0.3
-0.1
0.0
-1.0 -0.5 0.0 0.5 1.0 1.5
Singapore
Korea
Malaysia
Thailand
China
Indonesia
Philippines
India
Pakistan
Poland
Hungary
Turkey
Argentina
Brazil
Mexico
Chile
Costa Rica
Egypt
99
4.3 SUMMARY
Indonesia was ranked as a medium industrial producer in 1997 in terms of per capita manufacturing output, along with China and Egypt. Though it was higher than medium-low countries such as Philippines, India, Pakistan and Bangladesh, its per capita output was still only about a third of medium-high industrial producers such as Malaysia, Thailand, Brazil, Mexico, Poland, Hungary, Turkey and South Africa. Indonesia’s rate of growth in manufacturing output, though rapid by international standards, was nevertheless lower than medium-high Southeast Asian countries. As a result, while the share of manufacturing increased to about a quarter of domestic GDP by 1995, its contribution to overall economic growth remained lower than in these countries, except in Philippines. While rapid manufacturing growth was accompanied by corresponding changes in the structure of manufacturing output, the country’s drive towards industrialization suffered from a number of weaknesses. First, the country’s manufacturing sector remains less diversified than most countries in the region, and other large countries such as India, Brazil, Mexico, Turkey and South Africa. second, low-technology industries accounted for nearly 50% of manufactured output compared with typically 30% for other countries. These were moreover dominated by a few industries such as textile, garments, footwear, wood and paper. Their share increased by 3% in Indonesia while they commonly declined in most countries. Third, higher technology industries such as chemicals, electronics and machinery accounted for less than 20% of Indonesia’s total manufacturing production in 199 compared to 40% in other similar countries. This share stagnated in the 1985-97 period, even though consumer electronics, electrical appliances and vehicle and motorcycle assembly operations grew in this period. Though they are included in higher technology industries, the industries in this category were thus similar to labour-intensive industries, relying on good quality assembly labour, efficient infrastructure and good trading links in the region. The rising contribution of low-technology industries is related to the country’s increasing specialization in the production and export of labour-intensive products, in turn related to its low labour cost advantage. Nevertheless, calculations of revealed comparative advantage (RCA) indicate that Indonesia exported relatively more labour-intensive products than similarly endowed countries such as Thailand, Philippines, India and Turkey. Conversely, its RCA in physical-capital intensive and innovation-intensive products was significantly lower than these countries as well as other countries in Latin America and Eastern Europe. Moreover, while other countries improved their comparative advantage, Indonesia’s RCA stagnated in the latter categories. The above would suggest that, in its drive for the accelerated manufacturing and export of resource-based and labour-intensive products, Indonesia may have neglected the more arduous development of medium and higher-technology industries, leading to their relative decline in the overall output mix, as well as lack of competitiveness in the export of physical-capital intensive and innovative-intensive manufactures, particularly in comparison with other Southeast Asian countries and China. While the above findings imply the need for Indonesia’s industrial policy to renew its emphasis on the development and expansion of medium-technology industries as well as the deepening of the existing higher-technology industries, the industrial strategies which can

100
elicit such a response from the largely private manufacturing sector in a free-trade environment will necessarily be difficult to formulate and implement. Nevertheless, the
private sector may welcome some overall strategic vision provided by the government as to the desirable directions of manufacturing development in the medium and long term.

101
ANNEX 4.1: TABLES
A.4.1 Manufacturing Level, Productivity and Output Share, 1985 and 1995 (1990 Prices) A.4.2 Growth and Structural Change in Manufacturing Output, 1985 – 1995 (% p.a.) A.4.3 Technology Level of Manufacturing Production, 1985 and 1995 (% MVA) A.4.4 Manufactured Export Level and Share in Total Exports, 1985 and 1995(Current US$) A.4.5 Growth and Structural Change in Manufactured Exports, 1985 – 1995 (% p.a.) A.4.6 Revealed Comparative Advantage. 1985 and 1995 (Relative Export Shares)
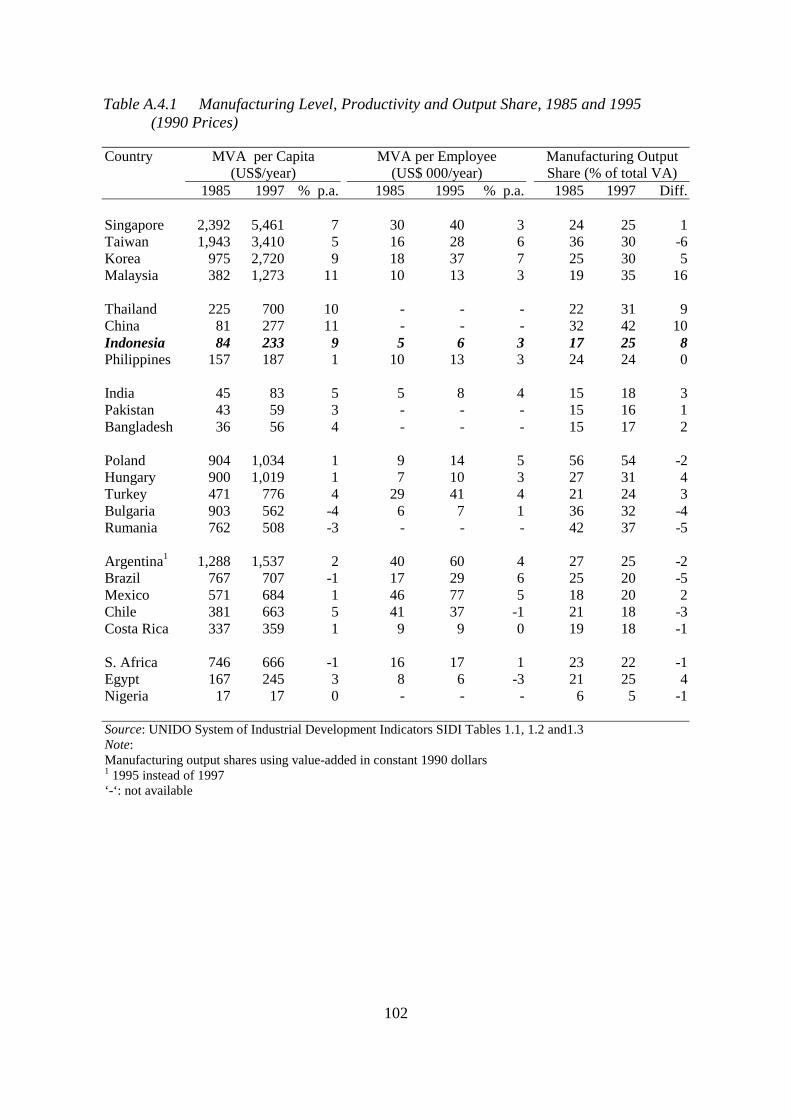
102
Table A.4.1 Manufacturing Level, Productivity and Output Share, 1985 and 1995 (1990 Prices)
Country MVA per Capita
(US$/year) MVA per Employee
(US$ 000/year) Manufacturing Output
Share (% of total VA) 1985 1997 % p.a. 1985 1995 % p.a. 1985 1997 Diff.
Singapore 2,392 5,461 7 30 40 3 24 25 1 Taiwan 1,943 3,410 5 16 28 6 36 30 -6 Korea 975 2,720 9 18 37 7 25 30 5 Malaysia 382 1,273 11 10 13 3 19 35 16 Thailand 225 700 10 - - - 22 31 9 China 81 277 11 - - - 32 42 10 Indonesia 84 233 9 5 6 3 17 25 8 Philippines 157 187 1 10 13 3 24 24 0 India 45 83 5 5 8 4 15 18 3 Pakistan 43 59 3 - - - 15 16 1 Bangladesh 36 56 4 - - - 15 17 2 Poland 904 1,034 1 9 14 5 56 54 -2 Hungary 900 1,019 1 7 10 3 27 31 4 Turkey 471 776 4 29 41 4 21 24 3 Bulgaria 903 562 -4 6 7 1 36 32 -4 Rumania 762 508 -3 - - - 42 37 -5 Argentina1 1,288 1,537 2 40 60 4 27 25 -2 Brazil 767 707 -1 17 29 6 25 20 -5 Mexico 571 684 1 46 77 5 18 20 2 Chile 381 663 5 41 37 -1 21 18 -3 Costa Rica 337 359 1 9 9 0 19 18 -1 S. Africa 746 666 -1 16 17 1 23 22 -1 Egypt 167 245 3 8 6 -3 21 25 4 Nigeria 17 17 0 - - - 6 5 -1 Source: UNIDO System of Industrial Development Indicators SIDI Tables 1.1, 1.2 and1.3 Note: Manufacturing output shares using value-added in constant 1990 dollars 1 1995 instead of 1997 ‘-‘: not available
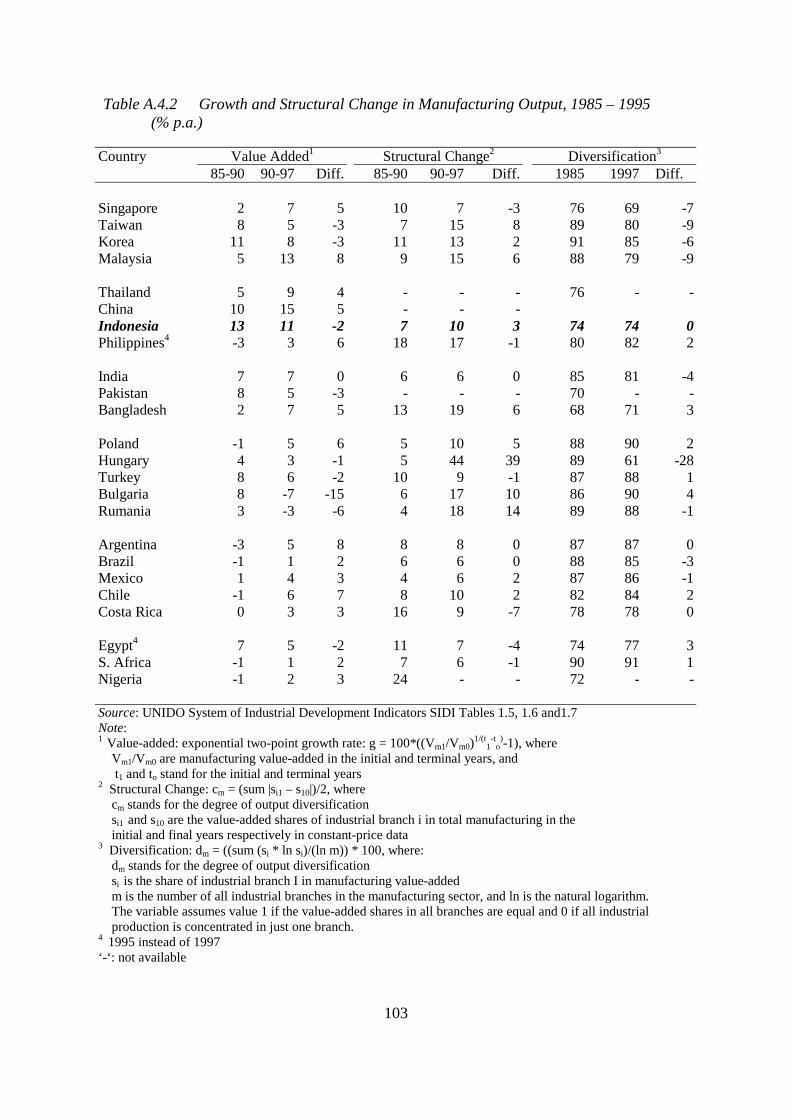
103
Table A.4.2 Growth and Structural Change in Manufacturing Output, 1985 – 1995 (% p.a.)
Country Value Added1 Structural Change2 Diversification3
85-90 90-97 Diff. 85-90 90-97 Diff. 1985 1997 Diff. Singapore 2 7 5 10 7 -3 76 69 -7 Taiwan 8 5 -3 7 15 8 89 80 -9 Korea 11 8 -3 11 13 2 91 85 -6 Malaysia 5 13 8 9 15 6 88 79 -9 Thailand 5 9 4 - - - 76 - - China 10 15 5 - - - Indonesia 13 11 -2 7 10 3 74 74 0 Philippines4 -3 3 6 18 17 -1 80 82 2 India 7 7 0 6 6 0 85 81 -4 Pakistan 8 5 -3 - - - 70 - - Bangladesh 2 7 5 13 19 6 68 71 3 Poland -1 5 6 5 10 5 88 90 2 Hungary 4 3 -1 5 44 39 89 61 -28 Turkey 8 6 -2 10 9 -1 87 88 1 Bulgaria 8 -7 -15 6 17 10 86 90 4 Rumania 3 -3 -6 4 18 14 89 88 -1 Argentina -3 5 8 8 8 0 87 87 0 Brazil -1 1 2 6 6 0 88 85 -3 Mexico 1 4 3 4 6 2 87 86 -1 Chile -1 6 7 8 10 2 82 84 2 Costa Rica 0 3 3 16 9 -7 78 78 0 Egypt4 7 5 -2 11 7 -4 74 77 3 S. Africa -1 1 2 7 6 -1 90 91 1 Nigeria -1 2 3 24 - - 72 - - Source: UNIDO System of Industrial Development Indicators SIDI Tables 1.5, 1.6 and1.7 Note: 1 Value-added: exponential two-point growth rate: g = 100*((Vm1/Vm0)1/(t
1-t
o)-1), where
Vm1/Vm0 are manufacturing value-added in the initial and terminal years, and t1 and to stand for the initial and terminal years 2 Structural Change: cm = (sum |si1 – s10|)/2, where cm stands for the degree of output diversification si1 and s10 are the value-added shares of industrial branch i in total manufacturing in the initial and final years respectively in constant-price data 3 Diversification: dm = ((sum (si * ln si)/(ln m)) * 100, where: dm stands for the degree of output diversification si is the share of industrial branch I in manufacturing value-added m is the number of all industrial branches in the manufacturing sector, and ln is the natural logarithm. The variable assumes value 1 if the value-added shares in all branches are equal and 0 if all industrial production is concentrated in just one branch. 4 1995 instead of 1997 ‘-‘: not available
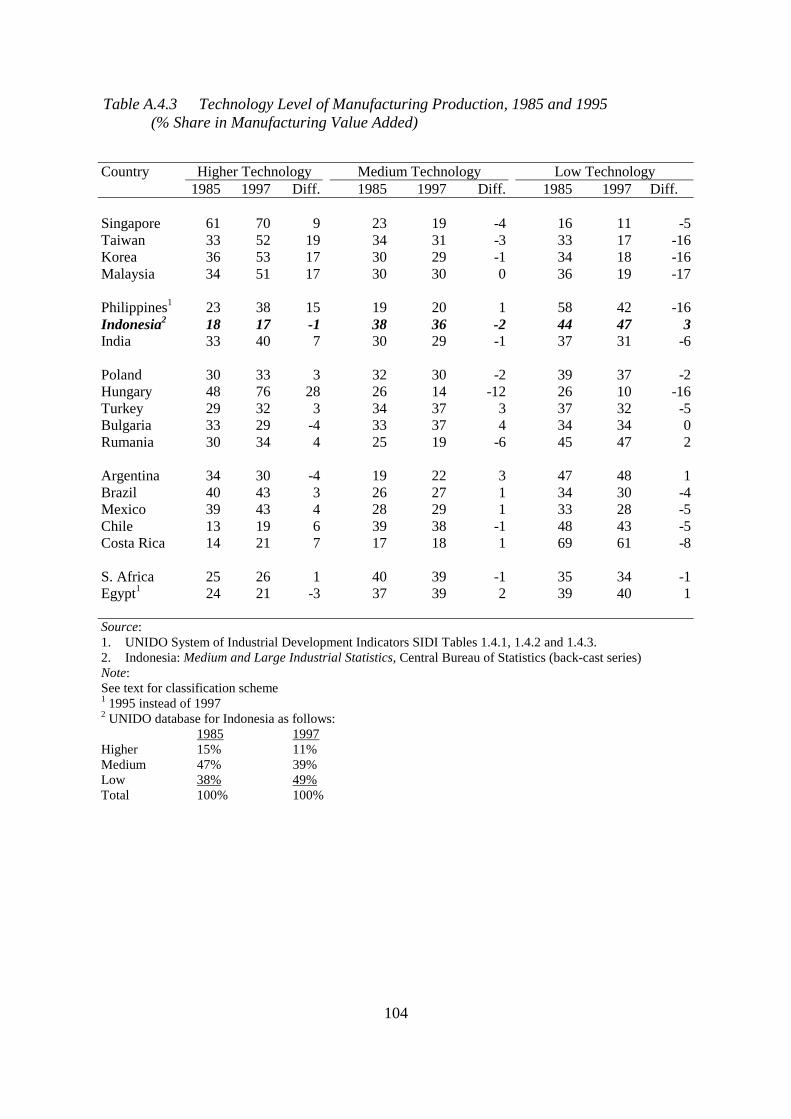
104
Table A.4.3 Technology Level of Manufacturing Production, 1985 and 1995 (% Share in Manufacturing Value Added)
Country Higher Technology Medium Technology Low Technology
1985 1997 Diff. 1985 1997 Diff. 1985 1997 Diff. Singapore 61 70 9 23 19 -4 16 11 -5 Taiwan 33 52 19 34 31 -3 33 17 -16 Korea 36 53 17 30 29 -1 34 18 -16 Malaysia 34 51 17 30 30 0 36 19 -17 Philippines1 23 38 15 19 20 1 58 42 -16 Indonesia2 18 17 -1 38 36 -2 44 47 3 India 33 40 7 30 29 -1 37 31 -6 Poland 30 33 3 32 30 -2 39 37 -2 Hungary 48 76 28 26 14 -12 26 10 -16 Turkey 29 32 3 34 37 3 37 32 -5 Bulgaria 33 29 -4 33 37 4 34 34 0 Rumania 30 34 4 25 19 -6 45 47 2 Argentina 34 30 -4 19 22 3 47 48 1 Brazil 40 43 3 26 27 1 34 30 -4 Mexico 39 43 4 28 29 1 33 28 -5 Chile 13 19 6 39 38 -1 48 43 -5 Costa Rica 14 21 7 17 18 1 69 61 -8 S. Africa 25 26 1 40 39 -1 35 34 -1 Egypt1 24 21 -3 37 39 2 39 40 1 Source: 1. UNIDO System of Industrial Development Indicators SIDI Tables 1.4.1, 1.4.2 and 1.4.3. 2. Indonesia: Medium and Large Industrial Statistics, Central Bureau of Statistics (back-cast series) Note: See text for classification scheme 1 1995 instead of 1997 2 UNIDO database for Indonesia as follows: 1985 1997 Higher 15% 11% Medium 47% 39% Low 38% 49% Total 100% 100%
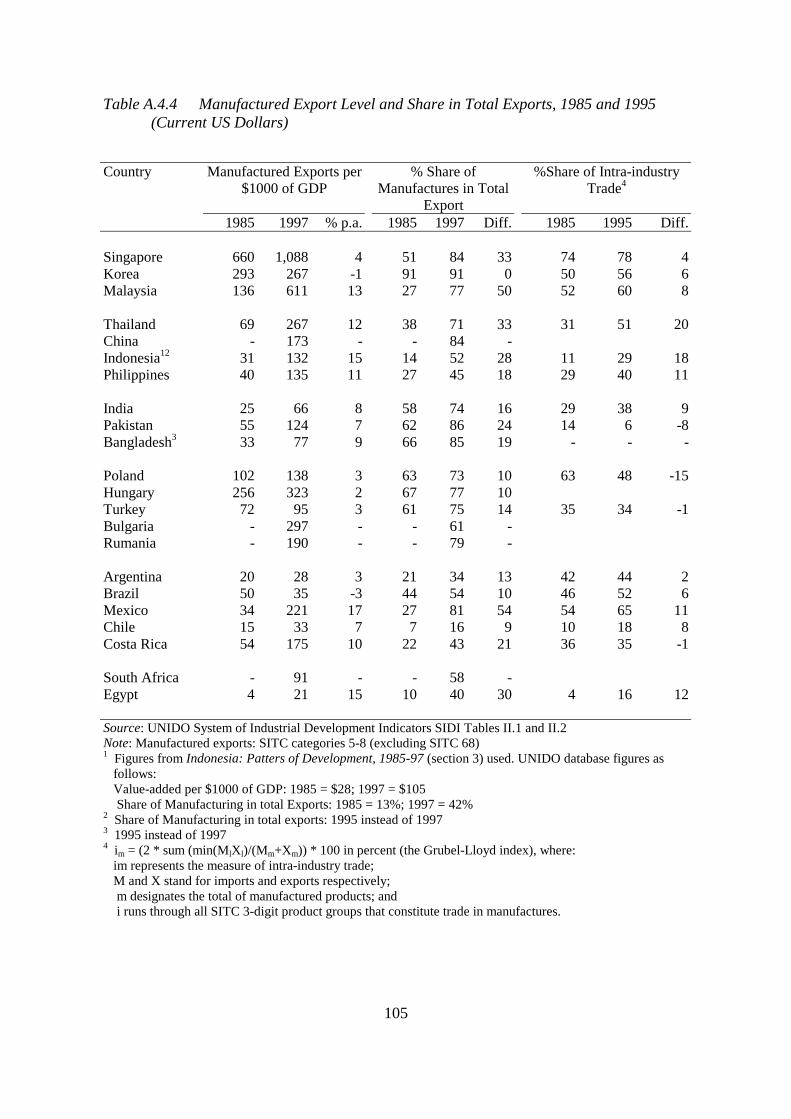
105
Table A.4.4 Manufactured Export Level and Share in Total Exports, 1985 and 1995 (Current US Dollars)
Country Manufactured Exports per $1000 of GDP
% Share of Manufactures in Total
Export
%Share of Intra-industry Trade4
1985 1997 % p.a. 1985 1997 Diff. 1985 1995 Diff. Singapore 660 1,088 4 51 84 33 74 78 4 Korea 293 267 -1 91 91 0 50 56 6 Malaysia 136 611 13 27 77 50 52 60 8 Thailand 69 267 12 38 71 33 31 51 20 China - 173 - - 84 - Indonesia12 31 132 15 14 52 28 11 29 18 Philippines 40 135 11 27 45 18 29 40 11 India 25 66 8 58 74 16 29 38 9 Pakistan 55 124 7 62 86 24 14 6 -8 Bangladesh3 33 77 9 66 85 19 - - - Poland 102 138 3 63 73 10 63 48 -15 Hungary 256 323 2 67 77 10 Turkey 72 95 3 61 75 14 35 34 -1 Bulgaria - 297 - - 61 - Rumania - 190 - - 79 - Argentina 20 28 3 21 34 13 42 44 2 Brazil 50 35 -3 44 54 10 46 52 6 Mexico 34 221 17 27 81 54 54 65 11 Chile 15 33 7 7 16 9 10 18 8 Costa Rica 54 175 10 22 43 21 36 35 -1 South Africa - 91 - - 58 - Egypt 4 21 15 10 40 30 4 16 12 Source: UNIDO System of Industrial Development Indicators SIDI Tables II.1 and II.2 Note: Manufactured exports: SITC categories 5-8 (excluding SITC 68) 1 Figures from Indonesia: Patters of Development, 1985-97 (section 3) used. UNIDO database figures as follows: Value-added per $1000 of GDP: 1985 = $28; 1997 = $105 Share of Manufacturing in total Exports: 1985 = 13%; 1997 = 42% 2 Share of Manufacturing in total exports: 1995 instead of 1997 3 1995 instead of 1997 4 im = (2 * sum (min(MlXl)/(Mm+Xm)) * 100 in percent (the Grubel-Lloyd index), where: im represents the measure of intra-industry trade; M and X stand for imports and exports respectively; m designates the total of manufactured products; and i runs through all SITC 3-digit product groups that constitute trade in manufactures.
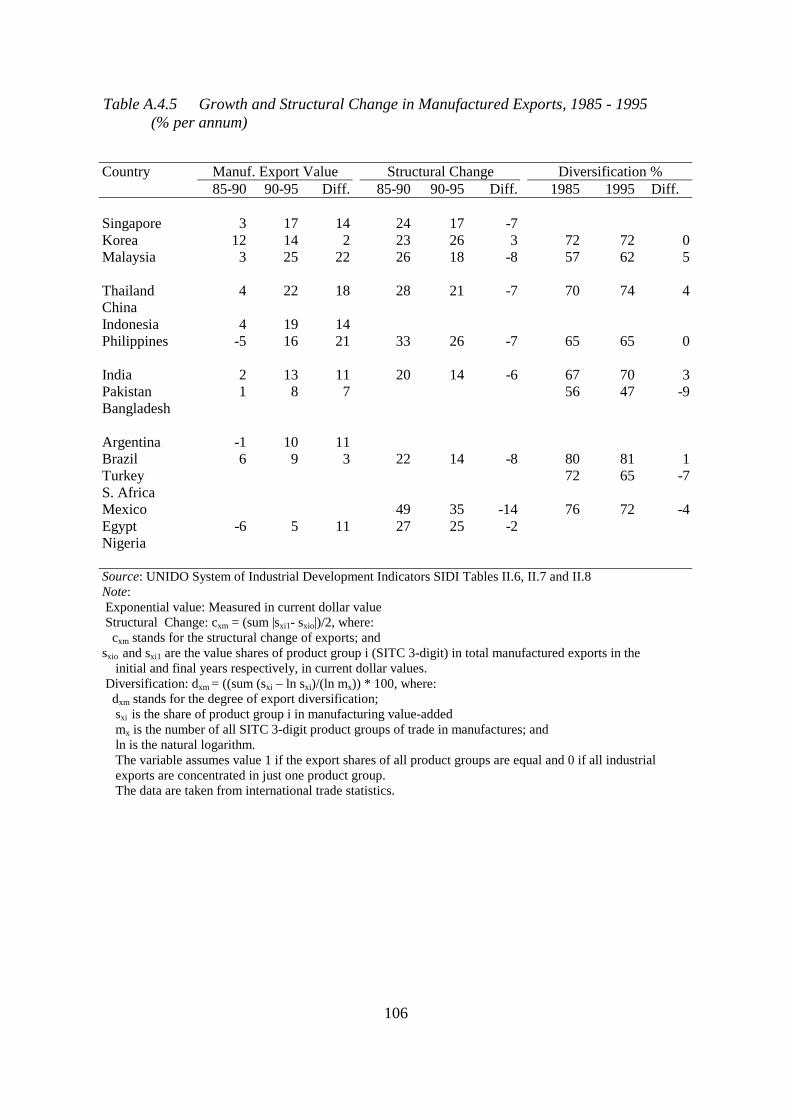
106
Table A.4.5 Growth and Structural Change in Manufactured Exports, 1985 - 1995 (% per annum)
Country Manuf. Export Value Structural Change Diversification %
85-90 90-95 Diff. 85-90 90-95 Diff. 1985 1995 Diff. Singapore 3 17 14 24 17 -7 Korea 12 14 2 23 26 3 72 72 0 Malaysia 3 25 22 26 18 -8 57 62 5 Thailand 4 22 18 28 21 -7 70 74 4 China Indonesia 4 19 14 Philippines -5 16 21 33 26 -7 65 65 0 India 2 13 11 20 14 -6 67 70 3 Pakistan 1 8 7 56 47 -9 Bangladesh Argentina -1 10 11 Brazil 6 9 3 22 14 -8 80 81 1 Turkey 72 65 -7 S. Africa Mexico 49 35 -14 76 72 -4 Egypt -6 5 11 27 25 -2 Nigeria Source: UNIDO System of Industrial Development Indicators SIDI Tables II.6, II.7 and II.8 Note: Exponential value: Measured in current dollar value Structural Change: cxm = (sum |sxi1- sxio|)/2, where: cxm stands for the structural change of exports; and sxio and sxi1 are the value shares of product group i (SITC 3-digit) in total manufactured exports in the initial and final years respectively, in current dollar values. Diversification: dxm = ((sum (sxi – ln sxi)/(ln mx)) * 100, where: dxm stands for the degree of export diversification; sxi is the share of product group i in manufacturing value-added mx is the number of all SITC 3-digit product groups of trade in manufactures; and ln is the natural logarithm. The variable assumes value 1 if the export shares of all product groups are equal and 0 if all industrial exports are concentrated in just one product group. The data are taken from international trade statistics.
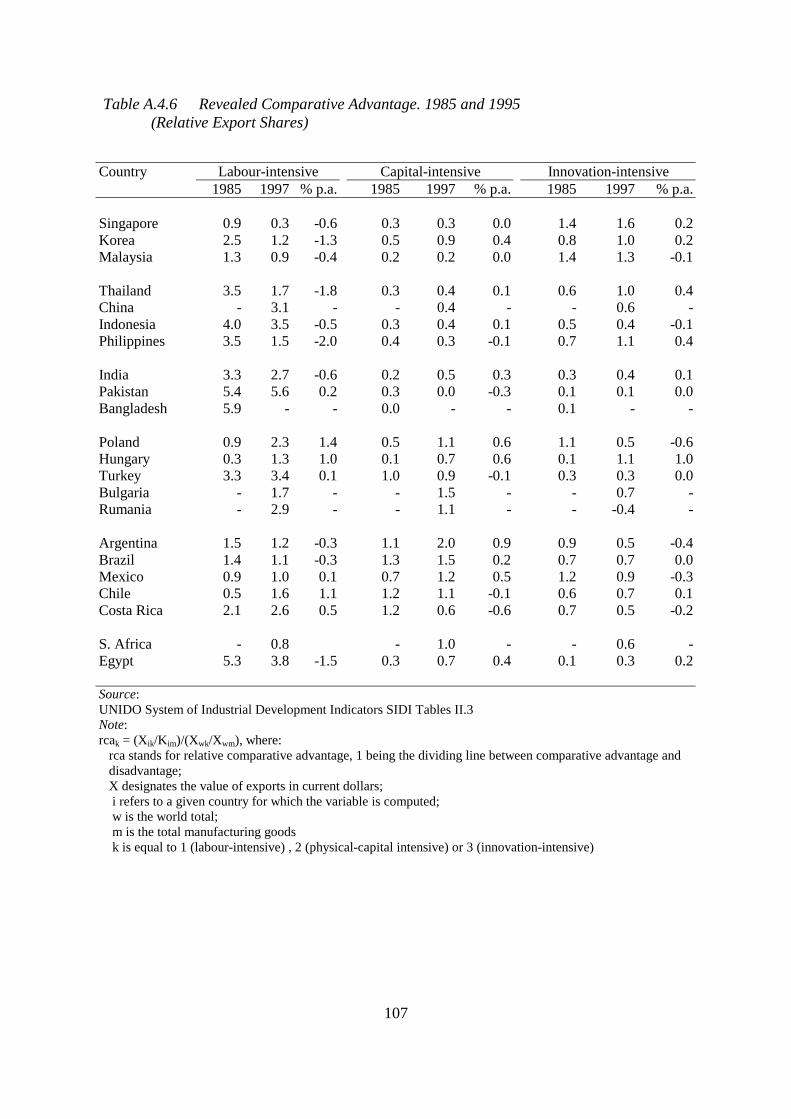
107
Table A.4.6 Revealed Comparative Advantage. 1985 and 1995 (Relative Export Shares)
Country Labour-intensive Capital-intensive Innovation-intensive
1985 1997 % p.a. 1985 1997 % p.a. 1985 1997 % p.a. Singapore 0.9 0.3 -0.6 0.3 0.3 0.0 1.4 1.6 0.2 Korea 2.5 1.2 -1.3 0.5 0.9 0.4 0.8 1.0 0.2 Malaysia 1.3 0.9 -0.4 0.2 0.2 0.0 1.4 1.3 -0.1 Thailand 3.5 1.7 -1.8 0.3 0.4 0.1 0.6 1.0 0.4 China - 3.1 - - 0.4 - - 0.6 - Indonesia 4.0 3.5 -0.5 0.3 0.4 0.1 0.5 0.4 -0.1 Philippines 3.5 1.5 -2.0 0.4 0.3 -0.1 0.7 1.1 0.4 India 3.3 2.7 -0.6 0.2 0.5 0.3 0.3 0.4 0.1 Pakistan 5.4 5.6 0.2 0.3 0.0 -0.3 0.1 0.1 0.0 Bangladesh 5.9 - - 0.0 - - 0.1 - - Poland 0.9 2.3 1.4 0.5 1.1 0.6 1.1 0.5 -0.6 Hungary 0.3 1.3 1.0 0.1 0.7 0.6 0.1 1.1 1.0 Turkey 3.3 3.4 0.1 1.0 0.9 -0.1 0.3 0.3 0.0 Bulgaria - 1.7 - - 1.5 - - 0.7 - Rumania - 2.9 - - 1.1 - - -0.4 - Argentina 1.5 1.2 -0.3 1.1 2.0 0.9 0.9 0.5 -0.4 Brazil 1.4 1.1 -0.3 1.3 1.5 0.2 0.7 0.7 0.0 Mexico 0.9 1.0 0.1 0.7 1.2 0.5 1.2 0.9 -0.3 Chile 0.5 1.6 1.1 1.2 1.1 -0.1 0.6 0.7 0.1 Costa Rica 2.1 2.6 0.5 1.2 0.6 -0.6 0.7 0.5 -0.2 S. Africa - 0.8 - 1.0 - - 0.6 - Egypt 5.3 3.8 -1.5 0.3 0.7 0.4 0.1 0.3 0.2 Source: UNIDO System of Industrial Development Indicators SIDI Tables II.3 Note: rcak = (Xik/Kim)/(Xwk/Xwm), where: rca stands for relative comparative advantage, 1 being the dividing line between comparative advantage and disadvantage; X designates the value of exports in current dollars; i refers to a given country for which the variable is computed; w is the world total; m is the total manufacturing goods k is equal to 1 (labour-intensive) , 2 (physical-capital intensive) or 3 (innovation-intensive)

108
109
5. Patterns of Manufacturing Development, 1975-1998
5.1 GROWTH AND STRUCTURAL CHANGE ..............................................................110 5.1.1 Growth in Manufacturing Value-added ........................................................................110 5.1.2 Structural Change..........................................................................................................111 5.1.3 Capacity Utilization.......................................................................................................115 5.1.5 Export Intensity .............................................................................................................116 5.1.4 Import Dependence .......................................................................................................117
5.2 PRODUCTION STRUCTURE AND PERFORMANCE...........................................119 5.2.1 Ownership .....................................................................................................................119 5.2.2 Concentration ................................................................................................................122 5.2.3 Cost Structure and Performance....................................................................................124 5.2.4 Labour Productivity and Profitability ...........................................................................126
5.3 MANUFACTURING EMPLOYMENT.......................................................................133 5.3.1 Employment Trends ......................................................................................................133 5.3.2 Employment Elasticity ..................................................................................................134
5.4 CONCLUSION...............................................................................................................135 ANNEX 5.1: TABLES .........................................................................................................138
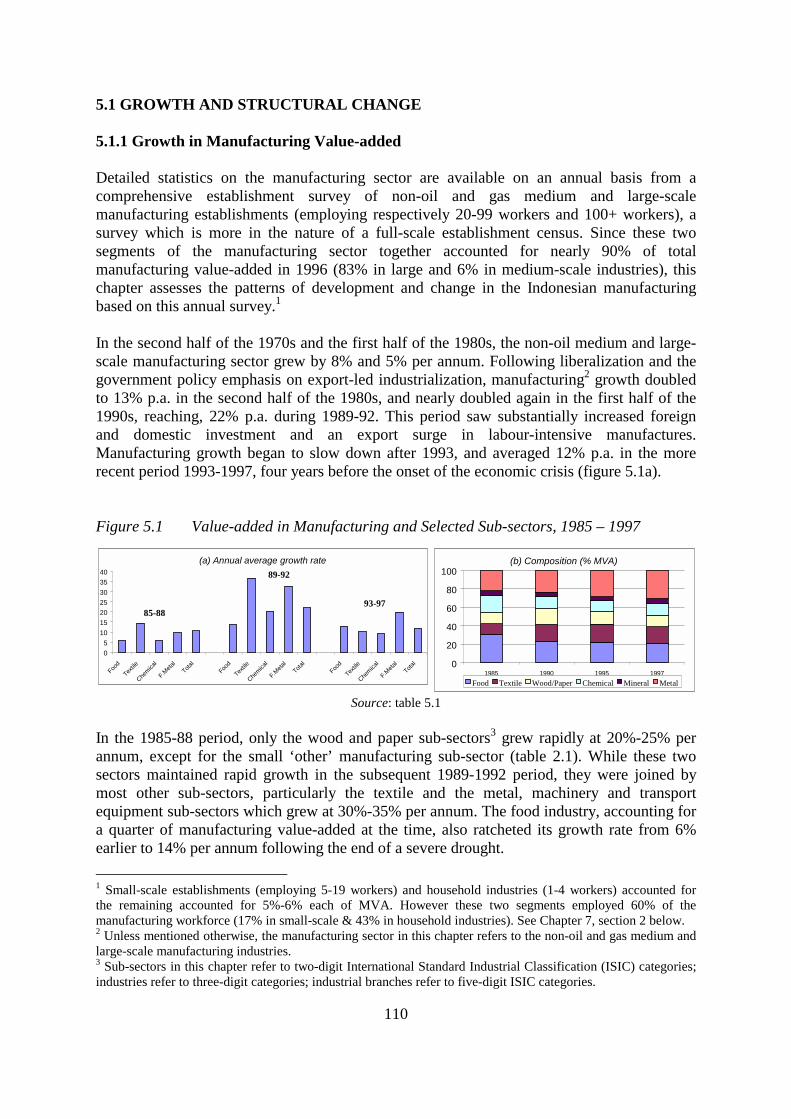
110
5.1 GROWTH AND STRUCTURAL CHANGE 5.1.1 Growth in Manufacturing Value-added Detailed statistics on the manufacturing sector are available on an annual basis from a comprehensive establishment survey of non-oil and gas medium and large-scale manufacturing establishments (employing respectively 20-99 workers and 100+ workers), a survey which is more in the nature of a full-scale establishment census. Since these two segments of the manufacturing sector together accounted for nearly 90% of total manufacturing value-added in 1996 (83% in large and 6% in medium-scale industries), this chapter assesses the patterns of development and change in the Indonesian manufacturing based on this annual survey.1 In the second half of the 1970s and the first half of the 1980s, the non-oil medium and large-scale manufacturing sector grew by 8% and 5% per annum. Following liberalization and the government policy emphasis on export-led industrialization, manufacturing2 growth doubled to 13% p.a. in the second half of the 1980s, and nearly doubled again in the first half of the 1990s, reaching, 22% p.a. during 1989-92. This period saw substantially increased foreign and domestic investment and an export surge in labour-intensive manufactures. Manufacturing growth began to slow down after 1993, and averaged 12% p.a. in the more recent period 1993-1997, four years before the onset of the economic crisis (figure 5.1a). Figure 5.1 Value-added in Manufacturing and Selected Sub-sectors, 1985 – 1997
Source: table 5.1 In the 1985-88 period, only the wood and paper sub-sectors3 grew rapidly at 20%-25% per annum, except for the small ‘other’ manufacturing sub-sector (table 2.1). While these two sectors maintained rapid growth in the subsequent 1989-1992 period, they were joined by most other sub-sectors, particularly the textile and the metal, machinery and transport equipment sub-sectors which grew at 30%-35% per annum. The food industry, accounting for a quarter of manufacturing value-added at the time, also ratcheted its growth rate from 6% earlier to 14% per annum following the end of a severe drought. 1 Small-scale establishments (employing 5-19 workers) and household industries (1-4 workers) accounted for the remaining accounted for 5%-6% each of MVA. However these two segments employed 60% of the manufacturing workforce (17% in small-scale & 43% in household industries). See Chapter 7, section 2 below. 2 Unless mentioned otherwise, the manufacturing sector in this chapter refers to the non-oil and gas medium and large-scale manufacturing industries. 3 Sub-sectors in this chapter refer to two-digit International Standard Industrial Classification (ISIC) categories; industries refer to three-digit categories; industrial branches refer to five-digit ISIC categories.
(a) Annual average growth rate
05
10152025303540
Food
Texti
le
Chemica
l
F.Meta
lTota
lFo
od
Texti
le
Chemica
l
F.Meta
lTota
lFoo
d
Texti
le
Chemica
l
F.Meta
lTota
l
(b) Composition (% MVA)
0
20
40
60
80
100
1985 1990 1995 1997Food Textile Wood/Paper Chemical Mineral Metal
89-92
93-97 85-88
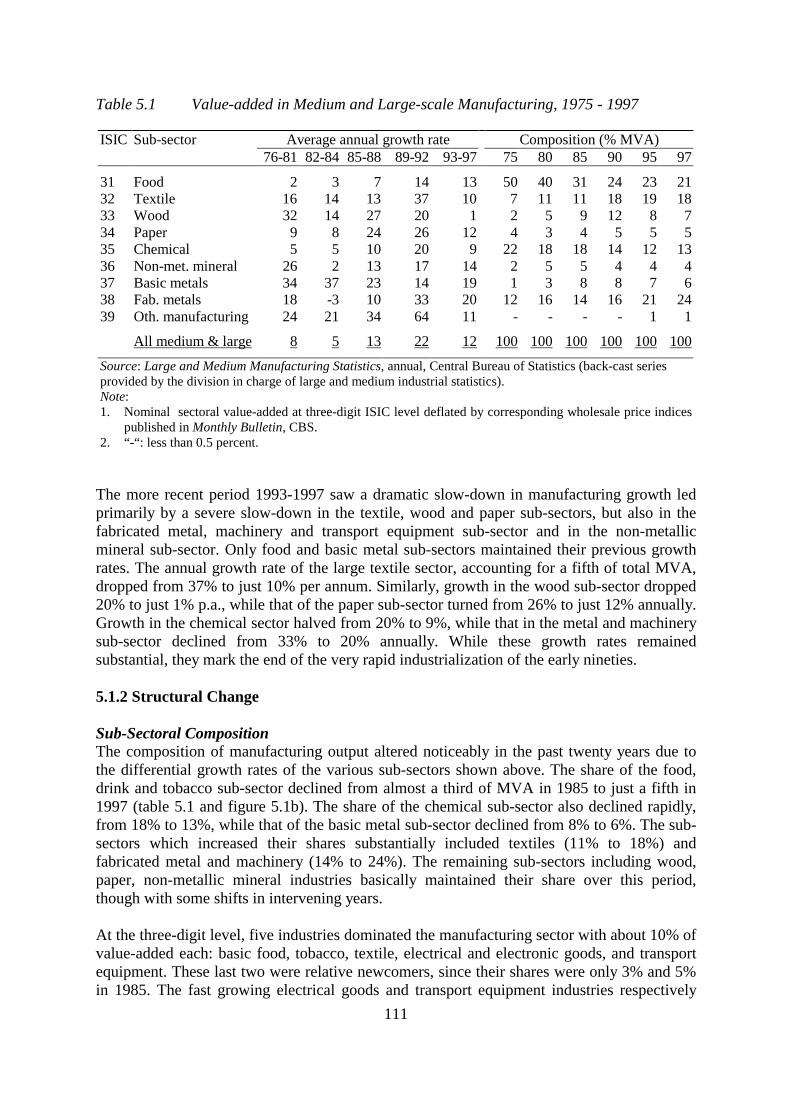
111
Table 5.1 Value-added in Medium and Large-scale Manufacturing, 1975 - 1997 ISIC Sub-sector Average annual growth rate Composition (% MVA) 76-81 82-84 85-88 89-92 93-97 75 80 85 90 95 97
31 Food 2 3 7 14 13 50 40 31 24 23 2132 Textile 16 14 13 37 10 7 11 11 18 19 1833 Wood 32 14 27 20 1 2 5 9 12 8 734 Paper 9 8 24 26 12 4 3 4 5 5 535 Chemical 5 5 10 20 9 22 18 18 14 12 1336 Non-met. mineral 26 2 13 17 14 2 5 5 4 4 437 Basic metals 34 37 23 14 19 1 3 8 8 7 638 Fab. metals 18 -3 10 33 20 12 16 14 16 21 2439 Oth. manufacturing 24 21 34 64 11 - - - - 1 1
All medium & large 8 5 13 22 12 100 100 100 100 100 100
Source: Large and Medium Manufacturing Statistics, annual, Central Bureau of Statistics (back-cast series provided by the division in charge of large and medium industrial statistics). Note: 1. Nominal sectoral value-added at three-digit ISIC level deflated by corresponding wholesale price indices
published in Monthly Bulletin, CBS. 2. “-“: less than 0.5 percent.
The more recent period 1993-1997 saw a dramatic slow-down in manufacturing growth led primarily by a severe slow-down in the textile, wood and paper sub-sectors, but also in the fabricated metal, machinery and transport equipment sub-sector and in the non-metallic mineral sub-sector. Only food and basic metal sub-sectors maintained their previous growth rates. The annual growth rate of the large textile sector, accounting for a fifth of total MVA, dropped from 37% to just 10% per annum. Similarly, growth in the wood sub-sector dropped 20% to just 1% p.a., while that of the paper sub-sector turned from 26% to just 12% annually. Growth in the chemical sector halved from 20% to 9%, while that in the metal and machinery sub-sector declined from 33% to 20% annually. While these growth rates remained substantial, they mark the end of the very rapid industrialization of the early nineties. 5.1.2 Structural Change Sub-Sectoral Composition The composition of manufacturing output altered noticeably in the past twenty years due to the differential growth rates of the various sub-sectors shown above. The share of the food, drink and tobacco sub-sector declined from almost a third of MVA in 1985 to just a fifth in 1997 (table 5.1 and figure 5.1b). The share of the chemical sub-sector also declined rapidly, from 18% to 13%, while that of the basic metal sub-sector declined from 8% to 6%. The sub-sectors which increased their shares substantially included textiles (11% to 18%) and fabricated metal and machinery (14% to 24%). The remaining sub-sectors including wood, paper, non-metallic mineral industries basically maintained their share over this period, though with some shifts in intervening years. At the three-digit level, five industries dominated the manufacturing sector with about 10% of value-added each: basic food, tobacco, textile, electrical and electronic goods, and transport equipment. These last two were relative newcomers, since their shares were only 3% and 5% in 1985. The fast growing electrical goods and transport equipment industries respectively
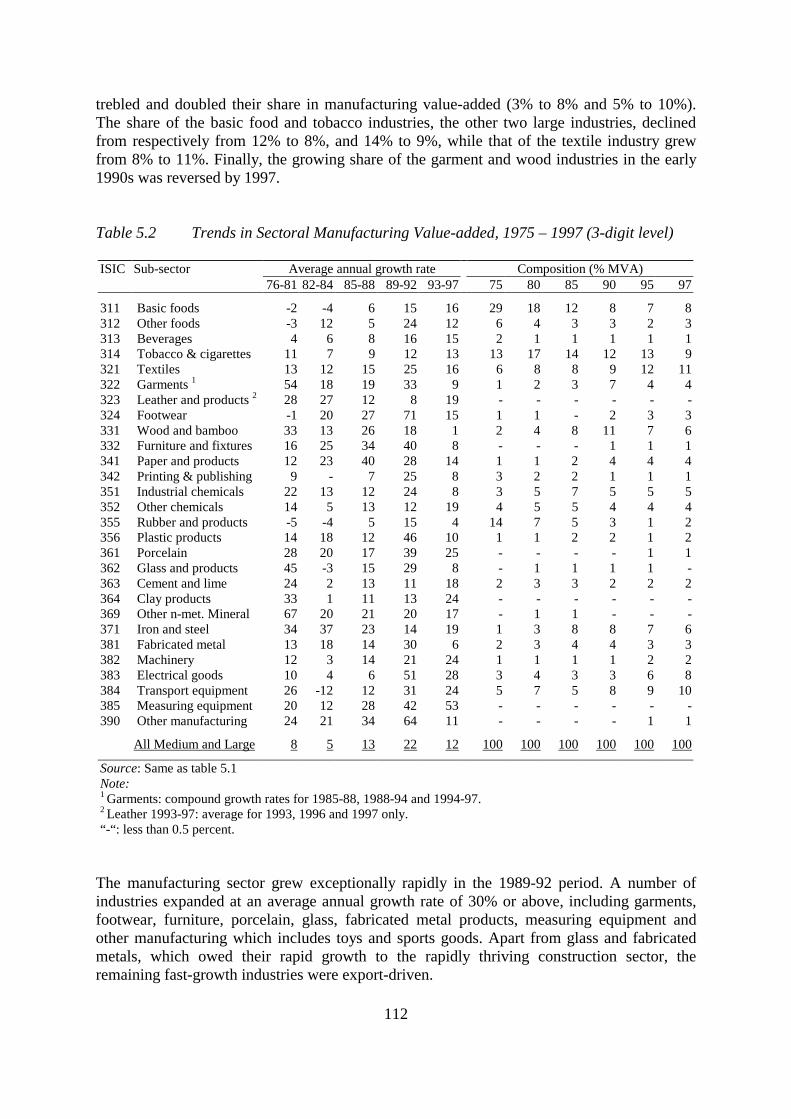
112
trebled and doubled their share in manufacturing value-added (3% to 8% and 5% to 10%). The share of the basic food and tobacco industries, the other two large industries, declined from respectively from 12% to 8%, and 14% to 9%, while that of the textile industry grew from 8% to 11%. Finally, the growing share of the garment and wood industries in the early 1990s was reversed by 1997. Table 5.2 Trends in Sectoral Manufacturing Value-added, 1975 – 1997 (3-digit level) ISIC Sub-sector Average annual growth rate Composition (% MVA) 76-81 82-84 85-88 89-92 93-97 75 80 85 90 95 97
311 Basic foods -2 -4 6 15 16 29 18 12 8 7 8 312 Other foods -3 12 5 24 12 6 4 3 3 2 3 313 Beverages 4 6 8 16 15 2 1 1 1 1 1 314 Tobacco & cigarettes 11 7 9 12 13 13 17 14 12 13 9 321 Textiles 13 12 15 25 16 6 8 8 9 12 11 322 Garments 1 54 18 19 33 9 1 2 3 7 4 4 323 Leather and products 2 28 27 12 8 19 - - - - - -324 Footwear -1 20 27 71 15 1 1 - 2 3 3 331 Wood and bamboo 33 13 26 18 1 2 4 8 11 7 6 332 Furniture and fixtures 16 25 34 40 8 - - - 1 1 1 341 Paper and products 12 23 40 28 14 1 1 2 4 4 4 342 Printing & publishing 9 - 7 25 8 3 2 2 1 1 1 351 Industrial chemicals 22 13 12 24 8 3 5 7 5 5 5 352 Other chemicals 14 5 13 12 19 4 5 5 4 4 4 355 Rubber and products -5 -4 5 15 4 14 7 5 3 1 2 356 Plastic products 14 18 12 46 10 1 1 2 2 1 2 361 Porcelain 28 20 17 39 25 - - - - 1 1 362 Glass and products 45 -3 15 29 8 - 1 1 1 1 -363 Cement and lime 24 2 13 11 18 2 3 3 2 2 2 364 Clay products 33 1 11 13 24 - - - - - -369 Other n-met. Mineral 67 20 21 20 17 - 1 1 - - -371 Iron and steel 34 37 23 14 19 1 3 8 8 7 6 381 Fabricated metal 13 18 14 30 6 2 3 4 4 3 3 382 Machinery 12 3 14 21 24 1 1 1 1 2 2 383 Electrical goods 10 4 6 51 28 3 4 3 3 6 8 384 Transport equipment 26 -12 12 31 24 5 7 5 8 9 10 385 Measuring equipment 20 12 28 42 53 - - - - - -390 Other manufacturing 24 21 34 64 11 - - - - 1 1
All Medium and Large 8 5 13 22 12 100 100 100 100 100 100
Source: Same as table 5.1 Note: 1 Garments: compound growth rates for 1985-88, 1988-94 and 1994-97. 2 Leather 1993-97: average for 1993, 1996 and 1997 only. “-“: less than 0.5 percent.
The manufacturing sector grew exceptionally rapidly in the 1989-92 period. A number of industries expanded at an average annual growth rate of 30% or above, including garments, footwear, furniture, porcelain, glass, fabricated metal products, measuring equipment and other manufacturing which includes toys and sports goods. Apart from glass and fabricated metals, which owed their rapid growth to the rapidly thriving construction sector, the remaining fast-growth industries were export-driven.
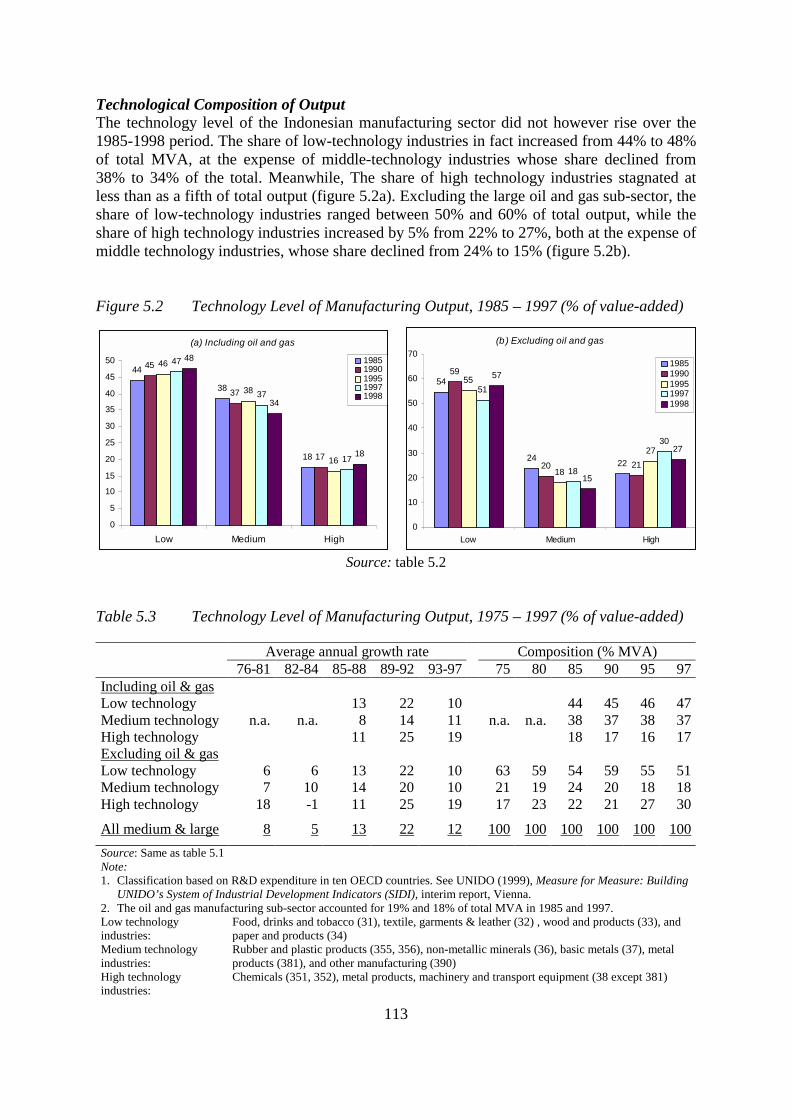
113
Technological Composition of Output The technology level of the Indonesian manufacturing sector did not however rise over the 1985-1998 period. The share of low-technology industries in fact increased from 44% to 48% of total MVA, at the expense of middle-technology industries whose share declined from 38% to 34% of the total. Meanwhile, The share of high technology industries stagnated at less than as a fifth of total output (figure 5.2a). Excluding the large oil and gas sub-sector, the share of low-technology industries ranged between 50% and 60% of total output, while the share of high technology industries increased by 5% from 22% to 27%, both at the expense of middle technology industries, whose share declined from 24% to 15% (figure 5.2b). Figure 5.2 Technology Level of Manufacturing Output, 1985 – 1997 (% of value-added)
Source: table 5.2 Table 5.3 Technology Level of Manufacturing Output, 1975 – 1997 (% of value-added) Average annual growth rate Composition (% MVA) 76-81 82-84 85-88 89-92 93-97 75 80 85 90 95 97Including oil & gas Low technology 13 22 10 44 45 46 47Medium technology n.a. n.a. 8 14 11 n.a. n.a. 38 37 38 37High technology 11 25 19 18 17 16 17Excluding oil & gas Low technology 6 6 13 22 10 63 59 54 59 55 51Medium technology 7 10 14 20 10 21 19 24 20 18 18High technology 18 -1 11 25 19 17 23 22 21 27 30
All medium & large 8 5 13 22 12 100 100 100 100 100 100Source: Same as table 5.1 Note: 1. Classification based on R&D expenditure in ten OECD countries. See UNIDO (1999), Measure for Measure: Building
UNIDO’s System of Industrial Development Indicators (SIDI), interim report, Vienna. 2. The oil and gas manufacturing sub-sector accounted for 19% and 18% of total MVA in 1985 and 1997. Low technology industries:
Food, drinks and tobacco (31), textile, garments & leather (32) , wood and products (33), and paper and products (34)
Medium technology industries:
Rubber and plastic products (355, 356), non-metallic minerals (36), basic metals (37), metal products (381), and other manufacturing (390)
High technology industries:
Chemicals (351, 352), metal products, machinery and transport equipment (38 except 381)
(a) Including oil and gas
44
38
18
45
37
17
46
38
16
47
37
17
48
34
18
0
5
10
15
20
25
30
35
40
45
50
Low Medium High
19851990199519971998
(b) Excluding oil and gas
54
24 22
59
20 21
55
18
27
51
18
30
57
15
27
0
10
20
30
40
50
60
70
Low Medium High
19851990199519971998
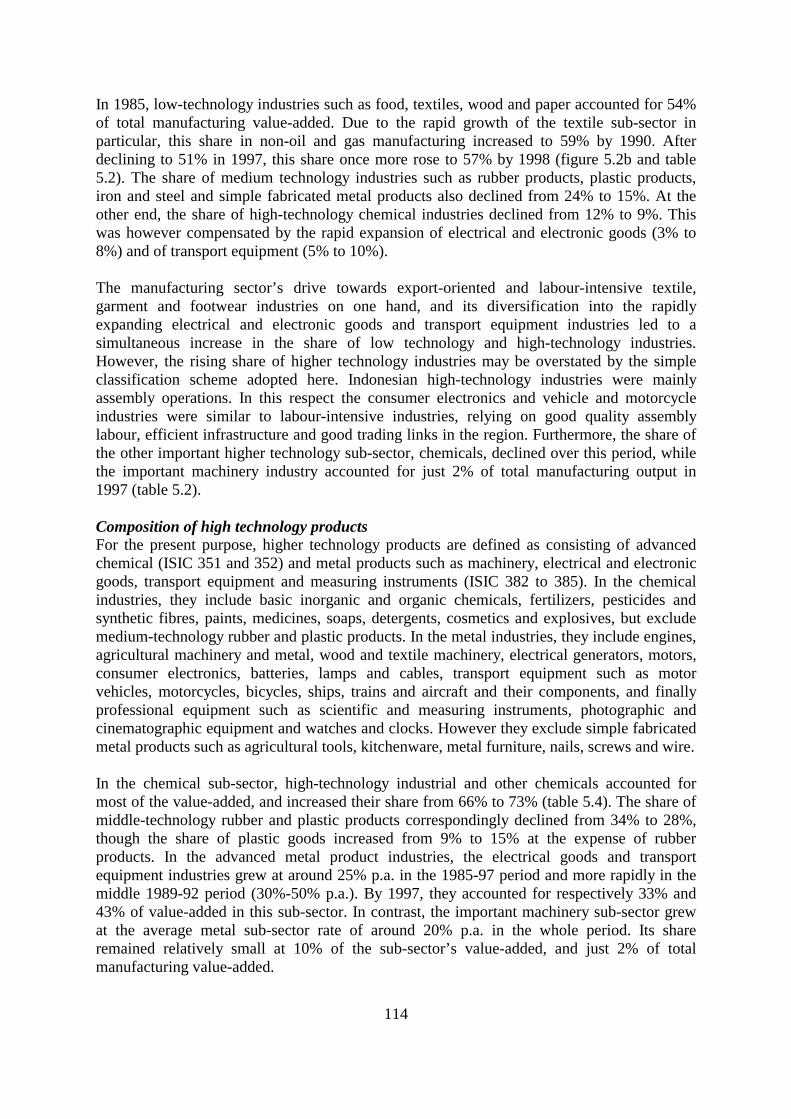
114
In 1985, low-technology industries such as food, textiles, wood and paper accounted for 54% of total manufacturing value-added. Due to the rapid growth of the textile sub-sector in particular, this share in non-oil and gas manufacturing increased to 59% by 1990. After declining to 51% in 1997, this share once more rose to 57% by 1998 (figure 5.2b and table 5.2). The share of medium technology industries such as rubber products, plastic products, iron and steel and simple fabricated metal products also declined from 24% to 15%. At the other end, the share of high-technology chemical industries declined from 12% to 9%. This was however compensated by the rapid expansion of electrical and electronic goods (3% to 8%) and of transport equipment (5% to 10%). The manufacturing sector’s drive towards export-oriented and labour-intensive textile, garment and footwear industries on one hand, and its diversification into the rapidly expanding electrical and electronic goods and transport equipment industries led to a simultaneous increase in the share of low technology and high-technology industries. However, the rising share of higher technology industries may be overstated by the simple classification scheme adopted here. Indonesian high-technology industries were mainly assembly operations. In this respect the consumer electronics and vehicle and motorcycle industries were similar to labour-intensive industries, relying on good quality assembly labour, efficient infrastructure and good trading links in the region. Furthermore, the share of the other important higher technology sub-sector, chemicals, declined over this period, while the important machinery industry accounted for just 2% of total manufacturing output in 1997 (table 5.2). Composition of high technology products For the present purpose, higher technology products are defined as consisting of advanced chemical (ISIC 351 and 352) and metal products such as machinery, electrical and electronic goods, transport equipment and measuring instruments (ISIC 382 to 385). In the chemical industries, they include basic inorganic and organic chemicals, fertilizers, pesticides and synthetic fibres, paints, medicines, soaps, detergents, cosmetics and explosives, but exclude medium-technology rubber and plastic products. In the metal industries, they include engines, agricultural machinery and metal, wood and textile machinery, electrical generators, motors, consumer electronics, batteries, lamps and cables, transport equipment such as motor vehicles, motorcycles, bicycles, ships, trains and aircraft and their components, and finally professional equipment such as scientific and measuring instruments, photographic and cinematographic equipment and watches and clocks. However they exclude simple fabricated metal products such as agricultural tools, kitchenware, metal furniture, nails, screws and wire. In the chemical sub-sector, high-technology industrial and other chemicals accounted for most of the value-added, and increased their share from 66% to 73% (table 5.4). The share of middle-technology rubber and plastic products correspondingly declined from 34% to 28%, though the share of plastic goods increased from 9% to 15% at the expense of rubber products. In the advanced metal product industries, the electrical goods and transport equipment industries grew at around 25% p.a. in the 1985-97 period and more rapidly in the middle 1989-92 period (30%-50% p.a.). By 1997, they accounted for respectively 33% and 43% of value-added in this sub-sector. In contrast, the important machinery sub-sector grew at the average metal sub-sector rate of around 20% p.a. in the whole period. Its share remained relatively small at 10% of the sub-sector’s value-added, and just 2% of total manufacturing value-added.
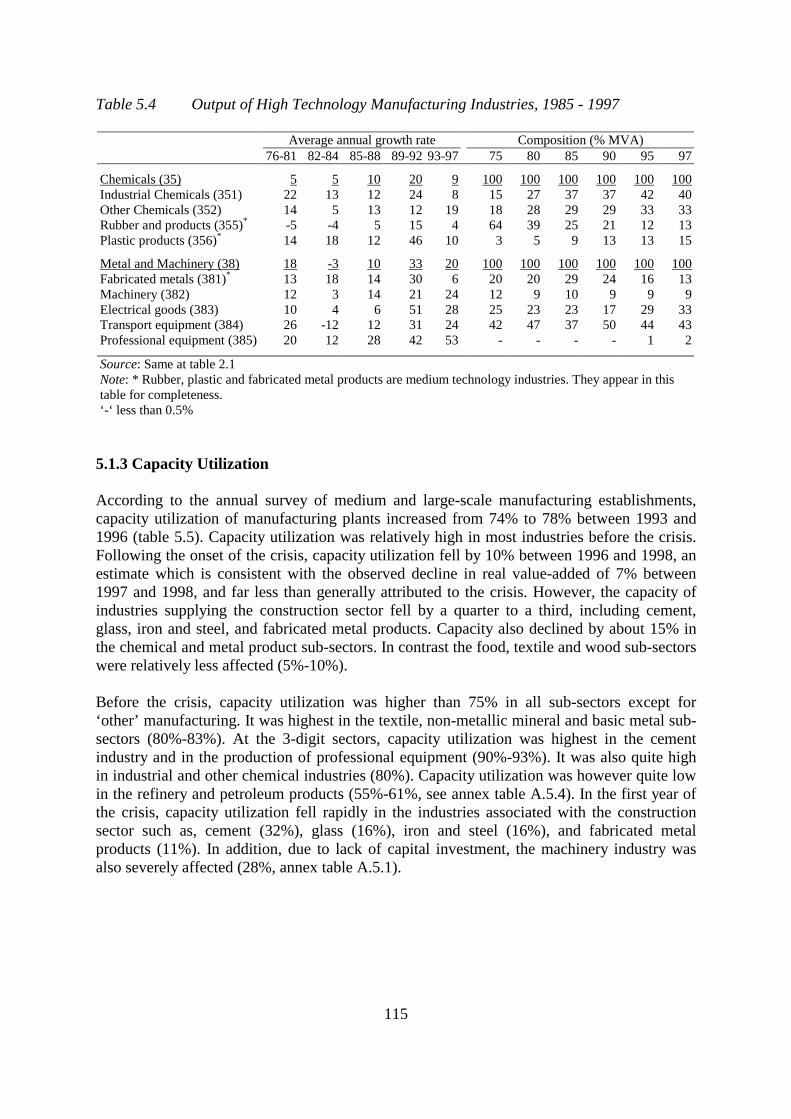
115
Table 5.4 Output of High Technology Manufacturing Industries, 1985 - 1997 Average annual growth rate Composition (% MVA) 76-81 82-84 85-88 89-92 93-97 75 80 85 90 95 97
Chemicals (35) 5 5 10 20 9 100 100 100 100 100 100Industrial Chemicals (351) 22 13 12 24 8 15 27 37 37 42 40Other Chemicals (352) 14 5 13 12 19 18 28 29 29 33 33Rubber and products (355)* -5 -4 5 15 4 64 39 25 21 12 13Plastic products (356)* 14 18 12 46 10 3 5 9 13 13 15
Metal and Machinery (38) 18 -3 10 33 20 100 100 100 100 100 100Fabricated metals (381)* 13 18 14 30 6 20 20 29 24 16 13Machinery (382) 12 3 14 21 24 12 9 10 9 9 9Electrical goods (383) 10 4 6 51 28 25 23 23 17 29 33Transport equipment (384) 26 -12 12 31 24 42 47 37 50 44 43Professional equipment (385) 20 12 28 42 53 - - - - 1 2
Source: Same at table 2.1 Note: * Rubber, plastic and fabricated metal products are medium technology industries. They appear in this table for completeness. ‘-‘ less than 0.5%
5.1.3 Capacity Utilization According to the annual survey of medium and large-scale manufacturing establishments, capacity utilization of manufacturing plants increased from 74% to 78% between 1993 and 1996 (table 5.5). Capacity utilization was relatively high in most industries before the crisis. Following the onset of the crisis, capacity utilization fell by 10% between 1996 and 1998, an estimate which is consistent with the observed decline in real value-added of 7% between 1997 and 1998, and far less than generally attributed to the crisis. However, the capacity of industries supplying the construction sector fell by a quarter to a third, including cement, glass, iron and steel, and fabricated metal products. Capacity also declined by about 15% in the chemical and metal product sub-sectors. In contrast the food, textile and wood sub-sectors were relatively less affected (5%-10%). Before the crisis, capacity utilization was higher than 75% in all sub-sectors except for ‘other’ manufacturing. It was highest in the textile, non-metallic mineral and basic metal sub-sectors (80%-83%). At the 3-digit sectors, capacity utilization was highest in the cement industry and in the production of professional equipment (90%-93%). It was also quite high in industrial and other chemical industries (80%). Capacity utilization was however quite low in the refinery and petroleum products (55%-61%, see annex table A.5.4). In the first year of the crisis, capacity utilization fell rapidly in the industries associated with the construction sector such as, cement (32%), glass (16%), iron and steel (16%), and fabricated metal products (11%). In addition, due to lack of capital investment, the machinery industry was also severely affected (28%, annex table A.5.1).
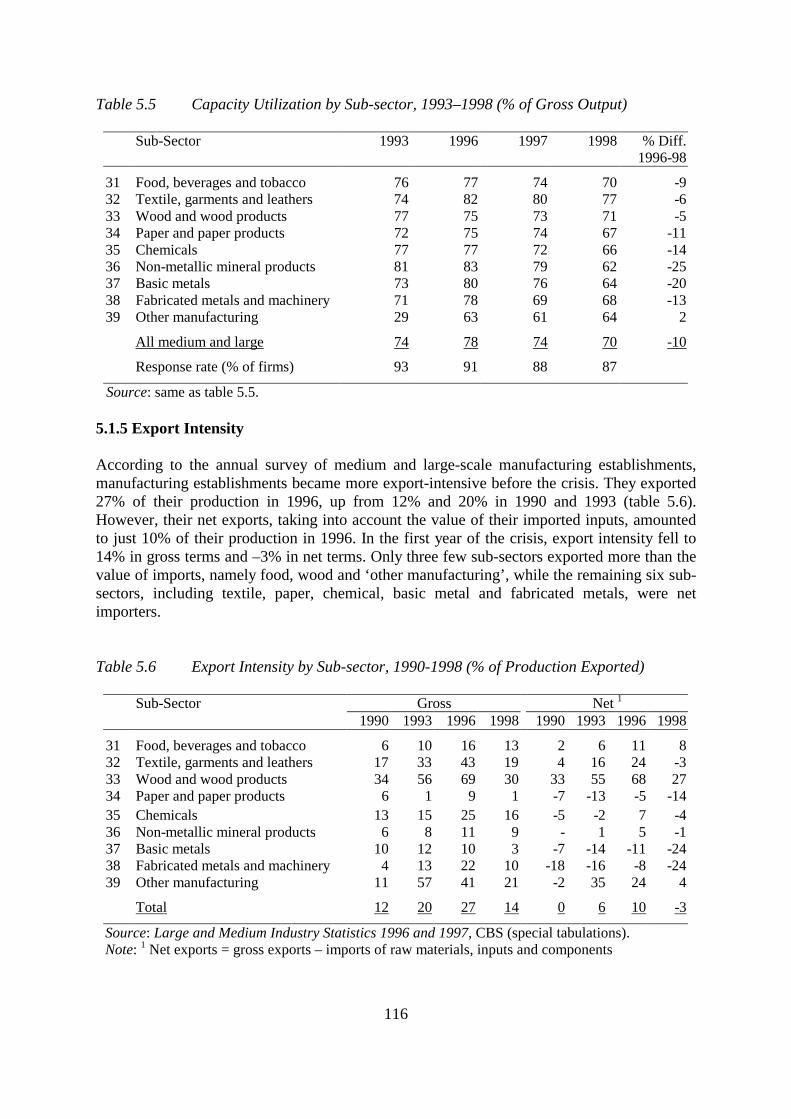
116
Table 5.5 Capacity Utilization by Sub-sector, 1993–1998 (% of Gross Output)
Sub-Sector 1993 1996 1997 1998 % Diff. 1996-98
31 Food, beverages and tobacco 76 77 74 70 -932 Textile, garments and leathers 74 82 80 77 -633 Wood and wood products 77 75 73 71 -534 Paper and paper products 72 75 74 67 -1135 Chemicals 77 77 72 66 -1436 Non-metallic mineral products 81 83 79 62 -2537 Basic metals 73 80 76 64 -2038 Fabricated metals and machinery 71 78 69 68 -1339 Other manufacturing 29 63 61 64 2
All medium and large 74 78 74 70 -10
Response rate (% of firms) 93 91 88 87
Source: same as table 5.5. 5.1.5 Export Intensity According to the annual survey of medium and large-scale manufacturing establishments, manufacturing establishments became more export-intensive before the crisis. They exported 27% of their production in 1996, up from 12% and 20% in 1990 and 1993 (table 5.6). However, their net exports, taking into account the value of their imported inputs, amounted to just 10% of their production in 1996. In the first year of the crisis, export intensity fell to 14% in gross terms and –3% in net terms. Only three few sub-sectors exported more than the value of imports, namely food, wood and ‘other manufacturing’, while the remaining six sub-sectors, including textile, paper, chemical, basic metal and fabricated metals, were net importers. Table 5.6 Export Intensity by Sub-sector, 1990-1998 (% of Production Exported)
Sub-Sector Gross Net 1
1990 1993 1996 1998 1990 1993 1996 1998
31 Food, beverages and tobacco 6 10 16 13 2 6 11 832 Textile, garments and leathers 17 33 43 19 4 16 24 -333 Wood and wood products 34 56 69 30 33 55 68 2734 Paper and paper products 6 1 9 1 -7 -13 -5 -1435 Chemicals 13 15 25 16 -5 -2 7 -436 Non-metallic mineral products 6 8 11 9 - 1 5 -137 Basic metals 10 12 10 3 -7 -14 -11 -2438 Fabricated metals and machinery 4 13 22 10 -18 -16 -8 -2439 Other manufacturing 11 57 41 21 -2 35 24 4
Total 12 20 27 14 0 6 10 -3
Source: Large and Medium Industry Statistics 1996 and 1997, CBS (special tabulations). Note: 1 Net exports = gross exports – imports of raw materials, inputs and components
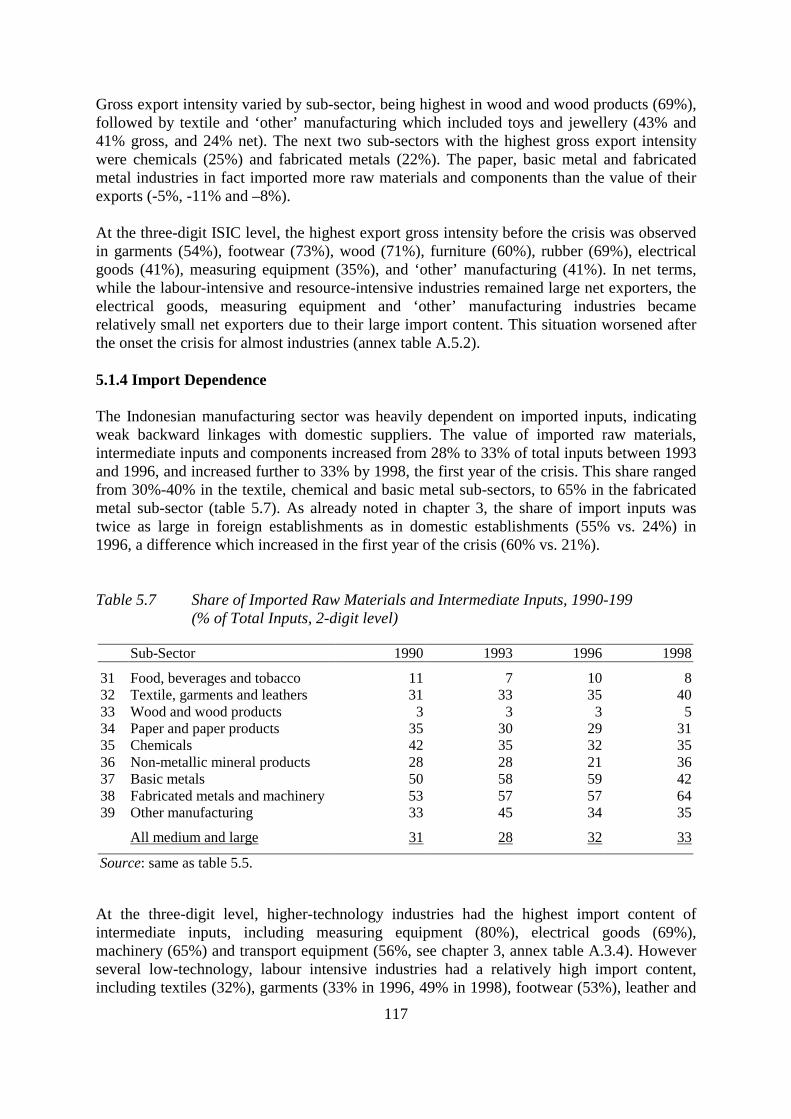
117
Gross export intensity varied by sub-sector, being highest in wood and wood products (69%), followed by textile and ‘other’ manufacturing which included toys and jewellery (43% and 41% gross, and 24% net). The next two sub-sectors with the highest gross export intensity were chemicals (25%) and fabricated metals (22%). The paper, basic metal and fabricated metal industries in fact imported more raw materials and components than the value of their exports (-5%, -11% and –8%). At the three-digit ISIC level, the highest export gross intensity before the crisis was observed in garments (54%), footwear (73%), wood (71%), furniture (60%), rubber (69%), electrical goods (41%), measuring equipment (35%), and ‘other’ manufacturing (41%). In net terms, while the labour-intensive and resource-intensive industries remained large net exporters, the electrical goods, measuring equipment and ‘other’ manufacturing industries became relatively small net exporters due to their large import content. This situation worsened after the onset the crisis for almost industries (annex table A.5.2). 5.1.4 Import Dependence The Indonesian manufacturing sector was heavily dependent on imported inputs, indicating weak backward linkages with domestic suppliers. The value of imported raw materials, intermediate inputs and components increased from 28% to 33% of total inputs between 1993 and 1996, and increased further to 33% by 1998, the first year of the crisis. This share ranged from 30%-40% in the textile, chemical and basic metal sub-sectors, to 65% in the fabricated metal sub-sector (table 5.7). As already noted in chapter 3, the share of import inputs was twice as large in foreign establishments as in domestic establishments (55% vs. 24%) in 1996, a difference which increased in the first year of the crisis (60% vs. 21%). Table 5.7 Share of Imported Raw Materials and Intermediate Inputs, 1990-199
(% of Total Inputs, 2-digit level)
Sub-Sector 1990 1993 1996 1998
31 Food, beverages and tobacco 11 7 10 832 Textile, garments and leathers 31 33 35 4033 Wood and wood products 3 3 3 534 Paper and paper products 35 30 29 3135 Chemicals 42 35 32 3536 Non-metallic mineral products 28 28 21 3637 Basic metals 50 58 59 4238 Fabricated metals and machinery 53 57 57 6439 Other manufacturing 33 45 34 35
All medium and large 31 28 32 33
Source: same as table 5.5. At the three-digit level, higher-technology industries had the highest import content of intermediate inputs, including measuring equipment (80%), electrical goods (69%), machinery (65%) and transport equipment (56%, see chapter 3, annex table A.3.4). However several low-technology, labour intensive industries had a relatively high import content, including textiles (32%), garments (33% in 1996, 49% in 1998), footwear (53%), leather and
118
products (40%), and fabricated metal products (43%). The important content of several basic industries was also high, including iron and steel (41%), non-ferrous basic metals (62%). At the industrial branch level, the import content of the following higher-technology industries was particularly high: communication equipment (97%), electronic components (85%-90%), vehicle components (89%), pharmaceuticals (86%), drugs and medicines (61%), vehicle engines, (80%), vehicle assembly (65%). While a high import content is expected at the early stages of manufacturing, the import content ratios of most of these industries did not decline over the 1990s, and the domestic procurement of production inputs did not appear to have increased to any significant extent. The precise reasons for their reliance on imported inputs and the inability of domestic producers to supply downstream industries with the necessary capital goods, raw materials and intermediate inputs and components are likely to vary from industry to industry. They could include one or more of the following: absence of domestic sources of raw materials, absence or limited capacity of domestic producers of intermediate inputs and components and sub-components required by more downstream industries, and the inability of domestic producers to meet the quantity, quality and price requirements set by the downstream industries. While a detailed investigation of weak backward linkages at the industrial branch level is beyond the scope of the present report, manufacturing industries encountered a range of difficult problems in procuring the necessary inputs and components domestically, as can be illustrated by the following examples. Many export-oriented garment and footwear manufacturers relied on job orders placed by intermediate buyers, often based in neighbouring Singapore, Hong Kong, Taiwan and Korea, and who place ad hoc orders on behalf of established brand names in the USA and Europe. The main task of the local manufacturers is to produce final products by making use of inexpensive labour. However, they had to use intermediate inputs whose specifications are strictly controlled by the ultimate buyers, and often worked under tight schedules to meet the seasonal demands of overseas markets. They thus had little opportunity to develop local suppliers of raw materials and intermediate inputs, a process requiring time and high transaction costs with small and medium industries, even though they may turn out to be cheaper in the long run. In contrast, approved and reliable suppliers of raw materials and these intermediate inputs are readily available in neighbouring countries, with the further advantage that the intermediate buyers could also supply them to the local manufacturers. Ready access to foreign exchange and reasonably efficient shipping provided further incentives to importing the necessary inputs. Domestic producers of sub-components and components for the vehicle and motorcycle industry face even more stringent specifications. In addition, they had to be approved first by the Japanese, European or American assembler located nationally, and at a second stage by the assembler’s headquarters, a process which often took up to three years. In the meantime, these assemblers purchased their components from approved and established suppliers located in their home country or other countries which had already developed a supplier base such as Taiwan and Korea. These two examples underline the often immense problems faced by domestic suppliers in developing a steady relationship and market for their intermediate products.
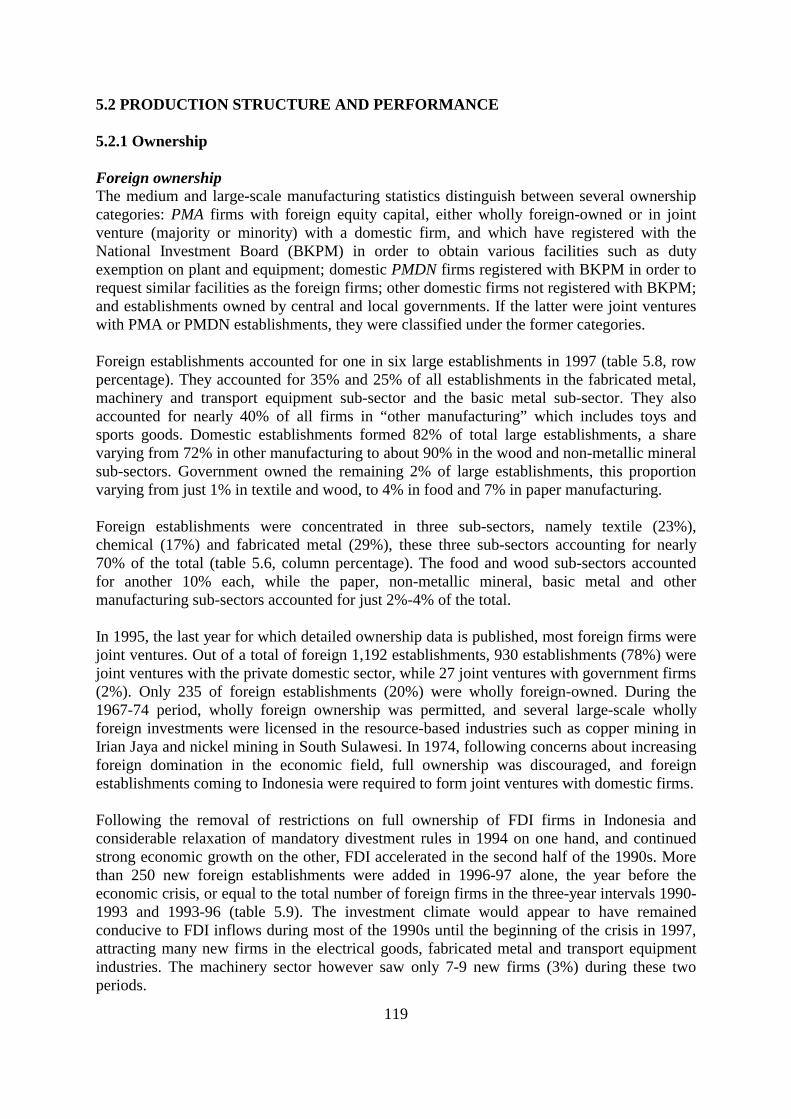
119
5.2 PRODUCTION STRUCTURE AND PERFORMANCE 5.2.1 Ownership Foreign ownership The medium and large-scale manufacturing statistics distinguish between several ownership categories: PMA firms with foreign equity capital, either wholly foreign-owned or in joint venture (majority or minority) with a domestic firm, and which have registered with the National Investment Board (BKPM) in order to obtain various facilities such as duty exemption on plant and equipment; domestic PMDN firms registered with BKPM in order to request similar facilities as the foreign firms; other domestic firms not registered with BKPM; and establishments owned by central and local governments. If the latter were joint ventures with PMA or PMDN establishments, they were classified under the former categories. Foreign establishments accounted for one in six large establishments in 1997 (table 5.8, row percentage). They accounted for 35% and 25% of all establishments in the fabricated metal, machinery and transport equipment sub-sector and the basic metal sub-sector. They also accounted for nearly 40% of all firms in “other manufacturing” which includes toys and sports goods. Domestic establishments formed 82% of total large establishments, a share varying from 72% in other manufacturing to about 90% in the wood and non-metallic mineral sub-sectors. Government owned the remaining 2% of large establishments, this proportion varying from just 1% in textile and wood, to 4% in food and 7% in paper manufacturing. Foreign establishments were concentrated in three sub-sectors, namely textile (23%), chemical (17%) and fabricated metal (29%), these three sub-sectors accounting for nearly 70% of the total (table 5.6, column percentage). The food and wood sub-sectors accounted for another 10% each, while the paper, non-metallic mineral, basic metal and other manufacturing sub-sectors accounted for just 2%-4% of the total. In 1995, the last year for which detailed ownership data is published, most foreign firms were joint ventures. Out of a total of foreign 1,192 establishments, 930 establishments (78%) were joint ventures with the private domestic sector, while 27 joint ventures with government firms (2%). Only 235 of foreign establishments (20%) were wholly foreign-owned. During the 1967-74 period, wholly foreign ownership was permitted, and several large-scale wholly foreign investments were licensed in the resource-based industries such as copper mining in Irian Jaya and nickel mining in South Sulawesi. In 1974, following concerns about increasing foreign domination in the economic field, full ownership was discouraged, and foreign establishments coming to Indonesia were required to form joint ventures with domestic firms. Following the removal of restrictions on full ownership of FDI firms in Indonesia and considerable relaxation of mandatory divestment rules in 1994 on one hand, and continued strong economic growth on the other, FDI accelerated in the second half of the 1990s. More than 250 new foreign establishments were added in 1996-97 alone, the year before the economic crisis, or equal to the total number of foreign firms in the three-year intervals 1990-1993 and 1993-96 (table 5.9). The investment climate would appear to have remained conducive to FDI inflows during most of the 1990s until the beginning of the crisis in 1997, attracting many new firms in the electrical goods, fabricated metal and transport equipment industries. The machinery sector however saw only 7-9 new firms (3%) during these two periods.
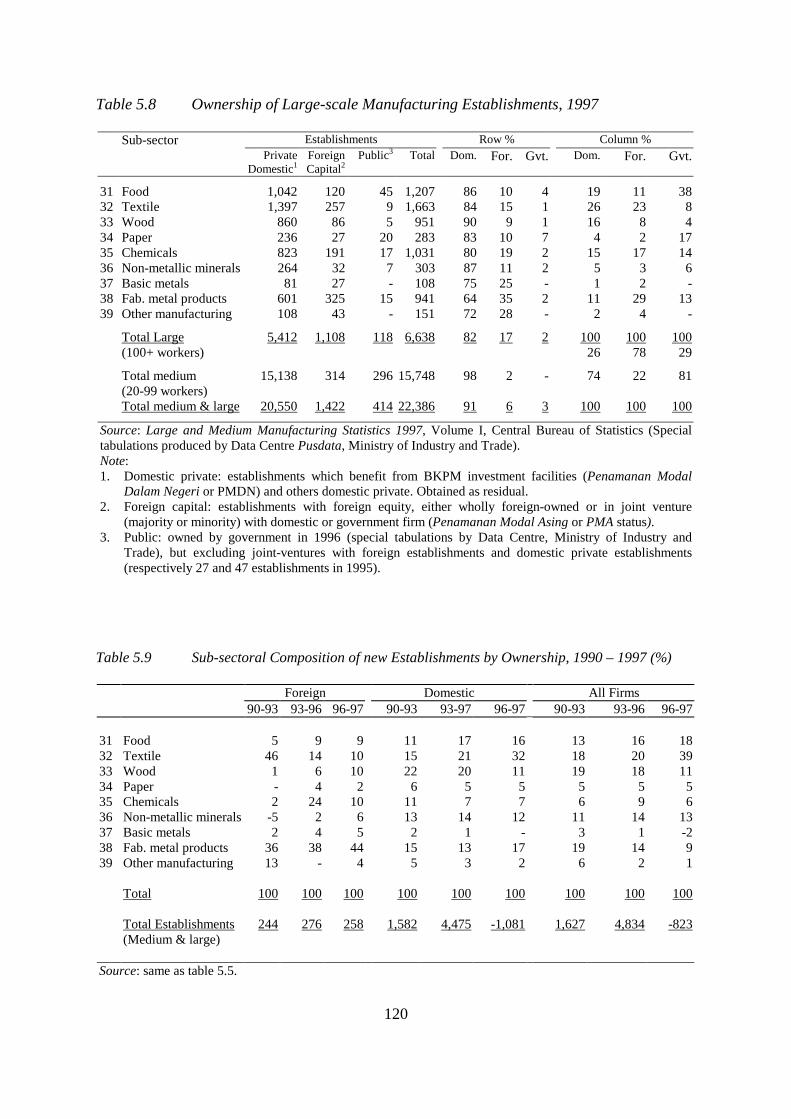
120
Table 5.8 Ownership of Large-scale Manufacturing Establishments, 1997
Sub-sector Establishments Row % Column % Private
Domestic1 Foreign Capital2
Public3 Total Dom. For. Gvt. Dom. For. Gvt.
31 Food 1,042 120 45 1,207 86 10 4 19 11 3832 Textile 1,397 257 9 1,663 84 15 1 26 23 833 Wood 860 86 5 951 90 9 1 16 8 434 Paper 236 27 20 283 83 10 7 4 2 1735 Chemicals 823 191 17 1,031 80 19 2 15 17 1436 Non-metallic minerals 264 32 7 303 87 11 2 5 3 637 Basic metals 81 27 - 108 75 25 - 1 2 -38 Fab. metal products 601 325 15 941 64 35 2 11 29 1339 Other manufacturing 108 43 - 151 72 28 - 2 4 -
Total Large 5,412 1,108 118 6,638 82 17 2 100 100 100 (100+ workers) 26 78 29
Total medium 15,138 314 296 15,748 98 2 - 74 22 81 (20-99 workers) Total medium & large 20,550 1,422 414 22,386 91 6 3 100 100 100
Source: Large and Medium Manufacturing Statistics 1997, Volume I, Central Bureau of Statistics (Special tabulations produced by Data Centre Pusdata, Ministry of Industry and Trade). Note: 1. Domestic private: establishments which benefit from BKPM investment facilities (Penamanan Modal
Dalam Negeri or PMDN) and others domestic private. Obtained as residual. 2. Foreign capital: establishments with foreign equity, either wholly foreign-owned or in joint venture
(majority or minority) with domestic or government firm (Penamanan Modal Asing or PMA status). 3. Public: owned by government in 1996 (special tabulations by Data Centre, Ministry of Industry and
Trade), but excluding joint-ventures with foreign establishments and domestic private establishments (respectively 27 and 47 establishments in 1995).
Table 5.9 Sub-sectoral Composition of new Establishments by Ownership, 1990 – 1997 (%)
Foreign Domestic All Firms 90-93 93-96 96-97 90-93 93-97 96-97 90-93 93-96 96-97
31 Food 5 9 9 11 17 16 13 16 1832 Textile 46 14 10 15 21 32 18 20 3933 Wood 1 6 10 22 20 11 19 18 1134 Paper - 4 2 6 5 5 5 5 535 Chemicals 2 24 10 11 7 7 6 9 636 Non-metallic minerals -5 2 6 13 14 12 11 14 1337 Basic metals 2 4 5 2 1 - 3 1 -238 Fab. metal products 36 38 44 15 13 17 19 14 939 Other manufacturing 13 - 4 5 3 2 6 2 1
Total 100 100 100 100 100 100 100 100 100 Total Establishments 244 276 258 1,582 4,475 -1,081 1,627 4,834 -823 (Medium & large)
Source: same as table 5.5.
121
The sub-sectoral composition of FDI became more diversified after 1993. In the period 1990-93, most foreign firms entered just two sub-sectors in 1993, textile, garment and footwear (46%) and fabricated metals and machinery (36%). After 1993, the proportion of new foreign firms entering the textile sub-sector fell to 10%, while that in the chemical sub-sector increased from 2% to 24% during 1993-96 and 10% during 1996-97. Foreign firms also invested more in furniture (from 1% to 6%-10%) and basic metals (from 2% to 5%). Nevertheless, the textile sub-sector still attracted new foreign firms around 30 new firms in these two periods, while the fabricated metal and machinery sub-sector continued to attract the most (100 new firms, or 38% and 40% in 1993-96 and 1996-97). Public ownership Altogether, the government owned about 630 establishments in 1995. Apart from joint ventures with foreign firms (27) and domestic private establishments (113), the government owned over 400 establishments, the majority of which were medium-scale establishments (71%), operated mainly by the central government (76%) rather than the local governments. These establishments were concentrated in the food (38%), paper (17%) chemical (14%), and fabricated metal (13%) sub-sectors, but were also found in the textile (8%), wood (4%) and non-metallic mineral (6%). The share of value-added produced by public manufacturing enterprises doubled from 7% to 13% between 1990 and 1996, primary due to the commissioning of new plants in the capital-intensive iron and steel sub-sector, and capacity expansion in the printing and publishing and transport goods industries (table 3.4 and annex table A.3.2, chapter 3). As a result, the public sector accounted for 62% of value-added in the iron and steel, 39% in the printing and publishing, and 16% in the transport goods industries. Other industries with a large public sector role included basic foods (17%), industrial chemicals (25%), and cement and lime (20%) in 1996. Domestic ownership Due to the rapid increase in the share of total manufacturing value-added of foreign and public sector establishments (from respectively 19% to 27% and 7% to 13%), the share of the domestic private establishments declined from 74% to 60% of total manufacturing value-added between 1990 and 1996. Their participation was particularly low in the beverage (37%), industrial chemicals (34%), other chemicals (45%), iron and steel (14%), other basic metals (23%) and other manufacturing industries, which include sports goods and toys (47%). Apart from iron and steel, where the public sector was the largest player, foreign establishments dominated all the industries mentioned. During 1990-1993 and 1993-96, the number of new domestic firms increased three-fold, from 1,500 to 4,500 establishments. However the majority of these medium-scale establishments. Their vulnerability was apparent in the subsequent closure of about 1,000 and 2,000 establishments in 1997 and 1998, the first and second year of the crisis (see impact of the crisis of firm closure in chapter 7, section 1). In contrast to foreign establishments, the sub-sectoral composition of new domestic establishments remained relatively stable. They entered mainly the resource-based and relatively low technology sub-sectors including food (11%-17%), wood (20%-22%), chemical (7%-11%), non-metallic mineral (13%-14%). However they also entered the textile (15%-20%), and fabricated metal sub-sectors (13%-15%).
122
5.2.2 Concentration Manufacturing production in Indonesia remained relatively concentrated between 1990 and 1996, and increased a little following the onset of the crisis. The four leading establishments produced more than 75% of the total output in more than half of the 300 industrial branches during this period. In fact, the four largest establishments accounted for virtually all the production in more than a quarter of all industrial branches. Concentration was highest in the basic metal and metal product sub-sectors, followed by the non-metallic, paper chemical and food sub-sectors. At the other end of the scale, the textile and wood sub-sectors were least concentrated. All sub-sectors maintained their concentration level in the 1990s. The simple average four-firm concentration ratio (CR4) was 71%-72% between 1990 and 1996, before rising to 73% in 1998 (table 5.10). The weighed CR4, using output shares at the 5-digit ISIC industrial branch level, increased from 53% to 55% during 1990-96, before declining to 52% in 1998. The Hirschmann-Herfindahl index (HHI) was 0.33 in 1990, but then remained at 0.31 between 1993 and 1998. The weighed HH index varied between 0.16 and 0.19 in this period. Allowing for foreign trade significantly reduces average concentration measures. The simple average trade-adjusted CR4 was 47%-48% or 23% lower without foreign trade adjustment before the crisis, though it increased to 54% in 1998. The corresponding figures for the trade-adjusted weighed CR4 was 45%-46%, or some 10% lower than without foreign trade adjustment. While part of this difference is due to the simplifying assumption that all imports are competitive, the gap would suggest that competition was stronger in the domestic market than suggested by the domestic concentration ratios, once export volumes were deducted, and competing imports were taken into account. It should be noted that the above CR4 and HHI measures may underestimate concentration for a number of reasons. First, the data is based on establishments rather than firms, so establishments belonging to one firm are in fact one commercial entity. Second, the data cannot take into account horizontal linkages between establishments owned by the same business groups or conglomerates. To the extent that this prevails, their market power will be stronger. While the extent of the biases is difficult to quantity, Indonesian conglomerates are believed to be more vertically than horizontally integrated, and their establishments often produce in unrelated markets4. Nevertheless, concentration trends remained relatively unchanged over the 1993-98 period, government attempts to reduce concentration notwithstanding. At the three-digit ISIC level, the most concentrated industries included measuring equipment (92%), transport equipment (87%), machinery (80%), non-ferrous metals (80%), iron and steel (78%), glass and products (81%), industrial chemicals (81%), and tobacco and cigarettes (75%). Most of these were highly capital-intensive, and thus had large economies of scale (see annex tables A.5.4 and A.5.5 for 3-digit and 5-digit level concentration ratios).
4 Kelly Bird (1999), ‘Concentration in Indonesian Manufacturing, 1975-93’ Bulletin of Indonesian Economic Studies (35) 1, pp. 43-73, April.
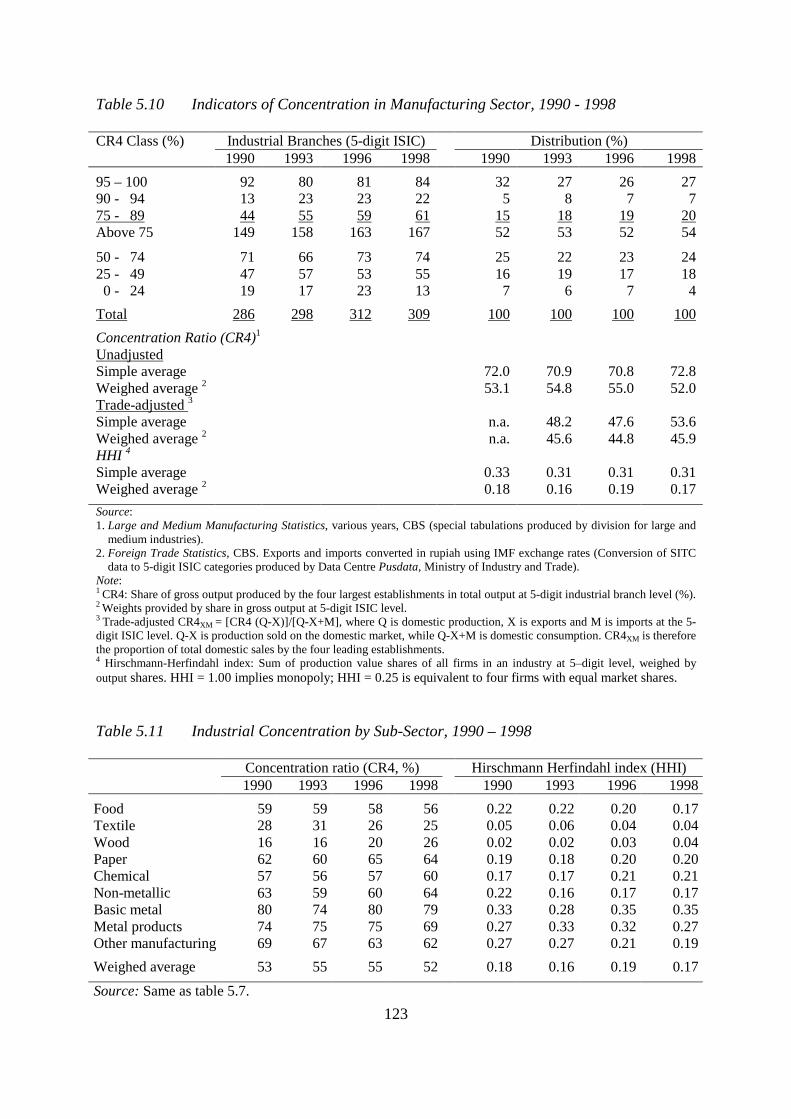
123
Table 5.10 Indicators of Concentration in Manufacturing Sector, 1990 - 1998 CR4 Class (%) Industrial Branches (5-digit ISIC) Distribution (%) 1990 1993 1996 1998 1990 1993 1996 199895 – 100 92 80 81 84 32 27 26 2790 - 94 13 23 23 22 5 8 7 775 - 89 44 55 59 61 15 18 19 20Above 75 149 158 163 167 52 53 52 54
50 - 74 71 66 73 74 25 22 23 2425 - 49 47 57 53 55 16 19 17 18 0 - 24 19 17 23 13 7 6 7 4Total 286 298 312 309 100 100 100 100Concentration Ratio (CR4)1 Unadjusted Simple average 72.0 70.9 70.8 72.8Weighed average 2 53.1 54.8 55.0 52.0Trade-adjusted 3 Simple average n.a. 48.2 47.6 53.6Weighed average 2 n.a. 45.6 44.8 45.9HHI 4 Simple average 0.33 0.31 0.31 0.31Weighed average 2 0.18 0.16 0.19 0.17Source: 1. Large and Medium Manufacturing Statistics, various years, CBS (special tabulations produced by division for large and
medium industries). 2. Foreign Trade Statistics, CBS. Exports and imports converted in rupiah using IMF exchange rates (Conversion of SITC
data to 5-digit ISIC categories produced by Data Centre Pusdata, Ministry of Industry and Trade). Note: 1 CR4: Share of gross output produced by the four largest establishments in total output at 5-digit industrial branch level (%). 2 Weights provided by share in gross output at 5-digit ISIC level. 3 Trade-adjusted CR4XM = [CR4 (Q-X)]/[Q-X+M], where Q is domestic production, X is exports and M is imports at the 5-digit ISIC level. Q-X is production sold on the domestic market, while Q-X+M is domestic consumption. CR4XM is therefore the proportion of total domestic sales by the four leading establishments. 4 Hirschmann-Herfindahl index: Sum of production value shares of all firms in an industry at 5–digit level, weighed by output shares. HHI = 1.00 implies monopoly; HHI = 0.25 is equivalent to four firms with equal market shares. Table 5.11 Industrial Concentration by Sub-Sector, 1990 – 1998
Concentration ratio (CR4, %) Hirschmann Herfindahl index (HHI) 1990 1993 1996 1998 1990 1993 1996 1998Food 59 59 58 56 0.22 0.22 0.20 0.17Textile 28 31 26 25 0.05 0.06 0.04 0.04Wood 16 16 20 26 0.02 0.02 0.03 0.04Paper 62 60 65 64 0.19 0.18 0.20 0.20Chemical 57 56 57 60 0.17 0.17 0.21 0.21Non-metallic 63 59 60 64 0.22 0.16 0.17 0.17Basic metal 80 74 80 79 0.33 0.28 0.35 0.35Metal products 74 75 75 69 0.27 0.33 0.32 0.27Other manufacturing 69 67 63 62 0.27 0.27 0.21 0.19Weighed average 53 55 55 52 0.18 0.16 0.19 0.17Source: Same as table 5.7.
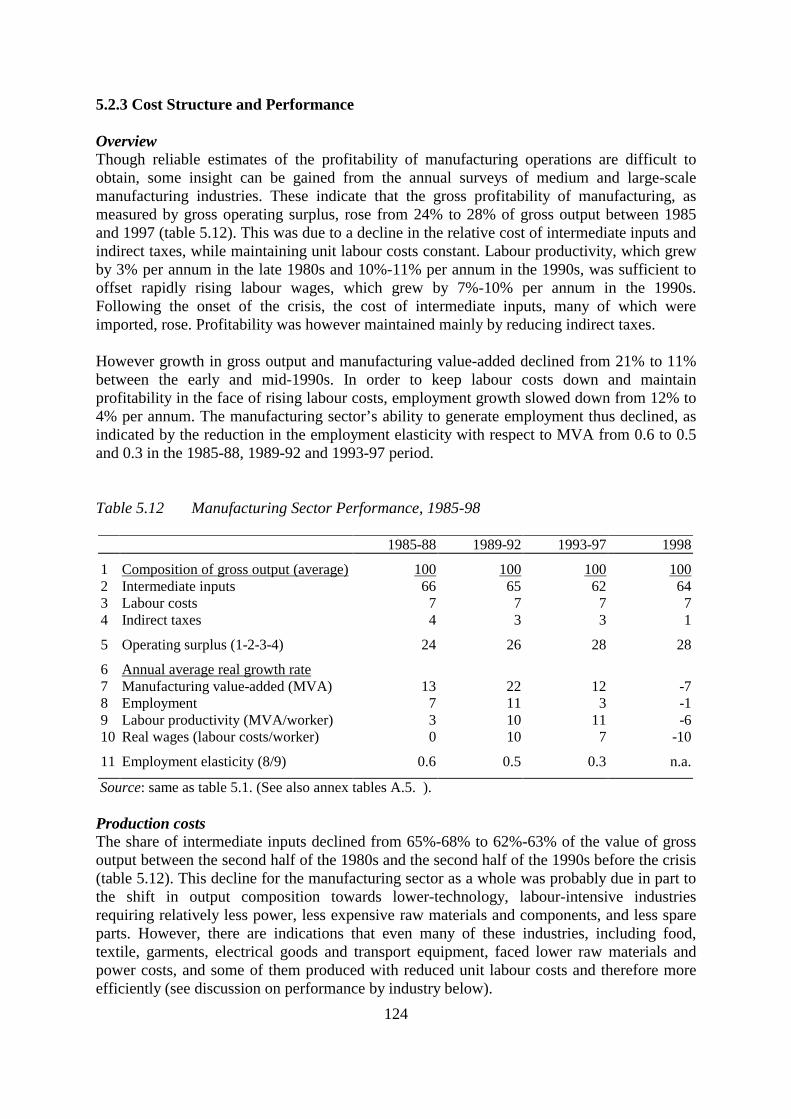
124
5.2.3 Cost Structure and Performance Overview Though reliable estimates of the profitability of manufacturing operations are difficult to obtain, some insight can be gained from the annual surveys of medium and large-scale manufacturing industries. These indicate that the gross profitability of manufacturing, as measured by gross operating surplus, rose from 24% to 28% of gross output between 1985 and 1997 (table 5.12). This was due to a decline in the relative cost of intermediate inputs and indirect taxes, while maintaining unit labour costs constant. Labour productivity, which grew by 3% per annum in the late 1980s and 10%-11% per annum in the 1990s, was sufficient to offset rapidly rising labour wages, which grew by 7%-10% per annum in the 1990s. Following the onset of the crisis, the cost of intermediate inputs, many of which were imported, rose. Profitability was however maintained mainly by reducing indirect taxes. However growth in gross output and manufacturing value-added declined from 21% to 11% between the early and mid-1990s. In order to keep labour costs down and maintain profitability in the face of rising labour costs, employment growth slowed down from 12% to 4% per annum. The manufacturing sector’s ability to generate employment thus declined, as indicated by the reduction in the employment elasticity with respect to MVA from 0.6 to 0.5 and 0.3 in the 1985-88, 1989-92 and 1993-97 period. Table 5.12 Manufacturing Sector Performance, 1985-98
1985-88 1989-92 1993-97 1998
1 Composition of gross output (average) 100 100 100 1002 Intermediate inputs 66 65 62 643 Labour costs 7 7 7 74 Indirect taxes 4 3 3 1
5 Operating surplus (1-2-3-4) 24 26 28 28
6 Annual average real growth rate 7 Manufacturing value-added (MVA) 13 22 12 -78 Employment 7 11 3 -19 Labour productivity (MVA/worker) 3 10 11 -610 Real wages (labour costs/worker) 0 10 7 -10
11 Employment elasticity (8/9) 0.6 0.5 0.3 n.a.
Source: same as table 5.1. (See also annex tables A.5. ). Production costs The share of intermediate inputs declined from 65%-68% to 62%-63% of the value of gross output between the second half of the 1980s and the second half of the 1990s before the crisis (table 5.12). This decline for the manufacturing sector as a whole was probably due in part to the shift in output composition towards lower-technology, labour-intensive industries requiring relatively less power, less expensive raw materials and components, and less spare parts. However, there are indications that even many of these industries, including food, textile, garments, electrical goods and transport equipment, faced lower raw materials and power costs, and some of them produced with reduced unit labour costs and therefore more efficiently (see discussion on performance by industry below).
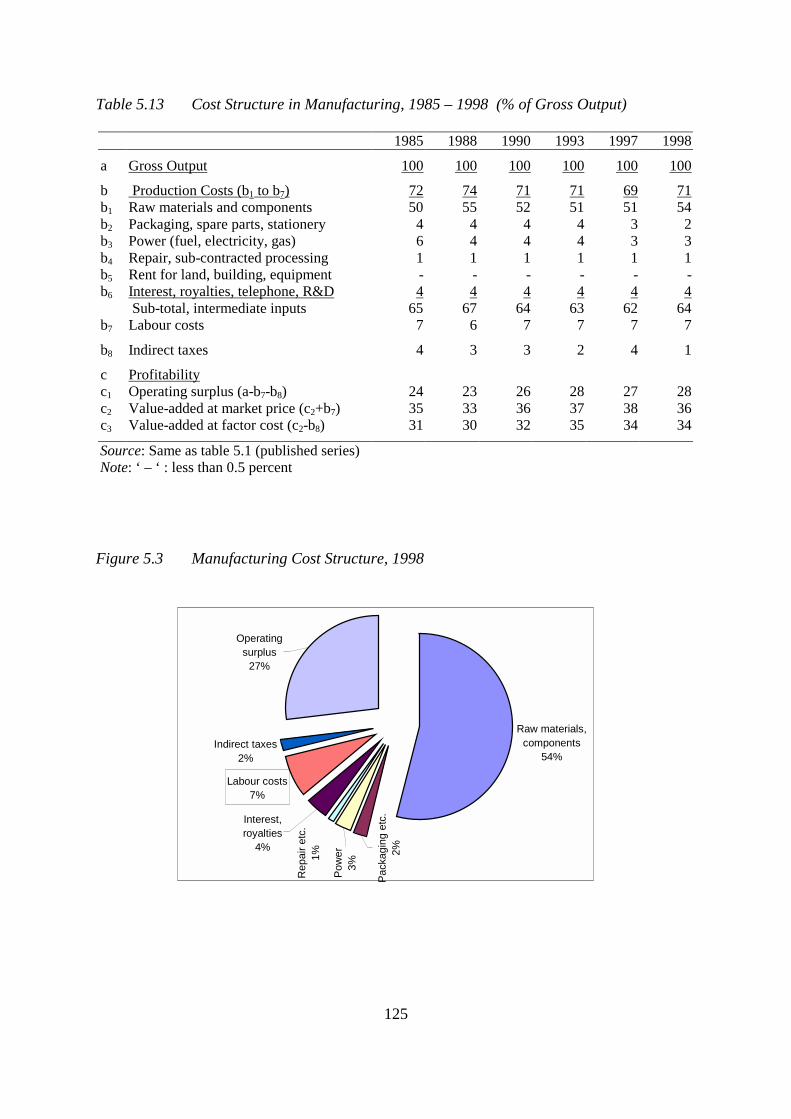
125
Table 5.13 Cost Structure in Manufacturing, 1985 – 1998 (% of Gross Output) 1985 1988 1990 1993 1997 1998
a Gross Output 100 100 100 100 100 100
b Production Costs (b1 to b7) 72 74 71 71 69 71b1 Raw materials and components 50 55 52 51 51 54b2 Packaging, spare parts, stationery 4 4 4 4 3 2b3 Power (fuel, electricity, gas) 6 4 4 4 3 3b4 Repair, sub-contracted processing 1 1 1 1 1 1b5 Rent for land, building, equipment - - - - - -b6 Interest, royalties, telephone, R&D 4 4 4 4 4 4 Sub-total, intermediate inputs 65 67 64 63 62 64b7 Labour costs 7 6 7 7 7 7
b8 Indirect taxes 4 3 3 2 4 1
c Profitability c1 Operating surplus (a-b7-b8) 24 23 26 28 27 28c2 Value-added at market price (c2+b7) 35 33 36 37 38 36c3 Value-added at factor cost (c2-b8) 31 30 32 35 34 34
Source: Same as table 5.1 (published series) Note: ‘ – ‘ : less than 0.5 percent
Figure 5.3 Manufacturing Cost Structure, 1998
Raw materials, components
54%Indirect taxes
2%
Operating surplus
27%
Rep
air e
tc.
1%
Pack
agin
g et
c.2%
Pow
er3%
Interest, royalties
4%
Labour costs7%
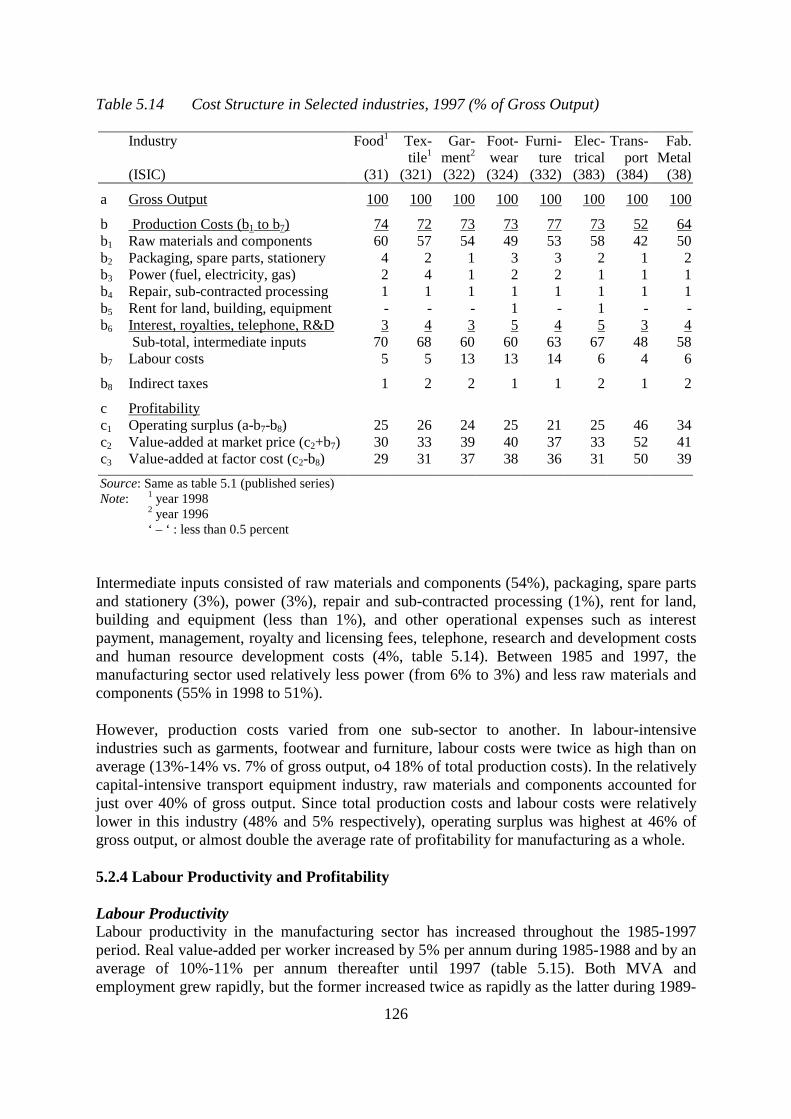
126
Table 5.14 Cost Structure in Selected industries, 1997 (% of Gross Output) Industry Food1 Tex-
tile1Gar-
ment2Foot-wear
Furni-ture
Elec-trical
Trans-port
Fab. Metal
(ISIC) (31) (321) (322) (324) (332) (383) (384) (38)
a Gross Output 100 100 100 100 100 100 100 100
b Production Costs (b1 to b7) 74 72 73 73 77 73 52 64b1 Raw materials and components 60 57 54 49 53 58 42 50b2 Packaging, spare parts, stationery 4 2 1 3 3 2 1 2b3 Power (fuel, electricity, gas) 2 4 1 2 2 1 1 1b4 Repair, sub-contracted processing 1 1 1 1 1 1 1 1b5 Rent for land, building, equipment - - - 1 - 1 - -b6 Interest, royalties, telephone, R&D 3 4 3 5 4 5 3 4 Sub-total, intermediate inputs 70 68 60 60 63 67 48 58b7 Labour costs 5 5 13 13 14 6 4 6
b8 Indirect taxes 1 2 2 1 1 2 1 2
c Profitability c1 Operating surplus (a-b7-b8) 25 26 24 25 21 25 46 34c2 Value-added at market price (c2+b7) 30 33 39 40 37 33 52 41c3 Value-added at factor cost (c2-b8) 29 31 37 38 36 31 50 39Source: Same as table 5.1 (published series) Note: 1 year 1998 2 year 1996 ‘ – ‘ : less than 0.5 percent
Intermediate inputs consisted of raw materials and components (54%), packaging, spare parts and stationery (3%), power (3%), repair and sub-contracted processing (1%), rent for land, building and equipment (less than 1%), and other operational expenses such as interest payment, management, royalty and licensing fees, telephone, research and development costs and human resource development costs (4%, table 5.14). Between 1985 and 1997, the manufacturing sector used relatively less power (from 6% to 3%) and less raw materials and components (55% in 1998 to 51%). However, production costs varied from one sub-sector to another. In labour-intensive industries such as garments, footwear and furniture, labour costs were twice as high than on average (13%-14% vs. 7% of gross output, o4 18% of total production costs). In the relatively capital-intensive transport equipment industry, raw materials and components accounted for just over 40% of gross output. Since total production costs and labour costs were relatively lower in this industry (48% and 5% respectively), operating surplus was highest at 46% of gross output, or almost double the average rate of profitability for manufacturing as a whole. 5.2.4 Labour Productivity and Profitability Labour Productivity Labour productivity in the manufacturing sector has increased throughout the 1985-1997 period. Real value-added per worker increased by 5% per annum during 1985-1988 and by an average of 10%-11% per annum thereafter until 1997 (table 5.15). Both MVA and employment grew rapidly, but the former increased twice as rapidly as the latter during 1989-
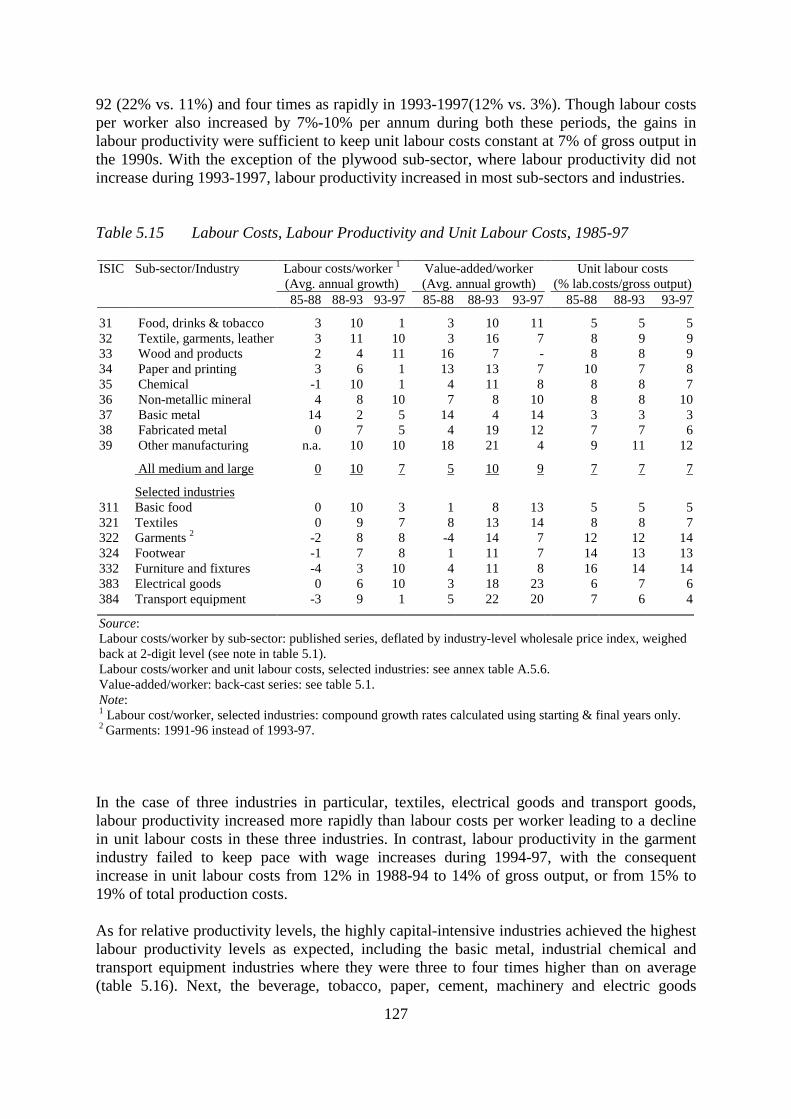
127
92 (22% vs. 11%) and four times as rapidly in 1993-1997(12% vs. 3%). Though labour costs per worker also increased by 7%-10% per annum during both these periods, the gains in labour productivity were sufficient to keep unit labour costs constant at 7% of gross output in the 1990s. With the exception of the plywood sub-sector, where labour productivity did not increase during 1993-1997, labour productivity increased in most sub-sectors and industries. Table 5.15 Labour Costs, Labour Productivity and Unit Labour Costs, 1985-97 ISIC Sub-sector/Industry Labour costs/worker 1
(Avg. annual growth) Value-added/worker (Avg. annual growth)
Unit labour costs (% lab.costs/gross output)
85-88 88-93 93-97 85-88 88-93 93-97 85-88 88-93 93-97
31 Food, drinks & tobacco 3 10 1 3 10 11 5 5 532 Textile, garments, leather 3 11 10 3 16 7 8 9 933 Wood and products 2 4 11 16 7 - 8 8 934 Paper and printing 3 6 1 13 13 7 10 7 835 Chemical -1 10 1 4 11 8 8 8 736 Non-metallic mineral 4 8 10 7 8 10 8 8 1037 Basic metal 14 2 5 14 4 14 3 3 338 Fabricated metal 0 7 5 4 19 12 7 7 639 Other manufacturing n.a. 10 10 18 21 4 9 11 12
All medium and large 0 10 7 5 10 9 7 7 7
Selected industries 311 Basic food 0 10 3 1 8 13 5 5 5321 Textiles 0 9 7 8 13 14 8 8 7322 Garments 2 -2 8 8 -4 14 7 12 12 14324 Footwear -1 7 8 1 11 7 14 13 13332 Furniture and fixtures -4 3 10 4 11 8 16 14 14383 Electrical goods 0 6 10 3 18 23 6 7 6384 Transport equipment -3 9 1 5 22 20 7 6 4
Source: Labour costs/worker by sub-sector: published series, deflated by industry-level wholesale price index, weighed back at 2-digit level (see note in table 5.1). Labour costs/worker and unit labour costs, selected industries: see annex table A.5.6. Value-added/worker: back-cast series: see table 5.1. Note: 1 Labour cost/worker, selected industries: compound growth rates calculated using starting & final years only. 2 Garments: 1991-96 instead of 1993-97. In the case of three industries in particular, textiles, electrical goods and transport goods, labour productivity increased more rapidly than labour costs per worker leading to a decline in unit labour costs in these three industries. In contrast, labour productivity in the garment industry failed to keep pace with wage increases during 1994-97, with the consequent increase in unit labour costs from 12% in 1988-94 to 14% of gross output, or from 15% to 19% of total production costs. As for relative productivity levels, the highly capital-intensive industries achieved the highest labour productivity levels as expected, including the basic metal, industrial chemical and transport equipment industries where they were three to four times higher than on average (table 5.16). Next, the beverage, tobacco, paper, cement, machinery and electric goods
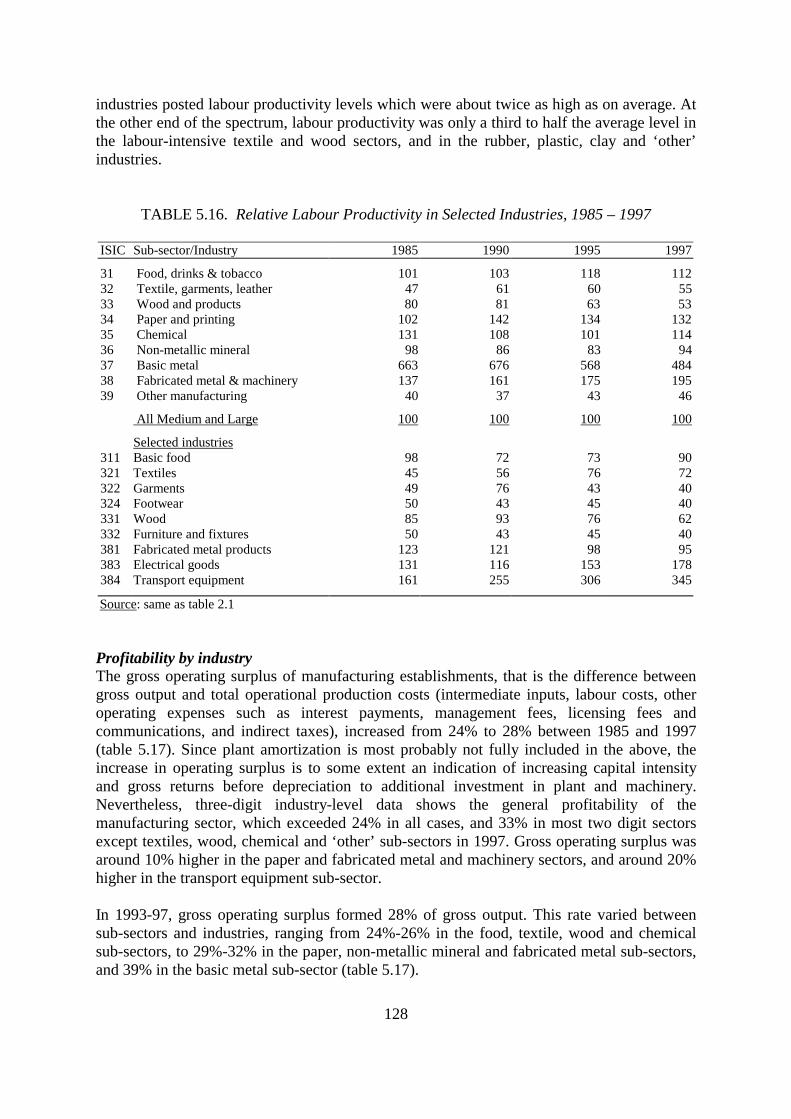
128
industries posted labour productivity levels which were about twice as high as on average. At the other end of the spectrum, labour productivity was only a third to half the average level in the labour-intensive textile and wood sectors, and in the rubber, plastic, clay and ‘other’ industries.
TABLE 5.16. Relative Labour Productivity in Selected Industries, 1985 – 1997 ISIC Sub-sector/Industry 1985 1990 1995 1997
31 Food, drinks & tobacco 101 103 118 112 32 Textile, garments, leather 47 61 60 55 33 Wood and products 80 81 63 53 34 Paper and printing 102 142 134 132 35 Chemical 131 108 101 114 36 Non-metallic mineral 98 86 83 94 37 Basic metal 663 676 568 484 38 Fabricated metal & machinery 137 161 175 195 39 Other manufacturing 40 37 43 46
All Medium and Large 100 100 100 100
Selected industries 311 Basic food 98 72 73 90321 Textiles 45 56 76 72322 Garments 49 76 43 40324 Footwear 50 43 45 40331 Wood 85 93 76 62332 Furniture and fixtures 50 43 45 40381 Fabricated metal products 123 121 98 95383 Electrical goods 131 116 153 178384 Transport equipment 161 255 306 345
Source: same as table 2.1 Profitability by industry The gross operating surplus of manufacturing establishments, that is the difference between gross output and total operational production costs (intermediate inputs, labour costs, other operating expenses such as interest payments, management fees, licensing fees and communications, and indirect taxes), increased from 24% to 28% between 1985 and 1997 (table 5.17). Since plant amortization is most probably not fully included in the above, the increase in operating surplus is to some extent an indication of increasing capital intensity and gross returns before depreciation to additional investment in plant and machinery. Nevertheless, three-digit industry-level data shows the general profitability of the manufacturing sector, which exceeded 24% in all cases, and 33% in most two digit sectors except textiles, wood, chemical and ‘other’ sub-sectors in 1997. Gross operating surplus was around 10% higher in the paper and fabricated metal and machinery sectors, and around 20% higher in the transport equipment sub-sector. In 1993-97, gross operating surplus formed 28% of gross output. This rate varied between sub-sectors and industries, ranging from 24%-26% in the food, textile, wood and chemical sub-sectors, to 29%-32% in the paper, non-metallic mineral and fabricated metal sub-sectors, and 39% in the basic metal sub-sector (table 5.17).
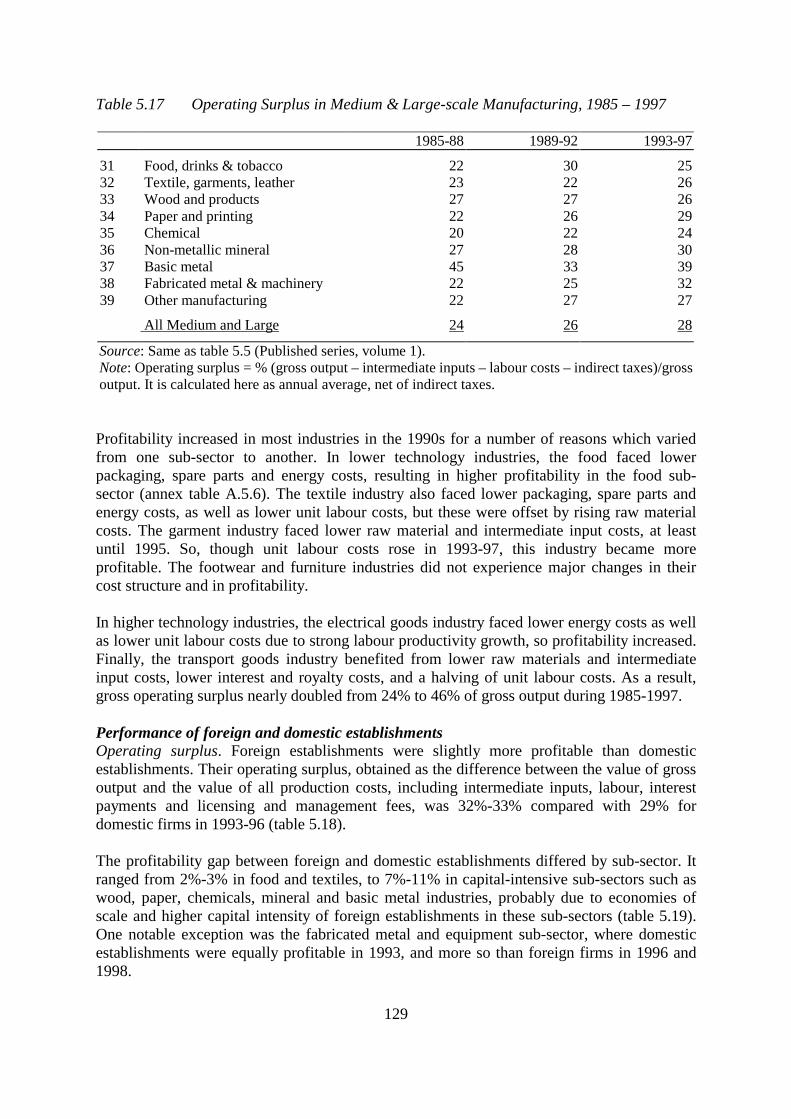
129
Table 5.17 Operating Surplus in Medium & Large-scale Manufacturing, 1985 – 1997 1985-88 1989-92 1993-97
31 Food, drinks & tobacco 22 30 2532 Textile, garments, leather 23 22 2633 Wood and products 27 27 2634 Paper and printing 22 26 2935 Chemical 20 22 2436 Non-metallic mineral 27 28 3037 Basic metal 45 33 3938 Fabricated metal & machinery 22 25 3239 Other manufacturing 22 27 27
All Medium and Large 24 26 28
Source: Same as table 5.5 (Published series, volume 1). Note: Operating surplus = % (gross output – intermediate inputs – labour costs – indirect taxes)/gross output. It is calculated here as annual average, net of indirect taxes. Profitability increased in most industries in the 1990s for a number of reasons which varied from one sub-sector to another. In lower technology industries, the food faced lower packaging, spare parts and energy costs, resulting in higher profitability in the food sub-sector (annex table A.5.6). The textile industry also faced lower packaging, spare parts and energy costs, as well as lower unit labour costs, but these were offset by rising raw material costs. The garment industry faced lower raw material and intermediate input costs, at least until 1995. So, though unit labour costs rose in 1993-97, this industry became more profitable. The footwear and furniture industries did not experience major changes in their cost structure and in profitability. In higher technology industries, the electrical goods industry faced lower energy costs as well as lower unit labour costs due to strong labour productivity growth, so profitability increased. Finally, the transport goods industry benefited from lower raw materials and intermediate input costs, lower interest and royalty costs, and a halving of unit labour costs. As a result, gross operating surplus nearly doubled from 24% to 46% of gross output during 1985-1997. Performance of foreign and domestic establishments Operating surplus. Foreign establishments were slightly more profitable than domestic establishments. Their operating surplus, obtained as the difference between the value of gross output and the value of all production costs, including intermediate inputs, labour, interest payments and licensing and management fees, was 32%-33% compared with 29% for domestic firms in 1993-96 (table 5.18). The profitability gap between foreign and domestic establishments differed by sub-sector. It ranged from 2%-3% in food and textiles, to 7%-11% in capital-intensive sub-sectors such as wood, paper, chemicals, mineral and basic metal industries, probably due to economies of scale and higher capital intensity of foreign establishments in these sub-sectors (table 5.19). One notable exception was the fabricated metal and equipment sub-sector, where domestic establishments were equally profitable in 1993, and more so than foreign firms in 1996 and 1998.
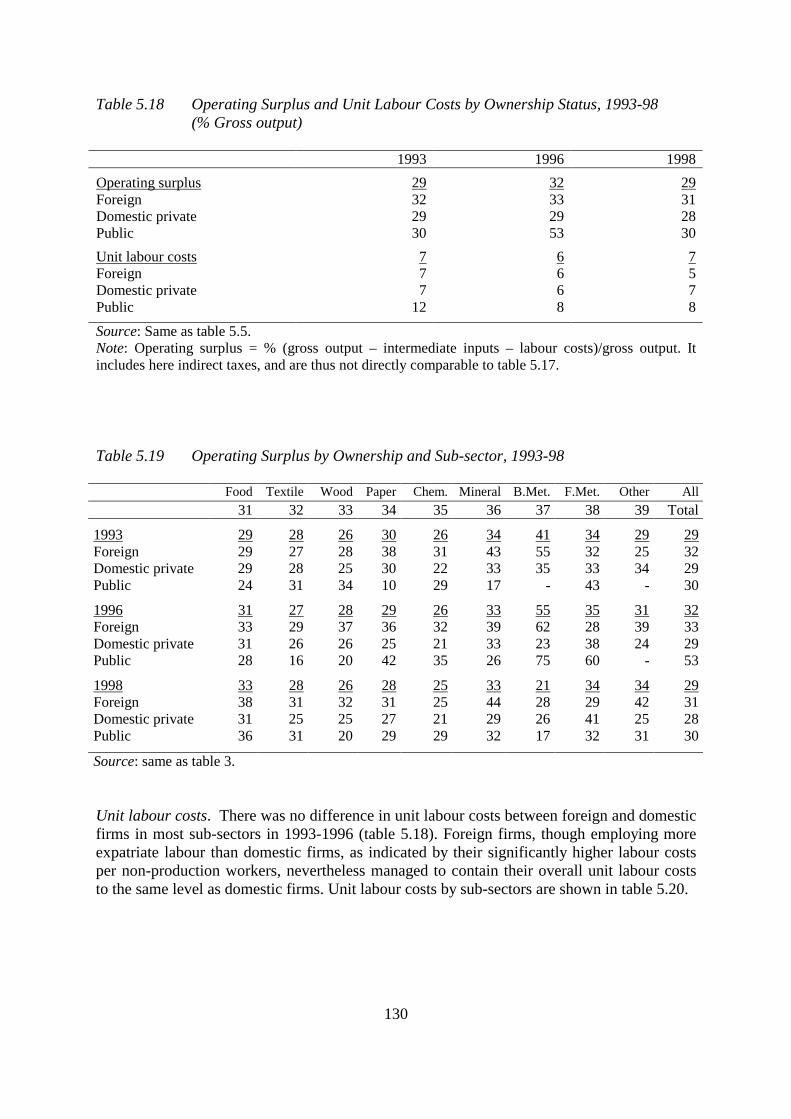
130
Table 5.18 Operating Surplus and Unit Labour Costs by Ownership Status, 1993-98 (% Gross output)
1993 1996 1998Operating surplus 29 32 29Foreign 32 33 31Domestic private 29 29 28Public 30 53 30Unit labour costs 7 6 7Foreign 7 6 5Domestic private 7 6 7Public 12 8 8Source: Same as table 5.5. Note: Operating surplus = % (gross output – intermediate inputs – labour costs)/gross output. It includes here indirect taxes, and are thus not directly comparable to table 5.17. Table 5.19 Operating Surplus by Ownership and Sub-sector, 1993-98 Food Textile Wood Paper Chem. Mineral B.Met. F.Met. Other All 31 32 33 34 35 36 37 38 39 Total
1993 29 28 26 30 26 34 41 34 29 29Foreign 29 27 28 38 31 43 55 32 25 32Domestic private 29 28 25 30 22 33 35 33 34 29Public 24 31 34 10 29 17 - 43 - 30
1996 31 27 28 29 26 33 55 35 31 32Foreign 33 29 37 36 32 39 62 28 39 33Domestic private 31 26 26 25 21 33 23 38 24 29Public 28 16 20 42 35 26 75 60 - 53
1998 33 28 26 28 25 33 21 34 34 29Foreign 38 31 32 31 25 44 28 29 42 31Domestic private 31 25 25 27 21 29 26 41 25 28Public 36 31 20 29 29 32 17 32 31 30
Source: same as table 3. Unit labour costs. There was no difference in unit labour costs between foreign and domestic firms in most sub-sectors in 1993-1996 (table 5.18). Foreign firms, though employing more expatriate labour than domestic firms, as indicated by their significantly higher labour costs per non-production workers, nevertheless managed to contain their overall unit labour costs to the same level as domestic firms. Unit labour costs by sub-sectors are shown in table 5.20.
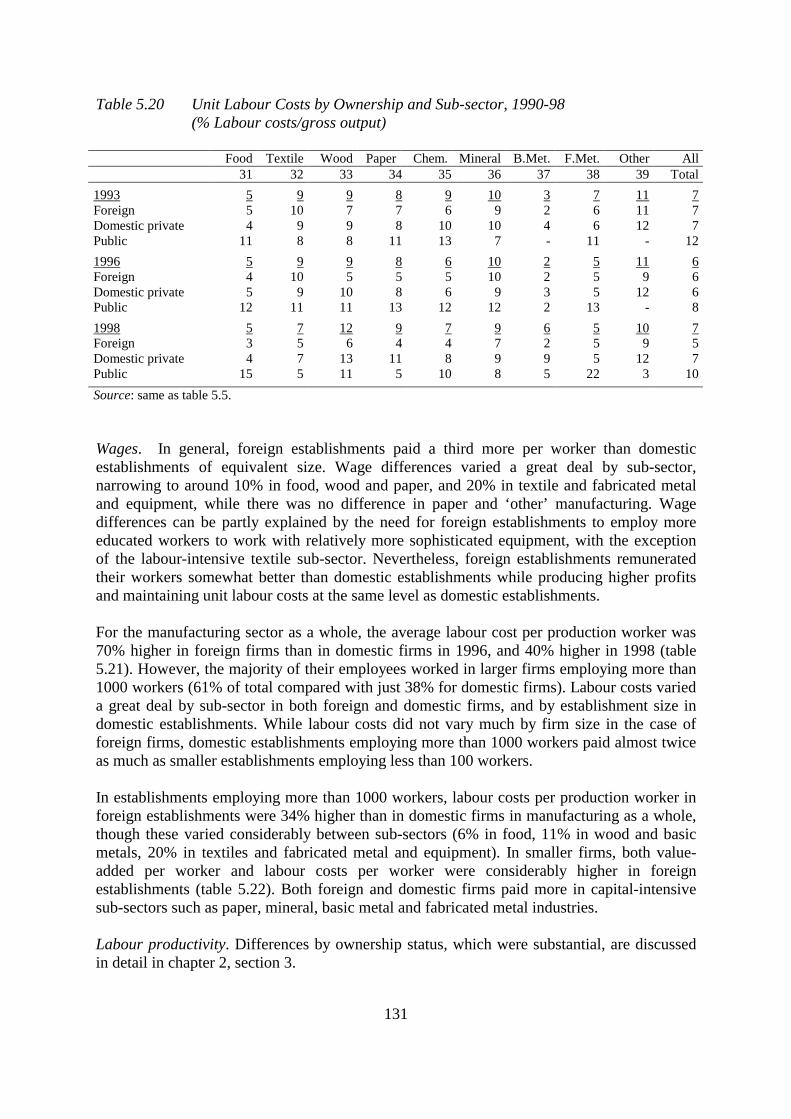
131
Table 5.20 Unit Labour Costs by Ownership and Sub-sector, 1990-98 (% Labour costs/gross output)
Food Textile Wood Paper Chem. Mineral B.Met. F.Met. Other All 31 32 33 34 35 36 37 38 39 Total1993 5 9 9 8 9 10 3 7 11 7Foreign 5 10 7 7 6 9 2 6 11 7Domestic private 4 9 9 8 10 10 4 6 12 7Public 11 8 8 11 13 7 - 11 - 121996 5 9 9 8 6 10 2 5 11 6Foreign 4 10 5 5 5 10 2 5 9 6Domestic private 5 9 10 8 6 9 3 5 12 6Public 12 11 11 13 12 12 2 13 - 81998 5 7 12 9 7 9 6 5 10 7Foreign 3 5 6 4 4 7 2 5 9 5Domestic private 4 7 13 11 8 9 9 5 12 7Public 15 5 11 5 10 8 5 22 3 10Source: same as table 5.5. Wages. In general, foreign establishments paid a third more per worker than domestic establishments of equivalent size. Wage differences varied a great deal by sub-sector, narrowing to around 10% in food, wood and paper, and 20% in textile and fabricated metal and equipment, while there was no difference in paper and ‘other’ manufacturing. Wage differences can be partly explained by the need for foreign establishments to employ more educated workers to work with relatively more sophisticated equipment, with the exception of the labour-intensive textile sub-sector. Nevertheless, foreign establishments remunerated their workers somewhat better than domestic establishments while producing higher profits and maintaining unit labour costs at the same level as domestic establishments. For the manufacturing sector as a whole, the average labour cost per production worker was 70% higher in foreign firms than in domestic firms in 1996, and 40% higher in 1998 (table 5.21). However, the majority of their employees worked in larger firms employing more than 1000 workers (61% of total compared with just 38% for domestic firms). Labour costs varied a great deal by sub-sector in both foreign and domestic firms, and by establishment size in domestic establishments. While labour costs did not vary much by firm size in the case of foreign firms, domestic establishments employing more than 1000 workers paid almost twice as much as smaller establishments employing less than 100 workers. In establishments employing more than 1000 workers, labour costs per production worker in foreign establishments were 34% higher than in domestic firms in manufacturing as a whole, though these varied considerably between sub-sectors (6% in food, 11% in wood and basic metals, 20% in textiles and fabricated metal and equipment). In smaller firms, both value-added per worker and labour costs per worker were considerably higher in foreign establishments (table 5.22). Both foreign and domestic firms paid more in capital-intensive sub-sectors such as paper, mineral, basic metal and fabricated metal industries. Labour productivity. Differences by ownership status, which were substantial, are discussed in detail in chapter 2, section 3.
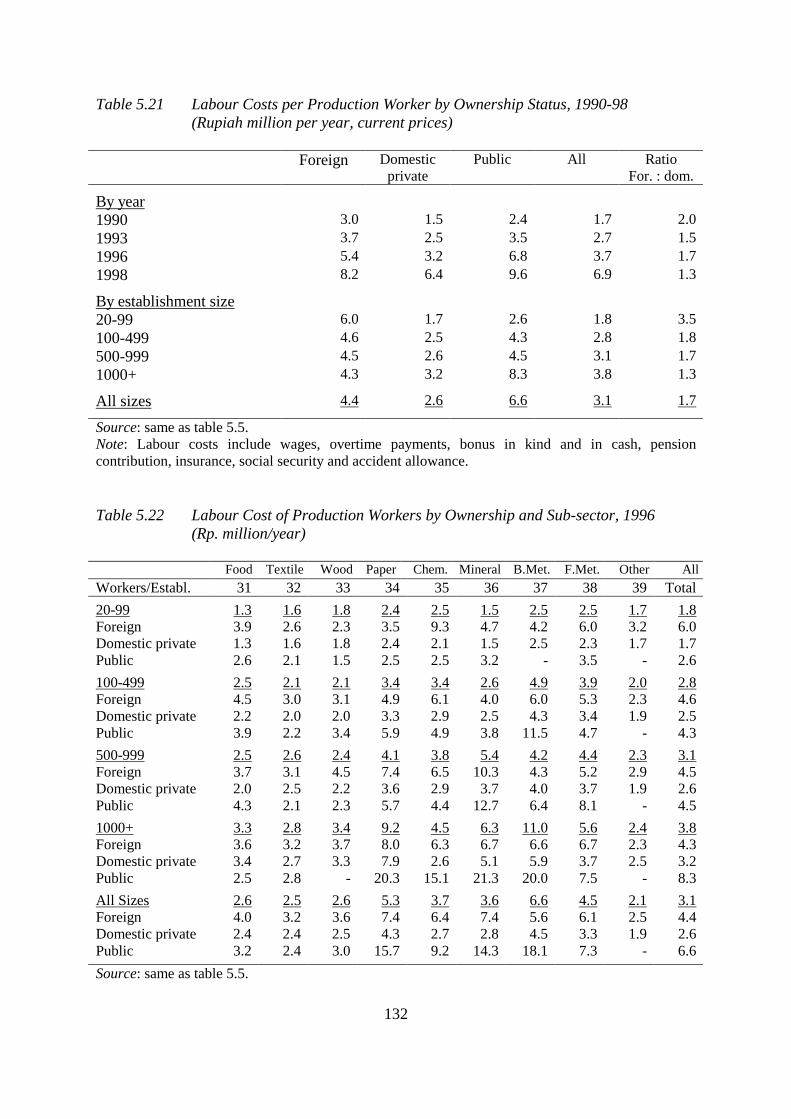
132
Table 5.21 Labour Costs per Production Worker by Ownership Status, 1990-98 (Rupiah million per year, current prices)
Foreign Domestic
private Public All Ratio
For. : dom.
By year 1990 3.0 1.5 2.4 1.7 2.01993 3.7 2.5 3.5 2.7 1.51996 5.4 3.2 6.8 3.7 1.71998 8.2 6.4 9.6 6.9 1.3
By establishment size 20-99 6.0 1.7 2.6 1.8 3.5100-499 4.6 2.5 4.3 2.8 1.8500-999 4.5 2.6 4.5 3.1 1.71000+ 4.3 3.2 8.3 3.8 1.3
All sizes 4.4 2.6 6.6 3.1 1.7
Source: same as table 5.5. Note: Labour costs include wages, overtime payments, bonus in kind and in cash, pension contribution, insurance, social security and accident allowance. Table 5.22 Labour Cost of Production Workers by Ownership and Sub-sector, 1996
(Rp. million/year) Food Textile Wood Paper Chem. Mineral B.Met. F.Met. Other AllWorkers/Establ. 31 32 33 34 35 36 37 38 39 Total20-99 1.3 1.6 1.8 2.4 2.5 1.5 2.5 2.5 1.7 1.8Foreign 3.9 2.6 2.3 3.5 9.3 4.7 4.2 6.0 3.2 6.0Domestic private 1.3 1.6 1.8 2.4 2.1 1.5 2.5 2.3 1.7 1.7Public 2.6 2.1 1.5 2.5 2.5 3.2 - 3.5 - 2.6100-499 2.5 2.1 2.1 3.4 3.4 2.6 4.9 3.9 2.0 2.8Foreign 4.5 3.0 3.1 4.9 6.1 4.0 6.0 5.3 2.3 4.6Domestic private 2.2 2.0 2.0 3.3 2.9 2.5 4.3 3.4 1.9 2.5Public 3.9 2.2 3.4 5.9 4.9 3.8 11.5 4.7 - 4.3500-999 2.5 2.6 2.4 4.1 3.8 5.4 4.2 4.4 2.3 3.1Foreign 3.7 3.1 4.5 7.4 6.5 10.3 4.3 5.2 2.9 4.5Domestic private 2.0 2.5 2.2 3.6 2.9 3.7 4.0 3.7 1.9 2.6Public 4.3 2.1 2.3 5.7 4.4 12.7 6.4 8.1 - 4.51000+ 3.3 2.8 3.4 9.2 4.5 6.3 11.0 5.6 2.4 3.8Foreign 3.6 3.2 3.7 8.0 6.3 6.7 6.6 6.7 2.3 4.3Domestic private 3.4 2.7 3.3 7.9 2.6 5.1 5.9 3.7 2.5 3.2Public 2.5 2.8 - 20.3 15.1 21.3 20.0 7.5 - 8.3All Sizes 2.6 2.5 2.6 5.3 3.7 3.6 6.6 4.5 2.1 3.1Foreign 4.0 3.2 3.6 7.4 6.4 7.4 5.6 6.1 2.5 4.4Domestic private 2.4 2.4 2.5 4.3 2.7 2.8 4.5 3.3 1.9 2.6Public 3.2 2.4 3.0 15.7 9.2 14.3 18.1 7.3 - 6.6Source: same as table 5.5.
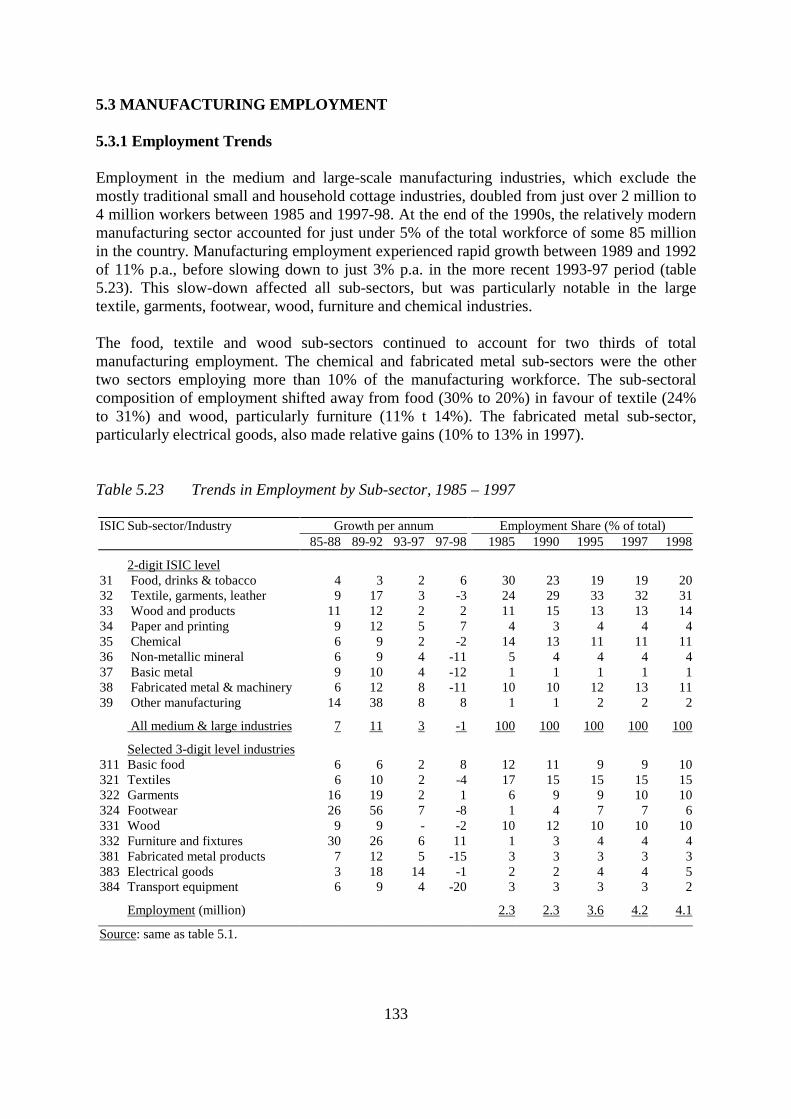
133
5.3 MANUFACTURING EMPLOYMENT 5.3.1 Employment Trends Employment in the medium and large-scale manufacturing industries, which exclude the mostly traditional small and household cottage industries, doubled from just over 2 million to 4 million workers between 1985 and 1997-98. At the end of the 1990s, the relatively modern manufacturing sector accounted for just under 5% of the total workforce of some 85 million in the country. Manufacturing employment experienced rapid growth between 1989 and 1992 of 11% p.a., before slowing down to just 3% p.a. in the more recent 1993-97 period (table 5.23). This slow-down affected all sub-sectors, but was particularly notable in the large textile, garments, footwear, wood, furniture and chemical industries. The food, textile and wood sub-sectors continued to account for two thirds of total manufacturing employment. The chemical and fabricated metal sub-sectors were the other two sectors employing more than 10% of the manufacturing workforce. The sub-sectoral composition of employment shifted away from food (30% to 20%) in favour of textile (24% to 31%) and wood, particularly furniture (11% t 14%). The fabricated metal sub-sector, particularly electrical goods, also made relative gains (10% to 13% in 1997). Table 5.23 Trends in Employment by Sub-sector, 1985 – 1997 ISIC Sub-sector/Industry Growth per annum Employment Share (% of total) 85-88 89-92 93-97 97-98 1985 1990 1995 1997 1998
2-digit ISIC level 31 Food, drinks & tobacco 4 3 2 6 30 23 19 19 2032 Textile, garments, leather 9 17 3 -3 24 29 33 32 3133 Wood and products 11 12 2 2 11 15 13 13 1434 Paper and printing 9 12 5 7 4 3 4 4 435 Chemical 6 9 2 -2 14 13 11 11 1136 Non-metallic mineral 6 9 4 -11 5 4 4 4 437 Basic metal 9 10 4 -12 1 1 1 1 138 Fabricated metal & machinery 6 12 8 -11 10 10 12 13 1139 Other manufacturing 14 38 8 8 1 1 2 2 2
All medium & large industries 7 11 3 -1 100 100 100 100 100
Selected 3-digit level industries 311 Basic food 6 6 2 8 12 11 9 9 10321 Textiles 6 10 2 -4 17 15 15 15 15322 Garments 16 19 2 1 6 9 9 10 10324 Footwear 26 56 7 -8 1 4 7 7 6331 Wood 9 9 - -2 10 12 10 10 10332 Furniture and fixtures 30 26 6 11 1 3 4 4 4381 Fabricated metal products 7 12 5 -15 3 3 3 3 3383 Electrical goods 3 18 14 -1 2 2 4 4 5384 Transport equipment 6 9 4 -20 3 3 3 3 2
Employment (million) 2.3 2.3 3.6 4.2 4.1
Source: same as table 5.1.
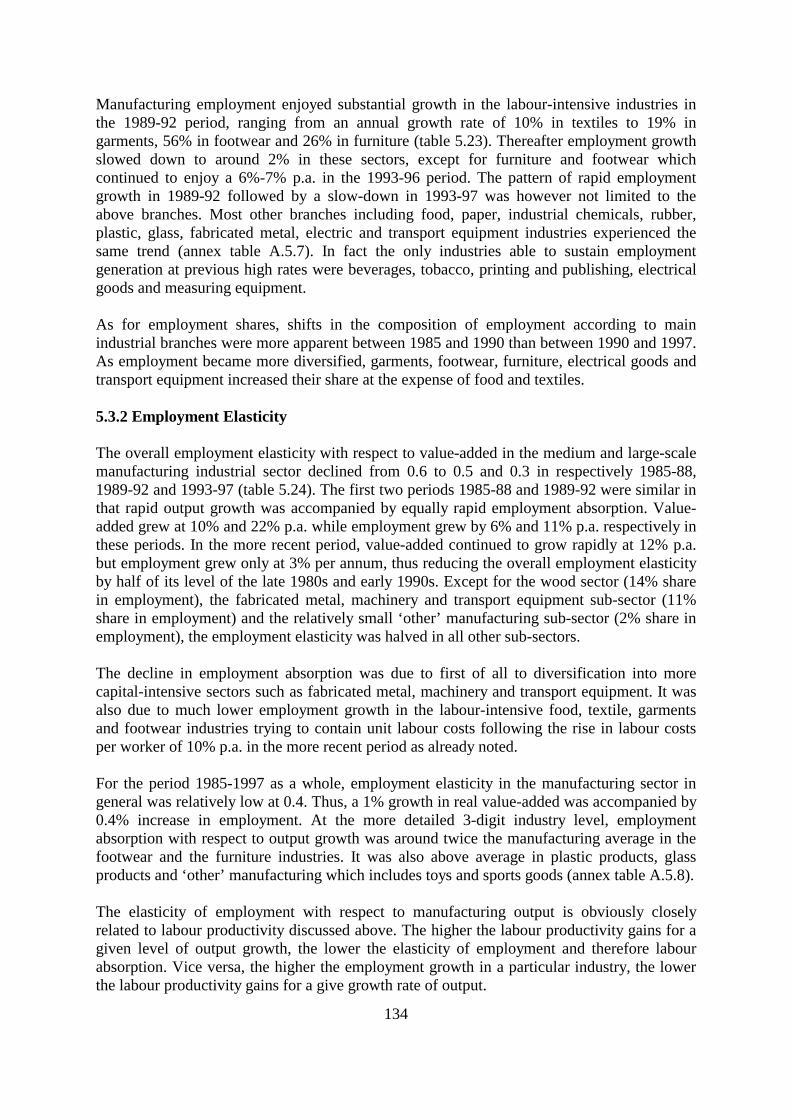
134
Manufacturing employment enjoyed substantial growth in the labour-intensive industries in the 1989-92 period, ranging from an annual growth rate of 10% in textiles to 19% in garments, 56% in footwear and 26% in furniture (table 5.23). Thereafter employment growth slowed down to around 2% in these sectors, except for furniture and footwear which continued to enjoy a 6%-7% p.a. in the 1993-96 period. The pattern of rapid employment growth in 1989-92 followed by a slow-down in 1993-97 was however not limited to the above branches. Most other branches including food, paper, industrial chemicals, rubber, plastic, glass, fabricated metal, electric and transport equipment industries experienced the same trend (annex table A.5.7). In fact the only industries able to sustain employment generation at previous high rates were beverages, tobacco, printing and publishing, electrical goods and measuring equipment. As for employment shares, shifts in the composition of employment according to main industrial branches were more apparent between 1985 and 1990 than between 1990 and 1997. As employment became more diversified, garments, footwear, furniture, electrical goods and transport equipment increased their share at the expense of food and textiles. 5.3.2 Employment Elasticity The overall employment elasticity with respect to value-added in the medium and large-scale manufacturing industrial sector declined from 0.6 to 0.5 and 0.3 in respectively 1985-88, 1989-92 and 1993-97 (table 5.24). The first two periods 1985-88 and 1989-92 were similar in that rapid output growth was accompanied by equally rapid employment absorption. Value-added grew at 10% and 22% p.a. while employment grew by 6% and 11% p.a. respectively in these periods. In the more recent period, value-added continued to grow rapidly at 12% p.a. but employment grew only at 3% per annum, thus reducing the overall employment elasticity by half of its level of the late 1980s and early 1990s. Except for the wood sector (14% share in employment), the fabricated metal, machinery and transport equipment sub-sector (11% share in employment) and the relatively small ‘other’ manufacturing sub-sector (2% share in employment), the employment elasticity was halved in all other sub-sectors. The decline in employment absorption was due to first of all to diversification into more capital-intensive sectors such as fabricated metal, machinery and transport equipment. It was also due to much lower employment growth in the labour-intensive food, textile, garments and footwear industries trying to contain unit labour costs following the rise in labour costs per worker of 10% p.a. in the more recent period as already noted. For the period 1985-1997 as a whole, employment elasticity in the manufacturing sector in general was relatively low at 0.4. Thus, a 1% growth in real value-added was accompanied by 0.4% increase in employment. At the more detailed 3-digit industry level, employment absorption with respect to output growth was around twice the manufacturing average in the footwear and the furniture industries. It was also above average in plastic products, glass products and ‘other’ manufacturing which includes toys and sports goods (annex table A.5.8). The elasticity of employment with respect to manufacturing output is obviously closely related to labour productivity discussed above. The higher the labour productivity gains for a given level of output growth, the lower the elasticity of employment and therefore labour absorption. Vice versa, the higher the employment growth in a particular industry, the lower the labour productivity gains for a give growth rate of output.
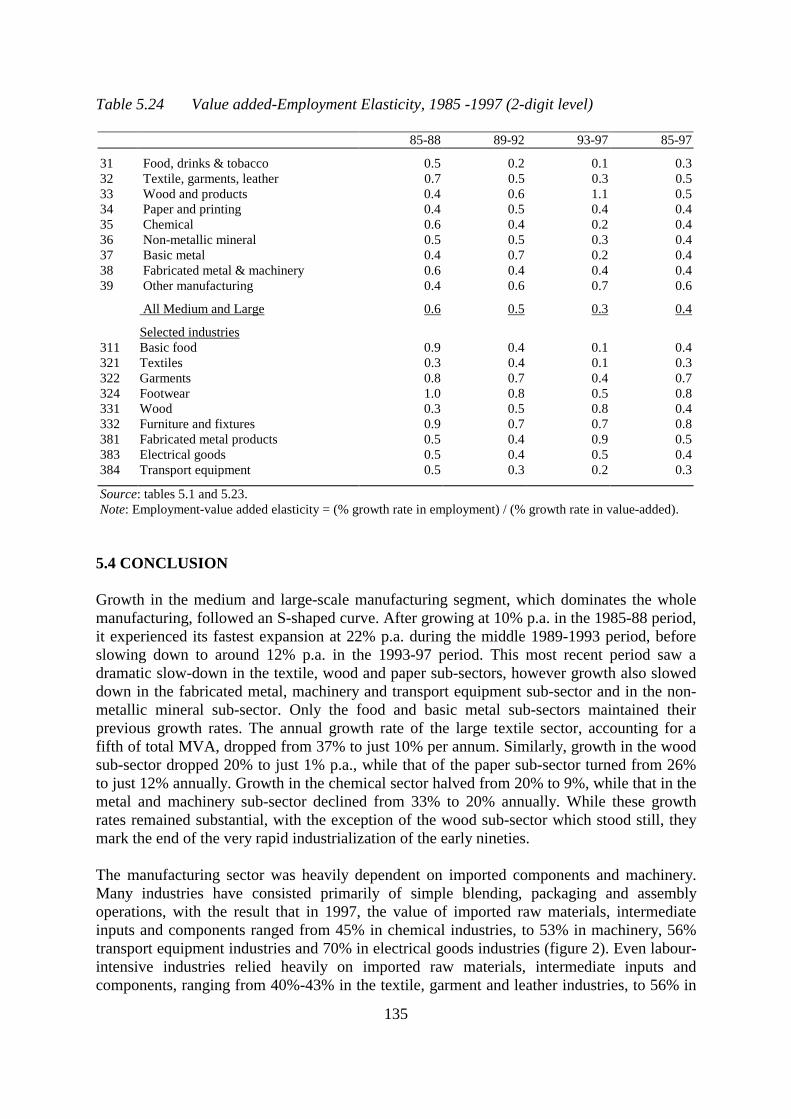
135
Table 5.24 Value added-Employment Elasticity, 1985 -1997 (2-digit level) 85-88 89-92 93-97 85-97
31 Food, drinks & tobacco 0.5 0.2 0.1 0.332 Textile, garments, leather 0.7 0.5 0.3 0.533 Wood and products 0.4 0.6 1.1 0.534 Paper and printing 0.4 0.5 0.4 0.435 Chemical 0.6 0.4 0.2 0.436 Non-metallic mineral 0.5 0.5 0.3 0.437 Basic metal 0.4 0.7 0.2 0.438 Fabricated metal & machinery 0.6 0.4 0.4 0.439 Other manufacturing 0.4 0.6 0.7 0.6
All Medium and Large 0.6 0.5 0.3 0.4
Selected industries 311 Basic food 0.9 0.4 0.1 0.4321 Textiles 0.3 0.4 0.1 0.3322 Garments 0.8 0.7 0.4 0.7324 Footwear 1.0 0.8 0.5 0.8331 Wood 0.3 0.5 0.8 0.4332 Furniture and fixtures 0.9 0.7 0.7 0.8381 Fabricated metal products 0.5 0.4 0.9 0.5383 Electrical goods 0.5 0.4 0.5 0.4384 Transport equipment 0.5 0.3 0.2 0.3
Source: tables 5.1 and 5.23. Note: Employment-value added elasticity = (% growth rate in employment) / (% growth rate in value-added).
5.4 CONCLUSION Growth in the medium and large-scale manufacturing segment, which dominates the whole manufacturing, followed an S-shaped curve. After growing at 10% p.a. in the 1985-88 period, it experienced its fastest expansion at 22% p.a. during the middle 1989-1993 period, before slowing down to around 12% p.a. in the 1993-97 period. This most recent period saw a dramatic slow-down in the textile, wood and paper sub-sectors, however growth also slowed down in the fabricated metal, machinery and transport equipment sub-sector and in the non-metallic mineral sub-sector. Only the food and basic metal sub-sectors maintained their previous growth rates. The annual growth rate of the large textile sector, accounting for a fifth of total MVA, dropped from 37% to just 10% per annum. Similarly, growth in the wood sub-sector dropped 20% to just 1% p.a., while that of the paper sub-sector turned from 26% to just 12% annually. Growth in the chemical sector halved from 20% to 9%, while that in the metal and machinery sub-sector declined from 33% to 20% annually. While these growth rates remained substantial, with the exception of the wood sub-sector which stood still, they mark the end of the very rapid industrialization of the early nineties. The manufacturing sector was heavily dependent on imported components and machinery. Many industries have consisted primarily of simple blending, packaging and assembly operations, with the result that in 1997, the value of imported raw materials, intermediate inputs and components ranged from 45% in chemical industries, to 53% in machinery, 56% transport equipment industries and 70% in electrical goods industries (figure 2). Even labour-intensive industries relied heavily on imported raw materials, intermediate inputs and components, ranging from 40%-43% in the textile, garment and leather industries, to 56% in
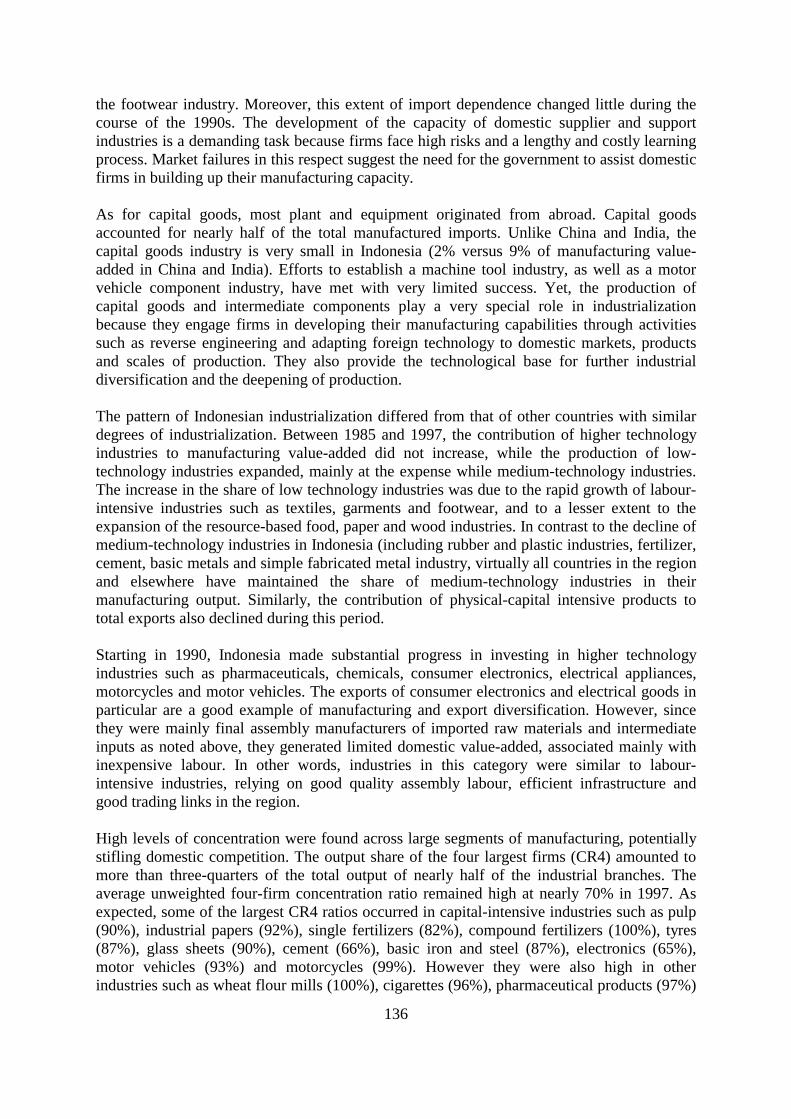
136
the footwear industry. Moreover, this extent of import dependence changed little during the course of the 1990s. The development of the capacity of domestic supplier and support industries is a demanding task because firms face high risks and a lengthy and costly learning process. Market failures in this respect suggest the need for the government to assist domestic firms in building up their manufacturing capacity. As for capital goods, most plant and equipment originated from abroad. Capital goods accounted for nearly half of the total manufactured imports. Unlike China and India, the capital goods industry is very small in Indonesia (2% versus 9% of manufacturing value-added in China and India). Efforts to establish a machine tool industry, as well as a motor vehicle component industry, have met with very limited success. Yet, the production of capital goods and intermediate components play a very special role in industrialization because they engage firms in developing their manufacturing capabilities through activities such as reverse engineering and adapting foreign technology to domestic markets, products and scales of production. They also provide the technological base for further industrial diversification and the deepening of production. The pattern of Indonesian industrialization differed from that of other countries with similar degrees of industrialization. Between 1985 and 1997, the contribution of higher technology industries to manufacturing value-added did not increase, while the production of low-technology industries expanded, mainly at the expense while medium-technology industries. The increase in the share of low technology industries was due to the rapid growth of labour-intensive industries such as textiles, garments and footwear, and to a lesser extent to the expansion of the resource-based food, paper and wood industries. In contrast to the decline of medium-technology industries in Indonesia (including rubber and plastic industries, fertilizer, cement, basic metals and simple fabricated metal industry, virtually all countries in the region and elsewhere have maintained the share of medium-technology industries in their manufacturing output. Similarly, the contribution of physical-capital intensive products to total exports also declined during this period. Starting in 1990, Indonesia made substantial progress in investing in higher technology industries such as pharmaceuticals, chemicals, consumer electronics, electrical appliances, motorcycles and motor vehicles. The exports of consumer electronics and electrical goods in particular are a good example of manufacturing and export diversification. However, since they were mainly final assembly manufacturers of imported raw materials and intermediate inputs as noted above, they generated limited domestic value-added, associated mainly with inexpensive labour. In other words, industries in this category were similar to labour-intensive industries, relying on good quality assembly labour, efficient infrastructure and good trading links in the region. High levels of concentration were found across large segments of manufacturing, potentially stifling domestic competition. The output share of the four largest firms (CR4) amounted to more than three-quarters of the total output of nearly half of the industrial branches. The average unweighted four-firm concentration ratio remained high at nearly 70% in 1997. As expected, some of the largest CR4 ratios occurred in capital-intensive industries such as pulp (90%), industrial papers (92%), single fertilizers (82%), compound fertilizers (100%), tyres (87%), glass sheets (90%), cement (66%), basic iron and steel (87%), electronics (65%), motor vehicles (93%) and motorcycles (99%). However they were also high in other industries such as wheat flour mills (100%), cigarettes (96%), pharmaceutical products (97%)
137
and soaps and toothpaste (73%, CBS 2000). Foreign firms were important players in many of these industries. The medium and large-scale manufacturing establishments employed some 4 million workers or just 4% of the total work force of around 90 million. Starting in 1992, manufacturing wages began to rise by about 10% p.a. Employers managed to contain unit labour costs by raising labour productivity, but at the cost of slowing down the recruitment of new workers. The annual surveys of medium and large-scale manufacturing industries show that the value added-employment elasticity declined form 0.5 in 1989-93 to 0.3 in 1994-97 in the manufacturing sector as a whole, and from 0.4-0.3 to 0.1 in textiles and garments. The low elasticities in these two relatively labour-intensive industries were the result of very small additions to the workforce, of the order of 1% versus 10%-15% p.a. in the previous period, while continuing to post healthy 10%-15% annual growth rates in output.

138
ANNEX 5.1: TABLES A.5.1 Manufacturing Capacity Utilization 1993 – 1998 (3-digit level) A.5.2 Manufacturing Export Intensity, 1993 – 1998 (3-digit level) A.5.3 Manufacturing establishments by investment facility, 1990 – 1998 (3-digit) A.5.4 Concentration Ratio and Hirschmann-Herfindahl Index, 1990 - 1998 (3-digit level) A.5.5 Concentration Ratio and Hirschmann-Herfindahl Index, 1990 - 1998 (5-digit level) A.5.6 Manufacturing Cost Structure, 1985 – 1998 A.5.7 Employment Growth and Composition 1975 – 1997 (3-digit level) A.5.8 Value-added per Worker, 1975 – 1997 (3-digit level)

139
Table A.5.1 Manufacturing Capacity Utilization, 1993 – 1998 (% gross Output, 3-digit level) ISIC Establishments Capacity Utilization
1993 1996 1997 1998 1993 1996 1997 1998
311 Basic foods 2,017 2,342 2,208 2,134 78 75 67 70312 Other foods 1,522 1,789 1,678 1,618 76 74 76 68313 Beverages 201 257 250 239 77 76 78 69314 Tobacco & cigarettes 869 774 805 676 71 81 82 73321 Textiles 1,697 2,051 1,857 1,867 71 83 80 76322 Garments 1,717 1,981 1,710 1,568 78 78 80 81323 Leather and products 178 197 190 185 55 79 73 77324 Footwear 315 385 337 379 81 81 79 76331 Wood and bamboo 1,402 1,687 1,534 1,475 77 75 72 70332 Furniture and fixtures 755 1,245 1,254 1,219 75 74 78 76341 Paper and products 265 320 285 316 73 76 74 66342 Printing & publishing 501 598 536 513 69 75 74 75351 Industrial chemicals 281 359 358 373 83 80 74 63352 Other chemicals 535 580 557 528 72 80 73 67353 Oil refineries, nat. gas 8 8 7 55 63 89354 Refinery & coal prod. 13 26 27 31 42 61 50 39355 Rubber and products 440 421 405 406 79 76 71 69356 Plastic products 784 1,015 992 830 72 72 70 68361 Porcelain 84 80 73 75 79 74 78 70362 Glass and products 53 74 57 85 77 81 75 65363 Cement and lime 466 628 542 475 84 90 82 58364 Clay products 620 998 951 825 76 83 78 82369 Other n-met. Mineral 217 269 296 268 75 77 75 58371 Iron and steel 76 94 90 103 73 81 75 65372 Non ferrous metals 44 75 73 77 66 75 81 62381 Fabricated metal 697 947 825 799 73 78 53 67382 Machinery 237 297 305 253 66 80 79 52383 Electrical goods 316 451 474 429 70 79 72 68384 Transport equipment 354 542 503 465 73 75 74 73385 Measuring equipment 52 71 52 65 52 93 83 81390 Other manufacturing 269 407 388 459 29 63 61 64
Total 16,977 20,968 19,620 18,742 74 78 74 70
Total firms in survey 18,163 22,997 22,386 21,423 Response Rate 93% 91% 88% 87%
Source: Large and Medium Industry Statistics 1996 and 1997, CBS (special tabulations produced by Data Centre Pusdata, Ministry of Industry and Trade).
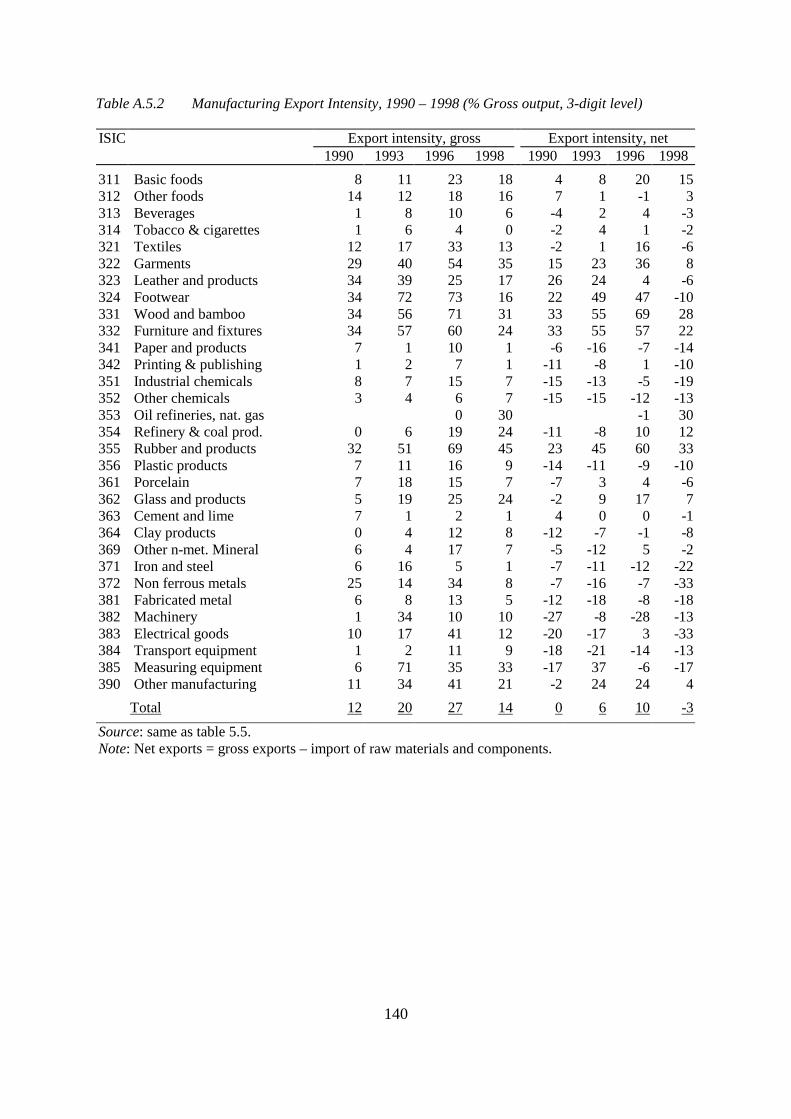
140
Table A.5.2 Manufacturing Export Intensity, 1990 – 1998 (% Gross output, 3-digit level) ISIC Export intensity, gross Export intensity, net
1990 1993 1996 1998 1990 1993 1996 1998311 Basic foods 8 11 23 18 4 8 20 15312 Other foods 14 12 18 16 7 1 -1 3313 Beverages 1 8 10 6 -4 2 4 -3314 Tobacco & cigarettes 1 6 4 0 -2 4 1 -2321 Textiles 12 17 33 13 -2 1 16 -6322 Garments 29 40 54 35 15 23 36 8323 Leather and products 34 39 25 17 26 24 4 -6324 Footwear 34 72 73 16 22 49 47 -10331 Wood and bamboo 34 56 71 31 33 55 69 28332 Furniture and fixtures 34 57 60 24 33 55 57 22341 Paper and products 7 1 10 1 -6 -16 -7 -14342 Printing & publishing 1 2 7 1 -11 -8 1 -10351 Industrial chemicals 8 7 15 7 -15 -13 -5 -19352 Other chemicals 3 4 6 7 -15 -15 -12 -13353 Oil refineries, nat. gas 0 30 -1 30354 Refinery & coal prod. 0 6 19 24 -11 -8 10 12355 Rubber and products 32 51 69 45 23 45 60 33356 Plastic products 7 11 16 9 -14 -11 -9 -10361 Porcelain 7 18 15 7 -7 3 4 -6362 Glass and products 5 19 25 24 -2 9 17 7363 Cement and lime 7 1 2 1 4 0 0 -1364 Clay products 0 4 12 8 -12 -7 -1 -8369 Other n-met. Mineral 6 4 17 7 -5 -12 5 -2371 Iron and steel 6 16 5 1 -7 -11 -12 -22372 Non ferrous metals 25 14 34 8 -7 -16 -7 -33381 Fabricated metal 6 8 13 5 -12 -18 -8 -18382 Machinery 1 34 10 10 -27 -8 -28 -13383 Electrical goods 10 17 41 12 -20 -17 3 -33384 Transport equipment 1 2 11 9 -18 -21 -14 -13385 Measuring equipment 6 71 35 33 -17 37 -6 -17390 Other manufacturing 11 34 41 21 -2 24 24 4
Total 12 20 27 14 0 6 10 -3Source: same as table 5.5. Note: Net exports = gross exports – import of raw materials and components.
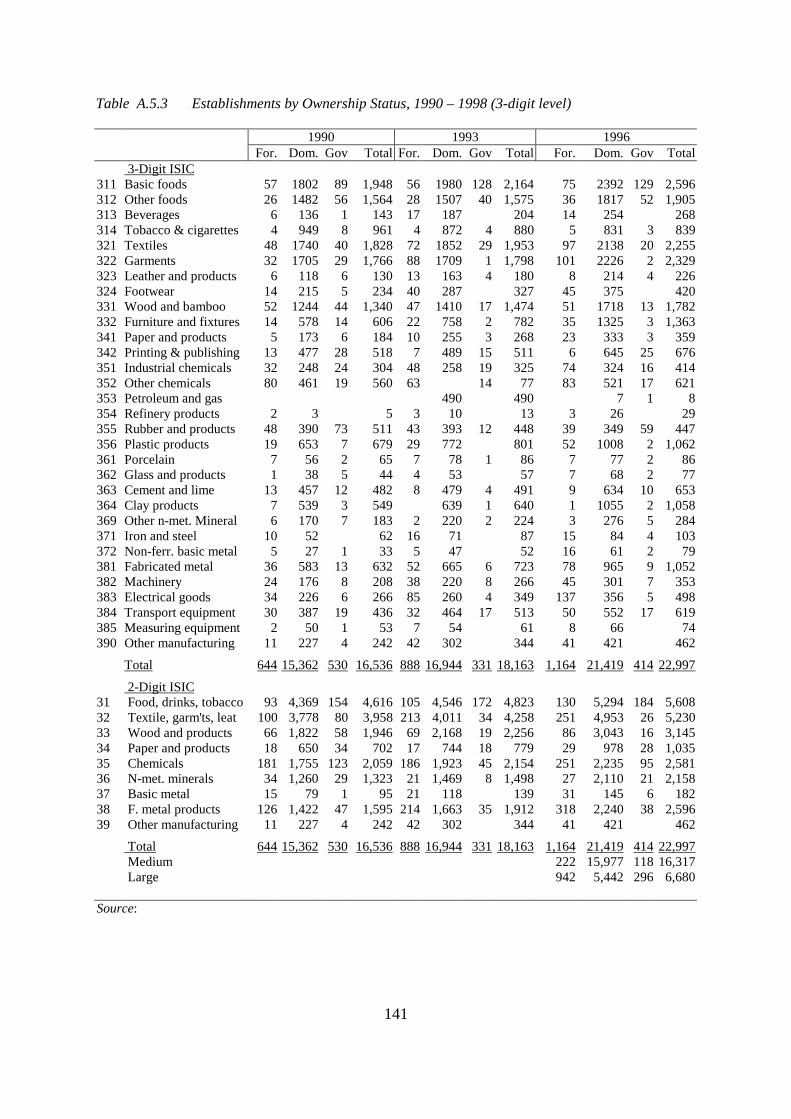
141
Table A.5.3 Establishments by Ownership Status, 1990 – 1998 (3-digit level)
1990 1993 1996 For. Dom. Gov Total For. Dom. Gov Total For. Dom. Gov Total 3-Digit ISIC
311 Basic foods 57 1802 89 1,948 56 1980 128 2,164 75 2392 129 2,596312 Other foods 26 1482 56 1,564 28 1507 40 1,575 36 1817 52 1,905313 Beverages 6 136 1 143 17 187 204 14 254 268314 Tobacco & cigarettes 4 949 8 961 4 872 4 880 5 831 3 839321 Textiles 48 1740 40 1,828 72 1852 29 1,953 97 2138 20 2,255322 Garments 32 1705 29 1,766 88 1709 1 1,798 101 2226 2 2,329323 Leather and products 6 118 6 130 13 163 4 180 8 214 4 226324 Footwear 14 215 5 234 40 287 327 45 375 420331 Wood and bamboo 52 1244 44 1,340 47 1410 17 1,474 51 1718 13 1,782332 Furniture and fixtures 14 578 14 606 22 758 2 782 35 1325 3 1,363341 Paper and products 5 173 6 184 10 255 3 268 23 333 3 359342 Printing & publishing 13 477 28 518 7 489 15 511 6 645 25 676351 Industrial chemicals 32 248 24 304 48 258 19 325 74 324 16 414352 Other chemicals 80 461 19 560 63 14 77 83 521 17 621353 Petroleum and gas 490 490 7 1 8354 Refinery products 2 3 5 3 10 13 3 26 29355 Rubber and products 48 390 73 511 43 393 12 448 39 349 59 447356 Plastic products 19 653 7 679 29 772 801 52 1008 2 1,062361 Porcelain 7 56 2 65 7 78 1 86 7 77 2 86362 Glass and products 1 38 5 44 4 53 57 7 68 2 77363 Cement and lime 13 457 12 482 8 479 4 491 9 634 10 653364 Clay products 7 539 3 549 639 1 640 1 1055 2 1,058369 Other n-met. Mineral 6 170 7 183 2 220 2 224 3 276 5 284371 Iron and steel 10 52 62 16 71 87 15 84 4 103372 Non-ferr. basic metal 5 27 1 33 5 47 52 16 61 2 79381 Fabricated metal 36 583 13 632 52 665 6 723 78 965 9 1,052382 Machinery 24 176 8 208 38 220 8 266 45 301 7 353383 Electrical goods 34 226 6 266 85 260 4 349 137 356 5 498384 Transport equipment 30 387 19 436 32 464 17 513 50 552 17 619385 Measuring equipment 2 50 1 53 7 54 61 8 66 74390 Other manufacturing 11 227 4 242 42 302 344 41 421 462
Total 644 15,362 530 16,536 888 16,944 331 18,163 1,164 21,419 414 22,997
2-Digit ISIC 31 Food, drinks, tobacco 93 4,369 154 4,616 105 4,546 172 4,823 130 5,294 184 5,60832 Textile, garm'ts, leat 100 3,778 80 3,958 213 4,011 34 4,258 251 4,953 26 5,23033 Wood and products 66 1,822 58 1,946 69 2,168 19 2,256 86 3,043 16 3,14534 Paper and products 18 650 34 702 17 744 18 779 29 978 28 1,03535 Chemicals 181 1,755 123 2,059 186 1,923 45 2,154 251 2,235 95 2,58136 N-met. minerals 34 1,260 29 1,323 21 1,469 8 1,498 27 2,110 21 2,15837 Basic metal 15 79 1 95 21 118 139 31 145 6 18238 F. metal products 126 1,422 47 1,595 214 1,663 35 1,912 318 2,240 38 2,59639 Other manufacturing 11 227 4 242 42 302 344 41 421 462
Total 644 15,362 530 16,536 888 16,944 331 18,163 1,164 21,419 414 22,997 Medium 222 15,977 118 16,317 Large 942 5,442 296 6,680
Source:
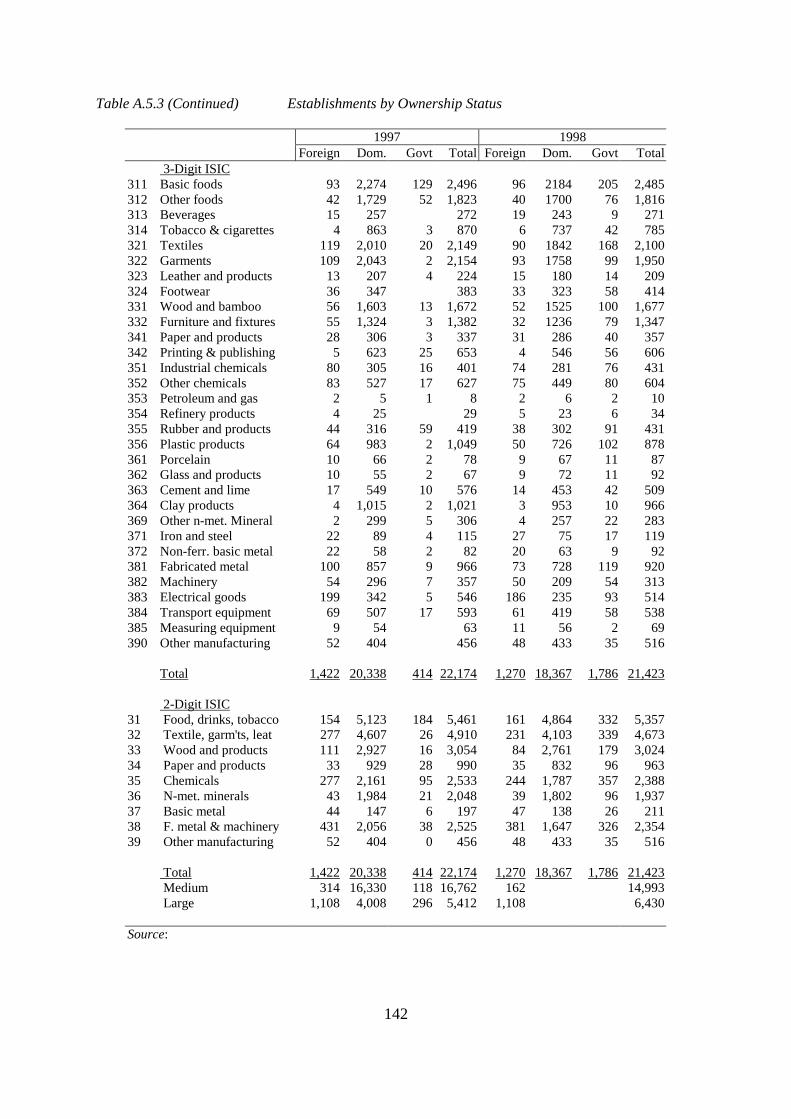
142
Table A.5.3 (Continued) Establishments by Ownership Status
1997 1998 Foreign Dom. Govt Total Foreign Dom. Govt Total 3-Digit ISIC
311 Basic foods 93 2,274 129 2,496 96 2184 205 2,485312 Other foods 42 1,729 52 1,823 40 1700 76 1,816313 Beverages 15 257 272 19 243 9 271314 Tobacco & cigarettes 4 863 3 870 6 737 42 785321 Textiles 119 2,010 20 2,149 90 1842 168 2,100322 Garments 109 2,043 2 2,154 93 1758 99 1,950323 Leather and products 13 207 4 224 15 180 14 209324 Footwear 36 347 383 33 323 58 414331 Wood and bamboo 56 1,603 13 1,672 52 1525 100 1,677332 Furniture and fixtures 55 1,324 3 1,382 32 1236 79 1,347341 Paper and products 28 306 3 337 31 286 40 357342 Printing & publishing 5 623 25 653 4 546 56 606351 Industrial chemicals 80 305 16 401 74 281 76 431352 Other chemicals 83 527 17 627 75 449 80 604353 Petroleum and gas 2 5 1 8 2 6 2 10354 Refinery products 4 25 29 5 23 6 34355 Rubber and products 44 316 59 419 38 302 91 431356 Plastic products 64 983 2 1,049 50 726 102 878361 Porcelain 10 66 2 78 9 67 11 87362 Glass and products 10 55 2 67 9 72 11 92363 Cement and lime 17 549 10 576 14 453 42 509364 Clay products 4 1,015 2 1,021 3 953 10 966369 Other n-met. Mineral 2 299 5 306 4 257 22 283371 Iron and steel 22 89 4 115 27 75 17 119372 Non-ferr. basic metal 22 58 2 82 20 63 9 92381 Fabricated metal 100 857 9 966 73 728 119 920382 Machinery 54 296 7 357 50 209 54 313383 Electrical goods 199 342 5 546 186 235 93 514384 Transport equipment 69 507 17 593 61 419 58 538385 Measuring equipment 9 54 63 11 56 2 69390 Other manufacturing 52 404 456 48 433 35 516
Total 1,422 20,338 414 22,174 1,270 18,367 1,786 21,423 2-Digit ISIC
31 Food, drinks, tobacco 154 5,123 184 5,461 161 4,864 332 5,35732 Textile, garm'ts, leat 277 4,607 26 4,910 231 4,103 339 4,67333 Wood and products 111 2,927 16 3,054 84 2,761 179 3,02434 Paper and products 33 929 28 990 35 832 96 96335 Chemicals 277 2,161 95 2,533 244 1,787 357 2,38836 N-met. minerals 43 1,984 21 2,048 39 1,802 96 1,93737 Basic metal 44 147 6 197 47 138 26 21138 F. metal & machinery 431 2,056 38 2,525 381 1,647 326 2,35439 Other manufacturing 52 404 0 456 48 433 35 516
Total 1,422 20,338 414 22,174 1,270 18,367 1,786 21,423 Medium 314 16,330 118 16,762 162 14,993 Large 1,108 4,008 296 5,412 1,108 6,430
Source:
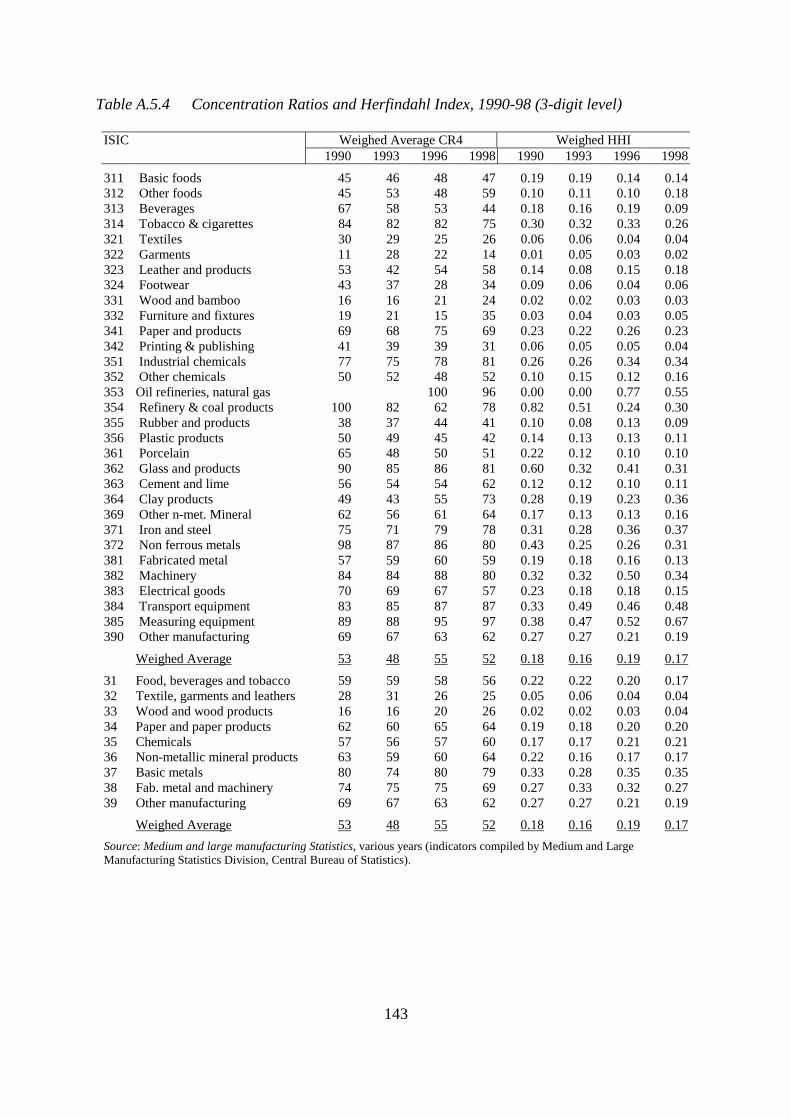
143
Table A.5.4 Concentration Ratios and Herfindahl Index, 1990-98 (3-digit level)
ISIC Weighed Average CR4 Weighed HHI 1990 1993 1996 1998 1990 1993 1996 1998
311 Basic foods 45 46 48 47 0.19 0.19 0.14 0.14312 Other foods 45 53 48 59 0.10 0.11 0.10 0.18313 Beverages 67 58 53 44 0.18 0.16 0.19 0.09314 Tobacco & cigarettes 84 82 82 75 0.30 0.32 0.33 0.26321 Textiles 30 29 25 26 0.06 0.06 0.04 0.04322 Garments 11 28 22 14 0.01 0.05 0.03 0.02323 Leather and products 53 42 54 58 0.14 0.08 0.15 0.18324 Footwear 43 37 28 34 0.09 0.06 0.04 0.06331 Wood and bamboo 16 16 21 24 0.02 0.02 0.03 0.03332 Furniture and fixtures 19 21 15 35 0.03 0.04 0.03 0.05341 Paper and products 69 68 75 69 0.23 0.22 0.26 0.23342 Printing & publishing 41 39 39 31 0.06 0.05 0.05 0.04351 Industrial chemicals 77 75 78 81 0.26 0.26 0.34 0.34352 Other chemicals 50 52 48 52 0.10 0.15 0.12 0.16353 Oil refineries, natural gas 100 96 0.00 0.00 0.77 0.55354 Refinery & coal products 100 82 62 78 0.82 0.51 0.24 0.30355 Rubber and products 38 37 44 41 0.10 0.08 0.13 0.09356 Plastic products 50 49 45 42 0.14 0.13 0.13 0.11361 Porcelain 65 48 50 51 0.22 0.12 0.10 0.10362 Glass and products 90 85 86 81 0.60 0.32 0.41 0.31363 Cement and lime 56 54 54 62 0.12 0.12 0.10 0.11364 Clay products 49 43 55 73 0.28 0.19 0.23 0.36369 Other n-met. Mineral 62 56 61 64 0.17 0.13 0.13 0.16371 Iron and steel 75 71 79 78 0.31 0.28 0.36 0.37372 Non ferrous metals 98 87 86 80 0.43 0.25 0.26 0.31381 Fabricated metal 57 59 60 59 0.19 0.18 0.16 0.13382 Machinery 84 84 88 80 0.32 0.32 0.50 0.34383 Electrical goods 70 69 67 57 0.23 0.18 0.18 0.15384 Transport equipment 83 85 87 87 0.33 0.49 0.46 0.48385 Measuring equipment 89 88 95 97 0.38 0.47 0.52 0.67390 Other manufacturing 69 67 63 62 0.27 0.27 0.21 0.19
Weighed Average 53 48 55 52 0.18 0.16 0.19 0.17
31 Food, beverages and tobacco 59 59 58 56 0.22 0.22 0.20 0.1732 Textile, garments and leathers 28 31 26 25 0.05 0.06 0.04 0.0433 Wood and wood products 16 16 20 26 0.02 0.02 0.03 0.0434 Paper and paper products 62 60 65 64 0.19 0.18 0.20 0.2035 Chemicals 57 56 57 60 0.17 0.17 0.21 0.2136 Non-metallic mineral products 63 59 60 64 0.22 0.16 0.17 0.1737 Basic metals 80 74 80 79 0.33 0.28 0.35 0.3538 Fab. metal and machinery 74 75 75 69 0.27 0.33 0.32 0.2739 Other manufacturing 69 67 63 62 0.27 0.27 0.21 0.19
Weighed Average 53 48 55 52 0.18 0.16 0.19 0.17Source: Medium and large manufacturing Statistics, various years (indicators compiled by Medium and Large Manufacturing Statistics Division, Central Bureau of Statistics).
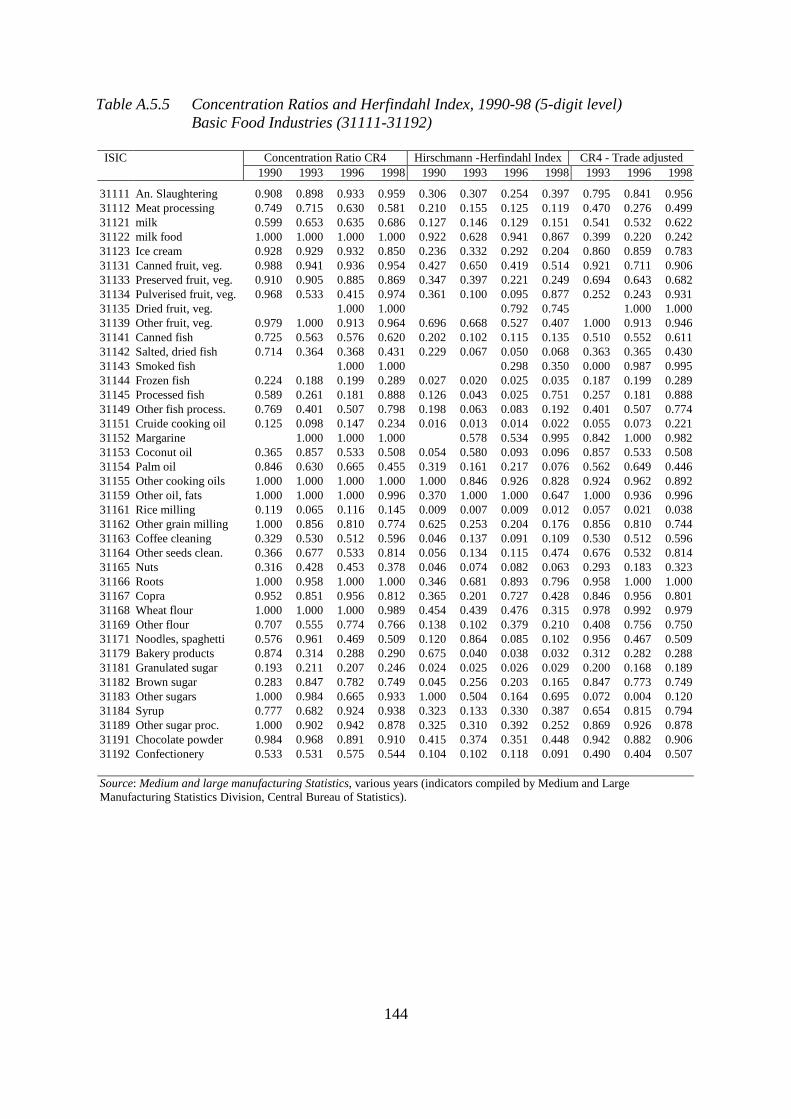
144
Table A.5.5 Concentration Ratios and Herfindahl Index, 1990-98 (5-digit level) Basic Food Industries (31111-31192)
ISIC Concentration Ratio CR4 Hirschmann -Herfindahl Index CR4 - Trade adjusted
1990 1993 1996 1998 1990 1993 1996 1998 1993 1996 1998
31111 An. Slaughtering 0.908 0.898 0.933 0.959 0.306 0.307 0.254 0.397 0.795 0.841 0.95631112 Meat processing 0.749 0.715 0.630 0.581 0.210 0.155 0.125 0.119 0.470 0.276 0.49931121 milk 0.599 0.653 0.635 0.686 0.127 0.146 0.129 0.151 0.541 0.532 0.62231122 milk food 1.000 1.000 1.000 1.000 0.922 0.628 0.941 0.867 0.399 0.220 0.24231123 Ice cream 0.928 0.929 0.932 0.850 0.236 0.332 0.292 0.204 0.860 0.859 0.78331131 Canned fruit, veg. 0.988 0.941 0.936 0.954 0.427 0.650 0.419 0.514 0.921 0.711 0.90631133 Preserved fruit, veg. 0.910 0.905 0.885 0.869 0.347 0.397 0.221 0.249 0.694 0.643 0.68231134 Pulverised fruit, veg. 0.968 0.533 0.415 0.974 0.361 0.100 0.095 0.877 0.252 0.243 0.93131135 Dried fruit, veg. 1.000 1.000 0.792 0.745 1.000 1.00031139 Other fruit, veg. 0.979 1.000 0.913 0.964 0.696 0.668 0.527 0.407 1.000 0.913 0.94631141 Canned fish 0.725 0.563 0.576 0.620 0.202 0.102 0.115 0.135 0.510 0.552 0.61131142 Salted, dried fish 0.714 0.364 0.368 0.431 0.229 0.067 0.050 0.068 0.363 0.365 0.43031143 Smoked fish 1.000 1.000 0.298 0.350 0.000 0.987 0.99531144 Frozen fish 0.224 0.188 0.199 0.289 0.027 0.020 0.025 0.035 0.187 0.199 0.28931145 Processed fish 0.589 0.261 0.181 0.888 0.126 0.043 0.025 0.751 0.257 0.181 0.88831149 Other fish process. 0.769 0.401 0.507 0.798 0.198 0.063 0.083 0.192 0.401 0.507 0.77431151 Cruide cooking oil 0.125 0.098 0.147 0.234 0.016 0.013 0.014 0.022 0.055 0.073 0.22131152 Margarine 1.000 1.000 1.000 0.578 0.534 0.995 0.842 1.000 0.98231153 Coconut oil 0.365 0.857 0.533 0.508 0.054 0.580 0.093 0.096 0.857 0.533 0.50831154 Palm oil 0.846 0.630 0.665 0.455 0.319 0.161 0.217 0.076 0.562 0.649 0.44631155 Other cooking oils 1.000 1.000 1.000 1.000 1.000 0.846 0.926 0.828 0.924 0.962 0.89231159 Other oil, fats 1.000 1.000 1.000 0.996 0.370 1.000 1.000 0.647 1.000 0.936 0.99631161 Rice milling 0.119 0.065 0.116 0.145 0.009 0.007 0.009 0.012 0.057 0.021 0.03831162 Other grain milling 1.000 0.856 0.810 0.774 0.625 0.253 0.204 0.176 0.856 0.810 0.74431163 Coffee cleaning 0.329 0.530 0.512 0.596 0.046 0.137 0.091 0.109 0.530 0.512 0.59631164 Other seeds clean. 0.366 0.677 0.533 0.814 0.056 0.134 0.115 0.474 0.676 0.532 0.81431165 Nuts 0.316 0.428 0.453 0.378 0.046 0.074 0.082 0.063 0.293 0.183 0.32331166 Roots 1.000 0.958 1.000 1.000 0.346 0.681 0.893 0.796 0.958 1.000 1.00031167 Copra 0.952 0.851 0.956 0.812 0.365 0.201 0.727 0.428 0.846 0.956 0.80131168 Wheat flour 1.000 1.000 1.000 0.989 0.454 0.439 0.476 0.315 0.978 0.992 0.97931169 Other flour 0.707 0.555 0.774 0.766 0.138 0.102 0.379 0.210 0.408 0.756 0.75031171 Noodles, spaghetti 0.576 0.961 0.469 0.509 0.120 0.864 0.085 0.102 0.956 0.467 0.50931179 Bakery products 0.874 0.314 0.288 0.290 0.675 0.040 0.038 0.032 0.312 0.282 0.28831181 Granulated sugar 0.193 0.211 0.207 0.246 0.024 0.025 0.026 0.029 0.200 0.168 0.18931182 Brown sugar 0.283 0.847 0.782 0.749 0.045 0.256 0.203 0.165 0.847 0.773 0.74931183 Other sugars 1.000 0.984 0.665 0.933 1.000 0.504 0.164 0.695 0.072 0.004 0.12031184 Syrup 0.777 0.682 0.924 0.938 0.323 0.133 0.330 0.387 0.654 0.815 0.79431189 Other sugar proc. 1.000 0.902 0.942 0.878 0.325 0.310 0.392 0.252 0.869 0.926 0.87831191 Chocolate powder 0.984 0.968 0.891 0.910 0.415 0.374 0.351 0.448 0.942 0.882 0.90631192 Confectionery 0.533 0.531 0.575 0.544 0.104 0.102 0.118 0.091 0.490 0.404 0.507 Source: Medium and large manufacturing Statistics, various years (indicators compiled by Medium and Large Manufacturing Statistics Division, Central Bureau of Statistics).
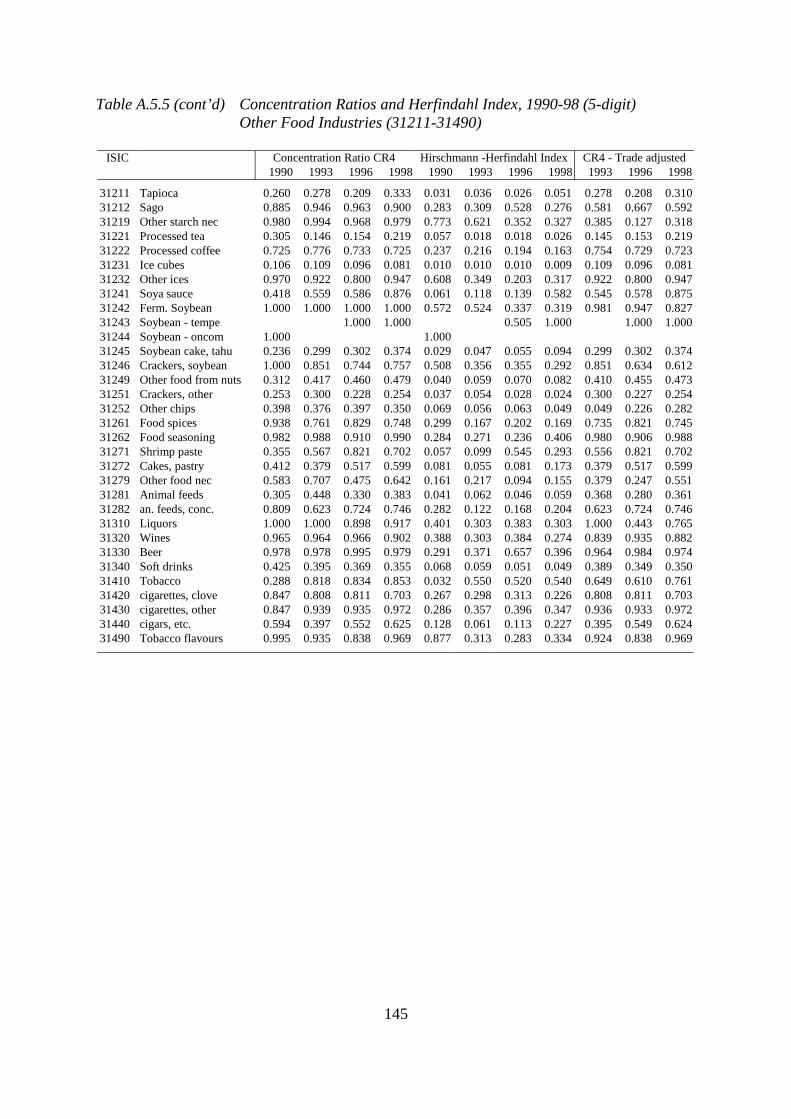
145
Table A.5.5 (cont’d) Concentration Ratios and Herfindahl Index, 1990-98 (5-digit) Other Food Industries (31211-31490)
ISIC Concentration Ratio CR4 Hirschmann -Herfindahl Index CR4 - Trade adjusted
1990 1993 1996 1998 1990 1993 1996 1998 1993 1996 1998
31211 Tapioca 0.260 0.278 0.209 0.333 0.031 0.036 0.026 0.051 0.278 0.208 0.31031212 Sago 0.885 0.946 0.963 0.900 0.283 0.309 0.528 0.276 0.581 0.667 0.59231219 Other starch nec 0.980 0.994 0.968 0.979 0.773 0.621 0.352 0.327 0.385 0.127 0.31831221 Processed tea 0.305 0.146 0.154 0.219 0.057 0.018 0.018 0.026 0.145 0.153 0.21931222 Processed coffee 0.725 0.776 0.733 0.725 0.237 0.216 0.194 0.163 0.754 0.729 0.72331231 Ice cubes 0.106 0.109 0.096 0.081 0.010 0.010 0.010 0.009 0.109 0.096 0.08131232 Other ices 0.970 0.922 0.800 0.947 0.608 0.349 0.203 0.317 0.922 0.800 0.94731241 Soya sauce 0.418 0.559 0.586 0.876 0.061 0.118 0.139 0.582 0.545 0.578 0.87531242 Ferm. Soybean 1.000 1.000 1.000 1.000 0.572 0.524 0.337 0.319 0.981 0.947 0.82731243 Soybean - tempe 1.000 1.000 0.505 1.000 1.000 1.00031244 Soybean - oncom 1.000 1.000 31245 Soybean cake, tahu 0.236 0.299 0.302 0.374 0.029 0.047 0.055 0.094 0.299 0.302 0.37431246 Crackers, soybean 1.000 0.851 0.744 0.757 0.508 0.356 0.355 0.292 0.851 0.634 0.61231249 Other food from nuts 0.312 0.417 0.460 0.479 0.040 0.059 0.070 0.082 0.410 0.455 0.47331251 Crackers, other 0.253 0.300 0.228 0.254 0.037 0.054 0.028 0.024 0.300 0.227 0.25431252 Other chips 0.398 0.376 0.397 0.350 0.069 0.056 0.063 0.049 0.049 0.226 0.28231261 Food spices 0.938 0.761 0.829 0.748 0.299 0.167 0.202 0.169 0.735 0.821 0.74531262 Food seasoning 0.982 0.988 0.910 0.990 0.284 0.271 0.236 0.406 0.980 0.906 0.98831271 Shrimp paste 0.355 0.567 0.821 0.702 0.057 0.099 0.545 0.293 0.556 0.821 0.70231272 Cakes, pastry 0.412 0.379 0.517 0.599 0.081 0.055 0.081 0.173 0.379 0.517 0.59931279 Other food nec 0.583 0.707 0.475 0.642 0.161 0.217 0.094 0.155 0.379 0.247 0.55131281 Animal feeds 0.305 0.448 0.330 0.383 0.041 0.062 0.046 0.059 0.368 0.280 0.36131282 an. feeds, conc. 0.809 0.623 0.724 0.746 0.282 0.122 0.168 0.204 0.623 0.724 0.74631310 Liquors 1.000 1.000 0.898 0.917 0.401 0.303 0.383 0.303 1.000 0.443 0.76531320 Wines 0.965 0.964 0.966 0.902 0.388 0.303 0.384 0.274 0.839 0.935 0.88231330 Beer 0.978 0.978 0.995 0.979 0.291 0.371 0.657 0.396 0.964 0.984 0.97431340 Soft drinks 0.425 0.395 0.369 0.355 0.068 0.059 0.051 0.049 0.389 0.349 0.35031410 Tobacco 0.288 0.818 0.834 0.853 0.032 0.550 0.520 0.540 0.649 0.610 0.76131420 cigarettes, clove 0.847 0.808 0.811 0.703 0.267 0.298 0.313 0.226 0.808 0.811 0.70331430 cigarettes, other 0.847 0.939 0.935 0.972 0.286 0.357 0.396 0.347 0.936 0.933 0.97231440 cigars, etc. 0.594 0.397 0.552 0.625 0.128 0.061 0.113 0.227 0.395 0.549 0.62431490 Tobacco flavours 0.995 0.935 0.838 0.969 0.877 0.313 0.283 0.334 0.924 0.838 0.969
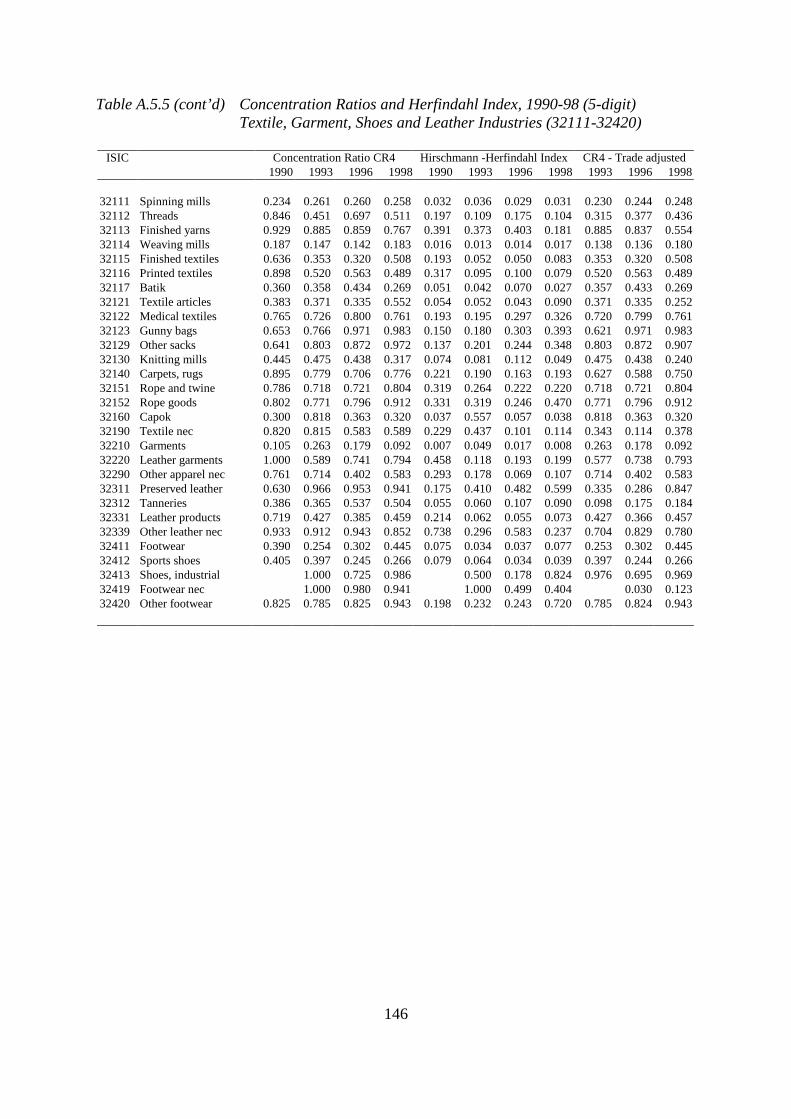
146
Table A.5.5 (cont’d) Concentration Ratios and Herfindahl Index, 1990-98 (5-digit) Textile, Garment, Shoes and Leather Industries (32111-32420)
ISIC Concentration Ratio CR4 Hirschmann -Herfindahl Index CR4 - Trade adjusted
1990 1993 1996 1998 1990 1993 1996 1998 1993 1996 1998
32111 Spinning mills 0.234 0.261 0.260 0.258 0.032 0.036 0.029 0.031 0.230 0.244 0.24832112 Threads 0.846 0.451 0.697 0.511 0.197 0.109 0.175 0.104 0.315 0.377 0.43632113 Finished yarns 0.929 0.885 0.859 0.767 0.391 0.373 0.403 0.181 0.885 0.837 0.55432114 Weaving mills 0.187 0.147 0.142 0.183 0.016 0.013 0.014 0.017 0.138 0.136 0.18032115 Finished textiles 0.636 0.353 0.320 0.508 0.193 0.052 0.050 0.083 0.353 0.320 0.50832116 Printed textiles 0.898 0.520 0.563 0.489 0.317 0.095 0.100 0.079 0.520 0.563 0.48932117 Batik 0.360 0.358 0.434 0.269 0.051 0.042 0.070 0.027 0.357 0.433 0.26932121 Textile articles 0.383 0.371 0.335 0.552 0.054 0.052 0.043 0.090 0.371 0.335 0.25232122 Medical textiles 0.765 0.726 0.800 0.761 0.193 0.195 0.297 0.326 0.720 0.799 0.76132123 Gunny bags 0.653 0.766 0.971 0.983 0.150 0.180 0.303 0.393 0.621 0.971 0.98332129 Other sacks 0.641 0.803 0.872 0.972 0.137 0.201 0.244 0.348 0.803 0.872 0.90732130 Knitting mills 0.445 0.475 0.438 0.317 0.074 0.081 0.112 0.049 0.475 0.438 0.24032140 Carpets, rugs 0.895 0.779 0.706 0.776 0.221 0.190 0.163 0.193 0.627 0.588 0.75032151 Rope and twine 0.786 0.718 0.721 0.804 0.319 0.264 0.222 0.220 0.718 0.721 0.80432152 Rope goods 0.802 0.771 0.796 0.912 0.331 0.319 0.246 0.470 0.771 0.796 0.91232160 Capok 0.300 0.818 0.363 0.320 0.037 0.557 0.057 0.038 0.818 0.363 0.32032190 Textile nec 0.820 0.815 0.583 0.589 0.229 0.437 0.101 0.114 0.343 0.114 0.37832210 Garments 0.105 0.263 0.179 0.092 0.007 0.049 0.017 0.008 0.263 0.178 0.09232220 Leather garments 1.000 0.589 0.741 0.794 0.458 0.118 0.193 0.199 0.577 0.738 0.79332290 Other apparel nec 0.761 0.714 0.402 0.583 0.293 0.178 0.069 0.107 0.714 0.402 0.58332311 Preserved leather 0.630 0.966 0.953 0.941 0.175 0.410 0.482 0.599 0.335 0.286 0.84732312 Tanneries 0.386 0.365 0.537 0.504 0.055 0.060 0.107 0.090 0.098 0.175 0.18432331 Leather products 0.719 0.427 0.385 0.459 0.214 0.062 0.055 0.073 0.427 0.366 0.45732339 Other leather nec 0.933 0.912 0.943 0.852 0.738 0.296 0.583 0.237 0.704 0.829 0.78032411 Footwear 0.390 0.254 0.302 0.445 0.075 0.034 0.037 0.077 0.253 0.302 0.44532412 Sports shoes 0.405 0.397 0.245 0.266 0.079 0.064 0.034 0.039 0.397 0.244 0.26632413 Shoes, industrial 1.000 0.725 0.986 0.500 0.178 0.824 0.976 0.695 0.96932419 Footwear nec 1.000 0.980 0.941 1.000 0.499 0.404 0.030 0.12332420 Other footwear 0.825 0.785 0.825 0.943 0.198 0.232 0.243 0.720 0.785 0.824 0.943
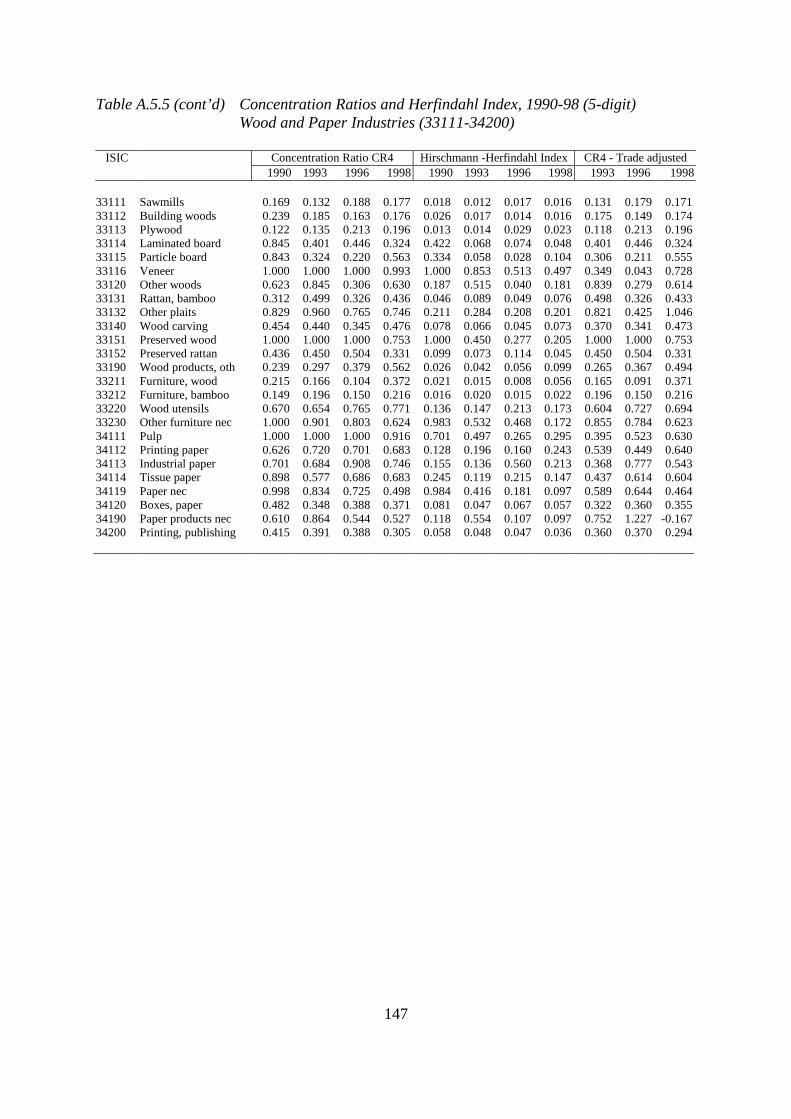
147
Table A.5.5 (cont’d) Concentration Ratios and Herfindahl Index, 1990-98 (5-digit) Wood and Paper Industries (33111-34200)
ISIC Concentration Ratio CR4 Hirschmann -Herfindahl Index CR4 - Trade adjusted
1990 1993 1996 1998 1990 1993 1996 1998 1993 1996 1998
33111 Sawmills 0.169 0.132 0.188 0.177 0.018 0.012 0.017 0.016 0.131 0.179 0.17133112 Building woods 0.239 0.185 0.163 0.176 0.026 0.017 0.014 0.016 0.175 0.149 0.17433113 Plywood 0.122 0.135 0.213 0.196 0.013 0.014 0.029 0.023 0.118 0.213 0.19633114 Laminated board 0.845 0.401 0.446 0.324 0.422 0.068 0.074 0.048 0.401 0.446 0.32433115 Particle board 0.843 0.324 0.220 0.563 0.334 0.058 0.028 0.104 0.306 0.211 0.55533116 Veneer 1.000 1.000 1.000 0.993 1.000 0.853 0.513 0.497 0.349 0.043 0.72833120 Other woods 0.623 0.845 0.306 0.630 0.187 0.515 0.040 0.181 0.839 0.279 0.61433131 Rattan, bamboo 0.312 0.499 0.326 0.436 0.046 0.089 0.049 0.076 0.498 0.326 0.43333132 Other plaits 0.829 0.960 0.765 0.746 0.211 0.284 0.208 0.201 0.821 0.425 1.04633140 Wood carving 0.454 0.440 0.345 0.476 0.078 0.066 0.045 0.073 0.370 0.341 0.47333151 Preserved wood 1.000 1.000 1.000 0.753 1.000 0.450 0.277 0.205 1.000 1.000 0.75333152 Preserved rattan 0.436 0.450 0.504 0.331 0.099 0.073 0.114 0.045 0.450 0.504 0.33133190 Wood products, oth 0.239 0.297 0.379 0.562 0.026 0.042 0.056 0.099 0.265 0.367 0.49433211 Furniture, wood 0.215 0.166 0.104 0.372 0.021 0.015 0.008 0.056 0.165 0.091 0.37133212 Furniture, bamboo 0.149 0.196 0.150 0.216 0.016 0.020 0.015 0.022 0.196 0.150 0.21633220 Wood utensils 0.670 0.654 0.765 0.771 0.136 0.147 0.213 0.173 0.604 0.727 0.69433230 Other furniture nec 1.000 0.901 0.803 0.624 0.983 0.532 0.468 0.172 0.855 0.784 0.62334111 Pulp 1.000 1.000 1.000 0.916 0.701 0.497 0.265 0.295 0.395 0.523 0.63034112 Printing paper 0.626 0.720 0.701 0.683 0.128 0.196 0.160 0.243 0.539 0.449 0.64034113 Industrial paper 0.701 0.684 0.908 0.746 0.155 0.136 0.560 0.213 0.368 0.777 0.54334114 Tissue paper 0.898 0.577 0.686 0.683 0.245 0.119 0.215 0.147 0.437 0.614 0.60434119 Paper nec 0.998 0.834 0.725 0.498 0.984 0.416 0.181 0.097 0.589 0.644 0.46434120 Boxes, paper 0.482 0.348 0.388 0.371 0.081 0.047 0.067 0.057 0.322 0.360 0.35534190 Paper products nec 0.610 0.864 0.544 0.527 0.118 0.554 0.107 0.097 0.752 1.227 -0.16734200 Printing, publishing 0.415 0.391 0.388 0.305 0.058 0.048 0.047 0.036 0.360 0.370 0.294
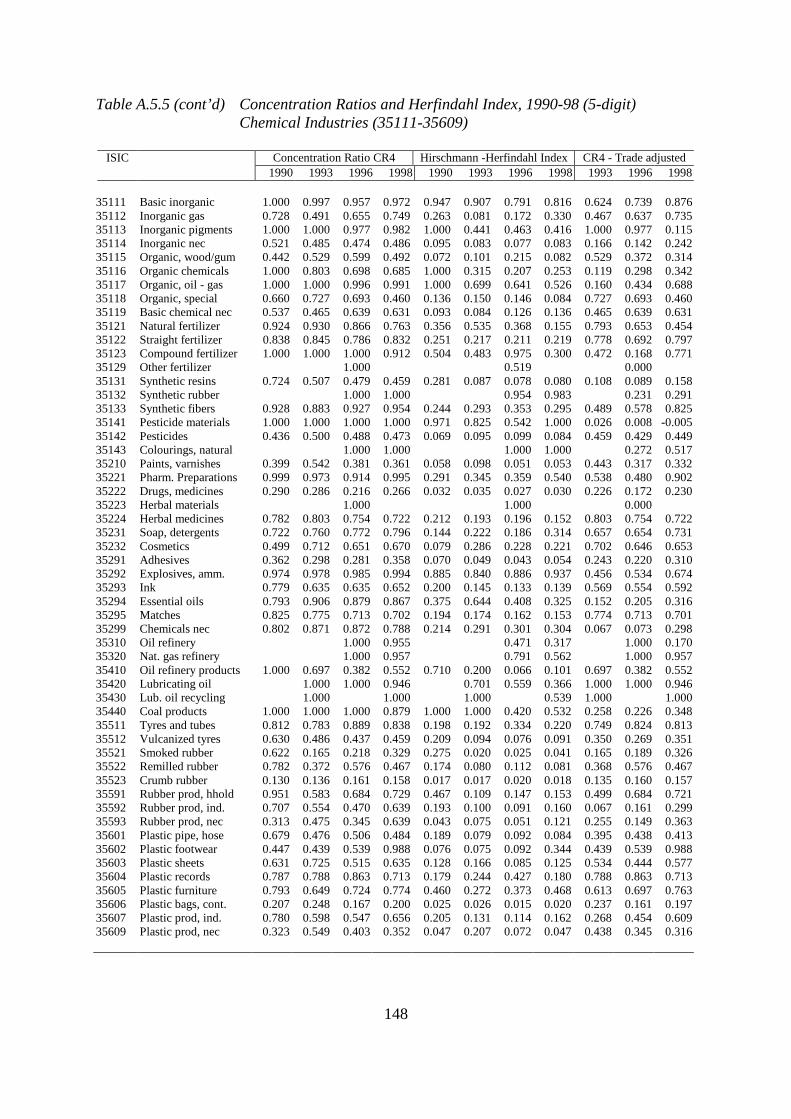
148
Table A.5.5 (cont’d) Concentration Ratios and Herfindahl Index, 1990-98 (5-digit) Chemical Industries (35111-35609)
ISIC Concentration Ratio CR4 Hirschmann -Herfindahl Index CR4 - Trade adjusted
1990 1993 1996 1998 1990 1993 1996 1998 1993 1996 1998
35111 Basic inorganic 1.000 0.997 0.957 0.972 0.947 0.907 0.791 0.816 0.624 0.739 0.87635112 Inorganic gas 0.728 0.491 0.655 0.749 0.263 0.081 0.172 0.330 0.467 0.637 0.73535113 Inorganic pigments 1.000 1.000 0.977 0.982 1.000 0.441 0.463 0.416 1.000 0.977 0.11535114 Inorganic nec 0.521 0.485 0.474 0.486 0.095 0.083 0.077 0.083 0.166 0.142 0.24235115 Organic, wood/gum 0.442 0.529 0.599 0.492 0.072 0.101 0.215 0.082 0.529 0.372 0.31435116 Organic chemicals 1.000 0.803 0.698 0.685 1.000 0.315 0.207 0.253 0.119 0.298 0.34235117 Organic, oil - gas 1.000 1.000 0.996 0.991 1.000 0.699 0.641 0.526 0.160 0.434 0.68835118 Organic, special 0.660 0.727 0.693 0.460 0.136 0.150 0.146 0.084 0.727 0.693 0.46035119 Basic chemical nec 0.537 0.465 0.639 0.631 0.093 0.084 0.126 0.136 0.465 0.639 0.63135121 Natural fertilizer 0.924 0.930 0.866 0.763 0.356 0.535 0.368 0.155 0.793 0.653 0.45435122 Straight fertilizer 0.838 0.845 0.786 0.832 0.251 0.217 0.211 0.219 0.778 0.692 0.79735123 Compound fertilizer 1.000 1.000 1.000 0.912 0.504 0.483 0.975 0.300 0.472 0.168 0.77135129 Other fertilizer 1.000 0.519 0.000 35131 Synthetic resins 0.724 0.507 0.479 0.459 0.281 0.087 0.078 0.080 0.108 0.089 0.15835132 Synthetic rubber 1.000 1.000 0.954 0.983 0.231 0.29135133 Synthetic fibers 0.928 0.883 0.927 0.954 0.244 0.293 0.353 0.295 0.489 0.578 0.82535141 Pesticide materials 1.000 1.000 1.000 1.000 0.971 0.825 0.542 1.000 0.026 0.008 -0.00535142 Pesticides 0.436 0.500 0.488 0.473 0.069 0.095 0.099 0.084 0.459 0.429 0.44935143 Colourings, natural 1.000 1.000 1.000 1.000 0.272 0.51735210 Paints, varnishes 0.399 0.542 0.381 0.361 0.058 0.098 0.051 0.053 0.443 0.317 0.33235221 Pharm. Preparations 0.999 0.973 0.914 0.995 0.291 0.345 0.359 0.540 0.538 0.480 0.90235222 Drugs, medicines 0.290 0.286 0.216 0.266 0.032 0.035 0.027 0.030 0.226 0.172 0.23035223 Herbal materials 1.000 1.000 0.000 35224 Herbal medicines 0.782 0.803 0.754 0.722 0.212 0.193 0.196 0.152 0.803 0.754 0.72235231 Soap, detergents 0.722 0.760 0.772 0.796 0.144 0.222 0.186 0.314 0.657 0.654 0.73135232 Cosmetics 0.499 0.712 0.651 0.670 0.079 0.286 0.228 0.221 0.702 0.646 0.65335291 Adhesives 0.362 0.298 0.281 0.358 0.070 0.049 0.043 0.054 0.243 0.220 0.31035292 Explosives, amm. 0.974 0.978 0.985 0.994 0.885 0.840 0.886 0.937 0.456 0.534 0.67435293 Ink 0.779 0.635 0.635 0.652 0.200 0.145 0.133 0.139 0.569 0.554 0.59235294 Essential oils 0.793 0.906 0.879 0.867 0.375 0.644 0.408 0.325 0.152 0.205 0.31635295 Matches 0.825 0.775 0.713 0.702 0.194 0.174 0.162 0.153 0.774 0.713 0.70135299 Chemicals nec 0.802 0.871 0.872 0.788 0.214 0.291 0.301 0.304 0.067 0.073 0.29835310 Oil refinery 1.000 0.955 0.471 0.317 1.000 0.17035320 Nat. gas refinery 1.000 0.957 0.791 0.562 1.000 0.95735410 Oil refinery products 1.000 0.697 0.382 0.552 0.710 0.200 0.066 0.101 0.697 0.382 0.55235420 Lubricating oil 1.000 1.000 0.946 0.701 0.559 0.366 1.000 1.000 0.94635430 Lub. oil recycling 1.000 1.000 1.000 0.539 1.000 1.00035440 Coal products 1.000 1.000 1.000 0.879 1.000 1.000 0.420 0.532 0.258 0.226 0.34835511 Tyres and tubes 0.812 0.783 0.889 0.838 0.198 0.192 0.334 0.220 0.749 0.824 0.81335512 Vulcanized tyres 0.630 0.486 0.437 0.459 0.209 0.094 0.076 0.091 0.350 0.269 0.35135521 Smoked rubber 0.622 0.165 0.218 0.329 0.275 0.020 0.025 0.041 0.165 0.189 0.32635522 Remilled rubber 0.782 0.372 0.576 0.467 0.174 0.080 0.112 0.081 0.368 0.576 0.46735523 Crumb rubber 0.130 0.136 0.161 0.158 0.017 0.017 0.020 0.018 0.135 0.160 0.15735591 Rubber prod, hhold 0.951 0.583 0.684 0.729 0.467 0.109 0.147 0.153 0.499 0.684 0.72135592 Rubber prod, ind. 0.707 0.554 0.470 0.639 0.193 0.100 0.091 0.160 0.067 0.161 0.29935593 Rubber prod, nec 0.313 0.475 0.345 0.639 0.043 0.075 0.051 0.121 0.255 0.149 0.36335601 Plastic pipe, hose 0.679 0.476 0.506 0.484 0.189 0.079 0.092 0.084 0.395 0.438 0.41335602 Plastic footwear 0.447 0.439 0.539 0.988 0.076 0.075 0.092 0.344 0.439 0.539 0.98835603 Plastic sheets 0.631 0.725 0.515 0.635 0.128 0.166 0.085 0.125 0.534 0.444 0.57735604 Plastic records 0.787 0.788 0.863 0.713 0.179 0.244 0.427 0.180 0.788 0.863 0.71335605 Plastic furniture 0.793 0.649 0.724 0.774 0.460 0.272 0.373 0.468 0.613 0.697 0.76335606 Plastic bags, cont. 0.207 0.248 0.167 0.200 0.025 0.026 0.015 0.020 0.237 0.161 0.19735607 Plastic prod, ind. 0.780 0.598 0.547 0.656 0.205 0.131 0.114 0.162 0.268 0.454 0.60935609 Plastic prod, nec 0.323 0.549 0.403 0.352 0.047 0.207 0.072 0.047 0.438 0.345 0.316
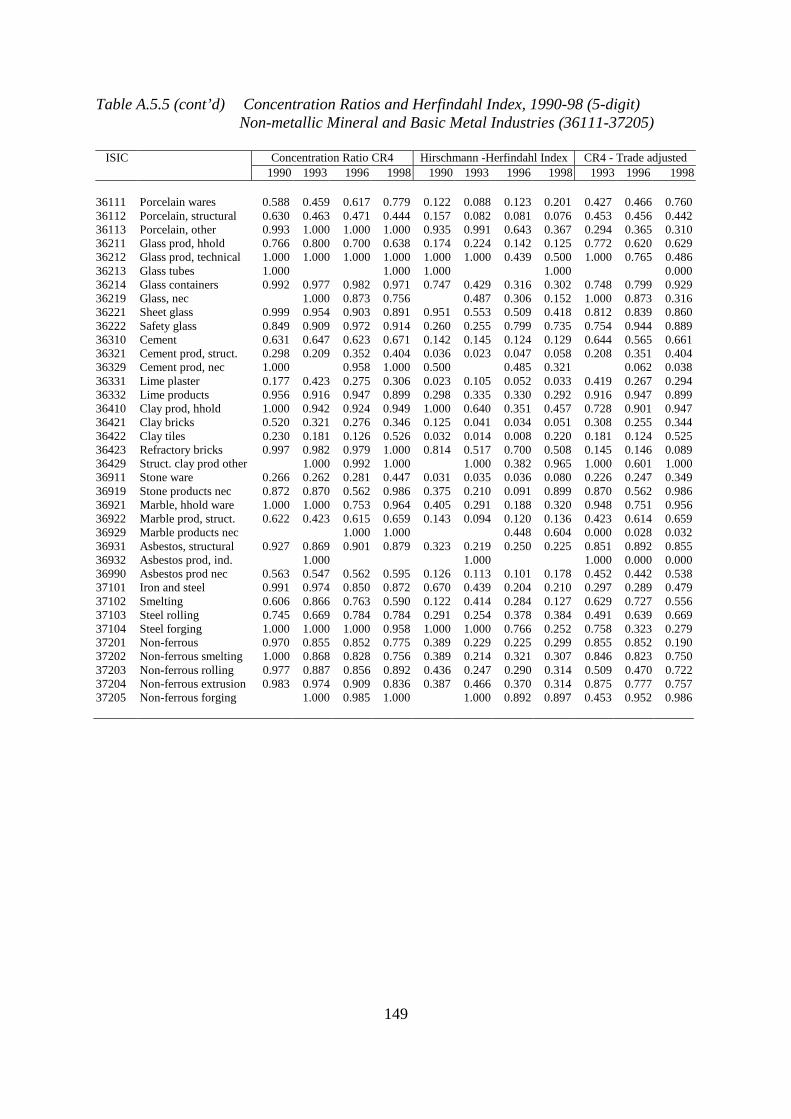
149
Table A.5.5 (cont’d) Concentration Ratios and Herfindahl Index, 1990-98 (5-digit) Non-metallic Mineral and Basic Metal Industries (36111-37205)
ISIC Concentration Ratio CR4 Hirschmann -Herfindahl Index CR4 - Trade adjusted
1990 1993 1996 1998 1990 1993 1996 1998 1993 1996 1998
36111 Porcelain wares 0.588 0.459 0.617 0.779 0.122 0.088 0.123 0.201 0.427 0.466 0.76036112 Porcelain, structural 0.630 0.463 0.471 0.444 0.157 0.082 0.081 0.076 0.453 0.456 0.44236113 Porcelain, other 0.993 1.000 1.000 1.000 0.935 0.991 0.643 0.367 0.294 0.365 0.31036211 Glass prod, hhold 0.766 0.800 0.700 0.638 0.174 0.224 0.142 0.125 0.772 0.620 0.62936212 Glass prod, technical 1.000 1.000 1.000 1.000 1.000 1.000 0.439 0.500 1.000 0.765 0.48636213 Glass tubes 1.000 1.000 1.000 1.000 0.00036214 Glass containers 0.992 0.977 0.982 0.971 0.747 0.429 0.316 0.302 0.748 0.799 0.92936219 Glass, nec 1.000 0.873 0.756 0.487 0.306 0.152 1.000 0.873 0.31636221 Sheet glass 0.999 0.954 0.903 0.891 0.951 0.553 0.509 0.418 0.812 0.839 0.86036222 Safety glass 0.849 0.909 0.972 0.914 0.260 0.255 0.799 0.735 0.754 0.944 0.88936310 Cement 0.631 0.647 0.623 0.671 0.142 0.145 0.124 0.129 0.644 0.565 0.66136321 Cement prod, struct. 0.298 0.209 0.352 0.404 0.036 0.023 0.047 0.058 0.208 0.351 0.40436329 Cement prod, nec 1.000 0.958 1.000 0.500 0.485 0.321 0.062 0.03836331 Lime plaster 0.177 0.423 0.275 0.306 0.023 0.105 0.052 0.033 0.419 0.267 0.29436332 Lime products 0.956 0.916 0.947 0.899 0.298 0.335 0.330 0.292 0.916 0.947 0.89936410 Clay prod, hhold 1.000 0.942 0.924 0.949 1.000 0.640 0.351 0.457 0.728 0.901 0.94736421 Clay bricks 0.520 0.321 0.276 0.346 0.125 0.041 0.034 0.051 0.308 0.255 0.34436422 Clay tiles 0.230 0.181 0.126 0.526 0.032 0.014 0.008 0.220 0.181 0.124 0.52536423 Refractory bricks 0.997 0.982 0.979 1.000 0.814 0.517 0.700 0.508 0.145 0.146 0.08936429 Struct. clay prod other 1.000 0.992 1.000 1.000 0.382 0.965 1.000 0.601 1.00036911 Stone ware 0.266 0.262 0.281 0.447 0.031 0.035 0.036 0.080 0.226 0.247 0.34936919 Stone products nec 0.872 0.870 0.562 0.986 0.375 0.210 0.091 0.899 0.870 0.562 0.98636921 Marble, hhold ware 1.000 1.000 0.753 0.964 0.405 0.291 0.188 0.320 0.948 0.751 0.95636922 Marble prod, struct. 0.622 0.423 0.615 0.659 0.143 0.094 0.120 0.136 0.423 0.614 0.65936929 Marble products nec 1.000 1.000 0.448 0.604 0.000 0.028 0.03236931 Asbestos, structural 0.927 0.869 0.901 0.879 0.323 0.219 0.250 0.225 0.851 0.892 0.85536932 Asbestos prod, ind. 1.000 1.000 1.000 0.000 0.00036990 Asbestos prod nec 0.563 0.547 0.562 0.595 0.126 0.113 0.101 0.178 0.452 0.442 0.53837101 Iron and steel 0.991 0.974 0.850 0.872 0.670 0.439 0.204 0.210 0.297 0.289 0.47937102 Smelting 0.606 0.866 0.763 0.590 0.122 0.414 0.284 0.127 0.629 0.727 0.55637103 Steel rolling 0.745 0.669 0.784 0.784 0.291 0.254 0.378 0.384 0.491 0.639 0.66937104 Steel forging 1.000 1.000 1.000 0.958 1.000 1.000 0.766 0.252 0.758 0.323 0.27937201 Non-ferrous 0.970 0.855 0.852 0.775 0.389 0.229 0.225 0.299 0.855 0.852 0.19037202 Non-ferrous smelting 1.000 0.868 0.828 0.756 0.389 0.214 0.321 0.307 0.846 0.823 0.75037203 Non-ferrous rolling 0.977 0.887 0.856 0.892 0.436 0.247 0.290 0.314 0.509 0.470 0.72237204 Non-ferrous extrusion 0.983 0.974 0.909 0.836 0.387 0.466 0.370 0.314 0.875 0.777 0.75737205 Non-ferrous forging 1.000 0.985 1.000 1.000 0.892 0.897 0.453 0.952 0.986
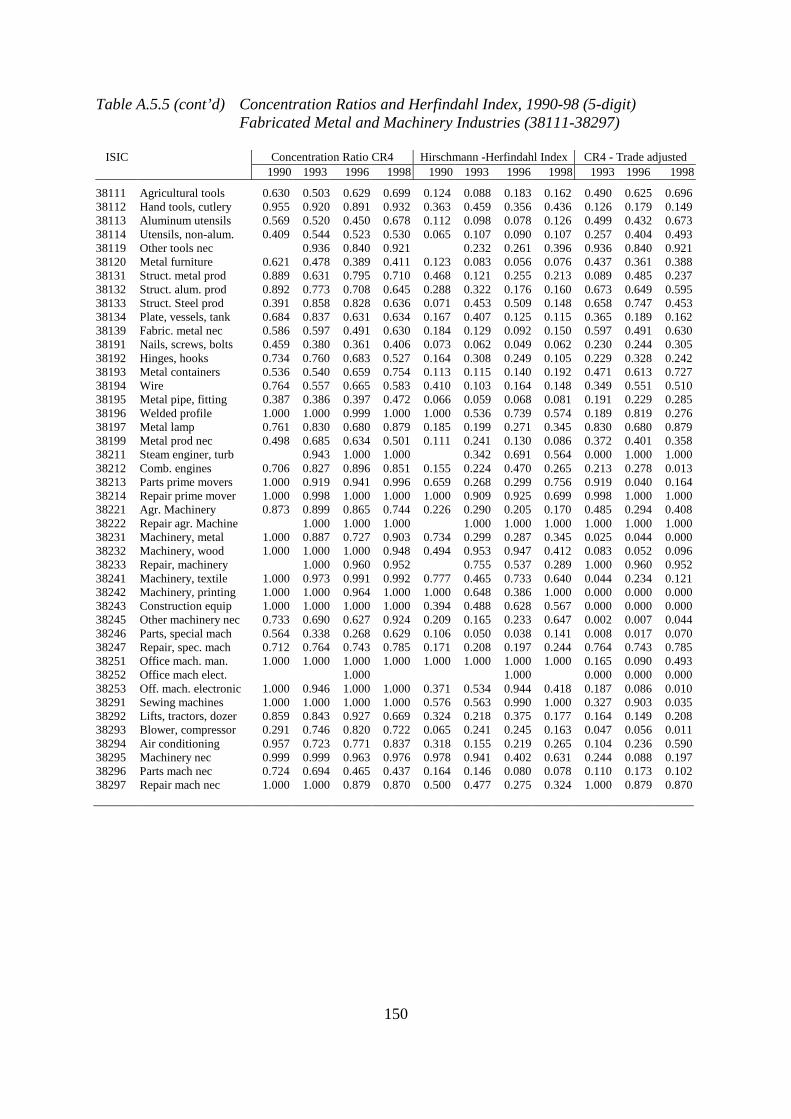
150
Table A.5.5 (cont’d) Concentration Ratios and Herfindahl Index, 1990-98 (5-digit) Fabricated Metal and Machinery Industries (38111-38297)
ISIC Concentration Ratio CR4 Hirschmann -Herfindahl Index CR4 - Trade adjusted
1990 1993 1996 1998 1990 1993 1996 1998 1993 1996 1998
38111 Agricultural tools 0.630 0.503 0.629 0.699 0.124 0.088 0.183 0.162 0.490 0.625 0.69638112 Hand tools, cutlery 0.955 0.920 0.891 0.932 0.363 0.459 0.356 0.436 0.126 0.179 0.14938113 Aluminum utensils 0.569 0.520 0.450 0.678 0.112 0.098 0.078 0.126 0.499 0.432 0.67338114 Utensils, non-alum. 0.409 0.544 0.523 0.530 0.065 0.107 0.090 0.107 0.257 0.404 0.49338119 Other tools nec 0.936 0.840 0.921 0.232 0.261 0.396 0.936 0.840 0.92138120 Metal furniture 0.621 0.478 0.389 0.411 0.123 0.083 0.056 0.076 0.437 0.361 0.38838131 Struct. metal prod 0.889 0.631 0.795 0.710 0.468 0.121 0.255 0.213 0.089 0.485 0.23738132 Struct. alum. prod 0.892 0.773 0.708 0.645 0.288 0.322 0.176 0.160 0.673 0.649 0.59538133 Struct. Steel prod 0.391 0.858 0.828 0.636 0.071 0.453 0.509 0.148 0.658 0.747 0.45338134 Plate, vessels, tank 0.684 0.837 0.631 0.634 0.167 0.407 0.125 0.115 0.365 0.189 0.16238139 Fabric. metal nec 0.586 0.597 0.491 0.630 0.184 0.129 0.092 0.150 0.597 0.491 0.63038191 Nails, screws, bolts 0.459 0.380 0.361 0.406 0.073 0.062 0.049 0.062 0.230 0.244 0.30538192 Hinges, hooks 0.734 0.760 0.683 0.527 0.164 0.308 0.249 0.105 0.229 0.328 0.24238193 Metal containers 0.536 0.540 0.659 0.754 0.113 0.115 0.140 0.192 0.471 0.613 0.72738194 Wire 0.764 0.557 0.665 0.583 0.410 0.103 0.164 0.148 0.349 0.551 0.51038195 Metal pipe, fitting 0.387 0.386 0.397 0.472 0.066 0.059 0.068 0.081 0.191 0.229 0.28538196 Welded profile 1.000 1.000 0.999 1.000 1.000 0.536 0.739 0.574 0.189 0.819 0.27638197 Metal lamp 0.761 0.830 0.680 0.879 0.185 0.199 0.271 0.345 0.830 0.680 0.87938199 Metal prod nec 0.498 0.685 0.634 0.501 0.111 0.241 0.130 0.086 0.372 0.401 0.35838211 Steam enginer, turb 0.943 1.000 1.000 0.342 0.691 0.564 0.000 1.000 1.00038212 Comb. engines 0.706 0.827 0.896 0.851 0.155 0.224 0.470 0.265 0.213 0.278 0.01338213 Parts prime movers 1.000 0.919 0.941 0.996 0.659 0.268 0.299 0.756 0.919 0.040 0.16438214 Repair prime mover 1.000 0.998 1.000 1.000 1.000 0.909 0.925 0.699 0.998 1.000 1.00038221 Agr. Machinery 0.873 0.899 0.865 0.744 0.226 0.290 0.205 0.170 0.485 0.294 0.40838222 Repair agr. Machine 1.000 1.000 1.000 1.000 1.000 1.000 1.000 1.000 1.00038231 Machinery, metal 1.000 0.887 0.727 0.903 0.734 0.299 0.287 0.345 0.025 0.044 0.00038232 Machinery, wood 1.000 1.000 1.000 0.948 0.494 0.953 0.947 0.412 0.083 0.052 0.09638233 Repair, machinery 1.000 0.960 0.952 0.755 0.537 0.289 1.000 0.960 0.95238241 Machinery, textile 1.000 0.973 0.991 0.992 0.777 0.465 0.733 0.640 0.044 0.234 0.12138242 Machinery, printing 1.000 1.000 0.964 1.000 1.000 0.648 0.386 1.000 0.000 0.000 0.00038243 Construction equip 1.000 1.000 1.000 1.000 0.394 0.488 0.628 0.567 0.000 0.000 0.00038245 Other machinery nec 0.733 0.690 0.627 0.924 0.209 0.165 0.233 0.647 0.002 0.007 0.04438246 Parts, special mach 0.564 0.338 0.268 0.629 0.106 0.050 0.038 0.141 0.008 0.017 0.07038247 Repair, spec. mach 0.712 0.764 0.743 0.785 0.171 0.208 0.197 0.244 0.764 0.743 0.78538251 Office mach. man. 1.000 1.000 1.000 1.000 1.000 1.000 1.000 1.000 0.165 0.090 0.49338252 Office mach elect. 1.000 1.000 0.000 0.000 0.00038253 Off. mach. electronic 1.000 0.946 1.000 1.000 0.371 0.534 0.944 0.418 0.187 0.086 0.01038291 Sewing machines 1.000 1.000 1.000 1.000 0.576 0.563 0.990 1.000 0.327 0.903 0.03538292 Lifts, tractors, dozer 0.859 0.843 0.927 0.669 0.324 0.218 0.375 0.177 0.164 0.149 0.20838293 Blower, compressor 0.291 0.746 0.820 0.722 0.065 0.241 0.245 0.163 0.047 0.056 0.01138294 Air conditioning 0.957 0.723 0.771 0.837 0.318 0.155 0.219 0.265 0.104 0.236 0.59038295 Machinery nec 0.999 0.999 0.963 0.976 0.978 0.941 0.402 0.631 0.244 0.088 0.19738296 Parts mach nec 0.724 0.694 0.465 0.437 0.164 0.146 0.080 0.078 0.110 0.173 0.10238297 Repair mach nec 1.000 1.000 0.879 0.870 0.500 0.477 0.275 0.324 1.000 0.879 0.870
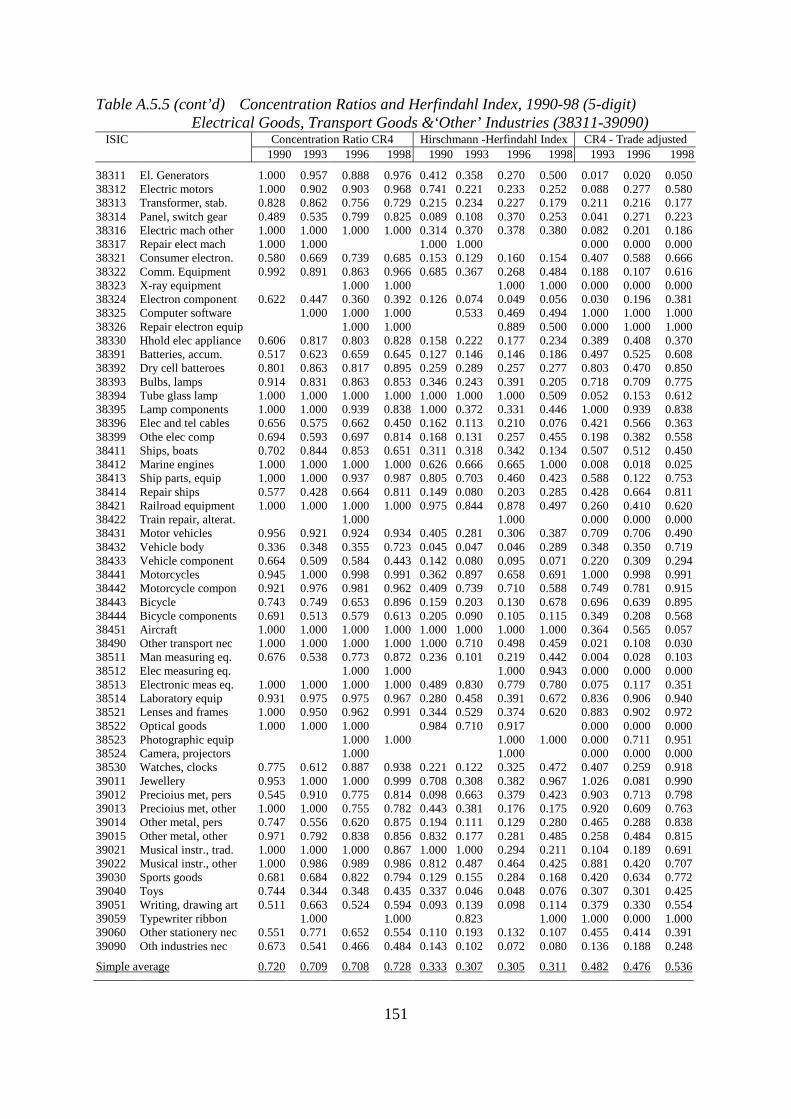
151
Table A.5.5 (cont’d) Concentration Ratios and Herfindahl Index, 1990-98 (5-digit) Electrical Goods, Transport Goods &‘Other’ Industries (38311-39090)
ISIC Concentration Ratio CR4 Hirschmann -Herfindahl Index CR4 - Trade adjusted 1990 1993 1996 1998 1990 1993 1996 1998 1993 1996 1998
38311 El. Generators 1.000 0.957 0.888 0.976 0.412 0.358 0.270 0.500 0.017 0.020 0.05038312 Electric motors 1.000 0.902 0.903 0.968 0.741 0.221 0.233 0.252 0.088 0.277 0.58038313 Transformer, stab. 0.828 0.862 0.756 0.729 0.215 0.234 0.227 0.179 0.211 0.216 0.17738314 Panel, switch gear 0.489 0.535 0.799 0.825 0.089 0.108 0.370 0.253 0.041 0.271 0.22338316 Electric mach other 1.000 1.000 1.000 1.000 0.314 0.370 0.378 0.380 0.082 0.201 0.18638317 Repair elect mach 1.000 1.000 1.000 1.000 0.000 0.000 0.00038321 Consumer electron. 0.580 0.669 0.739 0.685 0.153 0.129 0.160 0.154 0.407 0.588 0.66638322 Comm. Equipment 0.992 0.891 0.863 0.966 0.685 0.367 0.268 0.484 0.188 0.107 0.61638323 X-ray equipment 1.000 1.000 1.000 1.000 0.000 0.000 0.00038324 Electron component 0.622 0.447 0.360 0.392 0.126 0.074 0.049 0.056 0.030 0.196 0.38138325 Computer software 1.000 1.000 1.000 0.533 0.469 0.494 1.000 1.000 1.00038326 Repair electron equip 1.000 1.000 0.889 0.500 0.000 1.000 1.00038330 Hhold elec appliance 0.606 0.817 0.803 0.828 0.158 0.222 0.177 0.234 0.389 0.408 0.37038391 Batteries, accum. 0.517 0.623 0.659 0.645 0.127 0.146 0.146 0.186 0.497 0.525 0.60838392 Dry cell batteroes 0.801 0.863 0.817 0.895 0.259 0.289 0.257 0.277 0.803 0.470 0.85038393 Bulbs, lamps 0.914 0.831 0.863 0.853 0.346 0.243 0.391 0.205 0.718 0.709 0.77538394 Tube glass lamp 1.000 1.000 1.000 1.000 1.000 1.000 1.000 0.509 0.052 0.153 0.61238395 Lamp components 1.000 1.000 0.939 0.838 1.000 0.372 0.331 0.446 1.000 0.939 0.83838396 Elec and tel cables 0.656 0.575 0.662 0.450 0.162 0.113 0.210 0.076 0.421 0.566 0.36338399 Othe elec comp 0.694 0.593 0.697 0.814 0.168 0.131 0.257 0.455 0.198 0.382 0.55838411 Ships, boats 0.702 0.844 0.853 0.651 0.311 0.318 0.342 0.134 0.507 0.512 0.45038412 Marine engines 1.000 1.000 1.000 1.000 0.626 0.666 0.665 1.000 0.008 0.018 0.02538413 Ship parts, equip 1.000 1.000 0.937 0.987 0.805 0.703 0.460 0.423 0.588 0.122 0.75338414 Repair ships 0.577 0.428 0.664 0.811 0.149 0.080 0.203 0.285 0.428 0.664 0.81138421 Railroad equipment 1.000 1.000 1.000 1.000 0.975 0.844 0.878 0.497 0.260 0.410 0.62038422 Train repair, alterat. 1.000 1.000 0.000 0.000 0.00038431 Motor vehicles 0.956 0.921 0.924 0.934 0.405 0.281 0.306 0.387 0.709 0.706 0.49038432 Vehicle body 0.336 0.348 0.355 0.723 0.045 0.047 0.046 0.289 0.348 0.350 0.71938433 Vehicle component 0.664 0.509 0.584 0.443 0.142 0.080 0.095 0.071 0.220 0.309 0.29438441 Motorcycles 0.945 1.000 0.998 0.991 0.362 0.897 0.658 0.691 1.000 0.998 0.99138442 Motorcycle compon 0.921 0.976 0.981 0.962 0.409 0.739 0.710 0.588 0.749 0.781 0.91538443 Bicycle 0.743 0.749 0.653 0.896 0.159 0.203 0.130 0.678 0.696 0.639 0.89538444 Bicycle components 0.691 0.513 0.579 0.613 0.205 0.090 0.105 0.115 0.349 0.208 0.56838451 Aircraft 1.000 1.000 1.000 1.000 1.000 1.000 1.000 1.000 0.364 0.565 0.05738490 Other transport nec 1.000 1.000 1.000 1.000 1.000 0.710 0.498 0.459 0.021 0.108 0.03038511 Man measuring eq. 0.676 0.538 0.773 0.872 0.236 0.101 0.219 0.442 0.004 0.028 0.10338512 Elec measuring eq. 1.000 1.000 1.000 0.943 0.000 0.000 0.00038513 Electronic meas eq. 1.000 1.000 1.000 1.000 0.489 0.830 0.779 0.780 0.075 0.117 0.35138514 Laboratory equip 0.931 0.975 0.975 0.967 0.280 0.458 0.391 0.672 0.836 0.906 0.94038521 Lenses and frames 1.000 0.950 0.962 0.991 0.344 0.529 0.374 0.620 0.883 0.902 0.97238522 Optical goods 1.000 1.000 1.000 0.984 0.710 0.917 0.000 0.000 0.00038523 Photographic equip 1.000 1.000 1.000 1.000 0.000 0.711 0.95138524 Camera, projectors 1.000 1.000 0.000 0.000 0.00038530 Watches, clocks 0.775 0.612 0.887 0.938 0.221 0.122 0.325 0.472 0.407 0.259 0.91839011 Jewellery 0.953 1.000 1.000 0.999 0.708 0.308 0.382 0.967 1.026 0.081 0.99039012 Precioius met, pers 0.545 0.910 0.775 0.814 0.098 0.663 0.379 0.423 0.903 0.713 0.79839013 Precioius met, other 1.000 1.000 0.755 0.782 0.443 0.381 0.176 0.175 0.920 0.609 0.76339014 Other metal, pers 0.747 0.556 0.620 0.875 0.194 0.111 0.129 0.280 0.465 0.288 0.83839015 Other metal, other 0.971 0.792 0.838 0.856 0.832 0.177 0.281 0.485 0.258 0.484 0.81539021 Musical instr., trad. 1.000 1.000 1.000 0.867 1.000 1.000 0.294 0.211 0.104 0.189 0.69139022 Musical instr., other 1.000 0.986 0.989 0.986 0.812 0.487 0.464 0.425 0.881 0.420 0.70739030 Sports goods 0.681 0.684 0.822 0.794 0.129 0.155 0.284 0.168 0.420 0.634 0.77239040 Toys 0.744 0.344 0.348 0.435 0.337 0.046 0.048 0.076 0.307 0.301 0.42539051 Writing, drawing art 0.511 0.663 0.524 0.594 0.093 0.139 0.098 0.114 0.379 0.330 0.55439059 Typewriter ribbon 1.000 1.000 0.823 1.000 1.000 0.000 1.00039060 Other stationery nec 0.551 0.771 0.652 0.554 0.110 0.193 0.132 0.107 0.455 0.414 0.39139090 Oth industries nec 0.673 0.541 0.466 0.484 0.143 0.102 0.072 0.080 0.136 0.188 0.248
Simple average 0.720 0.709 0.708 0.728 0.333 0.307 0.305 0.311 0.482 0.476 0.536
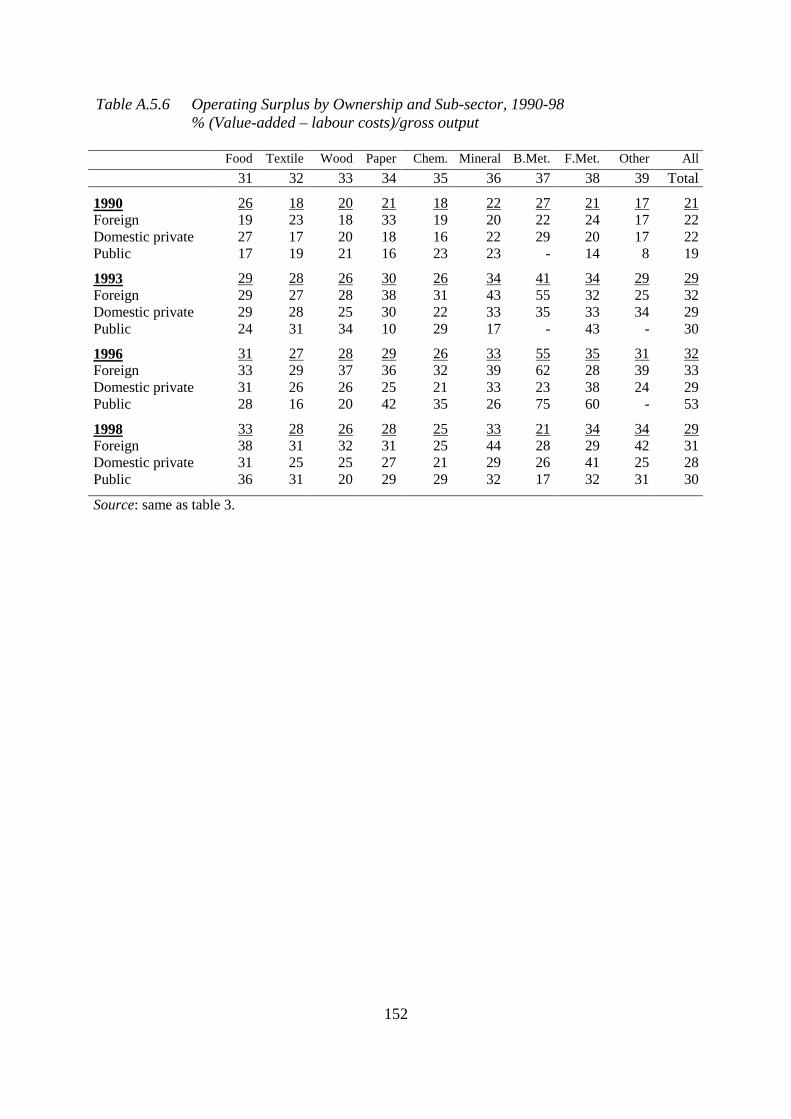
152
Table A.5.6 Operating Surplus by Ownership and Sub-sector, 1990-98 % (Value-added – labour costs)/gross output
Food Textile Wood Paper Chem. Mineral B.Met. F.Met. Other All 31 32 33 34 35 36 37 38 39 Total
1990 26 18 20 21 18 22 27 21 17 21Foreign 19 23 18 33 19 20 22 24 17 22Domestic private 27 17 20 18 16 22 29 20 17 22Public 17 19 21 16 23 23 - 14 8 19
1993 29 28 26 30 26 34 41 34 29 29Foreign 29 27 28 38 31 43 55 32 25 32Domestic private 29 28 25 30 22 33 35 33 34 29Public 24 31 34 10 29 17 - 43 - 30
1996 31 27 28 29 26 33 55 35 31 32Foreign 33 29 37 36 32 39 62 28 39 33Domestic private 31 26 26 25 21 33 23 38 24 29Public 28 16 20 42 35 26 75 60 - 53
1998 33 28 26 28 25 33 21 34 34 29Foreign 38 31 32 31 25 44 28 29 42 31Domestic private 31 25 25 27 21 29 26 41 25 28Public 36 31 20 29 29 32 17 32 31 30
Source: same as table 3.
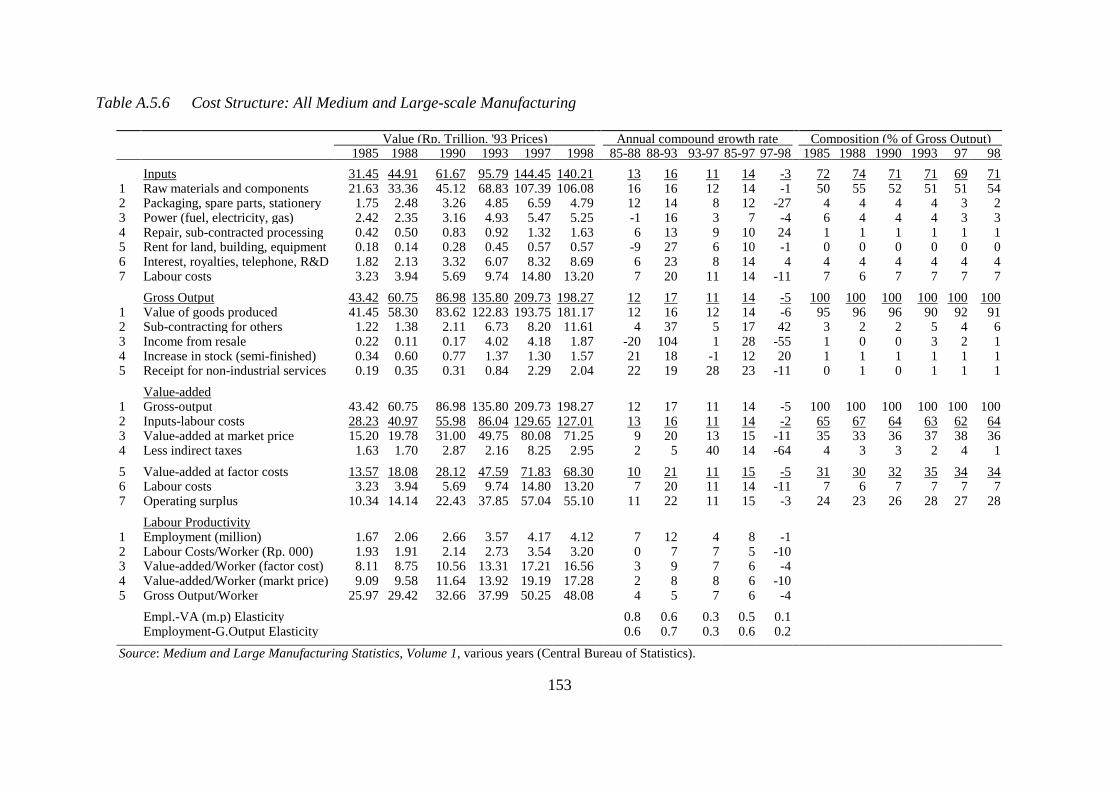
153
Table A.5.6 Cost Structure: All Medium and Large-scale Manufacturing
Value (Rp. Trillion, '93 Prices) Annual compound growth rate Composition (% of Gross Output) 1985 1988 1990 1993 1997 1998 85-88 88-93 93-97 85-97 97-98 1985 1988 1990 1993 97 98 Inputs 31.45 44.91 61.67 95.79 144.45 140.21 13 16 11 14 -3 72 74 71 71 69 71 1 Raw materials and components 21.63 33.36 45.12 68.83 107.39 106.08 16 16 12 14 -1 50 55 52 51 51 54 2 Packaging, spare parts, stationery 1.75 2.48 3.26 4.85 6.59 4.79 12 14 8 12 -27 4 4 4 4 3 2 3 Power (fuel, electricity, gas) 2.42 2.35 3.16 4.93 5.47 5.25 -1 16 3 7 -4 6 4 4 4 3 3 4 Repair, sub-contracted processing 0.42 0.50 0.83 0.92 1.32 1.63 6 13 9 10 24 1 1 1 1 1 1 5 Rent for land, building, equipment 0.18 0.14 0.28 0.45 0.57 0.57 -9 27 6 10 -1 0 0 0 0 0 0 6 Interest, royalties, telephone, R&D 1.82 2.13 3.32 6.07 8.32 8.69 6 23 8 14 4 4 4 4 4 4 4 7 Labour costs 3.23 3.94 5.69 9.74 14.80 13.20 7 20 11 14 -11 7 6 7 7 7 7 Gross Output 43.42 60.75 86.98 135.80 209.73 198.27 12 17 11 14 -5 100 100 100 100 100 100 1 Value of goods produced 41.45 58.30 83.62 122.83 193.75 181.17 12 16 12 14 -6 95 96 96 90 92 91 2 Sub-contracting for others 1.22 1.38 2.11 6.73 8.20 11.61 4 37 5 17 42 3 2 2 5 4 6 3 Income from resale 0.22 0.11 0.17 4.02 4.18 1.87 -20 104 1 28 -55 1 0 0 3 2 1 4 Increase in stock (semi-finished) 0.34 0.60 0.77 1.37 1.30 1.57 21 18 -1 12 20 1 1 1 1 1 1 5 Receipt for non-industrial services 0.19 0.35 0.31 0.84 2.29 2.04 22 19 28 23 -11 0 1 0 1 1 1 Value-added 1 Gross-output 43.42 60.75 86.98 135.80 209.73 198.27 12 17 11 14 -5 100 100 100 100 100 100 2 Inputs-labour costs 28.23 40.97 55.98 86.04 129.65 127.01 13 16 11 14 -2 65 67 64 63 62 64 3 Value-added at market price 15.20 19.78 31.00 49.75 80.08 71.25 9 20 13 15 -11 35 33 36 37 38 36 4 Less indirect taxes 1.63 1.70 2.87 2.16 8.25 2.95 2 5 40 14 -64 4 3 3 2 4 1 5 Value-added at factor costs 13.57 18.08 28.12 47.59 71.83 68.30 10 21 11 15 -5 31 30 32 35 34 34 6 Labour costs 3.23 3.94 5.69 9.74 14.80 13.20 7 20 11 14 -11 7 6 7 7 7 7 7 Operating surplus 10.34 14.14 22.43 37.85 57.04 55.10 11 22 11 15 -3 24 23 26 28 27 28 Labour Productivity 1 Employment (million) 1.67 2.06 2.66 3.57 4.17 4.12 7 12 4 8 -1 2 Labour Costs/Worker (Rp. 000) 1.93 1.91 2.14 2.73 3.54 3.20 0 7 7 5 -10 3 Value-added/Worker (factor cost) 8.11 8.75 10.56 13.31 17.21 16.56 3 9 7 6 -4 4 Value-added/Worker (markt price) 9.09 9.58 11.64 13.92 19.19 17.28 2 8 8 6 -10 5 Gross Output/Worker 25.97 29.42 32.66 37.99 50.25 48.08 4 5 7 6 -4 Empl.-VA (m.p) Elasticity 0.8 0.6 0.3 0.5 0.1 Employment-G.Output Elasticity 0.6 0.7 0.3 0.6 0.2
Source: Medium and Large Manufacturing Statistics, Volume 1, various years (Central Bureau of Statistics).
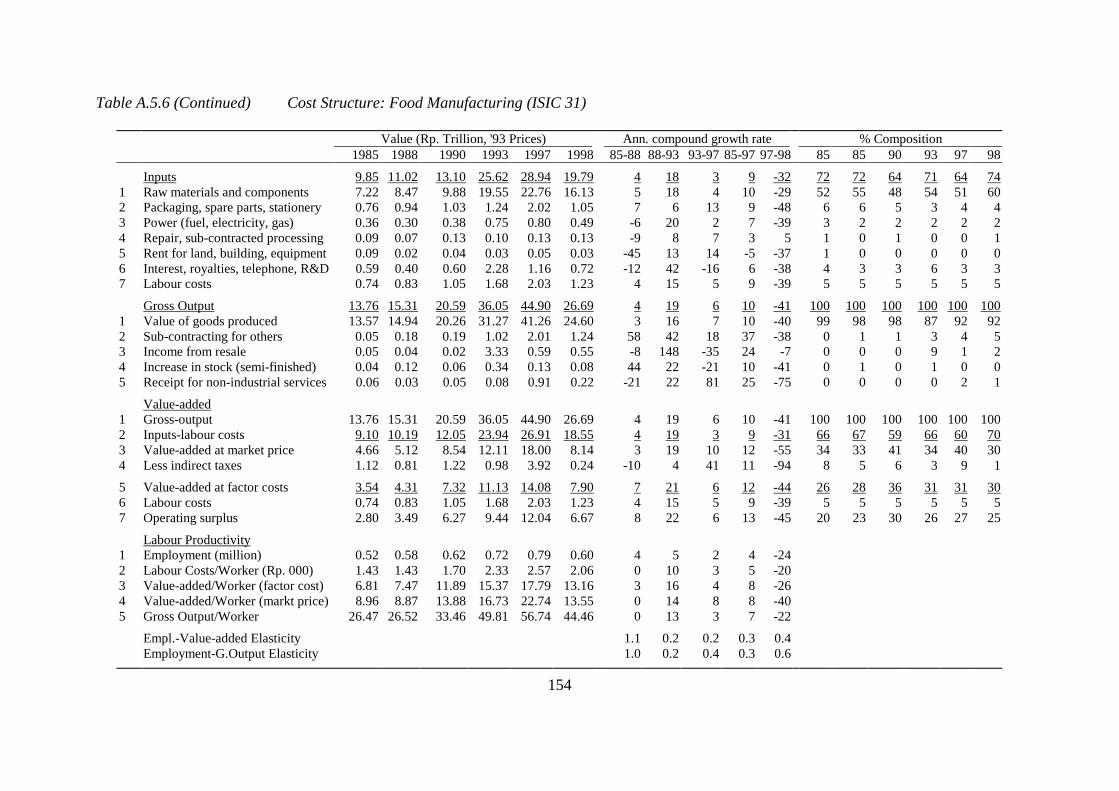
154
Table A.5.6 (Continued) Cost Structure: Food Manufacturing (ISIC 31)
Value (Rp. Trillion, '93 Prices) Ann. compound growth rate % Composition 1985 1988 1990 1993 1997 1998 85-88 88-93 93-97 85-97 97-98 85 85 90 93 97 98
Inputs 9.85 11.02 13.10 25.62 28.94 19.79 4 18 3 9 -32 72 72 64 71 64 74 1 Raw materials and components 7.22 8.47 9.88 19.55 22.76 16.13 5 18 4 10 -29 52 55 48 54 51 60 2 Packaging, spare parts, stationery 0.76 0.94 1.03 1.24 2.02 1.05 7 6 13 9 -48 6 6 5 3 4 4 3 Power (fuel, electricity, gas) 0.36 0.30 0.38 0.75 0.80 0.49 -6 20 2 7 -39 3 2 2 2 2 2 4 Repair, sub-contracted processing 0.09 0.07 0.13 0.10 0.13 0.13 -9 8 7 3 5 1 0 1 0 0 1 5 Rent for land, building, equipment 0.09 0.02 0.04 0.03 0.05 0.03 -45 13 14 -5 -37 1 0 0 0 0 0 6 Interest, royalties, telephone, R&D 0.59 0.40 0.60 2.28 1.16 0.72 -12 42 -16 6 -38 4 3 3 6 3 3 7 Labour costs 0.74 0.83 1.05 1.68 2.03 1.23 4 15 5 9 -39 5 5 5 5 5 5
Gross Output 13.76 15.31 20.59 36.05 44.90 26.69 4 19 6 10 -41 100 100 100 100 100 100 1 Value of goods produced 13.57 14.94 20.26 31.27 41.26 24.60 3 16 7 10 -40 99 98 98 87 92 92 2 Sub-contracting for others 0.05 0.18 0.19 1.02 2.01 1.24 58 42 18 37 -38 0 1 1 3 4 5 3 Income from resale 0.05 0.04 0.02 3.33 0.59 0.55 -8 148 -35 24 -7 0 0 0 9 1 2 4 Increase in stock (semi-finished) 0.04 0.12 0.06 0.34 0.13 0.08 44 22 -21 10 -41 0 1 0 1 0 0 5 Receipt for non-industrial services 0.06 0.03 0.05 0.08 0.91 0.22 -21 22 81 25 -75 0 0 0 0 2 1
Value-added 1 Gross-output 13.76 15.31 20.59 36.05 44.90 26.69 4 19 6 10 -41 100 100 100 100 100 100 2 Inputs-labour costs 9.10 10.19 12.05 23.94 26.91 18.55 4 19 3 9 -31 66 67 59 66 60 70 3 Value-added at market price 4.66 5.12 8.54 12.11 18.00 8.14 3 19 10 12 -55 34 33 41 34 40 30 4 Less indirect taxes 1.12 0.81 1.22 0.98 3.92 0.24 -10 4 41 11 -94 8 5 6 3 9 1
5 Value-added at factor costs 3.54 4.31 7.32 11.13 14.08 7.90 7 21 6 12 -44 26 28 36 31 31 30 6 Labour costs 0.74 0.83 1.05 1.68 2.03 1.23 4 15 5 9 -39 5 5 5 5 5 5 7 Operating surplus 2.80 3.49 6.27 9.44 12.04 6.67 8 22 6 13 -45 20 23 30 26 27 25
Labour Productivity 1 Employment (million) 0.52 0.58 0.62 0.72 0.79 0.60 4 5 2 4 -24 2 Labour Costs/Worker (Rp. 000) 1.43 1.43 1.70 2.33 2.57 2.06 0 10 3 5 -20 3 Value-added/Worker (factor cost) 6.81 7.47 11.89 15.37 17.79 13.16 3 16 4 8 -26 4 Value-added/Worker (markt price) 8.96 8.87 13.88 16.73 22.74 13.55 0 14 8 8 -40 5 Gross Output/Worker 26.47 26.52 33.46 49.81 56.74 44.46 0 13 3 7 -22
Empl.-Value-added Elasticity 1.1 0.2 0.2 0.3 0.4 Employment-G.Output Elasticity 1.0 0.2 0.4 0.3 0.6
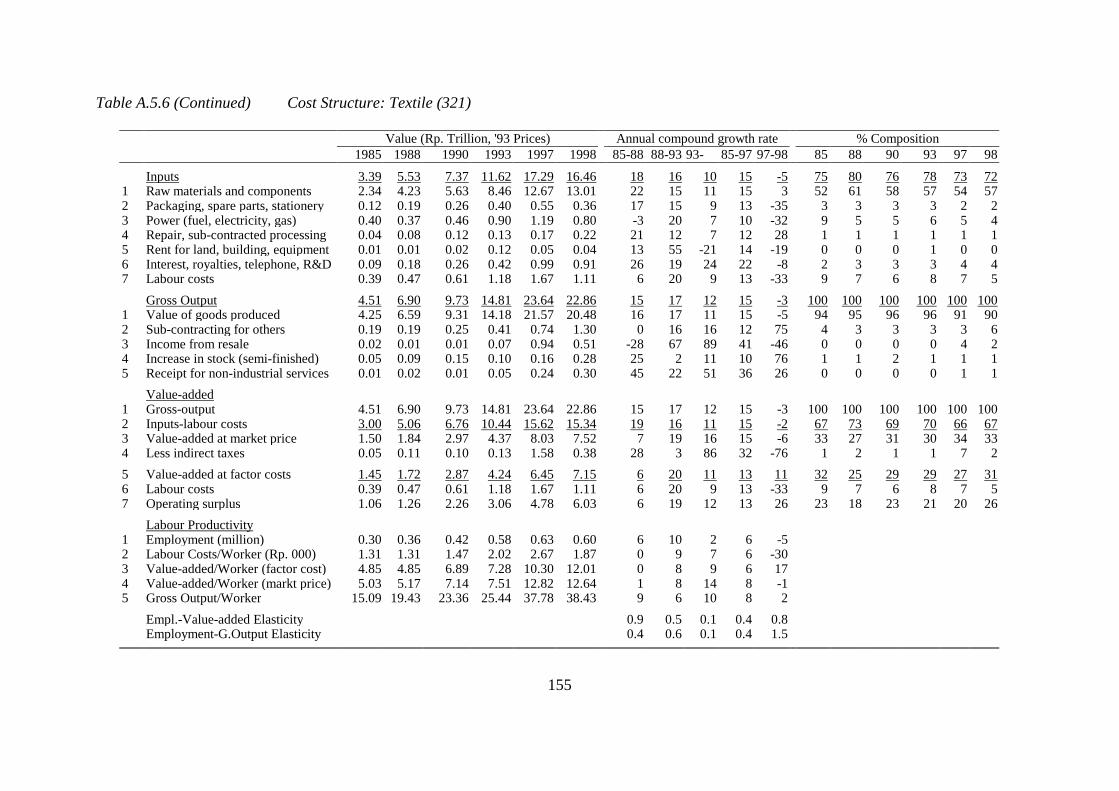
155
Table A.5.6 (Continued) Cost Structure: Textile (321)
Value (Rp. Trillion, '93 Prices) Annual compound growth rate % Composition 1985 1988 1990 1993 1997 1998 85-88 88-93 93- 85-97 97-98 85 88 90 93 97 98
Inputs 3.39 5.53 7.37 11.62 17.29 16.46 18 16 10 15 -5 75 80 76 78 73 72 1 Raw materials and components 2.34 4.23 5.63 8.46 12.67 13.01 22 15 11 15 3 52 61 58 57 54 57 2 Packaging, spare parts, stationery 0.12 0.19 0.26 0.40 0.55 0.36 17 15 9 13 -35 3 3 3 3 2 2 3 Power (fuel, electricity, gas) 0.40 0.37 0.46 0.90 1.19 0.80 -3 20 7 10 -32 9 5 5 6 5 4 4 Repair, sub-contracted processing 0.04 0.08 0.12 0.13 0.17 0.22 21 12 7 12 28 1 1 1 1 1 1 5 Rent for land, building, equipment 0.01 0.01 0.02 0.12 0.05 0.04 13 55 -21 14 -19 0 0 0 1 0 0 6 Interest, royalties, telephone, R&D 0.09 0.18 0.26 0.42 0.99 0.91 26 19 24 22 -8 2 3 3 3 4 4 7 Labour costs 0.39 0.47 0.61 1.18 1.67 1.11 6 20 9 13 -33 9 7 6 8 7 5 Gross Output 4.51 6.90 9.73 14.81 23.64 22.86 15 17 12 15 -3 100 100 100 100 100 100 1 Value of goods produced 4.25 6.59 9.31 14.18 21.57 20.48 16 17 11 15 -5 94 95 96 96 91 90 2 Sub-contracting for others 0.19 0.19 0.25 0.41 0.74 1.30 0 16 16 12 75 4 3 3 3 3 6 3 Income from resale 0.02 0.01 0.01 0.07 0.94 0.51 -28 67 89 41 -46 0 0 0 0 4 2 4 Increase in stock (semi-finished) 0.05 0.09 0.15 0.10 0.16 0.28 25 2 11 10 76 1 1 2 1 1 1 5 Receipt for non-industrial services 0.01 0.02 0.01 0.05 0.24 0.30 45 22 51 36 26 0 0 0 0 1 1 Value-added 1 Gross-output 4.51 6.90 9.73 14.81 23.64 22.86 15 17 12 15 -3 100 100 100 100 100 100 2 Inputs-labour costs 3.00 5.06 6.76 10.44 15.62 15.34 19 16 11 15 -2 67 73 69 70 66 67 3 Value-added at market price 1.50 1.84 2.97 4.37 8.03 7.52 7 19 16 15 -6 33 27 31 30 34 33 4 Less indirect taxes 0.05 0.11 0.10 0.13 1.58 0.38 28 3 86 32 -76 1 2 1 1 7 2 5 Value-added at factor costs 1.45 1.72 2.87 4.24 6.45 7.15 6 20 11 13 11 32 25 29 29 27 31 6 Labour costs 0.39 0.47 0.61 1.18 1.67 1.11 6 20 9 13 -33 9 7 6 8 7 5 7 Operating surplus 1.06 1.26 2.26 3.06 4.78 6.03 6 19 12 13 26 23 18 23 21 20 26 Labour Productivity 1 Employment (million) 0.30 0.36 0.42 0.58 0.63 0.60 6 10 2 6 -5 2 Labour Costs/Worker (Rp. 000) 1.31 1.31 1.47 2.02 2.67 1.87 0 9 7 6 -30 3 Value-added/Worker (factor cost) 4.85 4.85 6.89 7.28 10.30 12.01 0 8 9 6 17 4 Value-added/Worker (markt price) 5.03 5.17 7.14 7.51 12.82 12.64 1 8 14 8 -1 5 Gross Output/Worker 15.09 19.43 23.36 25.44 37.78 38.43 9 6 10 8 2 Empl.-Value-added Elasticity 0.9 0.5 0.1 0.4 0.8 Employment-G.Output Elasticity 0.4 0.6 0.1 0.4 1.5

156
Table A.5.6 (Continued) Cost Structure: Garments (322) Value (Rp. Trillion, '93 Prices) Ann. compd growth rate % Composition 1985 1988 1990 1993 1996 1997 1998 85-88 88-94 94- 97-98 85 88 90 93 96 97 98
Inputs 0.53 0.97 2.23 4.19 5.03 6.11 5.39 23 26 15 -12 80 80 76 61 73 80 76 1 Raw materials and components 0.38 0.73 1.64 2.98 3.67 4.19 4.09 24 24 17 -2 58 61 56 43 54 55 57 2 Packaging, spare parts, stationery 0.02 0.02 0.05 0.10 0.09 0.10 0.08 11 26 3 -20 2 2 2 1 1 1 1 3 Power (fuel, electricity, gas) 0.01 0.01 0.03 0.05 0.06 0.06 0.05 -1 29 11 -26 2 1 1 1 1 1 1 4 Repair, sub-contracted processing 0.01 0.03 0.05 0.10 0.10 0.12 0.12 68 21 9 0 1 2 2 2 1 2 2 5 Rent for land, building, equipment 0.00 0.00 0.01 0.02 0.03 0.03 0.02 36 34 2 -18 0 0 0 0 0 0 0 6 Interest, royalties, telephone, R&D 0.01 0.03 0.08 0.18 0.22 0.34 0.43 36 32 12 27 2 3 3 3 3 4 6 7 Labour costs 0.10 0.14 0.36 0.75 0.87 1.27 0.60 13 32 9 -52 15 11 12 11 13 17 8 Gross Output 0.65 1.21 2.92 6.89 6.85 7.63 7.14 23 28 14 -6 100 100 100 100 100 100 100 1 Value of goods produced 0.62 1.16 2.79 6.30 6.04 7.14 6.65 23 25 16 -7 94 96 96 91 88 94 93 2 Sub-contracting for others 0.02 0.04 0.08 0.43 0.39 0.28 0.30 17 48 -3 7 4 3 3 6 6 4 4 3 Income from resale 0.00 0.00 0.00 0.04 0.27 0.14 0.03 -47 190 28 -80 0 0 0 1 4 2 0 4 Increase in stock (semi-finished) 0.01 0.01 0.04 0.12 0.07 0.06 0.07 6 25 13 21 2 1 1 2 1 1 1 5 Receipt for non-industrial services 0.00 0.00 0.00 0.00 0.08 0.02 0.10 59 117 -1 534 0 0 0 0 1 0 1 Value-added 1 Gross-output 0.65 1.21 2.92 6.89 6.85 7.63 7.14 23 28 14 -6 100 100 100 100 100 100 100 2 Inputs-labour costs 0.43 0.83 1.87 3.44 4.17 4.84 4.79 25 24 16 -1 66 68 64 50 61 63 67 3 Value-added at market price 0.22 0.38 1.04 3.45 2.68 2.79 2.35 19 33 12 -16 34 32 36 50 39 37 33 4 Less indirect taxes 0.00 0.01 0.02 0.02 0.17 0.05 0.02 30 30 107 -64 0.6 0.7 0.7 0.3 2.5 0.6 0.2 5 Value-added at factor costs 0.22 0.37 1.02 3.43 2.51 2.74 2.33 19 33 9 -15 34 31 35 50 37 36 33 6 Labour costs 0.10 0.14 0.36 0.75 0.87 1.27 0.60 13 32 9 -52 15 11 12 11 13 17 8 7 Operating surplus 0.12 0.24 0.67 2.67 1.64 1.47 1.73 24 34 9 18 19 19 23 39 24 19 24 Labour Productivity 1 Employment (million) 0.07 0.11 0.24 0.35 0.40 0.40 0.35 16 22 5 -12 2 Labour Costs/Worker (Rp. 000) 1.38 1.29 1.46 2.14 2.20 3.20 1.73 -2 8 3 -46 3 Value-added/Worker (factor cost) 3.17 3.49 4.21 9.73 6.36 6.89 6.69 3 9 4 -3 4 Value-added/Worker (markt price) 3.22 3.57 4.29 9.79 6.79 7.01 6.74 3 9 6 -4 5 Gross Output/Worker 9.40 11.30 12.00 19.57 17.33 19.18 20.47 6 4 9 7 Employment-VA Elasticity (m.p.) 0.8 0.7 0.4 0.8 Employment-G.Output Elasticity 0.7 0.8 0.3 1.9
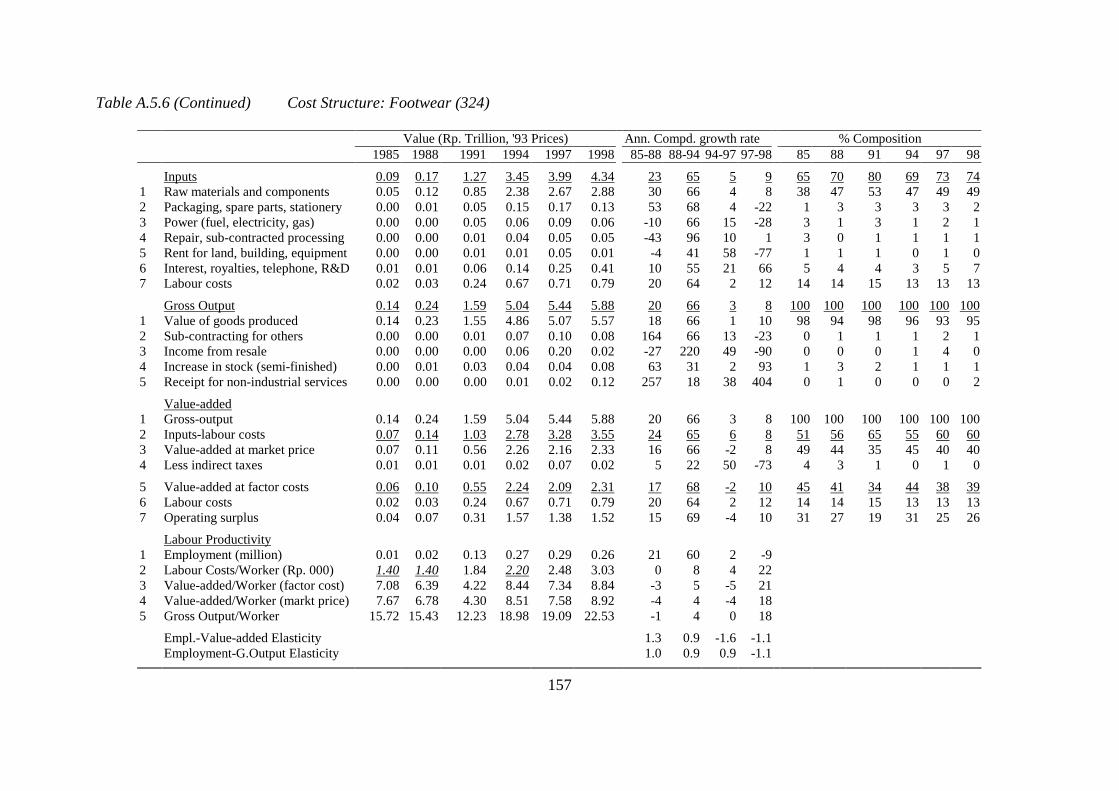
157
Table A.5.6 (Continued) Cost Structure: Footwear (324)
Value (Rp. Trillion, '93 Prices) Ann. Compd. growth rate % Composition 1985 1988 1991 1994 1997 1998 85-88 88-94 94-97 97-98 85 88 91 94 97 98
Inputs 0.09 0.17 1.27 3.45 3.99 4.34 23 65 5 9 65 70 80 69 73 741 Raw materials and components 0.05 0.12 0.85 2.38 2.67 2.88 30 66 4 8 38 47 53 47 49 492 Packaging, spare parts, stationery 0.00 0.01 0.05 0.15 0.17 0.13 53 68 4 -22 1 3 3 3 3 23 Power (fuel, electricity, gas) 0.00 0.00 0.05 0.06 0.09 0.06 -10 66 15 -28 3 1 3 1 2 14 Repair, sub-contracted processing 0.00 0.00 0.01 0.04 0.05 0.05 -43 96 10 1 3 0 1 1 1 15 Rent for land, building, equipment 0.00 0.00 0.01 0.01 0.05 0.01 -4 41 58 -77 1 1 1 0 1 06 Interest, royalties, telephone, R&D 0.01 0.01 0.06 0.14 0.25 0.41 10 55 21 66 5 4 4 3 5 77 Labour costs 0.02 0.03 0.24 0.67 0.71 0.79 20 64 2 12 14 14 15 13 13 13
Gross Output 0.14 0.24 1.59 5.04 5.44 5.88 20 66 3 8 100 100 100 100 100 1001 Value of goods produced 0.14 0.23 1.55 4.86 5.07 5.57 18 66 1 10 98 94 98 96 93 952 Sub-contracting for others 0.00 0.00 0.01 0.07 0.10 0.08 164 66 13 -23 0 1 1 1 2 13 Income from resale 0.00 0.00 0.00 0.06 0.20 0.02 -27 220 49 -90 0 0 0 1 4 04 Increase in stock (semi-finished) 0.00 0.01 0.03 0.04 0.04 0.08 63 31 2 93 1 3 2 1 1 15 Receipt for non-industrial services 0.00 0.00 0.00 0.01 0.02 0.12 257 18 38 404 0 1 0 0 0 2
Value-added 1 Gross-output 0.14 0.24 1.59 5.04 5.44 5.88 20 66 3 8 100 100 100 100 100 1002 Inputs-labour costs 0.07 0.14 1.03 2.78 3.28 3.55 24 65 6 8 51 56 65 55 60 603 Value-added at market price 0.07 0.11 0.56 2.26 2.16 2.33 16 66 -2 8 49 44 35 45 40 404 Less indirect taxes 0.01 0.01 0.01 0.02 0.07 0.02 5 22 50 -73 4 3 1 0 1 0
5 Value-added at factor costs 0.06 0.10 0.55 2.24 2.09 2.31 17 68 -2 10 45 41 34 44 38 396 Labour costs 0.02 0.03 0.24 0.67 0.71 0.79 20 64 2 12 14 14 15 13 13 137 Operating surplus 0.04 0.07 0.31 1.57 1.38 1.52 15 69 -4 10 31 27 19 31 25 26
Labour Productivity 1 Employment (million) 0.01 0.02 0.13 0.27 0.29 0.26 21 60 2 -92 Labour Costs/Worker (Rp. 000) 1.40 1.40 1.84 2.20 2.48 3.03 0 8 4 223 Value-added/Worker (factor cost) 7.08 6.39 4.22 8.44 7.34 8.84 -3 5 -5 214 Value-added/Worker (markt price) 7.67 6.78 4.30 8.51 7.58 8.92 -4 4 -4 185 Gross Output/Worker 15.72 15.43 12.23 18.98 19.09 22.53 -1 4 0 18
Empl.-Value-added Elasticity 1.3 0.9 -1.6 -1.1 Employment-G.Output Elasticity 1.0 0.9 0.9 -1.1
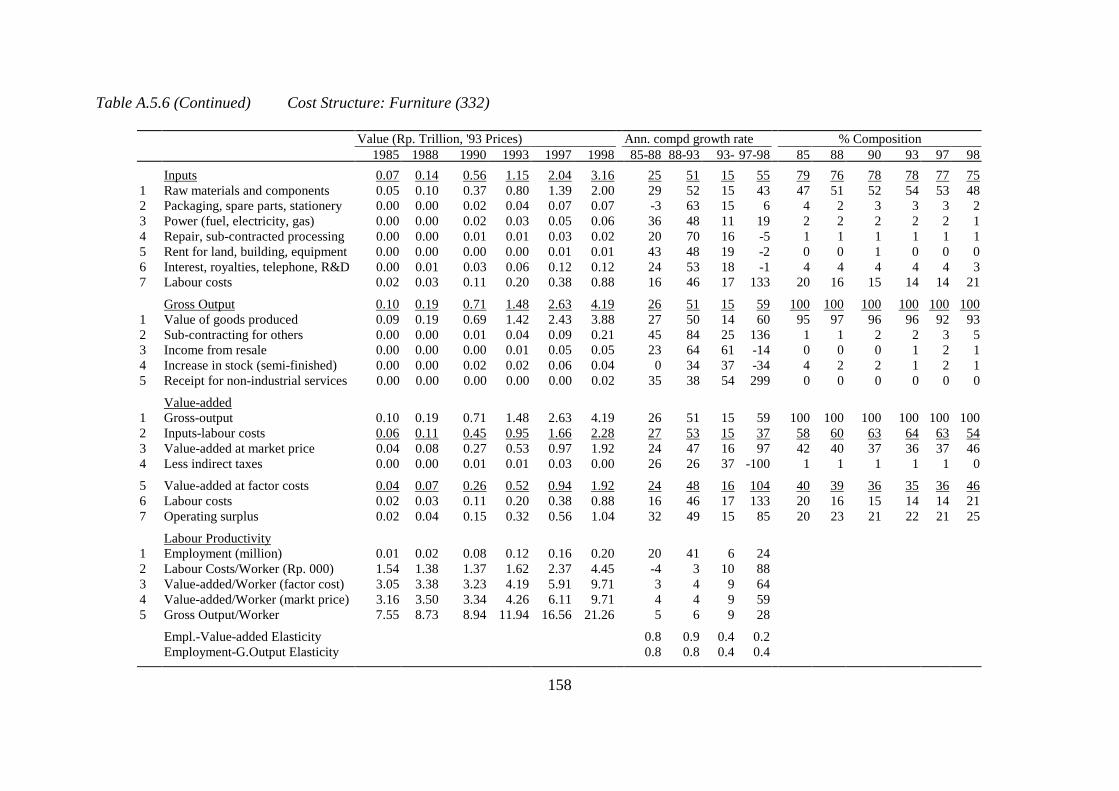
158
Table A.5.6 (Continued) Cost Structure: Furniture (332)
Value (Rp. Trillion, '93 Prices) Ann. compd growth rate % Composition 1985 1988 1990 1993 1997 1998 85-88 88-93 93- 97-98 85 88 90 93 97 98 Inputs 0.07 0.14 0.56 1.15 2.04 3.16 25 51 15 55 79 76 78 78 77 751 Raw materials and components 0.05 0.10 0.37 0.80 1.39 2.00 29 52 15 43 47 51 52 54 53 482 Packaging, spare parts, stationery 0.00 0.00 0.02 0.04 0.07 0.07 -3 63 15 6 4 2 3 3 3 23 Power (fuel, electricity, gas) 0.00 0.00 0.02 0.03 0.05 0.06 36 48 11 19 2 2 2 2 2 14 Repair, sub-contracted processing 0.00 0.00 0.01 0.01 0.03 0.02 20 70 16 -5 1 1 1 1 1 15 Rent for land, building, equipment 0.00 0.00 0.00 0.00 0.01 0.01 43 48 19 -2 0 0 1 0 0 06 Interest, royalties, telephone, R&D 0.00 0.01 0.03 0.06 0.12 0.12 24 53 18 -1 4 4 4 4 4 37 Labour costs 0.02 0.03 0.11 0.20 0.38 0.88 16 46 17 133 20 16 15 14 14 21
Gross Output 0.10 0.19 0.71 1.48 2.63 4.19 26 51 15 59 100 100 100 100 100 1001 Value of goods produced 0.09 0.19 0.69 1.42 2.43 3.88 27 50 14 60 95 97 96 96 92 932 Sub-contracting for others 0.00 0.00 0.01 0.04 0.09 0.21 45 84 25 136 1 1 2 2 3 53 Income from resale 0.00 0.00 0.00 0.01 0.05 0.05 23 64 61 -14 0 0 0 1 2 14 Increase in stock (semi-finished) 0.00 0.00 0.02 0.02 0.06 0.04 0 34 37 -34 4 2 2 1 2 15 Receipt for non-industrial services 0.00 0.00 0.00 0.00 0.00 0.02 35 38 54 299 0 0 0 0 0 0
Value-added 1 Gross-output 0.10 0.19 0.71 1.48 2.63 4.19 26 51 15 59 100 100 100 100 100 1002 Inputs-labour costs 0.06 0.11 0.45 0.95 1.66 2.28 27 53 15 37 58 60 63 64 63 543 Value-added at market price 0.04 0.08 0.27 0.53 0.97 1.92 24 47 16 97 42 40 37 36 37 464 Less indirect taxes 0.00 0.00 0.01 0.01 0.03 0.00 26 26 37 -100 1 1 1 1 1 0
5 Value-added at factor costs 0.04 0.07 0.26 0.52 0.94 1.92 24 48 16 104 40 39 36 35 36 466 Labour costs 0.02 0.03 0.11 0.20 0.38 0.88 16 46 17 133 20 16 15 14 14 217 Operating surplus 0.02 0.04 0.15 0.32 0.56 1.04 32 49 15 85 20 23 21 22 21 25
Labour Productivity 1 Employment (million) 0.01 0.02 0.08 0.12 0.16 0.20 20 41 6 242 Labour Costs/Worker (Rp. 000) 1.54 1.38 1.37 1.62 2.37 4.45 -4 3 10 883 Value-added/Worker (factor cost) 3.05 3.38 3.23 4.19 5.91 9.71 3 4 9 644 Value-added/Worker (markt price) 3.16 3.50 3.34 4.26 6.11 9.71 4 4 9 595 Gross Output/Worker 7.55 8.73 8.94 11.94 16.56 21.26 5 6 9 28
Empl.-Value-added Elasticity 0.8 0.9 0.4 0.2 Employment-G.Output Elasticity 0.8 0.8 0.4 0.4
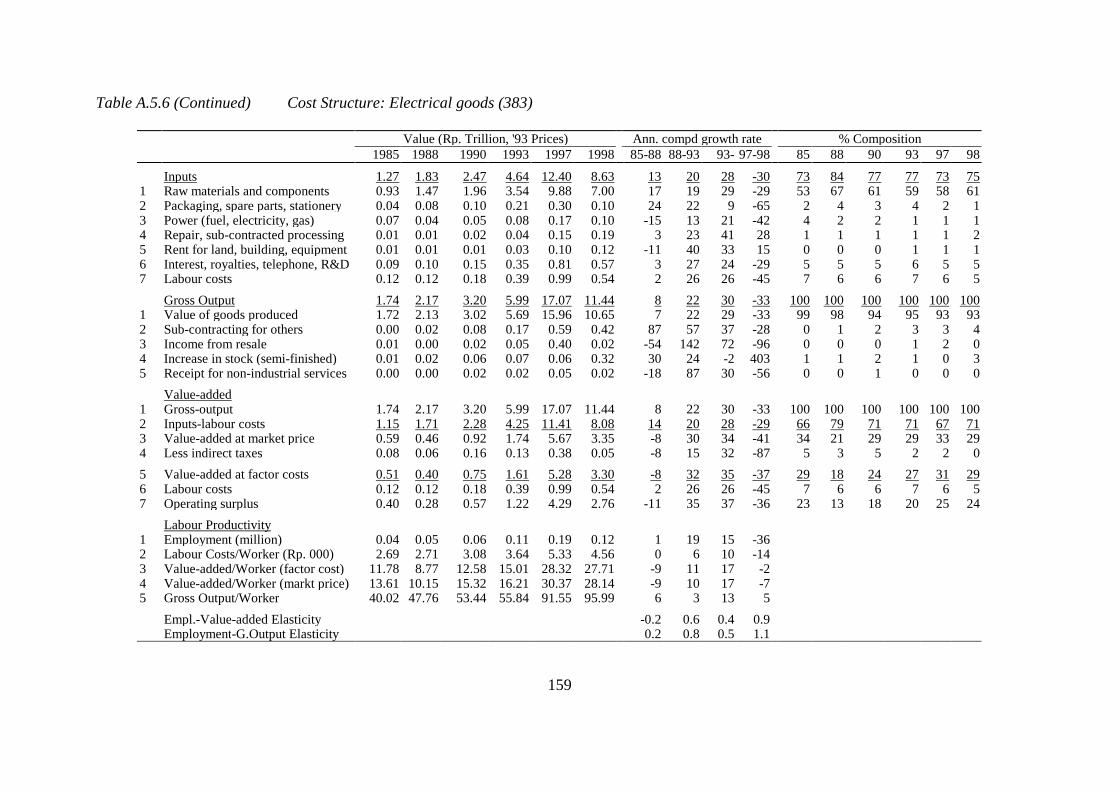
159
Table A.5.6 (Continued) Cost Structure: Electrical goods (383)
Value (Rp. Trillion, '93 Prices) Ann. compd growth rate % Composition 1985 1988 1990 1993 1997 1998 85-88 88-93 93- 97-98 85 88 90 93 97 98
Inputs 1.27 1.83 2.47 4.64 12.40 8.63 13 20 28 -30 73 84 77 77 73 751 Raw materials and components 0.93 1.47 1.96 3.54 9.88 7.00 17 19 29 -29 53 67 61 59 58 612 Packaging, spare parts, stationery 0.04 0.08 0.10 0.21 0.30 0.10 24 22 9 -65 2 4 3 4 2 13 Power (fuel, electricity, gas) 0.07 0.04 0.05 0.08 0.17 0.10 -15 13 21 -42 4 2 2 1 1 14 Repair, sub-contracted processing 0.01 0.01 0.02 0.04 0.15 0.19 3 23 41 28 1 1 1 1 1 25 Rent for land, building, equipment 0.01 0.01 0.01 0.03 0.10 0.12 -11 40 33 15 0 0 0 1 1 16 Interest, royalties, telephone, R&D 0.09 0.10 0.15 0.35 0.81 0.57 3 27 24 -29 5 5 5 6 5 57 Labour costs 0.12 0.12 0.18 0.39 0.99 0.54 2 26 26 -45 7 6 6 7 6 5 Gross Output 1.74 2.17 3.20 5.99 17.07 11.44 8 22 30 -33 100 100 100 100 100 1001 Value of goods produced 1.72 2.13 3.02 5.69 15.96 10.65 7 22 29 -33 99 98 94 95 93 932 Sub-contracting for others 0.00 0.02 0.08 0.17 0.59 0.42 87 57 37 -28 0 1 2 3 3 43 Income from resale 0.01 0.00 0.02 0.05 0.40 0.02 -54 142 72 -96 0 0 0 1 2 04 Increase in stock (semi-finished) 0.01 0.02 0.06 0.07 0.06 0.32 30 24 -2 403 1 1 2 1 0 35 Receipt for non-industrial services 0.00 0.00 0.02 0.02 0.05 0.02 -18 87 30 -56 0 0 1 0 0 0 Value-added 1 Gross-output 1.74 2.17 3.20 5.99 17.07 11.44 8 22 30 -33 100 100 100 100 100 1002 Inputs-labour costs 1.15 1.71 2.28 4.25 11.41 8.08 14 20 28 -29 66 79 71 71 67 713 Value-added at market price 0.59 0.46 0.92 1.74 5.67 3.35 -8 30 34 -41 34 21 29 29 33 294 Less indirect taxes 0.08 0.06 0.16 0.13 0.38 0.05 -8 15 32 -87 5 3 5 2 2 05 Value-added at factor costs 0.51 0.40 0.75 1.61 5.28 3.30 -8 32 35 -37 29 18 24 27 31 296 Labour costs 0.12 0.12 0.18 0.39 0.99 0.54 2 26 26 -45 7 6 6 7 6 57 Operating surplus 0.40 0.28 0.57 1.22 4.29 2.76 -11 35 37 -36 23 13 18 20 25 24 Labour Productivity 1 Employment (million) 0.04 0.05 0.06 0.11 0.19 0.12 1 19 15 -362 Labour Costs/Worker (Rp. 000) 2.69 2.71 3.08 3.64 5.33 4.56 0 6 10 -143 Value-added/Worker (factor cost) 11.78 8.77 12.58 15.01 28.32 27.71 -9 11 17 -24 Value-added/Worker (markt price) 13.61 10.15 15.32 16.21 30.37 28.14 -9 10 17 -75 Gross Output/Worker 40.02 47.76 53.44 55.84 91.55 95.99 6 3 13 5 Empl.-Value-added Elasticity -0.2 0.6 0.4 0.9 Employment-G.Output Elasticity 0.2 0.8 0.5 1.1
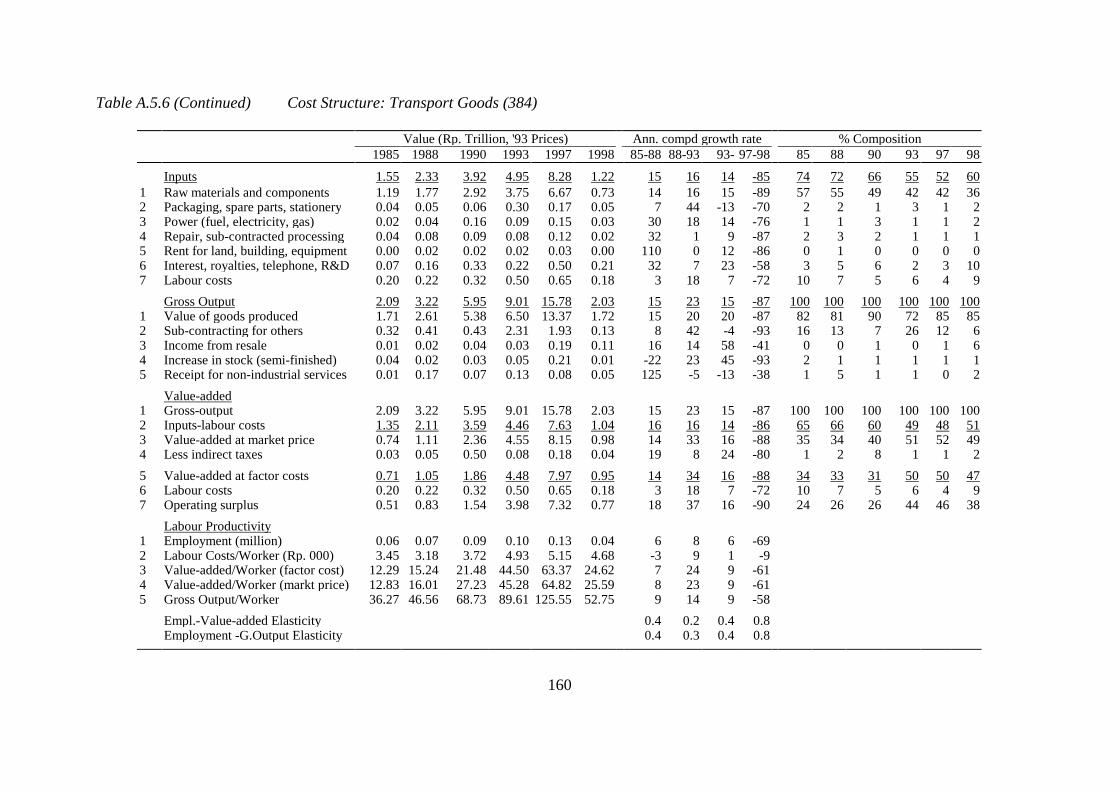
160
Table A.5.6 (Continued) Cost Structure: Transport Goods (384)
Value (Rp. Trillion, '93 Prices) Ann. compd growth rate % Composition 1985 1988 1990 1993 1997 1998 85-88 88-93 93- 97-98 85 88 90 93 97 98
Inputs 1.55 2.33 3.92 4.95 8.28 1.22 15 16 14 -85 74 72 66 55 52 601 Raw materials and components 1.19 1.77 2.92 3.75 6.67 0.73 14 16 15 -89 57 55 49 42 42 362 Packaging, spare parts, stationery 0.04 0.05 0.06 0.30 0.17 0.05 7 44 -13 -70 2 2 1 3 1 23 Power (fuel, electricity, gas) 0.02 0.04 0.16 0.09 0.15 0.03 30 18 14 -76 1 1 3 1 1 24 Repair, sub-contracted processing 0.04 0.08 0.09 0.08 0.12 0.02 32 1 9 -87 2 3 2 1 1 15 Rent for land, building, equipment 0.00 0.02 0.02 0.02 0.03 0.00 110 0 12 -86 0 1 0 0 0 06 Interest, royalties, telephone, R&D 0.07 0.16 0.33 0.22 0.50 0.21 32 7 23 -58 3 5 6 2 3 107 Labour costs 0.20 0.22 0.32 0.50 0.65 0.18 3 18 7 -72 10 7 5 6 4 9 Gross Output 2.09 3.22 5.95 9.01 15.78 2.03 15 23 15 -87 100 100 100 100 100 1001 Value of goods produced 1.71 2.61 5.38 6.50 13.37 1.72 15 20 20 -87 82 81 90 72 85 852 Sub-contracting for others 0.32 0.41 0.43 2.31 1.93 0.13 8 42 -4 -93 16 13 7 26 12 63 Income from resale 0.01 0.02 0.04 0.03 0.19 0.11 16 14 58 -41 0 0 1 0 1 64 Increase in stock (semi-finished) 0.04 0.02 0.03 0.05 0.21 0.01 -22 23 45 -93 2 1 1 1 1 15 Receipt for non-industrial services 0.01 0.17 0.07 0.13 0.08 0.05 125 -5 -13 -38 1 5 1 1 0 2 Value-added 1 Gross-output 2.09 3.22 5.95 9.01 15.78 2.03 15 23 15 -87 100 100 100 100 100 1002 Inputs-labour costs 1.35 2.11 3.59 4.46 7.63 1.04 16 16 14 -86 65 66 60 49 48 513 Value-added at market price 0.74 1.11 2.36 4.55 8.15 0.98 14 33 16 -88 35 34 40 51 52 494 Less indirect taxes 0.03 0.05 0.50 0.08 0.18 0.04 19 8 24 -80 1 2 8 1 1 25 Value-added at factor costs 0.71 1.05 1.86 4.48 7.97 0.95 14 34 16 -88 34 33 31 50 50 476 Labour costs 0.20 0.22 0.32 0.50 0.65 0.18 3 18 7 -72 10 7 5 6 4 97 Operating surplus 0.51 0.83 1.54 3.98 7.32 0.77 18 37 16 -90 24 26 26 44 46 38 Labour Productivity 1 Employment (million) 0.06 0.07 0.09 0.10 0.13 0.04 6 8 6 -692 Labour Costs/Worker (Rp. 000) 3.45 3.18 3.72 4.93 5.15 4.68 -3 9 1 -93 Value-added/Worker (factor cost) 12.29 15.24 21.48 44.50 63.37 24.62 7 24 9 -614 Value-added/Worker (markt price) 12.83 16.01 27.23 45.28 64.82 25.59 8 23 9 -615 Gross Output/Worker 36.27 46.56 68.73 89.61 125.55 52.75 9 14 9 -58 Empl.-Value-added Elasticity 0.4 0.2 0.4 0.8 Employment -G.Output Elasticity 0.4 0.3 0.4 0.8
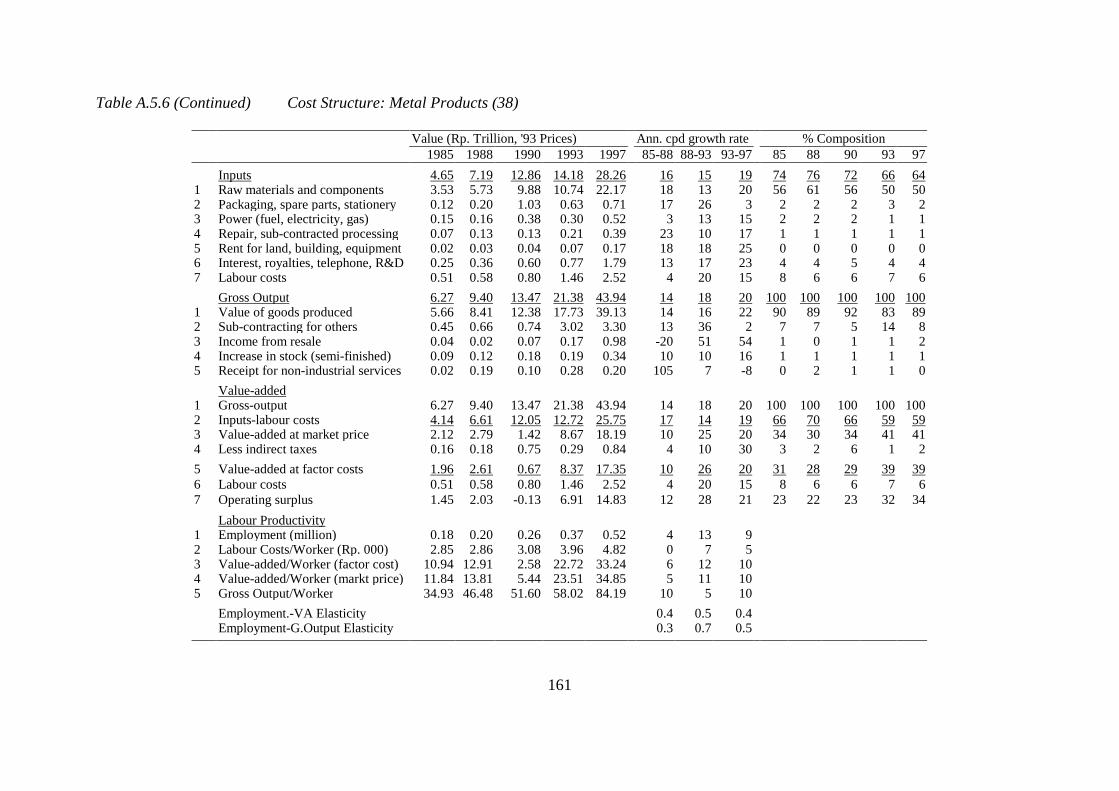
161
Table A.5.6 (Continued) Cost Structure: Metal Products (38)
Value (Rp. Trillion, '93 Prices) Ann. cpd growth rate % Composition 1985 1988 1990 1993 1997 85-88 88-93 93-97 85 88 90 93 97 Inputs 4.65 7.19 12.86 14.18 28.26 16 15 19 74 76 72 66 641 Raw materials and components 3.53 5.73 9.88 10.74 22.17 18 13 20 56 61 56 50 502 Packaging, spare parts, stationery 0.12 0.20 1.03 0.63 0.71 17 26 3 2 2 2 3 23 Power (fuel, electricity, gas) 0.15 0.16 0.38 0.30 0.52 3 13 15 2 2 2 1 14 Repair, sub-contracted processing 0.07 0.13 0.13 0.21 0.39 23 10 17 1 1 1 1 15 Rent for land, building, equipment 0.02 0.03 0.04 0.07 0.17 18 18 25 0 0 0 0 06 Interest, royalties, telephone, R&D 0.25 0.36 0.60 0.77 1.79 13 17 23 4 4 5 4 47 Labour costs 0.51 0.58 0.80 1.46 2.52 4 20 15 8 6 6 7 6 Gross Output 6.27 9.40 13.47 21.38 43.94 14 18 20 100 100 100 100 1001 Value of goods produced 5.66 8.41 12.38 17.73 39.13 14 16 22 90 89 92 83 892 Sub-contracting for others 0.45 0.66 0.74 3.02 3.30 13 36 2 7 7 5 14 83 Income from resale 0.04 0.02 0.07 0.17 0.98 -20 51 54 1 0 1 1 24 Increase in stock (semi-finished) 0.09 0.12 0.18 0.19 0.34 10 10 16 1 1 1 1 15 Receipt for non-industrial services 0.02 0.19 0.10 0.28 0.20 105 7 -8 0 2 1 1 0 Value-added 1 Gross-output 6.27 9.40 13.47 21.38 43.94 14 18 20 100 100 100 100 1002 Inputs-labour costs 4.14 6.61 12.05 12.72 25.75 17 14 19 66 70 66 59 593 Value-added at market price 2.12 2.79 1.42 8.67 18.19 10 25 20 34 30 34 41 414 Less indirect taxes 0.16 0.18 0.75 0.29 0.84 4 10 30 3 2 6 1 25 Value-added at factor costs 1.96 2.61 0.67 8.37 17.35 10 26 20 31 28 29 39 396 Labour costs 0.51 0.58 0.80 1.46 2.52 4 20 15 8 6 6 7 67 Operating surplus 1.45 2.03 -0.13 6.91 14.83 12 28 21 23 22 23 32 34 Labour Productivity 1 Employment (million) 0.18 0.20 0.26 0.37 0.52 4 13 92 Labour Costs/Worker (Rp. 000) 2.85 2.86 3.08 3.96 4.82 0 7 53 Value-added/Worker (factor cost) 10.94 12.91 2.58 22.72 33.24 6 12 104 Value-added/Worker (markt price) 11.84 13.81 5.44 23.51 34.85 5 11 105 Gross Output/Worker 34.93 46.48 51.60 58.02 84.19 10 5 10 Employment.-VA Elasticity 0.4 0.5 0.4 Employment-G.Output Elasticity 0.3 0.7 0.5
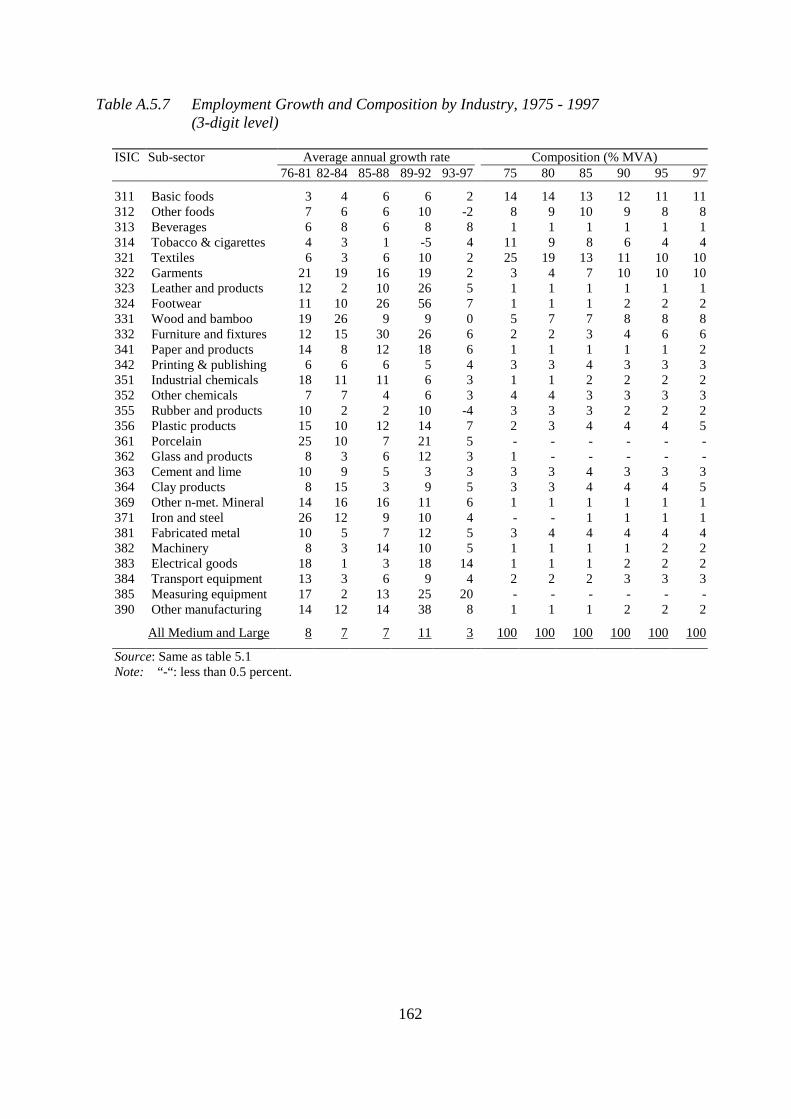
162
Table A.5.7 Employment Growth and Composition by Industry, 1975 - 1997 (3-digit level)
ISIC Sub-sector Average annual growth rate Composition (% MVA) 76-81 82-84 85-88 89-92 93-97 75 80 85 90 95 97
311 Basic foods 3 4 6 6 2 14 14 13 12 11 11312 Other foods 7 6 6 10 -2 8 9 10 9 8 8313 Beverages 6 8 6 8 8 1 1 1 1 1 1314 Tobacco & cigarettes 4 3 1 -5 4 11 9 8 6 4 4321 Textiles 6 3 6 10 2 25 19 13 11 10 10322 Garments 21 19 16 19 2 3 4 7 10 10 10323 Leather and products 12 2 10 26 5 1 1 1 1 1 1324 Footwear 11 10 26 56 7 1 1 1 2 2 2331 Wood and bamboo 19 26 9 9 0 5 7 7 8 8 8332 Furniture and fixtures 12 15 30 26 6 2 2 3 4 6 6341 Paper and products 14 8 12 18 6 1 1 1 1 1 2342 Printing & publishing 6 6 6 5 4 3 3 4 3 3 3351 Industrial chemicals 18 11 11 6 3 1 1 2 2 2 2352 Other chemicals 7 7 4 6 3 4 4 3 3 3 3355 Rubber and products 10 2 2 10 -4 3 3 3 2 2 2356 Plastic products 15 10 12 14 7 2 3 4 4 4 5361 Porcelain 25 10 7 21 5 - - - - - -362 Glass and products 8 3 6 12 3 1 - - - - -363 Cement and lime 10 9 5 3 3 3 3 4 3 3 3364 Clay products 8 15 3 9 5 3 3 4 4 4 5369 Other n-met. Mineral 14 16 16 11 6 1 1 1 1 1 1371 Iron and steel 26 12 9 10 4 - - 1 1 1 1381 Fabricated metal 10 5 7 12 5 3 4 4 4 4 4382 Machinery 8 3 14 10 5 1 1 1 1 2 2383 Electrical goods 18 1 3 18 14 1 1 1 2 2 2384 Transport equipment 13 3 6 9 4 2 2 2 3 3 3385 Measuring equipment 17 2 13 25 20 - - - - - -390 Other manufacturing 14 12 14 38 8 1 1 1 2 2 2
All Medium and Large 8 7 7 11 3 100 100 100 100 100 100
Source: Same as table 5.1 Note: “-“: less than 0.5 percent.
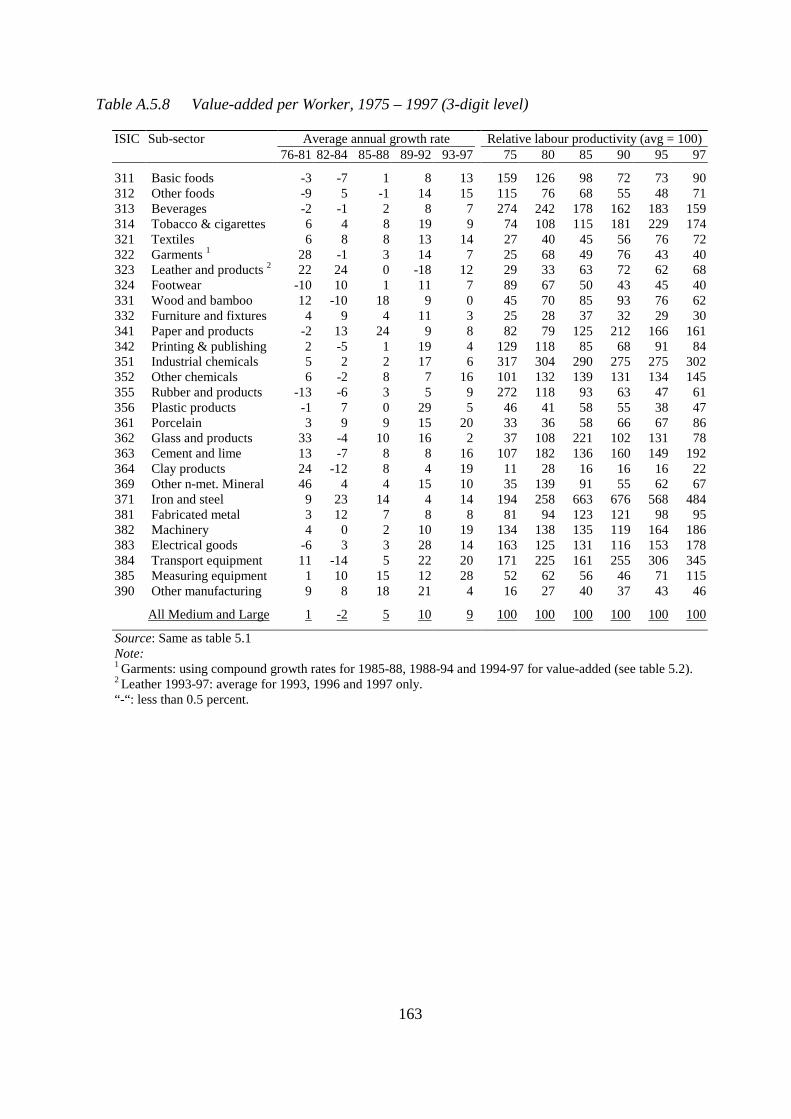
163
Table A.5.8 Value-added per Worker, 1975 – 1997 (3-digit level)
ISIC Sub-sector Average annual growth rate Relative labour productivity (avg = 100) 76-81 82-84 85-88 89-92 93-97 75 80 85 90 95 97
311 Basic foods -3 -7 1 8 13 159 126 98 72 73 90312 Other foods -9 5 -1 14 15 115 76 68 55 48 71313 Beverages -2 -1 2 8 7 274 242 178 162 183 159314 Tobacco & cigarettes 6 4 8 19 9 74 108 115 181 229 174321 Textiles 6 8 8 13 14 27 40 45 56 76 72322 Garments 1 28 -1 3 14 7 25 68 49 76 43 40323 Leather and products 2 22 24 0 -18 12 29 33 63 72 62 68324 Footwear -10 10 1 11 7 89 67 50 43 45 40331 Wood and bamboo 12 -10 18 9 0 45 70 85 93 76 62332 Furniture and fixtures 4 9 4 11 3 25 28 37 32 29 30341 Paper and products -2 13 24 9 8 82 79 125 212 166 161342 Printing & publishing 2 -5 1 19 4 129 118 85 68 91 84351 Industrial chemicals 5 2 2 17 6 317 304 290 275 275 302352 Other chemicals 6 -2 8 7 16 101 132 139 131 134 145355 Rubber and products -13 -6 3 5 9 272 118 93 63 47 61356 Plastic products -1 7 0 29 5 46 41 58 55 38 47361 Porcelain 3 9 9 15 20 33 36 58 66 67 86362 Glass and products 33 -4 10 16 2 37 108 221 102 131 78363 Cement and lime 13 -7 8 8 16 107 182 136 160 149 192364 Clay products 24 -12 8 4 19 11 28 16 16 16 22369 Other n-met. Mineral 46 4 4 15 10 35 139 91 55 62 67371 Iron and steel 9 23 14 4 14 194 258 663 676 568 484381 Fabricated metal 3 12 7 8 8 81 94 123 121 98 95382 Machinery 4 0 2 10 19 134 138 135 119 164 186383 Electrical goods -6 3 3 28 14 163 125 131 116 153 178384 Transport equipment 11 -14 5 22 20 171 225 161 255 306 345385 Measuring equipment 1 10 15 12 28 52 62 56 46 71 115390 Other manufacturing 9 8 18 21 4 16 27 40 37 43 46
All Medium and Large 1 -2 5 10 9 100 100 100 100 100 100
Source: Same as table 5.1 Note: 1 Garments: using compound growth rates for 1985-88, 1988-94 and 1994-97 for value-added (see table 5.2). 2 Leather 1993-97: average for 1993, 1996 and 1997 only. “-“: less than 0.5 percent.

164
165
6. Manufacturing Trade and Balance of Payments
6.1 EXPORT PERFORMANCE.........................................................................................166 6.2.1 Export Trends................................................................................................................166 6.2.2 Main Export Products and Markets...............................................................................171 6.2.3 Technological Composition of Exports ........................................................................173
6.2 IMPORTS .......................................................................................................................175 6.3 BALANCE OF PAYMENT...........................................................................................177 6.3.1 Deficit in Manufacturing Trade.....................................................................................177 6.3.2 Oil and Gas sector .........................................................................................................180 6.3.2 Balance of Payments .....................................................................................................181
6.4 CONCLUSION...............................................................................................................182 ANNEX 6.1: TABLES AND FIGURES .............................................................................185
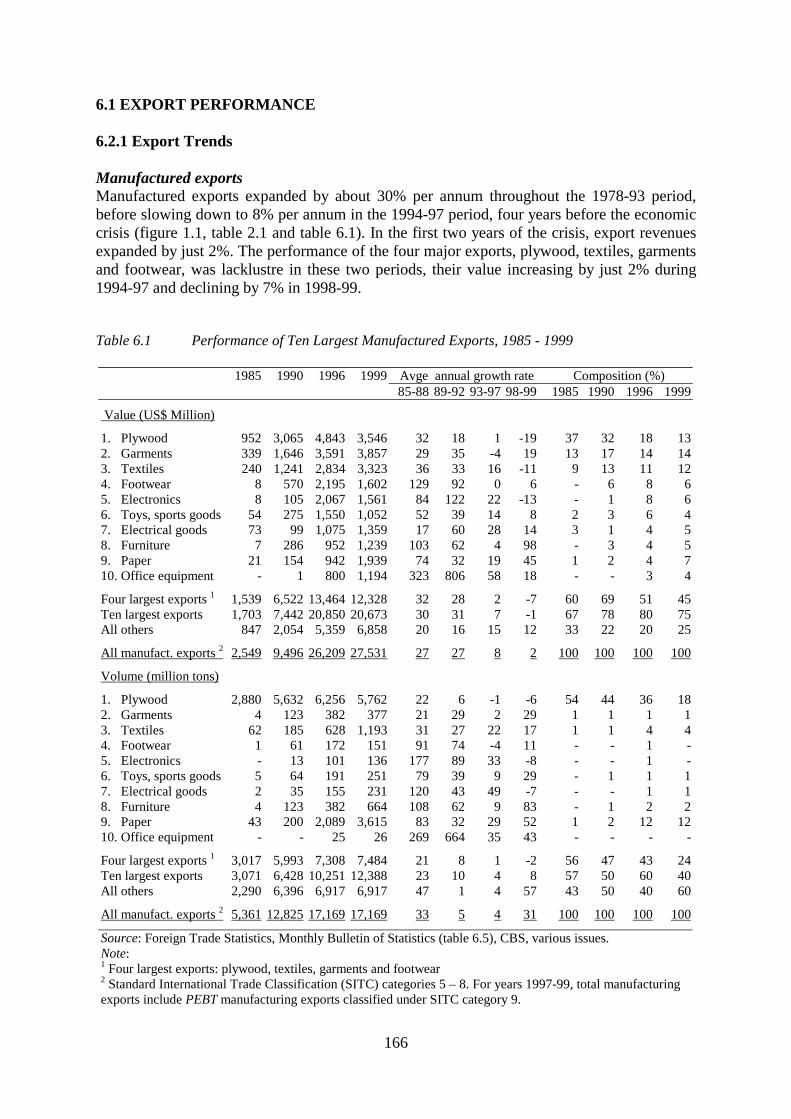
166
6.1 EXPORT PERFORMANCE 6.2.1 Export Trends Manufactured exports Manufactured exports expanded by about 30% per annum throughout the 1978-93 period, before slowing down to 8% per annum in the 1994-97 period, four years before the economic crisis (figure 1.1, table 2.1 and table 6.1). In the first two years of the crisis, export revenues expanded by just 2%. The performance of the four major exports, plywood, textiles, garments and footwear, was lacklustre in these two periods, their value increasing by just 2% during 1994-97 and declining by 7% in 1998-99. Table 6.1 Performance of Ten Largest Manufactured Exports, 1985 - 1999 1985 1990 1996 1999 Avge annual growth rate Composition (%) 85-88 89-92 93-97 98-99 1985 1990 1996 1999
Value (US$ Million)
1. Plywood 952 3,065 4,843 3,546 32 18 1 -19 37 32 18 13 2. Garments 339 1,646 3,591 3,857 29 35 -4 19 13 17 14 14 3. Textiles 240 1,241 2,834 3,323 36 33 16 -11 9 13 11 12 4. Footwear 8 570 2,195 1,602 129 92 0 6 - 6 8 6 5. Electronics 8 105 2,067 1,561 84 122 22 -13 - 1 8 6 6. Toys, sports goods 54 275 1,550 1,052 52 39 14 8 2 3 6 4 7. Electrical goods 73 99 1,075 1,359 17 60 28 14 3 1 4 5 8. Furniture 7 286 952 1,239 103 62 4 98 - 3 4 5 9. Paper 21 154 942 1,939 74 32 19 45 1 2 4 7 10. Office equipment - 1 800 1,194 323 806 58 18 - - 3 4
Four largest exports 1 1,539 6,522 13,464 12,328 32 28 2 -7 60 69 51 45 Ten largest exports 1,703 7,442 20,850 20,673 30 31 7 -1 67 78 80 75 All others 847 2,054 5,359 6,858 20 16 15 12 33 22 20 25
All manufact. exports 2 2,549 9,496 26,209 27,531 27 27 8 2 100 100 100 100
Volume (million tons)
1. Plywood 2,880 5,632 6,256 5,762 22 6 -1 -6 54 44 36 18 2. Garments 4 123 382 377 21 29 2 29 1 1 1 1 3. Textiles 62 185 628 1,193 31 27 22 17 1 1 4 4 4. Footwear 1 61 172 151 91 74 -4 11 - - 1 - 5. Electronics - 13 101 136 177 89 33 -8 - - 1 - 6. Toys, sports goods 5 64 191 251 79 39 9 29 - 1 1 1 7. Electrical goods 2 35 155 231 120 43 49 -7 - - 1 1 8. Furniture 4 123 382 664 108 62 9 83 - 1 2 2 9. Paper 43 200 2,089 3,615 83 32 29 52 1 2 12 12 10. Office equipment - - 25 26 269 664 35 43 - - - -
Four largest exports 1 3,017 5,993 7,308 7,484 21 8 1 -2 56 47 43 24 Ten largest exports 3,071 6,428 10,251 12,388 23 10 4 8 57 50 60 40 All others 2,290 6,396 6,917 6,917 47 1 4 57 43 50 40 60
All manufact. exports 2 5,361 12,825 17,169 17,169 33 5 4 31 100 100 100 100
Source: Foreign Trade Statistics, Monthly Bulletin of Statistics (table 6.5), CBS, various issues. Note: 1 Four largest exports: plywood, textiles, garments and footwear 2 Standard International Trade Classification (SITC) categories 5 – 8. For years 1997-99, total manufacturing exports include PEBT manufacturing exports classified under SITC category 9.
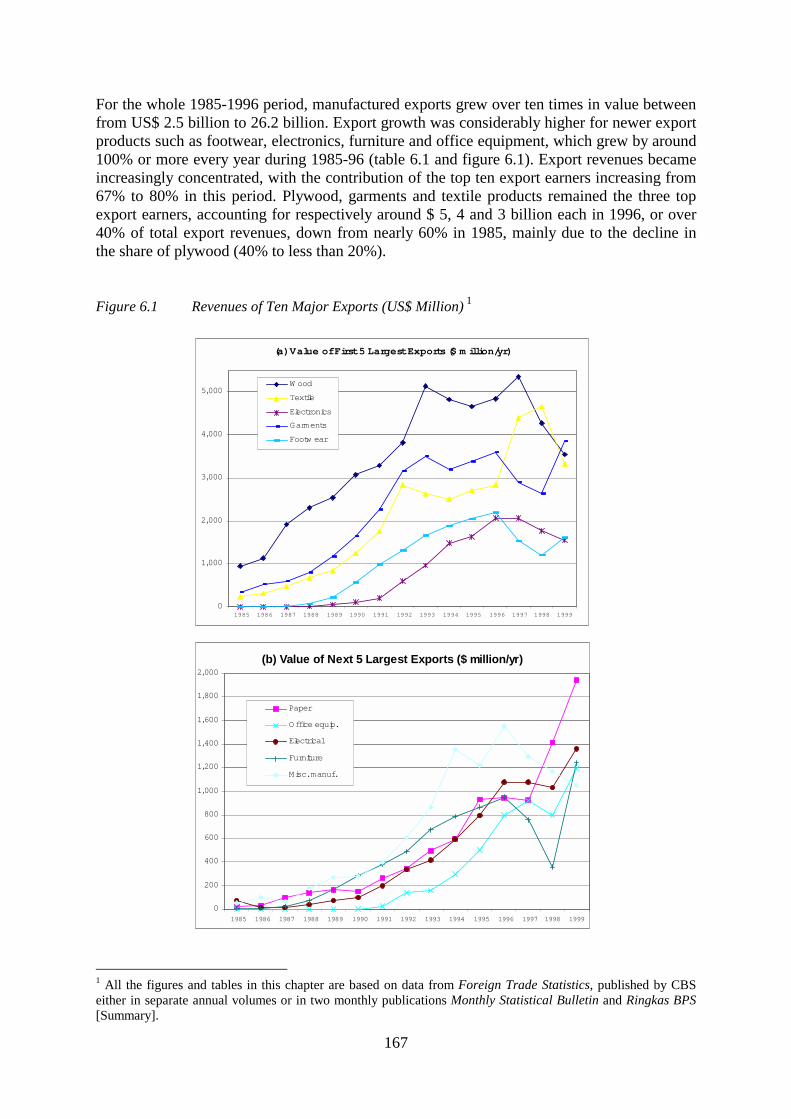
167
For the whole 1985-1996 period, manufactured exports grew over ten times in value between from US$ 2.5 billion to 26.2 billion. Export growth was considerably higher for newer export products such as footwear, electronics, furniture and office equipment, which grew by around 100% or more every year during 1985-96 (table 6.1 and figure 6.1). Export revenues became increasingly concentrated, with the contribution of the top ten export earners increasing from 67% to 80% in this period. Plywood, garments and textile products remained the three top export earners, accounting for respectively around $ 5, 4 and 3 billion each in 1996, or over 40% of total export revenues, down from nearly 60% in 1985, mainly due to the decline in the share of plywood (40% to less than 20%). Figure 6.1 Revenues of Ten Major Exports (US$ Million) 1
1 All the figures and tables in this chapter are based on data from Foreign Trade Statistics, published by CBS either in separate annual volumes or in two monthly publications Monthly Statistical Bulletin and Ringkas BPS [Summary].
(a) Value of First 5 Largest Exports ($ m illion/yr)
0
1,000
2,000
3,000
4,000
5,000
1985 1986 1987 1988 1989 1990 1991 1992 1993 1994 1995 1996 1997 1998 1999
W ood
Textile
Electronics
Garments
Footw ear
(b) Value of Next 5 Largest Exports ($ million/yr)
0
200
400
600
800
1,000
1,200
1,400
1,600
1,800
2,000
1985 1986 1987 1988 1989 1990 1991 1992 1993 1994 1995 1996 1997 1998 1999
Paper
Office equip.
Electrical
Furniture
Misc. manuf.
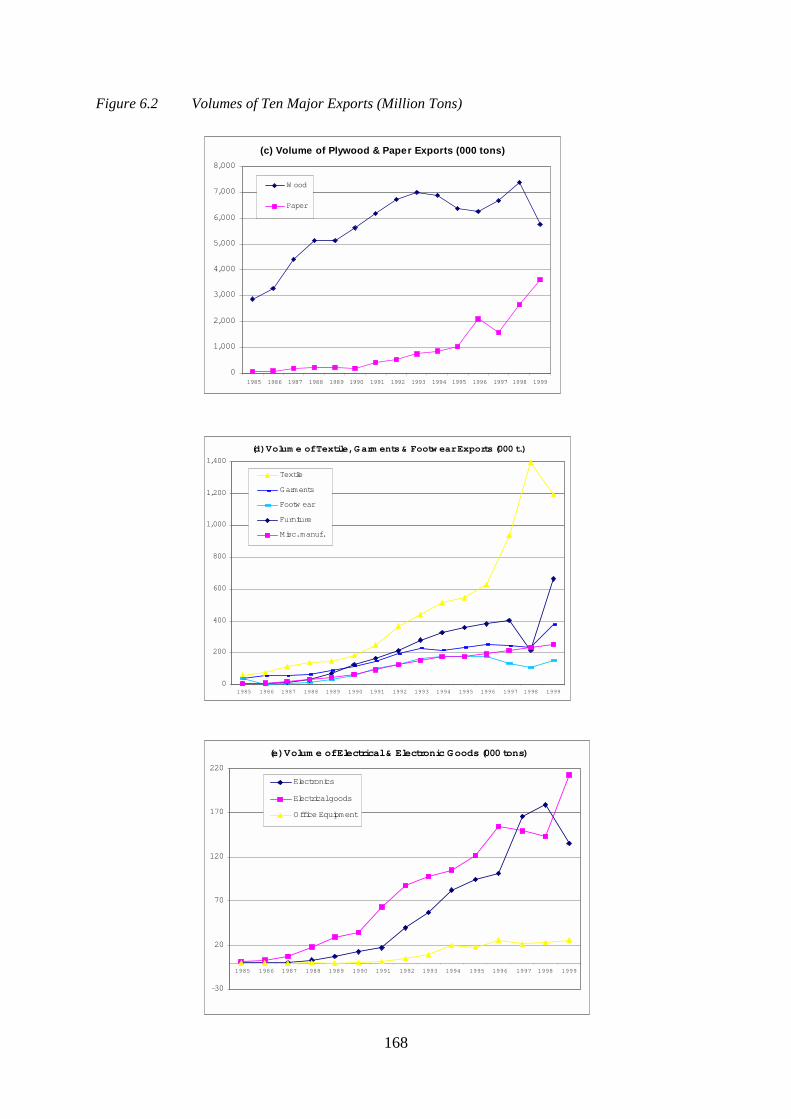
168
Figure 6.2 Volumes of Ten Major Exports (Million Tons)
(c) Volume of Plywood & Paper Exports (000 tons)
0
1,000
2,000
3,000
4,000
5,000
6,000
7,000
8,000
1985 1986 1987 1988 1989 1990 1991 1992 1993 1994 1995 1996 1997 1998 1999
W ood
Paper
(d) Volum e of Textile, Garm ents & Footw ear Exports (000 t.)
0
200
400
600
800
1,000
1,200
1,400
1985 1986 1987 1988 1989 1990 1991 1992 1993 1994 1995 1996 1997 1998 1999
Textile
Garments
Footw ear
Furniture
Misc. manuf.
(e) Volum e of Electrical & Electronic Goods (000 tons)
-30
20
70
120
170
220
1985 1986 1987 1988 1989 1990 1991 1992 1993 1994 1995 1996 1997 1998 1999
Electronics
Electrical goods
Office Equipment
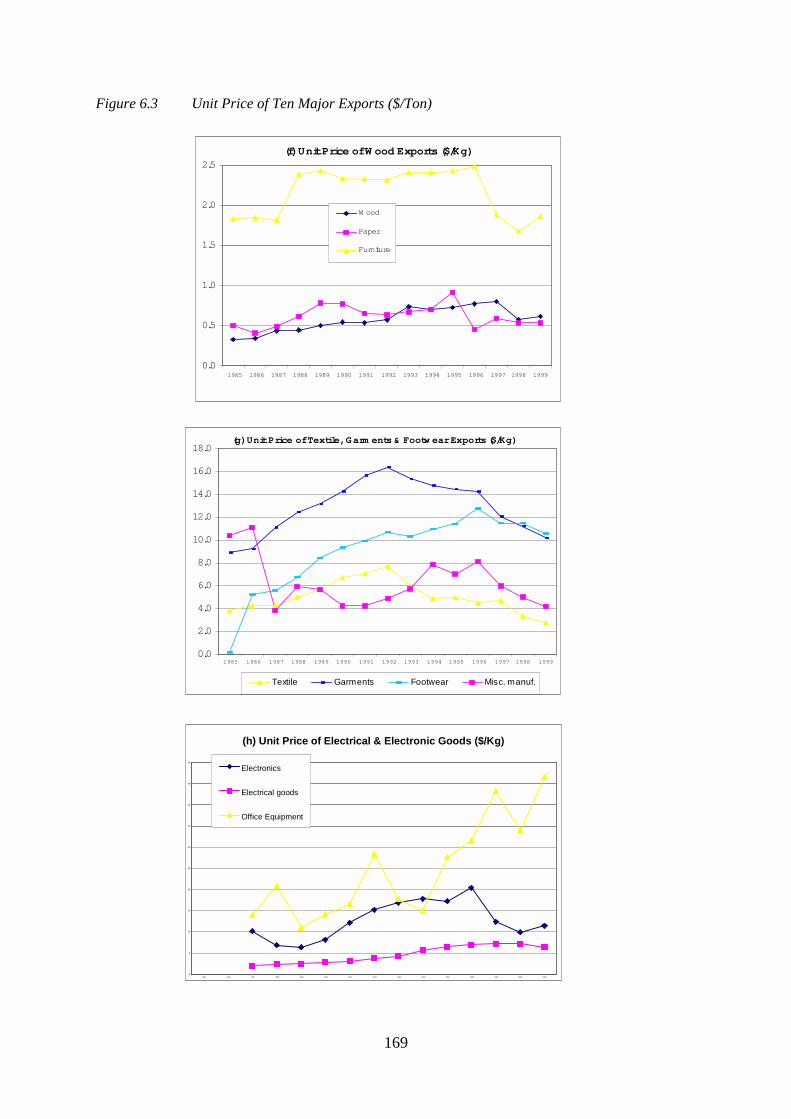
169
Figure 6.3 Unit Price of Ten Major Exports ($/Ton)
(f) Unit Price of W ood Exports ($/Kg)
0.0
0.5
1.0
1.5
2.0
2.5
1985 1986 1987 1988 1989 1990 1991 1992 1993 1994 1995 1996 1997 1998 1999
W ood
Paper
Furniture
(g) Unit Price of Textile, Garm ents & Footw ear Exports ($/Kg)
0.0
2.0
4.0
6.0
8.0
10.0
12.0
14.0
16.0
18.0
1985 1986 1987 1988 1989 1990 1991 1992 1993 1994 1995 1996 1997 1998 1999
Textile Garments Footwear Misc. manuf.
(h) Unit Price of Electrical & Electronic Goods ($/Kg)
0
5
10
15
20
25
30
35
40
45
50
1985 1986 1987 1988 1989 1990 1991 1992 1993 1994 1995 1996 1997 1998 1999
Electronics
Electrical goods
Office Equipment
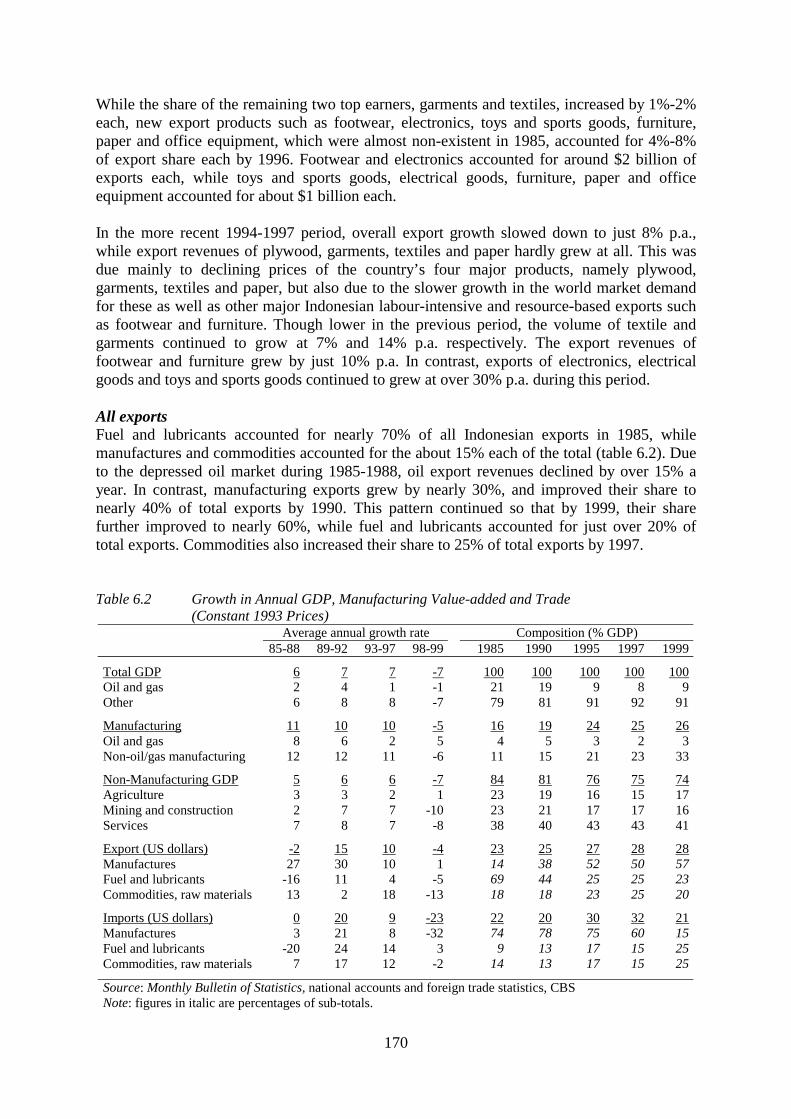
170
While the share of the remaining two top earners, garments and textiles, increased by 1%-2% each, new export products such as footwear, electronics, toys and sports goods, furniture, paper and office equipment, which were almost non-existent in 1985, accounted for 4%-8% of export share each by 1996. Footwear and electronics accounted for around $2 billion of exports each, while toys and sports goods, electrical goods, furniture, paper and office equipment accounted for about $1 billion each. In the more recent 1994-1997 period, overall export growth slowed down to just 8% p.a., while export revenues of plywood, garments, textiles and paper hardly grew at all. This was due mainly to declining prices of the country’s four major products, namely plywood, garments, textiles and paper, but also due to the slower growth in the world market demand for these as well as other major Indonesian labour-intensive and resource-based exports such as footwear and furniture. Though lower in the previous period, the volume of textile and garments continued to grow at 7% and 14% p.a. respectively. The export revenues of footwear and furniture grew by just 10% p.a. In contrast, exports of electronics, electrical goods and toys and sports goods continued to grew at over 30% p.a. during this period. All exports Fuel and lubricants accounted for nearly 70% of all Indonesian exports in 1985, while manufactures and commodities accounted for the about 15% each of the total (table 6.2). Due to the depressed oil market during 1985-1988, oil export revenues declined by over 15% a year. In contrast, manufacturing exports grew by nearly 30%, and improved their share to nearly 40% of total exports by 1990. This pattern continued so that by 1999, their share further improved to nearly 60%, while fuel and lubricants accounted for just over 20% of total exports. Commodities also increased their share to 25% of total exports by 1997. Table 6.2 Growth in Annual GDP, Manufacturing Value-added and Trade (Constant 1993 Prices)
Average annual growth rate Composition (% GDP) 85-88 89-92 93-97 98-99 1985 1990 1995 1997 1999
Total GDP 6 7 7 -7 100 100 100 100 100 Oil and gas 2 4 1 -1 21 19 9 8 9 Other 6 8 8 -7 79 81 91 92 91
Manufacturing 11 10 10 -5 16 19 24 25 26 Oil and gas 8 6 2 5 4 5 3 2 3 Non-oil/gas manufacturing 12 12 11 -6 11 15 21 23 33
Non-Manufacturing GDP 5 6 6 -7 84 81 76 75 74 Agriculture 3 3 2 1 23 19 16 15 17 Mining and construction 2 7 7 -10 23 21 17 17 16 Services 7 8 7 -8 38 40 43 43 41
Export (US dollars) -2 15 10 -4 23 25 27 28 28 Manufactures 27 30 10 1 14 38 52 50 57 Fuel and lubricants -16 11 4 -5 69 44 25 25 23 Commodities, raw materials 13 2 18 -13 18 18 23 25 20
Imports (US dollars) 0 20 9 -23 22 20 30 32 21 Manufactures 3 21 8 -32 74 78 75 60 15 Fuel and lubricants -20 24 14 3 9 13 17 15 25 Commodities, raw materials 7 17 12 -2 14 13 17 15 25
Source: Monthly Bulletin of Statistics, national accounts and foreign trade statistics, CBS Note: figures in italic are percentages of sub-totals.
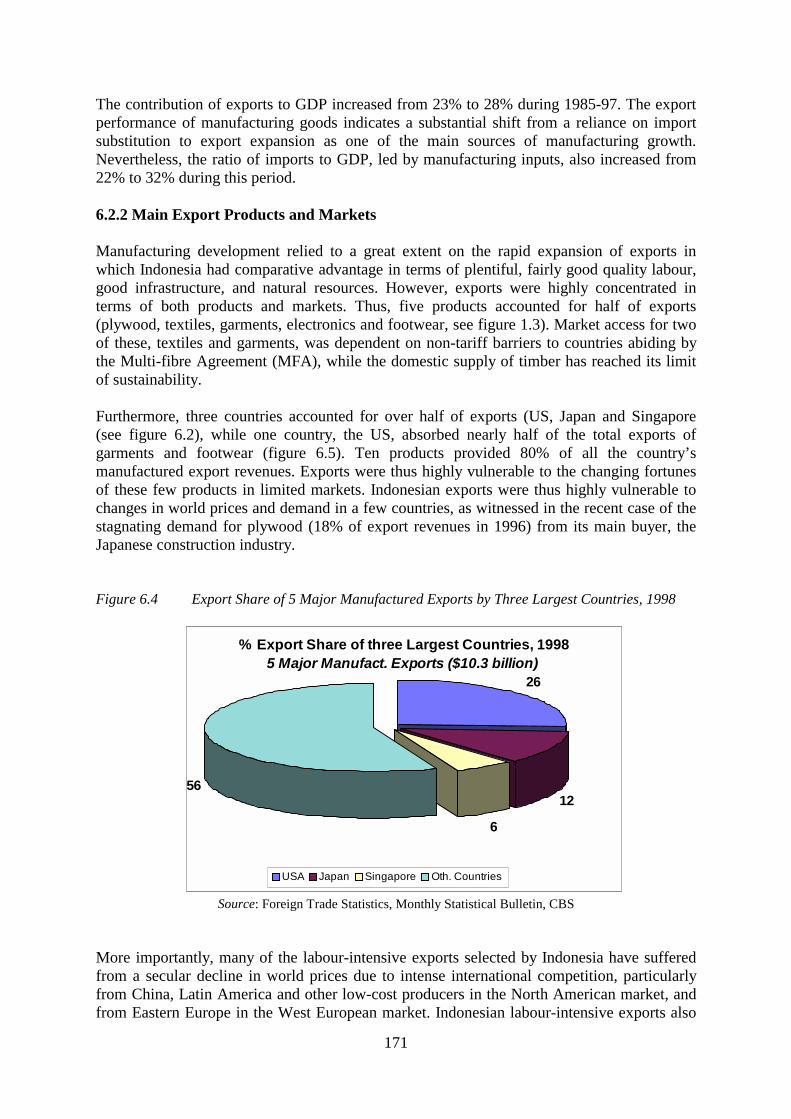
171
The contribution of exports to GDP increased from 23% to 28% during 1985-97. The export performance of manufacturing goods indicates a substantial shift from a reliance on import substitution to export expansion as one of the main sources of manufacturing growth. Nevertheless, the ratio of imports to GDP, led by manufacturing inputs, also increased from 22% to 32% during this period. 6.2.2 Main Export Products and Markets Manufacturing development relied to a great extent on the rapid expansion of exports in which Indonesia had comparative advantage in terms of plentiful, fairly good quality labour, good infrastructure, and natural resources. However, exports were highly concentrated in terms of both products and markets. Thus, five products accounted for half of exports (plywood, textiles, garments, electronics and footwear, see figure 1.3). Market access for two of these, textiles and garments, was dependent on non-tariff barriers to countries abiding by the Multi-fibre Agreement (MFA), while the domestic supply of timber has reached its limit of sustainability. Furthermore, three countries accounted for over half of exports (US, Japan and Singapore (see figure 6.2), while one country, the US, absorbed nearly half of the total exports of garments and footwear (figure 6.5). Ten products provided 80% of all the country’s manufactured export revenues. Exports were thus highly vulnerable to the changing fortunes of these few products in limited markets. Indonesian exports were thus highly vulnerable to changes in world prices and demand in a few countries, as witnessed in the recent case of the stagnating demand for plywood (18% of export revenues in 1996) from its main buyer, the Japanese construction industry. Figure 6.4 Export Share of 5 Major Manufactured Exports by Three Largest Countries, 1998
Source: Foreign Trade Statistics, Monthly Statistical Bulletin, CBS More importantly, many of the labour-intensive exports selected by Indonesia have suffered from a secular decline in world prices due to intense international competition, particularly from China, Latin America and other low-cost producers in the North American market, and from Eastern Europe in the West European market. Indonesian labour-intensive exports also
% Export Share of three Largest Countries, 19985 Major Manufact. Exports ($10.3 billion)
26
12
6
56
USA Japan Singapore Oth. Countries
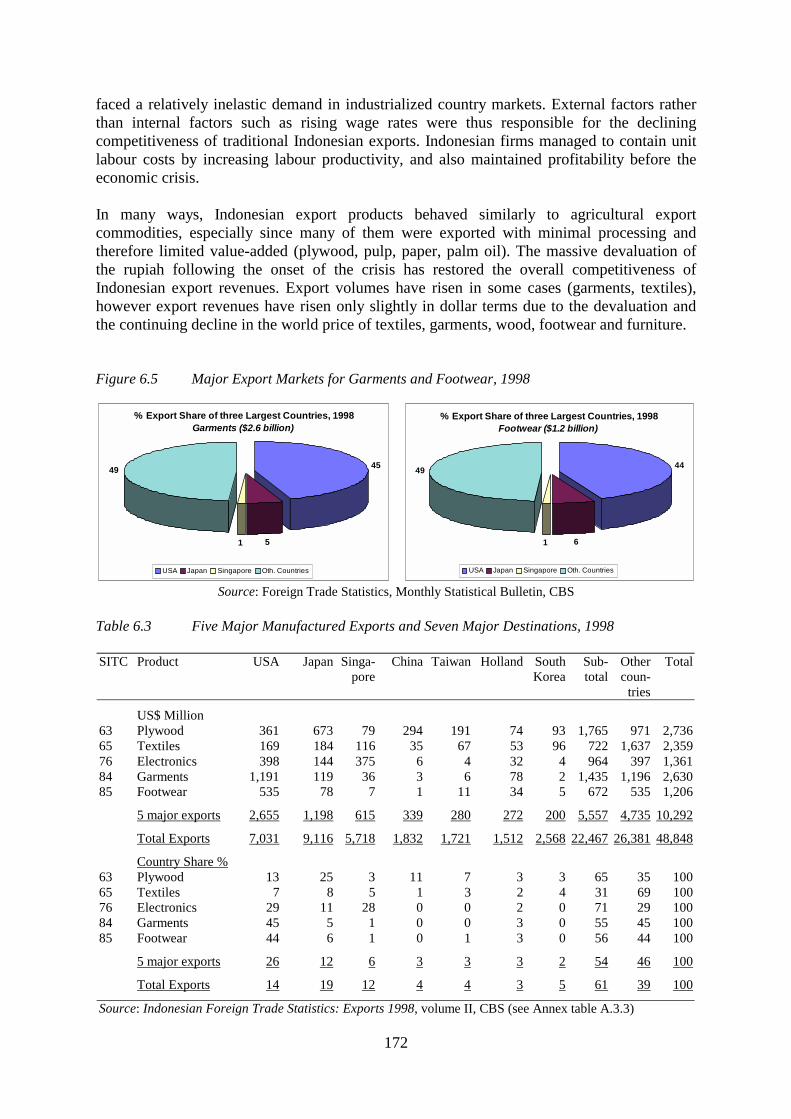
172
faced a relatively inelastic demand in industrialized country markets. External factors rather than internal factors such as rising wage rates were thus responsible for the declining competitiveness of traditional Indonesian exports. Indonesian firms managed to contain unit labour costs by increasing labour productivity, and also maintained profitability before the economic crisis. In many ways, Indonesian export products behaved similarly to agricultural export commodities, especially since many of them were exported with minimal processing and therefore limited value-added (plywood, pulp, paper, palm oil). The massive devaluation of the rupiah following the onset of the crisis has restored the overall competitiveness of Indonesian export revenues. Export volumes have risen in some cases (garments, textiles), however export revenues have risen only slightly in dollar terms due to the devaluation and the continuing decline in the world price of textiles, garments, wood, footwear and furniture. Figure 6.5 Major Export Markets for Garments and Footwear, 1998
Source: Foreign Trade Statistics, Monthly Statistical Bulletin, CBS Table 6.3 Five Major Manufactured Exports and Seven Major Destinations, 1998 SITC Product USA Japan Singa-
pore China Taiwan Holland South
Korea Sub-total
Other coun-
tries
Total
US$ Million 63 Plywood 361 673 79 294 191 74 93 1,765 971 2,736 65 Textiles 169 184 116 35 67 53 96 722 1,637 2,359 76 Electronics 398 144 375 6 4 32 4 964 397 1,361 84 Garments 1,191 119 36 3 6 78 2 1,435 1,196 2,630 85 Footwear 535 78 7 1 11 34 5 672 535 1,206
5 major exports 2,655 1,198 615 339 280 272 200 5,557 4,735 10,292
Total Exports 7,031 9,116 5,718 1,832 1,721 1,512 2,568 22,467 26,381 48,848
Country Share % 63 Plywood 13 25 3 11 7 3 3 65 35 100 65 Textiles 7 8 5 1 3 2 4 31 69 100 76 Electronics 29 11 28 0 0 2 0 71 29 100 84 Garments 45 5 1 0 0 3 0 55 45 100 85 Footwear 44 6 1 0 1 3 0 56 44 100
5 major exports 26 12 6 3 3 3 2 54 46 100
Total Exports 14 19 12 4 4 3 5 61 39 100
Source: Indonesian Foreign Trade Statistics: Exports 1998, volume II, CBS (see Annex table A.3.3)
% Export Share of three Largest Countries, 1998Garments ($2.6 billion)
45
51
49
USA Japan Singapore Oth. Countries
% Export Share of three Largest Countries, 1998Footwear ($1.2 billion)
44
61
49
USA Japan Singapore Oth. Countries
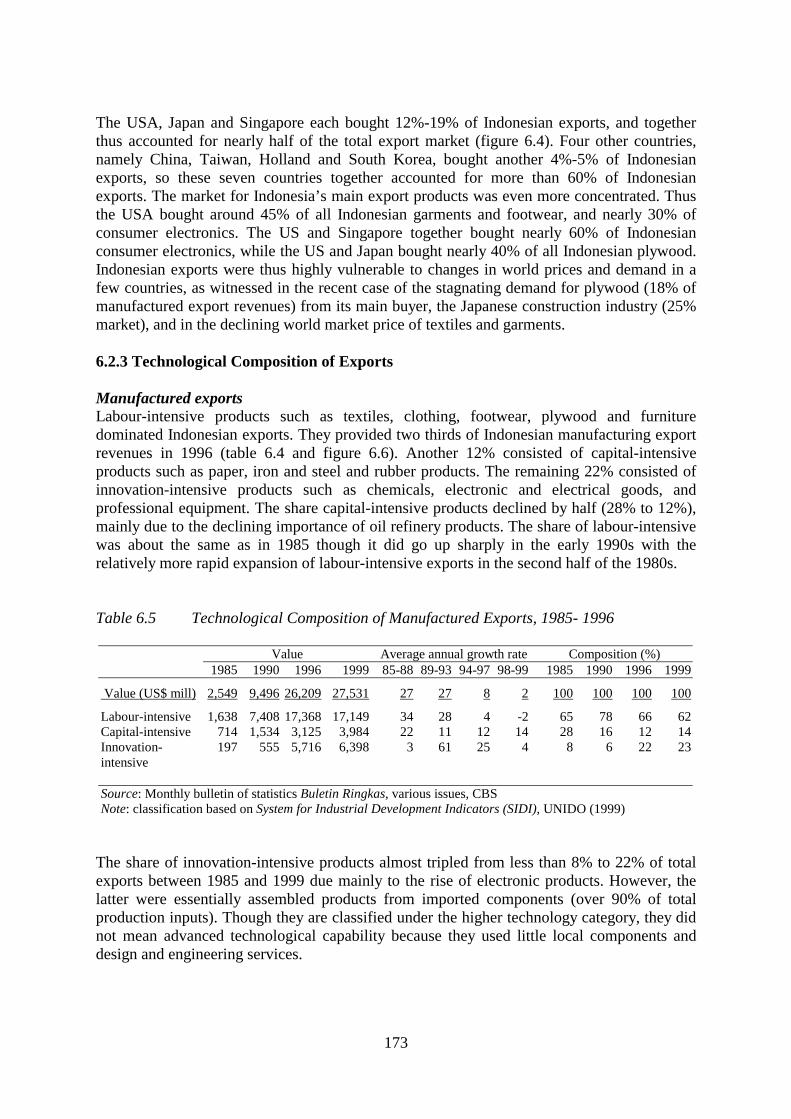
173
The USA, Japan and Singapore each bought 12%-19% of Indonesian exports, and together thus accounted for nearly half of the total export market (figure 6.4). Four other countries, namely China, Taiwan, Holland and South Korea, bought another 4%-5% of Indonesian exports, so these seven countries together accounted for more than 60% of Indonesian exports. The market for Indonesia’s main export products was even more concentrated. Thus the USA bought around 45% of all Indonesian garments and footwear, and nearly 30% of consumer electronics. The US and Singapore together bought nearly 60% of Indonesian consumer electronics, while the US and Japan bought nearly 40% of all Indonesian plywood. Indonesian exports were thus highly vulnerable to changes in world prices and demand in a few countries, as witnessed in the recent case of the stagnating demand for plywood (18% of manufactured export revenues) from its main buyer, the Japanese construction industry (25% market), and in the declining world market price of textiles and garments. 6.2.3 Technological Composition of Exports Manufactured exports Labour-intensive products such as textiles, clothing, footwear, plywood and furniture dominated Indonesian exports. They provided two thirds of Indonesian manufacturing export revenues in 1996 (table 6.4 and figure 6.6). Another 12% consisted of capital-intensive products such as paper, iron and steel and rubber products. The remaining 22% consisted of innovation-intensive products such as chemicals, electronic and electrical goods, and professional equipment. The share capital-intensive products declined by half (28% to 12%), mainly due to the declining importance of oil refinery products. The share of labour-intensive was about the same as in 1985 though it did go up sharply in the early 1990s with the relatively more rapid expansion of labour-intensive exports in the second half of the 1980s. Table 6.5 Technological Composition of Manufactured Exports, 1985- 1996 Value Average annual growth rate Composition (%) 1985 1990 1996 1999 85-88 89-93 94-97 98-99 1985 1990 1996 1999
Value (US$ mill) 2,549 9,496 26,209 27,531 27 27 8 2 100 100 100 100
Labour-intensive 1,638 7,408 17,368 17,149 34 28 4 -2 65 78 66 62 Capital-intensive 714 1,534 3,125 3,984 22 11 12 14 28 16 12 14 Innovation-intensive
197 555 5,716 6,398 3 61 25 4 8 6 22 23
Source: Monthly bulletin of statistics Buletin Ringkas, various issues, CBS Note: classification based on System for Industrial Development Indicators (SIDI), UNIDO (1999)
The share of innovation-intensive products almost tripled from less than 8% to 22% of total exports between 1985 and 1999 due mainly to the rise of electronic products. However, the latter were essentially assembled products from imported components (over 90% of total production inputs). Though they are classified under the higher technology category, they did not mean advanced technological capability because they used little local components and design and engineering services.
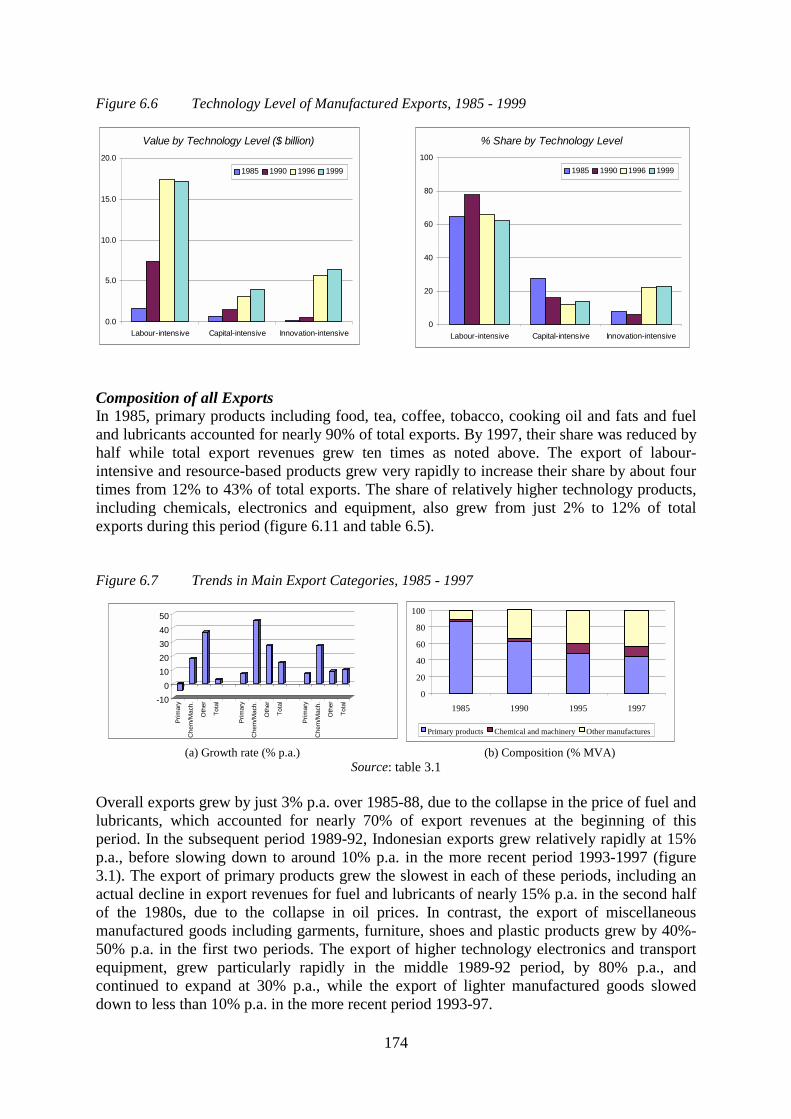
174
Figure 6.6 Technology Level of Manufactured Exports, 1985 - 1999
Composition of all Exports In 1985, primary products including food, tea, coffee, tobacco, cooking oil and fats and fuel and lubricants accounted for nearly 90% of total exports. By 1997, their share was reduced by half while total export revenues grew ten times as noted above. The export of labour-intensive and resource-based products grew very rapidly to increase their share by about four times from 12% to 43% of total exports. The share of relatively higher technology products, including chemicals, electronics and equipment, also grew from just 2% to 12% of total exports during this period (figure 6.11 and table 6.5). Figure 6.7 Trends in Main Export Categories, 1985 - 1997
(a) Growth rate (% p.a.) (b) Composition (% MVA) Source: table 3.1
Overall exports grew by just 3% p.a. over 1985-88, due to the collapse in the price of fuel and lubricants, which accounted for nearly 70% of export revenues at the beginning of this period. In the subsequent period 1989-92, Indonesian exports grew relatively rapidly at 15% p.a., before slowing down to around 10% p.a. in the more recent period 1993-1997 (figure 3.1). The export of primary products grew the slowest in each of these periods, including an actual decline in export revenues for fuel and lubricants of nearly 15% p.a. in the second half of the 1980s, due to the collapse in oil prices. In contrast, the export of miscellaneous manufactured goods including garments, furniture, shoes and plastic products grew by 40%-50% p.a. in the first two periods. The export of higher technology electronics and transport equipment, grew particularly rapidly in the middle 1989-92 period, by 80% p.a., and continued to expand at 30% p.a., while the export of lighter manufactured goods slowed down to less than 10% p.a. in the more recent period 1993-97.
-100
1020304050
Prim
ary
Che
m/M
ach.
Oth
er
Tota
l
Prim
ary
Che
m/M
ach.
Oth
er
Tota
l
Prim
ary
Che
m/M
ach.
Oth
er
Tota
l
0
20
40
60
80
100
1985 1990 1995 1997
Primary products Chemical and machinery Other manufactures
Value by Technology Level ($ billion)
0.0
5.0
10.0
15.0
20.0
Labour-intensive Capital-intensive Innovation-intensive
1985 1990 1996 1999
% Share by Technology Level
0
20
40
60
80
100
Labour-intensive Capital-intensive Innovation-intensive
1985 1990 1996 1999
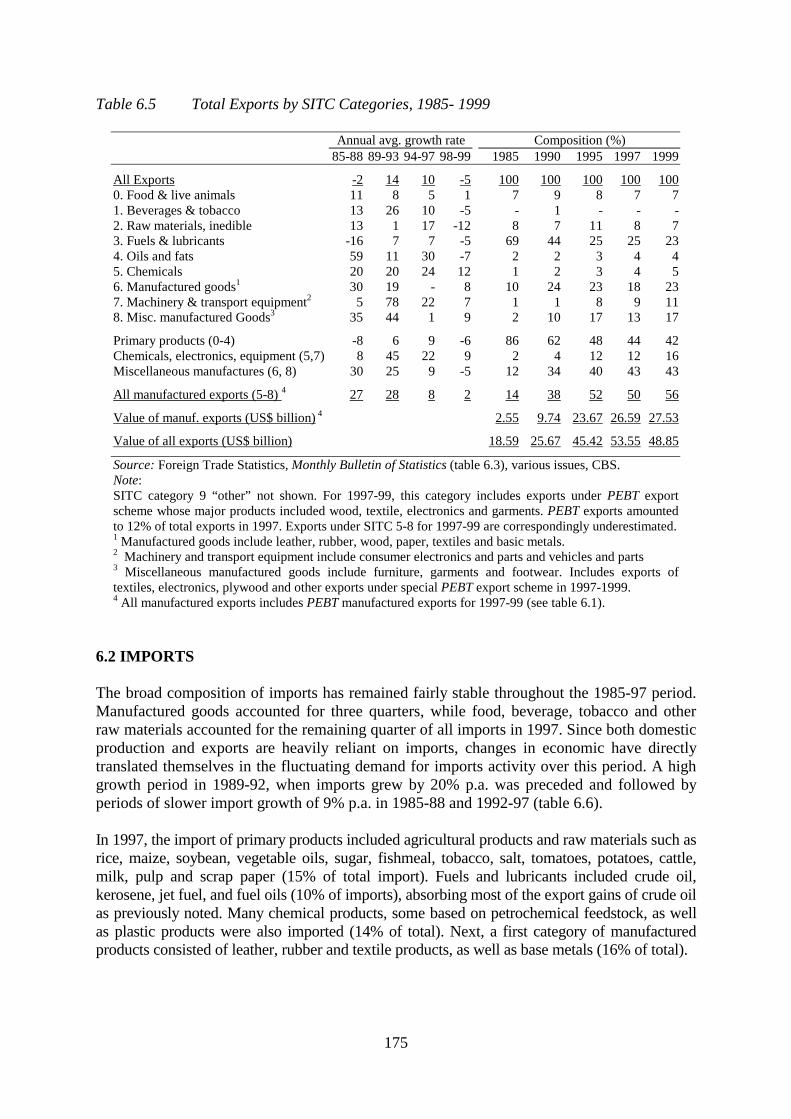
175
Table 6.5 Total Exports by SITC Categories, 1985- 1999
Annual avg. growth rate Composition (%) 85-88 89-93 94-97 98-99 1985 1990 1995 1997 1999
All Exports -2 14 10 -5 100 100 100 100 100 0. Food & live animals 11 8 5 1 7 9 8 7 7 1. Beverages & tobacco 13 26 10 -5 - 1 - - - 2. Raw materials, inedible 13 1 17 -12 8 7 11 8 7 3. Fuels & lubricants -16 7 7 -5 69 44 25 25 23 4. Oils and fats 59 11 30 -7 2 2 3 4 4 5. Chemicals 20 20 24 12 1 2 3 4 5 6. Manufactured goods1 30 19 - 8 10 24 23 18 23 7. Machinery & transport equipment2 5 78 22 7 1 1 8 9 11 8. Misc. manufactured Goods3 35 44 1 9 2 10 17 13 17
Primary products (0-4) -8 6 9 -6 86 62 48 44 42 Chemicals, electronics, equipment (5,7) 8 45 22 9 2 4 12 12 16 Miscellaneous manufactures (6, 8) 30 25 9 -5 12 34 40 43 43
All manufactured exports (5-8) 4 27 28 8 2 14 38 52 50 56
Value of manuf. exports (US$ billion) 4 2.55 9.74 23.67 26.59 27.53
Value of all exports (US$ billion) 18.59 25.67 45.42 53.55 48.85
Source: Foreign Trade Statistics, Monthly Bulletin of Statistics (table 6.3), various issues, CBS. Note: SITC category 9 “other” not shown. For 1997-99, this category includes exports under PEBT export scheme whose major products included wood, textile, electronics and garments. PEBT exports amounted to 12% of total exports in 1997. Exports under SITC 5-8 for 1997-99 are correspondingly underestimated. 1 Manufactured goods include leather, rubber, wood, paper, textiles and basic metals. 2 Machinery and transport equipment include consumer electronics and parts and vehicles and parts 3 Miscellaneous manufactured goods include furniture, garments and footwear. Includes exports of textiles, electronics, plywood and other exports under special PEBT export scheme in 1997-1999. 4 All manufactured exports includes PEBT manufactured exports for 1997-99 (see table 6.1).
6.2 IMPORTS The broad composition of imports has remained fairly stable throughout the 1985-97 period. Manufactured goods accounted for three quarters, while food, beverage, tobacco and other raw materials accounted for the remaining quarter of all imports in 1997. Since both domestic production and exports are heavily reliant on imports, changes in economic have directly translated themselves in the fluctuating demand for imports activity over this period. A high growth period in 1989-92, when imports grew by 20% p.a. was preceded and followed by periods of slower import growth of 9% p.a. in 1985-88 and 1992-97 (table 6.6). In 1997, the import of primary products included agricultural products and raw materials such as rice, maize, soybean, vegetable oils, sugar, fishmeal, tobacco, salt, tomatoes, potatoes, cattle, milk, pulp and scrap paper (15% of total import). Fuels and lubricants included crude oil, kerosene, jet fuel, and fuel oils (10% of imports), absorbing most of the export gains of crude oil as previously noted. Many chemical products, some based on petrochemical feedstock, as well as plastic products were also imported (14% of total). Next, a first category of manufactured products consisted of leather, rubber and textile products, as well as base metals (16% of total).
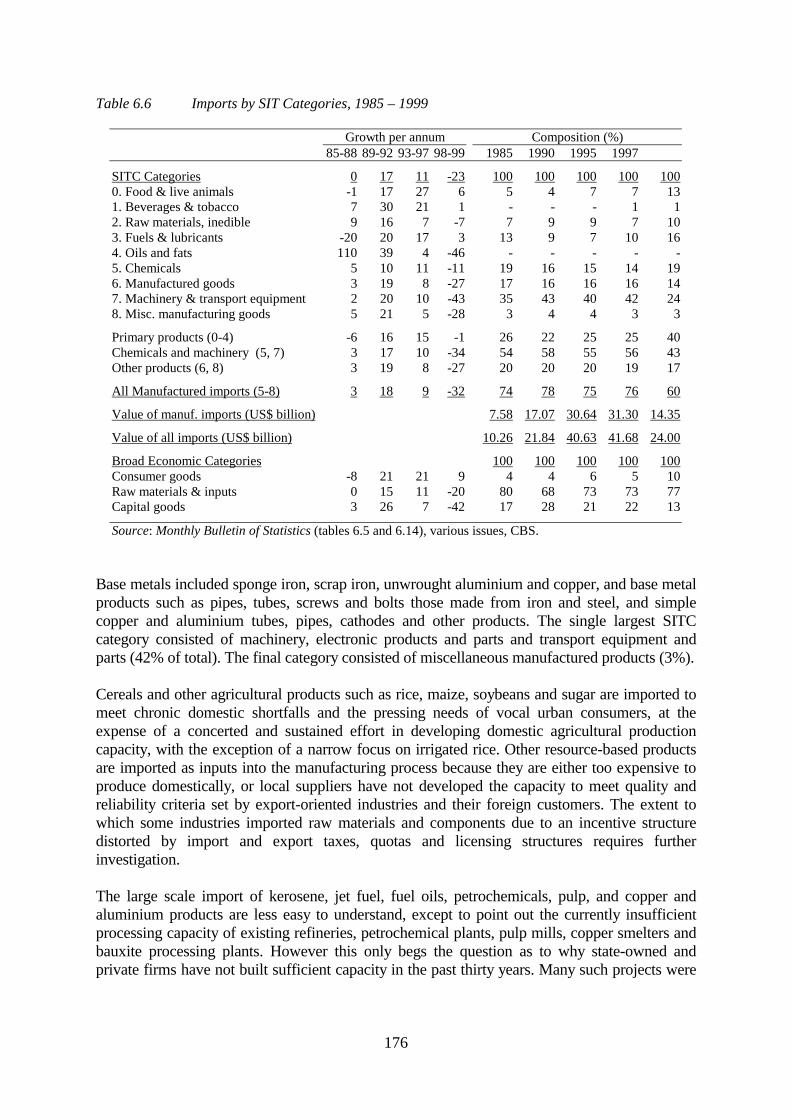
176
Table 6.6 Imports by SIT Categories, 1985 – 1999
Growth per annum Composition (%) 85-88 89-92 93-97 98-99 1985 1990 1995 1997
SITC Categories 0 17 11 -23 100 100 100 100 100 0. Food & live animals -1 17 27 6 5 4 7 7 13 1. Beverages & tobacco 7 30 21 1 - - - 1 1 2. Raw materials, inedible 9 16 7 -7 7 9 9 7 10 3. Fuels & lubricants -20 20 17 3 13 9 7 10 16 4. Oils and fats 110 39 4 -46 - - - - - 5. Chemicals 5 10 11 -11 19 16 15 14 19 6. Manufactured goods 3 19 8 -27 17 16 16 16 14 7. Machinery & transport equipment 2 20 10 -43 35 43 40 42 24 8. Misc. manufacturing goods 5 21 5 -28 3 4 4 3 3
Primary products (0-4) -6 16 15 -1 26 22 25 25 40 Chemicals and machinery (5, 7) 3 17 10 -34 54 58 55 56 43 Other products (6, 8) 3 19 8 -27 20 20 20 19 17
All Manufactured imports (5-8) 3 18 9 -32 74 78 75 76 60
Value of manuf. imports (US$ billion) 7.58 17.07 30.64 31.30 14.35
Value of all imports (US$ billion) 10.26 21.84 40.63 41.68 24.00
Broad Economic Categories 100 100 100 100 100 Consumer goods -8 21 21 9 4 4 6 5 10 Raw materials & inputs 0 15 11 -20 80 68 73 73 77 Capital goods 3 26 7 -42 17 28 21 22 13
Source: Monthly Bulletin of Statistics (tables 6.5 and 6.14), various issues, CBS. Base metals included sponge iron, scrap iron, unwrought aluminium and copper, and base metal products such as pipes, tubes, screws and bolts those made from iron and steel, and simple copper and aluminium tubes, pipes, cathodes and other products. The single largest SITC category consisted of machinery, electronic products and parts and transport equipment and parts (42% of total). The final category consisted of miscellaneous manufactured products (3%). Cereals and other agricultural products such as rice, maize, soybeans and sugar are imported to meet chronic domestic shortfalls and the pressing needs of vocal urban consumers, at the expense of a concerted and sustained effort in developing domestic agricultural production capacity, with the exception of a narrow focus on irrigated rice. Other resource-based products are imported as inputs into the manufacturing process because they are either too expensive to produce domestically, or local suppliers have not developed the capacity to meet quality and reliability criteria set by export-oriented industries and their foreign customers. The extent to which some industries imported raw materials and components due to an incentive structure distorted by import and export taxes, quotas and licensing structures requires further investigation. The large scale import of kerosene, jet fuel, fuel oils, petrochemicals, pulp, and copper and aluminium products are less easy to understand, except to point out the currently insufficient processing capacity of existing refineries, petrochemical plants, pulp mills, copper smelters and bauxite processing plants. However this only begs the question as to why state-owned and private firms have not built sufficient capacity in the past thirty years. Many such projects were
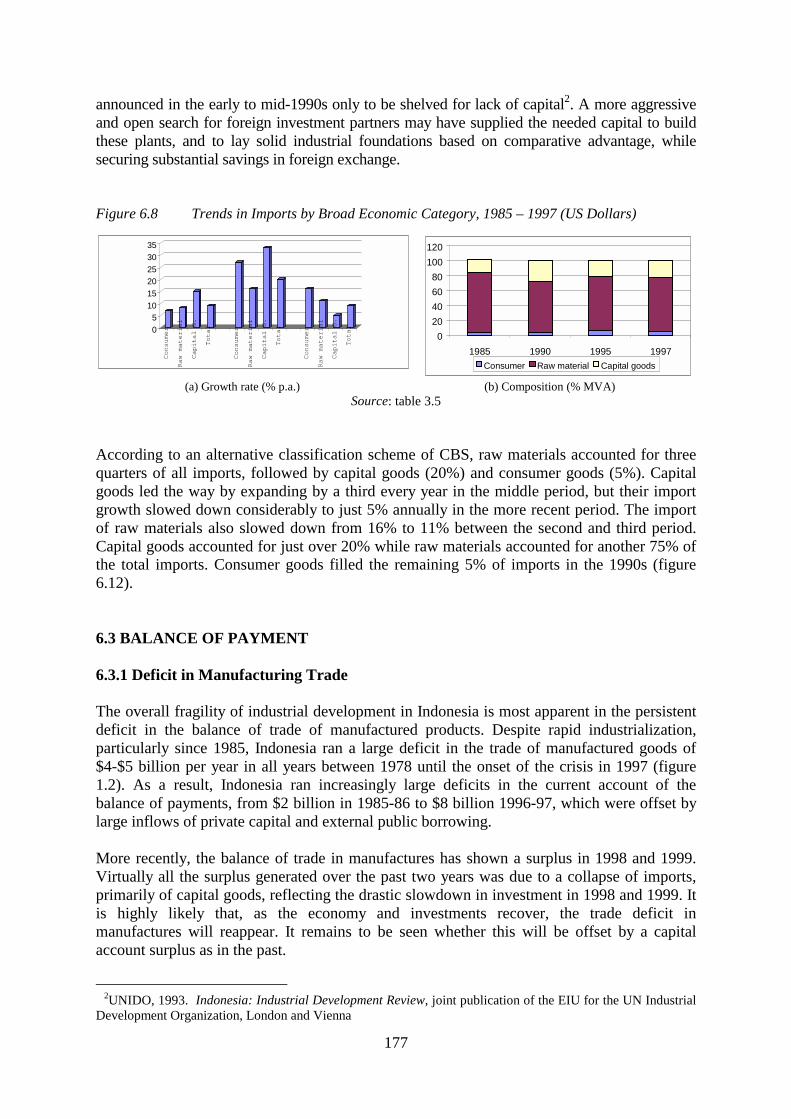
177
announced in the early to mid-1990s only to be shelved for lack of capital2. A more aggressive and open search for foreign investment partners may have supplied the needed capital to build these plants, and to lay solid industrial foundations based on comparative advantage, while securing substantial savings in foreign exchange. Figure 6.8 Trends in Imports by Broad Economic Category, 1985 – 1997 (US Dollars)
(a) Growth rate (% p.a.) (b) Composition (% MVA) Source: table 3.5
According to an alternative classification scheme of CBS, raw materials accounted for three quarters of all imports, followed by capital goods (20%) and consumer goods (5%). Capital goods led the way by expanding by a third every year in the middle period, but their import growth slowed down considerably to just 5% annually in the more recent period. The import of raw materials also slowed down from 16% to 11% between the second and third period. Capital goods accounted for just over 20% while raw materials accounted for another 75% of the total imports. Consumer goods filled the remaining 5% of imports in the 1990s (figure 6.12). 6.3 BALANCE OF PAYMENT 6.3.1 Deficit in Manufacturing Trade The overall fragility of industrial development in Indonesia is most apparent in the persistent deficit in the balance of trade of manufactured products. Despite rapid industrialization, particularly since 1985, Indonesia ran a large deficit in the trade of manufactured goods of $4-$5 billion per year in all years between 1978 until the onset of the crisis in 1997 (figure 1.2). As a result, Indonesia ran increasingly large deficits in the current account of the balance of payments, from $2 billion in 1985-86 to $8 billion 1996-97, which were offset by large inflows of private capital and external public borrowing. More recently, the balance of trade in manufactures has shown a surplus in 1998 and 1999. Virtually all the surplus generated over the past two years was due to a collapse of imports, primarily of capital goods, reflecting the drastic slowdown in investment in 1998 and 1999. It is highly likely that, as the economy and investments recover, the trade deficit in manufactures will reappear. It remains to be seen whether this will be offset by a capital account surplus as in the past.
2UNIDO, 1993. Indonesia: Industrial Development Review, joint publication of the EIU for the UN Industrial Development Organization, London and Vienna
05
101520253035
Consumer
Raw material
Capital G.
Total
Consumer
Raw material
Capital G.
Total
Consumer
Raw material
Capital G.
Total
020406080
100120
1985 1990 1995 1997Consumer Raw material Capital goods
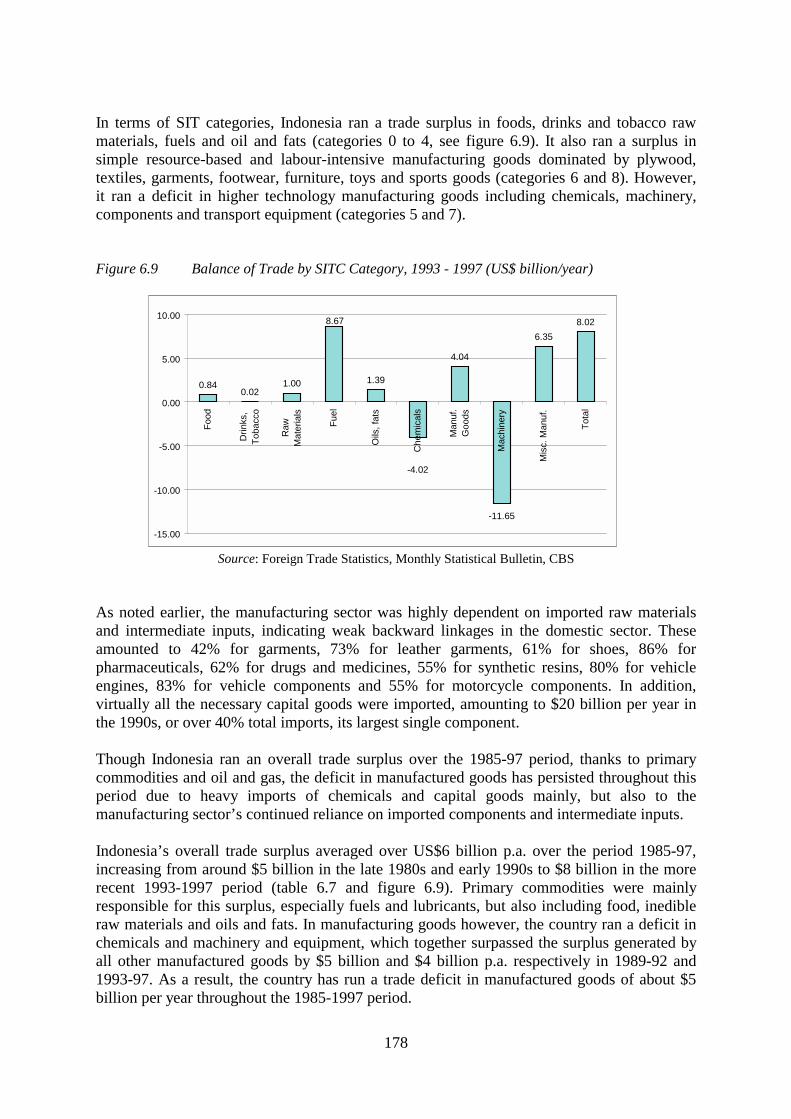
178
In terms of SIT categories, Indonesia ran a trade surplus in foods, drinks and tobacco raw materials, fuels and oil and fats (categories 0 to 4, see figure 6.9). It also ran a surplus in simple resource-based and labour-intensive manufacturing goods dominated by plywood, textiles, garments, footwear, furniture, toys and sports goods (categories 6 and 8). However, it ran a deficit in higher technology manufacturing goods including chemicals, machinery, components and transport equipment (categories 5 and 7). Figure 6.9 Balance of Trade by SITC Category, 1993 - 1997 (US$ billion/year)
Source: Foreign Trade Statistics, Monthly Statistical Bulletin, CBS As noted earlier, the manufacturing sector was highly dependent on imported raw materials and intermediate inputs, indicating weak backward linkages in the domestic sector. These amounted to 42% for garments, 73% for leather garments, 61% for shoes, 86% for pharmaceuticals, 62% for drugs and medicines, 55% for synthetic resins, 80% for vehicle engines, 83% for vehicle components and 55% for motorcycle components. In addition, virtually all the necessary capital goods were imported, amounting to $20 billion per year in the 1990s, or over 40% total imports, its largest single component. Though Indonesia ran an overall trade surplus over the 1985-97 period, thanks to primary commodities and oil and gas, the deficit in manufactured goods has persisted throughout this period due to heavy imports of chemicals and capital goods mainly, but also to the manufacturing sector’s continued reliance on imported components and intermediate inputs. Indonesia’s overall trade surplus averaged over US$6 billion p.a. over the period 1985-97, increasing from around $5 billion in the late 1980s and early 1990s to $8 billion in the more recent 1993-1997 period (table 6.7 and figure 6.9). Primary commodities were mainly responsible for this surplus, especially fuels and lubricants, but also including food, inedible raw materials and oils and fats. In manufacturing goods however, the country ran a deficit in chemicals and machinery and equipment, which together surpassed the surplus generated by all other manufactured goods by $5 billion and $4 billion p.a. respectively in 1989-92 and 1993-97. As a result, the country has run a trade deficit in manufactured goods of about $5 billion per year throughout the 1985-1997 period.
0.840.02
1.00 1.39
4.04
-11.65
6.358.02
-4.02
8.67
-15.00
-10.00
-5.00
0.00
5.00
10.00
Food
Drin
ks,
Toba
cco
Raw
Mat
eria
ls
Fuel
Oils
, fat
s
Che
mic
als
Man
uf.
Goo
ds
Mac
hine
ry
Mis
c. M
anuf
.
Tota
l
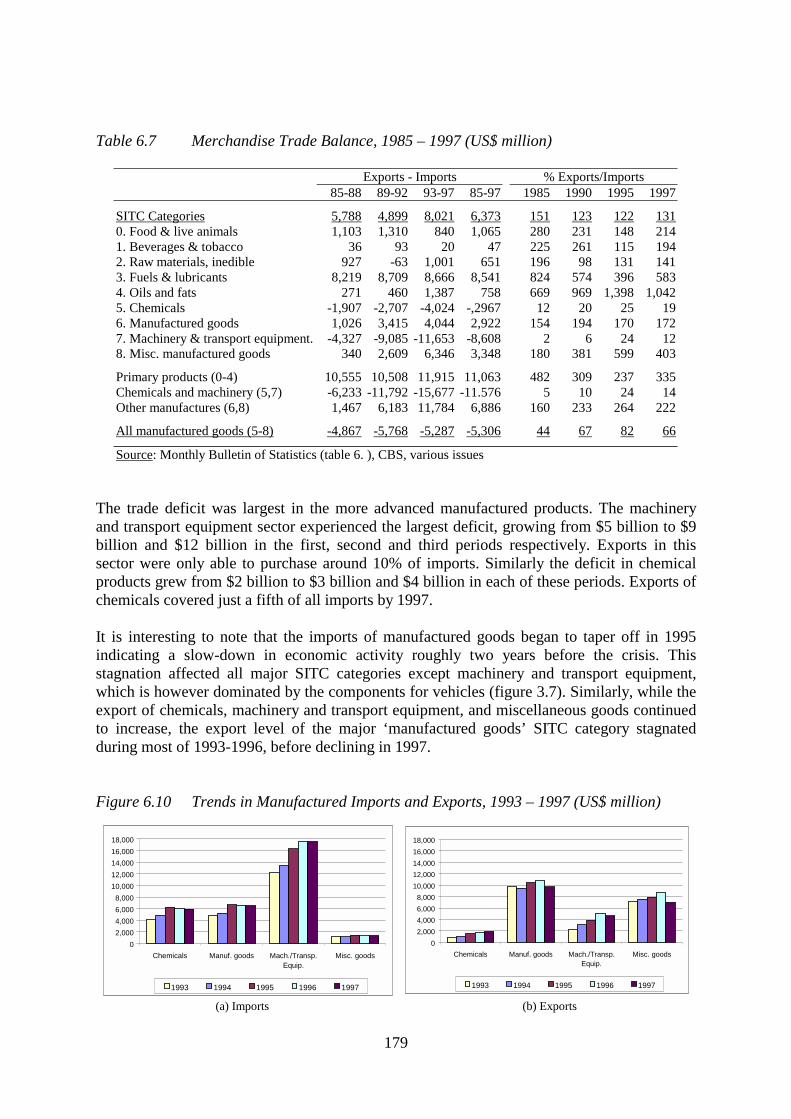
179
Table 6.7 Merchandise Trade Balance, 1985 – 1997 (US$ million)
Exports - Imports % Exports/Imports 85-88 89-92 93-97 85-97 1985 1990 1995 1997
SITC Categories 5,788 4,899 8,021 6,373 151 123 122 131 0. Food & live animals 1,103 1,310 840 1,065 280 231 148 214 1. Beverages & tobacco 36 93 20 47 225 261 115 194 2. Raw materials, inedible 927 -63 1,001 651 196 98 131 141 3. Fuels & lubricants 8,219 8,709 8,666 8,541 824 574 396 583 4. Oils and fats 271 460 1,387 758 669 969 1,398 1,042 5. Chemicals -1,907 -2,707 -4,024 -,2967 12 20 25 19 6. Manufactured goods 1,026 3,415 4,044 2,922 154 194 170 172 7. Machinery & transport equipment. -4,327 -9,085 -11,653 -8,608 2 6 24 12 8. Misc. manufactured goods 340 2,609 6,346 3,348 180 381 599 403
Primary products (0-4) 10,555 10,508 11,915 11,063 482 309 237 335 Chemicals and machinery (5,7) -6,233 -11,792 -15,677 -11.576 5 10 24 14 Other manufactures (6,8) 1,467 6,183 11,784 6,886 160 233 264 222
All manufactured goods (5-8) -4,867 -5,768 -5,287 -5,306 44 67 82 66
Source: Monthly Bulletin of Statistics (table 6. ), CBS, various issues The trade deficit was largest in the more advanced manufactured products. The machinery and transport equipment sector experienced the largest deficit, growing from $5 billion to $9 billion and $12 billion in the first, second and third periods respectively. Exports in this sector were only able to purchase around 10% of imports. Similarly the deficit in chemical products grew from $2 billion to $3 billion and $4 billion in each of these periods. Exports of chemicals covered just a fifth of all imports by 1997. It is interesting to note that the imports of manufactured goods began to taper off in 1995 indicating a slow-down in economic activity roughly two years before the crisis. This stagnation affected all major SITC categories except machinery and transport equipment, which is however dominated by the components for vehicles (figure 3.7). Similarly, while the export of chemicals, machinery and transport equipment, and miscellaneous goods continued to increase, the export level of the major ‘manufactured goods’ SITC category stagnated during most of 1993-1996, before declining in 1997. Figure 6.10 Trends in Manufactured Imports and Exports, 1993 – 1997 (US$ million)
(a) Imports (b) Exports
02,0004,0006,0008,000
10,00012,00014,00016,00018,000
Chemicals Manuf. goods Mach./Transp.Equip.
Misc. goods
1993 1994 1995 1996 1997
02,0004,0006,0008,000
10,00012,00014,00016,00018,000
Chemicals Manuf. goods Mach./Transp.Equip.
Misc. goods
1993 1994 1995 1996 1997
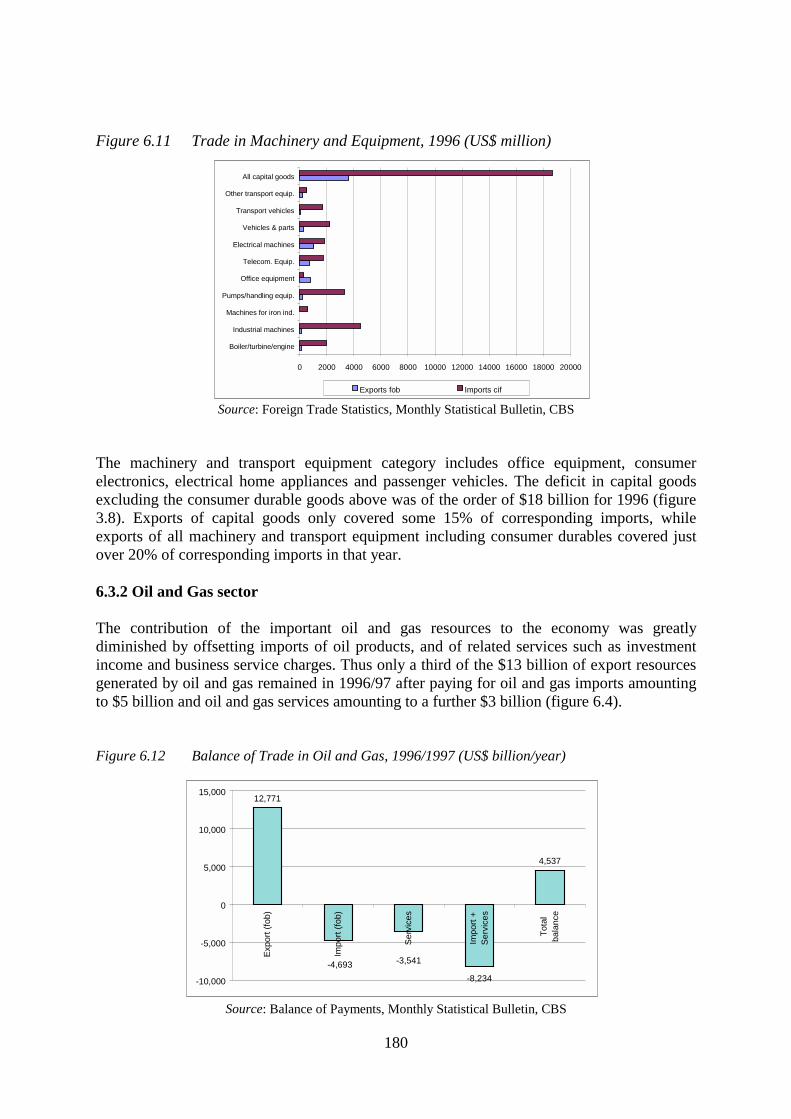
180
Figure 6.11 Trade in Machinery and Equipment, 1996 (US$ million)
Source: Foreign Trade Statistics, Monthly Statistical Bulletin, CBS The machinery and transport equipment category includes office equipment, consumer electronics, electrical home appliances and passenger vehicles. The deficit in capital goods excluding the consumer durable goods above was of the order of $18 billion for 1996 (figure 3.8). Exports of capital goods only covered some 15% of corresponding imports, while exports of all machinery and transport equipment including consumer durables covered just over 20% of corresponding imports in that year. 6.3.2 Oil and Gas sector The contribution of the important oil and gas resources to the economy was greatly diminished by offsetting imports of oil products, and of related services such as investment income and business service charges. Thus only a third of the $13 billion of export resources generated by oil and gas remained in 1996/97 after paying for oil and gas imports amounting to $5 billion and oil and gas services amounting to a further $3 billion (figure 6.4). Figure 6.12 Balance of Trade in Oil and Gas, 1996/1997 (US$ billion/year)
Source: Balance of Payments, Monthly Statistical Bulletin, CBS
0 2000 4000 6000 8000 10000 12000 14000 16000 18000 20000
Boiler/turbine/engine
Industrial machines
Machines for iron ind.
Pumps/handling equip.
Office equipment
Telecom. Equip.
Electrical machines
Vehicles & parts
Transport vehicles
Other transport equip.
All capital goods
Exports fob Imports cif
12,771
-8,234
4,537
-4,693 -3,541
-10,000
-5,000
0
5,000
10,000
15,000
Expo
rt (fo
b)
Impo
rt (fo
b)
Serv
ices
Impo
rt +
Serv
ices
Tota
lba
lanc
e
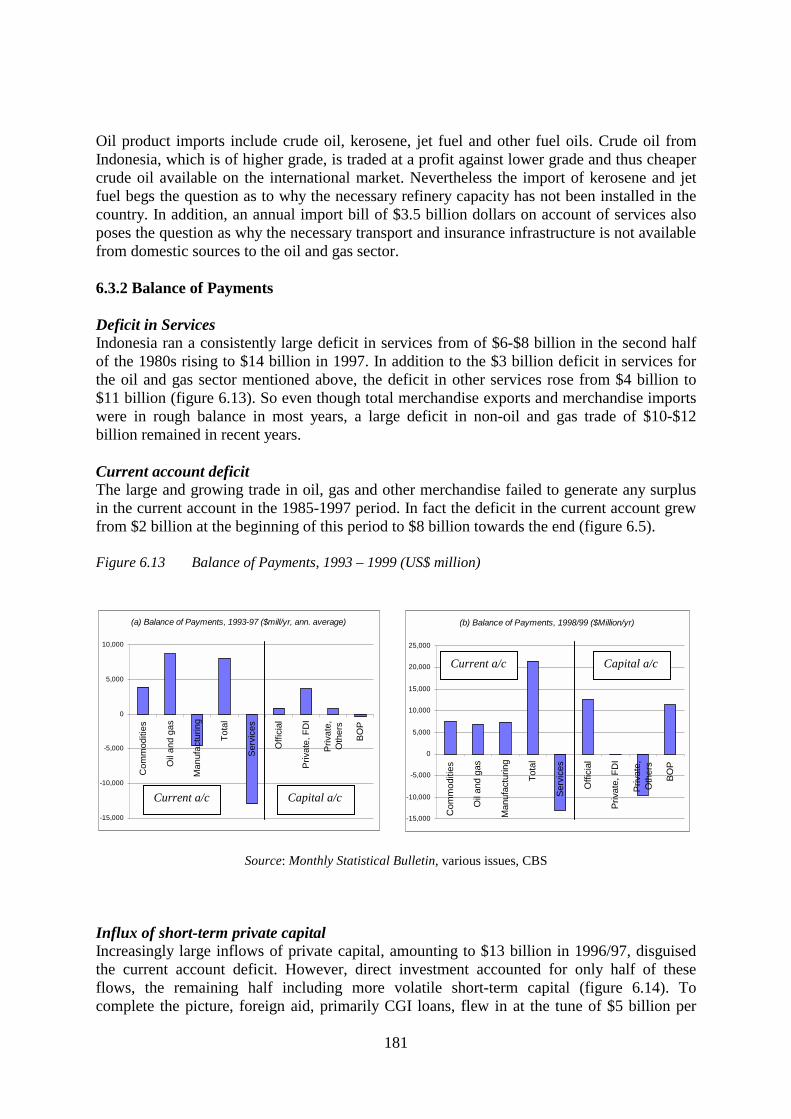
181
Oil product imports include crude oil, kerosene, jet fuel and other fuel oils. Crude oil from Indonesia, which is of higher grade, is traded at a profit against lower grade and thus cheaper crude oil available on the international market. Nevertheless the import of kerosene and jet fuel begs the question as to why the necessary refinery capacity has not been installed in the country. In addition, an annual import bill of $3.5 billion dollars on account of services also poses the question as why the necessary transport and insurance infrastructure is not available from domestic sources to the oil and gas sector. 6.3.2 Balance of Payments Deficit in Services Indonesia ran a consistently large deficit in services from of $6-$8 billion in the second half of the 1980s rising to $14 billion in 1997. In addition to the $3 billion deficit in services for the oil and gas sector mentioned above, the deficit in other services rose from $4 billion to $11 billion (figure 6.13). So even though total merchandise exports and merchandise imports were in rough balance in most years, a large deficit in non-oil and gas trade of $10-$12 billion remained in recent years. Current account deficit The large and growing trade in oil, gas and other merchandise failed to generate any surplus in the current account in the 1985-1997 period. In fact the deficit in the current account grew from $2 billion at the beginning of this period to $8 billion towards the end (figure 6.5). Figure 6.13 Balance of Payments, 1993 – 1999 (US$ million)
Source: Monthly Statistical Bulletin, various issues, CBS
Influx of short-term private capital Increasingly large inflows of private capital, amounting to $13 billion in 1996/97, disguised the current account deficit. However, direct investment accounted for only half of these flows, the remaining half including more volatile short-term capital (figure 6.14). To complete the picture, foreign aid, primarily CGI loans, flew in at the tune of $5 billion per
(a) Balance of Payments, 1993-97 ($mill/yr, ann. average)
-15,000
-10,000
-5,000
0
5,000
10,000
Com
mod
ities
Oil
and
gas
Man
ufac
turin
g
Tota
l
Serv
ices
Offi
cial
Priv
ate,
FD
I
Priv
ate,
Oth
ers
BOP
(b) Balance of Payments, 1998/99 ($Million/yr)
-15,000
-10,000
-5,000
0
5,000
10,000
15,000
20,000
25,000
Com
mod
ities
Oil
and
gas
Man
ufac
turin
g
Tota
l
Serv
ices
Offi
cial
Priv
ate,
FD
I
Priv
ate,
Oth
ers
BOP
Current a/c
Current a/c
Capital a/c
Capital a/c
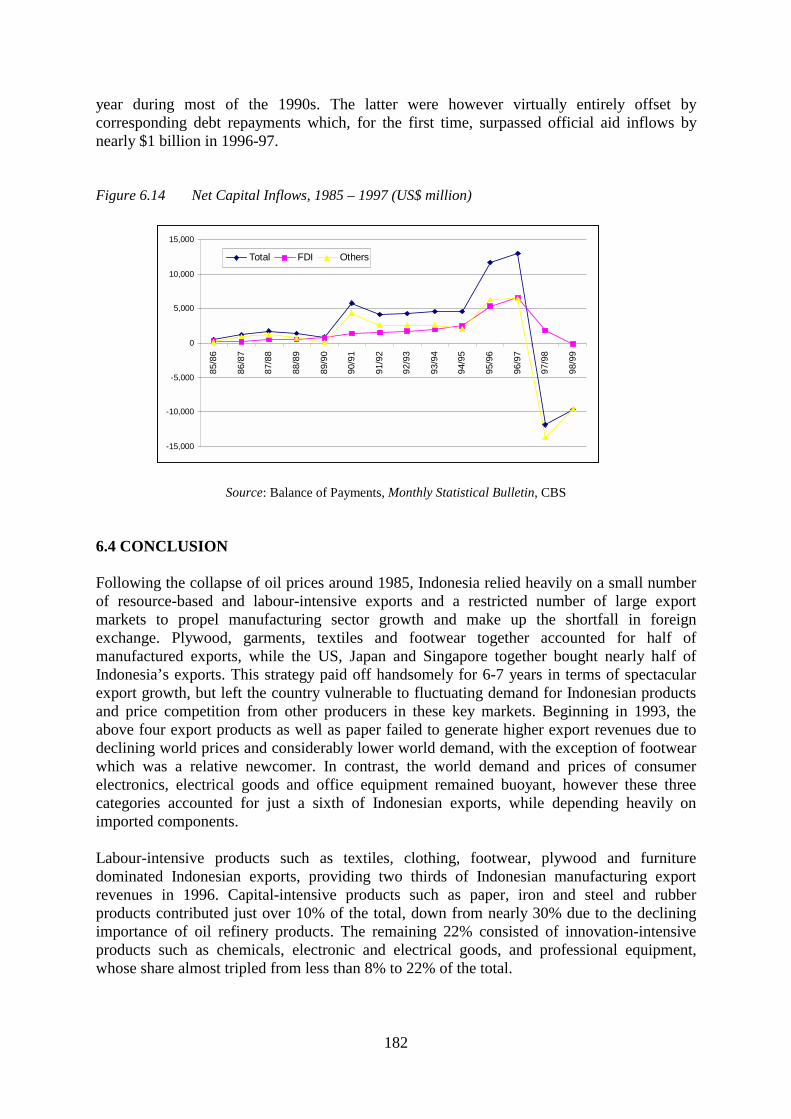
182
year during most of the 1990s. The latter were however virtually entirely offset by corresponding debt repayments which, for the first time, surpassed official aid inflows by nearly $1 billion in 1996-97. Figure 6.14 Net Capital Inflows, 1985 – 1997 (US$ million)
Source: Balance of Payments, Monthly Statistical Bulletin, CBS
6.4 CONCLUSION Following the collapse of oil prices around 1985, Indonesia relied heavily on a small number of resource-based and labour-intensive exports and a restricted number of large export markets to propel manufacturing sector growth and make up the shortfall in foreign exchange. Plywood, garments, textiles and footwear together accounted for half of manufactured exports, while the US, Japan and Singapore together bought nearly half of Indonesia’s exports. This strategy paid off handsomely for 6-7 years in terms of spectacular export growth, but left the country vulnerable to fluctuating demand for Indonesian products and price competition from other producers in these key markets. Beginning in 1993, the above four export products as well as paper failed to generate higher export revenues due to declining world prices and considerably lower world demand, with the exception of footwear which was a relative newcomer. In contrast, the world demand and prices of consumer electronics, electrical goods and office equipment remained buoyant, however these three categories accounted for just a sixth of Indonesian exports, while depending heavily on imported components. Labour-intensive products such as textiles, clothing, footwear, plywood and furniture dominated Indonesian exports, providing two thirds of Indonesian manufacturing export revenues in 1996. Capital-intensive products such as paper, iron and steel and rubber products contributed just over 10% of the total, down from nearly 30% due to the declining importance of oil refinery products. The remaining 22% consisted of innovation-intensive products such as chemicals, electronic and electrical goods, and professional equipment, whose share almost tripled from less than 8% to 22% of the total.
-15,000
-10,000
-5,000
0
5,000
10,000
15,000
85/8
6
86/8
7
87/8
8
88/8
9
89/9
0
90/9
1
91/9
2
92/9
3
93/9
4
94/9
5
95/9
6
96/9
7
97/9
8
98/9
9
Total FDI Others
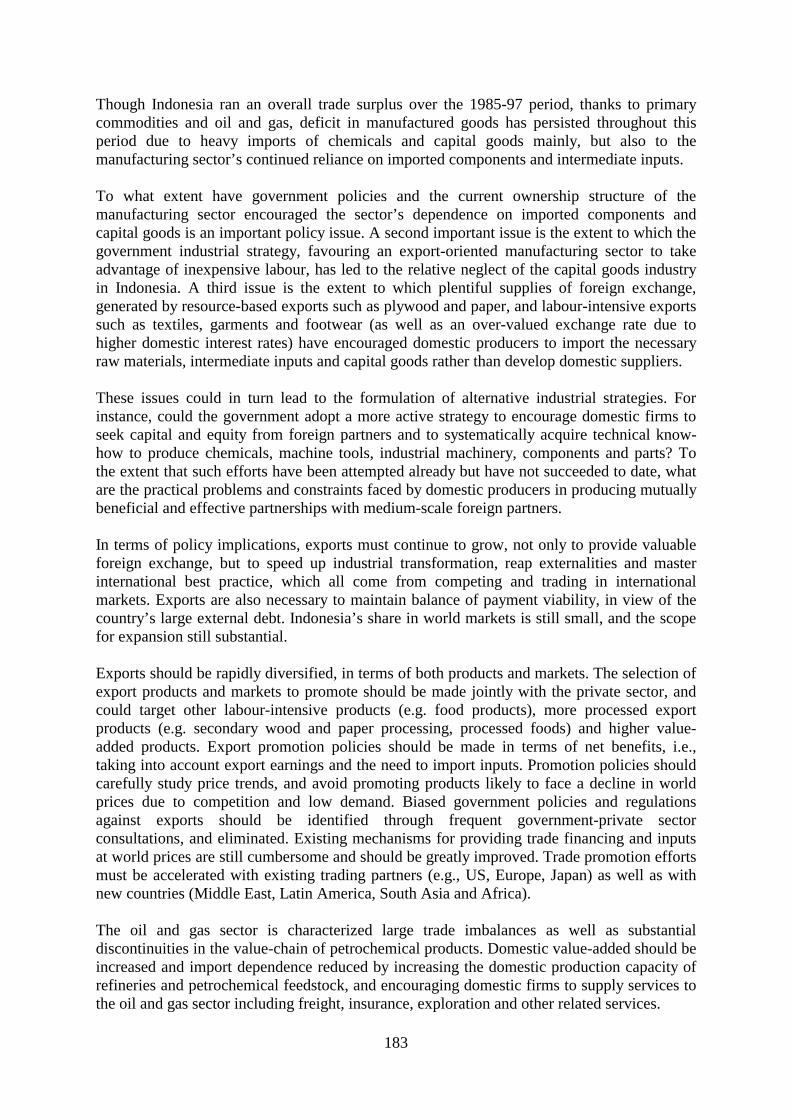
183
Though Indonesia ran an overall trade surplus over the 1985-97 period, thanks to primary commodities and oil and gas, deficit in manufactured goods has persisted throughout this period due to heavy imports of chemicals and capital goods mainly, but also to the manufacturing sector’s continued reliance on imported components and intermediate inputs. To what extent have government policies and the current ownership structure of the manufacturing sector encouraged the sector’s dependence on imported components and capital goods is an important policy issue. A second important issue is the extent to which the government industrial strategy, favouring an export-oriented manufacturing sector to take advantage of inexpensive labour, has led to the relative neglect of the capital goods industry in Indonesia. A third issue is the extent to which plentiful supplies of foreign exchange, generated by resource-based exports such as plywood and paper, and labour-intensive exports such as textiles, garments and footwear (as well as an over-valued exchange rate due to higher domestic interest rates) have encouraged domestic producers to import the necessary raw materials, intermediate inputs and capital goods rather than develop domestic suppliers. These issues could in turn lead to the formulation of alternative industrial strategies. For instance, could the government adopt a more active strategy to encourage domestic firms to seek capital and equity from foreign partners and to systematically acquire technical know-how to produce chemicals, machine tools, industrial machinery, components and parts? To the extent that such efforts have been attempted already but have not succeeded to date, what are the practical problems and constraints faced by domestic producers in producing mutually beneficial and effective partnerships with medium-scale foreign partners. In terms of policy implications, exports must continue to grow, not only to provide valuable foreign exchange, but to speed up industrial transformation, reap externalities and master international best practice, which all come from competing and trading in international markets. Exports are also necessary to maintain balance of payment viability, in view of the country’s large external debt. Indonesia’s share in world markets is still small, and the scope for expansion still substantial. Exports should be rapidly diversified, in terms of both products and markets. The selection of export products and markets to promote should be made jointly with the private sector, and could target other labour-intensive products (e.g. food products), more processed export products (e.g. secondary wood and paper processing, processed foods) and higher value-added products. Export promotion policies should be made in terms of net benefits, i.e., taking into account export earnings and the need to import inputs. Promotion policies should carefully study price trends, and avoid promoting products likely to face a decline in world prices due to competition and low demand. Biased government policies and regulations against exports should be identified through frequent government-private sector consultations, and eliminated. Existing mechanisms for providing trade financing and inputs at world prices are still cumbersome and should be greatly improved. Trade promotion efforts must be accelerated with existing trading partners (e.g., US, Europe, Japan) as well as with new countries (Middle East, Latin America, South Asia and Africa). The oil and gas sector is characterized large trade imbalances as well as substantial discontinuities in the value-chain of petrochemical products. Domestic value-added should be increased and import dependence reduced by increasing the domestic production capacity of refineries and petrochemical feedstock, and encouraging domestic firms to supply services to the oil and gas sector including freight, insurance, exploration and other related services.

184
In summary, the government assiduously promoted export-oriented industrialization since the late 1970s, and these efforts paid off in spectacular export growth. However, the government and the private sector did not accompany this drive with the necessary measures to diversify export products and markets, and to encourage the domestic production or raw materials, intermediate inputs and components used in the manufacturing process, and of machinery and equipment. As a result, the country faced a rising import bill to pay for capital goods and production inputs. In addition, the oil and gas sector generated only limited net revenues. These trade patterns generated persistent imbalances in the balance of trade and balance of payment, particularly in the following four areas: persistent deficit in the trade of manufactured goods, relatively limited surplus generated in the oil and gas sector, deficit in services, and overall deficit in the current account.

185
ANNEX 6.1: TABLES AND FIGURES Figure A.6.1 Country Composition of Exports, 1998-99 (US$ billion) Table A.6.1 Major Indonesian Exports by Major Destination, 1998 Table A.6.2 Trade in Machinery and Equipment, 1996 (US$ million) Table A.6.3 Ten Major Destinations of Five Major Exports, 1998 - 1999 (US$ million) Table A.6.4 Value of Manufacturing Exports, 1984 - 1999 (US$ million) Table A.6.5 Volume of Manufacturing Exports, 1984 - 1999 (million tonnes) Table A.6.6 Unit Price of Manufacturing Exports, 1984-1999 (US$ per kg)
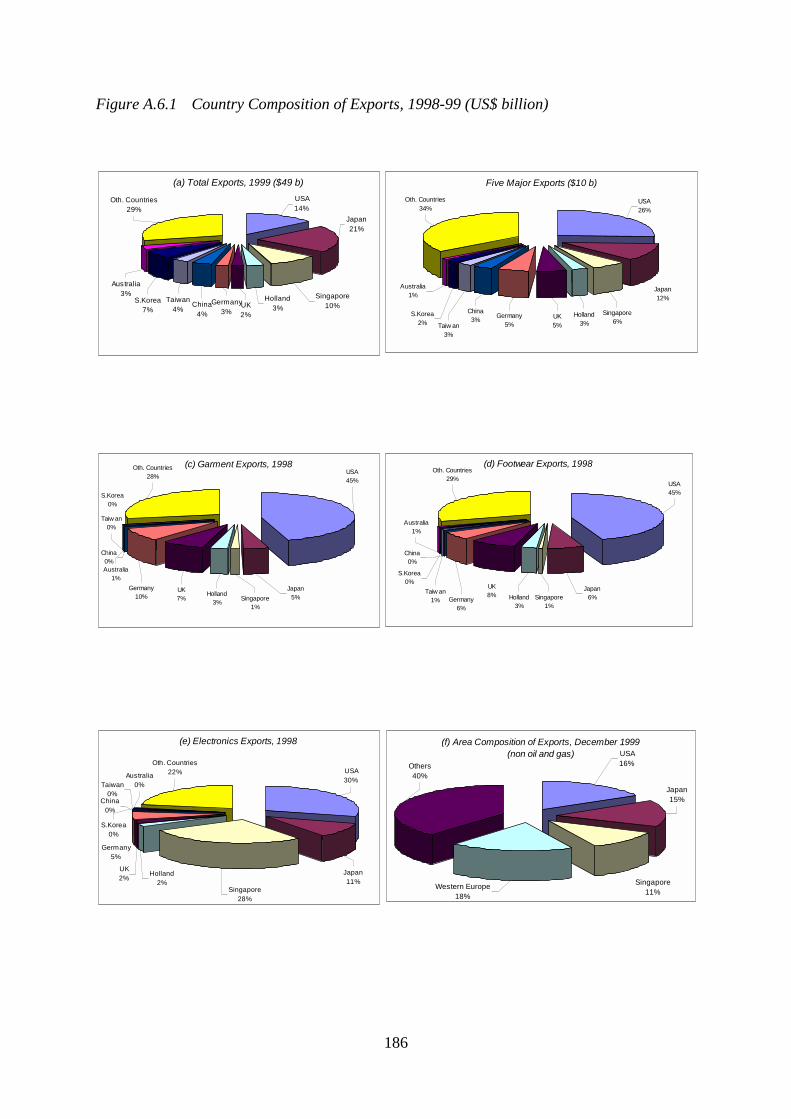
186
Figure A.6.1 Country Composition of Exports, 1998-99 (US$ billion)
(a) Total Exports, 1999 ($49 b)
Oth. Countries29%
Australia3%
S.Korea7%
Taiwan4%
China4%
Germany3%
UK2%
Holland3%
Singapore10%
Japan21%
USA14%
Five Major Exports ($10 b)
USA26%
Oth. Countries34%
Japan12%
Singapore6%
Holland3%
UK5%
Germany5%
China3%
Taiw an3%
S.Korea2%
Australia1%
(c) Garment Exports, 1998
China0%
Taiw an0%
S.Korea0%
Australia1%
Germany10%
UK7%
Holland3% Singapore
1%
Japan5%
Oth. Countries28%
USA45%
(d) Footwear Exports, 1998Oth. Countries
29%
Australia1%
S.Korea0%
Taiw an1% Germany
6%
UK8% Holland
3%Singapore
1%
Japan6%
USA45%
China0%
(e) Electronics Exports, 1998
Australia0%
S.Korea0%
Oth. Countries22% USA
30%
Japan11%
Singapore28%
UK2% Holland
2%
Germany5%
Taiwan0%
China0%
(f) Area Composition of Exports, December 1999(non oil and gas) USA
16%
Japan15%
Singapore11%
Western Europe18%
Others40%
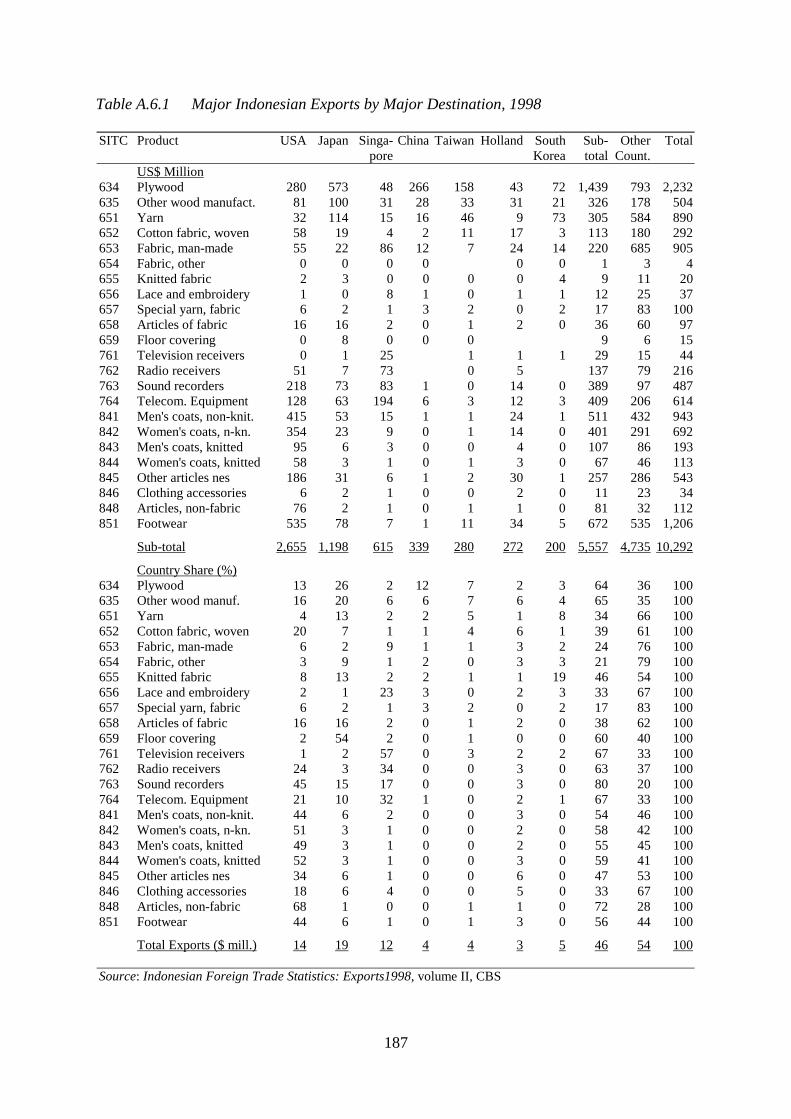
187
Table A.6.1 Major Indonesian Exports by Major Destination, 1998 SITC Product USA Japan Singa-
pore China Taiwan Holland South
Korea Sub-total
Other Count.
Total
US$ Million 634 Plywood 280 573 48 266 158 43 72 1,439 793 2,232 635 Other wood manufact. 81 100 31 28 33 31 21 326 178 504 651 Yarn 32 114 15 16 46 9 73 305 584 890 652 Cotton fabric, woven 58 19 4 2 11 17 3 113 180 292 653 Fabric, man-made 55 22 86 12 7 24 14 220 685 905 654 Fabric, other 0 0 0 0 0 0 1 3 4 655 Knitted fabric 2 3 0 0 0 0 4 9 11 20 656 Lace and embroidery 1 0 8 1 0 1 1 12 25 37 657 Special yarn, fabric 6 2 1 3 2 0 2 17 83 100 658 Articles of fabric 16 16 2 0 1 2 0 36 60 97 659 Floor covering 0 8 0 0 0 9 6 15 761 Television receivers 0 1 25 1 1 1 29 15 44 762 Radio receivers 51 7 73 0 5 137 79 216 763 Sound recorders 218 73 83 1 0 14 0 389 97 487 764 Telecom. Equipment 128 63 194 6 3 12 3 409 206 614 841 Men's coats, non-knit. 415 53 15 1 1 24 1 511 432 943 842 Women's coats, n-kn. 354 23 9 0 1 14 0 401 291 692 843 Men's coats, knitted 95 6 3 0 0 4 0 107 86 193 844 Women's coats, knitted 58 3 1 0 1 3 0 67 46 113 845 Other articles nes 186 31 6 1 2 30 1 257 286 543 846 Clothing accessories 6 2 1 0 0 2 0 11 23 34 848 Articles, non-fabric 76 2 1 0 1 1 0 81 32 112 851 Footwear 535 78 7 1 11 34 5 672 535 1,206
Sub-total 2,655 1,198 615 339 280 272 200 5,557 4,735 10,292
Country Share (%) 634 Plywood 13 26 2 12 7 2 3 64 36 100 635 Other wood manuf. 16 20 6 6 7 6 4 65 35 100 651 Yarn 4 13 2 2 5 1 8 34 66 100 652 Cotton fabric, woven 20 7 1 1 4 6 1 39 61 100 653 Fabric, man-made 6 2 9 1 1 3 2 24 76 100 654 Fabric, other 3 9 1 2 0 3 3 21 79 100 655 Knitted fabric 8 13 2 2 1 1 19 46 54 100 656 Lace and embroidery 2 1 23 3 0 2 3 33 67 100 657 Special yarn, fabric 6 2 1 3 2 0 2 17 83 100 658 Articles of fabric 16 16 2 0 1 2 0 38 62 100 659 Floor covering 2 54 2 0 1 0 0 60 40 100 761 Television receivers 1 2 57 0 3 2 2 67 33 100 762 Radio receivers 24 3 34 0 0 3 0 63 37 100 763 Sound recorders 45 15 17 0 0 3 0 80 20 100 764 Telecom. Equipment 21 10 32 1 0 2 1 67 33 100 841 Men's coats, non-knit. 44 6 2 0 0 3 0 54 46 100 842 Women's coats, n-kn. 51 3 1 0 0 2 0 58 42 100 843 Men's coats, knitted 49 3 1 0 0 2 0 55 45 100 844 Women's coats, knitted 52 3 1 0 0 3 0 59 41 100 845 Other articles nes 34 6 1 0 0 6 0 47 53 100 846 Clothing accessories 18 6 4 0 0 5 0 33 67 100 848 Articles, non-fabric 68 1 0 0 1 1 0 72 28 100 851 Footwear 44 6 1 0 1 3 0 56 44 100
Total Exports ($ mill.) 14 19 12 4 4 3 5 46 54 100 Source: Indonesian Foreign Trade Statistics: Exports1998, volume II, CBS
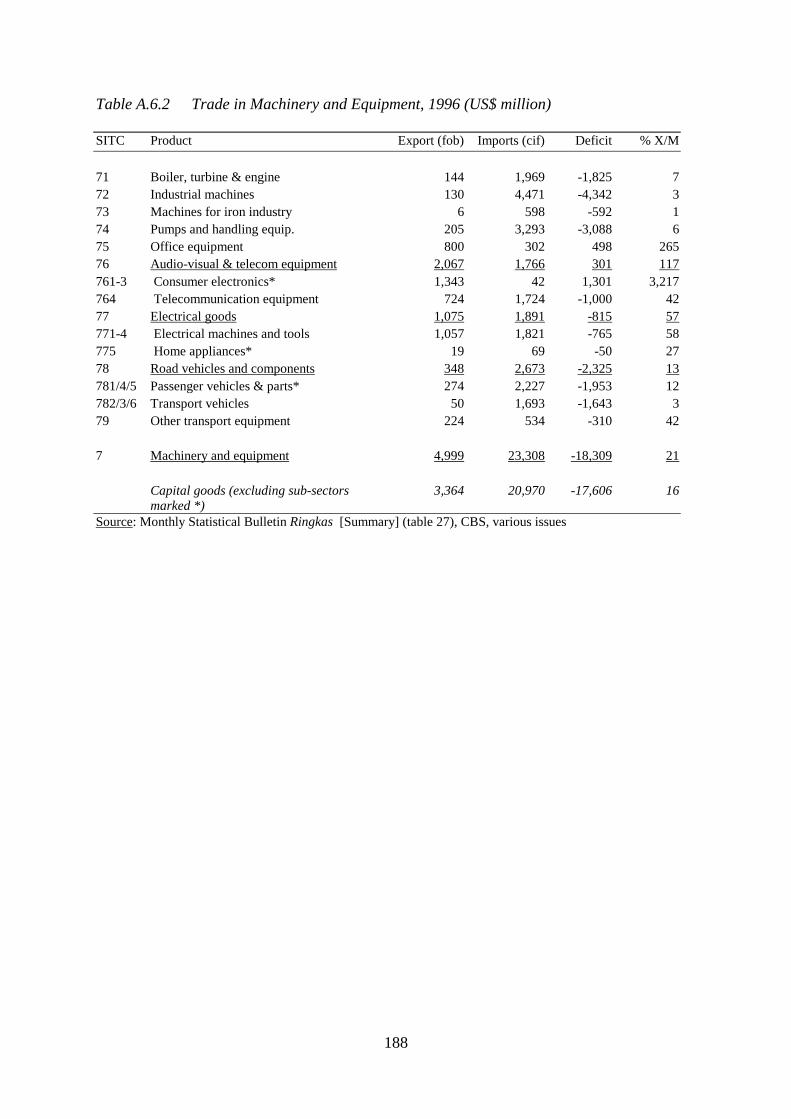
188
Table A.6.2 Trade in Machinery and Equipment, 1996 (US$ million) SITC Product Export (fob) Imports (cif) Deficit % X/M
71 Boiler, turbine & engine 144 1,969 -1,825 7 72 Industrial machines 130 4,471 -4,342 3 73 Machines for iron industry 6 598 -592 1 74 Pumps and handling equip. 205 3,293 -3,088 6 75 Office equipment 800 302 498 265 76 Audio-visual & telecom equipment 2,067 1,766 301 117 761-3 Consumer electronics* 1,343 42 1,301 3,217 764 Telecommunication equipment 724 1,724 -1,000 42 77 Electrical goods 1,075 1,891 -815 57 771-4 Electrical machines and tools 1,057 1,821 -765 58 775 Home appliances* 19 69 -50 27 78 Road vehicles and components 348 2,673 -2,325 13 781/4/5 Passenger vehicles & parts* 274 2,227 -1,953 12 782/3/6 Transport vehicles 50 1,693 -1,643 3 79 Other transport equipment 224 534 -310 42 7 Machinery and equipment 4,999 23,308 -18,309 21 Capital goods (excluding sub-sectors
marked *) 3,364 20,970 -17,606 16
Source: Monthly Statistical Bulletin Ringkas [Summary] (table 27), CBS, various issues
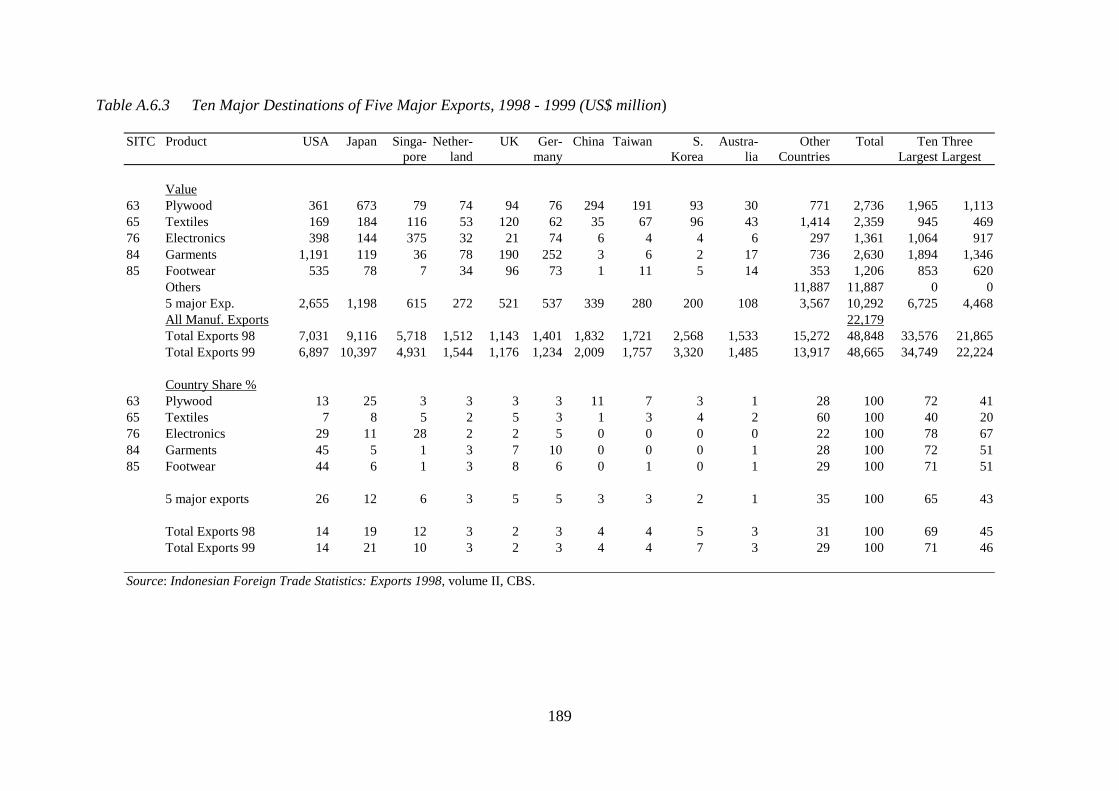
189
Table A.6.3 Ten Major Destinations of Five Major Exports, 1998 - 1999 (US$ million)
SITC Product USA Japan Singa-pore
Nether-land
UK Ger-many
China Taiwan S. Korea
Austra-lia
Other Countries
Total Ten Largest
Three Largest
Value
63 Plywood 361 673 79 74 94 76 294 191 93 30 771 2,736 1,965 1,113 65 Textiles 169 184 116 53 120 62 35 67 96 43 1,414 2,359 945 469 76 Electronics 398 144 375 32 21 74 6 4 4 6 297 1,361 1,064 917 84 Garments 1,191 119 36 78 190 252 3 6 2 17 736 2,630 1,894 1,346 85 Footwear 535 78 7 34 96 73 1 11 5 14 353 1,206 853 620 Others 11,887 11,887 0 0 5 major Exp. 2,655 1,198 615 272 521 537 339 280 200 108 3,567 10,292 6,725 4,468 All Manuf. Exports 22,179 Total Exports 98 7,031 9,116 5,718 1,512 1,143 1,401 1,832 1,721 2,568 1,533 15,272 48,848 33,576 21,865 Total Exports 99 6,897 10,397 4,931 1,544 1,176 1,234 2,009 1,757 3,320 1,485 13,917 48,665 34,749 22,224 Country Share % 63 Plywood 13 25 3 3 3 3 11 7 3 1 28 100 72 41 65 Textiles 7 8 5 2 5 3 1 3 4 2 60 100 40 20 76 Electronics 29 11 28 2 2 5 0 0 0 0 22 100 78 67 84 Garments 45 5 1 3 7 10 0 0 0 1 28 100 72 51 85 Footwear 44 6 1 3 8 6 0 1 0 1 29 100 71 51
5 major exports 26 12 6 3 5 5 3 3 2 1 35 100 65 43 Total Exports 98 14 19 12 3 2 3 4 4 5 3 31 100 69 45 Total Exports 99 14 21 10 3 2 3 4 4 7 3 29 100 71 46
Source: Indonesian Foreign Trade Statistics: Exports 1998, volume II, CBS.
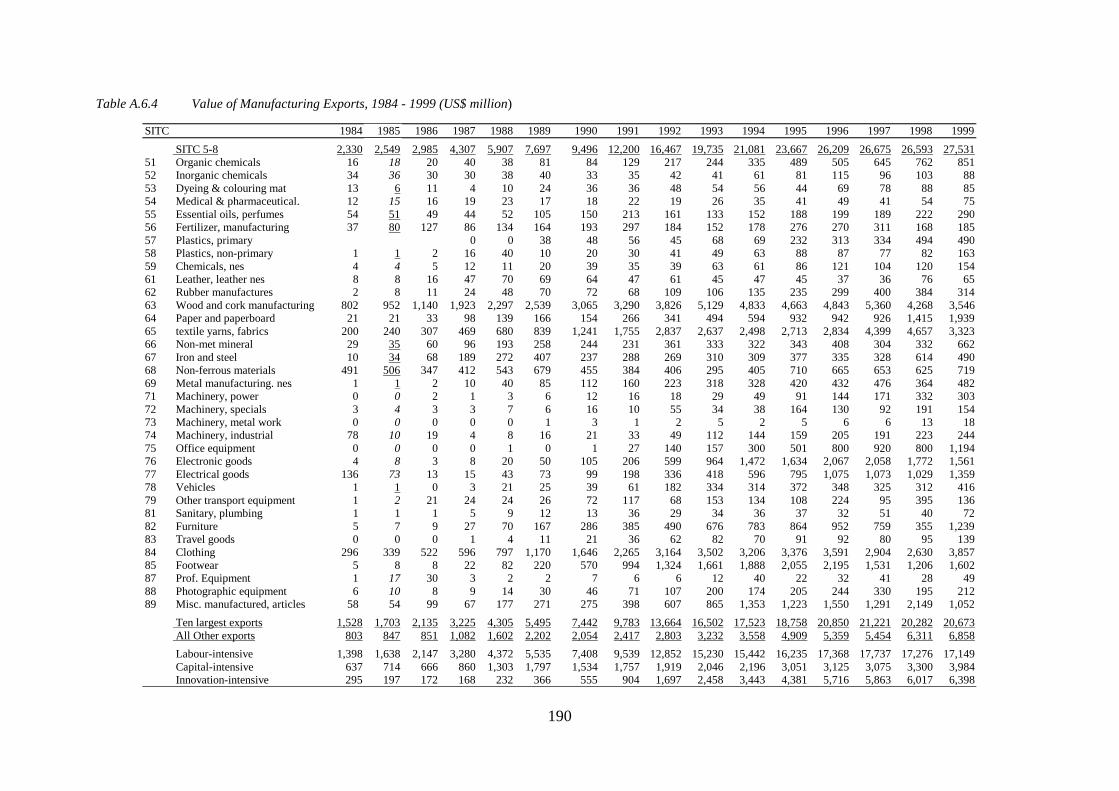
190
Table A.6.4 Value of Manufacturing Exports, 1984 - 1999 (US$ million)
SITC 1984 1985 1986 1987 1988 1989 1990 1991 1992 1993 1994 1995 1996 1997 1998 1999 SITC 5-8 2,330 2,549 2,985 4,307 5,907 7,697 9,496 12,200 16,467 19,735 21,081 23,667 26,209 26,675 26,593 27,531
51 Organic chemicals 16 18 20 40 38 81 84 129 217 244 335 489 505 645 762 851 52 Inorganic chemicals 34 36 30 30 38 40 33 35 42 41 61 81 115 96 103 88 53 Dyeing & colouring mat 13 6 11 4 10 24 36 36 48 54 56 44 69 78 88 85 54 Medical & pharmaceutical. 12 15 16 19 23 17 18 22 19 26 35 41 49 41 54 75 55 Essential oils, perfumes 54 51 49 44 52 105 150 213 161 133 152 188 199 189 222 290 56 Fertilizer, manufacturing 37 80 127 86 134 164 193 297 184 152 178 276 270 311 168 185 57 Plastics, primary 0 0 38 48 56 45 68 69 232 313 334 494 490 58 Plastics, non-primary 1 1 2 16 40 10 20 30 41 49 63 88 87 77 82 163 59 Chemicals, nes 4 4 5 12 11 20 39 35 39 63 61 86 121 104 120 154 61 Leather, leather nes 8 8 16 47 70 69 64 47 61 45 47 45 37 36 76 65 62 Rubber manufactures 2 8 11 24 48 70 72 68 109 106 135 235 299 400 384 314 63 Wood and cork manufacturing 802 952 1,140 1,923 2,297 2,539 3,065 3,290 3,826 5,129 4,833 4,663 4,843 5,360 4,268 3,546 64 Paper and paperboard 21 21 33 98 139 166 154 266 341 494 594 932 942 926 1,415 1,939 65 textile yarns, fabrics 200 240 307 469 680 839 1,241 1,755 2,837 2,637 2,498 2,713 2,834 4,399 4,657 3,323 66 Non-met mineral 29 35 60 96 193 258 244 231 361 333 322 343 408 304 332 662 67 Iron and steel 10 34 68 189 272 407 237 288 269 310 309 377 335 328 614 490 68 Non-ferrous materials 491 506 347 412 543 679 455 384 406 295 405 710 665 653 625 719 69 Metal manufacturing. nes 1 1 2 10 40 85 112 160 223 318 328 420 432 476 364 482 71 Machinery, power 0 0 2 1 3 6 12 16 18 29 49 91 144 171 332 303 72 Machinery, specials 3 4 3 3 7 6 16 10 55 34 38 164 130 92 191 154 73 Machinery, metal work 0 0 0 0 0 1 3 1 2 5 2 5 6 6 13 18 74 Machinery, industrial 78 10 19 4 8 16 21 33 49 112 144 159 205 191 223 244 75 Office equipment 0 0 0 0 1 0 1 27 140 157 300 501 800 920 800 1,194 76 Electronic goods 4 8 3 8 20 50 105 206 599 964 1,472 1,634 2,067 2,058 1,772 1,561 77 Electrical goods 136 73 13 15 43 73 99 198 336 418 596 795 1,075 1,073 1,029 1,359 78 Vehicles 1 1 0 3 21 25 39 61 182 334 314 372 348 325 312 416 79 Other transport equipment 1 2 21 24 24 26 72 117 68 153 134 108 224 95 395 136 81 Sanitary, plumbing 1 1 1 5 9 12 13 36 29 34 36 37 32 51 40 72 82 Furniture 5 7 9 27 70 167 286 385 490 676 783 864 952 759 355 1,239 83 Travel goods 0 0 0 1 4 11 21 36 62 82 70 91 92 80 95 139 84 Clothing 296 339 522 596 797 1,170 1,646 2,265 3,164 3,502 3,206 3,376 3,591 2,904 2,630 3,857 85 Footwear 5 8 8 22 82 220 570 994 1,324 1,661 1,888 2,055 2,195 1,531 1,206 1,602 87 Prof. Equipment 1 17 30 3 2 2 7 6 6 12 40 22 32 41 28 49 88 Photographic equipment 6 10 8 9 14 30 46 71 107 200 174 205 244 330 195 212 89 Misc. manufactured, articles 58 54 99 67 177 271 275 398 607 865 1,353 1,223 1,550 1,291 2,149 1,052 Ten largest exports 1,528 1,703 2,135 3,225 4,305 5,495 7,442 9,783 13,664 16,502 17,523 18,758 20,850 21,221 20,282 20,673 All Other exports 803 847 851 1,082 1,602 2,202 2,054 2,417 2,803 3,232 3,558 4,909 5,359 5,454 6,311 6,858 Labour-intensive 1,398 1,638 2,147 3,280 4,372 5,535 7,408 9,539 12,852 15,230 15,442 16,235 17,368 17,737 17,276 17,149 Capital-intensive 637 714 666 860 1,303 1,797 1,534 1,757 1,919 2,046 2,196 3,051 3,125 3,075 3,300 3,984 Innovation-intensive 295 197 172 168 232 366 555 904 1,697 2,458 3,443 4,381 5,716 5,863 6,017 6,398
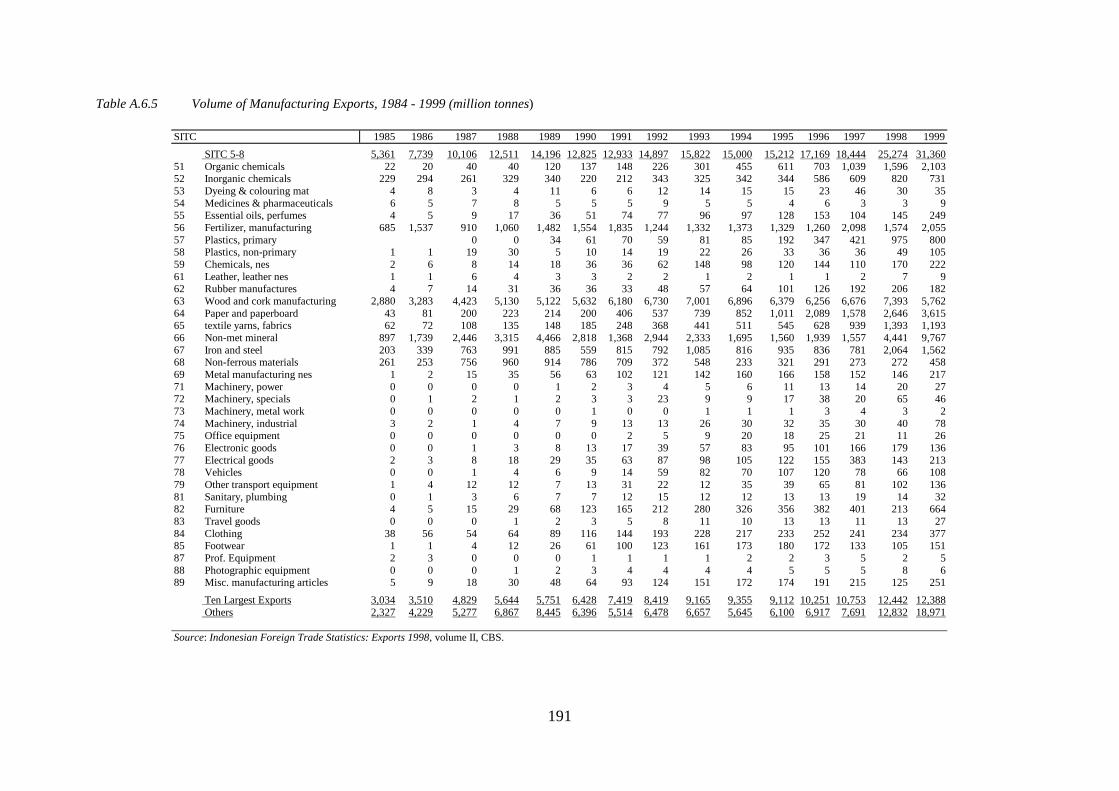
191
Table A.6.5 Volume of Manufacturing Exports, 1984 - 1999 (million tonnes)
SITC 1985 1986 1987 1988 1989 1990 1991 1992 1993 1994 1995 1996 1997 1998 1999 SITC 5-8 5,361 7,739 10,106 12,511 14,196 12,825 12,933 14,897 15,822 15,000 15,212 17,169 18,444 25,274 31,360
51 Organic chemicals 22 20 40 40 120 137 148 226 301 455 611 703 1,039 1,596 2,103 52 Inorganic chemicals 229 294 261 329 340 220 212 343 325 342 344 586 609 820 731 53 Dyeing & colouring mat 4 8 3 4 11 6 6 12 14 15 15 23 46 30 35 54 Medicines & pharmaceuticals 6 5 7 8 5 5 5 9 5 5 4 6 3 3 9 55 Essential oils, perfumes 4 5 9 17 36 51 74 77 96 97 128 153 104 145 249 56 Fertilizer, manufacturing 685 1,537 910 1,060 1,482 1,554 1,835 1,244 1,332 1,373 1,329 1,260 2,098 1,574 2,055 57 Plastics, primary 0 0 34 61 70 59 81 85 192 347 421 975 800 58 Plastics, non-primary 1 1 19 30 5 10 14 19 22 26 33 36 36 49 105 59 Chemicals, nes 2 6 8 14 18 36 36 62 148 98 120 144 110 170 222 61 Leather, leather nes 1 1 6 4 3 3 2 2 1 2 1 1 2 7 9 62 Rubber manufactures 4 7 14 31 36 36 33 48 57 64 101 126 192 206 182 63 Wood and cork manufacturing 2,880 3,283 4,423 5,130 5,122 5,632 6,180 6,730 7,001 6,896 6,379 6,256 6,676 7,393 5,762 64 Paper and paperboard 43 81 200 223 214 200 406 537 739 852 1,011 2,089 1,578 2,646 3,615 65 textile yarns, fabrics 62 72 108 135 148 185 248 368 441 511 545 628 939 1,393 1,193 66 Non-met mineral 897 1,739 2,446 3,315 4,466 2,818 1,368 2,944 2,333 1,695 1,560 1,939 1,557 4,441 9,767 67 Iron and steel 203 339 763 991 885 559 815 792 1,085 816 935 836 781 2,064 1,562 68 Non-ferrous materials 261 253 756 960 914 786 709 372 548 233 321 291 273 272 458 69 Metal manufacturing nes 1 2 15 35 56 63 102 121 142 160 166 158 152 146 217 71 Machinery, power 0 0 0 0 1 2 3 4 5 6 11 13 14 20 27 72 Machinery, specials 0 1 2 1 2 3 3 23 9 9 17 38 20 65 46 73 Machinery, metal work 0 0 0 0 0 1 0 0 1 1 1 3 4 3 2 74 Machinery, industrial 3 2 1 4 7 9 13 13 26 30 32 35 30 40 78 75 Office equipment 0 0 0 0 0 0 2 5 9 20 18 25 21 11 26 76 Electronic goods 0 0 1 3 8 13 17 39 57 83 95 101 166 179 136 77 Electrical goods 2 3 8 18 29 35 63 87 98 105 122 155 383 143 213 78 Vehicles 0 0 1 4 6 9 14 59 82 70 107 120 78 66 108 79 Other transport equipment 1 4 12 12 7 13 31 22 12 35 39 65 81 102 136 81 Sanitary, plumbing 0 1 3 6 7 7 12 15 12 12 13 13 19 14 32 82 Furniture 4 5 15 29 68 123 165 212 280 326 356 382 401 213 664 83 Travel goods 0 0 0 1 2 3 5 8 11 10 13 13 11 13 27 84 Clothing 38 56 54 64 89 116 144 193 228 217 233 252 241 234 377 85 Footwear 1 1 4 12 26 61 100 123 161 173 180 172 133 105 151 87 Prof. Equipment 2 3 0 0 0 1 1 1 1 2 2 3 5 2 5 88 Photographic equipment 0 0 0 1 2 3 4 4 4 4 5 5 5 8 6 89 Misc. manufacturing articles 5 9 18 30 48 64 93 124 151 172 174 191 215 125 251 Ten Largest Exports 3,034 3,510 4,829 5,644 5,751 6,428 7,419 8,419 9,165 9,355 9,112 10,251 10,753 12,442 12,388 Others 2,327 4,229 5,277 6,867 8,445 6,396 5,514 6,478 6,657 5,645 6,100 6,917 7,691 12,832 18,971 Source: Indonesian Foreign Trade Statistics: Exports 1998, volume II, CBS.
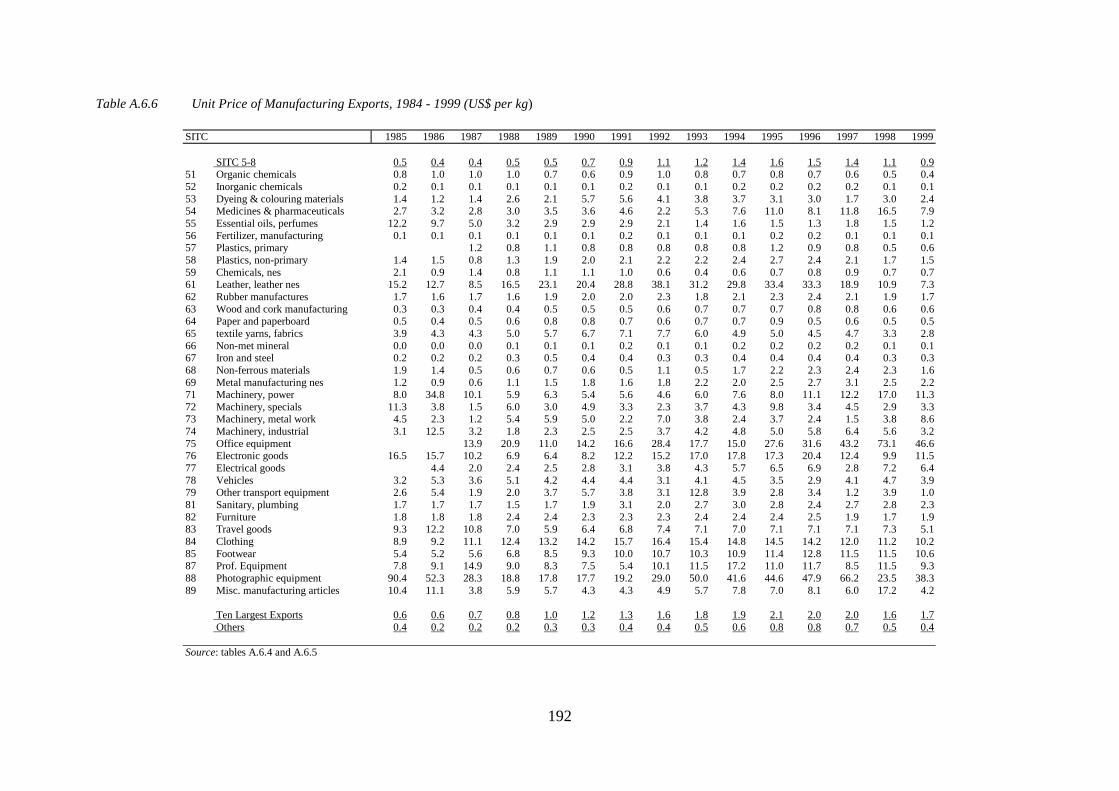
192
Table A.6.6 Unit Price of Manufacturing Exports, 1984 - 1999 (US$ per kg)
SITC 1985 1986 1987 1988 1989 1990 1991 1992 1993 1994 1995 1996 1997 1998 1999 SITC 5-8 0.5 0.4 0.4 0.5 0.5 0.7 0.9 1.1 1.2 1.4 1.6 1.5 1.4 1.1 0.9
51 Organic chemicals 0.8 1.0 1.0 1.0 0.7 0.6 0.9 1.0 0.8 0.7 0.8 0.7 0.6 0.5 0.4 52 Inorganic chemicals 0.2 0.1 0.1 0.1 0.1 0.1 0.2 0.1 0.1 0.2 0.2 0.2 0.2 0.1 0.1 53 Dyeing & colouring materials 1.4 1.2 1.4 2.6 2.1 5.7 5.6 4.1 3.8 3.7 3.1 3.0 1.7 3.0 2.4 54 Medicines & pharmaceuticals 2.7 3.2 2.8 3.0 3.5 3.6 4.6 2.2 5.3 7.6 11.0 8.1 11.8 16.5 7.9 55 Essential oils, perfumes 12.2 9.7 5.0 3.2 2.9 2.9 2.9 2.1 1.4 1.6 1.5 1.3 1.8 1.5 1.2 56 Fertilizer, manufacturing 0.1 0.1 0.1 0.1 0.1 0.1 0.2 0.1 0.1 0.1 0.2 0.2 0.1 0.1 0.1 57 Plastics, primary 1.2 0.8 1.1 0.8 0.8 0.8 0.8 0.8 1.2 0.9 0.8 0.5 0.6 58 Plastics, non-primary 1.4 1.5 0.8 1.3 1.9 2.0 2.1 2.2 2.2 2.4 2.7 2.4 2.1 1.7 1.5 59 Chemicals, nes 2.1 0.9 1.4 0.8 1.1 1.1 1.0 0.6 0.4 0.6 0.7 0.8 0.9 0.7 0.7 61 Leather, leather nes 15.2 12.7 8.5 16.5 23.1 20.4 28.8 38.1 31.2 29.8 33.4 33.3 18.9 10.9 7.3 62 Rubber manufactures 1.7 1.6 1.7 1.6 1.9 2.0 2.0 2.3 1.8 2.1 2.3 2.4 2.1 1.9 1.7 63 Wood and cork manufacturing 0.3 0.3 0.4 0.4 0.5 0.5 0.5 0.6 0.7 0.7 0.7 0.8 0.8 0.6 0.6 64 Paper and paperboard 0.5 0.4 0.5 0.6 0.8 0.8 0.7 0.6 0.7 0.7 0.9 0.5 0.6 0.5 0.5 65 textile yarns, fabrics 3.9 4.3 4.3 5.0 5.7 6.7 7.1 7.7 6.0 4.9 5.0 4.5 4.7 3.3 2.8 66 Non-met mineral 0.0 0.0 0.0 0.1 0.1 0.1 0.2 0.1 0.1 0.2 0.2 0.2 0.2 0.1 0.1 67 Iron and steel 0.2 0.2 0.2 0.3 0.5 0.4 0.4 0.3 0.3 0.4 0.4 0.4 0.4 0.3 0.3 68 Non-ferrous materials 1.9 1.4 0.5 0.6 0.7 0.6 0.5 1.1 0.5 1.7 2.2 2.3 2.4 2.3 1.6 69 Metal manufacturing nes 1.2 0.9 0.6 1.1 1.5 1.8 1.6 1.8 2.2 2.0 2.5 2.7 3.1 2.5 2.2 71 Machinery, power 8.0 34.8 10.1 5.9 6.3 5.4 5.6 4.6 6.0 7.6 8.0 11.1 12.2 17.0 11.3 72 Machinery, specials 11.3 3.8 1.5 6.0 3.0 4.9 3.3 2.3 3.7 4.3 9.8 3.4 4.5 2.9 3.3 73 Machinery, metal work 4.5 2.3 1.2 5.4 5.9 5.0 2.2 7.0 3.8 2.4 3.7 2.4 1.5 3.8 8.6 74 Machinery, industrial 3.1 12.5 3.2 1.8 2.3 2.5 2.5 3.7 4.2 4.8 5.0 5.8 6.4 5.6 3.2 75 Office equipment 13.9 20.9 11.0 14.2 16.6 28.4 17.7 15.0 27.6 31.6 43.2 73.1 46.6 76 Electronic goods 16.5 15.7 10.2 6.9 6.4 8.2 12.2 15.2 17.0 17.8 17.3 20.4 12.4 9.9 11.5 77 Electrical goods 4.4 2.0 2.4 2.5 2.8 3.1 3.8 4.3 5.7 6.5 6.9 2.8 7.2 6.4 78 Vehicles 3.2 5.3 3.6 5.1 4.2 4.4 4.4 3.1 4.1 4.5 3.5 2.9 4.1 4.7 3.9 79 Other transport equipment 2.6 5.4 1.9 2.0 3.7 5.7 3.8 3.1 12.8 3.9 2.8 3.4 1.2 3.9 1.0 81 Sanitary, plumbing 1.7 1.7 1.7 1.5 1.7 1.9 3.1 2.0 2.7 3.0 2.8 2.4 2.7 2.8 2.3 82 Furniture 1.8 1.8 1.8 2.4 2.4 2.3 2.3 2.3 2.4 2.4 2.4 2.5 1.9 1.7 1.9 83 Travel goods 9.3 12.2 10.8 7.0 5.9 6.4 6.8 7.4 7.1 7.0 7.1 7.1 7.1 7.3 5.1 84 Clothing 8.9 9.2 11.1 12.4 13.2 14.2 15.7 16.4 15.4 14.8 14.5 14.2 12.0 11.2 10.2 85 Footwear 5.4 5.2 5.6 6.8 8.5 9.3 10.0 10.7 10.3 10.9 11.4 12.8 11.5 11.5 10.6 87 Prof. Equipment 7.8 9.1 14.9 9.0 8.3 7.5 5.4 10.1 11.5 17.2 11.0 11.7 8.5 11.5 9.3 88 Photographic equipment 90.4 52.3 28.3 18.8 17.8 17.7 19.2 29.0 50.0 41.6 44.6 47.9 66.2 23.5 38.3 89 Misc. manufacturing articles 10.4 11.1 3.8 5.9 5.7 4.3 4.3 4.9 5.7 7.8 7.0 8.1 6.0 17.2 4.2 Ten Largest Exports 0.6 0.6 0.7 0.8 1.0 1.2 1.3 1.6 1.8 1.9 2.1 2.0 2.0 1.6 1.7 Others 0.4 0.2 0.2 0.2 0.3 0.3 0.4 0.4 0.5 0.6 0.8 0.8 0.7 0.5 0.4 Source: tables A.6.4 and A.6.5
193
7. Post-crisis Challenges and Priorities
7.1 FROM CRISIS TO RECOVERY.................................................................................194 7.1.1 Total and manufacturing GDP ......................................................................................194 7.1.2 Impact on Manufacturing Employment ........................................................................195 7.1.3 Impact on Medium and Large-scale Establishments.....................................................197 7.1.4 Impact on International Trade .......................................................................................199 7.1.5 Summary .......................................................................................................................202
7.2 SMALL AND MEDIUM-SCALE INDUSTRIES .......................................................203 7.2.1 Patterns of Growth ........................................................................................................203 7.2.2 Production Characteristics by size ................................................................................206 7.2.3 Education Level.............................................................................................................209 7.2.4 Policy Implications........................................................................................................209
7.3 REGIONAL DIMENSIONS OF INDUSTRIALIZATION .......................................212 7.3.1 Industrial Location ........................................................................................................212 7.3.2 Decentralization and provincial autonomy ...................................................................214 7.3.2 Summary .......................................................................................................................215
7.4 INDUSTRIAL SKILLS DEVELOPMENT.................................................................217 7.4.1 Educational and Occupational Structure .......................................................................217 7.4.2 Pre-Employment Education and Training.....................................................................219 7.4.4 In-Employment Training...............................................................................................222 7.4.5 Summary .......................................................................................................................224
ANNEX 7.1: MANPOWER MINISTRY’S VOCATIONAL TRAINING CENTRES..227 ANNEX 7.2: TABLES .........................................................................................................231
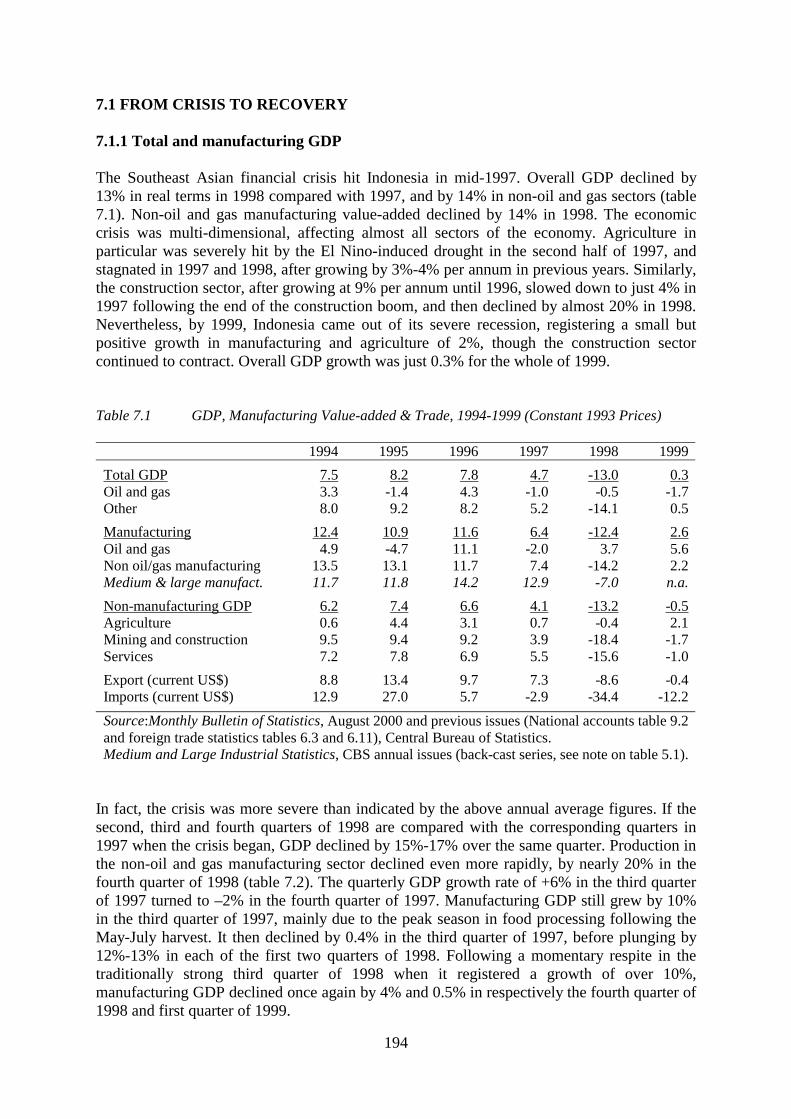
194
7.1 FROM CRISIS TO RECOVERY 7.1.1 Total and manufacturing GDP The Southeast Asian financial crisis hit Indonesia in mid-1997. Overall GDP declined by 13% in real terms in 1998 compared with 1997, and by 14% in non-oil and gas sectors (table 7.1). Non-oil and gas manufacturing value-added declined by 14% in 1998. The economic crisis was multi-dimensional, affecting almost all sectors of the economy. Agriculture in particular was severely hit by the El Nino-induced drought in the second half of 1997, and stagnated in 1997 and 1998, after growing by 3%-4% per annum in previous years. Similarly, the construction sector, after growing at 9% per annum until 1996, slowed down to just 4% in 1997 following the end of the construction boom, and then declined by almost 20% in 1998. Nevertheless, by 1999, Indonesia came out of its severe recession, registering a small but positive growth in manufacturing and agriculture of 2%, though the construction sector continued to contract. Overall GDP growth was just 0.3% for the whole of 1999. Table 7.1 GDP, Manufacturing Value-added & Trade, 1994-1999 (Constant 1993 Prices)
1994 1995 1996 1997 1998 1999 Total GDP 7.5 8.2 7.8 4.7 -13.0 0.3 Oil and gas 3.3 -1.4 4.3 -1.0 -0.5 -1.7 Other 8.0 9.2 8.2 5.2 -14.1 0.5 Manufacturing 12.4 10.9 11.6 6.4 -12.4 2.6 Oil and gas 4.9 -4.7 11.1 -2.0 3.7 5.6 Non oil/gas manufacturing 13.5 13.1 11.7 7.4 -14.2 2.2 Medium & large manufact. 11.7 11.8 14.2 12.9 -7.0 n.a. Non-manufacturing GDP 6.2 7.4 6.6 4.1 -13.2 -0.5 Agriculture 0.6 4.4 3.1 0.7 -0.4 2.1 Mining and construction 9.5 9.4 9.2 3.9 -18.4 -1.7 Services 7.2 7.8 6.9 5.5 -15.6 -1.0 Export (current US$) 8.8 13.4 9.7 7.3 -8.6 -0.4 Imports (current US$) 12.9 27.0 5.7 -2.9 -34.4 -12.2 Source:Monthly Bulletin of Statistics, August 2000 and previous issues (National accounts table 9.2 and foreign trade statistics tables 6.3 and 6.11), Central Bureau of Statistics. Medium and Large Industrial Statistics, CBS annual issues (back-cast series, see note on table 5.1).
In fact, the crisis was more severe than indicated by the above annual average figures. If the second, third and fourth quarters of 1998 are compared with the corresponding quarters in 1997 when the crisis began, GDP declined by 15%-17% over the same quarter. Production in the non-oil and gas manufacturing sector declined even more rapidly, by nearly 20% in the fourth quarter of 1998 (table 7.2). The quarterly GDP growth rate of +6% in the third quarter of 1997 turned to –2% in the fourth quarter of 1997. Manufacturing GDP still grew by 10% in the third quarter of 1997, mainly due to the peak season in food processing following the May-July harvest. It then declined by 0.4% in the third quarter of 1997, before plunging by 12%-13% in each of the first two quarters of 1998. Following a momentary respite in the traditionally strong third quarter of 1998 when it registered a growth of over 10%, manufacturing GDP declined once again by 4% and 0.5% in respectively the fourth quarter of 1998 and first quarter of 1999.
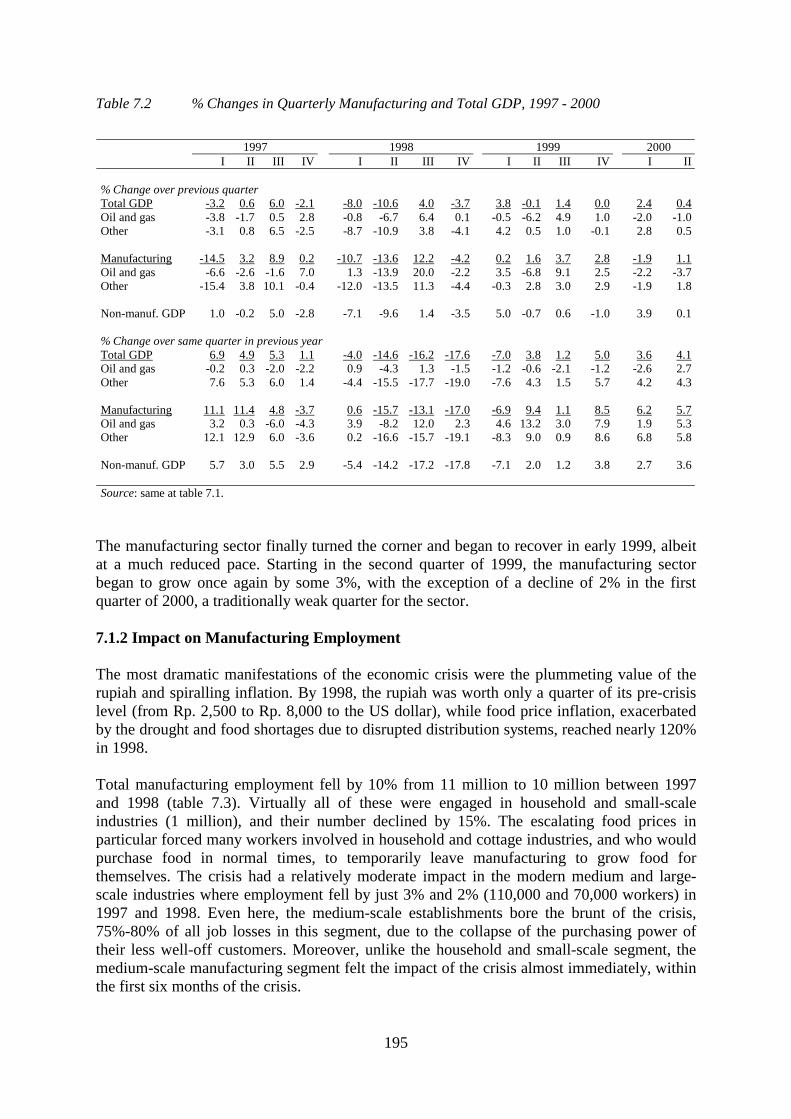
195
Table 7.2 % Changes in Quarterly Manufacturing and Total GDP, 1997 - 2000 1997 1998 1999 2000 I II III IV I II III IV I II III IV I II % Change over previous quarter Total GDP -3.2 0.6 6.0 -2.1 -8.0 -10.6 4.0 -3.7 3.8 -0.1 1.4 0.0 2.4 0.4 Oil and gas -3.8 -1.7 0.5 2.8 -0.8 -6.7 6.4 0.1 -0.5 -6.2 4.9 1.0 -2.0 -1.0 Other -3.1 0.8 6.5 -2.5 -8.7 -10.9 3.8 -4.1 4.2 0.5 1.0 -0.1 2.8 0.5 Manufacturing -14.5 3.2 8.9 0.2 -10.7 -13.6 12.2 -4.2 0.2 1.6 3.7 2.8 -1.9 1.1 Oil and gas -6.6 -2.6 -1.6 7.0 1.3 -13.9 20.0 -2.2 3.5 -6.8 9.1 2.5 -2.2 -3.7 Other -15.4 3.8 10.1 -0.4 -12.0 -13.5 11.3 -4.4 -0.3 2.8 3.0 2.9 -1.9 1.8 Non-manuf. GDP 1.0 -0.2 5.0 -2.8 -7.1 -9.6 1.4 -3.5 5.0 -0.7 0.6 -1.0 3.9 0.1 % Change over same quarter in previous year Total GDP 6.9 4.9 5.3 1.1 -4.0 -14.6 -16.2 -17.6 -7.0 3.8 1.2 5.0 3.6 4.1 Oil and gas -0.2 0.3 -2.0 -2.2 0.9 -4.3 1.3 -1.5 -1.2 -0.6 -2.1 -1.2 -2.6 2.7 Other 7.6 5.3 6.0 1.4 -4.4 -15.5 -17.7 -19.0 -7.6 4.3 1.5 5.7 4.2 4.3 Manufacturing 11.1 11.4 4.8 -3.7 0.6 -15.7 -13.1 -17.0 -6.9 9.4 1.1 8.5 6.2 5.7 Oil and gas 3.2 0.3 -6.0 -4.3 3.9 -8.2 12.0 2.3 4.6 13.2 3.0 7.9 1.9 5.3 Other 12.1 12.9 6.0 -3.6 0.2 -16.6 -15.7 -19.1 -8.3 9.0 0.9 8.6 6.8 5.8 Non-manuf. GDP 5.7 3.0 5.5 2.9 -5.4 -14.2 -17.2 -17.8 -7.1 2.0 1.2 3.8 2.7 3.6 Source: same at table 7.1.
The manufacturing sector finally turned the corner and began to recover in early 1999, albeit at a much reduced pace. Starting in the second quarter of 1999, the manufacturing sector began to grow once again by some 3%, with the exception of a decline of 2% in the first quarter of 2000, a traditionally weak quarter for the sector. 7.1.2 Impact on Manufacturing Employment The most dramatic manifestations of the economic crisis were the plummeting value of the rupiah and spiralling inflation. By 1998, the rupiah was worth only a quarter of its pre-crisis level (from Rp. 2,500 to Rp. 8,000 to the US dollar), while food price inflation, exacerbated by the drought and food shortages due to disrupted distribution systems, reached nearly 120% in 1998. Total manufacturing employment fell by 10% from 11 million to 10 million between 1997 and 1998 (table 7.3). Virtually all of these were engaged in household and small-scale industries (1 million), and their number declined by 15%. The escalating food prices in particular forced many workers involved in household and cottage industries, and who would purchase food in normal times, to temporarily leave manufacturing to grow food for themselves. The crisis had a relatively moderate impact in the modern medium and large-scale industries where employment fell by just 3% and 2% (110,000 and 70,000 workers) in 1997 and 1998. Even here, the medium-scale establishments bore the brunt of the crisis, 75%-80% of all job losses in this segment, due to the collapse of the purchasing power of their less well-off customers. Moreover, unlike the household and small-scale segment, the medium-scale manufacturing segment felt the impact of the crisis almost immediately, within the first six months of the crisis.

196
Table 7.3 Employment Changes, 1996 - 1999
Persons (000s) Change (000s) Change (% p.a.) 1996 1997 1998 1999 96-97 97-98 98-99 96-97 97-98 98-99
Total employment 83,900 85,406 87,672 88,817 1,506 2,267 1,144 1.8 2.7 1.3 Manufacturing Hhold and small (1-20) 6,291 6,839 5,832 7,414 564 -1,045 1,582 9.0 -15.2 27.2 Medium (20-99) 1 688 593 576 n.a. -95 -17 n.a. -13.8 -2.9 n.a. Large (100+)1 3,591 3,562 3,548 n.a. -29 -14 n.a. -0.8 -0.4 n.a. Total manufacturing 10,570 11,009 9,934 11,516 439 -1,075 1,582 4.2 -9.8 15.9 Medium & large only1 4,279 4,155 4,124 n.a. -125 -31 n.a. -2.9 -0.7 n.a.
Manuf. empl. by status 10,570 11,009 9,934 11,516 439 -1,075 1,582 4.2 -9.8 15.9 Wage workers 6,216 6,667 6,015 6,697 451 -652 682 7.3 -9.8 11.3 Non-wage workers 4,354 4,342 3,919 4,819 -12 -423 900 -0.3 -9.7 23.0
Agriculture 36,500 34,790 39,415 38,378 -1,710 4,625 -1,037 -4.7 13.3 -2.6 Other sectors 36,830 39,607 38,324 38,923 2,777 -1,283 599 7.5 -3.2 1.6 Source: Total, manufacturing, agricultural and other sector employment: annual national labour force survey Sakernas, CBS, various years. Medium and large-scale industries: Large and Medium Industrial Statistics, CBS, various years (back-cast series for total employment and published series for large-scale establishments. Employment in medium-scale establishments as residual). Household and small-scale establishments: residual difference between Sakernas total and medium and large-scale firms. Note: 1 Employment in medium and large-scale establishments for 1999 not available: assume no change between 1998 and 1999. Figure 7.1 Impact of Crisis on Manufacturing Employment, 1996 – 1999 (000s)
Source: Table 7.3
(a) Total Employment
0
2,000
4,000
6,000
8,000
10,000
12,000
14,000
Hhold and small (1-20) M edium (20-99) Large (100+) Total manufacturing
1996 1997 1998 1999
(b) Employment Change
564
-1,045
1,582
0
0
439
-1,075
1,582
-95
-17
-29
-14
96-97
97-98
98-99
Hhold and small (1-20) M edium (20-99)
Large (100+) Total manufacturing
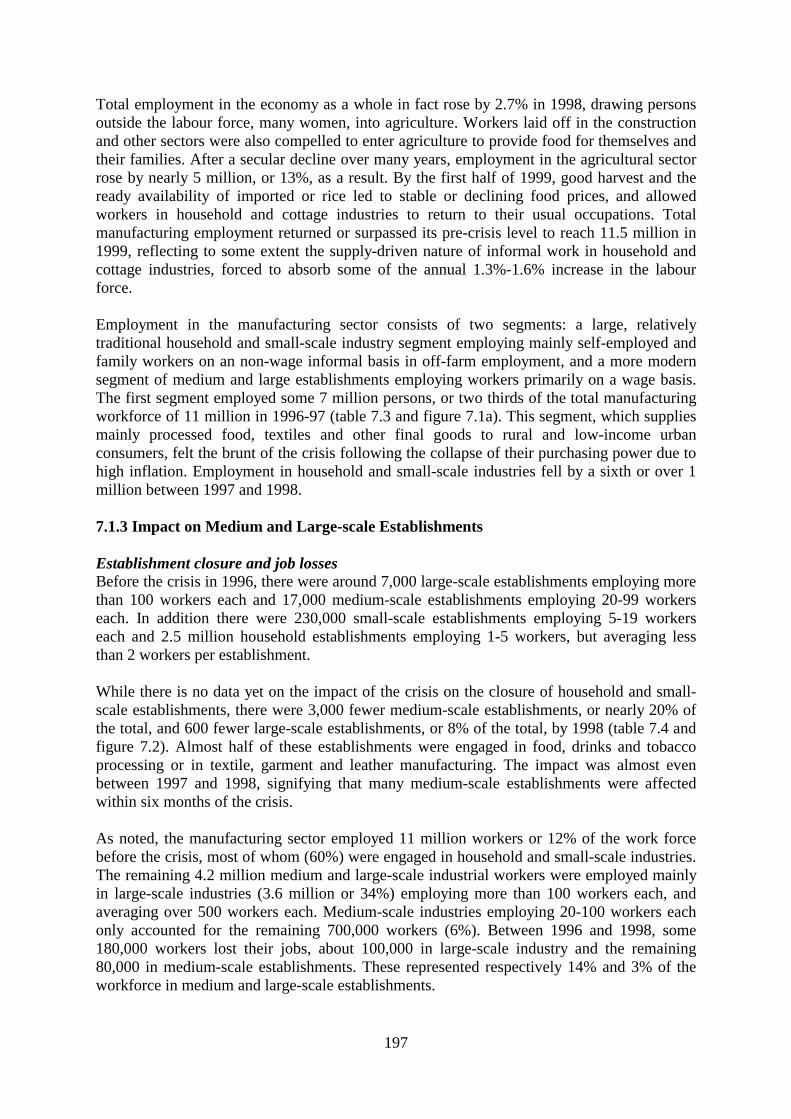
197
Total employment in the economy as a whole in fact rose by 2.7% in 1998, drawing persons outside the labour force, many women, into agriculture. Workers laid off in the construction and other sectors were also compelled to enter agriculture to provide food for themselves and their families. After a secular decline over many years, employment in the agricultural sector rose by nearly 5 million, or 13%, as a result. By the first half of 1999, good harvest and the ready availability of imported or rice led to stable or declining food prices, and allowed workers in household and cottage industries to return to their usual occupations. Total manufacturing employment returned or surpassed its pre-crisis level to reach 11.5 million in 1999, reflecting to some extent the supply-driven nature of informal work in household and cottage industries, forced to absorb some of the annual 1.3%-1.6% increase in the labour force. Employment in the manufacturing sector consists of two segments: a large, relatively traditional household and small-scale industry segment employing mainly self-employed and family workers on an non-wage informal basis in off-farm employment, and a more modern segment of medium and large establishments employing workers primarily on a wage basis. The first segment employed some 7 million persons, or two thirds of the total manufacturing workforce of 11 million in 1996-97 (table 7.3 and figure 7.1a). This segment, which supplies mainly processed food, textiles and other final goods to rural and low-income urban consumers, felt the brunt of the crisis following the collapse of their purchasing power due to high inflation. Employment in household and small-scale industries fell by a sixth or over 1 million between 1997 and 1998. 7.1.3 Impact on Medium and Large-scale Establishments Establishment closure and job losses Before the crisis in 1996, there were around 7,000 large-scale establishments employing more than 100 workers each and 17,000 medium-scale establishments employing 20-99 workers each. In addition there were 230,000 small-scale establishments employing 5-19 workers each and 2.5 million household establishments employing 1-5 workers, but averaging less than 2 workers per establishment. While there is no data yet on the impact of the crisis on the closure of household and small-scale establishments, there were 3,000 fewer medium-scale establishments, or nearly 20% of the total, and 600 fewer large-scale establishments, or 8% of the total, by 1998 (table 7.4 and figure 7.2). Almost half of these establishments were engaged in food, drinks and tobacco processing or in textile, garment and leather manufacturing. The impact was almost even between 1997 and 1998, signifying that many medium-scale establishments were affected within six months of the crisis. As noted, the manufacturing sector employed 11 million workers or 12% of the work force before the crisis, most of whom (60%) were engaged in household and small-scale industries. The remaining 4.2 million medium and large-scale industrial workers were employed mainly in large-scale industries (3.6 million or 34%) employing more than 100 workers each, and averaging over 500 workers each. Medium-scale industries employing 20-100 workers each only accounted for the remaining 700,000 workers (6%). Between 1996 and 1998, some 180,000 workers lost their jobs, about 100,000 in large-scale industry and the remaining 80,000 in medium-scale establishments. These represented respectively 14% and 3% of the workforce in medium and large-scale establishments.
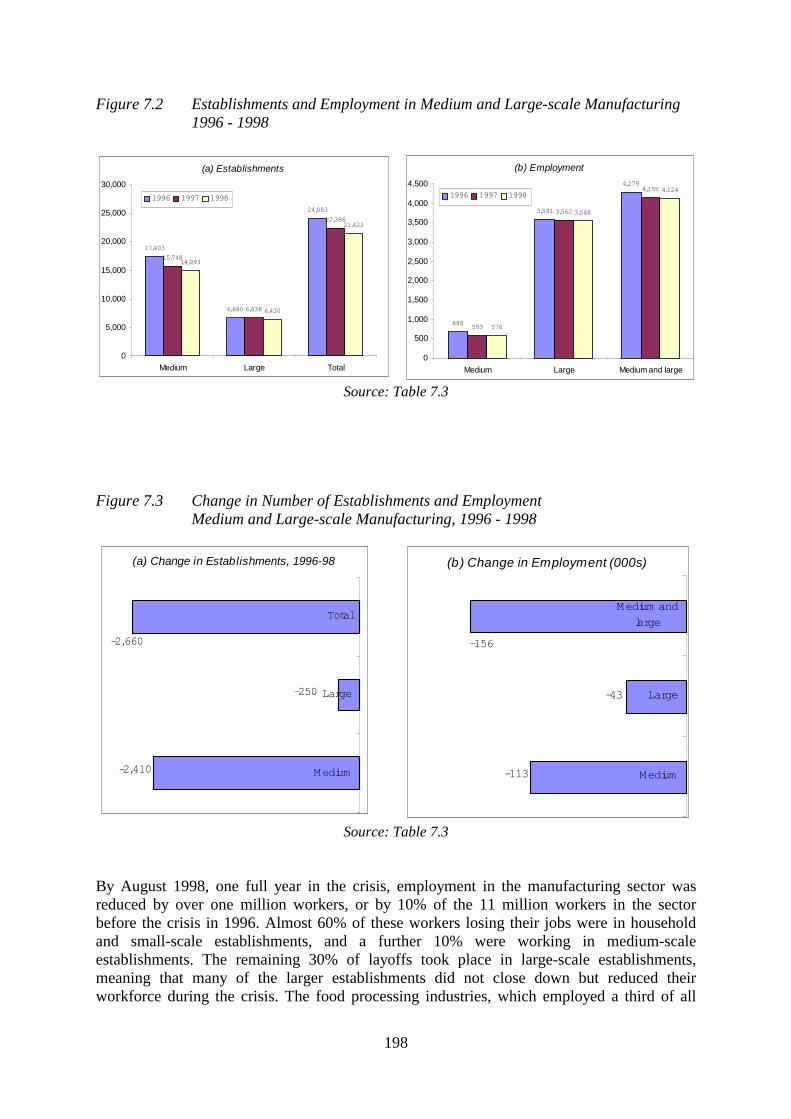
198
Figure 7.2 Establishments and Employment in Medium and Large-scale Manufacturing 1996 - 1998
Source: Table 7.3 Figure 7.3 Change in Number of Establishments and Employment
Medium and Large-scale Manufacturing, 1996 - 1998
Source: Table 7.3 By August 1998, one full year in the crisis, employment in the manufacturing sector was reduced by over one million workers, or by 10% of the 11 million workers in the sector before the crisis in 1996. Almost 60% of these workers losing their jobs were in household and small-scale establishments, and a further 10% were working in medium-scale establishments. The remaining 30% of layoffs took place in large-scale establishments, meaning that many of the larger establishments did not close down but reduced their workforce during the crisis. The food processing industries, which employed a third of all
(a) Establishments
17,403
6,680
24,083
15,748
6,638
22,386
14,993
6,430
21,423
0
5,000
10,000
15,000
20,000
25,000
30,000
Medium Large Total
1996 1997 1998
(b) Employment
688
3,591
4,279
593
3,562
4,155
576
3,548
4,124
0
500
1,000
1,500
2,000
2,500
3,000
3,500
4,000
4,500
Medium Large Medium and large
1996 1997 1998
(a) Change in Establishments, 1996-98
-250
-2,660
-2,410 Medium
Large
Total
(b) Change in Employment (000s)
-43
-156
-113 Medium
Large
Medium and
large
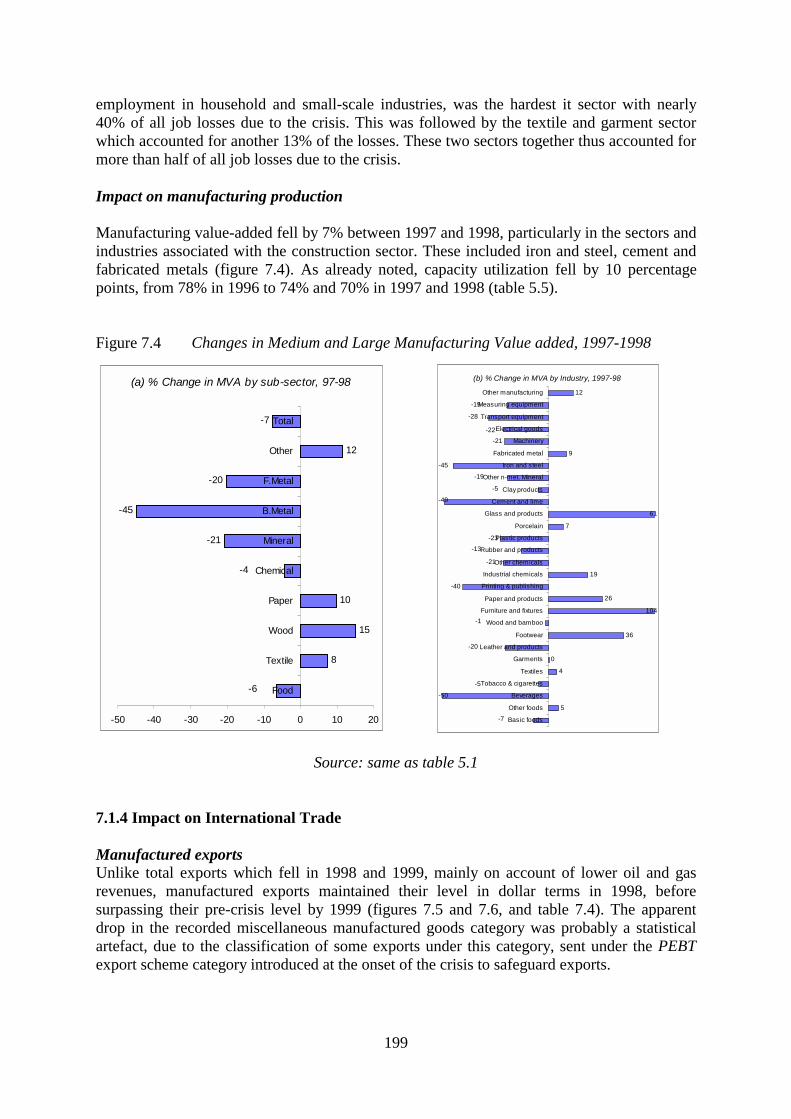
199
employment in household and small-scale industries, was the hardest it sector with nearly 40% of all job losses due to the crisis. This was followed by the textile and garment sector which accounted for another 13% of the losses. These two sectors together thus accounted for more than half of all job losses due to the crisis. Impact on manufacturing production Manufacturing value-added fell by 7% between 1997 and 1998, particularly in the sectors and industries associated with the construction sector. These included iron and steel, cement and fabricated metals (figure 7.4). As already noted, capacity utilization fell by 10 percentage points, from 78% in 1996 to 74% and 70% in 1997 and 1998 (table 5.5). Figure 7.4 Changes in Medium and Large Manufacturing Value added, 1997-1998
Source: same as table 5.1
7.1.4 Impact on International Trade Manufactured exports Unlike total exports which fell in 1998 and 1999, mainly on account of lower oil and gas revenues, manufactured exports maintained their level in dollar terms in 1998, before surpassing their pre-crisis level by 1999 (figures 7.5 and 7.6, and table 7.4). The apparent drop in the recorded miscellaneous manufactured goods category was probably a statistical artefact, due to the classification of some exports under this category, sent under the PEBT export scheme category introduced at the onset of the crisis to safeguard exports.
(a) % Change in MVA by sub-sector, 97-98
8
15
10
-21
-45
-20
12
-7
-6
-4
-50 -40 -30 -20 -10 0 10 20
Food
Textile
Wood
Paper
Chemical
Mineral
B.Metal
F.Metal
Other
Total
(b) % Change in MVA by Industry, 1997-98
5
-50
4
0
36
26
-40
19
-23
7
61
9
-21
12
-5
-1
-21
-5
-28
-7
-13
-45
-20
-19
-22
-19
-49
104
Basic foods
Other foods
Beverages
Tobacco & cigarettes
Textiles
Garments
Leather and products
Footwear
Wood and bamboo
Furniture and fixtures
Paper and products
Printing & publishing
Industrial chemicals
Other chemicals
Rubber and products
Plastic products
Porcelain
Glass and products
Cement and lime
Clay products
Other n-met. Mineral
Iron and steel
Fabricated metal
Machinery
Electrical goods
Transport equipment
Measuring equipment
Other manufacturing
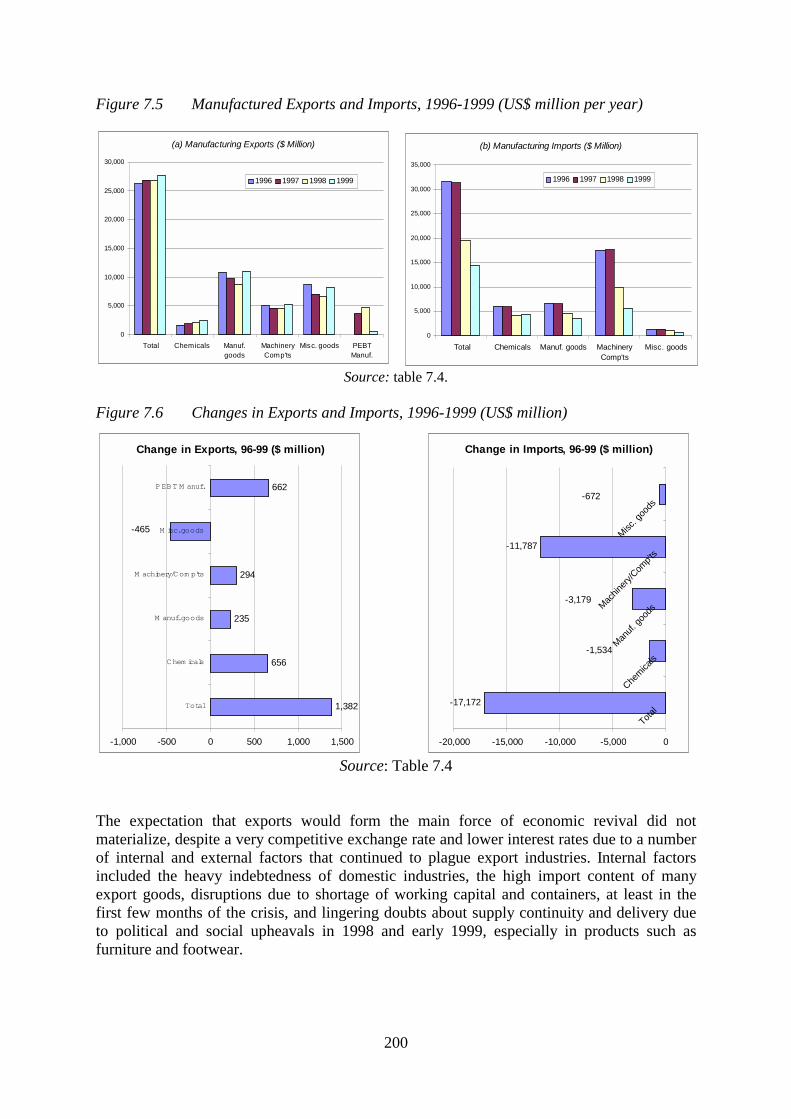
200
Figure 7.5 Manufactured Exports and Imports, 1996-1999 (US$ million per year)
Source: table 7.4. Figure 7.6 Changes in Exports and Imports, 1996-1999 (US$ million)
Source: Table 7.4 The expectation that exports would form the main force of economic revival did not materialize, despite a very competitive exchange rate and lower interest rates due to a number of internal and external factors that continued to plague export industries. Internal factors included the heavy indebtedness of domestic industries, the high import content of many export goods, disruptions due to shortage of working capital and containers, at least in the first few months of the crisis, and lingering doubts about supply continuity and delivery due to political and social upheavals in 1998 and early 1999, especially in products such as furniture and footwear.
Change in Exports, 96-99 ($ million)
1,382
656
235
294
662
-465
-1,000 -500 0 500 1,000 1,500
Total
Chem icals
M anuf. goods
M achinery/Com p'ts
M isc. goods
PEBT M anuf.
Change in Imports, 96-99 ($ million)
-17,172
-11,787
-3,179
-1,534
-672
-20,000 -15,000 -10,000 -5,000 0
Total
Chemica
lsMan
uf. go
odsMac
hinery
/Com
p'ts
Misc. g
oods
(a) Manufacturing Exports ($ Million)
0
5,000
10,000
15,000
20,000
25,000
30,000
Total Chemicals Manuf.goods
MachineryComp'ts
Misc. goods PEBTManuf.
1996 1997 1998 1999
(b) Manufacturing Imports ($ Million)
0
5,000
10,000
15,000
20,000
25,000
30,000
35,000
Total Chemicals Manuf. goods MachineryComp'ts
Misc. goods
1996 1997 1998 1999
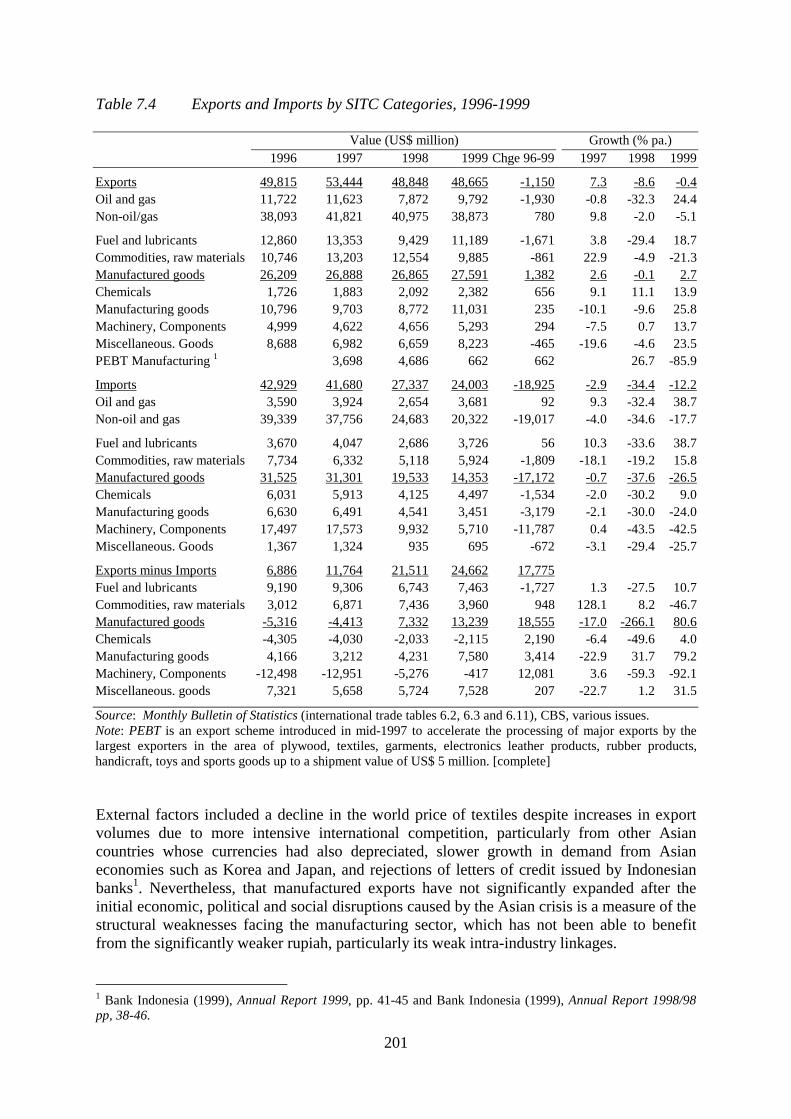
201
Table 7.4 Exports and Imports by SITC Categories, 1996-1999
Value (US$ million) Growth (% pa.) 1996 1997 1998 1999 Chge 96-99 1997 1998 1999
Exports 49,815 53,444 48,848 48,665 -1,150 7.3 -8.6 -0.4 Oil and gas 11,722 11,623 7,872 9,792 -1,930 -0.8 -32.3 24.4 Non-oil/gas 38,093 41,821 40,975 38,873 780 9.8 -2.0 -5.1
Fuel and lubricants 12,860 13,353 9,429 11,189 -1,671 3.8 -29.4 18.7 Commodities, raw materials 10,746 13,203 12,554 9,885 -861 22.9 -4.9 -21.3 Manufactured goods 26,209 26,888 26,865 27,591 1,382 2.6 -0.1 2.7 Chemicals 1,726 1,883 2,092 2,382 656 9.1 11.1 13.9 Manufacturing goods 10,796 9,703 8,772 11,031 235 -10.1 -9.6 25.8 Machinery, Components 4,999 4,622 4,656 5,293 294 -7.5 0.7 13.7 Miscellaneous. Goods 8,688 6,982 6,659 8,223 -465 -19.6 -4.6 23.5 PEBT Manufacturing 1 3,698 4,686 662 662 26.7 -85.9
Imports 42,929 41,680 27,337 24,003 -18,925 -2.9 -34.4 -12.2 Oil and gas 3,590 3,924 2,654 3,681 92 9.3 -32.4 38.7 Non-oil and gas 39,339 37,756 24,683 20,322 -19,017 -4.0 -34.6 -17.7
Fuel and lubricants 3,670 4,047 2,686 3,726 56 10.3 -33.6 38.7 Commodities, raw materials 7,734 6,332 5,118 5,924 -1,809 -18.1 -19.2 15.8 Manufactured goods 31,525 31,301 19,533 14,353 -17,172 -0.7 -37.6 -26.5 Chemicals 6,031 5,913 4,125 4,497 -1,534 -2.0 -30.2 9.0 Manufacturing goods 6,630 6,491 4,541 3,451 -3,179 -2.1 -30.0 -24.0 Machinery, Components 17,497 17,573 9,932 5,710 -11,787 0.4 -43.5 -42.5 Miscellaneous. Goods 1,367 1,324 935 695 -672 -3.1 -29.4 -25.7
Exports minus Imports 6,886 11,764 21,511 24,662 17,775 Fuel and lubricants 9,190 9,306 6,743 7,463 -1,727 1.3 -27.5 10.7 Commodities, raw materials 3,012 6,871 7,436 3,960 948 128.1 8.2 -46.7 Manufactured goods -5,316 -4,413 7,332 13,239 18,555 -17.0 -266.1 80.6 Chemicals -4,305 -4,030 -2,033 -2,115 2,190 -6.4 -49.6 4.0 Manufacturing goods 4,166 3,212 4,231 7,580 3,414 -22.9 31.7 79.2 Machinery, Components -12,498 -12,951 -5,276 -417 12,081 3.6 -59.3 -92.1 Miscellaneous. goods 7,321 5,658 5,724 7,528 207 -22.7 1.2 31.5
Source: Monthly Bulletin of Statistics (international trade tables 6.2, 6.3 and 6.11), CBS, various issues. Note: PEBT is an export scheme introduced in mid-1997 to accelerate the processing of major exports by the largest exporters in the area of plywood, textiles, garments, electronics leather products, rubber products, handicraft, toys and sports goods up to a shipment value of US$ 5 million. [complete] External factors included a decline in the world price of textiles despite increases in export volumes due to more intensive international competition, particularly from other Asian countries whose currencies had also depreciated, slower growth in demand from Asian economies such as Korea and Japan, and rejections of letters of credit issued by Indonesian banks1. Nevertheless, that manufactured exports have not significantly expanded after the initial economic, political and social disruptions caused by the Asian crisis is a measure of the structural weaknesses facing the manufacturing sector, which has not been able to benefit from the significantly weaker rupiah, particularly its weak intra-industry linkages. 1 Bank Indonesia (1999), Annual Report 1999, pp. 41-45 and Bank Indonesia (1999), Annual Report 1998/98 pp, 38-46.
202
Manufactured imports Total imports and manufactured imports both collapsed following the onset of the crisis. After a small decline of about 5% between 1996 and 1997, imports declined by a third in the first year of the crisis, and by a further 12% in 1999 (figures 7.5 and 7.6, and table 7.4). While oil and gas imports recovered their pre-crisis level, manufactured imports declined by a further 27%, reaching less than half of their pre-crisis level by 1999. The machinery, transport equipment and component category (SITC 7) was the hardest hit, its imports reaching just a third of its pre-crisis level. There is yet no detailed data at the SITC level to assess the rise in the import of intermediate inputs such as raw materials and components as a result of the rise in exports in 1999. 7.1.5 Summary The economic crisis, which began in mid-1997, had a moderate impact on medium and large-scale manufacturing. Production and capacity utilization declined by less than 10%, while employment declined by less than 3% in 1997 and 1% in 1998, mainly in medium-scale establishments, unlike the loss of 1 million jobs (15%) in the household and small-scale segment. The level of industrial concentration probably remained unchanged in the first full year of the crisis. Value-added per worker, or labour productivity, declined in medium and large-scale manufacturing in 1998, while real wages fell by 10% due to rapid inflation. Overall manufactured exports remained at pre-crisis level until 1998, and then surpassed it by 3% in 1999. Nevertheless, the expectation of a depreciation-led export boom did not materialize, mainly due to the sector’s continued dependence on imported intermediate inputs.
203
7.2 SMALL AND MEDIUM-SCALE INDUSTRIES 7.2.1 Patterns of Growth Size distribution The Indonesian manufacturing sector can be divided into four segments. In 1996, household or cottage industries (1-4 workers), small-scale industries (5-19 workers) and medium-scale establishments (20-99 workers) each accounted for about 6% of total manufacturing output, but employed respectively 44%, 17% and 6% of the total manufacturing workforce. At the other end, large-scale establishments (100+ workers) employed 33% of total employment, but accounted for 83% of total manufacturing value-added (table 7.6 and figure 7.7). Excluding household industries, small and medium industries thus accounted for 23% of total employment and 11% of total MVA. However, as discussed below, the SMIs displayed considerable dynamism, both in increasing their initial size and graduating into larger size categories, and in creating new establishments, thus fully sharing and contributing to manufacturing growth. The common impression that large establishments have been the most dynamic turns out to be erroneous when the data is examined in terms of their initial size. In addition to the large labour productivity differences between establishments of different sizes, large-scale units dominated all manufacturing sub-sectors, their share rarely falling below 80%, except in wood and non-metallic mineral industries (65%). Nearly 30% of those working in small-scale establishments were non-wage employees made up on average of about two family members in addition to the owner-operator (annex table A.7.1). Finally, household establishments basically comprised of the owner-operator and one additional worker, usually a family member. Only one in seven worker was a paid employee. Growth in employment and value-added All size categories shared in the rapid growth of employment and value-added in the manufacturing sector in the 1976-1996 period. Employment grew by respectively 6%, 9% and 8% per annum in household (1-4 workers), small (5-19 workers), and medium and large-scale establishments (20+ workers) between 1986 and 1996. Corresponding figures for real value-added growth were 8%, 13% and 16% per annum (table 7.5). During the 1990-96 period, employment and value-added grew at similar rates in establishments with 20-99, 100-499 and 500+ workers, thus maintaining their relative shares in employment and value-added. Much of the faster growth of larger establishments before 1990, and therefore of their increasing share, was in fact due to the successful growth of smaller establishments, which graduated into the larger size categories (table 7.6). The data does not support the view that the small and medium establishments have been held back relative to large enterprises. On the contrary, it suggests substantial dynamism at all levels. Much of the apparent increase in the share of very large establishments before 1990 was in fact attributable to the successful growth of smaller establishments into larger categories. In the conventional approach, which classifies establishments in the year of observation (as in table 7.5 and first and third columns of table 7.6), establishments employing 500 workers and above accounted for 56% of total employment and 68% of value-added in 1990. When classified by their original size (columns 2 and 4, table 7.6), this size category accounted for a far smaller proportion of growth, 33% of employment and 52% of value-added.
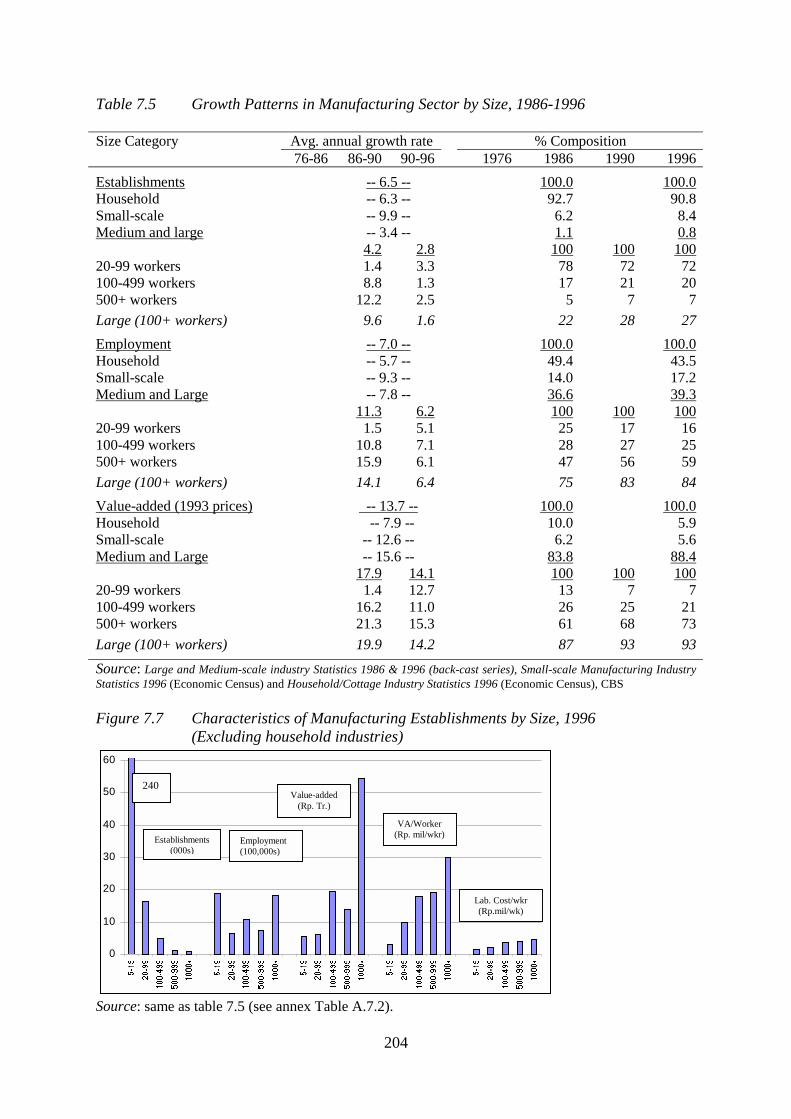
Table 7.5 Growth Patterns in Manufacturing Sector by Size, 1986-1996 Size Category Avg. annual growth rate % Composition
76-86 86-90 90-96 1976 1986 1990 1996 Establishments -- 6.5 -- 100.0 100.0 Household -- 6.3 -- 92.7 90.8 Small-scale -- 9.9 -- 6.2 8.4 Medium and large -- 3.4 -- 1.1 0.8 4.2 2.8 100 100 100 20-99 workers 1.4 3.3 78 72 72 100-499 workers 8.8 1.3 17 21 20 500+ workers 12.2 2.5 5 7 7 Large (100+ workers) 9.6 1.6 22 28 27 Employment -- 7.0 -- 100.0 100.0 Household -- 5.7 -- 49.4 43.5 Small-scale -- 9.3 -- 14.0 17.2 Medium and Large -- 7.8 -- 36.6 39.3 11.3 6.2 100 100 100 20-99 workers 1.5 5.1 25 17 16 100-499 workers 10.8 7.1 28 27 25 500+ workers 15.9 6.1 47 56 59 Large (100+ workers) 14.1 6.4 75 83 84 Value-added (1993 prices) -- 13.7 -- 100.0 100.0 Household -- 7.9 -- 10.0 5.9 Small-scale -- 12.6 -- 6.2 5.6 Medium and Large -- 15.6 -- 83.8 88.4 17.9 14.1 100 100 100 20-99 workers 1.4 12.7 13 7 7 100-499 workers 16.2 11.0 26 25 21 500+ workers 21.3 15.3 61 68 73 Large (100+ workers) 19.9 14.2 87 93 93 Source: Large and Medium-scale industry Statistics 1986 & 1996 (back-cast series), Small-scale Manufacturing Industry Statistics 1996 (Economic Census) and Household/Cottage Industry Statistics 1996 (Economic Census), CBS Figure 7.7 Characteristics of Manufacturing Establishments by Size, 1996 (Excluding household industries)
Source: s
0
10
20
30
40
50
60
240 Value-added
(Rp. Tr.)
Establishments (000s)
ame as table 7
Employment (100,000s)
2
.5 (see annex Table A.7.2)
VA/Worker (Rp. mil/wkr)
04
.
Lab. Cost/wkr (Rp.mil/wk)
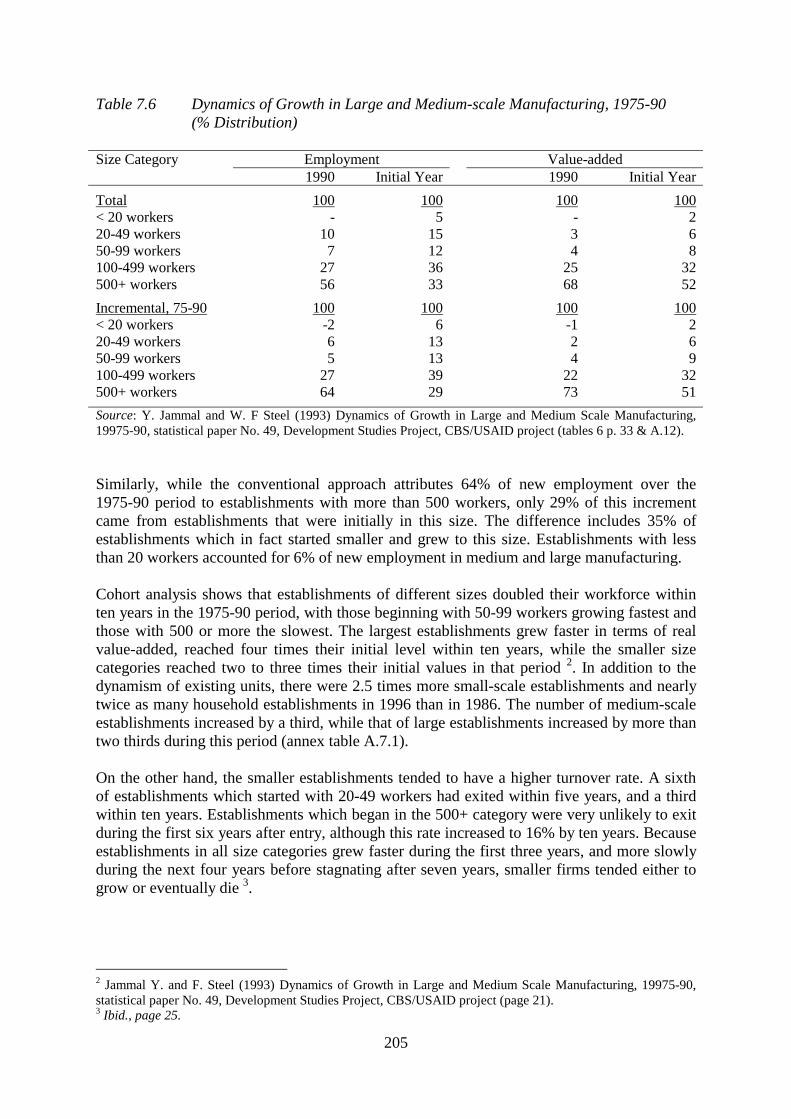
205
Table 7.6 Dynamics of Growth in Large and Medium-scale Manufacturing, 1975-90 (% Distribution) Size Category Employment Value-added 1990 Initial Year 1990 Initial Year Total 100 100 100 100 < 20 workers - 5 - 2 20-49 workers 10 15 3 6 50-99 workers 7 12 4 8 100-499 workers 27 36 25 32 500+ workers 56 33 68 52 Incremental, 75-90 100 100 100 100 < 20 workers -2 6 -1 2 20-49 workers 6 13 2 6 50-99 workers 5 13 4 9 100-499 workers 27 39 22 32 500+ workers 64 29 73 51 Source: Y. Jammal and W. F Steel (1993) Dynamics of Growth in Large and Medium Scale Manufacturing, 19975-90, statistical paper No. 49, Development Studies Project, CBS/USAID project (tables 6 p. 33 & A.12). Similarly, while the conventional approach attributes 64% of new employment over the 1975-90 period to establishments with more than 500 workers, only 29% of this increment came from establishments that were initially in this size. The difference includes 35% of establishments which in fact started smaller and grew to this size. Establishments with less than 20 workers accounted for 6% of new employment in medium and large manufacturing. Cohort analysis shows that establishments of different sizes doubled their workforce within ten years in the 1975-90 period, with those beginning with 50-99 workers growing fastest and those with 500 or more the slowest. The largest establishments grew faster in terms of real value-added, reached four times their initial level within ten years, while the smaller size categories reached two to three times their initial values in that period 2. In addition to the dynamism of existing units, there were 2.5 times more small-scale establishments and nearly twice as many household establishments in 1996 than in 1986. The number of medium-scale establishments increased by a third, while that of large establishments increased by more than two thirds during this period (annex table A.7.1). On the other hand, the smaller establishments tended to have a higher turnover rate. A sixth of establishments which started with 20-49 workers had exited within five years, and a third within ten years. Establishments which began in the 500+ category were very unlikely to exit during the first six years after entry, although this rate increased to 16% by ten years. Because establishments in all size categories grew faster during the first three years, and more slowly during the next four years before stagnating after seven years, smaller firms tended either to grow or eventually die 3.
2 Jammal Y. and F. Steel (1993) Dynamics of Growth in Large and Medium Scale Manufacturing, 19975-90, statistical paper No. 49, Development Studies Project, CBS/USAID project (page 21). 3 Ibid., page 25.
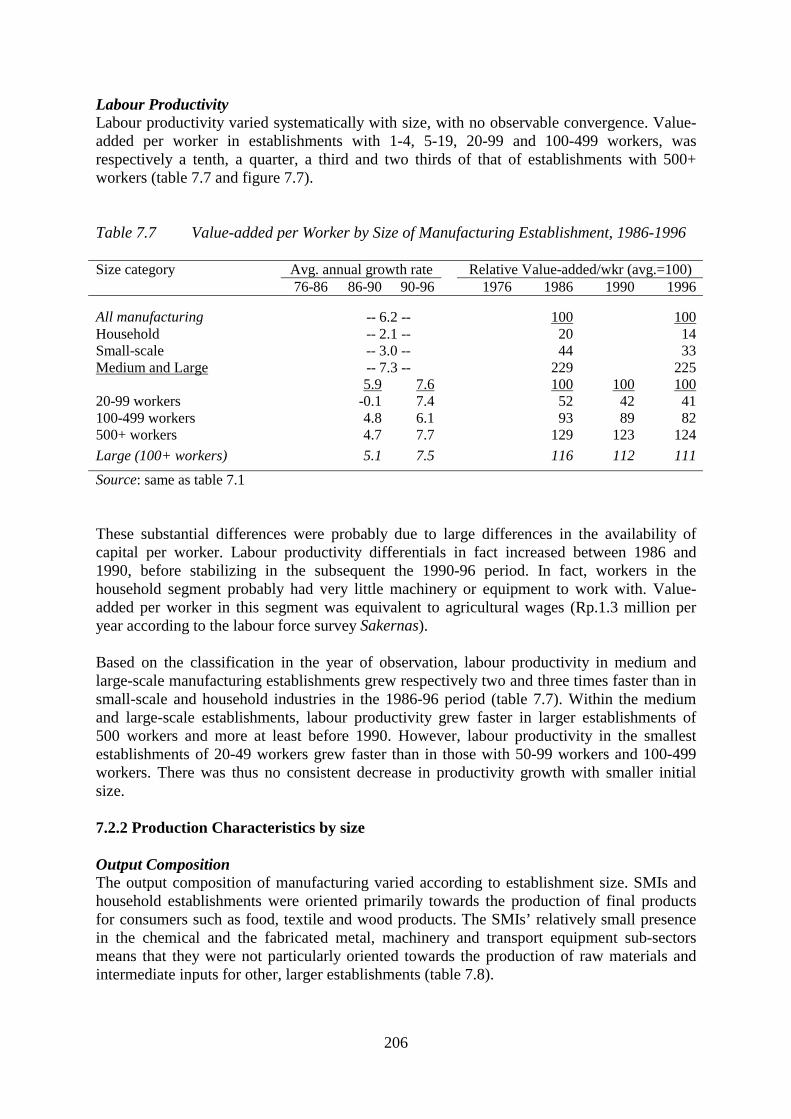
206
Labour Productivity Labour productivity varied systematically with size, with no observable convergence. Value-added per worker in establishments with 1-4, 5-19, 20-99 and 100-499 workers, was respectively a tenth, a quarter, a third and two thirds of that of establishments with 500+ workers (table 7.7 and figure 7.7). Table 7.7 Value-added per Worker by Size of Manufacturing Establishment, 1986-1996 Size category Avg. annual growth rate Relative Value-added/wkr (avg.=100) 76-86 86-90 90-96 1976 1986 1990 1996
All manufacturing -- 6.2 -- 100 100 Household -- 2.1 -- 20 14 Small-scale -- 3.0 -- 44 33 Medium and Large -- 7.3 -- 229 225 5.9 7.6 100 100 100 20-99 workers -0.1 7.4 52 42 41 100-499 workers 4.8 6.1 93 89 82 500+ workers 4.7 7.7 129 123 124 Large (100+ workers) 5.1 7.5 116 112 111 Source: same as table 7.1 These substantial differences were probably due to large differences in the availability of capital per worker. Labour productivity differentials in fact increased between 1986 and 1990, before stabilizing in the subsequent the 1990-96 period. In fact, workers in the household segment probably had very little machinery or equipment to work with. Value-added per worker in this segment was equivalent to agricultural wages (Rp.1.3 million per year according to the labour force survey Sakernas). Based on the classification in the year of observation, labour productivity in medium and large-scale manufacturing establishments grew respectively two and three times faster than in small-scale and household industries in the 1986-96 period (table 7.7). Within the medium and large-scale establishments, labour productivity grew faster in larger establishments of 500 workers and more at least before 1990. However, labour productivity in the smallest establishments of 20-49 workers grew faster than in those with 50-99 workers and 100-499 workers. There was thus no consistent decrease in productivity growth with smaller initial size. 7.2.2 Production Characteristics by size Output Composition The output composition of manufacturing varied according to establishment size. SMIs and household establishments were oriented primarily towards the production of final products for consumers such as food, textile and wood products. The SMIs’ relatively small presence in the chemical and the fabricated metal, machinery and transport equipment sub-sectors means that they were not particularly oriented towards the production of raw materials and intermediate inputs for other, larger establishments (table 7.8).
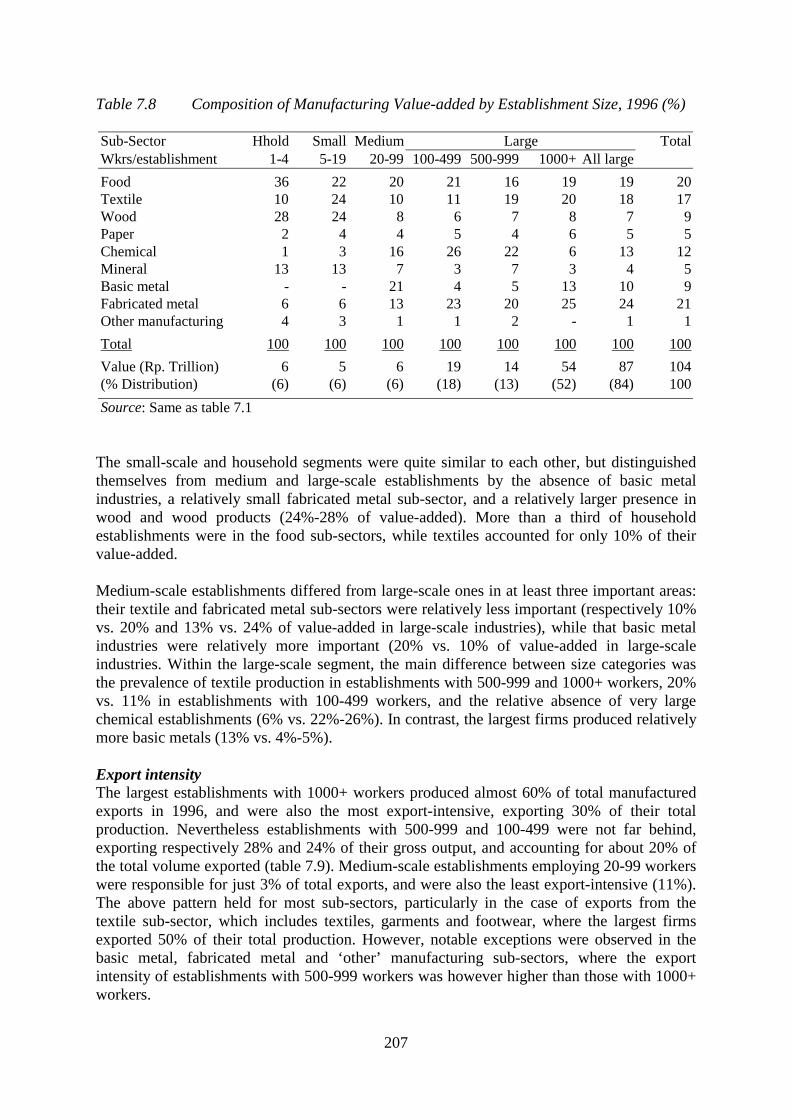
207
Table 7.8 Composition of Manufacturing Value-added by Establishment Size, 1996 (%) Sub-Sector Hhold Small Medium Large Total Wkrs/establishment 1-4 5-19 20-99 100-499 500-999 1000+ All large Food 36 22 20 21 16 19 19 20 Textile 10 24 10 11 19 20 18 17 Wood 28 24 8 6 7 8 7 9 Paper 2 4 4 5 4 6 5 5 Chemical 1 3 16 26 22 6 13 12 Mineral 13 13 7 3 7 3 4 5 Basic metal - - 21 4 5 13 10 9 Fabricated metal 6 6 13 23 20 25 24 21 Other manufacturing 4 3 1 1 2 - 1 1 Total 100 100 100 100 100 100 100 100 Value (Rp. Trillion) 6 5 6 19 14 54 87 104 (% Distribution) (6) (6) (6) (18) (13) (52) (84) 100 Source: Same as table 7.1
The small-scale and household segments were quite similar to each other, but distinguished themselves from medium and large-scale establishments by the absence of basic metal industries, a relatively small fabricated metal sub-sector, and a relatively larger presence in wood and wood products (24%-28% of value-added). More than a third of household establishments were in the food sub-sectors, while textiles accounted for only 10% of their value-added. Medium-scale establishments differed from large-scale ones in at least three important areas: their textile and fabricated metal sub-sectors were relatively less important (respectively 10% vs. 20% and 13% vs. 24% of value-added in large-scale industries), while that basic metal industries were relatively more important (20% vs. 10% of value-added in large-scale industries. Within the large-scale segment, the main difference between size categories was the prevalence of textile production in establishments with 500-999 and 1000+ workers, 20% vs. 11% in establishments with 100-499 workers, and the relative absence of very large chemical establishments (6% vs. 22%-26%). In contrast, the largest firms produced relatively more basic metals (13% vs. 4%-5%). Export intensity The largest establishments with 1000+ workers produced almost 60% of total manufactured exports in 1996, and were also the most export-intensive, exporting 30% of their total production. Nevertheless establishments with 500-999 and 100-499 were not far behind, exporting respectively 28% and 24% of their gross output, and accounting for about 20% of the total volume exported (table 7.9). Medium-scale establishments employing 20-99 workers were responsible for just 3% of total exports, and were also the least export-intensive (11%). The above pattern held for most sub-sectors, particularly in the case of exports from the textile sub-sector, which includes textiles, garments and footwear, where the largest firms exported 50% of their total production. However, notable exceptions were observed in the basic metal, fabricated metal and ‘other’ manufacturing sub-sectors, where the export intensity of establishments with 500-999 workers was however higher than those with 1000+ workers.
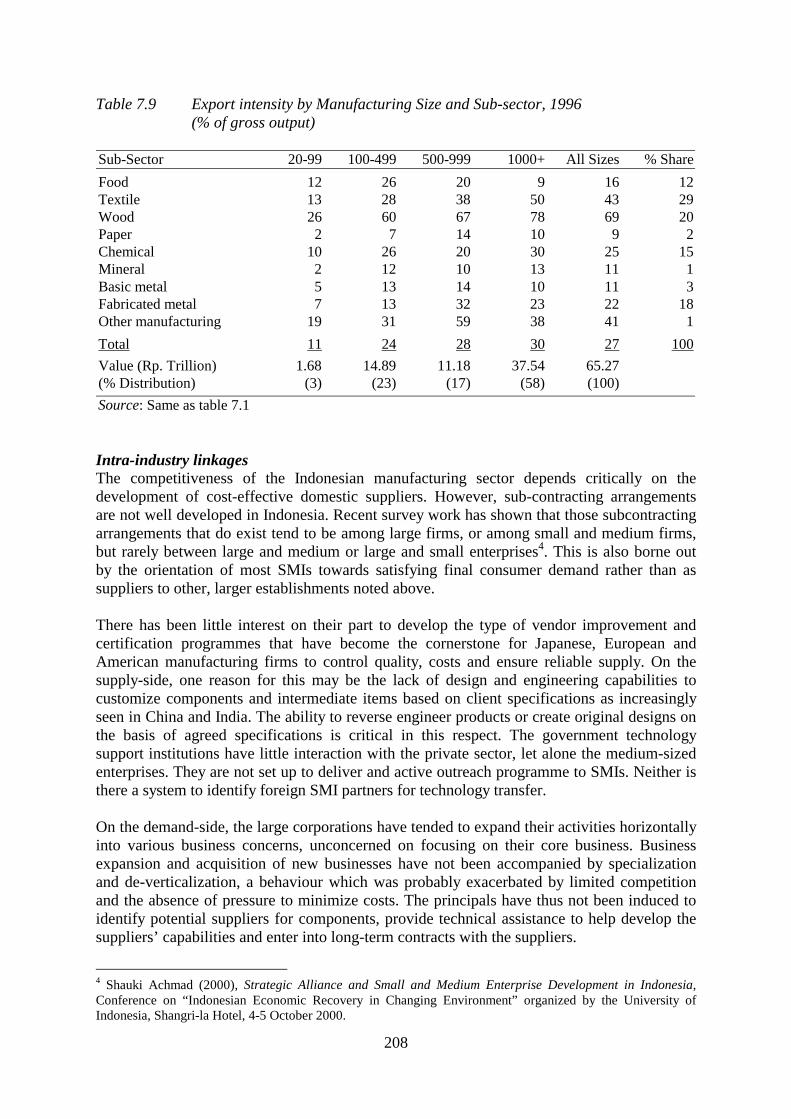
208
Table 7.9 Export intensity by Manufacturing Size and Sub-sector, 1996 (% of gross output)
Sub-Sector 20-99 100-499 500-999 1000+ All Sizes % Share Food 12 26 20 9 16 12 Textile 13 28 38 50 43 29 Wood 26 60 67 78 69 20 Paper 2 7 14 10 9 2 Chemical 10 26 20 30 25 15 Mineral 2 12 10 13 11 1 Basic metal 5 13 14 10 11 3 Fabricated metal 7 13 32 23 22 18 Other manufacturing 19 31 59 38 41 1 Total 11 24 28 30 27 100 Value (Rp. Trillion) 1.68 14.89 11.18 37.54 65.27 (% Distribution) (3) (23) (17) (58) (100) Source: Same as table 7.1 Intra-industry linkages The competitiveness of the Indonesian manufacturing sector depends critically on the development of cost-effective domestic suppliers. However, sub-contracting arrangements are not well developed in Indonesia. Recent survey work has shown that those subcontracting arrangements that do exist tend to be among large firms, or among small and medium firms, but rarely between large and medium or large and small enterprises4. This is also borne out by the orientation of most SMIs towards satisfying final consumer demand rather than as suppliers to other, larger establishments noted above. There has been little interest on their part to develop the type of vendor improvement and certification programmes that have become the cornerstone for Japanese, European and American manufacturing firms to control quality, costs and ensure reliable supply. On the supply-side, one reason for this may be the lack of design and engineering capabilities to customize components and intermediate items based on client specifications as increasingly seen in China and India. The ability to reverse engineer products or create original designs on the basis of agreed specifications is critical in this respect. The government technology support institutions have little interaction with the private sector, let alone the medium-sized enterprises. They are not set up to deliver and active outreach programme to SMIs. Neither is there a system to identify foreign SMI partners for technology transfer. On the demand-side, the large corporations have tended to expand their activities horizontally into various business concerns, unconcerned on focusing on their core business. Business expansion and acquisition of new businesses have not been accompanied by specialization and de-verticalization, a behaviour which was probably exacerbated by limited competition and the absence of pressure to minimize costs. The principals have thus not been induced to identify potential suppliers for components, provide technical assistance to help develop the suppliers’ capabilities and enter into long-term contracts with the suppliers.
4 Shauki Achmad (2000), Strategic Alliance and Small and Medium Enterprise Development in Indonesia, Conference on “Indonesian Economic Recovery in Changing Environment” organized by the University of Indonesia, Shangri-la Hotel, 4-5 October 2000.
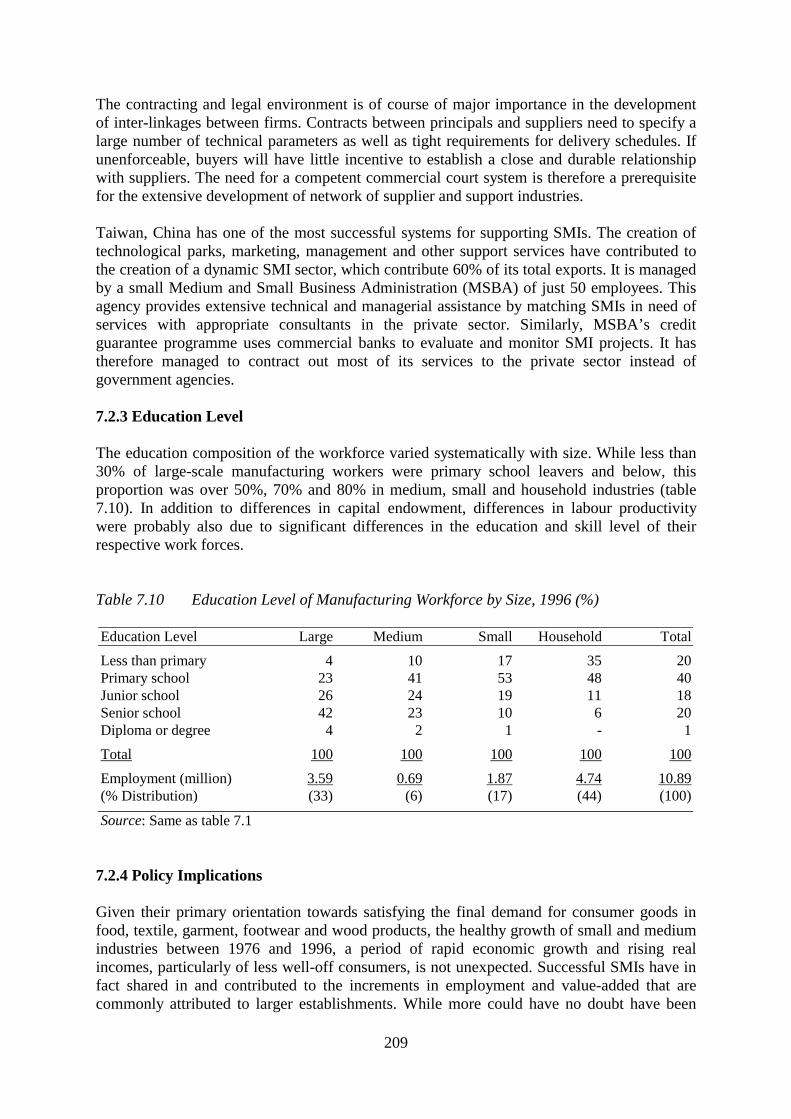
209
The contracting and legal environment is of course of major importance in the development of inter-linkages between firms. Contracts between principals and suppliers need to specify a large number of technical parameters as well as tight requirements for delivery schedules. If unenforceable, buyers will have little incentive to establish a close and durable relationship with suppliers. The need for a competent commercial court system is therefore a prerequisite for the extensive development of network of supplier and support industries. Taiwan, China has one of the most successful systems for supporting SMIs. The creation of technological parks, marketing, management and other support services have contributed to the creation of a dynamic SMI sector, which contribute 60% of its total exports. It is managed by a small Medium and Small Business Administration (MSBA) of just 50 employees. This agency provides extensive technical and managerial assistance by matching SMIs in need of services with appropriate consultants in the private sector. Similarly, MSBA’s credit guarantee programme uses commercial banks to evaluate and monitor SMI projects. It has therefore managed to contract out most of its services to the private sector instead of government agencies. 7.2.3 Education Level The education composition of the workforce varied systematically with size. While less than 30% of large-scale manufacturing workers were primary school leavers and below, this proportion was over 50%, 70% and 80% in medium, small and household industries (table 7.10). In addition to differences in capital endowment, differences in labour productivity were probably also due to significant differences in the education and skill level of their respective work forces. Table 7.10 Education Level of Manufacturing Workforce by Size, 1996 (%) Education Level Large Medium Small Household Total Less than primary 4 10 17 35 20 Primary school 23 41 53 48 40 Junior school 26 24 19 11 18 Senior school 42 23 10 6 20 Diploma or degree 4 2 1 - 1 Total 100 100 100 100 100 Employment (million) 3.59 0.69 1.87 4.74 10.89 (% Distribution) (33) (6) (17) (44) (100)
Source: Same as table 7.1 7.2.4 Policy Implications Given their primary orientation towards satisfying the final demand for consumer goods in food, textile, garment, footwear and wood products, the healthy growth of small and medium industries between 1976 and 1996, a period of rapid economic growth and rising real incomes, particularly of less well-off consumers, is not unexpected. Successful SMIs have in fact shared in and contributed to the increments in employment and value-added that are commonly attributed to larger establishments. While more could have no doubt have been
210
done to foster more rapid growth, such as access to credit and removal of bureaucratic barriers, they were not been left during the period of rapid economic growth, though they could have grown even faster with additional external finance and removal of constraints. The SMIs’ primary reliance on the production of final consumer goods, which served them so well prior to the crisis, made them more vulnerable to the economic crisis which started in mid-1997, as noted in section 7.1 above. Thus between 1996 and 1998, the number of medium and large-scale establishments declined by 2,700 establishments, of which 2,100 were medium-scale establishments (20-99 workers) and only 560 were larger ones. The corresponding figures for employment were 156,000, 113,000 in medium-scale and 43,000 workers in large-scale establishments. A mature industrial structure is characterized by small and medium-scale industries moving into highly specialized market niches where high levels of skills are often required. The opposite is found at present here, where low-productivity SMIs produce and market undifferentiated low-technology products requiring low skill levels. The major post-crisis challenge and opportunity facing SMIs is therefore to become integrated in the overall manufacturing sector as suppliers of raw materials, intermediate inputs and components to other establishments, both small and large. While efforts to provide better access to credit and the removal of bureaucratic constraints should be continued, there has been an over-emphasis on credit and subsidized rates as constraints to the development of SMIs. Moreover, efforts in other non-priority areas such as promoting SMI exports (medium-scale industries contributed only 3% to total manufacturing exports) may also have distracted the authorities from the crucial task of raising SMI manufacturing capability and upgrading their technology, management and marketing levels. The competitiveness of the Indonesian manufacturing sector depends critically on the development of cost-effective domestic suppliers. The government does not yet have effective programmes to promote sub-contracting, nor to provide channels for the arbitration between large firms and subcontractors, thus encouraging them to opt for vertical integration or to look for quality suppliers abroad. The following measures could be undertaken to develop sub-contracting arrangements and SMIs in general: a) Provide incentives for assemblers to identify potential suppliers for components, and to
provide technical assistance to them to develop their capabilities, including the development of a vendor improvement and certification programme.
b) Encourage local design and engineering capabilities to produce components based on
client specifications, and the ability to reverse engineer products or create original designs on the basis of agreed specifications.
c) Intensify interaction between the government technology support institutions and the
private sector, perhaps through joint management of such institutions with industry associations.
d) Deliver a private-sector led active outreach programme to SMIs through productivity
centres, with qualified and motivated teams visiting the industries, offering free diagnosis and putting together packages of technology, training and finance.
211
e) Undertake a thorough evaluation of all existing schemes such as the Technical Service Centres, the Small Industrial Estates and other schemes promoted by UNIDO (clusters), the World Bank (matching grant scheme) and GTZ (Business Advisory Network), and redirect viable schemes to private sector providers5.
f) Rationalize the SMI credit programmes based on the evaluation of the effectiveness and
performance of the numerous existing credit schemes, and improve access to market-based finance.
g) Study and seek to adapt successful SMI programmes in other countries such as Hong
Kong and Taiwan. The latter has provided extensive technical and managerial assistance by matching SMIs in need of services with appropriate consultants in the private sector, and has therefore managed to contract out most of its services to the private sector instead of government agencies.
h) Promote business to business electronic commerce (B2B). i) Promote medium-scale technology-based FDI partnerships between foreign and local
SMIs. j) Improve the contracting and legal environment to encourage assemblers and principals to
establish a close and durable relationship with suppliers, and establish a competent commercial court system.
5 Recommendations d) and e) form major components of a newly approved ADB loan for SMI development. See Asian Development Bank (2000), Report and Recommendation of the President of to the Board of Directors on a Proposed Loan and Technical Assistance Grants to the Republic of Indonesia for the Industrial Competitiveness and Small and Medium Enterprise Development Programme, RRP: INO 31644, January (p. 17 and p.30).
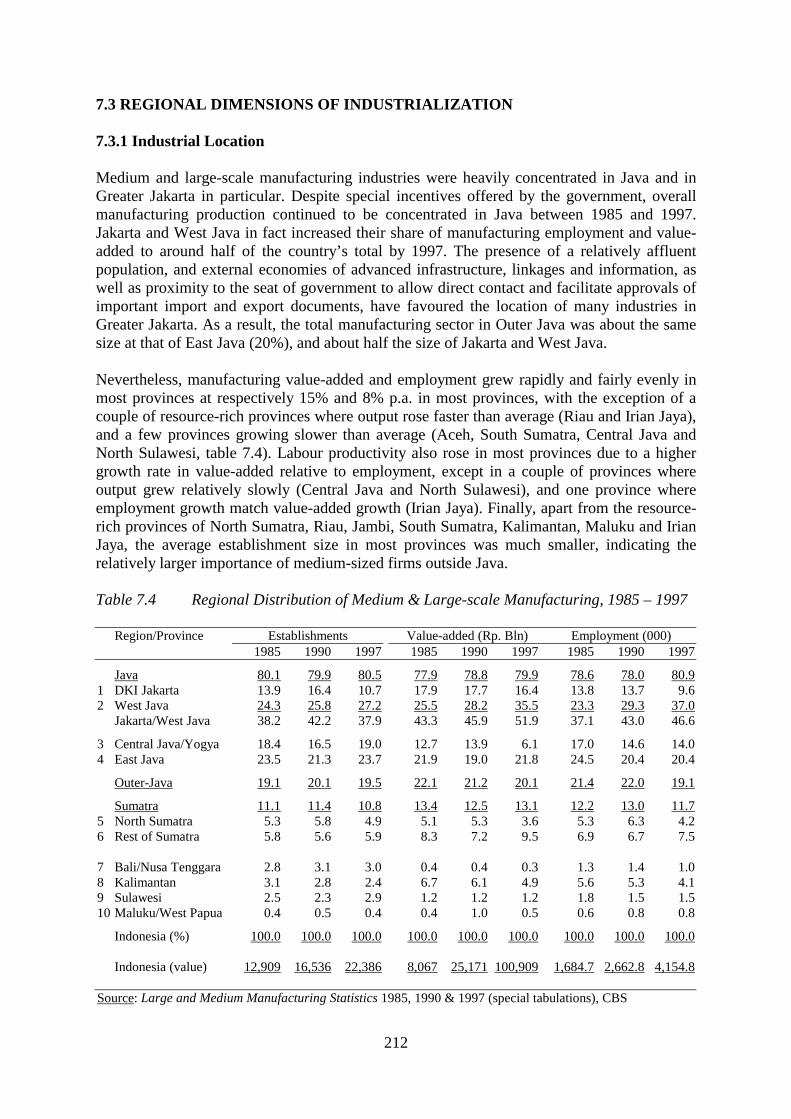
212
7.3 REGIONAL DIMENSIONS OF INDUSTRIALIZATION 7.3.1 Industrial Location Medium and large-scale manufacturing industries were heavily concentrated in Java and in Greater Jakarta in particular. Despite special incentives offered by the government, overall manufacturing production continued to be concentrated in Java between 1985 and 1997. Jakarta and West Java in fact increased their share of manufacturing employment and value-added to around half of the country’s total by 1997. The presence of a relatively affluent population, and external economies of advanced infrastructure, linkages and information, as well as proximity to the seat of government to allow direct contact and facilitate approvals of important import and export documents, have favoured the location of many industries in Greater Jakarta. As a result, the total manufacturing sector in Outer Java was about the same size at that of East Java (20%), and about half the size of Jakarta and West Java. Nevertheless, manufacturing value-added and employment grew rapidly and fairly evenly in most provinces at respectively 15% and 8% p.a. in most provinces, with the exception of a couple of resource-rich provinces where output rose faster than average (Riau and Irian Jaya), and a few provinces growing slower than average (Aceh, South Sumatra, Central Java and North Sulawesi, table 7.4). Labour productivity also rose in most provinces due to a higher growth rate in value-added relative to employment, except in a couple of provinces where output grew relatively slowly (Central Java and North Sulawesi), and one province where employment growth match value-added growth (Irian Jaya). Finally, apart from the resource-rich provinces of North Sumatra, Riau, Jambi, South Sumatra, Kalimantan, Maluku and Irian Jaya, the average establishment size in most provinces was much smaller, indicating the relatively larger importance of medium-sized firms outside Java. Table 7.4 Regional Distribution of Medium & Large-scale Manufacturing, 1985 – 1997 Region/Province Establishments Value-added (Rp. Bln) Employment (000) 1985 1990 1997 1985 1990 1997 1985 1990 1997
Java 80.1 79.9 80.5 77.9 78.8 79.9 78.6 78.0 80.9 1 DKI Jakarta 13.9 16.4 10.7 17.9 17.7 16.4 13.8 13.7 9.6 2 West Java 24.3 25.8 27.2 25.5 28.2 35.5 23.3 29.3 37.0 Jakarta/West Java 38.2 42.2 37.9 43.3 45.9 51.9 37.1 43.0 46.6
3 Central Java/Yogya 18.4 16.5 19.0 12.7 13.9 6.1 17.0 14.6 14.0 4 East Java 23.5 21.3 23.7 21.9 19.0 21.8 24.5 20.4 20.4
Outer-Java 19.1 20.1 19.5 22.1 21.2 20.1 21.4 22.0 19.1
Sumatra 11.1 11.4 10.8 13.4 12.5 13.1 12.2 13.0 11.7 5 North Sumatra 5.3 5.8 4.9 5.1 5.3 3.6 5.3 6.3 4.2 6 Rest of Sumatra 5.8 5.6 5.9 8.3 7.2 9.5 6.9 6.7 7.5 7 Bali/Nusa Tenggara 2.8 3.1 3.0 0.4 0.4 0.3 1.3 1.4 1.0 8 Kalimantan 3.1 2.8 2.4 6.7 6.1 4.9 5.6 5.3 4.1 9 Sulawesi 2.5 2.3 2.9 1.2 1.2 1.2 1.8 1.5 1.5 10 Maluku/West Papua 0.4 0.5 0.4 0.4 1.0 0.5 0.6 0.8 0.8
Indonesia (%) 100.0 100.0 100.0 100.0 100.0 100.0 100.0 100.0 100.0 Indonesia (value) 12,909 16,536 22,386 8,067 25,171 100,909 1,684.7 2,662.8 4,154.8 Source: Large and Medium Manufacturing Statistics 1985, 1990 & 1997 (special tabulations), CBS
213
Some 80% of medium and large-scale manufacturing establishments outside the oil and gas sector were located in Java, and almost 40% of all establishments were located in Jakarta and West Java. Java also generated around 80% of manufacturing value-added and employment. Jakarta and West Java in fact increased their share of manufacturing employment from 37% to 47%, and their share of total value-added from 43% to 52% in this period. Outside Java, Sumatra accounted for around 11% of all establishments and 13% of MVA. Here again, one province alone, North Sumatra, accounted for half of these, though this share declined a little in favour of Riau, whose share rose from 1% to 2% between 1985 and 1997. The remaining 14 provinces in Eastern Indonesia including Kalimantan, Sulawesi and Nusa Tenggara together accounted for less than 10% of establishments. Except for Bali and South Sulawesi which accounted for around 2% of establishments, the remaining provinces individually commonly accounted for less than 0.5% of all establishments. In most provinces, the manufacturing sector grew by an average of 15% p.a. while employment grew at an average of 8% p.a. between 1985 and 1997. Most provinces thus experienced a significant rise in labour productivity averaging 6% p.a. (annex table A.7.1). In the case of Central Java and North Sulawesi however, slow manufacturing growth was coupled with relatively rapid employment, while in Irian Jaya employment growth matched value-added growth. These three provinces thus saw only a moderate rise in labour productivity. While the average establishment size in Java and Sumatra was close to the national average of around 190 workers per establishment (except Yogyakarta), this was only around 60 and 100 workers per establishment in Bali, and the provinces of Nusa Tenggara and Sulawesi. Their share in value-added was also lower than their share in establishments. For instance, Bali accounted for 1.9% of all establishments but only 0.2% of total manufacturing value-added in 1997. In contrast, the establishments in the resource-rich provinces of Riau, South Sumatra, Kalimantan, Maluku and Irian Jaya employed over 300 workers per establishment. As a result, the share of the latter provinces in total employment was almost twice as their share in establishments. For instance, Maluku and Irian Jaya together accounted for 0.4% of all establishments but 0.8% of total employment. The Kalimantan provinces also accounted for a higher share in value-added than in establishments, 4.9% compared with 2.4%. In terms of diversity, Java also had the most comprehensive industrial structure, with all of the island’s five provinces possessing enterprises in more than 20 out of 28 three-digit ISIC categories of non-oil and gas manufacturing, and three provinces possessing the full complement of 28 branches 19896. Within Java, the heaviest concentration was found in Jakarta-Tanggerang-Bogor-Bekasi area. In addition, a heavy concentration has also emerged to the west of Jakarta towards the Sunda straits, where the towns of Serang and Cilegon have become important centres of heavy engineering, particularly in metal and chemical branches. The area surrounding Surabaya, one of the earliest centres of metal fabrication, shipbuilding and intermediate and light industry, also grew into a major industrial region. Outside Java, only North Sumatra had a well-diversified industrial structure with 27 different categories. As the main centre of plantation agriculture, this province had a strong raw material base for the agricultural and wood processing industries, the latter accounting for nearly half of all medium and large-scale establishments in that year.
6 UNIDO (1993), op. cited (table II.16)
214
7.3.2 Decentralization and provincial autonomy Provincial autonomy The present government’s drive towards decentralization and regional autonomy has given strong impetus to the provinces to build their manufacturing base by allowing them to formulate policies to attract both domestic and foreign manufacturing investment. While this process will create many new opportunities, the competition for scarce investment funds between provinces will at the same time raise new challenges to make optimum use of available investment funds. The provincial governments will need to intensify cooperation among them to avoid being played one against the other by potential investors. In addition, central government’s role will be crucial to coordinate their individual industrial policies to achieve maximum benefits from their relative comparative advantages and local resources. Pro-active central government policies and guidelines will be especially necessary to achieve effective cooperation and coordination between the provincial government in the following areas: identification of regional potentials, specializations and priorities taking into account economies of scale; creation of industrial clusters and provision of relevant information regarding business opportunities; adherence to common minimum national standards regarding labour conditions and environment; and harmonization of investment incentives, particularly concerning tax holidays and other fiscal incentives. Regional industrial policy One could argue that a functioning market system will eventually lead to a more decentralized pattern of industrial investment. Thus, just as the external economies of advanced infrastructure, linkages and information have favoured the concentration of industries in and around Jakarta and West Java, diseconomies of congestion, pollution, long travel distances and land prices in these centres will lead to spreading of industries in due course. Is there a need for a regional industrial policy in this case? The strongest argument yet revolves around the government desire to achieve balanced regional development, and its desire to assist poorer provinces in enjoying a higher standard of living than at present by allowing them a share of taxes and natural resource revenues raised in more prosperous provinces. There is considerable diversity among the Indonesian provinces with respect to population size, income and natural resources. Each of these provides an incentive to develop manufacturing industries. Even low-income provinces can provide incentive to manufacturing growth provided they have a large population. A review of these endowments concluded that, left to natural forces, the provinces of Sulawesi, Eastern Indonesia and West Papua are unlikely to develop a significant manufacturing base7. The October 1993 deregulation package, partly designed to encourage new industrial investment to locate outside Java, is unlikely to add to the prevailing geographical concentration of the manufacturing sector. On one hand, it allowed foreigners a period 10 years to hold on to their 100% equity before divesting for investments in remote areas such as Bengkulu, Jambi, Kalimantan and the Eastern provinces. On the other, it allowed wholly-owned foreign companies to establish themselves in Indonesia by investing as little as US$ 2 million to produce intermediate goods and components for domestic industries. By
7 Rao V.V.B (1994), Indonesia: Spatial Industrial and Skilled Manpower Development, Regional Manpower Planning and Training Project (RMPT), technical report No. ., Bappenas, Jakarta

215
encouraging medium-scale industries to mushroom in and around existing industries, the package may not have furthered the cause of regional development. A moderately activist option could be formulated around a liberalized market-friendly environment. Possible elements of such a strategy could include relocation, special development areas and industrial manpower development. Taking relocation first, one measure would be to discourage the location of a number of new manufacturing investments in Greater Jakarta, while providing incentives for gradual relocation of certain activities outside it. In order to encourage this movement, income tax concessions and infrastructure availability in the areas of relocation may be considered. Second, a direct incentive could be provided for manufacturing growth in Bali, Bengkulu, Lampung and South Sulawesi to promote them into regional industrial centres and thus enable them to spread industrialization to the Eastern islands, parts of Sumatra and Sulawesi. Special Development Areas (SDAs) could be declared, together with the production of promotional materials for investors to help them assess the investment value of these regions. This should be accompanied by the strengthening of regional development boards and the SDA authorities, together with fiscal incentives for new investments, such as tax holidays and accelerated depreciation allowances. SDAs can overlap and complement the growth triangles already established between Indonesia, Malaysia and Thailand including Aceh and North Sumatra, and Indonesia, Malaysia and Philippines including East Kalimantan and North Sulawesi. In addition, the possibility of setting up special business clusters of concentrations should be considered. For example, electronic industrial parks, garment export zones and leather product estates can benefit from common services, facilities and complementarities as well as from economies of scale in raw material delivery. And third, it could provide indirect incentives through industrial manpower training in these locations. Centres of excellence in vocational training and technical higher education could be established or further developed in the SDAs, jointly managed by industry and the government. 7.3.2 Summary Medium and large-scale manufacturing industries were heavily concentrated in Java and in Greater Jakarta in particular. Despite special incentives offered by the government, overall manufacturing production continued to be concentrated in Java between 1985 and 1997. Jakarta and West Java in fact increased their share of manufacturing employment and value-added to around half of the country’s total by 1997. The presence of a relatively affluent population and external economies of advanced infrastructure, linkages and information, as well as proximity to the seat of government which allowed direct contact with senior officials and facilitate approvals of important import and export documents, have favoured the location of many industries in Greater Jakarta. As a result, the total manufacturing sector in Outer Java was about the same size at that of East Java (20%), and about half the size of Jakarta and West Java. Manufacturing value-added and employment grew rapidly and fairly evenly in most provinces at respectively 15% and 8% p.a. in most provinces, with the exception of a couple of resource-rich provinces where output rose faster than average (Riau and Irian Jaya), and a few provinces growing slower than average (Aceh, South Sumatra, Central Java and North Sulawesi). Labour productivity also rose in most provinces due to a higher growth rate in
216
value-added relative to employment, except in a couple of provinces where output grew relatively slowly (Central Java and North Sulawesi), and one province where employment growth match value-added growth (Irian Jaya). Finally, apart from the resource-rich provinces of North Sumatra, Riau, Jambi, South Sumatra, Kalimantan, Maluku and Irian Jaya, the average establishment size in most provinces was much smaller, indicating the relatively larger importance of medium-sized firms outside Java. The strong impetus given by the present government to decentralization and regional autonomy will provide the provinces a new and powerful channel to build their manufacturing base by formulating policies to attract both domestic and foreign manufacturing investment. While this process will create many new opportunities, the competition for scarce investment funds between provinces will at the same time raise new challenges to make optimum use of available investment funds. The provincial governments will not only need to intensify cooperation among them to avoid being played one against the other by potential investors. In addition, central government’s role will be crucial to coordinate their individual industrial policies to achieve maximum benefits from their relative comparative advantages and local resources. Pro-active central government policies and guidelines will be especially necessary to achieve effective cooperation and coordination between the provincial government in the following areas: identification of regional potential, specializations and priorities taking into account economies of scale; creation of industrial clusters and provision of relevant information regarding business opportunities; adherence to common minimum national standards regarding labour conditions and environment; and harmonization of investment incentives, particularly concerning tax holidays and other fiscal incentives.
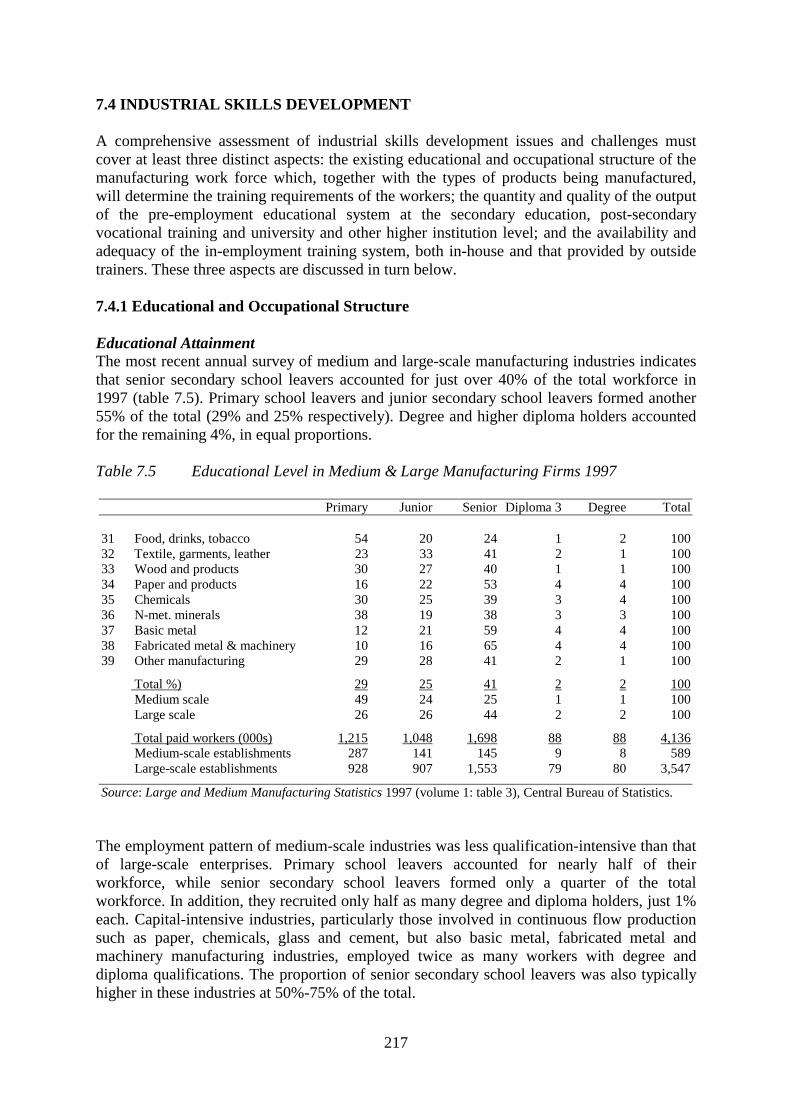
217
7.4 INDUSTRIAL SKILLS DEVELOPMENT A comprehensive assessment of industrial skills development issues and challenges must cover at least three distinct aspects: the existing educational and occupational structure of the manufacturing work force which, together with the types of products being manufactured, will determine the training requirements of the workers; the quantity and quality of the output of the pre-employment educational system at the secondary education, post-secondary vocational training and university and other higher institution level; and the availability and adequacy of the in-employment training system, both in-house and that provided by outside trainers. These three aspects are discussed in turn below. 7.4.1 Educational and Occupational Structure Educational Attainment The most recent annual survey of medium and large-scale manufacturing industries indicates that senior secondary school leavers accounted for just over 40% of the total workforce in 1997 (table 7.5). Primary school leavers and junior secondary school leavers formed another 55% of the total (29% and 25% respectively). Degree and higher diploma holders accounted for the remaining 4%, in equal proportions. Table 7.5 Educational Level in Medium & Large Manufacturing Firms 1997
Primary Junior Senior Diploma 3 Degree Total
31 Food, drinks, tobacco 54 20 24 1 2 100 32 Textile, garments, leather 23 33 41 2 1 100 33 Wood and products 30 27 40 1 1 100 34 Paper and products 16 22 53 4 4 100 35 Chemicals 30 25 39 3 4 100 36 N-met. minerals 38 19 38 3 3 100 37 Basic metal 12 21 59 4 4 100 38 Fabricated metal & machinery 10 16 65 4 4 100 39 Other manufacturing 29 28 41 2 1 100
Total %) 29 25 41 2 2 100 Medium scale 49 24 25 1 1 100 Large scale 26 26 44 2 2 100
Total paid workers (000s) 1,215 1,048 1,698 88 88 4,136 Medium-scale establishments 287 141 145 9 8 589 Large-scale establishments 928 907 1,553 79 80 3,547
Source: Large and Medium Manufacturing Statistics 1997 (volume 1: table 3), Central Bureau of Statistics. The employment pattern of medium-scale industries was less qualification-intensive than that of large-scale enterprises. Primary school leavers accounted for nearly half of their workforce, while senior secondary school leavers formed only a quarter of the total workforce. In addition, they recruited only half as many degree and diploma holders, just 1% each. Capital-intensive industries, particularly those involved in continuous flow production such as paper, chemicals, glass and cement, but also basic metal, fabricated metal and machinery manufacturing industries, employed twice as many workers with degree and diploma qualifications. The proportion of senior secondary school leavers was also typically higher in these industries at 50%-75% of the total.

218
All together, the medium and large scale manufacturing industries employed less than 90,000 degree holders and diploma holders each, almost all in large-scale industries. Chemical industries were among the most qualification-intensive industries, typically employing 6%-7% of degree holders, and a further 4%-5% of diploma holders in their workforce. The petroleum and gas sector in particular relied greatly on them, employing 13% degree holders and 26% diploma holders in their workforce. Occupational Structure Manufacturing surveys undertaken in the early 1990s revealed the following occupational structure8. Starting from the shop floor, unskilled elementary workers such as packers and hand assemblers formed 28% of all industrial workers (table 7.6). Their usual education background was primary education or less. Semi-skilled operators and assemblers such as sewing machine operators and electronic component assemblers formed another 49% of the work force. Their usual educational background was an equal mixture of junior secondary and senior secondary education. Thus unskilled and semi-skilled workers together formed just over three-quarters of the manufacturing work force. Table 7.6 Aggregate Occupational Structure, 1992 (% of Employment) Composition (%) Usual Education Level All sectors Capital-intensive
sectors
Unskilled/Semi-skilled workers 77 68-80 1 Elementary workers 28 28-30 Primary school or less 2 Operators and assemblers 49 40-50 Junior/senior secondary school 3 Skilled trades workers 7 7-11 Gen./vocational senior secondary 4 Technicians & assoc. professionals 6 6-8 Secondary school or diploma Administration/Service workers 8 6-8 5 Clerks 4 3-5 Not available 6 Service and sales workers 4 3 Not available Professionals/Managers 2 3-5 7 Professional workers 1 2-4 University education 8 Managers 1 1 Not available Total 100 100 Source: Dhanani S. (1993), Major Findings of the 1992 Enterprise Survey, in three volumes (West Java, North Sumatra and East Java), technical reports No. 2, 3 and 4, regional manpower planning and training project (RMPT), Bappenas, Jakarta Skilled trade workers such as mechanics, carpenters, welders and lathe operators formed 7% of total employment, and were usually senior secondary school leavers. Next, technicians and associate professionals such as engineering technicians, quality inspectors and supervisors, bookkeepers and designers formed about 6% of the total. Many of these were also senior secondary school leavers, but with substantial work experience. Non-production 8 Dhanani S. (1993), Major Findings of the 1992 Enterprise Survey, in three volumes (West Java, North Sumatra and East Java), technical reports No. 2, 3 and 4, regional manpower planning and training project (RMPT), Bappenas, Jakarta
219
administrative, clerical and service workers such as security guards formed a further 8% of the total. Finally, managers and professionals formed just over 1% of total employment. There were of course differences in the broad occupational structure described above between sectors, large and small firms and high and low technology firms. For instance, the capital-intensive metal, chemical and paper industries employed more professional workers (2%-4%) and skilled tradesmen (7%-11%), with a corresponding decrease in the share of semi-skilled operators. On the whole however, the differences between different sectors were rather small. 7.4.2 Pre-Employment Education and Training Secondary education According to estimates provided by the Ministry of National Education, the formal education system produced around 1.4 million senior secondary school leavers in 1999. Two thirds of these earned a general qualification (0.9 million) while the remaining third earned a vocational qualification (0.5 million), either in a technical or commercial field. Around half of these continued on to further education, leaving a balance of 0.7 million secondary school leavers potentially ready to enter the labour market. A further 0.9 million students left the education system with a junior secondary education certificate (nine years of basic education), so the country’s secondary schools produced over 1.6 million secondary school leavers who did not pursue further studies in 1999. The 1992 manufacturing survey noted above found that over 90% of employers were generally satisfied with the basic education level of their semi-skilled operators and assemblers, and that 80% were satisfied with their handling of equipment and machinery. More recent interviews with plant managers and owners also indicate that secondary school leavers are highly trainable and diligent, patient workers, qualities eminently suited to the repetitive nature of manufacturing processes currently in use in many export-oriented labour-intensive industries. However, as the country moves up the technology ladder and begins to produce more complex products in greater volumes such as capital goods and advanced chemicals, manufacturers are likely to require workers able to make use of judgement and other thinking skills in the operation of more advanced manufacturing processes and in the maintenance and repair of complex automated production equipment. Since most employers provide initial training and subsequent skills upgrading on-the-job, a good general education background which emphasizes mastery of basic numeracy and reading and writing skills (the three Rs) can provide a solid basis for workers to fully benefit from in-plant training. Whether the present education system fulfils these requirements adequately is debatable. Education specialists rate the quality of the Indonesian education system as poor for the following reasons: inadequate mastery of basic literacy and numeracy skills at all levels; reliance on rote learning with no room for the development of thinking and creative skills; poor questioning skills; and underdeveloped process skills such as observing, analyzing and hypothesizing. These specialists, both within the Ministry and outside, have urged its thorough overhaul, starting from the examination system which currently encourages rote learning, to a less academic curriculum which is child-centred and not subject centred and which develops all skills, the production of quality textbooks, the achievement of an appropriately trained teaching work force which is adequately remunerated, and to issues of education
220
management all levels from primary to senior secondary school9. Unfortunately, the Ministry has shown little will or interest in implementing its own recommendations in these and other keys areas. There is no shortage of large projects to develop basic education, many of them financed by the World Bank, ADB and OECF since at least the early 1970s. These projects have yielded very little benefit to the students, not only due to their often poor design, but also due to the poor implementation capacity of the Ministry of Education and the Ministry of Religious Affairs, in the centre and in the provinces. Until these Ministries begin to implement their development programmes and projects seriously, thoroughly and systematically, no substantive improvement can be expected in the quality of secondary school leavers in the foreseeable future. Vocational Training According to a study of technical vocational education, industry-oriented technical schools and centres in the private sector were virtually non-existent in 199510. This was not the result of market imperfections or weak private training capacity, but probably due to a lack of effective demand from school leavers and from industrial customers. As a result of this limited demand, private training providers have not yet undertaken the rather large and bulky investments in industrial technical training facilities. In contrast there is a thriving private training sector in office and commercial skills, in response to a large demand for these skills, and the relatively high wages paid in these occupations. Market distortions, weak private training capacity, externalities and equity are common justifications given for public training interventions. As a result, the Ministry of Manpower (MOM) operates an extensive network of centres across the country, consisting of larger centres in provincial capitals and in Java's other larger cities, and smaller centres located in district capitals and towns. The case for public intervention in training rests upon demonstrating strong external benefits which would accrue to society from a better trained work force, benefits which cannot be captured by individuals and employers. Because externalities are difficult to measure and quantify however, they can form a powerful argument in favour of public intervention, especially in the context of rapid changes in manufacturing technology and debates about international competitiveness. An alternative view is that changes in technology and product mix taking place in an economy, even if relatively substantial and rapid, will bring about corresponding market changes in the demand and therefore the supply of the required training. The development of employer-based training and private technical training centres is however likely to be a difficult and gradual process, because it will have to address the issues of cost-effectiveness and market-driven demand for training, and the issues of quality and the setting up of an effective accreditation system. Government's direct provision of technical training can provide a temporary solution until the economy and the labour market begin to pay higher wages to those in possession of technical skills, and until the corresponding private training capacity is built. Thereafter, government should ensure a level playing field between public and private training providers and cease subsidizing MOM centres, particularly in the procurement of equipment under grants and soft loans. It may consider redirecting resources currently spent on larger training centres located in large industrial and commercial areas, to less privileged areas, and to focus on its other important accreditation, coordination and supervisory roles. 9 Ministry of Education (1999), Lessons of Implementation, Directorate-General of Primary and Secondary Education, Jakarta 10 Dhanani S. (1995), Indonesia: Public Vocational Training Centres in the Ministry of Manpower, a report to the World Bank, Washington
221
A number of recommendations made by the above study for improving vocational education and training in MOM's training centres are summarized in Annex 3.1. The suggested options are made in the context of enhancing their cost-effectiveness, quality and relevance in this transition period. Professional education Science and engineering education has expanded rapidly in Indonesia in recent years. 11Based on Ministry of Education figures, over 17,000 degree-level engineers and a further 6,400 diploma-level engineers were produced annually. An equivalent number of scientists were also produced. Both state and private sectors have expanded their outputs at a rapid rate of around 20% p.a., leading to a doubling of the output of science and technology graduates, particularly agronomists and engineers. Strong economic growth, particularly in the large manufacturing, construction and trade sectors, has on the other hand generated a significant demand for technical graduates. Based on information on the employment of diploma and degree level graduates in manufacturing and other sectors and future sectoral employment growth prospects, an indicative supply-demand exercise undertaken in 1995 did not anticipate a shortage of engineering manpower in the manufacturing sector nor in the economy in general12. The annual demand for new degree-level and diploma level engineers was estimated at just 10,000 graduates each, about half of whom were expected to join the manufacturing sector. The supply of degree-level engineers (25,000) exceeded demand, while that of diploma-level engineers (7,600) fell short of demand. The degree-level engineers were however unlikely to remain unemployed, as they would have created their own demand, filling positions currently occupied by diploma holders or by secondary school leavers. While these adjustments would lead to a certain amount of qualification escalation, the excess supply, rather than leading to additional unemployment, was more likely to put downward pressure on the starting salaries of newly graduating engineers as witnessed in the first half of the 1990s. Employers paid substantially higher wages to all degree holders, and to diploma-holders in senior positions, once they had trained them, either for fear of poaching or in exchange for higher productivity, or a combination of both. Many of the skills imparted were however of quite a basic and general nature such as English language training and generic computer-aided design, which could be easily taught as part of their university course. If graduates were already conversant in these basic skills upon recruitment, employers would be in a better position to build on this base and provide more specialized training, and thus raise their efficiency more rapidly. Suggestions for curriculum development and reform should however also recognize the continued need and responsibility for employers to provide industry and occupation-specific professional training. The relatively low salaries offered to graduates of many less known universities, often less than half the median wage, particularly to those from private universities, reflect employers' recognition of the wide range of education standards achieved by higher education institutions. A more effective supervisory and accreditation role from the Ministry of Education would be welcomed by employers and students alike, as consumers of higher education services offered by a wide range of state and private institutions. 11 Dhanani S. (1995), Indonesia: Public Vocational Training Centres in the Ministry of Manpower, a report to the World Bank, Washington 12 Dhanani S and E. Sweeting (1995), Employment, Remuneration and Training in a 1994 Tracer Study of Technical Graduates in Indonesia, Regional Manpower Planning and Training Project (RMPT), Bappenas, Jakarta
222
The study above noted that the present higher education system was subject rather than skills-oriented, and produced graduates unable to work independently, though it had to contend with poorly prepared senior secondary school leavers. It made the following recommendations for the development of professional education. Employers undertook substantial training in the provision of general skills such as technical report writing, problem solving, teamwork, technical problem analysis and oral presentation skills. Developing these general skills at the higher education level would enable employers to concentrate on expanding and extending the base thus provided. University teaching methods can be adapted to involve students actively in the learning process, giving them joint responsibility for learning, and indirectly developing their general skills without introducing specific general skills courses into the already heavily loaded curriculum, including more essay and seminar report writing along with their subsequent oral presentation and group discussion. Teamwork skills can be developed through small-group assignments concentrating on technical problem analysis and problem solving. Other recommendations for degree industry engineering programmes included the improvement of the theoretical base already provided, ensuring that the 80-20 curriculum ratio between theoretical knowledge and practical work was strictly adhered to, developing the practical research skills of students in all specializations, improving student experience of sound design practices and the design techniques related to their field of specialization, including exposure to CAD and other computer-assisted aids for design and production, such as CNC and CAM equipment. This could be basic knowledge and familiarization only, but some attempt at acquainting students at a very basic level should be made in this area. At the very least, this could be achieved by approaching a local manufacturer or design office which uses the equipment to give a small demonstration. Recommendations for polytechnic industry engineering programmes were to continue to improve those areas in which they are renowned by students and employers alike, for example, in providing sound and varied experience in the practical aspects of engineering. Polytechnics could also expose their students to research techniques in their particular field of specialization, and to extend and improve their design programmes. Higher education programmes in the natural sciences need to improve laboratory and practical work experience and to develop the practical skills of scientific research in the university. These changes would also help enhance the research performance of higher education teachers, as well as broadening the career opportunities of graduates by making them more marketable outside teaching. As in the case of secondary education, a plethora of development projects financed by multilateral, bilateral and government sources have been undertaken by the Directorate-General of Higher Education of the Ministry of Education for the last thirty years. These and other recommendations notwithstanding, results to date have been disappointing due mainly to the absence of serious and sustained implementation efforts by the implementing authorities. 7.4.4 In-Employment Training In-house training The manufacturing survey cited in footnote 1 observed the limited extent of in-plant training undertaken in 1992, and noted the following. Only 10% of firms surveyed had specialized training staff and physical facilities. Though most employers provided induction and initial on-the-job training of new recruits, mainly of the ‘watching only’ kind, only 10% provided skills upgrading programmes such as on-the-job instruction and formal training, and this to
223
only 2% of their workforce. Only 20% of firms reported training expenditures and none had claimed tax reduction for training costs. Only a fifth of companies had undertaken a training needs assessment of their employees, and had some form of skills certification scheme in place. The lack of structured training programmes in most firms was consistent with other aspects of employment. First most shop floor employees were paid low subsistence wages made possible by a ‘control’ or heavily supervised system of labour management, not designed to elicit worker cooperation with management or owners or creativity. Around two thirds of operators and assemblers were employed on a permanent daily basis or casual temporary basis, and not on the more secure monthly wage payment system. More revealing, around third of skilled tradesmen and a fifth of experienced supervisors were also on less secure contracts, which by definition did not provide sickness leave and other important benefits. The prevalence of insecure contracts was not likely to encourage investment in training by employers and employees alike. Finally the wage differential between semi-skilled operators and skilled tradesmen was of the order of 10%-20% only, indicating that firms faced little shortage for adequately trained tradesmen in the labour market. In general, foreign-owned and non-export companies were twice as likely to employ training staff, possess training facilities, undertake training needs analysis and incur training expenditure. Since export-oriented firms produced relatively simple products while firms producing for the domestic market included vehicles, electronic goods, drugs and other chemicals, the survey indicated that training effort was related to the complexity of the manufacturing process. The survey hinted that in-plant skills upgrading programmes could not be promoted in isolation of at least three other major components of an overall company strategy. These included the payment of higher efficiency wages and the provision of more secure contracts to elicit maximum worker effort, cooperation and initiative, the participation and involvement of workers in company affairs and the willingness to undertake regular management-labour dialogues, and an overall commitment to quality dictated by the need to compete and survive against other producers of complex products. In short, the production of more complex products required a different type of worker whose thinking skills, commitment and initiative were necessary and needed to be developed, and therefore requiring a different management-labour relationship. There were nevertheless many firms producing more complex products for the domestic market which had not implemented an overall quality-oriented company philosophy and culture, and which did not have the above three components of such a strategy in place. In such cases, the government could usefully disseminate information on total quality management, quality control circles and cooperative management-labour relations to employers through their associations at the national and provincial level, as well as information on training programmes and tax deduction facilities for training expenditure. External trainers The above section on vocational training already noted the dearth of private technical training schools in Indonesia, and the fact that the Ministry of Manpower vocational training centres catered mainly for pre-employment school leavers. The expansion of the role of MOM’s training centres to include in-employment training programmes, either in-plant or in the centre themselves, is one avenue that should be highly encouraged.
224
7.4.5 Summary A comprehensive assessment of industrial skills development issues and challenges must cover at least three distinct aspects: the existing educational and occupational structure of the manufacturing work force which, together with the types of products being manufactured, will determine the training requirements of the workers; the quantity and quality of the output of the pre-employment educational system at the secondary education, post-secondary vocational training and university and other higher institution level; and the availability and adequacy of the in-employment training system, both in-house and that provided by outside trainers. Secondary school education Manufacturing surveys undertaken in the early 1990s found that most employers were generally satisfied with the basic education level of their semi-skilled operators and assemblers, and their handling of equipment and machinery. More recent interviews with plant managers and owners also indicate that secondary school leavers are highly trainable and diligent, patient workers, qualities eminently suited to the repetitive nature of manufacturing processes currently in use in many export-oriented labour-intensive industries. However, as the country moves up the technology ladder and begins to produce more complex products in greater volumes such as capital goods and advanced chemicals, manufacturers are likely to require workers able to make use of judgement and other thinking skills in the operation of more advanced manufacturing processes and in the maintenance and repair of complex automated production equipment. Since most employers provide initial training and subsequent skills upgrading on-the-job, a good general education background which emphasizes mastery of basic numeracy and reading and writing skills (the three Rs) can provide a solid basis for workers to fully benefit from in-plant training. Whether the present education system fulfils these requirements adequately is debatable. Education specialists rate the quality of the Indonesian education system as poor for the following reasons: inadequate mastery of basic literacy and numeracy skills at all levels; reliance on rote learning with no room for the development of thinking and creative skills; poor questioning skills; and underdeveloped process skills such as observing, analyzing and hypothesizing. A thorough overhaul of the education system is required, including the reform of the examination system, the curriculum, textbook production, teachers and the management and administration of education at the school and Ministry level. Until these reforms are effectively implemented, no substantive improvement can be expected in the quality of secondary school leavers in the foreseeable future. Vocational Training Industry-oriented technical schools and centres in the private sector were virtually non-existent in the mid-1990s. This was not the result of market imperfections or weak private training capacity, but probably due to a lack of effective demand from school leavers and from industrial customers. As a result of this limited demand, private training providers have not yet undertaken the rather large and bulky investments in industrial technical training facilities. The Ministry of Manpower operates an extensive network of centres across the country, consisting of larger centres in provincial capitals and in Java's other larger cities, and smaller centres located in district capitals and towns. The case for public intervention in training rests upon demonstrating strong external benefits which would accrue to society from a better trained work force, benefits which cannot be
225
captured by individuals and employers. Because externalities are difficult to measure and quantify however, they can form a powerful argument in favour of public intervention, especially in the context of rapid changes in manufacturing technology and debates about international competitiveness. An alternative view is that changes in technology and product mix taking place in an economy, even if relatively substantial and rapid, will bring about corresponding market changes in the demand and therefore the supply of the required training. The development of employer-based training and private technical training centres is likely to be a difficult and gradual process, because it has to address issues of cost-effectiveness and market-driven demand for training, and the issues of quality and the setting up of an effective accreditation system. Government's direct provision of technical training can provide a temporary solution until the economy and the labour market begin to pay higher wages to those in possession of technical skills, and until the corresponding private training capacity is built. Thereafter, government should ensure a level playing field between public and private training providers and cease subsidizing MOM centres, particularly in the procurement of equipment under grants and soft loans. It may consider redirecting resources currently spent on larger training centres located in large industrial and commercial areas, to less privileged areas, and to focus on its other important accreditation, coordination and supervisory roles. Professional education Science and engineering education has expanded rapidly in Indonesia in recent years. Strong economic growth until the 1997 economic crisis, particularly in the large manufacturing, construction and trade sectors, had on the other hand generated a significant demand for technical graduates. Indicative supply-demand exercise undertaken in the mid-1990s however did not anticipate a shortage of engineering manpower in the manufacturing sector nor in the economy in general. On the other hand, skilled manpower surveys undertaken at the time indicated employer concerns with the poor quality of such graduates, unable to work independently. Employers undertook substantial training in the provision of general skills such as technical report writing, problem solving, teamwork, technical problem analysis and oral presentation skills. Developing these general skills at the higher education level would enable employers to concentrate on expanding and extending the base thus provided. Other recommendations for degree industry engineering programmes included the improvement of the theoretical base already provided, ensuring that the 80-20 curriculum ratio between theoretical knowledge and practical work was strictly adhered to, developing the practical research skills of students in all specializations, improving student experience of sound design practices and the design techniques related to their field of specialization, including exposure to CAD and other computer-assisted aids for design and production, such as CNC and CAM equipment. Recommendations for polytechnic industry engineering programmes were to continue to improve those areas in which they are renowned by students and employers alike, for example, in providing sound and varied experience in the practical aspects of engineering. Polytechnics could also expose their students to research techniques in their particular field of specialization, and to extend and improve their design programmes. Higher education programmes in the natural sciences need to improve laboratory and practical work experience and to develop the practical skills of scientific research in the university. These changes would also help enhance the research performance of higher education teachers, as well as broadening the career opportunities of graduates by making them more marketable outside teaching.
226
As in the case of secondary education, a plethora of development projects financed by multilateral, bilateral and government sources have been undertaken by the Directorate-General of Higher Education of the Ministry of Education for the last thirty years. These and other recommendations notwithstanding, results to date have been disappointing due mainly to the absence of serious and sustained implementation efforts by the implementing authorities. In-house training Manufacturing surveys of the early 1990s observed the limited extent of in-plant training undertaken. The lack of structured training programmes in most firms was consistent with other aspects of employment. First most shop floor employees were paid low subsistence wages made possible by a ‘control’ or heavily supervised system of labour management not designed to elicit worker cooperation with management or owners or creativity. Around two thirds of operators and assemblers were employed on a permanent daily basis or casual temporary basis, and not on the more secure monthly wage payment system. More revealing, around third of skilled tradesmen and a fifth of experienced supervisors were also on less secure contracts, which by definition did not provide sickness leave and other important benefits. The prevalence of insecure contracts was not likely to encourage investment in training by employers and employees alike. Finally the wage differential between semi-skilled operators and skilled tradesmen was of the order of 10%-20% only, indicating that firms faced little shortage for adequately trained tradesmen in the labour market. The production of more complex products requires a different type of worker whose thinking skills, commitment and initiative are necessary and needed to be developed, and therefore requiring a different management-labour relationship. There were however many firms producing more complex products for the domestic market which had not implemented an overall quality-oriented company philosophy and culture, and which did not have the above three components of such a strategy in place. In such cases, the government could usefully disseminate information on total quality management, quality control circles and cooperative management-labour relations to employers through their associations at the national and provincial level, as well as information on training programmes and tax deduction facilities for training expenditure. External trainers The Ministry of Manpower vocational training centres could alleviate the dearth of private technical training schools in Indonesia by providing in-employment training programmes, either in-plant or in the centre themselves.

227
ANNEX 7.1: MANPOWER MINISTRY’S VOCATIONAL TRAINING CENTRES13 The Ministry of Manpower operates a total of 153 centres across the country, consisting of 33 large centres in provincial capitals and in Java's other larger cities, and a further 16 medium and 104 smaller centres located in district capitals and towns. While the larger centres provide mainly "institutional" courses, i.e., those taught in the centre for periods ranging from four to six months, the smaller centres provide both "institutional" and "non-institutional" courses, i.e., those taught in the centre and those taught by their instructors in other locations such as village or community halls for a period of two months on average. The latter accounted for half of MOM's total output of regular trainees of around 60,000 trainees in 1994-1995. A further 20,000 students of secondary technical schools, technical colleges and firm employees also made use of the centres in that year. Assuming that external benefits are sufficiently important to warrant public intervention, public financial support of private technical training may be desirable. A strong National Training Authority (NTA) should be established first, governed by a board with representatives of employers, worker organizations and government to assist government in implementing a responsive, market-oriented public training policy. There are at present two separate national training institutions, one under the aegis of the Ministry of Manpower (MOM) and the other under the Ministry of National Education (MNE), which moreover work independently. In addition, the National Development Planning Board (Bappenas) also set up a national training council as recently as 1994. A first rationalization measure would therefore be to merge these three bodies into a strong and unified national training authority. In addition to managing in MOM’s training institutions with a degree of freedom and flexibility which is difficult to achieve in line ministries, the NTA can play an important role in monitoring labour markets, training costs and outcomes, establishing outcome standards and in developing private training capacity. A successful NTA requires adequate and stable finance, the ability to use resources flexibly, and a high level of professional capability14. Training funds, provided by payroll levies and managed by the NTA, should be made available to both public and private training providers, and accountability enforced through contracts and supervision. The MOM vocational training centres are currently operating at only a quarter of their capacity and the larger centres are over-staffed. Their unit costs of training are relatively high primarily as a result of these two factors. Most of the courses they run, which have not changed much since the centres were established to cater primarily for primary school leavers and secondary school drop-outs, are less relevant to their current intake of mainly secondary school leavers. Enhancing the relevance and quality of training are therefore major challenges facing the centres. Whether they continue to be operated directly by MOM or by private training providers, either jointly with MOM, or on their own through management contracts or outright privatization, the centres will require to take decisive action to operate at higher capacity, more efficiently and cost-effectively, and to provide higher quality and more relevant training. The original objective of MOM's training centres was to provide primary school leavers and secondary school dropouts with a relatively short and practical course to enable them to enter the world of work. Though longer courses of six months have recently been introduced, the basic structure of the curricula, which has remained unchanged, reflects this original objective. Core 13 This annex is based on Dhanani S. (1995), Indonesia: Public Vocational Training Centres in the Ministry of Manpower, a report to the World Bank, Washington 14 World Bank (1991), Indonesia: Foundations for Industrialization, Washington.
228
theory forms just 5% of the total course content, while the remaining classroom teaching hours consist of general attitude-forming subjects, general technical subjects such as bench work, technical drawing and measurement, and general examination preparation. Since most trainees are now senior secondary school graduates who can grasp and benefit from a better understanding of underlying technical principles, the technical curricula should be updated and be made more relevant to this new clientele, with additional emphasis on acquiring basic knowledge, while maintaining the overall 30%-70% theory-practice balance. The emphasis on understanding principles is further underlined by the fact that manufacturing technology is rapidly replacing manual and electrically operated machines, requiring manual dexterity, by automated, computer-controlled machines and processes. Both Ministry staff and the training centre managers have paid too little attention to the actual teaching process in the classroom and in the workshop. Despite a relatively large budget allocated to the purchase of training materials, the trainees do not have access to textbooks and workshop manuals, and have to photocopy individual sections or work sheets in the workshops. Many larger BLKs have overhead projectors and have trained their staff in their use, but these are never used. Much of the conventional equipment used by students is out of date or plainly out of order, as in the case of some language laboratories. The centres do not have adequate numbers of lathe machines, welding machines, petrol and diesel engines, air conditioning units, refrigerators, oscilloscopes and other conventional equipment in sufficiently good order, and three to five students are often seen working together on one machine, instead of two trainees sharing one machine ideally. Trainees even share hand tools while each trainee should ideally possess his own set of hand tools. The quality of practical instruction is thus compromised. Broken down and out of order conventional equipment was observed in most BLKs, despite substantial funds allocated by Jakarta to maintain equipment. A repair and maintenance culture is that much harder to inculcate in trainees when the managers and instructors of their training centres do not appear to be unduly concerned about the value of expensive pieces of equipment. As will be noted in the following section, the annual development budgets of the BLKs make a substantial allocation of funds for equipment maintenance. To increase the accountability of BLK managers in the use operational and capital resources for their intended purpose, a effective network of training inspectors, located at the province level, and coordinated by Jakarta, must be set up to regularly supervise the teaching and training process in all centres. In order to increase the relevance and quality of training, and in order to provide middle-level technicians to the manufacturing and service sectors, MOM should seriously consider the possibility of introducing a one-year diploma course, fully recognized by the Ministry of Education and Culture. These courses can offer eight months of theoretical knowledge and basic workshop training in the centres, similar in depth to the level of training provided in the recently introduced apprenticeship scheme, followed by a four-month on-the-job component in firms. Training managers should ensure that the trainees are provided with good quality textbooks and training manuals in each subject, and with one equipment for two trainees, and should monitor the teaching process in the classroom and workshop. A benefit of a one-year diploma course accredited by the Ministry of Education is that it can be facilitate the export of such skilled manpower to neighbouring countries and the Middle East. A newly introduced apprenticeship programme was introduced to provide quality training in metal trades for the engineering and machinery sectors, and was designed to put 15 year olds through a three-year as an alternative to formal education. Though large resources have been spent in promoting it, the scheme has encountered a number of not unexpected obstacles.
229
Secondary school leavers, who are now entering the scheme, both because employers are unwilling to sign on junior school leavers and because they have formed the majority of entrants in all larger BLKs for a number of years now, are less willing to enter into a rather inflexible three-year contract, particularly in industrial areas with many employment alternatives. Many trainees are leaving the scheme at the end of their first year as a result. A second more important issue concerns the reluctance of private sector firms to take part in a scheme designed to secure skilled labour for future production. In a labour-surplus economy, employers can readily secure technicians in the open labour market. MOM officials readily admit that the scheme represents a heavy burden on firms in terms of supervision costs, job rotation requirements and labour market inflexibility, however they feel that private firms are under-investing in training, and must be persuaded to increase training efforts for the sake of industrialization and global competitiveness. A third important issue concerns the high unit costs of training, which are at least three times higher than the already substantial current unit costs, since the same trainees are trained for three years in a row, rather than different groups of trainees each year in the present system. In addition to operational costs, the establishment and promotion of the apprenticeship scheme is already absorbing over a fifth of the resources of the development budget allocated to the centres to finance its associated technical advisory service and company visit programme. The apprenticeship programme's potential for reducing the cost of technical training in MOM centres is far from being realized, by passing on the cost of equipment training to employers, since MOM is continuing to invest heavily in sophisticated and expensive computer-controlled equipment. Unfortunately, MOM has embarked wholeheartedly on the three-year apprenticeship programme, and has now extended it to all 31 non-agricultural BLKs without adequate testing and adaptation. In the process, it has sacrificed its own, relatively well received, two-month on-the-job training scheme which allowed employers the opportunity to recruit the trainees based on this initial trial period. Based on recent experience, the three-year scheme, which and to other courses such as vehicle maintenance and secretarial, should be confined to industrial areas, to junior secondary school leavers and to machine shop skills, provided there is a clear acceptance for such as scheme from engineering firms. In most other subjects, the answer to quality and relevant training may lie in the provision of relatively flexible one-year or longer courses leading to a recognizable diploma qualification rather than the rather obscure maester qualification presently promoted. The role of KLKs, the 100 or so smaller MOM training centres, is being down-graded from that of providing technical and other skills to job seekers in district towns and surrounding rural areas, to that of focusing on agro-processing and entrepreneurship training in order to raise the productivity of existing small business owners, usually in the form of short non-institutional courses and mobile training units. As a result of this re-orientation, KLK staff are seldom sent on technical skills upgrading courses, and well qualified technical staff from smaller centres are transferred to larger, "centres of excellence" BLKs in industrial cities. KLKs have limited equipment available to run technical courses, since most new equipment is concentrated in larger BLKs. Most foreign technical assistance is similarly concentrated in larger BLKs. This development fails to recognize that most KLKs are located in thriving commercial and service district capitals and towns, and that these and their surrounding rural areas offer great opportunities for trained youth to obtain diversified employment outside agriculture and
230
traditional sectors in small and medium scale industries, vehicle and motorcycle maintenance, and other repair services, while encouraging young persons to move to larger cities. MOM's desire to encourage specialization of its training centres should aim to reduce agro-processing, secretarial and handicraft courses, areas which are adequately supplied by other government agencies and private training providers, and to focus on their core competence, i.e., technical courses for repair and maintenance in vehicle, motorcycle, radio, television, refrigerators and other such equipment and appliances, which are currently very popular. Adequate provision of conventional, middle technology equipment to operate such courses should be made, since their existing stock dates back to a World Bank export credit facility in the early 1980s. Delivering effective training for the informal sector and entrepreneurship requires a great deal of expertise on the sector and those who work in it. Institutions which can devote a substantial amount of resources to acquire this expertise have been most effective. Supporting the efforts of effective NGOs through training funds provides an alternative option which avoids the further expansion of the public training system into unknown territory. MOM continues to acquire the latest equipment in use in industry with the assistance of various donors, a difficult undertaking in view of the rapid technological changes and short life of modern computer-operated equipment, and unsustainable at that in the absence of donors. In the process, it is attempting to hold on to two contradictory training philosophies, one emphasizing basic knowledge and skills acquisition in the training centres, while the other focusing on pre-service training in operating advanced equipment. The curriculum changes proposed above to cater for quality courses also emphasize the need to thorough basic knowledge and principles rather than familiarity with new equipment which can be acquired in the work place. MOM, distracted by donors and manufacturers of sophisticated equipment, training in which there may be little demand, is ignoring the more pressing need of most centres to replenish and expand their stock of conventional equipment such as welding machines, oscilloscopes, air-conditioners, vehicle and motorcycle engines, and refrigerators. Conventional equipment is however inexpensive, immediately available locally, and well within the reach of the centres' development budgets. How are the BLKs ever going to replace expensive out-of-date computer-aided equipment which has to be imported, when it cannot replace simple Japanese petrol and motorcycle engines manufactured in Indonesia? The contradiction in MOM's training system and philosophy may be to a large extent responsible for the neglect of demand-driven courses requiring conventional equipment. Though MOM has developed a number of ties with employers, its information on training outcomes is still inadequate. It is therefore unable to fully assess the result of its present courses. It should undertake a baseline tracer study of BLK-KLK graduates, with emphasis on duration of job search, sector of work, occupation, size of firm, starting and current salary. Following this initial effort, it should upgrade its existing monitoring system in each training centre for the collection of the above information on a routine basis. A better knowledge of training outcomes will assist in improving existing courses and planning new ones. It will also allow the calculation of private and social returns to vocational training on the basis of which government can allocate more or less resources to training centres. Additional research should study the possibility of establishing a network of provincial and national training inspectors who can monitor the instruction process in MOM's training centres, and who can monitor the use of resources allocated to the purchase of training materials and equipment maintenance.

231
ANNEX 7.2: TABLES A.7.1 Characteristics of Manufacturing Sector by Size, 1986 & 1996 A.7.2 Characteristics of Small, Medium & Large-scale Industries, 1996 Census Year
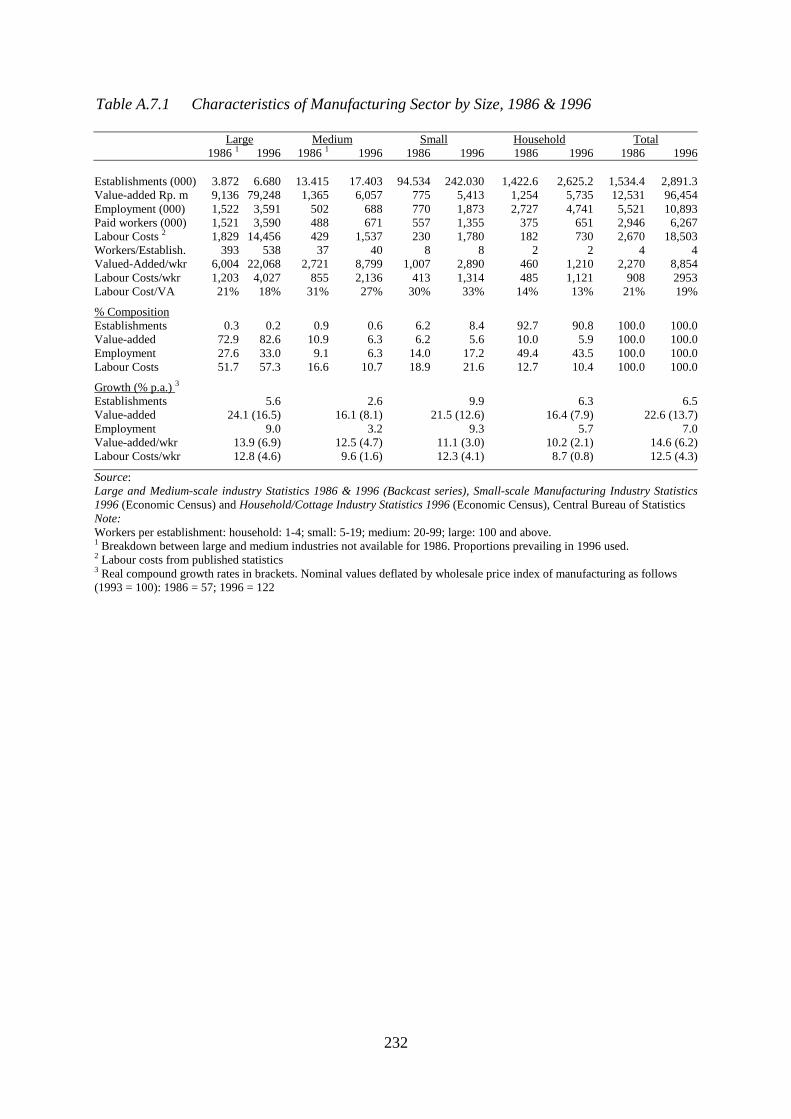
232
Table A.7.1 Characteristics of Manufacturing Sector by Size, 1986 & 1996 Large Medium Small Household Total 1986 1 1996 1986 1 1996 1986 1996 1986 1996 1986 1996 Establishments (000) 3.872 6.680 13.415 17.403 94.534 242.030 1,422.6 2,625.2 1,534.4 2,891.3 Value-added Rp. m 9,136 79,248 1,365 6,057 775 5,413 1,254 5,735 12,531 96,454 Employment (000) 1,522 3,591 502 688 770 1,873 2,727 4,741 5,521 10,893 Paid workers (000) 1,521 3,590 488 671 557 1,355 375 651 2,946 6,267 Labour Costs 2 1,829 14,456 429 1,537 230 1,780 182 730 2,670 18,503 Workers/Establish. 393 538 37 40 8 8 2 2 4 4 Valued-Added/wkr 6,004 22,068 2,721 8,799 1,007 2,890 460 1,210 2,270 8,854 Labour Costs/wkr 1,203 4,027 855 2,136 413 1,314 485 1,121 908 2953 Labour Cost/VA 21% 18% 31% 27% 30% 33% 14% 13% 21% 19%
% Composition Establishments 0.3 0.2 0.9 0.6 6.2 8.4 92.7 90.8 100.0 100.0 Value-added 72.9 82.6 10.9 6.3 6.2 5.6 10.0 5.9 100.0 100.0 Employment 27.6 33.0 9.1 6.3 14.0 17.2 49.4 43.5 100.0 100.0 Labour Costs 51.7 57.3 16.6 10.7 18.9 21.6 12.7 10.4 100.0 100.0
Growth (% p.a.) 3 Establishments 5.6 2.6 9.9 6.3 6.5 Value-added 24.1 (16.5) 16.1 (8.1) 21.5 (12.6) 16.4 (7.9) 22.6 (13.7) Employment 9.0 3.2 9.3 5.7 7.0 Value-added/wkr 13.9 (6.9) 12.5 (4.7) 11.1 (3.0) 10.2 (2.1) 14.6 (6.2) Labour Costs/wkr 12.8 (4.6) 9.6 (1.6) 12.3 (4.1) 8.7 (0.8) 12.5 (4.3)
Source: Large and Medium-scale industry Statistics 1986 & 1996 (Backcast series), Small-scale Manufacturing Industry Statistics 1996 (Economic Census) and Household/Cottage Industry Statistics 1996 (Economic Census), Central Bureau of Statistics Note: Workers per establishment: household: 1-4; small: 5-19; medium: 20-99; large: 100 and above. 1 Breakdown between large and medium industries not available for 1986. Proportions prevailing in 1996 used. 2 Labour costs from published statistics 3 Real compound growth rates in brackets. Nominal values deflated by wholesale price index of manufacturing as follows (1993 = 100): 1986 = 57; 1996 = 122
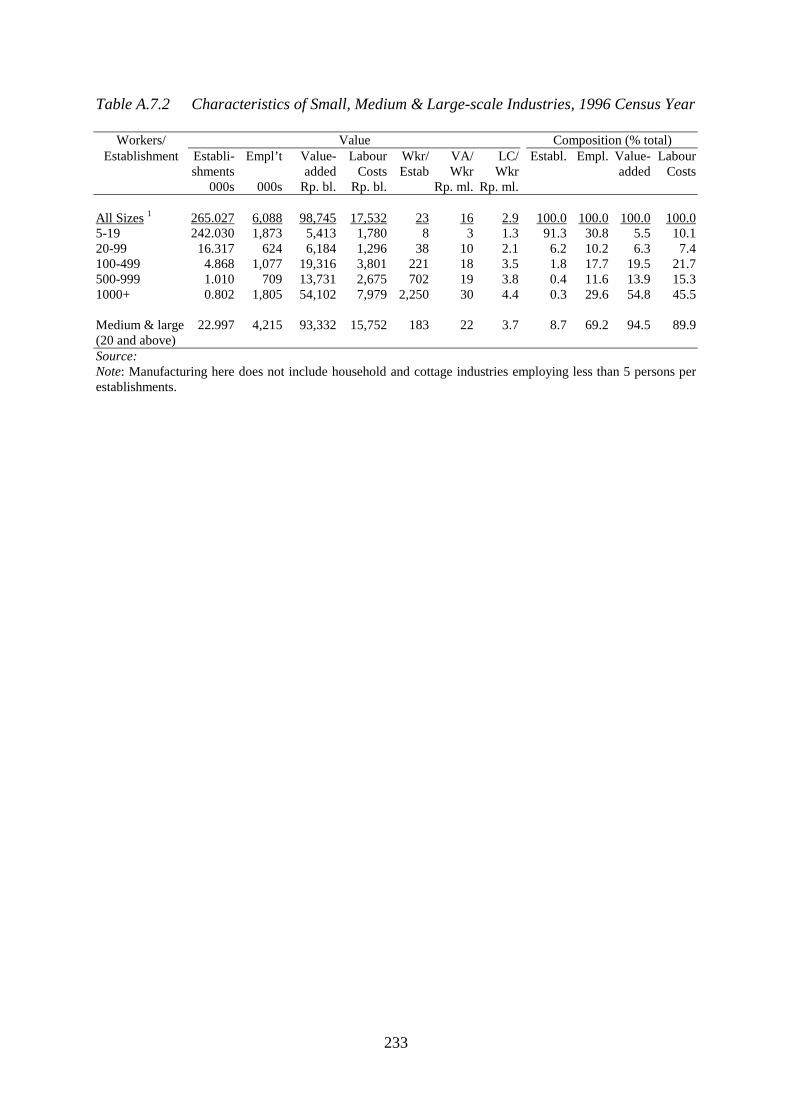
233
Table A.7.2 Characteristics of Small, Medium & Large-scale Industries, 1996 Census Year
Workers/ Value Composition (% total) Establishment Establi-
shments Empl’t Value-
added Labour
Costs Wkr/ Estab
VA/ Wkr
LC/ Wkr
Establ. Empl. Value-added
Labour Costs
000s 000s Rp. bl. Rp. bl. Rp. ml. Rp. ml. All Sizes 1 265.027 6,088 98,745 17,532 23 16 2.9 100.0 100.0 100.0 100.0 5-19 242.030 1,873 5,413 1,780 8 3 1.3 91.3 30.8 5.5 10.1 20-99 16.317 624 6,184 1,296 38 10 2.1 6.2 10.2 6.3 7.4 100-499 4.868 1,077 19,316 3,801 221 18 3.5 1.8 17.7 19.5 21.7 500-999 1.010 709 13,731 2,675 702 19 3.8 0.4 11.6 13.9 15.3 1000+ 0.802 1,805 54,102 7,979 2,250 30 4.4 0.3 29.6 54.8 45.5 Medium & large 22.997 4,215 93,332 15,752 183 22 3.7 8.7 69.2 94.5 89.9 (20 and above) Source: Note: Manufacturing here does not include household and cottage industries employing less than 5 persons per establishments.

234
235
APPENDICES APPENDIX A: LIST OF PERSONS CONSULTED........................................................236 1. Government........................................................................................................................236 2. International Agencies........................................................................................................239 3. Industry Associations .........................................................................................................240 4. Universities, Research Institutes and Consultants..............................................................242 5. Companies..........................................................................................................................243
APPENDIX B: LIST OF PARTICIPANTS IN SEMINARS & PRESENTATIONS...244 1. Ministry of Industry and Trade ..........................................................................................244 2. National Economic Council (DEN) ...................................................................................246 3. Office of the Deputy for Economic Affairs, Coordinating Minister for Economy............247 4. UNDP Office in Jakarta .....................................................................................................248 5. Coordinating Minister for Economy and Finance (EKUIN)..............................................249 6. National Chamber of Commerce and Industry (KADIN)..................................................250 7. Inter-ministerial officials Related to Industry & Trade......................................................251 8. University of Indonesia Seminar on Economic Recovery .................................................253 9. Presentation to Minister and Director-Generals of MOIT .................................................254 10. National Chamber of Commerce and Industry (KADIN)................................................255
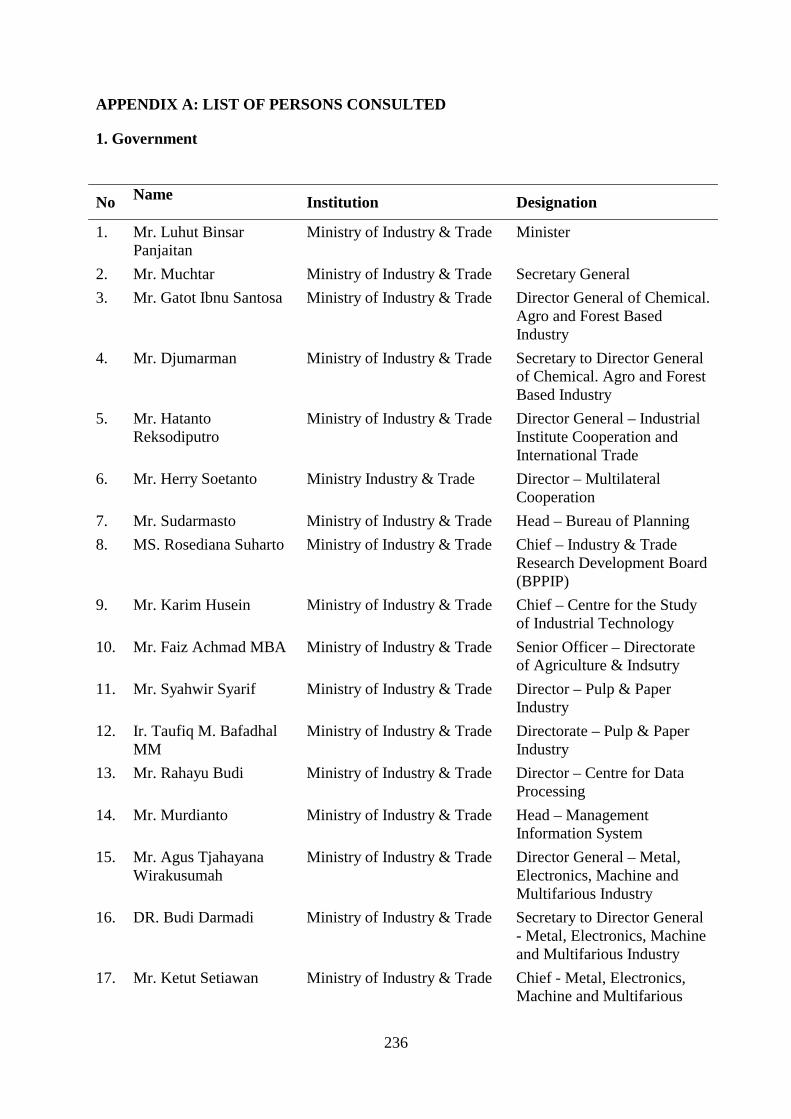
236
APPENDIX A: LIST OF PERSONS CONSULTED
1. Government
No Name Institution Designation
1. Mr. Luhut Binsar Panjaitan
Ministry of Industry & Trade Minister
2. Mr. Muchtar Ministry of Industry & Trade Secretary General 3. Mr. Gatot Ibnu Santosa Ministry of Industry & Trade Director General of Chemical.
Agro and Forest Based Industry
4. Mr. Djumarman Ministry of Industry & Trade Secretary to Director General of Chemical. Agro and Forest Based Industry
5. Mr. Hatanto Reksodiputro
Ministry of Industry & Trade Director General – Industrial Institute Cooperation and International Trade
6. Mr. Herry Soetanto Ministry Industry & Trade Director – Multilateral Cooperation
7. Mr. Sudarmasto Ministry of Industry & Trade Head – Bureau of Planning 8. MS. Rosediana Suharto Ministry of Industry & Trade Chief – Industry & Trade
Research Development Board (BPPIP)
9. Mr. Karim Husein Ministry of Industry & Trade Chief – Centre for the Study of Industrial Technology
10. Mr. Faiz Achmad MBA Ministry of Industry & Trade Senior Officer – Directorate of Agriculture & Indsutry
11. Mr. Syahwir Syarif Ministry of Industry & Trade Director – Pulp & Paper Industry
12. Ir. Taufiq M. Bafadhal MM
Ministry of Industry & Trade Directorate – Pulp & Paper Industry
13. Mr. Rahayu Budi Ministry of Industry & Trade Director – Centre for Data Processing
14. Mr. Murdianto Ministry of Industry & Trade Head – Management Information System
15. Mr. Agus Tjahayana Wirakusumah
Ministry of Industry & Trade Director General – Metal, Electronics, Machine and Multifarious Industry
16. DR. Budi Darmadi Ministry of Industry & Trade Secretary to Director General - Metal, Electronics, Machine and Multifarious Industry
17. Mr. Ketut Setiawan Ministry of Industry & Trade Chief - Metal, Electronics, Machine and Multifarious
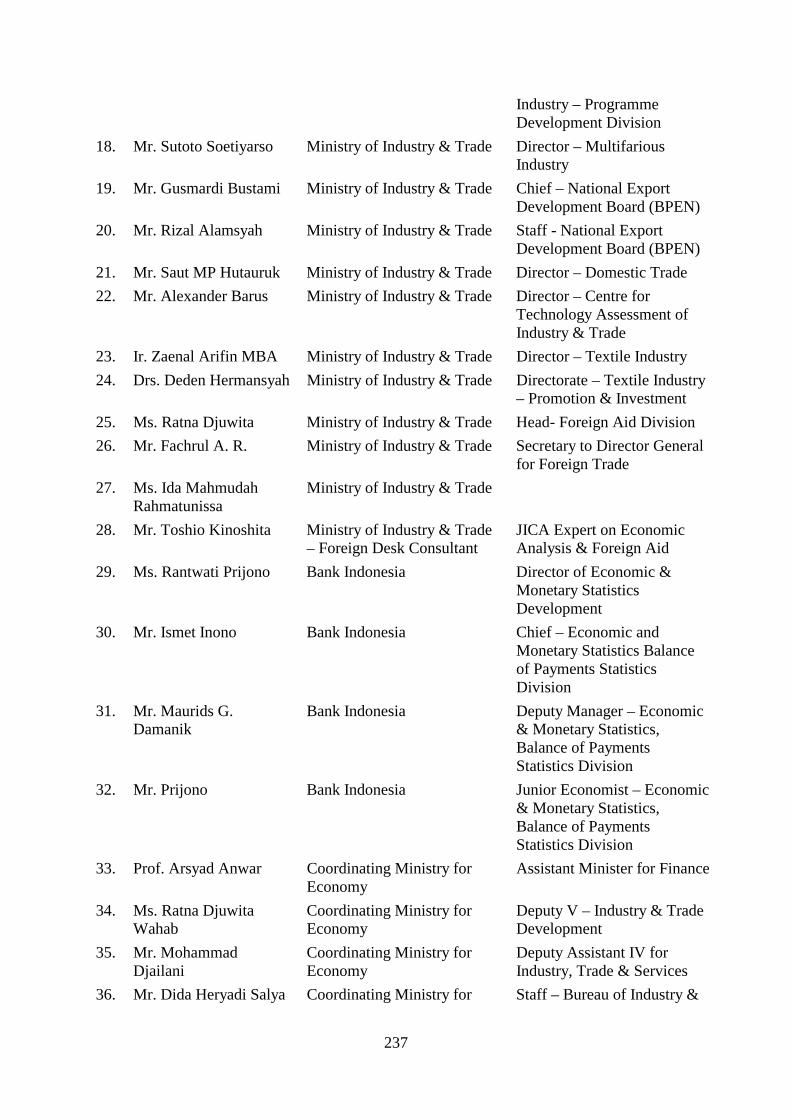
237
Industry – Programme Development Division
18. Mr. Sutoto Soetiyarso Ministry of Industry & Trade Director – Multifarious Industry
19. Mr. Gusmardi Bustami Ministry of Industry & Trade Chief – National Export Development Board (BPEN)
20. Mr. Rizal Alamsyah Ministry of Industry & Trade Staff - National Export Development Board (BPEN)
21. Mr. Saut MP Hutauruk Ministry of Industry & Trade Director – Domestic Trade 22. Mr. Alexander Barus Ministry of Industry & Trade Director – Centre for
Technology Assessment of Industry & Trade
23. Ir. Zaenal Arifin MBA Ministry of Industry & Trade Director – Textile Industry 24. Drs. Deden Hermansyah Ministry of Industry & Trade Directorate – Textile Industry
– Promotion & Investment 25. Ms. Ratna Djuwita Ministry of Industry & Trade Head- Foreign Aid Division 26. Mr. Fachrul A. R. Ministry of Industry & Trade Secretary to Director General
for Foreign Trade 27. Ms. Ida Mahmudah
Rahmatunissa Ministry of Industry & Trade
28. Mr. Toshio Kinoshita Ministry of Industry & Trade – Foreign Desk Consultant
JICA Expert on Economic Analysis & Foreign Aid
29. Ms. Rantwati Prijono Bank Indonesia Director of Economic & Monetary Statistics Development
30. Mr. Ismet Inono Bank Indonesia Chief – Economic and Monetary Statistics Balance of Payments Statistics Division
31. Mr. Maurids G. Damanik
Bank Indonesia Deputy Manager – Economic & Monetary Statistics, Balance of Payments Statistics Division
32. Mr. Prijono Bank Indonesia Junior Economist – Economic & Monetary Statistics, Balance of Payments Statistics Division
33. Prof. Arsyad Anwar Coordinating Ministry for Economy
Assistant Minister for Finance
34. Ms. Ratna Djuwita Wahab
Coordinating Ministry for Economy
Deputy V – Industry & Trade Development
35. Mr. Mohammad Djailani
Coordinating Ministry for Economy
Deputy Assistant IV for Industry, Trade & Services
36. Mr. Dida Heryadi Salya Coordinating Ministry for Staff – Bureau of Industry &
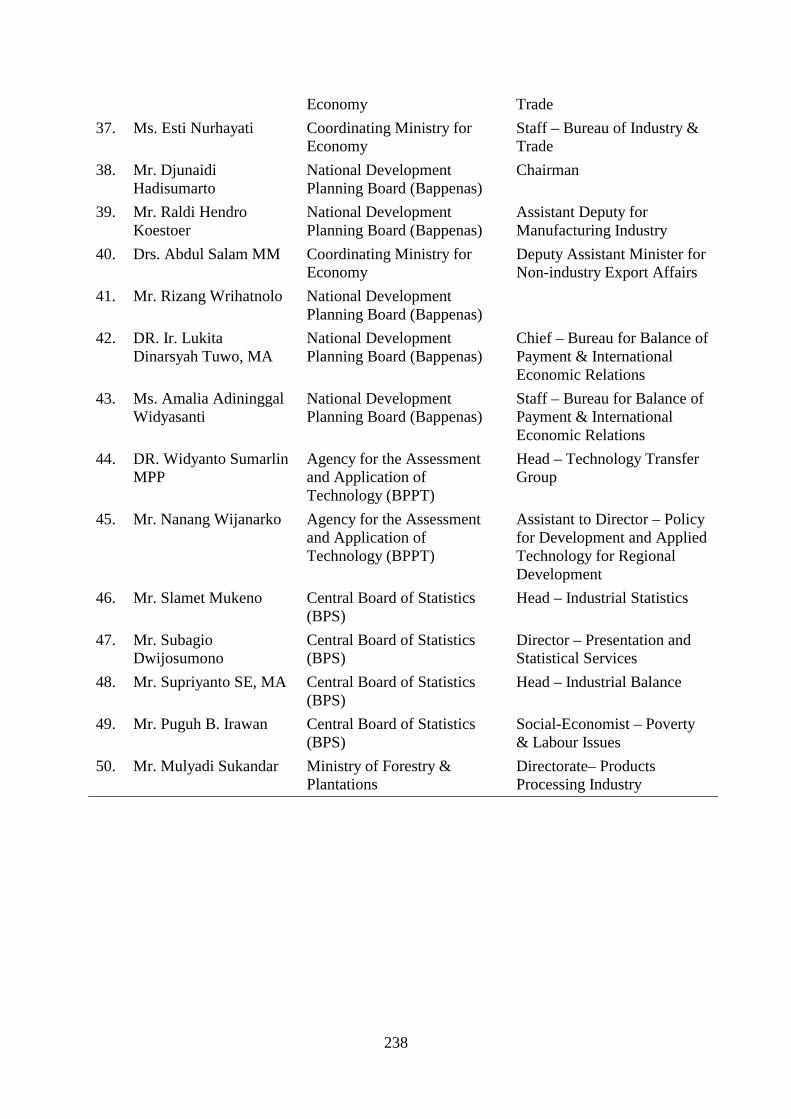
238
Economy Trade 37. Ms. Esti Nurhayati Coordinating Ministry for
Economy Staff – Bureau of Industry & Trade
38. Mr. Djunaidi Hadisumarto
National Development Planning Board (Bappenas)
Chairman
39. Mr. Raldi Hendro Koestoer
National Development Planning Board (Bappenas)
Assistant Deputy for Manufacturing Industry
40. Drs. Abdul Salam MM Coordinating Ministry for Economy
Deputy Assistant Minister for Non-industry Export Affairs
41. Mr. Rizang Wrihatnolo National Development Planning Board (Bappenas)
42. DR. Ir. Lukita Dinarsyah Tuwo, MA
National Development Planning Board (Bappenas)
Chief – Bureau for Balance of Payment & International Economic Relations
43. Ms. Amalia Adininggal Widyasanti
National Development Planning Board (Bappenas)
Staff – Bureau for Balance of Payment & International Economic Relations
44. DR. Widyanto Sumarlin MPP
Agency for the Assessment and Application of Technology (BPPT)
Head – Technology Transfer Group
45. Mr. Nanang Wijanarko Agency for the Assessment and Application of Technology (BPPT)
Assistant to Director – Policy for Development and Applied Technology for Regional Development
46. Mr. Slamet Mukeno Central Board of Statistics (BPS)
Head – Industrial Statistics
47. Mr. Subagio Dwijosumono
Central Board of Statistics (BPS)
Director – Presentation and Statistical Services
48. Mr. Supriyanto SE, MA Central Board of Statistics (BPS)
Head – Industrial Balance
49. Mr. Puguh B. Irawan Central Board of Statistics (BPS)
Social-Economist – Poverty & Labour Issues
50. Mr. Mulyadi Sukandar Ministry of Forestry & Plantations
Directorate– Products Processing Industry

239
2. International Agencies
No. Name Institution Designation
51. Mr. Frederic Richard UNIDO Vienna (IPR) Director 52. Mr. Philippe Scholtes UNIDO Vienna (IPR ) Industrial Development
Officer 53. Mr. Sarwar Hobohm UNIDO Vienna (IPR) Industrial Development
Officer 54. Mr. Ravi Rajan UNDP Jakarta Resident Coordinator 55. Ms. Bona Siahaan UNDP Jakarta Assistant Resident
Representative 56. Mr. Satish Mishra UNDP/UNSFIR Jakarta Chief Technical Adviser 57. Mr. Iyannatul Islam UNDP/UNSFIR/ILO Jakarta Economist 58. Mr. Kinoshita Japanese International
Cooperation Agency (JICA), posted in Ministry of Industry
Adviser, Planning Division
59. Mr. Masayoshi Matsushita
UNIDO – ITPO Tokyo Head – Industrial Development Division
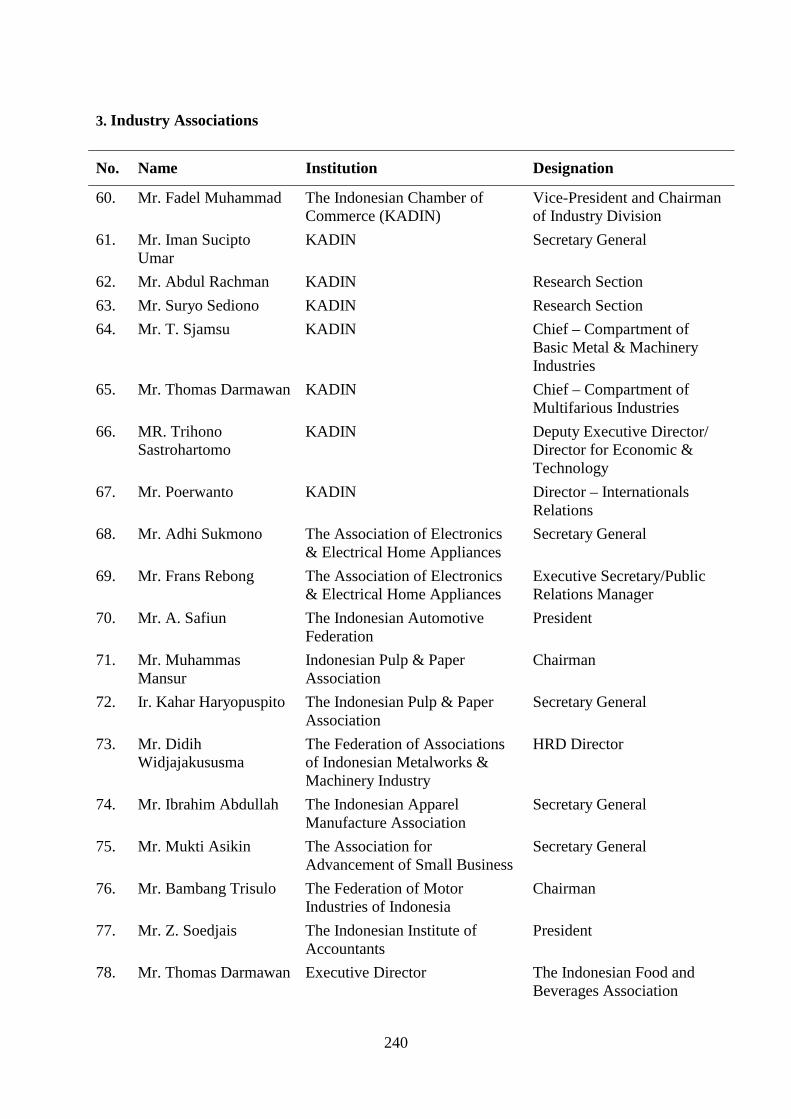
240
3. Industry Associations
No. Name Institution Designation
60. Mr. Fadel Muhammad The Indonesian Chamber of Commerce (KADIN)
Vice-President and Chairman of Industry Division
61. Mr. Iman Sucipto Umar
KADIN Secretary General
62. Mr. Abdul Rachman KADIN Research Section 63. Mr. Suryo Sediono KADIN Research Section 64. Mr. T. Sjamsu KADIN Chief – Compartment of
Basic Metal & Machinery Industries
65. Mr. Thomas Darmawan KADIN Chief – Compartment of Multifarious Industries
66. MR. Trihono Sastrohartomo
KADIN Deputy Executive Director/ Director for Economic & Technology
67. Mr. Poerwanto KADIN Director – Internationals Relations
68. Mr. Adhi Sukmono The Association of Electronics & Electrical Home Appliances
Secretary General
69. Mr. Frans Rebong The Association of Electronics & Electrical Home Appliances
Executive Secretary/Public Relations Manager
70. Mr. A. Safiun The Indonesian Automotive Federation
President
71. Mr. Muhammas Mansur
Indonesian Pulp & Paper Association
Chairman
72. Ir. Kahar Haryopuspito The Indonesian Pulp & Paper Association
Secretary General
73. Mr. Didih Widjajakususma
The Federation of Associations of Indonesian Metalworks & Machinery Industry
HRD Director
74. Mr. Ibrahim Abdullah The Indonesian Apparel Manufacture Association
Secretary General
75. Mr. Mukti Asikin The Association for Advancement of Small Business
Secretary General
76. Mr. Bambang Trisulo The Federation of Motor Industries of Indonesia
Chairman
77. Mr. Z. Soedjais The Indonesian Institute of Accountants
President
78. Mr. Thomas Darmawan Executive Director The Indonesian Food and Beverages Association

241
79. Ir. Chamroel Djafri The Indonesian Textile Association
Chairman
80. Mr. Benny Benyamin The Indonesian Textile Association
Chairman – DKI Jakarta Branch
81. Ms. Woro Nikendari The Indonesian Textile Association
Secretary – DKI Jakarta Branch
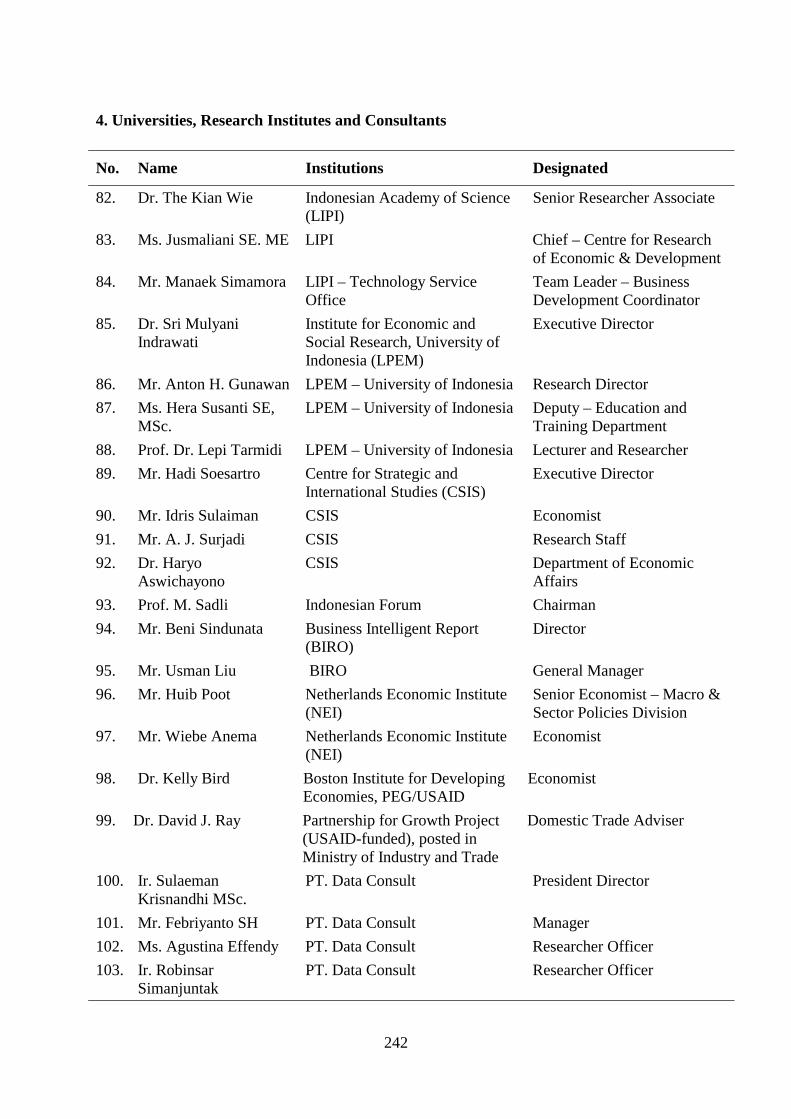
242
4. Universities, Research Institutes and Consultants
No. Name Institutions Designated
82. Dr. The Kian Wie Indonesian Academy of Science (LIPI)
Senior Researcher Associate
83. Ms. Jusmaliani SE. ME LIPI Chief – Centre for Research of Economic & Development
84. Mr. Manaek Simamora LIPI – Technology Service Office
Team Leader – Business Development Coordinator
85. Dr. Sri Mulyani Indrawati
Institute for Economic and Social Research, University of Indonesia (LPEM)
Executive Director
86. Mr. Anton H. Gunawan LPEM – University of Indonesia Research Director 87. Ms. Hera Susanti SE,
MSc. LPEM – University of Indonesia Deputy – Education and
Training Department 88. Prof. Dr. Lepi Tarmidi LPEM – University of Indonesia Lecturer and Researcher 89. Mr. Hadi Soesartro Centre for Strategic and
International Studies (CSIS) Executive Director
90. Mr. Idris Sulaiman CSIS Economist 91. Mr. A. J. Surjadi CSIS Research Staff 92. Dr. Haryo
Aswichayono CSIS Department of Economic
Affairs 93. Prof. M. Sadli Indonesian Forum Chairman 94. Mr. Beni Sindunata Business Intelligent Report
(BIRO) Director
95. Mr. Usman Liu BIRO General Manager 96. Mr. Huib Poot Netherlands Economic Institute
(NEI) Senior Economist – Macro & Sector Policies Division
97. Mr. Wiebe Anema Netherlands Economic Institute (NEI)
Economist
98. Dr. Kelly Bird Boston Institute for Developing Economies, PEG/USAID
Economist
99. Dr. David J. Ray Partnership for Growth Project (USAID-funded), posted in Ministry of Industry and Trade
Domestic Trade Adviser
100. Ir. Sulaeman Krisnandhi MSc.
PT. Data Consult President Director
101. Mr. Febriyanto SH PT. Data Consult Manager 102. Ms. Agustina Effendy PT. Data Consult Researcher Officer 103. Ir. Robinsar
Simanjuntak PT. Data Consult Researcher Officer
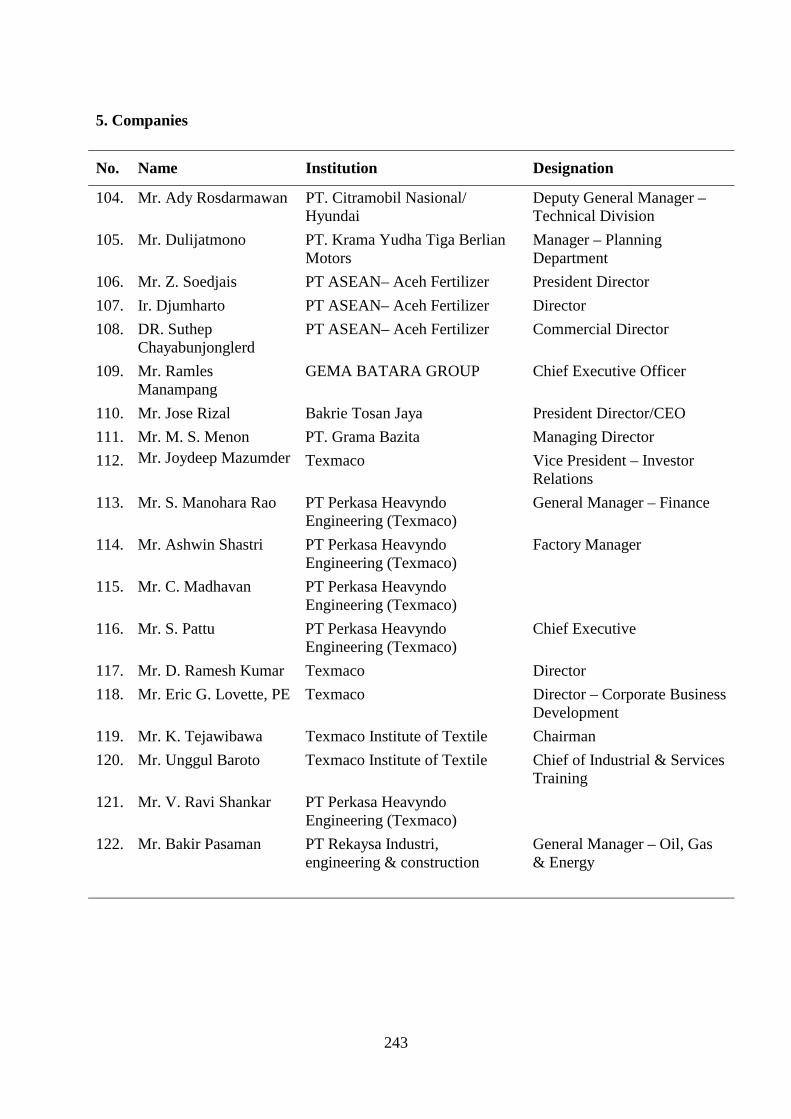
243
5. Companies
No. Name Institution Designation
104. Mr. Ady Rosdarmawan PT. Citramobil Nasional/ Hyundai
Deputy General Manager – Technical Division
105. Mr. Dulijatmono PT. Krama Yudha Tiga Berlian Motors
Manager – Planning Department
106. Mr. Z. Soedjais PT ASEAN– Aceh Fertilizer President Director 107. Ir. Djumharto PT ASEAN– Aceh Fertilizer Director 108. DR. Suthep
Chayabunjonglerd PT ASEAN– Aceh Fertilizer Commercial Director
109. Mr. Ramles Manampang
GEMA BATARA GROUP Chief Executive Officer
110. Mr. Jose Rizal Bakrie Tosan Jaya President Director/CEO 111. Mr. M. S. Menon PT. Grama Bazita Managing Director 112. Mr. Joydeep Mazumder Texmaco Vice President – Investor
Relations 113. Mr. S. Manohara Rao PT Perkasa Heavyndo
Engineering (Texmaco) General Manager – Finance
114. Mr. Ashwin Shastri PT Perkasa Heavyndo Engineering (Texmaco)
Factory Manager
115. Mr. C. Madhavan PT Perkasa Heavyndo Engineering (Texmaco)
116. Mr. S. Pattu PT Perkasa Heavyndo Engineering (Texmaco)
Chief Executive
117. Mr. D. Ramesh Kumar Texmaco Director 118. Mr. Eric G. Lovette, PE Texmaco Director – Corporate Business
Development 119. Mr. K. Tejawibawa Texmaco Institute of Textile Chairman 120. Mr. Unggul Baroto Texmaco Institute of Textile Chief of Industrial & Services
Training 121. Mr. V. Ravi Shankar PT Perkasa Heavyndo
Engineering (Texmaco)
122. Mr. Bakir Pasaman PT Rekaysa Industri, engineering & construction
General Manager – Oil, Gas & Energy
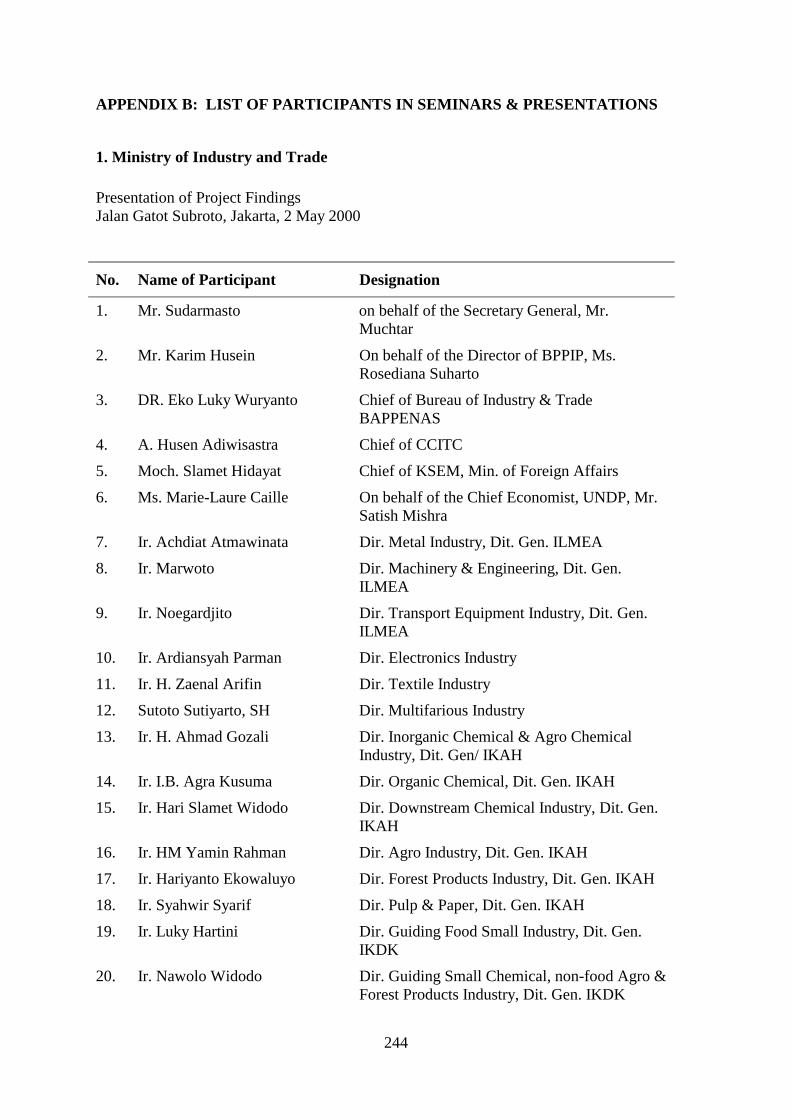
244
APPENDIX B: LIST OF PARTICIPANTS IN SEMINARS & PRESENTATIONS
1. Ministry of Industry and Trade Presentation of Project Findings Jalan Gatot Subroto, Jakarta, 2 May 2000
No. Name of Participant Designation
1. Mr. Sudarmasto on behalf of the Secretary General, Mr. Muchtar
2. Mr. Karim Husein On behalf of the Director of BPPIP, Ms. Rosediana Suharto
3. DR. Eko Luky Wuryanto Chief of Bureau of Industry & Trade BAPPENAS
4. A. Husen Adiwisastra Chief of CCITC
5. Moch. Slamet Hidayat Chief of KSEM, Min. of Foreign Affairs
6. Ms. Marie-Laure Caille On behalf of the Chief Economist, UNDP, Mr. Satish Mishra
7. Ir. Achdiat Atmawinata Dir. Metal Industry, Dit. Gen. ILMEA
8. Ir. Marwoto Dir. Machinery & Engineering, Dit. Gen. ILMEA
9. Ir. Noegardjito Dir. Transport Equipment Industry, Dit. Gen. ILMEA
10. Ir. Ardiansyah Parman Dir. Electronics Industry
11. Ir. H. Zaenal Arifin Dir. Textile Industry
12. Sutoto Sutiyarto, SH Dir. Multifarious Industry
13. Ir. H. Ahmad Gozali Dir. Inorganic Chemical & Agro Chemical Industry, Dit. Gen/ IKAH
14. Ir. I.B. Agra Kusuma Dir. Organic Chemical, Dit. Gen. IKAH
15. Ir. Hari Slamet Widodo Dir. Downstream Chemical Industry, Dit. Gen. IKAH
16. Ir. HM Yamin Rahman Dir. Agro Industry, Dit. Gen. IKAH
17. Ir. Hariyanto Ekowaluyo Dir. Forest Products Industry, Dit. Gen. IKAH
18. Ir. Syahwir Syarif Dir. Pulp & Paper, Dit. Gen. IKAH
19. Ir. Luky Hartini Dir. Guiding Food Small Industry, Dit. Gen. IKDK
20. Ir. Nawolo Widodo Dir. Guiding Small Chemical, non-food Agro & Forest Products Industry, Dit. Gen. IKDK

245
21. Ir. Effendi Sirait Dir. Guiding Small Industry, Metal, Machine & Electronics
22. Sri Hartini S. Teks. Dir. Guiding Small Industry, Clothing, Leather & Various
23. Mr. HM Yasin BSc. MBA Dir. For Guiding Small Business Facilities
24. Drs. Caheruddin Dir. Guiding Small Business Enterprises
25. Drs. Herry Sutanto Dir. Multilateral Cooperation, Dit. Gen. KLIPI
26. Ir. Anwar Wahab Ses. BPPIP
27. Drs. RD Irwan Purwana Ses. Ins. General
28. DR. IR. Budhi Darmadi, MSc Ses. Dit. Gen. ILMEA
29. Ir. Djumarman Ses. Dit. Gen. IKAH
30. Ir. Ansari, MBA Ses. Dit. Gen. IKDK
31. Drs. Ismailidin Wahaw Ses. Dit. Gen. PDN
32. Drs. Fachrul Abdul Rachman Ses. Dit. Gen. PLN
33. Drs. Fauzi Aziz Ses. BPEN
34. Drs. Ridwan Kurnaen Ses. BAPEBTI
35. Ir. Benny Wahyudi, MBA Chief, Centre for Business Climate & Small Industry Study, BPPIP
36. Dra. Laila Djanun N. Caropebeka
Chief, Centre for Export Information & Training, BPEN
37. Siti Rahayu Seoakrno, SH Chief, Centre for Developing Market in America, Australia & N. Zealand, BPEN
38. Drs. Suhartono, MA Chief, Centre for Developing Market in EUROPE, BPEN
39. Ir. Saut Hutauruk * Chief, Centre for Developing Market in Asia, BPEN
40. Sakri Widhianto, S. Teks. Chief, Centre for Developing Market in Africa & Middle East,
41. Faridz Suwardi Chairman of BPEN
42. BM Harimpat, Bk. Teks. Chief, KANWIL of Jakarta
43. Drs. Soewadji, H. Apt. Chief, Chemical Industry
44. Drs. Gatot Pudjanto, MBA STMI (University of Industrial Management)
45. Drs. Zulkarnaen, MM APP (College for Management)
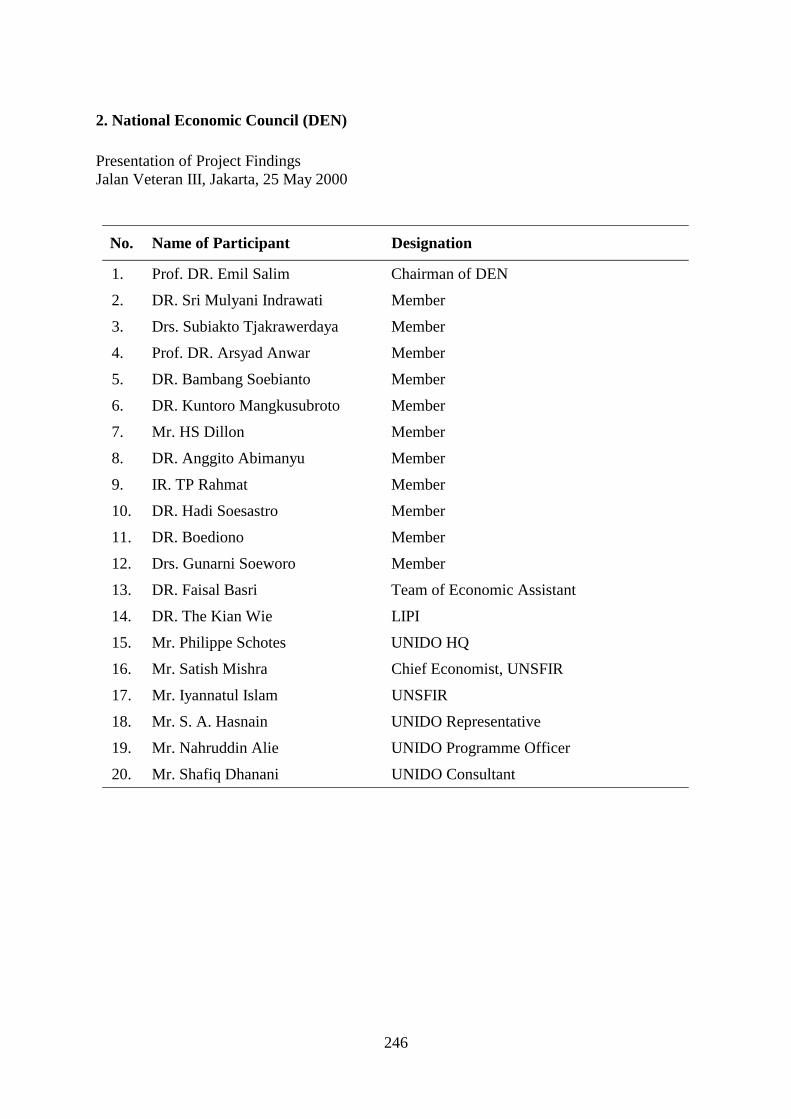
246
2. National Economic Council (DEN) Presentation of Project Findings Jalan Veteran III, Jakarta, 25 May 2000
No. Name of Participant Designation
1. Prof. DR. Emil Salim Chairman of DEN
2. DR. Sri Mulyani Indrawati Member
3. Drs. Subiakto Tjakrawerdaya Member
4. Prof. DR. Arsyad Anwar Member
5. DR. Bambang Soebianto Member
6. DR. Kuntoro Mangkusubroto Member
7. Mr. HS Dillon Member
8. DR. Anggito Abimanyu Member
9. IR. TP Rahmat Member
10. DR. Hadi Soesastro Member
11. DR. Boediono Member
12. Drs. Gunarni Soeworo Member
13. DR. Faisal Basri Team of Economic Assistant
14. DR. The Kian Wie LIPI
15. Mr. Philippe Schotes UNIDO HQ
16. Mr. Satish Mishra Chief Economist, UNSFIR
17. Mr. Iyannatul Islam UNSFIR
18. Mr. S. A. Hasnain UNIDO Representative
19. Mr. Nahruddin Alie UNIDO Programme Officer
20. Mr. Shafiq Dhanani UNIDO Consultant
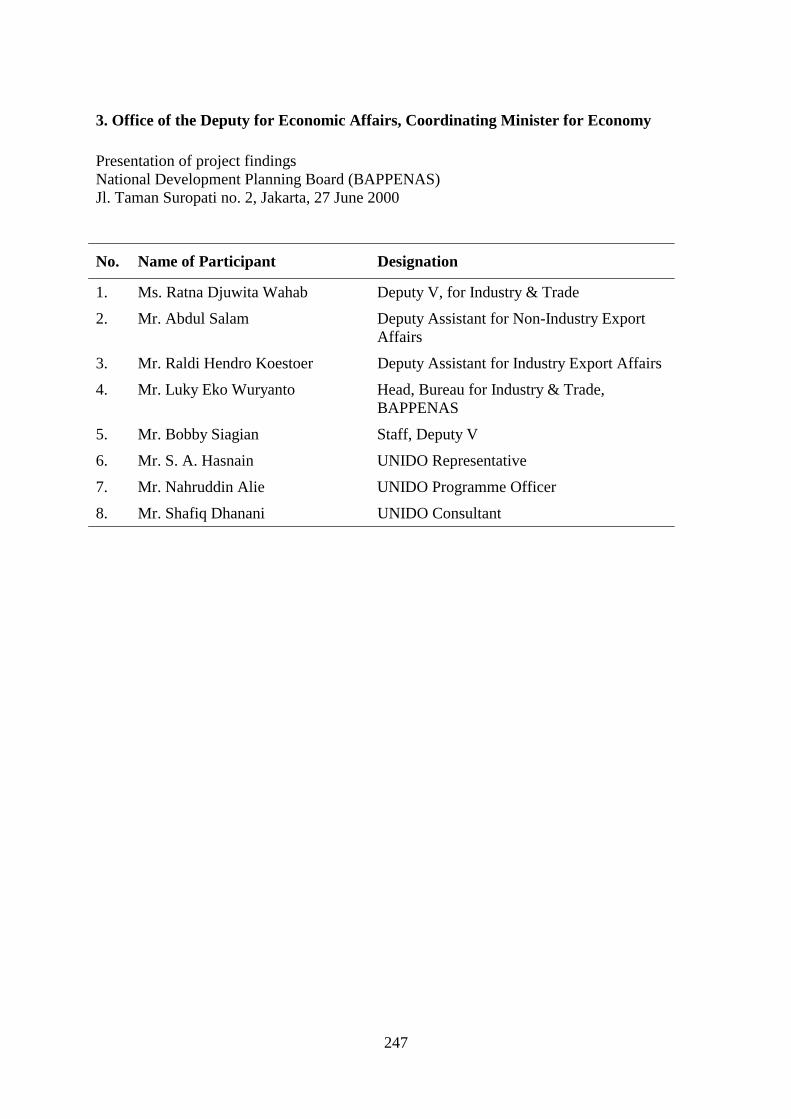
247
3. Office of the Deputy for Economic Affairs, Coordinating Minister for Economy Presentation of project findings National Development Planning Board (BAPPENAS) Jl. Taman Suropati no. 2, Jakarta, 27 June 2000
No. Name of Participant Designation
1. Ms. Ratna Djuwita Wahab Deputy V, for Industry & Trade
2. Mr. Abdul Salam Deputy Assistant for Non-Industry Export Affairs
3. Mr. Raldi Hendro Koestoer Deputy Assistant for Industry Export Affairs
4. Mr. Luky Eko Wuryanto Head, Bureau for Industry & Trade, BAPPENAS
5. Mr. Bobby Siagian Staff, Deputy V
6. Mr. S. A. Hasnain UNIDO Representative
7. Mr. Nahruddin Alie UNIDO Programme Officer
8. Mr. Shafiq Dhanani UNIDO Consultant
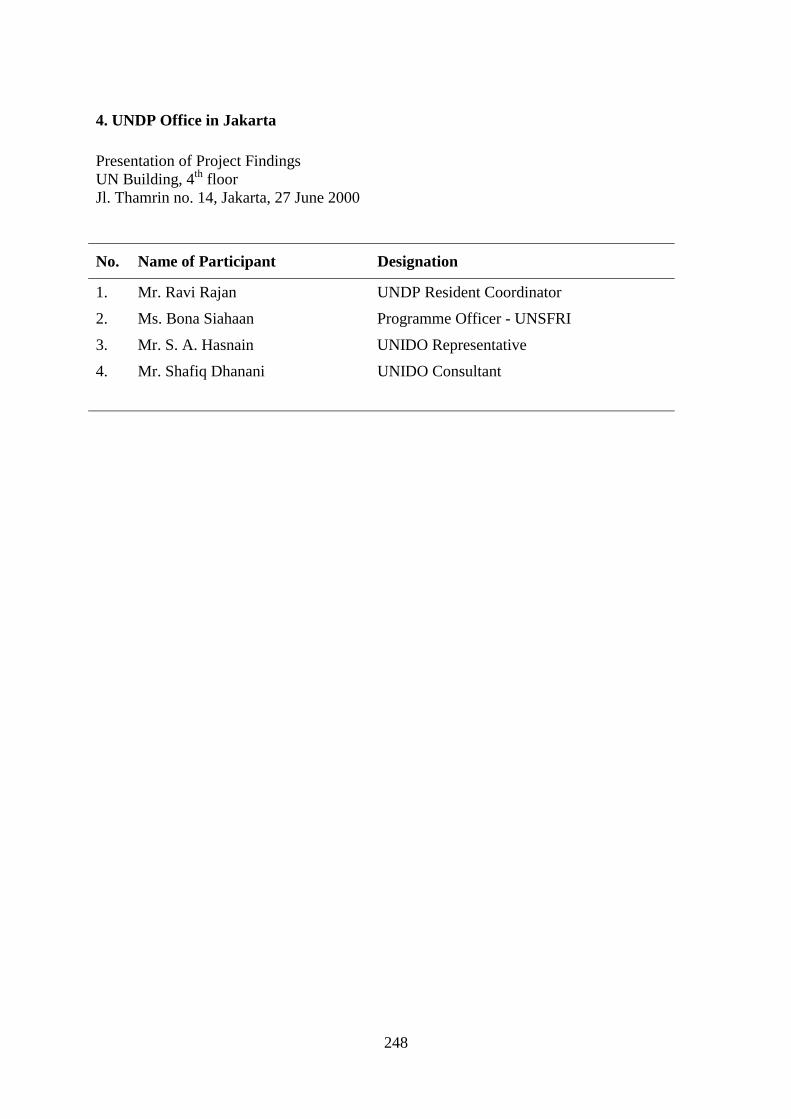
248
4. UNDP Office in Jakarta Presentation of Project Findings UN Building, 4th floor Jl. Thamrin no. 14, Jakarta, 27 June 2000
No. Name of Participant Designation
1. Mr. Ravi Rajan UNDP Resident Coordinator
2. Ms. Bona Siahaan Programme Officer - UNSFRI
3. Mr. S. A. Hasnain UNIDO Representative
4. Mr. Shafiq Dhanani UNIDO Consultant
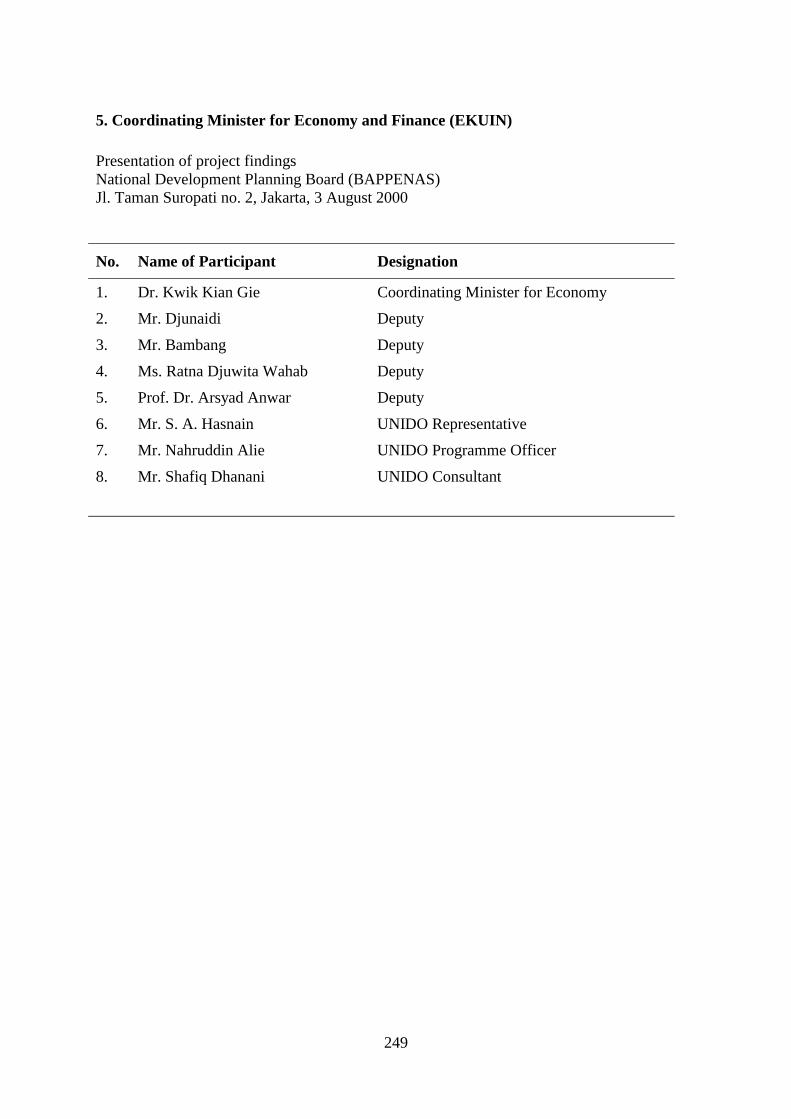
249
5. Coordinating Minister for Economy and Finance (EKUIN) Presentation of project findings National Development Planning Board (BAPPENAS) Jl. Taman Suropati no. 2, Jakarta, 3 August 2000
No. Name of Participant Designation
1. Dr. Kwik Kian Gie Coordinating Minister for Economy
2. Mr. Djunaidi Deputy
3. Mr. Bambang Deputy
4. Ms. Ratna Djuwita Wahab Deputy
5. Prof. Dr. Arsyad Anwar Deputy
6. Mr. S. A. Hasnain UNIDO Representative
7. Mr. Nahruddin Alie UNIDO Programme Officer
8. Mr. Shafiq Dhanani UNIDO Consultant
250
6. National Chamber of Commerce and Industry (KADIN) Presentation of Project Findings Menara Kadin Jl. Rasuna Said Jakarta, 5 September 2000
No. Name of Participant Designation
1. Chief Field of Metal, Machinery, Chemical & Agro Industries
2. Chief Field of Investment & Promotion
3. Chief Field of Foreign Affairs
4. Chief Field of Textile, Electronics & Multi Various Industries
5. Chief Compartment of Metal & Machinery
6. Chief Compartment of Chemical Industry
7. Chief Compartment of Agro Industry
8. Chief Compartment of Textile Industry
9. Chief Compartment of Electronics
10. Chief Compartment of Various Industry
11. Mr. Suryo Sediono LP3E KADIN (Research staff)
12. Mr. Tulus Tambunan LP3E KADIN (Research staff)
13. Mr. A Rahman LP3E KADIN (Research staff)
14. Mr. Syafiun Chief & Sec. Gen. GIAMM
15. Mr. Didik W. Chief & Sec. Gen. GAMMA
16. Chairman & Sec. Gen. Electronics Association
17. Chairman & sec. Gen. Textile Association
18. Chairman & Sec. Gen. Electronics & Home Appliances Association
19. Mr. Riswan Hamdani BKS/INKIMDAS
20. Mr. Badril GAPMI
251
7. Inter-ministerial officials Related to Industry & Trade Presentation of Project Findings National Development Planning Board (BAPPENAS) Jl. Taman Suropati No. 2, Jakarta, 14 September 2000 No. Name of Participant Designation
1. Ms. Ratna Djuwita Wahab Deputy V, MENKO EKUIN
2. Mr. Bambang Jaya Dir. Gen. Food Corps Production Development, Min. of Agriculture
3. Mr. Sutarto
4. Mr. Muslim Tanwir
5. Mr. Winarto
6. Mr. Iwa DJ
7. Ms. Euis MOIT
8. Djodi
9. Mr. Anthonius
10.
11. Mr. Slamet Ahmadi
12. Ms. Reni Kustiarsi Ministry of Agriculture
13. Mr. Chairul Arifin Ministry of Agriculture
14. Mr. Mulyadi
15. Mr. Pariang S. D-G Foreign Trade, MOIT
16. Mr. Supandi EKUIN
17. Mr. Sudarmasto D-G Foreign Trade
18. Mr. Loto S. Ginting Ministry of Finance
19. Mr. Momong Ministry of Forestry
20. Mr. Anwar M. D-G of Domestic Trade
21. Mr. M. Djailani EKUIN
22. Mr. Edy Putra EKUIN
23. Mr. Sadji Partoatmodjo EKUIN
24. Ms. Retno Pudji EKUIN
25. Mr. Anwar Nainggolan IKDK, MOIT
26. Mr. Fuadi EKUIN
27. Mr. Rusli Djalil BAPPENAS
252
28. Mr. A. Djamil H State Ministry of Cooperatives
29. Mr. Egi Djamisuardi
30. Mr. Bobby Siagian EKUIN
31. Mr. Toto Dit. Gen. Sea Communications, Min. of Communications
32. Mr. Irawan Dit. Gen. Sea Communications, Min. of Communications
33. Mr. Feri Ferdian
34. Mr. Harianto Institute of Agriculture, Bogor (IPB)
35. Mr. Abdul Salam EKUIN
253
8. University of Indonesia Seminar on Economic Recovery Presentation of Project Findings on FDI, Seminar on Indonesian Economic Recovery in Changing Environment Shangri-la Hotel, Jakarta, 5 October, 2000 Over 100 persons attended the break-out session of this seminar entitled the “Real Sector” from government agencies, universities, research institutions, international agencies and consulting firms. Professor Rustam Didong, Faculty of Economics, University of Indonesia, chaired the session. The following three topics were presented: 1. “Comprehensive Investment Policies in a Competitive Environment” by Dr. Hadi
Soesastro (FEUI-CSIS) and Dr. Thee Kian Wie (PEP-LIPI) 2. “Impact of Foreign Direct Investment on Indonesian Manufacturing” by Dr. Shafiq
Dhanani (UNIDO-Jakarta) 3. “SME and Strategic Alliances” by Achmad Shauki (LPEM) The above presenters also formed the discussion panel for each three papers.
254
9. Presentation to Minister and Director-Generals of MOIT Presentation of Project Findings, Ministry of Industry and Trade Jl. MI Ridwan Rais no. 5, Jakarta 21 September 2000 Name of Participant Designation
1. H.E. Luhut Panjaitan Minister of Industry & Trade
2. Mr. Teddy Sianturi Special Adviser to the Minister
3. Mr. Rahe Rahman Special Adviser to the Minister
4. Mr. Muchtar Secretary General
5. Mr. Agus Tjahayana Dir. Gen. Of ILMEA
6. Mr. Hatanto Reksodiputro Dir. Gen. KLIPI
7. Mr. Djoko Moeljono Dir. Gen. International Trade
8. Mr. Saut Hutauruk Director of Domestic Trade
9. Mr. Gusmardi Bustami Director National Agency for Export Development
10. Mr. Alex Sebarus Director of BPPIP
11. Ms. Ratna Djuwita Wahab Special Adviser to MENKO EKUIN for Industry & Trade
12. Mr. Edi Putra Irawady Staff of MENKO EKUIN
255
10. National Chamber of Commerce and Industry (KADIN) Presentation of Project Findings to Industry Associations KADIN/UNIDO Workshop on Industrial Competitiveness Menara Kadin Jl. Rasuna Said Jakarta, 15 November 2000
No. Name of Participant Designation
1. Mr. Fadel Muhammad Vice-President, KADIN, and Chairman of Industry Division
2. Mr. Syafiun Chief & Sec. Gen. Automotive Association (GIAMM)
3. Mr. Adhi Sukmono Sec. Gen., Assoc. of Electronics and Electrical Home Appliances
4. Mr. Didik W. Chief & Sec. Gen., Federation of Association of Indonesian of Metal Works and Machinery Industries GAMMA
5. Mr. Ray M. Federation of Association of Indonesian of Metal Works and Machinery Industries (GAMMA )
6. Mr. I. Kartono W. Federation of Association of Indonesian of Metal Works and Machinery Industries (GAMMA )
7. Mr. Azis Pane Field of Metal, Machinery, Chemical & Agro Industries (INKIM – KADIN)
8. Mr. Suryo Sediono Institute for Economic Studies, KADIN (LP3E)
9. Mr. Trihartono Sastrohartono Institute for Economic Studies LP3E – KADIN
10. Mr. Abdul Rachman Institute for Economic Studies, KADIN (LP3E)
11. Mr. Ali Almasyhua KADIN Secretariat
12. Mr. Syamsu KADIN Secretariat
13. Mr. Idris Suleiman Economist, Centre for Strategic for International Studies
14. Ms. Orzu Matyakub US-AID
15. Mr. Kahar Indonesian Leather Tannery Association (APKI )
16. Mr. Anton Supit Indonesian Footwear Association (APRISINDO)
256
17. Mr. Badril Indonesian Food and Beverage Producer Association (GAPMMI )
18. Ms. Ariana Indonesian Food and Beverage Producer Association (GAPMMI )
19. Mr. Masyhud Ali TEXMACO (Ltd.)
20. Mr. Erwin Tunas Indonesian Rubber Association (GAPKINDO) - KADIN
21. Mr. Budi Sadiman Indonesian Plastic Manufacturer Association (AB Plastik)
22. Mr. Karso Indonesian Fertiliser Association (APPI )
23. Mr. G. Ginting PT FRISINDO (Ltd.)
24. Mr. Salim U. Kosim ASI
25. Mr. Hadi S. Widodo Dit. Gen. Chemical, Agro-industry and Forest-based Industry , MOIT
26. Mr. Herry Hadisuyoto Directorate of Domestic Trade - MOIT
27. Mr. Marihot GLOBAL DINAMIKA (Ltd.)
28. Mr. Jeffrey Iwansantoso GLOBAL DINAMIKA (Ltd.)
29. Mr. Benny Wahyudi Director, Agency for Industry & Trade R&D - MOIT
30. Ms. Euis Staff, Agency for Industry & Trade R&D MOIT
31. Mr. Thomas Hanan Thoha KADIN - Metal Works Association
32. Mr. Safriudin PT KHI (Steel Pipe Company)
33. Mr. Halim Indonesian Association of Manpower (ITKI)
34. Ms. Risa Indonesian Synthetic Fibre Producer Association (APSYFI) - KADIN
35. Mr. Surynato PT Jasa Tariqa Indah (Ltd.)
36. Mr. Mr. Ibrahim Abdullah Indonesian Garment Association - KADIN
37. Mr. Anthony Suryo PT DOXA (Ltd.)
38. Mr. Arif BATARA (Ltd.)
39. Mr. Ervan BATARA (Ltd.)
40. Mr. ML Simbolon Director, Agency for Industry & Trade R&D MOIT
41. Mr. Achdiat Kurnadi Indonesian Engineer Association (PII)
42. Mr. Raswin Widjaja PT PANASONIC (Ltd.)
43. Mr. Ridwan Hamdani INKIM – KADIN
44. Mr. Budi Kristiar Indonesian Wood Panel Association (APKINDO) - KADIN

257
45. Mr. Achadiat Suahdi PT Kancil (Ltd.)
46. Mr. Kresna D. PT Kancil (Ltd.)
47. Mr. Setia W. PT Kancil (Ltd.)
Related Documents