Individuals with intellectual disability have lower voluntary muscle activation level Rihab Borji a, *, Firas Zghal b , Nidhal Zarrouk c , Sonia Sahli a , Haithem Rebai a a Unite ´ de Recherche Education, Motricite ´, Sports et sante ´, Institut Supe ´rieur du Sport et de l’Education Physique de Sfax, Universite ´ de Sfax, Tunisia b Laboratoire Adaptations Me ´taboliques a ` l’Exercice en Conditions Physiologiques et Pathologiques (AME2P, EA 3533), Universite ´ Blaise Pascal, Clermont-Ferrand, France c Laboratoire des techniques d’imagerie me ´dicale (LR 12ES06, LTIM), Faculte ´ de Me ´dicine de Monastir, Universite ´ de Monastir, Tunisia 1. Introduction Individuals with intellectual disabilities (ID) present several abnormalities in their nervous system structure (Gabrielli et al., 1998) localized in the white matter tracts that are responsible for the processing of sensory and motor Research in Developmental Disabilities 35 (2014) 3574–3581 ARTICLE INFO Article history: Received 6 June 2014 Received in revised form 26 August 2014 Accepted 28 August 2014 Available online Keywords: Intellectual disability Electrical stimulation Twitch interpolation technique Voluntary activation level Knee extensor muscles ABSTRACT The aim of this study was to explore the voluntary activation level during maximal voluntary contraction (MVC) in individuals with intellectual disability (ID) versus individuals without ID using the twitch interpolation technique. Ten individuals with mild ID (ID group) and 10 sedentary men without ID (control group) participated in this study. The evaluation of neuromuscular function consisted in three brief MVCs (3 s) of the knee extension superimposed with electrical nerve stimulation (NES) to measure voluntary activation. Muscle activity levels were also measured with surface EMG. The root mean square (RMS) was extracted from the EMG signal. The RMS/Mmax ratio and the neuromuscular efficiency (NME) were calculated. Our results reported that individuals with ID present lower muscle strength (p < 0.001), lower voluntary activation level (p < 0.001), lower RMS values of vastus lateralis (p < 0.05), vastus medialis (p < 0.05), and rectus femoris (p < 0.001) muscles. In addition, our results showed lower RMS/Mmax values in the ID group than in the control group for the VM (0.05 0.01 mV vs. 0.04 0.01 mV; p < 0.05) and the RF (0.06 0.02 mV vs. 0.05 0.02 mV; p < 0.05) muscles. However, no significant difference was reported for the VL muscle (0.05 0.02 mV vs. 0.05 0.02 mV; p = 0.463). Moreover, Individuals with ID present smaller potentiated twitch (p < 0.001). However, no significant difference was reported in the NME ratio. These results suggest that the lower muscle strength known in individuals with ID is related to a central nervous system failure to activate motor units and to some abnormal intrinsic muscle properties. It seems that the inactive lifestyle adopted by individuals with ID is one of the most important factors of their lower voluntary activation levels. Therefore, physical activities should be introduced in life style of individuals with ID to improve their neuromuscular function. ß 2014 Elsevier Ltd. All rights reserved. * Corresponding author at: Institut Supe ´ rieur de Sport et de l’Education Physique de Sfax, Route de l’Ae ´ rodro ˆme, Km 3.5, BP 1068, 3000 Sfax, Tunisia. Tel.: +216 22092322. E-mail addresses: [email protected] (R. Borji), zghal.fi[email protected] (F. Zghal), [email protected] (N. Zarrouk), [email protected] (S. Sahli), [email protected] (H. Rebai). Contents lists available at ScienceDirect Research in Developmental Disabilities http://dx.doi.org/10.1016/j.ridd.2014.08.038 0891-4222/ß 2014 Elsevier Ltd. All rights reserved.

Welcome message from author
This document is posted to help you gain knowledge. Please leave a comment to let me know what you think about it! Share it to your friends and learn new things together.
Transcript

Research in Developmental Disabilities 35 (2014) 3574–3581
Contents lists available at ScienceDirect
Research in Developmental Disabilities
Individuals with intellectual disability have lower voluntary
muscle activation levelRihab Borji a,*, Firas Zghal b, Nidhal Zarrouk c, Sonia Sahli a, Haithem Rebai a
a Unite de Recherche Education, Motricite, Sports et sante, Institut Superieur du Sport et de l’Education Physique de Sfax, Universite de Sfax,
Tunisiab Laboratoire Adaptations Metaboliques a l’Exercice en Conditions Physiologiques et Pathologiques (AME2P, EA 3533), Universite Blaise
Pascal, Clermont-Ferrand, Francec Laboratoire des techniques d’imagerie medicale (LR 12ES06, LTIM), Faculte de Medicine de Monastir, Universite de Monastir, Tunisia
A R T I C L E I N F O
Article history:
Received 6 June 2014
Received in revised form 26 August 2014
Accepted 28 August 2014
Available online
Keywords:
Intellectual disability
Electrical stimulation
Twitch interpolation technique
Voluntary activation level
Knee extensor muscles
A B S T R A C T
The aim of this study was to explore the voluntary activation level during maximal
voluntary contraction (MVC) in individuals with intellectual disability (ID) versus
individuals without ID using the twitch interpolation technique. Ten individuals with mild
ID (ID group) and 10 sedentary men without ID (control group) participated in this study.
The evaluation of neuromuscular function consisted in three brief MVCs (3 s) of the knee
extension superimposed with electrical nerve stimulation (NES) to measure voluntary
activation. Muscle activity levels were also measured with surface EMG. The root mean
square (RMS) was extracted from the EMG signal. The RMS/Mmax ratio and the
neuromuscular efficiency (NME) were calculated. Our results reported that individuals
with ID present lower muscle strength (p< 0.001), lower voluntary activation level
(p< 0.001), lower RMS values of vastus lateralis (p< 0.05), vastus medialis (p< 0.05), and
rectus femoris (p< 0.001) muscles. In addition, our results showed lower RMS/Mmax
values in the ID group than in the control group for the VM (0.05� 0.01 mV vs.
0.04� 0.01 mV; p< 0.05) and the RF (0.06� 0.02 mV vs. 0.05� 0.02 mV; p< 0.05) muscles.
However, no significant difference was reported for the VL muscle (0.05� 0.02 mV vs.
0.05� 0.02 mV; p = 0.463). Moreover, Individuals with ID present smaller potentiated twitch
(p< 0.001). However, no significant difference was reported in the NME ratio. These results
suggest that the lower muscle strength known in individuals with ID is related to a central
nervous system failure to activate motor units and to some abnormal intrinsic muscle properties.
It seems that the inactive lifestyle adopted by individuals with ID is one of the most important
factors of their lower voluntary activation levels. Therefore, physical activities should be
introduced in life style of individuals with ID to improve their neuromuscular function.
� 2014 Elsevier Ltd. All rights reserved.
1. Introduction
Individuals with intellectual disabilities (ID) present several abnormalities in their nervous system structure(Gabrielli et al., 1998) localized in the white matter tracts that are responsible for the processing of sensory and motor
* Corresponding author at: Institut Superieur de Sport et de l’Education Physique de Sfax, Route de l’Aerodrome, Km 3.5, BP 1068, 3000 Sfax, Tunisia.
Tel.: +216 22092322.
E-mail addresses: [email protected] (R. Borji), [email protected] (F. Zghal), [email protected] (N. Zarrouk),
[email protected] (S. Sahli), [email protected] (H. Rebai).
http://dx.doi.org/10.1016/j.ridd.2014.08.038
0891-4222/� 2014 Elsevier Ltd. All rights reserved.

R. Borji et al. / Research in Developmental Disabilities 35 (2014) 3574–3581 3575
information (Yu et al., 2008). Several studies have mentioned that individuals with ID present several abnormalities inmotor nervous control and neuromuscular coordination (Chia, Lee, & Teo-Koh, 2002). In addition, individuals with IDpresent lower muscle strength compared to individuals without ID (Angelopoulou, Tsimaras, Christoulas, Kokaridas, &Mandroukas, 1999; Blomqvist, Olsson, Wallin, Wester, & Rehn, 2013; Borji, Sahli, Zarrouk, Zghal, & Rebai, 2013; Carmeli,Ayalon, Barchad, Sheklow, & Reznick, 2002; Horvat, Croce, Pitetti, & Fernhall, 1999). Moreover, in a previous study, wedemonstrated that individuals with ID present lower root mean square (RMS) value in comparison with individualswithout ID (Borji et al., 2013). Nevertheless, the reason for this force deficiency has not been identified yet.
In individuals without ID, it has been demonstrated that muscle force level depends on several factors such as muscularfiber typology (Fitts & Widrick, 1996), training status (Fitts & Widrick, 1996), sex difference (Miller, MacDougall,Tarnopolsky, & Sale, 1993), and age difference (Lindle et al., 1997). Muscle force level depends also on neural mechanismssuch as the voluntary activation level of motor units (Gandevia, 2001, 1992). Voluntary activation describes the level ofneural drive of muscle during voluntary contractions (Gandevia, Allen, & McKenzie, 1995). One of the methods to evaluatethe activation of motor units by the central nervous system is the superimposed twitch technique (Gandevia, 2001; Milletet al., 2012). The presence of a superimposed twitch produced by motor nerve stimulation during a MVC indicates that thewhole motor units are not totally recruited by the central nervous system (Merton, 1954). If voluntary activation isincomplete, failure to drive the muscle should occur at or above the site of stimulation of the motor axons (Merton, 1954).
Using this technique, many studies have attempted to investigate the relationship between the reduced voluntary forceproduction and the voluntary activation levels in general population (Belanger & McComas, 1981; Bigland-Ritchie, Donovan, &Roussos, 1981), athletic population (Huber, Suter, & Herzog, 1998), and clinical populations (Hurley, Jones, & Newham, 1994;Rutherford, Jones, & Newham, 1986). Studies investigating this relationship in elderly persons and individuals with cerebralpalsy found that the lower muscle force noted in both populations had been related to the activation deficit (AD) from centralnervous system (Stackhouse et al., 2001; Stackhouse, Binder-Macleod, & Lee, 2005; Yue, Ranganathan, Siemionow, Liu, & Sahgal,1999). Nevertheless, to our knowledge no data is available about the voluntary activation in individuals with ID.
Thus, the aims of this study were to compare the force production and the level of voluntary activation betweenindividuals with ID and individuals without ID as well as to investigate the implication of the central nervous systemdeficiency in the force production in individuals with ID.
2. Methods
2.1. Participants
The sample population consisted of 20 sedentary men who met the same criteria in terms of socioeconomic status andethnicity. Ten men with ID (age = 24.9� 4.9 years; height = 1.7� 0.1 m; weight = 77.9� 8.3 kg; BMI = 25.7� 2.5 kg/m2)participated in the study as an experimental group. The control group consisted of 10 sedentary and healthy (no cardiovascular,metabolic, immunologic, or neuromuscular disorders) men without ID matched for age, height, and weight:(age = 25.2 � 2.7 years; height = 1.7 � 0.1 m; weight = 75.3 � 9.2 kg; BMI = 23.9 � 1.7 kg/m2).
All participants with ID suffered from a mild ID with an intelligence quotient (IQ) between 50 and 55 and 70 (TheAmerican Psychiatric Association, 2000) determined by the WAIS-IV test (Wechsler, 2008) elaborated by the educationalcenter psychologist (IQ = 62� 3.5). Participants with ID have been recruited randomly from the Tunisian Union of Aid to MentalInsufficiency (TUAMI). The sample excluded individuals with down syndrome, and with multiple disabilities. The participant’smorphological characteristics showed no statistical differences in terms of age, weight, height and BMI between the two groups.The participants were fully informed of the procedure and the risks involved and gave their written consent. The informed consentfor the individuals with ID was provided by their parents or legal guardians.
2.2. Study design
Three days after a familiarization session with the experimental procedures, participants engaged in the experimentalsession. The experimental session was preceded by a warm-up consisting of several submaximal contractions (12–15) ofknee extension muscles at a freely chosen intensity. The evaluation of neuromuscular function consisted in three brief (3 s)maximal voluntary contractions (MVCs) of the knee extension superimposed with nerve electrical stimulation (NES) tomeasure voluntary activation. Muscle activity levels were also measured with surface electromyography (EMG). To excludethe confounding effect of fatigue induced by repeated muscular contractions, the three MVCs were separated by a 2-minrecovery period. The comparison of data obtained during the first and the third MVC did not reveal any significant difference,suggesting that the experimental procedures did not induce any fatigue.
2.3. Testing procedures and instrumentation
2.3.1. Force measurement
The participants performed three MVCs with strong encouragement by the investigator. During testing, the participantswere seated on an isometric dynamometer (Good Strength, Metitur, Finland) equipped with a cuff attached to a strain gauge.This cuff was adjusted �2 cm above the lateral malleolus using a Velcro strap. The participants stabilized themselves by
R. Borji et al. / Research in Developmental Disabilities 35 (2014) 3574–35813576
grasping handles on the side of the chair during contractions. Safety belts were strapped across the chest, thighs and hips toavoid lateral, vertical or frontal displacements. All measurements were taken from the participant’s dominant leg, with thehip and knee angles set at 908 from full extension (= 08). All participants in our study presented the right leg as the dominantleg (determined by the leg used to kick a ball).
2.3.2. Electromyographic recordings
The EMG signals of the vastus lateralis (VL), vastus medialis (VM) and rectus femoris (RF) muscles were recorded usingbipolar silver chloride surface electrodes (Blue Sensor N-00-S, Ambu, Denmark) during MVC and stimulations. The recordingelectrodes were taped lengthwise on the skin over the muscle belly following SENIAM recommendations (Hermens, Feriks,Disselhorst-Klug, & Rau, 2000), with an inter-electrode distance of 20 mm. The position of the electrodes was marked on theskin in case they needed to be repositioned during the experiment. The reference electrode was attached to the patella. Lowimpedance (Z< 5 kV) at the skin-electrode surface was obtained by shaving, abrading the skin with thin sand paper andcleaning with alcohol. EMG signals were amplified (Octal Bio Amp ML 138, ADInstruments, Australia) with a bandwidthfrequency ranging from 10 Hz to 1 kHz (common mode rejection ratio> 96 dB, gain = 1000) and simultaneously digitizedtogether with the force signals using an acquisition card (Powerlab 16SP, ADInstruments, Australia) and Labchart7.0 software (ADInstruments, Australia). The sampling frequency was 2 kHz. MVC force was determined as the peak forcereached during maximal efforts. RMS values of the VL, VM and RF EMG activities were calculated during the MVC trials over a0.5 s period after the force had reached a plateau and before the superimposed stimulation was evoked.
Neuromuscular efficiency (NME) was calculated as the ratio of peak force to the sum RMS of the VL, RF, and VM muscles toprovide an overall representation of quadriceps muscle group activity (Deschenes et al., 2002; Woods & Bigland-Ritchie,1983; Zarrouk et al., 2012).
2.3.3. Peripheral nerve stimulation (NES)
The twitch interpolation method, proposed by Merton (1954), involves interpolation of a single supramaximal electricalstimulus to the motor nerve during MVC. Voluntary activation is thus quantified by comparing the amplitude of thesuperimposed twitch with the force evoked by the same stimulus intensity at rest, and immediately following thecorresponding MVC (Kufel, Pineda, & Mador, 2002). The femoral nerve was stimulated percutaneously with a single square-wave stimulus of 1 ms duration with maximal voltage of 400 V delivered by a constant current stimulator (Digitimer DS7A,Hertfordshire, United Kingdom). The cathode (self-adhesive electrode: Ag–AgCl, 10 mm diameter) was positioned in thefemoral triangle and pressed firmly into place by an experimenter. The anode, a 10� 5 cm self-adhesive stimulationelectrode (Medicompex SA, Ecublens, Switzerland) was placed midway between the greater trochanter and the iliac crest.Optimal stimulation intensity was determined from M-wave and force measurements before each testing session. Briefly,the stimulation intensity was increased by 5 mA until there was no further increase in either peak twitch force (i.e., thehighest value of the knee extension twitch force was reached) or in concomitant VL, VM and RF peak-to-peak M-waveamplitudes (Mmax). During the subsequent testing procedures, the intensity was set to 150% of the optimal intensity toovercome the potential confounding effect of axonal hyperpolarization (Burke, 2002). MVC superimposed with NES wereused to calculate the voluntary activation level as follows:
Voluntary activation ð%Þ ¼ 1� superimposed twitch
potentiated twitch
� �� 100
where ‘‘superimposed twitch’’ is the amplitude of the twitch evoked with NES during MVC and ‘‘potentiated twitch’’ is theamplitude of the twitch evoked by a single stimulation delivered 3 s after the end of the MVC. This provided the opportunityto obtain a potentiated mechanical response and so reduce the variability in voluntary activation values (Kufel et al., 2002).The ID group AV was calculated as follows:
AV ð%Þ ¼ 1� voluntary activation of ID group
voluntary activation of control group
� �� 100
2.4. Statistical analysis
All data are presented as means� SD and were analyzed by the Statistica for Windows software (version 6.0, StatSoft, Inc.,Tulsa, OK). Data distribution normality was confirmed with the Shapiro–Wilk W-test. Independent sample t-tests were executedin order to analyze group differences in characteristics (age, height, weight and BMI), MVC, voluntary activation, potentiatedresting twitch, RMS, RMS/Mmax and NME values. The level of significance for all statistical analyses was set at p< 0.05.
3. Results
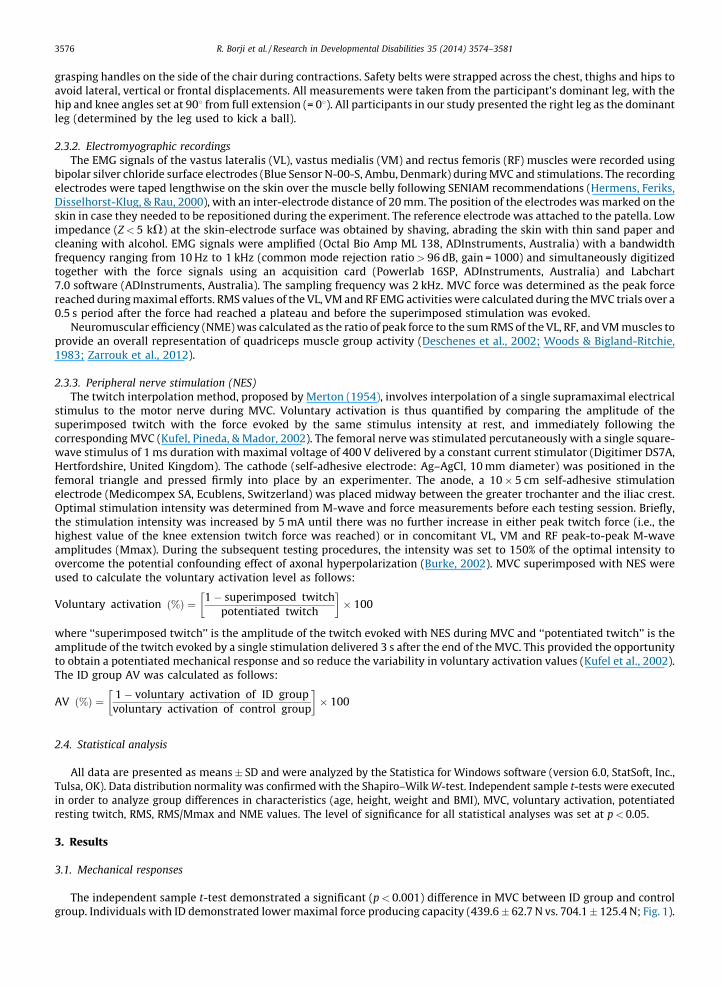
3.1. Mechanical responses
The independent sample t-test demonstrated a significant (p< 0.001) difference in MVC between ID group and controlgroup. Individuals with ID demonstrated lower maximal force producing capacity (439.6� 62.7 N vs. 704.1� 125.4 N; Fig. 1).

[(Fig._1)TD$FIG]
MVC
(N)
0
100
200
300
400
500
600
700
800
900
Controls ID
Fig. 1. Mean (� SD) values of maximal voluntary contraction (MVC) for individuals with intellectual disability (ID) and those without ID (controls). *** Significant
difference at p< 0.001.
[(Fig._2)TD$FIG]
Volu
ntar
y A
ctiv
atio
n Le
vel N
ES (%
)
0
10
20
30
40
50
60
70
80
90
100
Contrrols ID
Fig. 2. Mean (� SD) values of voluntary activation level for individuals with intellectual disability (ID) and those without ID (controls). *** Significant difference
at p< 0.001.
[(Fig._3)TD$FIG]
0
50
100
150
200
250
Pote
ntia
ted
Rest
ing
Twitc
h (N
)
Controols ID
Fig. 3. Mean (� SD) values of potentiated resting twitch (PRT) for individuals with intellectual disability (ID) and those without ID (controls). *** Significant
difference at p< 0.001.
R. Borji et al. / Research in Developmental Disabilities 35 (2014) 3574–3581 3577

Table 1
Root mean square (RMS), RMS/Mmax values of the vastus lateralis (VL), vastus medialis (VM), and rectus femoris (FR) muscles and neuromuscular efficiency
(NME) ratio for individuals with intellectual disability (ID group) and those without ID (controls).
Control group (n = 10)
Mean (SD)
ID group (n = 10)
Mean (SD)
Independent t-tests (p-value)
RMS VL (mV) 0.42 (0.15) 0.27 (0.15) 2.13 (0.046)*
RMS VM (mV) 0.51 (0.22) 0.29 (0.07) 2.79 (0.012)*
RMS RF (mV) 0.47 (0.17) 0.29 (0.06) 3.02 (0.007)***
RMS/Mmax VL (mV) 0.05 (0.02) 0.05 (0.02) 0.74 (0.463)
RMS/Mmax VM (mV) 0.05 (0.01) 0.04 (0.01) 2.59 (0.018)*
RMS/Mmax RF (mV) 0.06 (0.02) 0.05 (0.02) 2.55 (0.020)*
NME 536.8 (158.7) 539.3 (144.7) �0.03 (0.970)
* Significant differences at p< 0.05.
*** Significant differences at p< 0.001.
R. Borji et al. / Research in Developmental Disabilities 35 (2014) 3574–35813578
In addition, the independent sample t-test indicated a significant (p< 0.001) differences for both voluntary activation andpotentiated resting twitch between the ID group and the control group. Individuals with ID presented lower voluntary activationlevel (65.8� 8.0% vs. 85.6� 5.0%; Fig. 2) and potentiated resting twitch (115.8� 18.9 N vs. 186.3� 24.3 N; Fig. 3).
3.2. EMG responses
The independent sample t-test indicated significantly lower RMS values in the ID group than the control group for the VL(0.27� 0.15 mV vs. 0.42� 0.15 mV; p< 0.05), the VM (0.29� 0.07 mV vs. 0.51� 0.22 mV; p< 0.05), and the RF (0.29� 0.06 mVvs. 0.47� 0.17 mV; p< 0.001) muscles. Moreover, the independent sample t-test indicated significantly lower RMS/Mmax valuesin the ID group than the control group for the VM (0.05� 0.01 mV vs. 0.04� 0.01 mV; p< 0.05) and the RF (0.06� 0.02 mV vs.0.05� 0.02 mV; p< 0.05) muscles. However, no significant difference was reported for the VL muscle (0.05� 0.02 mV vs.0.05� 0.02 mV; p = 0.463; Table 1). Concerning the NME ratio, the independent sample t-test indicated no significant differencebetween the ID group and the control group (539.3� 144.7 vs.536.8� 158.7; p = 0.97; Table 1).
4. Discussion
The aims of this study were to compare the force production and the level of voluntary activation between individualswith ID and individuals without ID as well as to investigate the implication of the central nervous system deficiency in theforce production in individuals with ID. Our results showed that individuals with ID develop lower MVC than individualswithout ID. This result is consistent with previous studies investigating muscle force level in sedentary individuals with ID(Angelopoulou et al., 1999; Borji et al., 2013; Carmeli et al., 2002; Croce, Pitetti, Horvat, & Miller, 1996; Horvat et al., 1999;Pitetti & Boneh, 1995; Zafeiridis et al., 2010). Besides, smaller differences in force level were reported when comparing eliteathletes with ID to physical education students without ID (van de Vliet et al., 2006). Moreover, it has been demonstratedthat, in individuals without ID, the muscle force level depends on the training status (Fitts & Widrick, 1996) and thevoluntary activation level (Gandevia, 2001, 1992).
The main result of our study showed that individuals with ID have lower ability to activate motor units than individualswithout ID. They were only able to activate 65% of their motor units versus 85% in the control group. Moreover, our ID grouppresents an AD of 23.13% compared with the control group. Even in individuals without ID, it is well known that the centralnervous system fails to generate maximal evocable force (Gandevia, 2001; Strojnik, 1995). Therefore, concerning our controlgroup, our results were in agreement with those of Shield and Zhou (2004) who found that the quadriceps voluntaryactivation was between 85% and 95% of total motor units in sedentary individuals without ID. Moreover, Babault, Pousson,Ballay, and Van Hoecke (2001) found that the mean activation levels during MVC are 95.2% in individuals practicing regularphysical activities. Unfortunately, no data are available concerning the voluntary activation level in individuals with ID.Nevertheless, the AD in the ID group is similar in magnitude to deficits reported for the quadriceps femoris in someindividuals with central nervous system disorders. This AD was at 25–40% in adults after a stroke (Newham & Hsiao, 2001), at25% in individuals with multiple sclerosis (de Haan, de Ruiter, van der Woude, & Jongen, 2000), and at 33% in individuals withcerebral palsy (Stackhouse et al., 2005). The voluntary activation failure could be explained by the several central nervoussystem abnormalities. It has been documented that individuals with ID present a failure of growth and maturation in brainareas during the developmental years (Gabrielli et al., 1998). Post-mortem neuropathological studies in ID showed severalalterations in the cerebral cortex structure and in the hippocampus and a reduction in the number of neurons (Dierssen &Ramakers, 2006). Individuals with ID present also dendritic abnormalities (Dierssen & Ramakers, 2006; Fodale, Mafrica,Caminiti, & Grasso, 2006), and neurotransmitter system dysfunction with abnormal neuronal connectivity, resulting indeficient information processing (Kaufmann & Moser, 2000). They present also several abnormalities localized in the whitematter tracts that are responsible for the motor function (Yu et al., 2008). The maturational differences in neuromuscularfunction could be also responsible for the lower central activation level in individuals with ID. Therefore, while ourindividuals with ID sample are adults (24.9� 4.9 years), they demonstrated a voluntary activation level comparable with that

R. Borji et al. / Research in Developmental Disabilities 35 (2014) 3574–3581 3579
demonstrated by children without ID (65% vs. 68% respectively) as it has been reported by O’Brien, Reeves, Baltzopoulos, Jones,and Maganaris (2009). In fact, ID is defined as a condition of arrest or incomplete development of the mind, which does not onlyaffect cognitive functions, but motor functions as well (World Health Organization, 2007). An inactive lifestyle could be animportant factor of this lower central voluntary activation because individuals with ID are less active than general population(Hall & Thomas, 2008). For instance, it has been shown that sedentary individuals without ID have lower voluntary activation thantrained ones (Yamada, Kaneko, & Masuda, 2002).
Our results showed that individuals with ID present a lower potentiated resting twitch than individuals without ID, whichmeans that they have less muscle volume than individuals without ID. Although muscle size or volume was not directlymeasured in the present study, the reduced MVC is probably due to muscle atrophy usually reported in individuals with ID(Fryns et al., 1993; Hino-Fukuyo et al., 2006; Van’t Padje et al., 2009), which could be attributed to the inactive lifestyle.Moreover, it seems reasonable to expect that intrinsic muscle properties disorders such as reduced sarcolemmal and/or T-tubules excitability and reduced release of Ca++ from SR may additionally contribute to the lower potentiated twitchreported in individuals with ID. In fact, it has been documented that individuals with ID demonstrate different muscle lacticprofile compared to individuals without ID during maximal effort (Chia et al., 2002; Zafeiridis et al., 2010).
In the present study, individuals with ID present lower RMS and RMS/Mmax values during MVC than individuals withoutID. Nevertheless, no significant difference in the NME ratio was noted between individuals with and without ID. In fact, theNME was defined as ‘‘the responsiveness of muscle to neural excitation’’ (Deschenes et al., 2002). This result suggests that thelower force level is not resulting from functional muscle abnormalities but is related to neural factors. Our results are in linewith our previous study (Borji et al., 2013). In this previous study we have reported that, in spite of their lower MVC andlower RMS values, individuals with ID present similar NME values with individuals without ID. Moreover, some studiesestablished a relationship between muscle force level and different incapacities in individuals with ID such as cardiovascularreduced capacities (Pitetti & Boneh, 1995), and lower anaerobic power (Chia et al., 2002; Zafeiridis et al., 2010). In addition,some studies demonstrated that the force deficit in individuals with ID is strongly related to the degree of hypotonia reportedin these individuals (Morris, Vaughan, & Vacarro, 1982).
There are some limitations that should be addressed. First, while statistical analysis demonstrated no significantdifference on BMI between groups, we have not measured the % of body fat for both groups. In this context, it should benoted, that EMG signal may be affected by body fat and skinfold thickness individual differences (Nordander et al., 2003).Second, the original twitch interpolation technique described by Merton (1954) and subsequently employed by many others(Belanger & McComas, 1981; Bigland-Ritchie, Furbush & Woods, 1986) involved a single stimulus interpolated overvoluntary contractions. However, recently, it has become common for two or more stimuli (50–100 Hz) to be employedbecause the evoked force increments are larger and more readily detected (Strojnik, 1995; Suter & Herzog, 2001). Moreover,it has been reported that supramaximal twin, triple and quadruple stimuli (at 125 Hz) evoke less variable force incrementsthan single stimuli (Suter & Herzog, 2001). Finally, although the twitch interpolation technique is an efficient technique toexplore voluntary activation, spinal and supraspinal contributions on the AD in individuals with ID are still unknown. Futurestudy should explore cortical activation in individuals with ID during exercise using the transcranial magnetic stimulation.
5. Conclusion
The results of our study showed that individuals with ID have lower ability to activate their motor units. Moreover, ourstudy showed a muscle structure difference between individuals with and without ID. These results could have importantimplications for coaches of ID athletes. They should focus on neuromuscular function improvement in order to increase thenervous system efficiency to activate motor unit. As in individuals without ID, neuromuscular function and muscle structureimprovement could be possible in individuals with ID by inserting strength training program in their physical activities.
Conflict of interest
The authors declare that they have no conflict of interest.
Acknowledgements
The authors would like to thank all participants for their understanding and availability. Special gratitude is due to allcollaborating and volunteers of the Tunisian Union of Aid to Mental Insufficiency (TUAMI) for their contribution in this study.
References
American Psychiatric Association (2000). Diagnostic and statistical manual of mental disorders (4th ed. (DSM-IV)). Washington, DC: American PsychiatricAssociation.
Angelopoulou, N., Tsimaras, V., Christoulas, K., Kokaridas, D., & Mandroukas, K. (1999). Isokinetic knee muscle strength of individuals with mental retardation, acomparative study. Perceptual and Motor Skills, 88(3 Pt 1), 849–855.
Babault, N., Pousson, M., Ballay, Y., & Van Hoecke, J. (2001). Activation of human quadriceps femoris during isometric, concentric, and eccentric contractions.Journal of Applied Physiology, 91, 2628–2634.
Belanger, A. Y., & McComas, A. J. (1981). Extent of motor unit activation during effort. Journal of Applied Physiology, 51, 1131–1135.

R. Borji et al. / Research in Developmental Disabilities 35 (2014) 3574–35813580
Bigland-Ritchie, B., Donovan, E. F., & Roussos, C. S. (1981). Conduction velocity and EMG power spectrum changes in fatigue of sustained maximal efforts. Journal ofApplied Physiology, 51, 1300–1305.
Bigland-Ritchie, B., Furbush, F., & Woods, J. J. (1986). Fatigue of intermittent submaximal voluntary contractions: Central and peripheral factors. Journal of AppliedPhysiology, 61, 421–429.
Blomqvist, S., Olsson, J., Wallin, L., Wester, A., & Rehn, B. (2013). Adolescents with intellectual disability have reduced postural balance and muscle performance intrunk and lower limbs compared to peers without intellectual disability. Research in Developmental Disabilities, 34(1), 198–206.
Borji, R., Sahli, S., Zarrouk, N., Zghal, F., & Rebai, H. (2013). Neuromuscular fatigue during high-intensity intermittent exercise in individuals with intellectualdisability. Research in Developmental Disabilities, 34(12), 4477–4484.
Burke, D. (2002). Effects of activity on axonal excitability: Implications for motor control studies. Advances in Experimental Medicine and Biology, 508, 33–37.Carmeli, E., Ayalon, M., Barchad, S., Sheklow, S. L., & Reznick, A. Z. (2002). Isokinetic leg strength of institutionalized older adults with mental retardation with and
without Down’s syndrome. The Journal of Strength and Conditioning Research, 16(2), 316–320.Chia, Y. H. M., Lee, K. S., & Teo-Koh, S. M. (2002). High intensity cycling performances of boys with and without intellectual disability. Journal of Intellectual and
Developmental Disability, 27, 191–200.Croce, R. V., Pitetti, K. H., Horvat, M., & Miller, J. (1996). Peak torque, average power, and hamstrings/quadriceps ratios in nondisabled adults and adults with
mental retardation. Archives of Physical Medicine and Rehabilitation, 77(4), 369–372.de Haan, A., de Ruiter, C. J., van der Woude, L. H. V., & Jongen, P. J. H. (2000). Contractile properties and fatigue of quadriceps muscles in multiple sclerosis. Muscle
and Nerve, 23, 1534–1541.Deschenes, M. R., Giles, J. A., McCoy, R. W., Volek, J. S., Gomez, A. L., & Kraemer, W. J. (2002). Neural factors account for strength decrements observed after short-
term muscle unloading. American Journal of Physiology-Regulatory, Integrative and Comparative Physiology, 282, 578–583.Dierssen, M., & Ramakers, G. J. A. (2006). Dendritic pathology in mental retardation: From molecular genetics to neurobiology. Genes, Brain and Behavior, 5, 48–60.Fitts, R. H., & Widrick, J. J. (1996). Muscle mechanics: Adaptations with exercise-training. Exercise and Sport Sciences Reviews, 24, 427–473.Fodale, V., Mafrica, F., Caminiti, V., & Grasso, G. (2006). The cholinergic system in Down’s syndrome. Journal of Intellectual Disabilities, 10(3), 261–274.Fryns, J. P., Thiry, P., Geutjens, J., Smeets, E., Vinken, L., & Van den Berghe, H. (1993). Profound mental retardation, characteristic facies with midfacial hypoplasia
and premature fronttemporal balding, muscular hypotrophy, and small patellae in two unrelated male patients. Journal of Medical Genetics, 30(4), 319–321.Gabrielli, O., Coppa, G. V., Manzoni, M., Carloni, I., Kantar, A., Maricotti, M., et al. (1998). Minor cerebral alterations observed by magnetic resonance imaging in
syndromic children with mental retardation. European Journal of Radiology, 27(2), 139–144.Gandevia, S. C. (1992). Some central and peripheral factors affecting human motoneuronal output in neuromuscular fatigue. Sports Medicine, 13, 93–98.Gandevia, S. C. (2001). Spinal and supraspinal factors in human muscle fatigue. Physiological Reviews, 81(4), 1725–1789.Gandevia, S. C., Allen, G. M., & McKenzie, D. K. (1995). Central fatigue, critical issues, quantification and practical implications. Advances in Experimental Medicine
and Biology, 384, 281–294.Hall, J. M., & Thomas, M. J. (2008). Promoting physical activity and exercise in older adults with developmental disabilities. Topics in Geriatric Rehabilitation,
24, 64–73.Hermens, H. J., Feriks, B., Disselhorst-Klug, C., & Rau, G. (2000). Development of recommendations for SEMG sensors and sensor placement procedures. Journal of
Electromyography and Kinesiology, 10, 361–374.Hino-Fukuyo, N., Haginoya, K., Hayashi, Y. K., Nishino, I., Murakami, T., Nonaka, I., et al. (2006). A case of Fukuyama-type congenital muscular dystrophy with a
very mild mental deficit. Neuromuscular Disorders, 16(4), 274–276.Horvat, M., Croce, R., Pitetti, K. H., & Fernhall, B. (1999). Comparison of isokinetic peak force and work parameters in youth with and without mental retardation.
Medicine and Science in Sports and Exercise, 31(8), 1190–1195.Huber, A., Suter, E., & Herzog, W. (1998). Inhibition of the quadriceps muscles in elite male volleyball players. Journal of Sports Sciences, 16, 281–289.Hurley, M. V., Jones, D. W., & Newham, D. J. (1994). Arthrogenic quadriceps inhibition and rehabilitation of patients with extensive traumatic knee injuries. Clinical
Science, 86, 305–310.Kaufmann, W. E., & Moser, H. W. (2000). Dendritic anomalies in disorders associated with mental retardation. Cerebral Cortex, 10(10), 981–991.Kufel, T. J., Pineda, L. A., & Mador, M. J. (2002). Comparison of potentiated and unpotentiated twitches as an index of muscle fatigue. Muscle and Nerve, 25(3),
438–444.Lindle, R. S., Metter, E. J., Lynch, N. A., Fleg, J. L., Fozard, J. L., Tobin, J., et al. (1997). Age and gender comparisons of muscle strength in 654 women and men aged
20–93 yr. Journal of Applied Physiology, 83, 1581–1587.Merton, P. A. (1954). Voluntary strength and fatigue. Journal of Physiology, 123, 553–564.Miller, A. E., MacDougall, J. D., Tarnopolsky, M. A., & Sale, D. G. (1993). Gender differences in strength and muscle fiber characteristics. European Journal of Applied
Physiology and Occupational Physiology, 66(3), 254–262.Millet, G. Y., Bachasson, D., Temesi, J., Wuyam, B., Feasson, L., Verges, S., et al. (2012). Potential interests and limits of magnetic and electrical stimulation
techniques to assess neuromuscular fatigue. Neuromuscular Disorders, 22(3), 181–186.Morris, A., Vaughan, S., & Vacarro, P. (1982). Measurement of neuromuscular tone and strength in Down’s syndrome children. Journal of Mental Deficiency Research,
26, 122–126.Newham, D. J., & Hsiao, S. F. (2001). Knee muscle isometric strength, voluntary activation and antagonist cocontraction in the first six months after stroke.
Disability and Rehabilitation, 23, 379–386.Nordander, C., Willner, J., Hansson, G. A., Larsson, B., Unge, J., Granquist, L., et al. (2003). Influence of the subcutaneous fat layer, as measured by ultrasound,
skinfold calipers and BMI, on the EMG amplitude. European Journal of Applied Physiology, 89(6), 514–519.O’Brien, T. D., Reeves, N. D., Baltzopoulos, V., Jones, D. A., & Maganaris, C. N. (2009). The effects of agonist and antagonist muscle activation on the knee extension
moment–angle relationship in adults and children. European Journal of Applied Physiology, 106(6), 849–856.Pitetti, K. H., & Boneh, S. (1995). Cardiovascular fitness as related to leg strength in adults with mental retardation. Medicine and Science in Sports and Exercise, 27(3),
423–428.Rutherford, O. M., Jones, D. A., & Newham, D. J. (1986). Clinical and experimental application of the percutaneous twitch superimposition technique for the study
of human muscle activation. Journal of Neurology, Neurosurgery, and Psychiatry, 49, 1288–1291.Shield, A., & Zhou, S. (2004). Assessing voluntary muscle activation with the twitch interpolation technique. Sports Medicine, 34(4), 253–267.Stackhouse, S. K., Binder-Macleod, S. A., & Lee, S. C. (2005). Voluntary muscle activation, contractile properties, and fatigability in children with and without
cerebral palsy. Muscle and Nerve, 31(5), 594–601.Stackhouse, S. K., Stevens, J. E., Lee, S. C., Pearce, K. M., Snyder-Mackler, L., & Binder-Macleod, S. A. (2001). Maximum voluntary activation in nonfatigued and
fatigued muscle of young and elderly individuals. Physical Therapy, 81(5), 1102–1109.Strojnik, V. (1995). Muscle activation level during maximal voluntary effort. European Journal of Applied Physiology and Occupational Physiology, 72(1–2), 144–149.Suter, E., & Herzog, W. (2001). Effect of number of stimuli and timing of twitch application on variability in interpolated twitch torque. Journal of Applied
Physiology, 90(3), 1036–1040.van de Vliet, P., Rintala, P., Frojd, K., Verellen, J., van Houtte, S., Daly, D. J., et al. (2006). Physical fitness profile of elite athletes with intellectual disability.
Scandinavian Journal of Medicine & Science in Sports, 16, 417–425.Van’t Padje, S., Chaudhry, B., Severijnen, L. A., van der Linde, H. C., Mientjes, E. J., Oostra, B. A., et al. (2009). Reduction in fragile X related 1 protein causes
cardiomyopathy and muscular dystrophy in zebrafish. Journal of Experimental Biology, 212(16), 2564–2570.Wechsler, D. (2008). Wechsler adult intelligence scale (4th ed.). San Antonio, TX: Pearson.Woods, J. J., & Bigland-Ritchie, B. (1983). Linear and non-linear surface EMG/force relationships in human muscles. An anatomical/functional argument for the
existence of both. American Journal of Physical Medicine, 62, 287–299.World Health Organization (2007). ICD 10: International statistical classification of diseases and related health problems (2nd ed.). Geneva: World Health
Organization.

R. Borji et al. / Research in Developmental Disabilities 35 (2014) 3574–3581 3581
Yamada, H., Kaneko, K., & Masuda, T. (2002). Effects of voluntary activation on neuromuscular endurance analyzed by surface electromyography. Perceptual andMotor Skills, 95(2), 613–619.
Yu, C., Li, J., Liu, Y., Qin, W., Li, Y., Shu, N., et al. (2008). White matter tract integrity and intelligence in patients with mental retardation and healthy adults.Neuroimage, 40(4), 1533–1541.
Yue, G. H., Ranganathan, V. K., Siemionow, V., Liu, J. Z., & Sahgal, V. (1999). Older adults exhibit a reduced ability to fully activate their biceps brachii muscle. Journalof Gerontology (Series A) Biological Sciences, Medical Sciences, 54, 249–253.
Zafeiridis, A., Giagazoglou, P., Dipla, K., Salonikidis, K., Karra, C., & Kellis, E. (2010). Muscle fatigue during intermittent exercise in individuals with mentalretardation. Research in Developmental Disabilities, 31(2), 388–396.
Zarrouk, N., Chtourou, H., Rebai, H., Hammouda, O., Souissi, N., Dogui, M., et al. (2012). Time of day effects on repeated sprint ability. International Journal of SportsMedicine, 33(12), 975–980.
Related Documents