INDIVIDUAL, ORGANISATIONAL AND COMMUNITY EMPOWERMENT: APPLYING A COMMUNITY PSYCHOLOGY FRAMEWORK TO A SCHOOL DEVELOPMENT PROGRAMME Alexander Richard Hassett A thesis submitted to the Faculty of Arts, University of the Witwatersrand, Johannesburg in fulfilment of the requirements of Doctor of Philosophy. Johannesburg, 2006

Welcome message from author
This document is posted to help you gain knowledge. Please leave a comment to let me know what you think about it! Share it to your friends and learn new things together.
Transcript

INDIVIDUAL, ORGANISATIONAL AND COMMUNITY EMPOWERMENT: APPLYING A COMMUNITY PSYCHOLOGY FRAMEWORK TO A SCHOOL DEVELOPMENT PROGRAMME
Alexander Richard Hassett
A thesis submitted to the Faculty of Arts, University of the Witwatersrand,
Johannesburg in fulfilment of the requirements of Doctor of Philosophy.
Johannesburg, 2006

I
ABSTRACT
This study focused on whether empowerment at individual, organisational and
community levels was evident in the context of a school development
planning programme. A contextualist, multi-method approach to the study
was used, combining quantitative and qualitative data. A School
Development Planning Evaluation Scale was developed to assess
organisational empowerment in a school context. Quantitative data
measuring variables associated with empowerment were also examined to
establish whether involvement in the programme was associated with
empowerment at the individual (locus of control and general and specific
efficacy) and organisational (participation and leadership) levels.
An ex post facto analysis based on a post-test only comparison group
evaluation design was conducted to explore the impact of the programme.
Focus groups and interviews were conducted to establish whether school staff
reported that involvement in the programme had led to their personal
empowerment and the empowerment of their schools. Archival data relating
to the schools were also examined. Relationships between the variables
were explored using multiple regression and structural equation modelling. A
model of school development was developed and tested.
The results indicated that extent of involvement in the programme was not a
significant influence on level of empowerment. More important was the
influence of school leadership, and in particular the leadership style exercised
by the principal. Impact and relationship matrices, integrating the quantitative
and qualitative analyses, indicated that the programme had effects on both
individuals and schools, and that the process of school development planning
was related to aspects of organisational empowerment. Issues of
organisational internal capacity and contextual support, however, influenced
implementation of school development planning.
The study suggests that school development planning is a process which is
contextually related, and confirms and refines the nomological network of
II
organisational empowerment. The results indicate that a variety of individual,
organisational and contextual factors impact on individual and organisational
empowerment and that a multi-level perspective is necessary for
understanding the school development process. The study also suggests that
community psychology, and empowerment theory in particular, offer useful
frameworks for theorising and researching school development issues at
individual, organisational and community levels.
Key Words Community psychology, Empowerment, Organisational development, School
development, Ecological perspective, Contextualist epistemology, Multi-
method research

III
DECLARATION I hereby declare that this thesis is my own work and has not been submitted
to any other university.
______________________
Alexander Richard Hassett
___ day of ________ , 2006

IV
ACKNOWLEDGMENTS
To all of the people who made up the schools, thank you for providing me with
such a rich environment in which to learn.
To Outreach (St Mary’s DSG, Pretoria) for providing me with the opportunity
to do this work.
To Emma and Jo who provided the most faithful companionship through some
of the worst days of this research.
To Charles Potter my supervisor who, over this long period, has provided so
many opportunities for my personal development.
To Laura Simonds and Margie Callanan whose guidance and support was
invaluable and got me on the road again to finishing this research.
To Larry who has dealt with my divided attention by feeding me, thanks for
your patience.

V
TABLE OF CONTENTS: CHAPTER ONE: INTRODUCTION, AIMS OF THE STUDY AND RESEARCH QUESTIONS
1
1.1. INTRODUCTION 1 1.2. AIMS AND RESEARCH QUESTIONS 3 1.3. CONCEPTUALISATION OF EMPOWERMENT AND SCHOOL
DEVELOPMENT PLANNING FOR THE PRESENT STUDY 5
CHAPTER TWO: LITERATURE REVIEW 14 2.1. INTRODUCTION 14 2.2. COMMUNITY PSYCHOLOGY 14
2.3. EMPOWERMENT 17
2.3.1. Defining Empowerment 17
2.3.2. Empowerment’s Multiple Forms 19
2.3.3. Empowerment’s Different Levels of Analysis 20
2.3.4. Empowerment as a Process and an Outcome 27
2.3.5. The Dynamic Nature of Empowerment 28
2.3.6. The Contextual Embeddedness of Empowerment 28
2.3.7. Participation and Empowerment 30
2.3.8. Leadership and Empowerment 33
2.3.9. Leadership, Participation and Empowerment 37
2.4. RESEARCH ON EMPOWERMENT 37 2.4.1. Empowerment in the Workplace 38 2.4.2. Teacher and School Empowerment 38 2.4.3. Criticisms of Workplace and Teacher/School
Empowerment Research 39
2.4.4. Community-Based Empowerment Research 40 2.4.5. Context and Empowerment 40 2.4.6. Cross-Cultural Issues 41
2.5. CRITIQUE OF EMPOWERMENT’S DOMINANT ASSUMPTIONS 43 2.6. SCHOOL DEVELOPMENT: A CONTEXT FOR EXPLORING
EMPOWERMENT 47
2.6.1. School Effectiveness Approach 47 2.6.2. School Improvement Approach 48 2.6.3. School Development Planning 50

VI
2.6.4. Research on School Development Planning 51 2.6.5. School Development – a South African Perspective 53
2.7. SCHOOL DEVELOPMENT PLANNING AND ORGANISATIONAL EMPOWERMENT
54
2.7.1. A Nomological Network of Organisational Empowerment 55
CHAPTER THREE: THE SCHOOL DEVELOPMENT PROGRAMME BEING EVALUATED
60
3.1. THE SCHOOL DEVELOPMENT PLANNING PROGRAMME UNDER INVESTIGATION
60
3.2. DIFFERENT LEVELS OF EMPOWERMENT RELEVANT TO THE PROGRAMME AND STUDY, AND THEIR OPERATIONALISATIONS
61
3.3. AN EMPOWERMENT APPROACH TO SCHOOL DEVELOPMENT
63
3.4. THE PROGRAMME
64
3.4.1. The Approach of the Training Programme
66
3.4.2. School Development Team Training
68
3.4.3. Leadership and Management Training
69
3.4.4. School Based Support
70
3.5. DEFINING SUCCESSFUL SCHOOL DEVELOPMENT PLANNING AS ORGANISATIONAL EMPOWERMENT
71
3.6. SUMMARY OF THE ARGUMENT 74
3.7. RATIONALE FOR THE STUDY 75
3.8. CONCEPTUALISATION AND MEASUREMENT OF VARIABLES RELATED TO EMPOWERMENT
77
3.8.1. Measures Associated with Individual Empowerment 77
3.8.2. Measures of Participation in Decision-Making and Collaboration
78
3.8.3. Measures of Leadership 80 3.8.4. Conclusion 81
CHAPTER FOUR: METHODOLOGY 82 4.1. INTRODUCTION 82
VII
4.2. RESEARCH DESIGN ISSUES IN COMMUNITY PSYCHOLOGY 85 4.3. MULTI-METHOD APPROACHES TO RESEARCH DESIGN 87 4.3.1. Evaluation and Multi-Method Design
92
4.4. RESEARCH DESIGN OF THE PRESENT STUDY 94 4.5. MEASUREMENT OF SCHOOL DEVELOPMENT PLANNING 104 4.6. QUANTITATIVE MEASURES OF VARIABLES ASSOCIATED
WITH EMPOWERMENT 106
4.6.1. Measures Associated with Individual Levels of Empowerment
106
4.6.2. Measures of Participation in Decision-Making and Collaboration
108
4.6.3. Measures Of Leadership 110 4.6.4. Biographical Information 113 4.6.5. Exemplars, Operationalisations and Measures of
Empowerment 113
4.7. QUANTITATIVE DATA COLLECTION AND ANALYSIS 114 4.7.1. Sample 115 4.7.2. Analysis of the Quantitative Data 118
4.8. QUALITATIVE DATA COLLECTION AND ANALYSIS 119 4.8.1. Focus Groups 119 4.8.2. Archival Data and Analysis 129
4.8.3. Interviews on School Development Plan Implementation 131
4.9. COMPARISON BETWEEN SCHOOLS THAT SCORED WELL ON THE SCHOOL DEVELOPMENT PLANNING EVALUATION SCALE AND THOSE THAT DID NOT
134
4.10. ANALYSIS OF EVIDENCE OF EMPOWERMENT 104 4.11. ANALYSIS OF THE RELATIONSHIPS BETWEEN THE
VARIABLES 143
4.12. METHODOLOGICAL LIMITATIONS OF THE STUDY 145 4.13. SUMMARY 150 CHAPTER FIVE: STATISTICAL ANALYSES RELATING TO THE ASSUMPTIONS OF THE MEASURES AND THE SCHOOL DEVELOPMENT PLANNING EVALUATION SCALE
156
5.1. INTRODUCTION 156 5.2. TESTING THE STATISTICAL ASSUMPTIONS 156
5.2.1. Normal Distribution 157 5.2.2. Homogeneity of Variance 159

VIII
5.2.3. Interval Data and Independence 160 5.3. ANALYSIS OF THE SCHOOL DEVELOPMENT PLANNING EVALUATION SCALE: PILOT STUDY
160
5.3.1. Item Analysis 161 5.3.2. Validity Analysis 162 5.3.3. Reliability Analysis 172 5.3.4. Conclusions From The Pilot Study 173
5.4. ANALYSIS OF THE SCHOOL DEVELOPMENT PLANNING EVALUATION SCALE: MAIN STUDY
174
5.4.1. Factor Analysis 174 5.4.2. Reliability Analysis 182 5.4.3. Conclusions 182
CHAPTER SIX: RESULTS RELATING TO THE IMPACT OF THE PROGRAMME
184
6.1. INTRODUCTION 184
6.2. DESCRIPTIVE STATISTICS FOR BOTH GROUPS IN THE STUDY 186
6.3. QUANTITATIVE ANALYSES RELATING TO RESEARCH QUESTION ONE
189
6.3.1. Statistical Assumptions of MANOVA 189 6.3.2. MANOVA Results 191 6.3.3. Influence of Third Variables 192 6.3.4. Summary 196
6.4. QUALITATIVE ANALYSES: FOCUS GROUPS 197
6.4.1. Individual Level Change 198
6.4.2. School/Organisational Level Change 201 6.4.3. Community Level Change 210 6.4.4. Summary of Focus Groups Results 211
6.5. QUALITATIVE ANALYSES: ARCHIVAL DATA 213 6.5.1. Objectives Achieved from the School Development Plans 213
6.5.2. School Development Planning and School Development Team Functioning
215
6.5.3. Other Changes 217
6.5.4. Summary of Archival Results
224
IX
6.6. QUALITATIVE DATA AND ANALYSES: INTERVIEWS ON SCHOOL DEVELOPMENT PLAN IMPLEMENTATION
224
6.6.1. Use of the School Development Plan 225
6.6.2. School Development Team Functioning 226
6.6.3. The Role of the Principal in the School Development Plan 228
6.6.4. Summary of Interview Results 229
6.7. QUALITATIVE ANALYSES: SUMMARY 230 6.8. COMPARISON BETWEEN SCHOOLS THAT SCORED WELL ON
THE SCHOOL DEVELOPMENT PLANNING EVALUATION SCALE AND THOSE THAT DID NOT
231
6.8.1. Quantitative Differences 231 6.8.2. Qualitative Differences – Focus Group Data 233 6.8.3. Summary 235
6.9. IMPACT MATRICES 236 6.10. CONCLUSIONS FOR RESEARCH QUESTION 1 AND 2 249 CHAPTER SEVEN: RESULTS RELATING TO THE RELATIONSHIPS BETWEEN THE VARIABLES
253
7.1. INTRODUCTION 253 7.2. FOCUS GROUP RESULTS RELATING TO HELPING AND
HINDERING FACTORS AND ADVICE 254
7.2.1. Factors Helping the Implementation of the School Development Plan
255
7.2.2. Factors Hindering the Implementation of the School Development Plan
260
7.2.3. Advice to other Schools 268286
7.3. INTEGRATING THE HELPING AND HINDERING FACTORS – RELATIONSHIP DIAGRAM 1
270
7.4. COMPARISON BETWEEN SCHOOLS THAT SCORED WELL ON THE SCHOOL DEVELOPMENT PLANNING EVALUATION SCALE AND THOSE THAT DID NOT
272
7.4.1. Helping and Hindering Factors 272
7.4.2. Differences in Quality of Responses Successful Schools Offered
274
7.4.3. Summary 281
7.5. RELATIONSHIP MATRIX 282 7.6. SUMMARY
284
X
7.7. QUANTITATIVE ANALYSIS OF THE RELATIONSHIPS 286 7.7.1. Correlation Analyses 286 7.7.2. Multiple Regression 288 7.7.3. Structural Equation Modelling 294
7.8. INTEGRATION OF RELATIONSHIP RESULTS 298 7.9. SUMMARY 301 CHAPTER EIGHT: INTEGRATION OF FINDINGS 303 8.1. EVIDENCE OF EMPOWERMENT IN THE SCHOOLS – IMPACT OF
THE PROGRAMME 303
8.2 SCHOOL DEVELOPMENT PLANNING AS ORGANISATIONAL EMPOWERMENT
306
8.2.1. A Measurement of Organisational Empowerment 310 8.3. LEVELS OF EMPOWERMENT 312
8.3.1. Individual Empowerment 313
8.3.2. Interpersonal Empowerment 315
8.3.3. Organisational Empowerment 318
8.3.4. Community Empowerment 319
8.3.5. Formal Empowerment 320
8.3.6. Relationships Between the Levels 321
8.4. MATERIAL GAINS AS AN EMPOWERED OUTCOME 322
8.5. VARIABLES SUPPORTING SCHOOL DEVELOPMENT PLANNING
323
8.6. THE COMPLEX NATURE OF EMPOWERMENT 327
8.7. COMMUNITY PSYCHOLOGY – A FRAMEWORK FOR SCHOOL DEVELOPMENT
329
8.8. CONCLUSION 331 CHAPTER NINE: MAIN FINDINGS, LIMITATIONS OF THE ANALYSIS AND INDICATIONS FOR FURTHER RESEARCH
333
9.1. MAIN FINDINGS 333 9.2. LIMITATIONS 338
9.2.1. Research Design 339 9.2.2. Sample Characteristics 344 9.2.3. Measuring Instruments 346 9.2.4. Data Analysis 352
XI
9.2.5. Conclusion 353 9.3. FUTURE STUDIES 354 ABBREVIATIONS
357
REFERENCES
358
APPENDICES
411
Appendix 1: School Development Planning Evaluation Scale: Original version for pilot study
412
Appendix 2: Item categorisation for School Development Planning Evaluation Scale (Original version)
415
Appendix 3: School Development Planning Evaluation Scale (Final version)
419
Appendix 4: Measures used in the quantitative study
422
Appendix 5: Information given to schools at the preliminary meeting to discuss the proposed study
434
Appendix 6: Points to highlight to the schools when administering questionnaires for the evaluation
437
Appendix 7: Focus group interview schedule
439
Appendix 8: Letter requesting participants for focus groups
441
Appendix 9: Principal and school development team interview schedule
443
Appendix 10: Information relating to the test assumptions
444
Appendix 11: Kolmogorov-Smirnov statistic comparing normality scores for both groups before and after transformations
453
Appendix 12: Information relating to the reliability and validity analyses of the School Development Planning Evaluation Scale
456
Appendix 13: Descriptive statistics for schools in Group 1 and Group 2
467
Appendix 14: Descriptive statistics for Successful Group and Not Successful Group
472
Appendix 15: Casewise, residual and assumption statistics for the multiple regression
473
XII
LIST OF TABLES TABLE PAGE Table 1: A Comparison between Empowering Processes and Empowered
Outcomes Across Levels of Analysis 28
Table 2: Processes and Outcomes of Intraorganisational, Interorganisational, and Extraorganisational Components of Organisational Empowerment 58
Table 3: Demographic Characteristics of the Quantitative Data Samples 117
Table 4: Demographic Characteristics of the Focus Group Samples 124
Table 4b: Evidence of Objectives from the School Development Plans Being Achieved By the Schools 130
Table 5a: Linking Definitions and Outcomes Indicators of Empowerment to Data Sources in the Evaluation 142
Table 5b: Research Design Summary 154-5
Table 6: Factor Analysis for School Development Planning Evaluation Scale Pilot Study: Total Variance Explained 168
Table 7: Factor Matrix: School Development Planning Evaluation Scale Pilot Study 169
Table 8: Rotated Factor Matrix: School Development Planning Evaluation Scale Pilot Study 171
Table 9: Reliability Statistics: School Development Planning Evaluation Scale Pilot Study 172
Table 10: Factor Analysis School Development Planning Evaluation Scale Main Study: Total Variance Explained 177
Table 11: Factor Matrix: School Development Planning Evaluation Scale Main Study 178
Table 12: Rotated Factor Matrix: School Development Planning Evaluation Scale Main Study 179
Table 13: Oblique Rotation Pattern Matrix: School Development Planning Evaluation Scale Main Study 180
Table 14: Factor Correlation Matrix : School Development Planning Evaluation Scale Main Study 181
Table 15: Reliability Statistics School Development Planning Evaluation Scale Main Study 182
Table 16: Systems Categorisation of Profile of Organisational Characteristics Scores for Group 1 and Group 2 by School 188
Table 17: MANOVA Results: Roy’s Largest Root 191
Table 18: ANOVA Results Tests of Between-Subjects Effects 191
Table 19: MANOVA Results for Interaction of Group and Union Membership 194
Table 20: ANOVA Results for Interaction of Group and Union Membership 194
Table 21: Comparison of Groups 1 and 2 on Individual Level Change 198
Table 22: Comparison of Groups 1 and 2 on School Level Change 202
Table 23: Comparison of Groups 1 and 2 on Community Level Change 210
Table 24: Objectives from the School Development Plan Achieved by the Schools 213
Table 25: Changes Reported in the Programme’s Evaluations 218
Table 26: Categorisation of School Development Team’s Functioning
227

XIII
Table 27: Categorisation of the Principal’s Role in School Development Plan Implementation 228
Table 28: MANOVA Results Roy’s Largest Root - Comparing Schools that Scored Higher on the School Development Planning Evaluation Scale with those that Scored Lower
231
Table 29: ANOVA Results Tests of Between-Subjects Effects - Comparing Schools that Scored Higher on the School Development Planning Evaluation Scale with those that Scored Lower
232
Table 30: Comparison between the More Successful Group on the School Development Planning Evaluation Scale and the Less Successful Group on Individual Level Change
233
Table 31: Comparison between the More Successful Group on the School Development Planning Evaluation Scale and the Less Successful Group on School Level Change
234
Table 32: Comparison of the More Successful Group on the School Development Planning Evaluation Scale and the Less Successful Group on Community Level Change
235
Table 33: Comparison of Group 1 and 2 on Individual Level Factors that Helped to Implement the School Development Plan 255
Table 34: Comparison of Group 1 and 2 on Organisational Level Factors that Helped to Implement the School Development Plan 256
Table 35: Comparison of Group 1 and 2 on Community Level Factors that Helped to Implement the School Development Plan 259
Table 36: Comparison of Group 1 and 2 on Individual Level Factors that Hindered Implementation of the School Development Plan 261
Table 37: Comparison of Group 1 and 2 on Organisational Level Factors that Hindered Implementation of the School Development Plan 262
Table 38: Comparison of Group 1 and 2 on Community Level Factors that Hindered Implementation of the School Development Plan 267
Table 39: Comparison of Group 1 and 2 on the Advice They Would Offer to Other Schools That Wanted to Implement a School Development Plan 269
Table 40: Comparison of the More Successful Group on the School Development Planning Evaluation Scale and the Less Successful Group on the Factors that Helped to Implement the School Development Plan
272
Table 41: Comparison of the More Successful Group on the School Development Planning Evaluation Scale and the Less Successful Group on the Factors that Hindered the Implementation of the School Development Plan
273
Table 42:
Pearson’s Correlation Co-Efficients 288
Table 43: Regression Model Summary 289
Table 44: Coefficients 292
Table 45: Collinearity Diagnostics 293
Table 46: Standardized Regression Weights for Structural Equation Modelling Model 1 295
Table 47: Goodness of Fit Statistics Model Fit Summary for Model 1 296
Table 48: Standardized Regression Weights for Structural Equation Modelling Model 2 297
Table 49: Goodness of Fit Statistics Model Fit Summary for Model 2 298
Table 50: Processes and Outcomes of Intraorganisational, Interorganisational, and Extraorganisational Components of School Development Planning as Organisational Empowerment
309
XIV
LIST OF MATRICES MATRIX PAGE Matrix 1:
Exemplars, Operationalisations and Measures of Empowerment 114
Matrix 2:
School Development Planning Process Implementation 240
Matrix 3:
Difference in changes at an individual level reported after implementation of the school development plan
241
Matrix 4:
Difference in changes reported at an organisational level after implementation of school development plan
242-3
Matrix 5:
Difference in changes reported at the community level after implementation of the school development plan
244
Matrix 6: Relationship between school development planning and other individual, organisational and community level variables
283
LIST OF FIGURES FIGURES PAGE Figure 1:
Nomological Network for Psychological Empowerment 21
Figure 2:
Scree Plot for Principal Axis factoring of School Development Planning Evaluation Scale items – Pilot Study
167
Figure 3:
Scree Plot for Principal Axis factoring of School Development Planning Evaluation Scale items – Main Study
175
Figure 4: The Effect of Union Membership as a Third Variable on Differences in School Development Planning
195
Figure 5: The Effect of Union Membership as a Third Variable on Differences in Participation in Decision-Making
195
Figure 6:
Relationship Diagram 1: Group 1 And 2 Variables 271
Figure 7: Relationship Diagram 2: Group 1 And 2 Variables Combined With School Development Planning Evaluation Scale More or Less Successful Schools
285
Figure 8: Model 1 - Diagrammatic Representation of the Predicative Relationships Between Leadership Variables, Collaboration, Teacher Efficacy and School Development Planning Evaluation Scale
294
Figure 9: Model 2 - Diagrammatic Representation of the Predicative Relationships Between Leadership Variables, Collaboration, Teacher Efficacy and School Development Planning Evaluation Scale
296
Figure 10: Relationship Diagram 3: Combining All Results 300

1
CHAPTER ONE: INTRODUCTION, AIMS OF THE STUDY AND
RESEARCH QUESTIONS
1.1. INTRODUCTION The purpose of this study was to explore whether community psychology, and
empowerment theory in particular, applies in the context of a number of
school sites and in the context of a school development programme.
Empowerment, as the focus of study in community psychology, has been
used to understand a variety of contexts. More recently, but to a lesser
extent, it has also been used to explore and understand processes related to
organisational change. This study attempted to explore these issues more
thoroughly by assessing a school development programme’s impact on
various organisational aspects of the schools and the individuals within them.
In addition it looked at the factors that helped or hindered the implementation
of the school development planning process and explored their relationship
with empowerment. Based on the analyses the study explored whether this
framework provides an alternative, and potentially more useful, way of looking
at school development and whether it broadens our understanding of
empowerment as it is expressed in its various forms in different contexts and
at different times.
Although school development literature has evolved over the last 20 years
many of the approaches to school development have ignored, or only given
cursory acknowledgement to, the social or broader context in which the
school is embedded. Even those approaches based on eco-systems theories
of organisations and organisational development, which acknowledge factors
and dynamics external to the school, have often ignored or peripheralised a
broader contextual or social theoretical analysis in organisational
development interventions (Davidoff & Lazarus, 1997). Schools, as contexts
for exploring empowerment, have not been fully explored. Empowerment
theory allows us to take a multi-level, contextualist view of school change,
which has been missing from school development literature.

2
School development literature appears to lack a strong theoretical tradition
from which its formulations of school change have emerged and often these
models or frameworks are mechanistic in nature. Under conceptualisation
and under theorising in the field of school development has led to the lack of a
strong framework for understanding change at the individual, organisational
and community levels. Hopkins (1995) makes the point clearly: One of the great debates that our field is still to have, is that on the theories, models and strategies that underlie the work of school improvement practitioners, policy makers and researchers … Without considerably more work at the level of theory and strategy, school improvement will still be referred to as ‘random acts of kindness' (p. 3).
Sarason, as early as 1973, argued for the contribution psychology could make
to the schooling system and in 1997 reasserted that position. In 2000 Oxley
and in 2006 Rhodes and Camic made a case for the usefulness of school
reform and community psychology working together. Boyd & Angelique
(2002) argue for the strengthening of the relationship between community
psychology and organisation studies. It is the present author’s contention that
a fuller understanding of school development and change cannot be achieved
without placing it within a broader theoretical framework.
By placing school development within the field of community psychology, and
more specifically linking it to the concept of empowerment, this study has
attempted to strengthen the theoretical basis of school change literature and
provide new avenues for exploring how individuals, organisations and
communities change and the factors that hinder or support this change
process. By viewing empowerment within this context this study has also
attempted to expand the understanding of empowerment at various levels of
analysis, particularly at the organisational level.

3
1.2. AIMS AND RESEARCH QUESTIONS Using a community psychology framework based on the concept of
empowerment, this study aimed to:
1. establish whether empowerment at individual, organisational and
community levels was evident in the context of a school development
planning programme;
2. explore some of the factors that help or hinder school development
planning process;
3. explore the usefulness of conceptualising school development planning
as organisational empowerment and its contribution in terms of
confirming and refining the nomological network of organisational
empowerment.
The research questions emanating from these aims focused on two themes:
the first was the impact of the school development planning programme on
empowerment of the individuals, the schools as organisations and the
communities they served; the second was the relationship between the
different variables under investigation in the present study, particularly the
relationship between school development planning and those variables
associated with empowerment at individual, organisational and community
levels.
1.2.1. Theme One: Impact of the Programme at Individual, Organisational and Community Levels Research Question 1
What effect has the school development planning process had in terms of
empowering schools as organisations?
Research Question 2:
What effect has the school development planning process had on variables
associated with empowerment at the individual, organisational and community
levels?

4
1.2.2. Theme Two: Relationships between the Variables Research Question 3:
What factors help or hinder the school development planning process?
Research Question 4:
What is the relationship between the process of school development planning
and those variables associated with empowerment at the individual,
organisational and community levels?

5
1.3. TERMS OF REFERENCE OF THE STUDY
Empowerment Empowerment is defined as a multilevel, context specific, dynamic construct
(Zimmerman, 1995) occurring at the individual, organisational and community
level (Zimmerman, 1995; 2000).
The following offers a brief description of how empowerment at each level is
conceptualised in this study.
Empowerment at the individual level of analysis: This is a process by which individuals gain mastery and control over their lives
and a critical understanding of their environment (Rappaport, 1984, 1987;
Swift & Levin, 1987; Zimmerman 1990a). It includes participatory behaviour,
motivation to exert control and feelings of efficacy and control. At this level
empowerment bears on both the material and the psychological, on acquiring
access to resources as well as increasing control and value.
Empowerment at the organisational level of analysis: This is a process aimed at changing the power structures as they are
expressed within an organisation, such as a school, in order to establish new
structures, values and forms of interaction. Organisational empowerment
includes shared leadership, opportunities to develop skills, expansion and
effective community influence (Maton & Rappaport, 1984; Maton & Salem,
1995). Following Zimmerman’s (2000) lead a distinction was made between
an empowering organisation (what it provides to members) and an
empowered organisation (its impact on the community).
Empowerment at the community level of analysis This level of empowerment is concerned with collective action to improve the
quality of life within the community through the active engagement of
stakeholders. An empowered community is one that initiates efforts to
improve the community, responds to threats and provides opportunities for
citizens to participate (Zimmerman, 2000).

6
This conceptualisation of empowerment was explored within the context of a
school development programme, the key element of which was a process of
school development planning. School development planning is a multi-
dimensional, whole school strategy that aims to bring key stakeholders
together within the school to identify problem areas, agree where
improvements can be made and then decide how to make change happen
with the resources they have available (Hargreaves & Hopkins, 1995; 1991;
Hopkins, Ainscow & West, 1994). It seeks to:
1. develop the structural and procedural aspects of the school;
2. establish a decision-making process which is collaborative, with visible
procedures of accountability, transparency in the communication of
information and leadership characterised by facilitative directiveness;
3. promote staff and interpersonal development, with a culture of
collegiality in which such development can occur;
4. provide a mechanism for establishing structures and procedures for
internal evaluation of needs and innovation, as part of an ongoing
process of maintaining good practice and managing change.
Impact evaluation The logic model of programme impact evaluation as described by Kellogg
(2004); Taylor-Powell (2005) and NHS Health Scotland (2007) was used to
define the outputs, outcomes and impact of the programme. A logic model
views outputs, outcomes and impact as follows:
Outputs are the direct results of programme activities. They are usually
described in terms of the size and/or scope of the services and products
delivered or produced by the programme. They are the activities, services,
events and products that reach people who participate or who are targeted.
In the case of the programme under investigation this would include school
development planning workshops, various training courses (e.g. leadership
and management training, school development team training), school based
support sessions.

7
Outcomes and impacts are defined as results or changes for individuals,
groups, communities, organizations, communities, or systems. They include
shorter term results of the programme such as specific changes in learning
such as, awareness, attitudes, behaviours, knowledge, skills, status, or level
of functioning (and are most often expressed at an individual level). Medium
term results related to action such as changes in behaviour, practice,
decision-making, policies and social action and long-term or ultimate impacts
leading to changes in condition such as social, economic, civic and
environmental. Thus ultimate impacts are organizational, community, and/or
system level changes expected to result from program activities.
Applying this logic model of impact evaluation for the programme under
investigation allows the researcher to explicate the level of outcomes to be
investigated in the evaluation. Below are the programme outcomes and
impacts (including short, medium and long term outcomes).
Short term outcomes included:
• Drawing up of a school development plan
• Skills development e.g. planning ability
• Setting up a School Development Team
• Principal Involved in School Development Planning
• Awareness of the school development plan and its role in school
development
• Staff involvement in the development of, implementation of, and evaluation
and monitoring of the school development plan
• Management’s involvement in school development planning
• Involvement of other stakeholders in the school development planning
process.
Medium terms outcomes included:
• Access to resources
• Shared decision making
• Enhanced sense of control and efficacy

8
• Collaborative working
• Democratic leadership
• Supportive relationships
• Participatory culture
• Involvement of the parent body, the School Governing Body and the
broader community
• Develop the process of reflection and planning within the school
community
Long term or ultimate impacts included:
• Improved outcomes for children at the school in terms of achievement.
(Hopkins, West, Ainscow, Harris & Beresford, 1997). School development
planning aims to improve the capacity of the school, particularly the quality
of its teaching and learning (Hargreaves & Hopkins, 1991, 1995).
• The school becoming a community resource (Schofield, 1999)
These three levels of outcomes or impacts correspond with the development
of empowerment as described by Deacon, 1990; Ellsworth, 1989; Neath &
Read, 1998; Serrano-Garcia, 1994; & Swift & Levine (1987) which include
awareness, action and change in power relations.
This present study’s focus was on a combination of shorter term and medium
term outcomes and impacts. According to Humphris, Connell & Meyer (2004)
there is no univocal agreement as to what constitutes long-term evaluation.
However they suggest that these long term or ultimate impacts can only be
measured 7 to 10 years after the programme. As some schools had only
completed the programme and others had only had a year the focus could
only be on short and medium term outcomes and impacts.
For the purpose of this evaluation these programme outcomes were framed in
empowerment terms. This was done in two ways. The first was to
operationalise definitions of how it would be evidenced in the individuals, the
schools and the community they serve. These are by no means meant to be

9
universal definitions of empowerment at these levels as they relate to
individuals, schools or communities.
Operational Definition of Individual Empowerment:
The goal of empowerment at this level is to increase feelings of self-efficacy
and locus of control. This is most likely to occur in situations where people
feel there is increased access to resources.
Operational Definition of Organisational Empowerment:
At the organisational level of analysis a distinction was made between
empowering and empowered organisation (Zimmerman, 2000).
Empowering organisation:
The goal at this level is to create a participative work culture, collaborative
work structures, shared decision making. This is likely to manifest in a school
context as increased responsibility for school development among the whole
staff.
Empowered Organisation:
As an empowered organisation the school is in control of its own development
and is able to acquire the resources it requires and is having an impact on the
broader educational community. In a school development planning context,
this is likely to be found in situations where the school has actively
implemented the school development plan and has achieved the goals set for
itself (or is in a process of achieving).
Operational Definition of Community Empowerment:
The goal at this level is to have community stakeholders involved in collective
action. In a school development context, this is likely to manifest in situations
in which parents and members of the School Governing Body actively
involved in school activities and enable the school to move towards its goals.
The empowerment literature emphasises that empowerment outcomes should
be evident at various levels. In operationalising the study, a framework of
10
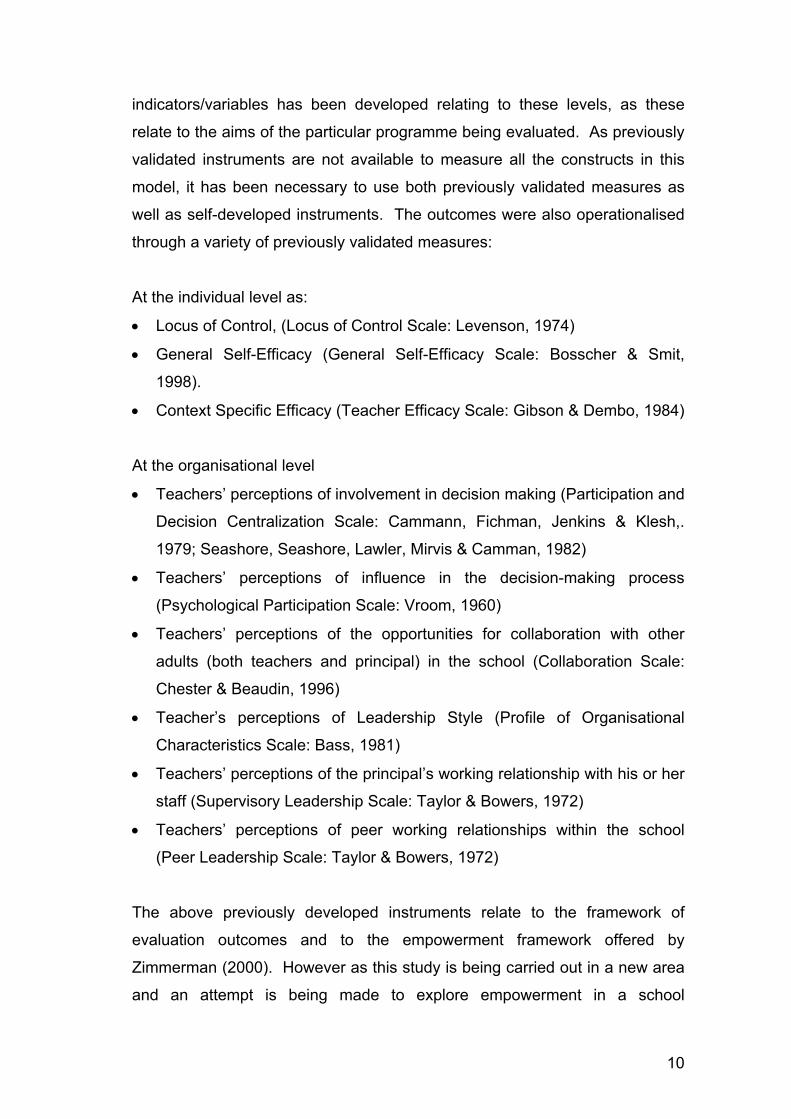
indicators/variables has been developed relating to these levels, as these
relate to the aims of the particular programme being evaluated. As previously
validated instruments are not available to measure all the constructs in this
model, it has been necessary to use both previously validated measures as
well as self-developed instruments. The outcomes were also operationalised
through a variety of previously validated measures:
At the individual level as:
• Locus of Control, (Locus of Control Scale: Levenson, 1974)
• General Self-Efficacy (General Self-Efficacy Scale: Bosscher & Smit,
1998).
• Context Specific Efficacy (Teacher Efficacy Scale: Gibson & Dembo, 1984)
At the organisational level
• Teachers’ perceptions of involvement in decision making (Participation and
Decision Centralization Scale: Cammann, Fichman, Jenkins & Klesh,.
1979; Seashore, Seashore, Lawler, Mirvis & Camman, 1982)
• Teachers’ perceptions of influence in the decision-making process
(Psychological Participation Scale: Vroom, 1960)
• Teachers’ perceptions of the opportunities for collaboration with other
adults (both teachers and principal) in the school (Collaboration Scale:
Chester & Beaudin, 1996)
• Teacher’s perceptions of Leadership Style (Profile of Organisational
Characteristics Scale: Bass, 1981)
• Teachers’ perceptions of the principal’s working relationship with his or her
staff (Supervisory Leadership Scale: Taylor & Bowers, 1972)
• Teachers’ perceptions of peer working relationships within the school
(Peer Leadership Scale: Taylor & Bowers, 1972)
The above previously developed instruments relate to the framework of
evaluation outcomes and to the empowerment framework offered by
Zimmerman (2000). However as this study is being carried out in a new area
and an attempt is being made to explore empowerment in a school

11
development setting there are no validated measure of school development
as organisational empowerment. Thus there was a need for self-developed
instruments. Within this study a measure of school development planning, the
School Development Planning Evaluation Scale was developed in an attempt
to assess this construct. This instrument has been based on the ways in
which the school development and change process has been conceptualised
and implemented in this particular school development programme. In this
way the framework of indicators/variables developed relates both to the
different levels theorised in the literature on empowerment, as well as the
school development programme’s implementation theory.
The primary focus of this study is on whether using a community psychology
framework, particularly an empowerment one, helps to further understanding
of school development. The focus of this study is thus on seeking evidence of
empowerment in a school development setting. The way in which this aim
has been realised has been through evaluation of a particular school
development planning programme. The focus is on seeking evidence of
empowerment outcomes in a school development setting, through a multi-
method analysis.
Multi-method Research Design A multi-method or mixed method design was adopted for this evaluation
including the use of both quantitative and qualitative methods for data
collection and data analysis. (Frechtling & Sharp, 1997). Rosenthal &
Rosnow (1991) refer to this approach as “methodological pluralism”. They
argue that it is imperative to use more than one approach to gathering data
given the limitations of any one particular strategy of inquiry, and justify its
usage as a form of critical multiplism.
The assumption guiding this thesis is that a strong case can be made for
using an approach that combines quantitative and qualitative elements in the
evaluation of school development and empowerment programmes (Cook,
1985; Cook & Shadish, 1986; Frechtling & Sharp, 1997; Houts, Cook &
Shadish, 1986; Patton, 1990; Shadish, 1986). By using different sources and

12
methods at various points in the evaluation process, the strength of each type
of data collection can be built on and the weaknesses of any single approach
minimized. A multi-method approach to evaluation can increase both the
validity and reliability of evaluation data.
The range of possible benefits that mixed method designs can yield has been
conceptualized by a number of evaluators (Greene, 2007; Greene, Caracelli &
Graham, 1989; Johnson, Onwuegbuzie, & Turner, 2007). The validity of
results can be strengthened by using more than one method to study the
same phenomenon. This approach - called triangulation - is most often
mentioned as the main advantage of the multi- or mixed method approach
(Denzin, 1978). Combining the two methods pays off in improved
instrumentation for all data collection approaches and in sharpening the
evaluator's understanding of findings. As Borkan (2004) says “This form of
research is more than simply collecting both quantitative and qualitative data;
it indicates that data will be integrated, related or mixed at some stage in the
research process” (p. 4)
Triangulating or using multiple sources, measures, methods and/or
approaches is primarily because multiple methods assess multiple realities
rather than because information gleaned from one apparently more objective
method necessarily validates information gleaned from another apparently
more subjective one (Shinn, 1990). In this study equal weight has been
accorded to measurement data, as to the self-reports of teachers and
principals involved in this particular school development planning programme.
The use of different data sources (various existing measures, a new measure,
the self-reports of teachers and principals and externally verified data e.g.
achievement of school development objectives) was necessary to provided
indicators not only of empowerment, but also of school development planning
outcomes.
McCormack, Kitson, Rycroft-Malone, Titchen, Seers (2002) point out that it is
now widely accepted that evaluation should emphasise the use of qualitative
data including practice narratives and leadership stories, and/or user

13
feedback. They and the Kellogg Foundation (2002) say that most commonly
a multi-method approach is chosen, even though the majority of data is self-
reported by the participants, this is considered a valid approach. The
combination of multiple methods, empirical materials, perspectives and
observers in a single study is therefore best understood as a strategy that
adds rigour, breadth and depth to any investigation (Denzin & Lincoln, 1998).
Ex post facto Research Design An ex post facto research design is an example of a descriptive non-
experimental design, which can be used where the evaluator cannot select
who is to be exposed to the programme, and to what degree (Lo-Biondo
Wood & Haber, 1998). As such ex post facto designs are potentially weak for
drawing conclusions concerning the effects of programmes (Potter, 2004). In
order to deal with these weaknesses a multi-method design as described
above was utilised, in which an ex post facto contrast group design was
nested. Because of the weakness of the design it was necessary to collect
data from various sources in order to provide any comment on the
effectiveness of the programme.
The overall design relied on the use of multiple methods and the logic of
triangulation between different sources of data, involving both quantitative
measurement and qualitative evidence of different kinds. The qualitative data
were used for interpretation of the quantitative results, as well as in their own
right, to yield perspectives on what teachers experienced in the programme.
This multi-method approach to the study allowed one to explore these various
perspectives. In this way unintended consequences could be explored to
provide a more thorough picture of the impact of the programme, issues of
process and the reasons for success could be tapped and achievement of the
specific aims of the programme could be assessed.

14
CHAPTER TWO: LITERATURE REVIEW
2.1. INTRODUCTION In this chapter it will be argued that community psychology's ecological
perspective and contextualist epistemology, and more specifically its
empowerment framework, provides a useful way of conceptualising school
development as a process for empowerment at a variety of levels. More
specifically it will make the case that it may be possible to conceptualise
effective school development planning as a form of organisational
empowerment. It will also be argued that in doing so it will be possible to
explore these phenomena in context and to look at factors at the individual,
organisational and community level that can facilitate or hinder the process of
empowerment. At the individual level, focus will be on issues of locus of
control, general self-efficacy and efficacy as a teacher. In terms of
organisational level factors, attention will be focused on the role of
participation and on leadership. At the community level issues of engagement
of stakeholders will be explored.
2.2. COMMUNITY PSYCHOLOGY Community psychology emerged from a field that was permeated by the
paradigm of the ahistorical, acultural, ahistorical individual (Heller &
Takemoto, 1984; Levine & Levine, 1970; Levine & Perkins, 1987; Sarason,
1981; Trickett, 1984; Trickett, Barone & Watts, 2000; Walsh, 1987) and in
response to problems and issues within society. It attempted to deal with
these social issues through programmes within the community. Its origins
reflect, in a large part, a disagreement with these broader paradigm premises
in psychology in general, and clinical psychology in particular (Fatimilehin &
Dye, 2003; Orford, 1992; Pretorius-Heuchert & Ahmed, 2001; Swartz &
Gibson, 2001). Psychology has been re-evaluating some of its assumptions
and in doing so there has been a shift away from locating problems,
particularly social problems, in individuals (e.g. blaming the victim, Ryan,
1971) towards more contextual or ecological understandings (Kelly, 1990;
Linney, 1990, 2000, Perkins, Hughey & Speer, 2002; Rappaport, 1981; Speer

15
& Perkins, 2003; Swift, 1984; Trickett, 1984, 1994; Trickett, Watts & Birman,
1993; Zimmerman, 1990a).
While the concept of ecology has many meanings, its general intent is to
focus on the community embeddedness of persons and the nature of
communities themselves. The essence of the ecological perspective is to
construct an understanding of the interrelationship of social structures and
social process of the groups, organisations and communities in which we live
and work. The concept of interdependence is the basic axiom of the
ecological perspective (Kelly, 1966, 1970a&b, 1971, 1979; Kelly, Ryan,
Altman & Stelzner, 2000). Designing change processes, creating new
organisations and services or reducing the harmful impacts of environmental
and societal factors requires a working sense of not only the current
interdependencies of people and structures but also the potential of creating
and facilitating new dependencies.
This perspective’s focus on context casts a naturalist’s eye on the school, the
neighbourhood and the region in order to understand the varied ecologies
within which persons develop and programmes are implemented. Trickett
(1996) argues that a field that is intent on contexualising human behaviour
across different levels of analysis is well served by a worldview and
epistemology that provides both rationale and guidance for its intellectual
journey. He, like many other community psychologists, argues that
contextualism can best serve this purpose (Kelly, 1990; Linney, 2000,
Rappaport, 1981, 1984, Swift, 1982). Rosnow & Georgoudi (1986) argue that
central to the contextualist viewpoint is the conception of social reality as
something active, ongoing and changing. The idea is that psychological
knowledge is made concrete and is framed by relevant factors, relations, and
conditions (the setting or context) within which, or among which, human acts
and events unfold. Contextualism underscores the idea that human activity
does not develop in a social vacuum, but rather it is rigorously situated within
a socio-historical and cultural context of meanings and relationships.

16
Contexts may be conceptualised as varying in degrees of generality and
specificity from macro-level (e.g. political and social institutions) to micro-level
(e.g. contexts created in interpersonal exchange and communication) (Moos,
1996; O’Neill, 2000). Everyday life incidents, and the contexts they create,
unfold within the wider socio-cultural and historical milieu in which they are
embedded. An emphasis on the interrelationship and continuity between
contexts is crucial in order to guard against reverting to a monistic position,
either of an idealist nature (contexts are products of human intentionally) or a
materialist nature (contexts determine the nature of activity) (Rosnow &
Georgoudi, 1986). In this way macro-level contexts enter and become
incorporated into the micro-level contexts of everyday life and everyday life
practices may (in an intentional or unintentional manner) instigate change in
the wider context within which they occur.
This framework is useful for understanding the issue of empowerment which
itself is a complex, multilevel, dynamic phenomenon. It is also hoped that this
framework, applied to empowerment within a school context, will help us
understand the process of school development in a more holistic way. In
order to understand a complex social process like school development a
theoretical framework is needed to guide our thinking. Community psychology
with its ecological perspective and contextualist epistemology offers a
framework which allows us to understand behaviour in context, focusing on
change at various levels within that context and taking into account the
dialectical relationship between actors and context, as well as allowing us to
attend to the varied social constructions of participants in those contexts
(Kingry-Westergaard & Kelly, 1990; McGuire, 1983, 1986). This enables us to
explore social processes in their settings and allow us to create interventions
of local relevance. Within this perspective there is an acceptance that
understanding a psychological event requires an appreciation of the meaning
of the event to its participants and that these will vary (Altman, 1986, 1987;
Altman & Rogoff, 1987).
Community psychologists are still struggling with the problem of how to
incorporate issues of context and culture into the questions they ask, the

17
research strategies they pursue and the ways they design and carry out
interventions. There is also a difficulty in taking a multi-level view of issues
and to incorporate the dynamic quality of social phenomena. Empowerment
is an area of study in community psychology where researchers have
attempted to incorporate context more effectively and to accommodate
multiple levels of analysis. These methodological issues in community
psychology research will be explored in the next section. Before looking at
the research methodology we need to explore the concept of empowerment
and those variables associated with it.
2.3. EMPOWERMENT Rappaport (1987) makes the case for empowerment as the subject of an
ecological theory for the field of Community Psychology. He feels that,
“whatever our area of study; children, adults, the elderly, organisations,
neighbourhoods or social policies what hold these diverse efforts together is a
concern for empowerment” (p. 129). Rappaport argues that each of the other
candidates for phenomenon of interest tend to be person centred and
developed within the traditions of the psychology of individual difference.
They are often too narrow, and too biased in the direction of a person blame
ideology.
2.3.1. DEFINING EMPOWERMENT Empowerment is a difficult term to define. There is little clarity at this point on
what we actually mean when we talk about empowerment (Perkins, 1995;
Perkins & Zimmerman, 1995). Zimmerman (1995) points out there are a vast
number of definitions of empowerment. Swift & Levin argued as early as
1987 that empowerment has no clearly operationalised or consensual
definition in the mental health field and this is echoed by many recent authors
working in organisational development (e.g. Foster-Fishman, Salem, Chibnall,
Legler, & Yapchai, 1998), school and teacher development (e.g. Bartunek,
Greenberg & Davidson, 1999) and those working in community development
(e.g. Rich, Edelstein, Hallman & Wandersman, 1995).

18
Rappaport (1984) suggested that empowerment is easy to define in its
absence – alienation, powerless, helpless – but difficult to define positively
because “it takes on a different form in different people and contexts” (p. 2).
Empowerment suggests a belief in the power of people to be both the masters
of their own fate and involved in the life of their several communities. It is a
process by which people, organisations and communities gain mastery over
issues of concern to them whether those be events, outcomes or resources
(Rappaport, 1987).
A definition by Rappaport (1984) accounts for the fact that empowerment may
occur at multiple levels of analysis: “Empowerment is viewed as a process:
the mechanism by which people, organizations and communities gain mastery
over their lives” (p. 2). However it does not provide details about the process
across levels of analysis. Eylon & Au (1999) adapting a definition of Swift &
Levin’s (1987) see empowerment as an enhancing and energising context-
specific process that expands the feeling of trust and control in oneself as well
as in one’s colleagues and one’s organisation, and which consequently leads
to certain individual and organisational outcomes.
This definition emphasises that empowerment at the individual level of
analysis is a process that expands an individual’s power as opposed to
merely a state of being. This process results from changes in contextual and
relational variables. It also emphasises the growth of power and control at an
interpersonal and an organisational level. What is common to these
definitions is their suggestion that empowerment is a process in which efforts
to exert control are central (Zimmerman, 2000). These definitions also
suggest that participation with others to achieve goals, efforts to gain access
to resources and some critical understanding of the socio-political
environment are basic components of the construct (Zimmerman, 2000).
The reasons for this lack of clarity of the definition of the term empowerment
seems to come from a variety of sources and it is vital that one is aware of
these philosophical, ideological and practical issues when attempting to look
at the notion of empowerment. Being based on a contextualist, ecological

19
approach empowerment has multiple forms and various levels of analysis; it is
contextually embedded and has a dynamic nature. These assumptions of
empowerment underlie the theoretical complexity of the term and we need to
understand and explore these more fully.
Recent developments in empowerment theory have significantly advanced
our understanding of the complexity of the construct of empowerment (Foster-
Fishman, et al., 1998). Empowerment theorists and researchers have argued
that empowerment assumes divergent forms and meanings across people, is
contextually determined and changes over time (Rappaport, 1984;
Zimmerman, 1995). Thus the desires for, pathways towards and
manifestations of empowerment will vary significantly depending upon the
populations we target, the setting we examine and the point of time we
witness. In light of this no one generic set of empowerment behaviours or
outcomes can be specified for a change initiative. However Rappaport (1995)
says this may not be necessary: I do not think it is reasonable to expect the word ‘empowerment’ to be a talisman that magically separates the sheep from the goats. … As a practical matter, all that is required is that one declare, in any particular context, exactly what empowerment means … The rest of us can then decide for ourselves if we agree or find useful these definitions, values, and goals for the settings in which we work. Perhaps we will also learn to listen to the voices of the people with whom we work so as to allow them to tell us what it means to be empowered in their particular context.
(p. 798-99)
Although many empowerment researchers acknowledge these assumptions,
little attention has been given to the impact they have on our capacity to
understand and elicit this complex phenomenon.
2.3.2. EMPOWERMENT’S MULTIPLE FORMS Empowerment theory assumes that empowerment takes on different forms for
different people. While the multifaceted nature of empowerment has been
well represented in the literature through the investigation of context-specific
questions (e.g. Fawcett, Paine-Andrews, Francisco, Schultz, Richter, Lewis, et
al., 1995; Gruber & Trickett, 1987; Kroeker, 1995; Prestby, Wandersman,
Florin, Rich & Chavis, 1990; Rich et al., 1995; Serrano-Garcia, 1984), the
range of empowerment experiences within a particular setting has not been

20
fully explored. Although, within a given context, setting members may be
working towards a common goal, these individuals have unique histories,
assume different roles and often represent different constituencies (Martin,
1992).
It has been argued that these social and historical characteristics shape
individual desire for empowerment (Zimmerman, 1995). Personal history
emerges from the intersection of demographic characteristics and social
opportunities (Hill Collins, 1986) and because of this individuals with different
racial, gender, ethnic, class and social backgrounds may desire different
forms of empowerment. These desires are also shaped by previous
experiences with empowerment. Bartunek and colleagues (Bartunek, Foster-
Fishman & Keys, 1993; Bartunek, Lacey & Wood, 1992) found that individuals
who had no previous empowerment experiences within a specific context
assigned different meanings than individuals who had more experience. For
example, newcomers to a participatory decision-making process were more
likely to define a directive leader as empowering while those more
experienced in this process needed real influence over decisions to feel
empowered (Bartunek et al., 1992).
2.3.3. EMPOWERMENT’S DIFFERENT LEVELS OF ANALYSIS
The second assumption is that empowerment differs across levels of analysis
(Hughes 1987; Speer & Hughey, 1995; Zimmerman, 1990a; 2000).
Rappaport (1987) asserts, “Empowerment is not only an individual
psychological construct, it is also organisational, political, sociological,
economic and spiritual” (p. 129). Zimmerman (1995; 2000) has provided one
of the most widely used distinctions between the different levels of
empowerment. He argues that a thorough development of empowerment
theory requires exploration and description at multiple levels of analysis. The
following is based on Zimmerman’s (1995; 2000) descriptions of
empowerment at the individual or psychological level as well as the
organisational and the community levels.

21
2.3.3.1. The Individual Level of Analysis Empowerment at the individual level of analysis is a process by which
individuals gain mastery and control over their lives and a critical
understanding of their environment (Berger & Neuhaus, 1977; Kieffer, 1984;
Rappaport, 1984, 1987; Swift & Levin, 1987; Zimmerman 1990a; Zimmerman,
Israel, Schulz & Checkoway, 1992). Zimmerman and colleagues
(Zimmerman, 1995; Zimmerman et al., 1992; Zimmerman & Rappaport, 1988;
Zimmerman & Zahniser, 1991) describe this level of empowerment as
psychological empowerment. Building on the ideas of enlightenment and
emancipation, critical theory and class consciousness (Deacon, 1990;
Ellsworth, 1989; Neath & Read, 1998; Serrano-Garcia, 1984; Swift & Levin,
1987) Zimmerman and colleagues argue that in the most general case
psychological empowerment may be conceptualised to include intrapersonal,
interactional and behavioural components (see Figure 1).
Figure 1: Nomological Network for Psychological Empowerment
(from Zimmerman, 1995)
The intrapersonal component refers to how people think about their capacity
to influence social and political systems important to them (Peterson, Lowe,
Hughey, Reid, Zimmerman, & Speer, 2006). It is a self-perception that
Psychological Empowerment
Intrapersonal Component
Interactional Component
Behavioural Component
• Domain specific perceived control
• Domain specific self-efficacy
• Motivation control • Perceived competence
• Critical awareness • Understanding causal
agents • Skill development • Skill transfer across life
domains • Resource mobilisation
• Community involvement
• Organisational participation
• Coping behaviours

22
includes domain specific perceived control (Paulhaus, 1983), self-efficacy,
motivation to exert control over community problems and perceived
competence. It may also include perceptions about the difficulty associated
with trying to exert control over community problems. This perceived difficulty
may refer to beliefs about one’s own capacity to influence social and political
systems or to beliefs about people in general (Zimmerman & Rappaport,
1988).
The interactional component refers to the transactions between persons and
environments that enable one to successfully master social or political
systems. It includes knowledge about the resources needed to achieve goals
(McCarthy & Zald, 1978), understanding causal agents (Sue and Zane, 1980),
a critical awareness of one’s environment (Freire, 1970; Kieffer, 1984) and the
development of decision-making and problem solving skills necessary to
engage in one’s environment. Zimmerman (1995) suggests that the
interactional component may be essential to the construct of psychological
empowerment because it connects self-perceptions about control
(intrapersonal component) with what one does to exert influence (behavioural
component).
The behavioural component of psychological empowerment refers to the
specific actions one takes to exercise influence on the social and political
environment through activities such as participation. These three components
merge to form a picture of a person who believes that he or she has the ability
to influence a given context (intrapersonal component) understands how the
system works in that context (interactional component) and engages in
behaviours to exert control in the context (behavioural component).
Several studies (Kieffer, 1984; Speer, 2000; Zimmerman & Rappaport, 1988)
support the idea that psychological empowerment includes personal control, a
sense of competence, a critical awareness of the socio-political environment
and participation in community organisations and activities, thus suggesting
that psychological empowerment includes intrapersonal, interactional and
behavioural components.

23
There is evidence for positive correlations between locus of control and self-
efficacy (Biggs, 1987; Harter, 1981; Landine & Stewart, 1998; Njus &
Brockway, 1999; Schnieder, Borkowski, Kurtz & Kerwin, 1986; Wallston,
1992) and that these variables are related to a person’s propensity and
willingness to engage in activities, their achievements and their willingness to
engage in change processes (Carns & Carns, 1991; Griffeth & Hom, 1988;
Harter, 1981; Jalajas & Bommer, 1999; Johnson, 1979; Judge, Bono & Locke,
2000; Sandler & Lakey, 1982; Schnieder et al., 1986; Solberg, Brown, Good,
Fischer & Nord, 1995; Stajovic & Luthans, 1998). It is for this reason that they
have been argued to be dimensions of psychological empowerment.
Zimmerman and colleagues (Zimmerman, 1989; Zimmerman & Rappaport,
1988; Zimmerman & Zahniser, 1991) argue that these areas of perceived
control, when combined and evidenced in action, represent psychological
empowerment. They argue that a sense of personal control (i.e. locus of
control) when combined with the confidence that action might be successful
(i.e. self-efficacy) will compel people into action. Bandura, as early as 1977,
asserted that merely exploring locus of control was not sufficient, that it was
also crucial to examine the perceived efficacy people feel about their abilities
to affect changes in their lives. Results from several studies clearly indicate
the importance of examining not only perceived locus of control but also
perceived efficacy or competence beliefs that individuals maintain (Armitage &
Conner, 1999; Njus & Brockway, 1999; Wallston, 1992). These studies
support the notion that in order for behavioural action to occur individuals
need both a personal internal sense of control and a confidence in their ability
to carry out the behaviour. An empowered individual has been characterised
as reporting personal competence, control and willingness, and desire to exert
control in one’s life (Kieffer, 1984; Zimmerman & Rappaport, 1988).
Although empowerment has been seen as a useful concept for community
psychology the development of measures specifically related to empowerment
has been difficult. Zimmerman & Rappaport (1988) report that, while no
single measure of empowerment is available, several scales exist that assess
what may be thought of as different aspects of psychological empowerment

24
(Zimmerman & Rappaport, 1988). For example personality aspects of
perceived control have been operationalised as locus of control (Levenson,
1973a, b, 1974; Rotter, 1966, 1971) and cognitive aspects of control are
reflected in self-efficacy theory and research (Bandura, 1977, 1992).
Zimmerman and colleagues developed measures using a combination of
perceived control measures (general self-efficacy and locus of control) in
order to look at psychological empowerment. This addresses two of the three
dimensions of psychological empowerment. The interactional component has
not received much attention. In the workplace literature a measure of
psychological empowerment composed of four cognitions (meaning,
competence, self-determination and impact) has been developed and refined
(Boudrias, Gaudreau & Laschinger, 2004; Conger & Kanungo, 1988;
Spreitzer, 1995a, b, 1996; Thomas & Velthouse, 1990).
A significant barrier to studying psychological empowerment is the
development of appropriate measures. However as has already been said
the development of a universal global measure of psychological
empowerment may not be feasible or conceptually sound, given that the
specific meaning of the construct is context and population specific. This
suggests that measures of psychological empowerment need to be developed
for the specific population one is working with. Similarly, measures of
psychological empowerment in one life domain may not be appropriate to
other settings of an individual’s life (Peterson & Zimmerman, 2004).
2.3.3.2. The Organisational Level of Analysis When looking at the organisational level of empowerment Zimmerman (2000)
argues that a distinction must be made between what the organisation
provides to members and what the organisation achieves in the community.
Organisations that provide opportunities for people to gain control over their
lives are empowering organisations. Organisations that successfully develop,
influence policy decisions or offer effective alternatives for service provision
are empowered organisations. Although a distinction is made, organisations
may have both characteristics.

25
An empowering organisation may have little impact on policy, but may provide
members with opportunities to develop skills and a sense of control.
Organisations with shared responsibilities, a supportive atmosphere and
social activities are expected to be more empowering than hierarchical
organisations (Maton & Rappaport, 1984; Prestby et al., 1990). Several
investigators suggest that formal organisational practices may play a central
role in empowering members (Conger & Kanungo, 1988; Klein, Ralls, Smith-
Major & Douglass, 2000). Maton & Salem (1995) examined three community
organisations to identify common empowering themes. They described four
vital characteristics of an empowering organisation: (1) a culture of growth and
community building; (2) opportunities for members to take on meaningful and
multiple roles (3) a peer based support system that help members develop a
social identity and (4) shared leadership and commitment to both members
and the organisation.
Empowered organisations are those that successfully thrive among
competitors, meet their goals and develop in ways that enhance their
effectiveness (Zimmerman, 2000). Empowered organisations may or may not
provide opportunities for members to develop a sense of empowerment but
they do become key brokers in the policy decision making process.
Empowered organisations may extend their influence to wider geographical
areas and more diverse audiences. They are also expected to effectively
mobilise resources such as money, facilities and members. One way to
efficiently compete for limited resources is to connect with other organisations
to share information and resources, and to create a strong support base.
2.3.3.3. The Community Level of Analysis At the community level of analysis empowerment may refer to collective action
to improve the quality of life in a community and to the connections among
community organisations and agencies (Zimmerman, 2000). An empowered
community is one that initiates efforts to improve the community, responds to
threats to quality of life and provides opportunities for citizens to participate.
Iscoe (1974) identifies a community in which its citizens have the skills, desire
and resources to engage in activities to improve community life as a
26
competent community. Cottrell (1983) describes a competent community by
the extent to which interdependent components of a community work together
to effectively identify community needs, develop strategies to address needs
and perform actions to meet those needs. Minkler (1990) suggests that
shared leadership and its development are critical to developing empowered
communities.
The structure and relationship among community organisations and agencies
also helps to define the extent to which a community is empowered. An
empowered community is expected to comprise well-connected organisations
(i.e. coalitions) that are both empowered and empowering. An empowering
community would include accessible resources for all community residents.
Empowering processes in a community also include an open governmental
system that takes citizens’ attitudes and concerns seriously and includes
strong leadership that seeks advice and help from community members
(Peterson & Zimmerman, 2004).
2.3.3.4. The Dialectical Relationship Between Levels Each level of analysis, though described separately, is inherently connected
to the others. Individual, organisational and community empowerment are
interdependent and are both a cause, and consequence, of each other. The
extent to which elements of one level of analysis are empowered is directly
related to the empowering potential of other levels of analysis. Similarly
empowering processes at one level of analysis contribute to empowered
outcomes at other levels of analysis. Zimmerman (2000) says that
empowered persons are the basis for developing responsible and
participatory organisations and communities, and that it is difficult to imagine
an empowered community or organisation devoid of empowered individuals.
However recent research indicates that we should not assume that change in
one level of analysis necessarily means there will be a concomitant change in
another level; for example putting participatory decision-making structures in
place within an organisation (making the organisation more empowering)
does not necessarily mean that there will be more participation from the
27
members of the organisation (individual level of analysis) (Campbell &
Martiniko, 1998; Chavis & Wandersman, 1990; Gruber & Trickett, 1987; Hardy
& Leiba-O’Sullivan, 1998; Liden, Wayne & Sparrowe, 2000; Soet, Dudley &
Dilorio, 1999; Speer & Hughey, 1995). For example, Soet et al. (1999) found
that changes in intrapersonal empowerment were not sufficient to bring about
behavioural change, as interpersonal factors play a greater role in whether a
person initiated changes in their safer sex behaviours than intrapersonal
factors such as self-efficacy.
Gruber & Trickett (1987) take the point even further pointing out that
empowering organisational structures may also work to undermine the act of
empowerment if members do not share real decision making power. Several
authors (Giffin, 1998; Koberg, Boss, Senjem & Goodman 1999; Liden et al.,
2000; Serrano-Garcia, 1984; Speer & Hughey, 1995) stress a reciprocal or
dialectical process between empowerment at the different levels of analysis.
Therefore efforts to understand empowering processes and outcomes are not
complete unless multiple levels of analysis are studied and integrated and one
takes cognisance of the dialectical relationships between the levels.
2.3.4. EMPOWERMENT AS A PROCESS AND AN OUTCOME The third assumption makes a distinction between empowering processes
and empowering outcomes (Swift & Levin, 1987; Zimmerman, 2000).
Empowering processes are ones in which attempts to gain control, obtain
needed resources and critically understand one’s social environment are
fundamental (Zimmerman, 2000). The process is empowering if it helps
people develop skills so they can become independent problem solvers and
decision makers.
Empowerment outcomes refer to operationalisations of empowerment so we
can study the consequences of people’s attempts to gain greater control in
their community, or the effects of interventions designed to empower
participants (Zimmerman, 2000). Empowering processes and outcomes vary
across levels of analysis (see Table 1 over the page for a comparison of
empowering processes and empowered outcomes across levels of analysis).

28
Table 1: A Comparison between Empowering Processes and Empowered Outcomes across Levels of Analysis
Levels of Analysis
Process (empowering) Outcome (empowered)
Individual Learning decision making skills Managing resources Working with others
Sense of control Critical awareness Participatory behaviours
Organisational Opportunities to participate in decision making Shared responsibilities Shared leadership
Effectively compete for resources Networking with other organisations Policy influence
Community Access to resources Open government structure Tolerance of diversity
Organisational coalitions Pluralistic leadership Residents participatory skills
(from Perkins & Zimmerman, 1995)
2.3.5. THE DYNAMIC NATURE OF EMPOWERMENT The fourth assumption concerns empowerment’s dynamic nature. An
essential aspect of any theory development is the recognition of the time and
space constraints of a phenomenon (Altman, 1996; Whetten, 1989). Contexts
continually shape themselves; they are dynamic and, at times, fluctuating in
their character (Gergen, 1985). As a contextually embedded construct,
empowerment is particularly prone to fluctuations over time. Empowerment at
all levels of analysis can have different intensities that can change over time.
This suggests that every individual has the potential to experience
empowering and disempowering processes and to develop a sense of
empowerment at one time and a sense of disempowerment at another. It also
suggests that people may become more empowered over time. When the
context of empowerment changes over time so too may the indicators of
empowered outcomes in the context. Empowerment should not be seen as
an absolute threshold that once reached can be labelled as empowerment
(Ackerson & Harrison, 2000; Barksdale, & Thomas, 1996; Campbell &
Martinko, 1998; Lightfoot, 1986).
2.3.6. THE CONTEXTUAL EMBEDDEDNESS OF EMPOWERMENT The fifth assumption emphasises the contextual embeddedness of
empowerment. Empowerment embodies an interaction between individuals
and environments that is culturally and contextually defined (Rappaport, 1987;

29
Serrano-Garcia & Bond, 1994; Speer, 2000; Trickett, 1984, 1994).
Consequently empowerment will look different in its manifest content for
different people, organisations and settings. In other words, it takes on
different forms for different people, in different contexts, at different time. This
contextual emphasis also suggests that psychological empowerment may
vary across different life domains (e.g. work, family, recreation). A high level
of empowerment might be expected among individuals who can generalise
skills across life domains, but some individuals may also experience
psychological empowerment in one life domain even if they have been less
successful in transferring skills to other life domains (Zimmerman, 1995).
Empowerment researchers have begun to explore the importance of context
in understanding empowerment’s processes and outcomes. The unique
forms empowerment takes in community coalitions (McMillan, Florin,
Stevenson, Kerman & Mitchell, 1995), community organisations (Rich et al.,
1995; Serrano-Garcia, 1984), neighbourhood association (Prestby et al.,
1990), corporate work settings (Spreitzer, 1996) and human service delivery
systems (Foster-Fishman & Keys, 1997) have been explored and
documented. The specific characteristics that facilitate empowerment within
these settings have also been considered (e.g. Prestby et al., 1990; Spreitzer,
1995a). This work has significantly advanced our understanding of the
multiple contingencies of empowerment and has emphasised the importance
of attending to the unique forms empowerment takes within any given context.
Swift & Levin (1987) point out that an empowerment approach needs to
consider environmental factors that may facilitate or hinder the development
of psychological empowerment. The focus of both empowerment theory and
practice is to understand and strengthen processes and context where
individuals gain mastery over decisions that affect their lives. Several models
of empowerment (Fawcett, White, Balcazar, Suarez-Balcazar, Mathews,
Paine-Andrews, et al., 1994) and school development (Stoll, 1999) that
attempt to link different levels of analysis within a contextual framework have
been advanced. These models allow us to take a more complex look at the
different variables, many of which are modifiable, that can impact on the
30
empowerment process. They provide a framework to look at the variety of
contexts and patterns in which the empowerment process occurs or does not.
However most of these models focus on the development of psychological
empowerment. Two recurring themes, in the workplace, community and
school research, in terms of contextual factors that support or hinder the
development of empowerment are the areas of participation and leadership.
2.3.7. PARTICIPATION AND EMPOWERMENT
A review of the literature on participation indicates that this, like
empowerment, is a complex, multi-level concept that will vary in type and
intensity and will change over time (Robertson & Minkler, 1994). Neumann,
(1989) and Pasmore & Fagans (1992), in their work on organisational change,
argue that level of participation, not simply a dichotomous measure of
participation or non-participation, is important. Few researchers have formally
studied the potential impact that differing levels of participation might have on
the outcomes of organisational change initiatives. In a study by Bartunek et
al. (1999) it was found that the level of participation in the change initiative
had a significant positive relationship on ratings of its impact on the individual
and on behavioural change.
Nurick (1985) argued that there are multiple types, not only levels of
participation and that to assume that different levels of participation reflect a
linear scale is not always useful. In a similar way the results of Bartunek et al.
(1999) suggest that if researchers simply assume that more participation is
better they are likely to miss important dimensions of the participation
experience. Several authors (e.g. Bartunek et al., 1999; Le Bosse, Lavalle,
Lacerte, Dube, Nadeau, Porcher, & Vandette, 1998/9; Speer, 2000; Speer &
Zippay, 2005) have distinguished between active and passive participation as
they have a different impact on the individual’s behaviour and outcomes. Not
only are there multiple levels and types of participation but these levels and
types will change over time (Florin & Wandersman, 1984) and different levels
and forms may combine in different ways to form a variety of different types of
participation (Klein, et al., 1999). Studies have also shown that different
31
levels and types of participation are needed at different phases within the life
of a group or organisation (Florin & Wandersman, 1990; Klein et al., 2000).
Theoretical inferences of a direct link between community participation and
psychological empowerment are suggested by many researchers (Berger &
Neuhaus, 1977; Conger & Kanungo, 1988; Gruber & Trickett, 1987; Kieffer,
1984; Klein et al., 2000; Rappaport, 1987; Wandersman & Florin, 1990;
Zimmerman & Rappaport, 1988). Researchers have found a link between
participation (in its various definitions) and empowerment in the workplace
(Herronkohl, Judson & Heffner, 1999; Koberg et al., 1999; Menon, 1999;
Tjosvold & Law, 1998); the community (LeBosse et al., 1998/9; Perkins,
Brown, & Taylor, 1996; Perkins, Florin, Rich, Wandersman, & Chavis, 1990;
Price, 1990; Peterson & Reid, 2003; Speer, 2000); and the school (Bartunek,
et al., 1999; Klecker & Loadman, 1998; Royal & Rossi, 1996).
Despite the heterogeneity of participation measures used, many studies give
empirical support to the empowering participation hypothesis (Berkowitz,
2000; Carr, Dixon, & Ogles, 1976; Prestby et al., 1990; Rissel, Perry,
Wagenaar, Woolfson, Finnegan, & Komro, 1996; Wandersman, & Giamartino,
1980; Wandersman, & Florin, 2000; Zimmerman, 1990b). Locus of control
and self-efficacy have been linked to participation (Abramowitz, 1974;
Bandura, 1993; Busch, 1998; Levenson, 1974; McKinney, Sexton &
Meyerson, 1999; Phares, 1978; Sandler & Lakey, 1982). Organisational
cultures reflecting participation, collaboration and co-operation have also been
linked to empowerment (Bond & Keys, 1993; Foster-Fishman & Keys, 1997;
Spreitzer, 1995; Tjosvold & Law, 1998).
In the community psychology literature, participation is frequently pointed out
as empirical evidence of psychological empowerment (Le Bosse et al.,
1998/9). Zimmerman & Rappaport (1988) state that: “Participation may be an
important mechanism for the development of psychological empowerment
because participants can gain experience organising people, identifying
resources, and developing strategies for achieving goals" (p.727). Perkins &
Zimmerman (1995), referring to empowerment, proposed that “participation

32
with others to achieve goals, efforts to gain access to resources and some
critical understandings of the socio-political environment are basic
components of the construct” (p.571). Elaborating further, they suggest that
at the organisational level of analysis, “empowerment includes organisational
processes and structure that enhance member participation and improve goal
achievement for the organisation” (p. 571).
Implicit in all these definitions of empowerment is the assumption that an
individual’s active participation in decision-making within the major
organisations that substantively influence his or her daily life will engender
both an increase in the individual’s sense of personal power and effectiveness
and an increase in the organisations’ abilities to meet the individuals needs.
Thus Zimmerman (1995) argues that participation can be viewed as an
integral component or important behavioural exemplar of individual
empowerment (Zimmerman, 1995).
Rich et al. (1995) argue slightly differently that participation is one process
that may lead to empowerment. They argue that participation in decision-
making can be empowering or disempowering, depending on the nature and
outcome of the experience. Thus participation is a process or context from
which empowerment may arise (Edelstein & Wandersman, 1987). Le Bosse
et al. (1998/9) point out that although it seems clear that there is a relationship
between the two concepts, as yet little is known about the mechanism which
governs the relationship (McMillan, et al., 1995).
As discussed above the literature suggests that ‘participation’ is not related to
a single but a complex and multivariate reality (Robertson & Minkler, 1994)
and depending on which aspect is examined will have a different effect on
psychological empowerment. Robertson & Minkler (1994), like Rich et al.
(1995), point out that some aspects could even have a disempowering effect.
Recent theoretical and empirical studies suggest that community participation
becomes an empowering activity when it involves personal contribution to the
collective action (Bartunek et al., 1999; Le Bosse et al., 1998/9). Moreover,
community participation, which implies a form of critical consciousness

33
development, appears to be more effective at improving psychological
empowerment.
Perkins (1995) argues that it may be more accurate to think of participation as
a cause and effect of empowerment. In either case, the two concepts are
closely linked at all levels, from individual to organisational and community.
He argues that focusing on citizen participation as a form of empowerment is
valuable in research and intervention for three reasons:
(1) As a behaviour, participation can more directly, and therefore reliably,
be measured than intrapsychic dimensions of empowerment;
(2) Participation forces psychologists to consider empowerment at various
levels of analysis (individual, organisational and community);
(3) A focus on participation highlights the need to understand how those
factors affect and are affected by empowerment.
From the above discussion we can conclude that there is evidence to suggest
a strong link between empowerment and participation, whether it is seen as a
cause of, an effect of, or a form of empowerment (e.g. Berkowitz, 2000; Le
Bosse et al., 1998/9; Perkins, 1995). However it is clear that further empirical
work is needed before the specific contribution of any participation component
is to be established.
2.3.8. LEADERSHIP AND EMPOWERMENT
Like empowerment and participation the concept of leadership too is a multi-
faceted, contextual and complex one, with definitions abounding. Bass (1981)
gives various descriptions of the concept of “leadership”. For instance it can
be seen as a personal property, as the art of inducing obedience, as a way of
convincing people or of exercising influence, as the result of interaction, as a
role differential in group processes or as a form of structuring. The field of
leadership research in general, and school leadership in particular, seems to
reflect the confusion already manifest in reality (Andriessen & Drenth, 1998;
DeCoux & Holdaway, 1999; Hall & Southworth, 1997).

34
Much research into leadership in both the workplace and schools has been
focused on the leader, attempting to explain individual, group or
organisational performance outcomes by analysing specific leader behaviours
and linking them to those outcomes (Atwater, Dionne, Avolio, Camobreco &
Lau, 1999; Giella, 1987; Goertz, 2000; Konovsky & Organ, 1996; Organ &
Ryan, 1995; Pratch & Jacobwitz, 1998; Revenson & Cassel, 1991; Sosik &
Godschalk, 2000). Andriessen & Drenth (1998) and Bass (1981) point out
that it has been impossible to find a single set of characteristics that enables
clear and reliable distinction to be drawn between good and bad leaders or for
that matter between leaders and followers.
In light of this many writers on leadership have begun looking at the issue of
leadership style (Awamleh, & Gardner, 1999; Cant & Bateman, 2000; Deluga,
1995; Diggins, 1997; Leithwood & Jantaz, 1999; Wolverton, 1998). A
consistent theme in this research has been on the importance of the bond
created between leader and followers. The focus on the bond between leader
and member has led to an interest in the interpersonal or relational aspects of
leadership (Deluga, 1994; Howell & Merenda, 1999; Wayne, Shore & Liden,
1997). Leader focused research implicitly assumes a relationship of some
sort between leader and follower and that this implied relationship is
fundamental to the link between leader behaviour and follower responses.
Several researchers on leadership are placing more and more importance on
the relationship between the leader and follower in understanding
organisational and leadership issues (Couto, 2000; Kemp, 1998; Knutson &
Miranda, 2000; Settoon, Bennett & Liden, 1996; Sondak, 1998). As Murphy
(1988) has pointed out, associating leadership with a person rather than an
interaction between leader and followers has led research findings to sideline
the influence of followers on leaders and of the context. If we take this
interaction into account we begin to have a view of leadership that is more
complex and contextual (April & Macdonald, 1998; Connelly, Gilbert, Zaccaro,
Threfall, Marks & Mumford, 2000; Mumford, Zaccaro, Johnson, Diana, Gilbert
& Threfall, 2000).

35
Several writers have argued that leadership may need to be viewed
contextually (Fidler, 1997; Podsakoff, MacKenzie & Brommer, 1996). In a
similar vein more recent writers have begun to argue that different
organisations may require different types of leadership and that different
forms of leadership may be more appropriate at different phases of change
programmes (Andriessen & Drenth, 1998; Connelly, et al., 2000; de Vries,
Roe & Taillieu, 1998; Wolverton, 1998). Podsakoff, et al. (1996) argue that
studies out of context do not provide many insights into leadership. What is
appropriate leadership at a particular point in time depends on: the context
and its pre-history; the nature of followers; the particular issues involved; in
addition to the predisposition of the leader. Thus although a leader may have
a preferred leadership style this may need to be varied according to
circumstance.
Andriessen & Drenth (1998) argue that a more differentiated view of
leadership is required. This view holds that leadership plays only a limited
role in motivating people, that leader and individual group members influence
each together in a process of continuous mutual interaction and that
leadership itself is just one element in a complex set of organisational
processes.
Andriessen & Drenth (1998) point out that each of the perspectives offered
above contain elements that are valuable. Fidler (1997) argues that no one
theory or approach can subsume the complexities of leadership and indeed
that a search for such all-encompassing theory may be illusory. It is therefore
a matter of choosing one or more conceptualisations of leadership which
appear appropriate in order to understand a particular situation, and using
these to formulate actions. The choice of conceptualisation will depend on
the situation and on the purpose for which understanding is being sought.
Fidler (1997) adds: Establishing a framework for studying leadership is an important stepping-stone but the extent of the remaining steps to greater understanding of the artistry of leadership may be gained from the analogy offered by Krug (1992) who points out that composers use the same 12 tone scale but the music produced can be very different. The

36
results produced by leaders using the same actions in different combinations and ways may be equally variable. (p. 35)
Leadership qualities such as encouraging, supporting and approachability
have been reported to play an important role in developing empowerment
(Kirkman & Rosen, 1999; Koberg et al., 1999; Kraimer, Seibert & Liden, 1999;
Liden, et al., 2000). Leadership styles such as participative; democratic and
transformational leadership have all been linked to empowerment in the
workplace (Bolin, 1989; Fuller, Morrison, Jones, Bridger & Brown, 1999;
Tjosvold & Law, 1998); in the community (Bond & Keys, 1993; Saegert &
Winkel, 1995) and in schools (Lightfoot, 1986; Stimson & Appelbaum, 1988).
Similar results, linking locus of control and self-efficacy to leadership
(Chemers, Watson & May, 2000; Hoffi-Hofsteter & Mannheim, 1999; Howell &
Avolio, 1993; Judge, Thoresen, Pucik & Welbourne, 1999; Valentine, 1999;
Weiss, 1996) have been found. Several writers (Ballentine & Nunns, 1998;
Mathieu, Martineau & Tannenbaum, 1993; Relich, Debus & Walker, 1986)
argue that leadership qualities and styles moderate the relationship between
these personal control and competence beliefs and performance.
What can be concluded is that leadership is a complex issue and that no
global, agreed upon definition of leadership exists (Andriessen & Drenth,
1998). It is also clear that leadership needs to be seen in context; that is, we
need to take a situational view of leadership rather than trying to understand it
outside of the context of the area of study (Podsakoff et al., 1996). It is
therefore pragmatic to take Fidler’s (1997) advice and choose one or more
conceptualisations of leadership which appear appropriate in order to
understand a particular situation. It is also clear from this brief review of the
leadership literature that leadership does not reside within an individual and
that we need to examine the relationship between leader and follower. Taking
these issues into account it is important for us to begin to clarify what types of
leadership and leader member relationships, within which contexts, can
promote feelings of psychological empowerment as well as organisational
empowerment.

37
2.3.9. LEADERSHIP, PARTICIPATION AND EMPOWERMENT
Several authors have suggested a link between levels of participation (and
thus empowerment) and the role of the leader (Driscoll, 1978; Prestby, et al.,
1990; Pretorius, 1993; White, 1979). Prestby et al. (1993) argue that this link
is important, as we may be able to find strategies for increasing individual
participation and thereby individual empowerment. They argue that leaders
can promote individual participation, and thereby individual empowerment,
through incentive management and cost management efforts. Several
authors have found a link between participation in decision making and
employees’ perceptions of supervisor support (Driscoll, 1978; Pretorius, 1993;
VanYperen, van den Berg & Willerig, 1999). Van Yperen et al. (1999) argue
that participation in decision making is associated with perceived support from
the supervisor, probably because the opportunity to participate in decision
making implies respect for the rights of individual employees and a full-status
relationship with the immediate supervisor.
Leadership, participation and empowerment are thus closely linked. Leaders
can play an important role in developing participative and collaborative
environments within their organisations and thus play a crucial role in
developing the empowerment of their staff as well as making the organisation
a more empowering place to work in. Exploration of the types of leadership
and leadership-staff interactions that would be most conducive to developing
empowered staff and organisations is needed.
2.4. RESEARCH ON EMPOWERMENT
As the previous section outlines empowerment is a complex, multi-
dimensional, multi-level and dynamic concept. Just as the definitions of
empowerment are varied so too is the research on empowerment. A review
of the literature on empowerment reveals research in a wide range of contexts
(Bartunek, et al., 1999; Dickerson, 1998; Klecker & Loadman, 1998;
Westphal, 2003), set in a variety of content areas (Beeker, Guenther-Grey &
Raj, 1998; Giffin, 1998; Mishra & Spreitzer, 1998); in a variety of populations
(Barksdale & Thomas, 1996; Hassin & Young, 1999; Peled, Eisikovits, Enosh
38
& Winstok, 2000; Schindler, 1999), using a wide range of levels of analysis
(intrapersonal, psychological, organisational and community) and a range of
different research methods, for example: quantitative (Spreitzer, De Janasz &
Quinn, 1999); qualitative (Foster-Fishman, et al., 1998); and multi-method
(Campbell & Martinko, 1998). Several measures of empowerment in the
workplace (Herronkohl, et al., 1999; Leslie, Kolzhalb & Holland, 1998; Menon,
1999; Spreitzer 1995b), in schools (Klecker & Loadman, 1998) and
community contexts (Speer & Peterson, 2000) have been developed.
Although there has been much research on the concept of empowerment it is
open to much criticism in that it has often failed to capture the complexity of
the concept it is exploring. For the purposes of this research study we will
focus on the research related to empowerment in the workplace, the school
and the community.
2.4.1. EMPOWERMENT IN THE WORKPLACE
While earlier research in the workplace conceptualised empowerment as a set
of management practices focused on delegating decision-making authority,
recent research has provided the conceptual base for a more psychological
definition of empowerment in the workplace (Spreitzer et al., 1999). The two
main thrusts of research in the organisational setting or workplace has
focused around developing and refining the intrapersonal component of
psychological empowerment (Boudrias, et al, 2004; Conger & Kanungo, 1988;
Menon, 1999; Mishra & Spreitzer, 1998; Spreitzer, 1995a, b; Thomas &
Velthouse, 1990) and looking at the preconditions and outcomes or
consequences of empowerment (Corsun & Enz, 1999; Fuller, et al., 1999;
Kizilos, 1990; Koberg, Boss, Senjem & Goodman, 1999; Liden, et al, 2000;).
Almost all of the research on empowerment in the workplace has focused on
empowerment as an intrapsychic cognitive or motivational state.
2.4.2. TEACHER AND SCHOOL EMPOWERMENT
Very little research has been done on teacher empowerment or empowerment
of the school at an organisational level even though the literature on school
39
development calls constantly for the empowerment of teachers (Garrison,
1988; Stone, 1995; Yonemura, 1986). School development literature also
emphasises the importance of viewing school development at an
organisational or community level rather than at the individual or teacher level
(Klecker & Loadman, 1998; Lightfoot, 1986). However empowerment
research in the school has predominantly focused on the teacher or on the
leadership. Teacher empowerment is described in much of the educational
literature as a multidimensional construct that is often used to define “new
roles” for classroom teachers. Many researchers identify the construct as
essential to the success of school restructuring effort (Fullan, 1993; Giffin,
1991; Sarason, 1997).
2.4.3. CRITICISMS OF WORKPLACE AND TEACHER/SCHOOL EMPOWERMENT RESEARCH
Several criticisms can be levelled at empowerment research in the work place
and the school:
(a) Very little of the research is theoretically linked. There has been little
attempt to genuinely develop ideas of others by many of the writers in
the field other than Spreitzer (1995a, 1995b, 1996);
(b) There has been an over emphasis on the individual intrapsychic level
of empowerment (Peterson & Zimmerman, 2004). Research in this
area has paid very little attention to other levels of analysis (e.g.
Boudrias, et al., 2004; Spreitzer, 1995a; Thomas & Velthouse, 1990);
(c) Many of the studies have made use of single methods for their
investigation, usually measures and self-report (e.g. Herronkohl, et al.,
1999; Leslie, et al., 1998; Menon, 1999; Spreitzer 1995b);
(d) Under theorising and a focus on the intrapsychic aspects of
empowerment has meant that few models capturing the complex
interaction between levels have been developed (Beeker et al., 1998;
Fawcett et al. 1994);
(e) The main focus has been on the intrapersonal dimension of
psychological empowerment (Conger & Kanungo, 1988; Spreitzer,
1995; Thomas & Velthouse, 1990) as defined by Zimmerman (1995,
40
2000). However, over the years researchers working on this concept
have begun calling it psychological empowerment (Mishra & Spreitzer,
1998; Spreitzer at al., 1999), which it is not – it is only one dimension of
a multi-dimensional concept, as defined by Zimmerman (2000). This
leads to confusion and simplistic notions of psychological
empowerment.
2.4.4. COMMUNITY-BASED EMPOWERMENT RESEARCH
Community based empowerment research provides many ideas, models,
interventions and evaluations of empowerment for a variety of populations
within a wide range of contexts. One of the main differences between this
community based research and that focusing on empowerment in the
workplace and the school is that it attempts to take into account the complex
nature of empowerment: its multiple forms, its contextual nature, its
expressions at different levels of analysis and its dynamic nature.
Kroeker (1995) demonstrates how the local and national context can impede
or facilitate different levels of empowerment. Speer & Hughey (1995) and
Serrano-Garcia & Bond (1994) look at the role of social power. Fawcett et al.
(1994) provide a context behavioural model for the way in which
empowerment and environmental factors interact. Many of these writers
attempt to incorporate the issue of power within their formulations of
empowerment. Even those authors focusing on the individual level of
empowerment (Balcazar, Seekins, Fawcett, & Hopkins, 1990; Dickerson,
1998; Giffin, 1998; Peled et al., 2000; Schindler, 1999) attempt to incorporate
issues of contextualism, power and the socio-political. Many of these writers,
such as Saegert & Winkel (1996) emphasise the dialectical nature between
the different levels of empowerment.
2.4.5. CONTEXT AND EMPOWERMENT
As was argued earlier, empowerment involves a critical understanding of the
socio-political environment; it is not a “static personality trait” but a “dynamic
contextually driven” construct (Zimmerman, 1990a). As Rappaport (1987)

41
argued, we need research to examine “the nature of settings in which
empowerment is developed or inhibited” (p.130). While contextual influences
have been studied in the area of community psychology they have received
less attention in the workplace and school development literature. However,
more recently there has been an increase in research that looks at individual
and contextual variables that can impact on the empowerment of the
individual (Beeker et al., 1998; Dickerson, 1998; Fawcett et al. 1994; Giffin,
1998; Peled et al., 2000; Schindler, 1999).
Although these models do incorporate other aspects and levels of the
empowerment process they do not fully integrate the various levels of
empowerment. It is essential to remember that empowering processes may
occur at all levels of analysis. The challenge for researchers interested in
empowerment is not to ignore one level of analysis in the interest of another
but to struggle with efforts to integrate levels of analysis for understanding the
construct in its entirety. However we need to acknowledge our limitations as
researchers. As O’Neill (2000) rightly points out none of these levels of
analysis gives a picture of reality that is true while the other levels are false.
However, we need to be aware that when one way of looking at a problem is
in the foreground other ways tend to fade into the background.
2.4.6. CROSS-CULTURAL ISSUES:
Although community psychology has emphasised diversity as a key theme in
its theorising and has conducted research in many varied contexts little
account has been taken of issues of culture. Similarly, in the areas of school
development, empowerment, participation and leadership research very little
attention has been paid to the issue of culture. However, the research that
has been done in this area shows that culture is an important issue when
looking at school development (Cheng, 1999; Godwin, 1999; Hallinger &
Kantamara, 2000), empowerment (Eylon & Au, 1999; Fan & Mak, 1998; Soet
et al., 1999), leadership (Kets de Vries, 2000; Rahim, Antonioni, Krumov, &
Ilieva, 2000) and participation (Ang & Chang, 1999; Tjosvold & Law, 1998).
Most of the theory and research in the fields of empowerment, participation

42
and leadership have been developed in the context of western, first world or
developed countries.
Studies of school development and empowerment from North America and
Western Europe have been well represented in the literature over the last ten
years whereas studies from “developing” countries and regions have not
(Elliott, 1999; Walker & Dimmock, 2000). Dimmock & Walker (2000) argue
that there is an ethnocentricity underlying theory development, empirical
research and prescriptive argument where Anglo-Americans continue to exert
a disproportionate influence on theory, policy and practice.
Including the issue of culture and taking a cross-cultural view on
empowerment has some important implications for empowerment theory,
research and programme development. Firstly, as implementers and policy
developers, if we want to provide successful empowerment programmes we
need to ensure that the intervention is appropriate for the culture within which
it is to be implemented. Secondly, as Eylon & Au (1999) stress, we need to
consider cultural differences when conducting research on organisational and
community phenomena. Thirdly, it is vital for developing countries to begin
developing knowledge within their own countries, not only to reflect on and
critique the application of models within their countries, but also to enter the
more global debate on these issues. Fourthly, reinterpretations of “borrowed”
models need to find their way into the mainstream debate and researchers
and theorists from the “lending” countries need to acknowledge the
contribution these can have both to their understanding of the concepts and to
reinterpretations of it.
The programme under investigation in the present study, although applying
many of the frameworks developed in these “lending” countries, is applying
them in a very different context, with a very different group of people. It is
thus important for us to consider the cross-cultural implications of this. The
schools in the present study provide a context to look at cross-cultural issues
related to organisational empowerment and will help to develop knowledge
about how school development planning, a process conceptualised in

43
“developed” countries, has been understood and re-invented in a “developing”
country. Community psychology has not only been critiqued on its lack of
focus on cross-cultural issues but has also been critiqued on some of its
dominant assumptions.
2.5. CRITIQUE OF EMPOWERMENT’S DOMINANT ASSUMPTIONS
Several writers and researchers (Amaro, 1995; Ellsworth, 1989; Riger, 1990,
1993; Saegert & Winkel, 1996; Serrano-Garcia, 1994; Serrano-Garcia &
Bond, 1994; Walsh, Bartunek & Lacey, 1998) have criticised empowerment
theory and research for its lack of integration with theories of socio-political
power, and thus its depoliticised, individualistic perspective which has led to a
study of individual cognitive process based on traditionally masculine
concepts of mastery, power and control.
Riger (1993) points out that although many definitions offered of
empowerment include both a psychological sense of personal control and
concern with actual social influence, political power and legal rights (e.g.
Perkins, 1995; Perkins & Zimmerman, 1995; Rappaport, 1987; Zimmerman,
1990), in a great deal of research actual control is conflated with the sense of
personal control. Thus a complex phenomenon is reduced to individual
psychological dynamics. This proclivity stems from a deeper unresolved
tension between two views of human nature, one that holds that “reality
creates the person” (as reflected for example in behaviourism/materialism)
and the opposing view that “the person creates reality” (as reflected for
example in cognition/idealism) (Riger, 1993, p. 281).
The emphasis in American and to a lesser extent British psychology (Riger,
1993; Rappaport, 1995) has been to ignore or downplay the influence of
situational or social factors in favour of individuals’ perceptions. In the context
of empowerment, if the focus of inquiry becomes not actual power but rather
the sense of empowerment, then the political is made personal and ironically
the status quo may be supported (Seedat, Cloete & Schochet, 1988).

44
Confusing one’s actual ability to control resources with a sense of
empowerment depoliticises the latter (Riger, 1993).
This distinction between an individual’s sense of empowerment and actual
group or community empowerment becomes critical in the post-apartheid
South Africa context. Self-empowerment, self-validation and self-actualisation
must not become substitutes for critical thinking about socio-political issues
and political action. Although a sense of psychological empowerment is an
important aspect of political effectiveness, community empowerment that
involves actual socio-political power will be needed to carry out these tasks
and produce social change. Therefore for psychology to be relevant in the
new South Africa, psychological intervention or a sense of empowerment
must go hand in hand with clear political intervention or actual community
empowerment (Nicholas, 1993; Seedat et al, 1988).
Several writers (Amaro, 1995; Soet et al., 1999) argue that this individualistic
approach ignores the interpersonal aspects of behaviour such as power in
relationships, socialisation and social roles. They argue that a person’s ability
to change their behaviour does not only depend on psychological
empowerment but also on the ability to influence those people in his or her
environment. In a similar vein other writers (Hughey & Speer, 2002; Speer,
2000; Walsh et al., 1998) have commented on the lack of attention paid to the
interpersonal or relational aspects of empowerment.
Riger (1993) argues that the underlying assumption of empowerment theory is
that of conflict, rather than co-operation, among groups and individuals,
control rather than communion. The image of the empowered person in
research and theory reflects the belief in psychology in separation,
individuation and individual mastery. Gilligan (1982) contrasts this view of
human nature with an alternate vision that emphasises relatedness and
interdependence as central values of human experience.
Many writers and researchers have emphasised the role relationships play in
one’s personal development and empowerment (Fletcher, 1998; Surrey,
45
1987; Walsh et al., 1998). In a relational approach, individuals experience a
sense of empowerment when group or organisational members work together
to create mutual, fulfilling connections with each other and use these
connections to facilitate change processes and act in a manner explicitly
consistent with their goals (Walsh et al., 1998). Others argue in a similar vein
that empowerment can only be realised through organisation, that social
power is accessed only through relation-based organising and that
organisations hold power to the extent that members collectively pursue a
common goal or purpose (Kroeker, 1995; Speer & Hughey, 1995).
School development literature has focused on the quality of the relationship
and its role in personal development – however the authors have not framed
school development in empowerment terminology (Fullan, 1981; Little, 1993;
Rosenholtz, 1989). Fullan’s (1991) theory of change emphasises
relationships between peers and the principal as central to the change
process with the quality of working relationships among teachers being
strongly related to implementation. Fullan & Hargreaves (1992) argue that
people do not develop in isolation, they develop through their relationships,
especially those with others who are significant for us.
More recent research has begun to explore the positive working relationships
amongst peers as important contexts for empowerment. Research on peer
relationships and empowerment has been done in the organisational and
school setting (Barksdale-Ladd & Thomas, 1996; Jex & Bliese, 1999). Corsun
& Enz (1999); Liden, et al. (2000); Soet et al. (1999); Speer (2000); Spreitzer
at al. (1999) and Walsh et al. (1998) have all found a positive relationship
between leadership and peer relationships and empowerment. Corsun & Enz
(1999) report that work environments fostering support based relationships,
which they defined as relationships that are characterised by helping,
participation, trust and/or involvement, result in worker empowerment. They
argue that the effects of a strongly pro-social culture are not only felt by the
individual members of the organisation but also by the groups in the form of
collective efficacy.
46
Some writers have argued that the development of individual empowerment
works against a sense of community, in that empowerment of all
underrepresented or needy groups merely increases the competition for the
same resources (Riger, 1993). Finding one’s voice, controlling one’s
resources, becoming empowered may reduce the interdependence that
produces a strong sense of community. Empowered individual’s rational
pursuit of their own best interest may end in the destruction of
neighbourhoods and networks of support.
Paradoxically, situations which foster community may be the opposite of
those, which foster empowerment. Lee (1999) makes a similar observation:
that empowerment at the organisational level may function as a form of
oppression for empowerment at the individual level. Recent research
suggests that there may be circumstances in which the two phenomena are
not contradictory, where a sense of community is linked to individual
empowerment (Bond & Keys, 1993; Chavis & Wandersman, 1990; Maton &
Rappaport, 1984).
These issues of power, individualism, community and culture relate to
people’s worldviews, which will determine if we give or enable empowerment,
whether we view the individual or the social as the primary target and whether
we see constructs as separate or interdependent (Dickerson, 1998; Hughes,
1987; Swift &Levin, 1987). One of the difficulties of defining empowerment is
that it does not fit easily into the philosophical worldview used most commonly
by social scientists. Interventions at the level of the individual are rarely
sufficient because lives do not exist in a vacuum; social, cultural and political
factors exert a profound influence on the behaviour of individuals. The
concept of empowerment is only meaningful in this larger context. It is hoped
that by viewing empowerment in the context of a school development
programme this will help us to take the issues of context and the interaction
between different levels of empowerment into account.
47
2.6. SCHOOL DEVELOPMENT: A CONTEXT FOR EXPLORING EMPOWERMENT Community psychology’s contextualist perspective, its focus on dealing with
issues at a variety of levels, social justice, equality and its emphasis on
empowerment of people and communities, provides a useful framework for
viewing school development in the South African context. School
development programmes in this context provide a unique opportunity for
exploring the concept of empowerment in a developing country facing rapid
social change. The school development process allows us to explore
empowerment at a variety of levels and explore organisational change
through a process of school development planning. It brings together the
issues of individual and organisational change, empowerment, participation
and leadership.
However, before exploring the ways in which community psychology, and
empowerment theory more specifically, can provide a framework for viewing
school development it is important to look briefly at the school development
literature and research. The research and literature on school development,
over the last two decades, has been dominated by two separate approaches,
the school effectiveness and the school improvement approaches (Bennett &
Harris, 1999).
2.6.1. SCHOOL EFFECTIVENESS APPROACH This approach to school development research has taken for granted that
schools are rational, goal-oriented systems, that the goals are clear and
agreed, that they relate to learner-achievement and that those achievements
should be measurable (Bennett & Harris, 1999). Effectiveness can be
measured by comparing the level of achievement in these measurable
attainment targets in order to identify which school’s pupils are achieving more
and which less. The issue of educational goal definition is not for debate
within the research: it centres on the extent to which school effects can be
consistent over time. Thus, despite its increasing methodological
sophistication, research on school effects typically adopts a very basic
conceptualisation of the school as input-throughput-output. School
48
effectiveness research attempts to link the quality of performance with
particular characteristics of the schools. A wide range of school
characteristics has been identified and correlational research has been
undertaken to link particular characteristics with higher pupils’ performance
(Brighthouse & Tomlinson, 1991; Reid, Hopkins & Holly, 1987; Sammons,
Hillman, & Mortimore, 1995).
Several criticisms have been levelled at the school effectiveness approach:
(a) The research is often not detailed enough to provide information on
what is needed for school improvement and the focus on structural
organisational aspects of schools is a severe weakness (Bennett &
Harris, 1999; Gultig & Butler, 1999; Hopkins, 1995). For this reason
the field has largely resided at the level of description rather than
action;
(b) This approach treats complex organisations like schools too
simplistically, ignoring the way in which characteristics interact with one
another in particular schools (Gultig & Butler, 1999; Hopkins, 1995) and
they assume that ineffective (or weak) schools could improve by
developing the same characteristics as effective schools (Gultig &
Butler, 1999);
(c) The range of outcomes being studied is often too narrow (Daly, 2000;
Gultig & Butler, 1999; Hopkins, 1995) and often does not address
issues of equity and social justice (Slee, Weiner & Tomlison, 1998);
(d) This approach has emphasised a positivist approach with an over
reliance on correlational studies that have applied statistical modelling
to hierarchically structured data (Daly, 2000);
(e) Review of past research has shown that policy and innovations, which
aim to develop teachers from lists of teacher effectiveness, have failed
to effect any observable change at the classroom level, or in student
outcome, beyond a few individual cases (Harris & Hopkins, 1999).
2.6.2. SCHOOL IMPROVEMENT APPROACH The recognition of the school effectiveness approach’s inability to map out a
strategy for school improvement led to a shift towards school improvement

49
and the development and application of school development planning
(Hopkins, Ainscow & West, 1994). In marked contrast to the school
effectiveness approach, a key assumption within the school improvement
literature is that school improvement strategies can lead to cultural change in
schools through modifications to their internal conditions (Hopkins, Harris &
Jackson, 1997). It is the cultural change that supports the teaching and
learning process which leads to enhanced outcomes for students (Hopkins,
West, Ainscow, Harris & Beresford, 1997). The types of school culture most
supportive of successful school improvement efforts appear to be those that
are collaborative, have high expectations for both students and staff and
which exhibit a consensus on values, support and orderly and secure
environment and encourage teachers to assume a variety of leadership roles
(Hopkins et al., 1997).
School improvement writers thus emphasise two particular dimensions of
schools: the norms and values that shape individual and collective action; and
the structural arrangements made at the school level. Collectively these two
dimensions produce a view of the organisation as a culturally coherent and
unified artefact. In particular they see a process of development planning as
crucial to creating a culturally coherent response to change, which alone will
increase the school’s capacity for further development. In development
planning a collaborative or at least participative process leads to priorities
being set and agreed upon, action plans created and organisational
frameworks established for their achievement (Hargreaves & Hopkins, 1995).
Through this collaborative activity it is argued that teachers begin to talk to
each other more about teaching, collaborative work outside of the particular
project becomes more commonplace and management structures are
adapted to support this and future changes.
When taken together such changes in culture and structure increase the
school’s capacity for development and prepare the ground for future change
efforts (Hopkins, 1996). Consequently the school improvement literature
tends to reflect Schein’s statement that ‘the only thing of real importance that
leaders do is to create and manage culture” (1992, p. 5). The emphasis of

50
school improvement is on cultural change, that is the processes that occur
within the structure and assumptions and values of the leaders and the led.
Several criticisms have been levelled at the school improvement approach:
(a) Despite its clear view on the change process there is much less clarity
about the theories upon which school improvement writers can justify
their practice and predict how interventions may work (Daly, 2000;
Hopkins, 1996);
(b) Its research often concentrates its attention inside schools, without
locating these schools in their broader contexts (Davidoff & Lazarus,
1997; Gultig & Butler, 1999);
(c) Its literature does not question what quality is and why some have it
and others do not, assuming that good schooling always means the
same thing and that this is available to everyone (Griffiths, 1998; Gultig
& Butler, 1999; Slee et al., 1998);
(d) Its approach is too strongly linked to market oriented forms of
educational management (Slee et al., 1998).
2.6.3. SCHOOL DEVELOPMENT PLANNING Many different approaches to school improvement have been offered over the
last 20 years (Delaney Horsch, 1992; Fullan & Miles, 1999; Miles, 1993;
Pristine & Bowen, 1993; Rainer & Guyton, 1999; Solkov, 1992; Vedder &
O’Dowd, 1999). Most of these approaches have taken an organisational
perspective on the change process within the school. One of the most
pervasive school improvement approaches which has been implemented in
countries as diverse as North America, Britain, Scotland, Australia and South
Africa is the school development plan approach to school development
(Davidoff, 1995; Hargreaves & Hopkins, 1991, 1995). School development
planning aims to improve the capacity of the school, particularly the quality of
its teaching and learning. Its strategy is to bring key stakeholders together
within the school to identify problem areas, agree where improvements can be
made and then decide how to make change happen with the resources they
have available.

51
School development plan is not a simple step-by-step approach to change
(Hargreaves & Hopkins, 1991, 1995) but rather it assumes that change is a
complex and dynamic process: it is cyclical (Hopkins, et al., 1994). School
development planning is a multidimensional process, seeking to address
change in a variety of key areas for example developing the structural and
procedural aspects of the school; establishing a decision-making process,
which is collaborative, with visible procedures of accountability and a
transparency in the communication of information, and leadership
characterised by facilitative directiveness; promoting staff and interpersonal
development, and a culture of collegiality in which such development can
occur; and providing a mechanism for establishing structures and procedures
for internal evaluation of needs and innovation, as part of an ongoing process
of maintaining good practice and managing change.
2.6.4. RESEARCH ON SCHOOL DEVELOPMENT PLANNING It has only been recently that research has focused on the impact that school
development plan has had on schools. Studies on the implementation of
school development plans have shown some interesting results. Firstly
questions have been raised about whether the plan is used as a blueprint in a
strategic way, linking issues of resources management and finances, or if it is
used in different ways. Bennett, Crawford, Levacic, Glover, & Earley (2000)
found that although most teachers want a say in the planning of the
curriculum and in resourcing to make teaching interesting and effective, they
are not concerned with strategic and developmental whole-school issues
unless their job security is threatened. West (2000) reported that schools
found it difficult to set priorities for more than a year and even then this is
seen as too long term due to the ever changing environment. West found
that, though priorities were important, it is not merely how these priorities are
selected but how effort within the school is managed around these and how
capacity to add or to vary from these priorities is created, which determines
the progress of the school.
Secondly, the role of the principal in school development plan has been
explored. Bennett et al., (2000) report that in the primary schools they studied

52
the principal was responsible for major strategic and financial decisions. West
(2000) found a contradiction in the role played by the principal. Although a
picture emerged of a strong principal with vision for the school who offered
clear leadership and management, they found that principals in these moving
schools have quite often deliberately distanced themselves from the
development within the school, expressing the belief that teachers must be
encouraged to take on the leadership of improvement activities themselves.
This suggests that principals may have a more complex view of leadership
than is apparent from studies on schools.
Thirdly, the focus on teaching and learning in the school development plan
has been explored. Several researchers (Broadhead, Hodgson, Cuckle &
Dunford, 1998; MacBeath, 1994; West, 2000) found that organisational need
is the major preoccupation whilst student learning is given very little emphasis.
Fourthly, although Reeves (2000) found a positive correlation between the
process of development planning and school effectiveness, he cautions that
there is evidence for a very complex set of relationships between a number of
variables related to planning in schools. In the study only internal factors
were considered and he cautions that the picture becomes even more
complex once one considers the external environment.
Given the findings from this study, Reeves (2000) stresses that the process of
planning for development and improvement in schools cannot be considered
simply as a matter of managerial competence. Planning and its outcomes are
linked to a complex set of personal and organisational variables which appear
more likely to influence its effectiveness than any attempt simply to refine on
planning techniques. Essentially development planning is a management
technique which is used more or less fruitfully according to the intentions,
commitment and skills of its users and the nature of the organisational context
in which they operate. Thus we are presented with a dynamic and
systemically complicated set of interaction within schools which we must not
ignore.

53
2.6.5. SCHOOL DEVELOPMENT – A SOUTH AFRICAN PERSPECTIVE Although education provides such a promising arena for transformation in
South Africa the crisis in South African Education is well documented
(Christie, 1998; Moonsammy & Hassett, 1997). It has a long history as a tool
of the apartheid government (Carrim & Sayed, 1992; Marah, 1987) and is
slowly trying to rebuild itself. Most teachers who were trained under the
apartheid system are not teaching in ways that prepare students to meet the
needs and demands of a society in transition (Davidoff, 1995). There are still
concerns about the low morale among teachers, tensions between teachers
and administrative staff (principals, deputies, heads of department), conflicts
among staff members, discipline problems with students, lack of vision and
direction and many other issues which make schools unhappy places to be for
most teachers and pupils (Davidoff, 1995). Since the advent of the new
government, and the restructuring of the education departments, many new
policies and ideas have been proposed for schools, placing an increasing
demand on teachers and school mangers to address issues beyond the
classroom and relating to the school as a whole. All of these issues highlight
a real challenge to develop effective schools and thereby quality education.
Because of the history of apartheid education in South Africa, many attempts
have been made to provide in-service training to teachers to rectify the
situation. A common trend in most in-service training (INSET) has been
individually focused, course based training. Other initiatives have tried to
move beyond this to what has been referred to as school focused INSET
(Hofmeyr, 1991). Davidoff & Robinson (1992) argue that ideally, in-service
education and training (INSET) needs to be school focused, located at
schools and with the initial interventions and support from INSET agencies.
Many Southern African writers on school development argue that in looking at
classroom practice and experience, we need to look at the whole school and
not only focus on classroom based activities (Halliday & Coombe, 1994;
Schofield, 1995).
Thus over the last 10 years there has been a shift away from classroom
focused, teacher individualised forms of teacher development. In general the

54
focus has been on whole school development or organisational development
of the school (referred to as the school-as-organisation approach). A more
recent addition to the school development approaches has been what is
termed by Gultig & Butler (1999) as the school-as-community approach (for
example Schofield, 1999). While the two approaches do have different
emphases, they are not mutually exclusive; their differences lie in the
emphasis they place on different factors. The school-as-organisation
approach focuses on the internal dynamics of schools and the school-as-
community approach gives more emphasis to external (out of school)
dynamics. Some writers (Gultig & Butler, 1999) suggest that they represent
positions on a continuum of approaches to school change, ranging from a
strong focus on the school to a strong focus on the community.
Organisational development has its origins in the business world. More
recently however organisational development has become an important
strategy for building organisational capacity in many different kinds of
organisations, including schools (Davidoff, 1995; Davidoff & Robinson, 1992;
Davidoff & Lazarus, 1997; Keys & Frank, 1987; Shinn & Perkins, 2000). It is
an important strategy for school development and indeed is often used
synonymously with the term “whole school development” (Gultig & Butler,
1999). Many of the agencies who have worked within this approach in South
Africa have focused on the implementation of School Development Plans
(Catholic Institute for Education, 1996; Halliday & Coombe, 1994). More
recently some of the provincial education departments have adopted this
strategy; thus school development planning has become a requirement for
schools in some provinces including Gauteng, the province in which the
present study was located.
2.7. SCHOOL DEVELOPMENT PLANNING AND ORGANISATIONAL EMPOWERMENT Although empowerment is considered to be multilevel in nature most of the
empirical work done on the construct has been limited to the individual level
(Minkler, Thompson, Bell & Rose, 2001; Seibert, Silver, & Randolph, 2004).
These studies have tended to focus on the development of psychological

55
empowerment through participatory mechanisms, rather than on processes,
structures and outcomes that are relevant for organisations and communities.
The Seibert, et al. (2004) study is one of the few that looks beyond the
individual level and focuses on a work-unit-level construct that they describe
as empowerment climate. A thorough development of empowerment theory
requires exploration and description at multiple levels of analysis. It is
important to stress that organisational and community empowerment are not
simply the aggregate of many empowered individuals.
Several authors (Bartle, Couchonnal, Canda & Staker, 2002; Boyd &
Angelique, 2002; Klein, et al., 2000; Peterson & Zimmerman, 2004) argue that
research on empowerment at the organisational level, what Peterson &
Zimmerman (2004) call Organisational Empowerment, is particularly needed.
Efforts to understand organisational and community empowerment are clearly
necessary to help move the theory beyond the individual bias of psychology.
Applying the general definition and framework of empowerment as laid out by
Zimmerman (2000) to an organisational level of analysis suggests that
empowerment may include organisational processes and structures that
enhance member participation and improve organisational effectiveness for
goal achievement (Zimmerman, 2000).
Zimmerman (2000) noted that a focus on organisational empowerment would
assist in moving empowerment theory beyond the individual bias with its
tendency to reduce complex person-in-environment phenomena to individual
dynamics. A focus on organisational empowerment may also help to address
the criticisms that empowerment theory favours traditionally individualistic and
conflict-oriented values (Riger, 1993), by incorporating collective principles
needed to describe empowerment in organisations (Rappaport, 1995;
Peterson & Zimmerman, 2004).
2.7.1. A NOMOLOGICAL NETWORK OF ORGANISATIONAL EMPOWERMENT Zimmerman’s (2000) theoretical framework, described earlier, provides a
basis for defining organisational empowerment and its interdependence with

56
empowerment at individual and community level analysis. This framework is
useful because it extends empowerment theory and asserts that there are
specific processes and outcomes across levels of analysis and that these
need to be developed in more detail to delineate a nomological network for
organisational empowerment.
Until recently, empowerment theorists have not developed a clear and
coherent nomological network for organisational empowerment that
articulates a clear distinction from psychological empowerment. Although the
term appears in the empowerment literature, organisational empowerment is
often defined as individual empowerment derived within organisational
contexts (Hardiman & Segal, 2003). This conceptualisation however fails to
incorporate organisational level constructs that are separate and distinct from
individual members. This focus on the individual may be why some
researchers (for example Rissel, 1994) caution against empowerment as a
major goal of intervention due to the lack of a clear theoretical underpinning
beyond the individual.
The conceptual distinction between empowering and empowered
organisations (Zimmerman, 2000) underscores differences between what
organisations achieve internally for members and what they achieve
externally for communities. Efforts have been made to move forward on
identifying organisational characteristics of empowering organisations (for
example Foster-Fishman & Keys, 1997; Maton & Salem, 1995; Matthews,
Diaz & Cole, 2003). These studies encourage further development of
conceptual models that explicitly include organisational-level attributes that
define organisational empowerment. Yet most of the focus of this work is on
the characteristics of organisations that make them empowering for their
members.
Peterson & Zimmerman (2004) argue that those characteristics of
organisations that indicate their level of empowerment are both less studied
and less conceptually developed. What they try to do in their 2004 paper is
present a model of organisational empowerment that allows us to examine the

57
extent to which organisations, and in the case of the present study, schools,
are empowered. In doing so they try to extend and develop the ideas
presented by Zimmerman (2000). They argue that an ecological perspective
is critical to the development of a theoretical model of organisational
empowerment because it offers an overarching framework that focuses
attention on levels of analysis beyond the individual and provides a lens for
examining the confluence of factors that characterise empowered
organisations.
Their model of organisational empowerment provides a first attempt to
develop a conceptual foundation upon which to build an empirical literature on
empowerment theory that extends beyond the individual level of analysis.
Using the framework of empowering processes and outcomes they suggest
that a conceptual model of empowered organisations includes three
components:
(a) Intraorganisational – This refers to the ways organisations are structured
and function as members engage in activities that contribute to individual
psychological empowerment and organisational effectiveness needed for
goal achievement. This forms part of the assessment of organisational
empowerment achieved by an organisation. Intraorganisational
empowerment is essential for conceptualising organisational
empowerment as it provides the foundation for actions necessary to
achieve organisational goals.
(b) Interorganisational – This includes connections and relations between
organisations such as collaboration with other organisations and resource
procurement. This component of organisational empowerment is vital
because it provides the linkages for organisations to gain resources, share
information, attain legitimacy and accomplish goals.
(c) Extraorganisational – This refers to actions taken by organisations to
affect the larger environments of which they are a part. This includes
qualities that characterise organisations’ efforts to exert influence beyond
their boundaries. This component of organisational empowerment is
important because the capacity or organisations to achieve changes in
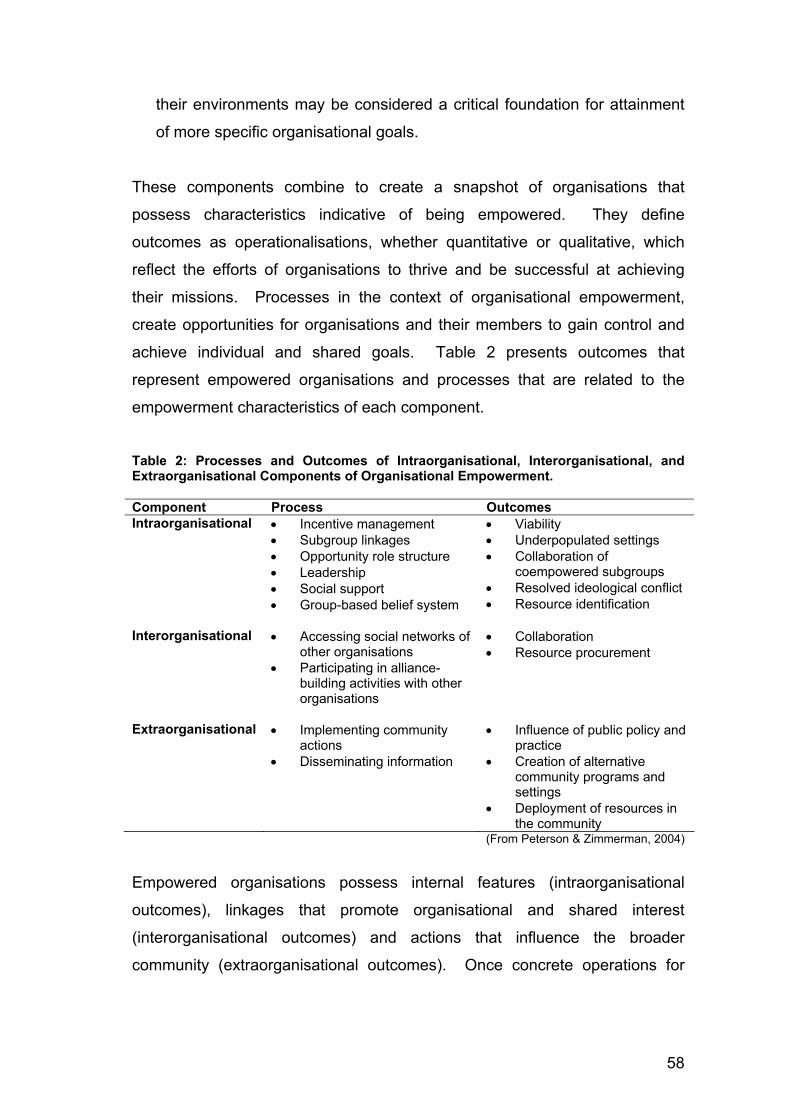
58
their environments may be considered a critical foundation for attainment
of more specific organisational goals.
These components combine to create a snapshot of organisations that
possess characteristics indicative of being empowered. They define
outcomes as operationalisations, whether quantitative or qualitative, which
reflect the efforts of organisations to thrive and be successful at achieving
their missions. Processes in the context of organisational empowerment,
create opportunities for organisations and their members to gain control and
achieve individual and shared goals. Table 2 presents outcomes that
represent empowered organisations and processes that are related to the
empowerment characteristics of each component.
Table 2: Processes and Outcomes of Intraorganisational, Interorganisational, and Extraorganisational Components of Organisational Empowerment. Component Process Outcomes Intraorganisational • Incentive management
• Subgroup linkages • Opportunity role structure • Leadership • Social support • Group-based belief system
• Viability • Underpopulated settings • Collaboration of
coempowered subgroups • Resolved ideological conflict • Resource identification
Interorganisational • Accessing social networks of
other organisations • Participating in alliance-
building activities with other organisations
• Collaboration • Resource procurement
Extraorganisational • Implementing community
actions • Disseminating information
• Influence of public policy and practice
• Creation of alternative community programs and settings
• Deployment of resources in the community
(From Peterson & Zimmerman, 2004)
Empowered organisations possess internal features (intraorganisational
outcomes), linkages that promote organisational and shared interest
(interorganisational outcomes) and actions that influence the broader
community (extraorganisational outcomes). Once concrete operations for
59
variables in a nomological network are made explicit, the validity of a
construct can then be empirically tested.
As was discussed previously however, empowerment like other constructs is
open-ended and the variables used to represent the construct may change
over time and depend on the specific circumstances in which they are
measured. Thus organisational empowerment may not be assessed by a
single operational definition because it takes different forms for different types
of organisations, environments in which organisations operate and times.
Nevertheless, one might expect each operationalisation to capture
intraorganisational, interorganisational and extraorganisational qualities of
organisational empowerment that are appropriate to that context. The
nomological network for organisational empowerment indicates that although
concrete operations may be context specific, data would need to be captured
on variables representing all three components to provide a complete picture
of an empowered organisation.
Concrete examples of organisational empowerment, such as school
development planning, can be developed for organisations, like schools.
Researchers could then test the validity of organisational empowerment by
empirically examining its relationship with goal achievement (e.g. achievement
of objectives set in the school development planning). Creating ways of
assessing and validating concepts are essential for designing corresponding
interventions focused on the organisational level.

60
CHAPTER THREE: SCHOOL DEVELOPMENT PLANNING AND
ORGANISATIONAL EMPOWERMENT
3.1. THE SCHOOL DEVELOPMENT PLANNING PROGRAMME UNDER INVESTIGATION All of the schools that participated in the present study had been engaged in a
school development planning programme offered by a non-governmental
organisation. The programme’s aim was to ‘facilitate the development of the
primary schools in that area so that they were functioning organisations
providing quality education’ (Outreach, 1996, p.1).
The programme conceptualised empowerment as a process that expands the
feeling of trust and control in oneself as well as in one’s colleagues and one’s
organisation which consequently leads to certain individual and organisational
outcomes (Outreach, 2001b). It sees empowerment as a multilevel and
context specific concept (Zimmerman, 1995) and thus the interventions are
based on multiple levels. The programme emphasised that empowerment at
the individual level of analysis was a process that expanded an individual’s
power as opposed to merely a state of being. This process resulted from
changes in contextual and relational variables. It also emphasised the growth
of power and control at an interpersonal and an organisational level.
Empowerment was seen as an interactional process linking the individual,
colleagues and the organisation. In this way empowerment referred to both
the phenomenological development of a certain state of mind (e.g. feeling
powerful, competent, worthy of esteem etc.) and to the modification of
structural conditions in order to reallocate power (e.g. modifying the
interactional and organisational opportunity structure) – in other words,
empowerment refers to both the subjective experience and the objective
reality and is thus both a process and a goal (Swift & Levine, 1987).
The programme emphasised the link between the different levels of
empowerment. It saw the creation of a sense of empowerment not only at an

61
individual level, but at the interpersonal and organisational levels as well as
vital. In this way processes are created that facilitate empowerment outcomes
(Outreach, 2001b). This is in line with Riger (1993) who emphasised how a
perceived sense of power (psychological empowerment) is not synonymous
with actual power (socio-political empowerment).
The programme stressed the distinction between an individual’s sense of
empowerment and actual group or community empowerment as this is seen
as critical in the post-apartheid South Africa context. Self-empowerment, self-
validation and self-actualisation must not become substitutes for critical
thinking about socio-political issues and political action. Although a sense of
personal empowerment is an important aspect of political effectiveness,
community empowerment that involves actual socio-political power will be
needed to carry out these tasks and produce social change. The programme
thus emphasised that a sense of empowerment must go hand in hand with
actual organisational or community empowerment (Outreach, 2001b)
3.2. DIFFERENT LEVELS OF EMPOWERMENT RELEVANT TO THE PROGRAMME AND STUDY, AND THEIR OPERATIONALISATIONS The following offer a brief description of how empowerment at each level was
conceptualised by the programme. This is then followed by an
operationalised definition based on theoretical descriptions and empirical
evidence related to empowerment. These operationalisations were used in
the study to assess the outcomes of the programme and as indicators of
empowerment in this setting.
1. Individual Level At this level empowerment focuses on both the material (acquiring access to
resources) and the psychological (increasing control and value). The
programme emphasised that the process of empowerment requires some
immediate successes, in areas expressed as needs by the participants,
particularly give the factors of powerlessness. However empowerment does
not occur if the process remains at the material level. Using the ideas of
Kroeker (1995) the programme argued that as people understand their reality
62
and the possible consequences of acting upon it, they can begin to visualise
possibilities of change and choices (Outreach, 2001b).
Operational Definition:
The psychological goal of empowerment is to increase feelings of self-efficacy
and locus of control and individual participation in the school’s activities and
people feel there is increased access to resources
2. Organisational Level The programme saw the aim of organisational empowerment as changing the
power structures of society as they are expressed in the school (Outreach,
2001b). Based on this idea the programme emphasised that within an
organisation, new structures, values and forms of interaction can be
established. By sharing control and allowing broader participation in decision
making people are given respect, value and power in the group. Collective
action also increases the potential to change things, the school/organisation
can carry out communal projects, pursue resources and overcome
dependence. The school can work to develop the skills and confidence of its
members, which enhances the potential for other changes. When the
organisation increases its self sufficiency in society, it also increases the level
of control and social status of its members.
Following Zimmerman (2000) the programme distinguished between and
empowering organisation and an empowered organisation. The programme
sees school development planning (discussed previously as a process for
empowering schools in order that they can change the contexts in which they
find themselves and this will result in empowered outcomes for the school.
Operational Definition:
Empowering organisation:
The goal at this level is to create a participative work culture, collaborative
work structures, shared decision making and increased responsibility for
school development among the whole staff.

63
Empowered Organisation:
As an empowered organisation the school is in control of its own development
and is able to acquire the resources they require and are having an impact on
the broader educational community. The school has actively implemented the
school development plan and has achieved the goals set for themselves (or is
in a process of achieving).
3. Community Level The programme emphasised the role of the parent body, the School
Governing Body and the broader community in enabling the school to achieve
the changes it had planned through the school development planning
process. It was felt that without their involvement the school could not sustain
change (Outreach, 2001b).
Operational Definition:
The goal at this level is to have community stakeholders involved in collective
action. In a school development context, this is likely to manifest in situations
in which parents and members of the School Governing Body actively
involved in school activities and enable the school to move towards its goals.
3.3. AN EMPOWERMENT APPROACH TO SCHOOL DEVELOPMENT The programme’s view on the process of becoming empowered was based on
ideas of enlightenment and emancipation, critical theory and class
consciousness (Deacon, 1990; Ellsworth, 1989; Levin, 1975; Neath & Read,
1998; Serrano-Garcia, 1994; Swift & Levine, 1987). This process involved the
following steps:
1. A cognitive and affective awareness of one’s position with regard to the
distribution of power and the position of others relative to oneself in the
system.
2. A sense of what action can be taken to deal with the empowerment deficit
3. The action is taken to produce changes in the distribution of power so as
to improve ones own or ones group’s condition.
Therefore one needed both the cognitive awareness of one’s own position
and that position within the broader society or broader socio-political issues

64
and affective energy in order to undertake or participate in empowering
activities. Each stage is a necessary precondition for those that follow; the
sufficient condition for the sense of empowerment is the combination of all
three stages (Levine, 1975). This perspective formed the foundation of the
programmes approach to training and development with the schools
(Outreach, 2001).
3.4. THE PROGRAMME The programme offered to the schools took a whole school development
approach to school development (Outreach, 1999a) similar to the
organisational approach of Davidoff and her colleagues described earlier
(Davidoff, 1995, Davidoff & Robinson, 1992; Davidoff & Lazarus, 1997). The
focus was on the development of the school as an organisation (Outreach,
1998). The central focus of the organisational change programme was on the
drawing up and implementation of a school development plan. This focus
was in line with several other similar programmes being implemented in
Southern Africa (Halliday & Coombe, 1994, Potterton, 1998; Schofield, 1995)
and was in line with regional education department policy. However the
programme did have a distinct focus on the issue of empowerment,
particularly in terms of developing empowered outcomes through leadership
development (Outreach, 2000) and school development planning (Outreach,
1999a).
The focus on School Development Planning is based on the assumption that
in order for a school to be empowered as an organisation it needs to take
charge/control of its own development process. By working with schools on
this process the programme assumed that schools would be empowered to
determine their own developmental path. The aim of school development
planning is to improve the performance of schools, particularly in relation to
the quality of teaching and learning. Development planning involves schools
in:
• Identifying their problem areas
• Agreeing on areas where improvements can be made

65
• Identifying local resources for making such improvements
• Building on existing good practice and developing new techniques
• Improving the management skills of all staff
• Improving the allocation of existing resources within the school
(For a fuller description of the model of school development planning see the
sections on school development planning 2.6.3. and 2.6.4.).
The aim of the programme was that schools would be actively implementing
the plan and taking steps to achieving the goals set out in the plan (Outreach,
1998). In order to put this in place the programme worked with staff,
management and the school governing body on drawing up a School
Development Plan. Although the outcome of this workshop was a physical
plan with both broad objectives and specific action plans, the main aim in this
process was to develop the process of reflection and planning within the
school community (Outreach, 1998). A critical issue here was the emphasis
on smaller goals (Kroeker, 1995; Perkins, 1995) while developing and
strengthening the organisation and individual skills development.
A variety of training courses, to further develop the capacity and skills of
teachers and management, were offered to the schools to support their
change initiative (Outreach, 1999b). Each school set up a School
Development Team (made up of the principal and at least 2 teachers) which
had the task of monitoring the implementation of the plan at the school and
provided fund-raising skills training to aid in the achievement of the plan
(Outreach, 1998). This committee was offered training over a year to develop
skills to fulfil their role at the school and to develop their leadership skills.
The programme assumed that in order for development planning to be
successful the change process needed to be managed in a planned and
coherent manner and reflect a management style within the school that was
consultative and participatory (Outreach, 1998). It was assumed that staff
involved in the process of development planning would be more directly
responsible for improving aspects of school performance and in formulating

66
priorities for development, and would be better motivated to implement agreed
priorities (Outreach, 1999a).
It was also assumed that the role of the principal and other senior members of
staff were crucial in developing and maintaining a consultative climate in the
school, and thus these staff members should lead by example in using
appropriate management styles. For this reason the school management
attended a year long Leadership and Management Training Course with the
express purpose of developing a more democratic, participatory and
consultative form of management style within the school (Outreach, 1998).
The programme worked with 24 primary schools in a township outside of
Pretoria. Ten of the schools have been working with the programme for
between 3-4 years, 6 for 2 years and 8 for 1 year. All of the schools had
engaged in a process of auditing their school, drawing up a school
development plan, selecting a school development team who attended
training and had sent some of the management on the leadership and
development course (Outreach, 2001).
3.4.1. The Approach of the Training Programme While the programme itself has definite assumptions about empowerment the
groups of school development team members and leaders are encouraged to
explore and develop their own understandings thus no working definition of
empowerment included in the process. The intention of the training is to
engage people in a collaborative effort of identifying, examining, reflecting on
and influencing the manifestations and effects of patterns of power with
regards to themselves and their settings. The process is an ongoing
construction of a shared reality among group members through their
interaction with one another within the programme.
The Training Programme’s Process
Making use of concepts from Transactional Analysis (Berne, 1964a;b; 1963;
1961) people reflect on the ways in which they are disempowered. They
examine the school setting in terms of patterns of disempowerment and share

67
their values for democracy, social transformation and empowerment. They
discuss the extent to which their behaviour is determined by the system and
become aware of the fact that one can either allow oneself to be pushed by
the past or be pulled by one’s vision and goals. Education is discussed as the
critical arena for transmitting disempowerment or achieving social
transformation. They assess the possibilities for being democratic and
empowering in their own settings. They reflect on and make choices about
whether to perpetuate the cycle of disempowerment and contribute to
maintaining their own powerlessness and those under their power or how to
resist the cycle and work towards transforming their settings to establish a
more democratic culture.
What follows during the remainder of the training courses primarily supports
people’s view of themselves as change agents within their spheres of
influence. They examine ways in which they and others maintain power
differences at various levels through authoritarianism, closed mindedness,
dogmatism and being judgmental and intolerant. People are taken through
experiences that enable them to see how their behaviour effects the way
others respond to them and how the behaviour of others impacts on them.
They are exposed to and develop skills to act in a manner consistent with the
values of democracy, empowerment and equality. The exercising of greater
responsibility is emphasised throughout the programme and contributes to
developing an internal sense of empowerment and lays the foundation for
developing addition interpersonal and group skills. People increasingly look
within themselves at the inner sense of victimisation or disempowerment and
the dynamics of keeping that process going in interpersonal relationships.
Issues of how organisations are structured and led or managed are also
looked at in terms of how they keep the processes of empowerment or
disempowerment going.
The Personal and Political Continuum
The intervention reflects an ongoing process of trying to link the personal and
the political in relevant and meaningful ways. The movement to the personal
from the political forces of domination involve profound psychological effects.

68
People often feel victimised and powerless to break the cycle of oppressive
values and activities promoted in schools. At times these are best addressed
at the personal-psychological level. However it also provides them with an
opportunity to see the role the system has played in their sense of
powerlessness and to look at concrete actions that can be taken to change
this. One is able to critically reflect if the system is actually causing the sense
of powerlessness or are there psychological barriers from past experiences
that are playing a role in maintaining their own powerlessness. Although this
forms the basic underlying approach to the training offered by the programme
each training course has its own particular focus. It is to the training of the
school development teams and the school management that we now turn.
3.4.2. School Development Team Training The programme’s model, based on those reviewed previously (Hargreaves, &
Hopkins, 1995; Jackson, 2000; West, 2000), involves the identification of a
small group of staff (the school development team) in each school to manage
the school development plan. Since the approach did not seek to impose
priorities for improvement on the school but rather encouraged the school to
review its own problems and opportunities and to select priorities for
development that relate to the particular context and point in time the School
Development Team were expected to take a lead in this process. Typically
the School Development Team was a cross-hierarchical team, consisting of
between three and six staff members (and preferably included the principal).
The School Development Team in consultation with the rest of the staff was
responsible for identifying the programme focus and for managing efforts on a
day to day basis. Their task was thus the monitoring of the implementation of
the plan at the school. They were supported through a core training
programme and by the fieldworker at their school. The core training
programme, offered over a year, attempted to develop skills to fulfil their role
at the school and to develop their leadership skills. There were several areas
of focus in this training:
1. seeing their role as agents of change
2. developing skills in effective planning and reflection
3. developing skills in working with groups

69
4. developing an understanding of change
A focus in this area is on developing a collaborative work culture, team work
or collective action. It was assumed by Outreach that in order for
development planning to be successful the change process needed to be
managed in a planned and coherent manner and reflect a management style
within the school which was consultative and participatory. Staff involved in
development planning were more directly responsible for improving aspects of
school performance and in formulating priorities for development, and were
better motivated to implement agreed priorities.
3.4.3. Leadership and Management Training Outreach also assumed that the role of the principal and other senior
members of staff was crucial in developing and maintaining a consultative
climate in the school, and thus these staff members should lead by example
in using appropriate management styles. For this reason the school
management attend a year long Leadership and Management Training
Course with the express purpose of developing a more democratic,
participatory and consultative form of management style within the school.
Although certain skills training and capacity building elements are included in
the training the emphasis is developing the reflective and process skills of the
school leadership and management. This approach did not distinguish
between the role of leader and manager as it felt that there was not a clear
line between them and that one is attempting to develop a participative
approach to both the more developmental and maintenance aspects of the
role.
Through a variety of training modules and experiences school management
was encouraged to develop more democratic and participatory practices. The
programme saw participatory workplace democracy as a true exemplar of
empowerment at the individual and organisational levels. Workplace
democracy included shared decision making, increased teacher responsibility
through teamwork and collaboration, non-oppressive ways of working with
people and climate, meaningful feedback, conditions for allowing for help and
respect from fellow workers, making work more meaningful, a sense of control

70
over goals setting and over paths to reach those goals. To be a democratic
manager both school leaders (i.e. principals and school management team
members) and teachers must be skilled and able to express their views
openly, consider opposing views, work for mutual benefit, show respect
though they disagree and incorporate opposing views into the solution. They
must also create the conditions under which this open discussion is likely, that
is, mutually co-operative goals.
In order to do this a focus was placed on the issue of power. It was felt by the
programme that, school managers and particularly principals, needed skills in
the uses of power so that they had the requisite skills to empower teachers. A
focus was placed on having power with people that values equality, co-
operation, sharing and interdependence. Power-with involves a relationship
of co-agency and allows the school to find ways to fulfil the needs of the
school and expand the resources for all rather than only a few. In this way the
systems and culture operating in the school would be transformed to create
empowering relationships, systems and culture.
3.4.4. School Based Support
Both the management team and the school development team were offered
school based support. The support was provided to assist the schools in
dealing with specific school issues that arose as they attempted to implement
the school development plan and new management systems. This support
combined ideas from action/reflection models and from a problem-solving
approach. The support provided both emotional support during this time of
change as well as the skills necessary for a sense of mastery or control in
problem situations faced at the school. These skills included defining the
problem, viewing issues from multiple perspectives, comprehending the
aetiology of the problem, generating alternative solutions to the problem and
foreseeing the possible consequences of those solutions. This approach
encouraged a diversity of ideas and solutions that were relevant to the school.

71
3.5. DEFINING SUCCESSFUL SCHOOL DEVELOPMENT PLANNING AS ORGANISATIONAL EMPOWERMENT As discussed in the previous chapter, what is common to most definitions of
empowerment is the suggestion that empowerment is a process in which
efforts to exert control are central (Zimmerman, 2000). These definitions also
suggest that participation with others to achieve goals, efforts to gain access
to resources and some critical understanding of the socio-political
environment are basic components of the construct (Zimmerman, 2000).
This thesis focuses on applying these notions about empowerment to school
development planning, locating it in the multi-level framework developed by
Zimmerman (2000) and framing it more specifically as organisational
empowerment (Peterson & Zimmerman, 2004). This allows consideration of
school development planning as a set of processes that empower a school to
take control of its own development, acquire the resources required and have
an impact on the broader educational community. The empowered school will
have actively implemented the school development plan and achieved the
goals set for themselves (or be in a process of achieving them) and in this
way school development planning could be operationalised as an exemplar of
organisational empowerment.
In order to measure constructs relating to empowerment in a school
development context, a School Development Planning Evaluation Scale was
developed (this will be elaborated on in the Methodology chapter). School
development planning was conceptualised as being made up of five separate
but linked components. These components measured aspects of individual,
organisational and community level variables that were seen as key to the
empowerment of the school, as follows:
(a) Awareness of the School Development Plan and its Role in School Development (School Staff’s Perception of Individual Level Change) This section of the instrument aimed to measure general awareness of the
school development plan at the school and its role in school change.
Zimmerman (1995) has argued that an empowering organisation is one that

72
stimulates awareness of the resources and factors which can facilitate the
reaching of individual and organisational goals. Awareness can also be
understood on a systemic level – where one is aware of the various activities
and information of an organisation, it means that such information has
become part of the system, and that all have access to this information
(Becvar & Becvar, 1996). In this way Awareness of the Plan, although an
individual level variable, indicates an organisational process and provide us
with an outcome measure – awareness of the plan.
(b) Involvement in the Development of, Implementation of, and Evaluation and Monitoring of the School Development Plan (School Staff’s Perception of Organisational Level Change) This section aimed to measure school staffs’ perceptions about how involved
they felt in the process of developing, implementing and evaluating the
progress of the school development plan. It focused on teachers’ sense of
ownership of the plan. Participation in important decision-making, as well as
collaborative relationships for developing, implementing and evaluating an
innovation, is cited as indicating a state of organisational empowerment
(Rappaport, 1987; Zimmerman, 1990). ‘Involvement’ was operationalised in
the instrument as a behavioural measure, but one which is facilitated by an
empowering organisation, where ecological constraints against it are not
present.
(c) Management’s Role in School Development Planning (School Staff’s Perception of Organisational Level Change) This section aimed to measure the perceptions of the school staff as to
management’s role in the school development planning process. Throughout
the literature, shared and collaborative leadership is seen as an essential
aspect of an empowering organisation (Zimmerman, 1990, 1995). This is
typically a behavioural measure, but one which suggests that ecological
constraints that exist from authoritarian leadership are not. Certainly, such
management arrangements can be seen as the structural aspects of
leadership, which stimulate the important processes of involvement and
participation.

73
(d) Assessment of the Effectiveness of the Plan in Bringing About School Change (School Staff’s Perception of Community Level Change) This section aimed to measure the school staffs’ perceptions of how
successful they thought the school development planning had been in terms
of facilitating the change process at the school. It focused on what outcomes
they felt the plan has effected at the school and beyond. Several
empowerment researchers (Kroeker, 1995; Rich et al., 1995; Suaz-Balcazar,
Orella-Damacela, Portillo, Sharma & Lanum, 2003) have argued for the
importance of outcome-focused measures as part of the overall assessment
of empowerment.
(e) Involvement of Other Stakeholders (School Staff’s Perception of Community Level Change) This section aimed to measure school staffs’ perceptions about whether the
parent body as a whole and the school governing body were aware of and
involved in school development planning. Like involvement above,
participation is an important measure of empowerment, especially for those
stakeholders who are not normally involved in important organisational
activities (Peterson & Zimmerman, 2004). Systemically, it means that shared
meanings exist more widely throughout the larger system; ecologically, it
represents the fact that further resources enter the setting, and all resources
are cycled more widely. Again, this is a behavioural measure, but one which
reflects an important state of organisational empowerment.
These were the conceptual bases of the items included in different sections of
the School Development Planning Evaluation Scale. Overall, the instrument
attempted to integrate various measures to illuminate various aspects of the
organisational empowerment process, and to operationalise the construct of
empowerment to school development contexts. Intrapsychic and behavioural
levels of analysis were used, which were conceptualised as demonstrating
ecological and systemic phenomena. It was assumed that this combination of
variables would best describe a school that was successful in terms of school
development planning, and thus a school that was empowered as an
74
organisation. The development of the scale and its analysis will be further
explored in the Methodology and Results sections.
The aim of using the broad frameworks of contextualism and ecological
perspectives and the developments within the field of empowerment research
was to enable a fuller picture of school development to emerge. By
conceptualising school development planning as a form of organisational
empowerment and focusing on the organisational level, this study would be
able to include organisational and community levels (in line with Zimmerman’s
conceptions of empowerment), as well as empowerment at the individual level
of analysis. This would also enable analysis of organisational empowerment
and its relationship with other organisational as well as individual and
community level variables.
3.6. SUMMARY OF THE ARGUMENT From the literature it is argued in this thesis that a contextualist epistemology
and an ecological perspective of community psychology as expressed in an
empowerment framework can provide a vehicle for exploring the processes of
individual, organisational and community change brought about by a school
development programme. In this framework empowerment is conceptualised
as a multilevel, context specific, dynamic concept. It has different dimensions
and is thus difficult to define as a unitary factor (Zimmerman, 1995).
Using Zimmerman’s (2000) theories of the different levels of empowerment,
empowerment in school development planning contexts is conceptualised as
occurring at the individual, organisational and community level. By extending
this multilevel view to include the interpersonal level, issues related to
collective or relational empowerment are incorporated into the theoretical
framework explored in this study.
The aim of this study is to apply a multilevel, dynamic and contextual
empowerment framework to school development planning. An argument is
presented that the various levels and processes of empowerment identified by
community psychologists can be found in the sense of empowerment

75
experienced by teachers and principals involved in school development
planning.
Central to the operationalisation of this contention is the development of a
measure of school development planning (the School Development Planning
Evaluation Scale), which has been conceptualised as having different
sections, each relating to the various levels of empowerment proposed in the
literature. The development of this instrument has been undertaken to enable
the relationship between school development planning and variables
associated with empowerment to be explored, at the various levels of analysis
identified in the empowerment literature, as this applies in the sample of
schools studied. The assumption is that these levels of empowerment may
also apply more generally in educational contexts.
In conceptualising this study, organisational empowerment has been
operationalised as a construct by using Peterson & Zimmerman’s (2004)
nomological network of organisational empowerment. The assumption has
been made that school development planning can by this means be directly
operationalised as organisational empowerment, enabling confirmation and
refinement of the nomological network of organisational empowerment on the
one hand, and exploration of its application in a school development context
on the other. A central thread in the logic of this study is whether it is possible
through the analysis of a measure of school development, for its relationship
to variables associated with empowerment to be established.
3.7. RATIONALE OF THE STUDY The rationale of this study is that, although much research has focused on the
importance of context in understanding empowerment’s processes and
outcomes, little has been done in the area of educational settings such as
schools. No studies to date have attempted to conceptualise school
development planning both as an empowering process for schools and one
that can achieve empowered outcomes. Recently several practitioners have
been applying community psychology as a framework for working with, and
intervening in, school settings, for example Camic & Rhodes (2003); Rhodes

76
& Camic (2006); Wood (2006). However whether school development
planning can be conceptualised as organisational empowerment has not been
explored, either in the context of research conducted in schools in developed
countries, or (importantly in terms of the sample of schools focused on in this
study) in developing countries.
The theoretical implications of this study are that utilising a
contextualist/ecological perspective can provide a framework for looking at the
complex social issues of empowerment and school change. If such a
framework can be applied to school contexts, it allows questions to be asked
within organisations, such as schools, that go far beyond intrapsychic or
interactional person-environment fits, and view persons embedded completely
within the ecological resources and constraints of their settings (Trickett,
1984; Yoshikawa & Shinn, 2002).
This allows for the exploration of both school development processes and
empowerment at various levels of analysis (for example teacher change,
change in leadership, change in participation and decision-making and
change in the organisation) and allows for the exploration of factors that
hinder or support this process. By focusing on the dialectical relationship
between the levels, insight into whether school development planning as an
organisational intervention impacts on other levels of analysis can also be
gained.
By exploring these issues within the context of South African township
schools, cross-cultural views on empowerment and school development can
also be gained. An empowerment-based analysis allows for the development
of knowledge about how school development planning, a process
conceptualised in “developed” countries, has been understood and re-
invented in a “developing” country.
Social issues, like education in a post-apartheid South Africa, are complex
and interrelated and the solutions to these problems needs to take into
account the interdependence of the world’s political, economic and social

77
structure (Roesch & Carr, 2000). Cowen (2000) suggests that intrinsically
complex human and social problems require multiple, divergent and changing
solutions. In the same way these complex multilevel issues require
contextualist multi-method approaches to their investigation.
3.8. CONCEPTUALISATION AND MEASUREMENT OF VARIABLES RELATED TO EMPOWERMENT The literature reviewed indicates that many variables have been associated
with empowerment at various levels of analysis (Foster-Fishman & Keys,
1997; Klein et al., 2000; Prestby et al., 1990; Spreitzer, 1996; Zimmerman,
2000). Zimmerman’s (2000) framework of empowerment at different levels of
analysis, namely the individual, organisational and community provides
exemplars of empowerment at each of these levels (see Table 1 and review,
Chapter 2.3.3). For the purposes of this study aspects related to the
individual and organisational level have been focused on as these were the
focus of the school development programme. Zimmerman (2000) highlights
issues of control and efficacy as exemplars of empowerment at the individual
level of analysis. At the organisational level issues of democratic or
participatory leadership, supportive organisational climate, collaborative
working and opportunities to participate in decision making are seen as
indicators of an empowering organisation (Zimmerman, 2000). As has been
argued empowerment is a context specific construct (Speer, 2000) and as
such context specific measures at both the individual and organisational
levels of analysis would be important to include in the study as exemplars of
these levels in a school development context.
3.7.1. MEASURES ASSOCIATED WITH INDIVIDUAL EMPOWERMENT
As no single measure of psychological empowerment has been developed,
and following previous research on empowerment at the individual level of
analysis (Chavis & Wandersman, 1990; Florin & Wandersman, 1984;
Zimmerman & Rappaport, 1988), a combination of locus of control and self-
efficacy measures were used in this study to measure the intrapersonal
aspects of psychological empowerment (Segal, Silverman & Temkin, 1995;
Speer & Peterson, 2000; Zimmerman, 2000).
78
In previous research on empowerment, measures of general self-efficacy
have been used (Zimmerman & Rappaport, 1988; Chavis & Wandersman,
1990; Florin & Wandersman, 1984). Although many authors argue for the use
of a general measure of efficacy (Bosscher & Smit, 1998; Bosscher, Smit &
Kempen, 1997; Gardner & Pierce, 1998; Jacobs & Rogers, 1982; Tipton &
Worthington, 1984) there has been some debate about whether situation
specific measures should be used (Bandura, 1992; Bandura, Adams, Hardy &
Howells, 1980).
It was therefore decided in conceptualising this study to include a context
specific measure of efficacy in the form of a Teacher Self Efficacy Scale to
assess if there were differences between general and specific measures of
efficacy with relation to organisational empowerment. It is acknowledged that,
while none of these three measures, or combination of measures, fully
assesses psychological empowerment, each measure used has been
associated with empowerment, particularly intrapersonal empowerment at the
individual level of analysis (Kieffer, 1984; Zimmerman, 1995, 2000).
3.7.2. MEASURES OF PARTICIPATION IN DECISION-MAKING AND COLLABORATION Evidence for the link between participation and empowerment has been
established in the workplace (Herronkohl, et al., 1999; Koberg et al., 1999;
Menon, 1999; Tjosvold & Law, 1998); the community (LeBosse et al., 1998/9;
Perkins, et al., 1996; Perkins, et al., 1990; Price, 1990; Peterson & Reid,
2003; Speer, 2000); and the school (Bartunek, et al., 1999; Klecker &
Loadman, 1998; Royal & Rossi, 1996). Several authors (e.g. Bartunek et al.,
1999; Le Bosse, et al., 1998/9; Speer, 2000; Speer & Zippay, 2005) have
made a distinction between active and passive participation arguing that they
have a different impact on the individual’s behaviour and outcomes.
In a similar vein Frank, Cosey, Angevine & Cardone (1985) make a distinction
between being involved in the decision-making process and having actual
influence on the decision taken. Zimmerman and colleagues (Perkins &
Zimmerman, 1995; Zimmerman & Rappaport, 1988) argue that an individual’s
79
active participation in decision-making within the major organisations that
substantively influence his or her daily life will engender both an increase in
the individual’s sense of personal power and effectiveness and an increase in
the organisations’ abilities to meet the individuals needs. Following the
distinction proposed by Frank et al., (1985) the present study focused on both
involvement in decision making and actual influence in terms of the decision
made.
Participation in decision-making is only one aspect of participation as a
concept (Robertson & Minkler, 1994). Several researchers have argued that
the type of participation is an important factor in determining its link to
empowerment (Bartunek, et al., 1999; LeBosse et al., 1998/9; Speer, 2000).
The school development literature emphasises the importance of
collaboration within the schools if the development process is to be success
(Hole, 1998; Lyman & Foyle, 1998; Mueller, Procter & Buchanan, 2000; Sullo,
1998). Collaboration in this literature is seen both as an outcome and a vital
process of the school change process. Collaboration has also been linked to
many positive individual and organisational outcomes (Ambrosie, 1989;
Conely, Schmidle & Shedd, 1988; Bickmore, 1998; Bryk & Driscoll, 1988; Fox
& Faver, 1984; Hord, 1986; Lee, Derick & Smith, 1991; Royal & Rossi, 1999).
Several writers have also stressed the important role collaboration play not
only in facilitating school development efforts but also it minimising the
overwhelming dimensions of change (Duttweiler, 1989; Miles & Louis, 1990;
Payne, 1991).
Collaboration and its relationship to empowerment per se has not been fully
explored, however links with indicators of psychological empowerment such
as self-efficacy have been found in several studies (Bryk & Driscoll, 1988;
Lee, et al., Royal & Rossi, 1996). In terms of the evidence for the link
between participation and empowerment and because this study’s area of
interest is empowerment in a school development setting a measure of
collaboration was also included in the study.
80
3.7.3. MEASURES OF LEADERSHIP The link between various aspects of leadership and empowerment has been
established. Several researchers report that leadership qualities such as
encouraging, supporting and approachability play an important role in
developing empowerment (Kirkman & Rosen, 1999; Koberg et al., 1999;
Kraimer, Seibert & Liden, 1999; Liden, et al., 2000).
Leadership styles such as participative; democratic and transformational
leadership have all been linked to empowerment in the workplace (Bolin,
1989; Fuller, Morrison, Jones, Bridger & Brown, 1999; Tjosvold & Law, 1998);
in the community (Bond & Keys, 1993; Saegert & Winkel, 1995) and in
schools (Lightfoot, 1986; Stimson & Appelbaum, 1988). Organisational
cultures reflecting participation, collaboration and co-operation have also been
linked to empowerment (Bond & Keys, 1993; Foster-Fishman & Keys, 1997;
Spreitzer, 1995; Tjosvold & Law, 1998). The link between leadership and
participation has been established by several researchers (Driscoll, 1978;
Prestby, et al., 1990; Pretorius, 1993; VanYperen, van den Berg & Willerig,
1999; White, 1979).
Leaders can play an important role in developing participative and
collaborative environments within their organisations and thus play a crucial
role in developing the empowerment of their staff as well as making the
organisation a more empowering place to work in (Bond & Keys, 1993;
Foster-Fishman & Keys, 1997). The quality of the relationship leaders have
with their staff also play an important role in developing empowerment
(Kirkman & Rosen, 1999; Koberg et al., 1999). Thus in order to take into
account both the relationship aspects of the leadership role and the
organisational culture related to the leadership style both of these aspects will
be measured in the present study.
The link between peer working relationships and empowerment has been
established in the organisational and school setting (Barksdale-Ladd &
Thomas, 1996; Jex & Bliese, 1999). Corsun & Enz (1999) report that work
environments fostering support based relationship result in worker

81
empowerment. With the emphasis on collaborative relationships (Hole, 1998;
Lyman & Foyle, 1998; Mueller et al, 2000; Sullo, 1998) or collegiality (Barth,
1990; Little, 1981) amongst teachers in terms of successful school
development, and as empowerment in this setting is being explored it was
decided to include a measure of peer working relationships.
3.7.4. CONCLUSION These measures have been included so as to provide and form reference
points of existing well-researched variables which could be used for validating
the School Development Planning Evaluation Scale developed as part of this
study. Including these variables also provided additional evidence as to the
presence of empowerment in the school development setting at various levels
of analysis. Information relating to the actual measures used and their
reliability and validity will be presented in the next chapter.

82
CHAPTER FOUR: METHODOLOGY
4.1. INTRODUCTION The central tenet of this thesis is that empowerment is complex, manifests in
different situations and can be tapped in various ways. As such it is assumed
that it occurs in school development, and that if it occurs in this particular
context, it can be measured. Thus the exploration of empowerment, in a
school development setting is a central focus of this study.
To assess whether empowerment is evidenced in schools a comparison of
schools that had been on the programme for three years with those that had
been on one year was undertaken. If evidence of empowerment at the
individual and organisational levels was found then the theoretical argument
would have been confirmed and it could be concluded that the school
development programme has been successful. The logic of the analysis was
that where evidence of empowerment at the individual and organisational
levels was found, then this could be taken as evidence that the theoretical
argument had been confirmed. It could also be concluded that the school
development programme had been successful.
An ex post facto, post hoc group comparison design was utilised to analyse
the impact of the school development planning programme. It should be
noted that ex post facto designs are descriptive, non-experimental designs,
and thus potentially weak for drawing conclusions concerning the effects of
programmes (Potter, 2004). In order to deal with these weaknesses a multi-
method design was utilised, in which an ex post facto contrast group design
was nested. The overall design relied on the use of multiple methods and the
logic of triangulation between different sources of data, involving both
quantitative measurement and qualitative evidence of different kinds. The
qualitative data were used for interpretation of the quantitative results, as well
as in their own right, to yield perspectives on what teachers experienced in
the programme.

83
An attempt was also made to measure the empowerment construct directly
through the construction of a school development questionnaire, the School
Development Planning Evaluation Scale. A pilot study on this instrument was
conducted, the results of which indicated that, though the factors measured by
the scale appeared to form a single construct or composite area, the construct
or area itself which was difficult to define. For this reason, the scale was
amended and its factorial structure scrutinised again. Again the scale yielded
indications that a unitary construct or area was being measured, but it did not
appear to comprise one single factor which was interpretable in terms of the
loading of its different components. The net result was that it was not possible
to establish whether or not the underlying school development construct
measured by the test was in fact an empowerment factor.
It should be borne in mind in this respect that Zimmerman (2000) has
suggested that empowerment is a multilayered construct which is difficult to
define. It may well be that this lack of conceptual clarity was the reason for
the difficulties experienced in interpreting the single unitary construct identified
in the factor analyses of the results of the School Development Planning
Evaluation Scale in our pilot study. What could be concluded was that both
factor analyses identified almost all the variance as related to a composite
area or construct, which, like empowerment, appeared to be an aggregation
or composite of many different layers or factorial entities.
However, for purposes of reporting the design of this study it should be noted
that it could not assume from the evidence of the pilot study that a unitary
factor of empowerment had been found. It could merely be establish that the
factor analyses could not be interpreted logically, as the different components
of the unitary construct identified were unclear.
For this reason, provision was made in the design of the main study for the
additional measures besides the School Development Planning Scale to be
used. These enabled the validation of the School Development Planning
Scale against a number of other measures which appeared from the literature

84
to be measuring aspects of empowerment (via separate empowerment-
related constructs).
In the main study, the reliability of these additional instruments (relating to
locus of control, efficacy, participation and leadership) was first established.
The information they yielded was then used for concurrent validation
purposes. This was done by administering these additional tests at the same
time as the School Development Planning Scale, and then establishing how
the results of these additional tests related to the results yielded by the School
Development Planning Scale.
In addition to this descriptive analysis, focus groups and interviews were also
conducted with teachers, principals and school development teams involved
in the programme. These data were collected to establish whether they
reported that involvement in the programme had led to their personal
empowerment, as well as the empowerment of their schools as organisations
and the communities in which their school was situated. Archival data on the
particular schools involved in the programme were examined as an additional
qualitative data source.
Regrouped data (both quantitative and qualitative) contrasting schools that
had performed well on the School Development Planning Evaluation Scale
with those that performed less well were analysed and interpreted to further
explore empowerment as evidenced in the schools. To integrate the findings
from the quantitative and qualitative analyses, impact matrices were
constructed to identify what the various data sources revealed about the
impact of the programme and its meaning in teachers’ lives and thus what
evidence there was for empowerment at the individual, organisational and
community levels of analyses.
In order to further explore the relationships between these variables various
qualitative and quantitative analyses were undertaken. The qualitative
analyses of factors that helped or hindered the school development process
were used in conjunction with multiple regression analysis to develop a model

85
of organisational empowerment. This model was tested using Structural
Equation Modelling. The findings from these qualitative and quantitative
analyses were integrated through the construction of relationship matrix and
diagrams to offer suggestions about the relationships between the various
variables. These various analyses were then integrated to provide
conclusions about school development planning as empowerment and about
empowerment as evidenced in school settings.
4.2. RESEARCH DESIGN ISSUES IN COMMUNITY PSYCHOLOGY One of the methodological challenges in community psychology has been
how community psychologists can research real world phenomena in a sound
and rigorous way (Tolan, Chertok, Keys & Jason, 1990). Community
psychology’s emphasis lies in the contextual nature of information, the utility
of divergent views. It also has an interest in real-life and ill-structured
problems (Tolan et al., 1990) as well as multiple-level and dynamic constructs
such as empowerment (Rappaport, 1990). These imperatives make it difficult
to fit the research methodologies used in community psychology within the
narrow positivistic framework offered by much of traditional scientific research
(Bhana & Kanjee, 2001; Swartz & Gibson, 2001). Community psychology’s
interests are in matters that are best understood by multiple methods and by
multidimensional analysis of data rather than through designs focusing on a
single causal element (e.g. Potter, 2004).
More specifically Foster-Fishman et al. (1998) argue that the recognition that
empowerment is a contextualised and dynamic process poses a critical
challenge for empowerment researchers – the identification of research
methods that capture this complexity. An overly individualistic conception of
empowerment may limit understanding of the construct. If the individual level
of analysis is focused on exclusively, single measures of competence and
trait-oriented conceptions of empowerment may be advanced while failing to
consider environmental influences, organisational factors or social, cultural
and political contexts. A more contextual and collectivist orientation however,
does not ignore individual experiences of control; rather, it allows for a more
86
culturally sensitive theory of control that is consistent with empowerment
theory (van Uchelen, 2000).
It is not only at a conceptual or research design level that these issues are
relevant. By conceptualising social issues, such as empowerment, at only
one level of analysis, and by not contexualising it, use can be made of limited
or faulty methods for researching empowerment-related issues. Foster-
Fishman et al. (1998) make the point that two strategies often used in
empowerment research may inadvertently obscure the variety of
empowerment experiences for persons in a given setting. Firstly, many
empowerment research studies and programmatic interventions have been
constructed around a particular researcher’s own definitions of empowerment
(for example, Spreitzer, 1995; Zimmerman & Rappaport, 1988). This
definition may not be consistent with the empowerment expectations and
experiences of stakeholders, beneficiaries or other community members in a
particular social or educational setting.
Secondly, researchers have tended to use singular operationalisations of
empowerment within their target setting (for example, Ozer & Bandura, 1989;
Spreitzer, 1995; Zimmerman et al., 1992; Zimmerman & Rappaport, 1988).
While targeting a limited number of process or predictor variables increases
the feasibility of an empirical investigation and the ability to identify certain
aspects of empowerment that are common across individuals, singular or
limited conceptualisations of empowerment potentially ignores alternative
routes to increased rigour and/or control. Such an approach can both
significantly limit our understanding of empowerment and our ability to
promote social change through empowering interventions (Foster-Fishman et
al., 1998).
Many writers have thus been calling for researchers in community psychology
to move away from the individual level of analysis and include other levels of
analysis in their studies (Rappaport, 1990; Seibert et al., 2004; Trickett, 1991;
Zimmerman, 2000). It is not only within the sphere of empowerment research
that a call has been made for a different approach that can take into account
87
complexity, context and multiple levels. A multiple level approach to
empowerment research has been advocated by many writers in the area of
community psychology (Glenwick, Heller, Linney & Pargament, 1990; Wicker,
1990), leadership (Conger, 1998; Parry, 1998), participation and school
development (Stoll, 1999). The use of a multiple level approach to
researching and analysing issues in the social world goes by several names:
multi-level (DiPrete & Forristal, 1994), cross-level (Shinn, 1990; Shinn &
Rapkin, 2000) or mixed level research (Glick, 1980, 1985). Although all of
these terms refer to something slightly different the emphasis has been on
looking at the interaction of variables between the different levels of analysis.
Kingry-Westergaard & Kelly (1990) and McGuire (1983, 1986) have shown
the relevance of a contextualist epistemology for research and intervention in
community psychology. Linking contextualist epistemology directly to an
ecological perspective, these authors suggest that understanding behaviour in
context means attending to the varied social constructions of participants in
the context. While this makes sense at a theoretical level the issue of context
is still a difficult one to grapple with (Shinn, 1996).
4.3. MULTI-METHOD APPROACHES TO RESEARCH DESIGN The investigation of complex social realties such as empowerment
necessitates the use of multiple research methods (House, 1994). Numerous
authors have called for multi-method research in community psychology
(Camic & Rhodes, 2003; Wicker, 1990), empowerment research (Campbell &
Martiniko, 1998), organisational studies (Bradshaw-Camball & Murray, 1991;
Gioia & Pitre, 1990) and educational development (Cafasso, Camic &
Rhodes, 2002).
Rosenthal & Rosnow (1991) refer to this approach as “methodological
pluralism”. They argue that it is imperative to use more than one approach to
gathering data given the limitations of any one particular strategy of inquiry,
and justify its usage as a form of critical multiplism (Brewer & Hunter, 2006;
Cook, 1985; Cook & Shadish, 1986; Houts, Cook & Shadish, 1986; Johnson,
Onwuegbuzie, & Turner, 2007; Shadish, 1986).
88
Although the debate between qualitative and quantitative methods of inquiry
has a long history in the fields of both education and psychology (Bryman,
1984; Collins, 1984; Eisner & Peshkin, 1990; Erikson, 1986; Guba, 1990;
Mishler, 1990; Phillips, 1990; Reichardt & Cook, 1979; Rossi, 1994; Smith, J.,
1983; Smith, M., 1994) many authors are now calling for a combination of
these two approaches, in an attempt to deal with the complex nature of the
phenomena of interest to community psychologist and also to deal with the
limitations of both approaches (Brewer & Hunter, 1989; Crabtree, Yanoshik,
Miller, & O’Connor, 1993; Fontana & Frey, 1998; Hedrick, 1994; Preissle,
1992; Reichardt & Rallis, 1994; Rossi & Berk, 1981; Taylor, 1995; Weinstein,
1991). Smaling (1992a, b) and Rossman & Wilson (1985) argue for a
pragmatic view on the combination of the two methods in one study and
thereby triangulating data and methodologies. Camic & Rhodes (2003) argue
for a ‘bending and blending’ of data collection through an integration of
methodologies in evaluating community psychology approaches in school
development.
There are several benefits of using integrated approaches in research
discussed in Bamberger (2000) that also apply to impact evaluations (Baker,
2000). Among them:
• Consistency checks can be built in through the use of triangulation
procedures that permit two or more independent estimates to be made for
key variables
• Different perspectives can be obtained. For example, although
researchers may consider income or consumption to be the key indicators
of household welfare, case studies may reveal that women are more
concerned about vulnerability (defined as the lack of access to social
support systems in times of crises), powerlessness, or exposure to
violence (Baker, 2000).
• Analysis can be conducted on different levels. Survey methods can
provide good estimates of individual, household, and community level
welfare, but they are much less effective for analyzing social processes.

89
• Opportunities can be provided for feedback to help interpret findings. The
greater flexibility of qualitative research means that it is often possible to
return to the field to gather additional data.
According to Robson (1993) the main advantage of employing multiple
methods is that it allows triangulation. Denzin (1978) suggested that this
might be done in social research by using multiple and different sources (e.g.
informants), methods, investigators or theories. A general prescription has
been to pick triangulation sources that have different biases, different
strengths, so they can complement each other (Huberman & Miles, 1998).
Several writers have written about the value of alternate sources of data for
enhancing cross-checking, credibility and depth to one’s research (Adler &
Adler, 1998; Guba & Lincoln, 1981; Stake, 1995). Potter (1992) referring to
Denzin (1970) says: a research design based on multiple sources of data, investigators, theories and methodologies had greater potential for providing valid information about phenomena in social settings than a research design based on one source of data alone. To achieve a composite perspective from a variety of data sources however would require appropriate methods of analysis as well as rigorous methodology for integrating indications and inferences drawn from each data source. (p.7)
Using multi-methods, or triangulation, reflects an attempt to secure an in-
depth understanding of the phenomenon in question. Objective reality can
never be captured through investigation (Denzin & Lincoln, 1998).
Triangulation is not a tool or strategy of validation, but an alternative to
validation (Denzin, 1994; Flick, 1992). The combination of multiple methods,
empirical materials, perspectives and observers in a single study is best
understood, then as a strategy that adds rigor, breadth and depth to any
investigation (Denzin & Lincoln, 1998). As Shinn (1990) aptly states this
triangulating or using multiple sources, measures, methods and/or
approaches is primarily because multiple methods assess multiple realities
rather than because information gleaned from one apparently more objective
method necessarily validates information gleaned from another apparently
more subjective one.

90
Ratcliffe (1983) and Mischler (1990), among others, argue that there is no one
universal guarantor of validity, but there are notions of validity – that the
concept of validity is no less a function of successively dominant modes of
thought than are the inquiry systems that have prevailed historically or than
the distinction between subjective-objective or qualitative modes of inquiry.
The point is that reality is difficult to apprehend and it is even more difficult to
represent symbolically. By acknowledging that there are a variety of methods
of apprehending the world and that there is no one right way to conduct
inquiry and generate validity and because every way is necessarily
approximate and partial and that each way has its own strengths and
weaknesses it is therefore crucial to try and capture a multitude of
interpretations.
If it is accepted that no notion of validity is either immutable or inviolate, for all
such notions are dynamic, instrumental and evolving – and therefore need not
be slavishly followed as if they are universal; laws of nature the process of
validation can, like the process of enquiry be broadened to include the
perspectives and judgements of the researched – so that those who have
been excluded historically from the process of problem definition, data
interpretation and validation can begin to participate in these processes as
authentic subjects in inquiry (Reason & Rowan, 1981) instead of being limited
to their traditional role as mere objects of inquiry. As John Heron (1981)
states Knowledge fuels power: it increases the efficacy of decision-making. Knowledge about persons can fuel power over persons or fuel power shared with persons. And the moral principle of respect for persons is most fully honored when power is shared not only in the application of knowledge about persons, but also in the generation of such knowledge. (p. 35)
Denzin (1994), talking about the evaluation of social programmes, stresses
the importance of understanding the implementation and impact of the
programme from the perspective of the participants. He argues that often
social programmes are based upon interpretations or judgements that bear
little relationship to the meaning, interpretations and lived experience of the
people they intend to serve. He feels that often programmes fail as they are

91
based on a failure to take the perspective of the people being served. He
argues that the human disciplines and the applied social sciences are under a
mandate to clarify how interpretations and understandings are formulated,
implemented and given meaning in problematic, lived situations. Ideally this
knowledge can be used to evaluate programmes that have been put in place
to assist people or communities. The perspectives and experiences of those
people who are served by the project must be grasped, interpreted and
understood if solid applied programmes are to be created.
He argues that through the use of personal experience and description of
lived experiences the perspective of people can be compared and contrasted
and in this way help identify different definitions of the problem and the
programme being evaluated. By focusing on the lived experience of people
and their judgements of the impact of the programme alternative points of
view can be gained. The limits of statistics and statistical evaluations can be
exposed with more qualitative, interpretative materials. Its emphasis on the
uniqueness of each life and each situation holds up the individual case as the
measure of the effectiveness of all applied programmes. This becomes vitally
important in the context of the present study because we need to understand
how a western model of school development has been implemented,
understood and reinterpreted by the community involved in the study.
This multilevel, multi-method approach to our area of study provides a design
and methods for our study that are consistent with the values of community
psychology. A commitment to diversity should also lead us to employ different
methods of understanding and representing people. Our commitment to and
valuing of diversity – in questions and solutions, in settings and services, and
in voices and perspectives (e.g. Rappaport, 1977) – should make us weary of
generalisations and universality and of the power of numeric representations
of persons (Trickett, 1990). As Cronbach (1975) argued “the goal of our work
is not to amass generalisations atop which a theoretical tower can someday
be erected. The special task of the social scientist in each generation is to pin
down the contemporary facts” (p. 126).

92
A commitment to contextual understanding and definitions should make
community psychologists wary of predetermined questions and standardised
measures which can be as obscuring of local meaning and understanding as
illuminating of them. An ecological perspective requires that we take seriously
the transactional nature of person-environment relationships (Altman &
Rogoff, 1987). A commitment to collaborative, empowering research methods
(e.g. Rappaport, 1990; Reinharz, 1992) should lead community psychologists
to converse with people they work with, to aim for intersubjective, emic
accounts of their lives and understandings and to the extent possible to
amplify their voices and foreground their expertise. In this way community
psychologists are being consistent with the value of collaboration and
empowerment of those they work with (Serrano-Garcia, 1990).
4.3.1. Evaluation and Multi-Method Design Although these ideas have been expressed for over a decade the values of
community psychology are often not reflected in the studies published
(Stewart, 2000). There is still an over reliance on individual level analysis,
quantitative measures and little attempt to incorporate issues of context.
Shadish (1990) argues that community psychology has been limited by the
social structure of its academic setting. He argues that programme evaluation
may offer a useful framework for community psychology research.
Spielberger, Piacente & Hobfoll (1976) argue that often research and
evaluation are seen as distinct from each other. They argue that programme
evaluation is seen as providing immediate feedback which permits continual
adjustments to programme objectives whereas research is generally seen as
being designed to test theories and contribute to general store of knowledge.
School development studies have relied almost exclusively on the evaluation
side of this distinction and this is reflected in the lack of theorising around the
process of school development. However Spielberger et al. (1976) and Chen
& Rossi (1983) argue that it is vitally important that impact evaluations take on
the task of developing theory as to why projects are successful.

93
Chen & Rossi (1983) argue that many mainstream programme evaluations
only focus on the impact or outcomes of the programme. They suggest that
by focusing solely on the attainment of goals without much reference to why
the programme was successful or not we are often left with narrow and
sometimes distorted understanding of programmes. Thus they feel that it is
vital that evaluators look at the process (what factors contributed to the
success of the programme) as well as the outcomes. Qualitative approaches
may be better suited to these descriptions of process and development (Guba
& Lincoln, 1995). Thus again the importance of a multi-method approach to
the evaluation is stressed.
In discussing the use of evaluation models in community psychology research
Chen & Rossi (1983) raise the issues of what criteria are to be used for
assessing the impact of a development programme. The specifying of
outcomes or goal specification constitutes one of the important distinctions
between basic and applied social research (Chen & Rossi, 1983). In basic
research outcome variables express the disciplinary interests of the
researcher; in applied social research, outcome variables are those of interest
to policy makers or other sponsors of applied research. As traditionally
viewed, goals specification in evaluation research tends to be a search for
appropriate operational definitions of the intended effects of the programme.
Chen & Rossi (1983) criticise the dominant paradigm allied to evaluation in
which the only focus is on the outcomes of the programme as defined by the
programme, policy makers or legislators. Their argument, in line with that of
Spielberger et al. (1976) is that by merely focusing on the attainment of goals
without much reference to why the programme was successful or not, and by
ignoring unintended consequences, evaluators may provide narrow and
sometimes distorted understandings of programmes.
Chen & Rossi (1983) argue that programmes may be accomplishing
something that were not intended by their designers and that such effects
may either be desirable or undesirable, may produce effects that offset those
intended and that a good evaluation should take into account inferred effects
as well as those directly intended. Related to this is the underlying
94
assumption in empowerment theory that empowerment in different contexts
will take different forms and thus we need to beware of putting forward
predetermined notions of empowerment as such an approach can both limit
our understanding of empowerment and our ability to promote social change
through empowering interventions (Foster-Fishman et al., 1998). This is of
vital importance in this context as notions of school development through
school development planning and notions of empowerment based very much
on “western” theories and frameworks was being applied in a developing
country context. However as argued previously the programme has some
clear aims and it is legitimate to explore whether school members behaviour
and organisational outcomes change in ways that are consistent with the
expectations of the initiative (Bartunek et al., 1999).
Again a multi-method approach to the study allowed one to explore these
various perspectives. In this way unintended consequences could be
explored to provide a more thorough picture of the impact of the programme,
issues of process and the reasons for success could be tapped and
achievement of the specific aims of the programme could be assessed.
Using multiple methods, or triangulation, reflects an attempt to secure an in-
depth understanding of the phenomenon in question (Potter, 2004). The
combination of multiple methods, empirical materials, perspectives and
observers in a single study is therefore best understood as a strategy that
adds rigour, breadth and depth to any investigation (Denzin & Lincoln, 1998).
This multilevel, multi-method approach not only provides a design and
methods for this study that are consistent with the values of community
psychology but also strengthens weaknesses in the ex post facto design and
provides an approach to the evaluation that will allow conclusions about the
programmes effectiveness to be made.
4.4. RESEARCH DESIGN OF THE PRESENT STUDY In line with the ecological and contextualist approach being advocated in this
study for understanding both community psychology and the field of school
development, a contextualist, multiple method approach to the evaluation was

95
taken combining both quantitative and qualitative data. Through this
methodological triangulation it was hoped that a more complete, holistic and
conceptual portrayal of the units under study could be captured (Jick, 1979)
as well as what Trickett (1991) refers to as the unintended as well as the
intended “ripples” of the intervention being evaluated. Due to the exploratory
nature of this study (i.e. attempting to apply empowerment concepts in a
school setting) it was felt that it was important to have a comparison of results
across methods as a means of triangulation (Jick, 1979). At present research
on empowerment within school settings appears to be in an exploratory phase
with very few studies of empowerment conducted in the school setting
(exceptions are Cafasso et al., 2002; Rhodes & Camic, 2006).
The use of multiple methods alleviates some of the issues associated with
questionnaire measures in empowerment research, particularly the restriction
of the range of potential responses from participants in the study (Foster-
Fishman et al., 1998). Empowerment theory is predicated on the assumption
that empowerment is a context specific construct that will vary across
individuals and time (Zimmerman, 2000). Researchers in the field of
empowerment have been criticised for constraining respondents’ views within
their own predetermined notions of empowerment (Foster-Fishman et al.,
1998). Thus qualitative techniques, like focus groups and interviewing,
allowed the exploration of teachers’ and principals’ perceptions of the change
process without predetermined dimensions, categories or constraints.
Measurement questionnaires are more appropriate in well-developed
theoretical domains where the variables and their relationships are well
known. However since the application of empowerment theory to school
development at an organisational level is in an exploratory phase, qualitative
methods are needed to fully examine the depth and range of the application of
empowerment theory in school settings. The use of multiple methods
provided the potential for a more thorough and in-depth understanding of
empowerment in the school setting.

96
To explore the impact of the programme an ex post facto analysis was
conducted based on a post-test only comparison group evaluation design.
Being an essentially descriptive, non-experimental design, a multi-method
approach followed the suggestions made by Cohen & Manion (1989) for
strengthening potentially weak research designs in education, with their
attendant problems of external and internal validity. Through the use of
different methods, and a process of triangulation across different sources of
data, the aim was to alleviate the problems encountered when conclusions
are drawn based on use of one method or one source of data only.
It has been necessary in this study to accord weight not only to measurement
data, but equally importantly to the self-reports of teachers and principals
involved in this particular school development planning programme. The use
of different data sources (various existing measures, a new measure, the self-
reports of teachers and principals and externally verified data e.g.
achievement of school development objectives) was necessary to provided
indicators not only of empowerment, but also of school development planning
outcomes. This use of multiple data sources was also necessary for the ex
post facto design used in the study to be nested within a larger multi-method
analysis.
Using a logics model of impact evaluation the focus of this study has been on
looking for impacts and effects of the programme (as defined in the terms of
reference Chapter 1 and explored in more detail below, and operationalised in
the evaluation model adopted in the study as described in Table 5a) across a
number of different data sources. The study also looked for various kinds of
evidence relating to the impact of the programme in line with previous studies
using similar an evaluation framework. Scriven (1983), talking about the
multi-model in evaluation, argues for the need for multiple perspectives when
conducting an evaluation. He says “it is often absolutely essential that
different points of view on the same program or product be taken into account
before any attempt at synthesis is begun, some preserved to the end” (p.
257).
97
The logic of a multi-method evaluation design relies on examination of more
than one source of data. The reason for this is that it is not possible to
conclude either that the programme is effective, or that is it ineffective, on the
basis of an ex post facto design. An ex post facto design is a descriptive
design. In order to provide any comment on the effectiveness of the
programme it was necessary to collect data from various sources. The results
of the analyses of the quantitative data would thus at best be one element
considered in building a case for the programme’s effects or impact. As
Scriven (1983) suggests, the reason for the multi-method model is that
evaluation deals with multiples e.g. multiple levels, dimensions, perspective.
There have to be other sources of data before firm conclusions become
possible.
4.4.1. Impact Evaluation: The Measurement of Programme Outcomes
The terms “effect” and “impact” are defined in a number of different ways in
the evaluation literature (Australian Public Service Commission, 2005;
Blamey, 2007; Halliday , Friedli, & McCollam, 2004). The focus in this study
on shorter term outcomes as “effect” and “impact” used in the current study
follows a line of definition and reasoning used by other evaluators
internationally.
The current study focuses on programme effects through a multi-method
study in which is nested a non-experimental research design focusing on
empowerment outcomes. This type of study is in line with international
practice in programme evaluation. The World Bank’s Independent Evaluation
Group, for example, states in a recent discussion paper
(http://www.worldbank.org/ieg/docs/world_bank_oed_impact_evalua-
tions.pdf) that: the research designs used in impact evaluations range from large scale sample surveys in which project populations and control groups are compared before and after, and possibly at several points during program intervention; to small-scale rapid assessment and participatory appraisals where estimates of impact are obtained from combining group interviews, key informants, case studies and available secondary data. (p. 2)

98
According to the World Bank’s Independent Evaluation Group there are
several methods or models of impact evaluation which are summarised
below:
Impact Evaluation Model Design 1. Randomized pre-test post-test evaluation
Subjects (families, schools, communities etc) are randomly assigned to project and control groups. Questionnaires or other data collection instruments (anthropometric measures, school performance tests, etc) are applied to both groups before and after the project intervention. Additional observations may also be made during project implementation.
2. Quasi-experimental design with before and after comparisons of project and control populations.
Where randomization is not possible, a control group is selected which matches the characteristics of the project group as closely as possible. Sometimes the types of communities from which project participants were drawn will be selected. Where projects are implemented in several phases, participants selected for subsequent phases can be used as the control for the first phase project group.
3. Ex-post comparison of project and non-equivalent control group.
Data are collected on project beneficiaries and a non-equivalent control group is selected as for Model 2. Data are only collected after the project has been implemented. Multivariate analysis is often used to statistically control for differences in the attributes of the two groups.
4. Rapid assessment ex post impact evaluations.
Some evaluations only study groups affected by the project while others include matched control groups. Participatory methods can be used to allow groups to identify changes resulting from the project, who has benefited and who has not, and what were the project’s strengths and weaknesses. Triangulation is used to compare the group information with the opinions of key informants and information available from secondary sources. Case studies on individuals or groups may be produced to provide more in-depth understanding of the processes of change.
At the definitional level the terms ‘impact’, ‘outcome’ and ‘results’ have been
differently defined and operationalised in the literature. For example the Big
Lottery Fund (www.biglotteryfund.org.uk/index/evaluationandresearch-
uk/eval_res_glossary.htmImpactevaluation) defines impact evaluation in the
following way: “Assesses the overall effects, intended or unintended, of the
programme on wider social, economic or environmental conditions” and
outcome evaluation: “Determines whether a programme caused demonstrable
effects on specifically defined outcomes”.
99
The UK Evaluation Society defines impacts as “a general term used to
describe the effects of a programme on society. Impacts can be either
positive or negative and foreseen or unforeseen. Initial impacts are called
results, whilst longer-term impacts are called outcomes”. It defines outcomes
as “the longer-term impact, usually expressed in terms of broad socio-
economic consequences, which can be attributed to an intervention” and
results as “the initial impact of an intervention”
(http://www.evaluation.org.uk/Pub_library/Glossary.htm).
The World Bank uses impact and outcome interchangeably when talking
about what impact evaluation can be used for: “Measuring outcomes and
impacts of an activity and distinguishing these from the influence of other,
external factors” (p. 4) Davies (2003) states that “Summative evaluation
(sometimes called impact evaluation) asks questions about the impact of a
policy, programme or intervention on specific outcomes and for different
groups of people” (p. 4). He distinguishes between goals based evaluation
(i.e. have the goals of a policy, programme or project, as set out in the targets
set, been achieved) and goals free evaluation which is interested in the
unintended consequences or outcomes of a policy, programme or project.
Goals-free methods determine the actual effects or outcomes of some policy,
programme or project, without necessarily knowing what the intended goals
might be.
Seymour & Searle (no date) define outcome evaluation as the extent to which
a programme achieves its outcomes. May be short or long term effect. May
include knowledge, skills or impact on practice. They define Impact
evaluation as “A form of outcome evaluation which assesses change which
can be attributed to a particular programme or project. This can be done by
comparing programme outcomes with what might happen in the absence of
the programme.
The definition of impact adopted in this study is linked to a number of
previously conducted impact evaluations in both health and educational
sectors that have used a similar definition focusing on both shorter term and

100
longer term outcomes or impacts (Australian Public Service Commission,
2005; Blamey, 2007; Halliday , Friedli, & McCollam, 2004) and those that
make use of a similar methodology (Hayton, Boyd, Campbell, Crawford,
Latimer, K., Lindsay, & Percy, 2007; Lloyd, O’Brien, & Lewis, 2003; NHS
Health Scotland, 2007; Ring, & Finnie, 2004; Philip, Shucksmith, & King,
2004).
Several studies have used frameworks that focus on shorter term outcomes or
effects of a programme. The Logic Model of programme evaluation (Kellogg
Foundation, 2001; NHS Health Scotland, 2007; Taylor-Powell, 2005) and the
Kirkpatrick model of training evaluation (Kirkpatrick, D, 1998; Kirkpatrick, S,
2001; Shea, 2004) offer broader views of impact evaluation. These two
frameworks incorporate shorter term outcomes in the impact evaluation of
development programmes and of training initiatives respectively. Both
frameworks see the assessment of shorter term outcomes as being legitimate
assessments of impact.
The four levels of Kirkpatrick's evaluation model (1998) essentially measures
(1) reactions of participants to the training; (2) learning in terms increase in
knowledge or capability; (3) behaviour and capability improvement and (4)
implementation/application results - the effects on the organisation or
environment resulting from the trainee's performance. He stresses that all of
these measures are recommended for full and meaningful evaluation of
learning in organizations.
The definition of impact used in the present study is based on the logic model.
The model describes the pieces of the project and expected connections
among them. A typical model has four categories of project elements that are
connected by directional arrows. These elements are: (1) Project inputs, (2)
Activities, (3) Short-term outcomes and (4) Long-term outcomes.
Kellogg (2004) defines outputs, outcomes and impact as follows:
101
Outputs are the direct results of program activities. They are usually
described in terms of the size and/or scope of the services and products
delivered or produced by the program.
Outcomes are specific changes in attitudes, behaviours, knowledge, skills,
status, or level of functioning expected to result from program activities and
which are most often expressed at an individual level.
Impacts are organisational, community, and/or system level changes
expected to result from program activities, which might include improved
conditions, increased capacity, and/or changes in the policy arena.
Several studies in various settings have used this and similar models in
evaluating impacts and outcomes of programme. Halliday, et al.’s (2004)
impact evaluation was designed to assess the extent to which a series of
training workshops was believed by participants to have influenced their
practice. The key focus of the evaluation was on impact on practice. It
focused on shorter terms outcomes such as: the extent to which participants
reported they were able to use the learning from the training event such as:
whether or not participants were able to initiate planned action points; were
able to influence practice at local or national level, within their spheres of
responsibility; developments in local networking following the workshop;
barriers and opportunities in implementing evidence based practice in mental
health improvement. This study used a combination of written questionnaires
and telephone interviews.
In the impact evaluation of a leadership development programme conducted
by Humphris, Connell & Meyer (2004) they make the point that little research
evaluates beyond individual learning, with only a small proportion of
evaluation programmes assess long-term impact and/or organisational impact
of development interventions (Kellogg Foundation 2002). They also point out
that there is no univocal agreement as to what constitutes long-term
evaluation. However, they suggested that organisational impact can only be
measured within the time period of 7-10 years after the initial training,
assuming that it is a continuous process. Therefore, short-term outcomes are
much more frequently investigated.

102
Humphris et al.’s (2004) evaluation uses a combination of self report data
(feedback forms, interviews, narrative data) as well as ‘objective’
organisational measures based on existing organisational performance
indicators. Humphris et al. (2004) argue that it has become widely accepted
that evaluation should emphasise the use of qualitative data including practice
narratives and leadership stories, and/or user feedback. They recommend
the use of a multi-method approach to evaluation. They argue like several
others (Kellogg Foundation 2002; McCormack, Kitson, Rycroft-Malone,
Titchen, & Seers, 2002) that even though the majority of data is self-reported
by the participants, this is considered a valid approach.
Hayton, Boyd, Campbell, Crawford, Latimer, Lindsay, & Percy’s (2007) study
was an evaluation of the Scottish Executive’s national community warden
programme to assess the impact community wardens were having upon the
quality of life in their patrol areas. The study used a multi-method design
including qualitative and quantitative data. The evaluation drew upon a
variety of sources of evidence, including case studies, analysis of crime and
antisocial behaviour statistics, surveys of wardens and managers’ perceptions
and surveys and focus groups of residents’ perceptions. In this study self-
report perceptions between wardens, managers and residents were
triangulated and archival data and reports were seen as acceptable forms of
external evidence.
In Lloyd, O’Brien, & Lewis’s (2003) evaluation of fathers’ involvement in a
community based programme a mixed method approach to information, data
collection and analysis was used. Alongside a national level analysis of
published documents relating to fathers’ involvement in the programme, staff
and service-user accounts and informal observations were also collected. In
this study the criteria for selecting comparison groups proved problematic but
the authors felt they could still draw conclusions about the programmes which
emerged as more effective in involving fathers in service delivery and
planning, regardless of categorisation. Their final analysis eventually centred
on the identification of common themes in programme approaches rather than
103
a reliance on a statistically-derived distinction used to classify groups taken at
one point in time.
Ring & Finnie’s (2004) study focused on obtaining a snapshot picture of
awareness and impact of new best practice guidance from a nursing and
midwifery perspective. It was conducted within the first year of
implementation of the Best Practice Statements and was thus focused on
short term outcomes. The study consisted of two parts, quantitative and
qualitative, conducted concurrently to gather as much information as possible
within the time available.
There are many other examples of impact evaluations of programmes and
training that have focused on shorter term outcomes and have used multi-
method approaches to their design (Challis, Clarkson, Hughes, Abendstern,
Sutcliffe, & Burns, 2004; Heaney, O’Donnell, Wood, Myles, Abbotts, Haddow,
Armstrong, Hall, & Munro, 2005; Philip, Shucksmith, & King, 2004). Both
Philip et al., (2004) and Challis et al., (2004) studies have used perspectives
of multiple stakeholders which are corroborated with external evidence.
Heaney et al., (2005) argue that the mechanisms (what was done to produce
the outcome, and why) and contexts (the circumstances in which the
mechanisms were successful or unsuccessful) need to be considered in order
to understand the outcomes of the initiative and how they are produced. The
relationship between different settings or models of organisation and
achievement of outcomes is particularly important. Factors that facilitate or
hinder the delivery of objectives should be studied, along with ways in which
the services develop or adapt.
Davies (2003) says that the use of a range of research methods is of
paramount importance in evaluation of outcomes or impacts. Policy evaluation
uses quantitative and qualitative methods, experimental and non-experimental
designs, descriptive and experiential methods, theory based approaches,
research synthesis methods, and economic evaluation methods. It privileges
no single method of inquiry and acknowledges the complementary potential of
different research methods. The methods used in policy evaluation and

104
analysis are usually driven by the substantive issues at hand rather than a
priori preferences (Greene, Benjamin and Goodyear, 2001).
In summary evaluation literature at the definitional level is very broad, and
terms such as “effect” and “impact” have been differently defined as well as
differently operationalised in the literature. There are different traditions
represented in the evaluation literature. There is not a single evaluation
tradition, nor one single definition or use of the terms “effect” or “impact” which
is accepted across the different traditions that do exist.
4.5. MEASUREMENT OF SCHOOL DEVELOPMENT PLANNING In order to assess whether empowerment was evidenced in school settings
an attempt was made to measure the empowerment construct directly through
the construction of a school development questionnaire, the School
Development Planning Evaluation Scale. Research into the construct of
empowerment has demonstrated how measures of empowerment capture
aspects of a particular ecological and systemic state. School development
planning may be conceptualised as an approach to develop a state of
organisational empowerment, facilitative of whole school development. This
perspective on development planning as organisational empowerment
provided the working definitions of organisational empowerment through
school development planning (this was elaborated on in Chapter 3.2.).
In accordance with the guidelines for scale construction proposed by
Loewethal (1996) and with reference to Converse & Presser (1986); Liggett &
Cochrane (1968) and Smith (1981) the following steps were undertaken in
developing the measure.
(a) Item Generation Combining archival data from the programme under review, with ideas taken
from the literature on school development planning (Bennett et al., 2000;
Hargreaves & Hopkins, 1995; Hopkins, 1995; Hopkins et al., 1994; Reeves,
2000; West, 2000), from other general school development questionnaires
(MacBeath, 1994, 1999) and from other professionals working in the field of
school development, items were generated to form the basis of the original
105
School Development Evaluation Scale. These were grouped according to 5
categories (as elaborated on in Chapter 3.2).
(b) Expert Content Validity Check The scale was given to a variety of experts in the fields of educational (5),
organisational (3) and community development (3) to check the content
validity of the items. Few suggested changes were recommended but where
they were identified they were revised accordingly.
(c) Checking for Meaning and Understanding Six teachers from 6 different schools completed the original version of the
School Development Planning Evaluation Scale in their own time. Feedback
was collected and suggestions and recommendations made by these
informants were then used to modify certain of the questions. The original
School Development Planning Evaluation Scale was refined to its final form
consisting of 52 items (see Appendix 1) which elicited response to issues
related to 5 core areas identified. The original items under their headings can
be found in Appendix 2.
(d) Pilot Study The scale was then piloted as part of an honours thesis study (Connolly,
2000), with six primary schools also participating in the school development
programme but not part of the larger study. All had been part of the
programme for 2 to 3 years. Seventy-one questionnaires were collected, from
principals and teachers. The sample consisted primarily of women, 62 in
total, with 9 men. Most participants fell between 40-60 years of age. Most
had at least 11 years of experience. Only 3 did not belong to a union.
There was no evidence of systematic attrition from the sample. Those
teachers who did not fill out a questionnaire were not at the school at the time
of administration. The scale was then subjected to a variety of psychometric
analyses, including item and factor analysis, in order to establish the factorial
properties and reliability of the scale. These results will be reported in the
next section. The resulting School Development Planning Evaluation Scale

106
can be found in Appendix 3. As will be reported in the next chapter the pilot
study indicated that though the factors measured appeared to form a single
construct, the construct itself was based on a variety of subcomponents. It
was thus difficult to define.
(e) Main Study The questionnaire was thus amended and its factorial structure scrutinised
again. These results will be elaborated on in the next chapter. The measure
again yielded clear but uninterpretable results. It was therefore not possible
from the psychometric evidence to establish whether the underlying school
development construct was in fact an empowerment factor.
4.6. QUANTITATIVE MEASURES OF VARIABLES ASSOCIATED WITH EMPOWERMENT Given the evidence that the School Development Planning Scale appeared to
measure a construct which was difficult to interpret, it was necessary to use
additional measures to attempt to establish evidence of empowerment within
the schools. For this reason, several other measures of variables associated
with empowerment at various levels were administered to the participating
teachers. A number of additional existing measures were thus selected and
an attempt was made to establish their reliability and validity, as outlined in
the sections following. .
4.6.1. MEASURES ASSOCIATED WITH INDIVIDUAL LEVELS OF EMPOWERMENT Three measures for the variables associated with empowerment at this level
of analysis were utilised in the study. The first was the Locus of Control Scale
developed by Levenson (1974) and utilised in previous research on
empowerment at the individual level (Zimmerman & Rappaport, 1988). It
consists of three sub-scales: internal control, chance control and powerful
others. Levenson (1974) reports alpha co-efficient of .64 for the Internal
Control Scale, .78 for the Chance Control Scale.77 and for the Powerful Other
Scale. The scale is a 24-item scale that is scored on a 6 point Likert scale.
The scale, used extensively in a wide range of populations (Burns, 2000;
107
Chiu, 1997; Farmer, 1999; Miner, 1997, Robinson, Stimpson, Huefner & Hunt,
1991; Ursin & Olff, 1995) including Dutch teachers (Olff, Brosschol & Godaert,
1993) evidenced adequate levels of reliability in all the studies.
In the present study only the overall scale score was used in the analysis
which had an alpha co-efficient of .75. A number of problems associated with
items in this scale for the population being assessed were identified. For
instance item 4 “whether or not I get into a car accident depends mostly on
how good a driver I am” was contextually inappropriate as the majority of the
teachers in this sample do not own cars nor do they have a driver’s licence.
Therefore this item and 2 others were omitted from the data analysis of the
teachers’ responses.
The second measure used to assess individual level empowerment was the
General Self-Efficacy Scale revised by Bosscher & Smit (1998). This scale
was originally developed by Sherer, Maddux, Mercandante, Prentice-Dunn,
Jacobs & Rogers (1982). Woodruff & Cashman (1993) obtained a factor
structure, based on the original 17 item scale, that represented the three
aspects underlying the scale; i.e. initiative (willingness to initiate behaviour),
effort (willingness to expend effort in completing the behaviour) and
persistence (persistence in the face of adversity).
Bosscher & Smit (1998) revised the scale to 12 items finding support for the
three correlated factors and one higher order factor (general self-efficacy).
They found reliability scores of over .60 for the overall scale and its sub-
scales. In-sue (2000), in a comparative study of general efficacy scale, found
adequate levels of reliability for this scale. The original scale (Sherer et al.,
1982) has been shown to have good criterion-related validity in studies of self-
efficacy and success in vocational, educational, and monetary domains and
construct validity was demonstrated by confirming several predicted
relationships between scores on the self-efficacy sub-scales and on other
personality measures (Bosscher & Smit, 1998; Bosscher, Smit, Kempen,
1997).

108
The scale is made up of 12 items that are scored on a 5 point Likert scale.
The higher the score, the greater a person’s self-efficacy (Bosscher & Smit,
1998). The scale has been used with a variety of populations (Bosscher, van
der Aa, van Dasler, Deeg, & Smit, 1995; de Groot, 2001; McClean, McLenay
& Andrews, 2001), however only de Groot’s (2001) study used the scale with
teachers. In the present study the overall reliability using the alpha co-
efficient was .68. For the purpose of this study only the total score was used
in the analysis as an attempt was being made to look at self-efficacy as a
component of individual level empowerment and its relationship to
organisational empowerment.
The final measure was the Teacher Efficacy Scale, developed by Gibson &
Dembo (1984) and revised by Guskey & Passaro (1994), which measures two
aspects of teacher efficacy. The internal aspect represents the teachers’
perceptions of personal influence, power and impact in teaching and learning
situations. The external aspect dimension relates to perceptions of the
influence, power and impact of elements that lie outside of the classroom and
hence may be beyond the direct control of individual teachers. The scale is
composed of 21 items. The construct was found to have both convergent and
divergent validity (Gibson & Dembo, 1984; Guskey & Passaro, 1994; Woolfolk
& Hoy, 1990). In the present study the overall reliability using the alpha co-
efficient was .62. Again it was decided to use the overall score in the
analysis.
4.6.2. MEASURES OF PARTICIPATION IN DECISION-MAKING AND COLLABORATION Three scales were selected to measure different aspects of participation and
collaboration. Often the scales were chosen on the basis of their face validity.
The selected measures were then discussed with experts in the area of
organisational and school development to assess their content validity.
Issues with this will be discussed in more detail in the limitations section
(Chapter 9). Two measures of participation in decision-making, one
measuring influence and the other involvement, and one measure of
109
collaboration were selected to measure this organisational level variable
associated with empowerment.
The first measure related to involvement in decision making. Two sub-scales,
the Participation and Decision Centralization, from the Michigan
Organisational Assessment Questionnaire (Cammann, Fichman, Jenkins &
Kesh, 1979; Seashore, Lawler, Mirvis & Cammann, 1982), were used. The
scale is designed to measure work attitudes and perceptions of leadership
with regards to decision-making processes from the perspective of the
subordinate (Cook, Hepworth, Wall, & Warr, 1981). The authors of the scale
argue that because of the strong correlation between sub-scales in the overall
test, short forms or the use of sub-scale items may be used. The authors
reported a reliability of .76 for the Participation sub-scale and .81 for the
Decision Centralization scale.
These sub-scales were combined to form a single 4 item scale measured on a
7 point Likert scale. The higher the score the higher the perception of
involvement (Cook, et al., 1981). A modification, replacing the word supervisor
with principal, was made to the questionnaire. In the present study the overall
reliability using the alpha co-efficient was .82. Several studies have used a
variety of subscales from the overall questionnaire (Obruba, 2001; Rumery,
1997; Smidt, van Riel & Pruyn, 2000; Young & Brymer, 2000). Studies by
Marcelina (1981), Rainhartlong & Steger (1998) & Richter (2001) have used
the Decision Centralization sub scale.
In order to try and access perceptions of influence in the decision-making
process, Vroom’s (1960) Psychological Participation scale was used. Vroom
(1960) set out to measure what he called “psychological participation”, the
amount of influence which a person perceives him or her self to have. In this
scale participation is viewed as influence in a process of joint decision making
by two or more parties in which the decisions have future effects on those
making them (Cook, et al., 1981; Vroom, 1960, 2000).

110
Several studies have confirmed the construct validity of the measure (Abdel-
Halim & Rowland, 1976; Hamner & Tosi, 1974; Morris, Steers & Koch, 1979).
White (1978; 1979) reports an alpha value of .81 using a 5 item version. The
scale consists of four items each with a five point dimension. A total score is
calculated ranging from 4 to 20. The lower the score the higher the perceived
level of influence is (Cook, et al., 1981). A modification was made to the
questionnaire. The word superior was replaced with principal and the word
station was replaced with school. In the present study the overall reliability
using the alpha co-efficient was .76.
The Collaboration Scale, designed by Chester & Beaudin (1996), measures
teachers’ perceptions of the opportunities for collaboration with other adults
(both teachers and principal) in the school. The scale was made up of 6 items
measured on a 7 point Likert Scale. In the Chester & Beaudin (1996) study
the scale’s reliability was .85 using the alpha co-efficient. In the present study
the overall reliability using the alpha co-efficient was .82.
4.6.3. MEASURES OF LEADERSHIP Two measures were selected to measure issues related to leadership and the
principal in the present study. The first measure related to systems of
organisational management arising from the principal’s leadership style. The
other related to the principal’s working relationship with the staff. A measure
of peer leadership was also included to assess the role of peer working
relationships in the empowerment process.
The first measure, the Profile of Organisational Characteristics Scale (Bass,
1981), related to the organisational climate or culture (Denison, 1996) arising
from the style of leadership and within the organisation (Sackney, 1988). The
scale was originally developed by Likert (1961) and adapted over a period of
years (Likert, 1967). The final shorter measure revised by Bass (1981) was
used in the present study as it had been used on a population of black South
African teachers in a previous study (Legodi, 1999) and exhibited good
reliability (.78).

111
The scale was designed in the light of the Likert’s four-fold classification of
management systems. Essentially the managerial systems fall into four
categories: System 1 - Exploitative-Authoritative; System 2 - Benevolent-
Authoritative; System 3 – Consultative; and System 4 - Participative. The
instrument incorporates eight characteristics that focus on leadership
processes, motivational forces, communication processes, interaction-
influence processes, decision-making processes, goal setting processes,
control processes and performance goals. These eight variables can be used
to map the profile of the school and place it on a continuum from authoritative
to participative systems.
Several writers argue that the scale has strong empirical support, and that the
measure has validity and reliability (Beehr, 1977; Bennett, 1977; Butterfield &
Farris, 1974; Hoy and Miskel, 1982; Owens, 1981). The scale has also been
used recently in a variety of organisational (Denison, 1996; Elmuti & Taisier,
1995) and school settings (Cunningham, Childress & Ranson, 1996; Legodi,
1999; Sackney, 1988). Modification to the questionnaire was made: the word
superior was changed to principal and subordinates was changed to teachers
to make it more relevant for the context. In the present study the internal
reliability was at .88.
To assess aspects of the principal’s working relationship with his or her staff
the Supervisory Leadership Scale developed by Taylor & Bowers (1972) was
used. It forms part of the Survey of Organizations questionnaire (Taylor &
Bowers, 1972) and the theoretical background to its four-fold focus is set out
by Bowers & Seashore (1966). This test covers 4 aspects of the working
relationship, namely Support, Goal Emphasis, Work Facilitation and
Interaction Facilitation. It is designed to obtain descriptions of the
respondents’ superior (in this case the principal). The Supervisory Leadership
scale consists of 13 items, with the four sub-scales made up of 3, 3, 4 and 3
items respectively. The items are measured on a five point continuum. In all
sub-scales, scores are calculated by adding the item responses on the five
point continuum. The higher the score the stronger the perception that the
area being measured is present in the principal.

112
Taylor & Bowers (1972) report, alpha co-efficients for Leadership Support,
Goal Emphasis, Work Facilitation and Interaction Facilitation were .94, .85,
.88, .89 respectively. The reliability and construct validity of the measure has
been established (Bowers & Hausser, 1977; Franklin, 1975a, b; Taylor &
Bower, 1972). The scale has been used in several recent studies on
organisations (Davidson, 2000; Fey & Beamish, 1999; Li & Shani, 1991). The
scale has also demonstrated sound psychometric properties when used on
South African samples (Ballantine, Nunns & Brown, 1992; Bluen, 1986). A
modification was made to the questionnaire by replacing supervisor with
principal. In the present study the overall alpha co-efficient for the
Supervisory Leadership Scale was .94.
In order to measure the peer working relationships within the school the Peer
Leadership instrument developed by Taylor & Bowers (1972) was used in the
present study. This test covers 4 aspects of the working relationship, namely
Support, Goal Emphasis, Work Facilitation and Interaction Facilitation. It is
designed to obtain descriptions of the respondent’s peers. It forms part of the
Survey of Organizations questionnaire (Taylor & Bowers, 1972) and the
theoretical background to its four-fold focus is set out by Bowers & Seashore
(1966). The Peer Leadership scale consists of 11 items, with the four sub-
scales made up of 3, 2, 3 and 3 items respectively. The items are measured
on a five point continuum. In all sub-scales, scores are calculated by adding
the item responses on the five point continuum. The higher the score the
stronger the perception that the area being measured is present in the peer
group.
Taylor & Bowers (1972) report alpha co-efficients for Peer Support, Goal
Emphasis, Work Facilitation and Interaction Facilitation were .87, .70, .89 and
.90 respectively. The reliability and construct validity of the measure has been
established (Bowers & Hausser, 1977; Franklin, 1975a, b; Taylor & Bower,
1972). The scale has been used in several recent studies on organisations
(Kreuger, Brazil, Lohfeld, Edward, Lewis & Tjam, 2002; Schultz, Juran &
Boudrea, 1997). In the present study the overall alpha co-efficient for the Peer

113
Leadership Scale was .93. Only the overall score for all of the leadership
measures were used in the analysis.
4.6.4. BIOGRAPHICAL INFORMATION In addition to the above measures a biographical questionnaire was compiled
to elicit information on the demographic data pertinent to the sample.
Information on personal details, such as age, gender, education level, years
of teaching experience, length of time at the school, home language, union
membership and involvement in the school development team. A copy of this
questionnaire and all of the measures used in the study can be found in
Appendix 4.
4.6.5. EXEMPLARS, OPERATIONALISATIONS AND MEASURES OF EMPOWERMENT As has been discussed previously (see Chapter 2.3.3) empowerment is
conceptualised as existing at various levels of analysis: the individual,
organisational and community levels (Zimmerman, 2000). Zimmerman (2000)
and many other researchers (Foster-Fishman & Keys, 1997; Kieffer, 1984;
Klein et al., 2000; Prestby et al., 1990; Zimmerman, 1995, 2000) have
provided what they see as exemplars of empowerment at these various levels
of empowerment. Matrix 1 provides a list of these exemplars for the various
levels as described by Zimmerman (2000). These exemplars were
operationalised and appropriate measures sought in order to find evidence of
empowerment in a school development setting. Matrix 1 lays out how the
measures used in the study link to the levels of empowerment and exemplars
from the framework offered by Zimmerman (2000).

114
Matrix 1: Exemplars, Operationalisations and Measures of Empowerment LEVEL OF ANALYSIS
EXEMPLAR (Zimmerman, 2000)
OPERATIONALISED IN THE STUDY AS
MEASURE USED IN THE STUDY
Control Locus of Control Locus of Control Scale (Levenson, 1974)
Efficacy General Self-Efficacy General Self-Efficacy Scale (Bosscher & Smit, 1998).
Individual
Context Specific Efficacy
Teacher Efficacy Teacher Efficacy Scale (Gibson & Dembo, 1984)
Involvement in Decision making
Participation and Decision Centralization Scales, from the Michigan Organisational Assessment Questionnaire (Cammann, et al., 1979; Seashore, et al., 1982)
Participation in decision making
Influence in Decision making
Psychological Participation Scale (Vroom, 1960)
Collaborative working
Collaboration Collaboration Scale, (Chester & Beaudin, 1996)
Democratic leadership
Leadership Style Profile of Organisational Characteristics Scale (Bass, 1981)
Working relationship between staff and leader
Supervisory Leadership Scale (Taylor & Bowers, 1972)
Organisational
Supportive relationship
Working relationship between peers
Peer Leadership instrument (Taylor & Bowers, 1972)
4.7. QUANTITATIVE DATA COLLECTION AND ANALYSIS A meeting with principals and teachers representatives of the primary schools
in the township was called to discuss the nature and purpose of the proposed
study. All 24 primary schools sent at least two representatives to this
meeting, at which they were informed about the purpose of the study and
what would be required from their school if they were to participate. Principals
and teacher representatives were then requested to discuss the evaluation
with their staff and to reply as to whether they were willing to take part or not.
An information pack was given to each school to aid them in giving feedback
to their staff (see Appendix 5). All of the schools replied positively and
participated in the study. Six of these schools engaged in the School
Development Planning Evaluation scale pilot study described previously.
115
The measuring instruments were combined into a single pack for participants
to fill in. All of the teachers and the principals of the eighteen schools were
invited to fill in the measurement instrument pack. The principals’ pack was
different from that of the teachers’ as it did not contain the questionnaires
pertaining to the leadership style (Profile of Organisational Leadership Scale),
their working relationship with staff (the Supervisory Leaderships Scale) or the
scales related to participation and collaboration (Psychological Participation;
Participation and Decision Centralization; Collaboration) and Peer Leadership
Scale.
Three people, the author of the present study and two members of the
programme staff, administered the instrument pack to the schools. The
author spent time training the two programme members in terms of the
process for administering the instrument pack and they both observed three
sessions of administration with the author (Appendix 6 outlines the main
points for administrators). Each of the administrators worked with 6 schools.
If teachers were not available at the time of the administration a pack was left
for them to fill in and was collected at a later date. Two hundred and twelve
questionnaires (85,5%) were completed during the administration time at the
school and 36 (14,5%) were completed later by individuals who were not
available.
4.7.1. SAMPLE The people participating in the quantitative section of this study were drawn
from eighteen primary schools that were involved in a School Development
Programme. The schools ranged in size from 5 to 24 staff (including only
teachers and management). Ten of the schools (from here on referred to as
Group 1) had been on the programme for three years or more. The
comparison group (from here on referred to as Group 2), made up of the other
eight schools, had been involved with the programme for one year. A table
summarising the demographic information of the sample can be found
overleaf.
116
Of the possible 274 teachers and principals at the schools 248 people
participated in the study. This is a response rate of 90,5%. Group 1
consisted of 153 participants (out of a possible 171 – 89% response rate) and
Group 2 consisted of 95 participants (out of a possible 103 – 92% response
rate).
The schools all came from the same township outside of Pretoria. The
reasons for choosing this form of comparison group were two fold. Firstly, the
schools are from the same community and thus provide some level of
comparison. It would have been preferable to have had schools that had had
no exposure to the programme; however the programme has worked with all
of the schools in the area. To use schools from another community would
make comparison impossible as the contextual differences would be far too
great. The second reason was for ease of assess. The author has been
working with the schools for several years and has access to the schools.
The other 6 primary schools in this area were used to pilot the School
Development Planning Evaluation Scale developed for this study. Only one
primary school of the 25 in the township was no longer contracted to work the
programme, a decision taken by the school’s principal two years before this
evaluation.
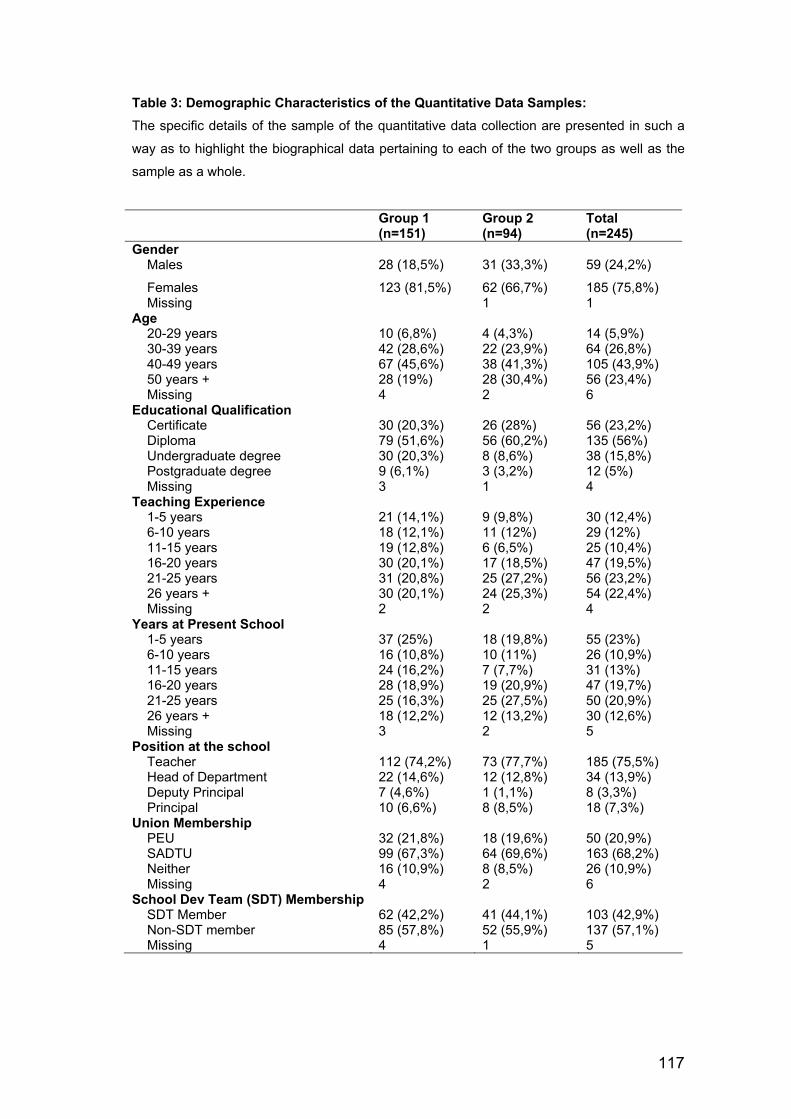
117
Table 3: Demographic Characteristics of the Quantitative Data Samples: The specific details of the sample of the quantitative data collection are presented in such a
way as to highlight the biographical data pertaining to each of the two groups as well as the
sample as a whole.
Group 1 (n=151)
Group 2 (n=94)
Total (n=245)
Gender Males 28 (18,5%) 31 (33,3%) 59 (24,2%)
Females 123 (81,5%) 62 (66,7%) 185 (75,8%) Missing 1 1
Age 20-29 years 10 (6,8%) 4 (4,3%) 14 (5,9%) 30-39 years 42 (28,6%) 22 (23,9%) 64 (26,8%) 40-49 years 67 (45,6%) 38 (41,3%) 105 (43,9%) 50 years + 28 (19%) 28 (30,4%) 56 (23,4%) Missing 4 2 6
Educational Qualification Certificate 30 (20,3%) 26 (28%) 56 (23,2%) Diploma 79 (51,6%) 56 (60,2%) 135 (56%) Undergraduate degree 30 (20,3%) 8 (8,6%) 38 (15,8%) Postgraduate degree 9 (6,1%) 3 (3,2%) 12 (5%) Missing 3 1 4
Teaching Experience 1-5 years 21 (14,1%) 9 (9,8%) 30 (12,4%) 6-10 years 18 (12,1%) 11 (12%) 29 (12%) 11-15 years 19 (12,8%) 6 (6,5%) 25 (10,4%) 16-20 years 30 (20,1%) 17 (18,5%) 47 (19,5%) 21-25 years 31 (20,8%) 25 (27,2%) 56 (23,2%) 26 years + 30 (20,1%) 24 (25,3%) 54 (22,4%) Missing 2 2 4
Years at Present School 1-5 years 37 (25%) 18 (19,8%) 55 (23%) 6-10 years 16 (10,8%) 10 (11%) 26 (10,9%) 11-15 years 24 (16,2%) 7 (7,7%) 31 (13%) 16-20 years 28 (18,9%) 19 (20,9%) 47 (19,7%) 21-25 years 25 (16,3%) 25 (27,5%) 50 (20,9%) 26 years + 18 (12,2%) 12 (13,2%) 30 (12,6%) Missing 3 2 5
Position at the school Teacher 112 (74,2%) 73 (77,7%) 185 (75,5%) Head of Department 22 (14,6%) 12 (12,8%) 34 (13,9%) Deputy Principal 7 (4,6%) 1 (1,1%) 8 (3,3%) Principal 10 (6,6%) 8 (8,5%) 18 (7,3%)
Union Membership PEU 32 (21,8%) 18 (19,6%) 50 (20,9%) SADTU 99 (67,3%) 64 (69,6%) 163 (68,2%) Neither 16 (10,9%) 8 (8,5%) 26 (10,9%) Missing 4 2 6
School Dev Team (SDT) Membership SDT Member 62 (42,2%) 41 (44,1%) 103 (42,9%) Non-SDT member 85 (57,8%) 52 (55,9%) 137 (57,1%) Missing 4 1 5

118
4.7.2. ANALYSIS OF THE QUANTITATIVE DATA In order to explore the impact of the school development planning programme
on empowerment at an individual, organisational and community level an ex
post facto analysis was conducted based on a post-test only comparison
group evaluation design. Empowerment was explored as a construct by
comparing schools involved in the programme for differing periods of time.
Scores on the empowerment-related tests were conceptualised as dependent
variables, and period of time (extent of involvement) in the programme as the
independent variable.
A general linear model, such as the Analysis of Variance (ANOVA), would
normally be the technique of choice when wanting to look at these
differences. However, as this study was interested in several dependent
variables which are linked theoretically and empirically, the simple ANOVA
model was inadequate. In these cases multivariate analysis of variance
(MANOVA), which can be thought of as an ANOVA for situations in which
there are several related dependent variables, is preferable (Field, 2004).
MANOVA is used to see the main and interaction effects of categorical
variables on multiple dependent interval variables. MANOVA uses one or
more categorical independents as predictors, like ANOVA, but, unlike
ANOVA, there is more than one dependent variable (Howell, 1997).
Selecting a MANOVA is preferable to an ANOVA for a variety of reasons
(Field, 2004). Firstly, when data about several dependent variables has been
collected it is possible to run a separate ANOVA for each dependent variable.
However, the more tests conducted on the same data the more the familywise
error rate is inflated. Basically the more tests we run on the data the
probability of making type I errors increases.
Secondly, there is important additional information that is gained from a
MANOVA. If separate ANOVAs are conducted on each dependent variable,
then any relationship between variables is ignored and thus we lose
information about any correlations that might exist between the dependent
variables. MANOVA, by including all dependent variables in the same

119
analysis, takes account of the relationship between outcome variables. Thus
MANOVA has greater power to detect an effect, because it can detect
whether groups differ along a combination of variables whereas ANOVA can
detect only if groups differ along a single variable (Huberty & Morris, 1989).
For these reasons MANOVA is preferable to conducting several ANOVAs.
Field (2004) cautions that as with many statistical techniques it is not
advisable to place all of your dependent variables together in a MANOVA
unless there is a good theoretical or empirical basis for doing so. However, it
had been established both theoretically and empirically in the Literature
Review that the constructs being compared in the present study are linked in
various ways. Based on this it was felt that a MANOVA would be the most
suitable statistical analysis to use to answer the quantitative component of
Research Questions 1 and 2.
4.8. QUALITATIVE DATA COLLECTION AND ANALYSIS To further explore whether empowerment was evidenced at an individual and
organisational level, focus groups and interviews were conducted with
principals, teachers and school development teams. As empowerment is a
complex, multilevel and dynamic construct it was important to establish
whether the staff within the schools reported that involvement in the
programme had led to personal empowerment, as well as empowerment of
their schools as organisations and of the community in which they were
situated. Archival data pertaining to the use of the school development plan,
objectives achieved and other changes in the schools involved in the
programme were examined as an additional data source, to yield indicators of
empowerment at the various levels of analysis.
4.8.1. FOCUS GROUPS From an empowerment perspective it was important to use a research method
which could incorporate the perspectives of those involved in the programme
in order to gain new insights into the programme (Denzin, 1994; Gitlin, 1990;
Stewart, 2000). This became even more important in the present context
where very little research has investigated Black teachers’ experiences of

120
empowerment and school development from their perspective. Stewart,
Shamdasani & Rook (2007) argue that focus groups are particulary useful for
exploratory research where little is known about the phenomenon of interest.
Focus groups have been argued to be useful in multi-method data collection
(Green & Hart, 1999; Krueger, 1988; Merton, Fiske & Kendall, 1990; Stewart
& Shamdasani, 1990; Wolff, Knodel & Sittitrai, 1993), increase opportunities
for triangulation (Frey & Fontana, 1993), are suited to dealing with the
complexity of behaviour, attitudes and motivation (Morgan & Krueger, 1993);
accessing community attitudes about issues (Waterton & Wynne, 1999),
exploring the processes involved in organisational change (Barbour, 1999),
and can be particularly sensitive to cultural variables and work with minority
groups (Chiu &Knight, 1999). For these reasons focus groups were seen as a
research method that was aligned with the values underlying community
psychology and selected as a method to enter into the world view of those
who were involved in the programme, to see how the impact of the
programme was experienced from their perspective (Shadish, 1990; Stewart,
2000).
4.8.1.1. Group Composition and Selection Convenience sampling was employed in selecting the groups. Stewart et al.,
(2007) point out however that although the generalisability from focus groups
is limited one still needs to consider characteristics of the group. Based on
work around break and control characteristics of focus groups (Knodel, 1993)
and power issues (Krueger, 1988) it was decided that groups would consist of
teachers, both school development team members and non-members, based
on the desire to stimulate the discussion and to explore agreement or
difference between them. The principal was excluded, based on the need for
participants in the groups to feel comfortable about openly communicating
their ideas, views or opinion (Stewart & Shamdasani, 1990). Kitzinger &
Barbour (1999) argue that the size of focus groups in the social sciences
attempting to explore a complex issue should be kept smaller than usually
recommended by those using them in market research. For this reason it was
decided to keep the focus groups to between 6 and 8 participants.

121
On the basis of the results of the School Development Planning Evaluation
Scale, four schools from Group 1 (of the quantitative study) and four schools
from Group 2 were selected. This was done by ranking the schools according
to their groups in terms of their performance on the School Development
Planning Evaluation Scale. The two highest and the two lowest ranking on
the scale from each group were chosen. This was done to try and provide a
variety of different experiences of the school development planning process
within each of the comparison groups. On the basis of the work by several
writers and researchers on optimal numbers of focus groups, it was decided to
begin with four schools from each group and if necessary, include more
(Morgan, 1997; Zeller, 1993).
As the focus groups for both groups were conducted concurrently it became
obvious that the groups were giving similar information, whether positive or
negative, successful or less successful, whether in the programme for a
longer period or not. However as a comparison between the groups was to
be undertaken it was decided that an equal number, in this case four, of each
would be conducted.
4.8.1.2. Interview Guide Development An unstructured phenomonologically driven interview format, adapted for the
focus groups, was adopted in order to maximise the articulation of the
respondents’ own stories (Fetterman, 2001). Although this approach
effectively elicits the insider’s perspective, it may not necessarily gather the
information required to compare and contrast the empowerment experiences
between schools and groups (Foster-Fishman et al., 1998). Thus, the
researcher ensured that the targeted research questions were addressed at
some point during the focus group while attempting not to significantly disrupt
the emergence of the informants’ perspective. Before concluding the group,
the researchers directly asked the informant those questions that had not
been discussed during the group. Thus an attempt was made to strike the
balance between what is important for the group and what is important for the
researcher.

122
Based on the work of several focus group researchers (Krueger, 1993; Merton
et al., 1990; Morgan, 1997) an interview schedule was developed. The
interview schedule was then offered to the same group of people who had
offered comment on the School Development Planning Evaluation Scale
items in the quantitative data collection phase. Once feedback was received
from all of these people and the necessary adjustments made the pre-testing
of the interview guide took place.
Several schools that formed part of the pilot study of the School Development
Planning Evaluation Scale were selected in terms of their availability to pilot
the interview schedule. Utilising a rolling interview guide development
process (Merton et al., 1990) the interview guide, as it was developed, was
used for the first group, and then revised for the use in the second group
based on the outcome of the first group discussion. The idea was that this
process would continue until a guide was developed with which the
researcher was comfortable. This process was conducted with two groups
and as there were very few changes made to the interview format it was
decide that this was acceptable for use with the two groups in the evaluation.
(See Appendix 7 for the full focus group interview schedule).
4.8.1.3. Focus Group Procedure
A letter was sent to all of the members of staff at the chosen schools (See
Appendix 8) requesting 6-8 volunteers (including several school development
team members) for the focus group. A follow up visit was made by the author
to ensure that the school understood what was expected from them and to
make the necessary arrangements for the focus group. At this meeting the list
of volunteer teachers was collected.
Schools chose slightly different methods of selecting participants: at some
schools the staff met and selection was based on availability after hours; at
others representatives from each of the grades was chosen. At one school,
teachers sent in their consent forms as a sign that they were willing to
participate and the principal then decided who would be involved. In order to

123
overcome this bias, which Krueger (1993) cautions against, all of the teachers
who filled in the consent forms were invited to attend.
Not all schools were able to ensure that half of the group was made up of
school development team members. Five of the schools had three
representatives (2 from Group 1 and 3 from Group 2), two had one
representative (1 from each Group) and one from Group 1 had four
representatives from the school development team. In two of the Group 1
schools teachers who were new to the school had been included. This was
not an issue as there were sufficient members who had been through the
process and, as Kitzinger & Barbour (1999) point out, this is not a
disadvantage and can produce illuminating information, as it did in the two
schools.
Each of the sessions was tape-recorded. At the beginning of each session
the purpose of the focus group was discussed with the group. Their
permission to tape the session was then asked for. If anyone felt
uncomfortable with the taping they were then free to leave. None of the
participants left. Notes were made during the session of impressions, body
language, and points for clarification.
4.8.1.4. Sample Demographics for Focus Groups The biographical details of the sample for the focus groups are presented in
Table 4. The overall sample for the focus groups comprised of 56 teachers.
Group 1 was made up of 31 participants making up 55,4% of the sample.
There were 25 participants in Group 2.

124
Table 4: Demographic Characteristics of the Focus Group Samples:
Group 1 (n=31)
Group 2 (n=25)
Total (n=56)
Gender Males 4 (12.9%) 6 (24%) 10 (17.9%) Females 27 (87.1%) 19 (76%) 46 (82.1%)
Age 20-29 years 3 (9.7%) 1 (4%) 4 (7.1%) 30-39 years 7 (22.6%) 8 (32%) 15 (26.8%) 40-49 years 16 (51.6%) 9 (36%) 25 (44.6%) 50 years + 5 (16.1%) 7 (28%) 12 (21.4%)
Educational Qualification Certificate 9 (29%) 5 (20%) 14 (25%) Diploma 21 (67.7%) 16 (64%) 37 (66.1%) Degree 1 (3.2%) 3 (12%) 4 (7.1%)
Teaching Experience 1-5 years 5 (16.1%) 2 (8%) 7 (12.5%) 6-10 years 1 (3.2%) 7 (28%) 8 (14.3%) 11-15 years 5 (16.1%) 1 (4%) 6 (10.7%) 16-20 years 6 (19.4%) 6 (24%) 12 (21.4%) 21-25 years 7 (22.6%) 4 (16%) 11 (19.6%) 26 years + 7 (22.6%) 5 (20%) 12 (21.4%)
Years at the Present School 1-5 years 7 (22.6%) 4 (16%) 11 (19.6%) 6-10 years 0 6 (24%) 6 (10.7%) 11-15 years 7 (22.6%) 1 (4%) 8 (14.3%) 16-20 years 7 (22.6%) 8 (32%) 15 (26.8%) 21-25 years 6 (19.4%) 3 (12%) 9 (16.1%) 26 years + 4 (12.9%) 3 (12%) 7 (12.5%)
Position at the school Teacher 26 (84%) 22 (88%) 48 (86%) Head of Department 2 (6.4%) 3 (12%) 5 (9%) Deputy Principal 3 (9.6%) 0 3 (5%)
Union Membership PEU 9 (29%) 4 (16%) 13 (23.2%) SADTU 19 (61.3%) 17 (68%) 36 (64.3%) Neither 2 (6.5%) 4 (16%) 6 (10.7%)
School Dev Team (SDT) Membership SDT Member 11 (35.5%) 10 (40%) 21 (37.5%) Non-SDT Member 20 (64.5%) 15 (60%) 35 (62.5%)
4.8.1.5. Analysis of the Focus Groups
Tapes were fully transcribed, immediately after the focus group session, by
the author as he knew the members voices well. These were then read while
listening to the tape to ensure accuracy. Further notes and impressions were
added during this process. Identification of speakers was aided by the
researcher reflecting the person’s comments to them using their name and
asking questions using their name. Litosseliti (2003) highlights the advantage
of the facilitator of the focus groups being the person analysing the
discussions. This dual role allows the researcher more insight and in-context

125
knowledge and thus enables one to make links between the research aims
and the data collected.
The approach taken to the analysis of the focus group data comes from a
variety of sources, particularly from content analysis (Holsti, 1969;
Krippendorff, 1980; Linkvist, 1981;Viney, 1981; Weber, 1990); educational
qualitative methodologies (Bogdan & Biklen, 1982; Guba, 1978; Huberman &
Miles 1998; Miles & Huberman, 1994); naturalistic approaches (Guba &
Lincoln, 1981; Lincoln & Guba, 1985); and systematic analysis (Frankland &
Bloor, 1999). An attempt was made to incorporate different aspects of
different methods of qualitative data analysis that seemed useful to the
present study. One of the most common methods of interpreting information
through qualitative research techniques is content analysis (Ortlepp, 1998).
Krippendorff (1980) describes content analysis as a method of information
processing which is a technique for making inferences by objectively and
systematically identifying specific characteristics of the message.
Although the analysis of focus groups involves essentially the same process
as does the analysis of any other qualitative data, the researcher does need
to reference the group context (Kitzinger & Barbour, 1999). This means
starting from an analysis of groups rather than individuals and striking a
balance between looking at the picture provided by the group as a whole and
recognising the operation of individual voices within it. Analysis involved
drawing together and comparing discussion of similar themes and examining
how these related to the variation between individuals and between groups.
The phenomenological approach attempts to minimise the deductive
reasoning and the influence of the researcher on the discovery process.
Researchers must consistently remind themselves that the constructed
knowledge should not reflect their own interpretation, judgements or beliefs.
Therefore during the focus groups, interviews and archival data reviews the
researcher demarked his thoughts and reactions in brackets to distinguish
them from actual respondents’ statements, observed behaviours or document

126
content and by doing so attempted to more accurately reflect the
organisational members’ point of view.
Before starting the process of analysis each group was assigned a number,
each school within the group another number and each individual within the
school a number. This was to aid the tracking of the analysis so that even at
the very end of the analysis when the data had been reduced to frequency
scores a particular item could be relocated within the transcript.
Using an integration of ideas and recommendations from Frankland & Bloor
(1999); Miles & Huberman (1994) and Taylor & Bogdan (1984) the following
steps were adhered to in the analysis of the focus group data in the present
study:
(a) To get a sense of the whole database each transcript of the focus group
interview was read and reread listening to the tape. Interpretations and ideas
were noted as the data was read and were incorporated with the memos
made during the focus group. Notes of emerging themes were also noted in
the margins (Miles & Huberman, 1994).
(b) The data were then classified under the main areas of investigation in the
focus group using a similar process as outlined by Potter, Meyer, Scott & Da
Silva (1991). Statements made by the participants were coded and grouped
in the following areas:
• Impact the School Development Plan has had on the school
• Factors that have helped the school in terms of implementing the
school development plan
• Factors that have hindered the school in terms of implementing the
school development plan
• Impact the School Development Plan has had on individuals in the
school
(c) The transcripts were reread and all units pertaining to each of the
questions were highlighted and then cut and pasted under the heading. Each
unit carried with it its code number and page reference from the transcript.

127
(d) The data set was now reread looking specifically for themes or categories
that were emerging under each question. Initially the categories were kept
broad and general. Holsti (1969) talks about having to construct appropriate
categories by trail and error, and that a central problem in any research
design is selection and definition of the categories into which content units are
classified.
(e) All units that pertained to a particular category were then grouped together
and sub-categories within the general categories were searched for.
Frankland & Bloor (1999) point out that this process of analysis is cyclical and
is equivalent to chapter headings and subheadings. Although this process of
forming categories and sub-categories is essentially inductive in nature,
reference was constantly made to the relevant literature and theoretical work
reviewed (Taylor & Bogdan, 1984). It is important to note that the
categorisation was done per group so that if different themes were emerging
between the groups this would be kept quite clear.
(f) To this point the unit of analysis had been kept intact, as it was taken from
the transcript, so as to retain some of the contextual quality. Frequency
tables were now constructed to pull the data from each of the groups together
and matrices drawn up (Miles & Huberman, 1994). The tracking number of
each item was placed in the matrix so that reference could be made back to
the original text. The matrices accommodated each school separately and
then totalled for the group. It was then possible to compare between groups.
Since all analysis is essentially comparative, the purpose of these steps is
simply to facilitate comparative analysis by gathering all data on a particular
topic under one heading, in order to make the study of material manageable
for analysis purposes (Frankland & Bloor, 1999). To account for individual,
school and group processes frequency counts were done both in terms of
numbers of individual references to particular themes within the group and
also to frequency counts of how many schools within a group referred to that
particular theme.
(g) Relevant exemplars of each category, which had been collected
throughout the analysis, were grouped together in order to add depth to the
frequency counts.

128
(h) In order to interpret these analyses the researcher attempted to stand
back and form larger meanings of what is going on in the individual schools
and the groups as a whole (Miles & Huberman, 1994). This was done in the
form of a written summary of the findings and graphic representations (Lincoln
& Guba, 1985). This then formed the basis for the integration phase of the
analysis.
Section 6.4 and 7.2 present the results of this analysis. Tables 21, 22, 23
provide the categories reported to have changed at the various levels of
analysis. Tables 33-39 provide the categories relating to the factors that were
seen as helping and hindering in the implementation of the school
development plan.
One of the strongest criticisms against qualitative analysis is that it is
subjective and inherently impressionistic (Bryman, 1984). In order to
counteract this limitation several methods of data authentication were
conducted. The researcher discussed the emerging themes and other
interpretations with a competent, disinterested third party (Lincoln & Guba,
1986). Lincoln and Guba (1985) refer to this a peer debriefing, a strategy for
improving the likelihood that findings and interpretations produced through
naturalistic inquiry methods are credible. The peer debriefer for this study
was an organisational psychologist working in an organisational consultancy.
This process involved discussions throughout the course of the study,
discussing the methodology, the data, and the framing of the study.
The focus groups were reanalysed by the researcher several months after the
first analysis to assess accuracy of the thematic content analysis. This
entailed relooking at the data and reassigning it to the categories. No
significant discrepancies in terms of the categories the data had been
assigned to were discovered. In addition a subset of the focus groups (data
from one school from each group) was reanalysed by an educationalist.
There were very few discrepancies found. In cases where there was
disagreement and this could not be resolved through discussion the case was
excluded. Finally the results were discussed with two experts, an
educationalist and a psychologist, both of whom affirmed the conclusions
129
drawn. An audit trail and copies of the data and the various analyses of the
data are available. With the triangulation of methodology, the ongoing
authentication and expert validation the credibility of the information gathered
was enhanced (Lincoln & Guba, 1986).
4.8.2. ARCHIVAL DATA AND ANALYSIS 4.8.2.1. Objectives Achieved From School Development Plans One of the central aims of the programme under investigation was the use of
the school development plans as a way for schools to take control of their own
development and to become empowered. In order to gather more evidence
about this eight schools’ development plans were evaluated to assess how
many of the objectives they had set for themselves they had achieved.
All of the schools drew up a school development plan setting out the
objectives they wanted to achieve over a 3-year period. The purpose of this
data set was to assess how many of the objectives those schools that had
completed the programme had achieved over the three-year period. Eight
school development plans were analysed. Objectives from the school
development plans were extracted and were then classified in terms of priority
areas and then grouped as to whether they related to individual,
organisational or community levels of change. Evidence was then sort from
the school or from programme reports of the school having achieved the
objective. Table 4b describes the type of evidence sort.
Each objective that was achieved was ticked off on a schedule, corroboration
sought from the school’s development team and the necessary amendments
made. The objectives were then categorised and frequency counts and
percentages were done to assess how many objectives the group had been
successful in achieving. These were scanned for trends in terms of which
groups of objectives were being achieved more readily. Results of this
analysis can be found in Chapter 6.5 with particular reference to Table 24.

130
Table 4b: Evidence of Objectives from the School Development Plans Being Achieved By the Schools Category Evidence
INDIVIDUAL LEVEL Skills training Of attendance at training either school based
or accessed externally (documentary evidence from school or programme e.g. attendance list)
Professionalism Improved attendance and late coming of teaching staff (documentary evidence from school or from programme worker reports)
Teaching and Learning Evidence (timetabling of and attendance at) of grade/subject/phases committees
ORGANISATIONAL LEVEL Infrastructure upgrade Observation Environment Observation Resources Observation Infrastructure new Observation Organisational Development Observation (e.g. administration – use of new
systems; policies – documentary evidence) Relationships Programme reports COMMUNITY LEVEL Parent Involvement Parent meeting attendance registers;
timetabling of parenting meetings; agenda for meetings; observation
Community Involvement Programme reports; copies of letters to community
School Governing Body Terms of reference, evidence of meetings, observation
4.8.2.2. Changes Reported in End of Programme Evaluations The programme evaluated changes in eight schools that had completed the
programme. Initial data was collected before the school began the
programme in order to assess the issues the school was facing and this
provided a starting point for schools in their analysis of the strengths and
weaknesses of their schools to guide the drawing up of their school
development plans. The evaluation compared this data with data collected at
the end of the programme. This evaluation covered a variety of areas of
organisational functioning such as planning, relationships, policies and
procedures, administration, communication, decision-making and stakeholder
involvement.
The evaluation reports from the 8 schools included data collected from 111
teacher questionnaires, 8 principal questionnaires, 8 general audit forms, 8

131
interviews with the principals of the schools, 14 focus groups with the teachers
of the 8 schools, 6 School Governing Body questionnaires, 34 parent
questionnaires and 8 administrative staff questionnaires. Individual evaluation
reports of each school were used in the analysis.
A content analysis of these eight evaluation reports was undertaken following
the principles as outlined in the focus group data analysis section. The areas
under investigation in the evaluations were used as categories and the
information provided in the report was used to assess whether there had been
change (yes), only some change or change but still issues (some) or if no
change had occurred. The issues reported were noted for that particular
category and kept with it in order to add to the understanding of change or
lack of it in that particular area. It was felt that this information could be used
to ascertain what changes had been noted in the schools over this time period
as this would provide corroborating or additional data for both the measures
and, more importantly, for the focus group data. This information also had the
added benefit of comparing the same school at the beginning and the end of
the programme. Results of this analysis can be found in Chapter 6.5
specifically Tables 25 and 26.
The data used for the evaluations was thus based on a triangulation of
various stakeholders (teachers, principal, administrative staff, parents and
school governing body) views on the school. In addition externally verified
evidence was also collected. For example new buildings, classrooms
converted into libraries were physically seen. Policies, financial plans and
budgets were requested and meetings were attended. Registers from parent
meetings were requested as were timetables for meetings with School
Governing Body and parents.
4.8.3. INTERVIEWS ON SCHOOL DEVELOPMENT PLAN IMPLEMENTATION Approximately a year after the original data for the study were collected a
structured questionnaire was used to assess the use of the school
development plans by the schools (see Appendix 9 for the interview

132
schedule). Information was gathered from the principals of the school and the
school development team. This information was then corroborated by using
archival data in the form of monthly reports on the progress of the schools and
externally verifiable evidence. As the researcher was attempting to gain
concrete proof of the use of the plan and functioning of the school
development team copies of the plans and minutes from school development
team meetings were requested by the researcher.
This data set provided evidence on the use of the school development plans
but it also provided a temporal dimension, by assessing if the plans were still
being used a year after the initial data was collected. It not only provided a
qualitative look at the use of the plans but also provided evidence of changes
that had occurred. In addition it also provided insight into the role of the
principal in the planning process and the functioning of the school
development team.
It was also decided to use the interviews as a way of exploring recurrent
themes that had emerged during the analysis of the primary and secondary
data sets e.g. it seemed that although the plans were being used they were
being used in a less formal way than the project had planned, there were
issues around the role of the principal in terms of the school development
plan; the functioning of the school development team and the role funds
played at the school.
4.8.3.1. Sample All 24 primary school principals whose school were participating in the
programme were interviewed by the researcher using the structured
questionnaire. Data from all 24 primary schools' school development teams
was collected in a similar way.
4.8.3.2. Data Analysis These data were then looked at in terms of the monthly progress reports
written by the fieldworkers on the programme in order to corroborate the
information given by the schools. Where the principal, the school

133
development team and the progress reports concurred this was taken as
evidence of what had been reported. Evidence was sort for the following
areas (these were linked to the interview questions):
1. School having a school development plan and when it was developed
2. Review of plan implementation by the school?
3. Plan being used by the school to guide their activities?
4. Form the plan is recorded in
5. Achievements the school has made in terms of implementation of the plan
6. Functioning of the school development team
7. Role of the principal in the School Development Team/planning?
8. Role of the school management team in School Development
Team/Planning
9. The link between the school development plan and fund-raising activities.
Externally verifiable evidence was also sought. Schools were asked for
copies of their school development plans. Evidence of School Development
Team meetings was sought through agendas, minutes, or other notes.
Evidence was sought of objective achievement e.g. resources and
infrastructure were seen by the researcher, concrete evidence of
organisational policies and procedures were sought e.g. copies of policies,
budgets etc. Where concrete evidence could not be found an attempt was
made to triangulate the data with input from various sources and programme
reports e.g. the role of the principal in the team was corroborated by the
school development team and the programme reports drawn up by the
fieldworkers. Once evidence from the interviews and archival progress
reports about each school in terms of the above questions was ascertained,
content analysis and frequency counts were conducted to get a broad picture
of the use of the school development plans within the schools. The same
principles used in the analysis of the focus groups were used to analyse this
data. Results relating to these analyses can be found in Chapter 6.6.

134
4.9. COMPARISON BETWEEN SCHOOLS THAT SCORED WELL ON THE SCHOOL DEVELOPMENT PLANNING EVALUATION SCALE AND THOSE THAT DID NOT An interesting trend became apparent in the focus group analysis with two of
the successful schools (in terms of their scores on the School Development
Planning Evaluation Scale) in Group 1 and the most successful school in
Group 2 reporting similar changes which were not as evident in the other
schools. These related to changes in the principal, financial management,
conflict management, pride in the school and skills development. Results
relating to these finding can be found in Chapter 6.8.
Schools that had been successful (based on their scores on the School
Development Planning Evaluation Scale), whether they been involved in the
programme for three years or one year, were expressing similar types of
change. It was for this reason that it was decided to group the schools
according to their success in terms of implementation of their school
development plans. The two schools from each group that scored highest on
the School Development Planning Evaluation Scale formed one group of four
schools and the two lowest scoring formed another group. Those schools that
scored well on the School Development Planning Evaluation Scale were
referred to as the more successful group and the other as the less successful
group.
Once the data was regrouped for these 8 schools the data was subjected to
the following analyses:
• The quantitative measures were analysed using a MANOVA to assess
differences between the groups;
• The focus group data relating to what had changed were reanalysed to look
for differences and similarities;
• The focus group data relating to helping and hindering factors were
reanalysed.

135
4.10. ANALYSIS OF EVIDENCE OF EMPOWERMENT In an attempt to explore the evidence base for empowerment at various levels
of analysis resulting from the school development programme, many sets of
data, both quantitative and qualitative, were collected and analysed. This
included: quantitative data measuring variables associated with
empowerment; focus groups and interviews exploring whether teachers,
principals and school development teams reported personal empowerment or
empowerment of their schools; and archival data relating to outcomes from
the school development plans. This approach added complexity to the overall
research design and specifically the analytic design. It attempted to maximise
the advantages from both the quantitative and qualitative designs. In
conducting a multi-method analysis, it is assumed that analyses of different
data sources are accorded equal weight. The researcher could switch back
and forth between data sets progressively clarifying the findings of one
approach by using the other. This helped to ensure that the scope and focus
of the issues were anchored more precisely.
It also helped the discrepancies between methods to be justified, increasing
reliability by explaining differences in the results obtained from each method.
Adopting this approach helped to triangulate findings and elaborate on the
results by using one method to inform another (Rossman & Wilson, 1985;
Cheung, 2001). Table 5b (p. 111-112) provides a summary of the various
quantitative and qualitative analyses undertaken in the study.
Although many authors have called for the combination of methods or multi-
method studies very little systematic evidence has been presented for
combining methods at the analytic phase (Miles & Huberman, 1984). Too
often researchers gloss over this phase with such generalisations as
“qualitative data should enrich survey information” or that “qualitatively-derived
hypotheses ought to be tested with subsequent quantitative analyses”
(Rossman & Wilson, 1985).
A general prescription has been to pick triangulation sources that have
different biases, different strengths so they can complement each other.
136
However as Huberman & Miles (1998) point out, “In the disorderly world of
empirical research, however, independent measures never converge fully.
Observations do not jibe completely with interview data, nor survey with
written records” (p. 199). In other words sources can be inconsistent or even
conflicting with no easy means of resolution. Rossman & Wilson (1985) argue
that in such cases a new way of thinking about the data at hand may be
needed and in doing so triangulation becomes less a tactic than a model of
inquiry. By self-consciously seeking out, collecting and double checking
findings using multiple sources and modes of evidence the researcher will
build the triangulation process into ongoing data collection and analysis. It will
be the way the researcher got to the finding in the first place – by seeing or
hearing multiple instances of it from different sources, using different methods,
and by squaring the findings with others with which it should coincide.
A process of triangulation has been attempted through out this study. As a
first step in collecting evidence of empowerment in the school development
setting a measure of school development, the School Development Planning
Evaluation Scale was developed. However, as it was not possible to interpret
whether the unitary school construct identified was related to an
empowerment construct, various other measures of variables associated with
empowerment, at both the individual and organisational levels, were
measured. The influence of third variables on these results was then
explored.
Staff within the schools were then given an opportunity to share whether they
felt the programme had impacted on them and their schools through the use
of focus groups. The results of this analysis were triangulated with those from
the archival data analyses of eight schools. The archival data analysis
involved a different cohort of schools who had completed the programme and
about whom baseline and end of programme data had been collected by the
programme. This data had been captured in audits written for each school.
Areas of change noted in the archival data were compared with those noted in
the focus groups and similarities and differences were noted. Data about the
achievement of objectives set in the school development plans were

137
triangulated with programme progress reports on the school and through the
interview data in order to ensure corroboration of evidence of achievement.
Interviews were undertaken with 24 school principals and 24 school
development teams. This was undertaken a year after the initial quantitative
data and focus groups had been undertaken. This added not only an
extended cohort of schools but also added the principals’ views (they were not
included in the focus groups) and also added an element of temporal
triangulation. Reported changes were triangulated within this set of data.
Principal views were triangulated with school development team views and
then these were triangulated with evidence from programme reports.
Evidence of change was only accepted if all three sources corroborated the
change reported. Through the use of these various data sets, each building
on the other, an attempt was made to gain a composite picture from various
sources for the evidence of empowerment in the school setting.
In order to integrate the findings from these different analyses, data impact
matrices, based on the work of Miles & Huberman (1994), were constructed to
identify what the various data sources revealed about the impact of the
programme and its meaning for school staff. It was decided to make use of
the categories suggested by the groups in the qualitative data analysis as well
as those measured in the quantitative section. These categories were
grouped in terms of whether they were seen as relating to the school
development plan, individual, organisational or community level variables.
Data from the quantitative analysis were entered first. This included the
descriptives, MANOVA and analysis of third variables from the comparison of
Group 1 and 2 and the MANOVA results comparing schools that scored well
on the School Development Planning Evaluation Scale. These were entered
according to whether there was evidence of the variables and if there was
evidence of impact (gauged by significant results).
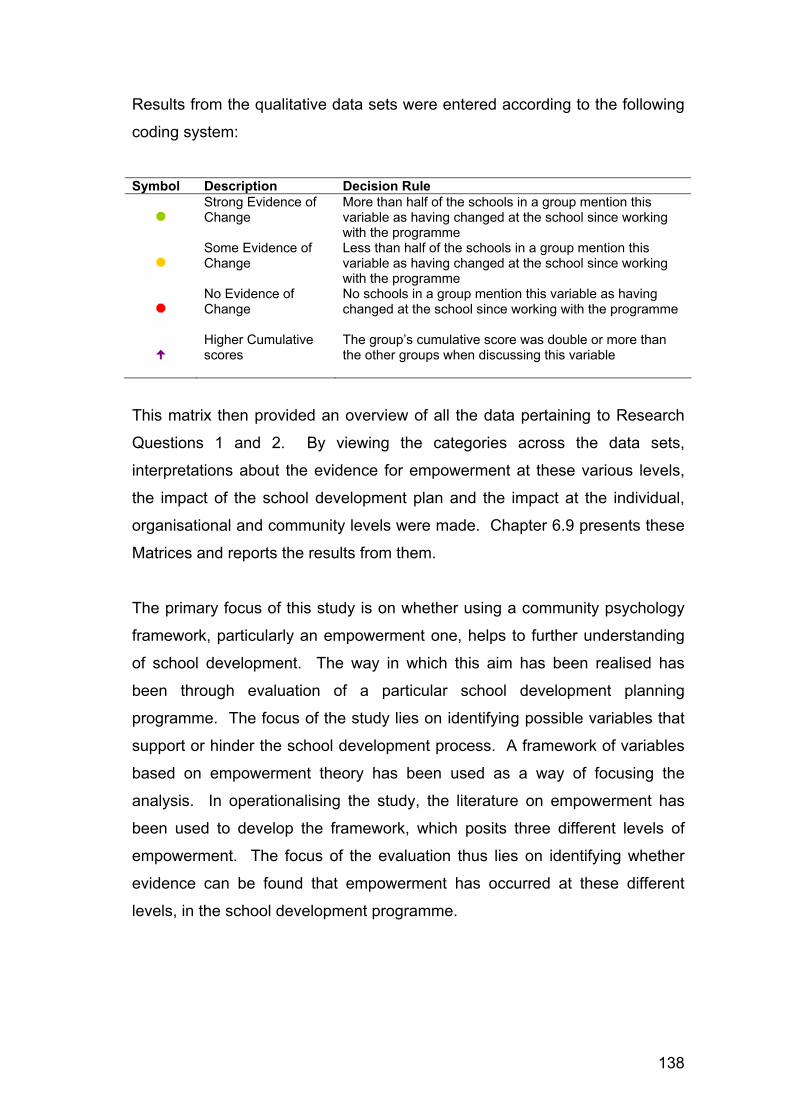
138
Results from the qualitative data sets were entered according to the following
coding system:
Symbol Description Decision Rule
Strong Evidence of Change
More than half of the schools in a group mention this variable as having changed at the school since working with the programme
Some Evidence of Change
Less than half of the schools in a group mention this variable as having changed at the school since working with the programme
No Evidence of Change
No schools in a group mention this variable as having changed at the school since working with the programme
Higher Cumulative scores
The group’s cumulative score was double or more than the other groups when discussing this variable
This matrix then provided an overview of all the data pertaining to Research
Questions 1 and 2. By viewing the categories across the data sets,
interpretations about the evidence for empowerment at these various levels,
the impact of the school development plan and the impact at the individual,
organisational and community levels were made. Chapter 6.9 presents these
Matrices and reports the results from them.
The primary focus of this study is on whether using a community psychology
framework, particularly an empowerment one, helps to further understanding
of school development. The way in which this aim has been realised has
been through evaluation of a particular school development planning
programme. The focus of the study lies on identifying possible variables that
support or hinder the school development process. A framework of variables
based on empowerment theory has been used as a way of focusing the
analysis. In operationalising the study, the literature on empowerment has
been used to develop the framework, which posits three different levels of
empowerment. The focus of the evaluation thus lies on identifying whether
evidence can be found that empowerment has occurred at these different
levels, in the school development programme.

139
Four research questions are posed to guide the analysis.
1. What effect has the school development planning process had in terms of
empowering schools as organisations?
2. What effect has the school development planning process had on
variables associated with empowerment at the individual, organisational
and community levels?
3. What factors help or hinder the school development planning process?
4. What is the relationship between the process of school development
planning and those variables associated with empowerment at the
individual, organisational and community levels?
As has been demonstrated above the terms “effect” and “impact” are defined
in a number of different ways in the evaluation literature. The focus of the
evaluation in the current study is not about a systematic impact evaluation of
a school development programme (which would require a measurement-
based design based on control or contrast groups). The focus is rather on
seeking evidence of empowerment outcomes in a school development
setting, through a multi-method analysis. In a multi-method evaluation, the
use of indicators of outcomes is in line with the ways in which multi-method
impact evaluations have been previously conducted in a number of arenas
internationally, and in particular in health and education.
This study attempts to do this by operationalising the evaluation in
empowerment terms. The indicators of possible empowerment outcomes are
defined in several ways in the present study:
a) through measures of various variables associated with empowerment
theoretically and empirically (i.e. measured by previously validated
scales),
b) contextually through teacher perceptions and
c) by operationalising the school development planning programme
outcomes in empowerment terms, in a new instrument (a school
development planning scale).
140
Empowerment theory has offered several constructs which are theorised as
indicators of empowerment at various levels. In this study these theoretical
constructs have been operationalised as a framework of empowerment
outcome variables, which have been related through archival analysis to the
particular work that the programme does.
The empowerment literature emphasises that empowerment outcomes should
be evident at various levels. In operationalising the study, a framework of
indicators/variables has been developed relating to these levels, as these
relate to the aims of the particular programme being evaluated. As previously
validated instruments are not available to measure all the constructs in this
model, it has been necessary to use both previously validated measures as
well as self-developed instruments.
These latter instruments have essentially relied on the self-reports of the
teachers and principals involved in the programme, and have focused on
asking these respondents about their perceptions and possible experience of
the various levels of empowerment, as well as their perceptions of the
outcomes of the programme at the individual, organisational and community
levels of empowerment.
The framework of indicators/variables developed relates both to the different
levels theorised in the literature on empowerment, as well as the school
development programme’s implementation theory. The evaluation thus
focuses on attempting to establish whether evidence of school development
outcomes can be identified in these different data sources. The design is
multi-method, in which is nested a non-experimental ex post facto design
using data obtained from two contrast groups. In this way the empowerment
outcomes framework links both with the literature on empowerment and
equally importantly to the programme’s theory.
In essence, the design is based on the assumption that programme
envisaged certain specific outcomes. These were established through
archival analysis. They were then related to an empowerment framework

141
based on analysis of the literature at a conceptual level. This framework was
then operationalised be identifying specific indicators of empowerment
outcomes. Stated a different way, empowerment theory has offered several
constructs which are theorised as indicators of empowerment at various
levels. In this study these theoretical constructs have been operationalised as
a framework of empowerment outcome variables, which have been related
through archival analysis to the particular work that the programme does.
Table 5a lays out how empowerment theory has been operationalised and
related to particular instruments used in the study and how this relates to the
various data sources collected. Table 5a presents a framework of
indicators/variables of programme outcomes which are based both in
empowerment theory, as well as the programme’s implementation theory
drawn from analysis of documents related to the programme’s
conceptualisation, planning and implementation. The table summarises the
programme’s implementation theory, and how the particular outcomes
towards which the programme has worked have been related to particular
indicators/variables in the research design, and then to the data sources and
instruments used in the multi-method analysis.

142

143
4.11. ANALYSIS OF THE RELATIONSHIPS BETWEEN THE VARIABLES The focus group analyses of the helping and hindering factors, and advice
schools would give to those embarking on a school development process,
were explored to offer some insights into the variables school staff felt were
important in the school development planning process. In order to integrate
these qualitative data sets relating to the relationships between the variables
a matrix was drawn up. Miles and Huberman (1994) suggest using a variable
ordered predictor-outcome matrix when exploring how several contributing
factors function together in relation to the outcome variable. A colour coding
system similar to the one used in the Impact Matrix was implemented to look
for trends and differences across the groups. Data were entered into the
matrix using the following criteria:
Symbol Description Decision Rule
Strong Evidence of Link
More than half of the schools in a group mention this variable/predictor as being helpful, hindering or would advise another school
Some Evidence of Link
Less than half of the schools in a group mention this variable/predictor as being helpful, hindering or would advise another school
No Evidence of Link No schools in a group mention this variable/predictor as
being helpful, hindering or would advise another school
Higher Cumulative scores
The group’s cumulative score was double or more than the other groups when discussing this variable
Using the variables described by the schools it was possible to explore what
variables Group 1 and Group 2 focus group schools saw as important in
bringing about change and successful school development planning
implementation. Data from the focus groups relating to helping and hindering
factors and advice that would be given were entered. The relationships noted
in the analysis comparing schools that were successful in implementing the
school development plan with those that were not, were then added to the
matrix. From this a variety of relationships between the variables were noted.
Chapter 7.5 presents the Relationship Matrix.
To further explore the relationship between school development planning and
the other variables the quantitative measures were subjected to several
statistical analyses. These results are reported in Chapter 7.7. To gain an
144
initial sense of the relationships between the variables and School
Development Planning Evaluation Scale, Pearson’s product-moment
correlations were used. The correlation co-efficients summarise the
relationship between two variables thereby indicating the degree to which
variation in one variable is related to variation in another (Kerlinger, 1986).
However, it is imperative to acknowledge that a positive correlation between
variables is an indication of association and should not been seen as implying
causality (Howell, 1997; Kerlinger, 1986).
A multiple regression analysis was conducted to further investigate the role of
various organisational and individual level variables in predicting school
development planning success. Correlations can be very powerful research
tools but they do not give information about the predictive power of variables
(Howell, 1997). In regression analysis a predictive model is fitted to the data
and this model is used to predict values of the outcome or dependent variable
from one or more predictors or independent variables. Simple regression
seeks to predict an outcome from a single predictor whereas multiple
regression seeks to predict an outcome from several predictors (Field, 1994).
This is a useful tool because it allows us to go a step beyond the actual data.
The results of the multiple regression give some idea of which variables
related to successful school development planning and allows us to construct
models of how these variables relate to each other (Howell, 1997). .
By combining the relationship matrix results with the regression analysis a
model of successful school development planning was developed. This
model was tested using Structural Equation Modelling, a statistical modelling
technique that takes a confirmatory (i.e. hypothesis testing) approach to the
analysis of a structural theory bearing on some phenomenon. Typically, this
theory represents ‘causal’ processes that generate observations on multiple
variables (Bentler, 1988). The term structural equation modelling conveys two
important aspects of the procedure (Byrne, 2001):
a) that the causal processes under study are represented by a series of
structural (i.e. regression) equations;

145
b) that these structural relations can be modelled pictorially to enable
clearer conceptualisation of the theory under study.
The hypothesised model can then be tested statistically in a simultaneous
analysis of the entire system of variables to determine the extent to which it is
consistent with the data. If the goodness of fit is adequate, the model argues
for the plausibility of postulated relationship among variables; if it is
inadequate, the tenability of such relations is rejected. Byrne (2001) argues
for Structural Equation Modelling as the method of choice for non-
experimental research, where methods for testing theories are not well-
developed and ethical considerations make experimental design unfeasible.
Using the information from the relationship matrix and the statistical
exploration of the relationships these relationships were then mapped
graphically (Miles & Huberman, 1994). This relationship diagram graphically
represented the variables according to level of analysis, i.e. individual,
organisational and community. Data relating to the comparison between
Group 1 and 2 made up the first diagram. A second diagram was drawn
adding to it the results relating to the comparison between those schools that
were more successful with those that were less successful. A final diagram
integrating the statistical relationships was drawn up. In this way a picture
began to emerge of the variables school staff felt were contributing to
successful school development planning.
4.12. METHODOLOGICAL LIMITATIONS OF THE STUDY Although the limitations of the study will be explored in more depth in Chapter
9 it is important to deal with some of those at this point so that the reader is
aware of them when going through the various analyses offered in the
following chapters. As with any evaluation there are limitations, as well as
compromises related to instrumentation, sampling, analysis and design as
well as the quality of the data actually available to the researcher. A number
of assumptions have been adopted in operationalising the study, which have
acted as limitations. Quantitative measures of empowerment as defined by
the theory and empirical research were identified. However, there was no

146
previous research which had examined empowerment in the context of school
development planning. There were also few previous studies which had
explored empowerment in the context of school development, and many of
the studies conducted had focused on teachers’ perceptions.
Certain previously developed instruments exist which relate to the framework
of evaluation outcomes (as described previously and displayed in Table 5a).
Others do not, implying the need for self-developed instruments. These latter
instruments have been based on the ways in which the school development
and change process has been conceptualised and implemented in this
particular school development programme. Other limitations relate to the
conceptualisation and use of both previously validated instruments as well as
a self-developed instrument as measures of empowerment outcomes within
the design. Others apply to the evidence obtained from the school
development planning scale developed as part of the study.
Self-reports of teachers have been gathered through focus groups. Additional
limitations apply to the use of methods of content analysis focusing on
indicators of outcomes in the self-reports of teachers concerning their
practices in the school contexts in which they work. A number of assumptions
were adopted in defining and operationalising the study which has led to the
use of non-experimental and multiple methods. The empowerment literature
emphasises that because of the contextual nature of empowerment it is
necessary to explore how empowerment is defined within that context, by the
people engaged in the context. This has influenced the design of this study,
in that evidence of empowerment outcomes has been sought in the self-
reports of teachers, and not merely in previously standardised measures.
Methods of content analysis focusing on indicators of outcomes in the self-
reports of teachers concerning their practices in the school contexts in which
they work were applied to assess this. This is a major limitation. However it
is still important to assess in this context what people feel about
empowerment and school development planning, and it is particularly
important to do so as this is a new area of study. Attempts were made to

147
counter the danger of solely using self-report data by using (analysis of
objectives achieved from the School Development Plan, audits and interviews
with external verification of self-report) that would act as external verification
to these self-report.
The issue of how self-report data have been substantiated against externally
verified evidence will be more clearly explicated in Chapters 6 and 8. Very
briefly the process involved using different data sources, some based on
triangulation of self-reports (i.e. self reports from various stakeholders); others
based on project records (e.g. externally conducted audits) and others on
direct observation (e.g. the researcher seeing a new library). Table 5a
presents these various data sets.
The samples in the study are samples of convenience, which are adequate in
the programme’s terms, but introduce limitations concerning generalisability
as there is no way of estimating the probability of selection for each unit of the
population. Such samples are less likely to be representative of the
population and are seen as weaker forms of sampling (Blacktop, 1996).
However, many researchers do use non-probability samples. This may be
because generalisability is not an aim of the research, or that not enough is
known about the population to use probability methods. However caution
must be exercised in applying findings from such samples to the wider group
from which they are drawn. This type of sample is clearly biased because the
selection process is influenced by numerous uncontrolled, and often
unknown, variables (Polit & Hungler, 1995).
Despite the shortcomings of non-probability samples, they are still useful, and
at times the only option for studies such as the present study. They may also
be used where generalisability beyond the sample is not an aim. Qualitative
research studies commonly use small, non-probability samples because the
focus is on gathering rich, in-depth, descriptive data (Holloway & Wheeler,
1996).
148
Another limitation relates to the issues of levels of analysis of empowerment in
the study. Firstly, most of the theoretical conceptualisations of empowerment,
although taking cognisance of issues of level, resort to individual level
measures. A limitation of much of this research is that the only validated
measures, amenable to the type of statistical procedures used in this study,
are of the self-report, individual level type. Secondly, in order to access
people’s perceptions of empowerment qualitative self-report focus groups
interviews normally have to be used.
The logic followed in the qualitative analyses is as follows. The study started
with an analysis of theoretical constructs, and their working and operational
definition in specific variables and indicators. As empowerment is contextual
it was important to first explore with the participants’ views on empowerment
and school development planning. Then three data sets were explored to
verify these findings.
While these additional analyses go a certain distance towards justifying
conclusions as to empowerment having occurred beyond the individual level,
there are still a number of limitations inherent in the type of analysis
conducted. It needs to be acknowledged that it is a challenge to establish
change at the organisational and community level. If teacher perceptions
indicate that change has taken place, and these trends can then be verified by
external sources of data (e.g. external audit data) it becomes possible to
make claims beyond the individual level. Where externally verified evidence
supporting teachers’ perceptions cannot be found, a more exploratory view
will be taken. It will also be made clearer that such evidence is only based on
teacher’s perceptions.
The evaluation thus focuses on attempting to establish whether evidence of
school development outcomes can be identified in these different data
sources. The design is multi-method, in which is nested a non-experimental
ex post facto design using data obtained from two contrast groups. The ideal
approach to testing hypotheses is to use an experimental design. However,
at times this is neither possible nor appropriate because it is impractical or

149
unethical to manipulate the variable(s) of interest and use random
assignment, both required for most experiments (Baker, 2000).
Where this is the case, ex post facto (after the fact) designs are the best that
can be used. This design is used in situations where the evaluator has only
limited options in terms of making comparisons. A common problem,
however, is that any relation which is identified may be spurious rather than
real. Nevertheless, ex post facto designs have been used extensively to
examine programmes which have been available in the past to the whole of
the relevant population (programmes with universal coverage) (Baker, 2000).
It must be highlighted though that even in well-designed ex post facto
designs, it is difficult to establish causality (Lo Biondo-Wood & Haber, 1998).
A multi-method approach, combining both quantitative and several qualitative
data sources, attempted to deal with the challenges posed by this area of
study and the limitations of the design.
The way on which the evaluation was conceptualised and operationalised has
also led to certain tensions and challenges. A central issue in the
conceptualisation and operationalisation of the study is that this was not a
commissioned evaluation nor was it a planned part of the programme. The
decision to undertake the evaluation and the focus on empowerment was the
researchers own. The departure point of the investigation was to examine
what the programme aimed to do, to pick up on the statements in the
programme’s planning and policy documents which either directly or indirectly
imply an aim of empowerment of teachers and schools and then to
operationalise these in terms of Zimmerman’s (2000) framework and then to
establish whether evidence for these indicators of empowerment could be
found in a school development setting. It was therefore the researcher’s
choice to focus on the effects of the programme with respect to
empowerment, in order to evaluate whether the programme has been
effective. Thus the evaluation was conducted for the researcher’s own
purposes, to see whether the programme’s statements of aim have actually
been fulfilled. This however has contributed to a number of challenges,
tensions and limitation in the design.

150
As this evaluation of the programme was not commissioned, it was not
possible for the researcher to design what the programme did so as to include
control groups. Also given the nature of the area worked in (all the primary
schools in a specific township) it was not possible to find control groups. In
order to deal with these realities the best available alternative was to use an
ex post facto design with two contrast groups (one three year and one year
exposure to the programme). In order to deal with the weaknesses of this
design it was necessary to nest this design in a wider multi-method design.
These contextual realities have been challenges in the study. The way in
which the programme has worked has affected the design and has also
introduced limitations in the study. Specifically, the design tension was that,
in order to evaluate this particular programme and establish whether its aims
of empowerment had actually been realised, it was necessary to establish
effects, in order to establish whether the programme had been effective. A
multi-method impact design was thus seen as the best option available to do
this. In a different setting in which there are high levels of control enabling
randomisation it may have been possible to use a more powerful design with
regard to establishing effects. In an educational development programme this
was not possible.
There are inevitable compromises and limitations inherent in any ex post facto
design. There are also compromises and limitations in content analysis, as
well as limitations in analysis of self-report data. Steps taken to counter these
limitations will be highlighted in the following sections and explored in more
detail in Chapter 9.
4.13. SUMMARY In this section it has been argued that a multi-method research design,
combining quantitative and qualitative data, not only suited the values of the
contextualist perspective of community psychology by providing a useful
approach to researching complex social issues such as empowerment, but
also provided an approach that strengthened the ex post facto design of the
evaluation. The procedure and logic for the collection and analysis of the
151
various forms of data were presented according to the research questions
they were aimed at providing evidence about. These research questions
focused on two areas, whether empowerment was evidenced in the context of
a school development programme and the relationship between school
development planning and the other variables associated with empowerment.
The overarching aim is to explore whether it is possible to find evidence
indicating that empowerment outcomes have taken place. A framework of
variables based on empowerment theory has been used as a way of focusing
the analysis. In operationalising the study, the literature on empowerment has
been used to develop the framework, which posits three different levels of
empowerment. The evaluation focuses on evidence relating to empowerment
outcomes at various levels of analysis as described by Zimmerman (2000).
The definitions of the various levels of empowerment provided by theorists are
quite clear about the outcomes at each level and most specifically at the level
of the organisation. The empowerment outcomes in the research design have
been defined theoretically in this thesis based on the work of Zimmerman
(2000; Peterson & Zimmerman, 2004). In operationalising the study, a
framework of indicators/variables has been developed relating to these levels,
as these relate to the aims of the particular programme being evaluated. As
Table 5a indicates the outcomes and their indicators wee derived from several
sources. Quantitative measures of empowerment as defined by the theory
and empirical research were identified. The focus of the evaluation thus lies
on identifying whether evidence can be found that empowerment has
occurred at these different levels, in the school development programme.
However, there was no previous research which had examined empowerment
in the context of school development planning. There were also few previous
studies which had explored empowerment in the context of school
development, and many of the studies conducted had focused on teachers’
perceptions. In this study, it was thus logical to use both quantitative
measures as well as instruments tapping teachers’ self-reports. These were
tapped both by a school development planning scale which attempted to
152
measure teachers’ perceptions of empowerment at individual, school and
community levels, as well as through qualitative focus groups. In order to
assess the effects of the programme operationalised as empowerment
outcomes three other data sets which included external verification were
collected (analysis of objectives achieved from the School Development Plan,
audits and interviews with external verification of self-report).
It has been necessary in this study to accord weight not only to measurement
data, but equally importantly to the self-reports of teachers and principals
involved in this particular school development planning programme. It was
also necessary to use different data sources (various existing measures, a
new measure, and the self-reports of teachers and principals), as this was
necessary to provided indicators not only of empowerment, but also of school
development planning outcomes.
What follows in the subsequent chapters (Chapters 5 to 7) is a sequential
presentation of the results relating to the quantitative analysis. This is then
followed by the results of the focus groups and then the data used for external
verification is presented. As this is a multi-method study, evidence is first
sought in each of the different data sources, separately, with the evidence
from each data source being equally weighted in the analysis. This is in line
with existing practice in multi-method research (Frechtling, & Sharp, 1997;
Hayton et al., 2007; Humphris et al., 2004). An attempt is then made to
integrate the findings from these different data sources. Convergences and
differences are highlighted. This is again in line with existing practice in multi-
method research, which uses triangulation across different methods, data,
investigators and time to link and interpret trends from different forms of
analysis and different forms of data (Challis et al., 2004; Philip et al., 2004).
Ultimately the data from both themes needed to be integrated and theoretical
links made, which is done in Chapter 8. School development literature and
research, particularly school development programme evaluation, has
suffered from a lack of theorising about how and why interventions succeed or
fail (Chen & Rossi, 1983). In order to do this we need to not only assess

153
impact but also explore process and in doing so make links to theoretical
frameworks. Huberman & Miles (1998) argue that “grounded theorists” have
long contended that theory generate from one data source works less well
than “slices of data” from different sources (p. 199).
At the end of the thesis (Chapter 9) an attempt is made to examine whether
the empowerment framework developed to guide the evaluation contributes to
the understanding of the school development process followed in the
programme, by focusing on the indicators of empowerment outcomes across
these different data sources and different forms of data. This focus of the
study has lain on effects, impacts and outcomes as opposed to process.
The following two pages offer a summary table of the Research Design. This
can be used to guide the reader through the next section on the results of
these many sets of data

154
1 A list of abbreviations used in the tables can be found on page 357
RESEARCH QUESTIONS DATA SOURCES AND COLLECTION DATA ANALYSIS SAMPLING
School Development Planning Evaluation Scale (SDPES)1 MANOVA 227 Teachers and 18 Principals Group 1 - 141 Group 2 - 86
Focus groups with teachers Content analysis Frequency counts
56 participants Group 1: 4 focus groups 31 teachers Group 2: 4 focus groups 25 teachers
8 School Evaluations of schools that had completed the programme – focusing on what had been achieved over the 3 years in terms of objectives set in School Development Plan (SDP) 8 School Development Plans evidence of objectives being achieved through archival analysis and through interviews (see below)
Checklist Frequency counts and percentages
8 school development plans of schools who had completed the programme
Interviews with principal and school development teams (SDT) relating to use of the SDP, functioning of the SDT and role of principal in SDP (this data was collected a year after the above 3 sources) Interviews Copies of SDP SDT meeting minutes Programmes monthly progress reports
Content analysis Frequency count Schools grouped according to year they started on the programme
24 principals interviewed 24 school development teams interviewed
SDPES Success Regrouped focus group data relating to what had changed in terms of school scores on SDPES.
MANOVA 4 schools were in the SDPES success group 4 schools were in the SDPES less success group
Research Question 1: What effect has the school development
planning process had in terms of
empowering schools as organisations?
Impact Matrix Results from the above data sources
Impact Matrix - classifying data as providing evidence of SDP Success or not, SDT functioning and role of principal
All of the results for Research Question
Individual: Locus of control Scale General Self-efficacy Scale Teacher Efficacy Scale
MANOVA 227 Teachers and 18 Principals Group 1 - 141 Group 2 - 86
Research Question 2: What effects has the school
development planning process had on
variables associated with empowerment
at the individual, organisational and
community levels?
Organisational: Involvement in decision making (Participation and Decision Centralisation Scale) Influence in decision-making (Psychological Participation Scale) Collaboration Scale Profile of Organisational Characteristics Supervisory Leadership Peer Leadership
MANOVA 227 Teachers and 18 Principals Group 1 - 141 Group 2 - 86
Table 5b: Research Design Summary
154
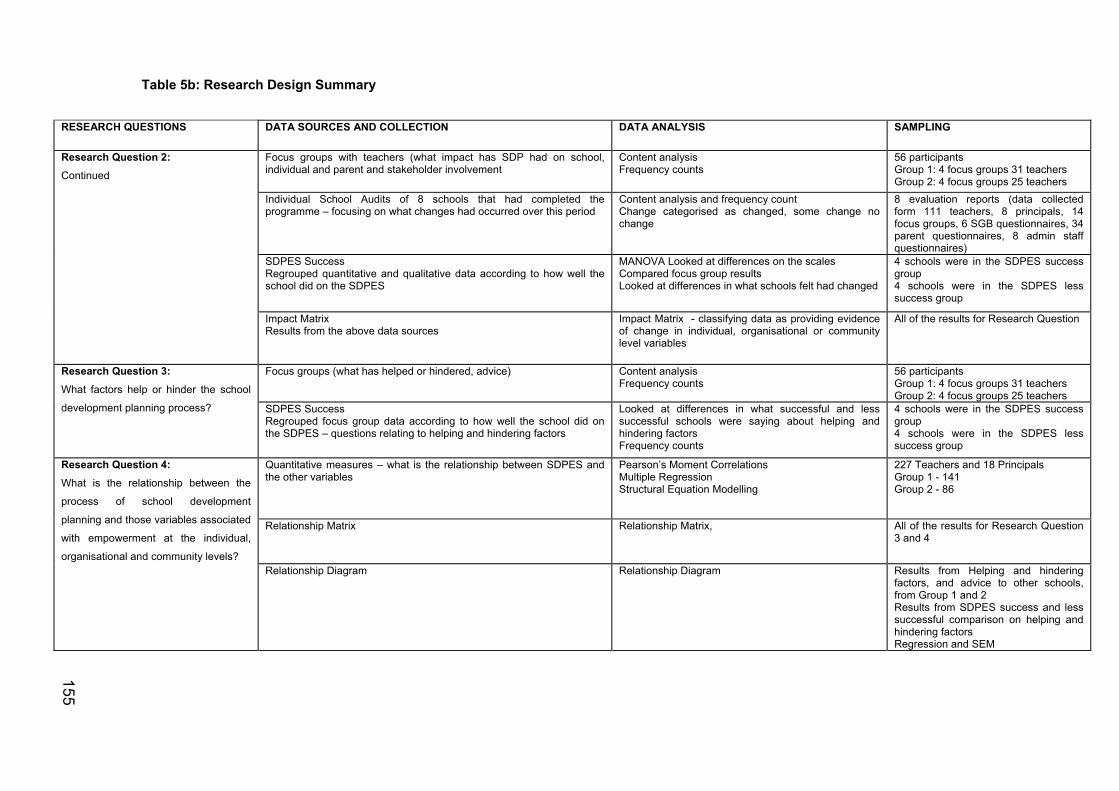
155
RESEARCH QUESTIONS DATA SOURCES AND COLLECTION DATA ANALYSIS SAMPLING
Focus groups with teachers (what impact has SDP had on school, individual and parent and stakeholder involvement
Content analysis Frequency counts
56 participants Group 1: 4 focus groups 31 teachers Group 2: 4 focus groups 25 teachers
Individual School Audits of 8 schools that had completed the programme – focusing on what changes had occurred over this period
Content analysis and frequency count Change categorised as changed, some change no change
8 evaluation reports (data collected form 111 teachers, 8 principals, 14 focus groups, 6 SGB questionnaires, 34 parent questionnaires, 8 admin staff questionnaires)
SDPES Success Regrouped quantitative and qualitative data according to how well the school did on the SDPES
MANOVA Looked at differences on the scales Compared focus group results Looked at differences in what schools felt had changed
4 schools were in the SDPES success group 4 schools were in the SDPES less success group
Research Question 2: Continued
Impact Matrix Results from the above data sources
Impact Matrix - classifying data as providing evidence of change in individual, organisational or community level variables
All of the results for Research Question
Focus groups (what has helped or hindered, advice)
Content analysis Frequency counts
56 participants Group 1: 4 focus groups 31 teachers Group 2: 4 focus groups 25 teachers
Research Question 3: What factors help or hinder the school
development planning process?
SDPES Success Regrouped focus group data according to how well the school did on the SDPES – questions relating to helping and hindering factors
Looked at differences in what successful and less successful schools were saying about helping and hindering factors Frequency counts
4 schools were in the SDPES success group 4 schools were in the SDPES less success group
Quantitative measures – what is the relationship between SDPES and the other variables
Pearson’s Moment Correlations Multiple Regression Structural Equation Modelling
227 Teachers and 18 Principals Group 1 - 141 Group 2 - 86
Relationship Matrix Relationship Matrix, All of the results for Research Question 3 and 4
Research Question 4: What is the relationship between the
process of school development
planning and those variables associated
with empowerment at the individual,
organisational and community levels?
Relationship Diagram Relationship Diagram Results from Helping and hindering factors, and advice to other schools, from Group 1 and 2 Results from SDPES success and less successful comparison on helping and hindering factors Regression and SEM
Table 5b: Research Design Summary
155

156
CHAPTER FIVE: STATISTICAL ANALYSES RELATING TO THE
ASSUMPTIONS OF THE MEASURES AND THE SCHOOL
DEVELOPMENT PLANNING EVALUATION SCALE
5.1. INTRODUCTION Before presenting the results as they relate to the research questions the
assumptions underlying the statistical tests used in the study will be discussed
and relevant analyses presented. In order to answer the research questions
the reliability and validity of the School Development Planning Evaluation
Scale also needs to be established. The analyses relating to this will be
presented. Once the evidence of the measures meeting the assumptions of
the statistics that were used and the reliability and validity of the School
Development Planning Evaluation Scale have been established the results
pertaining to the four research questions will be presented.
5.2. TESTING THE STATISTICAL ASSUMPTIONS The statistical tests used in the study (discussed earlier in the Methodology
Chapter) are all parametric and as such have four assumptions that must be
met for the test to be accurate (Field, 2004). These assumptions are:
(a) Normally distributed data – The rationale behind hypothesis testing relies
on having normally distributed populations and thus if this assumption is not
met the logic behind hypothesis testing is flawed.
(b) Homogeneity of variance – This assumption means that the variances
should not change systematically throughout the data. For the present
research each of the two groups should not have significantly different
variances.
(c) Interval data – Data should be measured at least at the interval level. This
means that the distance between points on the scale should be equal at all
parts along the scale.
(d) Independence – This assumption is that data from different subjects are
independent, which means that the behaviour of one participant does not
influence the behaviour of another.
(taken from Field, 2004, p. 37-38)

157
5.2.1. NORMAL DISTRIBUTION: To check the assumption of normality the distribution of the sample data was
explored. If the sample data are normally distributed then we tend to assume
that they came from a normally distributed population (Field, 2004). Summary
statistics of the data related to the distribution of the scores including
histograms, frequencies, Q-Q plots and Box plots of the data were initially
undertaken (Clark-Carter, 1997)2. The Box plots, in conjunction with the
frequency tables, indicated that there were no significant outliers in the data.
However, the histograms (see Appendix 10, Tables 1 and 2) and the Q-Q
plots (see Appendix 10, Table 3) indicated that several of the measures for
both groups were not normally distributed being skewed towards the positive
end of the scales. These summary statistics, however tell us little about
whether a distribution is close enough to normality to be useful.
Skewness and kurtosis give an idea of the data distribution as they are both
associated with standard error. Data may be skewed, with scores falling
predominantly at the lower or upper ends of the distribution (resulting in a
positive or negative skewness statistic respectively). The clustering of scores
around the mean is referred to as kurtosis, with a positive kurtosis statistic
indicating that scores lie close to the mean and negative scores indicating
scores are spread out around the mean (Field, 2004).
The z-scores for skewness and kurtosis scores (see Table 4 for Group 1 and
Table 5 for Group 2 in Appendix 10), indicate that although all the tests
appear to be normal with regards to kurtosis several of the measures exceed
the 1.96 limit in terms of their skewness (Field, 2004). It is possible that this
skewness has to do with a positive view of the programme and its impact. It is
interesting to note that it was generally the organisational level and not the
individual level measures that were skewed. This issue will be pursued later
in the results.
2 A list of abbreviations used in the Tables can be found on page 357
158
In order to assess whether these indications of non-normal distribution are
actually significantly different from the normal distribution the Kolmogorov-
Smirnov test was used. This test compares the set of scores in the sample to
a normally distributed set of scores with the same mean and standard
deviation. If the test is not significant (p>0.05) it tells us that the distribution of
the sample is not significantly different from a normal distribution (i.e. it is
probably normal). However, if the test is significant (p<0.05) then the
distribution in question is significantly different from a normal distribution (i.e. it
is non-normal) (Field, 2004).
Tables 4 and 5 (in Appendix 10) indicated that the data for School
Development Planning Evaluation Scale, Psychological Participation Scale,
Participation and Decision Centralisation Scale, Collaboration Scale and Peer
Leadership Scale reflect a deviation from normality and thus parametric tests
cannot be used on the data. In these circumstances non-parametric tests
could potentially have been used as a means of testing the hypotheses of
interest. However, not all of the scales broke this assumption and parametric
tests are more powerful and had more usefulness for the purpose of the
present study. Thus it was felt that not being able to use parametric tests
would limit the analysis of the data.
Clarke-Carter (1997), Field (2004) and Howell (1997) all argue that when data
are not normally distributed it is possible to transform the data into a form
which would allow parametric tests to be conducted. To transform the data
involves applying the same mathematical formula to each of the values in the
set of data. Clarke-Carter (1997) argues that this is perfectly legitimate as
long as you do not try out a number of transformations in order to find one that
produces a statistically significant result. He suggests that if the data is
negatively skewed, as is the case with School Development Planning
Evaluation Scale, Participation and Decision Centralisation Scale,
Collaboration Scale and Peer Leadership Scale, then all of the data points
can be squared. For positively skewed data, as is the case with the
Psychological Participation Scale, he suggests using the square root to
transform the data.

159
Transformations to the data were undertaken and the results from a new set
of Kolmogorov-Smirnov tests (Appendix 11), histograms (Tables 1 and 2,
Appendix 10), z-scores for skewness (Tables 6 and 7, Appendix 10) and Q-Q
plots (Table 3, Appendix 10) revealed promising shifts in the data towards a
normal distribution. The histograms and Q-Q plots give one a visual sense
that there has been a shift to the normal (see Tables 1, 2 and 3, Appendix
10). Calculating the z-scores for the transformed scales also revealed that all
of the scores were no longer significantly skewed (see Tables 7 and 8,
Appendix 10). The Kolmogorov-Smirnov tests (see Appendix 11) revealed
that although some of the scales still show a significant deviation from the
norm they have all moved towards the normal distribution.
The need for data to meet the normal distribution has been strongly
questioned (Bryman & Cramer, 2001; Welkowitz, Ewen, & Cohen, 2000).
Bryman and Cramer (2001) state that, ‘a number of studies have been carried
out where the values of statistics used to analyse samples have been
artificially set up to violate these conditions and have been found not to differ
greatly from those samples which do not violate those conditions’ (p.117).
Exceptions are stated as samples where the variances are unequal or where
the comparison variable is also non-normal (Bryman & Cramer, 2001).
Parametric tests have also been shown to be robust in the face of a deviation
from normality as long as the other assumptions are not violated (Lindman,
1974).
5.2.2. HOMOGENEITY OF VARIANCE This term means that the variances of the populations of the two sets of
scores are the same. However as researchers work with data from samples
rather than from populations it is unlikely that the two samples will have
exactly the same variance. Clark-Carter (1997) argues that as a rule of thumb
if the larger variance of the two samples is no more than three times the
smaller variance then it is legitimate to use parametric tests. As the
descriptives (Table 4 and 5, Appendix 10) show there is very little variance
between the groups. The assumption of homogeneity of variance is tested in
different ways for different procedures. Appropriate tests of variance and co-

160
variance will be applied as needed by further statistical tests applied to the
data.
5.2.3. INTERVAL DATA AND INDEPENDENCE The assumptions of interval data and independent measurements are, as
Field (2004) points out, tested only by common sense. The data collected for
this study could be considered interval if it is accepted that differences
between different points on the rating scale are equal (e.g. that the difference
between a rating of ‘strongly agree’ and ‘agree’ is the same as the difference
between a rating of ‘agree’ and ‘slightly agree’). This is often assumed for
rating scales such as the ones employed in this study although there is some
controversy about the issue (Field, 2004). It is also accepted that the data
from different participants in the study are independent.
Based on the normal distribution of over half the measures, the improved
normality tests for those scales that showed a deviation from the norm and the
fact that the data meets the other assumptions it was decided to go ahead
with the parametric data analysis.
5.3. ANALYSIS OF THE SCHOOL DEVELOPMENT PLANNING EVALUATION SCALE: PILOT STUDY In order to answer the research questions evidence that the School
Development Planning Evaluation Scale was both a reliable and valid
measure and was made up of the proposed five subscales described in
Chapter 3.2 needed to be demonstrated. According to Oppenheim (2001) a
measure needs to demonstrate the following attributes in order to be useful in
a study:
(a) Unidimensionality or homogeneity – the scale should be measuring one
thing at a time, as uniformly as possible; this means the item must be
internally cohesive and they should 'hang together' to measure the same
dimension with as little extraneous variance as possible.
(b) Reliability – this is about the internal consistency of the measure, the
correlation of the test within itself. It also relates to consistency over time.
Adequate reliability is a prerequisite to validity.

161
(c) Validity – this relates to the degree to which the scale measures what it
sets out to measure. Oppenheim (2001) argues that often it is impossible to
find a sufficiently reliable and valid external criterion against which to validate
some tests.
(d) Linearity and equal or equal appearing intervals – this has to do with
making quantitative scoring possible.
In order to establish the reliability and validity of the School Development
Planning Evaluation Scale the measure was put through two phases of
development and analysis. The first was a pilot study of the newly developed
scale which suggested certain changes. A revised scale was developed and
was reanalysed as part of the main study. The results of these analyses will
be presented in terms of the evidence they provide for the reliability and the
factorial structure of the scale. These will then be drawn together to provide
some overall conclusions about the features of the School Development
Planning Evaluation Scale and its usefulness for future studies in the area.
The initial scale construction as described in Chapter 4.5 was undertaken by
the present author and the pilot study formed part of a study undertaken by
Connolly (2000). As part of Connolly’s (2000) study the data were subjected
to the following analysis.
5.3.1. ITEM ANALYSIS Connolly (2000) argued that skewness and kurtosis should be measured and
items violating these limits removed to ensure the normality of the distribution
of the data. Although Cramer (1994) argues that items that produce a
skewness of above 1 or below -1 become inappropriate for parametric
analysis Connolly (2000) used above 1,5 and below -1,5 as the rule for
excluding items, as too many would have been removed using Cramer’s
criteria. Table 1 (in Appendix 12) lays out these results. Based on this the
following 8 items were removed from the set: 1, 2, 11, 14, 18, 20, 34, 43.
As with the measure of skewness items exhibiting a kurtosis of above 1 and
below -1 contribute almost no variance and should therefore be removed
162
(Cramer, 1994). Again Connolly (2000) made use of above 1.5 and below -
1.5 as the rule. Table 1 (Appendix 12) presents the results. Under this
criterion the decision to remove the items suggested above was confirmed.
Six other items were also dropped based on their levels of variance, these
were items: 6, 21, 26, 36, 41, 45.
Skewness and kurtosis figures may not be sufficient reason to exclude items
when examination of them produces no plausible argument as to why they
may be producing less variance than the others may. However, the items
generally produced low variance and this could be a problem for the rest of
the analyses, which are variance-based procedures. Given that all of the
items shared much of the variance and that the items to be excluded were
distributed fairly evenly across the five sub-scales Connolly (2000) argued for
the exclusion of those items identified as their removal would not weaken the
overall scale. Therefore a total of 14 items were dropped, leaving 38 items to
be used in the remaining analysis.
5.3.2. VALIDITY ANALYSIS The validity of a test is the extent to which it measures what it is intended to
measure. Validity can be established in a variety of ways (Oppenheim, 2001):
• Face validity:
The extent to which the items within the scale appear to measure what it is
they are supposed to measure. This is a very subjective process and not
good enough for establishing validity.
• Content validity:
Seeks to establish that the items or questions are a well-balanced sample of
the content domain to be measured.
• Concurrent validity:
Seeks to show how well the test correlates with other, well-validated
measures of the same topic, administered at about the same time.
• Predictive validity:
Shows how well the test can forecast some future criterion such as job
performance or future exam attainment.

163
• Construct validity:
Shows how well the test links up with a set of theoretical assumptions about
an abstract construct such as intelligence, conservatism or neuroticism. This
can take place in various ways. It can be established through measuring the
extent to which a test correlates with theoretically related (negatively or
positively) measures (convergent validity) while explaining its own unique
variance in the dependent variable of interest (discriminant validity).
As part of the development of the scale, content validity was established in a
variety of ways. Firstly, the items were selected based on the literature in the
area. Secondly, the items were discussed with professionals in the related
field, as well as representatives of the participating sample. All of this
contributes to arguing that the scale has content validity. In the pilot study
only construct validity, through item analysis and factor analysis, was
undertaken as no other tests were administered alongside the School
Development Planning Evaluation Scale. The exploration of the test’s validity
was further extended in the main study.
5.3.2.1. Item-Total Correlations In order to establish the unidimensionality (i.e. all of the items in a test
measure only one underlying dimension or construct) of the measure item-
total correlations were undertaken (Kline, 1994). This procedure correlates a
subject's score on the item, with the subject's total score, for all subjects in a
set. Where the correlation is high, it suggests that the item tends to measure
the underlying construct well. Where the correlation is low, it suggests that
the item is not a good measure of the underlying construct and should be
removed from the scale (Friedenberg, 1995). In establishing the
unidimensionality of a scale, its construct validity would be demonstrated, as
this would establish that the scale is measuring only one construct; however
what that construct is would have to be further explored (Breakwell, Hammond
& Fife-Schaw, 1997).
Based on the Pearson's Product Moment Correlation (see Table 2 Appendix
12) all items significantly correlate with the total (at the 0.01 level) except for

164
item 52. Connolly (2000) removed the item from the dataset for the rest of the
procedures. This updated dataset (with item 52 removed) was subjected to a
second item-total correlation. As Table 2 (Appendix 12) illustrates the results
for all item-correlations were significant at the 0.01 level except for item 5
which was only significant at the 0.05 level. However it was decided to retain
this item for the rest of the procedure. These results indicated that the scale
could adequately be described as unidimensional, clearly measuring one
construct consistently. However, item-total correlations only go part of the
way in establishing a test’s unidimensionality. In order to make a conclusive
statement about the dimensionality of the test its factorial structure needed to
be explored. Several writers (Nunnally, 1978; Oppenheim, 2001) advocate
that item analysis be used to make the first item selection and then the items
factored.
5.3.2.2. Factor Analysis Kline (1994) recommends the use of factor analysis in the construction of
psychological tests. Factor analysis, unlike item analysis, is a technique
whereby the multi-dimensionality of a scale can be examined (Breakwell et al,
1997). It is essentially a method of condensing data; the variance of a set of
variables (or set of items in this case) is condensed into a specific number of
factors which represent hypothetical underlying constructs, which account for
the relationship between sets of items. Where a set of items 'load' a particular
factor, the factor can be said to be representing a construct which that
particular set of items can be said to measure. Such a factor or construct can
be described in terms of explaining the variance of the entire set, how
important the factor is in explaining the data (Kline, 1994).
Factor analysis for this particular scale and dataset posed some potential
problems as the scale yielded very little variance. This issue can be dealt with
by using large samples, for example 100 according to Kline (1994) and 200
according to Guildford (1956, in Kline, 1994). However, in the pilot study
there were only 71 participants. It could be argued that with the sample size
of less than 100 and the issues facing the data set and scale it was
inadvisable to use factor analysis in the present study. However factor

165
analysis is a powerful technique and the factor solution was needed to see if
the scale could be conceptualised as multidimensional and if the five
hypothesised theoretical subscales derived from the working definition of
success in school development planning represent actual constructs
explaining the variance of the set. Thus a factor analysis was undertaken
being aware of the issues, but with the knowledge that this study would be
replicated using a larger group to confirm of disconfirm the pilot study’s
findings.
An exploration of the assumptions necessary for factor analysis supported the
decision to go ahead with it. The Determinant, which was testing for
multicollinearity or singularity, was less than 0.00001 indicating that
multicollinearity may be an issue. Mild multicollinearity is not a problem for
factor analysis; however it is important to avoid extreme multicollinearity and
singularity (where variables are perfectly correlated). However no variables
correlated very highly (R>0.8) (Table 2, Appendix 12) and the anti-image
correlation matrix indicates that the vast majority of the items have a value of
0.5 or more. The Kaiser-Meyer-Olkin (KMO) measure of sampling adequacy
score of .846 indicated that the sample was good enough and the significant
Bartlett’s test of sphericity indicated that the items were not perfectly
independent of one another. The test was highly significant (p<0.0001) and
therefore factor analysis was appropriate.
Due to the small sample size and the lack of variance the analysis was limited
to exploratory factor analysis. This is a technique that allows a large number
of correlated variables to be reduced to a smaller number of 'super variables'
by attempting to account for the pattern of correlations between the variables
in terms of a much smaller number of latent variables or factors (Field, 2004).
A latent variable is one that cannot be measured directly but is assumed to be
related to a number of measurable, observable manifest variables.
There are many different methods of identifying or extracting factors. Two of
the most common are Principal Component Analysis and Principal Factor
Analysis. Field (2004) argues that both of these methods are the preferred
166
methods and usually result in similar solutions. When these methods are
used conclusions are restricted to the sample collected and generalisation of
the results can only be achieved if analysis using different samples reveals
the same factor structure.
The difference between principal component analysis and principal factors
analysis lies in the communality estimates that are used. Basically, factor
analysis derives a mathematical model from what factors are estimated,
whereas principal component analysis merely decomposes the original data
into a set of linear variates (Dunteman, 1989). As such factor analysis can
only estimate the underlying factors and it relies on various assumptions for
these estimates to be accurate. Principal component analysis is concerned
only with establishing which linear components exist within the data and how
a particular variable might contribute to that component. Based on an
extensive literature review, Guadagnoli & Velicer (1988) concluded that the
solutions generated from principal component analysis differ little from those
derived from factor analytic techniques. However there is a lot of debate
about this issue (Cliff, 1987; Stevens, 1992).
Based on these arguments it was decided that Principal Axis factoring would
be used to explore the factorial structure of the measure. Table 6 presents
the results of this analysis. The decision to extract five factors was based
primarily on the theoretical question as to whether the five sets of theoretically
related items could constitute actual subscales. In an unrotated solution the
first factor can be described as the general (unidimensional) construct. After
rotation it just represents the most potent of the underlying multidimensional.
The Scree plot (see Figure 2) for confirming how many factors to extract was
difficult to interpret. It is clear that one factor exists; however the slope then
changes drastically and it becomes hard to determine how many other factors
should be extracted. Both the scree plot and eigen values might suggest 8
factors. Connolly (2000) argued that because this was such a tentative
suggestion, five were extracted to maximise the potential interpretability of the
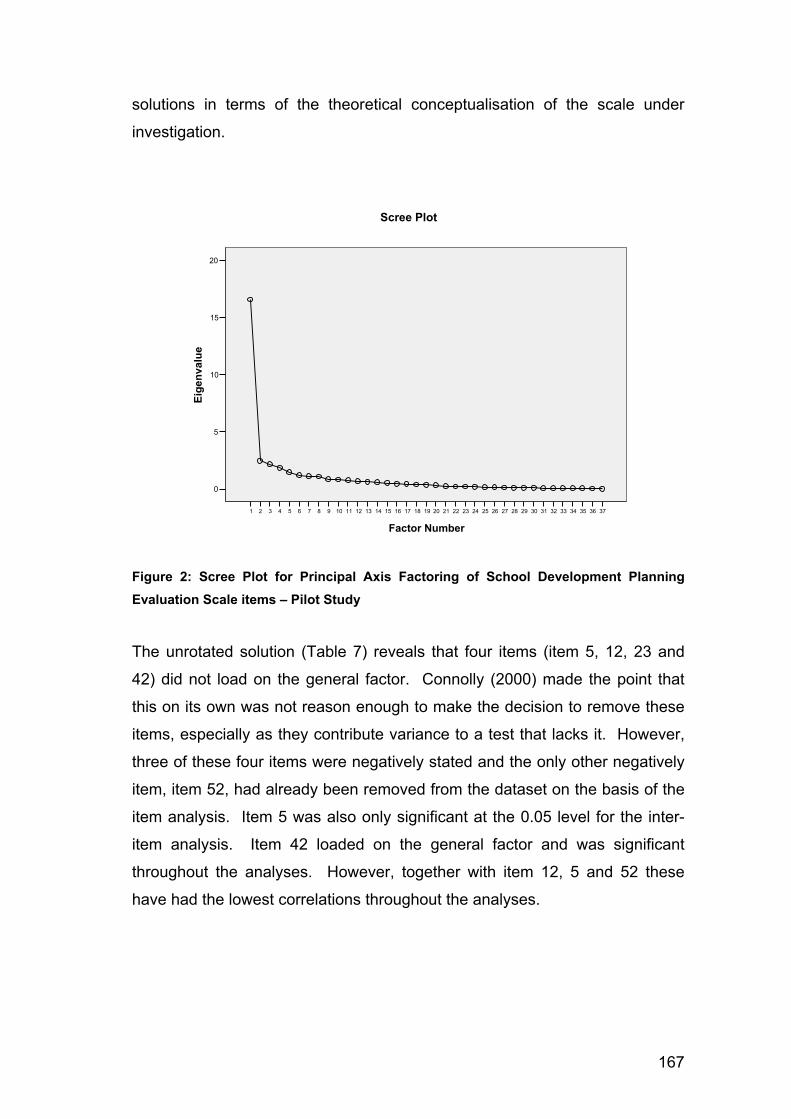
167
solutions in terms of the theoretical conceptualisation of the scale under
investigation.
37363534333231302928272625242322212019181716151413121110987654321
Factor Number
20
15
10
5
0
Eige
nval
ue
Scree Plot
Figure 2: Scree Plot for Principal Axis Factoring of School Development Planning Evaluation Scale items – Pilot Study
The unrotated solution (Table 7) reveals that four items (item 5, 12, 23 and
42) did not load on the general factor. Connolly (2000) made the point that
this on its own was not reason enough to make the decision to remove these
items, especially as they contribute variance to a test that lacks it. However,
three of these four items were negatively stated and the only other negatively
item, item 52, had already been removed from the dataset on the basis of the
item analysis. Item 5 was also only significant at the 0.05 level for the inter-
item analysis. Item 42 loaded on the general factor and was significant
throughout the analyses. However, together with item 12, 5 and 52 these
have had the lowest correlations throughout the analyses.

168
Table 6: Factor Analysis for School Development Planning Evaluation Scale Pilot Study: Total Variance Explained
Factor Initial Eigenvalues Extraction Sums of Squared Loadings Rotation Sums of Squared Loadings
Total% of
VarianceCumulative
% Total% of
VarianceCumulative
% Total% of
VarianceCumulative
%1 16.582 44.816 44.816 16.215 43.824 43.824 7.660 20.702 20.7022 2.471 6.680 51.496 2.063 5.577 49.400 5.083 13.739 34.4413 2.161 5.842 57.338 1.789 4.835 54.236 4.058 10.967 45.4084 1.843 4.982 62.320 1.434 3.875 58.111 3.031 8.191 53.5995 1.457 3.936 66.256 1.059 2.862 60.973 2.728 7.374 60.9736 1.190 3.216 69.4727 1.117 3.019 72.4918 1.099 2.971 75.4629 .871 2.353 77.816
10 .832 2.247 80.06311 .754 2.037 82.10012 .674 1.822 83.92213 .649 1.753 85.67514 .600 1.621 87.29615 .527 1.425 88.72116 .468 1.265 89.98617 .445 1.202 91.18718 .399 1.079 92.26619 .387 1.046 93.31220 .349 .943 94.25621 .259 .700 94.95522 .231 .625 95.58023 .222 .601 96.18124 .200 .540 96.72125 .172 .464 97.18426 .163 .440 97.62527 .139 .374 97.99928 .115 .310 98.30929 .114 .307 98.61630 .102 .275 98.89131 .082 .220 99.11132 .076 .207 99.31833 .069 .185 99.50334 .059 .159 99.66235 .052 .142 99.80436 .046 .124 99.92837 .027 .072 100.000
Extraction Method: Principal Axis Factoring.

169
Table 7: Unrotated Factor Matrix School Development Planning Evaluation Scale Pilot Study
Factor 1 2 3 4 5 Item 31 .806 -.143 -.129 -.072 -.197 Item 30 .784 -.133 .062 .078 -.116 Item 39 .778 .121 -.194 -.123 .054 Item 4 .778 .075 .048 .098 .057 Item 38 .773 -.150 -.285 .231 -.092 Item 40 .768 -.063 -.151 -.063 -.207 Item 37 .763 -.356 -.175 .075 .102 Item 19 .756 .129 .039 -.184 -.063 Item 15 .751 .011 .309 -.037 .150 Item 29 .745 .142 -.146 .363 -.058 Item 27 .741 -.155 -.157 -.006 -.027 Item 47 .734 -.003 -.243 -.168 -.058 Item 16 .734 .195 .066 .203 -.040 Item 44 .727 .252 .010 -.149 .261 Item 32 .718 -.371 -.149 -.176 .276 Item 50 .713 .240 -.288 -.072 .014 Item 49 .701 .140 -.419 -.076 -.023 Item 51 .679 .079 .068 -.192 .179 Item 35 .675 -.374 -.066 .078 .133 Item 33 .663 -.457 -.119 .077 .120 Item 24 .660 -.070 -.041 .038 -.040 Item 28 .647 -.335 .209 -.151 .000 Item 9 .637 -.048 .057 .322 -.016 Item 48 .628 .413 -.155 -.233 -.182 Item 17 .625 .083 -.016 .268 -.301 Item 25 .623 .015 .211 -.018 .020 Item 10 .618 .084 .436 -.142 -.010 Item 46 .615 .289 -.115 -.414 .007 Item 3 .585 -.272 .126 .105 .004 Item 13 .571 -.060 .286 -.216 .086 Item 22 .559 .095 .297 .093 -.504 Item 8 .557 -.219 .536 .176 .157 Item 7 .544 .299 .278 .222 -.078 Item 5_r .260 .454 -.136 .062 .285 Item 12_r .320 .429 .078 .392 .134 Item 23 .388 .099 .424 -.429 -.121 Item 42_r .392 .330 .084 .224 .402
Extraction Method: Principal Axis Factoring. a 5 factors extracted. 6 iterations required.
On the basis of this evidence Connolly (2000) concluded that these four
negatively weighted items (items 5, 12, 42, and 52) demonstrated less
construct validity than all the other items. A possible reason for this issue was

170
that the participants did not speak English as a first language and may have
experienced difficulties with negatively worded questions. In light of the fact
that the scale was going to be used in the main study with participants who
were also not English first language speakers and for the test to be of value
for use in assessing effective school development planning in South Africa, it
was decided that the items needed to be reworded or dropped from the scale.
Rotation of factors is only useful when analysing a multidimensional scale and
should not be used if the scale is conceptualised as unidimensional because
rotation takes variance from the first factor and distributes it across the other
factors (Kline, 1994). However, when looking at the results in Table 6 we see
a general factor, which explains about 43% of the variance on which most
items load highly. This is followed by a number of other relatively smaller
loadings. In these cases one should be cautious against assuming that this is
evidence of a unidimensional test. Such a solution is an algebraic artefact of
the method and should not be taken as proof of a general factor or what the
factor represents (Kline, 1994).
Kline (1994) points out no matter what method one uses for factor analysis,
factors have to be rotated before they can be interpreted in psychology and
the social sciences. The reason for this is that the aim of factor analysis is to
explain and account for the observed correlations and this means that the
factors must be interpreted and identified. For this unrotated solutions are not
useful. Rotating the factors is simply a way to distribute the factor loadings in
such a way as to make the job of interpreting the 'meaning' of the factors
easier. The aim is to ensure that each variable loads highly on only one
factor, thus ensuring simple structure. Simple structure is reached when each
item loads highly on one factor and does not load on any other (Kline, 1994).
For the pilot study a Varimax Kaiser rotation was undertaken. The rotated
solution, presented in Table 8, indicated that simple structure had not been
reached with roughly half the items loading on more than one factor. Some of
the items load on three factors. What this meant was that half of the items do
not clearly contribute to just one of the five theoretical subscale constructs

171
Table 8: Rotated Factor Matrix: School Development Planning Evaluation Scale Pilot Study Factor 1 2 3 4 5 Item 37 .801 .257 .136 .137 .100Item 33 .799 .132 .139 .082 .029Item 32 .767 .322 .262 -.133 .061Item 35 .742 .143 .187 .100 .091Item 38 .678 .355 -.027 .382 .173Item 27 .602 .384 .173 .224 .094Item 31 .579 .465 .240 .349 -.011Item 28 .564 .137 .490 .127 -.065Item 30 .563 .265 .321 .387 .122Item 3 .550 .043 .285 .228 .075Item 40 .504 .489 .204 .357 .020Item 9 .483 .090 .156 .396 .306Item 24 .473 .297 .213 .261 .141Item 4 .463 .321 .312 .296 .351Item 48 .065 .711 .228 .283 .185Item 46 .140 .698 .347 .031 .137Item 49 .420 .666 -.016 .179 .202Item 50 .339 .636 .095 .194 .295Item 39 .441 .588 .219 .157 .251Item 47 .475 .581 .175 .175 .076Item 19 .334 .505 .416 .246 .167Item 44 .315 .491 .388 .024 .436Item 23 -.023 .245 .680 .098 -.082Item 10 .210 .175 .660 .237 .182Item 8 .454 -.228 .578 .214 .250Item 15 .427 .198 .575 .180 .314Item 13 .318 .198 .559 .061 .096Item 25 .340 .200 .428 .229 .205Item 51 .364 .399 .427 .028 .258Item 22 .131 .176 .389 .687 -.018Item 17 .328 .249 .101 .591 .177Item 29 .464 .315 .020 .485 .426Item 7 .106 .134 .340 .454 .409Item 16 .348 .300 .258 .430 .402Item 42_r .137 .106 .154 .013 .654Item 12_r -.002 .067 .030 .290 .612Item 5_r -.041 .316 -.006 -.041 .524
Extraction Method: Principal Axis Factoring. Rotation Method: Varimax with Kaiser Normalization. a Rotation converged in 10 iterations.
and thus the theoretical factors share the overall variance. Examination of the
factors, in Table 8, revealed that each factor loaded items from a variety of the
five 'subscales' and no factor clearly demonstrated viability as a construct or
dependent variable. If the sample size had been much larger one could have
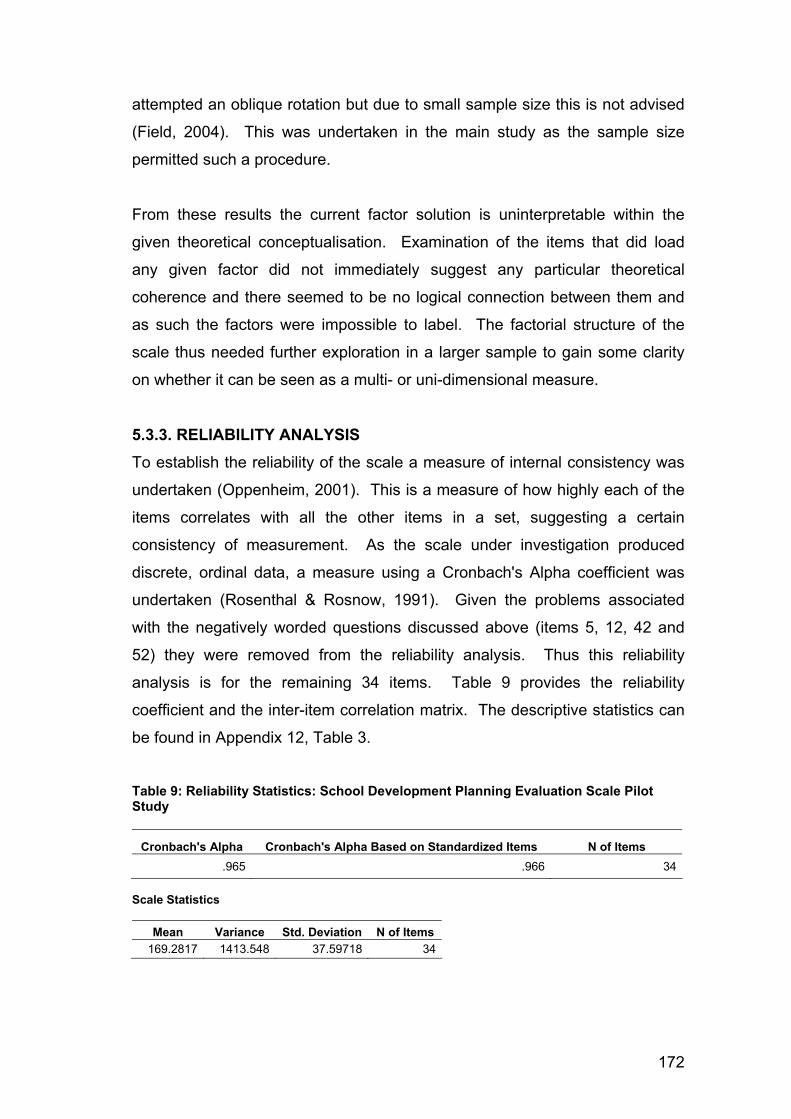
172
attempted an oblique rotation but due to small sample size this is not advised
(Field, 2004). This was undertaken in the main study as the sample size
permitted such a procedure.
From these results the current factor solution is uninterpretable within the
given theoretical conceptualisation. Examination of the items that did load
any given factor did not immediately suggest any particular theoretical
coherence and there seemed to be no logical connection between them and
as such the factors were impossible to label. The factorial structure of the
scale thus needed further exploration in a larger sample to gain some clarity
on whether it can be seen as a multi- or uni-dimensional measure.
5.3.3. RELIABILITY ANALYSIS To establish the reliability of the scale a measure of internal consistency was
undertaken (Oppenheim, 2001). This is a measure of how highly each of the
items correlates with all the other items in a set, suggesting a certain
consistency of measurement. As the scale under investigation produced
discrete, ordinal data, a measure using a Cronbach's Alpha coefficient was
undertaken (Rosenthal & Rosnow, 1991). Given the problems associated
with the negatively worded questions discussed above (items 5, 12, 42 and
52) they were removed from the reliability analysis. Thus this reliability
analysis is for the remaining 34 items. Table 9 provides the reliability
coefficient and the inter-item correlation matrix. The descriptive statistics can
be found in Appendix 12, Table 3.
Table 9: Reliability Statistics: School Development Planning Evaluation Scale Pilot Study
Cronbach's Alpha Cronbach's Alpha Based on Standardized Items N of Items .965 .966 34
Scale Statistics
Mean Variance Std. Deviation N of Items 169.2817 1413.548 37.59718 34

173
The alpha coefficient for the adjusted dataset was calculated as 0.96. This is
a particularly high result suggesting that the items were very consistent with
one another in the construct that they measure. This again provided clear
evidence that the scale produces little variability. If items 5, 12 and 42 were
included (52 had been dropped in the item analysis) the reliability figure only
changes by about 0.04.
5.3.4. CONCLUSIONS FROM THE PILOT STUDY It is clear that the scale produced very little variance, with responses both
within and between subjects homogeneously positive. This could be
interpreted as an indication of the effectiveness of school development
programme however there may be other explanations for this. Connolly
(2000) suggested that it may be construed as a form of instrument reactivity to
subtle forms of contextual effects. For example, it may be that participants felt
they had to be positive about the programme in order to receive continued
support or funding. In this case the scale may be measuring something other
than successful development planning i.e. a desire for continued support.
The five constructs derived from the working definitions of organisational
empowerment did not seem to be separate constructs within the data, with
each item and each 'construct' sharing a lot of variance with the others. The
extent to which factors overlapped and shared variance suggested that while
they may be separate constructs in theory, people are, in general,
approaching each item as if it were a general evaluation of the programme as
opposed to a specific aspect of the programme. It is possible that this led to
staff not being differentially critical of the various aspects of the process.
Connolly (2000) also felt that confidentiality might have played a part. In the
pilot the biographical questionnaire was administered first. Also people sat
closely together and could look at each other's papers. Negative responses
could be construed as negative about the people with whom participants
work. These issues were taken into account for the main study.
The results of the analysis from the pilot study clearly show that there is no
theoretical basis at present for viewing the scale as multidimensional. The
174
results show that the scale is consistently measuring a single construct.
However, at this pilot study phase we cannot state what this construct is. On
the basis of the results from the pilot study the following fourteen items were
omitted from the scale due to lack of variance (items 1, 2, 6, 11, 14, 18, 20,
21, 26, 34, 36, 41, 43 and 45), three of the four negatively worded items were
reworded and one was dropped as it was not possible to change the wording
to a positive.
5.4. ANALYSIS OF THE SCHOOL DEVELOPMENT PLANNING EVALUATION SCALE: MAIN STUDY The revised scale, made up of 37 items (see Appendix 3), was used in the
main study that had the benefit of a much larger sample, 248 in total. By
revisiting the issues of reliability and validity with this revised scale, on a larger
population, it was hoped that something more could be said about the
usefulness of this scale as a measure of organisational empowerment through
school development planning.
5.4.1. FACTOR ANALYSIS As in the pilot study some preliminary investigations of the data were
undertaken. The inter-item correlations between variables were looked at. As
Table 4 (Appendix 12) reflects, all items correlate significantly with the total.
The correlations were scanned to check for extremes, for example items that
did not correlate (0.05) or that correlated too highly (0.9) and none were
evident. The anti-image correlation matrix indicates that vast majority of the
items have a value of 0.5 or over. The Determinant was less than 0.00001
and thus multicollinearity could be an issue. However, there were no
variables that correlated very highly (R>0.8).
The KMO score of .945 indicated that the sample fell in the superb range thus
factor analysis is appropriate for these data (Hutcheson & Sofroniou, 1999).
The significant Bartlett’s test indicates that the items are not perfectly
independent of one another. The test is highly significant (p<0.0001) and
therefore factor analysis is appropriate. These results indicated that the scale
can be described as measuring one construct consistently, i.e. the test can be

175
construed as unidimensional. However, as was mentioned previously, to
conclude that this is the case we would need to look at the factorial structure
of the scale.
The factor analytic process followed in the main study was as follows:
Principal axis, scree plot, Varimax Rotation, oblique Direct Oblimin Rotation.
Principal Axis Factoring was used to examine the factorial structure of the
scale. In the pilot study the initial five-factor structure that had been proposed
was not supported and thus an exploratory factor analysis, in which the
number of factors to be extracted was not specified in advance, was used.
Similar results to the pilot study emerge from analysis of the tables. As Table
10 (see page 134) indicates there does seem to be a general factor that
accounts for 48% of the variance on which most items load highly. The Scree
test (Figure 3) indicates that there is one clear factor that exists. After that the
slope changes dramatically and it becomes difficult to determine how many
factors should be extracted. As was stated in the pilot study, we cannot take
this as evidence that the test is unidimensional as such a solution is an
algebraic artefact of the method and should not be taken as proof of a general
factor or what that factor represents. Table 11 (see p. 135) supported this,
indicating that although there is a single factor, several items load on more
than one factor.
37363534333231302928272625242322212019181716151413121110987654321
Factor Number
20
15
10
5
0
Eige
nval
ue
Scree Plot
Figure 3: Scree Plot for Principal Axis factoring of School Development Planning Evaluation Scale items – Main Study

176
A rotated factor analysis (Varimax) was undertaken to see if simple structure
could be reached by the test. From Table 12 (see page 136) it is clear that,
as in the pilot study, this simple structure was not reached. Although all the
factors do load highly on the first factor, several of them do load more highly
on the other factors. Twenty-nine of the items load on more than one factor.
Twelve of these items load on three factors and one on four items. What this
means is that the majority of the items do not clearly contribute to just one of
the five theoretical subscale constructs and thus the theoretical factors share
the overall variance. It thus appears that many of the items do not clearly
contribute to a subscale but rather they all contribute to the variance in the
scale as a whole. It would thus appear that the test, rather than measuring a
variety of areas, is unidimensional.
Kline (1994) suggests that in cases where simple structure was not achieved
using Varimax, an oblique rotation should be utilised. Table 13 (see page
137) gives the results of the oblique rotation. The Pattern Matrix of the
Oblique Rotation indicated that there may be five factors, the factor structure
of these items is not as simple as is desirable. Other tables relevant to this
oblique rotation can be found in Appendix 12, Tables 5 and 6.
Kline (1994) suggests that the content of the highest loading items is the key
to the identification of factors, although it should be noted that this is little
more than face validity. By looking at largest loadings one gets a sense that it
is measuring a particular factor, but because so many are shared this would
indicate that they are not purely measuring that factor and as such these
factors are linked. Eight of the items load highly on two factors. It is thus not
clear that there are five sub-factors within the scale. The correlation matrix
between factors (Table 14, see page 138) and the Structure Matrix (see Table
6, Appendix 12) indicated high interrelationships between most of the factors.

177
Table 10: Factor Analysis School Development Planning Evaluation Scale Main Study: Total Variance Explained
Factor Initial Eigenvalues Extraction Sums of Squared Loadings Rotation Sums of Squared Loadings
Total% of
VarianceCumulative
% Total% of
Variance Cumulative % Total% of
VarianceCumulative
%1 18.171 49.112 49.112 17.788 48.075 48.075 6.230 16.839 16.8392 1.677 4.532 53.644 1.337 3.612 51.687 5.001 13.516 30.3553 1.632 4.412 58.056 1.231 3.326 55.013 4.020 10.864 41.2194 1.273 3.442 61.498 .899 2.431 57.444 3.454 9.335 50.5545 1.223 3.307 64.804 .810 2.190 59.634 3.360 9.080 59.6346 .988 2.670 67.4757 .928 2.509 69.9838 .884 2.389 72.3729 .811 2.192 74.563
10 .741 2.004 76.56711 .687 1.857 78.42512 .609 1.645 80.07013 .590 1.595 81.66414 .507 1.372 83.03615 .485 1.311 84.34716 .462 1.249 85.59617 .437 1.181 86.77718 .398 1.076 87.85319 .390 1.054 88.90720 .383 1.036 89.94321 .373 1.008 90.95122 .339 .917 91.86823 .327 .884 92.75224 .317 .857 93.60925 .284 .766 94.37526 .254 .686 95.06127 .248 .669 95.73128 .232 .626 96.35729 .214 .577 96.93430 .195 .526 97.46031 .182 .491 97.95232 .167 .451 98.40333 .153 .415 98.81734 .134 .362 99.18035 .115 .310 99.49036 .105 .285 99.77437 .083 .226 100.000

178
Table 11: Unrotated Factor Matrix: School Development Planning Evaluation Scale Main Study
Factor Item 1 2 3 4 5
SDPE 27 .826 -.284 .037 -.158 .075SDPE 29 .821 -.298 -.058 -.129 .136SDPE 36 .808 -.147 -.107 .018 -.042SDPE 6 .794 .074 .134 -.102 .104SDPE 26 .793 -.157 -.043 .155 -.234SDPE 13 .787 -.103 .098 -.019 -.016SDPE 35 .769 -.305 .003 -.162 .103SDPE 31 .763 -.163 -.196 -.102 .125SDPE 23 .761 .026 -.222 .104 -.106SDPE 18 .751 .027 .126 .201 -.153SDPE 24 .746 -.048 -.173 .008 -.141SDPE 22 .738 -.030 -.079 .143 -.156SDPE 16 .727 -.034 .084 -.148 -.064SDPE 37 .722 -.004 -.268 -.138 -.056SDPE 10 .722 .167 .047 .123 .051SDPE 28 .719 -.258 -.140 -.203 .209SDPE 25 .711 -.090 -.157 .127 -.106SDPE 4 .705 .110 .232 .216 .124SDPE 33 .705 -.098 .008 .150 .148SDPE 5 .686 .512 -.170 -.195 -.022SDPE 9 .672 .374 -.118 -.240 -.121SDPE 3 .671 .154 .186 -.106 .172SDPE 19 .655 .153 -.274 .102 -.149SDPE 21 .654 .125 -.091 .255 .122SDPE 34 .647 -.114 -.072 .063 -.091SDPE 7 .643 .172 .210 .253 .302SDPE 12 .638 -.073 .454 -.223 -.270SDPE 14 .630 -.061 .092 -.024 -.213SDPE 17 .610 .192 -.156 .334 .162SDPE 2 .610 .266 .254 -.138 .221SDPE 11 .601 -.005 .403 .059 -.181SDPE 8 .597 .104 .318 .060 -.193SDPE 30 .586 -.124 .161 .006 .155SDPE 1 .583 .395 -.094 -.298 .058SDPE 32 .557 -.141 -.128 -1.56E-005 .144SDPE 15 .550 .128 -.190 .001 -.126SDPE 20 .519 -.109 .044 .068 .049
Extraction Method: Principal Axis Factoring. a 5 factors extracted. 9 iterations required.

179
Table 12: Rotated Factor Matrix: School Development Planning Evaluation Scale Main Study
Factor Item 1 2 3 4 5
SDPE 29 .749 .302 .263 .181 .217SDPE 28 .734 .226 .126 .232 .169SDPE 27 .716 .271 .368 .191 .194SDPE 35 .714 .246 .307 .164 .172SDPE 31 .639 .368 .128 .265 .207SDPE 36 .535 .482 .285 .202 .221SDPE 13 .486 .330 .420 .211 .274SDPE 37 .473 .465 .137 .387 .088SDPE 32 .472 .267 .075 .135 .223SDPE 33 .452 .331 .223 .112 .418SDPE 6 .445 .217 .387 .386 .361SDPE 16 .439 .275 .413 .311 .164SDPE 30 .433 .122 .300 .105 .326SDPE 20 .343 .234 .228 .071 .247SDPE 26 .402 .599 .409 .090 .193SDPE 23 .363 .594 .190 .275 .234SDPE 19 .217 .592 .119 .335 .191SDPE 22 .331 .548 .313 .177 .240SDPE 25 .391 .544 .224 .150 .212SDPE 24 .415 .533 .251 .261 .143SDPE 18 .249 .468 .466 .154 .351SDPE 15 .205 .437 .138 .322 .120SDPE 34 .385 .429 .262 .131 .175SDPE 12 .306 .101 .766 .218 .049SDPE 11 .183 .194 .641 .107 .259SDPE 8 .120 .246 .573 .197 .259SDPE 14 .302 .356 .443 .178 .103SDPE 5 .143 .354 .151 .759 .237SDPE 1 .215 .174 .143 .686 .172SDPE 9 .193 .348 .246 .667 .119SDPE 2 .259 -.014 .335 .460 .429SDPE 3 .345 .092 .337 .395 .391SDPE 7 .234 .161 .250 .196 .679SDPE 4 .252 .254 .386 .182 .562SDPE 17 .180 .453 .017 .209 .538SDPE 21 .250 .423 .115 .209 .483SDPE 10 .261 .358 .291 .311 .437
Extraction Method: Principal Axis Factoring. Rotation Method: Varimax with Kaiser Normalization. a Rotation converged in 10 iterations.

180
Table 13: Oblique Rotation Pattern Matrix School Development Planning Evaluation Main Study
Factor Item 1 2 3 4 5
SDPE 28 .876 .083 -.117 -.031 .041SDPE 29 .847 -.003 .050 .019 -.021SDPE 35 .809 -.016 .122 -.040 .013SDPE 27 .781 .008 .190 -.028 .005SDPE 31 .702 .146 -.092 .054 -.100SDPE 32 .524 .023 -.093 .143 -.064SDPE 36 .501 .076 .143 .100 -.238SDPE 37 .444 .359 -.032 -.059 -.239SDPE 30 .430 -.052 .178 .216 .112SDPE 13 .419 .071 .307 .123 -.069SDPE 33 .418 -.046 .072 .369 -.068SDPE 16 .365 .224 .310 -.027 -.034SDPE 6 .348 .284 .232 .190 .103SDPE 24 .334 .197 .141 .038 -.326SDPE 34 .329 .031 .176 .096 -.249SDPE 20 .319 -.048 .139 .183 -.057SDPE 5 -.090 .870 -.007 .106 -.061SDPE 1 .073 .768 -.023 -.002 .097SDPE 9 -.008 .752 .127 -.050 -.098SDPE 2 .124 .406 .191 .279 .331SDPE 15 .083 .334 .053 .060 -.273SDPE 3 .240 .314 .190 .241 .215SDPE 12 .157 .114 .808 -.210 .075SDPE 11 -.014 -.013 .682 .142 -.012SDPE 8 -.111 .122 .605 .161 -.060SDPE 18 .046 .044 .438 .303 -.243SDPE 14 .183 .099 .422 -.028 -.193SDPE 7 .086 .057 .109 .691 .159SDPE 17 .031 .144 -.129 .625 -.198SDPE 4 .076 .044 .294 .535 .039SDPE 21 .118 .126 -.023 .515 -.166SDPE 10 .088 .237 .176 .389 -.077SDPE 26 .284 -.036 .363 .118 -.411SDPE 19 .058 .344 .020 .168 -.402SDPE 23 .248 .221 .068 .181 -.370SDPE 25 .314 .056 .124 .160 -.349SDPE 22 .196 .090 .243 .186 -.345
Extraction Method: Principal Axis Factoring. Rotation Method: Oblimin with Kaiser Normalization. a Rotation converged in 20 iterations.

181
Table 14: Factor Correlation Matrix School Development Planning Evaluation Scale Main Study Factor 1 2 3 4 5
1 1.000 .567 .583 .564 -.3852 .567 1.000 .462 .508 -.3093 .583 .462 1.000 .480 -.1914 .564 .508 .480 1.000 -.2845 -.385 -.309 -.191 -.284 1.000
Extraction Method: Principal Axis Factoring. Rotation Method: Oblimin with Kaiser Normalization. It is possible that the original theoretical distinction between the five sub-
scales accounts for some of the issue here. Close scrutiny of the items, and
the dimensions they were initially said to be assessing, highlight that the initial
conceptualisation of the items that made up this factor may have not been as
clear as originally thought. This relates to issues of empowered outcomes
and empowering processes. Very often these can be one and the same
thing. In order to achieve certain goals that would describe the school as
empowered, certain empowered processes would need to be in place.
However these outcomes and processes are interchangeable; for example
having parent support for the school development plan may be a goal or an
outcome but it is a necessary process if one wants to raise funds effectively.
As another example, the school management team’s role in the school
development plan is closely linked to how involved teachers feel they are with
respect to decisions about the plan. Both of these were stated as desired
outcomes by schools but they are also processes that are not only linked but
are vital to successful implementation of the school development plan. This
seems to be true for most of the items and thus it would be difficult to group
them, as it would be difficult to know how the school was assessing each
issue.
Closer analysis of the factors seems to suggest that there are some factors
being highlighted however this would need some critical analysis and it is
difficult to think of which would be the higher order area of school
development planning and the factors that make it up. We may therefore just
have to accept that the test is measuring one broad area of school
development planning as a process and as an outcome. If the scale was
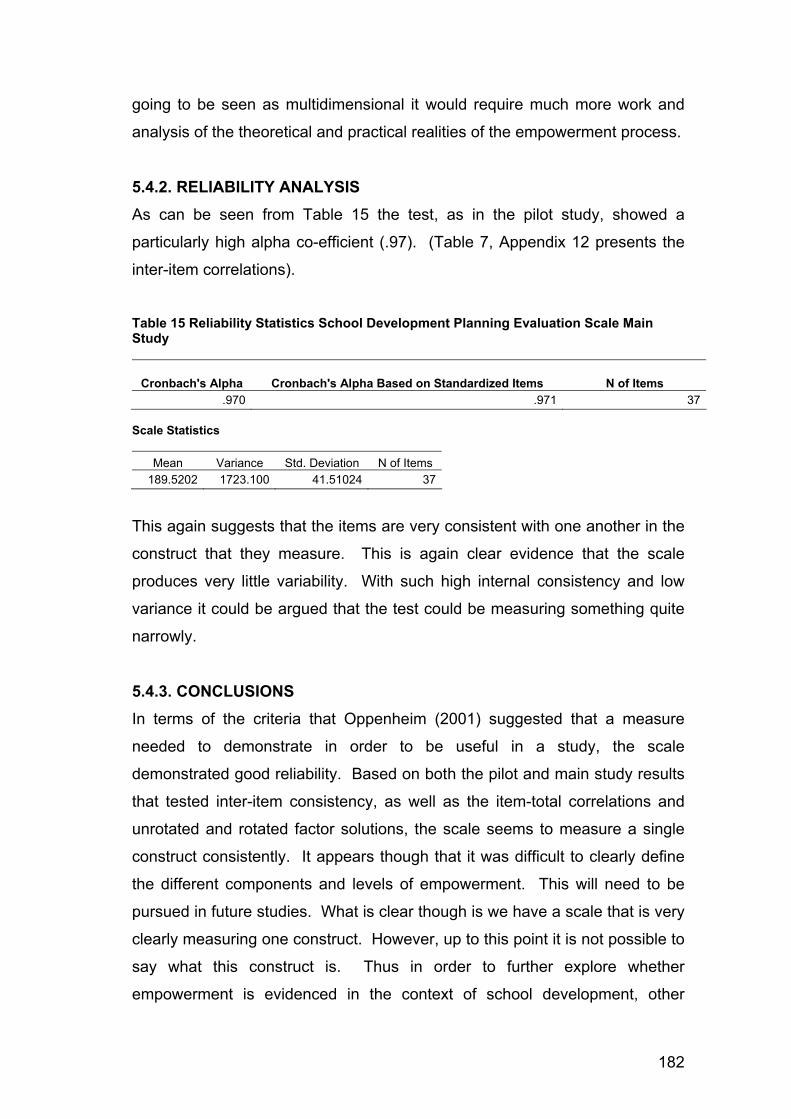
182
going to be seen as multidimensional it would require much more work and
analysis of the theoretical and practical realities of the empowerment process.
5.4.2. RELIABILITY ANALYSIS As can be seen from Table 15 the test, as in the pilot study, showed a
particularly high alpha co-efficient (.97). (Table 7, Appendix 12 presents the
inter-item correlations).
Table 15 Reliability Statistics School Development Planning Evaluation Scale Main Study
Cronbach's Alpha Cronbach's Alpha Based on Standardized Items N of Items .970 .971 37
Scale Statistics
Mean Variance Std. Deviation N of Items 189.5202 1723.100 41.51024 37
This again suggests that the items are very consistent with one another in the
construct that they measure. This is again clear evidence that the scale
produces very little variability. With such high internal consistency and low
variance it could be argued that the test could be measuring something quite
narrowly.
5.4.3. CONCLUSIONS In terms of the criteria that Oppenheim (2001) suggested that a measure
needed to demonstrate in order to be useful in a study, the scale
demonstrated good reliability. Based on both the pilot and main study results
that tested inter-item consistency, as well as the item-total correlations and
unrotated and rotated factor solutions, the scale seems to measure a single
construct consistently. It appears though that it was difficult to clearly define
the different components and levels of empowerment. This will need to be
pursued in future studies. What is clear though is we have a scale that is very
clearly measuring one construct. However, up to this point it is not possible to
say what this construct is. Thus in order to further explore whether
empowerment is evidenced in the context of school development, other

183
measures associated with empowerment at various levels were explored.
The issue of what the underlying construct being measured by the School
Development Planning Evaluation Scale is further explored once these other
analyses are presented.

184
CHAPTER SIX: RESULTS RELATING TO THE IMPACT OF THE
PROGRAMME
6.1. INTRODUCTION An attempt was made to develop a measure of school development planning
to assess the level of organisational change brought about by the programme
and to establish evidence for this construct as one related to empowerment.
However as the results from the previous section highlighted it was clear that
although the factors being measured by the scale appeared to form a single
construct it was not possible to establish whether the underlying school
development construct was an empowerment factor. In order to establish that
empowerment was indeed evidenced in the school development setting it was
therefore necessary to focus on those variables that have previously been
established as being related to empowerment at various levels of analysis.
To assess whether empowerment was evidenced in the schools a comparison
of those schools that had been on the programme for three years with those
who had been on one year was undertaken. Evidence of empowerment
within this setting was sought from a variety of sources. As empowerment is a
complex, multilevel and dynamic construct both qualitative and quantitative
data, from various sources and collected at different times, were analysed.
Research Questions 1 and 2 were operationalised and assessed in the
following way:
RESEARCH QUESTION 1 What effect has the school development planning process had in terms of
empowering schools as organisations?
This was assessed through the following data sets:
• School Development Planning Evaluation Scale to measure differences
between the schools which had been in the programme for 3 years and
those which had been in the programme for 1 year;

185
• Focus groups with teachers to get their perspectives on the impact of
school development planning as an empowerment process;
• Objectives from previous school development plans the schools had
achieved;
• Interviews with the principals and School Development Teams of the 24
schools involved with the programme related to use of the school
development planning, functioning of the School Development Team and
role of principal in school development planning;
• Regrouped quantitative data contrasting schools that had performed well
on the School Development Planning Evaluation Scale with those which
performed less well;
• Impact Matrix integrating all of the above information.
RESEARCH QUESTION 2 What effects has the school development planning process had on variables
associated with empowerment at the individual, organisational and community
levels?
This was assessed through the following data sets:
• Quantitative Measures of variables associated with empowerment at the
individual level (intrapersonal empowerment) both personal (locus of
control and self-efficacy) and professional (teacher efficacy), and at the
organisational level such as leadership (Profile of Organisational
Characteristics, Supervisory Leadership), peer leadership (Peer Leadership
Scale), participation in decision-making (Psychological participation Scale
and Participation and Decision Centralisation Scale), and collaboration
(Collaboration Scale) were used to assess if there were differences
between the schools that have been in the programme for 3 years and
those that have been in the programme for 1 year. No measure of the
community level was used, as the School Development Planning
Evaluation Scale’s stakeholder involvement subscale did not appear to be
an independent sub-scale;
• Focus groups with teachers to get their perspectives on the impact of the
programme in terms of changes experienced by teachers personally as

186
well as on organisational variables (such as involvement in decision-
making, participation in school activities and management) and community
variables (such as parent and other stakeholder involvement);
• Evaluation reports documenting changes in the schools that had completed
the programme at the individual, organisational and community levels;
• Regrouped quantitative data contrasting schools that had performed well
on the School Development Planning Evaluation Scale with those who
performed less well;
• Impact Matrices constructed to integrate the various data sources.
Thus an attempt will be made to:
1. Assess whether the programme under investigation has been successful
in terms of empowering the schools as organisations through the process
of school development planning;
2. Assess the change at an individual, organisational and community level
linked to school development planning for evidence of empowerment.
6.2. DESCRIPTIVE STATISTICS FOR BOTH GROUPS IN THE STUDY From the descriptives, in Tables 4 and 5 (in Appendix 10), of the School
Development Planning Evaluation Scale it can been seen that, on average,
participants from both groups felt the school development planning
programme had brought about change within their schools, with both mean
total scores corresponding to the ‘great change has occurred’ category on the
response scale (that is scores between 185 and 259). However, this does not
give a reflection of the schools within the groups. The descriptive statistics for
each school (see Table 1, Appendix 13) indicated that all of the schools rated
school development planning as having brought about some form of change
at their school. Nine (6 from Group 1 and 3 from Group 2) felt it had brought
about some change (between 112 and 184) and 9 (4 from Group 1 and 5 from
Group 2) felt it had brought about great change (between 185 and 259). Both
groups showed a large amount of variability in their scores on this scale. This
issue of variability and its impact on comparisons between the groups will be
explored later.

187
In terms of the Locus of Control Scale Tables 4 and 5 (Appendix 10) indicated
that both groups scored above the moderate range, indicating that they felt a
sense of personal control over the issues that affect their lives. Tables 4 and
5 (Appendix 10) indicated that on the General Self-Efficacy Scale both groups
showed moderate levels of self-efficacy as was the case for the Teacher-
Efficacy Scale. Again, when looking at the descriptive statistics for the
individual schools (see Appendix 13, Tables 2, 3 and 4) both groups exhibit a
fair amount of variation on the scales of individual empowerment. For Locus
of Control and Teacher Efficacy the variability of Group 2 looks greater.
The groups reported a moderate level of involvement in decision making at
the school as measured by the Participation and Decision Centralisation
Scale. Both groups felt they have influence, to some extent, in the decision-
making processes within the school, as measured by the Psychological
Participation Scale. Both groups reported having moderate levels of
collaboration within the schools as measured on the Collaboration Scale.
(These results are presented in Tables 4 and 5, Appendix 10). Although the
groups reported similar means scores on the descriptive statistics, the
individual school results (Appendix 13, Tables, 5, 6 and 7) indicated a large
amount of variability on the measures of participation and collaboration
between schools and large variance within school scores.
According to the development of the Profile of Organisational Characteristics
scale the scores are to be interpreted according to the following scale:
System 1 – Exploitative Authoritative: 16-32
System 2 – Benevolent Authoritative: 32-48
System 3 – Consultative: 48-56
System 4 – Participative: 56-64
Tables 4 and 5 (Appendix 10) indicated that the scores of both groups fell
within the System 2 level of benevolent authoritative leadership however there
was a lot of variation. A slightly different picture emerges when looking at the
scores of the individual schools (see Appendix 13, Table 9). As Table 14
indicates, although the majority of the schools from both Group 1 and 2 see

188
their principals as falling within the benevolent authoritative system, three of
the Group 1 schools did fall into the consultative system.
Table 16: Systems Categorisation of Profile of Organisational Characteristics Scores for Group 1 and Group 2 by School Group 1 Group 2 Total
System 1: Authoritative 0 0 0
System 2: Benevolent Authoritative 7 7 14
System 3: Consultative 3 1 4
System 4: Participative 0 0 0
Tables 4 and 5 (Appendix 10) indicated that both groups felt that, overall, the
qualities measured by the Supervisory Leadership scale were present to
some extent in their relationship with the principal. Again there is evidence of
variability within and between schools on the leadership scales (see Table 10,
Appendix 13). The descriptives for the Peer Leadership Scale (Tables 4 and
5, Appendix 10) indicated that both groups feel that overall the qualities as
measured by this scale are present to some extent amongst their peers.
From the descriptive statistics all of the schools’ scores reflected that school
staff felt the school development programme had brought about some change
in their schools. The groups report being involved in the decision making
process to some extent, that they have some influence in decision making
and that there are high levels of collaborative working. In terms of leadership
the groups generally rated their school’s organisational culture as being
benevolent authoritarian and that the qualities that make up Supervisory
Leadership are present to some extent in their relationship with the principal.
Both groups also report moderate levels of peer leadership in terms of
support, goal emphasis and work facilitation and higher levels of interaction
facilitation. The groups also report a moderate sense of personal control, self-
efficacy and efficacy as a teacher.
What was also evident from the descriptives was the large amount of
variability displayed within the schools, across the schools and between the
groups. This may interfere with the ability to compare differences between the

189
groups. Although both groups of schools express that change has been
brought about by the school development programme (as measured by the
School Development Planning Evaluation Scale), this provides no evidence
as to whether being on the programme for one year or three years makes a
significant difference to the various measures of variables related to
empowerment. In order to assess this, an ex post facto analysis was
conducted based on a post-test only comparison group evaluation design.
6.3. QUANTITATIVE ANALYSES RELATING TO RESEARCH QUESTION ONE In order to assess the difference between several variables that are linked
theoretically and empirically a MANOVA was used to quantitatively assess
Research Question One and Two. As was argued in the Methodology,
MANOVA has greater power to detect effects based on whether groups differ
along a combination of variables.
6.3.1. STATISTICAL ASSUMPTIONS OF MANOVA MANOVA is based on the same assumptions as those for other parametric
tests but some of these are extended to the multivariate level. MANOVA
assumes that the independent variable is, or variables are, categorical and
that the dependent variables are continuous and interval level. As discussed
previously the data are interval and independent.
The additional assumptions for MANOVA are: multivariate normality and
homogeneity of variances and covariances. In practice, it is common to
assume multivariate normality if each variable considered separately follows a
normal distribution. This assumption has already been established. This
solution is practical and useful because univariate normality is a necessary
condition for multivariate normality but it does not guarantee multivariate
normality; however MANOVA is robust in the face of most violations of this
assumption if sample size is not small (that is <20) (Field, 2004).
The assumption of homogeneity of variances and covariances is examined by
testing whether the population variance -covariance matrices are equal. The
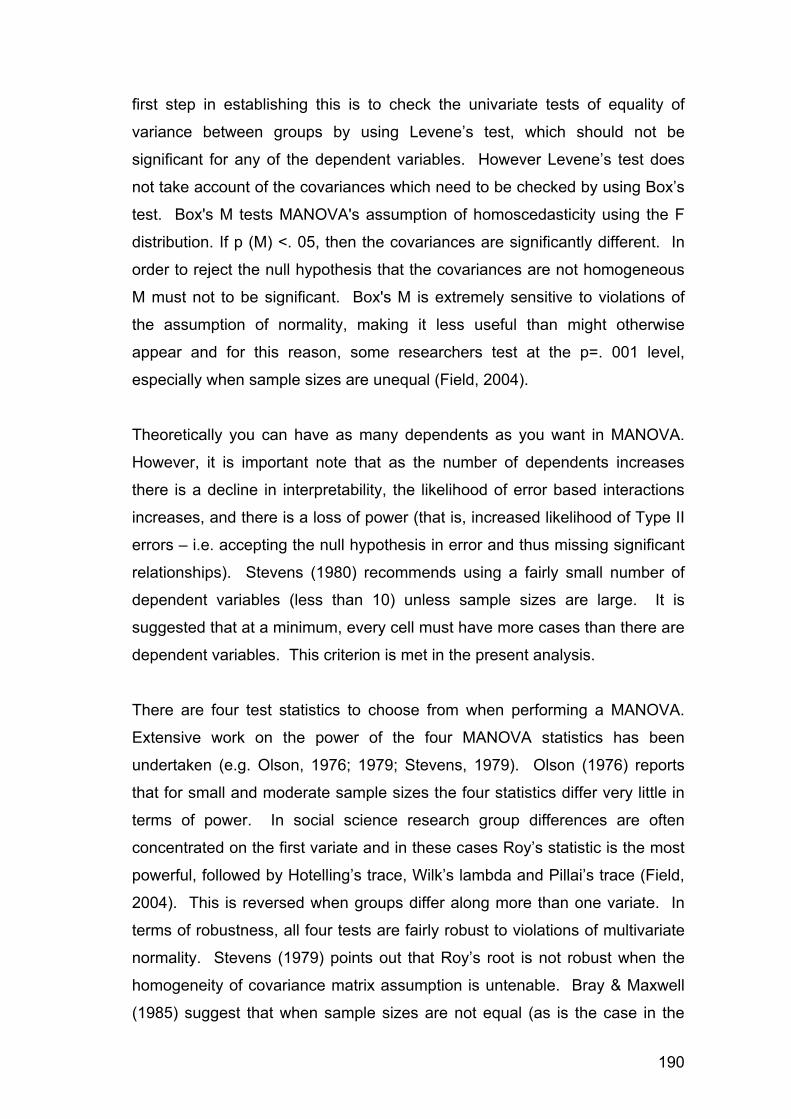
190
first step in establishing this is to check the univariate tests of equality of
variance between groups by using Levene’s test, which should not be
significant for any of the dependent variables. However Levene’s test does
not take account of the covariances which need to be checked by using Box’s
test. Box's M tests MANOVA's assumption of homoscedasticity using the F
distribution. If p (M) <. 05, then the covariances are significantly different. In
order to reject the null hypothesis that the covariances are not homogeneous
M must not to be significant. Box's M is extremely sensitive to violations of
the assumption of normality, making it less useful than might otherwise
appear and for this reason, some researchers test at the p=. 001 level,
especially when sample sizes are unequal (Field, 2004).
Theoretically you can have as many dependents as you want in MANOVA.
However, it is important note that as the number of dependents increases
there is a decline in interpretability, the likelihood of error based interactions
increases, and there is a loss of power (that is, increased likelihood of Type II
errors – i.e. accepting the null hypothesis in error and thus missing significant
relationships). Stevens (1980) recommends using a fairly small number of
dependent variables (less than 10) unless sample sizes are large. It is
suggested that at a minimum, every cell must have more cases than there are
dependent variables. This criterion is met in the present analysis.
There are four test statistics to choose from when performing a MANOVA.
Extensive work on the power of the four MANOVA statistics has been
undertaken (e.g. Olson, 1976; 1979; Stevens, 1979). Olson (1976) reports
that for small and moderate sample sizes the four statistics differ very little in
terms of power. In social science research group differences are often
concentrated on the first variate and in these cases Roy’s statistic is the most
powerful, followed by Hotelling’s trace, Wilk’s lambda and Pillai’s trace (Field,
2004). This is reversed when groups differ along more than one variate. In
terms of robustness, all four tests are fairly robust to violations of multivariate
normality. Stevens (1979) points out that Roy’s root is not robust when the
homogeneity of covariance matrix assumption is untenable. Bray & Maxwell
(1985) suggest that when sample sizes are not equal (as is the case in the

191
present study) this can have an impact on the Pillai’s trace and as such one
needs to check the assumption of homogeneity of covariance matrices using
Box’s test. If this test is non-significant and if the assumption of multi-variate
normality is tenable then assume that Pillai’s trace is accurate. For the
purpose of the present study Roy’s statistics was run.
6.3.2. MANOVA RESULTS The non-significant result Box’s test (M = 71.69, p=.112, df 55) indicated that
the covariance matrices are equal and therefore the assumption of
homogeneity is met. Levene’s test was non-significant and thus the
assumption of equality of variance has been met. Table 17 shows the main
table of MANOVA results.
Table 17: MANOVA Results: Roy’s Largest Root Effect Value F Hypothesis
df Error df Sig.
Group Roy's Largest Root .019 .400 10.000 211.000 .946
Table 18: ANOVA Results: Tests of Between-Subjects Effects Source Dependent Variable Type III Sum of
Squares df Mean Square F Sig.
GROUP School Dev Plan Eval 1360698.602 1 1360698.602 .007 .935 Psych Participation .259 1 .259 .833 .362 Participation Central 4082.512 1 4082.512 .084 .773 Collaboration Scale 57759.150 1 57759.150 .351 .554 Gen Self Efficacy 25.241 1 25.241 .965 .327 Locus of Control 26.918 1 26.918 .169 .682 Profile Org Character 2.168 1 2.168 .025 .874 Teacher Efficacy 67.104 1 67.104 .779 .378 Supervisor Lead 19.532 1 19.532 .157 .693 Peer Leadership 4006.413 1 4006.413 .010 .920
For the purpose of this study the group effects are of interest as they tell us
whether being on the programme for different lengths of time has had a
different effect on the groups of schools. Table 18 contains the ANOVA
summary table for the dependent variables. The results indicate that there
are no differences between those who had been in the programme for 3 years
or more and those that had been in the programme for 1 year.

192
6.3.3. INFLUENCE OF THIRD VARIABLES A possible explanation for the lack of difference between the two groups could
have been the influence of third factors (e.g. variables such as age, sex,
educational level and teaching experience of respondents in the study). In an
ex post facto design, such as the present study, in which subjects are not
randomly assigned to groups we need to ask whether there have been third
variables which have influenced what has been found, and which have
changed, moderated or obscured differences (which would be apparent if
those third variables were not operating).
One way to establish the influence of third variables is through analysis of
covariance (ANCOVA) which is used to test the main and interaction effects of
categorical variables on a continuous dependent variable, controlling for the
effects of selected other continuous variables, which covary with the
dependent. This control variable is called the "covariate" and there may be
more than one covariate. Multiple analysis of covariance (MANCOVA) is
similar to MANOVA, but interval independents may be added as "covariates."
These covariates serve as control variables for the independent factors,
serving to reduce the error term in the model. Like other control procedures,
MANCOVA can be seen as a form of "what if" analysis, asking what would
happen if all cases scored equally on the covariates, so that the effect of the
factors over and beyond the covariates can be isolated.
An issue in using ANCOVA or MANCOVA was that in both cases the
covariates have to be continuous. However, the biographical data being
utilised as ‘covariates’ were categorical. In order to deal with this difficulty it
was possible to look at the interaction of the group effect with the covariates
such as age, sex etc. by performing a MANOVA with the categorical third
variable placed in as a fixed factor. This gave an indication of whether the
two factors interact in such a way as to mask the differences between the
groups.
In an ideal world the decision to make these comparisons would have been
precisely planned, based on hypotheses and other considerations derived

193
from theory and previous research, before the analysis. However, with
psychological theory it is often not possible to predict the precise patterns of
outcome expected and thus the details of the statistical analysis are often
decided upon after the data has been collected. Comparisons decided upon
after the data have been collected and tabulated are called a posteriori or post
hoc comparisons. It would not be appropriate to analyse and evaluate these
comparisons as if one had predicted it all along. The problem here is one of
capitalizing on chance when performing multiple tests post hoc, that is,
without a priori hypotheses (Field, 2004).
In making post hoc comparisons a test that was more conservative was
needed. Although there is a wide range of post hoc tests the Scheffé test is a
widely used method of controlling Type I errors in post hoc testing of
differences in group means (Field, 2004). While the Scheffé test maintains an
experimentwise .05 significance level in the face of multiple comparisons, it
does so at the cost of a loss in statistical power (more Type II errors may be
made). The Scheffé test is a conservative one (more conservative than Dunn
or Tukey, for example), and is thus not appropriate for planned comparisons
but rather restricted to post hoc comparisons. There is always a trade-off: if a
test is conservative (the probability of Type I error is small) then it is likely to
lack statistical power (the probability of a Type II error will be high).
It was decided to look at the interaction of age, sex, educational qualification,
teaching experience, membership of the School Development Team, union
membership and group to see if these in any way masked a difference
between the groups on any of the measures. In this respect the researcher
could be accused of fishing (which is probably a justified criticism). However,
it is justified in an exploratory piece of research to do some fishing. It is
hoped that by utilising a more conservative approach it is fishing in a
reasonably focused way (i.e. ‘using a fishing rod as opposed to dynamite’,
Potter, personal communication, 2002). The only significant result produced
was between the interaction of group and union membership and as such this
will be the only analysis reported on.

194
The non-significant Box’s test result (M = 309.885, p=.113, df 55) indicated
that the covariance matrices are equal and therefore the assumption of
homogeneity is met. Levene’s test was non-significant and thus the
assumption of equality of variance has been met. From the results in Tables
19 and 20 it appears that union membership interacted with length of time on
the programme to mask differences on both the School Development
Planning Evaluation Scale and the Participation and Decision Centralisation
Scale.
Table 19: MANOVA Results for Interaction of Group and Union Membership Effect Value F Hypothesis
df Error df Sig.
GROUP * UNION
Roy's Largest Root .134 2.673 10.000 200.000 .004
Table 20: ANOVA Results for Interaction of Group and Union Membership Source Dependent Variable Type III Sum of
Squares df Mean Square F Sig.
GROUP * School Dev Plan Eval 1624300361.87 2 812150180.935 4.250 .016 UNION Psych Participation .741 2 .371 1.185 .308
Particip Decis Central 308963.331 2 154481.666 3.224 .042 Collaboration Scale 76937.692 2 38468.846 .239 .788 Gen Self Efficacy 18.331 2 9.166 .350 .705 Locus of Control 73.659 2 36.830 .229 .796 Profile Org Character 48.942 2 24.471 .285 .752 Teacher Efficacy 177.808 2 88.904 1.055 .350 Supervisor Lead 142.196 2 71.098 .583 .559 Peer Leadership 560848.131 2 280424.065 .712 .492
Figure 4 (see next page) shows that in the case of the School Development
Planning Evaluation Scale non-union members exhibit a different trend
between the groups. In Group 1 they are the least positive about the
implementation of the school development planning, less positive than both
Teachers Union and Association members. However, in Group 2 they are
much more positive and in the same range as those from the Teacher
Association.
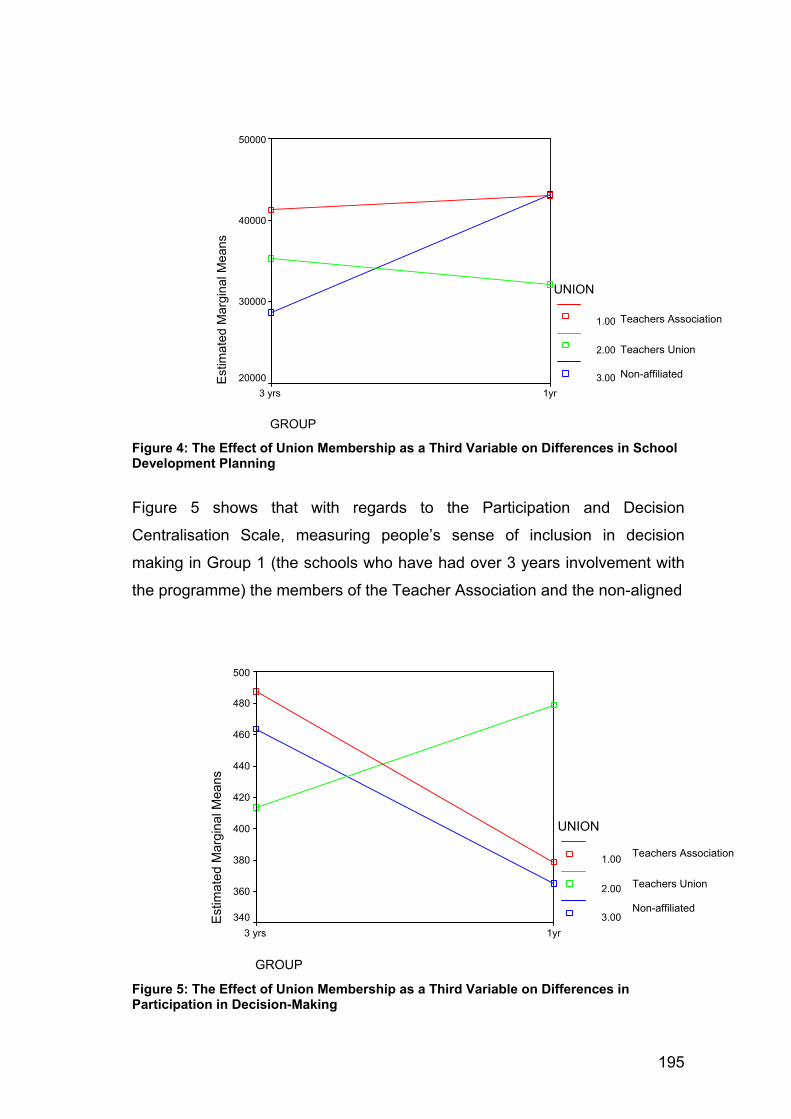
195
Estimated Marginal Means of SDPES Transf
GROUP
1yr3 yrs
Est
imat
ed M
argi
nal M
eans
50000
40000
30000
20000
UNION
1.00
2.00
3.00
Figure 4: The Effect of Union Membership as a Third Variable on Differences in School Development Planning
Figure 5 shows that with regards to the Participation and Decision
Centralisation Scale, measuring people’s sense of inclusion in decision
making in Group 1 (the schools who have had over 3 years involvement with
the programme) the members of the Teacher Association and the non-aligned
Estimated Marginal Means of PCSTRANS
GROUP
1yr3 yrs
Est
imat
ed M
argi
nal M
eans
500
480
460
440
420
400
380
360
340
UNION
1.00
2.00
3.00
Figure 5: The Effect of Union Membership as a Third Variable on Differences in Participation in Decision-Making
Teachers Association
Teachers Union Non-affiliated
Teachers Association
Teachers Union Non-affiliated

196
participants are more positive than the Teacher Union members about their
involvement in the decision-making of the school. In Group 2 (the schools
that had had only 1 year of input) it was the Union Members who were most
positive and the other two groups that were less positive.
Differences in union membership between the groups may be masking the
impact the programme is having and thus evidence of its empowerment of the
individuals and the organisation. Katz (1997) found that teachers’ union
membership impacted on their view of procedural and interpersonal justice
within their schools. The differences in group size between these three
groups needs to born in mind when considering these results. However the
role that union membership plays in the process of school development needs
to be explored in order to understand it more fully.
6.3.4. SUMMARY The results of the MANOVA show that schools that has been on the
programme for three years showed no significant statistical difference from
those schools who had been on the programme for one year, on any of the
measures. There is some indication that Union Membership may be masking
some of these differences particularly on the School Development Planning
Evaluation Scale and the Participation and Centralisation Scale, however this
would need to be further investigated. It is possible that there are a variety of
reasons for this lack of significant results.
Firstly it may be that there is no difference in impact between those schools
that had had 3 years on the programme and those that had had 1 year. This
could be for a variety of reasons e.g. the programme had not impacted on
either group, the programme had impacted positively on both groups and
there are other variables, rather than time on the programme, that determine
whether school development planning is empowering. Another reason for
these non-significant results is that there are differences but these are not
being measured by the chosen measures or it may need to be measured in
some other way or by some other variables. A third possibility may be that
schools could be attaching very different meanings to the change process at

197
different points in the programme e.g. Group 2, because they were new on
the programme and getting intensive input may have been in a ‘honeymoon
phase’ and thus very positive while Group 1 has become more realistic in
terms of expectations. This could lead to schools scoring the same on
measures for different reasons.
However before exploring these issues in any detail the qualitative data
gathered from the focus groups, interviews and archival analyses need to be
explored. These data may offer additional insight into potential differences
between the groups. The qualitative data would also establish whether school
staff reported that involvement in the school development programme had led
to their personal empowerment as well as the empowerment of their schools
as organisations.
6.4. QUALITATIVE ANALYSES: FOCUS GROUPS The aim of the focus groups was to further explore and clarify the findings
which emerged in the quantitative phase of this study by allowing the schools
to talk about the changes they felt had taken place within their schools. In the
focus groups, schools were asked to talk about the way in which the school
development plan had impacted on them as individuals, on their school and
on stakeholders in their school community. The data was collected in terms of
several broad themes:
1. Changes relating to the individuals within the schools;
2. Changes relating to the organisational level, that is changes within the
school as an organisation;
3. Changes relating to stakeholder involvement or community level
change;
4. What they felt helped or hindered their school development;
5. What advice they give to a school embarking on the process.
The results of the first three questions are presented in this section as they
relate to the impact of the programme and thus provide evidence about
whether empowerment was related to time on the programme. Themes
relating to questions 4 and 5 are explored later in Research Question 3.

198
Results pertaining to the individual, organisational and community levels will
be presented. For each section a table is shown reflecting the cumulative
scores of how often that particular theme was mentioned by the schools
making up that particular group, as well as how many schools reported that
particular theme. Tables, containing the category label, the definition or
description of the category and an illustrative quote from the focus groups, will
be offered for each theme. This will provide a deeper understanding of the
numerical results presented.
6.4.1. INDIVIDUAL LEVEL CHANGE Table 21 (see following page) indicates the types of change at the individual
level that school staff were reporting. All of the focus group participants from
seven of the schools reported changes in themselves as individuals. Only
one school from Group 2 reported changes in only one member. As Table 21
indicates there were many common themes related by the individuals in terms
of change they have experienced; however there were also differences
between the groups.
Table 21: Comparison of Groups 1 and 2 on Individual Level Change CATEGORY Cumulative Scores Number Of Schools Group 1 Group 2 Total Group 1 Group 2 Total Attitude towards school
30 26 56 4 4 8
Teaching and Learning
10 5 15 4 4 8
Willing to Engage in Collaborative Activity
12 8 20 3 2 5
Self-confidence
4 3 7 2 2 4
Attitude towards colleagues
9 1 10 4 1 5
Planning
6 1 7 2 1 3
Skills development
3 2 5 2 1 3
6.4.1.1. Themes Common to Both Groups Individual’s attitudes to the school, teaching and learning, a willingness to
engage in collaborative activities and improved feelings of self-confidence
were common changes cited by the individuals across the groups.

199
Category - Attitudes towards the school Definition - changes in staff feelings and beliefs (and as a consequence behaviours) towards the school. Illustrative Example: • it has brought about a great change in me because I now look at the school as not just a
building. It is something that needs to, we need to look at the needs of the school besides the building itself and to encourage the learners to do the best of their ability and there are other means that a teacher can help, not coming to school teaching in the classroom other thing environmental things that can help the child (Participant 2.2.2)
• If you want to achieve something you must be committed prepared to sacrifice … Sacrifice your time (Participant 1.1.1)
Individuals from all of the schools felt that there had been a change in their
attitude towards the school. The most common elements in terms of
individual change in terms of attitude towards the school were an increase in
willingness to sacrifice time and effort for the school, in feelings of
commitment towards the school and improved professionalism.
Category - Teaching and learning Definition - changes in teaching and learning, classroom based activities. Illustrative Example: • apart from the fund-raising it helped us a lot to come together, more especially when it
comes to teaching and learning and where we have the the standard guardians(staff heading that grade) where we sit together, plan together, help each other with the methods we can use in teaching. (Participant 1.2.5)
Staff in all the schools referred to improvements in teaching and learning. All
of the references to change in this area, except for those referring to lesson
preparation, were linked to collaboration between teachers. Teachers
reported that their teaching had improved through their working with other
teachers on classroom issues.
Category – Willing to Engage in Collaborative Activity Definition - a change in teacher’s ability or willingness to work as part of a team. Illustrative Example: • me as an individual it has helped a lot I realise I cannot do a thing on my own I have to
share with other people and I have to listen to other people as far as decision making is concerned (Participant 1.4.7)

200
Twenty individuals from five of the schools reported that their ability or
willingness to engage in collaborative activities had improved.
Category - Self-confidence Definition - teachers’ perceptions that their confidence, self-esteem and willingness to take risks had improved. Illustrative Example: • I think it has changed me because I am confident you see … I can do somethings on my
own (Participant 2.4.4)
Seven participants from four schools mentioned that their self-confidence had
grown.
6.4.1.2. Differences Between the Groups Although there were many common themes across the groups the participants
in Group 1 emphasised changes in individual planning abilities and skills
development and showed a marked difference in terms of attitudes towards
others.
Category - Planning Definition – individual’s personal planning abilities having improved. Illustrative Example: • when it comes to planning, I mean planning my own things, and I am trying learn to give
time constraints, I mean time frames, yes, as to whether I want to do this between this time, and that between this time, and that time, that is what I am learning (2.3.5)
Seven participants (six from Group 1 and one from Group 2) from three
schools (2 from Group 1 and 1 from Group 2) mentioned that their individual
planning abilities had changed. All three of these schools had scored well on
the School Development Planning Evaluation Scale a theme that will be
explored more fully on the school level change section.

201
Category – Skills Development Definition - the staff’s perception that there has been development of certain skills. Illustrative Example: • your school development plan it developed our principal to have the know-how of asking
those people who sponsored us with money to do the centre then she wrote to them and faxed and did this and this and the other principals didn’t know the know-how and at the end of the day she achieved a goal (the media centre) (Participant 1.1.14)
• Competence, I think I have improved a lot because compared with what I was in the past I thought I was doing the best but now looking around my classroom now I have improved a lot (Participant 1.1.7.)
Again only three schools mentioned this theme; all of them had scored well on
the School Development Planning Evaluation Scale.
Category - Change in attitude towards colleagues Definition - changes in teachers’ feelings and beliefs (and as a consequence behaviours) towards their colleagues. Illustrative Example: • I’ve improved a lot I used to get angry easily now I can tolerate people I can listen I can
accept criticism and change, I listen to her and when she says I’m wrong I listen to her, in the past we used to fight (1.3.6)
Ten individuals from five of the schools (nine individuals from four schools in
Group 1 and one individual from Group 2) reported that there had been a
change in their attitude towards their colleagues. At the individual level of
change this was the main difference between Group 1 and 2.
6.4.2. SCHOOL/ORGANISATIONAL LEVEL CHANGE In terms of organisational level change there were several common themes
relating to change at the organisational level between the two groups. Table
22 reflects the cumulative scores of how often that particular theme was
mentioned by the schools making up that particular group as well as how
many schools reported that particular theme.

202
Table 22: Comparison of Groups 1 and 2 on School Level Change
Cumulative Scores Number Of Schools CATEGORY Group 1 Group 2 Total Group 1 Group 2 Total
Collaboration
35 34 69 4 4 8
Infrastructure and resources
12 8 20 4 4 8
Organisational Change
35 17 52 4 3 7
Decision making
12 6 18 4 3 7
Planning
22 19 41 3 3 6
Relationships
31 12 43 3 3 6
Atmosphere
9 4 13 3 2 5
Fund-raising
5 3 8 3 2 5
Finances
11 4 15 4 1 5
School Management Team
17 9 26 2 2 4
Pride in Achieve and School
10 3 13 3 1 4
Principal
16 8 24 2 1 3
Conflict management
2 1 3 2 1 3
6.4.2.1. Themes Common to Both Groups Collaboration, infrastructure and resources and fund-raising were all areas
that both groups felt had improved whether they had been in the programme
for a year or three years.
Category - Collaboration: Definition - the staffs’ perception that they worked together on issues related to school development and maintenance. Illustrative Example: • the school development has brought the staff more closer together (agreement from around
the table) we know that teamwork, through teamwork, there is nothing that we cannot achieve, through the help of every member of the staff we will be able to achieve whatever we need, we are now a team ,a family that works together (Participant 1.1.1)
Sub-theme: Peer Collaboration: The positive thing as participant 2.2.5 said is that you have that communication … Meaning if you have a problem we do sit here as a staff and the the team will go and give the feedback, the report to the master there (referring to the principal) (laughter) then come back with the feedback then do discuss again about that feedback (Participant 2.2.1)

203
All of the schools referred to what the literature refers to as collaboration and
what they referred to as teamwork as having changed since working on their
school development plans. This would make sense in that one of the aims of
the development planning process is that collectively the staff develop a vision
of how they would like their school to be, draw up a plan of how they would
achieve that and implement that plan.
The staff reported an interesting trend in terms of collaboration from five of the
schools (three from Group 2 and two from Group 1). Staff in these schools
emphasised that it was peer collaboration that was taking place: for example
teachers were working together in committees, or taking decisions
collaboratively; however the principal was excluded from this process. All of
these schools had issues in terms of collaborating with the principal or
management. Thus the principal was often seen as outside of this form of
collaboration between the teachers. This was often as a result of conflict with
the principal over his leadership style (in all cases the principals in these
schools were men). This sub-theme was mentioned predominantly by the
schools that scored lower on the School Development Planning Evaluation
Scale.
Category - Infrastructure and Resources Definition - the acquisition of infrastructure, administrative resources and teaching and learning resources. Illustrative Example: • We used to complain previously about a lack of resources but I must say we are amongst a
few schools in Atteridgeville that we do not have so many complaints um teaching in the near future will not be as difficult as it used to be because we now have a TV set we have a video and we are in a position to teach by showing the kids videos. We have a photocopier. There are so many schools that have a problem with making copies the question of security. So if we have to talk about lack of resources we are a step or two steps ahead of other schools and its because of the development plan and er perhaps that will make us to solve many of the learning and teaching problems that we have and you know I sometimes wish we were a high school. It’s unfortunate that we can’t measure our performance the same way that the high schools are doing but er I think the resources that we have helped us to improve our results (Participant 1.1.2.)
All of the schools reported acquiring resources e.g. photocopiers, computers,
and faxes. Two of the schools participating in the focus groups acquired new

204
infrastructure: one a media centre and sports fields and another four
classrooms and an administration block.
Category - Fund-raising Definition - changes in the school’s ability to raise funds to take care of their prioritised needs. Illustrative Example: • Before the Development plan we never used to raise funds … the school used to rely
entirely on school funds (Participant 1.1.1)
Five schools (Three from Group 1 and two from Group 2) reported that fund-
raising had changed. This theme links with the increase in ability to acquire
resources and infrastructure. Both groups also mentioned organisational
development, decision-making, planning, relationships, atmosphere and
management as areas of change however Group 1 schools emphasised
these more than Group 2 schools.
Category - Organisational change Definition - changes within the schools’ structures, procedures and policies in all areas except finance and management Illustrative Example: • We have our subject committees the subject policies are being drawn we have dates we
are working with (fieldworker’s name) we have elected committees school development teams, disciplinary committee em and what else (Participant 2.4.3)
Seven of the schools reported changes within the organisational structure of
the school. Group 1 made double the amount of references to this theme.
The main areas of change related to development of policies, setting up of
committees, improved communication flow and improved administration. In
some of the schools organisational structures supporting collaboration were
being developed. For example committees were being set up, particularly
around teaching and learning areas.

205
Category - Decision-making Definition - staff’s perception of changes in their involvement and influence in the decision-making processes within the school. Illustrative Example: • No more unilateral decision-making … We sit together, lets say maybe there is something,
we sit together people raising their points, lets say you have raised a point, people don’t understand and then they try to help you here and there, how about doing this in this way so I think (Participant 1.2.5.)
Sub-theme: Peer Decision-making: • We debate issues, we meet as staff, we have an issue we debate we get a decision and
then as she said we take it to the [Participant 2.2.1.: Master] up there (pointing to principal’s office) and then it gets blocked Participant (2.2.5.)
Seven of the schools reported improvements in decision-making. Group 1,
again, made double the amount of references to this theme. An interesting
sub-theme emerged in terms of decision-making in some of the schools that
reported an improvement in this area. This related to decision-making as
peers, without the principal, and seemed to be linked to peer collaboration.
Four schools (two from Group 1 and two from Group 2) report the
improvement is in terms of peer decision-making. That is, the staff are more
involved in terms of making decisions at a committee or staff level. These
four schools report that although they are often consulted more in the decision
making process the decisions were often overturned by the principal. The
schools reporting this sub-theme scored lower on the School Development
Planning Evaluation Scale.
The schools made a very clear distinction between being involved and having
influence in the decision-making process. The following example clearly
illustrates this: The group were discussing whether staff are involved in decision-making at the school or not:
1.3.4: they are involved 1.3.4: because in the past we used to come into the staff meeting and just sit and the chairman will talk and a few teachers will respond but now it seems everybody is taking part 1.3.6: What was your question, were you asking about the involvement of the staff or the decision making of the staff? Alex: How involved are the staff in decision-making? 1.3.4: How involved are the staff in making decision, how is it involved? That is why I say, in the past we just come and sit and listen to whoever is talking with no responses I will do whatever I want whether I write or I read I don’t respond I don’t involve myself in the discussions but now we are all involved 1.3.6: It seems to me ous 1.3.4 is giving answers to two things at present

206
Alex: okay 1.3.6 talk to me a little bit about why you think she is talking about two things 1.3.6: you are asking about decision making she is answering about involvement… in the past we used to come in there and just listen now I don’t think it has improved because we do come in now for decision making and make decisions and it is not carried out 1.3.4: But it is being carried out in the meeting 1.3.6: Ja 1.3.4: In the meeting we share ideas and the decisions are taken 1.3.6: And then [1.3.2 the final decision] 1.3.3: I can give you an example of what happened when we did the AIDS awareness day we had our decision of which people would be coming who will be invited but we were crushed, the other people were invited so decisions are being made but not carried out. So although you asked to contribute [1.3.1: just to get ideas] but then you feel they 1.3.6: It is as if we just contribute to have the ideas and then they are not going to be implemented Alex: So you feel that in some ways you really are not involved in decision-making 1.3.6: No we are not Alex: So you don’t really have say 1.3.6: We just say 1.3.2: But it is not carried out 1.3.6: Now how do you say about that?
Category - Planning Definition - the staffs’ perception that relates to changes in the process of school development planning, the skills related to school development planning and the product of the actual plan. Illustrative Example: • We never generated money and we never identified needs before and may I share
something with you Alex eh when I started with Mufti, I wonder if some of you still remember, we would collect that money one Friday or two Fridays and then there would be an urgent need and then we would say lets use the mufti money and it was because (all laugh) because you know you taught us we must identify needs before and a make it a point that we, we achieve those needs then we would say is that need written in the development plan, then if the staff said no then we won’t spend this money. (Participant 1.1.2)
Teachers in six of the schools reported that planning had changed. At some
of the schools teachers reported that the planning has impacted not only at
the level of the school development plan but at all other levels, such as
classroom planning.

207
Category - Relationships Definition - staff perceptions that their interactions with their colleagues, in terms of both the quality of their behaviour towards colleagues and colleagues’ behaviour towards them, has changed. Illustrative Example: • We are also celebrating our birthdays [Participant 1.2.7: together] we sit around the table
and that teaching mood goes away and we refresh ourselves and another thing Alex the reason why we feel we must do this stokvel is not mainly for us to get the groceries it is to socialise [ mm to socialise] to know you and to enjoy the outside of you you know what I mean … Yes that is the motive and even if you know it becomes difficult if I must fight with Participant 1.2.1 today and month end I must go to her house you you can just imagine what happens so we make it a point that you know we finish up this fighting early this understanding thing it helps us a lot the teamwork that is happening outside equals the teamwork that is happening inside … Participant 1.2.6: Even there let me say I quarrel with Participant 1.2.8 I say Oh 1.2.8 it’s a joke that day you said this and this [Participant 1.2.8: and I was so angry] and then I say I’m sorry (lots of laughter and comment) … and then it was because I knew somewhere month end I must go to her house and so you see how important it is to go house by house it alleviates the misunderstandings and fights within the school and if you fight within the school yard within the school premises the school development plan will be empty (Participant 1.2.8)
Six of the schools felt that relationships had changed. Group 1 however
made many more references to these changes. The main areas of change in
terms of relationships were in the quality of the interaction, spending more
time together and that the relationship was no longer only about work but also
about one’s personal life. This emphasis on the personal aspect of the
relationship seemed connected to the issue of conflict resolution, which will be
explored later. The improvement in relationships was often linked to a change
in attitude towards colleagues, a friendly or improved atmosphere, improved
collaboration, particularly around teaching and learning and less conflict, all
themes emphasised by Group 1.
Category - Atmosphere Definition - changes in the overriding feeling within the school. Illustrative Example: • there is an atmosphere of friendliness (Participant 2.1.5)
Five schools (three from Group 1 and two from Group 2) reported that the
atmosphere at the school had changed. Often this theme related to reduced
conflict leading to a more pleasant atmosphere of open-ness, freedom and
friendliness.

208
Category – School Management Team (SMT) Definition - staff’s perceptions that the school management team had changed. Illustrative Example: • And they (referring to the SMT) don’t despise us … What I mean is that if if you want to
come up with something if you want to, how can I put it, you come up with a solution they don’t despise that solution, they simply tell you this is the solution Participant 1.2.7 has brought this solution up lets go on with it [Participant 1.2.4: How do you feel about it] as management they don’t [1.2.5: to take a unilateral decision] let us talk about it [1.2.5: get us involved] (Participant 1.2.8)
Four of the schools reported that management had changed in terms of their
own functioning, their relationships with teachers, their involvement of
teachers in decision-making, their willingness to share information and their
support for teachers in their classroom activities. All four of these schools had
scored well on the School Development Planning Evaluation Scale.
6.4.2.2. Differences Between the Groups Although the two groups showed many similarities in the areas of change they
see as having taken place at a school level, there were also some differences
between the two groups. These included changes in financial management,
changes in the principal, improved pride in the school and/or in their
achievements and improved conflict management.
Category - Finances: Definition - changes in financial administration, management and reporting within the school. Illustrative Example: • financial management has also improved we are able to know the balance statement in the
school [2.1.2: the telephone bills] the financial management has improved (Participant 2.1.1)
Five schools (four from Group 1 and one from Group 2) reported that financial
management had changed.
Category - Pride in Achievement and in the School Definition - the staffs’ perceptions that relate to having pride in the school and in the school’s achievements. Illustrative Example: • the pride of the teachers concerning their school if you can look at at our school right now at
least when it comes to the map we are at the top somehow its because our pride to the prioritising and such things you see (1.2.4.)

209
Four schools (three from Group 1 and one from Group 2) reported that pride
in the school and/or pride in their achievements had improved since working
on the programme.
Category - Principal: Definition - staff’s perception of changes in the principal, as opposed to the school management team as a whole. Illustrative Example: • most of the time when we come to a meeting even the principal is so open many things she
tells us how she runs the school we come up with our ideas. In the past the principal couldn’t tell us many things (Participant 1.1.4.)
Sub-group: “The small things”: • Anytime a teacher want to make tea I meet her here she won’t say anything to me mm I
didn’t have my tea this morning anytime and she doesn’t say anything. [1.2.7: maybe it is because she knows when you are in class you work then you are refreshing by coming.] I’m trying to say some of the things that other principals won’t allow us to do … Yes and she even makes you feel free in the school I told some of my colleagues .. I wonder if the principal will allow me to go to to the tea-room anytime … I think this is something I appreciate about her this is a change I have seen in her you see and the freedom that I have it is amazing I feel free there are things you know there are those things but there are important things that make me stay here in this school those are the things that I am talking about (Participant 1.2.8.)
Three of the schools (two from Group 1 and one from Group 2), all having
success in terms of the implementation of their plans, reported that the
principal had changed. This theme included changes in the staff’s
relationship with the principal, the principal’s support, willingness to include
the staff and change in attitude. In terms of changes reported about the
principal an important sub-theme emerged relating to the staff’s perception of
the principal’s valuing, respect and trust, in them often shown through small
interpersonal interactions and attitudes. This sub-theme was termed “the
small things” based on the phrase used by one of the teachers describing her
principal’s lack in this quality.
Category - Conflict management Definition - staffs’ perception that there has been a change in the school’s ability to deal with conflict in an effective manner. Illustrative Example: • We solve problems together … We do fight at times, like myself, sometimes I loose my
temper but … we sort it out and then things run smoothly again (Participant 1.1.5)

210
Three schools reported this change all of which were schools that had been
successful in terms of implementation of the school development planning
(according to the School Development Planning Evaluation Scale). This
change seemed to be based on the connections due to improved
relationships, particularly personal, rather than formal procedures (see
relationship example above). The issue of improved financial management
also seemed linked to better relationships between staff and principal.
Teachers reported that financial mistrust within the school was often a source
of conflict.
6.4.3. COMMUNITY LEVEL CHANGE As Table 23 indicates the schools not only reported changes at the individual
and organisational or school level but also at the community level.
Table 23: Comparison of Groups 1 and 2 on Community Level Change
Cumulative Scores Number Of Schools CATEGORY Group 1 Group 2 Total Group 1 Group 2 Total
Parent involvement
16 8 24 4 3 7
School Governing Body Involvement
14 5 19 3 2 5
Collaborating with other schools
3 0 3 3 0 3
Community Involvement
2 0 2 2 0 2
6.4.3.1. Themes Common to Both Groups Both groups mentioned parent involvement and school governing body as
area of community level change that has occurred. Category - Parent Involvement Definition - parents have become more involved in the school in terms of school activities, and/or the educational progress of their children. Illustrative Example: • Like we are having a trip on Saturday usually we used to go out being teachers alone but
this time there are parents who are willing to accompany us with the kids to show that now they are interested in what we are doing here at school (Participant 2.1.3)
Seven of the schools reported improvements in parent involvement. Group 1
however, made double the amount of references to this theme.

211
Category - School Governing Body Involvement: Definition - improved functioning of the school governing body (SGB), improved interest and support for the school, improved relationship between staff and SGB. Illustrative Example: • We never used to we let me say we never had a SGB going through full term being intact
this time we have had a SGB serving for the whole term of office. Being intact. … Meaning that that shows that the SGB is committed and they are interested in the development of the school and as well as in the education of their children (Participant 1.1.1)
Five schools reported that the School Governing Body had changed, however
Group 1 made nearly three times more references to this theme.
6.4.3.2. Differences Between the Groups Group 1 schools were the only ones to mention collaboration with other
schools and improved community involvement. Both of these areas were
about building bridges into the wider community and thus would probably only
have been possible after an extended time of internal change within the
school.
Category - Collaboration with other schools Definition - staff’s perceptions that there were improvements in the schools working with other schools in a variety of activities. Illustrative Example: • we built a centre and the other schools were envying us and other schools were using it and
now we have even encouraged them to get their own centre and at (a neighbouring school) they have their own computers … Yes even the library the media centre other schools want to know how did you go about to get the media centre (Participant 1.1.4)
Category – Community Involvement Definition – staff’s perceptions of improvements in the involvement of the community in school activities. Illustrative Example: • When we were busy with the media centre the members of the community were very very
active in that builders themselves were members of the community. Also in that way we didn’t have problems with the security because the community was involved and I think they own the building because they proudly when they pass the school that building was built by us and I don’t think they would want to see it vandalised (Participant 1.1.2)
6.4.4. SUMMARY OF FOCUS GROUPS RESULTS
From these results the individuals who participated in the focus groups felt the
programme had had a positive impact on the school at an individual,
organisational and a community level. There were many themes common to
212
both groups. Several of the themes were areas assessed by the quantitative
measures related to empowerment at various levels of analysis. For example:
at the individual level, a willingness to engage in collaborative activities and
development of self-confidence; at the organisational level, collaboration,
decision-making, relationship with the principal and peers. From the focus
groups results one can begin to argue that school staff felt that school
development planning had impacted on both groups in terms of areas
assessed by the quantitative measures.
There were differences between the two groups. Those that had been on the
programme for longer reported more themes, emphasised themes more and
showed some marked differences in themes. At the individual level Group 1
emphasised individual planning abilities and reported a marked difference in
their attitudes towards their colleagues. At the organisational level Group 1
emphasised changes in financial management, the principal, conflict
management and pride in achievements and the school. Group 1 schools
were the only one’s to mention collaboration with other schools and improved
community involvement as changes.
In line with the theoretical conception of empowerment and its expressions,
participants reported many other changes, not measured by the quantitative
measures, that related to a variety of themes and levels of analysis. At the
individual level changes related to attitudes and individual planning. At the
organisational level changes related to material and monetary gains. All the
schools reported improvements in infrastructure and the acquisition of
resources, and linked to this were improvements in fund-raising. Groups also
mentioned school atmosphere and other organisational changes in terms of
structures and policies. There were also community level changes related to
the involvement of the broader school community such as parents and the
governing body (which due to the unidimensional nature of the School
Development Planning Evaluation Scale we were unable to measure using
the stakeholder involvement sub-scale) and links with other schools and the
broader community.

213
This indicates that the school development planning process was seen by the
participants to have empowered them, their schools and, for some, their
communities. Thus the quantitative data may not have noted any differences
due to changes having occurred in both groups of school. However, before
any conclusions could be drawn about the presence of empowerment in the
context of school development and the impact of the programme other
qualitative data sets were examined, in the spirit of triangulation, as additional
sources.
From the focus group data one can start to build an argument for effects on
participants. However, these data are based on self-reports, which may be
distorted. The trends are also based on content analyses, which have their
own biases (discussed in Chapter 4 and will be elaborated on in Chapter 9).
Following the logic of a multi-method investigation it was thus important to use
other sources of data to verify these trends, before reaching a conclusion as
to the effectiveness of the programme, or its effects on participants. It is for
these reasons that additional data sources were used which are not based on
self-reports.
6.5. QUALITATIVE ANALYSES: ARCHIVAL DATA At the end of the programme’s work with the schools an evaluation was
undertaken with each school; this provided a baseline comparison of the
school’s functioning before and at the end of the programme. These were
written up for each individual school. The results of the analysis of these
evaluations focused on three areas: objectives from the school development
plan achieved, the use of the school development plans, and role of the
school development team and other areas of change.
6.5.1. OBJECTIVES ACHIEVED FROM THE SCHOOL DEVELOPMENT PLANS One of the central aims of the programme under investigation was the use of
the school development plans as a way for schools to take control of their own
development and to become empowered. In order to gather more evidence

214
about this eight schools’ development plans were evaluated to assess how
many of the objectives they had set for themselves they had achieved.
All of the schools drew up a school development plan setting out the
objectives they wanted to achieve over a 3-year period. These objectives
were classified in the current study in terms of priority areas and then grouped
as to whether they related to individual, organisational or community levels of
change. Evidence was then sort from the school or from programme reports
of the school having achieved the objective.
Eight school development plans were evaluated to assess how many
objectives had achieved. Table 24 (see following page) indicated that over
the 3-year period the eight schools managed to achieve 65% of the objectives
they set for themselves. The priority areas for schools in terms of
development were related to resources, organisational development,
infrastructure and parent involvement. What is interesting is that these issues
were prioritised over teaching and learning. Issues of organisational and
community development also took priority over individual development. The
main areas of achievement were in the areas of infrastructure, resources and
organisational development, and parent involvement. All objectives set
around environment and professionalism were also met.
One of the central aims of the programme being evaluated was the use of the
school development plans as a way for schools to take control of their own
development and to become empowered. The data of these eight schools
indicates that the schools are being successful in terms of the implementation
of their plans particularly in the areas of resources and infrastructure,
organisational development and parent involvement.

215
Table 24: Objectives from the School Development Plans Achieved By the Schools Category Priorities
Set Priorities Achieved
INDIVIDUAL LEVEL Skills training 4 3 Professionalism 4 4 Teaching and Learning 9 5 ORGANISATIONAL LEVEL Infrastructure upgrade 18 18 Environment 4 4 Resources 39 26 Infrastructure new 5 2 Organisational Development 29 15 Relationships 2 1 COMMUNITY LEVEL Parent Involvement 16 8 Community Involvement 1 0 School Governing Body 2 1 Other 7 4 TOTAL 140 91 (65%)
From the analysis of the school development plan objectives schools were
using the school development plans as a way to take control of their own
development and to become empowered. The objectives achieved spanned
the three levels described by the empowerment framework used to guide the
study. Many of the objectives achieved at the various levels were also in line
with the changes school staff had reported as having changed in the focus
groups. This data set also provides evidence that was externally verified
through various methods (direct observation, collection of documentation).
This provides confirmatory evidence to the self-report evidence offered by
teachers in the focus groups. In terms of the empowerment literature a key
aspect of organisational empowerment is the ability to make changes to the
material conditions in which one finds one self (Kroeker, 1995; Zimmerman,
2000). The school staff were particularly successful at making changes to
their school environments through access to additional resources and funds
and through infrastructure development.
6.5.2. SCHOOL DEVELOPMENT PLANNING AND SCHOOL DEVELOPMENT TEAM FUNCTIONING The content analysis also revealed information about the use of the school
development plans and the functioning of the school development teams.
Although seven of the eight schools had been successful in terms of their

216
implementation of the plan there was little review or monitoring of the
implementation and little feedback from the school development team to the
staff on progress made. Only at one school was the school development plan
regularly on the staff meeting agenda. In three of the schools disruption in
implementation occurred when the principal overturned a decision about the
use of funds for a particular objective. In three of the eight schools there was
some link between the school development planning/team and the School
Governing Body. These three schools were also more successful than the
other schools in implementing the plan and achieving their goals.
Six of the eight school development teams were seen as effective in helping
the school implement their school development planning. One had been
effective but, due to changes in management and conflict between the
teachers and the principal, was no longer. Although they were seen as
effective what is interesting is that none of these teams had regular meetings,
they never kept minutes and only met when the need arose. Reviewing and
follow up were also not done on a regular basis. This was interesting as it
was an assumption of the programmes that the team needed to be
formalised, meet regularly, have clear roles, give regular feedback to the staff
and keep track of their meetings as well as review the plans regularly. The
informal use of the plans and the functioning of the school development teams
links to the issue of how schools use these processes in ways that are
meaningful for them in their contexts rather than following set formal
procedures.
The analysis of the use of the school development plans and the functioning
of the school development teams again provides confirmatory evidence that
the schools were using the plans to take control of their development. This
may not have been in the way anticipated by the programme but as the
previous data set indicated schools were achieving many of the objectives
they had set for themselves. This data also provides externally verified
evidence of the use of the plans and the functioning of the teams, both seen
as key to the organisational empowerment of the school.

217
6.5.3. OTHER CHANGES The data from the eight evaluations of schools that had completed their term
on the programme was useful in terms of providing information about how
individual schools had changed over the programme period, thus providing a
baseline comparison of their initial functioning before the programme to their
functioning after the programme. Table 25 presents the results of a broader
analysis of the evaluation reports which revealed the following changes in the
schools’ functioning and development. Each of the themes related to a
section within the evaluation reports. They were classified for the purpose of
this study according to the three levels of empowerment under investigation in
the current study i.e. individual, organisational and community. The majority
of changes reported related to resources, infrastructure, teaching and
learning, collaboration, administration, financial management, staff
development and organisational development. What had not changed were
issues related to conflict management. In terms of community level change
the emphasis was on parent involvement. Although the school development
plans did not prioritise teaching and learning it is seen by stakeholders to
have changed in all but one school. The data used for the evaluations was
based on a triangulation of various stakeholders (teachers, principal,
administrative staff, parents and school governing body) views on the school.
In addition externally verified evidence was also collected. For example new
buildings, classrooms converted into libraries were physically seen. Policies,
financial plans and budgets were requested and meetings were attended.
Registers from parent meetings were requested as were timetables for
meetings with School Governing Body and parents.
Teaching and learning
Seven of the eight schools feel that the quality of teaching and learning in
their schools has improved. Five of the schools report that the
grade/subject/phases committees (see Collaboration theme below) have been
useful in assisting them with their classroom work and has re-oriented them to
the curriculum.

218
Table 25: Changes Reported in the Programme’s Evaluations THEME MUCH
CHANGE SOME
CHANGE NO
CHANGE INDIVIDUAL LEVEL 1. Teaching And Learning 7 0 1 ORGANISATIONAL LEVEL 1. Resources 8 0 0 2. Infrastructure 6 2 0 3. Collaboration 6 2 0 4. Staff Involvement 5 2 1 5. Relationship Between Teachers 4 3 1 6. Relationship With Principal 3 3 2 7. School Management Team 3 4 1 8. Planning 6 1 1 9. Follow Up And Evaluation 1 6 1 10. Decision-Making 4 3 1 11. Financial Management 4 3 1 12. Fund-Raising 7 1 0 13. Policies 3 4 1 14. Committees 7 1 0 15. Procedures (Conflict And Grievance) 0 0 8 16. General Administration 7 1 0 17. Communication 3 4 1 COMMUNITY LEVEL 1. Parent Involvement 7 1 0 2. School Governing Bodies 3 1 4 3. Community Involvement 3 4 1 4. Collaboration With Other Schools 0 7 1
Resources and Infrastructure
All 8 schools report having acquired more resources since drawing up the
plan. All of the schools managed to get a photocopier, a fax machine and at
least one computer. Several of the schools acquired many more resources
through their planning and fund-raising efforts. Six of the 8 schools made
significant changes to the infra structure of their schools. Three of them had
new buildings erected such as a media centre, sports fields, classrooms and
administration blocks. For all six their were also upgrades in the present
structures such as painting of school buildings, cleaning of the school yard,
putting up fencing and getting general repairs done to the schools structure.
Three of the six schools also converted empty classrooms into mini-libraries.
This confirms the focus group findings that the schools report changes in this
area.

219
Collaboration
This change in collaboration related specifically to teachers meeting as a
group to discuss issues related to teaching and learning. Six of the eight
school staff were having regular grade/subject/phase meetings in which
teachers collaborated on issues related to their classroom work. All but one of
these schools is a junior primary school, the sixth is a combined primary. The
other two schools are both combined and only their foundation phase
teachers meet regularly to collaborate on classroom related issues. This item
and the individual level theme related to teaching and learning provides
support for the Teaching and Learning Theme from the focus groups as well
as the issue of collaboration which is also supported by the next item.
Staff involvement
Five of the school staff reported that staff involvement in activities at the
school has improved. Two felt that although there had been improvements
not all staff were involved. One school reported that although involvement
had improved initially, problems within the school have led to the collapse of
the change. This provides support for the improvement in collaboration
reported in the focus groups.
Relationships Between Teachers
In support of the changes in relationships noted in the focus groups 4 of the
school staff reported that relationships between teachers had improved.
Three reported that although they had changed there were still some issues
such as groupings and divisions that needed to be dealt with. Only one
school felt very little had changed in terms of relationships.
Relationship with the Principal
Teachers at three of the schools felt that the relationship with the principal
was good and had improved. Three reported that although the relationship
had improved there were still some issues. In all of these cases the issues
related to the principals attitude when communicating with the staff (“the small
things” as discussed in the focus groups). Two of the schools reported that
the relationship with the principal was poor. In both of these cases the

220
principal changed towards the end of the school development planning
programme process. At one school the principal had been on long leave for 3
years and returned during the school’s final year on the programme and at the
other the principal was appointed during the school’s last year on the
programme. These reported changes provided evidence both for a change in
this area and also for the importance of the quality of the relationship (the
small things) which will be elaborated on stage.
School Management Team
Three of the schools reported having effective school management teams.
Four felt that although the management had improved there were still issues.
The main issues involved the follow up and monitoring offered by the school
management team and the involvement of the staff in decision making by the
school management team. Again this provided support for the reported
changes in the results from the focus groups.
Planning, follow-up and evaluation
Six of the schools felt that the planning in general at the school had improved,
one felt that although there have been improvements it was still not
satisfactory. One of the schools felt planning had not improved. Only one
school felt satisfied with the levels of follow up. Six of the schools report that
although there have been improvements this was still an area of weakness.
At one of the schools there was virtually no follow up. This confirmed the
findings in terms of the changes in planning from the focus group results that
indicated that evaluation and follow up were issues. This also confirms staff’s
report there were issues with regards to the lack of follow up from
management.
Decision-making
Four schools reported that decision making had improved, with staff being
more involved and decisions being taken in a participatory manner. Three felt
that although decision making had become more inclusive an issue was that
at times the decisions taken by the staff were later overturned by the principal.
Only one school felt there had been no improvement. This confirms the

221
findings from the focus groups and gives some insight into the issue of the
principal’s role in overturning decisions which was highlighted in the focus
groups and will be explored later. This change also links to the staff’s
reported improvement in collaboration and staff involvement as well as to the
setting up of committee (discussed below).
Financial Management and Fund-raising
Seven of the schools reported that financial management and accountability
had improved at their schools. At one school there was still an issue around
management openness about the use of funds at the school. Seven of the
schools reported that their ability to raise funds had improved. This is clearly
evidenced in the number of resources the schools have acquired over the
time. However there were issues at three of the schools about the use of the
funds as the staff would be working towards a particular goal and then the
principal would use the money for another issue (usually justifiably) but it was
the manner in which it was done.
Although this provides support for both the findings of improvements in fund-
raising and financial management from the focus groups it also adds to our
understanding of the complexity of the relationship between teachers and
principals. Teachers report that the principal’s' unilateral decision-taking over
use of funds, overturning of decisions and the manner in which they interact
with their staff impacts on the relationship. It also provides evidence for the
finding on the Profile of Organisational Characteristics that the organisational
climate was one of Benevolent Authoritarianism.
Policy and procedures
Three of the schools had completed all of the policies required by the
department of education. Four had made some progress in terms of
developing some of the policies or having drawn up draft policies. However
implementation of the policies was to be quite different. Government
mandated policies such as admission polices were being implemented but
policy related to professional behaviour, discipline, internal functioning of the
school were only being implemented by a few of the schools. In terms of

222
grievance and conflict management procedures within the school none of the
schools reported having clear procedures.
Committees
All eight schools had set up new committees. Only in one instance were
these committees not functional. However an issue was that there were too
many committees and thus several of them were not functional. The
Department of Education had made the setting up of many committees
mandatory for the schools however many of the schools were not clear on the
function of these committees and had a limited number of teachers. This in
addition to all of the other demands being placed on them, meant some of
these committees did not function.
Administration and Communication
All of the schools reported that administration within the school had improved.
Only one felt that although it had improved there were still several issues that
needed to be ironed out. Three of the schools felt that communication had
improved significantly at the school. Four felt that although it had improved
there were still issues. In all of these cases the communication issues related
to the manner in which the principal spoke to the staff.
These results provided confirmatory evidence for the changes reported by
school staff in terms of the school’s organisational development. What was
interesting was that although school staff reported that schools were running
more smoothly external verification indicated that the implementation of formal
policies, structures and procedures was not happening successfully. For
example there were no procedures for dealing with conflict within the schools
however several successful schools in the focus groups spoke about
improved conflict management. It seemed that the schools were making use
of processes based on informal relationships as a way of dealing with these
issues. This will be elaborated on later.

223
Involvement of other stakeholders (Parents, School Governing Body and
Community)
Seven of the schools reported that parent involvement has improved. The
two main areas of improvement were an increase in parent attendance at
meetings and more involvement in activities or events at the schools.
Teachers reported that parents were still not getting involved in the classroom
or with their children’s progress in a significant way. Only three of the schools
had functional governing bodies. The other five bodies did not function
although at one school the chair person of the governing body worked well
with the school. Three schools feel that their relationship with the community
has improved a lot and four a little. This involvement relates mainly to the
school offering their facilities for the community to use and the community not
dumping rubbish around the school. Seven of the eight schools tried to form
some form of partnership with other schools in the area. Although these
lasted from between 1 year to 3 years they all eventually failed.
These findings confirm the focus groups results in several ways. Firstly it
confirms that parent involvement was an area of change however it was still
seen as an area that needed much more work. Secondly it confirms the
difficulties the schools had in engaging in collaborative activities with other
schools and the community. Thirdly a shift in the involvement of the School
Governing Bodies had occurred. The data from the evaluations (collected
about 18 months before the focus group data) indicated that very few schools
had functional School Governing Bodies however from the focus groups
teachers report that this had improved and the interview data supported this
conclusion.
The changes reported in the programme evaluations of the eight schools that
had completed the programme provided additional evidence that the schools
had changed at various levels during their engagement with the programme.
The changes reported in the evaluations correspond with those reported in
the focus groups and with the objectives schools had achieved. The data in
the evaluation adds support to the self report of teachers by providing an
additional data source that not only triangulated views of several stakeholders
224
but also made use of externally verified evidence of change in many of the
areas. Thus by using multiple data sources as case can begin to be made
that the programme had had an impact on staff, schools and the parent
bodies they work with.
6.5.4. SUMMARY OF ARCHIVAL RESULTS These results provided confirmatory evidence for the changes reported in the
focus groups. The results from the archival analyses indicated that school
development planning was being used as a process to empower schools i.e.
they were taking control over their development and were achieving many of
the objectives they had set for themselves. The results also indicated that the
school development team in collaboration with the principal and School
Governing Body play an important role in making school development
planning effective. However the school development teams functioned more
informally than was originally determined by the programme and the literature.
From the eight evaluations it was clear that many changes had occurred
within the schools. What it also revealed were similar trends in terms of the
areas of change, for example collaboration, decision-making, relationships,
the principal. What it also confirmed is that many other variables are at play in
terms of the change process, involving a range of organisational and
community variables. Due to the nature of the school audits not much
information about the individual level could be assessed. The data provides
evidence of empowered outcomes for the schools (for example through the
access to resources and infrastructure as well as the many other objectives
achieved) and empowering processes (for example the setting up and
functioning of the school development team and their collaborative work with
the principals and the school governing bodies)
6.6. QUALITATIVE DATA AND ANALYSES: INTERVIEWS ON SCHOOL DEVELOPMENT PLAN IMPLEMENTATION Interviews and other archival data analyses relating to the use of the school
development plans were undertaken a year after the quantitative and focus
group data were collected. This analysis pertained to three groups of schools:

225
those who had been in the programme for more than four years (Phase 1
schools), those who had had three years of intervention (Phase 2 schools),
and those who were in their second year (Phase 3 schools). A comparison of
these three groups was undertaken to see if there were qualitative differences
between the schools that had more or less exposure to the programme on the
following: the use of the school development plans; the functioning of their
school development teams; and the role of the principal in implementing the
plans. The analysis of the data provided the following results.
6.6.1. USE OF THE SCHOOL DEVELOPMENT PLAN The programme’s intervention with the schools was based upon the
assumption that the school development team, with the rest of the staff, would
on a regular basis, review the progress of the implementation of the plan.
Adjustments and changes would be made to the plan as implementation
proceeded. This was to accommodate the very rapid pace of change
happening in the country and in education particularly. Another assumption
was that on a yearly basis the staff guided by the school development team
would review the plan and draw up a new plan for the following year. The
time frame of a year was felt to be sufficiently long as the environment was
too unpredictable for schools to really do any strategic planning.
From the 24 interviews only one school was not using the development plan
at all. Thus the analysis only pertained to the 23 schools using their plans. Of
these 23 schools, 16 were still using their original plan and 7 had drawn up
new plans.
Phase 1 Schools:
These nine schools had completed the 4-year programme by the time the
interviews were done. Five of the schools were still using their original plan
but over a longer time frame than originally anticipated. Of these five schools
two had drawn up individual plans that had been added to their original plans.
For one of these schools the school development team undertook this and in
the other it was done in consultation with the whole staff. For all of these
schools review was done on an ad hoc basis (usually by the school

226
development team) and none of them had done a complete review with the
whole staff. The four other schools had drawn up new school development
plans in collaboration with the whole staff after an initial three-year period of
working with the original plan. All of these plans were an outline of the
priorities or objectives set by the school for the next time frame with no action
plans attached to these objectives. Review was done on an ad hoc basis but
had involved the whole staff.
Phase 2 Schools:
These six schools had been on the programme for 3 years. Only one school
in this group had drawn up a new plan, in consultation with the whole staff,
that included both objectives and action plans. They had drawn up this plan
two years after drawing up their original plan, once it had been completed.
They did regular reviews with the whole staff. Three schools were still using
the original plan but had added new plans to it. These plans again consisted
of objectives only and no action plans. In one of these schools the school
development team reviewed their plans regularly; in the other two schools it
was done on an ad hoc basis. The other two schools were still using the
original plan and reviewed it on an ad hoc basis.
Phase 3 Schools:
This group was made up of eight schools that had been working with the
programme for 2 years. Six of these schools were still using the original plan
and reviewed it on an ad hoc basis. The other two had drawn up new plans,
in consultation with the staff, after they had completed their previous one. In
both cases the plan consisted of a list of objectives but no action plans. Both
of these schools reviewed the plan on a regular basis.
6.6.2. SCHOOL DEVELOPMENT TEAM FUNCTIONING The school development teams were classified in terms of their level of
functioning according to one of the following categories: Active, Functional,
Erratic, Previously Functional, Never Functioned. Table 26 describes these
categories and the classification of the school development team’s functioning
across phases of involvement in the programme. Table 26 indicated that six

227
Table 26: Categorisation of School Development Team’s Functioning
Category Phase
1 Phase
2 Phase
3 Total
Active - these teams were formally set up, clear roles, consistent in their functioning, actively involved in developing the school, showed initiative
3 1 2 6
Functional - as above; however they were not as active and did not show much initiative
3 2 2 7
Erratic - as above however they were not consistent in their functioning
2 0 1 3
Previously functional - these teams had been either functional or erratic but at this point were no longer functioning
1 2 1 4
Never functioned - these teams were set up but had never functioned in their role as a school development team
0 1 1 2
TOTAL 9 6 7 22 One of the Phase 3 schools was too small (a staff of 5) to have a development team.
fell into the Active category; seven fell into the Functional category; three in
the Erratic, four into the Previously Functional and two in the Never Functional
category. The most common issues expressed as reasons for the poor
functioning of the school development teams were:
No. of
Schools Issues Related to school development team Functioning
9 Demands being placed on them by the Department of Education 5 Conflicts between the staff and the principal 4 Redeployment of staff 3 Lack of support from management in their activities 3 Conflicts within the School Development Team
Most of these issues were either conflicts internal to the school or external
pressures and changes brought about by the Department of Education. It
seemed that some schools were unable to deal with these issues and this led
to a breakdown in the functioning of the school development team.
During the data collection and analysis an interesting link between the school
development team and the fund-raising committee or fund-raising activities at
the school emerged. The data indicated a link between those schools that
achieved many of their objectives and there being a positive relationship

228
between the school development team and the fund-raising committee.
Twelve of the school development teams had links with the fund-raising
committee. This relationship usually took the form of an individual being on
both committees. This would make sense in terms of the emphasis on
resources and upgrading the infrastructure in all of the plans.
6.6.3. THE ROLE OF THE PRINCIPAL IN THE SCHOOL DEVELOPMENT PLAN The principal’s role in terms of the school development implementation was
classified according to one of the following categories: Guiding, Active,
Involved, Uninvolved and Interfering. Table 27 (see following page) presents
these categories and the classification of the principal’s role in the school
development planning across phase of involvement in the programme.
Table 27: Categorisation of the Principal’s Role in School Development Plan Implementation Category Phase
1 Phase
2 Phase
3 Total
Guiding - principal not member of school development team, but aware of and supportive of their activities. Staff take lead but principal still had strong input into activities.
3 1 2 6
Active - principal an active member of the school development team, taking part in all of its activities and providing strong leadership
2 1 0 3
Involved - principal part of the team but did not provide strong leadership or support
2 1 2 5
Uninvolved - principal was not part of the team and did not play a role in the school development plan implementation
1 2 1 4
Interfering - principal took over decision making from the team when it suited him or her
1 1 1 3
TOTAL 9 6 6 21 One school did not have a principal and the other was too small to have a development team.
Table 27 indicated that six of the principals provided guidance for the
implementation of the schools development plan, three were actively involved,
five were involved, four were uninvolved and three interfered with the
implementation. The data indicates that the role of the principal as being

229
actively involved or guiding was the most effective. In both instances though,
there were members of the school management team on the development
team as well. In those schools where neither the principal nor management
played a role, the school development teams found it difficult to function
effectively. However, where the principal did not support the management
team they were also not successful – it appears that if the school
development team has School Management Team members and is guided or
supported by the principal, the principal does not have to be a team member.
However this would need further study before any conclusion about the
interaction between the school management team and the principal role in the
school development team can be made.
6.6.4. SUMMARY OF INTERVIEW RESULTS The results from the interview data indicated that the schools were utilising the
school development plans; 23 of the 24 schools were still using it. Sixteen of
these had been using the plan over a much longer period than the programme
and the literature had anticipated. The other seven of these schools had
drawn up a new plan, however this was basically an outline of their objectives
as opposed to a full plan containing action plans as was anticipated by the
programme and the literature. The data indicated that the schools were
utilising the plans in a different way, one which suited the context in which
they found themselves.
Results also indicated that thirteen of the school development teams were
active or functional in terms of working with the school development planning.
This supports the idea that they play an important role in school development
planning implementation. However the teams were not set up in the formal
way as described by the programme or as suggested by the literature. These
teams were more focused on activity and outcome as opposed to structure
and procedure. The interview data indicated the importance of principal
support and or involvement in successful implementation. Fifteen of the
principals were engaged (either through guidance, active participation or
being involved).

230
This data set confirms that the schools involved in the programme were using
the school development plans to achieve the changes they wanted to make in
their schools. It also confirmed the functioning of the schools development
teams and the key role that the principal plays in taking school development
planning forward. It again provided data that has been externally verified as
well as triangulated with the perspectives of several stakeholders. Again this
emphasises the importance of using multiple data sources in evaluating the
impact of the programme.
6.7. QUALITATIVE ANALYSES: SUMMARY
From the qualitative data sets that schools were using their plans and that
change had occurred at the individual, organisational and community level.
The qualitative data also indicated that change had occurred not only in terms
of the variables that had been measured in the quantitative data but had also
occurred in many other areas. The focus of the change was at an
organisational level; however the role of community level variables was
stressed. The central role of the principal in development planning was
emphasised throughout the qualitative data. The results of the archival data
and the interviews indicated that schools were reinterpreting the use of the
plans and the function of the school development teams to suit their contexts.
The qualitative data offered more interpretable data about the impact of the
programme and evidence of empowerment at the various levels. The focus
group data tapped teachers’ perceptions more directly than through
predetermined measures. These data yielded clearer information based on
what teachers felt about their lives and the meaning of school development
planning on a practical level. In this way evidence was gained that teachers
had benefited from the process, felt they were doing their jobs better and were
practically empowered in their lives and in the work that they did. It also gave
insight into what they felt had changed at the school and community level.
However this data was self-report and based on content analysis, both pose
limitations to conclusions that can draw about impact and change at various
levels. Following the approach of the multi-method design adopted other data
sources were collected. The archival data, the school development plan

231
objective analysis and the interviews provided not only multiple stakeholder
views on the changes at the school but also provided eternally verified
evidence of change at both the organisational and community level. These
additional data sets confirmed many of the changes described by teachers
and also added to these reported and verified changes.
6.8. COMPARISON BETWEEN SCHOOLS THAT SCORED WELL ON THE SCHOOL DEVELOPMENT PLANNING EVALUATION SCALE AND THOSE THAT DID NOT The regrouped quantitative and focus group data from these two groups
offered some insight into what, for these particular groups of schools, were
the factors that were contributing to their success or lack of success.
6.8.1. QUANTITATIVE DIFFERENCES As in the original quantitative study a MANOVA was performed for all of the
variables to ascertain if there were any differences between those who scored
well on the School Development Planning Evaluation Scale and those who did
not. The non-significant result Box’s test (M = 53.637, p=.737) indicates that
the covariance matrices are equal and therefore the assumption of
homogeneity is met. Levene’s tests of equality of variance for each of the
dependent variables were non-significant and thus the assumption of equality
of variance has been met.
Table 28 shows the main table of results. Roy’s statistic indicates that there
were significant group differences.
Table 28: MANOVA Results Roy’s Largest Root – Comparing Schools That Scored Higher on the School Development Planning Evaluation Scale with those that Scored Lower
Effect Value F Hypothesis df
Error df Sig.
SPDES Success
Roy's Largest Root .570 5.305 10.000 93.000 .000
Table 29, containing the ANOVA summary table for the dependent variables,
indicates that there were significant differences on the following scales:
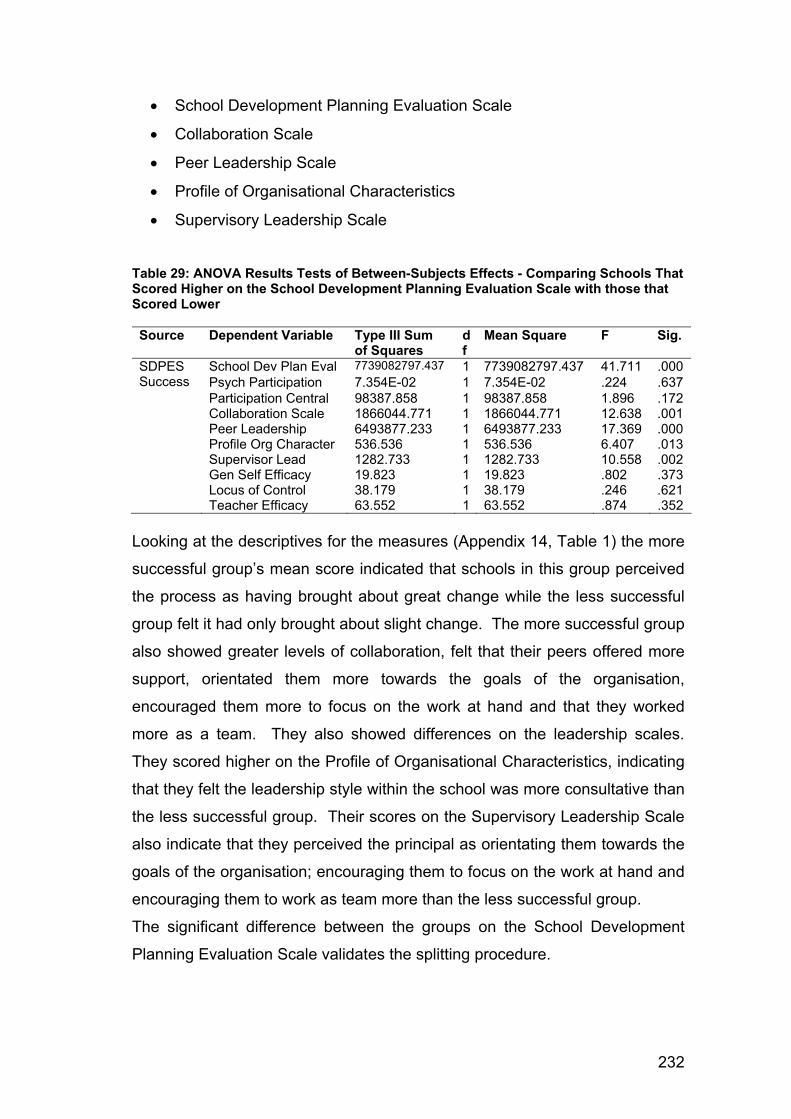
232
• School Development Planning Evaluation Scale
• Collaboration Scale
• Peer Leadership Scale
• Profile of Organisational Characteristics
• Supervisory Leadership Scale
Table 29: ANOVA Results Tests of Between-Subjects Effects - Comparing Schools That Scored Higher on the School Development Planning Evaluation Scale with those that Scored Lower Source Dependent Variable Type III Sum
of Squares df
Mean Square F Sig.
School Dev Plan Eval 7739082797.437 1 7739082797.437 41.711 .000 Psych Participation 7.354E-02 1 7.354E-02 .224 .637
SDPES Success Participation Central 98387.858 1 98387.858 1.896 .172 Collaboration Scale 1866044.771 1 1866044.771 12.638 .001 Peer Leadership 6493877.233 1 6493877.233 17.369 .000 Profile Org Character 536.536 1 536.536 6.407 .013 Supervisor Lead 1282.733 1 1282.733 10.558 .002 Gen Self Efficacy 19.823 1 19.823 .802 .373 Locus of Control 38.179 1 38.179 .246 .621 Teacher Efficacy 63.552 1 63.552 .874 .352
Looking at the descriptives for the measures (Appendix 14, Table 1) the more
successful group’s mean score indicated that schools in this group perceived
the process as having brought about great change while the less successful
group felt it had only brought about slight change. The more successful group
also showed greater levels of collaboration, felt that their peers offered more
support, orientated them more towards the goals of the organisation,
encouraged them more to focus on the work at hand and that they worked
more as a team. They also showed differences on the leadership scales.
They scored higher on the Profile of Organisational Characteristics, indicating
that they felt the leadership style within the school was more consultative than
the less successful group. Their scores on the Supervisory Leadership Scale
also indicate that they perceived the principal as orientating them towards the
goals of the organisation; encouraging them to focus on the work at hand and
encouraging them to work as team more than the less successful group.
The significant difference between the groups on the School Development
Planning Evaluation Scale validates the splitting procedure.

233
6.8.2. QUALITATIVE DIFFERENCES – FOCUS GROUP DATA As in the previous focus group results, changes in the individual,
organisational and community levels are reported on.
6.8.2.1. Individual Level: As Table 30 indicates the individuals within the schools mentioned very similar
changes they had experienced personally. These focused on planning skills,
changes in attitudes to both work and colleagues, a willingness to engage in
teamwork and self-confidence. The more successful group did emphasise
changes in attitudes towards work, improvements in their teaching and
learning and a willingness to engage in collaborative activities. Only the more
successful group mentioned skills development.
Table 30: Comparison between the More Successful Group on the School Development Planning Evaluation Scale and the Less Successful Group on Individual Level Change
Cumulative Scores Number Of Schools CATEGORY More
Successful Less
Successful Total More
Successful Less
Successful Total
Attitude towards school
37 19 57 4 4 8
Willing to Engage in Collaborative Activity
17 3 20 4 1 5
Teaching and Learning
11 4 15 4 4 8
Attitude towards colleagues
4 6 10 2 3 5
Planning
4 3 7 1 2 3
Self-confidence
5 2 7 2 2 4
Skills development
5 0 5 3 0 3
6.8.2.2. Organisational Level As Table 31 indicates the schools offered many similar areas of change, with
the more successful group mentioning these changes more frequently. Areas
of marked difference were in the area of management, principal, fund-raising,
a sense of achievement or results, skills development and improved conflict
management. In all cases the less successful group did not mention these
areas of change expect for management, where it was mentioned once and
related to a better flow of information.
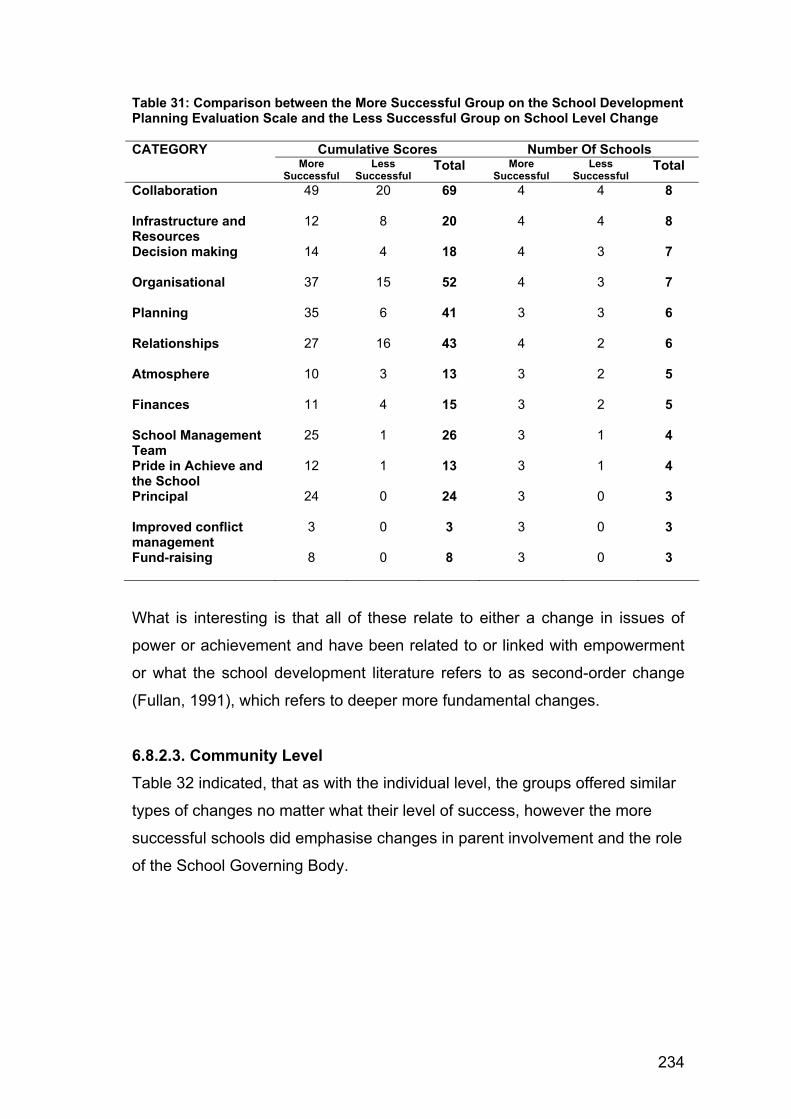
234
Table 31: Comparison between the More Successful Group on the School Development Planning Evaluation Scale and the Less Successful Group on School Level Change
Cumulative Scores Number Of Schools CATEGORY More
Successful Less
Successful Total More
Successful Less
Successful Total
Collaboration
49 20 69 4 4 8
Infrastructure and Resources
12 8 20 4 4 8
Decision making
14 4 18 4 3 7
Organisational
37 15 52 4 3 7
Planning
35 6 41 3 3 6
Relationships
27 16 43 4 2 6
Atmosphere
10 3 13 3 2 5
Finances
11 4 15 3 2 5
School Management Team
25 1 26 3 1 4
Pride in Achieve and the School
12 1 13 3 1 4
Principal
24 0 24 3 0 3
Improved conflict management
3 0 3 3 0 3
Fund-raising
8 0 8 3 0 3
What is interesting is that all of these relate to either a change in issues of
power or achievement and have been related to or linked with empowerment
or what the school development literature refers to as second-order change
(Fullan, 1991), which refers to deeper more fundamental changes.
6.8.2.3. Community Level Table 32 indicated, that as with the individual level, the groups offered similar
types of changes no matter what their level of success, however the more
successful schools did emphasise changes in parent involvement and the role
of the School Governing Body.

235
Table 32: Comparison of the More Successful Group on the School Development Planning Evaluation Scale and the Less Successful Group on Community Level Change
Cumulative Scores Number Of Schools CATEGORY More
Successful Less
Successful Total More
Successful Less
Successful Total
Parent involvement
18 6 24 4 3 7
School Gov Body Involvement
14 5 19 3 2 5
Community Involvement
1 1 2 1 1 2
Collaborating with other schools
2 1 3 1 1 2
However the main differences between the groups were at an organisational
level of change. This corresponds to the differences noted in the quantitative
data analysis that there were no differences between the more and less
successful groups on the measures of individual empowerment but there were
on several of the organisational level measures.
6.8.3. SUMMARY What these results indicated is that although all schools evidenced changes,
schools that were more successfully implementing the school development
plan evidenced some additional changes that were different from those
schools that were less successful. Most of these differences were at the
organisational level, variables that were present within the school. It may be
that schools need to have certain organisational level variables in place to
effectively implement the school development planning. This would be
supported by Peterson and Zimmerman’s (2004) nomological framework of
organisational empowerment, which they see as being made up of various
intraorganisational processes that lead to empowered outcomes.
Both groups of schools, whether they were more or less successful have
evidenced changes within the school that they felt were due to the
implementation of the school development plan. In order to make a reliable
comment on what effect school development planning has had on
empowerment in terms of the individuals, schools and communities they
serve, the data sets from the various analyses were integrated.

236
6.9. IMPACT MATRICES To integrate the findings from the quantitative and qualitative analyses four
impact matrices were constructed relating to the impact and implementation of
the school development plan (see Matrix 2), the impact of the programme at
the individual level (see Matrix 3 on page 185), at the organisational level (see
Matrix 4 on pages 186-7) and at the community level (see Matrix 5 on page
188).
The aim of the programme under investigation was that each school would
draw up a school development plan. The development of a school
development plan was seen as an empowering process for schools and
through this process schools could become empowered. In order to do this
the programme staff assumed that schools would need to have drawn up a
school development plan, be implementing it and achieving the goals set for
themselves. It was also assumed that in order to achieve this, the school
development team would play a central role in facilitating the implementation
of the school development plan.
It was a programme objective that the school development team be a formally
structured committee within the school, where roles in the team were clearly
defined, where the team met on a regular basis to assess the implementation
of the plan, that they gave regular feedback to the staff, that they had links
with the principal, School Management Team and the School Governing Body
and that they assisted the school in revising the plan and drawing up a new
set of actions plans for the plan on a yearly basis.
Matrix 1 indicates that all eighteen schools that were involved with the
programme found it useful to some extent in that they rated the School
Development Planning Evaluation Scale as having brought about at least
some change. The audit analysis provides evidence that eight schools, which
had been in the programme for more than 3 years, had achieved 65% of the
objectives they had set for themselves. The interviews indicate that 23 of the
24 schools were using the plans to some extent.

237
However the way in which the plan was being utilised and the school
development teams were functioning showed many differences from the
programmes assumptions about how this would be effected. Firstly, for all of
the schools staff the approach to the school development plan process and
the functioning of the school development team was much less formal than
originally assumed by the programme. Review happened on an ad hoc basis,
there was little or no evaluation of progress and very few new plans that were
drawn up consisted of action plans. Secondly, the schools staff were using
the plans over a much longer period than they had originally drawn the plan
up for. Thus the plans were used, with very little review, until all of the
objectives were met. If new plans were included they were often developed
separately from the original plan. What seemed more important for many of
the school staff was not the actual plan but the skills of planning, as all school
staff managed effect some level of change. Bennett et al. (2000) argue that
the commonly used technicist-rational approach to development planning is
not appropriate for primary schools
There was a definite focus on resources and infrastructure for the schools in
terms of priorities and objectives achieved. This is understandable given the
context in which they find themselves i.e. schools are poorly resources,
infrastructure is poor and often in bad condition. This focus on issues other
than teaching and learning however is not unique to South African schools.
Research from western countries that suggest that often the focus in the
school development plan is not on teaching and learning but on organisational
issues (Bennett et al., 2000; Broadhead, et al., 1998; MacBeath, 1994; West,
2000).
In summary Matrix 2 indicated that schools were using the school
development plan to effect change and achieve the objectives they had set as
a school, particularly those relating to resources and infrastructure. However,
the way in which the plans were used and the school development teams
functioned were more informal and ad hoc than anticipated by the programme
or as described by the literature. Although the school development team was

238
seen as important in the development planning process the role of the
principal was emphasised.
Matrices 3 and 4 indicated that with regards to the quantitative data analysis
there is no evidence of a difference between the schools. The only evidence
was that of union membership which seemed to be interacting with the group
variable and thus masking differences between the groups on School
Development Planning Evaluation Scale and Participation and Decision
Centralisation Scale (Involvement in decision-making).
However Matrices 3, 4 and 5 indicated that there was evidence of changes at
the individual, organisational and community levels. At the individual level
(see Matrix 3) themes related to teaching and learning, teachers’ attitudes
towards the school and self-confidence were reported as having changed for
individuals in both groups. Attitudes towards others, skills development, a
willingness to engage in collaborative activities and planning skills were
emphasised by Group 1 schools. At this level teacher attitudes (whether
towards the school or colleagues) and teaching practice were reported to
have changed the most. Despite differences in emphasis there were not any
striking differences between the groups at the individual level. The same is
true when the analysis focused on schools that were more successful on the
School Development Planning Evaluation Scale with those who were less
successful.
At the individual level of analysis several writers have defined empowerment
as a process by which individuals gain mastery and control over their lives
and a critical understanding of their environment (Rappaport, 1984, 1987;
Swift & Levin, 1987; Zimmerman 1990a). It includes participatory behaviour,
motivation to exert control and feelings of efficacy and control. At this level
empowerment bears on both the material and the psychological, on acquiring
access to resources as well as increasing control and value. The exemplars
of empowerment described by Zimmerman (2000) include control, general
and context specific efficacy. For the programme empowerment at the
individual was operationalised as an increase in feelings of self-efficacy and

239
locus of control. It was felt that this was most likely to occur in situations
where people feel there was increased access to resources. Matrix 3
indicates that there were changes at the individual level for teachers.
Teachers reported feeling more confident and had made changes in their
teaching. They also reported being more willing to engage in collaborative
activities. As Matrix 4 indicates there was also much more access to
resources through the use of the school development plan. It can therefore
be concluded that in terms of the theoretical definitions and the programmes
indicators there is evidence of empowerment at the individual level of
analysis. What teachers stressed was the change in their attitudes both
towards the school and their colleagues.
The Organisational Impact Matrix (see Matrix 4) indicated that this was the
level where most change had occurred. This would make sense, as school
development planning is an organisational level intervention. As with the
individual level there were similarities between both groups on the types of
change they have experienced: collaboration, planning, decision-making,
relationships, fund-raising, organisational issues, management and the
atmosphere. There were some differences; Group 1 emphasised several of
these changes more and reported changes in finance and pride in their school
and achievements.
At the organisational level of analysis empowerment was seen as a process
aimed at changing the power structures as they are expressed within an
organisation, such as a school, in order to establish new structures, values
and forms of interaction. Organisational empowerment includes shared
leadership, opportunities to develop skills, expansion and effective community
influence (Maton & Rappaport, 1984; Maton & Salem, 1995). The exemplars
of empowerment described by Zimmerman (2000) include participation in
decision making, collaborative working, democratic leadership, supportive
relationships.

Ma
trix
2:
Sch
oo
l D
ev
elo
pm
en
t P
lan
nin
g P
roc
es
s I
mp
lem
en
tati
on
SD
PE
S S
uccess
Qu
an
tita
tive
Da
ta
Descrip
tive
s
MA
NO
VA
3
rd V
ari
ab
les
MA
NO
VA
F
oc
us
Gro
up
s
Au
dit
an
d S
DP
A
na
lys
is
Inte
rvie
ws
Fo
cu
s
Gro
up
s
Gro
up
1
Gro
up
2
Co
mp
ari
so
n
Grp
1 a
nd
2
Co
mp
ari
so
n
Grp
1 a
nd
2
Gro
up
1
G
rou
p
2
8 A
ud
its a
nd
S
DP
s
Ph
as
e 1
9
sc
ho
ol
Ph
as
e 2
6
sc
ho
ol
Ph
as
e 3
8
sc
ho
ol
Qu
an
tita
tive
D
ata
C
om
pari
so
n
Su
cc
ess
Less
Su
c
S
CH
OO
L
DE
VE
LO
PM
EN
T
PL
AN
NIN
G
6 S
om
e
ch
an
ge
4
Mu
ch
ch
an
ge
3 S
om
e
ch
an
ge
5
Mu
ch
ch
an
ge
If
Un
ion
Me
mb
ta
ke
n in
to
acco
un
t
6
5%
ob
jective
s a
ch
ieve
d
4 (
ne
w),
Outlin
e, A
d
ho
c
5 (
2 a
dded;
3
ori
gin
al)
Ou
tlin
e,
Ad
ho
c
1 (
ne
w),
Outlin
e,
Re
vie
w
5 (
3 a
dded;
3
orig
ina
l)
Ou
tlin
e,
Ad
ho
c
4 (
ne
w),
Outlin
e, A
d
ho
c
6 (
2 a
dd
ed
; 4
orig
ina
l)
Ou
tlin
e,
Ad
ho
c
Mo
re
Success
School develo
pm
ent te
am
fu
nctio
nin
g a
nd
in
volv
em
ent in
SD
P
6
se
en
as h
elp
ing
F
un
ctio
ne
d in
an
ad
ho
c
ma
nn
er
3,
3,
3
1,
2,
2
, 1
2,
2,
2
, 1
Leader
involv
em
ent in
S
DP
G
– 3
, A
– 2
, I – 2
,
U –
1, In
t -
1
G –
1, A
– 1
, I -
1
U –
2, In
t -1
G
– 2
, A
– 0
, I -
2
U –
1, In
t -1
MA
TE
RIA
L C
HA
NG
ES
Infr
astr
uctu
re
8
Reso
urc
es
6
2
Str
ong E
vid
ence o
f C
hange
Som
e E
vid
ence o
f C
hange
N
o e
vid
ence o
f C
hange
T
here
had b
een e
vid
ence -
err
atic
H
igher
Cum
ula
tive s
core
s
S
ignific
ant
sta
tistical diffe
rence
Sym
bo
l C
ate
go
ry
G -
G
uid
ing
A -
A
ctive
I -
Invo
lve
d
U -
U
nin
volv
ed
In -
In
terf
erin
g
184 240

Matr
ix 3
: D
iffe
ren
ce i
n C
han
ges a
t an
In
div
idu
al
Level
Rep
ort
ed
Aft
er
Imp
lem
en
tati
on
of
Sch
oo
l D
evelo
pm
en
t P
lan
Qu
an
tita
tive
Da
ta
Descrip
tive
s
MA
NO
VA
3
rd V
ari
ab
les
MA
NO
VA
F
ocu
s G
rou
ps
SD
PE
S S
uccess
Qu
an
tita
tive
S
DP
ES
Su
ccess
Fo
cu
s G
rou
ps
Gro
up
1
Gro
up
2
Co
mp
ari
so
n
Grp
1 a
nd
2
Co
mp
ari
so
n
Grp
1 a
nd
2
Gro
up
1
G
rou
p
2
Pro
gra
mm
e
Eva
lua
tio
ns
a
nd
S
ch
oo
l D
ev P
lan
A
na
lys
is
Su
cc
ess
L
es
s
Su
cc
ess
S
uc
ce
ss
L
es
s
Su
cc
ess
Locus o
f C
ontr
ol
Genera
l S
elf E
ffic
acy
Te
ach
er
Eff
ica
cy
Se
lf C
on
fid
ence
Te
ach
ing
an
d le
arn
ing
7
1
Att
itu
de
s to
wa
rds s
ch
oo
l
Att
itu
de
s to
wa
rds o
ther
Skill
s D
evelo
pm
ent
Pla
nn
ing
Will
ing
to
enga
ge
in
colla
bora
tive a
ctivity
Str
ong E
vid
ence
So
me
Evid
en
ce
of
Ch
an
ge
No e
vid
ence o
f C
hange
T
here
had b
een e
vid
ence -
err
atic
H
igher
Cum
ula
tive s
core
s
E
vid
ence o
f th
e v
ariable
but
uncert
ain
of
evid
ence o
f change d
ue
to p
rog
ram
me
185 241
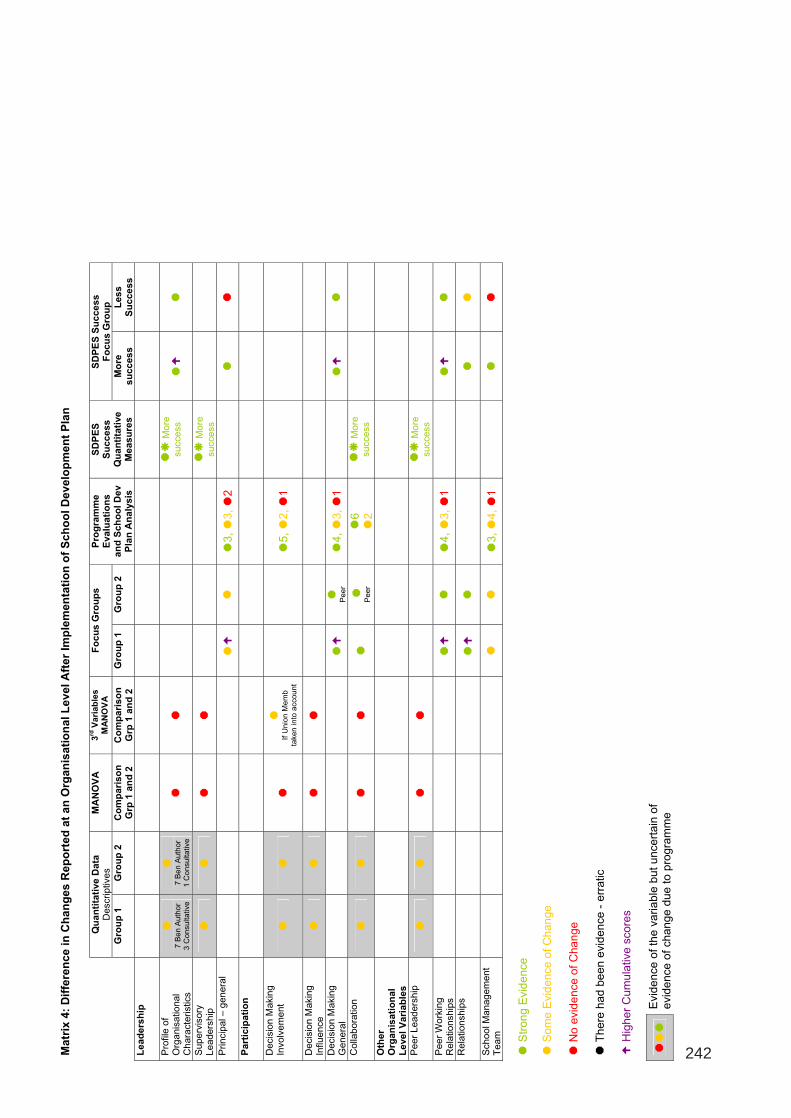
Ma
trix
4:
Dif
fere
nc
e i
n C
ha
ng
es
Re
po
rte
d a
t a
n O
rgan
isa
tio
na
l L
ev
el
Aft
er
Imp
lem
en
tati
on
of
Sc
ho
ol
De
ve
lop
me
nt
Pla
n
Qu
an
tita
tive
Da
ta
Descrip
tive
s
MA
NO
VA
3
rd V
ari
ab
les
MA
NO
VA
F
ocu
s G
rou
ps
SD
PE
S S
uccess
Fo
cu
s G
rou
p
Gro
up
1
Gro
up
2
Co
mp
ari
so
n
Grp
1 a
nd
2
Co
mp
ari
so
n
Grp
1 a
nd
2
Gro
up
1
Gro
up
2
Pro
gra
mm
e
Eva
lua
tio
ns
an
d S
ch
oo
l D
ev
Pla
n A
na
lys
is
SD
PE
S
Su
cc
ess
Q
ua
nti
tati
ve
M
ea
su
res
M
ore
s
uc
ces
s
Le
ss
S
uc
ce
ss
Le
ad
ers
hip
Pro
file
of
Org
an
isa
tio
na
l C
hara
cte
ristics
7
Be
n A
uth
or
3 C
on
su
lta
tive
7
Be
n A
uth
or
1 C
on
su
lta
tive
M
ore
succe
ss
Superv
isory
L
ea
de
rsh
ip
M
ore
succe
ss
Pri
ncip
al –
gen
era
l
3,
3,
2
Part
icip
ati
on
Decis
ion
Makin
g
Involv
em
ent
If U
nio
n M
em
b
take
n in
to a
cco
un
t
5
, 2
, 1
Decis
ion
Makin
g
Influence
Decis
ion
Makin
g
Ge
nera
l
P
ee
r
4,
3,
1
Colla
bora
tion
P
ee
r
6
2
Mo
re
succe
ss
Oth
er
Org
an
isati
on
al
Level
Vari
ab
les
Pe
er
Lea
ders
hip
Mo
re
succe
ss
Peer
Work
ing
Rela
tionship
s
4,
3,
1
Rela
tionship
s
Sch
oo
l M
an
ag
em
en
t T
ea
m
3,
4,
1
S
trong E
vid
ence
Som
e E
vid
ence o
f C
hange
N
o e
vid
ence o
f C
hange
T
here
had b
een e
vid
ence -
err
atic
H
igher
Cum
ula
tive s
core
s
E
vid
ence o
f th
e v
ariable
but
uncert
ain
of
evid
ence o
f change d
ue t
o p
rogra
mm
e
186 242
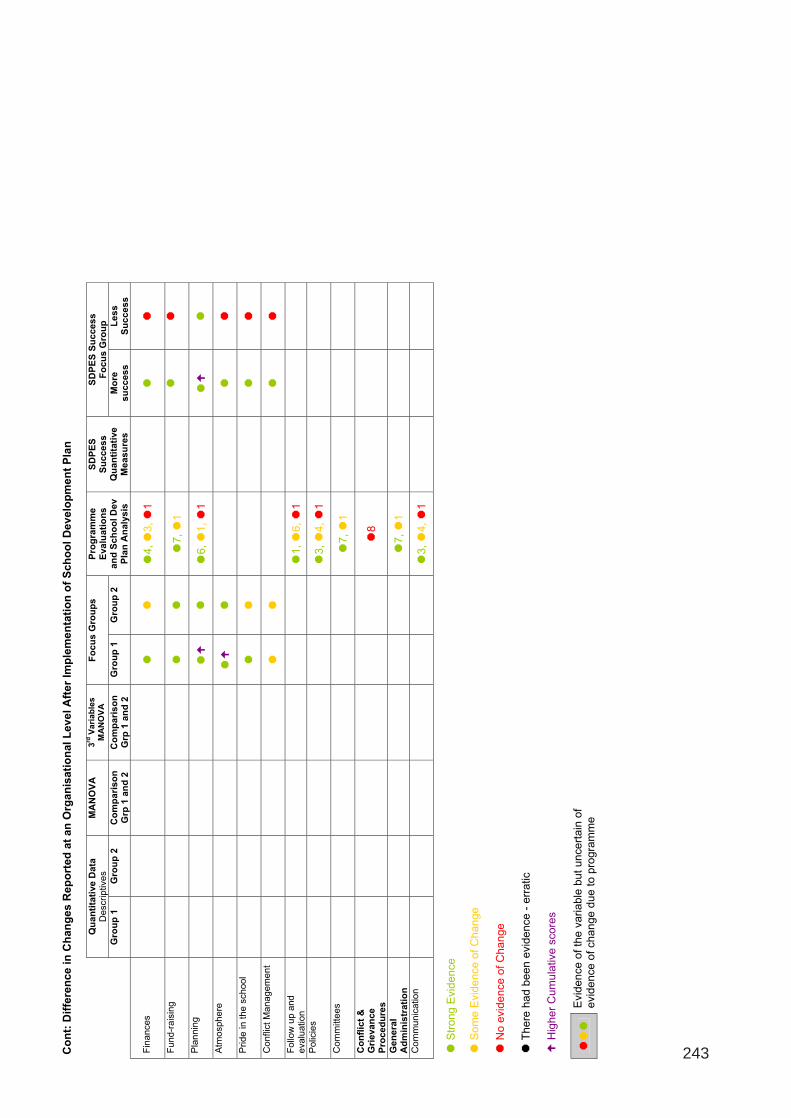
Q
ua
nti
tati
ve
Da
ta
Descrip
tive
s
MA
NO
VA
3
rd V
ari
ab
les
MA
NO
VA
F
ocu
s G
rou
ps
SD
PE
S S
uccess
Fo
cu
s G
rou
p
Gro
up
1
Gro
up
2
Co
mp
ari
so
n
Grp
1 a
nd
2
Co
mp
ari
so
n
Grp
1 a
nd
2
Gro
up
1
Gro
up
2
Pro
gra
mm
e
Eva
lua
tio
ns
an
d S
ch
oo
l D
ev
Pla
n A
na
lys
is
SD
PE
S
Su
cc
ess
Q
ua
nti
tati
ve
M
ea
su
res
M
ore
s
uc
ces
s
Le
ss
S
uc
ce
ss
Fin
ances
4
, 3
, 1
Fu
nd-r
ais
ing
7
, 1
Pla
nn
ing
6
, 1
, 1
Atm
osphere
Pride in the s
chool
Conflic
t M
anagem
ent
Fo
llow
up
and
evalu
ation
1,
6,
1
Po
licie
s
3
, 4
, 1
Com
mitte
es
7
, 1
Co
nfl
ict
&
Gri
eva
nc
e
Pro
ce
du
res
8
Gen
era
l A
dm
inis
tra
tio
n
7,
1
Co
mm
un
ica
tio
n
3
, 4
, 1
Str
ong E
vid
ence
Som
e E
vid
ence o
f C
hange
N
o e
vid
en
ce
of
Ch
an
ge
There
had b
een e
vid
ence -
err
atic
H
igh
er
Cu
mu
lative
sco
res
E
vid
ence o
f th
e v
ariable
but
uncert
ain
of
evid
ence o
f change d
ue t
o p
rogra
mm
e
Co
nt:
Dif
fere
nc
e i
n C
ha
ng
es
Re
po
rte
d a
t an
Org
an
isati
on
al
Lev
el
Aft
er
Imp
lem
en
tati
on
of
Sch
oo
l D
ev
elo
pm
en
t P
lan
187 243

Ma
trix
5:
Dif
fere
nc
e i
n C
ha
ng
es
Re
po
rte
d a
t th
e C
om
mu
nit
y L
ev
el
Aft
er
Imp
lem
en
tati
on
of
the
Sc
ho
ol
De
ve
lop
me
nt
Pla
n
Qu
an
tita
tive
Da
ta
Descrip
tive
s
MA
NO
VA
3
rd V
ari
ab
les
MA
NO
VA
F
oc
us
Gro
up
s
Au
dit
an
d S
DP
A
na
lys
is
SD
PE
S S
uccess
Fo
cu
s G
rou
ps
Gro
up
1
Gro
up
2
Co
mp
ari
so
n
Grp
1 a
nd
2
Co
mp
ari
so
n
Grp
1 a
nd
2
Gro
up
1
G
rou
p
2
8 A
ud
its a
nd
S
DP
s
Mo
re
Su
cc
ess
L
es
s
Su
cc
ess
Pare
nt In
volv
em
ent
7
1
School G
overn
ing B
ody
3
1
4
Colla
bora
tion w
ith o
ther
sch
oo
ls
7
1
Com
munity Involv
em
ent
3
4
1
Str
ong E
vid
ence
Som
e E
vid
ence o
f C
hange
N
o e
vid
ence o
f C
hange
T
here
had b
een e
vid
ence -
err
atic
H
igher
Cum
ula
tive s
core
s
188 244

245
The programme defined an empowering organisation as one in which there is
a participative work culture, collaborative work structures and shared decision
making. This is likely to manifest in a school context as increased
responsibility for school development among the whole staff. It defined an
empowered organisation as a school that is in control of its own development
and is able to acquire the resources it requires and is having an impact on the
broader educational community. In a school development planning context,
this is likely to be found in situations where the school has actively
implemented the school development plan and has achieved the goals set for
itself (or is in a process of achieving).
It was evident from the focus groups, interviews and the various archival
analyses that in terms of the theoretical definitions and the programmes
indicators there is evidence of empowerment at the organisational level of
analysis. In terms of empowering processes there is evidence of
collaboration, supportive relationships, shared decision-making and
improvements in the relationships between teachers and the principal and
management. There is also evidence that the schools were implementing the
school development plans and that most school development teams were
functional. These empowering processes appeared to be linked to the
empowered outcomes that the schools were experiencing, however this was
only based on the self-report of teachers and thus would require further
exploration. From the analysis of the schools’ planning documents it was
evident that schools were achieving the goals they were setting for
themselves and were able to acquire much needed resources and make
infrastructure changes within their schools.
The Community Level Impact Matrix (see Matrix 5) indicated that again there
was evidence of change in both groups in terms of parent and School
Governing Body involvement in the schools. However it was only Group 1
schools that had engaged the wider community in the school and have been
involved in collaborative activities with other schools. It may be that effective
engagement with community level variables takes time and the schools may
need to deal with issues internal to the school first. The fact that only Group 1

246
schools mentioned collaboration with other schools and the community lends
support to the idea that these areas take time to develop. However this would
need further exploration.
Theoretically community level empowerment was seen as being focused on
collective action to improve the quality of life within the community through the
active engagement of stakeholders. An empowered community is one that
initiates efforts to improve the community, responds to threats and provides
opportunities for citizens to participate (Zimmerman, 2000). The exemplars of
empowerment described by Zimmerman (2000) include collective action,
stakeholder involvement, improvements in the community. The programme
saw the indicators of community empowerment in a school development
context parents and members of the School Governing Body actively involved
in school activities and in this way enabling the school to move towards its
goals.
Both groups of schools reported that parent engagement and the School
Governing Bodies had improved. Group 1 schools also evidenced changes in
their engagement with the broader community and were involved in
collaborative activities with other schools in the area. In terms of the
theoretical definitions and the programmes indicators there is evidence of
empowerment at the community level of analysis.
In summary the matrices indicated that there was evidence of change at the
individual, school and community level and that empowerment had occurred
at these levels of analysis. They also indicated that this impact had occurred
in both groups and thus length of involvement in the programme did not seem
to be a significant influence on empowerment in the context of school
development; and that there were other variables that were more important
(which will be discussed in more detail below).
The addition of the regrouped data, comparing those schools that were more
successful on the School Development Planning Evaluation Scale with the
less successful, offered some interesting results with regard to potential

247
variables that were impacting on the school development process. The more
successful group showed significant statistical differences from the less
successful group with regards to variables relating to the principal in terms of
leadership style and supervisory leadership, collaboration and peer
leadership. These differences were also reflected in the qualitative analysis
with School Development Planning Evaluation Scale success reporting more
changes in the principal, management, finances, pride in the school and
conflict management. These successful schools emphasised the changes in
the principal not only in terms of how he or she managed the school but also
in terms of their personal relationship with him or her. “The small things”
relating to the staff’s perception of the principals’ valuing, respect and trust in
them, often shown through small interpersonal interaction and attitudes, was
stressed.
What also emerged as important in the qualitative analysis was the active
engagement of the principal in the process of school development planning
both in terms of collaboration and decision-making (in terms of being involved
in decision making as well as being able to influence decisions). In the less
successful schools peer collaboration and decision-making were being used
rather than including the principal in the process.
The differences between School Development Planning Evaluation Scale
success schools seemed to be related to change within the power structures
in the school. This difference between these groups seems to reflect what
Fullan (1991) and Clarke (1999) referred to as the distinction between first-
order (or surface) change and second-order change. In the less successful
schools change was evidenced; however it focused on the acquisition of
resources and less on structural and cultural change. Although access to
resources is seen as central to the empowerment process and the importance
of small gains at the material level in aiding the empowerment process has
been stressed by several writers (Kroeker, 1995; Perkins, 1995) it has been
argued that for true empowerment to occur this needs to move on to a
different level from the physical to issues of structure and process and to
issues of power (Kroeker, 1995).

248
What seemed to have happened in successful schools is that second-order
change or change that can support the school development planning
implementation had occurred. These schools were then able to move beyond
a focus on resources and make other changes in the way the school
operates. In doing this it seems they were able to bring about more change.
What seems to have occurred is what Gardner & Pierce (1998) refer to as a
spiral of success for these schools and with it a pride in their achievements
and in their school, which in turn initiated more activity. This also links to the
fact that it was these same schools that felt their own personal skills had
developed. Several writers (Hopkins, 2000; Hopkins, et al., 1997; Stoll, 1999)
have argued that some schools may not have the internal capacity to effect
these changes.
The data indicates that school development planning as a process can be
empowering for schools if they have the internal capacity to make use of the
process, i.e. certain variables need to be in place for school development
planning to be truly empowering. The schools had responded differently to
the programme based on internal capacity as opposed to length of time on the
programme. Thus although the school development planning approach to
school empowerment taken by the programme has brought about change in
the schools at all levels, particularly in terms of the acquisition of resources, it
may not be the most effective method of school empowerment for all schools.
The qualitative data and the externally verified data offered evidence that
school development planning has empowered schools at various levels of
analysis. In integrating these data a number of clear indications about what
the programme had done and its meaning in teachers’ lives emerged. School
development planning was an empowering process for the schools and had
led to a variety of empowered and empowering outcomes. The quantitative
data was less easy to interpret. The complex and multidimensional nature of
empowerment may make it particularly difficult to measure quantitatively.
While the quantitative evidence had been difficult to interpret, triangulation
with qualitative methods has been successful in providing evidence that
empowerment is multidimensional and occurs in school development work. It

249
was however difficult to measure as it has so many aspects and dimensions.
There was also evidence of the power of qualitative methods for exploring
complex, multilevel, dynamic, contextual constructs as empowerment. The
use of qualitative methods in conjunction with quantitative methods in multi-
method research clearly has an important role.
6.10. CONCLUSIONS FOR RESEARCH QUESTIONS 1 AND 2 The quantitative measures of the different variables show quite clearly that
there were no statistical differences between the two groups on the variables
associated with empowerment. From the impact matrices, it can be seen that
all of the schools found the experience of being involved in the programme
and the school development plan useful in terms of bringing about some
change at an individual, organisational and community level. There is also
externally verified evidence from various data sets (the analysis of school
development objective achieved, verifying interview data and archival data)
that the schools were using the school development plans to bring about
changes at their schools and that this change was occurring at the individual,
organisational and community levels. There may be several reasons for the
lack of significant differences between the two groups on the different
measures in the quantitative section.
The first possible reason may be that both groups have been engaged with
the programme for at least one year and that the programme has had a
positive impact over this year. As described in Chapter 3, during the first year
of the programme the schools engaged in many activities including: training
for management, for the school development team, the school draws up a
school development plan, financial management training, fund-raising training
and training for administrators. There is also ongoing support at the school.
Thus with this amount of input, the schools may go through a “honey moon”
phase of rapid change within their schools, and as is often observed there is a
lot of enthusiasm in the first year. Both groups’ mean scores, for all of the
scales were positive (see Tables 1 – 10, Appendix 13).

250
The second possibility does not exclude the first but may also be a reason on
its own. After the first year of intensive intervention and initial enthusiasm
around change the schools now move into a stronger implementation phase.
During this time schools become faced with many of the realities of change
and often meet with many barriers and difficulties. Change literature also
indicates that after a time of rapid change within an organisation there is often
a period of moving back or a downward trend in the change process. As both
school development (Hopkins, 1995; Schofield, 1995) and organisational
development (refs) literature have shown there is often a dip in the
implementation of change programmes after a period of initial rapid change.
A third possibility for the lack of difference may be that part of the process of
school development and of empowering people is raising an awareness of,
not only of how thing could be or what the possibilities are, but also on critical
reflection of one’s present situation (Deacon, 1990). This is the interactional
component of psychological empowerment (Speer, 2000; Speer & Hughey,
1995; Zimmerman, 2000; 1995). This often leads to people becoming more
critical of their situation even if it has improved. Thus teachers in Group 1
may be applying harsher standards or criteria when responding to the
measurement questionnaires than when teachers from Group 2 do.
It has also been argued earlier that social and historical characteristics shape
individual desire for, and experience of, empowerment (Zimmerman, 1995).
These desires are also shaped by previous experiences with empowerment.
Bartunek and colleagues (Bartunek, Foster-Fishman & Keys; Bartunek, Lacey
& Wood, 1992) found that individuals who had no previous empowerment
experiences within a specific context assigned different meanings that
individuals who had more experience. For example, newcomers to a
participatory decision-making process were more likely to define a directive
leader as empowering while those more experienced in this process needed
real influence over decisions to feel empowered (Bartunek et al., 1992). Thus
the same scores on the scales between the groups may be reflecting very
different realities for the schools.

251
The fourth possibility is that the programme has failed in its mission and that
the schools have actually not changed. It is difficult to ascertain from the
statistical analysis of the quantitative data which of these possibilities is more
possible. However the matrices indicate that there have been changes in the
schools. When a comparison is made between schools that have been in the
programme for over three years and those who have only started the process
the qualitative results show that both groups report having experienced
changes. This may indicate that both groups had been impacted on by the
programme.
Both groups were using the School Development Plan to some extent. Both
were reporting similar sorts of changes within the schools at an individual,
organisational and community level as well as improvements in infrastructure
and acquiring. This indicates that Group 2 had experienced much change
during their first year of implementation. Group 1, however did make more
reference to all of these changes except for collaboration and planning and
did mention more areas of change especially at the community level of
analysis.
Any conclusion drawn from the data need to take into account the limitations
of the design and sampling of the current study. The ex post facto design
used is a descriptive design which provides useful information at an
exploratory level. It was for these reasons that the ex post facto design was
nested within a multi-method design. Thus in order to reach conclusions
about the effectiveness of the school development programme other sources
of data were collected. As has been demonstrated above the terms “effect”
and “impact” are defined in a number of different ways in the evaluation
literature. The focus of the evaluation in the current study is not about a
systematic impact evaluation of a school development programme (which
would require a measurement-based design based on control or contrast
groups). The focus is rather on seeking evidence of empowerment outcomes
in a school development setting, through a multi-method analysis. In a multi-
method evaluation, the use of indicators of outcomes is in line with the ways
252
in which multi-method impact evaluations have been previously conducted in
a number of arenas internationally and in particular in health and education.
Integrating the various data sources the impact matrices indicated that there
was evidence of changes on the individuals, schools and the communities
they served. It also indicated that school development planning was related
to aspects of organisational empowerment. However the extent of
involvement in the programme did not have a significant influence on the level
of empowerment. More important was the internal capacity of the school,
particularly the influence of school leadership, and contextual factors. The
various data sources indicated that school development planning, linked with
other empowering processes, does bring about change within schools;
however this will vary according to what those other empowering variables
may be. Based on this evidence it can be concluded that empowerment, at
various levels of analysis was evident within the context of a school
development setting.

253
CHAPTER SEVEN: RESULTS RELATING TO THE
RELATIONSHIPS BETWEEN THE VARIABLES
7.1. INTRODUCTION In order to establish whether school development planning could usefully be
conceptualised as a form of organisational empowerment its relationship with
variables associated with empowerment was explored. Qualitative data
exploring what participants in the programme felt were factors that helped or
hindered the school development planning were collected. These were
integrated in a relationship matrix to explore what participants saw as
important in bringing about change and successful school development
planning implementation. The relationships between the quantitative
measures were explored statistically through multiple regression and through
the construction and testing of a model of school development using structural
equation modelling. The quantitative and qualitative data were integrated in a
relationship matrix and diagrams to provide a broader understanding of the
relationship between school development planning and the other variables.
Research Questions 3 and 4 were operationalised and assessed in the
following way:
RESEARCH QUESTION 3 What factors help or hinder the school development planning process?
This was assessed through the following:
• Focus groups relating to what school felt had helped or hindered the school
development planning process and what advice they would give to a school
embarking on school development planning process.
• Regrouped focus group data, according to School Development Planning
Evaluation Scale scores, relating to similarities and differences between
what more and less successful schools felt had helped or hindered the
school development planning process.
• Relationship Matrix and Diagrams integrating the above data sets.

254
RESEARCH QUESTION 4 What is the relationship between the process of school development planning
and those variables associated with empowerment at the individual,
organisational and community levels?
• Quantitative measures and analysis of the relationship between School
Development Planning Evaluation Scale and those variables associated
with empowerment at the individual (locus of control and general and
context specific efficacy) and organisational (participation and leadership)
levels of analysis. The community (stakeholder involvement) level of
analysis could not be included, as the Stakeholder subscale of the School
Development Planning Evaluation Scale was not seen as a separate factor.
• Relationship Matrix and Diagrams integrating the qualitative analysis from
Research Question 3 with the quantitative analysis (the multiple regression
and structural equation modelling) in Research Question 4
Thus an attempt will be made to:
1. Explore, from the school’s perspective, the factors they see as playing a
role in the organisational empowerment of their schools;
2. Explore the relationships between the measure of school development
planning and the individual and organisational level variable measured in
the study;
3. Integrate this into an understanding of what factors, individual,
organisational and community, contribute to the empowerment of schools
as organisations.
7.2. FOCUS GROUP RESULTS RELATING TO HELPING AND HINDERING FACTORS AND ADVICE The focus groups were used to explore what factors schools felt had helped
or hindered the implementation of the school development plans. In line with
the values of community psychology, and with an understanding of the
complex and multidimensional nature of empowerment, it was felt that schools
should be given an opportunity to talk about their understanding of the change
process in their schools. Criticisms of programme evaluation and much of

255
school development work focus on a lack of understanding of why
programmes succeed or fail in their endeavours (Chen & Rossi, 1983). This
data will therefore add to our understanding of the factors that played a role in
the success or failure of the school development planning process and
empowerment within the context of school development.
Results pertaining to factors at the individual, organisational and community
levels will be presented. For each section a table reflecting the cumulative
scores of how often that particular theme was mentioned by the schools
making up that particular group, as well as how many schools reported that
particular theme, will be presented. As in the previous chapter tables,
containing the category label, the definition or description of the category and
an illustrative quote from the focus groups will be offered for each theme to
provide a richer understanding of the results presented.
7.2.1. FACTORS HELPING THE IMPLEMENTATION OF THE SCHOOL DEVELOPMENT PLAN The following results illustrate the factors that the participants felt had assisted
them in the implementation of the school development plan.
7.2.1.1. Individual Level Factors As Table 33 indicates, at the individual level schools only mentioned factors
relating to their attitudes as having played a role in the implementation of the
school development plan.
Table 33: Comparison of Groups 1 and 2 on Individual Level Factors that Helped to Implement the School Development Plan
Cumulative Scores Number Of Schools CATEGORY Group 1 Group 2 Total Group 1 Group 2 Total
Attitudes towards the school
6 7 13 3 3 6
Attitudes towards others
7 1 8 2 1 3
Both groups felt that the change in their attitudes towards the school had
helped with the school development planning implementation.

256
Category - Attitudes towards the school Definition - staff feelings and beliefs (and as a consequence behaviours) towards the school that are positive and linked to wanting to better the school. Illustrative Example: • I remember there was a time when … we came together and said lets just prove these
people wrong and when they came well they came from wherever even if they can make an unannounced visit they can find us working very well (2.4.1.)
However Group 1 schools emphasised that it was not only a change in their
attitude towards the school but also towards their colleagues that had played
a role in their successful implementation of the school development plan.
Category - Attitudes towards others Definition - staff feelings and beliefs (and as a consequence behaviours) towards their colleagues that are positive and contribute to positive relationships and work atmosphere Illustrative Example: • It is because of this em development what ever you call it [1.3.2: Development plan]
although I didn’t attend the training but from the reports I used to get from those who went there I think that has really improved my attitude and made me a better person to be able to work with others we have a better understanding to some of the things (1.3.6.)
7.2.1.2. Organisational Level Factors In contrast to the individual level, there were many organisational level
variables the schools felt had aided the school development plan
implementation. As Table 34 indicates, both of the groups mentioned a wide
Table 34: Comparison of Group 1 and 2 on Organisational Level Factors that Helped to Implement the School Development Plan
Cumulative Scores Number Of Schools CATEGORY Group 1 Group 2 Total Group 1 Group 2 Total
Collaboration
10 11 21 3 3 6
School Development Team
3 5 8 3 2 5
Development of Positive Relationships
5 3 8 3 2 5
Atmosphere of achievement
4 3 7 2 2 4
The principal and management
9 3 12 2 1 3
School Development Plan
1 6 7 1 2 3
Decision making
3 2 5 2 1 3

257
variety of themes relating to the factors they felt had helped them implement
their school development plans.
There were several factors that both groups felt had helped them in the
implementation of their School Development Plans within the school. These
included:
Category - Collaboration Definition - working together on issues related to school development and maintenance Illustrative Example: • the school development plan is there to to remind us if we are not prepared to change we
won’t do it now the answer to your question is the one you got from 1.2.1 that we we accepted ourselves and we agreed to work as a team that’s it. (Participant 1.2.8.)
Category - School Development Team Definition – Team set up as part of school development planning programme to co-ordinate, monitor and review the implementation of the SDP Illustrative Example: • the school development team was also able to make us more focused in that we were
able to realise our weaknesses and where the strengths lie and make some educators aware of their capabilities in terms of what they like to do most and what they can do best and so they had been actually eh developing their talents for the benefit of the school (Participant 2.1.4.)
Category – Development of Positive Relationships Definition - interactions with their colleagues, in terms of both the quality of their behaviour towards colleagues and colleagues, behaviour towards them Illustrative Example: • we are here eating together even sharing ideas and there are a lot of jokes here and we
are always laughing (Participant 1.1.5.) Category - Atmosphere of Achievement Definition – a feeling in the school that relates specifically to having pride in the school and in the school’s achievements. Illustrative Example: • the joy of having achieved … it really helped us and we saw what was needed and we
took it upon ourselves that we were going to do this and we are going to have that (Participants 2.1.2.)
There were however, some clear differences in the groups’ perceptions about
some of the factors that had helped them implement the plan. Group 1

258
schools emphasised changes in the principal and decision-making as helping
factors.
Category – Changes in the Principal and Management Definition – Changes in the way the principal and school management team manage the schools and engage with teachers Illustrative Example: • The attitude (lots of comments ja the attitude) the attitude of the management the attitude
of the principal changes the mood of the school (Participant 1.2.8) Category – Decision-making Definition – staff’s involvement and influence in the decision making processes within the school. Illustrative Example: • Ja, ja the principal of the management team isn’t the one to make decisions, everybody
has a say in the decision that is taken (Participant 1.1.1.)
Group 2 however, emphasised the school development plan as being a
helping factor. This centred on providing a focus, enabling them to see
strengths and weaknesses, identify needs and the need for regular follow up
and review.
Category – School Development Plan Definition – Plan drawn up by the whole school reflecting action plans for dealing with key areas of need in the school Illustrative Example: • we saw the need … We saw the need for those things without those things other things
would not be accomplished like a Photostat machine we need we are now doing OBE and we need the handouts for pupils so without it and the circulars and notices to parents also … the fax because we used to use the fax of the neighbouring school and we said we needed our own (2.2.2.)
7.2.1.3. Community Level Factors At the community level there was a clear distinction between Group 1 and
Group 2 schools. As Table 35 (see following page) indicates it was Group 1
schools that saw support coming from this level of analysis.

259
Table 35: Comparison of Group 1 and 2 on Community Level Factors that Helped to Implement the School Development Plan
Cumulative Scores Number Of Schools CATEGORY Group 1 Group 2 Total Group 1 Group 2 Total
Programme’s Courses and Support
13 4 17 4 2 6
School Governing Body Support
11 0 11 3 0 3
Parent Support
3 0 3 3 0 3
Community Involvement
3 0 3 2 0 2
Although both groups mentioned the programme’s courses and support as a
helping factor it was Group 1 that emphasised this. What was interesting was
that at the time it was Group 2 schools that were getting more training and
support from the programme.
Category – Programme’s courses and support Definition – Courses and support offered to schools as outlined in Chapter 3.4. Illustrative Example: • Your support. Outreach as a whole, you were here to see you didn’t just help us to draw
the plan but they were here to see that we are able to achieve what we have planned, sort of coming to see how far are we, are you able to do this, do you need help here (Participant 1.1.1.)
It was only Group 1 schools that felt the School Governing Body, parental
support and community involvement supported their school development plan
implementation.
Category – School Governing Body Support Definition – School Governing Body’s interest and support for the school, improved relationship between staff and School Governing Body. Illustrative Example: • And they (referring to the governing body) really represent the parents. When we have
parents’ meetings the principal let me say the management do not tell them … at times they chair the meetings and they give parents information and that shows the parents that we are not dictating … And they have been very supportive (Participant 1.1.2)

260
Category – Parental Support Definition – Parental involvement in the school in terms of school activities, and the educational progress of their children. Illustrative Example: • To show really some of the parents are concerned they even volunteered to paint the
classes (Participant 1.3.2.) Category – Community Involvement Definition - the involvement of the community in school activities. Illustrative Example: • We have not had a burglary for some time … the community is trying to watch over the
school (Participant 1.3.1.)
7.2.1.4. Summary In terms of the variables seen to have helped the schools implement their
school development plans, participants emphasised a wide range of variables
at various levels of analysis. Some of these variables overlapped with those
measured in the quantitative part of the study. Both groups emphasised the
importance of collaboration and relationships and Group 1 mentioned the
principal and decision-making.
Additional factors were mentioned, both internal and external to the school.
Internal to the school both groups emphasised a change in attitudes towards
the school, the role of the school development team and a change in the
atmosphere within the school. Group 1 emphasised that a change in attitude
towards their colleagues had also been helpful. Group 2 felt that the actual
plan had been useful in implementing the school development plan. Group 1
also emphasised several factors external to the school. They felt parent
involvement, the School Governing Body, community involvement and the
programme’s courses and support had all been instrumental in bring about
change within the school.
7.2.2. FACTORS HINDERING THE IMPLEMENTATION OF THE SCHOOL DEVELOPMENT PLAN The following illustrate the factors that participants felt had hindered
implementation of the school development plan.

261
7.2.2.1. Individual Level As Table 36 indicates, at the individual level of analysis, schools again only
mentioned issues related to attitude.
Table 36: Comparison of Group 1 And 2 on Individual Level Factors that Hindered Implementation of the School Development Plan
Cumulative Scores Number Of Schools CATEGORY Group 1 Group 2 Total Group 1 Group 2 Total
Negative attitudes towards the school 4 2 6 1 2 3
Category - Negative attitudes towards the school Definition - staff feelings and beliefs (and as a consequence behaviours) towards the school that lead to negative outcomes. Illustrative Example: • there are those teachers who do not want to involve themselves in whatever activities we
have done in this school they are only here for teaching they will even tell you I am not prepared to do such and such I have been working for a long time and that is hurting (2.2.4)
Attitudes of the staff, focusing on a lack of motivation, commitment and
willingness to participate were stressed.
7.2.2.2. Organisational Level As in the helping factors organisational level factors were emphasised as
having hindered the implementation of the school development plan. As
Table 37 (see following page) indicates there were several factors that both
groups felt had hindered their implementation of the school development plan
within the school.

262
Table 37: Comparison of Group 1 And 2 on Organisational Level Factors that Hindered Implementation of the School Development Plan
Cumulative Scores Number Of Schools CATEGORY Group 1 Group 2 Total Group 1 Group 2 Total
School Development Team Issues
8 10 18 3 3 6
School Development Planning Issues
9 7 16 3 3 6
Financial Issues
4 6 10 3 3 6
Lack of Collaboration
9 12 21 2 3 5
Difficulties With the Principal
8 13 21 2 3 5
Management Issues
6 11 17 2 3 5
Issues Related to Decision-making
6 6 12 2 3 5
Organisational Issues
8 13 21 1 3 4
Planning Issues
3 8 11 1 3 4
Time Constraints
1 3 4 1 3 4
Negative Atmosphere
4 1 5 2 1 3
Lack of Funds
1 1 2 1 1 2
Category – School Development Team Issues Definition – Problems Associated with the Functioning of the School Development Team and Their Role in terms of School Development Planning. Illustrative Example: • To be honest with you Alex we (the school development team) don’t give them feedback
after we have met to be honest and from my observation the plan is not functioning well (2.3.4)
Issues with the School Development Team related to four main areas: a split
between the School Development Team and the staff; the School
Development Team not keeping the staff informed; a lack of clarity by some
staff on the composition of the School Development Team; and the
management team not supporting the School Development Team. These
issues confirmed those mentioned in the interviews with the School
Development Teams (see Chapter 6.6.2).

263
Category – School Development Planning Issues Definition – Problems Associated with the Implementation, Monitoring and Reviewing of the SDP Illustrative Example: • we draw a plan, the problem is we lack … follow ups, we do have the plan and the time
also do run short we don’t do our things at the exact time. Maybe it is because we just draw the plan and nothing more, no follow ups so to say, so it is time and we don’t have any follow ups … Meaning that we draw the plan and no one is saying now you are to do this and what are we from here where are we going also … Within that period of time (2.2.1)
The school development plan issues related to unrealistic time frames set for
actions, not focusing on the planned priorities, a lack of follow up and review
and a lack of clarity by some staff on the purpose of the school development
plan.
Category – Financial Issues Definition – Issues related to financial management at the school that impact on implementation of the School Development Plan Illustrative Example: • According to our plan we did that Saturday, eh the budget was to come before the year
plan itself, so budget has to do with money and anything that is related to money has not been done, so issues around money at the school, so really not having procedures at the school for administering finances hinders the implementation of the plan (Participant 2.4.3)
Financial issues related to two main areas: the use of funds that were raised
(an important issue for some schools was that funds that were raised were
then used for something else, usually at the discretion of the principal) and the
transparency and administration about finances.
Category – Lack of Collaboration Definition – Staff are not working together collaboratively on the implementation of the School Development Plan Illustrative Example: • they are still sectoral … Meaning we are still sticking to groups other than working as a
team, other than to work as a team that is team work doesn’t prevail (Participant 1.4.4) • I think the school development is not successful because … there is a lack of teamwork
and commitment (Participant 1.4.8)
This theme not only focused on a lack of teamwork between staff but also
focused on the fact that the principal was not part of the collaborative activity.

264
Peer collaboration and decision-making emerged as a theme as a way of
dealing with a poor relationship with the principal. This supports the active or
guiding role of the principal in school development plan implementation as
evidenced in the interviews (see Chapter 6.6.3).
Category – Difficulties with the Principal Definition – Issues related to the working relationship between staff and principal Illustrative Example: • Maybe he doesn’t consider himself part of us teachers he is [???: Above] a separate
entity we have to discuss the things and bring it to him and rules on his own and then it comes back to us I think that is how he wants it to work and that is where he cannot get our appreciation’s of whatever we are trying to do here at school he cannot get the atmosphere and the passion of whatever we are trying to do here because he is not here with us so it is a different issue when it gets to him the office (Participant 2.2.5)
Difficulties with the principal related to the principal’s behaviour and the
relationship he or she had with his or her staff. The main issues reported by
the staff included: principal’s behaviour interfering with the running of the
school e.g. not being at school during office hours; autocratic behaviour and
what has been referred to in the previous chapter as “the small things” relating
to the quality of the interpersonal relationship between teachers and principal.
Category – Management Issues Definition – Issues related broadly to the functioning of the School Management Team and specifically to their role in School Development Planning Illustrative Example: • at the end of the day even the management itself the office itself doesn’t come up with a
particular mechanism to alleviate such problems or to drive maybe whatever positive plan that they want to (Participant 1.4.4)
Management team issues included the functioning of the management team;
conflict between staff and management; management not giving the staff
information; school management team’s lack of involvement in the school
development plan; and time constraints due to a heavy work load.

265
Category - Issues Related to Decision-making Definition – Issues related to staff involvement and influence in the decision-making processes within the school. Illustrative Example: He (the principal) will always disagree with whatever we agree as a staff because the thing is he does not attend our meetings so we discuss things here then somebody must go and report then give the feedback it goes [???: It is a dialogue] (Participant 2.2.1)
Decision-making consisted of two issues: a lack of involvement in decision-
making and whether the involvement actually had any influence. At some
schools the way of dealing with this was to make decisions as peers; however
this was often not successful as the principal still had the final say.
Category - Atmosphere Definition - overriding feeling within the school is negative and works against the implementation of the School Development Plan Illustrative Example: • teachers in this school mostly run away from their responsibilities and there is a lot of look
that has been focusing to the management people run away from their responsibilities and focus on management one two three every talk around this school is on top of the management but they are not doing anything in their classrooms … I can give an example of an assembly in the morning it is higher primary assembly every day I am always with 1.4.5. yet we are not the only 2 teaching the higher primary pupils yet the lot of saying about the management is always going to be there so where is the responsibility of the teachers (Participant 1.4.1)
Schools spoke about certain atmospheres that worked against
implementation e.g. an atmosphere of fault finding and putting down, a culture
of blame and not taking responsibility and a culture of groupings as opposed
to collaboration. In the latter category, a culture of groupings, three main
forms of grouping were identified based on gender, educational qualification
and age or teaching experience. Thus older teachers, teachers with more
experience or males kept themselves separate from the rest of the staff.
Only two schools (one from Group 1 and one from Group 2) felt that a lack of
funds had interfered with the implementation of their plans. Both of these
schools had been very successful in terms of fund-raising and getting their
plans implemented. It is possible that they could see the potential they could
achieve if they had the money.

266
There were certain hindering factors that were emphasised more by Group 2.
Four schools (three from Group 2 and one from Group 1) mentioned issues
relating to:
Category – Organisational Issues Definition – Issues related to broader organisational problems not specifically categorised Illustrative Example: • No what I can say is we formed committees … the committees do not function sad to say
but we have those committees that is again the lack of follow ups because it is like so and so can do this [let it be her work] so everything is shifted to that person (Participant 2.2.1)
• We meet irregularly (Participant 2.3.3) • Here we are not well organised (Participant 2.2.4.) Category – Planning Issues Definition – Issues related to general planning within the school Illustrative Example: • Apparently you don’t indicate early enough … But you don’t plan that you want this to be
done within three months time or two months time you only indicate (Participant 2.2.2) Category – Time Constraints Definition – Issue related to not having enough time to implement the plan Illustrative Example: • It (having full teaching load and being and HOD) plays a role I mean you find that
sometimes there are courses when do you get these teachers to give them feedback you wait a little bit you say maybe next week you will have some time there is something next week there is something else that next week you end up having I mean completing the whole quarter without giving feedback (Participant 2.3.5)
Group 2 schools reported more hindering factors at the organisational level.
This may link to why they felt less had changed in their schools.
7.2.2.3. Community Level As Table 38 (see following page) indicates both groups mentioned several
community level factors hindering their school development plan
implementation.

267
Table 38: Comparison of Group 1 and 2 on Community Level Factors that Hindered Implementation of the School Development Plan
Cumulative Scores Number Of Schools CATEGORY Group 1 Group 2 Total Group 1 Group 2 Total
Parent Involvement
8 7 15 4 4 8
Department of Education
14 9 23 3 3 6
School Governing Body Involvement
1 2 3 1 2 3
Category – Parent Involvement Definition – Issues related to parental involvement in the school in terms of school activities, and the educational progress of their children. Illustrative Example: • I still I also feel whilst still on parent involvement, if these parents could involve
themselves … some of them feel that is the duty of the teachers, they do not feel they are part of the education system … we have tried several times in meetings to make them aware (that they are stakeholders in their children’s education) and when they are called to meetings some of them, most of them, do not come to meetings you find this, I mean, you call a meeting, you see the same faces yes and only a handful (Participant 2.3.?)
Although all of the groups mentioned that parent involvement had improved it
was only some Group 1 schools that felt that parent involvement had helped
with the implementation. Most of the schools felt that parent involvement,
although having improved still needed much improvement.
Category – Department of Education Definition – Issue related to the Department of Education’s demands and relationship with the school Illustrative Example: • Sometimes even the demands of the GDE(education department) … you know what they
do, sometimes they just write a letter such and such a day they want such and such a thing and we had our plans for that day, a meeting for that day, and automatically its off because we have to fulfil what they want (Participant 1.2.4)
Issues with the Department of Education included: unrealistic demands being
placed on the schools, a top-down approach, poor planning, a lack of
openness, a lack of appreciation for what was being done, and the poor way
in which issues being faced at the school were dealt with by the department.

268
Category – School Governing Body Definition – Issues related to the School Governing Body’s interest and support for the school, and relationship with staff. Illustrative Example: • They (referring to the school governing body) never frequented the school … Never made
any follow ups but when we met with them we would take them out and show them the pitch I think we used to give them a report in the meetings (2.2.2)
Three schools mentioned issues with the School Governing Body. One
school had had no School Governing Body and this was an ongoing issue
especially due to the misadministration of funds. Although Group 1 schools
reported that parent and School Governing Body involvement had improved,
and that these factors aided their school development plan implementation,
they still saw them as needing to be developed.
7.2.2.4. Summary In terms of the hindering factors a wider variety of themes were mentioned,
particularly by Group 2 schools. These factors covered individual (attitudes),
organisational (leadership and participation) and broader contextual issues of
parent and community involvement as well as the role of the Department of
Education. The distinction between being involved in decision-making and
having real influence was again made, with lack of involvement and influence
seen as hindering. Peer collaboration and decision-making emerged as a
way of dealing with a poor relationship with the principal. As has already
been stated schools that were successful in the implementation of their plans,
whether they were in Group 1 or 2 were showing similar trends in the
outcomes they were reporting and in the factors they felt were supporting
them. This will be elaborated on below.
7.2.3. ADVICE TO OTHER SCHOOLS The advice the schools would give to other schools that wanted to embark on
school development planning gave more insights into what were seen as
important factors in the successful implementation of this process. As Table
39 indicates there were some similarities between the two groups as well as
some clear differences.

269
Table 39: Comparison of Groups 1 and 2 on the Advice They Would Offer to Other Schools That Wanted to Implement a School Development Plan
Cumulative Scores Number Of Schools CATEGORY Group 1 Group 2 Total Group 1 Group 2 Total
INDIVIDUAL Positive Attitudes Towards the School
12 4 16 4 3 7
ORGANISATIONAL Planning
9 9 18 3 3 6
Positive Engagement of Management
6 4 10 3 3 6
Collaboration
13 4 17 4 1 5
Vision/Direction
5 1 6 4 1 5
Positive Staff Relationships
6 7 13 2 2 4
Positive Atmosphere
2 3 5 2 2 4
School Development Team
0 7 7 0 2 2
COMMUNITY Make use of other organisations
2 5 7 2 1 3
Stakeholder involvement
2 0 2 2 0 2
Both groups felt that positive attitudes towards the school, planning, positive
staff relationships and atmosphere, the role of management and making use
of outside organisations were crucial to the successful implementation of your
school development plan. Group 1 however emphasised attitudes. They also
felt more strongly that the need for a vision and direction, collaboration and
stakeholder involvement were crucial to successful implementation. Group 2
emphasised the importance of the School Development Team.
Here again we see some clear links with the other data. Collaboration and
relationships feature as they did in both the quantitative and helping factors.
Atmosphere, attitudes, stakeholder involvement, the School Development
Team and planning, management and the use of outside organisations for
assistance were also mentioned in the helping and hindering factors. The
only additional feature was Group 1’s emphasis on the importance of having a
vision and a sense of direction.

270
7.3. INTEGRATING THE HELPING AND HINDERING FACTORS – RELATIONSHIP DIAGRAM 1 In integrating the data into the relationship diagram trends in terms of what
variables were reported to have impacted on the implementation of the school
development plan were evident. Group 1 had not only experienced more
changes within their schools but they also reported more factors that assisted
them and less hindering factors. The qualitative results also emphasised the
importance of community level, as well as organisational level, variables for
the successful implementation of the school development plan.
A Relationship Diagram mapping these variables to the level of analysis was
drawn as described in the Methodology (Chapter 4.11). Schools saw a wide
range of variables as being associated with the school development plan
process and that these occurred at an individual (indicated by the area in grey
lines), organisational (indicated by the grey shaded area) and community or
contextual level (variables outside of the circles). Relationship Diagram 1
(see Figure 6) indicated that there were some clear similarities between the
groups in terms of the factors they saw as playing a role in the school
development plan implementation. There were some common elements that
all schools saw as important for the development of their schools. These are
all represented in white circles with black writing. What distinguished Group 1
schools from Group 2 schools was the change in attitude towards others and
the additional community elements necessary for effective development
(these are represented in orange).

271
Figure 6: Relationship Diagram 1: Group 1 And 2 Variables
Organisational Empowerment
through the School Development
Planning Process
Principal
Collaboration
Decision Making
Relationships
Atmosphere
School Dev. Plan
School Dev. Team
Project Courses and Support
Parent Involvement
Department of Education
Collaboration with other schools
School Gov Body
Community Involvement
Attitude towards school
Attitude towards other staff
Management
Grey Lined Area: Individual Level Grey Shaded: Organisational Level Outside Area: Community Level White fill: Variables that Group 1& 2
mentioned Orange fill: Variables that Group 1
emphasised
271

272
7.4. COMPARISON BETWEEN SCHOOLS THAT SCORED WELL ON THE SCHOOL DEVELOPMENT PLANNING EVALUATION SCALE AND THOSE THAT DID NOT Not only did those schools that scored higher on the School Development
Planning Evaluation Scale show differences in the areas they reported as
changing in their schools they also reported different helping and hindering
factors.
7.4.1. HELPING AND HINDERING FACTORS Table 40 and 41 illustrates the types of factors that participants reported had
assisted or hindered the implementation of the school development plan.
Table 40: Comparison of the More Successful Group on the School Development Planning Evaluation Scale and the Less Successful Group on the Factors that Helped to Implement the School Development Plan
Cumulative Scores Number Of Schools CATEGORY More
Successful Less
Successful Total More
Successful Less
Successful Total
INDIVIDUAL Attitudes to work
8 5 13 4 2 6
Attitudes to other
1 7 8 1 2 3
ORGANISATIONAL School Development Team
7 1 8 4 1 5
School Development Plan
7 0 7 3 0 3
Collaboration
11 10 21 4 2 6
The principal
12 0 12 3 0 3
Decision making
5 0 5 3 0 3
Atmosphere of achievement
7 0 7 4 0 4
Relationship
6 2 8 3 2 5
Parent involvement
2 1 3 2 1 3
Planning in other areas
0 1 1 0 1 1
COMMUNITY Programme’s Courses and Support
9 8 17 3 3 6
School Governing Body Support
9 2 11 2 1 3
Community Involvement
2 1 3 1 1 2

273
Although there were similarities it was only the successful schools that
mentioned issues relating to the leadership, decision-making, the school
development planning process and an atmosphere of achievement. They
also emphasised the role of the School Development Team, collaboration and
a change in attitude to work. These are the factors that less successful
schools said were not evident or that were causing difficulties and thus
hindering. The less successful schools also emphasised issues with
management and broader organisational issues as well time constraints as
hindering factors.
Table 41: Comparison of the More Successful Group on the School Development Planning Evaluation Scale and the Less Successful Group on the Factors that Hindered the Implementation of the School Development Plan
Cumulative Scores Number Of Schools CATEGORY More
Successful Less
Successful Total More
Successful Less
Successful Total
INDIVIDUAL Negative Attitudes Towards the School
1 5 6 1 2 3
ORGANISATIONAL School Development Team Issues
6 12 18 2 4 6
School Development Planning Issues
6 10 16 2 4 6
Financial Issues
3 7 10 2 4 6
Issues Related to Decision making
3 9 12 1 4 5
Lack of Collaboration
7 14 21 1 4 5
Negative Atmosphere
1 4 5 1 2 3
Management issues
2 15 17 1 4 5
Difficulties with the Principal
6 15 21 1 4 5
Planning issues
4 7 11 1 3 4
Organisational Issues
2 19 21 1 3 4
Time constraints
1 3 4 1 3 4
Lack of funds
2 0 2 2 0 2
COMMUNITY Department of Education
12 11 23 3 3 6
School Governing Body involvement
1 2 3 1 2 3
Parent involvement
6 9 15 4 4 8

274
What was striking about these results was that the successful schools offered
many more examples of helping factors and less successful schools offered
many more hindrances.
7.4.2. DIFFERENCES IN QUALITY OF RESPONSES SUCCESSFUL SCHOOLS OFFERED Not only did the more successful group show significant differences to the less
successful group on the quantitative measures and differences in their focus
group responses but in the analysis it became clear that there were also
qualitative differences in the way successful schools spoke about the change
process in their school. They offered a more in-depth understanding of the
change process, were able to see the links between different areas of school
development, were able to take a more holistic view of the change process
within the school, and there was also a clear understanding of the connection
between school development and the improvement of education for the pupils
within the school – the schools seemed to evidence a greater level of
individual empowerment amongst the staff as well as a greater level of
organisational empowerment. The following illustrates these differences.
(a) Understanding the process of change The more successful schools appeared to have an understanding of the
process of change and were more able to make the necessary shifts to fully
implement those changes. Firstly, these schools showed initiative and took
responsibility for the change process within their schools. The following
examples illustrate the differences between two schools that took very
different approaches to the government’s, often haphazard, implementation of
the new curriculum within their schools. The following is a quote from a less
successful school discussing when they plan to work collaboratively on
teaching and learning: • You know what makes the foundation phase to work as a team is because they are all
involved in Curriculum 2005 and em the the intermediate is only in fact Grade 7, its senior phase, but since they are at the primary school they are with us and it is only them who are busy with curriculum 2005 and as soon as it reaches the other grades I think we are going to come together because they have already experienced that and they will be helping us (Participant 2.3.5)

275
There was a willingness on the part of the school to sit back and wait for the
government’s plans to roll out. This was in sharp contrast to a more
successful school as can be seen by the following quote: • Alex we are over developed now (laughter) the reason I am saying that is because we
have gone steps beyond the GDE (education department) in this why because we saw there was a need for the school to work in phases not in standards in doing policies we saw problems in as far as training for intermediate phase was concerned we had Gr. 4 teachers who had a problem of attending courses with the higher primary teachers there wouldn’t be a good hand over from the foundation phase to the intermediate phase and therefore we did away with Gr. 4 we added Gr. 5 so we can work in Groups … we encountered problems in Gr. 4 and because we were overburdened we decided to introduce Gr. 5 so that we can easily work as a phase and yes the department is still against that um but I think we have made a good kick off we have made them aware that the planning goes along with change with development in the schools because I think that before they introduced OBE (outcomes based education) they should have changed the structures of the standards in the schools. (Participant 1.1.2)
The more successful schools often spoke about developing the school in
totality, the importance of completion and the need for continuity in
development. They displayed an understanding of the process of
development and a commitment to that process. For example: • Mamma 1.1.3. has just said something about discipline you know we are to receive free
training from you as far as development is concerned, but because we don’t discipline ourselves we don’t attend yet at the end we expect to be developed so they must attend. That is what is happening in other schools they’ll tell you they have problems but once we are to attend courses only one attends … one would come one day another another day and there wasn’t a continuation yet other people will come here and ask us how we and why … 1.1.1: How do you achieve this … 1.1.3: If I attend a course half day and then on the next here comes another one then we are not getting full ideas and I am not going to build …1.1.1. There is no continuity (Participant 1.1.2)
(b) Taking a Holistic View of the School Development Plan The successful schools displayed a sense that the process of school
development plan was not only about acquiring resources or raising funds but
that it was linked to the educational purpose or vision of the school. The
variety of plans and changes made in the school were seen as connected to
that overarching vision or mission. For example: • I must say we are amongst a few schools in Atteridgeville that we do not have so many
complaints um teaching in the near future will not be as difficult as it used to be because we now have a TV set we have a video and we are in a position to teach by showing the kids videos we have a photocopier … perhaps that will make us to solve many of the learning and teaching problems that we have … I think the resources that we have helped us to improve our results (Participant 1.1.2)
• I now look at the school as not just a building it is something that needs to we need to looks at the needs of the school besides the building itself and to encourage the learners to do the best of their ability and there are other means that a teacher can help not coming to school teaching in the classroom other thing environmental things that can help the child (Participant 2.2.2)

276
These schools also seemed able to see the connection between
implementation of the school development plan and a variety of other areas of
organisational functioning. The plan was clearly linked to other activities e.g.
setting priorities, fund-raising and decision-making, that were seen as
essential to successful implementation. For example: • We never generated money and we never identified needs before and may I share
something with you Alex eh when I started with Mufti, I wonder if some of you still remember, we would collect that money one Friday or two Fridays and then there would be an urgent need and then we would say lets use the mufti money and it was because (all laugh) because you know you taught us we must identify needs before and a make it a point that we, we achieve those needs then we would say is that need written in the development plan, then if the staff said no then we won’t spend this money (Participant 1.1.2)
The plan was not only linked to broader organisational issues but was also
made meaningful for the individuals within the school. For example: • the school development team was also able to… make some educators aware of their
capabilities in terms of what they like to do most and what they can do best and so they had been actually eh developing their talents for the benefit of the school (Participant 2.1.4)
These schools were planning at a different level. They had a true grasp of the
cycle of planning. They had a sense of vision, which allowed them to focus
on the plans at hand. They spoke of having goals, priorities, targets and
being single-minded. Their vision and planning were linked to a process of
regular reporting, follow up and review. For example: • it also helped us not to do things half way we see to it that is we have a project we
complete it and we get results … Not exactly half way but you find that sometimes things are uncompleted take time to come back and say by the way we discussed this but we never completed it but now of late if there is a project we step in and get the results (Participant 2.1.2)
Finally, these schools also extended their planning to other areas including
year planning, parents meetings, programmes of activities for after hours.
There was also more mention of the planning being extended to their lives
outside of the school in this group. For example: • A lot (referring to the benefits of planning) even with the parents meeting it helps that we
we know what to in advance with the parents meeting and then we draw everything in advance and so a plan is very important it helps a lot (Participant 2.1.5)

277
(c) Collaboration The area of collaboration also showed some qualitative differences. In three
of the successful schools collaboration was fully participative. There was an
atmosphere of teamwork and working together that included all of the staff
and the principal. In the less successful schools collaboration was between
peers and in some cases not all of the staff. The principal was also excluded
from this collaboration. Committees became a way, for those schools that did
not work with the principal, of being more involved in decision-making,
improving information flow and developing teamwork. However what seemed
to occur in these schools was that the gap widened between the principal and
the staff, thus second order change could not occur and a lot of energy was
spent on the process of fighting the principal and not on school development.
These schools also had “qualified team spirit” in that some staff did not
participate and this led to dissatisfaction. • We know that if you go to so and so he will help you if you go to so and so but others they
don’t but if we can push all of us the work will be more lesser than now (Participant 2.2.6) • Like she said people have their likes and dislikes those who love music had to go and
help her but those who don’t have an ear for the music don’t bother themselves to get there (Participant 2.2.4)
This is in contrast to the successful schools where people were willing to
participate in activities even if it was not their area of expertise or interest. • (referring to positive attitude) for example when we were doing AIDS awareness day we
did all of us sharing work … [2.1.3: Sharing duties] so it was there was no one who said I won’t be there I won’t I am not willing to give no no (Participant 2.1.5)
• When the teachers were busy with the music practising for the music not only the choir masters were busy with the children even the other teachers that were not in the music they were helping the teachers and then they also accompanied them to the to the hall (Participant 1.2.7.)
The successful schools also exhibited an understanding of the importance of
collaboration for achieving their goals. It was not only something that made
life in the school more pleasant, it was seen as essential to organisational
success. For example: • the school development has brought the staff more closer together (agreement from
around the table) we know that teamwork through teamwork there is nothing that we cannot achieve through the help of every member of the staff we will be able to achieve whatever we need, we are now a team ,a family that works together (Participant 1.1.1)
• The teamwork goes together with the decision-making, when we are together and we work together and if there is a problem we come together and we decide and come to a conclusion that we take a solution (Participant 1.1.6)

278
Linked to collaboration were not only issues of atmosphere, offering support
and being supported, but also the quality of the relationship described.
People were relating differently to each other at both a personal and
professional level and this was linked to issues of respect and accepting of
criticism and being open to negative feedback.
In these schools not only was there a culture of collaboration but the schools
had also made changes within the structures of the schools to accommodate
collaboration. It was this link between change in culture and structure that
was important for success, as less successful schools often made the shift in
structure but these didn’t function effectively as the culture of collaboration
was not in place.
What was evident in the successful schools was a stronger sense of inclusive
collaboration. This collaboration seemed to be based on a change in
attitudes, improved staff relationships, improved relationship between staff
and principal and management and thus a change in atmosphere. Thus this
collaborative or participative atmosphere, which extended to management
and principal, was in sharp contrast to the peer collaboration and decision-
making or a spirit of individualism and groupings as noted in the less
successful schools.
(d) Conflict Resolution The change in relationships between staff and staff and management seemed
to be connected to the better conflict resolution skills of successful schools as
they were the only schools to mention that their ability to resolve conflict had
changed. In most cases it was not through formal procedures of an
organisational nature but rather through the use of teamwork, a change in
attitude on the part of the staff and an acknowledgement of the importance of
the relationships between them. For example: • we discuss as a staff and see what to do so that there are no squabbles and that maybe
we alleviate the problem if we sit as a staff and decide … if there is something going behind the curtain we are going to end up in a conflict and when I look at this development plan and what you have done to us you have opened our eyes so it means we must work as a team and where there is a problem we should try and solve it in a good way you know Alex if people keeps on fighting it limits one persons life because

279
today I am angry for the rest of the month or the week I am going to be angry and it won’t help and I am going to look at 1.2.1 or 1.2.3 eh saying hey that person annoys me so I think if we should come together and sit together decide what to do and avoid squabbles, I think that’s the way eh to solve problems (Participant 1.2.5)
Thus these schools were making use of interpersonal relationships or a
personal bond as a way of dealing with conflict. Archival data (see Table 25)
supported this with all of the eight schools that had completed the programme
having no formal grievance or conflict management procedures in place.
(e) Atmosphere of Achievement There were also differences in the atmosphere in the successful schools due
exactly to that – their success. Their success in effectively bringing about
change within the school seems to have led to a feeling of agency within the
school, that they are able to take control of their environments. All the
schools, whether successful or not, managed to secure some resources for
their school; however those that were less successful seemed unable to move
on from this point. They seemed unable to create a collective process for
transforming their environments into a supportive empowering organisation
that was able to more fully exert its control. It appeared therefore that
successful schools were able to set up a spiral of success within the school.
(f) Changes in the principal and management The successful schools described changes in the principal particularly in the
area of “the small things” relating to the principal’s attitude towards the staff,
respect and trust which all of the less successful schools noted was missing.
In three of the successful schools the principal actively involved teachers in
the decision making process. In all 4 less successful schools teachers were
either not involved or felt that their involvement had little or no influence. This
theme also related to the way the school management team dealt with issues.
Two clear examples are in the way the issue of decision-making was dealt
with at the school and how issues/problems were dealt with. In this regard
schools spoke about the fact that the school management team listened to the
staff, they took their views into account in terms of decision-making or in
dealing with an issue/problem, thus emphasising people’s need to feel valued

280
and respected in the way they are treated not only by the principal but also by
management.
(g) Change In Teachers Attitudes Towards Principal It was not only a change in the principal that these schools spoke about, they
also reported a change in the teachers’ attitude towards the principal. For
example: • if the principal is angry maybe she is shouting at us you know we don’t even answer we
are just keeping quiet (sits back and folds her arms) and let her cool down and then somebody who is next to her or for instance like 1.2.1 will go and say principal there you didn’t do well you see we are not those type of people who are fighting with the principal (1.2.5)
This new strategy for dealing with conflict situations provided them with a
sense of other and more understanding. This ability to see one’s self as an
agent within social situations, as an agent of change, as responsible for one’s
own life and choices, is part of the process of empowerment, it is an
acknowledgement of the dialectical process in which we find ourselves and
that although change in others, structures, power bases etc. is important, so is
change in oneself (Hassin & Young, 1999).
(h) School Development Teams In the successful group all of the schools had active or functional school
development teams that were clear on their roles and function within the
school. Three of the schools’ development teams functioned very well, with
the principal playing an active or guiding role and members of the
management team being part of the team. Even in the one school where
there were issues with the principal and the team could not function
maximally, they had still been functional. In the less successful group two
schools that originally had functional school development teams did not
manage to continue functioning once a change in school management had
occurred. In the other two schools the school development teams had never
been functional and there was no principal support.

281
(i) Stakeholder Involvement Successful schools were able to get stakeholders involved within the schools
e.g. School Governing Bodies and parents. In the successful group three of
the schools had functional School Governing Bodies which were supportive of
the development process and the school development team and were aware
of the school development plan or had been part of the process in the
schools. In the less successful group 2 of the schools had functional School
Governing Bodies however they were not involved at the same level and often
the staff used this body as a way of dealing with the principal. In the other two
schools there were no School Governing Bodies.
In all 4 successful schools an effort had been made on the part of the school
to involve parents. In three of the less successful schools there were no
regular meetings with parents, little effort was made on the school’s side to
engage the parents. It seemed that in order for a school to successfully
engage other stakeholders there needed to be a certain level of functioning
within the school – or a level of empowerment for the school to effectively
empower parents to co-operate in a constructive manner.
7.4.3. SUMMARY Thus not only did those schools that scored higher on the School
Development Planning Evaluation Scale achieve more changes within their
schools and report more helping factors and less hindering factors, they also
offered a qualitatively different view on the change process within their
schools. These staff in these schools seemed to have combined a variety of
variables and had managed to change not only the structures but also the
culture within the school and have managed to effect second-order changes.
It seems they had an understanding of the complex interaction of the
variables needed to bring about lasting change. These observations though
would require additional exploration to further understand their role in the
school development process.

282
7.5. RELATIONSHIP MATRIX A Relationship Matrix (see Matrix 6 on the following page) integrating the
various analyses relating to factors the schools felt were linked to school
development planning was drawn up. The Matrix indicated that a wide range
of variables were seen as being linked to the school development planning
process and that these occurred at an individual, organisational and
community level. These results were added to Relationship Diagram 1
(Figure 6) to develop a visual display of how the variables interrelated.
Successful and less successful schools report the same elements as being
important for school development planning what is different is the quality of
the elements described. Relationship Diagram 2 (see Figure 7 on the
following page) incorporated these into the diagram where they are reflected
in the green circles and arrows used to highlight qualities of the variables.
What this indicated is that in order for schools to be effective there need to be
certain elements in place (the internal capacity to change). However for this
change to be sustained there are also certain contextual and broader
community supports that need to be in place.
What is clear from the Matrix 6 and Figure 7 is that many variables from
various levels of analysis were seen by the schools to play a role in school
development planning and that organisational level variables were being
emphasised. At this level of analysis the principal, as school leader, was
central. There were two key aspects to this: the involvement of the principal in
activities, and the relationship the principal had with the staff. In terms of
involvement there was an emphasis on the principal being involved in
decision-making, collaboration, school development planning and the school
development team. In terms of decision-making influence as well as
involvement were seen as core to the process. The schools also felt that an
atmosphere of achievement was important to successful organisational
empowerment. Individual level variables were not stressed. Although several
community level variables were seen as playing a part in successful school
development planning it the data indicates that parent and School Governing
Body involvement were key to the process.

Ma
trix
6:
Rela
tio
ns
hip
Be
twe
en
Sc
ho
ol
De
ve
lop
me
nt
Pla
nn
ing
an
d O
the
r In
div
idu
al,
Org
an
isa
tio
na
l an
d C
om
mu
nit
y L
ev
el
Va
ria
ble
s
F
ocu
s G
rou
ps
He
lpin
g
Fo
cu
s G
rou
ps
Hin
deri
ng
A
dvic
e
SD
PE
S S
uccess
He
lpin
g
SD
PE
S S
uccess
Hin
de
ring
Pre
dic
tor
Gro
up
1
Gro
up
2
Gro
up
1
Gro
up
2
Gro
up
1
Gro
up
2
Su
cc
ess
ful
Le
ss
S
uc
ce
ss
ful
Su
cc
ess
ful
Le
ss
S
uc
ce
ss
ful
IND
IVID
UA
L L
EV
EL
VA
RIA
BL
ES
Att
itu
de
to
wa
rds
th
e s
ch
oo
l
Att
itu
de
to
wa
rds
oth
ers
Te
ac
he
r E
ffic
ac
y
OR
GA
NIS
AT
ION
AL
LE
VE
L
VA
RIA
BL
ES
Co
llab
ora
tio
n
Sch
oo
l D
evelo
pm
en
t T
eam
Rela
tio
nsh
ips
Atm
osp
he
re
(A
) (
A)
(A
) (
A)
Pri
ncip
al
Man
ag
em
en
t
Decis
ion
Makin
g
Sch
oo
l D
evelo
pm
en
t P
lan
Fu
nd
ing
/Fin
an
ces
Org
an
isati
on
al G
en
era
l
Pla
nn
ing
Gen
era
l
Lack o
f F
un
ds
Vis
ion
/Dir
ecti
on
Tim
e C
on
str
ain
ts
CO
MM
UN
ITY
/CO
NT
EX
TU
AL
LE
VE
L
VA
RIA
BL
ES
Pro
gra
mm
e’s
Co
urs
es a
nd
Su
pp
ort
Makin
g u
se o
f o
ther
org
an
isati
on
s
De
part
me
nt
of
Ed
uc
ati
on
Sch
oo
l G
ove
rnin
g B
od
y S
up
po
rt
Pa
ren
t In
vo
lve
me
nt
Co
mm
un
ity In
vo
lve
me
nt
Sta
ke
ho
lde
r In
vo
lve
me
nt
S
trong E
vid
ence o
f Lin
k (
either
due t
o h
elp
ing o
r hin
dering o
r as r
ecom
mended b
y t
he s
taff)
Som
e E
vid
ence o
f Lin
k
N
o e
vid
ence o
f Lin
k
H
igher
Cum
ula
tive s
core
s
(A)
Atm
osphere
specific
ally
refe
rred t
o o
ne o
f pride in a
chie
vem
ent
rath
er
than g
enera
l
222 283

284
7.6. SUMMARY The qualitative data indicated that schools that have certain variables in place,
an internal capacity to change, were more likely to be able to use school
development planning as a way of effecting organisational change and
empowerment. The role of the principal in promoting school development and
thus empowerment was stressed. Contextual supports were also seen as
playing a role in supporting the school development process. This supported
the findings from Research Question 1 and 2 where length of involvement on
the programme was not a significant predictor of empowerment.
This has important implications for school development programmes that see
school development planning as a process to empowering schools and
successful implementation as an empowered outcome. It may be that if
school development planning is to be successful other variables associated
with an empowered organisation need to be in place. Thus we need to
explore the relationship between school development planning and the other
variables. The qualitative analysis has given us some ideas about what
schools see as having helped them with the implementation of their plans.
We now turn to the quantitative data to explore this issue further.

285
Figure 7: Relationship Diagram 2: Group 1 And 2 Variables Combined With School Development Planning Evaluation Scale Success
Organisational Empowerment
through the School Development
Planning Process
Principal
Collaboration
Decision Making
Relationships
Atmosphere
School Dev. Plan
School Dev. Team
Inclusive
Small Things
Project Courses and Support
Parent Involvement
Department of Education
Collaboration with other schools
School Gov Body
Community Involvement
Holistic View
Conflict Resolution
Achievement
Attitude towards principal
Attitude towards school
Attitude towards other staff
Empowered
Active / Functional
Better response
set
Guiding, Active, Involved
Management
Inclusive
White fill: Variables that Group 1& 2 mentioned
Orange fill: Variables that Group 1 emphasised
Green fill: Variables that SDPES Successful Group mentioned
Green Arrows: Role of the principal linked to variables
Grey Lined Area: Individual Level Grey Shaded: Organisational Level Outside Area: Community Level
285

286
7.7. QUANTITATIVE ANALYSIS OF THE RELATIONSHIPS In order to quantitatively explore the relationship between school development
planning and those variables associated with empowerment at the individual
(locus of control and general and context specific efficacy) and organisational
(participation and leadership) levels of analysis the data were subjected to
various statistical analyses.
7.7.1. CORRELATION ANALYSES The first step in looking at the relationships between the variables was to look
at the correlations between the variables. The parametric assumptions of
interval data and normality were met, as outlined earlier, and scatter plots
revealed there to be no outliers or non-linear relationships between variables.
Therefore Pearson's correlations were conducted. One-tailed tests were used
as the direction of the relationship between School Development Planning
and the predictor variables was predicted, based on previous research and
theory.
Table 42 (see following page) shows the Pearson's r correlation coefficients
between School Development Planning Evaluation Scale and the other
variables associated with empowerment. All of the predictors correlated with
the school development planning scale with approximately medium effect size
except Locus of Control, which had a less strong relationship. Thus, school
development planning was significantly associated with the following
variables: Participation and Decision Centralisation Scale, Psychological
Participation Scale, Collaboration Scale, the Profile of Organisational
Leadership Scale, Supervisory Leadership Scale, General Self Efficacy,
Teacher Efficacy, Locus of Control, and Peer Leadership. Looking at the
predictors the highest correlation is between the Profile of Organisational
Characteristics and School Development Planning Evaluation Scale which is
significant at a 0.01 level (r = .554) and so it is likely that this variable will best
predict school development planning implementation as measured by the
School Development Planning Evaluation Scale.
287
Many of the individual and organisational level variables are themselves
significantly correlated. The leadership variables correlated strongly with each
other, as well as with the participation and collaboration scales and the peer
leadership scales. The participation and collaboration scales correlated
strongly with each other as well as with the Peer Leadership variable. At the
individual level only General Self Efficacy correlated with all of the other
variables. Teacher empowerment did not correlate with the Collaboration
Scale. Locus of Control did not correlate with the Participation and Decision
Centralisation Scale, Collaboration Scale, Profile of Organisational
Characteristics, Supervisory Leadership and Peer Leadership. These
correlations may suggest that their relationship with school development
planning could in part be explained by their shared variance, a possibility that
will be explored in the multiple regression.
Looking at these correlations gives us a rough idea not only of the relationship
between the predictors and outcome but also allows us a preliminary look at
multicollinearity. There is no multicollinearity in the data as there are no
substantial correlations (r > .90) between predictors. Thus although School
Development Planning Evaluation Scale correlates with all of the measures
associated with empowerment at an organisational level it is distinct as none
of the correlations is very high.

288
Table 42: Pearson’s Correlation Co-Efficients
SDPES PPS PCS CS GSES LC PROF TE SUPL PEERL1 -.385(**) .411(**) .552(**) .294(**) .139(*) .554(**) .264(**) .512(**) .417(**)
.000 .000 .000 .000 .014 .000 .000 .000 .000
SchoolDevelopment Planning Evaluation Scale (SDPES) 248 229 229 230 248 248 226 229 229 228
-.385(**) 1 -.604(**) -.610(**) -.258(**) -.179(**) -.628(**) -.180(**) -.576(**) -.216(**)
.000 .000 .000 .000 .003 .000 .003 .000 .001
Psychological Participation Scale (PPS) 229 229 229 229 229 229 225 228 228 227
.411(**) -.604(**) 1 .501(**) .234(**) .097 .629(**) .193(**) .614(**) .293(**)
.000 .000 .000 .000 .073 .000 .002 .000 .000
Participation and Decision Centralisation Scale(PCS) 229 229 229 229 229 229 225 228 228 227
.552(**) -.610(**) .501(**) 1 .264(**) .102 .673(**) .085 .568(**) .489(**)
.000 .000 .000 .000 .062 .000 .101 .000 .000
Collaboration Scale(CS)
230 229 229 230 230 230 226 229 229 228
.294(**) -.258(**) .234(**) .264(**) 1 .406(**) .172(**) .283(**) .216(**) .149(*)
.000 .000 .000 .000 .000 .005 .000 .001 .012
General Self Efficacy Scale (GSES)
248 229 229 230 248 248 226 229 229 228
.139(*) -.179(**) .097 .102 .406(**) 1 .122(*) .235(**) .072 .024
.014 .003 .073 .062 .000 .033 .000 .140 .361
Locus of Control (LC)
248 229 229 230 248 248 226 229 229 228
.554(**) -.628(**) .629(**) .673(**) .172(**) .122(*) 1 .181(**) .711(**) .441(**)
.000 .000 .000 .000 .005 .033 .003 .000 .000
Profile of Organisational Characteristics (PROF) 226 225 225 226 226 226 226 225 225 224
.264(**) -.180(**) .193(**) .085 .283(**) .235(**) .181(**) 1 .200(**) .173(**)
.000 .003 .002 .101 .000 .000 .003 .001 .005
TeacherEfficacy (TE)
229 228 228 229 229 229 225 229 228 227
.512(**) -.576(**) .614(**) .568(**) .216(**) .072 .711(**) .200(**) 1 .421(**)
.000 .000 .000 .000 .001 .140 .000 .001 .000
Supervisory Leadership Scale(SUPL) 229 228 228 229 229 229 225 228 229 228
.417(**) -.216(**) .293(**) .489(**) .149(*) .024 .441(**) .173(**) .421(**) 1
.000 .001 .000 .000 .012 .361 .000 .005 .000
PeerLeadership Scale(PEERL) 228 227 227 228 228 228 224 227 228 228
** Correlation is significant at the 0.01 level (1-tailed). * Correlation is significant at the 0.05 level (1-tailed).
7.7.2. MULTIPLE REGRESSION A multiple regression was conducted to further investigate the role of
organisational level variables such as participation variables, leadership
variables, and peer relationships as well as individual level variables such as
locus of control and efficacy, both professional and personal, in predicting
school development planning. Correlations can be very powerful research
tools but they tell us nothing about the predictive power of variables. In
regression analysis a predictive model is fitted to the data and that model is
used to predict values of the outcome variable from one or more predictors.
Simple regression seeks to predict an outcome from a single predictor

289
whereas multiple regression seeks to predict an outcome from several
predictors. This is a useful tool because it allows us to go a step beyond the
data we actually possess and allows us to fit a model that best describes the
data collected.
School development planning was entered as the outcome variable and the
nine organisational and individual level variables were entered as predictor
variables. Although this was a large number of predictors there was
theoretical as well as research evidence for their role in organisational level
empowerment and school development planning. There were also sufficient
numbers in the sample to deal with this number of variables. According to
Field (2004) at least 15 participants per predictor are needed; thus for this
analysis 135 were required and the present sample was 224.
All of the variables were entered using the forward entry method. This
method conducts the analysis by first entering the variable most strongly
associated with the outcome variable (i.e. school development planning).
This variable is then controlled for and any of the remaining variables that
significantly add to the model are then entered. This process is repeated until
no remaining variables account for significant unique variance in the outcome
variable (Field, 2004). Table 43 (over the page) presents the Model Summary
(the overall model) and indicates which of the predictor variables successfully
predict school development planning.
Table 43: Regression Model Summary
Change Statistics Model
R Square
Adjusted R Square
Std. Error of the Estimate
R Square Change
F Change df1 df2
Sig. F Change
Durbin-Watson
1 .302(a) .299 11970.46180 .302 95.358 1 220 .000 2 .357(b) .351 11517.37808 .055 18.650 1 219 .000 3 .389(c) .381 11251.40839 .032 11.476 1 218 .001 4 .400(d) .389 11177.00966 .011 3.912 1 217 .049 1.593a Predictors: (Constant), Profile of Organisational Characteristics b Predictors: (Constant), Profile of Organisational Characteristics, Collaboration Scale c Predictors: (Constant), Profile Of Organisational Characteristics, Collaboration Scale, Teacher Efficacy d Predictors: (Constant), Profile Of Organisational Characteristics, Collaboration Scale, Teacher Efficacy,
Supervisory Leadership

290
R Square indicates how much of the variability in the outcome is accounted
for by the predictors. For the first model Profile of Organisational
Characteristics accounts for 30.2% of the variation in school development
planning. This increases to 35.7% when Collaboration is added, 38.9% when
Teacher Empowerment is added and 40% when Supervisory Leadership is
added. Adding the other three variables has accounted for about 10% of the
variance. The Adjusted R square were quite similar to the R square, the
difference being 0.011 (about 1.1%) in the final model, indicating that if the
model was derived from the population rather than a sample it would account
for approximately 1.1% less variance in the outcome. The Durbin-Watson
statistic (1.593) indicated that the assumption of independent errors is
tenable.
From these analyses the model had improved our ability to predict the
outcome variable. The model parameter statistics indicated that all four
predictors have positive β values indicating positive relationships between
them and school development planning, (see Table 44 on page 231). This
indicates that as the leadership style becomes less authoritarian and more
consultative school development planning improves; as collaboration
increases in the school, development planning improves; as teachers’ efficacy
improves and as their relationship with the principal improves so too does
school development planning improve. Table 44 indicates that there is no
collinearity within the data, for the current model the VIF values are all well
under 10 and the tolerance statistics all well above 0.2 therefore we can
safely conclude that that collinearity was not a problem (Field, 2004).
The variance portions in the Collinearity Diagnostics in Table 45 (on page
232) indicate that although leadership style and teacher empowerment load
onto different dimensions (94% on dimension 4 and 90% on dimension 5)
collaboration and supervisory leadership share their variance over several
dimensions, and with each other, and with leadership style. It is therefore
important to note this collinearity as this could lead to the model potentially
becoming biased. It is therefore important to acknowledge that although

291
leadership style predicts school development planning, supervisory leadership
and collaboration may contribute to leadership style being more consultative
and thus the strongest predictor.
The casewise and residual statistics allowed for an examination of the
influence of extreme cases on the model. These statistics gave no cause for
concern (see Appendix 15, Tables 1 and 2 for an elaboration on these) and
thus it appeared that the outliers did not have a large effect on the regression
analysis. Therefore the sample appeared to conform to what would be
expected for a fairly accurate model.

292
Table 44: Coefficients Model
Unstandardized Coefficients
Standardized Coefficients
95% Confidence Interval for B Correlations
Collinearity Statistics
B Std. Error Beta t Sig. Lower Bound
Upper Bound
Zero-order
Partial Part
Toler ance VIF
1 (Constant) -1913.091 3928.489 -.487 .627 -9655.380 5829.197
Prof Org Char 852.498 87.300 .550 9.765 .000 680.447 1024.550 .550 .550 .550 1.000 1.000
2 (Constant) 887.446 3835.022 .231 .817 -6670.828 8445.721
Prof Org Char 522.667 113.528 .337 4.604 .000 298.921 746.414 .550 .297 .249 .547 1.827
Collaboration 11.170 2.587 .316 4.319 .000 6.072 16.268 .543 .280 .234 .547 1.827
3 (Constant) -19891.516 7187.402 -2.768 .006 -34057.207 -5725.825
Prof Org Char 458.008 112.537 .295 4.070 .000 236.209 679.807 .550 .266 .215 .532 1.881
Collaboration 11.591 2.530 .328 4.582 .000 6.605 16.577 .543 .296 .242 .546 1.831
Teach Efficacy 281.638 83.137 .183 3.388 .001 117.783 445.493 .266 .224 .179 .964 1.038
4 (Constant) -20475.653 7145.982 -2.865 .005 -34560.071 -6391.235
Prof Org Char 319.160 132.007 .206 2.418 .016 58.980 579.340 .550 .162 .127 .381 2.623
Collaboration 10.791 2.545 .305 4.239 .000 5.774 15.808 .543 .277 .223 .532 1.879
Teach Efficacy 263.979 83.068 .171 3.178 .002 100.255 427.703 .266 .211 .167 .953 1.050
Super Leader 192.992 97.577 .150 1.978 .049 .672 385.311 .501 .133 .104 .478 2.093
a Dependent Variable: School Development Planning Evaluation Scale
292

293
Table 45: Collinearity Diagnostics
Model Dimension Eigenvalue Condition
Index Variance Proportions
(Constant) Prof of Organ Characteristic
Collaboration Scale
Teacher Efficacy Scale
Super Leader Scale
1 1 1.979 1.000 .01 .01 2 2.113E-02 9.676 .99 .99 2 1 2.917 1.000 .00 .00 .01 2 6.827E-02 6.536 .23 .01 .61 3 1.482E-02 14.029 .76 .99 .38 3 1 3.889 1.000 .00 .00 .00 .00 2 8.836E-02 6.634 .02 .00 .51 .03 3 1.666E-02 15.276 .03 .99 .48 .07 4 6.197E-03 25.050 .95 .01 .00 .91 4 1 4.865 1.000 .00 .00 .00 .00 .00 2 8.840E-02 7.419 .02 .00 .49 .03 .00 3 2.827E-02 13.118 .04 .04 .36 .05 .52 4 1.217E-02 19.994 .00 .94 .15 .03 .47 5 6.174E-03 28.070 .94 .02 .00 .90 .01
In terms of the assumptions of the model, normality of distribution and
collinearity within the data had been checked previously. Durbin-Watson
indicated that the residuals in the model were independent. The scatterplot
(Appendix 15, Figure 1) indicated that the assumptions of linearity and
homoscedasticity had been met. The partial plots (Appendix 15, Figures 2 –
5) indicated that for collaboration, leadership style, teacher empowerment and
supervisory leadership a strong positive relationship to school development
planning was evident, there were no obvious outliers (except in teacher
efficacy) and the assumption of homoscedasticity was met.
The model appeared in most senses to be accurate for the sample and
generalisable to the population. School Development Planning was predicted
by a consultative leadership style (as measured by the Profile of
Organisational Characteristics), leaders’ working relationship with staff (as
measured by the Supervisory Leadership Scale), collaboration between staff
and principal (as measured by the Collaboration Scale), and teacher efficacy.
This indicated the importance of organisational level variables, particularly the
role of the principal, in predicting school development planning. What was
also interesting was that at the individual level of analysis it was the context
specific professional measure of efficacy and not the two personal measures

294
that predicted school development planning. There is a concern though over
the predictive power of the Profile of Organisational Characteristics,
Collaboration and Supervisory Leadership. The assumptions seemed to have
been met and thus it could probably be assumed that this model would
generalise to other school development planning situations.
7.7.3. STRUCTURAL EQUATION MODELLING Based on the results of the multiple regression and the ideas generated from
the qualitative data collection and the relationship matrix and diagrams about
what supported school development, it seemed clear that the organisational
level variables played an important role. What was even clearer was the
crucial role played by the principal. Based on the results of these data sets a
model, as represented in Figure 8 was constructed. The variables were
chosen on the basis of the regression and the direction of prediction from the
qualitative data. The model was then subjected to a structural equation
modelling analysis which statistically tested the hypothesised model in a
simultaneous analysis of the entire system of variables to determine the
extent to which it was consistent with the data.
Profile ofOrganisationalCharactertics
SupervisoryLeadership
CollaborationScale
Teacher Efficacy SchoolDev Eval Scale
.71
.55 -.04
.22
.18.18
.25
.39
Res1
Res2
Res3 Res4Err1
Figure 8: Model 1 - Diagrammatic Representation of the Predicative Relationships Between Leadership Variables, Collaboration, Teacher Efficacy and School Development Planning Evaluation Scale (The above diagram represents the results of the multiple regression outlined earlier. The one-way arrows show the direction of prediction (from predictor variable to predicted variable) and are not intended to represent causation.)

295
Figure 8 shows the model with the associated R² values, which are also
highlighted in Table 46.
Table 46: Standardized Regression Weights for Structural Equation Modelling Model 1:
Estimate C.R. P
Supervisory Leadership <--- Profile of Org Character .710 15.203 ***Collaboration Scale <--- Profile of Org Character .549 8.000 ***Collaboration Scale <--- Supervisory Leadership .178 2.595 .009Teacher Efficacy <--- Collaboration Scale -.042 -.532 .595Teacher Efficacy <--- Supervisory Leadership .223 2.828 .005School Dev Plan Eval <--- Teacher Efficacy .180 3.436 ***School Dev Plan Eval <--- Supervisory Leadership .253 3.981 ***School Dev Plan Eval <--- Collaboration Scale .394 6.325 ***
Both Figure 8 and Table 46 indicated that all of the critical ratios were
significant except for that between Teacher Efficacy and Collaboration. This
was an interesting finding because in the focus groups participants spoke
about how working together had empowered them as teachers in terms of
their teaching. Both the school development and the empowerment literature
talk about the link between working together and individual level
empowerment. This may indicate that a different set of processes are at play
here, for example, collective empowerment and not direct individual teacher
empowerment may be at work. Byrne (2001) suggests that a non-significant
parameter, with the exception of error variances, can be considered as
unimportant to the model and that in the interest of parsimony should be
deleted from the model. Thus the predictive value of collaboration on teacher
efficacy was not being held up in this model.
In order for the results to be useful the goodness of fit between the model and
the data needs to be assessed. Basically, the primary task of the model fitting
process is to determine the goodness of fit between the hypothesised model
and the sample data. In other words, does the model generated from the
integration of the theory and the results of the regression fit with the sample
data collected in this study? As Table 47 (over the page) indicates the
minimum discrepancy (CMIN) = 7.958 (with 2 degrees of freedom and a
probability of more than .01) and the comparative fit index is > .95 thereby

296
suggesting that the model represents an adequate fit to the data. However,
the RMSEA index (error approximation in the population) is greater than .10
and suggests this may not be a good fit.
Table 47: Goodness of Fit Statistics Model Fit Summary for Model 1 Model NPAR CMIN DF P CFI RMSEA HOELTER
.05 HOELTER
.01 Default model
18 7.958 2 .019 .986 .110 186 286
Independence model
5 434.743 15 .000 .000 .337 15 18
Saturated model
20 .000 0 1.00
The final fit statistic focused on the adequacy of the sample size rather than
on model fit and its purpose was to estimate a sample size that would be
sufficient to yield an adequate model fit for a χ2 test. Hoelter (1983) proposed
that a value of over 200 is indicative of a model that adequately represents
the sample data; however as shown in Table 47 only the .01 was > 200.
Based on the issues raised by the goodness of fit statistics and the lack of
significant predictive value of collaboration on teacher efficacy it was decided
to respecify the model, as shown in Figure 9.
Profile ofOrganisationalCharactertics
SupervisoryLeadership
CollaborationScale
Teacher Efficacy SchoolDev Eval Scale
.71
.55
.20
.18.18
.25
.39
Res1
Res2
Res3 Res4Err1
Figure 9: Model 2 - Diagrammatic Representation of the Predicative Relationships Between Leadership Variables, Collaboration, Teacher Efficacy and School Development Planning Evaluation Scale (The above diagram represents the results of the multiple regression outlined earlier. The one-way arrows show the direction of prediction (from predictor variable to predicted variable) and are not intended to represent causation.)

297
It is important to state though that in making this decision the rest of the
analysis was framed within an exploratory rather than a confirmatory mode.
Now that the hypothesised model derived from the regression had been
rejected this ended the confirmatory factor-analytic approach in its truest
sense. Although confirmatory factor analytic procedures continued to be used
these analyses were exploratory in the sense that they focused on the
detection of misfitting parameters in the originally hypothesised model. In
doing this one has to be cautious of trying to overfit the model (Wheaton,
1987). It was therefore decided that the only change to the model would be to
move the predictive relationship between collaboration and teacher
empowerment in the model to see if this provided a better model fit.
Table 48 reflects the critical ration (CR), which is > ±1.96 and thus the null
hypothesis was rejected. As Table 48 and Figure 9, reflect all of critical ratios
are significant.
Table 48: Standardized Regression Weights for Structural Equation Modelling Model 2: Estimate C.R. P Supervisory Leadership <---- Profile of Org Character .710 15.201 *** Collaboration Scale <---- Profile of Org Character .549 7.999 *** Teacher Efficacy <---- Supervisory Leadership .199 3.071 .002 Collaboration Scale <---- Supervisory Leadership .178 2.595 .009 School Dev Plan Eval <---- Teacher Efficacy .180 3.438 *** School Dev Plan Eval <---- Supervisory Leadership .252 3.994 *** School Dev Plan Eval <---- Collaboration Scale .393 6.328 ***
Table 49 (on the following page) indicated a minimum discrepancy of 8.241
with 3 degrees of freedom and a probability of .041 which suggested a better
fit than the previous model. The comparative fit index and RMSEA all showed
improvements in model fit although RMSEA was still only showing a
reasonable to mediocre fit. Browne & Cudeck (1993) argue that values as
high as .08 represent reasonable errors of approximation in the population.
Hoelter’s .05 and .01 CN values for our hypothesised school development
model were >200 (235 and 342 respectively). This leads us to conclude that
for this model the size of the sample (N = 224) in this study was satisfactory.
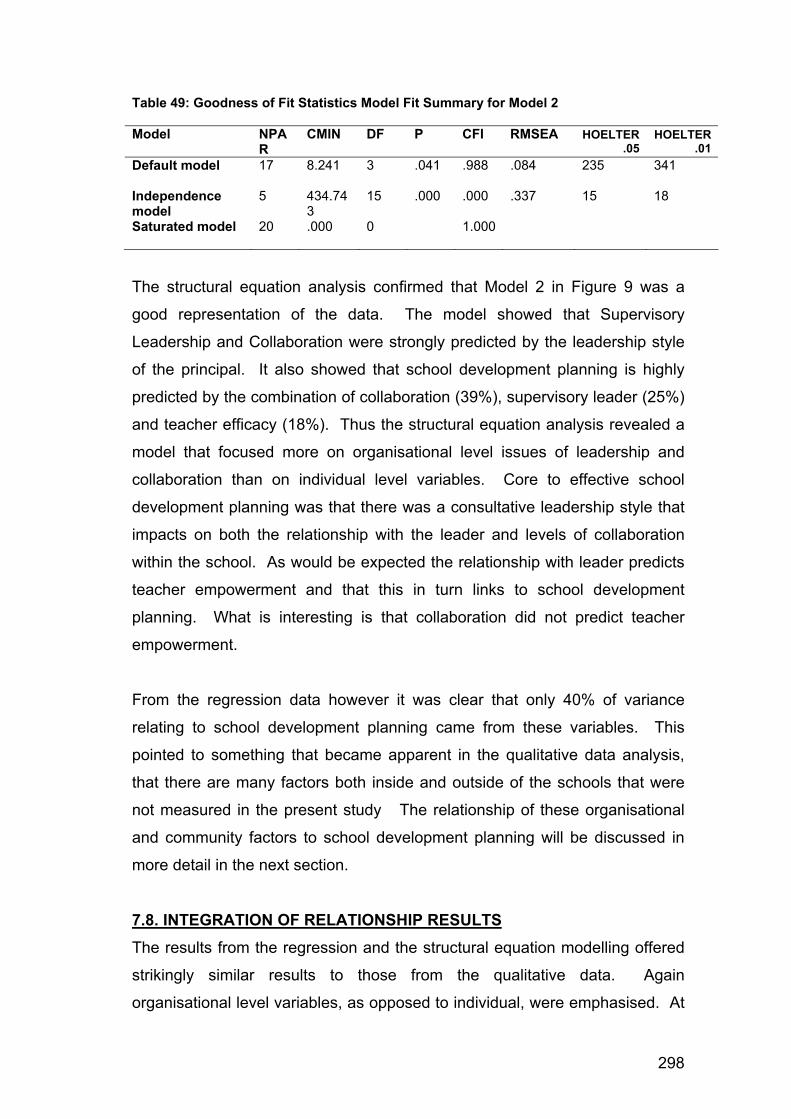
298
Table 49: Goodness of Fit Statistics Model Fit Summary for Model 2 Model NPA
R CMIN DF P CFI RMSEA HOELTER
.05 HOELTER
.01 Default model
17 8.241 3 .041 .988 .084 235 341
Independence model
5 434.743
15 .000 .000 .337 15 18
Saturated model
20 .000 0 1.000
The structural equation analysis confirmed that Model 2 in Figure 9 was a
good representation of the data. The model showed that Supervisory
Leadership and Collaboration were strongly predicted by the leadership style
of the principal. It also showed that school development planning is highly
predicted by the combination of collaboration (39%), supervisory leader (25%)
and teacher efficacy (18%). Thus the structural equation analysis revealed a
model that focused more on organisational level issues of leadership and
collaboration than on individual level variables. Core to effective school
development planning was that there was a consultative leadership style that
impacts on both the relationship with the leader and levels of collaboration
within the school. As would be expected the relationship with leader predicts
teacher empowerment and that this in turn links to school development
planning. What is interesting is that collaboration did not predict teacher
empowerment.
From the regression data however it was clear that only 40% of variance
relating to school development planning came from these variables. This
pointed to something that became apparent in the qualitative data analysis,
that there are many factors both inside and outside of the schools that were
not measured in the present study The relationship of these organisational
and community factors to school development planning will be discussed in
more detail in the next section.
7.8. INTEGRATION OF RELATIONSHIP RESULTS The results from the regression and the structural equation modelling offered
strikingly similar results to those from the qualitative data. Again
organisational level variables, as opposed to individual, were emphasised. At

299
the organisational level there was an emphasis on the role of the principal in
terms of leadership style (with a more consultative style being linked to better
outcomes) and relationships with staff. Collaboration, including the principal,
was also seen as an important determinant of success. At the individual level
it was only Teacher Efficacy that was seen to play a role in successful
implementation. The exploration of third variables did reveal that one of the
demographic variables, union membership, could also be influencing the
perception of the school development planning process. Figure 10,
Relationship Diagram 3, visually represents these factors combined with the
variables that emerged from the Relationship Matrix 6 between school
development planning and other variables. The pink dots and circles indicate
these additions to the Relationship Diagram.
What was lacking from the quantitative data analysis was community level
variables. As stated in the regression and Structural Equation Modelling the
variables offered in the model only account for 40% of the variance. It is quite
possible that community or contextual variables could account for some of
that. The results from the various data sets are integrated in Relationship
Diagram 3 (see Figure 10 over the page) to provide a visual display of the
variables at their different levels.
Figure 10, Relationship Diagram 3 indicated that the principal played a central
role in determining school development and thus organisational
empowerment. This related to two aspects; the principal’s relationship with
the staff, and the principal’s active involvement in school activities. The first
issue related to the principal’s leadership style which included being
consultative, supportive of the staff and having a good relationship with them.
The second related to the principal working with the staff on issues such as
school development planning, engaging with the School Development Team
and including staff in activities such as decision-making and collaboration.

300
Figure 10: Relationship Diagram 3: Combining All Results
Organisational Empowerment
through the School Development
Planning Process
Principal
Collaboration
Decision Making
Relationships
Atmosphere
School Dev. Plan
School Dev. Team
Inclusive
Small Things
Project Courses and Support
Parent Involvement
Department of Education
Collaboration with other schools
School Gov Body
Community Involvement
Holistic View
Conflict Resolution
Achievement
Attitude towards principal
Attitude towards school
Attitude towards other staff
Empowered
Active / Functional
Better response
set
Guiding, Active, Involved
Teacher Efficacy
Union
Management
Inclusive
Principal
Grey Lined Area: Individual Level Grey Shaded: Organisational Level Outside Area: Community Level White fill: Variables that Group
1& 2 mentioned
Orange fill: Variables that Group 1 emphasised
Green fill: Variables that SDPES Successful Group mentioned
Green Arrows: Role of the principal linked to variables
Pink fill: Addition of variables from model tested
300

301
Decision-making was also seen as an important variable and was reported to
be central to the relationship the principal had with the staff. Staff needed to
feel they had influence as well as involvement in decision-making.
Collaboration amongst the whole staff, including the principal and the issue of
good relationships between the staff was also seen as key. This linked to the
atmosphere of the school, one that is not only collegial but also proud of its
achievements. A functional School Development Team was also seen as an
important element.
At the individual level the attitudes of staff towards the school, colleagues and
the principal were seen as important. The results from the structural equation
model indicated that teacher efficacy was seen as an important individual
level variable. The MANOVA results also indicated that the demographic
variable of union membership may play a role in the change process within
the school. Demographic variables make up the person and they affect their
interest in and reaction to innovation and their motivation to seek
improvement. However as Fullan & Hargreaves (1992) point out most school
reform interventions ignore these differences and treat teachers as a
homogeneous group, which can lead to resistance and failure in terms of
programme implementation.
Figure 10, Relationship Diagram 3 indicated that there are not only
organisational and individual level variables that play a role in determining the
empowerment of the school as an organisation, there are variables external to
the school. Contextual supports, through active engagement of parents, the
School Governing Body and the broader community, through links with other
schools and from the Department of Education and the programme, all played
a role in assisting schools to implement their school development plans.
7.9. SUMMARY Qualitative data were analysed to explore teachers’ views on what variables
they felt were responsible for successful school development planning. This
provided some initial ideas about the relationship between school

302
development planning and variables at various levels of analysis. A model of
school development planning, emphasising the role of the principal in
developing organisational empowerment, was developed and tested. This
model attempted to offer some insight into the complex, multilevel
relationships that exist and impact on school development, and thus
empowerment, at an organisational level.
The Structural Equation Modelling was unable to capture some of the
community or contextual variables, as these were not measured. However
through the relationship matrix and diagram some of the complexity was
hopefully captured. What emerged from this integration of the various
analyses was that in order for schools to effectively implement their school
development plans there needed to be certain elements in place (internal
capacity), particularly with regards to the principal. However for this change to
be sustained there were also certain contextual and broader community
supports that needed to be in place.

303
CHAPTER EIGHT: INTEGRATION OF FINDINGS The present study explored whether empowerment, at various levels of
analysis, was evident in a school development planning programme.
Particular focus was on exploring school development planning as
organisational empowerment. This aim was realised through an evaluation of
an educational programme, by examining its empowerment effects on those
working in the programme, and on their schools as organisations, and also on
the broader community. Through the analyses of the quantitative and
qualitative data relating to Research Question 1 and 2 evidence of
empowerment at various levels within a school development setting were
found. Analyses of data relating to Research Questions 3 and 4 indicated that
a wide range of variables from various levels of analysis were implicated in
successful school development planning. Based on these data, a model of
school development planning emphasising the role of the principal in
developing organisational empowerment was developed and tested.
At a design and methodological level a case is made in this thesis for the logic
of assessing the impact or effects of a school development programme using
a multi-method research design. This argument was focused on gathering
evidence of empowerment in individuals working in schools at the individual
level, as well as on their schools as organisations, and also on the wider
community. The argument is made that it is possible to establish effects
through the type of research design used, and the type of evidence gathered
and analysed through a multi-method research design. This section offers an
integration of these findings in order to expand the understanding of
empowerment as evidenced in a school development context and the
relationships between organisational empowerment and other variables
associated with empowerment.
8.1. EVIDENCE OF EMPOWERMENT IN THE SCHOOLS: IMPACT OF THE PROGRAMME The focus of this study was to conduct a multi-method evaluative analysis of
the school development programme’s work, and in the process of fulfilling this

304
aim, to focus on the programme’s effects with respect to empowerment. The
first step in focusing on the programme’s effects with regards to
empowerment of the individuals and their schools was focused on what the
programme stated it wanted to achieve in terms of empowerment. Evidence
concerning whether empowerment had actually taken place was then
examined. To do this the study was operationalised by focusing on evidence
of impact or effects on a number of levels and across a number of data
sources. Following the type of impact evaluation model described in Chapter
Four the study was designed as a multi-method study.
Using a multi-method design, evidence was first sought in each of the different
data sources, separately, with the evidence from each data source being
equally weighted in the analysis. An attempt was then made to integrate the
findings from these different data sources. Convergences and differences
were highlighted. This is in line with existing practice in multi-method
research, which uses triangulation across different methods, data,
investigators and time to link and interpret trends from different forms of
analysis and different forms of data (Hayton, et al., 2007; Lloyd, et al., 2003;
NHS Health Scotland, 2007; Ring, & Finnie, 2004; Philip, et al., 2004).
The evaluation was based on seeking evidence of empowerment in a school
development setting. Indicators of empowerment outcomes were defined
theoretically based on Zimmerman’s (2000) work and in terms of the
programme’s own stated aims. Based on these descriptions of empowerment
indicators the results of the focus groups, archival data and the interviews
summarised in the impact matrices indicate that there is evidence of these
outcomes in the schools at the individual, organisational and community
levels. At the individual level teachers reported feeling more confident, a
willingness to engage in collaborative activities and access to resources all in
line with the outcome indicators. At the organisational level teachers reported
a more participatory form of leadership, shared decision-making, supportive
relationships and collaboration amongst staff. This was supported by
externally verified evidence in that committees had been set up at the schools,

305
the school development teams were functional, the principal was playing a
role in development planning etc. At the community level teachers reported
that parents were involved in school activities and the schools had set up
School Governing Bodies that were also involved in development planning.
Again these self-report were corroborated by various other externally verified
data sources. All the schools also were able to acquire additional resources
and make changes to infrastructure.
The impact matrices also provide evidence of many other changes reported
by school staff and found through other data sources that were not described
as the programme outcomes. At the individual level teachers emphasised a
change in attitude. At the organisational level elements of the relationship
between staff and the principal were emphasised, financial management and
communication about funds was stressed and fund-raising as an activity had
improved. At the community level collaborating with neighbouring school and
involvement of the community within the schools were reported by staff of a
some schools as having changed. School staff also emphasised what has
been termed interpersonal empowerment – stressing the change in the
relationships between school staff and the importance of those relationships
for effective implementation of the school development plan. The data also
suggested that consideration be given to formal levels of empowerment – that
is the broader power base in society and refers to the institutional supports in
the form of governmental legislation and policy.
School staff reported that they felt the school development planning process
had led to positive outcomes for them, their schools and the communities in
which those schools are located. There was also evidence that schools were
using the school development plans to achieve changes in their schools. This
was supported through various data sets. School development planning
therefore was an empowering process for schools that had led to many
changes and had led to schools becoming more empowered organisationally.
This conclusion was not only supported by teacher self-reports but through
analysis of the school development plan objectives that had been achieved,
306
archival data and the data from the interviews that were also externally
verified.
In summary the results of Research Question 1 and 2 indicated that the
schools had developed and were using the school development plans and
that they had been successful in achieving many of the objectives they had
set in the plans. There was also evidence of empowerment outcomes at the
individual, organisational and community levels. Schools, whether they were
in the programme for one or three years, had evidenced similar changes.
Staff in schools that had been in the programme longer reported more
changes, particularly those related to community level variables. Schools that
had scored higher on the School Development Planning Evaluation Scale
showed more second-order changes in both the qualitative and quantitative
data. Thus the school’s internal capacity to change and community level
support were better predictors of successful school development planning
than length of time on the programme. However this would require further
exploration. What was clear was that empowerment, at various levels of
analysis, was evident in both groups of schools.
8.2 SCHOOL DEVELOPMENT PLANNING AS ORGANISATIONAL EMPOWERMENT Most studies at the organisational level of empowerment have focused on
characteristics of organisations that lead to increased psychological
empowerment, that is on the characteristics of organisations that make them
empowering for their members (Bartle, et al., 2002; Gutierrez, GlenMaye,
DeLois, 1995; Matthews, Diaz & Cole, 2003; Peterson & Hughey, 2002). Less
studied and less conceptually developed are those characteristics of
organisations that indicate their level of empowerment. In the present study
school development planning was cast as a process for the empowerment of
the school as an organisation, the outcome or successful implementation of
the process leading to the school becoming empowered. The results
supported the idea that school development planning was a useful process for
the empowerment of schools with all of the schools able to use the plan, to

307
some extent, to achieve some goals.
The study provided evidence that the process of school development planning
had the capacity to enable a school to create a participative work culture,
collaborative work structures, shared decision making and increased
responsibility for school development among the staff and provided an
empowering environment through the development of empowering processes.
It also had the capacity to enable the school to be in control of its own
development and to achieve the goals set for itself (or be in a process of
achieving them). Through school development planning several of the
schools were able to influence their environments and thus become
empowered. These conclusions are supported the focus group data, the
analysis of the school development plan objectives achieved, archival data
and the interviews. Thus providing both slef-report daya from several groups
of school stakeholders as well as externally verified data. All of these
observations are in line with previous research on empowered organisations
(Beeker et al., 1998; Swift & Levin, 1987; Zimmerman, 1995, 2000) and
supported Zimmerman’s (2000) distinction between empowering and
empowered organisations linked to empowerment processes and outcomes.
The results supported Peterson & Zimmerman’s (2004) nomological network
of organisational empowerment in that they suggested there are various
components to organisational empowerment. Before describing how these
were evidenced in school development planning as organisational
empowerment it is necessary to make some distinctions. Peterson &
Zimmerman’s (2004) nomological network focuses on community based
organisations and research on these organisations. Community based
organisations are often non-governmental and thus independently funded and
often have active community action or intervention as their goals. Schools, as
part of a formal bureaucratic educational system, are quite different
organisations. Most schools’ goals are much more inward focused, around
achievement and attainment of their pupils.
Only recently have schools in South Africa been encouraged to become more

308
outwardly focused and view themselves as community resources that can
impact more broadly on the communities in which they are located (Schofield,
1999). However this is often still a secondary goal. In addition, this shift in
focus is often dependent on a change in governmental policies and targets for
schools and the need for funding to be made available and in this way more
formal levels of power impact on schools’ decisions about outcomes. This
has implications for how the various components of organisational
empowerment will exhibit themselves.
Peterson & Zimmerman (2004) suggested three components to organisational
empowerment. Using the framework of empowering processes and
outcomes, Table 50 (over the page) illustrates, from the results, what school
development planning, as organisational empowerment, looked like in terms
of these components.
(a) Intraorganisational – related to the internal structure and functioning of
organisations that are the foundation for goal achievement. This
component provided the infrastructure for members to engage in proactive
behaviour necessary for goal achievement. As can be seen in Table 50
this component included empowering processes and outcomes related to
leadership, collaboration, decision-making etc.
(b) Interorganisational – related to the connections and relations between
organisations critical for them to marshal resources, provide and receive
information and realise objectives. For schools this was about linking with
groups (such as parents) as well as organisations (other schools,
businesses) outside of the school.
Extraorganisational – related to the actions taken by organisations to affect
the larger environment of which they are a part. Here the impact would be
determined by a combination of inward, pupil focused activities, and outward
community focused activities. Changes in teaching and learning, more holistic
outcomes for the learners in the schools and being community-based schools
all fitted here. This component was about schools being able to make
changes in their own environments and achieve their outcomes.

309
Table 50: Processes and Outcomes of Intraorganisational, Interorganisational, and Extraorganisational Components of School Development Planning as Organisational Empowerment Component Process Outcomes Intraorganisational • Leadership
• Positive Supervisory Leadership
• Inclusive Collaboration • Inclusive Decision-making • Joint planning • Positive relationships
• Consultative Leadership • Leader actively involved • Functioning and Effective
School Development Team • Collaboration of subgroups • Resolved conflict • Resource identification • Functional Committees • Active and inclusive School
Management Team • School Development Plan
Interorganisational • School Development
Planning – linking internal processes and outcomes of school development planning to broader aims
• Developing linkages with stakeholders to support the implementation of School Development Plan
• Implementation and achievement of School Development Plan
• Collaboration • Resource procurement • Parent Involvement • School Governing Body
Involvement • Community Involvement • Collaboration with other
schools Extraorganisational • Engagement of stakeholders
as agents of change • Developing joint actions with
other schools • Making use of outside
agencies to achieve aims • Positive relationship with
Department of Education
• Improved outcomes for children
• Influence education across the area
• Used as a community centre • Creation of alternative
community programs and settings
• Deployment of resources in the community
From the results it was clear that schools had varying success in terms of
establishing processes and outcomes in terms of these various components.
The focus group data, the analysis of the school development objectives
achieved, the archival data and the interviews indicated that all of the schools
were able to make some changes at the intraorganisational level and to
secure some resources. From the focus groups Group 1 schools were able to
make the links with the community and other schools. The qualitative analysis
of the comparing schools on their School Development Planning Evaluation
Scale scores indicated that it was only the schools that scored well on the

310
Scale that seemed to take these and link them to the broader aims of the
school in terms of the educational purpose of schools. This nomological
network enables researchers to identify areas that need potential
development and in this way enable those developing community
programmes or interventions around school development planning to think
more holistically about what processes and outcomes need to be effected if
organisational empowerment is to be the desired outcome.
The nomological network help to see school development planning as part of
a network of elements and variables that enables schools to become
empowered. When schools have all of the components school development
planning is an empowering process and leads to empowered outcomes.
However, if school development planning is taken out of context and the focus
is only on the actual drawing up of the plan this can become a technical
process which is neither empowering for the school nor the staff within it.
What school development planning seems to offer schools is a set of
processes that make the vital link between the internal structures and
functioning, collaborative relationships with outside groups and agencies, the
acquisition of resources and the broader educational and community action
aims of the school.
8.2.1. A MEASUREMENT OF ORGANISATIONAL EMPOWERMENT In order to measure this level of organisational empowerment the School
Development Planning Evaluation Scale was constructed. It was established
that this scale consistently measured a single underlying factor indicating the
presence of a single construct related to school development. However it was
difficult to interpret and name this factor and thus establish whether the
underlying school development construct was an empowerment factor. In
order to answer the research questions other quantitative data measuring
variables associated with empowerment were collected, which not only
allowed for evidence of empowerment to be collected but also allowed for
further exploration of the validity of this scale.

311
To establish construct validity in this way the new measure should correlate
with well validated measures of the same topic. At present there are no well-
validated tests of empowerment as an organisational construct. However,
there were several tests that measured aspects of organisational
empowerment such as consultative leadership and participation. Table 42
indicated that the School Development Planning Evaluation Scale correlated
with all of the measures in the study, both organisational and individual level.
However the stronger correlations were with the organisational level scales
and all at the .001 significance level:
• Psychological Participation scale r = - .385
• Participation and Decision Centralisation Scale r = .411
• Collaboration Scale r = .552
• Peer Leadership r = .417
• Profile or Organisational Characteristics r = .554
• Supervisory Leadership r = .512
Although these are strong correlations it appeared that the construct School
Development Planning Evaluation Scale was measuring was distinct, as none
of the correlations were very high (discriminant validity). The correlations with
the variables associated with individual level empowerment were much lower
and locus of control was only significant at the 0.05 level. This would indicate
that the test was measuring something related to the organisational level
measures as opposed to a psychological process. Obviously this would need
to be further tested on other populations using similar or the same tests to
further ascertain the construct validity of the test. Kline (1994) and
Oppenheim (2001) do point out though that this is a common limitation for
educational, psychological and other social science measurement
development; there are seldom well-validated measures of the area of
interest.
When the schools were ranked according to their scores on the School
Development Planning Evaluation Scale and a comparison undertaken
between those who scored highest and those who scored lowest, there were

312
significant differences between them on several of the other measures
associated with organisational empowerment (see Tables 28 and 29):
• Collaboration Scale
• Peer Leadership Scale
• Profile of Organisational Leadership scale
• Supervisory Leadership
The schools that scored higher on the School Development Planning
Evaluation Scale showed higher levels of collaboration, peer and supervisory
leadership and a more consultative leadership style.
Thus the test appeared to consistently measure a single construct that
seemed related to organisational empowerment. It also appeared to have
predictive validity in that it was able to clearly distinguish between schools that
had scored well on the School Development Planning Evaluation Scale and
those that had not, on the measures of several variables associated with
organisational empowerment. However, it would need further exploration and
development to conclusively say it is measuring school development planning
as a form of organisational empowerment.
What was clear was that it was difficult to develop a measure that was
sensitive enough to distinguish between the schools staffs’ perceptions of
different levels of analysis and between empowerment processes and
outcomes. Both of these issues made it difficult to identify subscales within
the School Development Planning Evaluation Scale. Empowerment as a
complex, multidimensional and contextual construct is difficult to measure and
further test construction, validation and research are needed in this area to
fully understand this complex construct and its many forms.
8.3. LEVELS OF EMPOWERMENT The results, both in terms of the changes resulting from school development
planning and variables linked with it, supported Zimmerman’s (2000)
framework of empowerment at different levels of analysis, namely the
individual, organisational and community. The impact matrices combine the

313
focus group data, the archival data and the interviews as well as the
relationship matrix and diagrams combining data from the focus groups and
the model developed and tested all indicate that change had occurred at
various levels of analysis. This was supported by both self-report and
externally verified evidence. The results added to this framework by exploring
other levels such as the interpersonal and formal levels, which will be
expanded on below.
8.3.1. INDIVIDUAL EMPOWERMENT At a personal or individual level certain aspects of Zimmerman's (1995, 2000)
components of psychological empowerment were reflected, however no
attempt was made to measure all aspects of these components and thus this
level was referred to as individual empowerment. Teachers did report several
changes at the individual level including feeling more confident, a willingness
to engage in collaborative activities, skills development and a change in
attitude. They also reported a change in their teaching and learning. Based
on the focus groups and the qualitative data analysis of made some school
more successful the elements of psychological empowerment seemed to be
evident. In line with Zimmerman (1995) it appeared that there was an
intrapersonal aspect of feelings of personal competence, an interactional
component of an understanding of what was hindering or causing a sense of
powerlessness and what behaviours needed to be taken in order to deal with
this powerlessness, and the behaviour component, that action to change it.
However psychological empowerment in this context would need further
exploration. The present study added to our understanding of this level of
analysis in several ways.
8.3.1.1. Context Specific Efficacy From the model developed it was the context specific measure of efficacy,
rather than more general forms, that was seen to play an important key role in
the development of the school. In the qualitative data teachers also
emphasised teaching and learning as having changed within their schools due
to the school development planning. It would therefore be interesting, when

314
looking at organisational empowerment in the context of schools, to explore
whether a more context specific measure of teacher empowerment would be
more appropriate or would add to our understanding of this level of
empowerment. This aspect of individual level empowerment needs further
exploration.
8.3.1.2. Attitudes From the results of the focus groups it appeared that there may be an
attitudinal component to the process of individual empowerment. Most
research on empowerment at the individual level has focused on the cognitive
aspects of empowerment (Deacon, 1990; Koberg, et al., 1999; Spreitzer,
1995; Zimmerman, 2000). Researchers such as Huberman (1988), Hopkins,
(1990) and Fullan (1991) have emphasised the importance of teacher
attitudes in bringing about change; however this has not been explored within
the framework of empowerment.
What was evident from the qualitative data was that teachers reported and
emphasised that there had been a change in teachers’ attitudes. Firstly, they
reported that there was an attitude change towards the change process itself
and a willingness to engage fully with this process. However, the change in
attitude was also towards peers and the principal, and this they felt had had
an impact on their behaviour towards them and thus their relationships.
From the qualitative data (the focus group discussions) empowerment was
evident in the teacher’s realisation and ability to make choices and how he or
she subsequently behaved. This ability to make choices meant that they
could change their responses, could let things slide, could confront, and could
change their inaction into action. They were able to see their own actions
from a different perspective and were aware that the change in their attitude
and behaviour had led to improved relationships. Thus they were able to take
responsibility for their behaviour and responses. This change in attitude
meant that teachers had developed a variety of repertoires and thus had a
choice in terms of how they chose to respond to the process of change and to

315
their colleagues. Hassin & Young (1999) reported similar findings in their
work with Native Americans.
8.3.2. INTERPERSONAL EMPOWERMENT In the focus groups school staff reported that not only had relationships
improved in their schools since implementing school development planning
but they saw these relationships as having played a crucial role in the
successful implementation of school development planning. This finding was
supported by the archival data analysis. The interpersonal level of
empowerment involved working together with colleagues and others to create
mutually fulfilling connections that facilitated the change process. It was about
building relationships and connections with ones peers. In previous research
the terms “interpersonal” (Liden, et al., 2000), “relational” (Walsh et al., 1998)
and “team” (Kirkman & Rosen, 1999) empowerment and “collective efficacy”
(Jex & Bliese, 1999) have been used to describe what is seen as the level of
empowerment expressed through one’s relationships or collective action with
others.
The data suggested that this level may consist of two elements, relating to
different levels of analysis. The first was relational empowerment related to
the individual and interpersonal level of analysis, the psychological outcomes
of an interpersonal process. The second was collective empowerment related
to the organisational level of analysis and had an action, or change
component.
8.3.2.1. Relational Empowerment At this level it was the relationships between people that were central. This
aspect was related to the quality of the relationships between the people
within the school. From the data it appeared that this level of empowerment
consisted of two aspects. The first was the experience of interpersonal
relationships as being empowering for one’s self (at the individual level). The
other is the transfer of empowerment to others – the process of transferring
one’s own sense of empowerment to others by sharing information directly or

316
by letting them take responsibility for their own experience (at the
interpersonal level). Participants used and extended the self-empowerment
process to others by sharing, modelling and enabling others to realise the
consequences of their own experience.
The first element was evident in most of the schools. However, it seemed that
it was only in the successful schools that people were able to transfer this
empowerment to others. The increased time spent together interacting had
implications for the classroom as teachers were now talking about school
related activities. Teachers also emphasised the importance of support and
advice with personal issues and also the importance of socialising with one
another outside of the school. The results supported both the emphasis
placed on the role of relationships in the school development literature (Fullan,
1991, 1998) and supported the ideas of Walsh et al. (1998) and Speer (2000)
that emphasise this aspect of the empowerment process.
8.3.2.2. Collective Empowerment Both the model developed and tested in the study and the qualitative data
emphasised collaboration as central to successful school development
planning. This was a group level or organisational level construct that related
to collective action on the part of the staff of the school. The school
development literature (Fullan, 1991; Fullan & Hargreaves, 1992) as well as
some of the organisational development literature (Kirkman & Rosen, 1999)
suggests that having good relationships between staff leads to collective
empowerment or efficacy. Previous research suggests that as members’ self-
efficacy grows so does the collective efficacy of the group (Corsun & Enz,
1999). Saegert & Winkel (1996) and Kroeker (1995) however argue that
collective empowerment leads to individual empowerment.
From the data in the present study it would appear that relationships could
improve and exist without collective action. It also appeared that in some
schools collective action may have led to the development of positive
relationships and thus existed prior to the development of these positive

317
relationships. How sustainable positive relationships or collective action
would be without the other would need to be explored in future studies. What
was being suggested by the data however was that the relational level related
to the quality of the transactions between people and the collective related to
the action that the group as a whole could take. The two are not mutually
exclusive and they are probably most effective together. This relates to what
the leadership and group process literature describe as maintenance and task
functions in teamwork (Andriessen & Drenth, 1998). What is clear is that this
area needs more research.
What seemed to play a role in moving the development of positive
relationships onto collective action was the inclusion of the principal within the
collaborative action and organisational structures within the school that
supported collaborative activity, for example committees and processes for
collaborative decision-making. This was a feature of those schools that were
successful in their implementation. For the other schools peer collaboration
was utilised as a way of gaining relational support and some level of efficacy
in the organisation; however it work against what were seen as unfair
organisational practices (such as lack of involvement in decision-making and
poor relationship with the principal). In this way it allowed individuals to work
together even if the organisation itself was not empowering. However longer-
term studies would need to be undertaken to assess the effectiveness of this
strategy.
These results also supported Speer’s (2000) contention that individual level
empowerment and collective empowerment may not work against each other
as was suggested by Riger (1996) and Lee (1999). Those individuals and
schools who were able combine an understanding that power was accessed
by working through the collective with an understanding that power required
strong relationships with others were more successful. The successful
schools seemed able to combine this critical awareness about how to bring
about change in their environment (the interactional component of
psychological empowerment) with strong relationships between staff and

318
collective action. This is in line with Zimmerman’s (2000) assertion that critical
awareness and knowledge of resources required to create community change
are necessary elements of empowerment.
The interpersonal level of empowerment needs further study as the above
discussion is based on the self-report of school staff and other stakeholders.
8.3.3. ORGANISATIONAL EMPOWERMENT In this study school development planning, cast as organisational
empowerment, was seen as an active, participatory process through which
schools as organisations could gain greater control, efficacy, access to
resources and impact on their community. The results of the focus groups,
the school development planning objectives anlsysis, the archival data and
the interviews all support the conclusion that staff and other school
stakeholders indicated that the school development planning had brought
about changes within the school. These results are based on both the self-
report of numerous stakeholders and on externally verified evidence of
change. All schools reported changes in infrastructure and having acquired
additional resources as well as numerous other changes in other areas of the
school.
However from the results of the interview data and the archival data it was
clear that school development planning may not be the only or the most
effective method of empowerment for all schools. This supported Foster-
Fishman et al.’s (1998) argument that there are multiple pathways to
empowerment and that individuals and organisations can use a variety of
strategies and may use different ones at different time. Further research into
organisational empowerment and school development planning will allow us
to further clarify these different pathways.
The impact and relationship matrices indicated that issues of organisational
internal capacity and contextual support were important influences in the
implementation of school development planning. The importance of a schools

319
internal capacity for change has been stressed by several school
development writers (Hopkins, 2000; Hopkins et al., 1997; Stoll, 1999) when
applying the school development planning process. Only once the school’s
structure and culture can support the process of school development planning
can it be useful. This fits clearly with the nomological network of
organisational empowerment, which asserts that intraorganisational
processes and outcomes need to be in place for organisations to be
empowered.
The results also suggested that it is not only important to consider the school’s
internal capacity it is also vital to consider the contextual support e.g. from
parents, the community, the Education Department and the socio-economic
context. Again the interorganisational component of the nomological network
of organisational empowerment clearly indicates the need for these kinds of
links and supports (Peterson & Zimmerman, 2004).
From the focus groups, archival data and the externally verified data other
levels of empowerment, such as community and formal levels, were evident.
This is an important issue as the school as an organisation does not exist in a
vacuum but is firmly embedded within a community and within formal
structures of institutional power (Perkins, Crim, Silberman & Brown, 2004). As
Haberman (1994) argues, what is generally missing from school development
literature is clear connections between societal problems and the school
change process.
8.3.4. COMMUNITY EMPOWERMENT: Many variables related to community level empowerment were cited by school
staff as having hindered their progress e.g. parents’ involvement, school
governing body involvement and community involvement. From the focus
groups and the interviews teachers and principals reported that these factors
often worked against the process of empowerment rather than supporting it.
Very few school staff reported being able to have an impact on their
community. Given the context in which these schools find themselves one

320
wonders how sustainable a school development programme is without
concurrent changes in the community. Schofield (1999) argues that schools
should be seen as the centre of community development and empowerment.
Several school development writers emphasise the importance of parents and
community in the school development process (Kelley, Fritterer, Kling,
Timbrooks, Kirkwood, & Calvin, 1995; Walley, 1995).
Several of the schools attempted to work together collectively; however this
was not particularly successful. This form of community empowerment
referred to the schools, as a collective, working jointly on collective issues and
having an impact. In this way the school community, rather than individual
schools, could achieve collective action. Rich et al., (1995) argue that a
community is composed of both its citizens and its formal institutions and
community empowerment (the capacity to respond effectively to collective
problems) will occur only when both individuals and institutions have been
empowered to achieve satisfactory outcomes. Foster-Fishman, Salem, Allen
& Fahrbach (2001) argue for the benefits of interorganisational alliances and
collaboration to enhance organisational outcomes.
These results indicate that school development programmes need to take into
account not only the internal capacity of the school for change but also need
to look at ways in which the external environment negatively impacts on the
school and ways in which this can be worked with in order to support rather
than hinder the school (Nation, Wandersman & Perkins, 2002; Zippay, 1995).
8.3.5. FORMAL EMPOWERMENT The results of the focus groups and the interviews indicated that the majority
of the schools saw the Department of Education as working against their
development rather than supporting them. As discussed above, the
educational community consists of both the people who make up the schools
and the formal institutions, and as such community empowerment can only
occur when both individuals within the schools and the formal institutions have
been empowered to achieve satisfactory outcomes.

321
Many school development writers stress the importance of the role of the local
level education department (Bishop & Mulford, 1999; Cheng, 1999; Cooper,
Slavin, & Madden, 1998; Godwin, 1999; Hopkins & Levin, 2000; Wideen,
1992; Wilkins, 2000). Rich et al. (1995) argue that formal empowerment is
created when institutions provide a mechanism for the public to influence
decisions that affect them. However, at present not only is this level of formal
empowerment not available to schools, it appears they are experiencing the
formal structures as disempowering. The role of formal empowerment in the
school development process needs further exploration.
8.3.6. RELATIONSHIPS BETWEEN THE LEVELS The impact and relationship matrices as well as the relationship diagrams
indicated that there was evidence of empowerment at several levels i.e. the
individual, organisational and community levels. Examples of these changes
at the various levels were externally verified in the analysis of the school
development planning objectives achieved, the interviews data and the
archival data analyses. The model tested through a structural equation
modelling procedure also indicated that there are multi-level processes
involved in the school development planning process. The relationship
between the levels of empowerment would need further exploration and more
sophisticated measures of the various levels need to be developed in order to
do this.
The focus group results offered support for those writers who question
whether change in one level will necessarily lead to change in others (Soet et
al., 1999). Often there is an implicit expectation in organisational and school
change initiatives aimed at empowerment that the introduction of an
empowerment initiative will have a positive impact on the organisation as a
whole as well as the individuals (Bartunek et al., 1999). At several schools
individuals reported having changed, however they did not feel that their
schools had changed. This supported the finding of Bartunek et al. (1999)
who found that an organisational empowerment initiative had a positive effect

322
at the individual level but not at the organisational level.
The analysis of those schools that were more successful on the School
Development Planning Evaluation Scale suggest that school development
programmes need to impact upon the actual power wielded by schools and
their members and not only on the individual members of the organisation.
This is important because “success for empowerment activities necessities
change … in successful interventions members … will achieve greater control
over their lives” (Swift & Levin, 1987, p. 90). This form of collective
empowerment extends beyond the sense of accomplishment and mastery
inherent in individual level empowerment activities and many teacher
development programmes, and emphasises the need for schools to obtain
increased mastery over their affairs by altering the distribution of power and
decision making authority within the school and within the educational
community (Speer, Ontkush, Schmitt & Raman, 2003).
Rich et al. (1995) argue that distinguishing between these forms of
empowerment is important to assess the degree of empowerment or
disempowerment present in a situation because it is possible to achieve some
forms without achieving the others and because different forms have very
different implications for actual power relations. Understanding the interaction
between the forms is valuable to practitioners because some forms facilitate
development of others. Those who want to empower individuals and
communities should be aware of these relationships. The way in which the
various levels of empowerment interact is an area for future study.
8.4. MATERIAL GAINS AS AN EMPOWERED OUTCOME The School Development Planning Matrix indicated that in terms of school
development planning outcomes, all the schools were able to access more
material resources, this being the main area of success for them. In line with
Kroeker (1995) and Saegert & Winkel (1995) the present study confirmed that
actual changes in the material life of the participants (i.e. access to resources)
were an important part of the empowerment process. This linked to issues of
323
material power as opposed to power at a purely psychological level (Riger,
1993; White & Potgieter, 1996) as people could have a tangible impact on the
environmental conditions they found themselves within. In line with this,
issues of acquisition of resources and infrastructure, finances and fund-raising
became important features of the empowerment process for the schools. This
became a concrete way of dealing with feelings of powerlessness. As Barth
(1990) argues, money can be an antidote to powerlessness.
What was clear from the results though, and in line with Kroeker’s (1995)
study, was that to be empowered as an organisation the process could not
remain at this level. The Relationship Matrix and Diagrmas as well as the
model indcated that other individual, relational, and organisational levels
needed to change and support this process. Thus the small wins (Perkins,
1995) may be an important aspect of the initiation or innovation phase of
empowerment but the change process is more long term and complex than
this (Cheung, 1999) and needs organisational and contextual support. These
ideas are supported by the integration of the results in the Relationship Matrix
and Diagrams which indicated the importance of both organisational
(particularly the principal) and community (particularly parental support) in the
process of school development planning.
Both Kroeker (1995) and Saegert & Winkel (1996) argue that the most
effective means of transforming one’s reality is through collective process.
The analysis of those schools more successful on the School Development
Planning Evaluation Scale indicated that these schools had made the link
between resource acquisition and a broader vision for the school and pupils.
This links with the nomological network described above which sees resource
procurement as part of the interorganisational component of organisational
empowerment. Although gaining access to resources is an important part of
the empowerment process, if this is not linked to broader outcomes, such as
better performance of pupils or being a community resource, then the
procurement of resources will not contribute to the empowerment of the
school as an organisation.

324
8.5. VARIABLES SUPPORTING SCHOOL DEVELOPMENT PLANNING The results of the model development and testing indicated that organisational
level variables played more of a role than individual level variables. The role
of the principal and inclusive collaboration were central to the model. What
became clear when integrating these results with the qualitative data was that
there was a range of variables relating to the community, organisation and
individual that were not measured quantitatively that were seen by school staff
to be playing a role in the school development planning process. Table 50,
setting out the nomological network of school development planning as
organisational empowerment, clearly presented these variables. What was
clear though was that the principal was seen to play a central role in
successful school development planning and thus empowerment.
This supported the school development (Barth, 1990; Bergman, 1992; Fullan,
1991) and organisational development literature (Skogstad & Einarsen, 1999;
Wolverton, 1998) that sees the leader as playing a central role in
empowerment and change initiatives. The qualitative data indicated that in
schools that were successful the principal exhibited three aspects: firstly, he
or she was actively involved or guided the school development planning
process; secondly, he or she was supportive of a collaborative culture within
the schools and at times provided structures to support this; and thirdly, there
was a good relationship between the leader and teachers. The principal’s role
in school development planning was also supported by the archival data and
verified through school records.
The focus group analysis of the schools that were more successful on the
School Development Planning Evaluation Scale indicated that principals in
these schools played a more inclusive role in terms of collaboration and
decision-making with teachers. This was supported by the interview data
which was verified externally. Many writers (Biott , Easen & Atkins, 1995;
Newman & Pollard, 1995; Rosenholtz, 1989; Stoll, 1992) argue for the role of
the principal in developing collaborative structures within the school. As the
data from the focus groups indicated issues of relationships, trust and the

325
“small things” were important variables in the successful implementation of the
school development plan. Although the interaction/relationship between
leader and staff member has been explored in previous research (Deluga,
1994; Howell & Hall-Merenda, 1999; Settoon et al., 1996; Wayne et al., 1997)
the relationship is often seen or typified as the way in which managers can
empower encourage, motivate etc. the staff. There has been very little written
about the mutuality of the relationship and not much on the actual micro-skills
needed for effective leadership. The teachers’ perceptions from the focus
groups give some insight into this mutuality and what these micro-skills might
look like however this would require further exploration.
Wideen (1992) argues for the importance of supportive leadership in
successful implementation of development programmes and talks about the
importance of interaction and the principal becoming part of the learning
group. However Wideen argues that it needs to be borne in mind that this is
an interplay, the staff need to provide a conducive atmosphere for the
principal to do this. This mutuality was confirmed in the study in terms of the
change that teachers and other school stakeholders reported had occurred in
teachers’ attitudes towards the principal and management.
Many writers and researchers in both the fields of organisational and school
development literature make a link between democratic or consultative
leadership and the empowerment of staff members (Bond & Keys, 1993;
Gruber & Trickett, 1987; Fuller, et al., 1999; Lightfoot, 1986; Spreitzer, 1995;
Tjosvold & Law, 1998). The present study questioned the validity of this link
for all settings, cultural groups and phases of an empowerment programme.
The relationship between the individual level measures associated with
empowerment and more democratic leadership, participation and
collaboration were either weak or did not exist. However there were strong
relationships between more democratic leadership and organisational level
empowerment and participation and collaboration. This suggested that the
link between empowerment and more democratic leadership may not be a
simple one. Without acknowledging this complexity we may again provide

326
simple solutions to complex issues. However in order to make any definitive
comment on the relationship between democratic leadership and the
empowerment of teachers in this context would requires further exploration.
The data also offered some interesting findings related to participation and
collaboration. There were weak relationships between the measures of
participation and the variables associated with individual levels of
empowerment, particularly Locus of Control and Teacher Efficacy. In the
analysis of the model the link between collaboration and teacher efficacy was
not evidenced. Perkins, et al. (1996) found that locus of control was also not
linked to participation in their study. This goes against much previous
research that saw a strong link between individual level empowerment and
participation (Bartunek, et al., 1999; Fawcett et al., 1995; LeBosse et al.,
1998/9; Perkins, 1995; Perkins & Zimmerman, 1995). It may be that for this
group, in this context, participation may not impact on individual level
empowerment and may contribute towards a more collective sense of
empowerment. At the organisational level there is a clear link between school
development planning and the measures of collaboration and decision-
making. However this would require further investigation.
From the focus groups teachers reported that involvement in decision-making
with no real influence disempowering and often made use of peer decision-
making and collaboration as a way of dealing with this. Although this did not
give teachers access to school wide decision making power it did allow them
a sense of agency in their own area or domain. Although this proved
functional for the teachers it widened the gap between the principal and
teachers and meant that issues were not being dealt with.
It was also interesting to note how a positive change such as setting up of
committees can then be used to undermine real change within the school.
This issue links to the notion of first order and second order change. In this
case structures within the school were changing, but the actual power
relationships between teachers and principal were not and thus any real

327
sustainable change did not seem possible. Bartunek & Keys (1982)
emphasise the importance of equalisation of power between principal and
teachers. Often teachers were using these structures to subvert the principal.
This peer collaboration was an interesting finding in terms of the literature on
collaboration in school development and in terms of empowerment literature.
Most of this literature emphasises peer collaboration or self-managed teams
as being empowering for staff members (Barth, 1990; Kirkman & Rosen,
1999). However in these schools, this form of collaboration did not lead to
collective empowerment. It appeared that peer collaboration in the context of
South African township schools had a different meaning from that attached in
most western studies (for example, Nias, 1989; Nias, Southworth, &
Yeomans, 1989). It would appear that although peer collaboration may
provide a short-term solution to feelings of disempowerment by the teachers
this was not a long-term solution and the principal needed to be part of the
collaborative effort. This role of peer collaboration however would need
further research to make any firm conclusions.
8.6. THE COMPLEX NATURE OF EMPOWERMENT From these results it is clear that empowerment is a complex multi-
dimensional, dynamic construct that is difficult to measure. The results
supported and further explored the arguments put forward by Foster-Fishman
& Keys (1997) in terms of empowerment, and Fullan (1991) in terms of school
development, that the process of empowerment and development is a
complex one. The results were also consistent with writers who have argued
for school change to be cast within a complex social system (Cheung, 1999;
Clarke, 1999; Oxley, 2000) and those who argue that we need to look at the
interplay between school development planning and deeper contextual and
social issues (Biott, et al., 1995; Reeves, 2000).
The present study provided support for the usefulness of a multi-method
research design in exploring empowerment and for capturing some of its
complexity. Quantitative measurement of organisational empowerment

328
proved difficult and again supported the idea that this construct is
multidimensional and has many aspects. Qualitative methods seemed more
able to access information about these variables, and their integration with
quantitative analyses provided evidence of empowerment at various levels of
analysis in school settings. Thus the triangulation of several sets of data, both
quantitative and qualitative, provided evidence for the argument that
empowerment does occur in the context of school development work.
Taking this complexity into account also has implications for school
programme developers. Some researchers may argue that by being this
inclusive, by taking into account all of these things, it becomes messy and
things become obscured and it becomes a pointless exercise. This argument
has relevance; however by not acknowledging this complexity an untrue
picture may be developed, as offered by school effectiveness literature, which
is clear, measurable and of no real use.
If we fail to view the empowerment and school change process as contextual
and dynamic and exclude notions such as power we miss the complexity and
provide simplistic solutions to complex social problems. Many writers in the
fields of both organisational development and school development have
raised the issue of the failure of empowerment programmes due to simplistic
notions of empowerment and change (Cuban, 1990; Fullan, 1991; Riddel,
1999). They argue that these simplistic notions lead to a lack of success or
first order change occurs in place of second-order change. As Foster-
Fishman & Keys (1997) argue, if we ignore this person-environment
interaction and the critical role that both individual and contextual
characteristics play in the empowerment process, we risk implementing ill-
fated empowerment initiatives, or worse, creating disempowering experiences
for the participants.

329
8.7. COMMUNITY PSYCHOLOGY – A FRAMEWORK FOR SCHOOL DEVELOPMENT The results of both the evaluation of the school development programme and
the exploration of the relationships involved in school development planning
indicated that community psychology and the theory of empowerment provide
a useful way of adding to our understanding of school development and
change. Using empowerment theory and concepts to frame the evaluation of
the school development programme provided useful way of conceptualising
the evaluation. Not only does it provide a unifying framework for ideas and
models that already exist in the school development sphere but it also allows
us to expand and develop those ideas in what seems a meaningful way. The
application of the theory in a school development context has also added
richness to our understanding of empowerment at its various levels.
In viewing school development planning as organisational empowerment, in
exploring the various levels of change through an empowerment framework
and doing this in the context of school development, empowerment was cast
as an interactional process, both multilevel and context specific, linking the
individual with the group, organisation or community. In this way
empowerment refered to both the phenomenological development of a certain
state of mind (e.g. feeling powerful, competent, worthy of esteem etc.) and to
the modification of structural conditions in order to reallocate power (e.g.
modifying the interactional and organisational opportunity structure) – in other
words, empowerment refered to both the subjective experience and the
objective reality and is thus both a process and an outcome (Swift & Levin,
1987). By using both self-report data and externally verified evidence of
change as part of the evaluation both of these elements were able to be
assessed.
Community psychology’s contextualist view not only allowed the exploration of
organisational and individual aspects of the school development process but
also placed these processes within a broader community and social context,
something school development literature has been critiqued for not doing.

330
This perspective allowed us to view the relationships between variables and to
understand the way in which school development planning as an
organisational process interacted with the school’s and individual’s internal
capacity to change. In this way questions about whether a single process like
school development planning can be usefully applied to schools without
viewing the other community, organisational and individual level variables that
need to be in place to support it were explored. By taking in the notions of
culture and context it also questioned whether this process was applicable to
the context schools in developing countries undergoing rapid change find
themselves in. It also challenged the views on leadership and participation
within these contexts.
By focusing merely on the internal processes of the schools as an
organisation one loses sight of the various contextual constraints or supports
on the change process. By assuming that schools can take organisationally
focused change initiatives and implement them in a rational logical way
assumes that schools are in charge of their own development and can
determine what needs to be done. As the study clearly demonstrated this is
not the case; the schools’ internal capacity, both at an individual and
organisational level, interact with a multitude of other environmental factors.
This study provided evidence for the importance of attending to the ecology,
the contextual elements of empowerment initiatives. As Foster-Fishman &
Keys (1997) argue it is not simply the presence of empowering contextual
elements or the presence of motivated, capable people that foster the
empowerment process. It is the dynamic interplay between person and
environment that creates the infrastructure for empowerment. If we ignore
this person-environment interaction and the critical role that both individual
and contextual characteristics play in the empowerment process, we risk
implementing ill-fated empowerment initiatives, or worse, creating
disempowering experiences for the participants (Parker, Baldwin, Israel &
Salinas, 2004; Rich, et al., 1995).

331
8.8. SUMMARY In summary, the focus in this thesis was on an evaluation of an educational
programme, by examining its empowerment effects on those working in the
programme, and on their schools as organisations, and also on the broader
community. At a design and methodological level a case was made for the
logic of assessing the impact or effects of a school effectiveness programme
using a multi-method research design. The argument was focused on
gathering evidence of empowerment in individuals working in schools at the
individual level, as well as on their schools as organisations, and also on the
wider community. The argument was made in this thesis that it is possible to
establish effects through the type of research design used, and the type of
evidence gathered and analysed through a multi-method research design.
The results of this study confirmed the findings of several previous studies of
empowerment and contributed new empirical findings that enlarge the
theoretical understanding of empowerment, particularly in terms of its
organisational dimensions. It also further explored other levels that have not
been fully explored i.e. the interpersonal and formal. The results supported
the idea that empowerment is a multilevel, dynamic, contextual phenomenon
and provided some insight into the dynamic nature of the relationships
between the levels and their links with other variables such as participation
and leadership. It provides evidence of how empowerment is displayed and
developed within a different context – that of a school development
programme.
In no way is this an exhaustive or complete exploration of empowerment at its
various levels, and forms within levels, or of the factors supporting or
hindering its development. However it is hoped that what this does is make
researchers, policy developers and programme implementers aware of the
multiple and complex nature of empowerment and to see that our attempts at
finding solutions in one level of analysis may be hindered by factors within
another level. We need to be aware that there are no simple solutions to
issues of empowerment and development and that it is a many-layered area.

332
It is hoped that by framing school development planning within this theoretical
framework it extends the school development / improvement literature and
makes for a richer, more complex understanding of the process of change and
development within the school setting.

333
CHAPTER NINE: MAIN FINDINGS, LIMITATIONS OF THE ANALYSIS AND INDICATIONS FOR FURTHER RESEARCH
9.1. MAIN FINDINGS The primary aim of this study was to explore whether using a community
psychology framework, particularly an empowerment one, helps to further
understanding of school development. This aim was realised through an
evaluation of a school development planning programme. A framework of
variables based on empowerment theory was used as a way of focusing the
analysis. In operationalising the study, the literature on empowerment was
used to develop the framework, which posits three different levels of
empowerment.
The focus in this thesis was on an evaluation of an educational programme,
by examining its empowerment effects on those working in the programme,
and on their schools as organisations, and also on the broader community.
The focus thus lay on identifying whether evidence could be found that
empowerment has occurred at these different levels, in the context of a school
development programme. The study also identified possible variables that
supported or hindered the school development process.
Based on the results of the focus groups, the archival data and the interviews,
combining both self report of several school stakeholders and externally
verified evidence it can be concluded that school development planning has
impacted on the schools and has brought about changes at an individual,
organisational and community level. However the results indicated that extent
of involvement in the programme was not a significant influence on level of
empowerment. More important was the influence of school leadership, and in
particular the leadership style exercised by the principal.
Impact and relationship matrices, integrating the quantitative and qualitative
analyses, indicated that the programme had effects on both individuals and
schools, and that the process of school development planning was related to
aspects of organisational empowerment. Issues of organisational internal

334
capacity and contextual support, however, influenced implementation of
school development planning. This indicated that the school’s internal
capacity to change and community level support were better predictors of
successful school development planning, and thus empowerment, than length
of time on the programme.
The results from the focus groups, interviews and archival data indicated that
empowerment, at various levels of analysis, was evident in both groups of
schools. This finding supported Zimmerman’s (2000) framework of
empowerment at different levels of analysis, namely the individual,
organisational and community. It added to this framework by exploring other
levels, namely the interpersonal and formal levels.
In terms of the interpersonal level the present study confirmed the importance
of the relational aspects of empowerment and added to this the concept of
collective empowerment. It also suggested that formal levels of
empowerment need to be included in an understanding of empowerment. At
the individual level the study indicated that there was an attitudinal aspect to
individual level empowerment, in addition to cognitive and behavioural
aspects, and that context specific measures of efficacy may play an important
role in understanding and assessing individual level empowerment. Teacher
efficacy proved to be an important predictor of school development as
opposed to a more general measure of efficacy.
While these additional analyses go a certain distance towards justifying
conclusions as to empowerment having occurred beyond the individual level,
there are still a number of limitations inherent in the type of analysis
conducted. It needs to be acknowledged that it is a challenge to establish
change at the organisational and community level. This will be further
explored in the following section.
The study thus provides evidence that school development planning is a
process which is contextually related, and confirms and refines the
335
nomological network of organisational empowerment as described by
Peterson & Zimmerman (2004). The results supported the idea that school
development planning was a useful process for the empowerment of schools,
both by providing empowering processes and enabling schools to achieve
empowered outcomes.
In this way school development planning was seen as an active, participatory
process through which schools as organisations could gain greater control,
efficacy, acquire additional resources and impact on their community. The
present study placed a framework from the school development literature
within the context of community psychology and, more specifically,
empowerment literature, and in doing so provided a multilevel view of school
development that sees school development planning as a form of
organisational empowerment. This supported Zimmerman’s (2000) distinction
between empowering and empowered organisations and linked to this
empowerment processes and outcomes.
The results supported Peterson & Zimmerman’s (2004) nomological network
of organisational empowerment with schools evidencing processes and
outcomes related to the intra-, inter- and extraorganisational components of
organisational empowerment. It extended this by applying it in a variety of
school settings. From the results it was clear that schools had varying
success in terms of establishing processes and outcomes in terms of these
various components. This study examined the extent to which schools as
organisations were empowered and in doing so contributed to the definition of
the relevant processes, structures and outcomes for organisations to be
empowered. This study contributed to the understanding of the basic features
of organisational empowerment, its observable manifestations and the
interrelationship between them. This research helps to clarify and develop the
framework offered by Peterson & Zimmerman (2004) and thus contributes to
the development of a clear and coherent nomological network of
organisational empowerment, which differentiates it from psychological
empowerment.

336
Applying an ecological perspective to the school development process
allowed insight into the factors that supported or hindered the organisational
empowerment process to be gained. The results from the impact and
relationship matrices indicated that organisational level variables, particularly
those relating to the principal, were seen as playing a crucial role. A model
combining the leadership variables (leadership style and supervisory
leadership), collaboration and teacher efficacy was tested. Although the
model did fit the data, what was clear was there were other factors at play that
had not been measured. By including the perspectives of the school staff it
was possible to demonstrate the importance of the community and formal
level and question the narrow focus on the school as an organisation,
focusing specifically on the internal processes without relating this to the
broader social context.
By exploring empowerment in the context of a school development
programme in township schools in a developing country, the study added a
cross-cultural dimension to the empowerment literature that has been
severely lacking. From analysis of the use of the school development plans
and the functioning of the school development team it was evident that
schools, in this setting, may not operate under the same organisational
principles as expressed in western literature. School development planning
may not be the only, or the most effective, method of empowerment for all
schools, supporting the argument for multiple pathways to empowerment
(Foster-Fishman et al., 1998). Teachers in the focus groups stressed the
importance of looking at the interconnectedness developed through
interpersonal relationships and bonds. They also stressed that different forms
of participation, collaboration and leadership may be appropriate in these
settings. Thus the study offered a cross-cultural understanding of the use of
these particular pathways to empowerment. These aspects of empowerment
in relation to school development planning would require further exploration.
This study indicated that community psychology, and empowerment theory in
particular, offers a useful framework for conceptualising and researching

337
school development issues at individual, organisational and community levels.
Not only did it provide a unifying framework for ideas and models that already
existed in the school development sphere but it also allowed the expansion
and development of those ideas in a meaningful way. The application of the
theory in a school development context has also added richness to the
understanding of empowerment at its various levels. Through the use of
multi-method evaluation it was possible to establish the effects of the
programme on the schools involved in the school development planning.
Empowerment theory provided a useful framework for conceptualising this
evaluation.
Looking at school development through the lens of empowerment has meant
a multi-level, contextualist view could be taken. It has also allowed different
questions about school development to be asked and in doing so encouraged
different methods of exploring these issues to be used. From these results it
is clear that empowerment is a complex multilevel, dynamic and contextual
phenomenon. In trying to measure it quantitatively it was clear was that it was
difficult to develop a measure that was sensitive enough to distinguish
between perceptions of the different levels of analysis and between
empowerment processes and outcomes.
The present study provided support for the usefulness of a multi-method
research design in exploring empowerment and for capturing some of its
complexity. Thus community psychology not only provided useful theories
and frameworks but also research methodologies. By nesting an ex post
facto design within a multi-method design the study indicated that it is possible
to establish effects related to empowerment in a school setting.
In conclusion the results from this study provide evidence that school
development planning is a process which is contextually related, and confirms
and refines the nomological network of organisational empowerment. The
results indicate that a variety of individual, organisational and contextual
factors impact on individual and organisational empowerment and that a multi-
338
level perspective is necessary for understanding the school development
process. The study also provides evidence that community psychology, and
empowerment theory in particular, offers useful frameworks for theorising and
researching school development issues at individual, organisational and
community levels.
9.2. LIMITATIONS As discussed at length in the Methodology section the conceptualisation and
operationalisation of the study has contributed to a number of challenges,
tensions and limitation in the design. Having made the choice to evaluate the
programme based on the stated aims (sought through analysis of programme
documentation) and operationalising these aims more concretely in an
empowerment framework the challenge was to find a suitable design and
methodology which would enable one to establish effects, and thus form
conclusions concerning whether the programme was effective. The design
chosen in this study reflects the reality of working in education, community
development or health psychology as fields. The tradition of many other
evaluators has been followed in using the strongest design available. The
dilemma faced in the context of this study was similar to those evaluators who
developed the multi-method impact evaluation models on which this
evaluation design has been based.
Finding an appropriate design for establishing effects, and effectiveness was
thus a challenge in this study. In an ideal world or in a laboratory a researcher
would use control, manipulation of an independent variable and randomisation
in order to do this. In the real world of educational and social programmes
this is not usually possible. In particular, it is normally impossible to randomly
assign subjects to conditions in an experiment in programmes. Programme
evaluators thus normally have to opt for weaker measurement designs, and
nest these in multi-method designs. Effects are then established by analysis
of different strands in these designs. This is essentially the design context in
which the current programme was found, and the design decisions were
based on these options. The literature reviewed earlier supports this logic.

339
It was for these reasons that the ex post facto design was nested within a
multi-method design. Based on the results from a weak design like the ex
post facto design it would not be possible to reach firm conclusions whether or
not the results of the analysis were significant. Before reaching conclusions
either that the school development programme was or was not effective or
that it produces effects on participants or that it does not produce effects on
participants, it was necessary to turn to other sources of data.
In this multi-method design there were many data source. Some were from
focus groups, others from archival data. These additional analyses were thus
considered after considering the results of the ex post facto analysis, before
reaching conclusions about the effectiveness of the programme. In order to
make any conclusive statement about the effectiveness of the programme it
would have been necessary to look for additional evidence regardless of
whether the results from the nested ex post facto design had been significant,
or not.
This the final section offers a critique of the study in terms of identifying and
elaborating on these limitations. In so doing ways in which future research
studies in this area can be improved will be identified. These limitations can
be classified into the following broad categories: research design; sample
characteristics; measuring instruments and data analysis.
9.2.1. RESEARCH DESIGN 9.2.1.1. Ex Post Facto, Post-test Comparison Group Design In order to explore the impact of the programme under investigation an ex
post facto, post-test comparison group design was utilised. This study, like so
many community and organisational change evaluations, was not able to
include a true control group. Although an attempt was made to use schools
that had been in the programme for a year as a means of comparison, staff
within those schools felt that that the first year of the programme had had an
impact on them and their schools.

340
Trying to paint a consistent and coherent picture of impact was difficult in this
study, given the weaknesses of the ex post facto design and the use of a
convenience sample with the comparisons group having been exposed to a
year of the programme. It was also a new area in which to study
empowerment and thus there were very few scales designed to measure the
constructs in this context. Using a multi-method approach allowed
triangulation of data from various sources and allowed various perspectives to
be collected on the impact of the programme. Quantitative data was collected
that yielded non-significant results. Self-report data collected in the focus
groups was verified in several ways. Data was collected from other sources
so that perspectives from other stakeholders in the schools and from the
programme could be triangulated. Data that was externally verified was also
collected thus confirming the reports of school staff.
However, despite these challenges, the conclusion was that there was
evidence from a number of sources that school stakeholders felt the
programme had impacted on their schools and that empowerment outcomes
at various levels of analysis as defined theoretically and through
operationalising programme aims were evident in the school context. There
was also evidence that schools were using the school development plans in
order to achieve empowerment outcomes for the school. There was variability
in its use across schools in both groups and schools used the plan in a slightly
different way to the programme aims.
As the purpose of the evaluation was the identification of empowerment at
various levels of analysis, and several sets of qualitative data were analysed,
it was thus possible to explore empowerment in the context of a school
development programme. However it must be acknowledged that ex post
facto and post-test comparison group designs are very weak. It was of this
reason that a multi-method design was selected for this evaluation. The logic
of a multi-method evaluation design relies on examination of more than one
source of data. The reason for this is that it is not possible to conclude either
that the programme is effective, or that is it ineffective, on the basis of an ex
341
post facto design. An ex post facto design is a descriptive design. In order to
provide any comment on the effectiveness of the programme it was necessary
to collect data from various sources. The results of the analyses of the
quantitative data would thus at best be one element considered in building a
case for the programme’s effects or impact.
9.2.1.2. Qualitative and Quantitative Research Designs Qualitative and quantitative methods have different strengths, weaknesses,
and requirements. These are related both to theoretical and practical issues.
Baker (2000) argues that quantitative and qualitative techniques provide a
trade-off between breadth and depth and between generalizability and
targeting to specific populations. In the current study an attempt was made to
measure constructs in a wider sample and link this with more targeted
populations for the focus groups and interviews. It was important in this study
to gather qualitative data as a way of exploring participants understanding of
the school development process. This fits with the contextulualist notion of
empowerment employed in this study and is also consistent with the values of
community psychology. The collection of the qualitative data was also
important in trying to understand the process of empowerment in a school
development context more fully. However this technique does limit the extent
to which findings apply beyond the specific individuals included in the focus
groups and interviews.
Data collected through quantitative methods are often believed to yield more
objective and accurate information because they were collected using
standardized methods, can be replicated, and, unlike qualitative data, can be
analysed using sophisticated statistical techniques. According to these
arguments some evaluators and researchers argued that qualitative methods
are most suitable for formative evaluations, whereas summative evaluations
require "hard" (quantitative) measures to judge the ultimate value of the
project (Baker, 2000). However Baker (2000) cautions that this distinction is
too simplistic as both approaches may or may not satisfy the standards of
scientific rigor (Frechtling & Sharp 1997). Quantitative researchers are
342
becoming increasingly aware that some of their data may not be accurate and
valid, due to respondents may not understand the meaning of questions to
which they respond, and because people’s recall of even recent events is
often faulty. On the other hand, qualitative researchers have developed better
techniques for classifying and analysing large bodies of descriptive data. It is
also increasingly recognized that all data collection - quantitative and
qualitative - operates within a cultural context and will be affected to some
extent by the perceptions and beliefs of investigators and data collectors
(Baker, 2000).
The debate between qualitative and quantitative data is also based on a
philosophical distinction with some researchers differing about the respective
merits of the two approaches largely because of different views about the
nature of knowledge and how knowledge is best acquired. Many qualitative
researchers, taking a constructivist view argue that there is no objective social
reality, and that all knowledge is "constructed" by observers who are the
product of traditions, beliefs, and the social and political environment within
which they operate (Rosnow & Georgoudi, 1986). Many quantitative
researchers adhere to the scientific model and seek to develop increasingly
sophisticated techniques and statistical tools to improve the measurement of
social phenomena. The qualitative approach emphasises the importance of
understanding the context in which events and outcomes occur, whereas
quantitative researchers seek to control the context by using random
assignment and multivariate analyses. Similarly, qualitative researchers
believe that the study of deviant cases provides important insights for the
interpretation of findings; quantitative researchers tend to ignore the small
number of deviant and extreme cases (Baker, 2000).
This distinction affects the nature of research designs. Community
psychology has its roots in a contextulaist perspective and thus qualitative
approaches suit this view. However evaluating a school development
programme and its stated aims in terms of an empowerment framework
required a multi-method approach to be taken. The debate over the merits of

343
qualitative versus quantitative methods is ongoing in the academic
community, however when deciding on the approach for this study a
pragmatic strategy was adopted and this kind of approach has been gaining
increased support. As was discussed previously many respected practitioners
have argued for integrating the two approaches building on their
complementary strengths. Others have stressed the advantages of linking
qualitative and quantitative methods when performing studies and
evaluations, showing how the validity and usefulness of findings will benefit
(Miles and Huberman, 1994).
9.2.1.3. Measurement of Complex, Multi-level and Context Specific Variables There are issues associated with measuring complex, multilevel and context
specific variables such as empowerment, participation and leadership. Firstly
the definitions of empowerment used in the quantitative section of the present
study limited the exploration of other forms of empowerment. In order to deal
with this a multi-method approach was utilised with focus groups and
interviews utilised to gain an understanding of the teachers’ and principals’
perceptions of empowerment. The results indicated that this has important
implications for more positivist approaches to empowerment research in that
when concepts are determined and defined a priori people’s empowerment
experiences may be misrepresented. By triangulating a constructivist method
with a more traditional positivist approach to inquiry, steps were taken to
address this limitation.
Secondly, due to the static nature of quantitative measures it is difficult to
capture the dynamic and multilevel nature of the variables and the importance
of context in determining the parameters of variation in measures (Saegert &
Winkel, 1996). All of the dimensions of the model that were measured co-
exist, change over time, and do not necessarily vary in a way that is reliably
time lagged because they involve a flow-through of different participants and
groups, processes that may tend towards certain general outcomes but vary
among the individuals engaged in them. These limitations arise from the
344
ecological, historical and cultural nature of the phenomenon of interest. Using
a variety of data sources collected over a period of time hopefully provided a
broader picture. What is needed though is more long-term studies of the
phenomena.
9.2.2. SAMPLE CHARACTERISTICS 9.2.2.1. Black Teachers in Townships One of the unique features of the present study was the exploration of
empowerment in a school development programme in township primary
schools. The sample of black township school teachers and managers
allowed for the investigation of the impact of the programme and exploration
of these hindering or helping factors, something that has not previously been
done in the South African setting. However while this may be one of the
positive attributes of the present study it can also be viewed as an inherent
weakness. This was due to the fact that the results of the present study may
not be generalised to other populations of teachers. The results can be more
confidently generalised to black teachers in township primary schools and less
to those in high schools and from other race groups and from other contexts.
Future studies on school development planning and the empowerment of
schools utilising the same or similar methodology but on different samples of
teachers and schools will determine the generalisability of the current study’s
findings.
9.2.2.2. Convenience Sample and Voluntary Nature of Participation The samples in the study are samples of convenience, a form of non-
probability sampling (Frechtling & Sharp, 1997). This type of sampling was
adequate in the programme’s terms, but introduced limitations concerning
generalisability as there was no way of estimating the probability of selection
for each unit of the population. Convenience or non-probability samples are
less likely to be representative of the population and are therefore seen as
weaker forms of sampling (Blacktop, 1996) and are clearly biased because
the selection process is influenced by numerous uncontrolled, and often
unknown, variables (Polit & Hungler, 1995). Despite the shortcomings of non-

345
probability samples, they are still useful, and at times the only option for
exploratory studies such as the present study. For pragmatic reasons
discussed in the Methodology this was the only option available for the current
study. However caution must be exercised in applying findings from these
samples to the wider group from which they are drawn.
A further limitation of the current study related to the voluntary nature of the
subjects’ participation. Problems related to the use of volunteer samples are
well documented in the literature (Kerlinger, 1986; Rosenthal & Rosnow,
1991). Kerlinger (1986) states that the self-selection of subjects allows for the
potential influence of extraneous variables to occur on the research variables.
Accordingly, there are specific reasons why some respondents will agree to
participate, while others decline and it is these reasons that may have an
impact on the research variables under investigation. In the present study this
was more of an issue with the qualitative section than the quantitative. In the
quantitative section 90.5% of the staff members participated. In the focus
groups, due to the features of this method, the number of participants was
restricted. It was difficult to ensure that a representative sample of the staff
were present at the focus groups. Therefore the study’s findings need to be
seen in that light.
9.2.2.3. Sample Size Limitations pertaining to the sample size in the present study also need to be
noted. While the total sample size is adequate for the types of statistical
analyses undertaken in the quantitative section of the study, the researcher
could not ensure the two groups for comparison were of the same size. This
was due to the difference in number of schools involved in the different stages
of the programme and the differences in sizes of the schools.
9.2.2.4. Language The language used in both the quantitative and qualitative data collection is a
limitation of the present study. All of the respondents spoke English as a
second or third language; however all of the measures were administered in
346
English. This practice increases the chances of subjects misunderstanding
the questionnaires and responding inaccurately (Bulmer, 1983). Furthermore
Legodi (1999) argues that given the political issues associated with language
in South Africa, administering questionnaires in English may alienate certain
people and therefore increase the chances of reporting bias. However,
translation into all of the languages spoken in the sample was not feasible.
Also several writers have reported that questionnaire translations can lead to
distortions in meaning as exact translations from one language to another is
virtually impossible (Bulmer, 1983; Werner & Campbell, 1970). Therefore the
questionnaires completed in different languages may not be comparable
(Legodi, 1999). The focus groups were also conducted in English and this
may have limited people’s expression of their understanding of the impact of
the programme, empowerment and helping and hindering factors.
9.2.3. MEASURING INSTRUMENTS One of the challenges in undertaking this study was the fact that relevant
theory in the area is still in development. Even less progress has been made
in the development and refinement of valid standardised instruments for the
measurement of empowerment at the different levels evident in the school
environment. Definitions of empowerment abound, as do the measures used
to study them. These issues are also relevant for issues of participation and
leadership. Thus for the present study measures from a variety of sources
had to be used and this led to certain issues. Before exploring some of the
issues related to specific areas the issue of using individual self-report
measures to assess various levels of a construct needs to be explored.
As previously validated instruments were not available to measure all the
constructs in this model, it was necessary to use both previously validated
measures as well as self-developed instruments. It has therefore been
necessary to use different data sources (various existing measures, a new
measure, and the self-reports of teachers and principals), as this was
necessary to provided indicators not only of empowerment, but also of school
development planning outcomes

347
Quantitative measures of empowerment as defined by the theory and
empirical research were identified. However, there was no previous research
which had examined empowerment in the context of school development
planning. There were also few previous studies which had explored
empowerment in the context of school development, and many of the studies
conducted had focused on teachers’ perceptions
Most of the theoretical conceptualisations of empowerment, although taking
cognisance of issues of level (i.e. the organisational and community), resort to
individual level measures. A limitation of much of this research is that the only
validated measures, amenable to the type of statistical procedures used in
this study, are of the self-report, individual level type. Secondly, in order to
access people’s perceptions of empowerment qualitative self-report focus
groups interviews normally have to be used.
The use of qualitative data within a this multi-method study was not an
attempt at fishing, but represented an attempt to use different types of data
and different types of analysis within a single design framework. This has
been done in this study as there were indicators/variables in the
empowerment outcomes framework which could not be tapped through the
use of previously standardised measures. It was also necessary to gather
evidence to both substantiate and thus confirm school staff self-reports (both
quantitative and qualitative) or to challenge them. It was also necessary to
gather externally verifiable data about changes at the organisational and
community levels to deal with the weakness of the design in having to use
standardised individual level measures and self-reports though focus groups.
While these additional analyses go a certain distance towards justifying
conclusions as to empowerment having occurred beyond the individual level,
there are still a number of limitations inherent in the type of analysis
conducted. It needs to be acknowledged that it is a challenge to establish
change at the organisational and community level. By using external sources
of data that could verify teacher perceptions of change that had taken place, it
348
was possible to make claims beyond the individual level.
9.2.3.1. Measures of Individual Empowerment Measures of self-efficacy and locus of control used by numerous researchers
on individual level empowerment were utilised in the present study. However
these are only components of intrapersonal empowerment, which Zimmerman
(2000) defined as one of three components of psychological empowerment.
Teacher efficacy as an expression of individual level empowerment had not
been explored previously. Although these measures were validated in
previous studies and utilised with a variety of populations they had not been
used with black primary school teachers in South Africa. These measures
although showing acceptable levels overall in reliability, were still low
(Nunnally, 1978). Furthermore, the author identified a number of problems
associated with the items in the Locus of Control scale as discussed in the
chapter on Methodology and thus three items were removed from the scale
for the analysis; thus the results pertaining to individual level of empowerment
need to be seen in this light.
9.2.3.2. Measures of Participation and Collaboration Distinctions between the different forms of participation and collaboration were
made using different measures. Due to the issues faced at a theoretical and a
measurement level the measures were selected on the basis of their face and
content validity. Only the measure of influence in decision-making, the
Psychological Participation scale, has shown good construct validity (Abdel-
Halim & Rowland, 1976; Hamner & Tosi, 1974; Morris, et al., 1979).
The other measures, although correlating well with each other (see Table 40)
did not do so very highly and thus seemed different enough from each other to
assume they were each measuring something different. However it was only
on the basis of content validity and confirmatory evidence from the other data
sources that hypotheses about what they were measuring were made. In the
present study these scales were found to have adequate internal reliability.
However, the construct validity of these scales remains an area requiring
349
attention and may be an avenue for future research.
9.2.3.3. Measure of Organisational Empowerment The scale developed to measure the organisational level of empowerment,
although having been through a rigorous process of psychometric
development and demonstrated some construct and predictive validity, still
needs further validation and exploration. Another problem associated with the
use of such a new instrument is the development of appropriate norms. The
results pertaining to this scale were interpreted without reference to previously
established norms. However the development of population specific norms
will be a challenge for future research on the development of this instrument
and thus the findings of the study should be seen within the context of these
limitations.
9.2.3.4. Common Method Variance It is acknowledged that field studies using self-report, cross-sectional data are
subject to problems associated with common method variance (Podsakoff &
Organ, 1986). The impact of common method variance is to inflate observed
relations among variables due to the influence of monomethod measures
(Campbell & Martinko, 1998). Spector (1987) proposed that method variance
might well be more of a problem with single items or poorly designed scales
and less of a problem with multi-item and well designed and validated scales.
Several other researchers have also argued that common method variance
may not be as much of an artefact as is commonly assumed (Avolio,
Yammarino & Bass, 1991; Spector & Brannnick, 1995). Common method
variance has been a concern in past studies examining organisational and
empowerment phenomena, so in order to alleviate the problem in this study
focus groups and a variety of other qualitative data were utilised in order to
hopefully attenuate some of these issues.
9.2.3.5. Self-Report or Personal Perceptions The empowerment literature emphasises that because of the contextual
nature of empowerment it is necessary to explore how empowerment is

350
defined within that context, by the people engaged in the context. This has
influenced the design of this study, in that evidence of empowerment
outcomes were sought in the self-reports of teachers, and not merely in
previously standardised measures. Methods of content analysis focusing on
indicators of outcomes in the self-reports of teachers concerning their
practices in the school contexts in which they work were applied to assess
this. Self-reports of teachers have been gathered through focus groups.
Additional limitations apply to the use of methods of content analysis focusing
on indicators of outcomes in the self-reports of teachers concerning their
practices in the school contexts in which they work. Interviews with principals
and school development teams also relied on self-reports.
Although his is a major limitation it is still important to assess in this context
what people feel about empowerment and school development planning, and
it is particularly important to do so as this is a new area of study. Attempts
were made to counter the danger of solely using self-report data by using
other data sources (analysis of objectives achieved from the School
Development Plan, programme evaluations and interviews with external
verification of self-report) that would act as external verification to these self-
report. Programme evaluations had also triangulated the perceptions of
multiple stakeholders and the interviews triangulated principals and school
development teams’ perceptions with the perceptions of the programme
reports as well as through external verification.
Thus these self reported data are subject to biases and may not accurately
describe the situations. Crampton & Wagner (1994), however, argue that self-
report data may not be as limited as commonly thought and recent evidence
also indicates that respondents often accurately perceive their social
environments (Balzer & Sulsky, 1992; Harris & Schaubroek, 1988; Murphey,
Jako & Anhalt, 1992). However, it is important to acknowledge that the
measures and the focus group data were focused on personal perception.
This in itself however may not be a limitation. Spreitzer (1995) argues that a
critical theoretical issue is whether characteristics of the “objective”

351
environment or individual perceptions of the environment influence
empowerment. Bandura (1989) suggested that, rather than being completely
free from or determined by their environment, persons actively perceive the
nature of their environment and are influenced by those perceptions.
Thomas & Velthouse (1990) offered a “soft constructionist” perspective to
understanding empowerment in the workplace: individuals’ judgements about
observable organisational conditions are shaped by interpretations that go
beyond verifiable reality. Thus, it is important to understand how the
individual sees his or her environment because previous research has shown
that individuals within the same environmental context are likely to view their
work environment quite differently (e.g. Lawrence & Lorsch, 1967). The basic
proposition is that when individuals view their work environment as providing
opportunities for, rather than constraints on, individual behaviour, they feel
empowered.
Therefore when looking at the results we need to bear in mind that these are
people’s perceptions of their behaviour, their interactions and their
environments and not necessarily characteristics of the “objective”
environment. Direct observation of individual’s behaviour and the interaction
between people could have provided additional information. However
concrete observation of the school or organisation and reference back to
archival data did provide useful information. Concrete changes were also
assessed in terms of the objectives achieved from the school development
plan.
9.2.3.6. Likert-Type Rating Scales A further problem associated with the measurement instruments adopted in
the quantitative phase of the study relates to the use of Likert-type rating
scales in each of the instruments. These types of measuring instruments
have the inherent limitations associated with different aspects of rating bias
such as the central tendency (Oppenheim, 2001; Rosenthal & Rosnow, 1991).
352
9.2.4. DATA ANALYSIS: 9.2.4.1. Quantitative Analysis Although community psychology, and empowerment theory in particular,
argues that a multi-level view of variables should be taken, it is difficult to
statistically take these into account when performing one’s analysis. None of
the statistical techniques used in the present study took the issue of different
levels of analysis into account. When looking at the relationship between the
different level variables, a better solution to the levels of analysis problem
would involve the use of multilevel modelling techniques (Bryk & Raudenbush,
1992; Goldstein, 1995), which have only recently begun to be used in
community psychology research (e.g. Brown, Perkins, Brown, 2003; Perkins &
Long, 2002).
However, in the present study the available data would not have supported
the use of these techniques as there were not enough schools in each group
and in a number of schools too few individuals. There was also high levels of
variance between individuals within the schools as well as between the
schools making up the groups. The analysis of the data therefore needs to be
seen within this limitation, as multilevel modelling techniques may have
provided a different set of relationships between the variables. However, the
present study’s focus on relationships was exploratory and multilevel analyses
are better suited for model testing (Kirkman & Rosen, 1999; Saegert & Winkel,
1996).
Future studies can begin to develop models of the interrelationship between
the variables and test the effect of group level phenomenon on individual level
variables and vice versa by making use of analytic strategies developed to
study contextual effects (Kirkman & Rosen, 1999; McMillan et al., 1995;
Saegert & Winkel, 1996). What is needed is an attempt to look more
rigorously at possible complex models of causal relationships between each
of the variables now that some exploratory work and analysis has given more
insight into this complex process.

353
9.2.4.2. Qualitative data analysis In the qualitative phase of the present study thematic content analysis was
used to analyse the data. Thematic content analysis has been criticised for
being descriptive, subjective and impressionistic in nature (Sommer &
Sommer, 1980). In order to counteract this limitation to some extent several
methods of data authentication were conducted (see Methodology Chapter
4.8.1.5). However Fox (1969, p 656) suggests that the data which emerge
from content analysis are extremely sensitive to the nature of the analysis
attempted, to the unit of content selected, as well as the researcher’s
expectations as reflected in the categories he or she develops. He states that
categories do not emerge, nor do responses fall into categories but rather
they are pushed into categories, and cautions that researchers should never
forget who did the pushing. The results therefore need to be seen within this
limitation.
9.2.5. CONCLUSION Despite the limitations the use of a multi-method design, combining
quantitative and qualitative data; incorporating various data sources, the
triangulation of various stakeholder perspectives and the triangulation of self-
report and externally verified data, allows us to conclude that empowerment at
various levels of analysis was evident in school development settings under
investigation and that based on these analyses school development planning
can usefully be conceptualised as an exemplar of organisational
empowerment. Through school development planning the programme
achieved the outcomes it envisaged at the individual, organisational and for
some schools at the community level. The results of the study strengthen
both the conceptual understanding of empowerment as a dynamic, multilevel,
temporal process and the factors that are related to it. However, this will need
to be further explored and the model suggested in this study tested in a more
rigorous fashion.

354
9.3. FUTURE STUDIES The present study’s results offers several avenues for further research.
Further test construction, validation and research, particularly around
organisational level empowerment are needed in this area to fully understand
this complex construct and its many forms. Linked to this is the further
exploration of school development planning as an exemplar of organisational
empowerment. Future studies could begin to further expand the
understanding of this as an empowering process and its role in achieving
empowered outcome in an organisation.
The role of context specific efficacy as an exemplar of individual level
empowerment and its relationship to organisational level empowerment needs
further exploration. Future studies could assess whether a more context
specific measure of teacher empowerment would be more appropriate or
would add to our understanding of this level of empowerment. The possible
role that attitudes play as a component of individual level empowerment
needs further study. Linked to this is the need for further exploration of
psychological empowerment in the school development context.
Issues of organisational internal capacity and contextual support were noted
as important influences in the implementation of school development planning
in this study. The variables related to internal capacity and contextual support
need further exploration. The relationship between the levels of
empowerment would also need further exploration and more sophisticated
measures of the various levels need to be developed in order to do this. The
way in which the various levels of empowerment interact is an area for future
study.
The study not only emphasised the role of the principal and his or her
relationship with his or her staff but also the mutuality of the relationship and
the micro-skills needed for effective leadership. The teachers’ perceptions
from the focus groups give some insight into this mutuality and what these
micro-skills might look like however this would require further exploration.
355
The study also provided a cross-cultural perspective on empowerment. The
data indicated that the relationship between the relationship between
democratic leadership and the empowerment of teachers in these schools
may be different to western studies. It also suggested that peer collaboration
may be being used in a different way. However in order to make any
definitive comment on these issues in this context would require further
exploration.
More broadly further refinement of empowerment theory is needed to more
clearly understand the natural settings in which individuals and organisation
become empowered, describe how and why interventions designed to
empower are effective or ineffective, study the mechanisms involved in the
empowerment process and identify contextual characteristics that may inhibit
or promote the development of psychological and organisational
empowerment (Zimmerman et al., 1992).
The study of particular levels of empowerment is also needed. At the
organisational level the issue of school development planning needs to be
more fully explored as a pathway of empowerment. It is also essential to
further explore the constraints on this pathway and other possible methods of
empowerment at this level. Studies exploring the link between empowering
organisations and empowered organisations will further clarify this level of
empowerment. Researchers need to begin looking at more complex models
of organisational empowerment that attempt to take into account the
individual, organisational and community level variables and look at the
interaction between these variables. Further elaboration on the model
developed in this study may offer a place to start.
By further articulating the nomological network of organisational
empowerment the development of new measures, measurement models and
organisational empowerment-guided interventions is possible. Concrete
operations of organisational empowerment like school development planning

356
can be further developed and their validity tested by empirically examining its
relationship with goal achievement, which we have done in this study.
Creating ways to assess and validate organisational empowerment is to
describe its nomological network. Studies determining the construct validity of
measures of empowerment and participation are required in order to enable
accurate testing of models and hypotheses.
Longitudinal studies of empowerment interventions are essential to capture
the dynamic nature of this complex variable. The present study provides a
glimpse into one moment of empowerment in the history of the development
of empowerment for this group of people. Long-term studies will allow one to
look at the development and fluctuations in empowerment in the change
process and allow the fuller exploration of the relationships between
empowerment and other variables. These longitudinal studies will also
provide information about the sustainability of the interventions and offer
insight into the continuation phases of change processes.

357
ABBREVIATIONS:
ABBREVIATION/ ACRONYMS
CSTOTAL………………... Collaboration Scale
CSTRANS……………….. Collaboration Scale after transformation
GDE………………………. Gauteng Department of Education (Local Education Authority)
GSES……………………. General Self-Efficacy Scale
LC………………………… Locus of Control Scale
LEA……………………….. Local Education Authority
PCS……………………… Participation and Decision Centralisation Scale
PCSTOTAL……………… Participation and Decision Centralisation Scale Total
PCSTRANS……………... Participation and Decision Centralisation Scale after transformation
PEERTOTAL……………. Peer Leadership Scale
PEERTRANS……………. Peer Leadership Scale after transformation
POC………………………. Profile of Organisational Characteristics
PPS……………………… Psychological Participation Scale
PPSTOTAL……………… Psychological Participation Scale
PPSTRANS……………… Psychological Participation Scale after transformation
SDPE TOTAL…………… School Development Planning Evaluation Scale
SDPES Transformed…… School Development Planning Evaluation Scale after transformation
SDPES…………………… School Development Planning Evaluation Scale
SDPESUC……………….. School Development Planning Evaluation Scale Success
SDT……………………… School Development Team
SGB……………………… School Governing Body
SMT……………………… School Management Team
SEM ……………………… Structural Equation Modelling
TE………………………… Teacher Efficacy Scale

358
REFERENCES Abramowitz, S. I. (1974). Research on internal-external control and social-
political activism: A note and bibliography. Psychological Reports, 34,
619-621.
Abdel-Halim, A. A. & Rowland, K. M. (1976). Some personality determinants
of the effects of participation: A further investigation. Personnel
Psychology, 29, 41-55.
Ackerson, B. J. & Harrison, W. D. (2000). Practitioner’s perceptions of
empowerment. Families in Society: The Journal of Contemporary
Human Services, 81 (3), 238-244.
Adler, P. A. & Adler, P. (1998). Observational techniques. In N. K. Denzin & Y.
S. Lincoln (Eds.), Collecting and interpreting qualitative materials (pp.
377-392). Thousand Oaks: Sage.
Altman, I. (1986). Contextualism and environmental psychology. In R. L.
Rosnow & M. Georgoudi (Eds.), Contextualism and understanding in
behavioral science: Implications for research and theory (pp. 25-46).
New York: Praeger.
Altman, I. (1987). Community psychology twenty years later: Still another
crisis in psychology. American Journal of Community Psychology, 15,
613-627.
Altman, I. & Rogoff, B. (1987). World views in psychology: Traits, interactional,
organismic and transactional perspectives. In D. Stokols & I. Altman
(Eds.), Handbook of environmental psychology (pp. 7-40). New York:
Wiley.
Amaro, H. (1995). Love, sex and power: Considering women’s realities in HIV
prevention. American Psychologist, 50, 437-447.
Ambrosie, F. (1989). The case for collaborative, versus negotiated, decision
making. NASSP Bulletin, 73 (518), 56-59.
Andriessen, E. J. H. & Drenth, P. J. D. (1998). Leadership: Theories and
models. In P. J. D. Drenth, H. Thierry & C. J. de Wolf (Eds.), Handbook
of work and organisational psychology: (Vol. 4). Organisational
psychology (pp. 321-355). East Sussex: Psychology Press.
359
Ang, R. P. & Chang, W. C. (1999). Impact of domain-specific locus of control
on need for achievement and affiliation. The Journal of Social
Psychology, 139 (4), 527-529.
April, K. A. & Macdonald, R. (1998). New science and leadership: The shift in
thinking. People Dynamics, June, 15-18.
Armitage, C. J. & Conner, M. (1999). Distinguishing perceptions of control
from self-efficacy: Predicting consumption of a low fat diet using the
theory of planned behaviour. Journal of Applied and Social Psychology,
29 (1), 72-90.
Atwater, L. E., Dionne, S. D., Avolio, B., Camobreco, J. F. & Lau, A. W.
(1999). A longitudinal study of the leader development process:
Individual differences predicting leader success. Human Relations, 52
(12), 1543-1562.
Australian Public Service Commission (2005) Evaluating learning and
development: A framework for judging success. Australian Government:
Canberra
Avolio, B. J., Yammarino, F. J. & Bass, B. M. (1991). Identifying common
methods variance with data collected from a single source: An
unresolved sticky issue. Journal of Management, 17 (3), 571-587.
Awamleh, R. & Gardner, W. L. (1999). Perceptions of leader charisma and
effectiveness: The effects of vision content, delivery and organisational
performance. Leadership Quarterly, 10 (3), 345-373.
Baker, J. L. (2000) Evaluating the impact of development projects on poverty:
a handbook for practitioners: Directions In Development. The World
Bank: Washington, D.C.
Balcazar, F. E., Seekins, T., Fawcett, S. B. & Hopkins, B. H. (1990).
Empowering people with physical disabilities through advocacy skills
training. American Journal of Community Psychology, 18 (2), 281-296.
Ballantine, K. & Nunns, C. G. (1998). The moderating effect of supervisory
support on the self-efficacy work-performance relationship. South African
Journal of Psychology, 28 (3), 164-173.
Ballantine, K., Nunns, C. G. & Brown, S. (1992). Development of the goal
setting support scale: Subordinate assessment of supervisory support in

360
the goal setting success. South African Journal of Psychology, 22, 208-
241.
Balzer, W. K., & Sulsky, L. M. (1992). Halo and performance appraisal
research: A critical examination. Journal of Applied Psychology, 77,
975-985.
Bamberger, Michael. 2000. Integrating quantitative and qualitative methods in
development research. Washington, D.C.: World Bank.
Bandura, A. (1977). Self-efficacy: Towards a unifying theory of behavioural
change. Psychological Review, 84 (2), 191-215.
Bandura, A. (1989). Human agency in social cognitive theory. American
Psychologist, 44, 1175-1184.
Bandura, A. (1992). Self-efficacy: Towards a unifying theory of behavioural
change. In V. H. Vroom & E. L. Deci (Eds.), Management and
motivation: Selected readings (pp. 78-89). London: Penguin Books.
Bandura, A., Adams, N., Hardy, A. B. & Howells, G. N. (1980). Tests of the
generality of self-efficacy theory. Cognitive Therapy and Research, 4 (1),
39-66
Barbour, R. S. (1999). Are focus groups an appropriate tool for studying
organisational change? In R. S. Barbour & J. Kitzinger (Eds.),
Developing focus group research: Politics, theory and practice (pp. 113–
126). Thousand Oaks: Sage Publications.
Barksdale-Ladd, M. A. & Thomas, K. F. (1996). The development of
empowerment in reading instruction in eight elementary teachers.
Teaching and Teacher Education, 12 (2), 161-178.
Barth, R. S. (1990). Improving Schools from Within. San Francisco: Jossey-
Bass.
Bartle, E. E., Couchonnal, G., Canada, E. R. & Staker, M. D. (2002).
Empowerment as a dynamically developing concept for practice:
Lessons learned from organizational ethnography. Social Work, 47 (1),
32-43.
Bartunek, J. M., Foster-Fishman, P. & Keys, C. B. (1996). Using collaborative
advocacy to foster intergroup co-operation. Human Relations, 49, 701-
733.

361
Bartunek, J. M., Greenberg, D. N. & Davidson, B. (1999). Consistent and
inconsistent impacts of a teacher-led empowerment initiative in a
federation school. Journal of Applied Behavioural Science, 35 (4), 457-
478.
Bartunek, J. M. & Keys, C. B. (1982). Power equalization in schools through
organisation development. The Journal of Behavioural Science, 18 (2),
171-183.
Bartunek, J. M., Lacey, C.A. & Wood, D. R. (1992). Social cognition in
organisational change: An insider-outsider approach. Journal of Applied
Behavioural Science, 28, 204-223.
Bass, B. M. (1981). Stogdill’s handbook of leadership: A survey of theory and
research. New York: The Free Press.
Beehr, T. A. (1977). Hierarchical cluster analysis of the Profile of
Organisational Characteristics. Journal of Applied Psychology, 62 (1),
120-123.
Beeker, C., Guenther-Grey, C. & Raj, A. (1998). Community empowerment
paradigm drift and the primary prevention of HIV/AIDS. Social Science
and Medicine, 46 (7), 831-842.
Bennett, M. (1977). Response characteristics of bilingual managers to
organisational questionnaires. Personnel Psychology, 30, 29-36.
Bennett, N., Crawford, M., Levacic, R., Glover, D. & Earley, P. (2000). The
reality of school development planning in the effective primary school:
Technicist or guiding plan? School Leadership and Management, 20 (3),
333-351.
Bennett, N. & Harris, A. (1999). Hearing truth from power? Organisation
theory, school effectiveness and school improvement. School
Effectiveness and School Improvement, 10 (4), 533-550.
Bentler, P. M. (1988). Causal modelling via structural equation systems. In J.
R. Nesselroade & R. B. Cattell (Eds.), Handbook of multivariate
experimental psychology (pp. 317-335). New York: Plenum.
Berger, P. J. & Neuhaus, R. J. (1977). To empower people: The role of
mediating structures in public policy. Washington, D.C.: American
Enterprise Institute for Public Policy Research.

362
Bergman, A. B. (1992). Lessons from principals from site-based management.
Educational Leadership, 9, 48-51.
Berkowitz, B. (2000). Community and neighbourhood organisations. In J.
Rappaport & E. Seidman (Eds.), Handbook of community psychology
(pp. 331-358). New York: Kluwer/Plenum Publishers.
Bhana, A. & Kanjee, A. (2001). Epistemological and methodological issues in
community psychology. In M. Seedat, N. Duncan & S. Lazarus (Eds.).
Community Psychology: Theory, method and practice South African and
other perspectives (pp. 113-158). Cape Town: Oxford Press.
Bickmore, K. (1998). Teacher development for conflict resolution. The Alberta
Journal of Educational Research, 44 (1), 53-69.
Biggs, J. B. (1987). Student approaches to learning and studying. Melbourne:
Australian Council for Educational Research.
Biott, C., Easen, P. & Atkins, M. (1995). Written planning and school
development: Biding time or making time. In D. H. Hargreaves & D.
Hopkins (Eds.), Development planning for school improvement (pp. 80-
90). London: Cassell.
Bishop, P. & Mulford, B. (1999). When will they ever learn? Another failure of
centrally-imposed change. School Leadership and Management, 19 (2),
179-187.
Blacktop, J. (1996) A discussion of different types of sampling techniques.
Nurse Researcher, 3(4): 5–15.
Blamey, A. (2007) Keep well national evaluation research design and
specification schedule. NHS Health Scotland.
http://www.healthscotland.com/uploads/documents/3627-
Keep%20Well%20National%20Evaluation%20research%20&%20design
%20specification.pdf
Bluen, S. D. (1986). Consequences and moderators of industrial relations
stressors. Unpublished Master’s Thesis, University of the Witwatersrand,
South Africa.
Bogdan, R. C. & Biklen, S. K. (1982). Qualitative research for education: An
introduction to theory and methods. Boston: Allyn and Bacon, Inc.
Bolin, F. S. (1989). Empowering leadership. Teachers College Record, 91 (1),

363
81-96.
Bond, M. A. & Keys, C. B. (1993). Empowerment, diversity and collaboration:
Promoting synergy on community boards. American Journal of
Community Psychology, 21 (1), 37-57.
Bosscher, R. J. & Smit, J. H. (1998). Confirmatory factor analysis of the
General Self-Efficacy Scale. Behavioural Research and Therapy, 36,
339-343.
Bosscher, R. J., Smit, J. H. & Kempen, G. I. J. M. (1997). Algemene
competentieverwachtingen bij ouderen. Nederlands Tiijdschrift Voor De
Psychologie, 52, 239-248.
Bosscher, R. J., van der Aa, H., van Dasler, M., Deeg, D. J. H., & Smit, J. H.
(1995). Physical performance and physical self-efficacy in the elderly: A
pilot study. Journal of Ageing & Health, 7, 459-475.
Boudrias, J., Gaudreau, P. & Laschinger, H. K. S. (2004) Testing the structure
of psychological empowerment: Does gender make a difference?
Educational and Psychological Measurement, 64 (5), 861-877.
Bowers, D. G. & Hausser, D. L. (1977). Work group types and intervention
effects in organizational development. Administrative Science Quarterly,
22, 76-94.
Bowers, D. G. & Seashore, S. E. (1966). Predicting organizational
effectiveness with a four factor theory of leadership. Administrative
Science Quarterly, 11, 238-263.
Boyd, N. M. & Angelique, H. (2002). Rekindling the discourse: Organization
studies in community psychology. Journal of Community Psychology, 30
(4), 325-348.
Bradshaw-Camball, P. & Murray, V. V. (1991). Illusions and other games: A
trifocal view of organisational politics. Organization Science, 2 (4), 379-
398.
Bray, J. H. & Maxwell, S. E. (1985). Multivariate analysis of variance. Sage
university paper series on quantitative application in the social sciences,
07-054. Newbury Park, CA: Sage.
Breakwell, G. M., Hammond, S. & Fife-Schaw, C. (Eds.), (1997). Research
methods in psychology. London: Sage.

364
Brewer, J. D. & Hunter, A. (2006) Foundations of multimethod research:
synthesizing styles. Albert Hunter: Northwestern University, Evanston,
IL
Brewer, J. & Hunter, A. (1989). Multi-method research: A synthesis of styles.
Newbury Park, CA: Sage.
Brighthouse, T. & Tomlinson, J. (1991). Successful schools (Education and
Training Paper No. 4). London: Institute for Public Policy Research.
Broadhead, P., Hodgson, J., Cuckle, P. & Dunford, J. (1998). School
development planning: Moving from the amorphous to the dimensional
and making it your own. Research Papers in Education, 13 (1), 3-18.
Brown, B., Perkins, D. D. & Brown, G. (2003). Place attachment in a
revitalizing neighbourhood: Individual and block levels of analysis.
Journal of Environmental Psychology, 23, 259-271.
Browne, M. W. & Cudeck, R. (1993). Alternative ways of assessing goodness
of fit. In K. A. Bollen & J. S. Long (Eds.), Testing structural equation
models (pp. 136-162). Newbury Park, CA: Sage.
Bryk, A., & Driscoll, M. E. (1988). The high school as community: Contextual
influences and consequences for students and teachers. Madison:
National Center on Effective Secondary Schools. (ED 302 539).
Bryk, A. S. & Raudenbush, S. W. (1992). Hierarchical linear models:
Applications and data analysis methods. Newbury Park, CA: Sage.
Bryman, A. (1984). The debate about quantitative and qualitative research: A
question of method or epistemology? British Journal of Sociology, 35,
75-92.
Bryman, A. & Cramer, D. (2001). Quantitative data analysis with SPSS
release 10 for Windows. Hove: Routledge.
Bulmer, M. (1983). Sampling. In M. Bulmer & D. P. Warwick (Eds.), Social
research in developing countries (pp. 91-100). Chichester, UK: John
Wiley and Sons.
Burns, A. (2000). Chapters of our lives: Life narratives of low-income midlife
and older women. Paper presented at the Australian Institute of Family
Studies Conference, Family Futures: Issues in Research and Policy,
Sydney, Australia.
365
Busch, T. (1998). Attitudes towards management by objectives: An empirical
investigation of self-efficacy and goal commitment. Scandinavian Journal
of Management, 14 (3), 289-299.
Butterfield, D. A. & Farris, G. F. (1974). The Likert Organisational Profile:
Methodological analysis and test of system 4 theory in Brazil. Journal of
Applied Psychology, 59 (1), 15-23.
Byrne, B. M. (2001). Structural Equation Modelling with AMOS: Basic
concepts, applications ands programming. Lawrence Erlbaum,
Associates: London.
Cafasso, L. L., Camic, P. M. & Rhodes, J. E. (2002). Middle school climate
examined and altered by teacher-directed intervention assessed through
qualitative and quantitative methodologies. Research in Middle Level
Education Online, 25 (2), 1-14.
Camic, P. M. & Rhodes, J. E. (2003). Blending and bending paradigms in
large-scale multi-site educational research. Paper presented at the
British Educational Research Association Annual Conference, Heriot-
Watt University, Edinburgh.
Camman, C., Fichman, M., Jenkins, D. & Klesh, J. (1979). The Michigan
Organizational Assessment Questionnaire. Unpublished Manuscript,
University of Michigan, Ann Arbor, Michigan.
Campbell, C. R. & Martinko, M. J. (1998). An integrative attributional
perspective of empowerment and learned helplessness: A multi-method
field study. Journal of Management, 24 (2), 172-200.
Cant, J. M. & Bateman, T. S. (2000). Charismatic leadership viewed from
above: the impact of proactive personality. Journal of Organisational
Behaviour, 21, 63-75.
Carns, A. & Carns, M. (1991). Teaching studying skills, cognitive strategies
and metacognvite skills through self-diagnosed learning styles. School
Counsellor, 38 (5), 341-346.
Carrim, N. & Sayed, Y. (1992). Open schools: Reform or Transformation.
Work in Progress, 74, 21-24.
Catholic Institute of Education (1996). CIE pilot project in whole school
development and renewal: A working document. Unpublished Paper.

366
Challis, D., Clarkson, P., Hughes, J., Abendstern, M., Sutcliffe, C. & Burns, A.
(2004) A systematic evaluation of the development and impact of the
single assessment process in England: Outline of a research study
funded by the department of health. Personal Social Services Research
Unit: England (www.PSSRU.ac.uk)
Chavis, D. M. & Wandersman, A. (1990). Sense of community in the urban
environment: A catalyst for participation and community development.
American Journal of Community Psychology, 19, 757-768. Chemers, M. M., Watson, C. B. & May, S. T. (2000). Dispositional affect and
leadership effectiveness: A comparison of self-esteem, optimism and
efficacy. Personality and Social Psychology Bulletin, 26 (3), 267-277.
Chen, H. & Rossi, P. H. (1983). Evaluating with sense: The theory driven
approach. Evaluation Review, 7 (3), 283-302.
Cheng, Y. C. (1999). The pursuit of school effectiveness and educational
quality in Hong Kong. School Effectiveness and School Improvement, 10
(1), 10-30.
Chester, M. D. & Beaudin, B. Q. (1996). Efficacy beliefs of newly hired
teachers in urban schools. American Educational Research Journal, 33
(1), 233-257.
Cheung, M. Y. M. (1999). The process of innovation adoption and teacher
development. Evaluation and Research in Education, 13 (2), 55-75.
Chiu, .H. K. T. (1997). The Schizotypals' attributions of anomalous
experiences. www.cityu.edu.hk/dss/profile/schchiu.html.
Chiu, L. & Knight, D. (1999). How useful are focus groups for obtaining the
views of minority groups? In R. S. Barbour & J. Kitzinger (Eds.),
Developing focus group research: Politics, theory and practice (pp. 99-
112). Thousand Oaks: Sage Publications.
Christie, P. (1998). School as (dis)organisations: The breakdown of the
culture of learning and teaching in South African schools. Cambridge
Journal of Education, 28 (3), 283-300.
Clarke, P. (1999). Improving school intervention approaches: Facilitative
activity for learning schools. Evaluation and research education, 13 (1),
32-44.
367
Clarke-Carter, D. (1997). Doing quantitative psychological research: From
design to report. Psychology Press: East Sussex.
Cliff, N. (1987). Analysing multivariate data. New York: Harcourt, Brace
Jovanovich.
Cohen, L. & Manion, L. (1989). Research methods in education. London:
Croon Helm.
Collins, R. (1984). Statistics versus words. In R. Collins (Ed.), Sociological
theory. San Francisco: Jossey-Bass.
Conger, J. A. (1998). Qualitative research as the cornerstone for leadership
understanding. Leadership Quarterly, 9 (1), 107-121.
Conger, J. A. & Kanungo, R. N. (1988). The empowering process: Integrating
theory and practice. Academy of Management Practice, 13 (3), 471-482.
Conley, S. C., Schmidle, T., & Shedd, J. B. (1988). Teacher participation in
the management of school systems. Teachers College Record, 90, 259-
280.
Connelly, M. S., Gilbert, J. A., Zaccaro, S. J. Threfall, K. V., Marks, M. A. &
Mumford, M. D. (2000). Exploring the relationship of leadership skills and
knowledge to leader performance. Leadership Quarterly, 11 (1), 65-86.
Connolly, J. P. (2000). Pilot study in questionnaire construction: The School
Development Planning Implementation Scale. Unpublished Honours
Dissertation, University of the Witwatersrand, Johannesburg.
Converse, J. M. & Presser, S. (1986). Survey questions: Handcrafting the
standardised questionnaire. California: Sage Publications.
Cook, J. D., Hepworth, S. J., Wall, T. D. & Warr, P. B. (1981). The experience
of work: A compendium and review of 249 measures and their use.
London: Academic Press Inc.
Cook, T. D. (1985). Postpositivist critical multiplism. In L. Shortland & M. M.
Marks (Eds.), Social science and social policy (pp. 21-62).Beverly Hills,
CA: Sage.
Cook, T. D. & Shadish, W. R. (1986). Program evaluation: The worldy
science. Annual Review of Psychology, 37, 193-232.
Cooper, R., Slavin, R. E. & Madden, N. (1998). Improving the quality of
implementation of whole school change through the use of a national

368
reform network. Education and Urban Society, 30 (3), 385-408.
Corsun, D. L. & Enz, C. A. (1999). Predicting psychological empowerment
among service workers: The effect of support based relationships.
Human Relations, 52 (2), 205-224.
Cottrell, L. S. (1983). The competent community. In R. Warren & L. Lyons
(Eds.), New perspectives on the American community (401-411).
Homewood, IL: Porsey.
Couto, R. A. (2000). Community health as social justice: Lessons on
leadership. Family and Community Health, 23 (1), 1-17.
Cowen, E. L. (2000). Community psychology and routes to psychological
wellness. In J. Rappaport & E. Seidman (Eds.), Handbook of community
psychology (pp. 79-100). New York: Kluwer/Plenum Publishers.
Crabtree, B. F., Yanoshik, M. K., Miller, W. L. & O’Connor, P. J. (1993).
Selecting individual or group interviews. In D. L. Morgan (Ed.),
Successful focus groups: Advancing the state of the art (pp.118-36).
Newbury Park, CA: Sage.
Cramer, D. (1994). Introducing statistics for social research: Step-by-step
calculations and computer techniques using SPSS. London: Routledge.
Crampton, S. M. & Wagner, J. A. (1994). Percept-percept inflation in
microorganizational research: An investigation of prevalence and effect.
Journal of Applied Psychology, 79, 67-76.
Cronbach, L. J. (1975). Beyond the two disciplines of scientific psychology.
American Psychologist, 30, 116-126.
Cuban, L. (1990). A fundamental puzzle of school reform. In A. Lieberman
(Ed.), Schools as collaborative cultures: Creating the future now (pp. 71-
77). New York: Falmer Press.
Cunningham, M. L., Childress, R. B. & Ranson, J. T. (1996). A study of the
relationship between school and district office linkage and the
implementation of middle level practices
www.nationalforum.com/CUNNINaer10e3.html
Daley, P. (2000). Recent critiques of school effectiveness research. School
Effectiveness and School Improvement, 11 (1), 131-143.
Davidoff, S. (1995). Whole school development: An organisational

369
Perspective. Paper presented at Whole School Development
Conference EQUIP – Thousand Schools Project, KwaZulu/Natal.
Davidoff, S. & Robinson, M. (1992). A developmental approach to teacher
education: Implications for INSET. Paper presented at Kenton
Conference, October 1992.
Davidoff, S. & Lazarus, S. (1997). The learning school: An organisation
development approach. Cape Town: Juta and Co, Ltd.
Davidson, M. C. G. (2000). Organisational climate and its influence upon
performance: A study of Australian hotels in South East Queensland.
Doctoral Thesis, Griffith University.
Davies, P. (2003) The magenta book: Guidance notes for policy evaluation
and analysis. Chapter 1: What is Policy Evaluation? Background
Document. Government Chief Social Researcher’s Office, Prime
Minister’s Strategy Unit, Cabinet Office, London.
http://www.policyhub.gov.uk/magenta_book/index.asp
Deacon, R. (1990). Education for transformation? Reflections on critical
theory. Working Paper, 6; Education for transformation. University of
Natal, Durban.
de Groot, M. (2001). De relatie tussen equity sensitivity, self-efficacy en
burnout bij leraren in het middelbaar onderwijs. Scriptie van het Open
Universiteit Nederland. www.ou.nl/open/wpo-psy/OUNL-Work/APO-
scripties/VoorbeeldScriptie2.pdf
de Vries, R., Roe, R. A. & Taillieu, T. C. B. (1998). Need for supervision: Its
impact on leadership effectiveness. The Journal of Applied Behavioural
Science, 34 (4), 486-501.
Decoux, B. V. & Holdaway, E. A. (1999). Some aspects of leadership in
independent schools in Alberta. The Alberta Journal of Educational
Research, 45 (1), 67-84.
De Laney Horsch, P. (1992). School change: A partnership approach. Early
Education and Development, 3 (2), 128-138.
Deluga, R. J. (1994). Supervisor trust building, leader-member exchange and
organisational citizenship behaviour. Journal of Occupational and
Organisational Behaviour, 67, 315-326.

370
Deluga, R. J. (1995). The relationship between attributional charismatic
leadership and organisational citizenship behaviour. Journal of Applied
Social Psychology, 25, 1652-1669.
Denison, D. R. (1996). What is the difference between organizational culture
and organizational climate? A native's point of view on a decade of
paradigm wars. Academy of Management Review, 21(3), 1-36.
Denzin, N. K. (1978). The research act: A theoretical introduction to
sociological methods. New York: McGraw-Hill.
Denzin, N. K. (1994). Interpretive interactionism: The interpretive process. In
Crabtree, B. F., Miller, W. L., Addison, R. B., Gilchrist, V. J. & Kuzel, A.
J. (Eds.), Exploring collaborative research in primary care (pp. 87-102)
Sage: Thousand Oaks.
Denzin, N, K. & Lincoln, Y. S. (1998). Entering the field of qualitative research.
In N. K. Denzin & Y. S. Lincoln (Eds.), Collecting and interpreting
qualitative materials (pp. 1-17). Thousand Oaks: Sage.
Dickerson, F. B. (1998). Strategies that foster empowerment. Cognitive And
Behavioural Practice, 5, 255-275.
Diggins, P. B. (1997). Reflections on leadership characteristics necessary to
develop and sustain learning school communities. School Leadership &
Management, 17 (3), 413-425.
Dimmock, C. & Walker, A. (2000). Developing comparative and international
educational leadership and management: A cross-cultural model. School
Leadership & Management, 20 (2), 143-160.
DiPrete, T. & Forristal, J. D. (1994). Multilevel models: Methods and
substance. Annual Review of Sociology, 20, 331-357.
Driscoll, J. W. (1978). Trust and participation in organisational decision
making as predictors of satisfaction. . Academy of Management Journal,
21 (1), 44-56.
Dunteman, G. E. (1989). Principal component analysis. Sage university paper
series on quantitative applications in the social sciences, 07-069.
Newbury Park, CA: Sage.
Duttweiler, P. C. (1989). A look at school-based management. Insights on
Educational Policy and Practice 6. (ED 330 050).

371
Edelstein, M. R. & Wandersman, A. W. (1987). Community dynamics in
coping with toxic exposure. In I. Altman & A. Wandersman (Eds.),
Neighbourhood and community environments (pp. 69–112). New York:
Plenum Press.
Eisner, E. W. & Peshkin, A. (Eds.), (1990). Qualitative inquiry in education:
The continuing debate. New York: Teachers College Press.
Elliot, J. (1999). Introduction: global and local dimensions of reforms in
teacher education. Teaching and Teacher Education, 15, 133-141.
Ellsworth, E. (1989). Why doesn’t this feel empowering? Working through the
repressive myths of critical pedagogy. Harvard Educational Review, 59
(3), 297-324.
Elmuti, D. & Taisier, F. A. (1995). Improving Quality and Organizational
Effectiveness Go Hand in Hand Through Deming's Management
System. Journal of Business Strategies, 12, (1), 86-98.
Erickson, F. (1986). Qualitative methods in research on teaching. In M. C.
Wittrock (Ed.), Handbook of research on teaching. (pp. 119-161). New
York: MacMillan.
Eylon, D. & Au, K. Y. (1999). Exploring empowerment cross-cultural
differences along the power distance dimension. International Journal of
Intercultural Relations, 23 (3), 373-385.
Fan, C. & Mak, A. S. (1998). Measuring social self-efficacy in a culturally
diverse student population. Social Behaviour and Personality, 26 (2),
131-144.
Farmer, S. M. (1999). Why are styles of upward influence neglected? Making
the case for a configurational approach to influences. Journal of
Management, 27, 191-211.
Fatimilehin, I. A. & Dye, L. (2003). Building bridges and community
empowerment. Clinical Psychology, 24, 51-55.
Fawcett, S. B., Paine-Andrews, A., Francisco, V. T., Schultz, J. A., Richter, K.
P., Lewis, R. K., et al. (1995). Using empowerment theory in
collaborative partnerships for community health and development.
American Journal of Community Psychology, 23 (5), 677-697.
Fawcett, S. B., White, G. W., Balcazar, F. E., Suarez-Balcazar, Y., Mathews,
372
R. M., Paine-Andrews, L., et al. (1994). A contextual-behavioral model of
empowerment: Case studies involving people with physical disabilities.
American Journal of Community Psychology, 22, 471-486.
Fetterman, D. M. (2001). Foundations of empowerment evaluation. Thousand
Oaks, CA: Sage.
Fey, C. F. & Beamish, P. W. (1999). Joint venture conflict: The case of
Russian international joint ventures. Stockholm School of Economics in
St Petersburg Working Paper #99-102. Fidler, B. (1997). School leadership: Some key ideas. School Leadership &
Management, 17 (1), 23-37.
Field, A. (2004). Discovering statistics using SPSS for Windows. London:
Sage.
Fletcher, J. K. (1998). Relational practice: A feminist reconstruction of work.
Journal of Management Inquiry, 7, 163-186.
Flick, U. (1992). Triangulation revisited - Strategy of or alternative to validation
of qualitative data. Journal for the Theory of Social Behaviour, 2/1992,
175-197.
Florin, P. & Wandersman, A. (1984). Cognitive social learning and
participation in community development. American Journal of
Community Psychology, 12 (6), 689-708.
Florin, P. & Wandersman, A. (1990). An introduction to citizen participation,
voluntary organisations, and community development: Insights for
empowerment through research. American Journal of Community
Psychology, 18 (1), 41-54.
Fontana, A & Frey, J. H. (1998). Interviewing: The art of science. In N. K.
Denzin & Y. S. Lincoln (Eds.), Collecting and interpreting qualitative
materials (pp. 361-376). Thousand Oaks: Sage.
Foster-Fishman, P. G. & Keys, C. B. (1997). The person/environment
dynamics of employee empowerment: An organisational culture
analysis. American Journal of Community Psychology, 25 (3), 345-369.
Foster-Fishman, P. G., Salem, D. A., Allen, N. A. & Fahrbach, K. (2001).
Facilitating interorganizational collaboration: The contributions of
interorganizational alliances. American Journal of Community
373
Psychology, 29 (6), 875-905.
Foster-Fishman, P. G., Salem, D. A., Chibnall, S., Legler, R. & Yapchai, C.
(1998). Empirical support for the critical assumptions of empowerment
theory. American Journal of Community Psychology, 26 (4), 507-536.
Fox. D.J. (1969). The research process in education. New York: Holt Rinehart
and Winston
Fox, M. F. & Faver, C. A. (1984): Independence and cooperation in research:
The motivations and costs of collaboration. Journal of Higher Education
55 (3), 347-59.
Frank, S., Cosey, D., Angevine, J. & Cardone, L. (1985). Decision making and
job satisfaction among youth workers in community-based agencies.
American Journal of Community Psychology, 13 (3), 269-287.
Frankland, J. & Bloor, M. (1999). Some issues arising in the systematic
analysis of focus group material. In R. S. Barbour & J. Kitzinger (Eds.),
Developing focus group research: Politics, theory and practice (pp. 144–
155). Thousand Oaks: Sage Publications.
Franklin, J. L. (1975a). Down the organization: Influence processes across
levels of hierarchy. Administrative Science Quarterly, 20, 153-164.
Franklin, J. L. (1975b). Relations among four social psychological aspects of
organization. Administrative Science Quarterly, 20, 422-433.
Frechtling, J. & Sharp, L. (eds.) (1997) User-friendly handbook for mixed
method evaluations. National Science Foundation, Division of Research,
Evaluation and Communication Arlington, VA
Freire, P. (1970). Pedagogy of the oppressed. New York: Continuum/Scribner.
Frey, J. H. & Fontana, A. (1993). The group interview in social research. In D.
L. Morgan (Ed.), Successful focus groups: Advancing the state of the art. (pp. 20–340). Newbury Park, CA: Sage.
Friedenberg, L. (1995). Psychological testing: Design, analysis and use.
Boston: Allyn Bacon.
Fullan, M. G. (1991). The new meaning of educational change. New York:
Teacher College Press.
Fullan, M. (1993). Change forces. London: Falmer Press.
Fullan, M. (1998). Leadership for the 21st century: Breaking the bonds of
374
dependency. Educational Leadership, 55 (7), 6-10.
Fullan, M. G. & Hargreaves, A. (1992). Teacher development and educational
change. London: Falmer.
Fullan, M. G. & Miles, M. (1999). Getting school reform right. In J. Gultig, T.
Ndhlovu & C. Bertram (Eds.), Creating people-centred school: School
organisation and change in South Africa. Cape Town: Oxford University
Press.
Fuller, J. B., Morrison, R., Jones, L., Bridger, D & Brown, V (1999). The
effects of psychological empowerment on transformational leadership
and job satisfaction. The Journal of Social Psychology, 139 (3), 389-391.
Gardner, D. G. & Pierce, J. L. (1998). Self-esteem and self-efficacy within the
organisational context. Group and Organisation Management, 23 (1), 48-
70.
Garrison, J. W. (1988). Democracy, scientific knowledge and teacher
empowerment. Teachers College Record, 89 (4), 487-504.
Gergen, K. (1985). The social constructionist movement in social psychology.
American Psychologist, 40, 266-275.
Gibson, S. & Dembo, M. H. (1984). Teacher efficacy: A construct validation.
Journal of Educational Psychology, 76 (4), 569-582.
Giella, M. (1987). Developing principals’ problem solving capacities.
Educational Leadership, 45 (1), 38-42.
Giffin, K. (1998). Beyond empowerment: Heterosexualities and the prevention
of AIDS. Social Science and Medicine, 46 (2), 151-156.
Gilligan, C. (1982). In a different voice: Psychological theory and women’s
development. Cambridge, MA: Harvard University Press.
Gioia, D. & Pitre, E. (1990). Multiparadigm perspective on theory building.
Academy of Management Review, 15 (4), 584-602.
Gitlin, A. D. (1990). Educative research, voice and school change. Harvard
Educational Review, 60 (4), 443-466.
Glenwick, D. S., Heller, K., Linney, J. A. & Pargament, K. I. (1990). Criteria of
excellence I. Models for adventuresome research in community
psychology: Commonalties, dilemmas, and future directions. In P. Tolan,
C. Keys, F. Chertok & L. Jason (Eds.), Researching community

375
psychology: Issue of theory and methods (pp. 76-90). Washington, DC:
American Psychological Association.
Glick, W. (1980). Problems in cross-level inferences. In K. H. Roberts & L.
Burnstein (Eds.), Issues in aggregation, new directions for methodology
of social and behavioral science, Vol. 6 (pp. 17-21). San Francisco:
Jossey-Bass.
Glick, W. (1985). Conceptualizing and measuring organisational and
psychological climate: Pitfalls in multilevel research. Academy Of
Management Review, 10, 601-616.
Godwin, C. D. (1999). Difficulties in reforming education policy: The Hong
Kong case. Management Learning, 30 (1), 63-81.
Goertz, J. (2000). Creativity: An essential component of effective leadership in
today’s school. Roeper Review, 22 (3), 158-161.
Goldstein, H. (1995). Multilevel statistical models. London: Edward Arnold.
Green, J. & Hart, L (1999). The impact of context on data. In R. S. Barbour &
J. Kitzinger (Eds.), Developing focus group research: Politics, theory and
practice (pp. 21-35). Thousand Oaks: Sage Publications.
Greene, J. C. (2007). Mixed methods in social inquiry. San Francisco, CA:
Jossey Bass Wiley .
Greene, J., Benjamin, L. & Goodyear, L. (2001) The merits of mixing methods
in evaluation. Evaluation, 7(1), 25–44
Greene, J. C., Caracelli, V. J. & Graham, W. F. (1989) Toward a Conceptual
Framework for Mixed Method Evaluation Designs. Educational
Evaluation and Policy Analysis, 11(3), 255-274.
Griffeth, R. W. & Hom, P. W. (1988). Locus of control and delay of gratification
as moderators of employee turnover. Journal of Applied Social
Psychology, 18, 1318-1333.
Griffiths, M. (1998). Educational research for social justice: Getting off the
fence. Buckingham: Open University Press.
Gruber, J. & Trickett, E. J. (1987). Can we empower other? The paradox of
empowering in the governing of an alternative public school. American
Journal of Community Psychology, 15, 353-371.
Guadagnoli, E. & Velicer, W. (1988). Relation of sample size to the stability of

376
component patterns. Psychological Bulletin, 103, 265-275.
Guba, E. G. (1978). Towards a methodology of naturalistic inquiry in
educational evaluation. CSE Monograph Series in Evaluation, Vol. 8. LA:
Centre for the Study of Evaluation University of California.
Guba, E. G. (1990). Subjectivity and objectivity. In E. W. Eisner & A. Peshkin
(Eds.), Qualitative inquiry in education: The continuing debate (74-91).
New York: Teachers College Press.
Guba, E. G. & Lincoln, Y. S. (1981). Effective evaluation: Improving the
usefulness of evaluation results through responsive and naturalistic
approaches. California: Jossey-Bass.
Gultig, J. & Butler, D. (Eds.), (1999). Creating people-centred school: School
organisation and change in South Africa: Learning Guide. Cape Town:
Oxford University Press.
Guskey, T. R. & Passaro, P. D. (1994). Teacher efficacy: A study of construct
dimensions. American Educational Research Journal, 31 (3), 627-643.
Gutierrez, L., GlenMaye, L. & DeLois, K. (1995). The organizational context of
empowerment practice: Implications for social work administration.
Social Work, 40 (2), 249-258.
Haberman, M. (1994). Vision of equal educational opportunities: The top 10
fantasies of school reformers. Phi Delta Kappan, May, 689-692.
Hall, V. & Southworth, G. (1997). Headship. School Leadership &
Management, 17 (2), 151-170.
Halliday, E., Friedli, L. & McCollam, A. (2004) Evidence into practice
workshops: impact evaluation. Scottish Development Centre for Mental
Health
Halliday, I. & Coombe, C. (1994). Malawi German basic education project
Zomba: Discussion paper on school development planning. Unpublished
Paper.
Hallinger, P. & Kantamara, P. (2000). Educational change in Thailand:
Opening a window onto leadership as a cultural process. School
Leadership & Management, 20 (2), 189-205.
Hamner, W. C. & Tosi, H. L. (1974). Relationship of role conflict and role
ambiguity to job involvement measures. Journal of Applied Psychology,

377
59, 497-499.
Hardiman, E. R. & Segal, S. P. (2003). Community membership and social
networks in mental health self-help agencies. Psychiatric Rehabilitation
Journal, 27 (1), 25-33.
Hardy, C. & Leiba-O’Sullivan, S. (1998). The power behind empowerment:
Implications for Research and Practice. Human Relations, 51 (4), 451-
483.
Hargreaves, D. H. & Hopkins, D. (1991). The empowered school: The
management and practice of development planning. London: Cassell.
Hargreaves, D. H. & Hopkins, D. (Eds.), (1995). Development planning for
school improvement. London: Cassell.
Harris, A. & Hopkins, D. (1999). Teaching and learning and the challenge of
educational reform. School Effectiveness and School Improvement, 10
(2), 257-267.
Harris, M. M. & Schaubroek, J. (1988). A meta-analysis of self-supervisor,
self-peer and peer-supervisor ratings. Personnel Psychology, 41, 43-62.
Harter, S. (1981). A new self-report scale of intrinsic versus extrinsic
orientation in the classroom: Motivational and informational components.
Developmental Psychology, 17 (3), 300-312.
Hassin, J. & Young, R. S. (1999). Self-sufficiency, personal empowerment,
and community revitalization: The impact of a leadership program on
American Indians in the Southwest. American Indian Culture and
Research Journal, 23 (3), 265-286.
Hayton, K., Boyd, C., Campbell, M., Crawford, K., Latimer, K., Lindsay, S. &
Percy, V. (2007) Evaluation of the impact and implementation of
community wardens. GEN Consulting Scottish Executive, Social
Research, www.scotland.gov.uk/socialresearch
Heaney, D., O’Donnell, C., Wood, A., Myles, S., Abbotts, J., Haddow, G.,
Armstrong, I., Hall, S. & Munro, J. (2005) Evaluation of the Introduction
of NHS 24 in Scotland: Short Report. Report to Scottish Executive
Hedrick, T. E. (1994). The quantitative-qualitative debate: Possibilities for
integration. In C. S. Reichardt & S. F. Rallis (Eds.), The qualitative-
quantitative debate: New perspectives (pp. 45-52). California: Jossey-
378
Bass Publishers.
Heller, K. & Takemoto, M. A. (1984). Academic-practice divergence in
community psychology. American Journal of Community Psychology, 12
(3), 307-311.
Heron, J. (1981) Philosophical basis for a new paradigm. In P. Reason & J.
Rowan (Eds.) Human inquiry: A sourcebook of new paradigm research.
New York: MacMillan
Herrenkohl, R. C., Judson, G. T. & Heffner, J. A. (1999). Defining and
measuring employee empowerment. The Journal of Applied Behavioural
Science, 35 (3), 373-389.
Hill Collins, P. (1986). Learning from the outsider within: The sociological
significance of black feminist thought. Social Problems, 33, 514-532.
Hoelter, J. W. (1983). The analysis of covariance structures: Goodness-of-fit
indices. Sociological Methods and Research, 11, 325-344.
Hoffi-Hoffstter, H. & Mannheim, B (1999). Manager’s coping resources,
perceived organisational patterns, and responses during organisational
recovery from decline. Journal of Organisational Behaviour, 20, 665-685.
Hofmeyr, J. (1991). Inset policy change in the 1990s. Paper prepared for the
Inset Policy Initiative (IPI), Transvaal Regional Conference.
Hole, S. (1998). Working together, learning together: Collegiality in the
classroom. Teaching and Change, 5 (3-4), 3-11.
Holloway, I. & Wheeler, S. (1996) Qualitative research for nurses. Blackwell
Scientific Publications, Oxford.
Holsti, O. R. (1969). Content Analysis for the Social Sciences and Humanities.
Reading, MA: Addison-Wesley.
Hopkins, D. (1990). Integrating teacher development and school
improvement: A study in teacher personality and school climate. In B.
Joyce (Ed.), Changing school culture through staff development (pp.41-
67). Alexandria, VA: Association for Supervision & Curriculum
Development.
Hopkins, D. (1995). Improving the quality of education for all. Paper presented
at the Seminar on Whole School Development, Cambridge, U.K.
Hopkins, D. (1996). Towards a theory of school improvement. In J. Gray, D.
379
Reynolds, C. Fritz-Gibbon & D. Jesson (Eds.), Merging traditions: The
future of research on school effectiveness and school improvement (pp.
(pp. 30-51). London: Cassell.
Hopkins, D. (2000). One size does not fit all: Arguments for a differential
approach to school improvement. Paper given as part of the University
of Keele – TES lecture series.
Hopkins, D., Ainscow, M. & West, M. (1994). School improvement in an era of
change. London: Cassell.
Hopkins, D., Harris, A. & Jackson, D. (1997). Understanding the school’s
capacity for development: Growth states and strategies. School
Leadership and Management, 17 (3), 401-411.
Hopkins, D. & Levin, B. (2000). Government policy and school development.
School Leadership and Management, 20 (1), 15-30.
Hopkins, D., West, M., Ainscow, M., Harris, A. and Beresford, J. (1997).
Creating the classroom conditions for school improvement. London:
David Fulton Publishers Ltd.
Hord, S. M. (1986). A synthesis of research on organizational collaboration.
Educational Leadership, 43 (5), 22-26.
House, P. H. (1994). Integrating the quantitative and qualitative. In C. S.
Reichardt & S. F. Rallis (Eds.), The qualitative-quantitative debate: New
perspectives (pp. 13-22). California: Jossey-Bass Publishers.
Houts, A. C., Cook, T. D. & Shadish, W. R. (1986). The person-situation
debate: A critical multiplist perspective. Journal of Personality, 54, 52-
105.
Howell, D. C. (1997). Statistical methods for psychology. Belmont, CA:
Duxbury.
Howell, J. M. & Avolio, B. J. (1993). Transformational leadership, transaction
leadership, locus of control and support for innovation: Key predictors of
consolidated-business-unit performance. Journal of Applied Psychology,
76, 380-391.
Howell, J. M. & Hall-Merenda, K. E. (1999). The ties that bind: The impact of
leader-member exchange, transformational and transactional leadership
and distance on predicting follower performance. Journal of Applied
380
Psychology, 84 (5), 680-694.
Hoy, W. & Miskel, C. (1982). Educational administration: theory. research, and
practice. New York: Random House.
Huberman, M. (1988). Teacher careers and school improvement. Journal of
Curriculum Studies, 20 (2), 119-132.
Huberman, A. M. & Miles, M. B. (1998). Data management and analysis
methods. In N. K. Denzin & Y. S. Lincoln (Eds.), Collecting and
interpreting qualitative materials (pp. 179-210). Thousand Oaks: Sage
Publications.
Huberty, C. J. & Morris, D. J. (1989). Multivariate analysis versus multiple
univariate analysis. Psychological Bulletin, 105, 302-308.
Hughes, R. (1987). Empowering rural families and communities. Family
Relations, 36, 396-401.
Hughey, J. & Speer, P. W. (2002). Community, sense of community, and
networks. In A. T. Fisher (Ed.), Sense of community: Research,
applications and implications. Kluwer Academic/Plenum Publishers, New
York.
Humphris, D., Connell, C. & Meyer, E. (2004) Leadership Evaluation: An
Impact Evaluation of a Leadership Development Programme. Health
Care Innovation Unit & School of Management: University of
Southampton.
Hutcheson, G. & Sofroniou, N. (1999). The multivariate social scientist.
London: Sage
In-sue, O. (2000). Testing, measurement and evaluation of general self-
efficacy scales. www.netian.com/~nicesue/finalprojectreal.htm
Iscoe, I. (1974). Community psychology and the competent community.
American Psychologist, 29, 607-613.
Jalajas, D. S. & Bommer, M. (1999). The influence of job motivation versus
downsizing on individual behaviour. Human Resource Development
Quarterly, 10 (4), 329-341.
Jex, S. M. & Bliese, P. D. (1999). Efficacy beliefs as a moderator of the impact
of work-related stressors: A multilevel study. Journal of Applied
Psychology, 84 (3), 349-361.
381
Jick, T. D. (1979). Mixing qualitative and quantitative methods: Triangulation
in action. Administrative Science Quarterly, 24, 609-611.
Johnson, D. W. (1979). Educational psychology. Englewood Cliffs, NJ:
Prentice-Hall.
Johnson, R. B., Onwuegbuzie, A. J. & Turner, L. A. (2007) Toward a Definition
of Mixed Methods Research. Journal of Mixed Methods Research, 1,
112-133
Judge, T. A., Bono, J. E. & Locke, E. A. (2000). Personality and job
satisfaction: the mediating role of job characteristics. Journal of Applied
Psychology, 85 (2), 237-249.
Judge, T. A., Thoresen, C. J., Pucik, V. & Welbourne, T. M. (1999).
Managerial coping with organisational change: A dispositional
perspective. Journal of Applied Psychology, 84 (1), 107-122.
Katz, L. (1997). The relationship between perceptions of organisational
justice, propensity to engage in industrial action and organisational
commitment. Unpublished Honours Dissertation, University of the
Witwatersrand, Johannesburg.
Kelley, M. F., Fritterer, C., Kling, K., Timbrooks, P., Kirkwood, S. & Calvin, S.
(1995). Creating a climate for change: The Aztec experience. Childhood
Education, Annual Theme, 270-274.
Kellogg Foundation (2002) Evaluating Outcomes and Impacts: A Scan of 55
Leadership Development Programs, Battle Creek, MI, W.K. Kellogg
Foundation
Kellogg Foundation (2004) Logic Model Development Guide: Using Logic
Models to Bring Together Planning, Evaluation, and Action. W. K.
Kellogg Foundation: Michigan
Kellogg Foundation. (2001) Logic model development guide: Logic models to
bring together planning, evaluation & action. Battle Creek, MI: W. K.
Kellogg Foundation.
Kelly, J. G. (1966). Ecological constraints on mental health services. American
Psychologist, 21, 535-539.
Kelly, J G. (1970a). Research contributions from psychology to community
mental health. In D. E. Adelson & B. L. Kalis (Eds.), Community
382
psychology and mental health (pp. 126-145). Scranton, Penn.: Chandler.
Kelly, J. G. (1970b). Antidotes for arrogance: Training for a community
psychology. American Psychologist, 25, 524-531.
Kelly, J. G. (1971). The quest for valid preventive interventions. In G.
Rosenbaum (Ed.), Issues in community psychology and preventive
mental health (pp. 109-139). New York: Behavioural Publications. Kelly, J. G. (1979). ‘Tain’t what you do, it’s the way you do it. American
Journal of Community Psychology, 7, 244-261. Kelly, J. G. (1990). Changing contexts and the field of community psychology.
American Journal of Community Psychology, 18, 769-792.
Kelly, J. G., Ryan, A. M., Altman, B. E. & Stelzner, S. P. (2000).
Understanding and changing social systems: An ecological view. In J.
Rappaport & E. Seidman (Eds.), Handbook of community psychology.
(pp. 133-159). Kluwer/Plenum Publishers: New York.
Kemp, D (1998). Influencing the behaviour of others. People Dynamics, 16
(5), 13-17.
Kerlinger, F N (1986). Foundations of behavioral research. Hong Kong: Holt,
Rinehart and Winston, Inc.
Kets de Vries, M. F. R. (2000). A journey to the “Wild East”: Leadership and
organisational practices in Russia. Organisational Dynamics, 28 (4), 67-
81.
Keys, C. B. & Frank, S. (1987). Community psychology and the study of
organisation: A reciprocal relationship. American Journal of Community
Psychology, 15 (3), 239-251.
Kieffer, C. H. (1984). Citizen empowerment: A developmental perspective.
Prevention in Human Services, 6, 9-36.
Kingry-Westergaard, C. & Kelly, J. G. (1990). A contextualist epistemology for
ecological research. In P. Tolan, C. Keys, F. Chertok & L. Jason (Eds.),
Researching community psychology: Issue of theory and methods (pp.
23-31). Washington, DC: American Psychological Association.
Kirkman, B. L. & Rosen, B. (1999). Beyond self-management: Antecedents
and consequences of team empowerment. Academy of Management
Journal, 42 (1), 58-74.

383
Kirkpatrick, D. L. (1998). Evaluating Training Programs: The Four Levels
(Second Edition). Berrett-Koehler Publishers, San Francisco, CA.
Kirkpatrick, S. (2001). The program logic model: What, why and how? From:
http://www.charityvillage.com/charityvillage/research/rstrat3.html Kitzinger, J. & Barbour, R. S. (1999). Introduction: The challenge and promise
of focus groups. In R. S. Barbour & J. Kitzinger (Eds.), Developing focus
group research: Politics, theory and practice (pp. 1–20). Thousand Oaks:
Sage Publications.
Kizilos, P. (1990). Crazy about empowerment? Training, 27, 47-56.
Klecker, B. M. & Loadman, W. E. (1998). Another look at the dimensionality of
the school participant empowerment scale. Educational and
Psychological Measurement, 58 (6), 944-954.
Klein, K. J., Ralls, R. S., Smith-Major, V. & Douglass, C. (2000). Power and
participation in the workplace: Implications for empowerment theory,
research and practice. In J. Rappaport & E. Seidman (Eds.), Handbook
of community psychology (pp. 273-296). New York: Kluwer
Academic/Plenum Publishers.
Kline, P. (1994). An easy guide to factor analysis. New York: Routledge.
Knodel, J. (1993). The design and analysis of focus group studies. In D. L.
Morgan (Ed.), Successful focus groups: Advancing the state of the art
(pp. 35-50). Newbury Park, CA: Sage.
Knutson, K. A. & Miranda, A. O. (2000). Leadership characteristics, social
interest and learning organisations. The Journal of Individual
Psychology, 56 (2), 205-213.
Koberg, C. S., Boss, R. W., Senjem, J. C. & Goodman, E. A. (1999).
Antecedents and outcomes of empowerment. Group and Organisation
Management, 24 (1), 71-91.
Konovsky, M. A. & Organ, D. W. (1996). Dispositional and contextual
determinants of organisational citizenship behaviour. Journal of
Organisational Behaviour, 17, 253-266.
Kraimer, M. L., Seibert, S. E. & Liden, R. C. (1999). Psychological
empowerment as a multidimensional construct: A test of construct
validity. Educational and Psychological Measurement, 59 (1), 127-142.

384
Krippendorff, K. (1980). Content analysis: An introduction to its methodology.
Newbury Park, CA: Sage.
Kroeker, C. J. (1995). Individual, organisational and societal empowerment: A
study of the processes in a Nicaraguan agricultural co-operative.
American Journal of Community Psychology, 23 (5), 749-764.
Krueger, P., Brazil, K., Lohfeld, L.,, Edward, G., Lewis, D & Tjam, E. (2002).
Organization specific predictors of job satisfaction: findings from a
Canadian multi-site quality of work life cross-sectional survey. BMC
Health Services Research, 2 (6): http://www.biomedcentral.com/1472-
6963/2/6.
Krueger, R. A. (1988). Focus groups: A practical guide for applied
researchers. Newbury Park, CA: Sage.
Krueger, R. A. (1993). Quality control in focus group research. In D. L. Morgan
(Ed.), Successful focus groups: Advancing the state of the art (pp. 65-
88). Newbury Park, CA: Sage.
Landine, J. & Stewart, J. (1998). Relationship between metacognition,
motivation, locus of control, self-efficacy and academic achievement.
Canadian Journal of Counselling, 32 (3), 200-212.
Lawrence, P., and J. Lorsch. 1967. Organization and Environment.
Cambridge, MA: Harvard University Press.
Le Bosse, Y., Lavalle, M., Lacerte, D. Dube, N., Nadeau, J. Porcher, E. &
Vandette, L. (1998/99). Is community participation empirical evidence for
psychological empowerment? A distinction between passive and active
participation. Social Work and Social Science, 8 (1), 59-82.
Lee, M. (1999). The lie of empowerment: Empowerment as impotence.
Human Relations, 52 (2), 225-262.
Legodi, S. M. (1999). A study to determine the role of school leadership and to
see whether this impacts on teachers’ locus of control and job
satisfaction. Unpublished Honours Thesis, University of the
Witwatersrand, South Africa.
Leithwood, K. & Jantzi, D. (1999). Transformational school leadership effects:
A replication. School Effectiveness and School Improvement, 10 (4),
451-479.

385
Leslie, D. R., Kolzhalb, C. M. & Holland, T. P. (1998). Measuring staff
empowerment: Development of a Worker Empowerment Scale.
Research on Social Work Practice, 8 (2), 212-222.
Levenson, H. (1973a). Perceived parental antecedents of internal, powerful
others and chance locus of control orientation. Developmental
Psychology, 9, 268-274.
Levenson, H (1973b). Multidimensional locus of control in psychiatric patients.
Journal of Consulting and Clinical Psychology, 41, 397-404.
Levenson, H. (1974). Activism and powerful others: Distinctions within the
concept of internal-external control. Journal of Personality Assessment,
38, 377-383.
Levine, M. & Levine, A. G. (1970). A social history of the helping services.
New York: Appleton-Century-Crofts.
Levine, M. & Perkins, D. N. (1987). Principles of community psychology:
Perspectives and applications. New York: Oxford University Press.
Li, E. Y. & Shani, A. B. (1991). Stress dynamics of information systems
manager: A contingency model. http://129.65.90.150/eli/pdf/jmis-91.pdf.
Liden, R. C., Wayne, S. J. & Sparrowe, R. T. (2000). An examination of the
mediating role of psychological empowerment on the relations between
the job, interpersonal relationship and work outcomes. Journal of Applied
Psychology, 85 (3), 407-416.
Liggett, J. & Cochrane, R. (1968). Exercises in social science. London:
Constable & Co Ltd.
Lightfoot, S. L. (1986). On goodness in schools: Themes of empowerment.
Peabody Journal of Education, 63 (3), 9-28.
Likert, R. L. (1961). New patterns of management. New York: McGraw-Hill
Likert, R. L. (1967). The human organisation: Its management and value. New
York: McGraw-Hill.
Lincoln, Y. S. & Guba, E. G. (1985). Naturalistic inquiry. Newbury Park: Sage
Publications.
Lincoln, Y. S. & Guba, E. G. (1986). But is it rigorous? Trustworthiness and
authenticity in naturalistic evaluation. In New Directions for program
evaluation. San Francisco: Jossey-Bass.

386
Lindman, H. R. (1974). Analysis of variance in complex experimental designs.
San Francisco: W H Freeman & Co.
Linkvist, K. (1981). Approaches to textual analysis. In K. E. Rosengren (Ed.),
Advances in content analysis. Beverly Hills: Sage.
Linney, J. A. (1990). Community psychology into the 1990s: Capitalising
opportunity and promoting innovation. American Journal of Community
Psychology, 18, 1-17.
Linney, J. A. (2000). Assessing ecological constructs and community context.
In J. Rappaport & E. Seidman (Eds.), Handbook of community
psychology (pp. 647-668). Kluwer/Plenum Publishers: New York.
Little, J. W. (1993). Teachers’ professional development in a climate of
educational reform. Educational Evaluation and Policy Analysis, 15 (2),
129-151.
Litosseliti, L. (2003) Using focus groups in research. Continuum: London.
Lowenthal, K. M. (1996). An Introduction to psychological tests and scales.
London: UCL Press Limited.
Lloyd, N., O’Brien, M. & Lewis, C (2003) Fathers in Sure Start local
programmes, The National Evaluation of Sure Start (NESS). Institute for
the Study of Children, Families and Social Issues, Birkbeck, University of
London
Lo Biondo-Wood, G., & Haber, J. (1998) Nursing research: Critical appraisal
and utilisation. (4th edition). Mosby, Missouri.
Lyman, L. & Foyle, H. C. (1998). Facilitating collaboration in schools.
Teaching and Change, 5 (3-4), 312-339.
MacBeath, J. (1994). A role for parents, students and teachers in school self-
evaluation and development planning. In K. Riley & D. Nuttall (Eds.),
Measuring quality (pp. 100-121). London: The Falmer Press.
MacBeath, J. (1999). Schools must speak for themselves: The case for school
self-evaluation. London: Routledge.
Marah, J. K. (1987). Educational adaptation and Pan-Africanism:
Developmental trends in Africa. Journal of Black Studies, 17 (4), 460-
481.
Martin, J. (1992). Cultures in organizations: Three perspectives. New York:
387
Oxford University Press.
Marcelina, S. M. (1981). The relationship of organizational climate, job
performance and job satisfaction. Educational Administration.
www.fapenet.org/old/private/educpage/educ/library/uptda49.htm.
Mathieu, J. E., Martineau, J. W. & Tannenbaum, S. I. (1993). Individual and
situational influences on the development of self-efficacy. Personnel
Psychology, 46, 125-147.
Maton, K. I. & Rappaport, J. (1984). Empowerment in a religious setting: A
multivariate investigation. Prevention in Human Services, 3, 37-70.
Maton, K. I. & Salem, D.A. (1995). Organizational characteristics of
empowering community settings: A multiple case study approach.
American Journal of Community Psychology, 23, 631-656.
Matthews, R. A., Diaz, W. M. & Cole, S. G. (2002). The organizational
empowerment scale. Personnel Review, 32 (3), 297-318.
McCarthy, J. D. & Zald, M. (1978). Resource mobilization and social
movements: A partial theory. American Journal of Sociology, 82, 1212-
1241.
McClean, M. T., McLElnay, J. C. & Andrews, W. J. (2001). The association of
psychosocial and diabetes factors to diabetes knowledge. The
International Journal of Pharmacy Practice, September, 9.
McCormack, B., Kitson, A., Rycroft-Malone, J., Titchen, A., Seers, K. (2002),
Getting evidence into practice: The meaning of ‘context’ , Journal of
Advanced Nursing, 38(1), 94-104
McGuire, W. J. (1983). Contextualist theory of knowledge: Its implications for
innovation and reform in social psychology. In L. Berkowitz (Ed.),
Advances in experimental social psychology, Vol. 16 (pp. 1 - 47). New
York: Academic Press.
McGuire W. J. (1986). The vicissitudes of attitudes and similar
representational constructs in twentieth century psychology. European
Journal of Social Psychology, 16, 89-130.
McKinney, M., Sexton, T. & Meyerson, M. J. (1999). Validating the efficacy-
based change model. Teaching and Teacher Education, 15, 471-485.
McMillan, B., Florin, P., Stevenson, J. Kerman, B. & Mitchell, R. E. (1995).

388
Empowerment praxis in community coalitions. American Journal of
Community Psychology, 23 (5), 699-727.
Menon, S. J. (1999). Psychological empowerment: Definition, measurement
and validation. Canadian Journal of Behavioural Science, 31 (3), 161-
164.
Merton, R. K., Fiske, M. & Kendall, P. L. (1990). The focused interview. New
York: Free Press.
Miles, M. B. (1993). 40 years of change in schools: Some personal reflections.
Educational Administration Quarterly, 29 (2), 213-248.
Miles, M. B. & Huberman, A. M. (1994). Qualitative data analysis: An
expanded sourcebook. London: Sage Publications.
Miles, M. B., & Louis, K. S. (1990). Mustering the will and skill for change.
Educational Leadership, 47(8), 57-61.
Miner, J. B. (1997). Testing a psychological typology: Relation to subsequent
entrepreneurial activity among graduate students in business
management. Paper presented at the 42nd World Conference
International Council for Small Business San Francisco.
Minkler, M. (1990). Improving health through community organization. In K.
Glanz, F. M. Lewis, & B. K. Rimer (Eds.), Health behavior and health
education: Theory, research and practice (pp. 257-287). San Francisco:
Jossey-Bass.
Minkler, M., Thompson, M., Bell, J. & Rose, K. (2001). Contributions of
community involvement to organizational-level empowerment: The
Federal Healthy Start experience. Health Education & Behavior, 28 (6),
783-807.
Mishler, E. G. (1990). Validation in inquiry-guided research: The role of
exemplars in narrative studies. Harvard Educational Review, 60 (4), 415-
442.
Mishra, A. K. & Spreitzer, G. M. (1998). Explaining how survivors respond to
downsizing: The roles of trust, empowerment, justice and work redesign.
Academy of Management Review, 23 (3), 567-588.
Moonsammy, G. & Hassett, A. (1997). Reconstructing schools: Management
and development from within. Swaziland: Macmillan.

389
Moos, R. H. (1996). Understanding environments: The key to improving social
processes and program outcomes. American Journal of Community
Psychology, 24, (1), 193-201.
Morgan, D. L. (1997). Focus groups as qualitative research. Newbury,
California: Sage Publications.
Morgan, D. L. & Krueger, R. A. (1993). When to use focus groups and why. In
D. L. Morgan (Ed.), Successful focus groups: Advancing the state of the
art (pp. 3-19). Newbury Park, CA: Sage.
Morris, J. H., Steers, R. M. & Koch, J. L. (1979). Influence of organizational
structure on role conflict and ambiguity for three occupational groupings.
Academy of Management Journal, 22, 58-71.
Mueller, F., Procter, S. & Buchanan, D. (2000). Teamworking in its context(s):
Antecedents, nature and dimensions. Human Relations, 53 (11), 1387-
1424.
Mumford, M. D., Zaccaro, S. J., Johnson, J. F., Diana, M., Gilbert, J. A. &
Threfall, K. V. (2000). Patterns of leader characteristics: Implications for
performance and development. Leadership Quarterly, 11 (1), 115-133.
Murphy, J. T. (1988). The unheroic side of leadership: Notes from the swamp.
Phi Delta Kappan, 69, 654-659.
Murphy, K. R., Jako, R. A., & Anhalt, R. L. (1993). The nature and
consequences of halo error: A critical analysis. Journal of Applied
Psychology, 78, 218-225.
Nation, M., Wandersman, A. & Perkins, D. D. (2002). Promoting healthy
communities through community development. In L. Jason (Ed.),
Promoting health and mental health across the life span (pp. 324-344).
Springer Publishers: New York.
Neath, J. F. & Reed, C. A. (1998). Power and empowerment in multicultural
education: Using the radical democratic model for rehabilitation
education. Rehabilitation Counselling Bulletin, 42 (1), 16-39.
Neumann, J. E. (1989). Why people don’t participate in organizational change.
In R. W. Woodman & W. A. Pasmore (Eds.), Research in organizational
change and development (pp. 181-212). Greenwich, CT:JAI.
Newman, E. & Pollard, A. (1995). Observing primary school change: Through
390
conflict to whole school collaboration? In D. H. Hargreaves & D. Hopkins
(Eds.), Development planning for school improvement (pp. 100-115).
London: Cassell.
NHS Health Scotland (2007). Prevention 2010: Logic modeling to guide
planning, monitoring and evaluation. Scotland: NHS Health.
Nias, J. (1989). Primary teachers talking: A study of teaching at work. London:
Routledge.
Nias, J., Southworth, G. & Yeomans, R. (1989). Staff relationships in the
primary school: A study of organisational cultures. London: Cassells.
Nicholas, L. J. (Ed.). (1993). Psychology and oppression: Critiques and
proposals. Johannesburg: Skotaville.
Njus, D. M. & Brockway, J. H. (1999). Perceptions of competence and locus of
control for positive and negative outcomes: Predicting depression and
adjustment to college. Personality and Individual Differences, 26, 531-
548.
Nunnally, J. (1978). Psychometric theory. McGraw-Hill: New York.
Nurick, A. J. (1985). The paradox of participation: Lessons from the
Tennessee Valley. Human Resource Management, 24, 341-356.
Obruba, P. J. (2001). Predictability, work-family conflict, and intent to stay: An
air force case study. Masters thesis, Graduate School of Engineering
and Management, Ohio.
Olff, M., Brosschol, J. F. & Godaert, G. L. R. (1993). Coping styles and health.
Personality and Individual Differences, 15, 81-90
Olson, C. L. (1976). On choosing a test statistic in multivariate analysis of
variance. Psychological Bulletin, 83, 579-586.
Olson, C. L. (1979). Practical considerations in choosing a MANOVA test
statistic: a rejoinder to Stevens. Psychological Bulletin, 86, 1350-1352
O’Neill, P. O. (2000). Cognition in social context: Contributions to community
psychology. In J. Rappaport & E. Seidman (Eds.), Handbook of
community psychology (pp. 115-132). Kluwer/Plenum Publishers: New
York.
Oppenheim, A. N. (2001). Questionnaire design, interviewing and attitude
measurement. Continuum International: London.
391
Orford, J. (1992). Community psychology: Theory and practice. New York:
Wiley.
Organ, D. W. & Ryan, K. (1995). A meta-analytical review of attitudinal and
dispositional predictors for organisational citizenship behaviour.
Personnel Psychology, 48, 755-802.
Ortlepp, K. (1998). Non-professional trauma debriefers in the workplace:
individual and organisational antecedents and consequences of their
experiences. Unpublished Thesis (Ph.D.), University of the
Witwatersrand, Johannesburg.
Outreach, St Mary’s DSG. (1996). The Project: A whole school change
project. Unpublished document.
Outreach, St Mary’s DSG. (1998). The Project: Outcome indicators.
Unpublished document.
Outreach, St Mary’s DSG. (1999a). Whole school change project: Newsletter.
Unpublished document.
Outreach, St Mary’s DSG. (1999b). Memorandum of understanding between
Outreach and the schools. Unpublished document.
Outreach, St Mary’s DSG. (1999c). The school development process.
Unpublished document.
Outreach, St Mary’s DSG. (2000). Leadership and management training
brochure. Unpublished document.
Outreach, St Mary’s DSG. (2001a). Progress Report. Unpublished document.
Outreach, St Mary’s DSG. (2001b). Empowerment and school development.
Unpublished document.
Owens, R. G. (1981). Organizational Behavior in Education. Englewood Cliffs:
Prentice Hall.
Oxley, D. (2000). The school reform movement: Opportunities for community
psychology. In J. Rappaport & E. Seidman (Eds.), Handbook of
community psychology (pp. 565-590). Kluwer/Plenum Publishers: New
York.
Ozer, E. & Bandura, A. (1989). Mechanisms governing empowerment effects:
A self-efficacy analysis. Journal of Personality and Social Psychology,
58, 472-88.
392
Parker, E. A., Baldwin, G. T., Israel, B. & Salinas, M. A. (2004). Applications of
health promotion and models for environmental health. Health Education
and Behaviour, 31 (4), 491-509.
Parry, K. W. (1998). Grounded theory and social process: A new direction for
leadership research. Leadership Quarterly, 9 (1), 85-105.
Pasmore, W. A. & Fagans, M. R. (1992). Participation, individual development
and organizational change: A review and a synthesis. Journal of
Management, 18, 375-397.
Patton, M. Q. (1990). Qualitative Evaluation and Research Method, 2nd Ed.
Newbury Park, CA: Sage.
Paulhaus, D. (1983). Sphere-specific measures of perceived control. Journal
of Personality and Social Psychology, 44, 12553-1265.
Payne, C. (1991). The Comer intervention model and school reform in
Chicago: Implications of two models of change. Urban Education, 26 (1),
8-24.
Peled, E., Eisikovits, Z., Enosh. G. & Winstok, Z. (2000). Choice and
empowerment for battered women who stay: Toward a constructivist
model. Social Work, 45 (1), 9-25.
Perkins, D. G. (1995). Speaking truth to power: Empowerment ideology as
social intervention and prevention. American Journal of Community
Psychology, 23 (5), 765-794.
Perkins, D. D., Brown, B. B. & Taylor, R. B. (1996). The ecology of
empowerment: Predicating participation in community organizations.
Journal of Social Issues, 52 (10), 85-110.
Perkins, D. D., Crim, B., Silberman, P. & Brown, B. B. (2004). Community
development as a response to community-level adversity: Ecological
theory and research and strengths-based policy. In K. I. Maton, C. J.
Schellenbach, B. J. Leadbeater & A. L. Solarz (Eds.), Investing in
children, youth, families and communities: Strengths-based research
and policy (pp. 321-340). Washington, DC: American Psychological
Association.
Perkins, D. D., Florin, P., Rich, R. C., Wandersman, A. & Chavis, D. M.
(1990). Participation and social and physical environment of residential
393
blocks: Crime and community context. American Journal of Community
Psychology, 18 (1), 83-115.
Perkins, D. D., Hughey, J. & Speer, P. W. (2002). Community psychology
perspectives on social capital theory and community development
practice. Journal of Community Development Society, 33 (1), 33-52.
Perkins, D. D. & Long, D. A. (2002). Neighbourhood sense of community and
social capital: A multilevel analysis. In A. T. Fisher (Ed.), Psychological
sense of community: Research, applications and implications (pp. 291-
318). Kluwer Academic/Plenum Publishers, New York.
Perkins, D. D. & Zimmerman, M. A. (1995). Empowerment theory, research
and application. American Journal of Community Psychology, 23 (5),
569-579.
Peterson, N. A. & Hughey, J. (2002). Tailoring organizational characteristics
for empowerment: Accommodating individual economic resources.
Journal of Community Practice, 10 (3), 41-59.
Peterson, N.A., Lowe, J.B., Hughey, J., Reid, R.J., Zimmerman, M.A., &
Speer, P. (2006). Measuring the intrapersonal component of
psychological empowerment: Confirmatory factor analysis of the socio-
political control scale. American Journal of Community Psychology. 38,
287-297.
Peterson, N. A. & Reid, R. J. (2003). Paths to psychological empowerment in
an urban community: Sense of community and citizen participation in
substance abuse prevention activities. Journal of Community
Psychology, 31 (1), 25-38.
Peterson, N. A. & Zimmerman, M. A. (2004). Beyond the individual: Toward a
nomological network of organizational empowerment. American Journal
of Community Psychology, 34 (1/2), 129-145.
Phares, E. J. (1978). Locus of control. In H, London & J. E. Exner (Eds.),
Dimensions of personality. New York: John Wiley & Sons.
Phillips, D. C. (1990). Subjectivity and objectivity: An objective inquiry. In E.
W. Eisner & A. Peshkin (Eds.), Qualitative inquiry in education: The
continuing debate. Teachers College Press: New York.
Philip, K., Shucksmith, J. & King, C. (2004) ‘Sharing a laugh? A qualitative

394
study of mentoring interventions with young people. York: Joseph
Rowntree Foundation.
Podsakoff, P. M., MacKenzie, S. B. & Bommer, W. H. (1996). Meta-analysis of
the relationships between Kerr and Jermier’s substitute for leadership
and employee job attitudes, role perceptions and performance. Journal
of Applied Psychology, 81 (4), 380-399.
Podsakoff, P. M. & Organ, D. W. (1986). Self-reports in organizational
research: Problems and prospects. Journal of Management, 12, 69-82.
Polit, D. F. & Hungler, B. P. (1995) Nursing research: Principles and methods.
(5th edition). J. B. Lippincott: Philadelphia.
Potter, C. (1992). Vision, intention, policy and action: Dimensions in
curriculum evaluation. Paper presented at the HSRC Conference on
Science and Vision, Pretoria, South Africa.
Potter, C. (2004). Measuring outcomes. Vancouver: Commonwealth of
Learning.
Potter, C. S., Meyer, M. I., Scott, A. S. & Da Silva, M. (1991). Study habits and
attitudes of students in five engineering disciplines. Centre for
Continuing Education, Report and Reprint Series No. 7. University of
the Witwatersrand, Johannesburg, South Africa.
Potterton, M. (1998). Quality for all: Improving the quality of Catholic Schools.
Johannesburg: CIE.
Pratch, L. & Jacobowitz, J. (1998). Integrative capacity and the evaluation of
leadership. Journal of Applied Behavioural Science, 34 (2), 180-201.
Preissle, J. (1992). The choreography of design: A personal view of what
design means in qualitative research. M. D. LeCompte, W. L. Millroy & J.
Preissle (Eds.), The handbook of qualitative research in education. San
Diego, California: Academic Press.
Prestby, J. E., Wandersman, A., Florin, P., Rich, R. & Chavis, D. (1990).
Benefits, costs incentive management and participation in voluntary
organisations: A means to understanding and promoting empowerment.
American Journal of Community Psychology, 18 (1), 117-149.
Prestine, N. A. & Bowen, C. (1993). Benchmarks of change: Assessing
essential school restructuring effort. Educational Evaluation and Policy

395
Analysis, 15 (3), 298-319.
Pretorius, T. B. (1993). Commitment, participation in decision-making and
social support: Direct and moderating effects on the stress-burnout
relationship within an educational setting. South African Journal of
Psychology, 23 (1), 10-14.
Pretorius-Heuchert, J. W. & Ahmed, R. (2001). Community psychology: Past,
present and future. In M. Seedat, N. Duncan & S. Lazarus (Eds.).
Community Psychology: Theory, method and practice South African and
other perspective. (pp. 17-36). Cape Town: Oxford Press.
Rahim, A. A., Antonioni, D., Krumov, K. & Ilieva, S. (2000). Power, conflict and
effectiveness: A cross-cultural study in the United States and Bulgaria.
European Psychologist, 5 (1), 28-33.
Rainer, J. & Guyton, E. (1999). Democratic practices in teacher education and
the elementary classroom. Teaching and Teacher Education, 15, 121-
132.
Rappaport, J. (1977). Community psychology: Values, research and action .
New York: Holt, Rinehart & Winston
Rappaport, J. (1981). In praise of paradox: A social policy of empowerment
over prevention. American Journal of Community Psychology, 9 (1), 1-
25.
Rappaport, J. (1984). Studies in empowerment: A social policy of
empowerment over prevention. Prevention in Human Services, 3, 1-7.
Rappaport, J. (1995). Empowerment meets narrative: Listening to stories and
creating settings. American Journal of Community Psychology, 23 (5),
795-807.
Rappaport, J. (1987). Terms of empowerment/exemplars of prevention:
Toward a theory for community psychology. American Journal of
Community Psychology, 15 (2), 121-148.
Rappaport, J. (1990). Research methods and the empowerment social
agenda. In P. Tolan, C. Keys, F. Chertok & L. Jason (Eds.), Researching
community psychology: Issue of theory and methods (pp. 51-63).
Washington, DC: American Psychological Association.
Ratcliffe, J. W. (1983). Notions of validity in qualitative research methodology.

396
Knowledge: Creation, Diffusion, Utilization, 5 (2), 143-167.
Reeves, J. (2000). Tracking the links between pupil attainment and
development planning. School Leadership and Management, 20 (3), 315-332.
Reichardt, C. S. & Cook, T. D. (1979). Beyond qualitative versus quantitative
methods. T. D. Cook & C. S. Reichardt (Eds.), Qualitative and
quantitative methods in evaluation research (pp.7-32). Beverly Hills:
Sage.
Reichardt, C. S. & Rallis, S. F. (1994). The relationship between the
qualitative and the quantitative traditions. In C. S. Reichardt & S. F.
Rallis (Eds.), The qualitative-quantitative debate: New perspectives (pp.
85-92). California: Jossey-Bass Publishers.
Reid, K., Hopkins, D. and Holly, P. (1987). Towards the effective school. Oxford: Blackwell.
Reinharz, S. (1992). Feminist methods in social research. New York: Oxford
University Press.
Relich, J. D., Debus, R. L. & Walker, R. (1986). The mediating role of
attribution and self-efficacy variables for treatment effects on
achievement outcomes. Contemporary Educational Psychology, 11,
195-216.
Revenson, T. A. & Cassel, J. B. (1991). An exploration of leadership in a
medical mutual help organisation. Journal of Community Psychology, 19
(5), 683-698.
Rhodes, J. E. & Camic, P.M. (2006). Building bridges between universities
and middle schools: A teacher-centred collaboration. Educational and
Child Psychology, 23 (1), 42-51.
Rich, R. C., Edelstein, M., Hallman, W. K. & Wandersman, A. H. (1995).
Citizen participation and empowerment: The case of local environmental
hazards. American Journal of Community Psychology, 23 (5), 657-676.
Richter, L. K. (2001). Factors affecting exchange relationships among
subordinates and supervisors: A study of military officers. Airforce
Institute of Technology. Wright-Patterson Air Force Base, Ohio.
Riger, S. (1990). Ways of knowing and organisational approaches to
397
community research. In P. Tolan, C. Keys, F. Chertok & L. Jason (Eds.),
Researching community psychology: Issue of theory and methods (pp.
42-50). Washington, DC: American Psychological Association.
Riger, S. (1993). What’s wrong with empowerment? American Journal of
Community Psychology, 21 (3), 279-292
Ring, N. & Finnie, A. (2004) Best practice statements: report of the impact
evaluation study. Nursing and Midwifery Practice Development Unit:
NHS Quality Improvement Scotland 2004
Rissel, C. (1994). Empowerment: The holy grail of health promotion. Health
Promotion International, 9, 39-47.
Rissel, C., Perry, C., Wagenaar, A., Woolfson, M., Finnegan, J. & Komro, K.
(1996). Empowerment, alcohol, 8th grade students and health promotion.
Journal of Alcohol and Drug Education, 41 (2), 105-119.
Robertson, A. & Minkler, M. (1994). New health promotion movement. Health
Education Quarterly, 21, 295–312.
Robinson, P. B., Stimpson, D. V., Huefner, J. C. & Hunt, H. K. (1991). An
attitude approach to the prediction of entrepreneurship.
Entrepreneurship Theory and Practice, Summer, 13-31
Robson, C. (1993). Real world research: A resource for social scientists and
practitioner researchers. Blackwell: Oxford.
Roesch, R. & Carr, G. (2000). Psychology in the international community:
Perspectives on peace and development. In J. Rappaport & E. Seidman
(Eds.), Handbook of community psychology (pp. 811-832).
Kluwer/Plenum Publishers: New York.
Rosenholtz S. J. (1989). Teachers’ workplace: The social organisation of
schools. New York: Longman.
Rosenthal R & Rosnow, R. (1991). Essentials of behavioural research:
Methods and data analysis. USA: McGraw-Hill Inc.
Rosnow, R. L. & Georgoudi, M. (1986). The spirit of contextualism. In R. L.
Rosnow & M. Georgoudi (Eds.), Contextualism and understanding in
behavioural science: Implication for research and theory (pp. 3-24). New
York: Praeger.
Rossi, P. H. (1994). The war between the quals and the quants: Is lasting
398
peace possible? In C. S. Reichardt & S. F. Rallis (Eds.), The qualitative-
quantitative debate: New perspectives (pp. 23-36). California: Jossey-
Bass Publishers.
Rossi, P. H. & Berk, R. A. (1981). An overview of evaluation strategies and
procedures. Human Organization, 40 (4), 287-299.
Rossman, G. B. & Wilson, B. W. (1985). Numbers and words: Combining
quantitative and qualitative methods in a single large-scale evaluation
study. Evaluation Review, 9 (5), 627-643.
Rotter, J. B. (1966). Generalised expectancies of internal versus external
control of reinforcement. Psychological Monographs: General and
Applied, 80 (1), 1-28.
Rotter, J. B. (1971). External control and internal control. Psychology Today,
5, 37-59.
Royal, M. A. & Rossi, R. J. (1999). Predictors of within-school differences in
teachers’ sense of community. The Journal of Educational Research, 92
(5), 259-266.
Rumery, S. M. (1997). A cross-level analysis of the influence of group-level
turnover on individual-level intent to turnover. Masters Thesis University
of Connecticut.
Ryan, W. (1971). Blaming the victim. New York: Vintage Books.
Sackney, l. (1988). Enhancing School Learning Climate: Theory, Research
and Practice. A report with recommendations prepared under the
auspices of the Saskatchewan School Trustees Association Research
Centre, SSTA Research Centre Report #180.
www.ssta.sk.ca/research/school_improvement/180.htm.
Saegert, S. & Winkel, G. (1996). Paths to community empowerment:
Organizing at home. American Journal of Community Psychology, 24,
517-559.
Sammons P., Hillman, T and Mortimore, P. (1995). Key Characteristics of
School Effectiveness Research. London: Institute of Education.
Sandler, I. N. & Lakey, B (1982). Locus of control as a stress moderator: The
role of control perceptions and social support. American Journal of
Community Psychology, 10 (1), 65-80.

399
Sarason, S. B. (1973). Jewishness, Blackness and the nature-nurture
controversy. American Psychologist, 28, 962-971.
Sarason, S. B. (1981). Psychology misdirected. New York: Free Press.
Sarason, S. B. (1997). The public schools: America’s Achilles heel. Journal of
Community Psychology, 25 (6), 771-785.
Schein, E. (1992). Organisational culture and leadership. San Francisco:
Jossey Bass.
Schindler, R. (1999). Empowering the aged – A post-modern approach.
International Journal of Ageing and Human Development, 49 (3), 165-
177.
Schneider, W., Borkowski, J. G., Kurtz, B. & Kerwin, K. (1986). Metamemory
and motivation: A comparison of strategy use and performance in
German and American children. Journal of Cross-cultural Psychology,
17, 315-336.
Schofield, A. (1995). Report on whole school development Seminar,
Cambridge, UK. Unpublished report for British Council and Education
Support Project.
Schofield, A. (1999). It takes a community to educate a child: A school-as-
community strategy. In J. Gultig, T. Ndhlovu & C. Bertram (Eds.),
Creating people-centred school: School organisation and change in
South Africa (pp. 110-118). Cape Town: Oxford University Press.
Schultz, K. L., Juran, D. J. & Boudreau, J. W. (1997). The effects of JIT on the
development of productivity norms. http://www.irl.cornell.edu/cahrs.
Scriven M.S. (1983) Evaluation Ideologies. In G.F. Madaus, M. Scriven & D.L.
Stufflebeam (Eds.), Evaluation models: Viewpoints on educational and
human services evaluation (pp 229-260). Boston: Kluwer-Nijhoff.
Seashore, S. E. Lawler, E. E. Mirvis, P. & Camman, C. (Eds.), (1982).
Observing and measuring organisational change: A guide to field
practice. Wiley, New York.
Seedat, M, Cloete, N. & Shochet, I. (1988). Community psychology: Panic or
panacea. Psychology in Society, 11, 39-54.
Segal, S. P., Silverman, C. & Temkin, T. (1995). Measuring empowerment in
client-run self-help agencies. Community Mental Health Journal, 31 (3),
400
215-227.
Seibert, S. E., Silver, S. R. & Randolph, W. A. (2004). Taking empowerment
to the next level: A multiple-level model of empowerment, performance
and satisfaction. Academy of Management Journal, 47 (3), 332-349.
Serrano-Garcia, I. (1984). The illusion of empowerment: Community
development within a. colonial context. Prevention in Human Services, 3,
173-200.
Serrano-Garcia, I. (1990). Implementing research: Putting our values to work.
In P. Tolan, C. Keys, F. Chertok & L. Jason (Eds.), Researching
community psychology: Issue of theory and methods. Washington, DC:
American Psychological Association.
Serrano-Garcia, I. & Bond, M. A. (1994). Empowering the silent ranks:
Introduction. American Journal of Community Psychology, 22, 433-446.
Settoon, R. P., Bennett, N. & Liden, R. C. (1996). Social exchange in
organisations: perceived organisational support, leader-member
exchange, and employee reciprocity. Journal of Applied Psychology, 81
(3), 219-227.
Seymour, J. & Searle, L. (no date) NHS End of Life Care Programme:
Facilitator/Manager Workshop: Table top discussion: Evaluation.
Shadish, W. R. (1986). Planned critical multiplism: Some elaborations.
Behavioural Assessment, 8, 75-103.
Shadish, W. R. (1990). What can we learn about problems in community
research by comparing it with program evaluation? In P. Tolan, C. Keys,
F. Chertok & L. Jason (Eds.), Researching community psychology: Issue
of theory and methods (pp. 214-223). Washington, DC: American
Psychological Association.
Shadish, W. R. (1993) Program evaluation: A pluralistic enterprise. New
directions for program evaluation, No. 60. San Francisco: Jossey-Bass.
Shea, M. P. (2004) Model For The Comprehensive Evaluation Of Training
Programs In Injury Prevention: Kirkpatrick’s Four Levels Of Training
Evaluation: SMARTRISK Point of View Document.
http://www.smartrisk.ca/ContentDirector.aspx?dd=1&tp=841
Sherer, M., Maddux, J. E., Mercandante, B., Prentice-Dunn, S., Jacobs, B. &

401
Rogers, R. W. (1982). The self-efficacy scale: Construction and
validation. Psychological Reports, 51, 663-671.
Shinn, M. (1996). Ecological assessment: Introduction to the Special issue.
American Journal of Community Psychology, 24 (1), 1-3.
Shinn, M. (1990). Mixing and matching: Levels of conceptualisation,
measurement, and statistical analysis in community research. In P.
Tolan, C. Keys, F. Chertok & L. Jason (Eds.), Researching community
psychology: Issue of theory and methods (pp. 111-126). Washington,
DC: American Psychological Association.
Shinn, M. & Perkins, D. N. T. (2000). Contribution from organisational
psychology. In J. Rappaport & E. Seidman (Eds.), Handbook of
community psychology (pp. 615-642). Kluwer/Plenum Publishers: New
York.
Shinn, M. & Rapkin, D. (2000). Cross-level research without cross-ups in
community psychology. In J. Rappaport & E. Seidman (Eds.), Handbook
of community psychology (pp. 647-668). Kluwer/Plenum Publishers:
New York.
Skogstad, A. & Einarsen, S. (1999). The importance of a change-centred
leadership style in four organisational cultures. Scandinavian Journal of
Management, 15, 289-306.
Slee, R., Weiner, G. & Tomlinson, S. (Eds.) (1998). School effectiveness for
whom? Challenges to the school effectiveness and the school
improvement movements. London, Falmer Press.
Smaling, A. (1992a). Objectivity, reliability and validity. In G. J. N. Bruisma &
M. A. Zwanenburg (Eds.), Methodology for management specialists:
Trends and methods (pp. 302-322). Muiderberg: Dick Coutinho.
Smaling, A. (1992b). The pragmatic dimension: Paradigmatic aspects of
choosing a qualitative or quantitative method. Research Report:
University for Humanistic Studies: Utrecht, The Netherlands.
Smidt, A., van Riel, C. B. M. & Pruyn, A. (2000). The impact of employee
communication and perceived external prestige on organizational
identification. Erasmus Research Institute of Management, Erasmus
University the Netherlands.

402
Smith, H. W. (1981). Strategies of social research: The methodological
imagination. Englewood Cliffs, New Jersey: Prentice-Hall, Inc.
Smith, J. K. (1983). Quantitative versus qualitative research: An attempt to
clarify the issue. Educational Researcher, 12 (3), 6-13.
Smith, M. L. (1994). Qualitative plus/versus quantitative: The last word. In C.
S. Reichardt & S. F. Rallis (Eds.), The qualitative-quantitative debate:
New perspectives (pp. 37-44). California: Jossey-Bass Publishers.
Soet, J. E., Dudley, W. N. & Dilorio, C. (1999). The effects of ethnicity and
perceived power on woman’s sexual behaviour. Psychology of Women
Quarterly, 23, 707-723.
Solberg, V. S., Brown, S. D., Good, G. E., Fischer, A. R. & Nord, D. (1995).
Career decision-making and career search activities: Relative effects of
career search self-efficacy and human agency. Journal of Consulting
Psychology, 42 (4), 448-455.
Solkov, J. I. (1992). A successful model for school-based planning.
Educational Leadership, (September), 52-54.
Sommer, R. & Sommer, B. A. (1980). A practical guide to behavioural
research: Tools and techniques. Oxford: Oxford University Press.
Sosik, J. J. & Godshalk, V. M. (2000). Leadership styles, mentoring functions
received and job related stress: A conceptual model and preliminary
study. Journal of Organisational Behaviour, 21, 365-390.
Spector, P. E. (1987). Method variance as an artefact in self-reported affect
and perceptions at work: Myth or significant problem. Journal of Applied
Psychology, 72 (3), 438-443.
Spector, P. E. & Brannick, M. T. (1995). The nature and effects of method
variance in organizational research. In C. L. Cooper & I. T. Robertson
(Eds.), International review of industrial and organizational psychology
(Vol. 10) (pp.249-74). New York: John Wiley.
Speer, P. W. (2000). Intrapersonal and interactional empowerment:
Implications for theory. Journal of Community Psychology, 28 (1), 51-61.
Speer, P. W. & Hughey, J. (1995). Community organising: An ecological route
to empowerment and power. American Journal of Community
Psychology, 23 (5), 729-748.
403
Speer, P. W., Ontkush, M., Schmitt, B. & Raman, P. (2003). The intentional
exercise of power: Community organizing in Camden, New Jersey.
Journal of Community & Applied Social Psychology, 13, 399-408.
Speer, P. W. & Perkins, D. D. (2003). Community-based organization,
agencies and groups. In J. W. Gutherie (Ed.), Encyclopedia of
education. Vol. 2 Common Expertise. MacMillan: New York.
Speer, P. W. & Peterson, N. A. (2000). Psychometric properties of an
empowerment scale: Testing cognitive, emotional and behavioural
domains. Social Work Research, 24 (2), 109-118.
Speer, P. W. & Zippay, A. (2005). Participatory decision-making among
community coalitions: An analysis of task group meetings. Administration
in Social Work, 29 (3), 61-77.
Spielberger, C. D., Piacente, B. S. & Hobfoll, S. E. (1976). Program evaluation
in community psychology. American Journal of Community Psychology,
4 (4), 393-404.
Spreitzer, G. M. (1995a). An empirical test of a comprehensive model of
intrapersonal empowerment in the workplace. American Journal of
Community Psychology, 23 (5), 601-629.
Spreitzer, G. M. (1995b). Psychological empowerment in the workplace:
Dimensions, measurement and validation. Academy of Management
Journal, 38 (5), 1442-1465.
Spreitzer, G. M. (1996). Social structural characteristics of psychological
empowerment. Academy of Management Journal, 39 (2), 483-504.
Spreitzer, G. M., De Janasz, S. C. & Quinn, R. E. (1999). Empowered to lead:
the role of psychological empowerment in leadership. Journal of
Organizational Behavior, 20, 511-526.
Stajkovic, A. D. & Luthans, F. (1998). Self-efficacy and work-related
performance: A meta-analysis. Psychological Bulletin, 124 (2), 240-261.
Stake, R. E. (1995). The art of case study research. Thousand Oaks: Sage.
Stevens, J. P. (1979). Comment on Olson: Choosing a test statistic in
multivariate analysis of variance. Psychological Bulletin, 86, 355-360.
Stevens, J. P. (1980). Power of multivariate analysis of variance tests.
Psychological Bulletin, 88, 728-737.

404
Stevens, J. P. (1992). Applied multivariate statistics for the social sciences.
Hillsdale, NJ: Erlbaum.
Stewart, D. W. & Shamdasani, P. N. (1990). Focus Groups: Theory and
practice. Newbury, California: Sage Publications.
Stewart, D. W., Shamdasani, P. N. & Rook, D. W. (2007) Focus groups:
Theory and practice. London: Sage Publications
Stewart, E. (2000). Thinking through others: Qualitative research in
community psychology. In J. Rappaport & E. Seidman (Eds.), Handbook
of community psychology. Kluwer/Plenum Publishers: New York.
Stimson, T. D. & Appelbaum, R. P. (1988). Empowering Teachers: Do
Principals Have the Power? Phi Delta Kappan, 70 (4), 313-16.
Stoll, L. (1999). Realising our potential: Understanding and developing
capacity for lasting improvement. School Effectiveness and School
Improvement, 10 (4), 503-532.
Stoll, L. (1992). Teacher growth in the effective school. In M. Fullan & A.
Hargreaves. Teacher development and educational change. London:
Falmer Press.
Stone, S. J. (1995). Empowering teachers, empowering children. Childhood
Education, 294-295.
Surrey, J. (1987). Relationship and empowerment. Work in progress (No. 30).
Wellesley, MA: Stone Centre Working Paper.
Suarez-Balcazar, Y., Orella-Damacela, L., Portillo, N., Sharma, A. & Lanum,
M. (2003). Implementing an outcomes model in the participatory
evaluation of community initiatives. Journal of Prevention and
Intervention, 26 (2), 5-20.
Sue, S. & Zane, N. (1980). Learned helplessness theory and community
psychology. In M. S. Gibbs, J. R. Lachenmeyer & J. Sigal (Eds.),
Community psychology: Theoretical and empirical approaches. New
York: Gardner.
Sullo, R. A. (1998). Inspiring quality in your school: Inspiring your colleagues.
Teaching and Change, 5 (3-4), 294-311.
Swartz, L. & Gibson, K. (2001). The ‘old’ versus the ‘new’ in South African
community psychology: The quest for appropriate change. In M. Seedat,

405
N. Duncan & S. Lazarus (Eds.). Community Psychology: Theory, method
and practice South African and other perspectives (pp. 37-50). Cape
Town: Oxford Press.
Swift, C. (1984). Foreword: Empowerment: An antidote for folly. In J.
Rappaport, C. Swift & R. Hess (Eds.), Prevention in human services.
Studies in empowerment: Steps toward understanding and action. (pp.
xi-xv). New York: The Hawthorn Press.
Swift, C. & Levin, G. (1987). Empowerment: An emerging mental health
technology. Journal of Primary Prevention, 8 (1&2), 71-94.
Taylor, N. (1995). Inset, NGOs and evaluation: A review. Paper presented to
the Kenton-at-Settlers Conference, Settlers, South Africa.
Taylor, S. J. & Bogdan, R. C. (1984). Introduction to qualitative research
methods: the search for meanings. Chichester: Wiley.
Taylor, J. C. & Bowers, D. G. (1972). Survey of organisations: A Machine
scored standardised questionnaire. Institute of Social Research,
University of Michigan, Ann Arbor, Michigan.
Taylor-Powell, E. (2005) Logic Models: A framework for program planning and
evaluation. Paper presented at the Nutrition, Food Safety and Health
Conference, Baltimore, Maryland.
Thomas, K. W. & Velthouse, B. A. (1990). Cognitive elements of
empowerment: An interpretive model of intrinsic task motivation.
Academy of Management Review, 15 (4), 666-81.
Tipton, R. M. & Worthington, E. (1984). The measurement of generalised self-
efficacy: A study of construct validity. Journal of Personality Assessment,
48 (5), 545-548.
Tjosvold, D. & Law, C. H. K. S. (1998). Empowerment in the management-
employee relationship in Hong Kong: Interdependence and controversy.
The Journal of Social Psychology, 138 (5), 624-636.
Tolan, P., Chertok, F., Keys, C. & Jason, L. (1990). Conversing about
theories, methods and community research. In P. Tolan, C. Keys, F.
Chertok & L. Jason (Eds.), Researching community psychology: Issue of
theory and methods (pp. 3-8). Washington, DC: American Psychological
Association.
406
Trickett, E. J. (1984). Towards a distinctive community psychology: An
ecological metaphor for training and the conduct of research. American
Journal of Community Psychology, 12, 261-277.
Trickett, E. J. (1991). Paradigms and the research report: Making what
actually happens a heuristic for theory. American Journal of Community
Psychology, 19 (3), 365-370.
Trickett, E. J. (1994). Human diversity and community psychology: Where
ecology and empowerment meet. American Journal of Community
Psychology, 22 (4), 583-592.
Trickett, E. J. (1996). A future for community psychology: The contexts of
diversity and the diversity of contexts. American Journal of Community
Psychology, 24 (2), 209-236.
Trickett, E. J., Barone, C. & Watts, R. (2000). Contextual influences in mental
health consultation: Towards an ecological perspective on radiating
change. In J. Rappaport & E. Seidman (Eds.), Handbook of community
psychology (pp. 303-330). Kluwer/Plenum Publishers: New York.
Trickett, E. J., Watts, R. & Birman, D. (1993). Human diversity and community
psychology: Still hazy after all these years. Journal of Community
Psychology, 21, 264-279.
Ursin, H. & Olff, M. (1995). Aggression, defense and coping in humans.
Aggressive Behavior, 21, 13-19.
Valentine, S. (1999). Assessing organisational behaviour models: A
comparison of linear and non-linear methods. Journal of Applied Social
Psychology, 29 (5), 1028-1044.
Van Uchelen, C. (2000). Individualism, collectivism, and psychological
research. In J. Rappaport & E. Seidman (Eds.), Handbook of community
psychology. Kluwer/Plenum Publishers: New York.
VanYperen, N. W., van den Berg, A. E. & Willering, M. C. (1999). Towards a
better understanding of the link between participation in decision-making
and organisational citizenship behaviour: A multilevel analysis. Journal
of Occupational Psychology, 72, 377-392.
Vedder, P. & O’Dowd, M. (1999). Empowering teachers in times of change.
The Swedish comprehensive school system. Scandinavian Journal of
407
Educational Research, 43 (3), 313-326.
Vinney, L. L. (1981). Content analysis: A research tool for community
psychologists. American Journal of Community Psychology, 9 (3), 269-
281.
Vroom, V. H. (1960). Some personality determinants of the effects of
participation. Prentice-Hall: Englewood Cliffs.
Vroom, V. H. (2000). Leadership and the decision-making process.
Organisational Dynamics, 28 (4), 82-94.
Walker, A. & Dimmock, C. (2000). Mapping the way ahead: Leading
educational leadership into the globalised world. School Leadership &
Management, 20 (2), 227-233.
Walley, C. (1995). Looking at school change. Childhood Education, Annual
Theme, 259-260
Wallston, K. A. (1992). Hocus-pocus, the focus isn't strictly on locus: Rotter's
social learning theory modified for health. Cognitive Therapy and
Research, 16(2), 183-199.
Walsh, R. T. (1987). The evolution of the research relationship in community
psychology. Journal of Community Psychology, 20, 116-131.
Walsh, K., Bartunek, J. M. & Lacey, C. A. (1998). A relational approach to
empowerment. In C. L. Cooper & D. M. Rousseau (Eds.), Trends in
organisational behaviour (pp. 103-126). Sussex: John Wiley & Sons Ltd.
Wandersman, A. & Florin, P. (2000). Citizen participation and community
organisations. In J. Rappaport & E. Seidman (Eds.), Handbook of
community psychology (pp. 247-272). Kluwer/Plenum Publishers: New
York.
Wandersman, A. & Giamartino, G. A. (1980). Community and individual
difference characteristics as influences on initial participation. American
Journal of Community Psychology, 8 (2), 217-228.
Waterton, C. & Wynne, B. (1999). Can focus groups access community
views? In R. S. Barbour & J. Kitzinger (Eds.), Developing focus group
research: Politics, theory and practice (pp. 127-143). Thousand Oaks:
Sage Publications.
Wayne, S. J., Shore, L. M. & Liden, R. C. (1997). Perceived organisational

408
support and leader-member exchange: A social exchange perspective.
Academy of Management Journal, 40 (1), 82-111.
Weber, R. P. (1990). Basic Content Analysis, 2nd ed. Newbury Park, CA.
Weinstein, R. S. (1991). Caught between paradigms: Obstacle or opportunity
– a comment on the commentaries. American Journal of Community
Psychology, 19 (3), 395-403.
Weiss, J. W. (1996). Organisational behaviour and change. New York: West
Publishing.
Welkowitz, J., Ewen, R. B. & Cohen, J. (2000). Introductory statistics for the
behavioural sciences. Orlando: Harcourt Bruce.
Werner, L., & Campbell, D. T. (1970). Translating, working through
interpreters and the problem of decentering. In R. Naroll & R. Cohen
(Eds.), A handbook of method in cultural anthropology (pp. 127-
143).New York: Natural History Press.
West, M. (2000). Supporting school improvement: Observations on the inside,
reflections from the outside. School Leadership and Management, 20
(1), 43-60.
Westphal, L. M. (2003). Urban greening and social benefits: A study of
empowerment outcomes. Journal of Arboriculture, 29 (3), 137-147.
Wheaton, B. (1987). Assessment of fit in overidentified models with latent
variable. Sociological Methods and Research, 16, 118-154.
Whetten, D. A. (1989). What constitutes a theoretical contribution? Academy
of Management Review, 14, 490-495.
White, J. K. (1978). Generalizability of individual difference moderators of the
participation in decision-making employee response relationship. Academy of Management Journal, 21 (1), 36-43.
White, J. K. (1979). The scanlon plan: Causes and correlates of success.
Academy of Management Journal, 21 (2), 292-312.
White, A. M. & Potgieter, C. A. (1996). Teaching community psychology in
postapartheid South Africa. Teaching Psychology, 23 (2), 82-86.
Wicker, A. W. (1990). Theoretical perspectives and levels of analysis. In P.
Tolan, C. Keys, F. Chertok & L. Jason (Eds.), Researching community
psychology: Issue of theory and methods (pp. 127-130). Washington,
409
DC: American Psychological Association.
Wideen, M. F. (1992). School-based teacher development. In M. Fullan & A.
Hargreaves. Teacher development and educational change. (pp. 123-
155). London: Falmer Press.
Wilkins, R. (2000). Leading the learning society: The role of local education
authorities. Educational Management and Administration, 28 (3), 339-
352.
Wolff, B., Knodel, J. & Sittitrai, W. (1993). Focus groups and surveys as
complementary research methods. In D. L. Morgan (Ed.), Successful
focus groups: Advancing the state of the art. (pp. 89-104). Newbury
Park, CA: Sage.
Wolverton, M. (1998). Champions, agents and collaborators: Leadership keys
to successful systemic change. Journal of Higher Education Policy and
management, 20 (1), 19-30.
Wood, V. (2006) Using an empowerment model in developing the service
delivery of community projects. Educational and Child Psychology, 23
(1), 52-58.
Woodruff, R. M. & Cashman, J. (1993). Age and health care beliefs: Self-
efficacy as a mediator of low desire control. Psychology and Aging, 28,
337-364.
Woolfolk, A. E. & Hoy, W. K. (1990). Prospective teachers’ sense of efficacy
and beliefs about control. Journal of Educational Psychology, 82 (1), 81-
91.
Yonemura, M. (1986). Reflections of teacher empowerment and teacher
education. Harvard Educational Review, 56 (4), 473-480.
Young, A. M. & Brymer, R. A. (2000). The role of individual differences in the
referent selection process. Journal of Behavioral and Applied
Management, 1(1), 83.
Yoshikawa, H. & Shinn, M. (2002). Facilitating change: Where and how
should community psychology intervene? In T. A. Revenson, A.
D'Augelli, et al., A quarter century of community psychology: Readings
from the American Journal of Community Psychology (pp. 33-49).New
York: Plenum.

410
Zeller, R. A. (1993). Focus group research on sensitive topics: Setting the
agenda without setting the agenda. In D. L. Morgan (Ed.), Successful
focus groups: Advancing the state of the art (pp. 167-183). Newbury
Park, CA: Sage.
Zimmerman, M. A. (1990a). Taking aim on empowerment research: On the
distinction between psychological and individual conceptions. American
Journal of Community Psychology, 18, 169-177.
Zimmerman, M. A. (1990b). Toward a theory of learned hopefulness: A
structural model analysis of participation and empowerment. Journal of
Research in Personality, 24, 71-86.
Zimmerman, M. A. (1995). Psychological empowerment: Issues and
Illustrations. American Journal of Community Psychology, 23, 581-599.
Zimmerman, M. A. (2000). Empowerment theory: Psychological,
organisational and community levels of analysis. In J. Rappaport & E.
Seidman (Eds.), Handbook of community psychology (pp 43-63).
Kluwer/Plenum Publishers: New York.
Zimmerman, M. A., Israel, B. A., Schulz, A. & Checkoway, B. (1992). Further
exploration in empowerment theory: An empirical analysis of
psychological empowerment. American Journal of Community
Psychology, 23, 707-727.
Zimmerman, M. A. & Rappaport, J. (1988). Citizen participation, perceived
control and psychological empowerment. American Journal of
Community Psychology, 16, 725-750.
Zimmerman, M. A. & Zahniser, J. H. (1991). Refinements of sphere-specific
measures of perceived control: Development of a socio-political control
scale. Journal of Community Psychology, 19, 189-204.
Zippay, A. (1995). Politics of empowerment. Social Work, 40, 263-267.

411
APPENDICES

412
APPENDIX 1: SCHOOL DEVELOPMENT PLANNING EVALUATION SCALE: ORIGINAL VERSION FOR PILOT STUDY
Listed below are a series of statements about the School Development Plan please indicate your response to the statements using the following scale: 1 = strongly disagree 2 = disagree 3 = slightly disagree 4 = neither agree nor disagree 5 = slightly agree 6 = agree 7 = strongly agree
STATEMENT 1 2 3 4 5 6 7 1. My school has a clear School Development Plan. 2. Teachers have been involved in the drawing up the
School Development Plan.
3. Parents at the school are aware of the School Development Plan.
4. Our school has been successful in terms of achieving the objectives we have set out for ourselves in the School Development Plan.
5. The School Management Team does not offer support for the implementation of the School Development Plan
6. My school has a written up School Development Plan.
7. Teachers’ views are listened to and included in the ideas of the School Development Plan at our school.
8. Parents at the school are involved in implementing the School Development Plan.
9. Our school is more in control of its own development since we drew up the School Development Plan.
10. The School Management Team thinks School Development Planning at our school is important
11. The needs of the school have been clearly identified in our School Development Plan.
12. I do not feel part of implementing the School Development Plan.
13. Parents at the school think development planning at our school is important.
14. Drawing up the School Development Plan has raised our expectations about what ought to be achieved at the school.
15. The School Management Team make themselves available to help with the School Development Plan
16. I am clear about the objectives for development at our school.

413
STATEMENT 1 2 3 4 5 6 7 17. I have been involved in activities that have helped
the school achieve the objectives set out in the School Development Plan.
18. The School Governing Body thinks development planning at our school is important.
19. The School Development Plan has improved the quality of the teaching in the classroom.
20. The School Management Team is aware of what is happening in terms of development at the school
21. Development is a planned activity at our school.
22. Activities from the School Development Plan have been assigned to me.
23. The School Governing Body were involved in drawing up the development plan.
24. Our school has gained more resources since implementing the School Development Plan.
25. The implementation of the School Development Plan is effectively managed by the School Management Team
26. I am clear about the advantages of School Development Planning.
27. The School’s Development Plan is discussed regularly at our school.
28. The School Governing Body are involved in evaluation of the School Development Plan.
29. As a school we are aware of our strengths and weaknesses
30. The implementation of the School Development Plan is effectively monitored by the School Management Team
31. Time is made available for development planning at our school.
32. As a staff we meet regularly to monitor the implementation of the School Development Plan.
33. Stakeholders (parents and the School Governing Body) at the school are given regular reports on progress made in terms of the School Development Plan.
34. Drawing up the School Development Plan has raised our expectations about what can be achieved at the school.
35. The School Development Plan is used in allocating financial resources at our school
36. The staff at our school think development planning is important.

414
STATEMENT 1 2 3 4 5 6 7 37. Progress on the School Development Plan is
reported to the staff regularly.
38. Since the School Development Plan was drawn up there is a growing commitment to improving the school.
39. The staff at the school are working well together to achieve the objectives of the School Development Plan.
40. Drawing up the School Development Plan has improved the culture of teaching and learning at our school.
41. Developing the School Development Plan has helped the school move towards its vision.
42. The School Development Plan has been a waste of time at our school.
43. As a staff we agree on what improvements are to be made at our school.
44. Implementing the School Development Plan has given everyone involved a role to play in the school’s continuing improvement.
45. As a school we use our knowledge of our strengths and weaknesses to guide the development of the school.
46. Workload, in terms of the School Development Plan, is fairly distributed amongst the staff.
47. Teachers are more involved in decision-making at the school since we drew up our School Development Plan.
48. We are clear about the how to measure the achievement of our objectives in the School Development Plan.
49. The School Development Plan has increased the self-confidence of the staff.
50. When we encounter problems in implementing our School Development Plan we are able to assess the problem and get back on track
51. Parent involvement has improved at our school since the School Development Plan was drawn up.
52. The development planning process is far too time consuming.
© A Hassett
Thank you for taking time to complete this questionnaire

415
APPENDIX 2: ITEM CATEGORISATION FOR SCHOOL DEVELOPMENT PLANNING EVALUATION SCALE (ORIGINAL VERSION)
1. Awareness of the School Development Plan and its Role in School Development (Individual Level of Analysis) Questions:
• My school has a clear and written up School Development Plan
• My school has a written up School Development Plan
• The needs of the school have been clearly identified in our School
Development Plan
• I am clear about the objectives for development at the school
• Development is a planned activity at our school
• I am clear about the advantages of School Development Planning
• As a school we are aware of our strengths and weaknesses
• Time is made available for development planning at our school
• The staff at our school think development planning is important
• The staff at the school are working together to achieve the objectives of the
School Development Plan
• As a school we use our knowledge of our strengths and weaknesses as a
school and use this to guide development of the school
2. Involvement in the Development of, Implementation of, and Evaluation and Monitoring the School Development Plan (Organisational Level of Analysis)
• Teachers have been involved in the drawing up the School Development
Plan
• Teachers’ views are listened to and included in the ideas of the School
Development Plan at our school
• I do not feel part of implementing the School Development Plan
• I have been involved in activities that have helped the school achieve the
objectives set out in the School Development Plan
• I have activities from the School Development Plan assigned to me
• The School’s Development Plan is discussed regularly at our school

416
• As a staff we meet regularly to monitor the implementation of the School
Development Plan
• Progress on the School Development Plan is reported to the staff regularly
• Teachers are too busy to implement the School Development Plan
• We agree on what improvements are to be made at our school
• Workload, in terms of the School Development Plan, is fairly distributed
amongst the staff
• We are clear about the how to measure the achievement of our objectives in
the School Development Plan
• When we encounter problems in implementing our School Development
Plan we are able to assess the problem and get back on track
3. Management’s Role in School Development Planning (Organisational Level of Analysis)
• The implementation of the School Development Plan is effectively managed
by the School Management Team
• The School Management Team does not offer support for the
implementation of the School Development Plan
• The School Management Team thinks School Development Planning at our
school is important
• The School Management Team make themselves available to help with the
School Development Plan
• The School Management Team is aware of what is happening in terms of
development at the school
• The implementation of the School Development Plan is effectively monitored
by the School Management Team
• The School Development Plan is used in allocating financial resources at
our school
4. Assessment of the Effectiveness of the Plan in Bringing About School Change (Community Level of Analysis)
• Our school has been successful in terms of achieving the objectives we
have set out for ourselves in the School Development Plan

417
• Our school is more in control of its own development since we drew up the
School Development Plan.
• Drawing up the School Development Plan has raised our expectations about
what ought to be achieved at the school has been raised
• The School Development Plan has improved the quality of the teaching in
the classroom
• Our school has gained more resources since implementing the School
Development Plan
• Drawing up the School Development Plan has raised our expectations about
what can be achieved at the school
• Drawing up the School Development Plan has improved the culture of
teaching and learning at our school
• Doing the School Development Plan has helped the school move towards its
vision
• The School Development Plan has been a waste of time at our school
• Since the School Development Plan was drawn up there is a growing
commitment to improving the school
• Implementing the School Development Plan has given everyone involved a
role to play in the school’s continuing improvement
• Teachers are more involved in decision-making at the school since we drew
up our School Development Plan
• The School Development Plan has increased the confidence of the staff
• Parent involvement has improved at our school since the School
Development Plan was drawn up
5. Involvement of Other Stakeholders (Community Level of Analysis)
• Parents at the school are aware of the School Development Plan
• Parents are involved in implementing the School Development Plan
• Parents at the school think development planning at our school is important
• The School Governing Body thinks development planning at our school is
important
• The School Governing Body were involved in drawing up the development
plan

418
• The School Governing Body are involved in evaluation of the School
Development Plan
• Stakeholders (parents and the School Governing Body) at the school are
given an annual report on progress made in terms of the School
Development Plan

419
APPENDIX 3: SCHOOL DEVELOPMENT PLANNING EVALUATION SCALE (FINAL VERSION) Listed below are a series of statements about the School Development Plan please indicate your response to the statements using the following scale: 1 = strongly disagree 2 = disagree 3 = slightly disagree 4 = neither agree nor disagree 5 = slightly agree 6 = agree 7 = strongly agree
STATEMENT 1 2 3 4 5 6 7 1. Parents at the school are aware of the School
Development Plan. 1 2 3 4 5 6 7
2. Our school has been successful in terms of achieving the objectives we have set out for ourselves in the School Development Plan.
1
2
3
4
5
6
7
3. The School Management Team offers support for the implementation of the School Development Plan
1 2 3 4 5 6 7
4. Teachers’ views are listened to and included in the ideas of the School Development Plan at our school.
1 2 3 4 5 6 7
5. Parents at the school are involved in implementing the School Development Plan.
1 2 3 4 5 6 7
6. Our school is more in control of its own development since we drew up the School Development Plan.
1 2 3 4 5 6 7
7. The School Management Team thinks School Development Planning at our school is important
1 2 3 4 5 6 7
8. I feel part of implementing the School Development Plan.
1 2 3 4 5 6 7
9. Parents at the school think development planning at our school is important.
1 2 3 4 5 6 7
10. The School Management Team make themselves available to help with the School Development Plan
1 2 3 4 5 6 7
11. I am clear about the objectives for development at our school.
1 2 3 4 5 6 7
12. I have been involved in activities that have helped the school achieve the objectives set out in the School Development Plan.
1
2
3
4
5
6
7
13. The School Development Plan has improved the quality of the teaching in the classroom.
1 2 3 4 5 6 7
14. Activities from the School Development Plan have been assigned to me.
1 2 3 4 5 6 7
15. The School Governing Body were involved in drawing up the development plan.
1 2 3 4 5 6 7
16. Our school has gained more resources since implementing the School Development Plan.
1 2 3 4 5 6 7

420
STATEMENT 1 2 3 4 5 6 7
17. The implementation of the School Development Plan is effectively managed by the School Management Team
1
2
3
4
5
6
7
18. The School’s Development Plan is discussed regularly at our school.
1 2 3 4 5 6 7
19. The School Governing Body are involved in evaluation of the School Development Plan.
1 2 3 4 5 6 7
20. As a school we are aware of our strengths and weaknesses
1 2 3 4 5 6 7
21. The implementation of the School Development Plan is effectively monitored by the School Management Team
1
2
3
4
5
6
7
22. Time is made available for development planning at our school.
1 2 3 4 5 6 7
23. As a staff we meet regularly to monitor the implementation of the School Development Plan.
1 2 3 4 5 6 7
24. Stakeholders (parents and the School Governing Body) at the school are given regular reports on progress made in terms of the School Development Plan.
1
2
3
4
5
6
7
25. The School Development Plan is used in allocating financial resources at our school
1 2 3 4 5 6 7
26. Progress on the School Development Plan is reported to the staff regularly.
1 2 3 4 5 6 7
27. Since the School Development Plan was drawn up there is a growing commitment to improving the school.
1
2
3
4
5
6
7
28. The staff at the school are working well together to achieve the objectives of the School Development Plan.
1
2
3
4
5
6
7
29. Drawing up the School Development Plan has improved the culture of teaching and learning at our school.
1
2
3
4
5
6
7
30. The School Development Plan has been a waste of time at our school.
1 2 3 4 5 6 7
31. Implementing the School Development Plan has given everyone involved a role to play in the school’s continuing improvement.
1
2
3
4
5
6
7
32. Workload, in terms of the School Development Plan, is fairly distributed amongst the staff.
1 2 3 4 5 6 7
33. Teachers are more involved in decision-making at the school since we drew up our School Development Plan.
1
2
3
4
5
6
7
34. We are clear about the how to measure the achievement of our objectives in the School Development Plan.
1
2
3
4
5
6
7

421
STATEMENT 1 2 3 4 5 6 7
35. The School Development Plan has increased the self-confidence of the staff.
1 2 3 4 5 6 7
36. When we encounter problems in implementing our School Development Plan we are able to assess the problem and get back on track
1
2
3
4
5
6
7
37. Parent involvement has improved at our school since the School Development Plan was drawn up.
1 2 3 4 5 6 7
© A R Hassett 1999

422
APPENDIX 4: MEASURES USED IN THE QUANTITATIVE STUDY
BIOGRAPHICAL INFORMATION: 1. HOW OLD ARE YOU?
20-29 years 30-39 years 40-49 years 50-59 years 60 years +
2. SEX:
MALE FEMALE
3. WHAT IS YOUR HOME LANGUAGE: _____________________________ 4. EDUCATIONAL QUALIFICATIONS:
Highest school standard passed:
Std 8 Std 10
What teaching qualifications do you have?
CERTIFICATE DIPLOMA UNDERGRADUATE DEGREE HONOURS DEGREE MASTERS DEGREE 5. TEACHING EXPERIENCE:
1-5 yrs 6-10 yrs 11-15 yrs 16-20 yrs 21-25 yrs 26 yrs + Years of teaching experience.
1-5 yrs 6-10 yrs 11-15 yrs 16-20 yrs 21-25 yrs 26 yrs + How long have you been at this school?
6. AT THIS SCHOOL ARE YOU A:
TEACHER HEAD OF DEPARTMENT DEPUTY PRINCIPAL PRINCIPAL OTHER 7. WHICH TEACHER ORGANISATION DO YOU BELONG TO?
PEU (Formally TUATA) SADTU Neither 8. Are you a member of the School Development Team?
Yes: No

423
LOCUS OF CONTROL Listed below are a series of statements please indicate your response to the statements using the following scale: 1. = strongly disagree 2. = disagree 3. = slightly disagree 4. = slightly agree 5. = agree 6. = strongly agree
STATEMENT 1 2 3 4 5 6 1. Whether or not I get to be a leader depends mostly
on my ability 1 2 3 4 5 6
2. To a great extent my life is controlled by accidental happenings
1 2 3 4 5 6
3. I feel like what happens in my life is mostly determined by powerful people
1 2 3 4 5 6
4. Whether or not I get into a car accident depends mostly on how good a driver I am
1 2 3 4 5 6
5. When I make plans, I am almost certain to make them work
1 2 3 4 5 6
6. Often there is no chance of protecting my personal interest from bad luck happenings
1 2 3 4 5 6
7. When I get what I want, it’s usually because I’m lucky
1 2 3 4 5 6
8. Although I might have good ability, I will not be given leadership responsibility without appealing to those in positions of power
1
2
3
4
5
6
9. How many friends I have depends on how nice a person I am
1 2 3 4 5 6
10. I have often found that what is going to happen will happen
1 2 3 4 5 6
11. My life is chiefly controlled by powerful others 1 2 3 4 5 6 12. Whether or not I get into a car accident is mostly a
matter of luck 1 2 3 4 5 6
13. People like myself have very little chance of protecting our personal interests when they conflict with those of strong pressure groups
1
2
3
4
5
6
14. It’s not always wise for me to plan too far ahead because many things turn out to be a matter of good or bad fortune
1
2
3
4
5
6
15. Getting what I want requires pleasing those people above me
1 2 3 4 5 6
16. Whether or not I get to be a leader depends on whether I’m lucky enough to be in the right place at the right time
1 2 3 4 5 6
17. If important people were to decide they didn’t like me, I probably wouldn’t make many friends
1 2 3 4 5 6
18. I can pretty much determine what will happen in my life
1 2 3 4 5 6

424
STATEMENT 1 2 3 4 5 6
19. I am usually able to protect my personal interests
1 2 3 4 5 6
20. Whether or not I get into a car accident depends mostly on the other driver
1 2 3 4 5 6
21. When I get what I want it is usually because I worked hard for it
1 2 3 4 5 6
22. In order to have my plans work, I make sure that they fit in with the desires of people who have power over me
1 2 3 4 5 6
23. My life is determined by my own actions
1 2 3 4 5 6
24. It’s chiefly a matter of fate whether or not I have a few friends or many friends
1 2 3 4 5 6

425
GENERAL SELF EFFICACY SCALE Listed below are a series of statements please indicate your response to the statements as honestly as possible using the following scale: 1. = strongly disagree 2. = disagree 3. = neither agree nor disagree 4. = agree 5. = strongly agree
STATEMENT 1 2 3 4 5 1. If something looks too complicated I
will not even bother to try it 1 2 3 4 5
2. I avoid trying to learn new things when they look too difficult
1 2 3 4 5
3. When trying to learn something new, I soon give up if I am not initially successful
1
2
3
4
5
4. When I make plans, I am certain I can make them work
1 2 3 4 5
5. If I can’t do a job the first time, I keep trying until I can
1 2 3 4 5
6. When I have something unpleasant to do, I stick to it until I finish
1 2 3 4 5
7. When I decide to do something, I go right to work on it
1 2 3 4 5
8. Failure just makes me try harder
1 2 3 4 5
9. When I set important goals for myself, I rarely achieve them
1 2 3 4 5
10. I do not seem capable of dealing with most problems that come up in my life
1 2 3 4 5
11. When unexpected problems occur, I don’t handle them very well
1 2 3 4 5
12. I feel insecure about my ability to do things
1 2 3 4 5

426
TEACHER EFFICACY Listed below are a series of statements please indicate your response to the statements using the following scale: 1. = strongly disagree 2. = disagree 3. = slightly disagree 4. = slightly agree 5. = agree 6. = strongly agree
STATEMENT 1 2 3 4 5 6 1. When a student does better than usual, many
times it is because the teacher exerts a little extra effort.
1 2 3 4 5 6
2. The time spent in my class has little influence on students compared to the influence of their home environment.
1
2
3
4
5
6
3. Student learning is primarily related to their family background.
1 2 3 4 5 6
4. If students are not disciplined at home, they are not likely to accept discipline at school.
1 2 3 4 5 6
5. I have not been trained to deal with many of the problems my students have.
1 2 3 4 5 6
6. When a student is having difficulty with an assignment, I often have trouble adjusting it to his/her level.
1
2
3
4
5
6
7. When a student performs higher than usual, it is often because I found better ways to teach him/her.
1 2 3 4 5 6
8. When I try really hard I can get to most difficult student.
1 2 3 4 5 6
9. I am very limited in what I can achieve because a student’s home environment is a large influence on his/her achievement.
1
2
3
4
5
6
10. Teachers are not a very powerful influence on student achievement when all factors are considered.
1
2
3
4
5
6
11. When the performance of a student improves, it is usually because their teacher found more effective teaching approaches.
1
2
3
4
5
6
12. If a student masters a new skill or concept quickly, it might be because the teacher knows the necessary steps in teaching it.
1
2
3
4
5
6
13. If parents would do more for their children, teachers could do more.
1 2 3 4 5 6

427
STATEMENT 1 2 3 4 5 6
14. If a student did not remember information I gave in a previous lesson, I would know how to increase his/her retention in the next lesson.
1
2
3
4
5
6
15. The influence of a student’s home experience can be overcome by good teaching.
1 2 3 4 5 6
16. If a student in my class becomes disruptive and noisy, I feel assured that I know some technique to redirect him/her quickly.
1
2
3
4
5
6
17. Even a teacher with good teaching abilities may not reach many students.
1 2 3 4 5 6
18. If a student couldn’t do a class assignment, most teachers would be able to accurately assess whether the assignment was at the correct level of difficulty.
1
2
3
4
5
6
19. If I try really hard, I can get through to even the most difficult or unmotivated students.
1 2 3 4 5 6
20. When it comes right down to it, a teacher cannot really do much because most of a student’s motivation and performance depends on his/her home environment.
1
2
3
4
5
6
21. My teacher training programme and/or experience did not give me the necessary skills to be an effective teacher.
1
2
3
4
5
6
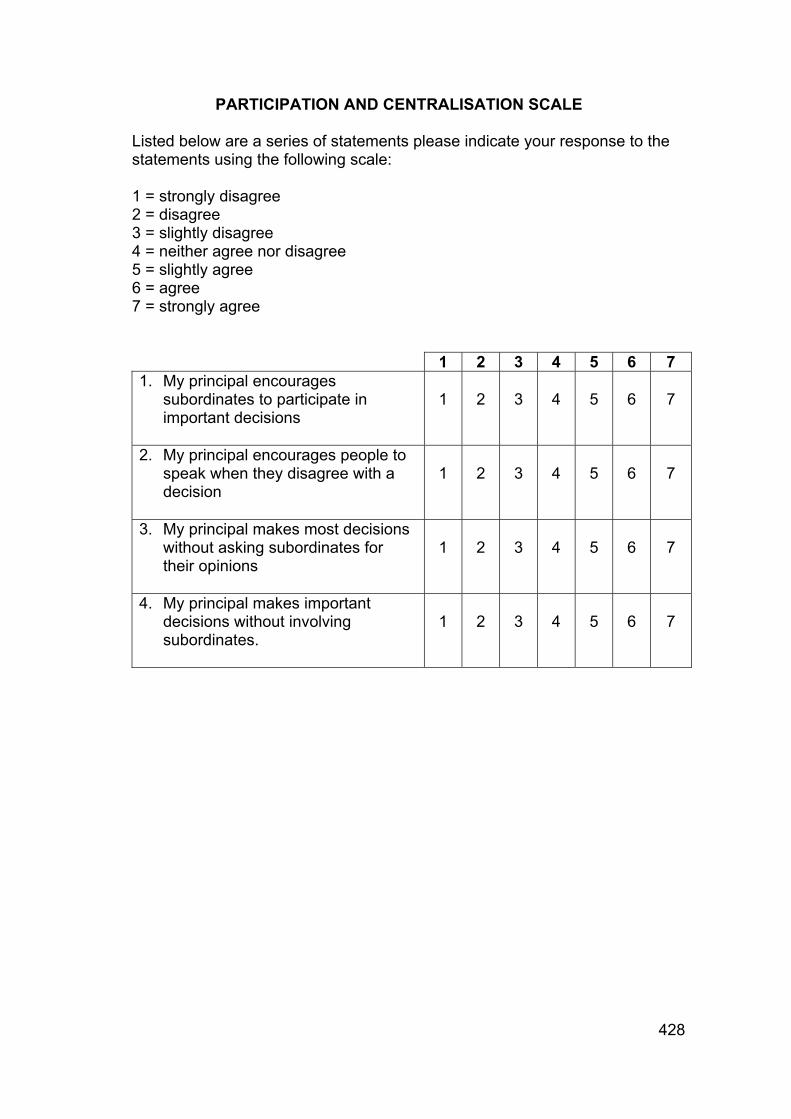
428
PARTICIPATION AND CENTRALISATION SCALE Listed below are a series of statements please indicate your response to the statements using the following scale: 1 = strongly disagree 2 = disagree 3 = slightly disagree 4 = neither agree nor disagree 5 = slightly agree 6 = agree 7 = strongly agree
1 2 3 4 5 6 7 1. My principal encourages
subordinates to participate in important decisions
1
2
3
4
5
6
7
2. My principal encourages people to speak when they disagree with a decision
1
2
3
4
5
6
7
3. My principal makes most decisions without asking subordinates for their opinions
1
2
3
4
5
6
7
4. My principal makes important decisions without involving subordinates.
1
2
3
4
5
6
7

429
PSYCHOLOGICAL PARTICIPATION SCALE Please answer the following questions as honestly as possible:
1. In general, how much say or influence do you feel you have on what goes
on in your school?
A very great deal of influence
A great deal of influence
Quite a bit of influence
Some influence
Little or no influence
2. Do you feel you can influence the decisions of your principal regarding
things about which you are concerned?
I can influence him/her to a great extent
To a considerable extent
To some extent
To a very little extent
I cannot influence him/her at all
3. Does your principal ask your opinion when a problem comes up that
involves your work?
He/she always asks my opinion
Often asks Sometimes asks
Seldom asks He/she never asks my opinion
4. If you have a suggestion for improving the job or changing the set up in
some way, how easy is it for you to get your ideas across to your principal?
It is very difficult
Somewhat difficult
Not too easy Fairly easy It is very easy to get my ideas across

430
COLLABORATION SCALE: Listed below are a series of statements please indicate your response to the statements using the following scale: 1 = strongly disagree 2 = disagree 3 = slightly disagree 4 = neither agree nor disagree 5 = slightly agree 6 = agree 7 = strongly agree
STATEMENT 1 2 3 4 5 6 7 In this school the administrator(s) and teachers collaborate in making the school run effectively
1
2
3
4
5
6
7
In this school teachers share the responsibility for making many of the important decisions that affect this school
1
2
3
4
5
6
7
In this school experienced teachers help new teachers with problems that arise
1 2 3 4 5 6 7
In this school I feel that I can have input with administrators and other teachers regarding important decisions that affect me
1
2
3
4
5
6
7
In this school there is often opportunities to reflect on my teaching with experienced teachers
1
2
3
4
5
6
7
In this school there is good communication between staff members and the principal
1 2 3 4 5 6 7

431
PEER LEADERSHIP INSTRUMENT:
Please answer the following questions as honestly as possible:
PEER LEADERSHIP INSTRUMENT
To a very little extent
To a little extent
To some extent
To a great extent
To a very great excellent
1. How friendly or easy to approach are the people in your school?
1
2
3
4
5
2. When you talk with people in your school to what extent do they pay attention to what you are saying?
1
2
3
4
5
3. To what extent are people in your school willing to listen to your problems?
1
2
3
4
5
4. How much do people in your school encourage each other to give their best effort?
1
2
3
4
5
5. To what extent do people in your school maintain high standards?
1
2
3
4
5
6. To what extent do people in your school help you find ways to do a better job?
1
2
3
4
5
7. To what extent do people in your school provide the help you need so that you can plan, organise and schedule work ahead of time?
1
2
3
4
5
8. To what extent do people in your school offer each other new ideas for solving job-related problems?
1
2
3
4
5
9. How much do people in your school encourage each other to work as a team?
1
2
3
4
5
10. How much do people in your school emphasise a team goal?
1
2
3
4
5
11. To what extent do people in your school exchange opinions and ideas?
1
2
3
4
5

432
PROFILE OF ORGANISATIONAL CHARACTERISTICS SCALE Listed below are descriptive statements about organisations. For each statement I would like you to tell me the extent to which you perceive your school as somewhere on the dimension from System 1 to System 4. System 1 System 2 System 3 System 4 1. How free do you feel to talk to your principal about your job?
Not very free
Somewhat free
Quite free Very free
2. How often are teachers’ ideas sought and used constructively?
Seldom Sometimes Often Very frequently
3. Where is responsibility felt for achieving organisation’s goals?
Mostly on top
Top and middle
Fairly general
At all levels
4. How much co-operative team work exists?
Very little Relatively little
Moderate amount
Great deal
5. What is the usual direction of information flow?
Downward Mostly downward
Down and up
Down, up and sideways
6. How well do management know problems faced by teachers?
Not very well?
Rather well Quite well Very well
7. At what level are decisions made?
Mostly at the top
Policy at top some delegation
Broad policy top, more delegation
Throughout but well integrated
8. Are teachers involved in decisions related to their work?
Almost never
Occasionally consulted
Generally consulted
Fully involved
9. How are organisational goals established?
Orders issued
Orders, some comments invited
After discussion by order
By group action (except in crisis)
10. How much covert resistance to goals is present?
Strong resistance
Moderate resistance
Some resistance at times
Little or none
11. How concentrated are review and control functions?
Very highly at the top
Quite highly at the top
Moderate delegation to lower levels
Widely shared
12. What decision making processes contribute to motivation?
Not very much
Relatively little
Some contribution
Substantial contribution
13. How accurate is upward communication?
Usually inaccurate
Often inaccurate
Often accurate
Almost always accurate
14. How is downward communication accepted?
With suspicion
Possibly with suspicion
With caution
With a receptive mind
15. Is predominant use made of (1) fear, (2) threats, (3) punishment (4) rewards, (5) involvement?
1,2,3 and occasionally 4
4 and some of 3
4, some of 3 and 5
5, 4 based on group
16. How much confidence and trust is shown in teachers?
Virtually none
Some Substantial amount
A great deal

433
SUPERVISORY LEADERSHIP INSTRUMENT
Please answer the following questions as honestly as possible:
SUPERVISORY LEADERSHIP INSTRUMENT To a very
little extent
To a little extent
To some extent
To a great extent
To a very great excellent
1. How friendly and easy to approach is your principal?
1
2
3
4
5
2. When you talk with your principal, to what extent does he/she pay attention to what you are saying?
1
2
3
4
5
3. To what extent is your principal willing to listen to your problems?
1
2
3
4
5
4. How much does your principal encourage people to give their best effort?
1
2
3
4
5
5. To what extent does your principal maintain high standards of performance?
1
2
3
4
5
6. To what extent does your principal set an example by working hard him or her self?
1
2
3
4
5
7. To what extent does your principal encourage subordinates to take action without waiting for detailed review and approval from him or her?
1
2
3
4
5
8. To what extent does your principal show you how to improve your performance?
1
2
3
4
5
9. To what extent does your principal provide the help you need so that you can schedule work ahead of time?
1
2
3
4
5
10. To what extent does your principal offer new ideas for solving job-related problems?
1
2
3
4
5
11. To what extent does your principal encourage the people who work for him or her to work as a team?
1
2
3
4
5
12. To what extent does your principal encourage people who work for him or her to exchange opinions and ideas?
1
2
3
4
5
13. How often does your principal hold group meetings where the people who work for him or her can really discuss things together?
1
2
3
4
5

434
APPENDIX 5: INFORMATION GIVEN TO SCHOOLS AT THE PRELIMINARY MEETING TO DISCUSS THE PROPOSED STUDY
Dear Principal and Staff
As you are already aware Outreach has been working on a Whole School
Development Project with the Atteridgeville Primary Schools since 1996. This
year we have worked with all of the primary schools in the area. It is now
becoming important for us to assess how successful we have been in the
work we set out to do. This is important for us in terms of changes we need to
make to our programme and plans we make for the future. It is also very
important for us to be able to give our funders a clear picture of what results
we have achieved using their money.
It is also important for us to explore what things in the programme helped or
hindered the empowerment of the school and of the people who work in the
school. This will help us to understand the way in which organisations, such
as schools, change and the way in which the individuals in those
organisations change. In this way we can ensure that we strengthen our
programme and therefore the likelihood that it will bring about change in the
schools we work with. The findings of this research will also be important for
the department as it will help to guide them in their attempts to develop and
change the schools in their district. It will also guide them as to whether the
process of school development planning is a useful tool for schools.
In order to do this we will need the involvement of all of the schools we have
worked with. Attached to the letter is a list of all the schools and what we will
require from them. The reason some schools (Group B) will be involved less
in terms of time is because we need to compare those schools who have
been in the programme the longest (Group A) with those who have been in
the shortest (Group C). Group B is the middle group who have been in the
programme for 2 years. I’m sure you’ll agree that the time required is very
minimal. Outreach will also provide the schools with feedback from the study.

435
I have undertaken to do the evaluation as part of my Doctorate degree. It will
therefore help me in furthering my studies. It will also provide me with an
opportunity to critically reflect on the work I have been doing with the schools
over the past 4 years. Something I don’t often get the time to do when I am
busy running around Atteridgeville from school to school.
Your schools are in the unique position that you have School Development
Plans and have been implementing them. Most schools in South Africa have
not implemented this new policy. Your schools involvement in this evaluation
will therefore give light on a very new concept that all schools will eventually
have to implement. I would therefore appreciate your assistance in this
process. If you have any questions you would like to have addressed please
feel free to contact me. If you would like me to explain the process to your
staff I will also gladly do this.
Many thanks
Alex Hassett

436
GROUP 1: THREE YEAR OR
MORE
GROUP A: PILOT GROUP
GROUP 2: ONE YEAR
1. (Name of school)
2.
3.
4.
5.
6.
7.
8.
9.
10.
1. (Name of school)
2.
3.
4.
5.
6.
1. (Name of school)
2.
3.
4.
5.
6.
7.
8.
REQUIREMENTS FROM GROUP A:
• Half an hour to fill in a questionnaire that is being designed to measure
how effectively the school is implementing the school development plan.
REQUIREMENTS OF GROUPS 1 AND 2:
• One hour for staff to fill in questionnaires relating to leadership in the
school (both management and staff leadership); staff involvement and
participation at the school; individual empowerment and school
development planning implementation
• One three hour session to discuss the results of the school development
implementation questionnaire with a group of the staff.

437
APPENDIX 6: POINTS TO HIGHLIGHT TO THE SCHOOLS WHEN ADMINISTERING QUESTIONNAIRES FOR THE EVALUATION:
1. OUTREACH HAS NOW WORKED WITH ALL OF THE PRIMARY SCHOOLS AND IT IS IMPORTANT FOR US TO EVALUATE OUR PROJECT TO SEE IF WE HAVE BEEN SUCCESSFUL AND TO ASSESS IF WE NEED TO CHANGE OUR PROJECT As you are already aware Outreach has been working on a Whole School
Development Project with the Atteridgeville Primary Schools since 1996. This
year we have worked with all of the primary schools in the area. It is now
becoming important for us to assess how successful we have been in the
work we set out to do. This is important for us in terms of changes we need to
make to our programme and plans we make for the future.
2. IT IS IMPORTANT FOR US TO UNDERSTAND THE THINGS THAT HELP OR HINDER THE PROCESS OF SCHOOL DEVELOPMENT AND EMPOWERMENT OF THE PEOPLE WE WORK WITH: It is also important for us to explore what things in the programme helped or
hindered the empowerment of the school and of the people who work in the
school. This will help us to understand the way in which organisations, such
as schools, change and the way in which the individuals in those
organisations change. In this way we can ensure that we strengthen our
programme and therefore the likelihood that it will bring about change in the
schools we work with. The findings of this research will also be important for
the department as it will help to guide them in their attempts to develop and
change the schools in their district. It will also guide them as to whether the
process of school development planning is a useful tool for schools.
3. THE ATTERIDGEVILLE PRIMARY SCHOOLS ARE IN A UNIQUE POSITION IN THAT THEY HAVE BEEN IMPLEMENTING GOVERNMENT POLICY FOR OVER 4 YEARS WHEREAS MOST SCHOOLS IN GAUTENG ONLY STARTED IN 1999: Your schools are in the unique position that you have School Development

438
Plans and have been implementing them. Most schools in South Africa have
not implemented this new policy. Your school’s involvement in this evaluation
will therefore give light on a very new concept that all schools will eventually
have to implement. I would therefore appreciate your assistance in this
process.
4. THE EVALUATION IS BEING DONE AS PART OF ALEX’S DOCTORAL STUDIES Alex has undertaken to do the evaluation as part of my Doctorate degree. He
is presently working on his Doctorate in Community Psychology at the
University of the Witwatersrand. This study is designed to evaluate the impact
of the school development planning project on the level of empowerment of
the school and at an individual level and to explore some of the factors that
help or hinder this process.
5. IMPORTANCE OF ANSWERING ALL OF THE ITEMS ON EACH QUESTIONNAIRE: If participants leave items out we cannot use the questionnaires.
6. IMPORTANCE OF ANSWERING THE QUESTIONNAIRES AS HONESTLY AND AS ACCURATELY AS POSSIBLE In order to do this we will need the involvement of all of the schools and their
staff. Outreach will also provide the schools with feedback from the study.
The questionnaires should take about 60 minutes to complete. It is important
that you answer each question as accurately as you can. It is also important
that you give a response to each of the questions or statements. If you are
unsure of your response please try and think which response is most like your
thoughts, feelings, perceptions about the statement or question.
This questionnaire will not require you to identify yourself and your individual
responses will remain confidential at all times. Once you have completed the
form you can give it to me. Feedback on the overall findings will be made
available to the schools once the study is complete.

439
APPENDIX 7: FOCUS GROUP INTERVIEW SCHEDULE: Introduction: Your school has been involved with Outreach for some years and you have
worked on a School Development Plan (SDP). We are here to exchange
opinions and feelings about the SDP. Please share your point of view even if
it different from what others have said. There are no right or wrong answers
but rather differing points of view. I am just as interested in negative
comments as positive comments, and at times the negative comments may
be more helpful.
I am here to learn as much as possible about your experience of the School
Development Plan. I need to know both those things you found useful and
those you did not. All of this discussion will remain anonymous. I am tape
recording because I don’t want to miss any of your comments. If you do not
feel comfortable with being tape recorded and would prefer not to do so you
may as this is a voluntary exercise and I need people to feel comfortable in
the group. (give time for people to decide). Please speak up and let’s try to
have just one person speak at a time. I will play traffic cop and try and assure
that everyone gets a turn.
Please say exactly what you think, don’t worry about what others or I may
think.
Introductory exercise: Before you start ask each participant to spend a few minutes thinking about
the SDP and to jot down their ideas about the SDP.
To start off with I’d like you to spend a few minutes on your own thinking about
the SDP and how you feel it has helped the school or hasn’t helped the
school. I’d like you to think about what things have helped you implement the
plan and what things have hindered that implementation.
First question: Let’s talk about your experience of being involved in School Development
Planning.

440
(1). “I am interested in finding out how you feel about the usefulness of the
school development plan at the school. What can you tell me about that?”
Questions: (2). Has the School Development Plan brought about any changes in your
school? Can you tell me about these changes. Or
Do you feel the School Development Plan has empowered your school. If yes
why if no why not?
(this question will be adapted if the group has already spoken about changes in previous question)
Probes:
• Are teachers more involved at the school since implementing the School
Development Plan? Can you explain to me.
• Has decision making improved? Can you elaborate on this.
• Do you think the management at the school has changed since
implementing the School Development plan.? How involved are the School
Management Team in the implementation of the plan.
• How involved are parents since implementing the School Development
Plan?
• How involved are the School Governing Body in implementing the plan?
(3). What factors have helped your school in terms of implementing the school
development plan?
(4). What factors have hindered your school in terms of implementing the
school development plan?
(5). Has the School Development Plan brought about any changes in you as
an individual? Can you tell me about that? Or
Do you feel empowered as a teacher by the School Development Plan?
Ending off session: At the end of the focus group I will encourage each participant to summarise
his or her point of view on the critical topics of interest. “If you could offer one
minute of advice to another school about the School Development Plan what
would it be”.

441
APPENDIX 8: LETTER REQUESTING PARTICIPANTS FOR FOCUS GROUPS
Dear Sir/Madam
Thank you very much for taking the time last term to fill in the questionnaires
designed to evaluate the work the St Mary’s DSG Outreach Project has been
doing with your school. I would now like to spend some time with a small
group of teachers from the school to discuss your experiences of the School
Development Plan implementation at your school. I would like between 6 to 8
teachers. I would like the group to be made up of half School Development
Team members and half teachers who were not part of the School
Development Team. So for example if the school selects 8 teachers I would
like 4 to be from the School Development Team and 4 from the rest of the
staff. The principal should not be part of this group. I will meet with the
principals to discuss issues related to the study if necessary.
The discussion group will be happening on:
Date: _____________________
Time: _____________________
Venue: ____________________
Refreshments will be served.
If you would be willing to be part of this group please fill in the form attached
and give it to the principal.
Thanks very much
Alex Hassett

442
CONSENT TO BE INVOLVED IN DISCUSSION GROUP AROUND THE IMPLEMENTATION OF THE SCHOOL DEVELOPMENT PLAN.
I, (name) ___________________________________________ am willing to
participate in the above mentioned discussion group. I am aware that the
above group discussion is part of Alex Hassett’s study of the St Mary’s DSG
Outreach Programme for his doctorate in Psychology. I am participating in
this discussion group on a voluntary basis and am aware that the data
collected can be used in writing up the evaluation.
Signature: _________________________________

443
APPENDIX 9: PRINCIPAL AND SCHOOL DEVELOPMENT TEAM INTERVIEW SCHEDULE
1. Does your school presently have a school development plan?
2. When was this plan developed?
3. Was the plan implementation reviewed by the school?
4. Is the plan being used by the school to guide their activities?
5. In what form is the plan recorded and where?
6. Has the school made any achievements in terms of implementation of the
plan?
7. Is the school development team functioning (e.g. do they meet regularly,
keep minutes, offer regular feedback to the staff, review and monitor the
implementation of the plan)?
8. What role is the principal playing in the School Development
Team/planning?
9. What role does the school management team play in School Development
Team/Planning
10. In what way is the plan connected to fund-raising
444
APPENDIX 10: INFORMATION RELATING TO THE TEST ASSUMPTIONS3
3 A Table of Abbreviations used in the Tables can be found on page 280

445
TABLE 1: GROUP 1 HISTOGRAMS COMPARING SCALES BEFORE AND AFTER TRANSFORMATION Histogram Group 1 (before) Histogram Group 1 (after)
SDPE TOTAL
250.0240.0
230.0220.0
210.0200.0
190.0180.0
170.0160.0
150.0140.0
130.0120.0
110.0100.0
90.080.0
SDPE TOTAL
GROUP: 1.00 3 yrsFr
eque
ncy
20
10
0
Std. Dev = 41.30 Mean = 186.5
N = 153.00
PPSTOTAL
20.018.016.014.012.010.08.06.04.0
PPSTOTAL
GROUP: 1.00 3 yrs
Freq
uenc
y
30
20
10
0
Std. Dev = 3.85 Mean = 11.3
N = 143.00
PCSTOTAL
27.525.022.520.017.515.012.510.07.55.0
PCSTOTAL
GROUP: 1.00 3 yrs
Freq
uenc
y
40
30
20
10
0
Std. Dev = 6.04 Mean = 19.8
N = 143.00
CSTOTAL
42.540.0
37.535.0
32.530.0
27.525.0
22.520.0
17.515.0
12.510.0
7.5
CSTOTAL
GROUP: 1.00 3 yrs
Freq
uenc
y
40
30
20
10
0
Std. Dev = 7.39 Mean = 31.2
N = 143.00
PEERLTOTAL
55.052.5
50.047.5
45.042.5
40.037.5
35.032.5
30.027.5
25.022.5
20.017.5
15.0
PEERLTOTAL
GROUP: 1.00 3 yrs
Freq
uenc
y
30
20
10
0
Std. Dev = 7.96 Mean = 39.6
N = 142.00
SDPES Transformed
62500.0
57500.0
52500.0
47500.0
42500.0
37500.0
32500.0
27500.0
22500.0
17500.0
12500.0
7500.0
SDPES Transformed
GROUP: 1.00 3 yrs
Freq
uenc
y
12
10
8
6
4
2
0
Std. Dev = 14577.77 Mean = 36474.0
N = 153.00
PPSTRANS
4.504.25
4.003.75
3.503.25
3.002.75
2.502.25
2.00
PPSTRANS
GROUP: 1.00 3 yrs
Freq
uenc
y
30
20
10
0
Std. Dev = .58 Mean = 3.32
N = 143.00
PCSTRANS
800.0700.0
600.0500.0
400.0300.0
200.0100.0
0.0
PCSTRANS
GROUP: 1.00 3 yrs
Freq
uenc
y
30
20
10
0
Std. Dev = 222.16 Mean = 429.0
N = 143.00
CSTRANS
1800.01600.0
1400.01200.0
1000.0800.0
600.0400.0
200.00.0
CSTRANS
GROUP: 1.00 3 yrs
Freq
uenc
y
40
30
20
10
0
Std. Dev = 418.67 Mean = 1027.3
N = 143.00
PEERTRAN
3000.02750.0
2500.02250.0
2000.01750.0
1500.01250.0
1000.0750.0
500.0250.0
PEERTRAN
GROUP: 1.00 3 yrs
Freq
uenc
y
30
20
10
0
Std. Dev = 601.79 Mean = 1627.7
N = 142.00

446
TABLE 2: GROUP 2 HISTOGRAMS COMPARING SCALES BEFORE AND AFTER TRANSFORMATION Histogram Group 2 (before) Histogram Group 2 (after)
SDPE TOTAL
250.0240.0
230.0220.0
210.0200.0
190.0180.0
170.0160.0
150.0140.0
130.0120.0
110.0100.0
90.080.0
70.0
SDPE TOTAL
GROUP: 2.00 1yrFr
eque
ncy
14
12
10
8
6
4
2
0
Std. Dev = 41.75 Mean = 184.7
N = 95.00
PPSTOTAL
20.018.016.014.012.010.08.06.04.0
PPSTOTAL
GROUP: 2.00 1yr
Freq
uenc
y
30
20
10
0
Std. Dev = 3.26 Mean = 10.7
N = 86.00
PCSTOTAL
27.525.022.520.017.515.012.510.07.55.0
PCSTOTAL
GROUP: 2.00 1yr
Freq
uenc
y
20
10
0
Std. Dev = 5.73 Mean = 20.3
N = 86.00
CSTOTAL
42.540.0
37.535.0
32.530.0
27.525.0
22.520.0
17.5
CSTOTAL
GROUP: 2.00 1yr
Freq
uenc
y
30
20
10
0
Std. Dev = 6.16 Mean = 32.1
N = 87.00
PEERLTOTAL
55.050.045.040.035.030.025.020.015.0
PEERLTOTAL
GROUP: 2.00 1yr
Freq
uenc
y
30
20
10
0
Std. Dev = 8.92 Mean = 39.6
N = 86.00
SDPES Transformed
65000.0
60000.0
55000.0
50000.0
45000.0
40000.0
35000.0
30000.0
25000.0
20000.0
15000.0
10000.0
5000.0
SDPES Transformed
GROUP: 2.00 1yr
Freq
uenc
y
12
10
8
6
4
2
0
Std. Dev = 14001.02 Mean = 35843.5
N = 95.00
PPSTRANS
4.254.003.753.503.253.002.752.502.252.00
PPSTRANS
GROUP: 2.00 1yr
Freq
uenc
y
20
10
0
Std. Dev = .50 Mean = 3.23
N = 86.00
PCSTRANS
800.0700.0
600.0500.0
400.0300.0
200.0100.0
0.0
PCSTRANS
GROUP: 2.00 1yr
Freq
uenc
y
16
14
12
10
8
6
4
2
0
Std. Dev = 214.52 Mean = 443.7
N = 86.00
CSTRANS
1800.01600.0
1400.01200.0
1000.0800.0
600.0400.0
CSTRANS
GROUP: 2.00 1yr
Freq
uenc
y
30
20
10
0
Std. Dev = 383.16 Mean = 1065.5
N = 87.00
PEERTRAN
3000.02750.0
2500.02250.0
2000.01750.0
1500.01250.0
1000.0750.0
500.0250.0
PEERTRAN
GROUP: 2.00 1yr
Freq
uenc
y
16
14
12
10
8
6
4
2
0
Std. Dev = 679.09 Mean = 1643.9
N = 86.00

447
TABLE 3: GROUP 1 AND 2 Q-Q PLOTS COMPARING SCALES BEFORE AND AFTER TRANSFORMATION Normal Q-Q Plots before transformation Normal Q-Q Plots after transformation
Normal Q-Q Plot of SDPE TOTAL
For GROUP= 3 yrs
Observed Value
3002001000
Expe
cted
Nor
mal
3
2
1
0
-1
-2
-3
Normal Q-Q Plot of SDPE TOTAL
For GROUP= 1yr
Observed Value
3002001000
Expe
cted
Nor
mal
3
2
1
0
-1
-2
-3
Normal Q-Q Plot of PPSTOTAL
For GROUP= 3 yrs
Observed Value
3020100
Expe
cted
Nor
mal
3
2
1
0
-1
-2
-3
Normal Q-Q Plot of PPSTOTAL
For GROUP= 1yr
Observed Value
2018161412108642
Expe
cted
Nor
mal
3
2
1
0
-1
-2
-3
Normal Q-Q Plot of SDPES Transformed
For GROUP= 3 yrs
Observed Value
800006000040000200000-20000
Expe
cted
Nor
mal
3
2
1
0
-1
-2
-3
Normal Q-Q Plot of SDPES Transformed
For GROUP= 1yr
Observed Value
700006000050000400003000020000100000
Expe
cted
Nor
mal
3
2
1
0
-1
-2
-3
Normal Q-Q Plot of PPSTRANS
For GROUP= 3 yrs
Observed Value
5.04.54.03.53.02.52.01.5
Expe
cted
Nor
mal
3
2
1
0
-1
-2
-3
Normal Q-Q Plot of PPSTRANS
For GROUP= 1yr
Observed Value
4.54.03.53.02.52.01.5
Expe
cted
Nor
mal
3
2
1
0
-1
-2
-3

448
Normal Q-Q Plot of PCSTOTAL
For GROUP= 3 yrs
Observed Value
403020100
Expe
cted
Nor
mal
2
1
0
-1
-2
-3
Normal Q-Q Plot of PCSTOTAL
For GROUP= 1yr
Observed Value
3020100
Expe
cted
Nor
mal
2
1
0
-1
-2
-3
Normal Q-Q Plot of CSTOTAL
GROUP= 3 yrs
Observed Value
50403020100
Expe
cted
Nor
mal
3
2
1
0
-1
-2
-3
Normal Q-Q Plot of CSTOTAL
GROUP= 1yr
Observed Value
5040302010
Expe
cted
Nor
mal
2
1
0
-1
-2
-3
Normal Q-Q Plot of PCSTRANS
For GROUP= 3 yrs
Observed Value
10008006004002000-200
Expe
cted
Nor
mal
2
1
0
-1
-2
-3
Normal Q-Q Plot of PCSTRANS
For GROUP= 1yr
Observed Value
8006004002000-200Ex
pect
ed N
orm
al
2
1
0
-1
-2
-3
Normal Q-Q Plot of CSTRANS
For GROUP= 3 yrs
Observed Value
3000200010000-1000
Expe
cted
Nor
mal
3
2
1
0
-1
-2
-3
Normal Q-Q Plot of CSTRANS
For GROUP= 1yr
Observed Value
200010000
Expe
cted
Nor
mal
2
1
0
-1
-2
-3

449
Normal Q-Q Plot of PEERLTOTAL
GROUP= 3 yrs
Observed Value
605040302010
Expe
cted
Nor
mal
3
2
1
0
-1
-2
-3
Normal Q-Q Plot of PEERLTOTAL
GROUP= 1yr
Observed Value
605040302010
Expe
cted
Nor
mal
3
2
1
0
-1
-2
-3
Normal Q-Q Plot of PEERTRAN
For GROUP= 3 yrs
Observed Value
40003000200010000
Expe
cted
Nor
mal
3
2
1
0
-1
-2
-3
Normal Q-Q Plot of PEERTRAN
For GROUP= 1yr
Observed Value
40003000200010000Ex
pect
ed N
orm
al
3
2
1
0
-1
-2
-3

450
TABLE 4: DESCRIPTIVE STATISTICS FOR GROUP 1 (3 years or more in the programme):
School Dev Plan Eval
Locus of Control
Gen Self Efficacy
Teacher Efficacy
Participation Centralisation
Psychological Participation
Collaboration Prof Org Characteristic
Supervisory Leadership
Peer Leadership
N Valid
153 153 153 142 143 143 143 139 143 142
Missing
0 0 0 11 10 10 10 14 10 11
Mean
186.4925 91.7715 39.7415 81.7144 19.8182 11.3310 31.1944 44.1751 46.5613 39.5576
Std. Error of Mean
3.33889 1.00018 .43094 .80296 .50523 .32221 .61795 .81292 .97430 .66767
Median
193.0000 91.3500 40.0000 81.0000 21.0000 11.0000 32.0000 44.0000 48.0000 40.0000
Mode
229.00 92.00 46.00 78.00 22.00 12.00 36.00 43.00 52.00 36.00
Std. Deviation
41.29975 12.37158 5.33048 9.56832 6.04168 3.85303 7.38956 9.58415 11.65097 7.95618
Variance
1705.66925 153.05606 28.41404 91.55276 36.50192 14.84585 54.60560 91.85600 135.74516 63.30087
Skewness
-.561 .077 -.172 .228 -.590 .233 -.893 -.205 -.719 -.534
Std. Error of Skewness
.196 .196 .196 .203 .203 .203 .203 .206 .203 .203
Skewness z-scores
2.862 .393 .877 1.123 2.906 1.147 4.399 .995 3.54 2.6
Kurtosis
-.485 -.414 -.489 .342 -.318 -.634 .454 -.611 .206 .023
Std. Error of Kurtosis
.390 .390 .390 .404 .403 .403 .403 .408 .403 .404
Kurtosis z-score
1.69 .63 .93 1.06 1.7 1.07 2.09 .99 1.88 1.6
Range
166.75 58.47 24.44 61.00 24.00 16.00 34.00 43.80 52.00 40.00
Minimum
83.25 62.00 25.56 51.00 4.00 4.00 8.00 19.20 13.00 15.00
Maximum
250.00 120.47 50.00 112.00 28.00 20.00 42.00 63.00 65.00 55.00
450

451
TABLE 5: DESCRIPTIVE STATISTICS FOR GROUP 2 (1 year in the programme):
School Dev Plan Eval
Locus of Control
Gen Self Efficacy
Teacher Efficacy
Participation Centralisation
Psychological Participation
Collaboration Prof Org Characteristic
Supervisory Leadership
Peer Leadership
N Valid
95 95 95 87 86 86 87 87 86 86
Missing
0 0 0 8 9 9 8 8 9 9
Mean
184.7122 92.7413 40.4304 82.8254 20.2791 10.6977 32.0621 43.7963 46.0155 39.5628
Std. Error of Mean
4.28368 1.25658 .52877 .92920 .61794 .35130 .66032 .91781 1.10348 .96190
Median
193.0000 93.0000 40.0000 83.0000 21.5000 10.0000 34.0000 44.0000 47.0000 40.0000
Mode
179.00 85.00 39.00 83.00 22.00 8.00 36.00 45.00 44.00 39.00
Std. Deviation
41.75218 12.24766 5.15380 8.66704 5.73052 3.25782 6.15908 8.56072 10.23322 8.92026
Variance
1743.24419 150.00513 26.56166 75.11761 32.83885 10.61341 37.93424 73.28598 104.71871 79.57107
Skewness
-.922 -.428 -.485 .459 -.665 .365 -.371 -.128 -.287 -.435
Std. Error of Skewness
.247 .247 .247 .258 .260 .260 .258 .258 .260 .260
Skewness z-scores
3.732 1.733 1.96 1.77 2.55 1.403 1.4 .496 1.104 1.67
Kurtosis
.291 .143 .374 .337 -.135 -.225 -.796 -.343 -.388 -.227
Std. Error of Kurtosis
.490 .490 .490 .511 .514 .514 .511 .511 .514 .514
Kurtosis z-scores
1.93 1.3 1.4 1.33 1.60 1.18 1.18 0.7 1.05 1.29
Range
185.00 59.15 25.56 45.00 23.00 15.00 24.00 41.00 42.00 40.00
Minimum
69.00 59.85 24.44 66.00 5.00 4.00 18.00 23.00 22.00 15.00
Maximum
254.00 119.00 50.00 111.00 28.00 19.00 42.00 64.00 64.00 55.00
a Multiple modes exist. The smallest value is shown
451

452
TABLE 6: SKEWNESS AND KURTOSIS STATISTICS FOR GROUP 1 AFTER THE TRANSFORMATION OF THE SCALES: Group 1 (3 years on the programme) School Dev
Plan Eval Scale
Psychological Participation
Scale
Participation Centralisation
Scale
Collaboration Scale
Peer Leadership
Scale N Valid
153 143 143 143 142
Missing
0 10 10 10 11
Skewness
-.165 -.107 -.015 -.314 -.017
Std. Error of Skewness
.196 .203 .203 .203 .203
Skewness z-scores
.84 .053 .0074 1.55 .049
Kurtosis
-.988 -.697 -1.132 -.712 -.486
Std. Error of Kurtosis
.390 .403 .403 .403 .404
Kurtosis z-score
0.91 .23 .086 1.24 .22
TABLE 7: SKEWNESS AND KURTOSIS STATISTICS FOR GROUP 2 AFTER THE TRANSFORMATION OF THE SCALES: Group 2 (1 year on the programme) School Dev
Plan Eval Scale
Psychological Participation
Scale
Participation Centralisation
Scale
Collaboration Scale
Peer Leadership
Scale N Valid
95 86 86 87 86
Missing
0 9 9 8 9
Skewness
-.412 -.040 -.074 -.060 .086
Std. Error of Skewness
.247 .260 .260 .258 .260
Skewness z-scores
1.66 .154 .285 .23 .33
Kurtosis
-.509 -.161 -.932 -.963 -.630
Kurtosis z-scores
1.289 .39 .53 .48 .57
Std. Error of Kurtosis
.490 .514 .514 .511 .514

453
APPENDIX 11: KOLMOGOROV-SMIRNOV STATISTIC COMPARING NORMALITY SCORES FOR BOTH GROUPS BEFORE AND AFTER TRANSFORMATIONS: SCHOOL DEVELOPMENT PLANNING EVALUATION SCALE (SDPES): Before transformation:
Kolmogorov-Smirnov(a) Group Statistic df Sig. SDPES 1 .083 153 .012SDPES 2 .140 95 .000
a Lilliefors Significance Correction After transformation:
Kolmogorov-Smirnov(a) Group Statistic df Sig. SDPES Trans 1 .073 153 .044SDPES Trans 2 .088 95 .69
a Lilliefors Significance Correction PSYCHOLOGICAL PARTICIPATION SCALE (PPS): Before transformation:
Kolmogorov-Smirnov(a) Group Statistic df Sig. PPS 1 .090 143 .007PPS 2 .108 86 .015
a Lilliefors Significance Correction After transformation:
Kolmogorov-Smirnov(a) Group Statistic df Sig. PPS 1 .090 143 .006PPS 2 .085 86 .180
a Lilliefors Significance Correction PARTICIPATION CENTRALISATION SCALE (PCS): Before transformation:
Kolmogorov-Smirnov(a) Group Statistic df Sig. PCS 1 .110 143 .000PCS 2 .118 86 .005
a Lilliefors Significance Correction

454
After transformation:
Kolmogorov-Smirnov(a) Group Statistic df Sig. PCS 1 .096 143 .003PCS 2 .081 86 .200
a Lilliefors Significance Correction COLLABORATION SCALE (CS): Before transformation:
Kolmogorov-Smirnov(a) Group Statistic df Sig. CS 1 .124 143 .000CS 2 .129 87 .001
a Lilliefors Significance Correction After transformation:
Kolmogorov-Smirnov(a) Group Statistic df Sig. CS 1 .087 143 .010CS 2 .099 87 .034
a Lilliefors Significance Correction PEER LEADERSHIP SCALE (PEERLEAD): Before transformation:
Kolmogorov-Smirnov(a) Group Statistic df Sig. PEERLEAD 1 .074 142 .056PEERLEAD 2 .103 86 .025
a Lilliefors Significance Correction After transformation:
Kolmogorov-Smirnov(a) Group Statistic df Sig. PEERLEAD 1 .041 142 .200PEERLEAD 2 .060 86 .200
a Lilliefors Significance Correction

455
KOLMOGOROV-SMIRNOV STATISTIC FOR THOSE NOT TRANSFORMED PROFILE OF ORGANISATIONAL CHARACTERISTICS (POC):
Kolmogorov-Smirnov(a) Group Statistic df Sig. POC 1 .071 139 .082POC 2 .062 87 .200
a Lilliefors Significance Correction SUPERVISORY LEADERSHIP SCALE (SUPLEAD):
Kolmogorov-Smirnov(a) Group Statistic df Sig. SUPERLEAD 1 .079 143 .028SUPERLEAD 2 .066 86 .200
a Lilliefors Significance Correction LOCUS OF CONTROL (LC):
Kolmogorov-Smirnov(a) Group Statistic df Sig. LC 1 .055 153 .200LC 2 .074 95 .200
a Lilliefors Significance Correction GENERAL SELF-EFFICACY SCALE (GSES):
Kolmogorov-Smirnov(a) Group Statistic df Sig. GSES 1 .075 153 .033GSES 2 .082 95 .119
a Lilliefors Significance Correction TEACHER EFFICACY SCALE (TE):
Kolmogorov-Smirnov(a) Group Statistic df Sig. TE 1 .067 142 .200TE 2 .067 87 .200
a Lilliefors Significance Correction

456
APPENDIX 12: INFORMATION RELATING TO THE RELIABILITY AND VALIDITY ANALYSES OF THE SCHOOL DEVELOPMENT PLANNING EVALUATION SCALE

457
SMETI SEP
DS R
OF SISOT
RU
K D
NA SS E
NWE
KS :1 ELB
AT
ssenwekS
sisotru
K
citsitatS
rorrE .dt
Scitsitat
S rorr
E .dtS
72 metI
518.-582.
944.-365.
82 metI
945.-582.
446.-365.
92 metI
981.1-582.
296.365.
03 metI
5 38.-5 82 .
961.-3 65 .
13 metI
2 08.-582.
040.-365 .
23 metI
6 65.-5 82 .
0 26. -365 .
33 metI
058.-582.
833. -3 65 .
4 3 m etI
755.1-582.
090.3365.
53 metI
4 97.-5 82.
4 21. -365 .
63 metI
743.1-582.
546.2365.
73 metI
908.-582.
152. -3 65 .
83 me tI
422.1-582.
377.365.
9 3 metI
382.1-582.
753.1365.
04 metI
502.1-582.
530.1365.
1 4 m etI
643.1-582.
326.1365.
24 metI
402.1-582.
282.365.
34 metI
786.1-582.
676.2365.
4 4 m et I
271.1-582.
722.1365.
54 metI
653.1-582.
766.1365.
64 metI
177.-582.
4 03. -365.
74 metI
440.1-582.
771.365.
8 4 m etI
208.-582.
662.365.
94 metI
731.1-582.
930.1365.
05 metI
278.-582.
230.365.
15 metI
856.-582.
306.-365.
25 metI
7 93. -582 .
16 0.1 -3 65 .
ssenwekS
sisotru
K
cit si ta tS
ro rrE .dt
Scitsitat
S rorr
E .d tS
1 met I
267. 1-582.
323 .3365.
2 met I
771.2-582.
116.7365.
3 metI
469. -58 2.
14 0.365.
4 metI
550.1-582.
458.365.
5 met I
473. -582.
591. 1-365.
6 metI
954.1-582.
157.1365.
7 met I
642.1-582.
392.1365.
8 met I
796.-582.
614.-365.
9 metI
499.-582.
125.365.
01 metI
420.1-582.
933.365.
11 met I
617.1-582.
359.3365.
21 me tI
090.1-582.
321.-365.
31 met I
917.-582.
880.-365.
41 met I
02 5.1-582.
980.2365.
51 metI
220.1-582.
751.365.
61 met I
541.1-582.
576.365.
71 metI
831.1-582.
395.365.
81 metI
466.1-582.
761.3365.
91 metI
188.-582.
403.365.
02 metI
178. 1-582.
721.4365.
12 met I
503.1-582.
366.1365.
22 metI
865. -58 2.
319. -365.
32 metI
497. -582.
865. -365.
42 metI
490.1-582.
010.1365.
52 metI
418.-582.
550.365.
62 metI
10 4.1-58 2.
737.1365.

458
TABLE 2: ITEM CORRELATIONS (Pearson’s) WITH ITEM 52 INCLUDED AND EXCLUDED
With Item 52 Included
With Item 52 removed
Item 3 .589** .593**Item 4 .786** .789**Item 5 .305** .303*Item 7 .566** .570**Item 8 .576** .569**Item 9 .642** .644**Item 10 .641** .641**Item 12 .361** .361**Item 13 .595** .592**Item 15 .769** .764**Item 16 .747** .747**Item 17 .624** .628**Item 19 .760** .764**Item 22 .571** .573**Item 23 .428** .420**Item 24 .672** .670**Item 25 .646** .641**Item 27 .724** .735**Item 28 .656** .658**Item 29 .749** .751**Item 30 .783** .780**Item 31 .784** .795**Item 32 .702** .705**Item 33 .650** .655**Item 35 .672** .675**Item 37 .745** .748**Item 38 .751** .755**Item 39 .771** .773**Item 40 .757** .763**Item 42 .451** .433**Item 44 .735** .737**Item 46 .631** .631**Item 47 .729** .732**Item 48 .628** .635**Item 49 .690** .692**Item 50 .712** .715**Item 51 .705** .697**Item 52 .230 sdpis_t 1.000 1.000 N 77
** Correlation is significant at the 0.01 level (2-tailed). * Correlation is significant at the 0.05 level (2-tailed).
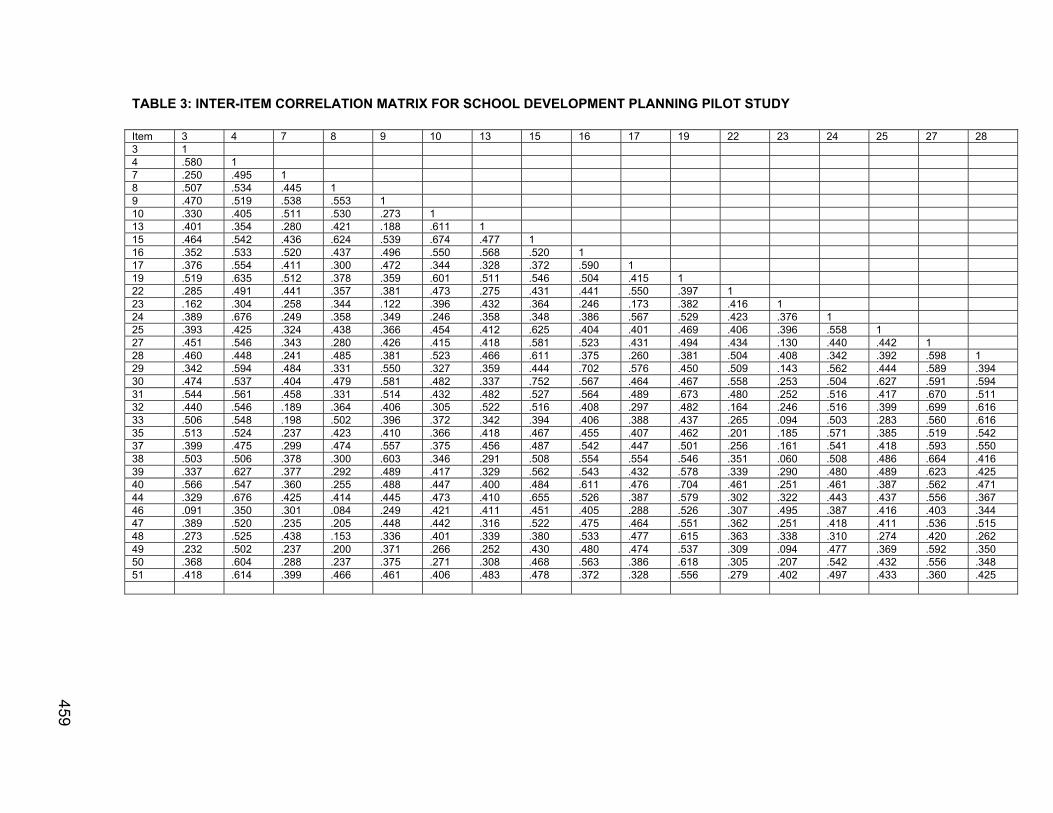
459
TABLE 3: INTER-ITEM CORRELATION MATRIX FOR SCHOOL DEVELOPMENT PLANNING PILOT STUDY Item 3 4 7 8 9 10 13 15 16 17 19 22 23 24 25 27 28 3 1 4 .580 1 7 .250 .495 1 8 .507 .534 .445 1 9 .470 .519 .538 .553 1 10 .330 .405 .511 .530 .273 1 13 .401 .354 .280 .421 .188 .611 1 15 .464 .542 .436 .624 .539 .674 .477 1 16 .352 .533 .520 .437 .496 .550 .568 .520 1 17 .376 .554 .411 .300 .472 .344 .328 .372 .590 1 19 .519 .635 .512 .378 .359 .601 .511 .546 .504 .415 1 22 .285 .491 .441 .357 .381 .473 .275 .431 .441 .550 .397 1 23 .162 .304 .258 .344 .122 .396 .432 .364 .246 .173 .382 .416 1 24 .389 .676 .249 .358 .349 .246 .358 .348 .386 .567 .529 .423 .376 1 25 .393 .425 .324 .438 .366 .454 .412 .625 .404 .401 .469 .406 .396 .558 1 27 .451 .546 .343 .280 .426 .415 .418 .581 .523 .431 .494 .434 .130 .440 .442 1 28 .460 .448 .241 .485 .381 .523 .466 .611 .375 .260 .381 .504 .408 .342 .392 .598 1 29 .342 .594 .484 .331 .550 .327 .359 .444 .702 .576 .450 .509 .143 .562 .444 .589 .394 30 .474 .537 .404 .479 .581 .482 .337 .752 .567 .464 .467 .558 .253 .504 .627 .591 .594 31 .544 .561 .458 .331 .514 .432 .482 .527 .564 .489 .673 .480 .252 .516 .417 .670 .511 32 .440 .546 .189 .364 .406 .305 .522 .516 .408 .297 .482 .164 .246 .516 .399 .699 .616 33 .506 .548 .198 .502 .396 .372 .342 .394 .406 .388 .437 .265 .094 .503 .283 .560 .616 35 .513 .524 .237 .423 .410 .366 .418 .467 .455 .407 .462 .201 .185 .571 .385 .519 .542 37 .399 .475 .299 .474 .557 .375 .456 .487 .542 .447 .501 .256 .161 .541 .418 .593 .550 38 .503 .506 .378 .300 .603 .346 .291 .508 .554 .554 .546 .351 .060 .508 .486 .664 .416 39 .337 .627 .377 .292 .489 .417 .329 .562 .543 .432 .578 .339 .290 .480 .489 .623 .425 40 .566 .547 .360 .255 .488 .447 .400 .484 .611 .476 .704 .461 .251 .461 .387 .562 .471 44 .329 .676 .425 .414 .445 .473 .410 .655 .526 .387 .579 .302 .322 .443 .437 .556 .367 46 .091 .350 .301 .084 .249 .421 .411 .451 .405 .288 .526 .307 .495 .387 .416 .403 .344 47 .389 .520 .235 .205 .448 .442 .316 .522 .475 .464 .551 .362 .251 .418 .411 .536 .515 48 .273 .525 .438 .153 .336 .401 .339 .380 .533 .477 .615 .363 .338 .310 .274 .420 .262 49 .232 .502 .237 .200 .371 .266 .252 .430 .480 .474 .537 .309 .094 .477 .369 .592 .350 50 .368 .604 .288 .237 .375 .271 .308 .468 .563 .386 .618 .305 .207 .542 .432 .556 .348 51 .418 .614 .399 .466 .461 .406 .483 .478 .372 .328 .556 .279 .402 .497 .433 .360 .425
459

460
TABLE 3: INTER-ITEM CORRELATION MATRIX FOR SCHOOL DEVELOPMENT PLANNING PILOT STUDY (Continued) Item 29 30 31 32 33 35 37 38 39 40 44 46 47 48 49 50 51 3 4 7 8 9 10 13 15 16 17 19 22 23 24 25 27 28 29 1 30 .558 1 31 .543 .707 1 32 .432 .562 .652 1 33 .517 .466 .564 .644 1 35 .465 .549 .597 .658 .721 1 37 .600 .600 .654 .721 .745 .722 1 38 .686 .676 .685 .565 .568 .593 .737 1 39 .606 .622 .609 .609 .433 .410 .550 .709 1 40 .561 .634 .813 .538 .545 .591 .580 .632 .572 1 44 .457 .474 .521 .542 .394 .364 .468 .396 .709 .478 1 46 .434 .414 .533 .377 .301 .365 .411 .361 .551 .533 .605 1 47 .524 .601 .549 .567 .499 .440 .613 .645 .707 .623 .499 .535 1 48 .417 .379 .490 .306 .193 .253 .297 .429 .621 .549 .518 .563 .563 1 49 .582 .522 .563 .448 .495 .399 .601 .614 .593 .522 .586 .606 .649 .590 1 50 .568 .540 .573 .466 .363 .365 .481 .528 .593 .531 .579 .496 .591 .666 .772 1 51 .375 .491 .490 .553 .388 .341 .537 .444 .591 .401 .578 .509 .579 .506 .507 .523 1
460

461
TABLE 4: ITEM-TOTAL CORRELATIONS:
SDPES TOTAL
SDPE 1 .587(**) SDPE 2 .623(**) SDPE 3 .716(**) SDPE 4 .724(**) SDPE 5 .669(**) SDPE 6 .770(**) SDPE 7 .654(**) SDPE 8 .598(**) SDPE 9 .655(**) SDPE 10 .708(**) SDPE 11 .664(**) SDPE 12 .644(**) SDPE 13 .768(**) SDPE 14 .644(**) SDPE 15 .579(**) SDPE 16 .700(**) SDPE 17 .642(**) SDPE 18 .720(**) SDPE 19 .638(**) SDPE 20 .537(**) SDPE 21 .655(**) SDPE 22 .756(**) SDPE 23 .749(**) SDPE 24 .748(**) SDPE 25 .725(**) SDPE 26 .744(**) SDPE 27 .792(**) SDPE 28 .722(**) SDPE 29 .770(**) SDPE 30 .567(**) SDPE 31 .743(**) SDPE 32 .590(**) SDPE 33 .706(**) SDPE 34 .684(**) SDPE 35 .743(**) SDPE 36 .763(**) SDPE 37 .653(**) SDPE TOTAL 1 N 248
** Correlation is significant at the 0.01 level (2-tailed).
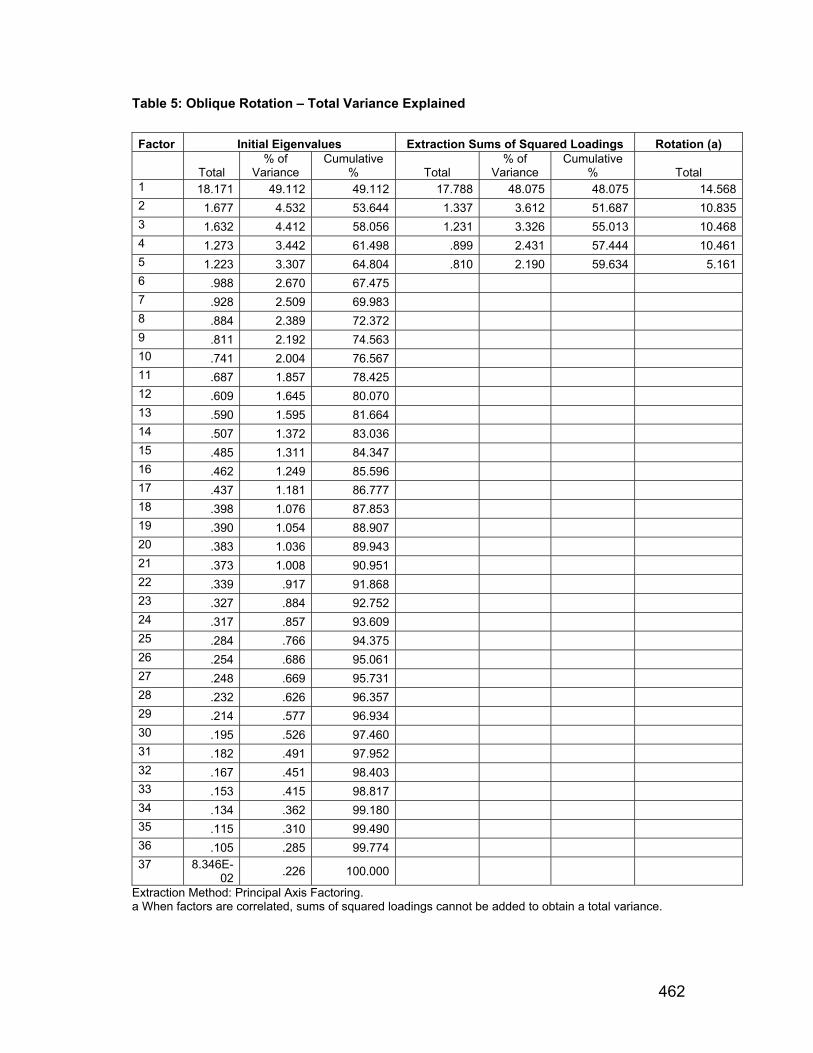
462
Table 5: Oblique Rotation – Total Variance Explained Factor Initial Eigenvalues Extraction Sums of Squared Loadings Rotation (a)
Total % of
Variance Cumulative
% Total % of
Variance Cumulative
% Total 1 18.171 49.112 49.112 17.788 48.075 48.075 14.5682 1.677 4.532 53.644 1.337 3.612 51.687 10.8353 1.632 4.412 58.056 1.231 3.326 55.013 10.4684 1.273 3.442 61.498 .899 2.431 57.444 10.4615 1.223 3.307 64.804 .810 2.190 59.634 5.1616 .988 2.670 67.475 7 .928 2.509 69.983 8 .884 2.389 72.372 9 .811 2.192 74.563 10 .741 2.004 76.567 11 .687 1.857 78.425 12 .609 1.645 80.070 13 .590 1.595 81.664 14 .507 1.372 83.036 15 .485 1.311 84.347 16 .462 1.249 85.596 17 .437 1.181 86.777 18 .398 1.076 87.853 19 .390 1.054 88.907 20 .383 1.036 89.943 21 .373 1.008 90.951 22 .339 .917 91.868 23 .327 .884 92.752 24 .317 .857 93.609 25 .284 .766 94.375 26 .254 .686 95.061 27 .248 .669 95.731 28 .232 .626 96.357 29 .214 .577 96.934 30 .195 .526 97.460 31 .182 .491 97.952 32 .167 .451 98.403 33 .153 .415 98.817 34 .134 .362 99.180 35 .115 .310 99.490 36 .105 .285 99.774 37 8.346E-
02 .226 100.000
Extraction Method: Principal Axis Factoring. a When factors are correlated, sums of squared loadings cannot be added to obtain a total variance.
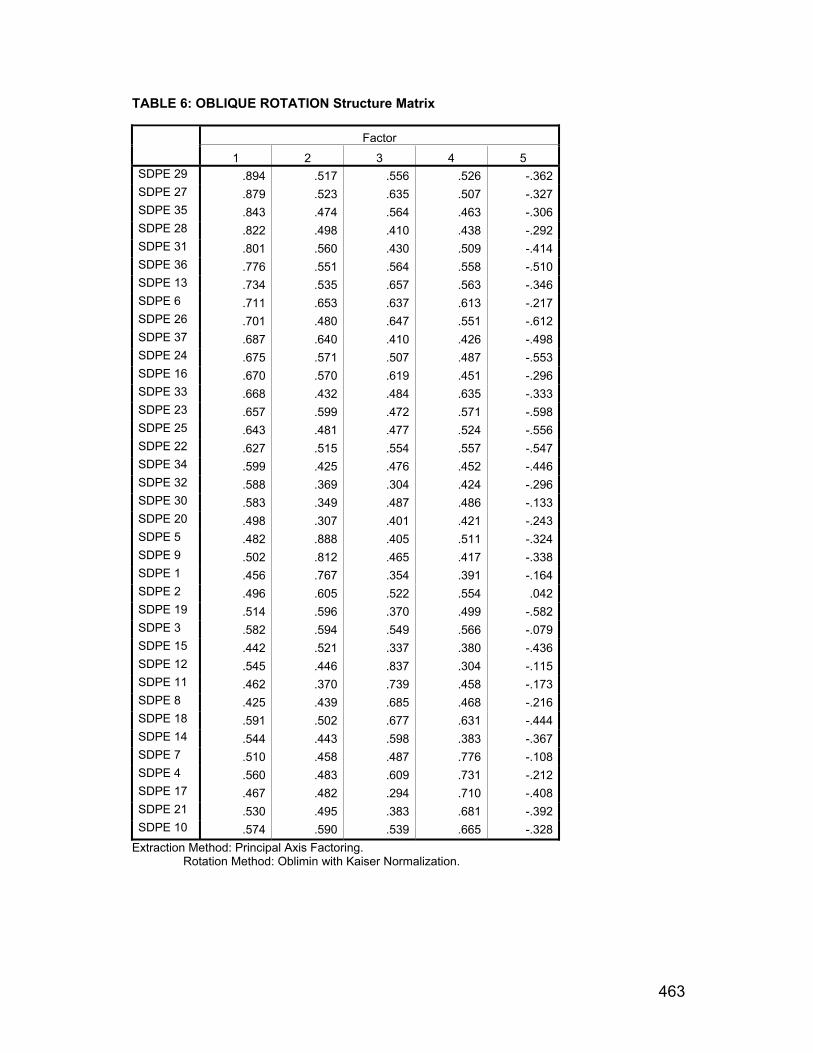
463
TABLE 6: OBLIQUE ROTATION Structure Matrix
Factor 1 2 3 4 5 SDPE 29 .894 .517 .556 .526 -.362SDPE 27 .879 .523 .635 .507 -.327SDPE 35 .843 .474 .564 .463 -.306SDPE 28 .822 .498 .410 .438 -.292SDPE 31 .801 .560 .430 .509 -.414SDPE 36 .776 .551 .564 .558 -.510SDPE 13 .734 .535 .657 .563 -.346SDPE 6 .711 .653 .637 .613 -.217SDPE 26 .701 .480 .647 .551 -.612SDPE 37 .687 .640 .410 .426 -.498SDPE 24 .675 .571 .507 .487 -.553SDPE 16 .670 .570 .619 .451 -.296SDPE 33 .668 .432 .484 .635 -.333SDPE 23 .657 .599 .472 .571 -.598SDPE 25 .643 .481 .477 .524 -.556SDPE 22 .627 .515 .554 .557 -.547SDPE 34 .599 .425 .476 .452 -.446SDPE 32 .588 .369 .304 .424 -.296SDPE 30 .583 .349 .487 .486 -.133SDPE 20 .498 .307 .401 .421 -.243SDPE 5 .482 .888 .405 .511 -.324SDPE 9 .502 .812 .465 .417 -.338SDPE 1 .456 .767 .354 .391 -.164SDPE 2 .496 .605 .522 .554 .042SDPE 19 .514 .596 .370 .499 -.582SDPE 3 .582 .594 .549 .566 -.079SDPE 15 .442 .521 .337 .380 -.436SDPE 12 .545 .446 .837 .304 -.115SDPE 11 .462 .370 .739 .458 -.173SDPE 8 .425 .439 .685 .468 -.216SDPE 18 .591 .502 .677 .631 -.444SDPE 14 .544 .443 .598 .383 -.367SDPE 7 .510 .458 .487 .776 -.108SDPE 4 .560 .483 .609 .731 -.212SDPE 17 .467 .482 .294 .710 -.408SDPE 21 .530 .495 .383 .681 -.392SDPE 10 .574 .590 .539 .665 -.328
Extraction Method: Principal Axis Factoring. Rotation Method: Oblimin with Kaiser Normalization.
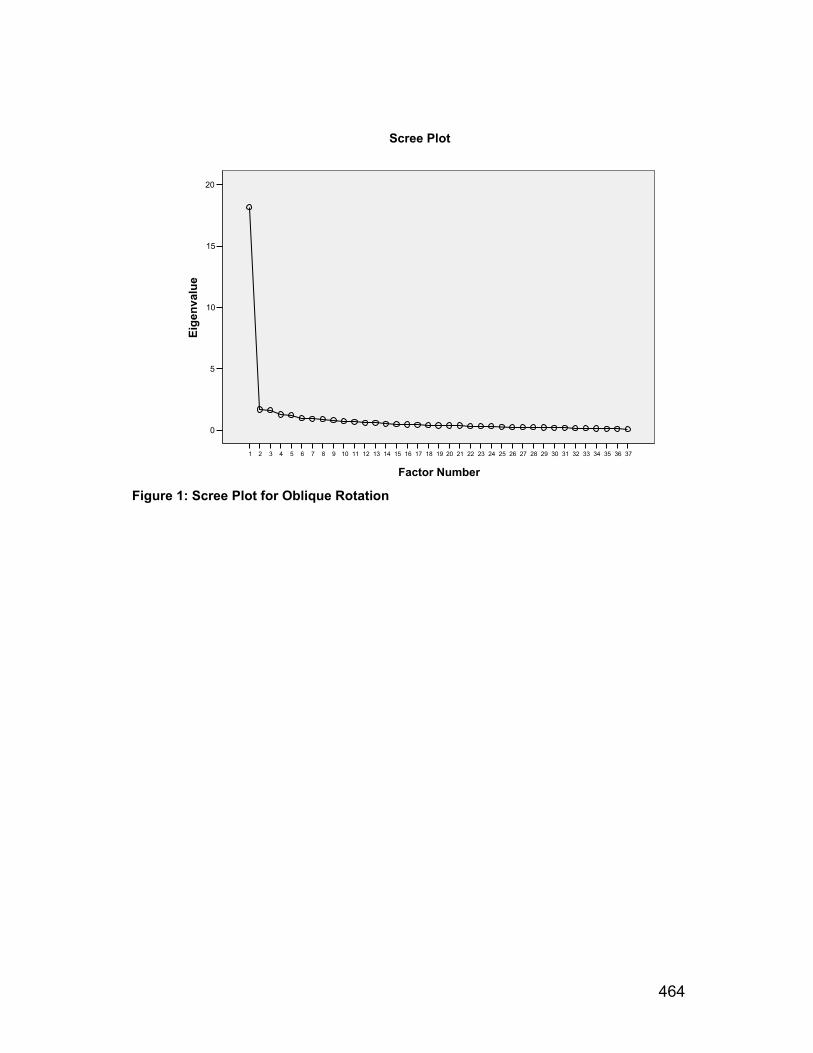
464
37363534333231302928272625242322212019181716151413121110987654321
Factor Number
20
15
10
5
0
Eige
nval
ue
Scree Plot
Figure 1: Scree Plot for Oblique Rotation

465
TABLE 7: INTER-ITEM CORRELATION MATRIX FOR SCHOOL DEVELOPMENT PLANNING FINAL VERSION Item 1 2 3 4 5 6 7 8 9 10 11 12 13 14 15 16 17 18 19
1 1 2 .507 1 3 .523 .604 1 4 .340 .561 .566 1 5 .665 .558 .516 .501 1 6 .515 .609 .619 .565 .555 1 7 .352 .488 .495 .572 .442 .570 1 8 .291 .396 .410 .511 .414 .479 .467 1 9 .630 .428 .445 .425 .744 .581 .387 .461 1 10 .483 .436 .549 .569 .538 .512 .559 .515 .523 1 11 .302 .413 .404 .532 .320 .487 .399 .521 .365 .471 1 12 .370 .425 .432 .431 .346 .538 .393 .546 .469 .448 .675 1 13 .395 .470 .553 .543 .458 .632 .477 .516 .470 .543 .526 .546 1 14 .247 .345 .453 .410 .443 .479 .360 .509 .400 .358 .408 .525 .570 1 15 .363 .289 .272 .353 .492 .371 .304 .290 .429 .473 .258 .301 .448 .413 1 16 .434 .500 .480 .435 .472 .646 .436 .430 .468 .469 .437 .574 .596 .506 .465 1 17 .327 .422 .360 .434 .428 .460 .567 .285 .428 .486 .302 .219 .487 .323 .347 .389 1 18 .379 .464 .515 .584 .424 .614 .497 .530 .473 .579 .539 .502 .622 .479 .367 .576 .497 1 19 .368 .333 .408 .446 .537 .444 .383 .333 .500 .454 .323 .298 .502 .468 .626 .507 .516 .516 1 20 .166 .404 .285 .406 .315 .454 .390 .281 .269 .351 .316 .317 .365 .276 .295 .391 .273 .366 .250 21 .361 .358 .416 .498 .463 .535 .515 .350 .432 .566 .424 .310 .494 .338 .337 .449 .708 .471 .480 22 .398 .346 .469 .514 .480 .611 .416 .479 .471 .562 .470 .400 .535 .470 .373 .489 .433 .596 .486 23 .498 .350 .479 .471 .591 .568 .441 .408 .523 .558 .413 .332 .576 .496 .434 .483 .482 .643 .566 24 .450 .421 .428 .433 .517 .573 .405 .402 .466 .451 .352 .451 .544 .483 .404 .599 .495 .568 .568 25 .377 .319 .403 .487 .489 .504 .418 .378 .439 .475 .385 .394 .504 .426 .401 .441 .458 .537 .490 26 .381 .393 .467 .531 .429 .577 .418 .462 .476 .544 .467 .522 .595 .545 .393 .564 .479 .699 .488 27 .386 .478 .532 .502 .445 .709 .478 .441 .500 .564 .468 .562 .680 .526 .397 .674 .399 .564 .458 28 .361 .441 .472 .416 .427 .560 .380 .327 .453 .465 .367 .398 .563 .432 .307 .507 .393 .426 .432 29 .421 .428 .543 .510 .427 .605 .480 .446 .438 .543 .433 .526 .749 .514 .422 .629 .459 .529 .497 30 .302 .368 .420 .455 .346 .471 .515 .336 .291 .379 .356 .432 .493 .360 .258 .489 .337 .440 .269 31 .407 .401 .479 .455 .472 .617 .443 .356 .512 .500 .349 .429 .575 .448 .447 .528 .457 .534 .530 32 .334 .269 .331 .395 .311 .430 .365 .263 .337 .401 .223 .254 .419 .364 .292 .375 .286 .400 .331 33 .390 .347 .431 .647 .416 .515 .547 .410 .374 .561 .414 .374 .574 .455 .434 .430 .410 .498 .433 34 .312 .348 .397 .511 .411 .455 .289 .329 .385 .433 .420 .406 .543 .419 .359 .408 .363 .474 .454 35 .398 .432 .541 .515 .395 .593 .400 .362 .427 .507 .487 .538 .648 .456 .391 .555 .359 .497 .398 36 .401 .397 .492 .525 .481 .606 .473 .470 .518 .584 .441 .481 .605 .504 .440 .611 .486 .637 .544 37 .497 .347 .386 .413 .577 .526 .355 .364 .598 .502 .349 .400 .588 .399 .424 .514 .451 .461 .528
465

466
TABLE 7: INTER-ITEM CORRELATION MATRIX FOR SCHOOL DEVELOPMENT PLANNING FINAL VERSION (Continued) Item 20 21 22 23 24 25 26 27 28 28 30 31 32 33 34 35 36 37
1 2 3 4 5 6 7 8 9 10 11 12 13 14 15 16 17 18 19 20 1 21 .298 1 22 .430 .519 1 23 .363 .484 .664 1 24 .427 .487 .602 .558 1 25 .377 .463 .584 .634 .630 1 26 .474 .527 .674 .705 .723 .696 1 27 .490 .487 .576 .563 .620 .604 .720 1 28 .419 .489 .482 .565 .515 .476 .534 .748 1 29 .396 .537 .558 .603 .597 .579 .627 .773 .779 1 30 .333 .310 .370 .396 .432 .468 .444 .582 .400 .530 1 31 .379 .493 .579 .603 .575 .538 .537 .677 .715 .728 .457 1 32 .294 .310 .428 .478 .413 .395 .392 .455 .486 .473 .354 .492 1 33 .413 .432 .467 .535 .461 .510 .533 .579 .452 .578 .490 .550 .588 1 34 .409 .425 .547 .548 .480 .480 .560 .489 .464 .523 .311 .494 .399 .523 1 35 .348 .435 .529 .548 .551 .575 .608 .738 .670 .765 .479 .660 .527 .619 .597 1 36 .482 .480 .634 .616 .628 .620 .654 .683 .630 .731 .471 .683 .466 .573 .519 .626 1 37 .399 .462 .522 .539 .647 .531 .543 .600 .553 .621 .360 .592 .446 .500 512 .584 .659 1
466

467
APPENDIX 13: DESCRIPTIVE STATISTICS FOR SCHOOLS IN GROUP 1 AND GROUP 2 Table 1: Descriptive statistics for Group 1 and Group 2 on the SDPES
N Minimum Maximum Mean SDGroup 1 1 14 144 244 222.19 25.692 13 118 237 180.56 43.193 15 92 250 210.31 40.294 10 102 237 175.51 42.705 22 95 238 195.70 39.376 22 83 229 154.33 43.427 19 113 250 178.17 35.388 9 143 239 195.95 33.879 16 113 232 184.66 31.8710 13 126 248 181.68 35.02Total 153 83 250 186.49 41.30Group 2 11 13 100 238 163.92 41.3612 16 109 234 189.01 34.0013 20 109 254 201.17 31.0214 12 73 243 195.86 49.8915 10 69 233 154.13 64.9416 10 125 224 183.13 33.1317 10 139 231 189.40 32.8218 4 179 200 188.06 10.73Total 95 69 254 184.71 41.75 Table 2: Descriptive statistics for Group 1 and Group 2 on the Locus of Control
N Minimum Maximum Mean SDGroup 1 1 14 64 115 89.14 14.262 13 71 121 95.95 14.563 15 67 107 89.72 10.994 10 62 111 92.96 14.835 22 70 117 91.68 12.456 22 74 113 93.35 11.597 19 69 120 89.46 13.818 9 72 105 87.67 10.639 16 76 109 92.33 10.7810 13 77 112 94.89 10.86Total 153 62 121 91.77 12.37Group 2 11 13 85 109 94.19 6.5312 16 74 116 94.66 11.2413 20 79 117 93.17 11.5014 12 76 106 95.89 10.3715 10 60 111 90.12 17.3916 10 62 119 89.92 18.6117 10 64 107 87.31 12.0018 4 85 102 95.96 7.58Total 95 60 119 92.74 12.24

468
Table 3 Descriptive statistics for Group 1 and Group 2 on the General Self-Efficacy:
N Minimum Maximum Mean SDGroup 1 1 14 30 46 40.00 5.072 13 30 49 40.49 6.213 15 32 49 40.03 4.754 10 30 50 39.79 6.465 22 29 46 39.31 4.376 22 26 48 38.16 5.127 19 26 49 40.13 6.508 9 29 47 37.77 6.089 16 35 50 40.43 4.3210 13 34 50 41.69 5.62Total 153 26 50 39.74 5.33Group 2 11 13 30 48 39.68 4.7612 16 24 47 39.28 6.5713 20 27 50 40.90 5.2114 12 34 49 41.40 5.1015 10 32 50 41.12 6.3216 10 30 47 39.88 4.7117 10 34 46 40.30 3.2718 4 39 48 42.22 4.30Total 95 24 50 40.43 5.15 Table 4 Descriptive statistics for Group 1 and Group 2 on the Teacher-Efficacy:
SCHOOL N Minimum Maximum Mean SDGroup 1
1.00 13 71.00 92.00 81.85 6.182.00 12 73.00 104.00 84.75 10.053.00 14 73.00 101.00 84.04 9.964.00 9 66.00 92.63 79.25 8.855.00 21 51.00 112.00 82.27 12.606.00 20 65.00 96.00 79.49 8.147.00 18 67.00 102.00 81.67 9.898.00 8 67.00 97.00 80.34 9.239.00 15 65.00 99.00 81.29 10.0410.00 12 67.00 96.00 81.90 9.34Total 142 51.00 112.00 81.71 9.57Group 2
11.00 12 69.00 94.00 84.21 6.9212.00 15 69.00 100.00 84.06 9.1313.00 19 69.00 111.00 83.53 11.8114.00 11 74.00 91.00 83.64 6.0315.00 9 75.00 96.00 83.33 6.3416.00 9 66.00 83.33 74.82 5.8417.00 9 70.00 92.00 82.23 7.3818.00 3 78.95 95.00 87.98 8.21Total 87 66.00 111.00 82.83 8.67

469
Table 5. Descriptive statistics for Group 1 and Group 2 on the Participation and Decision Centralisation scale:
N Minimum Maximum Mean SDGroup 1 1 13 15 28 24.15 4.122 12 11 28 20.67 6.973 14 5 28 19.00 7.424 9 6 21 14.89 4.835 21 4 27 19.14 6.726 21 4 28 16.3 5.607 18 8 28 20.00 5.508 8 15 25 21.75 4.239 15 16 28 22.53 3.6410 12 14 28 21.67 4.50Total 143 4 28 19.82 6.04Group 2 11 12 10 28 20.75 4.7112 15 7 28 22.33 5.8913 19 5 27 16.05 5.7614 11 12 28 22.00 4.7715 8 19 28 24.00 3.5916 9 11 28 19.44 6.1517 9 8 26 19.44 5.2518 3 21 28 23.67 3.79Total 86 5 28 20.27 5.73 Table 6: Descriptive statistics for Group 1 and Group 2 on the Psychological Participation Scale:
N Minimum Maximum Mean SDGroup 1 1 13 6 15 9.77 3.322 12 4 17 9.75 4.353 14 6 19 11.86 3.974 9 8 20 14.00 4.445 21 5 20 11.14 3.906 21 6 20 12.81 3.787 18 5 20 11.63 3.988 8 5 15 10.87 3.609 15 6 14 9.80 2.4210 12 5 16 11.50 3.60Total 143 4 20 11.33 3.85Group 2 11 12 5 15 9.92 2.5012 15 8 15 10.87 2.6713 19 7 19 13.16 3.6114 11 4 16 9.55 3.6715 8 6 11 9.00 1.9016 9 4 14 9.78 3.0717 9 5 15 10.11 3.3018 3 9 12 10.67 1.50Total 86 4 19 10.7 3.26
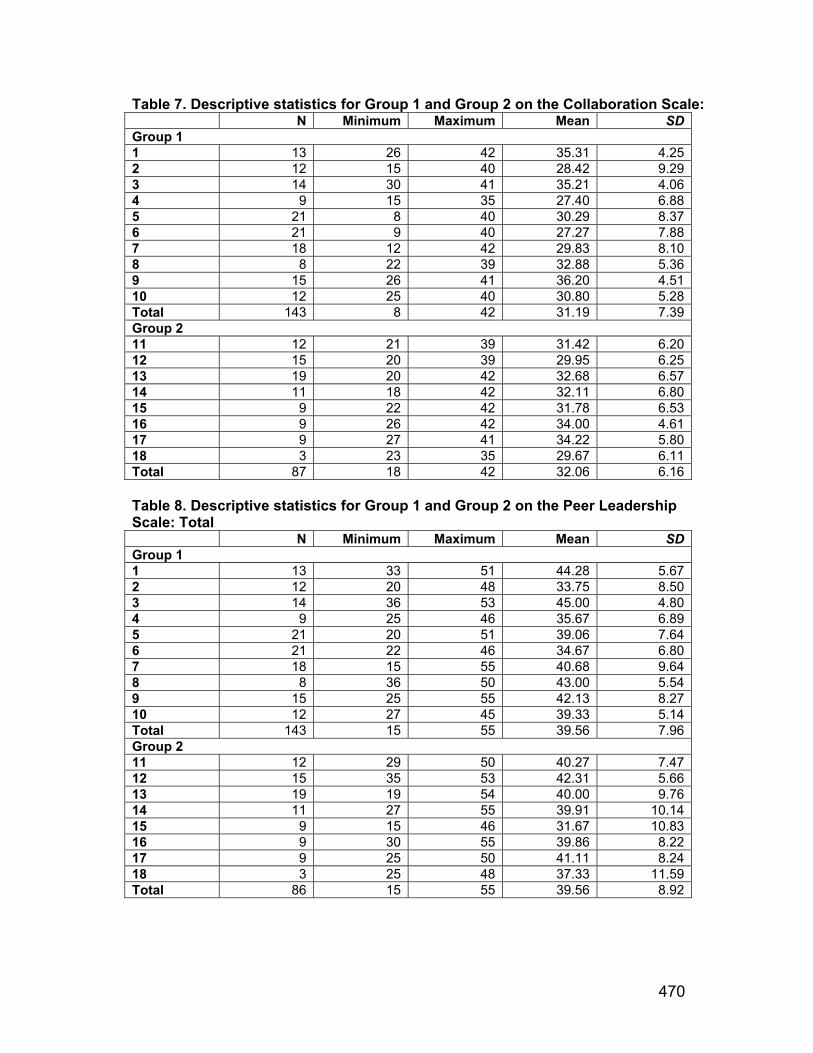
470
Table 7. Descriptive statistics for Group 1 and Group 2 on the Collaboration Scale: N Minimum Maximum Mean SD
Group 1 1 13 26 42 35.31 4.252 12 15 40 28.42 9.293 14 30 41 35.21 4.064 9 15 35 27.40 6.885 21 8 40 30.29 8.376 21 9 40 27.27 7.887 18 12 42 29.83 8.108 8 22 39 32.88 5.369 15 26 41 36.20 4.5110 12 25 40 30.80 5.28Total 143 8 42 31.19 7.39Group 2 11 12 21 39 31.42 6.2012 15 20 39 29.95 6.2513 19 20 42 32.68 6.5714 11 18 42 32.11 6.8015 9 22 42 31.78 6.5316 9 26 42 34.00 4.6117 9 27 41 34.22 5.8018 3 23 35 29.67 6.11Total 87 18 42 32.06 6.16 Table 8. Descriptive statistics for Group 1 and Group 2 on the Peer Leadership Scale: Total
N Minimum Maximum Mean SDGroup 1 1 13 33 51 44.28 5.672 12 20 48 33.75 8.503 14 36 53 45.00 4.804 9 25 46 35.67 6.895 21 20 51 39.06 7.646 21 22 46 34.67 6.807 18 15 55 40.68 9.648 8 36 50 43.00 5.549 15 25 55 42.13 8.2710 12 27 45 39.33 5.14Total 143 15 55 39.56 7.96Group 2 11 12 29 50 40.27 7.4712 15 35 53 42.31 5.6613 19 19 54 40.00 9.7614 11 27 55 39.91 10.1415 9 15 46 31.67 10.8316 9 30 55 39.86 8.2217 9 25 50 41.11 8.2418 3 25 48 37.33 11.59Total 86 15 55 39.56 8.92

471
Table 9. Descriptive statistics for Group 1 and Group 2 on the Profile of Organisational Characteristics:
N Minimum Maximum Mean SDGroup 1 1 13 37 60 51.87 7.252 11 27 61 45.10 11.023 14 24 57 43.32 9.724 9 19 54 39.29 10.505 21 28 60 43.17 10.146 20 23 51 37.19 6.867 16 23 63 42.74 10.588 8 34 52 44.62 5.399 15 38 59 49.24 5.8710 12 32 60 48.33 8.41Total 139 19 63 44.18 9.58Group 2 11 12 34 61 45.38 6.6412 15 26 59 43.81 9.6013 19 23 58 41.69 10.3514 11 31 57 44.68 8.8015 9 32 51 41.98 6.9816 9 36 64 46.25 7.7917 9 30 55 42.98 8.3318 3 42 57 48.00 7.94Total 87 23 64 43.80 8.56 Table 10. Descriptive statistics for Group 1 and Group 2 on the Supervisory Leadership Scale: Total
N Minimum Maximum Mean SDGroup 1 1 13 37 65 53.01 8.902 12 32 65 51.19 12.543 14 23 62 48.05 11.034 9 17 63 43.19 14.955 21 13 62 44.10 13.616 21 17 48 35.81 8.787 18 16 56 45.76 9.528 8 30 52 41.94 7.419 15 46 62 54.60 5.6010 12 44 62 53.08 6.54Total 143 13 65 46.56 11.65Group 2 11 11 25 60 41.27 10.1212 15 31 64 48.22 9.8313 19 22 59 42.52 10.8514 11 36 64 49.82 10.7715 9 28 57 46.89 8.6816 9 40 62 49.78 7.5017 9 23 61 44.56 12.4018 3 49 55 51.00 3.46Total 86 22 64 46.02 10.23
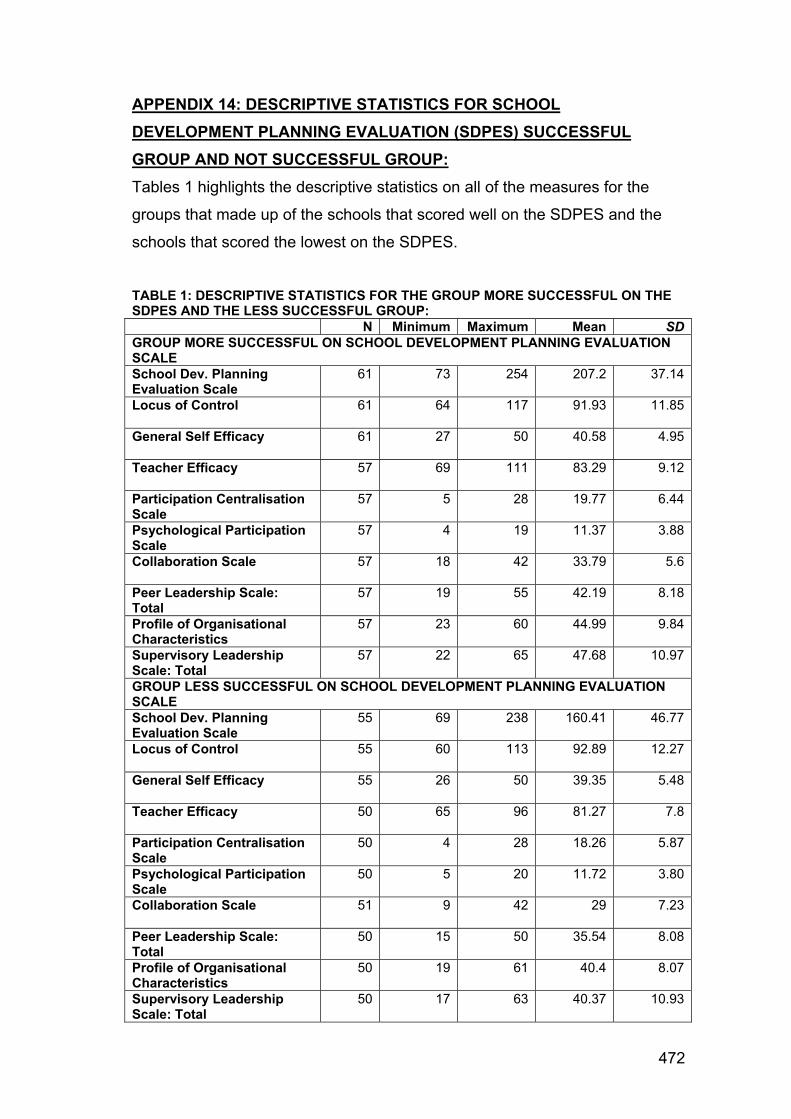
472
APPENDIX 14: DESCRIPTIVE STATISTICS FOR SCHOOL DEVELOPMENT PLANNING EVALUATION (SDPES) SUCCESSFUL GROUP AND NOT SUCCESSFUL GROUP: Tables 1 highlights the descriptive statistics on all of the measures for the
groups that made up of the schools that scored well on the SDPES and the
schools that scored the lowest on the SDPES.
TABLE 1: DESCRIPTIVE STATISTICS FOR THE GROUP MORE SUCCESSFUL ON THE SDPES AND THE LESS SUCCESSFUL GROUP:
N Minimum Maximum Mean SDGROUP MORE SUCCESSFUL ON SCHOOL DEVELOPMENT PLANNING EVALUATION SCALE School Dev. Planning Evaluation Scale
61 73 254 207.2 37.14
Locus of Control
61 64 117 91.93 11.85
General Self Efficacy
61 27 50 40.58 4.95
Teacher Efficacy
57 69 111 83.29 9.12
Participation Centralisation Scale
57 5 28 19.77 6.44
Psychological Participation Scale
57 4 19 11.37 3.88
Collaboration Scale
57 18 42 33.79 5.6
Peer Leadership Scale: Total
57 19 55 42.19 8.18
Profile of Organisational Characteristics
57 23 60 44.99 9.84
Supervisory Leadership Scale: Total
57 22 65 47.68 10.97
GROUP LESS SUCCESSFUL ON SCHOOL DEVELOPMENT PLANNING EVALUATION SCALE School Dev. Planning Evaluation Scale
55 69 238 160.41 46.77
Locus of Control
55 60 113 92.89 12.27
General Self Efficacy
55 26 50 39.35 5.48
Teacher Efficacy
50 65 96 81.27 7.8
Participation Centralisation Scale
50 4 28 18.26 5.87
Psychological Participation Scale
50 5 20 11.72 3.80
Collaboration Scale
51 9 42 29 7.23
Peer Leadership Scale: Total
50 15 50 35.54 8.08
Profile of Organisational Characteristics
50 19 61 40.4 8.07
Supervisory Leadership Scale: Total
50 17 63 40.37 10.93

473
APPENDIX 15: CASEWISE. RESIDUAL AND ASSUMPTION STATISTICS FOR THE MULTIPLE REGRESSION: Casewise diagnostics: The summary table of the residual statistics (Table 1) shows any cases that
have a standardised residual less than -2 or greater than 2 (Field. 2004). As
we have a sample of 224 it would be reasonable to expect about 11 cases
(5%) to have residuals outside of these limits.
Table 1: Casewise Diagnostics Case Number
Std. Residual
School Development Planning Eval Scale
Predicted Value Residual
29 -2.023 8464.00 31071.3064 -22607.3064 73 2.641 52441.00 22925.4834 29515.5166 79 -2.071 14641.00 37788.0172 -23147.0172 134 -2.345 15876.00 42082.8249 -26206.8249 140 -2.754 12769.00 43546.1919 -30777.1919 159 -2.420 14523.69 41567.8052 -27044.1121 199 2.085 41831.61 18527.4005 23304.2114 207 -2.423 5329.00 32408.2101 -27079.2101 212 3.138 55879.71 20808.3778 35071.3290 215 -2.464 9216.00 36758.9072 -27542.9072 217 -2.386 6426.69 33095.9334 -26669.2390 224 -2.226 15876.00 40750.7522 -24874.7522
a Dependent Variable: School Development Planning Evaluation Scale
Table 1 indicates that there are 12 cases (4.9%) that are outside of the limits
therefore the sample is within what we would expect. In addition. 99% of
cases should lie within ± 3 and so we could expect only 1% of cases to lie
outside of these limits. Three (1.3%) cases are over ± 2.5. one of which is
over 3. The Residual Statistics Table 45 indicates that there is little difference
between the predicted value and adjusted predicted value. Cook's distance
considers the effect of a single case on the model as a whole. Cook's
distance is a measure of the overall influence of a case on the model and
Cook & Weisberg (1982) have suggested that values great than 1 may be
cause for concern. Table 2 indicates Cook's distance is 0. Both the Centred
Leverage Value and the Mahalanobis distance (both measuring influence)
indicate there is no need for concern. It would appear that the outliers do not
have a large effect on the regression analysis. Therefore the sample appears

474
to conform to what would be expected for a fairly accurate model. These
diagnostics give no real cause for concern.
Table 2: Residuals Statistics
Minimum Maximum Mean Std.
Deviation N Predicted Value 10631.4053 55316.2422 35584.5310 9052.09738 224
Std. Predicted Value -2.765 2.176 -.006 1.001 224
Standard Error of Predicted Value 865.34882 3617.75586 1612.18399 457.63784 224
Adjusted Predicted Value 10643.9971 55273.6992 35575.0752 9076.60929 224
Residual -30777.1914 35071.3281 -56.3575 11088.49879 224
Std. Residual -2.754 3.138 -.005 .992 224
Stud. Residual -2.782 3.173 -.005 1.005 224
Deleted Residual -31422.5527 35873.4375 -46.9017 11374.13812 224
Stud. Deleted Residual -2.827 3.242 -.005 1.010 224
Mahal. Distance .329 22.158 3.971 3.110 224
Cook's Distance .000 .182 .005 .014 224
Centered Leverage Value .001 .100 .018 .014 224
a Dependent Variable: School Development Planning Evaluation Scale

475
Figure 1: Scatter Plot Partial Regression Plot
Dependent Variable: SDPES Transformed
CSTRANS
10008006004002000-200-400-600-800
SDPE
S Tr
ansf
orm
ed
40000
30000
20000
10000
0
-10000
-20000
-30000
-40000
Partial Regression Plot
Dependent Variable: SDPES Transformed
PROFTOTAL
20100-10-20
SDPE
S Tr
ansf
orm
ed
40000
30000
20000
10000
0
-10000
-20000
-30000
-40000
Partial Regression Plot
Dependent Variable: SDPES Transformed
TETOTAL
403020100-10-20-30
SDPE
S Tr
ansf
orm
ed
40000
30000
20000
10000
0
-10000
-20000
-30000
-40000
Partial Regression Plot
Dependent Variable: SDPES Transformed
SUPLTOTAL
3020100-10-20-30
SDPE
S Tr
ansf
orm
ed
40000
30000
20000
10000
0
-10000
-20000
-30000
-40000
Figures 2 – 5 Partial Regression Plots
Scatterplot
Dependent Variable: SDPES Transformed
Regression Standardized Predicted Value
3210-1-2-3
Reg
ress
ion
Stud
entiz
ed R
esid
ual
4
3
2
1
0
-1
-2
-3
Related Documents