22 T axpayers filed 142.5 million returns for Tax Year 2008. Of those, 90.7 million (or 63.6 percent) were classified as taxable returns. This represents the lowest percentage in more than 23 years. A taxable return is a return that has total income tax greater than $0. The number of taxable returns for 2008 was 5.8 percent lower than for 2007. Adjusted gross income (AGI) on these taxable returns decreased 6.1 percent to $7,583 billion for 2008, while total income tax decreased 7.5 percent to $1,032 billion. The average tax rate for taxable returns decreased 0.2 percentage points to 13.6 percent. The top 1 percent of taxpayers, those with AGI of at least $380,354, accounted for 20.0 percent of AGI for 2008. This represents a decrease in income share of 2.8 percentage points from the previous year, when the cutoff for this group was $410,096. These taxpayers accounted for 38.0 percent of the total income tax reported, a decrease from 40.4 percent in 2007. The top 5 percent of taxpayers accounted for 34.7 percent of AGI and 58.7 percent of total income tax. To be included in the top 5 percent, a taxpayer must have reported AGI of at least $159,619, whereas, in 2007, the cutoff for this group was $160,041. This article discusses the individual income tax rates and tax shares and the computation of “total income tax” for 2008. To put this discussion into perspective, the article provides explanations of selected terms used in the article and describes the income tax structure, certain tax law changes, income and tax concepts (the “1979 Income Concept,” “modified” taxable income, and marginal tax rates), the computation of “alternative minimum taxable income,” and data sources and limitations. Income Tax Rates Discussions of income tax rates generally center on measuring two distinct tax rates: average tax rates and marginal tax rates. Average tax rates are Individual Income Tax Rates and Shares, 2008 calculated by dividing some measure of tax by some measure of income. For the statistics in this article, the average tax rate is “total income tax” (see the Explanation of Selected Terms section of this article) divided by AGI reported on returns showing some income tax liability. Measures of marginal tax rates focus on deter- mining the tax rate imposed on the last (or next) dollar of income received by a taxpayer. For this article, the marginal tax rate is the statutory rate at which the last dollar of taxable income is taxed. (See the Income and Tax Concepts section of this article for a more detailed explanation of marginal tax rates.) The following sections describe the measure- ment of the average and marginal tax rates in more detail, and discuss the statistics based on these rates for 2008. Average Tax Rates Figure A presents statistics for 1986 through 2008 on income (based on each year’s definition of AGI and on the common 1979 Income Concept) and taxes reported. (See the Income and Tax Concepts section of this article for a more detailed explanation of the 1979 Income Concept.) These tax years can be parti- tioned into seven distinct periods: (1) Tax Year 1986 was the last year under the Economic Recovery Tax Act of 1981 (ERTA81). The tax bracket boundaries, personal exemptions, and standard deduc- tions were indexed for inflation, and the maximum tax rate was 50 percent. (2) Tax Year 1987 was the first year underthe Tax Reform Act of 1986 (TRA86). For 1987, a 1-year, transitional, five-rate tax bracket structure was established with a partial phase-in of new provisions that broadened the definition of AGI. The maximum tax rate was 38.5 percent. (3) During Tax Years 1988 through 1990, there was effectively a three-rate tax bracket struc- ture. 1 The phase-in of the provisions of TRA86 continued with a maximum tax rate of 33 percent. by Kyle Mudry Kyle Mudry is an economist with the Individual Returns Analysis Section. This article was prepared under the direction of Jeff Hartzok, Chief. 1 For Tax Years 1988 through 1990, the tax rate schedules provided only two basic rates: 15 percent and 28 percent. However, taxable income over certain levels was subject to a 33-percent tax rate to phase out the benefit of the 15-percent tax bracket (as compared to the 28-percent rate) and the deduction for personal exemptions. At the taxable income level, where these benefits were completely phased out, the tax rate returned to 28 percent.

Welcome message from author
This document is posted to help you gain knowledge. Please leave a comment to let me know what you think about it! Share it to your friends and learn new things together.
Transcript

22
Taxpayers fi led 142.5 million returns for Tax Year 2008. Of those, 90.7 million (or 63.6 percent) were classifi ed as taxable returns.
This represents the lowest percentage in more than 23 years. A taxable return is a return that has total income tax greater than $0. The number of taxable returns for 2008 was 5.8 percent lower than for 2007. Adjusted gross income (AGI) on these taxable returns decreased 6.1 percent to $7,583 billion for 2008, while total income tax decreased 7.5 percent to $1,032 billion. The average tax rate for taxable returns decreased 0.2 percentage points to 13.6 percent.
The top 1 percent of taxpayers, those with AGI of at least $380,354, accounted for 20.0 percent of AGI for 2008. This represents a decrease in income share of 2.8 percentage points from the previous year, when the cutoff for this group was $410,096. These taxpayers accounted for 38.0 percent of the total income tax reported, a decrease from 40.4 percent in 2007. The top 5 percent of taxpayers accounted for 34.7 percent of AGI and 58.7 percent of total income tax. To be included in the top 5 percent, a taxpayer must have reported AGI of at least $159,619, whereas, in 2007, the cutoff for this group was $160,041.
This article discusses the individual income tax rates and tax shares and the computation of “total income tax” for 2008. To put this discussion into perspective, the article provides explanations of selected terms used in the article and describes the income tax structure, certain tax law changes, income and tax concepts (the “1979 Income Concept,” “modifi ed” taxable income, and marginal tax rates), the computation of “alternative minimum taxable income,” and data sources and limitations.
Income Tax RatesDiscussions of income tax rates generally center on measuring two distinct tax rates: average tax rates and marginal tax rates. Average tax rates are
Individual Income Tax Rates and Shares, 2008
calculated by dividing some measure of tax by some measure of income. For the statistics in this article, the average tax rate is “total income tax” (see the Explanation of Selected Terms section of this article) divided by AGI reported on returns showing some income tax liability.
Measures of marginal tax rates focus on deter-mining the tax rate imposed on the last (or next) dollar of income received by a taxpayer. For this article, the marginal tax rate is the statutory rate at which the last dollar of taxable income is taxed. (See the Income and Tax Concepts section of this article for a more detailed explanation of marginal tax rates.) The following sections describe the measure-ment of the average and marginal tax rates in more detail, and discuss the statistics based on these rates for 2008.
Average Tax RatesFigure A presents statistics for 1986 through 2008 on income (based on each year’s defi nition of AGI and on the common 1979 Income Concept) and taxes reported. (See the Income and Tax Concepts section of this article for a more detailed explanation of the 1979 Income Concept.) These tax years can be parti-tioned into seven distinct periods:
(1) Tax Year 1986 was the last year under the Economic Recovery Tax Act of 1981 (ERTA81). The tax bracket boundaries, personal exemptions, and standard deduc-tions were indexed for infl ation, and the maximum tax rate was 50 percent.
(2) Tax Year 1987 was the fi rst year underthe Tax Reform Act of 1986 (TRA86). For 1987, a 1-year, transitional, fi ve-rate tax bracket structure was established with a partial phase-in of new provisions that broadened the defi nition of AGI. The maximum tax rate was 38.5 percent.
(3) During Tax Years 1988 through 1990, there was effectively a three-rate tax bracket struc-ture.1 The phase-in of the provisions of TRA86 continued with a maximum tax rate of 33 percent.
by Kyle Mudry
Kyle Mudry is an economist with the Individual Returns Analysis Section. This article was prepared under the direction of Jeff Hartzok, Chief.
1 For Tax Years 1988 through 1990, the tax rate schedules provided only two basic rates: 15 percent and 28 percent. However, taxable income over certain levels was subject to a 33-percent tax rate to phase out the benefi t of the 15-percent tax bracket (as compared to the 28-percent rate) and the deduction for personal exemptions. At the taxable income level, where these benefi ts were completely phased out, the tax rate returned to 28 percent.

23
Individual Income Tax Rates and Shares, 2008Statistics of Income Bulletin | Winter 2011
Figure A
[Money amounts are in billions of dollars, except where indicated]
Taxable returns
Average per return (whole dollars) [3]Current dollars Constant dollars [4]
Totalincome
tax
Adjusted gross income (less
deficit)
Totalincome
tax
Adjustedgross income (less deficit)
Totalincome
tax
Average tax rate (percent)
[2], [3]
Adjusted Gross Income, Total Income Tax, Average Tax Rate, and Average Total Income Tax, Tax Years 1986–2008
Taxyear
Total number of returns Number of
returns
As a percentage
of totalreturns [1]
Adjusted gross income (less
deficit)
(1) (2) (3) (4) (5) (6) (7) (8) (9) (10)Using each tax year's adjusted gross income
1986 103,045,170 83,967,413 81.5 2,440 367 15.1 29,062 4,374 26,516 3,991 1987 106,996,270 86,723,796 81.1 2,701 369 13.7 31,142 4,257 27,414 3,747 1988 109,708,280 87,135,332 79.4 2,990 413 13.8 34,313 4,738 29,005 4,005 1989 112,135,673 89,178,355 79.5 3,158 433 13.7 35,415 4,855 28,560 3,915 1990 113,717,138 89,862,434 79.0 3,299 447 13.6 36,711 4,976 28,088 3,807 1991 114,730,123 88,733,587 77.3 3,337 448 13.4 37,603 5,054 27,609 3,711 1992 113,604,503 86,731,946 76.3 3,484 476 13.7 40,168 5,491 28,630 3,914
tax deficit) taxdeficit)
1992 113,604,503 86,731,946 76.3 3,484 476 13.7 40,168 5,491 28,630 3,9141993 114,601,819 86,435,367 75.4 3,564 503 14.1 41,233 5,817 28,535 4,026 1994 115,943,131 87,619,446 75.6 3,737 535 14.3 42,646 6,104 28,776 4,119 1995 118,218,327 89,252,989 75.5 4,008 588 14.7 44,901 6,593 29,463 4,326 1996 120,351,208 90,929,350 75.6 4,342 658 15.2 47,750 7,239 30,433 4,614 1997 122,421,991 93,471,200 76.4 4,765 731 15.3 50,980 7,824 31,763 4,875 1998 124,770,662 93,047,898 74.6 5,160 789 15.3 55,458 8,475 33,836 5,171 1999 127,075,145 94,546,080 74.4 5,581 877 15.7 59,028 9,280 35,431 5,570 2000 129,373,500 96,817,603 74.8 6,083 981 16.1 62,832 10,129 36,488 5,882 2001 130,255,237 94,763,530 72.8 5,847 888 15.2 61,702 9,370 34,840 5,291 2002 130,076,443 90,963,896 69.9 5,641 797 14.1 62,015 8,762 34,472 4,870 , , , , , , , , ,2003 130,423,626 88,921,904 68.2 5,747 748 13.0 64,625 8,412 35,122 4,572 2004 132,226,042 89,101,934 67.4 6,266 832 13.3 70,318 9,337 37,225 4,943 2005 134,372,678 90,593,081 67.4 6,857 935 13.6 75,687 10,319 38,754 5,284 2006 * 138,394,754 92,740,927 67.0 7,439 1,024 13.8 80,218 11,041 39,791 5,477 2007 ** 142,978,806 96,272,958 67.3 8,072 1,116 13.8 83,851 11,588 40,449 5,590 2008 142,450,569 90,660,104 63.6 7,583 1,032 13.6 83,647 11,379 38,851 5,285
Using 1979 Income Concept [5]1986 103,045,170 83,967,413 81.5 2,703 367 13.6 32,194 4,374 29,374 3,991 1987 106,996,270 86,723,796 81.1 2,736 369 13.5 31,551 4,257 27,774 3,747 1988 109,708,280 87,135,332 79.4 3,011 413 13.7 34,556 4,738 29,210 4,005 , , , , , , , , ,1989 112,135,673 89,178,355 79.5 3,188 433 13.6 35,752 4,855 28,832 3,915 1990 113,717,138 89,862,434 79.0 3,335 447 13.4 37,108 4,976 28,392 3,807 1991 114,730,123 88,733,587 77.3 3,387 448 13.2 38,169 5,054 28,024 3,711 1992 113,604,503 86,731,946 76.3 3,553 476 13.4 40,964 5,491 29,198 3,914 1993 114,601,819 86,435,367 75.4 3,625 503 13.9 41,938 5,817 29,023 4,026 1994 115,943,131 87,619,446 75.6 3,796 535 14.1 43,322 6,104 29,232 4,119 1995 118,218,327 89,252,989 75.5 4,075 588 14.4 45,655 6,593 29,957 4,326 1996 120,351,208 90,929,350 75.6 4,418 658 14.9 48,582 7,239 30,964 4,614 1997 122,421,991 93,471,200 76.4 4,849 731 15.1 51,875 7,824 32,321 4,875 1998 124,770,662 93,047,898 74.6 5,299 789 14.9 56,947 8,475 34,745 5,171 1999 127 075 145 94 546 080 74 4 5 736 877 15 3 60 666 9 280 36 414 5 5701999 127,075,145 94,546,080 74.4 5,736 877 15.3 60,666 9,280 36,414 5,570 2000 129,373,500 96,817,603 74.8 6,294 981 15.6 65,012 10,129 37,754 5,882 2001 130,255,237 94,763,530 72.8 5,943 888 14.9 62,716 9,370 35,413 5,291 2002 130,076,443 90,963,896 69.9 5,758 797 13.8 63,297 8,762 35,184 4,870 2003 130,423,626 88,921,904 68.2 5,849 748 12.8 65,777 8,412 35,749 4,572 2004 132,226,042 89,101,934 67.4 6,399 832 13.0 71,817 9,337 38,019 4,943 2005 134,372,678 90,593,081 67.4 7,016 935 13.3 77,448 10,319 39,656 5,284 2006 * 138,394,754 92,740,927 67.0 7,640 1,024 13.4 82,379 11,041 40,863 5,477 2007 ** 142,978,806 96,269,751 67.3 8,282 1,116 13.5 86,028 11,588 41,499 5,590 2008 142,450,569 90,660,104 63.6 7,760 1,032 13.3 85,592 11,379 39,754 5,285 * Includes 742 859 Form 1040 EZ-T returns* Includes 742,859 Form 1040 EZ-T returns.** The total number of returns does not include the returns filed by individuals only to receive the economic stimulus payment and who had no other reason to file.[1] Number of taxable returns (column 2) divided by total number of returns (column 1).[2] Average tax rate is "total income tax" (column 5) divided by "adjusted gross income less deficit (AGI)" (column 4).[3] The average adjusted gross income (less deficit), average total income tax, and average tax rate were calculated from unrounded data.[4] Constant dollars were calculated using the U.S. Bureau of Labor Statistics' consumer price index for urban consumers (CPI-U, 1982-84=100). For 2008, the CPI-U = 215.303.[5] These statistics are based on adjusted gross income less deficit (AGI) recomputed to reflect the 1979 Income Concept, thus enabling more valid comparisons to be made of the average tax rates among years. Changes in the definition of AGI among years render direct comparison of the unadjusted figures misleading. For additional information, see Statisticsof Income —Individual Income Tax Returns, for 1986-2008. See Figure G for components of the 1979 Income Concept.

24
Individual Income Tax Rates and Shares, 2008Statistics of Income Bulletin | Winter 2011
(4) Tax Years 1991 and 1992 brought a three-rate tax bracket structure (with a maximum tax rate of 31 percent), a limitation on some itemized deductions, and a phaseout of personal exemptions for some upper-income taxpayers.
(5) Tax Years 1993 through 1996 had a fi ve-rate tax bracket structure (with a maximum statu-tory tax rate of 39.6 percent), a limitation on some itemized deductions, and a phaseout of personal exemptions for some upper-income taxpayers.
(6) Tax Years 1997 through 2000 were subject to the Taxpayer Relief Act of 1997, which added three new capital gain tax rates to the previous rate structure to form a new eight-rate tax bracket structure (with maximum statutory tax rate of 39.6 percent). See the Income and Tax Concepts section of this article for a more detailed description of the capital gain rates.
(7) Tax Years 2001 through 2008 were affected mainly by two new laws, the Economic Growth and Tax Relief Reconciliation Act of 2001 (EGTRRA) and the Jobs and Growth Tax Relief Reconciliation Act of 2003 (JGTRRA). EGTRRA included a new 10-percent tax rate bracket, as well as reduc-tions in tax rates for brackets higher than 15 percent of one-half percentage point for 2001 and 1 percentage point for 2002. It also included increases in the child tax credit and an increase in alternative minimum tax exemptions. Tax Year 2003, under JGTRRA, saw additional rate reductions (accelera-tions of EGTRRA’s phased-in reductions) in ordinary marginal tax rates higher than the 15-percent rate, as well as expansions to particular income thresholds in the rates from 15 percent and below. Also, the rate for most long-term capital gains was reduced from 20 percent to 15 percent. Further, qualifi ed dividends were taxed at this same 15-percent rate. These changes are detailed in Appendix C of the previously published article, “Individual Income Tax Rates and
Shares, 2003” (under Tax Rate Reduc-tion). Under EGTRRA, beginning ins 2006, the complete phase-out of personal exemp-tions and the limitation on some itemized deductions for upper-income taxpayers were modifi ed to limit the maximum phaseout of two-thirds of both the exemption amount and the itemized deduction limitation amount. For 2008, the limit was changed to one-third. Beginning in 2004, the Working Families Tax Relief Act increased the additional child tax credit refundability rate from 10 percent to 15 percent.
About 90.7 million, or 63.6 percent, of the 142.5 million individual returns fi led for 2008 were classi-fi ed as taxable returns. This was a 5.8-percent decrease in the number of taxable returns from 2007. This also represents the lowest percentage of individ-ual returns that were taxable in more than 23 years. Total AGI reported on taxable returns decreased 6.1 percent to $7,583 billion. Using the 1979 Income Concept, total AGI on taxable returns decreased 6.3 percent to $7,760 billion for 2008. Total income tax decreased by more than $84 billion (7.5 percent) to $1,032 billion for 2008. Average AGI for taxable returns decreased to $83,647 for 2008, (a small decrease from 2007). Average income tax also decreased for 2008 by 1.8 percent to $11,379.
In order to analyze the average tax rate over time, it is necessary to use a more consistent measure of income than AGI, because some tax law changes have resulted in the defi nition of AGI changing from year to year. The 1979 Income Concept controls for much of this variation in tax law, and its use provides a more consistent estimate of the average tax rate across years. Under the 1979 Concept, the average tax rate for 2008 decreased to 13.3 percent from 13.5 percent for the previous year.
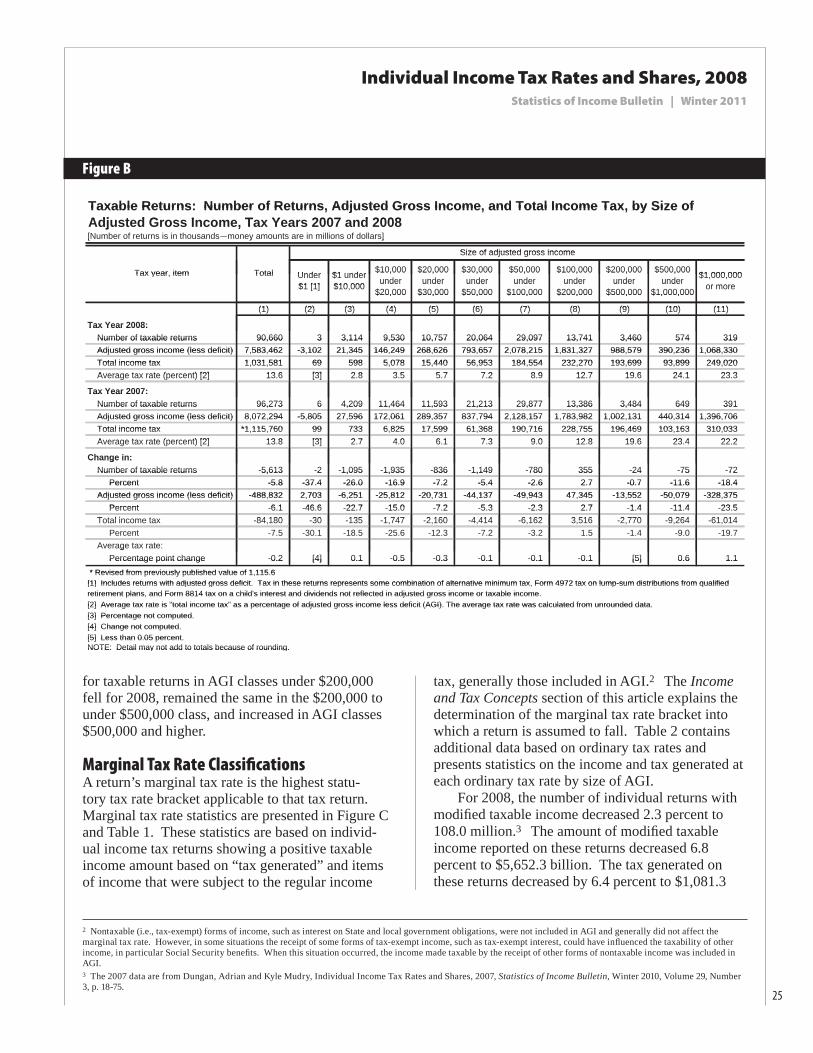
As shown in Figure B, the average tax rate on all taxable returns as a percentage of AGI was 13.6 percent for 2008. The average tax rate for the AGI-size classes ranged from 2.8 percent for the “$1 under $10,000” AGI-size class to 24.1 percent for the “$500,000 under $1,000,000” AGI-size class.
The average tax rate of 13.6 percent for 2008 for all income classes combined was 0.2 percent-age points lower than in 2007. The average tax rate
25
Individual Income Tax Rates and Shares, 2008Statistics of Income Bulletin | Winter 2011
for taxable returns in AGI classes under $200,000 fell for 2008, remained the same in the $200,000 to under $500,000 class, and increased in AGI classes $500,000 and higher.
Marginal Tax Rate Classifi cationsA return’s marginal tax rate is the highest statu-tory tax rate bracket applicable to that tax return. Marginal tax rate statistics are presented in Figure C and Table 1. These statistics are based on individ-ual income tax returns showing a positive taxable income amount based on “tax generated” and items of income that were subject to the regular income
tax, generally those included in AGI.2 The Income and Tax Concepts section of this article explains the determination of the marginal tax rate bracket into which a return is assumed to fall. Table 2 contains additional data based on ordinary tax rates and presents statistics on the income and tax generated at each ordinary tax rate by size of AGI.
For 2008, the number of individual returns with modifi ed taxable income decreased 2.3 percent to 108.0 million.3 The amount of modifi ed taxable income reported on these returns decreased 6.8 percent to $5,652.3 billion. The tax generated on these returns decreased by 6.4 percent to $1,081.3
Taxable Returns: Number of Returns Adjusted Gross Income and Total Income Tax by Size ofTaxable Returns: Number of Returns, Adjusted Gross Income, and Total Income Tax, by Size of Adj t d G I T Y 2007 d 2008Adjusted Gross Income, Tax Years 2007 and 2008[Number of returns is in thousands—money amounts are in millions of dollars]
j ,[Number of returns is in thousands money amounts are in millions of dollars]
Size of adjusted gross incomeSize of adjusted gross income
$20,000 $30,000 $50,000 $100,000 $200,000 $500,000 $1 000 000Tax year item Total Under $1 under $10,000 $20,000under
$30,000under
$50,000under
$100,000under
$200,000under
$500,000under $1,000,000
or moreTax year, item Total Under
$1 [1]$1 under $10 000
$10,000under under
$30,000under
$50,000under
$100,000under
$200,000under
$500,000under
$1,000,000 or more$1 [1] $10,000 under$20,000
(1) (2) (3) (4) (5) (6) (7) (8) (9) (10) (11)
$30,000 $50,000 $100,000 $200,000 $500,000 $1,000,000$20,000
(1) (2) (3) (4) (5) (6) (7) (8) (9) (10) (11)
Tax Year 2008:Tax Year 2008: Number of taxable returns 90,660 3 3,114 9,530 10,757 20,064 29,097 13,741 3,460 574 319 Number of taxable returns 90,660 3 3,114 9,530 10,757 20,064 29,097 13,741 3,460 574 319
Adjusted gross income (less deficit) 7 583 462 -3 102 21 345 146 249 268 626 793 657 2 078 215 1 831 327 988 579 390 236 1 068 330 Adjusted gross income (less deficit) 7,583,462 -3,102 21,345 146,249 268,626 793,657 2,078,215 1,831,327 988,579 390,236 1,068,330Total income tax 1 031 581 69 598 5 078 15 440 56 953 184 554 232 270 193 699 93 899 249 020 Total income tax 1,031,581 69 598 5,078 15,440 56,953 184,554 232,270 193,699 93,899 249,020Average tax rate (percent) [2] 13 6 [3] 2 8 3 5 5 7 7 2 8 9 12 7 19 6 24 1 23 3 Average tax rate (percent) [2] 13.6 [3] 2.8 3.5 5.7 7.2 8.9 12.7 19.6 24.1 23.3
Tax Year 2007:Tax Year 2007: Number of taxable returns 96,273 6 4,209 11,464 11,593 21,213 29,877 13,386 3,484 649 391 Number of taxable returns 96,273 6 4,209 11,464 11,593 21,213 29,877 13,386 3,484 649 391
Adjusted gross income (less deficit) 8,072,294 -5,805 27,596 172,061 289,357 837,794 2,128,157 1,783,982 1,002,131 440,314 1,396,706 Adjusted gross income (less deficit) 8,072,294 -5,805 27,596 172,061 289,357 837,794 2,128,157 1,783,982 1,002,131 440,314 1,396,706Total income tax *1 115 760 99 733 6 825 17 599 61 368 190 716 228 755 196 469 103 163 310 033 Total income tax *1,115,760 99 733 6,825 17,599 61,368 190,716 228,755 196,469 103,163 310,033Average tax rate (percent) [2] 13 8 [3] 2 7 4 0 6 1 7 3 9 0 12 8 19 6 23 4 22 2 Average tax rate (percent) [2] 13.8 [3] 2.7 4.0 6.1 7.3 9.0 12.8 19.6 23.4 22.2
Change in:Change in: Number of taxable returns -5,613 -2 -1,095 -1,935 -836 -1,149 -780 355 -24 -75 -72 Number of taxable returns 5,613 2 1,095 1,935 836 1,149 780 355 24 75 72
Percent -5.8 -37.4 -26.0 -16.9 -7.2 -5.4 -2.6 2.7 -0.7 -11.6 -18.4 Percent -5.8 -37.4 -26.0 -16.9 -7.2 -5.4 -2.6 2.7 -0.7 -11.6 -18.4Adjusted gross income (less deficit) -488 832 2 703 -6 251 -25 812 -20 731 -44 137 -49 943 47 345 -13 552 -50 079 -328 375 Adjusted gross income (less deficit) -488,832 2,703 -6,251 -25,812 -20,731 -44,137 -49,943 47,345 -13,552 -50,079 -328,375
Percent 6 1 46 6 22 7 15 0 7 2 5 3 2 3 2 7 1 4 11 4 23 5 Percent -6.1 -46.6 -22.7 -15.0 -7.2 -5.3 -2.3 2.7 -1.4 -11.4 -23.5T t l i t 84 180 30 135 1 747 2 160 4 414 6 162 3 516 2 770 9 264 61 014 Total income tax -84,180 -30 -135 -1,747 -2,160 -4,414 -6,162 3,516 -2,770 -9,264 -61,014
Percent -7.5 -30.1 -18.5 -25.6 -12.3 -7.2 -3.2 1.5 -1.4 -9.0 -19.7 Average tax rate:g Percentage point change -0.2 [4] 0.1 -0.5 -0.3 -0.1 -0.1 -0.1 [5] 0.6 1.1 Percentage point change 0.2 [4] 0.1 0.5 0.3 0.1 0.1 0.1 [5] 0.6 1.1* Revised from previously published value of 1 115 6 * Revised from previously published value of 1,115.6[1] Includes returns with adjusted gross deficit Tax in these returns represents some combination of alternative minimum tax Form 4972 tax on lump-sum distributions from qualified[1] Includes returns with adjusted gross deficit. Tax in these returns represents some combination of alternative minimum tax, Form 4972 tax on lump-sum distributions from qualified retirement plans and Form 8814 tax on a child's interest and dividends not reflected in adjusted gross income or taxable income[2] Average tax rate is "total income tax" as a percentage of adjusted gross income less deficit (AGI). The average tax rate was calculated from unrounded data.retirement plans, and Form 8814 tax on a child s interest and dividends not reflected in adjusted gross income or taxable income.[2] Average tax rate is total income tax as a percentage of adjusted gross income less deficit (AGI). The average tax rate was calculated from unrounded data.[3] Percentage not computed.[3] Percentage not computed.[4] Change not computed.[4] Change not computed.[5] Less than 0.05 percent.[5] Less than 0.05 percent.NOTE: Detail may not add to totals because of rounding.NOTE: Detail may not add to totals because of rounding.
Figure B
2 Nontaxable (i.e., tax-exempt) forms of income, such as interest on State and local government obligations, were not included in AGI and generally did not affect the marginal tax rate. However, in some situations the receipt of some forms of tax-exempt income, such as tax-exempt interest, could have infl uenced the taxability of other income, in particular Social Security benefi ts. When this situation occurred, the income made taxable by the receipt of other forms of nontaxable income was included in AGI.3 The 2007 data are from Dungan, Adrian and Kyle Mudry, Individual Income Tax Rates and Shares, 2007, Statistics of Income Bulletin, Winter 2010, Volume 29, Number 3, p. 18-75.

26
Individual Income Tax Rates and Shares, 2008Statistics of Income Bulletin | Winter 2011
billion. Figure C presents the amounts and percent-ages of modifi ed taxable income and income tax generated (before alternative minimum tax and reduction by tax credits, including the earned income credit) by the marginal tax rate categories (defi ned in the Income and Tax Concepts section of this article).
Returns with modifi ed taxable income in the “15-percent” (ordinary income) marginal tax rate bracket contained the largest share of returns for 2008, at 39.3 percent. These returns reported 20.6 percent of modifi ed taxable income for 2008 and generated 13.9 percent of income tax. Conversely, taxpayers in the “35-percent” (ordinary income) marginal rate, the least represented (ordinary income) bracket, accounted for only 0.9 percent of returns, but reported 20.1 percent of the modifi ed taxable income and 31.2 percent of the tax generated (the largest of any tax bracket). The “10-percent” (ordinary income) marginal rate bracket reported the second largest share of returns, at 24.3 percent. However, such returns accounted for only 2.6 percent of modifi ed income and 1.3 percent of income tax generated. With a 21.6-percent share
of returns, making it the third largest bracket, the “25-percent” (ordinary income) marginal rate bracket reported 29.1 percent of the modifi ed taxable income and 25.7 percent of income tax generated. Returns in the “28-percent” (ordinary income) marginal rate bracket represented 3.9 percent of the total share of returns and accounted for 10.8 percent of the modifi ed taxable income and 11.8 percent of the generated income tax. Returns in the “33-percent” (ordinary income) marginal rate bracket represented the second smallest share of ordinary tax rate returns, at 1.5 percent, and accounted for 8.0 percent of the modifi ed taxable income and 10.1 percent of the tax generated. Returns in the capital gain and dividends 0-percent, 15-percent, 25-percent, and 28-percent tax brackets represented 8.2 percent of returns and reported a total of 8.8 percent of modifi ed taxable income and 5.9 percent of the tax.
As shown in Table 2, the total tax generated for 2008 at the 15-percent rate was more than any other rate. The 34.9 percent of income taxed at this rate was reported by 74.3 percent of returns with modifi ed taxable income, producing 27.4 percent
Figure C
Returns with Modified Taxable Income: Tax Generated at All Rates on Returns with the IndicatedReturns with Modified Taxable Income: Tax Generated at All Rates on Returns with the Indicated Marginal Tax Rate Tax Year 2008Marginal Tax Rate, Tax Year 2008[Money amounts are in thousands of dollars]
g ,[Money amounts are in thousands of dollars]
N mber of ret rns Modified ta able income Ta generatedNumber of returns Modified taxable income Tax generatedMarginal tax rate classes
Number Percent of total Amount Percent of total Amount Percent of totalg
Number Percent of total Amount Percent of total Amount Percent of total
(1) (2) (3) (4) (5) (6)(1) (2) (3) (4) (5) (6)
Total 107,978,328 100.0 5,652,315,095 100.0 1,081,295,469 100.0Total 107,978,328 100.0 5,652,315,095 100.0 1,081,295,469 100.0*0 percent 828 798 0 8 5 641 894 0 1 0 0 *0 percent 828,798 0.8 5,641,894 0.1 0 05 percent (prior year rate) 36 171 [1] 401 369 [1] 20 069 0 0 5 percent (prior year rate) 36,171 [1] 401,369 [1] 20,069 0.010 t 26 189 462 24 3 144 416 442 2 6 13 653 580 1 3 10 percent 26,189,462 24.3 144,416,442 2.6 13,653,580 1.3
10 percent (Form 8814) [2] 19,088 [1] 24,916 [1] 2,492 0.0 10 percent (Form 8814) [2] 19,088 [1] 24,916 [1] 2,492 0.015 percent 42,389,614 39.3 1,163,636,276 20.6 149,790,612 13.9 15 percent 42,389,614 39.3 1,163,636,276 20.6 149,790,612 13.915 percent (capital gains) [3] 7 742 786 7 2 453 870 406 8 0 57 572 176 5 3 15 percent (capital gains) [3] 7,742,786 7.2 453,870,406 8.0 57,572,176 5.325 t 23 286 637 21 6 1 644 133 455 29 1 278 040 704 25 7 25 percent 23,286,637 21.6 1,644,133,455 29.1 278,040,704 25.7
25 percent (capital gains) 184,687 0.2 31,530,529 0.6 5,349,787 0.5 p ( p g ) , , , , , 28 percent 4,257,855 3.9 610,072,127 10.8 127,944,621 11.8 28 percent 4,257,855 3.9 610,072,127 10.8 127,944,621 11.8
28 percent (capital gains) 18 108 [1] 3 766 145 0 1 794 906 0 1 28 percent (capital gains) 18,108 [1] 3,766,145 0.1 794,906 0.133 percent 1 669 518 1 5 451 864 124 8 0 109 741 449 10 1 33 percent 1,669,518 1.5 451,864,124 8.0 109,741,449 10.135 971 510 0 9 1 138 591 766 20 1 337 546 859 31 2 35 percent 971,510 0.9 1,138,591,766 20.1 337,546,859 31.2
Form 8615 [4] 384,095 0.4 4,365,648 0.1 838,213 0.1 Form 8615 [4] 384,095 0.4 4,365,648 0.1 838,213 0.1* For tax year 2008, the 5 percent tax rate on qualified dividends and net capital gain was reduced to zero. For tax year 2008, the 5 percent tax rate on qualified dividends and net capital gain was reduced to zero.[1] Less than 0.05 percent.[1] Less than 0.05 percent.[2] Form 8814 was filed for a dependent child, meeting certain age requirements, for whom the parents made an election to report the child's investment income on the parents' tax [ ] p , g g q , p p preturn. This rate classification is comprised of those returns with a tax liability only from the dependent's income.p y y p[3] The 15 percent capital gains rate also includes qualified dividends.[ ] p p g q[4] Form 8615 was filed for a child meeting certain age requirements, to report the child's investment income. The returns in this rate classification are not distributed by tax rate.NOTE: Detail may not add to totals because of rounding.

27
Individual Income Tax Rates and Shares, 2008Statistics of Income Bulletin | Winter 2011
of tax generated. The 35-percent rate generated the next largest amount of income tax. Tax in that bracket was reported on only 0.9 percent of returns. However, 11.0 percent of all modifi ed taxable income was taxed at this rate, generating 20.2 percent of tax generated. The 25-percent (ordinary income) rate had the third largest amount of tax generated. Tax in that bracket was reported on 28.1 percent of returns, with 15.4 percent of all modifi ed taxable income taxed at this rate, generating 20.1 percent of the tax generated.
Components of Total Income Tax
Regular Tax
Regular tax is generally tax determined from a taxpayer’s taxable income based on statutory tax rates. It does not include the “alternative minimum tax” (AMT) nor does it exclude allowable tax credits. Figure D illustrates the derivation of the aggregate tax generated for 2007 and 2008 returns. Table 1 includes two tax amounts: “tax generated” and “income tax after credits.” Tables 5 through 8 and Figures A and B include an additional measure of tax, “total income tax,” which also includes distrib-uted tax on trust accumulations.
As shown (Figure D and column 5 of Table 1), the tax generated by applying statutory ordinary income and capital gain tax rates to modifi ed taxable income was $1,081.3 billion, a 6.4-percent decrease from 2007.4 For most taxpayers, tax generated was equal to income tax before credits. However, for some taxpayers, income tax before credits included the alternative minimum tax (AMT) and/or special taxes on lump-sum distributions from qualifi ed retirement plans (when a 10-year averaging method was used).5 The AMT increased 6.4 percent to $25.6 billion for 2008. Income tax before credits
was $1,106.9 billion for 2008, down from $1,179.5 billion, representing a 6.2-percent decrease from 2007. Taxpayers used $75.4 billion of tax credits to reduce their income tax before credits. The earned income credit (EIC) is included in this computa-tion to the extent that its application did not reduce income tax before credits below zero. Any portion of the EIC that is refundable to the taxpayer because it exceeds the taxpayer’s liability and any portion of the EIC used to reduce taxes other than income taxes are excluded from the computation of income tax after credits.6 Both income tax after credits (Figure D) and total income tax (the sum of income tax after credits and tax on trust accumulation distributions) totaled $1,031.6 billion. These taxes both repre-sented a 7.5-percent decrease from 2007.
For returns with modifi ed taxable income, Table 4a shows estimates of income tax before credits by the type of tax computation. It shows the amount of tax before credits assuming that all taxable income is subject to regular tax rates with the amount of tax before credits actually computed after refl ecting both regular tax rates and any special tax computa-tions that the taxpayer is either permitted or required to make. In particular, qualifi ed dividends and long-term capital gains are generally subject to lower tax rates and certain dependent tax fi lers are required to compute their tax as if their income were the marginal income of their parent or guardian.7 The capital gains computations generally reduce taxes; the special provision for certain dependent fi lers can only increase taxes.
For 2008, 85.4 million returns had their tax before credits computed using only regular income tax rates, compared with 85.3 million for 2007 that used only regular tax computations, an increase of 0.2 percent. The top portion of Table 4a shows the data for these returns. Since these returns did not
4 Tax generated does not include certain other taxes reported on the individual income tax return, such as self-employment tax (the Social Security and Medicare tax on income from self-employment), the Social Security tax on certain tip income, household employment taxes, tax from the recapture of prior-year investment, low-income housing, or other credits, penalty tax applicable to early withdrawals from an Individual Retirement Arrangement (IRA) or other qualifi ed retirement plans, and tax on trusts, accumulation, and distributions. The statistics for “total tax liability,” shown in Bryan, Justin, “Individual Income Tax Returns: 2008,” Statistics of Income Bulletin, Fall 2010, Volume 29, Number 2, include these taxes.5 The income amounts on which these special computations for lump-sum distributions were based were not refl ected in current-year AGI or current-year taxable income.6 For 2008, the total earned income credit was $50.7 billion. This amount includes the amount used to reduce the income tax ($1.0 billion), the amount used to reduce other taxes reported on individual income tax returns ($5.4 billion), and the amount refunded to taxpayers ($44.3 billion). Table 4 in Bryan, Justin, “Individual Income Tax Returns: 2008,” Statistics of Income Bulletin, Fall 2010, Volume 29, Number 2, shows these amounts.7 Dependents with income of more than $1,800 other than earned income could fi le their own returns but were suggested to calculate their tax on other than earned income in excess of $1,800 as if it were their parent’s or guardian’s marginal income. Form 8814 was used to compute the higher tax. For dependents with only modest amounts of investment income, the parent or guardian could elect to include the dependent’s income on the parent’s tax return, relieving the dependent of having to fi le his or her own tax return.

28
Individual Income Tax Rates and Shares, 2008Statistics of Income Bulletin | Winter 2011
use any special tax computations, the difference due to special computation (shown in columns 4 and 8) is zero.
As shown in the middle section of Table 4a, for 2008, the number of tax returns fi led by dependents under age 18 with Form 8615 for reporting invest-ment income greater than $1,800 (see Changes in Law section on tax on child’s investment income) was a 0.4 million decrease of 8.4 percent from 2007. Form 8615 was used to compute the dependents’ tax, as the dependents’ income was the marginal income of the parent or guardian. This mandatory calcu-lation can result in no change or an increase in tax before credits; it cannot lower the dependent’s tax before credits. Thus, for Form 8615 fi lers, the differ-ence in tax before credits due to special computations (column 8) refl ects the combination of the lower tax from use of the special tax rates for dividends and capital gains and the possibly higher tax from the
required Form 8615 tax computation. The combina-tion of the two offsetting provisions reduced taxes by $26.1 million for 2008. The net tax reduction was due to a tax reduction of $259.9 million from use of dividend and capital gains, and a tax increase of $233.8 million from the Form 8615 tax computation.
As shown in the bottom section of Table 4a, for 2008, 20.9 million returns had their tax liability decreased by Schedule D (capital gains) and dividend tax computations. This was a decrease of 9.7 percent from the 23.2 million returns in 2007. Taxpayers fi ling these tax returns paid $68.3 billion (column 8) less in tax before credits than they would have paid if they had not received the benefi ts of the lower tax rates for qualifi ed dividends and capital gains. This was down from the $125.7 billion in savings for 2007 due to use of these special tax rates. For these taxpayers, the average tax savings decreased from $5,420 for 2007 to $3,264 for 2008.
Figure D
Derivation of Tax Years 2007 and 2008 Total Income Tax as Shown in Statistics of Income[Money amounts are in billions of dollars]
Item 2007 2008Percentage
change (2007–2008)
(1) (2) (3)
Tax generated from tax rate schedules or tax table 1,155.4 1,081.3 -6.4PLUS: Tax on lump-sum distributions from qualified retirement plans [1] [1] [2] Alternative minimum tax 24.1 25.6 6.4
EQUALS:Income tax before credits 1,179.5 1,106.9 -6.2LESS: Tax credits, total [3] 63.8 75.4 18.1 Child-care credit 3.5 3.5 1.3 Child tax credit [3] 31.6 30.5 -3.2 Education credit 6.9 7.6 10.5 Foreign tax credit 15.4 16.6 7.4 General business credit 0.8 1.6 95.1 Earned income credit (limited to the amount needed to reduce total income tax to zero) 0.9 1.0 3.9 Credit for prior-year minimum tax 1.0 0.9 -8.7 Retirement savings contribution credit 1.0 1.0 0.1 Other credits [4] 2.6 12.5 381.8
EQUALS:Income tax after credits 1,115.8 1,031.6 -7.5PLUS: Trusts accumulation distribution [1] [1] [2]
EQUALS:Total income tax *1,115.8 1,031.6 -7.5* Revised from previously published value of 1,115.6[1] Less than $0.05 billion.[2] Percentage not computed.[3] Does not include the additional child tax credit that for 2008 was $20.43 billion which was refunded to taxpayers and not included in total income tax.[4] Includes credits listed separately in table 2 of Individual Income Tax Returns: 2008, Statistics of Income Bulletin, Fall 2010, Volume 29, Number 2.NOTE: Detail may not add to totals because of rounding.
29
Individual Income Tax Rates and Shares, 2008Statistics of Income Bulletin | Winter 2011
Alternative Minimum TaxThe Revenue Act of 1978 established the alterna-tive minimum tax (AMT) to ensure that a minimum amount of income tax was paid by taxpayers who might otherwise be able to legally reduce, or totally eliminate, their tax burdens. The AMT provisions may recapture some of the tax reductions under the ordinary income tax. Form 6251, Alternative Minimum Tax—Individuals, is used to calculate AMT. (See the Computation of Alternative Minimum Taxable Income section of this article for an
explanation of the computation of income for AMT purposes.)
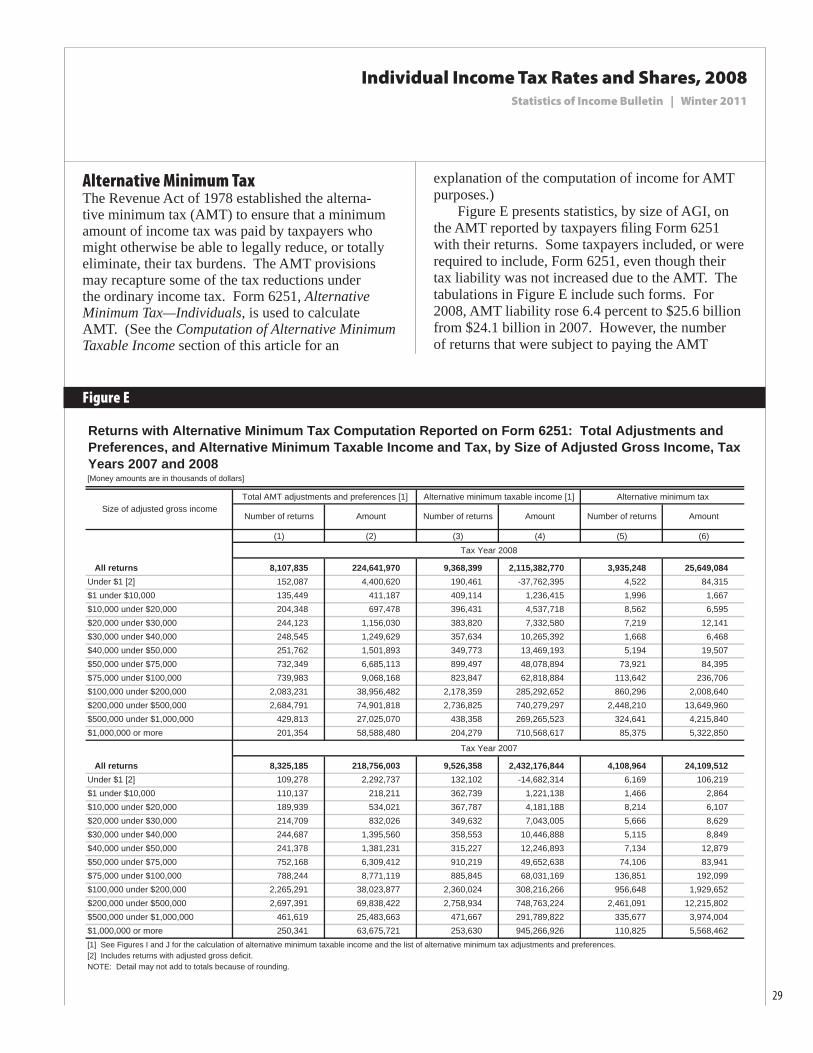
Figure E presents statistics, by size of AGI, on the AMT reported by taxpayers fi ling Form 6251 with their returns. Some taxpayers included, or were required to include, Form 6251, even though their tax liability was not increased due to the AMT. The tabulations in Figure E include such forms. For 2008, AMT liability rose 6.4 percent to $25.6 billion from $24.1 billion in 2007. However, the number of returns that were subject to paying the AMT
Figure E
[Money amounts are in thousands of dollars] Total AMT adjustments and preferences [1] Alternative minimum taxable income [1] Alternative minimum tax
(1) (2) (3) (4) (5) (6)Tax Year 2008
All returns 8,107,835 224,641,970 9,368,399 2,115,382,770 3,935,248 25,649,084 Under $1 [2] 152,087 4,400,620 190,461 -37,762,395 4,522 84,315 $1 under $10,000 135,449 411,187 409,114 1,236,415 1,996 1,667 $10,000 under $20,000 204,348 697,478 396,431 4,537,718 8,562 6,595 $20,000 under $30,000 244,123 1,156,030 383,820 7,332,580 7,219 12,141 $30,000 under $40,000 248,545 1,249,629 357,634 10,265,392 1,668 6,468 $40,000 under $50,000 251,762 1,501,893 349,773 13,469,193 5,194 19,507 $50,000 under $75,000 732,349 6,685,113 899,497 48,078,894 73,921 84,395 $75,000 under $100,000 739,983 9,068,168 823,847 62,818,884 113,642 236,706 $100,000 under $200,000 2,083,231 38,956,482 2,178,359 285,292,652 860,296 2,008,640 $200,000 under $500,000 2,684,791 74,901,818 2,736,825 740,279,297 2,448,210 13,649,960 $500,000 under $1,000,000 429,813 27,025,070 438,358 269,265,523 324,641 4,215,840 $1,000,000 or more 201,354 58,588,480 204,279 710,568,617 85,375 5,322,850
Tax Year 2007
All returns 8,325,185 218,756,003 9,526,358 2,432,176,844 4,108,964 24,109,512 Under $1 [2] 109,278 2,292,737 132,102 -14,682,314 6,169 106,219 $1 under $10,000 110,137 218,211 362,739 1,221,138 1,466 2,864 $10,000 under $20,000 189,939 534,021 367,787 4,181,188 8,214 6,107 $20,000 under $30,000 214,709 832,026 349,632 7,043,005 5,666 8,629 $30,000 under $40,000 244,687 1,395,560 358,553 10,446,888 5,115 8,849 $40,000 under $50,000 241,378 1,381,231 315,227 12,246,893 7,134 12,879 $50,000 under $75,000 752,168 6,309,412 910,219 49,652,638 74,106 83,941 $75,000 under $100,000 788,244 8,771,119 885,845 68,031,169 136,851 192,099 $100,000 under $200,000 2,265,291 38,023,877 2,360,024 308,216,266 956,648 1,929,652 $200,000 under $500,000 2,697,391 69,838,422 2,758,934 748,763,224 2,461,091 12,215,802 $500,000 under $1,000,000 461,619 25,483,663 471,667 291,789,822 335,677 3,974,004 $1,000,000 or more 250,341 63,675,721 253,630 945,266,926 110,825 5,568,462 [1] See Figures I and J for the calculation of alternative minimum taxable income and the list of alternative minimum tax adjustments and preferences.[2] Includes returns with adjusted gross deficit.NOTE: Detail may not add to totals because of rounding.
Returns with Alternative Minimum Tax Computation Reported on Form 6251: Total Adjustments and Preferences, and Alternative Minimum Taxable Income and Tax, by Size of Adjusted Gross Income, Tax Years 2007 and 2008
Number of returns Amount Number of returns Amount Number of returns AmountSize of adjusted gross income
30
Individual Income Tax Rates and Shares, 2008Statistics of Income Bulletin | Winter 2011
decreased by 0.2 million for the period.8 Alternative Minimum Taxable Income (AMTI) for all returns fi ling a Form 6251 decreased 13.0 percent to $2.1 trillion from 2007.
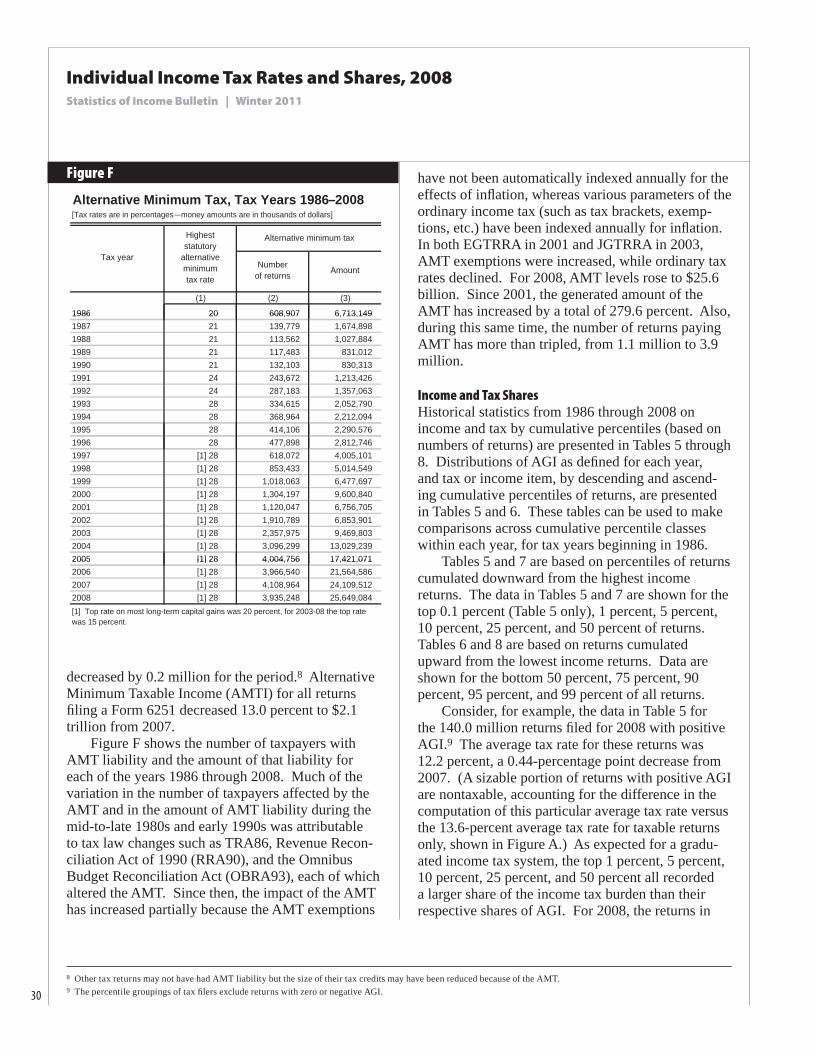
Figure F shows the number of taxpayers with AMT liability and the amount of that liability for each of the years 1986 through 2008. Much of the variation in the number of taxpayers affected by the AMT and in the amount of AMT liability during the mid-to-late 1980s and early 1990s was attributable to tax law changes such as TRA86, Revenue Recon-ciliation Act of 1990 (RRA90), and the Omnibus Budget Reconciliation Act (OBRA93), each of which altered the AMT. Since then, the impact of the AMT has increased partially because the AMT exemptions
have not been automatically indexed annually for the effects of infl ation, whereas various parameters of the ordinary income tax (such as tax brackets, exemp-tions, etc.) have been indexed annually for infl ation. In both EGTRRA in 2001 and JGTRRA in 2003, AMT exemptions were increased, while ordinary tax rates declined. For 2008, AMT levels rose to $25.6 billion. Since 2001, the generated amount of the AMT has increased by a total of 279.6 percent. Also, during this same time, the number of returns paying AMT has more than tripled, from 1.1 million to 3.9 million.
Income and Tax Shares
Historical statistics from 1986 through 2008 on income and tax by cumulative percentiles (based on numbers of returns) are presented in Tables 5 through 8. Distributions of AGI as defi ned for each year, and tax or income item, by descending and ascend-ing cumulative percentiles of returns, are presented in Tables 5 and 6. These tables can be used to make comparisons across cumulative percentile classes within each year, for tax years beginning in 1986.
Tables 5 and 7 are based on percentiles of returns cumulated downward from the highest income returns. The data in Tables 5 and 7 are shown for the top 0.1 percent (Table 5 only), 1 percent, 5 percent, 10 percent, 25 percent, and 50 percent of returns. Tables 6 and 8 are based on returns cumulated upward from the lowest income returns. Data are shown for the bottom 50 percent, 75 percent, 90 percent, 95 percent, and 99 percent of all returns.
Consider, for example, the data in Table 5 for the 140.0 million returns fi led for 2008 with positive AGI.9 The average tax rate for these returns was 12.2 percent, a 0.44-percentage point decrease from 2007. (A sizable portion of returns with positive AGI are nontaxable, accounting for the difference in the computation of this particular average tax rate versus the 13.6-percent average tax rate for taxable returns only, shown in Figure A.) As expected for a gradu-ated income tax system, the top 1 percent, 5 percent, 10 percent, 25 percent, and 50 percent all recorded a larger share of the income tax burden than their respective shares of AGI. For 2008, the returns in
Figure F
8 Other tax returns may not have had AMT liability but the size of their tax credits may have been reduced because of the AMT.9 The percentile groupings of tax fi lers exclude returns with zero or negative AGI.
Alternative Minimum Tax, Tax Years 1986–2008[Tax rates are in percentages—money amounts are in thousands of dollars]
(1) (2) (3)
1986 20 608 907 6 713 149
Higheststatutory
alternativeminimumtax rate
Numberof returns Amount
Alternative minimum tax
Tax year
1986 20 608,907 6,713,1491987 21 139,779 1,674,898 1988 21 113,562 1,027,884 1989 21 117,483 831,012 1990 21 132,103 830,313 1991 24 243,672 1,213,426 1992 24 287,183 1,357,063 1993 28 334,615 2,052,790 1994 28 368,964 2,212,094 1995 28 414,106 2,290,576 1996 28 477,898 2,812,746 1997 [1] 28 618,072 4,005,101 1998 [1] 28 853,433 5,014,549 1999 [1] 28 1,018,063 6,477,697 2000 [1] 28 1,304,197 9,600,840 2001 [1] 28 1,120,047 6,756,705 2002 [1] 28 1,910,789 6,853,901 2003 [1] 28 2,357,975 9,469,803 2004 [1] 28 3,096,299 13,029,239 2005 [1] 28 4,004,756 17,421,0712005 [1] 28 4,004,756 17,421,0712006 [1] 28 3,966,540 21,564,586 2007 [1] 28 4,108,964 24,109,512 2008 [1] 28 3,935,248 25,649,084 [1] Top rate on most long-term capital gains was 20 percent, for 2003-08 the top rate was 15 percent.
31
Individual Income Tax Rates and Shares, 2008Statistics of Income Bulletin | Winter 2011
the top 0.1 percent reported 10.0 percent of total AGI and 18.5 percent of total income tax. The amount of AGI needed for inclusion in this percentile group (i.e., the AGI fl oor) was $1,803,585. For 2007, the returns in this percentile group (i.e., those with at least $2,155,365 in AGI) reported 11.9 percent of total AGI and 20.2 percent of total income tax.
For 2008, the returns in the top 1 percent reported 20.0 percent of total AGI and 38.0 percent of income tax. The amount of AGI needed for inclu-sion in this percentile group (i.e., the AGI fl oor) was $380,354. For 2007, the returns in this percen-tile group (i.e., those with at least $410,096 in AGI) reported 22.8 percent of total AGI and 40.4 percent of total income tax.
For 2008, the returns in the top 5-percent group (returns reporting AGI of $159,619 or more) reported 34.7 percent of total AGI and 58.7 percent of income tax, compared to 37.4 percent and 60.6 percent, respec-tively, for 2007 (when the AGI fl oor was $160,041). For 2008, returns in the top 10-percent group (returns with AGI of at least $113,799) reported 45.8 percent of AGI and paid 69.9 percent of income tax. For 2007, the returns in this percentile group (with AGI of $113,018 or more) reported 48.1 percent of total AGI and 71.2 percent of income tax. The top 50-percent group (reporting AGI of $33,048 or more) accounted for 87.2 percent of AGI and paid almost all (97.3 percent) of the income tax for 2008.
The statistics by percentile in Tables 5 and 6 for years prior to 1991 and in Tables 7 and 8 for years prior to 1994 were estimated, using a mathe-matical technique called “osculatory interpolation,” applied to aggregated data tabulated by income-size classes, in order to distribute the tax returns within each class.10 For 1991 and later years, the statis-tics by percentiles in Tables 5 and 6, were computed based on an actual ranking of the returns in the statis-tical sample that served as the basis for Individual Statistics of Income estimates. The same was done for Tables 7 and 8 for 1994 and later years. The differences under the two methods were judged to be minor enough so that the pre-1991 and post-1990 data are believed to be comparable for Tables 5 and 6. Similarly for Tables 7 and 8, pre-1994 and post-1993 data are believed to be comparable.
Explanation of Selected TermsThis section provides brief explanations of the major tax concepts discussed in this article. For more extensive defi nitions, see Individual Income Tax Returns 2008, Statistics of Income Division, Internal Revenue Service, Publication 1304.
Adjusted gross income—Adjusted gross income is “total income,” as defi ned by the Internal Revenue Code, less “statutory adjustments” (primarily business, investment, or certain other deductions, such as payments to a Keogh self-employed retire-ment plan, certain deductible contributions to an Individual Retirement Arrangement (IRA), self-employed health insurance deductions, and one-half of Social Security taxes for the self-employed). Total income includes, for example, salaries and wages, taxable interest, dividends, alimony, and net amounts from such sources as business income, rents and royalties, and sales of capital assets.
Difference due to special tax computation—For this article, the tax difference is the amount of tax resulting from using provisions of one of the special tax computations (Form 8615 or Schedule D and qualifi ed dividends) less the amount of tax that would have resulted from not having used any of these provisions (regular tax computation).
Dividends—Ordinary dividend income consisted of distributions of money, stock, or other property received by taxpayers from domestic and foreign corporations, either directly or passed through estates, trusts, partnerships, or regulated investment companies. Ordinary dividends also included distri-butions from money market mutual funds.
Ordinary dividends did not include nontax-able distributions of stock or stock rights, returns of capital, capital gains, or liquidation distributions. Taxpayers were also instructed to exclude amounts paid on deposits or withdrawable accounts in banks, mutual savings banks, cooperative banks, savings and loan associations, and credit unions, which were treated as interest income.
Qualifi ed dividends are the ordinary dividends received in tax years beginning after 2002 that met certain conditions. These conditions include: the dividend must have been paid by a U.S. corpora-tion or a “qualifi ed” foreign corporation; the stock
10 For an explanation of the osculatory interpolation technique, see Oh, H. Lock, “Osculatory Interpolation with a Monotonicity Constraint,” 1977 Proceedings of the American Statistical Association, Section on Statistical Computing, 1978.

32
Individual Income Tax Rates and Shares, 2008Statistics of Income Bulletin | Winter 2011
ownership must have met certain holding period requirements; the dividends were not from certain institutions, such as mutual savings banks, coopera-tive banks, credit unions, tax-exempt organizations, or farmer cooperatives; and the dividends were not for any share of stock which was part of an employee stock ownership plan (ESOP). The maximum tax rate for qualifi ed dividends was 15 percent generally (or 0 percent for amounts that would otherwise have been taxed at the 10-percent or 15-percent regular income rates).
Form 8615 tax computation—Form 8615, in addition to being used to fi gure the tax of certain children who are under 18, was required to fi gure the tax for a child with investment income of more than $1,800 if the child:
(1) Was age 18 at the end of 2008 and did not have earned income that was more than half of the child’s support, or
(2) Was a full-time student over age 18 and under age 24 at the end of 2008 and did not have earned income that was more than half of the child’s support.
Income tax before credits—This amount consisted of the tax liability on taxable income, computed by using the tax tables, tax rate schedules, Schedule D Tax worksheet, foreign-earned income tax worksheet, Schedule J, or Form 8615, plus Form (s) 8814, any additional taxes from Form 4972, and the alternative minimum tax.
Income tax before credits (regular tax computa-tion)—This amount consisted of the tax liability on ordinary income, computed by using the tax table or applying the rates from one of the four tax rate schedules, plus any additional tax (tax on lump-sum distributions from qualifi ed retirement plans). When Form 8615 tax was payable on investment income of children, for this concept, all the income was taxed at the child’s rate rather than at the rate of the parents. When the Schedule D tax was payable on net long-term capital gains, the tax was based on the regular tax rates rather than the 0-percent, 15-percent, 25-percent, or 28-percent tax rate for capital gains. When a tax was payable on a qualifi ed dividend, the tax was based on regular tax rates instead of the maximum tax rate for qualifi ed dividends, 15 percent
(0 percent for amounts that would otherwise have been taxed in the 10-percent tax bracket). This is in contrast to the computation of Income tax before credits (see above) in which special tax computations such as those involved on Form 8615, Schedule D and qualifi ed dividends are taken into account. See Table 4.
Marginal tax rate—See Income and Tax Concepts.
Modifi ed taxable income—See Income and Tax Concepts.
Regular tax computation—Depending on marital status and size of taxable income, the taxpayer used one of the four tax rate schedules (or an approxima-tion from the tax table) to determine tax. Returns of taxpayers who had taxes computed by the Internal Revenue Service were classifi ed under the regular tax computation method.
Schedule D and qualifi ed dividend tax computa-tion—Schedule D was used to compute the 0-percent, 15-percent, 25-percent, and 28-percent taxes on net long-term capital gains (in excess of net short-term capital losses) if such computations were benefi cial to the taxpayer. Any investment interest allocated to long-term capital gains (on Form 4952) was excluded from this computation. Qualifi ed dividends were taxed at a maximum tax rate of 15 percent (0 percent for amounts that would otherwise have been taxed in the 15-percent bracket).
Taxable income—Taxable income is AGI less the sum of personal exemption amounts and either the standard deduction for non-itemizers or total itemized deductions. The amounts for personal exemptions and total itemized deductions are net of any reductions because of taxpayers’ incomes exceeding certain income thresholds.
Taxable returns—A return is classifi ed as “taxable” based on the presence of “total income tax.” The following additional taxes were not taken into account for this purpose: self-employment; household employment; Social Security; Railroad Retirement Tax Act (RRTA) taxes; tax from recom-puting prior-year investment; low-income housing and a few other business credits; penalty taxes on Individual Retirement Arrangements; section 72 penalty taxes; advance earned income credit payments; or “golden parachute” payments (made to key employees as compensation under certain circumstances).

33
Individual Income Tax Rates and Shares, 2008Statistics of Income Bulletin | Winter 2011
Tax generated—This is the amount of tax computed on modifi ed taxable income either from the tax rate schedules or the tax table. Tax generated does not take into account the alternative minimum tax or the effect of tax credits. For most returns (those without the special tax on lump-sum distri-butions from qualifi ed retirement plans or alterna-tive minimum tax), tax generated equals “income tax before credits.”
Total income tax—This is the sum of income tax after credits and tax on accumulated trust distribu-tion from Form 4970, less the portion of EIC used to offset other taxes as well as the refundable portion of EIC (with tax limited to zero).
Income Tax StructureTaxpayers must fi le an income tax return if they meet certain minimum fi ling requirements. The fi ling requirements for 2008 were generally based on the amount of “gross income,” fi ling status, age, dependency, and blindness.11 Generally, the minimum level of income for which a return was required to be fi led equaled the sum of the standard deduction for the particular fi ling status and the amount of the personal exemption deduction allowed for the taxpayer or taxpayers (but not for any dependents). In addition to the general fi ling requirements, individuals were required to fi le a return for Tax Year 2008 if they had net earnings from self-employment of at least $400; liability for Social Security or Medicare tax on unreported tip income; Social Security, Medicare, or Railroad Retirement tax on reported tip income or group-term life insurance; “alternative minimum tax”; tax on qualifi ed retirement plan distributions, including an Individual Retirement Arrangement (IRA) or a Medical Savings Account (MSA); tax on the recap-ture of investment credit, low-income housing credit, or a few other business credits; recapture tax on the
disposition of a home purchased with a Federally subsidized mortgage; any advance earned income credit payments; or wages of $108.28 or more from a church or qualifi ed church-controlled organization that was exempt from Social Security taxes.
Gross income includes all income received as money, goods, property, or services that was not expressly exempt from tax.12 Adjusted gross income (AGI) is equal to gross income less deduc-tions for certain expenses.13 “Taxable income,” the base on which income tax before credits is computed, equals AGI less the amount for personal exemptions and less either total allowable itemized deductions for taxpayers who itemize deductions, or the standard deduction (including the additional amounts for age and blindness) for all other taxpay-ers. The amounts for personal exemptions and total itemized deductions are net of any reductions because of taxpayers’ incomes exceeding certain income thresholds.
Income tax before credits is calculated from taxable income using: tax tables or tax rate sched-ules, both of which vary with taxpayer fi ling status (single, married fi ling jointly, surviving spouse, married fi ling separately, and head of house-hold); Form 8615 or Form 8814 for children’s invest-ment income; Schedule J for farmers and fi shermen to income-average; foreign-earned income worksheet; Schedule D and Qualifi ed Dividends worksheet for net long-term capital gains and qualifi ed dividends; or some combination of the above. For 2008, the tax rates for each fi ling status were 0 percent, 10 percent, 15 percent, 25 percent, 26 percent, 28 percent, 33 percent, and 35 percent. The tax rates of 0 percent and 15 percent were used for qualifi ed dividends and net long-term capital gains (in excess of net short-term capital losses). The 26-percent tax rate was only for the alternative minimum tax. Income tax before credits includes any alternative minimum tax.14
11 Taxpayers fall into one of fi ve fi ling statuses: single; married fi ling jointly; married fi ling separately; head of household; or surviving spouse. Being age 65 or older or being legally blind affects the amount of the standard deduction and, hence, the fi ling requirements. Taxpayers who are (or could be) dependents of other taxpayers have different fi ling requirements. For more information on the general fi ling requirements, see Bryan, Justin, “Individual Income Tax Returns: 2008,” Statistics of Income Bulletin, Fall 2010, Volume 30, Number 2.12 As defi ned under section 61 of the Internal Revenue Code, gross income includes amounts from wages and salaries, interest and dividends, alimony, bartering income, canceled debt income, gambling winnings, rents and royalties, and gains from property sales or exchanges, as well as gross income from sole proprietorships and farming, income from partnerships and S corporations, and distributions from estates and trusts. This defi nition of gross income is slightly different from the Form 1040, U.S. Individual Income Tax Return, concept of “total income,” which is a component of the adjusted gross income (AGI) calculation on Form 1040. Total income includes net amounts rather than gross amounts (income prior to deductions) from such items as business income and rents and royalties.13 As defi ned under Internal Revenue Code section 62, deductible expenses are those incurred in the course of a trade or business or in connection with rents and royalties; losses from property sales or exchanges; and certain statutory adjustments, such as deductible contributions to an IRA or Keogh plan, moving expenses, the health insur-ance deduction for certain self-employed taxpayers, and one-half of self-employment tax.14 Income tax before credits includes tax on lump-sum distributions from qualifi ed retirement plans.

34
Individual Income Tax Rates and Shares, 2008Statistics of Income Bulletin | Winter 2011
To calculate their Federal income tax liability for 2008, taxpayers used either the tax table or the tax rate schedules. Taxpayers with taxable income less than $100,000 were required to use the tax table, while those with taxable income of $100,000 or more were required to use the tax rate sched-ules. The tax table was based on income tax “brack-ets” up to $50 wide.15 The tax within each bracket was based on the tax calculated at the midpoint of the bracket and then rounded to the nearest whole dollar. As a result, the tax tables and the tax rate schedules could produce different amounts of tax for the same amount of taxable income. Use of the tax tables could have produced either a slightly higher or lower amount of tax than that produced by the tax rate schedules. For taxpayers using the tax tables with taxable income that was subject to the 28-percent marginal rate, the maximum differ-ence in tax between the tax rate schedules and the tax table was $8.00.16 However, for most taxpayers, the actual difference in tax was smaller.
Changes in Law for 2008The defi nitions used in this article are generally the same as those in Statistics of Income—2008, Individual Income Tax Returns (IRS Publication 1304). The following is a partial list of tax law and Internal Revenue Service administrative changes that had a major bearing on the Tax Year 2008 data presented in this article.
Additional child tax credits—Modifi cations were made to the additional child tax credit for 2008. In Tax Year 2007, the credit limit based on earned income was 15 percent of a taxpayer’s earned income that exceeded $11,750. For 2008, the limit was 15 percent of a taxpayer’s earned income that exceeded $8,500.
Alternative minimum tax (AMT)—For Tax Year 2008, the minimum exemption rose to $69,950 for a married couple fi ling a joint return, up from $66,250 in 2007, and to $46,200 for singles and heads of household, up from $44,350, and to $34,975 from $33,125 for a married person fi ling separately.
Earned income credit—The maximum amount of the earned income credit increased, as did the amounts of earned income and investment income an individ-ual could have and still claim the credit. The maximum amount of investment income (interest, dividends and capital gain income) a taxpayer could have and still claim the credit increased to $2,950 from $2,900. The maximum credit for taxpayers with no qualify-ing children increased to $438 from $428. For these taxpayers, earned income and AGI had to be less than $12,880 ($15,880 if married fi ling jointly) to get any EIC. For taxpayers with one qualifying child, the maximum credit increased $64 to $2,917 and, for taxpayers with two or more qualifying children, the maximum credit increased to $4,828 from $4,716. To be eligible for the credit, a taxpayer’s earned income and AGI had to be less than $33,995 ($36,995 for married fi ling jointly) for one qualifying child, or less than $38,646 ($41,646 for married fi ling jointly) for two or more qualifying children.
Exemption amount—For Tax Year 2008, the exemption amount increased by $100 to $3,500. Taxpayers could have lost a portion of their exemp-tion benefi ts if their adjusted gross income was above certain amounts ($119,975 married persons fi lling separately, $159,950 single individuals, $199,950 for heads of household, and $239,950 for married persons fi lling jointly or qualifying widow(er)s). For 2008, a taxpayer could lose no more than one-third of the dollar amount of their exemption, so the amount of each exemption could not be reduced to less than $2,333. For 2007 and 2006, a taxpayer could lose no more than two-thirds of the dollar amount of their exemption. For 2005 and previous years, exemption amounts could be reduced to zero.
First-time homebuyer credit—New for Tax Year 2008, a taxpayer may have claimed this refund-able credit if he or she bought a home after April 8, 2008, and did not own a main home during the prior 3 years. Taxpayers were allowed to claim this credit in Tax Year 2008 or 2009, if their modifi ed adjusted gross income was below $95,000 ($170,000, if married fi ling jointly). For homes purchased in
15 For taxable income between $0 and $5 and between $5 and $25, the tax brackets were $5 and $10 wide, respectively. For taxable income between $25 and $3,000, the brackets were $25 wide. For taxable income above $3,000, the brackets were $50 wide.16 For example, assume a taxpayer fi ling as “married fi ling separately” reported taxable income of $99,950. Using the tax table, the tax would be $22,365, but, using the tax rate schedules, the tax would be $22,358, a difference of $7.00.17 For more details on the income computation under the 1979 Income Concept for 2008, see Individual Income Tax Returns 2008, Statistics of Income Division, Internal Revenue Service, Publication 1304.
35
Individual Income Tax Rates and Shares, 2008Statistics of Income Bulletin | Winter 2011
2008, the credit operated much like an interest-free loan. Taxpayers generally had to repay the credit over a 15-year period. For homes purchased in 2009, taxpayers had to repay the credit only if the home ceases to be their main home within a 36-month period beginning on the purchase date. For 2008, 1.2 million taxpayers claimed this credit for a total of $8.4 billion.
General business credit—For 2008, certain business credits such as the investment credit were allowed against the alternative minimum tax.
Health savings account deduction—For Tax Year 2008, contributions were not limited to the taxpayers annual health plan deductible. The maximum HSA deduction increased by $50 to $2,900 ($5,800, if family coverage, up from $5,650). These limits were $900 higher if the taxpayer was age 55 or older.
Heartland Disaster Tax Relief Act of 2008—Temporary tax relief was enacted as a result of severe storms, tornadoes, or fl ooding affecting Midwestern disaster areas after May 19, 2008, and before August 1, 2008. Major provisions provided by this relief act included:
(1) Suspended limits for certain personal casualty losses and cash contributions;
(2) An additional exemption amount if a taxpayer provided housing for a person displaced by the Midwestern disaster;
(3) An election to use 2007 earned income to calcu-late 2008 EIC and additional child tax credit.
Indexing—The following items increased due to indexing for infl ation: personal exemption amounts, the basic standard deduction amounts, the tax bracket boundaries, and the beginning income amounts for limiting certain itemized deductions and for the phaseout of personal exemptions. Also, the maximum amount of earnings subject to self-employment social security tax increased based on the percentage change in average covered earnings.
Individual retirement arrangement deduc-tion—For 2008, a taxpayer (or both taxpayers for taxpayers fi ling jointly) may have been able to take a deduction for an IRA contribution up to $5,000 ($6,000 if age 50 or older). Taxpayers not covered by a retirement plan may have been able to deduct all contributions. The phase-out range for deductible
IRA contributions for those covered by a retirement plan began at income of $85,000, if married fi ling jointly or a qualifying window(er), up from $83,000 in 2007. The phaseout was $53,000 for single person or head of household, up from $52,000 in 2007, and at $0 for a married person fi ling a separate return. A taxpayer may have been able to deduct an additional $3,000 if he or she were a participant in a 401(k) plan and his or her employer was in bankruptcy in an earlier year.
Limit on itemized deductions increased—Taxpayers who had adjusted gross income above $159,950 ($79,975, if married fi ling separately) could have lost part of their deduction for itemized deductions. This was an increase from 2007 amounts of $156,400 ($78,200, if married fi ling separately). For Tax Year 2008, the amount by which the deduction was reduced was one-third of the amount of the reduction that would have other-wise applied for 2005 and previous years. For Tax Years 2007 and 2006, the amount by which the deduction was reduced was two-thirds of the amount of the reduction that would have otherwise applied for 2005 and previous years.
Qualifi ed dividends and net capital gain—For Tax Year 2008, the 5-percent tax rate on qualifi ed dividends and net capital gain for taxpayers whose marginal tax rate on ordinary income was 10 percent or 15 percent was reduced to zero. For 2008, 10.9 million taxpayers had a total of $48.9 billion in this rate.
Real estate tax and net disaster loss deduc-tion—New for 2008, taxpayers could increase their standard deduction by a limited amount of their State and local real estate taxes and their net disaster loss. Taxpayers could have increased their standard deduc-tion by the State and local real estate taxes paid, up to $500 ($1,000, if married fi ling jointly). This deduc-tion was for the real estate taxes that would have been deductible on Schedule A if the taxpayer had itemized their deductions. A taxpayer’s net disas-ter loss was fi gured by taking their personal casualty losses from a Federally declared disaster minus any personal casualty gains. A total of $12.1 billion were deducted due to the addition of these two new provi-sions. Most of this ($11.3 billion) was deducted by 15.7 million taxpayers for real estate taxes paid.
Recovery rebate credit—A taxpayer was able to take this credit only if he or she had not received an economic stimulus payment in Tax Year 2007 or if
36
Individual Income Tax Rates and Shares, 2008Statistics of Income Bulletin | Winter 2011
his or her economic stimulus payment was less than $600 ($1,200, if married fi ling jointly) plus $300 for each qualifying child the taxpayer had for 2008. This credit was fi gured like the economic stimulus payment the previous year, except the amounts were based on Tax Year 2008 instead of Tax Year 2007. The maximum credit was $600 ($1,200, if married fi ling jointly) plus $300 for each qualifying child.
Residential energy credit—The credit for nonbusiness energy property expired and did not apply for 2008.
Standard deduction amount increased—The standard deduction for people who did not itemize deductions on Schedule A of Form 1040 was, in most cases, higher for 2008 than it was in 2007. The amount depended on fi ling status, being 65 or older or blind, and whether an exemption could be claimed for a taxpayer by another person. For 2008, the standard deduction increased to $10,900 for joint fi lers, up from $10,700 in 2007. For single fi lers and married fi ling separately the deduction amount increased by $100 to $5,450. For heads of house-holds, the deduction was $8,000 ($150 higher than in 2007). In addition, the additional standard deduction for being 65 or older or blind was increased by $50 per taxpayer for single and head of household fi lers only. As mentioned above, the standard deduction could be increased by a limited amount of real estate taxes paid and certain net casualty losses.
Tax on child’s investment income—New for 2008, Form 8615, in addition to being used to fi gure the tax of certain children who are under 18, was required to fi gure the tax for a child with investment income of more than $1,800 if the child:
(1) Was age 18 at the end of 2008 and did not have earned income that was more than half of the child’s support, or
(2) Was a full-time student over age 18 and under age 24 at the end of 2008 and did not have earned income that was more than half of the child’s support.
Income and Tax ConceptsAs discussed in the Income Tax Structure section, gross income is all income received that is not specif-ically excluded. Total income is the net amount of
gross income after certain expenses (i.e., business or rent and royalty expenses) have been deducted. Adjusted gross income (AGI) is total income less statutory adjustments to income (i.e., deductible contributions to an IRA or Keogh plan).
1979 Income Concept
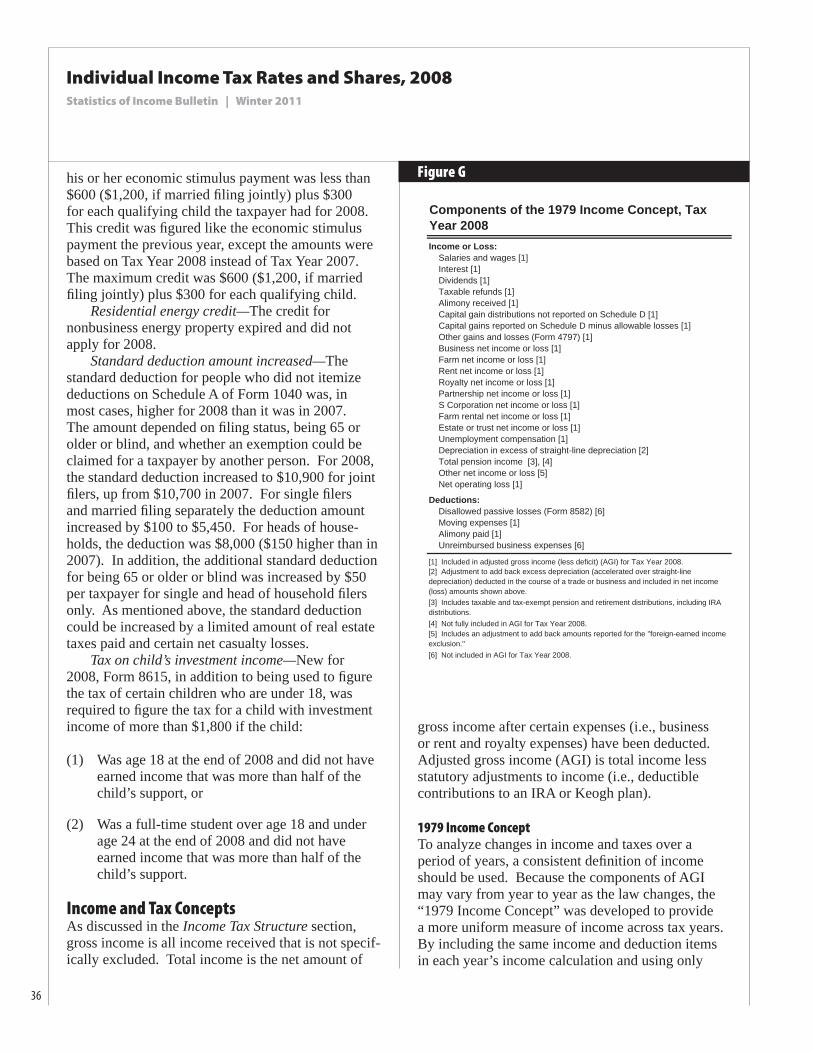
To analyze changes in income and taxes over a period of years, a consistent defi nition of income should be used. Because the components of AGI may vary from year to year as the law changes, the “1979 Income Concept” was developed to provide a more uniform measure of income across tax years. By including the same income and deduction items in each year’s income calculation and using only
Components of the 1979 Income Concept, Tax Year 2008Income or Loss: Salaries and wages [1] Interest [1] Dividends [1] Taxable refunds [1] Alimony received [1] Capital gain distributions not reported on Schedule D [1] Capital gains reported on Schedule D minus allowable losses [1] Other gains and losses (Form 4797) [1] Business net income or loss [1] Farm net income or loss [1] Rent net income or loss [1] Royalty net income or loss [1] Partnership net income or loss [1] S Corporation net income or loss [1] Farm rental net income or loss [1] Estate or trust net income or loss [1] Unemployment compensation [1] Depreciation in excess of straight-line depreciation [2] Total pension income [3], [4] Other net income or loss [5] Net operating loss [1]
Deductions: Disallowed passive losses (Form 8582) [6] Moving expenses [1] Alimony paid [1] Unreimbursed business expenses [6]
[1] Included in adjusted gross income (less deficit) (AGI) for Tax Year 2008.[2] Adjustment to add back excess depreciation (accelerated over straight-line depreciation) deducted in the course of a trade or business and included in net income (loss) amounts shown above.[3] Includes taxable and tax-exempt pension and retirement distributions, including IRA distributions.[4] Not fully included in AGI for Tax Year 2008.[5] Includes an adjustment to add back amounts reported for the "foreign-earned income exclusion."[6] Not included in AGI for Tax Year 2008.
Figure G

37
Individual Income Tax Rates and Shares, 2008Statistics of Income Bulletin | Winter 2011
items available on Federal individual income tax returns, the defi nition of the 1979 Income Concept is consistent throughout the base years and can be used for future years to compare income by including only income components common to all years. Tax Years 1979 through 1986 were used as base years in identifying the income and deduction items included in this concept. The 1979 Income Concept applied to 2008 includes many income and deduction items that are also components of AGI (Figure G). However, unlike AGI, the 1979 Income Concept also includes some nontaxable (i.e., tax-exempt) amounts of income reported on individual income tax returns and disallowed passive loss deductions. In addition, only straight-line deductions for depreciation are included in the 1979 Income Concept.17
Modifi ed Taxable Income
This concept is relevant only for “prior-year returns” (about 4.3 million returns) or certain farm sole proprietor returns using income-averaging on Schedule J (about 82 thousand returns) or those returns with foreign-earned income having to use a worksheet to determine their taxes (about 171.6 thousand returns). For all other returns, modifi ed taxable income is identical to taxable income.
This is the term used in the statistics to describe “income subject to tax,” the actual base on which tax
is computed. Each year, a small number of returns for prior tax years are fi led during the same calendar year in which the tax returns for the current tax year are being selected for the Statistics of Income sample. Some of these returns are selected for the sample and act as proxies for returns for the current tax year that will be fi led during a later calendar year. The tax on these returns is based on a previous year’s tax law (which may refl ect different tax rates and income concepts). For the statistics in this article, the taxable incomes reported on these prior-year returns and those fi led with a Schedule J or foreign-earned income are modifi ed to equal an amount necessary to generate the tax actually shown on these returns using current-year rates.
Marginal Tax Rates
Under the progressive U.S. income tax rate struc-ture, different portions of taxable income are taxed at different rates. Figure H illustrates how income tax is determined for a single taxpayer with AGI of $410,000 who used the standard deduction. As shown in the example, six different tax rates were applied to the taxable income to arrive at total tax. The fi rst $8,025 of taxable income were taxed at the 10-percent rate; the next $24,525 of taxable income were taxed at the 15-percent rate; the next $46,300 were taxed at the 25-percent rate; the next $85,700 were taxed at the 28-percent rate; the next $193,150 were taxed at the 33-percent rate; and the remain-ing $44,517 were taxed at the 35-percent rate. For purposes of this article, the tax rate applied to the last dollar of income (given certain assumptions about which source of income provided the last dollar of income subject to tax) is the marginal tax rate for that return. In the example, the marginal tax rate is 35 percent.
Since the individual income tax structure includes various types of income, deductions, exclu-sions, credits, and taxes that are not subject to the same treatment under tax laws, the marginal tax rate is not always apparent. For instance, investment income of a dependent under age 18 in excess of a specifi c amount is treated differently than salaries and wages of the same dependent (see changes in law section on tax on child’s investment income). The investment income in excess of $1,800 was taxed
Figure H
[Money amounts are in dollars]
Item Amount
Adjusted gross income 410,000 Less: Exemption [1] 2,333
Standard deduction 5,450 Equals: Taxable income 402,217 Tax based on tax rates for single taxpayers: First $8,025 taxed at 10 percent 803 Next $24,525 taxed at 15 percent 3,679 Next $46,300 taxed at 25 percent 11,575 Next $85,700 taxed at 28 percent 23,996 Next $193,150 taxed at 33 percent 63,740 Next $44,517 taxed at 35 percent 15,581 Total tax from tax rate schedule 119,373 [1] The exemption amount was limited to $2,333 because AGI exceeded $282,450.
Income Tax Calculation for a Single Taxpayer With One Exemption Who Used the Standard Deduction, Tax Year 2008
17 For more details on the income computation under the 1979 Income Concept for 2008, see Individual Income Tax Returns 2008, Statistics of Income Division, Internal Revenue Service, Publication 1304.
38
Individual Income Tax Rates and Shares, 2008Statistics of Income Bulletin | Winter 2011
at the marginal tax rate of the parents, whereas the salaries and wages were taxed at the dependent’s own rate.
Calculating marginal tax rates for a specifi c individual income tax return generally depends both on the types and amounts of income reported and the assumptions made about the order in which the income is taxed, in particular, which type of income is assumed to be received “last.” Additional complexity is added by the presence of such items as the alternative minimum tax and various tax credits.
For this article, it is assumed that the income taxed at the marginal (highest) rate was the “last” income received. The alternative minimum tax and income tax credits, such as the earned income credit, are excluded in determining the marginal tax rates. The marginal tax rate is defi ned as follows:
(1) If a return showed taxable income, the marginal tax rate of the return was the highest rate at which any amount of taxable income reported on the return was taxed.
(2) If the return had no taxable income except for net long-term capital gains or qualifi ed dividends and that amount was less than or equal to the 15-percent tax bracket limit, the return was defi ned as having an “0-percent” marginal tax rate. If the return had taxable income (from other than net long-term capital gains) to which only the 15-percent tax rate applied, as well as net long-term capital gains to which the 25-percent rate on the net gain applied, the return was defi ned as having a marginal tax rate equal to the maximum rate at which the net gains were taxed. If the return had taxable income (from other than net long-term capital gains) to which the 25-percent tax rate applied as the highest rate, as well as net long-term capital gains to which the maximum 28-percent rate on net gain applied, the return was defi ned as having a “28-percent” marginal tax rate. However, if the return had taxable income (from other than net long-term capital gains) above the maximum amount to which the 25-percent applied, as well as net long-term
capital gains to which the 28-percent rate on the net gain applied, the return was classifi ed as having the highest rate at which any amount of taxable income reported on the return was taxed.
(3) For returns of dependents with a Form 8615 attached when the use of this form resulted in the taxation of some of the dependent’s income as if it were that of the parents, the return was classifi ed as having a “Form 8615” marginal tax rate (the returns in the Form 8615 classifi cation are not distributed by tax rate).
(4) For returns of parents choosing to report inter-est, dividend, and capital gain distribution income of their dependents under age 18 (or under 24 if students) on their own (i.e., the parents’) return using Form 8814, when the dependent’s income generated the only tax liability on the parent’s return, the return was classifi ed with a “Form 8814” marginal tax rate of 10 percent.
The classifi cation of returns into marginal tax rate categories for Statistics of Income purposes was essentially a function of fi ling status, size of taxable income, presence of net long-term capital gains (in excess of net short-term capital losses) and/or quali-fi ed dividends, and presence of Form 8615 or Form 8814. Returns were classifi ed into 1 of the following 12 mutually exclusive marginal tax rate categories: (1) 0-percent rate (capital gains); (2) 10-percent rate; (3) Form 8814 (10-percent rate with no tax liability other than that generated by the dependent’s income); (4) 15-percent rate; (5) 15-percent (capital gains); (6) 25-percent rate; (7) 25-percent (capital gains); (8) 28-percent rate; (9) 28-percent (capital gains); (10) 33-percent rate; (11) 35-percent rate; and (12) Form 8615 (with income taxed at any rate).18 Table 1 presents statistics by marginal tax rate classifi cation and fi ling status for returns with modifi ed taxable income. For each marginal rate classifi cation, modifi ed taxable income and “income tax gener-ated” were computed “at all rates” and “at marginal rate.” The “at all rates” computations (columns 3
18 For some taxpayers, the statutory marginal tax rate may differ from the effective marginal tax rate. For example, extra income received by certain taxpayers may result in the partial phaseout of their personal exemptions as well as some of their itemized deductions. Therefore, an extra $1 of income could add more than $1 of taxable income. While this taxpayer could face a statutory marginal tax rate of 35 percent, the effective marginal rate faced by the taxpayer would be somewhat higher.
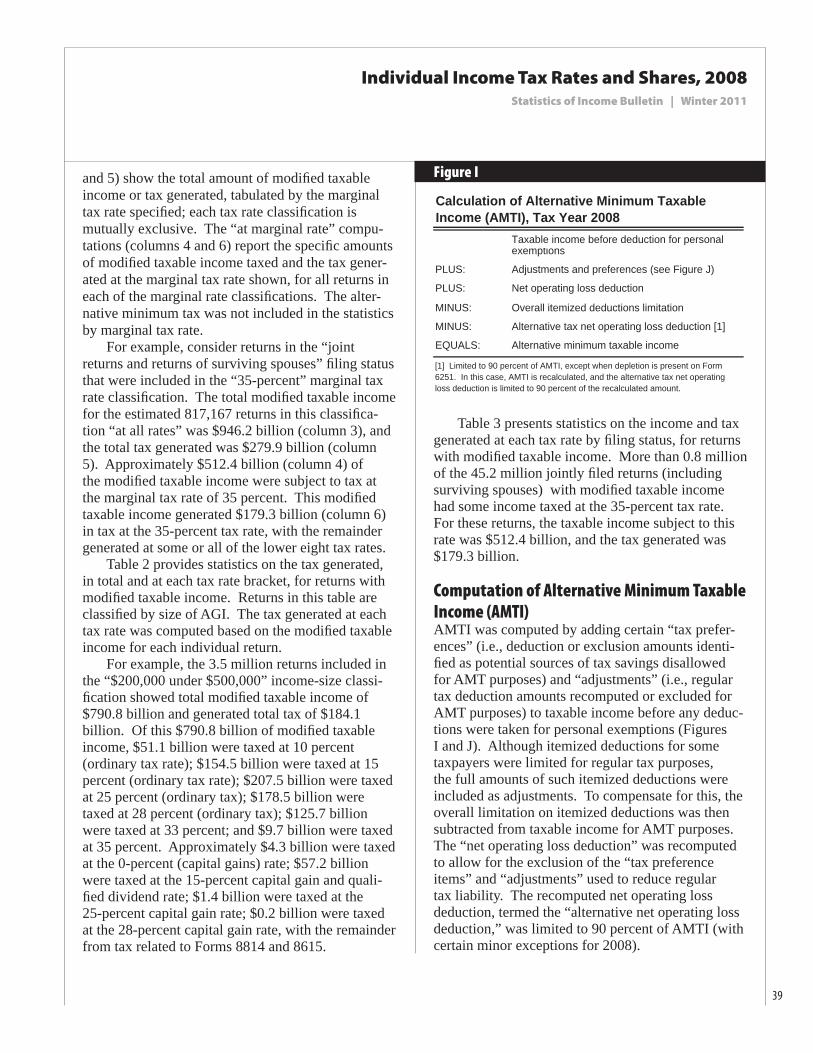
39
Individual Income Tax Rates and Shares, 2008Statistics of Income Bulletin | Winter 2011
and 5) show the total amount of modifi ed taxable income or tax generated, tabulated by the marginal tax rate specifi ed; each tax rate classifi cation is mutually exclusive. The “at marginal rate” compu-tations (columns 4 and 6) report the specifi c amounts of modifi ed taxable income taxed and the tax gener-ated at the marginal tax rate shown, for all returns in each of the marginal rate classifi cations. The alter-native minimum tax was not included in the statistics by marginal tax rate.
For example, consider returns in the “joint returns and returns of surviving spouses” fi ling status that were included in the “35-percent” marginal tax rate classifi cation. The total modifi ed taxable income for the estimated 817,167 returns in this classifi ca-tion “at all rates” was $946.2 billion (column 3), and the total tax generated was $279.9 billion (column 5). Approximately $512.4 billion (column 4) of the modifi ed taxable income were subject to tax at the marginal tax rate of 35 percent. This modifi ed taxable income generated $179.3 billion (column 6) in tax at the 35-percent tax rate, with the remainder generated at some or all of the lower eight tax rates.
Table 2 provides statistics on the tax generated, in total and at each tax rate bracket, for returns with modifi ed taxable income. Returns in this table are classifi ed by size of AGI. The tax generated at each tax rate was computed based on the modifi ed taxable income for each individual return.
For example, the 3.5 million returns included in the “$200,000 under $500,000” income-size classi-fi cation showed total modifi ed taxable income of $790.8 billion and generated total tax of $184.1 billion. Of this $790.8 billion of modifi ed taxable income, $51.1 billion were taxed at 10 percent (ordinary tax rate); $154.5 billion were taxed at 15 percent (ordinary tax rate); $207.5 billion were taxed at 25 percent (ordinary tax); $178.5 billion were taxed at 28 percent (ordinary tax); $125.7 billion were taxed at 33 percent; and $9.7 billion were taxed at 35 percent. Approximately $4.3 billion were taxed at the 0-percent (capital gains) rate; $57.2 billion were taxed at the 15-percent capital gain and quali-fi ed dividend rate; $1.4 billion were taxed at the 25-percent capital gain rate; $0.2 billion were taxed at the 28-percent capital gain rate, with the remainder from tax related to Forms 8814 and 8615.
Table 3 presents statistics on the income and tax generated at each tax rate by fi ling status, for returns with modifi ed taxable income. More than 0.8 million of the 45.2 million jointly fi led returns (including surviving spouses) with modifi ed taxable income had some income taxed at the 35-percent tax rate. For these returns, the taxable income subject to this rate was $512.4 billion, and the tax generated was $179.3 billion.
Computation of Alternative Minimum Taxable
Income (AMTI)AMTI was computed by adding certain “tax prefer-ences” (i.e., deduction or exclusion amounts identi-fi ed as potential sources of tax savings disallowed for AMT purposes) and “adjustments” (i.e., regular tax deduction amounts recomputed or excluded for AMT purposes) to taxable income before any deduc-tions were taken for personal exemptions (Figures I and J). Although itemized deductions for some taxpayers were limited for regular tax purposes, the full amounts of such itemized deductions were included as adjustments. To compensate for this, the overall limitation on itemized deductions was then subtracted from taxable income for AMT purposes. The “net operating loss deduction” was recomputed to allow for the exclusion of the “tax preference items” and “adjustments” used to reduce regular tax liability. The recomputed net operating loss deduction, termed the “alternative net operating loss deduction,” was limited to 90 percent of AMTI (with certain minor exceptions for 2008).
Figure I
Taxable income before deduction for personalexemptions
PLUS: Adjustments and preferences (see Figure J)
PLUS: Net operating loss deduction
MINUS: Overall itemized deductions limitation
MINUS: Alternative tax net operating loss deduction [1]
EQUALS: Alternative minimum taxable income
Calculation of Alternative Minimum Taxable Income (AMTI), Tax Year 2008
[1] Limited to 90 percent of AMTI, except when depletion is present on Form 6251. In this case, AMTI is recalculated, and the alternative tax net operating loss deduction is limited to 90 percent of the recalculated amount.

40
Individual Income Tax Rates and Shares, 2008Statistics of Income Bulletin | Winter 2011
Alternative Minimum Tax Adjustments and Preferences, Tax Year 2008Alternative Minimum Tax Adjustments and Preferences, Tax Year 2008 Medical and dental expenses from Schedule A (the lesser of deductible medical and dental expenses or 2.5 percent of AGI) Medical and dental expenses from Schedule A (the lesser of deductible medical and dental expenses or 2.5 percent of AGI)
Deductions for State and local income sales real estate personal property and foreign taxes Deductions for State and local income, sales, real estate, personal property, and foreign taxesM t i t t dj t t th k h t f th F 6251 i t ti Mortgage interest adjustment on the worksheet from the Form 6251 instructionsg g j
Miscellaneous itemized deductions subject to the 2-percent-of-AGI limitation Miscellaneous itemized deductions subject to the 2-percent-of-AGI limitationItemized deduction limitation on the worksheet from the Schedule A instructions Itemized deduction limitation on the worksheet from the Schedule A instructions
If standard deduction is claimed, amount from Form 4684, line 18a as a negative amount, , gRefunds of State and local income, sales, real estate, personal property, and foreign taxes previously deducted (negative) Refunds of State and local income, sales, real estate, personal property, and foreign taxes previously deducted (negative)Investment interest expense (the result could be negative) Investment interest expense (the result could be negative)
Excess of percentage depletion deduction for sections 611 and 613 property over the adjusted basis (the result could be negative) Excess of percentage depletion deduction for sections 611 and 613 property over the adjusted basis (the result could be negative)Deduction for net operating loss from Form 1040 Deduction for net operating loss from Form 1040Tax exempt interest from private activity bonds issued after August 7 1986 Tax-exempt interest from private activity bonds issued after August 7, 1986
Excluded gain, under the section 1202 gain on qualified small business stock held more than 5 years, multiplied by 7% if sold after Excluded gain, under the section 1202 gain on qualified small business stock held more than 5 years, multiplied by 7% if sold after May 5, 2003, otherwise multiplied by 42% May 5, 2003, otherwise multiplied by 42%Incentive stock options which were exercised after 1987 (the amount by which the value of the option when exercised exceeded the Incentive stock options which were exercised after 1987 (the amount by which the value of the option when exercised exceeded the
i id b th t th lt ld b ti ) price paid by the taxpayer; the result could be negative) Difference between income distributions to beneficiaries of estates and trusts for regular tax purposes and the amounts refigured for Difference between income distributions to beneficiaries of estates and trusts for regular tax purposes and the amounts refigured for
AMT purposes (the result could be negative) AMT purposes (the result could be negative)Electing large partnerships enter the amount from Schedule K 1 (Form 1065 B) box 6 Electing large partnerships, enter the amount from Schedule K-1 (Form 1065-B), box 6.
Adjustment of gain or loss on property, the basis of which was affected by accelerated depreciation or rapid amortization and which Adjustment of gain or loss on property, the basis of which was affected by accelerated depreciation or rapid amortization and which was reduced for AMT purposes (the result could be negative) was reduced for AMT purposes (the result could be negative)
Excess of depreciation on property placed in service after 1986 over less liberal methods allowed for alternative minimum tax (AMT) Excess of depreciation on property placed in service after 1986 over less liberal methods allowed for alternative minimum tax (AMT)( t i ht li 150 t d li i b l th d d di th t f t th lt ld b ti ) purposes (straight-line or 150-percent declining balance method, depending on the type of property; the result could be negative)
Passive activity gains and losses allowed for regular tax purposes for activities acquired before October 23, 1986, taking into account Passive activity gains and losses allowed for regular tax purposes for activities acquired before October 23, 1986, taking into accountAMT adjustments and preference items and any AMT prior-year unallowed losses (the result could be negative) AMT adjustments and preference items and any AMT prior-year unallowed losses (the result could be negative)Adjustment for refigured loss from activities in which allowable losses from partnerships or S Corporations were limited by "at risk" Adjustment for refigured loss from activities in which allowable losses from partnerships or S Corporations were limited by "at-risk"
d th l t ki i t t AMT dj t t d f it (th lt ld b ti ) and other rules, taking into account AMT adjustments and preference items (the result could be negative)g j p ( g ) Excess of circulation expenditures paid or incurred after 1986 over allowable amortization if the expenditures were capitalized (the Excess of circulation expenditures paid or incurred after 1986 over allowable amortization if the expenditures were capitalized (the
result could be negative) result could be negative)D f d i f l t t t t d i t ft F b 28 1986 ith t i ti d li it ti (th lt Deferred income from long-term contracts entered into after February 28, 1986, with certain exceptions and limitations (the result
could be negative)g )Excess of mining exploration and development costs paid or incurred after 1986 over allowable amortization if the expenditures were Excess of mining exploration and development costs paid or incurred after 1986 over allowable amortization if the expenditures werecapitalized (the result could be negative) capitalized (the result could be negative)E f h d i t l dit id i d ft 1986 ll bl ti ti if th dit Excess of research and experimental expenditures paid or incurred after 1986 over allowable amortization if the expenditures werep p p p
capitalized (the result could be negative) capitalized (the result could be negative)Adjustment from disallowing the installment sales method of accounting for sales of inventory and stock in trade after March 1 1986 Adjustment from disallowing the installment sales method of accounting for sales of inventory and stock in trade after March 1, 1986,with certain exceptions (the result is negative) with certain exceptions (the result is negative)A b hi h i ibl d illi d d d l ll bl i i (if h i li d) Amount by which excess intangible drilling costs deducted currently over allowable amortization (if these costs were capitalized) wasy g g y ( p )
more than 65 percent of the taxpayer's "net income" from oil, gas, and geothermal wells, with exceptions for independent oil more than 65 percent of the taxpayer s net income from oil, gas, and geothermal wells, with exceptions for independent oilproducers and royalty owners producers and royalty ownersExcess of accelerated depreciation on property placed in service using pre 1987 rules over straight line depreciation as refigured for AMT Excess of accelerated depreciation on property placed in service using pre-1987 rules over straight-line depreciation as refigured for AMT
purposesp p Adjustment for taxable distributions received from a cooperative (total AMT patronage dividend and per-unit retain allocation adjustment) Adjustment for taxable distributions received from a cooperative (total AMT patronage dividend and per unit retain allocation adjustment)
Excess of rapid amortization of pollution control facilities placed in service after 1986 over otherwise allowable depreciation (the Excess of rapid amortization of pollution control facilities placed in service after 1986 over otherwise allowable depreciation (theresult could be negative) result could be negative)
Adjustment for charitable contributions of certain property for which section 170(e) of the Internal Revenue Code applies Adjustment for charitable contributions of certain property for which section 170(e) of the Internal Revenue Code appliesAdjustment for alcohol fuel credit included in taxable income (the amount is included as a negative) Adjustment for alcohol fuel credit included in taxable income (the amount is included as a negative)Adj t t f fi d t h lt f l t ki i t t AMT dj t t d f it (th lt ld b Adjustment for refigured tax shelter farm losses, taking into account AMT adjustments and preference items (the result could be
negative)g )Related adjustments, refigured for AMT purposes, including section 179 expense deduction, expenses for business or rental use Related adjustments, refigured for AMT purposes, including section 179 expense deduction, expenses for business or rental useof the home conservation expenses taxable IRA distributions self-employed health insurance deduction Keogh retirement plan or of the home, conservation expenses, taxable IRA distributions, self-employed health insurance deduction, Keogh retirement plan orself employed SEP deduction and IRA deductions (the result could be negative) self-employed SEP deduction, and IRA deductions (the result could be negative)
Deduction for alternative tax net operating loss Deduction for alternative tax net operating loss
Figure J

41
Individual Income Tax Rates and Shares, 2008Statistics of Income Bulletin | Winter 2011
AMTI was reduced by an exemption amount which depended on the fi ling status of the individ-ual and which was subject to phaseout at higher AMTI levels. The AMT exemption for single fi lers (and heads of households) for 2008 was $46,200; for joint fi lers and surviving spouses, $69,950; and for married persons fi ling separately, $34,975. The exemption was reduced (but not below zero) by 25 percent of the amount by which the AMTI exceeded threshold levels of $112,500 for single fi lers and heads of households, $150,000 for joint fi lers, and $75,000 for married persons fi ling separately. The exemption was phased out completely for individuals whose fi ling status was single or head of household, married fi ling jointly, and married fi ling separately, at $297,300, $429,800, and $214,900, of AMTI, respectively.
After reduction by the exemption, the fi rst $175,000 ($87,500, if married fi ling separately) of the remaining AMTI was subject to tax at a 26-percent rate, with any excess taxed at a 28-percent rate. However, capital gains and qualifi ed dividends (recalculated for AMT purposes) that were taxed at lower rates (0 percent, 15 percent, and 25 percent) were taxed at these same rates for the AMT, with the rest of AMTI being taxed at the rates mentioned above (26 percent or 28 percent). The resulting tax was reduced by the “alternative minimum tax foreign tax credit,” which produced a “tentative minimum tax.” Tentative minimum tax was further reduced by the individual’s regular tax before credits (excluding tax on lump-sum distributions from qualifi ed retire-ment plans) less the foreign tax credit (for regular tax purposes) to yield the alternative minimum tax.
Dependents under the age of 18 and certain children under 24 with investment income over a certain amount who fi led their own returns were subject to special rules for AMT purposes. These rules required that the dependents pay the same amount of AMT as their parents would have paid if
the parents included the dependents’ incomes on their own tax returns. (Dependents fi ling their own returns were limited to an AMT exemption of $6,400 plus their “earned incomes.” The dependent’s AMT could be reduced if the parents had regular tax greater than the child’s own tentative minimum tax, or if any other dependent under age 18 and certain children under 24, of the same parents had regular tax greater than this dependent’s own tentative minimum tax.)
Data Sources and LimitationsThese statistics are based on a sample of individ-ual income tax returns (Forms 1040, 1040A, and 1040EZ, including electronically fi led returns) fi led during Calendar Year 2008. Returns in the sample were stratifi ed based on: (1) the larger of positive income or negative income (absolute value); (2) the size of business and farm receipts; (3) the presence or absence of specifi c forms or schedules; and (4) the usefulness of returns for tax policy modeling purposes.19 Returns were then selected at rates ranging from 0.10 percent to 100 percent. The 2008 data are based on a sample of 328,630 returns and an estimated fi nal population of 142,580,866 returns.20 The corresponding sample and population for the 2007 data were 336,226 and 153,832,380 returns, respectively.
Since the data presented here are estimates based on a sample of returns fi led, they are subject to sampling error. To properly use the statistical data provided, the magnitude of the potential sampling error must be known; coeffi cients of variation (CVs) are used to measure that magnitude. Figure K shows estimated CVs for the numbers of returns and money amounts for selected income items. The reliability of estimates based on samples, and the use of coeffi -cients of variation for evaluating the precision of estimates based on samples, are discussed in SOI Sampling Methodology and Data Limitations, later in this issue of the SOI Bulletin.
19 Returns in the sample were stratifi ed based on the presence or absence of one or more of the following forms or schedules: Form 2555, Foreign Earned Income; Form 1116, Foreign Tax Credit (Individual, Fiduciary, or Nonresident Alien Individual); Schedule C, Profi t or Loss from Business (Sole Proprietorship); and Schedule F, Profi t or Loss From Farming.20 This population includes an estimated 130,297 returns that were excluded from other tables in this report because they contained no income information or represented amended or tentative returns identifi ed after sampling or were fi led to receive a stimulus payment only.

42
Individual Income Tax Rates and Shares, 2008Statistics of Income Bulletin | Winter 2011
Figure K
Coefficients of Variation for Selected Items, by Size of Adjusted Gross Income, Tax Year 2008[Coefficients of variation are percentages]
Modified taxable income
(1) (2) (3) (4) (5) Total 0.13 0.11 0.14 0.15 0.15 Under $2,000 [1] 6.33 7.59 10.97 12.66 12.66 $2,000 under $4,000 4.87 5.85 7.64 7.75 7.75 $4,000 under $6,000 3.96 6.53 8.43 8.30 8.30 $6,000 under $8,000 2.88 3.33 3.74 3.64 3.64 $8,000 under $10,000 2.37 3.13 3.31 3.58 3.58 $10,000 under $12,000 1.96 2.39 2.55 3.26 3.26 $12,000 under $14,000 1.89 2.09 2.16 2.76 2.76 $14,000 under $16,000 1.82 1.99 2.04 2.56 2.56 $16,000 under $18,000 1.78 1.95 2.01 2.42 2.42 $18,000 under $20,000 1.67 1.88 1.93 2.27 2.27 $20,000 under $25,000 1.01 1.15 1.19 1.43 1.43 $25,000 under $30,000 1.02 1.14 1.19 1.44 1.44 $30,000 under $40,000 0.75 0.82 0.85 0.99 0.99 $40,000 under $50,000 0.82 0.87 0.91 1.03 1.03 $50,000 under $75,000 0.49 0.53 0.57 0.64 0.64 $75,000 under $100,000 0.75 0.76 0.80 0.85 0.85 $100,000 under $200,000 0.52 0.53 0.55 0.57 0.57 $200,000 under $500,000 0.66 0.63 0.65 0.64 0.64 $500,000 under $1,000,000 1.02 0.93 0.95 0.95 0.95 $1,000,000 under $1,500,000 1.26 1.24 1.29 1.28 1.28 $1,500,000 under $2,000,000 0.95 0.97 1.01 1.01 1.01 $2,000,000 under $5,000,000 0.55 0.49 0.52 0.52 0.52 $5,000,000 under $10,000,000 0.62 0.55 0.58 0.58 0.58 $10,000,000 or more 0.03 0.03 0.04 0.04 0.04 [1] Includes returns with adjusted gross deficit.
Totalincome
taxSize of adjusted gross income
Number of returns Amount
Incometax after credits
Taxgenerated
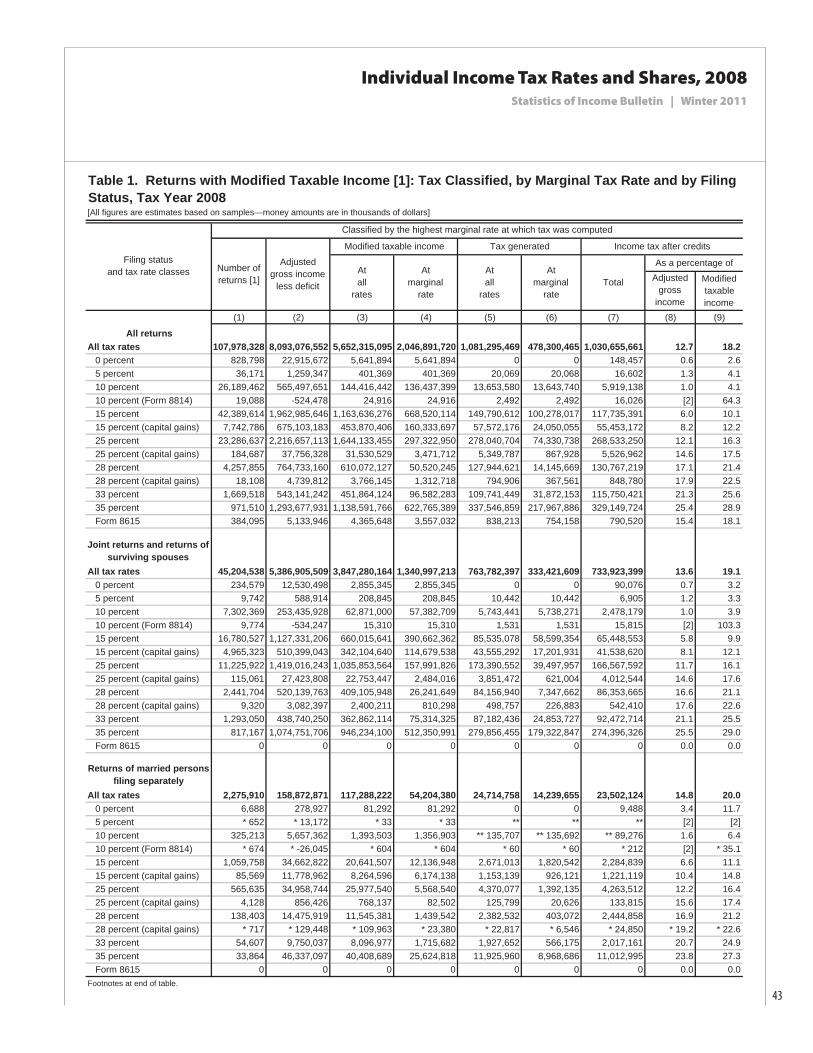
43
Individual Income Tax Rates and Shares, 2008Statistics of Income Bulletin | Winter 2011
(1) (2) (3) (4) (5) (6) (7) (8) (9)
All returnsAll tax rates 107,978,328 8,093,076,552 5,652,315,095 2,046,891,720 1,081,295,469 478,300,465 1,030,655,661 12.7 18.2 0 percent 828,798 22,915,672 5,641,894 5,641,894 0 0 148,457 0.6 2.6 5 percent 36,171 1,259,347 401,369 401,369 20,069 20,068 16,602 1.3 4.1 10 percent 26,189,462 565,497,651 144,416,442 136,437,399 13,653,580 13,643,740 5,919,138 1.0 4.1 10 percent (Form 8814) 19,088 -524,478 24,916 24,916 2,492 2,492 16,026 [2] 64.3 15 percent 42,389,614 1,962,985,646 1,163,636,276 668,520,114 149,790,612 100,278,017 117,735,391 6.0 10.1 15 percent (capital gains) 7,742,786 675,103,183 453,870,406 160,333,697 57,572,176 24,050,055 55,453,172 8.2 12.2 25 percent 23,286,637 2,216,657,113 1,644,133,455 297,322,950 278,040,704 74,330,738 268,533,250 12.1 16.3 25 percent (capital gains) 184,687 37,756,328 31,530,529 3,471,712 5,349,787 867,928 5,526,962 14.6 17.5 28 percent 4,257,855 764,733,160 610,072,127 50,520,245 127,944,621 14,145,669 130,767,219 17.1 21.4 28 percent (capital gains) 18,108 4,739,812 3,766,145 1,312,718 794,906 367,561 848,780 17.9 22.5 33 percent 1,669,518 543,141,242 451,864,124 96,582,283 109,741,449 31,872,153 115,750,421 21.3 25.6 35 percent 971,510 1,293,677,931 1,138,591,766 622,765,389 337,546,859 217,967,886 329,149,724 25.4 28.9 Form 8615 384,095 5,133,946 4,365,648 3,557,032 838,213 754,158 790,520 15.4 18.1
Joint returns and returns of surviving spouses
All tax rates 45,204,538 5,386,905,509 3,847,280,164 1,340,997,213 763,782,397 333,421,609 733,923,399 13.6 19.1 0 percent 234,579 12,530,498 2,855,345 2,855,345 0 0 90,076 0.7 3.2 5 percent 9,742 588,914 208,845 208,845 10,442 10,442 6,905 1.2 3.3 10 percent 7,302,369 253,435,928 62,871,000 57,382,709 5,743,441 5,738,271 2,478,179 1.0 3.9 10 percent (Form 8814) 9,774 -534,247 15,310 15,310 1,531 1,531 15,815 [2] 103.3 15 percent 16,780,527 1,127,331,206 660,015,641 390,662,362 85,535,078 58,599,354 65,448,553 5.8 9.9 15 percent (capital gains) 4,965,323 510,399,043 342,104,640 114,679,538 43,555,292 17,201,931 41,538,620 8.1 12.1 25 percent 11,225,922 1,419,016,243 1,035,853,564 157,991,826 173,390,552 39,497,957 166,567,592 11.7 16.1 25 percent (capital gains) 115,061 27,423,808 22,753,447 2,484,016 3,851,472 621,004 4,012,544 14.6 17.6 28 percent 2,441,704 520,139,763 409,105,948 26,241,649 84,156,940 7,347,662 86,353,665 16.6 21.1 28 percent (capital gains) 9,320 3,082,397 2,400,211 810,298 498,757 226,883 542,410 17.6 22.6 33 percent 1,293,050 438,740,250 362,862,114 75,314,325 87,182,436 24,853,727 92,472,714 21.1 25.5 35 percent 817,167 1,074,751,706 946,234,100 512,350,991 279,856,455 179,322,847 274,396,326 25.5 29.0 Form 8615 0 0 0 0 0 0 0 0.0 0.0
Returns of married persons filing separately
All tax rates 2,275,910 158,872,871 117,288,222 54,204,380 24,714,758 14,239,655 23,502,124 14.8 20.0 0 percent 6,688 278,927 81,292 81,292 0 0 9,488 3.4 11.7 5 percent * 652 * 13,172 * 33 * 33 ** ** ** [2] [2] 10 percent 325,213 5,657,362 1,393,503 1,356,903 ** 135,707 ** 135,692 ** 89,276 1.6 6.4 10 percent (Form 8814) * 674 * -26,045 * 604 * 604 * 60 * 60 * 212 [2] * 35.1 15 percent 1,059,758 34,662,822 20,641,507 12,136,948 2,671,013 1,820,542 2,284,839 6.6 11.1 15 percent (capital gains) 85,569 11,778,962 8,264,596 6,174,138 1,153,139 926,121 1,221,119 10.4 14.8 25 percent 565,635 34,958,744 25,977,540 5,568,540 4,370,077 1,392,135 4,263,512 12.2 16.4 25 percent (capital gains) 4,128 856,426 768,137 82,502 125,799 20,626 133,815 15.6 17.4 28 percent 138,403 14,475,919 11,545,381 1,439,542 2,382,532 403,072 2,444,858 16.9 21.2 28 percent (capital gains) * 717 * 129,448 * 109,963 * 23,380 * 22,817 * 6,546 * 24,850 * 19.2 * 22.6 33 percent 54,607 9,750,037 8,096,977 1,715,682 1,927,652 566,175 2,017,161 20.7 24.9 35 percent 33,864 46,337,097 40,408,689 25,624,818 11,925,960 8,968,686 11,012,995 23.8 27.3 Form 8615 0 0 0 0 0 0 0 0.0 0.0Footnotes at end of table.
Table 1. Returns with Modified Taxable Income [1]: Tax Classified, by Marginal Tax Rate and by Filing Status, Tax Year 2008[All figures are estimates based on samples—money amounts are in thousands of dollars]
Classified by the highest marginal rate at which tax was computed
Modified taxable income Tax generated Income tax after credits
As a percentage ofNumber ofreturns [1]
Adjustedgross income
less deficit
Filing status and tax rate classes
Modifiedtaxableincome
Atall
rates
Atmarginal
rate
Atall
rates
Atmarginal
rateTotal Adjusted
grossincome

44
Individual Income Tax Rates and Shares, 2008Statistics of Income Bulletin | Winter 2011
(1) (2) (3) (4) (5) (6) (7) (8) (9)Returns of heads of
householdsAll tax rates 13,612,171 589,358,159 316,316,689 141,658,936 49,686,348 25,068,019 38,846,395 6.6 12.3 0 percent 10,198 498,220 142,386 142,386 0 0 4,469 0.9 3.1 5 percent * 381 * 45,654 * 4,315 * 4,315 * 216 * 216 * 98 * 0.2 * 2.3 10 percent 5,874,894 139,608,134 31,509,745 31,303,847 3,131,151 3,130,385 264,414 0.2 0.8 10 percent (Form 8814) 7,184 34,592 7,229 7,229 723 723 0 [2] [2] 15 percent 5,908,726 250,001,479 135,536,789 67,869,884 16,947,334 10,180,483 9,928,467 4.0 7.3 15 percent (capital gains) 290,037 19,902,145 12,846,179 4,433,391 1,606,781 665,009 1,422,936 7.1 11.1 25 percent 1,343,607 117,966,589 84,592,606 20,019,793 14,394,523 5,004,948 13,691,757 11.6 16.2 25 percent (capital gains) 4,034 782,873 663,315 91,791 117,520 22,948 118,975 15.2 17.9 28 percent 109,511 19,951,606 15,666,664 1,537,098 3,396,957 430,387 3,663,248 18.4 23.4 28 percent (capital gains) 321 207,637 163,460 52,831 34,657 14,793 35,420 17.1 21.7 33 percent 43,947 13,554,371 11,312,480 2,530,139 2,830,272 834,946 3,030,517 22.4 26.8 35 percent 19,331 26,804,860 23,871,520 13,666,231 7,226,214 4,783,181 6,686,096 24.9 28.0 Form 8615 0 0 0 0 0 0 0 0.0 0.0
Returns of single personsAll tax rates 46,885,709 1,957,940,013 1,371,430,020 510,031,190 243,111,965 105,571,185 234,383,743 12.0 17.1 0 percent 577,332 9,608,027 2,562,871 2,562,871 0 0 44,424 0.5 1.7 5 percent 25,395 611,607 188,177 188,177 9,409 9,409 9,597 1.6 5.1 10 percent 12,686,986 166,796,226 48,642,193 46,393,940 4,643,283 4,639,394 3,087,272 1.9 6.3 10 percent (Form 8814) * 1,456 * 1,223 * 1,773 * 1,773 * 177 * 177 [3] [2] [2] 15 percent 18,640,602 550,990,140 347,442,339 197,850,920 44,637,187 29,677,638 40,073,532 7.3 11.5 15 percent (capital gains) 2,401,857 133,023,032 90,654,990 35,046,630 11,256,964 5,256,995 11,270,497 8.5 12.4 25 percent 10,151,472 644,715,537 497,709,744 113,742,792 85,885,552 28,435,698 84,010,390 13.0 16.9 25 percent (capital gains) 61,464 8,693,221 7,345,630 813,402 1,254,994 203,351 1,261,628 14.5 17.2 28 percent 1,568,237 210,165,873 173,754,134 21,301,956 38,008,192 5,964,548 38,305,447 18.2 22.0 28 percent (capital gains) 7,750 1,320,330 1,092,512 426,210 238,675 119,339 246,101 18.6 22.5 33 percent 277,915 81,096,583 69,592,552 17,022,138 17,801,090 5,617,306 18,230,028 22.5 26.2 35 percent 101,149 145,784,268 128,077,457 71,123,349 38,538,229 24,893,172 37,054,306 25.4 28.9 Form 8615 384,095 5,133,946 4,365,648 3,557,032 838,213 754,158 790,520 15.4 18.1
[2] Percentage not computed.
NOTE: Detail may not add to totals because of rounding.
* Estimate should be used with caution because of the small number of sample returns on which it is based.
[1] For definition of modified taxable income, see section 4 in 2008 Individual Income Tax Returns publication 1304 .
Table 1. Returns with Modified Taxable Income [1]: Tax Classified, by Marginal Tax Rate and by Filing Status, Tax Year 2008—Continued[All figures are estimates based on samples—money amounts are in thousands of dollars]
Tax generated Income tax after credits
Atall
rates
Atmarginal
rate
Atall
rates
[3] Less than $500.
** Data combined to avoid disclosure of information for specific taxpayers.
Atmarginal
rateTotal
As a percentage ofAdjusted
grossincome
Modifiedtaxableincome
Filing status and tax rate classes
Classified by the highest marginal rate at which tax was computed
Number ofreturns [1]
Adjustedgross income
less deficit
Modified taxable income
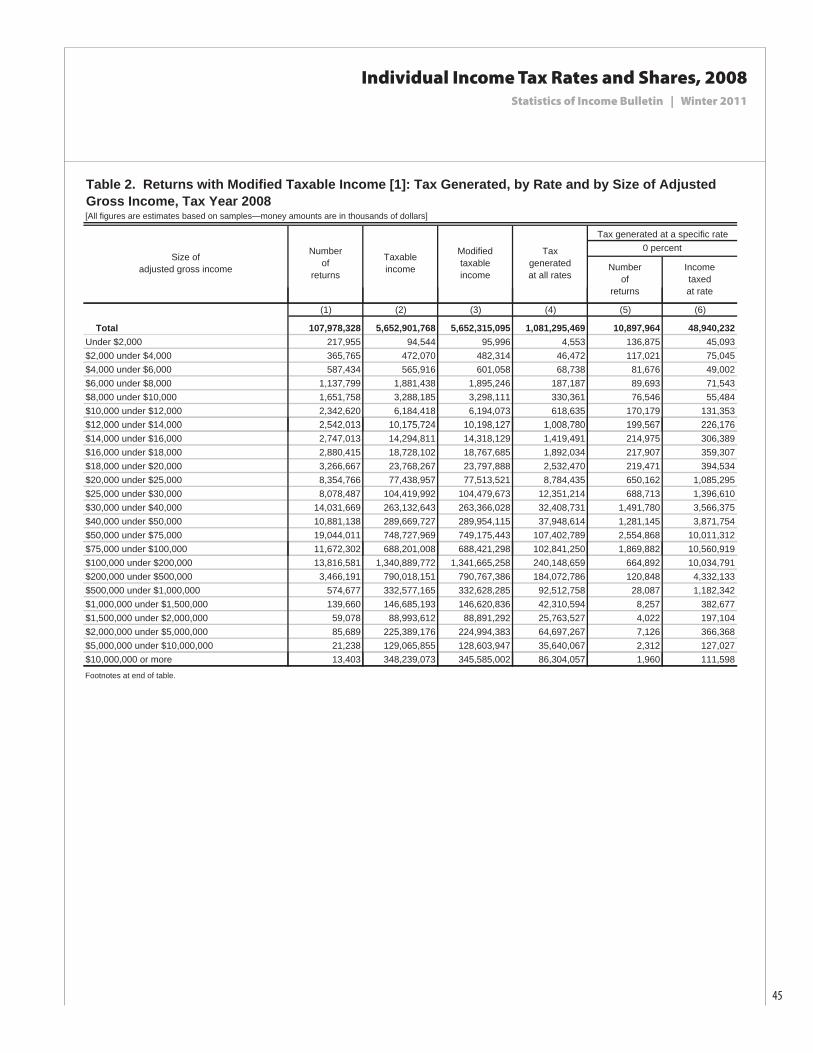
45
Individual Income Tax Rates and Shares, 2008Statistics of Income Bulletin | Winter 2011
[All figures are estimates based on samples—money amounts are in thousands of dollars]
Size ofadjusted gross income Number
ofreturns
0 percent
Incometaxedat rate
Taxableincome
Numberof
returns
Taxgeneratedat all rates
Modifiedtaxableincome
Tax generated at a specific rate
Table 2. Returns with Modified Taxable Income [1]: Tax Generated, by Rate and by Size of Adjusted Gross Income, Tax Year 2008
(1) (2) (3) (4) (5) (6)
Total 107,978,328 5,652,901,768 5,652,315,095 1,081,295,469 10,897,964 48,940,232Under $2,000 217,955 94,544 95,996 4,553 136,875 45,093$2,000 under $4,000 365,765 472,070 482,314 46,472 117,021 75,045$4,000 under $6,000 587,434 565,916 601,058 68,738 81,676 49,002$6,000 under $8,000 1,137,799 1,881,438 1,895,246 187,187 89,693 71,543$8,000 under $10,000 1,651,758 3,288,185 3,298,111 330,361 76,546 55,484$10,000 under $12,000 2,342,620 6,184,418 6,194,073 618,635 170,179 131,353$12 000 d $14 000 2 542 013 10 175 724 10 198 127 1 008 780 199 567 226 176$12,000 under $14,000 2,542,013 10,175,724 10,198,127 1,008,780 199,567 226,176$14,000 under $16,000 2,747,013 14,294,811 14,318,129 1,419,491 214,975 306,389$16,000 under $18,000 2,880,415 18,728,102 18,767,685 1,892,034 217,907 359,307$18,000 under $20,000 3,266,667 23,768,267 23,797,888 2,532,470 219,471 394,534$20,000 under $25,000 8,354,766 77,438,957 77,513,521 8,784,435 650,162 1,085,295$25,000 under $30,000 8,078,487 104,419,992 104,479,673 12,351,214 688,713 1,396,610$30,000 under $40,000 14,031,669 263,132,643 263,366,028 32,408,731 1,491,780 3,566,375$40,000 under $50,000 10,881,138 289,669,727 289,954,115 37,948,614 1,281,145 3,871,754$50,000 under $75,000 19,044,011 748,727,969 749,175,443 107,402,789 2,554,868 10,011,312$ $$75,000 under $100,000 11,672,302 688,201,008 688,421,298 102,841,250 1,869,882 10,560,919$100,000 under $200,000 13,816,581 1,340,889,772 1,341,665,258 240,148,659 664,892 10,034,791$200,000 under $500,000 3,466,191 790,018,151 790,767,386 184,072,786 120,848 4,332,133$500,000 under $1,000,000 574,677 332,577,165 332,628,285 92,512,758 28,087 1,182,342$1,000,000 under $1,500,000 139,660 146,685,193 146,620,836 42,310,594 8,257 382,677$1,500,000 under $2,000,000 59,078 88,993,612 88,891,292 25,763,527 4,022 197,104$2,000,000 under $5,000,000 85,689 225,389,176 224,994,383 64,697,267 7,126 366,368$5,000,000 under $10,000,000 21,238 129,065,855 128,603,947 35,640,067 2,312 127,027$10,000,000 or more 13,403 348,239,073 345,585,002 86,304,057 1,960 111,598
Footnotes at end of table.

46
Individual Income Tax Rates and Shares, 2008Statistics of Income Bulletin | Winter 2011
[All figures are estimates based on samples—money amounts are in thousands of dollars]
Incometaxedat rate
Taxgenerated
at rate
Numberof
returns
Size ofadjusted gross income
5 percent 10 percent
Incometaxedat rate
Taxgenerated
at rate
Numberof
returns
Tax generated at specified rate—continued
Table 2. Returns with Modified Taxable Income [1]: Tax Generated, by Rate and by Size of Adjusted Gross Income, Tax Year 2008—Continued
(7) (8) (9) (10) (11) (12)
Total 205,858 2,275,699 113,790 106,892,311 1,109,076,691 110,907,669Under $2,000 * 1,304 * 925 * 46 107,879 47,544 4,754$2,000 under $4,000 * 1,978 * 3,740 * 186 293,611 264,889 26,489$4,000 under $6,000 * 2,306 * 4,589 * 229 542,703 352,669 35,267$6,000 under $8,000 * 3,647 * 9,629 * 482 1,126,133 1,692,294 169,229$8,000 under $10,000 * 3,912 * 11,694 * 584 1,619,827 3,112,456 311,246$10,000 under $12,000 * 5,550 * 11,610 * 580 2,282,810 5,892,351 589,235$12 000 d $14 000 * 6 858 * 12 132 * 607 2 485 043 9 828 013 982 801$12,000 under $14,000 * 6,858 * 12,132 * 607 2,485,043 9,828,013 982,801$14,000 under $16,000 * 3,542 * 9,345 * 468 2,701,603 13,633,799 1,363,380$16,000 under $18,000 * 4,249 * 22,003 * 1,100 2,848,743 17,457,164 1,745,716$18,000 under $20,000 * 3,861 * 23,057 * 1,152 3,234,074 19,574,031 1,957,403$20,000 under $25,000 7,181 26,180 1,310 8,253,215 53,634,315 5,363,432$25,000 under $30,000 14,203 62,680 3,134 8,028,431 62,309,008 6,230,901$30,000 under $40,000 30,892 164,404 8,221 13,955,182 131,340,150 13,134,015$40,000 under $50,000 15,620 82,959 4,150 10,832,691 118,904,133 11,890,413$50,000 under $75,000 31,607 235,289 11,763 18,970,982 239,532,319 23,953,232$ $$75,000 under $100,000 27,241 288,758 14,439 11,622,236 164,297,557 16,429,756$100,000 under $200,000 28,755 795,300 39,766 13,724,260 203,337,741 20,333,774$200,000 under $500,000 9,440 352,558 17,629 3,407,780 51,142,105 5,114,211$500,000 under $1,000,000 1,710 59,953 2,998 556,825 8,308,851 830,885$1,000,000 under $1,500,000 690 29,700 1,485 133,286 1,983,374 198,337$1,500,000 under $2,000,000 308 14,906 745 55,662 825,105 82,511$2,000,000 under $5,000,000 604 32,639 1,632 79,077 1,164,861 116,486$5,000,000 under $10,000,000 213 11,470 574 18,920 276,863 27,686$10,000,000 or more 187 10,181 509 11,339 165,099 16,510
Footnotes at end of table.
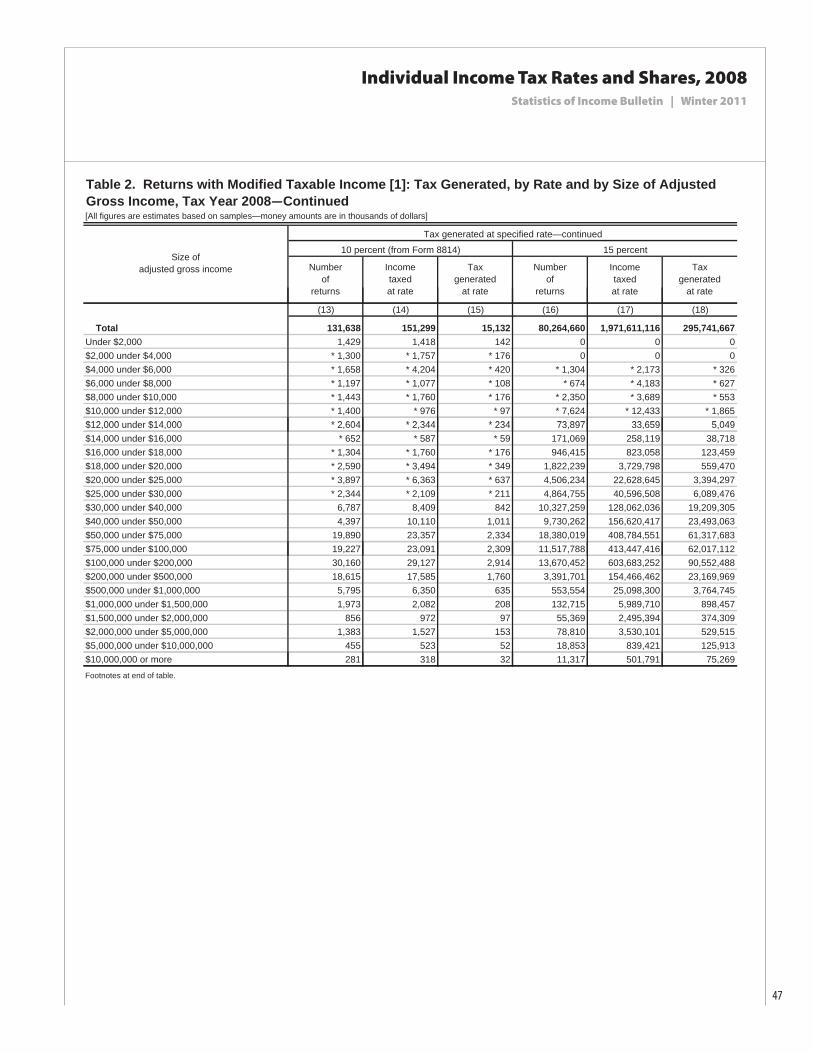
47
Individual Income Tax Rates and Shares, 2008Statistics of Income Bulletin | Winter 2011
[All figures are estimates based on samples—money amounts are in thousands of dollars]
Incometaxedat rate
Taxgenerated
at rate
Numberof
returns
Taxgenerated
at rate
Numberof
returns
Incometaxedat rate
10 percent (from Form 8814) 15 percent
Table 2. Returns with Modified Taxable Income [1]: Tax Generated, by Rate and by Size of Adjusted Gross Income, Tax Year 2008—Continued
Size ofadjusted gross income
Tax generated at specified rate—continued
(13) (14) (15) (16) (17) (18)
Total 131,638 151,299 15,132 80,264,660 1,971,611,116 295,741,667Under $2,000 1,429 1,418 142 0 0 0$2,000 under $4,000 * 1,300 * 1,757 * 176 0 0 0$4,000 under $6,000 * 1,658 * 4,204 * 420 * 1,304 * 2,173 * 326$6,000 under $8,000 * 1,197 * 1,077 * 108 * 674 * 4,183 * 627$8,000 under $10,000 * 1,443 * 1,760 * 176 * 2,350 * 3,689 * 553$10,000 under $12,000 * 1,400 * 976 * 97 * 7,624 * 12,433 * 1,865$12 000 d $14 000 * 2 604 * 2 344 * 234 73 897 33 659 5 049$12,000 under $14,000 * 2,604 * 2,344 * 234 73,897 33,659 5,049$14,000 under $16,000 * 652 * 587 * 59 171,069 258,119 38,718$16,000 under $18,000 * 1,304 * 1,760 * 176 946,415 823,058 123,459$18,000 under $20,000 * 2,590 * 3,494 * 349 1,822,239 3,729,798 559,470$20,000 under $25,000 * 3,897 * 6,363 * 637 4,506,234 22,628,645 3,394,297$25,000 under $30,000 * 2,344 * 2,109 * 211 4,864,755 40,596,508 6,089,476$30,000 under $40,000 6,787 8,409 842 10,327,259 128,062,036 19,209,305$40,000 under $50,000 4,397 10,110 1,011 9,730,262 156,620,417 23,493,063$50,000 under $75,000 19,890 23,357 2,334 18,380,019 408,784,551 61,317,683$ $$75,000 under $100,000 19,227 23,091 2,309 11,517,788 413,447,416 62,017,112$100,000 under $200,000 30,160 29,127 2,914 13,670,452 603,683,252 90,552,488$200,000 under $500,000 18,615 17,585 1,760 3,391,701 154,466,462 23,169,969$500,000 under $1,000,000 5,795 6,350 635 553,554 25,098,300 3,764,745$1,000,000 under $1,500,000 1,973 2,082 208 132,715 5,989,710 898,457$1,500,000 under $2,000,000 856 972 97 55,369 2,495,394 374,309$2,000,000 under $5,000,000 1,383 1,527 153 78,810 3,530,101 529,515$5,000,000 under $10,000,000 455 523 52 18,853 839,421 125,913$10,000,000 or more 281 318 32 11,317 501,791 75,269
Footnotes at end of table.

48
Individual Income Tax Rates and Shares, 2008Statistics of Income Bulletin | Winter 2011
[All figures are estimates based on samples—money amounts are in thousands of dollars]
Incometaxedat rate
Taxgenerated
at rate
Numberof
returns
Numberof
returns
Incometaxedat rate
Taxgenerated
at rate
15 percent (capital gains)
Table 2. Returns with Modified Taxable Income [1]: Tax Generated, by Rate and by Size of Adjusted Gross Income, Tax Year 2008—Continued
25 percentSize of
adjusted gross income
Tax generated at specified rate—continued
(19) (20) (21) (22) (23) (24)
Total 12,006,157 466,964,547 70,044,999 30,355,956 871,091,740 217,772,935Under $2,000 0 0 0 0 0 0$2,000 under $4,000 0 0 0 0 0 0$4,000 under $6,000 0 0 0 0 0 0$6,000 under $8,000 0 0 0 0 0 0$8,000 under $10,000 0 0 0 0 0 0$10,000 under $12,000 0 0 0 0 0 0$12 000 d $14 000 0 0 0 0 0 0$12,000 under $14,000 0 0 0 0 0 0$14,000 under $16,000 0 0 0 0 0 0$16,000 under $18,000 0 0 0 0 0 0$18,000 under $20,000 0 0 0 0 0 0$20,000 under $25,000 0 0 0 0 0 0$25,000 under $30,000 0 0 0 * 834 * 2,007 * 502$30,000 under $40,000 1,978 7,390 1,109 13,451 83,285 20,821$40,000 under $50,000 411,335 480,212 72,043 2,720,058 9,844,320 2,461,080$50,000 under $75,000 1,507,035 5,224,457 783,707 6,263,571 85,051,625 21,262,906$ $$75,000 under $100,000 1,566,962 6,258,690 938,844 4,829,948 91,658,056 22,914,514$100,000 under $200,000 5,448,564 36,575,197 5,486,422 12,375,750 424,686,487 106,171,622$200,000 under $500,000 2,320,993 57,161,544 8,574,295 3,321,243 207,510,779 51,877,695$500,000 under $1,000,000 467,536 43,291,626 6,493,756 540,886 34,073,508 8,518,377$1,000,000 under $1,500,000 120,214 26,227,346 3,934,105 129,286 8,112,508 2,028,127$1,500,000 under $2,000,000 52,049 18,746,808 2,812,022 54,180 3,399,825 849,956$2,000,000 under $5,000,000 77,111 58,472,479 8,770,874 77,114 4,825,327 1,206,332$5,000,000 under $10,000,000 19,682 43,685,989 6,552,899 18,509 1,153,450 288,363$10,000,000 or more 12,699 170,832,810 25,624,922 11,126 690,562 172,641
Footnotes at end of table.

49
Individual Income Tax Rates and Shares, 2008Statistics of Income Bulletin | Winter 2011
[All figures are estimates based on samples—money amounts are in thousands of dollars]
Taxgenerated
at rate
Numberof
returns
Numberof
returns
Incometaxedat rate
Incometaxedat rate
Taxgenerated
at rate
28 percent
Table 2. Returns with Modified Taxable Income [1]: Tax Generated, by Rate and by Size of Adjusted Gross Income, Tax Year 2008—Continued
25 percent (capital gains)Size of
adjusted gross income
Tax generated at specified rate—continued
(25) (26) (27) (28) (29) (30)
Total 334,377 6,515,717 1,628,972 6,903,701 296,231,725 82,944,883Under $2,000 0 0 0 0 0 0$2,000 under $4,000 0 0 0 0 0 0$4,000 under $6,000 0 0 0 0 0 0$6,000 under $8,000 0 0 0 0 0 0$8,000 under $10,000 0 0 0 0 0 0$10,000 under $12,000 0 0 0 0 0 0$12 000 d $14 000 0 0 0 0 0 0$12,000 under $14,000 0 0 0 0 0 0$14,000 under $16,000 0 0 0 0 0 0$16,000 under $18,000 0 0 0 0 0 0$18,000 under $20,000 0 0 0 0 0 0$20,000 under $25,000 0 0 0 0 0 0$25,000 under $30,000 0 0 0 0 0 0$30,000 under $40,000 0 0 0 ** ** **$40,000 under $50,000 * 1,002 * 8 * 2 ** 97 ** 83 ** 24$50,000 under $75,000 24,835 38,202 9,553 4,297 31,407 8,794$ $$75,000 under $100,000 32,671 74,665 18,672 301,449 1,716,138 480,519$100,000 under $200,000 133,101 714,609 178,671 2,683,916 59,862,073 16,761,380$200,000 under $500,000 93,943 1,401,172 350,303 3,103,825 178,486,047 49,976,093$500,000 under $1,000,000 27,024 1,119,770 279,946 526,435 36,461,730 10,209,284$1,000,000 under $1,500,000 8,711 664,898 166,226 125,746 8,729,724 2,444,323$1,500,000 under $2,000,000 3,818 383,921 95,981 52,919 3,670,035 1,027,610$2,000,000 under $5,000,000 6,106 895,123 223,781 75,748 5,249,080 1,469,742$5,000,000 under $10,000,000 1,809 476,346 119,087 18,239 1,266,182 354,531$10,000,000 or more 1,357 747,001 186,750 11,030 759,227 212,584
Footnotes at end of table.

50
Individual Income Tax Rates and Shares, 2008Statistics of Income Bulletin | Winter 2011
[All figures are estimates based on samples—money amounts are in thousands of dollars]
Taxgenerated
at rate
Numberof
returns
Incometaxedat rate
Numberof
returns
Incometaxedat rate
Taxgenerated
at rate
Size ofadjusted gross income
28 percent (capital gains) 33 percent
Table 2. Returns with Modified Taxable Income [1]: Tax Generated, by Rate and by Size of Adjusted Gross Income, Tax Year 2008—Continued
Tax generated at specified rate—continued
(31) (32) (33) (34) (35) (36)
Total 26,390 2,310,169 646,849 2,641,250 250,813,195 82,768,354Under $2,000 0 0 0 0 0 0$2,000 under $4,000 0 0 0 0 0 0$4,000 under $6,000 0 0 0 0 0 0$6,000 under $8,000 0 0 0 0 0 0$8,000 under $10,000 0 0 0 0 0 0$10,000 under $12,000 0 0 0 0 0 0$12 000 d $14 000 0 0 0 0 0 0$12,000 under $14,000 0 0 0 0 0 0$14,000 under $16,000 0 0 0 0 0 0$16,000 under $18,000 0 0 0 0 0 0$18,000 under $20,000 0 0 0 0 0 0$20,000 under $25,000 0 0 0 0 0 0$25,000 under $30,000 0 0 0 0 0 0$30,000 under $40,000 0 0 0 0 0 0$40,000 under $50,000 0 0 0 0 0 0$50,000 under $75,000 * 3,866 * 6,706 * 1,878 0 0 0$ $$75,000 under $100,000 * 2,680 * 62 * 18 311 5,415 1,787$100,000 under $200,000 8,644 22,541 6,312 79,729 1,670,248 551,182$200,000 under $500,000 7,381 243,474 68,172 1,770,145 125,681,601 41,474,928$500,000 under $1,000,000 1,586 146,156 40,924 512,891 79,806,362 26,336,099$1,000,000 under $1,500,000 877 180,199 50,456 123,023 19,317,254 6,374,694$1,500,000 under $2,000,000 312 74,630 20,897 51,886 8,132,814 2,683,829$2,000,000 under $5,000,000 661 423,679 118,630 74,368 11,661,379 3,848,255$5,000,000 under $10,000,000 192 297,591 83,326 17,970 2,826,956 932,895$10,000,000 or more 191 915,129 256,236 10,926 1,711,165 564,684
Footnotes at end of table.

51
Individual Income Tax Rates and Shares, 2008Statistics of Income Bulletin | Winter 2011
[All figures are estimates based on samples—money amounts are in thousands of dollars]
Incometaxedat rate
Size ofadjusted gross income Income
taxedat rate
Taxgenerated
at rate
Numberof
returns
35 percent Form 8615
Taxgenerated
at rate
Numberof
returns
Table 2. Returns with Modified Taxable Income [1]: Tax Generated, by Rate and by Size of Adjusted Gross Income, Tax Year 2008—Continued
Tax generated at specified rate—continued
(37) (38) (39) (40) (41) (42)
Total 971,591 622,775,935 217,971,577 384,095 3,557,032 754,158Under $2,000 0 0 0 9,831 1,016 144$2,000 under $4,000 0 0 0 123,811 136,883 25,528$4,000 under $6,000 0 0 0 84,745 188,422 36,412$6,000 under $8,000 0 0 0 37,949 116,520 19,350$8,000 under $10,000 0 0 0 28,159 113,028 19,318$10,000 under $12,000 0 0 0 25,838 145,350 28,685$12 000 d $14 000 0 0 0 11 970 95 802 20 387$12,000 under $14,000 0 0 0 11,970 95,802 20,387$14,000 under $16,000 0 0 0 14,198 109,890 17,912$16,000 under $18,000 0 0 0 9,854 104,393 21,879$18,000 under $20,000 0 0 0 4,719 72,974 14,229$20,000 under $25,000 0 0 0 7,965 132,723 25,124$25,000 under $30,000 0 0 0 5,678 110,752 26,691$30,000 under $40,000 0 0 0 5,522 133,924 34,180$40,000 under $50,000 0 0 0 3,763 140,174 26,419$50,000 under $75,000 0 0 0 4,543 236,218 50,308$ $$75,000 under $100,000 0 0 0 1,275 90,530 23,027$100,000 under $200,000 1,429 6,626 2,319 2,529 247,265 60,822$200,000 under $500,000 225,614 9,741,240 3,409,434 749 230,686 38,223$500,000 under $1,000,000 476,985 102,688,961 35,941,136 564 384,376 93,941$1,000,000 under $1,500,000 118,048 74,734,035 26,156,912 254 267,328 57,262$1,500,000 under $2,000,000 49,733 50,784,347 17,774,521 107 165,431 41,049$2,000,000 under $5,000,000 71,636 138,216,384 48,375,734 51 155,436 36,127$5,000,000 under $10,000,000 17,429 77,513,307 27,129,657 19 128,822 25,083$10,000,000 or more 10,717 169,091,034 59,181,862 3 49,088 12,058
* Estimate should be used with caution because of the small number of sample returns on which it is based.** Data combined to avoid disclosure of information for specific taxpayers.[1] For definition of modified taxable income, see section 4 in 2008 Individual Income Tax Returns publication 1304 .NOTE: Detail may not add to totals because of rounding.

52
Individual Income Tax Rates and Shares, 2008Statistics of Income Bulletin | Winter 2011
[All figures are estimates based on samples—money amounts are in thousands of dollars]
(1) (2) (3) (4) (5) (6) (7)
All tax rates 107,978,328 5,652,315,095 1,081,310,619 45,204,538 3,847,280,164 763,780,726 2,275,910 0 percent 10,897,964 48,940,232 0 6,316,269 33,260,187 0 113,425 5 percent 205,858 2,275,699 113,785 92,778 1,404,081 70,204 3,740 10 percent 106,892,311 1,109,076,691 110,907,669 44,859,462 659,881,863 65,988,186 2,262,646 10 percent (Form 8814) [1] 131,638 151,299 15,132 106,646 120,341 12,036 1,736 15 percent 80,264,660 1,971,611,116 295,741,667 37,511,255 1,294,009,644 194,101,447 1,936,708 15 percent (capital gains) [2] 12,006,157 466,964,547 70,044,682 7,806,371 349,650,170 52,447,525 190,419 25 percent 30,355,956 871,091,740 217,772,935 15,883,000 575,346,945 143,836,736 796,466 25 percent (capital gains) 334,377 6,515,717 1,628,929 223,309 4,891,220 1,222,805 7,870 28 percent 6,903,701 296,231,725 82,944,883 4,553,917 210,811,277 59,027,157 227,548 28 percent (capital gains) 26,390 2,310,169 646,847 15,965 1,617,100 452,788 746 33 percent 2,641,250 250,813,195 82,768,354 2,110,217 203,936,346 67,298,994 88,471 35 percent 971,591 622,775,935 217,971,577 817,167 512,350,991 179,322,847 33,864 Form 8615 [3] 384,095 3,557,032 754,158 0 0 0 0Footnotes at end of table.
Table 3. Returns with Modified Taxable Income: Taxable Income and Tax, Classified by Tax Rate and by Filing Status, Tax Year 2008
Returns of married persons filing separately
Numberof
returns [1]
Income taxgenerated
at rate
Tax rateclass Number
ofreturns
Incometaxedat rate
Income taxgenerated
at rate
Numberof
returns
Incometaxedat rate
Allreturns
Joint returns andreturns of surviving spouses
[All figures are estimates based on samples—money amounts are in thousands of dollars]
(8) (9) (10) (11) (12) (13) (14) (15)
All tax rates 117,288,222 24,714,668 13,612,171 316,316,689 49,685,818 46,885,709 1,371,430,020 243,129,407 0 percent 468,920 0 389,634 1,362,886 0 4,078,636 13,848,239 0 5 percent 17,835 892 8,262 77,414 3,871 101,077 776,369 38,818 10 percent 16,902,109 1,690,211 13,585,066 119,568,442 11,956,844 46,185,137 312,724,277 31,272,428 10 percent (Form 8814) [1] 946 94 20,471 27,041 2,705 2,785 2,970 297 15 percent 32,771,640 4,915,746 7,708,044 120,959,765 18,143,965 33,108,653 523,870,067 78,580,510 15 percent (capital gains) [2] 17,368,984 2,605,348 308,600 10,582,624 1,587,394 3,700,767 89,362,769 13,404,415 25 percent 14,592,266 3,648,066 1,520,580 36,802,921 9,200,730 12,155,910 244,349,607 61,087,402 25 percent (capital gains) 160,388 40,097 7,629 141,164 35,291 95,569 1,322,945 330,736 28 percent 4,947,157 1,385,204 173,089 7,141,053 1,999,495 1,949,147 73,332,239 20,533,027 28 percent (capital gains) 52,359 14,661 371 68,324 19,131 9,307 572,386 160,268 33 percent 4,380,799 1,445,664 63,277 5,918,824 1,953,212 379,285 36,577,226 12,070,484 35 percent 25,624,818 8,968,686 19,331 13,666,231 4,783,181 101,229 71,133,894 24,896,863 Form 8615 [3] 0 0 0 0 0 384,095 3,557,032 754,158
Table 3. Returns with Modified Taxable Income: Taxable Income and Tax, Classified by Tax Rate and by Filing Status, Tax Year 2008—Continued
[1] Form 8814 was filed for a dependent child under age 18 for whom the parents made an election to report the child's investment income (if it was from interest, dividends, or capital gains totaling between $900 and $9,000) on the parents' income tax return. This rate classification is comprised of those returns with a tax liability only from the dependent's income.[2] The 15 percent capital gains rate also includes qualified dividends.[3] Form 8615 was filed for a child under age 18 to report the child's investment income in excess of $1,800. The returns in this rate classification are not distributed by tax rate.
Incometaxedat rate
Income taxgenerated
at rate
Numberof
returns
Incometaxedat rate
Numberof
returns
NOTE: Detail may not add to totals because of rounding.
Income taxgenerated
at rate
Returns of married persons filing separately—continued
Returns of headsof households
Returns ofsingle persons
Incometaxedat rate
Income taxgenerated
at rate
Tax rateclass
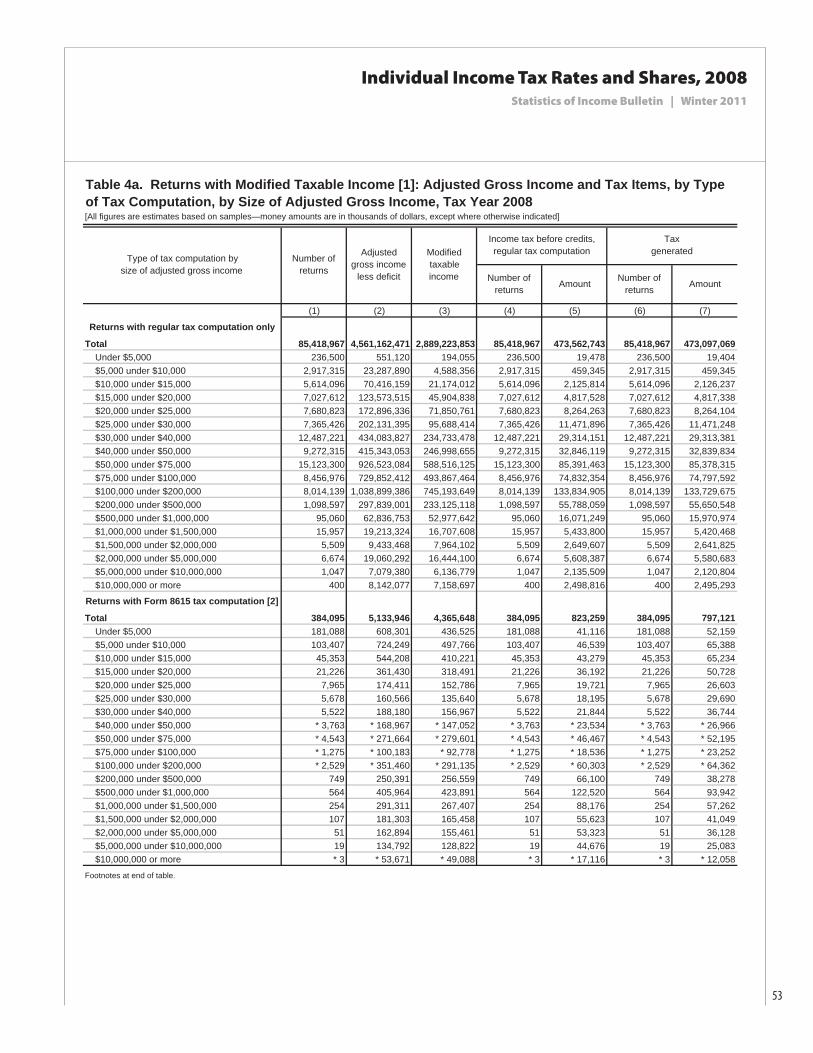
53
Individual Income Tax Rates and Shares, 2008Statistics of Income Bulletin | Winter 2011
(1) (2) (3) (4) (5) (6) (7)
Returns with regular tax computation only
Total 85,418,967 4,561,162,471 2,889,223,853 85,418,967 473,562,743 85,418,967 473,097,069 Under $5,000 236,500 551,120 194,055 236,500 19,478 236,500 19,404 $5,000 under $10,000 2,917,315 23,287,890 4,588,356 2,917,315 459,345 2,917,315 459,345 $10,000 under $15,000 5,614,096 70,416,159 21,174,012 5,614,096 2,125,814 5,614,096 2,126,237 $15,000 under $20,000 7,027,612 123,573,515 45,904,838 7,027,612 4,817,528 7,027,612 4,817,338 $20,000 under $25,000 7,680,823 172,896,336 71,850,761 7,680,823 8,264,263 7,680,823 8,264,104 $25,000 under $30,000 7,365,426 202,131,395 95,688,414 7,365,426 11,471,896 7,365,426 11,471,248 $30,000 under $40,000 12,487,221 434,083,827 234,733,478 12,487,221 29,314,151 12,487,221 29,313,381 $40,000 under $50,000 9,272,315 415,343,053 246,998,655 9,272,315 32,846,119 9,272,315 32,839,834 $50,000 under $75,000 15,123,300 926,523,084 588,516,125 15,123,300 85,391,463 15,123,300 85,378,315 $75,000 under $100,000 8,456,976 729,852,412 493,867,464 8,456,976 74,832,354 8,456,976 74,797,592 $100,000 under $200,000 8,014,139 1,038,899,386 745,193,649 8,014,139 133,834,905 8,014,139 133,729,675 $200,000 under $500,000 1,098,597 297,839,001 233,125,118 1,098,597 55,788,059 1,098,597 55,650,548 $500,000 under $1,000,000 95,060 62,836,753 52,977,642 95,060 16,071,249 95,060 15,970,974 $1,000,000 under $1,500,000 15,957 19,213,324 16,707,608 15,957 5,433,800 15,957 5,420,468 $1,500,000 under $2,000,000 5,509 9,433,468 7,964,102 5,509 2,649,607 5,509 2,641,825 $2,000,000 under $5,000,000 6,674 19,060,292 16,444,100 6,674 5,608,387 6,674 5,580,683 $5,000,000 under $10,000,000 1,047 7,079,380 6,136,779 1,047 2,135,509 1,047 2,120,804 $10,000,000 or more 400 8,142,077 7,158,697 400 2,498,816 400 2,495,293
Returns with Form 8615 tax computation [2]
Total 384,095 5,133,946 4,365,648 384,095 823,259 384,095 797,121 Under $5,000 181,088 608,301 436,525 181,088 41,116 181,088 52,159 $5,000 under $10,000 103,407 724,249 497,766 103,407 46,539 103,407 65,388 $10,000 under $15,000 45,353 544,208 410,221 45,353 43,279 45,353 65,234 $15,000 under $20,000 21,226 361,430 318,491 21,226 36,192 21,226 50,728 $20,000 under $25,000 7,965 174,411 152,786 7,965 19,721 7,965 26,603 $25,000 under $30,000 5,678 160,566 135,640 5,678 18,195 5,678 29,690 $30,000 under $40,000 5,522 188,180 156,967 5,522 21,844 5,522 36,744 $40,000 under $50,000 * 3,763 * 168,967 * 147,052 * 3,763 * 23,534 * 3,763 * 26,966 $50,000 under $75,000 * 4,543 * 271,664 * 279,601 * 4,543 * 46,467 * 4,543 * 52,195 $75,000 under $100,000 * 1,275 * 100,183 * 92,778 * 1,275 * 18,536 * 1,275 * 23,252 $100,000 under $200,000 * 2,529 * 351,460 * 291,135 * 2,529 * 60,303 * 2,529 * 64,362 $200,000 under $500,000 749 250,391 256,559 749 66,100 749 38,278 $500,000 under $1,000,000 564 405,964 423,891 564 122,520 564 93,942 $1,000,000 under $1,500,000 254 291,311 267,407 254 88,176 254 57,262 $1,500,000 under $2,000,000 107 181,303 165,458 107 55,623 107 41,049 $2,000,000 under $5,000,000 51 162,894 155,461 51 53,323 51 36,128 $5,000,000 under $10,000,000 19 134,792 128,822 19 44,676 19 25,083 $10,000,000 or more * 3 * 53,671 * 49,088 * 3 * 17,116 * 3 * 12,058
Footnotes at end of table.
[All figures are estimates based on samples—money amounts are in thousands of dollars, except where otherwise indicated]
Number ofreturns
Adjustedgross income
less deficit
Taxgenerated
Type of tax computation bysize of adjusted gross income
Modifiedtaxableincome
Income tax before credits,regular tax computation
Amount Number ofreturns AmountNumber of
returns
Table 4a. Returns with Modified Taxable Income [1]: Adjusted Gross Income and Tax Items, by Type of Tax Computation, by Size of Adjusted Gross Income, Tax Year 2008

54
Individual Income Tax Rates and Shares, 2008Statistics of Income Bulletin | Winter 2011
(1) (2) (3) (4) (5) (6) (7)
Returns with Schedule D tax computation
Total 20,936,388 3,291,004,790 2,190,413,003 20,936,388 645,240,720 20,936,388 576,898,737 Under $5,000 97,268 278,525 63,242 97,268 9,920 97,268 6,362 $5,000 under $10,000 157,981 1,173,429 255,412 157,981 33,479 157,981 25,981 $10,000 under $15,000 356,068 4,523,750 991,402 356,068 126,375 356,068 100,277 $15,000 under $20,000 473,796 8,308,943 2,818,465 473,796 348,059 473,796 289,956 $20,000 under $25,000 558,401 12,616,505 4,291,706 558,401 582,390 558,401 481,972 $25,000 under $30,000 654,183 18,040,240 7,106,562 654,183 981,009 654,183 838,867 $30,000 under $40,000 1,450,106 50,953,001 24,264,597 1,450,106 3,373,755 1,450,106 2,989,328 $40,000 under $50,000 1,542,995 69,471,581 37,752,615 1,542,995 5,478,539 1,542,995 4,981,523 $50,000 under $75,000 3,827,165 238,776,606 143,789,385 3,827,165 23,533,636 3,827,165 21,753,685 $75,000 under $100,000 3,151,460 273,457,579 176,125,593 3,151,460 29,729,011 3,151,460 27,752,147 $100,000 under $200,000 5,672,903 783,623,260 542,858,507 5,672,903 109,532,567 5,672,903 104,793,647 $200,000 under $500,000 2,280,189 665,613,273 484,901,296 2,280,189 132,491,571 2,280,189 124,679,561 $500,000 under $1,000,000 451,937 308,430,371 227,032,986 451,937 80,228,774 451,937 73,322,123 $1,000,000 under $1,500,000 114,410 138,081,370 99,105,694 114,410 39,118,095 114,410 34,971,365 $1,500,000 under $2,000,000 48,813 84,037,419 59,287,300 48,813 24,658,726 48,813 21,741,025 $2,000,000 under $5,000,000 70,666 210,875,738 143,973,871 70,666 63,822,855 70,666 55,165,147 $5,000,000 under $10,000,000 17,402 118,927,039 75,323,812 17,402 36,928,071 17,402 30,660,333 $10,000,000 or more 10,647 303,816,161 160,470,557 10,647 94,263,888 10,647 72,345,441Footnotes at end of table.
[All figures are estimates based on samples—money amounts are in thousands of dollars, except where otherwise indicated]
Type of tax computation bysize of adjusted gross income
Number ofreturns
Table 4a. Returns with Modified Taxable Income [1]: Adjusted Gross Income and Tax Items, by Type of Tax Computation, by Size of Adjusted Gross Income, Tax Year 2008—Continued
Adjustedgross income
less deficit
Modifiedtaxableincome
Income tax before credits,regular tax computation
Taxgenerated
Number ofreturns Amount Number of
returns Amount
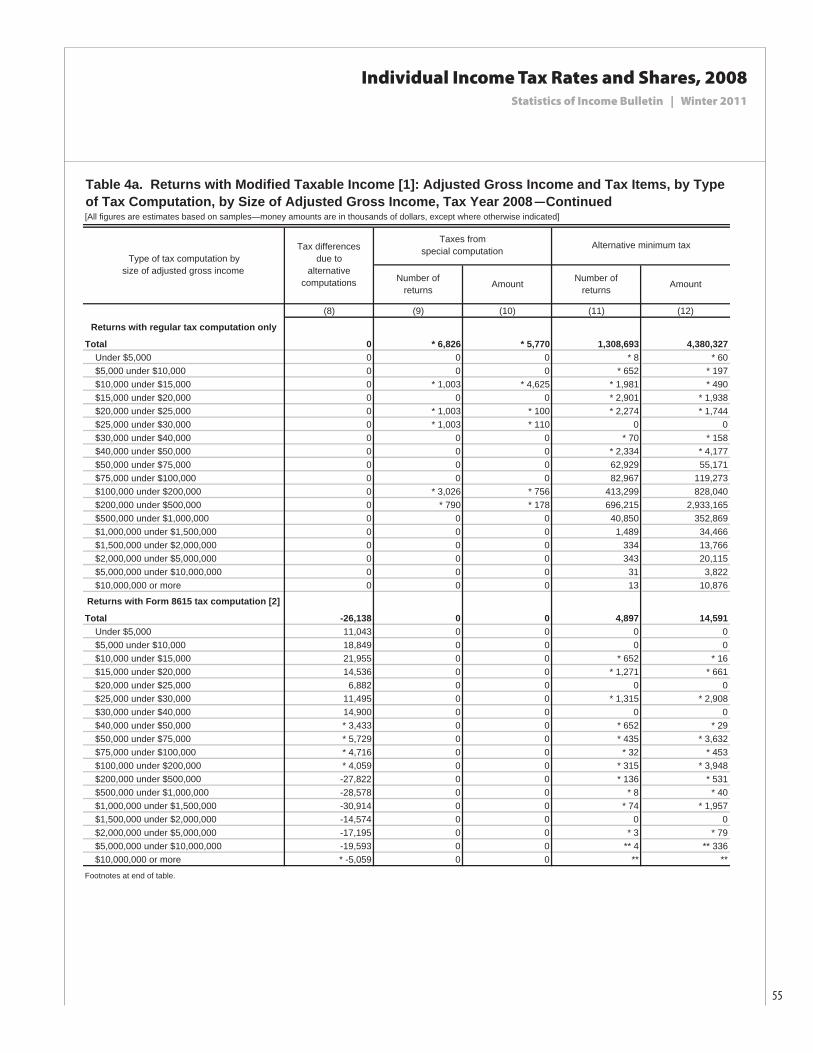
55
Individual Income Tax Rates and Shares, 2008Statistics of Income Bulletin | Winter 2011
(8) (9) (10) (11) (12)
Returns with regular tax computation only
Total 0 * 6,826 * 5,770 1,308,693 4,380,327 Under $5,000 0 0 0 * 8 * 60 $5,000 under $10,000 0 0 0 * 652 * 197 $10,000 under $15,000 0 * 1,003 * 4,625 * 1,981 * 490 $15,000 under $20,000 0 0 0 * 2,901 * 1,938 $20,000 under $25,000 0 * 1,003 * 100 * 2,274 * 1,744 $25,000 under $30,000 0 * 1,003 * 110 0 0 $30,000 under $40,000 0 0 0 * 70 * 158 $40,000 under $50,000 0 0 0 * 2,334 * 4,177 $50,000 under $75,000 0 0 0 62,929 55,171 $75,000 under $100,000 0 0 0 82,967 119,273 $100,000 under $200,000 0 * 3,026 * 756 413,299 828,040 $200,000 under $500,000 0 * 790 * 178 696,215 2,933,165 $500,000 under $1,000,000 0 0 0 40,850 352,869 $1,000,000 under $1,500,000 0 0 0 1,489 34,466 $1,500,000 under $2,000,000 0 0 0 334 13,766 $2,000,000 under $5,000,000 0 0 0 343 20,115 $5,000,000 under $10,000,000 0 0 0 31 3,822 $10,000,000 or more 0 0 0 13 10,876
Returns with Form 8615 tax computation [2]
Total -26,138 0 0 4,897 14,591 Under $5,000 11,043 0 0 0 0 $5,000 under $10,000 18,849 0 0 0 0 $10,000 under $15,000 21,955 0 0 * 652 * 16 $15,000 under $20,000 14,536 0 0 * 1,271 * 661 $20,000 under $25,000 6,882 0 0 0 0 $25,000 under $30,000 11,495 0 0 * 1,315 * 2,908 $30,000 under $40,000 14,900 0 0 0 0 $40,000 under $50,000 * 3,433 0 0 * 652 * 29 $50,000 under $75,000 * 5,729 0 0 * 435 * 3,632 $75,000 under $100,000 * 4,716 0 0 * 32 * 453 $100,000 under $200,000 * 4,059 0 0 * 315 * 3,948 $200,000 under $500,000 -27,822 0 0 * 136 * 531 $500,000 under $1,000,000 -28,578 0 0 * 8 * 40 $1,000,000 under $1,500,000 -30,914 0 0 * 74 * 1,957 $1,500,000 under $2,000,000 -14,574 0 0 0 0 $2,000,000 under $5,000,000 -17,195 0 0 * 3 * 79 $5,000,000 under $10,000,000 -19,593 0 0 ** 4 ** 336 $10,000,000 or more * -5,059 0 0 ** **
Footnotes at end of table.
[All figures are estimates based on samples—money amounts are in thousands of dollars, except where otherwise indicated]
Tax differencesdue to
alternativecomputations Number of
returns
Type of tax computation bysize of adjusted gross income
Taxes fromspecial computation Alternative minimum tax
Number ofreturnsAmount Amount
Table 4a. Returns with Modified Taxable Income [1]: Adjusted Gross Income and Tax Items, by Type of Tax Computation, by Size of Adjusted Gross Income, Tax Year 2008—Continued

56
Individual Income Tax Rates and Shares, 2008Statistics of Income Bulletin | Winter 2011
(8) (9) (10) (11) (12)
Returns with Schedule D tax computation
Total -68,341,983 * 1,799 * 3,766 2,495,351 17,745,760 Under $5,000 -3,558 0 0 0 0 $5,000 under $10,000 -7,499 0 0 0 0 $10,000 under $15,000 -26,099 0 0 * 652 * 521 $15,000 under $20,000 -58,103 0 0 0 0 $20,000 under $25,000 -100,418 0 0 0 0 $25,000 under $30,000 -142,142 0 0 * 1,977 * 2,388 $30,000 under $40,000 -384,427 0 0 * 1,302 * 2,251 $40,000 under $50,000 -497,015 0 0 * 1,247 * 5,043 $50,000 under $75,000 -1,779,951 * 1,621 * 2,835 4,213 6,286 $75,000 under $100,000 -1,976,865 * 141 * 801 21,353 39,294 $100,000 under $200,000 -4,738,920 * 31 * 127 426,171 1,024,947 $200,000 under $500,000 -7,812,010 * 6 * 3 1,711,196 10,198,618 $500,000 under $1,000,000 -6,906,651 0 0 264,492 3,291,593 $1,000,000 under $1,500,000 -4,146,731 0 0 30,849 759,211 $1,500,000 under $2,000,000 -2,917,701 0 0 11,069 351,040 $2,000,000 under $5,000,000 -8,657,708 0 0 15,187 791,661 $5,000,000 under $10,000,000 -6,267,738 0 0 3,465 359,912 $10,000,000 or more -21,918,447 0 0 2,178 912,996Footnotes at end of table.
[All figures are estimates based on samples—money amounts are in thousands of dollars, except where otherwise indicated]
Table 4a. Returns with Modified Taxable Income [1]: Adjusted Gross Income and Tax Items, by Type of Tax Computation, by Size of Adjusted Gross Income, Tax Year 2008—Continued
Type of tax computation bysize of adjusted gross income
Tax differencesdue to
alternativecomputations
Taxes fromspecial computation Alternative minimum tax
Number ofreturns AmountNumber of
returns Amount
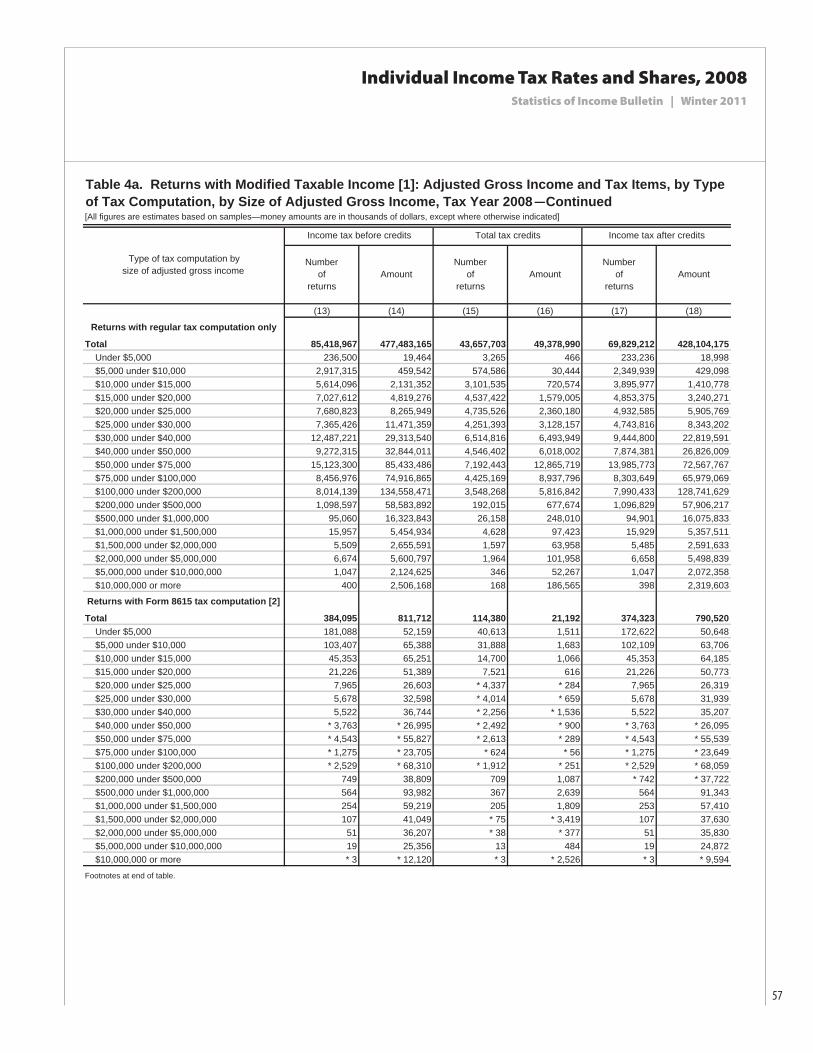
57
Individual Income Tax Rates and Shares, 2008Statistics of Income Bulletin | Winter 2011
(13) (14) (15) (16) (17) (18)
Returns with regular tax computation only
Total 85,418,967 477,483,165 43,657,703 49,378,990 69,829,212 428,104,175 Under $5,000 236,500 19,464 3,265 466 233,236 18,998 $5,000 under $10,000 2,917,315 459,542 574,586 30,444 2,349,939 429,098 $10,000 under $15,000 5,614,096 2,131,352 3,101,535 720,574 3,895,977 1,410,778 $15,000 under $20,000 7,027,612 4,819,276 4,537,422 1,579,005 4,853,375 3,240,271 $20,000 under $25,000 7,680,823 8,265,949 4,735,526 2,360,180 4,932,585 5,905,769 $25,000 under $30,000 7,365,426 11,471,359 4,251,393 3,128,157 4,743,816 8,343,202 $30,000 under $40,000 12,487,221 29,313,540 6,514,816 6,493,949 9,444,800 22,819,591 $40,000 under $50,000 9,272,315 32,844,011 4,546,402 6,018,002 7,874,381 26,826,009 $50,000 under $75,000 15,123,300 85,433,486 7,192,443 12,865,719 13,985,773 72,567,767 $75,000 under $100,000 8,456,976 74,916,865 4,425,169 8,937,796 8,303,649 65,979,069 $100,000 under $200,000 8,014,139 134,558,471 3,548,268 5,816,842 7,990,433 128,741,629 $200,000 under $500,000 1,098,597 58,583,892 192,015 677,674 1,096,829 57,906,217 $500,000 under $1,000,000 95,060 16,323,843 26,158 248,010 94,901 16,075,833 $1,000,000 under $1,500,000 15,957 5,454,934 4,628 97,423 15,929 5,357,511 $1,500,000 under $2,000,000 5,509 2,655,591 1,597 63,958 5,485 2,591,633 $2,000,000 under $5,000,000 6,674 5,600,797 1,964 101,958 6,658 5,498,839 $5,000,000 under $10,000,000 1,047 2,124,625 346 52,267 1,047 2,072,358 $10,000,000 or more 400 2,506,168 168 186,565 398 2,319,603
Returns with Form 8615 tax computation [2]
Total 384,095 811,712 114,380 21,192 374,323 790,520 Under $5,000 181,088 52,159 40,613 1,511 172,622 50,648 $5,000 under $10,000 103,407 65,388 31,888 1,683 102,109 63,706 $10,000 under $15,000 45,353 65,251 14,700 1,066 45,353 64,185 $15,000 under $20,000 21,226 51,389 7,521 616 21,226 50,773 $20,000 under $25,000 7,965 26,603 * 4,337 * 284 7,965 26,319 $25,000 under $30,000 5,678 32,598 * 4,014 * 659 5,678 31,939 $30,000 under $40,000 5,522 36,744 * 2,256 * 1,536 5,522 35,207 $40,000 under $50,000 * 3,763 * 26,995 * 2,492 * 900 * 3,763 * 26,095 $50,000 under $75,000 * 4,543 * 55,827 * 2,613 * 289 * 4,543 * 55,539 $75,000 under $100,000 * 1,275 * 23,705 * 624 * 56 * 1,275 * 23,649 $100,000 under $200,000 * 2,529 * 68,310 * 1,912 * 251 * 2,529 * 68,059 $200,000 under $500,000 749 38,809 709 1,087 * 742 * 37,722 $500,000 under $1,000,000 564 93,982 367 2,639 564 91,343 $1,000,000 under $1,500,000 254 59,219 205 1,809 253 57,410 $1,500,000 under $2,000,000 107 41,049 * 75 * 3,419 107 37,630 $2,000,000 under $5,000,000 51 36,207 * 38 * 377 51 35,830 $5,000,000 under $10,000,000 19 25,356 13 484 19 24,872 $10,000,000 or more * 3 * 12,120 * 3 * 2,526 * 3 * 9,594
Footnotes at end of table.
[All figures are estimates based on samples—money amounts are in thousands of dollars, except where otherwise indicated]
AmountNumber
ofreturns
Income tax before credits
Type of tax computation bysize of adjusted gross income
Total tax credits Income tax after credits
AmountNumber
ofreturns
Amount
Table 4a. Returns with Modified Taxable Income [1]: Adjusted Gross Income and Tax Items, by Type of Tax Computation, by Size of Adjusted Gross Income, Tax Year 2008—Continued
Numberof
returns

58
Individual Income Tax Rates and Shares, 2008Statistics of Income Bulletin | Winter 2011
(13) (14) (15) (16) (17) (18)
Returns with Schedule D tax computation
Total 20,936,388 594,648,263 11,158,504 18,234,713 20,068,594 576,413,550 Under $5,000 97,268 6,362 16,129 337 92,920 6,025 $5,000 under $10,000 157,981 25,981 29,459 744 152,046 25,237 $10,000 under $15,000 356,068 100,798 149,749 23,266 284,683 77,531 $15,000 under $20,000 473,796 289,956 255,517 76,239 406,872 213,716 $20,000 under $25,000 558,401 481,972 264,374 87,972 482,634 394,000 $25,000 under $30,000 654,183 841,255 306,738 117,913 571,926 723,343 $30,000 under $40,000 1,450,106 2,991,578 690,737 353,420 1,290,383 2,638,158 $40,000 under $50,000 1,542,995 4,986,566 764,177 515,470 1,415,331 4,471,096 $50,000 under $75,000 3,827,165 21,762,806 1,937,815 1,881,768 3,641,548 19,881,038 $75,000 under $100,000 3,151,460 27,792,242 1,799,855 2,145,244 3,095,815 25,646,998 $100,000 under $200,000 5,672,903 105,818,721 3,260,948 3,576,293 5,644,225 102,242,428 $200,000 under $500,000 2,280,189 134,878,182 1,201,072 1,856,619 2,277,427 133,021,563 $500,000 under $1,000,000 451,937 76,613,716 291,480 1,206,016 451,244 75,407,700 $1,000,000 under $1,500,000 114,410 35,730,575 79,709 718,617 114,270 35,011,959 $1,500,000 under $2,000,000 48,813 22,092,065 35,258 418,163 48,745 21,673,902 $2,000,000 under $5,000,000 70,666 55,956,808 52,828 1,461,677 70,548 54,495,130 $5,000,000 under $10,000,000 17,402 31,020,245 13,751 863,282 17,359 30,156,963 $10,000,000 or more 10,647 73,258,436 8,909 2,931,672 10,619 70,326,764Footnotes at end of table.
[All figures are estimates based on samples—money amounts are in thousands of dollars, except where otherwise indicated]
Table 4a. Returns with Modified Taxable Income [1]: Adjusted Gross Income and Tax Items, by Type of Tax Computation, by Size of Adjusted Gross Income, Tax Year 2008—Continued
Type of tax computation bysize of adjusted gross income
Income tax before credits Total tax credits Income tax after credits
Numberof
returnsAmount
Numberof
returnsAmount
Numberof
returnsAmount
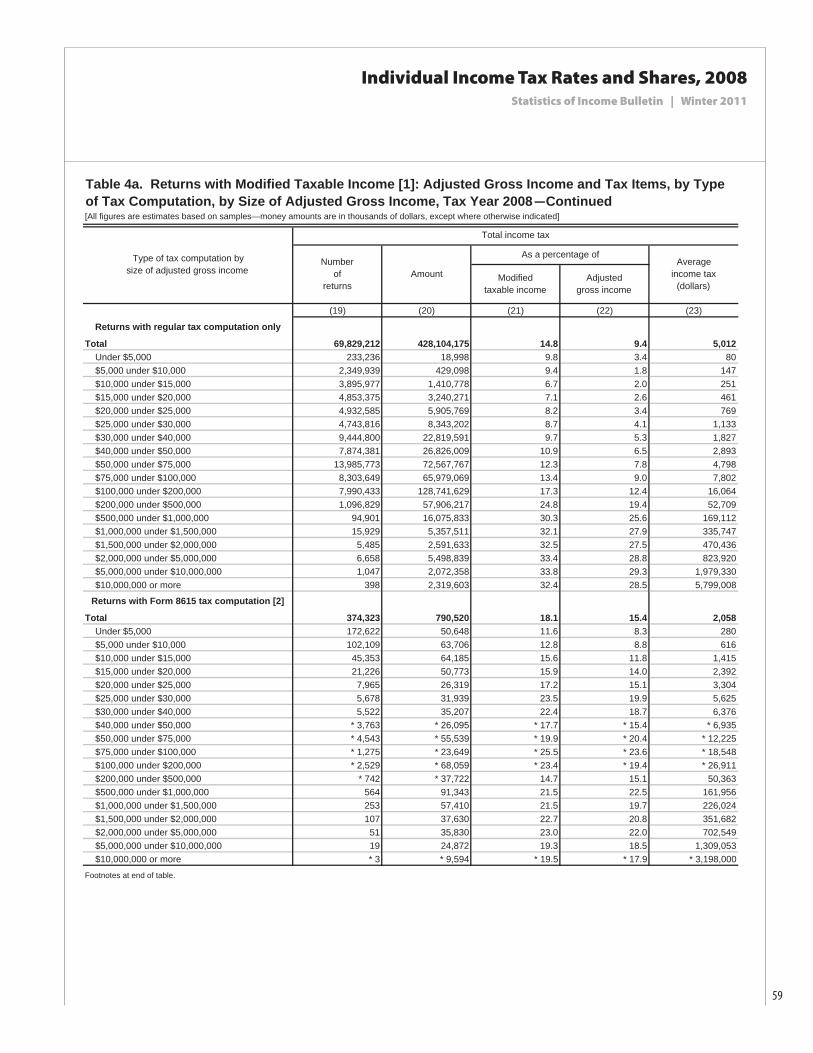
59
Individual Income Tax Rates and Shares, 2008Statistics of Income Bulletin | Winter 2011
(19) (20) (21) (22) (23)
Returns with regular tax computation only
Total 69,829,212 428,104,175 14.8 9.4 5,012 Under $5,000 233,236 18,998 9.8 3.4 80 $5,000 under $10,000 2,349,939 429,098 9.4 1.8 147 $10,000 under $15,000 3,895,977 1,410,778 6.7 2.0 251 $15,000 under $20,000 4,853,375 3,240,271 7.1 2.6 461 $20,000 under $25,000 4,932,585 5,905,769 8.2 3.4 769 $25,000 under $30,000 4,743,816 8,343,202 8.7 4.1 1,133 $30,000 under $40,000 9,444,800 22,819,591 9.7 5.3 1,827 $40,000 under $50,000 7,874,381 26,826,009 10.9 6.5 2,893 $50,000 under $75,000 13,985,773 72,567,767 12.3 7.8 4,798 $75,000 under $100,000 8,303,649 65,979,069 13.4 9.0 7,802 $100,000 under $200,000 7,990,433 128,741,629 17.3 12.4 16,064 $200,000 under $500,000 1,096,829 57,906,217 24.8 19.4 52,709 $500,000 under $1,000,000 94,901 16,075,833 30.3 25.6 169,112 $1,000,000 under $1,500,000 15,929 5,357,511 32.1 27.9 335,747 $1,500,000 under $2,000,000 5,485 2,591,633 32.5 27.5 470,436 $2,000,000 under $5,000,000 6,658 5,498,839 33.4 28.8 823,920 $5,000,000 under $10,000,000 1,047 2,072,358 33.8 29.3 1,979,330 $10,000,000 or more 398 2,319,603 32.4 28.5 5,799,008
Returns with Form 8615 tax computation [2]
Total 374,323 790,520 18.1 15.4 2,058 Under $5,000 172,622 50,648 11.6 8.3 280 $5,000 under $10,000 102,109 63,706 12.8 8.8 616 $10,000 under $15,000 45,353 64,185 15.6 11.8 1,415 $15,000 under $20,000 21,226 50,773 15.9 14.0 2,392 $20,000 under $25,000 7,965 26,319 17.2 15.1 3,304 $25,000 under $30,000 5,678 31,939 23.5 19.9 5,625 $30,000 under $40,000 5,522 35,207 22.4 18.7 6,376 $40,000 under $50,000 * 3,763 * 26,095 * 17.7 * 15.4 * 6,935 $50,000 under $75,000 * 4,543 * 55,539 * 19.9 * 20.4 * 12,225 $75,000 under $100,000 * 1,275 * 23,649 * 25.5 * 23.6 * 18,548 $100,000 under $200,000 * 2,529 * 68,059 * 23.4 * 19.4 * 26,911 $200,000 under $500,000 * 742 * 37,722 14.7 15.1 50,363 $500,000 under $1,000,000 564 91,343 21.5 22.5 161,956 $1,000,000 under $1,500,000 253 57,410 21.5 19.7 226,024 $1,500,000 under $2,000,000 107 37,630 22.7 20.8 351,682 $2,000,000 under $5,000,000 51 35,830 23.0 22.0 702,549 $5,000,000 under $10,000,000 19 24,872 19.3 18.5 1,309,053 $10,000,000 or more * 3 * 9,594 * 19.5 * 17.9 * 3,198,000
Footnotes at end of table.
[All figures are estimates based on samples—money amounts are in thousands of dollars, except where otherwise indicated]
Total income tax
As a percentage of
Amount Adjustedgross income
Numberof
returnsModified
taxable income
Type of tax computation bysize of adjusted gross income
Table 4a. Returns with Modified Taxable Income [1]: Adjusted Gross Income and Tax Items, by Type of Tax Computation, by Size of Adjusted Gross Income, Tax Year 2008—Continued
Averageincome tax
(dollars)

60
Individual Income Tax Rates and Shares, 2008Statistics of Income Bulletin | Winter 2011
(19) (20) (21) (22) (23)
Returns with Schedule D tax computation
Total 20,068,595 576,413,756 26.3 17.5 27,532 Under $5,000 92,920 6,025 9.5 2.2 62 $5,000 under $10,000 152,046 25,237 9.9 2.2 160 $10,000 under $15,000 284,683 77,531 7.8 1.7 218 $15,000 under $20,000 406,872 213,716 7.6 2.6 451 $20,000 under $25,000 482,634 394,000 9.2 3.1 706 $25,000 under $30,000 571,926 723,343 10.2 4.0 1,106 $30,000 under $40,000 1,290,383 2,638,158 10.9 5.2 1,819 $40,000 under $50,000 1,415,331 4,471,096 11.8 6.4 2,898 $50,000 under $75,000 3,641,548 19,881,038 13.8 8.3 5,195 $75,000 under $100,000 3,095,815 25,646,998 14.6 9.4 8,138 $100,000 under $200,000 5,644,225 102,242,428 18.8 13.0 18,023 $200,000 under $500,000 2,277,428 133,021,563 27.4 20.0 58,338 $500,000 under $1,000,000 451,244 75,407,765 33.2 24.4 166,855 $1,000,000 under $1,500,000 114,270 35,011,959 35.3 25.4 306,022 $1,500,000 under $2,000,000 48,745 21,673,902 36.6 25.8 444,019 $2,000,000 under $5,000,000 70,548 54,495,271 37.9 25.8 771,167 $5,000,000 under $10,000,000 17,359 30,156,963 40.0 25.4 1,732,960 $10,000,000 or more 10,619 70,326,764 43.8 23.1 6,605,313* Estimate should be used with caution due to the small number of sample returns on which it is based.** Data combined to avoid disclosure of information for specific taxpayers.[1] See section 4 for the definition of modified taxable income.[2] See table 3.1A for more details on returns with Form 8615 tax computation.NOTE: Detail may not add to totals because of rounding.
[All figures are estimates based on samples—money amounts are in thousands of dollars, except where otherwise indicated]
Table 4a. Returns with Modified Taxable Income [1]: Adjusted Gross Income and Tax Items, by Type of Tax Computation, by Size of Adjusted Gross Income, Tax Year 2008—Continued
Numberof
returnsAmount
Type of tax computation bysize of adjusted gross income
Total income tax
Modifiedtaxable income
Adjustedgross income
As a percentage ofAverage
income tax(dollars)

61
Individual Income Tax Rates and Shares, 2008Statistics of Income Bulletin | Winter 2011
[All figures are estimates based on samples—money amounts are in thousands of dollars]
(1) (2) (3) (4) (5) (6)
Total 384,095 823,259 563,346 -259,913 797,121 233,775 Under $5,000 181,088 41,116 35,172 -5,944 52,159 16,987 $5,000 under $10,000 103,407 46,539 34,273 -12,266 65,388 31,115 $10,000 under $15,000 45,353 43,279 32,922 -10,357 65,234 32,312 $15,000 under $20,000 21,226 36,192 27,527 -8,665 50,728 23,201 $20,000 under $25,000 7,965 19,721 13,592 -6,129 26,603 13,011 $25,000 under $30,000 5,678 18,195 14,587 -3,608 29,690 15,103 $30,000 under $40,000 5,522 21,844 14,938 -6,906 36,744 21,806 $40,000 under $50,000 * 3,763 * 23,534 * 14,785 * -8,749 * 26,966 * 12,181 $50,000 under $75,000 * 4,543 * 46,467 * 30,219 * -16,248 * 52,195 * 21,976 $75,000 under $100,000 * 1,275 * 18,536 * 16,165 * -2,371 * 23,252 * 7,087 $100,000 under $200,000 * 2,529 * 60,303 * 45,300 * -15,003 * 64,362 * 19,062 $200,000 under $500,000 749 66,100 34,227 -31,873 38,278 4,051 $500,000 under $1,000,000 564 122,520 85,118 -37,402 93,942 8,824 $1,000,000 under $1,500,000 254 88,176 54,235 -33,941 57,262 3,027 $1,500,000 under $2,000,000 107 55,623 38,896 -16,727 41,049 2,153 $2,000,000 under $5,000,000 51 53,323 34,684 -18,639 36,128 1,444 $5,000,000 under $10,000,000 19 44,676 24,766 -19,910 25,083 317 $10,000,000 or more * 3 * 17,116 * 11,940 * -5,176 * 12,058 * 118
Size of adjusted gross income
Table 4b. Returns with Form 8615 Tax Computation: Tax Items, by Type of Tax Computation, by Size of Adjusted Gross Income, Tax Year 2008
* Estimate should be used with caution due to the small number of sample returns on which it is based.
NOTE: Detail may not add to totals because of rounding.
Income tax before credits,
regular tax computation
Tax generatedwith Schedule Dcomputation [1]
[1] For returns that did not have Schedule D worksheet, the regular tax computation was used to calculate tax generated. For 2008, 207,126 returns had no worksheet.
Tax differences due to regular tax computation vs. with Schedule D
computation
Tax differences due to Form 8615 computation vs. with Schedule D
computation
Number ofreturns
Taxgenerated

62
Individual Income Tax Rates and Shares, 2008Statistics of Income Bulletin | Winter 2011
Descending cumulative percentiles
Top5 percent
Top10 percent
Top25 percent
Top50 percent
Item, tax year Total Top0.1 percent
Top1 percent
Table 5. Returns with Positive Adjusted Gross Income (AGI): Number of Returns, Shares of AGI and Total Income Tax, AGI Floor on Percentiles in Current and Constant Dollars, and Average Tax Rates, by Selected Descending Cumulative Percentiles of Returns Based on Income Size Using the Definition of AGI for Each Year, Tax Years 1986–2008[All figures are estimates based on samples]
(1) (2) (2) (3) (4) (5) (6)Number of returns [1]: 1986 102,087,623 102,088 1,020,876 5,104,381 10,208,762 25,521,906 51,043,811 1987 106,154,761 106,155 1,061,548 5,307,738 10,615,476 26,538,690 53,077,380 1988 108,872,859 108,873 1,088,729 5,443,643 10,887,286 27,218,214 54,436,429 1989 111,312,721 111,313 1,113,127 5,565,636 11,131,272 27,828,181 55,656,361 1990 112,812,262 112,812 1,128,123 5,640,613 11,281,226 28,203,066 56,406,132 1991 113,804,104 113,804 1,138,041 5,690,205 11,380,410 28,451,026 56,902,052 1992 112,652,759 112,653 1,126,528 5,632,638 11,265,276 28,163,190 56,326,380 1993 113,681,387 113 681 1,136,814 5,684,069 11,368,139 28,420,347 56,840,6941993 113,681,387 113,681 1,136,814 5,684,069 11,368,139 28,420,347 56,840,694 1994 114,989,920 114,990 1,149,899 5,749,496 11,498,992 28,747,480 57,494,960 1995 117,274,186 117,274 1,172,742 5,863,709 11,727,419 29,318,546 58,637,093 1996 119,441,767 119,442 1,194,418 5,972,088 11,944,177 29,860,442 59,720,884 1997 121,503,284 121,503 1,215,033 6,075,164 12,150,328 30,375,821 60,751,642 1998 123,775,831 123,776 1,237,758 6,188,792 12,377,583 30,943,958 61,887,915 1999 126,008,974 126,009 1,260,090 6,300,449 12,600,897 31,502,244 63,004,487 2000 128,227,143 128,227 1,282,271 6,411,357 12,822,714 32,056,786 64,113,572 2001 128,817,051 128,817 1,288,171 6,440,853 12,881,705 32,204,263 64,408,526 2002 128,323,986 128,324 1,283,240 6,416,199 12,832,399 32,080,997 64,161,993
2003 128 609 786 128 610 1 286 098 6 430 489 12 860 979 32 152 447 64 304 893 2003 128,609,786 128,610 1,286,098 6,430,489 12,860,979 32,152,447 64,304,893 2004 130,371,156 130,371 1,303,712 6,518,558 13,037,116 32,592,789 65,185,578 2005 132,611,637 132,612 1,326,116 6,630,582 13,261,164 33,152,909 66,305,819 2006 135,719,160 135,719 1,357,192 6,785,958 13,571,916 33,929,790 67,859,580 2007 [2] 141,070,971 141,071 1,410,710 7,053,549 14,107,097 35,267,743 70,535,486 2008 139,960,580 139,961 1,399,606 6,998,029 13,996,058 34,990,145 69,980,290Adjusted gross income floor on percentiles (current dollars): 1986 N/A [6] 118,818 62,377 48,656 32,242 17,302 1987 N/A [6] 139,289 68,414 52,921 33,983 17,7681987 N/A [6] 139,289 68,414 52,921 33,983 17,768 1988 N/A [6] 157,136 72,735 55,437 35,398 18,367 1989 N/A [6] 163,869 76,933 58,263 36,839 18,993 1990 N/A [6] 167,421 79,064 60,287 38,080 19,767 1991 N/A [6] 170,139 81,720 61,944 38,929 20,097 1992 N/A [6] 181,904 85,103 64,457 40,378 20,803 1993 N/A [6] 185,715 87,386 66,077 41,210 21,179 1994 N/A [6] 195,726 91,226 68,753 42,742 21,802 1995 N/A [6] 209,406 96,221 72,094 44,207 22,344 1996 N/A [6] 227,546 101,141 74,986 45,757 23,174 1997 N/A [6] 250,736 108,048 79,212 48,173 24,393[ ] 1998 N/A [6] 269,496 114,729 83,220 50,607 25,491 1999 N/A [6] 293,415 120,846 87,682 52,965 26,415 2000 N/A [6] 313,469 128,336 92,144 55,225 27,682 2001 N/A 1,324,487 292,913 127,904 92,754 56,085 28,528 2002 N/A 1,191,673 285,424 126,525 92,663 56,401 28,654 2003 N/A 1,262,760 295,495 130,080 94,891 57,343 29,019 2004 N/A 1,548,941 328,049 137,056 99,112 60,041 30,122 2005 N/A 1,848,791 364,657 145,283 103,912 62,068 30,881 2006 N/A 2,044,689 388,806 153,542 108,904 64,702 31,987 2007 N/A 2,155,365 410,096 160,041 113,018 66,532 32,879
2008 N/A 1 803 585 380 354 159 619 113 799 67 280 33 048 2008 N/A 1,803,585 380,354 159,619 113,799 67,280 33,048Footnotes at end of table.

63
Individual Income Tax Rates and Shares, 2008Statistics of Income Bulletin | Winter 2011
Descending cumulative percentiles
Top5 percent
Top10 percent
Top25 percent
Top50 percent
Item, tax year Total Top0.1 percent
Top1 percent
Table 5. Returns with Positive Adjusted Gross Income (AGI): Number of Returns, Shares of AGI and Total Income Tax, AGI Floor on Percentiles in Current and Constant Dollars, and Average Tax Rates, by Selected Descending Cumulative Percentiles of Returns Based on Income Size Using the Definition of AGI for Each Year, Tax Years 1986–2008—Continued[All figures are estimates based on samples]
(1) (2) (2) (3) (4) (5) (6)Adjusted gross income floor on percentiles (constant dollars) [3]:
1986 N/A [6] 108,411 56,913 44,394 29,418 15,786 1987 N/A [6] 122,614 60,224 46,585 29,915 15,641 1988 N/A [6] 132,828 61,484 46,861 29,922 15,526 1989 N/A [6] 132,152 62,043 46,986 29,709 15,317 1990 N/A [6] 128,096 60,493 46,126 29,135 15,124 1991 N/A [6] 124,919 60,000 45,480 28,582 14,756
1992 N/A [6] 129 654 60 658 45 942 28 780 14 8281992 N/A [6] 129,654 60,658 45,942 28,780 14,828 1993 N/A [6] 128,522 60,475 45,728 28,519 14,657 1994 N/A [6] 132,069 61,556 46,392 28,841 14,711 1995 N/A [6] 137,406 63,137 47,306 29,007 14,661 1996 N/A [6] 145,026 64,462 47,792 29,163 14,769 1997 N/A [6] 156,222 67,320 49,353 30,014 15,198 1998 N/A [6] 164,427 69,999 50,775 30,877 15,553 1999 N/A [6] 176,119 72,537 52,630 31,792 15,855 2000 N/A [6] 182,038 74,527 53,510 32,070 16,075 2001 N/A 747,875 165,394 72,221 52,374 31,669 16,108 2002 N/A 662,409 158,657 70,331 51,508 31,351 15,928 2003 N/A 686,283 160,595 70,696 51,571 31,165 15,771 2004 N/A 819,979 173,663 72,555 52,468 31,785 15,946 2005 N/A 946,642 186,716 74,390 53,206 31,781 15,812 2006 N/A 1,014,231 192,860 76,162 54,020 32,094 15,867 2007 N/A 1,039,732 197,827 77,203 54,519 32,095 15,861 2008 N/A 837,708 176,662 74,138 52,856 31,249 15,350
Adjusted gross income (millions of dollars): 1986 2,524,124 [6] 285,197 608,467 886,510 1,490,173 2,103,569
1987 2 813 728 [6] 346 635 722 221 1 038 221 1 709 389 2 373 869 1987 2,813,728 [6] 346,635 722,221 1,038,221 1,709,389 2,373,869 1988 3,124,156 [6] 473,527 890,702 1,232,536 1,950,860 2,657,865 1989 3,298,858 [6] 468,079 918,421 1,286,539 2,054,478 2,805,235 1990 3,451,237 [6] 483,252 953,337 1,338,032 2,144,177 2,932,537 1991 3,516,142 [6] 456,603 943,350 1,343,202 2,174,765 2,984,003 1992 3,680,552 [6] 523,586 1,031,093 1,443,784 2,299,401 3,131,400 1993 3,775,578 [6] 520,586 1,048,252 1,474,463 2,357,953 3,212,299 1994 3,961,146 [6] 546,700 1,103,084 1,552,205 2,481,074 3,371,352 1995 4,244,607 [6] 619,610 1,222,723 1,704,513 2,689,820 3,627,542 1996 4,590,527 [6] 736,545 1,393,805 1,909,149 2,952,637 3,944,383 1997 5,023,457 [6] 872,826 1,597,107 2,151,401 3,267,600 4,327,9921997 5,023,457 [6] 872,826 1,597,107 2,151,401 3,267,600 4,327,992 1998 5,469,211 [6] 1,010,245 1,796,647 2,393,716 3,589,600 4,721,430 1999 5,909,329 [6] 1,152,820 2,011,763 2,652,835 3,927,308 5,126,164 2000 6,423,977 [6] 1,336,773 2,267,403 2,955,386 4,313,786 5,589,755 2001 6,241,036 505,752 1,094,296 1,996,492 2,690,589 4,071,034 5,379,286 2002 6,113,778 431,644 985,781 1,867,787 2,553,475 3,935,504 5,244,029 2003 6,287,586 476,041 1,054,567 1,960,676 2,663,470 4,078,227 5,407,851 2004 6,875,123 628,522 1,306,417 2,299,595 3,049,275 4,546,401 5,952,781 2005 7,507,958 799,403 1,591,711 2,683,934 3,487,010 5,069,455 6,544,824 2006 8,122,040 911,054 1,791,886 2,977,714 3,843,144 5,535,830 7,105,599 2007 8,798,500 1,049,358 2,008,259 3,294,542 4,227,839 6,045,354 7,720,213 2008 8,426,625 839,371 1,685,472 2,926,701 3,856,462 5,678,179 7,352,111Footnotes at end of table.

64
Individual Income Tax Rates and Shares, 2008Statistics of Income Bulletin | Winter 2011
Descending cumulative percentiles
Top25 percent
Top50 percent
Item, tax year Total Top0.1 percent
Top1 percent
Top5 percent
Top10 percent
Table 5. Returns with Positive Adjusted Gross Income (AGI): Number of Returns, Shares of AGI and Total Income Tax, AGI Floor on Percentiles in Current and Constant Dollars, and Average Tax Rates, by Selected Descending Cumulative Percentiles of Returns Based on Income Size Using the Definition of AGI for Each Year, Tax Years 1986–2008—Continued[All figures are estimates based on samples]
(1) (2) (2) (3) (4) (5) (6)Total income tax (millions of dollars) [4]: 1986 366,979 [6] 94,491 156,240 200,703 278,976 343,289 1987 369,046 [6] 91,559 159,642 205,230 283,857 346,655 1988 412,761 [6] 113,841 188,303 236,411 321,297 389,145 1989 432,838 [6] 109,259 190,188 241,458 334,258 407,599 1990 447,061 [6] 112,338 195,088 247,514 344,340 421,075 1991 448,349 [6] 111,267 194,480 250,282 346,511 423,759 1992 476,163 [6] 131,156 218,479 276,213 373,700 452,070
1993 502 720 [6] 145 836 238 083 297 808 398 516 478 5631993 502,720 [6] 145,836 238,083 297,808 398,516 478,563 1994 534,754 [6] 154,337 254,106 317,902 425,402 509,256 1995 588,331 [6] 178,035 287,741 357,402 472,808 561,225 1996 658,124 [6] 212,626 335,433 411,404 535,164 629,684 1997 727,303 [6] 241,239 377,241 459,639 594,007 696,161 1998 788,452 [6] 274,009 424,506 512,836 651,964 755,240 1999 877,292 [6] 317,419 486,464 583,002 732,890 842,168 2000 980,521 [6] 366,929 553,670 660,150 823,706 942,179 2001 887,882 142,616 300,898 472,823 576,163 736,053 852,642 2002 796,862 122,975 268,608 428,680 523,812 668,558 768,963 2003 747,939 117,275 256,340 406,597 492,452 627,380 722,027 2004 831,890 145,118 306,902 475,224 567,273 705,915 804,471 2005 934,703 180,008 368,132 557,759 657,085 803,772 906,028 2006 1,023,739 200,281 408,369 615,680 724,740 883,153 993,176 2007 1,115,504 225,239 450,926 676,293 794,432 965,875 1,083,243 2008 1,031,512 190,498 392,149 605,718 721,421 890,614 1,003,639
Average tax rate (percentage) [5]: 1986 14.54 [6] 33.13 25.68 22.64 18.72 16.32 1987 13.12 [6] 26.41 22.10 19.77 16.61 14.60 1988 13.21 [6] 24.04 21.14 19.18 16.47 14.641988 13.21 [6] 24.04 21.14 19.18 16.47 14.64 1989 13.12 [6] 23.34 20.71 18.77 16.27 14.53 1990 12.95 [6] 23.25 20.46 18.50 16.06 14.36 1991 12.75 [6] 24.37 20.62 18.63 15.93 14.20 1992 12.94 [6] 25.05 21.19 19.13 16.25 14.44 1993 13.32 [6] 28.01 22.71 20.20 16.90 14.90 1994 13.50 [6] 28.23 23.04 20.48 17.15 15.11 1995 13.86 [6] 28.73 23.53 20.97 17.58 15.47 1996 14.34 [6] 28.87 24.07 21.55 18.12 15.96 1997 14.48 [6] 27.64 23.62 21.36 18.18 16.09 1998 14.42 [6] 27.12 23.63 21.42 18.16 16.00 1999 14.85 [6] 27.53 24.18 21.98 18.66 16.43 2000 15.26 [6] 27.45 24.42 22.34 19.09 16.86 2001 14.23 28.20 27.50 23.68 21.41 18.08 15.85 2002 13.03 28.49 27.25 22.95 20.51 16.99 14.66 2003 11.90 24.64 24.31 20.74 18.49 15.38 13.35 2004 12.10 23.09 23.49 20.67 18.60 15.53 13.51 2005 12.45 22.52 23.13 20.78 18.84 15.86 13.84 2006 12.60 21.98 22.79 20.68 18.86 15.95 13.98 2007 12.68 21.46 22.45 20.53 18.79 15.98 14.03 2008 12.24 22.70 23.27 20.70 18.71 15.68 13.65Footnotes at end of tableFootnotes at end of table.

65
Individual Income Tax Rates and Shares, 2008Statistics of Income Bulletin | Winter 2011
(1) (2) (2) (3) (4) (5) (6)
Top25 percent
Top50 percent
Descending cumulative percentiles
Table 5. Returns with Positive Adjusted Gross Income (AGI): Number of Returns, Shares of AGI and Total Income Tax, AGI Floor on Percentiles in Current and Constant Dollars, and Average Tax Rates, by Selected Descending Cumulative Percentiles of Returns Based on Income Size Using the Definition of AGI for Each Year, Tax Years 1986–2008—Continued[All figures are estimates based on samples]
Item, tax year Total Top0.1 percent
Top1 percent
Top5 percent
Top10 percent
(1) (2) (2) (3) (4) (5) (6)
Adjusted gross income share (percentage): 1986 100.00 [6] 11.30 24.11 35.12 59.04 83.34 1987 100.00 [6] 12.32 25.67 36.90 60.75 84.37 1988 100.00 [6] 15.16 28.51 39.45 62.44 85.07 1989 100.00 [6] 14.19 27.84 39.00 62.28 85.04 1990 100.00 [6] 14.00 27.62 38.77 62.13 84.97 1991 100.00 [6] 12.99 26.83 38.20 61.85 84.87 1992 100.00 [6] 14.23 28.01 39.23 62.47 85.08
1993 100 00 [6] 13 79 27 76 39 05 62 45 85 081993 100.00 [6] 13.79 27.76 39.05 62.45 85.08 1994 100.00 [6] 13.80 27.85 39.19 62.64 85.11 1995 100.00 [6] 14.60 28.81 40.16 63.37 85.46 1996 100.00 [6] 16.04 30.36 41.59 64.32 85.92 1997 100.00 [6] 17.38 31.79 42.83 65.05 86.16 1998 100.00 [6] 18.47 32.85 43.77 65.63 86.33 1999 100.00 [6] 19.51 34.04 44.89 66.46 86.75 2000 100.00 [6] 20.81 35.30 46.01 67.15 87.01 2001 100.00 8.10 17.53 31.99 43.11 65.23 86.19 2002 100.00 7.06 16.12 30.55 41.77 64.37 85.77 2003 100.00 7.57 16.77 31.18 42.36 64.86 86.01 2004 100.00 9.14 19.00 33.45 44.35 66.13 86.58 2005 100.00 10.65 21.20 35.75 46.44 67.52 87.17 2006 100.00 11.22 22.06 36.66 47.32 68.16 87.49 2007 100.00 11.93 22.83 37.44 48.05 68.71 87.74 2008 100.00 9.96 20.00 34.73 45.77 67.38 87.25
Total income tax share (percentage): 1986 100.00 [6] 25.75 42.57 54.69 76.02 93.54 1987 100.00 [6] 24.81 43.26 55.61 76.92 93.93 1988 100.00 [6] 27.58 45.62 57.28 77.84 94.28 1989 100.00 [6] 25.24 43.94 55.78 77.22 94.17 1990 100.00 [6] 25.13 43.64 55.36 77.02 94.19 1991 100.00 [6] 24.82 43.38 55.82 77.29 94.52 1992 100.00 [6] 27.54 45.88 58.01 78.48 94.94 1993 100.00 [6] 29.01 47.36 59.24 79.27 95.19 1994 100.00 [6] 28.86 47.52 59.45 79.55 95.23 1995 100.00 [6] 30.26 48.91 60.75 80.36 95.39 1996 100.00 [6] 32.31 50.97 62.51 81.32 95.68 1997 100.00 [6] 33.17 51.87 63.20 81.67 95.721997 100.00 [6] 33.17 51.87 63.20 81.67 95.72 1998 100.00 [6] 34.75 53.84 65.04 82.69 95.79 1999 100.00 [6] 36.18 55.45 66.45 83.54 96.00 2000 100.00 [6] 37.42 56.47 67.33 84.01 96.09 2001 100.00 16.06 33.89 53.25 64.89 82.90 96.03 2002 100.00 15.43 33.71 53.80 65.73 83.90 96.50 2003 100.00 15.68 34.27 54.36 65.84 83.88 96.54 2004 100.00 17.44 36.89 57.13 68.19 84.86 96.70 2005 100.00 19.26 39.38 59.67 70.30 85.99 96.93 2006 100.00 19.56 39.89 60.14 70.79 86.27 97.01
200 100 00 20 19 40 42 60 63 1 22 86 9 9 11 2007 100.00 20.19 40.42 60.63 71.22 86.59 97.11 2008 100.00 18.47 38.02 58.72 69.94 86.34 97.30
N/A—Not applicable.
[1] The number of returns with negative adjusted gross income, i.e., returns with an adjusted gross deficit, and the corresponding amounts for adjusted gross deficit, were excluded from Table 1. By excluding deficit returns, alternative minimum tax reported on some of these returns was also excluded. For Tax Year 2008, there were 3,495 returns with no adjusted gross income that reported income tax.
[3] For Table 1, constant dollars were calculated using the U.S. Bureau of Labor Statistics' consumer price index for urban consumers (CPI-U, 1982-84=100). For 2008 the CPI-U = 215.3.[4] Total income tax is income tax after credits (includes alternative minimum tax) reported on returns that showed a positive amount for adjusted gross income. Therefore, total income tax excludes alternative minimum tax, Form 8814 tax (tax on a child's interest or dividends), and Form 4972 tax (tax on lump-sum distributions from qualified retirement plans) reported on some returns with a negative amount for adjusted gross income. See also Footnote 1.
[2] The total number of returns does not include the returns filed by individuals to only receive the economic stimulus payment and who had no other reason to file.
[5] The average tax rate was computed by dividing total income tax (see footnote 4) by (positive) adjusted gross income.[6] Not Calculated.
returns with a negative amount for adjusted gross income. See also Footnote 1.
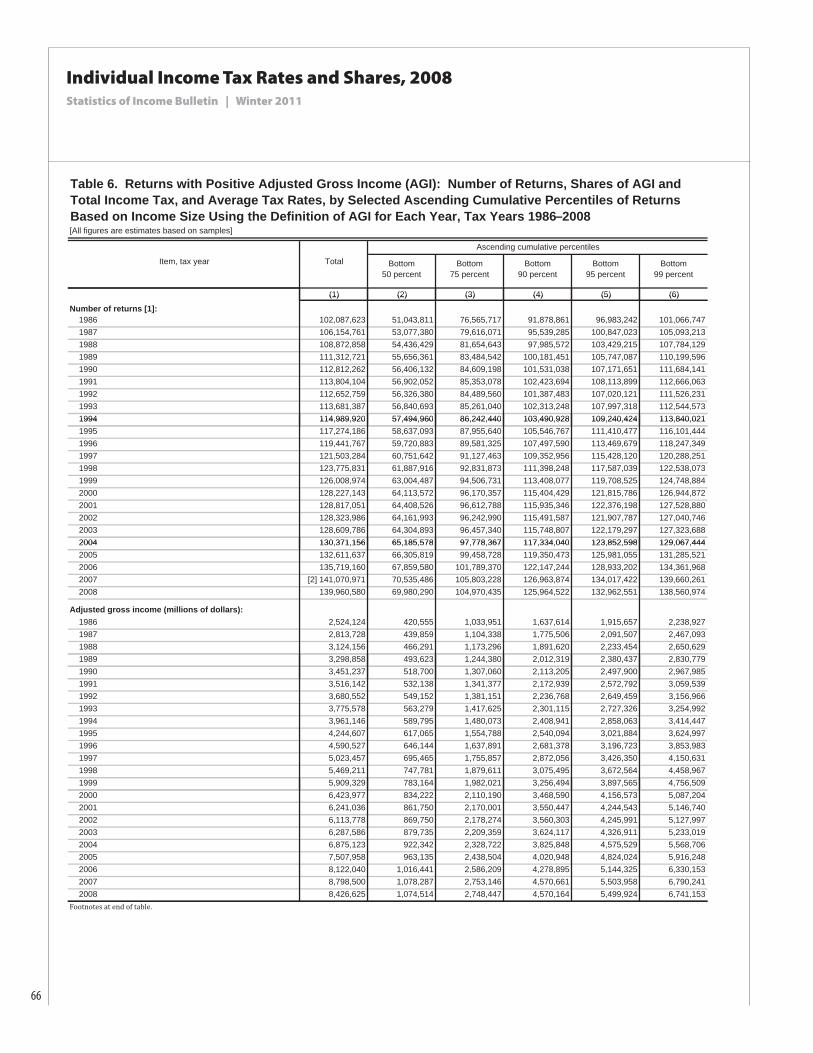
66
Individual Income Tax Rates and Shares, 2008Statistics of Income Bulletin | Winter 2011
Ascending cumulative percentiles
(1) (2) (3) (4) (5) (6)
Table 6. Returns with Positive Adjusted Gross Income (AGI): Number of Returns, Shares of AGI and Total Income Tax, and Average Tax Rates, by Selected Ascending Cumulative Percentiles of Returns Based on Income Size Using the Definition of AGI for Each Year, Tax Years 1986–2008[All figures are estimates based on samples]
Item, tax year Total Bottom50 percent
Bottom75 percent
Bottom90 percent
Bottom95 percent
Bottom99 percent
(1) (2) (3) (4) (5) (6)
Number of returns [1]: 1986 102,087,623 51,043,811 76,565,717 91,878,861 96,983,242 101,066,747 1987 106,154,761 53,077,380 79,616,071 95,539,285 100,847,023 105,093,213 1988 108,872,858 54,436,429 81,654,643 97,985,572 103,429,215 107,784,129 1989 111,312,721 55,656,361 83,484,542 100,181,451 105,747,087 110,199,596 1990 112,812,262 56,406,132 84,609,198 101,531,038 107,171,651 111,684,141 1991 113,804,104 56,902,052 85,353,078 102,423,694 108,113,899 112,666,063 1992 112,652,759 56,326,380 84,489,560 101,387,483 107,020,121 111,526,231 1993 113,681,387 56,840,693 85,261,040 102,313,248 107,997,318 112,544,573
1994 114,989,920 57,494,960 86,242,440 103,490,928 109,240,424 113,840,0211994 114,989,920 57,494,960 86,242,440 103,490,928 109,240,424 113,840,021 1995 117,274,186 58,637,093 87,955,640 105,546,767 111,410,477 116,101,444 1996 119,441,767 59,720,883 89,581,325 107,497,590 113,469,679 118,247,349 1997 121,503,284 60,751,642 91,127,463 109,352,956 115,428,120 120,288,251 1998 123,775,831 61,887,916 92,831,873 111,398,248 117,587,039 122,538,073 1999 126,008,974 63,004,487 94,506,731 113,408,077 119,708,525 124,748,884 2000 128,227,143 64,113,572 96,170,357 115,404,429 121,815,786 126,944,872 2001 128,817,051 64,408,526 96,612,788 115,935,346 122,376,198 127,528,880 2002 128,323,986 64,161,993 96,242,990 115,491,587 121,907,787 127,040,746 2003 128,609,786 64,304,893 96,457,340 115,748,807 122,179,297 127,323,688
2004 130 371 156 65 185 578 97 778 367 117 334 040 123 852 598 129 067 4442004 130,371,156 65,185,578 97,778,367 117,334,040 123,852,598 129,067,444 2005 132,611,637 66,305,819 99,458,728 119,350,473 125,981,055 131,285,521 2006 135,719,160 67,859,580 101,789,370 122,147,244 128,933,202 134,361,968 2007 [2] 141,070,971 70,535,486 105,803,228 126,963,874 134,017,422 139,660,261 2008 139,960,580 69,980,290 104,970,435 125,964,522 132,962,551 138,560,974
Adjusted gross income (millions of dollars): 1986 2,524,124 420,555 1,033,951 1,637,614 1,915,657 2,238,927 1987 2,813,728 439,859 1,104,338 1,775,506 2,091,507 2,467,093 1988 3,124,156 466,291 1,173,296 1,891,620 2,233,454 2,650,629 1989 3,298,858 493,623 1,244,380 2,012,319 2,380,437 2,830,779 1990 3,451,237 518,700 1,307,060 2,113,205 2,497,900 2,967,985 1991 3,516,142 532,138 1,341,377 2,172,939 2,572,792 3,059,539 1992 3,680,552 549,152 1,381,151 2,236,768 2,649,459 3,156,966 1993 3,775,578 563,279 1,417,625 2,301,115 2,727,326 3,254,992 1994 3,961,146 589,795 1,480,073 2,408,941 2,858,063 3,414,447 1995 4,244,607 617,065 1,554,788 2,540,094 3,021,884 3,624,997 1996 4,590,527 646,144 1,637,891 2,681,378 3,196,723 3,853,983 1997 5,023,457 695,465 1,755,857 2,872,056 3,426,350 4,150,631 1998 5,469,211 747,781 1,879,611 3,075,495 3,672,564 4,458,967 1999 5,909,329 783,164 1,982,021 3,256,494 3,897,565 4,756,509 2000 6,423,977 834,222 2,110,190 3,468,590 4,156,573 5,087,204 2001 6,241,036 861,750 2,170,001 3,550,447 4,244,543 5,146,740 2002 6,113,778 869,750 2,178,274 3,560,303 4,245,991 5,127,997 2003 6,287,586 879,735 2,209,359 3,624,117 4,326,911 5,233,019 2004 6,875,123 922,342 2,328,722 3,825,848 4,575,529 5,568,706 2005 7,507,958 963,135 2,438,504 4,020,948 4,824,024 5,916,248 2006 8,122,040 1,016,441 2,586,209 4,278,895 5,144,325 6,330,153 2007 8,798,500 1,078,287 2,753,146 4,570,661 5,503,958 6,790,241 2008 8,426,625 1,074,514 2,748,447 4,570,164 5,499,924 6,741,153
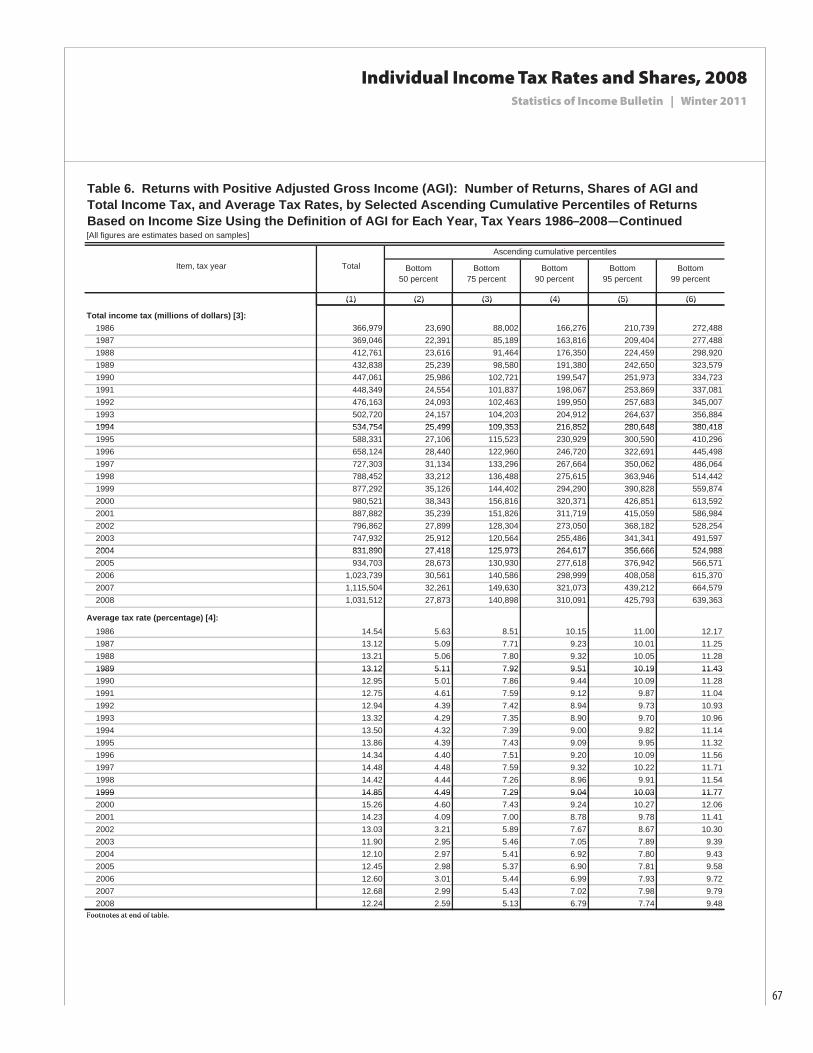
67
Individual Income Tax Rates and Shares, 2008Statistics of Income Bulletin | Winter 2011
Ascending cumulative percentiles
(1) (2) (3) (4) (5) (6)
Table 6. Returns with Positive Adjusted Gross Income (AGI): Number of Returns, Shares of AGI and Total Income Tax, and Average Tax Rates, by Selected Ascending Cumulative Percentiles of Returns Based on Income Size Using the Definition of AGI for Each Year, Tax Years 1986–2008—Continued[All figures are estimates based on samples]
Item, tax year Total Bottom50 percent
Bottom75 percent
Bottom90 percent
Bottom95 percent
Bottom99 percent
(1) (2) (3) (4) (5) (6)
Total income tax (millions of dollars) [3]: 1986 366,979 23,690 88,002 166,276 210,739 272,488 1987 369,046 22,391 85,189 163,816 209,404 277,488 1988 412,761 23,616 91,464 176,350 224,459 298,920 1989 432,838 25,239 98,580 191,380 242,650 323,579 1990 447,061 25,986 102,721 199,547 251,973 334,723 1991 448,349 24,554 101,837 198,067 253,869 337,081 1992 476,163 24,093 102,463 199,950 257,683 345,007 1993 502,720 24,157 104,203 204,912 264,637 356,884
1994 534 754 25 499 109 353 216 852 280 648 380 418 1994 534,754 25,499 109,353 216,852 280,648 380,418 1995 588,331 27,106 115,523 230,929 300,590 410,296 1996 658,124 28,440 122,960 246,720 322,691 445,498 1997 727,303 31,134 133,296 267,664 350,062 486,064 1998 788,452 33,212 136,488 275,615 363,946 514,442 1999 877,292 35,126 144,402 294,290 390,828 559,874 2000 980,521 38,343 156,816 320,371 426,851 613,592 2001 887,882 35,239 151,826 311,719 415,059 586,984 2002 796,862 27,899 128,304 273,050 368,182 528,254 2003 747,932 25,912 120,564 255,486 341,341 491,597
2004 831 890 27 418 125 973 264 617 356 666 524 988 2004 831,890 27,418 125,973 264,617 356,666 524,988 2005 934,703 28,673 130,930 277,618 376,942 566,571 2006 1,023,739 30,561 140,586 298,999 408,058 615,370 2007 1,115,504 32,261 149,630 321,073 439,212 664,579 2008 1,031,512 27,873 140,898 310,091 425,793 639,363
Average tax rate (percentage) [4]: 1986 14.54 5.63 8.51 10.15 11.00 12.17 1987 13.12 5.09 7.71 9.23 10.01 11.25 1988 13.21 5.06 7.80 9.32 10.05 11.28 1989 13.12 5.11 7.92 9.51 10.19 11.431989 13.12 5.11 7.92 9.51 10.19 11.43 1990 12.95 5.01 7.86 9.44 10.09 11.28 1991 12.75 4.61 7.59 9.12 9.87 11.04 1992 12.94 4.39 7.42 8.94 9.73 10.93 1993 13.32 4.29 7.35 8.90 9.70 10.96 1994 13.50 4.32 7.39 9.00 9.82 11.14 1995 13.86 4.39 7.43 9.09 9.95 11.32 1996 14.34 4.40 7.51 9.20 10.09 11.56 1997 14.48 4.48 7.59 9.32 10.22 11.71 1998 14.42 4.44 7.26 8.96 9.91 11.54 1999 14.85 4.49 7.29 9.04 10.03 11.771999 14.85 4.49 7.29 9.04 10.03 11.77 2000 15.26 4.60 7.43 9.24 10.27 12.06 2001 14.23 4.09 7.00 8.78 9.78 11.41 2002 13.03 3.21 5.89 7.67 8.67 10.30 2003 11.90 2.95 5.46 7.05 7.89 9.39 2004 12.10 2.97 5.41 6.92 7.80 9.43 2005 12.45 2.98 5.37 6.90 7.81 9.58 2006 12.60 3.01 5.44 6.99 7.93 9.72 2007 12.68 2.99 5.43 7.02 7.98 9.79 2008 12.24 2.59 5.13 6.79 7.74 9.48
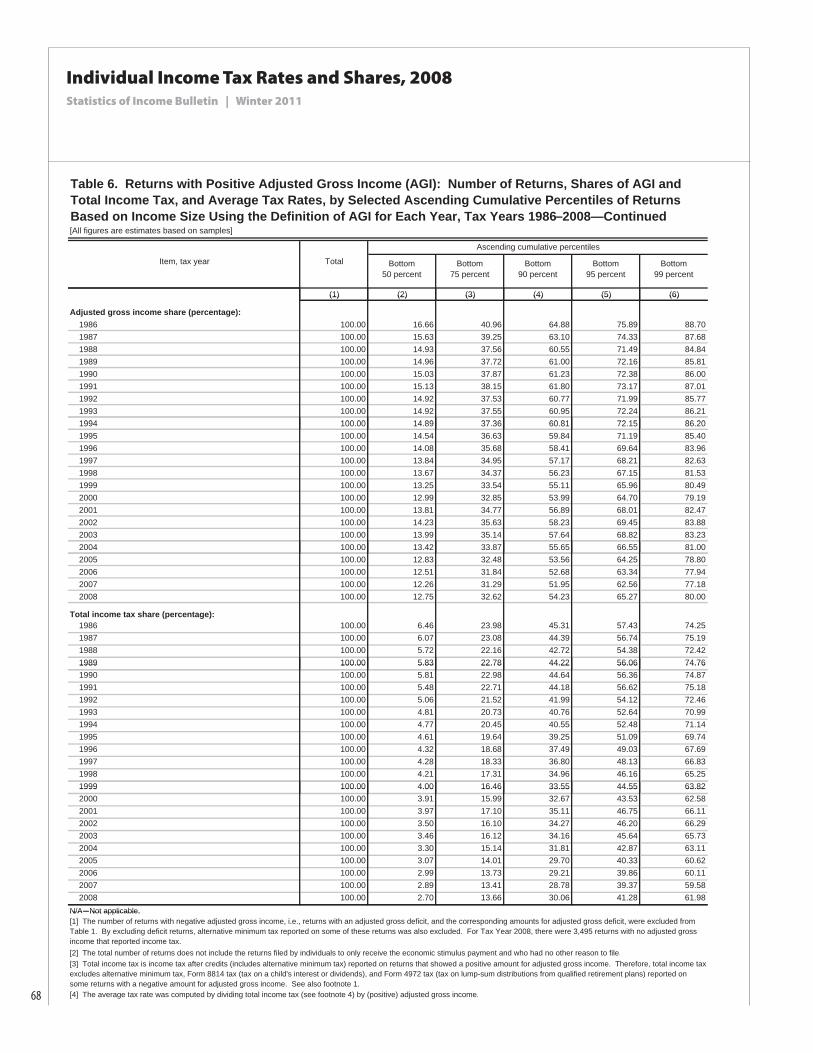
68
Individual Income Tax Rates and Shares, 2008Statistics of Income Bulletin | Winter 2011
Ascending cumulative percentiles
(1) (2) (3) (4) (5) (6)
[All figures are estimates based on samples]
Table 6. Returns with Positive Adjusted Gross Income (AGI): Number of Returns, Shares of AGI and Total Income Tax, and Average Tax Rates, by Selected Ascending Cumulative Percentiles of Returns Based on Income Size Using the Definition of AGI for Each Year, Tax Years 1986–2008—Continued
Bottom99 percent
Item, tax year Total Bottom50 percent
Bottom75 percent
Bottom90 percent
Bottom95 percent
(1) (2) (3) (4) (5) (6)
Adjusted gross income share (percentage): 1986 100.00 16.66 40.96 64.88 75.89 88.70 1987 100.00 15.63 39.25 63.10 74.33 87.68 1988 100.00 14.93 37.56 60.55 71.49 84.84 1989 100.00 14.96 37.72 61.00 72.16 85.81 1990 100.00 15.03 37.87 61.23 72.38 86.00 1991 100.00 15.13 38.15 61.80 73.17 87.01 1992 100.00 14.92 37.53 60.77 71.99 85.77 1993 100.00 14.92 37.55 60.95 72.24 86.21
1994 100 00 14 89 37 36 60 81 72 15 86 20 1994 100.00 14.89 37.36 60.81 72.15 86.20 1995 100.00 14.54 36.63 59.84 71.19 85.40 1996 100.00 14.08 35.68 58.41 69.64 83.96 1997 100.00 13.84 34.95 57.17 68.21 82.63 1998 100.00 13.67 34.37 56.23 67.15 81.53 1999 100.00 13.25 33.54 55.11 65.96 80.49 2000 100.00 12.99 32.85 53.99 64.70 79.19 2001 100.00 13.81 34.77 56.89 68.01 82.47 2002 100.00 14.23 35.63 58.23 69.45 83.88 2003 100.00 13.99 35.14 57.64 68.82 83.23
2004 100 00 13 42 33 87 55 65 66 55 81 00 2004 100.00 13.42 33.87 55.65 66.55 81.00 2005 100.00 12.83 32.48 53.56 64.25 78.80 2006 100.00 12.51 31.84 52.68 63.34 77.94 2007 100.00 12.26 31.29 51.95 62.56 77.18 2008 100.00 12.75 32.62 54.23 65.27 80.00
Total income tax share (percentage): 1986 100.00 6.46 23.98 45.31 57.43 74.25 1987 100.00 6.07 23.08 44.39 56.74 75.19 1988 100.00 5.72 22.16 42.72 54.38 72.42 1989 100.00 5.83 22.78 44.22 56.06 74.761989 100.00 5.83 22.78 44.22 56.06 74.76 1990 100.00 5.81 22.98 44.64 56.36 74.87 1991 100.00 5.48 22.71 44.18 56.62 75.18 1992 100.00 5.06 21.52 41.99 54.12 72.46 1993 100.00 4.81 20.73 40.76 52.64 70.99 1994 100.00 4.77 20.45 40.55 52.48 71.14 1995 100.00 4.61 19.64 39.25 51.09 69.74 1996 100.00 4.32 18.68 37.49 49.03 67.69 1997 100.00 4.28 18.33 36.80 48.13 66.83 1998 100.00 4.21 17.31 34.96 46.16 65.25 1999 100.00 4.00 16.46 33.55 44.55 63.821999 100.00 4.00 16.46 33.55 44.55 63.82 2000 100.00 3.91 15.99 32.67 43.53 62.58 2001 100.00 3.97 17.10 35.11 46.75 66.11 2002 100.00 3.50 16.10 34.27 46.20 66.29 2003 100.00 3.46 16.12 34.16 45.64 65.73 2004 100.00 3.30 15.14 31.81 42.87 63.11 2005 100.00 3.07 14.01 29.70 40.33 60.62 2006 100.00 2.99 13.73 29.21 39.86 60.11 2007 100.00 2.89 13.41 28.78 39.37 59.58 2008 100.00 2.70 13.66 30.06 41.28 61.98N/A—Not applicable.
[3] Total income tax is income tax after credits (includes alternative minimum tax) reported on returns that showed a positive amount for adjusted gross income. Therefore, total income tax excludes alternative minimum tax, Form 8814 tax (tax on a child's interest or dividends), and Form 4972 tax (tax on lump-sum distributions from qualified retirement plans) reported on some returns with a negative amount for adjusted gross income. See also footnote 1.[4] The average tax rate was computed by dividing total income tax (see footnote 4) by (positive) adjusted gross income.
N/A—Not applicable.[1] The number of returns with negative adjusted gross income, i.e., returns with an adjusted gross deficit, and the corresponding amounts for adjusted gross deficit, were excluded from Table 1. By excluding deficit returns, alternative minimum tax reported on some of these returns was also excluded. For Tax Year 2008, there were 3,495 returns with no adjusted gross income that reported income tax.[2] The total number of returns does not include the returns filed by individuals to only receive the economic stimulus payment and who had no other reason to file.

69
Individual Income Tax Rates and Shares, 2008Statistics of Income Bulletin | Winter 2011
Table 7. Returns with Positive "1979 Income Concept" Income: Number of Returns, Shares of Income and Total Income Tax, Income Floor on Percentiles in Current and Constant Dollars, and Average Tax Rates, by Selected Descending Cumulative Percentiles of Returns Based on Income Size, Tax Years 1986–2008[All figures are estimates based on samples]
Top50 percent
Top10 percent
Top25 percent
Descending cumulative percentiles
Item, tax year Total Top1 percent
Top5 percent
(1) (2) (3) (4) (5) (6)Number of returns [1]: 1986 101,988,805 1,019,888 5,099,440 10,198,881 25,497,201 50,994,402 1987 106,191,624 1,061,916 5,309,581 10,619,162 26,547,906 53,095,812 1988 108,879,154 1,088,792 5,443,958 10,887,915 27,219,788 54,439,577 1989 111,328,835 1,113,288 5,566,442 11,132,884 27,832,209 55,664,418 1990 112,717,959 1,127,180 5,635,898 11,271,796 28,179,490 56,358,980 1991 113,823,123 1,138,231 5,691,156 11,382,312 28,455,781 56,911,562 1992 112,687,747 1,126,877 5,634,387 11,268,775 28,171,937 56,343,874
pp pp p
1993 113,721,706 1,137,217 5,686,085 11,372,171 28,430,426 56,860,853 1994 115,061,112 1,150,611 5,753,056 11,506,111 28,765,278 57,530,556 1995 117,333,779 1,173,338 5,866,689 11,733,378 29,333,445 58,666,889 1996 119,487,813 1,194,878 5,974,391 11,948,781 29,871,953 59,743,906 1997 121,555,156 1,215,552 6,077,758 12,155,516 30,388,789 60,777,578 1998 123,852,016 1,238,520 6,192,601 12,385,202 30,963,004 61,926,008 1999 126,107,596 1,261,076 6,305,380 12,610,760 31,526,899 63,053,798 2000 128,340,271 1,283,403 6,417,014 12,834,027 32,085,068 64,170,135 2001 128,863,007 1,288,630 6,443,150 12,886,301 32,215,752 64,431,504
2002 128,415,184 1,284,152 6,420,759 12,841,518 32,103,796 64,207,5922002 128,415,184 1,284,152 6,420,759 12,841,518 32,103,796 64,207,592 2003 128,757,145 1,287,571 6,437,857 12,875,715 32,189,286 64,378,573 2004 130,508,966 1,305,090 6,525,448 13,050,897 32,627,242 65,254,483 2005 132,730,734 1,327,307 6,636,537 13,273,073 33,182,684 66,365,367 2006 135,854,749 1,358,547 6,792,737 13,585,475 33,963,687 67,927,375 2007 [2] 141,252,080 1,412,521 7,062,604 14,125,208 35,313,020 70,626,040 2008 140,118,702 1,401,187 7,005,935 14,011,870 35,029,676 70,059,351
Income floor on percentiles (current dollars): 1986 N/A 147,863 68,362 52,035 33,623 17,909 1987 N/A 145,624 69,222 53,094 34,165 17,959, , , , , 1988 N/A 161,774 73,451 55,532 35,432 18,534 1989 N/A 169,603 77,542 58,429 36,783 19,152 1990 N/A 174,813 80,400 60,623 38,026 19,947 1991 N/A 180,268 83,300 62,413 38,913 20,302 1992 N/A 197,031 87,370 65,283 40,423 21,041 1993 N/A 199,698 88,992 66,685 41,013 21,390 1994 N/A 210,742 93,186 69,118 42,480 22,000 1995 N/A 224,523 98,420 72,210 43,860 22,575 1996 N/A 246,268 103,489 75,574 45,508 23,378
1997 N/A 268 889 110 949 79 598 47 738 24 5511997 N/A 268,889 110,949 79,598 47,738 24,551 1998 N/A 301,513 120,262 84,904 50,232 25,612 1999 N/A 332,253 126,643 89,172 52,399 26,487 2000 N/A 353,945 134,128 93,715 54,592 27,647 2001 N/A 323,861 131,728 93,633 55,203 28,404 2002 N/A 315,937 132,253 93,833 55,695 28,541 2003 N/A 327,160 134,818 96,021 56,573 28,896 2004 N/A 363,905 142,975 100,957 59,112 29,899 2005 N/A 402,354 152,048 105,958 61,055 30,588 2006 N/A 437,036 162,043 111,560 63,694 31,693 2007 N/A 458,846 168,478 115,564 65,340 32,400 2008 N/A 429,502 166,540 116,010 65,824 32,545Footnotes at end of table.

70
Individual Income Tax Rates and Shares, 2008Statistics of Income Bulletin | Winter 2011
Top1 percent
Top5 percent
Top10 percent
Top25 percent
Top50 percent
Table 7. Returns with Positive "1979 Income Concept" Income: Number of Returns, Shares of Income and Total Income Tax, Income Floor on Percentiles in Current and Constant Dollars, and Average Tax Rates, by Selected Descending Cumulative Percentiles of Returns Based on Income Size, Tax Years 1986–2008—Continued[All figures are estimates based on samples]
Item, tax year Total
Descending cumulative percentiles
(1) (2) (3) (4) (5) (6)Income floor on percentiles (constant dollars): [3] 1986 N/A 134,912 62,374 47,477 30,678 16,340 1987 N/A 128,190 60,935 46,738 30,075 15,809 1988 N/A 136,749 62,089 46,942 29,951 15,667 1989 N/A 136,777 62,534 47,120 29,664 15,445 1990 N/A 133,751 61,515 46,383 29,094 15,262 1991 N/A 132,355 61,160 45,825 28,571 14,906 1992 N/A 140,436 62,274 46,531 28,812 14,997
1993 N/A 138 199 61 586 46 149 28 383 14 8031993 N/A 138,199 61,586 46,149 28,383 14,803 1994 N/A 142,201 62,879 46,638 28,664 14,845 1995 N/A 147,325 64,580 47,382 28,780 14,813 1996 N/A 156,959 65,959 48,167 29,004 14,900 1997 N/A 167,532 69,127 49,594 29,743 15,297 1998 N/A 183,962 73,375 51,802 30,648 15,627 1999 N/A 199,432 76,016 53,525 31,452 15,899 2000 N/A 205,543 77,891 54,422 31,703 16,055 2001 N/A 182,869 74,381 52,870 31,171 16,038 2002 N/A 175,618 73,515 52,158 30,959 15,865, , , , , 2003 N/A 177,804 73,271 52,185 30,746 15,704 2004 N/A 192,644 75,688 53,445 31,293 15,828 2005 N/A 206,018 77,854 54,254 31,262 15,662 2006 N/A 216,784 80,378 55,337 31,594 15,721 2007 N/A 221,344 81,273 55,747 31,520 15,630 2008 N/A 199,490 77,353 53,883 30,573 15,116
Income (millions of current dollars): 1986 2,804,691 427,513 796,935 1,097,550 1,732,231 2,368,620 1987 2,856,118 363,880 749,240 1,067,438 1,741,747 2,411,715 1988 3,153,639 484,675 911,170 1,255,108 1,973,061 2,683,524 1989 3,336,571 486,976 947,363 1,317,619 2,085,003 2,838,481 1990 3,497,118 504,687 987,582 1,376,162 2,182,091 2,973,847 1991 3,577,337 478,756 985,590 1,390,924 2,224,979 3,038,428 1992 3,763,002 556,421 1,090,019 1,509,728 2,369,701 3,206,490 1993 3,849,532 554,075 1,105,014 1,537,285 2,422,475 3,278,866 1994 4,033,642 579,564 1,161,972 1,617,250 2,544,400 3,436,167 1995 4,317,506 653,717 1,284,726 1,772,890 2,754,988 3,692,267 1996 4,670,644 772,868 1,462,979 1,984,931 3,025,107 4,015,461
1997 5 112 706 918 007 1 679 877 2 242 353 3 353 245 4 409 0751997 5,112,706 918,007 1,679,877 2,242,353 3,353,245 4,409,075 1998 5,626,390 1,072,779 1,925,214 2,542,399 3,742,006 4,869,467 1999 6,082,931 1,236,081 2,166,370 2,825,789 4,099,929 5,290,805 2000 6,601,494 1,424,436 2,430,957 3,138,299 4,495,910 5,758,808 2001 6,361,523 1,159,037 2,121,055 2,828,677 4,202,776 5,491,703 2002 6,262,714 1,057,775 2,005,658 2,712,226 4,092,069 5,383,263 2003 6,429,711 1,122,582 2,091,401 2,813,645 4,226,517 5,539,087 2004 7,044,141 1,383,978 2,453,830 3,228,229 4,726,625 6,111,786 2005 7,701,103 1,678,406 2,863,229 3,694,152 5,278,659 6,729,456 2006 8,365,645 1,900,311 3,202,445 4,101,178 5,798,340 7,340,135 2007 9,048,579 2,121,037 3,533,346 4,502,869 6,324,119 7,963,204 2008 8,657,921 1,802,841 3,157,272 4,117,545 5,937,731 7,574,417Footnotes at end of table.

71
Individual Income Tax Rates and Shares, 2008Statistics of Income Bulletin | Winter 2011
[All figures are estimates based on samples]
Item, tax year Total
Descending cumulative percentiles
Top1 percent
Top5 percent
Top10 percent
Top25 percent
Top50 percent
Table 7. Returns with Positive "1979 Income Concept" Income: Number of Returns, Shares of Income and Total Income Tax, Income Floor on Percentiles in Current and Constant Dollars, and Average Tax Rates, by Selected Descending Cumulative Percentiles of Returns Based on Income Size, Tax Years 1986–2008—Continued
(1) (2) (3) (4) (5) (6)
Total income tax (millions of current dollars) [4]: 1986 366,763 93,128 155,553 198,862 277,578 342,296 1987 368,924 89,908 158,485 204,050 282,970 346,228 1988 412,549 112,208 186,793 235,121 320,152 388,631 1989 432,643 107,508 188,588 240,229 333,285 407,106 1990 446,906 110,530 192,991 245,856 342,926 420,345 1991 448,177 107,926 192,548 246,745 345,168 423,180 1992 476,067 127,361 216,303 272,361 372,352 451,494, , , , , , 1993 502,638 142,329 235,908 294,238 397,261 477,997 1994 534,693 150,133 250,770 314,909 423,743 508,540 1995 588,292 173,877 284,036 354,427 471,035 560,748 1996 658,059 208,071 331,404 407,726 532,750 628,918 1997 731,123 238,978 376,046 459,674 595,060 699,131 1998 783,437 262,464 413,303 503,577 644,182 749,547 1999 877,199 307,382 479,531 577,903 729,679 841,172 2000 980,459 355,911 546,102 654,155 819,937 941,304 2001 887,770 291,907 466,057 570,430 732,094 851,539
2002 796 763 259 192 420 834 517 937 664 670 767 8902002 796,763 259,192 420,834 517,937 664,670 767,890 2003 747,800 248,107 400,202 487,657 624,070 720,861 2004 831,815 297,199 467,728 562,092 702,203 803,521 2005 934,524 359,060 549,667 651,220 800,022 904,857 2006 1,023,556 396,274 605,877 717,713 878,565 991,763 2007 1,115,338 437,537 665,659 786,765 961,228 1,081,951 2008 1,031,252 378,608 594,941 713,703 885,883 1,002,156
Average tax rate (percentage) [5]: 1986 13.08 21.78 19.52 18.12 16.02 14.45
1987 12.92 24.71 21.15 19.12 16.25 14.361987 12.92 24.71 21.15 19.12 16.25 14.36 1988 13.08 23.15 20.50 18.73 16.23 14.48 1989 12.97 22.08 19.91 18.23 15.98 14.34 1990 12.78 21.90 19.54 17.87 15.72 14.13 1991 12.53 22.54 19.54 17.74 15.51 13.93 1992 12.65 22.89 19.84 18.04 15.71 14.08 1993 13.06 25.69 21.35 19.14 16.40 14.58 1994 13.26 25.90 21.58 19.47 16.65 14.80 1995 13.63 26.60 22.11 19.99 17.10 15.19 1996 14.09 26.92 22.65 20.54 17.61 15.66 1997 14.30 26.03 22.39 20.50 17.75 15.86 1998 13.92 24.47 21.47 19.81 17.21 15.39 1999 14.42 24.87 22.14 20.45 17.80 15.90 2000 14.85 24.99 22.46 20.84 18.24 16.35 2001 13.96 25.19 21.97 20.17 17.42 15.51 2002 12.72 24.50 20.98 19.10 16.24 14.26 2003 11.63 22.10 19.14 17.33 14.77 13.01 2004 11.81 21.47 19.06 17.41 14.86 13.15 2005 12.13 21.39 19.20 17.63 15.16 13.45 2006 12.24 20.85 18.92 17.50 15.15 13.512006 12.24 20.85 18.92 17.50 15.15 13.51 2007 12.33 20.63 18.84 17.47 15.20 13.59 2008 11.91 21.00 18.84 17.33 14.92 13.23Footnotes at end of table.
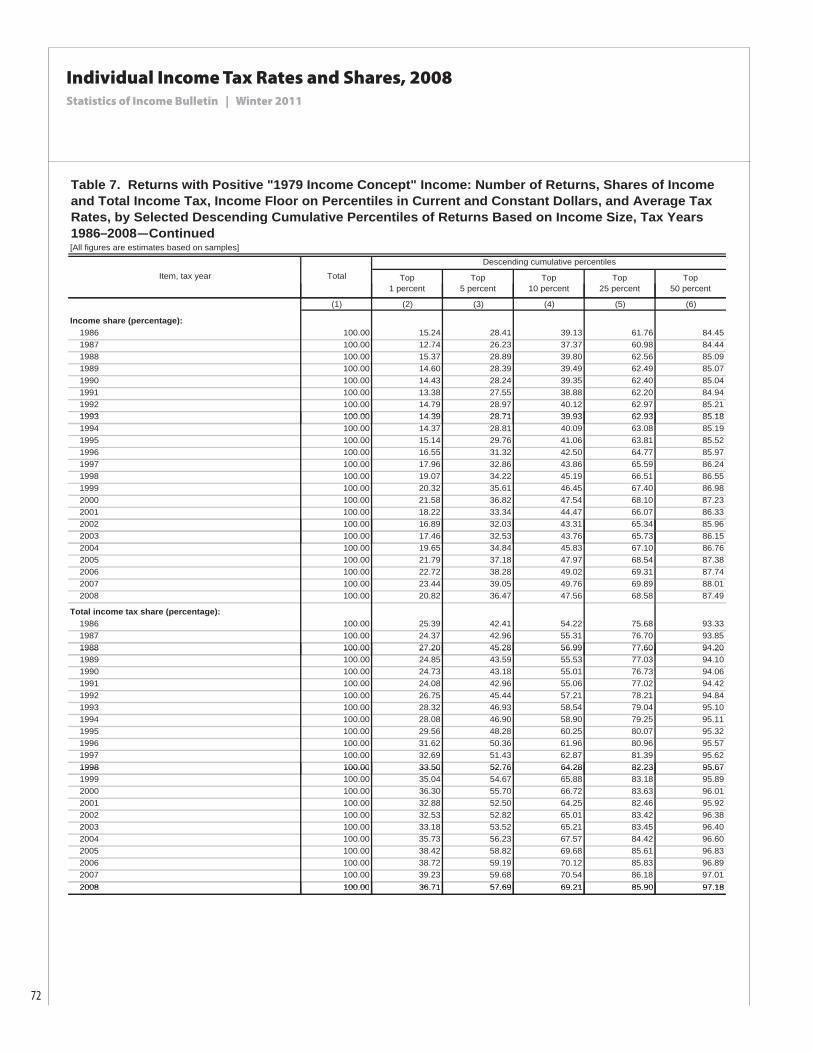
72
Individual Income Tax Rates and Shares, 2008Statistics of Income Bulletin | Winter 2011
Table 7. Returns with Positive "1979 Income Concept" Income: Number of Returns, Shares of Income and Total Income Tax, Income Floor on Percentiles in Current and Constant Dollars, and Average Tax Rates, by Selected Descending Cumulative Percentiles of Returns Based on Income Size, Tax Years 1986–2008—Continued[All figures are estimates based on samples]
Item, tax year Total
Descending cumulative percentiles
Top1 percent
Top5 percent
Top10 percent
Top25 percent
Top50 percent
(1) (2) (3) (4) (5) (6)
Income share (percentage): 1986 100.00 15.24 28.41 39.13 61.76 84.45 1987 100.00 12.74 26.23 37.37 60.98 84.44 1988 100.00 15.37 28.89 39.80 62.56 85.09 1989 100.00 14.60 28.39 39.49 62.49 85.07 1990 100.00 14.43 28.24 39.35 62.40 85.04 1991 100.00 13.38 27.55 38.88 62.20 84.94 1992 100.00 14.79 28.97 40.12 62.97 85.21
1993 100 00 14 39 28 71 39 93 62 93 85 18 1993 100.00 14.39 28.71 39.93 62.93 85.18 1994 100.00 14.37 28.81 40.09 63.08 85.19 1995 100.00 15.14 29.76 41.06 63.81 85.52 1996 100.00 16.55 31.32 42.50 64.77 85.97 1997 100.00 17.96 32.86 43.86 65.59 86.24 1998 100.00 19.07 34.22 45.19 66.51 86.55 1999 100.00 20.32 35.61 46.45 67.40 86.98 2000 100.00 21.58 36.82 47.54 68.10 87.23 2001 100.00 18.22 33.34 44.47 66.07 86.33 2002 100.00 16.89 32.03 43.31 65.34 85.96
2003 100 00 17 46 32 53 43 76 65 73 86 15 2003 100.00 17.46 32.53 43.76 65.73 86.15 2004 100.00 19.65 34.84 45.83 67.10 86.76 2005 100.00 21.79 37.18 47.97 68.54 87.38 2006 100.00 22.72 38.28 49.02 69.31 87.74 2007 100.00 23.44 39.05 49.76 69.89 88.01 2008 100.00 20.82 36.47 47.56 68.58 87.49
Total income tax share (percentage): 1986 100.00 25.39 42.41 54.22 75.68 93.33 1987 100.00 24.37 42.96 55.31 76.70 93.85 1988 100.00 27.20 45.28 56.99 77.60 94.201988 100.00 27.20 45.28 56.99 77.60 94.20 1989 100.00 24.85 43.59 55.53 77.03 94.10 1990 100.00 24.73 43.18 55.01 76.73 94.06 1991 100.00 24.08 42.96 55.06 77.02 94.42 1992 100.00 26.75 45.44 57.21 78.21 94.84 1993 100.00 28.32 46.93 58.54 79.04 95.10 1994 100.00 28.08 46.90 58.90 79.25 95.11 1995 100.00 29.56 48.28 60.25 80.07 95.32 1996 100.00 31.62 50.36 61.96 80.96 95.57 1997 100.00 32.69 51.43 62.87 81.39 95.62
1998 100.00 33.50 52.76 64.28 82.23 95.671998 100.00 33.50 52.76 64.28 82.23 95.67 1999 100.00 35.04 54.67 65.88 83.18 95.89 2000 100.00 36.30 55.70 66.72 83.63 96.01 2001 100.00 32.88 52.50 64.25 82.46 95.92 2002 100.00 32.53 52.82 65.01 83.42 96.38 2003 100.00 33.18 53.52 65.21 83.45 96.40 2004 100.00 35.73 56.23 67.57 84.42 96.60 2005 100.00 38.42 58.82 69.68 85.61 96.83 2006 100.00 38.72 59.19 70.12 85.83 96.89 2007 100.00 39.23 59.68 70.54 86.18 97.01
2008 100 00 36 71 57 69 69 21 85 90 97 182008 100.00 36.71 57.69 69.21 85.90 97.18
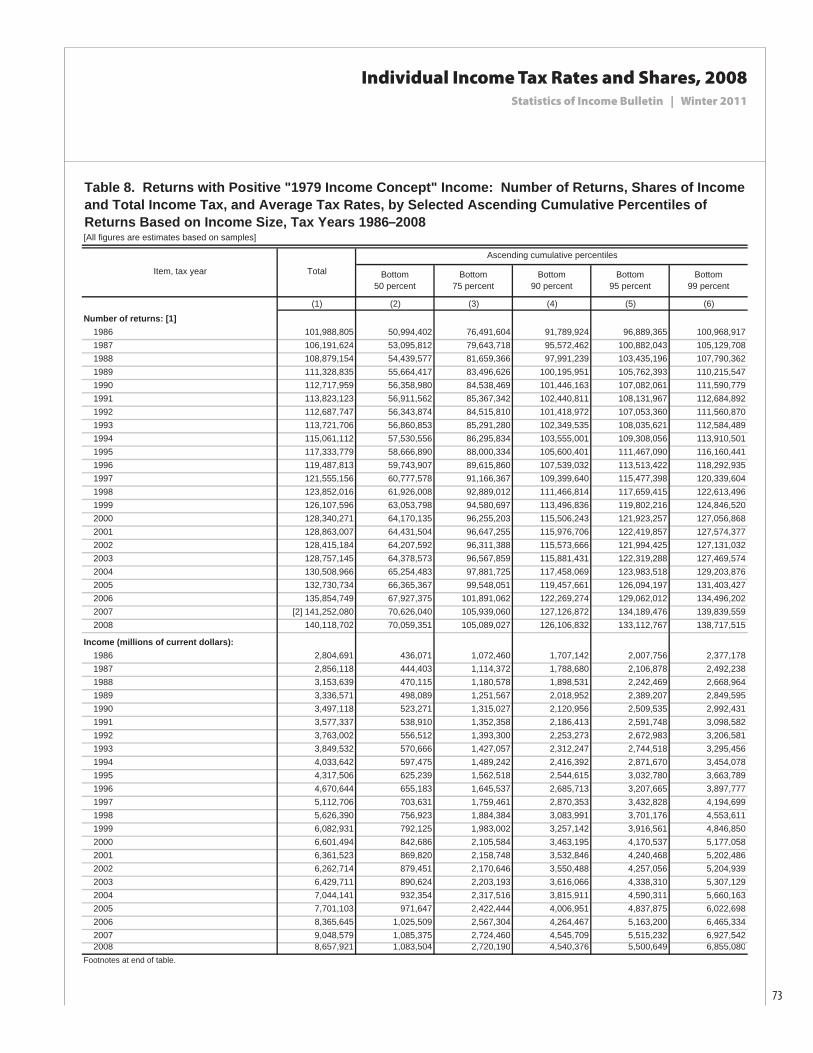
73
Individual Income Tax Rates and Shares, 2008Statistics of Income Bulletin | Winter 2011
(1) (2) (3) (4) (5) (6)
Number of returns: [1] 1986 101,988,805 50,994,402 76,491,604 91,789,924 96,889,365 100,968,917 1987 106,191,624 53,095,812 79,643,718 95,572,462 100,882,043 105,129,708 1988 108,879,154 54,439,577 81,659,366 97,991,239 103,435,196 107,790,362 1989 111,328,835 55,664,417 83,496,626 100,195,951 105,762,393 110,215,547 1990 112,717,959 56,358,980 84,538,469 101,446,163 107,082,061 111,590,779 1991 113,823,123 56,911,562 85,367,342 102,440,811 108,131,967 112,684,892 1992 112,687,747 56,343,874 84,515,810 101,418,972 107,053,360 111,560,870 1993 113,721,706 56,860,853 85,291,280 102,349,535 108,035,621 112,584,489 1994 115,061,112 57,530,556 86,295,834 103,555,001 109,308,056 113,910,501 1995 117,333,779 58,666,890 88,000,334 105,600,401 111,467,090 116,160,441 1996 119,487,813 59,743,907 89,615,860 107,539,032 113,513,422 118,292,935 1997 121,555,156 60,777,578 91,166,367 109,399,640 115,477,398 120,339,604 1998 123,852,016 61,926,008 92,889,012 111,466,814 117,659,415 122,613,496 1999 126,107,596 63,053,798 94,580,697 113,496,836 119,802,216 124,846,520 2000 128,340,271 64,170,135 96,255,203 115,506,243 121,923,257 127,056,868 2001 128,863,007 64,431,504 96,647,255 115,976,706 122,419,857 127,574,377 2002 128,415,184 64,207,592 96,311,388 115,573,666 121,994,425 127,131,032 2003 128,757,145 64,378,573 96,567,859 115,881,431 122,319,288 127,469,574 2004 130,508,966 65,254,483 97,881,725 117,458,069 123,983,518 129,203,876 2005 132,730,734 66,365,367 99,548,051 119,457,661 126,094,197 131,403,427 2006 135,854,749 67,927,375 101,891,062 122,269,274 129,062,012 134,496,202 2007 [2] 141,252,080 70,626,040 105,939,060 127,126,872 134,189,476 139,839,559 2008 140,118,702 70,059,351 105,089,027 126,106,832 133,112,767 138,717,515
Income (millions of current dollars): 1986 2,804,691 436,071 1,072,460 1,707,142 2,007,756 2,377,178 1987 2,856,118 444,403 1,114,372 1,788,680 2,106,878 2,492,238 1988 3,153,639 470,115 1,180,578 1,898,531 2,242,469 2,668,964 1989 3,336,571 498,089 1,251,567 2,018,952 2,389,207 2,849,595 1990 3,497,118 523,271 1,315,027 2,120,956 2,509,535 2,992,431 1991 3,577,337 538,910 1,352,358 2,186,413 2,591,748 3,098,582 1992 3,763,002 556,512 1,393,300 2,253,273 2,672,983 3,206,581 1993 3,849,532 570,666 1,427,057 2,312,247 2,744,518 3,295,456 1994 4,033,642 597,475 1,489,242 2,416,392 2,871,670 3,454,078 1995 4,317,506 625,239 1,562,518 2,544,615 3,032,780 3,663,789 1996 4,670,644 655,183 1,645,537 2,685,713 3,207,665 3,897,777 1997 5,112,706 703,631 1,759,461 2,870,353 3,432,828 4,194,699 1998 5,626,390 756,923 1,884,384 3,083,991 3,701,176 4,553,611 1999 6,082,931 792,125 1,983,002 3,257,142 3,916,561 4,846,850 2000 6,601,494 842,686 2,105,584 3,463,195 4,170,537 5,177,058 2001 6,361,523 869,820 2,158,748 3,532,846 4,240,468 5,202,486 2002 6,262,714 879,451 2,170,646 3,550,488 4,257,056 5,204,939 2003 6,429,711 890,624 2,203,193 3,616,066 4,338,310 5,307,129 2004 7,044,141 932,354 2,317,516 3,815,911 4,590,311 5,660,163 2005 7,701,103 971,647 2,422,444 4,006,951 4,837,875 6,022,698 2006 8,365,645 1,025,509 2,567,304 4,264,467 5,163,200 6,465,334 2007 9,048,579 1,085,375 2,724,460 4,545,709 5,515,232 6,927,542
2008 8,657,921 1,083,504 2,720,190 4,540,376 5,500,649 6,855,080Footnotes at end of table.
Table 8. Returns with Positive "1979 Income Concept" Income: Number of Returns, Shares of Income and Total Income Tax, and Average Tax Rates, by Selected Ascending Cumulative Percentiles of Returns Based on Income Size, Tax Years 1986–2008[All figures are estimates based on samples]
Ascending cumulative percentiles
Bottom95 percent
Bottom99 percent
Item, tax year Total Bottom50 percent
Bottom75 percent
Bottom90 percent
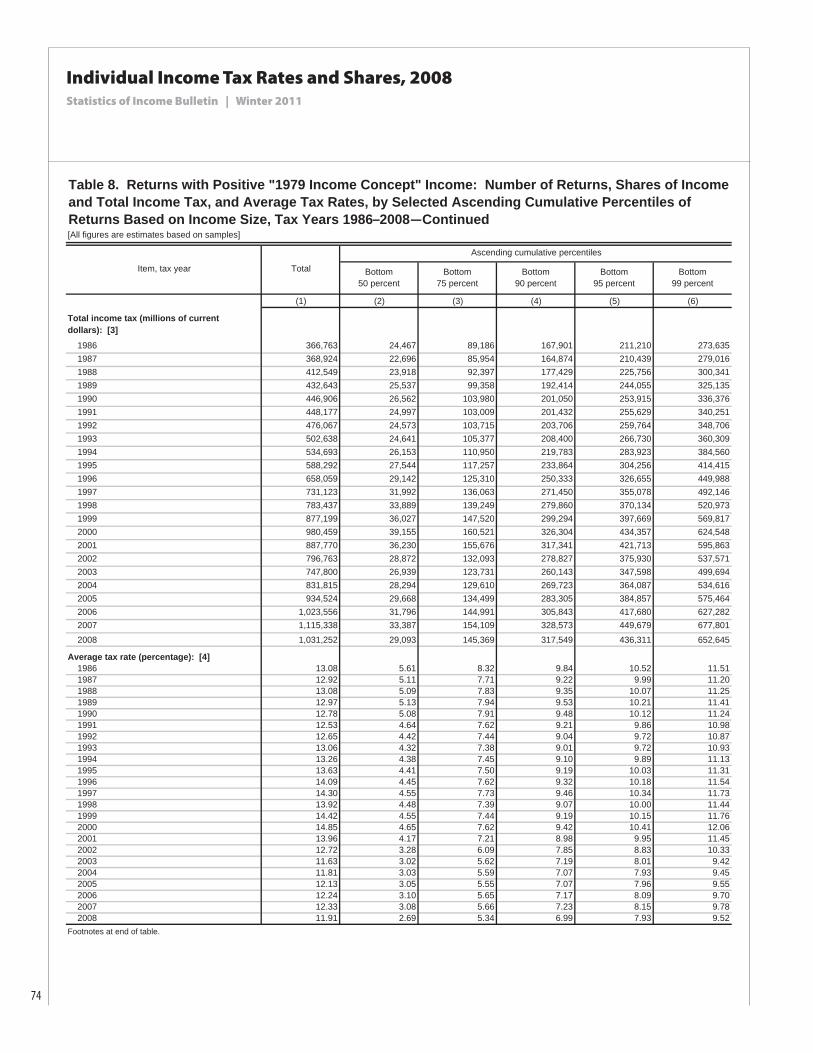
74
Individual Income Tax Rates and Shares, 2008Statistics of Income Bulletin | Winter 2011
(1) (2) (3) (4) (5) (6)
Total income tax (millions of currentdollars): [3] 1986 366,763 24,467 89,186 167,901 211,210 273,635 1987 368,924 22,696 85,954 164,874 210,439 279,016 1988 412,549 23,918 92,397 177,429 225,756 300,341 1989 432,643 25,537 99,358 192,414 244,055 325,135 1990 446,906 26,562 103,980 201,050 253,915 336,376 1991 448,177 24,997 103,009 201,432 255,629 340,251 1992 476,067 24,573 103,715 203,706 259,764 348,706 1993 502,638 24,641 105,377 208,400 266,730 360,309 1994 534,693 26,153 110,950 219,783 283,923 384,560 1995 588,292 27,544 117,257 233,864 304,256 414,415 1996 658,059 29,142 125,310 250,333 326,655 449,988 1997 731,123 31,992 136,063 271,450 355,078 492,146 1998 783,437 33,889 139,249 279,860 370,134 520,973 1999 877,199 36,027 147,520 299,294 397,669 569,817 2000 980,459 39,155 160,521 326,304 434,357 624,548 2001 887,770 36,230 155,676 317,341 421,713 595,863 2002 796,763 28,872 132,093 278,827 375,930 537,571 2003 747,800 26,939 123,731 260,143 347,598 499,694 2004 831,815 28,294 129,610 269,723 364,087 534,616 2005 934,524 29,668 134,499 283,305 384,857 575,464 2006 1,023,556 31,796 144,991 305,843 417,680 627,282 2007 1,115,338 33,387 154,109 328,573 449,679 677,801 2008 1,031,252 29,093 145,369 317,549 436,311 652,645
Average tax rate (percentage): [4] 1986 13.08 5.61 8.32 9.84 10.52 11.51 1987 12.92 5.11 7.71 9.22 9.99 11.20 1988 13.08 5.09 7.83 9.35 10.07 11.25 1989 12.97 5.13 7.94 9.53 10.21 11.41 1990 12.78 5.08 7.91 9.48 10.12 11.24 1991 12.53 4.64 7.62 9.21 9.86 10.98 1992 12.65 4.42 7.44 9.04 9.72 10.87 1993 13.06 4.32 7.38 9.01 9.72 10.93 1994 13.26 4.38 7.45 9.10 9.89 11.13 1995 13.63 4.41 7.50 9.19 10.03 11.31 1996 14.09 4.45 7.62 9.32 10.18 11.54 1997 14.30 4.55 7.73 9.46 10.34 11.73 1998 13.92 4.48 7.39 9.07 10.00 11.44 1999 14.42 4.55 7.44 9.19 10.15 11.76 2000 14.85 4.65 7.62 9.42 10.41 12.06 2001 13.96 4.17 7.21 8.98 9.95 11.45 2002 12.72 3.28 6.09 7.85 8.83 10.33 2003 11.63 3.02 5.62 7.19 8.01 9.42 2004 11.81 3.03 5.59 7.07 7.93 9.45 2005 12.13 3.05 5.55 7.07 7.96 9.55 2006 12.24 3.10 5.65 7.17 8.09 9.70 2007 12.33 3.08 5.66 7.23 8.15 9.78 2008 11.91 2.69 5.34 6.99 7.93 9.52Footnotes at end of table.
Bottom99 percent
Table 8. Returns with Positive "1979 Income Concept" Income: Number of Returns, Shares of Income and Total Income Tax, and Average Tax Rates, by Selected Ascending Cumulative Percentiles of Returns Based on Income Size, Tax Years 1986–2008—Continued[All figures are estimates based on samples]
Item, tax year Total
Ascending cumulative percentiles
Bottom50 percent
Bottom75 percent
Bottom90 percent
Bottom95 percent

75
Individual Income Tax Rates and Shares, 2008Statistics of Income Bulletin | Winter 2011
(1) (2) (3) (4) (5) (6)Income share (percentage): 1986 100.00 15.55 38.24 60.87 71.59 84.76 1987 100.00 15.56 39.02 62.63 73.77 87.26 1988 100.00 14.91 37.44 60.20 71.11 84.63 1989 100.00 14.93 37.51 60.51 71.61 85.40 1990 100.00 14.96 37.60 60.65 71.76 85.57 1991 100.00 15.06 37.80 61.12 72.45 86.62 1992 100.00 14.79 37.03 59.88 71.03 85.21 1993 100.00 14.82 37.07 60.07 71.29 85.61 1994 100.00 14.81 36.92 59.91 71.19 85.63 1995 100.00 14.48 36.19 58.94 70.24 84.86 1996 100.00 14.03 35.23 57.50 68.68 83.45 1997 100.00 13.76 34.41 56.14 67.14 82.04 1998 100.00 13.45 33.49 54.81 65.78 80.93 1999 100.00 13.02 32.60 53.55 64.39 79.68 2000 100.00 12.77 31.90 52.46 63.18 78.42 2001 100.00 13.67 33.93 55.53 66.66 81.78 2002 100.00 14.04 34.66 56.69 67.97 83.11 2003 100.00 13.85 34.27 56.24 67.47 82.54 2004 100.00 13.24 32.90 54.17 65.16 80.35 2005 100.00 12.62 31.46 52.03 62.82 78.21 2006 100.00 12.26 30.69 50.98 61.72 77.28 2007 100.00 12.00 30.11 50.24 60.95 76.56 2008 100.00 12.51 31.42 52.44 63.53 79.18
Total income tax share (percentage): 1986 100.00 6.67 24.32 45.78 57.59 74.61 1987 100.00 6.15 23.30 44.69 57.04 75.63 1988 100.00 5.80 22.40 43.01 54.72 72.80 1989 100.00 5.90 22.97 44.47 56.41 75.15 1990 100.00 5.94 23.27 44.99 56.82 75.27 1991 100.00 5.58 22.98 44.94 57.04 75.92 1992 100.00 5.16 21.79 42.79 54.56 73.25 1993 100.00 4.90 20.96 41.46 53.07 71.68 1994 100.00 4.89 20.75 41.10 53.10 71.92 1995 100.00 4.68 19.93 39.75 51.72 70.44 1996 100.00 4.43 19.04 38.04 49.64 68.38 1997 100.00 4.38 18.61 37.13 48.57 67.31 1998 100.00 4.33 17.77 35.72 47.24 66.50 1999 100.00 4.11 16.82 34.12 45.33 64.96 2000 100.00 3.99 16.37 33.28 44.30 63.70 2001 100.00 4.08 17.54 35.75 47.50 67.12 2002 100.00 3.62 16.58 34.99 47.18 67.47 2003 100.00 3.60 16.55 34.79 46.48 66.82 2004 100.00 3.40 15.58 32.43 43.77 64.27 2005 100.00 3.17 14.39 30.32 41.18 61.58 2006 100.00 3.11 14.17 29.88 40.81 61.28 2007 100.00 2.99 13.82 29.46 40.32 60.77 2008 100.00 2.82 14.10 30.79 42.31 63.29[1] The number of returns with negative adjusted gross income, i.e., returns with an adjusted gross deficit, and the corresponding amounts for adjusted gross deficit, were excluded from Table 8. By excluding deficit returns, alternative minimum tax reported on some of these returns was also excluded. For Tax Year 2008, there were 3,495 returns with no adjusted gross income that reported income tax.[2] The total number of returns does not include the returns filed by individuals to only receive the economic stimulus payment and who had no other reason to file.[3] Total income tax is income tax after credits (includes alternative minimum tax) reported on returns that showed a positive amount for adjusted gross income. Therefore, total income tax excludes alternative minimum tax, Form 8814 tax (tax on a child's interest or dividends), and Form 4972 tax (tax on lump-sum distributions from qualified retirement plans) reported on some returns with a negative amount for adjusted gross income. See also footnote 1.[4] The average tax rate was computed by dividing total income tax (see footnote 3) by (positive) adjusted gross income.
Table 8. Returns with Positive "1979 Income Concept" Income: Number of Returns, Shares of Income and Total Income Tax, and Average Tax Rates, by Selected Ascending Cumulative Percentiles of Returns Based on Income Size, Tax Years 1986–2008—Continued[All figures are estimates based on samples]
Item, tax year Total
Ascending cumulative percentiles
Bottom50 percent
Bottom75 percent
Bottom90 percent
Bottom95 percent
Bottom99 percent
Related Documents