Individual Differences in Puberty Onset in Girls: Bayesian Estimation of Heritabilities and Genetic Correlations Ste´phanie M. van den Berg, 1,4 Adi Setiawan, 2 Meike Bartels, 1 Tinca J. C. Polderman, 1,3 Aad W. van der Vaart, 2 and Dorret I. Boomsma 1 Received 2 Mar. 2005—Final 12 Jul. 2005 We report heritabilities for individual differences in female pubertal development at the age of 12. Tanner data on breast and pubic hair development in girls and data on menarche were obtained from a total of 184 pairs of monozygotic and dizygotic twins. Genetic correlations were estimated to determine to what extent the same genes are involved in different aspects of physical development in puberty. A Bayesian estimation approach was taken, using Markov- chain Monte Carlo simulation to estimate model parameters. All three phenotypes were to a significant extent heritable and showed high genetic correlations, suggesting that a common set of genes is involved in the timing of puberty in general. However, gonadarche (menarche and breast development) and adrenarche (pubic hair) are affected by different environmental factors, which does not support the three phenotypes to be regarded as indicators of a unitary physiological factor. KEY WORDS: Bayesian statistics; genetic correlation; MCMC; menarche; puberty; tanner. INTRODUCTION Entering puberty, children undergo large changes in their physiology and physical appearance which will turn them into adults. All these changes can be related to the endocrine system, specifically the hypothalamic- pituitary-gonadal (HPG) and the hypothalamic-pitui- tary-adrenal (HPA) axes. Gonadarche, or reproductive puberty, results from a reactivation of the gonadotro- pin-releasing hormone (GnRH) pulse generator, which in girls leads to the stimulation of the ovaries producing estradiol. Breast tissue is the primary target for estra- diol and therefore breast development is usually the first sign of puberty. Menarche most often occurs in middle or late puberty. Puberty actually consists of two independent but overlapping endocrine processes. As opposed to gonadarche, adrenarche is the result of the activation of the HPA axis which leads to increased concen- trations of the three adrenal androgens DHEA, DHEAS and androstenedione. These lead to pubic hair, body odour and often acne. Adrenarche is a much more gradual process which may start at an age as early as six years in girls or even earlier and con- tinues well into the third decade of life (Dorn and Rotenstein, 2004). There is quite some variability in the timing of the overt onset of puberty: it may start at an age even as young as seven years. To some extent this vari- ability is related to pathologies that make some children enter puberty either very early (precocious puberty) or relatively late (delayed puberty). What is called precocious, normal or delayed is based on statistical considerations (Palmert and Boepple, 2001). Usually a deviance of 22.5 times the standard 1 Department of Biological Psychology, Vrije Universiteit Amsterdam, Amsterdam, The Netherlands. 2 Department of Mathematics, Vrije Universiteit Amsterdam, Amsterdam, The Netherlands. 3 Department of Child and Adolescent Psychiatry, Erasmus MC Sophia, Rotterdam, The Netherlands. 4 To whom correspondence should be addressed at Department of Biological Psychology, Vrije Universiteit Amsterdam, Van der Boechorststraat 1, 1081, BT, Amsterdam, The Netherlands. Tel.: +31-(0)20-598-8824; Fax: +31-(0)20-598-8832; e-mail: SM.van. [email protected] 261 0001-8244/06/0300-0261/0 Ó 2006 Springer Science+Business Media, Inc. Behavior Genetics, Vol. 36, No. 2, March 2006 (Ó 2006) DOI: 10.1007/s10519-005-9022-y

Welcome message from author
This document is posted to help you gain knowledge. Please leave a comment to let me know what you think about it! Share it to your friends and learn new things together.
Transcript
Individual Differences in Puberty Onset in Girls: Bayesian
Estimation of Heritabilities and Genetic Correlations
Stephanie M. van den Berg,1,4
Adi Setiawan,2Meike Bartels,
1Tinca J. C. Polderman,
1,3
Aad W. van der Vaart,2and Dorret I. Boomsma
1
Received 2 Mar. 2005—Final 12 Jul. 2005
We report heritabilities for individual differences in female pubertal development at the age of12. Tanner data on breast and pubic hair development in girls and data on menarche were
obtained from a total of 184 pairs of monozygotic and dizygotic twins. Genetic correlationswere estimated to determine to what extent the same genes are involved in different aspects ofphysical development in puberty. A Bayesian estimation approach was taken, using Markov-
chain Monte Carlo simulation to estimate model parameters. All three phenotypes were to asignificant extent heritable and showed high genetic correlations, suggesting that a common setof genes is involved in the timing of puberty in general. However, gonadarche (menarche and
breast development) and adrenarche (pubic hair) are affected by different environmentalfactors, which does not support the three phenotypes to be regarded as indicators of a unitaryphysiological factor.
KEY WORDS: Bayesian statistics; genetic correlation; MCMC; menarche; puberty; tanner.
INTRODUCTION
Entering puberty, children undergo large changes intheir physiology and physical appearance which willturn them into adults. All these changes can be relatedto the endocrine system, specifically the hypothalamic-pituitary-gonadal (HPG) and the hypothalamic-pitui-tary-adrenal (HPA) axes. Gonadarche, or reproductivepuberty, results from a reactivation of the gonadotro-pin-releasing hormone (GnRH) pulse generator, whichin girls leads to the stimulation of the ovaries producingestradiol. Breast tissue is the primary target for estra-
diol and therefore breast development is usually thefirst sign of puberty. Menarche most often occurs inmiddle or late puberty.
Puberty actually consists of two independentbut overlapping endocrine processes. As opposed togonadarche, adrenarche is the result of the activationof the HPA axis which leads to increased concen-trations of the three adrenal androgens DHEA,DHEAS and androstenedione. These lead to pubichair, body odour and often acne. Adrenarche is amuch more gradual process which may start at an ageas early as six years in girls or even earlier and con-tinues well into the third decade of life (Dorn andRotenstein, 2004).
There is quite some variability in the timing ofthe overt onset of puberty: it may start at an age evenas young as seven years. To some extent this vari-ability is related to pathologies that make somechildren enter puberty either very early (precociouspuberty) or relatively late (delayed puberty). What iscalled precocious, normal or delayed is based onstatistical considerations (Palmert and Boepple,2001). Usually a deviance of 2�2.5 times the standard
1 Department of Biological Psychology, Vrije Universiteit
Amsterdam, Amsterdam, The Netherlands.2 Department of Mathematics, Vrije Universiteit Amsterdam,
Amsterdam, The Netherlands.3 Department of Child and Adolescent Psychiatry, Erasmus MC �Sophia, Rotterdam, The Netherlands.
4 To whom correspondence should be addressed at Department of
Biological Psychology, Vrije Universiteit Amsterdam, Van der
Boechorststraat 1, 1081, BT, Amsterdam, The Netherlands. Tel.:
+31-(0)20-598-8824; Fax: +31-(0)20-598-8832; e-mail: SM.van.
261
0001-8244/06/0300-0261/0 � 2006 Springer Science+Business Media, Inc.
Behavior Genetics, Vol. 36, No. 2, March 2006 (� 2006)DOI: 10.1007/s10519-005-9022-y
deviation from the mean in the population isregarded as abnormal. Precocious puberty may bethe result of a lesion in the central nervous system,but often it is the result of the same increase ofGnRH secretion that is also the start of puberty inchildren within the normal age-range; the only dif-ference being its early start. Also with delayed pub-erty onset, in most cases there seems to be nounderlying pathology. Therefore, most of the varia-tion in puberty onset remains largely unexplained,except that it is the direct result of increases in GnRHand androgen secretion that start off a whole array ofphysiological changes. One motivation for studyingindividual differences in pubertal timing and theiraetiology is that early puberty onset has consis-tently been shown to be associated with psychosocialproblems (Johansson and Ritzen, 2005).
In most countries the median age of pubertyonset has been decreasing for a long time but seemsto have stabilized during the nineties of last century.There still seems to be some decrease in the US(Herman-Giddens et al., 1997, 2004), although this isdisputed by some (Coleman and Coleman, 2002;Styne, 2004). Precocity has been associated withmigrating children: children adopted from othercountries mature faster when compared with bothfoster country and country of origin (Parent et al.,2003). In addition, there are reports that menarche isearlier in girls in homes with absent fathers (e.g.,Maestripieri et al., 2004). It is uncertain however towhat extent these environmental correlations are in-deed attributable to non-genetic causes. For instance,the absent-father effect could be partially explainedby the transmission of a particular allele of theandrogen receptor gene inherited from the father(Comings, et al., 2002, but see Jorm et al., 2004).Other (environmental) factors are nutrition-related,particularly to food substances such as phyto-oestrogens and lignans (Muinck Keizer-Schrama andMul, 2001) and malnutrition in early and prenatal life(Da Silva Faria et al., 2004; Veening et al., 2004).There also seems to be a relation between the amountof body fat and delayed menarche (Frisch, 1996). Butagain, genetic factors responsible for this associationcannot be ruled out.
Be that as it may, these factors together explainonly a small portion of the total variability. Thereseem to be significant yet unexplained genetic influ-ences on pubertal timing, with heritability estimatesup to 50 to 80% (Fischbein, 1977; Sklad, 1977; Meyer
et al., 1991; Loesch et al., 1995; Palmert and Hir-schhorn, 2003; Eaves et al., 2004) depending onphenotype definition and mode of assessment.Molecular studies have found more direct evidencefor the influence of genes. The Oct-2 transcriptionfactor, a homeodomain gene of the POU family, andthe thyroid transcription factor-1 (TTF-1) have beenassociated with the onset of puberty in femalemammals (Ojeda et al., 1999, 2000).
It is unknown to what extent the genes thatexplain individual differences in age at menarche arethe same genes as those involved in other processesrelated to pubertal development, such as breastdevelopment and pubic hair growth. There have beentwo recent reports on the heritability of differentindicators of puberty (Mustanski et al., 2004; Eaveset al., 2004) but both are based on common factormodels that explicitly postulate one latent traitunderlying several indicator variables and do notallow for extra covariance between a subset of indi-cators. Thus, the fact that there are two distinguish-able endocrinological processes is not taken intoaccount in these models. This study therefore aims atestimating the extent to which the same genes and thesame environmental factors are involved in individualdifferences in menarche, the timing of breast devel-opment and pubic hair in females. Low genetic/environmental correlations would indicate that tim-ing of two pubertal phenotypes is influenced by dif-ferent genes/environmental factors. High correlationswould indicate that, even though the underlyingprocesses may be different, their timing is influencedby the same genetic/environmental factors. Sincegonadarche and adrenarche are determined by inde-pendent physiological processes, it is hypothesisedthat both genetic and environmental correlationsbetween menarche and breast development are high,but their respective correlations with pubic hairdevelopment are low.
A Bayesian approach (Gelman et al., 2004) wastaken to estimate heritabilities and genetic correla-tions, using Markov-chain Monte Carlo (MCMC)simulation (Gilks et al., 1996) for numerical imple-mentation. This approach is flexible in that it handlespractically any kind of model. Instead of point esti-mates and confidence intervals, it yields posteriormarginal distributions for the parameters of interest.If desired, it can also incorporate information fromearlier, similar studies through the specification ofso-called prior distributions.
262 van den Berg, Setiawan, Bartels, Polderman, Vaart, and Boomsma
METHOD
Subjects
Female twins came from two cohorts. The firstcohort was 12 years old in 1998, when data onpubertal status were obtained from female twinswho participated in a longitudinal study on hor-mone levels, cognition and behaviour problems inchildren (Bartels et al., 2002). All participants wereregistered with the Netherlands Twin Registry (NTR;Boomsma et al., 2002). There were 102 twin pairswith at least one data point on a female twin (meanage: 12.2 years, SD=0.2, range=11.7�12.8). Therewere 35 monozygotic pairs with complete data onboth twins, and two monozygotic pairs with completedata on one twin but incomplete data on the othertwin. There were 33 same-sex dizygotic pairs withcomplete data on both twins, one pair with datacomplete on only one twin and incomplete data onthe other, and one pair with incomplete data on bothtwins. From the female twins with a male co-twin, 28females had complete data, and only two hadincomplete data. Zygosity status of same-sex twinswas based on either DNA (15%) or blood polymor-phisms (61%) or, if no DNA or blood was available,questionnaire data (24%).
The second cohort consists of female twins whowere 12 years old in 2003 and participated in asimilar study. All twins were registered with theNTR and were selected on the basis of age, zygosityand geography: children were selected at the age offive and only if they lived within a 100 km radiusfrom Amsterdam (Groot et al., 2004). The parentsof the twins were invited by mail to participate in astudy on neuropsychological development andattention. None of the children suffered from severephysical or mental handicaps. Parents and childrensigned an informed consent before participation.There were 82 twin pairs with at least one data pointon a female twin (mean age: 12.4 years, SD=0.1,range=12.1�12.9). There were 39 pairs of mono-zygotic female twins with complete data on bothtwins, one pair with complete data on only one twin,and three pairs with incomplete data on both twins.There were 11 pairs of same-sex dizygotic femaletwins with complete data on both twins, two pairswith complete data on only one twin, and one pairwith incomplete data on both twins. There were 22female twins with a male co-twin on whom we hadcomplete data; on three others we had incompletedata. Zygosity was determined from DNA poly-morphisms.
Materials
In the first cohort, female twins filled out anextended Tanner questionnaire (based on Marshalland Tanner, 1969) asking about their menarche (no/yes), breast development (5 ordered categories), andpubic hair development (5 categories). The categoriesconsisted of drawn figures showing all stages ofdevelopment. In the second cohort, female twins filledout an extended Tanner questionnaire asking abouttheir menarche (no/yes), breast development (5 cate-gories), and pubic hair development (6 categories).The categories were indicated by photographsshowing all stages of development. Tanner self-reports correlate 0.82 with GP (physician) ratings(Coleman and Coleman, 2002).
Statistical Analysis
To obtain estimates for heritabilities and geneticcorrelations based on categorical data, some assump-tions need to be made. It was assumed that for eachvariable, the frequencies in the different categoriesreflected a continuous underlying normally distrib-uted trait with a number of thresholds (Crittenden,1961; Falconer, 1965; Lynch and Walsh, 1998). Whenthere were very few observations in one category,adjacent categories were collapsed (for the firstcohort we had three categories for breast develop-ment and three for pubic hair; for the second cohort,two and four respectively). Polychoric correlationswere estimated for the three phenotypes, separatelyfor monozygotic and dizygotic twins and for bothcohorts. Modelling these correlations on the latentcontinuous traits in monozygotic and dizygotic twinswould then allow estimation of heritabilities (basedon within-trait, cross-twin correlations) and geneticcorrelations (based on cross-trait, cross-twin corre-lations).
It was assumed that, even though slightly dif-ferent measurement instruments were used (i.e.,photographs and drawings), heritabilities and geneticcorrelations were similar for the two cohorts. Themodel was implemented in the freely obtainableWinBUGS�1.4 package that allows MCMC simu-lation using the Gibbs sampler (for a review onWinBUGS�1.4 and an example, see Cowles, 2004).The fully specified model is described below.
MCMC
MCMC is often used to fit Bayesian statisticalmodels. For a proper understanding of the MCMC
263Heritability of Puberty Onset in Girls
method, it is therefore necessary to know the basics ofBayesian inference. In Bayesian statistics, inference isbased on the posterior marginal density of a param-eter value, P(h|Y), where h represents a modelparameter and Y the observed data. By Bayes’ theo-rem, the density P(h|Y) is proportional to the productof the likelihood of the data given the modelparameter P(Y|h) and the marginal density for h,P(h). In formula form
PðhjYÞ / PðYjhÞPðhÞ:The marginal distribution of h is termed the priordistribution (prior in the sense of before the data havebeen taken into account), and must be specified by theuser. The model provides us with the likelihoodfunction P(Y|h), as usual, and hence the posteriordistribution of h is determined (posterior in the senseof after the data have been taken into account). Theposterior distribution is a description of the prob-abilities of possible values for h given the observeddata and forms the basis for statistical inference. Wemay for example take the mean or the median of thisdistribution as our point estimate for h. The intervalbetween the 2.5th and the 97.5th percentile of theposterior distribution is known as the central 95%credibility region. Under some conditions, and givensufficient data, it can be interpreted as a 95% confi-dence interval.
Sometimes it is easy to compute the posteriordistribution analytically, but very often this is notpossible. One can then use computer simulation todraw a sample of h-values from the posterior distri-bution. The mean or median of the posterior distri-bution can then be approximated by the mean ormedian of the sampled h-values, and approximatecredibility intervals can be determined in a similarway. In practice, exact simulation from the poster-ior distribution may not be feasible either and onereplaces this with MCMC-methods. These methodsinvolve drawing from a Markov chain with the pos-terior distribution as the stationary distribution.Although the initial draws cannot be considered to besampled from the posterior distribution, the chaineventually approximates stationarity sufficientlyclosely to consider, after discarding the initial draws(‘burn-in’), the remaining draws as sampled from theposterior distribution. These are then used to calculatemeans or percentiles. For an introduction to Bayesiandata analysis and MCMC, see Gelman et al. (2004).
One of the advantages of Bayesian methods isthat it is possible to incorporate prior knowledge intothe modelling. This is particularly useful when the
amount of observed data is limited. For example,suppose we have data on menarche in 20 MZ twinsand 20 DZ twins. We then have very little statisticalpower to estimate heritability. But menarche has beenfound to be heritable before and earlier reportedestimates hover around 0.60. We can use this a prioriinformation by using an informative prior distribu-tion for our heritability parameter, and use a distri-bution with mean 0.6 and a standard deviation of 0.1,indicating the degree of our uncertainty. The resultwill be that our estimate from the data will be biasedtowards 0.60 and will show smaller posterior credi-bility intervals. Of course, the danger is that we mightcapitalize too much on earlier reports and that ourresulting posterior credibility interval is too optimis-tic. This is a problem when the assessment method ofmenarche used in the earlier studies differed in animportant way from the assessment method used inthe present study. Often then, a non-informative or‘vague’ prior is specified so that the posterior distri-bution depends mostly on the observed data. For nottoo small data sets, the inference will then typically besimilar to inference based on maximum likelihood.For the modelling reported here, only vague priorswere specified so that inference is not based on priorknowledge.
Modelling Genetic and Environmental Contributions
to the (co-)variance of the Phenotypes
In order to estimate models using WinBUGS, itis necessary to specify, apart from the prior distri-butions of the parameter values, the conditional dis-tribution of the data given all current parametervalues. It was assumed that the observed proportionsin the different answer categories were dependent onscores on normally distributed latent continuoustraits with a number of thresholds (Crittenden, 1961;Falconer, 1965). These latent scores were decom-posed into additive genetic effects, shared environ-mental effects and nonshared environmental effects.In order to speed up the MCMC estimation, thenonshared environmental effects were furtherdecomposed into two parts. See the appendix fortechnical details.
RESULTS
Descriptives
In the first cohort, 86% of the girls had not yethad their first menses. In 22% of the girls breast
264 van den Berg, Setiawan, Bartels, Polderman, Vaart, and Boomsma
development had not yet started (they indicated thefirst of four ordered categories) and in 27% pubichair was still absent (first of five categories). In thesecond cohort the respective percentages were 74%,5% (first of five categories) and 10% (first of 6 cat-egories). Highest degree of breast development wasindicated by 12% in the first cohort and 4% in thesecond cohort. Highest degree of pubic hair devel-opment was indicated by 2% in the first cohort and4% in the second cohort.
Polychoric Correlations
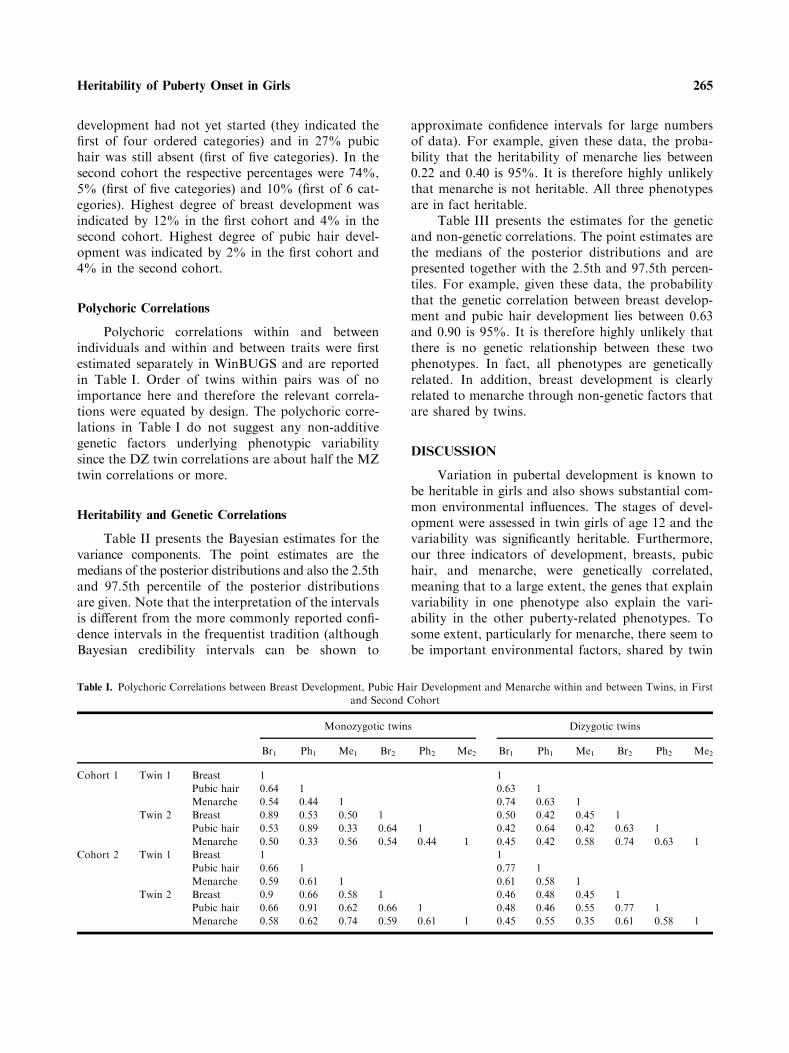
Polychoric correlations within and betweenindividuals and within and between traits were firstestimated separately in WinBUGS and are reportedin Table I. Order of twins within pairs was of noimportance here and therefore the relevant correla-tions were equated by design. The polychoric corre-lations in Table I do not suggest any non-additivegenetic factors underlying phenotypic variabilitysince the DZ twin correlations are about half the MZtwin correlations or more.
Heritability and Genetic Correlations
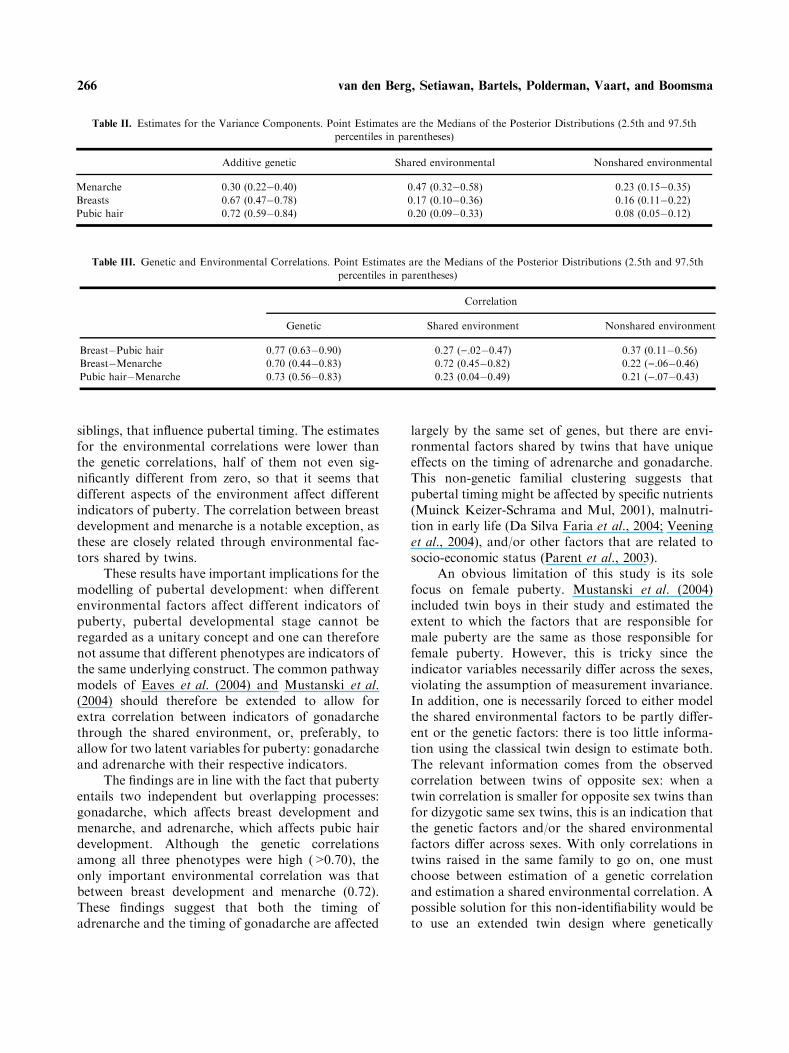
Table II presents the Bayesian estimates for thevariance components. The point estimates are themedians of the posterior distributions and also the 2.5thand 97.5th percentile of the posterior distributionsare given. Note that the interpretation of the intervalsis different from the more commonly reported confi-dence intervals in the frequentist tradition (althoughBayesian credibility intervals can be shown to
approximate confidence intervals for large numbersof data). For example, given these data, the proba-bility that the heritability of menarche lies between0.22 and 0.40 is 95%. It is therefore highly unlikelythat menarche is not heritable. All three phenotypesare in fact heritable.
Table III presents the estimates for the geneticand non-genetic correlations. The point estimates arethe medians of the posterior distributions and arepresented together with the 2.5th and 97.5th percen-tiles. For example, given these data, the probabilitythat the genetic correlation between breast develop-ment and pubic hair development lies between 0.63and 0.90 is 95%. It is therefore highly unlikely thatthere is no genetic relationship between these twophenotypes. In fact, all phenotypes are geneticallyrelated. In addition, breast development is clearlyrelated to menarche through non-genetic factors thatare shared by twins.
DISCUSSION
Variation in pubertal development is known tobe heritable in girls and also shows substantial com-mon environmental influences. The stages of devel-opment were assessed in twin girls of age 12 and thevariability was significantly heritable. Furthermore,our three indicators of development, breasts, pubichair, and menarche, were genetically correlated,meaning that to a large extent, the genes that explainvariability in one phenotype also explain the vari-ability in the other puberty-related phenotypes. Tosome extent, particularly for menarche, there seem tobe important environmental factors, shared by twin
Table I. Polychoric Correlations between Breast Development, Pubic Hair Development and Menarche within and between Twins, in First
and Second Cohort
Monozygotic twins Dizygotic twins
Br1 Ph1 Me1 Br2 Ph2 Me2 Br1 Ph1 Me1 Br2 Ph2 Me2
Cohort 1 Twin 1 Breast 1 1
Pubic hair 0.64 1 0.63 1
Menarche 0.54 0.44 1 0.74 0.63 1
Twin 2 Breast 0.89 0.53 0.50 1 0.50 0.42 0.45 1
Pubic hair 0.53 0.89 0.33 0.64 1 0.42 0.64 0.42 0.63 1
Menarche 0.50 0.33 0.56 0.54 0.44 1 0.45 0.42 0.58 0.74 0.63 1
Cohort 2 Twin 1 Breast 1 1
Pubic hair 0.66 1 0.77 1
Menarche 0.59 0.61 1 0.61 0.58 1
Twin 2 Breast 0.9 0.66 0.58 1 0.46 0.48 0.45 1
Pubic hair 0.66 0.91 0.62 0.66 1 0.48 0.46 0.55 0.77 1
Menarche 0.58 0.62 0.74 0.59 0.61 1 0.45 0.55 0.35 0.61 0.58 1
265Heritability of Puberty Onset in Girls
siblings, that influence pubertal timing. The estimatesfor the environmental correlations were lower thanthe genetic correlations, half of them not even sig-nificantly different from zero, so that it seems thatdifferent aspects of the environment affect differentindicators of puberty. The correlation between breastdevelopment and menarche is a notable exception, asthese are closely related through environmental fac-tors shared by twins.
These results have important implications for themodelling of pubertal development: when differentenvironmental factors affect different indicators ofpuberty, pubertal developmental stage cannot beregarded as a unitary concept and one can thereforenot assume that different phenotypes are indicators ofthe same underlying construct. The common pathwaymodels of Eaves et al. (2004) and Mustanski et al.(2004) should therefore be extended to allow forextra correlation between indicators of gonadarchethrough the shared environment, or, preferably, toallow for two latent variables for puberty: gonadarcheand adrenarche with their respective indicators.
The findings are in line with the fact that pubertyentails two independent but overlapping processes:gonadarche, which affects breast development andmenarche, and adrenarche, which affects pubic hairdevelopment. Although the genetic correlationsamong all three phenotypes were high (>0.70), theonly important environmental correlation was thatbetween breast development and menarche (0.72).These findings suggest that both the timing ofadrenarche and the timing of gonadarche are affected
largely by the same set of genes, but there are envi-ronmental factors shared by twins that have uniqueeffects on the timing of adrenarche and gonadarche.This non-genetic familial clustering suggests thatpubertal timing might be affected by specific nutrients(Muinck Keizer-Schrama and Mul, 2001), malnutri-tion in early life (Da Silva Faria et al., 2004; Veeninget al., 2004), and/or other factors that are related tosocio-economic status (Parent et al., 2003).
An obvious limitation of this study is its solefocus on female puberty. Mustanski et al. (2004)included twin boys in their study and estimated theextent to which the factors that are responsible formale puberty are the same as those responsible forfemale puberty. However, this is tricky since theindicator variables necessarily differ across the sexes,violating the assumption of measurement invariance.In addition, one is necessarily forced to either modelthe shared environmental factors to be partly differ-ent or the genetic factors: there is too little informa-tion using the classical twin design to estimate both.The relevant information comes from the observedcorrelation between twins of opposite sex: when atwin correlation is smaller for opposite sex twins thanfor dizygotic same sex twins, this is an indication thatthe genetic factors and/or the shared environmentalfactors differ across sexes. With only correlations intwins raised in the same family to go on, one mustchoose between estimation of a genetic correlationand estimation a shared environmental correlation. Apossible solution for this non-identifiability would beto use an extended twin design where genetically
Table II. Estimates for the Variance Components. Point Estimates are the Medians of the Posterior Distributions (2.5th and 97.5th
percentiles in parentheses)
Additive genetic Shared environmental Nonshared environmental
Menarche 0.30 (0.22�0.40) 0.47 (0.32�0.58) 0.23 (0.15�0.35)Breasts 0.67 (0.47�0.78) 0.17 (0.10�0.36) 0.16 (0.11�0.22)Pubic hair 0.72 (0.59�0.84) 0.20 (0.09�0.33) 0.08 (0.05�0.12)
Table III. Genetic and Environmental Correlations. Point Estimates are the Medians of the Posterior Distributions (2.5th and 97.5th
percentiles in parentheses)
Correlation
Genetic Shared environment Nonshared environment
Breast�Pubic hair 0.77 (0.63�0.90) 0.27 ().02�0.47) 0.37 (0.11�0.56)Breast�Menarche 0.70 (0.44�0.83) 0.72 (0.45�0.82) 0.22 ().06�0.46)Pubic hair�Menarche 0.73 (0.56�0.83) 0.23 (0.04�0.49) 0.21 ().07�0.43)
266 van den Berg, Setiawan, Bartels, Polderman, Vaart, and Boomsma
unrelated opposite sex siblings that have grown up inthe same home (e.g., foster children) or geneticallyrelated opposite sex siblings grown up elsewhere areincluded in the study.
In this study, an MCMC approach was used toestimate heritabilities and genetic and environmentalcorrelations. Much has already been said about theadvantages of this approach in the context of twinstudies (Eaves and Erkanli, 2003; Eaves et al., 2004).Nevertheless, the reader should realise that the use ofthis method requires more than some experience withstatistical modelling. It requires basic knowledge ofBayesian statistics in general and knowledge con-cerning problems that are specific to MCMC esti-mation. Convergence is affected by the choice ofinitial values and the number of burn-in samples.Other important decisions in MCMC estimation are(1) how many samples are needed from the posteriordistributions in order to be confident about an esti-mate, because the samples are correlated, (2) howmany independent chains one should run using dif-ferent starting points, (3) how best to parametrise themodel and (4) which priors to use. Using appropriatepriors is essential to avoid simulation problems and isparticularly important when estimating variancecomponents and correlations, since variances arebounded at zero. Moreover, assessing model fit usingMCMC and model comparison are issues that stillrequire a lot of theoretical work. For more on theseand other issues, see Cowles (2004) and Gilks et al.(1996).
APPENDIX
Estimating Heritabilities and Genetic and
Environmental Correlations using MCMC
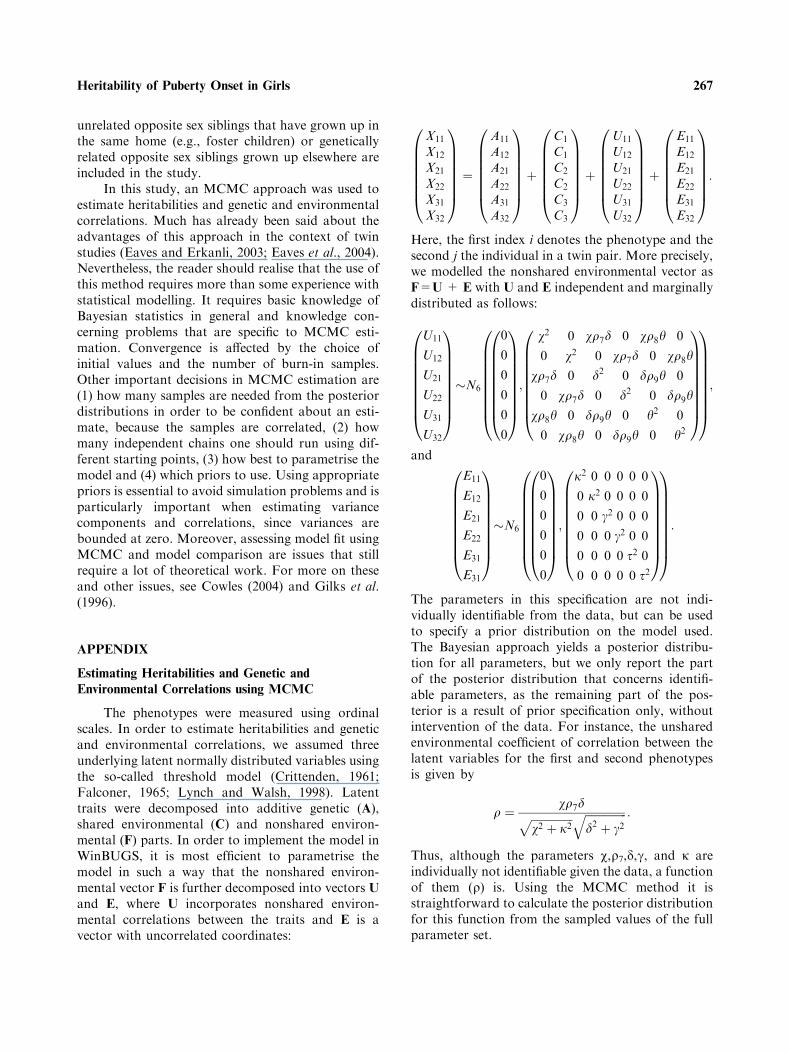
The phenotypes were measured using ordinalscales. In order to estimate heritabilities and geneticand environmental correlations, we assumed threeunderlying latent normally distributed variables usingthe so-called threshold model (Crittenden, 1961;Falconer, 1965; Lynch and Walsh, 1998). Latenttraits were decomposed into additive genetic (A),shared environmental (C) and nonshared environ-mental (F) parts. In order to implement the model inWinBUGS, it is most efficient to parametrise themodel in such a way that the nonshared environ-mental vector F is further decomposed into vectors Uand E, where U incorporates nonshared environ-mental correlations between the traits and E is avector with uncorrelated coordinates:
X11
X12
X21
X22
X31
X32
0BBBBBB@
1CCCCCCA¼
A11
A12
A21
A22
A31
A32
0BBBBBB@
1CCCCCCAþ
C1
C1
C2
C2
C3
C3
0BBBBBB@
1CCCCCCAþ
U11
U12
U21
U22
U31
U32
0BBBBBB@
1CCCCCCAþ
E11
E12
E21
E22
E31
E32
0BBBBBB@
1CCCCCCA:
Here, the first index i denotes the phenotype and thesecond j the individual in a twin pair. More precisely,we modelled the nonshared environmental vector asF=U + E with U and E independent and marginallydistributed as follows:
U11
U12
U21
U22
U31
U32
0BBBBBBBB@
1CCCCCCCCA�N6
0
0
0
0
0
0
0BBBBBBBB@
1CCCCCCCCA;
v2 0 vq7d 0 vq8h 0
0 v2 0 vq7d 0 vq8h
vq7d 0 d2 0 dq9h 0
0 vq7d 0 d2 0 dq9h
vq8h 0 dq9h 0 h2 0
0 vq8h 0 dq9h 0 h2
0BBBBBBBB@
1CCCCCCCCA
0BBBBBBBB@
1CCCCCCCCA;
and
E11
E12
E21
E22
E31
E31
0BBBBBBBB@
1CCCCCCCCA�N6
0
0
0
0
0
0
0BBBBBBBB@
1CCCCCCCCA;
j2 0 0 0 0 0
0 j2 0 0 0 0
0 0 c2 0 0 0
0 0 0 c2 0 0
0 0 0 0 s2 0
0 0 0 0 0 s2
0BBBBBBBB@
1CCCCCCCCA
0BBBBBBBB@
1CCCCCCCCA:
The parameters in this specification are not indi-vidually identifiable from the data, but can be usedto specify a prior distribution on the model used.The Bayesian approach yields a posterior distribu-tion for all parameters, but we only report the partof the posterior distribution that concerns identifi-able parameters, as the remaining part of the pos-terior is a result of prior specification only, withoutintervention of the data. For instance, the unsharedenvironmental coefficient of correlation between thelatent variables for the first and second phenotypesis given by
q ¼ vq7dffiffiffiffiffiffiffiffiffiffiffiffiffiffiffiv2 þ j2
p ffiffiffiffiffiffiffiffiffiffiffiffiffiffiffid2 þ c2
q :
Thus, although the parameters v,q7,d,c, and j areindividually not identifiable given the data, a functionof them (q) is. Using the MCMC method it isstraightforward to calculate the posterior distributionfor this function from the sampled values of the fullparameter set.
267Heritability of Puberty Onset in Girls
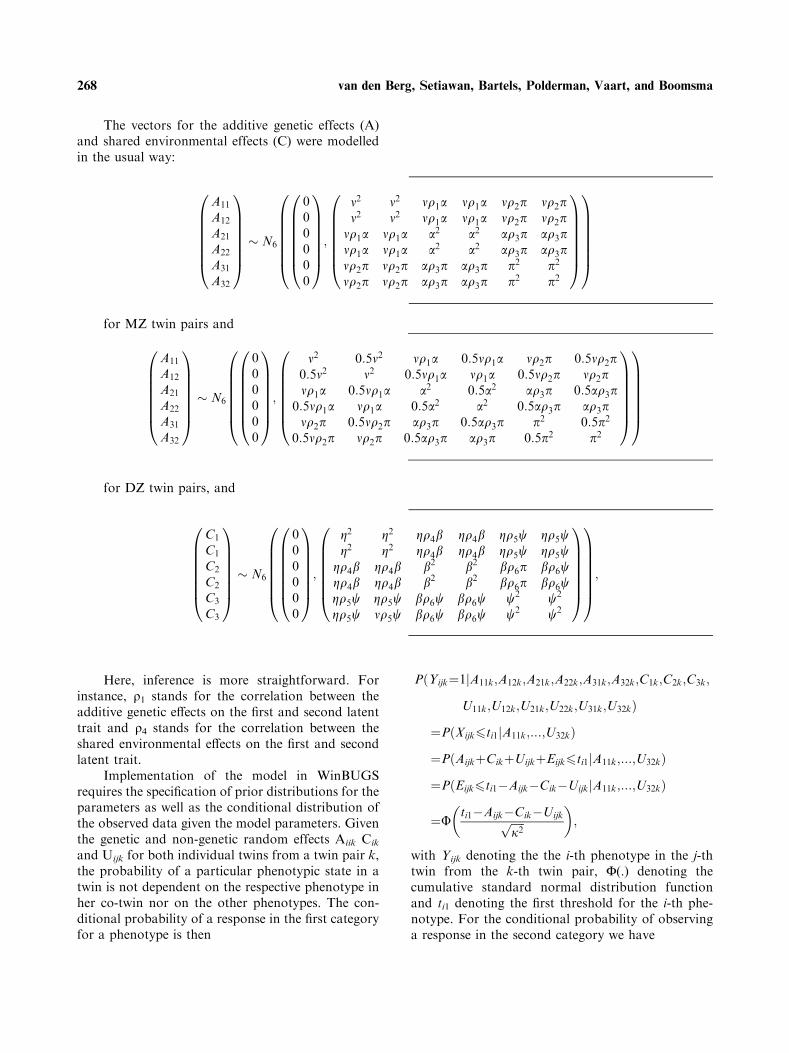
The vectors for the additive genetic effects (A)and shared environmental effects (C) were modelledin the usual way:
for MZ twin pairs and
for DZ twin pairs, and
Here, inference is more straightforward. Forinstance, q1 stands for the correlation between theadditive genetic effects on the first and second latenttrait and q4 stands for the correlation between theshared environmental effects on the first and secondlatent trait.
Implementation of the model in WinBUGSrequires the specification of prior distributions for theparameters as well as the conditional distribution ofthe observed data given the model parameters. Giventhe genetic and non-genetic random effects Aiik Cik
and Uijk for both individual twins from a twin pair k,the probability of a particular phenotypic state in atwin is not dependent on the respective phenotype inher co-twin nor on the other phenotypes. The con-ditional probability of a response in the first categoryfor a phenotype is then
PðYijk¼1jA11k;A12k;A21k;A22k;A31k;A32k;C1k;C2k;C3k;
U11k;U12k;U21k;U22k;U31k;U32kÞ
¼PðXijk6ti1jA11k;...;U32kÞ
¼PðAijkþCikþUijkþEijk6ti1jA11k;...;U32kÞ
¼PðEijk6ti1�Aijk�Cik�UijkjA11k;...;U32kÞ
¼Uti1�Aijk�Cik�Uijkffiffiffiffiffi
j2p
� �;
with Yijk denoting the the i-th phenotype in the j-thtwin from the k-th twin pair, F(.) denoting thecumulative standard normal distribution functionand ti1 denoting the first threshold for the i-th phe-notype. For the conditional probability of observinga response in the second category we have
A11
A12
A21
A22
A31
A32
0BBBBBB@
1CCCCCCA� N6
000000
0BBBBBB@
1CCCCCCA;
m2 m2 mq1a mq1a mq2p mq2pm2 m2 mq1a mq1a mq2p mq2p
mq1a mq1a a2 a2 aq3p aq3pmq1a mq1a a2 a2 aq3p aq3pmq2p mq2p aq3p aq3p p2 p2
mq2p mq2p aq3p aq3p p2 p2
0BBBBBB@
1CCCCCCA
0BBBBBB@
1CCCCCCA
A11
A12
A21
A22
A31
A32
0BBBBBB@
1CCCCCCA� N6
000000
0BBBBBB@
1CCCCCCA;
m2 0:5m2 mq1a 0:5mq1a mq2p 0:5mq2p0:5m2 m2 0:5mq1a mq1a 0:5mq2p mq2pmq1a 0:5mq1a a2 0:5a2 aq3p 0:5aq3p
0:5mq1a mq1a 0:5a2 a2 0:5aq3p aq3pmq2p 0:5mq2p aq3p 0:5aq3p p2 0:5p2
0:5mq2p mq2p 0:5aq3p aq3p 0:5p2 p2
0BBBBBB@
1CCCCCCA
0BBBBBB@
1CCCCCCA
C1
C1
C2
C2
C3
C3
0BBBBBB@
1CCCCCCA� N6
000000
0BBBBBB@
1CCCCCCA;
g2 g2 gq4b gq4b gq5w gq5wg2 g2 gq4b gq4b gq5w gq5w
gq4b gq4b b2 b2 bq6p bq6wgq4b gq4b b2 b2 bq6p bq6wgq5w gq5w bq6w bq6w w2 w2
gq5w mq5w bq6w bq6w w2 w2
0BBBBBB@
1CCCCCCA
0BBBBBB@
1CCCCCCA;
268 van den Berg, Setiawan, Bartels, Polderman, Vaart, and Boomsma
PðYijk¼2jA11k;A12k;A21k;A22k;A31k;A32k;C1k;C2k;C3k;
U11k;U12k;U21k;U22k;U31k;U32kÞ¼Pðti1<Xijk6ti2jA11k;...;U32kÞ¼Pðti1<AijkþCikþUijkþEijk6ti2jA11k;...;U32kÞ¼Pðti1�Aijk�Cik�Uijk<Eijk6ti2�Aijk�Cik
�UijkjA11k;...;U32kÞ
¼Uti2�Aijk�Cik�Uijkffiffiffiffiffi
j2p
� ��U
ti1�Aijk�Cik�Uijkffiffiffiffiffij2p
� �:
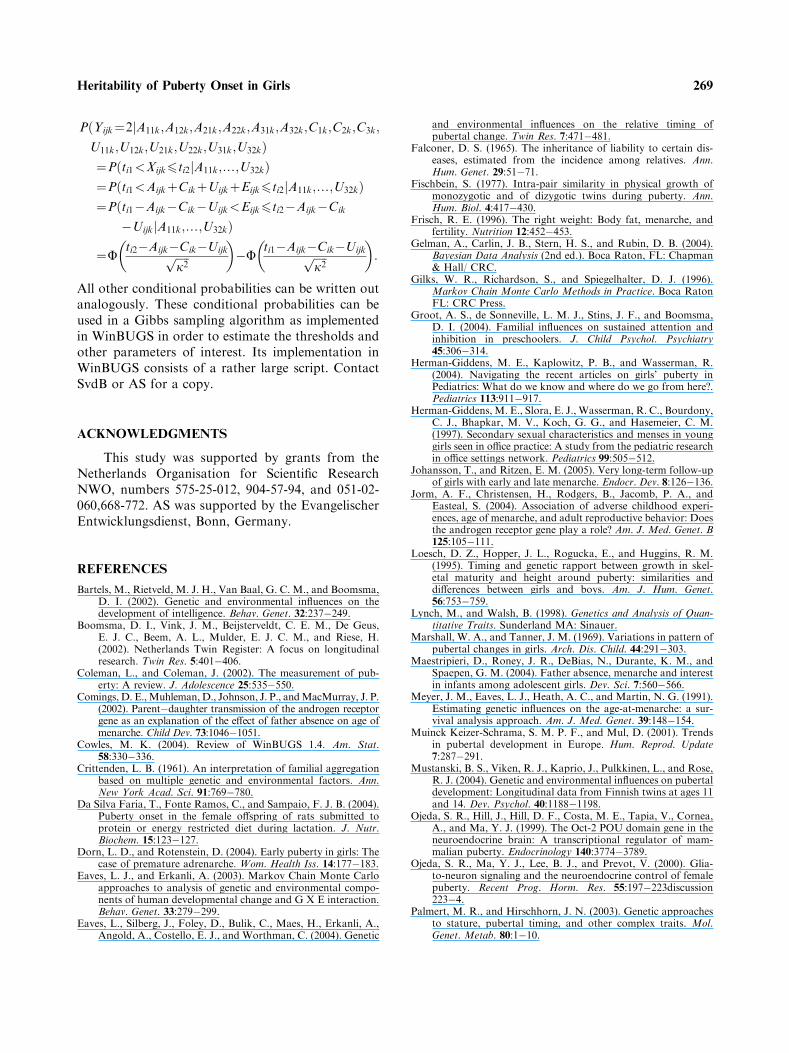
All other conditional probabilities can be written outanalogously. These conditional probabilities can beused in a Gibbs sampling algorithm as implementedin WinBUGS in order to estimate the thresholds andother parameters of interest. Its implementation inWinBUGS consists of a rather large script. ContactSvdB or AS for a copy.
ACKNOWLEDGMENTS
This study was supported by grants from theNetherlands Organisation for Scientific ResearchNWO, numbers 575-25-012, 904-57-94, and 051-02-060,668-772. AS was supported by the EvangelischerEntwicklungsdienst, Bonn, Germany.
REFERENCES
Bartels, M., Rietveld, M. J. H., Van Baal, G. C. M., and Boomsma,D. I. (2002). Genetic and environmental influences on thedevelopment of intelligence. Behav. Genet. 32:237�249.
Boomsma, D. I., Vink, J. M., Beijsterveldt, C. E. M., De Geus,E. J. C., Beem, A. L., Mulder, E. J. C. M., and Riese, H.(2002). Netherlands Twin Register: A focus on longitudinalresearch. Twin Res. 5:401�406.
Coleman, L., and Coleman, J. (2002). The measurement of pub-erty: A review. J. Adolescence 25:535�550.
Comings, D. E.,Muhleman,D., Johnson, J. P., andMacMurray, J. P.(2002). Parent�daughter transmission of the androgen receptorgene as an explanation of the effect of father absence on age ofmenarche. Child Dev. 73:1046�1051.
Cowles, M. K. (2004). Review of WinBUGS 1.4. Am. Stat.58:330�336.
Crittenden, L. B. (1961). An interpretation of familial aggregationbased on multiple genetic and environmental factors. Ann.New York Acad. Sci. 91:769�780.
Da Silva Faria, T., Fonte Ramos, C., and Sampaio, F. J. B. (2004).Puberty onset in the female offspring of rats submitted toprotein or energy restricted diet during lactation. J. Nutr.Biochem. 15:123�127.
Dorn, L. D., and Rotenstein, D. (2004). Early puberty in girls: Thecase of premature adrenarche. Wom. Health Iss. 14:177�183.
Eaves, L. J., and Erkanli, A. (2003). Markov Chain Monte Carloapproaches to analysis of genetic and environmental compo-nents of human developmental change and G X E interaction.Behav. Genet. 33:279�299.
Eaves, L., Silberg, J., Foley, D., Bulik, C., Maes, H., Erkanli, A.,Angold, A., Costello, E. J., and Worthman, C. (2004). Genetic
and environmental influences on the relative timing ofpubertal change. Twin Res. 7:471�481.
Falconer, D. S. (1965). The inheritance of liability to certain dis-eases, estimated from the incidence among relatives. Ann.Hum. Genet. 29:51�71.
Fischbein, S. (1977). Intra-pair similarity in physical growth ofmonozygotic and of dizygotic twins during puberty. Ann.Hum. Biol. 4:417�430.
Frisch, R. E. (1996). The right weight: Body fat, menarche, andfertility. Nutrition 12:452�453.
Gelman, A., Carlin, J. B., Stern, H. S., and Rubin, D. B. (2004).Bayesian Data Analysis (2nd ed.). Boca Raton, FL: Chapman& Hall/ CRC.
Gilks, W. R., Richardson, S., and Spiegelhalter, D. J. (1996).Markov Chain Monte Carlo Methods in Practice. Boca RatonFL: CRC Press.
Groot, A. S., de Sonneville, L. M. J., Stins, J. F., and Boomsma,D. I. (2004). Familial influences on sustained attention andinhibition in preschoolers. J. Child Psychol. Psychiatry45:306�314.
Herman-Giddens, M. E., Kaplowitz, P. B., and Wasserman, R.(2004). Navigating the recent articles on girls’ puberty inPediatrics: What do we know and where do we go from here?.Pediatrics 113:911�917.
Herman-Giddens,M. E., Slora, E. J., Wasserman, R. C., Bourdony,C. J., Bhapkar, M. V., Koch, G. G., and Hasemeier, C. M.(1997). Secondary sexual characteristics and menses in younggirls seen in office practice: A study from the pediatric researchin office settings network. Pediatrics 99:505�512.
Johansson, T., and Ritzen, E. M. (2005). Very long-term follow-upof girls with early and late menarche. Endocr. Dev. 8:126�136.
Jorm, A. F., Christensen, H., Rodgers, B., Jacomb, P. A., andEasteal, S. (2004). Association of adverse childhood experi-ences, age of menarche, and adult reproductive behavior: Doesthe androgen receptor gene play a role? Am. J. Med. Genet. B125:105�111.
Loesch, D. Z., Hopper, J. L., Rogucka, E., and Huggins, R. M.(1995). Timing and genetic rapport between growth in skel-etal maturity and height around puberty: similarities anddifferences between girls and boys. Am. J. Hum. Genet.56:753�759.
Lynch, M., and Walsh, B. (1998). Genetics and Analysis of Quan-titative Traits. Sunderland MA: Sinauer.
Marshall, W. A., and Tanner, J. M. (1969). Variations in pattern ofpubertal changes in girls. Arch. Dis. Child. 44:291�303.
Maestripieri, D., Roney, J. R., DeBias, N., Durante, K. M., andSpaepen, G. M. (2004). Father absence, menarche and interestin infants among adolescent girls. Dev. Sci. 7:560�566.
Meyer, J. M., Eaves, L. J., Heath, A. C., and Martin, N. G. (1991).Estimating genetic influences on the age-at-menarche: a sur-vival analysis approach. Am. J. Med. Genet. 39:148�154.
Muinck Keizer-Schrama, S. M. P. F., and Mul, D. (2001). Trendsin pubertal development in Europe. Hum. Reprod. Update7:287�291.
Mustanski, B. S., Viken, R. J., Kaprio, J., Pulkkinen, L., and Rose,R. J. (2004). Genetic and environmental influences on pubertaldevelopment: Longitudinal data from Finnish twins at ages 11and 14. Dev. Psychol. 40:1188�1198.
Ojeda, S. R., Hill, J., Hill, D. F., Costa, M. E., Tapia, V., Cornea,A., and Ma, Y. J. (1999). The Oct-2 POU domain gene in theneuroendocrine brain: A transcriptional regulator of mam-malian puberty. Endocrinology 140:3774�3789.
Ojeda, S. R., Ma, Y. J., Lee, B. J., and Prevot, V. (2000). Glia-to-neuron signaling and the neuroendocrine control of femalepuberty. Recent Prog. Horm. Res. 55:197�223discussion223�4.
Palmert, M. R., and Hirschhorn, J. N. (2003). Genetic approachesto stature, pubertal timing, and other complex traits. Mol.Genet. Metab. 80:1�10.
269Heritability of Puberty Onset in Girls

Palmert, M. R., and Boepple, P. A. (2001). Variation in the timingof puberty: Clinical spectrum and genetic investigation.J. Clin. Endocr. Metab. 86:2364�2368.
Parent, A. S., Teilmann, G., Juul, A., Skakkebaek, N. E., Toppari,J., and Bourguignon, J. P. (2003). The timing of normalpuberty and the age limits of sexual precocity: Variationsaround the world, secular trends, and changes after migration.Endocr. Rev. 24:668�693.
Sklad, M. (1977). The rate of growth and maturing of twins. Acta.Genet. Med. Gemel. 26:221�237.
Styne, D. M. (2004). Puberty, obesity and ethnicity. Trends Endo-crin. Met. 15:472�478.
Veening, M. A., van Weissenbruch, M. M., Roord, J. J., andDelemarre-Van Waal, H. A. (2004). Pubertal development inchildren born small for gestational age. J. Pediatr. Endocr.Met. 17:1497�1505.
Edited by Pak Sham
270 van den Berg, Setiawan, Bartels, Polderman, Vaart, and Boomsma
Related Documents