Individual Development and Educational Assessment Technical Report No. 13 Disciplinary Differences in Student Ratings Donald P. Hoyt Eun-Joo Lee December 2002

Welcome message from author
This document is posted to help you gain knowledge. Please leave a comment to let me know what you think about it! Share it to your friends and learn new things together.
Transcript
Individual Development and Educational Assessment
Technical Report No. 13
Disciplinary Differences in Student Ratings
Donald P. Hoyt Eun-Joo Lee
December 2002


IDEA Technical Report No. 13
Disciplinary Differences in Student Ratings
Donald P. Hoyt
Eun-Joo Lee
The Individual Development and Educational Assessment Center
December 2002


3


Table of Contents Page
List of Disciplines .................................................................................................................. ii
Introduction.............................................................................................................................1
Procedure ................................................................................................................................1
Interpreting the Measures .......................................................................................................2
Format of the Report...............................................................................................................4
Limitations ..............................................................................................................................5
Discipline Discussions ............................................................................................................7
Appendix – Percentage of Classes Within T Score Categories ...........................................83
i
List of Disciplines Page
Discipline 1: Accounting .......................................................................................................7
Discipline 2: Administration/Management..........................................................................10
Discipline 3: Art...................................................................................................................13
Discipline 4: Biology/Life Sciences ....................................................................................16
Discipline 5: Business/General ............................................................................................19
Discipline 6: Chemistry .......................................................................................................21
Discipline 7: Communications.............................................................................................24
Discipline 8: Computer/Information Sciences.....................................................................27
Discipline 9: Design/Applied Arts.......................................................................................30
Discipline 10: Economics ....................................................................................................32
Discipline 11: Education/General ........................................................................................34
Discipline 12: Engineering ..................................................................................................37
Discipline 13: English Literature .........................................................................................40
Discipline 14: Fine and Applied Arts ..................................................................................43
Discipline 15: Foreign Language and Literature .................................................................45
Discipline 16: History ..........................................................................................................48
Discipline 17: Health Professions/Related Sciences............................................................51
Discipline 18: Liberal Arts/General Studies/Humanities ....................................................54
Discipline 19: Mathematics/Statistics..................................................................................57
Discipline 20: Music ............................................................................................................60
Discipline 21: Nursing .........................................................................................................62
Discipline 22: Philosophy....................................................................................................65
Discipline 23: Physical Education/Health/Safety Education...............................................67
Discipline 24: Physics..........................................................................................................70
Discipline 25: Political Science/Government ......................................................................72
Discipline 26: Psychology ...................................................................................................74
Discipline 27: Religion ........................................................................................................77
Discipline 28: Sociology......................................................................................................80
ii

Introduction Participants in the IDEA student rating system frequently ask whether or not results differ significantly among disciplines. Do disciplines emphasize different objectives? Do their students report similar levels of progress on objectives selected by the instructor? Do teaching “approaches” differ across disciplines? Do specific disciplines enroll students with distinctive characteristics? All of these questions are of inherent interest; their answers could also have an important impact on the interpretation of results from the IDEA system. The purpose of this report is to examine such questions by analyzing data obtained by The IDEA Center from August 1998, through August 2001. Technical Report #121 describes this database more completely. Procedure Faculty participants select a “Department Code” from a list of modified CIP2 codes provided by the Center. These codes were used to identify the disciplines included in this study. To ensure reasonable stability in the statistics, only departments/disciplines for which the Center had processed at least 500 classes were included in the study. The sample was further restricted to classes for which there were at least 10 student responses with a response rate of at least 75 percent. Disciplinary differences were studied for the following ratings:
1. Faculty ratings of the importance of each of the 12 learning objectives included on the IDEA Student Rating forms.
2. Student ratings of progress on each objective that was identified as “Important” or
“Essential” by the instructor.
3. Scores on five “Teaching Approach” scales derived from the 20 teaching methods items.
4. Three “Course Characteristics”: Amount of reading; Amount of other (non-reading)
work; and Difficulty.
5. Three “Student Characteristics”: Effort (“I worked harder on this course than on most courses I have taken”); Course motivation (“I really wanted to take this course regardless of who taught it”); and Work habits (“As a rule, I put forth more effort than other students on my academic work”).
6. Three “Global outcome” measures: Increased positive attitude (“As a result of taking
this course, I have more positive feelings toward this field of study”); Excellent instructor (“Overall, I rate this instructor an excellent teacher”); and Excellent course (“Overall, I rate this course as excellent”).
1 Hoyt, D. P. and Lee, EJ. (2002). Basic Data for the Revised IDEA System. Technical Report #12. The IDEA Center, Manhattan, Kansas. 2 Classification of Instruction Programs, U.S. Department of Education, 1990.
1

The first two of these involve the list of 12 objectives included on both the Diagnostic (long) and Short Forms of the instrument. Therefore, the 28 disciplines/departments for which at least 500 classes were rated on either form were included in these analyses. The remaining analyses involved items included only on the Diagnostic Form3. This reduced the number of qualifying disciplines/departments to 20. For each discipline, averages were computed for each of the measures. “All disciplines” averages and standard deviations were computed by combining results for all classes in the 28 (or 20 in the case of measures available only on the Diagnostic Form4). To highlight the distinctiveness of each discipline, z (deviation) scores were also computed. These required a computation of the “mean of the means” (the average of the mean scores of the 28 disciplines) as well as the standard deviation of these means. The z score describes the number of standard deviations a given measure was above (positive scores) or below (negative scores) the “all disciplines” average. Interpreting the Measures 1. Learning Objectives (faculty ratings of “importance;” student ratings of “progress.”) Of the 12 learning objectives included in the IDEA system, the three most frequently rated by instructors as “important” or “essential” stress cognitive development. The two most popular ones, Gaining factual knowledge and Learning fundamental principles, generalizations, or theories, focus on acquiring a basic cognitive background. The third, Learning to apply course material, while involving cognitive activity, centers on applications that are frequently related to professional preparation. As such, it shares a focus with the fourth most frequently chosen objective, Developing specific skills, competencies, and points of view needed by professionals in the field most closely related to this course. One way to characterize disciplines involves making a “basic vs. applied” comparison [i.e., contrasting the emphasis placed on the first two objectives (basic cognitive background) with that placed on the next two (professionally-oriented cognitive development)]. Other ways of identifying a discipline’s distinctiveness involves comparing it with the “all disciplines” average on four other combinations of objectives: (a) emphasis on “life-long learning” objectives (Learning how to find and use resources for answering questions or solving problems and Acquiring an interest in learning more by asking questions and seeking answers); (b) emphasis on “general intellectual/academic skills” objectives (Developing skill in expressing oneself orally or in writing and Learning to analyze and critically evaluate ideas, arguments, and points of view); (c) emphasis on “personal development” objectives (Gaining a broader understanding and appreciation of intellectual/cultural activity and Developing a clearer understanding of, and commitment to, personal values); and (d) emphasis on objectives stressing “specific skills” (Acquiring skills in working with others as a member of a team and Developing creative capacities).
3 The Short Form includes the “global outcomes” measures, but results on these were not considered so that an identical database could be used to derive all figures on Part II of disciplinary results. 4 The “all disciplines” averages were slightly different from those reported for “all classes” in Technical Report #12 because disciplines with fewer than 500 classes were excluded.
2

2. Teaching Approach. By combining selected items from the 20 that describe teaching methods, the IDEA system provides results on five scales indicative of teaching approach5. Each describes a distinct learning environment. These environments are not independent; a technique that establishes rapport may also encourage student involvement, etc. The first scale, A--Stimulating Student Interest, emphasizes teaching techniques designed to arouse student interest and excitement about the subject; for most objectives, scores on this scale are more closely related to student ratings of progress than are scores on the other four scales. Scale B--Fostering Student Collaboration, features methods that encourage students to learn from each other; scores are especially related to progress on “team skills” and on objectives related both to personal development and to general intellectual skills. The third scale, C--Establishing Rapport, assesses the degree to which instructors seek to encourage academic effort and commitment by establishing positive personal relationships with students; it is especially relevant to progress on “creative capacities,” “communication skills,” and on objectives related to “lifelong learning.” Scale D--Encouraging Student Involvement, is based on teaching methods that stress student responsibility for their learning; scores on this scale are related to progress on creative capacities, objectives related to professional development, and the “lifelong learning” objectives. The final scale, E--Structuring Classroom Experiences, consists of items that stress clear communication of both the subject matter and of the instructor’s expectations; scores on this scale are predictive of progress on objectives describing basic cognitive development. 3. Course Characteristics Three ratings are summarized: F--Amount of reading, G--Amount of work in other (non-reading) assignments, and H--Difficulty of subject matter. “Difficulty” ratings are significantly related to ratings of the other two characteristics. Therefore, it is meaningful to compare the three ratings. If the “Difficulty” rating is substantially above the other two, it can be inferred that the discipline’s content is particularly challenging. Similarly, if the “Difficulty” rating is substantially below the other two, the inference is that students found the concepts and content of the discipline relatively easy to grasp. 4. Student Characteristics Three additional ratings are summarized. Two of these assess student motivation (I--I really wanted to take this course regardless of who taught it and J--As a rule, I put forth more effort than other students on my academic work). Ratings on these scales are generally related to student ratings of progress6. The other rating (K--I worked harder on this course than on most courses I have taken) describes student effort in the class. Results on this item can be compared meaningfully with those on the motivation items. When “motivation” is substantially higher than “effort,” it can be inferred that the discipline’s demands are 5 These scales are described more completely in Teaching “Styles” and Learning Outcomes by Donald P. Hoyt and Eun-Joo Lee, Research Report #4, Manhattan, Kansas: The IDEA Center, 2002. 6 Both are used in adjusting progress ratings to take into account factors that influence progress ratings but are beyond the instructor’s control.
3

minimal; conversely, when “effort” is substantially higher than motivation, it can be inferred that the discipline makes unusually heavy demands. This “index of demands” is related to, but not identical with, the index of disciplinary difficulty described in the section on “Course characteristics.” 5. Global Outcomes In addition to student ratings of progress on instructor-chosen objectives, the IDEA system includes three overall measures of teaching effectiveness. Two of these (L--As a result of taking this course, I have more positive feelings toward this field of study and N--Overall, I rate this course as excellent) are highly correlated; ratings on these items are related principally to scores on Stimulating Student Interest and, to a lesser degree, to scores on Structuring Classroom Experiences; they are also positively related to student motivation and effort (I, J, K), but are unrelated to the three course characteristics (F, G, and H). The other rating (M--Overall, I rate this instructor as an excellent teacher) reflects a teaching style that places equal emphasis on three approaches: Stimulating Student Interest, Establishing Rapport, and Structuring Classroom Experiences. The IDEA measures of student motivation and effort were only slightly related to ratings on this global outcome and those assessing course characteristics were unrelated. Format of the Report Two sets of data are provided for each discipline7. The first set focuses on the 12 learning objectives. The percent of instructors choosing each objective as “important” or “essential” is shown for the discipline and for all classes included in this study. Mean progress ratings and standard deviations for those classes where the objective was “important” or “essential” are also shown for the discipline and for the combined group. In addition, a graph of z scores compares results for the discipline with those of all disciplines. On the vertical axis, instructor ratings of “Importance” are plotted. On the horizontal axis, student ratings of progress are plotted. The figure makes it possible to examine simultaneously the relative degree of emphasis given to each objective and the relative amount of progress reported on relevant objectives8. A commentary on these results is provided on the following page. Part II results include findings for 14 other measures derived from classes where the Diagnostic Form was employed. As before, means and standard deviations for both the discipline and for the “all disciplines” group are provided along with plots of z scores to provide a graphic description of how a given discipline compared with the combined group. The shaded area on the graph shows the “average range” (the mean ± ½ standard deviation). A commentary on these results is also provided.
7 Only one set of information is provided for the eight disciplines where the IDEA database included over 500 Short and Diagnostic (long) Form classes (combined), but fewer than 500 classes for the Diagnostic Form alone. 8 In general, there is a positive relationship between the frequency with which an objective was chosen in a given discipline and the amount of progress reported by the discipline’s students.
4

Limitations
1. Representativeness. Results are based on classes processed between August, 1998, and August, 2001. Excluded from this data base were classes for which fewer than 10 student ratings were provided (to ensure reasonable reliability), those for which the response rate was less than 75 percent (to ensure that results were reasonably representative of the class), and those obtained from institutions that were in their first year of participation in the IDEA program (to ensure that instructors were sufficiently familiar with the system to make sound judgments about objectives). Most of the institutions participating in the IDEA program are four-year liberal arts colleges, community colleges, or universities whose highest degree offering is the master’s degree. Although some doctoral-offering institutions participate, very few large research institutions are included. In addition, by participating in the IDEA program, an institution demonstrates a commitment to teaching and learning that is not characteristic of all colleges and universities. There is no way to know how disciplinary differences found in this study would be affected if a more representative sample of institutions was available. 2. Impact of Audience. Previous studies9 have shown that indices of teaching effectiveness differed depending on the student audience. In general, lower division classes were rated less favorably than upper division classes that, in turn, were rated less favorably than graduate classes. Similarly, those intended to satisfy general/liberal education or distribution requirements were rated less favorably than those related to the student’s major interest. Additional studies, requiring very large data sets, will be required before these potentially confounding effects can be eliminated from disciplinary comparisons. 3. Judgment Standards. The reports for individual disciplines describe a large number of differences that are significant both statistically and practically. The degree to which these differences might affect judgments about teaching effectiveness can be inferred from data provided in the appendix. For some disciplines, both progress ratings and ratings of teaching approaches are much more favorable than those for all disciplines. For others, the opposite is true. At this stage, it is impossible to know whether low progress ratings are the result of poor teaching approaches, if students in some disciplines employ unusually severe rating standards, or if there are disciplinary differences in the adequacy of students’ academic background. In general, both progress ratings and ratings of teaching approaches were much lower for the “hard” sciences, mathematics, and engineering; they were much higher in disciplines directed to specific professions (e.g., education, nursing, health related professions). Additional research is needed before effects due to differences in teaching skills, student standards, student background, and discipline can be disentangled. 4. Incomplete Survey. The IDEA form is too brief to provide a comprehensive assessment of all possible teaching objectives and strategies; thus the data more adequately describe some disciplines more than others. In addition, this study provides information about 28 disciplines. It provides no information about many others simply because too few classes were processed to assure stable results. Especially noteworthy is the lack of information about disciplines in specialized colleges like Agriculture, Veterinary Medicine, Architecture,
9 Hoyt, D. P. and Perera, S. “Are Student Ratings of Courses and Instructors Fair to Faculty Teaching General/Liberal Education Classes?,” Research Report #5, The IDEA Center, Manhattan, Kansas, December 2002.
5

Law, and Medicine. Similarly, because of the relatively small number of classes processed, it was unable to examine potentially important departmental differences or specialty areas in a number of disciplines (including education, engineering, business administration, and home economics). 5. Potential Institutional Biases. The study of disciplinary differences should, ideally, exclude institutional differences. Despite the fact that the study utilized a database consisting of over 70,000 classes, a much larger database is required to eliminate the potential dominance of one or two institutions in the compilation of disciplinary results. While this is not a major concern in disciplines taught at nearly every college (the basic liberal arts and sciences), it is problematical in such specializations as engineering, design/applied arts, health professions/related sciences, nursing, and religion. 6. Progress on Infrequently Selected Objectives. In many disciplines, lower progress ratings were reported for objectives that were less frequently judged to be relevant (“important” or “essential”) by the instructor. It is not known whether low progress ratings on infrequently chosen objectives is due to faculty errors in identifying objectives, student errors in judging progress on non-traditional objectives, or teacher ineffectiveness in promoting learning on such objectives. Given these limitations, it seems prudent to treat the information provided on the following pages as a highly tentative indicator of differences among academic disciplines. The IDEA Center intends to conduct additional studies to reduce the ambiguities introduced by the limitations described above. Hopefully, other researchers will join in this effort.
6
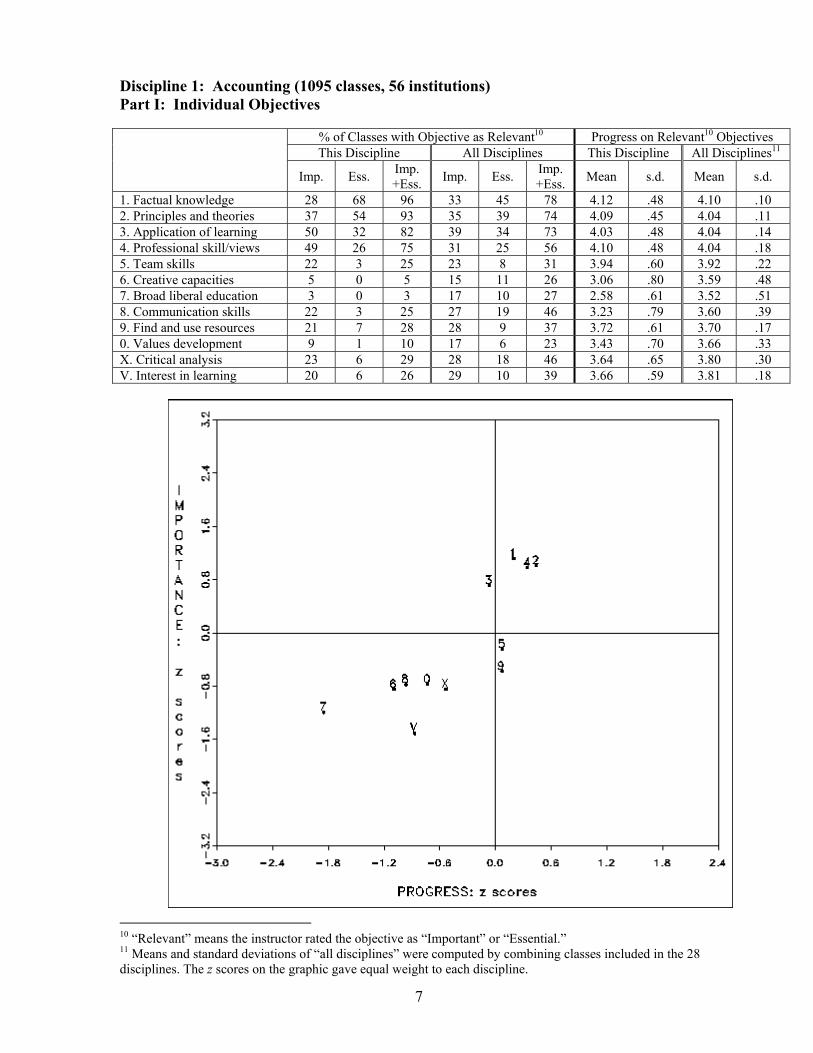
Discipline 1: Accounting (1095 classes, 56 institutions) Part I: Individual Objectives
% of Classes with Objective as Relevant10 Progress on Relevant10 Objectives This Discipline All Disciplines This Discipline All Disciplines11
Imp. Ess. Imp. +Ess. Imp. Ess. Imp.
+Ess. Mean s.d. Mean s.d.
1. Factual knowledge 28 68 96 33 45 78 4.12 .48 4.10 .10 2. Principles and theories 37 54 93 35 39 74 4.09 .45 4.04 .11 3. Application of learning 50 32 82 39 34 73 4.03 .48 4.04 .14 4. Professional skill/views 49 26 75 31 25 56 4.10 .48 4.04 .18 5. Team skills 22 3 25 23 8 31 3.94 .60 3.92 .22 6. Creative capacities 5 0 5 15 11 26 3.06 .80 3.59 .48 7. Broad liberal education 3 0 3 17 10 27 2.58 .61 3.52 .51 8. Communication skills 22 3 25 27 19 46 3.23 .79 3.60 .39 9. Find and use resources 21 7 28 28 9 37 3.72 .61 3.70 .17 0. Values development 9 1 10 17 6 23 3.43 .70 3.66 .33 X. Critical analysis 23 6 29 28 18 46 3.64 .65 3.80 .30 V. Interest in learning 20 6 26 29 10 39 3.66 .59 3.81 .18
10 “Relevant” means the instructor rated the objective as “Important” or “Essential.” 11 Means and standard deviations of “all disciplines” were computed by combining classes included in the 28 disciplines. The z scores on the graphic gave equal weight to each discipline.
7

Commentary The graph compares accounting classes with those in all 28 disciplines included in this study. It reports the degree to which each objective was emphasized (horizontal axis) and the degree to which progress was reported on each emphasized objective (vertical axis). Plots are made in terms of deviation z scores.
The accounting discipline focused largely on basic cognitive objectives (1. Factual knowledge, chosen more frequently in accounting than in any other discipline; and 2. Principles and theories, chosen as relevant much more frequently than for all disciplines combined). Objectives related to professional preparation (3 and 4) were also selected as important or essential more often in accounting than in most other disciplines. In contrast, two objectives were stressed in fewer than 10 percent of accounting classes: 6. Creative capacities and 7. Broad liberal education. Relative to other disciplines, accounting instructors gave a low emphasis to these two objectives as well as those concerned with V. Increasing interest in learning, 8. Communication skills, 0. Values development, and X. Critical analysis. Progress ratings were above 4.0 and generally well above the “all disciplines” figure on objectives that were stressed most frequently; they were well below average on those stressed the least.
8

Discipline 1: Accounting (602 classes, 42 institutions) Part II: Other Ratings This
Discipline All
Disciplines11 Mean s. d. Mean s. d. Teaching Approach A. Stimulate Interest 3.86 .50 4.01 .15 B. Foster Collaboration 3.33 .66 3.67 .32 C. Establish Rapport 3.97 .49 4.05 .11 D. Encourage Student
Involvement 3.67 .54 3.91 .26
E. Structuring Class 4.19 .46 4.19 .10 Class Characteristics F. Amount of reading 3.42 .46 3.23 .46 G. Amount of other work 3.65 .48 3.45 .24 H. Difficulty 3.90 .45 3.47 .30 Student Characteristics3.60 I. Effort in class 3.79 .43 3.60 .20 J. Wanted course 3.34 .39 3.34 .24 K. Usually work hard 3.68 .28 3.66 .09 Global Outcomes L. Increased positive
attitude 3.66 .57 3.88 .23
M. Excellent teacher 4.03 .71 4.20 .12 N. Excellent course 3.77 .55 3.94 .18 Commentary
In terms of teaching approaches, accounting classes were unusual in that none of the five assessed by the IDEA system was employed as frequently as the “all disciplines” average. The approaches most predictive of progress on the objectives stressed by accounting were A. Stimulating Student Interest (primary), D. Encouraging Student Involvement (tertiary), and E. Structuring the Classroom (tertiary). Accounting classes were average on the latter, but well below average on the other two. The challenge to teachers in this discipline is to stimulate interest and elicit student involvement in a discipline whose course content is typically highly structured. Students regarded accounting classes as demanding. Although rated only slightly above average on F. Amount of reading, they were well above average on G. Amount of other (non-reading) work and, especially, on H. Difficulty; these findings are consistent with the well-above average ratings on I. Student effort despite only average ratings on motivation (J and, indirectly, K). Content of accounting courses appears to offer a significant intellectual challenge. Overall (global) outcomes, although all above 3.6 on the 5.0 rating scale, were relatively low—about one standard deviation below the average for all disciplines. These outcomes are influenced primarily by the teaching approach related to stimulating interest on which accounting ratings were relatively low. 11 Means and standard deviations of “all disciplines” were computed by combining classes included in the 28 disciplines. The z scores on the graph gave equal weight to each discipline.
9
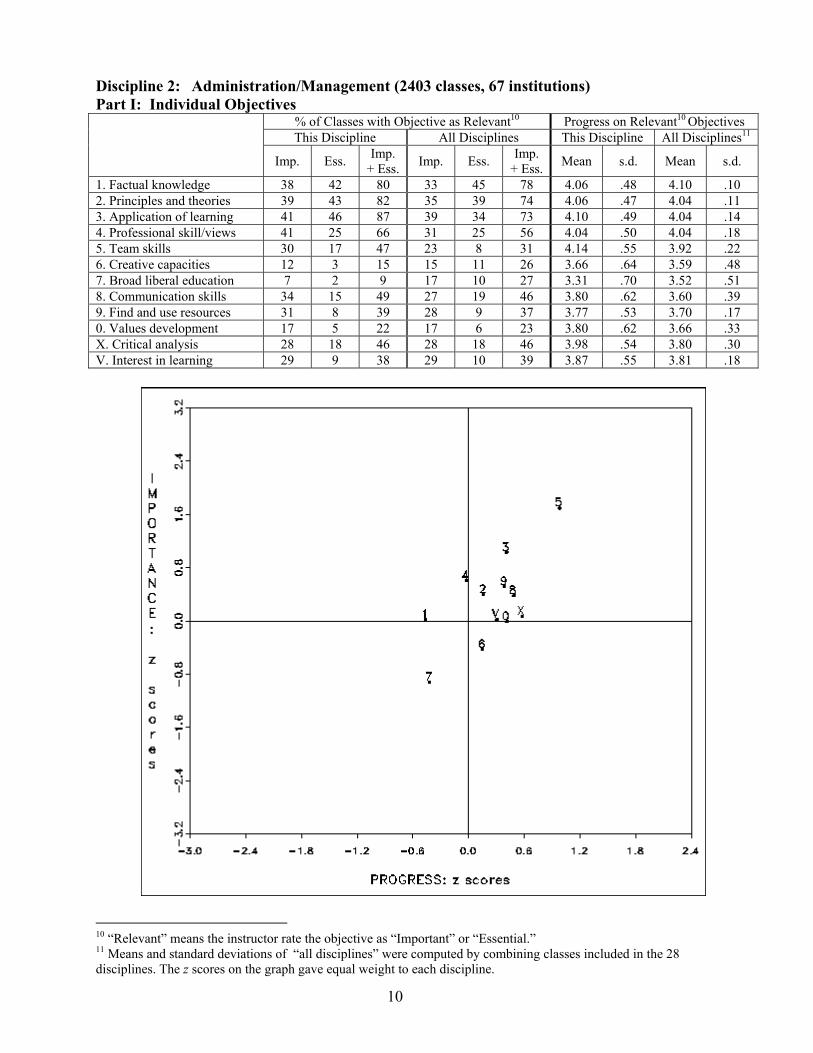
Discipline 2: Administration/Management (2403 classes, 67 institutions) Part I: Individual Objectives
% of Classes with Objective as Relevant10 Progress on Relevant10 Objectives This Discipline All Disciplines This Discipline All Disciplines11
Imp. Ess. Imp. + Ess. Imp. Ess. Imp.
+ Ess. Mean s.d. Mean s.d.
1. Factual knowledge 38 42 80 33 45 78 4.06 .48 4.10 .10 2. Principles and theories 39 43 82 35 39 74 4.06 .47 4.04 .11 3. Application of learning 41 46 87 39 34 73 4.10 .49 4.04 .14 4. Professional skill/views 41 25 66 31 25 56 4.04 .50 4.04 .18 5. Team skills 30 17 47 23 8 31 4.14 .55 3.92 .22 6. Creative capacities 12 3 15 15 11 26 3.66 .64 3.59 .48 7. Broad liberal education 7 2 9 17 10 27 3.31 .70 3.52 .51 8. Communication skills 34 15 49 27 19 46 3.80 .62 3.60 .39 9. Find and use resources 31 8 39 28 9 37 3.77 .53 3.70 .17 0. Values development 17 5 22 17 6 23 3.80 .62 3.66 .33 X. Critical analysis 28 18 46 28 18 46 3.98 .54 3.80 .30 V. Interest in learning 29 9 38 29 10 39 3.87 .55 3.81 .18
10 “Relevant” means the instructor rate the objective as “Important” or “Essential.” 11 Means and standard deviations of “all disciplines” were computed by combining classes included in the 28 disciplines. The z scores on the graph gave equal weight to each discipline.
10

Commentary The graph compares administration/management classes with those in all 28 disciplines included in this study. It reports the degree to which each objective was emphasized (horizontal axis) and the degree to which progress was reported on each emphasized objective (vertical axis). Plots are made in terms of deviation z scores. In absolute terms, the three objectives most often selected for administration/management classes were 1. Factual knowledge, 2. Principles and theories, and 3. Applications; 4. Professional skills and viewpoints was also selected in the majority of such classes. Almost half of all administration/management classes stressed 5. Team skills; no other discipline chose this objective so frequently. In general, progress ratings paralleled importance ratings. Relative to classes in other disciplines, those in administration/management received very high progress ratings on 5. Team skills; ratings on eight other objectives were somewhat above those for all disciplines. The only objectives for which progress ratings were distinctly below the “all disciplines” average were 7. Broad general education (of little significance since this objective was chosen as relevant in only 9% of the classes) and 1. Factual knowledge. This is only of minor concern, since this discipline’s average was 4.06 on the 5-point rating scale.
11

Discipline 2: Administration/Management (1485 classes, 53 institutions) Part II: Other Ratings This
Discipline All
Disciplines11 Mean s. d. Mean s. d. Teaching Approach A. Stimulate Interest 3.98 .52 4.03 .50 B. Foster Collaboration 3.83 .65 3.76 .71 C. Establish Rapport 3.98 .50 4.08 .48 D. Encourage Student
Involvement 4.06 .51 3.97 .56
E. Structuring Class 4.15 .49 4.21 .47 Class Characteristics F. Amount of reading 3.37 .53 3.25 .76 G. Amount of other work 3.49 .55 3.47 .59 H. Difficulty 3.41 .51 3.44 .61 Student Characteristics I. Effort in class 3.59 .53 3.61 .57 J. Wanted course 3.27 .44 3.34 .56 K. Usually work hard 3.73 .29 3.68 .30 Global Outcomes L. Increased positive
attitude 3.88 .57 3.90 .60
M. Excellent teacher 4.10 .68 4.21 .63 N. Excellent course 3.89 .61 3.95 .60 Commentary Classes in administration/management were characterized by relatively high scores on two of the teaching approaches; B. Fostering Student Collaboration and D. Encouraging Student Involvement, both of which are associated with progress ratings on 5. Team skills, an objective featured in this discipline. Ratings were somewhat below average on C. Establishing Rapport and E. Structuring the Classroom. The latter, together with A. Stimulating Student Interest (rated average) are most relevant to progress on 1. Factual knowledge, an important objective in this discipline (see previous page). Administration/management classes required an above average F. Amount of reading, but were considered a little less difficult (H) than the “all disciplines” average. Students believed they generally work harder on academics than do their friends (K), and reported making a “normal” effort (I) on classes in administration/management. Their motivation to enroll (J) was slightly below average. The overall rating of the teacher’s excellence (M) was well below the “all disciplines” average. This rating is most closely related to the three teaching approaches in which administration/management classes scored average or below. The other global outcome ratings were about average. 11 Means and standard deviations of “all disciplines” were computed by combining classes included in the 28 disciplines. The z scores on the graphic gave equal weight to each discipline.
12

Discipline 3: Art (1149 classes, 64 institutions) Part I: Individual Objectives
% of Classes with Objective as Relevant10 Progress on Relevant10 Objectives This Discipline All Disciplines This Discipline All Disciplines11
Imp. Ess. Imp. + Ess. Imp. Ess. Imp.
+ Ess. Mean s.d. Mean s.d.
1. Factual knowledge 37 27 64 33 45 78 4.09 .50 4.10 .10 2. Principles and theories 37 24 61 35 39 74 3.96 .50 4.04 .11 3. Application of learning 34 22 56 39 34 73 4.07 .50 4.04 .14 4. Professional skill/views 42 27 69 31 25 56 4.19 .44 4.04 .18 5. Team skills 14 2 16 23 8 31 3.61 .75 3.92 .22 6. Creative capacities 17 66 83 15 11 26 4.38 .42 3.59 .48 7. Broad liberal education 37 23 60 17 10 27 4.20 .45 3.52 .51 8. Communication skills 22 7 29 27 19 46 3.48 .60 3.60 .39 9. Find and use resources 25 7 32 28 9 37 3.58 .60 3.70 .17 0. Values development 15 6 21 17 6 23 3.53 .63 3.66 .33 X. Critical analysis 24 12 36 28 18 46 3.78 .56 3.80 .30 V. Interest in learning 27 10 37 29 10 39 3.90 .53 3.81 .18
10 “Relevant” means the instructor rate the objective as “Important” or “Essential.” 11 Means and standard deviations of “all disciplines” were computed by combining classes included in the 28 disciplines. The z scores on the graph gave equal weight to each discipline.
13

Commentary The graph compares art classes with those in all 28 disciplines included in this study. It reports the degree to which each objective was emphasized (horizontal axis) and the degree to which progress was reported on each emphasized objective (vertical axis). Plots are made in terms of deviation z scores. Over half of all art classes stressed one or more of six objectives: 6. Creative capacities (selected as relevant in 83% of art classes, more frequently than for any other discipline), 4. Professional skills/viewpoints (69%), 1. Factual knowledge (64%), 2. Principles and theories (61%), 7. Broad liberal education (60%), and 3. Applications (56%). Relative to other disciplines, art instructors gave especially high ratings to the importance of 6. Creative capacities and 7. Broad liberal education. In contrast, three cognitive objectives (1, 2, and 3), although relevant in most art classes, was selected less frequently than the “all disciplines” average. Progress ratings tended to parallel relevance ratings, with unusually high scores on 6. Creative capacities and 7. Broad liberal education. Although progress ratings on several objectives were below the “all disciplines” average, except for 2. Principles and theories these were on objectives infrequently stressed in art.
14

Discipline 3: Art (659 classes, 45 institutions) Part II: Other Ratings This
Discipline All
Disciplines11 Mean s. d. Mean s. d. Teaching Approach A. Stimulate Interest 4.11 .44 4.01 .15 B. Foster Collaboration 3.56 .65 3.67 .32 C. Establish Rapport 4.07 .45 4.05 .11 D. Encourage Student
Involvement 4.03 .50 3.91 .26
E. Structuring Class 4.19 .42 4.19 .10 Class Characteristics F. Amount of reading 2.17 .83 3.23 .46 G. Amount of other work 3.72 .66 3.45 .24 H. Difficulty 3.27 .47 3.47 .30 Student Characteristics I. Effort in class 3.77 .52 3.60 .20 J. Wanted course 3.65 .49 3.34 .24 K. Usually work hard 3.70 .29 3.66 .09 Global Outcomes L. Increased positive
attitude 4.15 .47 3.88 .23
M. Excellent teacher 4.26 .56 4.20 .12 N. Excellent course 4.18 .51 3.94 .18 Commentary In terms of teaching approaches, classes in art were well above the “all disciplines” average on A. Stimulating Student Interest and D. Encouraging Student Involvement, but somewhat below average on B. Fostering Student Collaboration. Stimulating Student Interest was a primary predictor of progress ratings on the six objectives chosen most frequently by art instructors; Encouraging Student Involvement was also related to progress on three other relevant objectives—6. Creative capacities and, to a lesser degree, 4. Professional skills/viewpoints and 3. Applications (see previous page). Art classes required much less reading (F), but much more work of other kinds (G), than did classes in other disciplines. They were also considered somewhat below average in difficulty (H). Students in art classes were exceptionally well motivated (J and, indirectly, K) which may explain the high effort they put forth in these classes (I). The combination of high motivation and high effort is probably related to the positive ratings on all three global outcomes (improved attitude toward the discipline, excellence of teacher, and excellence of course).
11 Means and standard deviations of “all disciplines” were computed by combining classes included in the 28 disciplines. The z scores on the graph gave equal weight to each discipline.
15

Discipline 4: Biology/Life Science (1763 classes, 66 institutions) Part I: Individual Objectives
% of Classes with Objective as Relevant10 Progress on Relevant10 Objectives This Discipline All Disciplines This Discipline All Disciplines11
Imp. Ess. Imp. + Ess. Imp. Ess. Imp.
+ Ess. Mean s.d. Mean s.d.
1. Factual knowledge 20 74 94 33 45 78 4.25 .47 4.10 .10 2. Principles and theories 39 52 91 35 39 74 4.04 .44 4.04 .11 3. Application of learning 42 22 64 39 34 73 3.94 .52 4.04 .14 4. Professional skill/views 33 14 47 31 25 56 4.05 .50 4.04 .18 5. Team skills 24 5 29 23 8 31 3.97 .60 3.92 .22 6. Creative capacities 6 1 7 15 11 26 3.15 .60 3.59 .48 7. Broad liberal education 21 5 26 17 10 27 3.31 .56 3.52 .51 8. Communication skills 22 5 27 27 19 46 3.33 .66 3.60 .39 9. Find and use resources 28 5 33 28 9 37 3.73 .54 3.70 .17 0. Values development 7 2 9 17 6 23 3.49 .60 3.66 .33 X. Critical analysis 23 7 30 28 18 46 3.61 .56 3.80 .30 V. Interest in learning 26 6 32 29 10 39 3.74 .52 3.81 .18
10 “Relevant” means the instructor rate the objective as “Important” or “Essential.” 11 Means and standard deviations of “all disciplines” were computed by combining classes included in the 28 disciplines. The z scores on the graph gave equal weight to each discipline.
16

Commentary The graph compares biology/life sciences classes with those in all 28 disciplines included in this study. It reports the degree to which each objective was emphasized (horizontal axis) and the degree to which progress was reported on each emphasized objective (vertical axis). Plots are made in terms of deviation z scores. Over 90% of the classes in this discipline focused on the two basic cognitive objectives (1. Factual knowledge and 2. Principles and theories)—well above the average for all disciplines. The only other objective stressed by more than half of the classes (3. Applications) was selected less frequently than the “all disciplines” average, as were six other objectives. Three objectives (5. Team skills, 7. Broad liberal education, and 9. Finding and using resources) were regarded as “important” or “essential” in 25-35% of classes both for this discipline and for “all disciplines.” Progress ratings were substantially above the “all disciplines” average on 1. Factual knowledge, and about average on 2. Principles and theories, the two most emphasized objectives. Although they tended to be below average on all objectives whose importance was also below average in this discipline, they were still above 3.5 (on a 5-point scale) for all objectives except 6. Creative capacities, 7. Broad liberal education, 8. Communication skills, and 0. Values development.
17

Discipline 4: Biology/Life Science (1176 classes, 53 institutions) Part II: Other Ratings
This Discipline
All Disciplines11
Mean s. d. Mean s. d. Teaching Approach A. Stimulate Interest 4.03 .45 4.01 .15 B. Foster Collaboration 3.40 .68 3.67 .32 C. Establish Rapport 4.00 .46 4.05 .11 D. Encourage Student
Involvement 3.86 .50 3.91 .26
E. Structuring Class 4.18 .47 4.19 .10 Class Characteristics F. Amount of reading 3.37 .67 3.23 .46 G. Amount of other work 3.42 .59 3.45 .24 H. Difficulty 3.92 .56 3.47 .30 Student Characteristics I. Effort in class 3.82 .57 3.60 .20 J. Wanted course 3.32 .54 3.34 .24 K. Usually work hard 3.69 .28 3.66 .09 Global Outcomes L. Increased positive
attitude 3.87 .58 3.88 .23
M. Excellent teacher 4.18 .63 4.20 .12 N. Excellent course 3.91 .60 3.94 .18
Commentary
In terms of teaching approaches, biology/life science teachers were rated as slightly above average on A. Stimulating Student Interest but below average on the other four approaches; averages on B. Fostering Student Collaboration and C. Establishing Rapport were especially low. For the two objectives stressed most frequently in this discipline, the major teaching approaches related to progress ratings were those where the discipline’s scores compared most favorably to the “all disciplines” average: A. Stimulating Student Interest (primary) and E. Structuring the Classroom (tertiary); techniques related to B. Fostering Student Collaboration, the approach that was most under-emphasized in this discipline, generally had a negative affect on these two progress ratings. Classes in this discipline were perceived as much more difficult than those in other disciplines (H), a finding which may explain why students claimed to have worked unusually hard (I) despite having only an average amount of motivation to enroll (J). “Difficulty” ratings are most closely related to requirements in reading (F) and other work (G). Since these were in the average range, the high difficulty rating is best attributed to the inherent intellectual challenges posed by the discipline. All three ratings of global outcomes were in the average range. The generally low ratings on progress and on teaching approaches may have been compensated for by high ratings on 1. Factual knowledge (see previous page) and effort (I). 11 Means and standard deviations of “all disciplines” were computed by combining classes included in the 28 disciplines. The z scores on the graph gave equal weight to each discipline.
18

Discipline 5: Business/General (605 classes, 60 institutions) Part I: Individual Objectives
% of Classes with Objective as Relevant10 Progress on Relevant10 Objectives This Discipline All Disciplines This Discipline All Disciplines11
Imp. Ess. Imp. + Ess. Imp. Ess. Imp.
+ Ess. Mean s.d. Mean s.d.
1. Factual knowledge 40 45 85 33 45 78 4.07 .44 4.10 .10 2. Principles and theories 35 45 80 35 39 74 4.01 .44 4.04 .11 3. Application of learning 41 43 84 39 34 73 4.07 .45 4.04 .14 *4. Professional skill/views 35 30 65 31 25 56 4.04 .44 4.04 .18 5. Team skills 31 10 41 23 8 31 4.00 .56 3.92 .22 6. Creative capacities 12 4 16 15 11 26 3.65 .68 3.59 .48 7. Broad liberal education 7 2 9 17 10 27 3.19 .72 3.52 .51 *8. Communication skills 33 18 51 27 19 46 3.60 .65 3.60 .39 9. Find and use resources 34 11 45 28 9 37 3.75 .49 3.70 .17 0. Values development 15 6 21 17 6 23 3.70 .57 3.66 .33 X. Critical analysis 32 16 48 28 18 46 3.83 .48 3.80 .30 V. Interest in learning 30 9 39 29 10 39 3.73 .58 3.81 .18
10 “Relevant” means the instructor rate the objective as “Important” or “Essential.” 11 Means and standard deviations of “all disciplines” were computed by combining classes included in the 28 disciplines. The z scores on the graph gave equal weight to each discipline. * The plots for these measures overlap; only the first is shown on the graph.
19
Commentary The graph compares business/general classes with those in all 28 disciplines included in this study. It reports the degree to which each objective was emphasized (horizontal axis) and the degree to which progress was reported on each emphasized objective (vertical axis). Plots are made in terms of deviation z scores. The four most commonly chosen objectives in this discipline were all cognitively oriented—either basic cognitive understandings (1 and 2) or those more applied/professionally oriented (3 and 4). Compared to all other classes, the emphasis on the latter was especially strong. Slightly over half of the classes in business/general also emphasized the development of 8. Communication skills, but this did not distinguish the discipline from others. Over 40% of the classes emphasized 5. Team skills and/or 9. Finding and using resources; these percentages were much higher than the “all disciplines” average. Progress ratings were somewhat below the “all disciplines” average on basic cognitive objectives (1 and 2), but still above 4.0; for other objectives commonly stressed, these ratings were at or slightly above the “all disciplines” average. Because only 350 classes used the Diagnostic Form, results for Part II are not reported.
20

Discipline 6: Chemistry (969 classes, 64 institutions) Part I: Individual Objectives
% of Classes with Objective as Relevant10 Progress on Relevant10 Objectives This Discipline All Disciplines This Discipline All Disciplines11
Imp. Ess. Imp. + Ess. Imp. Ess. Imp.
+ Ess. Mean s.d. Mean s.d.
1. Factual knowledge 37 54 91 33 45 78 4.07 .47 4.10 .10 2. Principles and theories 32 57 89 35 39 74 4.03 .45 4.04 .11 3. Application of learning 45 36 81 39 34 73 3.89 .48 4.04 .14 4. Professional skill/views 37 15 52 31 25 56 3.89 .46 4.04 .18 5. Team skills 18 5 22 23 8 31 3.97 .58 3.92 .22 6. Creative capacities 5 1 6 15 11 26 2.67 .82 3.59 .48 7. Broad liberal education 16 4 20 17 10 27 3.14 .60 3.52 .51 *8. Communication skills 17 4 21 27 19 46 2.96 .75 3.60 .39 9. Find and use resources 25 6 31 28 9 37 3.60 .52 3.70 .17 0. Values development 4 1 5 17 6 23 3.11 .72 3.66 .33 *X. Critical analysis 21 6 27 28 18 46 3.31 .59 3.80 .30 V. Interest in learning 20 5 25 29 10 39 3.56 .56 3.81 .18
10 “Relevant” means the instructor rate the objective as “Important” or “Essential.” 11 Means and standard deviations of “all disciplines” were computed by combining classes included in the 28 disciplines. The z scores on the graph gave equal weight to each discipline. * The plots for these measures overlap; only the first is shown on the graph.
21
Commentary The graph compares chemistry classes with those in all 28 disciplines included in this study. It reports the degree to which each objective was emphasized (horizontal axis) and the degree to which progress was reported on each emphasized objective (vertical axis). Plots are made in terms of deviation z scores. Three cognitively-oriented objectives were stressed in over 80% of chemistry classes— 1. Factual knowledge, 2. Principles and theories, and 3. Applications; these emphases were well above the “all disciplines” averages. Just over half of the chemistry classes emphasized gaining 4. Professional skills and viewpoints, which was about average for all disciplines. The amount of emphasis on other objectives was well below the “all disciplines” average. Progress ratings were generally lower than the “all disciplines” average, although only slightly so on the objectives stressed most frequently (1 and 2). On these two objectives, average progress ratings were still above 4.0 on the 5-point scale.
22

Discipline 6: Chemistry (728 classes, 53 institutions) Part II: Other Ratings This
Discipline All
Disciplines11 Mean s. d. Mean s. d. Teaching Approach A. Stimulate Interest 3.80 .51 4.01 .15 B. Foster Collaboration 3.12 .65 3.67 .32 C. Establish Rapport 3.93 .49 4.05 .11 D. Encourage Student
Involvement 3.49 .54 3.91 .26
E. Structuring Class 4.02 .51 4.19 .10 Class Characteristics F. Amount of reading 3.19 .69 3.23 .46 G. Amount of other work 3.66 .60 3.45 .24 H. Difficulty 4.02 .56 3.47 .30 Student Characteristics I. Effort in class 3.79 .59 3.60 .20 J. Wanted course 3.10 .50 3.34 .24 K. Usually work hard 3.67 .30 3.66 .09 Global Outcomes L. Increased positive
attitude 3.49 .57 3.88 .23
M. Excellent teacher 4.02 .73 4.20 .12 N. Excellent course 3.60 .57 3.94 .18 Commentary Chemistry teachers were rated well-below average on all five of the teaching approaches assessed by the IDEA student rating form; the learning atmosphere, as assessed by the IDEA items describing teaching methods, had few of the attributes normally associated with effective instruction. The teaching challenge in chemistry appears to be a considerable one. On average, students were poorly motivated to take the class (J) and found chemistry classes to be more difficult than those in any other discipline (H). These findings, coupled with an average amount of reading (F) and well-above average amount of other work (G) may account for the high effort put forth in these classes (I). Global ratings (L, M, N) were all well below average. These disappointing outcomes probably reflect a combination of factors – a non-facilitative learning environment, poorly motivated students, and a difficult, academically challenging discipline.
11 Means and standard deviations of “all disciplines” were computed by combining classes included in the 28 disciplines. The z scores on the graph gave equal weight to each discipline.
23
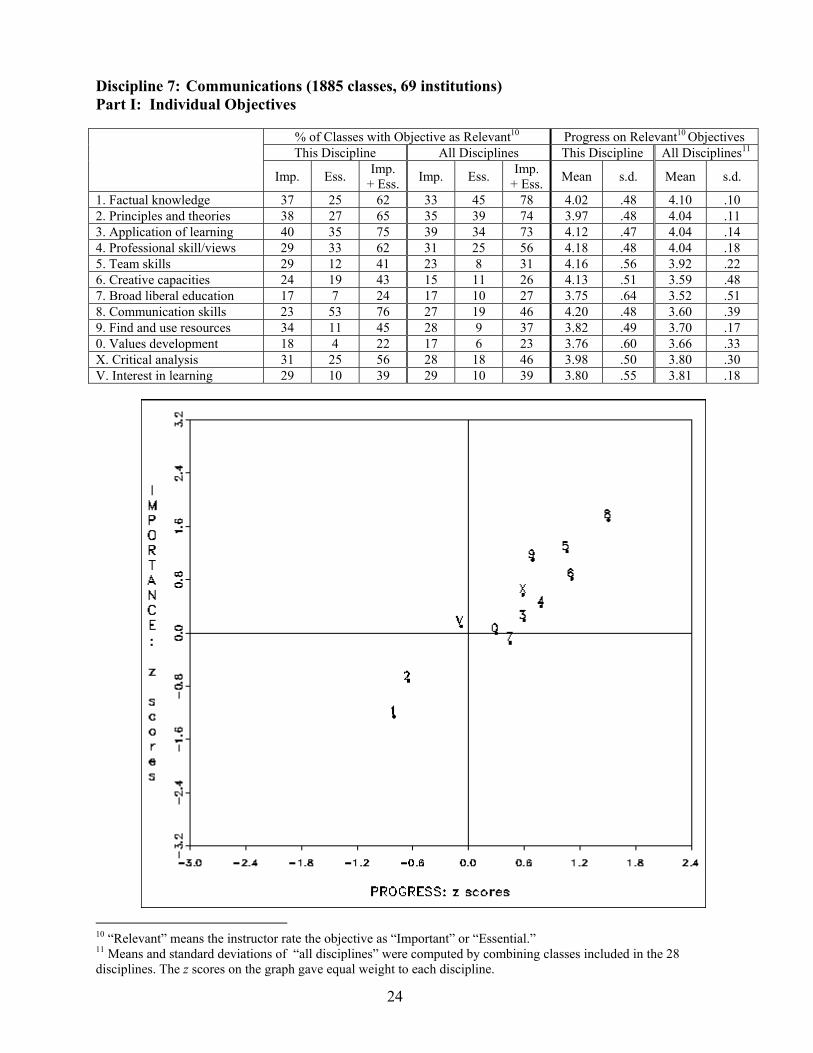
Discipline 7: Communications (1885 classes, 69 institutions) Part I: Individual Objectives
% of Classes with Objective as Relevant10 Progress on Relevant10 Objectives This Discipline All Disciplines This Discipline All Disciplines11
Imp. Ess. Imp. + Ess. Imp. Ess. Imp.
+ Ess. Mean s.d. Mean s.d.
1. Factual knowledge 37 25 62 33 45 78 4.02 .48 4.10 .10 2. Principles and theories 38 27 65 35 39 74 3.97 .48 4.04 .11 3. Application of learning 40 35 75 39 34 73 4.12 .47 4.04 .14 4. Professional skill/views 29 33 62 31 25 56 4.18 .48 4.04 .18 5. Team skills 29 12 41 23 8 31 4.16 .56 3.92 .22 6. Creative capacities 24 19 43 15 11 26 4.13 .51 3.59 .48 7. Broad liberal education 17 7 24 17 10 27 3.75 .64 3.52 .51 8. Communication skills 23 53 76 27 19 46 4.20 .48 3.60 .39 9. Find and use resources 34 11 45 28 9 37 3.82 .49 3.70 .17 0. Values development 18 4 22 17 6 23 3.76 .60 3.66 .33 X. Critical analysis 31 25 56 28 18 46 3.98 .50 3.80 .30 V. Interest in learning 29 10 39 29 10 39 3.80 .55 3.81 .18
10 “Relevant” means the instructor rate the objective as “Important” or “Essential.” 11 Means and standard deviations of “all disciplines” were computed by combining classes included in the 28 disciplines. The z scores on the graph gave equal weight to each discipline.
24

Commentary The graph compares communications classes with those in all 28 disciplines included in this study. It reports the degree to which each objective was emphasized (horizontal axis) and the degree to which progress was reported on each emphasized objective (vertical axis). Plots are made in terms of deviation z scores. This discipline was unusual in terms of the number of objectives (9 of 12) that were “important” or “essential” in at least 40% of classes. As expected, relative to other disciplines, this one placed a heavy emphasis on learning to speak and write (8). It was also well above average on 5. Team skills, 9. Finding and using resources, and 6. Creative capacities. Although over 60% of communications classes emphasized 1. Factual knowledge and/or 2. Principles and theories, these were well below the “all disciplines” average. Progress ratings tended to parallel importance ratings. In relative terms, the more an objective was emphasized, the higher the progress rating. Except for the two basic cognitive objectives (1 and 2) and the objective concerned with increasing interest in learning (V), all progress ratings were above average. The average progress rating for relevant (chosen) objectives was 3.75 or higher for all twelve objectives, a highly positive finding given the discipline’s propensity to select multiple objectives.
25
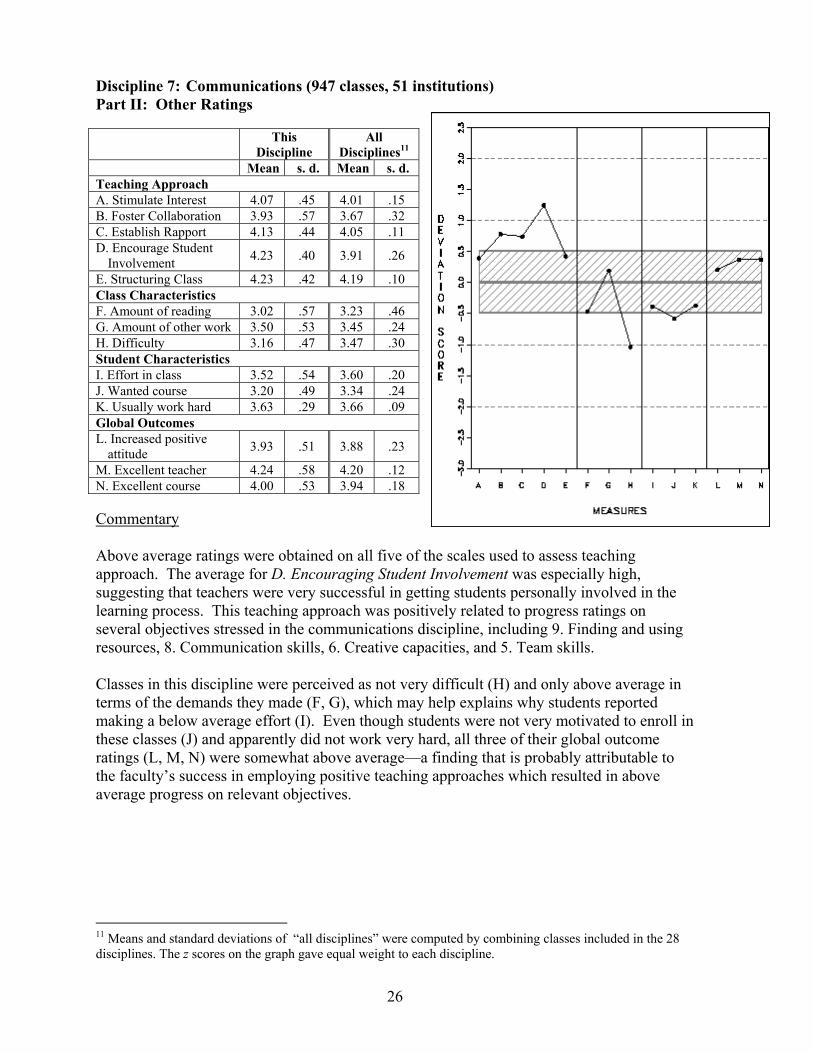
Discipline 7: Communications (947 classes, 51 institutions) Part II: Other Ratings This
Discipline All
Disciplines11 Mean s. d. Mean s. d. Teaching Approach A. Stimulate Interest 4.07 .45 4.01 .15 B. Foster Collaboration 3.93 .57 3.67 .32 C. Establish Rapport 4.13 .44 4.05 .11 D. Encourage Student
Involvement 4.23 .40 3.91 .26
E. Structuring Class 4.23 .42 4.19 .10 Class Characteristics F. Amount of reading 3.02 .57 3.23 .46 G. Amount of other work 3.50 .53 3.45 .24 H. Difficulty 3.16 .47 3.47 .30 Student Characteristics I. Effort in class 3.52 .54 3.60 .20 J. Wanted course 3.20 .49 3.34 .24 K. Usually work hard 3.63 .29 3.66 .09 Global Outcomes L. Increased positive
attitude 3.93 .51 3.88 .23
M. Excellent teacher 4.24 .58 4.20 .12 N. Excellent course 4.00 .53 3.94 .18 Commentary Above average ratings were obtained on all five of the scales used to assess teaching approach. The average for D. Encouraging Student Involvement was especially high, suggesting that teachers were very successful in getting students personally involved in the learning process. This teaching approach was positively related to progress ratings on several objectives stressed in the communications discipline, including 9. Finding and using resources, 8. Communication skills, 6. Creative capacities, and 5. Team skills. Classes in this discipline were perceived as not very difficult (H) and only above average in terms of the demands they made (F, G), which may help explains why students reported making a below average effort (I). Even though students were not very motivated to enroll in these classes (J) and apparently did not work very hard, all three of their global outcome ratings (L, M, N) were somewhat above average—a finding that is probably attributable to the faculty’s success in employing positive teaching approaches which resulted in above average progress on relevant objectives.
11 Means and standard deviations of “all disciplines” were computed by combining classes included in the 28 disciplines. The z scores on the graph gave equal weight to each discipline.
26

Discipline 8: Computer/Information Sciences (1409 classes, 71 institutions) Part I: Individual Objectives
% of Classes with Objective as Relevant10 Progress on Relevant10 Objectives This Discipline All Disciplines This Discipline All Disciplines11
Imp. Ess. Imp. + Ess. Imp. Ess. Imp.
+ Ess. Mean s.d. Mean s.d.
1. Factual knowledge 32 61 93 33 45 78 4.06 .45 4.10 .10 2. Principles and theories 38 38 76 35 39 74 3.93 .47 4.04 .11 3. Application of learning 43 37 80 39 34 73 4.00 .46 4.04 .14 4. Professional skill/views 37 46 83 31 25 56 4.00 .45 4.04 .18 5. Team skills 18 7 25 23 8 31 3.74 .66 3.92 .22 6. Creative capacities 17 3 20 15 11 26 3.46 .64 3.59 .48 *7. Broad liberal education 7 2 9 17 10 27 2.99 .72 3.52 .51 *8. Communication skills 17 4 21 27 19 46 3.20 .69 3.60 .39 9. Find and use resources 39 11 50 28 9 37 3.67 .52 3.70 .17 0. Values development 5 1 6 17 6 23 3.27 .61 3.66 .33 X. Critical analysis 19 5 24 28 18 46 3.37 .58 3.80 .30 V. Interest in learning 29 7 36 29 10 39 3.69 .52 3.81 .18
10 “Relevant” means the instructor rate the objective as “Important” or “Essential.” 11 Means and standard deviations of “all disciplines” were computed by combining classes included in the 28 disciplines. The z scores on the graph gave equal weight to each discipline. * The plots for these measures overlap; only the first is shown on the graph.
27

Commentary The graph compares computer/information science classes with those in all 28 disciplines included in this study. It reports the degree to which each objective was emphasized (horizontal axis) and the degree to which progress was reported on each emphasized objective (vertical axis). Plots are made in terms of deviation z scores. Classes in this discipline focused on the four cognitively-oriented objectives (1. Factual knowledge, 2. Principles and theories, 3. Applications, and 4. Professional skills/viewpoints). In addition, over half of them selected 9. Finding and using resources as an important or essential objective. Relative to other disciplines, the emphasis on 9. Finding and using resources, 4. Professionals skills/viewpoints, and 1. Factual knowledge were especially strong. All progress ratings were below the “all disciplines” averages (although, with the exception of 2. Principles and theories, they were near average for the most relevant objectives in the discipline). Although students reported less learning in computer/information science classes than in other classes, average ratings on the four most frequently chosen objectives were above 3.9 on the 5-point scale. On the other commonly selected objective (9. Finding and using resources), the discipline’s average progress rating (3.67) was only slightly below the average for all disciplines.
28

Discipline 8: Computer/Information Sciences (887 classes, 57 institutions) Part II: Other Ratings
11
Mean s. d. Mean s. d. Teaching Approach
3.83 .51 4.01 .15 B. Foster Collaboration 3.24 .67 3.67 .32
3.92 .47 4.05 .11 D. Encourage Student
Involvement 3.81 .51 3.91 .26
4.12 .47 4.19 .10 Class Characteristics F. Amount of reading 2.99 .61 3.23
This Discipline
All Disciplines
A. Stimulate Interest
C. Establish Rapport
E. Structuring Class
.46 G. Amount of other work 3.53 .54 3.45 .24 H. Difficulty 3.37 .59 3.47 .30 Student Characteristics I. Effort in class 3.51 .57 3.60 .20 J. Wanted course 3.52 .47 3.34 .24 K. Usually work hard 3.60 .28 3.66 .09 Global Outcomes L. Increased positive
attitude 3.85 .52 3.88 .23
M. Excellent teacher 4.07 .63 4.20 .12 N. Excellent course 3.90 .55 3.94 .18 Commentary Below average scores were obtained on all five of the “teaching approach” scales; the lowest ratings were made on A. Stimulating Student Interest, B. Fostering Student Collaboration, and C. Establishing Rapport. The first of these is closely related to progress ratings on the four most important objectives in this discipline. Progress on 9. Finding and using resources, another objective commonly emphasized in this discipline (see previous page), was most closely related to D. Encouraging Student Involvement, where, on a relative basis, computer/information sciences had its highest score (though still below average). Courses in this discipline required less reading (F), but more other work (G), than the “all disciplines” average. Students regarded them as slightly less difficult than most of their courses (H). Although students were highly motivated to enroll in these classes (J) they were not accustomed to working hard in their classes (K) and made a below average effort in their computer/information sciences classes (I). Overall, ratings were about average in terms of an increased positive attitude toward the field of study (L) and the excellence of the course (N). Consistent with the low ratings on teaching approach and academic progress, the overall rating of the excellence of the teacher was well below average (M); on an absolute basis, this average rating was 4.07 on a 5-point scale.
11 Means and standard deviations of “all disciplines” were computed by combining classes included in the 28 disciplines. The z scores on the graph gave equal weight to each discipline.
29

Discipline 9: Design/Applied Arts (1601 classes, 23 institutions) Part I: Individual Objectives
% of Classes with Objective as Relevant10 Progress on Relevant10 Objectives This Discipline All Disciplines This Discipline All Disciplines11
Imp. Ess. Imp. + Ess. Imp. Ess. Imp.
+ Ess. Mean s.d. Mean s.d.
1. Factual knowledge 35 47 82 33 45 78 4.12 .47 4.10 .10 2. Principles and theories 39 41 80 35 39 74 4.13 .44 4.04 .11 3. Application of learning 37 46 83 39 34 73 4.18 .44 4.04 .14 4. Professional skill/views 34 53 87 31 25 56 4.16 .46 4.04 .18 5. Team skills 20 6 26 23 8 31 3.74 .63 3.92 .22 6. Creative capacities 30 39 69 15 11 26 4.01 .49 3.59 .48 7. Broad liberal education 18 7 25 17 10 27 3.78 .57 3.52 .51 8. Communication skills 22 6 28 27 19 46 3.54 .57 3.60 .39 9. Find and use resources 37 13 50 28 9 37 3.80 .53 3.70 .17 0. Values development 15 3 18 17 6 23 3.66 .51 3.66 .33 X. Critical analysis 26 14 40 28 18 46 3.84 .51 3.80 .30 V. Interest in learning 35 15 50 29 10 39 3.96 .49 3.81 .18
10 “Relevant” means the instructor rate the objective as “Important” or “Essential.” 11 Means and standard deviations of “all disciplines” were computed by combining classes included in the 28 disciplines. The z scores on the graph gave equal weight to each discipline.
30

Commentary The graph compares design/applied arts classes with those in all 28 disciplines included in this study. It reports the degree to which each objective was emphasized (horizontal axis) and the degree to which progress was reported on each emphasized objective (vertical axis). Plots are made in terms of deviation z scores. Like most disciplines, design/applied arts placed heavy emphasis on the four cognitively oriented objectives: (1. Factual knowledge, 2. Principles and theories, 3. Applications, and 4. Professional skills/viewpoints). Three other objectives were stressed in the majority of classes in this discipline—6. Creative capacities, 9. Finding and using resources, and V. Increasing interest in learning. Compared to other classes, those in this discipline were most distinguished by their high emphasis on 6. Creative capacities, V. Increased interest in learning, 4. Professional skills/viewpoints, and 9. Finding and using resources. Progress ratings were well above the “all disciplines” average on most objectives. The exceptions were the average ratings for 0. Values development, X. Critical analysis, and 8. Communication skills together with a well below average rating on 5. Team skills. Because only 421 classes used the Diagnostic Form, results for Part II are not reported.
31

Discipline 10: Economics (792 classes, 62 institutions) Part I: Individual Objectives
% of Classes with Objective as Relevant10 Progress on Relevant10 Objectives This Discipline All Disciplines This Discipline All Disciplines11
Imp. Ess. Imp. + Ess. Imp. Ess. Imp.
+ Ess. Mean s.d. Mean s.d.
1. Factual knowledge 46 45 91 33 45 78 4.01 .45 4.10 .10 2. Principles and theories 24 72 96 35 39 74 4.04 .42 4.04 .11 3. Application of learning 46 38 84 39 34 73 3.87 .46 4.04 .14 4. Professional skill/views 26 7 33 31 25 56 3.79 .47 4.04 .18 5. Team skills 8 2 10 23 8 31 3.40 .81 3.92 .22 6. Creative capacities 5 1 6 15 11 26 2.82 .59 3.59 .48 7. Broad liberal education 9 1 10 17 10 27 2.86 .61 3.52 .51 8. Communication skills 16 3 19 27 19 46 3.13 .81 3.60 .39 9. Find and use resources 19 4 23 28 9 37 3.54 .64 3.70 .17 0. Values development 8 1 9 17 6 23 3.29 .64 3.66 .33 X. Critical analysis 30 16 46 28 18 46 3.65 .54 3.80 .30 V. Interest in learning 23 4 27 29 10 39 3.55 .54 3.81 .18
10 “Relevant” means the instructor rate the objective as “Important” or “Essential.” 11 Means and standard deviations of “all disciplines” were computed by combining classes included in the 28 disciplines. The z scores on the graph gave equal weight to each discipline.
32

Commentary The graph compares economics classes with those in all 28 disciplines included in this study. It reports the degree to which each objective was emphasized (horizontal axis) and the degree to which progress was reported on each emphasized objective (vertical axis). Plots are made in terms of deviation z scores. Three objectives were chosen as relevant in over 80% of classes in economics—1. Factual knowledge, 2. Principles and theories, and 3. Applications. No other objective was addressed in the majority of classes; although in 46% of them X. Critical analysis was regarded as important or essential. The frequency of the latter was average for all classes; but the first three were chosen much more frequently in economics than in other disciplines. Progress ratings on all objectives were well below the “all disciplines” average except for 2. Principles and theories where an average rating was found. In general, students reported less learning in these classes than in their classes in other disciplines. Nonetheless, on an absolute basis, progress ratings on the four most frequently chosen objectives were reassuring, varying from 3.79 to 4.04 on a 5-point rating scale. Because only 489 classes used the Diagnostic Form, results for Part II are not reported.
33

Discipline 11: Education/General (4424 classes, 67 institutions) Part I: Individual Objectives
% of Classes with Objective as Relevant10 Progress on Relevant10 Objectives This Discipline All Disciplines This Discipline All Disciplines11
Imp. Ess. Imp. + Ess. Imp. Ess. Imp.
+ Ess. Mean s.d. Mean s.d.
1. Factual knowledge 36 42 78 33 45 78 4.18 .52 4.10 .10 2. Principles and theories 40 36 76 35 39 74 4.17 .50 4.04 .11 3. Application of learning 37 46 83 39 34 73 4.30 .49 4.04 .14 4. Professional skill/views 39 45 84 31 25 56 4.30 .49 4.04 .18 5. Team skills 31 14 45 23 8 31 4.20 .52 3.92 .22 6. Creative capacities 17 7 24 15 11 26 4.06 .57 3.59 .48 7. Broad liberal education 12 7 19 17 10 27 3.89 .67 3.52 .51 8. Communication skills 34 13 47 27 19 46 4.00 .53 3.60 .39 9. Find and use resources 33 16 49 28 9 37 4.01 .56 3.70 .17 0. Values development 23 10 33 17 6 23 4.07 .55 3.66 .33 X. Critical analysis 29 17 46 28 18 46 4.07 .55 3.80 .30 V. Interest in learning 29 14 43 29 10 39 4.07 .54 3.81 .18
10 “Relevant” means the instructor rate the objective as “Important” or “Essential.” 11 Means and standard deviations of “all disciplines” were computed by combining classes included in the 28 disciplines. The z scores on the graph gave equal weight to each discipline.
34

Commentary The graph compares education/general classes with those in all 28 disciplines included in this study. It reports the degree to which each objective was emphasized (horizontal axis) and the degree to which progress was reported on each emphasized objective (vertical axis). Plots are made in terms of deviation z scores. Like most disciplines, education/general classes most frequently emphasized the four cognitively-oriented objectives; those related to professional development (3. Applications and 4. Professional skills/viewpoints) were addressed in over 80% of classes in this discipline, while the two concerned with basic cognitive background (1. Factual knowledge and 2. Principles and theories) were relevant in over 70% of such classes. The discipline was unusual in that over 40% of the classes also emphasized one or more of five other objectives. Compared to classes in other disciplines, those in education/general selected a large number of objectives. The discipline was most differentiated by its high emphasis on 4. Professional skills/viewpoints, 5. Team skills, and 9. Finding and using resources. Progress ratings were highest on the three “most differentiating” objectives and they were at least average on all other objectives except 7. Broad liberal education, an objective rated “important” or “essential” in only 18% of classes in this discipline.
35

Discipline 11: Education/General (3011 classes, 56 institutions) Part II: Other Ratings This
Discipline All
Disciplines11 Mean s. d. Mean s. d. Teaching Approach A. Stimulate Interest 4.25 .50 4.01 .15 B. Foster Collaboration 4.26 .52 3.67 .32 C. Establish Rapport 4.26 .48 4.05 .11 D. Encourage Student
Involvement 4.36 .44 3.91 .26
E. Structuring Class 4.32 .50 4.19 .10 Class Characteristics F. Amount of reading 3.19 .64 3.23 .46 G. Amount of other work 3.51 .55 3.45 .24 H. Difficulty 3.18 .49 3.47 .30 Student Characteristics I. Effort in class 3.64 .58 3.60 .20 J. Wanted course 3.48 .50 3.34 .24 K. Usually work hard 3.80 .30 3.66 .09 Global Outcomes L. Increased positive
attitude 4.17 .56 3.88 .23
M. Excellent teacher 4.28 .66 4.20 .12 N. Excellent course 4.10 .63 3.94 .18 Commentary Exceptionally high ratings were obtained on all five of the scales assessing teaching approaches; it can be inferred that positive learning climates were established in these classes. They were rated about average in their demands (F. Reading, G. Other work) and well below average in difficulty (H). Student motivation was above average (J and, indirectly, K), which may account for the above average rating on effort (I) despite the low difficulty of these classes. All three global ratings (increased positive attitude, excellence of teacher, excellence of course) were well above the “all disciplines” average. Students felt most classes in this discipline were well taught and valuable.
11 Means and standard deviations of “all disciplines” were computed by combining classes included in the 28 disciplines. The z scores on the graph gave equal weight to each discipline.
36

Discipline 12: Engineering (1249 classes, 26 institutions) Part I: Individual Objectives
% of Classes with Objective as Relevant10 Progress on Relevant10 Objectives This Discipline All Disciplines This Discipline All Disciplines11
Imp. Ess. Imp. + Ess. Imp. Ess. Imp.
+ Ess. Mean s.d. Mean s.d.
1. Factual knowledge 32 51 83 33 45 78 4.02 .49 4.10 .10 2. Principles and theories 29 53 82 35 39 74 3.99 .50 4.04 .11 3. Application of learning 48 41 89 39 34 73 3.97 .50 4.04 .14 4. Professional skill/views 46 27 73 31 25 56 3.95 .49 4.04 .18 5. Team skills 25 15 40 23 8 31 4.11 .57 3.92 .22 6. Creative capacities 12 8 20 15 11 26 3.31 .76 3.59 .48 7. Broad liberal education 6 1 7 17 10 27 2.64 .65 3.52 .51 8. Communication skills 27 5 32 27 19 46 3.23 .72 3.60 .39 9. Find and use resources 27 7 34 28 9 37 3.61 .59 3.70 .17 0. Values development 9 2 11 17 6 23 3.26 .66 3.66 .33 X. Critical analysis 18 9 27 28 18 46 3.38 .59 3.80 .30 V. Interest in learning 26 5 31 29 10 39 3.55 .53 3.81 .18
10 “Relevant” means the instructor rate the objective as “Important” or “Essential.” 11 Means and standard deviations of “all disciplines” were computed by combining classes included in the 28 disciplines. The z scores on the graph gave equal weight to each discipline.
37

Commentary The graph compares engineering classes with those in all 28 disciplines included in this study. It reports the degree to which each objective was emphasized (horizontal axis) and the degree to which progress was reported on each emphasized objective (vertical axis). Plots are made in terms of deviation z scores. Over 80% of engineering classes stressed at least one of the first three objectives, all of which were cognitively oriented (1. Factual knowledge, 2. Principles and theories, and 3. Applications). And over 70% chose 4. Professional skills/viewpoints). Only a minority of engineering classes selected any of the other objectives. Compared with other disciplines, classes in engineering were more likely to stress the two professionally oriented objectives (3 and 4); they were also much more likely to emphasize 5. Team skills, even though this was relevant in only 40% of the classes in engineering. Except for the well above average ratings on 5. Team skills, progress ratings were all below the average for all disciplines. The lowest progress ratings were on objectives that were seldom pursued by engineering classes; but they were also somewhat below average on the four most frequently selected objectives. Even though students in engineering classes consistently reported less progress on relevant objectives than did those in other types of classes, on an absolute basis, progress ratings on the most frequently chosen objectives averaged about 4.0 on a 5-point rating scale.
38

Discipline 12: Engineering (795 classes, 23 institutions) Part II: Other Ratings This
Discipline All
Disciplines11 Mean s. d. Mean s. d. Teaching Approach A. Stimulate Interest 3.71 .50 4.01 .15 B. Foster Collaboration 3.37 .73 3.67 .32 C. Establish Rapport 3.85 .50 4.05 .11 D. Encourage Student
Involvement 3.66 .56 3.91 .26
E. Structuring Class 3.93 .48 4.19 .10 Class Characteristics F. Amount of reading 2.85 .69 3.23 .46 G. Amount of other work 3.57 .72 3.45 .24 H. Difficulty 3.48 .71 3.47 .30 Student Characteristics I. Effort in class 3.48 .67 3.60 .20 J. Wanted course 3.34 .53 3.34 .24 K. Usually work hard 3.59 .27 3.66 .09 Global Outcomes L. Increased positive
attitude 3.70 .60 3.88 .23
M. Excellent teacher 3.93 .69 4.20 .12 N. Excellent course 3.71 .60 3.94 .18 Commentary Engineering classes averaged very low on all five scales describing teaching approaches designed to establish a positive learning climate; they appeared to be especially deficient in clearly communicating content and expectations (E), fostering student interest and excitement (A), and creating positive instructor/student relationships (C). Given these ratings, the very low overall rating of “excellence of teacher” (M) was expected. Although ratings of course difficulty of these were only “average” (H) compared to other courses the students have taken, it is important to note that these “other courses” in the engineering curriculum are generally acknowledged to provide a high level of academic challenge. Below average reading requirements (F) were offset by above average requirements in other types of assignments (G). Student motivation as inferred by desire to enroll in engineering classes (J) was about average; as inferred from effort (I and, indirectly, K) it was below average. This, together with low ratings on the scales assessing teaching approaches, may help account for relatively low overall ratings on the global outcomes of L. Increased appreciation for the field and N. Excellence of course.
11 Means and standard deviations of “all disciplines” were computed by combining classes included in the 28 disciplines. The z scores on the graph gave equal weight to each discipline.
39

Discipline 13: English Literature (3777 classes, 85 institutions) Part I: Individual Objectives
% of Classes with Objective as Relevant10 Progress on Relevant10 Objectives This Discipline All Disciplines This Discipline All Disciplines11
Imp. Ess. Imp. + Ess. Imp. Ess. Imp.
+ Ess. Mean s.d. Mean s.d.
1. Factual knowledge 25 10 35 33 45 78 3.86 .53 4.10 .10 2. Principles and theories 23 12 35 35 39 74 3.78 .54 4.04 .11 3. Application of learning 30 18 48 39 34 73 3.94 .48 4.04 .14 4. Professional skill/views 18 9 27 31 25 56 4.00 .51 4.04 .18 5. Team skills 24 4 28 23 8 31 3.89 .56 3.92 .22 6. Creative capacities 24 22 46 15 11 26 4.27 .46 3.59 .48 7. Broad liberal education 24 29 53 17 10 27 4.11 .54 3.52 .51 8. Communication skills 23 66 89 27 19 46 4.26 .44 3.60 .39 9. Find and use resources 34 9 43 28 9 37 3.88 .49 3.70 .17 *0. Values development 18 4 22 17 6 23 3.68 .57 3.66 .33 X. Critical analysis 39 33 72 28 18 46 4.09 .44 3.80 .30 *V. Interest in learning 30 8 38 29 10 39 3.82 .52 3.81 .18
10 “Relevant” means the instructor rate the objective as “Important” or “Essential.” 11 Means and standard deviations of “all disciplines” were computed by combining classes included in the 28 disciplines. The z scores on the graph gave equal weight to each discipline. * The plots for these measures overlap; only the first is shown on the graph.
40

Commentary The graph compares English literature classes with those in all 28 disciplines included in this study. It reports the degree to which each objective was emphasized (horizontal axis) and the degree to which progress was reported on each emphasized objective (vertical axis). Plots are made in terms of deviation z scores. Classes in this discipline were quite distinctive. They gave relatively high emphasis to five objectives—8. Communication skills, X. Critical analysis, 7. Broad liberal education, 6. Creative capacities, and 9. Finding and using resources. Almost all classes emphasized 8. Communication skills, and nearly three-fourths selected X. Critical analysis. On these five “most popular” objectives, progress ratings were well above average. Whereas the four cognitively-oriented objectives (1. Factual knowledge, 2. Principles and theories, 3. Applications, and 4. Professional skills/viewpoints) were chosen most often when all disciplines were combined, they were considered “relevant” in only a minority of English literature classes. When these objectives were chosen in literature classes, progress ratings were well below average. For the other three objectives (5. Team skills, 0. Values development, and V. Increased interest in learning) both relevance and progress ratings were about average. English literature courses exposed students to objectives not featured in most other disciplines; and students reported high progress on these objectives.
41

Discipline 13: English Literature (2458 classes, 73 institutions) Part II: Other Ratings This
Discipline All
Disciplines11 Mean s. d. Mean s. d. Teaching Approach A. Stimulate Interest 4.01 .47 4.01 .15 B. Foster Collaboration 4.00 .55 3.67 .32 C. Establish Rapport 4.13 .44 4.05 .11 D. Encourage Student
Involvement 3.98 .47 3.91 .26
E. Structuring Class 4.18 .42 4.19 .10 Class Characteristics F. Amount of reading 3.59 .67 3.23 .46 G. Amount of other work 3.50 .48 3.45 .24 H. Difficulty 3.29 .45 3.47 .30 Student Characteristics I. Effort in class 3.60 .46 3.60 .20 J. Wanted course 3.10 .51 3.34 .24 K. Usually work hard 3.58 .30 3.66 .09 Global Outcomes L. Increased positive
attitude 3.68 .57 3.88 .23
M. Excellent teacher 4.25 .58 4.20 .12 N. Excellent course 3.88 .56 3.94 .18 Commentary Instructors in English literature classes appeared to be especially proficient in B. Fostering Student Collaboration and C. Establishing Rapport. These teaching approaches are positively related to progress ratings on the four objectives most frequently stressed in this discipline (8. Communication skills, X. Critical analysis, 7. Broad liberal education, and 6. Creative capacities; see previous page). English literature classes required more reading than those in other disciplines, and also somewhat more in non-reading (probably writing) assignments. Despite these requirements, students reported only an average effort (I) and rated the classes as below average in difficulty (H). Students were not well motivated (J and, indirectly, K) which may help explain the relatively low rating on “improved appreciation for the discipline” (L) and the somewhat below average rating on N. Excellence of the course. The above average rating on M. Excellence of teacher is consistent with positive ratings on the teaching approach scales (A-E).
11 Means and standard deviations of “all disciplines” were computed by combining classes included in the 28 disciplines. The z scores on the graph gave equal weight to each discipline.
42

Discipline 14: Fine and Applied Arts (1093 classes, 60 institutions) Part I: Individual Objectives
% of Classes with Objective as Relevant10 Progress on Relevant10 Objectives This Discipline All Disciplines This Discipline All Disciplines11
Imp. Ess. Imp. + Ess. Imp. Ess. Imp.
+ Ess. Mean s.d. Mean s.d.
1. Factual knowledge 35 40 75 33 45 78 4.16 .49 4.10 .10 2. Principles and theories 40 35 75 35 39 74 4.10 .50 4.04 .11 3. Application of learning 39 30 69 39 34 73 4.14 .49 4.04 .14 4. Professional skill/views 29 46 75 31 25 56 4.20 .45 4.04 .18 5. Team skills 24 12 36 23 8 31 4.05 .64 3.92 .22 6. Creative capacities 30 40 70 15 11 26 4.17 .54 3.59 .48 7. Broad liberal education 22 17 39 17 10 27 4.08 .60 3.52 .51 8. Communication skills 22 8 30 27 19 46 3.76 .64 3.60 .39 9. Find and use resources 27 8 35 28 9 37 3.64 .58 3.70 .17 0. Values development 18 3 21 17 6 23 3.75 .62 3.66 .33 X. Critical analysis 28 12 40 28 18 46 3.83 .59 3.80 .30 V. Interest in learning 34 13 47 29 10 39 3.99 .54 3.81 .18
10 “Relevant” means the instructor rate the objective as “Important” or “Essential.” 11 Means and standard deviations of “all disciplines” were computed by combining classes included in the 28 disciplines. The z scores on the graph gave equal weight to each discipline.
43
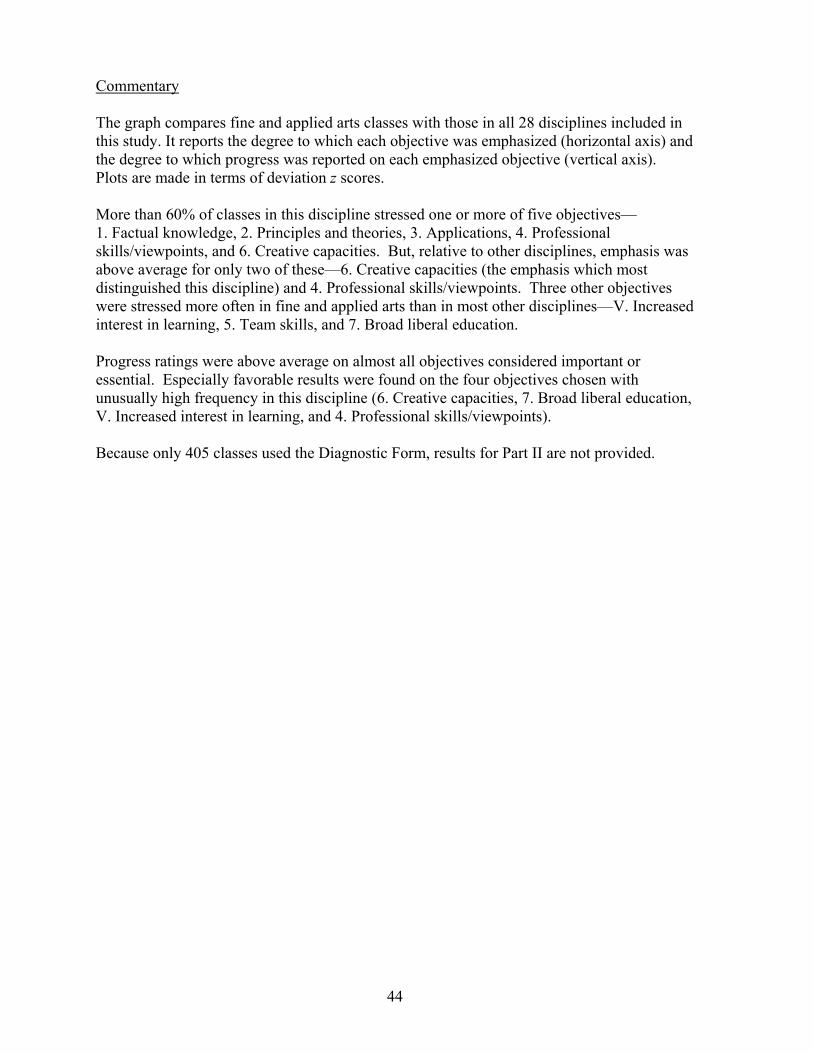
Commentary The graph compares fine and applied arts classes with those in all 28 disciplines included in this study. It reports the degree to which each objective was emphasized (horizontal axis) and the degree to which progress was reported on each emphasized objective (vertical axis). Plots are made in terms of deviation z scores. More than 60% of classes in this discipline stressed one or more of five objectives— 1. Factual knowledge, 2. Principles and theories, 3. Applications, 4. Professional skills/viewpoints, and 6. Creative capacities. But, relative to other disciplines, emphasis was above average for only two of these—6. Creative capacities (the emphasis which most distinguished this discipline) and 4. Professional skills/viewpoints. Three other objectives were stressed more often in fine and applied arts than in most other disciplines—V. Increased interest in learning, 5. Team skills, and 7. Broad liberal education. Progress ratings were above average on almost all objectives considered important or essential. Especially favorable results were found on the four objectives chosen with unusually high frequency in this discipline (6. Creative capacities, 7. Broad liberal education, V. Increased interest in learning, and 4. Professional skills/viewpoints). Because only 405 classes used the Diagnostic Form, results for Part II are not provided.
44
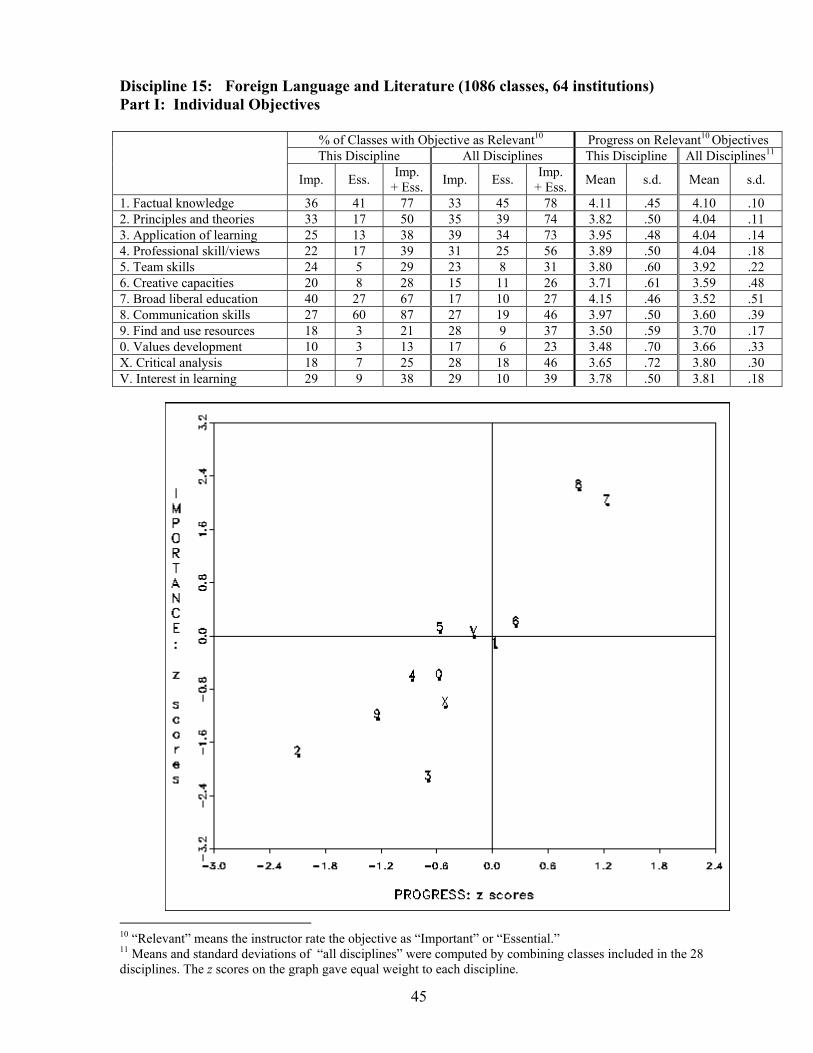
Discipline 15: Foreign Language and Literature (1086 classes, 64 institutions) Part I: Individual Objectives
% of Classes with Objective as Relevant10 Progress on Relevant10 Objectives This Discipline All Disciplines This Discipline All Disciplines11
Imp. Ess. Imp. + Ess. Imp. Ess. Imp.
+ Ess. Mean s.d. Mean s.d.
1. Factual knowledge 36 41 77 33 45 78 4.11 .45 4.10 .10 2. Principles and theories 33 17 50 35 39 74 3.82 .50 4.04 .11 3. Application of learning 25 13 38 39 34 73 3.95 .48 4.04 .14 4. Professional skill/views 22 17 39 31 25 56 3.89 .50 4.04 .18 5. Team skills 24 5 29 23 8 31 3.80 .60 3.92 .22 6. Creative capacities 20 8 28 15 11 26 3.71 .61 3.59 .48 7. Broad liberal education 40 27 67 17 10 27 4.15 .46 3.52 .51 8. Communication skills 27 60 87 27 19 46 3.97 .50 3.60 .39 9. Find and use resources 18 3 21 28 9 37 3.50 .59 3.70 .17 0. Values development 10 3 13 17 6 23 3.48 .70 3.66 .33 X. Critical analysis 18 7 25 28 18 46 3.65 .72 3.80 .30 V. Interest in learning 29 9 38 29 10 39 3.78 .50 3.81 .18
10 “Relevant” means the instructor rate the objective as “Important” or “Essential.” 11 Means and standard deviations of “all disciplines” were computed by combining classes included in the 28 disciplines. The z scores on the graph gave equal weight to each discipline.
45

Commentary The graph compares foreign language and literature classes with those in all 28 disciplines included in this study. It reports the degree to which each objective was emphasized (horizontal axis) and the degree to which progress was reported on each emphasized objective (vertical axis). Plots are made in terms of deviation z scores. More than 60% of the classes in this discipline stressed one or more of 7 of the objectives included in the IDEA system. The 4 that were cognitively oriented (1. Factual knowledge, 2. Principles and theories, 3. Applications, and 4. Professional skills/viewpoints), though commonly chosen as relevant to foreign language and literature classes, were selected much less frequently than in most other disciplines. Two of the other three (8. Communication skills and 7. Broad liberal education) were chosen more often in foreign language and literature classes than in 95% of all other classes. For objectives that were relatively important, progress ratings were relatively high; and vice versa. Very high ratings were found on 8. Communication skills and 7. Broad liberal education; but very low progress was reported on 2. Principles and theories, an objective chosen relatively infrequently in this discipline.
46

Discipline 15: Foreign Language and Literature (666 classes, 51 institutions) Part II: Other Ratings This
Discipline All
Disciplines11 Mean s. d. Mean s. d. Teaching Approach A. Stimulate Interest 4.03 .45 4.01 .15 B. Foster Collaboration 3.91 .57 3.67 .32 C. Establish Rapport 4.14 .44 4.05 .11 D. Encourage Student
Involvement 3.75 .53 3.91 .26
E. Structuring Class 4.33 .41 4.19 .10 Class Characteristics F. Amount of reading 3.03 .58 3.23 .46 G. Amount of other work 3.52 .50 3.45 .24 H. Difficulty 3.56 .41 3.47 .30 Student Characteristics I. Effort in class 3.53 .46 3.60 .20 J. Wanted course 3.44 .57 3.34 .24 K. Usually work hard 3.66 .30 3.66 .09 Global Outcomes L. Increased positive
attitude 3.90 .57 3.88 .23
M. Excellent teacher 4.34 .58 4.20 .12 N. Excellent course 4.04 .56 3.94 .18 Commentary Instruction in foreign language classes was characterized by clear communication of content and expectations (E), encouragement of student collaboration (B), and the establishment of positive student-teacher relationships (C); efforts to involve students in the instructional process (D) were below the “all disciplines” average. This pattern of approaches is related to progress ratings on both 6. Creative capacities and 8. Communication skills, two of the objectives frequently emphasized in this discipline. Although the amount of reading (F) was somewhat below the “all disciplines” average, the amount of other work (G) was slightly above average as was the rating of difficulty (H). Students were generally well motivated for these classes (J), but reported a below average amount of effort (I). The three global outcome ratings were above average, distinctively so for M. Excellence of teacher. Ratings on this item are related to teaching approach E. Structuring Classroom Experiences, on which this discipline was rated especially high.
11 Means and standard deviations of “all disciplines” were computed by combining classes included in the 28 disciplines. The z scores on the graph gave equal weight to each discipline.
47

Discipline 16: History (1058 classes, 72 institutions) Part I: Individual Objectives
% of Classes with Objective as Relevant10 Progress on Relevant10 Objectives This Discipline All Disciplines This Discipline All Disciplines11
Imp. Ess. Imp. + Ess. Imp. Ess. Imp.
+ Ess. Mean s.d. Mean s.d.
1. Factual knowledge 28 65 93 33 45 78 4.21 .42 4.10 .10 2. Principles and theories 31 25 56 35 39 74 3.89 .47 4.04 .11 3. Application of learning 31 12 43 39 34 73 3.72 .52 4.04 .14 4. Professional skill/views 20 5 25 31 25 56 3.92 .53 4.04 .18 5. Team skills 9 2 11 23 8 31 3.71 .63 3.92 .22 6. Creative capacities 15 3 18 15 11 26 3.48 .65 3.59 .48 7. Broad liberal education 30 12 42 17 10 27 3.85 .55 3.52 .51 8. Communication skills 46 21 67 27 19 46 3.78 .54 3.60 .39 9. Find and use resources 25 9 34 28 9 37 3.73 .58 3.70 .17 0. Values development 19 3 22 17 6 23 3.54 .61 3.66 .33 X. Critical analysis 37 32 69 28 18 46 3.98 .51 3.80 .30 V. Interest in learning 32 10 42 29 10 39 3.80 .53 3.81 .18
10 “Relevant” means the instructor rate the objective as “Important” or “Essential.” 11 Means and standard deviations of “all disciplines” were computed by combining classes included in the 28 disciplines. The z scores on the graph gave equal weight to each discipline.
48

Commentary The graph compares history classes with those in all 28 disciplines included in this study. It reports the degree to which each objective was emphasized (horizontal axis) and the degree to which progress was reported on each emphasized objective (vertical axis). Plots are made in terms of deviation z scores. Over 80% of history classes emphasized 1. Factual knowledge and over half identified X. Critical analysis, 8. Communication skills, and/or 2. Principles and theories as relevant. All but 2. Principles and theories were chosen much more frequently in this discipline than for the “all disciplines” group. Broad liberal education (7), though chosen as “important” or “essential” in only 43% of history classes, was rated as much more important in this discipline than in all disciplines combined. Except for 1. Factual knowledge, this discipline gave less emphasis to cognitively-oriented objectives than did most other disciplines; the same was true of 5. Team skills. Progress ratings corresponded closely with importance ratings. Compared to other classes, students in history classes rated their progress as above average on factual knowledge, broad liberal education, critical analysis, and communication skills. But ratings were well below the “all disciplines” average on the four objectives which, on a relative basis, were selected less frequently (3. Applications, 2. Principles and theories, 5. Team skills, and 4. Professional skills/viewpoints).
49

Discipline 16: History (634 classes, 58 institutions) Part II: Other Ratings This
Discipline All
Disciplines11 Mean s. d. Mean s. d. Teaching Approach A. Stimulate Interest 4.01 .47 4.01 .15 B. Foster Collaboration 3.35 .78 3.67 .32 C. Establish Rapport 3.99 .46 4.05 .11 D. Encourage Student
Involvement 3.69 .56 3.91 .26
E. Structuring Class 4.21 .41 4.19 .10 Class Characteristics F. Amount of reading 3.91 .51 3.23 .46 G. Amount of other work 3.08 .53 3.45 .24 H. Difficulty 3.47 .40 3.47 .30 Student Characteristics I. Effort in class 3.54 .44 3.60 .20 J. Wanted course 3.12 .45 3.34 .24 K. Usually work hard 3.63 .26 3.66 .09 Global Outcomes L. Increased positive
attitude 3.86 .55 3.88 .23
M. Excellent teacher 4.24 .57 4.20 .12 N. Excellent course 3.96 .56 3.94 .18 Commentary History instruction was rated about average in the clarity of content and expectations (E) and in inducing student excitement about the subject (A). On the other hand, well below average ratings were obtained on three other approaches—B. Fostering student collaboration, D. Encouraging student involvement, and establishing positive student-faculty relationships (C). Despite these ratings, overall ratings of teacher excellence (M) were slightly above average. Ratings on this item are positively influenced by the teaching approaches that were appraised most favorably; but, because these were no higher than the average for all disciplines, the positive impression of the instructor probably reflects student satisfaction with the progress they made on the objectives most emphasized in this discipline. History classes required an unusual amount of reading (F) but little in the way of other work (G). They were considered about average in difficulty (H). Enrollees were generally not well motivated to take these classes (J). When considered with the generally below average ratings on the teaching approaches scales, it is surprising that ratings as high as “average” were obtained on overall course excellence (N) and increased appreciation for the discipline (L).
11 Means and standard deviations of “all disciplines” were computed by combining classes included in the 28 disciplines. The z scores on the graph gave equal weight to each discipline.
50

Discipline 17: Health Professions/Related Sciences (1412 classes, 44 institutions) Part I: Individual Objectives
% of Classes with Objective as Relevant10 Progress on Relevant10 Objectives This Discipline All Disciplines This Discipline All Disciplines11
Imp. Ess. Imp. + Ess. Imp. Ess. Imp.
+ Ess. Mean s.d. Mean s.d.
1. Factual knowledge 24 59 83 33 45 78 4.28 .48 4.10 .10 *2. Principles and theories 38 37 75 35 39 74 4.14 .48 4.04 .11 3. Application of learning 38 44 82 39 34 73 4.28 .48 4.04 .14 4. Professional skill/views 35 40 75 31 25 56 4.32 .47 4.04 .18 5. Team skills 28 10 38 23 8 31 4.28 .47 3.92 .22 **6. Creative capacities 7 2 9 15 11 26 3.78 .63 3.59 .48 7. Broad liberal education 7 2 9 17 10 27 3.42 .68 3.52 .51 8. Communication skills 31 5 36 27 19 46 3.77 .61 3.60 .39 9. Find and use resources 31 9 40 28 9 37 3.94 .54 3.70 .17 *0. Values development 14 7 21 17 6 23 3.93 .64 3.66 .33 **X. Critical analysis 21 11 32 28 18 46 3.93 .56 3.80 .30 V. Interest in learning 25 8 33 29 10 39 4.03 .56 3.81 .18
10 “Relevant” means the instructor rate the objective as “Important” or “Essential.” 11 Means and standard deviations of “all disciplines” were computed by combining classes included in the 28 disciplines. The z scores on the graph gave equal weight to each discipline. * The plots for these measures overlap; only the first is shown on the graph. ** The plots for these measures overlap; only the first is shown on the graph.
51

Commentary The graph compares health professions/related sciences classes with those in all 28 disciplines included in this study. It reports the degree to which each objective was emphasized (horizontal axis) and the degree to which progress was reported on each emphasized objective (vertical axis). Plots are made in terms of deviation z scores. Over 70% of classes in this discipline stressed one or more of the four cognitively-oriented objectives (1. Factual knowledge, 2. Principles and theories, 3. Applications, and 4. Professional skills/viewpoints); no other objective was rated important or essential in more than 40% of health professions classes. Compared to all classes in the IDEA database, the stress on the two professionally-oriented objectives (3 and 4) was well above average; the same was true of 5. Team skills and 9. Finding and using resources although only a minority of classes emphasized these objectives. Progress ratings were well above the “all disciplines” average on all objectives except 7. Broad liberal education, an objective relevant in less than 10% of classes in this discipline. Progress ratings were highest on the objectives that most distinguished health professions/related sciences from other disciplines in terms of their relative importance.
52

Discipline 17: Health Professions/Related Sciences (1150 classes, 35 institutions) Part II: Other Ratings This
Discipline All
Disciplines11 Mean s. d. Mean s. d. Teaching Approach A. Stimulate Interest 4.17 .48 4.01 .15 B. Foster Collaboration 3.91 .58 3.67 .32 C. Establish Rapport 4.16 .50 4.05 .11 D. Encourage Student
Involvement 4.16 .47 3.91 .26
E. Structuring Class 4.23 .52 4.19 .10 Class Characteristics F. Amount of reading 3.46 .70 3.23 .46 G. Amount of other work 3.61 .56 3.45 .24 H. Difficulty 3.69 .62 3.47 .30 Student Characteristics I. Effort in class 3.86 .64 3.60 .20 J. Wanted course 3.80 .59 3.34 .24 K. Usually work hard 3.85 .32 3.66 .09 Global Outcomes L. Increased positive
attitude 4.23 .52 3.88 .23
M. Excellent teacher 4.23 .65 4.20 .12 N. Excellent course 4.15 .59 3.94 .18 Commentary Regardless of the type of measure displayed by this graph—teaching approach, course characteristics, student characteristics, or global outcomes—scores for the health professions/related sciences discipline were well above the average for all disciplines. Of the 5 measures of teaching approach, this discipline’s average was especially high on A. Stimulating Student Interest, C. Establishing Rapport, and D. Encouraging Student Involvement—approaches related closely to progress on the objectives it emphasized more than most other disciplines (see previous graph). Classes were considered quite demanding in terms of F. Reading, G. Amount of other work, and H. Difficulty. But the level of student motivation was extremely high (J and, indirectly K) and students reported working harder in these classes than in others they have taken (I). Overall, students reported a substantial increased appreciation for the field of study and gave high overall ratings to the course. Overall ratings of the excellence of the teacher were only slightly above average.
11 Means and standard deviations of “all disciplines” were computed by combining classes included in the 28 disciplines. The z scores on the graph gave equal weight to each discipline.
53
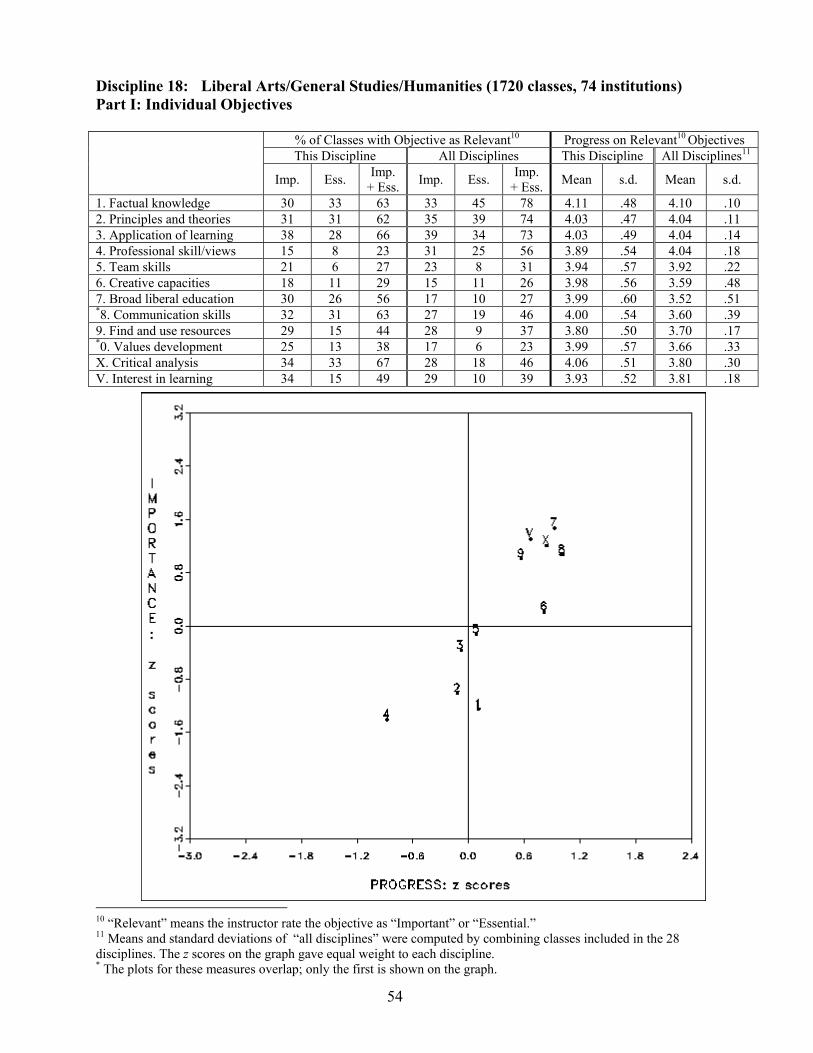
Discipline 18: Liberal Arts/General Studies/Humanities (1720 classes, 74 institutions) Part I: Individual Objectives
% of Classes with Objective as Relevant 10 Progress on Relevant Objectives 10
This Discipline All Disciplines This Discipline All Disciplines 11
Ess. Imp. + Ess. Imp. Ess. Imp.
+ Ess. s.d. Mean s.d.
1. Factual knowledge 33 63 33 45 78 .48 .10 2. Principles and theories 31 31 35 39 74 4.03 .47 .11 3. Application of learning 38 28
Imp. Mean
30 4.11 4.10 62 4.04 66 39 34 73 4.03 .49 4.04 .14
4. Professional skill/views 15 8 23 31 25 56 3.89 .54 4.04 .18 5. Team skills 21 6 27 23 8 31 3.94 .57 3.92 .22 6. Creative capacities 18 11 29 15 11 26 3.98 .56 3.59 .48 7. Broad liberal education 30 26 56 17 10 27 3.99 .60 3.52 .51 *8. Communication skills 32 31 63 27 19 46 4.00 .54 3.60 .39 9. Find and use resources 29 15 44 28 9 37 3.80 .50 3.70 .17 *0. Values development 25 13 38 17 6 23 3.99 .57 3.66 .33 X. Critical analysis 34 33 67 28 18 46 4.06 .51 3.80 .30 V. Interest in learning 34 15 49 29 10 39 3.93 .52 3.81 .18
10 “Relevant” means the instructor rate the objective as “Important” or “Essential.” 11 Means and standard deviations of “all disciplines” were computed by combining classes included in the 28 disciplines. The z scores on the graph gave equal weight to each discipline. * The plots for these measures overlap; only the first is shown on the graph.
54
Commentary The graph compares liberal arts/general studies/humanities classes with those in all 28 disciplines included in this study. It reports the degree to which each objective was emphasized (horizontal axis) and the degree to which progress was reported on each emphasized objective (vertical axis). Plots are made in terms of deviation z scores. Perhaps because this discipline includes a wide variety of “general education” classes, none of the twelve objectives covered by the IDEA system were considered “important” or “essential” by more than 69% of such classes; but a majority of classes stressed at least one of six objectives—1. Factual knowledge, 2. Principles and theories, 3. Applications, 8. Communication skills, X. Critical analysis, and 7. Broad liberal education. When compared with importance ratings for “all disciplines,” those in this discipline were relatively low on the two objectives related to basic cognitive development (1 and 2) and on 4. Professional skills/viewpoints; but they were much higher on other objectives, including three that were commonly stressed in this discipline (7, 8, and X). Progress ratings paralleled relative importance ratings. They were highest on the five objectives that this discipline stressed much more than did other disciplines. And they were somewhat below average on the two basic cognitive objectives (1 and 2) and on 4. Professional skills and viewpoints.
55

Discipline 18: Liberal Arts/General Studies/Humanities (790 classes, 59 institutions) Part II: Other Ratings This
Discipline All
Disciplines11 Mean s. d. Mean s. d. Teaching Approach A. Stimulate Interest 3.99 .49 4.01 .15 B. Foster Collaboration 3.87 .65 3.67 .32 C. Establish Rapport 4.03 .46 4.05 .11 D. Encourage Student
Involvement 3.97 .51 3.91 .26
E. Structuring Class 4.14 .46 4.19 .10 Class Characteristics F. Amount of reading 3.47 .79 3.23 .46 G. Amount of other work 3.31 .50 3.45 .24 H. Difficulty 3.21 .56 3.47 .30 Student Characteristics I. Effort in class 3.27 .54 3.60 .20 J. Wanted course 2.94 .59 3.34 .24 K. Usually work hard 3.57 .29 3.66 .09 Global Outcomes L. Increased positive
attitude 3.59 .65 3.88 .23
M. Excellent teacher 4.20 .62 4.20 .12 N. Excellent course 3.70 .69 3.94 .18 Commentary The “teaching approach” profile of this discipline featured above average scores on B. Fostering Student Collaboration and D. Encouraging Student Involvement but a below average score on E. Structuring Classroom Experiences. Teachers appeared to place much more stress on giving students responsibility for learning than on clearly communicating course content and expectations. These courses required an above average amount of reading (F), but less “other work” (G) than most classes. They were also considered less difficult (H) than most classes. Student motivation was extremely low (J and, indirectly, K) which, coupled with low ratings of difficulty, may account for an effort rating (I) that was well below average. Although the overall rating of the teacher was average, global ratings of course excellence (N) and increased appreciation for the field of study (L) were substantially below the average for all disciplines. Given the utilitarian nature of the academic motivation of many students, it is not surprising that global ratings were low for classes in this discipline.
11 Means and standard deviations of “all disciplines” were computed by combining classes included in the 28 disciplines. The z scores on the graph gave equal weight to each discipline.
56
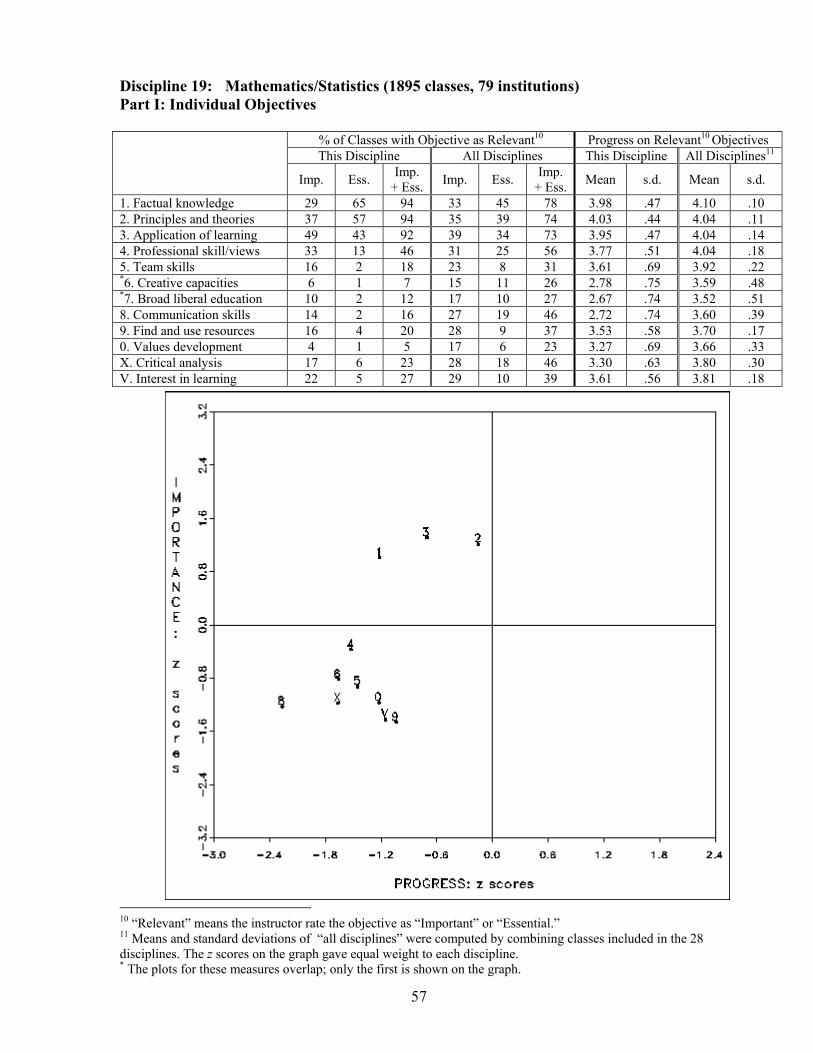
Discipline 19: Mathematics/Statistics (1895 classes, 79 institutions) Part I: Individual Objectives
% of Classes with Objective as Relevant10 Progress on Relevant10 Objectives This Discipline All Disciplines This Discipline All Disciplines11
Imp. Ess. Imp. + Ess. Imp. Ess. Imp.
+ Ess. Mean s.d. Mean s.d.
1. Factual knowledge 29 65 94 33 45 78 3.98 .47 4.10 .10 2. Principles and theories 37 57 94 35 39 74 4.03 .44 4.04 .11 3. Application of learning 49 43 92 39 34 73 3.95 .47 4.04 .14 4. Professional skill/views 33 13 46 31 25 56 3.77 .51 4.04 .18 5. Team skills 16 2 18 23 8 31 3.61 .69 3.92 .22 *6. Creative capacities 6 1 7 15 11 26 2.78 .75 3.59 .48 *7. Broad liberal education 10 2 12 17 10 27 2.67 .74 3.52 .51 8. Communication skills 14 2 16 27 19 46 2.72 .74 3.60 .39 9. Find and use resources 16 4 20 28 9 37 3.53 .58 3.70 .17 0. Values development 4 1 5 17 6 23 3.27 .69 3.66 .33 X. Critical analysis 17 6 23 28 18 46 3.30 .63 3.80 .30 V. Interest in learning 22 5 27 29 10 39 3.61 .56 3.81 .18
10 “Relevant” means the instructor rate the objective as “Important” or “Essential.” 11 Means and standard deviations of “all disciplines” were computed by combining classes included in the 28 disciplines. The z scores on the graph gave equal weight to each discipline. * The plots for these measures overlap; only the first is shown on the graph.
57
Commentary The graph compares mathematics/statistics classes with those in all 28 disciplines included in this study. It reports the degree to which each objective was emphasized (horizontal axis) and the degree to which progress was reported on each emphasized objective (vertical axis). Plots are made in terms of deviation z scores. More than 90% of the classes in this discipline focused on one or more of three cognitive objectives—1. Factual knowledge, 2. Principles and theories, and 3. Applications. No other objective was stressed in a majority of mathematics/statistics classes. When compared with other disciplines, the emphasis given to various objectives was well above average for the three most stressed objectives and below average on all others. All ratings of progress were below the average for all disciplines, although that for 2. Principles and theories was just slightly so. Students consistently reported that they learned less in these classes than in most others they have taken. Nonetheless, on an absolute basis, progress ratings on the most relevant objectives were 3.98, 4.03, and 3.95. Since these ratings were made on a 5-point scale, they support that classes in mathematics/statistics generally produced satisfactory outcomes.
58
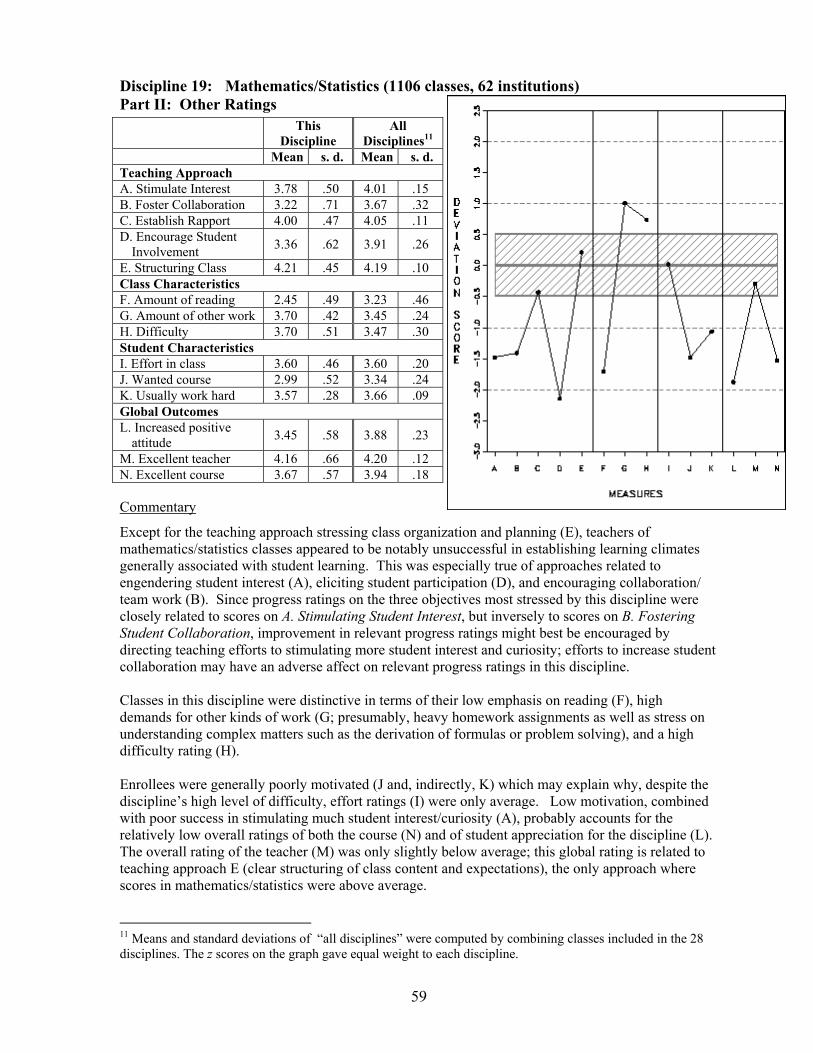
Discipline 19: Mathematics/Statistics (1106 classes, 62 institutions) Part II: Other Ratings This
Discipline All
Disciplines11 Mean s. d. Mean s. d. Teaching Approach A. Stimulate Interest 3.78 .50 4.01 .15 B. Foster Collaboration 3.22 .71 3.67 .32 C. Establish Rapport 4.00 .47 4.05 .11 D. Encourage Student
Involvement 3.36 .62 3.91 .26
E. Structuring Class 4.21 .45 4.19 .10 Class Characteristics F. Amount of reading 2.45 .49 3.23 .46 G. Amount of other work 3.70 .42 3.45 .24 H. Difficulty 3.70 .51 3.47 .30 Student Characteristics I. Effort in class 3.60 .46 3.60 .20 J. Wanted course 2.99 .52 3.34 .24 K. Usually work hard 3.57 .28 3.66 .09 Global Outcomes L. Increased positive
attitude 3.45 .58 3.88 .23
M. Excellent teacher 4.16 .66 4.20 .12 N. Excellent course 3.67 .57 3.94 .18 Commentary
Except for the teaching approach stressing class organization and planning (E), teachers of mathematics/statistics classes appeared to be notably unsuccessful in establishing learning climates generally associated with student learning. This was especially true of approaches related to engendering student interest (A), eliciting student participation (D), and encouraging collaboration/ team work (B). Since progress ratings on the three objectives most stressed by this discipline were closely related to scores on A. Stimulating Student Interest, but inversely to scores on B. Fostering Student Collaboration, improvement in relevant progress ratings might best be encouraged by directing teaching efforts to stimulating more student interest and curiosity; efforts to increase student collaboration may have an adverse affect on relevant progress ratings in this discipline. Classes in this discipline were distinctive in terms of their low emphasis on reading (F), high demands for other kinds of work (G; presumably, heavy homework assignments as well as stress on understanding complex matters such as the derivation of formulas or problem solving), and a high difficulty rating (H). Enrollees were generally poorly motivated (J and, indirectly, K) which may explain why, despite the discipline’s high level of difficulty, effort ratings (I) were only average. Low motivation, combined with poor success in stimulating much student interest/curiosity (A), probably accounts for the relatively low overall ratings of both the course (N) and of student appreciation for the discipline (L). The overall rating of the teacher (M) was only slightly below average; this global rating is related to teaching approach E (clear structuring of class content and expectations), the only approach where scores in mathematics/statistics were above average.
11 Means and standard deviations of “all disciplines” were computed by combining classes included in the 28 disciplines. The z scores on the graph gave equal weight to each discipline.
59

Discipline 20: Music (790 classes, 54 institutions) Part I: Individual Objectives
% of Classes with Objective as Relevant10 Progress on Relevant10 Objectives This Discipline All Disciplines This Discipline All Disciplines11
Imp. Ess. Imp. + Ess. Imp. Ess. Imp.
+ Ess. Mean s.d. Mean s.d.
1. Factual knowledge 34 36 70 33 45 78 4.19 .46 4.10 .10 2. Principles and theories 32 25 57 35 39 74 4.13 .50 4.04 .11 3. Application of learning 23 22 45 39 34 73 4.16 .52 4.04 .14 4. Professional skill/views 27 39 66 31 25 56 4.28 .47 4.04 .18 5. Team skills 19 12 31 23 8 31 4.16 .68 3.92 .22 6. Creative capacities 24 40 64 15 11 26 4.29 .53 3.59 .48 7. Broad liberal education 33 40 73 17 10 27 4.43 .40 3.52 .51 8. Communication skills 18 6 24 27 19 46 3.68 .59 3.60 .39 9. Find and use resources 11 4 15 28 9 37 3.65 .77 3.70 .17 0. Values development 12 2 14 17 6 23 3.66 .67 3.66 .33 X. Critical analysis 15 4 19 28 18 46 3.59 .69 3.80 .30 V. Interest in learning 23 6 29 29 10 39 3.78 .58 3.81 .18
10 “Relevant” means the instructor rate the objective as “Important” or “Essential.” 11 Means and standard deviations of “all disciplines” were computed by combining classes included in the 28 disciplines. The z scores on the graph gave equal weight to each discipline.
60

Commentary The graph compares music classes with those in all 28 disciplines included in this study. It reports the degree to which each objective was emphasized (horizontal axis) and the degree to which progress was reported on each emphasized objective (vertical axis). Plots are made in terms of deviation z scores. About two-thirds of music classes emphasized one or more of four objectives—1. Factual knowledge, 4. Professional skills/viewpoints, 6. Creative capacities, and 7. Broad liberal education. When compared with classes in other disciplines, music placed much more emphasis on 6 and 7, but less emphasis on 1. Progress ratings tended to be generally high in this discipline. The only exceptions were on objectives that were rarely chosen as important or essential. Ratings on 7. Broad liberal education, 6. Creative capacities, 4. Professional skills/viewpoints, and 5. Team skills were all substantially above the average for all disciplines. Because only 487 classes used the Diagnostic Form, results for Part II are not reported.
61
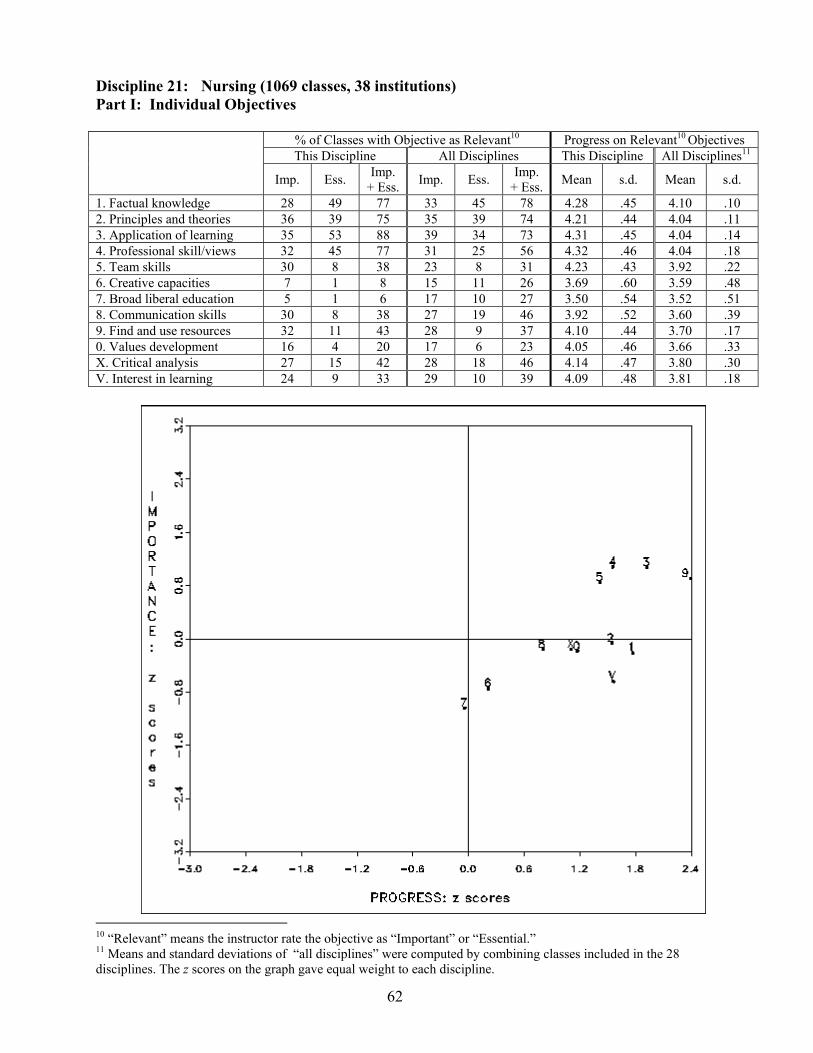
Discipline 21: Nursing (1069 classes, 38 institutions) Part I: Individual Objectives
% of Classes with Objective as Relevant10 Progress on Relevant10 Objectives This Discipline All Disciplines This Discipline All Disciplines11
Imp. Imp. + Ess. Imp. Ess. Imp.
+ Ess. Mean s.d. Mean s.d.
1. Factual knowledge 28 49 77 33 45 78 4.28 .45 4.10 .10 2. Principles and theories 36 39 75 35 39 74 4.21 .44 4.04 .11 3. Application of learning 35 53 88 39 34 73 4.31 .45 4.04 .14 4. Professional skill/views 32 45 77 31 25 56 4.32 .46 4.04 .18 5. Team skills 30 8 38 23 8 31 4.23 .43 3.92 .22 6. Creative capacities 7 1 8 15 11 26 3.69 .60 3.59 .48 7. Broad liberal education 5 1 6 17 10 27 3.50 .54 3.52 .51 8. Communication skills 30 8 38 27 19 46 3.92 .52 3.60 .39 9. Find and use resources 32 11 43 28 9 37 4.10 .44 3.70 .17 0. Values development 16 4 20 17 6 23 4.05 .46 3.66 .33 X. Critical analysis 27 15 42 28 18 46 4.14 .47 3.80 .30 V. Interest in learning 24 9 33 29 10 39 4.09 .48 3.81 .18
Ess.
10 “Relevant” means the instructor rate the objective as “Important” or “Essential.” 11 Means and standard deviations of “all disciplines” were computed by combining classes included in the 28 disciplines. The z scores on the graph gave equal weight to each discipline.
62

Commentary The graph compares nursing classes with those in all 28 disciplines included in this study. It reports the degree to which each objective was emphasized (horizontal axis) and the degree to which progress was reported on each emphasized objective (vertical axis). Plots are made in terms of deviation z scores. In over 70% of nursing classes, one or more of the four cognitively-oriented objectives was rated as important or essential—1. Factual knowledge, 2. Principles and theories, 3. Applications, and 4. Professional skills and viewpoints. Compared to other classes, the amount of stress on the last two of these was well above average. The degree of emphasis on 5. Team skills and 9. Finding and using resources, although not high in an absolute sense, was also well above the average for all disciplines. Progress ratings were relatively high on most objectives, although only average on two objectives infrequently chosen for nursing classes: 6. Creative capacities and 7. Broad liberal education. For all of the discipline’s most important objectives (on either an absolute or relative basis), average progress ratings were extremely high.
63

Discipline 21: Nursing (828 classes, 33 institutions) Part II: Other Ratings This
Discipline All
Disciplines11 Mean s. d. Mean s. d.
A. Stimulate Interest 4.28 .49 4.01 .15 B. Foster Collaboration 4.07 .57 3.67 .32 C. Establish Rapport 4.28 .48 4.05 .11 D. Encourage Student
Involvement 4.27 .47 3.91 .26
E. Structuring Class 4.31 .50 4.19 .10 Class Characteristics F. Amount of reading 3.92 .71 3.23 .46 G. Amount of other work 3.87 .56 3.45 .24 H. Difficulty 3.88 .65 3.47 .30 Student Characteristics I. Effort in class 4.01 .64 3.60 .20
3.79 .65 3.34 .24 K. Usually work hard 3.85 .28 3.66 .09
L. Increased positive attitude 4.22 .52 3.88 .23
M. Excellent teacher 4.31 .63 4.20 .12 N. Excellent course 4.10 .59 3.94 .18
Teaching Approach
J. Wanted course
Global Outcomes
Commentary The overall rating of teaching excellence (M) was well above average. This probably reflects the very high scores obtained on all five of the “teaching approach” scales (A-E) as well as high progress ratings (see previous graph). Nursing instructors were successful in establishing a highly positive learning environment that aroused student interest, stressed teamwork, encouraged student involvement, promoted student-faculty rapport, and clearly communicated course content and expectations. Nursing classes were rated as very demanding. Both amount of reading (F) and of other work (G) were well above the “all disciplines” average, as was the rating of course difficulty (H). However, student motivation was exceptionally high (J and, indirectly, K) and students reported working very hard (I). Coupled with high ratings on instructional approaches, these results are consistent with the generally high ratings of progress, high overall ratings of the course (N), and high ratings of increased appreciation for the field of study (L).
11 Means and standard deviations of “all disciplines” were computed by combining classes included in the 28 disciplines. The z scores on the graph gave equal weight to each discipline.
64
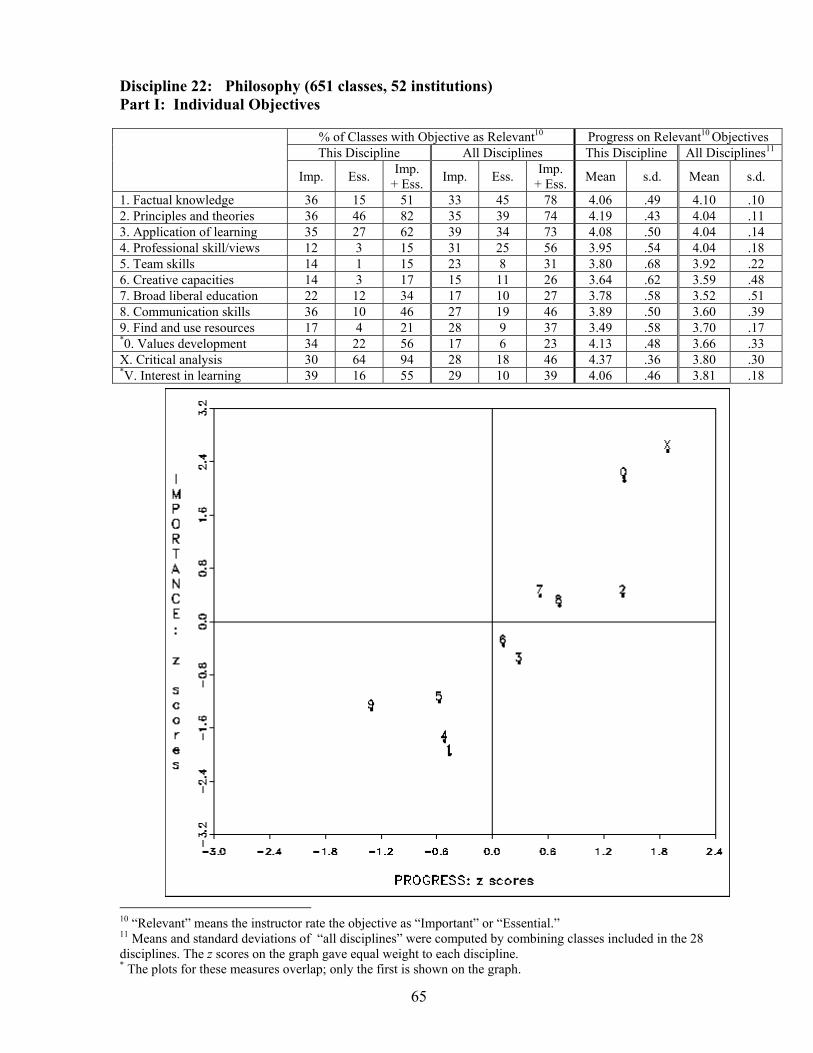
Discipline 22: Philosophy (651 classes, 52 institutions) Part I: Individual Objectives
% of Classes with Objective as Relevant10 Progress on Relevant10 Objectives This Discipline All Disciplines This Discipline All Disciplines11
Imp. Ess. Imp. + Ess. Imp. Ess. Imp.
+ Ess. Mean s.d.
1. Factual knowledge 36 15 51 33 45 78 4.06 .49 4.10 .10 2. Principles and theories 36 46 82 35 39 74 4.19 .43 4.04 .11 3. Application of learning 35 27 62 39 34 73 4.08 .50 4.04 .14 4. Professional skill/views 12 3 15 31 25 56 3.95 .54 4.04 .18 5. Team skills 14 1 15 23 8 31 3.80 .68 3.92 .22 6. Creative capacities 14 3 17 15 11 26 3.64 .62 3.59 .48 7. Broad liberal education 22 12 34 17 10 27 3.78 .58 3.52 .51 8. Communication skills 36 10 46 27 19 46 3.89 .50 3.60 .39 9. Find and use resources 17 4 21 28 9 37 3.49 .58 3.70 .17 *0. Values development 34 22 56 17 6 23 4.13 .48 3.66 .33 X. Critical analysis 30 64 94 28 18 46 4.37 .36 3.80 .30 *V. Interest in learning 39 16 55 29 10 39 4.06 .46 3.81 .18
Mean s.d.
10 “Relevant” means the instructor rate the objective as “Important” or “Essential.” 11 Means and standard deviations of “all disciplines” were computed by combining classes included in the 28 disciplines. The z scores on the graph gave equal weight to each discipline. * The plots for these measures overlap; only the first is shown on the graph.
65
Commentary The graph compares philosophy classes with those in all 28 disciplines included in this study. It reports the degree to which each objective was emphasized (horizontal axis) and the degree to which progress was reported on each emphasized objective (vertical axis). Plots are made in terms of deviation z scores. Over 90% of philosophy classes rated X. Critical analysis as an important or essential objective; no other discipline gave so much emphasis to this objective. Over 80% of classes stressed 2. Principles and theories, but this was only about average for all disciplines combined. Over half of all philosophy classes rated 0. Values development as a relevant objective; except for religion, no other discipline stressed this objective so much. Progress ratings were substantially above average on 0. Values development and X. Critical analysis, both of which distinguished philosophy from other disciplines. They were also very high on 2. Principles and theories and somewhat above average on both 7. Broad liberal education and 8. Communication skills. The only below average progress ratings were on objectives that this discipline stressed infrequently. Because only 348 classes used the Diagnostic Form, results for Part II are not reported.
66

Discipline 23: Physical Education/Health/Safety Education (1315 classes, 51 institutions)
Part I: Individual Objectives
% of Classes with Objective as Relevant10 Progress on Relevant10 Objectives This Discipline All Disciplines This Discipline All Disciplines11
Imp. Ess. Imp. + Ess. Imp. Ess. Imp.
+ Ess. Mean s.d. *1. Factual knowledge 38 51 89 33 45 78 4.07 .53 4.10 .10 2. Principles and theories 44 31 75 35 39 74 3.99 .53 4.04 .11 3. Application of learning 44 33 77 39 34 73 4.11 .49 4.04 .14 4. Professional skill/views 29 31 60 31 25 56 4.20 .47 4.04 .18 5. Team skills 30 13 43 23 8 31 4.17 .54 3.92 .22 6. Creative capacities 11 4 15 15 11 26 3.60 .76 3.59 .48 7. Broad liberal education 11 3 14 17 10 27 3.59 .74 3.52 .51 8. Communication skills 24 5 29 27 19 46 3.60 .66 3.60 .39 9. Find and use resources 24 7 31 28 9 37 3.66 .67 3.70 .17 0. Values development 33 13 46 17 3.81 6 23 .56 3.66 .33 X. Critical analysis 21 8 29 28 18 46 3.63 .71 3.80 .30 *V. Interest in learning 33 10 43 29 10 39 3.75 .61 3.81 .18
Mean s.d.
10 “Relevant” means the instructor rate the objective as “Important” or “Essential.” 11 Means and standard deviations of “all disciplines” were computed by combining classes included in the 28 disciplines. The z scores on the graph gave equal weight to each discipline. * The plots for these measures overlap; only the first is shown on the graph.
67

Commentary The graph compares physical education/health/safety education classes with those in all 28 disciplines included in this study. It reports the degree to which each objective was emphasized (horizontal axis) and the degree to which progress was reported on each emphasized objective (vertical axis). Plots are made in terms of deviation z scores. The emphasis in this discipline was on the first four (cognitively-oriented) objectives— 1. Factual knowledge, 2. Principles and theories, 3. Applications, and 4. Professional skills/viewpoints. However, relative to all other disciplines, the degree to which these objectives were stressed was only slightly above average. Although stressed in only about 45% of classes, objectives related to 5. Team skills and 0. Values development were chosen much more frequently in this discipline than in most others. Progress ratings were well above average on 5. Team skills; they were also somewhat above average on the two professional development objectives (3 and 4) and on 0. Values development. On a relative basis, they were slightly below average on the two basic cognitive objectives (1 and 2); but on an absolute scale, progress ratings averaged about 4.0 on a 5-point scale, indicating at least a satisfactory level of success. For several other objectives, all selected as relevant only infrequently, both relative and absolute measures of progress tended to be on the low side.
68

Discipline 23: Physical Education/Health/Safety Education (826 classes, 44 institutions).
Part II: Other Ratings This
Discipline All
Disciplines11 Mean s. d. Mean s. d. Teaching Approach A. Stimulate Interest 4.10 .45 4.01 .15 B. Foster Collaboration 3.86 .63 3.67 .32 C. Establish Rapport 4.09 .46 4.05 .11 D. Encourage Student
Involvement 3.99 .53 3.91 .26
E. Structuring Class 4.25 .45 4.19 .10 Class Characteristics F. Amount of reading 2.57 .86 3.23 .46 G. Amount of other work 2.95 .72 3.45 .24 H. Difficulty 2.85 .81 3.47 .30 Student Characteristics I. Effort in class 3.30 .66 3.60 .20 J. Wanted course 3.52 .59 3.34 .24 K. Usually work hard 3.68 .31 3.66 .09 Global Outcomes L. Increased positive
attitude 4.07 .50 3.88 .23
M. Excellent teacher 4.33 .56 4.20 .12 N. Excellent course 4.16 .59 3.94 .18 Commentary Instructors were relatively successful in creating positive learning environments; scores on each of the five scales assessing teaching approaches (A-E) were about a half standard deviation above average. Classes were perceived as making low demands. Ratings of both reading (F) and other kinds of academic work assignments (G) were well below average, as was the perception of class difficulty (H). These findings probably account for the low level of effort reported by students (I) despite their above average motivation to enroll (J and, indirectly, K). Overall ratings (L, M, N) were well above average. Ratings of both teacher and course excellence were in the top 15% of all disciplines, and students also reported a well above average increased appreciation for this field of study. Such positive outcomes are probably more a function of the positive learning climate established in these classes (A-E) than of their relatively “easy” nature.
11 Means and standard deviations of “all disciplines” were computed by combining classes included in the 28 disciplines. The z scores on the graph gave equal weight to each discipline.
69

Discipline 24: Physics (530 classes, 54 institutions) Part I: Individual Objectives
% of Classes with Objective as Relevant10 Progress on Relevant10 Objectives This Discipline All Disciplines This Discipline All Disciplines11
Imp. Ess. Imp. + Ess. Imp. Ess. Imp.
+ Ess. Mean s.d. Mean s.d.
1. Factual knowledge 53 36 89 33 45 78 3.94 .49 4.10 .10 2. Principles and theories 25 70 95 35 39 74 4.00 .48 4.04 .11 3. Application of learning 38 45 83 39 34 73 3.84 .52 4.04 .14 4. Professional skill/views 31 9 40 31 25 56 3.59 .55 4.04 .18 5. Team skills 28 7 35 23 8 31 3.86 .58 3.92 .22 6. Creative capacities 6 0 6 15 11 26 2.69 .45 3.59 .48 7. Broad liberal education 30 10 40 17 10 27 2.98 .62 3.52 .51 8. Communication skills 13 2 15 27 19 46 2.86 .83 3.60 .39 9. Find and use resources 17 3 20 28 9 37 3.30 .46 3.70 .17 0. Values development 4 1 5 17 6 23 2.97 .83 3.66 .33 X. Critical analysis 28 8 36 28 18 46 3.23 .59 3.80 .30 V. Interest in learning 28 8 36 29 10 39 3.42 .55 3.81 .18
10 “Relevant” means the instructor rate the objective as “Important” or “Essential.” 11 Means and standard deviations of “all disciplines” were computed by combining classes included in the 28 disciplines. The z scores on the graph gave equal weight to each discipline.
70

Commentary The graph compares physics classes with those in all 28 disciplines included in this study. It reports the degree to which each objective was emphasized (horizontal axis) and the degree to which progress was reported on each emphasized objective (vertical axis). Plots are made in terms of deviation z scores. Classes in physics focused heavily on three objectives—two stressing building a basic cognitive background (1. Factual knowledge and 2. Principles and theories) and one emphasizing applications of this background (3). These objectives were commonly stressed in most disciplines; but the degree of emphasis was especially high in physics. Although 5. Team skills and 7. Broad liberal education were selected as “important” or “essential” objectives in only a minority of physics classes, the degree of emphasis was above the “all disciplines” average reflecting, perhaps, the teamwork expectations of laboratory assignments as well as the “general education” responsibilities that are commonly assigned to physics. Relative to other disciplines, progress ratings were significantly below average on all objectives except for 2. Principles and theories and 5. Team skills. On an absolute level, however, progress ratings on the three most commonly chosen objectives (1, 2, and 3) and on 5. Team skills were all between 3.85 and 4.0 on a 5-point scale; ratings that typically are regarded as at least “satisfactory.” Those emphasizing 7. Broad liberal education averaged only 2.98, indicating a general lack of success in addressing this objective. In general, students reported learning less in their physics classes than in others, a finding that may be related to the reputation of the discipline for its high level of academic challenge. Because only 361 classes used the Diagnostic Form, results for Part II are not reported.
71

Discipline 25: Political Science/Government (677 classes, 56 institutions) Part I: Individual Objectives
% of Classes with Objective as Relevant10 Progress on Relevant10 Objectives This Discipline All Disciplines This Discipline All Disciplines11
Imp. Ess. Imp. + Ess. Imp. Ess. Imp.
+ Ess. Mean s.d.
1. Factual knowledge 31 53 84 33 45 78 4.14 .45 4.10 .10 2. Principles and theories 38 45 83 35 39 74 4.13 .45 4.04 .11 3. Application of learning 40 22 62 39 34 73 4.00 .52 4.04 .14 4. Professional skill/views 21 7 28 31 25 56 4.01 .52 4.04 .18 5. Team skills 15 4 19 23 8 31 3.85 .67 3.92 .22 6. Creative capacities 11 5 16 15 11 26 3.47 .63 3.59 .48 7. Broad liberal education 13 6 19 17 10 27 3.59 .68 3.52 .51 8. Communication skills 44 15 59 27 19 46 3.80 .57 3.60 .39 *9. Find and use resources 25 10 35 28 9 37 3.77 .58 3.70 .17 *0. Values development 17 7 24 17 6 23 3.80 .58 3.66 .33 X. Critical analysis 36 37 73 28 18 46 4.17 .49 3.80 .30 V. Interest in learning 32 12 44 29 10 39 3.90 .56 3.81 .18
Mean s.d.
10 “Relevant” means the instructor rate the objective as “Important” or “Essential.” 11 Means and standard deviations of “all disciplines” were computed by combining classes included in the 28 disciplines. The z scores on the graph gave equal weight to each discipline. * The plots for these measures overlap; only the first is shown on the graph.
72

Commentary The graph compares physical science/government classes with those in all 28 disciplines included in this study. It reports the degree to which each objective was emphasized (horizontal axis) and the degree to which progress was reported on each emphasized objective (vertical axis). Plots are made in terms of deviation z scores. Over 80% of classes in this discipline emphasized the two basic cognitive objectives (1. Factual knowledge and 2. Principles and theories), a figure that was slightly above the average for all disciplines. Almost three-fourths of these classes stressed X. Critical analysis; only philosophy gave this objective more emphasis. Unusually high emphasis was also placed on 8. Communication skills (59% of classes) and V. Increased interest in learning (44% of classes). Only 28% of classes emphasized 4. Professional skills and viewpoints, one of the lowest percentages of the 28 disciplines included in the study. Progress ratings on objectives corresponded to ratings of their relative degree of importance. They were especially high on X. Critical analysis and slightly above average on all other objectives where political science’s emphasis exceeded that of other disciplines. They were slightly below average on objectives stressed less frequently by political science than by other disciplines; but for “applied cognitive” objectives (3 and 4), the average progress rating of 4.0 (on a 5-point scale) suggests that progress was at least satisfactory. Because only 400 classes used the Diagnostic Form, results for Part II are not reported.
73

Discipline 26: Psychology (1767 classes, 76 institutions) Part I: Individual Objectives
% of Classes with Objective as Relevant10 Progress on Relevant10 Objectives This Discipline All Disciplines This Discipline All Disciplines11
Imp. Ess. Imp. + Ess. Imp. Ess. Imp.
+ Ess. Mean s.d. Mean s.d.
1. Factual knowledge 31 56 87 33 45 78 4.21 .43 4.10 .10 2. Principles and theories 33 54 87 35 39 74 4.20 .41 4.04 .11 3. Application of learning 46 29 75 39 34 73 4.12 .47 4.04 .14 4. Professional skill/views 28 15 43 31 25 56 4.14 .47 4.04 .18 5. Team skills 15 4 19 23 8 31 4.03 .61 3.92 .22 6. Creative capacities 6 2 8 15 11 26 3.54 .62 3.59 .48 7. Broad liberal education 10 3 13 17 10 27 3.22 .59 3.52 .51 8. Communication skills 32 7 39 27 19 46 3.73 .57 3.60 .39 *9. Find and use resources 23 6 29 28 9 37 3.76 .55 3.70 .17 0. Values development 16 7 23 17 6 23 3.94 .59 3.66 .33 X. Critical analysis 35 19 54 28 18 46 3.93 .50 3.80 .30 *V. Interest in learning 26 8 34 29 10 39 3.88 .52 3.81 .18
10 “Relevant” means the instructor rate the objective as “Important” or “Essential.” 11 Means and standard deviations of “all disciplines” were computed by combining classes included in the 28 disciplines. The z scores on the graph gave equal weight to each discipline. * The plots for these measures overlap; only the first is shown on the graph.
74
Commentary The graph compares psychology classes with those in all 28 disciplines included in this study. It reports the degree to which each objective was emphasized (horizontal axis) and the degree to which progress was reported on each emphasized objective (vertical axis). Plots are made in terms of deviation z scores. This discipline differed only slightly from the “all disciplines” average in its emphases on objectives. Slightly above average emphasis was placed on the two concerned with basic cognitive development (1. Factual knowledge and 2. Principles and theories) as well as on X. Critical analysis. Compared with other disciplines, psychology classes placed less emphasis on 6. Creative capacities, 5. Team skills, 7. Broad liberal education, 9. Finding and using resources, and 4. Professional skills/viewpoints. Progress ratings were well above average of both basic cognitive objectives and somewhat above average on all but two other objectives. They were about average on 6. Creative capacities and below average on 7. Broad liberal education, neither of which were chosen as “important” or “essential” in most psychology classes.
75

Discipline 26: Psychology (1114 classes, 58 institutions) Part II: Other Ratings This
Discipline All
Disciplines11 Mean s. d. Mean s. d. Teaching Approach A. Stimulate Interest 4.08 .43 4.01 .15 B. Foster Collaboration 3.73 .67 3.67 .32 C. Establish Rapport 4.06 .44 4.05 .11 D. Encourage Student
Involvement 4.00 .48 3.91 .26
E. Structuring Class 4.29 .40 4.19 .10 Class Characteristics F. Amount of reading 3.46 .57 3.23 .46 G. Amount of other work 3.22 .64 3.45 .24 H. Difficulty 3.47 .53 3.47 .30 Student Characteristics I. Effort in class 3.57 .53 3.60 .20 J. Wanted course 3.38 .48 3.34 .24 K. Usually work hard 3.63 .28 3.66 .09 Global Outcomes L. Increased positive
attitude 4.02 .50 3.88 .23
M. Excellent teacher 4.30 .54 4.20 .12 N. Excellent course 4.06 .53 3.94 .18 Commentary Psychology instructors had above average success in employing teaching approaches designed to create a positive learning environment. They were rated as well above average on the scale depicting clear communication of content and expectations (E); scores on this scale are related to progress ratings on several objectives commonly stressed in psychology classes (1, 2, and 3; see preceding page). Academic demands appeared to be about average—above average in reading (F); below average in amount of other work (G); and average in difficulty (H). These demands, coupled with student motivation levels that were about average (J and, indirectly, K) probably explain the average rating on amount of student effort (I). All three overall ratings (L. Increased positive attitude toward the discipline, M. Excellence of teacher, and N. Excellence of course) were above average; a finding consistent both with the above average ratings of progress on relevant objectives (preceding page) and those describing teaching approaches (A-E).
11 Means and standard deviations of “all disciplines” were computed by combining classes included in the 28 disciplines. The z scores on the graph gave equal weight to each discipline.
76

Discipline 27: Religion (1039 classes, 35 institutions) Part I: Individual Objectives
% of Classes with Objective as Relevant10 Progress on Relevant10 Objectives All Disciplines This Discipline All Disciplines11
Imp. Ess. Imp. + Ess. Imp. Ess. Imp.
+ Ess. Mean s.d. Mean s.d.
1. Factual knowledge 33 48 81 33 45 78 4.15 .46 4.10 .10 2. Principles and theories 38 41 79 35 39 74 4.12 .44 4.04 .11 3. Application of learning 31 24 55 39 34 73 4.04 .49 4.04 .14 4. Professional skill/views 19 10 29 31 25 56 4.00 .47 4.04 .18 5. Team skills 8 2 10 23 8 31 3.70 .74 3.92 .22 *6. Creative capacities 11 3 14 15 11 26 3.46 .75 3.59 .48 7. Broad liberal education 19 11 30 17 10 27 3.81 .60 3.52 .51 8. Communication skills 33 9 42 27 19 46 3.75 .60 3.60 .39 *9. Find and use resources 24 5 29 28 9 37 3.67 .59 3.70 .17 0. Values development 39 27 66 17 6 23 4.29 .43 3.66 .33 X. Critical analysis 34 26 60 28 18 46 4.12 .47 3.80 .30 V. Interest in learning 35 14 49 29 10 39 4.00 .47 3.81 .18
This Discipline
10 “Relevant” means the instructor rate the objective as “Important” or “Essential.” 11 Means and standard deviations of “all disciplines” were computed by combining classes included in the 28 disciplines. The z scores on the graph gave equal weight to each discipline. * The plots for these measures overlap; only the first is shown on the graph.
77

Commentary The graph compares religion classes with those in all 28 disciplines included in this study. It reports the degree to which each objective was emphasized (horizontal axis) and the degree to which progress was reported on each emphasized objective (vertical axis). Plots are made in terms of deviation z scores. The most frequently selected objectives in religion classes were the two concerned with basic cognitive development (1. Factual knowledge and 2. Principles and theories). The amount of stress on these objectives was about average for all disciplines. Religion classes were most distinguished from those in other disciplines principally by the high importance attached to 0. Values development, X. Critical analysis, and V. Interest in learning more. Over 60% stressed 0. Values development and/or X. Critical analysis while about half identified V. Increased interest in learning as “important” or “essential.” The stress placed on 0. Valued development exceeded that of all other disciplines. Progress ratings corresponded closely to the relative importance of each objective. They were exceptionally high on 0. Values development and well above average for both X. Critical analysis and V. Increased interest in learning. Although progress ratings were below the average for all disciplines on several objectives, none of these was chosen as relevant for a large percentage of classes in religion. Furthermore, when “absolute” rather than “relative” figures are considered, average progress ratings on all objectives except 6. Creative capacities, were 3.67 or higher (on a 5-point scale).
78

Discipline 27: Religion (642 classes, 30 institutions) Part II: Other Ratings This
Discipline All
Disciplines11 Mean s. d. Mean s. d. Teaching Approach A. Stimulate Interest 4.11 .41 4.01 .15 B. Foster Collaboration 3.72 .68 3.67 .32 C. Establish Rapport 4.09 .44 4.05 .11 D. Encourage Student
Involvement 3.90 .51 3.91 .26
E. Structuring Class 4.24 .39 4.19 .10 Class Characteristics F. Amount of reading 3.60 .46 .54 3.23 G. Amount of other work 3.18 .53 3.45 .24 H. Difficulty 3.37 .46 3.47 .30 Student Characteristics I. Effort in class 3.42 .45 3.60 .20 J. Wanted course 3.29 .47 3.34 .24 K. Usually work hard 3.59 .25 3.66 .09 Global Outcomes L. Increased positive
attitude 4.04 .49 3.88 .23
M. Excellent teacher 4.31 .56 4.20 .12 N. Excellent course 4.08 .53 3.94 .18 Commentary Ratings of all five teaching approaches were at or above the average for all disciplines. Scores on Scales A. Stimulating Student Interest and E. Structuring Classroom Experiences were somewhat higher than those on the other three scales. Religion classes generally required a lot of reading (F), but a below average amount of other work (G). Their difficulty rating (H) was somewhat below average; a finding that, coupled with somewhat below average student motivation (J and, indirectly, K), may explain the relatively low rating of student effort (I). All three global ratings (L. Increased interest in the discipline, M. Excellence of teacher, and N. Excellence of course) were well above average. These high ratings probably reflect high student satisfaction with their progress on the discipline’s most distinctive objectives (0, X, and V; preceding page). The excellence of teacher rating placed religion in the top 15% of all disciplines.
11 Means and standard deviations of “all disciplines” were computed by combining classes included in the 28 disciplines. The z scores on the graph gave equal weight to each discipline.
79

Discipline 28: Sociology (871 classes, 60 institutions) Part I: Individual Objectives
% of Classes with Objective as Relevant10 Progress on Relevant10 Objectives This Discipline All Disciplines This Discipline All Disciplines11
Imp. Ess. Imp. + Ess. Imp. Ess. Imp.
+ Ess. Mean s.d. Mean s.d.
1. Factual knowledge 40 47 87 33 45 78 4.03 .48 4.10 .10 2. Principles and theories 37 45 82 35 39 74 4.04 .48 4.04 .11 3. Application of learning 41 30 71 39 34 73 3.97 .51 4.04 .14 4. Professional skill/views 24 11 35 31 25 56 4.03 .51 4.04 .18 5. Team skills 18 7 25 23 8 31 3.81 .62 3.92 .22 6. Creative capacities 11 3 14 15 11 26 3.50 .62 3.59 .48 7. Broad liberal education 13 10 23 17 10 27 3.75 .59 3.52 .51 8. Communication skills 36 11 47 27 19 46 3.75 .54 3.60 .39 9. Find and use resources 26 6 32 28 9 37 3.68 .58 3.70 .17 0. Values development 28 14 42 17 6 23 3.94 .48 3.66 .33 X. Critical analysis 34 31 65 28 18 46 4.01 .51 3.80 .30 V. Interest in learning 33 15 48 29 10 39 3.84 .54 3.81 .18
10 “Relevant” means the instructor rate the objective as “Important” or “Essential.” 11 Means and standard deviations of “all disciplines” were computed by combining classes included in the 28 disciplines. The z scores on the graph gave equal weight to each discipline.
80

Commentary The graph compares sociology classes with those in all 28 disciplines included in this study. It reports the degree to which each objective was emphasized (horizontal axis) and the degree to which progress was reported on each emphasized objective (vertical axis). Plots are made in terms of deviation z scores. Sociology classes focused most often on 1. Factual knowledge, 2. Principles and theories, and 3. Applications, although the amount of emphasis on these objectives was only about average for all disciplines. On a relative basis, sociology classes stressed three objectives with unusual frequency—0. Values development, X. Critical analysis, and V. Increased interest in learning. The emphasis on 4. Professional skills/viewpoints was well below the “all disciplines” average. Well above average progress ratings were obtained on the 0. Values development and X. Critical analysis objectives. These ratings were also somewhat above average on 7. Broad liberal education (relevant in only 23% of sociology classes) and 8. Communication skills (relevant in 48% of the discipline’s classes). The above average progress rating on 1. Factual knowledge, although substantially below the “all disciplines” average, was still 4.03 on a 5-point scale, a rating generally considered to be satisfactory.
81

Discipline 28: Sociology (513 classes, 45 institutions) Part II: Other Ratings This
Discipline All
Disciplines11 Mean s. d. Mean s. d. Teaching Approach A. Stimulate Interest 3.93 .48 4.01 .15 B. Foster Collaboration 3.77 .62 3.67 .32 C. Establish Rapport 3.94 .48 4.05 .11 D. Encourage Student
Involvement 3.92 .48 3.91 .26
E. Structuring Class 4.15 .44 4.19 .10 Class Characteristics F. Amount of reading 3.51 .53 3.23 .46 G. Amount of other work 3.07 .50 3.45 .24 H. Difficulty 3.23 .47 3.47 .30 Student Characteristics I. Effort in class 3.33 .51 3.60 .20 J. Wanted course 3.24 .46 3.34 .24 K. Usually work hard 3.56 .28 3.66 .09 Global Outcomes L. Increased positive
attitude 3.87 .52 3.88 .23
M. Excellent teacher 4.10 .61 4.20 .12 N. Excellent course 3.87 .56 3.94 .18 Commentary Sociology instructors placed slightly above average emphasis on teaching approaches that foster student collaboration (B) but below average emphasis on those which establish rapport (C), stimulate student interest (A), or clearly communicate content and expectations (E). Because gaining 1. Factual knowledge (see previous page) is facilitated much more by A. Stimulating student interest than by B. Fostering student collaboration, the relatively low progress rating on this objective (1, see previous page) is consistent with the pattern of teaching approaches that characterize this discipline. Although sociology classes required a somewhat above average amount of reading (F), non-reading requirements were very low (G), and difficulty (H) was well below the average for all disciplines. These findings, coupled with below average ratings of student motivation (J and, indirectly, K) probably explain the very low rating of how hard students worked in sociology classes (I). Overall ratings of the excellence of the course (N) and teacher (M) were below the “all disciplines” average, a finding that may be related to below average ratings on several “teaching approach” scales (A, C, E) as well as the relatively low progress rating on the important objective of 1. Factual knowledge (previous page).
11 Means and standard deviations of “all disciplines” were computed by combining classes included in the 28 disciplines. The z scores on the graph gave equal weight to each discipline.
82

Appendix
83

Overview Tables in the Appendix provide a practical way of observing the magnitude of differences among disciplines. For each discipline, the percentage of classes in each of five categories is shown. The categories were defined by T Scores, a statistical way of describing how far a given rating deviated from average. Conventionally, these categories are called “Low” (T Score of 37 or below, roughly the lowest 10 percent), “Low Average” (T Score of 38-44, about the next 20 percent), “Average” (T Score of 45-55, about the middle 40 percent), “High Average” (T Score of 55-62, the next 20 percent), and “High” (T Score 63 or higher, the highest 10 percent). The first 12 tables show, by discipline, the percentage of classes in each of these five categories; figures were derived only from those classes where the objective was identified by the instructor as “Important” or “Essential.” The last four tables include data from all classes; they describe results on the four IDEA “global” measures (i.e., overall or summary measures) of effectiveness – increase positive attitudes toward the discipline, overall excellence of the teacher, overall excellence of the course, and Progress on Relevant Objectives, a measure combining student ratings of progress on objectives emphasized by the instructor. Results for a given discipline are considered “atypical” if the percentage of classes in the five categories departs markedly from the “typical” distribution (10%, 20%, 40%, 20%, 10%, from Low to High, respectively, as described above). Fluctuations of ±5% from the “typical” percentage for a category are too small to have practical significance. In some disciplines, there were fewer than 100 classes for which a given objective was selected as “Important” or “Essential.” Results from such small samples are generally not stable enough to permit dependable generalizations.
84

Table 1: Percentage of Classes Within T Score1 Categories Objective 1. Gaining factual knowledge
Unadjusted T Score
Discipline
Number of
Classes2 ≤ 37 38-44 45-54 55-62 63 +
Accounting 981 9.4 9.3 37.1 33.6 10.6 Administration/Management 1699 11.1 13.3 36.7 30.0 8.9 Art 650 11.4 13.1 32.5 32.0 11.1 Biology/Life Science 1584 5.6 8.5 28.7 36.8 20.4 Business/General 480 8.3 11.7 41.7 31.9 6.5 Chemistry 847 10.4 11.1 38.3 32.4 7.9 Communications 1074 11.8 13.5 40.0 26.2 8.5 Computer/Information Sciences 1267 9.8 11.4 42.2 29.6 7.0
Design/Applied Arts 1147 8.0 8.9 35.6 32.7 14.8 Economics 693 12.1 14.3 40.3 27.7 5.6 Education/General 3135 8.8 9.1 30.2 33.8 18.2 Engineering 987 12.3 13.5 39.9 26.2 8.1 English Literature 1189 21.6 18.0 35.7 20.0 4.6 Fine and Applied Arts 738 10.0 7.7 32.4 35.4 14.5 Foreign Language and Literature 777 6.4 12.2 39.9 33.0 8.5
History 946 4.7 8.4 35.3 38.2 13.5 Health Professions/Related Sciences 1108 5.7 6.1 26.7 40.6 20.9
Liberal Arts/General Studies/Humanities 972 8.7 11.4 36.7 31.4 11.7
Mathematics/Statistics 1733 12.5 15.4 41.6 25.8 4.8 Music 522 7.7 9.6 32.8 33.9 16.1 Nursing 762 6.0 5.5 29.4 38.3 20.7 Philosophy 316 10.1 11.4 42.1 26.0 10.4 Physical Education/Health/ Safety Education 1093 13.4 10.0 33.6 31.3 11.8
Physics 447 14.3 17.2 41.6 22.2 4.7 Political Science/Government 550 7.8 9.8 36.4 35.3 10.7
Psychology 1443 5.1 8.1 35.8 37.1 13.9 Religion 791 8.1 11.9 31.2 36.3 12.5 Sociology 728 11.5 14.8 37.9 27.5 8.2 1A standardized score with an average of 50 and a standard deviation of 10. 2Refer to the tables provided in the report to determine how frequently this objective was selected relative to
other objectives within a discipline (Part I for each discipline).
85

Table 2: Percentage of Classes Within T Score1 Categories Objective 2. Principles and theories
Unadjusted T Score
Discipline
Number of
Classes2 ≤ 37 38-44 45-54 55-62 63 +
Accounting 936 6.9 10.7 41.9 32.2 8.3 Administration/Management 1702 7.9 12.6 40.2 31.3 8.0 Art 602 13.3 15.0 39.7 24.9 7.1 Biology/Life Science 1474 6.8 14.5 44.2 27.2 7.3 Business/General 432 7.2 14.1 45.4 30.1 3.2 Chemistry 811 8.1 13.3 43.3 29.1 6.2 Communications 1099 11.4 15.2 42.5 24.8 6.1 Computer/Information Sciences 967 12.6 15.6 44.9 23.1 3.8
Design/Applied Arts 1126 4.8 11.1 39.5 33.1 11.5 Economics 726 7.0 14.2 45.2 27.8 5.8 Education/General 2995 7.3 9.5 31.8 35.2 16.3 Engineering 958 11.7 15.5 37.3 28.9 6.7 English Literature 1097 22.9 18.9 35.7 18.0 4.6 Fine and Applied Arts 712 9.0 11.4 34.4 33.6 11.7 Foreign Language and Literature 443 19.2 17.2 42.0 20.5 1.1
History 530 12.8 19.1 43.6 20.6 4.0 Health Professions/Related Sciences 982 6.3 10.3 34.5 37.9 11.0
Liberal Arts/General Studies/Humanities 924 8.0 13.6 42.3 28.1 7.9
Mathematics/Statistics 1673 7.4 14.8 43.0 29.8 5.0 Music 407 8.1 10.1 34.9 31.2 15.7 Nursing 713 4.9 8.3 32.7 41.9 12.2 Philosophy 497 4.0 8.5 39.2 34.6 13.7 Physical Education/Health/ Safety Education 862 12.8 12.3 38.5 28.2 8.2
Physics 471 8.9 16.6 41.0 28.0 5.5 Political Science/Government 527 5.3 11.0 38.5 34.9 10.3
Psychology 1431 3.2 8.5 38.3 38.2 11.7 Religion 741 5.4 12.7 37.5 33.7 10.7 Sociology 667 9.0 13.9 40.5 27.3 9.3 1A standardized score with an average of 50 and a standard deviation of 10. 2Refer to the tables provided in the report to determine how frequently this objective was selected relative to other objectives within a discipline (Part I for each discipline).
86

Table 3: Percentage of Classes Within T Score1 Categories Objective 3. Application of learning
Unadjusted T Score
Discipline
Number of
Classes2 ≤ 37 38-44 45-54 55-62 63 +
Accounting 825 9.3 12.1 42.8 29.0 6.8 Administration/Management 1824 8.1 11.6 35.9 32.7 11.7 Art 557 11.0 11.7 35.9 29.8 11.7 Biology/Life Science 999 12.8 18.0 38.4 24.0 6.7 Business/General 452 7.5 10.6 44.0 31.6 6.2 Chemistry 684 12.9 19.0 42.4 22.2 3.5 Communications 1244 6.7 10.5 37.1 34.9 10.9 Computer/Information Sciences 1018 8.5 15.4 43.4 27.9 4.8
Design/Applied Arts 1193 5.1 9.0 35.1 38.1 12.7 Economics 612 14.2 19.4 43.5 19.8 3.1 Education/General 3279 4.9 6.4 25.3 36.1 27.3 Engineering 1016 12.6 15.5 39.0 26.1 6.9 English Literature 1578 11.9 17.2 42.3 23.2 5.5 Fine and Applied Arts 666 8.0 10.8 32.9 35.1 13.2 Foreign Language and Literature 351 11.4 17.1 42.7 24.5 4.3
History 383 25.3 21.2 35.5 15.4 2.6 Health Professions/Related Sciences 1096 4.2 6.8 26.6 39.9 22.5
Liberal Arts/General Studies/Humanities 1010 9.7 14.0 39.1 28.8 8.4
Mathematics/Statistics 1645 10.9 16.0 46.0 22.7 4.4 Music 319 6.9 11.6 32.6 29.8 19.1 Nursing 875 3.7 5.9 28.2 38.7 23.4 Philosophy 376 8.2 10.9 38.8 32.7 9.3 Physical Education/Health/ Safety Education 887 8.1 12.1 34.3 33.2 12.4
Physics 389 15.7 21.1 37.8 22.4 3.1 Political Science/Government 389 10.5 13.9 40.1 28.3 7.2
Psychology 1189 6.5 11.2 36.7 34.5 11.2 Religion 491 8.2 15.1 37.5 31.8 7.5 Sociology 552 13.2 17.0 35.7 25.7 8.3 1A standardized score with an average of 50 and a standard deviation of 10. 2Refer to the tables provided in the report to determine how frequently this objective was selected relative to other objectives within a discipline (Part I for each discipline).
87

Table 4: Percentage of Classes Within T Score1 Categories Objective 4. Professional skill/views
Unadjusted T Score
Discipline
Number of
Classes2 ≤ 37 38-44 45-54 55-62 63 +
Accounting 760 9.7 9.1 38.0 34.3 8.8 Administration/Management 1371 11.3 12.3 39.0 29.4 8.1 Art 702 6.6 10.3 34.1 35.6 13.5 Biology/Life Science 749 11.2 13.2 38.1 26.8 10.7 Business/General 357 8.7 12.0 46.2 28.9 4.2 Chemistry 442 16.1 22.6 37.8 19.5 4.1 Communications 1063 8.1 9.3 32.4 36.0 14.2 Computer/Information Sciences 1117 10.1 16.6 41.2 27.3 4.8
Design/Applied Arts 1233 8.2 8.6 35.0 36.5 11.8 Economics 226 26.6 15.9 41.2 15.0 1.3 Education/General 3390 6.5 6.6 24.2 37.8 25.0 Engineering 856 14.6 16.5 39.7 23.5 5.7 English Literature 906 14.4 13.9 36.2 27.6 8.0 Fine and Applied Arts 737 6.2 8.7 33.8 37.5 13.8 Foreign Language and Literature 354 17.5 18.4 39.0 20.9 4.2
History 233 17.2 18.5 35.2 22.3 6.9 Health Professions/Related Sciences 1001 5.0 5.6 25.2 40.2 24.1
Liberal Arts/General Studies/Humanities 344 18.9 18.0 35.8 22.1 5.2
Mathematics/Statistics 803 23.3 19.8 39.1 15.6 2.2 Music 494 4.5 8.3 30.2 36.0 21.1 Nursing 747 5.6 5.5 24.5 39.9 24.5 Philosophy3 91 18.7 16.5 33.0 22.0 9.9 Physical Education/Health/ Safety Education 702 8.7 7.0 30.1 38.8 15.5
Physics 190 41.1 22.1 24.2 12.1 0.5 Political Science/Government 181 13.3 10.5 40.3 29.3 6.6
Psychology 684 7.2 9.9 39.5 30.1 13.3 Religion 263 10.3 20.2 39.2 22.4 8.0 Sociology 279 13.6 14.0 31.9 31.5 9.0 1A standardized score with an average of 50 and a standard deviation of 10. 2Refer to the tables provided in the report to determine how frequently this objective was selected relative to other objectives within a discipline (Part I for each discipline). 3Fewer than 100 classes identified this objective as “Important” or “Essential.” Results from such small samples are generally not stable enough to permit dependable generalizations.
88

Table 5: Percentage of Classes Within T Score1 Categories Objective 5. Team skills
Unadjusted T Score
Discipline
Number of
Classes2 ≤ 37 38-44 45-54 55-62 63 +
Accounting 241 12.5 7.1 45.6 31.5 3.3 Administration/Management 943 6.0 7.5 36.6 39.9 10.0 Art 153 30.1 9.2 37.3 19.0 4.6
451 11.5 10.6 39.3 31.9 Business/General 210 9.5 8.1 41.9 38.1 2.4 Chemistry 185 8.7 10.3 46.0 29.2 6.0 Communications 693 6.8 5.9 33.9 42.3 11.1 Computer/Information Sciences 315 20.6 12.1 42.9 21.6 2.9
Design/Applied Arts 329 18.8 17.6 40.1 18.8 4.6 Economics3 66 30.3 19.7 36.4 12.1 1.5 Education/General 1732 4.3 6.5 35.5 40.8 13.1 Engineering 451 6.7 6.7 37.7 37.7 11.3 English Literature 909 10.6 12.3 47.4 26.3 3.4 Fine and Applied Arts 322 10.9 9.6 31.7 37.6 10.3 Foreign Language and Literature 256 14.8 13.7 45.7 23.1 2.7
History3 96 20.8 11.5 47.9 19.8 0 Health Professions/Related Sciences 486 2.3 3.7 35.8 44.0 14.2
Liberal Arts/General Studies/Humanities 391 10.0 10.5 46.8 28.1 4.6
Mathematics/Statistics 304 21.7 15.5 45.4 15.5 2.0 Music 217 9.7 6.0 24.0 44.2 16.1
2.6 3.5 40.5 45.5 7.9 Philosophy3 89 12.4 14.6 48.3 20.2 4.5 Physical Education/Health/ Safety Education 485 4.1 7.2 36.5 38.6 13.6
Physics 159 12.6 10.1 51.6 18.2 7.6 Political Science/Government 121 14.1 14.9 37.2 29.8 4.1
Psychology 292 9.9 9.9 37.0 35.6 7.5 Religion3 88 17.1 14.8 42.1 19.3 6.8 Sociology 199 17.6 12.6 44.2 22.6 3.0
Biology/Life Science 6.7
Nursing 341
1A standardized score with an average of 50 and a standard deviation of 10. 2Refer to the tables provided in the report to determine how frequently this objective was selected relative to other objectives within a discipline (Part I for each discipline). 3Fewer than 100 classes identified this objective as “Important” or “Essential.” Results from such small samples are generally not stable enough to permit dependable generalizations.
89

Table 6: Percentage of Classes Within T Score1 Categories Objective 6. Creative capacities
Unadjusted T Score
Discipline
Number of
Classes2 ≤ 37 38-44 45-54 55-62 63 +
Accounting 50 50.0 20.0 20.0 10.0 0 Administration/Management 284 20.1 18.3 36.3 22.9 2.5 Art 888 1.2 3.6 17.2 60.9 17.0 Biology/Life Science 104 44.2 26.0 26.9 1.9 1.0 Business/General3 79 17.7 15.2 40.5 26.6 0 Chemistry3 49 73.5 10.2 8.2 6.1 2.0 Communications 709 3.7 8.3 35.1 43.7 9.2 Computer/Information Sciences 243 27.6 23.9 32.5 15.6 0.4
Design/Applied Arts 916 4.6 11.1 40.3 40.3 3.7 Economics3 39 64.1 25.6 10.3 0 0
5.6 11.4 31.5 41.0 10.5 Engineering 214 39.3 16.4 29.4 14.5 0.5 English Literature 1521 1.8 4.7 27.9 51.2 14.3 Fine and Applied Arts 656 4.0 7.5 31.4 43.0 14.2 Foreign Language and Literature 238 14.3 21.4 35.3 27.3 1.7
History 156 28.2 16.0 41.7 13.5 0.6 Health Professions/Related Sciences 107 14.0 16.8 40.2 24.3 4.7
Liberal Arts/General Studies/Humanities 429 7.0 11.9 39.2 36.8 5.1
Mathematics/Statistics 104 67.3 15.4 13.5 3.9 0 Music 474 2.7 4.6 24.3 48.5 19.8 Nursing3 67 14.9 23.9 38.8 20.9 1.5 Philosophy3 96 19.8 18.8 40.6 19.8 1.0 Physical Education/Health/ Safety Education 158 26.0 16.5 31.7 21.5 4.4
Physics3 30 83.3 10.0 6.7 0 0 Political Science/Government3 94 27.7 21.3 34.0 16.0 1.1
Psychology 110 16.4 30.9 31.8 20.9 0 Religion 123 28.5 21.1 29.3 21.1 0 Sociology 108 27.8 23.2 30.6 16.7 1.9
Education/General 923
1A standardized score with an average of 50 and a standard deviation of 10. 2Refer to the tables provided in the report to determine how frequently this objective was selected relative to other objectives within a discipline (Part I for each discipline). 3Fewer than 100 classes identified this objective as “Important” or “Essential.” Results from such small samples are generally not stable enough to permit dependable generalizations.
90

Table 7: Percentage of Classes Within T Score1 Categories Objective 7. Broad liberal education
Unadjusted T Score
Discipline
Number of
Classes2 ≤ 37 38-44 45-54 55-62 63 + 3 29 75.9 17.2 3.5 3.5 0
Administration/Management 160 30.6 20.0 30.0 16.9 2.5 Art 617 1.1 3.4 27.4 52.8 15.2 Biology/Life Science 396 23.0 30.8 34.6 11.1 0.5 Business/General3 43 30.2 20.9 34.9 14.0 0
32.3 31.0 28.5 7.6 0.6 Communications 387 9.6 15.8 37.5 31.0 6.2 Computer/Information Sciences 104 47.1 17.3 29.8 4.8 1.0
Design/Applied Arts 317 7.6 12.0 43.5 32.8 4.1 Economics3 68 54.4 26.5 14.7 4.4 0 Education/General 684 8.3 9.7 35.2 33.8 13.0 Engineering3 83 67.5 16.9 14.5 0 1.2 English Literature 1790 2.7 6.2 29.5 45.1 16.5 Fine and Applied Arts 360 3.3 9.2 27.8 44.4 15.3 Foreign Language and Literature 627 1.8 3.2 31.4 50.1 13.6
History 399 5.3 10.3 46.1 34.3 4.0 Health Professions/Related Sciences 105 22.9 19.1 34.3 21.9 1.9
Liberal Arts/General Studies/Humanities 844 4.7 9.0 31.6 41.8 12.8
Mathematics/Statistics 186 67.7 14.0 12.4 5.9 0 Music 541 0.7 0.9 12.0 54.0 32.4
3 51 9.8 23.5 52.9 13.7 0 Philosophy 211 8.1 10.0 49.3 27.5 5.2 Physical Education/Health/ Safety Education 154 17.5 14.3 38.3 22.7 7.1
Physics 179 44.7 25.1 25.7 3.9 0.6 Political Science/Government 120 16.7 13.3 41.7 25.8 2.5
Psychology 195 29.2 26.2 35.4 9.2 0 Religion 281 8.2 12.5 38.4 33.5 7.5 Sociology 178 9.0 14.6 41.6 32.0 2.8
Accounting
Chemistry 158
Nursing
1A standardized score with an average of 50 and a standard deviation of 10. 2Refer to the tables provided in the report to determine how frequently this objective was selected relative to other objectives within a discipline (Part I for each discipline).
3Fewer than 100 classes identified this objective as “Important” or “Essential.” Results from such small samples are generally not stable enough to permit dependable generalizations.
91
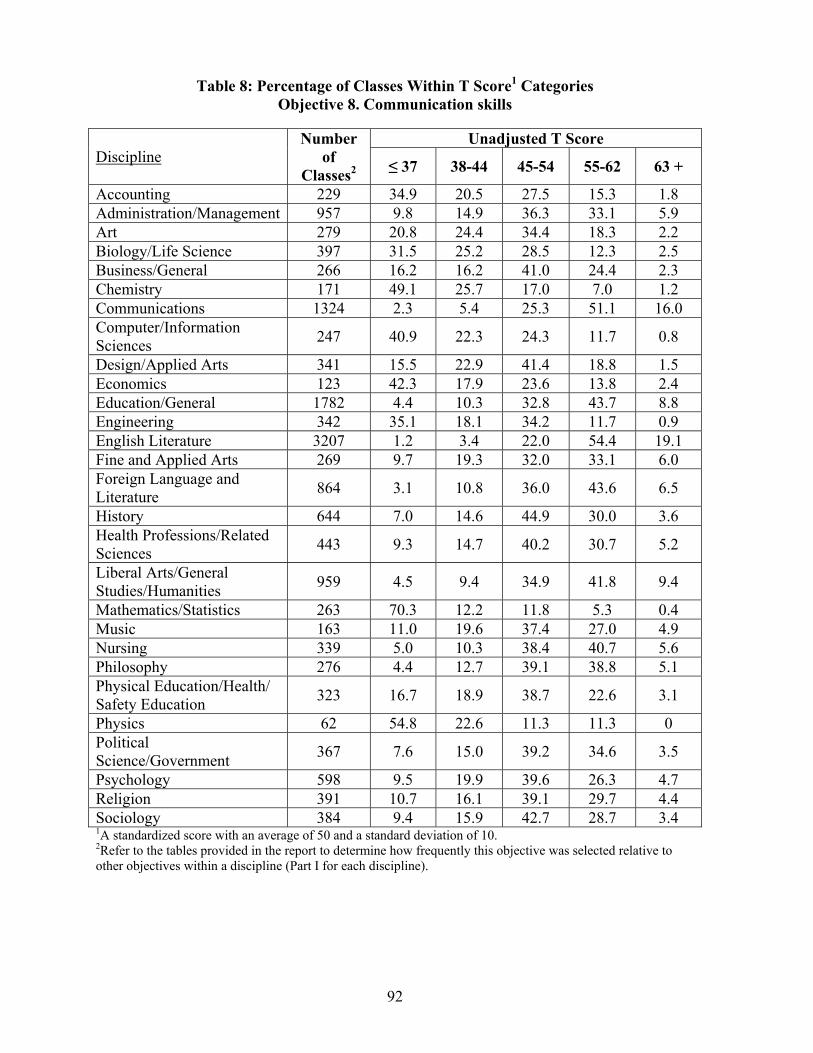
Table 8: Percentage of Classes Within T Score1 Categories Objective 8. Communication skills
Unadjusted T Score
Discipline Number
of Classes2 ≤ 37 38-44 45-54 55-62 63 +
Accounting 229 34.9 20.5 27.5 15.3 1.8 Administration/Management 957 9.8 14.9 36.3 33.1 5.9 Art 279 20.8 24.4 34.4 18.3 2.2 Biology/Life Science 397 31.5 25.2 28.5 12.3 2.5 Business/General 266 16.2 16.2 41.0 24.4 2.3 Chemistry 171 49.1 25.7 17.0 7.0 1.2 Communications 1324 2.3 5.4 25.3 51.1 16.0 Computer/Information Sciences 247 40.9 22.3 24.3 11.7 0.8
Design/Applied Arts 341 15.5 22.9 41.4 18.8 1.5 Economics 123 42.3 17.9 23.6 13.8 2.4 Education/General 1782 4.4 10.3 32.8 43.7 8.8 Engineering 342 35.1 18.1 34.2 11.7 0.9 English Literature 3207 1.2 3.4 22.0 54.4 19.1 Fine and Applied Arts 269 9.7 19.3 32.0 33.1 6.0 Foreign Language and Literature 864 3.1 10.8 36.0 43.6 6.5
History 644 7.0 14.6 44.9 30.0 3.6 Health Professions/Related Sciences 443 9.3 14.7 40.2 30.7 5.2
Liberal Arts/General Studies/Humanities 959 4.5 9.4 34.9 41.8 9.4
Mathematics/Statistics 263 70.3 12.2 11.8 5.3 0.4 Music 163 11.0 19.6 37.4 27.0 4.9 Nursing 339 5.0 10.3 38.4 40.7 5.6 Philosophy 276 4.4 12.7 39.1 38.8 5.1 Physical Education/Health/ Safety Education 323 16.7 18.9 38.7 22.6 3.1
Physics 62 54.8 22.6 11.3 11.3 0 Political Science/Government 367 7.6 15.0 39.2 34.6 3.5
Psychology 598 9.5 19.9 39.6 26.3 4.7 Religion 391 10.7 16.1 39.1 29.7 4.4 Sociology 384 9.4 15.9 42.7 28.7 3.4
1A standardized score with an average of 50 and a standard deviation of 10. 2Refer to the tables provided in the report to determine how frequently this objective was selected relative to other objectives within a discipline (Part I for each discipline).
92

Table 9: Percent of Classes Within T Score1 Categories Objective 9. Find and use resources
Unadjusted T Score
Discipline
Number of
Classes2 ≤ 37 38-44 45-54 55-62 63 +
Accounting 258 12.0 10.9 39.5 26.0 11.6 Administration/Management 742 9.8 13.5 36.0 31.1 9.6 Art 300 20.3 16.3 32.3 21.3 9.7 Biology/Life Science 493 11.8 15.4 34.5 30.0 8.3 Business/General 224 8.0 14.3 38.4 32.6 6.7 Chemistry 247 15.0 22.7 37.7 20.2 4.5 Communications 731 6.0 13.3 38.6 32.8 9.3 Computer/Information Sciences 605 11.9 17.9 39.7 25.0 6.6
Design/Applied Arts 637 8.5 11.9 37.7 31.4 10.5 Economics 148 25.0 16.9 26.4 25.0 6.8 Education/General 1828 5.3 8.3 27.2 34.6 24.7 Engineering 367 20.7 17.4 8.2 28.3 25.3 English Literature 1453 5.9 11.2 33.2 38.9 10.9 Fine and Applied Arts 317 17.7 13.9 34.4 26.5 7.6 Foreign Language and Literature 188 21.3 23.4 29.3 22.3 3.7
History 314 12.1 17.5 32.8 28.0 9.6 Health Professions/Related Sciences 495 5.9 9.3 30.5 37.4 17.0
Liberal Arts/General Studies/Humanities 638 7.5 12.9 38.2 32.8 8.6
Mathematics/Statistics 333 20.7 16.8 37.8 19.8 4.8 Music 104 23.1 18.3 19.2 20.2 19.2 Nursing 394 2.5 3.3 26.9 44.9 22.3 Philosophy 119 21.9 20.2 35.3 20.2 2.5 Physical Education/Health/ Safety Education 340 17.4 10.0 36.2 28.2 8.2
Physics 3 90 34.4 24.4 33.3 7.8 0 Political Science/Government 218 11.5 11.0 33.9 34.4 9.2
Psychology 437 12.6 12.1 32.5 31.4 11.4 Religion 251 15.9 17.1 30.7 26.3 10.0 Sociology 238 14.7 16.8 32.4 25.6 10.5 1A standardized score with an average of 50 and a standard deviation of 10. 2Refer to the tables provided in the report to determine how frequently this objective was selected relative to other objectives within a discipline (Part I for each discipline).
3Fewer than 100 classes identified this objective as “Important” or “Essential.” Results from such small samples are generally not stable enough to permit dependable generalizations.
93
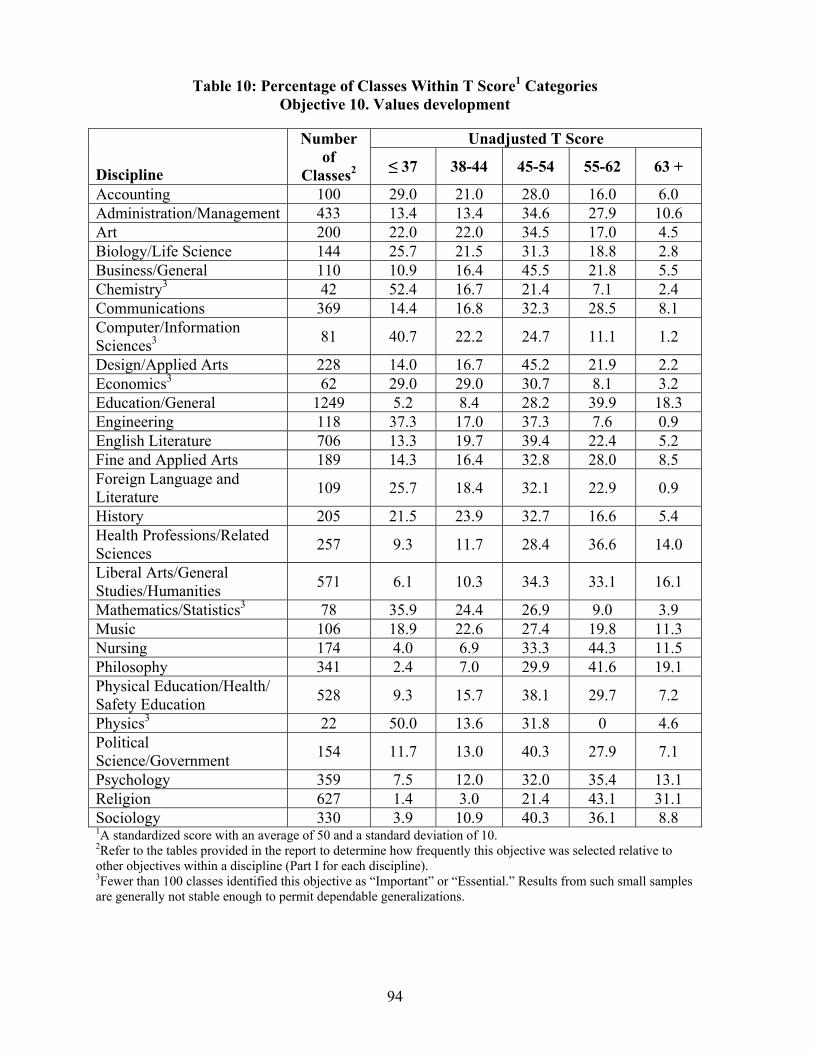
Table 10: Percentage of Classes Within T Score1 Categories Objective 10. Values development
Unadjusted T Score
Discipline
Number of
Classes2 ≤ 37 38-44 45-54 55-62 63 +
Accounting 100 29.0 21.0 28.0 16.0 6.0 Administration/Management 433 13.4 13.4 34.6 27.9 10.6 Art 200 22.0 22.0 34.5 17.0 4.5 Biology/Life Science 144 25.7 21.5 31.3 18.8 2.8 Business/General 110 10.9 16.4 45.5 21.8 5.5 Chemistry3 42 52.4 16.7 21.4 7.1 2.4 Communications 369 14.4 16.8 32.3 28.5 8.1 Computer/Information Sciences3 81 40.7 22.2 24.7 11.1 1.2
228 14.0 16.7 45.2 21.9 2.2 Economics3 62 29.0 29.0 30.7 8.1 3.2 Education/General 1249 5.2 8.4 28.2 39.9 18.3 Engineering 118 37.3 17.0 37.3 7.6 0.9 English Literature 706 13.3 19.7 39.4 22.4 5.2 Fine and Applied Arts 189 14.3 16.4 32.8 28.0 8.5 Foreign Language and Literature 109 25.7 18.4 32.1 22.9 0.9
History 205 21.5 23.9 32.7 16.6 5.4 Health Professions/Related Sciences 257 9.3 11.7 28.4 36.6 14.0
Liberal Arts/General Studies/Humanities 571 6.1 16.1 10.3 34.3 33.1
Mathematics/Statistics3 78 35.9 24.4 26.9 9.0 3.9 Music 106 18.9 22.6 27.4 19.8 11.3 Nursing 174 4.0 6.9 33.3 44.3 11.5 Philosophy 341 2.4 7.0 29.9 41.6 19.1 Physical Education/Health/ Safety Education 528 9.3 15.7 38.1 29.7 7.2
Physics3 22 50.0 13.6 31.8 0 4.6 Political Science/Government 154 11.7 13.0 40.3 27.9 7.1
Psychology 359 7.5 12.0 32.0 35.4 13.1 Religion 627 1.4 3.0 21.4 43.1 31.1 Sociology 330 3.9 10.9 40.3 36.1 8.8
Design/Applied Arts
1A standardized score with an average of 50 and a standard deviation of 10. 2Refer to the tables provided in the report to determine how frequently this objective was selected relative to other objectives within a discipline (Part I for each discipline).
3Fewer than 100 classes identified this objective as “Important” or “Essential.” Results from such small samples are generally not stable enough to permit dependable generalizations.
94

Table 11: Percentage of Classes Within T Score1 Categories Objective 11. Critical analysis
Unadjusted T Score
Discipline
Number of
Classes2 ≤ 37 38-44 45-54 55-62 63 +
Accounting 284 21.8 19.7 35.2 16.2 7.0 Administration/Management 918 7.7 11.9 38.5 39.2 12.8 Art 360 13.9 18.9 39.2 20.8 7.2 Biology/Life Science 466 19.7 25.8 36.3 14.4 3.9 Business/General 250 9.2 15.6 47.6 23.2 4.4 Chemistry 227 37.9 27.8 26.4 5.7 2.2 Communications 940 7.0 10.5 41.4 30.2 10.9 Computer/Information Sciences 303 36.3 23.8 30.0 8.6 1.3
Design/Applied Arts 526 10.3 16.9 43.0 24.3 5.5 Economics 330 17.6 23.9 40.3 13.0 5.2 Education/General 1758 6.5 10.6 31.7 31.3 19.9 Engineering 298 38.6 23.2 27.2 10.4 0.7 English Literature 2542 3.0 8.3 40.7 33.1 14.9 Fine and Applied Arts 364 12.9 16.2 37.4 23.1 10.4 Foreign Language and Literature 224 24.6 17.4 28.1 21.4 8.5
History 685 5.7 13.1 41.9 27.0 12.3 Health Professions/Related Sciences 408 8.6 12.5 40.2 27.2 11.5
Liberal Arts/General Studies/Humanities 1041 5.3 11.2 35.8 30.6 17.0
Mathematics/Statistics 399 39.1 23.8 28.6 6.8 1.8 Music 141 27.7 14.9 37.6 12.1 7.8 Nursing 388 4.1 6.4 34.5 38.4 16.5 Philosophy 582 1.2 1.9 19.1 44.0 33.9 Physical Education/Health/ Safety Education 334 20.7 19.8 35.0 17.7 6.9
Physics 166 47.0 23.5 22.3 6.6 0.6 Political Science/Government 477 3.4 8.4 29.1 35.9 23.3
Psychology 861 7.0 13.4 44.1 25.4 10.1 Religion 571 4.2 6.1 37.3 34.9 17.5 Sociology 534 5.8 9.9 40.5 30.7 13.1 1A standardized score with an average of 50 and a standard deviation of 10. 2Refer to the tables provided in the report to determine how frequently this objective was selected relative to other objectives within a discipline (Part I for each discipline).
95

Table 12: Percentage of Classes Within T Score1 Categories Objective 12. Interest in learning
Unadjusted T Score
Discipline
Number of
Classes2 ≤ 37 38-44 45-54 55-62 63 +
Accounting 248 18.6 19.0 36.7 21.0 4.8 Administration/Management 751 11.7 14.1 32.6 31.6 10.0 Art 370 8.7 16.0 35.1 28.4 11.9 Biology/Life Science 487 13.1 21.6 38.2 21.6 5.5 Business/General 199 13.1 19.6 37.2 24.1 6.0 Chemistry 212 21.2 23.6 37.3 14.2 3.8 Communications 646 11.8 19.2 34.5 27.7 6.8 Computer/Information Sciences 449 14.3 24.7 34.7 22.1 4.2
Design/Applied Arts 652 5.8 14.3 32.7 39.0 8.3 Economics 186 25.3 25.3 30.7 17.2 1.6 Education/General 1630 6.1 9.9 27.1 36.5 20.4 Engineering 344 22.7 27.6 28.2 20.1 1.5 English Literature 1253 10.5 18.5 34.3 29.1 7.6 Fine and Applied Arts 430 7.2 12.6 29.1 38.6 12.6 Foreign Language and Literature 342 10.8 20.8 37.7 26.3 4.4
History 406 11.6 15.8 40.2 26.4 6.2 Health Professions/Related Sciences 415 8.2 10.1 27.7 36.6 17.4
Liberal Arts/General Studies/Humanities 721 7.9 14.7 31.5 35.5 10.4
Mathematics/Statistics 465 17.6 25.6 34.4 18.9 3.4 Music 206 15.5 17.5 32.0 27.2 7.8 Nursing 293 4.8 7.5 27.7 46.1 14.0 Philosophy 338 3.6 11.0 30.5 40.5 14.5 Physical Education/Health/ Safety Education 493 16.6 16.0 32.3 26.2 8.9
Physics 170 32.9 25.9 27.7 12.4 1.2 Political Science/Government 282 11.7 10.6 31.9 36.2 9.6
Psychology 533 9.0 16.7 34.2 31.7 8.4 Religion 460 5.0 10.2 34.6 40.0 10.2 Sociology 377 11.1 17.0 33.2 32.1 6.6 1A standardized score with an average of 50 and a standard deviation of 10. 2Refer to the tables provided in the report to determine how frequently this objective was selected relative to other objectives within a discipline (Part I for each discipline).
96

Table 13: Percentage of Classes Within T Score1 Categories Global Outcome Measure: Increased positive attitude
Unadjusted T Score
Discipline
Number of
Classes2 ≤ 37 38-44 45-54 55-62 63 +
Accounting 1095 15.6 18.9 38.7 23.7 3.1 Administration/Management 2403 9.6 12.4 38.5 33.5 6.0 Art 1149 3.0 8.0 31.2 42.9 15.0 Biology/Life Science 1763 10.4 14.8 35.3 31.7 7.9 Business/General 605 8.9 14.4 46.0 26.9 3.8 Chemistry 969 23.6 24.6 37.6 12.8 1.4 Communications 1885 9.3 12.2 39.6 31.4 7.6 Computer/Information Sciences 1409 10.0 13.4 43.7 29.2 3.8
Design/Applied Arts 1601 4.6 8.9 33.7 41.6 11.1 Economics 792 18.2 20.3 41.8 17.9 1.8 Education/General 4424 5.1 6.9 25.1 40.0 22.9 Engineering 1249 18.3 16.1 38.3 22.9 4.5 English Literature 3776 15.5 19.7 38.5 21.5 4.8 Fine and Applied Arts 1093 4.8 7.4 29.6 41.5 16.7 Foreign Language and Literature 1086 9.9 13.2 37.8 30.6 8.7
History 1058 8.3 14.2 40.9 30.6 6.0 Health Professions/Related Sciences 1412 4.6 7.2 25.0 43.7 19.5
Liberal Arts/General Studies/Humanities 1720 16.4 19.6 37.4 21.6 4.9
Mathematics/Statistics 1895 24.8 25.3 37.9 11.4 0.5 Music 790 6.3 7.9 34.8 35.4 15.6 Nursing 1068 4.4 6.4 27.9 39.8 21.5 Philosophy 651 9.2 14.1 44.4 25.0 7.2 Physical Education/Health/ Safety Education 1315 4.7 7.4 33.1 42.4 12.5
Physics 525 32.0 23.1 33.5 10.3 1.1 Political Science/Government 677 8.9 10.6 38.0 36.0 6.5
Psychology 1767 5.3 8.7 37.2 40.0 8.9 Religion 1039 3.8 6.1 34.4 43.0 12.8 Sociology 871 8.5 13.0 38.6 32.4 7.6 1A standardized score with an average of 50 and a standard deviation of 10. 2Refer to the tables provided in the report to determine how frequently this objective was selected relative to other objectives within a discipline (Part I for each discipline).
97

Table 14: Percentage of Classes Within T Score1 Categories Global Outcome Measure: Excellent teacher
Unadjusted T Score
Discipline
Number of
Classes2 ≤ 37 38-44 45-54 55-62 63 +
Accounting 1070 14.3 12.2 36.5 35.0 2.1 Administration/Management 2352 12.9 12.8 33.8 38.1 2.5 Art 1127 7.5 11.8 34.5 41.3 5.0 Biology/Life Science 1727 10.4 11.8 31.7 41.7 4.5 Business/General 600 10.0 16.0 37.8 34.8 1.3 Chemistry 940 16.3 13.2 32.1 35.9 2.6 Communications 1851 10.1 11.8 32.6 41.9 3.6 Computer/Information Sciences 1371 13.3 15.5 37.0 32.2 2.1
Design/Applied Arts 1571 8.9 8.2 33.4 45.3 4.4 Economics 779 11.9 14.3 39.4 33.4 1.0 Education/General 4353 9.7 9.0 26.1 47.2 8.0
1207 18.0 17.1 37.2 25.7 2.1 English Literature 3709 8.1 11.0 33.7 43.3 3.9 Fine and Applied Arts 1071 7.0 9.6 33.0 45.8 4.7 Foreign Language and Literature 1071 7.0 8.7 28.9 50.7 4.8
History 1039 6.8 11.6 36.5 42.3 2.9 Health Professions/Related Sciences 1374 10.8 10.9 31.1 42.2 5.0
Liberal Arts/General Studies/Humanities 1692 7.6 9.7 36.3 43.1 3.3
Mathematics/Statistics 1854 11.2 11.8 34.3 38.9 3.8 Music 781 6.0 9.2 33.6 43.9 7.3 Nursing 1056 9.0 8.7 31.3 45.7 5.2 Philosophy 644 4.4 9.2 36.7 46.0 3.9 Physical Education/Health/ Safety Education 1303 6.0 8.1 31.2 48.9 5.9
Physics 510 20.2 16.3 34.7 28.0 0.8 Political Science/Government 668 6.0 10.5 32.3 48.7 2.5
Psychology 1737 6.7 10.2 32.1 47.5 3.6 Religion 1023 5.7 7.6 32.0 50.5 4.2 Sociology 851 11.1 11.2 34.4 41.0 2.4
Engineering
1A standardized score with an average of 50 and a standard deviation of 10. 2Refer to the tables provided in the report to determine how frequently this objective was selected relative to other objectives within a discipline (Part I for each discipline).
98

Table 15: Percentage of Classes Within T Score1 Categories Global Outcome Measure: Excellent course
Unadjusted T Score
Discipline
Number of
Classes2 ≤ 37 38-44 45-54 55-62 63 +
Accounting 1070 12.3 14.4 41.4 26.6 5.2 Administration/Management 2356 11.2 10.1 35.1 34.6 9.0 Art 1137 4.6 6.6 27.8 42.2 18.8 Biology/Life Science 1708 10.3 12.8 32.5 34.3 10.1 Business/General 594 8.8 11.1 43.1 32.7 4.4 Chemistry 930 20.2 15.3 44.2 18.4 1.9 Communications 1847 8.7 9.2 36.7 35.7 9.7 Computer/Information Sciences 1373 9.9 12.6 39.3 31.2 7.1
Design/Applied Arts 1570 6.0 7.7 32.6 41.2 12.6 Economics 767 16.3 15.4 42.4 23.6 2.4 Education/General 4349 8.2 7.5 24.9 36.8 22.5 Engineering 1203 19.3 13.8 38.8 23.1 5.0 English Literature 3681 10.3 11.3 39.1 30.6 8.7 Fine and Applied Arts 1080 6.4 7.8 29.4 39.2 17.2 Foreign Language and Literature 1071 7.3 8.2 32.7 39.3 12.5
History 1040 7.3 9.8 36.6 36.4 9.8 Health Professions/Related Sciences 1398 7.2 7.7 27.8 38.1 19.2
Liberal Arts/General Studies/Humanities 1667 15.7 12.9 36.8 26.4 8.3
Mathematics/Statistics 1828 16.9 16.4 43.8 21.6 1.5 Music 781 6.3 6.3 32.1 33.4 21.9 Nursing 1057 8.5 7.3 28.8 38.4 17.0 Philosophy 639 7.4 8.5 39.4 33.5 11.3 Physical Education/Health/ Safety Education 1297 6.2 5.8 24.7 40.4 23.0
Physics 503 26.2 16.7 37.4 18.7 1.0 Political Science/Government 661 7.9 8.9 34.8 38.6 9.8
Psychology 1744 6.2 7.1 33.9 39.4 13.5 Religion 1027 4.2 6.7 30.1 41.4 17.6 Sociology 850 10.4 11.3 35.9 32.4 10.1 1A standardized score with an average of 50 and a standard deviation of 10. 2Refer to the tables provided in the report to determine how frequently this objective was selected relative to other objectives within a discipline (Part I for each discipline).
99

Table 16: Percentage of Classes Within T Score1 Categories Progress on Relevant Objectives2
Unadjusted T Score
Discipline
Number of
Classes3 ≤ 37 38-44 45-54 55-62 63 +
Accounting 1040 8.9 10.3 43.5 31.0 6.4 Administration/Management 2192 7.8 11.5 40.0 32.8 8.1 Art 1097 3.7 7.8 38.7 42.2 7.6 Biology/Life Science 1700 6.8 13.1 40.6 31.1 8.4 Business/General 574 6.5 11.9 49.8 29.4 2.4 Chemistry 923 10.3 17.3 42.4 25.1 4.9 Communications 1809 3.9 7.6 38.5 40.7 9.3 Computer/Information Sciences 1347 8.2 17.0 47.1 24.2 3.5
Design/Applied Arts 1518 5.5 9.6 42.1 35.1 7.8 Economics 756 11.8 16.3 44.1 23.3 4.6 Education/General 4156 4.7 7.4 30.6 39.5 17.8 Engineering 1208 10.8 18.9 41.5 25.2 3.7 English Literature 3658 2.4 7.2 38.3 40.7 11.5 Fine and Applied Arts 1023 4.1 10.1 36.8 39.1 10.0 Foreign Language and Literature 1024 5.2 12.4 46.5 31.5 4.4
History 1005 5.5 12.3 46.8 29.6 5.9 Health Professions/Related Sciences 1365 3.7 6.7 33.0 43.4 13.2
Liberal Arts/General Studies/Humanities 1654 4.6 9.0 42.6 35.6 8.3
Mathematics/Statistics 1821 12.3 17.0 44.8 23.2 2.8 Music 767 3.5 5.2 33.0 43.2 15.1 Nursing 1026 3.5 5.5 31.7 42.3 17.1 Philosophy 629 3.0 5.3 34.8 43.6 13.4 Physical Education/Health/ Safety Education 1222 9.8 11.5 40.5 30.4 7.8
Physics 492 14.4 20.1 41.9 21.5 2.0 Political Science/Government 644 5.3 9.6 42.1 34.9 8.1
Psychology 1691 3.8 9.3 41.7 35.4 9.9 Religion 991 2.5 9.1 38.7 38.6 11.2 Sociology 847 8.7 12.9 40.7 30.1 7.6 1A standardized score with an average of 50 and a standard deviation of 10. 2Weighted T Score average for objectives selected as “Important” or “Essential.” “Essential” objectives are double weighted; a single weight is given to “Important” objectives. 3Refer to the tables provided in the report to determine how frequently this objective was selected relative to other objectives within a discipline (Part I for each discipline).
100
Related Documents


![HANGING SCALES/CRANE SCALES - Aviga HFO 159 page 166 1020,-from € Hanging scales/Crane scales Lisa Mayer Product specialist Hanging scales/Crane scales Tel. +49 [0] 7433 9933 - 219](https://static.cupdf.com/doc/110x72/5afd22507f8b9a68498c727e/hanging-scalescrane-scales-hfo-159-page-166-1020-from-hanging-scalescrane.jpg)