1 Individual Consumer Differences and Design Implications for Web-Based Decision Support Barry G. Silverman, Gnana Bharathy, John Pourdehnad, Melanie Green, Dave Lowe, Doug Riley, Joyce Salisbury Ackoff Center for the Advancement of Systems Approaches (ACASA) University of Pennsylvania, Towne 251 Towne Bldg, Philadelphia, PA 19104-6315 [email protected] April 2006 ABSTRACT This paper summarizes a study as to whether individual differences are significant factors that should affect the design of consumer decision support over the web. Our study postulates two orthogonal dimensions appear to be of relevance – Need for Cognition and Purchase Preference (ie, lifestyle vs. utilitarian), and that consumers can be sorted into one of 4 cells of a 2x2 matrix of these dimensions. The Need for Cognition is a well-researched dimension with its own instrument for measuring it, while we had to develop and validate an instrument for measuring the Purchase Preference. Applying these instruments to two study groups totaling 175 users forced us to reject the null hypothesis that individual differences are unimportant (90% confidence), and accept that 3 matrix groupings are distinct (two of them are clustered together in our sample). The study concludes with design implications that might best support the decision support needs of each of the categories of consumers in terms of features such as linear vs. non-linear processes, more vs. less analytical information, and when to deploy stylized photos, videos, and product placements. Keywords: consumer decision support, website design, individual differences, empirical results 1 INTRODUCTION It is well-established that online shopping websites designed for decision support offer better support to the consumer: Silverman et al.(2001). An important question is whether consumer characteristics should be taken into account in buyer information dissemination and decision support through websites. The most common practice for the design of web-based decision support is to assume one uniform user group with similar characteristics, needs, and preferences (Stephanidis, 2001; Lu et al. 1999; Stary, 2002). This approach permits software to be developed with uniform controls, functions, and user interfaces. A concern with this approach is that not all users are necessarily alike. Another design approach is to assume different user groups with different characteristics, needs, and performances who will be using the system. There are few scientific principles upon which to base such designs. This approach thus requires a careful examination of the user population in order to identify such groups, as well as different interface modes, media, and modules for tailoring the design of decision support. The objective of this research is to find out if consumers and web-based users differ with respect to their cognitive needs and, therefore, are better serviced by individualized interfaces and decision support. Our earlier investigation, Silverman et al. (2001), found that buyer behavior theory could be fruitfully used to enhance the Decision Support System (DSS) functionality of e-commerce websites. Following up on that research, we decided to investigate other models of consumer cognition and affect that might lead to individual differences and guidelines for design of web-based decision support, although the current study was limited in scope to psychological differences and excluded any physiological and socio-cultural differences. This article proceeds through the following steps: development of model of consumer differences, model formulation of the hypothesis to be tested, development of the instrument, validation of the instrument, carrying out the survey, analysis of results and learning, framework for exploitation of the model to enhance design of web-based decision support. First, however, we review the literature pertinent to our study. 1.1 Survey of Literature Need for Cognition (NFC) is an individual-difference variable that has been examined extensively in the literature on preferences and persuasion. NFC has been well-documented in the literature (Cacioppo and Petty et al., 1984) and is widely used to guide marketing media, and it thus struck us as potentially relevant to decision support. Need for cognition (NFC) is an individual difference measuring how much people like to think. It is a motivational

Welcome message from author
This document is posted to help you gain knowledge. Please leave a comment to let me know what you think about it! Share it to your friends and learn new things together.
Transcript
1
Individual Consumer Differences and Design Implications for Web-Based Decision Support Barry G. Silverman, Gnana Bharathy, John Pourdehnad, Melanie Green, Dave Lowe, Doug Riley, Joyce Salisbury
Ackoff Center for the Advancement of Systems Approaches (ACASA) University of Pennsylvania, Towne 251
Towne Bldg, Philadelphia, PA 19104-6315 [email protected]
April 2006
ABSTRACT
This paper summarizes a study as to whether individual differences are significant factors that should affect the design of consumer decision support over the web. Our study postulates two orthogonal dimensions appear to be of relevance – Need for Cognition and Purchase Preference (ie, lifestyle vs. utilitarian), and that consumers can be sorted into one of 4 cells of a 2x2 matrix of these dimensions. The Need for Cognition is a well-researched dimension with its own instrument for measuring it, while we had to develop and validate an instrument for measuring the Purchase Preference. Applying these instruments to two study groups totaling 175 users forced us to reject the null hypothesis that individual differences are unimportant (90% confidence), and accept that 3 matrix groupings are distinct (two of them are clustered together in our sample). The study concludes with design implications that might best support the decision support needs of each of the categories of consumers in terms of features such as linear vs. non-linear processes, more vs. less analytical information, and when to deploy stylized photos, videos, and product placements. Keywords: consumer decision support, website design, individual differences, empirical results 1 INTRODUCTION
It is well-established that online shopping websites designed for decision support offer better support to the consumer: Silverman et al.(2001). An important question is whether consumer characteristics should be taken into account in buyer information dissemination and decision support through websites. The most common practice for the design of web-based decision support is to assume one uniform user group with similar characteristics, needs, and preferences (Stephanidis, 2001; Lu et al. 1999; Stary, 2002). This approach permits software to be developed with uniform controls, functions, and user interfaces. A concern with this approach is that not all users are necessarily alike. Another design approach is to assume different user groups with different characteristics, needs, and performances who will be using the system. There are few scientific principles upon which to base such designs. This approach thus requires a careful examination of the user population in order to identify such groups, as well as different interface modes, media, and modules for tailoring the design of decision support. The objective of this research is to find out if consumers and web-based users differ with respect to their cognitive needs and, therefore, are better serviced by individualized interfaces and decision support. Our earlier investigation, Silverman et al. (2001), found that buyer behavior theory could be fruitfully used to enhance the Decision Support System (DSS) functionality of e-commerce websites. Following up on that research, we decided to investigate other models of consumer cognition and affect that might lead to individual differences and guidelines for design of web-based decision support, although the current study was limited in scope to psychological differences and excluded any physiological and socio-cultural differences.
This article proceeds through the following steps: development of model of consumer differences, model formulation of the hypothesis to be tested, development of the instrument, validation of the instrument, carrying out the survey, analysis of results and learning, framework for exploitation of the model to enhance design of web-based decision support. First, however, we review the literature pertinent to our study. 1.1 Survey of Literature
Need for Cognition (NFC) is an individual-difference variable that has been examined extensively in the literature on preferences and persuasion. NFC has been well-documented in the literature (Cacioppo and Petty et al., 1984) and is widely used to guide marketing media, and it thus struck us as potentially relevant to decision support. Need for cognition (NFC) is an individual difference measuring how much people like to think. It is a motivational
2
variable, and should not be confused with cognitive ability or intelligence. Readers should note that intelligence measures the capacity and speed of cognitive processing whereas cognitive styles such as NFC measure the form (or style) this cognition takes (Benyon et al., 2001). Within the NFC literature, the elaboration likelihood model is one of the major dual-process models of persuasion, and it refers to the two different ways of being persuaded as: (1) the central route – paying attention to arguments; and (2) the peripheral route, or being influenced by cues in the message (such as an attractive source). A person high in Need for Cognition tends to be highly analytical and enjoys being presented with a lot of data. These individuals enjoy thinking, problem-solving, and effortful cognitive activity. It is conceivable that a high NFC person might be well served by a website which is laden with non-linear hyperlinks, analysis documents and multi-faceted decision support, e.g., as in sears.com, webmart.com, or Amazon among others. Conversely, a person with a low NFC focuses less on analytical tasks and prefers not to be overrun with data. These individuals do not like to exert mental effort unless a task is important or personally relevant. It seems plausible that such people might be more greatly influenced and serviced by a website whose layout might be described by a visually attractive style and linearly arranged data and decision processes (e.g., as in many of the fashion-conscious websites such as www.gucci.com). This example of Sears vs. Gucci also highlights the fact that consumer websites and decision support are often subjected to the “artistic view” of designers and directors to decide the lifestyle tastes of the target consumers such as for movies, in television productions, in online and print media, and so on. We think this consumer preference can be measured and fruitfully harnessed for improved design of interactive media. From our perspective, the relevant distinction between types of consumers is the function that measures their preferences to purchases. Two ends of the preference function scales are Utility (purchasing products based on practical considerations) and Lifestyle (purchasing products to convey a certain image or impress others) (Barabba, 2004). People who fall into the Utility class will be considered those who make purchasing decisions based on efficiency and need. Conversely, those who fall into the Lifestyle class will be those who generally make purchasing decisions based on aesthetics, appeal, and perception. Our second dimension or Purchase Preference Function (preferences that form the basis for their purchasing decision) has no formal measurement instruments, a topic we address in the next section. For now, however, we conducted our survey by contracting and consulting with a panel of experts in consumer differences. Specifically, in order to validate our findings on Need for Cognition and our addition of preference function considerations, we consulted subject matter experts (SMEs) in the fields of psychology and marketing at the University of Pennsylvania, Wharton, and General Motors. The consensus among the SMEs was that while human decision-making processes is known to be governed by an individual’s need for cognition, experience has also shown that preference attributes directly affect decision-making processes; therefore, its supplementation of Need for Cognition is warranted. We also noted the recent interest in attitude and adjustive functions (DeBono, 2000; Petty et al. 1999; Ennis and Zanna, 2000). Ennis and Zanna have examined the relative contributions of functional distinctions to overall attitudes in studies of four automobile models that were assumed to offer distinct functional profiles, which they compared along a spectrum of uni-functional and utilitarian needs vs. multi-functional and symbolic needs. They classified subcompact and family style vehicles as representing predominantly utilitarian, and luxury and sports models as multifunctional, offering greater opportunity for satisfying symbolic needs. Ennis et al. have demonstrated that there is a motivational similarity between models of automobiles and the related attitudinal structure. In sum, our approach seems warranted to characterizing an individual’s purchase preference function as mappable onto a spectrum between purely “Utilitarian” and purely “Lifestyle” orientation. This has similarity to Ennis and Zanna’s instrumental versus symbolic function. In addition, utilitarian vs lifestylist scale is also easily more measurable than more abstract symbolic vs instrumental function, which suits the current purpose of our research.
The Elaboration Likelihood Model (ELM) (Baxter, 1988, Griffin, 2000, Petty et.al., 1986) postulates that there are two routes to persuasion - the central route and the peripheral route. The central route uses message elaboration, and can produce a major positive attitude change in those with a high need for cognition, while the peripheral route uses six different message-irrelevant cues to illicit a quick response with a minor shift in attitude. The latter is effective for consumers who don’t want to think deeply about the buying decision. Both routes of persuasion have been pursued in the US, which uses overt selling as well as covert placement of product in an ad. Persuassion itself has received much attention in the psychology literature. For example, reviews (Ajzen 2001, Albarrac´ın et al. 2005, Haddock & Zanna 1999, Maio & Olson 2000, Wood 2000) provide useful snapshots of the field, to name a few.
3
Finally, as a caution, Woods in the Annual Review chapter on empirical and theoretical developments in research on social influence and message-based persuasion, outlines work carried out in the recent years on preference functions. In one account of the role of preference functions in influencing persuasive attempts, Lavine & Snyder (1996) argue that persuasive attempts are effective to the extent that the position outlined in the appeal matches the function underlying recipients’ preferences. In another account, Petty & Wegener (1998) matching between attitude (preference) function and message orientation enhances careful thought about an appeal (scrutiny of the message). However, they also add that scrutiny enhances persuasion only when the message contained strong, cogent arguments and not when it contained weak arguments. It appears that preference functions are beginning to be studied, but there has yet to be any significant application involving the preference functions in decision-making analyses at this time, which left us with the task of validating its relevance on our own.
2 Development of the model
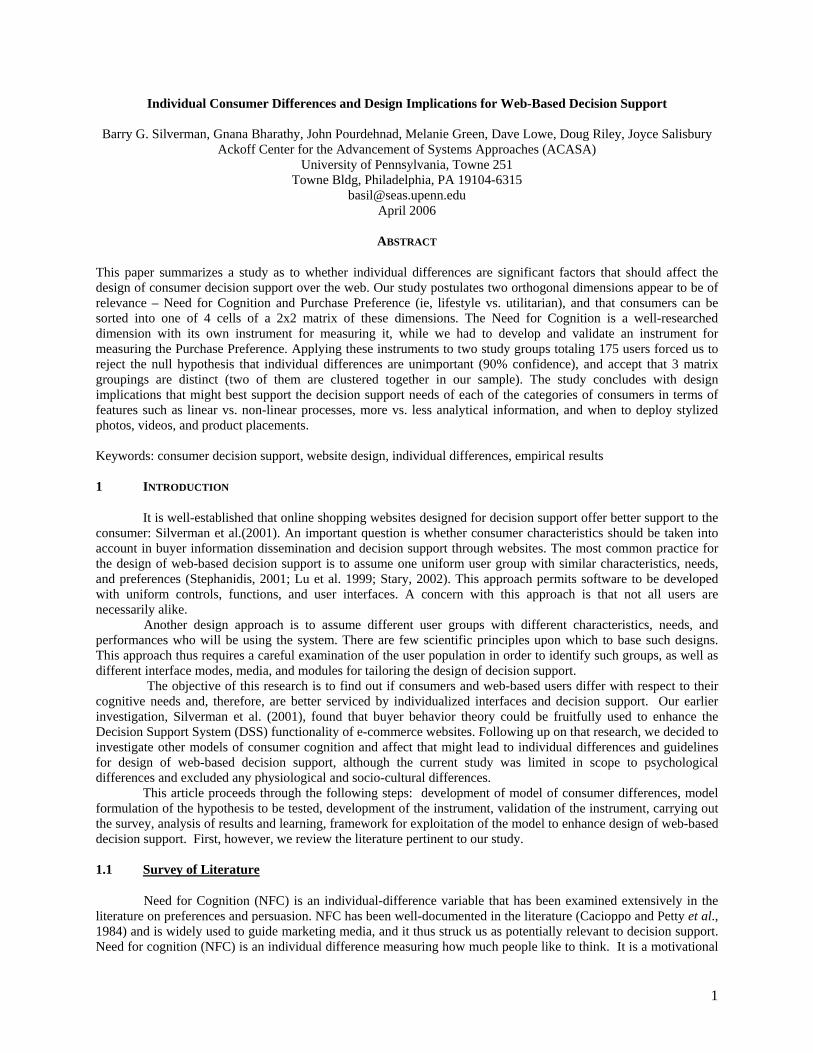
With these two dimensions (NFC and preference), it was possible to hypothesize a two-by-two matrix with the following four quadrants or cells. The goal for this phase was to generate a plan for a model, which will tailor the site’s information to individuals whose data processing inclinations and preference functions will be broken down into four quadrants. We categorized these inclinations as:
• whether a person exhibits high inclination for cognitive data processing (high cognitive effort) or low inclination for cognitive data processing (low cognitive effort). This tendency is referred to as high vs. low need for cognition.
• whether the person bases purchasing decisions on utility or the maintenance/improvement of a certain lifestyle.
Based on these definitions, we have created the following matrix representation of this model: Low Need for
Cognition High Need for Cognition
Lifestyle
LL
HL
Utilitarian
LU
HU
Figure 1: Model
The model was then “put on the validation chopping block,” so to speak. Once again we felt that it was sufficient to consult our SMEs to seek approval. Upon review, they confirmed that we were on the right track, as long as we consider the operational definitions that follow:
• Lifestyle: someone who believes that the value of an object depends on how it reflects the person’s values and preferences. (We have chosen the word “lifestyle”, instead of symbolic needs mentioned in Ennis and Zanna’s study). • Utilitarian: someone who believes that the value of an object depends on its practical usefulness.
With this approval in hand, we proceeded with the formulation of the hypothesis and the construction of an appropriate questionnaire to be used to differentiate those individuals in one “cell” from those in another.
4
1.2 Formulation of the hypothesis to be tested
In order to investigate whether the web users could be segmented into one of four cells in the matrix shown in Figure 1, we have formed the following hypotheses:
Null Hypothesis (H0):
There is no statistically significant difference in the need for cognition and purchase preference function scores of the people between the four classes (quadrants). That is, the variances within the classes are not significantly smaller than the variance between the classes.
Alternative Hypothesis (Ha):
There is a significant difference in the need for cognition and purchase preference function scores of the people between the four classes (quadrants). That is, the variances within the classes are significantly smaller than the variance between the classes.
1.3 Development of instruments for measurement
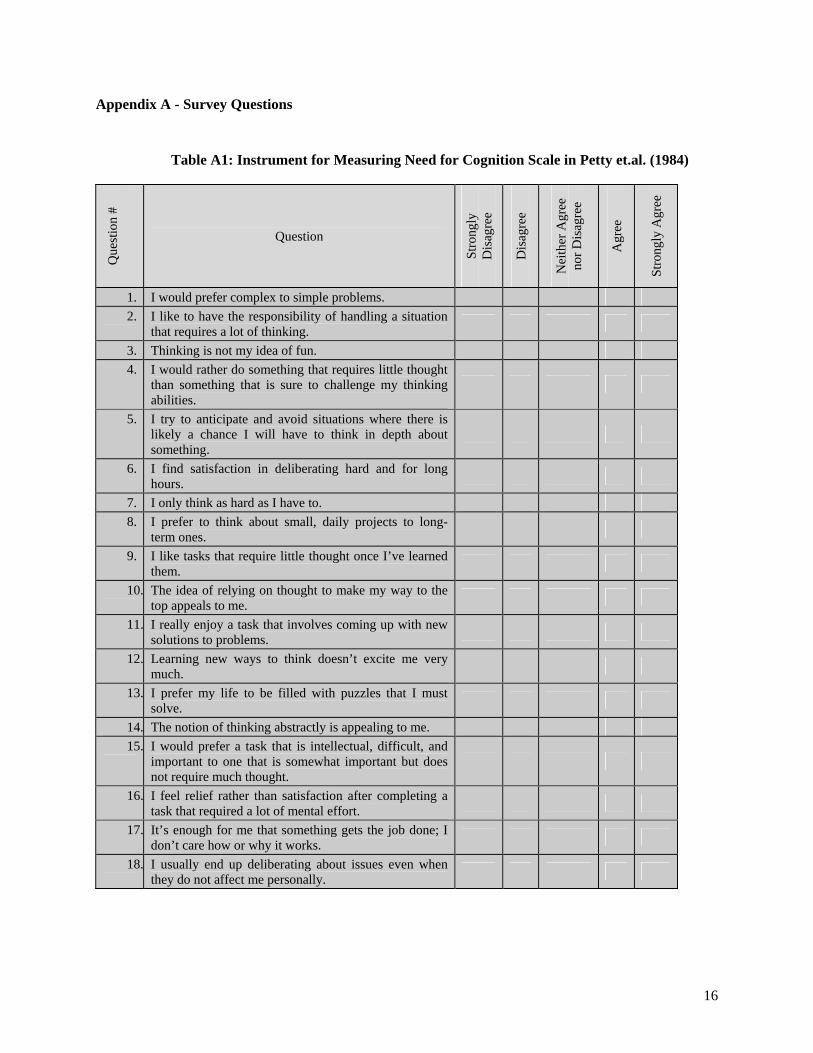
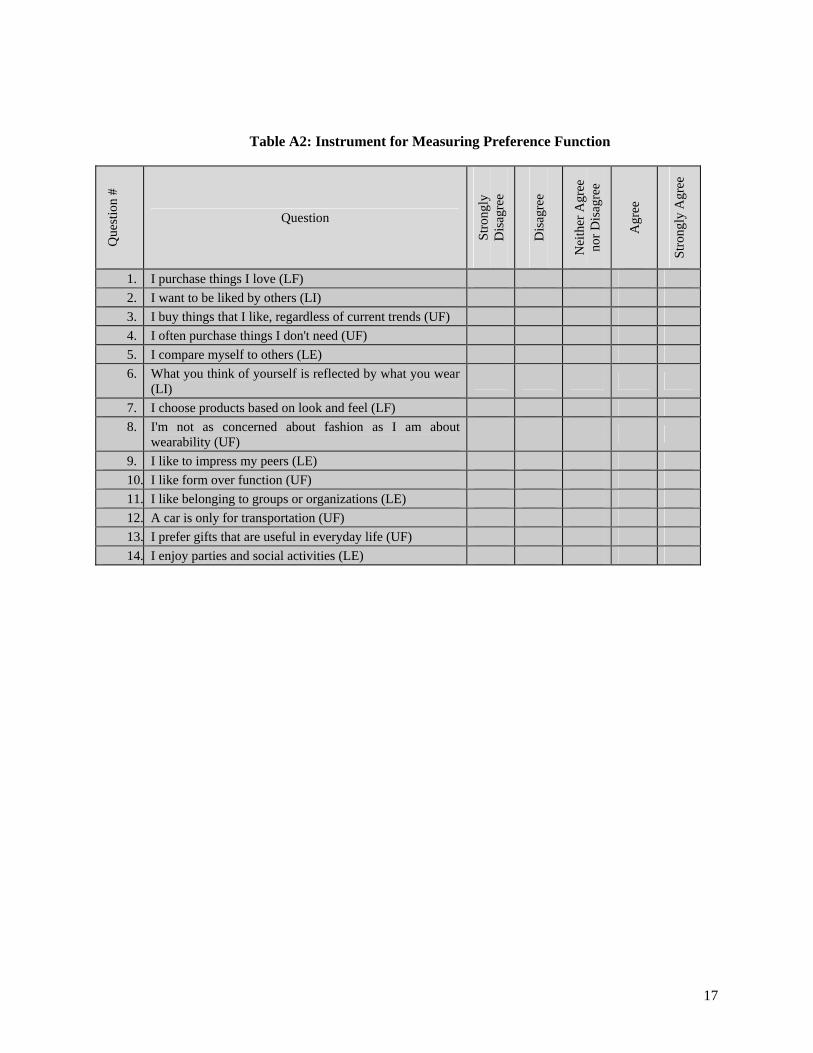
As a measure of Need for Cognition, we used the Need for Cognition Scale in Petty et al. (Cacioppo and Petty et.al., 1984): see Appendix A, Table A1. For the purchase preference function dimension, there is no existing instrument. Instead, we had to construct our own questionnaire that would allow us to identify an individual’s preferences that form the basis for their purchasing decisions based on their orientation towards utility or lifestyle. The macro-dimensions of this scale are the aforementioned Lifestyle and Utilitarian orientations. We then defined questions that could capture a person’s ratings along each of these sub-dimensions as follows: I purchase things I love, I want to be liked by others, I buy things that I like, regardless of current trends, I often purchase things I don't need, I compare myself to others, What you think of yourself is reflected by what you wear, I choose products based on look and feel, I'm not as concerned about fashion as I am about wearability, I like to impress my peers, I like form over function, I like belonging to groups or organizations, A car is only for transportation, I prefer gifts that are useful in everyday life, and I enjoy parties and social activities. The resulting preference function questionnaire is shown in Table A2. The combined instrument is thus constructed to measure both the need for cognition and the preference function, and employs a Likert scale where the set of preference statements (see the list above) are presented. Subjects are asked to express agreement or disagreement with the statement on a five-point scale. Each degree of agreement is given a numerical value from one to five. Thus a total numerical value is calculated from all the responses. The questions pertaining to identifying low need for cognition and the need for utilitarian orientation (lower end of preference function scale) are reverse scored. The survey instrument did not offer the option of declining to answer on a per question basis, and the default responses of the survey were set to middle or central options (3 in the scale of 5). Additionally, a self-assessment exercise was conducted.
1.4 Survey After the survey was designed, our panel of experts in the field of consumer psychology and consumer marketing were once again consulted to provide an independent review. An iterative process ensued and when the subject matter experts (SMEs) were satisfied, we turned the survey into an online instrument for testing purposes. J. Salisbury of GM then administered the on-line survey to the following groups of potential customers:
• Group I consisted of 112 participants of 2 general GM online communities (CCO/CCOC) set up to conduct market research. They are new vehicle shoppers and are approximately 50% male and 50% female, with half under the age of 45 and half 45 and older. The sample is all from the Los Angeles, California area., and
• Group II consisted of 69 consumer, also part of a GM online community (CEO), who are interested in cutting edge technology, alternative fuels, hybrid vehicles, or the environment. This group has higher income and more education that the traditional new car shopper. The sample is also skewed approximately 75% male. In addition, the participants in this group are willing to pay at least $35K for a hydrogen-powered vehicle at the point of recruitment. Half live within 100 miles of Los Angeles, CA and the other half live within 100 miles of Philadelphia, PA (with a few outliers)
The minimum information accepted from a respondent was a fully completed survey instrument. Incomplete responses (6 of them in Group I) were, therefore, eliminated from the survey.
5
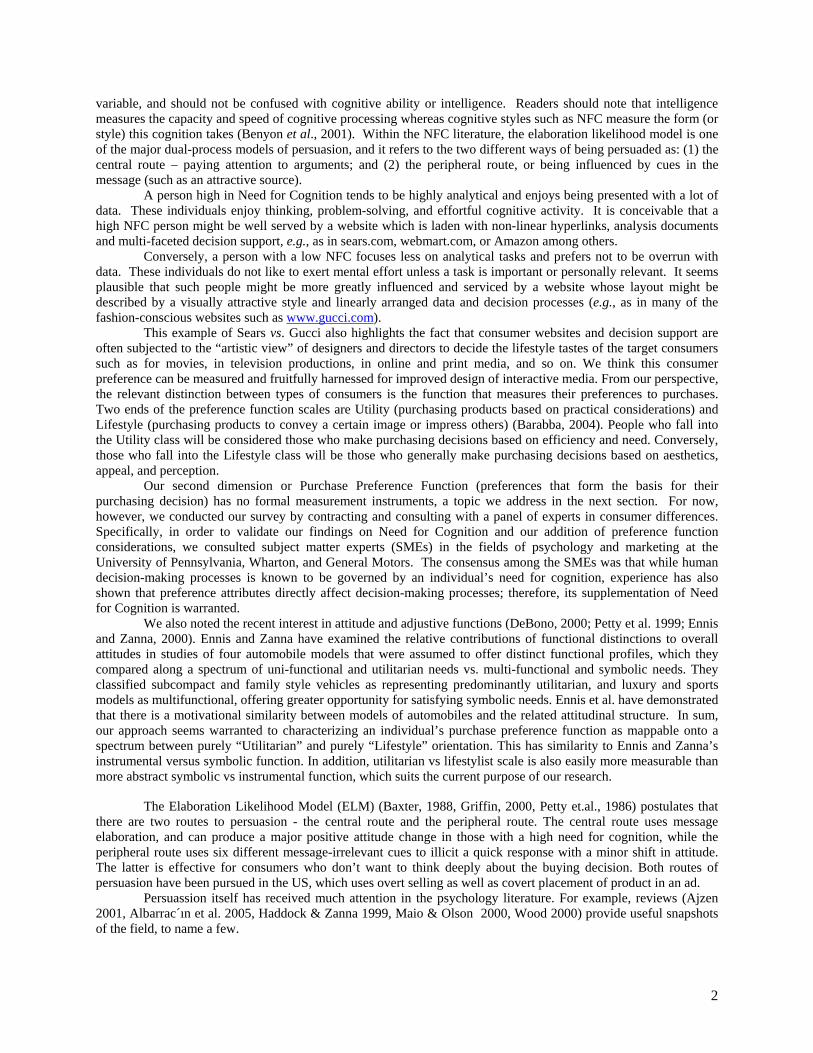
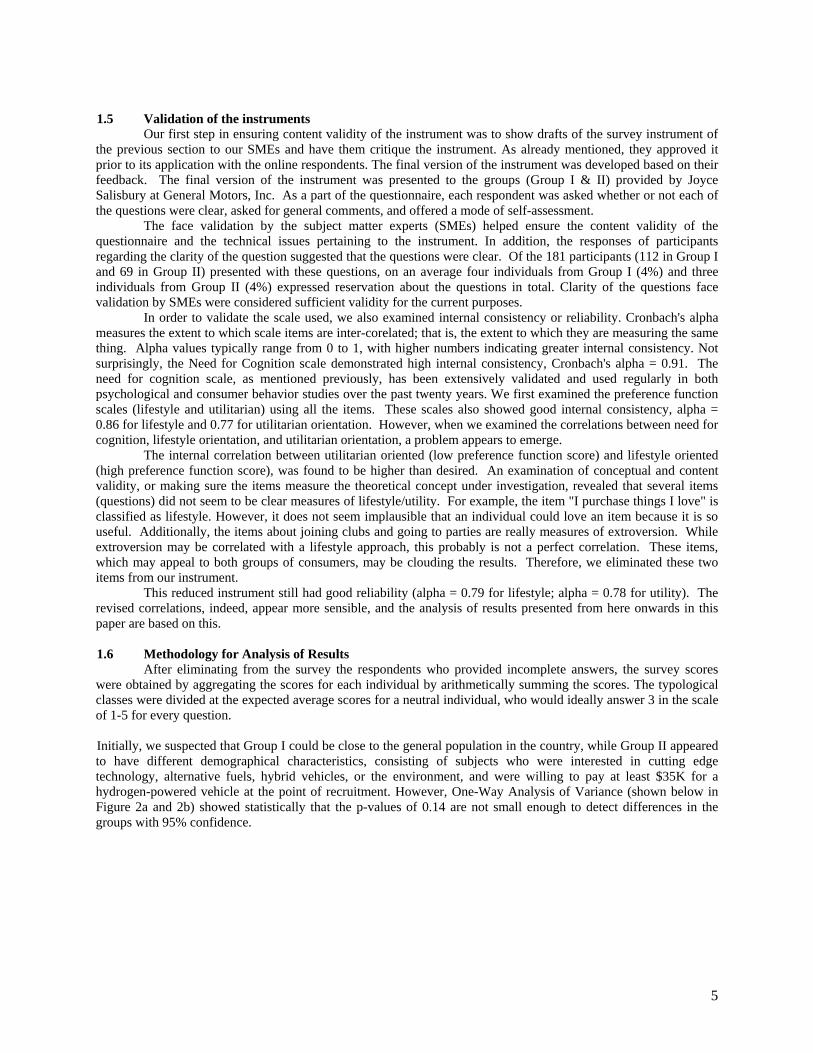
1.5 Validation of the instruments Our first step in ensuring content validity of the instrument was to show drafts of the survey instrument of the previous section to our SMEs and have them critique the instrument. As already mentioned, they approved it prior to its application with the online respondents. The final version of the instrument was developed based on their feedback. The final version of the instrument was presented to the groups (Group I & II) provided by Joyce Salisbury at General Motors, Inc. As a part of the questionnaire, each respondent was asked whether or not each of the questions were clear, asked for general comments, and offered a mode of self-assessment. The face validation by the subject matter experts (SMEs) helped ensure the content validity of the questionnaire and the technical issues pertaining to the instrument. In addition, the responses of participants regarding the clarity of the question suggested that the questions were clear. Of the 181 participants (112 in Group I and 69 in Group II) presented with these questions, on an average four individuals from Group I (4%) and three individuals from Group II (4%) expressed reservation about the questions in total. Clarity of the questions face validation by SMEs were considered sufficient validity for the current purposes. In order to validate the scale used, we also examined internal consistency or reliability. Cronbach's alpha measures the extent to which scale items are inter-corelated; that is, the extent to which they are measuring the same thing. Alpha values typically range from 0 to 1, with higher numbers indicating greater internal consistency. Not surprisingly, the Need for Cognition scale demonstrated high internal consistency, Cronbach's alpha = 0.91. The need for cognition scale, as mentioned previously, has been extensively validated and used regularly in both psychological and consumer behavior studies over the past twenty years. We first examined the preference function scales (lifestyle and utilitarian) using all the items. These scales also showed good internal consistency, alpha = 0.86 for lifestyle and 0.77 for utilitarian orientation. However, when we examined the correlations between need for cognition, lifestyle orientation, and utilitarian orientation, a problem appears to emerge. The internal correlation between utilitarian oriented (low preference function score) and lifestyle oriented (high preference function score), was found to be higher than desired. An examination of conceptual and content validity, or making sure the items measure the theoretical concept under investigation, revealed that several items (questions) did not seem to be clear measures of lifestyle/utility. For example, the item "I purchase things I love" is classified as lifestyle. However, it does not seem implausible that an individual could love an item because it is so useful. Additionally, the items about joining clubs and going to parties are really measures of extroversion. While extroversion may be correlated with a lifestyle approach, this probably is not a perfect correlation. These items, which may appeal to both groups of consumers, may be clouding the results. Therefore, we eliminated these two items from our instrument. This reduced instrument still had good reliability (alpha = 0.79 for lifestyle; alpha = 0.78 for utility). The revised correlations, indeed, appear more sensible, and the analysis of results presented from here onwards in this paper are based on this. 1.6 Methodology for Analysis of Results After eliminating from the survey the respondents who provided incomplete answers, the survey scores were obtained by aggregating the scores for each individual by arithmetically summing the scores. The typological classes were divided at the expected average scores for a neutral individual, who would ideally answer 3 in the scale of 1-5 for every question. Initially, we suspected that Group I could be close to the general population in the country, while Group II appeared to have different demographical characteristics, consisting of subjects who were interested in cutting edge technology, alternative fuels, hybrid vehicles, or the environment, and were willing to pay at least $35K for a hydrogen-powered vehicle at the point of recruitment. However, One-Way Analysis of Variance (shown below in Figure 2a and 2b) showed statistically that the p-values of 0.14 are not small enough to detect differences in the groups with 95% confidence.
6
Nee
d 4
Cog
Sco
re
40
45
50
55
60
65
Group I Group II
Experiment
Figure 2a: NFC Scores for Groups I & II
Pref
eren
ce F
unct
ion
Scor
e
20
30
Group I Group II
Experiment
Figure 2b: Preference Function Scores for Groups I & II
Since the difference between the Groups I and II was found to be statistically insignificant, we combined groups I and II for subsequent analysis. We employed the short versions of the survey and treated Groups I and II as a combined, larger group in our analysis. In addition to preliminary statistical explorations and an analysis of internal correlations to determine the internal consistency between the scale items, a number of statistical tests were employed test the hypotheses. The Analysis of Variance (MANOVA) was employed between and within the typological classes to test the hypothesis, but the normality requirement was found to be violated. Therefore, non-parametric statistical tests were employed, after reformulating the multivariate hypotheses into a set of univariate hypothesis. In addition to top down statistical analysis, clustering and discriminant analysis were employed to determine the number of clusters formed with least error. The intention is to investigate whether there is natural clustering in the data. The clustering analysis was carried out using MATLAB software, while correlations, ANOVAs and MANOVA and other statistical calculations were carried out in JMP IN. 2 RESULTS & DISCUSSION
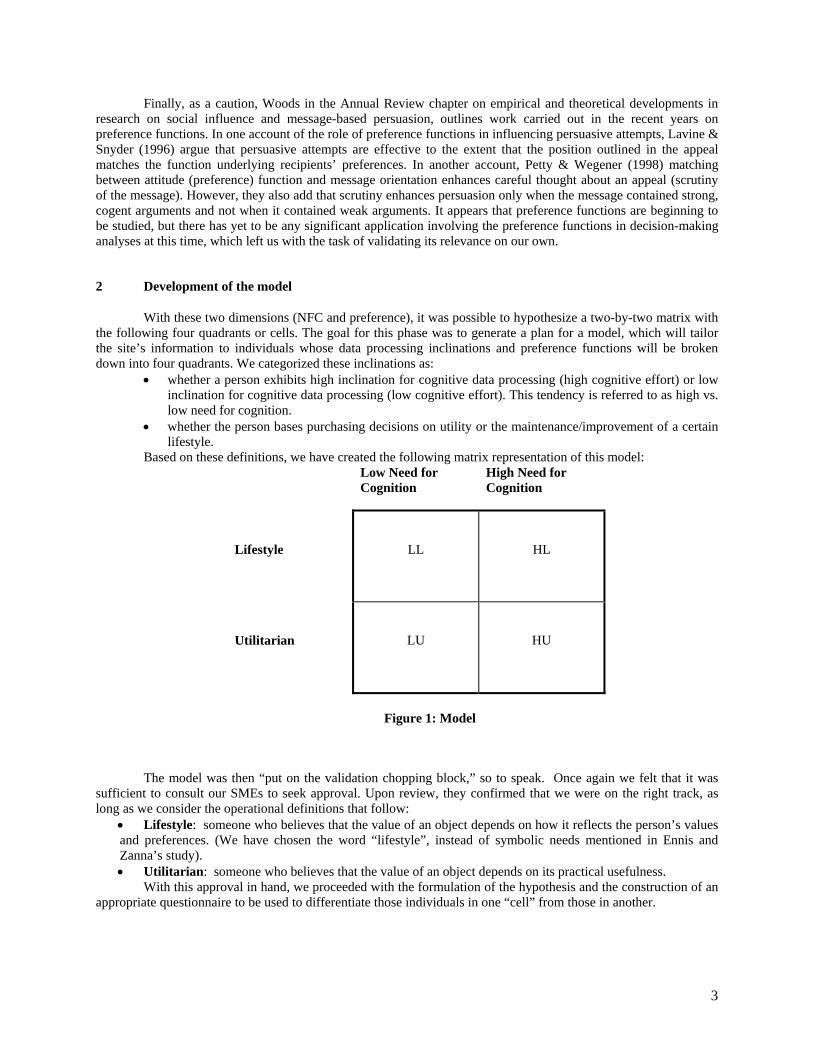
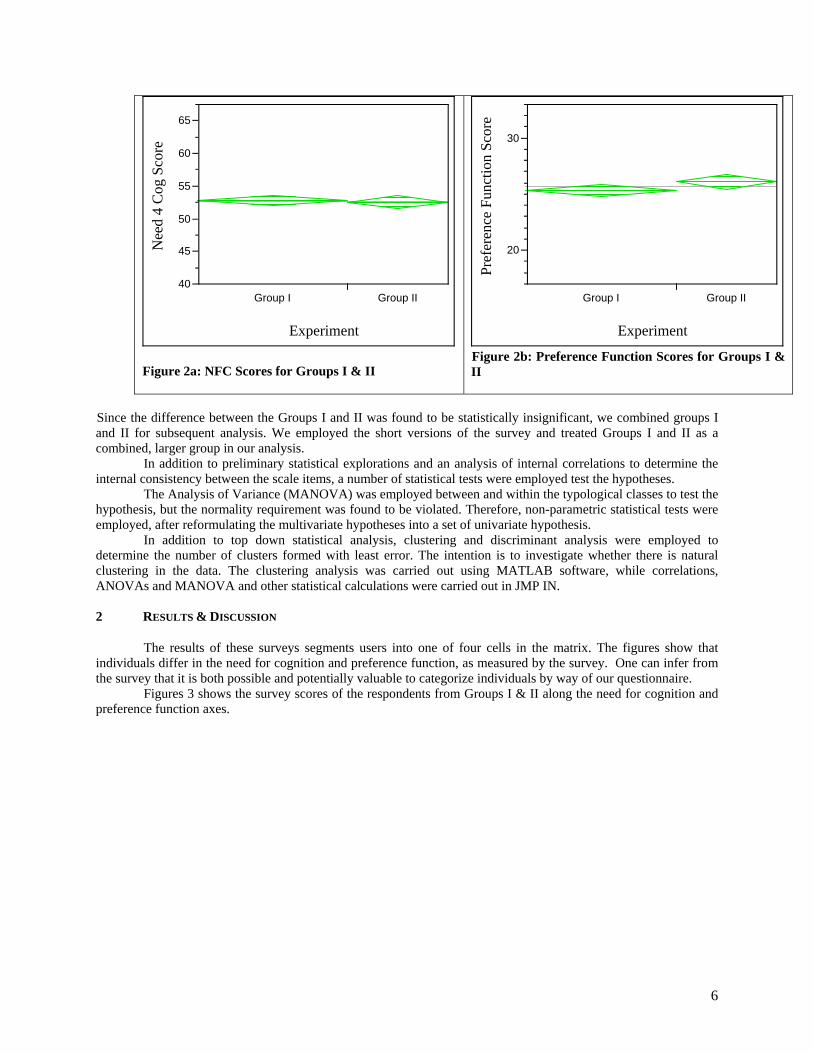
The results of these surveys segments users into one of four cells in the matrix. The figures show that individuals differ in the need for cognition and preference function, as measured by the survey. One can infer from the survey that it is both possible and potentially valuable to categorize individuals by way of our questionnaire. Figures 3 shows the survey scores of the respondents from Groups I & II along the need for cognition and preference function axes.
7
Survey Results
0
5
10
15
20
25
30
35
40
45
50
15 20 25 30 35 40 45 50 55 60 65 70 75 80 85 90
Need for Cognition
Pref
eren
ce F
unct
ion
Survey Group 1 Survey Group 2
Low Need for Cognition / Utilitarian Oriented
High Need for Cognition / Utilitarian Oriented
Low Need for Cognition / Lifestyle Oriented
High Need for Cognition /Lifestyle Oriented
Figure 3: Results of the Survey for Groups I & II 2.1 Statistical Analysis and Testing of the Hypothesis We carried out several tests to reject the null hypothesis that the four quadrants of types are essentially the same. We found that the null hypothesis can be rejected with 90% confidence and the within-quadrant variance is significantly different from between-quadrant variance. We carried out Multivariate Analysis of Variance (MANOVA, which is simply an ANOVA with several dependent variables) in a model-fitting procedure to test the hypothesis. The results were similar for all the common statistics - Wilks' , Hotelling's T2, Roy's R, including Pillai's V. With all p values << 0.05, the multivariate statistics obtained for NFC indicate that the class factor produces significant amounts of between-class variance (relative to within-class variance) with 95% confidence. However, Preference Function scores could only be separated with a 90% confidence (interaction and Preference Class separations had p values between 0.02 and 0.10). The following table shows a summary of MANOVA tests for Pillai’s V statistics, which is considered the most conservative and robust against violations of assumptions.
Table 1: Example MANOVA Statistics
Test Value Approx. F NumDF DenDF Prob>F
Pillai's Trace 0.82 39.19 6 338 <0.01
In this broad-brush study, we do not pursue any further interpretation based on discriminant function and between-subjects contrast. We consider the overall effect as sufficient here. One of the assumptions for MANOVA, namely the normal distribution of variables was also found to be violated. In order to understand the effect of non-normality, we have formulated an alternative to the MANOVA test. We decomposed the hypothesis into a series sub-hypothesis suitable for univariate tests, on which we were able to carry out a series of ANOVAs as well as non-parametric tests, although interaction effect is difficult to test this way. These tests also confirm with 90% or higher confidence that the four quadrants differ.
8
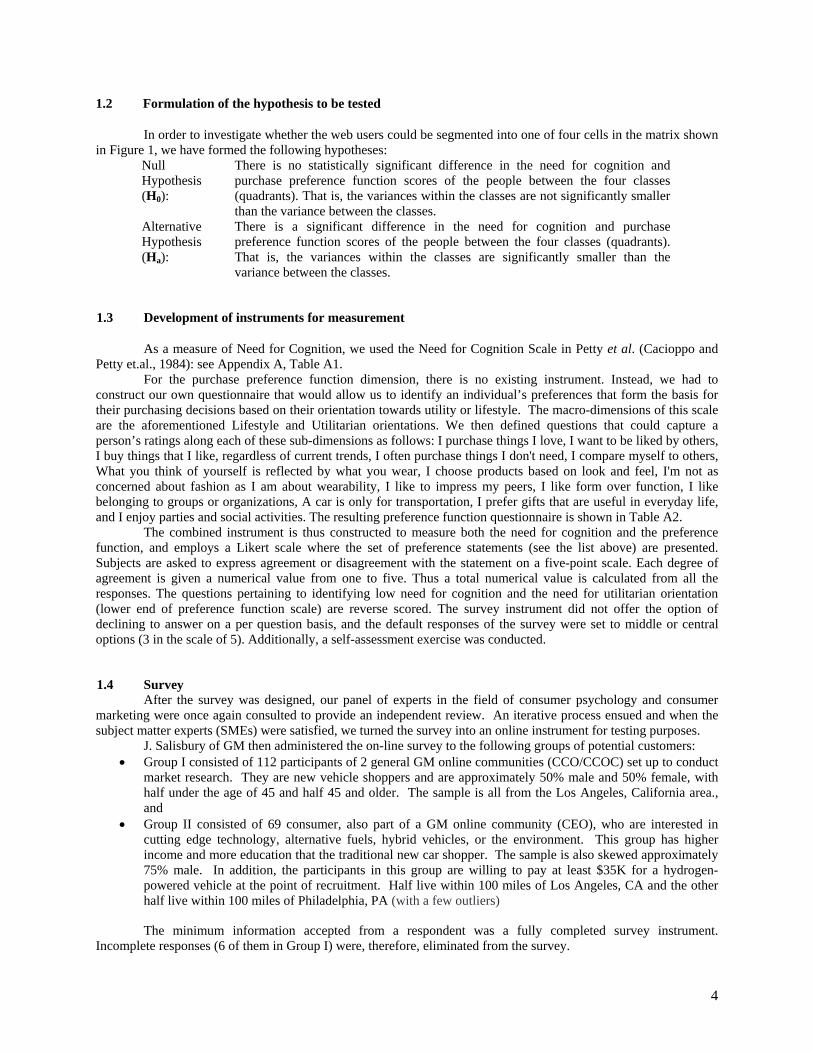
2.2 Finding Patterns in the Data In order to further increase our confidence in the results, we have attempted to find patterns in the data through bottom-up techniques such as cluster analysis and discriminant analysis.
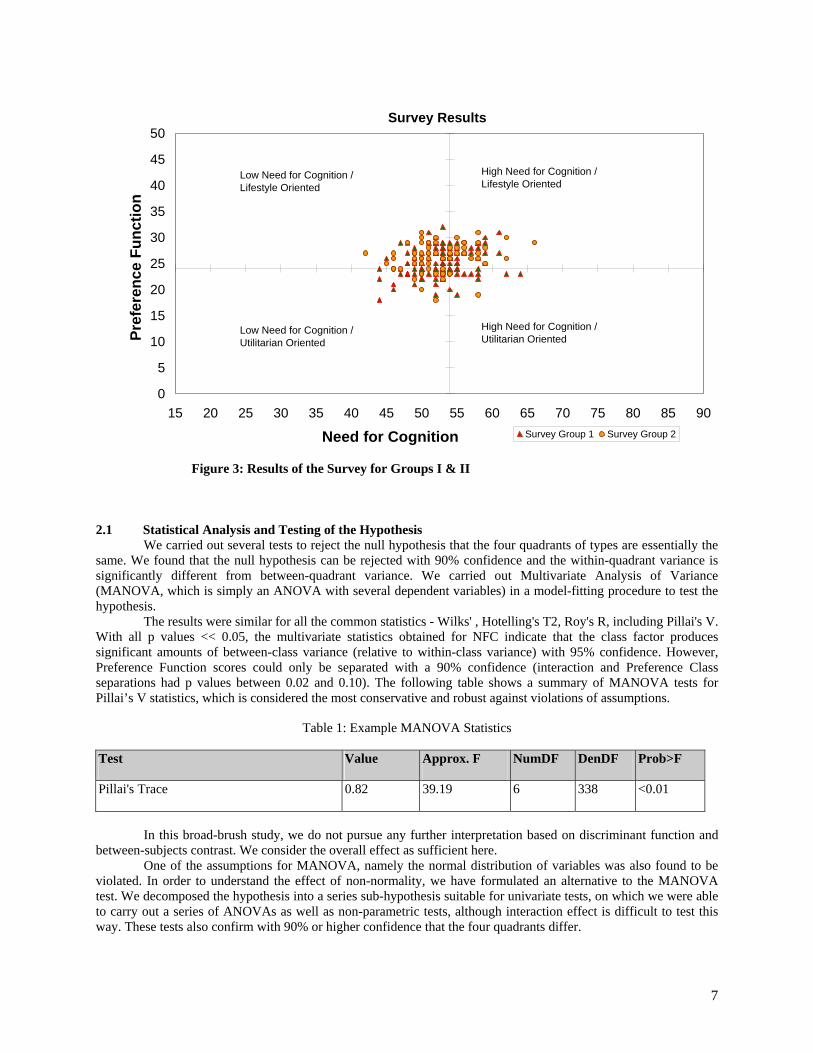
2.2.1 Cluster Analysis We partitioned the results through the K-means clustering technique, which partitions the observations in the data into K mutually exclusive clusters, and is a bottom-up method of creating a single level of cluster patterns in the dataset. We have employed a silhouette plot to get an idea of how well-separated the resulting clusters are. The silhouette plot displays a measure of how close each point in one cluster is to points in the neighboring clusters. This measure ranges from +1, indicating points that are very distant from neighboring clusters, through 0, indicating points that are not distinctly in one cluster or another, to -1, indicating points that are probably assigned to the wrong cluster. In our analysis, we varied the number of clusters (the value of K), similar to sensitivity analysis, to find a better grouping of the data. A comparison of silhouette plots for different number of clusters indicates that three to four clusters can be formed with relatively very low errors, and are better separated than runs containing other number of clusters. The silhouette plots are given below.
Figure 4: Silhouette plots for K-Means Clustering with Different Number of Clusters (k) In the figures of the silhouette plot showing two cases of 3-4 clusters, one can see that most points in this cluster have a large silhouette value, greater than 0.6, indicating that the cluster is somewhat separated from neighboring clusters. Large proportion of positive silhouette values indicates that there are points that are very distant from neighboring clusters. The negative portion is also comparatively smaller in this case. It appears to have a small negative area, which means most clusters are assigned correctly. In contrast, the figures having 2, 5, 6 and 7 clusters show significantly high level of incorrect clustering, as indicated by the large silhouette negative value. As the number of clusters increase beyond 4, most points in these clusters have a smaller silhouette values, less than 0.6, indicating that the cluster is not well separated from neighboring clusters. 2.2.2 Discriminant Analysis We have also employed discriminant analysis, another bottom up technique, to supplement the hypothesis testing. Discriminant Analysis seeks to find a way to predict a classification variable based on known continuous responses. It can be regarded as inverse prediction from a multivariate analysis of variance (MANOVA).
k = 3 k = 4 k = 2
k = 5 k = 6 k = 7
9
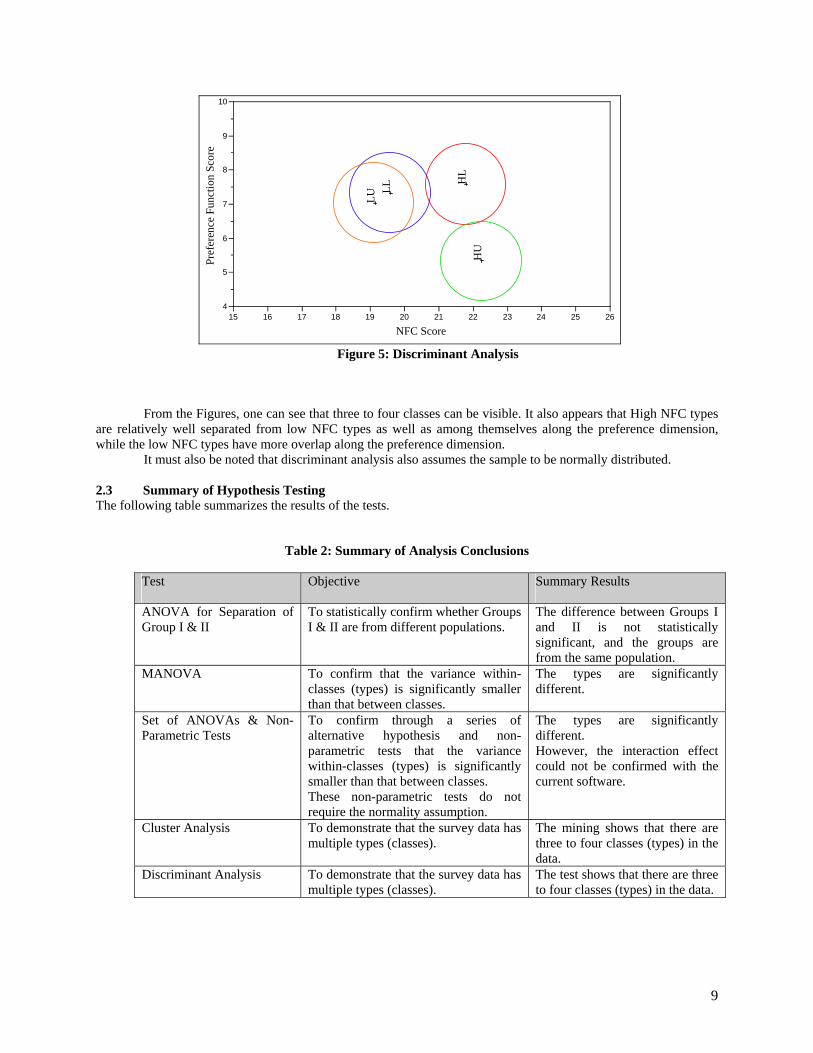
Figure 5: Discriminant Analysis
From the Figures, one can see that three to four classes can be visible. It also appears that High NFC types are relatively well separated from low NFC types as well as among themselves along the preference dimension, while the low NFC types have more overlap along the preference dimension. It must also be noted that discriminant analysis also assumes the sample to be normally distributed. 2.3 Summary of Hypothesis Testing The following table summarizes the results of the tests.
Table 2: Summary of Analysis Conclusions
Test Objective Summary Results
ANOVA for Separation of Group I & II
To statistically confirm whether Groups I & II are from different populations.
The difference between Groups I and II is not statistically significant, and the groups are from the same population.
MANOVA To confirm that the variance within-classes (types) is significantly smaller than that between classes.
The types are significantly different.
Set of ANOVAs & Non-Parametric Tests
To confirm through a series of alternative hypothesis and non-parametric tests that the variance within-classes (types) is significantly smaller than that between classes. These non-parametric tests do not require the normality assumption.
The types are significantly different. However, the interaction effect could not be confirmed with the current software.
Cluster Analysis To demonstrate that the survey data has multiple types (classes).
The mining shows that there are three to four classes (types) in the data.
Discriminant Analysis To demonstrate that the survey data has multiple types (classes).
The test shows that there are three to four classes (types) in the data.
4
5
6
7
8
9
10
Pref
eren
ce F
unct
ion
Scor
e
HL
HU
LLLU
15 16 17 18 19 20 21 22 23 24 25 26
NFC Score
10
While these studies are not a hypothesis testing per se, they support the existence of a typology containing nearly four classes in the data. However, it must also be cautioned that the four classes discovered are not distinct, discrete lumps, but rather have contiguous edges with the other classes and form a continuous surface with several points near the boundary, which explains some of the errors observed. 3 SELF-ASSESSMENT
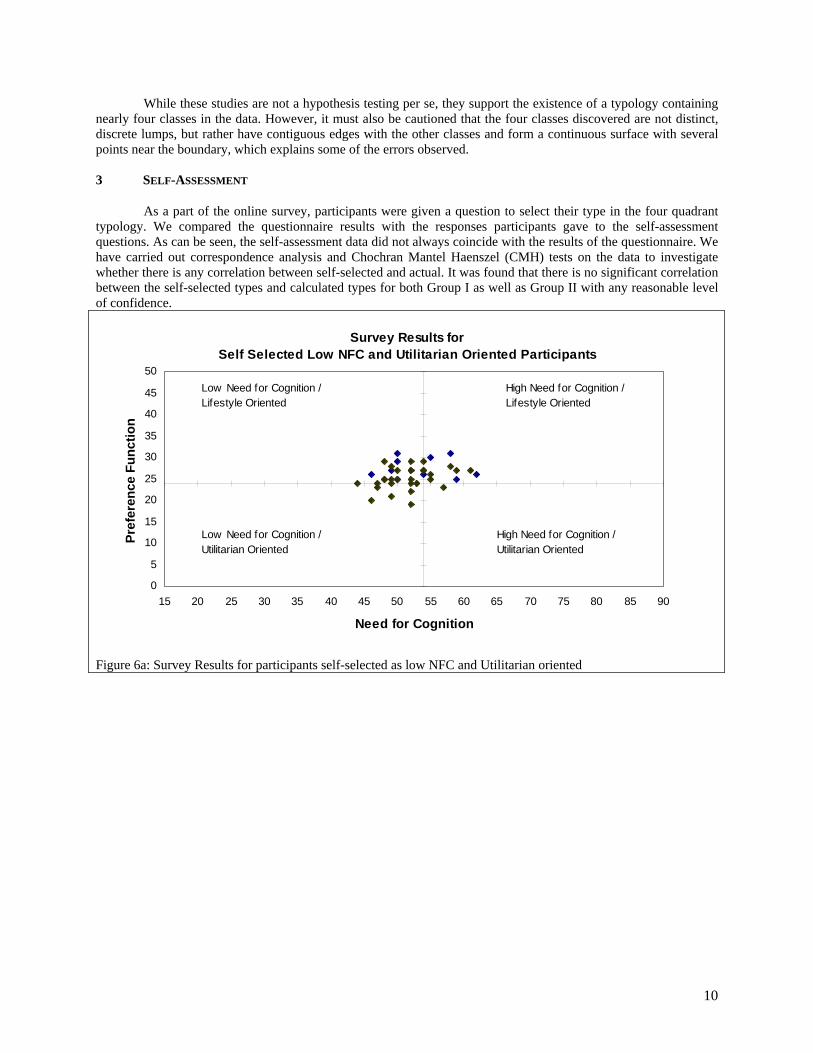
As a part of the online survey, participants were given a question to select their type in the four quadrant typology. We compared the questionnaire results with the responses participants gave to the self-assessment questions. As can be seen, the self-assessment data did not always coincide with the results of the questionnaire. We have carried out correspondence analysis and Chochran Mantel Haenszel (CMH) tests on the data to investigate whether there is any correlation between self-selected and actual. It was found that there is no significant correlation between the self-selected types and calculated types for both Group I as well as Group II with any reasonable level of confidence.
Survey Results for Self Selected Low NFC and Utilitarian Oriented Participants
0
5
10
15
20
25
30
35
40
45
50
15 20 25 30 35 40 45 50 55 60 65 70 75 80 85 90
Need for Cognition
Pref
eren
ce F
unct
ion
Low Need for Cognition / Utilitarian Oriented
High Need for Cognition / Utilitarian Oriented
Low Need for Cognition / Lifestyle Oriented
High Need for Cognition /Lifestyle Oriented
Figure 6a: Survey Results for participants self-selected as low NFC and Utilitarian oriented
11
Survey Results for Self Selected Low NFC and Life Style Oriented Participants
0
5
10
15
20
25
30
35
40
45
50
15 20 25 30 35 40 45 50 55 60 65 70 75 80 85 90
Need for Cognition
Pref
eren
ce F
unct
ion
Low Need for Cognition / Utilitarian Oriented
High Need for Cognition / Utilitarian Oriented
Low Need for Cognition / Lifestyle Oriented
High Need for Cognition /Lifestyle Oriented
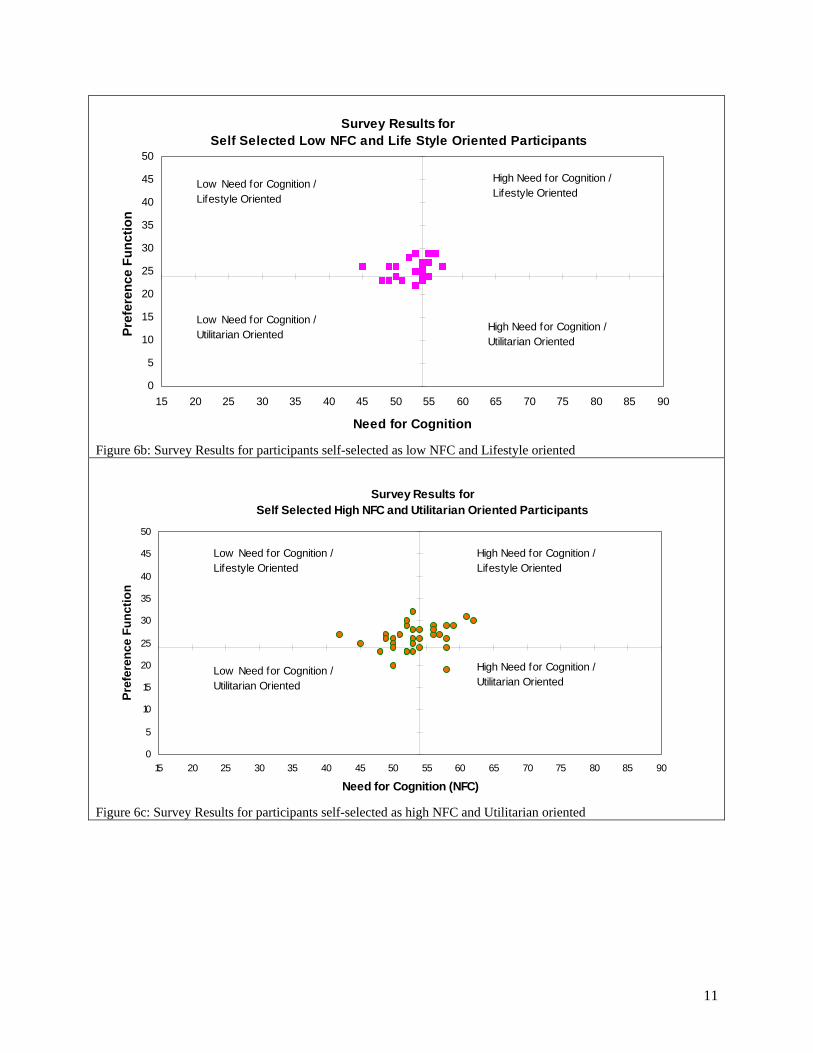
Figure 6b: Survey Results for participants self-selected as low NFC and Lifestyle oriented
Survey Results for Self Selected High NFC and Utilitarian Oriented Participants
0
5
10
15
20
25
30
35
40
45
50
15 20 25 30 35 40 45 50 55 60 65 70 75 80 85 90
Need for Cognition (NFC)
Pref
eren
ce F
unct
ion
Low Need for Cognition / Utilitarian Oriented
High Need for Cognition / Utilitarian Oriented
Low Need for Cognition / Lifestyle Oriented
High Need for Cognition /Lifestyle Oriented
Figure 6c: Survey Results for participants self-selected as high NFC and Utilitarian oriented
12
Survey Results for Self Selected High NFC and Utilitarian Oriented Participants
0
5
10
15
20
25
30
35
40
45
50
15 20 25 30 35 40 45 50 55 60 65 70 75 80 85 90
Need for Cognition (NFC)
Pref
eren
ce F
unct
ion
Low Need for Cognition / Utilitarian Oriented
High Need for Cognition / Utilitarian Oriented
Low Need for Cognition / Lifestyle Oriented
High Need for Cognition /Lifestyle Oriented
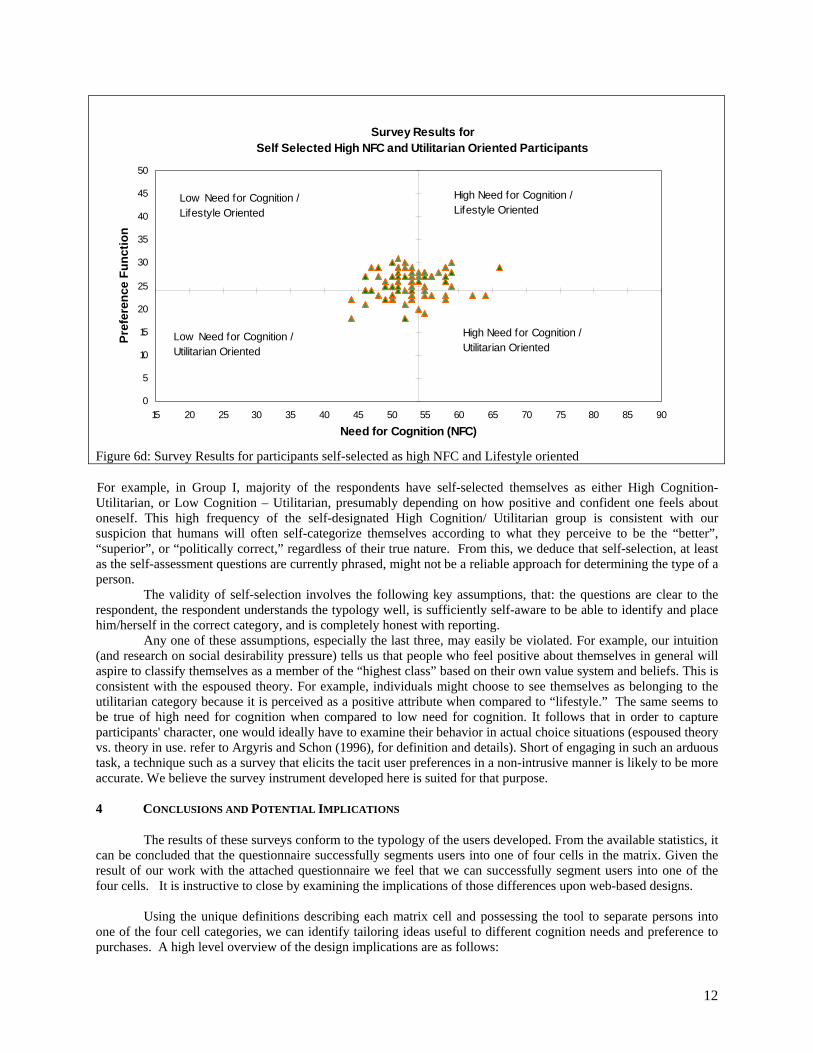
Figure 6d: Survey Results for participants self-selected as high NFC and Lifestyle oriented For example, in Group I, majority of the respondents have self-selected themselves as either High Cognition-Utilitarian, or Low Cognition – Utilitarian, presumably depending on how positive and confident one feels about oneself. This high frequency of the self-designated High Cognition/ Utilitarian group is consistent with our suspicion that humans will often self-categorize themselves according to what they perceive to be the “better”, “superior”, or “politically correct,” regardless of their true nature. From this, we deduce that self-selection, at least as the self-assessment questions are currently phrased, might not be a reliable approach for determining the type of a person. The validity of self-selection involves the following key assumptions, that: the questions are clear to the respondent, the respondent understands the typology well, is sufficiently self-aware to be able to identify and place him/herself in the correct category, and is completely honest with reporting. Any one of these assumptions, especially the last three, may easily be violated. For example, our intuition (and research on social desirability pressure) tells us that people who feel positive about themselves in general will aspire to classify themselves as a member of the “highest class” based on their own value system and beliefs. This is consistent with the espoused theory. For example, individuals might choose to see themselves as belonging to the utilitarian category because it is perceived as a positive attribute when compared to “lifestyle.” The same seems to be true of high need for cognition when compared to low need for cognition. It follows that in order to capture participants' character, one would ideally have to examine their behavior in actual choice situations (espoused theory vs. theory in use. refer to Argyris and Schon (1996), for definition and details). Short of engaging in such an arduous task, a technique such as a survey that elicits the tacit user preferences in a non-intrusive manner is likely to be more accurate. We believe the survey instrument developed here is suited for that purpose. 4 CONCLUSIONS AND POTENTIAL IMPLICATIONS
The results of these surveys conform to the typology of the users developed. From the available statistics, it can be concluded that the questionnaire successfully segments users into one of four cells in the matrix. Given the result of our work with the attached questionnaire we feel that we can successfully segment users into one of the four cells. It is instructive to close by examining the implications of those differences upon web-based designs. Using the unique definitions describing each matrix cell and possessing the tool to separate persons into one of the four cell categories, we can identify tailoring ideas useful to different cognition needs and preference to purchases. A high level overview of the design implications are as follows:
13
High Need for Cognition (H):
An individual who is highly analytical and enjoys being presented with a lot of data and the opportunity to process that data. It seems reasonable to conclude that these people prefer details, charts, and graphs available in nonlinear, searchable schemes.
Low Need for Cognition (L):
An individual who is most influenced by peripheral cues. It is likely that these people prefer pictures and audio representations. Product placement is useful, as is having desirable characters or celebrities make use of the product in linear stories.
Lifestyle Oriented or High Preference Function Score (L):
Someone who believes that the value of a thing depends on how it reflects the person's values and preferences. They will want insights on how others view someone who has this product.
Utilitarian or High Preference Function Score (U):
Someone who believes that the value of a thing depends on its practical usefulness. The will want information on the product’s functions and “ilities”.
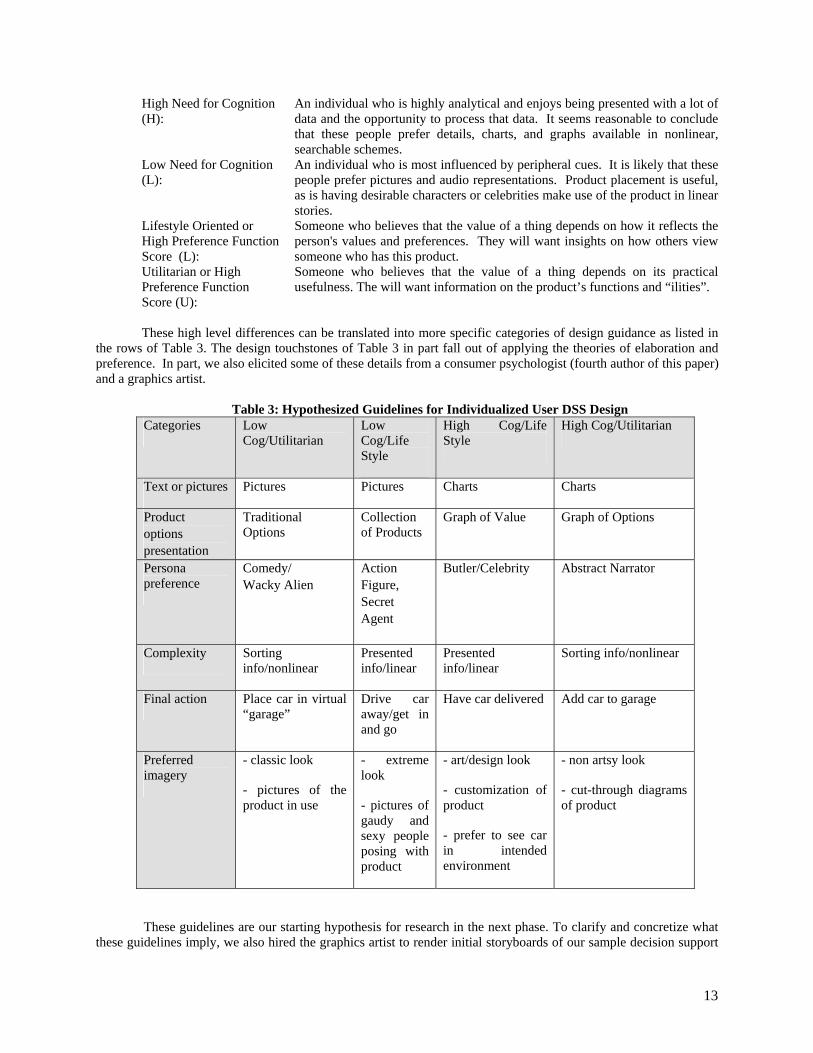
These high level differences can be translated into more specific categories of design guidance as listed in
the rows of Table 3. The design touchstones of Table 3 in part fall out of applying the theories of elaboration and preference. In part, we also elicited some of these details from a consumer psychologist (fourth author of this paper) and a graphics artist.
Table 3: Hypothesized Guidelines for Individualized User DSS Design Categories Low
Cog/Utilitarian Low Cog/Life Style
High Cog/Life Style
High Cog/Utilitarian
Text or pictures Pictures Pictures Charts Charts
Product options presentation
Traditional Options
Collection of Products
Graph of Value Graph of Options
Persona preference
Comedy/ Wacky Alien
Action Figure, Secret Agent
Butler/Celebrity
Abstract Narrator
Complexity Sorting info/nonlinear
Presented info/linear
Presented info/linear
Sorting info/nonlinear
Final action Place car in virtual “garage”
Drive car away/get in and go
Have car delivered Add car to garage
Preferred imagery
- classic look
- pictures of the product in use
- extreme look
- pictures of gaudy and sexy people posing with product
- art/design look
- customization of product
- prefer to see car in intended environment
- non artsy look
- cut-through diagrams of product
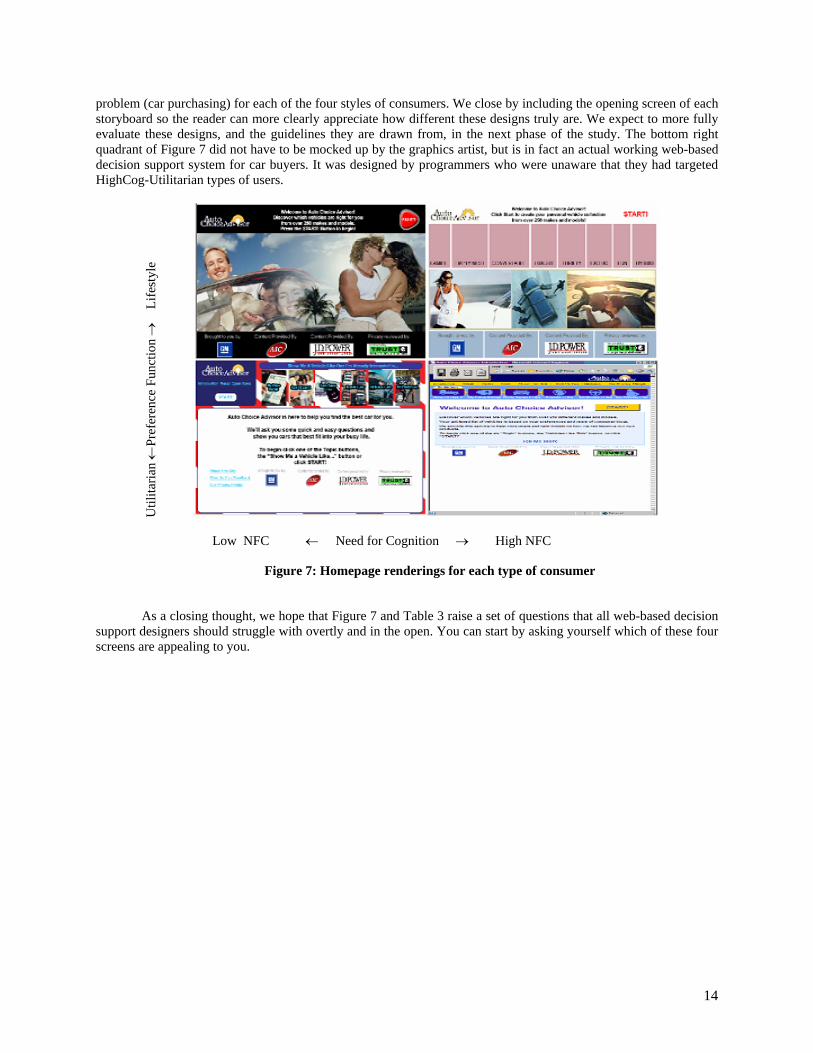
These guidelines are our starting hypothesis for research in the next phase. To clarify and concretize what these guidelines imply, we also hired the graphics artist to render initial storyboards of our sample decision support
14
problem (car purchasing) for each of the four styles of consumers. We close by including the opening screen of each storyboard so the reader can more clearly appreciate how different these designs truly are. We expect to more fully evaluate these designs, and the guidelines they are drawn from, in the next phase of the study. The bottom right quadrant of Figure 7 did not have to be mocked up by the graphics artist, but is in fact an actual working web-based decision support system for car buyers. It was designed by programmers who were unaware that they had targeted HighCog-Utilitarian types of users.
Util
itaria
n ←
Pref
eren
ce F
unct
ion →
L
ifest
yle
Low NFC ← Need for Cognition → High NFC
Figure 7: Homepage renderings for each type of consumer
As a closing thought, we hope that Figure 7 and Table 3 raise a set of questions that all web-based decision
support designers should struggle with overtly and in the open. You can start by asking yourself which of these four screens are appealing to you.
15
5 REFERENCES
Ajzen, I. 2001. Nature and operation of attitudes. Annu. Rev. Psychol. 52:27–58
Albarrac´ın D, Johnson BT, Zanna MP, eds. 2005. The Handbook of Attitudes. Hillsdale, NJ: Erlbaum
Argyris and Schon (1996) Organisational learning II: Theory, method and practice, Reading, Mass: Addison Wesley. Baxter, L.A. (1988). A dialectical perspective on communication strategies in relationship development. In S. Duck (Ed.), Handbook of Personal Relationships, pp.257-273.
Benyon et al., (2001). In M. Benyon, C. L. Nehaniv, and K. Dautenhahn, editors, Instruments of Mind: Proceedings of The Fourth International Conference on Cognitive Technology, volume 2117 of Lecture Notes in Artificial Intelligence, pages 325--341, Berlin, 2001. Springer-Verlag. Cacioppo, J. T., Petty, R. E., & Kao, C. E. (1984). The efficient assessment of need for cognition. Journal of Personality Assessment, 48, 306-307.
Davis, G.B., Olson, M.H., (1985). Management Information Systems: Conceptual Foundations, Structure, and Development, second ed. McGraw-Hill, New York. DeBono, K.G. (2000). Attitude functions and consumer psychology: Understanding perceptions of product quality. In G. Maio & J. Olson (Eds.), Why we evaluate: Functions of attitudes (pp. 195-221). Mahwah, NJ: Erlbaum Associates, Inc.
Ennis and Zanna, (2000). "Attitude Function and the Automobile," in Why We Evaluate: Functions of Attitudes, Gregory R. Maio and James M. Olson, eds., Mahwah, NJ: Lawrence Erlbaum. 395-415.
Griffin, E. (2000). A first look at communication theory (4th ed.). Boston, MA: McGraw-Hill. pp. 109-201.
Lavine H, Snyder M. 1996. Cognitive processing and the functional matching effect in persuasion: the mediating role of subjective perceptions of message quality.J. Exp. Soc. Psychol.32:580–604
Maio GR, Olson J. (2000). Why We Evaluate: Functions of Attitudes. Mahwah, NJ: Erlbaum Barabba, V. (2004), Surviving Transformation, Oxford University Press, ISBN10: 0-19-517141-1
Petty RE, Cacioppo JT. (1986). Communication and Persuasion: Central and Peripheral Routes to Attitude Change. New York: Springer-Verlag
Petty RE-, Wegener DT (1999). The elaboration likelihood model: current status and controversies. In Chaiken S-, Trope Y (1999). Dual Process Theories in Social Psychology. New York: Guilford, pp. 37–72
Petty RE, Wegener DT. (1998). Matching versus mismatching attitude functions: implications for scrutiny of persuasive messages. Pers. Soc. Psychol. Bull.24:227–40
Silverman, BG, Bachann,m, Al-Akharas, K, (2001), “Implications of Buyer Decision Theory for the Design of Online e-Commerce Websites”, International J. of Human Computer Studies, 55/4, Nov, pp.815-44
Stephanidis, C. (2001). “User interfaces for All”, In Salvendy, G (eds). The Human Factors and Ergonomics Series, Lawrence Erlbaum Associates, ISBN: 0-8058-2967-9
Wood W. (2000). Attitude change: persuasion and social influence. Annu. Rev. Psychol. 51: 539–70
16
Appendix A - Survey Questions
Table A1: Instrument for Measuring Need for Cognition Scale in Petty et.al. (1984)
Que
stio
n #
Question
Stro
ngly
D
isag
ree
Dis
agre
e
Nei
ther
Agr
ee
nor D
isag
ree
Agr
ee
Stro
ngly
Agr
ee
1. I would prefer complex to simple problems. 2. I like to have the responsibility of handling a situation
that requires a lot of thinking.
3. Thinking is not my idea of fun. 4. I would rather do something that requires little thought
than something that is sure to challenge my thinking abilities.
5. I try to anticipate and avoid situations where there is likely a chance I will have to think in depth about something.
6. I find satisfaction in deliberating hard and for long hours.
7. I only think as hard as I have to. 8. I prefer to think about small, daily projects to long-
term ones.
9. I like tasks that require little thought once I’ve learned them.
10. The idea of relying on thought to make my way to the top appeals to me.
11. I really enjoy a task that involves coming up with new solutions to problems.
12. Learning new ways to think doesn’t excite me very much.
13. I prefer my life to be filled with puzzles that I must solve.
14. The notion of thinking abstractly is appealing to me. 15. I would prefer a task that is intellectual, difficult, and
important to one that is somewhat important but does not require much thought.
16. I feel relief rather than satisfaction after completing a task that required a lot of mental effort.
17. It’s enough for me that something gets the job done; I don’t care how or why it works.
18. I usually end up deliberating about issues even when they do not affect me personally.
17
Table A2: Instrument for Measuring Preference Function
Que
stio
n #
Question
Stro
ngly
D
isag
ree
Dis
agre
e
Nei
ther
Agr
ee
nor D
isag
ree
Agr
ee
Stro
ngly
Agr
ee
1. I purchase things I love (LF) 2. I want to be liked by others (LI) 3. I buy things that I like, regardless of current trends (UF) 4. I often purchase things I don't need (UF) 5. I compare myself to others (LE) 6. What you think of yourself is reflected by what you wear
(LI)
7. I choose products based on look and feel (LF) 8. I'm not as concerned about fashion as I am about
wearability (UF)
9. I like to impress my peers (LE) 10. I like form over function (UF) 11. I like belonging to groups or organizations (LE) 12. A car is only for transportation (UF) 13. I prefer gifts that are useful in everyday life (UF) 14. I enjoy parties and social activities (LE)
Related Documents