23o2- Latin America and the Caribbean Technical Departmeilt RCL)lollal Siudic,- Proo rai Report No. 30 Indigenous People and Poverty in Latin America: An Empirical Analysis Edited by George Psacharopoulos and Harry A. Patrinos Advisory Group August 1993 ipers in di aries ae ntforal publicads ofr e World Bank. They prese prelimiary an unpolished res~ri ofcounry analysis or research u ated te dscusson and comment; ny iuon and te me of dåi pper suld ate acour of ia provisioul dchracar. The findingsl, Utpres ressed inths paper are endrely those of de anor(s) and should not be auad in my nnnr o the World Bank its afftlhted ngni mbers of is lard of Execu~ve Dectors or dhe co~ntries they represent. Public Disclosure Authorized Public Disclosure Authorized Public Disclosure Authorized Public Disclosure Authorized

Welcome message from author
This document is posted to help you gain knowledge. Please leave a comment to let me know what you think about it! Share it to your friends and learn new things together.
Transcript
23o2-Latin America and the Caribbean
Technical Departmeilt
RCL)lollal Siudic,- Proo rai
Report No. 30
Indigenous People and Poverty in Latin America:An Empirical Analysis
Edited by
George Psacharopoulos and Harry A. Patrinos
Advisory Group
August 1993ipers in di aries ae ntforal publicads ofr e World Bank. They prese prelimiary an unpolished res~ri ofcounry analysis or research
u ated te dscusson and comment; ny iuon and te me of dåi pper suld ate acour of ia provisioul dchracar. Thefindingsl, Utpres ressed inths paper are endrely those of de anor(s) and should not be auad in my nnnr othe World Bank its afftlhted ngni mbers of is lard of Execu~ve Dectors or dhe co~ntries they represent.
Pub
lic D
iscl
osur
e A
utho
rized
Pub
lic D
iscl
osur
e A
utho
rized
Pub
lic D
iscl
osur
e A
utho
rized
Pub
lic D
iscl
osur
e A
utho
rized

This report was written and edited by George Psacharopoulos (Task Manager) and HarryAnthony Patrinos. Mary Lisbeth Gonzalez provided the Statistical Overview, and the countrycase studies were written by Donna MacIsaac (Peru), Diane Steele (Guatemala), Alex Panagides(Mexico), and Bill Wood and Harry Anthony Patrinos (Bolivia). Material prepared by SandraRosenhouse and George Psacharopoulos was incorporated into the Bolivia chapter. Backgroundstudies were prepared by Haeduck Lee and Johanna Coenen. Johanna Coenen formatted andedited the document, and provided useful feedback throughout the report's preparation. We aregrateful for the comments received at a review meeting and thank all those who attended. Weappreciate the detailed comments we 1eceived from Shelton Davis, Sandra Rosenhouse, ZafirisTzannatos, Eduardo Velez, David Hughart, Professor Simon Brascoup6 and Renee Dankerlinon earlier drafts. This study could not have materialized without the support and guidance ofShelton Davis.

Foreword
Indigenous people make up a large and distinct portion of Latin America's population. Insome countries, the mqjority of the population is indigenous. In Bolivia, for example, more thanhalf of the total population is of Indigenous origin. Indigenous people are more likely than anyother group of a country's population to be poor. To a very large extent, being of indigenousorigin is synonymous with poverty.
While the incidence of poverty is high in Latin America, h it particularly severe and deepamong the indigenous population. In Bolivia, more than half of the total population is poor, butover two-thirds of the indigenous population is poor. In Guatemala, over two-thirds of thepopulation is poor, but almost 90 percent of the indigenous population is poor.
There is a very strong correlation between schooling attainment and ethnicity, and betweenschooling attainment and poverty incidence. The indigenous population possesses considerablylower endowments of human capital. In Guatemala, for example, the indigenous male workingpopulation averages only 1.8 years of schooling.
This report documents that equalization of income-generating characteristics would boostthe productivity of the indigenous population in their market and non-market activities and leadto a considerable reduction in inequality and poverty. This suggests that the socioeconomiccondition of indigenous people can be improved since policy-Influenced variables such aseducation are largely responsible for observed earnings differences. This unrealized ptentialprovides considerable hope for the future. The challenge that remains, however, is to devisethe means by which to enhance the human capital endowments of the indigenous population andcreate the circumstances by which the indigenous population can derive the maximum benefitfrom their productivity-enhandag attributes according to their individual and collectivepredisposition.
George PsacharopoulosSenior Adviser
Human Resources Development and Operations Policy
1
Contents
ForewordExecutve Sunny xi
1. Introduction1Georg. Pwhckropoukog and Hmny Andhoy Pwrlins
Study Objectvele Problem 2
2. Literature Review 5Hany Anhony Paino
Global 5Indigenous People of North America 8Indgenous People of NewZealand and Australia 11Indigenous People of Latin America 12Conclusion 18
3. Statisial Overview 19Mary L~se 0~at
Operational Definitions of Indigenous People 19Sources of Informaton 23Population Size and L fcation 26E ihnolilgulstic Characeist*e 30Literacy and PAucational Characteristics 35Concluslon 40
4. Data and Methodoloy 41Narry A~nony Pa~ns
11e Household Surveys and Defnitions 41Ares of Analyses 45Main Hypotheses 46Methodology 49Conclusion 53
5. Bolivla 55Aut Wo~d and Hny Anony Pawino
Introduction 55Income Distribudon 55Magutude of PoveFty 56
ä1 ~ IdIgenou People and P~wrty in Lar ~m A : An D ~pIrical AabIs
Poverty Proffle 58of Poverty 73
Effects of Gender and Eicky on Educational Ananung t 76Educadon and Earning: Males 83Educadion'nd ERings: Females 88Fertfity, Educalon and Pmale Labor Force Participadon 92Conc~uston 101
6. Guatemala 105Diane eele
Introduction 105Populadon Distribution 106Poverty Incidence 107Educadon 114Child Labor 126Occnpadloal Attainment 129Earnings 131Concusion 140
7. Mexico 141Alais Pan~gida
Introduction 141Sample Characteilstics 141Income and Povey Incidence 145Educadona.l II C c ics • 1153Determinanta of Earnings 159Child Labor and Education 167Conclusion 176
8. Peru 179DÖ~mn Macisaac
Introduction 179Identifying Peru's Indigenous Populadon 179Poverty Profle 183Earnings Projections 199Sciooling and Work Acdvties of Peruvian Youth 213Migraton 221Concusfon 223
9. Coneluslon 225George Psacharopoulas and Harry Anony Parra~
Lessons Learned 232Future Research 233
Referenoces 237
coments v
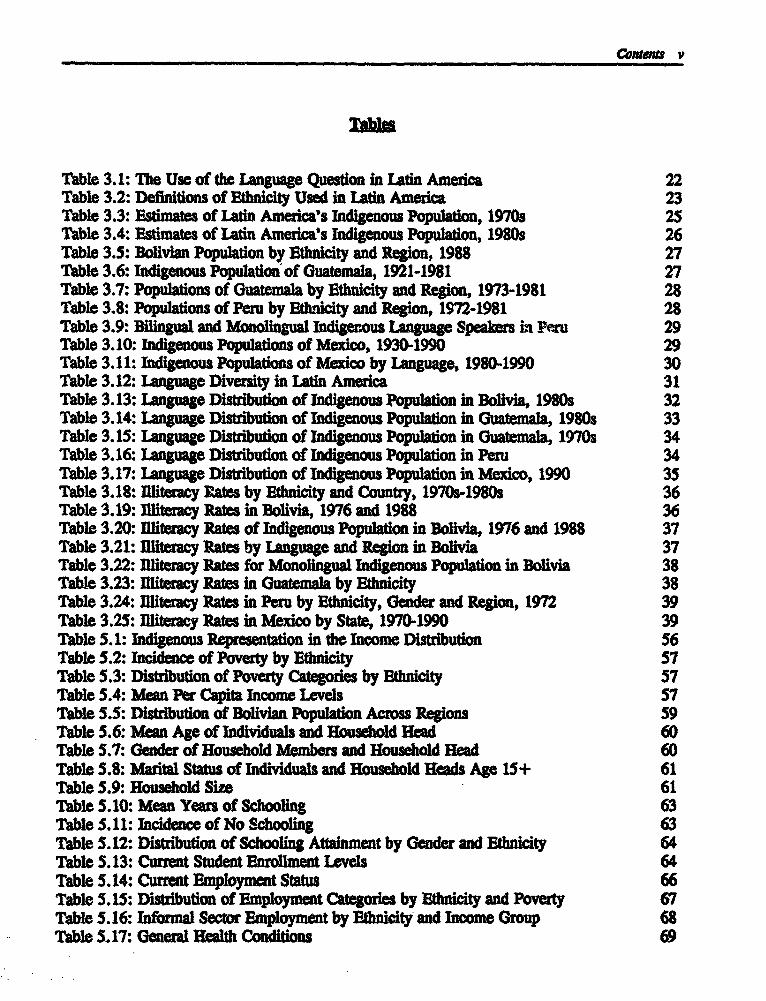
Table 3.1: The Use of the Language Question in Latin America 22Table 3.2: Definitions of Ethnicity Used in Latin America 23Table 3.3: Estimates of Latin America's Indigenous Population, 1970s 25Table 3.4: Estimates of Latin America's Indigenous Population, 1980s 26Table 3.5: Bolivian Population by Ethnicity and Region, 1988 27Table 3.6: Indigenous Population of Guatemala, 1921-1981 27Table 3.7: Populations of Guatemala by Ethnicity and Region, 1973-1981 28Table 3.8: Populations of Peru by Etinicity and Region, 1972-1981 28Table 3.9: Bilingual and Monolingual Indigenous Language Speakers in Peru 29Table 3.10: Indigenous Populations of Mexico, 1930-1990 29Table 3.11: Indigenous Populations of Mexico by Language, 1980-1990 30Table 3.12: Language Diversity in Latin America 31Table 3.13: Language Distribution of Indigenous Population in Bolivia, 1980s 32Table 3.14: Language Distribution of Indigenous Population in Guatemala, 1980s 33Table 3.15: Language Distribution of Indigenous Population in Guatemala, 1970s 34Table 3.16: Language Distribution of Indigenous Population in Peru 34Table 3.17: Language Distribution of Indigenous Population in Mexico, 1990 35Table 3.18: Illiteracy Rates by Ethnicity and Country, 1970s-1980s 36Table 3.19: illiteracy Rates in Bolivia, 1976 and 1988 36Table 3.20: Illiteracy Rates of Indigenous Population in Bolivia, 1976 and 1988 37Table 3.21: Illiteracy Rates by Language and Region in Bolivia 37Table 3.22: Illiteracy Rates for Monolingual Indigenous Population in Bolivia 38Table 3.23: Illiteracy Rates In Guatemala by Ethnicity 38Table 3.24: Illiteracy Rates in Peru by Ethnicity, Gender and Region, 1972 39Table 3.25: Illiteracy Rates in Mexico by State, 1970-1990 39Table 5.1: Indigenous Representation in the Income Distribution 56Table 5.2: Incidence of Poverty by Ethnicity 57Table 5.3: Distribution of Poverty Categories by Ethnicity 57Table 5.4: Mean Per Capita Income Levels 57Table 5.5: Distribution of Bolivian Population Across Regions 59Table 5.6: Mean Age of Individuals and Household Head 60Table 5.7: Gender of Household Members and Household Head 60Table 5.8: Marital Status of Individuals and Household Heads Age 15+ 61Table 5.9: Household Size 61Table 5.10: Mean Years of Schooling 63Table 5.11: Incidence of No Schooling 63Table 5.12: Distribution of Schooling Attainment by Gender and Ethnicity 64Table 5.13: Current Student Enrollment Levels 64Table 5.14: Current Employment Status 66Table 5.15: Distribution of Employment Categories by Ethnicity and Poverty 67Table 5.16: Informal Sector Employment by Ethnicity and Income Group 68Table 5.17: General Health Conditions 69
vi fdigenous Pople and Powny In Laril Ameai An &qpWri Anlrl
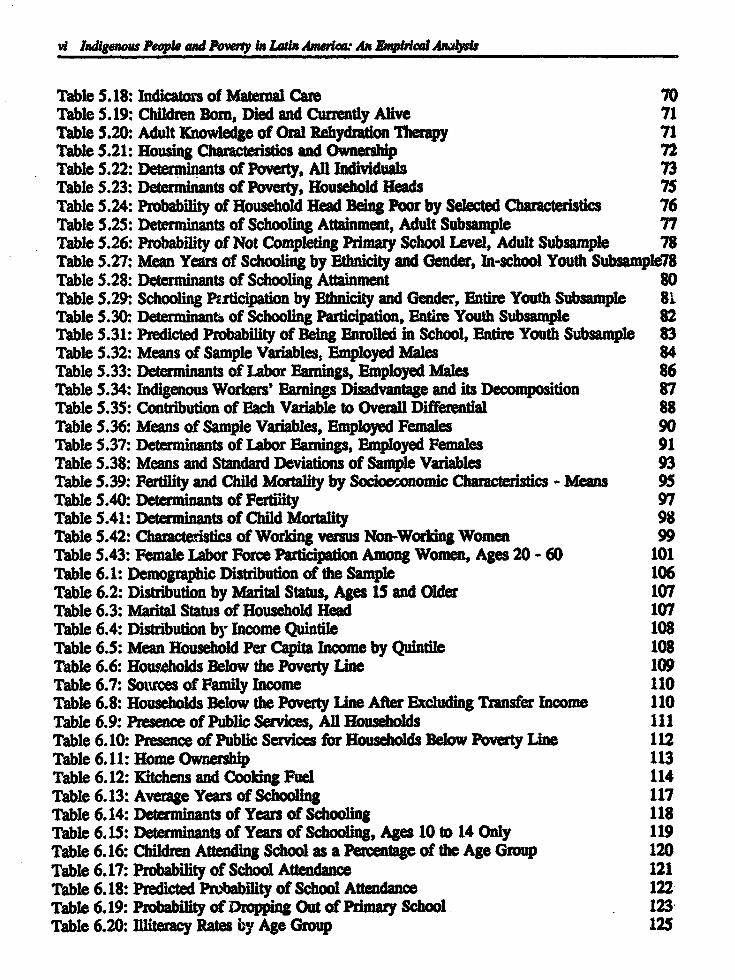
Table 5.18: Indicators of Maternal Care 70Table 5.19: Children Born, Died and Currently Alive 71Table 5.20: Adult Knowledge of Oral Rehydration Therapy 71Table 5.21: Housing Characteristics and Ownership 72Table 5.22: Determinants of Poverty, All Individuals 73Table 5.23: Determinants of Poverty, Household Heads 75Table 5.24: Probability of Household Head Being Poor by Selected Characteristics 76Table 5.25: Determinants of Schooling Attainment, Adult Subsample 77Table 5.26: Probability of Not Completing Primary School Level, Adult Subsample 78Table 5.27: Mean Years of Schooling by Ethnicity and Gender, In-school Youth Subsample78Table 5.28: Determinants of Schooling Attainment 80Table 5.29: Schooling PAticipation by Ethnicity and Gender, Entire Youth Subsample 81Table 5.30: Determinants of Schooling Participation, Entire Youth Subsample 82Table 5.31: Predicted Probability of Being Enrolled in School, Entire Youth Subsample 83Table 5.32: Means of Sample Variables, Employed Males 84Table 5.33: Determinants of Labor Earnings, Employed Males 86Table 5.34: Indigenous Workers' Earnings Disadvantage and its Decomposition 87Table 5.35: Contribution of Each Variable to Overall Differential 88Table 5.36: Means of Sample Variables, Employed Females 90Table 5.37: Determinants of Labor Earnings, Employed Females 91Table 5.38: Means and Standard Deviations of Sample Variables 93Table 5.39: Fertility and Child Mortality by Socioeconomic Characteristics - Means 95Table 5.40: Determinants of Fertility 97Table 5.41: Determinants of Child Mortality 98Table 5.42: Characteristics of Working versus Non-Working Women 99Table 5.43: Female Labor Force Participation Among Women, Ages 20 - 60 101Table 6.1: Demographic Distribution of the Sample 106Table 6.2: Distribution by Marital Status, Ages 15 and Older 107Table 6.3: Marital Status of Household Head 107Table 6.4: Distribution by Income Quintile 108Table 6.5: Mean Household Per Capita Income by Quintile 108Table 6.6: Households Below the Poverty Line 109Table 6.7: Sources of Family Income 110Table 6.8: Households Below the Poverty Line After Excluding Transfer Income 110Table 6.9: Presence of Public Services, All Households 111Table 6.10: Presence of Public Services for Households Below Poverty Line 112Table 6.11: Home Ownership 113Table 6.12: Kitchens and Cooking Fuel 114Table 6.13: Average Years of Schooling 117Table 6.14: Determinants of Years of Schooling 118Table 6.15: Determinants of Years of Schooling, Ages 10 to 14 Only 119Table 6.16: Children Attending School as a Percentage of the Age Group 120Table 6.17: Probability of School Attendance 121Table 6.18: Predicted Probability of School Attendance 122Table 6.19: Probability of Dropping Out of Primary School 123Table 6.20: Illiteracy Rates by Age Group 125

Table 6.1: Probability of Illitency 126Table 6.22: Characteristics of Working Children 127Table 6.23: Probability of a Child Working 128Table 6.24: Predicted Probability of a Child Worldng 129Table 6.25: Selected Characteristics of Wordng People 130Table 6.26: Principal Occupation 131Table 6.27: Average Incomes 132Table 6.28: Average Monthly Income by Education Level, Ages 14 and Older 133Table 6.29: Wages, Schooling, Weekly Rours and Potential Experience by Occupation 135Table 6.30: Labor Market Participation Analysis Variables 137Table 6.31: Earnings Functions 139Table 6.32: Decomposition of the Earnings Differential 140Table 7.1: Full Sample Averages for Selected Variables 144Table 7.2: Distribution of Average Monthly Incomes by Mwdicipo Indigenous Group 146Table 7.3: PGT Poverty Indices 148Table 7.4: Determination of Poverty 149Table 7.5: Gini Coefficients 152Table 7.6: Illiteracy by Gender and Mwdcplo Indigenous Percentage 155Table 7.7: Average Schooling Years by Gender, Mwdlpto and Indigenous Percentage 156Table 7.8: Determination of Schooling Years 156Table 7.9: Primary School Dropout Rates by Gender and Mwdciplo Indigenous Category 157Table 7.10: Determination of Primary School Dropout 158Table 7.11: Simulated Probability of Primary School Dropout 159Table 7.12: Average Wages for Selected Sectors 160Table 7.13: Sample Mean Characteristics 161Table 7.14: Earnings Functions by Mwdcipto Indigenous Category 162Table 7.15: Unionization and Earnings 163Table 7.16: Decomposition of Ethnic Earnings Differential 164Table 7.17: Variable Contribution 165Table 7.18: Earnings Functions by Gender 166Table 7.19: Mean Educational Attainment by Selected Sample Characteristics 170Table 7.20: Average Years of Schooling by Gender, Age and Mwdcplo 172Table 7.21: Explaining Educational Performance and Child Employment 173Table 7.22: Means of Significant Determinants of Schooling Attainment 174Table 7.23: Average Child Earnings and Percent of Family lacome 176table 8.1: Language Distribution 180Table 8.2: Household Description by Rural/Urban Location 181Table 8.3: Age Distribution 182table 8.4: Regional Distribution of Population 183Table 8.5: PGT Family of Poverty Measures for Poverty Lines 185'ble 8.6: Indigenous Population Share in Each Income Decile 186table 8.7: Gini Index of Income Inequality by Ethnicity and Location 187Table 8.8: Income Distribution by Ecowmic Sector 189Table 8.9: Housing Conditions 191Table 8.10: Health Status 193Iable 8.11: Years of School Attained by Age and Location 194
wU adgw Må~ pl ~ wGd P~wn ta LOlsM ~. An 0~Mn Air~
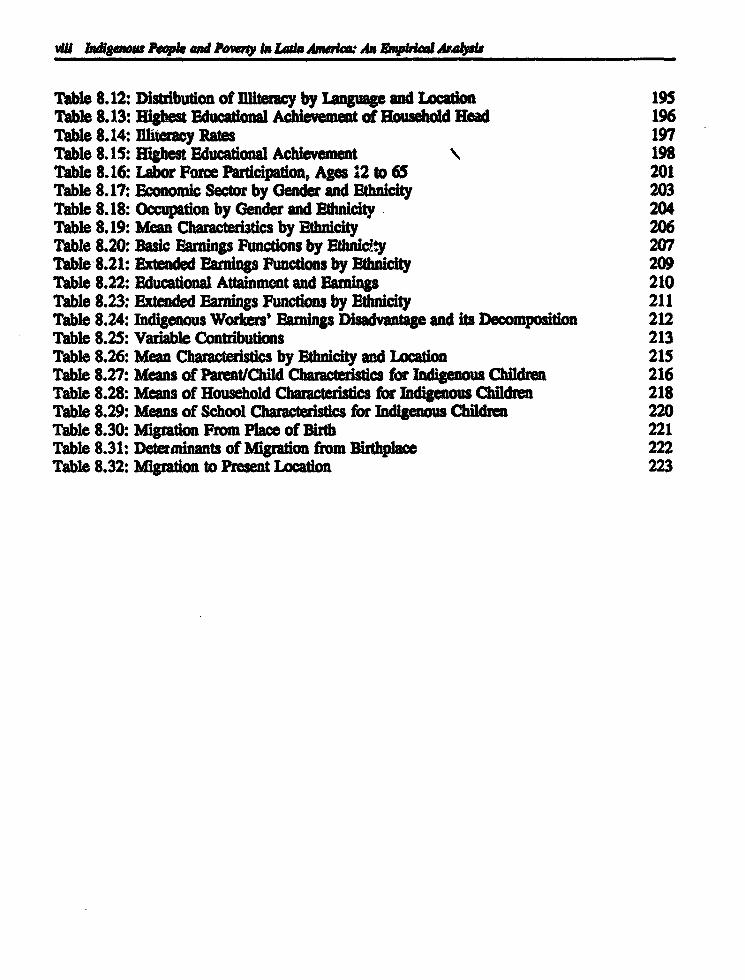
Table 8.12: Distrbution of l~tercy by Language and Location 195Table 8.13: Higbest Educational Achievement of Household ead 196Table 8.14: I111eracy Rates 197Table 8.15: Highest Educational Achievement 198Table 8.16: Labor Force Participaton, Ages 12 to 65 201Table 8.17: Economic Sector by Gender and Ethnicity 203Table 8.18: Occupation by Gender and Ethnicity 204Table 8.19: Mean Characterlatics by Ethncity 206Table 8.20: Basic Earnings Puncdons by Ethnici.y 207Table 8.21: Extended E~rings Funcons by Ethnicity 209Table 8.22: Educational Attainment and Earings 210Table 8.23: Extended Earnings Functions by Ethnicity 211Table 8.24: Indigenous Workers' Earnings Disadvantage and its Decomposition 212Table 8.25: Vadable Contributions 213Table 8.26: Mean Characteristics by Ethnicity and Locatim n 215Table 8.27: Means of Parent/Child Charactristics for Indigenous Cilden 216Table 8.28: Means of Household Charcteristics for Indigenous Children 218Table 8.29: Means of School Characteristics for Indigenous Children 220Table 8.30: Mgrtion From Place of Birth 221Table 8.31: Determinants of Migration from Birthplac 222Table 8.32: Migration to Present Location 223

Figure 5.1: Educational Attainment by Ethnicity and Birth Cohort 65Figure 5.2: Fertility and Child Mortality by Ethnicity and Education 96Figure 5.3: Female Labor Force Participation and Earnings by Ethnicity and Education 100Figure 6.1: Educational Distribution by Ethnicity 115Figure 6.2: Indigenous Educational Distribution 116Figure 6.3: Non-indigenous Educational Distribution 116Figure 6.4: Illiteracy by Area of Residence 124Figure 6.5: Average Monthly Income by Age Group 133Figure 7.1: Distribution of Observations by Mwdcplo Indigenous Concentratioa 142Figure 7.2: Percentage of Indigenous Population by Mexican State 143Figure 7.3: Average Household Income per Capita per Mwdciplo 147Figure 7.4: Poverty Incidence by Mwdplo Type 148Figure 7.5a: Material Assets 150Figure 7.5b: Household Services 151Figure 7.6: Material Composition of Housing Walls 151Figure 7.7: Income and Educational Attainment 153Figure 7.8: Average Educational Attainment by Age Cohort 154Figure 7.9: Sample and Subsample Distribution 168Figure 7.10: '"In School' Distribution by Mwdcplo Group 169Figure 7.11: *Working' Distribution by Mudcplo Group 169Figure 7.12: Average Educational Attainment by Ethnicity 171Figure 8.1: National Household Income Distribution 186Figure 8.2: Per Capita Households Income Distribution 188Figure 8.3: Formal Education By Birth Cohort 197
x Indigenow People and Powry in Lain Amwew An ZnpIric Anals
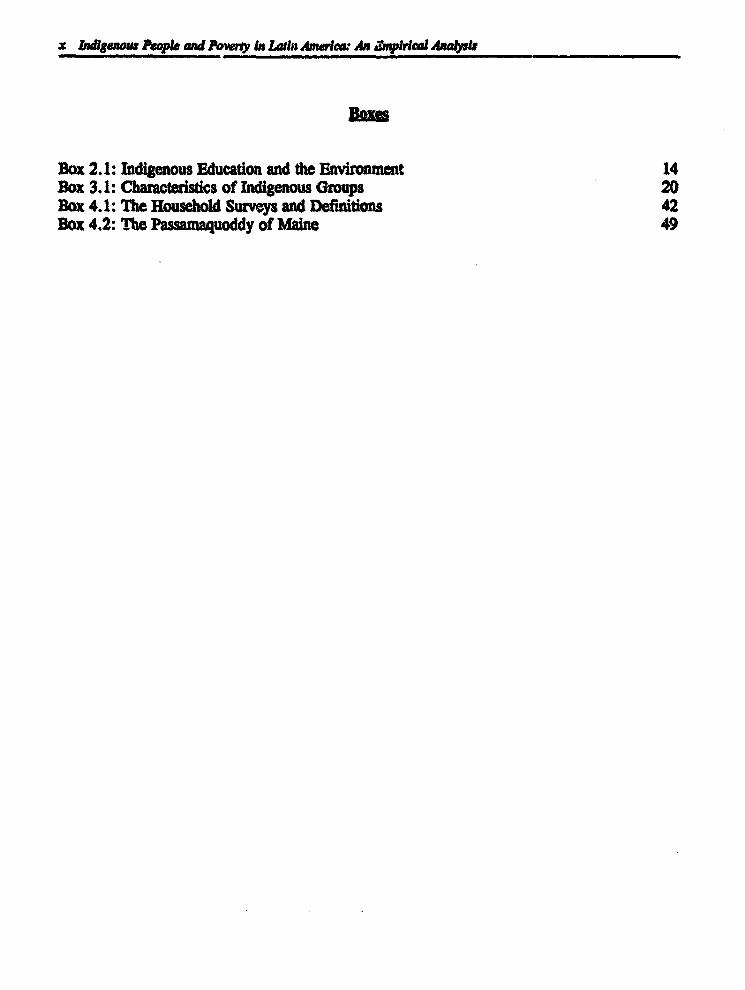
Box 2.1: Indigenous Education and the Environment 14Box 3.1: Characteristics of Indigenous Groups 20Box 4.1: The Household Surveys and Definitions 42Box 4.2: The Passaiaquoddy of Maine 49

Executive Summary
This report presents the results of an economic analysis of the socioeconomic conditionsof Latin America's indigenous population. A review of the literature on the indigenous peopleof Latin America, in comparison with the much richer literature on the subqect dealing withindustrialized countries, reveals a paucity of empirical studies of the socioeconomic conditionsof Latin America's indigenous population. The present study confirms that the incidence ofpoverty iG very high among indigenous people in the countries under investigation.Nevertheless, the equalizing of income-generating characteristics would boost the productivityof the indigenous population in their market and non-market activities, and lead to a considerablereduction in inequality and poverty among the indigenous population, although the actualestimates of this reduction vary from country to country.
Since socioeconomic inequalities are affected by public policies, it is critical to understandin what ways, by how much, and under what circumstances these inequalities are influenced.The results presented in this report can feed into country poverty assessments, poverty profiles,the analysis of poverty incidence, and examinations of the interethnic distribution of income andsocial indicators. The commitment to analyze poverty and devise strategies for its reductionmust include indigenous and ethnic components.
Dsfinidol of indg=nnL g differ fivm country to country due to the use of differentsurvey instruments. Given available data, three different variables identify indigenousrespondents: (i) language spoken, (i) self-perception, and (iii) geographic concentration. In thisanalysis, language defines the indigenous population in Bolivia and Peru. In BoUvia, it ispossible to distinguish between monolingual and bilingual (Spanish and indigenous language)individuals, while in Peru, only monolingual indigenous or Spanish speakers can be isolated.The Guatemalan study uses the self-identification or self-perception method of defining thereference population. The geographic location or concentration of the indigenous population isgenerally used when the indigenous population is concentrated in specific territories, and incombination with questions dealing with self-perception or language inty. This method isused in order to include Mexico, a country with a large absolute number of indigenous people.
The results of this study show that most indigenous people in Latin America live inconditions of extreme poverty as distinguished from the non-indigenous or Spanish-speakingpopulation. The principal conclusions follow.
Poverty among Latin America's indigenouspopulation is pervasive and severe. InAgliyia,while more than half of the total population is impoverished, over two-thirds of the bilingualindigenous population and almost three-quarters of the monolingual indigenous population ispoor.
The majority, 66 percent, of the population of Guatmiala is poor, and 38 percent of allhouseholds are below the extreme poverty line. The indigenous population, however, is

il Idlgenow People and Powry in Latin America: An Empirial Analpki
disproportionately poor; 87 percent of all indigenous households are below the poverty line and61 percent are below the extreie poverty line.
In Mi, munk 19o indigenous population density strongly correlates with the incidenceof poverty. In nwdaptos with a less than 10 percent indigenous population, the povertyheadcount index is 18 percent; in mnidcptos 10 to 40 percent indigenous, 46 percent of thepopulation is poor; and in municiplos over 70 percent indigenous, over 80 percent of thepopulation is poor.
Most of the indigenous people of Ea are poor, at 79 percent, and more than half areextremely poor. In fact, indigenous people are one and a half times as likely to be poor thannon-indigenous people, and almost three times as likely to be extremely poor. Consequently,indigenous people account for 11 percent of the sample population, yet they comprise 19 percentof poor and 27 percent of extremely poor Peruvians.
In Guatemala, the degree of income inequality among the combined indigenous and non-indigenous population in each region is greater than the estimated income inequality for separategroups. This proves that income inequalft is clearly an inter-ethnic problem.
The results of a statistical analysis of the determinants of poverty in Meic indicate thata 1 percent increase in a mnidplo's indigenous population leads to an increase in anindividual's probability of being poor by approximately 0.5 percent. This variable hasconsiderable impact given the potential range of indigenous population concentration, 0 to 100percent. Uving in a 50 percent indigenous madciplo increases one'4 probability of being poorby a substantial 25 percent, marking the greatest possible increase in the marginal probabilityof being poor than possible with any other observed factor.
In a similar exercise for Rdia, we find that being indigenous increases the probabilityof being poor by 16 percent. The probability of poverty increases by almost 45 percent forhousehold members whose household head is unemployed. This suggests that employment isa more important factor than being indigenous in reducing poverty. Among indigenous headsof household, participation in the labor force leads to a 40 percent reduction in the incidence ofpoverty.
Closely related to poverty status, the living conditions of the indigenous population aregenerally abysmal, especially when compared to the non-indigenous population. The.GuMastudy reveals that the majority of the population does not have access to such public services aswater, sanitation and electricity. Less than one-third of all indigenous households have waterpiped to their homes for their exclusive use, compared to almost half of non-indigenoushouseholds. The study also shows that approximately half of all indigenous households have nosanitary services, and three-fourths have no electricity.
There is a very strong correlation between sling atament and indigenous origins,and between schooling attainment and poverty category. In Bolivia, the schooling levels ofindigenous people are approximately three years less, on average, than for non-indigenousindividuals. The difference is even greater for indigenous females, suggesting that they are themost disadvantaged in Bolivian society. In Guatemala, the m4ority of indigenous people haveno formal education, and of those who do, the majority have only a primary education. Onaverage, indigenous people have only 1.3 years of schooling and only 40 percent are literate.

Ecwvelw SumMary Xli
Each country analysis reveals that parents' skills and educational attainment is reflectedin the schooling and other human capital characteristics of their children. Nine percent of non-indigenous children and 21 percent of indigenous chilren are reported as being employed. Thechildren of indigenous origins are born with many socioeconomic disadvantages and are unableto keep up with their non-Indigenous peers. Indigenous children are more likly to rer t gradesat the primary level and are more likely to drop out of school altogether.
Much of the earnings disadvantage of indigenous workers is due to lower human capitalendowments. While the returns to cooling are lower for the Indigenous population, anincrease in schooling attainment would lead to a significant increase in earnings in mostcountries. The relative magnitude, however, differs from country to country. In Bolivia, non-indigenous men experience higher returns than indigenous men, and the average schoolingattainment for the indigenous male labor force is about seven years. In Guatemala, the returnsto schooling differ by 14.5 percent for non-indigenous male workers versus 9.1 percent forindigenous male workers, wo average only 1.8 years of schooling. In Mexico there is verylittle difference in the returns to schooling for individuals in more or less indigenous mucpios,at about 9 percent. Workers in less indigenous mwdciplos average 7.3 years of schooling, whileworkers in more indigenous nuddpios, however, average only 3.8 years of schooling.Estimation of earnings functions in Peru show that the average returns to schooling for Spanish-speaking workers are three times that of indigenous workers. While higher levels of educationprovide higher earnings, obtaining some university education is the most significant factorleading to increased earnings for indigenous men in Peru.
A greater percentage of all indigenous persons participate in the labor force, and a lowerpercentage of the indigenous population in the labor force is unemployed. Bilingual individualsare more likely to have a second job and they tend to work more hours than their non-indigenouscounterparts. Yet bilingual Indigenous workers earn, on average, less than two-thirds the salaryof non-indigenous persons. Therefore, a high proportion of the indigenous poor are workingpoor."
In Guatemala, most indigenous people work in the grclral st whe wages arelower than in any other sector. Overall, Indigenous earnings comprise only 55 percent of non-indigenous earnings. The workforce in Guatemala is composed primarily of males among bothindigenous and non-indigenous workers; indigenous workers are more likely than non-indigenousworkers to be self-employed. In Peru, the agricultural sector depends heavily upon the laborof indigenous people: 70 percent of indigenous women and 63 percent of indigenous men areinvolved in agricultural activities. Yet, on average, indigenous women and men earn only one-third the salary of non-indigenous workers employed in agriculture.
In Bolivia, approximately one-half of the indigenous population is seL-emWQ whilethe majority of non-indigenous individuals work as employees. Poorer individuals are morelikely to be self-employed and less likely to be an employee or a business owner.Approximately 40 percent of both blina indigenous and monolingual Sp employees arelikely to work in the public sector, while the remaining 60 percent work m the private sector.
iual Indigenous people, however, are far more likely to work in the private sector.Also, public sector employees are less likely to fall below the poverty line than private sector
employees.
Indigenous people have less education than non-indigenous people. Equalizing educationlevels would result in a considerable increase in relative earnings. The issue that is addressedin this study is whether the equalization of human capital and other productive characteristics

XV Inditeness People and Poer"y In Ladn Amer"c An EnpWcal Anaywrs
would result in the virtual elimination of economic Inequalities based on indigenous origins, orwhether the support of affirmative action programs would have the desired effect of nullifyingthose inequalities. Differential outcomes, of course, may be due to outright discrimination.Discrimination against indigenous people may work to deleteriously affect their access toschooling, the quality of schooling they receive, and their labor market performance.
The statisticaLdeompsian of earnings differential between indigenous and non-indigenous workers produces mixed, but promising, results. In Bolivia, for example, the portionof the overall earnings differential due to disparities in the productive characteristics ofindigenous and non-indigenous working males is 72 percent. In other words, based on observedcharacteristics, the earnings differential between indigenous and non-indigenous worldng maleswould narrow by 72 percent if each group were endowed with the same productivecharacteristics. The remaining 28 percent difference in earnings is "unexplained," and reflectsboth measurement error and unaccounted factors such as disparities in ability, quality ofeducation, labor force participation, culture and labor market discrimination. Therefore,discrimination could only account for 28 percent of the overall earnings differential betweenindigenous and non-indigenous workers in the urban Bolivian labor market. In Guatemala,however, about half of all the overall earnings differential between indigenous and non-indigenous workers is unaccounted for by productive characteristics Therefore, up to 50percent of the overall differential could be due to discrimination against the indigenous workingpopulation. For both Mexico and Peru, the proportion of the overall earnings differential thatis due to the productive characteristics of individuals is 50 percent
There is, fortunately, an unrealized potential; this is evident, for example, in the case ofBolivia, where the educational level of the population has been increasing rapidly over the lastfew decades. The average educational level of indigenous males has increased continuously overtime, with a sharp rise for individuals born in 1959 and later. For indigenous women, theincrease is even more dramatic, particularly for the post-1952 Revolution population. Thestatistical results show that by equalizing human capital characteristics, much of the earningsdifferential between Indigenous and non-indigenous workers would disappear. This providesconsiderable hope for the future. The question that remains, however, is how to improve theproductive capabilities of the indigenous population. One obvious solution is to raise theeducational level.
Knowledge of the indigenous population can aid in determining the location of newschools, targeting those with poor performance, and - if appropriate and in demand - providingbilingual education. The apparent strong influence of education to ameliorate poverty andincrease earnings, especially in indigenous areas, conveys a need to focus on improving accessto education as an important development issue with significant and beneficial long-termsocioeconomic gains. One of several frequently noted methods of improving access to educationamong the indigenous population is the implementation of bilingual education.
The involvement of indigenous people can aid in the improvement of the design and,implementation of development projects. First, agreement on what must be done should be.reached between the interested parties. It is necessary to decide on the goals of the interventionfrom the outset. Is it reform? And if so, what is meant by reform? In the case ofindigenouspeople, is the goal assimilation, integration, and the erasure of indigenous culture? Or thepreseration of indigenous culture through policies designed with the niiaticonmof idigmouSAAD]g? In the case of education, the lack of meaningful participation by indigenous peoplecould result in severe loss of native multure and language.

Emeadw MUamy Xv
Institutional issues associated with the functioning of labor markets are also importantconsiderations. To some extent, indigenous people receive lower earnings and have a higherincidence of poverty because they are locked into the secondary sector of the economy. Thisinformation can aid in the creation of appropriate employment generation schemes. While manypoor and non-poor workers are located in the infomsto of the economy, it is especiallyimportant for the indigenous poor. This information points to an appropriate sector to target inany poverty reduction strategy.
More detailed knowledge about indigenous populations can aid in the design of flahhinterventions in the region. In Bolivia, indigenous people are more likely to have been sick orinjured In the previous month than are non-indigenous people. There is a greater tendencyamong indigenous individuals that their disability is sufficiently severe to keep them out of worfor more than a weeL Furthermore, indigenous persons are less likely to seek medical help fortheir ailments.
In Peru, indigenous people are more likely to become ill than non-indigenous people, butthey are much less likely to consult a physician. Perhaps as a result of poor initial health, oras a result of neglecting treatment, the duration and severity of illness is greater among theindigenous population. The proportion of indigenous people hospitalized is almost twice thatof the Spanish-speaking population. Although the average cost of both hospitalization andmedicine is less for indigenous people, only 57 percent of indigenous people purchase medicinefor their illness, as compared to 81 percent of the non-indigenous popuation.
Access to medical care for pregnant women is essential for the preservation of the mother'slife and to healthy development of the child. In Bolivia, indigenous women are in asubstantially inferior position with regard to comprehensive maternal care. Surprisingly, whilethe poor are less likely to receive professional attention at birth in a medical establishment,effectively targeted programs through public clinics have actually led to higher provision ratesfor certain preventive health care procedures - such as tetanus vaccination - for poor womenthan for non-poor women.
Future Research
There is a lack of empirical studies regarding the socioeconomic conditions of LatinAmerica's indigenous population. Important issues to be addressed include: defining the targetpopulation; solving the problem of scarce data; and designing appropriate researchmethodologies.
To identify the reference population in this study, it was necessary to make do withsurveys that provide single indicators. However, what is needed are multiple indicators - asused a the United States and Canada census. The whole range of indicators are necessary,including language, self-identification or self-perception, geographic location or concentration,ancestry, and, possibly, dress (as in the Guatemala 1993 census now underway).
What is needed are better data, so that in the future researchers can undertake more in-
depth analyses and include a larger number of countries. In addition, longitudinal researchshould be conducted; that is, an attempt should be made to answer questions such as: *What was
the level of discimiatio 10, 20, and 30 years ago? What will it be 5 10,, 15 years from

t Idigenw Popkle and Pony to Ladn Anwfow An Mspirical Anal.Ws
now?' *What were the effects of past policies and programs?' "What will be the effects ofpresent policies and programs?'
A future research project on Indigenous people should combine the quantitative approachtaken here with qualitative analysis, such as the participatory-observation research approach (orparticipatory sse oet). The idea is to combine comprehensive cal work withfieldwork anicr-uretechniques. For example, if it is found that Indigenous people inthe cities of Bolivia are worling as self-employed Individuals who earn less than non-ladigenousindividuals with the sam level of educato, then in-depth interviews with these groups ofIndividuals should be conducted in order to ascertain the reasons for the income discrepancy.Without this qualitative data, probable reasons for the discrepancy, including race, access totraining, and cultural values, are merely speculative. Such sophisticated differences are difficultto assess using only empirical analysis, generally based upon less than perfect data sets.
Many indigenous groups living in urban areas maintain ties with the rural communities totheir mutual advantage. Resources are constantly exchanged between town and country. Thistransfer of resources is important and not always adequately captured in household survey data.The complex social networks can only be examined with a qualitative research approach. Aneamnation of Informal safety nets can be accommodated through a participatory researchexercise.
The purpose is to tie in future research with the goal of poverty reduction. The ultimategoal of the link between empirical and qualitative work, therefore, is to assist in overall povertyreduction strategies. The division between empirical work (usually done by an economist) andfield surve work (usually done by an anthropologist) is probably not the best method ofachivng tgoal of making the poverty assessment more practical and more meaningful. Anindividual or a team of economists/sociologistsanthropologists should be responsible for boththe emphical work and the verifying field work. This way, both aspects of the work feed intoeach other and the divisions between quantitative and qualitative research methodologies aremuch less distinct And, most importantly, the efforts to reduce poverty will be enhanced. Thequalitative - quantitative research mix, or hard results from soft results, or vice versa, arecompatible methodologies that must be merged, especially in terms of the indigenous populationand poverty.

1
IntroductionGeoge ftadawWoplar ad Hary Anthoy Porada
The indigenous people of Lain America live in conditios of extreme poverty. While thismay be common knowledge, this study represents an initial attempt at documenting thesocioeconomic conditions of indigenous people using empirical data from national survesources.. Standard economic techniques are applied, while taking Into account the importantcultural and behavioral differences across ethnolinguistic groups.
Study Objective
It is well known that indigenous people worldwide are in an inferior economic and socialposition vis-4-vis the non-indigenous, or *mainstream,* population. Yet not muchdocumentation exists regarding their exact position. Concerning Latin America, obtainingreliable indigenous population estimates is difficult (but see below) and reliable povertyindicators almost impossible. Such documentation would provide the vital information neededto assist in designing poverty reduction strategies.
If ethnicity is intimately associated with poverty and disadvantage in many developingcountries, and ethnic inequalities are affected by public policies regarding education,employment, infrastructure, markets and affirmative action, then an important challenge is tounderstand how, by how much, and under what circumstances (Klitgaard 1991: 200; Birdsalland Sabot 1991). In this study, the focus is primarily on this challenge. The goals are:
1. To determine the extent of poverty among Latin America's indigenous population;
2. To compare the living conditions of the indigenous population with the non-indigenouspopulation;
3. To examine differences in educational and occupational attainment between the indigenousand non-indigenous populations;
4. To determine what part of the difference between indigenous and non-indigenous workers'earnings cannot be explained by differences in their respective productive characteristics;and
5. To review the findings with the aim of developing policy suggestions that can contributetowards the alleviation of poverty while taking into account the indigenous dimension andsuggesting areas for further research.
1

2 Indigenow Peopl. and Powey In Ladn Amerct An Empbi Anall
Previous work in the area of indigenous people in Latin America and the Caribbean hasconcentrated on issues related to land rights, tenure, and the environment (Wali and Davis 1992;Davis 1993; Hicks et al. 1990). In contrast, the aim of the present study is to empiricallyinvestigate the socioeconomic conditions of the indigenous people of the Americas and to identifythe correlates of poverty. The work that has been carried out in this area to date suggests theneed for more in-depth analyses of the living conditions of indigenous people in Latin America.In addition, hypotheses regarding the position of indigenous people in the Americas will betested. The specific areas of investigation are enumerated below.
The study's ultimate purpose is to assist in the design of poverty alleviation activities inLatin America and the Caribbean. The results can feed into country poverty assessments andcan aid in the creation of employment generation schemes. Much can be learned from theempirical examination of interethnic education and income differences, the results of which canbe used by policy makers. In the area of health, the project contributes to our knowledge offertility issues, infant mortality and demographic change. In the area of education, the resultsof the analysis can aid in the planning of school construction by helping to determine where totarget indigenous populations, and to what extent. Targeting activities could also be improvedby knowing more about the schooling performance of indigenous children, including age-gradeprogress, repetition and dropout rates.
The Problem
A study of the socioeconomic conditions of indigenous people is an auspiciousdevelopment. The General Assembly of the United Nations has declared 1993 as InternationalYear of the World's Indigenous People. Multilateral development institutions have begun tofocus on indigenous people. The Inter-American Development Bank has established anIndigenous Peoples Fund to support the self-development processes of indigenous peoples,communities, and organizations of Latin America. The World Bank recently formulated a policytowards indigenous people, becoming the first multilateral organization to do so.
In 1982, the World Bank published its Operational Manual Statement on indigenous/tribalpeople (Goodland 1982). Its main concern was with "isolated" populations. This documentattempted to set out policy, stating, among other things, that the World Bank will not supportprojects that tribal people reject. The document's assertion that all tribal people will be"developed" led to a lively debate (see, for example, Bodley 1990, 1988). The 1982 OperationalManual Statement was used by Bradford Morse and Thomas Berger to evaluate the SardarSarovar project in India and its effect on tribal people in the area. The Statement wasinstrumental in the verdict against the project. The main problem associated with the
implementation of the project was its failure to appraise and provide basic data on the region'stribal population (Morse and Berger 1992: 79). This was the verdict of the World Bank'sIndependent Review evaluating the project. This was the first independent assessment of aninternationally supported development project, representing a significant positive step forward(Burger 1987: 253).
Latin American projects that affect indigenous people (Price 1989; Burger 1987) led to a
reevaluation of the World Bank's policies and to the adoption of the World Bank's OperationalDirective on indigenous people. The World Bank's Operational Directive "Indigenous Peoples,"introduced in 1991, specifically calls for the creation and maintenance of baseline data that

introducsion 3
includes *analysis of the social structure and income sources," and the "full range of productionand marketing activities in which indigenous people are engaged. The new OperationalDirective adopts a broader definition of indigenous people, and emphasizes the need for ensuringthat they are not adversely affected by World Bank projects and that the social and economicbenefits they receive are in harmony with their cultural preferences. It also stresses the needto address issues concerning indigenous people in economic and sector work, and to includecomponents on indigenous people in World Bank-financed projects. It calls for ensuring theinformed participation of indigenous people in the preparation of development plans and in thedesign and implementation of projects.
The first international organization to begin examining issues related to indigenous peopleis the International Labour Organization (LO), which commissioned a series of studies onindigenous workers in 1921 (Cycon 1991: 781). The ILO published the first compendiumsurveying indigenous populations throughout the world and summarizing various national andinternational actions in support of indigenous people (ILO 1949, 1953). In 1953, the ILOestablished the Andean Programme, designed to contribute to improving the living conditionsof the indigenous populations of Bolivia, Peru and Ecuador (and subsequently those ofColombia, Chile and Argentina), with a view to integrating them into their respective nationalcommunities (Rens 1961, 1963). Recently, the ILO revised Convention No. 107 (1957) - thesole multilateral convention specifically addressing the rights of indigenous persons -- toConvention No. 169. The most important revision eliminates the advocacy of integration, andsupports instead indigenous people's freedom to decide their own priorities for development andto exercise control over their own economic, social and cultural development.
The socioeconomic situation of North America's indigenous people is described as beingsimilar to that of low-income countries, but wdistiled, concentrated, raised to a power" (Hagen1962: 471). If this is true, then the abysmal situation of indigenous people in less developedcountries must be raised to an even greater power. In many countries, due to a variety offactors, including language, lack of provision of social services, geographic location anddiscrimination, being an indigenous person is associated with, among other things, extremepoverty and illiteracy (see, for example, Kelley 1988; Stephen and Wearne 1984; del Aguila1987). This is especially the case in rural, isolated areas (IFAD 1992). Sources indicate thatindigenous people worldwide have less schooling and are concentrated in low-paying jobs withfew opportunities for advancement. Moreover, indigenous people are much less likely to beemployed in the public sector, often excluded on the basis of their lack of education. In theUnited States, the secondary school dropout rate of indigenous people is twice the nationalaverage, while in Guatemala illiteracy among the rural indigenous population is estimated at over80 percent (Waggoner 1991; del Aguila 1987; Burger 1987).
A recent UNICEF report, Chile of the Americas (1992), states that to a large extentindigenous children suffer the consequences of discrimination against their parents. Many diefrom lack of clean water, food or health care. In some Bolivian communities, one in three diesin childhood. The life of the survivors is often difficult, with little chance to study in theirnative language and/or to be supported by their native traditions. Indigenous people suffer fromhigh rates of maternal and child mortality, while the children experience high dropout rates andan alarmingly high incidence of malnutrition. The report goes on to say that governments oftenpress for the assimilation of Indigenous people on the grounds that their cultural differencesimpede their development. Modernization, however, often fails to create a better life.Indigenous people are forced to give up their language, along with their knowledge of botanyand ecology, and receive nothing in return (UNICEF 1992: 38).

4 I0geowr People and Powny In Lastx Amera An &bWrcl Anlysi
The western model of development views traditional cultures as poor, so that efforts aredirected at improving their standard of living (Brascoup6 1992; Bodley 1990). This is based onthe ideology that all cultures must achieve a certain level of material acquisition in order to bedeveloped. There is the belief that tribal cultures are unable to satisfy the material needs of theirpeople. Some argue that all people share a desire for what is deflned as material wealth,prosperity and progress. Others, it is believed, have different cultures only because they havenot yet been exposed to the superior technological alternatives offered by industrdal civiltion.
The problem with this reasoning is that the materialistic values of industrial civilization arenot cultural universals. Indigenous populations am different, and taking this into account meansnot imposing non-indigenous values. It is possible to learn from lndigenous people in areas suchas the environment and sustainable development, as is suggested in the report of the WorldCommission on Environment and Development (1987), uCmm Enture (the BrundtlandReport). Any attempt to improve the conditions of indigenous populations must be groundedin their own traditional customs and expertise.
There are also many examples of indigenous people takling control of and using technologyto benefit their ties in accordance with their cultural preferences. For example, theCree of Canada own and operate an airline company; the Aborigines of Australia broadcasttelevision programs in their language; the Blackfoot Indians of the United States established thefirst indigenous financial institution; the Cordillera people of the Philippines are managing theirown development projects; and the Shuar people have educational radio programs since1972 in Amazonian Ecuador (Burger 1990: 148). Hihy successful examples of self-managedindigenous craft production enterprises in Ecuador, Mexico and Panama prove that indigenousvalues are compatible with commercial success without assimilation or dependency on themainstream culture (Stephen 1991).
In the next chapter a review of the relevant literature is presented. This includes theinternational literature on ethnicity and socioeconomic differences, followed by a review of theNorth American literature on the socioeconomic characteristics of indigenous people. A briefreview of the empirical work on Australia's and New Zealand's indigenous population isincluded because of its quality and relevance. The review is completed with an overview of theLatin American literature on indigenous people. Chapter 3 presents an overview of the numberand conditions of the indigenous people of Latin America using consus and other publishedsources. Chapter 4 presents the methodology that is applied in the empirical work, a descriptionof the data that is analyzed, the definidons used, the areas of analyses, and the hypothesestested. Chapters 5 through 8 present the results of the empirical analysis of household surveysas country case studies, covering Bolivia, Guatemala, Mexico and Peru. The conclusion,Chapter 9, summarizes the findings, discusses the lessons learned from the analysis, and presentsa series of priority research issues for the future.

2
Literature ReviewHany Anthony Parinm
In many countries there exist diverse ethnic groups with very different levels of educationaland economic opportunities. The ethnic concentration of poverty has been increas1iglyrecognized in the development literature (see, for example, Klitgaard, 1991). The relationshipbetween ethnicity and economic inequality in developing countries has come to the fore in recentyears (see, for example, Birdsall and Sabot 1991). Empirical analyses of ethnic earningsdifferentials concentrated in the past on black-white differences in the United States. Someresearchers have examined the experiences of other ethnic groups, but much less research,however, has been undertaken regarding ethnic groupp in developing countries. Very littleinvestigation has been made of the different economic experiences of the indigenous populationwithin a society, but as shal be seen in the brief review that follows, this particular literatureis growing.
Global
The empirical investigation of black/white economic differences began in the early 1960s.Siegel (1965) estimates the cost of being black in the United States. Although much of theearnings differential is due to occupation, quality of education, and educational attainment,equalization of such characteristics would not lead to equality of earnings. After controlling forproductivity-enhancing characteristics, about two-fifths of the difference in average earnings ofwhites and blacks is the 'cost* of being black in the United States. Smith and Welch (1977)present evidence to show that black-white earnings differentials are narrowing over time and thatparity will eventually occur. Gains are being made, particularly by the young and educated newentrants to the labor market. The authors find that increased schooling is a major cause ofequality of earnings, thus lending support to human capital theory. Furthermore, Smith (1984)presents evidence to show that as the human capital of blacks increases relative to that of whiteworkers, so do their relative earnings. While the existence of discrimination in the labor maroetis not denied, it generally occurs early in the individuaPs career. Smith (1984) lends supportto Becker's odginal hypothesis that ethnic wage differences are a short-run, disequilibriumphenomeon.
This explanation, however, is criticized for its inability to account for enduring differencesin earnings between whites and non-whites. Darity (1982) reviews the main economic theoriespurporting to explaino ethnic differences in earnings and concludes that they areThe main assumption of such theories, that differences in income are due to the orproductivity of non-whites is questioned. Evidence shows that non-whites with similar
c ct i and measures of "productivity' do not receive equal wages with whites (Dark1982).
. 5
6 Indigenow People and Powy tM Latin Amefa An EMIIdW Anabliy
More recently, researchers document a widening in black-white earnings and employmentgaps among young men in the United States, covering the period from the mid-1970s throughthe 1980s. The earnings gaps increased most among college graduates. The reasons for thisinclude demand shifts, falling real minimum wages, the deunionization of the labor force, thegrowing supply of black graduates, and increased crime among high school dropouts (Bound andFreeman 1992). The proportion of individual black wage earners receiving more than $35,000fell by 22 percent during the 1980s. There has been an increase in the number of blacks inpoverty, as well as an increase in poverty incidence among employed blacks. This is also truefor those with four or more years of college. The growth in low wage employment for blacksis most pronounced for men between the ages of 25 and 34 (Harrison and Gorham 1992). Inan examination of different ethnic groups, including Hispanics, Amerindians, Asians, anddifferent white ethnic groups, Parley (1990) finds that blacks are the most disadvantaged groupin terms of earnings, education, and through decomposition of differences, returns tocharacteristics. Of the sample, only Amerindians, Vietnamese (mostly foreign-born), and PuertoRicans approximated blacks' disadvantaged state.
Other researchers examine the economic inequality between whites and other ethnic groupsin the United States. Hirschman and Wong (1984) find that education explains much of thedifference in earnings between whites and Hispanics. Equality in years of schooling betweenthese groups would not totally eliminate the gap, but this variable has the strongest impact oninequality than any other variable analyzed. Wong (1982) studies the 'cost* of being Asian inthe United States and finds substantial inequality when examining such factors as generationalstatus, educational attainment and occupational status. Japanese and Filipino Americans havereached earnings parity with whites given equal rates of education and other personalcharacteristics. Still, the "cost- of being Asian remains substantial; for example, the individualChinese-American male cannot expect to earn as much as an Anglo male with the samegenerational status, years of schooling completed and general level of experience (Wong 1982:76).
Reimers (1983) examines the earnings differential between white, black and Hispanic men.She finds that much of the difference between whites and Puerto Ricans, blacks, Central andSouth Americans and other Hispanic men is overwhelmingly due to discrimination, while muchof the differential between whites and Mexican American and Cuban men is not due todiscrimination.
Ethnicity and socioeconomic differences in other countries have also been examined.Knight and Sabot (1982) investigate earnings differentials by ethnicity and gender in Tanzania.Decomposition analysis reveals that the gross ethnic earnings differentials are mainly the resultof wage and job discrimination (see also Armitage and Sabot 1991).
For Brazil, wage differences between white and non-white males remain after controllingfor education and estimated experience (Webster and Dwyer 1988). In fact, the income gapbetween the two groups widens with increased schooling. Silva (1985) estimates a significantcost to "being non-white irrespective of being mdao or black; non-whites are equallydiscriminated against in Brazil relative to whites.
Caste discrimination in the labor market in India has been empirically examined (Banerjeeand Knight 1985; Bhattacherjee 1985; Dhesi and Singh 1989). Banejee and Knight (1985)decompose the gross wage difference between "acheduled* and "non-scheduled* castes into itsmexplained* and wage and job discrimination components. They find that discrimination exists,
Lieratre Review 7
and that it operates through job assignment, with the scheduled castes entering poorly-paid,"dead-end" jobs.
The demographic and socioeconomic composition of China's ethnic minorities is describedin Poston and Shu (1987). Ethnic minorities compose about 7 percent of the total population.While most groups are assimilated Into mainstream Han-dominated society, there is still a lackof socioeconomic advancement in a few cases.
Race and inequality over a long time period (1914-1976) in Kenya is the subject of analysisin Bigsten (1988). This paper documents how the Africans' share of national income evolvedover time, whereby it increased as discrimination against them declined. Decompositionanalyses show that the share of inequality due to inequality between ethnic groups peaked in1936, and then gradually fell. A rapid increase in inequality among Africans developedthereafter, reflecting the reduction of discrimination towards Africans.
Evidence of decreased discrimination against blacks and other non-white groups in SouthAfrica has been estimated over time (Moll 1992). Moll (1992) estimates earnings functions forwhites and "colored" individuals using data for 1970 and 1980, and decomposes the grossearnings differential into "explained" and "unexplained" components. He also estimates theeffect of job discrimination - the relative representation of different ethnic groups in particularjobs. A decrease in discrimination is detected over time, benefitting in particular the youngercohort of workers. Lachman and Berenson (1992) examine the interracial distribution of incomeand find that income inequality in South Africa is overwhelmingly the result of incomedifferentials between the races.
Several evaluations of the socioeconomic effects of Malaysia's New Economic Policy(NEP), designed in the 1970s to overcome the disadvantages of the largest ethnic group, thebwpitra, appear in the literature (see, for example, Klitgaard and Katz 1983; Hirschman1983). Reverse discrimination in higher education, as part of a policy to promote the interestsof the buniputras against the Chinese and the Indians has also been examined. Tzannatos (1991)finds that such policies have not reduced inequality and that the poor have been hurt in theprocess. Concerning the primary and secondary level, however, a recent study by Hammer,Cercone and Nabi (1992) demonstrates that public education expenditures have been progressiveduring the two decades of the NEP. The study shows that Malay children attend school atsignificantly higher rates than Chinese, Indians and other races.
Ethnic inequalities also exist in Japan. The educational and socioeconomic disadvantagesof Japan's minority populations have been examined. This includes both the burakwnin and theAinu, the latter being the indigenous population of Japan (Shimahara 1984; Hawkins 1983). TheAinu suffer from a large living standards gap between them and the rest of the population. Forexample, among the Ainw, almost 7 percent are dependent on welfare payments, which is muchhigher than the rate for the rest of the population at only 1 percent (Takaai 1987: 147).
Semyonov (1986) decomposes the socioeconomic gaps between noncitizen Arab workersand Israeli citizens employed in Israel. While age and education can explain much of the Arabs'segregation at the bottom of the occupational ladder, this cannot, however, fully explain theirlower earnings.

8 adlgnew People and Pourny In Lat# AMtw An &pria Analyst
Indigenous People of North America
By far the greatest attention paid to the socioeconomic disadvantages of indigenous peoplehas been by sociologists and economists exploring the situation of Amerindians in the UnitedStates (see Gwartney and long 1978; Trosper 1980; Sandefur and Scott 1983; Sandefur 1986;Sandefur and Sakamoto 1988; Snipp and Sandefur 1988a; Chiswick 1988; Snipp 1988; Sandefuret al. 1989; Sandefur and Pahari 1989). Still, there is little empirical research on the inequalitiesbetween Indigenous and non-indigenous people in the United States and Canada. Consequently,little is known about indigenous people's socioeconomic conditions and the policy responsesnecessary to improve the relative status of indigenous people in the labor market. The availablestudies reviewed here suggest that both labor market discrimination and lower levels of humancapital endowments are responsible for the observed differentials. The experiences of indigenouspeople in the United States and Canada, however, point to divergent policy responses vis-A-visthe roles of investment in human capital and other actions.
There are a number of differences in economic behavior between indigenous and non-indigenous people, many of which are not easily grasped or observed. This is evident whentrying to analyze important economic events such as "unemployment." The problem ofmeasuring unemployment among indigenous people is discussed by Kleinfeld and Kruse (1982),who argue that standard measures of unemployment do not adequately take into account the jobsearch activities of Native Americans. Many indigenous people in the United States do notactively look for work because they know It is not available. Many voluntarily drop out of thelabor market for community and family obligations. To take these and other factors intoaccount, the United States Bureau of Indian Affairs claims that all adults without a wage job areunemployed, thus providing estimates of unemployment rates varying between 50 and 80percent. These are, however, overestimates; a true measure of unemployment among indigenouspeople can only be ascertained through surveys specially designed to uncover the reasons for notworking or not looking for work. Most labor force surveys do not usually ask indigenous peopleif they prefer intermittent participation in the wage economy, and many indigenous people willnot openly state that they prefer this for fear of being classified as not wanting work.Nevertheless, statistics on the intermittent worker effect are required. Kleinfeld and Kruse(1982) present the results of studies designed to properly estimate Indigenous unemployment.
Snipp and Sandefur (1988a) examine the effects of residence in metropolitan areas on theearnings of Amerindians and Alaskan Native householders. The results indicate that the earningsof metropolitan Amerindians are markedly higher than those of nonmetropolitan Amerindians,but that the earnings of nametropolitan-to-metropolitan migrants are not much higher than thoseof nonmetropolitan stayers. The difference in earnings between metropolitan and
onmetropolitan Amierladians is due to better opportunities in metropolitan areas and to theinteraction between these opportunities and the higher levels of human capital of metropolitanAmerindians (see also Sandefur 1986). Urban residents earn more than rural residents, but theurban advantage is less than many policymakers believe, and the short-term benefits are foundto be insignificant (Saipp and Sandefur 1988b). Sandefur and Jean (1991) examine the rate ofinterstate migration of Ameriodians and other minority groups in the United States over time(1960-1980) to test whether they are converging with tho rates of migration of whites. They findsome support for convergence, which is consistent with the view that members of minoritygroups are gaining access to national labor markets.
Sandefur and Sakamoto (1988) find that differences in household size are important inexplaining Amerindian/non-Amerindian differences in Income. Among female-headed
LJtNw Review 9
households, household size accounts for more of the black-white income difference than theAmerindian-white difference. Parental education is more important than family structure inaccounting for differences in schooling among whites and Amerindians (Sandefur et al. 1989).The same study finds that family structure and parental education are equally important inaccounting for differences between whites and blacks. Amerindians living in traditional areasand on reservations are more likely to be poor than Amerindians living in other areas; thegreatest improvement has occurred among those outside traditional areas (Sandefur and Pahari1989: 209).
A numbers of studies have been published on the determinants of Indigenous workers'earnings and differences with the white population of the United States. In their analysis,Gwartney and Long (1978) examine Amerindian/non-Amerindian earnings differences for 1970-* when Amerindian earnings as a portion of white earnings were 0.68 - and find that personalcharacteristics such as education explain 57 percent of the gross earnings differential. Theresidual 43 percent is 'unexplained.1 This represents little change from the analysis using 1960data, which show that productive characteristics account for 58 percent of the overalldifferential, with 42 percent remaining *unexplained." This lack of improvement occurreddespite an increase in the educational characterstics of Amerindians over the decade. Trosper(1980) finds that the returns to education that Amerindians receive are lower than that for whitesand that differences in characteristics explain about half the average difference in earningsbetween whites and Amerindians. Chiswick (1988) also examines the returns to schooling andthe schooling attainment of Amerindians in the United States, along with other ethnictracialgroups, using data for the 1970s. In general, those ethnic groups with low levels of schoolingattainment also experience low returns to schooling; indigenous people have among the lowestschooling attainment levels and returns to schooling.
Sandefur and Scott (1983), however, find that Amerindians receive more favorable returnsto human cwital variables than whites. However, Amerindlans have fewer of these variables,suggesting that discrimination occurs at an earlier point in their lives. Still, according to theauthors, much of the earnings differential between Amerindians and whites would disappear ifAmerindians had the same human capital, regional, and jot. characteristics as whites. In fact,about 75 percent of the difference in earnings between Ameriodians and whites in the UnitedStates in 1976 was due to personal charactenstics (Sandefur and Scott 1983: 63). A relativelyvery small portion of the observed gross differential was due to what can be classified asdiscrimination.
More recently, improvements in educational attainment have a significant impact on thereduction of the Ameriodian earnings disadvantage. The percentage increase In earnings thatwould result if the educational characteristics of Amerindians were equal to those of white menare as follows: in 1959, 20 percent; in 1969, 15.7 percent; and in 1979, 7.7 percent (Sandefdrand Pahari 1989: 214). The percentage increase in earnings that would result if thecharacteristics of Amerindian men received the same returns as those of white men arecalculated to be: in 1959, 45.1 percent; in 1969, 35.8 percent; and in 1979, 13.4 percent(Sandefur and Pahari 1989: 215). The results appear to suggest that the reduction in earningsinequality from 1959 to 1979 is due to the decline in the negative effect of being Amerindianon the earnings structure over time in the United States. In a study using the 1980 United Statescensus, Snipp (1988) finds that all of the indigenoustnon-indigenous earnings differential isexplained by productivity characteristics.
There is little research on indigenous people's earnings in Canada, although concern overeducational and earnings disparities is strong. The gross earnings differential between

10 Indigeou People and Po"rty in Latin Amwra An EnridcalAnalwr
Aboriginals and non-Aboriginals In Canada is large (Hull 1987: 128-129; Armstrong et al. 1990)and occupational segregation, whereby the indigenous working population is concentrated in low-skill, low-wage occupations, exists (Lautard 1982). Evidence of a positive correlation betweenyears of schooling and r (official indigenous community settlement) per capita income isreported for the 1960s (Hawthorn 1967: 103; but see Deprez 1973 for a discussion).
While little research has been published on the effects of education and other productivity-enhancing characteristics on the Aboriginal earnings structure, the existing literatue shows thathuman capital attributes have a sizable effect on indigenous people's earnings structure.Clatworthy (1981a) finds that education has a positive effect on Aboriginal labor forceparticipation. Education is highly correlated with occupational status attainment, but the effectis large only for individuals completing eleven or more years of schooling. Evidence also showsthat post-secondary schooling leads to higher earnings (Clatworthy 1981a: 24). Education hasan especially strong positive effect on Aborin female labor force participation rates(Clatworthy 1981b). Evidence suggests the existence of the 'dual labor market' and labormarket segmentation (Clatworthy 1981a, 1981c). Gerber (1990) documents the low educationalattainment of indigenous females in Canada in a study of gender and ethnic differences.
Researchers have presented results from their studies of Northern Canadian labor markets(Stabler 1989, 1990; Kuo 1976). Stabler (1989) attempts to determine the extent to which nativepeople in the Northwest Territories continue to participate in the traditional sector and toascertain whether there is a queue in which people wait for a job in the modern economy.Utilizing the dual labor market methodology, the author finds that for many indigenous peopleparticipation in traditional pursuits is a way of keeping occupied while waiting in the queue fora job in the modern economy. The degree of disonmination against indigenous people in theprimary sector is high. For native people, however, increased levels of education lead toconsiderable reductions in discrimination.
In the first study of its kind for Aboriginal people in Canada, using 1970 data for a regionin Northern Canada, Kuo (1976) estimates the effect of education on Aboriginal earnings. Hecompares the results with white worker earnings in the area and finds that most of the earningsdifferential between whites and Aboriginal (Amerindian, Mtis and Inuit) workers is due toeducation, age, duration of employment, size of the labor market and marital status. A mere13-16 percent of the gross differential is due to *unexplained* factors.
Patrinos and Sakellariou (1992, 1993), using data from the 1986 Canadian Labour MarketActivity Survey, decompose the earnings differential between Aboriginal and non-Aboriginalworkers living off-g=n in Canada. When both full- and part-time workers are included inthe analysis, the portion of the gross earnings differential due to productive characteristics is 17percent (Patrinos and Sakellariou 1993). The remaining difference in wages, 83 percent, isunaccounted for and attributed to unmeasured factors such as discrimination. When the analysisis limited to full-time workers, the portion of this differential that is due to productivecharacteristics increases to 41 percent (Patrinos and Sakellariou 1992). Among the explanationsoffered for the large difference in explained earnings differentials between full-time and part-timeemployment are that Aboriginal people working part-time may be involved in low wage, lowproductivity, Odead-end* jobs (Patrinos and Sakellariou 1993). Also, those Aboriginals workingpart-time may be Itarget workers,' or straditionalo persons who are in the labor force only aslong as necessary to obtain a predetermined, fixed sum of wages (Patrinos and Sakellariou 1992,1993).
Liteawe Review 11
This brief review of North American studies on Indigenoustnon-indigenous socioeconomicdifferences shows that discrimination, or the Uunplained' component, increases as theeducational level of Aboriginal people increases in Canada, but that the same is not true in thecase of Amerindians in the United States. In the United States, the evidence suggests that theeffect of being indigenous is declining over time; also, the wunexplained- portion of thedifferential is relatively smaller. When recent results are compared to the Northwest Territoriesstudy conducted in the 1970s, discrimination in Canada appears to be increasing over time. Theexclusion of part-time employees does not drastically change the main conclusion: the"unexplained" component of the differential is still larger for Indigenous people in Canada thanfor indigenous people in the United States.
Indigenous People of New Zealand and Australia
Indigenous people in other countries of the world are also the topic of study. However,there is little empirical research on this subject. A notable exception is the research related tothe MaorL of New Zealand and the Aborigines of Australia. Empirical studies based on theAboriginal populations of Australia and New Zealand are important and relevant studies thatoffer insights into the experiences of indigenous people in the non-indigenous labor force.
Brosnan (1984) examines the earnings differential between the native population of NewZealand, the Maoris, and the non-native, white population. Age and education account for onlya small part of the over-all earnings differential (17 percent); the remainder is due to factorsassociated with being indigenou& Moorls receive lower returns to schooling investments andreceive less schooling. Brosnan and Hill (1983) examine earnings differentials between Maoriand non-Maord males and females, as well as occupational segregation. They confirm thatMaos receive lower earnings, although this differential varies significantly by occupationexamined. Occupational segregation is a major factor explaining substantial earningsdifferentials between the Moor! and non-Mood populations.
The economic situation of Australia's aboriginal population is also examined (Miller 1989;Junankar and Kapuscinsid 1991a; 1991b; Welch 1988). Differential rates of unemploymentbetween aboriginal and non-aboriginal youth in the Australian labor market have been examined(Miller 1989) . The unemployment rates for aboriginal youth are three times the average fornon-aboriginal youth (see also Junankar and Kapuscinsld 1991ab). Even after controlling foreducation, age and other factors the unemployment rate of aboriginal youth is predicted to beabout two and one-half times greater than that of other groups (Miller 1989: 48).Decomposition of the differential unemployment rates reveals that only a very small portion isdue to differences in marketable skills between the two groups (Miller 1989: 50).
In a study of the earnings of Aboriginals using the 1976 census, Treadgold (1980) findsthat per capita income is only about half that of the Australian population as a whole. While theAboriginal population is younger, with more children, even for those over 15 years of age, meanincome is less than two-thirds of non-Aboriginals. Also, a greater number of Aboriginals areunemployed or out of the labor force, and face other occupational and educational disadvantages(rreadgold 1980).

12 bIga, ~ uople tod Pourt ln Leth Amatl: A EA~-al AnaD~ A
jIdigenous P eople of latin Ameri~
Th1ere is little empirical analysis of the sociosconomic conditlns of Latin America'sindigenous people. In this section, the avalable lierture on poverty, ~nequality, and socialindicators, as It relates to indigenous people, is reviewed briefly.
Indigenous, ethnic ad tribal populations make up a n porton of the rura poor(IFAD 1992). These groups live on the periphery in aga=s , and are ofen landless.In Latin America, indigenous people make up about 27 percent of the rural population (IFAD1992: 49). A rural poverty mapping documents that ln 11 of 18 cases (countries), theindigenous population is listed among the main groups of the rural poor (IFAD 1992: 98-102).
Prior to the revolution of 1944, indigenous migrnt labor in Guatemala was recruited bya variety of coercive techniques including labor dras (mandandeaos), debt servitude and, afterthe abolition of debt servitude in 1936, restrctive vagrancy legislation (Swetnam 1989). Whileindigenous people no longer face such instndon~liza forms of dibcriminatinn, their humancapital disadvantages are severe, representing a onsidable barder to competing in the labormarket on an equal basis with the non-indigenous population.
The functional and educational alienatin of indigenous ple is documented. nemjority still ue their languages and are unable to communicate Spanish. For example, 70percent of ruma Bolivans communicate only in Quechua or Aymara (IFAD 1992). In ruralPeru, where the mjority of the popution is indigenous,70 percent of Quechua-speaking peopleover the age of five have never received any schooling, relative to only 40 percent of non-indigenous Peruvians (Bernandez 1988: 126). In Argentina, 56 percent of the Mapuche peoplehave no schooling, while the ame is true for only 7 percent of the non-indigenous population(Hlernandez 1988: 125).
A study of the indigenous, education and camings connecton in Guatemala and Boliviafinds that those who are indigenous have much lower levels of schooling, receive lowerearnings, and expedence lower rates of return to schooling than does the non-indigenouspopganu 1993). Kelley (1988) analyzes the *cost of being Indian in ruralBolivia using a 1966 survey of about 1,000 male household heads. He decomposes thedifferentialbetween indigenous nd non-Indigenous individualsin ters of education, occupationand income. With informatio n father's and son's education and occupation, Keey concludesthat all (between 95 and 100 percent) of the over-all difMre~ntis is due to -class" components
mYbackgound, educado and occupadon). In other words, equalizing the human capitaland sof indivuals would result in virtual elmination of socioeconomic
The effect of being indigenous is controlled for in a study of cducation and ~arings inPeru using census data for 1961 and 1972. Toledo (Carnoy 1979) finds that while thepercentage of Quechua/Aymam speakers in the labor force fel, their relative income Increasednhtantially. Results of logeangs functions for the two periods reveals a considerable
decrease in the penatys with speaking a native language over time.
Stil there is much that we do not kow about the work activity of indigenous people,especially those residing In rural areas. The unpad but productive activities of indigenouspeople living and w~ddig in rural commities in countdes such as Peru and Guatemala arefien misrepresented as unemployment or underemployment (Swetnam 1989; Brush 1977).

Many pasants, such as those living in the highlands of Guatemala, are inolved in a vadety ofactivities that provide incom., although these are not easily observed with aggregate householddata. In the northern Peruvan Andes peasants are involved In many taska on a day to day basisbesides agricultural pursuits. These include house buildin~g and malntmna, distnbutiveactivities of tade and exchange, craft producdon, fiewood collecon and community workprojects (Brush 1977:77). atly id.eare in most cases heavily involved ~ n manyadties but these are not Ceol . This has lhd to some observera to wdte about"disgulsed employment" (Swetnam 1980.
The children of indigenous parents are bor with mnmy socioconomic disada es andare unable to l~aep up with their non-indgenous peers. In a tudy of child operformance in Guatemala and olivia, It is found that me more limy torepeat grades at the level(Patrin and 1992). Rojas (1991)reports thatbeng non-white dg ~ - affecuatna ~ in Guateaa (e also Loui1982). A simir rIn a study usigPeruvian data(Parnos andPsacharopoulos 1993). In fact, being rural and indigenos b te bs e ofrepetition for Peruvan puimary school studenta.

14 Inigea& People and Foursy in Larln Am.fls An skapia AnaEaIs
Box 2.1: Indigenous Education and the Environnent
peole Reet eeac on the Sama Iniao Ñ?aagu ~ilustatth pathways by which
Sums w thafaa1dWada Wa the bilt toseahe language of the larger soiety
duatoèteucs url ndgeo¡s oIe* deedneo h forest through threeinirt bmils Iicr*sstheablfft oagrsoøet th ontyi iimprove the use
an i edwithtil i
dereuie crdnil,idaàteta9tooti inomto abut th Jobt makt, ad
forest land fo atI gahg.Hwvrwt poe lnig the inceased wealth~ can beinete itot nionet..a.licdn
vamandhiger H¢e árheiprolie4 pyloer r .e fo hire s adbetter cope with
poidanalga ates näßgtnàgcftlmdrniatonepsors conseratin
Førexnge rete fetfe se~ .t ,ud i n ihl*rrte fdfrsain I mTheseåfing árås vt.i atehoggiëidá4nth um Idas
Ih ln:n 1¢ pšó i!åtöi reoitv gd oerluiet telaormrkt
s one $úlùu reverend ducadonis hrteftr,nt o h rsn

Lertwwe Review 15
The appalling state of indigenous people in terms of fertility and infant mortality rates isdocumented. Fertility levels of indigenous women tend to be higher than those of non-indigenous women for a number of reasons. Indigenous couples prefer a larger than averagefamily size (Rosenhouse 1992). Although income disparities between indigenous and non-indigenous groups may account for part of this effect, anthropological studies have documentedcultural differences regarding the value of children (Mondloch 1979). However, knowledge anduse of modern contraceptive methods is substantially lower among the indigenous populationthan in either overall or rural populations (Rosenhouse 1992). This low contraceptive prevalenceis correlated with low educational attainment, low access to medical attention at birth and highchild mortality rates. Collins (1983) links reproductive decisions among highland Aymarapeople in Peru to economic, cultural and environmental factors. The Aymara typically seek afamily size of five, with children spaced three years apart. Labor activities, including domesticwork and childcate, are distributed across the entire family, with specific tasks assigned tochildren according to their age and birth order. Both parents are then free to focus on moreproductive endeavors. Fertility decisions thus balance the need for the labor input of childrenwith a desire to mitigate the risk of raising more children than the productive capacity of thefamily can support.
In general, indigenous people have much higher mortality rates than the national averagesin most countries. This is especially the case in countries where the indigenous populationmakes up a large proportion of the total population. In Peru, the national infant mortality rateis 169 per 1000 live births, as compared to 269 per 1000 live births for the indigenouspopulation (Masferrer 1983: 600). The national under-five mortality rate per thousand livebirths in Bolivia is 122 for Spanish language speakers, but 186 for indigenous language speakers(Institute for Resource Development 1989). In Guatemala, under-five mortality per thousandlive births is 120 for ladinos and 142 for indigenous people (Institute for Resource Development1987).
Concerning health care services, indigenous people are faced with the problems of unequalaccess and the effects of discrimination (United Nations 1983). Unequal access is the result ofthree principal factors: the general isolation of many indigenous communities; widespreadimbalances in the allocation of medical personnel and services which favor urban areas whilemost indigenous people live in rural areas; and the overall poverty of indigenous populationswhich limits their ability to pay for adequate services. In Guatemala, at the national level thereare 1.6 hospital beds for every 1000 persons; there are only 0.4 hospital beds for every 1000indigenous persons (Masferrer 1983: 602).
Seasonal migration has serious implications for the transmission of disease amongindigenous communities. Richards (1987) studies a highland Guatemalan Mayan community andfinds a circular effect between high susceptibility to disease due to poverty and malnutrition, andthe high transmission rate of disease resulting from seasonal migration as individuals try tosupplement family income.
Scott (1992) controls for indigenous origins in her study of malelfemale earnings and labormarket participation in Bolivia. She finds that non-Spanish Spea" women have a lower laborforce participation rate. The present disadvantaged socioecononic position of all women inBolivia is believed to be the result of the Boropean conquest, prior to which women are thoughtto have had equality with men (GAlvez Barrera 1980). However, some researchers do not detectevidence of discrimination. Among the Bolivian Aymara, the economic contribution and valueof labor of both genders is equal (Collins 1983).

16 Indigeamw People and Powy In tin Amedca An Enirdal Anabls
Bilingual education appears to offer a solution to the problem of repettion, drop out andlow educational attainment among indigenous children. Drawing on the success of a programemploying bilingual promoters in 1965 during the casellantracton program, Guatemalaestablished a national bilingual education program (Motren 1988). Since 1979, the governmentof Guatemala and the United States Agency for International Development have been workingtogether to improve the quality of education for the indigenous population. Historically, Mayanchildren have had less access to schooling, although they represent half the school-agepopulation. The national curriculum was adapted and translated for the pre-primay throughgrade four levels into four of the Mayan languapes. The government instituted the use of theMayan language in prar education and a national bilingual education proram (PRONEBi)was created. Culturally v t inst on in and Mayan lansuasis provided. Thisprogram has led to an increase in student com , and has reduced failure, repetition anddropout rates. The program is operational in 400 schools with the full curriculum, and Inanother 400 schools the pre-primary curriculum is in place. The program serves 85,000students, and will be adapted to four more Mayan languages to serve an additional 900 schools.
The success of PRONEBI can be judged from the indicators derived from the evaluations.Attendance rates, dropouts rates and promotions have improved, compared to a control groupof Mayan children being taught only in Spanish. The bilingual education project has had asignificant Impact on promotion rates; more than 9 percent higher for bilingual students relativeto the control group in the first grade in 1983 (Townsend and Newman 1985). Program studentsreceive higher scores on all subject matters, including mastery of Spanish (More 1988: 365).These results confirm the findings of other researchers (Modiano 1973; Dutcher 1982), whoargue that the advantage of bilingual education lies in teaching students in native tongue alongwith formally teaching Spanish as a second language. Bilingual education also has the supportof the parents of the indigenous children (Richards and Richards 1990).
Carvajal and Morris (1989/1990), analyzing 1986 PRONEBI data from 297 communitiesand from a questionnaire administered to the same communities, find sizable differences amoaIndigenous groups with respect to grade repetition and dropout, ranging from 30 to 46 percent
*tion rates, and 6 to 16 percent dropout rates. The authors attempt to explain the* with the use of community socioeconomic characteristics and differences among
indigenous groups. They find that bilingualism reduces grade repetition and drop out rates.
Bilingual education has also been successful in other Latin American countries. Thebilingual approach produces better results in tests of reading comprehension (Modiano 1973;Dutcher 1982; Miller 1982). That is, reading comprehension is greator for those students taughtin bilingual schools where they first learn to read in their native language, and then transfer theirreading skill to the second language (Spanish). These are the findings of a classic study byModiano (1973), who was instrumental in developing the materials needed to provide bilingualschooling in Mexico (Miller 1982: 801), where the indigenous school system covers about600,000 primary level students (DGEi 1993). Children in monolingual Spanish schools learnedto read in their second language as they were learning to use their second language. This doubleburden is probably what accounts for their poorer performance in reading tests (Dutcher 1982:25). Education in the vernmacular lan e also improves and develops a student's native abilityto learn a second language in Ecuador (Davis 1981: 240). Without taking sides in the debateover language policy, it is worth mentioning that some advocate instructing students in their firstlanguage because the literacy skills acquired in one language can be transferred to otherlanguages, and developing these skills is easiest in the student's mother tongue (Dutcher 1982).Others argue that teaching students in their first language places them at a disadvantage forfurther educational opportunities. Moreover, it is not clear whether indigenous children, located

itiø~~ t Fliqj.i
Føl 91,m
18 IndigeiSSW People and POw"y i Lara Anaer An Z*kWalndyst
two anthropological studies with information on employment and wages among the poorestnatives in Ecuador In the Colta Lake region. In one of the few studies reporting on livingconditions over time, Beals (1952, 1966) examines the employment and wages of an indigenouscommunity on the outskirts of Quito. He finds that although living standards improved overtime, the community was experiencing "Increasing social disintegration" (Luzuriaga and Zuvekas1983: 108).
Luzuriaga and Zuvekas (1983) also examine studies focusing on discrimination againstindigenous people in Ecuador. Pearse (1975) and Villavicencil (1973) compare living standardsand examine discrimination against indigenous people in the Otavato region. Whitten (1976)finds increased incidence of discrimination and, as a result of increased economic activityassociated with petroleum exploration in the Puyo region, disruptions to the indigenous cultureand way of life.
Conclusion
This brief review indicates that relatively little empirical research an the socioeconomicconditions of the indigenous people of Latin America exists. This is especially the case whencompared with the rich literature on ethnicity and socioeconomic conditions in developedcountries. The small but growing literature on socioeconomic differences between theindigenous and non-indigenous populations of North America is particularly interesting andinformative. The results of analyses of the socioeconomic differences between indigenous andnon-indigenous people in Canada and the United States point to divergent policy responses,suggesting that a country by country approach be undertaken in Latin America.
The review also suggests some priority areas of research which this study will attempt toundertale. This will include estimation of the extent of poverty among Latin America'sindigenous population. In addition, the living conditions of the indigenous population will becompared with those of the non-indigenous population. The basic human capital differencesbetween the indigenous and non-indigenous population will be examined, as will differences inoccupational attainment. The estimation and decomposition of earnings differentials will allowfor the development of appropriate policy responses, as is shown in this review.
Before presenting the results of the empirical analysis, an overview of the number andconditions of the indigenous people of Latin America using census and other published sourcesare presented in the next chapter
3
Statistical OverviewMay Lea Ce.am
Although the Latin American ethnic spectrum is very diverse, this chapter categorizes theregion's population into two broad groups: Indigenous and non-indigenous. These two groupsdo not represent homogenous communities; both include a variety of cultures, Identities,languages, traditions, faiths and beliefs. Furthermore, some indigenous communities are betteroff than others, and some are more integrated than others. However, the available dataaggregate information across Indigenous groups. Census data and household surveys providestatistics on indigenous people as a whole without differentiating among communities.
This chapter uses census data and other published sources to provide an overview of theindigenous population of Latin America. Information covered includes population size andlocation, ethnolinguistic characteristics, illiteracy and schooling. The chapter opens with adiscussion of operational definitions of indigenous people and examines the limitations of theavailable sources of information.
Operational Definitions of Indigenous People
The term 'ethnic group is often used loosely, and in a similar fashion the definition ofOindigenous people' is not always clear. From a broader perspective, the concept of "ethnicgroups. relates to language, culture and territory; studies of ethnicity have focused on self-identification, ethnic consciousness and solidarity. An wedmic group' is a recognizably distinctgroup of people embedded in a larger society (Urban and Sherzr 1992: 5). Some authors pointout that the concept of 'ethnicity' involves two factors. Members might share physicalcharacteristics, faith, language and population concentration in a given region. Members mightalso share a sense of solidarity and might be in contact with other groups within the society(Segal 1979). The major task in defining an ethnic group is to identify its 'uniqueness,' thatis, to determine its identity and language (Snipp 1989: 37). An ethnic group is also defined asa self-perceived group of people who hold in common a set of traditions not shared by the otherswith whom they are in contact (Snipp 1989: 37-38). Ethnic groups share a common language,as well as cultural values, religion and identi (Snip 1989: 37-38). Smith defines an ethnicgroup as "a self-reproducing social collectivity iden myths ofa common provenance andby identifying markers' (Smith 1990: 152). For Smith, this is a two-part definition. Themembers should identify themselves as members of the ethnic group, and the ethnic group maybe externally identified by members of another group (Smith 1990: 152). Box 3.1 presents alist of variables that may be used to define an ethnic group.
19
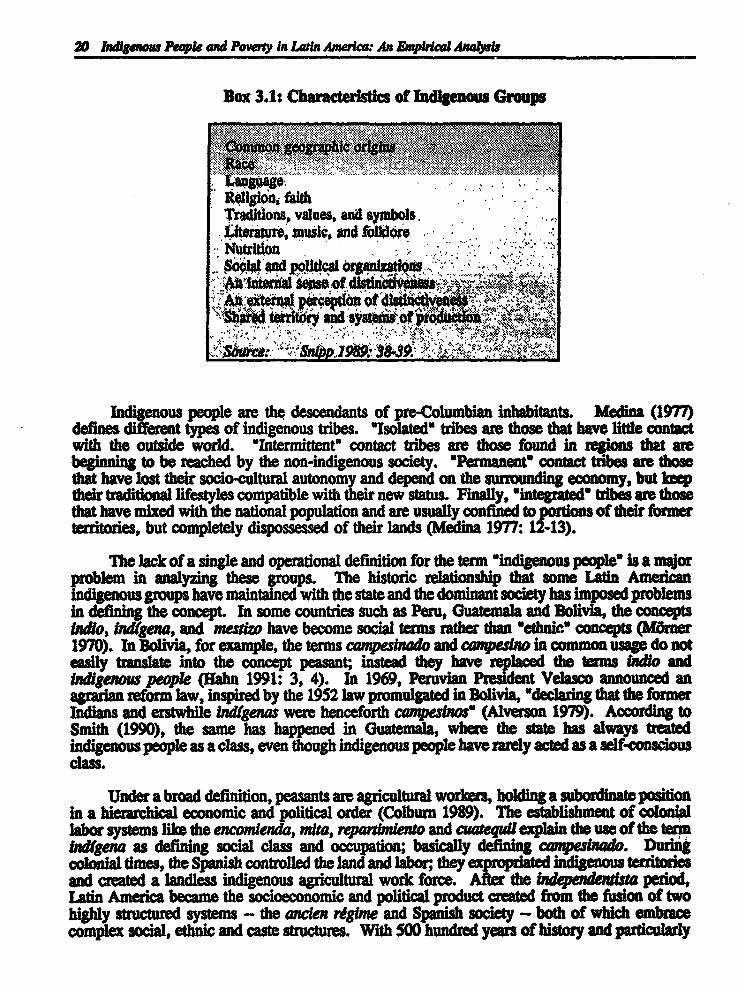
20 Indigenau People and Pony ln Latin Ameria: An En~al Aalaus
Box 3.1: Characterlstics of Indigenous Groups
I ligion, faithTraditIons, values, and symbols.Literature, uk, and föolklroNutritonSo*Isl and polficul örgputstlo
2 et Ialm S -ns,of
AAb~ "hgpto noyteuo
Indigenous people are the descendants of pre-Columbian inhabitants. Metina (1977)defines different types of indigenous tribes. "Isolated tribes are those that have little contactwith the outside wold. *Intermittent' contact tribes are those found in regions that arebeginning to be reached by the non-indigenous society. wPermanent contact tribes are thosethat have lost their socio-cultural autonomy and depend on the surrounding economy, but keeptheir traditional lifestyles compatible with their new status. FImally, Intete tribes are thosethat have mixed with the national population and are usually confined to rt of their formerterritories, but completely dispossessed of their lands (Medina 1977: 1 -13).
The lack of a single and operational definition for the term "indigenous people' is a marproblem in analyzing these groups. The historic relationship that some Latin Americanindigenous groups have maintained with the state and the dominant society has imposed problemsin defining the concept. In some countries such as Peru, Guatemala and Bolvia, the conceptsbaito, Indigena, and mes~z have become social terms rather than *ethnic concepts (Mörner1970). In Bolivia, for example, the terms capesinado and cm~pesino in common usage do noteasily tanste into the concept peasant; bntead they have replaced the terms indo and"^0igenon people (Kahn 1991: 3, 4). In 1969, Peruvian President Velasco announced an
agrarian reform law, inspired by the 1952 law promulgated in Bolvia, Mdeaing that the formerIndians and erstwhile indigenas were henceforth canpesnos" (Alverson 1979). According toSmith (1990), the same has happened in Guatemala, where the state has always treatedindigenous people as a class, even though indigenous people have rarely acted as a self-consciousclass.
C=
Under a broad definition, peasants are agricultural workers, holding a subordinate positionin a hierarhical economic and political order (Colburn 1989). The cstnblishment of colonilabor systems like the encomienda, mta, repardmlento and cuarequllexplain the use of the termlndtgena as defining social class and occupation; basically defining cmnado. Dudngcolonial times, the Spanish controlled the land and labor they expropriated indigenous territoreand created a landless indigenous agricultural work force. After the independendsua pedid,latin America became the socieconomic and political product created from the fusion of twohighly structured systems - the ancien régime and Spanish society - both of which embracecomplex social, ethnic and caste structures. With 500 hundred years of history and particularly

Swistial Owrfw 21
with the social and political impact of the current century, the Latin American social spectrumis today even more complicated. Social class and ethnic elements are still interrelated. Inseveral countries Indigenous groups are peasants, but not all of the peasants are IAdigenouspeople, and not all of the iadigenous people are peasants. Using an ethnic concept to defineoccupation or social class will narrow the analytical prspective and will restrict the capacity tounderstand that there are Indigenous individuals within all sectors of the rural, peasantry, poor,and urban populations.
In many respects, the Latin American indigenous population is diverse. Elein (1982)shows that in Bolivia, there are major differences between the highland and the lowland groups.Evidence of the cultural diversity as abundant; Klein describes in detail the historical differencesbetween the Tiahuanaco civilization and the Aymaras' kingdoms (Klein 1982: 3, 26). Althoughthe multiethnic perspective provides a more accurate analysis, it causes some problems in termsof social research. First, comprehensive data are unavailable; second, collecting such datarequires a large investment of resources; and, third, covering the whole map of cultures andidentities presents an overwhelming task.
The task, nevertheless, is not only to define indigenous people, but also to define anoperational indicator or act of indicators to identify them In census an' sample surveys(CELADE 1992: 20). The approaches that have been employed in son, .atin Americacountries are: language spoken, self-perception, and geographic concentration.
Language, along with ethnic unity and division of power and resources, is almost aninvariable factor in determining whether the people identify with one nation state or group overanother (Sagarin and Moneymaker 1979: 20). The United Nations claims that language,especially the mother tongue, is a key variable in identifying ethnic groups; the underlyingassumption is that language differences tend to persist unless social integration has occurred(Shyrock et al. 1976: 157). Language is a reliable indicator given indigenous people's strongsense of identity, maintained in large part by language use (Brascoup6 1992). Language is alsoconsidered to be the most robust indicator of ethnicity over time (Modiano 1988: 314). Thesocial meaning of languages goes beyond linguistic codes; any language may have a "socialvalue as a signal distinctness and of a speaker's identification with others (Urban and Sherzer1992: 308). It works as a marker of a social group and of an ethnic community. Language,and particularly mother tongue, is the *most suitable expression of spiritual individuality"(Sagarin and Moneymaker 1979: 19). Mother tongue is, in fact, an operational indicator ofethnicity, especially in areas with a wide spectrum of ethnic groups exposed to bilingualenvironments.
The Spanish language and the berian culture are the Odominant systems in LatinAmerica, but they coexist with other linguistic and cultural systems (Plaza 1990: 377). Althoughthe coexistence s not always peaceful (Mumsel 1973; Urban and Sherzer 1992), some ethnicgroups have developed such a level of social integration that linguistic differences and, at times,cultural differences are dispelled. The Garifunas of the Atlantic coast of Honduras provide agood example of language integration. These descendants of Africa speak an Amerindianlanguage. The African descendants of the Chota valley in Ecuador have adopted many Andeancutral features (Gonerre 1990: 3). The indigenous people living in the Kulta territory in Boliviaare a remarkable example of cultural integration. These communities have adopted the "fiesta-cargo sym established by the Spanish colonial authorities into their culture so completely thatthey eit now as an indigenous cultural tradition instead of a colonial legacy (Urban andSherer 19: 101-103). However, there are other indigenous groups that preserve theirprecolonlal cultural patterns because they were never actively colonized. The Shuars of
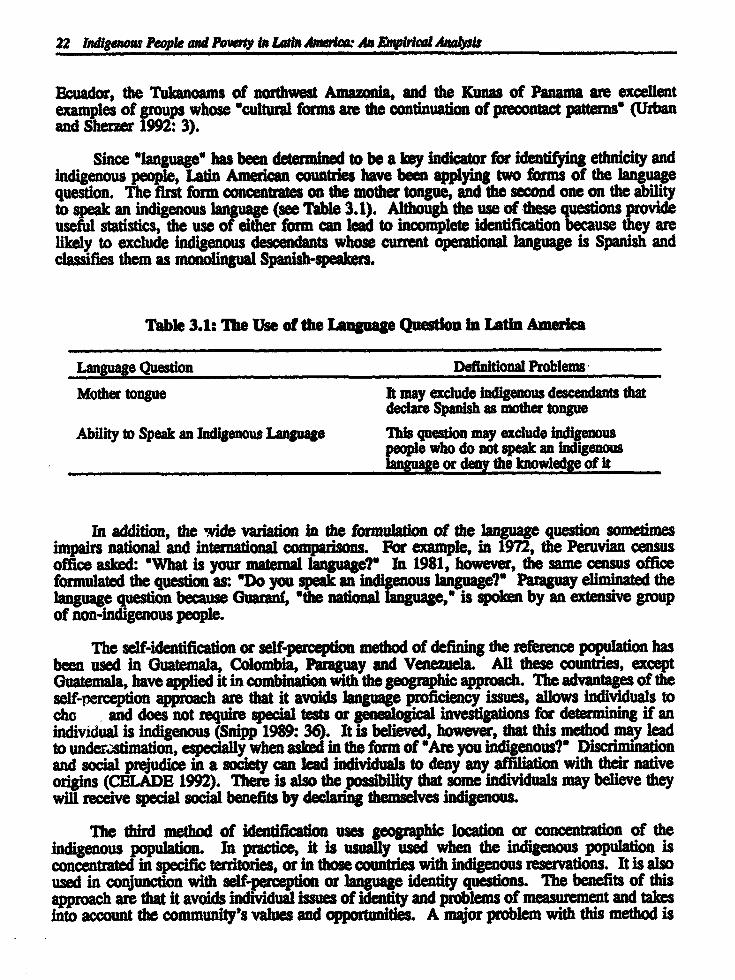
22 Indigeno People and Powr"y in Laths Anwilat An EqrfcA Analysts
Ecuador, the Tukanoams of northwest Amazonia, and the Kunas of Panama are excellentexamples of groups whose 'cultural forms ate the continuation of precontact patterns' (Urbanand Sherzer 1992 3).
Since language" has been determined to be a key indicator for identifying ethnicity andindigenous people, Latin American countries have been applying two forms of the languagequestion. The first form concentrates on the mother tongue, and the second one on the abilityto speak an indigenous language (see Table 3.1). Although the use of these questions provideuseful statistics, the use of either form can lead to incomplete identification because they arelikely to exclude indigenous descendants whose current operational language is Spanish andclassifies them as monolingual Spanish-speakers.
Table 3.1: The Use of the Language Question la Lat America
Language Question Definitional Problems
Mother tongue It may exclude Indigenous dethatdeclare Spanlsh as mother tongue
Ability to Speak an Indigenous Language This question may exclude indigenouspeople who do not speak an Indigenouslanguage or deny the knowledge of it
In addition, the wide variation in the formulation of the lan question sometimesimpairs national and international comparisons. For example, in 1972, the Peruvian censusoffice asked: 'What is your maternal language?" In 1981, however, the same census officeformulated the question as: 'Do you speak an indigenous language?' Paraguay eliminated thelanguage question because Guarant, 'the national language,' is spoken by an extensive groupof non-indigenous people.
The self-identification or self-perception method of defining the reference population hasbeen used in Guatemala, Colombia, Paraguay and Venezuela. All these countries, exceptGuatemala, have applied it in combination with the geographic approach. The advantages of theself-perception approach are that it avoids language proficiency issues, allows individuals tocho and does not require special tests or genealogical investigations for determining if anindividual is indigenous (Snipp 1989: 36). It is believed, however, that this method may leadto under.stimation, especially when asked in the form of "Are you indigenous?* niscriminationand social prejudice in a society can lead individuals to deny any aniliation with their nativeorigins (CELADE 1992). There is also the possibility that some individuals may believe theywill receive special social benefits by declaring themselves indigenous.
The third method of identification uses geographic location or concentration of theindigenous population. In practice, it is usually used when the indigenous population isconcentrated in specific territories, or in those countries with indigenous reservations. It is alsoused in conjunction with self-perception or language identity questions. The benefits of thisapproach are that it avoids individual issues of identity and problems of measurement and takesinto account the community's values and opportunities. A mqjor problem with this method is

&~adai Ovnøew 23
that some non-indgenous indlviduals may be c~anified indigenous and vice versa. Table 3.2prosents some of the different ident,fcation approaches used by Latin American countries.
Table 3.2: Definit~os of M ~ntetty Used In Latin Amerln
Country Sources Ethncity DefInition
Bolivia Census, 1976 Language SpokenHoulng Survey, 1988
Colombia Census, 1973, 1985 Self PerceptionGeographic Locadon
Guatemala Censa, 1973, 1981 Self Perception
Ronduras Census, 1988 Language Spoken
Mexico Census, 1988, 1990 Language SpokenPanama Census, 1980. 1990 Language Spoken
Paraguay National Census, 1981 Geographic Locadon andIndgenous C =sus, 1982 Seif-percepdon
Peru Census, 1972 Maternal TongueCns=, 1981 Language Spoken
Venezuela Nadonal Census, 1981 Geographic Locadon andIndigenus Cmsus, 1982 Seif-perception
Sourcr; CLDE 1992.
Depending on the county, estimate of the indigenous population are determined byindividuals who; (1) identified their maternal o as an indigenous language or:ke anindigenous language, (i) identied themselves as i ons and/r, (iii) live in an enousterritory, a reservation, or an arma where indigenous people are geogrphically concentrated.
Sources of Information
The scn major problem in analyzing the indigenos population is the availability of dataand the Jack of a ta~ statistil iifieion system. Although some Latin Americancountries have large indigenous populations, not all have collecte information on indlgenouspeople. All Latin American countries except for Uruguay and the insular countries of theCarib<ean have indigenous inhabitants; in total, although esrimat vary, the are approximately34 million indigenous penple, about 8 percent of the total population of the continent (Gnerre1990: 1), but only nin cantries have a census and/or household surveys including informationon the indigenous population (Table 3.2).
24 ~dignou People Iat Poury ln Udlåa AM Oc An ~pral~Ana
The Lati American Demographic Center (CELADB) ~cently publiehed abulledn that includes information on indigenous people obtained from the census and nationalhonenhold surveys of nine Latin American countries. This publication contains valuable dataused her in combination with other sources to provide a statiscal overvew of the ndigenouspeople of Latin America.
Estimates of Latin America's indigenous populatfon vary significantly according to source.Examples of these variations are provided in Tables 3.3 and 3.4. In Honduras, for example,the 1988 census estimates the indigenous populadon as 48,789 (Tal 3.4), while other sourcesput it as high as 110,000 (Table 3.4). The Iwntuto Indigenista adwnoamercano states that inthe 1970s, the Peruvian Indigenous popu~tin was 9,300,000 (Table 3.3), while the 1972 censusestimated it as 3,467,140 (Table 3.3). The 1981 Peruvan census caIculated the indigenouspopulation as 3,626,944 (Tale 3.4), while other sources estimated 9,100,000 (Table 3.4).

k.dt~ O~niw 25
Table 3.3: BØ~iatn of Latin Aherica's Indigeno s Population, 1970s
(1) (2)Estimat of Percent of Prcen ofIndigmnous Total Egtimates of Total
Country Population Populadlon Indmnous Populaton PoputadonArgetina 350,000 1.0 ..
Bolivia 4,900,000 71.0 2,514,851 65.0
Braz 300,000 0.2 .
Chae 1,000,000 8.0 .. ..
Colombia 600,000 2.0 318,425 1.5
Domhdica 2,000 2.0 .
Ecuador 4,100,000 43.0 ..
Et Salvador 400,000 7.0 ..
Onaua~n 5,300,000 66.0 2,260,024 43.7
Honduras 700,000 15.0 ..
Jamaica 48,000 2.0
M~xdeo 12,000,000 14.0 3,111,415 8.0
Nicaragua 16,000 5.0 .
Panama 14,000 6.0 93,089 4.8
Paraguay 100,000 3.0 ..
Peru 9,300,000 47.0 3,467,140 30.5
Puerto ikco 72,000 2.0 .
Vaneala 400,000 2.0 ..
Somarc: (1) Jonan Pando 199; <2) C~ELDE 1992.Now: .. ZNo amUlabe.

26 Ind ~ P# and P~ in Lada A An An~
Tablb 3.4: Esimatb~ et Lain America's lndigeaous Population, 1980
(1) (2)
Estimates of Percent ofOfIndigenous Total Total
Country Population Populaton Population Populaton
Argetina 360,000 1,1
Belize 27,000 14.7 ..
Bolivia 4,150,000 56.8 2,754,000 54.0
Brazil 225,000 0.2
Chile 550,000 4.2
Colombia 300,000 0.9 225,830 0.8
Costa Rica 26,000 0.9
Ecuador 3,100,000 29.5
El Salvador 1,000 0.02
Guatemala 3,900,000 43.8 2,536,523 42.0
Honduras 110,000 2.1 48,789 1.3
Mexico 12,000,000 14.2 5,181,038 9.0
Nicaragua 48,000 1.2
Panama 99,000 4.1 72,615 4.0
Paraguay 80,000 1.9 18,317 1.2
Peru 9,100,000 40.8 3,626,944 24.8
Venezmela 150,000 0.0 140,562 0.9
Source: (1) Gnerre 19 ; 12) CELADE 1992.
Eopulation Sie and Locaton
This section presents an overall picture of indigenous people in terma of population sizeand location etno characteristics, illiteracy and schooling. Despite the limited scopead cacteristics the available information, this section shows that indigenous peoplezepresent a large proportion of the popntatin of some Latin American countries. It also shows

that indigenous communities are mostly located in te rual aras, and at tey have highilliteracy rates. In the 1980s, over 50, 40 and 25 percent of the olivan, adPeruvian populations, respectively, wre bdigmnous. ApproMately 80 p =cent of theindigenous we rural inhabitants in Bolivia and Guatmala, and about 50 p =cent in Peru.
Klein def~es Bolvia as *the most ndian of the Am~rian republics," and as a societycreated by *imperial conquests and native ad(1ein 1982: Iv). Most of the indigenouspeople are Quechua and Aymara descendant and ve in the ral regions. I 198, 56 p =centof the population5 years and over, and 71 percent of the rua popula~on was indigenous (Tal3.5).
Table 3.5: Bolvlan Pop~lation by Zth~icity and Reg~on, 198g(pere~t, 5 years and older)
Regio Ingua Non-ndlgpouTotal 56 44
Urban 41 59
Rural 71 29
Souce: C ELDE 1992: 33-35.
Most of Guatemala's indigenous people are Mayan leaeaante In 1973,44 percent ofthe Guatemalan population was indigenous, while the 1981 census estimate the indigenouspopulation at 41 percent. The indigenous population as a proporton of the total popnlation hasben dereasing over the long run. According to the 1921 census, theindigenous populatonwas65 percent, falling to 54 percent by 1950 (see Table 3.6). High inant and crude mortality raesmight expln this phenomenon, alongh some authors arge that the cuent Gnatemalanclas~ficati*on system, based on self-perception instead of ancestry, leads to n(Smith 1992: 3).
Table 3.6: Ispulatln of natenala, 1921-1981
Year Percent of Populatian
1921 65
1940 56
1950 54
1973 44
1981 42
Surcr: PAHO 190.
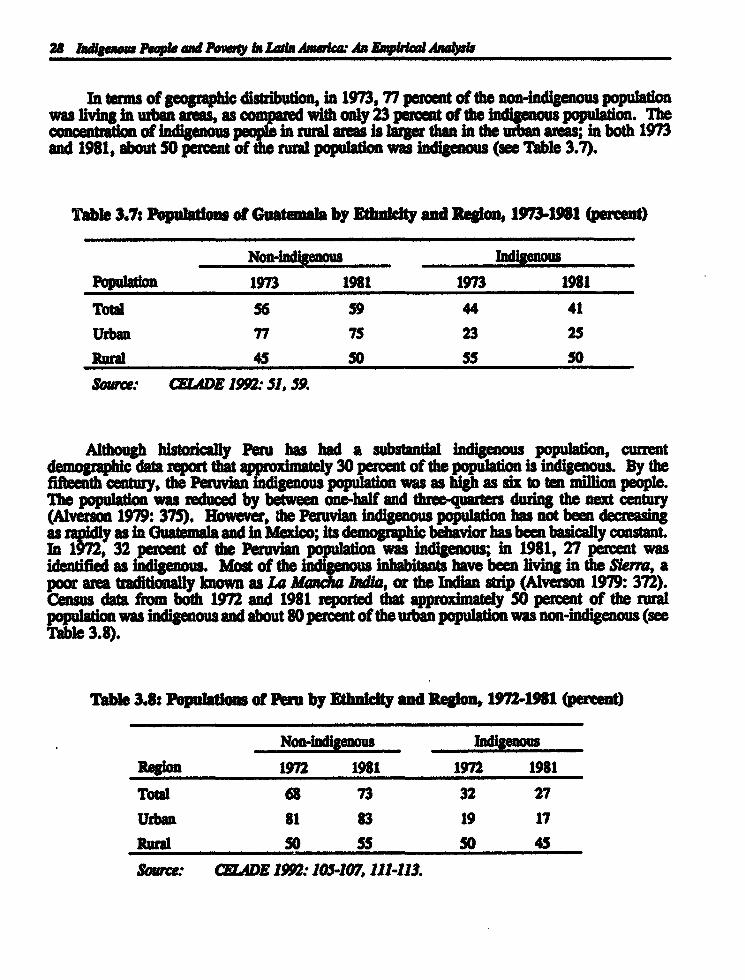
28 Indignour P.opl. aM ~ hsy in uPölan tam An D ~fra Anab~ls
In terms of geographc distibuton, In 1973, 77 percent of the non-Indgenous populationwas living in ban auas, a I with only 23 p ~cent of the indgenous population. Theconcentraton of Indigenous ieln ual areas Is larger than in the uban areas; in both 1973and 1981, about 50 percet of the mral populatlon was indigenous (see Table 3.7).
Table 3.7: Population of Guatemala by Etbi~ty and Regon, 1973-1981 (percmnt)
Non-Indgenous Indigenous
Population 1973 1981 1973 1981
Total 56 59 44 41
Urban 77 75 23 25
Rural 45 50 55 50
Sourw: C EADE 1992:5 1, 59.
Alt~ histocally Peru bas bad a subsantial indigenous populaton, crente,data repor that ny 30 percent of the ion is indigenous. By the
pop wa as higåas six to ten million people.Th population was reduced by between one-half and three-quarters during the next century(Alverson 1979: 375). Howiver, the Peruvan indigenous populatio has not been decreasingas y as in Guamaa and in Mexco; its d ap bi a b b ~y cin 197, 32 pol t of the Peruvian populatIn was indigenous; in 1981, 27 percent wasidentified as . Most of the indigenous inhnbitants have been living in the Sierra, apoor area tradi known as Mancha Ida, or the Indian strip (Alverson 1979: 372).Census data from both 1972 and 1981 reported that approximately 50 percent of the ruralpopnlation was indigenous and about 80 percent of the uban population was non-idigenous(seeTable 3.8).
Table 3.8: dpation of Peru by EhnIety and Region, 1972-1981 (perent)
Non-indgenous Indigenous
Region 1972 1981 1972 1981
Total 68 73 32 27
Urban 81 83 19 17Rural 50 55 50 45
Source: CEDE 12: 15-107, 111-113.

In 1981, only 35 percent of the inPerm we=and 65 percent were bilingual Most of thp wrca nawem, while most of tho monongual s l percent) wo rmsiding in rural regions (seeTable 3.9).
Table 3.9 Biupal and Monolingual ndigenous Languag. Spuakr in peruby Reg~on, 1981 (percent)
Region Biisual MonolingualTotal 65 35Urban 88 .12uRa!a 48 52
Source: CE~DE 1992:111-113.
In absoluto terms, Mxico has tho largest indigenous population on the cotinent.According to the b~ldao Nacional de Antropologfa e Hstoua (INAR), tn 1980, 429nadm registered the bighest id ous population dens~ty; 217 of th~ese iuwicpio were
in Oaxaca, 74 in Yucatn, 43 in Puebla, 33 in Veracruz and 26 In Chiaps (INAR1987). This population however, has been decreasing. The 1930 cenus reported that 14percent of the Mexican populatin was indigenous this perctago fk1l to 10 percent by 1950,and to 8 percent by 1990 (see Table 3.10).
Table 3.10: Indous Populations of Muxico, 193-1990
Perceat ofYer Total Populaton
1930 14
1950 10
1970 7
1980 10
1990 8
Sou~: IMGI M1992., b; MÅH 1=.
Census data from 1980 and 1990 show that apprniately 80 percent of the indigenouslanguage spakers were bIn the sam. yea, 23 and 16 perceat were mann~ngnal-indigenous speakers, rey (see Table 3.1

30 ~adgman Ppl - Powry ~ In Lu~n A~a-e.• anplrlaul AAane>ls
Tabbe 3.11: Indig s Pnopult s t M0en by Ianguage, 190-1990(pemet,5 yeas and wve)
Indigeous Pop~lattan 1980 1990
Bilgual 71 80Monolingual 23 16Not Specied 6 4
Soww: . CN EG1992b: 22-24.
Therareteretidigenouslanguages throughout Latin America, andeach country ha 7 to 2 languas. Uruguay is the only country on the continent thatis Spanish-monolingual (se Table 3.12).

sakt~ai omvlew 31
Tabl 3.12: Language Divi in latin America
Country Number of Languages 10,000 + Speakers
Argendna 23 9Beize* 9 8
Bolivia 38 7BrazR 208 7Chile 7 2
Colombia 78 7Costa Rica 1 3Ecuador 23 9El Salvador 4 4
Gunatemaa 26 15Hondåras* 10 4
Meco 72 37Nicaragu * 9 4
Pama 6 3
Paraguay 21 5
Peru 85 27
Uruguay 1 1
Ven~ela 40 5Source: Horberger 1992:191. * oner LItitute of LinguIteR
1988.
te mjor indigenous population centers are in Gutemala, Mexico, Bolivia, Ecuador andPeru. Some countries have declared an indigenous language as a second w4or language. In1975, Peru stated that Spanish is the *dominant language and Quechua the "official language(Center for Applied Liguistics 1975). The Paraguayan Constitution of 1967 pronouncedGuaranf as the "nationald language, and the Constitution of 1992 pr~~isimed it an *o~ffialanguage. Guaran is spoken by both indigenous and non-indigenous people in Paraguay. Thiscountry is an exception n Latin America where wGuara flourishes alongside Spanish, despitethe virtual disappearance of the Amerindian culture (Urban and Sherzer 1992: 308). ForHanratty, the Parguayan ref~tinneip between language and culture shows a dichotomy, whilethe dominant language maine Guarani, the res the the dominnt social institutions and cultureremaind Hispanic" (Banraty 1990: 63). In Bolivia in 1987, the Secretary of Edumation andCultural Affairs approved the recognition of 'p-G~uaranf as a national language along withSpanish, Quechua and Aymara, and its inclusion in the academic curriculum of all educationallevelin thse urban and rural areas with large'Tp-Guaranp9 concentrations (7pltp = and Riester1987: 453).

32 ~ndigao~ P~pt and F~rry in .atin mart : An »~oal Analy
Bolivia is a muilingual and mu~ethnic country encompassing more than 30 indigenouslanguages within its boundades. The major ndigenous languages te verslons of Quechua andAyma (se Table 3.13). Other linguistic families such as Amwakan, Chapacuan, Ura-C aMataco-faca, Panoan and Tupi ulso exlst, and some pre-Incan languages such as Uruaar Pum me stil e (Summer Instite of Lingu~stics 198g; Kei 1982). Aymara isspokaa them west iphæ of the eastern Andes. Two versons of Quechua ar spoken: southBolivian and north Qu~chua. There are also several variants of the Guan Milanguage;on the easter side of the country, indigenous s the Ioce I o, T=enio and theC gaolangagswhle on the western side, Boli~ Gumnt Is spolen (Summer Insttute
Table 3.13: Language DIstribution of Indigenous Population in Boila, 19s
Percent of TotalLanguage oulto
Quechua 39Aymara 24
Guara 1Source: Summer Inut~tute ofLingulice
1988: 86~8.
The easter region of Boliva covers more than half of the national territory; it includespart of the Am na, el Chaco, and what it is known as nzona de trandci~n." Thero inthis region apprn>imately 30 languages, 26 of which belong to 9 well identied linguisdifamIles, and the dest are of unknown origin (Zolessi and Riester 1987: 425-426). Among thosmgrups, there ar, in the deparment of Santa Cruz, 16 zoceo-Guaani communitifs thatemigrated from Pmguay during the fi=eenth century. They belong to the Tupf-Guaranlinguistic family.
Depending on the soure, there aro between 20 and 30 indigenous languages in Guntemaa(R~chards and R ~chards 1990: 5). Most belong to te Ma the Xinca of unkn~wn origin, andthe Garifuna or Cauibe (Tujab 1987: 529). Most of the es uro spok n by monolingualpopulations (see Tables 3.14 and 3.15).

Table 3.14: la uage Distribution Indignous Popul~atln in Guatemal, 9fs
Prcent of TotalImuage PopumanQulch6 15
~adchquel 10Man (Maya) 8
Ttuju 2Achi 2Pokoman 1
Source: Snmer In~e QfLinuStIcS 198&61-65.
According to the Summ=r Institute of Linguistics, the internal migrations from thehighlands to the coatal plantations helped to develop different versions of the Q~ich6 language(Summor Instittb of Linguistics 1992). The Quiché Central is spoken in the central highlands,the Quich West Central in the southwest of Lake Atittan, the Quiche Cunén, astor, and theQuich Joyab are spoken in the depmr~nento of Quiché. Indigenous communities located Inthe Qu~aago and Totonicapmn depamnento also speak versions of Quich. ThoCak~hquel dialet is wide-spread, spoken in 10 different regions, including the central, a~rtrnand western regions of the country.
Both Richards and Tujab use sdmilar figures to estimate the number of the speakers bylanguage (Richards and Richards 1990; Tujab 1987). According to Richards, the high degreof economic interaction among indigenous communities has generated a dynami process of
interchange giving Guatemala a variety of linguistic families and languages (RichardsRichards 1990: 3-5). In contrast, Tujab considers that migration and spatial mobility has
contrb to dth of many languages (Tujab 1987).
Despite the broad lingustic diversity, Mayan languages are the "languages of intra-ethniccommunication (Richards and Richards 1990: 50). Thero are three Mayan or Mam linguisticregions; western, southern and northem. The linguistic divergence and variety within thelanguage is explned by the topographical cs of the country that may have led tothe isn~atia of the Mam speakers <Richuds and Richards 1990: 28). T1e Mam and riche'an(Quché) anguages we at one time linguscally related. Their separation took place morthan 1,500 years ago, and a separation within the Man 400 years ago. DifferencesW~it1n the Mam speakers involve such major cultural and i features that communicaden
tnong My.u or Mam speakers is often difficul t divisions among Kiche (Quich),(Cakchiquel) and Quechi (KLch!) spea~ers are minor phonological and lexical(Richards and Richards 1990: 28).

34 Indigesaas PbpI. and Powrty n.in Lin mne$s.- An &nW~Mul Ana~lt
Table 3.15: Language Distribution of Indigenus Populaton iu Guata^, 1970s
100,000 + 50,000 + 10,000 + - 10,000Speakers Speakers Speakers Speakers
Q~ich6 Pokomcht Jacateco MopnMam Kajobal Chortf Tectitaro
Cakchiquel Pokomam Acateco UspantecoKkcht xil Aguacateco Scapulteco
Tzutujil Gariffa or Ca SkacIta
L.ncandduXinca
Sarce: 17¥ab 1987: 530.
In Peru, there are more than 30 different indigenous languages. 'Ie main languagefamilie are Arawakan, Aymaran, 'ahuapanan Harakbet, Huiotoan, Ivaran, Panoan andQmechua. Most of the indigenous individuals speak different versions of Quechua, which is widespread throughout Peru (Table 3.16). Te Acash version of Quechua is spoken in thesoutheast, east, and northern sides of the Ancas* depar~mento. Te Quechua Aequipa is spokenin the Province of Cayloma in the Arequipa deparamen. The Quechua Ayacucho or Ca~nkais spoken in the southwestemn side of Ayacucho. Thera are also other versions of Quechuaspoken in different regions.
Table 3.16: LanguageD of ge Popntatlan in Peru
Percent of TotalLanguage Popnineinn
Quechua 30Aymara 22
Source: Swaner I otltwe of LO~guinter 198&
In Mexico, the main linguistic famle ar the 'gonkian, Hokan, Mayan, Mixe-Zoqu,;Mixtecan and Otopmean. There are 56 differe t indigenous languages in Mexico. Accordingto the 1990 census, 23 percent of the Indigenous people spoke Nahuati, 14 percent Maya, and7 percent spok Mixtec and Zapoteco (see Table 3.17). According to the INAR, approxately90 Of the indigenous languages were spoken in Onan, Yucatdn, Puebla, Veacruz andCha (INAR 1987: 41).

Sata~ OwrvRew 35
Table 3.17: Language istof dgos Poplaton tia M *o, 199
Prce of TowaLanguage . IdgeunousPopuladlonNahuad 23
Maya 14
Mlxteco 7
Zapoteco 7
Ot omf 5
TMeltal 5
Taozil 4
Totonaco 4
Ma~te 3
Chol 2
Mana 2
Sour: EGI 1991: 26-27.
Literacy and watlnaC
The Unted Nations dencs literacy as the abeity of a person to both read and write a shortsimple statement (Shyrock et al. 1976: 182). i r~ats provide an approximation of theCountry's socioconomic level and, if it is ma~ by subcategories of the population, itprovides baslne information for comprng oneothe population with another. Forexample, a cross analysis betuo~ eth~icity and ed an can be used as an indicator ofdiWrentisi educational opporti for indigenous and non-indigenous group.
l some countdes, the variations between the two group may be as significant, or evenmore revealing, than a omacross countds. For n in Colombia in the 1970s,only 21 percent of the n eus people wr lit, while 45 percent of the indigenous
was illiterate. In Bolvia, In the 1980&, the Illiteracy rt r for non-indigenousndiv s was 14 percent, while illiteracy among the indigenous population was 24 percent
In Panama, the level of ~literacy also differs . In the 1980s, the illiteracy rate forn~n-indigenous people was 14 percent and 62 percent indigenous individuals (see Table3.18).
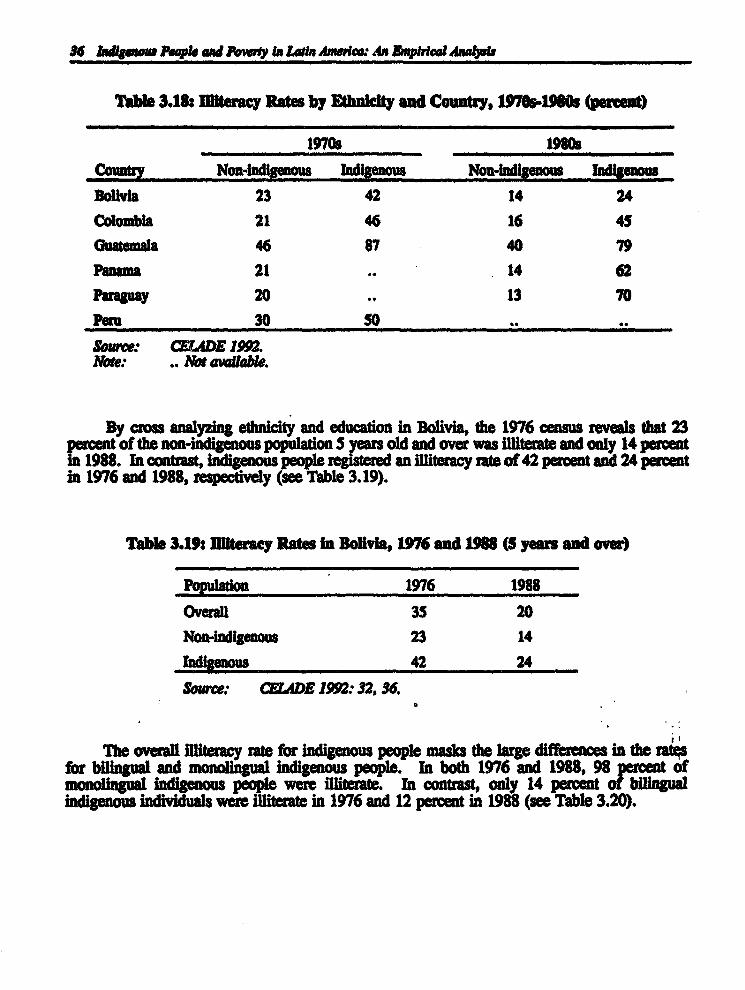
36 latgaan Pepl ~ ad Pony in Lon ~m An irika Anl~is
Table 3.18: i~teracy Ratus by U ~nictty and Countr, 1970619~s (pereet)
1970s 198NCoty Non-Indgenous Indigenous Non-lndigenous IndigenousBoliva 23 42 14 24Colombia 21 46 16 45Guatemala 46 87 40 79Panama 21 .. 14 62
Paragnay 20 13 70Per 30 50 ..
Soure: cE ADE 1992.
By cross a ethnicity and education in Bolivia, the 1976 census reveals that 23percent of the a- e population 5 years old and over was illiterate and only 14 percentin 1988. In contrast, people registeed an ifliteracy rate of 42 percent and 24 percentin 1976 and 1988, respectively (see Table 3.19).
Table 3.19: = ~teacy Rates i Bovla, 1976 and 198 (5 yeas and over)
Populadon 1976 1988Overall 35 20Non-indigenous 23 14
Indigenous 42 24
Source: az 4DE 1992: 32, 36.
The overall iteracy rate for indigenous people maks the large differences in the ratqsfor bilingual and monolingual indigenous people. In both 1976 and 1988, 98 percent ofmonolingual indigenous people werv illiterate. In contast, only 14 percent of bilingualindigenous individuals wee iiteate in 1976 and 12 percent in 1988 (see Table 3.20).
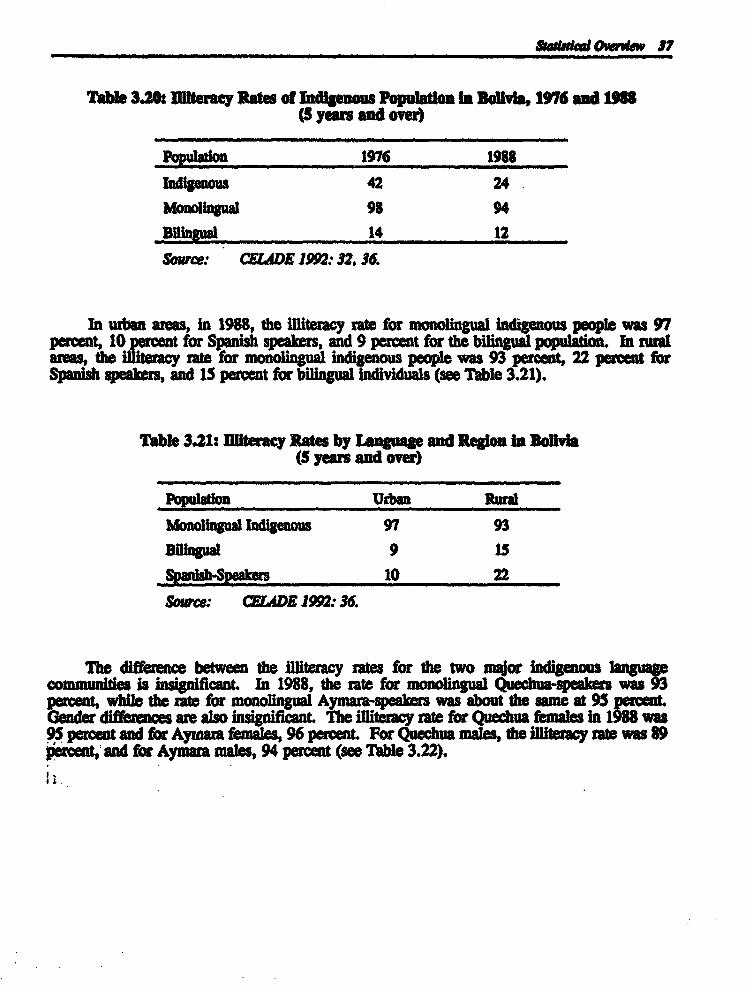
Tabb 3.20 :flteracy Rats of Indgenous Pop~ation la Bolivla, 1976 and 19M(5 years and over)
Populadon 1916 1988
Indigewus 42 24
Moiual 98 94
Blingual 14 12
Source: C~EDE 1992: 32, 36.
In urban areas, in 1988, the illiteracy rte for monolingual indigenous people was 97percent, 10 p~t for Spanish speakers, and 9 percent for the bilingual popution In ruralarea, the rate for non indigenous people was 93 percent, 22 per t forSpanish speaers, and 15 percent for b individuals (see Table 3.21).
Table 3.21: II~teracy Rates by Languge and Regon ln hova(5 years and over)
Population Urban Rural
Monolingual Indigenous 97 93
Blingual 9 15Spanish-Spekers 10 22
Source: CEUDE 1992: 36.
The difference between the Illiteracy rates for the two jor indigenouslnmmunnkit is insignificant. In 1988, the rate for monolingual Quchua-speakers was
percent, whie the rate for monolingual Aymara-speakers was about the ame at 95 pu~Gender diffemnces are also insgifLcant The illiteracy rate for Quechua fkn ian 1 was95 percent and for Aymara females, 96 percent For Quchua males, the literacy rate was 89percent, and for Aymara nales, 94 percent (see Table 3.22).

38 Iaigaow Fpi. ad Po~ in La~ a An asried Analyde
Table 3.22: Dhlteracy Rates for Monl1gual Indigeus Populatan ln Bovlaby Language (5 yeas and over, 198)
Population Quechua Aymara Other
Total 93 95 29
Maes 89 94 42
Females 95 96 22
Source: C~EDE 1992: 36.
In Guatemala, differeaces in ifliteracy rates between indigenous and non-Indigenous peoplewere significant. In 1973, the indigenous i1Literacy rate was 87 percent and 46 percent for thenon-indigenous group. In 1981, differences were as dramatic as in 1973; almost 80 percent ofthe indigenous populadon was ilfiterate, contrasd~g with only 40 percent for non-Indigenousindividuals. Table 3.23 shows that ilmitercy uates of the two groups differ signifianty byregion. In urban areas, 62 percent of the mdigenous people were illiterate, while only 22percent of the non-indigenous were illterate.
Table 3.23: Illiteray ltes ln Gunatenal by Ehulety(30 years and over, 1973 and 1981)
Non-Indigenous IndiennusRegion 1973 1981 1973 1981
Total 46 40 87 79
Urban 27 22 72 62
Rural 67 55 89 83
Source: CELADE 1992:5 3, d2.
In Peru, the level of iffiteracy also differs damati~ay between the indigenous and non-indigenous populations. In 1972, the non-indigenous population bad an illiteracy rate of 22percent, while 50 percent of indigenous individuals were iiterate. Most of the illiterateindigenous people (60 percent) we living in rurat areas. illteracy rates by gender reveal anunequal distribution of ducatin among indigenous people. While 65 percent of the indigenousfemales were illiterate, the indigenous mates registered a rate of only 35 percent. In rurat areas,whie high illiteracy rates were found among all f~natee, differences we more signifiantwithin the indigenous population by #~, the ndigenous femates' rate was 74 percent, whileindigenous males registered a rate 44 percent (see Table 3.24).

Satbual Owr~*w 39
Table 3.24: Initeracy lates i Perm by ~9ety, Gender and R ^egon, 1972
Non-Indigenous IndigenousRegion Total Mal* F~*ale Total Male Fe~ale
Total 22 17 26 50 35 65Urban 14 11 16 31 17 46
Rural 42 32 52 60 44 74
Source: C£ E IDE 1992:1110.
The Mexican census excludes information on indigenous illiteracy. However, statisticsfrom the census show that general access to achooling has expanded during the last few decae.The national illiteracy rate decreased from 26 percent in 1970 to 12 percent in 1990. Despiethis general improvement, states with high indigenous populations such as Oaxaca and Chiapasstill experience high ratos. According to the 1980 census, Oaxaca rogistered the highestilliteracy rate at 46 percent In 1990, the nationa illiteray rate was 12 percent and Oaxaca hada rate of 28 percent more than twice the national rate. In 1970, 45 percent of the Chiapas'population 15 years and over was illiterat, and 30 percent in 1990. Despite this improvement,the Chiapas' rate was double tho national proportion of iMiteracy (see Table 3.25).
Table 3.25: I~teracy Rates in Mexico by State, 1970.1990(15 years and over)
Stat 1970 1990
Mexico 26 12
Chiapas 45 30Hidalgo 42 21
campeche 25 15
Oaxaca 46 28
Q ntRnaRoo : 26 12
Yucad 21 16
Source: MEGII992b: 33.

40 Indgu Peqple ad Powry in Ladu Amra An Bed Analysts
Conclusion
This chapter highlights the multiethnic and a n1 alumre of some of Latin Amedca'sindigenous populations. There a approximately olanguages on the continent, witheach country having from 7 to 200 different languages. While man indigenous arebilingual, others are monolingual in their native language. Some wiely spoken enouslanuages have been recognized as national or official languages, such as in Paraguay, Bolivia,
Despite this recognition, indigenous people experience higher levels offiliteray than donon-indigenous people. This is one of the mequalities documented in this report using theavailable data. While many sources are used to compile the Information presented, reliable andconsistent data remain a problem. Better data is required in order to improve the analysis of thesocioeconomic conditions of indigenous people.
The challenge is to define a set of operational indicators in order to accuraiay identifyindigenous people in census or sample surveys. Latin American countries, In combination withindigenous organizations and specialzed agencies, should review the United States and Canadiancensus in order to appl some of the Indicators used by these sources. Rather than r solelyon one indicator to de I igenous populations, a combination of indicators be used.Using a range of indicators across countries, including lnguae spken, self-dentification,geographic location, ancestry and dress, among others, would paint a more comprehensive,reliable and accurate picture of the region's indigenous populations.

4
Data and MethodologyHardy Antiy PaW"r
When conducting research on ethnici and socioeconomic development, the problems thatmust be addressed at the outset include; defining the target population, deciding which researchmethodologies to apply, and the scarcity of data. The approach taken here is empiricaleconomic analysis using micro-data from household surveys conducted in four Latin Americancountries.
The Household Surveys and Delidenaos
While many countries in the region have sizeable indigenous populaions, few includequestions to identify the ethnolinguistic charactstictics of individuals in their househoid or laborforce surveys. In some cases, countries collect such information in their census, but do notcollect information on Income characteristics. Other countries undertake a separate indigenouscensus, but in these cases it is difficult to make comparisons with the non-i enous population.In any case, census data in raw form are not available, although published sources aresummarized in Chapter 3.
These data limitations, although important since it would have been preferable to covermore countries in the empirical analysis, necessitate concentrating on the countries for whichhousehold surveys with information on ethnolinguistic characteristics exist, and in which theLadigenous population is suffidently large in both absolute numbers and in proportion to the
national population. For this reason, the analysis is limited to four countries: Bolivia,Guatemala, Mexico and Peru. It would have been preferable to include Ecuador, a country witha large indigenous population, but a household survey with ethmolinguistic information is notavailable. The recent census in Ecuador collected information on language, but did not includeincome.
Indigenous p le assert that they alone have the right to define what an indigenous personis. Nevertheless at is necessary that an operational definition(s) be adopted in order to carry outthe study. Therefore, three approaches have been taken to identify the reference ongiven the nature of the data at hand. The three methods encompass (i) language (i)self-perception, and (iii) geographic concentRationianguage spoken (see Box 4.1).
41

柑 加 物 鯽 勰 h 印細�耐 為 鬧唧 細乙“細油馴州豳勵血 勵甲劍d 月關物細
B囉 4.1:償細 B誠川由ddsul 門同門“ dD 國她州OI睡
鑼

Dua and M~kw 43
The four &"r used differ in cm~ and in for ~ *e rdetence~ dm. The Bolivlan ceners with 10,000 ar mm whilethe odw =mys have For Bö^ % dua w= fl= the Dw~lwgmda de Hogam ~9 wn~ d~ N~~ t989 by the b~ Nw~ deEsu~ ~. The ~ owers 379864 indh~ Uvåg in ~ =ten with 10.000 orMore inbahitants. - Mm affle of individuals was dm~ acceMing to *e
One usuauy ~. it is =to distä~ b~= now~ and täl-I(Sjiål and I~ e) Individukäs. Only 1.2 pement of ~le wo MMMMW;windigenous lan~ q~ , whffe 26.4 pement wc 4~ S~ andanindigenous languege such as Aym&N Que~ ar
For Peru, data from the &~ a Nw~ De M~ De conducted in October andNovember 1991 by the 1~~ ~wi, aro ~. As om of the WÖffi BanWa LivingStandards , --- xa -- i Studiesp M u" is based en LSM å -MogY and is commWyre~ tc> u the 1991 Peru Llving Slandards Survey (PUS). The mm covm 9~ 11,491individuals and pm~ household. - .1x1.10 and Individuaf ~ informetkn.Unfor~ ly, duc to difficult politlad x i - x e! -i -ýi ý -p & at the en of the survey, c~ rq~of Peru were not su~. The su" omm househölds in four re~ Låvä4 the U~Coast, and the Rural and Utan Sierm The Rural CaLi4 the ~re Selva (which ~des tkAn~ and w= vnthin the Rural Sktra were 4 In additlon. also duo to ~consi~ ons. ~ Uxns and inom remote housé~ In ft Siena WCNnotý&Mqed.Conwquatlyý the data from Om Siwa ~ 9, and *e När~ m ~~9 ~ apopuMon which is located Mi or near cities. Mm su",, ~~ accounts for about ~q~ ers of the PM~ pV~ ad is, thweforej, not of &C e~ country.Using PLSS information on language Wken. individuals wc identified a indigenous if they
Quecht94 Ayrnam or u~ Indigenous 1-pa- m~ C~ Of the F«~is 11,1.3 perimt of OLe popuMlon. Queehuar~ am~ for the
13 ng 37 percent OnlyAymarar am~ for ift
or SpanM be iw~ in dda sumey.
Since indiv~ are seW*d~ with a pu~ ha~ ar lånpageb it ~ bethe case that some indigenom pepple me dan~ as SpuW-16- t4-- in theanalysis, eltlier ft~ cowW~ of their In ar bu~ dicy do nota non-s~ ~ e. M, however, is as ~ a ~lm as it ~ fl= appear.Thow individ" who d=se to identify MUy with Sp~ a ~ way bo e~ - ------- 2into the Sparn*~ M ~ den om who sa p ~mun Iffiguagesaft aregularNås. An axgument oftm cm~~ b d* the m~ of ledigmouS p~ Will &~ OMtime as tlicy bowme socialM ~ gb the of Spnåsh-hm~ whooling. Ihls isnot ålways m~ for two reawris. Irg indigw~ effidt= wc 1ý= ~Y to Oend dag=conducted solely m ~ . They hae higher dff out rates in *e g~ and theyO~mm ~er rates of and MM 1991; U" andDiEmflio 1992). Se~ the for p~ it almost twice the non-indigenouv rate, implying that Spanlälå-lar~ wh~ Will riot have u ~ a somd~
(CE1ADE 1992).
ne Guatew an data ud~ in ffis ~ come km HaMWDmog*M ",JU 1989). m m" was ål- - u Om h~ ~nd deFxa~ in 1989 to 9,,270 kw~ds cm~ of 339262 pm* gpa 10 yeats and older.The data co~ Indlude both hounköld~ infamatlon mJ h~al~ infor~.The bom~~ dac pm~ inko~ an tknu~ of people in U hmw, the pr~w of wnm,, 9 and m~
44 Id~gueu Peopte and hwiwy in Uda AMei An a~plrkul An4wl
loaton. The individual-leve data incude ep, level of education, income, source of income,employment and enous origins. The self-selecdon or self-perception method of identiyLngthe Indigenous "tion is used, as determined from the question "Are you indigenous?Although this method ag a more accurate, it may Mcad to underestimation (or overetimatnn)If social prejudices in a society individuals to deny their native odgins (or someindividuals behleve they will receme spq~al social benefits by doclaring tiemselves indigenous).
The Mexican data come from the 1989 survey conducted by the In~dtto Nad alO deEstad(sca Geogr~a e Ibmiddca (IN«), titled Ecuesta NadOnal de Zn - de losHogars. The survey covered 11,545 households and contains 57,332 indi dualobservations.The geographcal coverage Includes uach of the 31 Mexican States, representing 260 counties(nmfdplos) and the Federal District. Each household Is identi by the state and the
~wdciplo in which it is located. Income measures are determined by roported houshold andindividual incomes, tncluding imputed monetary value for certan In-ind income. Though thesurvey contains much useful Informaton, in~cuding income, education, and empo entindicators, it Is lacking an indigenous varable. In an attempt to overcome this, pub ' 1990census figures of percentages and numbers of indigenous language speakers per state andmu#dciplo (county) are combined with the 1989 household data. The oiginal data set isaugmented by variables that include the concentration of the indigenous population by state andmmdcplo at the individual level. Therefore, instead of knowing whether each individual isindigenous, what is known is the individual's probability of being Indigenous, which correspondsto the percentage of indigenous people recorded in the state and m~ndplo of residence. Byexamining statistical characteristics of inhabitants at the state and umnIdplo level and byknowing the corresponding degree to which each state and ~wdciplo is indigenous, generaldescriptive profiles of Indigenous and non-hndigenous people will be drawn.
To examino mein differences across different categories, the Mexican sample is dividedinto state and mic(plo groups by percentage of indigenousp 'on. For example, averageincomes for secondary school graduates inwaidplas 30 percent indigenous versusgraduates in m~lcp<ar 30 prcent Indigenous and over are calculated. Percentage values usedto divide the data ae selected according to numbers of avalable observations Beee the vastmajority ofnudc(plor contain only a small indigenous population (averoge mddplo indigenouspercentage is 6.2), care is taken to ensure that sub-samples, grouped according to indigenouspercentage, retaln a healthy number of observations for accumte analyses. Accurate is definedas at least 30 observatn per mean (McClave and Benson 1991). This limitation ensures agreater probability of having a normal distribution among the observations that produce the meanscore. Although 30 percent of a population does not represent a majority, it does represent asicnifien portion. Additional tests are conducted at different percentage levels to ensure thatpatterns observed botween mein levels below and above 30 percent indigenous concentration areconsistent for all percentage levels. Further, the object is not to analyze "indigenous"m ilas, but to analyze what chamcteristics mwddplw of varyig indigenous concentrationpossess, and to illicit any observable correlations between indigenous concentration andsocioconomic conditin
Duc to the methodology just descdbed, for sifplicity the terms *indigenous and *non-4 enous" will refer tomudplos in Mexico that are either above or below specific percentage
of indigenous population. For example, if the sample is divided into two sub-samples,those mnd~plm below 30 percent indigenous and those 30 percent and above, the term *non-indigenous would refer to the former subsample and *indigenous" to the latter. Thissimplificatdn avoids repetitive mention of percentage levels. Though most nmid0plo sub-sampls are created by the 30 percent indigenous population splt, on occasion another
Daraand Mahodere 45
ercentage will be used. The percentage leve! used will ither be expliitly stated or includedin an accompayling table or figur.
Areas of Analyses
The areas to be ~cered in the analytical chapters include the following: poverty incidence,income, education, earnings, occupational attainment, child schoolng/non-schoolng activitiesand, where the data permits, migration and health.
The poverty analysis will Include proffies of the poor, with oveai we~tates of povertyrates for the indigenous and non-indigenous populations. Poverty ras by selectedcharactedsdcs will be presented in an attempt to beter Isolate the correlates of poverty. Theheadcount index of poverty, the proportion of the population for which income Is less than thepoverty line, will be etimadtd (Ravallion 1992).
The educational attainment and earnings differentials between indigenous and non-indigenous workers la eamined, and the differential returs to invsments in human capitalaestimatd. In addition, the comporents of the qros we differential that can be explned byproductivity-enhancing attdbutes and those which are du to %unexplan~% factors and labormarket discrimnatin are empirically determined using established theore~cal and appliedtechniques.
The dual effects of gender and being indigenous on poverty are taken into account. Forexample, in terms of educational and carnings at~~inment, compadsons between indigenousmales and females, as wei as between indigenous and non-indigenous fal~pe, is attmpted.
The health dimension, aside from broad interehic indicatoM, serves as an addition to theother thematic dimensions. That is, the health aspet as it relates to educadon, occupation,urbanizaton and, especially, poverty Is examined.
The effects of Identity and geographic concentraon as they relate to hi enouspeople, and the social prudices t them, are thought to be reoe~e in the c r'sexperiences in terms scholasd f attainment and performance and non-school ac~vities. Forthis reason, an eamination of children's activities ls included. The analysis looks at schoolingattainment and performance, as well as child labor. Schooling performance may be poorbecause of indigenous odgins or beu of family backgrund. Differentf chid schoolingperformance may be a consequence of parental investments in home-peoduced human capital.Children of parents with higher levels of schooling, fewer siblin to compete with for parentaldme and other family resources and with mohers who are lss y to work usually performbetter in school (Chiswick 1988). Similary, indigenous children may be more lkely toparticipate in the labor force bocause of poverty, or because of certain indigenous values.
46 Indiemu Peqpts and Po"wy I Lata Amw"m An &vpIdf Anald
Mala Hypothees
Several hypotheses regarding the role of ethnicity i society are implicitly and explicitlytested, such as human capital theory,scrmnaon theories, institutional hypotheses,socioeconomic status/family aund theories, theories of Intemal colonialism, culturaltheories ('target workers") and W values/paths to developmentL
The significant and positive relationship between human capital and earnings is welldocumented in the literature (see aar l and Woodhall 1985 for a review). The usualexplanation put forward, consistent withe human capital approach, is that schoolingcontributes to individual productivity which, in turn, leads to higher individual earnings. Theearnings advantage of the more educated relative to the less educated is subject to the laws ofsupply and demand; as the numbers of the more educated increase relative to the less educated,their earnings advantage declines and the minimum qualIIcations for given jobs rises in line withincreased relative supplies (Schultz 1961; Mincer 1974; Becker 1975). The hypothesis to betested here is that indigenous people attain less schooling and, therefore, receive lower earnings.The indicators of schooling include years and levels attained Other indicators of human capitalmay include labor market experience and health status.
Institutional hypotheses emphasize the centrality of the functioning of labor markets(Doeringer and Plore 1972). In this tradition, labor market segmentation theories view the labormarket as being divided between the primary - high p activity, high wage - and thesecondary - low productivity, low wae - sectors. Individuals in the secondary labor marketare locked into that sector and bamers exist to their moving into the high wage, highproductivity, primary labor market (Carnoy 1980). The hypothesis here is that indigenouspeople receive lower earnings and have a higher incidence of poverty because they are lockednto the secondary sector of the economy. The key indicators here are the returns to schoolingand employment in the informal sector.
Theories of internal colonialism, which have been applied to indigenous people in all partsof the world, including Australia (Welch 1988), the United States (Jensen 1984; Jorgenson 1977;Jacobson 1984), Mexico (van Ginneken 1980), Ecuador (Burgos Guevara 1970), Peru (van denBerghe 1992) and Vietnam (Evans 1992), postulate that the conditions of colonialism can existwithin a nation-state when one group dominates a previously independent nation within itsborders. In such a case, a dual economy, with a dual wage and labor market, is in place. Alsopresent are the conditions of Oanftee" labor, a dual occupational structure and dual wage scales,with the more rewarding occupations reserved for the non-indigenous population. Theindigenous population often plays the role of a reserve labor force. Poverty, a lower standardof living, lower expectations, and a lack of knowledge of labor laws are just some of the reasonswhy the indigenous labor force may agree to sell its labor cheaply. Also, in many cases,indigeious workers wish to return to their families and homes and may be willing to toleratediscrimination and low wages in order to faenitte their return (similar to the 'target' workerstheory; see below).
The screeningO hypothesis states that, in general, employers pay higher salaries to themore educated because they use schooling level as a proxy for ote characteristics that 'signal'which individuals could be more productive. Thus, it is not the content of their education thatmakes individuals more productive, but rather that years of schooling demonstrate to employerswhich potential employees are more productive since the more able will attain higher levels ofschooling (Arrow 1973). The hypothesis here is that indigenous people receive lower earnings

Daa and Mathdology 47
because they a=e screend on the basis of their schooling, which reflects their ehnolinguisticcharacteristles. Another key indicator could be employment in the public sector.
Other explanations of outcomes are concerned with the productivity of schooling. Thatis, for the sam level of schooling and the same level of ability, different octcomes can resultduo to the application of *s1s in the labor market Individual skills may be developed bothin and out of school. Group variations in rat~s of return to schoolng arse from differences inthe ability to convert the schooling process into earnings (Chiswick 1988: 590). This may bea consequence of parentaI investments in the home-produced components of child quality,although one can think of many other renasons. It would appear that tembers of mor successfulethnic groups have parents with higher levels of schooling, fewer siblings to compete with forparental time and other family resources, and have mothers who are less likely to work whenyoung children are in the household (Ch~swick 1988). Further, a positive relationsip betweeneducational attainmenta across generations reflects the intergenerational transmission of humanwealth. In the case of indigenous people, if parents have low levels of schooling and otherforms of human capital, then this will be reflected In the human capital acquisition of theirchildren. Lower ~tocks of human capital will be converted into lower relative earnings and ahigher incidence of poverty. A similar hypothesis states that differences are due to classbackground rather than discrimination (this hypothesis is veied for Bolivia in Keley (1988),and often put forward for the cas if Brasil, but has not been verified; see Webster and Dwyer1988; Silva 1985). That is, the great differences between ethnic groups could be duc to thenatural woring of economic forces, rather than discrimination. Accsding to this hypot~esis,an individual's socioeconomic background in terms of family income, and father's and mother'seducation and occupation, are more important factors in determining present socioeconomicconditions than is eticity.
Differential outcomes, of course, may be due to outright discrimination against ethnic,minarity or indigenous groups. Dlseriminataon against ethnic groups may work to d ri yaffect an individual's access to schooling, the quality of schooling that ind dual receives andlabor market performance. This leads to lower schooling leves, lower returns to schooling,lower earnings and, ultimately, higher levels of poverty. Becker's (1971) seminal work ondisorinilnatin attempts to explain segregaon in the workplace. He postulates that thedifferential is duc to individual *tasts for discrimination against other labor marketparticipants. Becker also predicts that competitive force. in the economy lad to a gradualelimination of wage discrimination over time. Bthnic arnings differentials theun, according tothis theory, are a short-term or ddisequilibriumn situation that are bound to disappear as longas some employees prefer profits over prejudice. This explanation, however, has been criticizedfor its inability to account for enduring differences in earnings between white. and non-white.in the United State. (Darity 1982). To test for discrimination, it is ncessary to control forproductve differences between ethnic groups so that any remaining differencm in earnings aftereqali~ing productive characteuistics becomes an estimate of the *upper bound* of discrimmationin the labor market (see below for a full exposition of this methodology).
Related to the above, but coming from another social science disciplin~, assimilatintheory, or the indusrntiatinn hypothesis, is the c~ial sociological theory of ethnic relatins.It suggests that divisions based upon race and ethnicity will whither away in the long-run inmodern societie.. This outoome s supposed to reflect modern industial rgan t-n wheresocial mobility is based upon achieved, rather than ascrbed, status (lirschman 1983). Alsoknown as acculturation theories, they-predict that inequality based on "traditional criteria arebeing replaced by radonal or legaleriteria, and that particularistic riteia are being replacdby cuniver~alistic' critada such as education and ability (Weber 1947; Parsons 1954). The

4 Indignaou People and Pou~ty in Lain Arrc: An &npirid Ana~>,
Implicadon is that the slgnifcance of race and ethnicity will declne as society develops.However, there is considerable evidence of persistent ethmc inequality in many countries. Them0hod of testing thes hypotheses is similar to those regarding econonc disriminationmentioned above.
It is arued that d people who are "tradtional wfi place lessIprt on thelabor force and wi use i to achieve a speci9c, short ter end, such as obtnng cash to
nance a lengthy period out the labor market. Such individuals have been labelled as tagetworlers: y work only as long as necessary to obtuin a xed sm of wages (Sandefur andScott 1983: 49). The reasons put forward for this behavlor incude a desire to work at one'sown pace and theimportance of kinship and community in Amedndian society. Tdit~oniAmerindians see themselves as members of communities first, and are driven more for the goodof the community than for individual achievement. This charcteristic is expected to have anegativ. effect on labor force attachment and, ultimately, wages. Level of ducation, however,is expected to lead to a decline In traditional activities (Stabler 1990: 58). Many Aymara whonow live in urban environments matain ties with the rural communities to their mutualadvantage (ardan 1981: 3). Indigenous people who reside in the cities normally maintaintheir rural ties and landholdings (Saavedra 1981: 21). The Aymam value education y,which meshes with their traditional values of individualism, hard work and communal andprvate advancement (Hardman 1981: 6). Open competition and forceful self-expression,however, are missing from Aymara culture (Saavedra 1981: 27).
The theory of wtarget* workers was developed from analyses of the work behavior ofpeasants and has been applied to Amerindins. It is argued that peasant agricultural wores caneither work more hours, more intensely, or both. They seek output adequate to meet their basicneeds. Since this work often involves drudgery, their effort is not pushed beyond the pointwhere increases in output are outweighed by the irksomeness of the extra work A r~equilibrium is struck between the degre of atisfactin of family needs and the degree of thedrudgery of labor (Chayanov 1966). Peasant may have a certain target level of income. Oncethis is rened, they begin consuming leisure. Thus, interventions designed to increase incomemight result only in an mcrease in the amount of leisure consumed.
Traditional community values have persisted among Amerindin. Prior to Europeancontact, thes inuled entrepreneudial activity, which was crushed by the European immiganta.When this entrepreneurial spirit again became active in North America, it was community-rather than individually-based (agen 1968). This is based on the importance idigenous peopleplace on the kinship system, or co~nes in Latin America (IFAD 1992). Economic and well-being are provided to some extent through iship-based exchange relationshipsas the Institutin of compad ~go (Collins 1983).
Most theodes, however, predict that discimination will eventually decrease in society inthe long run for a variety of reasons. These include the Ineficiency associated withdiscrimination from the perspective of profit-maximizing employers, the process of ami~of ethic s, and the pari ethnic groups will achieve in tems of productivesuch as u-atan, tramning dexpeence. Frec markets and access to quality education shouldead to less dicnrminatin over time. Yet, segmented labor markets, as a result of such factors
as ethnic and linguistic differences, can restrain the equalizing forces of competition.

Data and Methodlog 49
Box 4.2: lessamaquoddy of Maine
... ........ .
Dauhoitions of poverty nd utiNg p~vet fiUto are numeransn an subs~eni a on woh o e more relevan,t Te howe. n is focus on t
pn~oit.nsrr, ses on a adrd wmethodology hd at~au to avid døatogcase tdy trtibal asuesm, wfsperth ds ~ni ta no, ver han t to
anlye h eiseneand conrdates of abslteý ~.ery a petyln,a mm~ur hat uaaethepar fomtb wwnporg ib ~. Th=s whose ibo~ falbs below the line are poor, tbam
abvearm"~-oo. FoR~oin commuitog two poverty inbm are ~sd an u*~e and aslower s povefMy aine. bie alscate ti bogndary teen he por ad te very po,re vdesy. Ielor th Une wl be r d to a the ext e H.
Absolute povferty re l to dw ~tin of indiators ar nuserbom d in do to apvert dli whon real value iss as over dm. An absogune poverty line. is bad on the cost
of a nimum Teni e din baset d on the fod neesny ft or an e y cpor

50 hsdgnow People and Powny In LaI Amerew An aptrial Anatl
intake. The poverty ine is then augmented by an allowance for non-food needs, consistent withthe spending patterns of the poor (CEPAL 1991).
The country analyses in this study utilize an income-based definition of poverty, wherebyindividuals living on a per capita household income which is less than a given standard areclassified as poor. In a recent analysis of poverty in Latin America (Psacharopoulos et al.1992), a uniform poverty line of $ U.S. 60 per person per month in 1985 purchasing powerparity (PPP) dollars is used following the approach taken by the 1990 World DevelopmentReport. Rather than attempting to reformulate a new poverty standard, the present studyemploys this same $ U.S. 60 PPP poverty line in each of the four country analyses. An extremepoverty line of $ U.S. 30 per person per month in 1985 PPP dollars is also utilized. While itis recognized that different poverty standards may be recognized by individual countries, thereasoning behind this choice of poverty lines is nMt to establish a dermitive standard of poverty.In any case, all poverty lines are arbitrary to some dere. Rather, the emphasis here is toexamme poverty within the context of being indigenous in latin America, and a poverty line of$ U.S. 60 PPP per person per month serves as an effective cut-off point for assessing povertyas it relates to both indigenous and non-indigenous groups. (See Psacharopoulos et al. 1992 forindividual country poverty lines in local currency.)
Most household surveys in developing countries are plagued to some degree byunderreporting of income. This will tend to lower incomes across the entire distribution, thougnot necessarily In a uniform manner. Unfortunately, it is difficult to assess and correct thisunder reporting; furthermore, the income adjustment process itself may introduce new biases intothe poverty analysis. However, absolute poverty statistics reflect the intersection of the incomedistribution with an exogenous standard, such as a poverty lin Because the value of thepoverty line is determined independently of the income level of a country, the underreportingof income can cause the poverty line to Intersect the income distribution at a much higher pointthan if there were no underreporting. The result is a poverty estimate which is highly biasedin an upward direction. Therefore, the income data used in the poverty analyses in this studyhave been adjusted to match corresponding national account figures. National accounts areusually subject to a system of cross-checking in an effort to determine the most accurate figurespossible. While these figures may contain flaws, they ordinarily represent the most accuratedata available for each country. For reasons stated above, survey data tend to be less reliablefor estimating total national income, though they do allow for microanalyses of income data ina way which national accounts do not (Altimir 1987). The methodology followed here isidentical to that which is used in a recent study of poverty and income distribution in LatinAmerica (Psacharopoulos et al. 1992), and is detailed extensively in that report. In this study,the poverty lines are used to examine differences in socioeconomic well-being betweenindigenous and non-indigenous people.
While a profile of the poor is useful and informative, it is based on only a few categoriesof the independent variables entering into the explanation of 2Ne poverty measure. For a morethorough investigation of the determimants of poverty, a multivariate model is used to standardizefor the many factors that simultaneously affect the probability of an individual being poor. Alogit model is estimated since poverty incidence is a dichotomous variable. A logit model isused in attempt to capture the major determinants of poverty at the individual level. The modelexpresses the probability (P) of being poor as a function of various characteristics (X) such aseducation, employment, and being indigenous.

Daa ad Mako lg SI
Pu (4.1)1+
The reported coeffcients am parial dedvatves indicating the change in the probabty of beingpoor, relative to a single unit change In one of the independent vadables, where i is the logitcoefficient:
L p, P (1 -P) (4.2)8 ZI
Similar logit models are used in various sections of this study to assess the determinants of suchvariables as educational participaton and child labor.
Differential outcomes indicate the leve of neand poverty associated withindigenous people. The higher incidenceof , less , and lower earnings, reflect,in a sense, the *cost of being indigenous m a . It is necesmary to control for themany factors that influence the various indi^ntors of w- before estimating how much ofthe difference between indigenous and non-indigenous people is duo to isdes afby pubfic policy and those individual charac dithat canot be chaned. In other words,the point is to calculate how much of the difference in outcomes is "explaned, and how muchis "unexplned," representing the potential level of irintinin society.
On earnings differentials, the usw of multivarite regresson analysis allows fo- thesimulation of a~temative oucomes and the of gross differentials. Thedecomposid~n method, the technique for analyzing differentia, was popuarized in theeconomics terature by Oaxaca (1973) and Blindr (1 ). It was used earer in sociology(Sieget 1965; Duncan 1968), and before that in cg y (1 a 1955). Although in theeconomics literature it was firat used to analyz the detp* of malefematM earningsdifferentials, the decomposition technique has been used since to an ethnic arningsdifferentials, publi/p^vate sector nings differenals,arningsdifferetials bysocioeconoinebackground, to test the s hypothesis, and to test the effectiveness of a job trainingprogram. Most y have fosed on developed co~res although some studies fordeveloping nations (Psacharopoulos and Tzannatn 1992; Bird~all and Sabot 1991).
The standard procedure for analyzing the determinants of eauings differentials betweentwo groups is to fit the following two equatfons, or carnings fmcions, for employed membersof the economically dominant group and employed mnmbers of the marginal group:
LaY,mb,/a'a (4.3)
LnY,-bß,+a, (4.4)
where subs~dpts a and l represent nonindigenous and indigenous worlors, respectively; Ysymbo1izes labor market earnings; X represents measured producvity-determing

52 ndgmeuW People ad Powry In Latn Amrka An EmpI*Wl AnalI
charactedstics of the workers, such as education, experience and other control variables. Theregression coefficient, b, reflects the returns that the market yields to a unit change incharacteIstics such as education and experience. The error term, u, reflects measurement error,as well as the effect of factors unmeasured or unobserved by the researcher.
It Is known that the regression lines pass through the mean values of the variables so that,(4.5)
(4.6)
where hats (^) denote estimated values and bars () represent mean values.
If indigenous workers received the same returns as do non-indigenous workers for theirendowments of wage-determining characteristics, then their average earnings would be:
LnmS 3 (4.7)
which are the average earnings of indigenous workers that would prevail in the absence of wagedisrrimination. Subtracting Equation 4.7 from 4.5 gives the difference between average non-indigenous earnings and the average hypothetical indigenous earnings that would prevail Ifindigenous workers were paid according to the pay structure faced by non-indigenous workers.This difference reflects their unequal endowments of income-generating charactedstics, so that*
(4.L8)
Subtrading Equation 4.6 from 4.7 yields the difference between the hypotheticalnndiscriminatory earnings of indigenous workers and their actual earnings. This differencereflects the different returns to the same income-generating characteristics:
(4.9)
Adding Equations 4.8 and 4.9 yields:
(4.10)
Thus, the overall earnings gap can be decomposed into two components: one is the portionattributable to differences in the endowments of income generating characteristics (Ma-.%)
Doa and Merkudaln 53
evaluated with the non-indigenous workr pay structure (b4); the other portion is attributable todifferences in the returns (b) that non-indigenous and workers receive for the sam.endowmoent of income-generating characteristics (2). This latter component is often taken asreglcting wage dlsbriminatin In economic terms discuimination refers to diffmences ineconomic outomes between groups that cannot be accounted for by the slfs and productvecharacteristics of these groups (Schultz 1991). This method, although Illuminating since itallows one to determine the extent of discriminntion in the labor market, does not allow one todetermine the origins of discrimination. Direct discrimination in the labor market can affectearnings, occupational attainment and training access; or it can be indirect, throughdiacrimination m the acquisition of skil (schooling), prior to entering the labor market(Chiswck 1987).
The use of earnings functions to estimate discrimination mens that there will alwas bea problem of omitted variables. This type of data problem mens that the *unexplamedcomponent is not only a measure of discimination, but also of our ignorance (Filer 1983: 84).It is because of omitted and unobserved factors that the *unexplained' component is seen as an*upper bound* estimae of wage discrimination in the labor market. Included among the omittedvariables that are expected to account for some of the *unexplained component are: the qualityof labor, attnchment to the labor force, lack of specific training, interrupted work careers, tastesand personality (Hill 1979; Goldin and Polachek 1987; Polachek 1975; Mincer and Polachek1974, 1978; Fler 1983). There is also evidence to suggest that much of the discriminationagainst the minority group is duc to occupational segregation; that is the *crowding" of theminority group into certain occupations where rates of pay and chances for promotion are low.This, of course, suggests that prior disciminntion has taken place, such as lack of access tojobs, training, schooling, and so on. The results of a number of studies has shown that thegreater the number of variables used to control for differences in productivity related factors,the smaller the productivity-adjusted earnings #ap (unexplained component) relativ to theunadjusted gap. However, even when an extensve list of control variables b used, most studiesfind some residual gap that they attribute to discriminatin. When the gap is close to zero, thisusually results from the inclusion of control variables whose values themselves may reect piordisrimination (Gunderson 1989: 51).
Condlu~l
The hypotheses outlined above will be directly and indirectly tested in the country casestudies that follow, data pernitting, using recent, empirical data from household surveys. Theresults of research based in devopedcountries point& to the eradication of di-crimination overtime. Little research effort has gone into enmining these issues in less developed societies,where, theoretically, discimination is most likely duc to the nature of the market and the greatlinguistic and ethme differences not dissipated by schooling (Ke1ffy 1988: 400). Ie fac thatindigenous popnlatin have remained distinct efter centuries of asmilation policies, increaslnglevels of schooling, and rural-urban migration, for example, refects the insuffciency of mosttheories. It Is hoped that the understanding of ethnicty and being indigenous in loss developedcountries will increase as a result of the present study by contributing to the theoretical debatead by pro a soci economic overview of the importance of being indigenous in LatinAmerica at a m poverty reduction is paramount. The present study also indicates somprigrty areas for further research.
5
Bolivia
as Wood and MWry AWhOny PasbW
Introduction
In this chapter, individual level data from a large-scale household survey conducted inurban Bolivia in 1989 are used to examine and compare the socioeconomic conditions ofindigenous and non-indigenous people. An examination of poverty, education, employment,health and population issues is also provided. The objective of this chapter is to documentdifferences in these important areas in order to better understand the conditions anddisadvantages affecting both indigenous and non-indigenous people.
The determinants of poverty are estimated, and the effects of changes in individualcharacteristics are simulated. It is determined that policy-influenced variables such as schoolingand employment creation are important factors that can lead to a significant reduction in povertylevels. In addition, the overall earnings differential between indigenous and non-indigenousworkers is decomposed into its 'explained' and ounexplained' components. It is found thatequalization of income-generating characteristics would boost the productivity of the indigenouspopulation in their market and non-market activities and lead to a considerable reduction inearnings inequality in Bolivia.
The analysis focusses on indigenous and non-indigenous language individuals. Indigenouslanguage speakers include both monolingual and bilingual (Spanish and indigenous language)speakers. In some cases, due to insufficient sample size, the monolingual and bilingualindigenous language spealers have been grouped together.
Income Distribution
Income inequality is high throughout Latin America, and Bolivia is no exception. Thebottom fifth of the urban income distribution receives only 3.5 percent of total income, whilethe top fifth receives 57.5 percent (Psacharopoulos et al. 1992). Individuals of indigenousbackground are disproportionately represented at lower income levels. While 28 percent of theurban population speak at least one indigenous language, Table 5.1 shows that this groupcomprises 38 percent of the bottom quintile and less than 17 percent of the top quintile.
55

S6 Indigenow Peopk and Powny In Larta Amric An EMpident Analple
Table 5.1: Indigenous Representation In the InMone Distribution (percent)
Per Capita lacome QUlatile1 2 3 4 5 All
ladigenous Population 37.5 32.9 29.8 22.4 16.5 27.6
Source: ElH 1989
Magnitude of Poverty
Bolivia is one of the poorest countries in Latin America as measured by per capita income.The following section assesses the magnitude of poverty in the country, and its distribution byIndigenous and non-indigenous population. The poverty line used in this chapter is consistentwith the $60 per person per month in 1985 purchasng power panty' (PPP) U.S. dollars whichis applied throughout this study. The extreme poverty line is $30 PPP per person per month.
Pa"y Incidence and Iter-ethnic Income D(Ormdals
The Incidence of poverty among individuals who speak at least one indigenous languageis far higher than for monolingual speakers of Spanish (Table 5.2). While the overall urbanpoverty rate is 52.6 percent, the incidence of poverty among indigenous people is more than 15percentage points higher than among their non-indigenous counterparts. And the incidence ofextreme poverty is one-half times greater among indigenous than non-indigenous individuals.
The distribution of poverty categories across ethnic groups is given in Table 5.3.InditenousgIndividuals are overrepresented among the poor and extreme poor relative to theirpopulion share, while monolingual Spanish speakers comprise a disproportionate positionamong the non-poor.
Both the incidence and the distribution of poverty reflect the disparity in income levelsfound across ethnic groups. The magnitude of this disparity is apparent m Table 5.4. Onsarg, indigenous Individuals live on a per capita income which is less than two-thirds that of
nonindgenuspeople.
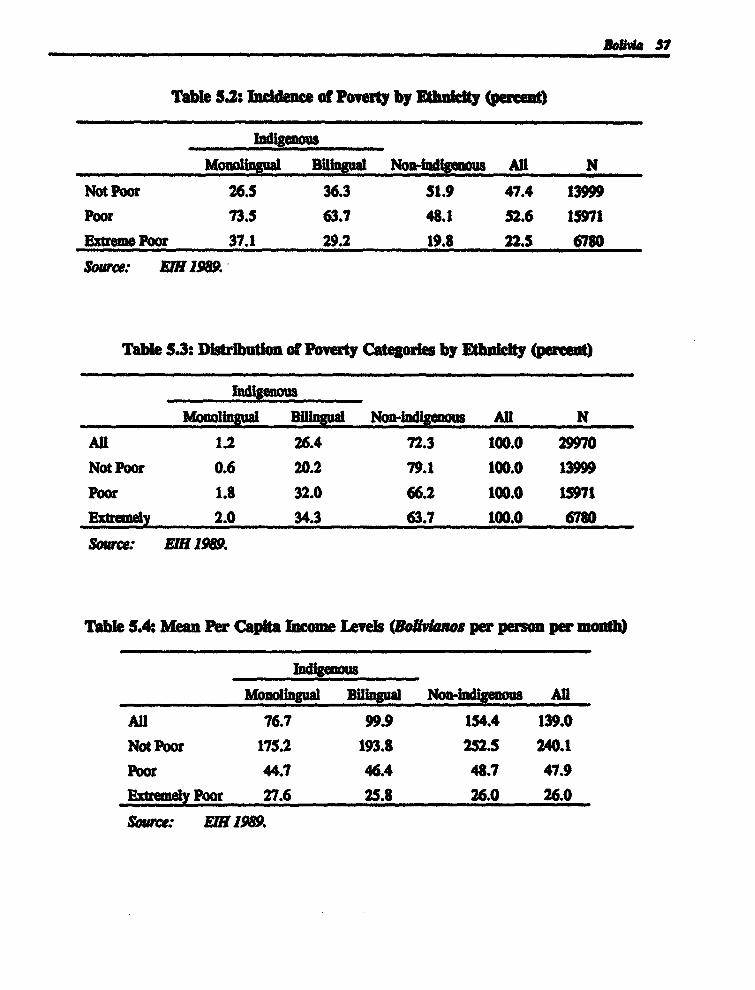
Bos va 57
Table 5.2: Inld~ne f Poverty by Zhn~ety (perce)
IndigenousMonolingual Bingual No-lndigeous All N
Not Poor 26.5 36.3 51.9 47.4 13999
Poor 73.5 63.7 48.1 52.6 15971reme Poor 37.1 29.2 19.8 22.5 6780
Source: H 1989.
Table 5.3: Distribution of Poverty Categores by Etu~ty (perce)
Monoligual Bingual Non- i All NAll 1.2 26.4 72.3 100.0 29970Not Poor 0.6 20.2 79.1 100.0 13999
Poor 1.8 32.0 66.2 100.0 15971Eutrenely 2.0 34.3 63.7 100.0 6780
Source: E 1989.
Table 5.4. Mean Per Capita Income Ivels (BOW4ans per peron per moth)
IndgenusAll-
All 76.7 99.9 154.4 139.0Not Poor 175.2 193.8 252.5 240.1
Poor 44.7 46.4 48.7 47.9
E~tremely Poor 27.6 25.8 26.0 26.0
Sou.r: E 1989.
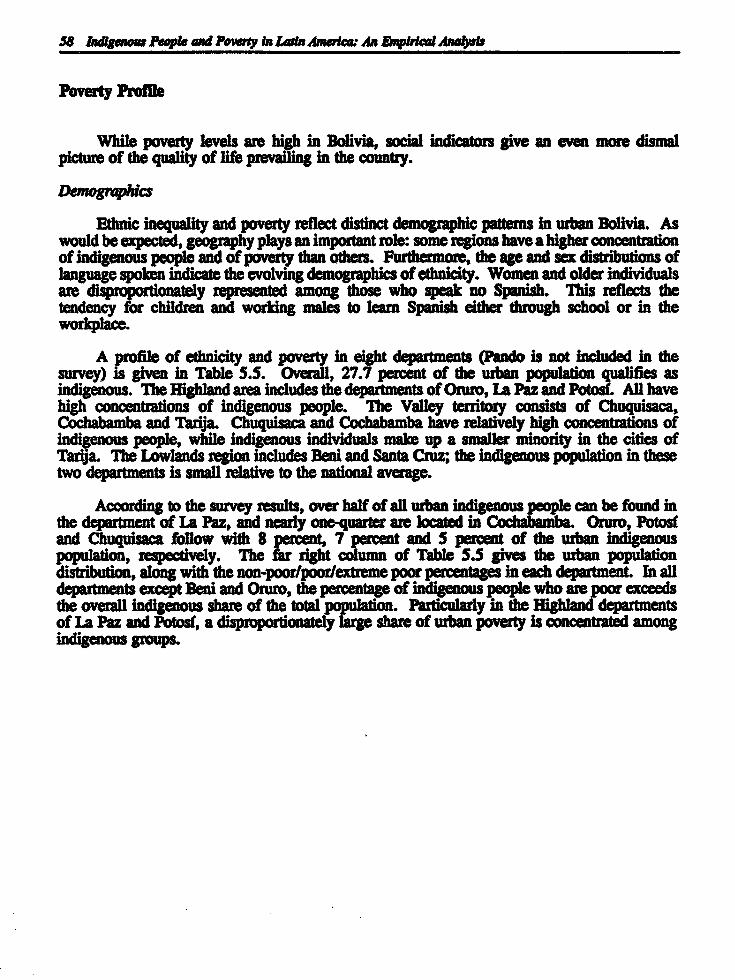
58 Igo medple tad Poury ln L~bn Am~'a: An ~apbrtl Ana~>s
Poverty Proll
While poverty levels are high in Bolivia, social indientors give an even more dismalp~cture of the quality of life prevailing in the country.
Demograpu
Ethnic inequality and poverty relect distinct demographic patterns in urban Bolivia. Aswould be expected, geogrphy plays an important role: some regions have a higher concentrationof indigenous people and of poverty than others. Furthermore, the age and sex distributions oflanguage spoken indicate the evolving demographics of ethnicity. Women and older individualsare disproportionately represented among those who speak no Spmnish. This reflects thetendency for children and working males to learn Spanish either through school or in theworkcplace.
A profite of ethnicity and poverty in eight departments (Pando is not included in thesurvey) Is given in Table 5.5. Overall, 27.7 percent of the urban population qualif~es asindigenous. The Highland area inciudes the departments of Oruro, La Paz and Potosd. All havehigh concentrations of indigenous people. The Valley territory consists of Chuquisaca,Cochabamba and Tarija. Chuquisaca and Cochabamba have relatively high concentrtions ofindigenous people, while indigenous individuals make up a smaler minority in the cities ofTarja. The Lowlands region in~ndes Beni and Santa Cruz; the indigenous population in thesetwo departments is sman relative to the national average.
According to the survey results, over half of all urban indigenous people can be found inthe department of La Paz, and nearly one-quarter are locaed in Oruro, Potosiand Ch~uiuca follow with 8 percent, 7 percent and 5 percent of the urban indigenouspopulation, respectively. The far right column of Table 5.5 gives the urban populatindistribution, atong with the non-poorlpoor/extreme poor percentages in cach department. In alldepartments except Beni and Oruro, the percentage of indigenous people who are poor exceedsthe overall indigennus share of the total ton. Particularly in the Highland departmentsof La Paz and Potos, a disproportionately ge share of urban poverty is concentrated amongindigenous groups.

DolMa 59
Table 5.5: Distibuton of lolan gArm Regi. (pereent)
Urba PopuladonRegion Monoluni Binnugua Distritdon
Nadonal 1.2 26.4 72.3 100.0
La Paz (ighland) 1.6 37.6 60.8 38.1Not Poor 1.1 29.0 70.0 41.6Poor 2.0 43.7 54.3 58.4Extreme Poor 1.9 45.0 53.1 26.8
Oruro (HighIand) 1.3 24.0 74.7 8.7Not Poor 1.1 24.6 74.3 29.1Poor 1.4 23.7 74.9 70.9Extrem. Poor 1.4 23.7 74.9 36.5
Potos (Hghland) 4.1 34.8 61.1 4.8Not Poor 1.2 25.4 73.5 27.2Poor 5.2 38.3 56.5 72.8ExtremePoor 6.2 42.8 51.1 39.0
Cochabamba (Vailey) 0.1 36.0 63.0 17.0Not Poor 0.7 33.6 65.7 51.6Poor 1.3 38.6 60.1 48.4Extreme Poor 1.0 36.6 62.4 18.0
Chuquisaca (Valley) 2.9 29.5 67.6 3.9Not Poor 1.2 26.0 72.8 46.9Poor 4.4 32.6 63.0 53.1Extreme Poor 6.8 29.3 63.9 21.2
Tarija (Valley) 0.2 6.7 93.1 2.5Not Poor 0.0 6.5 93.5 45.8Poor 0.4 6.9 92.8 54.2Extreme Poor 0.6 6.9 92.5 24.1
Ber (Lowand) 0.0 1.3 98.7 2.8Not Poor 0.0 1.8 98.2 57.7Poor 0.0 0.7 99.3 42.3Extrem. Poor 0.0 0.5 92.8 13.8
Santa Cruz (Lowand) 0.2 4.0 95.8 22.3Not Poor 0.1 3.7 96.2 64.8Poor 0.3 4.6 95.1 35.2Extrem. Poor 0.5 6.8 92.8 10.6
Soure: E H 1989.
It is clear from Table 5.6 that the age mg h ar difrent for fndg~g~ than for indigenous p p The indgn1 , ohirt is older than its non-i~ ncounterpar. Tis is purtcularly trm for balingnal indigenous individuals. hI
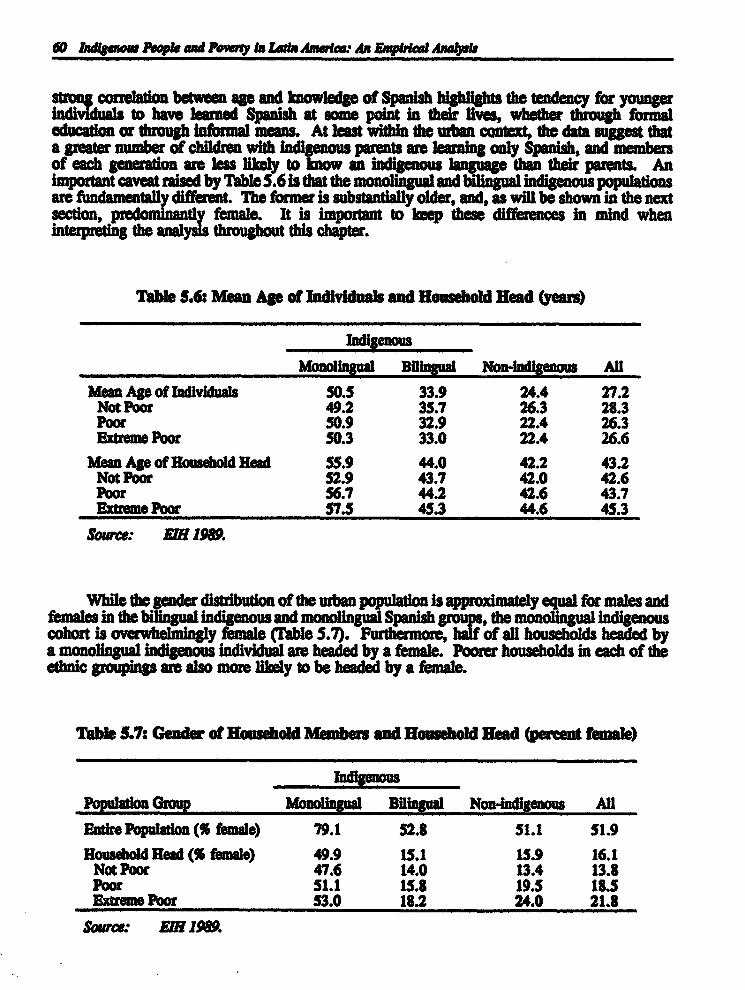
6* InMg.a n$ peand Poesy ta Lt.a Amat.. An Engfia Anablst
m ~colaton between age and knowledge of Spanish highlights the tendency for youngerto have learned Spauish at some point in their liv, whether through fornal
education or through Informal mmann. At east within the aban context, the data suggest thata greter number of children with indigenous patent are lerning only Spaniah, and membersof esch generaton are les lihaly to know an language than their parents. Animportant caveat rased by Table 5.6 is that the bilingual indigenous populatinare fundamentall different. The former is older, and, as will be shown in the nextsection, female. It is important to kep these differences in md whenntrn~ the ys throughout this chapter.
Table 5.6: Mean Age of Invduals and Household Bead (yea)
Mnolingual BMi22~ual AUMmn Age of ndvluals 50.5 33.9 24.4 27.2
Not Poor 49.2 35.7 26.3 28.3Poor 50.9 32.9 22.4 26.3Btreme Poor 50.3 33.0 22.4 26.6
MeanA of Houseoldm uad 55.9 44.0 42.2 43.2Not Poor 52.9 43.7 42.0 42.6Poor 56.7 44.2 42.6 43.7Extreme Poor 57.5 45.3 44.6 45.3
Soure: MJI198.
Whie the gender distibuton of the urban population Is approximately equal for males andfemnae in the bilingualindigenousand monolingual Spanish , the monolingual indigenouscohort is overwhelmingly female (Table 5.7). Furthermore, of all households headed bya monolingual indigenous individual are headed by a female. Poorer households in esch of theethnic groupings ae also more likely to be headed by a female.
Tabie 5.7: Gender of Household Members and Rousehold ead (pere~t fema~e)
Populat1on Group Monolingual B~ingual Non-Indigenous AllEndre Populafon~(% *emate) 79.1 52.8 51.1 51.9Household Head (% femat.) 49.9 15.1 15.9 16.1
Not Poor 47.6 14.0 13.4 13.8Poor 51.1 15.8 19.5 18.5Extrem Poor 53.0 18.2 24.0 21.8
Source: £ Mi l989.

~via 61
There is a disn=t correlatin between marital status and language pkn amongindividuals who ar 15 ar older (Tble 5.8). Whethcr for cultura, or ecooamicreasons, onanntin8al id sadults are mast likely to be married, wh&ile the apposh is truefor manolgSpansh adu. rhuseholdheads,however,thereIslitdediffwanebtweebilingual g anrd mono~-gual Spanish individuals. lle sarkily lowr tendncy formonolingual indigenous household heads mat ta be maied Is due to the hgh numberof widows In this category. Far the population a a whole, *hme Is a tendecy for poorerpersons not to be married.
Table 5.g: Marital Status of Individuals and Rousehold Heads Age 15+(Per~u M ~rred
IndlgenousMoDolingual ADUgust Non-nAl
ldividuals 69.1 68.5 51.5 57.2Not Poor 71.6 67.8 54.0 57.5Poor 68.2 68.9 48.2 56.9Exreme Por 70.7 67.7 46.5 56.1
Rousehold Head 47.2 79.6 79.0 78.7Not Poor 55.0 78.4 80.1 79.4Poor 45.2 80.3 77.5 78.0Extre Poor 45.4 77.2 73.8 74.8
Sour : Ei 1989.
Househald sire is greater far the indigenous cohort tham for the non-indigenous grup(Table 5.9). Tbere is also a tendency for poorer housebokds to be larger, though d fferencebetween te sie of poor and extremely poor househad is negligible.
Table S.9 J:usehold She
Indigeous All
M~an HousEhold Size 4.9 4.7 4.8Not Poor 4.3 4.4 4.4Poor 5.3 5.2 5.2ExtremPoor 5.4 5.1 5.2
Source: EIN 1989.
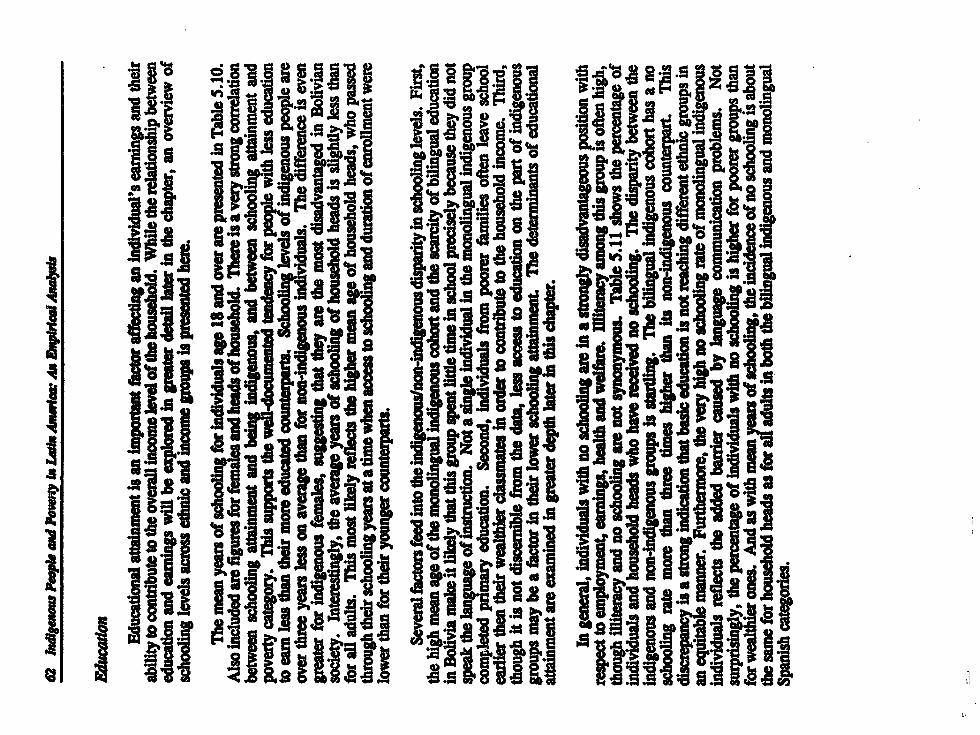
jobol
I !tsi0
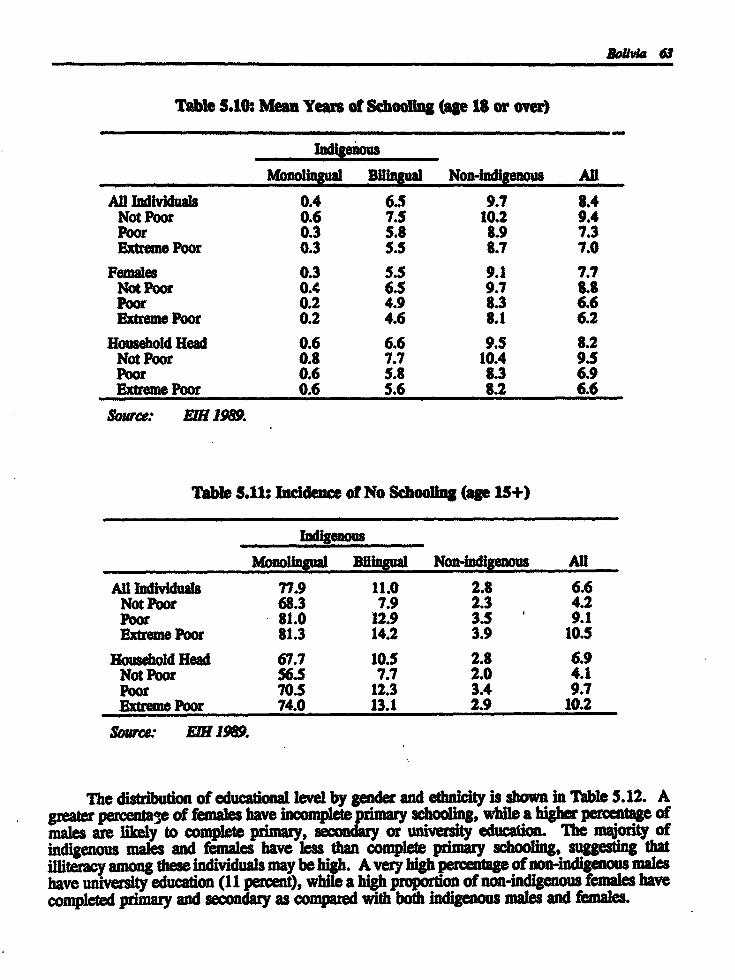
BoRvia a
Table S.10. Mea Years of Schooing (age 18 or over)
Monolingual Bilingual Non-Ldigenous AliAll Individuals 0.4 6.5 9.7 8.4
Not Poor 0.6 7.5 10.2 9.4Poor 0.3 S.8 8.9 7.3Extreme Poor 0.3 5.5 8.7 7.0
Females 0.3 5.5 9.1 7.7Not Poor 0.4 6.5 9.7 88Poor 0.2 4.9 8.3 6.6Extreme Poor 0.2 4.6 8.1 6.2
Household Head 0.6 6.6 9.5 8.2Not Poor 0.8 7.7 10.4 9.5Poor 0.6 5.8 8.3 6.9Extreme Poor 0.6 S.6 8.2 6.6
Searce: EiNf1989.
Tabl 5.U: Incidence of No Schooling (age 15+)
IndigenousMonolingual Bilingual Non-indigenous All
All Individuals 77.9 11.0 2.8 6.6Not Poor 68.3 7.9 2.3 4.2Poor 81.0 12.9 3.5 9.1Extreme Poor 81.3 14.2 3.9 10.5
Household Head 67.7 10.5 2.8 6.9Not Poor 56.5 7.7 2.0 4.1Poor 70.5 12.3 3.4 9.7Extreme Poor 74.0 13.1 2.9 10.2
Source. EI 1989.
The distribution of educational level by gender and ethnicity is shown in Table 5.12. A. greater percentae of females have incomplete p schooling, while a higher percentage ofmales are likely to complete primary, seC or university education. The majority ofindigenous males and females have less than complete primary schooling, suggesting thatiliteacy among these individuals may he high. A very high percentage of nn-indigenous maleshave university education (11 percent), while a high proportion of non-indigenous females havecompleted primary and secondary as compared with both indigenous males and females.
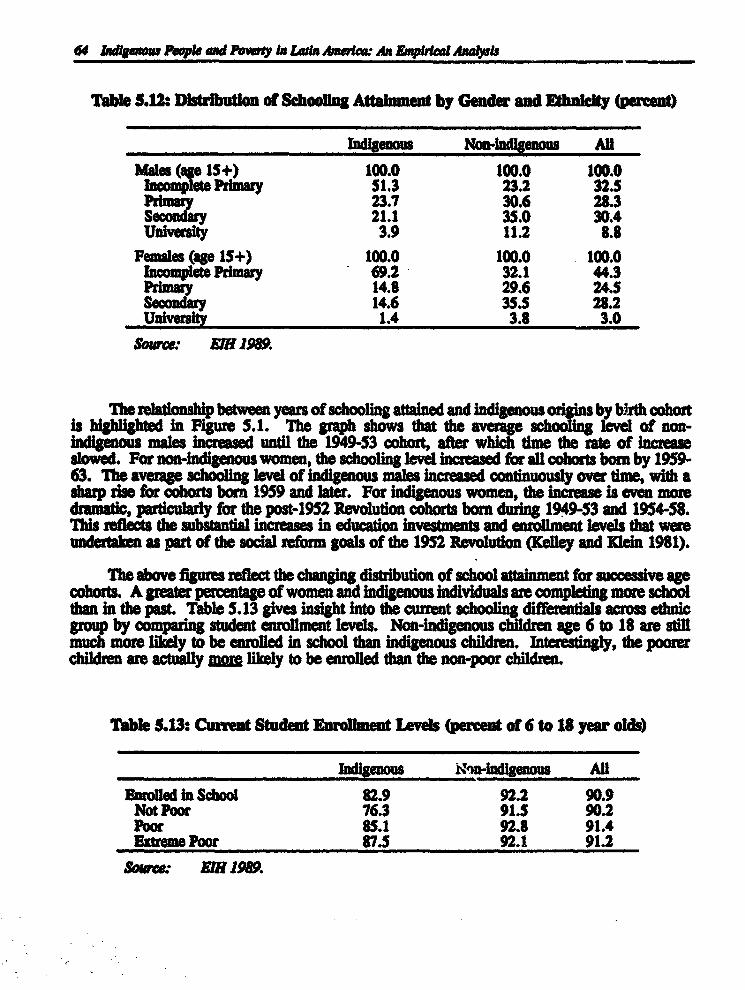
M4 I ~dg.iu People and ~naty In Lain Amrcw An Enirod AnabN~s
Table 5.12: Distributn f Scho~lng Afalinnt by Gender and Zte~ty (perent)
Indigenouis Non.indigenous AllMales (age 15+ 100.0 100.0 100.0
ndomplete Prmary 51.3 23.2 32.523.7 30.6 28.3
M=c 21.1 35.0 30.4Univesity 3.9 11.2 8.8
Femals (ae 15+) 100.0 100.0 100.0Incomplete~Pdmary 69.2 32.1 44.3Puimary 14.8 29.6 24.5Secondary 14.6 35.5 28.2University 1.4 3.8 3.0
Souce: EH 1989.
Them1ltinnahip between years of chooling attained and indigenous o by birth cohoutis hIghlghted in Pigure 5.1. The graph shows that the average schoo level of non-indigenous alm increased until the 1949-53 cohort, aer which time the rate of increaseslowed. For non-indigenous women, the schooling level increased for all cohorts bom by 1959-63. The average schooling level of indigenous malm increased continuously over time, with asharp rise for cohorts bor 1959 and later. For indigenous women, the increase is even moredramati, particularly for the post-1952 Revolution cohorts bom during 1949-53 and 1954-58.Thi reects the substantial increases In education investments and enro1ment levels that wereundertka as part of the social reform goals of the 1952 Revolution (Kelley and Klein 1981).
The above figures reect the changing distribution of school attainment for successive agecoarts. A greater percentage of women and indigenous individuals are completing more schoolthan in the past. Table 5.13 gives insight into the current schooling differentia"s across ethnicgroup by comparing student enrollment levels. Non-indigenous children age 6 to 18 are stillmuch mor. Mlkely to be enroed in school than indigenous children. Interestingly, the poorerchildren are actuay mom likely to be enrolled than the non-poor children.
Table 5.13: Currnt Student Enro ent IUvels (percent of 6 to 18 year olds)
Indigenous Non-indigenous AUlEolled in School 82.9 92.2 90.9
Not Poor 76.3 91.5 90.2Poor 85.1 92.8 91.4Exreme Poor 87.5 92.1 91.2
Sour¶ce: Dm 1989.
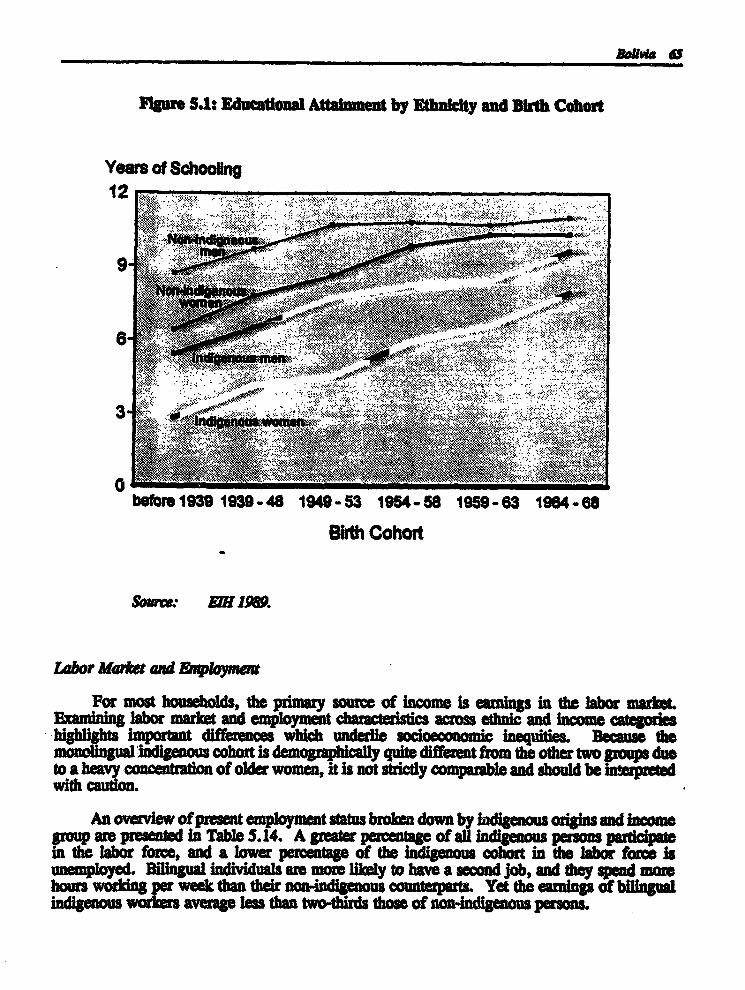
igure 5.1: dunentlOna Attatnuent by mtntey and Bith Co~r
Years of Schoolng12
Some.: E éiH M~
3 2
.5 .ss . . . . .. .
b~fr 1939 193-48 1949-53 1954-58 1959-63 1964-68
WihCohort
Labor Mrket aud &nploynhe
For most b nous ds, the primary source of income is earnings in the labor mrket.xamng labor m~ and employmet and ca
hihlgtsimotatdiffirnce~ hc undr~ J .ow in~qite. B«c~s thechy qute different from the other two group due
nof older wome, it is not stricy comparable and should b. intrprtedwith =minn.
An overview ofpreent employmnt status broken dowa by indigenous origins and incmegroup ar. pratln Table 5.14. A greter percentage ofall Indigenous pernarin the labor force, and a lower percentage of the indigenous cohort in the labor force isiemployed. Bilingua individuel are more liely to have a cond job, and they spend moreours worcing per week than their non-indigenous counterparts. Yet the earnings of bilingual
indigenous wMdMer average less than two-thirds thoe of non-indigenous persons.

66 Indliaf w heple and Powry In LAtIn Amic An &picad Analpks
Not surprisingly, there is a strong correlation between poverty and employment status atthe Individual and head of household levels. By definition, the increased income fromemployment reduces the probability that per capita household income falls below the povertyline. In the same light, those with second jobs are less likely to fall in the poor and extremepoor categories than those who work only one job. However less than 10 percent of the workingpopulation in any ethnic or income category works a second job. Interestingly, the number ofhours worked is consistent across all income groups for those individuals who are employed.Given that 38 percent of poor individuals and 74 percent of poor household heads are working,there is a significant number of "working poor" who are unable to maintain their per capitahousehold income above the poverty line despite active employment.
Table 5.14: Current Employment Status
Indigenous
Monolingual Billagual Non-Indigenous AllIndividual Working (%) 45.3 57.9 41.2 46.1
Not Poor 61.3 71.3 49.6 54.5Poor 40.0 49.9 31.4 38.1Extreme Poor 36.5 41.4 24.2 31.0
Household Head Working (%) 69.2 82.2 82.8 82.4Not Poor 77.4 91.5 90.4 90.7Poor 67.0 76.3 72.0 73.9Extreme Poor 55.8 65.2 54.3 60.1
Individual Works Two Jobs (%) 5.3 7.3 6.9 7.0Not Poor 6.5 8.9 8.4 8.5Poor 4.7 5.8 4.1 4.9Extreme Poor 4.1 3.5 4.7 2.4
Total Hours Worked/Week 46.2 49.0 48.4 48.6Not Poor 45.3 49.4 48.4 48.6Poor 46.7 48.7 48.3 48.5Extreme Poor 48.0 49.1 47.3 48.2
Mean Labor Individual Income 189.4 308.5 479.3 413.5Not Poor 285.8 444.8 620.7 566.8Poor 128.6 186.9 200.6 192.8Extreme Poor 102.1 136.4 132.1 133.5
Unemployment Rate (%) 4.5 7.6 9.0 8.4Not POo 5.7 3.1 5.3 4.6Poor 3.8 11.1 15.2 13.1Extreme Poor 6.1 17.9 22.0 19.6
Source: EWf 1989.

41. i 'Iii! ~IitiI~ i Ilij
w
i~p -1Vo
III.
'.4 ~4QO ~rn~ I ~ 0-
.~0~aji~
0 .~
I
itt i!UD; ,~0
IsI

a Ima . People mn~ Po~ny ln Lain meti : An D~pletai Ana~L,
Tabbe 5.16: Info~nal Setor mnployua by Ut~ty and lacome Group (percent)
IndigenousMonoin~gual Bhingual Non-lndigenous Ali
All Idividuals 84.8 66.7 52.2 57.9Not Poor 89.1 65.9 49.0 54.2Poor 82.5 67.5 5SA 62.9Extrem Poor 76.8 68.0 61.3 65.1
Household Head 75.0 56.7 43.2 49.0Not or 72.9 56.1 39.5 44.7Poor 75.7 57.2 50.0 54.2Extre= Poor 61.9 57.0 51.1 54.7
Sure: E 1989.
HeaM
An overview of the general health of the urban population In Bolivia is provided in Table5.17. On average, the indigenous groups are more likely to have been sick or injured in theprevious month than the non-indigenous cohort. There is a higher tendency among indigenousindividuals for their disability to be sufficiently severe to keep them out of work for more thana week. Furthermore, indigenous persons are less likly to seek medical helP for their ~lment.Both g ups are equally likely to receive some form of med~ction for their health problem.Regarding an important preventative mesure, the vaccination rate against yellow fever is doublefor non-indigenous than for indigenous individuals.
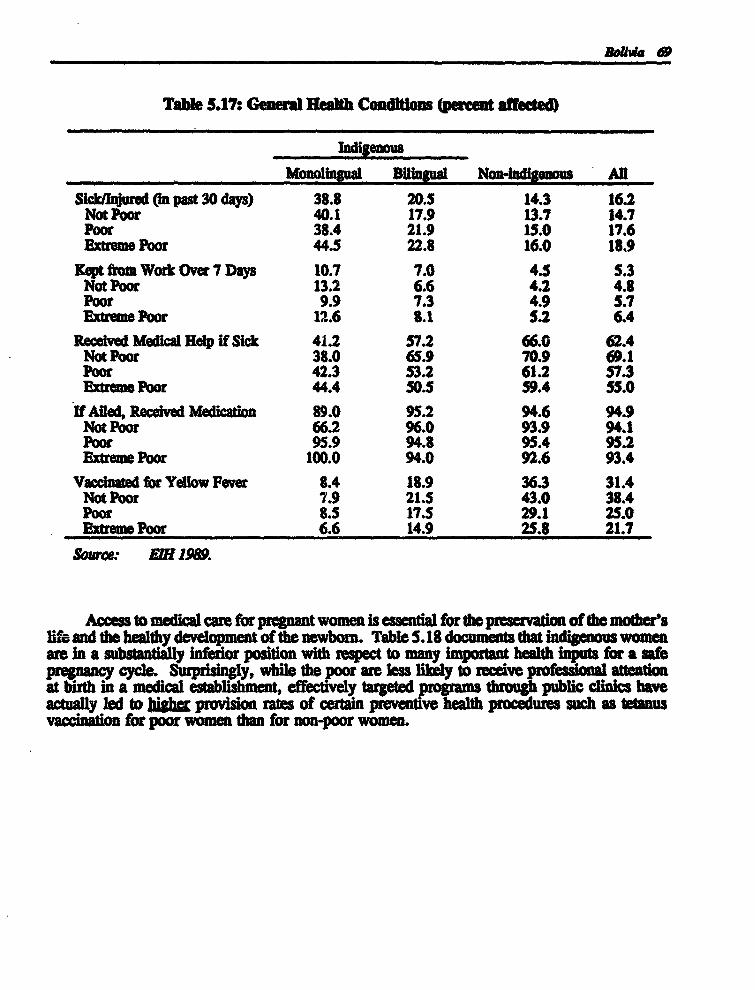
D.ai 0
Table 5.17: General feulth Cond~tions (percent affeced)
IndigenousMonolingual Bingual Non-Indigenous All
Sick~jured (in past 30 days) 38.8 20.5 14.3 16.2Not Poor 40.1 17.9 13.7 14.7Poor 38.4 21.9 15.0 17.6Extrem. Poor 44.5 22.8 16.0 18.9
Kept from Work Over 7 Days 10.7 7.0 4.5 5.3Not Poor 13.2 6.6 4.2 4.8Poor 9.9 7.3 4.9 5.7Extreme Poor 12.6 8.1 5.2 6.4
Receved Medical Help If Sick 41.2 57.2 66.0 62.4Not Poor 38.0 65.9 70.9 69.1Poor 42.3 53.2 61.2 57.3Extrem. Poor 44.4 50.5 59.4 55.0
If Afed, Receved Medcadon 89.0 95.2 94.6 94.9Not Poor 66.2 96.0 93.9 94.1Poor 95.9 94.8 95.4 95.2Extreme Poor 100.0 94.0 92.6 93.4
Vaccinated for Yellow Pever 8.4 18.9 36.3 31.4Not Poor 7.9 21.5 43.0 38.4Poor 8.5 17.5 29.1 25.0EtremePoor 6.6 14.9 25.8 21.7
Source: IM1989.
Access to medical care for pregnant women is essential for the preseration of the mother'slifM and the healthy development of the newborn. Table 5.18 doumna that indigenous womenare in a substantially inferior position with respect to many important health inputs for a safepregnancy cycle. Surprlsingly, while the poor are less lik~ly to receive profesuional attentionat birth in a medical establishment, effectvely targeted prorams through public clinis haveactually led to ~ighe provsion rats of certain preventive health procedures such as tetanusvaccinatin for poor women than for non-poor women.

70 Indgeaom People and Poverty in Lada Amfe: An Eqrical Analwkv
Table 5.18: Indicators of 1aternal Care
Indigenous Non-indigenous All
Number of Prenatal Visits 4.0 4.7 4.5Not Poor 3.7 5.0 4.7Poor 4.2 4.4 4.3Extreme Poor 4.0 4.0 4.0
Birth in Hospital/Clinic 50.2 78.1 67.0Not Poor 72.2 81.0 78.6Poor 42.5 75.7 59.8Extreme Poor 33.4 78.4 54.5
Birth w/ Doctor/Nurse/Midwife 67.0 93.2 82.8Not Poor 86.3 98.3 95.1Poor 60.2 88.9 75.2Extreme Poor 48.6 90.5 68.2
Took Iron during Pregnancy 39.8 50.8 47.6Not Poor 36.5 58.6 53.6Poor 41.2 40.8 41.2Extreme Poor 44.0 33.4 37.6
Tetanus Vaccination (1 or more) 40.0 49.9 46.6Not Poor 39.2 47.9 45.7Poor 40.4 52.4 47.5Extreme Poor 38.4 48.6 44.1
Source: EH 1989.
The strong correlation between being indigenous group and rates of fertility/child mortalityis highlighted in Table 5.19. Indigenous women give birth to more children, and suffer higherchild mortality than non-indigenous women. However, the monolingual indigenous sample issubstantially older than the others, and therefore should be interpreted with caution since noneof the three cohorts has bon corrected for truncation bias. Poor women also have higher thanaverage fertility and child mortality rates.

Bolivia 71
Table 5.19: Children Born, Died and Currently Alive (all women, aged 13 plus)
Monolingual Bilagual Non-Indigenous AllLive Births 6.0 4.5 3.6 4.0
Not Poor 5.7 3.9 3.2 3.5Poor 6.1 4.8 4.0 4.5Extreme Poor 6.1 5.1 4.2 4.7
Children Died 1.7 0.9 0.4 0.7Not Poor 1.6 0.8 0.3 0.5Poor 1.7 0.9 0.6 0.8Extreme Poor 1.6 1.0 0.5 0.8
Children Alive Today 4.3 3.6 3.1 3.3Not Poor 4.1 3.1 2.9 3.0Poor 4.4 3.8 3.5 3.7Extreme Poor 4.5 4.1 3.6 3.9
Source: EII 1989.
Knowledge and use of oral rehydration therapy (ORT) is one of the principal means bywhich parents can prevent deaths of their young children, since diarrheal diseases are one of theleading causes of death for young children. As Table 5.20 indicates, a greater percentage ofnon-indigenous adults are knowledgeable about the uses of ORT; non-poor adults are also betterinformed about ORT. This overlap is reflective of the educational attainment of these groups,since the know-how to provide ORT is often disseminated through community health programsand printed materials which may require some level of basic education to comprehend.However, among those who know ORT, the poorest bilingual indigenous adults have the highestactual usage of ORT with their children, which could be indicative of the health conditions inwhich that group lives.
Table 5.20: Adult Knowledge of Oral Rehydratlon Therapy (percent)
Indigenous Non-ladigenous All
Know ORT (%) 51.7 65.8 61.9Not Poor 56.0 71.3 68.2Poor 50.0 61.1 57.4Extreme Poor 48.8 60.3 56.1
Have Used ORT (%) 77.5 74.7 75.3Not Poor 71.1 72.7 72.4Poor 80.6 76.8 77.9Extreme Poor 82.0 78.1 79.4
Source: Fy 1989.

72 Indigew People and Poyry In Lada Amea:w An LpriWlAnawlyst
Hawtg ad CbastwWqpon
A breakdown of housing characteristics and home ownership is presented in Table 5.21.(liven their higher Rer capita household income, it is not surprising that households headed bya monolingual Spanish speaker have a higher number of rooms and more ronms per capita thanouaseholds headed by an indigenous speaker; the same Is true of the non-poor relative to the
poor. Interestingly, the indigenous group has a much higher level of home ownership.However, this says little about quality of housing, which may be lower for the indigenous group.Tis possibility is reflected in the lower rate of sewage facility connections to indigenoushouseholds, and the lower prevalence of latrines for these households' use. An importantfinding is the substantially higher prevalence of land ownership among indigenous people. Thiscould indicate that the urban indigenous population maintains ties to rural areas through thecontinued ownership cf land.
Table 5.21: Housing Characteristles and Ownership (household level)
Indigenous Non-indigenous All
Rooms per Household 2.9 3.2 3.1Not Poor 3.3 3.5 3.4Poor 2.7 2.8 2.7Extreme Poor 2.5 2.8 2.7
Rooms per Capita 0.72 0.82 0.78Not Poor 0.89 0.92 0.91Poor 0.61 0.68 0.64Extreme Poor 0.60 0.78 0.68
Home Ownership 62.5 57.4 59.5Not Poor 64.5 60.0 61.4Poor 61.2 53.7 57.5Extreme Poor 62.6 55.0 59.2
Land Ownership 26.7 19.0 22.1Not Poor 28.4 21.7 23.8Poor 25.6 15.0 20.4Extreme Poor 21.5 16.3 19.2
Sewage/Water Drainoff 52.4 78.0 67.5Not Poor 64.9 85.9 79.4Poor 44.6 66.8 55.5Extreme Poor 42.2 65.5 52.7
Latrine 50.0 63.3 57.8Not Poor 60.8 70.0 67.1Poor 43.3 53.7 48.4Extreme Poor 42.0 56.3 48.4
Sor=: EIN 1989.
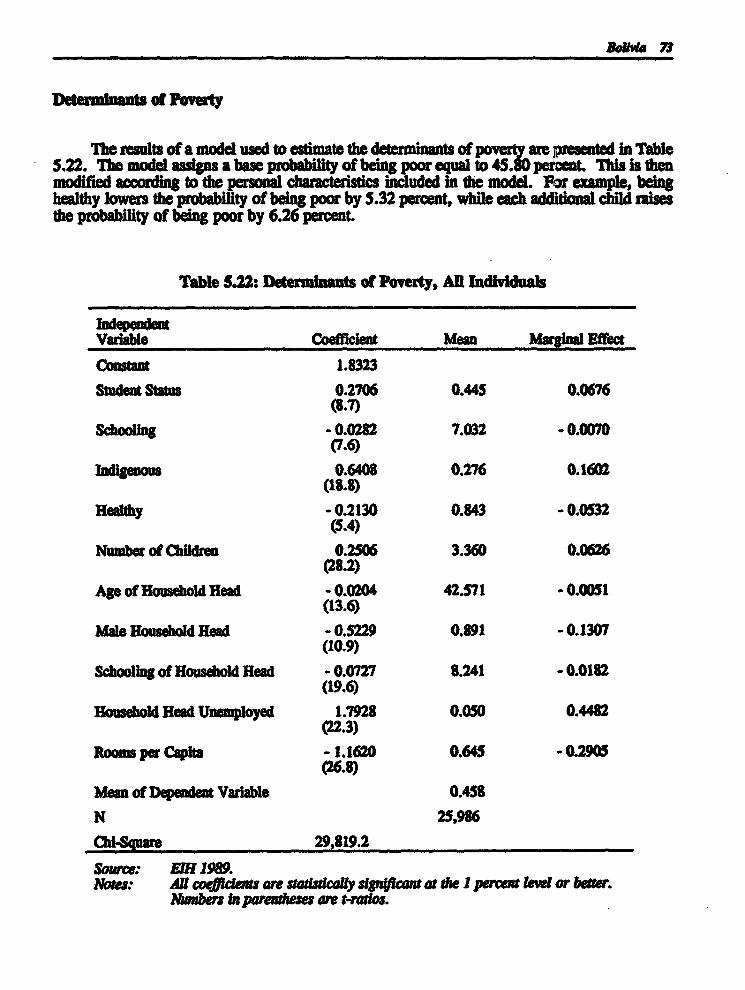
ki~73
Poverty
The reulta of a modet used to estnate the deterninants of are presented in Table5.22. The modet signs a base probabiity of being poor qual to 45.~ percent This Is thenmodified according to the personal characteristics included in the modet. For example, beinghealthy lowers the probability of being poor by 5.32 perent, while each addidonal child risesthe probability of being poor by 6.26 percent.
Table 5.22: Deterinants of Poverty, Ah ~ Indlvduals
Vaa Coefficient Mcan Margunal Effect
Constant 1.8323Student Statns 0.2706 0.445 0.0676
(8.7)Schooling -0.0282 7.032 f0.0070
(7.6)
Indgenous 0.6408 0.276 0.1602(18.8)
Healthy -0.2130 0.843 -0.0532(5.4)
Number of Chfl~de 0.2506 3.360 0.0626(28.2)
Ag of Houseiold Read -0.0204 42.571 - 0.0051(13.6)
Mat. Household Head -0.5229 0.891 -0.1307(10.9)
Schoolig of Houshold Mead -0.0727 8.241 -0.0182(19.6)
Household Head Une~ployed 1.7928 0.050 0.4482(22.3)
Room per Capia -1.1620 0.645 -0.2905(26.8)
Moan of Dependent Varable 0.458
N 25,986
Chi-Squiar. 29,819.2
sowree: EIH198.Not: AU coficieo~ are stau~y sgn~lcant at die 1 percent leel or beaer.
nber n paremee are t-ra~os.
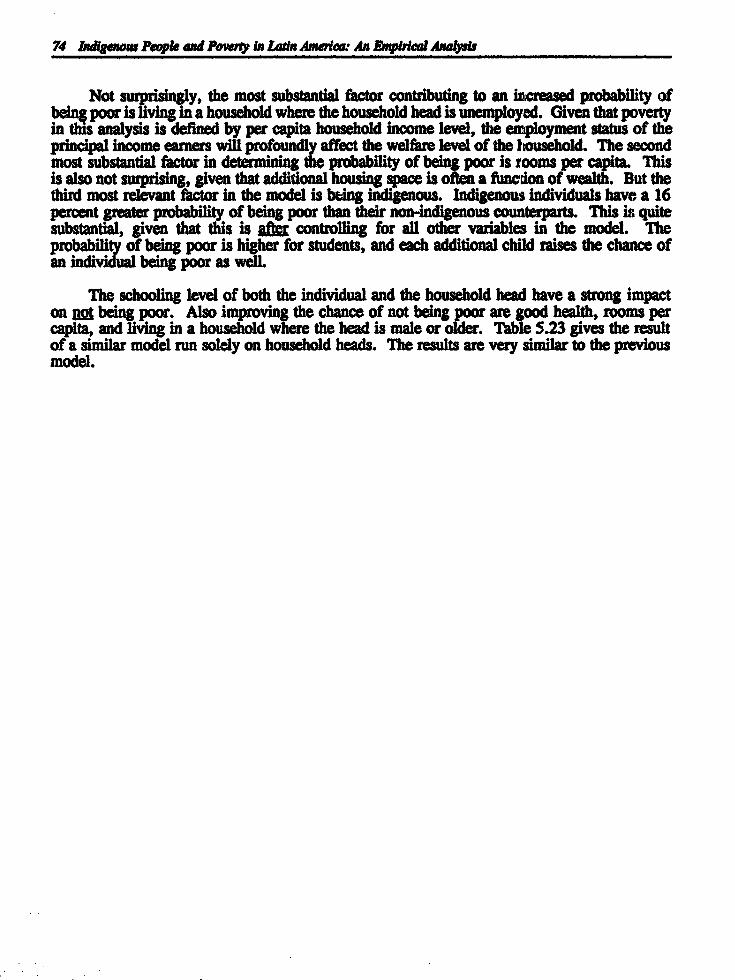
74 Idigenour People aNd Powy In Larin Amwke An MpWral Anayst
Not surprisingly, the most substantial factor contributing to an increased probability ofbein poor is living in a household where the household head is unemployed. Given that povertyin this analysis is defined by per capita household income level, the employment status of theprincipal income earners will profoundly affect the welfare level of the household. The secondmost substantial factor in determining the probability of being poor is rooms per capita. Thisis also not surprising, given that additional housing space is often a funion of wealth. But thethird most relevant factor in the model is being indigenous. Indigenous Individuals have a 16percent greater probability of being poor than their non-indigenous counterparts. This is quitesubstantial, given that this is a controlling for all other variables in the model. Theprobability of being poor is higher for students, and each additional child raises the chance ofan individual being poor as well.
The schooling level of both the individual and the household head have a strong impacton nol being poor. Also improving the chance of not being poor are good health, rooms percapita, and living in a household where the head is male or older. Table 5.23 gives the resultof a similar model run solely on household heads. The results are very similar to the previousmodel.
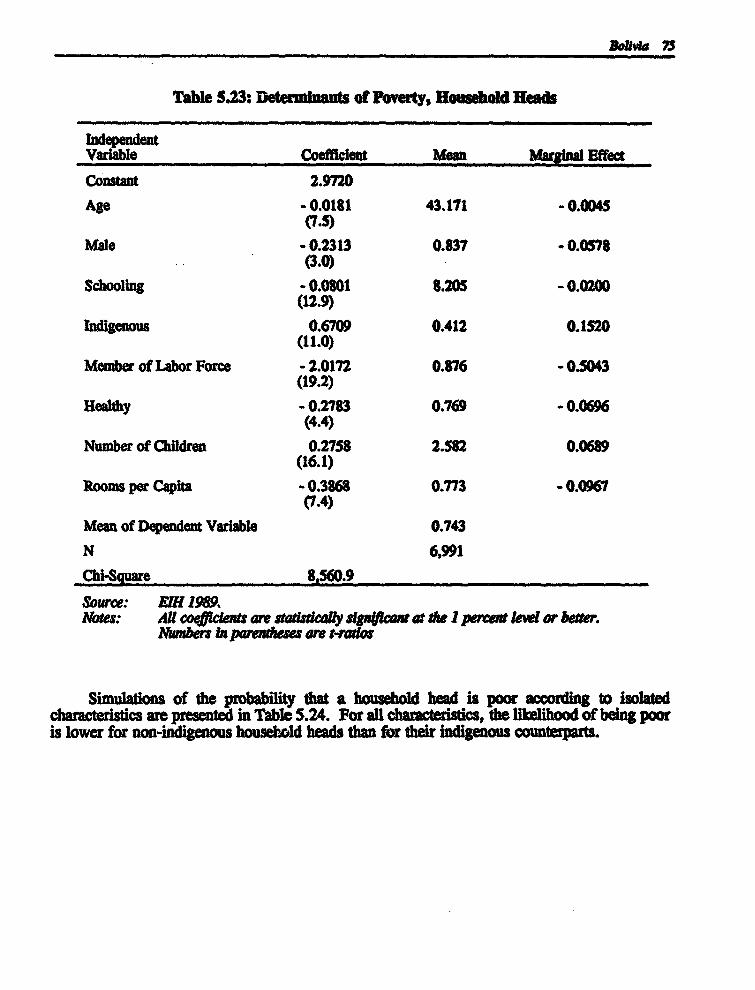
Table 5.23: Deterninnute foverty, HouseoM Heads
IndependentVariable Coeffient Mean Marginal Effect
Constant 2.9720
Age -0.0181 43.171 -0.0045(7.5)
Male -0.2313 0.837 -0.0578(3.0)
Schoolng -0.0801 8.205 -0.0200(12.9)
Indigenoua 0.6709 0.412 0.1520(11.0)
Member of Labor Force - 2.0172 0.876 -0.5043(19.2)
Healthy -0.2783 0.769 -0.0696(4.4)
Number of Children 0.2758 2.582 0.0689(16.1)
Rooms per Capita -0.3868 0.773 -0.0967(7.4)
Mean of Dependent Variable 0.743
N 6,991
Chl-Square 8,560.9
source: IE 1989.Note: AR co<lener ar statWcay ug4?cant at dw I pereent led or beer.
hbers in partheses are t-ra~os
Simulations of the prob that a houshold head is poor according to isolatedcharacteristics are i Table 5.24. For all characteristics, the ikelihod of being pooris lower for non-indigenous household heads than for their indigenous counterparts.
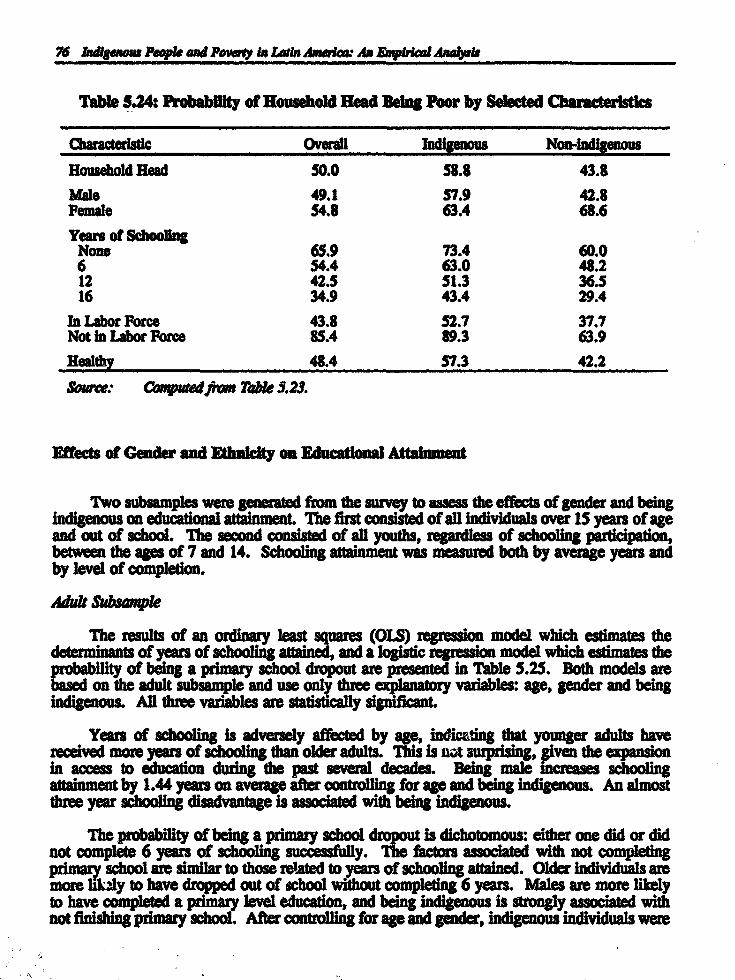
76 Ad ~ no ~ keople and P~mry In lan Ame: An aprialAnalyts
Table 5.24: ProbabWity of Hushold Head Being Poer by Sdected
Charactcdadc Overall Indignous Non-indigenous
Houshold Head 50.0 58.8 43.8
Male 49.1 57.9 42.8Female 54.8 63.4 68.6
Years of SchooibngNon# 65.9 73.4 60.06 54.4 63.0 48.212 42.5 51.3 36.516 34.9 43.4 29.4
in Labor Force 43.8 52.7 37.7Not in Labor Force 85.4 89.3 63.9
ealthy 48.4 57.3 42.2
Sourar: C~aedpuno Ta~e 5.23.
Effects of Gender and Etfui ty on dncatlonal Attalnmnt
Two subsamples we generated from the survey to asens the effects of gender and beingindigenous on educational atuadment The first consisted of all individuals over 15 years of ageand out of school. The second oned of all youths, regardess of schooling participation,between the ages of 7 and 14. Schooling atainment was measured both by average years andby level of compeion.
Tbe results of an ordinary least squares (OU) regression model which estimates thedeterminanta of years of schooling attained, and a logist regresson model which estimates theprobabity of being a prinary school dropout are presented in Table 5.25. Both models arebased on the adult subsample and use only thr explanatory vadables: age, gender and beingindigenous. All three variables are statistically significant.
Years of schooling is adversely affected by age, indicating that younger adufts havereceived more years of schooling than older aduts. This is not surprisng, given the expansionin access to education during the past several deade Being male increases schoolingm«tinment by 1.44 years on average after controing for age and being indigenous. An almostthree year schooling d isav is associated with being indigenous.
The probabiffty of being a pdmay school dropout Is dichotomous: emther one did or didnot complete 6 years of schooling muenaefly. The factors associated with not completingp school are similar to those related to years of schooling attained. Older individuals aremore ly to have dropped out of school without compledng 6 years. Males are more likelyto have completed a primary level education, and being ndigenous is strongly associated withnot finishing primary school. After controlling for ge and gender, indigenous individuals were

somvia 77
30 percent more li~ely to have not completed primary school than their nn-indigenous
Table 5.2g: Dton Adolt Sub
Dependent Vadlableln~ndest Independent Years of Puimary School
Variable Me= Schoonug (OLS) Dropot (L~or
Age 34.7 -0.071 0.011(40.4) (43.8)
Mal 46.8 1.442 -0.148(26.7) (19.8)
Indigenous 33.9 -2.850 0.307(49.0) (40.4)
Constant 11.190 -0.559Mean of Dependent Vaucable 8.5 0.388N 22,348 22,348R*/Ch-Square 0.205 5077.8
Source: Efi1989.Not: All co&~icleu a stlcicaRy amignldcat at die 1 percent lewel or beaer.
Mnbr In parenes are t-ratos.
Simulated eimate of the predicted ~*~of~aolbyoge,gender and being indigenous are p in Table 5.26. The of less thansix years of schooling increases with age. As expected, femae have a hkhofdropping out than males, and indigenous individuals are less likely to completethan their non-indigenous peers. Non-indigenous ales at 15 years of age have the lowestprobability of not having completed primary school - 10 percent At the other end of thespectrum, indigenous females who are 50 years of age have more than an 80 percent chan ofnot finishing six years of school Interestingly, the results show that non-Indigenous femaleshave a higher primary school completion rat than indigenous males, Indi that the factors
w school attainment are stronger for indigenous individuals than females. Theof these factors indicates that indigenous females ar the most diadvantaged in
urban Bolivia with respect to schooling atrainment.
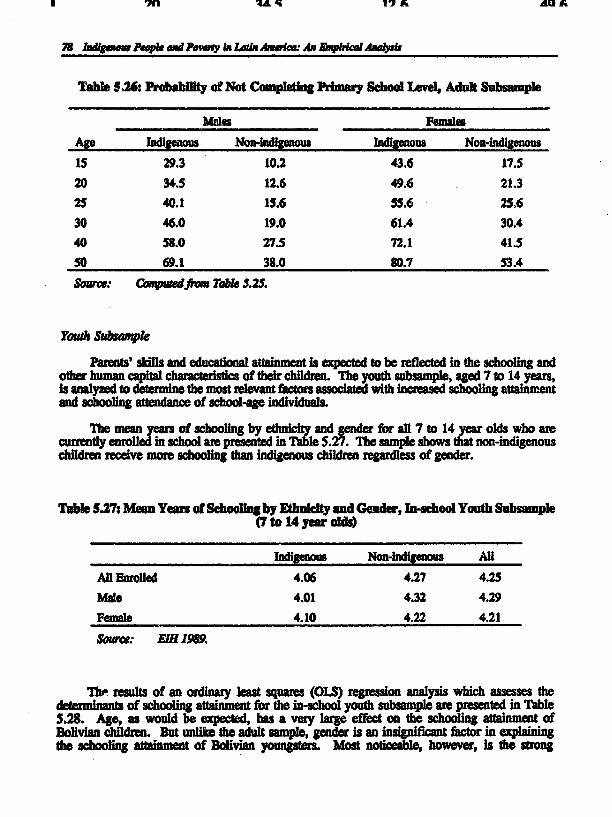
1•n la 1 A XA
78 bdla* e~pman,MP IngLannne Ananpirca AnD~ li
Table 5.26: Pr~obabity of Not Completing PImary School Lvel, Adult Subsample
Mde Fmals
Age Idigmnous Non-indigmnous Indigenous Non-indigenous
15 29.3 10.2 43.6 17.520 34.5 12.6 49.6 21.325 40.1 15.6 55.6 25.630 46.0 19.0 61.4 30.440 58.0 27.5 72.1 41.5
50 69.1 38.0 80.7 53.4
Sera: Cmadfrm ToM 5.25.
Youls Subwample
Parents' skills and educational atainmet is expected to be re~eced in the schooling andother human capital characteriitics of their childr~ . The youth subsampl , aged 7 to 14 years,is analyzed to determine the most relevant factors associated with increased schooling attainmentand schooling attendance of school-age individuals.
Te n of schooling by ethniity and gender for all 7 to 14 year olds who arecurrently enr in chool are presented in Table 5.27. The sample show that non-indigenouschildren receive mom schooling than indigenous children regaudless of gender.
Table 5.27: MenYea of Schoolng by Mbni~ly and Gender, In-school Yuth Subsamp e(7 to 14 year ölds)
Indig~ous Non-indigenous All
All Enrolled 4.06 4.27 4.25Mal 4.01 4.32 4.29Feal 4.10 4.22 4.21
Source: £IH 1989.
The results of an ordinary least squares (OIB) regression analysis which assesses thedeemn of achooling attainment for the in-school youth subsample are presented in Table5.28. Age, as would be expected, has a very large effect on the schooling attainment ofBoliva children. But unlike the adult sample, gonder is an nifimt factor in explningthe achoong atinent of Bolivian youngsters. most le, however, is the sUtrong

Boliia 79
negative effect which ethmicity has on schooling attainment. This highlights the relatively greaterImportance of ethnicity than gender in explaining present levels of schooling aa t, at leastfor the "in-school' youth sample.
Other factors are also significant in explaining educational attainment. Geographic locationcan be important; youths living in the Valley departanemos of Cochabamba and Chuquisacaaverage more years of schooling relative to youths in La Paz, while students in Beni averageless. Family background, as determined by mother's schooling, has a positive and significanteffect on the amount of education her children receive. Family income is an insignificantexplanatory variable. However, other wealth Indicators do show a significant impact on theschooling attainment of youth: the number of siblings has a negative effect, but the number ofrooms in the household, the presence of running water, and the presence of a Idtchen all havepositive effects on schooling attainment. A male head of household also has a positive effecton schooling attainment, as does private school attendance.
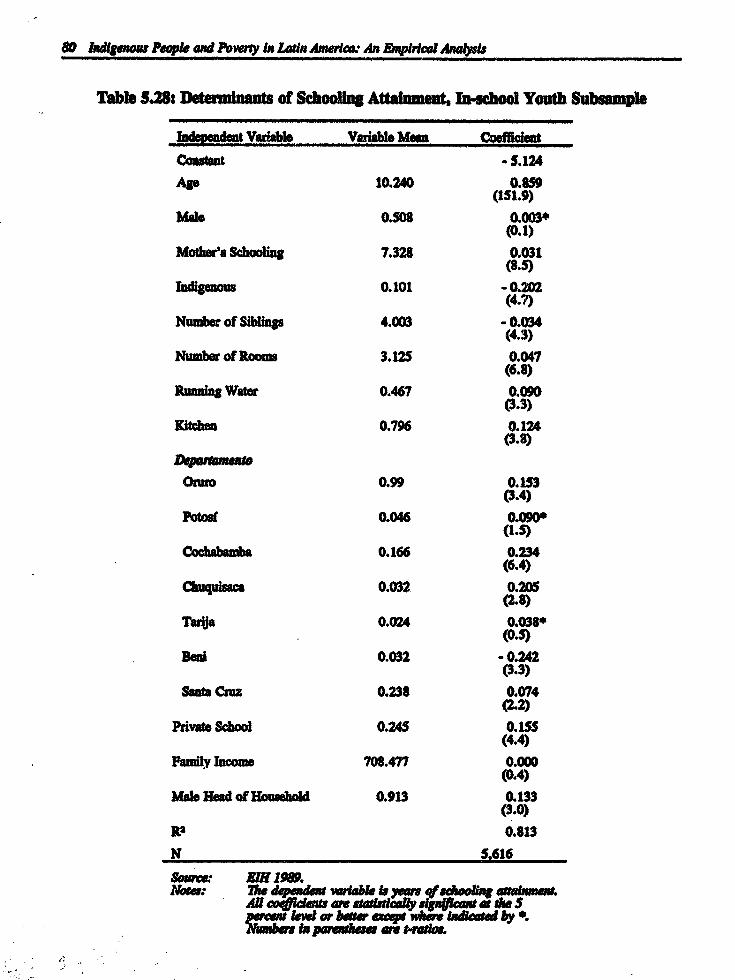
80 ndlgenoau Peqple mnd Pow~wy in Latin Amer~co An anirical Anal>vLs
Table 5.28: Determinants of Sho0~ng Attament, In-scho01Youth nheSmplb
d Vauiabie Vadable MeI n Coeffi~etCoastant -5.124
Agv 10.240 0.859(151.9)
Male 0.508 0.003*(0.1)
Mo~her's Schooliug 7.328 0.031(8.5)
Indigenos 0.101 -0.202(4.7)
Number of Siblings 4.003 -0.034(4.3)
Number of Room 3.125 0.047(6.8)
Rnlng Water 0.467 0.090(3.3)
Kitchen 0.796 0.124(3.8)
Omro 0.99 0.153(3.4)
Potoaf 0.046 0.090*(1.5)
Cochan~ba 0.166 0.234(6.4)
Cq~ 0.032 0.205(2.8)
Tarija 0.024 0.038*(0.5)
Eil 0.032 -0.242(3.3)
Santa Cruz 0.238 0.074(2.2)
Private School 0.245 0.155(4.4)
Family Tncome 708.477 0.000(0.4)
Mae Head of Ho.sent~ 0.913 0.133(3.0)
Ra 0.813
N 5,616
So~r.: EN9 1989.Notar:p dee ariab1le 41&doolig eabmeknt.
Mv de~ v Is ymnd athe 5yy _p~ ~ r b~ a ret eMt by K.
W ~In pmn~ka anm t~ds
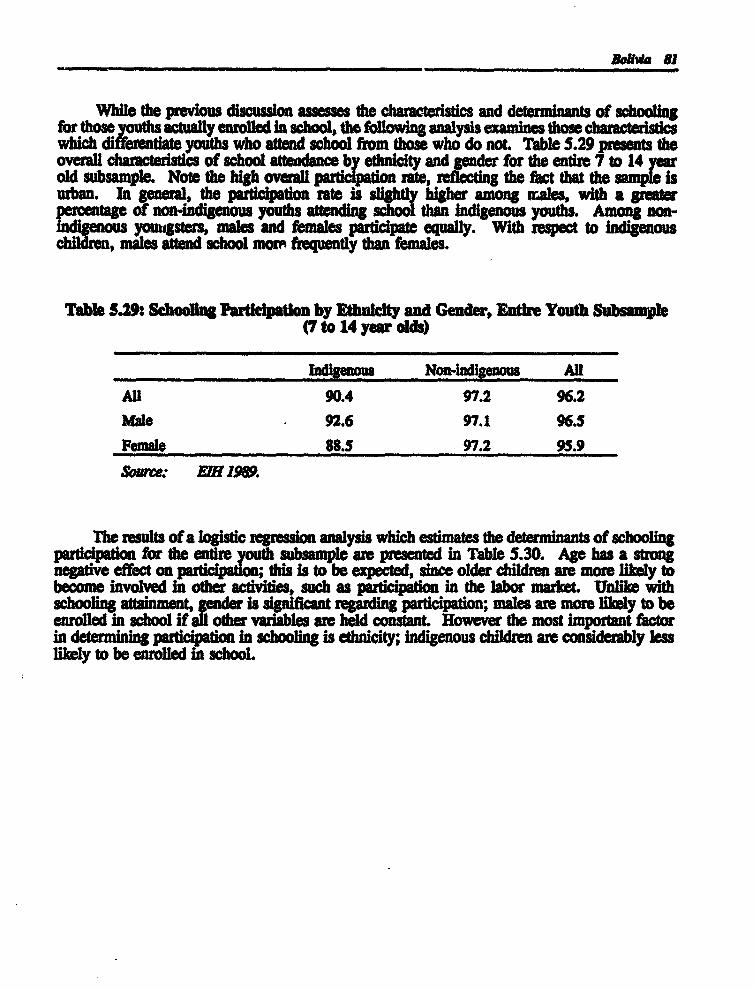
While the prvious discusson asesses the chamctoristics and determinants of schoolingfor those youths eolledia school, the following analysis exandnes thos charactd.sticswhich diferentatou who attend school from those who do not. Table 5.29 presents theoveral c r Å of school attennc ethnlcity and gender for the endre 7 to 14old subsample. Note the high overalon rate, reflecting the fact that the sampurban. In general, the participaton rte i slightly higher aong oales, with a g~sterpercentage of non-indigenous youths school than Indigenous youths. mong non-indigenous yougsters, maes and female pequaly. With respect to indigenouschildren, males attend school mor ~e ty than e~.
Table 5.29: Schoo~hg litllpaton by Ehn~ctty and Gender, Entire Youth Subsmp e(7 to 14 yar olds)
Indigenous Non-indlgenous All
All 90.4 97.2 96.2
Ma 92.6 97.1 96.5
Femae 88.5 97.2 95.9
Sorce: EIH1989.
The results of a logistic regression analysis which estimates the determinant of schoolingparticipation for the entire youth subsamplo are presented in Table 5.30. Age has a strongnegativ. efect on participation; this 1s to be expected, sice older children are more lily tobecome involved in other acd~vties, such as participation in the labor market. Unlike withschooling attninment, gender is significant regarding participation; males are more likely to beenrolled in school if all other variables are held ofstant However the most important factorin derminng participatio n schooling is ethnicity; indigenous children are considerably lesslikely to be enrolled in school

82 bdgenou Peple nd Porsy i Latin Amer~e: An Enprklal Anal~ws
Table 5.30: Determnant of Schoolng Part~cpatUon, Etre Youth Subsample
Indee Vadable Variable Mean Marginal Effect Coofficient
Constant 0.152
Age 10.353 -0.006(6.4)
Male 0.507 0.013(3.1)
Moter's Schooling 7.241 0.003(3.8)
Indigenous 0.110 -0.053(8.8)
Nuber of Siblings 3.858 0.002(1.9)
Number of Rooms 3.233 0.002*(1.5)
Ruming Water 0.475 0.007*(1.4)
Kithem 0.796 0.032(6.5)
Oruro 0.094 - 0.004*(0.4)
Potouf 0.046 0.014*(1.0)
Cochabamba 0.167 - 0.007*(1.0)
Chuquiaca 0.032 0.008*(0.5)
Tarija 0.024 -0.033(2.2)
Beal 0.035 -0.040(3.6)
Santa Cruz 0.244 -0.032(7.5)
Family Income 1977.948 0.000*(1.2)
Male Head of Household 0.892 0.012(1.6)
Men of Dependent Variable 0.969
Chi-Square 1626.3
N 6,924
Sorce: EIH 1989.NSa: he dpw~ variable LI y schoolig aa=lunt AR co<#cen&s
are st~at she d5 D orbeer ep herejpd,antqai by la are t-ra~os.

Boia 83
Simulated estimates of the predicted probability of =t being enrolled In school by genderand ethnicity, based on the logit model presented in Table 5.30, are presented in Table 5.31.Non-indigenous males have a higher enrollment rate than any other group, with non-indigenousfemales close behind. Indigenous youths have a substantially lower participation rate. Thelowest predicted probability of school enrollment is for indigenous girls, again reflecting thedisadvantaged position which indigenous females occupy relative to all other groups in urbanBolivian society.
Table 5.31: Predicted Probability of Being Enrolled In School, Entire Youth Subsample(7 to 14 years olds)
Indigenous Non-lndi;enous All
All 86.6 97.4 96.9
Male 89.0 97.9 97.5
Fmale 83.8 96.8 96.1
Source: Computed from Table 5.30.
Education and Earnings: Males
In this section, an analysis of educational attainment and earnings differentials is performedfor the subsample of males employed in the labor market. The differential rates of return toschooling associated with specific characteristics are then assessed. Differences in mean labormarket earnings between indigenous and non-indigenous male workers are decomposed intoOexplained' and "unexplained* factors, controlling for differences in economic, social, anddemographic characteristics. The "explained" component refers to that portion of labor earningsdifferences attributable to variations in productivity-enhancing characteristics between ethnicgroups, while the "unexplained" component is generally attributed to labor market discriminationand other unobserved factors.
The analysis excludes women who are employed in the labor markeL This is becausewomen are often subject to discrimination based on gender, and to include them would thereforebias an analysis which seeks to focus on discrimination due to being indigenous. Thedeterminants of women's earnings in the Bolivian labor market is explored in a later section ofthis chapter.
A profile of relevant characteristics of the subsample according to ethnic category arepresented in Table 5.32. Indigenous workers comprise 37 percent of the subsample population;over half of this group live in La Paz, while an additional 22 percent live in Cochabamba.Indigenous members of the labor force average 7.5 years of schooling, and almost half have acomplete primary education.
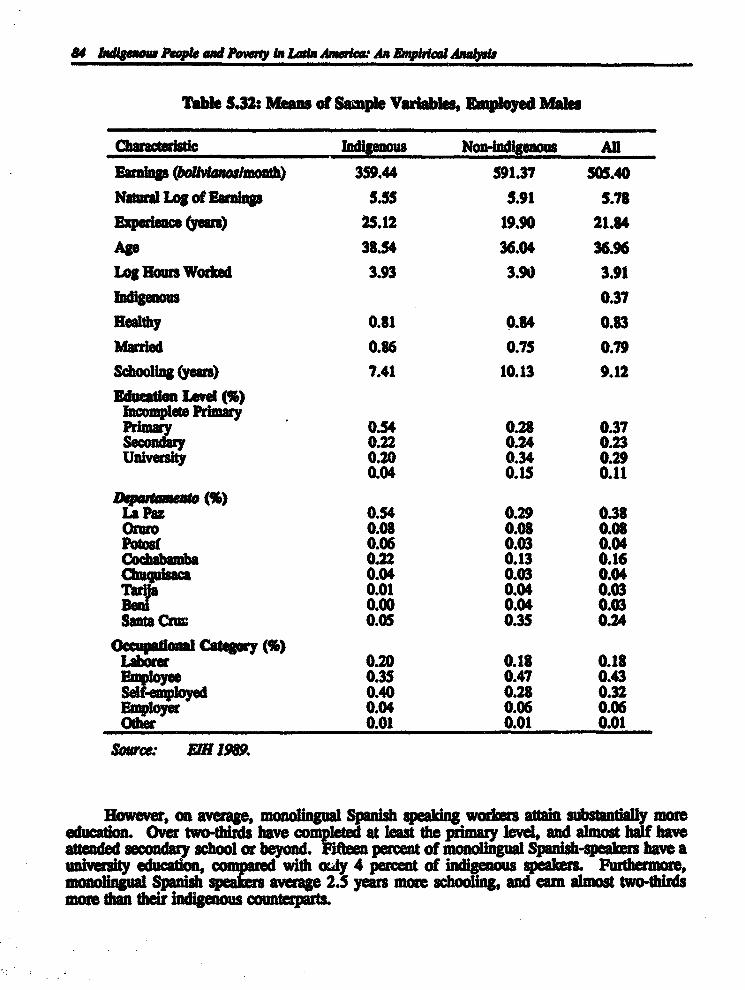
541rg.os Pep. ndPo~w in Lami AM~-w An ka~lMbL
Tabie 5.32: Means of Sample Variables, Employed Males
Characterisdec Indigenous Non-lndigenous All
Eaings (bialmonth) 359.44 591.37 505.40Naual Logof Earnlas 5.55 5.91 5.78
Expernc (y1 a) 25.12 19.90 21.84
AP 38.54 36.04 36.96Log Ho=s Worked 3.93 3.90 3.91Indigenous 0.37Healthy 0.81 0.84 0.83Maruied 0.86 0.75 0.79Schooling(yes) 7.41 10.13 9.12Educado. lveI (%)
Incomplete Pdmary 02 2Pmary54 0.28 0.37Secodary 0.22 0.24 0.23Universty 0.20 0.34 0.29
0.04 0.15 0.11
La p= 0.54 0.29 0.38Orwo 0.08 0.08 0.08Poosf 0.06 0.03 0.04Cochabamba 0.22 0.13 0.16Chngnieac 0.04 0.03 0.04
a 0.01 0.04 0.030.00 0.04 0.03
Santa Cru 0.05 0.35 0.24
C~be M0.20 0.18 0.181,l" 0.35 0.47 0.43
0.40 0.28 0.320.04 0.06 0.06
Other 0.01 0.01 0.01
Source: 21119.
However, on average, monolingual Spanish speaking wod~ers attain subsantially morecdu~on Over two-thirds have completed at least the primar level, and almost half haveand scondary school or b~ ~Pi&en perce t of monolingual Spanish-sp er have a
university educatio, m with aly 4 percent of indigenous spualaers Furthermore,mnl anl Sp h q r average 2.5 years more chooling, and earn almost two-thirdsom than thei indigen~ oneprs
GWn t the d g oup of wor~s are older and have fewer yas of schooliug,t have ye of tial 1 awket a eeage ac(fo ä - 4
A IM-äg. purc~aa of hnd~nu ~aes th e "abw forc ame sefso~e rat* toite -'popuaPCn, whe fewer indigenous worrs are stlarid employes, employers or
ay indigenous cohort is more likely to be aui, wbile the non-indigenous cohort is slightly more healthy than the indigenous group of woders.
Deenna~ of Labor Mare~ EaWringshfr Males
The results of an ordinary least squares (OLS) carnings fu~adon analysis for both then~igenou and non-indigeous ohorts, as weR as for the populaton a a whole, are presentedin Table 5.33. The dependent variable is natural logarithm of labor mar~net eaings.
Thler Is a sigificant negative effect on labor maret ~a um with beingindigenous. Examming the determinanta of earnings separately indigenous and non-ni us wor~ers, the average retus to schooling am b~ for nan-Indigenous males thanfor aes by almost 3 percentage points. Sim , work~s eceyvhigher retums to labor mar~ket experence. Good heth is mor h y rewarded a ongindigenous worers, whle number of hours wored per week bas a payoff for nom-indigenous workers by a margin of 8 percentage ponts.
Decomiposin qfeLabor Market Earnns
Uuing the e~gs functions estimated and presented in Table 5.33, the overalldifferential between indigemus and non-indigenous mate wor~aers is decomposdtechnique outlined above (Chapter 4).

86 Intgeou People and P~wrty ln Latin Amercw. An Empitical Anayis
Table 5.33:1Dtsninants of Labor Earnings, Employed Maks
Indigenous id Al
Constant 4.372 3.758 4.047
SMhoo~ig 0.057 0.086 0.075(14.1) (23.7) (27.8)
Experience 0.027 0.045 0.038(6.8) (13.3) (15.0)
Exp- 0.0003 -0.0006 - 0.000(5.2) (9.8) (11.1)
Log Hours Worked 0.154 0.238 0.208(3.5) (6.5) (7.3)
Indigenous -0.129(5.8)
Healhy 0.081 0.070 0.081(2.2) (2.1) (3.3)
Married 0.294 0.239 0.270(6.0) (6.9) (9.6)
- 0.079* -0.269 -0.203(1.5) (.)(5.7)
P~tos - 0.156 - 0.19 - 0.149(2.6) (2:0) (3.2)
Cochåbamba 0.141 0.2 0.121(3.9) (3.0) 4.4)2
Chuqulsaca .151 - 0.020* 0.062(2.2) (0.3) (1_2)
Tr - 0.028* - 0.0
Bad 1.0~32031032(2.8) (05.20) (O3L
Saota cm 0.3920.0034(5.7) (13.0) (14.7)
Laboe -0.672 -0.788 -0.765.6 (13.7) (16:7
Employe. - 0.669(9.0) 7(12.6)(63
Sel4mpoye - .60 -0.499 -10.7(81 (94 (13:3)
other .16 -1.0 l ii3(8.5) (6.9) (11.0)
N 2,394 4,070 6,464
Ra 0.201 0.328 0.310Adiusted RI 0.195 0.325 0.308
So~.e: EWH 1989.Nota: Dependent vriable is de naural log un of earnings. AU c ~ W
are stad~ialys,n#cn at>d 5'n p e~e~ or beufr, ec~p wfweebda by 4' n ar ~c are t-rats

Bolivs 87
The decomposition results are presented in Table 5.34. The portion of the oversall earningsdifferential due to disparities in the productive characteristics of indigenous and non-Indigenousworking males is 71.7 percent. In other words, based on the variables included in Table 5.33,the earnings differential between indigenous and non-indigenous working males would narrowby 71.7 percent If each group were endowed with the same productive characteristics. Theremaining 28.3 percent difference in earnings is unexplained, and reflects both measurementerror and unaccounted factors such as disparities in ability, quality of education, labor forceparticipation, culture and labor market discrimination. Therefore, discrimination could accountfor as much as 28 percent of the overall earnings differential between indigenous and non-indigenous workers in the urban Bolivian labor market.
Table 5.34: Indigenous Workers' Earnings Disadvantage and Its DecompositIon
Amount Attributed To:
Indigenous Worker's Earnings Overall Differential Endowments Wage Structure
Gap (in current belvianos) 232.0 166.0 66.0As Percent ofOverall Differential 100.0 71.7 28.3As Percent ofNon-indigenous Earnings 60.7 43.5 17.2
Source: Calculatedjhm Table 5.33.
The contribution of individual variables to the overall earnings differential betweenindigenous and non-indigenous workers is shown in Table 5.35. A positive entry indicates anadvantage in favor of non-indigenous workers while a negative entry indicates an advantage infavor of indigenous workers. With respect to the endowment of specific characteristics, muchof the non-indigenous workers' earnings advantage can be explained by three factors: schoolingattainment, residence in Santa Cruz and higher pay for self-employment.
Regarding the "unexplained" discrepancies in the pay structure, the returns to non-indigenous workers are higher for education, experience and hours worked. That is, for thesame level of schooling, experience, and hours worked, indigenous workers are always paid lessthan their non-indigenous counterparts. The only substantial advantage that indigenous workershave in terms of the pay structure is due to the very large entry for the constant term.

88 lndigur Peopl and Forrny in L.arin miA.~. An Ekaur l An~ult
Table 5.35: Contrdbution of ach Varable to Overa DIfferetial
Contribution of Each VarabIe to Contribd~o a a Percentageo) E~aings Differental of Total Earnings Differentlal
Endowments Pay Stroctur WageVariable b.(X. - X) XA - bo Endowment Structue
Constant 0.00000 -0.61412 01W - 171.06Schooling 0.23227 0.20954 64.70 58.37
Experence - 0.08092 0.66431 - 22.54 61.38Log Hors Worked - 0.00618 0.33049 - 1.72 92.06Healthy 0.00231 - 0.00893 0.64 -2.49Married -0.02457 -0.04783 -6.85 -13.32
Oruro -0.00027 -0.01540 -0.08 -4.29Potosf 0.00376 0.00103 1.05 0.29Cochabamba -0.01054 -0.00458 -2.94 - 1.28Chuquisaca -0.00027 -0.00575 -0.07 -1.60Tarija - 0.00067 0.00004 -0.19 0.01Beni 0.01304 - 0.00071 3.63 -0.20Santa Cruz 0.12288 0.00040 34.23 0.11
Occponal
La~ 0.01734 -0.02299 4.83 -6.40Employe -0.07851 0.01591 -21.87 4.43Sef-employed 0.06041 0.04293 16.83 11.96Other 0.00881 0.00131 2.46 0.37
Total 0.25887 0.10173 71.66 28.34
Overall 0.35900 100.0
Source: Calculaed frmn Table 5.33.
Education and Earnings. Fenales
As mentioned above, an analysis of discrimination in the labor mariet duc to ethnicitywould likely be b~ased if both sexes were included because dIscimnatin often occurs on thebasis of gender, independent of ethnicity. Furthermore, women face different issues than menIn their decisions on whether to enter the labor market, and in what capacity. This occursbecause childrearing, domestic housework and cultural factor are more liMely to keep womenout of the work force than men. And when women do enter the work force, they may be moreinclned to work in the informal sector in order to have the flexibility to meet otherresponsibilities despite the lower pay which prevails there. On the other band, they may beforced into the informal sector duc to disrmination ln the format uecaor.
Because of the complexity of these issues, this sed on aeses the determinanto of laboreaings for womn separtely from those of males. The analysis is based on the subsample ofwomen aged 15 and older who were mployed in the labor force at the time of the .Table 5.36 presents a profile of relevant charactedlsds of the subsample accori~ng tocategory.
Thirty-eight percent of workig wome in Bolvia are indigenous. On average, theIndignous women are almost four years older than their non-ind ~ *CountrIndigenous females employed In the labor force have 5.3 years of schooi and le ta 30percent have ted prmary school. In contrast, 65 percent of the non-indigenous grouphave completed education. Furthermore,non-indignous femalesaverge almost 4 moryears of schooling, and carn almost 50 percent more than their indigenous counterparts.
The higher average age and lower years of schooling for indigenous women means thatthey have more potential years of labor marlet experience. A very high percentage ofindigenous women are self-employed relative to the non-indigenous group, while relatively feware salaried employees or employers. Lastly, the non-indigenous cohortis slightly mor healthy,while employed indigenous females are mor likely to be maruied relativ to the non-indigenousgroup of workers.
Detennn of Lebor Market Eamngs for Females
B~rnings function estimates are presented in Table 5.37. The effect of schoolingexpnence and hours worked on labor earnings Is greater for non-Md~genous women; the onlyadvantage indigenous women have is due to the constant term. The extended model in the farright column shows that there is a strong, negadve effect on earnings anssodated with beingindigenous.
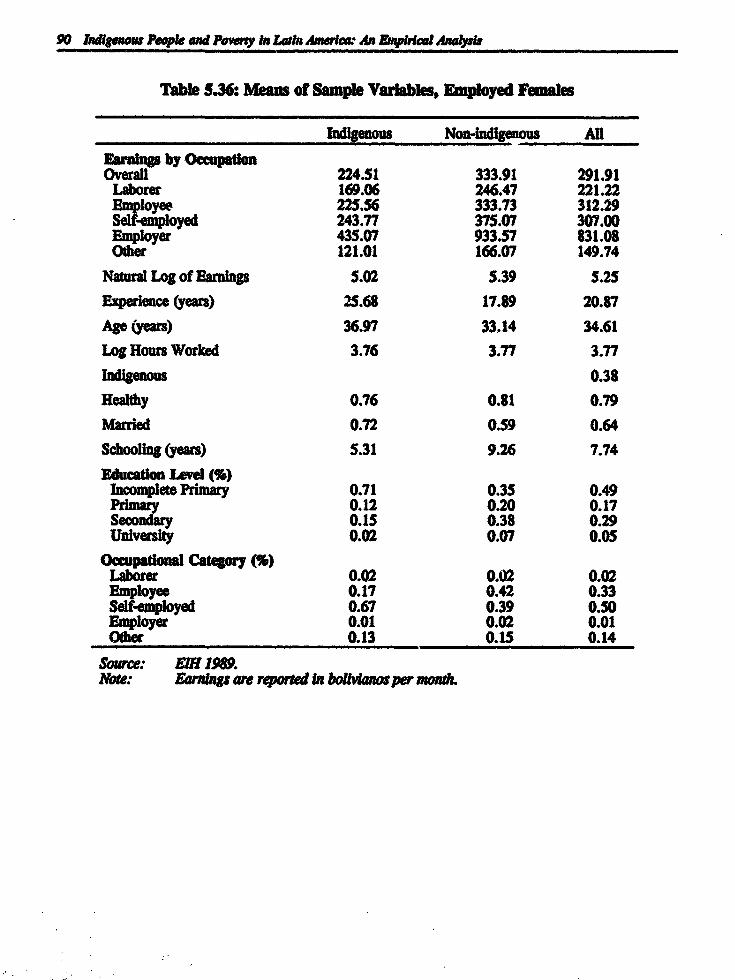
90 Indigenow People and Poeruy In Latn Ame"f- An SWphcal Anabwk
Table 5.36: Means of Sample Variables, Employed Females
Indigenous Non-indigenous All
Earnings by OecupationOverall 224.51 333.91 291.91
Laborer 169.06 246.47 221.22Employee 225.56 333.73 312.29Self-employed 243.77 375.07 307.00Employer 435.07 933.57 831.08Other 121.01 166.07 149.74
Natural Log of Earangs 5.02 5.39 5.25
Experience (years) 25.68 17.89 20.87
Age (years) 36.97 33,14 34.61Log Hours Worked 3.76 3.77 3.77Indigenous 0.38
Healthy 0.76 0.81 0.79Married 0.72 0.59 0.64
Schooling (years) 5.31 9.26 7.74
Education Level (%)Incomplete Primary 0.71 0.35 0.49Primary 0.12 0.20 0.17Secondary 0.15 0.38 0.29University 0.02 0.07 0.05
Occupational Category (%)Laborer 0.02 0.02 0.02Employee 0.17 0.42 0.33Self-employed 0.67 0.39 0.50Employer 0.01 0.02 0.01Other 0.13 0.15 0.14
Sowce: ENI 19.Note: Earngs are repormd In bolivianos per meaa.

souvia 91
Table 5.37: of Labor Earnings, Employed Feunaln
A AUVadiable Indigenous Non-indigenous (standard) (extended)constat 3.1664 2.7454 3.0214 3.4996
Schooäng 0.0666 0.0843 0.0774 0.0751(12.6) (20.6) (24.1) (20.0)
Experience 0.0342 0.0418 0.0398 0.0315(6.1) (10.0) (12.4) (9.4)
-0.0004 - 0.0004 -0.0004 - 0.0003(3.7) (4.8) (6.8) (5.2)
Log Hours Worked 0.2468 0.3493 0.3006 0.3208(5.7) (9.1) (10.5) (11.5)
Indigenous -0.1180(4.0)
Healthy 0.1088(3.7)
Married 0.0402*(1.4)
-0.8431
Employee -:27
Other -0921(8.4)
- 0.2442
Trija - .21487
t-.11 28.3.4.
cåu~usc 0.0190*T~ 30.11 3)
13 9)sa c. 0:3450
(10.0)R2 0.100 0.165 0.173 0.238
N 1,661 2.675 4,336 4,336
Source: FM 1989.No~: ariable s at I level or beuer, cept wisere *ndlmeni by *.
N besta pafres. ametrto

92 Inadlgno,u Peqp. and Po~my In LaO nm- An A~lriawlnalits
BrtUhty, Educadeon and Female Labor Fore Partlelpadlan
In this fia u~eedon, fertl~ and cild mare amind within the context of femalepurtdcpadon in th labor force. roL of ~is incuded as a factor condidoning faMlysi8 proferences and hence ctual famiy size. ~ asessing the factors asnted with thedemand for children, the oelationhip betwen fert~ty, oucatn and employment is explored.
The sub for this analysis is all women ina unon with a spouse present in thehousof the . Information on the woman and her spouse are inciuded,as wel as swveral household les. The fertlty varlable Is simply the number ofchidren over bor. Infant and child mortality is dened as tho difference betwemn the numberof children over bom to a woman and the number of children alivo at the dme of the survey.
A proffie of relevant subsample characterstls are presented in Table 5.38. These resutsdiffer somewhat from those ted in Table 5.19, since the earlier table is based on allwomen age 13 or more j reof the presence of a spous . Tho average number of childrenover bom to the women of allges Is 4.13, whil e mean level of infnt and/or chUd deathsper woman is 0.62. Thre quarters of the women are under *ge 45. The average schooliugattainment for all women Is 7 years. Sixty-three percent of the women are mono Spanishspeakers, 34 percent are bilingual indgenous, and 3 percent are monolingual ous. Ingeneral, the husbands are four years older than their spouses, and have atine an additional
.6yasof schoollng.
Men houshold incom is 690 bollk~os per month. Husbands' arnings account for ther of this, white woring women contribute an average of 258 holivkans through their
mn WhIle ess than half of thO women in a conjugal union are in the labor market, thowho dwork an average of 42 hors per week at their jobs. The unemployment rateamong women force participants Is 6 prcent, and only one-third of working women arecoveed by socialsecuty.

Tabbe 5.38: M~ans and StandardDevtadas of Sample Varablus(wainen t a union with apouse present)
Vadlable Mean s.d.Al Wom (N=6,043)
Age (years) 37.9 12.145 or under (%) 76.0 43.046+ (%) 24.0 43.0
Yem of Schooling 7.0 4.7
Monal Indigenous (%) 3.0 17.0ine34.0 47.0
Monlinual (%)63.0 4.0Verilty4.13 2.6
Child Mm~tlk 0.62 1.3Labor Force Pard*lpadon 0.48 50.0
Ag 41.9 13.0Years of Schoolng 8.6 4.6Barnings (baaor/month) 465.4 953.0
Rousehold ChuracteristlcHousehold Incom (bo.L/nath) 689.8 1154.7Number of Persons 5.3 2.0Number of ChUdren 2.8 1.8
Ww Wäome (N=2,740)Hou~ 7.1 3.5
Dayoficek 5.1 2.1Flou~Weck 41.9 25.2E~ ~(bolaumonth) 258.1 333.0Social S Coverage (%) 33.0 46.0Lookig for Work (%) 6.0 26.0
So~rc: EM119 .
Fertilty and Osild Mortality
Ouc of the draw~ of opkying f a t ferttICtyhistory of women who are sdl in thar reprodue~le years, msam is tru with respet tochild mortality. Furthermore, cmulativo mesues do not tel us much about the timing ofbirths or dtha Therefore, analyses have been conducted for wome 45 y andyounger, and for women over 45 years of ag who have thb~r .Anal ' the two groups separately h~lps to disentangl som of the period cobortThe ideal s~wntion would be to have complete bith hisinrls in order to analyze teends ~ iferlity by cohort and time pedod. A1teately, data from th older cohort could be employcdto predict completed ferlity for the cob~rt however this would li~oly be bad giventhat the substhntial increase in fmales during th last two dads has changed
94 IndigeM eople a POm4y in Lars Amaw An O4pii Analpt
women's preferences for children. Due to these potential sources of error, the analysis of theyounger cohort employs age controls (age and age-squared) to offset possible age diherences infertlit patterns.
Mean fertility (children ever born) and mortality (child deaths) rates per woman for thetwo age groups accordagto ethnicity, educational level and place of residence are presented inTable 5.39. Of the 6,043 couples in the subsample, 76 percent of the women are in thechildbearing ages of 15 through 45, while 24 percent of the women are past age 45 and thereforehave completed their fertility at the time of the survey.
Women over age 45 at the time of interview gave birth to an average of 5.7 childrenduring their reproductive years; on average 1.1 children died per woman in this group. Themean number of children ever born to women age 45 or under was 3.6, with an average of 0.5child deaths per woman.
It is evident that indigenous respondents have substantially higher fertility levels than non-indigenous interviewees. For women with complete fertility histories, the indigenous cohort hasgiven birth to an average of almost one child more than the non-indigenous group. Thisdifference increases to almost two children per woman for those in their childbearing years;however the disparity between the two groups is partially due to the fact that women ofindigenous origin tend to marry at a younger age. Child mortality levels show a pattern similarto fertility levels, being substantially higher among indigenous women. This is not surprisingsince women with higher fertility levels are more likely to see a greater absolute number of theirchildren die; in fact, high child mortality levels are often a primary factor resulting in highfertility levels as couples seek to ensure that an adequate number of children live to adulthood.Figure 5.2 depicts the variation of fertility and child mortality by ethnicity and level ofeducation.
For women of all ages, there is a strong correlation between level of education and bothfertility and child morality levels. Fertility is higher among the older cohort for two principalreasons. First, as discussed earlier, this group has completed their reproductive cycle while theyounger group may still have children in the future. Second, Imowledge and availability ofcontraception was probably less widespread when the older cohort was in its prime reproductiveyears, although use of modern contraceptive methods is still low in Bolivia in comparison to therest of Latin America. Third, reductions in infant mortality may have impacted the fertility rateof women, as couples feel more assured that a greater number of children will survive toadulthood.

Bouvia 95
Table 5.39: Fertity and Cld Morta~ty by Socioecononde Characterlstles Means(women ta a union with spouse present)
A 15 hrough 45 Age Over 45
characterstle Prdi1ty Mortality Ferdlity Mortality
Ethnic GroupMoniligual S3.3 0.3 5.3 0.7Bilingual 4.1 0.6 6.0 1.4Monolingualdg 5.5 1.1 6.5 1.8
Educational LavelNo Schooling 5.5 1.3 6.4 1.7Pr~mary Dropout 4.6 0.8 6.5 1.5Primary Completed 4.0 0.5 5.9 0.9SecondaryDropout 3.4 0.3 5.1 0.6Secondary Completed 2.5 0.1 4.1 0.4University Dropout ,.6 0.1 4.3 0.4University Completed 2.4 0.1 4.2 0.2
Department (Mean Jncome)La Paz (619) 3.5 0.4 5.1 0.9Oruro (552) 4.3 0.8 6.8 1.8Potot (496) 4.5 0.9 6.8 2.1Cochabamba (713) 3.3 0.3 6.0 1.1Chuqusaca (602) 3.6 0.4 5.9 0.9Tarija (564) 3.6 0.3 5.9 1.0Beni (1034) 4.2 0.5 7.1 1.3Santa Cruz (876) 3.5 0.4 5.9 1.0
Overall 3.6 0.5 5.7 1.1
Source: EI1989.Not: Mean total household Income In boltvianos per mont.

96 Im*ga~ P~ an d Povny In L Atin ca: An Empircol naws
1gure 5.2: Frtity and ChUd Mortalty by EthnltIy and Ednat~on(womn over ag 45)
ChtMtes eve boris7
6.8 .
4
n d Nead Pf* See UIidEthate group EdUSBetoto fw
ChUdea dees.sed2
e.~
71.
0.7
Ne.",.., .,.. ,., Ne.d P,. ... 13
Ettale gress Edseion t.ee
Sæn'r: EIH 1989.

BoUVIa 97
Table 5.40: Determiinants of Ferthty(women In a union with spouse present)
Aga 45 orVaDable Under Age 46+
Constant - 1.758 6.691Woman's Educatlon - 0.135 -0.146
(14.3) (5.5)Husband's Educaton -0.055 - 0.050
(5.8) (2.0)
Age 0.289(8.2)
Age-squared -0.002(4.2)
Monolingual Indigenous 0.015* -0.043*(0.1) (0.1)
Bilingual Indigeaous - 0.080 0.203*(1.3) (1.2)
Household Income (000 boltvianos) 0.005 0.058*(0.2) (0.6)
Ra 0.370 0.089
N 4,370 1,400
So~. EI11989.Notes: Dependent vauabe is mWnber <f li births eu~r born to a
wMan. Nabers In pareneses are t-ratos. ANw~rables are signcwnt at the 1 percent le~t or bewer,rcept wlere indicated by*.
Many of the factors presented in Table 5.39 are interrelated and jointly deterine theobserved fertility behavior. Table 5.40 presents the results of a simple logistic regression modelwhich assees the factors associated with fertility. Separate regreeein are reported foryounger and older women in order to tak into account the truncated fertility histories of theformer. The depen variable Is the total number of live births per woman. Thenvarinles erve e following purposes: educational levels of the woman and her hund capturedifferential frtility prefemences; age and its square reflect biological differences; income asessethe income effect on fertility behavior and ethnicity captures possible cultural differencesregarding preferred family siz. Monolingual indigenous and bilingual indigenous status arenseesed using non-indigenous women as the comparison group.
Education demonstates the strongest effect in reducing fertility for both age groups.However the husband's educational level, though highly significant, has less than half of theimpact on lowering fertility as does the educational level of the woman.. Importantly, ethnli-tyand household income levels are not significantly associated with fertility once educa~inn is

9l lndigeou People and ~neny In ta Mt : An a ~pfrmml A~a<ls
contro~d for In the rgreuuion. This imptäs that fdbavlor Is not an iisurmountablecultural datum, but rather is sto chang. interventions such asncreMsed accs to eua-s. Ta i r5.41~premst the of aimilar model regarding the
deenian~ of child m ~rtHt.
Tabe 5.41: Dn Ch8d Mtmaty
Womc~ e 45Varabor Womn Ag 46+
Catant 0.078 1.832
Woman's Pucatdon -0.045 -0.056(9.0) (3.7)
Husband's Educadon -0.021 -0.045(4.1) (3.2)
Ag 0.027 - 0.005(12.7) (0.8)
Mo~ol~igual Indigmnous 0.152* 0.340(1.3) (1.8)
3ingualIndigenou 0.093 0.362(2.9) (3.7)
Rousehold com. (000) 0.004 -0.007(0.3) (1.1)
1' 0.137 0.106
N 4,370 1,400
Source: IR 1989 .Noter: Depandent mutlie Is omnber gf d~ru w*o hw died per
uI@IWL7. h ubample is mawn Is a sfo ii spo ssr present.Nionbers la paradhem are t-ratlos. 40 iutaitla are sIgn yIcwntat the 1 pnt lel or beme except wew blcaed by*.
Fertiity, Schoodng and Feale Labor ce ParicIpado
Meni characterisdcs for wodd~g versus non-wdd~g women in the subsample arepenmed inl Tabk 5.42. Wo~dg wsan have barly a on yuar educational advantage overaon-w women. Intersangly, women who wor av~age the mme number of chidren as
who not. The mem ~ icome from the huland's employmmnt is a about the same foreach go therere, as a~result of thir own wome who wor belong to households
w.tof ndigenous women among thoseis half of not igure 53 depicts foma labor fores participation and-annsby ~ an eltnd leeof
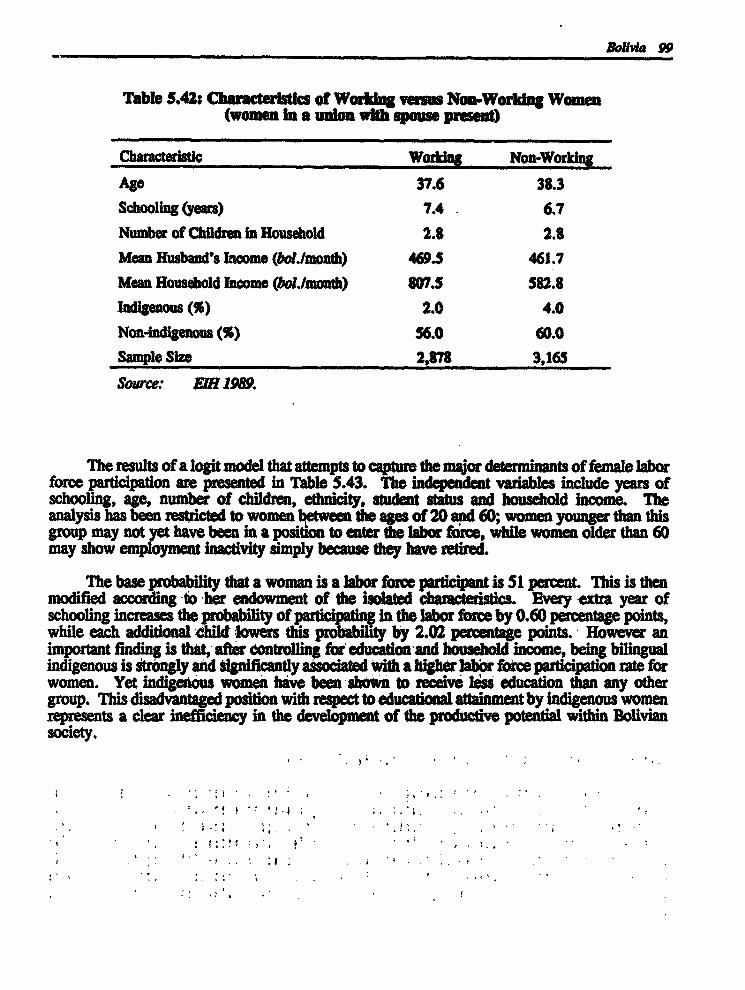
Bolivia 99
Table 5.42: Characteristics of Worklhg versus Non-Wordkg Women(women In a unlon with spouse present)
Characteristic Working Non-Woria
Age 37.6 38.3Schooling (years) 7.4 6.7
Number of Childrein Household 2.8 2.8Mean Husband's Income (bol.oath) 469.5 461.7
Mean Household Income (bol.lmonth) 807.5 582.8
Indigenous (%) 2.0 4.0
Non-Indigenous (S) 56.0 60.0Sample Size 2,878 3,165
Source: EI 1989.
The results of a logit model that attempts to capture the major determinants of female laborforce participation are presented in Table 5.43. The independent variables include years ofschooling, age, number of children, ethnicity, student status and household income. Theanalysis has been restricted to women between the ages of 20 and 60; women younger than thisgroup may not yet have been in a position to enter the labor force, while women older than 60may show employment inactivity simply because they have retired.
The base probability that a woman is a labor force participant is 51 percent. This is thenmodified according to her endowment of the isolated characteristics. Every extra year ofschooling increases the probability of r in the labor force by 0.60 percentage points,while each additional child lowers ti prbait by 2.02 percentage points. However animportant finding is that, after controlling for education'and household income, being bilingualindigenous is strongly and significantly associated with a higher labor force participation rate forwomen. Yet indigedkous women have been shown to receive Iass education than any othergroup. This disadvantaged position with respect to educational attainment by indigenous womenrepresents a clear inefficiency in the development of the productive potential within Boliviansociety.

J
Lへ
-:町 科
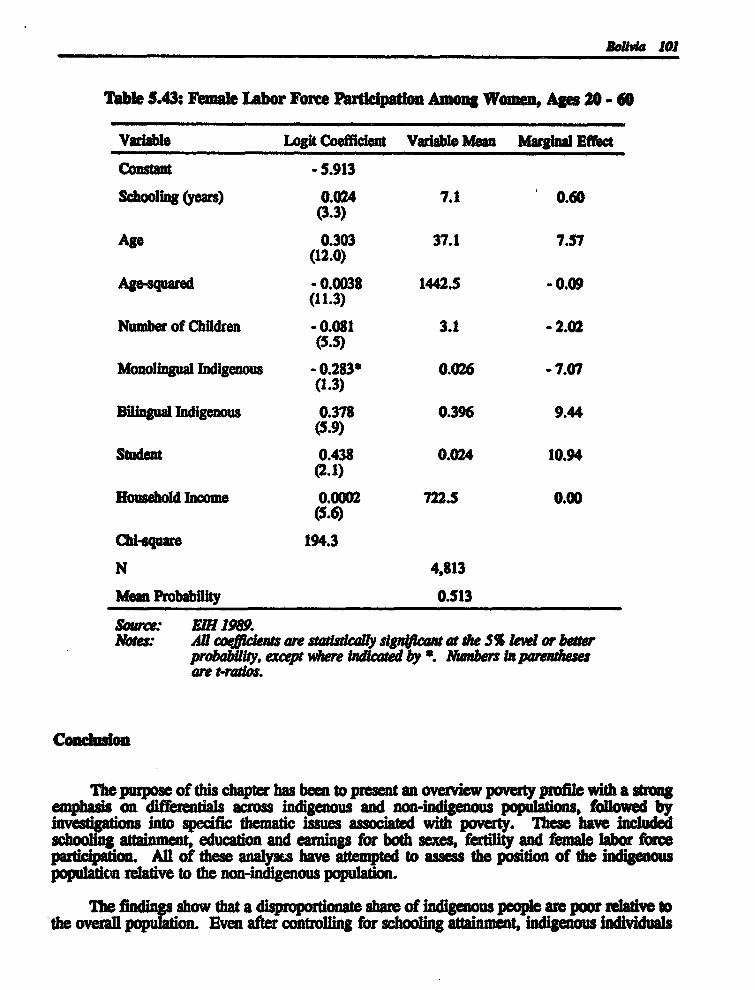
Table 5.43: F~ 1~ Force Pård Am~ W~ Aga » - 60
V~* Lögk Coofficim V~ Mé= Mu~ Effla
nwii ý -5.913
S~liqg (YOM) 0.024 7.1 0.60(3.3)
Agc 0.303 37.1 7.57(12.0)
Agm~ - O.W38 1442-5 -0.09(11.3)
Nu~ of ChUdren -0.081 3.1 -2.02(5.5)
I~ = - 0.283* 0.026 -7.07(1.3)
Indigmus 0.378 0.396 9.44(5.9)0.438 0.024 10.94
(2.1)
Hoa~ ha= 0.0002 722.5 O.W(5.6)
Ch~ 194.3
N 4,813
Möm Probability 0.513
So~.- Effl 1989.ÅR coq~ am av~ äg~ at the 5% or b~~Isy. ~ ~ bd~ by 11ý Kw~ In para~are t~.
Cond~
TU purpm of this d~ has bem to premt an ov~ p~ pr~ wfth aca~ on diffim~ acr= ind~us and 1=4 A:#~~ fog~ by-w~ POPU~*Infl2~Rtflin into ~ th~ im= asw~ with hd~8~ a~mt c~on and ~ for both ~ f~ and femb ~ fom
All of *me ~ have aftffted te mm the ~ of do UK~r~c to Om non-indigenous popubtim
The ~ show ~ a g= of ix~ 1~ m poor rek~ toEvm con~ for whooling uw=Cn4 Mftenous bh~
102 Indgenaw People and Powry In Lads Ameim As BapbrI*d Analyt
have a 16 percentage point greater probability of being poor than nn-indigenous individuals.Furthermore, mean per capita income levels for the indigenous group are less than two-thirdsthat of the non-indigenous group.
Decomposition analysis of earnings differentials shows that, for the male sample,endowments of assessed characteristics account for 72 percent of the disparity betweenindigenous and non-indigenous earnings. Unexplained factors such as variations in ability,quality of education, labor force participation, culture and labor market discrimination areresponsible for the remaining 28 percent of the earnings gap.
Of the measured persona charaeristics in this analysis, higher schooling attainment isthe strongest factor in the greater a of non-indigenous males, accounting for nearly two-thirds of the total differential. Nous males in the labor force average almost threemore years of schooling than their inignoscounterparts, while the disparity betweenindigenous and non-indigenous females is almost four years. Furthermore, the returns toschooling are substantially higher for both exes of the non-indigenous population.
These findings indicate that raisin; the schooling levels of the indigenous population is animportant step towards increasing their incomes, which in turn will lower the high incidence ofpoverty which affects them. Kelley (1988), using a rural Bolivian sample from the mid-1960s,finds that most, if not all, of the disadvantages faced by indigenous males would disappear ifhuman capital and family background differences were equaliued. The results here show thatwhile the gains for modern-day urban areas would not be as substantial as those found byKelley, a very large share of the earnings differential would disappear if indigenous workerspossessed equal levels of human capital and other attributes.
But investigation into the determinants of schooling attainment shows that being indigenousis strongly associated with lower schooling levels even after controlling for family income andmaternal education level. This i true for both adults and youths currently in school. Withrespect to irdigenous individuals in the labor force, over half of the males and over two-thirdsof the females never completed primary school. This compares with about one-third of non-indigenous individuals who did not finish primary school. In fact, the negative associationbetween being indigenous and schooling attainment is stronger than between gender andschooling attainment. Indigenous females are the most disadvantaged group with respect toschooling, and subsequently earnings as well. Interestingly, though, bilingual indigenous womenare more likely to participate in the labor force than non-indigenous women.
Thus there is a need for educational programs to raise the participation and completionrates of indigenous persons, particularly females. Bilingual education is a possible method forachieving this goal. This could be an effective means not only for raising enrollment levels, butalso for increasing the rate of return to education for indigenous groups by improving the qualityof the learning which they achieve.
However, increased education affects more than earnings. Fertility and child mortalitylevels decline significantly in response to greater education for both the mother and the father.Lower fertility, in turn, is associated with higher participation in the labor force for women,thereby reflecting one indirect effect of education on earnings.
Increasing the educational attainment of indigenous persons is not the only means by whichto improve the conditions in which this group lives. Equally important are Improvements intheir access to health care and family planning, and assessments for improving demand in the

;11. ,‘… .··.&.,..닉
6
Guatemala
Dime &ede
I All
rx way of life for Guaten" s indigenous people has not changed since ftconquest over 4W yew ap. In the Mayari tradition, a person is expected to producefood and sustenance to support ft family and to meet community .Sations.
dation of goods is not admized; excess n* perceived as having been gained through theft..greed or witchcraft. E[ard work eVecially w"king on the lands, is highly valued, and is seenas to a We wbm basic needs we satisfied and my surplus is given to communal
Land represents a major link to the earth, a lwy element of Mayan cosmology, andworIft the land is associated widi a sense of community (Goldin 1M).
Prior tD the arrival of do indigenous people did not "own- land In the Westernsense,* at least part of all farm. was communal. Families worked p1ots to provide for theirneeds and for the needs of the comiaunitv as a whole. After the Samish domination, theindigenous people resisted proving W of their land and often I@Wto register *ks.This made it easy fee outsiders to gain Ion and push the indigenous people from theirlands. While some efforts were made to fight bacl; the usual response was to retreat furtherinto the higher elevations. Even in the 1980s, many indigenous people had no legd fide to theland they huned Qqyrop 1983).
A JA..... ange resulted as the indigenous people were for c P d to resort to wage laborwhen unable to provide for their needs on mamasiqoy smaller hrm plots. IU economy ofGuatemala has long been based an do labor provided- by the People. LeVI methodsfor coercmg labor began with the sixteenth =ft" which. Umsferred the Crown'sright to tribute to an Individual. Indigenous people were included in the grant and theaeomer4m enjoyed total dominion over the indigenous ople (Handy 1984). Variousadditional measures were used continuing into the twentieth century when Vagrancy laws werewritten requiring landless peasants to work as many as IOD days per "I plantatim.Today, few Indigenous hmilies could survive without the income sea grant workIn addition,, as the indigenous people were pushed entirely fiom. the land, they took an now
-- I as wage laboars,, as teachers, in trade, in tourism.
M chapter uses data from a recent national household survey of Guatemala,, the E*wmNadand (ENSD 1989), to = nine pwerty. education, child labor,occupation and earnings. ne analyses compare and contrast the situations for indigenous andnon-indigenous people.
105
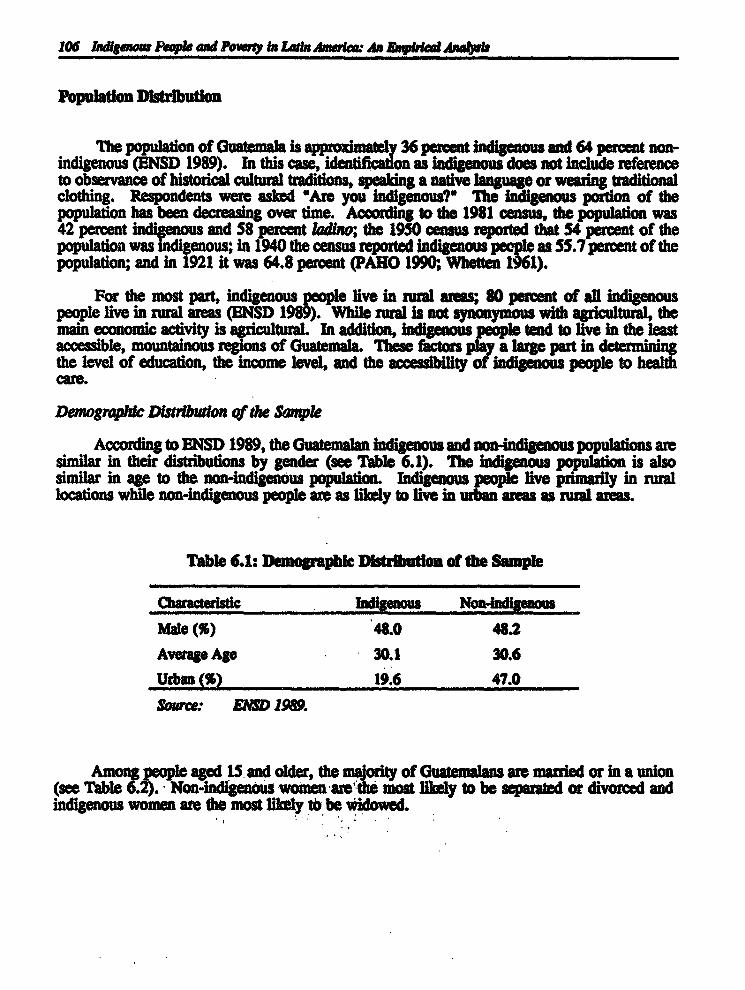
106 Idg4ow Peqple iulP.meryn Luu A& ~m: An Empirlaal Ana~wb
PopulatlonD»iributlon
The population of Guatemala is appoimately 36 percmnt indigenous and 64 percent non-indigenous (ENSD 1989). In this cass, identification as indigenous dos not include referenceto observance of historical cultural traditions, speaking a native language or wearing traditionulclothing. Respondents we asked Are you idigenous?* The indigenous pordon of thepopulation has been decreasidg over time. According to the 1981 census, the population was42 percent .q'eous and 58 percent ladkno; the 1950 census reported that 54 percent of thepopulation was digenous; in 1940 the census reported indigenous people as 55.7 percent of thepopulation; and in 1921 it was 64.8 percent (PAHO 1990; Whetten 1961).
For the most part, indigenous e live in rural am; 80 percent of all immu muspeople live in rural areas (ENSD 19 ). While rura is not synonymous with 9 ~ , themain economic activity is agricultural. In additon, indigenous tend to ive in the leastaccessible, mountainous regions of Guatemala. These factors a large part in determiningthe level of education, the income level, and the a eslmy of indgenous people to healthcare.
Demograpmc D~stribulon Qf the Sale
According to ENSD 1989, the Guatenalan indigenous and non-indigenous~populatin aresimitar in their distributions by gender (see Table 6.1). The indigenous population is alsoimilar in age to the non-indigenous population. Indigenous people liv pdmadly in rural
locations while non-indigenous people are as likely to live in urban aras as rural area.
Tapbe6: Dengrapblc Distribution of the Sample
Mae (%) 48.0 48.2
Av~rage Ags 30.1 30.6Urban (%) 19.6 47.0
Source: ENSD 1989.
Among people aged 15 and older, the majority of ilaemninn are married or in a union(see Table 6.2). Non-indigenous womenaethe most liely to be separted or divorced andindigenous women are the most likely tå be widowed.

Outenda 107
Table 6.2: Distribution by Maritaltatus, Age 15 and Older (perceu~
Indgenou NnldieousMarital Status Total Mac F=*le Total Mac Female
SinglO 23.2 26.5 20.2 29.7 34.3 25.4Marrid/Uumon 68.6 70.9 66.7 60.4 61.5 59.4
SeparatedlDivorced 2.0 0.8 3.0 4.7 1.9 7.2Widow/er 6.2 1.9 10.1 5.3 2.3 8.0
Source: ENSD1989.
Households in Guatenala are usually headed by maried couples; over 80 p t of bothindigenous and non-indigenous households are haWdm by marred couples (see T1e6.3). Non-indigenous househoLds are slightly more ~lihly to have s~ngle parent household heads whethermale or female.
Table 6.3: Maital Status of lamenoanMead (percem)
ousdhold Read
Marred F~male, Male,Couple SpouseAbsen Spouse Abseat
Indigenous -85.3 10.7 4.0
Non-indigenous 80.3 13.8 5.9
Sourœ: EMD 1989.Note: Marred rT to how~kd hed, iÉer male h m* fraale. whw rporte
demsels as maorras a wn.
Poverty lncidence
In gene the population of Guatemala is pooq tre out of four p live below thenational average standard of living. In 1989, the om n CoefflMatnwas 0.60 and the share of income for the bottom 20 percent of the was only 2.1percent. Income inequality increasd during the 1980s overall and indigenous people inparticular (Psacharopoulos et al. 1992).
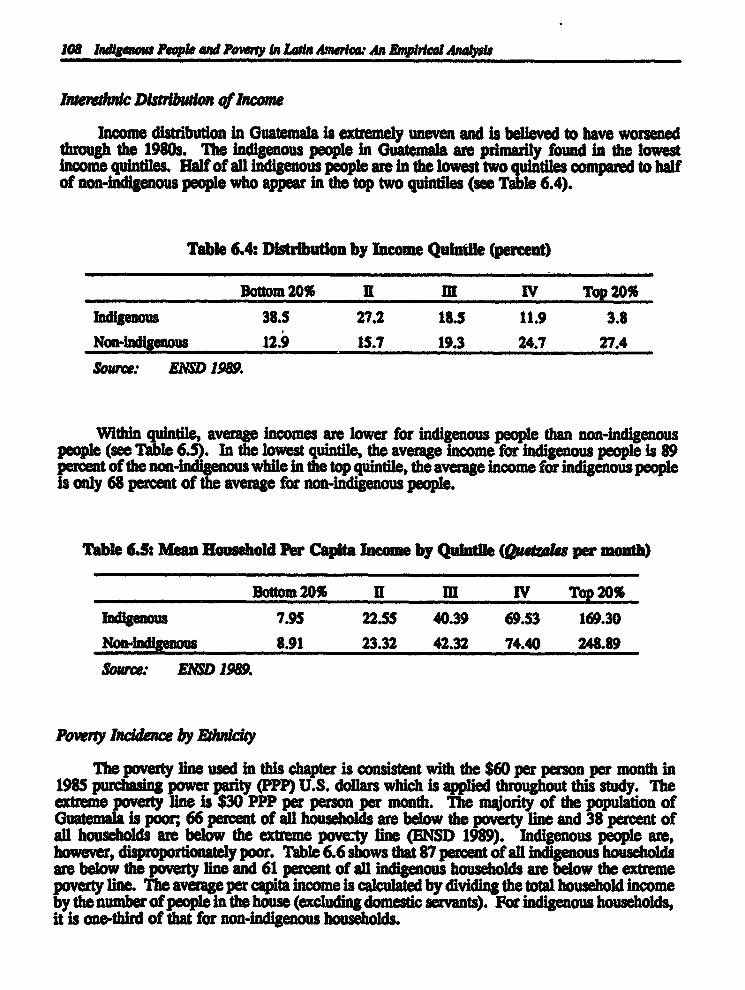
108 hpam People wd Po"ny in lain Ameriwc An EMpiated Anatli
Interedudc Dbistbuon q WIncome
Income distribution in Guatemala is extremely uneven and Is believed to have worsenedthrough the 1980s. The Indigenous people In Guatemala are primarily found in the lowestIncome quintiles. Half of all indigenous people are in the lowest two qulitiles compared to halfof nn-indigenous people who appear In the top two quintiles (see Table 6.4).
Table 6.4: Distribution by lbcome Qulatile (percent)
Bottom 20% R III IV Top 20%
Indigenous 38.5 27.2 18.5 11.9 3.8Noadedigenous 12.9 15.7 19.3 24.7 27.4
Source: ENSD 1989.
Within quintile, average Incomes are lower for indigenous people than non-indigenouspeople (see Table 6.5). In the lowest ulntile, the average income for indigenous people is 89
t f t while in quintile, the average income for indigenous peopler'Mpercent of thrage for non-Indigenous people.
Table 6.5: Mean Household er Capita Income by Qulatile (ustaer per month)
Bottom20% H m IV Top20%Indigenous 7.95 22.55 40.39 69.53 169.30NoIdigenous 8.91 23.32 42.32 74.40 248.89
Source: aSo1989.
ftny Incidence by Niciy
The poverty line used in this chapter is consistent with the $60 per person per month in1985 purchasing power parity (PPP) U.S. dollars which is applied throughout this study. Theatreme poverty line is $30 PPP per person per month. The majority of the population ofGuatemala is poor; 66 percent of all households are below the poverty line and 38 percent ofall households are below the extreme povety line (ENSD 1989). Indigenous people are,however, disproportionately poor. Table 6.6 shows that 87 percent of all indigenous householdsare below the poverty line and 61 percent of all indigenous households are below the extremepoverty line. The average per capita income is calculated by dividing the total household incomeby the number of people in the house (excluding domestic servants). For indigenous households,it is one-third of that for non-indigenous households.
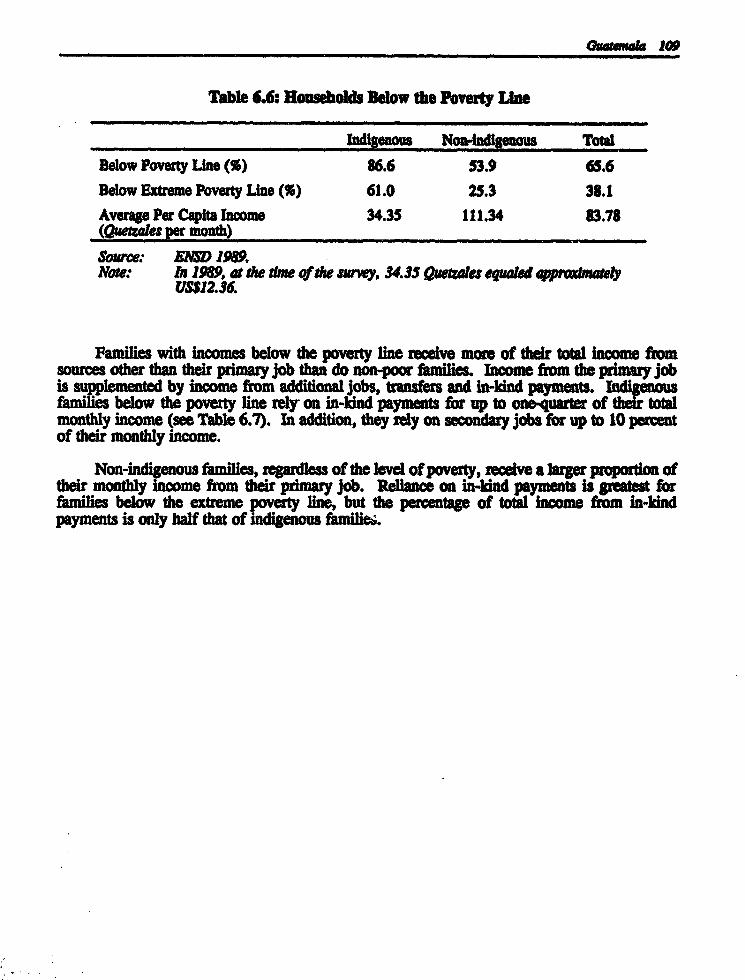
Guaenate 109
Table 6.6: Housebolds Below the Poverty Ioe
Indigenous Non-ntdigenous TotalBelow Poverty Line (%) 86.6 53.9 65.6Below Extreme Poverty Line (%) 61.0 25.3 38.1Average Per Capita Income 34.35 111.34 83.78(QueVales per month)Source: SMD 198.Note. In 1989, at de time qf the swwy, 34.35 Quetrats equalad 4pprtmatey
US$12.36.
Families with Incomes below the poverty line receive more of their total income fromsources other than their primary job than do non-poor families. Income from the primary jobis supplemented by income from additional jobs, transfers and in-kind payments. Indlpnousfamilies below the poverty line rely on in-kind payments for up to onequarter of their totalmonthly income (see Table 6.7). In addition, they tely on secondary jobs for up to 10 percentof their monthly income.
Non-indipenous families, regardless of the level of poverty, receive a larger proportion oftheir monthly income from their primary job. Reliance on in-kind payments Is greatest forfamilies below the extreme poverty line, but the percentage of total income from in-kindpayments is only half that of indigenous familie.
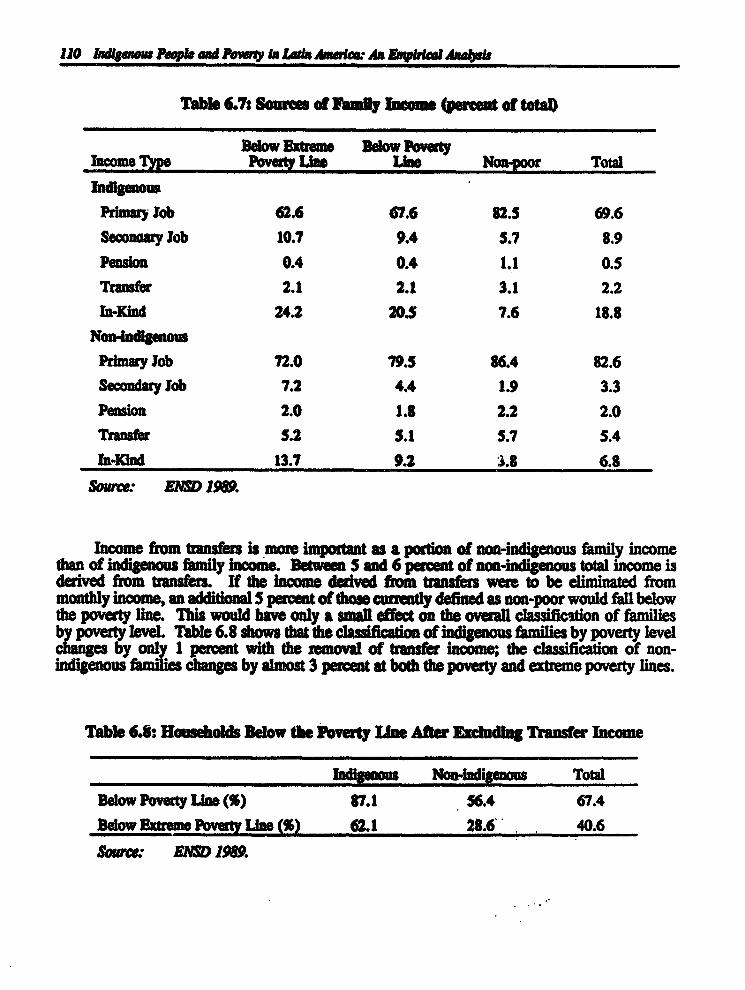
110 Indgmuuus ftple end .iway ln Lila 4 im.4 balpIri a4al
Table 6.7: Sourmes of Emiily Imnm (perma~ of tota
8elow amae low veutyIncome Type Poverty Isa Lie Noa.poor Total
IniguPdmary lob 62.6 67.6 82.5 69.6Seconary lob 10.7 9.4 5.7 8.9Pension 0.4 0.4 1.1 0.5Transfer 2.1 2.1 3.1 2.2In-Kind 24.2 20.5 7.6 18.8
Non-indigemousPuimary ob 72.0 79.5 86.4 82.6Secondary Job 7.2 4.4 1.9 3.3Pension 2.0 1.8 2.2 2.0
Transfer 5.2 5.1 5.7 5.4In-Kind 13.7 9.2 3.8 6.8
Source: ENS1 189.
Income from transfers is mor impoutant as a portion of non-indigenous family incomethan of indigenous family income. Between 5 and 6 percent of non-indigenous total income isderived from transfers. If the income derived from transfers were to be eliminated frommonthly income, an additiOna 5 percenat of thos. curently dened as non-poor would fall belowthe poverty line. Tis would have only a smal effect on the overall nainnation of familiby poverty level. Tble 6.8 shows that the nof indigenous familis by poverty levelchanges by only1 percent with the removal of transfer income; the classifiation of non-indigenous familie changes by almost 3 percent at both the poverty and extreme poverty lines.
Table 6.8: Households Bel~w the Povety Line After Ew~lding Transfer Inome
Indmf ~ NTotal
Below Poverty Line (%) 87.1 56.4 67.4
Below Bxtreme Povarty Li= (%) 62.1 28.6 40.6
somce: ENSDo198.

Vjuqspala111
Distribradon qf Public Services
In Guateomala, the n4odty of the popt~n does not have access to such public servicesas water, sanitation, and , although urban arasar not as limited in services s ruralarem. Table 6.9 shows the pesenc of services for all housholds. Lss than one.third of allindigenous housholds have water piped to their homes for ther exclusive use compared toalmost half of non-indigenous households. Hlsf of indigenous households have no sanitaryservices, and thre-fourths have no electricity.
Table 6.9: Preu~e of Public Services, Al Rouseholds (perent)
Inilgenons ____Non-Jnd~e
Total Urban Rural Total Urban Rural
Water
Exclusive Use 30.9 44.4 27.4 48.2 61.4 36.1Shared Use 4.4 14.7 1.8 13.7 22.4 5.7
Public Source 19.3 22.9 18.5 7.2 4.6 9.5Well 16.1 5.8 18.7 15.5 4.1 25.9
Rive, Lake or Spring 25.8 4.5 31.2 9.9 0.8 18.2Other 3.5 7.7 2.4 5.6 6.6 4.6
Santary Servees
Private PacRities 4.7 17.8 1.3 27.1 48.9 7.2Shared Facies 2.5 9.5 , 0.8 10.1 17.9 2.8
Public Waroom 3.1 13.0 0.6 6.3 9.6 3.3Well 23.3 28.4 22.0 23.6 16.4 30.2Latrin 20.9 14.3 22.5 11.4 3.9 18.2
None 45.6 17.0 52.8 21.6 3.3 38.2
ElectrIlCty
Yes 25.4 65.6 15.1 63.4 91.8 37.5No 74.6 34.4 84.9 36.6 8.2 62.5
Source: EM D 1989.
Bemne, the majouity of indigenous hffnf h1dS are below the poverty lie, the presenceof public services in poor indigenous is virtually idendcal to that of all households

112 Infigenou People and Powrty in Latin Amerka AN ENqpirlal AnaIs
(see Table 6.10). Non-indigenous poor households do show differences from all households,with fewer households having services.
Table 6.10: 1kesence of Pubic Services for Households Below Poverty Line (percent)
Indigenous Non-IndigenousTotal Urban Rural Total Urban Rural
WaterExclusive Use 29.0 41.0 26.2 38.5 51.3 30.7
Shared Use 4.2 13.8 1.9 11.5 22.7 4.6
Public Source 20.4 26.1 19.0 9.6 7.7 10.8
Well 16.2 6.0 18.6 18.8 6.4 26.4
River, Lake or Spring 27.0 5.2 32.2 14.8 1.5 23.0
Other 3.2 7.7 2.1 6.8 10.5 4.5
Sanitary ServicesPrivate Facilities 3.2 13.2 0.7 13.0 30.4 2.4
Shared Facilities 2.1 7.7 0.7 8.5 18.8 2.2
Public Washroom 2.9 13.2 0.4 5.8 12.2 1.8
Well 22.9 30.9 21.0 28.2 25.6 29.7
Latrine 21.2 15.9 22.5 13.3 6.5 17.5
None 47.8 19.2 54.6 31.3 6.6 46.4
Electrcdty
Yes 22.2 60.7 12.9 50.0 85.4 28.3
No 77.8 39.3 87.1 50.0 14.6 71.7
Source: ENSD 1989.
More indigenous households own their home than non-indigenous households; 84 percentof all indigenous households own their homes, compared to only 66 percent of non-indAgenoushouseholds (see Table 6.11). In urban areas the indigenous advantage is maintained; 74 percentof indigenous urban households own their homes compared to 58 percent of non-indigenousurban households. The advantage is also maintained among poor households. Eighty-fourpercent of poor indigenous households own their homes, while only 69 percent of poor non-indigenous households own their homes.

Guaetaa 113
Although more indigenous households own the home in which they live, those homes aresmaller than the homes in which non-indigenous households live. The average number of roomsIn an indigenous household is 2.2 compared to 2.8 for a non-indigenous household. Informaonon the quality of homes is lacking.
Table 6.11: Home Ownership
Average Number of Rooms
Homes Owned (%) Total SleepingAll Households
IndigenousTotal 83.6 2.2 1.3Urban 73.9 2.5 1.5Iural 86.1 2.1 1.3
NoMdemu
Total 65.9 2.8 1.6Urban 57.7 3.3 1.8Rural 73.5 2.4 1.4
Households Below Poverty Line
IndlgnOMTotal 84.4 2.1 1.3Urban 75.6 2.3 1.4
Rural 86.5 2.0 1.2
Non-ladigenous
Total 69.1 2.4 1.4Urban 55.9 2.6 1.5
Rural 77.1 2.2 1.3
Source: ENSD 1989.
The Brcuea Nadonal Soco-Demogrqfica contains information on two more measureswhich can be used to describe the level of basic services in households; the presence of a kitchenin the household and type of fuel used for cooking. Overall and in rural areas, indigenoushouseholds are as likely to have a room inside the household in which cooking is done as non-indigenous households (see Table 6.12). However, indigenous households are overwhelminglydependent on firewood as the main fuel for cooking. Non-indigenous households also usefirewood as cooking fuel, but have much greater access to propane (see Table 6.12).

114 Indigraew People and Powr"y in Lada Ameaim An qpkral Analw
Poor indigenous households do not show large differences from all indigenous households.This Is because the majority of indigenous households are poor. Non-indigenous poorhouseholds are also similar to all non-indigenous households except in the use of propane as acooking fuel (see Table 6.12).
Table 6.12: Kltchens and Cooking Fuel (percent)
Location of Kitchen Cooking Fuel
Inside House Outside House Firewood Propane
All Households
Indigenous
Total 69.3 30.7 96.6 2.2
Urban 69.5 30.5 87.0 9.3
Rural 69.1 30.9 99.0 0.5
Non-indigenous
Total 74.4 25.6 62.8 31.7Urban 85.2 14.8 34.5 56.5Rural 64.6 35.4 88.7 8.9
Households Below Poverty Line
Indigenous
Total 69.4 30.6 98.4 1.0
Urban 66.6 33.4 94.1 3.8
Rural 70.1 29.9 99.4 0.3
Non-indigenous
Total 68.4 31.6 81.2 15.4
Urban 78.5 21.5 56.8 35.8
Rural 62.1 37.9 96.2 2.8
Sorce: ENSD 1989.
Edcation
One of Guatemala's greatest challenges is the low educational attainment levels of itseconomically active population. This results in low productivity and a high concentration ofworkers in low-skilled occupations. The situation for indigenous people is especially grave.
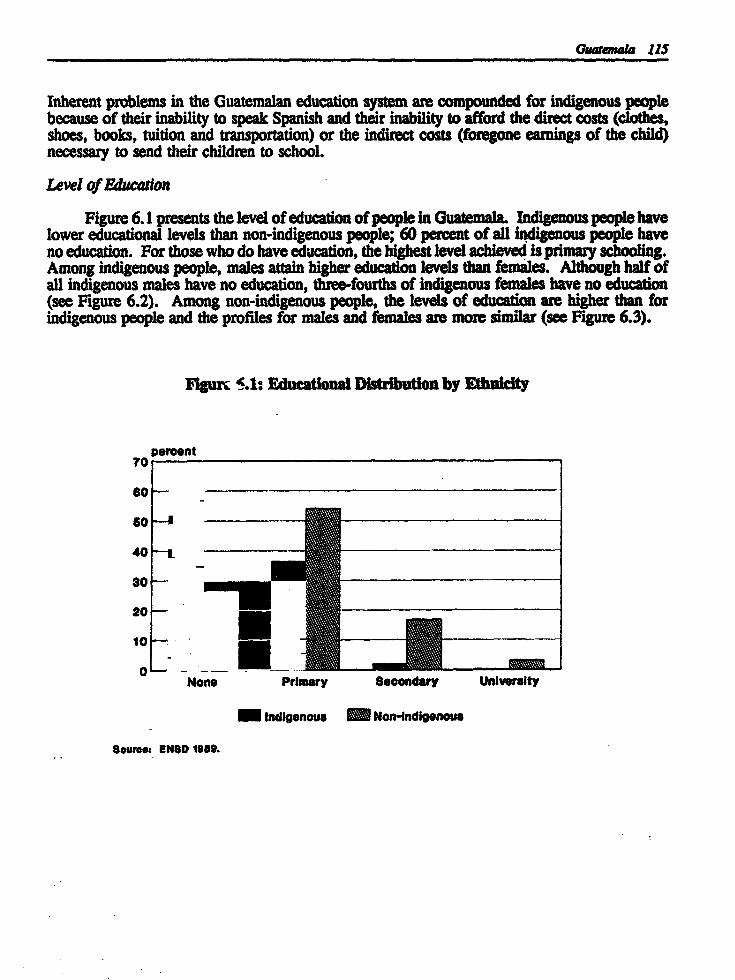
Guakemala 115
Inherent problems in the Guatemalan education system are compounded for indigenous peoplebecause of their inability to speak Spanish and their inability to afford the direct costs (clothes,shoes, books, tuition and transportation) or the inditect costs (foregone earnings of the child)necessary to send their children to school.
Level of Educaion
Figure 6.1 presents the level of education of people in Guatemala. Indigenous people havelower educational levels than non-indigenous people; 60 percent of all indigenous people haveno education. For those who do have education, the highest level achieved is primary schooling.Among indigenous people, males attain higher education levels than females. Although half ofall indigenous males have no education, three-fourths of indigenous females have no education(see Figure 6.2). Among non-indigenous people, the levels of education are higher than forindigenous people and the profiles for males and females are more similar (see Figure 6.3).
gurc '.1: Educational Distribution by Ethacity
percent70
80 -
60--A
40
30-
20-
10 -
0 - - - --
None Primary Secondary University
Indigenous Non-indigenous
Souree: ENSOD 199.

S116 Indigeaa Fla pi and Pury in Latin Amnt: An Endtntcal Ana~ets
None Primary Secondary University
-Male LU FemMte
swomg EKSD lese.
Pg 6.3: ~Indgeous EdcatonalDtrluto
eroent60
30
20
10-
None Primary Secoondary University
Male Femaee
GOurOe ENG0 19.

Guat.nzla 117
Years Mf Schnoolig
On average, ndigenous people have only 1.3 years of schooling compared to 4.2 years fornon-ndigenous people. The average number of years of schooling for indigenous males is 1.8years and for indigenous females 0.9 years. Non-Indigenous a1s have 4.5 years of schoolingon average and non-Indigenous females have 4.0 years. Table 6.13 details the average numberof years of schooling by gender and ethnicity. For both indigenous and non-ndigenous people,
ales have more education than fem~le, but non-indigenous females have more ducatin, enaverage, than indigenous males. Average years of schooling peaks in the 14 to 19 year agcgroup for indigenous people and in the 20 to 24 year age group for non-indigenous people.
Table 6.13: Average Years of Schooling
Indigenous Non-iMdigenousAge Group Total Mal Female Total Mal FemaleOverall 1.3 1.8 0.9 4.2 4.5 4.010 to 13 1.4 1.6 1.2 2.8 2.9 2.814 to 19 2.4 2.9 1.8 5.1 5.2 4.920 to 24 1.9 2.7 1.3 5.7 6.2 5.425 to 29 1.5 2.3 0.9 5.3 5.7 5.230 to 24 1.2 1.9 0.6 5.1 5.5 4.735 to 39 0.9 1.5 0.4 4.1 4.5 3.940 to 44 0.7 1.0 0.4 3.7 4.4 3.245 to 49 0.6 0.9 0.3 3.2 3.6 2.850 to 54 0.4 0.7 0.2 3.0 3.2 2.755to59 0.4 0.8 0.2 2.9 3.3 2.560 and Older 0.3 0.5 0.1 2.1 2.4 2.0
Sowm ENSD 1989.
Ordinary leat squares regression analyses run separately on the school age poputatin( 10 to 18) and the adult population (ages 19 and olde) show the effects of gender, ap and
0city an years of schoolig (see Table 6.14). Being male increases average schooling forboth age groups; increasing the average by almost one year for the adult . Beingindigenous decreases aver~ge years of schooling by two years for school age hdren and byover three years for adults. Age is a positive characteristic for the school ge group and anegative characteristic for the adult group. Thes results indicate a slight improvement in accessto schooling; as children get older they are mor likely to have more years of schooling.
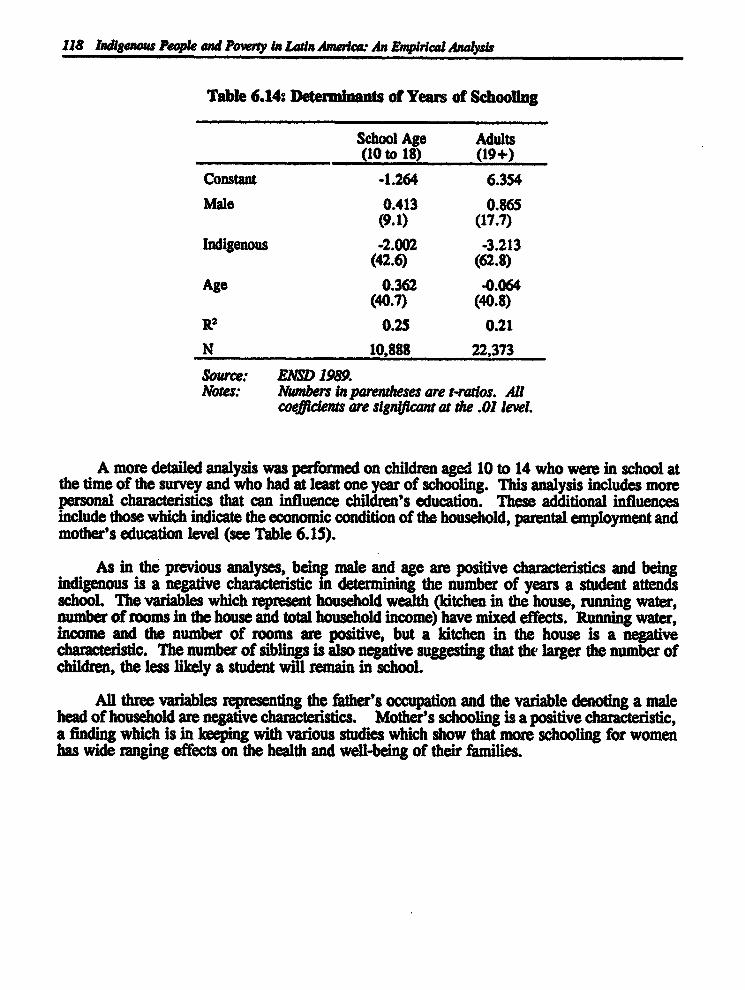
118 Indigenous People and Powry In Lad Ameram An EnIpirica Analis
Table 6.14: DetermInants of Years of Schooling
School Age Adults(10 to 18) (19+)
Constant -1.264 6.354Male 0.413 0.865
(9.1) (17.7)
Indigenous -2.002 -3.213(42.6) (62.8)
Age 0.362 -0.064(40.7) (40.8)
R2 0.25 0.21
N 10,888 22,373
Source: ENSD 1989.Notes: Nonbers In parentdeses are r-ratios. All
coefficients are significant at he .01 level.
A more detailed analysis was performed on children aged 10 to 14 who were in school atthe time of the survey and who had at least one year of schooling. This analysis includes morepersonal characteristics that can influence children's education. These additional influencesinclude those which indicate the economic condition of the household, parental employment andmother's education level (see Table 6.15).
As in the previous analyses, being male and age are positive characteristics and beingindigenous is a negative characteristic in determining the number of years a student attendsschool. The variables which represent household wealth (kitchen in the house, running water,number of rooms in the house and total household income) have mixed effects. Running water,income and the number of rooms are positive, but a Idtchen in the house is a negativecharacteristic. The number of siblings is also negative suggesting that the larger the number ofchildren, the less likely a student will remain in schooL
Al three variables representing the father's occupation and the variable denoting a malehead of household are negative characteristics. Mother's schooling is a positive characteristic,a finding which is in keeping with various studies which show that more schooling for womenhas wide ranging effects on the health and well-being of their families.
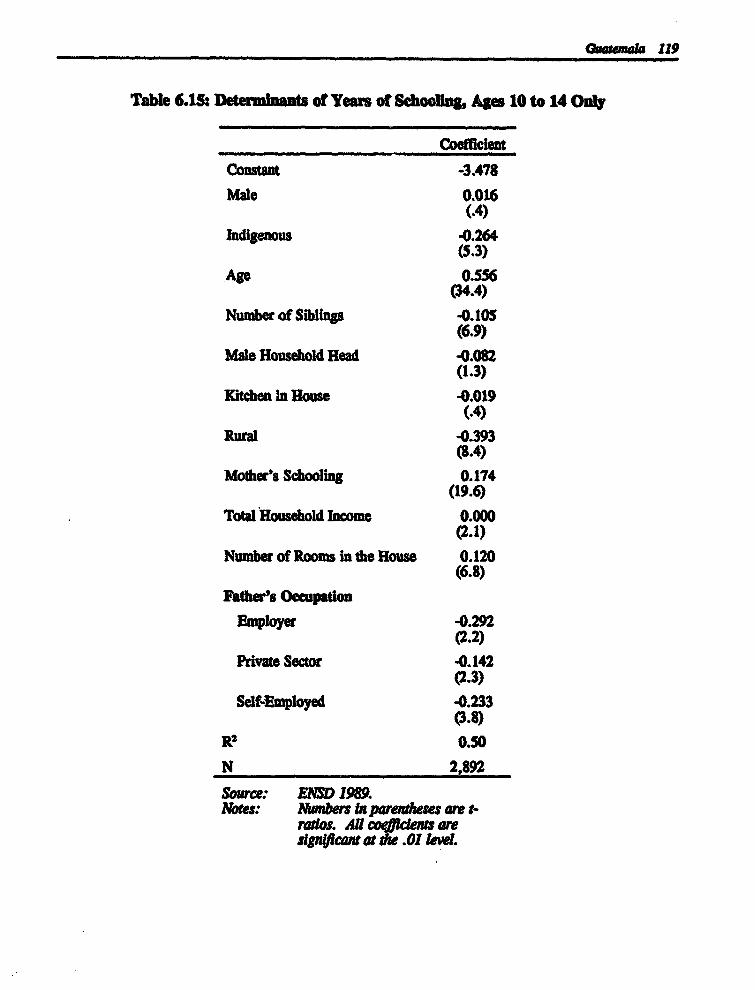
Guatonala 119
Table 6.15: Deteretinant of Years of Schoomng, Ages 10 to 14 Only
Coolclent
Constant -3.478Male 0.016
(.4)Indigenous -0.264
(5.3)Ap 0.556
(34.4)Number of Siblings -0.105
(6.9)Male Household Head -0.082
(1.3)
]Kite In Rouse -0.019(.4)
Rural -0.393(8.4)
Mother's Scowoling 0.174(19.6)
Total Household Income 0.000(2.1)
Nuber of Rooms in the House 0.120(6.8)
Father's Occupaton
Employer -0.292(2.2)
Private Sector -0.142(2.3)
Self-Employed -0.233(3.8)
R% 0.50N 2,892
Source: EMNSD 1989.Nots: N bers ta pare eses are t-
ratios. All coedenI areignyfca at the .01 leve.
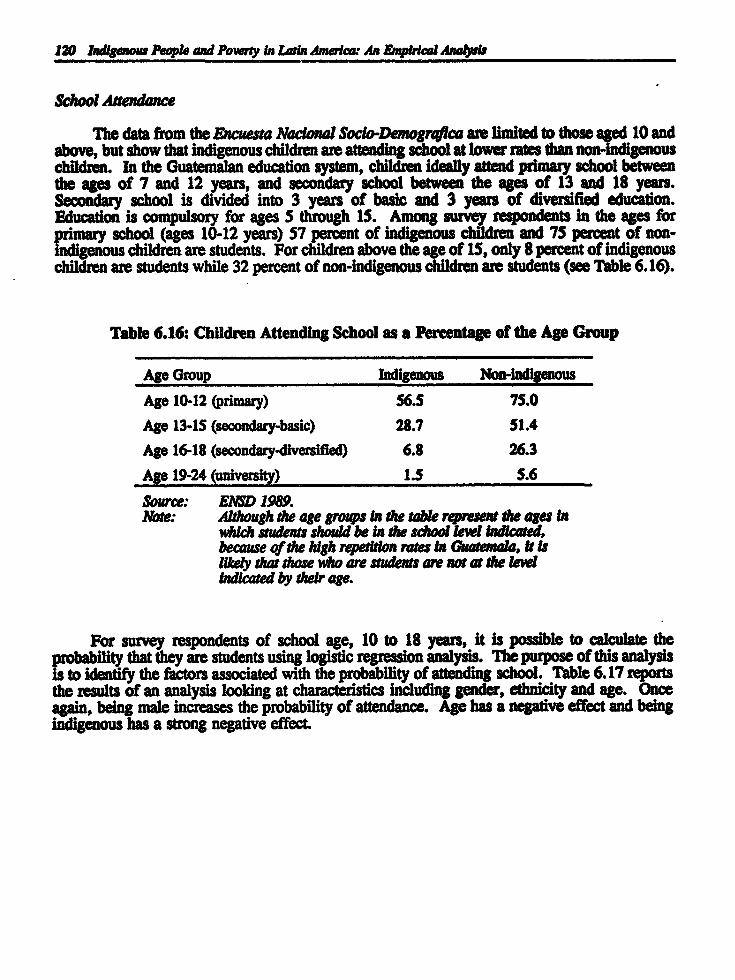
120 Ildgenoar People and Po"rty In Latin Amerla- An Bpirical Analyrs
School AUendance
The data from the Ecuesta Nacional Socto-Demogrqice are limited to those aged 10 andabove, but show that Indigenous children are attending school at lower rates than genouschildren. In the Guatemalan education system, children ideally attend primary school betweenthe ages of 7 and 12 years, and secondary school between the ages of 13 and 18 years.Secondary school is divided into 3 years of basic and 3 years of diversified education.Education is compulsory for ages 5 through 15. Among survey respondents in the ages forprimary school (ages 10-12 years) 57 percent of Indigenous children and 75 percent of non-Indigenous children are students. For children above the age of 15, only 8 percent of indigenouschildren are students while 32 percent of non-indigenous children are students (see Table 6.16).
Table 6.16: Children Attending School as a Percentage of the Age Group
Age Group Indigenous Non-ladigenous
Age 10-12 (primary) 565 75.0
Age 13-15 (secondary-basic) 28.7 51.4
Age 16-18 (secondary-diversified) 6.8 26.3
Age 19-24 (university) 1.5 5.6
Source: ENSD 1989.Note. Although the age graqps in the table r4present the ages In
which students should be In the school le Indicated,because of the high repetton rates In Gaate,a, It Isikely that those who are studets are not at the levelIndicated by their age.
For survey respondents of school age, 10 to 18 years, it is possible to calculate theprobability that they are students using logistic regression analysis. Th purpose of this analysisis to identify the factors associated with the probability of attending school. Table 6.17 reportsthe results of an analysis looldng at characteristics including gender, ethnicity and age. Onceagain, being male increases the probability of attendance. Age has a negative effect and beingindigenous has a strong negative effect.
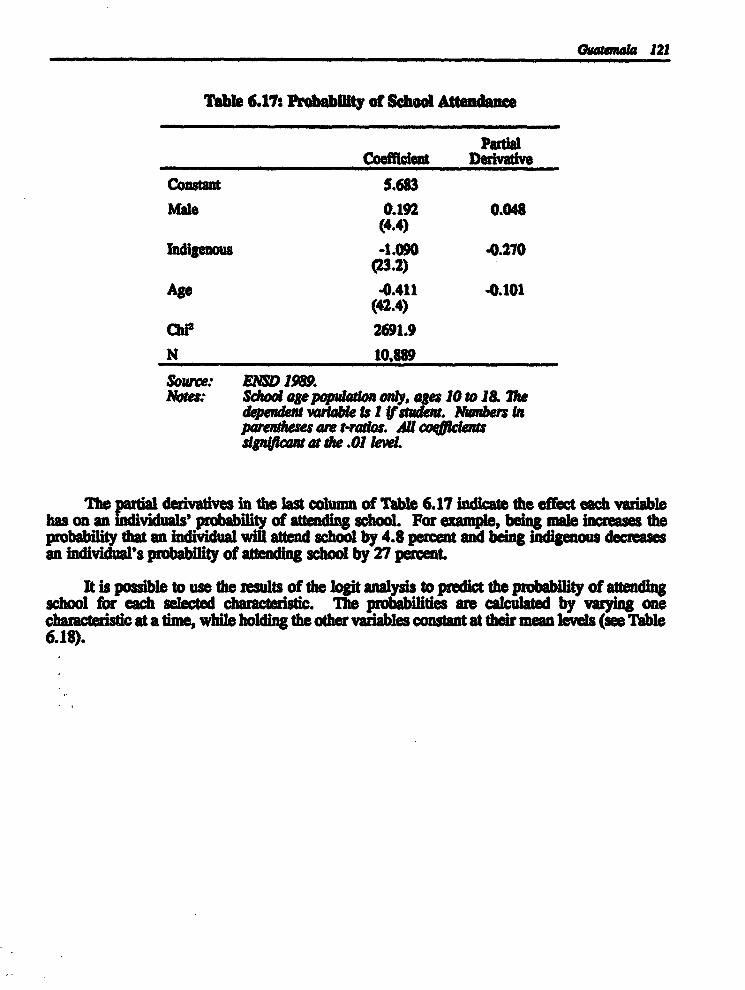
Guata 121
Table 6.17: hobabity of Sbool AN
Coeicent Deuvadve
Constant 5.683Mate 0.192 0.048
(4.4)Indgenous -1.090 -0.270
(23.2)
Age .0.411 -0.101(42.4)
Chi 2691.9N 10,889
Sowce: END1989.Nores: Se~ol age popdadon only, ag 10 to 1& ie
dependent va~rae Is I rfstuden. Members Inpareneses are t.ratos. Agl odidaussiflcant at dme .01 le~d.
lie puW derivatives in the last column of Table 6.17 indicate the effect uach v icablehas on an nviduals'probab of attding school. For example, being male increas theprobab*ity tat an individual w atted chool by 4.8 percent and being indigenous dereasesan indiVidual's probability of attending school by 27 percent.
It is possible to use the results of the logit analysis to predict the probability of attendingschool for each selected characteristic. The probabilitle are calculated by varying anecharacteristic at a time, while holding the other variables constant at their mean leve (se Table6.18).
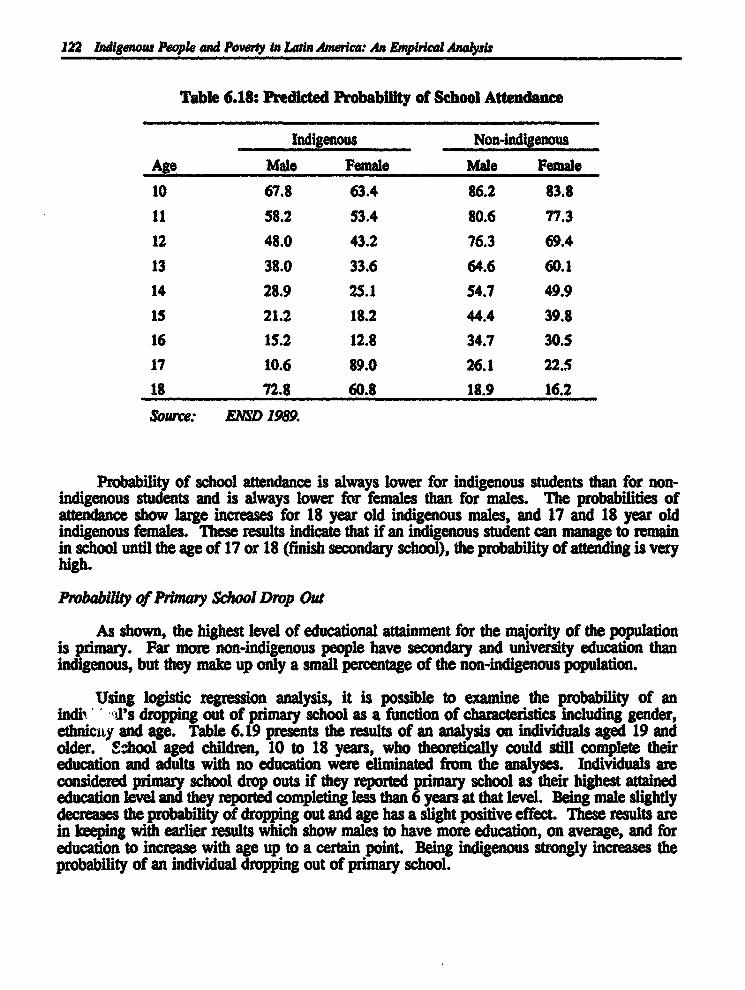
122 Indigenour People and Powrly in Latn Amerlad An Empirical Analysi
Table 6.18: Predicted Probability of School Attendance
Indigenous Non-ladigenous
Age Male Female Male Female
10 67.8 63.4 86.2 83.811 58.2 53.4 80.6 77.312 48.0 43.2 76.3 69.4
13 38.0 33.6 64.6 60.114 28.9 25.1 54.7 49.9
15 21.2 18.2 44.4 39.816 15.2 12.8 34.7 30.517 10.6 89.0 26.1 22.5
18 72.8 60.8 18.9 16.2
Source: ENSD 1989.
Probability of school attendance is always lower for indigenous students than for non-indigenous students and is always lower for females than for males. The probabilities ofattendance show large increases for 18 year old indigenous males, and 17 and 18 year oldindigenous females. These results indicate that if an indigenous student can manage to remainin school until the age of 17 or 18 (finish secondary school), the probability of attending is veryhigh.
Probabiiy of Primary School Drop Out
As shown, the highest level of educational attainment for the majority of the populationis primary. Far more non-indigenous people have secondary and university education thanindigenous, but they make up only a small percentage of the non-indigenous population.
Using logistic regression analysis, it is possible to examine the probability of anindix ' -Ps dropping out of primary school as a function of characteristics including gender,ethniciy and age. Table 6.19 presents the results of an analysis on individuals aged 19 andolder. Sxhool aged children, 10 to 18 years, who theoretically could still complete theireducation and adults with no education were eliminated from the analyses. Individuals areconsidered primary school drop outs if they reported primary school as their highest attainededucation level and they reported completing less than 6 years at that level. Being male slightlydecreases the probability of dropping out and age has a slight positive effect. These results arein keeping with earlier results which show males to have more education, on average, and foreducation to increase with age up to a certain point. Being indigenous strongly increases theprobability of an individual dropping out of primary school.

Guahmala 123
Table 6.19: Probability of Dropplag Out of Primary School
PartialCoefficleft Derivative
Constant -1.035Male -0.086 -0.034
(2.3)Indigenous 1.531 0.608
(28.0)Age 0.026 0.010
(18.7)ChP 1178.4
N 22,373
Source: ENSD 1989.Notes: Adutpopulatm ony, aer 19 and alder. The
dependent variable Is I (f dropped out.Nwmbers in paremeses are t-walos. AUcofatlentr sgaffcatm at Mhe .01 lew.
Illiteracy
The low levels of education are also reflected in the illiteracy rates for indigenous people.Overall, 60 percent of all indigenous people are illiterate compared to 24 percent of all non-indigenous people. Illiteracy is defined as those who answered no to the question *Do you knowhow to read and write a paper, a story or a message?o There are large differences between theilliteracy rates by place of residence. For both indigenous and non-indigenous people, the ruralilliteracy rate is well above the urban illiteracy rate. Figure 6.4 shows illiteracy rates by areaof residence.
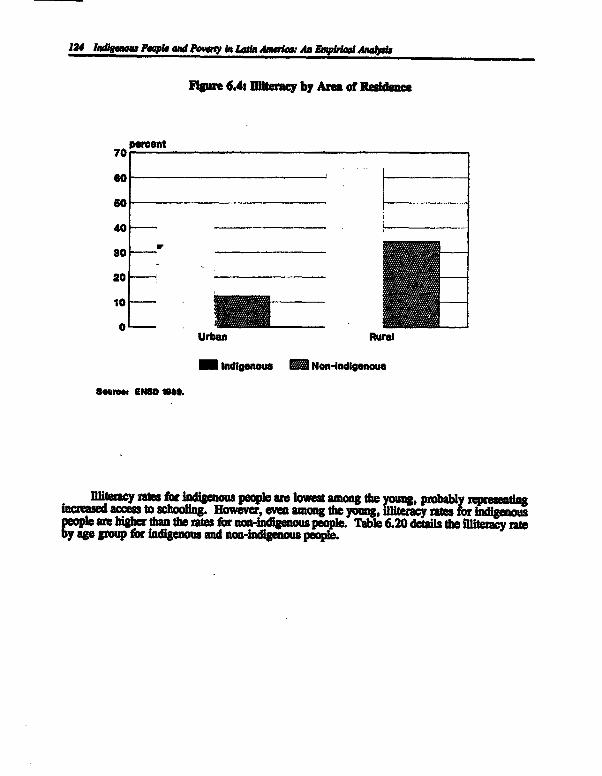
124 ladigau P~rPle mal Pwini la L DM ~'AD ~n Engdriul Aaple
Elgmre 6A4 Eiluracy by Arma of Reance
40
30
20
00
0Urban Rural
- IndIgenous Non-indigenous
Seret se uNe8.
fnsthmney rats for indigenous people are lwest among the , probablånginci=sed acess to schoo~ag. Howevet, eeamn * young, 4raes förindigenouspeople are igher than the ras non-d . Table 6.20 details th Iiteracy mteby age group for indigenous and ie people.

Gutaaa 125
Table 6.20: Dl~teracy Rates by Age Group (perce)
Indimnous Non-digenousAge Total Malt Female Total Mal* PmalG10-14 43.0 37.7 48.5 15.0 14.1 15.915-19 39.9 27.9 51.2 12.9 9.8 15.820-24 53.4 35.2 68.4 15.6 10.0 20.425-29 60.4 41.5 76.1 20.0 15.8 23.830-34 63.4 44.0 81.5 21,2 14.7 27.135-39 70.3 53.1 86.5 28.8 21.5 33.940-44 77.1 64.6 88.2 33.3 22.0 43.145-49 79.8 65.3 92.2 37.4 29.4 44.950-54 83.1 69.5 95.1 39.1 30.3 47.5
55-59 81.4 67.3 94.4 42.9 33.3 53.060-64 86.1 76.7 95.3 48.6 36.2 60.165-99 89.2 81.1 96.8 46.7 46.2 59.8
Sourœ: ENSD1989.
A c ression was run on the adult , ages 19 and older, to oanine thefe of '- s on the probability of gilliterate. Table 6.21 presents the sults.
Being ma has a strong negative effect. Age has a slight positive effect and being indigenoushas a strong positive effect.

126 Indgenouw People and PowPy In Laate Anrna An Apial Analrfs
Table 6.21: Probability of lliteracy
PardialCoefficient Derivative
Constant -2.116
Male -1.028 -0.248(31.9)
Indigenous 1.951 0.471(58.0)
Age 0.041 0.010(39.0)
ChP 6094.2
N 22,373
Source: ENSD 1989.Notes: Adrd populaton only, ages 19 and older.
The dependent mortable is I (ffterate.Nobers In parendeses are -ratos. Alcoqkictena signiicant te .01 ew.
Child Labor
As shown in Table 6.16, only 57 percent of indigenous children aged 10 to 12 years and29 percent of Indigenous children aged 13 to 15 years are attending school. The labor force inGuatemala will be analyzed below using all individuals aged 14 to 65 years, however, it is alsopossible to look at the working status of children aged 10 to 13. Some of these children arereported as being employed in the Encuesta Nacia Soco-Demogrqfica.
Nine percent of non-indigenous children and 21 percent of indigenous children are reportedas being employed. The majority of these children are employed in agriculture; 82 percent ofthe indigenous children and 73 percent of the non-indigenous children (ENSD 1989).
Table 6.22 shows the characteristics of the working children. They are most often maleand live in rural areas. The average age of both indigenous and non-indigenous workingchildren Is 12.
Non-indigenous working children are evenly split between having no education andprimary education. One-third more indigenous working children have no education than primaryeducation. Non-indigenous working children have slightly more years of schooling as indigenousworking children.
WorkIng children, whether indigenous or non-indigenous are more far likely to live in afemale headed household than the population as a whole (see Table 6.3). This is especially true

Guaremala 127
for indigenous worldng children. Parents of working children also have fewer years ofschooling than the population as a whole (see Table 6.13).
Table 6.22: Characteristles of Working Children
Characteristic Indigenous Non-Indigenous
Male (%) 87.0 70.4Rural (%) 89.8 76.9Average Age 12.0 12.0Education Level (%)
None 57.3 48.2
Primary 42.7 51.8Average Years of Schooling 1.1 1.6Female Head of Household (%) 22.3 15.3Mother's Years of Schooling 0.6 1.4Father's Years of Schooling 1.1 1.8
Source: END 1989.Note: Cidren aged 10 to 13 years only.
Using logistic regression, the probability that a child will be employed is calculated. Theresults of an analysis looking at characteristics of both the children and their parents arepresented in Table 6.23. Being indigenous, male, living in rural area and living in a femaleheaded household increase the probability that a child will be working. The partial derivativesindicate that being male increases the probability by 24 percent. The results also indicate thatthe more education the parents have, the less likely a child is to work.
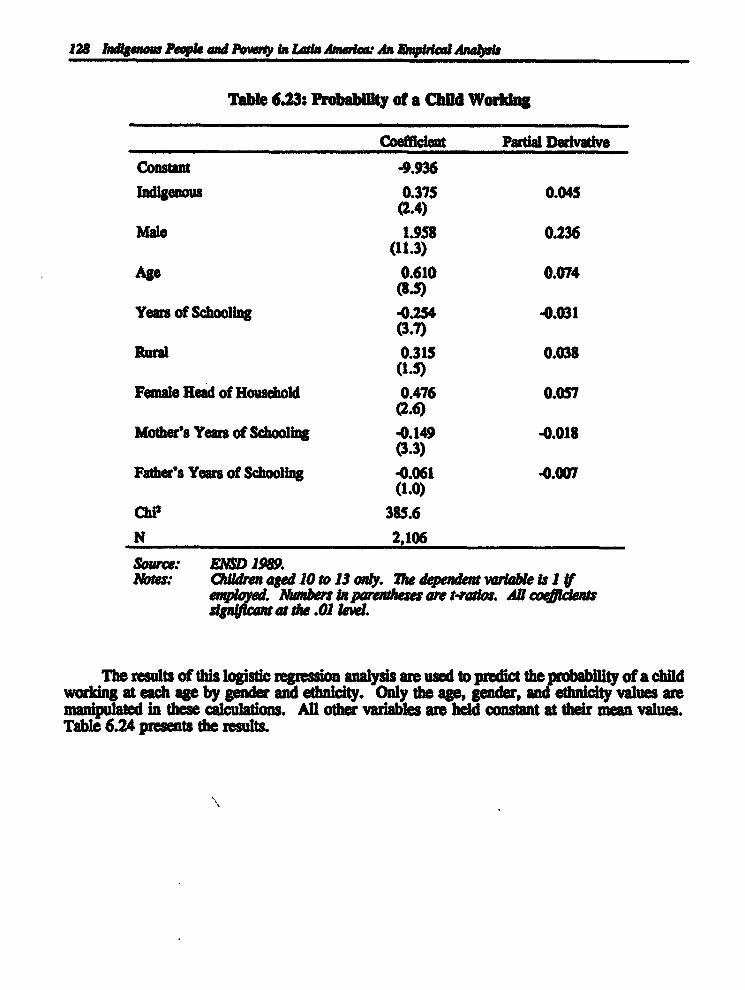
128 Ingous Pe piu iv# Lakn A~*umet An &ptrical Ana~Iu
Table 6.23: Probabty of a Chld Woring
Co ~fcket Patial Derivative
Constant -9.936
Indigenous 0.375 0.045(2.4)
Male 1.958 0.236(11.3)
Aga 0.610 0.074(8.5)
Years of Schooling -0.254 -0.031(3.7)
Rural 0.315 0.038(1.5)
Female Head of Household 0.476 0.057(2.6)
Mother's Years of Schooling -0.149 -0.018(3.3)
Father's Years of Schooling -0.061 -. 07(1.0)
chi 385.6N 2,106
Source: ENSD 1989.Notes: ildren aged 10 to 13 ony. lhe dependen vrlable is I (f
v . Nw nl parv are t-t. AU co~ilentudp ~lca at dhe. .01 ~ev
The results of this logistic regresson analysis are used to predict the b ity of a childwordng at each age by gender and ethncity. Only the ag, gender, ethnicty values aremanipulated in these calculations. All other variables are held onstant at their memn values.Table 6.24 presents the resuts.

Gsamala 129
Table 6.24: Pedicted Probablity of a Child Working
ladigenous Non-indigenous
Age Mae Female Male Female
10 17.7 3.0 12.9 2.0
11 28.4 5.3 21.4 3.7
12 42.2 9.3 33.4 6.6
13 57.4 15.9 48.0 11.5
Source: ENSD 1989.
The predicted probabilities are higher for indigenous children than non-indigenouschildren, and increase with every year of age. Both indigenous and non-indigenous girls showlarge increases in probability from ages 12 to 13 years. Indigenous boys have a 57 percentprobability of worldng at age 13.
Occupational Ateanment
The workforce in Guatemala is made up primarily of males among both indigenous andnon-indigenous workers. Indigenous workers, overall, are (i) more likely than non-indigenousworkers to be self-employed; (Hl) more likely than non-indigenous workers to work more thanone job; and (iii) earn less than non-indigenous workers. Indigenous women workers work theleast number of hours per week on average, over six hours less a week than non-indigenouswomen (see Table 6.25).
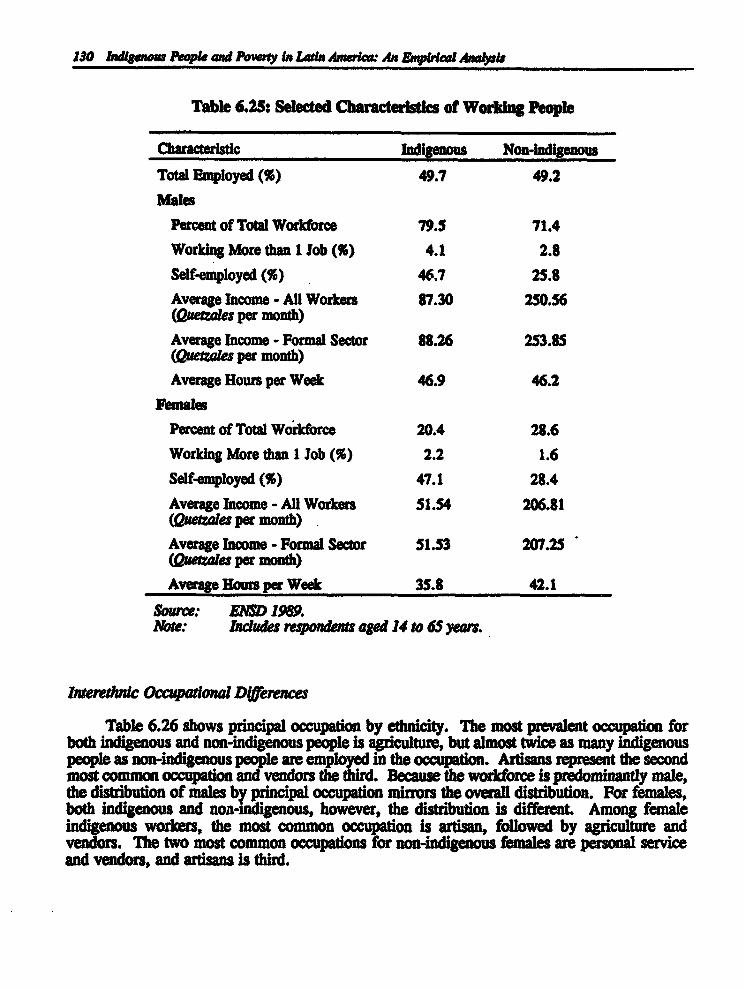
130 Indigenoar People and Poveny in Lad America An Empirical alp
Table 6.25: Selected Characteristics of Working People
Characteristic Indigenous Non-Ldigenous
TotalEmployed (%) 49.7 49.2
MalesPercent of Total Workforce 79.5 71.4Worklng More than Job (%) 4.1 2.8
Self-employed (%) 46,7 25.8Average Income - All Workers 87.30 250.56(Querales per month)
Average Income - Formal Sector 88.26 253.85(QueXates per month)Average Hours per Week 46.9 46.2
Female
Percent of Total Workforce 20.4 28.6Working More than 1 Job (%) 2.2 1.6Self-employed (%) 47.1 28.4Average Income - Al Workers 51.54 206.81(Quetrates per month)Average Income - Formal Sector 51.53 207.25(Oerates per month)Average Hours per Week 35.8 42.1
Source: ENSD 1989.Note: Includes responder aged 14 to 65 year.
Interellac Occqparonal Dernces
Table 6.26 shows principal occupation by ethnicity. The most prevalent occupation forboth indigenous and non-indigenous people is agriculture, but almost twice as many indigenouspeople as non-indigenous people are employed in the occupation. Artisans represent the secondmost common occupation and vendors the thrd. Because the workforce is predominantly male,the distribution of males by principal occupation mirrors the overall distribution. For females,both indigenous and non-mdigenous, however, the distribution is different. Among femaleindigenous workers, the most common occupation is artisan, followed by agriculture andvendors. The two most common occupations for non-indigenous females are personal serviceand vendors, and artisans is third.

Guatemala 131
Table 6.26: Principal Occupation
Indigenous Non-Indigenous
Total Male Female Total Male Female
Professional 1.3 1.3 1.5 7.9 5.9 13.1Administrator 0.7 0.6 1.1 3.9 3.8 4.4
Office Worker 0.5 0.4 0.6 5.1 3.7 8.6
Vendors 7.9 5.3 18.1 11.1 6.3 23.1Agriculture 67.6 78.0 26.9 35.2 45.7 9.1Miners 0.2 0.2 n.a. 0.2 0.2 n.a.
Transport 0.7 0.8 n.a. 3.3 4.5 0.2
Artisans 14.7 8.9 37.6 18.2 19.3 15.4
Manual Laborer 2.7 3.3 0.5 5.7 7.0 2.4
Personal Service 3.8 1.2 13.6 9.4 3.7 23.7
Source: ENSv. 1989.Notes: Indudes respondents aged 14 to 65 years.
n.a. Not applicable.
Earnings
There are many factors that determine an individual's earnings. These factors include suchthings as the individual's job, the area in which the individual lives, the level of education, theamount of training, and years of experience, among others. Indigenous people in Guatemalahave far less of some of these factors, especially education, yet often have more experience thantheir non-indigenous counterparts.
Average Income Levels
As shown above, the principal occupational category for indigenous workers is agriculture;68 percent of all indigenous workers are employed in apiculture (BNSD 1989). An analysisof data from the Guatemalan Institute of Social Security shows that wages for agriculturalworkers steadily declined during the 1980s; the average agricultural wage stood at only 50percent of the average wage of the overall economy. This low level wage is reflected in theaverage incomes reported in the ENSD (see Table 6.27). On average, indigenous workers'average income is less than half of non-indigenous workers' average income. From theirprincipal occupation, the monthly income of indigenous workers is 34 percent of non-indigenousincome. From all sources of income, indigenous workers have 38 percent of non-indigenousworkers' income.
Formal sector workers fare only slightly better than all workers combined. Those in theformal sector represent different proportions among indigenous and non-indigenous workers; 16
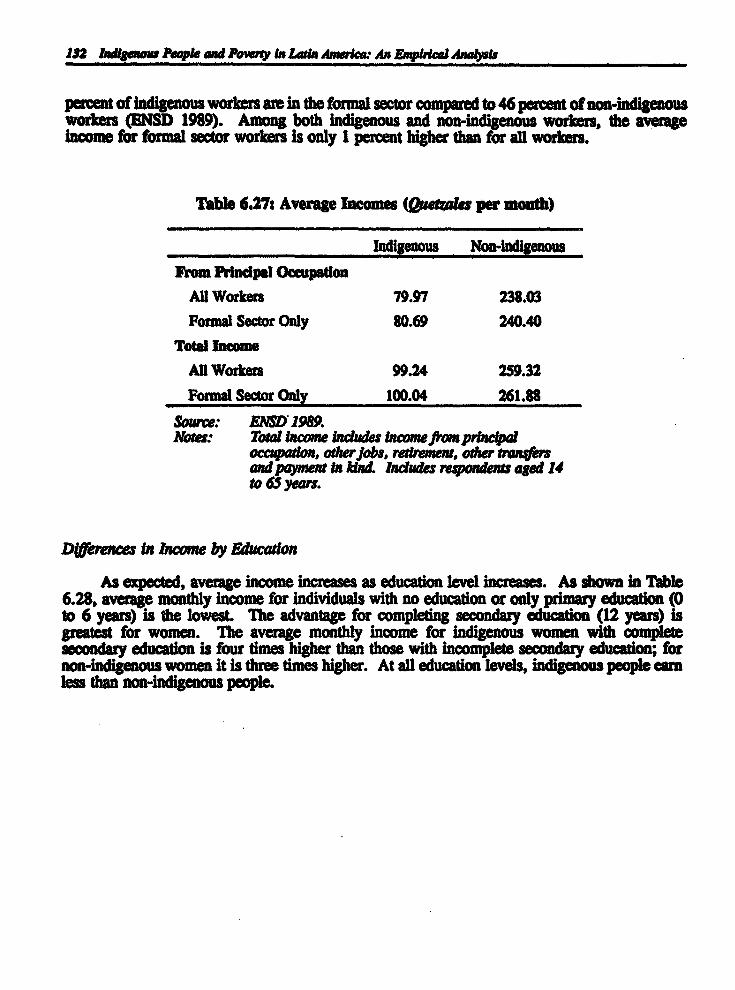
132 Ianfau teple and Po~ry tn Lan Anerla: An kapdrel Ånab#
percent of Indigenous workers are in the formal sector compAed to 46 percent of no-indgenousworkers (ENSD 1989). Among both indigenous and non-Indigenous workers, the averageincome for formal sector workers Is oaly 1 percent higher than for all workers.
Table 6.27: Average Incomes (Quaier per no~tb)
Indignous Non-Indigenousro. Prndpal Occupation
All Workers 79.97 238.03
Forma Secor Only 80.69 240.40
Total Inome
All Workers 99.24 259.32
Porma Sector Only 100.04 261.88
Source: ENSD'1989.Notes: Total income indudes income fom princ~al
occaon, oterjobs, rtiment, oder trasfersadpayment In Aat. Ind~tes M fpondei agem 14
to 65 years.
D =ences In Income by Edcan
As expected, averag iom increases as education levet incresses. As shown in Table6.28, average monthly income for individuals with no education or only primary education (0to 6 years) is the lowest. The advantage for completing secondary education (12 years) isgreatest for women. The average monthly income for indigenous women with completescondary education is four times higher than those with incomplete secondary educadon; for
non-indigenous women it is three times higher. At all education levels, indigenous people earnless than non-Ind~genous people.

Table 6.28: Average Monthly Income by Education I4ve, Ags 14 and Older (DLas)
Indigenous Non-indigenouaYears of Educadon Total Mac Female Total Male Fe~*ae0 to 6 42.06 77.52 10.35 94.41 162.55 33.887 to 11 109.35 144.31 46.06 147.78 214.92 77.5312 232.61 254.94 187.64 316.44 387.93 259.5613+ 409.51 409.88 407.07 661.38 798.20 440.46Sour. E~D 1989.
Dffencr in Income by Ae
By age group, the average monthly income of indigenous males is tmilar to that of non-indigenous femalee, although the income for non-Mdioffous females falls sarply a~er ages 50to 54 (see Figure 6.5). Indigenous females' average nmes remain fairly constant regardessof age. Average incomes for non-indigenous males peak at ages 40 to 44 with a small shift Inthe decreame at ages 55 to 59.
Igure 6.5: Average Monthly lncome by Ag Group
400
300
200-
100
14-19 20-24 26-29 30-34 35-39 40-44 46-49 60-64 66-69 60-64 66-99Age Group
•- Indgenous Malet -+ Indigenovs Fomtig
No-dlgenous Males - Non-indg Females
sour.es anao 198.
134 Indigenour People and Powey in Latin Amehw An Empbal Analpris
Dmerences in Occupational Eanings
Within profession, there are large differences in the hourly wages, years of schooling,weekly hours and potential experience of indigenous and non-indigenous workers (see Table6.29). Hourly wages for indigenous workers are always lower than for non-indigenous workerswith the exception of those in the transportation occupations where the indigenous hourly wageis 25 percent higher than the non-indigenous wage. In all other occupations, the indigenoushourly wage ranges from 38 to 72 percent of the non-indigenous hourly wage and averages 54percent of the non-indigenous hourly wage.
Among males in all professions, the hourly wage for indigenous workers averages 63percent of the non-indigenous hourly wage. Indigenous female hourly wages are, on average,53 percent of non-indigenous female hourly wages. Indigenous females in office workeroccupations receive slightly higher hourly wages than indigenous males in this occupation. Thiscould be a result of the small number of women in these occupations. Although the percentagesof indigenous males and females in the occupation are similar (see Table 6.26), the overallpercentage of indigenous female workers is small. Only 20 percent of all indigenous workersare female (see Table 6.25). Non-indigenous females in the office worker occupations also havehigher hourly wages than non-indigenous males in this occupation. In addition, hourly wagesin the professional and manual labor occupations are essentially equal for non-indigenous malesand females.
Indigenous workers have fewer years of schooling than non-indigenous workers in alloccupations. Even in the transportation occupations where they receive higher hourly wages,indigenous workers have fewer years of schooling.
As shown in Table 6.25, overall both indigenous and non-indigenous male workers workapproximately the same number of hours per week. However, in five of the occupations,indigenous male workers actually work more hours than non-indigenous male workers.Although overall, female indigenous workers average fewer hours per week than female non-indigenous workers (see Table 6.29), in two occupations, they average more hours (officeworkers and personal service).
With a few exceptions, indigenous workers have more potential experience in alloccupations than non-indigenous workers. This is potential experience calculated by subtractingthe number of years of schooling plus 6 (the age at which children are supposed to begin school)from age; actual experience was not included in the data seL In the mining occupations,indigenous workers have 13 years less experience than non-indigenous workers. Femaleindigenous office workers have only half as much potential experience as non-indigenous femaleoffice workers.
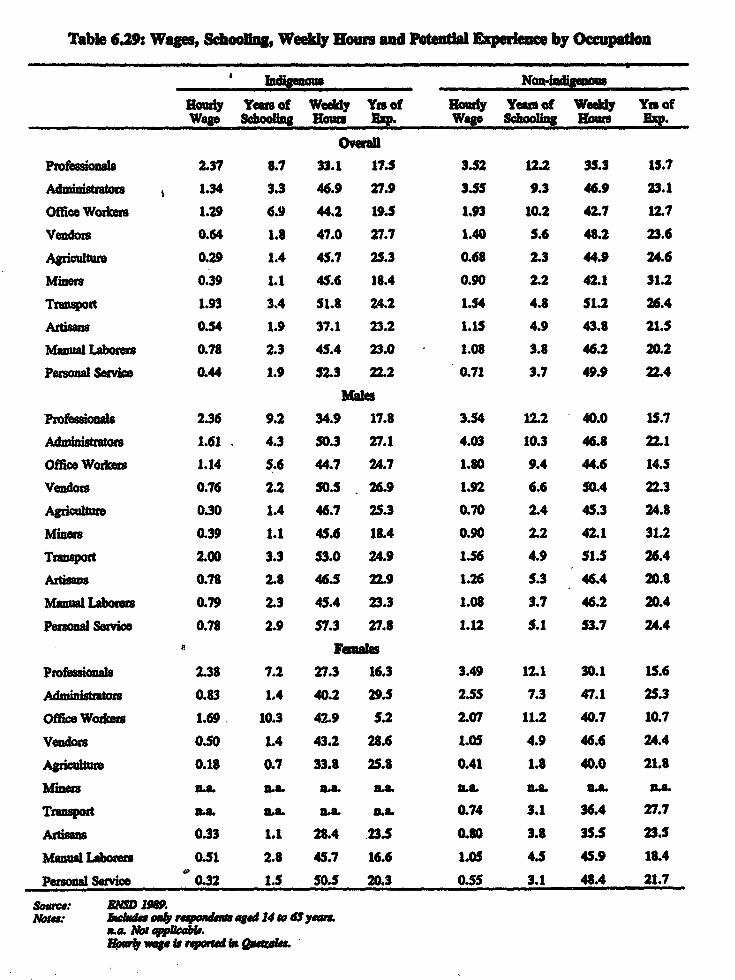
Table 6.29: Wages, Schoug, Weely Ho~r and Päntii Experim ce by Occupadon
Indigenous Nom.indigenous
Roury Yea of Wely Ya of Hary Yers of Wukly Ya ofWag Schooling Hon xp. Wagi Shooling Hos Exp.
Profeasionuls 2.37 8.7 33.1 17. 3.52 12.2 35.3 15.7
1.34 3.3 46.9 27.9 3.55 9.3 46.9 23.1
Office Workers 1.29 6.9 44.2 19.5 1.93 10.2 42.7 12.7
Vendors 0.64 1.8 47.0 27.7 1.40 5.6 48.2 23.6
Agriculture 0.29 1.4 45.7 25.3 0.68 2.3 44.9 24.6
Miners 0.39 1.1 45.6 18.4 0.90 2.2 42.1 31.2
Transport 1.93 3.4 51.8 24.2 1.54 4.8 51.2 26.4
Artisans 0.54 1.9 37.1 23.2 1.15 4.9 43.8 21.5
Manual Laborer 0.78 2.3 45.4 23.0 1.08 3.8 46.2 20.2
Persona3ervice 0.44 1.9 52.3 22.2 0.71 3.7 49.9 22.4
Professionalu 2.36 9.2 34.9 17.8 3.54 12.2 40.0 15.7
Adminl~ 1.61 4.3 50.3 27.1 4.03 10.3 46.8 22.1
Office Worus 1.14 5.6 44.7 24.7 1.80 9.4 44.6 14.5
Vedors 0.76 2.2 50.5 26.9 1.92 6.6 50.4 22.3
Agriculture 0.30 1.4 46.7 25.3 0.70 2.4 45.3 24.8
Miners 0.39 1.1 45.6 18.4 0.90 2.2 42.1 31.2
Transport 2.00 3.3 53.0 24.9 1.56 4.9 51.5 26.4
Artisans 0.78 2.8 46.5 22.9 1.26 5.3 46.4 20.8
Mmnual Laborer 0.79 2.3 45.4 23.3 1.08 3.7 46.2 20.4
Personal Service 0.78 2.9 57.3 27.8 1.12 5.1 53.7 24.4
Femnale
Profeasioals 2.38 7.2 27.3 16.3 3.49 12.1 30.1 15.6
Adaninistha 0.83 1.4 40.2 29.5 2.55 7.3 47.1 25.3
Office Wor~ers 1.69. 10.3 42.9 5.2 2.07 11.2 40.7 10.7
Väsdo~ 0.50 1.4 43.2 28.6 1.05 4.9 46.6 24.4
Agriculture 0.18 0.7 33.8 25.8 0.41 1.8 40.0 21.8
Miners U.a. .a. Z.. 3.a. 3.a. 3.a. C.a. 3.a.
Transport .a. a.a. .a. a.a. 0.74 3.1 36.4 27.7
Artisans 0.33 1.1 28.4 .23.5 0.80 3.8 35.5 23.5
Manal Laboers 0.51 2.8 45.7 16.6 1.05 4.5 45.9 18.4
Personal Service 0.32 1.5 50.5 20.3 0.55 3.1 48.4 21.7
Source: ENSD 189.Norar: Iradent ,vqomynnage4 14. ESeye.
a. Nr qplì¢fr.iur@v ing. is rqerrails Quga.
136 Indigenew People and Powry in Lain Ameice An mpirlad Analple
EwWangs DVmerenials
Prior to the current study, an analysis of the effects of ethnicity and education on earningsin Guatemala was done using the ENSD 1989. If indigenous have the same educationallevel as non-indigenous people, they would still earn about of non-indigenous people.Other factors beyond education, experience and hours worked determined the earmngs ofindigenous workers relative to non-indigenous workers. While education did boost earnings forindig enous workers, it was not to the extent shown for non-indigenous workers (Psacharopoulos1993). Here the exercise is repeated, but including additional explanatory variables, such asmarital status, rural location and self-employment.
In order to analyze earnings it is necessary to select asample from the ENSD. For theseanalyses, only those individuals between the ages of 14 and 65 are included giving a sample of26,286 individuals. Those people who reported positive hours and positive income are classifiedas working. In this sample, 13 percent of the indigenous people are classified as working and31 percent of non-indigenous people.
These percentages are smaller than the percentages of those who self-report beingemployed. Fifty percent of both indigenous and non-indigenous respondents report that they areemployed (ENSD 1989). Of the indigenous respondents who report they are employed, butreport either no hours or no wages, 87 percent are employed in agricultural occupations,presumably as family workers or self-employed subsistence farmers. Sixty-seven percent of thenon-indigenous respondents who report they are employed but report no positive hours orpositive wages are in agricultural occupations.
Table 6.30 presents the means and standard deviations of the variables used in thefollowing analyses. As with the full sample, indigenous people have less education, morepotential experence, are more likely to be self-employed, are more likely to live In rural areasand are more Ikly to own their homes. Indigenous workers are most heavily represented inagricultural occupations.

Guwenala 137
Table 6.30 Lbor Ma~ K rage va ~a (Workr ny),
Mo m o _Mandrd_De_
Total Male Female Total Mal. Femal.
Years of Sdnn~lng 1.70 1.81 1.30 5.13 4.89 5.68(2.57) (2.58) (2.50) (4.60) (4.44) (4.88)
No Education 0.56 0.52 0.69 0.22 0.22 0.23(.50) (.50) (.46) (.41) (.41) (.42)
8o:t. priay 0.33 0.37 0.22 0.33 0.35 0.271Mida (.47) (.48) (.41) (.47) (.48) (.44)
Compl~tePumay 0.07 0.08 0.05 0.19 0.19 0.17Education (.26) (.27) (.22) (.39) (.40) (.38)
Som ~Scondary 0.02 0.02 0.03 0.12 0.12 0.13Eduann . (.15) (.15) (.17) (.33) (.32) (.34)
Complet. Scdar 0.01 0.01 0.12 0.08 0.06 0.13Eduan (.10) (.09) (.11) (.27) (.24) (.33)University 0.00 0.01 0.00 0.06 0.06 0.07
(.07) (.08) (.03) (.24) (.23) (.26)Pottial 27.73 28.35 25.51 22.87 23.61 21.14Experience (14.50) (14.38) (14.73) (14.51) (14.57) (14.22)Self-EmpIoyed 0.55 0.52 0.63 0.27 0.25 0.30
(.50) (.50) (.48) (.44) (.43) (.46)I 0.72 0.76 0.58 0.46 0.53 0.30
(.45) (.43) (.49) (.50) (.50) (.46)Own Rom. 0.52 0.62 0.15 0.29 0.38 0.08
(.50) (.49) (.36) (.46) (.49) (.28)
Total Household 265.36 238.64 361.18 658.26 573.75 856.03Monbly eningt (345.92) (271.00) (523.49) (851.68) (735.48) (1049.50)lcom ftm Pdcipul 119.72 132.65 73.34 269.11 289.76 220.79Occupati ' (170.77) (185.74) (85.34) (366.39) (388.19) (304.04)
Weely Ho=r 45.91 48.09 38.10 46.93 48.25 43.83(12.68) (9.64) (18.07) (14.14) (12.21) (17.46)
orly WW 0.64 0.67 0.51 1.49 1.52 1.42(0.93) (1.00) (0.58) (2.74) (2.89) (2.36)
Ag 35.42 36.16 32.80 34.00 34.51 32.82(13.53) (13.38) (13.78) (12.93) (13.08) (12.49)
N 3,180 2,459 721 8,597 6,029 2,568
3aue. I8E 1989.Notm: Sandard édeal la paathe kw. Indadawcpmadea&, aged 14 to 5 ya.
138 Indigeno People and Powry In Lad* Amerlar An &VIrcal Analydi
Overall, indigenous workers earn 44 percent of non-indigenous worker earnings in theirprincipal occupation (see Table 6.30). Male indigenous workers earn 46 percent of male non-indigenous earnings and female indigenous workers earn only 33 percent of the female non-indigenous earnings. Both indigenous and non-indigenous worken reported approximately thesame number of hours worked per week although, however, when broken down by gender,indigenous female workers reported almost six hours a week less than non-indigenous femaleworkers.
Earnings Functions
The results of earnings regressions for indigenous and non-indigenous workers usingordinary least squares regression are presented in Table 6.31. Overall, the rate of return forschooling is 11 percent for indigenous workers and 12 percent for non-indigenous workers. Therate of return for schooling is higher for female workers, both indigenous and non-indigenous.Log earnings increase with experience, but as expected in a normal age-earnings profile, theydecrease with age.
Being self-employed has a negative effect overall on both indigenous and non-indigenousworkers. However, it has a positive effect on female indigenous workers and male Pon-indigenous workers. Living in a rural area is always negative regardless of edmicity or gender.The rate of return for formal sector workers is positive for all except female non-indigenousworkers, and being married has a positive effect on earnings.

Gusanala 19
Table 6.31. Earuings Fkuconn
Indigenous Non-indigenousVariable Total Male Fumale Total Male Female
Constant 2.229 3.630 1.638 2.082 2.525 3.576Years of Schooling 0.106 0.091 0.121 0.120 0.105 0.144
(14.6) (10.7) (8.7) (53.9) (38.6) (40.0)
Log of Weekly 0.411 0.170 0.433 0.432 0.309 0.378Hours (9.0) (2.1) (7.5) (19.6) (9.2) (13.0)
Experience 0.030 0.029 0.040 0.038 0.043 0.041(5.5) (4.4) (4.4) (16.4) (15.2) (10.4)
Experienc squared -. 000 -. 000 .0.001 .0.000 4.001 -0.001(4.8) (4.0) (3.7) (12.2) (12.2) (7.7)
Self-employed -0.336 -0.572 0.127 -0.028 0.236 -1.528(1.1) (1.5) (0.3) (0.1) (0.9) (2.4)
Rural 4.190 -0.239 4.310 4.157 .0.267 -0.179(5.3) (5.5) (5.1) (8.9) (12.8) (5.5)
ForMal Sector 0.273 0.073 0.307 0.316 0.558 -1.302Worker (0.9) (0.2) (0.8) (1.3) (2.2) (2.1)Married 0.170 0.038 0.053 0.232 0.162 0.081
(4.1) (0.7) (0.8) (12.2) (6.6) (2.6)Ri 0.21 0.18 0.25 0.40 0.37 0.50N 3,180 2,459 721 8,597 6,029 2,567
Source: ENSD 1989.Notes: Nu=bers In parehe are t-r~dos. 17w dependen wrable is he log of earnings.
AlU cofficlen sindr ca at the .01 le~el.
The carnings funcoA for indigenus workrs ha far les c~planatory power than thefunction for the non-indigenous group, whether that equation is calculated overall ar by gender.This means there are other factors beyond the human capital variables included that determinethe earnings of the indigeaous group relative to the non-indigenous group. Tis is especiallytrue for indigenous males where the carnings function has the least explanatory power.
Decomposion
Using the Oaxaca (1973) method, der~bed in Chapter 4, i is possible to decompose theearnings differential into a component attributable to differences in human capital endowMentsand a component which is largely attributable to wage imninatinn Theoreticaly, there isno advantage to e~imating the results using indigenous mens or non-indigenus means, so bothare presented.
140 hIdigenur People and Pomy I Latin Amerw An Enapbcal Amaltrps
Table 6.32 presents the results separately for males and females. For males,approximately one-half of the earnings differential can be attributed to differences inendowments. For females, as much as three-fourths of the differential is due to differences inhuman capital. These represent the upper bound on discrimination. Non-indigenous workersmay have endowments superior to indigenous workers which are not measured. This lack ofinformation will bias the estimate of the component due to wage discrimination upwards.
Table 6.32: Decomposition of the Earnings DIfferential
Percentage of Earnings DifferentialDue to Differences bu
Specification Endowments Wage Structure
Mates
Evaluated at Indigenous Means 48 52
Evaluated at Non-Indigenous Means 57 43
malndes
Evaluated at Indigenous Means 76 24
Evaluated at Non-Indigenous Means 69 31
Source: ENSD 1989.Note: For males WW^ = 218% andforfemales W/W = 301%.
Conclusion
Guatemala is a country where the income distribution is highly unequal and the majorityof the population is poor. The indigenous people in Guatemala are the poorest of the poor.They have the lowest education levels, the least access to health services, the least access tobasic services such as water and sanitation, and income levels half that of non-indigenous people.
Indigenous people lag far behind non-indigenous people in all of the indicators used toindicate poverty that can be defined using the present data set. Thirty-nine percent of theindigenous population is in the lowest income quintile; 87 percent of all indigenous householdsare below the poverty line. Sixty-fivepercent of indigenous households do not have a safe watersupply, 46 percent have no sanitary services and 75 percent have no electricity.
The majority of indigenous people have no formal education and of those who do, themqjority have only primary education. On average, indigenous people have only 1.3 years ofschooling and 60 percent indicate that they are illiterate.
Most indigenous people work in the agricultural sector where wages are lower than anyother sector with the exception of persond services. Overall, indigenous waes average only55 percent of non-indigenous wages. Finally, indigenous people face discrmination in theworkplace that causes them to receive lower wages.

7
Mexlco
Introduction
According to the 1990 Mexcan census, 7.5 percent or 5.3 million of Mexico's populationspeaks an indigenous language. In absolute numbers, no other country in the Americas has anindigenous population as large as Mexico's. One researcher examining the state of Indigenouspeople in Mexico states that "because of the great diversity of languages, habitats, and world-views, relatively little can be said to characterize the Indian population as a whole, except thatit is overwhelmingly rural and poverty stricken* (Modiano 1988). Thoug indieo peoplein Mexico have been commonly associated with poverty, the degree and dymc of povertyin indigenous communities has yet to be fully explored. Much of the difficulty in studying theindigenous population stems largely from the paucity of information. Other than censusInformation, relevant data are rare and limited in scope, and often very difficult to access.Through a technique described above (Chapter 4), this chapter attempts to bypass obstaclespresented by data insufficiency and will examine the socioeconomic condition of indigenouspeople in Mexico.
This study combines information from the literature on Indigenous peoples and newanalyses of a 1989 household survey. It examines such topics as income, earnings, education,and child labor. The earning differential between indigenous and non-indigenous workers isdecomposed into its "explained' and "unexplained components. Additionally, the determinantsof poverty are estimated and policy simulations are conducted.
Sample
Though some general discussion of the data upon which this chapter is based is presentedin Chapter 4 (above), what follows are some important details concerning the data's distributionand how the results will be interpreted using the aforementioned geographical signature forethnicity, namely, the comparison of soco-economic differences between mnakptWr of varyingindigenous percentages. Figure 7.1 illustrates the distribution of observations by mw4ipleindigenous concentration. Muiciplor with indienous populations repesenting 0 to 10 percentof their total population contain the vast qjnorty of observations within the sample, over 50thousand. All other mwdpto (10 percent Indienous concentration and above) represent theremaining cases at just over 7 thousand observations. Generally, as the indigenous percentageof nautiples increase, the number of observations decrease.
141
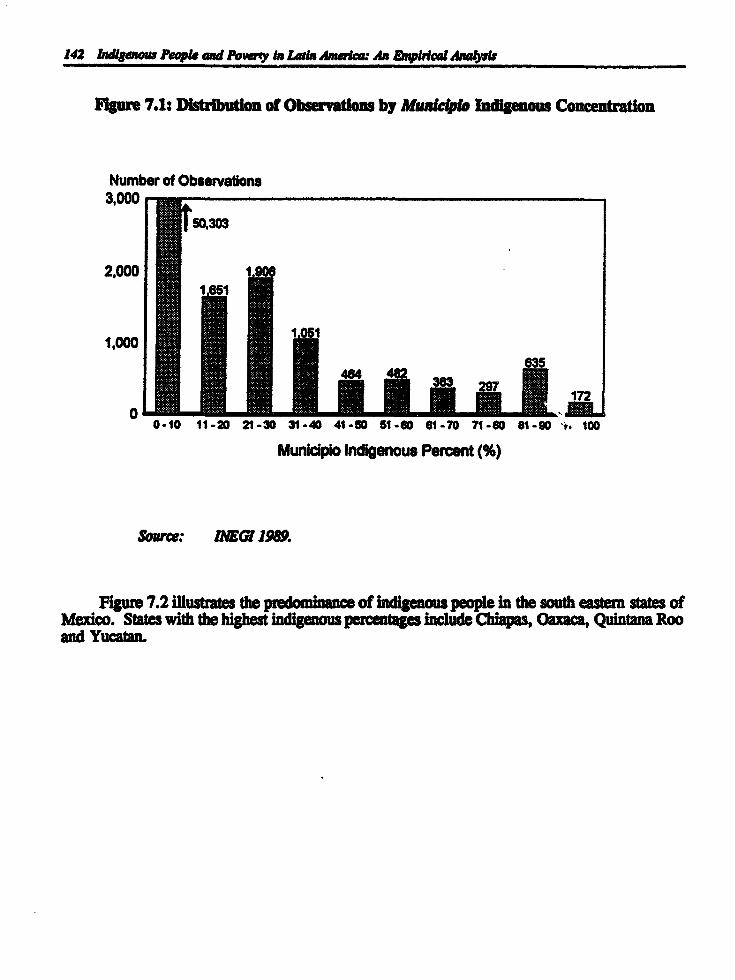
142 Infgto People ind Porry En Laia Am~lw An &NpW*ul Anal~U
1gure 7.1: Distribution of Observatos by Mu~cpe Idigenous Concentraton
Number of Observations3,000 - - - - - -- -
2,000
1,000
10635
0-10 11-20 21-30 31-40 41-80 51-60 61-70 71-80 81-90 9. 100
Municiplo indigenous Percent (%)
Soarce: INEi m1989.
Figur. 7.2 illustrates the of indigenous people in the south eastern states ofMexico. States with the highest indigenous percentages include Chiapas, Oaxaca, Quintana Rooand Yucatan.
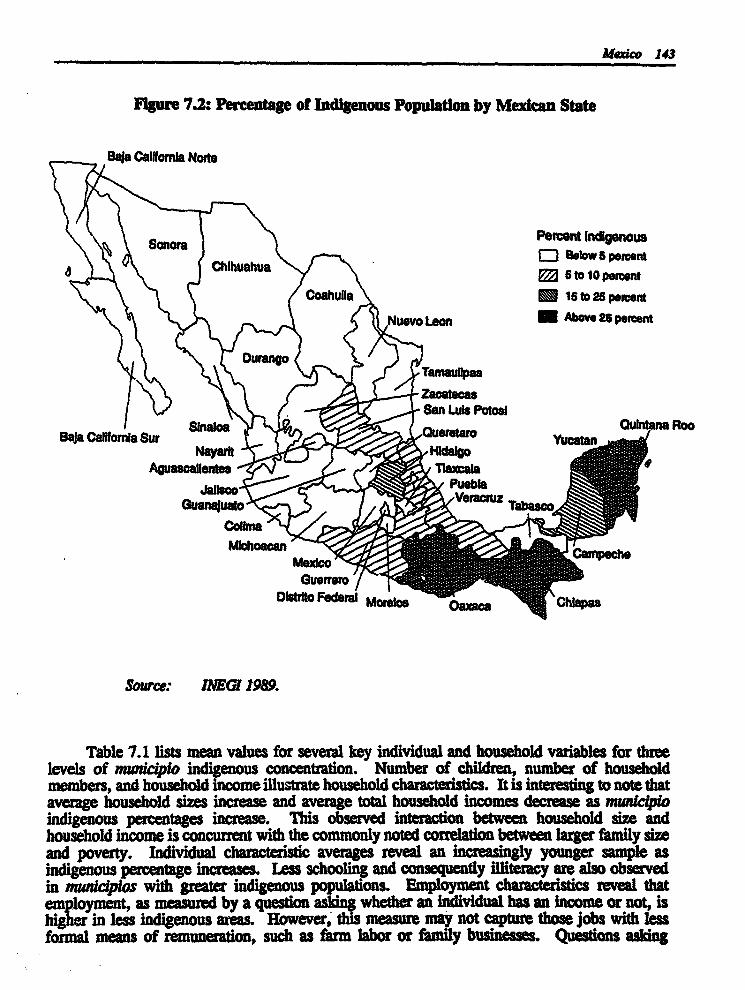
Ma~ 143
Figure 7.2: Perceutage of Indigenous Population by Mexican State
Baja CalifoNia Note
pSor idgenousB] Below 5 penent
Chhuahua to10 poement
Coahuga 16 2to5p dent
NumvoLonmm Abov porn
Durangm~
Zaca~eaSan Luft Po1s
Bala Ca .efornisa i$ur aswoa ad h al Ro*
Naya~ H~lg
Gu ~ Vera=r= Tä~
Guem~r
Dk*trto F~ Mor~o Oaxac Ch~aa
Sourc: IM GI 1989.
Table 7.1 Hist mean value for seea key indivda and houshld varibles for threelevels of mcipio indigenous concentration. Number of children, number of householdmembers, and household income illustrate household charactestics. itis interesting to note thataverage household sizes increase and average total household incomes decrease as m cptoindigenous percentages increase. This observed interaction between household size andhousehold icome is concurrent with the commonly noted correlation between larger family sizeand poverty. Individual chamcteristic averages revea an increasingly younger sample asindigenous percentage increses. Less schooling and consequently illiteracy are also observedin niplas with greater indigenous populations. Employment characteristics reveal thatemployent, as measured by a queston a whether an individual has an icome or not, ishigher in less indigenous areas. However, this m= e May not capture those jobs with lessforma means of remuneration, such as farm labor or Y businesses. Questions asidng

144 Idigea Peoplk and Pour~y in Lain äer An b~ ~Mar Aalyte
instead whether the individual bas workd in the last week and moth show litte differencebetween udcpio categories, supporting the concusion that employment is not necessrlydetermined by monetary payment. Unionfzation Is clearly more prevalent In less indigenousareas, most probably duc to the predoinantly rural nature of indigenom nnicpios (INI 1991).Personal income averages reafrm household income averages, decreasing as indigenouspopulation increases.
Table 7.1: Full Sample Averages for Seleted Variables
Non-Indigelous MedA m 1 tIghI enousVwwcbl (0-30%) (30%-78%)_ (70% +)
Household
Children 2.59 2.79 3.09
Household Members 4.89 5.42 5.51
Household Incom 1,863.63 390.66 375.07(x1000pesos)
Indåvidual
Age 24.8 23.3 21.4
Years of School 4.9 2.8 2.0
Road 0.76 0.59 0.48
Male 0.49 0.49 0.51
EmploymentHa Income 0.35 0.29 0.25
Hours Worked/Week 42.3 38.3 43.5
Union 0.21 0.12 0.07
Worked In Last Week 0.47 0.48 0.45
Worked In Last Month 0.46. 0.49 0.46
Personal Income (x1000pe) 323.86 112.39 90.5
Source: EG 1989.
The fo~owing sections discuss the empirical ncminatin of various development relatedissues with regard to ethnicity.
Medw 145
Income and Poverty Incidence
This section examines average income levels and potential determinants of poverty. Priorstudies have provided strong evidence of a correlation between average income levels andethnicity. Further empirical analysis examines the Incidence of poverty by ethnicity and testsvarious determinants on the probability of being poor.
It should be noted that since the method of analysis In this chapter is really based on theprobability of being indigenous instead of its actuality, some estimates may be biased. Incomeestimates may underestimate the incidence of poverty among indigenous people since It Isinevitable that in a 70 percent and over municipio, for example, some individuals will not beindigenous people and thus probably raise the estimated mean income.
Income
Previous research on indigenous issues in Mexico has often relied on the methodologyemployed in this chapter. Comparing regional socioeconomic conditions to regional iadigenouspopulation levels has been a popular analytical method for overcoming the difficulties ofattaining timely and adequate data on indigenous populations in Mexico. Following thediscussion of prior studies, the presentation of original research aims to contribute to the smallbut existing body of literature by adding analyses of recent survey data (1989), and by exploringsome previo unexamined issues concerning the indigenous population.
In a 1985 study, researchers examined the geographic distribution of individualsocioeconomic conditions in Mexico. To conduct the study, a single measure of socioeconomicwell-being was created and named the 'marginalization* index, a composite of 19 indicatorsrelated to income, economic activity, nutrition, health, housing and services. The higher thevalue of the *marginaliation* index, the worse was an individual's socioeconomic condition.Once determined, the index was examined at the nedcpdo, state and regional level, by servingas a dependent variable for assorted geographic determinants. Analyses revealed that ruralresidence, agricultural activity, and regions with ineffective means of communications had astrong positive impact on the index, indicating poorer socioeconomic conditions. On the otherhand, non-agricultural activity and muddpios located in the north had a weak impact on theindex, indicating better conditions. Most of the municiplos with the greatest positive effect onthe index were located in the rural areas of the "highly indigenous" states of Oaxaca, Chiapas,Guerrero, Hidalgo, Puebla and Yucatin. According to the study, 84 percent of the indigenouspopulation was living in mnidcplos and regions with a %very high' index ofPeople living in these areas had the worst social conditions. Seventy-seven percent of theeconomically active population earned less than the minimum salary (Ovalle and Canto 1982).
The Istiuwo Naconal Indigentsta (INI) in Mexico has been collecting information on theindigenous population in an effort to build a pool of data that includes geographic distribution,poverty, economic and social indicators, as well as cultural activities. Recent examination ofthis data in terms of poverty analysis, employing an index of "marginalivAtion" similar to thatused by Ovalle and Cantu (1982), reveal a direct relationship between density of Indigenouspopulation and socioeconomic conditions, especially in the rural mWdciples. In 1980, 97 percentof indigenous people of 5 years and over were living In mwicip1os classified in the category ofohigh' and 'very high' level of marginalizaton In highly-marginalized rural mwdciplo, 65percent of the marginalized population was indigenous, while only 19 percent was non-indigenous. None of the rural mwddpos with more than 70 percent ladigenous population fit

146 Indigenow People and Povmry in Latin Amerlca: An Empirical Analysi
into the categories of *medium" and "lown level of marginalization. Only two muddplos witha range of Indigenous population from 31 to 59 percent fit into the category of *medium*marginalization level (Warnam 1992).
In another publication, the INI states that 70 percent of indigenous people base theireconomy on primary and subsistence economic activities. Most indigenous economic activityis agricultural and little production is market oriented (INI 1991).
The findings of both Ovalle and Cantu (1982) and the INI (1991) are consistent with thefindings of the original research conducted in this chapter. As this chapter will illustrate,individuals in more indigenous nadclplos are on average in poorer socioeconomic conditionthan Individuals in less indigenous mwaiciplos. Also, in a simple model, a positive correlationexists between mwdcipie indigenous concentration and incidence of poverty.
Musiciplo analysis conducted on three different categories of indigenous concentration,under 10 percent, 10 to 40 percent and above 40 percent indigenous mnidcplo population, showsa consistent inverse relationship between household and personal income and the percentage ofindigenous people within each mwcipio. Higher income levels, whether individual laborearnings or household per capita income, for mwuiciplos of lower percentages of indigenouspopulation, persist in every tested category. Table 7.2 illustrates the average income differencesacross various categories by mwdcplo grouping.
Table 7.2: Distribution of Average Monthly Incomes by Mwdcio Indigenous Group(pesOs x1000)
Mwdcipo Indigenous (percent)Category Under 10 10-39 Above 40As*
20-29 483.4 322.9 214.230-39 661.4 450.3 259.240-50 729.8 328.3 242.3
EducationNone 283.8 154.9 102.7Primary Completed 441.3 294.3 171.2Secondary Completed 484.4 358.9 273.7
EmploymentAgricultural Worker 257.8 161.4 114.5Non-agri. Worker 579.5 393.5 353.6
Total 548.2 317.1 196.5Soarce: INEGI 1989.
The correlation between average incomes and the indigenous percentage of a mwuddpto canbe clearly seen in a scatter plot. In Figure 7.3, each point represents a munciple and is plottedby the average household income per capita (vertical axis) and the indigenous percentage of themodedplo (horizontal axis). One can clearly see the general trend of falling average per capita
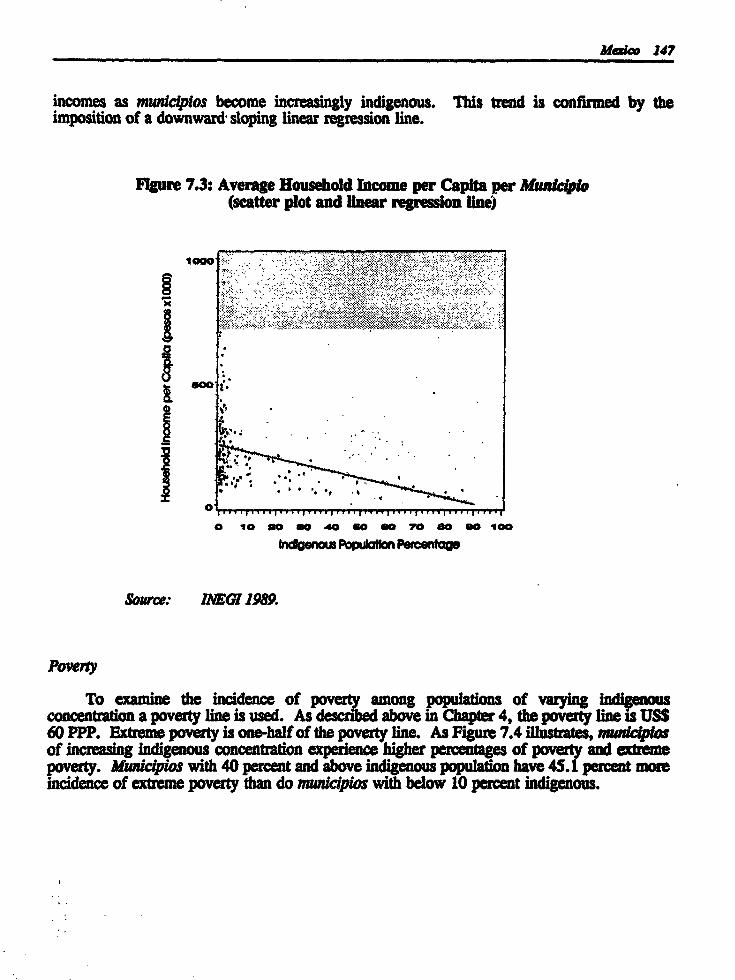
Me" 147
incomes as mndciplos become increasingly indigenous. This trend is confirmed by theimposition of a downward sloping linear regression line.
Fmgure 7.3: Average Household Income per Capita per Manicipe(scatter plot and Hnear regression lie)
1000
O ................... ...... ........
0 10 o so 40 so so so so 100
neous Populatn PerCentage
Soarce: INEGI 1989.
Povery
To examine the incidence of poverty among populations of varying indienousconcentration a poverty line is used. As described above a Chapter 4, the poverty line as TSS60 PPP. Extreme poverty is one-half of the poverty line. As Figure 7.4 illustrates, nacpitof increasing indigenous concentration experience higher percentages of poverty and extremepoverty. Mwdcipios with 40 percent and above indigenous population have 45.1 percent moreincidence of extreme poverty than do nwddpios with below 10 percent indigenous.

148 IndIi~w Pen o ple and Pourty In Latn A~merie. An Empil Ana~yls
gure 7.4: Poverty Incidence by M ~uici Type
P~ f M~uaØ Type k»C
aoof
40%
u~1%ba"% ~~kum
M~,cII Type
Særc: REGI 1989.
Th~~g die above ftgur does give sam= " ~iata as to tbo ea=n. of pcmetty amaeof diffe~~ ind&geams xcx P,nlat, it hais to re~ea the severity of p~vrt othet dma tbataev~al dm thun of the extrmm poverty line. For a ben&e --audna.-oa of the depth and
iin in~ea and non-indigenaus sereas, --Tu h alie FOT P re ~ esets he eent of povaty in a pp~t by W ng
each poor person according to their degree of deprivation or income leve below the pavertyline. Table 7.3 list the FOT P2 inde of poverty, including two other indices in die FOT"family* of poverty measurement, the FGT Pø or head count and the FOT P, or aggregatepoverty gap (for more detail se Psacharopoulos et al. 1992).
Table 7.3: FGT Poverty Ind~es
Hud Count Aggregat PavertySjb.sample Index (P) Gap (P) FOT P, IderIndgenous (mor than 70%) 80.6 44.5 28.4
Nnd O dessta 10%) 17.9 6.2 3.1Total 22.6 8.6 4.6
Sorce: IGD 1989.
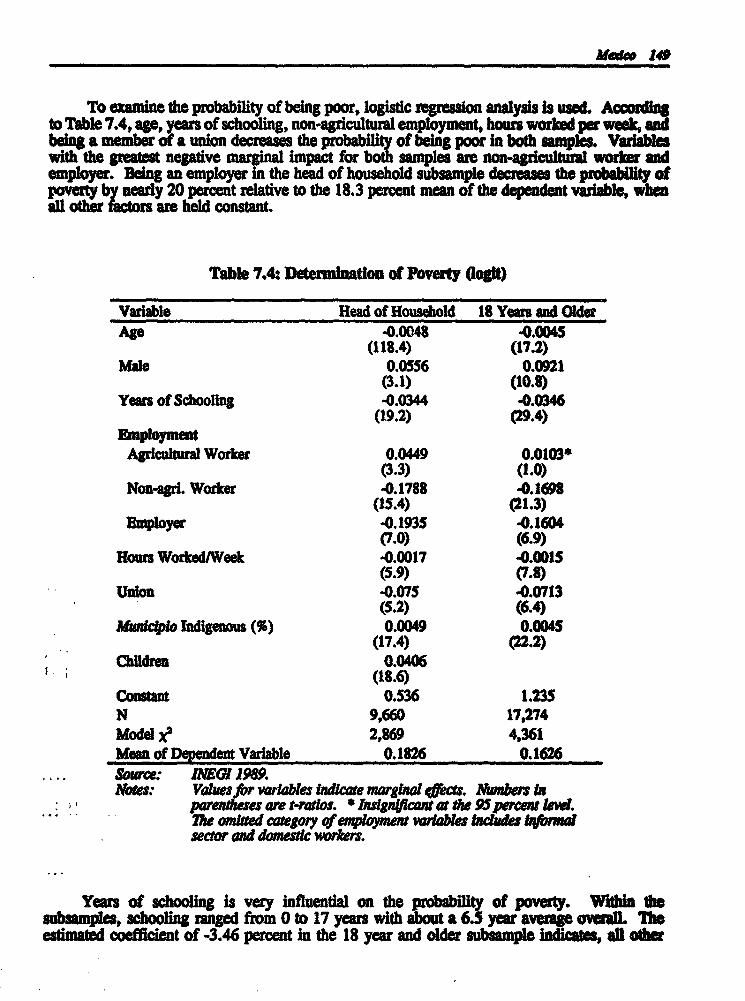
Mo~. 149
To eamune the probability of beUng poor, logistic egression analysis is usd. Acco~dagto Table 7.4, age, years of schooling, non-agrculturalemployment, hours worked per wek, andbeng a member of a union decreasms the probability of being poor in both samples. Variabcswith the greatest negative manal impact for both samples are non-agricultural woirer ande=ployer. eing an employer n the head of household subample decam~ the probability of
rty b early 20 percent relative to the 18.3 percent mem of the dependent vadable, whmnall o are held constant.
Table 7.4: Determinatlon of Poverty (ogi)
Varlable Road of Household 18 Years and OlderAg -0.0048 -. 0045
(118.4) (17.2)Mac 0.0556 0.0921
(3.1) (10.8)Years of SchoolIng -0.0344 -0.0346
(19.2) (29.4)Employment
Agricultural Worker 0.0449 0.0103*(3.3) (1.0)
Non-agri. Worker -0.1788 -0.1698(15.4) (21.3)
Employer -0.1935 0.1604(7.0) (6.9)
Rours Worked/Week -0.0017 4.0015(5.9) (7.8)
Union -0.075 .0.0713(5.2) (6.4)
M cipio hndigenom (%) 0.0049 0.0045(17.4) (22.2)
CbRldren 0.0406r (18.6)
Constant 0.536 1.235N 9,660 17,274Model je 2,869 4.361Mean of Dependent Variable 0.1826 0.1626Source: NE 1989.Notes: Values for varkables bdicate marginal ~<Oct,. SM~nbr ln
parendeses are t-rados. * Insgncant at de 95 percent leel.~h n ed egoryv of m~ xynzm ~ k~abe W ~ue lgra
sector and dm workers
Years of schooling is very influential on the probability of poverty. Within tesubsamples, sc ling ranged from 0 to 17 years with about a 6.5 year average overall. Theestimated coff ent of -3.46 percent in the 18 year and older subsample indientes, mll other
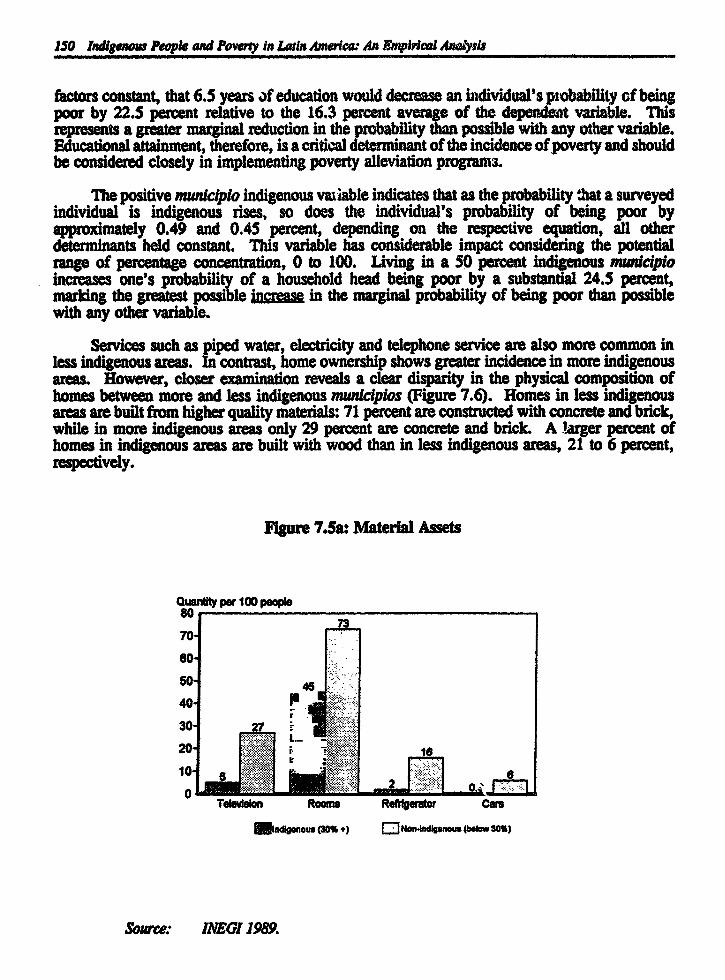
150 Indigenow People and Poverty in Latin Amerca An E&pficl AnalNs
factors constant, that 6.5 years of education would decrease an individual's piobability of beingpoor by 22.5 percent relative to the 16.3 percent average of the dependent variable. Thisrepresents a greater marginal reduction in the probability than possible with any other variable.Educational attainment, therefore, is a critical determinant of the incidence of poverty and shouldbe considered closely in implementing poverty alleviation programs.
The positive municiplo indigenous vaiable indicates that as the probability 'hat a surveyedindividual is indigenous rises, so does the individual's probability of being poor byapproximately 0.49 and 0.45 percent, depending on the respective equation, all otherdeterminants held constant. This variable has considerable impact considering the potentialrange of percentage concentration, 0 to 100. Living in a 50 percent indigenous mwiploincreases one's probability of a household head being poor by a substantial 24.5 percent,marking the greatest possible increase in the marginal probability of being poor than possiblewith any other variable.
Services such as piped water, electricity and telephone service are also more common inless indigenous areas. In contrast, home ownership shows greater incidence in more indigenousareas. However, closer examination reveals a clear disparity in the physical composition ofhomes between more and less indigenous mwdciplos (Figure 7.6). Homes in less indigenousareas are built from higher quality materials: 71 percent are constructed with concrete and brick,while in more indigenous areas only 29 percent are concrete and brick. A larger percent ofhomes in indigenous areas are built with wood than in less indigenous areas, 21 to 6 percent,respectively.
Figure 7.5a: Material Assets
Quantity per 100 peopl80
7370
80
5045
40 P
30 7
20-
10- 102 60
Teledalon Rooms Reftigeraor Cars
*lafgnous (301% ) NonIdigenous (bdow30%)
Source: IREGI 1989.

m MD~
.........
0~0.
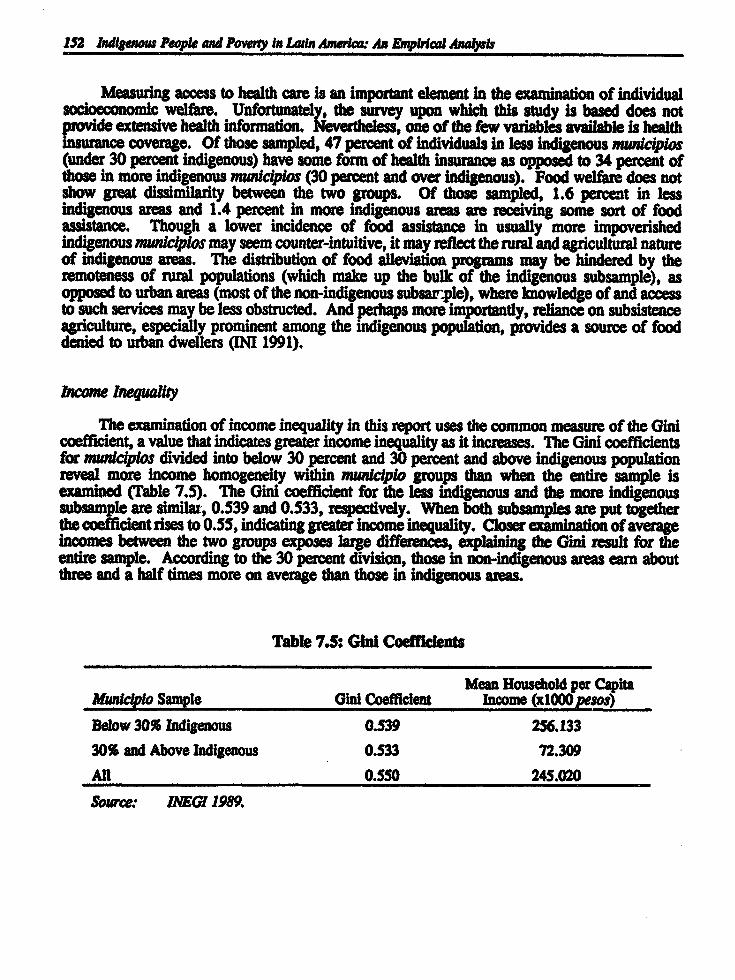
152 Indigenow People and Powny In Larin Amerla An ENirical Analypk
Measuring access to health care is an important element in the examination of individualsocioeconomic welfare. Unfortunately, the survey upon which this study is based does notprovide extensive health information. Nevertheless, one of the few variables available is healthinsurance coverage. Of those sampled, 47 percent of individuals in less indigenous amiciplos(under 30 percent indigenous) have some form of health Insurance as opposed to 34 percent ofthose in more indigenous munciplos (30 percent and over indigenous). Food welfare does notshow great dissimilarity between the two groups. Of those sampled, 1.6 percent in lessindigenous areas and 1.4 percent in more indigenous areas are receiving some sort of foodassistance. Though a lower incidence of food assistance in usually more impoverishedindigenous municiplos may seem counter-intuitive, it may reflect the rural and agricultural natureof indigenous areas. The distribution of food alleviation programs may be hindered by theremoteness of rural populations (which make up the bulk of the indigenous subsample), asopposed to urban areas (most of the non-indigenous subaple), where knowledge of and accessto such services may be less obstructed. And perhaps more importantly, reliance on subsistenceagriculture, especially prominent among the indigenous population, provides a source of fooddenied to urban dwellers (INI 1991).
ncome Inequalty
The examination of income inequality in this report uses the common measure of the Ginicoefficient, a value that indicates greater income inequality as it increases. The Gini coefficientsfor maWcples divided into below 30 percent and 30 percent and above indigenous populationreveal more income homogeneity within muiciplo groups than when the entire sample isexamined (Table 7.5). The Gini coefficient for the less indigenous and the more indigenoussubsample are similar, 0.539 and 0.533, respectively. When both subsamples are put togetherthe coefficient rises to 0.55, indicating greater income inequality. Closer examination of averageincomes between the two groups exposes large differences, explaining the Gini result for theentire sample. According to the 30 percent division, those in non-indigenous areas earn aboutthree and a half times more on average than those in indigenous areas.
Table 7.5: Ghid Coedents
Mean Household per CapitaMuniciplo Sample Gd Coefficient Income (x4000 pesos)
Below 30% Indigenous 0.539 256.13330% and Above Indigenous 0.533 72.309All 0.550 245.020
Source: JNEGI 1989.
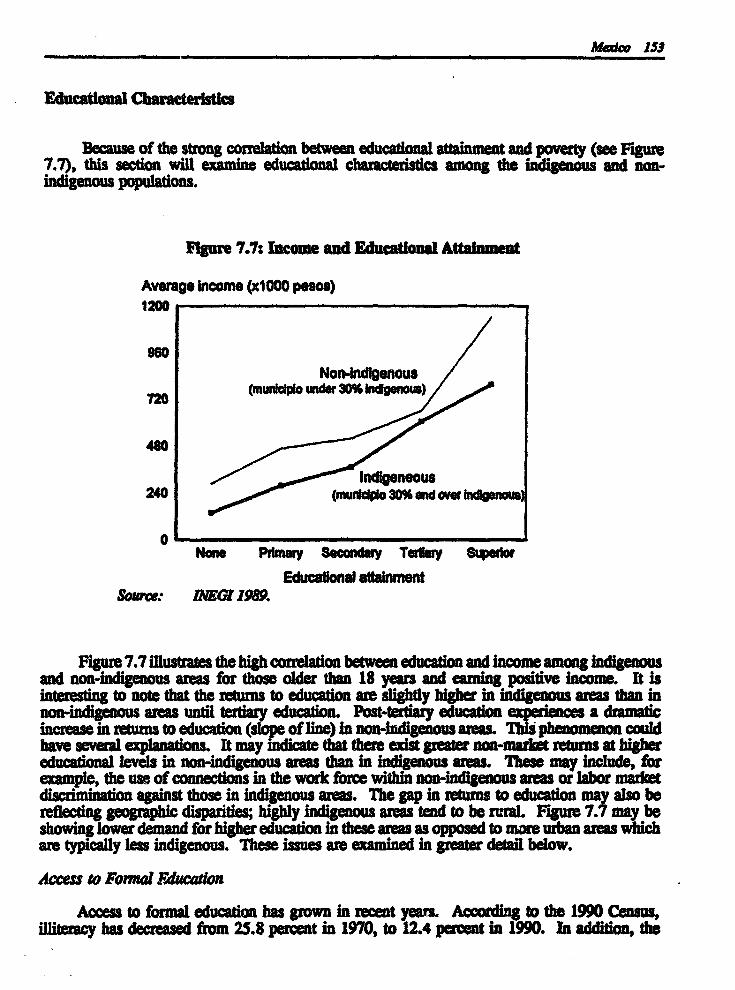
Makeo 153
Educational Characters
Beane~ of the strong cormlation between educational attainment and poverty (see Figur7.7), this section will amine eduational charactrisdes among the indigenous and non-indigenous populations.
Flgure 7.7: Inemoe and Educational Att~ment
Average income (x1000 pesos)1200
960Non-Indgenous
7 (munipounder 30%ftdgenous)
480
indgencous240 (muniplo 30% and over dgenous)
0Non Pdary Seconday T~Uaiy Supdor
Educational attainmentSource: MNEGI 1989.
Figure 7.7 illustrates the high correlation between Odumtion and income among indigenousand non-indigenous areas for those older than 18 years and earing positiv. income. It isinteresting to note that the returns to education are slightly higher in indigenous areas than in
igenousaeas until tertiary ducatin Post-tertiary eduction ep=ine a dramatiincrease in returns to education (si of line) in non-indigenous areas. Tishave several * ~planatn. It my na that te xi ga nn-m t r e t Dgrducatina levels in non-indigenous areas than in indigenous aras. These may include, for
example, the ue of connections in the work force within non-indigenous areas or labor martdiscrimination against those in indigenous areas. The gap in returns to edatin may also bere~ecting geographic disparities; highly indigenous areas tend to be rural. Fligure 7. my beshowing lower demand for higher education in these areas as opposed to more urban area whichare typically less indigenous. These issues are eamined in greater detail below.
Access to Fon~l E&caion
Access to forma! education has grown in recent years. According to the 1990 Cen^,illitera~y has decreasd from 25.8 percent in 1970, to 12.4 percent in 1990. In additian, the
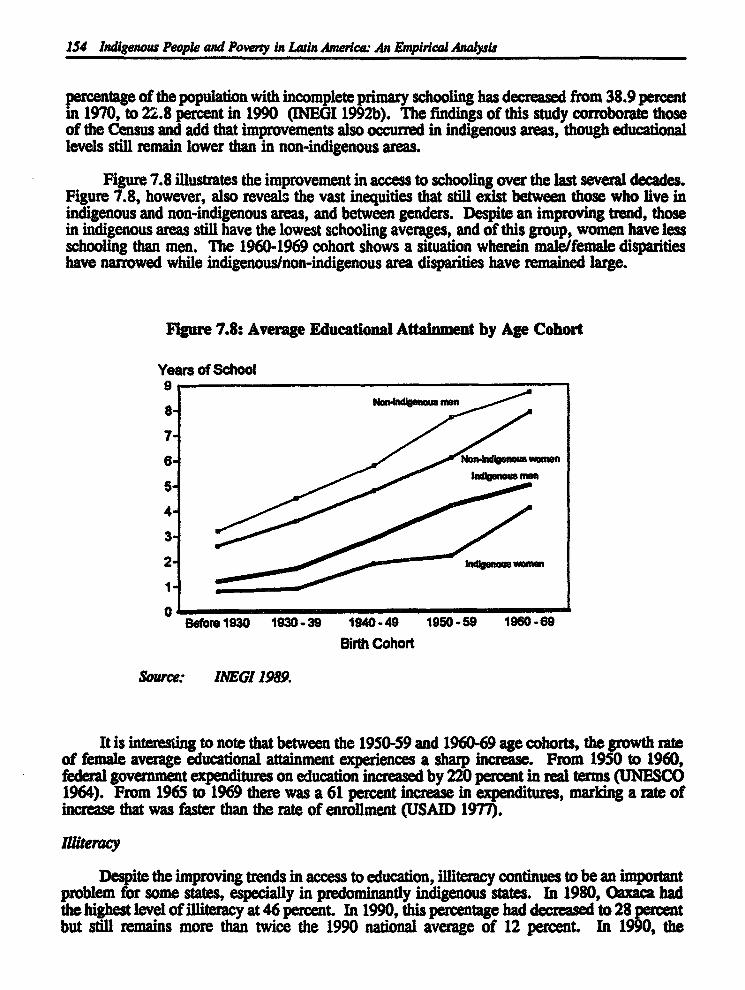
154 Inigenow Peopk and Poersy in Latin America: An Empirial Analysis
percentage of the population with incomplete primary schooling has decreased from 38.9 percentin 1970, to 2.8 percent in 1990 (INEGI 1992b). The findings of this study corroborate thoseof the Census and add that improvements also occurred in indigenous areas, though educationallevels still remain lower than in non-indigenous areas.
Figure 7.8 illustrates the improvement in access to schooling over the last several decades.Figure 7.8, however, also reveals the vast inequities that still exist between those who live inindigenous and non-indigenous areas, and between genders. Despite an improving trend, thosein indigenous areas still have the lowest schooling averages, and of this group, women have lessschooling than men. The 1960-1969 cohort shows a situation wherein male/female disparitieshave narrowed while indigenous/non-indigenous area disparities have remained large.
FIgure 7.8: Average Educational Attainment by Age Cohort
Years of School90
7-
e- NcnWbwnxw
4-
3-
Befor 1930 1930-39 1940-49 1950-59 1960-69
Birth Cohort
Source: 11EG 1989.
It is interesting to note that between the 1950-59 and 1960-69 age cohorts, the growth rateof female average educational attainment experiences a sharp increase. From 1950 to 1960,federal government expenditures on education increased by 220 percent in real terms (UNESCO1964). From 1965 to 1969 there was a 61 percent increase in expenditures, marking a rate ofincrease that was faster than the rate of enrollment (USAID 1977).
Ieracy
Despite the improving trends in access to education, illiteracy continues to be an importantproblem for some states, especially in predominantly indigenous states. In 1980, Oaxaca hadthe highest level of illiteracy at 46 percent. In 1990, this percentage had decreased to 28 percentbut still remains more than twice the 1990 national average of 12 percent. In 1990, the
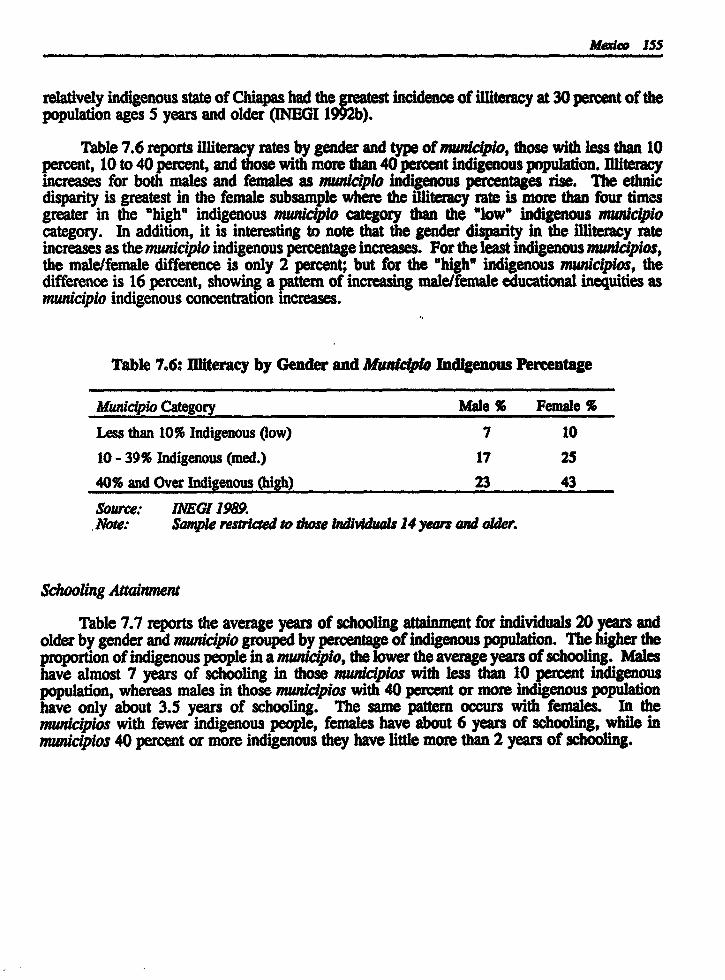
MaO 155
relatively indigenous state of Chiapas had the greatest incidence of illiteracy at 30 percent of thepopulation ages 5 years and older (INEGI 1992b).
Table 7.6 reports illiteracy rates by gender and type of adc(pio, those with less than 10percent, 10 to 40 percent, and those with more than 40 percent Indigenous population. Illiteracyincreases for both males and females as meldpto indigenous percentages rise. The ethnicdisparity is greatest in the female subsample where the illiteracy rate is more than four timesgreater in the "high" indigenous manciplo category than the "low" indigenous awciplocategory. In addition, it is interesting to note that the gender disparity in the illiteracy rateincreases as the municiplo indigenous percentage increases. For the least indigenous mnwdcpos,the male/female difference is only 2 percent; but for the "high" indigenous municiplos, thedifference is 16 percent, showing a pattern of increasing male/female educational inequities asmunicipio indigenous concentration mcreases.
Table 7.6: Illiteracy by Gender and Municiple Indigenous Percentage
Municipo Category Male % Female %
Less than 10% Indigenous (low) 7 10
10 - 39% Indigenous (med.) 17 25
40% and Over Indigenous (high) 23 43
Source. INEGI 1989.S.Ne: Sample restricted to those Individuals 14 years and oder.
Schooling Aainment
Table 7.7 reports the average years of schooling attainment for individuals 20 years andolder by gender and mnidcplo grouped by percentage of indigenous population. The higher theproportion of indigenous people in a maWciplo, the lower the average years of schooling. Maleshave almost 7 years of schooling in those mwdiplos with less than 10 percent indigenouspopulation, whereas males in those mwdcplos with 40 percent or more indigenous populationhave only about 3.5 years of schooling. The same pattern occurs with females. In themwdciplos with fewer indigenous people, females have about 6 years of schooling, while inmuiclpios 40 percent or more indigenous they have little more than 2 years of schooling.
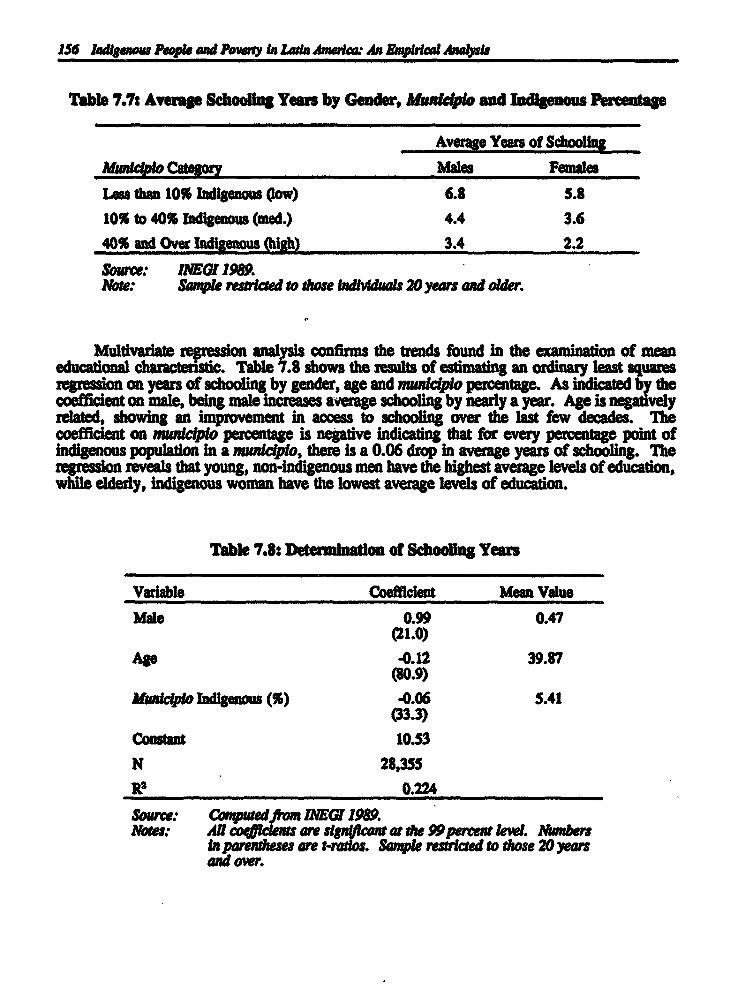
156 Iawig~ou Peqpte and Pny in Lain ~mra: An Emca An~kl
Table 7.7: Average Schooling Years by Gender, Munipfe and Indigenous P~rentage
Average Years of Schoolig
Mwnclplo Cateory Males Females
Lss th 10% Indigenous (low) 6.8 5.810% to 40% Indigenous (ed.) 4.4 3.6
40% and Over Indigenous (high) 3.4 2.2
So~.e: IGI 1989.Note: Sple restricted ro ose Indtuals 20 years a d older.
Mulivadrate on analysis conrms the trends found in the ernminatin of memeda~tlnal charactenstic. Table 7.8 shows the results of estimating an ordinary hast squaresregression on years of schooling by gender, age and nudclpio percentage. As indicate by thecoefficient on mal, being mal increases average schooling by nearly a year. Age is negatvelyrelated, showing an improvement in access to schooling over the last few daMe. Thecoefficient on m~iclpio percentage is negative indicating that for every percentage point ofindigenous popuin in a nndcplo, there is a 0.06 drop in average years of schooling. Theregress1on reveals that young, non-indigenous men have the highest average levels of education,while elderly, indigenous woman have the lowest average levels of education.
Table 7.8: Deter-unntin of Schoong Years
Variable Coecent Men Valuc
Ma 0.99 0.47(21.0)
Age -0.12 39.87(80.9)
Mnciplo Indigenous (%) -0.06 5.41(33.3)
Constant 10.53N 28,355
0.224
Source: Cm~p~edfro IAEGI 1989.Notes: AN coleu are udgn~lcaat at Oe 99percent level. Nwers
in pare eses are s-raios. Sple resricted ro tose 20 yearsand owr.
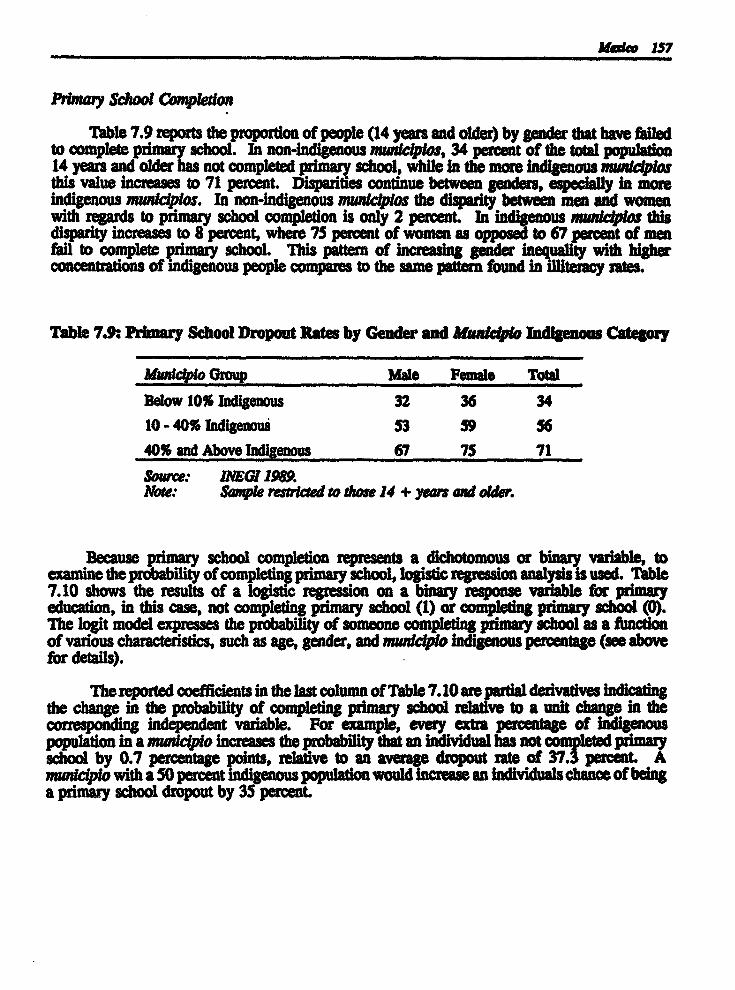
M~d. 157
Prmy School C oM n
Table 7.9 repouts the proportion of people (14 years and older) by gender that have faledto complete primary school. In non-indigenous ~9cpior, 34 percent of the total populatin14 yea and older has not completed pdmary school, while In the mor indigenous nMfatcplthis value increases to 71 percent. Disparities continue between geders, aspecally in morindigenous mmdcplos. In non-Indigenous m~cplos the disparity between men and womemwith regards to pmary school completion is only 2 percent. In indigenous numcfipr thisdisparity increases to 8 percent, where 75 percent of women as opposed to 67 percent of menfail to complete primary school. This pattern of increasing genader neuatywith higherconcentrations of mdigenous people compares to the same pattern found in ilieayrates.
Table 7.9: W nary School Dropout Rates by Gender and M ~sWpIe Indigenous Category
Municipio Group Male Pemale Total
Below 10% Indigenous 32 36 3410 - 40% Indgenou 53 59 5640% and Above Indigenos 67 75 71
Source: NaEG 1989.Note: Sample xrmican doee 14 + years a older.
Because primary school completion represents a dichotomous or binary variable, toexamne the probability of oprimay school, logist regresson analys is used. Table7.10 shows the results of a lo regression on a binary response varable for primaryeducatlon, in this cas, not cmpt primary school (1) or compleng priary school (0).The logit model expresses the probability of someone compl~dng primary school as a functonof varlous characterisdcs, such as age, gender, and nsmcipio indigenous percentage (see abovefor details).
Ihe reported coefficients in the last column of Table7.10are partial derivatves indicadngthe change in the probability of completing primary school relativ to a unit change in thecorresponding independat vaiable. For example, every extra percentage of Indigenouspop~latin in a mn~Mciplo increases the probability that an individual has not completcd prImaryschool by 0.7 percentage ponts, relative to an averag dropout rate of 37.3 percnt.A
dmciplo with a 50 percent mdigenous populaton would increase an individuals chance of beinga primary school drpout by 35 percent.
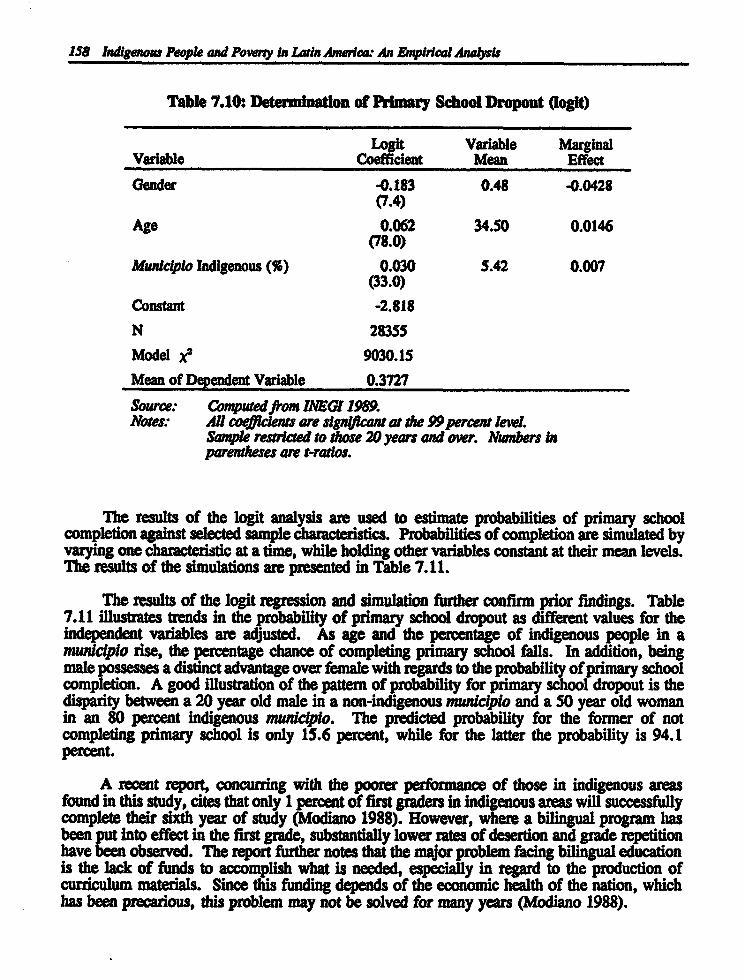
158 IndigeneW People and Povery in Lain Amerla: An EmWrIcal Analysi
Table 7.10: Determluation of Primary School Dropout (logit)
Logit Variable MarginalVariable Coefficient Mean Effect
Gender -0.183 0.48 -0.0428(7.4)
Age 0.062 34.50 0.0146(78.0)
MudciplO Indigenous (%) 0.030 5.42 0.007(33.0)
Constant -2.818
N 28355
Model )e 9030.15Mean of Dependent Variable 0.3727
Source: Computed fom INEGI 1989.Notes: AM coqniclems are signficant at the 99 percent lev.
Sample restricted to those 20 year and over. Nwnbers inparentheses are t-ratdos.
The results of the logit analysis are used to estimate probabilities of primary schoolcompletion against selected sample characteristics. Probabilities of completion are simulated byvarying one characteristic at a time, while holding other variables constant at their mean levels.The results of the simulations are presented in Table 7.11.
The results of the logit regression and simulation further confirm prior findings. Table7.11 illustrates trends in the probability of primary school dropout as different values for theindependent variables are adjusted. As age and the percentage of indigenous people in amunicipio rise, the percentage chance of completing primary school falls. In addition, beingmale possesses a distinct advantage over female with regards to the probability of primary schoolcompletion. A good illustration of the pattern of probability for primary school dropout is thedisparity between a 20 year old male in a non-indigenous mnidcpio and a 50 year old womanin an 80 percent indigenous municipio. The predicted probability for the former of notcompleting primary school is only 15.6 percent, while for the latter the probability is 94.1percent.
A recent report, concurring with the poorer performance of those in indigenous areasfound in this study, cites that only 1 percent of first graders in indigenous areas will successfullycomplete their sixth year of study (Modiano 1988). However, where a bilingual program hasbeen put into effect in the first grade, substantially lower rates of desertion and grade repetitionhave been observed. The report further notes that the mqjor problem facing bilingual educationis the lack of funds to accomplish what is needed, especially in regard to the production ofcurriculum materials. Since this funding depends of the economic health of the nation, whichhas been precarious, this problem may not be solved for many years (Modiano 1988).
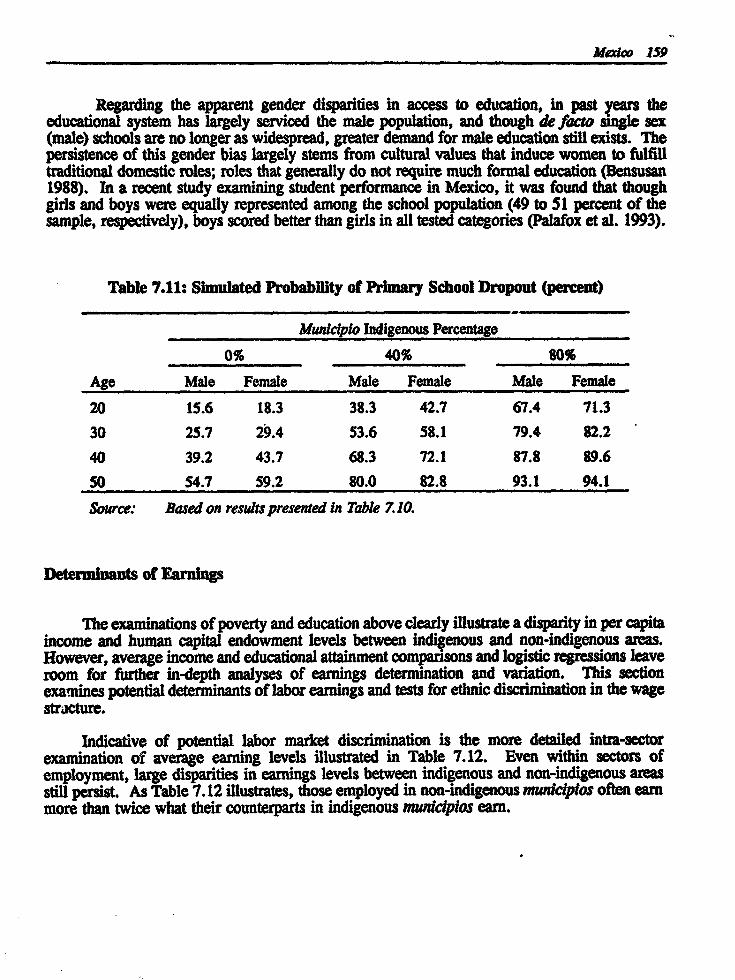
Medko 159
Regarding the apparent gender disparities in access to education, in past years theeducational system has largely serviced the male population, and though defacto single sex(male) schools are no longer as widespread, greater demand for male education still exists. Thepersistence of this gender bias largely stems from cultural values that induce women to fulfilltraditional domestic roles; roles that generally do not require much formal education (Bensusan1988). In a recent study examining student performance in Mexico, it was found that thoughgirls and boys were equally represented among the school population (49 to 51 percent of thesample, respectively), boys scored better than girls in all tested categories (Palafox et al. 1993).
Table 7.11: Simulated Probability of Prnary School Dropout (percent)
Muniplo Indigenous Percentage
0% 40% 80%
Age Male Female Male Female Male Female
20 15.6 18.3 38.3 42.7 67.4 71.330 25.7 29.4 53.6 58.1 79.4 82.2
40 39.2 43.7 68.3 72.1 87.8 89.650 54.7 59.2 80.0 82.8 93.1 94.1
Source: Based on results presented in Table 7.10.
Determinants of Earnings
The examinations of poverty and education above clearly illustrate a disparity in per capitaincome and human capital endowment levels between indigenous and non-indigenous areas.However, average income and educational attainment comparisons and logistic regressions leaveroom for further in-depth analyses of earnings determination and variation. This sectionexamines potential determinants of labor earnings and tests for ethnic discrimination in the wagestructure.
Indicative of potential labor market discrimination is the more detailed intra-sectorexamination of average earning levels illustrated in Table 7.12. Even within sectors ofemployment, large disparities in earnings levels between indigenous and non-indigenous areasstill persist. As Table 7.12 illustrates, those employed in non-indigenous mwdcipios often earnmore than twice what their counterparts in indigenous municiples earn.

160 mndig~nn, Peopte and Poury in Latin Amr.v: An EpirkIl Aal,
Table 7.12: Average Wages for Selected Sectors
Non-indigenous IndignousD dd Seor !(E x1000) (psos x1000)
Agriculture 1111 126.58 73.57
Forestry 1112 116.15 58.36Construcdon 5011 407.31 274.25Food and Bevage 6210 113.58 53.66Public Education 9212 641.47 413.84
Domestic Services 9540 197.29 77.13
Source: INiG1989.Note: AN ecror codes are u the AMU= dd
Emn xiaK yLr1dctoä~arL Non-lfdfgenous rers to mw~c{plobelow 30percent ~ndigenos. 7ndlgenous røfrs to unuicipior 30percentand abow sndlgenou.
Earings Am~alnent
The apparent differences in earnings between those in indigenous areas and those in non-indigenous area is amnd using the decomposition technique des~dhed in the introduction(see above).
The varation in earnings in the sample duc to differeaces in human capital characteristics(endowments) will first be examined by using carnings functions. Years of schooling, years ofpotentiallabor market expe~ence (age-schooling-6) and its transformation (experience squared),hours worked per week, and several additional variables with potential uignificance to ~arninglevels, such as gender and unionatin, are the independent vadables. The dependent vaiableis the log of monthly carnings.
The first column of estimate coefficients In Table 7.13 is based on the full sample oferployed adults. Regression analyses on this sample allows the inclusion of a mwcplo
ousvaable, tin the probability of being indigenous. The erimated negativecoeffli for this a le Indns that for each percent of indigenous population within amudcnpio (increasing probability of an individual being indigenous), the log of earnings of theindividual in the mmclp~o decreases. However, though this indi~e a tendency of lowerCarnings in more indigenous areas, it does not reveal what portion of the decrease between moreand les indigenous aeas is duc to differences in income geneating personal chaactedistics or*unexplained causes such as discrimination. To answer this question a decomposition technqueis employed.

Make 161
Table 7.13: Sample Mean Characteritics
Below 30% 30% and AboveCharacteristics Total Sample es Indigenous) (mrne nadigenous)
Natural Log of Earabags 12.83 12.89 11.70
Years of Schooling 7.15 7.34 3.83
Experience 20.51 20.27 24.66
Natural Log of Work Hours 3.78 3.78 3.73
Married 0.61 0.61 0.62
Non-Agri. Worker 0.80 0.83 0.26
Agricultural Worker 0.16 0.14 0.54
Employer 0.004 0.003 0.01
Unionization 0.23 0.23 0.13
Source* JNEGI 1989.Note. Se4pte rawical t men earning perMwiv Income and 14+ years onty.
Table 7.13 lists the means of earnings function characteristics between the two mwddptoindigenous categories. Mddkplfr with a greater percentage of indigenous people expedencenot only lower mean earnings but also less of those characteristics expected to influence carningspositively, with the exception of experience. Average years of schooling is 91 percent higherin less indigenous anWcplos. Experience levels are higher for the indigenous areas largelyreflecting the lower levels of schooling due to the construction of the experience variable. Non-agricultural laborers formed 87 percent and agricultural laborers only 10 percent of the Olessindigenous group. In the "more indigenous subsample, agricultural laborers outnumbered non-agricultural laborers, 48 to 34 percent, respectively. These differences are indicative of thepredominance of indigenous people in the rural areas of Mexico. Furthermore, the percentageof employers in indigenous areas is substantially greater. Regarding organised labor, unions arenearly two times more prevalent in less indigenous mnwddpios than in more indigenousmwdcplos, largely reflecting the greater tendency of unionization to occur in urban areas(Hirsch 1980).
The last 2 columns of Table 7.14 present the results of the expanded earnings functionestimated separately for both Oless" and *more* indigenous mwddplos. With the exception ofcoeffcients on dummy variables, all other coefficients can be interpreted as the percentagechange in earnings caused by a unit change In the corresponding characteristic. The coeficientson dumm variables can be converted to percentage values by the following equation asdescribed m Halvorsen and Palmqulst (1980).
For the first four variables listed, table 7.14 teveals few substantial differences incoefficients between the indigenous and non-indigenous earnings functions. The average returnfor years of schooling for those in highly indigenous mwdcplos is nearly 9 percent per

162 Indigenor People and Poveny In Latin Amerc: An Empirical Analts
additional year and only slightly higher in less indigenous mnc(plos. Those living in lessindigenous areas receive higher returns for labor market experience than do those in moreindigenous areas, 3.7 to 2.0 percent, respectively. This disparity may be explained in part bythe higher level of experience in indigenous areas. The premium for hours worked per weekis nearly the same for the two areas.
Table 7.14: Earnings Fwctlos by Masttpo Indigenous Category
MW*icipto Indigenous
Below 30% 30% and AboveVariable Total (low) (bigh)
Years of Schooling 0.092 0.093 0.087(47.9) (47.6) (7.4)
Experience 0.036 0.037 0.020(22.0) (22.0) (2.5)
Experience Squared -0.0005 -0.0005 -0.0002(-19.0) (-18.9) (-2.1)
Log Hours Worked/Week 0.00 0.297 0.286(16.1) (15.5) (3.3)
Married (1,0) 0.261 0.262 0.192(15.6) (15.2) (2.5)
Employment (1,0)Non-Agri. Worker 0.925 0.892 1.203
(26.2) (22.5) (12.4)
Agri. Worker 0.465 0.439 0.492(12.6) (10.4) (5.9)
Employer 0.448 0.409 0.575(4.0) (3.2) (2.2)
Union (1,0) 0.028* 0.023* 0.190*(1.8) (1.4) (1.9)
Midpto Indigenous (%) -0.010(-20.6)
Constant 9.68 9.68 9.28
N 8,820 8,343 476
R2 0.502 0.443 0.465
Source: IEGI 1989.Notes: * InUgaicant, ofherwise all parameter estMates are slnUkant at the 95 percent
leW. Numbers In parendeses are t-radfos. Sample restried to men earafng positivehcome and 14 years and older. 21e anttd category of exployment variable Is thetijoromal sector.

MCO 16a
Type of employment has the greatest impact on earnings. In non-indigenous areas a non-agricultural worker earns 144 percent more than his counterparts in mother* occupations;agricultural workers earn 59.2 percent more. Even more dramatic is the impact of non-agricultural employment in indigenous areas. Non-agricultural workers earn 232 percent more,on average, than other" workers in indigenous areas. This figure is considerably reduced,though still a high 63.6 percent increase in earnings for agricultural workers in indigenous areas.However, the non-agricultural and agricultural worker variables might be capturing much of theurban/rural differences not controlled for by a missing variable identifying urban/rural residence.Those who are not employed in the listed categories form the self-employed (without employees)and the informal sector.
Table 7.15 shows the mean incomes of unionized and non-unionized male workers inindigenous and non-indigenous areas. A greater percentage of workers in less indigenous areasare members of unions than those in more indigenous areas. According to the earnings functionslisted in Table 7.14, the union estimates are insignificant at the 95% level, possibly Indicatingthe long-run inability of unions to maintain long-run, above market wage rates (Hirsch andAddison 1986). However, evidence suggests that unions provide additional, non-monetaryremuneration. Within the sample, the percentage of unionized workers with health insuranceis nearly twice that of non-unionized workers, approximately 40 to 80 percent respectively.
Table 7.15: Unionization and Earnings (males)
Mwi Indigenous
Non-Indigenous Indigenousnon Under 30% 30% and Above
Yes Income (x1000) 651.2 397.5(23.7) (13.7)
No Income (x1000) 520.1 146.6(76.3) (86.3)
Source: NEGI 198.Note: Income Is In pess.
Table 7.16 lists the results of a decomposition performed on the two earnings functionsdetailed in Table 7.14. By putting the two earnings functions together in the method describedin Chapter 4, a decomposition identifies the Oexplained' and OunexplainedO portion of thedifference in earnings between non-indigenous and indigenous areas.

164 Indgenow Aeple and Povwy In Latin Ameria An Enpiria Analyt,
Table 7.16: Decomposition f Ethnic Earings Diferential
Percentage of the Differential Due to Differences bc
Speclicatlon Endowments Wage Structure
£3 r,-) + X,. 4 52 48
64-si + ZAAJ$, 66 3(Wag. / Wages) = 328%
Source: Computedfom Table 714.Note: Wage / Wagel is the rado of the non-Ladigenous to IAdigenous mean
n*41~ earings.
For the first specification, the portion of the differential that is due to the productivecharacteristics or endowments of individuals is equivalent to 52 percent of the differential.in logof wages between workers in indi;enous and non-indigenous areas. In other words, if those inindigenous areas were endowed with the same amounts of productive characteristics as those innon-mndigenous areas, the difference in earnings between them would narrow by 52 percent.However, the remaining 48 percent difference in earnings is unexplained.' Por the secondspecification, 66 percent of the wage differential is 'explained,' and 34 percent is'unexplained." The "unexplained' portion is comprised of the unmeasured difference inearnings between indigenous and non-indigenous areas and may include differences in ability,health, quality of education, labor force attachment, culture, as well as wage discrimination.Therefore, depending on the specification, discrimination against those In indigenous areas mayexplain up to 48 or 34 percent of the wage differential, thus forming the bound' ofdiscrimination. The actual figure would be much lower if the unexamined factors mentionedcould be controlled for in the analysis. But it should be kept in mind that these values inthemselves may reflect discrimination (Oaxaca and Ransom 1989).
As Table 7.16 indicates, regardless of which decomposition specification is used, part ofthe indigenous/non-indigenous wage differential comes from "unexplained' sources other thanan individual's initial endowments. In other words, discrimination against those in indigenousareas appears to exist in the Mexican labor market.
Table 7.17 shows the contribution of each variable to the earnings differential betweennon-indigenous and indigenous areas. A positive value indicates an earnings advantage in favorof workers in non-indigenous areas, whereas a negative value indicates an earnings advantagein favor of workers in indigenous areas. For the differential in earnins due to 'explained'factors or endowments, higher educational attainment plays a large role m explaining the non-indigenous earnings advantage. However, the largest contribution to the non-ladigenosadvantage stems from non-agricultural employment, refecting the predominance of non-agricultural workers in non-indigenous areas. As previously mentioned, non-ariculturalworkers have higher salaries on average than most other employment categories examined. Theagricultural worker variable's negative value indicates the predominant percentage of agriculturalworkers in indigenous areas. Greater labor market experience among the indigenous subsamplealso further reduces the earnings differential. The contribution of endowment differences in theremaining determinants is not very large.
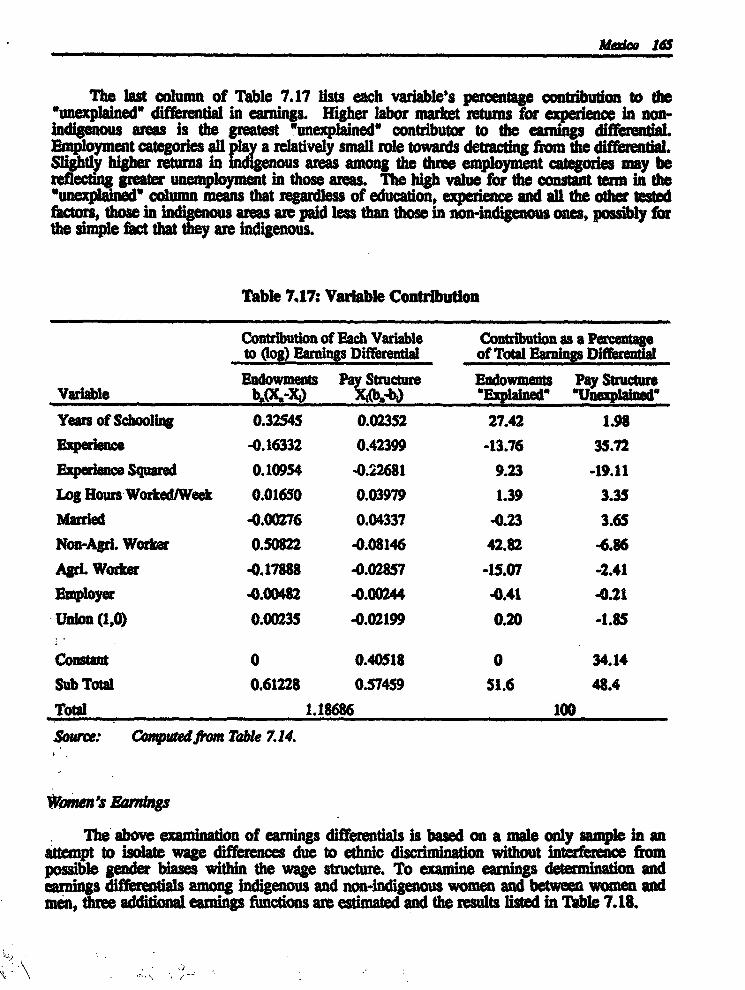
Md~ 165
The last column of Table 7.17 lists each varable's percentage contrbudon to theOunexplaned differential in earnings. Higher labor market returns for expedence in non-Indigenous ares is the greatest unexplained contributor to the earings differntlal.Emp ncategories all ay a relatively small role towards detra~dng from the differential.
thigher returns agenous areas among the thre employment categories may beunemployment in those armas. The high valuc for the consant term In the
ead column means that regardess of education, experience and all the other tesedfactors, thos in indige ares re paid lss than those in non-indigenous ones, possbly forthe simple fact that Ohcy are Indigenous.
Table 7.17: Varable Contribution
Contribution of ach Variable Contributon as a Percentageto (log) Earuings Differental of Total Earnings Differendal
Endowments Pay Structure Endowmen=s Pay StrctureVarable K_(X,-X_ X&(b.-b~) Explained" Uexplainedm
Years of Schooling 0.32545 0.02352 27.42 1.98
Experence -0.16332 0.42399 -13.76 35.72Experience Squared 0.10954 -0.22681 9.23 -19.11Log Hours Worked/Week 0.01650 0.03979 1.39 3.35Married -0.00276 0.04337 -0.23 3.65Non-Agr. Worker 0.50822 -0.08146 42.82 -6.86Agr. Wor~er -0.17888 -0.02857 -15.07 -2.41
Employer -0.00482 -0.00244 -0.41 -0.21
Union (1,0) 0.00235 -0.02199 0.20 -1.85
Constant 0 0.40518 0 34.14
Sub Total 0.61228 0.57459 51.6 48.4
Total 1.18686 100
Sorce: Computed rom Table 714.
*,men's Earnings
The abov amina~in of earnings differ~tia1s is based on a mae only sample in anauempt to isolate wage differences due to ethnic discrimination without interference frompssible gender biases within the wage structure. To uxamin carnings determinatin andca~ning differnia among indigenous and non-indigenous women and between women andmen, three addidonal earnings funcuions are estimated and the results listed in Table 7.18.

166 Indgenow Peopl and Fowrty ta Latin Am~eria An EmpIral AnalyE
Table 7.18: Earnings letons by Geder
Non-indignous Indgeous WomenVarable Men and Wmen Men and Women OnlyYears of Schooling 0.098 0.099 0.110
(58.0) (8.6) (32.4)
Experience 0.038 0.021 0.045(25.9) (2.6) (16.4)
Experience Squared -0.0005 -0.0002 0.000721.6 (2.0) (13.3)
Log Hour Worked/Week 0.421 0.441 C.540(27.9) (6.2) (22.0)
Male 0.185 0.473(13.8) (4.4)
Married (1,0) 0.185 0.165* ).116(11.5) (1.9) (3.1)
Non-Agri. Worker 0.812 1.120 0.532(21.3) (11.0) (4.4)
Agri. Worker 0.390 0.470 0.219*(9.5) (5.3) (1.5)
Employer 0.330 0.510* -0.086*(2.8) (1.8) (0.3)
Union (1,0) 0.061 0.322 0.124(4.4) (3.3) (4.8)
M ~dclpk> Indigenous (%) -0.009(7.0)
Children -0.0009* -0.010* -0.048(0.2) (0.5) (4.1)
Constant 9.083 8.181 8.848
N 11,743 544 3,467
Ri 0.425 0.455 0.420
o . WEGI 199.Natot: * Inigm I. WWE a pawneter eatata are usifCant at ih 99%
le~L Nwnbr inpaenthe.m øy :·ratta. Smpie red to thisw earningpawmb Iaco~e aud 14 yeai and older. Non-ndIow< rs tomulplos below 3Opercent magwso~. Odlgmou riØr~ to mwadplo~ 30pø~ent and abou indiguow.
The women's earnings functions are similar to those of men but differ with rspect to theinclusion of a gender variable in the first two listed funcions, and a variable controlling for thenumber of children in all three. The first two functions examine non-indigenous and indigenous
Make 167
areas as a whole and control for gender. Comparisons of the estimated coefficients on the maledummy variable between the two equations reveal that men in in enous areas earn 60.5 percentmore than their female counterparts, as opposed to 20.3 percent in non-indigenous areas. Thisdisparity may Indicate greater income inequities between genders in indigenous areas than innon-indigenous area.
The last column lists the results of an earnings function on a female only subsample.Education, log hours worked per week, non-agricultural labor, unionization and children playsignificant roles in earnings determination. Education has a very strong impact on femaleearnings. The estimated coefficient on education indicates that for each year of a woman'seducation, her earnings increase by 11 percent. This is a very significant determinantconsidering female education in the subsample can range from 0 to 17 years. Al otherdeterminants equal., a woman who has completed prinary school (6 years) earns 66 percent morethan a woman without education. Another variable of significant impact is the log hours ofwork. Each one point of increase in the log hours of work increases a woman's earnings by 54percent. Non-agricultural labor increases a woman's income by 70 percent. Interestingly, thenumber of children becomes statistically significant in the women only subsample, indicative ofthe greater impact of children on female rather than male earnings in a traditional society.
The negative value on the mwdcplo indigenous percent variable confirms the trend oflower earnings in indigenous areas than in non-indigenous areas. The -0.009 value listed for thefemale subsample is nearly the same as the -0.01 value seen in the male only earnings functions.This finding reveals that individual earnings, regardless of gender, fall by 1 percent for eachpercent of indigenous concentration within a =addpIo, all other factors constant.
Child Labor and Education
This section attempts to empirically examine the determinants of schooling and no-schooling activities for children in non-indigenous and indigenous areas. Household anddemographic determinants of schooling participation, years of schooling attainment and childemployment will be analyzed for nuodciplos of varying indigenous population percentages.
Figure 7.9 schematically describes the sample and the school/non-school activities ofMexican children and youth (those 12-18 years of age) for mmore" and less* indigenous areas.The subsamples to be used in the analysis are also shown. The "in school* population includes6,071 and 295 observations for the less and more indigenous mwddplos, respectively. The *notin school' population comprises the remainder, or 3,702 non-indigenous and 325 indigenousobservations, respectively. The 'not in school- sample is further divided into sworking* (thoseworking 30 plus hours/week) and *not workang' subsamples. Due to the nature of the survey,schooling and non-schooling decisions are mutually exclusive. That is, either a child is in schoolor is not; a child cannot be classified as workiag and be enrolled in school at the same time.This represents a limitation since it is known from other sources that working children oftenattend school (Myers 1989).
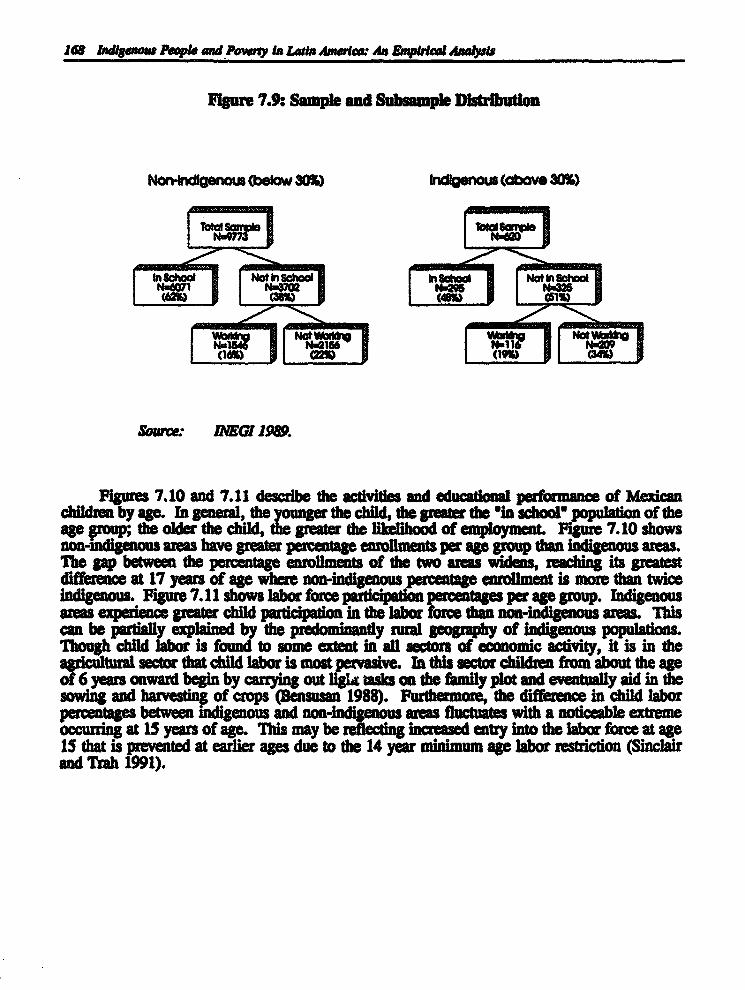
16 Indgenau People and Pony n L~atn Ami: An Empril Analp
gure 7.9: Sample and %ns .npie Distribution
Non-indigenous0seuow30% Indigenous (above 30%
In% N ~i* s N&IN
~.156
Source: iNEiGZ'1989.
Figures 7.10 and 7.11 descudb the acdvdties and educanal performane of Mexicanchildren by age. In general, the younger the child, th greater the in school" population of theage oup; the older the child, the greater the ikelihand of employment. Pigur 7.10 showsnon-mdigenous areas have greater percentage erof1mais per ag group than indigenous areas.The gap between the percentage enrollments of the two arias widens, aching its greatestdifference at 17 years of age where non-indige enro is m than tindigenous. gur 7.11 shows labor force g .amas experinnen greater child partcipada in the Jabor force than non-indigenous aras. hiscan be pardally explained by the predominantly rurl geography of indigenous populatins.Though chld labor is found to some extent in all sectors of economic acvity, it is in theagricultual ector that bchildbismopersren from about the ageof 6 years onward begin by carrying out lgIa asks on the famiy plot and eventually aid in thesowing and harvesting of crops (Bensusan 1988). Furthermore, the difference in child laborpercentages between indigenous and non-'n'menous areas fluctuates with a notieable extremeoccurnng at 15 years of age. This may be ~ increased entry into the labor force at age15 that is prevented at earlier ages due to the 14 year minimum age labor restric~on (Sinclairand Trah 1991).
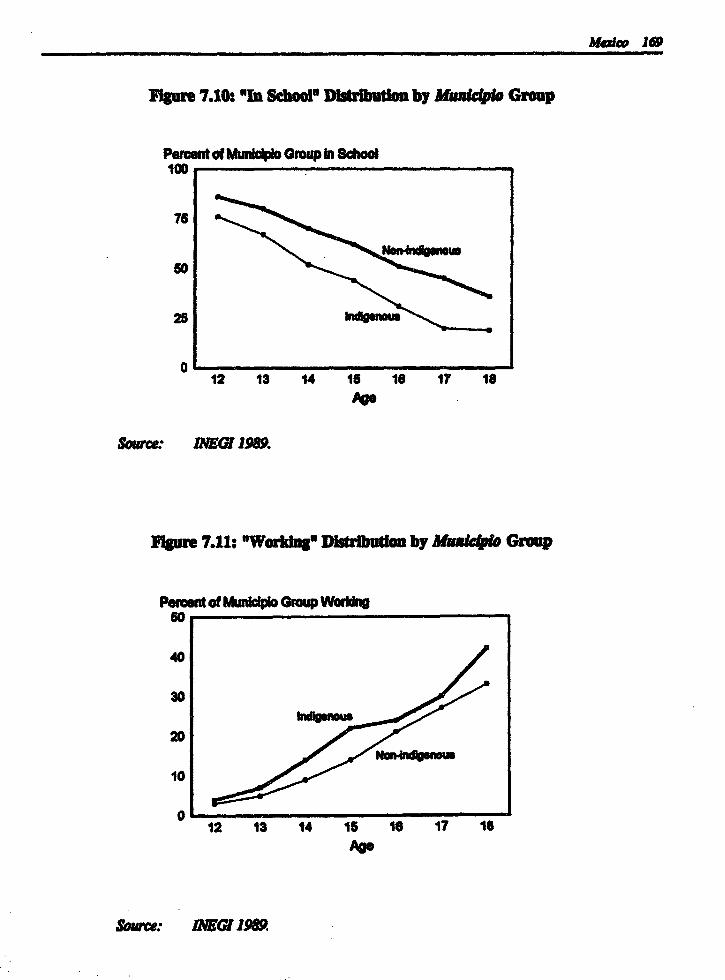
Matæ 1e
lYg~r 7.10: In School" Diribnui by Muid(pfe Group
Percent of Municpi Group in School100
75
26
012 13 14 18 18 17 18
Age
Searce: ma 1sap.
1lgure 7.11: "Workdug Distribudeon by M~alc(plo Group
Pren of Municipo Group Wordng60
40
30
20
10
0 12 13 14 15 16 17 16
B09
Source: ZNG198R

170 Indigeos People and Powrsy In Latin Amelcw Ai Empiriarl Analysis
Table 7.19 presents mean educational atainment and their correlates broken down into the'in school* and "not in school" subsamples for non-indigenous and indigenous areas. The 'notin school* sample is further broken down into *working" and 'not working" subsamples.
Table 7.19: Mean Educational AttaInment by Selected Sample Characteristics
Non-indigenous Municiplos Indigenous Municiplos
Not in School Not in School
Not NotCharacteristic In School Working Working In School Working Working
Gender
Male 7.1 6.0 5.7 5.3 4.7 4.6
Female 7.4 7.1 5.7 5.8 4.6* 4.0
Mother's EducationNone 5.9 5.0 4.3 4.6 4.1 3.6Primary and Below 7.3 6.7 6.3 6.2 6.1* 4.9Secondary and Above 8.3 9.4 8.3* 8.5* 0.0 0.0
Father's Education
None 5.7 5.1 4.5 4.4 4.1 3.4
Primary avd Below 7.2 6.6 6.1 5.6 5.2 4.6
Secondary and Above 8.2 8.7 7.5 7.3 0.0 0.0
Household Head Employment
Non-agri. Worker 7.6 7.1 6.3 7.5 5.1* 4.1*
Agricultural Worker 5.6 4.8 5.3 4.6 4.2* 4.4
Other 7.1 5.9 5.7 5.1 4.4 3.9
Source: 11GI 1989.Notes: Sample for ddldren 12-18 years of age. * Mean conpsoed with less than 30
obsermaions. Working Is defined by 30plus hours of labor per wek "Non-Iadigenous" rqfers to mwdcplos below3perc Indigenous. Indigenous" refers tomaiciptos 30 percent and above Inditenous.
Examination of average years of schooling for the indigenous and non-indigenoussubsamples reveals much higher educational attainment averages among the non-indigenous(Figure7.12). Within indigenous and non-indigenous groups, the "in school" subsamples havethe highest average schooling followed by those "not in school' and "working.' Children notin school and unemployed have the lowest average schooling attainment.
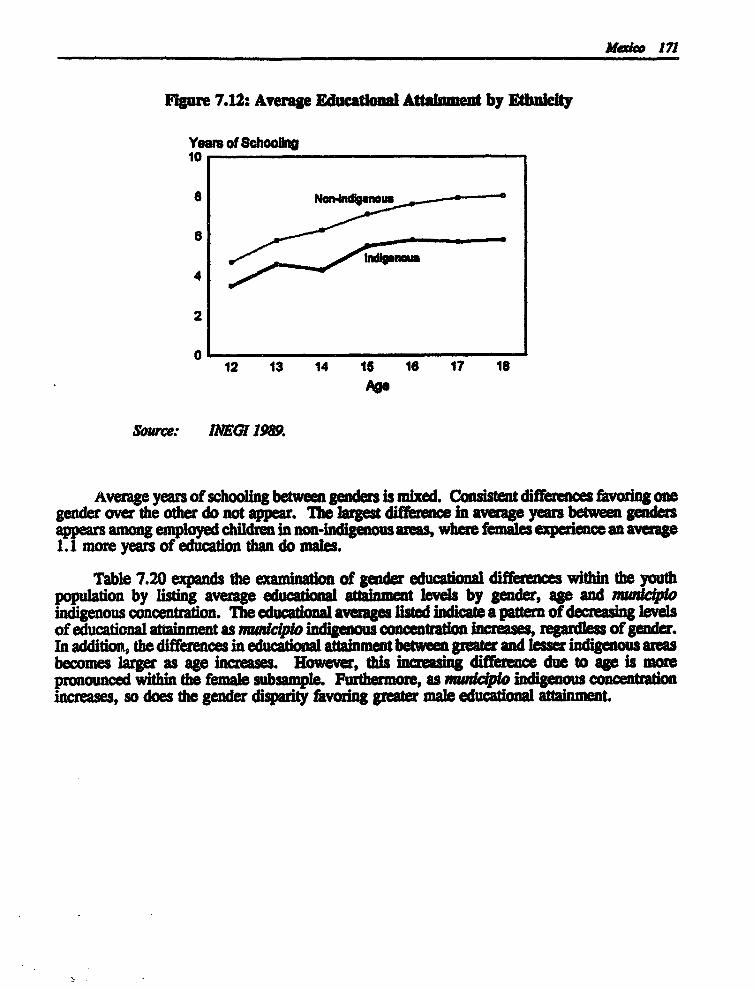
M~dae 171
Fgure 7.12: Averae catonl Attatnnt by Et~tty
Years of Schoo8ng10
8 NonØgnous
4
2
012 13 14 15 16 17 18
Ag
Source: IEGI 1989.
Average years of schooling between genders is mixed. Consistent differences favodmg onegender over the other do not appear. The largest difference in averago years betweem gendesappears among employed children in non-indigenous areas, where femae experence an average1.1 more years of education than do in.
Table 7.20 expands the examination of gender educational differences within the youthpopulation by listing average educational attainment levels by gender, age and m cpioindigenous concentration. The educational averages lsted indieca a pattern of decreasing levelsof educational atinment as nwWclpm o indigenous concentration increases, regarde of gender.In addition, the differences in educational at~inment between greater and lesser indigenous arebecomes larger as age increases. However, this inceasing difference due to ae is mompronounced within the female subsample. Furthermore, as mndlpio indigenous concentrationincreases, so does the gender disparity favodng greater mate educational attainmet

172 ~ag~u ~ aNd Prn la Anla a ~alw An kpbrul ~aL>ls
Table 7.20: Average Year of SchooUng by Gnde, Age and M ~nfaþ<oIdgous Category (percent)
Average Years of Schooling
Mal Ages Femal AgesMunckpm Category 6-12 13-17 18-24 6-12 13-17 18-24
Less than 10% ndigenous 3.1 6.9 8.7 3.2 7.2 8.4
10% to 40% Indigenous 2.7 6.0 6.7 2.8 5.8 6.640% and Over Indigeno 2.4 5.2 5.3 2.4 4.9 4.4
Soure: IEGI 1989.
Parental eduation seems to play an important role in average educadonal levels amongchildren. The average Increase in educational achievement for a child with a mother withsecondary or greater education, as opposed to a mother with no ed&~ati,n is 3.5 years in non-indigenous areas. For fathers the impact is only slightly diminished to a 3.0 year difference.Similar differences exist in indigenous areas, but due to the lack of mothers with an educationabove the primary level in the subsample, this could not be fully aamine. However, wherecomparisons are available between areas, the impact of parental education is gratet inindigenous areas.
The employment conditions of the head of the household has a clear ~mpact on a child'svraa~e Ed iol mean a com for non-agricur
d t l o cpo contains the sef-employed including the inforal sector. Households whose heads are non-agricultural workersin either indigenous or non-indigenous areas have children with higher educational rttinmentaverages than otherwise employed household heads. Household heads employed in agriculturaljobs tend to have the children with the lowest educational averages. However, f~rther analysesis n e the means presented here do not control for other oritical factors such as theage of the chidre.
The resuts of regression analysis using multivariate models that contra for factors thatsultaneously determine ducational attainment, schooling participation, and child labor appearin Table 7.21. The educational ettninment mode is a simple OLS regression. Schoolparticipation and child labor are estmated by logistic regression analyuis. The qualitativedepmndent varable for the school participation model is the binary response of in schaa ornot in schoot* ~ma1ly, the child labor dendent vadmable ases a binary response as the
child Is ther "workig or *not wodd~g.*

Makic 173
Table 7.21: Expluining FAucatlonal Performance and Chd Ipoyment
Years of
Varable (OLS) (Ii) tAge 0.136 4.099 0.0689
(8.5) (29.6) 26.2)Male 0.850 0.0197* 0.1111
(2.2) (1.3) (10.4)Mwicpo lndigenous (%) -0.010 0.0004* 0.0*
(4.5) (1.1) (0.1)Sibligs 0.100 -0.0271 0.0055
(5.9) (9.0) 2.6)Male Household Head 0.100* 0.0123 .. 0403
(1.0) (3.8) (3.1)Mother's schooling 0.586 0.0494 -0.0221
(64.1) (20.6) (13.1)Household Income 0.000* 0.0002 0.0*Per Capita (1.5) (5.3) (0.6)RoUSeOd Read Occupaton
Non-agrl. Worker 0.192 0.1587 -0.0514(3.1) (12.3) (5.5)
Agricultural Worker -0.423 -0.0783 0.0034*(3.3) (3.9) (0.2)
Constant 0.460 5.988 -9.038R3/Ch~-square 0.501 2,350 1,238N 5,684 8,893 8,893
Source: Ima 1989.Notes: * Insigncant. Al tvhe vues are udgnlaa at the 99percent ~at. Mnbers
In parentheses r ad. Yars of scooling estima~jr in soolsamle. ue L category qfhoasold head occpaions Indudes sef-engøoyed and te io l sector. Logit resuk report marginat eae.
The firt column of Tabe 7.21 reports the resuts from the OLS regression an yCars ofschooling. Determinant such as number of siblings, houehnM income per capite- and head ofhousehold occupatian show positive and dignificant cne1~tiona with a chdId's educatioualatainment. However, the mast udgificant contdbutar to a child's educntinnal attninment ismother's education. The ertimatod coef~cient of 0.586 suggests that, on aeraqe, atherdeterminants held constant, a child's eductiona attainment is increased 58.6 percet ar 7months for each year of his mother's educational atainment.

174 Indgeam People and Powry In LatX Amfew An MqpiriWcl Analrl
The only negative coefficiaent In the school attament model is the MaMIcpIo's indigenousconcentration. Though this coefficient is signitcant, it Is not very large. A child living in a 70percent indigenous modcipto will, on average, all else held constant, have about 8 months lessschoolfng than a child in a completely non-Indigenous mwdciplo. The small impact of theindigenous variable indicates differences in school attainment are better explained by the otherdeterminants. Table 7.22 lists tht significant determinants found in the regressions and theiraverage values for areas of different indigenous concentration.
Table 7.22: Means of Sigfat e-nnants of Schooling Attainment
MpLe laiEnou Concentraton
Variable Below 10% 10- 50% Above 70%
Male 0.25 0.25 0.27
Sibltgs 3.6 3.6 4.1
Mother's Education 4.4 2.6 1.0
Household Income per Capita 228.2 98.7 44.9
Household Head as Laborer 0.54 0.46 0.33Dependent Variables
School Attainment in Years 5.4 3.8 2.2
Student 0.64 0.59 0.44
Worker 0.16 0.16 0.24
Soew: INEGI 1989.Noter. 2e dependent variables 'student" aid Woater* are dumny
variables, tOwdeqore mea alues are equtwlent to raes. Forerample, 64 percent q tde below 10 percen Indigenous subsanpleare stents.
As Table 7.22 illustrates, most determinant averages drop as indigenous concentrationsincrease. Most notable is the fall in mother's education, the determinant with the mostpronounced impact on child schooling attainment. It is clear that the poorer scholasticachievement of children in indigenous areas is due largely to poor levels in these significantdeterminants and any significance remaining to the indigenous percent variable is capturingrelevant determinants not included in the model.
The second column of Table 7.21 presents the results of a model attempting to explainparticipation in schooling. The qualitative dependent variable is school attendance. Positivecoefients indicate increased probability of school attendance. Male headed households andhouseholds headed by laborers tend to substantially increase the probability of school attendance.Again mother's education has a significant and large impact on a child's enrollment probability.For every year of a mother's educational attainment, the marginal probability of her child'senrollment increases by nearly 5 percent, all else held constant. A mother with incomplete

Madco 175
primary school education, representing 3 years, increases her child's probabilities of enrollmentby nearly 15 percent. If a mother has completed primary school, the probability increases to30 percent. Number of siblings and age have negative coefficients, reducing enrollmentprobabilities as their values rise. It is interesting to note that the midciplo indigenouspercentage coefficient is not statistically significant, though it is negative. This lack ofsignificance is discussed below.
The last column of Table 7.21 shows the results of a logit regression on the probabilityof employment among the child population. Among those determinants with the greatest positiveimpact on the probability of employment are age, gender, and number of siblings. Gender hasa.strong positive impact; being male increases a child's chances for employment by nearly 8percent. Those determinants detracting from child employment are male head of household,mother's education and a laborer as the head of household. The coefficient of household incomeper capita is insignificant. This does not indicate that the probability of child labor is not partlydetermined by household income, but instead may represent bias introduced by a simultaneitycondition since household income per capita and child labor are determined simultaneously byeach other. In the estimated model, child labor is partly determined by household income, buthousehold income per capita is partially determined by child labor, as Table 7.23 illustrates.In addition, similar to the school participation model, naiciplo's indigenous percentage isinsignificant in determining child labor.
Though the mwiciplo indigenous percent is insignificant in the two logit models, it shouldnot be interpreted that indigenous areas do not differ from non-indigenous areas in educationalattainment and in the probabilities of schooling and working. As Table 7.22 illustrates, meanlevels of other significant determinants, such as mother's education, differ greatly betweenindigenous and non-indigenous areas, explaining much of the inter-ethnic differential in thedependent variables. The lack of statistical significance of the mnedciplo indigenous percentdeterminant shows that the differences in child education and child labor between indigenous andnon-indigenous areas are due to differences in socioeconomic conditions. The presence ofdeterminants measuring these conditions, such as mother's education, income per capita andnumber of siblings, Wexplain" much of the significance that would be attributed to a mundcipiodeterminant regressed on a simpler model. Any significance the mwiciplo percentagedeterminant maintains is due to missing socioeconomic variables to which the nsWmcipiodeterminant is highly correlated. For the averages of those determinants that are significant toschool participation and child labor, the indigenous subsample predicts lower probabilities ofschool participation and higher child labor than in the non-indigenous subsample. For example,the average difference in mother's educational level between the two areas is 2.7 years more innon-indigenous mncpios. Based on the estimated model for school participation, this wouldmean, holding all other determinants of school participation consam, the average probability ofschool enrollment in non-indigenous areas is 13.4 percent greater than the probability ofenrollment in indigenous areas.
The contribution of child labor income to total family income is substantial. Table 7.23shows the percent contribution of child labor for age, educational attainment, gender andmunicipo indigenous percentage categories. As expected the percent contribution of child laborto family income increases with age. Increasing educational attainment reduces the contribution.Child income plays a slightly greater role in total family income in indigenous areas than in non-indigenous areas. It is interesting to nte that male mean earnings are less than female meanearnings; this difference, however, is not statistically significant.

4A.
i{ {{{4ip,irjijt$ Ia t

Mait 177
Examination of specific economic sectors confirms persistent income differences between thosein non-indigenous and indigenous areas.
Large educational differences exst between indigenous and non-indigenous mrddplar, butthere has been substantial improvement over the last several decades. Trends in average yearsof education show improvement over past years in indigenous and non-Indigenous areas. Mostnotable has been the closing gap between genders within muiciplo groups. However, the gapbetween indigenous and non-indigenous areas i still large.
Primary school completion rates show significant variation along both ethnic and genderdifferences. Men in non-indigenous areas experience the highest rates of primary school
.completion. In contrast, women in indigenous areas experience the lowest rates of primaryschool completion.
the original research in this report operates at the MnWdclplo level, the emphicalresults c tently indicate lower earnings, lower standards of living, less educational attinmntand higher labor market discrimination in mwdciptos where indigenous people represent agreater percentage of the population than in mwdidplos where they represent a smallerpercentage.
The empirical results presented in this chapter show a clear socioeconomic disadvantageamong those living in mWcpos with high percentages of indigenous people to those living inmuniciples with low percentages of indigenous people. Poverty assessments cannot afford toignore the visible socioeconomic disparity presented by ethnicity. Interventions with anindigenous component would likely benefit the poor and extremely poor, since as the evidenceshows, indigenous and poor are often synonymous. In what areas could such programs befurther focused to maximize their economic rates of return? The analyses within this chapteroffers several ideas. The following briefly summarises two of the primary determinants ofpoverty found by this study, suggesting these determinants as guides for targeting mechanisms.
The apparent strong influence of education to ameliorate poverty and increase earnings,especially in indigenous areas, conveys a need to focus on improving access to education as animportant development issue with significant and beneficial long-term socioeconomicrepercussions. One of several frequently noted methods used to Improve the access ofindigenous populations to education is the Implementation of bilingual education programs.Though the original research within this repxt is unable to measure the effects of bilingualeducation, the benefits of bilingual education for indigenous populations has been welldocumented in Mexico and in other countries (see above). What the original research within thisreport does Is confirm the existing inequities of educational attainment and the critical value ofeducation within and between etanic groups in Mexico.
Large discrepancies in socioeconomic conditions between genders, especially pronouncedwithin indigenous mwadcIpkw, should also be noted when formulating policy. The largemeasured impact of mother's education on child labor, child educational attainment and povertyemphasizes the importance of gender awareness. Attempts at correcting gender biases in orderto provide a more equitable distribution of access to education may, in the long run, reap thebenefits of poverty alleviation that the empirical analyses would predict.

8
PeruDeans Mdadrar
Introduction
The purpose of this chapter is to document the socioeconomic conditions of the indigenouspeople of Peru. The analysis based on the Peruvian 1991 Living Standards MeasurementStudy. First, the identification of the ladigenous population, including its location andsocioeconomic profile, is discussed. The incidence of poverty among the indigenous and non-indigenous populations is examined, including an analysis of Peru's income distribui and theposition of the indigenous population within this distribution. Also included are an analysis ofearnings distribution across economic sectors, an examination of housing conditions and healthstatus, and an evaluation of educational achievements with respect to age, location, gender andhousehold head.
Estimates of labor force participation and the earnings of indigenous and non-indigenousmen and women by economic sector and ocuptin are included. The earnings of working-agedmales are estimated and decomposed In to determine the existence and causes of theearnings differential between indigenous and non- nous workers. The factors affectingchild schooling, school attendance and attinment, and force participation are empiricallyexamined. Finally, an investigation is made of the migratory patterns of Peru's indigenouspopulation.
Identifying Peru's Indigenous Population
Using PLSS information on language spoken, individuals are identified as indigenous ifthey speak Quechua, Aymara or another indigenous language. The resulting estimate of thePeruvian indigenous population is 11.3 percent of the total population. Quechua-speakersaccount for the majority, or 63 percent, while A -speakers account for the remaining 37percent (see Table 8-1). This estimate of the in enous lation is somewhat less than the24.8 percent estimate from the latest (1981) census of Peru (CELADB 1992), and considerablyless than the 47 percent estimate (9.3 million people) of the indigenous population reported for1970 (Jordan Pando 1990).
179

180 IMSdigeow People and Powry in Lea Amei An Emplical Analts
Table 8.1: Language Distribution
Language Group Number Percent
Quechua 996 7.1
Aymara 520 4.2
Spanish 9973 88.7Total Indigenous 1518 11.3
Source: PLSS 1991.
Some of the difference in estimates can be attributed to the definition of indigenous peopleemployed in each survey. The PLSS estimate is unable to classify bilingual native languagespeakert as indigenous people because language specification is mutually exclusive.Accordingly, PLSS estimates of the indigenous population are much smaller than other surveyestimates, such as CELADE's, which allow for language combinations. Moreover, it ispossible, given the low status awarded to indigenous people, that indigenous Peruvians who alsospeak Spanish chose to classify themselves as Spanish-speakers. Equating ethnicity withlanguage must be kept in mind when interpreting statistics on indigenous people; it is probablethat the omitted Spanish-speaking indigenous people are in a better socioeconomic position thanare native-speaking monolingual indigenous people.
Underestimates of the Indigenous populrion also result from incomplete survey coverage.Due to security considerations, small farms and more remote households in the Sierra regionwere not surveyed. Consequently, the data from the Sierra region, and the Northern Sierra Inparticular, depict a population which is located in or near cities. In addition, the rural areas ofthe Coast and the entire Selva (which is primarily rural) are excluded from the survey. Giventhe rural and, more specifically, remote locations of indigenous people, it is Ikely that theindigenous population is underestimated. However, regardless of overall population estimates,the data from the LSMS includes a wealth of information about the socioeconomic situation ofthe indigenous people of Peru.
Socoeconomic Profle
While It appears that the indigenous population contains slightly more women than theSpamish-speaking population (52.3 percent versus 50.7 percent), it is likely that this is a resultof lingutically defining the indigenous population, i.e., given their greater work forceparticipation rate, indigenous men are more likely to speak Spanish.
In general, indigenous households are more *traditional* than non-aindigenous households.They are more likely to be headed by a man, more likely to contain married couples and alsoto have both the household head and her/his spouse present. While households are classified asindigenous If the household head speaks an indigenous language, closer examination reveals thatnot all individuals within households speak an indigenous language, and the proportion of thehousehold which speaks an indigenous language varies considerably by ruralurban location.The average rural household contains 4.6 individuals, of which 4.1 people, or 89 percent, speakan indigenous language. An average indigenous household in the city contains 5.1 people, lof
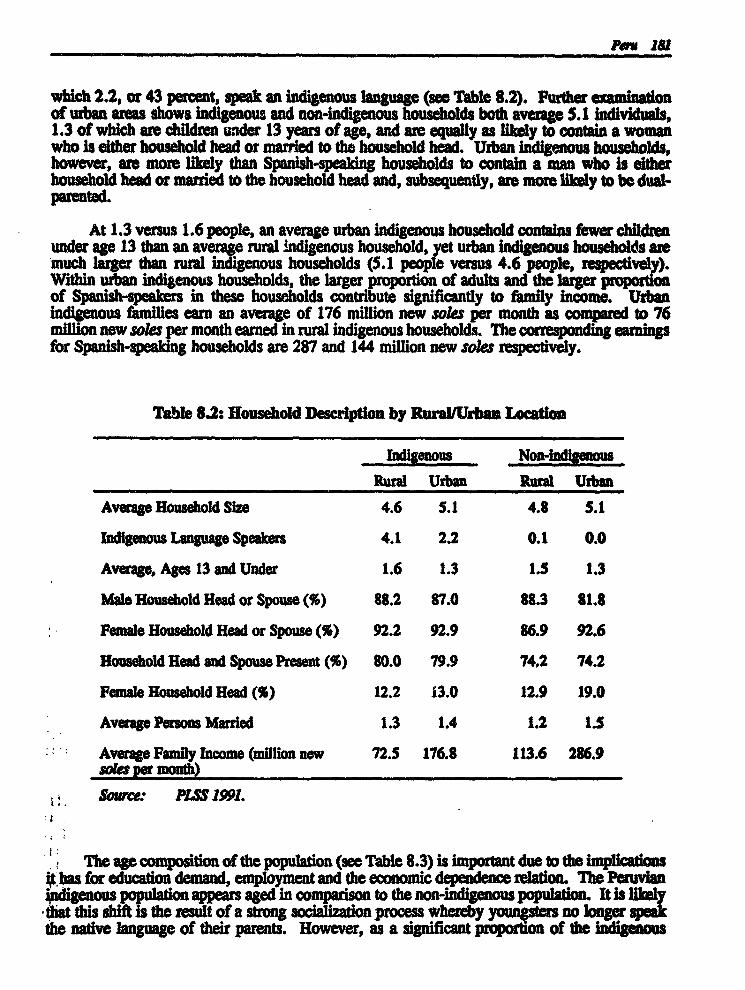
Pers 15
which 2.2, or 43 percent, speak an indigenous language (see Table 8.2). Further xamninationof urban areas shows indigenous and non-indigenous households both average 5.1 Individuals,1.3 of which are children under 13 years of age, and are equally as likely to contain a womanwho Is either household head or married to the household head. Urban Indigenous households,however, are more likely than Spanish-speaking households to contain a man who Is eitherhousehold head or married to the household head and, subsequently, are more likely to be dual-patented.
At 1.3 versus 1.6 people, an average urban indigenous household contains fewer childrenunder age 13 than an averae rural indigenous household, et urban indigenous households ammuch larger than rural adigenous households (5.1 peope versus 4.6 people, respectivel).Within urban indigenous households, the larger proportion of adults and the larger P onof Spanish-speakers in these households contribute significantly tof iy ncome. Urbanindigenous families earn an average of 176 million new soles per month as compared to 76million new soles per month earned in rural indigenous households. The earningsfor Spanish-speaking households are 287 and 144 million new soles respe y.
Table 8.2: Household Description by Rural/Urbau Location
Indigenous No-IndiseouRural Urban Rural Umban
Average Household Size 4.6 5.1 4.8 5.1
Indigenous Language Speakers 4.1 2.2 0.1 0.0
Average, Ages 13 and Under 1.6 1.3 1.5 1.3
Male Household Head or Spouse (%) 88.2 87.0 88.3 81.8
Female Household Head or Spouse (%) 92.2 92.9 86.9 92.6
Household Head and Spouse Present (%) 80.0 79.9 74.2 74.2
Female Household Head (%) 12.2 13.0 12.9 19.0
Average Persons Married 1.3 1.4 1.2 1.5
Average Family Income (million new 72.5 176.8 113.6 286.9soles per month)
Source: Ps 1991.
The age composition of the population (see Table 8.3) is important due to the implicationsA.has for education demand, employment and the economic dependence relation. The Peruvian#digenous population appears aged in comparison to the non-indigenous population. It is ikelythat this shift is the result of a strong socialization process whereby youngsters no longer speakthe native language of their parents. However, as a significant proportion of the indigenous
102 Indgou Peape and Po~rty in La~ m.a: An MapirEfl An~b
population is school-aged, the delivery of cducanal services becoms a primary concern. Therelatively large proportion of elderly people within the indigenous population places similaringustic demands u the delivery social rvices, ch as heaith care for the aged.
Table 8.3: Age Dstrbution (per~en)
Age ladigenous Non-Indgeuous
Younger than 5 8.3 8.85-14 22.0 23.415-29 24.6 31.630-44 18.9 17.345-59 16.1 11.2Older than 59 10.3 7.8
Total 100.0 100.0
Surc: PIJS 1991.
Regional Distibution
Despite recent internal wmigraton from rural to urban areas, and in particular to .ima, only6.7 percent of the indigenous populadon Is found in lima, and 16.9 perceht Is found in otherurban areas (see Table 8.4). In contrast, 87 percent of Spanish-speakers are located in urbanareas: 46 percent in Lima and 40 percent in other urban areas.
An overwhelming magority, 76 percent, of indigenous people are located in rural areas,and balf are located in rural areas of the south sier. While indigenou people comprise 11percent of the total Peruvia population, account for 42 percent of r~l Permvians. Ruralprevalence Is Important to keep in mnd w informaton about the indigenouspeople of Peru. Indigenous people in urban areas have access to services and moreeducation than their rural counterparts; however, it is always the cas that indigenous people fareworse than non-indigenous people in any given location.
P., 1a3
Table 8.4: RegealD t of DipuatIon (percent)
Replon Inieos Non-indipmuouslIma 6.7 46.4
Other Urban 16.9 40.3
Urban Coast Nor 0.4 18.2Urban Coast So~e 1.5 1.7Urban Sierra Noh 0.0 2.0Urban Sierra Central 2.5 8.7Urban Sierra Sout 12.5 9.7
Rura! 76.4 13.3
Rural Sima Nor* 6.4 7.3Rural Sierra Central 20.6 4.5Rural Sierra Sout 49.5 1.5
Total 100.0 100.0
Source: PLSS 1991.
Poverty Prof&l
A correlate of poverty is being lndgenous. This section eimate the poverty incidencefor indigenous people and as~ees the potion of indigenous people within the Pervian incomedistribution. Comparisons of incom distdbudins ae undertaes by ethuicity and locationFinally, the monetary meanr~s of poverty ar m by an analysis of the housing,health and oducation itation of indigmnous peop.
Povrty kw~enc
Using poverty lines which take into acount urban/al diI, e ofpoverty and extreme poverty among bot lndigenous and non-indlgaous is xained. Tepoverty line is defined as the local currency equvalent of US$60 month in 1985 purchasingpower parity (PPP) dollars, and the extreme povrty line is
The Foster-Greer-Thorbecke (FT) family of poverty ratus (P., P and P2) using bothpoverty lines are presented in Table 8.5. lhe FOT?P mnease gives the headcount index, whichis the proportion of the population whose hnnehmld per capha fcome is below the poverty liue.Household per capita incomls calculated by dividing the totalh Mof people in the household (excluding household servants). FOT På measurespoverty gap which is the amount needed to rasc the income of all poor individuals in apopulation to the poverty line, as a proporon n of the poverty line. This poverty gap shows thedepth of poverty for the aton a whole, but it gives no special wei#ht to those who mevery poor relative to the = yd poor. POT Pj is a mor lusive maes a inceIt repredets theseverity of poverty in a populadon by wei~hang each poor person by theirdegree of depudvadn,i.e., it calculates the aggregate of each idividual's poverty gap as a påoportion of the undre

184 ndgenoa People and Powry to Lads Amew An & ~pid Anulpi
population. In summary, FosterGreer-Thorbefe Po, P, and P2 Indices are poverty measureswith successive sensitivity to the conditions of the poorest of the poor.
At 79 percent, most of the Indigenous population Is poor and 55 percent is extremely poor.Indigenous people experience higher rates of poverty and extreme poverty do than non-Indigenous people. Indigenous people are one and a half times as likely to be poor than are non-indigenous people, and almost three times as likely to be extremely poor. Consequently,Indigenous people account for 11 percent of the Peruvian population, yet they comprise 19percent of the poor and 27 percent of extremely poor Peruvians.
Both the aggregate poverty gap and the FGT P3 indices give a picture similar to theheadcount index. Indigenous people are the poorest of the poor. Indigenous people, whetherurban or rural, have larger poverty gaps and suffr more severe levels of poverty than doSpanIsh-spekers.
It is often argued that indigenous people are economically disadvantaged as a consequenceof their prevalence in rural areas. However, as presented in Table 8.5, rural residence is notsolely responsible for the low incomes of Indigenous people. Comparison of average per capitaincomes of rural dwellers shows the average income of Spanish-speakers to be significantlygreater than for indigenous people. Moreover, rural indigenous people are 1.3 times as likelyto be poor than are rural Spanish-speakers, and twice as likely to be extremely poor (Table 8.5).

peu 185
Table 85: FGT EmF~y of Poverty M~eare for Poverty Lnes
e Povurty ~ ap FOT P,D tde~ DL~) IndLM sto) Index
Poverty Indignous Urban 67.3 34.7 21.7Rural 82.6 52.8 38.0National 79.0 48.4 34.1
Non-Indlgenous Urban 47.4 18.5 9.8Rural 64.7 29.3 17.9National 49.7 19.9 10.8
Overall Urban 48.1 19.0 10,2
Rural 72.3 39.1 26.3Natonal 53.0 23.1 13.4
Extrem Povrty Indigenous Urban 32.4 14.4 7.8Rural 62.3 30.7 19.0Nadonal 55.3 26.8 16.3
Non-Indigenous Urban 17.3 5.0 2.5
Rural 30.0 11.9 7.2
National 19.0 5.9 3.1
Overa l Urban 17.8 5.4 2.7Rural 43.7 19.8 12.1
Nadonal 23.1 8.3 4.6
SOure: PLSS 1991.
nw Dtr
The indigenous people of Peru are found primarily in the lowest income deciles. In fact,74 percent of indigenous language speakers are found in the bottom 3 deciles and 45 percent arefou in the bottom decile (see Figure 8.1). Table 8.6 shows the proporon of bdigenouspeople within each income dcc as wel as the relation of the dece m ~atin to the samplepopl~in The p ~oto of Indge~u peopl wiha ch ~nom &cfle d=ccame s haverage per capita income increases. Fifty e of the lowest income decile is comprised ofindigenous people, whereas they comprise len dm 2 percent of the top income de~de. If theindigenous population were evenly distributed among all income dec&es, each decle would be11 percent indigenous. In the present income distribution, 4.5% as many indigenous peopleare found in the bottom decile as are found in the overall pc,ulati .

186 Indgeou People and Fony in Latdn Amea. An apIrlel An a
Ngure 8.1: National Household Income Distdbution
Proportion of Indigenous Population
50
40-
30-
20-
10-
10 20 30 40 60 60 70 80 90 100Income Decile
Source: PLSS 1991.Note: Per Cpta Inco~e = Total HouseoM Snciwe/HehoM Sie
Table 8.6: Indignous Populatlon Share ln Esch Income Deff
ncom Dcde and Mm Prct M ofmr Capha Household Indigenous Mnus p
Icom ah Duk R~ te
1: 4.7 50.2 4.52: 11.1 21.5 1.93: 16.9 11.1 1.04: 22.5 6.8 0.65: 28.3 5.4 0.56: 35.6 5.6 0.57: 44.4 4.4 0.48: 56.2 2.9 0.39: 76.7 2.1 0.210: 163.0 2.0 0.2
Average 11.1 1.0
Source: P isS 1991.Note: Inconme Is eq»predm la nilon new sola per aIUWW.
The Gini coeffients reveal mo omeity aamong indigenous peope (see Table 8.7). 8.2 iflu Oms ik. income distdbudWo of bo*groups. The highest incoe de of 43 p of aindigenous income while ~ 34percent of income. The relatively arg Gin coufachat for thM rural populaonindicates there is greater incom dispedty among bual indgenous people.
Table 8.7: Ginå Index of I~~onse Inequality by M ~ntetty and L~ mton
Indigenous Non-lndigenous AllNational Gini Coelflent 0.571 0.458 0.481Men Income 18.1 49.4 45.9
Urban Gini Coeffidet 0.430 0.438 0.439Men Income 31.9 53.4 52.7
Rural Gid Coe~clent 0.577 0.490 0.539Men Income 13.7 23.0 19.1
Source: PS 1991.Note: income 1s aresed ta iWou new s per r~on.

188 Indgmwss Poplend Po¾äry in Latia Amer~: An Empir~ul Anlsis
lgure 8.2: Per Capka Rouseholds Incnee DltributionIndigenous and Non-ndgenous Pople
Cummutative Percent of Total Income100*
00
80
70
010 20 80 40 80 60 70 80 0 100
Population Share
Source PLS 1991.
-E- Indigenous -+- Non-IndIgenous
Table 8.8 cianiine income distribution by economic sector using worker arings as themonetary measure of welfare. In support of previous observations on income iequality betwengroups, notice that, in every sector except agricultue, the Spanish-spealdng population receivesmare than its proportionate share of earnings. Overall, 15 percent of the Peruvian workforceconsists of indigenous people, yet this group receives only 6 percent of total earnings.
The agdcultura~usctor contributes heavily to the overawl income inequality. Ten percentof Peru's workforce consists of indigenous wodkers in the agricultural sector, yet these peoplereceive only 1.3percent of total earnings. While Spanish-spea.rs in the agricultural sector alsoreceive le than their prnportionate share of earnings, at 4 percent of total earnings for their 11percent presece in this sector, the ~arrdngs disparity Is much lss severe. Second to theagicultural sector, the industral bector contributes to mcome inequality, as indigenous peoplewithin the industri sector receive almost half their due share of earnings. Spmnish-speakers inthe mining, transportation and w~nane sectors all acquire much mor da their propor-innateshare of total hucome.

Pm 189
Table 8. Income Distribution by Econ9ni Sector
Indigenous Non._nigen _
Industry Population Income Populadlon IncomNo Cassification 0.0 0.0 0.3 0.2
Agricu»ure 9.6 1.3 10.7 5.3
M~ning 0.1 0.0 1.3 3.9
Industry 0.9 0.5 13.6 14.9
Electical 0.0 0.0 0.6 1.2
Construction 0.5 0.4 3.7 4.8
Commercial 2.3 1.7 25.6 26.6
Transportaton 0.3 0.3 5.0 8.9
Finance 0.0 0.0 3.7 6.3
Servles (incl. 1.5 1.5 20.3 21.9government)Total Shares 15.2 5.8 84.8 94.2
Source: PLS 1991.
Housing CondWtons
The previous two secons examine the inter-ethnic distribution of economic Inequality andpoverty as dened by either income or consumption expenditure. However, other meases ofwelfare, such as housing condtions, eucational attainment and access te and ue of health carefacilities, serve to complement these monetary meases and clarify the plcture of individualwe1-being.
Table 8.9 shows the housing conditions for each Whli ndigenous people are morelikely to own their own home than non-indigenous pel, the composition of thesehomes is consistently deficient in comparison to that ofSP OfParimportance in health considerations is the availability of p water and mantatian fälitles.Oly 46 percent of indigenous homes have public water aiti, while 31percentus wells and15 percent us the river as a source of water. Only 21 percent of homes have publicwaste disposal. Both of these factors contdbute to intestinal and may therefore beassociated with the higher incidence of diarrhea (13 percent) among the indigenous popnlatnversus that of Spanish-speakers (7 percent).
An examinatin of rural/urban diffrences provides some interesting observations. Asindigenous households are less Mikely to have a public source of water In both rural and urban

13o Ingadru plueand Ann ln Lain Aatel: As anpletail4Aaulv
aen, Indoenous people are uch more Ilkaiy to obtain water from wells. Sixteen percent ofurban indigenous honsonh and 39 M ~=l ndigenos househoIds have wells, whereasthe corrsponding proporeons for S honek s are only 2 and 10 percent. Among ruralhouseholds, a of homes us rivers as a water source. However, therural prevalence odipeopleresultsinagra proportion of th indigenouspopulationbeing exposed to the diaame seenciated with poor water quality.
Indigenous households are also les mlely than their non-Indigenous counterparts to haveulic ewage disposal both in rual and urban aten. Subsequmnt1 latrines are more prevalent
=nthe indig=moa pop~lto. la both rundl and ud rm tn the pmp art Of indisenomsods latriå0s is u~ tly large than th POPoo Uf Span
households. While 24 percent of indigenous househods la urban areas have latrines, only 8percent of urban Spanish households have latrines.
At 48 percent, an xceptionally larg p of indgenous househods use kroseneas a source of light; 88 percent of the homes of use eletricity. Witin urbanarias the use of kerosene is sen times greaer in in bomes than m the homes ofSpanih-speakers. Bea~n lerosene ht r~ates airborn partculates, the average indigenousperson is exposed to highr levels of adoor air pollutn the average Spnish-speaker.Indoor air pollution is direcdy associated with respiratory disorders and cancers (World Bank1992).
Furthermore, the relativelyarge proportion of urban indigenous households without publicwater, public bewage d&spom and electncity, is evidence of a group of indigenous squattersettlements la urban areas. The survey icae there is a larger incidence of squatter dwellingsamong the urban indigenous poplation (5.8 percent) than among the urban Spmnish-speakingpopulation (3.1 percent).

P9w 191
Table 8.9: a ~ousig C =onditlos (percent Of b neboide)
Indignous Naa-ini____
Total Urban Rura Total Ura Rumral
Type! of wdigDetache 97.5 92.7 100.0 85.8 83.5 100.0Apartmnta 0.0 0.0 0.0 5.2 6.1 0.0Søveral Houe ia Courtyard 0.3 0.9 0.0 3.9 4.6 0.0Dwelling inCepoan 1.9 5.5 0.0- 3.2 3.7 0.0Improvied Dwing 0.3 0.9 0.0 1.3 1.5 0.0Other 0.0 0.0 0.0 0.5 0.6 0.0
Aveage N~ of Roomg 2.8 3.2 2.6 3.5 3.6 3.0Ro~s per Capita 0.7 0.7 0.7 0.8 0.8 0.8
TenureSquatter 3.0 5.8 1.5 3.0 3.1 1.9Own Home 86.2 80.2 89.4 71.1 68.3 89.0Rent 3.4 6.9 1.6 14.4 16.1 3.2Otier 7.4 7.1 7.6 11.5 12.4 5.9
Sour~e .f WaterPublic Water Supply 46.3 79.2 38.1 80.7 92.0 47.9Public: nsd. Dwuiling 34.1 60.3 20.3 74.4 19.4 42.4Public: Inuide Building 12.2 12.2 12.2 6.3 7.0 2.3Public: Otside Budig 6.0 6.7 5.6 5.3 5.6 3.2
Wen 30.8 16.1 38.6 3.2 2.1 10.0River 14.8 0.0 22.6 5.4 0.1 39.0Water Tru*k 0.9 2.6 0.0 3.0 3.4 0.2Other 1.3 2.4 0.7 2.5 2.4 2.9
Se~ %ul~lmPublic 21.4 54.7 3.7 71.6 81.0 12.2WelSptic 6.2 5.0 6.8 3.7 3.6 4.6Latrine 39.1 24.2 47.0 10.9 7.9 29.7None 33.4 16.1 42.6 13.8 7.3 53.5
source øf Lighi~gEeceity 41.8 75.2 24.0 88.3 96.3 37.4Korosefe 48.0 15.3 65.4 9.3 2.3 53.8Cman 9.6 8.7 10.2 2.1 1.0 8.9None 0.3 0.9 0.0 0.1 0.1 0.0Other 0.3 0.0 0.4 0.3 0.4 0.0
Telone Servi 2.2 5.3 0.5 18.0 20.8 0.0
SOur. PL=S 1991.
Health
Indigenous p are mo M y to become ill than are non-indigenous people, but theyare much less y to consult a C(able 8.10). Perhaps as a resut of po=r intialhealth conditions, or as a result onglecting tratnat, the duration and severity of illness is
192 Iausou ?eepe ad Pory in ain tm An aprkel Ana~wfs
greter among the ndgenous p. The propoution of indigenous people hnspitaliæt isalmost twice that of the S population. Although the averge cost of bothhosptaln1rtinn and i a less indigenous le, only 57 percent of indgenous peoplepurchase medicne for their ilness in coim n to 81 percent of the non-indigenouspopulation.
When Indigenous people seek medical help they are moe y to see elther a puaredic,pharmacologist or a trditional heater tha a medical psoM uch as a doctor, dentist,obstetrician or nurse. Partially due to rural locaton, people ar twice as ly toreceive treatmn in mobile clnis or at the hom of the padent or doctor in comparison toSpanish-spakers. Spanish-speakers are twice ss ~lkely to receve teeatment In a clnic or privateoffice than indigenous language speakrs. While public is the most common methodof tnqwt to health cl~ncs for the non-Ind~genous n (46 percent), 56 percent ofthe indw populal k to the treatment center. As a rsultof rnsportation, ittakes speakers 1nger to reach treatment felIl Spansh-speakers.Once at the clinic, iaftenous people walt longer than Spmnish-speakers to receive treatment.
In terms of prventative health cre, 73 percent of the indigenus population has receivedBCG, polio, triple and measles vaccinations in comparlson to 81 percent of the non-indigenouspoplation. Two percent of the indigenous population have not received any vaccinations, which
ts four mtes the rate for the non-indigenous population.
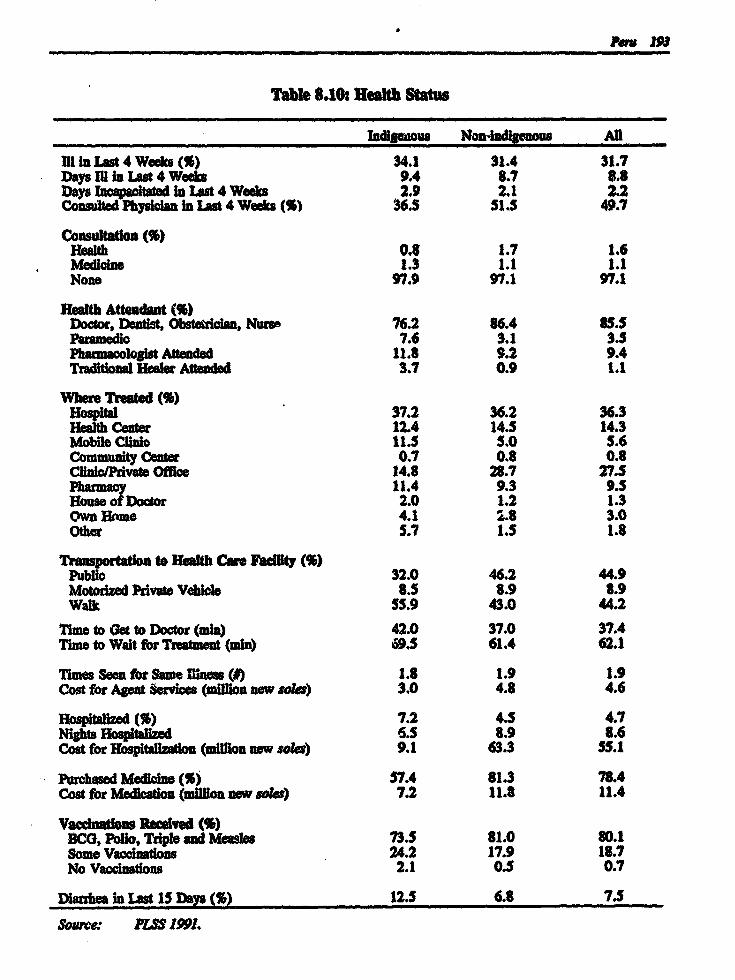
Table 8.10: Health Status
Indigenous Non4mdigenous Allin in Last4Weks(%) 34.1 31.4 31.7Days IU in Last 4 Wek 9.4 8.7 8.8Days oapa in Last 4 W ks 2.9 2.1 2.2Comt yl In Last 4 Wka (%1 36.5 51.5 49.7
Consultato* (%)ealth 0.8 1.7 1.6
Medicin 1.3 1.1 1.1Non 97.9 97.1 97.1
Meafth Attedant (%)Dotor, Dentit, Obstetrican, Nurs. 76.2 86.4 85.5Paramedio 7.6 3.1 3.5Pharmaoologst Attended 11.8 9.2 9.4Traditional Haler Atidd 3.7 0.9 1.1
Where 'Deated (%)Hospital 37.2 36.2 36.3
ealth Center 12.4 14.5 14.3Mobile C~alo 11.5 5.0 5.6Community Center 0.7 0.8 0.8Clinic/Pivate Offic 14.8 28.7 27.5P ~armaoy 11.4 9.3 9.5House of Dotor 2.0 1.2 1.3Own HomC 4.1 2.8 3.0Other 5.7 1.5 1.8
Tansportation to Heath Care Fallty (%)Publio 32.0 46.2 44.9Motodzed Privat Vil. 8.5 8.9 8.9Walk 55.9 43.0 44.2
Time to Oet to Doctor (mia) 42.0 37.0 37.4Time to Wait for Treatment (min) 69.5 61.4 62.1
Times Son for Same lme~s (#) 1.8 1.9 1.9Cost for Agent ervices (w~Ron new sola) 3.0 4.8 4.6
Hospita ( 7.2 4.5 4.7N Hp ~ 6.5 8.9 8.6Cot for on~(mlon newsola) 9.1 63.3 55.1
Purhasd Medicn (%) 57.4 81.3 78.4Cost for Medicaon (miion nw 101.) 7.2 11.8 11.4
Vädainaetseelvedl (%)OCO, Polo, Tdp~e and MesIes 73.5 81.0 80.1Som. Vaccinatons 24.2 17.9 18.7No Vaccinations 2.1 0.5 0.7
D hea in Lst 15 Days (%) 12.5 6.8 7.5
Surce: PSS 1991.
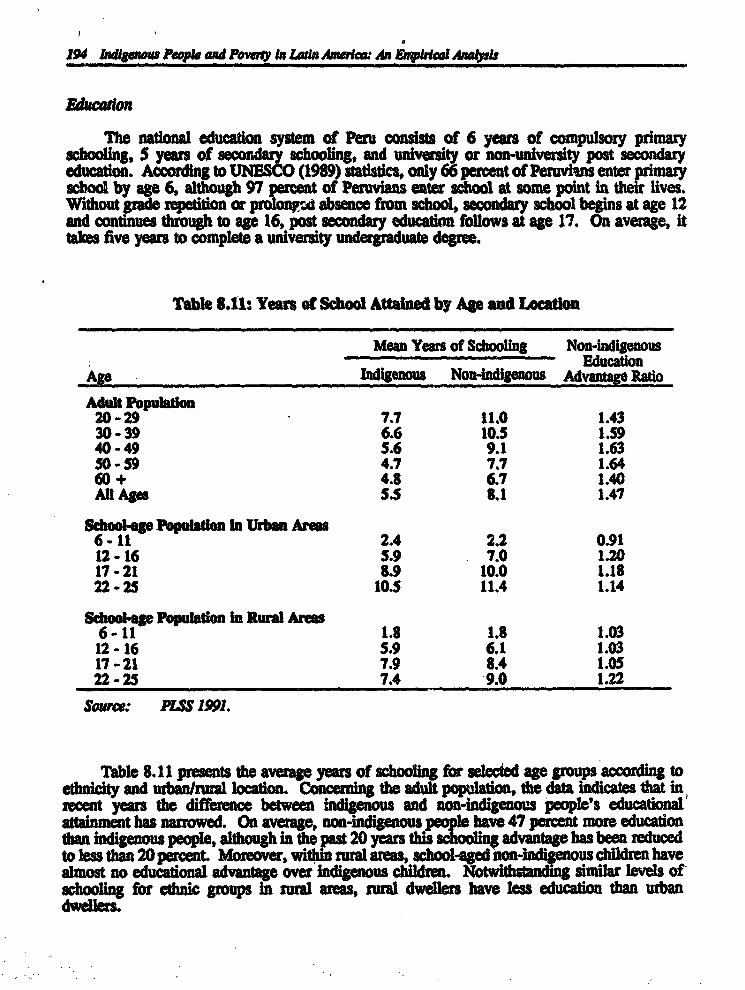
194 I,sdigaou hp and P~wery in Laa rA An &ngrial Aalpus
Macaron
Th natlnnal educaon system of Peru conssts of 6 years of compulsory primaryschooling, 5 years of secondary schooling, and university or non-university post secondarycdu~atin. According to UNESCO (1989) statisdes, only 66 percent of Peruvlus enter primaryschool by age 6, although 97 percent of Peruvans enter school at some poit in their lives.Without grade repetition or prolonyd absence from school, secondary school begins at age 12and continues though to age 16, post secondary education follows at age 17. On average, ittakes ftve years to complete a university undergraduate degree.
Table 8.11: Years of School Atta~nd by Age and Location
Mean Years of Schooling Non-IndigenousEducation
Age Indigenus Non-Indigenous Advantage Ratio
Adult Populadon20-29 7.7 11.0 1.4330-39 6.6 10.5 1.5940-49 5.6 9.1 1.6350-59 4.7 7.7 1.6460+ 4.8 6.7 1.40All Ages 5.5 8.1 1.47
Sboolge Pöpuatln tn Urban Areas6-11 2.4 2.2 0.9112- 16 5.9 7.0 1.2017-21 8.9 10.0 1.1822-25 10.5 11.4 1.14
Schoo-ge Populadon in Rura~ Arms6-11 1.8 1.8 1.0312-16 5.9 6.1 1.0317-21 7.9 8.4 1.0522-25 7.4 9.0 1.22
Sourcr: PLSS 1991.
Table 8.11 presents the average years of schooling for selected age groups according toethnicity and urban/rural location. Concerning the adult population, th data indicates that inrecent years the difference between indigenous and non-indigenous people's educationalatainment has nanowed. On average, non-indigenous people have 47 percent more educationthan indigenous people, although in the past 20 years this schooling advantago has been reducedtoless than 20 percent. Moreover, within rural areas, school-ged non-indigenous children havealmost no educational advantage over indigenous children. Notwthst=nding similar levels ofschooling for ethnic groups in rural areas, rural dwellers have les education than urbandwelers

Pers 195
In urban areas, primary school-aged Indigenous children have more education then theirnon-indigenous counterparts. However, among secondary school-aged urban children, theeducational advantage favors Spanish-speakers. Given this analysis, we can conclude that alarger proportion of urban indigenous children are either dropping out of school or repeatinggrades.
At present, 40 percent of the non-indigenous population Is enrolled in school in comparisonto 36 percent of the indigenous population. It is probable, therefore, that without intervention,Spanish-speakers will retain an educational advantage.
Illiteracy rates by lang-aage and location are presented in Table 8.12. Individuals areconsidered to be illiterate if they cannot read or write and are at least 14 years of age. Illiteracyrates are much higher for indigenous people than non-Indigenous people, at 5.2 and 0.3 percent,respectively. Although a relatively small proportion of the indigenous population speaksAymara, they comprise the majority of the illiterate indigenous population. The prevalence ofilliteracy among Aymara may be partially attributed to their history of geographic isolation(Escobar 1988). Rural areas often have higher illiteracy rates than urban areas as their lowpopulation density makes schools less accessible and, additionally, there has been less emphasison schooling for traditional rural occupatas. However, at present, larger proportions ofilliterate Aymara-speakers are found in urban areas (10.9 percent) than in rural areas (6.2percent). For both Quechua and Spanish speakers, higher rates of illiteracy are found In ruralareas.
Table 8.12: Distribution of Iliteracy by Language and Location (percent)
Language Total Urban Rural
Total Indigenous 5.2 4.1 5.8Quechua 3.9 1.2 5.6Aymara 7.3 10.9 6.2
Non-indigenous 0.3 0.2 0.8
Source: PLSS 1991.
Not only is the indigenous population less educated and less literate than the Spanish-speaking population, but it also lags behind the non-indigenous population in terms of trainingcourses. Only 8 percent of indigenous people report having taken a training course incomparison to 28 percent of Spanish-speakers.
The difference in educational achievements between household heads of ethnic groups issubstantial. Table 8.13 shows that only 40 percent of indigenous household heads haveeducation in excess of primary school. In contrast, 41 percent of Spanish-speaking householdheads have some secondary school education and 22 percent have some post secondaryeducation. Only 6 percent of indigenous household heads have some post secondary education.

196 Indigene People and Pourty la Latin Ameres An &>pWicl Aals
Table 813: Highest Educatoal Aebleveent of Rousehold Head (peeut)
Highst Levelof Educaton Rached Indigenous Non-indigenous
NonelIuitial 1.7 0.5
Incomplete Prmary 29.8 14.3
Primary 28.9 22.6
Incomplete Secondary 15.5 13.8
Seeonary 18.4 27.3
Non-University Higher 0.5 4.8
Incomplete University 1.5 4.0
Complete University 3.8 12.2
Post Graduate University 0.3 0.7
Total 100.0 100.0
Source: PLSS 1991.
Analysis of education levels by gender and ethnic group shows that educatonal gaps have
been slowly decreasing over time, both between groups as wel as between genders (see Figur
8.3). For all individuals bom before 1980, there is a stable pattemn of mean years of schooling
bae~d on ethnic group and gender. Non-indigenous males have more education than non-Indigenous females who, in tum, have mor. education than indigenous males who are s d
by indigenous females In all birth cohorts, indigenous people have less education den Spanish-speakers and indigenous women have the least amount of education.
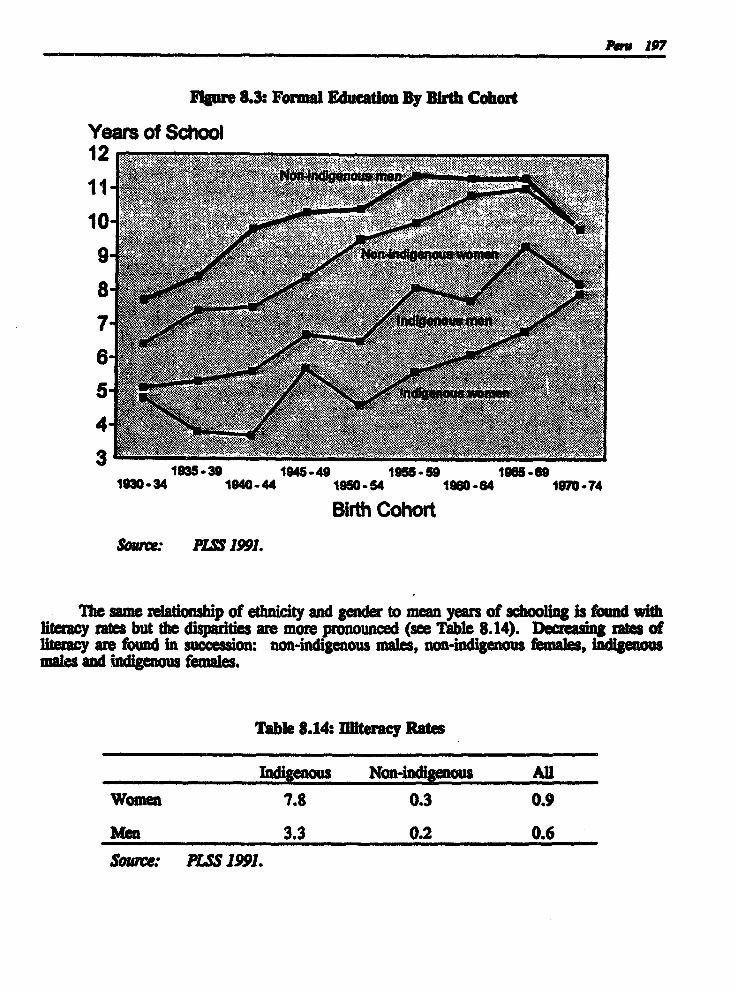
Pa 197
lgure 8.3: Formal Educatlon By irth Cohort
Years of School
11*12 ........10 ... .
4
19M-39 1945-49 1985-59 1985 -81930-34 1940-44 190 -54 1980-64 1970-74
Birth Cohort
So~: Pi= 1991.
lhe same relatinhip of ethnicity and gender to mean years of schooling is found withliteracy rates but the diepuritim are more pronounced (se Table 8.14). Decreaing rates ofliteacy are found in fl eion: non-indigenous males, non-indigenous females, indigenousmales and indigenous fema.
Table 8.14: Dl~teracy Rates
Mndigennus Non-indigenous All
Women 7.8 0.3 0.9
Men 3.3 0.2 0.6
Source: PLSS 1991.
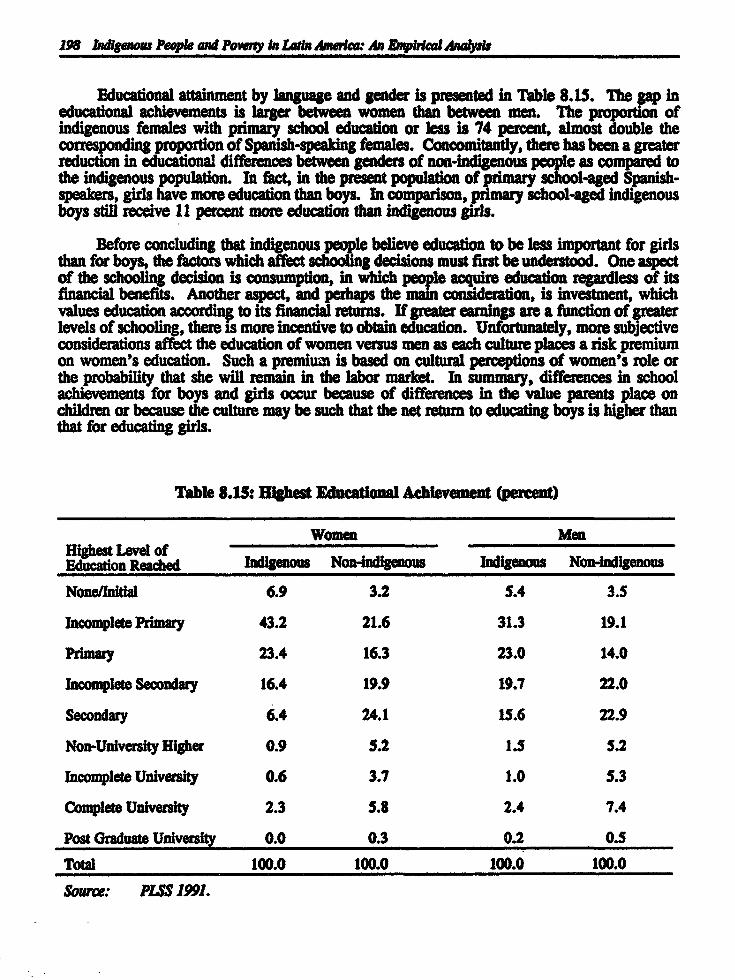
198 Indigenow People and Powny in Latn Amrkar An AVhqrcal alss
Educational attainment by language and gender is presented in Table 8.15. The gap ineducational achievements is larger between women than between men. The propordon ofindigenous females with primary school education or less is 74 percent, almost double thecorresponding proportion of Spanish-speaking females. Concomitantly, there has been a greaterreduction in educational differences between genders of non-indigenous people as compared tothe indigenous population. In fact, in the present population of primary school-aged Spanish-speakers, girls have more education than boys. In comparison, primary school-aged indigenousboys still receive 11 percent more education than indigenous girls.
Before concluding that indigenous people believe education to be less important for girlsthan for boys, the factors which affect schooling decisions must first be understood. One aspectof the schooling decision is consumption, in which p acquire education regardless of itsfinancial benefits. Another aspect, and perhaps the consideration, is investment, whichvalues education accor i to its financial returns. If greater earnings are a function of geaterlevels of schooling, there is more incentive to obtain education. Unfortunately, more subjectiveconsiderations affect the education of women versus men as each culture places a risk premiumon women's education. Such a premium is based on cultural perceptions of women's role orthe probability that she will remain in the labor market. In summary, differences In schoolachievements for boys and girls occur because of differences in the value parents place onchildren or because the culture may be such that the net return to educating boys is higher thanthat for educating girls.
Table 8.15: Highest Educational Achievement (percent)
Women MenHighest Level ofEducaton Reached Indignou s Non-Indigenous Indigenous Non-indigenous
None/Initial 6.9 3.2 5.4 3.5
Incomplete Primary 43.2 21.6 31.3 19.1
Primary 23.4 16.3 23.0 14.0
Incomplete Secondary 16.4 19.9 19.7 22.0
Secondary 6.4 24.1 15.6 22.9
Non-University Higher 0.9 5.2 1.5 5.2
Incomplete University 0.6 3.7 1.0 5.3
Complete University 2.3 5.8 2.4 7.4
Post Graduate University 0.0 0.3 0.2 0.5
Total 100.0 100.0 100.0 100.0
Source: PLSS 1991.

Pem 199
In a study of the relationship between gender and education in rural Peru, Gertler andGlewwe (1992) find parents are less willih to pay for girls' schooling relative to boys. As thisstudy shows, the average income of indigenous rural households is less than that of non-indigenous households in rural areas, 51 and 72 million new soles, respectively. Therefore, Itmay be more difficult for indigenous households to afford to pay for schooling. Furthermore,in many low and middle income Peruvian families, such as the mqjority of indigenoushouseholds, Oparents prefer to send their sons to school and give their daughters the bareminimum of education and then put them in charge of domestics tasks' (Vargas 1987). Familiesin rural areas of Peru, *maintain preferential attitudes toward boys and discriminatory onestowards girls" (Fernandez 1986). While the socio-historical status of Indigenous people of Peruis such that women and men once had equal status, it appears that indigenous parents are nowmore predisposed to educating their sons than their dagters (Galvez Barmer 1980).
Earnings Projections
In this section we develop a model of individual earnings based on economic and otherfactors. The primary purpose of this model is to examine the existence, and caaes of, anearnings differential between indigenous and non-indigenous people.
Toledo (Carnoy 1979) presented an earnings model based on 1961 and 1972 income datafor the purpose of examining changes in the (overall) Peruvian income distribution. He foundthat the income gap widened in the 1960s, not as much due to changes in the characteristics ofthe workfbrce itself, but more due to the 'payoff" levels of these characteristics (changes in thewage rate for different occupations). This study explains, in part, the exacerbation In theindigenous/non-indigenous income distribution, as we know that indienous people have beenless mobile and less likely to change jobs out of the (discounted) agrclture sector. We alsonote that, as would be expected given the results of our study, dummy variables for indigenouslanguages are negatively correlated with earnings in Toledo s model.
Adult Labor Force Palicipaton
In order to describe the Peruvian labor market and, more specifically, the position ofindigenous people in the labor market, a sample of the PLSS is selected which represents thepotential labor force. In general, the potential labor force is composed of work-aged individualswho are eligible for work. Given the high labor force participation rate for young Peruvians,our potential labor force sample contains Mdividuals of ages 12 to 65, and excludes those whowork less than 30 hours per week while attending school.
Using the PLSS data, labor income is defined as any income derived from both primaryand secondary jobs undertaken during the last 7 days, or any income derived from both primaryor secondary jobs undertaken during the last year. This income is expressed in millions of newsoles per month. Employment categories are similarly defined according to work undertaeMin either the last 7 days or, if unspecified, that undertaken during the last year.
Labor force participants are usually defined as individuals who are presently employed orsearching for work. However, there are many Peruvians who report being employed and yetdo not receive labor earnings. Thus, we analyze the employment categories of individuals whoreceive labor income separately from those who do not receive labor income. In doing so, wedefine labor force participants as work-aged individuals who receive labor income and,

20 a~genom People and Po~eny la Lafå AMwe: An Dntr~al Anabats
subsequenly, divide the sample of potential labor force into labor force perdicpmntsand non-labor force partcipants. Table 8.16 presents the and occupational distributonfor each ethnc group.
Two important observations can be made from this data. First, at 64 and 54 percent,respectively, a larger proportion of the non-In ienous populatin bs p y employed than inthe indigenous population. Second, labor ca are com~y hh fnon-indigenousworkers than for indigenous workers the average earni gs of S speakng workers aremore than double the average earnings of indigenous workers.
The relative proportions of Spanish-speaking workers are higher in the privat sector (23percent versus 10 percent), the public sector (11 percent versus 7 percent), and among thoseself-employed (26 percent versus 15 percent). In stark contrast, the farming sector contains 54percent of the indigenous, and only 7 percent of the Spanish-speaking labor force.
Aiong occupations, the largest income disparity occurs between indigenous and non-indigenous farmers. Twenty-nine percent of indigenous farmers do not receive labor income,while the corresponding figure for non-indigenous farmers is 3ao t. From this we may inferthat there is a large group of the indigenous subsistence who ae, consequently,exceptionally poor. Among farmers who report employment earnings, the average indigenousfarmer receives less than half the income of an average Spanish-speaking farmer.
Within the public sector, the earnings differential is dependent on emplo ent as eithera worker or a professMonal. Indigenous public sector workers recelve only percent of thewages of non-indigenous workers. Given the positive anoition between education and jobplacement in the public sector, it appears that indigenous lic sector workers are educationallyrestrcted to lower level or menial jobs. In contrast, publi sector indigenous professionals havevirtualw parity with Spanish-speaking public sector professonals, and their educational
minimal. Within the private sector, indigenous workers and professionals receive58 and 61 percent of non-indigenous labor earnings, respeevely.

Peu 201
Table 8.16: Labor Force Partl^patton, AgM 12 to 65
Average AverageEmploymt Catgory Numbr 14toent Income Number Pmat Inome
Public Sctor Worker (18) 2.0 87.2 97 1.8 190.8
Privat. Sctor Workr 80 8.8 58.4 632 12.5 101.7
Public Setor Prof. 40 4.5 149.3 490 9.2 152.7
Privat. Selor Prof. (7) 0.7 100.7 524 10.5 165.1
Hom. Worker (4) 0.4 56.6 52 1.0 50.3
Slf Employed 102 12.4 101.6 1162 22.7 148.9
Farm Employed 236 25.1 38.0 258 4.2 82.0
Total Labor Force 490 54.2 67.6 3,287 63.5 137.5
Seaf Employed (19) 2.2 2a. 167 3.1 .a.
parm Employed 270 29.2 nLa. 211 3.6 .a.
Total Non Labor Force 416 45.8 a.. 1,884 36.5 a.a.
Potential Labor Force 906 100.0 n.a. 5,171 100.0 n.a.
Sore. PLMS 1991.Noter: 0 Isiga~flant ce cou=t
an.a Not appa~Mr
In the conventional concept of unemploymnt, the unemployed are dened as individualswho have no Ompipym are available for work and have recently engaged in job seekingactivities. If we apply this definition of unemployent and, therefore, include those Peruvianswho report having loked for work in the past 7 days as part of the labor force, the Spanish-speaSing labor frce has a higher rate of unemployment than the indigenous labor force, 4.8percent and 1.2 percent, respectively. However, there are remsons that the definitin ofunemployment above understates the unemployment of indigenous peope First, it is likely thatthe informal network in indigenous communties provides excellent employment information sothat indigenous adults do not actively seek work because they are awae that no work isavailablo. Second, it is possible that indigenous people are more li~ely to accept periods ofintermittent unemployment as a fact of life and therefore rely on family support while pursuingcommunity and family obligations. In response to these problems, some researchers claMify anyindigenous working-aged person who does not hold a wage job as unemployed (Keinfeld andKruse 1982). When we apply this definition of unemployment, it appears that a larerproportion of the indigenous population is unemployed1 than in the Spmnish-speaking populatn- 46 pexent of the indigenous population versus 37 percent of the non-indigenous population.

202 digenom People and Powrly In Latin America: An Empirical Anabsk
The low average earnings of indigenous people are not only associated with theirparticipation in farming activities, but are also a consequence of their employment in seasonalwork. Eleven percent of work-aged indigenous people are involved in seasonal work and theiraverage income is only 42 million new soles per month. While 4.4 percent of work-agedSpanish-speakers are seasonal workers, their average earnings are much more substantial, 158.6million now soles per month. Presumably, indigenous seasonal workers are employed in lowpaying agricultural activities, whereas the average earnings of Spanish seasonal workers suggestsmore professional employment.
The distribution of the Peruvian population by industry and gender is presented in Table8.17. The agriculture industry depends heavily on the labor of indigenous people - 70 percentof indigenous women and 63 percent of indigenous men are involved in agricultural activities.Yet, on average, indigenous women and men earn only one-third the salary of non-indigenousworkers employed in agriculture.
The primary employer for the Spanish-speaking population is the commercial sector, whichemploys 42 percent of women and 22 percent of men. This sector is the second largestemployer of indigenous women, at 21 percent, and the third largest employer of Indigenous men,at 10 percent. The earnings differential within the commercial sector is only marginally in favorof non-indigenous people with non-indigenous women earning 1.2 times the salary of indigenouswomen and non-indigenous men earning 1.5 times the salary of indigenous men.
Including almost a quarter of the Spanish-speaking population, the service sector is theirsecond largest employer. It is also the second largest employer of indigenous men at 13 percentand ranks third for indigenous women at 7 percent.
The fourth largest employer of indigenous workers is industry, which contains 3 percentof women and 8 percent of men. The average salary for these women is half that of both non-indigenous women and indigenous men, and almost one-fourth the average salary of non-indigenous men.
The finance sector is composed exclusively of Spanish-speakers. It also provides some ofthe highest salaries in Peru. The highest earnings advantage is found between males, as non-indigenous males earn 2.3 times the wage of indi;enous males. The next highest earningsadvantage is found between genders of the Spanish-speaking population; on average non-indigenous men earn 1.7 times the wage of non-indigenous women. The wage differential issomewhat smaller between women workers, yet still in favor of non-indigenous women whoreceive 1.5 times the wage of indigenous women. The smallest earnings differential is foundbetween genders of the indigenous population - men ece,e 1.3 times the average earnings ofwomen. Despite greater wage parity between genders of indigenous people versus non-indigenous people, we conclude that not only are earnings less for the Indigenous population,but they are markedly less for indigenous women.

POu 203
Table 8.17: Ecokmule &cltr by Gendr and Ethielty
Indigenous Naa-idigmnous Indigmnous Non-indigenous
Aveage Av~ng Av~.8. AvergeEcnmcSJo ncome % lncom. % Jucome % Ismome
No Classifloadon 0.0 n.a. 0.4 86.7 0.3 55.0 0.2 139.1
Agricultur 69.2 18.0 11.1 52.0 58.1 36.2 13.7 105.4
Mining 0.0 9.a. 0.3 323.3 0.7 96.5 2.4 353.4
Industry 3.3 40.8 15.1 87.4 7.8 85.1 16.8 151.0
Electrical 0.0 n.'. 0.2 156.0 0.6 119.3 1.0 241.5
Construtioa 0.0 i.a. 0.3 68.0 6.9 87.1 7.3 147.5
Commerolal 20.6 84.0 41.6 100.4 9.6 114.7 22.1 166.4
Transportation 0.0 f.a. 1.9 178.9 3.6 108.8 8.7 202.5
Finance 0.0 na. 2.9 162.6 0.0 na. 5.4 202.7
Servicsa d"l. 6.9 73.4 26.2 88.9 12.6 136.3 22.4 151.5govemnment)
Total 100.0 57.1 100.0 97.3 100.0 71.9 100.0 163.0
Source: PIm 1991.NMe: n.a. Nor appwcaNe.
The indigenous workig population is n. Sventy percent ofindigenous women and 58 percent of ändigenous men are faers workers (see Table8.18). In Spanish-speakera ars wudg in a much wider variety of occupadous.Better paigj in trades, trnprao, teaching and cledical fields are dominatedi bySpaniaga-~ar.
Second to farming, a large proportion of nd=geuous women are self-employed in trade (11percent), and 8 percent of indignus women wok as street vmndors. While these ocupadlonshave a high level of compatibuity with household po i , te lw gwith such occupations resuts in litde fl~for ndie women Non-indigenous women are employd in a wider * ofoccupadons than mdigenous women, yetfocused in traditionally female occupadions, w pay lss than tradid~onal mal occupations.At 18.6 percent, the major occupation of Spanish-spealag women is Ulf-employment in trade.Afer trade, equal proporons of non-indigenous women are farmers, street vendors, andsecretaries.
Theoccupational distributionof ndgenous mendiffers subtantialy from Spanish-speakingmen. More than half of working indigenous men arm farmers, wherems les than 10 percent of
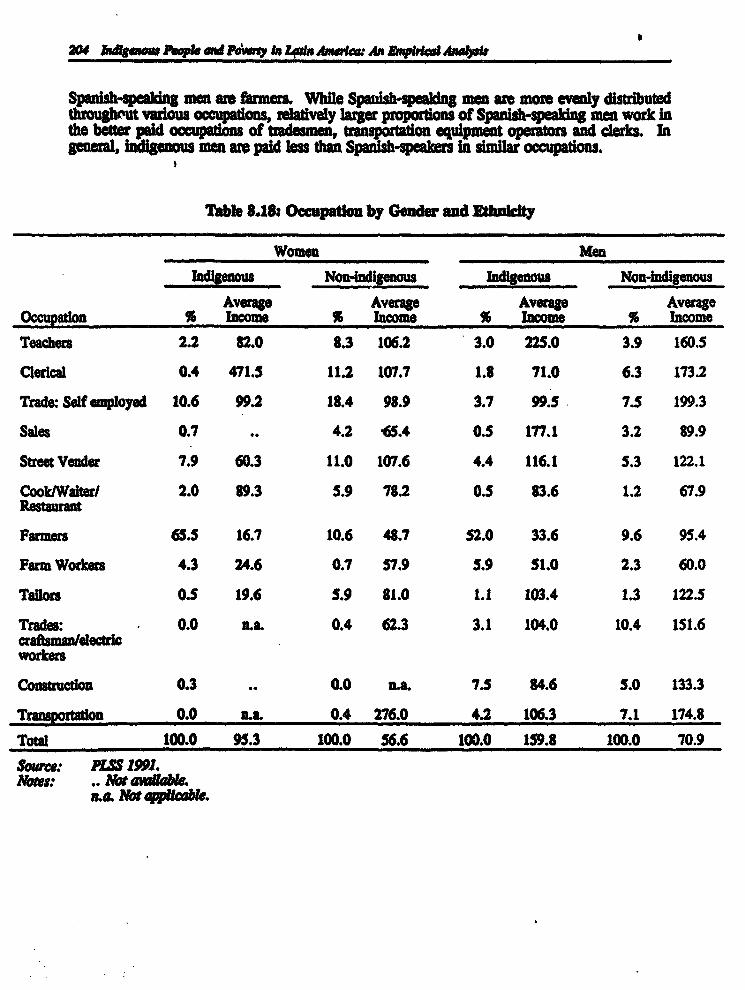
20 hdl.st epi .d ~w~im LOMa Am~< An b~prm5An~L
Spanish-spealdng mn m farmrs. White Spmnish-spadng men are more evenly distd~utedthrough"ut vaulous occupations, relatively larger proporons of Spanish-speadng men work inthe better pald occupations of t0aan,n transportation equipment operators and clerk. Ingeneral, ad=i e men wo paid lss than Spanish-speakers in similar occupations.
Table 8.18: Occupaton by Gender and Ethnicty
Women Men
Indgenous Non-Indgnousgen Non-indigenous
Average Average Average AverageOccupat=on % Income % Income % Income % Income
Teachers 2.2 82.0 8.3 106.2 3.0 225.0 3.9 160.5
Clerical 0.4 471.5 11.2 107.7 1.8 71.0 6.3 173.2
Trade: Sef employed 10.6 99.2 18.4 98.9 3.7 99.5 7.5 199.3
Sales 0.7 .. 4.2 -65.4 0.5 177.1 3.2 89.9
Street Vender 7.9 60.3 11.0 107.6 4.4 116.1 5.3 122.1
Cook/Walter/ 2.0 89.3 5.9 78.2 0.5 83.6 1.2 67.9Rstant
Farmers 65.5 16.7 10.6 48.7 52.0 33.6 9.6 95.4
Farm Workers 4.3 24.6 0.7 57.9 5.9 51.0 2.3 60.0
Taors 0.5 19.6 5.9 81.0 1.1 103.4 1.3 122.5
Tr : 0.0 n.a. 0.4 62.3 3.1 104.0 10.4 151.6pram leectriworkers
Construcdon 0.3 .. 0.0 S.a. 7.5 84.6 5.0 133.3
Rn 0.0 n.a. 0.4 276.0 4.2 106.3 7.1 174.8
Total 100.0 95.3 100.0 56.6 100.0 159.8 100.0 70.9
Source: PIU 1991.Noty: .. NavlM~.
n.a. Not oppliobMe.
Pa 205
Decomposion of Ewnngs Dertlas
In order to ftly understand the position of ladigenous people in the labor market, it isnecessary to examine the respective roles of ethnicity and personal endowments, such asschooling and experience, in determining the level of worker earnings.
The Data. Given the high labor force participation rate of yon Peruvians, labor marketanalysis is undertaken for adults between the ages of 12 and 65. However, due to the complexrelationship between earnings and school attendance? all individuals who are presently attendingschool are excluded from the analysis. The sample contains 2,180 males who reported laborearnings within the past year.
Because we are specifically interested in the factors which contribute to the earningsdifferential between groups, we limit the analysis to males and, in doing so, present an *uWerbound* estimate of discrimination due to indigenous origin. This limitation avoids compoundngthe results with gender discrimination. Unfortunately, the sample of indigenous women whoreported employment earnings is insufficient to generate confident estimates of female earningsequations.
Mean characteristics of indigenous and non-indigenous males are presented in Table 8.19.Average earnings in the sample are 152.3 million new soler per month. Indipnous workersearn less than half the income of non-indigenous workers. The level of educational attainmenof the two groups differs substantially. Indigenous men have only 6.7 mean years of schrelative to 10.0 mean years of schooling for Spanish-speaking men. In terms of levels atnenearly 60 percent of the indigenous group have not exceeded primary school education, whereasonly 23 percent of the non-Indigenous group belong to this category. Only 5 percent ofindigenous workers have post secondary education as compared to 25 percent of nn-digenousworkers.
Although the PSS contains information on experience in present occupation, a Mincerlanmeasure of experience is also created. The average months of experience reported in the surveyis dramatically greater for indigenous people; on average indigenous workers have almost twicethe experience of non-indigenous people. Mincerlan experience is also greater among indigenousworkers but the difference between groups is less pronounced.
The prevalent occupation for indigenous people is farming, which contains 50 percent ofindigenous males. This sector contains only 8 percent of nn-indigenous males. In contrast,at 41 percent, the private sector employs the largest proportion of non-indigenous males, whileit contains only 21 percent of indigenous males. Indigenous workers are also half as likely tobe self-employed and less likely to work in the public sector than are non-indigenous workers.At 68 percent, the mjority of indigenous workers are located in rural areas, whereas themojority, 52 percent, of non-indigenous workers are located in lAma. Average age and hoursworked as well as percent married are marginally higher among ladigenous workers.
narnings of youths are negatively associated with school attendae wherea earnings of older agedindividuals ar positively associated with eucadon. Presumably, youths are attendlg school fAil timeand older workers are strending school part time.

206 Indgenou Pe~psa ~ ad wry 1a La~ia A.n An z~ ~aaIMati
Table .19: Memn by E~uiclty
Cera dd u No-indign u All
Effploya.et Eaag 70.6 164.7 152.3
Ymn of Sbooling 6.7 10.0 9.6
1Uglaest Zascatoannl Attatemn (%)1.4 0.3 0.5
bo~ P r 26.5 7.9 10.228.8 15.0 16.8
hm=~ p 9e16.4 16.8 16.8Copsld Seondary 21.6 35.1 33.4
Non-University I1gbr 2.0 8.2 7.4Univsity 3.3 16.6 14.9
Tnig Co~(%) 11.3 33.0 30.1
Månri~a EXper.ao. (Yrs) 25.9 21.4 22.0Rpotd Expriue (Y) 17.3 9.8 10.8
Hora Wo~ddMonth 222.3 204.0 206.4
ZnOni Ser (%)Paruisg 50.1 7.7 13.3
Public 12.9 18.4 17.7Pvate 20.8 40.9 38.38Slf.m4ployed 15.1 30.8 28.7Oder Baiploymnt 1.1 2.2 2.0
8.....l Wok (%) 9.2 4.0 4.7
Ag 39.3 37.6 37.8
Mar~dd (%) 64.0 55.7 56.8
8.9 51.5 45.9Rual67.8 11.1 18.5
SocalSeuriy %)51.6 65.5 64.4
Union (%) 34.3 37.3 37.0
Number 315 1858 2174
S08rLv: PULS1991.
Emilia.flo T e sulta of earnings fu~ncti estinaes ao preead In Table 8.20. The coefficienton years of schooling can be interpreed as the percentage increase in carnings associated withan extra yar of schooling. Et al of a basic esmings function gives an overall rate ofreturn to education of 5.7 percent However, as shown in Tablb 8.21, including other varableswhich capture regional wncadan and economic ector reduc the returns to education to 4.2
percent. Tis can bo explned by th positiv, nesocian between schooling and obtaining a

Peru 207
job in a well paying sector. In effect, the coefficient for schooling in the simple equationrepresents not only the direct effect on earnings but also schooling's indirect effect (via economicsector) on earnings. The basic equation Is Important from a policy perspective because itindirect., points to the importance of schooling in gaining access to better paying jobs.
Table 8.20: Basic Earnings Functions by Ethalcity
Variable All Indigenous Non-indigenous
Years of Schooling 0.0571 0.0256 0.0617(12.07) (1.69) (12.56)
Years of Experience 0.0412 -0.0116 0.0462(8.87) (1.19) (9.12)
Years of Experience -0.0009 -0.0000 0.0010(7.55) (0.04) (6.72)
Hours Worked (log) 0.3818 0.1793 0.4185(8.96) (1.47) (9.31)
Indigenous -0.8353(14.67)
Constant 1.9536 2.9441 1.6723
N 2180 316 1863
Adjusted I' 0.2115 0.0603 0.1455
Source: PSs 1991.Notes. The dependent variabe Is the natural logarliuhqf earnlngs.
NAubers In parentheses are t-rarts. Nonbers greater than 1.96are stgniftcat at the Spercet levd and arnbers greater t*an1.65 are sIgnpcam at Ahe 10 percent le or beaer.
While schooling is the strongest determinant of earnings in the extended equation, whenestimated over both groups, all other factors are statistically significant at the 1 percent level.Moreover, the magnitude and influence of each factor is intuitive. This equation tells us, otherthings being equal, that indigenous people earn 44 percent less than Spanish-speakers. In otherwordsp even if indigenous people had the same amount of education and experience or, moreimportantly, the same proportion of workers in farming and rural locations as non-indigenouspeople, they would still earn about one-half that of non-indigenous people.
Estimation of the expanded equation foi each group provides some interesting results. Theaverage returns to schooling for Spanish-speaking workers are 3 times that of indigenousworkers, at 4.8 and 1.6 percent, respectively. Moreover, schooling is not a significantcontributor to the earnings of indigenous men but it is a significant factor in the earnings of non-Indigenous men. Similarly, non-indigenous men receive positive yet diminishing returns to labor

208 ndg4ow Fple a owny n Lain Amea:cw An ~Ipial Anab~E
market experience; indigenous men ao not rewarded for labor market experience. This suggeststhat the experience reported by indigenous men represents time trapped In low paying sectors.
ie fk~tors which are silgnificant in predic&ng earnings of indigenous mm are locadion andjob speci. Employ nt In the publi sector, self employment, and Ilving in Lima Increasethe earnings of O i a populaton, while employment in the farming sector negatvelyaffects earnings. The r proporons of indigenous to non-indigenous people in the areasabove supports the di~snet enings advantage found for Spanish-speukers.
It Is also Interesd~g to note the differential effect of marriage on the eamnings of indigengusand non-indigenous populadons. carriage increases the earnings of non-indigenaous men by 3.3percent while mardage has no effect on the earnings of ind~genous mn.
Unfortunately, because there are fewer observations for the union and social scurityvarables, these varables are not incorported in the finsl earnings equaons. Their independentimpact on earnings, however, Is more posively assocated with the earnings of non-indigenouspeople than it Is with the earnings of indigenous peop

Table 8.21: Eeae E ~rungs hctine by E lelty
Varable All Indigeous Non-lndgenous
Years of Scioollng 0.0425 0.0156 0.0479(9.04) (1.10) (9.62)
Yas of Expriece 0.0281 -0.0007 0.0309(6.17) (0.05) (6.17)
Yar of Eprn -0.0005 4.0001 4.0005(4.51) (0.26) (3.99)
Hours Worked (1og) 0.3562 0.2019 0.3827(8.91) (1.83) (8.98)
Indigenos .0.4380(7.43)
Married 0.3064 0.0515 0.3288(8.40) (0.49) (8.52)
Parm Employment 0.3975 -0.4013 -0.2555(5.02) (2.55) (2.64)
Public Employmnt 0.1046 0.5113 0.0504(2.04) (2.85) (0.95)
Seif Employment 0.2464 0.3737 0.2315(5.93) (2.19) (5.46)
uma 0.1168 0.4062 0.1086(3.09) (2.11) (2.83)
Rural 4.3756 .0.2321 -0.4414(5.36) (1.54) (5.44)
Constant 2.0210 2.8183 1.8072
N 2,174 315 1,858
Adjusted R2 0.3257 0.2549 0.2565
Sotuwe: PL' 1991.Notar: Ie d ~pendent v~riaNe is #w a~ma logar~hm «< ~sning.
Anber ti parø e are t-ra~M. N~nbe greaer dn 1.96ar dg~tflæn at dm Spercent le~t and mmnbr greaer dan1.65 art sig~licwn at du 10percent lepa or beer.
Economic theory states that the more schooling or training an individual has recived, thehigher the rewards later in life lative to a lesse schooled individual. Furthermore, asmentioned previously, the schooling decision is dominated by such economic

210 laige. People and Pny tn .ala Am l0: An En~rdnl Analyvis
Table 8.22 shows that education helps to increase the eamnings of all groups in the Peruvianpopulation, wheher Indigenous or not.
Table 8.22: Edctiual AttaLnent and Earnings
Mean Earnings (mIlon new olu per mont)Highiest Level ofEducadon Reached Indigenous Non-ad~gnous
None/~nItial 6.1 152.9
Prfary 68.5 133.9
Secondary 74.2 145.6
Non-University Higher 116.0 166.0
University 131.1 275.2
Source: PLS 1991.
In the basic *arnings equaton, years of schooling contrbutes uignificantly to increase theearnings of both ethnic groups. However, when regional and job related variables are added,both the magnitude and significance of the schooli var~able are reduced. In fact, schoolingia insigniacant in the extended earnigs equation estmated for Indigenous people.
The schooling variable assumes that carnings are a =ontinuous function of schooling, thatis, each successive year of schooling contributes the sam amount to carnings as the previousyear. Ths specification of schooing cannot account for diminishing marginal returns toschoo n nor, more importantly, can it account for the ½* anti1m inherent in both hiringand With the hypothesis that different levels of schooling have different impacts oncarnings, a seres of dummy variables for school levels replace the years of schooling variableand the earnings equations are re.estimated. Table 8.23 presents the resufts. Three points arenoteworthy. First, the explanatory power of all equations increases in comparison to similarequations with the years of schooling variable Second, the ~mpact of the employment sectoris less in thes equations. From both duese points we can conclude that educaton levels areassociated with employment sector, which in turn affets earnings. Third, while higher levelsof educationhigher arnings, ob som university experienc is the only significanteducational to increase earnngs for men.
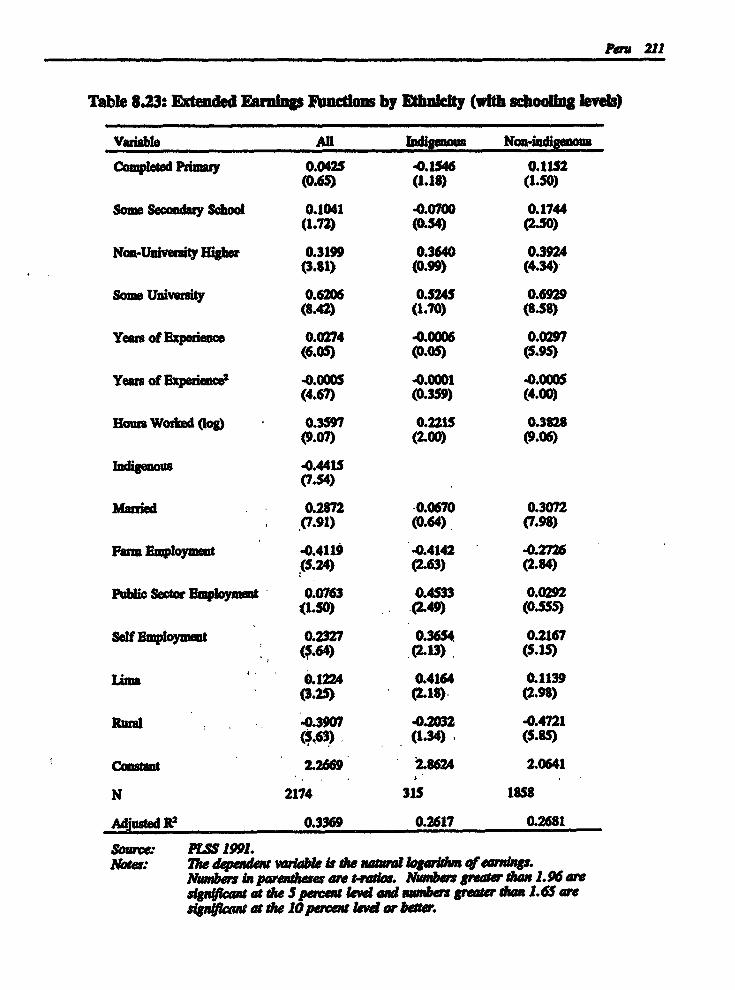
Peru 211
Table 8.23: Extended Ernings Fctons by thnicity (with schoo~ig leveh)
Variabl Al Indigenou Non-indgeous
coMIPeted Pdary 0.0425 4.1546 0.1152(0.65) (1.18) (1.50)
som. Sconduay Sebool 0.1041 -0.0700 0.1744(1.72) (0.54) (2.50)
No~-U~iversity Higher 0.3199 0.3640 0.3924(3.81) (0.99) (4.34)
Soms Unvemity 0.6206 0.5245 0.6929(8.42) (1.70) (8.58)
Years of Expeniece 0.0274 -0.0006 0.0297(6.05) (0.05) (5.95)
Years of Experience -0.0005 -. 0001 4.0005(4.67) (0.359) (4.00)
Houms Wored (log) 0.3597 0.2215 0.3828(9.07) (2.00) (9.06)
ndieous -0.4415(7.54)
Mauied 0.2872 0.0670 0.3072(7.91) (0.64) (7.98)
Farm Employmet -0.4119 -0.4142 4.2726(5.24> (2.63) (2.84)
Publi Sector Efploymeit 0.0763 0.4533 0.0292(1.50) (2.49) (0.555)
Self Bmploymt 0.2327 0.3654 0.2167(5.64) (2.13) . (5.15)
Lima 0.1224 0.4164 0.1139(3.25) (2.18). (2.98)
Rural -0.3907 4.2032 -0.4721(63) (1.34), (5.85)
canernnt 2.2669 2.8624 2.0641
N 2174 315 1858
AdiMs~d R2 0.3369 0.2617 0.2681
Source PLS 1991.Nota: Me dep~ m~ene tariable dw de ,aanI logarkhan k ~ una<ags.
Non(ern ia p~aau are t-ra~do. Nwnk~s greater han 1.96 aresgngigwat t ia 5percnt ewl and auunbers greater Man 1.65 ares1gagigcat at d¢.0lppercealekwi ar bsr

212 Indigenow Peqple amd Poer"y In Latin Aericm: An Empilda AnalyIs
Decmpost i s . The Oaxaca (1973) decomposition method described above in Chapter4 is used to decompose the indigenousinon-indigenous male workers' earnings differential (seeTable 8.24).
Table 8.24: Indigenous Workers' Earnings Disadvantage and its Decompositon
Amount Attributed To:
Indigenous Worker's Earnings Overall Differential Endowments Wage Structure
Gap (In current soles) 94.1 46.9 47.2
As Percent ofOverall Differential 100.0 49.8 50.2
As Percent ofNon-ladigenous Earnings 42.9 21.4 21.5
Source: Calculatedfrom Tale 8.23.
The proportion of this differential that is due to the productive characteristics of individualsis eauivalent to about 50 percent of the differential in log of earnings between indigenous andnon-ndigenous men. In other words, if indigenous workers were endowed with the sameproductive characteristics as non-indigenous workers, the earnings differential between themwould narrow by 50 percent. The remaining difference in wages is unexplained. Thiscomponent also contains any unmeasured factors which contribute to the earnings differentialsuch as ability, health, the quality of education, labor force attachment, and culture. Therefore,if these factors could have been included in the wage analysis, wage discrimination a theindigenous population would account for less than 50 percent of the earnings differential. Sucha reduction, however, would be tempered by any discrimination inherent in the factors.
The contribution of each variable to the overall earnings differential between indigenousand non-indigenous males is shown in Table 8.25. A positive entry indicates an advantage infavor of the non-indigenous population, and a negative entry indicates an advantage in favor ofthe indigenous population. On the endowments side, much of Spanish-speakers' earningsadvantage can be explained by their education, particularly at the university level, and location.Rural location is a mqjor disadvantage to the economic well being of indigenous people.
Much of the "unexplained" portion of the earnings differential is due to hours worked andexperience; that is, for the same amounts of work and market experience, indigenous people arepaid less than non-indigenous people. In addition, as married indigenous language speakers donot receive as large an earnings premium as married Spanish-speakers, part of the 0unexplained"earnings differential is due to marriage. With respect to education, indigenous people are paidless than non-indigenous people for both their primary and secondary education, but they receiveequal compensation for their university education. Rural location affects the earnings ofSpanish-speaking workers more negatively than it affects the earnings of indigenous men.Conversely, indigenous men receive greater economic rewards for their urban location than doSpanish-speaking men.
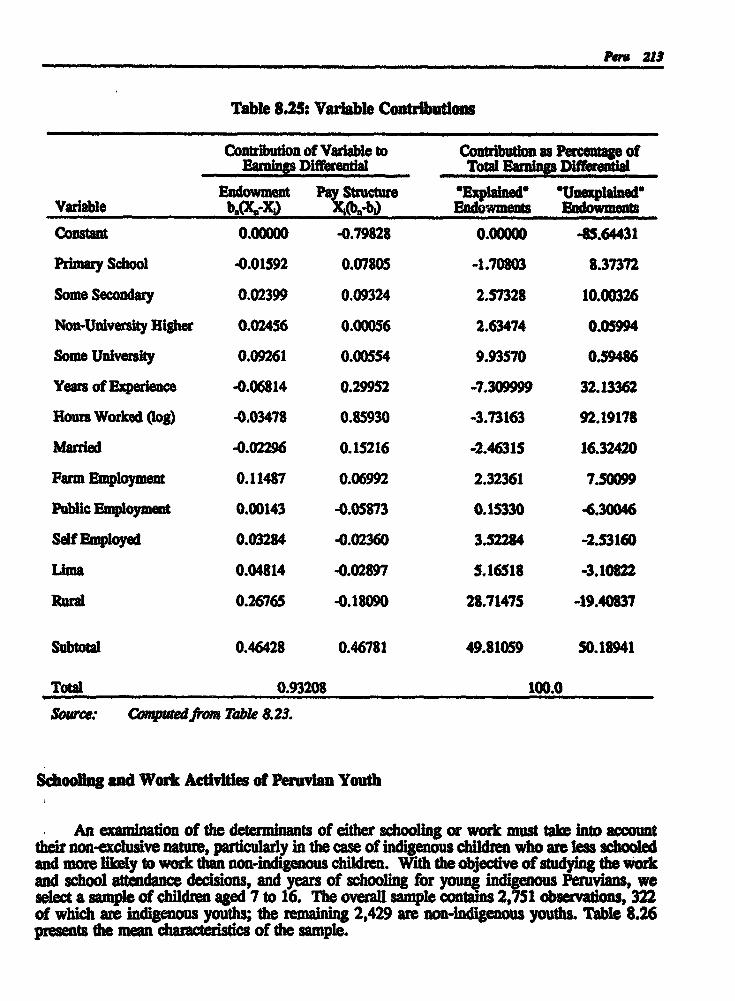
Pou 21S
Table 8.25: Varlable Contrlbutlos
Contribution of Varable to Contibution a Prceage ofEarnings Differental Total r~nings Dfferential
E~do m Pay Struc~r tal ~@ WU11,4~48Varable X b)Endowmm
Constant 0.00000 -0.79828 0.00000 -85.64431
Primary School -0.01592 0.07805 -1.70803 8.37372
Some Secondary 0.02399 0.09324 2.57328 10.00326
Non-UnIversIty Migher 0.02456 0.00056 2.63474 0.05994
Somc University 0.09261 0.00554 9.93570 0.59486
Years of Experienc -0.06814 0.29952 -7.309999 32.13362
Hours Worked (log) -0.03478 0.85930 -3.73163 92.19178
Married -0.02296 0.15216 -2.46315 16.32420
Farm Employment 0.11487 0.06992 2.32361 7.50099
Public Employment 0.00143 -0.05873 0.15330 -4.30046
Self Employed 0.03284 -0.02360 3.52284 -2.53160
Lima 0.04814 -0.02897 5.16518 -3.10822
Rural 0.26765 -0.18090 28.71475 -19.40837
Subtotal 0.46428 0.46781 49.81059 50.18941
Total 0.93208 100.0
Source: Co~ped fom TaMe &23.
Schooing and Work Activtles of Peruvan Youth
An examination of the determinants of either schooling or work must take into accounttheir non-exclusive nature, particularly in the case of indigenous children who are less schooledand more lely to work than non-indigenous children. With the objective of studying the workand school attendance decisions, and years of schooling for young indigenous Peruvians, weselect a sample of children aged 7 to 16. The overall sample contains 2,751 observations, 322of which are indigenous youths; the remaining 2,429 are non-indigenous youths. Table 8.26presents the mea chaicteristics of the sample.

214 Indmenou Peqpe and Pow"y In Latin AmP".* An Bkral Anablk
The average indigenous child is just over 11 years of age, has 3.1 siblings, and comesfrom a family with an average per capita income of 9.5 million new soles per month. Ninety-sixpercent of indigenous children attend school (almost exclusively public school, and none of thesechildren received scholarships). On average these children have 3.9 years of schooling. Fifty-four percent of children are working - workforce participation i defned as greater than zerohours worked and includes paid and unpaid work.
As 93 percent of the indigenous sample is located in rural areas, it is interesting tocompare the indigenous sample to the rural Sanish-speaking sample to see whether differencesin educational achievements and work participation are due to location or ethnicity. A muchhigher proportion of indigenous children work, yet the rate of school attendance is greater forindigenous children than or rural Spanish-speaking children. Indigenous children have similarlevels of education as rural Spanish-speaking children (who are slightly younger), but are lesseducated than urban Spanish-speaking children (who are slightly older). While indigenouschildren are more likel to work, their mean hours of work, both at home and in the labormarket, are similar to e of Spanish-speaking children.
The proportion of the child workers who are paid for their work is slightly higher forindigenous children than for Spanish-speaking children (3.1 percent versus 2.5 percent), but theearnings are similar at 34 million new soles per month. However, family wealth, in terms offamily income and other household-based proxies such as rooms per capita, is much lower forthe indigenous population. The average per capita household income of indigenous children isless than half that of rural, and less than one-quarter that of urban, non-indigenous children.Indigenous households are also more crowded. Both parents of Spanis-speaking children arebetter educated than their indigenous counterparts. This is especially true of Spanish-speakingmothers. Schooling costs are significantly less for indigenous chilr, mainly due to theirlimited presence in private schools, than for non-indigenous children.

Pdw 215
Table 8.26:1 ean by in icly and Locadon
Indigenous Non-indigenousTotal Total U=ban Rural
Quechua (%) 57.4 0.0 0.0 0.0Aymara (%) 42.6 0.0 0.0 0.0
Age (years) 11.3 11.6 11.6 11.2
Male (%) 48.1 50.0 49.7 51.6
Rural (%) 93.0 15.4 0.0 100.0Lima (%) 0.4 43.9 51.9 0.0
Mother's Schooling (years) 3.8 7.5 7.9 4.9Father's Schooling (years) 5.5 8.8 9.3 6.1
Child Working (%) 53.6 11.5 7.5 33.3
Child Attending School (%) 95.7 97.1 97.6 94.4
Schooling (years) 3.9 4.7 4.9 3.9
Number of Siblinig 3.1 2.8 2.8 2.9
Income per Capita (million 9.5 41.1 44.7 20.8new soler)
Rooms per Capita 0.45 0.59 0.60 0.55
Hours of Work/Week 22.6 22.8 23.0 22.4
Hours of Chores/Week 9.4 8.0 7.7 9.7
Cost of School (million new 9.2 36.3 39.5 18.1sles)
Public School (%) 99.6 83.5 81 97.0
Scholarship (%) 0 1.6 1.8 0.2
N 322 2429 1976 453
Source: PLUS 1991.
It is clear that indigenous children have less schooling and a higher M e of workparticipation than non-indigenous children. The succeeding analysis will examine the differencesbetwe different groups of indigenous youths. Tables 8.27, 8.28 and 8.29 show the facmarswhich affect the years of schooling, school atnne and work participation of indigenousPeruvian youths.

1 0 -40
teill[l 1 11 0ese:eeg ggl ggt $2 ee esama $g
&4 05 pc t*s cc WI 0 10 A Ck )9! a40~~ % -a 0 -
^919l a gså,C:s ^ ¥=s9 a^5 c391
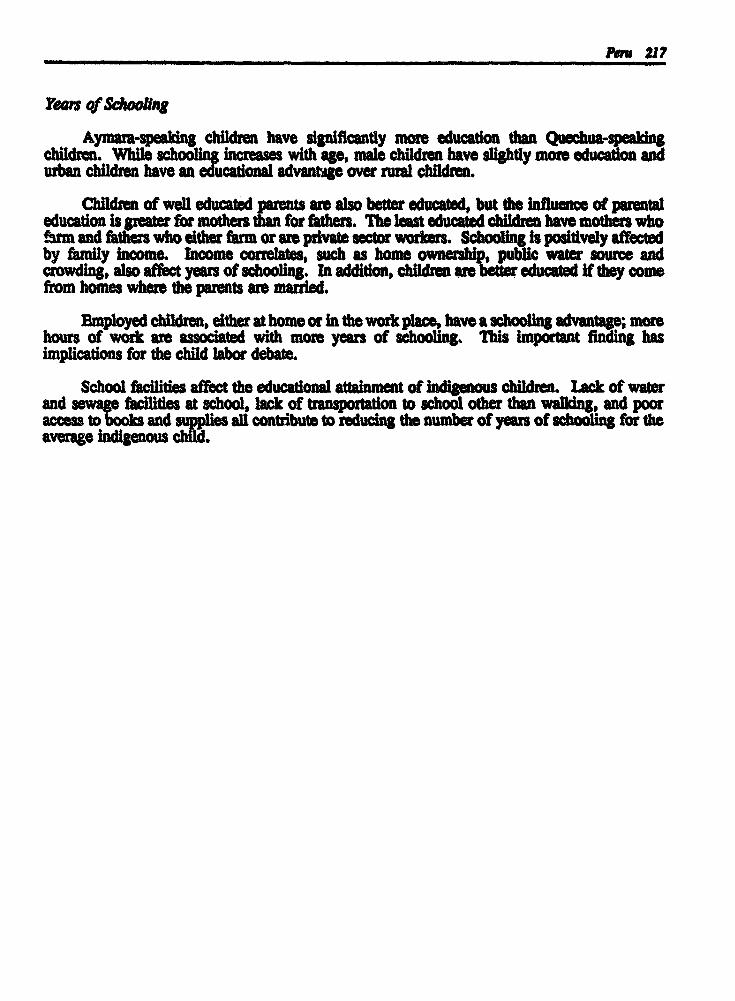
Pm. 21?
Yeors of Schooling
Aym s children have signicantly more educaon than Quchua-spealdngchildren. Whil ~ increases with ge., mae children have slightly mom ducadon andurban children have an ona advantge over rural children.
Children of well educated pa ts are also beer educated, but the Inuence of purentaleducaton is peter for mothers foathers. The last educated chidren have mothers whotrm and fathers who Cither farm or are private astor workers. Schooling is posMtvely affectedby family income. Income correlates, such as home ownership, public water source andcrowding, also affec year of s o . In addido, hd ar du e If thy comefrom homes where the parents are marr~ed.
Employed cildren, either at home or in the work place, have a schooling advantage; morehours of work are associated with more years of schooling. This important findig hasimplications for the child labor debate.
School facilities affect the educational attainment of indigenous children. Lack of waterand sewage facities at school, lack of transportaton to school other than walkdng, and pooraccess to books and suppies all contribute to reducing the number of years of achooling for theaverage indigenous chdd.
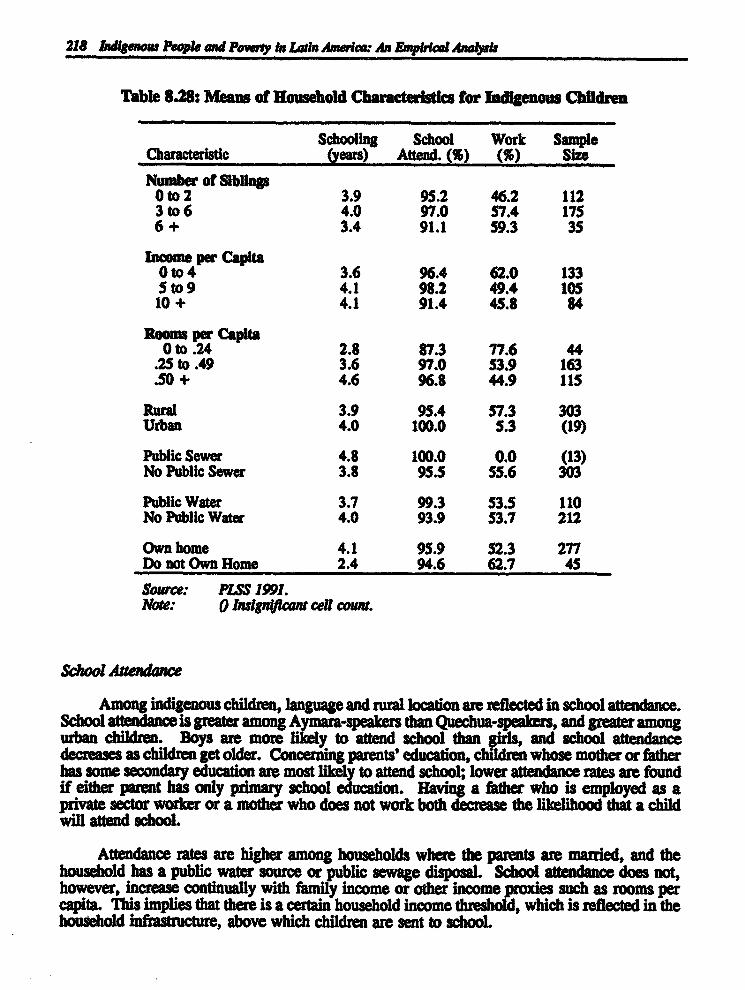
218 Indlgenes People and Powry In Lin Ameim An EMprical Analpt
Table 8.28: Means of Household Characteristics for Indigenous Cbldren
Schooling School Work SampleCharacteristic (years) Attend. (%) (%) Size
Number of SiblingsOto2 3.9 95.2 46.2 1123 to 6 4.0 97.0 57.4 1756 + 3.4 91.1 59.3 35
Income per Capita0 to 4 3.6 96.4 62.0 133Sto9 4.1 98.2 49.4 10510+ 4.1 91.4 45.8 84
Rooms per Capita0 to .24 2.8 87.3 77.6 44
.25 to .49 3.6 97.0 53.9 163
.50 + 4.6 96.8 44.9 115
Rural 3.9 95.4 57.3 303Urban 4.0 100.0 5.3 (19)
Public Sewer 4.8 100.0 0.0 (13)No Public Sewer 3.8 95.5 55.6 303
Public Water 3.7 99.3 53.5 110No Public Water 4.0 93.9 53.7 212
Own home 4.1 95.9 52.3 277Do not Own Home 2.4 94.6 62.7 45
Source: PLSS 1991.Ite: 0 ulg4*an cell cowt.
School Auendance
Among indigenous children, language and rural location are reflected in school attendance.School attendance is greater among Aymara-speakers than Quachua-speakers, and greater amongurban children. Boys are more likely to attend school than girls, and school attendancedecreases as children get older. Concerning parents' education, children whose mother or fatherhas some secondary education are most likely to attend school; lower attendance rates are foundif either parent has only primary school education. Having a father who is employed as aprivate sector worker or a mother who does not work both decrease the likelihood that a childwill attend school.
Attendance rates are higher among households where the parents are married, and thehousehold has a public water source or public sewage disposal. School attendance does not,however, increase continually with family income or other income proxies such as rooms percapita. This implies that there is a certain household income threshold, which is reflected in thehousehold infrastructure, above which children are sent to school.

111J111o
jagVi

220 Infgenorw People ent Powry in Ladn Amerle* An nVrical AnalYR
Table 8.29: Means of School Characteristics for Indigenous Children
Schoollmg School Work SampleCharacteristic (years) Attail. (%) (%) Size
Work Glours/week)1 to9 3.0 100.0 100.0 501o to 19 3.2 97.1 100.0 5220 to 29 3.7 91.5 100.0 3030+ 5.6 88.1 100.0 46
Eousehold Chores (hours/week)1 to 4 3.3 97.0 48.1 295to9 3.9 98.8 51.9 12510+ 4.3 91.5 59.3 114
Seasonally Employed 5.1 93.0 100.0 (17)Not Seasonally Employed 3.8 94.4 100.0 161
School FacilitiesPublic Water 4.2 96.5 44.3 165Public Sewer 4.3 98.1 54.9 89No Water or Sewer 2.6 89.1 78.1 52
Transportation to SchoolPublic Trmport 7.3 100.0 27.2 (8)Private Transport 10.0 100.0 100.0 (1)Walk 3.8 99.5 53.0 282
look AccessAccess to All Books 3.4 100.0 47.3 73Acces to Less than 50 Percent 4.0 100.0 55.5 38Share Books in Household 3.8 100.0 50.7 34ShareBooks Outsde Household 4.0 98.7 50.1 63Use Library 5.1 100.0 52.8 62No Book Access 2.0 95.2 77.3 (20)
Changed School 4.9 73.1 29.4 (7)Did Not Change School 3.9 100.0 52.8 283
Cost for School (million newsoler)
0 to 2 3.4 83.8 63.1 873to6 3.1 100.0 50.5 656+ 4.4 99.5 49.7 170
Source: PLSS 1991.Aoe. 0 Insignmicant cen count.
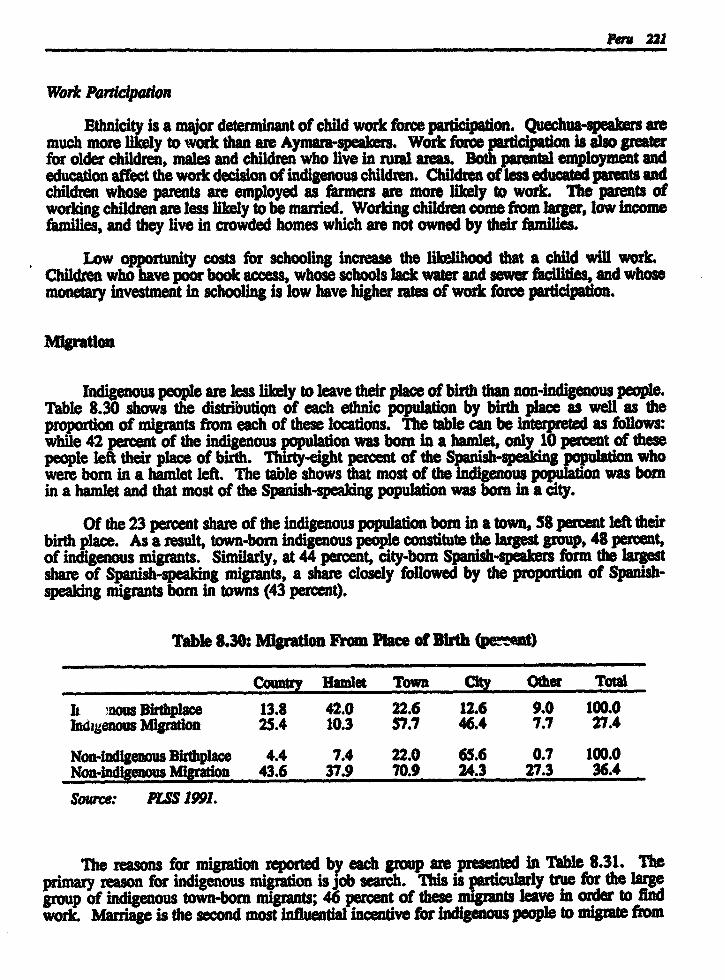
Peu 231
Work Paicipation
Ethnicity is a major determinant of child work force participation. Quechuw-speakers aremuch more ikely to work than are Aym eakers. Work force ipation Is also greaterfor older children, males and children who live In rural areas. Both parental employment andeducation affect the work decision of indigenous children. Children of less educated parents andchildren whose parents are employed as farmers are more likely to work. The parents ofworking children are less likely to be married. Working children come from larger, low incomefamilies, and they live in crowded homes which are not owned by their families.
Low opportunity costs for schooling increase the likelihood that a child will work.Children who have poor book access, whose schools lack water and sewer facilities, and whosemonetary Investment in schooling is low have higher rates of work force participation.
Migration
Indigenous people are less likely to leave their place of birth than nn-indigenous people.Table 8.30 shows the distributiQn of each ethnic population by birth place as well as theproportion of migrants from each of these locations. The table can be Interpreted as follows:while 42 percent of the indigenous was born in a hamlet, only 10 percent of thesepeople left their place of birth. Thirty-eight percent of the Spanish-saing population whowere born In a hamlet left. The table shows that most of the population was bornin a hamlet and that most of the Spanish-speaking population was In a city.
Of the 23 percent share of the indigenous population born in a town, 58 percent left theirbirth place. As a result, town-born indigenous people constitute the largest group, 48 percent,of indigenous migrants. Similarly, at 44 percent, city-born Spanish-speakers form the largestshare of Spanish-speaking migrants, a share closely followed by the proportion of Spanish-spealdng migrants born in towns (43 percent).
Table 8.30: Migration From Place of Birth (peeant)
Country Hamlet Town City Other Total
It nUous Birthplace 13.8 42.0 22.6 12.6 9.0 100.0Indgenous Migration 25.4 10.3 57.7 46.4 7.7 27.4
Non-indigenous Birthplace 4.4 7.4 22.0 65.6 0.7 100.0Non-ldigenous Migration 43.6 37.9 70.9 24.3 27.3 36.4
Source: PLSS 1991.
The reasons for migration reported by each group are presented in Table 8.31. Theprimary reason for indigenous mipation is job search. This is tarticulary true for the largegroup of indigenous town-born ngrants; 46 percent of these gnts leave in order to findwok Marriage is the second most influential incentive for indigenous people to migrate from

m3t igeur People w ~d ony~ lt L~an Aa4~. An ~oEaa Aute
runal amaL Among the smal populaon of county-born a us migrants, as well as therlatively larger group of city-orn indigenous migants, Is a factor in the decison toIgrate. However, in all bith places, but mo soli hamles and towns, non-lndigenous people
are more Ilkely to migrat. in order to study than indigenous peope Almost equal proportionsof both ethnic groups lef their birth place for monetary reasons, but money is not a dominantc-r for ither population.
Table 8.31: of M graton fro= erthplaee (perceat)
Reason for L ~ving Country Hamlet Town CityIndgous Ngrant0
More Money 0.0 13.7 3.7 83Work 38.8 22.3 45.9 39.0Study 15.4 5.3 8.2 17.0Maa 15.6 21.5 10.1 7.5Tör~s 0.0 0.0 0.5 0.0Other 30.2 37.3 31.7 28.2
Total 100.0 100.0 100.0 100.0
mmt 6.5 8.7 8.0 6.0Wö* 29.4 27.4 21.2 17.4Stady 17.3 11.8 18.5 18.4Mara 5.0 7.5 5.3 5.7Terrodsm 0.0 0.0 0.2 0.1Other 41.8 44.6 47.0 52.3
Total 100.0 100.0 100.0 100.0SO.rce: PL.= 1991.
lod~nu miat r much ~ldma =ndlgem m~gats; tOm avemage age OfinI mgran years, where the in migra s 15yea
(see Table 8.32). While indigenous peoplrel y to move to their present location inorder to obtain sasonal work, they me more lily to have lef this present residence for workreans than are non-indigenous people.
At 34 and 24 percent, work is the primary reason for the location of both indigenous andnon-indigenous populations, respectively. After work, marriage remains a deciasve factor forthe present residence of th indigenous population. The proportion of the indigenous populationwho lves in its present locamn far reasons of mariage is more than double the correspondingproporion of the1 oadigenous e e n dl agrole in the b~atin delans population than for t genous-onsIn.
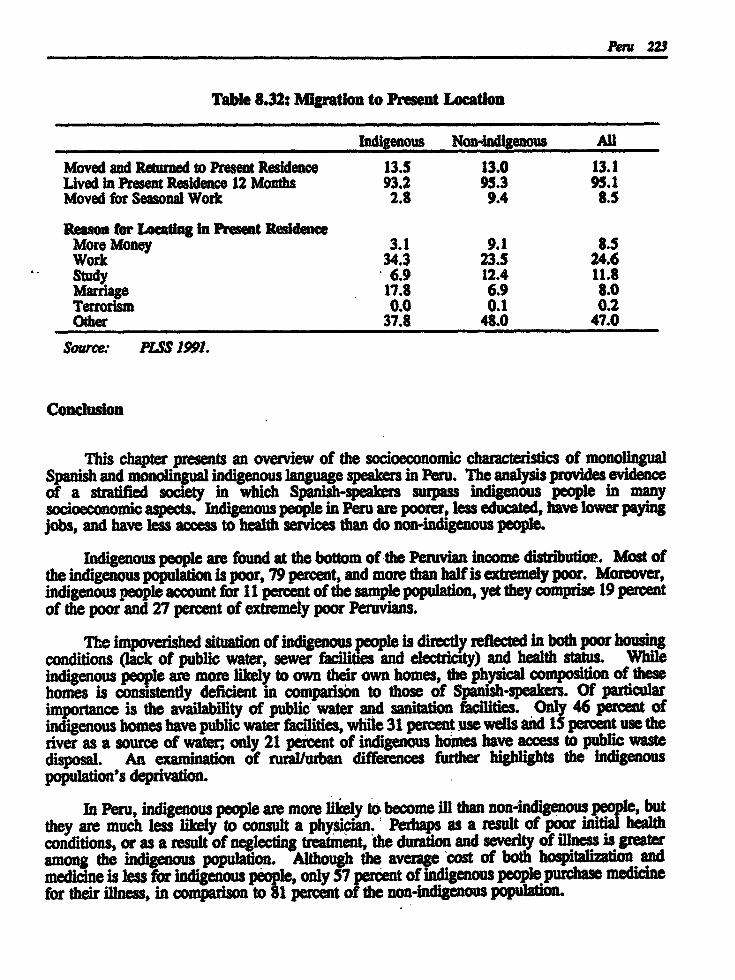
Peru 223
Table 8.32: Migration to Present Location
Indigenous Non-adigenous All
Moved and Returned to Present Residence 13.5 13.0 13.1Lived in Present Residence 12 Months 93.2 95.3 95.1Moved for Seasonal Work 2.8 9.4 8.5
Reaso for Locating in Present ResidenceMore Money 3.1 9.1 8.5Work 34.3 23.5 24.6Study 6.9 12.4 11.8Marriage 17.8 6.9 8.0Terrorism 0.0 0.1 0.2Other 37.8 48.0 47.0
Source: PLSS 1991.
Conclusion
This chapter presents an overview of the socioeconomic characteristics of monolingualSpanish and monolingual indigenous language speakers in Peru. The analysis provides evidenceof a stratified society in which Spanish-speakers surpass indigenous people in manysocioeconomic aspects. Indigenous people in Peru are poorer, less educated, have lower payingjobs, and have less access to health services than do non-indigenous people.
Indigenous people are found at the bottom of the Peruvian income distribution. Most ofthe indigenous population is poor, 79 percent, and more than half is extremely poor. Moreover,indigenous people account for 11 percent of the sample population, yet they comprise 19 percentof the poor and 27 percent of extremely poor Peruvians.
The impoverished situation of indigenous people is directly reflected in both poor housingconditions (lack of public water, sewer facilities and electricity) and health status. Whileindigenous people are more likely to own their own homes, the physical composition of thesehomes is consistently deficient in comparison to those of Spansh-speakers. Of particularimportance is the availability of public water and sanitation facilities. Only 46 percent ofindigenous homes have public water facilities, while 31 percent use wells and 15 percent use theriver as a source of water; only 21 percent of indigenous homes have access to public wastedisposal. An examination of rural/urban differences further highlights the indigenouspopulation's deprivation.
In Peru, indigenous people are more likely to become ill than non-indigenous people, butthey are much less likely to consult a physician. Perhaps as a result of poor initial healthconditions, or as a result of neglecting treatment, the duration and severity of illness is greateramong the indigenous population. Although the averap cost of both hospitalization andmedicine is less for indigenous people, only 57 percent of Indigenous people purchase medicinefor their illness, in comparison to 81 percent of the non-indigenous population.

224 Indigeme People ad Powrsy In Lain Amrwicm An Apial Analyps
Anal)ais of education levels by gender and ethnicity shows that educational gaps have beenslowly decreasing over time, both between ethnic groups as well as between genders. Still, asa group, non-indigenous people have 47 percent more education than indigenous people. Notonly is the Indigenous population less educated and less literate than the Spanish-speakingpopulation, but it also lags behind the non-indigenous population In terms of training. Similarly,the difference In educational achievements of household heads Is substantial. Only 40 percentof indigenous households-heads have education in excess of primary school, 6 percent have somepost secondary education. In contrast, 41 percent of Spanish-speaking heads of households havesome secondary school education and 22 percent have some post secondary education.
On average, the earnings of Indigenous people are less than half those of Spanish-speakers.Better paying occupations are dominated by Spanish-speakers. While sections of the indigenouspopulation have moved to new occupations as wage laborers, teachers, and in trade, the ajorityof the population remains involved in agricultural work Seventy percent of Indigenous peopleare involved In agricultural work, yet those who are paid for their work receive less than halfthe wages of their Spanish-speaklfg counterparts. Thirty percent of Indigenous people aresubsistence farmers.
Estimation of earnings functions by ethnic group show that the average returns to schoolingfor Spanish-spealing workers are 3 times that of indigenous workers, at 4.8 and 1.6 percent,respectively. Indigenous men are not rewarded for labor market experience. This suggests thatthe experience reported by indigenous men represents time trapped in low paying sectors. Itshould be kept In mind that the indigenous population in Peru is defined as monolingual Aymaraand Quechua speakers. Consequently, these groups are not competing in the same segment ofthe labor market as the non-indigenous population (or the bilingual indigenous workingpulation). Although higher levels of education provide higher earnings, university experienceis the only significant educational factor to increase earnings for indigenous men in Peru.
In Peru, the proportion of the overall earnings differential that is due to the productivecharacteristics of individuals is valent to 50 percent In other words, if Indigenous workerswere endowed with the same productive characteristics as non-indigenous workers, the earningsdifferential between them would narrow by 50 percent. The remaining difference In wages iswunexplained," and may include any unmeasured factors which contribute to the earningsdifferential such as ability, health, the quality of education, labor force attachment, and culture.However, wage discrimination against the indigenous population may account for as much as50 percent of the overall earnings differential.
An analysis of the contribution of each variable to the overall earnings differential betweenindigenous and non-indigenous workers indicates that much of Spanish-speaking workers'earnings advantage can be explained by education, particularly at the university level. Rurallocation is a major disadvantage to the economic well being of indigenous people. Yet, rurallocation does not affect Spanish-speakers as negatively as it does indienous-language speakers,with the result that adienous people are unduly penalized for thwir location. Much of the"unexplained portion of the earnings differential is due to hours worked and experience; thatis, for the same amounts of work and labor market experience, indigenous people are paid lessthan non-indigenous people.
ふ!・j》>「\・

226 "Seww Peopk wd Po" In Lada Amaim An Empiricd Awtok
0 Poverty among I intin Americats hdigenous population Is pervasive and severe.
in Bolivia, while move than half of the total papWation is poor,, over two-thirds of thebilingual Indigenous popWation and almost dueeVmlers of die 1 Kmoliigpual indigenouspopulation. is'pm. The majority,, 66 pereen4 of the population of Guatemala is poor,, with 38
t of all households below the oftme poverty line, The indigenous populafm,, howeversionately pow,, 87 percent of all Indigenous households an below the poverty hue
and 61 percent are below the aftme poverty lim
In Maxim, individuals in "mom indieenous* mwskiplos are In poorer xioccowmiccondition than individuals in less i AS WdpW. A positin correlation exists betweennuuddplo indigenous collre I at!-- the incidence of poverty. Munidplos of increasing
.. .1 ..indigenous n ri I P C % R ka vqmem higha percentages of pvaty ad mtreme poverty. ]hmgWdpW with a less than 10 percent indigenous population,, the poverty headcount index is 18percent; In mwildplos 10 to 40 percent indigenous,, 46 percent of the population is poon and inmuddplos over 70 percent indigenous,, over 80 percent of die population is poor.
Most of the indigenous population of Peru is poor, at 79 mt, and more than half isextremely poor. In fict, indigenous people we one and a half as Moly to be poor dware non-Huffsenous people, and Almost three times as likely to be adremely poor. Consequently,indigenous people account for I I percent of the sample p*fiation, yet they comprise 19 percentof the poor and 27 percent of ex1remely poor ftuvians.
in Guaemah4 die degree of income inqWlity among the combined indigenous and non-Indigenous populations m. each region is greater than die estimated income inequalfty for separategroups. This proves that income inequality is clearly an uAff-edmic problem.
1U results of a statistical analysis of die W - -bomb of poverty in Mexico reveals duaa I percent increase in the mwddpiolz indigenous population leads to an increase in ftindiVidual's probability of being poor by Wro4mately 0.5 perceaL This variable has
impact given the potential range of indigenous popiladoin 0 to 100a So percent Indigenous nwdeipto kaum one's probability of being Poor
r mirt-at m percent, maddng the greatest possible increase in the marginal pvbabilityof being poor than possible with any other observed fictor.
In a simila exercise for Bolivia, it is found that being increases the probabilityof being poor by 16 percent. The probability of Poverty I IN I q by "_ost 4:5 percent f"household members whose head of 3ehW is unerq*)*. V& ." employmentis == Important than, being indigenous in reducing povvty. LM= heads ofhousehold,, 4. d - i in the labor face leads to a 40 P wmt in the incidence ofpoverty.
o The living conditions ot the Indigenous population an generally abysmal, enm:%*when compared to the non-ludIgenous; populatioL
In Guatemak, the majority of the population does not hm access to such public servicesas water, sanitation and electricity. Len than one-third of I indigenous households have Waterp#W to their homes for their mdusive use, compared to almost half of nori-indigenous
holds, PM study" shows halfof all indigenous households have nosanh,ary services, and &twfttft Q ;o electricity.
Condrtoin 227
In Bolivia, households headed by a non-indigenous person have a higher number of roomsand more rooms per capita than households headed by an indigenous person. And although theindigenous group has a much higher level of home owtership, this says little about the qualityof housing, which is lower for the Indigenous group. This is reflected in the lower rate ofsewage facility connections to indigenous households, and the lower prevalence of latrines. Animportant finding is the substantially higher prevalence of land ownership among indigenouspeople. This could indicate that idigenous people maintain ties to rural areas, allowing themto maintain already established support networks.
In the less indigenous areas of Mexico, material possessions such as televisions,refrigerators and automobiles are more plentiful than in the more indigenous areas. Servicessuch as piped water, electricity and telephone service are also more common in less indigenousareas. In contrast, home ownership is more prevalent in more indigenous areas, but a closerexamination reveals a clear disparity in the physical composition of homes between more andless indigenous musciplor. Homes in less indigenous areas are built from higher qualitymaterials: 71 percent are constructed with concrete and brick, while in more indigenous areasonly 29 percent are concrete and brick. A larger percentage of homes in indigenous areas arebuilt with wood than in less indigenous areas: 21 and 6 percent, respectively.
While indigenous people are more likely to own their homes in Peru, here, too, thephysical composition of these homes is consistently deficient in comparison to that of Spanish-speakers. Of particular importance is the availability of public water and sanitation facilities.Only 46 percent of indigenous homes have public water facilities, while 31 percent use wells and15 percent use the river as a source of water; only 21 percent of indigenous homes have publicwaste disposal. An examination of rural/urban differences further highlights the indigenouspopulation's deprivation. As indigenous households are less likely to have a public source ofwater in both rural and urban areas, indigenous people are much more likely to obtain waterfrom wells; 16 percent of urban indigenous households and 39 percent of rural indigenoushouseholds have wells, whereas the corresponding proportions of Spanish households are only2 and 10 percent. While the proportion of rural Spanish households that use rivers as theirwater source is larger than in rural indigenous households, the rural prevalence of indienouspeople results in a greater proportion of the indigenous ulation being exposed to the diseaassociated with poor water quality. Almost half of all igous households rely on keroseneas a source of light; 88 percent of the homes of Spanish-speakers use electricity. Within urbanareas the use of kerosene is seven times greater in Indirnous homes than in the homes ofSpanish-speakers. The relatively large proportion of urban indigenous households without publicwater, public sewage disposal and electricity is evidence of a group of indigenous squattersettlements in the urban areas.
* There is a very strong correlation between schoolng attannment and being Indigenous,and between schooling aaetno and poverty category.
In Bolivia, the schooling levels of indigenous people are approximately three years less,on average, than for non-indigenous individuals. The difference is even greater for indigenousfemales, suggesting that they are the most disadvantaged in Bolivian society.
In Guatemala, the majority of indigenous people have no formal education and of thosewho do, the majority have only primary education. On average, indigenous people have only1.3 years of schooling and only 40 percent are literate.

228 Ind(gear People and Pow In Lattn Ameriw An Xmpiral Analyls
Access to formal education in Mexico has expanded in recent ears, and improvementshave occurred in Indigenous areas. Nevertheless, educational levesrem higher In non-Indigenous areas. Illiteracy continues to be an important problem for some states, especiallythose which are predominantly indigenous. The rate of Illiteracy increases for both males andfemales as mwddpio indigenous percentages rise. The disparity is greatest in the femalesubsample, where the Illiteracy rate is more than four times greater in the *high* Indigenousmwciplo category than in the "low" indigenous maadpto category. In addition, it is interestlagto note that the gender disparity in the illiteracy rate increases as the nautcpk Indigenouspercentage Increases. For the least indigenous amiciplos, the male/female difference is only2 percent but for the *high" indigenous muWciplos, the difference is 16 percent, showla apattern of increasing malelfemale educational inequities as mndlplo indigenousincreases. The higher the proportion of indigenous people in a mwacpio, the lower the averagelevel of schooling of its population. Males have almost 7 years of schooling in those mlc'iorwith less than 10 percent indigenous population, whereas males in those andclptor with 40percent or more indigenous population have only 3.5 years of schooling.
For the adult population of Peru, the data indicate that in recent years the differencebetween indigenous and non-indigenous people's educational attainment has narrowed. Still,non-indigenous people have 20 percent more education than indigenous people. Not only is theindigenous population less educated and less literate than the Spanish-spealing population, butit also lags behind the non-indigenous population in terms of training. Differences in educationallevels of indigenous and non-indigenous individuals are substantial. Only 40 percent ofindigenous heads of household have education in excess of primary school In contrast, 41percent of Spanish-speaking heads of household have some secondary school education, and 22percent have som post secondary education. Only six percent of indigenous heads of householdhave some post-secondary education. Educational gaps between the indigenous and non-indigenous populations, as well as between genders, have been decreasing over time.
* The parents' skills and educational attakment are reflected in the schooling and otherhuman capital characteristics of their children.
In Guatemala, 9 percent of non-indigenous children and 21 percent of indigenous childrenare reported as being employed. The children of indigenous origins are born with manysocioeconomic disadvantages and are unable to keep up with their non-indigenous peers.Indigenous children are more likely to repeat grades at the primary level and are more likely todrop out of school altogether.
In Bolivia, non-indigenous children age six to eighteen are still much more likely to beenrolled in school than indigenous children. Interestingly, the poorer children are actually mJDIlikely to be enrolled than the non-poor children. In terms of years of schooling anninmentamong the in-school population, non-indigenous children receive more schooling than indigenouschildren regardless of gender. Multivariate analysis shows that being indigenous has a strongeffect on schooling attainment. In terms of school enrollment, the participation rate is slightlyhigher among males, with a greater percentage of non-indigenous youths attending school thanIndigenous youths.
In Peru, 40 percent of non-indigenous children are enrolled in school, as compared to 36percent of indigenous children. The effects of language and rural location are reflected in schoolattendance; school attendance is greater among Aymara speakers than Quecha speakers, andgreater among urban children. School attendance is also affected by child labor, both In thehome and in the labor market; as hours worked increases, school attendance decreases. Being

Cmdawe 22
Indigenous is a major determinant of child work force participation. Quechua speakers are muchmore lhely to work than Aymara speakers. In addition, both parental employment andeducation affect the work decision of indigenous children. Children of less educated parents,children of fathers who are empioyed as farmers, and children of mothers who are not In thelabor force are more likely to work.
In Mexico, enrollment rates are higher in non-indigenous areas. The gap in enrollmentrates between Indigenous and non-indigenous areas widens with age, reaching a peak at 17 years,when the non-indigenous enrollment rate is approximately twice the indigenous rate. Child laborforce participation is greater in indigenous areas than in non-indigenous areas. This can bepartially explained by the rural concentration of the indigenous population. Parental educationplays an important role in average educational levels among children. The average increase inschooltainment fora child with a mother with secondary or greater education, as opposed toa mother with no education, is 3.5 years in non-indigenous areas. Similar differences exist inindigenous areas. Where comparisons are available, the impact of parental education is greatestin less indigenous mwdcpfos. The employment conditions of the head of the household also hasa clear impact on a child's average educational attainment. Heads of household who work innon-agricultural pursuits in either indigenous or non-indigenous areas have children with higherlevels of educational attainment than otherwise employed heads of household. The contributionof the income of working children to total family income is substantial. As expected, thecontribution of child labor to family income increases with age, while increasing educationalattainment reduces the contribution. Child income plays a slightly greater role in total familyincome in indigenous areas than in non-indigenous areas.
* The health problems of Indigenous groups are serious.
In Bolivia, indigenous people are more likely to have been sick or injured in the previousmonth than ae non-Indigenous people. There is a higher tendency among indigenous individualsfor their disability to be sufficiently severe to keep them out of work for more than a week.PUrthermore, indigenous persons are less likely to seek medical help for their ailment-Regarding an important preventive measure, the vaccination rate against yellow fever is doublefor no-idienu than for indigenous individuals. Indigenous women are in a substantiallyinferior p with respect to comprehensive maternal health care. SurprIsingly, while thepoor are less likely to receive professional attention at birth in a medical ablishment,effectively targeted programs through public clinics have actually led to high provision ratesof certain preventive health procedures - such as tetanus vaccination - for poor women thanfor non-poor women.
In Peru, indigenous people are more licely to become ill than non-indigenous people, butthey are much less likely to consult a physician. Perhaps as a result of poor initial healthconditions, or as a result of neglected treatment, the duration and severity of illness is greateramong the indigenous population. The proportion of indigenous people hospitalized is almosttwice that in the Spanish-speaking population. Although the average cost of both Aopitalzationand medicine is less for indigenous people, only 57 percent of indigenous people purchasemedicine for their illness, as compared to 81 percent of the non-indigenous population.

290 Indigenow People and Pow In Larn Americw An Dqphiaf Analt
* Labor force participation is higher and the rate of umemployment is lower forIndigenous people, who are concentrated In particular secto of the economy.
In Bolivia, a greater percentage of all indigenous persons participate In the labor force, anda lower percentage of the indigenous labor force is unemployed. Indigenous workers are morelikely to have a second job, and they tend to work mnore hours than their non-indigenouscounterparts. Yet bilingual indigenous workers earn, on average, less than two-thirds the salaryof non-indigenous persons. Therefore, a high proportion of the indigenous poor are *workingpoor." Approximately one-half are self-employed, while the majority of non-indigenousindividuals work as employees. Poorer individuals are more likely to be self-employed, and lesslikely to be an employee or a business owner. About 40 percent of both bilingual indigenousand monolingual Spanish employees are likely to work in the public sector, while the remaining60 percent work in the private sector. Monolingual indigenous speakers, however, are far morelikely to work in the private sector.
In Guatemala, most indigenous people work In the agricultural sector where wages arelower than in any other sector. The workforce is composed primarily of males both theindigenous and non-indigenous populations. Indigenous workers are more likely than non-indigenous workrs to be self-employed.
Noting t importan-e of organized labor in Mexico, unions are nearly two times moreprevalent in I as indigenous minciplos than in more indigenous mWciplos. Unionization,however, is more important for indigenous workers, as it helps pull them out of poverty.
In Peru, the agricultural industry depends heavily on the labor of indigenous people.Seventy percent of indigenous women, and 63 percent of indigenous men, are involved inagricultural activities. Yet, on average, indigenous women and men earn only one-third thesalary of non-indigenous workers employed in agriculture.
* Indigenous people have much lower levels of schooling relative to the non-Indigenouspopulation, but equallAng schooling attanment would result In a considerableIncrease In relative earnings.
Much of the earnings disadvantage of indigenous workers is due to lower human capitalendowments. While the monetary benefits of schooling are lower for the indigenous population,an increase in schooling levels would lead to a significant increase in earnings in all countriesexcept Peru. The relative magnitude, however, differs from country to country. In Bolivia,there is a significant negative effect on earnins associated with being indigenous. Examiningthe determinants of earnings separately for indigenous and non-indigenous workers, the averagereturns to schooling are for non-indigenous males than for indigenous males by almost3 percentage points, at 8.6 and 5.7 percent, respectively. Similarly, non-indigenous workersreceive higher returns to labor market experience. Hours worked per week has a higher payofffor non-indigenous workers by a margin of eight percentage points.
The rate of return to schooling in Guatemala is 11 percent for indigenous workers and 12percent for non-indigenous workers. The rate of return to schooling is higher for femaleworkers, both indigenous and non-indigenous. In Mexico there is a very little difference in thereturns to schooling for individuals in more or less indigenous mWaViplos.
In Peru, the returns to schooling for Spanish-speaking workers are 3 times that ofindigenous workers, at 4.8 and 1.6 percent, respectively. Indigenous men are not rewarded for
Cndaron 231
labor market experience, suggesting that the ence reported by indigenous men representstime trapped in low paying sectors. While hi levels of I po'Idehigher earnings,obtaining some university education is the most significant factor to increased earaagsfor indigenous men in Peru. It should also be kept in mind that the target population in Peruis defined as the monolingual Aymara and Quechua speakers. In general, these groups do notcompete in the same segment of the labor market as the non-Indigenous population (or thebilingual indigenous working population). Also, the omission of externalities associated withincreased schooling may lead to an underestimation of the *true returns to schooling.
One of the primary concerns of this report is the question of whether the equalization ofhuman capital and other productive characteristics would result ia the virtual elimination ofsocioeconomic inequalities, or whether the support of affirmative action programs would havethe desired effect of nullifying the inequities. Differential outcomes, of course, may be due tooutright discrimination. Discrimination against indigenous people may deleteriously affect theiraccess to schooling, the quality of schooling they receive, and their labor market performance.
The statistical decomposition of earnings differential between indigenous and non-indigenous workers produces mixed results. In Bolivia, for example, the portion of the overallearnings differential due to disparities in the productive characteristics o indigenous and non-indigenous working males is 72 percent. In other words, based on observed characteristics, teoearnings differential between indigenous and non-indigenous workers would narrow by 72percent if each group were endowed with the same productive characteristics. Themaining28 percent difference in earnings is lunexplained,' and reflects both measurement error andunaccounted factors such as disparities in ability, quality of education, labor force participation,culture and labor market discrimination. Therefore, discrimination could only account for 28percent of the overall earnings differential between indigenous and non-indigenous workers Inthe urban Bolivian labor market.
In Guatemala, however, approximately one-half of the earnings differential can beattributed to differences in endowments. For females, as much as three-fourths of thedifferential is due to differences in human capital. These upper bound estimates ofdiscrimination indicate that up to 50 percent of the overall differential could be due todiscrimination against the indigenous working population.
In Peru, the proportion of the overall earnings differential that is due to the productivecharacteristics of individuals is equivalent to 50 percent. In other words, if indigenous workerswere endowed with the same productive characteristics as non-indigenous workers, the earningsdifferential between them would marrow by 50 percent. The remaining difference In wages is'unexplained,' and may include any unmeasured factors which contribute to the earningsdifferential such as abI, health, the qality of education, labor force attachment and cultme.Therefore, wage dism t against the indigenous population could account for as much as50 percent of the overall earnings differential. An analysis of the contribution of each variableto the overall earnings differential between indigenous and ann-indigenous workers indicates thatmuch of the Spanish-speaidng workers' earnings advantage can be explained by education,particularly at the university level. Rural location is a major e to the economic wellbeing of indigenous people. Yet, rural location does not affect Spanish-speakers as negativelyas it does indigenous-language speakers, with the result that indigenous people are undulypenalized for their location. Much of the *unexplained' portion of the earnings differential ISdue to hours worked and experience; that is, for the same amounts of work and labor marketexperience, Indigenous people are paid less than non-indigenous people.

232 hm~geow eple and Pnny in La~n ~m,e: An Opdrial Analsk
Snnary Table: Schoolång A unsat, Retur~ to Schodbag, and Dlser mnntoa
Bolivia Gnatena~a Mexico PeruReturu to Schooling (%) 5.7 9.1 8.7 2.6Averag Years of Schooling 7.4 1.8 3.8 6.7
Upper BoundofDscriminatin(%) 28 52 48 50
In Mexico, the portion of the differential that is duo to the produclvo characteristics orendowments of individuals is e"uivalent to 52 percent of the differential in earnings betweenworkers in indigenous and non-åtdigenous areas. In other words, if thoC in indigenous areaswere endowed with the same amounts of productive chaMcterisdes as those in non-indigenousareas, the difference in earnings between them would narrow by 52 percent. However, theremaning 48 percent difference in earnings is nplained." Therefore, dirimination againstthose in Indigenous areas may explain up to 48 percent of the wage differential, thus formingthe *upper bound of d~sdmrnation. For the differental in earuings duc to wexplained factorsor endowments, higher educational attainment plays a large role in explaining the non-indigenousarnings advatage. However, the largest contnbution to the non-indigenous advantage stems
fro= on-agriculemployment, regecting the pirekmin ne of non-agricultura workers innon-indigenous areas.
There is, foruately, an unrali~e potential. This is evident, for example, in the caseof Bolivia, where the educational leve of the has been Lncreasing rapidly over thelast fw dede The average schooling ved~genous males has increased continuouslyover dme, with a sharp rise for individuals bo In 1959 and later. For indigenous women, theincrease is even more dramae, particularly for the post-1952 Revolution population. Thestatistical resuts show that by e ftt~ human capita! characteristics, much of the earningsdifferential between indigenous and dgosworkers would ' .These findingssuggest that the socieconomic condition findigenous people in lvia can be improvedbecause p infuc variables such as education and are la y re l forarnings fr . This provides considerable hope for the the that remains,
however, is how to impme the productive of the indigenous population. Oneobvlous solution is to nn their educational .
For education projects, knowIedge about the indgenous population can aid in determiningthe locadon of new schools, targeting those with poor perforMnce, and - when and ifappropdate and in demand - providing bilgual «hncation. The apparent strong influence ofeducation to ameliorate poverty and increase earnings, especially in indigenous areas, conveysa need to focus on improving access as an important development isse with significant andbeneficial long term socioeconomic r nepesin On. of several f ly noted methods forimproving acces to education among the indigenous populatin is the tatin of someform of bilingual education.

Cnd~ 233
The involvement of indigenous people can sid in the imprv.ment of the design andimplementation of development projects. Pirt, agreement on what must be don should boreached between the inte'ested parties. It is necessary to decide on the gos of tho interventionfrom the outset. Is it reform? And if o, what is meant by reform? In the case of indigenouspeople, is the goal assimilation, integration, and the erasure of indigenous culture? Or thepreservation of indigenous culture licies designed with the parIcipation of indigenouspeople? In the case of educadon, thelack of meaningful paricipation by indigenous peoplecould result in the loss of their culture and language.
Institutonal issues associated with the functioning of labor markets ae also importantconuidemtions. To som. extent, Indigenous people receve lower ~rnings and have a higherIncidence of poverty becaume they are locked into the secondary sector of the economy. TisInformaton can aid in the creaton of appropd-ate empWh i e on ms le manypoor and non-poor workers are located in th* Onfr f th it is e yinportant for the indigenous poor. This information points to an appropriate sector to target inany poverty reduction strategy.
More extensive knowledge about the indigenous population can sid in the design of healthinterventions in the region. For example, access to medical care for pregnant women is eentialfor the preservaton of the mother's life and the healthy development of the newbom child.Among indigenous women, however, this medical attention is lacking. An important challengeis to devise strategies to extend health care to indigenous people.
The western model of development views traditional cultures as so that efforts aredirected at improving their standard of living. 'Iis is based on the i ogy that al culturesmust achieve a certain level of materal acquisition in order to be developed. is the beliefthat tribal cultures are unable to satisfy the matedal needs of their people. Some argue that allpeople share a desäre for what is deined as material wealth, prosperity and progress. Others,it Is believed, have different cultures only because they have not yet been expoued to the supedortechnological alternatives offered by industrial civitinn The problem with this reasoning isthat the materistic values of the industrialized countes of the world are not culturaluniversals. Indigenous populations am different, and taking this into account means notimposing non-indigenous values. Any attempt to improve the conditions of indigenouspopulations would beneftit from the cneideratin of 'traditionaI customs and expertise.Traditional community values have persisted among Amerindan Prior to European contact,these included entrepreneudal activity, which was crushed bythe European immigrants. Whenthis entrepreneurial spirit again became active, it was communi ather than individually-based.This reMets the importance indigenous people place on the system (comueos).
Fur Research
There is a Jack of empiricul studies regarding the socioeconomic conditions of LatinAmerica's indigenous population. Important issues to be tackled include: defning the targetpopuladon; solving the problem of scarce data; and designing appropdate researchmethodologies.
While many countries in the region have ilabte in~ upopuladons, few includequestions to iden~fy the ethnolingu cstic of Mndividuals in their household or laborforce surveys. To identify the reference population in this study, it was necesary to make do
234 IndIgno People wad Po"ny in Latn Ane:- An anpiol Analr
with surveys that provide single indicators. However, what is needed are multiple indicators -as used in the United States and Canada census. The whole range of indicators are necessary,including language, self-identification or self-perception, geographic location or concentration,ancestry and, possibly, dress (as in the Guatemala 1993 census).
Therefore, what is needed is better data, so that in the future researchers can undertakemore in-depth analyses and include a larger number of countries. In addition, longitudinalresearch could be conducted; that is, an attempt should be made to answer questions such as"What was the level of discrimination 10, 20, and 30 years ago?' *What will it be 5, 10, 15years from now?- "What were the effects of past policies and programs?" 'What will be theeffects of present policies and programs?'
It may also be useful to study the experiences of developed countries with inpopulations. Their treatment of the 'indigenous question' could prove useful, interms of analyzing what these countries did successfully and what efforts were .The information at their disposal, as well as how they use it and collect it, could also beexamined.
A future research project on indigenous people could combine the quantitative approachtaken here with qualitative analysis, such as the participatory-observation research approach (orparticipatory poverty assessment) (Salmen 1987; see also Stanley 1978). The idea is to combinecomprehensive empirical work with fieldwork and micro-survey techniques. For example, ifit is found that indigenous people in the cities of Bolivia are working as self-employedindividuals who earn less than non-indigenous individuals with the same level of schooling, thenin-depth interviews with these groups of individuals should be conducted in order to ascertainthe reasons for the income discrepancy. Without this qualitative data, probable reasons for thediscrepancy, including race, access to training and cultural values, are merely speculative. Suchsophisticated differences are difficult to assess using only empirical analysis, generally basedupon less than perfect data sets.
Many indigenous people living in urban areas maintain ties with the rural communities totheir mutual advantage. Resources are constantly exchanged between town and country. Thistransfer of resources is important and not always adequately captured in household survey data.The complex social networks can only be examined with a qualitative research approach. Anexamination of informal safety nets can be accommodated through a participatory research
The unpaid but productive activities of indigenous people living and working in ruralcommunities are often misrepresented as unemployment or underemployment. Many peasants,however, are often involved in a variety of activities that provide income, although these are noteasily observed, especially with aggregate household data. Apparently idle peasants are in mostcases heavily involved in many activities, but these are not easily categorized. This type ofinformation can only be obtained through direct observation. The information collected,however, can be quantified and analyzed. This can aid in the design of rural developmentefforts with indigenous components.
There is much useful information regarding the manifestations of poverty that individualsare usually not open to disclosing. This may include information about their health, sanitationpractices, attitudes and behavior regarding birth control, income or discrimination. A newapproach, therefore, is necessary to supplement conventional sources. Conversationalfaterviewscan be used to ascertain not only the people's income and ability to pay, but also their values
ti
lin

References
237
R~~enme 239
Adamson, R. 1992. "Investing in Indigenous KnowIedge.* A e n o 9(2): 50-51.
Altimir, 0. 1987. OIncome Distribution Statistics in Latin America and Their Reliability."Review of Income and Wealth 33(2): 111-155.
Alverson, R. 1979. The Roots of Time: A Comment on Utilitarin and Primordeal Sentimentsin Ethnic Identi 49ation." In R Eal, ed., Ethnic Aumlnm .Compa D ~:namics:ThAmeicas Europe and the Developing World. New York: Pergamon Pmes.
Arcos, C. and C. Marchn. 1978. *Guaytacama y Cusubamba: Dos Modatidades de Desarrol1ode la Agricultura Serrana. evidsta Ci Soiale 2(5): 13-51.
Armitage, 1. and R. Sabot. 1991. *Discrimination in East Africa's Urban Labor Markets.'In N. Birdsall and R. Sabot, eds., Unfai A ag Lb Market Discrimination inE . Washington, D.C.: The World Bank.
Armn , R., 1. Kennedy and P. R. Oberle. 1990. JUn Education Ad BIOnOmcn: Indanhi nt nd Pro t. Ottawa: lndian and Northem Affairs Canada,
Quantitative Analysis and Socio-Demographic Research.
Arrow, K. 1973. OHigher Education as a Filter." Joumal of ublienomics 2(3): 193-216.
Banco Central del Ecuador (BCE) and Fondo de Desarrollo Rural Marginal (FODERUMA).1978. Indian Community 'El Panecillo'. Quito.
Banerjee, B. and 1. B. Knight. 1985. *Caste Discrimination in the Indian Labour Market.JunaL f Dedlom nmics 17:277-307.
Barsky, 0. 1978. Mniciativa Terrateniente en las Transformaciones de la Sierra Ecuatorina:1959-1964.* Master's Thesis, PUCE-FLACSO, Quito.
Beals, R. 1952. 'Acculturation, Economics, and Social Change in an Ecuadorean Village.' InS. Tax, ed., AccultuMtion in the Americas. Proceedings and Selected Papers of theXXIXth International Congress of Americanists. Chicago: University of Chicago Press.
Beals, R. 1966. Community in Transition: Navdn-Ecuador. Los Angeles: University ofCalifornia.
Becker, G. S. 1971. Thng is of Disrimination. Chicago: University of Chicago Press.
Becker, G. S. 1975. Huma Caita. New York National Bureau of Economic Research.
Beghin, F. . 1964. "Informe Sobre las Condiciones de Servidumbre Vigentes en las Haciendasdel Oriente Ecuatoriano.* Humanita 5:112-128.
Bensusan, G. 1988. 'Mexico.' In E. Mendelievich, ed., Children at Work. Geneva:International Labour Office.
240 Mndigeuu eople and P~sy la Lala Am*& A- EAnvirl AnalyL,
Bhattacherje, D. 1985. "A Note on Caste Disciminatlon in a Bombay Automobile Firm.24(1): 155-159.
Bigsten, A. 1988. *Race and Inequalty in Kenya, 1914-1976. Bat r frm4(1): 1-11.
Birdsall, N. and R. Sabot, eds. 1991. Unfair Advantage: Labor Market Discrimination inDg C s. Washington, D.C.: The World Bank.
Blinder, A. S. 1973. *Wage d:crimlnatin Reduced form and Structura Estmates.* Jounlof Human Reou 8:436-65.
Bodley, L H. , ed. 1988. Trib p and.~ ~pnssucs:. MountnView, CA: Mayfild Publishing Co.
Bodley, . H. 1990. of P Mountain View, CA: Mayfield Publihing Co.
Bound, J. and R . Freeman. 1992. Wa Went Wrong? 'i1e Broion of Relative EaMningsand Employment among Young Black Men in the 1980s." Ouarterly Journal ofBEgbomics February:201-32.
Brascoup6, S. 1992. *Indigenous Perspectves onInternationalDevelopment.w konj9(2): 6-17.
Brosnan, P. 1984. *Age, Educaton and Maori-Pakeha Income Differences.- Mw ZeEcoomi P r 18:49-61.
Brosnan, P. and C. Hill. 1983. Income, Occupation and Ethnic Origin in New Zealand.wBft oi P r 17:51-57.
Brownrigg, L. A. 1972. %The Nobles of Cuenca: The Agrrian Elite of Southemn Ecuador."Ph.D. Diss., Columbia University, New York.
Brush, S. B. 1977. -Ih Myth of the Idle Peasant: Employment in a Subsistence Economy.'In R. Ha~perin and J. Dow, eds., Pa~
Cuta . New York: St. Martin's Press.
Burger, 1. 1987. Report from the Frontier: The State of the World's Indigenous Peoples.London: Zed Books Ltd.
Burger, J. 1990. The .i a of Firt E~ : A f~ for the IffiMM W NewYork: Anchor Books.
Burgos Guevara, H. 1970. elo nes It ~t en ibaba. Ediciones Especiales No. 55.M6xico: Instituto Indegenista Interamericano.

Rane 241
Carnoy, M. 1979. Can Educational Policy Equalise Income Distribution in potin America?Westmead: Saxon House, for the Internatonal Labour Office.
Carnoy, M. 1980. ~Segmented Labou Markets: A Reviw of the Teoretical and EmpiricalLiterat~e and Its Implicatons for Educational Planning.* In M. Carnoy et al., eds.,Eci. Work and E y Volume B. Paris: UNESCO, International Insitutefor Educational Planning.
Carvajal, M. J. and F. KC. Morris. 1989/1990. ,Educacion Formal: ¿Vehiculo de IntegracionEconomica y Social del Indio Guatemalteco." Revista de la Integracion y el Dearr~lode C mr 45/46:95-110.
Casagrande, JB. 1974. *Strategies for Survival: The Indians of ighland Ecuador.' In D. B.Heath, ed.,and Societies ofIanAm 2nd ed. New York:Random House. Spanish translation: *Estratgias para sobre-vivir: Los Indigenas de laSierra del Ecuador. ca 36(January, 1976): 95-114.
Center for Applied Linguistics and the World ank 1975. Perd: A Profile of Languages andtheirUe. Washington, D.C.
CELADE (Latin American Demographic Center). 1992. Dem 25(50). Santiago,Chile.
CEPAL (United Nations Economic Commtion for Latin America and the Caribbean). 1991.Magnitud de la Pobreza en America Latina en los Affos Oche. Estudios e Informesde la CEPAL 81. Santiago, Chile.
Chayanov, A. V. 1966. %On the Theory of Non-Capitalist Economic Systems. In D. Torner,ed., The Theor= of Pean E my. Homewood, IL: Richard D. Irwin, Inc.
Chiswick, B. R. 1987. 'Race Earnings Different*als." In 0. Psacharpoulos, ed., Enomicof Education: Researha Studi. Oxford: Pergamon Press.
Chiswick, B. R. 1988. *Differences in Education and Earnings Across Racial and EthnicGroups: Tastes, Discrimination, and Investments in Child Quality." Qu ra£conomics August571-97.
Clatworthy, S. 1. 1981a. 'ihe Effects of Education on Native Behaviour in the Urban LabourMarket." Report to the Federal Task Force on Labour Market Development, CanadaDepartment of Employment and Tmigatin.
Clatworthy, S. J. 1981b. "Issues Concerning the Role of Native Women in the Winnipeg LabourMarket.* Institute of Urban Studies, Winnipeg.

242 Idg ea pl a d P~iry in Lada :~ An ~ ~ pEical Anab t
Clatworthy, S. 1. 1981c. *Patters of Native Employment in the Winnipeg Labour Markt."Report to the Federal Tak Force on Labour Market Development, Canada Departmentof Employment and Immigration.
Colburn, F. 1989. Every Da ForM of Pe ns.sitac. New York: M. E. Sharpe, Inc.
Collins, 1 L. 1983. "Fertiity Determinants in a High Andes Community.* Po andDev p Revw 9(1): 61-75.
Comit Interamedcano de Desarrollo Agrcola (CIDA). 1965. Tenenela de la Tierra yDe o SoICn del S a - Ec r. Washington, D.C.: PAU.
Cornell University, Department of Anthropology. 1965. Indianh in Miser: A PreliminaryReport on the Colta Lake Zone. Chimborazo. Ecuador. Prepared in collaboration withthe Ecuadorean Institute of Agrian Reform and Coloniatin Quito: USAID/Ecuador.
Cornell University, Department of Anthropology. 1966. B. Maynard, ed., T nEssays on the Colta Lake Zone. Chimborazo (Ecuador). Quito: USAID/Ecuador.
Crespi, M. 1968. The Patrons and Peons of Pesillo: A Traditional Hacienda System inHighland Ecuador.- Ph.D. Diss., University of Elinois, Urbana.
Cycon, D. E. 1991. *When Worlds Collide: Law, Development and Indigenous Peoples" NmEn d Law Rev 25(3): 761-94.
Darity, W. A. 1982. OThe Human Capital Approach to Black-White Earnings Inequality: SomeUnsettled Questions.9 JraL of Hman Resu 17:72-93.
Davis, P. M. 1981. What We Have Learned from the Peruvian Experiment.- In M. L.Larson and P. M. Davis, eds., Bilingual Education: An Experience in PeruvianAmnia Dallas: Summer Institute of Linguistics.
Davis, S., ed. 1993. Indigenous Views of Land and the Environment Discussion Paper 188.Washington, D.C.: The World Bank.
de Villalobos, R. and A. Monares. 1990. "Poverty Profile for Ecuador.' Working Paper No.100. The International Fund for Agricultural Development, Rome.
del Agula, W. 1987. 'Educational Effects of Multilingualism in Guatemala.' JouralofMullingual nd MjulticuIlDeomn 8(4): 379-82.
Deprez, P. 1973. 'FÅucation and Economic Development The Case of Indian Reserves inCanada. In Two Papers on Canadian Indians Series 5: Occasional Papers Nos. 5 and6. Winnipeg: University of Manitoba.
R~s~a 243
Dhesl, A. S. and H. Singh. 1989. *Pucation, 1lbour Market Distortions and Relative Earningsof Different Religion-Caste Catego~es in India (A Case Study of Delhi).-% Canadjournal of DeonpmmentStudie 10(1): 75-89.
Direccidn General de Educacid Indtgena. (DOEI) 1993. Informaion de ~Aunos.fMfaesry Escuelas de Educacion Inicial. Preesolar y Primada Indigena pMr Entidad Y GrupoEtno. Mexico: Secretada de Educacion Publica.
Doeringer, P. B. and M. J. Piore. 1972. Internal Labor Mr=Ists and Manpower Anal~-is.Lexington, MA: D.C. Heath.
Duncan, 0. D. 1968. I ra of Poverty or Inheritance of Race?* In D. P. Moynihan, ed.,Q Under ing-Poery. New York: Basic Books.
Dutcher, N. 1982. *The Use of First and Second Languages in Primary Pucation: SelectedCase Studies." Report No 504. The World Bank, Washington, D.C.
Ecuador, Grupo de Evaluacidu de la Reforma Agraria (MERAC, JUNAPLA, MAG). 1977.Ev c del P e Se Ca . Quito: CENCOTAP.
Escobar, A. 1988. "Bilingualism in Peru." In C. B. Paulston, ed., InteratioalHanbk OfBimlnguulism and BilingaJlEdua. New York Greenwood Press.
Evans, G. 1992. Ot elnal Colonialism in the Central HighIands of Vietnam."SoJour 7(2): 274-304.
Farley, R. 1990. *Blacks, Hispauics, and White E~hnic Groups: Are Blacks UniquelyDisadvantaged? A ~mian Review 80(2): 237-41.
Fernandez, H. 1986. "Women's Educational Situation in Peru.* Mimeo. Instituto Nacional deInvestigacion y Desarrollo de la Pducacidn, Lima, Peru.
Filer, R. K. 1983. *Sexual Difference in Eanings: The 1o16 af Individual Permoalities andTastes.* Joural Of umaResu 18(1): 82-99.
Gdlvez Barrera, A. 1980. 'The Historical Status of Women in, Peru." Impact of Science onSocity 30(1): 7-9.
Gerber, L. M. 1990.' *Multiple Jeopardy: A Socio-Economic Comparison of Men and WomenAmong the Indian, Metis and Inuit Peoples of Canada-. Canadian Ethc Sdi 3:69-84.
Gertler, P. and P. Glewwe. 1992. -lie Willingness to Pay for Education for Daughters inContrast to Sons: Evidence from Rural Peru.' T WorldBakEnmceview 6(1):171-88.
244 Indig~ous People ~ad Powy in Lain Amia: An plrial Aalj~Ls
Onerre, M. 1990. "Indigenous Peoples in Latin America." Working Paper No. 30. InternationalPund for Agricultural Development, Rome.
Godoy, R. 1992. OThe Effect of Rural Education on the Use of the Tropical Ratn Forest bythe Sumu Indians of Nicaragua: Possible Pathways, Qualitative Findings, and PolicyOptions.' Cambridge, MA: Harvard Institute for International Development.
Goldin, C. and S. Polachek 1987. "Residual Differences by Sex: Perspectives on the GenderGap in Earnings." Amerin Ecnomi eiew 77(2): 143-151.
Goldin, L. R. 1992. "Work and Ideology in the Maya Highlands of Guatemala: EconomicB~elief in the Context of Occupational Change.9 Ecom PD met adCuturalChag 41(1): 103-123.
Goodland, R. 1982. Trial Peoples and Economic Development: Human EcologicConsidr s Washington, D.C.: The World Bank.
Granja B., A. M. 1977. Reforma Agraria en Ichubamba de Cebadas: Un Estudio de Caso."Documentos de Trabajo No. 3. Thesis for Licentiate in Anthropology, PUCE, Quito.
Gunderson, M. 1989. 9Male-Pemale Wage Differentials and Policy Responses.' JounaLDoLiter 27(1): 46-72.
Gwartney, 1. D. and L.. Long. 1978. -The Relative Earnings of Blacks and Other Minorities."Indusia and Lo Rei ns Rei 31(3): 336-46.
Hagen, E. E. 1962. On the Theory of Social Change: How Exonomic Grwth Begins.Homewood, IL: Dorsey Press, Inc.
Hagen, E. E. 1968. Th Eco of Deomnt. Homewood, IL: Richard D. Irwin, lnc.
~ah, D. R. 1991. The Divde woridofm thwolva~Ads A StrctrView ofDmnatioad Ra New York: Crane Russak.
Halvorsen, R. and R. Palmquist 1980. The Interpretation of Dummy Variables inemilogarithmic Equations. Jurnal of Hman Resor 17:72-93.
Hammer, J., 1. Cercone, and L Nabi. 1992. "Disbonal Effects of Social Sector Spendingin Malaysia, 1974-1989." Paper presented at the World Bank Conference, 'PublicExpenditures and the Poor: Incidence and Targeting, Washington, D.C.
Handy, 1. 1984. Gift of the Devil: A History of Guatemala Boston: South End Press.
Hanratty, D. 1990. Paraguav: A Country Study. Washington, D.C.: Government PrintingOffice.
Hardman, M. 1. 1981. OIntroductory Essay." In M. 1. Hardman, cd., Th ymar Languagein Its Social and Cultural Context: A Collection of Essays on Aspects of Avmara
Gainesville: University Presses of Florida.
Harrison, B. and L. Gorham. 1992. *Growing Inequality In Black Wages in the 1980s and theEmergence of an Affican-American Middle Class.* Journal of Policy Analvsis and
Management 11(2): 235-53.
Hawkins, 1. N. 1983. %Educational Demands and Institutional Response: Dowa Educ~tion inJapan. Compative Eduation Rei 27(2): 204-226.
Hawthorn, H. B. 1967. A S e ofthe Conemp In s of CanEdu naNes and-Poici Volume II. Ottawa: Indian Affairs Branch.
Hernandez, L 1988. "Identidad Indigena y Educacion.8 Dearo E=cmi 28(109): 121-137.
Heyneman, S. 1979. *Primary Education in Bolivia: What's Wrong? Education Department,The World Bank, Washington, D.C.
Hicks, 1. F., H. B. Daly, S. H. Davis and M. de Lourdes de Freitas. 1990. Ear Am=nR n Do mnt Issues ad tis. Discussion Paper 75. Washington, D.C.: TeWorld Bank
Hill, M. 8. 1979. 'The Wage Effects of Marital Status and Children. Jr of HmanResourms 14(4): 579-594.
Hirsch, B. T. 1980. *The Determinants of Unionization: An Analysis of Interarea Differences.'lIutrima and Laor Reations Revi 33(2): 147-61.
Hrsch,B. T. and J. Addison. 1986. TE Eco Als of Unos Ne Aa d"videc. Boston: Allen & Unwin.
Hirachman, C. 1983. 'Labor Markets and Ethnic Inequality in Peninsular Malaysia, 1970.'Jounalof Develoing Ares 18:1-20.
Hlranhman, C. and M. G. Wong. 1984. -Socioeconomic Gains of Asian Amedcans, Blagk, andHispanics: 1960-1976." Amria Journal of Soogy 90(3): 584-607.
Hornberger, N. 1992. "Literacy in South America.w Annual Review of Applied Lingistics12:190-215.
Hull. . 1987. An Ov e of the Eduat Chartstics et r na nCaOttawa: Indian and Northern Affairs Canada.
246 Iälg~o Peple and Pouny Latin ~".dw An E~pirca3l A~alple
Institute for Resource Development/Macro Systems. 1987. EnuaNacin Salud ~MateroInfantil. 1987: Guatemala. Columbia, MD.
Institute for Resource Development/Macro Systems. 1989. Materna and Child Health inBolivia: Report on the In-depth DS Survey in Bolivia 1989. Columbia, MD.
Instituto Ecuatoriano de Reforna Agraria y Colonizacidn (ERAC), Instituto Ecuatoriano deAntropologíay Geograffa (KEAG), and Junta Nacional de Planificaciny CoordinacidnEcondmica (JUNAPLA). 1965. Zla. Prepared by A. C. Samaniego, field work by C.S. Garcfa.
Instituto Nacional de Antropologfa Historia (INAE). 1987. Dinmia de la i de hablaInd (1900-10 Mexico, D.P.
Instituto Nacional de EstnMftica Geograf~a t Informatica (DEGI). 1991. 'Continua la Entregadel Censo de Poblacidn de 1990. wIfomac Bepn c SdelINEGI 3(3): 26-53.
Instituto Nacional de Estadfstica Geograf a e Informática (INEGI). 1992a. X Censp N ode Poblacidn Vivienda. 1990. Mexico, D.P.
Instituto Nacional de Estadística Geografa e Informtica (DEGI. 1992b. EBffSidf ~ . Censo acional de Pab~ X 3 a . 1990 Mexico, D.F.
Instituto Nacional Indigenista (IM). 1991. *Programa Nacional de Desarrollo de los PueblosIndigenas, 1991-1994.w ComeRo 41(3): 304-17.
International Pund for Agricultural Development (IFAD). 1992. The State of World RuralPB : An Inb inm ls Ca s lad C s. New York: New York Universitypress.
International Labour Office (LO). 1949. Conditions of Life and Work of IndigenousP ions of Latin Amer utr. Genea
International Labour Office (ILO). 1953. Igeo o : and Wnof Aboriginal Populations in Independent Countries. Studies and Reports No. 35.Geneva
Jacobson, C. K 1984. "Intemal Colonialism and Native Americans: Indian Labor in the UnitedStates from 1871 to World War II.O SocaL cieQn artry 65(1): 158-71.
Jensen, K. 1984. "Civii~tion and Assimilation in the Colonized Schooling of NativeAmericans." In P. G. Altbach and G. P. Kelly, eds., Educatin and the ColoniaIExpric. New York: Advent Books.

Rfws 247
Jordan Pando, R. 1990. Desarrollo en Pølaciones Indipenas de 4mdrica Lating y El Caribe.Mexico City: Insatuto Indigensta Interamericano ad FAO.
Jorgensen, J. 0. 1977. ~Poverty ad Work among American Indians.* Il H. R. Kaplan, ed.,Sand Itasca, IL: F. E. Peacock.
Junankar, P. N. and C. A. Kapuscinski. 1991a. *Aboriginal Employment and Unenployment:An Overvew." Discussion Paper No. 255. Austmalin National University, Centre forEconomic Policy Research.
lunankar, P. N. and C. A. Kapuscnski. 1991b. uThe Incidence of Long Term Unemploymentin Australian." Australian ~Buletn of Labour 17(4): 325-52.
Kdlley, J. 1988. "Class Conflict or Ethnic Oppression? The Cost of Being Indian in RuralBolivia.* R 53(4): 399-420.
Kelley, 1. and H. S. Klein. 1981. Revolution ad the Rebirth gf Inequality: A Theory gfRevoluation Applied to the National Rvolution in jolivia Berkley: University ofCalifornia Press.
Kitagawa, B. M. 1955. 'Components of a Difference between Two Rates.* JR ofA r&taisa A 50:1168-1194.
Klein, H. 1982. .a tNew York: Oxfod UniversityPress.
Kleinfeld, J. and I. A. Kruse. 1982. *Native Amerlcans in the Labor Fore: Hunting for anAccurate Measure. Mnh L Review July:47-51.
Klitgaard, R. 1991. Adjuting to Reality Beyond State Versus Market' in B ~nomicDevloment. San Francisco: ICS Press.
KlitgUard, R. and R. Katz. 1983. *Overcoming Ethnic Inequalities: ~ as from Malaysia"ofdM ý i2(3): 33349.
Knight, I. B. and R. H. Sabot. 1982. Labor Markt niserimtnation in a Poor UrbanEconomy.* ornal of Delpm entStudieS 19(1): 67-97.
Kuo, C.-Y. 1976. "The Effect of Educalon on the Earnings of Indan, Eakimo, Mtis, andWhite Workers in the M~ne District of North=ern Canad Enoic Devlopmetand Culturl C e 24(2): 387-398.
Lachman, D. and K. Berson, eds. 1992. OEconomc Policies for a New South Africa."Occasional Paper No. 91. International Monetary Fund, Washington, D.C.
248 Indi ou Popk and Po~ny In LtUu Am~: An D ~pirkul Ana~rts
Lautard, E. R. 1982. "Occupational Segregation and Inequalty between Native and non-NadveCanadians, 1971. T Canadan JuaL of Natie StudieS 2(2): 303-320.
López, L. E. and L. D'Emilio. 1992. "Bilingual Education beyond National Frontiers. Bolivian- Peruvian Cooperation.9 The Mgor Project of Education in Lbtin America and theC e an B n 27:41-56.
Lourie, S. 1982. DInequalities in Education in Rural Guatemala.' In Inquai i duationalDevelopment: Paper Presented at an IlEP Seminar. Paris: UNESCO, InternationalInstitute for Educational Planning.
Luzuriaga, C. C. and C. Zuve.as, 1983. Inc~me Distribution and Poverty in 1~ural Ecuador.1950-1979: A Surve of the Literature. Tempe, AZ: Arizona State University.
Martnez, 0. and A. Dubly. 1967-8. Diagnstico Socio-Econmico del Medio Rural de laPrvini de iinha. Quito: JUNAPLA.
Masferrer, E. 1983. *La Situacion Social de los Grupos Indigenas de America atina." In N.1. Rodríguez, B. Masferrer, and R. Vargas Vega, eds., Educacion, Etnias yDescolonizacio en America latin: Una Gälå. par=l Educc~ BiiM eItecluaVolume I. Mexico: UNESCO.
McClave, 1. and P. Benson. 1991. Statistic äforBsness and Economics. San Francisco: DellenPublishing Co.
Medina, C. 1977. "The Legal Status of ndians In Brazil.* Ameia Indian Jouna1 3(9): 12-24.
Micklin, M. 1990. "Guatemala." In C. B. Nam, W. . Serow and D. F. Sly, eds., IntaionaHabk o Intenal M. New York: Greenwood Press.
Miller, P. W. 1989. *The Structure of Aborginal and Non-Aboriginal Youth Unemployment.Autraian Ecom Pa 28:39-56.
Miller, R. 1982. "The Mexican Approach to Developing Bilingual Materias and TeachingLiteracy to Bilingual Students.8 Te Rd Tec AprilO-804.
Mincer, J. 1974. Scoinig.jEprieadarnnga. New York: NatIonal Bureau of EconomicResearch.
Mincer, . and S. Polachek. 1974. *Family Investments in Human Capital: Earnings ofWomen.' Juna Of Pliticl Enomv 82(2): 576-5108.
Mincer, 7. and S. Polachek. 1978. "Women's Earnings Reexamined. J oResourcs 8(1): 118-134.

R<Omw 249
Modiano, N. 1973. Indian Educaointhe Cbaa ighlnd. New York: Ho, Rinehart andWinston, Inc.
Modiano, N. 1988. *Public Bilingual Education in Mexico.' In C. B. Paulston, ed., anaaMkofBliusndBiligualEucatin. New York, Greenwood Press.
Moll, P. G. 1992. "The Declne of Dlscrimination gainst Colored People in South Africa, 1970to 1980." Jornalof Develoment~coomic 37:289-307.
Mondloch, L 1979. "Gufa Antropoldgica sobre la Planificncini Pamiliar Aras Indigenas."Report prepared for the Asociacifn Pro-Bienestar de la Familia, Guatemala.
M ~rer, M., ed. 1970. Race and Class in Ladn Americ. New York: Columbia Press.
Morren, R. C. 1988. *Bilingual Education Curuiculum Development in Guatemala.' JournafMulingual and Mulicuura uxDevelopmen 9(4): 353-70.
Morse, B. and T. Berger. 1992. Sardar Sarovar Report of the Independent Review. OttawaResource Futures International, Inc. for the Indepmndent Review.
Munzel, M. 1973. 'The Aché Indians: Genocide in Parguay." International Work Group forIndigenous Affairs, Copenhagen.
Myers, W. B. 1989. "Urban Working Children: A Comparison of Pour Surveys from SouthAmerica.' I6ntatinal abu Rei 128(3): 321-335.
Nyrop, Richard, ed. 1983. Guatemala: A Country Study. Washington, D.C.: The AmericanUniversity.
Oaxaca, R. 1973. 'Male-female Wage Differences in Urban Labor Markets." InitgainalEco i Rview 14(1): 693-701.
Oaxaca, R L. and M. R. Ransom. 1989. 'Overpaid Men and Underpad Women: A Tale ofthe Gender Specific Wage Effects of abor Mark~t niscrlmination." Paper presented atthe InternationalEconomic Association World Congress, Athens, August 28 - September1, 1989.
Ovalle, L and A. Cantu. 1982. Necesidades Esenciales en México. Situacin Actual y
Perspectivas al ao 2000. Mexico: Editorial Siglo XXI.
Palafox, J. C., J. Prawda and B. Velez. Forthcoming. "Primary School Qualty in Mexico.'Comparave Education Review.
Pan Amercan Health Organntion (PAHO). 1990. Health conditldns in the Americas.Washington, D.C.: The World Hen1th Organiztin
250 Indg~ao Peple ad P~uny In Lain Amav: An Mtprcal Anab
Paredes Barros, C. R. 1967. øIncidenca Econdca y Social del Proceso de Lquidaci6n delHuasipungo en la Provincia de Pichincha." Tesis for degre of Economista, PUCE,Quito.
Parkyn, L. K. 1989. The Ladinoization of the Guatemalan Urban Indigena - An EthnographicStudy of the Processes of Sociocultural Change in Santa Cruz del Quiche."Ph.D. Thesis,Temple University.
Parsons, T. 1954. EMs in Sciqloial o. New York: Fre Press.
Patrinos, H. A. and G. Psacharopoulos. 1992. "Sooeconomic and Ethnic Determinants ofGrade Repetition in Bolivia and Guatemala." Working Paper WPS 1028. World Bank,Latin America and the Caribbean Technical Department, Washington, D.C.
Patrinos, H. A. and G. Psacharpoulos. 1993. "Schooling and non-Schooling Activities ofPeruvian Youth.ø Mimeo. World Bank, Washington, D.C.
Patrinos, H. A. and C. N. Sakttarine . 1992. 'North American Indians in the Can~dian LabourMarket: A Decomposition of Wage Differentials." Economics of Education Review11(3): 257-266.
Patrinos, H. A. and C. N. Sak~1ariou. 1993. -Decomposing Aboriginal/non-AboiginalEarnngs Differentials in Canada: Culture versus ni~crimination. Mlmeo. University ofSusse.
Pearse, A. 1975. The latin Am neaat. The Library of Peasant Studies, No. 1. London:FMnk Cass.
Plaza, P. 1990. *Towards Standardlznfion of Language for Teachng in the Andean Countries.PEcM t 20(3): 377-384.
Polachek, S. W. 1975. Potential Biases in Measuring Male-Female Discrimination. Journalof Human Resources 10(2): 205-229.
Poston, D. L. and J. Shu. 1987. 8The Demographic and Socioeconomic Composition of China'sEtnic MIlnorities. Ppato and Dvel md e Revi 13(4): 703-722.
Preston, R. 1987. Bducation and Migration In Highiand Ecuador." Compratie Education23(2): 191-207.
Price, D. 1989. Befor the Bulldozer: 'FIe Nambiguara Idians a the World Bank. CabinJohn, MD/Washington, D.C.: Seven Icks Press.
Programa Regional para Desarrollo del Sur del Ecuador (PREDESUR). 1978. CaSoi-ecdms del G oS al s
de ZabaChnhp. ~nom final. Quito.

tqe, vac 251
Psacharopoulos, 0. 1993. "Ethnicity, Education, and Earings in Boliva and Guatemala.Compaatv Educd~ Reie 37(1): 9-20.
Psacharopoulos, G. and Z. Tzannatos. 1992. Women'. Emplyment and Pa in Latin AmericaQ~riew and Mthodology. Washington, D.C.: Tfhe World Bank.
Psacharopoulos, G. and M. Woodhall. 1985. Educain rDmewetpment. New York OxfordUniversity Press.
Psacharopoulos, G., et al. 1992. 'Povcrty and Income Distribuo n Lada America: The Storyof the 1980s.* Report No. 27. World Bank Latin America and the Caribbean TechnicalDepartment, Regional Studies Progrm, Washington, D.C.
Ravallion, M. 1992. "Poverty Comparisons: A Guide to Concepts and Methods.* LivingStandards Measurement Study Working Paper No. 88. World Bank, Washington, D.C.
Reimers, C. W. 1983. "Labor Market Dscrimination against Hispanic and Black Men.- Reviewof Enmics nd Statisics 65:570-9.
Rens, 1. 1961. The Andean Programme." RnterntionaLIauei 84:423-459.
Rens, 1. 1963. The Development of the Andean Programme and Its Puture."Labor Review 86:547-63.
Richards, M. F. 1987. Seamnal Migation and Physiological Risk in a Guatemalan MayaCgmmunity. Ph.D. Diss., University of Wisconsin, Madison.
Richards, M. and 1. Richards. 1990. Languages and Communities Encompsed byGuatemala's National Bilingual Education Program.* USAID in conjunction with theMinisterio de Educacidn de Guatemala.
Rojas, E. 1991. *Factores quo Explican los Niveles de Escolaridad Meda de los Hijos enGuatemala." UNESCO-OREALC, Santiago.
Rosenhouse, S. 1992. wPolíticas y Programas de Poblacin ante la Diversidad Étnica:Diferencias Culturales o Insensibilidad Po~itica. Revista Mexicana de Socig~faforthcoming.
Saavedra, C. 1981. "Social and Cultural Context of the Aymara in Bolivia Today.' In M. 1.Hardman. ed., The Aymara Language in Its Social and Cultural Contxt: A Colectionof Esason ApcsfAv raLn und Cutr. Gahnevilke: uniest Pres=eOf Plorda
Sáenz Andrade, A. 1978. *El Proceso de Transformacida de la Estrut~a Agraria, EstructuraOcupacionaly Migraciones en la Parquia Cutuglahua en el Perodo 1950-1974.' Thesisfor Licentiate in Sociology, PUCE-CLACSO, Quito.

252 Indi~ Pcope and Puny wP Latin Amel~ : An E ~piriea Ana~fts
Saga~n, E. and J. Moneymaker. 1979. *Language Natonalist, Separatist, Secess~onistMovement. In R. Hall, ed.. E Autonoi Co£ ra~ Dnmc Th AMme
e ad the De g wärld. New York: Pergamon Press.
Salmen, L. F. 1987. Listen to the People: Parcipant-Observer Evaluaon of DevelopmentRziggig. New York: Oxford University Press for The World Bank
Sandefur, 0. D. 1986. *American Indian Migration and Economic Opportunities.20(1): 55-68.
Sandefur, 0. D. and 7. kon. 1991. Mlgration, Race and Ethnicity, 1960-1980." Interationulmg R 25(2): 392-407.
Sandeftr, 0. D. and A. Pahari. 1989. Racial and Ethnic Inequality in Farnings and EducationalAttainment.* Social Service Rev 63(2): 199-221.
Sandefur, 0. D. and A. Sakamoto. 1988. *American Indian Household Structure and Income.wD ra 25(1): 71-80.
Sandefur, 0. D. and W. 1. Scott. 1983. *Minority Group Status and the Wages of Indian andBlack Males Social i Research 12:44-68.
Sandeftr, 0. D., S. Mctana and R. A. Wojtklewicz. 1989. -Race and Ethnicity, FamilyStructure, and High School Graduation.' Discussion Paper No. 893-89. University ofWisconsin-Madison, Institute for Research on Poverty.
Schultz, T. P. 1991. uLabor Market Discrimination: Measurement and Interpretation." In N.Birdsall and R. Sabot, eds., Unfair Advantage: Labor Marmet Discuiminadon. inDev i Cotries. Washington, D.C.: The World Bank
Schultz, T. W. 1961. Iv~estment in Human Capita." Ami Econm Reiew 51:1-17.
Scott, K. 1992. 'Women in the Labor Force in Bolivia Participation and Earnings.1 In G.Pm~~haropoulo and Z. Tzannatos, ed., Case Studies on Women's Employment and PavSla Am . Washington, D.C.: The World Bank
Segal, B. 1979. Ethnicity Where the Present is the Past." In R. Hall, ed., ithic Atnomy-Go m få Umb Th Arnrics. a. New York
Pergmonpress.
Semyonov, M. 1986. OThe Socioeconoic Status of Noncitizen Arab Workers in the IsraelLabor Madkwt Cost and Benefits.* Social Siene Q ~uartery 67(2): 411-18.
Shimaha, N. 1984. wToward the Equality of a Japanese Minority: The Case of Burakumin.9co umaieEuation 20(3): 339-353.

R~ =i~ 25S
Shryock, H., et al. 1976 Th M o and Ma s of D r . San Diego: Acaepress.
Siegel, P. M. 1965. "On the Cost of Being a Negro.* Sog 35:41-57.
Silva, N. V. 1985. *Updating the Cost of Not Being White In Brazil In P.-M. Fontaine, ed.,ace. Class and Power in Brazil. Los Angeles: University of California.
Silvers, A. 1980. Rural Development and Urban-ound Miton in Meico. Washington,D.C.: Resources for the Future.
Sinclair, V. and G. Trah. 1991. *Child Labour: Natonal Tq¥s~ation on the Minimum Age forAdmissfon to Employment or Work" C ~ndins of WorkDiges 10(1): 19-38.
Smith, C. 1992. -GW=lan ~ s and th S=* 15 to 199f. Austin: University of Texas.
Smith, G. H. 1990. "The Politics of Reforming Maori Education: The Transformng Potentialof Kura Kaupapa Maori." In R. fauder and C. Wylie, eds.,Schn~1ing. London: The Falmer Press.
Smith, 3. P. 1984. *Race and Human Capital." Americn. Ekonomic Review 74(4): 685-98.
Smith, 1. P. and F. R. Welch. 1977. "Back White Mal Wage Ratios: 1960-70.* A ~mrlenEconoic R 67(3): 323-38.
Snipp, M. 1988. "On the Costs of Being an American Indian: Ethnic Identity and EcnomicOpportunity.* In 1. H. Johnson, Jr. and M. L. Oliver, eds., Pc i ofConference on Comparative Ethnicity: Ethnic Dilemmas in Comparadve Perspeedve.University of California, Los Angeles, June 1-3, 1988.
Snipp, M. 1989. American Indians: The First of this Land. New York: Russell SageFoundatio.
Snipp, M. and G. D. Sandefur. 1988a. *Earnings of American ndians and akan Natives:The Effects of Residence and Migration.' E~ 66(4): 994-1008.
Snipp, M. and 0. D. Sandefr. 1988b. "SmaU Gains for Rural Indians Who Move to Cites."Rul Deeup en~tpcv 5(1): 22-25.
Stabler, J. C. 1989. *Dualism and Development in the Northwest Territo~des.' mu 'Deeopmen and Cultural Chag 37:805-839.
Stabler, J. C. 1990. *A Utility Analysis of Activity Patterns of Native Males in the NorthwestTerritories." Eomic D2v ~m nd Cultural Cn 39(1): 47-60.
Stanley, S., ed. 1978. American ndi ~n noaDevelomnt. Paris: Mouton Publishers.
254 Indigeness People and Pomrty in Latin AmerIm An Earih*a Anawkr
Stephen, D. and P. Wearne. 1984. Cna America's ndian. London: Minority Rights Group.
Stephen, L. 1991. 'Culture as a Resource: Four Cases of Self-managed Indigenous CraftProduction in Latin America. 40(4): 101-30.
Stevens, S. M. 1978. "Pasanaquoddy Economic Development in Cultural and HistoricalPerspective." In S. Stanley, ed., American Indian Economic Development. Paris:Mouton Publishers.
Summer Institute of Linguistics. 1988, 1992. Ethnologue Languages of the World. Dallas:Summer Institute of Linguistics, Inc.
Swetnam, J. 1980. 'Disguised Employment and Development Policy in Peasant Economies.'uan O 39(1): 32-9.
Swetnam, J. 1989. "What Else Did Indians Have to Do with Their Time? Alternatives to LaborMigration in Prerevolutionary Guatemala.' Econmic Developm and CulftualChuan38(1): 89-112.
Takaaki, M. 1987. QAinu, The Invisible Minority.' Jabn Ouart April-June: 143-8.
Townsend, J. and B. Newman. 1985. gBilingual Education Project in Guatemala- PreliminaryResults on the Test of Principal Hypothesis during 1983.' Nutrition Institute for CentralAmerica and Panama (INCAP), Guatemala City.
Treadgold, M. 1980. *Aboriginal Incomes: An Aggregative Analysis of the 1976 CensusResults.' Australian Bulletin of Labo 7(1): 31-46.
Trosper, R. L. 1980. 'Earnings and Labor Supply: A Microeconomic Comparison of AmericanIndians and Alaskan Natives to American Whites and Blacks.' Publication No. 55.Boston College, Social Welfare Research Institute.
Tujab, G. 1987. -La Polftica de Revitalizatida de las Lenguas Mayas." America Indfwea 47(3):535-45.
Tzannatos, Z. 1991. "Reverse Racial Discrimination in Higher Education in Malaysia: Has itReduced Inequality and at What Cost to the Poor?" International Joua ofEDeveopmen 11(3): 177-192.
UNESCO. 1964. StaticLY ogk 1963. Paris.
UNESCO. 1989. Stiscl Yaboo 18. Paris.
UNICFP. 1992. Children of the Americas: Child Survival. Protection and IntegratedDevelopment in the 1990s. Santafe de Bogota, Colombia.

R4mw 255
United Nations. 1983. *Study of the Problem of Discrimination Against IndigenousPopulations." Report FJCN.4/Sub.2/l983/21/Add.5. Economic and Social Council,Commission on Human Rights, Subcommission on Prevention of Discrimination andProtection of Minorities.
United States Agency for International Development (USAID). 1977. Statistics fr the Analyiof the Education Sector Mexico. Washington, D.C.
Urban, 0. and J. Sherer. 1992. s od ians in Wo Amodm Austin: Universityof Texas.
van den Berghe, P. L. 1992.'Education, Class, and Ethnicity in Southern Peru: RevolutionaryColonialism." In P. 0. Altbach and 0. P. Kelly, eds., PAucation and the ColonialExprienc 2nd Revised Edition. New York Advent Books.
van Gianekeu , W. 1980. . A StudyPrepared for the ILO World Employment Programme. New York: St. Martin's Press.
Vargas, V. 1987. 'Reflecting on Women's Education in Peru.' Mimeo. Centro Flora Tristan,Lima, Peru.
Villavicencio, G. 1973. Relaciones Inter6tnicas en Otavao. Ecuador. Serle do edicionesespeciales, No. 64. Mdxico: Instituto Indigenista Interamericano.
Waggoner, D. 1991. .New York Auburn House.
Wali, A. and S. Davis. 1992. Protecting Amerindian Lands: A Review of World BankExperience with Indigenous Land Regularization Programs in Lowland South America.'Report No. 19. World Bank, Latin America and the Caribbean Technical Department,Regional Studies Program, Washington, D.C.
Walter, L. B. 1976. OInteraction and Organization in an Ecuadorean Indian HighlandCommunity." Ph.D. Diss., University of Wisconsin-Madison.
Warnam, A. 1992. Cuadgmas de_DemgraffaMdgen. Mexico, D. F.: Instituto NacionalIndfgenista.
Weber, M. 1947. The Theory of Social and Economic Organizations. New York OxfordUniversity Press.
Webster, P. L. and J. W. Dwyer. 1988. 'The Cost of Being Nonwhite in Brazil. Soiolak ndSocialeachb 72(2): 136-142.
Welch, A. R. 1988. 'Aboriginal Education as Internal Colonialism.' CmpaMtie Eduation24(2): 203-215.
256 IdIgenous Plpe and Pounty En Latin AnrlweM Anplrical AalynI
Whetten, N. L. 1961. Guatemala. The Land and the People. New Haven: Yale UniversityPres.
Whitten, N. E. 1976. Sacha Runa: Ethncty and Adaptation of Ecuadorian Jungle Onehua.Urbana: University of linois Pms.
Wong, M. 0. 1982. uThe Cost of Being Chinese, Japanese, and Pilipino in the United States:1960, 1970, 1976.1 Pacfic cg ca R e 25(1): 59-78.
World Bank. 1992. World Devlopmn t1992. Washington, D.C.
World Commission on Environment and Development. 1987. r Common (BrndtlandReport). New York: Oxford University Press.
Zolezzi, G and . Riester. 1987. "Lengua Ind~genas de Oriente Bolviano. Clnsifionci6nPiminar. 3:425-435.

her Reports in the Series
to. 1: World Bank Strategy for the Natural Gas Sector in LAC, LATIE, March 1991
No. 2: Women in Development: Issues for the Latin American and Caribbean Region, LATHR,4 April 1991
No. 3: Easing the Poor Through Economic Crisis and Adjustment: The Story of Bolivia's EmergencySocial Fund, LATHR, May 1991
No. 4: Direct Credit for Privatized Firms, LATTP, June 1991
No. 5: Decentralization to Local Government in LAC: National Strategies and Local Response inPlanning, Spending and Management, LATIE, July 1991
No. 6: Mexico Labor Retraining Program: Poverty Alleviation and Contribution to Growth,LATHR, August 1991
Po. 7: The Evolution, Situation, and Prospects of the Electric Power Sector in the Latin American andCaribbean Countries, LATIE, August 1991
o.8: Choice of Nutritional Status Indicators for Young Children in Public Health Programs, SeptemberLATHR, 1991
Jo. 9: Developing Educational Assessment Systems in Latin America, LATHR, September 1991
So. 10: Women's Employment & Pay in Latin America, LATHR, October 1991Part I: Overview and Methodology; Part II: Country Case Studies
o. 11: Feeding Latin America's Children: An Analytical Survey of Food Programs, LATHR,November 1991.
o14. 12: Incentive Structure & Resolution of Financial Institution Distress: Latin American Experience,LATTP, November 1991.
o. 13: Tax Administration in Latin America, LATPS, January 1992.
o. 14: Public Policies and Deforestation: A Case Study of Costa Rica, LATEN, February 1992
0. 15: Auctioning Credit: Vol. 1: Conceptual Issues; Vol. II: The Case of Chile;Vol. III: The Case of Bolivia, LATTP, January 1992.
o. 16: Economic Policies and Performance under Alternative Trade Regimes: Latin America During the80s, LATIP, April 1992.
So. 17: Infrastructure Maintenance in LAC: The Costs of Neglect and Options for Improvement, Volumes1-5, LATIE, June 1992.
No. 18: Private Financing of Higher Education in Latin America and the Caribbean, LATHR, July 1992.
'o. 19: Protecting Amerindian Lands: A Review of World Bank Experience with Indigenous LandRegularization Programs in Lowland South America, LATEN, July 1992.

No. 20: Getting Beyond the "National Institute Model" for Agricultural Research in Latin America:A Cross-Country Study of Brazil, Chile, Colombia and Mexico, LATAG, August 1992.
No. 21: From Platitudes to Practice: Targeting Social Programs in Latin America, LATHR, September,1992.
No. 22: State-Owned Monopolies: Horizontal and Vertical Restructuring and Private Sector Access Issues,LATAD, March 1993 (Revised).
No. 23: Housing Delivery System and the Urban Poor: A Comparison Among Six Latin AmericanCountries, LATIE, December 1992.
No. 24: Gaining Momentum: Economywide and Agricultural Reform in Latin America, LATAG,Forthcoming.
No. 25: Trade Facilitation and Transport Reform, LATIE, September 1992.
No. 26: Coastal Zone Management: Cases Studies from the Caribbean, LATEN, December 1992.
No. 27: Poverty and Income Distribution in Latin America: The Story of the 1980s, LATHR, December1992.
No. 28: Improving the Quality of Primary Education in Latin America: Towards the 21st Century,LATAD, May, 1993.
No. 29: The Design and Administration of Intergovernmental Transfers, LATAD, forthcoming.
Related Documents