Ecological Indicators 11 (2011) 1277–1289 Contents lists available at ScienceDirect Ecological Indicators journal homepage: www.elsevier.com/locate/ecolind Indicators to support environmental sustainability of bioenergy systems Allen C. McBride a , Virginia H. Dale a,∗ , Latha M. Baskaran a , Mark E. Downing a , Laurence M. Eaton a , Rebecca A. Efroymson a , Charles T. Garten Jr. a , Keith L. Kline a , Henriette I. Jager a , Patrick J. Mulholland a , Esther S. Parish a , Peter E. Schweizer a , John M. Storey b a Center for Bioenergy Sustainability, Environmental Sciences Division, Oak Ridge National Laboratory, 1 Bethel Valley Road, Oak Ridge, TN 37831-6036, USA b Fuels, Engines and Emissions Research Center, Oak Ridge National Laboratory, Oak Ridge, TN 37831-6472, USA article info Article history: Received 2 November 2010 Received in revised form 21 January 2011 Accepted 24 January 2011 Keywords: Bioenergy Biofuel Sustainability Environment Indicator Feedstock abstract Indicators are needed to assess environmental sustainability of bioenergy systems. Effective indicators will help in the quantification of benefits and costs of bioenergy options and resource uses. We identify 19 measurable indicators for soil quality, water quality and quantity, greenhouse gases, biodiversity, air quality, and productivity, building on existing knowledge and on national and international programs that are seeking ways to assess sustainable bioenergy. Together, this suite of indicators is hypothesized to reflect major environmental effects of diverse feedstocks, management practices, and post-production processes. The importance of each indicator is identified. Future research relating to this indicator suite is discussed, including field testing, target establishment, and application to particular bioenergy systems. Coupled with such efforts, we envision that this indicator suite can serve as a basis for the practical evaluation of environmental sustainability in a variety of bioenergy systems. © 2011 Elsevier Ltd. All rights reserved. 1. Introduction Indicators to assess the condition of the environment and mon- itor trends over time are needed to characterize conditions under which resource uses are sustainable. We define environmental indicators as environmental measures (Heink and Kowarik, 2010) that provide information about potential or realized effects of human activities on environmental phenomena of concern. We define environmental sustainability as the capacity of an activity to continue while maintaining options for future generations and considering the environmental systems that support the activity (Bruntland, 1987). Whereas much work has focused on the devel- opment of environmental indicators in general, only recently have stakeholders focused attention on developing indicators for sus- tainable bioenergy systems, and no consensus has yet emerged regarding which indicators should be given the highest priority (Buchholz et al., 2009). The bioenergy supply chain includes the production or pro- curement of biomass feedstock, post-production processing and conversion (referred to in this paper as “processing”), and various transportation stages. Beneficial co-products (e.g., distillers grains) and waste by-products (e.g., biorefinery effluent) may be created in different stages of the supply chain. Feedstocks include annual and ∗ Corresponding author. Tel.: +1 865 576 8043; fax: +1 865 576 3989. E-mail address: [email protected] (V.H. Dale). perennial plants, residues from agriculture, forestry, and related industries, and other organic wastes. The choice of feedstocks is a strong determinant in characterizing a given bioenergy pathway with implications for the applicable set of sustainability indicators. Bioenergy systems are expected to expand in coming decades for several reasons. First, leaders in many countries view domestic bioenergy systems as more secure and sustainable than imported fossil fuels. Second, economic growth is expected to increase energy demand overall. Third, bioenergy systems are perceived to sup- port rural development and employment. Fourth, technological advances continue to increase the affordability and sustainability of bioenergy. Furthermore, government policies in the United States (U.S.) and Europe call for an expansion of liquid fuel generation and combustion from cellulosic bioenergy feedstock sources, although those feedstocks are not currently in heavy use. The Energy Inde- pendence and Security Act of 2007 (EISA) mandates that at least 16 billion gallons (∼60.6 billion liters) of cellulosic biofuel be pro- duced annually in the U.S. by 2022 (EISA, 2007). Member states of the European Union aim for biofuel to comprise 10% of their trans- portation fuel use by 2020, with incentives to encourage cellulosic and other second-generation biofuels (European Parliament and Council, 2009). As societies increase use of bioenergy, stakeholders are ques- tioning the environmental benefits of bioenergy compared to other energy options. Currently there is disagreement regarding whether bioenergy systems contribute to or ameliorate environ- mental problems such as depletion of nutrients in soil, erosion, 1470-160X/$ – see front matter © 2011 Elsevier Ltd. All rights reserved. doi:10.1016/j.ecolind.2011.01.010

Welcome message from author
This document is posted to help you gain knowledge. Please leave a comment to let me know what you think about it! Share it to your friends and learn new things together.
Transcript

Journal Identification = ECOIND Article Identification = 778 Date: May 6, 2011 Time: 7:23 pm
I
ARPa
b
a
ARRA
KBBSEIF
1
iwithdtc(ostr(
cctad
1d
Ecological Indicators 11 (2011) 1277–1289
Contents lists available at ScienceDirect
Ecological Indicators
journa l homepage: www.e lsev ier .com/ locate /eco l ind
ndicators to support environmental sustainability of bioenergy systems
llen C. McBridea, Virginia H. Dalea,∗, Latha M. Baskarana, Mark E. Downinga, Laurence M. Eatona,ebecca A. Efroymsona, Charles T. Garten Jr. a, Keith L. Klinea, Henriette I. Jagera,atrick J. Mulhollanda, Esther S. Parisha, Peter E. Schweizera, John M. Storeyb
Center for Bioenergy Sustainability, Environmental Sciences Division, Oak Ridge National Laboratory, 1 Bethel Valley Road, Oak Ridge, TN 37831-6036, USAFuels, Engines and Emissions Research Center, Oak Ridge National Laboratory, Oak Ridge, TN 37831-6472, USA
r t i c l e i n f o
rticle history:eceived 2 November 2010eceived in revised form 21 January 2011ccepted 24 January 2011
a b s t r a c t
Indicators are needed to assess environmental sustainability of bioenergy systems. Effective indicatorswill help in the quantification of benefits and costs of bioenergy options and resource uses. We identify19 measurable indicators for soil quality, water quality and quantity, greenhouse gases, biodiversity, airquality, and productivity, building on existing knowledge and on national and international programsthat are seeking ways to assess sustainable bioenergy. Together, this suite of indicators is hypothesized
eywords:ioenergyiofuelustainabilitynvironmentndicator
to reflect major environmental effects of diverse feedstocks, management practices, and post-productionprocesses. The importance of each indicator is identified. Future research relating to this indicator suite isdiscussed, including field testing, target establishment, and application to particular bioenergy systems.Coupled with such efforts, we envision that this indicator suite can serve as a basis for the practicalevaluation of environmental sustainability in a variety of bioenergy systems.
© 2011 Elsevier Ltd. All rights reserved.
eedstock. Introduction
Indicators to assess the condition of the environment and mon-tor trends over time are needed to characterize conditions under
hich resource uses are sustainable. We define environmentalndicators as environmental measures (Heink and Kowarik, 2010)hat provide information about potential or realized effects ofuman activities on environmental phenomena of concern. Weefine environmental sustainability as the capacity of an activityo continue while maintaining options for future generations andonsidering the environmental systems that support the activityBruntland, 1987). Whereas much work has focused on the devel-pment of environmental indicators in general, only recently havetakeholders focused attention on developing indicators for sus-ainable bioenergy systems, and no consensus has yet emergedegarding which indicators should be given the highest priorityBuchholz et al., 2009).
The bioenergy supply chain includes the production or pro-urement of biomass feedstock, post-production processing andonversion (referred to in this paper as “processing”), and various
ransportation stages. Beneficial co-products (e.g., distillers grains)nd waste by-products (e.g., biorefinery effluent) may be created inifferent stages of the supply chain. Feedstocks include annual and∗ Corresponding author. Tel.: +1 865 576 8043; fax: +1 865 576 3989.E-mail address: [email protected] (V.H. Dale).
470-160X/$ – see front matter © 2011 Elsevier Ltd. All rights reserved.oi:10.1016/j.ecolind.2011.01.010
perennial plants, residues from agriculture, forestry, and relatedindustries, and other organic wastes. The choice of feedstocks is astrong determinant in characterizing a given bioenergy pathwaywith implications for the applicable set of sustainability indicators.
Bioenergy systems are expected to expand in coming decadesfor several reasons. First, leaders in many countries view domesticbioenergy systems as more secure and sustainable than importedfossil fuels. Second, economic growth is expected to increase energydemand overall. Third, bioenergy systems are perceived to sup-port rural development and employment. Fourth, technologicaladvances continue to increase the affordability and sustainability ofbioenergy. Furthermore, government policies in the United States(U.S.) and Europe call for an expansion of liquid fuel generation andcombustion from cellulosic bioenergy feedstock sources, althoughthose feedstocks are not currently in heavy use. The Energy Inde-pendence and Security Act of 2007 (EISA) mandates that at least16 billion gallons (∼60.6 billion liters) of cellulosic biofuel be pro-duced annually in the U.S. by 2022 (EISA, 2007). Member states ofthe European Union aim for biofuel to comprise 10% of their trans-portation fuel use by 2020, with incentives to encourage cellulosicand other second-generation biofuels (European Parliament andCouncil, 2009).
As societies increase use of bioenergy, stakeholders are ques-
tioning the environmental benefits of bioenergy compared toother energy options. Currently there is disagreement regardingwhether bioenergy systems contribute to or ameliorate environ-mental problems such as depletion of nutrients in soil, erosion,
Journal Identification = ECOIND Article Identification = 778 Date: May 6, 2011 Time: 7:23 pm
1 l Indicators 11 (2011) 1277–1289
rg(fmtRehsphbtaiciss
stdsoptIgt2
mdbgtIanf(BBcaiifettwpstpnFmsar
t
Table 1Criteria for selection of useful environmental indicators.
Are easily measuredAre sensitive to stresses on systemRespond to stress in a predictable mannerAre anticipatory: signify an impending change in the environmental systemPredict changes that can be averted by management actionsAre integrative: the full suite of indicators provides a measure of coverage of
the key gradients across the environmental systems (e.g., soils, vegetationtypes, and temperature)
Have a known response to natural disturbances, anthropogenic stresses, andchanges over time
278 A.C. McBride et al. / Ecologica
unoff of nutrients and toxins, consumptive water use, greenhouseas buildup, biodiversity loss, air pollution, and productivity lossJordan et al., 2007; Keeney, 2008; Williams et al., 2009). Dif-erences of opinion often relate to past land use, crop choice,
anagement practices, processing, and prevailing environmen-al conditions where the feedstock is grown (Jordan et al., 2007;obertson et al., 2008; Scharlemann and Laurance, 2008; Klinet al., 2009). In the U.S., much of the debate has focused on theistoric effects of conventional crop systems in the Midwest, theource of corn (Zea mays) for the majority of current U.S. ethanolroduction. However, cellulosic bioenergy is often perceived asolding greater opportunity for future sustainability than corn-ased ethanol (Robertson et al., 2008; Kline et al., 2009). Becausehis debate coincides with an expected increase in bioenergy usend because of regulations that require bioenergy to be producedn an environmentally responsible manner, there is a need toharacterize conditions under which bioenergy systems can bemplemented sustainably (Hecht et al., 2009). This paper presents aet of indicators that can be used to characterize the environmentalide of this equation.
The set of environmental indicators selected for assessing theustainability of different types of bioenergy systems should applyo both large regions and local sites and should be useful toiverse stakeholders. For example, policymakers may focus onustainability of the entire supply chain, agronomists may rec-mmend sustainable bioenergy feedstock crops and managementractices for different locations, and operation managers may seeko improve their feedstock production and processing systems.ndicators may also help in the implementation of certification pro-rams (several are already in development) that can be appliedhroughout the supply chain or to its components (van Dam et al.,008).
Although much work is still needed to identify, test, and imple-ent a small set of environmental indicators that is useful to the
iverse stakeholders involved in bioenergy systems, progress haseen made. Sustainability attributes of agricultural practices ineneral have been discussed and defined by the Millennium Ecosys-em Assessment (MEA, 2005), the National Sustainable Agriculturenformation Service (Sullivan, 2003; Earles and Williams, 2005),nd Dale and Polasky (2007). In addition, several national and inter-ational efforts are underway to select sustainability indicators
or bioenergy, including the Roundtable on Sustainable BiofuelsRSB, 2010), U.S. Biomass Research and Development Board, Globalioenergy Partnership (GBEP, 2010), and Council on Sustainableiomass Production (CSBP, 2010). The preliminary suites of indi-ators arising from these efforts are diverse, and the differencesmong them are important, but here we note two broad character-stics. First, these suites tend to include numerous, broadly definedndicators. Second, many of the indicators in these suites tend toocus on assessments of management practices and their predictednvironmental effects rather than on measurements that relateo realized environmental effects. These approaches have advan-ages. Large numbers of broad indicators can in principle capture aide range of environmental effects. Also, assessing managementractices may often be less expensive than making empirical mea-urements; indeed, simple measurements of some effects, such asropospheric ozone formation, may not be feasible with respect toarticular bioenergy systems. On the other hand, measuring largeumbers of indicators can be prohibitively expensive (NRC, 2008a).urthermore, current understanding of the effects of bioenergyanagement practices on the environment is limited, especially for
ystems not yet in wide use, such as cellulosic bioenergy. Therefore
need remains for a small set of concrete indicators that focus onealized environmental effects of bioenergy systems.This paper identifies a suite of 19 indicators selected to collec-
ively characterize important effects that many bioenergy systems
Have known variability/spread in response to given environmental changes
Adapted from Dale and Beyeler (2001).
have or are likely to have on environmental sustainability. The suiteis organized according to six categories: soil quality, water qualityand quantity, greenhouse gases, biodiversity, air quality, and pro-ductivity. These categories were selected to reflect the major areasof environmental concern surrounding bioenergy systems. They arealso similar to categories used by national and international effortsworking to establish suites of sustainability indicators for bioen-ergy. For each category, we discuss the relationship of proposedindicators to ecosystem properties and address measurement con-siderations. After presenting indicators in each category, we discussfuture research directions, applications of these indicators to spe-cific bioenergy systems, and interpretation of these indicators. Thispaper provides a basis for other researchers and investigators tomove forward to evaluate and implement environmental indicatorsfor bioenergy systems.
2. Approach
Where feasible, indicators were selected to empirically mea-sure environmental effects rather than to infer such effects throughassessment of management practices. In some cases, however,models based on management practices are the only feasible wayto estimate the environmental effects of bioenergy systems (e.g.,greenhouse gas fluxes or secondary particulate formation, dis-cussed in Sections 3.3 and 3.5, respectively).
Our selection of indicators was based on research in the dis-ciplines related to each category of indicators, on other efforts toselect sets of indicators, and on previous work describing criteria forselecting useful indicators [e.g., Dale and Beyeler (2001), Table 1].The diversity of indicators needed to broadly assess environmentalsustainability may not allow for a uniform, well-defined indicatorselection process (NRC, 2008a); therefore, expert judgment is animportant part of the selection process. Collectively, the proposedsuite of indicators forms a hypothesis of how environmental effectsof bioenergy systems may be assessed, and that hypothesis needsto be tested in diverse bioenergy systems.
3. Categories of indicators
3.1. Indicators of soil quality
Among the environmental systems for which indicators havebeen chosen, soils are especially important because soil qual-ity affects the broader ecosystem, the immediate productivity ofbioenergy crops, and the maintenance of productive capacity forfuture generations. Our selection of soil indicators was influencedby prior research on soil indicators in general (Doran and Parkin,
1996; Garten et al., 2003; Karlen et al., 2003; Pattison et al., 2008;Adair et al., 2009) as well as on agronomy research focused onbioenergy crops in particular (Mann and Tolbert, 2000; Tolbertet al., 2002; Moscatelli et al., 2005; Garten et al., 2010).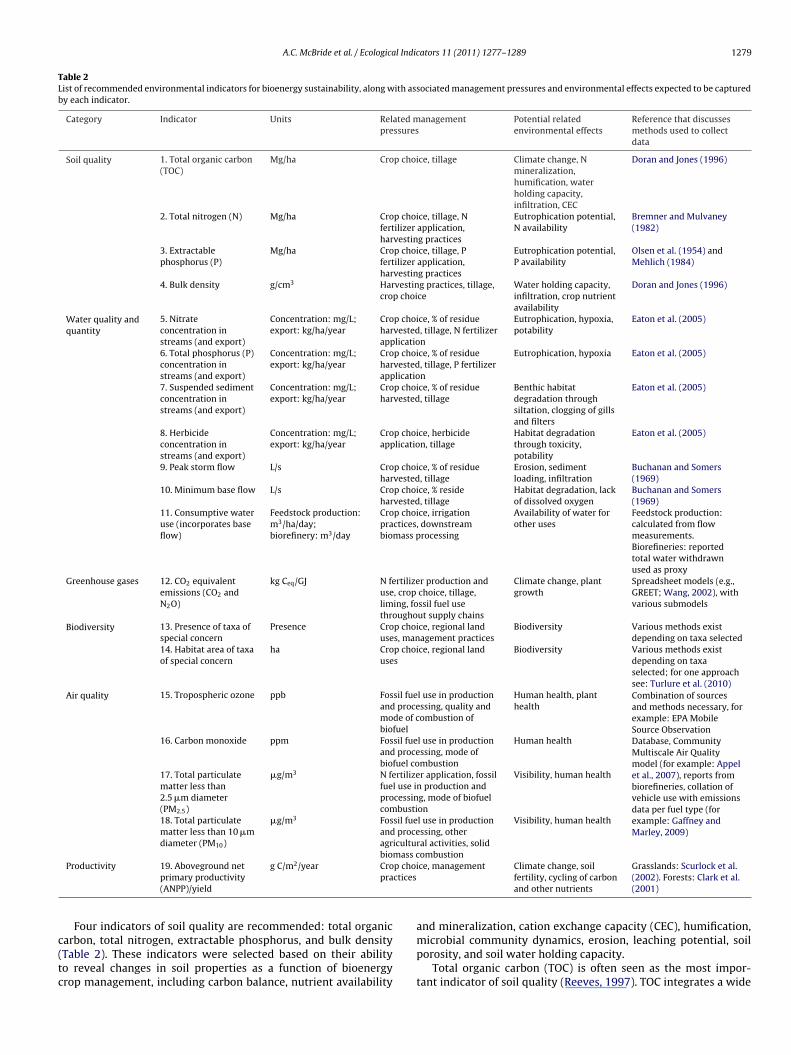
Journal Identification = ECOIND Article Identification = 778 Date: May 6, 2011 Time: 7:23 pm
A.C. McBride et al. / Ecological Indicators 11 (2011) 1277–1289 1279
Table 2List of recommended environmental indicators for bioenergy sustainability, along with associated management pressures and environmental effects expected to be capturedby each indicator.
Category Indicator Units Related managementpressures
Potential relatedenvironmental effects
Reference that discussesmethods used to collectdata
Soil quality 1. Total organic carbon(TOC)
Mg/ha Crop choice, tillage Climate change, Nmineralization,humification, waterholding capacity,infiltration, CEC
Doran and Jones (1996)
2. Total nitrogen (N) Mg/ha Crop choice, tillage, Nfertilizer application,harvesting practices
Eutrophication potential,N availability
Bremner and Mulvaney(1982)
3. Extractablephosphorus (P)
Mg/ha Crop choice, tillage, Pfertilizer application,harvesting practices
Eutrophication potential,P availability
Olsen et al. (1954) andMehlich (1984)
4. Bulk density g/cm3 Harvesting practices, tillage,crop choice
Water holding capacity,infiltration, crop nutrientavailability
Doran and Jones (1996)
Water quality andquantity
5. Nitrateconcentration instreams (and export)
Concentration: mg/L;export: kg/ha/year
Crop choice, % of residueharvested, tillage, N fertilizerapplication
Eutrophication, hypoxia,potability
Eaton et al. (2005)
6. Total phosphorus (P)concentration instreams (and export)
Concentration: mg/L;export: kg/ha/year
Crop choice, % of residueharvested, tillage, P fertilizerapplication
Eutrophication, hypoxia Eaton et al. (2005)
7. Suspended sedimentconcentration instreams (and export)
Concentration: mg/L;export: kg/ha/year
Crop choice, % of residueharvested, tillage
Benthic habitatdegradation throughsiltation, clogging of gillsand filters
Eaton et al. (2005)
8. Herbicideconcentration instreams (and export)
Concentration: mg/L;export: kg/ha/year
Crop choice, herbicideapplication, tillage
Habitat degradationthrough toxicity,potability
Eaton et al. (2005)
9. Peak storm flow L/s Crop choice, % of residueharvested, tillage
Erosion, sedimentloading, infiltration
Buchanan and Somers(1969)
10. Minimum base flow L/s Crop choice, % resideharvested, tillage
Habitat degradation, lackof dissolved oxygen
Buchanan and Somers(1969)
11. Consumptive wateruse (incorporates baseflow)
Feedstock production:m3/ha/day;biorefinery: m3/day
Crop choice, irrigationpractices, downstreambiomass processing
Availability of water forother uses
Feedstock production:calculated from flowmeasurements.Biorefineries: reportedtotal water withdrawnused as proxy
Greenhouse gases 12. CO2 equivalentemissions (CO2 andN2O)
kg Ceq/GJ N fertilizer production anduse, crop choice, tillage,liming, fossil fuel usethroughout supply chains
Climate change, plantgrowth
Spreadsheet models (e.g.,GREET; Wang, 2002), withvarious submodels
Biodiversity 13. Presence of taxa ofspecial concern
Presence Crop choice, regional landuses, management practices
Biodiversity Various methods existdepending on taxa selected
14. Habitat area of taxaof special concern
ha Crop choice, regional landuses
Biodiversity Various methods existdepending on taxaselected; for one approachsee: Turlure et al. (2010)
Air quality 15. Tropospheric ozone ppb Fossil fuel use in productionand processing, quality andmode of combustion ofbiofuel
Human health, planthealth
Combination of sourcesand methods necessary, forexample: EPA MobileSource ObservationDatabase, CommunityMultiscale Air Qualitymodel (for example: Appelet al., 2007), reports frombiorefineries, collation ofvehicle use with emissionsdata per fuel type (forexample: Gaffney andMarley, 2009)
16. Carbon monoxide ppm Fossil fuel use in productionand processing, mode ofbiofuel combustion
Human health
17. Total particulatematter less than2.5 �m diameter(PM2.5)
�g/m3 N fertilizer application, fossilfuel use in production andprocessing, mode of biofuelcombustion
Visibility, human health
18. Total particulatematter less than 10 �mdiameter (PM10)
�g/m3 Fossil fuel use in productionand processing, otheragricultural activities, solidbiomass combustion
Visibility, human health
Productivity 19. Aboveground net g C/m2/year Crop choice, managementctices
Climate change, soil Grasslands: Scurlock et al.
c(tc
primary productivity(ANPP)/yield
pra
Four indicators of soil quality are recommended: total organic
arbon, total nitrogen, extractable phosphorus, and bulk densityTable 2). These indicators were selected based on their abilityo reveal changes in soil properties as a function of bioenergyrop management, including carbon balance, nutrient availabilityfertility, cycling of carbonand other nutrients
(2002). Forests: Clark et al.(2001)
and mineralization, cation exchange capacity (CEC), humification,
microbial community dynamics, erosion, leaching potential, soilporosity, and soil water holding capacity.Total organic carbon (TOC) is often seen as the most impor-tant indicator of soil quality (Reeves, 1997). TOC integrates a wide
Journal Identification = ECOIND Article Identification = 778 Date: May 6, 2011 Time: 7:23 pm
1 l Indic
rcmt(ppsf2
qeabto
taaionasNeP
snosucls
ibOioao
3
ofbpeiecmttaaicd
280 A.C. McBride et al. / Ecologica
ange of important soil properties and functions and also is a directause of several positive soil responses. First, it serves as the pri-ary source of energy for soil microbial communities, which, in
urn, promote crop growth by supporting nitrogen mineralizationNRCS, 2009). Second, high TOC suggests high humus levels, whichromote water holding capacity, infiltration, and CEC. Third, com-ounds in soil organic matter, which correlates with TOC, help bindoil aggregates in non-calcareous soils, contributing to porosity andurther enhancing water holding capacity and infiltration (NRCS,009).
In addition to the role of TOC as an indicator in assessing soiluality, accurate measurements of soil carbon are also important instimating carbon dioxide flux associated with bioenergy systems,s discussed in Section 3.3. Soil carbon changes are likely to occurecause of land-use changes associated with the initial implemen-ation of bioenergy systems, as well as during the ongoing operationf those systems.
Total nitrogen (N) and extractable phosphorus (P) measure thewo most important soil nutrients in typical productive land man-gement systems. Most N in soil is bound in organic compoundsnd is not available to plants. However, total N is considered a validndicator because N mineralization is driven by the availability ofrganic N in the soil, so that plant-available N (ammonium anditrate) is closely related to total N (Vlassak, 1970). Excessive soil Nnd P can result in nutrient runoff and leaching, leading to down-tream eutrophication. In addition, excess soil nitrate may increase
volatilization as the potent greenhouse gas nitrous oxide (Dalalt al., 2003; Snyder et al., 2009). Conversely, depletion of soil N andthreatens the future productivity of soil.
Finally, bulk density is recommended as a physical indicator ofoil quality. Bulk density can rapidly be affected by human agro-omic practices (Unger and Kaspar, 1994). Bulk density is especiallyf concern in forestry, because tree harvesting activities can causeoil compaction (Hatchell et al., 1970). Increases in bulk density aresually considered harmful (Unger and Kaspar, 1994), but in somerops, such as switchgrass (Panicum virgatum), it is desirable to haveight surface soil compaction before sowing in order to improveeed–soil contact (Monti et al., 2001).
Techniques for measuring TOC and bulk density can be foundn Doran and Jones (1996). Techniques for measuring total N cane found in Bremner and Mulvaney (1982). Mehlich (1984) andlsen et al. (1954) describe techniques for measuring extractable P
n acidic and calcareous soils, respectively. The appropriate depthf measurement for soil indicators depends on depth of soil layersnd cultivation practices on a given site and should remain constantver time.
.2. Indicators of water quality and quantity
The properties of water in streams draining bioenergy croplandsr forest stands influence the ecosystems within and downstreamrom those streams. Indicators based on water properties cane used to assess whether the agricultural aspects of bioenergyroduction allow for the maintenance of soil quality, aquaticcosystems, and clean and plentiful water for human use. Waterndicators are affected by some of the same pressures that influ-nce soil indicators (e.g., fertilizer application and vegetativeover). In contrast to soil indicators, water indicators can changeore rapidly and integrate changes over an entire watershed,
hereby allowing for finer temporal resolution and broader spa-ial integration of relevant effects. In this sense water qualitynd quantity reflect the diversity of environmental conditions
nd land practices that occur upstream and upslope as well asn the past. For example, runoff attributes are influenced byurrent and past land cover, chemical applications, and soil con-itions.ators 11 (2011) 1277–1289
Seven indicators of water quality and quantity are recom-mended: stream concentrations of nitrate, total phosphorus,suspended sediment, and herbicides; peak storm flow; minimumbase flow; and consumptive water use (Table 2). These indicatorswere selected based on their ability to reveal changes in severalenvironmental properties that might occur as a result of bioen-ergy crop management: water availability, water potability, aquaticbiodiversity, eutrophication, dissolved oxygen, soil erosion, sedi-ment loading, soil leaching potential, soil porosity, and soil waterholding capacity. In selecting these indicators, we assume that inmost cases, water from feedstock production sites will drain intostreams (some of which may be only ephemeral) before reachinglakes, estuaries, or other lentic waters.
Concentrations of nitrate and total phosphorus (P) in streamsare indicators of potential eutrophication. Whereas aquatic sys-tems respond to nitrogen (N) in other forms, nitrate is usuallythe most abundant form, relatively inexpensive to measure, highlymobile, and expected to be sensitive to the management of bioen-ergy feedstock systems. Furthermore, nitrate in drinking wateris also associated with health risks such as methemoglobinemia(Ward et al., 2005). In streams, total P includes dissolved phos-phate, organic phosphorus, and phosphate sorbed to suspendedsediment. Measurement of total P in streams is especially importantduring storm events, because P export during storm events tends todominate watershed P export and is sensitive to crop managementpractices (Sharpley et al., 2008).
Recent meta-analyses suggest that lotic, lentic and coastalmarine ecosystems are generally responsive to both N and P(Francoeur, 2001; Elser et al., 2007). Environmental effects ofeutrophication were reviewed by Smith et al. (1999) and arecharacterized by increased biomass of algae, periphyton, and/orphytoplankton, decreased dissolved oxygen, and death of fish andother animals. In the U.S., the contributions of N and P export tohypoxia in the Gulf of Mexico are of particular concern (Alexanderet al., 2008; Dale et al., 2010a).
Concentration of herbicides in streams measures exposure ofaquatic life to these chemicals and their potentially toxic effects.Most pesticide use in the U.S. consists of herbicides. In 2000 and2001 combined, 62% of conventional pesticides used (by mass ofactive ingredient) consisted of herbicides (Kellogg et al., 2000; Kielyet al., 2004). Schäfer et al. (2007) found that various pesticides,including herbicides, were detrimental to stream macroinverte-brate community structure and ecosystem function when theyoccur at concentrations lower than those previously known to havesuch effects. Measuring herbicide concentrations is expensive, andtherefore we recommend that only herbicides known to be used orof concern in a given area should be measured.
Suspended sediment concentration is an indicator of streamhabitat quality. Siltation diminishes interstitial space in stream sub-strata, impairs fish spawning grounds, and reduces the ability ofsessile benthic organisms to attach to streambeds. Increased tur-bidity reduces the ability of benthic plants and attached algae tophotosynthesize. Reduced benthic productivity and biodiversitycan reduce available food for grazing organisms. Suspended sedi-ment also clogs the gills of fish and hinders nutrient uptake by filterfeeders. These and other effects of sediment load in lotic environ-ments were reviewed by Wood and Armitage (1997). In additionto its adverse effects on aquatic habitat, suspended sediment alsoserves as an indicator of soil erosion, which can be used to assessthe sustainability of bioenergy systems (Smeets and Faaij, 2010).
In addition to concentrations of nitrate, total P, herbicides,and sediments, export levels per unit watershed area of these
substances are also important. Whereas concentrations are indi-cators of the effects these substances may have on the streams inwhich they are measured, export levels are related to the effects ofthese substances on downstream bodies of water (e.g., hypoxia in
Journal Identification = ECOIND Article Identification = 778 Date: May 6, 2011 Time: 7:23 pm
l Indic
tibmman
tpaTsoc
dflscsd
alaorgrl
iwspa2tsagg
i2ediNtt(i
i(B
3
iate
A.C. McBride et al. / Ecologica
he Gulf of Mexico or propagation of sediment downstream dur-ng flushing events). Area-specific export levels can be calculatedy multiplying stream concentrations of each substance by floweasurements and dividing by total watershed area. Because esti-ating watershed area is straightforward and flow measurements
re recommended as indicators in the following paragraph, we doot treat these area-specific export levels as separate indicators.
Two flow properties, peak storm flow and base flow, are indica-ors of environmental effects of changes in soil and crop hydrologicrocesses. Base flow is related both to availability and quality ofquatic habitat and to the availability of water for human use.hese two issues are considered separately. Interpreting flow mea-urements requires also measuring rainfall on similar timescales inrder to separate the effects of rainfall from those resulting fromhanges in soil and crop hydrologic properties.
Increased peak flow during storm events can be caused byecreased infiltration and water holding capacity in soil. High peakows during storms can increase erosion (de Lima et al., 2003) andediment loading (Lawler et al., 2006). In addition, high peak flowsan reduce benthic organism biomass and habitat as a result oftreambed scouring and can contribute to potential flood damageownstream.
As an indicator of water quality, base flow should be consideredt its minimum, often occurring in summer or early fall, becauseotic habitat quality can be limited by minimum base flow (Bunnnd Arthington, 2002). During periods of low base flow, dissolvedxygen levels in streams are usually at their lowest due to lowerates of oxygen diffusion into water from the atmosphere andreater depletion of available oxygen supplies in water from respi-ation by aquatic organisms. Very low dissolved oxygen levels canead to stress or death of some aquatic organisms, particularly fish.
In addition to its utility as an indicator of lotic habitat qual-ty, base flow also serves as one of two measures of consumptive
ater use, the seventh recommended water-related indicator. Con-umptive water use in bioenergy systems, mostly during feedstockroduction and in biorefineries, may affect the amount of watervailable for other human uses (Berndes, 2002; de Fraiture et al.,008; Stone et al., 2010). Changes in base flow can reflect consump-ive water use in feedstock production. For this purpose, base flowhould be considered throughout the growing season. It shouldlso be measured sufficiently downstream to capture both irri-ation return flow (Huffaker, 2010) and the surface discharge ofroundwater sources drawn upon by deep-rooted crops.
Water withdrawn from public sources is recommended as anndicator reflecting consumptive water use in biorefineries (NRC,008b). Most consumptive water use in biorefineries consists ofvaporation from cooling towers and dryers/evaporators duringistillation (NRC, 2008b; Wu et al., 2009). Total water withdrawal
s typically metered and easily reported by biorefinery managers.ot all water withdrawn represents consumptive use; however,
he extent to which water withdrawal overestimates consump-ive use is decreasing as water recycling in biorefineries increasesNRC, 2008b). Consumptive water use in biorefineries can be locallyntense (NRC, 2008b).
Standard methods for measuring nitrate, total P, suspended sed-ment, and several common herbicides can be found in Eaton et al.2005). Techniques for measuring stream flow can be found inuchanan and Somers (1969) and Hudson (1993).
.3. Indicator of greenhouse gas flux
Estimated net carbon equivalent (Ceq) flux to the atmosphere
s recommended to measure the effect of bioenergy systems ontmospheric concentration of greenhouse gases that contributeo climate change (IPCC, 2007) (Table 2). The direct and indirectnvironmental effects of elevated atmospheric Ceq concentrationsators 11 (2011) 1277–1289 1281
differ regionally, but, because the atmosphere is well-mixed, thoseeffects do not depend on the locations of Ceq release or seques-tration. Therefore, Ceq release and sequestration throughout thebioenergy supply chain can be summed, and the marginal envi-ronmental effects of those fluxes can be estimated using standardglobal climate models. Hansen et al. (2006) and McMichael et al.(2006) discuss the expected effects of increasing greenhouse gasconcentrations on climate, environment, and human health, suchas increases in temperature, sea level, extreme weather events,species loss, and disease.
To estimate net Ceq flux associated with bioenergy, we rec-ommend that nitrous oxide (N2O) flux and carbon dioxide (CO2)flux be considered. N2O is emitted directly from soil during bothnitrification and denitrification (Bouwman et al., 2010), as well asindirectly when volatilized nitric oxide and nitrogen dioxide (NOx)and ammonia (NH3) are deposited offsite and converted to N2Oor when leached nitrate is denitrified in waterways (Adler et al.,2007). In agricultural systems, N2O emissions are strongly depen-dent on the amount of N fertilizer applied to the soil (Crutzenet al., 2008). In addition to application-related emissions, N2O isalso released, typically in smaller amounts, during the productionof nitrate fertilizers, specifically during the intermediate step ofnitric acid production (Snyder et al., 2009).
The bioenergy supply chain also contains several sources andsinks for CO2 that must be considered in estimating net greenhousegas flux. Where feedstocks are produced, these sources and sinksinclude changes in carbon stocks in biomass and soil, dissolutionof agricultural lime, and fossil fuel used in sowing, tilling, harvest,and application of soil inputs. Offsite sources upstream from feed-stock production include fossil fuel used in the manufacture andtransport of agricultural inputs such as fertilizer, pesticide, seed,and agricultural lime. Offsite sources downstream from feedstockproduction include fossil fuel used in processing (such as at biore-fineries) and in the transportation of feedstock and fuel. In addition,electricity must be generated off-site for use in all stages of the sup-ply chain. This list of sources and sinks is an extension of that usedby West et al. (2010) for agriculture. The exclusion from this list ofcarbon fixed in photosynthesis or released through the oxidationof biomass is consistent with the assumption of other researchers(e.g., West et al., 2010) that any difference between these two quan-tities is represented by changes in soil or standing biomass carbonstocks.
Estimated values for these various sources and sinks of N2O andCO2 can be collected and summed using the life cycle assessment(LCA) approach. Standard and useful tools for LCA are multidimen-sional spreadsheet models such as the GREET (Greenhouse gases,Regulated Emissions, and Energy use in Transportation) and GHGe-nius software models, which are designed to address full fuel cycle(or well-to-wheels) effects (Wang, 2002; Stanciulescu and Fleming,2006). These spreadsheet models have advantages in that theyare user-friendly, publicly available, straightforward, and relativelytransparent. By default, such spreadsheet models often have built-in statistical submodels that can be retained or overridden withmeasured values or with the results of more sophisticated, exter-nal submodels. This flexibility allows users simultaneously to takeadvantage of information relevant to a given problem and to makeuse of standard estimates where problem-specific information isnot available.
Some default values in spreadsheet models are best replacedwith empirical measurements where available. For example, soilcarbon measurements are recommended as an environmental indi-cator of sustainability in part because they relate not only to several
aspects of soil quality but also to greenhouse gas flux. Assuming soilcarbon measurements are made, the accuracy of site-specific LCAscan be improved by substituting those measurements for statisti-cally modeled estimates in spreadsheet models.
Journal Identification = ECOIND Article Identification = 778 Date: May 6, 2011 Time: 7:23 pm
1 l Indic
fmDt(esflsN(tcwemtehchhetfp(am
ipdpscPmsb(
LLe2wmrdcpsgeb
3
itBtb
282 A.C. McBride et al. / Ecologica
Default emission factors in spreadsheet models for N2O releasedrom soil can be replaced with empirical measurements or with
ore sophisticated models when appropriate data are available.efault factors may be based on straightforward statistical models
hat estimate N2O emissions from N fertilizer application rate aloneWang et al., 2008). Such approaches are appropriate for globalmissions but fail to capture important site- and management-pecific variations in the relationship between applied N and N2Oux (Del Grosso et al., 2010). Ideally, local N2O emissions are mea-ured empirically, but the two common methods for measuring2O emissions face practical challenges: eddy covariance towers
e.g., Eugster et al., 2007) are expensive to establish and main-ain, and chamber measurements are also expensive when enoughhambers are used to detect the effects of “hotspots,” small areasith high N2O emissions compared to surrounding soil (Neftel
t al., 2007; Hellebrand et al., 2008). Because of these challenges,odels are often used to estimate soil N2O flux from agronomic sys-
ems, including bioenergy production (Adler et al., 2007; Bouwmant al., 2010). The simulation model DAYCENT (Parton et al., 1998)as been used to estimate soil N2O flux from various bioenergyrops, using as inputs daily weather simulations, soil texture andydraulic properties, crop growth dynamics, N application rate,arvest schedule, and tillage (Adler et al., 2007). However, mod-ling of N2O emissions faces “tremendous challenges” becausehe potentially confounding influences and interactions of severalactors (such as the pore space characteristics, bulk density, tem-erature, pH, and carbon content of soil) are not well understoodFarquharson and Baldock, 2008). As data become more widelyvailable, measurements should be used to validate modeled esti-ates of N2O flux (e.g., Del Grosso et al., 2010).In addition to CO2 and N2O, methane (CH4) can be important
n calculating Ceq emissions. In bioenergy systems, CH4 is emittedrimarily when solid biomass is burned on small scales, such as foromestic cooking and heating, or when open biomass burning is aart of feedstock production. In these cases CH4 may be a small butignificant contributor to Ceq flux, contributing 14% or less of totalombustion-related Ceq emissions (Yevich and Logan, 2003; Ito andenner, 2004; Macedo et al., 2008). Changes in land managementay alter the balance of methanogenesis and methanotrophy in
oil, but such changes typically do not affect the Ceq balance ofioenergy systems as much as do changes in CO2 and N2O fluxesUssiri et al., 2009; Cherubini, 2010; Shurpali et al., 2010).
Estimates of net Ceq flux from bioenergy systems based onCAs differ, even for similar systems. Reviews of greenhouse gasCAs for bioenergy have sought to identify sources of those differ-nces (Liska and Cassman, 2008; Cherubini et al., 2009; Davis et al.,009; Gnansounou et al., 2009). Differences in system boundariesere important (e.g., inclusion of co-products and use of economicodels to attempt prediction of indirect land-use changes). Most
eviews also cited differences in the treatment of reference con-itions (i.e., displaced fossil fuel systems). Such methodologicalhallenges compound challenges in accurately estimating com-onents of Ceq flux, such as soil carbon and N2O emission fromoils. Despite these difficulties, the openness and flexibility ofreenhouse gas LCAs makes them an appropriate tool for differ-nt stakeholders to evaluate and compare the Ceq flux of differentioenergy systems.
.4. Indicators of biodiversity
Measures of biodiversity are valuable indicators of sustainabilityn agroecosystems (Biala et al., 2005). Biodiversity can relate to any
ype of organism, including plants, animals, fungi, and microbes.iodiversity indicators are useful in comparing different agricul-ural systems because, in addition to being valued for its own sake,iodiversity is affected by other environmental changes such asators 11 (2011) 1277–1289
erosion, nutrient loss, and land-use change. Bioenergy systems arelikely to affect biodiversity in several ways. For example, feedstockcultivation in extensive monocultures or pollution from biorefiner-ies may cause loss of species, changes in abundance of species,and habitat degradation or loss. By contrast, appropriately man-aged perennial bioenergy cropping systems can improve habitat forsome species, such as grassland birds (Murray et al., 2003). For thepurpose of selecting biodiversity indicators, we focus on the directeffects on biodiversity of land-use changes involved in the produc-tion or procurement of feedstocks because those effects are likelyto be measurable in the short term and can be spatially extensive.
The presence and habitat area of taxa of special concern arerecommended as indicators to measure the effects of bioenergysystems on biodiversity (Table 2). The actual taxa that are of specialconcern vary in identity and number by site and region. Examplesinclude rare native species, biodiversity-related keystone species,and taxa that are part of bioindicators. These three examples aredefined and discussed below. Other taxa of special concern includespecies of commercial value, cultural importance, or recreationalvalue.
Native species that are locally or globally rare (whether natu-rally or through human activity) or that could become rare due tobioenergy system implementation are examples of taxa of specialconcern. Rare or potentially rare species may be at greater risk ofextinction (local or global) than common species; therefore, mon-itoring their presence may lead to a relatively larger probabilityof capturing a decrease in biodiversity due to their extirpation. Inan effort that focused on rare species at risk [using the definitionof Master (1991)], Lawler et al. (2003) found that habitat of at-risk species correlated well with the habitat of other species in theMiddle Atlantic region of the U.S., thus serving as an indicator ofbiodiversity beyond the at-risk species themselves.
Biodiversity-related keystone species are another example oftaxa of special concern. Power et al. (1996) defined a keystonespecies as “one whose impact on its community or ecosystemis large, and disproportionately large relative to its abundance.”Power et al. (1996) explained that “impact” can be defined withrespect to various ecosystem traits. Here we are interested inspecies with disproportionate effects on biodiversity, such as thegopher tortoise (Gopherus polyphemus) in the southeastern U.S.,whose burrows provide habitat for a large number of other species(McCoy and Mushinsky, 2007), or other ecosystem engineers suchas prairie dogs (Cynomys spp.) in arid grasslands (Bangert andSlobodchikoff, 2006; Shipley and Reading, 2006). The impact of theloss of such a species from an ecosystem can be amplified by theresultant loss of other species.
Other taxa of special concern are those that comprise what arecommonly termed “bioindicators,” which are taxa frequently usedto monitor the condition of an environment or ecosystem. Bioindi-cators often consist of aquatic taxa and are used to assess theimpacts of anthropogenic stresses on water quality. The presenceof some taxa in aquatic systems downstream from bioenergy feed-stock production may indicate positive effects of bioenergy systems(e.g., if bioenergy land management results in less chemical or sed-iment loading than prior land use). The presence of other taxa mayindicate negative effects of bioenergy (e.g., if crops require morefertilizers, herbicides or pesticides than prior land use).
In addition to aquatic organisms, other generalizations can bemade about types of taxa likely to be affected by bioenergy systems,even though the selection of particular indicator taxa is inherentlysite- or region-specific. Organisms likely to be affected includeaquatic animals, arthropods (Gardiner et al., 2010), birds, small
mammals, and ground flora (Semere and Slater, 2007).For many species of special concern, it is more feasible to mea-sure the extent of suitable habitat than to measure the presence orabundance of a taxon directly. For example, Turlure et al. (2010)
Journal Identification = ECOIND Article Identification = 778 Date: May 6, 2011 Time: 7:23 pm
l Indic
duttssmd
3
oclfoq
dsatotobimMpbItClecp
ctti(oaatpauorsa
ltsPni“cb
A.C. McBride et al. / Ecologica
emonstrated the validity of using habitat area as a proxy for pop-lation size for two vulnerable peat bog butterflies. By showinghat habitat area worked best as a proxy when defined accordingo functional resources rather than host plants, their study empha-ized the importance of carefully defining suitable habitat. Becausepecies of special concern in different systems differ widely in habit,ethods for measuring presence and habitat area of those taxa also
iffer.
.5. Indicators of air quality
Most air pollutants resulting from bioenergy use derive directlyr indirectly from combustion in feedstock production and pro-essing as well as in final use (e.g., powering vehicles by burningiquid biofuels). Carbon monoxide, tropospheric ozone, and tworactions of suspended particulate matter (PM10 and PM2.5) are rec-mmended as indicators to measure the effects of bioenergy on airuality (Table 2).
Almost all carbon monoxide (CO) emissions related to bioenergyerive from combustion. Combustion throughout the bioenergyupply chain includes combustion of biofuels for vehicles, heat,nd electricity, as well as the combustion of fossil fuels used inhe production of bioenergy. However, CO emissions from cars andther transportation sources have been virtually eliminated withhe advent of the catalytic converter in the 1970s and replacementf the legacy fleet. CO is a minor contributor to climate change,ut it is of environmental concern primarily for two reasons. First,
t has severe effects on human health in high concentrations anday also be harmful at low, chronic concentrations (Townsend andaynard, 2002; Chen et al., 2007). Second, it is a precursor to ozone
roduction, as discussed below. The emission of CO in biofuel com-ustion varies widely based on fuel type and combustion method.
n some cases, an increase in the overall efficiency of a combus-ion process can have a counterintuitive inverse relationship withO emissions (Venkataraman and Rao, 2001). Because present-day
iquid biofuels are oxygen-containing compounds, burning biofuelither as an additive to petroleum products or as a primary fuelan result in lower CO emissions than burning pure gasoline oretroleum diesel fuel.
Tropospheric ozone is an important pollutant and is also asso-iated with smog and haze. Ozone can aggravate or damagehe respiratory system and can also damage vegetation, poten-ially reducing crop yields and biodiversity. Tropospheric ozones formed by the reaction of nitric oxide and nitrogen dioxideNOx) with non-methane organic gases (NMOGs) (Atkinson, 2000)r with CO (NRC, 1977). These compounds are emitted in varyingmounts from all combustion processes involved in the productionnd use of bioenergy. NOx is particularly associated with distilla-ion processes for ethanol production. The reaction of these ozonerecursors may occur far from emission sources; therefore, NOx
ssociated with bioenergy may react with NMOGs or CO fromnrelated sources or vice versa. Ambient air quality standards forzone in the U.S. (EPA, 2010) have been growing stricter, and manyegions, mostly urban, have entered or will enter non-attainmenttatus for ozone. Thus, any effect of bioenergy production or use onmbient ozone levels will be closely monitored by regulators.
PM2.5 measures mass per unit volume of all airborne particlesess than 2.5 �m in diameter, also known as the fine particle frac-ion. Fine particles can be emitted directly from point sources;uch particles (soot, for example) are called “primary” (Seinfeld andankow, 2003). Fine particles such as ammonium nitrate, ammo-ium sulfate, and secondary organic aerosols (SOA) are formed
n the atmosphere from gaseous emissions and are known assecondary” (Seinfeld and Pankow, 2003). Bioenergy systems canontribute to fine particulate pollution through solid biomass com-ustion or through the emission of various secondary particulate
ators 11 (2011) 1277–1289 1283
precursors through biofuel combustion (i.e., NMOGs leading toSOA), through burning of fossil fuels during feedstock productionor processing [i.e., oxides of sulfur (SOx), NOx], or from soil bio-chemical processes during feedstock production (i.e., ammonia).Fine particles are associated with increased mortality due to lungcancer, cardiopulmonary disease, and other factors (Pope et al.,2002). This association with increased mortality is especially strongfor fine particles associated with combustion (Laden et al., 2000).Because the diameters of fine particles in the atmosphere are closeto the wavelengths of visible light, fine particles also scatter lighteffectively and typically reduce visibility more than larger particles(Malm, 1999).
PM10 measures mass per unit volume of all airborne particlesless than 10 �m in diameter and thus includes those particles mea-sured by PM2.5. In addition to fine particles, PM10 includes coarseparticles, those between 2.5 �m and 10 �m in diameter. Agricul-tural systems can affect this coarse fraction through tilling and solidbiomass combustion (Aneja et al., 2009). As with the fine fraction,the coarse fraction can affect human respiratory health, thoughhealth effects may be restricted to the short term (Brunekreefand Forsberg, 2005). Coarse particles also impair visibility, thoughalso to a lesser extent than fine particles (Malm, 1999). The lesserenvironmental concerns relating to coarse particles, as well as theconfounding inclusion of both fine and coarse particles in PM10, aredrawbacks to using PM10 as an indicator of environmental aspectsof bioenergy sustainability. Nonetheless, we recommend its use fortwo reasons. First, the coarse fraction may have greater influence onhealth and visibility issues where it dominates the fine fraction inabundance, such as on feedstock production sites and where solidbiomass is burned. Second, because of historical EnvironmentalProtection Agency (EPA) regulations in the U.S., more infrastruc-ture exists to measure PM10 than to measure PM2.5; therefore, evenwhere the fine fraction is of primary concern, PM10 may serve as arough but affordable proxy measure of the fine fraction.
Methods for measuring CO, tropospheric ozone, PM2.5, and PM10vary by location. Extensive ambient air monitoring networks havebeen installed in many regions of the U.S. (AIRNow, 2010) as well asin Europe. The U.S. EPA requires large emitters such as biorefiner-ies to report emissions of some pollutants. Feedstock producerscan report equipment usage, which can be combined with datasources such as the EPA’s Mobile Source Observation Database(MSOD) to calculate emissions of CO and primary PM2.5. Becausetropospheric ozone and much PM2.5 are created at a regional scalefrom locally emitted precursor pollutants, models such as Com-munity Multiscale Air Quality (CMAQ) (Appel et al., 2007, 2008)must be employed to connect regional PM2.5 and troposphericozone measurements to bioenergy-related precursor emissions.Emissions from liquid biofuel combustion in mobile sources canbe estimated from country-scale estimates of consumption by fueltype combined with estimates of emissions from those fuels (Niven,2005; Anderson, 2009; Gaffney and Marley, 2009). Emission esti-mates by fuel type should also be country-specific, as emissionsvary with atmospheric conditions and policy-influenced design fac-tors. For example, in some countries ethanol is consumed as an 85%blend with gasoline in specially equipped vehicles, whereas in othercountries ethanol may be blended at lower levels with gasoline andconsumed in all vehicles.
3.6. Indicator of productivity
One indicator, aboveground net primary productivity (ANPP), isrecommended to assess the ecosystem productivity of bioenergy-
associated land use (Table 2). The selection of this indicator ismotivated by the importance of net primary productivity (NPP),which is defined as the net flux of carbon from the atmosphere intogreen plants per unit time and measures the rate of production of
Journal Identification = ECOIND Article Identification = 778 Date: May 6, 2011 Time: 7:23 pm
1 l Indic
uttpanN
bsgtd2
Aapab
wFiahbe
aewettomcd
4
4
tqtfevcstco
owlitsiu
284 A.C. McBride et al. / Ecologica
seful net energy by all plants in an ecosystem. NPP is a measure ofhe condition of both the land (e.g., soil fertility, topography, vegeta-ion type, and prevailing weather conditions) and several ecologicalrocesses (including photosynthesis and autotrophic respiration asffected by local hydrology and temperature). Cramer et al. (1999)oted that “a better grasp upon the controls and distribution of . . .PP . . . is pivotal for sustainable human use of the biosphere.”
NPP manifests physically as total new plant biomass generatedy photosynthesis per unit time (typically measured per year). Eveno, the continual death and decay of plant tissue, especially below-round, as well as the import and export of organic compoundso and from the environment, make direct measurement of NPPifficult (Clark et al., 2001; Scurlock et al., 2002; Matamala et al.,003).
Because of these and other challenges in directly measuring NPP,NPP is often used as a substitute for NPP. Even measuring ANPPccurately is not trivial; however, certain difficult-to-measure com-onents of ANPP (e.g., biomass consumed by herbivores or that diesnd decomposes during the growing season) are often assumed toe small enough to ignore (Clark et al., 2001; Scurlock et al., 2002).
In agricultural systems, producers routinely measure yield,hich in the case of biomass crops can serve as a proxy for ANPP.
or some bioenergy systems in which not all aboveground biomasss harvested, such as corn starch ethanol, harvest indices are avail-ble for specific sites and systems (e.g., Pordesimo et al., 2004). Aarvest index is the ratio of dry grain mass to total dry abovegroundiomass for a given crop, and it varies somewhat with local vari-ties, conditions and management practices (Prince et al., 2001).
Because ANPP can be roughly approximated for both managednd unmanaged ecosystems, it provides a simple way to comparecosystems that may differ dramatically in many respects. In caseshere bioenergy feedstock crops replace less intensively managed
cosystems, the yield or estimated annual aboveground biomass ofhe feedstock crop can be compared to the ANPP of the prior ecosys-em, measured either before bioenergy system implementation orn similar nearby proxy sites. Coupled with harvest indices to esti-ate NPP based on ANPP, such comparisons can also serve as one
omponent for calculating the effects of land-use change on carbonioxide flux.
. Discussion
.1. Developing and testing suite of indicators
These 19 indicators collectively represent how bioenergy sys-ems may affect environmental sustainability with respect to soiluality, water quality and quantity, greenhouse gas concentra-ions, biodiversity, air quality, and productivity. Transitions fromossil-fuel based energy systems to bioenergy systems can affectnvironmental sustainability because of increases or decreases inarious anthropogenic stresses, including resource exploitation;hanges in land use, water use, and disturbance regime; and emis-ions of waste, pollutants, and greenhouse gases. Measured overime, this suite of indicators should reveal many of the effects ofhanges in these stressors not only pertaining to the current statef ecosystems but also relating to their resilience (Folke et al., 2004).
The suite of indicators presented here was selected with the goalf being useful in reflecting the environmental sustainability of aide range of bioenergy systems. Even so, it is clear that particu-
ar applications may require modifications to the proposed suite ofndicators as discussed in Section 4.2. The range of bioenergy sys-
ems includes variation in management and environmental contextuch as differences in feedstock choice, tillage and inputs, process-ng pathways, past land use, climate, and soil type. The desiredtility of the suite of indicators across this range of systems includesators 11 (2011) 1277–1289
the extent to which the indicators provide information as expectedregarding environmental effects of concern as well as whether anyindicators in the suite prove redundant with each other. It alsoincludes the extent to which indicators are feasible, given availableresources of money, time, access, and expertise. The success of thisindicator suite at meeting these goals must be evaluated throughfield testing before it can be adopted.
Field testing consists of measuring the full suite of indicators ina set of established or pilot bioenergy systems. This set of systemsshould represent the range of potential production pathways andmay require testing at various scales. One test with respect to feed-stock production would consist of replicated pairs of experimentalwatersheds with each pair including a watershed that supportsbioenergy production and a watershed that does not. Watershedsrepresent an ideal spatial resolution of focus for water quality andquantity indicators, which are most easily interpreted in the con-text of whole-watershed treatments.
In addition to assessing whether the suite meets goals relatingto information and feasibility, field testing can also help in estimat-ing variability and establishing appropriate targets for the suite ofindicators in the context of particular bioenergy systems. By “vari-ability” we mean the dispersion of an indicator’s values both amongthe variety of bioenergy systems and within those with similarenvironmental and management context. Estimates of variabilityare needed to calculate the power of statistical tests performed tocompare indicators over time, among different bioenergy systems,or between bioenergy systems and alternative land uses or energysources.
Targets reflect knowledge about the sustainability of bioenergysystems given possible values of indicators and inform manage-ment responses to those values. Targets, along with guidelines formanagement actions, can be part of a comprehensive set of bestmanagement practices (BMPs) for bioenergy systems. Some tar-gets take the form of thresholds or ranges, where measurementsbelow, above, or between certain points are acceptable. Other tar-gets might take the form of desired trends; for example, a targetmight be a continued increase in soil carbon over several years.Because the indicator suite presented here should be interpretedas an integrated whole, targets for each indicator depend on theoverall effects of bioenergy systems on the environment as mea-sured by the full suite of indicators, as well as on economic andsocial aspects of sustainability, as discussed in Section 4.4.
Finally, experience from field testing can also help in establish-ing detailed protocols for measuring the values of the indicators.In this paper we have provided references to standard methods forsome indicators, but important details are left unspecified (e.g., fre-quency of measurement). Establishing more detailed protocols is aniterative process that should be part of field testing but should alsoextend into subsequent use of the suite of indicators. Standard-ization of protocols is desirable to increase comparability amongindicator values estimated from different bioenergy systems. Onthe other hand, different situations require somewhat differentmethods, as discussed in Section 4.2.
The proposed indicator suite will undoubtedly be modified overtime as knowledge and technology develop. As experience is gainedwith bioenergy systems and sustainability assessments, it willlikely become apparent that some indicators measure attributesthat are important but not changing with some bioenergy pro-duction pathways. And new indicators may prove necessary tomeasure conditions that change in unexpected ways. It may be use-ful to eliminate indicators in the former case and to add othersin the second case in order to provide more detailed informa-
tion about unexpected effects of bioenergy systems. In addition,advancements in technology will allow updates of the suite ofenvironmental indicators for bioenergy sustainability. Ease of mea-surement is one reason that certain indicators have been chosen
Journal Identification = ECOIND Article Identification = 778 Date: May 6, 2011 Time: 7:23 pm
l Indic
omo
4
agtrctstscisFwba2
eittwiet(mSstsffdm
ieqiiimptmFvtcssts
euf
A.C. McBride et al. / Ecologica
ver others. More advanced and cost-effective instrumentationay allow for the replacement of some indicators identified here by
thers that measure related environmental effects more directly.
.2. Adapting the suite of indicators for particular situations
The suite of 19 indicators presented here is not intended to bepplied directly to particular bioenergy systems and managementoals. Instead, this suite is intended as a basis or starting point forhe selection of indicator suites for particular situations, which mayequire a subset or expansion of this proposed indicator suite. Thehoice of indicators for those suites may be driven by environmen-al context as well as cost. There are several advantages to givingpecial weight to a standard set of indicators when selecting indic-or suites for specific purposes. First, to the extent that a standarduite has been field tested in a variety of conditions, stakeholdersan have greater confidence in their suitability for similar scenar-os. Second, if sets of indicators chosen for different applications areimilar, their measured values are more likely to be comparable.inally, improved coordination among those selecting indicatorsill improve coherence and efficiency in certification of sustainable
iomass, avoid proliferation of redundant or nonaligned standards,nd provide direction for the appropriate approach (van Dam et al.,008).
The context of particular bioenergy systems and accompanyingnvironmental concerns may suggest the selection of additionalndicators beyond the 19 presented here. For example, indicatorshat measure contamination by heavy metals may be useful in sys-ems where sewage sludge is used as fertilizer (McBride, 1995) orhere bioenergy crops are expected to filter or immobilize contam-
nation from other sources (e.g., Wu et al., 2003). Where geneticallyngineered feedstocks are grown, it may be important to moni-or the spread of engineered genes and their effects on ecosystemsSnow et al., 2005). Similarly, where concern exists that feedstocks
ay become invasive in a given area (Barney and Ditomaso, 2008;imberloff, 2008), their presence beyond the feedstock productionite should be monitored. Where feedstock production is expectedo exacerbate or ameliorate other biological invasions, it may beimilarly important to monitor those invasive species on or neareedstock production sites. When water for irrigation is withdrawnrom deep aquifers whose discharge to surface water is too slow oristant to be captured by base flow, groundwater levels should beonitored as an additional measure of consumptive water use.By contrast, cost and management goals may require the elim-
nation of some indicators. There are large costs involved instablishing a rigorous scientific monitoring of soil quality, wateruality and quantity, greenhouse gases, biodiversity, air qual-
ty, and productivity. For example, although water indicators aremportant, they can be especially expensive to measure. Calculat-ng flows, concentrations, and exports may require combinations of
easurements using flumes or weirs, in situ instrumentation, anderiodic sampling surveys, all in multiple locations and with highemporal resolution (Haan et al., 1994). The costs and feasibilities of
easuring other indicators vary with different bioenergy systems.or example, the cost of accurately estimating net Ceq emissionsaries depending on whether relevant data on fossil fuel consump-ion and feedstock management are readily available or must beollected specifically for indicator assessment. Similarly, the fea-ibility of estimating the abundance or habitat area of species ofpecial concern depends on whether such species are already iden-ified in a given system as well as the form and habit of thosepecies.
In addition to adding or removing indicators to the suite, differ-nt situations and goals also require modifications to the protocolssed in applying indicators. For example, measuring productivity inorests requires different techniques than measuring productivity
ators 11 (2011) 1277–1289 1285
in crops. In addition, cost constraints of efforts to estimate the suiteof indicators may call for different methodologies relating to trade-offs between the cost, precision, and accuracy of specific protocols.Stakeholder goals may affect protocols as well. For example, bioen-ergy systems are often envisioned as integral parts of sustainablelandscape designs (Dale et al., 2010a). Consideration of landscapepatterns and diversity in planning feedstock production systemsmay result in environmental benefits such as increased biodiver-sity and decreased erosion and runoff pollution (Firbank, 2008;Dale et al., 2010b). To assess the success of management practicesthat consider landscape design, indicators might best be applied toextents larger than individual bioenergy operations.
4.3. Interpreting the suite of indicator measurements
Indicators should be interpreted in view of baseline conditionsand the particular context of a proposed bioenergy system. Base-line conditions are a set of observations or data that are usedfor comparison to new activities or for a reference case. Withregard to the environmental sustainability of bioenergy, base-line conditions attempt to characterize environmentally relevantaspects of a situation in which a given bioenergy system had notbeen implemented. Ideally, a comparison between indicator valuesand baseline conditions should reveal the marginal environmentaleffects of a bioenergy system. Some baseline conditions can be rep-resented by initial values of indicators if measurements are takenbefore bioenergy operations are initiated. For example, indicatorsthat characterize land-use attributes, such as those relating to soiland water, can be measured prior to bioenergy-related land-usechange. As a proxy, when initial values of indicators are not avail-able, baseline conditions can be measured in areas that are similarto the prior state of production land – most often at a nearbylocation that has similar weather, topography, soils, vegetation,drainage area/hydrology, and management practices as the initialconditions of the bioenergy production site. Similarly, air qualityindicators, especially important in relation to processing facilitiessuch as biorefineries, can be measured before the facility is broughton line or at a suitable proxy site; however, the complex regionaldynamics of air pollutants such as ozone and PM2.5 may complicatethe selection of such sites.
Because business-as-usual scenarios for energy are based onfossil fuels, the baseline for bioenergy sustainability should con-sider environmental implications of fossil fuel exploration, drilling,mining, production, transportation, and use (Gorissen et al., 2010).However, data are rarely available to determine the full environ-mental effects of fossil fuel systems. Even so, life cycle assessment(LCA) for fossil fuel systems demonstrates that the environmen-tal effects of those systems vary widely with geography and otherfactors (Furuholt, 1995).
In addition to baseline conditions, contextual variables mustbe used to interpret indicator measurements. Contextual variablesmeasure characteristics of the operation of a bioenergy system thatmay affect the value of an indicator. Some contextual variableschange with time but are beyond the direct control of operationmanagers. As an example, information on rainfall intensity and fre-quency is used to interpret measures of stream flow. Similarly, soil,water, and biodiversity indicators depend on disturbance regimesincluding the frequency and intensity of fire and floods. Somecontextual variables are site characteristics that change little ornot at all over time (e.g., land-use history, soil texture, slope, andaspect) and thus may be measured with lower frequency. Othercontextual variables are aspects of land management, such as crop
choice, tillage intensity, frequency of burning, percentage of residueremoved, and applications of fertilizers, pesticides, and herbicides.For example, measures of soil nitrogen and stream nitrate shouldbe considered in the context of the amount of nitrogen fertilizer
Journal Identification = ECOIND Article Identification = 778 Date: May 6, 2011 Time: 7:23 pm
1 l Indic
acomfealr
atracitchiald
ldtdsipAatkote
4
tav2hebatnictGitt
5
ss
286 A.C. McBride et al. / Ecologica
pplied to the soil. These management-related contextual variablesan further be divided into those under the control of bioenergyperation managers and those under the control of other resourceanagers, such as farmers growing non-bioenergy crops upstream
rom bioenergy crops. Those variables under direct control of bioen-rgy operation managers serve not only as contextual variables butlso as objects of manipulation for the application of BMPs. Table 2ists examples of management-related contextual variables withespect to each of the indicators presented.
As an indicator of environmental sustainability, measurement ofboveground net primary productivity (ANPP) is especially impor-ant to interpret along with contextual variables. For example,ainfall records may allow a decline in feedstock ANPP to bettributed to unsustainable soil degradation or to drought or otheronditions beyond the control of land managers. Similarly, increas-ng ANPP may reflect increasing sustainability if accompanied byhe adoption of precision agriculture techniques or by a shift torops or crop varieties better suited for a given site. On the otherand, such an increasing trend may reflect decreasing sustainabil-
ty if accompanied by increases in fertilizer or irrigation input. Asthird example, the maintenance of ANPP at relatively consistent
evels in the context of disturbances such as hurricane, drought, orisease may reflect a resilient agroecosystem.
In response to given management practices, some indicators areikely to change in favorable directions and others in unfavorableirections. Such differences represent the unavoidable tradeoffshat make sustainable management challenging. To some extent,etermining optimal management practice depends on inherentlyubjective judgments on the part of stakeholders regarding themportance of different indicators or the extent that options forotential environmental benefits should be maintained over time.multivariate analysis of the 19 indicators’ values will providebasis for stakeholders to discuss characteristics of environmen-
ally sustainable bioenergy systems. Sustainability polygons (alsonown as cobweb polygons, star plots, or radar charts) representne method for visualizing the measured values of suites of indica-ors as multivariate observations (e.g., Gomez et al., 1996; de Vriest al., 2010).
.4. Economic and social sustainability
Indicators of environmental sustainability also provide informa-ion about economic and social sustainability, because economiesnd societies rely on the continued provision of ecosystem ser-ices, defined as the benefits people obtain from ecosystems (MEA,005). The indicators of environmental sustainability identifiedere relate to the provisioning, regulating, cultural, and supportingcosystem services (MEA, 2005) that can be enhanced or degradedy bioenergy systems. However, because sustainable economiesnd societies rely on conditions other than the provision of ecosys-em services, indicators of social and economic sustainability areeeded in addition to the indicators of environmental sustainabil-
ty proposed in this paper (Niemi and McDonald, 2004). Developingomprehensive suites of sustainability indicators for bioenergy ishe goal of the Roundtable on Sustainable Biofuels (RSB, 2010), thelobal Bioenergy Partnership (GBEP, 2010), and other national and
nternational organizations. The current paper strives to supporthose efforts by presenting a short list of environmental indicatorshat can be used to evaluate bioenergy systems.
. Conclusion
We identify a suite of 19 indicators in six categories to mea-ure the environmental sustainability of bioenergy systems. Theuite is intended to be a practical toolset for capturing key
ators 11 (2011) 1277–1289
environmental effects of bioenergy across a range of bioenergysystems, including different pathways, locations, and managementpractices. To evaluate the hypothesis that the suite meets this goal,and also to help measure variability and establish appropriate tar-gets, the suite should be field tested in systems spanning a widevariety of conditions. If the hypothesis is confirmed, the suite canbe implemented more broadly, modified as necessary for particu-lar contexts. This broader implementation will further two goals.First, it will help stakeholders judge the relative environmental sus-tainability of different bioenergy systems, including the questionof which feedstocks, management practices, and post-productionprocesses are appropriate for different locations as well as the ques-tion of how bioenergy systems compare with alternative energysystems. Second, it will help provide an empirical foundation forindicators designed to assess environmental sustainability basedon the predicted effects of management practices, such as many ofthe indicators proposed for use in certifying sustainable bioenergysystems (e.g., GBEP, 2010; RSB, 2010).
Acknowledgments
Robin Graham, Gbadebo Oladosu, Andy Aden, and two anony-mous referees provided helpful comments on earlier versionsof this paper. Tristram West provided advice on greenhousegas accounting. Jennifer Smith helped organize references. Thisresearch was supported by the U.S. Department of Energy (DOE)under the Office of the Biomass Program. Oak Ridge National Lab-oratory is managed by UT-Battelle, LLC, for DOE under contractDE-AC05-00OR22725.
References
Adair, C.E., Reich, P., Hobbie, S., Knops, J., 2009. Interactive effects of time, CO2, N, anddiversity on total belowground carbon allocation and ecosystem carbon storagein a grassland community. Ecosystems 12, 1037–1052.
Adler, P.R., Del Grosso, S.J., Parton, W.J., 2007. Life-cycle assessment of netgreenhouse-gas flux for bioenergy cropping systems. Ecol. Appl. 17, 675–691.
AIRNow, 2010. AIRNow. http://www.airnow.gov/ (accessed January 2011).Alexander, R.B., Smith, R.A., Schwarz, G.E., Boyer, E.W., Nolan, J.V., Brakebill, J.W.,
2008. Differences in phosphorus and nitrogen delivery to the Gulf of Mexicofrom the Mississippi River basin. Environ. Sci. Technol. 42, 822–830.
Anderson, L.G., 2009. Ethanol fuel use in Brazil: air quality impacts. Energy Environ.Sci. 2, 1015–1037.
Aneja, V.P., Schlesinger, W.H., Erisman, J.W., 2009. Effects of agriculture upon the airquality and climate: research, policy, and regulations. Environ. Sci. Technol. 43,4234–4240.
Appel, K.W., Gilliland, A.B., Sarwar, G., Gilliam, R.C., 2007. Evaluation of the Commu-nity Multiscale Air Quality (CMAQ) model version 4.5: sensitivities impactingmodel performance. Part I. Ozone. Atmos. Environ. 41, 9603–9615.
Appel, K.W., Bhave, P.V., Gilliland, A.B., Sarwar, G., Roselle, S.J., 2008. Evaluation ofthe Community Multiscale Air Quality (CMAQ) model version 4.5: sensitivitiesimpacting model performance. Part II. Particulate matter. Atmos. Environ. 42,6057–6066.
Atkinson, R., 2000. Atmospheric chemistry of VOCs and NOx. Atmos. Environ. 34,2063–2101.
Bangert, R.K., Slobodchikoff, C.N., 2006. Conservation of prairie dog ecosystem engi-neering may support arthropod beta and gamma diversity. J. Arid Environ. 67,100–115.
Barney, J.N., Ditomaso, J.M., 2008. Nonnative species and bioenergy: are we culti-vating the next invader? Bioscience 58, 64–70.
Berndes, G., 2002. Bioenergy and water—the implications of large-scale bioenergyproduction for water use and supply. Global Environ. Change 12, 253–271.
Biala, K., Peeters, A., Muys, B., Hermy, M., Brouckaert, V., García, V., Van der Veken,B., Valckx, J., 2005. Biodiversity indicators as a tool to assess sustainability lev-els of agro-ecosystems, with a special consideration of grassland areas. Opt.Méditerran., Ser. A 67, 439–443.
Bouwman, A.F., van Grinsven, J.J.M., Eickhout, B., 2010. Consequences of the culti-vation of energy crops for the global nitrogen cycle. Ecol. Appl. 20, 101–109.
Bremner, J.M., Mulvaney, C.S., 1982. Nitrogen: total. In: Page, A.L., Miller, R.H.,Keeney, D.R. (Eds.), Methods of Soil Analysis. Part 2. Chemical and Microbio-logical Properties. , 2nd ed. American Society of Agronomy, Soil Science Society
of America Inc., Madison, WI.Brunekreef, B., Forsberg, B., 2005. Epidemiological evidence of effects of coarse air-borne particles on health. Eur. Respir. J. 26, 309–318.
Bruntland, G.H. (Ed.), 1987. Our Common Future: The World Commission on Envi-ronment and Development. Oxford University Press, Oxford.

Journal Identification = ECOIND Article Identification = 778 Date: May 6, 2011 Time: 7:23 pm
l Indic
B
B
B
C
C
C
C
C
C
C
D
D
D
D
D
D
d
d
d
D
D
D
E
E
E
E
E
E
E
A.C. McBride et al. / Ecologica
uchanan, T.J., Somers, W.P., 1969. Discharge measurements at gaging stations.Techniques of Water-Resources Investigations, vol. 3. U.S. Geological Survey.
uchholz, T., Luzadis, V.A., Volk, T.A., 2009. Sustainability criteria for bioenergy sys-tems: results from an expert survey. J. Cleaner Prod. 17, S86–S98.
unn, S.E., Arthington, A.H., 2002. Basic principles and ecological consequences ofaltered flow regimes for aquatic biodiversity. Environ. Manage. 30, 492–507.
hen, T.M., Gokhale, J., Shofer, S., Kuschner, W.G., 2007. Outdoor air pollution: nitro-gen dioxide, sulfur dioxide, and carbon monoxide health effects. Am. J. Med. Sci.333, 249–256.
herubini, F., 2010. GHG balances of bioenergy systems—overview of key stepsin the production chain and methodological concerns. Renew. Energy 35,1565–1573.
herubini, F., Bird, N.D., Cowie, A., Jungmeier, G., Schlamadinger, B., Woess-Gallasch,S., 2009. Energy- and greenhouse gas-based LCA of biofuel and bioenergy sys-tems: key issues, ranges and recommendations. Resour. Conserv. Recycl. 53,434–447.
lark, D.A., Brown, S., Kicklighter, D.W., Chambers, J.Q., Thomlinson, J.R., Ni, J., 2001.Measuring net primary production in forests: concepts and field methods. Ecol.Appl. 11, 356–370.
ramer, W., Kicklighter, D.W., Bondeau, A., Iii, B.M., Churkina, G., Nemry, B., Ruimy,A., Schloss, A.L., 1999. The participants of the Potsdam NPP model intercom-parison. Comparing global models of terrestrial net primary productivity (NPP):overview and key results. Global Change Biol. 5 (S1), 1–15.
rutzen, P.J., Mosier, A.R., Smith, K.A., Winiwarter, W., 2008. N2O release from agro-biofuel production negates global warming reduction by replacing fossil fuels.Atmos. Chem. Phys. 8, 389–395.
SBP, 2010. Draft Provisional Standard for Sustainable Production ofAgricultural Biomass. Council on Sustainable Biomass Production,http://www.csbp.org/files/survey/CSBP Provisional Standard.pdf (accessedJanuary 2011).
alal, R.C., Wang, W.J., Robertson, G.P., Parton, W.J., 2003. Nitrous oxide emissionfrom Australian agricultural lands and mitigation options: a review. Aust. J. SoilRes. 41, 165–195.
ale, V.H., Beyeler, S.C., 2001. Challenges in the development and use of ecologicalindicators. Ecol. Indic. 1, 3–10.
ale, V.H., Kline, K.L., Weins, J., Fargione, J., 2010a. Biofuels: implications for landuse and biodiversity. In: Biofuels and Sustainability Reports. Ecological Society ofAmerica, http://www.esa.org/biofuelsreports/files/ESA Biofuels Report VH Daleet al.pdf (accessed January 2011).
ale, V.H., Lowrance, R., Mulholland, P.J., Robertson, G.P., 2010b. Bioenergy sus-tainability at the regional scale. Ecol. Soc. 15, http://www.ecologyandsociety.org/vol15/iss4/art23/ (accessed January 2011).
ale, V.H., Polasky, S., 2007. Measures of the effects of agricultural practices onecosystem services. Ecol. Econ. 64, 286–296.
avis, S.C., Anderson-Teixeira, K.J., DeLucia, E.H., 2009. Life-cycle analysis and theecology of biofuels. Trends Plant Sci. 14, 140–146.
e Fraiture, C., Giordano, M., Liao, Y.S., 2008. Biofuels and implications for agricul-tural water use: blue impacts of green energy. Water Policy 10, 67–81.
e Lima, J., Singh, V.P., de Lima, M.I.P., 2003. The influence of storm movement onwater erosion: storm direction and velocity effects. Catena 52, 39–56.
e Vries, S.C., van de Ven, G.W.J., van Ittersum, M.K., Giller, K.E., 2010. Resourceuse efficiency and environmental performance of nine major biofuel crops,processed by first-generation conversion techniques. Biomass Bioenergy 34,588–601.
el Grosso, S.J., Ogle, S.M., Parton, W.J., Breidt, F.J., 2010. Estimating uncertainty inN2O emissions from US cropland soils. Global Biogeochem. Cycles 24 (GB1009),1–12.
oran, J.W., Jones, A.J. (Eds.), 1996. Methods for Assessing Soil Quality. Soil ScienceSociety of America, Inc., Madison, WI.
oran, J.W., Parkin, T.B., 1996. Quantitative indicators of soil quality: a minimumdata set. In: Doran, J.W., Jones, A.J. (Eds.), Methods for Assessing Soil Quality.Soil Science Society of America, Inc., Madison, WI, pp. 25–37.
arles, R., Williams, P., 2005. Sustainable Agriculture: An Introduction.National Center for Appropriate Technology, http://attra.ncat.org/attra-pub/PDF/sustagintro.pdf (accessed January 2011).
aton, A.D., Clesceri, L.S., Rice, E.W., Greenberg, A.E., Franson, M.A.H. (Eds.), 2005.Standard Methods for the Examination of Water and Wastewater. , 21st ed.American Public Health Association, Washington, D.C..
lser, J.J., Bracken, M.E.S., Cleland, E.E., Gruner, D.S., Harpole, W.S., Hillebrand, H.,Ngai, J.T., Seabloom, E.W., Shurin, J.B., Smith, J.E., 2007. Global analysis of nitro-gen and phosphorus limitation of primary producers in freshwater, marine andterrestrial ecosystems. Ecol. Lett. 10, 1135–1142.
nergy Independence and Security Act of 2007. 110-140.2007. http://frwebgate.access.gpo.gov/cgi-bin/getdoc.cgi?dbname=110 cong publiclaws&docid=f:publ140.110.pdf (accessed January 2011).
PA, 2010. National Ambient Air Quality Standards (NAAQS). United States Envi-ronmental Protection Agency, http://epa.gov/air/criteria.html (accessed January2011).
ugster, W., Zeyer, K., Zeeman, M., Michna, P., Zingg, A., Buchmann, N., Emmeneg-ger, L., 2007. Methodical study of nitrous oxide eddy covariance measurementsusing quantum cascade laser spectrometery over a Swiss forest. Biogeosciences
4, 927–939.uropean Parliament and Council, 2009. Directive 2009/28/EC of the EuropeanParliament and of the Council. Official J. Eur. Union 52 (L140), 16–62, http://eur-lex.europa.eu/LexUriServ/LexUriServ.do?uri=OJ:L:2009:140:0016:0062:en:PDF(accessed January 2011).
ators 11 (2011) 1277–1289 1287
Farquharson, R., Baldock, J., 2008. Concepts in modelling N2O emissions from landuse. Plant Soil 309, 147–167.
Firbank, L.G., 2008. Assessing the ecological impacts of bioenergy projects. BioenergyRes. 1, 12–19.
Folke, C., Carpenter, S., Walker, B., Scheffer, M., Elmqvist, T., Gunderson, L., Holling,C.S., 2004. Regime shifts, resilience, and biodiversity in ecosystem management.Annu. Rev. Ecol., Evol. Syst. 35, 557–581.
Francoeur, S.N., 2001. Meta-analysis of lotic nutrient amendment experiments:detecting and quantifying subtle responses. J. N. Am. Benthol. Soc. 20, 358–368.
Furuholt, E., 1995. Life cycle assessment of gasoline and diesel. Resour. Conserv.Recycl. 14, 251–263.
Gaffney, J.S., Marley, N.A., 2009. The impacts of combustion emissions on air qualityand climate—from coal to biofuels and beyond. Atmos. Environ. 43, 23–36.
Gardiner, M.A., Tuell, J.K., Isaacs, R., Gibbs, J., Ascher, J.S., Landis, D.A., 2010. Implica-tions of three biofuel crops for beneficial arthropods in agricultural landscapes.Bioenergy Res. 3, 6–19.
Garten, C.T., Ashwood, T.L., Dale, V.H., 2003. Effect of military training on indicatorsof soil quality at Fort Benning, Georgia. Ecol. Indic. 3, 171–179.
Garten, C.T., Smith, J.L., Tyler, D.D., Amonette, J.E., Bailey, V.L., Brice, D.J., Castro,H.F., Graham, R.L., Gunderson, C.A., Izaurralde, R.C., Jardine, P.M., Jastrow, J.D.,Kerley, M.K., Matamala, R., Mayes, M.A., Metting, F.B., Miller, R.M., Moran, K.K.,Post, W.M., Sands, R.D., Schadt, C.W., Phillips, J.R., Thomson, A.M., Vugteveen, T.,West, T.O., Wullschleger, S.D., 2010. Intra-annual changes in biomass, carbon,and nitrogen dynamics at 4-year old switchgrass field trials in west Tennessee,USA. Agric. Ecosyst. Environ. 136, 177–184.
GBEP, 2010. Second Draft of GBEP Sustainability Criteria and Indicators forBioenergy. Global Bioenergy Partnership, http://www.globalbioenergy.org/fileadmin/user upload/gbep/docs/partners only/sust docs/2nd DRAFT ofGBEP Criteria Indicators with TEMPLATES.doc (accessed January 2011).
Gnansounou, E., Dauriat, A., Villegas, J., Panichelli, L., 2009. Life cycle assessmentof biofuels: energy and greenhouse gas balances. Bioresour. Technol. 100,4919–4930.
Gomez, A.A., Swete Kelly, D.E., Seyers, J.K., Coughlan, K.J., 1996. Measuring sustain-ability of agricultural systems at the farm level. In: Doran, J.W., Jones, A.J. (Eds.),Methods for Assessing Soil Quality. Soil Science Society of America, Inc., Madison,WI, pp. 401–410.
Gorissen, L., Buytaert, V., Cuypers, D., Dauwe, T., Pelkmans, L., 2010. Why the debateabout land use change should not only focus on biofuels. Environ. Sci. Technol.44, 4046–4049.
Haan, C.T., Barfield, B.J., Hayes, J.C., 1994. Design Hydrology and Sedimentology forSmall Catchments. Academic Press, San Diego.
Hansen, J., Sato, M., Ruedy, R., Lo, K., Lea, D.W., Medina-Elizade, M., 2006. Globaltemperature change. Proc. Natl. Acad. Sci. U.S.A. 103, 14288–14293.
Hatchell, G.E., Ralston, C.W., Foil, R.R., 1970. Soil disturbances in logging: effects onsoil characteristics and growth of loblolly pine in the Atlantic Coastal Plain. J.For. 68, 772–775.
Hecht, A.D., Shaw, D., Bruins, R., Dale, V., Kline, K., Chen, A., 2009. Good policy fol-lows good science: using criteria and indicators for assessing sustainable biofuelproduction. Ecotoxicology 18, 1–4.
Heink, U., Kowarik, I., 2010. What are indicators? On the definition of indicators inecology and environmental planning. Ecol. Indic. 10, 584–593.
Hellebrand, H.J., Scholz, V., Kern, J., 2008. Fertiliser induced nitrous oxide emis-sions during energy crop cultivation on loamy sand soils. Atmos. Environ. 42,8403–8411.
Hudson, N.W., 1993. Field Measurement of Soil Erosion and Runoff.Food and Agriculture Organization of the United Nations, Rome,http://www.fao.org/docrep/t0848e/t0848e00.htm (accessed January 2011).
Huffaker, R., 2010. Protecting water resources in biofuels production. Water Policy12, 129–134.
IPCC, 2007. In: Core Writing Team, Pachauri, R.K., Reisinger, A. (Eds.), ClimateChange 2007: Synthesis Report. Contribution of Working Groups I, II and IIIto the Fourth Assessment Report of the Intergovernmental Panel on ClimateChange. IPCC, Geneva, Switzerland, http://www.ipcc.ch/publications anddata/publications ipcc fourth assessment report synthesis report.htm(accessed January 2011).
Ito, A., Penner, J.E., 2004. Global estimates of biomass burning emissions basedon satellite imagery for the year 2000. J. Geophys. Res. 109 (D14S05),1–18.
Jordan, N., Boody, G., Broussard, W., Glover, J.D., Keeney, D., McCown, B.H., McIsaac,G., Muller, M., Murray, H., Neal, J., Pansing, C., Turner, R.E., Warner, K., Wyse, D.,2007. Environment: sustainable development of the agricultural bio-economy.Science 316, 1570–1571.
Karlen, D.L., Ditzler, C.A., Andrews, S.S., 2003. Soil quality: why and how? Geoderma114, 145–156.
Keeney, D., 2008. Ethanol USA. Environ. Sci. Technol 43, 8–11.Kellogg, R.L., Nehring, R., Grube, A., Goss, D.W., Plotkin, S., 2000. Environmental indi-
cators of pesticide leaching and runoff from farm fields. In: Paper presented at:Agricultural Productivity: Data, Methods, and Measures , March 9–10, 2000,Washington, D.C., http://www.nrcs.usda.gov/technical/NRI/pubs/eip pap.html(accessed January 2011).
Kiely, T., Donaldson, D., Grube, A., 2004. Pesticide Industry Sales and Usage: 2000
and 2001 Market Estimates. United States Environmental Protection Agency,http://www.epa.gov/opp00001/pestsales/01pestsales/market estimates2001.pdf (accessed January 2011).Kline, K., Dale, V.H., Lee, R., Leiby, P., 2009. In defense of biofuels, done right. IssuesSci. Technol. 25, 75–84.
Journal Identification = ECOIND Article Identification = 778 Date: May 6, 2011 Time: 7:23 pm
1 l Indic
L
L
L
L
M
M
M
M
M
M
M
M
M
M
M
M
M
N
N
N
N
N
N
N
O
P
P
P
P
P
P
R
R
288 A.C. McBride et al. / Ecologica
aden, F., Neas, L.M., Dockery, D.W., Schwartz, J., 2000. Association of fine particu-late matter from different sources with daily mortality in six US cities. Environ.Health Perspect. 108, 941–947.
awler, D.M., Petts, G.E., Foster, I.D.L., Harper, S., 2006. Turbidity dynamics duringspring storm events in an urban headwater river system: the Upper Tame, WestMidlands, UK. Sci. Total Environ. 360, 109–126.
awler, J.J., White, D., Sifneos, J.C., Master, L.L., 2003. Rare species and the use ofindicator groups for conservation planning. Conserv. Biol. 17, 875–882.
iska, A.J., Cassman, K.G., 2008. Towards standardization of life-cycle metrics forbiofuels: greenhouse gas emissions mitigation and net energy yield. J. BiobasedMater. Bioenergy 2, 187–203.
acedo, I.C., Seabra, J.E.A., Silva, J.E.A.R., 2008. Green house gases emissions in theproduction and use of ethanol from sugarcane in Brazil: the 2005/2006 averagesand a prediction for 2020. Biomass Bioenergy 32, 582–595.
alm, W., 1999. Introduction to Visibility. Cooperative Institute forResearch in the Atmosphere, Colorado State University, Fort Collins, CO,http://www.epa.gov/visibility/pdfs/introvis.pdf (accessed January 2011).
ann, L., Tolbert, V., 2000. Soil sustainability in renewable biomass plantings. Ambio29, 492–498.
aster, L.L., 1991. Assessing threats and setting priorities for conservation. Conserv.Biol. 5, 559–563.
atamala, R., Gonzalez-Meler, M.A., Jastrow, J.D., Norby, R.J., Schlesinger, W.H., 2003.Impacts of fine root turnover on forest NPP and soil C sequestration potential.Science 302, 1385–1387.
cBride, M.B., 1995. Toxic metal accumulation from agricultural use of sludge: areUSEPA regulations protective? J. Environ. Qual. 24, 5–18.
cCoy, E.D., Mushinsky, H.R., 2007. Estimates of minimum patch size depend on themethod of estimation and the condition of the habitat. Ecology 88, 1401–1407.
cMichael, A.J., Woodruff, R.E., Hales, S., 2006. Climate change and human health:present and future risks. Lancet 367, 859–869.
EA, 2005. Ecosystems and Human Well-being: Synthesis. Island Press,Washington, D.C., http://www.maweb.org/documents/document.356.aspx.pdf(accessed January 2011).
ehlich, A., 1984. Mehlich 3 soil test extractant: a modification of Mehlich 2 extrac-tant. Commun. Soil Sci. Plant Anal. 15, 1409–1416.
onti, A., Venturi, P., Elbersen, H.W., 2001. Evaluation of the establishment of low-land and upland switchgrass (Panicum virgatum L.) varieties under differenttillage and seedbed conditions in northern Italy. Soil Tillage Res. 63, 75–83.
oscatelli, M.C., Lagomarsino, A., Marinari, S., De Angelis, P., Grego, S., 2005. Soilmicrobial indices as bioindicators of environmental changes in a poplar planta-tion. Ecol. Indic. 5, 171–179.
urray, L.D., Best, L.B., Jacobsen, T.J., Braster, M.L., 2003. Potential effects on grass-land birds of converting marginal cropland to switchgrass biomass production.Biomass Bioenergy 25, 167–175.
eftel, A., Flechard, C., Ammann, C., Conen, F., Emmenegger, L., Zeyer, K., 2007. Exper-imental assessment of N2O background fluxes in grassland systems. Tellus Ser.B: Chem. Phys. Meteorol. 59, 470–482.
iemi, G.J., McDonald, M.E., 2004. Application of ecological indicators. Annu. Rev.Ecol., Evol. Syst. 35, 89–111.
iven, R.K., 2005. Ethanol in gasoline: environmental impacts and sustainabilityreview article. Renew. Sustain. Energy Rev. 9, 535–555.
RC, 1977. Ozone and Other Photochemical Oxidants. Printing and Publishing Office,National Academy of Sciences, Washington, D.C.
RC, 2008a. Monitoring Climate Change Impacts: Metrics at the Intersection of theHuman and Earth Systems. The National Academies Press, Washington, D.C.,http://www.nap.edu/catalog.php?record id=12965 (accessed January 2011).
RC, 2008b. Water Implications of Biofuels Production in the United States. TheNational Academies Press, Washington, D.C., http://www.nap.edu/catalog.php?record id=12039 (accessed January 2011).
RCS, 2009. Total Organic Carbon. USDA Natural Resources Conservation Service,http://soils.usda.gov/sqi/assessment/files/toc sq biological indicator sheet.pdf(accessed January 2011).
lsen, S.R., Cole, C.V., Watanabe, F.S., Dean, L.A., 1954. Estimation of available phos-phorus in soils by extraction with sodium bicarbonate. In: USDA Circular 939.U.S. Government Printing Office, Washington, D.C.
arton, W.J., Hartman, M., Ojima, D., Schimel, D., 1998. DAYCENT and its land surfacesubmodel: description and testing. Global Planet. Change 19, 35–48.
attison, A.B., Moody, P.W., Badcock, K.A., Smith, L.J., Armour, J.A., Rasiah, V., Cobon,J.A., Gulino, L.M., Mayer, R., 2008. Development of key soil health indicators forthe Australian banana industry. Appl. Soil Ecol. 40, 155–164.
ope, C.A., Burnett, R.T., Thun, M.J., Calle, E.E., Krewski, D., Ito, K., Thurston, G.D.,2002. Lung cancer, cardiopulmonary mortality, and long-term exposure to fineparticulate air pollution. J. Am. Med. Assoc. 287, 1132–1141.
ordesimo, L.O., Edens, W.C., Sokhansanj, S., 2004. Distribution of abovegroundbiomass in corn stover. Biomass Bioenergy 26, 337–343.
ower, M.E., Tilman, D., Estes, J.A., Menge, B.A., Bond, W.J., Mills, L.S., Daily, G., Castilla,J.C., Lubchenco, J., Paine, R.T., 1996. Challenges in the quest for keystones. Bio-science 46, 609–620.
rince, S.D., Haskett, J., Steininger, M., Strand, H., Wright, R., 2001. Net primary pro-duction of U.S. Midwest croplands from agricultural harvest yield data. Ecol.Appl. 11, 1194–1205.
eeves, D.W., 1997. The role of soil organic matter in maintaining soil quality incontinuous cropping systems. Soil Tillage Res. 43, 131–167.
obertson, G.P., Dale, V.H., Doering, O.C., Hamburg, S.P., Melillo, J.M., Wander, M.M.,Parton, W.J., Adler, P.R., Barney, J.N., Cruse, R.M., Duke, C.S., Fearnside, P.M., Fol-lett, R.F., Gibbs, H.K., Goldemberg, J., Mladenoff, D.J., Ojima, D., Palmer, M.W.,
ators 11 (2011) 1277–1289
Sharpley, A., Wallace, L., Weathers, K.C., Wiens, J.A., Wilhelm, W.W., 2008. Agri-culture: sustainable biofuels redux. Science 322, 49–50.
RSB, 2010. RSB Principles and Criteria. École Polytechnique Fédérale de Lausanne,http://rsb.epfl.ch/files/content/sites/rsb2/files/Biofuels/Version 2/PCs V2/10-11-12 RSB PCs Version 2.pdf (accessed January 2011).
Schäfer, R.B., Caquet, T., Siimes, K., Mueller, R., Lagadic, L., Liess, M., 2007. Effectsof pesticides on community structure and ecosystem functions in agriculturalstreams of three biogeographical regions in Europe. Sci. Total Environ. 382,272–285.
Scharlemann, J.P.W., Laurance, W.F., 2008. Environmental science: how green arebiofuels? Science 319, 43–44.
Scurlock, J.M.O., Johnson, K., Olson, R.J., 2002. Estimating net primary productiv-ity from grassland biomass dynamics measurements. Global Change Biol. 8,736–753.
Seinfeld, J.H., Pankow, J.F., 2003. Organic atmospheric particulate material. Annu.Rev. Phys. Chem. 54, 121–140.
Semere, T., Slater, F.M., 2007. Ground flora, small mammal and bird species diversityin miscanthus (Miscanthus × giganteus) and reed canary-grass (Phalaris arundi-nacea) fields. Biomass Bioenergy 31, 20–29.
Sharpley, A.N., Kleinman, P.J.A., Heathwaite, A.L., Gburek, W.J., Folmar, G.J., Schmidt,J.P., 2008. Phosphorus loss from an agricultural watershed as a function of stormsize. J. Environ. Qual. 37, 362–368.
Shipley, B.K., Reading, R.P., 2006. A comparison of herpetofauna and small mammaldiversity on black-tailed prairie dog (Cynomys ludovicianus) colonies and non-colonized grasslands in Colorado. J. Arid Environ. 66, 27–41.
Shurpali, N.J., Strandman, H., Kilpelainen, A., Huttunen, J., Hyvonen, N., Biasi, C.,Kellomaki, S., Martikainen, P.J., 2010. Atmospheric impact of bioenergy basedon perennial crop (reed canary grass, Phalaris arundinaceae L.) cultivation on adrained boreal organic soil. Global Change Biol. Bioenergy 2, 130–138.
Simberloff, D., 2008. Invasion biologists and the biofuels boom: cassandras or col-leagues? Weed Sci. 56, 867–872.
Smeets, E.M.W., Faaij, A.P.C., 2010. The impact of sustainability criteria on the costsand potentials of bioenergy production—applied for case studies in Brazil andUkraine. Biomass Bioenergy 34, 319–333.
Smith, V.H., Tilman, G.D., Nekola, J.C., 1999. Eutrophication: impacts of excess nutri-ent inputs on freshwater, marine, and terrestrial ecosystems. Environ. Pollut.100, 179–196.
Snow, A.A., Andow, D.A., Gepts, P., Hallerman, E.M., Power, A., Tiedje, J.M., Wolfen-barger, L.L., 2005. Genetically engineered organisms and the environment:current status and recommendations. Ecol. Appl. 15, 377–404.
Snyder, C.S., Bruulsema, T.W., Jensen, T.L., Fixen, P.E., 2009. Review of greenhousegas emissions from crop production systems and fertilizer management effects.Agric. Ecosyst. Environ. 133, 247–266.
Stanciulescu, V., Fleming, J.S., 2006. Life cycle assessment of transportation fuels andGHGenius. In: EIC Climate Change Technology, 2006 IEEE , pp. 1–11.
Stone, K.C., Hunt, P.G., Cantrell, K.B., Ro, K.S., 2010. The potential impacts of biomassfeedstock production on water resource availability. Bioresour. Technol. 101,2014–2025.
Sullivan, P., 2003. Applying the Principles of Sustainable Farming. National Centerfor Appropriate Technology, http://attra.ncat.org/attra-pub/PDF/Transition.pdf(accessed January 2011).
Tolbert, V.R., Todd, D.E., Mann, L.K., Jawdy, C.M., Mays, D.A., Malik, R., Bandaranayake,W., Houston, A., Tyler, D., Pettry, D.E., 2002. Changes in soil quality and below-ground carbon storage with conversion of traditional agricultural crop lands tobioenergy crop production. Environ. Pollut. 116, S97–S106.
Townsend, C.L., Maynard, R.L., 2002. Effects on health of prolonged exposure to lowconcentrations of carbon monoxide. Occup. Environ. Med. 59, 708–711.
Turlure, C., Choutt, J., Van Dyck, H., Baguette, M., Schtickzelle, N., 2010. Functionalhabitat area as a reliable proxy for population size: case study using two butterflyspecies of conservation concern. J. Insect Conserv. 14, 379–388.
Unger, P.W., Kaspar, T.C., 1994. Soil compaction and root growth: a review. Agron.J. 86, 759–766.
Ussiri, D.A.N., Lal, R., Jarecki, M.K., 2009. Nitrous oxide and methane emissions fromlong-term tillage under a continuous corn cropping system in Ohio. Soil TillageRes. 104, 247–255.
van Dam, J., Junginger, M., Faaij, A., Jurgens, I., Best, G., Fritsche, U., 2008. Overviewof recent developments in sustainable biomass certification. Biomass Bioenergy32, 749–780.
Venkataraman, C., Rao, G.U.M., 2001. Emission factors of carbon monoxide andsize-resolved aerosols from biofuel combustion. Environ. Sci. Technol. 35,2100–2107.
Vlassak, K., 1970. Total soil nitrogen and nitrogen mineralization. Plant Soil 32,27–32.
Wang, M., 2002. Fuel choices for fuel-cell vehicles: well-to-wheels energy and emis-sion impacts. J. Power Sources 112, 307–321.
Wang, M., Wu, M., Huo, H., Liu, J.H., 2008. Life-cycle energy use and greenhouse gasemission implications of Brazilian sugarcane ethanol simulated with the GREETmodel. Int. Sugar J. 110, 527–545.
Ward, M.H., deKok, T.M., Levallois, P., Brender, J., Gulis, G., Nolan, B.T., VanDerslice,J., 2005. Workgroup report: drinking-water nitrate and health—recent findingsand research needs. Environ. Health Perspect. 113, 1607–1614.
West, T.O., Brandt, C.C., Baskaran, L.M., Hellwinckel, C.M., Mueller, R., Bernac-chi, C.J., Bandaru, V., Yang, B., Wilson, B.S., Marland, G., Nelson, R.G., Ugarte,D.G.D., Post, W.M., 2010. Cropland carbon fluxes in the United States: increas-ing geospatial resolution of inventory-based carbon accounting. Ecol. Appl. 20,1074–1086.

Journal Identification = ECOIND Article Identification = 778 Date: May 6, 2011 Time: 7:23 pm
l Indic
W
W
W
production of ethanol and petroleum gasoline. Environ. Manage. 44,
A.C. McBride et al. / Ecologica
illiams, P.R.D., Inman, D., Aden, A., Heath, G.A., 2009. Environmental and sustain-ability factors associated with next-generation biofuels in the U.S.: what do we
really know? Environ. Sci. Technol. 43, 4763–4775.ood, P.J., Armitage, P.D., 1997. Biological effects of fine sediment in the lotic envi-ronment. Environ. Manage. 21, 203–217.
u, J., Mersie, W., Atalay, A., Seybold, C.A., 2003. Copper retention from runoff byswitchgrass and tall fescue filter strips. J. Soil Water Conserv. 58, 67–73.
ators 11 (2011) 1277–1289 1289
Wu, M., Mintz, M., Wang, M., Arora, S., 2009. Water consumption in the
981–997.Yevich, R., Logan, J.A., 2003. An assessment of biofuel use and burning of agri-
cultural waste in the developing world. Global Biogeochem. Cycles 17 (1095),1–40.
Related Documents