Final report Barcelona, 27 January 2005 European Commission Directorate for Public Health and Safety Work DG- SANCO Grant agreement: SI2.328106 (2001CVG3- 513) The project is also partially funded by GlaxoSmithKline (GSK)

Welcome message from author
This document is posted to help you gain knowledge. Please leave a comment to let me know what you think about it! Share it to your friends and learn new things together.
Transcript
Final report
Barcelona, 27 January 2005
European Commission Directorate for Public Health and Safety Work
DG- SANCO Grant agreement: SI2.328106 (2001CVG3-513)
The project is also partially funded by GlaxoSmithKline (GSK)
2
Indicators for monitoring COPD and asthma in the EU
A report for the Directorate for Public Health and Safety Work (DG-SANCO) of the European Commission
Prepared by
Enric Duran-Tauleria and the IMCA Working Group
Address for correspondence:
Enric Duran-Tauleria Project Co-ordinator
Respiratory and Environmental Health Research Unit (REHRU) Institut Municipal d’Investigació Mèdica (IMIM)
Dr. Aiguader, 80 08003 Barcelona – SAPAIN
Tel: +0034 93 2211009 - 2515 e-mail: [email protected]

3
__________Members of the IMCA Working Group__________
Manfred Neuberger Hanns Moshammer Abteilung für allgemeine Präventivmedizin Institut für Umwelthygiene der Universität Wien, Austria
Paul A. Vermeire Department of Respiratory Medicine and Epidemiology University of Antwerpen Antwerpen, Belgium
Charlotte Suppli Ulrik Department of Respiratory Diseases Hvidovre Hospital Hvidovre, Denmark
Pekka Jousilahki Department of Epidemiology and Health Promotion, National Public health Institut Helsinki, Finland
Denis Charpin Sandrine Boutin Service de Pneumologie-Allergologie, Centre Hospitalier Régional et Universitaire de Marseille Hôpital Nord, Marseille, France
Stephan Weiland Department of Epidemiology University of Ulm Ulm, Germany
Mina Gaga Department of Respiratory Medicine Medical School of Athens University Sotiria Hospital Athens, Greece
Luke Clancy University Teaching Hospital of Trinity College Dublin, St Jame’s Hospital Dublin, Ireland
Francesco Forastiere Department of Epidemiology ASL RME Agency for Public Health Roma. Italy
Romain Nati Service de Pneumologie Centre Hospitalier de Luxembourg Luxembourg
Henriette A. Smit Department of Chronic Diseases Epidemiology National Institute of Public Health and the Environtment Bilthoven, The Netherlands
Màrio Morais-Almeida Servicio de Immunoalergologia Hospital de Dona Estefanía Lisboa, Portugal.
Christer Janson Department of Medical Sciences Respiratory Medicine and Allergology Uppsala University Uppsala, Sweden
Enric Duran Josep Mª Antó Unitat de Recerca Respiratòria i Ambiental Institut Municipal d’Investigació Mèdica (IMIM) Barcelona, Spain
Per Bakke Institut of Medicine, Department of Thoracic Medicine University of Bergen Haukeland University Hospital Bergen, Norway
Deborah Jarvis Department of Public Health Sciences University of London, Guy’s Hospital London, United Kingdom
Giovanni Viegi CNR Institute of Clinical Physiology, European Respiratory Society (ERS) Pisa, Italy
Nikolai Khaltaev Paolo M. Matricardi Eva Mantzouranis Chronic Respiratory Diseases and Arthritis Unit NMH/CHP Department WHO, World Health Organisation Geneva, Switzerland
4
Acknowledgements
The I MCA project was supported by the Health Monitor ing Program of the European Comm ission under the grant agreement : SI 2.328106 (2001CVG3-513) . The project was also part ially funded by GlaxoSmithKline (GSK).
We are most grateful to I olanda Molina and Crist ina Borrás (Fundació I MI M) , for her substant ial contribution to meetings organization and project administration.
The data collect ion and analysis of data on indicators availability and pr ior it izat ion would not have been possible without the valuable contribution of Montserrat Vergara (Fundació IMIM).
During this project development , we had the opportunity to learn from the experience of other projects carr ied out under the Health Monitor ing Program of the European Comm ission and exchange ideas on many different issues with several project leaders. We would like to thank especially Pieter Kramers (ECHI Project ) for his support and st im ulat ion during the init ial stages of the project . We would also like to thank Hugh Magee, Arpo Aromaa, Piet ro Folino and Andrea Michelli for br inging us the opportunity to exchange documents on several issues common to our respective projects.
We are indebted to Henr iet te Chamouillet , who was the person from DG-SANCO that init ially st imulated the project development , to Antoni Montserrat and John Ryan for facilitat ing the exchange of ideas among I MCA and other HMP projects and for the ext raordinary support given to the IMCA group over the project development.
5
Executive Summary
This report presents the results of the project “ Indicators for Monitor ing COPD and asthm a in the EU ( I MCA)” . The overall aim of the project was to get a consensus am ong clinicians and researchers in the field of respiratory diseases, representat ives from internat ional organizat ions ( i.e. WHO Europe) and scient ific societ ies ( i.e. ERS and EACCI) on a proposal for a set of indicators to monitor these two conditions among all EU Member States.
I n all project developm ent stages, we have taken into account all previous projects carr ied out under the Health Monitoring Program and we have considered in detail the fram ework and proposals of the European Com m unity Health I ndicators (ECHI ) project and the proposals set up by DG-SANCO under the New Public Health Program (2003-2008) to build a “European System of I nform at ion and knowledge on Major and Chronic Diseases”.
The project work was carr ied out according to the agreed work plan and it was divided into five m ajor steps. First , the co-ordinat ing cent re, based on the init ial select ion of indicators carr ied out by the COPD and asthm a panels, created the “ I nit ial mat r ix list of indicators” for COPD and asthm a and based on the fram ework suggested by the ECHI group. Second, based on a scient ific literature review, a sum m ary report of the relevant inform at ion for each group of indicators was produced and included into the “ I nit ial m at r ix of indicators” creat ing the “Annotated list of indicators” . Third, the consistency of the indicators proposed in relat ion to internat ional research studies, rout ine data sources and clinical guidelines was assessed. Fourth, the sam e process was carr ied out at nat ional level by each IMCA part icipant . Finally, a process to decide indicators final selection and priorities was established.
Overall, including dem ographic and socio-econom ic indicators (m ainly used as denom inators or for st rat ificat ion) a total of 117 and 145 indicators are proposed and defined for COPD and asthma respectively. Indicators are grouped into four main groups: 1) Dem ography and socio-econom ic, 2) Health status, 3) Determ inants of Health and 4) Health systems. The number of indicators may seem too large for many readers having a general interest in Public Health. However, the I MCA group, st rongly suggest a careful reading of detailed inform at ion at tached to each group of indicators to appreciate their value and appropriateness. For each group of indicators you will f ind the following inform at ion: a) rat ionale, b) aim s, c) data sources, d) data quality, e) m ethods to be used for new data collect ion, f) data presentat ion, g) potent ial use, h) consistency at internat ional level, i) com m ents, j ) availabilit y and consistency at nat ional level and k) priority.
I n order to facilitate the indicators implem entat ion process according to the DG-SANCO plans for operat ing a European Union Public Health I nform at ion and Knowledge System we established a prioritization process but without excluding any indicator. The process is explained in detail on the m ethodology sect ion. I n this sum m ary, we will m ent ion only the indicators selected as the top 20 for COPD and asthm a and am ong these, those selected as the top 4 recom m ended for short t im e im plem entat ion and to be included in the “ECHI-2 short list”.
The top 20 indicators selected for COPD were:
current sm okers, past sm okers, hospital adm issions, age, age- specific death rate , standardized death rate (SDR) , intervent ions to prevent tobacco exposure, em ergency room visits, prevalence of chronic

6
symptoms, prevalence of physician diagnosed COPD , gender, COPD pat ients invited to stop sm oking, COP pat ients who followed a stop sm oking program , prevalence of chronic bronchit is, prevalence of airway obst ruct ion, crude death rates, current sm okers (<15 pack years), COPD patients that have managed stop smoking, hospitalization costs and total number of death. The top four indicators are marked in bold.
The top 20 indicators selected for asthm a were:
prevalence of physician diagnosed
asthm a, prevalence of w heeze, prevalence of asthm a at tacks, inhaled corticosteroids, hospital adm ission rates, current sm okers, prevalence of asthm a t reatm ent , age-specific death rates, past sm okers, current ETS exposure at present , standardized death rates (SDR) , short act ing β2 agonists, total num ber of death, crude death rates, ETS exposure at hom e, ETS exposure at work, sm oking exposure during m other pregnancy, hospitalizat ion cost , total cost of m edicines prescribed for asthm a treatment and cost of total asthma care. The top four indicators are marked in bold.
Either the top twenty and four are m arked in the “Annotated list of indicators for COPD and asthm a” and also sum m arized in Annex V. As we said before, all indicators are im portant and each indicator or group of indicators is relevant to m onitor specific issues of these two condit ions. However, a clear st rategy for short , m iddle and long term im plem entat ion m ay be needed. I n order to facilitate im plem entat ion pr iorit ies without excluding any indicator, independent ly of the previously m ent ioned select ion, all indicators were classified into three levels of pr ior ity by each subcategory. This classification is also described in the “Annotated list of indicators for COPD and asthma”
I n conclusion, a large num ber of indicators useful to m onitor COPD and asthm a have been ident ified and defined. Only a sm all proport ion of them are rout inely available but with sm all methodological changes a great im provem ent on the quality and quant ity of indicators could be achieved. A very large num ber of indicators are not available from rout ine health exam inat ion surveys but they could be obtained from large internat ional research studies. Although these studies have been carr ied out several years ago, a system at ic analysis of these databases could provide a good picture on the variabilit y of these indicators within and between count r ies across Europe. I n the near future, specific m odules including the appropriate quest ionnaires and m easurem ents required to m onitor COPD and asthm a have to be developed. The inclusion of these m odules into future Health Examination Surveys have to be explored in feasibility studies.
We t ruly wish that the indicators selected and presented in this report will cont r ibute and st im ulate the developm ent of inform at ion system s to m onitor COPD and asthm a in all member estates of the European Union.

7
Index
Acknowledgements ………………………………………………………………………………………………..
3
Executive summary ……………………………………………………………………………………………….
4
Part I
1. Background ………………….………………………………………………………………………………….……
8
2. Aims
2.1 General ………………………………………………………………………………………………………………
12
2.2 Specific ……………………………………………………………………………………………………………..
12
3. Organization and management
3.1 Steering Committee ……………………………………………………………………………….………….
13
3.2 Study co-ordinating Centre …………………………………………………………………….………..
1 3
3.3 IMCA Working Group ……………………………………………………………………………….………..
14
3.4 Organization Framework …………………………………………………………………………….…….
15
4. Work Plan and methodology
4.1 Revised Work Plan …………………………………………………………………………………….…….
17
4.1.1 Step 1: The initial matrix list of indicators ………………………….……………
17
4.1.2 Step 2: An annotated list of indicators ………...............................…
17
4.1.3 Step 3: Assessm ent of the consistency of the list of indicators at international level …………………………………………………….. 18
4.1.4 Step 4: Assessm ent of the consistency of the list of indicators at national level ………………………………………………………………………..
18
4.1.5 Step 5: Final selection and prioritization of the list of indicators ….… 19
4.2 How we did the main results summary?: “Annotated list of indicators for COPD and asthma …...………………………………………………………………………………………..
23
5. Project results
5.1. Indicators for monitoring COPD in the EU ……………………………………............……
24
5.2. Indicators for monitoring Asthma in the EU ……………………………………...........….
76
8
Part II
Annex I New Work Plan Proposal
Annex II Revised Work Plan Timetable
Annex III COPD and asthma questionnaires: data availability and indicators priority
Annex IV Indicators availability: tables by country
Annex V Indicators priority: tables by indicator group
Annex VI National consistency reports
Annex VII Agenda and minutes of all IMCA meetings List of participants

9
1. Background
I n 1977 the European Com m ission established the Health Monitor ing Program m e
(hereafter called HMP) seeking to produce com parable inform at ion on the health and
health related behaviour of the populat ion, on health prom ot ion and health system s. The
activit ies under the HMP were set out under three headings or “Pillars” : A: Establishm ent
of Com m unity Health I ndicators; B: Developm ent of a Com m unity-wide network for
sharing health data; and C: analysis and report ing report ing1,2. The three Pillars served
different funct ions. Pillar A
asks the quest ion which
data and indicators should be
included in a Com m unity health data exchange system . Pillar B
addresses the quest ion
how
this system should, technically, be m ade to operate. Pillar C
refers to the use
of
the data for policy decision makers.
Under Pillar A, over the past years, around 47 projects have been funded to develop
indicators in many areas of public health and produce recommendations on how to collect
these indicators to be incorporated to the future European Union Public Health
I nform at ion Network (EUPHI N)3 developed under Pillar B. Most projects covered a wide
spect rum of health issues ( i.e. child-health indicators, perinatal health indicators, work
related health, etc.) . However, since it is not possible to m onitor all relevant areas of
chronic diseases using just one indicator ( i.e. prevalence, t reatm ent , m ortality, etc.)
som e projects had a focus on acute or chronic diseases and with the object ive of
recom m ending a set of indicators for m onitoring these condit ions: cancer4,5
musculoskeletal6, cardiovascular7 and diabetes m ellitus8. Although the ECHI project had
already recom m ended som e indicators for m onitor ing respiratory diseases no previous
project had a specific focus on indicators for COPD and asthma.
These two condit ions are affect ing a large proport ion of the populat ion, and have an
im portant impact on the quality of life of those suffer ing them and on costs of health
services. The asthm a prevalence am ong children is about 13% and in adults 8.4% 10,11.
The prevalence of chronic obst ruct ive pulm onary disease (COPD) ranges from 4 to
8%12,13. Although asthm a m ay cause death, the im pact of COPD on m ortality is higher.
The World Health Organisat ion (WHO) est im ates that COPD is current ly the twelfth m ost
common cause of morbidity and sixth leading cause of death in the world 14.
The rout ine data current ly available to m onitor these two condit ions, their r isk factors,
and their impact of health services and clinical care on outcom es is ext rem ely limited.
10
Mortality and hospital discharge data are rout inely collected in m ost count r ies and they
may allow to monitor trends and geographical variations between and within countries.
However, these data sources have im portant lim itat ions in term s of the accuracy of
data15 and also with regard to the level of inform at ion they provide about the
epidemiology or clinical management of the disease.
Health interview/ exam inat ion surveys are other im portant sources of inform at ion, which
could provide bet ter inform at ion on both, the epidem iology and the process of clinical
care of these two condit ions. However, the reality is ext rem ely disappoint ing, during the
period 1998-2002, 60 health interview surveys were carr ied out at nat ional/ internat ional
level and 49 collected inform at ion about chronic condit ions. However, only 12 carr ied out
clinical examinat ions and only 5 of them collected inform at ion on respiratory funct ion
(spirometry)16.
The lim ited inform at ion available ( in term s of quality and quant ity) cont rasts with the
large num ber of aspects ident ified by the internat ional clinical guidelines such as GI NA17
or GOLD18 that could be m onitored in order to have a full picture of the epidem iology
(prevalence and r isk factors) , the process of care (diagnosis, t reatm ent , exacerbat ions) ,
intervent ions for prevent ion (avoidance of specific r isk factors) and the m ain outcom es
(quality of life, use of health services, mortality etc.) for these two conditions.
Using the guidelines standards, an im portant num ber of research studies have been able
to invest igate specific issues of these two condit ions but in m ost cases, results m ay not
be considered representat ive at nat ional or even regional level. Som e exam ples are the
ident ificat ion of under-diagnosis and under- treatment in both condit ions and its
determinants13,19,20 or the im pact of different form s of health care organisat ion on clinical
outcomes20. I n cont rast with this view at nat ional level, there are specific projects ( I
would say except ional) focused on sm all geographical areas that have developed a
com prehensive surveillance system s based on several surveys carr ied out in different
set t ing and target populat ions. We can use the Chicago Asthm a Surveillance I nit iat ive
(CASI)21 as an exam ple. Although they are ext rem ely interest ing, they m ay not be cost -
effective for national or international surveillance systems.
The im plem entat ion of a com m unity-wide surveillance system that describes the
epidem iology, character ize health care for asthm a and COPD and its im pact on outcomes
its a com plex task, and probably even m ore difficult at internat ional level. I t requires
careful thinking in term s of either the issues to be covered, the potent ial users of the
inform at ion at different geographical levels, the relevance of the inform at ion for either
11
prevent ion or st rategies to im prove clinical m anagem ent and the feasibility and costs
associated to the methods to be used.
Over the past decades, large internat ional research studies such as ECRHS22 or I SAAC23
have developed m ethods and tools that could be incorporated in the rout ine inform at ion
system s for m onitoring COPD and asthm a across the EU. This project , will ident ify the
m ost relevant areas of these two condit ions for monitoring, and by consensus am ong
project part icipants w ill recom m end a set of indicators appropriate for
m onitor ing asthm a and COPD in the EU, and the m ethods and tools that should
be used for data collection.
References:
1. McKee M, Ryan J. Monitor ing health in Europe: opportunit ies and challenges and
progress. Eur J Publ Health 2003; 13(3 Suppl):1-4.
2. Byrne D. Foreword. Eur J Publ Health 2003; 13(3 Suppl):5.
3. The Euphin, the telem at ics support for public health in the EU. Eur J Publ Health
2003; 13(3 Suppl):114-115.
4. Micheli A, Cpocaccia R, Mart inez C, Mugno E, Coebergh JW, Baili P, Verdecchia A,
Berr ino F, Colem an M. Caqncer cont rol in europe: a proposed set of european
Cancer Health Indicators. Eur J Publ Health 2003; 13(3 Suppl):116-118.
5. Bray F, Guerra M, Parkin DM. The Comprehennsive Cancer Monitoring Programme in
Europe. Eur J Publ Health 2003; 13(3 Suppl):61-66.
6. Bruusgaard D. I nternat ional m onitoring of m usculoskeletal com plaints: a need for
consensus. Eur J Publ Health 2003; 13(3 Suppl):20-23.
7. The EUROCI SS Working Group. Coronary and cerebrovascular population-based
registers in Europe: are m orbidity indicators com parable? Ressults from the
EUROCISS Project. Eur J Publ Health 2003; 13(3 Suppl):55-60.
8. De Beaufort CE, Reunanen A, Raleigh V, Storm s F, Kleinebreil L, Gallego R, Giorda
C, Midthjell K, Jecth M, De Leeuw I , Schoeber E, Boran G, Tolis G. European Union
diabetes indicators: fact or fiction? Eur J Publ Health 2003; 13(3 Suppl):51-54.

12
9. Kramers PG. The ECHI project. Eur J Publ Health 2003; 13(3 Suppl):101-106.
10. The I nternat ional Study of –asthma and allergies in Childhood ( I SAAC Steering
Com m it tee) . Worldwide variat ions in the prevalence of asthm a sym ptom s: the
I nternat ional study of Asthm a and Allergies in Childhood ( I SAAC) . Eur Respir J;
12:315-335.
11. European Com m unity Respiratory Health survey. Variat ions in the prevalence of
respiratory sym ptom s, self- reported asthm a at tacks, and use of asthm a m edicat ion
in the European Com m unity Respiratory Health Survey (ERHS) . Eur Respir J 1996;
9:687-695.
12. Antó JM, Verm eire P, Vestbo J, Sunyer J. Epidem iology of chronic obst ruct ive
pulmonary disease. Eur Respir J 2001; 17:982-994.
13. Rennard S, Decram er M, Calverley PMA, Pride NB, Soriano JB, Verm eire PA, Vestbo
J. I m pact of COPD in North Am erica and Europe in 2000: subjects’ perspect ive of
Confronting COPD International Survey. Eur Respir J 2002; 20:799-805.
14. Murray CJ, Lopez AD. Alternat ive project ion of m ortality by cause 1990-2020:
global burden of disease study. Lancet 1997; 349:1498-1504.
15. William VM, Molly OL, Buist S. Uses and lim itat ions of m ortality and health care
utilization satatistics in asthma research. Am J Respir Crit Care Med 1994; 149:579-
587.
16. Arom aa A, Koponen P, Tafforeau J, Verm eire C and the HI S/ HES Core Group.
Evaluat ion of health I nterview Surveys and Health exam inat ion Surveys in the
European Union. Eur J Publ Health 2003; 13(3 Suppl):67-72.
17. Global I nit iat ive for A (GI NA) . Global St rategy for Asthm a Managem ent and
Prevent ion. NHLB/ WHO workshop report .Nat ional I nst itutes of Health, Nat ional
Heart, and Blood Institut. February 2002, NIH Publication No. 02-3659.
18. Pauwells RA, Buist AS, Calverley PM, Jenkins CR, Hurd SS. Global strategy for the
diagnosis, m anagem ent , and prevent ion of chronic obst ruct ive pulmonary

13
disease. NHLBI / WHO Global I nit iat ive for Chronic Obst ruct ive Lung Disease
(GOLD) Worshop summary. Am J Resp Crit Care Med 2001; 163:1256-1276.
19. Janson C, Chinn S, Jarvis D, Burney P, on behalf of the European Com m unity
Respiratory Health Survey. Physician-diagnosed asthm a and drug ut ilizat ionin the
European Com m unity Respiratory Health Survey. Eur Respir J 1997; 10: 1795-
1802.
20. Maziak W, von Mut ius E, Beim fohr C, Hirsch T, Leupold W, Keil U, Weiland S. The
management of childhood asthma in the community. Eur respir J 2002; 20:1476-
1482.
21. Weiss KB, Grant E and the Chicago Asthm a Surveillance I nit iat ive Project Team .
The chicago asthma surveillance Initiative. Chest 1999; 116:141S-145S.
22. Janson C, Anto J, Burney P et al. The European Respiratory Health survey: what
are the main results so far? Eur Respir J 2001; 18:598-611.
23. The I nternat ional Study of Asthma and Allergies in Childhood ( I SAAC) Steer ing Comm it tee.
Worldwide var iat ion in prevalence of symptoms of asthma, allergic rhinoconjunct iv it is, and
atopic eczema: ISAAC. Lancet. 1998 Apr 25;351(9111):1225-32.
2. Aims
2.1 General:
• To get a consensus am ong part icipants of all EU count r ies about a set of
indicators relevant for monitoring asthma and COPD across the EU.
2.2 Specific:
• To ident ify all rout inely and research ( large studies) sources of data providing
useful informat ion for m onitoring COPD and asthm a in the EU and assess their
com parability (within and between count r ies) , and their st rengths and
limitations.
• Explore to what extent international databases such as OCDE, WHO, EUROSTAT
could be improved based on the information available for these two conditions.

14
• To ident ify the best scient ific evidence on risk factors (exposures) , prevalence,
clinical m anagem ent and policy intervent ions and explore to what extent the
evidence is (or could be incorporated to the information systems).
• To ident ify the m ost im portant protocol or clinical guidelines recom m end by
national or international scientific societies implemented in each EU country and
assess their comparability.
• To identify a set of indicators useful for monitoring and covering several aspects
of these two condit ions such as r isk factors, prevalence, clinical m anagem ent ,
and outcomes.
3. Organization and management
3.1 Steering Committee
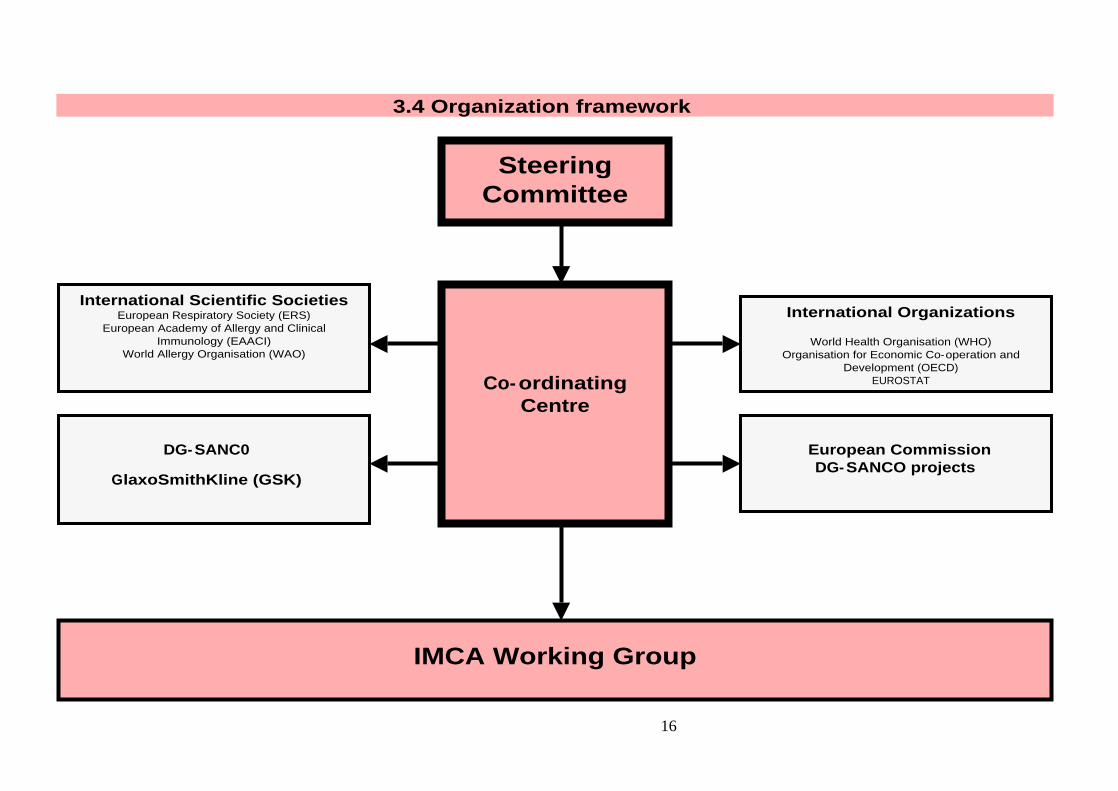
The Steering Com m it tee (SC) was integrated by the “core group” as it was
established in the init ial proposal subm it ted to DG-SANCO. The role of the SC was to
advice on specific m ethodological issues of the project , to establish on links with
other internat ional organizat ions or scient ific societ ies and to m onitor the overall
project development. The SC was integrated by the project co-ordinator, Enric Duran
(Spain) , Josep Mª Antó (Spain) , Christer Janson (Sweden) , Debborah Jarvis (UK) ,
Stephen Weiland (Germ any) and Francesco Forast iere ( I taly) and Giovanni Viegi in
representation of the European Respiratory Society (ERS).
3.2 Study co-ordinating Centre
The study co-ordinat ing cent re was established at the Fundació I MI M in Barcelona
and co-ordinated by Enr ic Duran. The cent re was responsible for the ongoing
adm inist rat ive and financial m anagem ent tasks, meet ings organizat ion and overall
project developm ent according to decisions taken by the Steer ing Com mit tee and
suggestions from other partners.
The cent re was also responsible for guaranteeing good com m unicat ion between
partners, DG-SANCO representat ives, other DG-SANCO project co-ordinators and
representatives of international organisations and scientific societies.

15
Over the past years, the Health Monitor ing Program m e (DG-SANCO) funded several
projects aim ing to cont r ibute to the developm ent of a new EU health inform at ion
system . Although each project studied specific areas of inform at ion or diseases,
there were several issues com m on to our project . I n order to get good interact ion
between projects, the co-ordinat ing cent re and according to the SC advice, ident ified
projects with com m on links and established appropriate ways of com m unicat ion and
collaborat ion. Som e of these projects were: The European Com m unity Health
I ndicators (ECHI ) , Environm ent and Health I ndicators, European Health Risk
Monitoring, Hospital Data Project and Health Surveys in the EU.
The I MCA group, through the co-ordinat ing cent re established appropriate links and
ident ify areas of collaborat ion with internat ional organisat ions such as Eurostat ,
OECD, and WHO that have been collect ing data from MS for a long period of t im e
with large experience in data collection and reporting.
3.3 IMCA Working Group
All I MCA part icipants represent ing m ost EU Mem ber States (MS) were m em bers of
the group. The group had two general meetings of two and one days. During the first
m eet ing, it was decided which DG-SANCO project co-ordinators, experts, or
representat ives of internat ional organizat ions or scient ific societ ies had to be
contacted to discuss specific issues related to the project.
16
3.4 Organization framework
Steering Committee
Co-ordinating Centre
International Scientific Societies
European Respiratory Society (ERS) European Academy of Allergy and Clinical
Immunology (EAACI) World Allergy Organisation (WAO)
International Organizations
World Health Organisation (WHO) Organisation for Economic Co-operation and
Development (OECD) EUROSTAT
IMCA Working Group
European Commission DG-SANCO projects
DG-SANC0
GlaxoSmithKline (GSK)

17
4. Work plan and methodology
I n the or iginal project proposal there was a br ief descript ion of the tasks and
t im etable to carry out the project and reach the object ives previously set up. I n
order to reach a consensus am ong the I MCA part icipants on the work plan and
m ethods to follow, the co-ordinat ing cent re prepared a “New Work Plan Proposal”
(Annex I ) to be discussed during the 1st I MCA general m eet ing (Annex VI I ) and to
decide a definitive strategy for the project development.
After and overall discussion and considering in detail all object ives of the project
and the m ethods previously suggested, the I MCA group considered very important
to start the project with the ident ificat ion of the m ain issues or indicators m ore
relevant for m onitoring COPD and asthm a. Part icipants considered that issues
related to the assessm ent of rout ine sources of inform at ion, research databases
and consistency with clinical guidelines should be carried out in a second step.
Consequent ly, during the 1st I MCA m eet ing and as a start ing point , two different
panels were set up to select the first list of indicators. The com posit ion of the two
panels was established as follows:
The Asthm a panel included :
Deborah Jarvis (Chair) , Enric Duran (Rapporteur) ,
Roman Nati, Henriette Smit, Mario Morais, Denis Charpin, Hans Moshammer.
The COPD panel included :
Giovanni Viegi (Chair) , Josep Mª Antó (Rapporteur) ,
Mina Gaga, Per Bakke, Pekka Jousilahti, Paul Vermeire, Nikolai Khaltaev.
The two panels were asked to provide the first list of indicators related to the m ain
areas described in the “New Work Plan Proposal” (Annex I ) including indicators on
risk factors, measures of disease frequency, clinical management and outcomes for
the two condit ions under study. For both condit ions, in addit ion to the indicators,
the sources of inform at ion available, or desirable to be developed in the future
were also identified. The two lists provided by the COPD and asthma panels (Annex
VI I , m inutes of the 1st I MCA general m eet ing) were used as the start ing point for
the project developm ent and a definit ive t im etable was established (Annex I I ,
“Revised Work Plan Tim etable” ) . I n addit ion to the t im etable, the group decided
the steps to follow in order to reach the project object ives according to the new
t im etable. I t was decided to st ructure the project developm ent in five steps that
18
will be described in detail in the following sect ion under the heading “Revised Work
Plan”.
4.1 Revised Work Plan
One of the outcom es of the 1st I MCA general m eet ing was the establishm ent of a
Revised Work Plan and t im etable for the project developm ent that included five
important steps.
4.1.1 Step 1: The initial matrix list of indicators.
Although the group clearly ident ified several m odels and ways for indicators
classificat ion, it was decided to use the m odel/ m at r ix suggested by “The European
Com m unity Health I ndicators (ECHI ) ” . There were two m ain reasons for this
select ion. First , it was clear that the ECHI proposal was widely accepted by other
projects focused on indicators developm ent . Second, DG-SANCO had high interest
in integrat ing all indicators into the ECHI list as a m ethods for avoiding
duplicat ions, generate com m on m ethodologies and prepare future inform at ion
st rategies. As the first step, the co-ordinat ing cent re, based on the init ial list of
issues selected by the COPD and asthm a panels, prepared a m at r ix list of
indicators using the sam e axis of classificat ion as proposed by the ECHI project . I n
carrying out this work, the co-ordinat ing cent re, produced a m uch m ore detailed
descript ion of the indicators previously selected by the I MCA group, including the
operat ional definit ion, inform at ion on availability and data sources. This init ial
m at r ix list of indicators have not been included as an annex because it was very
sim ilar to the annotated list of indicators that will be described in the following
sect ion (step 2) . After the review by all part icipants, the gaps ident ified and new
suggestions were incorporated into the matrix.
4.1.2 Step 2: An annotated list of indicators.
The co-ordinat ing cent re carr ied out a scient ific literature review and produced a
sum m ary report of the relevant scient ific inform at ion for each group of indicators
selected and included in three major areas of classification established by the IMCA
group: measures of disease frequency, risk factors and clinical management.
The literature review and sum m ary of the inform at ion was ext rem ely useful for: a)
bet ter specificat ion of the areas to include, b) just ificat ion of each indicator, c) to
19
know the scient ific validity and d) to provide inform at ion on data sources. Based
on the literature review, an annotated list of indicators was produced. The
annotated list was reviewed by all participants and a final document was produced.
4 .1 .3 Step 3 : Assessm ent of the consistency of the list of indicators
at the international level.
This step was int roduced to assess the consistency of the indicators proposed in
relat ion to internat ional research studies, rout ine data sources and internat ional
guidelines. This work cont r ibuted to the bet ter specificat ion of indicators and to
discard som e indicators previously selected including a wider perspect ive of the
inform at ion on clinical and public health needs and also considering the ECHI
perspect ive (user-window not ion) . This work was carr ied out by the co-ordinating
centre with the contribution of all participants.
4 .1 .4 Step 4 : Assessm ent of the consistency of the list of indicators
at the national level.
All part icipants checked the consistency at nat ional level for all indicators included
on the annotated list of indicators. The consistency was assessed like at
internat ional level in rout ine data sources, internat ional guidelines and research
studies at nat ional level. This process was carr ied out in two steps. First , the co-
ordinat ing cent re prepared a quest ionnaire (Annex I I I ) to be com pleted by all
part icipants in order to assess the data availabilit y and the prior ity for each
indicator in their own count ry. The first colum n of the quest ionnaire was designed
to collect the inform at ion on data availabilit y in each count ry. The co-ordinating
centre produced a brief guideline (details in Annex III) to complete the first column
of the quest ionnaire. Each part icipant com pleted the colum n indicat ing the
availabilit y of each indicator taking into account the specificat ions of the indicators
provided by the “Annotated list of indicators for COPD and asthm a” and the
availability of the information in their own country.
Before filling up the first colum n, each part icipant considered the inform at ion
published in specific nat ional or regional reports, in scient ific publicat ions with a
clear Medline reference or reports produced without m aking it available to the
public ( internal reports) . The concept of availabilit y was understood as data
available independent ly if it s publicat ion. The data available should be
representative at national level.

20
In cases for which data were available and perhaps representative but only for sub-
nat ional geographical areas, the details were reported for each indicator in the
report on the national consistency or communicated to the co-ordinating centre.
I n order to classify the indicators according their availabilit y at nat ional level we
took into account the sources of data available at present (m ainly rout ine data,
general HI S/ HES surveys and specific research surveys) and the ones that m ay be
needed to develop in the future at national level.
Based on these cr iter ia, we suggest to classify the availabilit y of each indicator at
nat ional level by using six groups of classificat ion. However, once the co-ordinating
cent re had the data analyzed, in order to have a bet ter picture of the reality and in
order to sim plify the view on the availabilit y in each count ry for the sum m ary of
the inform at ion, the I MCA group decided to reduce the classificat ion into three
m ain groups: 1) data available either form rout ine or HI S/ HES surveys (yellow) , 2)
data available but from specific research surveys m ore or less than ten years old
(orange) , 3) not available and in the future data have to be developed in the m ost
appropriate way (red).
A. Available from routine data and no modifications are required. B. Available from routine data but methodological changes are required. C. Available from national HIS/HES surveys (less than 10 years). D. Available from national HIS/HES surveys (more than 10 years).
E. Available from specific research surveys (less than 10 years). F. Available from specific research surveys (more than 10 years).
G. Not available and in the future data should be developed from routine data. H. Not available and in the future data should be developed from HI S/ HES
surveys. I. Not available and in the future data should be developed from specific
national/international surveys.
The results of this informat ion are sum m arized and incorporated in the “Annotated
list of indicators for COPD and asthm a” under the sect ion on “Availability and
nat ional consistency” . For a m ore detailed inform at ion by count ry, the informat ion
is described in the Annex IV.
4 .1 .5 Step 5 : Final select ion and prior it isat ion of the list of indicators.
The general object ive of the I MCA project was to get a consensus am ong the
project part icipants on a set of indicators for m onitoring the prevalence, r isk
factors, clinical management and outcomes of asthma in the EU.
21
Although the I MCA group considered all indicators very im portant , in order to
facilitate the implementation process according to DG-SANCO needs on information
st rategies, the group designed and organized a pr ior it izat ion process to select the
m ost relevant indicators. The m ethods to follow were agreed during the 1st and 2nd
Steering Com m it tee m eet ings and carr ied out once steps 1, 2, 3, and 4 were
com pleted. During the project developm ent , taking into account the num ber of
indicators developed, DG-SANCO invited the I MCA group to m ake a core list
selection.
Why it was necessary to select a core list of indicators?
The first quest ion the group had to deal with was why it was im portant to decide
indicators pr ior it ies. The European Com m unity Health I ndicators (ECHI -2) project ,
already m ent ioned, developed a long list of indicators that included about 400
item s/ indicators. By March 2003, DG-SANCO expressed a st rong wish to ext ract a
short list from the m ain indicators list in order to pr ior it ize the work for
harmonization of the EU member State’s data collection. The ECHI project selected
a short list of core indicators by using the following m ethods: 1) nineteen public
health generalists individually selected 50 first and 50 second choice pr ior it ies from
the total of approxim ately 400 item s in the long ECHI list ; 2) explicit cr iteria were:
size of the public health problem and possibilit ies to im prove on these; 3) ranking
the item s according to the num ber of votes, taking an arbit rary cut -off point ,
produced a list of approxim ately 50 indicators. This list was further developed after
amendments from specific projects and other general discussions.
When the results of this first select ion were available to part icipants of other HMP
projects defining indicators, m ost felt that the recom m endat ions m ade by their own
project were not considered with enough detail and required further discussions in
order to be included in the first short list of indicators. This situat ion led to the
revision of the m ethods used by other projects in select ing indicators. From this
review it was possible to see that som e projects already carr ied out a pr ior it isat ion
process, selecting only top ten indicators and others did not.
Based on the discussions of this situat ion, DG-SANCO recom m ended all projects
not already finished to provide recom m endat ions that include clear pr iorit ies for
implementation and development. The specification of indicators priority should not
m ean that only a sm all num ber of indicators should be im plemented. This should
be understood as a priority for short- term implementation.

22
Based on this background, the co-ordinat ing cent re suggested a m ethodology for
deciding prior it ies on indicators which will not exclude any indicator selected but
will clearly establish the prior it ies for im mediate, short and long term
implem entat ion. The m ethodology was approved by the I MCA Steering Com m it tee
and the rest of the group.
Which methods did we use?
As it has been explained before, the co-ordinat ing cent re developed two
questionnaires that included a complete list of the indicators selected for COPD and
asthm a. The quest ionnaire included one colum n to collect inform at ion on data
availabilit y and three colum ns to collect inform at ion on indicators pr ior ity (Annex
III). The quest ionnaires were designed using the software Teleform . Each
part icipant had to sent the quest ionnaires to the co-ordinat ing cent re by fax and
automatically a database was created. The columns, second, third, and fourth were
designed to collect data on indicators pr ior ity. The data collected in each colum n,
reflected an independent way of classifying indicators priority.
The second colum n of the quest ionnaire (which was the first of the quest ionnaire
for collect ing data on prior it ies) , was com pleted by each part icipant put t ing a score
for each indicator based on their own experience and view and considering the
scientific information provided in the “Annotated list of indicators for asthma”.
I t was difficult to establish a com m on set of cr iter ia for all indicators of each
disease since usually different cr iter ia reflect different aspects of the disease.
However, since this should be a score helping to produce a ranking of all indicators
we decided to use the following criteria:
1) I m portance of the indicator to describe the burden of the disease at
population level or within the group of patients suffering from the disease.
2) Evidence on the st rength of the associat ion ( in case of r isk factors) or
evidence on its relat ionship with health outcom es ( in the case of health
system indicators).
3) Suscept ibilit y to intervent ions, either to reduce the burden of the disease or
health outcomes inequalities.
Taking into account these cr iter ia, each part icipant gave a score ranking from 0 to
4 (4 = essent ial; 3 = very im portant ; 2 = im portant ; 1 = less im portant ; and 0 =
not useful) to each indicator.

23
For each indicator, the scores given by each part icipant were added and the m ean
est im ated. Based on the m ean score, all indicators were ordered within each sub-
category and the rank and order num ber was at tached to each indicator. The
indicator with the highest mean value had the order number 1.
I n order to be able to decide the prior ity of the indicators within each sub-category
( in case some indicators had the sam e score in the colum n two) , part icipants were
asked to com plete the third colum n ordering the indicators in a decreasing order of
pr ior ity. For instance, the sub-category, “2.2.8 Mortality Respiratory System ” that
have six indicators, part icipants had to order the six indicators in a decreasing
order of relevance from 1 to 6, attaching the number “01” to the most relevant and
the “06” to the less relevant. this process was done for all indicator sub-categories.
The pr ior ity order given by each part icipant to each indicator within sub-category did not
help in deciding priorities within the main groups of indicators. As explained before, all COPD
and asthma indicators were grouped in four main groups (Class 1 to 4) each represent ing
relevant information of both conditions. To solve this problem, each participant was asked to
complete the fourth colum n ordering the indicators in decreasing order of relevance for each
main category. For instance, if we considerer the m ain category “Class 2- Health status” for
asthma, since there are 21 indicators included, part icipants had to order them from “01” to
“21” in decreasing order.
I n addit ion to scoring individual indicators, ordering them within sub-categories
and m ain categories, each part icipant was also asked to considerer the relevance
of each sect ion for m onitor ing COPD and asthm a and order the m ain categories
at taching to each category the order pr iority num ber ( from 1 to 4) . To collect this
inform at ion the quest ionnaire had a special box on the r ight hand side of each
main section title.
The results of the pr ior ity exercise were presented and discussed in the final I MCA
m eet ing in a plenary session and decisions taken according to debate results. The
m ost st rong point that was m ade evident early in the final m eet ing was the
difficulty in classifying indicators within sub-categories and m ain categories. As we
already said before, m ost part icipants considered all indicators relevant although
each group reflected different aspects or even stages of disease developm ent
m aking the classificat ions of the second and third colum n ext rem ely difficult .
Although the results of the m ethods previously established are described in detail
(Annex V) the group decided not to take into account the results of the third and
fourth columns due to the lack of validity of the inform at ion given. The group
decided to use m ainly the results of the scores given in the second colum n and to
recom m end different levels of pr iority. First , based on the score of the second
24
column a score was attached to each indicator. These scores were used to order all
indicators according to the level of prior ity. From this list , the top 20 indicators for
COPD and asthma were selected. In order to recommend at least four indicators for
each condit ion to be included in the “ECHI short list ” for im m ediate
implementation, a final exercise to select the top 4 indicators for each condit ion
was carried out.
Taking into account that the group considered all indicators im portant and because
considering just the top 4 or 20 can be an underest im at ion of the value of m any
indicators it was decided to classify the indicators within each sub-category into
three levels of pr ior ity. This process was carr ied out taking into account the scores
of the second colum n and the group consensus. This three levels classificat ion is
included in the corresponding sect ion on indicators pr ior ity of the “Annotated list of
indicators for COPD and asthma”.
4 .2 How w e did the m ain results sum m ary?: “Annotated list of indicators for COPD and asthma”.
The “Annotated list of indicators for COPD and asthm a” was established as the
“Step 2” in the project developm ent . Basically, as it has been explained before, in
this step we only included the inform at ion collected from the scient ific literature
review for each group of indicators. As the project was progressing, we decided to
include all new inform at ion produced into the annotated list in order to sum m arize
the inform at ion specifically for each group of indicators and to facilitate its
readership. In general the information for each group of indicators takes two pages.
At the top of the first page there is always the t it le describing the indicators group
according to the ECHI taxonom y but including the relevant indicators selected by
the IMCA group. The top box on the left, contains the indicators list. The top box on
the r ight , contains the indicators definit ion. Under these two boxes, there are
several paragraphs containing the following sect ions: rat ionale, aim s, data sources,
data quality, m ethods to be used for new data collect ion, data presentation,
potent ial use, consistency at nat ional level, com m ents, availabilit y and consistency
at nat ional level, and finally prior ity including a table describing the scores and the
I MCA group recom m endat ion. This will facilitate to get the relevant inform at ion for
each group without having to read all text.
25
ANNOTATED LIST OF INDICATORS
Indicators for monitoring COPD in the EU
ECHI-2/IMCA framework

26
Class 1
Demography and socioeconomic situation
27
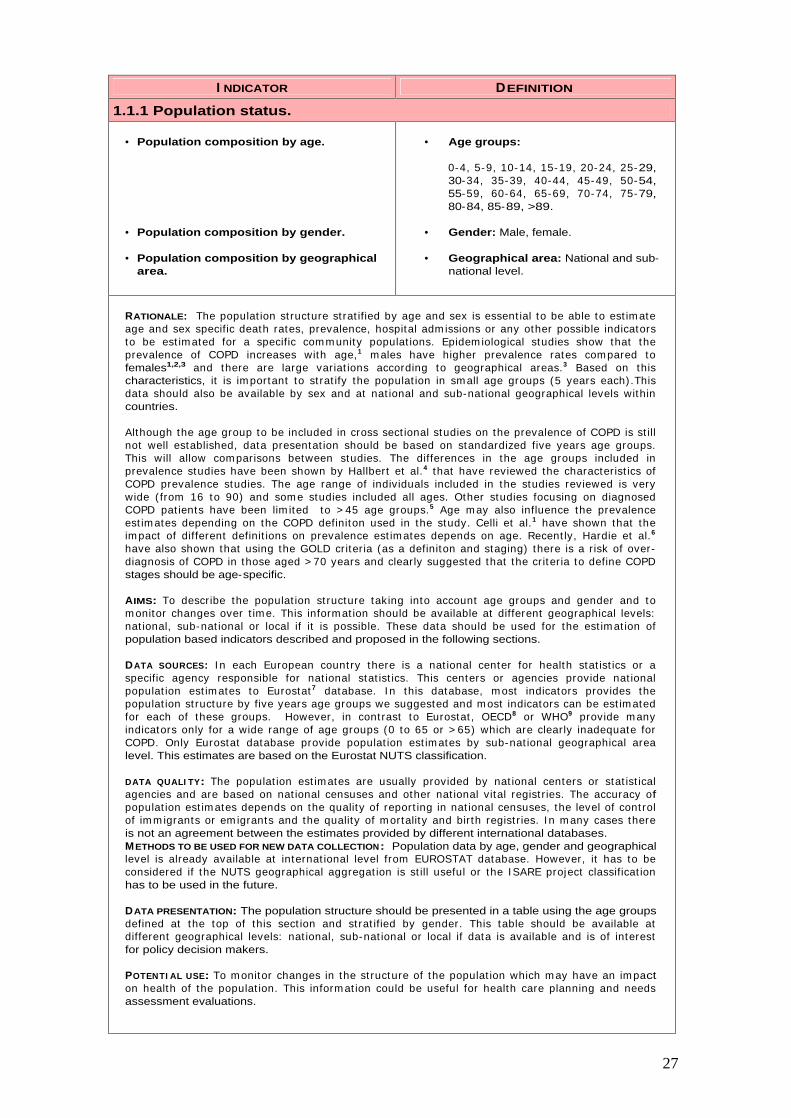
I NDICATOR DEFINITION
1.1.1 Population status.
• Population composition by age.
• Population composition by gender.
• Population composition by geographical area.
• Age groups:
0-4, 5-9, 10-14, 15-19, 20-24, 25-29, 30-34, 35-39, 40-44, 45-49, 50-54, 55-59, 60-64, 65-69, 70-74, 75-79, 80-84, 85-89, >89.
• Gender: Male, female.
• Geographical area: National and sub-national level.
RATIONALE: The populat ion st ructure st rat ified by age and sex is essent ial to be able to est im ate age and sex specific death rates, prevalence, hospital adm issions or any other possible indicators to be est im ated for a specific com m unity populat ions. Epidem iological studies show that the prevalence of COPD increases with age,1 m ales have higher prevalence rates compared to females1,2,3 and there are large variat ions according to geographical areas.3 Based on this characteristics, it is im portant to st rat ify the populat ion in sm all age groups (5 years each) .This data should also be available by sex and at nat ional and sub-nat ional geographical levels within countries.
Although the age group to be included in cross sect ional studies on the prevalence of COPD is st ill not well established, data presentat ion should be based on standardized five years age groups. This will allow com parisons between studies. The differences in the age groups included in prevalence studies have been shown by Hallbert et al.4 that have reviewed the characterist ics of COPD prevalence studies. The age range of individuals included in the studies reviewed is very wide ( from 16 to 90) and som e studies included all ages. Other studies focusing on diagnosed COPD pat ients have been lim ited to > 45 age groups.5 Age m ay also influence the prevalence est im ates depending on the COPD definiton used in the study. Celli et al.1 have shown that the im pact of different definit ions on prevalence est im ates depends on age. Recent ly, Hardie et al.6
have also shown that using the GOLD criter ia (as a definiton and staging) there is a r isk of over-diagnosis of COPD in those aged > 70 years and clearly suggested that the cr iter ia to define COPD stages should be age-specific.
AIMS: To describe the populat ion st ructure taking into account age groups and gender and to m onitor changes over t im e. This inform at ion should be available at different geographical levels: nat ional, sub-nat ional or local if it is possible. These data should be used for the est im at ion of population based indicators described and proposed in the following sections.
DATA SOURCES: I n each European count ry there is a nat ional center for health stat ist ics or a specific agency responsible for nat ional stat ist ics. This centers or agencies provide nat ional populat ion est im ates to Eurostat 7 database. I n this database, m ost indicators provides the populat ion st ructure by five years age groups we suggested and m ost indicators can be est im ated for each of these groups. However, in cont rast to Eurostat , OECD8 or WHO9 provide m any indicators only for a wide range of age groups (0 to 65 or > 65) which are clearly inadequate for COPD. Only Eurostat database provide populat ion est im ates by sub-nat ional geographical area level. This estimates are based on the Eurostat NUTS classification.
DATA QUALI TY: The populat ion est im ates are usually provided by nat ional centers or stat ist ical agencies and are based on nat ional censuses and other nat ional vital regist r ies. The accuracy of populat ion est im ates depends on the quality of report ing in nat ional censuses, the level of cont rol of im m igrants or em igrants and the quality of m ortality and birth regist r ies. I n m any cases there is not an agreement between the estimates provided by different international databases. METHODS TO BE USED FOR NEW DATA COLLECTION: Population data by age, gender and geographical level is already available at internat ional level from EUROSTAT database. However, it has to be considered if the NUTS geographical aggregat ion is st ill useful or the I SARE project classificat ion has to be used in the future.
DATA PRESENTATION: The population structure should be presented in a table using the age groups defined at the top of this sect ion and st rat ified by gender. This table should be available at different geographical levels: nat ional, sub-nat ional or local if data is available and is of interest for policy decision makers.
POTENTI AL USE: To m onitor changes in the st ructure of the populat ion which m ay have an im pact on health of the populat ion. This inform at ion could be useful for health care planning and needs assessment evaluations.
28
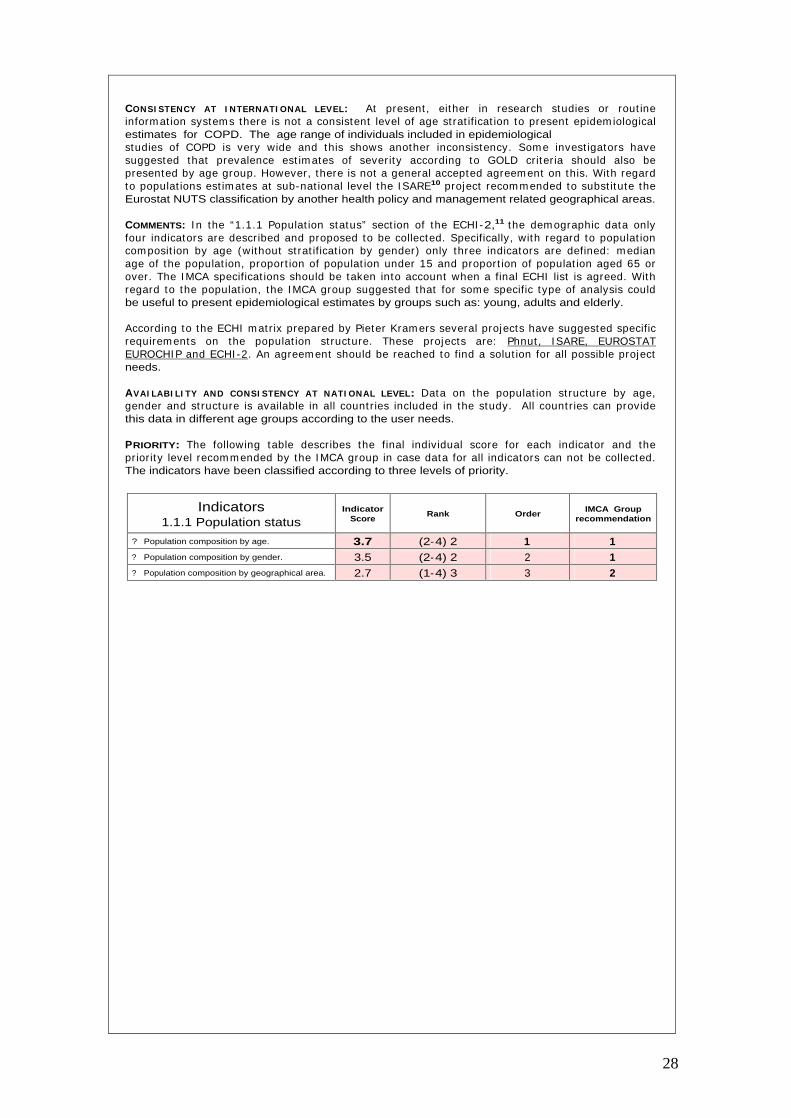
CONSI STENCY AT I NTERNATI ONAL LEVEL: At present , either in research studies or rout ine inform at ion system s there is not a consistent level of age st rat ificat ion to present epidem iological estimates for COPD. The age range of individuals included in epidemiological studies of COPD is very wide and this shows another inconsistency. Som e invest igators have suggested that prevalence est im ates of sever ity according to GOLD criter ia should also be presented by age group. However, there is not a general accepted agreem ent on this. With regard to populat ions est im ates at sub-nat ional level the I SARE10 project recom m ended to subst itute the Eurostat NUTS classification by another health policy and management related geographical areas.
COMMENTS: I n the “1.1.1 Populat ion status” sect ion of the ECHI -2,11 the dem ographic data only four indicators are described and proposed to be collected. Specifically, with regard to populat ion com posit ion by age (without st rat ificat ion by gender) only three indicators are defined: m edian age of the populat ion, proport ion of populat ion under 15 and proport ion of populat ion aged 65 or over. The I MCA specificat ions should be taken into account when a final ECHI list is agreed. With regard to the populat ion, the I MCA group suggested that for som e specific type of analysis could be useful to present epidemiological estimates by groups such as: young, adults and elderly.
According to the ECHI m atr ix prepared by Pieter Kram ers several projects have suggested specific requirem ents on the populat ion st ructure. These projects are: Phnut , I SARE, EUROSTAT EUROCHI P and ECHI -2. An agreem ent should be reached to find a solut ion for all possible project needs.
AVAI LABI LI TY AND CONSI STENCY AT NATI ONAL LEVEL: Data on the populat ion st ructure by age, gender and st ructure is available in all count r ies included in the study. All count r ies can provide this data in different age groups according to the user needs.
PRIORITY: The following table describes the final individual score for each indicator and the pr ior ity level recom m ended by the I MCA group in case data for all indicators can not be collected. The indicators have been classified according to three levels of priority.
Indicators 1.1.1 Population status
Indicator Score
Rank Order IMCA Group
recommendation
?
Population composition by age. 3.7 (2-4) 2 1 1 ?
Population composition by gender. 3.5 (2-4) 2 2 1 ?
Population composition by geographical area. 2.7 (1-4) 3 3 2
29
I NDICATOR DEFINITION
1.2 Socio-economic factors.
• Level of education.
• Social class.
• Ethnicity.
• GDP.
• Poverty.
• Proport ion of populat ion by level of educat ion in 4 classes: elem entary, lower secondary, upper secondary, tert iary (ISCED, 1997).
• Proport ion of populat ion by social class in 6 I SCO groups: upper non-m anual, lower non-m anual, skilled m anual, unskilled m anual, self-em ployed, farm er. (Based on occupation).
• Proport ion of populat ion in each ethnic group ( to de agreed am ong DG-SANCO projects.
• The GDP at nat ional level. (As defined in the OECD).
• Proport ion of populat ion within income below 60% of the national median.
RATIONALE: Socioeconomic factors are considered determ inants of populat ion health status. However, the effects of socioeconom ic status are not equal for all condit ions and have to be considered specifically for each disease or health status problem . I n the case of COPD, there is evidence showing that the r isk of developing COPD is inversely related to socioeconom ic status.12
This is consistent across different type of studies and in different populat ions.13 I t is not clear, however, whether this pat tern reflects exposures to indoor and outdoor air pollutants, crowding, poor nut r it ion, or other factors that are related to low socioeconom ic status. I n Europe, de Marco et al.3 using data from the European Com m unity Respiratory Survey have shown that individuals from low socioeconom ic groups have a higher r isk of COPD either in stage 0 or stages I or m ore. I n US m ortality rates for COPD are higher in whites than in non whites, but the difference is decreasing in males.14 Morbidity and m ortality rates are inversely related to socioeconom ic status and are higher in blue collar than white collar workers.15
The socioeconom ic indicators to m onitor inequalit ies in health in the European Union have been reviewed recent ly by Kunst et al.16 The socioeconom ic indicators can be classified into five m ain groups according to the characterist ics they are based on: educat ion, occupat ion, incom e, wealth and composite indicators. Som e indicators m ay be preferred over other for theoret ical reasons. However, there is no consensus on these issues, and the m easures are com plem entary rather than exclusive. The theoret ical preferences depend on m any factors. Som e data sources or research studies have collected inform at ion in one or m ore indicators. Most of these indicators are collected at individual level but they can also be used at ecological level. With regard to ethnicit y and COPD the inform at ion available is lim ited but differences m ay exist either in prevalence or in m any other indicators of health care m anagem ent and outcom es. An agreem ent should be reached on the classificat ion of ethnic groups across European count r ies. There is not inform at ion on the associat ion between GDP and level of poverty but it could be very useful to incorporate these indicators for future ecological analysis.
AIMS: 1 ) To describe the dist r ibut ion of the populat ion at com m unity level according to the socioeconom ic indicators proposed ( level of educat ion, social class and ethnicity) and to m onitor changes over time. 2) To compare countries according to the GDP and the level of poverty (if it is possible at sub-nat ional level. 3) to describe the dist r ibut ion of COPD pat ients according to the socioeconom ic indicators proposed and to m onitor changes over t im e. This inform at ion should be available at different geographical levels: nat ional, sub-nat ional or local if it is possible. These data should useful in monitoring policy interventions to reduce society inequalities.
DATA SOURCES: I n general m ost general health interview or exam inat ion surveys include quest ions on socioeconomic status. However, there are im portant differences in the quest ions used in surveys carr ied out either in the sam e or different count ry. For specific quest ion com parisons between health surveys the HI S/ HES database can be used.17 I nform at ion on socioeconomic status can be obtained also from rout ine data bases such as m ortality or specific regist r ies. However, the num ber of count r ies including socioeconom ic inform at ion in this databases is m uch m ore lim ited. Many research studies also collect this inform at ion but in m any occasions the inform at ion produced is not representat ive of the general populat ion. The indicator which describes the proportion of population living in poverty is collected by EUROSTAT.7,18
30
DATA QUALI TY: Three m ajor problem s have been ident ified in socioeconom ic indicators: a) high non response rates in som e count r ies ( these problem s are greater when incom e indicators are used, b) some populations may be excluded (institutionalized populations), c) problems with comparability (both over t im e and across countr ies) of som e health indicators specially in those based on occupat ion.16 Data on ethnicity has to be developed in order to have a hom ogeneous classification.
METHODS TO BE USED FOR NEW DATA COLLECTI ON: Specific quest ions should be incorporated in HI S/ HES surveys or research studies in order to collect inform at ion on the level of educat ion and social class according to the I MCA recom m endat ions. The GDP is usually provided by the OECD and no further developm ent is required. The level of poverty, is provided by the EUROSTAT database, but it has to be explored if it is possible to have this indicator at sub-nat ional level or for specific geographical areas. This inform at ion is well developed in count r ies like UK but nearly impossible in most EU countries.
DATA PRESENTATI ON: For each of the three indicators, a table showing the dist r ibut ion of the populat ion according to the categories established should be presented. I n addit ion cross tabulat ions with the age groups proposed and st rat ified by gender should be presented or available. These tables should be available at different geographical levels: nat ional, sub-national or local if data is available and is of interest for policy decision makers.
POTENTI AL USE: To m onitor changes in the st ructure of the populat ion according to socioeconom ic status indicators. To m onitor changes in the dist r ibut ion of COPD pat ients according to socioeconom ic status indicators. This inform at ion could be useful for health care planning and needs assessm ent evaluat ions for COPD pat ients and also to m onitor policy intervent ions to reduce health and health care inequalities among COPD patients.
CONSI STENCY AT I NTERNATI ONAL LEVEL: Although the associat ion between socioeconom ic status and COPD seem s to be consistent in m ost studies, the m ajor problem is to ident ify a reliable and useful measure to compare socioeconomic status across different EU countries.
COMMENTS: The ECHI project , the sect ion “1.2 Socioeconom ic factors” have been st ructured in six parts: “1.2.1 Populat ion by household situat ion” ; “1.2.2 Populat ion by ethnicity” ; “1.2.3 Educat ion” ; “1.2.4 Em ploym ent” ; “1.2.5 I ncom e dist r ibut ion” ; and “1.2.6 General econom ics” . From these sect ions, the I MCA group selected only four indicators which have been used in epidemiological research studies and are clear determinants of health.
The ones selected, are the m ost consistent ly used although potent ial bias have to be considered when cross count ry com parisons are m ade. The level of educat ion and social class indicators should be used in three different ways: 1) to describe the dist r ibut ion of the populat ion according to socioeconom ic status by the age groups suggested, gender and nat ional and sub-national geographical levels; 2) to adjust prevalence est im ates and 3) to describe the proport ion of individuals with COPD according to socioeconomic status. I n this group, ethnicity should also be included with a consistent classificat ion of ethnic origin for all the EU count r ies ( to be developed). This inform at ion should also be available by the age groups suggested, gender and nat ional and sub-nat ional geographical levels. The level of poverty m ay be useful as an ecological indicator but difficult to incorporate in cross-sectional studies of COPD. We believe it is more important to have socioeconom ic indicators at individual level, however in som e ecological analysis, GDP and the level of poverty could be very useful.
According to the ECHI m atr ix prepared by Pieter Kram ers several projects have suggested specific requirem ents on socioeconom ic indicators. The level of educat ion and social class based on occupat ion are proposed by the SES and PHNUT projects. Ethnicity and GDP are proposed only by the ECHI -2 project only despite its interest for m any condit ions. Poverty is only recom m ended by the PHNUT project. Due to the limitations of each indicator individually, in many occasions several indicators of socioeconom ic status are used. I t would be good to have all five indicators proposed by the IMCA group, although some of them require further development.
AVAI LABI LI TY AND CONSI STENCY AT NATI ONAL LEVEL: Data for m ost socioeconom ic indicators is available in all count r ies included in the study with the except ion of ethnicity. However, it is not clear to what extend the com parability of these indicators between count r ies is good enough at present. In some countries methodological modifications are required to improve comparability.
PRIORITY: The following table describes the final individual score for each indicator and the pr ior ity level recom m ended by the I MCA group in case data for all indicators can not be collected. The indicators have been classified according to three levels of priority.

31
Indicators
1.2 Socio-economic factors Indicator
Score Rank Order
IMCA Group recommendation
?
Level of education 2.9 (1-4) 3 1 1
?
Social class 2.9 (2-4) 2 1 1
?
Ethnicity 2.3 (0-4) 4 3 2
?
GDP 1.7 (0-3) 3 4 3
?
Poverty 2.4 (1-4) 3 2 2

32
Class 2
Health Status

33
I NDICATOR DEFINITION
2.2 Mortality by cause specific.
• 2.2.8 Respiratory system.
• Total number of death.
• Crude death rates.
• Standardized death rates (SDR).
• Age-specific death rate.
• Age- specific death rate having COPD as a contributing cause of death.
• Potential years of life lost (PYLL).
• Death defined by I CD-9: 490-492, 494 and 496, (493 should be excluded) ; I CD-10: J40-J44, J47 (J45 and J46 should be excluded).
• Total num ber of COPD death by 100.000 population.
• Standardizat ion m ethod and standard populat ion should be the sam e as WHO/EUROSTAT databases).
• Total num ber of COPD death by 100.000 population by the age groups specified.
• Total num ber of death by 100.000 populat ion having COPD as underlying cause of death or with a cont r ibut ing cause of death by the age groups specified.
• Num ber of death in each age group multiplied by the number of remaining years to live unt il selected age lim it . The sam e m ethods used in WHO / EUROSTAT databases should be used).
RATIONALE: The World health Organization (WHO) estimates that COPD is the fifth leading cause of death in the wor ld and it is est im ated to be the third m ost frequent cause of death by 2020.19 The social burden, in term s of days lost to disability, is also expected to increase from twelfth to fifth among all chronic disease. 20,21
I n a review of internat ional pat terns of respiratory m ortality with I CD-9 490-496 codes which also include asthm a ( I CD-9, 493) , the highest rates were found in UK, Easter Europe, Scandinavian count r ies, I srael and Japan.22 I n the ERS consensus Statem ent , after considering together the I CD codes 490-493, the m ortality rates in m ales for the period 1988-1991 ranged from > 30 deaths per 100,000 person-years in Hungary, Denm ark and form er East Germ any to < 10 in Spain, France and Greece.23 I n the UK, from 1970 to 2000, there has been a steady and cont inuing decline in COPD m ortality in m en but an increase in m ortality in wom en. During the 1990s, there was a 25% fall in m ale m ortality but a 33% rise in fem ale m ortalit y so that in 1999 wom en accounted for 44% of the total deaths at t r ibuted to COPD.24 I n the recent European Lung Book,25 using data from the WHO database, standardized m ortalit y rate for COPD have been published. I n 1990, the standardized m ortality rate of COPD was 50 / 100,000 populat ion in m ales and 20 / 100,000 populat ion in fem ales in 45 European count r ies. This m eans that in Europe, m ortality rates are 2-3 t im es higher in m en compare to wom en. From this data it was est im ated that between 200,000 to 300,000 people die from COPD each year in Europe. There were large variat ions between count r ies. This est im ates were based on I CD-8/ 9 codes 490-493 which om its codes 519.3 in ICD-8 and 496 in ICD-9.
I n Canada, from 1980 to 1995, the total num ber of death from COPD increased from 4,438 to 8,583. although the age-standardized m ortality rate rem ained stable throughout this period in men (around 45/100,000 population), it doubled in women 8.3/100,000 in 1980 to 17.3/100,000 in 1995.26 This rates were est im ated using I CD-9 490-492 and 496) . I n the United States m ortality data can be obtained form the Nat ional Vital Stat ist ics System . The age-adjusted death rates for COPD have been r ising steadily from 1960 to 1996 for m en and wom en. COPD death rates are very low am ong people under the age 45 in the US, but then increase with age, and COPD becom es the fourth or fifth leading cause of death am ong those over 45 and there are clear differences am ong socioeconom ic groups.27 While the death rate am ong m en has reached a plateau, the rate am ong wom en has cont inued to increase. I n 1998, 54,615 m en and 51,377 wom en died from COPD. From 1995 to 1998, the death rate at t r ibutable to COPD am ong m en rem ained stable at 53.1 death per 100,000 populat ion (age-adjusted to the 2000 US populat ion) , whereas the death rate at t r ibutable to COPD am ong wom en increased 9.5% from 29.3 to 32.1 death per 100,000 populat ion.28 All these estimates were based on the ICD-9-CM (codes 490, 491, 492 and 496).
AIMS: 1) To describe and compare COPD mortality using the indicators proposed; 2) To assess
34
changes in the total num ber of death, crude and age-specific death rates by the age groups suggested and gender. 3) Changes should be m onitored at different geographical levels: nat ional, sub-national or local if it is possible.
DATA SOURCES: At present , the World Health Organizat ion (WHO) internat ional database9 presents m ortality data based on two lists of diseases categories (A and B) to lim it the num ber of individual codes to be published. Under the list A, standardized rates for bronchit is, em physem a and asthm a (ICD-10, J40 – J46) by 100,000 populat ion and for ages 0-64 and all ages are est im ated. At present , it is not possible to dist inguish between COPD and asthm a. The sam e est im ates are published in the OECD database8 in addit ion to another category for COPD which include I CD-9 code 490-496. From EUROSTAT database7 you can obtain est im ates for asthm a alone but not COPD without asthm a. For respiratory diseases you can select two codes: (40) Chronic lower respiratory disease ( I CD-10, J40-J47; I CD-9, 490-494, 496) and (41) Asthm a ( I VD-10, J45-J46; ICD-9, 493) . I n this database you can obtain these est im ates by five years age groups and also by geographical level according to NUTS classificat ion. This classificat ions recent ly have been challenged by the I SARE project .10 I n all these databases DALYs or PYLL specific for COPD are not available.
DATA QUALI TY: Although am ong the descript ive epidem iological data for COPD m ortality data are the m ost readable available, there are several problem s that should be taken into considerat ion when analyzing m ortality data and specially t rends over t im e. I n addit ion to the lim itat ions of the validity of m edical death cert ificates, the analysis of m ortality data is further com plicated by the lack of using the sam e standardized codes in all analysis (either in research or rout ine databases) . This is further com plicated when t im e t rends are analyzed due to changes over t im e in the I nternat ional classificat ion of Diseases ( I CD-8, ICD-9, I CD-10, I CD-9-CM). This changes have not been int roduced at the sam e t im e in m any EU count r ies and this brings serious problem s when the analysis is focused on geographical variat ions. Several studies have shown that m any death with COPD have their death at t r ibuted to another cause.29 I n 1998, only 45.4% of the 233,610 deaths with COPD m ent ioned on their death cert ificates had this ult im ately listed as the underlying cause of death, despite the presence of prospective studies showing that people with COPD listed on their death certificates have severe disease.12,30 I n a study carr ied out in UK and using m ortality data for England and Wales (1993-1999) , est im ated that obst ruct ive lung disease com prised underlying cause of death in 59.8% of deaths with mention of COPD. In this analysis ICD-9 490-493, 496 were used. These studies show that using only underlying cause of death underest im ates m ortality rates.31
METHODS TO BE USED FOR NEW DATA COLLECTI ON: The sam e used at present by internat ional organizations (EUROSTAT, WHO, OECD) but introducing the changes specified in the indicators.
DATA PRESENTATI ON: The total num ber of death and crude death rates should be presented as a total and also by age group. Tables by age group should also be st rat ified by gender. Age-specific and also when using COPD as a cont r ibut ing cause of death, should also be presented by gender. These tables should be available at different geographical levels: nat ional, sub-nat ional or local if data is available. Person years of life lost should also be presented by gender. POTENTI AL USE: To m onitor changes in COPD m ortality across age, gender and geographical areas. These data should useful for m onitor ing policy intervent ions aim ing to reduce COPD m ortality. Unfortunately, occupat ion is not available in all count r ies to m ake com parisons according to socioeconomic status.
CONSI STENCY AT I NTERNATI ONAL LEVEL: For all European count r ies m ortality data is available and internat ional databases (OECD, WHO and EUROSTAT) provide inform at ion at internat ional level. However, there is not a consistent presentat ion of COPD m ortality indicators for all these databases. Changes should be recom m ended on the indicators provided, the precise codes to be used (different iat ing asthm a and COPD), the age group st rat ificat ion. The relevance of using m ult iple cause m ortality to avoid underest im at ion of COPD m ortality should also be pointed out . The changes in I CD classificat ions over t im e m ay have int roduced im portant bias on m ortality est im ates. This possible bias have not been evaluated consistent ly at nat ional or internat ional level. The im pact of recent changes ( from I CD-9 to I CD-10) on m ortality est im ates have not been evaluated.
COMMENTS: Most indicators suggested by the I MCA project on COPD m ortality are already included in the ECHI -2 list . However, age-specific death rates and the age-specific death rate having COPD as a cont r ibut ing cause of death are not included.
The I CD-10 codes used at present by EUROSTAT in the 65 European short list of causes of m ortality should be corrected
in order to clearly separate asthma and COPD as it is indicated in the indicator definition.
AVAI LABI LI TY AND CONSI STENCY AT NATI ONAL LEVEL: Mortality data is available from rout ine data sources in all EU count r ies. However, m ost part icipants have indicated that m ethodological changes will be required in order to improve the com parability of these indicators between count r ies and to im prove the way in which these indicators are published according to I MCA group recommendations. Although the indicator: “Age-specific death rate having COPD as contributing
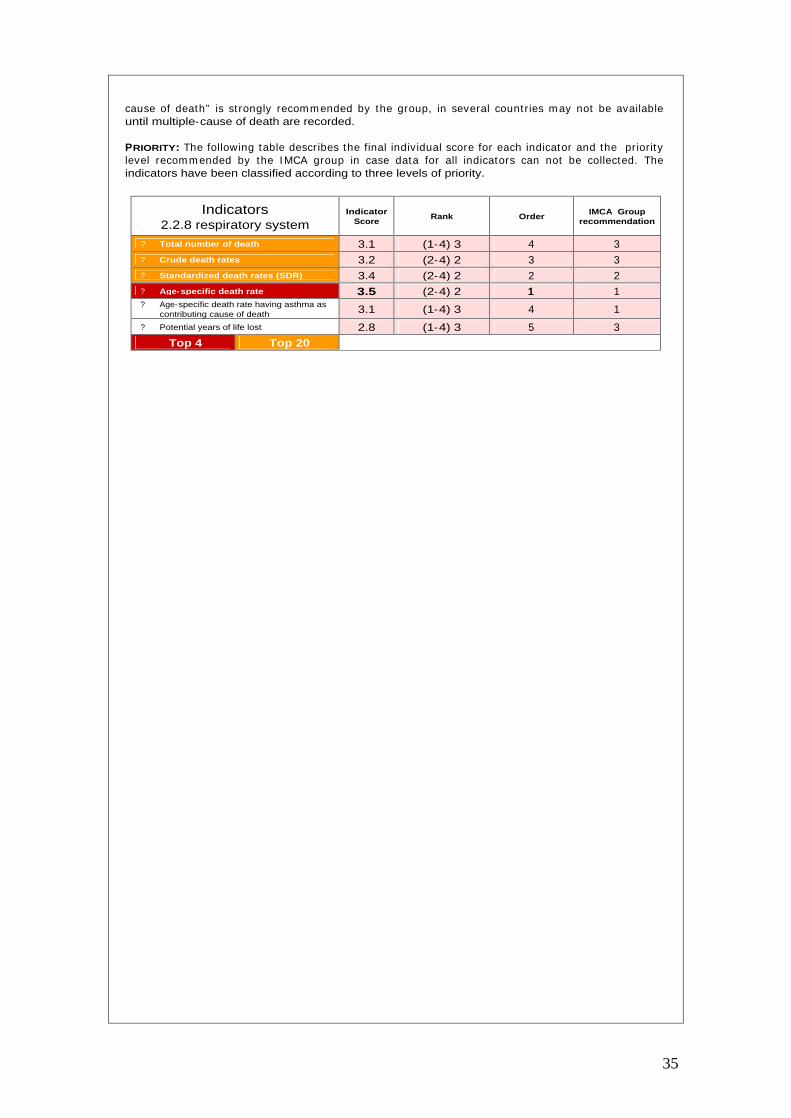
35
cause of death” is st rongly recom m ended by the group, in several count r ies m ay not be available until multiple-cause of death are recorded.
PRIORITY: The following table describes the final individual score for each indicator and the pr iority level recom m ended by the I MCA group in case data for all indicators can not be collected. The indicators have been classified according to three levels of priority.
Indicators 2.2.8 respiratory system
Indicator Score
Rank Order IMCA Group
recommendation
?
Total number of death 3.1 (1-4) 3 4 3
?
Crude death rates 3.2 (2-4) 2 3 3 ?
Standardized death rates (SDR) 3.4 (2-4) 2 2 2 ?
Age-specific death rate 3.5 (2-4) 2 1 1 ?
Age-specific death rate having asthma as contributing cause of death 3.1 (1-4) 3 4 1
?
Potential years of life lost 2.8 (1-4) 3 5 3
Top 4 Top 20

36
I NDICATOR DEFINITION
2.3.8 Respiratory system.
• Prevalence of chronic sym ptom s ( cough,
phleghm or sputum production).
• Prevalence of chronic bronchitis.
• Prevalence of airway obstruction.
• Prevalence of physician diagnosed COPD.
• Proport ion of individuals having cough and/ or phleghm from the chest , usually in winter, and as long as 3 m onths each year and for at least two successive years.
• Proport ion of individuals with FEV1/ FVC < 70% with or without chronic sym ptoms (post bronchodilator).
• Proport ion of individuals report ing to have suffered chronic bronchitis.
• Proport ion of individuals report ing to have been diagnosed of COPD by a physician.
RATIONALE: Chronic obst ruct ive pulm onary disease is a leading cause of chronic m orbidity. However, reliable COPD prevalence est im ates are lacking for m any parts of the world. The conflicts am ong published COPD prevalence rates m ay be due to m any factors, including t rue differences in disease occurrence, differences in defining COPD, cultural biases, and m ethodological issues such as the use of lung funct ion test in cont rast to self reported sym ptoms or est im ates based on physician diagnosis. The num ber of epidem iological studies which have assessed the prevalence of COPD is still limited. In a recent review which included population based studies from 1962 to 2001, Hallbert et al. only found 32 prevalence studies.4 Most studies were carr ied out in a single count ry although som e count r ies had m ore than one study. Only three studies provided data for m ore than one country. These studies could be broadly grouped into four categories according to the methods used to assess prevalence: 1) spirom etry, with or without clinical exam inat ion; 2) the presence of respiratory sym ptom s; 3) pat ient - reported disease; and 4) expert opinion. A sim ilar classificat ion of studies have been used in the GOLD conensus report.32
I n these studies, COPD prevalence est im ates ranged from < 1 to > 18% , and tended to vary by the m ethod used to est im ate the prevalence. Only eleven of these studies used spirom etry, either in conjunt ion with clinical exam inat ion or used alone but m ost of them carr ied out in recent years and there was considerable variat ion in the spirom etr ic cr iter ia for defining COPD. The use of different cr iter ia m ay be due to the lack of consensus and cont inuing changes over t im e adopted by the consensus statem ents provided by the scient ific societ ies. I n 1997, in the UK the prevalence of COPD was 1.7% am ong m en and 1.4% am ong wom en. These est im ates are low because the database used includes all ages and thus underest im ates the t rue im pact of COPD on older adults. Between 1990 and 1997, the prevalence increased by 25% in m en and 69% in wom en. These prevalence est im ates were based on data from the UK General Pract ice Research Database,33 which is based on 525 pract ices serving 3.4 m illion pat ients (6.4% of the total populat ion of England and Wales) and provides data on physician-diagnosed COPD.
AIMS: 1 ) To describe the prevalence of chronic respiratory sym ptom s, chronic bronchit is, airways obst ruct ion and physician diagnosed COPD by age group, gender, socioeconom ic status and geographical area. 2 ) The availability of this data at fixed intervals will allow monitor changes over time in the indicators proposed.
DATA SOURCES: I nform at ion on the prevalence of COPD can be obtained from two m ain sources of data: 1) general health interview or exam inat ion surveys and 2) research studies. However, the quality of the inform at ion is very poor and lim ited in general health interview surveys and the inform at ion provided from research studies is difficult to com pare as it will be described in the following sect ion. I n UK, the General Pract ice Research Database is another source of data. However, this kind of database is not widely available across European countries.
DATA QUALI TY: The data qualit y m ainly depends on the m ethods used in each specific study. However, the m ost relevant problem s seem s to be the difficult ies in com paring results between studies due to the lack of consensus on the m ethods and definit ions. Over the past decade, several definitions for COPD have been proposed, and these different definitions can have a large impact on the populat ion est im ates of the burden of disease. The differences in COPD definit ions have been recent ly exam ined by several authors. 1,2,28 The Am erican Thoracic Society (ATS) has defined COPD as “a lim itat ion due to chronic bronchit is or em physem a: the airflow obst ruct ion is generally reversible”.34 The European Respiratory Society (ERS) defined COPD as “ reduced m axim um expiratory flow and slow forced em ptying of the lungs which is slow progressive and m ost ly irreversible to present m edical t reatm ent ” .23 More recent ly, the Global I nit iat ive for Chronic Obstructive Lung Disease (GOLD) defined COPD as “a disease state characterized by airflow lim itat ion that is not fully reversible. The airflow lim itat ion is usually both progressive and associated with and abnorm al inflam m atory response of the lungs to noxious part icles or gases.32
However, the precise classification of the airflow, reversibility, and severity of disease varies.
37
The 1995 ATS definit ion did not list specific level of the FEV1/ FVC rat io for air flow lim itat ion.34 The 1995 ERS definit ion for air flow lim itat ion is an FEV1/ FVC capacity rat io of < 80% of the predicted value.23 The recent GOLD definit ion for air flow lim itat ion is an FEV1/ FVC rat io < 70% post -bronchodilator.
The 1995 ATS definit ion did not list specific level of the FEV1/ FVC rat io for air flow lim itat ion.34 The 1995 ERS definit ion for air flow lim itat ion is an FEV1/ FVC capacity rat io of < 80% of the predicted value.23 The recent GOLD definit ion for air flow lim itat ion is an FEV1/ FVC rat io < 70% post -bronchodilator. The recent GOLD definit ion for air flow lim itat ion is an FEV1/ FVC rat io < 70% post -bronchodilator. However, the fact that the rat io should be est im ated after bronchodilator adm inist rat ion, was not clearly specified and adopted in recent studies.32 Som e studies have invest igated the effects of using different definit ions on the prevalence est im ates. They concluded that the prevalence of COPD in a general populat ion depends very m uch on the cr iter ion used for definit ion of airways obst ruct ion. Differences in the definit ion m ay produce variat ions on the estimates more than 200%.1
Alternat ively to studies which have used lung funct ion m easurem ents, as m ent ioned previously, other studies have used only self- reported sym ptom s or diagnosis or a com binat ion of both with sm oking status. This m ethod is used in general health interview surveys. The quest ion m ost frequent ly used is: “Do you have chronic bronchit is or em physema?” . However, in m any cases this is m ixed with asthm a. An exam ple of the com binat ion of self- reported disease com bined with symptoms and sm oking status is the recent m ult inat ional study “The Confront ing COPD I nternat ional Survey” . The definit ion used in this study was: “Proport ion of individuals aged ≥45 years who had cum ulat ive cigaret te consumpt ion of ≥10 pack-years and who had been diagnosed with COPD, em physem a or chronic bronchit is, or whose sym ptom s fulfilled a definit ion of chronic bronchit is, i.e. “persistent coughing with phleghm or sputum from the chest for the last 2 years or more”.5
METHODS TO BE USED FOR NEW DATA COLLECTION: We recom m end to incorporate in future quest ionnaires several quest ions in order to assesses the prevalence of COPD. I t is desirable, to be able to est im ate the prevalence of individuals with specific sym ptom s, chronic bronchit is, airway obstruction or physician diagnosed COPD independent ly. Using different quest ions, there is always the possibility of com bining them according to any consensus or newly established criter ia for a specific definit ion of COPD ( including r isk factors such as smoking) . The use of lung funct ion m easurem ents is cost ly and int roduces complexit ies in the study fieldwork. However, the group highly recommend to introduce its use in future studies either research or routine HIS/HES surveys.
DATA PRESENTATI ON: Prevalence est im ates should be obtained using different quest ions and presented independent ly for the following indicators: a) chronic sym ptoms, b) chronic bronchit is, c) airways obst ruct ion and d) diagnosed COPD. From these quest ions, specific est im ates taking into account different aspects of the quest ions previously m ent ioned could be obtained. Tables by age group and also st rat ified by gender should be presented. These tables should be available at different geographical levels: national, sub-national or local if data is available.
POTENTI AL USE: To evaluate the im pact on COPD prevalence of possible health policy intervent ions focused on the reduction specific COPD risk factors susceptible to intervention.
CONSI STENCY AT I NTERNATI ONAL LEVEL: Over the past decades several m ethods to est im ate prevalence of COPD have been used. Several consensus statem ents have im proved definit ions and criter ia for lung funct ion m easurem ents. However, the recom m endat ions have been changing over t im e and led to m ore com plex m ethodologies. At present , there is not any study in which the m ost recent GOLD criter ia have been used and the num ber of studies including several count r ies is very lim ited. The quest ions used in general health interview surveys in European count r ies are very different and difficult to com pare est im ates. The results are not presented in a standardized age groups by sex and severity at national and sub-national geographical levels.
COMMENTS: Based on this review, we recom m end to use several quest ions in order to be able to assesses the prevalence of sym ptom s, chronic bronchit is, airway obst ruct ion and physician diagnosed COPD and avoid problems of comparability. Using different questions, there is always the possibility of combining them according to any consensus or newly established criteria for a specific definit ion of COPD. The use of lung funct ion m easurem ents is cost ly and int roduces com plexit ies in the study fieldwork. However, the group highly recom m end to int roduce its use in future studies. The ECHI -2 project have only included one indicator on the prevalence of COPD. We st rongly recom m end to int roduce four indicators to describe the prevalence of COPD. These indicators should also be presented by age, gender, socioeconomic status and geographical level.
The ECHI-2 project included the sect ion “2.4 Perceived and funct ional health” which include “2.4.1 Perceived health” ; 2.4.2 Chronic disease general” ; “ 2.4.3 Funct ional lim itat ions” ; 2.4.4 Act iv ity lim itat ions” ; “2.4.5 Short - term act ivity rest r ict ions” ; “2.4.6 General m ental health” ; “2.4.7 General quality of life” and “2.4.8 Absenteeism from work” . Most of the indicators that could be included in this sect ion have been dist r ibuted in other sect ions of health system s sect ion and included as outcom e m easures. The next sect ion “2.5 Com posite m easures of health status” includes disease specific measures and the IMCA project recommends DALYs as a composite indicator for COPD.
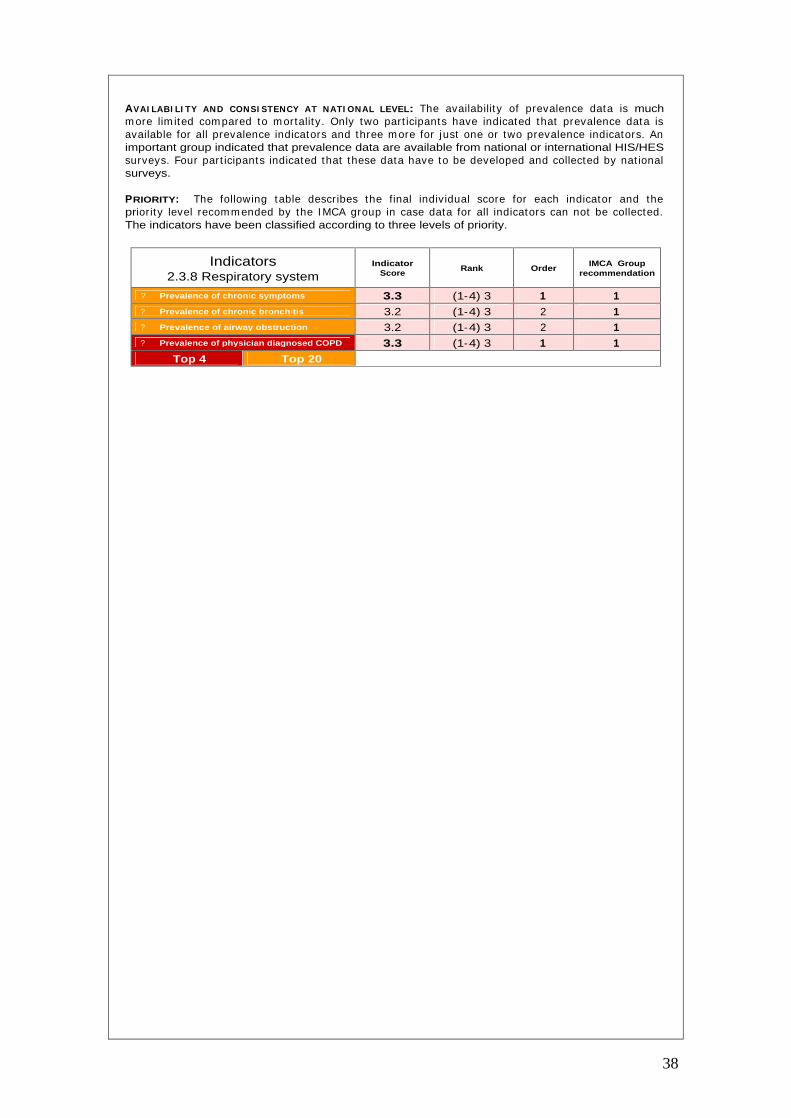
38
AVAI LABI LI TY AND CONSI STENCY AT NATI ONAL LEVEL: The availability of prevalence data is much m ore lim ited com pared to m ortality. Only two part icipants have indicated that prevalence data is available for all prevalence indicators and three m ore for just one or two prevalence indicators. An important group indicated that prevalence data are available from national or international HIS/HES surveys. Four part icipants indicated that these data have to be developed and collected by nat ional surveys.
PRIORITY: The following table describes the final individual score for each indicator and the prior ity level recom m ended by the I MCA group in case data for all indicators can not be collected. The indicators have been classified according to three levels of priority.
Indicators 2.3.8 Respiratory system
Indicator Score
Rank Order IMCA Group
recommendation
?
Prevalence of chronic symptoms 3.3 (1-4) 3 1 1 ?
Prevalence of chronic bronchitis 3.2 (1-4) 3 2 1 ?
Prevalence of airway obstruction 3.2 (1-4) 3 2 1 ?
Prevalence of physician diagnosed COPD 3.3 (1-4) 3 1 1 Top 4 Top 20
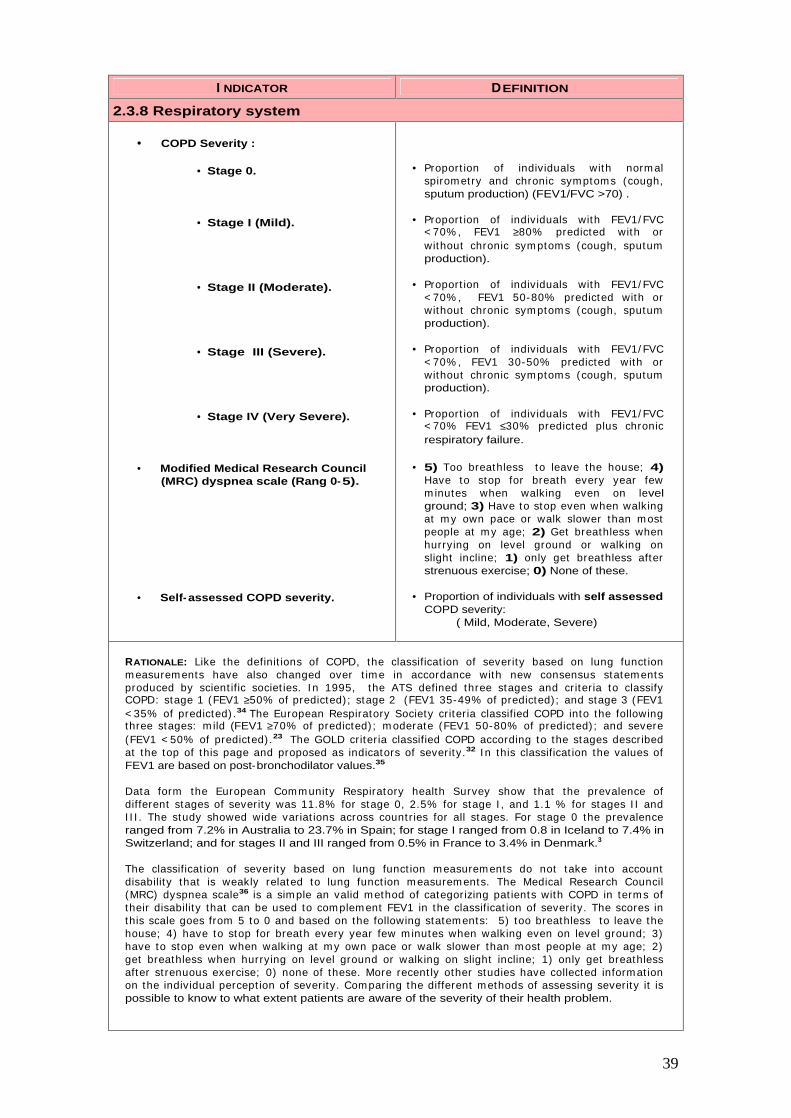
39
I NDICATOR DEFINITION
2.3.8 Respiratory system
• COPD Severity :
• Stage 0.
• Stage I (Mild).
• Stage II (Moderate).
• Stage III (Severe).
• Stage IV (Very Severe).
• Modified Medical Research Council (MRC) dyspnea scale (Rang 0-5).
• Self- assessed COPD severity.
• Proport ion of individuals with norm al spirom etry and chronic symptom s (cough, sputum production) (FEV1/FVC >70) .
• Proport ion of individuals with FEV1/ FVC < 70% , FEV1 ≥80% predicted with or without chronic sym ptoms (cough, sputum production).
• Proport ion of individuals with FEV1/ FVC < 70% , FEV1 50-80% predicted with or without chronic sym ptoms (cough, sputum production).
• Proport ion of individuals with FEV1/ FVC < 70% , FEV1 30-50% predicted with or without chronic sym ptoms (cough, sputum production).
• Proport ion of individuals with FEV1/ FVC < 70% FEV1 ≤30% predicted plus chronic respiratory failure.
• 5) Too breathless to leave the house; 4) Have to stop for breath every year few m inutes when walking even on level ground; 3) Have to stop even when walking at m y own pace or walk slower than m ost people at m y age; 2) Get breathless when hurrying on level ground or walking on slight incline; 1) only get breathless after strenuous exercise; 0) None of these.
• Proportion of individuals with self assessed COPD severity:
( Mild, Moderate, Severe)
RATIONALE: Like the definit ions of COPD, the classificat ion of severity based on lung funct ion m easurem ents have also changed over t im e in accordance with new consensus statem ents produced by scient ific societ ies. I n 1995, the ATS defined three stages and criter ia to classify COPD: stage 1 (FEV1 ≥50% of predicted) ; stage 2 (FEV1 35-49% of predicted) ; and stage 3 (FEV1 < 35% of predicted) .34 The European Respiratory Society cr iter ia classified COPD into the following three stages: m ild (FEV1 ≥70% of predicted) ; m oderate (FEV1 50-80% of predicted) ; and severe (FEV1 < 50% of predicted) .23 The GOLD criter ia classified COPD according to the stages described at the top of this page and proposed as indicators of severity.32 I n this classificat ion the values of FEV1 are based on post-bronchodilator values.35
Data form the European Comm unity Respiratory health Survey show that the prevalence of different stages of severity was 11.8% for stage 0, 2.5% for stage I , and 1.1 % for stages I I and I I I . The study showed wide variat ions across count r ies for all stages. For stage 0 the prevalence ranged from 7.2% in Australia to 23.7% in Spain; for stage I ranged from 0.8 in Iceland to 7.4% in Switzerland; and for stages II and III ranged from 0.5% in France to 3.4% in Denmark.3
The classificat ion of severity based on lung funct ion m easurem ents do not take into account disability that is weakly related to lung funct ion m easurem ents. The Medical Research Council (MRC) dyspnea scale36 is a sim ple an valid m ethod of categorizing pat ients with COPD in term s of their disability that can be used to com plem ent FEV1 in the classificat ion of severity. The scores in this scale goes from 5 to 0 and based on the following statem ents: 5) too breathless to leave the house; 4) have to stop for breath every year few m inutes when walking even on level ground; 3) have to stop even when walking at m y own pace or walk slower than m ost people at m y age; 2) get breathless when hurrying on level ground or walking on slight incline; 1) only get breathless after st renuous exercise; 0) none of these. More recent ly other studies have collected inform at ion on the individual percept ion of severity. Com paring the different m ethods of assessing severity it is possible to know to what extent patients are aware of the severity of their health problem.
40
These com parisons have been m ade using data from the Confront ing COPD I nternat ional Survey were the self assessed severity and the MRC disability score were com pared. I n this study, 31.8% of pat ients classified them selves as m ild, 44.1% as m oderate and 21% as severe. I m portant disparities between subjects’ perception of disease severity and the severity measured by the MRC scale. Of those with the m ost severe breathlessness, 35.8% described their condit ion as m ild or moderate.5
AIMS: 1 ) To describe the prevalence of chronic respiratory sym ptom s, chronic bronchit is, airways obst ruct ion and physician diagnosed COPD according to three different indicators of severity. 2) To provide est im ates of the prevalence severity by age group, gender, socioeconom ic status and geographical area. 3 ) To describe the dist r ibut ion of COPD pat ients according to three different indicators of severity. 4) The availability of this data at fixed intervals will allow m onitor changes over time in the indicators proposed.
DATA SOURCES: General health interview surveys do not collect inform at ion on severity. Only health exam inat ion surveys which have m easured lung funct ion can provide data on severity. However, to date there are not studies which have reported inform at ion on severity based on the new criter ia established by GOLD. As far as we know only the European Com m unity Respiratory Health Survey3
have est im ated variat ions on the prevalence of COPD across European count r ies using the recent ly established GOLD criter ia, although they were not based on post -bronchodilator m easurem ents. Data based on the self assessed severity and the MRC scale have been collected by the Confront ing COPD International Survey.5
DATA QUALI TY: The data quality of severity m easurem ents based on lung funct ion tests depends on the standards of quality of each individual study. However, the m ajor problem that m ay arise in epidem iological studies is the non acceptance of the tests by part icipat ing individuals. I n som e circumstances, the non acceptance rates can be high and creat ing serious problem s of representat iveness. I n spite of these problem s, lung funct ion m easurem ents in epidem iological studies should be encouraged. The MMRC scale and the self-assessed severity can be influenced by cultural factors and individual perceptions of severity.
METHODS TO BE USED FOR NEW DATA COLLECTI ON: We st rongly recom m end to int roduce lung funct ion m easurem ents to assess severity in future research or rout ine studies. I n addit ion appropriate questions based on the MMRC and the self-assessed scale should be incorporated.
DATA PRESENTATI ON: I n this sect ion different indicators of severity are presented and recom m ended. However, each one independent ly m ay reflect clearly different iated aspects of severity. We suggest to present cross- tabulations between the four groups of prevalence estimates suggested with the three different m ethods of severity assessm ent . These est im ates would be populat ion based est im ates of the prevalence and severity. I n addit ion to populat ion based estimates it would be good to know within the COPD patients group the proportion of individuals in each severity group. This should be available for each of the three m ethods of severity m easurem ent proposed and presented as total and st rat ified by age and sex. I n order to know the level of agreem ent between the different m ethods of severity classificat ion and its possible clinical m anagem ent im plicat ions for COPD pat ients, cross- tabulat ions of the self-perceived severity with the severity (according to GOLD criter ia) and severity (according to MMRC dyspnea scale) should be presented. These tables should be available at different geographical levels: nat ional, sub-national or local if data is available.
POTENTI AL USE: To evaluate the im pact on COPD severity of possible health policy intervent ions focused on the reduction specific COPD risk factors susceptible to intervention.
CONSI STENCY AT I NTERNATI ONAL LEVEL: The criter ia for severity classificat ion have changed over t im e during the last years and between different consensus statem ents. The GOLD consensus have provided standards useful to be applied in epidem iological or clinical studies. However, to date only one study have at tem pted to use them . The post -bronchodilator est im at ion of FEV1 m ay be incompatible with the performance of a bronchial responsiveness (BHR) test. The latest is important in all asthm a studies or in COPD studies in which BHR is included as a r isk factor. I f the perform ance of both m easurem ents is incom pat ible, it m ay imply that COPD and asthm a studies should be carr ied out separately. The self-perceived severity and the MRC classificat ion of disbility have been used in a limited number of studies.
COMMENTS: Based on this review, we recom m end to m onitor COPD severity based on the three m easures indicated. This m easures of severity should be presented in two different ways: 1) as the prevalence of different COPD stages in the com m unity and 2) as the proport ion of individuals at each severity stage in COPD pat ients. The ECHI -2 project have only included and indicator on the prevalence of COPD and severit y is not considered. We st rongly recom m end to int roduce COPD severity indicators as suggested. These indicators should also be presented by age, gender, socioeconomic status and geographical level.

41
AVAI LABI LI TY CONSI STENCY AT NATI ONAL LEVEL: Sim ilar ly to data on prevalence, severity is not collected and rout inely available in all EU countr ies. At present , severity indicators can only be est im ated from the specific surveys such as ECRHS. Although six part icipants said that sever ity data are available the rest of part icipants said that they have to be developed and collected in the future. Self-assessed severity can be obtained form The Confronting COPD survey.
PRIORITY: The following table describes the final individual score for each indicator and the pr iority level recom m ended by the I MCA group in case data for all indicators can not be collected. The indicators have been classified according to three levels of priority.
Indicators 2.3.8 Respiratory system
Indicator Score
Rank Order IMCA Group
recommendation
?
COPD severity 2.9 (1-4) 3 4 2 ?
Stage 0 2.6 (1-4) 3 6 2 ?
Stage I (Mild) 2.6 (1-4) 3 6 2 ?
Stage II (Mderate) 2.6 (1-4) 3 6 2 ?
Stage III (Severe) 2.8 (1-4) 3 5 2 ?
Stage IV (Very severe) 3.0 (1-4) 3 3 2 ?
Modified Medical Research Council dyspnea scale 2.6 (1-4) 3 6 2
?
Self-assessed COPD severity 2.3 (0-4) 4 7 3

42
Class 3
Determinants of health

43
I NDICATOR DEFINITION
3.1.1 Biological risk factors.
• Age.
• Gender.
• Body Mass Index (BMI).
• BODE Index.
• Family history.
• Childhood infections.
• Birth weight.
• Sensitization to indoor/outdoor allergens.
• Bronchial hyperresponsiveness (BHR).
• Age
• Gender
• Proport ion of individuals in each category of the BMI defined as weight ( in Kg) / height 2 . The categories according to the values are: underweight (< 18.4) ; norm al weight 18.5-24.9) ; overweight (25.0-29.9) ; obese (>30.0).
• The proport ion of individuals in each category of the BODE I ndex: 1) scores of 0 to 2; 2) scores 3 to 4; 3) scores 5 to 6; 4) scores 7 to 10. The BODE I ndex is a m ult idim ensional 10 point scale in which higher scores indicates higher r isk of death and based on four factors: BMI , degree of air flow obst ruct ion (based on FEV1) , dyspnea (based on the MMRC scale) and exercise capacity (based on a six m inute walk test).
• Proport ion of individuals with either the father or mother history of having COPD.
• Proport ion of individuals with history of having had serious childhood infect ions before 5 year of age.
• Proport ion of individuals in the lowest bir th weight quartile.
• Proport ion individuals sensit ized to at least one of the tested com m on indoor/ outdoor allergens.
• Proport ion of individuals with a posit ive bronchial responsiveness test.
RATIONALE: Epidemiological studies show that the prevalence of COPD increases with age,1,37 males have higher prevalence rates com pared to fem ales1,2,3,37 I n addit ion to considerer age as a r isk factor for COPD, it is very im portant to take into considerat ion age in any research study when the selection of the study populat ion is m ade. Hallbert et al.4 that have reviewed the characterist ics of COPD prevalence studies have shown large variations in the age range of individuals included in the studies reviewed (from 16 to 90) and some studies included all ages.
Other studies focusing on diagnosed COPD pat ients have been lim ited to > 45 age groups.5
Although it is rare to ident ify individuals with a diagnosis of COPD before 40 years old, recent studies have shown that a considerable proport ion of young people already suffered from COPD. The results from a ECRHS analysis, which included a populat ion between 20-44 years, 11.8% were already in stage 0, 2.5% in stage I and 1.1% in stages I I - III.3 So studies focusing only in populat ions m ore than 45 years, like the Confront ing COPD internat ional Survey m ay m iss a substant ial proport ion of individuals.5 Another im portant issue is the age group st rat ificat ion used in research or rout ine studies. Although the age range of individuals included m ay be different , it would be im portant to use a standard age group st rat ificat ion in all studies like it have been suggested before in the populat ion indicators sect ion. I f these issues are not standardized, in the future, there will be serious difficult ies in comparing prevalence est im ates or exposure effects between studies.
Differences in mortality and prevalence between m en and women suggest a gender effect on the developm ent of COPD but the role of gender rem ains unclear. Studies carr ied out in the past , showed that COPD prevalence and m ortality were greater am ong m en than wom en.22,38,39 However more recent studies 27,39 show that the prevalence of the disease tend to be equal and probably this reflects changing patterns of tobacco smoking.
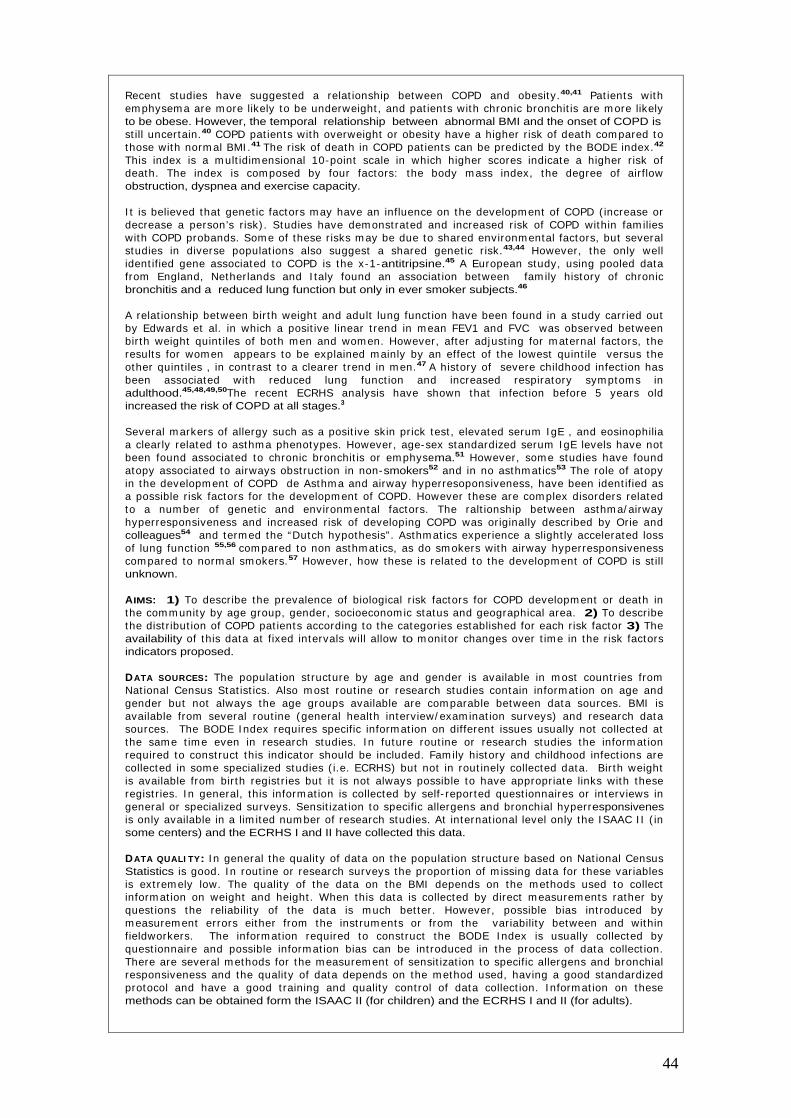
44
Recent studies have suggested a relat ionship between COPD and obesity.40,41 Pat ients with em physem a are m ore likely to be underweight , and pat ients with chronic bronchit is are m ore likely to be obese. However, the temporal relationship between abnormal BMI and the onset of COPD is st ill uncertain.40 COPD pat ients with overweight or obesity have a higher r isk of death com pared to those with norm al BMI .41 The r isk of death in COPD pat ients can be predicted by the BODE index.42
This index is a m ult idim ensional 10-point scale in which higher scores indicate a higher r isk of death. The index is composed by four factors: the body mass index, the degree of air flow obstruction, dyspnea and exercise capacity.
I t is believed that genet ic factors m ay have an influence on the developm ent of COPD ( increase or decrease a person’s r isk) . Studies have dem onst rated and increased r isk of COPD within fam ilies with COPD probands. Som e of these r isks m ay be due to shared environm ental factors, but several studies in diverse populat ions also suggest a shared genet ic r isk.43,44 However, the only well ident ified gene associated to COPD is the x-1-antitripsine.45 A European study, using pooled data from England, Netherlands and I taly found an associat ion between fam ily history of chronic bronchitis and a reduced lung function but only in ever smoker subjects.46
A relat ionship between bir th weight and adult lung funct ion have been found in a study carr ied out by Edwards et al. in which a posit ive linear t rend in m ean FEV1 and FVC was observed between birth weight quint iles of both men and wom en. However, after adjust ing for m aternal factors, the results for women appears to be explained m ainly by an effect of the lowest quint ile versus the other quint iles , in cont rast to a clearer t rend in m en.47 A history of severe childhood infect ion has been associated with reduced lung funct ion and increased respiratory sym ptoms in adulthood.45,48,49,50The recent ECRHS analysis have shown that infect ion before 5 years old increased the risk of COPD at all stages.3
Several m arkers of allergy such as a posit ive skin prick test , elevated serum I gE , and eosinophilia a clearly related to asthm a phenotypes. However, age-sex standardized serum I gE levels have not been found associated to chronic bronchit is or em physema.51 However, som e studies have found atopy associated to airways obstruct ion in non-smokers52 and in no asthm at ics53 The role of atopy in the developm ent of COPD de Asthm a and airway hyperresoponsiveness, have been ident ified as a possible r isk factors for the developm ent of COPD. However these are com plex disorders related to a num ber of genet ic and environm ental factors. The ralt ionship between asthm a/ airway hyperresponsiveness and increased r isk of developing COPD was originally described by Orie and colleagues54 and term ed the “Dutch hypothesis” . Asthm at ics experience a slight ly accelerated loss of lung funct ion 55,56 com pared to non asthm at ics, as do sm okers with airway hyperresponsiveness com pared to norm al smokers.57 However, how these is related to the developm ent of COPD is st ill unknown.
AIMS: 1) To describe the prevalence of biological r isk factors for COPD developm ent or death in the com m unity by age group, gender, socioeconom ic status and geographical area. 2) To describe the dist r ibut ion of COPD pat ients according to the categories established for each r isk factor 3) The availability of this data at fixed intervals will allow to m onitor changes over t im e in the r isk factors indicators proposed.
DATA SOURCES: The populat ion st ructure by age and gender is available in m ost count r ies from Nat ional Census Stat ist ics. Also m ost rout ine or research studies contain inform at ion on age and gender but not always the age groups available are com parable between data sources. BMI is available from several rout ine (general health interview/ exam inat ion surveys) and research data sources. The BODE I ndex requires specific inform at ion on different issues usually not collected at the sam e t im e even in research studies. I n future rout ine or research studies the inform at ion required to const ruct this indicator should be included. Fam ily history and childhood infect ions are collected in some specialized studies ( i.e. ECRHS) but not in rout inely collected data. Bir th weight is available from birth regist r ies but it is not always possible to have appropriate links with these regist r ies. I n general, this inform at ion is collected by self- reported quest ionnaires or interviews in general or specialized surveys. Sensit izat ion to specific allergens and bronchial hyperresponsivenes is only available in a lim ited num ber of research studies. At internat ional level only the I SAAC I I ( in some centers) and the ECRHS I and II have collected this data.
DATA QUALI TY: I n general the quality of data on the populat ion st ructure based on Nat ional Census Statistics is good. I n rout ine or research surveys the proport ion of m issing data for these variables is ext rem ely low. The quality of the data on the BMI depends on the m ethods used to collect inform at ion on weight and height . When this data is collected by direct m easurem ents rather by quest ions the reliability of the data is m uch bet ter. However, possible bias int roduced by m easurem ent errors either from the inst rum ents or from the variability between and within fieldworkers. The inform at ion required to const ruct the BODE I ndex is usually collected by quest ionnaire and possible inform at ion bias can be int roduced in the process of data collect ion. There are several m ethods for the m easurem ent of sensit izat ion to specific allergens and bronchial responsiveness and the quality of data depends on the m ethod used, having a good standardized protocol and have a good t raining and quality cont rol of data collect ion. I nform at ion on these methods can be obtained form the ISAAC II (for children) and the ECRHS I and II (for adults).
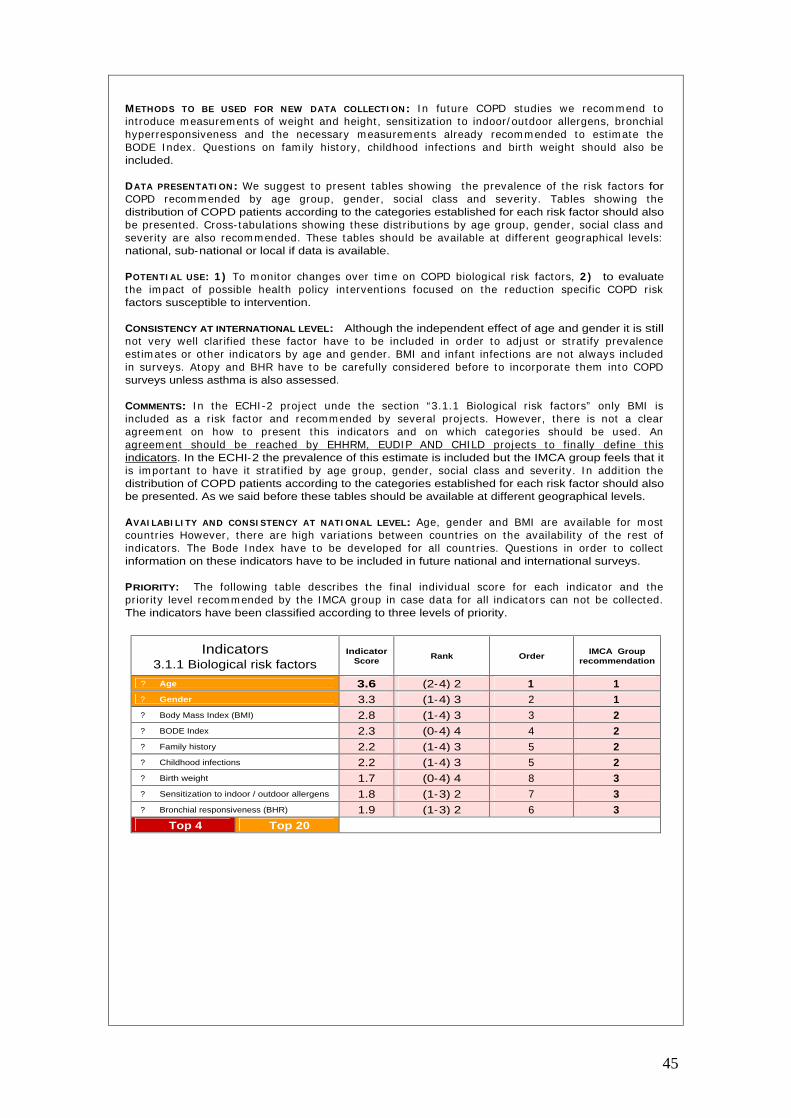
45
METHODS TO BE USED FOR NEW DATA COLLECTI ON: I n future COPD studies we recom m end to int roduce m easurem ents of weight and height , sensit izat ion to indoor/ outdoor allergens, bronchial hyperresponsiveness and the necessary m easurem ents already recom m ended to est im ate the BODE I ndex. Quest ions on fam ily history, childhood infect ions and birth weight should also be included.
DATA PRESENTATI ON: We suggest to present tables showing the prevalence of the r isk factors for COPD recom m ended by age group, gender, social class and severity. Tables showing the distribution of COPD patients according to the categories established for each risk factor should also be presented. Cross- tabulat ions showing these dist r ibut ions by age group, gender, social class and severity are also recom m ended. These tables should be available at different geographical levels: national, sub-national or local if data is available.
POTENTI AL USE: 1 ) To m onitor changes over t im e on COPD biological r isk factors, 2 ) to evaluate the im pact of possible health policy intervent ions focused on the reduct ion specific COPD risk factors susceptible to intervention.
CONSISTENCY AT INTERNATIONAL LEVEL: Although the independent effect of age and gender it is still not very well clar ified these factor have to be included in order to adjust or st rat ify prevalence est im ates or other indicators by age and gender. BMI and infant infect ions are not always included in surveys. Atopy and BHR have to be carefully considered before to incorporate them into COPD surveys unless asthma is also assessed.
COMMENTS: I n the ECHI -2 project unde the sect ion “3.1.1 Biological r isk factors” only BMI is included as a r isk factor and recom m ended by several projects. However, there is not a clear agreem ent on how to present this indicators and on which categories should be used. An agreem ent should be reached by EHHRM, EUDI P AND CHILD projects to finally define this indicators. In the ECHI-2 the prevalence of this estimate is included but the IMCA group feels that it is im portant to have it st rat ified by age group, gender, social class and severity. I n addit ion the distribution of COPD patients according to the categories established for each risk factor should also be presented. As we said before these tables should be available at different geographical levels.
AVAI LABI LI TY AND CONSI STENCY AT NATI ONAL LEVEL: Age, gender and BMI are available for m ost count r ies However, there are high variat ions between count r ies on the availability of the rest of indicators. The Bode I ndex have to be developed for all count r ies. Quest ions in order to collect information on these indicators have to be included in future national and international surveys.
PRIORITY: The following table describes the final individual score for each indicator and the pr ior ity level recom m ended by the I MCA group in case data for all indicators can not be collected. The indicators have been classified according to three levels of priority.
Indicators 3.1.1 Biological risk factors
Indicator Score
Rank Order IMCA Group
recommendation
?
Age 3.6 (2-4) 2 1 1 ?
Gender 3.3 (1-4) 3 2 1 ?
Body Mass Index (BMI) 2.8 (1-4) 3 3 2 ?
BODE Index 2.3 (0-4) 4 4 2 ?
Family history 2.2 (1-4) 3 5 2 ?
Childhood infections 2.2 (1-4) 3 5 2 ?
Birth weight 1.7 (0-4) 4 8 3 ?
Sensitization to indoor / outdoor allergens 1.8 (1-3) 2 7 3 ?
Bronchial responsiveness (BHR) 1.9 (1-3) 2 6 3 Top 4 Top 20
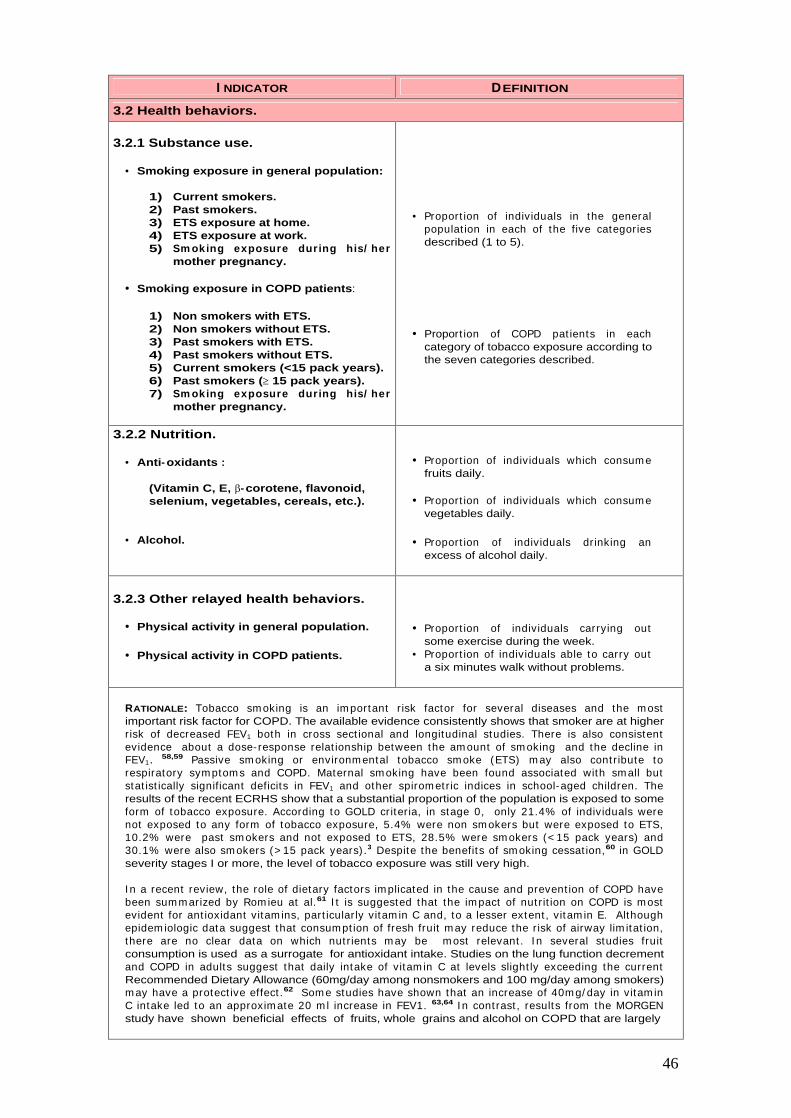
46
I NDICATOR DEFINITION
3.2 Health behaviors.
3.2.1 Substance use.
• Smoking exposure in general population:
1) Current smokers. 2) Past smokers. 3) ETS exposure at home. 4) ETS exposure at work. 5) Sm oking exposure during his/ her
mother pregnancy.
• Smoking exposure in COPD patients:
1) Non smokers with ETS. 2) Non smokers without ETS. 3) Past smokers with ETS. 4) Past smokers without ETS. 5) Current smokers (<15 pack years). 6) Past smokers ( 15 pack years). 7) Sm oking exposure during his/ her
mother pregnancy.
• Proport ion of individuals in the general populat ion in each of the five categories described (1 to 5).
• Proport ion of COPD pat ients in each category of tobacco exposure according to the seven categories described.
3.2.2 Nutrition.
• Anti-oxidants :
(Vitamin C, E, -corotene, flavonoid, selenium, vegetables, cereals, etc.).
• Alcohol.
• Proport ion of individuals which consum e fruits daily.
• Proport ion of individuals which consum e vegetables daily.
• Proport ion of individuals drinking an excess of alcohol daily.
3.2.3 Other relayed health behaviors.
• Physical activity in general population.
• Physical activity in COPD patients.
• Proport ion of individuals carrying out some exercise during the week.
• Proport ion of individuals able to carry out a six minutes walk without problems.
RATIONALE: Tobacco sm oking is an im portant r isk factor for several diseases and the m ost important risk factor for COPD. The available evidence consistently shows that smoker are at higher r isk of decreased FEV1 both in cross sect ional and longitudinal studies. There is also consistent evidence about a dose- response relat ionship between the am ount of sm oking and the decline in FEV1. 58,59 Passive sm oking or environm ental tobacco sm oke (ETS) m ay also cont r ibute to respiratory sym ptom s and COPD. Maternal sm oking have been found associated with sm all but stat ist ically significant deficits in FEV1 and other spirom etr ic indices in school-aged children. The results of the recent ECRHS show that a substantial proportion of the population is exposed to some form of tobacco exposure. According to GOLD cr iter ia, in stage 0, only 21.4% of individuals were not exposed to any form of tobacco exposure, 5.4% were non sm okers but were exposed to ETS, 10.2% were past sm okers and not exposed to ETS, 28.5% were sm okers (< 15 pack years) and 30.1% were also sm okers (> 15 pack years) .3 Despite the benefits of sm oking cessat ion,60 in GOLD severity stages I or more, the level of tobacco exposure was still very high.
I n a recent review, the role of dietary factors im plicated in the cause and prevent ion of COPD have been sum m arized by Rom ieu at al.61 I t is suggested that the im pact of nut r it ion on COPD is m ost evident for ant ioxidant vitam ins, part icularly vitam in C and, to a lesser extent , vitam in E. Although epidem iologic data suggest that consum pt ion of fresh fruit m ay reduce the r isk of airway lim itat ion, there are no clear data on which nut r ients m ay be m ost relevant . I n several studies fruit consumption is used as a surrogate for antioxidant intake. Studies on the lung function decrement and COPD in adults suggest that daily intake of vitam in C at levels slight ly exceeding the current Recommended Dietary Allowance (60mg/day among nonsmokers and 100 mg/day among smokers) m ay have a protect ive effect .62 Som e studies have shown that an increase of 40m g/ day in vitam in C intake led to an approxim ate 20 m l increase in FEV1. 63,64 I n cont rast , results from the MORGEN study have shown beneficial effects of fruits, whole grains and alcohol on COPD that are largely

47
addit ive and could not be explained by sm oking habits.66 I n another analysis, using data from the sam e study protect ive effects of vitam in E were found but not from vitam in C, beta carotene and vegetables.67
Exercise t raining have been indicated as a com ponent of the pulm onary rehabilitat ion program s to reduce sym ptom s, im prove quality of life, and increase physical and em ot ional part icipat ion in everyday act ivit ies. However, there are im portant variat ions in the m ethods of assessing physical act ivity. They can be very com plex such as using cycle ergometer m easurem ents or very sim ple such as simples quest ions int roduced in a self-answered quest ionnaire. The m inim um lengths of an effect ive rehabilitat ion program is two m onths; the longer the program cont inues, the m ore effective results.68,69 However, no effective program has been developed to maintain the effect over time. 70 Due to these problem s doctors tend to recom m end to pat ients to do exercise on their own (i.e. walking 20 minutes daily).
AIMS: 1) To describe the prevalence of behavioral r isk factors for COPD developm ent or death in the com m unity by age group, gender, socioeconom ic status and geographical area. 2) To describe the dist r ibut ion of COPD pat ients according to the categories established for each r isk factor 3) The availability of this data at fixed intervals will allow to monitor changes over t im e in the r isk factors indicators proposed.
DATA SOURCES: All rout ine general health interview or exam inat ion surveys and research studies provide inform at ion on tobacco sm oking. However, the precise definit ion and quest ions used in all these studies are highly variable. The inform at ion on alcohol is perhaps m ore lim ited but have the sam e problem s of com parability m ent ioned for tobacco. Physical act ivity is also collected in general surveys but there is a wide range of m ethods that goes from sim ple quest ions to a com plex m ethods of m easurem ent . The inform at ion on ant i-oxidants or other nut r it ion aspects usually are collected by specific nut r it ion surveys and in som e research studies interested in ident ifying associations between some aspects of nutrition and specific diseases.
DATA QUALI TY: The quality of data on tobacco exposure even when collected by quest ionnaire ( in com parison with cot inine m easurem ents or other m ethods) can be good. The m ajor problem is the com parability of quest ions used in different studies and the categories of interest to assess exposures. The data on nut r it ion is difficult to collect and standardized quest ionnaires should be used to provide com parable inform at ion. The quality of data collect ion on physical act ivity also depends on the methods used for its measurement. Standardized methods should be agreed.
METHODS TO BE USED FOR NEW DATA COLLECTION: We recommend the used of standardized questions already used in previous studies. For sm oking status ECRHS quest ions could be used. For nut r it ion and physical activity questions suggested by an European Respiratory Review could be used.
DATA PRESENTATI ON: We suggest to present tables showing the prevalence of the r isk factors for COPD recom m ended by age group, gender, social class and severity. Tables showing the distribution of COPD patients according to the categories established for each risk factor should also be presented. Cross- tabulat ions showing these dist r ibut ions by age group, gender, social class and severity are also recom m ended. These tables should be available at different geographical levels: national, sub-national or local if data is available.
POTENTI AL USE: 1 ) To m onitor changes over t ime on COPD behavioral r isk factors, 2 ) to evaluate the im pact of possible health policy intervent ions focused on the reduct ion specific COPD risk factors susceptible to intervention.
I NTERNATI ONAL CONSI STENCY: I t seem s clear that m ost of the indicators proposed are relevant to the prevent ion or reduct ion of progression of COPD. Tobacco sm oke is the m ost im portant r isk factor for COPD and in general is included in m ost surveys. However, the data presentat ion in order to show different levels of exposure in COPD pat ients is not consistent . The ECRHS analysis have used the following categories for tobacco exposure: 1) Non-sm okers and ETS - ; 2) Past sm okers and ETS - ; 3) Non-sm okers and ETS + ; 4) Past -sm okers and ETS + ; 5) Sm okers < 15 pack years; 6) Smokers >15 pack years; 7) Smokers of other tobaccos. BMI or changes in BMI probably are not always included. The BMI and how to assess changes in BMI in cross sect ional surveys should be discussed. Physical exercise can be m easured by different m ethods and with high degree of com plexity and costs. The m ethods to use in HI S/ HES surveys or specific COPD surveys have to be discussed.
COMMENTS: I n the ECHI -2 several indicators on tobacco exposures are proposed and several projects have suggested specific proposals. It is necessary to review the current proposal and reach a rational number of indicators relevant to health. The project that should be contacted are: CHILD, EUROCHI P, EHRM, PERI STAT, EUDI P, PHNUT and ECHI -2. The sam e agreem ent should be reached am ong PHNUT, ECAS, CHI LD, ECAS and ECHI -2 on alcohol exposure; with DAFNE, EFCOSUM, PHNUT on nutrition indicators; with EUPASS, PHNUT, CHILD and ECHI-2 for physical activity.
AVAI LABI LI TY AND CONSI STENCY AT NATI ONAL LEVEL: There are high variat ions between count r ies on the availability of these indicators. Only current and past smoking seems to be available for most
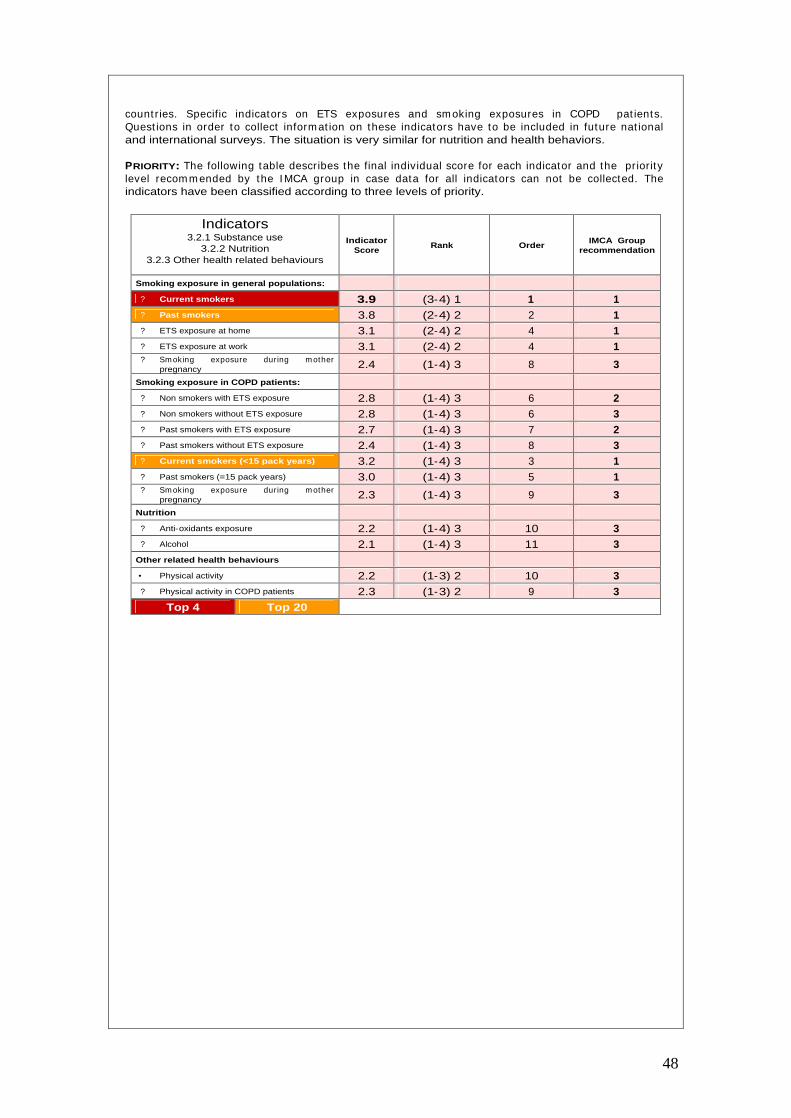
48
countries. Specific indicators on ETS exposures and sm oking exposures in COPD pat ients. Quest ions in order to collect inform at ion on these indicators have to be included in future nat ional and international surveys. The situation is very similar for nutrition and health behaviors.
PRIORITY: The following table describes the final individual score for each indicator and the pr iority level recom m ended by the I MCA group in case data for all indicators can not be collected. The indicators have been classified according to three levels of priority.
Indicators 3.2.1 Substance use
3.2.2 Nutrition 3.2.3 Other health related behaviours
Indicator Score
Rank Order IMCA Group
recommendation
Smoking exposure in general populations:
?
Current smokers 3.9 (3-4) 1 1 1 ?
Past smokers 3.8 (2-4) 2 2 1 ?
ETS exposure at home 3.1 (2-4) 2 4 1 ?
ETS exposure at work 3.1 (2-4) 2 4 1 ?
Sm oking exposure during m other pregnancy 2.4 (1-4) 3 8 3
Smoking exposure in COPD patients:
?
Non smokers with ETS exposure 2.8 (1-4) 3 6 2 ?
Non smokers without ETS exposure 2.8 (1-4) 3 6 3 ?
Past smokers with ETS exposure 2.7 (1-4) 3 7 2 ?
Past smokers without ETS exposure 2.4 (1-4) 3 8 3 ?
Current smokers (<15 pack years) 3.2 (1-4) 3 3 1 ?
Past smokers (=15 pack years) 3.0 (1-4) 3 5 1 ?
Sm oking exposure during m other pregnancy 2.3 (1-4) 3 9 3
Nutrition
?
Anti-oxidants exposure 2.2 (1-4) 3 10 3 ?
Alcohol 2.1 (1-4) 3 11 3 Other related health behaviours
• Physical activity 2.2 (1-3) 2 10 3 ?
Physical activity in COPD patients 2.3 (1-3) 2 9 3 Top 4 Top 20
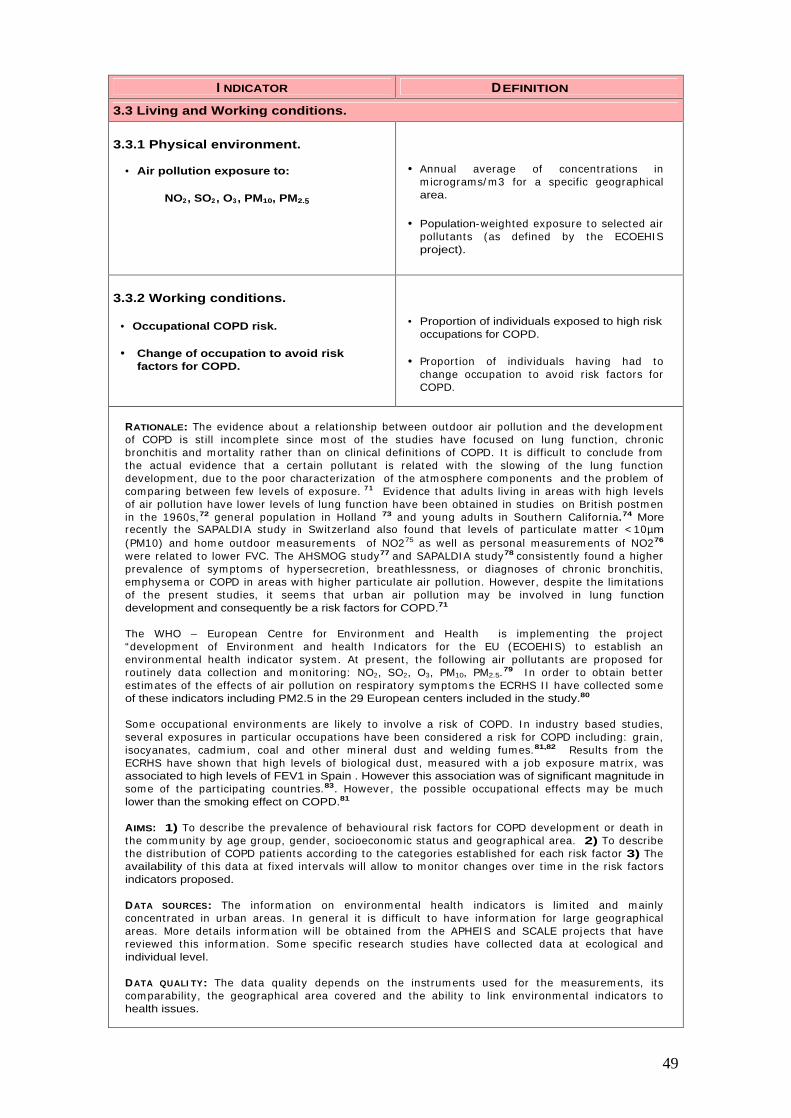
49
I NDICATOR DEFINITION
3.3 Living and Working conditions.
3.3.1 Physical environment.
• Air pollution exposure to:
NO2, SO2, O3, PM10, PM2.5
• Annual average of concent rat ions in m icrograms/ m 3 for a specific geographical area.
• Population-weighted exposure to selected air pollutants (as defined by the ECOEHI S project).
3.3.2 Working conditions.
• Occupational COPD risk.
• Change of occupation to avoid risk factors for COPD.
• Proportion of individuals exposed to high risk occupations for COPD.
• Proport ion of individuals having had to change occupat ion to avoid r isk factors for COPD.
RATIONALE: The evidence about a relat ionship between outdoor air pollut ion and the developm ent of COPD is st ill incom plete since m ost of the studies have focused on lung funct ion, chronic bronchit is and m ortality rather than on clinical definit ions of COPD. I t is difficult to conclude from the actual evidence that a certain pollutant is related with the slowing of the lung funct ion developm ent , due to the poor characterizat ion of the atm osphere com ponents and the problem of com paring between few levels of exposure. 7 1 Evidence that adults liv ing in areas with high levels of air pollut ion have lower levels of lung funct ion have been obtained in studies on Brit ish postm en in the 1960s,72 general populat ion in Holland 73 and young adults in Southern California.74 More recent ly the SAPALDI A study in Switzerland also found that levels of part iculate m at ter < 10µm (PM10) and hom e outdoor m easurem ents of NO275 as well as personal m easurem ents of NO276
were related to lower FVC. The AHSMOG study77 and SAPALDI A study78 consistent ly found a higher prevalence of sym ptom s of hypersecret ion, breathlessness, or diagnoses of chronic bronchit is, em physem a or COPD in areas with higher part iculate air pollut ion. However, despite the lim itat ions of the present studies, it seem s that urban air pollut ion m ay be involved in lung function development and consequently be a risk factors for COPD.71
The WHO – European Cent re for Environm ent and Health is im plem ent ing the project “developm ent of Environm ent and health I ndicators for the EU (ECOEHI S) to establish an environm ental health indicator system . At present , the following air pollutants are proposed for rout inely data collect ion and monitor ing: NO2, SO2, O3, PM10, PM2.5.79 I n order to obtain bet ter est im ates of the effects of air pollut ion on respiratory sym ptom s the ECRHS I I have collected som e of these indicators including PM2.5 in the 29 European centers included in the study.80
Som e occupat ional environm ents are likely to involve a r isk of COPD. I n indust ry based studies, several exposures in part icular occupat ions have been considered a r isk for COPD including: grain, isocyanates, cadm ium , coal and other m ineral dust and welding fum es.81,82 Results from the ECRHS have shown that high levels of biological dust , m easured with a job exposure m atr ix, was associated to high levels of FEV1 in Spain . However this association was of significant magnitude in som e of the part icipat ing countr ies.83. However, the possible occupat ional effects m ay be m uch lower than the smoking effect on COPD.81
AIMS: 1) To describe the prevalence of behavioural r isk factors for COPD developm ent or death in the com m unity by age group, gender, socioeconom ic status and geographical area. 2) To describe the dist r ibut ion of COPD pat ients according to the categories established for each r isk factor 3) The availability of this data at fixed intervals will allow to m onitor changes over t im e in the r isk factors indicators proposed.
DATA SOURCES: The inform at ion on environm ental health indicators is lim ited and m ainly concent rated in urban areas. I n general it is difficult to have inform at ion for large geographical areas. More details inform at ion will be obtained from the APHEI S and SCALE projects that have reviewed this inform at ion. Some specific research studies have collected data at ecological and individual level.
DATA QUALI TY: The data quality depends on the inst rum ents used for the m easurem ents, its com parability, the geographical area covered and the ability to link environmental indicators to health issues.

50
METHODS TO BE USED FOR NEW DATA COLLECTI ON: I n m any count r ies inform at ion on the air pollut ion indicators is already collected in some specific areas but in many cases difficult or impossible to link data on exposure and health. The challenge for the future is to collect air pollut ion data rout inely in selected geographical areas over t im e and for this specific areas to evaluate the health effects over t im e. On the other hand and alternat ive to the rout ine data collect ion would be to incorporate ecological or individual m easurem ents on the exposure to air pollut ion in the research or rout ine surveys.
DATA PRESENTATION: Details should be specified according to ECOEHIS project recommendations.
POTENTIAL USE: 1) To monitor changes over time on COPD risk factors related ot living and working conditions, 2 ) to evaluate the im pact of possible health policy intervent ions focused on the reduction specific COPD risk factors susceptible to intervention.
I NTERNATI ONAL CONSI STENCY: I t seem s difficult to dist inguish which air pollutants have a specific r isk for COPD. However, the data collect ion of m ost of the pollutants indicated for m onitor ing are going to be collected across Europe. Perhaps it would be im portant to discuss how to link cross sectional-surveys with this ecological data. Air pollutants are not going to be collected in all geographical areas and this m ay be a problem for designing surveys with a nat ional representat ion. I n the ECRHS indoor and outdoor exposures are collected and in som e areas of the I SAAC Phase I I . However, these are not nat ionally representat ive studies. How to links indoor and outdoor exposures in HIS/HES or specific surveys on COPD is probably and issue for discussion.
COMMENTS: Several projects have proposed indicators on environm ental exposures but there is not a specific definit ion and m ethod of data presentat ion. These issues should be m ainly discussed with the ECOHI S project and also with projects that have suggested som e indicators such as EUROCHIP, CHILD AND ECHI-2 projects.
AVAI LABI LI TY AND CONSI STENCY AT NATI ONAL LEVEL: Nearly all count r ies have inform at ion available collected rout inely on the annual average of NO2, SO2, O3 and PM10. The inform at ion on PM2.5 is available only in nine countries and is available form research studies or have to be produced in the future in seven count r ies. Part icipants from three count r ies said that populat ion weighted indicators have to be produced in the future from specific surveys and three said that they are only available from research surveys. Most indicators on working condit ions are available only from research surveys or have to be produced in the future.
PRIORITY: The following table describes the final individual score for each indicator and the pr iority level recom m ended by the I MCA group in case data for all indicators can not be collected. The indicators have been classified according to three levels of priority.
Indicators 3.3.1 Physical environment 3.3.2 Working conditions
Indicator Score
Rank Order IMCA Group
recommendation
Annual average
?
NO2 2.4 (1-3) 2 5 2 ?
SO2 2.3 (1-4) 3 6 3 ?
O3 2.2 (1-3) 2 7 3 ?
PM10 2.8 (1-4) 3 2 2 ?
PM2.5 2.7 (1-4) 3 3 2 Population weighted
?
NO2 2.3 (1-3) 2 6 3 ?
SO2 2.3 (0-4) 4 6 3 ?
O3 2.2 (1-3) 2 7 3 ?
PM10 2.7 (2-4) 2 3 2 ?
PM2.5 2.5 (2-4) 2 4 2 Working conditions
?
Occupational COPD risk in general population 2.9 (2-4) 2 1 1 ?
Occupational exposures in COPD patients 2.9 (1-4) 3 1 1

51
Class 4
Health Systems
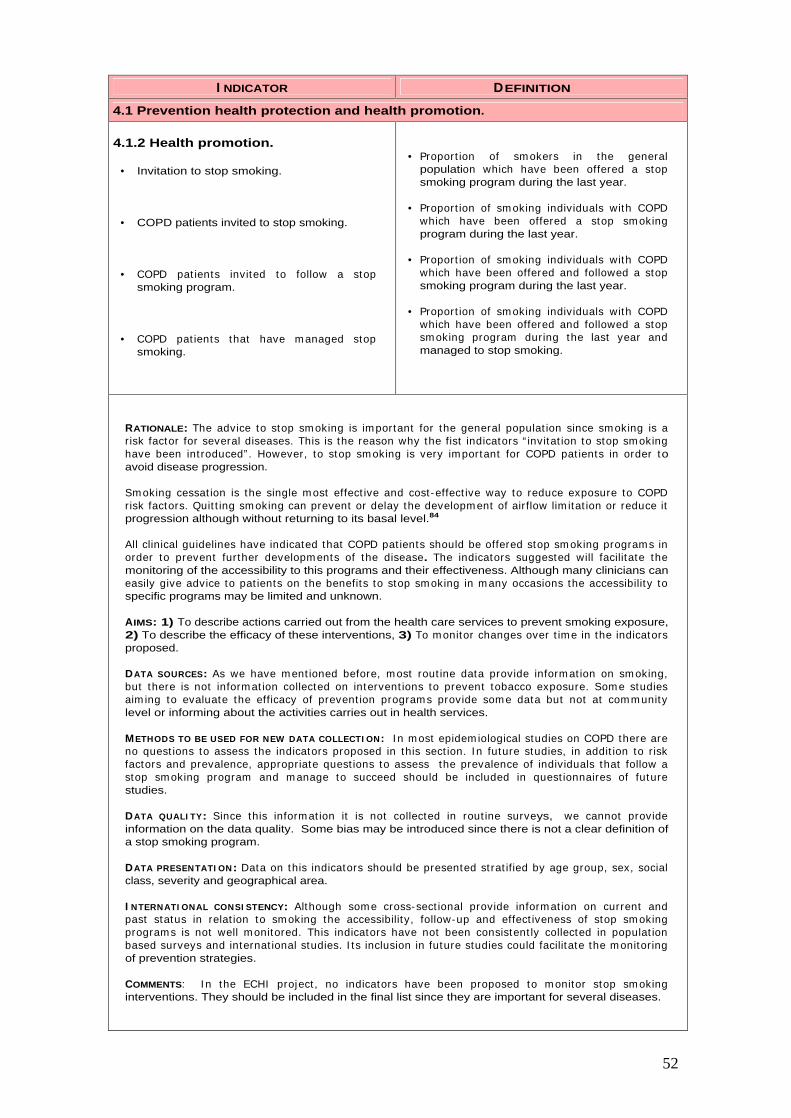
52
I NDICATOR DEFINITION
4.1 Prevention health protection and health promotion.
4.1.2 Health promotion.
• Invitation to stop smoking.
• COPD patients invited to stop smoking.
• COPD pat ients invited to follow a stop smoking program.
• COPD pat ients that have m anaged stop smoking.
• Proport ion of sm okers in the general population which have been offered a stop smoking program during the last year.
• Proport ion of sm oking individuals with COPD which have been offered a stop sm oking program during the last year.
• Proport ion of sm oking individuals with COPD which have been offered and followed a stop smoking program during the last year.
• Proport ion of sm oking individuals with COPD which have been offered and followed a stop sm oking program during the last year and managed to stop smoking.
RATIONALE: The advice to stop sm oking is im portant for the general populat ion since sm oking is a r isk factor for several diseases. This is the reason why the fist indicators “ invitat ion to stop sm oking have been int roduced” . However, to stop sm oking is very im portant for COPD pat ients in order to avoid disease progression.
Sm oking cessat ion is the single m ost effect ive and cost -effect ive way to reduce exposure to COPD risk factors. Quit t ing sm oking can prevent or delay the developm ent of air flow lim itat ion or reduce it progression although without returning to its basal level.84
All clinical guidelines have indicated that COPD pat ients should be offered stop sm oking programs in order to prevent further developm ents of the disease. The indicators suggested will facilitate the monitoring of the accessibility to this programs and their effectiveness. Although many clinicians can easily give advice to pat ients on the benefits to stop sm oking in m any occasions the accessibility to specific programs may be limited and unknown.
AIMS: 1) To describe actions carried out from the health care services to prevent smoking exposure, 2) To describe the efficacy of these interventions, 3) To m onitor changes over t im e in the indicators proposed.
DATA SOURCES: As we have m ent ioned before, m ost rout ine data provide inform at ion on sm oking, but there is not inform at ion collected on intervent ions to prevent tobacco exposure. Som e studies aim ing to evaluate the efficacy of prevent ion program s provide som e data but not at com m unity level or informing about the activities carries out in health services.
METHODS TO BE USED FOR NEW DATA COLLECTI ON: I n m ost epidem iological studies on COPD there are no quest ions to assess the indicators proposed in this sect ion. I n future studies, in addit ion to r isk factors and prevalence, appropriate quest ions to assess the prevalence of individuals that follow a stop sm oking program and m anage to succeed should be included in quest ionnaires of future studies.
DATA QUALI TY: Since this inform at ion it is not collected in rout ine surveys, we cannot provide information on the data quality. Some bias may be introduced since there is not a clear definition of a stop smoking program.
DATA PRESENTATI ON: Data on this indicators should be presented st rat ified by age group, sex, social class, severity and geographical area.
I NTERNATI ONAL CONSI STENCY: Although som e cross-sect ional provide inform at ion on current and past status in relat ion to sm oking the accessibility, follow-up and effect iveness of stop sm oking program s is not well m onitored. This indicators have not been consistent ly collected in populat ion based surveys and internat ional studies. I ts inclusion in future studies could facilitate the m onitor ing of prevention strategies.
COMMENTS: I n the ECHI project , no indicators have been proposed to m onitor stop sm oking interventions. They should be included in the final list since they are important for several diseases.

53
AVAI LABI LI TY AND CONSI STENCY AT NATI ONAL LEVEL: These indicators are not available and the data required for its est im at ions is not included in COPD studies. I n the future, the appropriate quest ions to collect the information required have to be introduced in HES or specific surveys.
PRIORITY: The following table describes the final individual score for each indicator and the pr ior ity level recom m ended by the I MCA group in case data for all indicators can not be collected. The indicators have been classified according to three levels of priority.
Indicators 4.1.2 Health promotion
Indicator Score
Rank Order IMCA Group
recommendation
?
Invitation to follow a stop smoking program 3.1 (1-4) 3 3 1 ?
COPD patients invited to stop smoking 3.3 (1-4) 3 1 1 ?
COPD pat ients which followed a stop sm oking program 3.3 (1-4) 3 1 2
?
COPD patients that have managed stop smoking 3.2 (1-4) 3 2 1
Top 20

54
I NDICATOR DEFINITION
4.1 Prevention health protection and health promotion.
4.1.3 Health protection.
• I ntervent ions to prevent tobacco exposure
• Occupational risk
• Air pollution
• COPD patient vaccinated against influenza
• COPD pat ients vaccinated against pneumococcus
• Presence of sm oking rest r ict ion in specific types of buildings.
• Existence and enforcem ent of laws/ regulat ions to protect children from tobacco exposure in public places.
• Proport ion of individuals with COPD which are exposed to vapors, gasses or fum es at work.
• Proport ion of individuals with COPD which are liv ing near highways or high t raffic density.
• Proport ion of individuals with COPD that have had influenza vaccinat ions during the last year.
• Proport ion of individuals with COPD that have had pneum occocus vaccinat ions during the last year.
RATIONALE: Indicators on interventions to reduce environmental exposure to tobacco in public places have been proposed by the ECHI , the Child Health and the ECOHI S project . Since, tobacco smoke, as have already been m ent ioned before is the st rongest r isk factor for COPD these indicators perhaps should also be recom mended by the I MCA project . However, although they can provide information on the policies being implemented in different countries, they may be a poor indicator of exposure.
I n the previous sect ion on r isk factors, it was already m ent ioned that som e occupat ional exposures m ay be a r isk for COPD (although sm aller than tobacco) . Although the proport ion of individuals exposed to vapors, gases or fum es at work is not a very detailed m easure of exposure, it could be used as a proxy of occupat ional r isk. This quest ion have been used in the ECRHS. I n the sam e way, the proport ion of individuals with COPD which are liv ing near highways or high t raffic density could be a crude m easure of persistent exposure to air pollut ion ( in absence of other m easures m ore specific). This indicator could be important to assess prevention policies.
I nfluenza vaccines can reduce serious illness and death in COPD pat ients by about 50% .85 Vaccines containing killed or live , inact ivated viruses are recom m ended86 as they are m ore effect ive in elderly pat ients with COPD. I nfluenza vaccinat ion is recom m ended in the GOLD guidelines at all COPD severity stages. So the indicator on the proport ion of individuals with COPD vaccinated during the last year could be an indicator of good management.
AIMS: 1) To describe actions carried out from the health care services to prevent smoking exposure, at com m unity level 2) To describe the proport ion of pat ients expose to air pollut ion or occupat ional r isk despite knowig they have COPD, 3) To describe the num ber of COPD pat ients that are taking preventive actions (vaccinations), 4) To monitor changes over time in the indicators proposed.
DATA SOURCES: As we have m ent ioned before, m ost rout ine data provide inform at ion on sm oking, but there is not inform at ion collected on intervent ions to prevent tobacco exposure. The inform at ion on legislat ion m ay be very unreliable and specific m easurem ents m ay be required. I nform at ion on occupat ional r isks and air pollut ion can be obtained form sim ple quest ions already used in studies such as ECRHS.
DATA QUALI TY: The data quality m ay depend on the quality of individuals report ing. However som e of these quest ions have already been validated for other studies and have been found very useful and simple.
METHODS TO BE USED FOR NEW DATA COLLECTION: I nform at ion on these indicators is not available form rout ine stat ist ics. Standardized definit ions for the health care resources indicated should be developed and compared with the existing ones in different countries.
DATA PRESENTATI ON: : Data on this indicators should be presented st rat ified by age group, sex, social class, severity and geographical area.
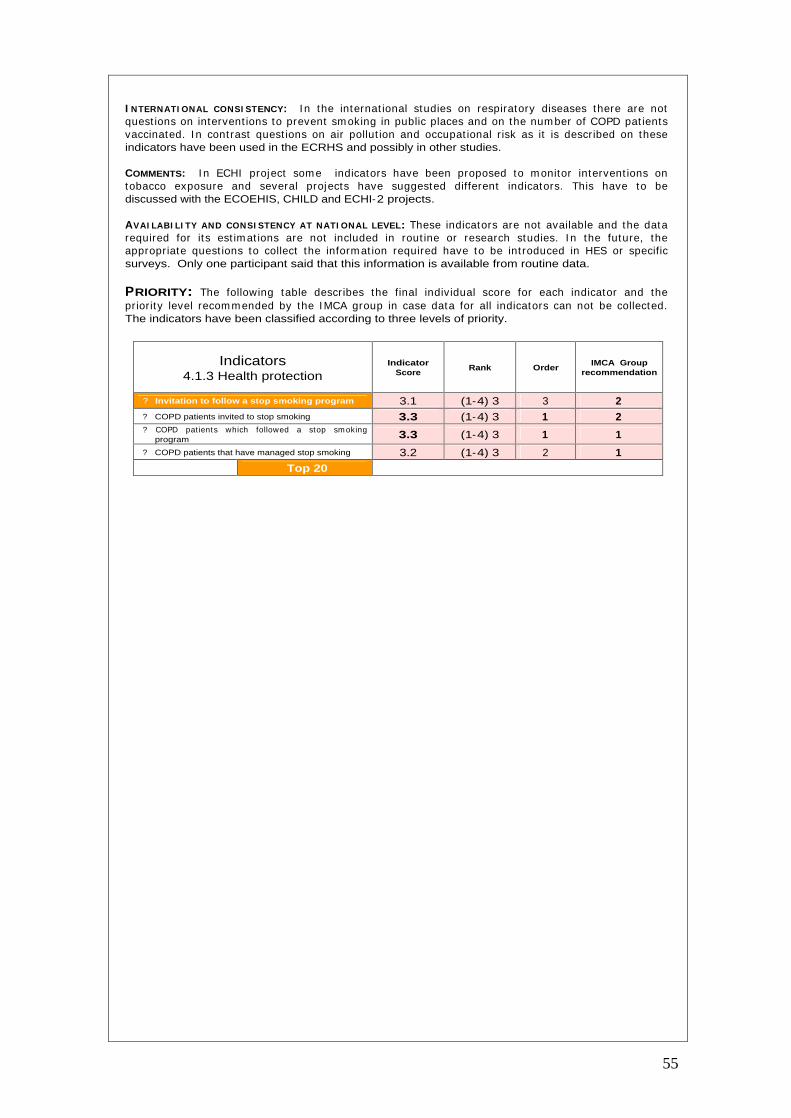
55
I NTERNATI ONAL CONSI STENCY: I n the internat ional studies on respiratory diseases there are not quest ions on intervent ions to prevent sm oking in public places and on the num ber of COPD pat ients vaccinated. I n cont rast quest ions on air pollut ion and occupat ional r isk as it is described on these indicators have been used in the ECRHS and possibly in other studies.
COMMENTS: I n ECHI project som e indicators have been proposed to m onitor intervent ions on tobacco exposure and several projects have suggested different indicators. This have to be discussed with the ECOEHIS, CHILD and ECHI-2 projects.
AVAI LABI LI TY AND CONSI STENCY AT NATI ONAL LEVEL: These indicators are not available and the data required for its est im at ions are not included in rout ine or research studies. I n the future, the appropriate quest ions to collect the inform at ion required have to be int roduced in HES or specific surveys. Only one participant said that this information is available from routine data.
PRIORITY: The following table describes the final individual score for each indicator and the pr ior ity level recom m ended by the I MCA group in case data for all indicators can not be collected. The indicators have been classified according to three levels of priority.
Indicators 4.1.3 Health protection
Indicator Score
Rank Order IMCA Group
recommendation
?
Invitation to follow a stop smoking program 3.1 (1-4) 3 3 2 ?
COPD patients invited to stop smoking 3.3 (1-4) 3 1 2 ?
COPD pat ients which followed a stop sm oking program 3.3 (1-4) 3 1 1
?
COPD patients that have managed stop smoking 3.2 (1-4) 3 2 1
Top 20
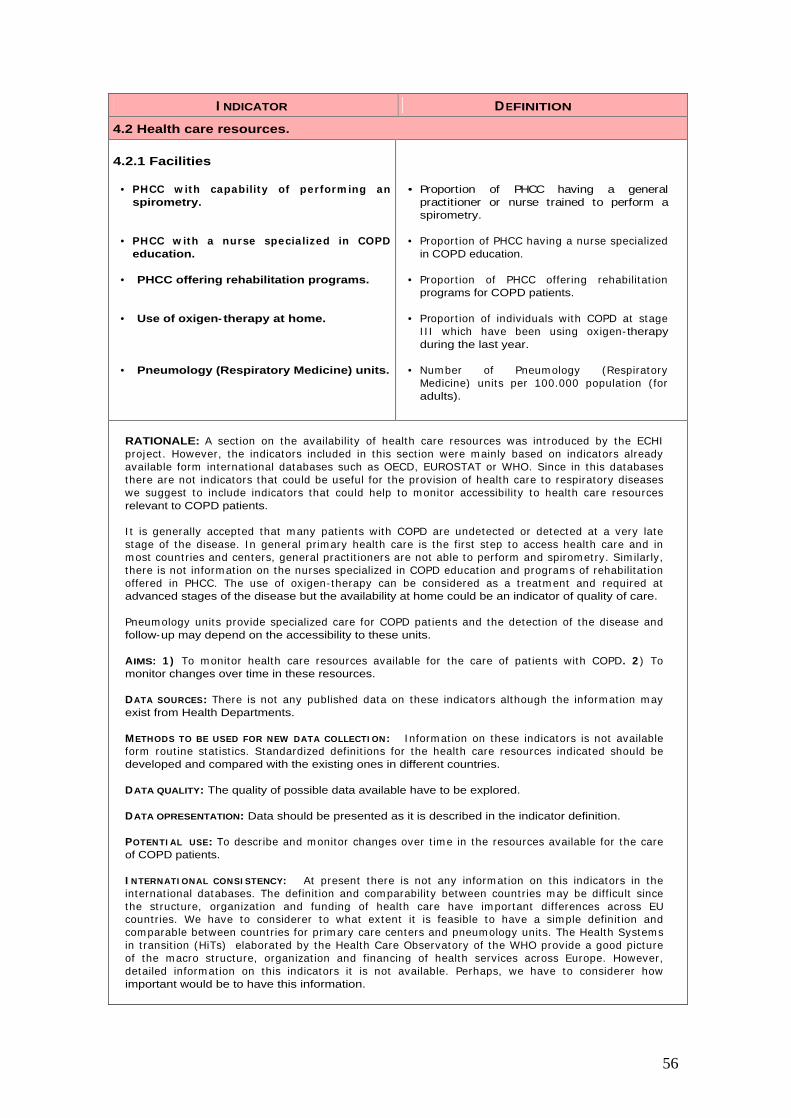
56
I NDICATOR DEFINITION
4.2 Health care resources.
4.2.1 Facilities
• PHCC w ith capability of perform ing an spirometry.
• PHCC w ith a nurse specialized in COPD education.
• PHCC offering rehabilitation programs.
• Use of oxigen- therapy at home.
• Pneumology (Respiratory Medicine) units.
• Proportion of PHCC having a general
practitioner or nurse trained to perform a spirometry.
• Proport ion of PHCC having a nurse specialized in COPD education.
• Proport ion of PHCC offer ing rehabilitat ion programs for COPD patients.
• Proport ion of individuals with COPD at stage I I I which have been using oxigen- therapy during the last year.
• Num ber of Pneum ology (Respiratory Medicine) units per 100.000 populat ion ( for adults).
RATIONALE: A sect ion on the availability of health care resources was int roduced by the ECHI project . However, the indicators included in this sect ion were m ainly based on indicators already available form internat ional databases such as OECD, EUROSTAT or WHO. Since in this databases there are not indicators that could be useful for the provision of health care to respiratory diseases we suggest to include indicators that could help to m onitor accessibility to health care resources relevant to COPD patients.
I t is generally accepted that m any pat ients with COPD are undetected or detected at a very late stage of the disease. I n general pr im ary health care is the first step to access health care and in m ost count r ies and centers, general pract it ioners are not able to perform and spirom etry. Sim ilar ly, there is not inform at ion on the nurses specialized in COPD educat ion and program s of rehabilitat ion offered in PHCC. The use of oxigen- therapy can be considered as a t reatm ent and required at advanced stages of the disease but the availability at home could be an indicator of quality of care.
Pneum ology units provide specialized care for COPD pat ients and the detect ion of the disease and follow-up may depend on the accessibility to these units.
AIMS: 1 ) To m onitor health care resources available for the care of pat ients with COPD. 2 ) To monitor changes over time in these resources.
DATA SOURCES: There is not any published data on these indicators although the inform at ion m ay exist from Health Departments.
METHODS TO BE USED FOR NEW DATA COLLECTI ON: I nform at ion on these indicators is not available form rout ine stat ist ics. Standardized definit ions for the health care resources indicated should be developed and compared with the existing ones in different countries.
DATA QUALITY: The quality of possible data available have to be explored.
DATA OPRESENTATION: Data should be presented as it is described in the indicator definition.
POTENTI AL USE: To describe and m onitor changes over t im e in the resources available for the care of COPD patients.
I NTERNATI ONAL CONSI STENCY: At present there is not any inform at ion on this indicators in the internat ional databases. The definit ion and com parability between count r ies m ay be difficult since the st ructure, organizat ion and funding of health care have im portant differences across EU count r ies. We have to considerer to what extent it is feasible to have a simple definit ion and com parable between count r ies for pr im ary care centers and pneum ology units. The Health Systems in t ransit ion (HiTs) elaborated by the Health Care Observatory of the WHO provide a good picture of the m acro st ructure, organizat ion and financing of health services across Europe. However, detailed inform at ion on this indicators it is not available. Perhaps, we have to considerer how important would be to have this information.

57
COMMENTS: In the ECHI-2 the indicators on health care resources included are very general and not related to disease specific. The indicators included in this sect ion were m ainly based on indicators already available form internat ional databases such as OECD, EUROSTAT or WHO. Since in this databases there are not indicators that could be useful for the provision of health care to respiratory diseases we suggest to include indicators that could help to m onitor accessibility to health care resources. These indicators proposed should be included for further development.
AVAI LABI LI TY AND CONSI STENCY AT NATI ONAL LEVEL: Most of the inform at ion required to const ruct these indicators is available from rout ine data in all count r ies. Methodological changes are required in som e count r ies to produce the indicators according to the definit ion established. I n France and Luxem bourg do not exist pr im ary health care centers. This is way the inform at ion for some indicators is missing for these two countries.
PRIORITY: The following table describes the final individual score for each indicator and the pr iority level recom m ended by the I MCA group in case data for all indicators can not be collected. The indicators have been classified according to three levels of priority.
Indicators 4.2.1 Facilities
Indicator Score
Rank Order IMCA Group
recommendation
?
PHCC with capability to perform a spirometry 2.9 (0-4) 4 1 1
?
PHCC with a nurse specialized in COPD 2.3 (0-4) 4 2 2 ?
PHCC offering rehabilitation programs 2.3 (0-4) 4 2 2 ?
Use of oxygen therapy at home 2.9 (1-4) 3 1 1 ?
Pneumology units 2.9 (1-4) 3 1 1
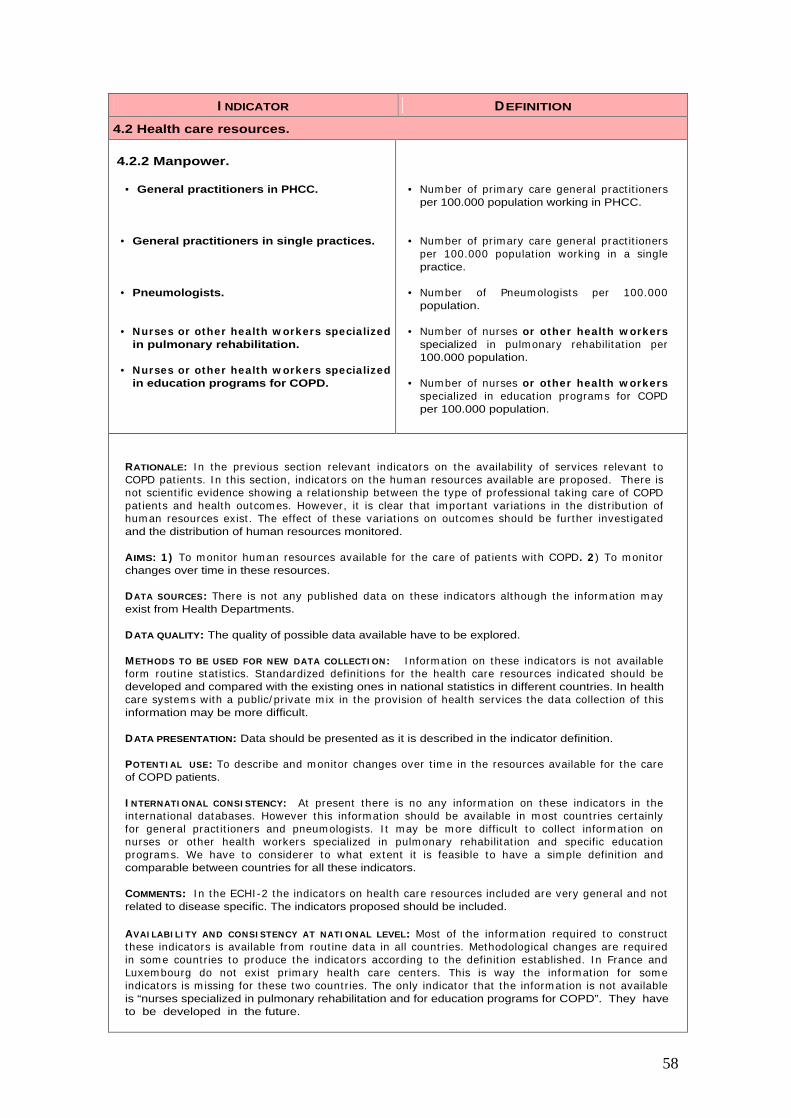
58
I NDICATOR DEFINITION
4.2 Health care resources.
4.2.2 Manpower.
• General practitioners in PHCC.
• General practitioners in single practices.
• Pneumologists.
• Nurses or other health w orkers specialized in pulmonary rehabilitation.
• Nurses or other health w orkers specialized in education programs for COPD.
• Num ber of pr imary care general pract it ioners per 100.000 population working in PHCC.
• Num ber of pr imary care general pract it ioners per 100.000 populat ion working in a single practice.
• Num ber of Pneum ologists per 100.000 population.
• Num ber of nurses or other health w orkers specialized in pulm onary rehabilitat ion per 100.000 population.
• Num ber of nurses or other health w orkers specialized in educat ion program s for COPD per 100.000 population.
RATIONALE: I n the previous sect ion relevant indicators on the availability of services relevant to COPD pat ients. I n this sect ion, indicators on the hum an resources available are proposed. There is not scient ific evidence showing a relat ionship between the type of professional taking care of COPD pat ients and health outcom es. However, it is clear that im portant variat ions in the dist r ibut ion of hum an resources exist . The effect of these variat ions on outcomes should be fur ther invest igated and the distribution of human resources monitored.
AIMS: 1 ) To m onitor hum an resources available for the care of pat ients with COPD. 2 ) To m onitor changes over time in these resources.
DATA SOURCES: There is not any published data on these indicators although the inform at ion m ay exist from Health Departments.
DATA QUALITY: The quality of possible data available have to be explored.
METHODS TO BE USED FOR NEW DATA COLLECTI ON: I nform at ion on these indicators is not available form rout ine stat ist ics. Standardized definit ions for the health care resources indicated should be developed and compared with the existing ones in national statistics in different countries. In health care system s with a public/ pr ivate m ix in the provision of health services the data collect ion of this information may be more difficult.
DATA PRESENTATION: Data should be presented as it is described in the indicator definition.
POTENTI AL USE: To describe and m onitor changes over t im e in the resources available for the care of COPD patients.
I NTERNATI ONAL CONSI STENCY: At present there is no any inform at ion on these indicators in the internat ional databases. However this inform at ion should be available in m ost count r ies certainly for general pract it ioners and pneum ologists. I t m ay be m ore difficult to collect inform at ion on nurses or other health workers specialized in pulm onary rehabilitat ion and specific educat ion program s. We have to considerer to what extent it is feasible to have a sim ple definit ion and comparable between countries for all these indicators.
COMMENTS: I n the ECHI -2 the indicators on health care resources included are very general and not related to disease specific. The indicators proposed should be included.
AVAI LABI LI TY AND CONSI STENCY AT NATI ONAL LEVEL: Most of the inform at ion required to const ruct these indicators is available from rout ine data in all count r ies. Methodological changes are required in som e count r ies to produce the indicators according to the definit ion established. I n France and Luxem bourg do not exist pr im ary health care centers. This is way the inform at ion for som e indicators is m issing for these two count r ies. The only indicator that the inform at ion is not available is “nurses specialized in pulmonary rehabilitation and for education programs for COPD”. They have to be developed in the future.
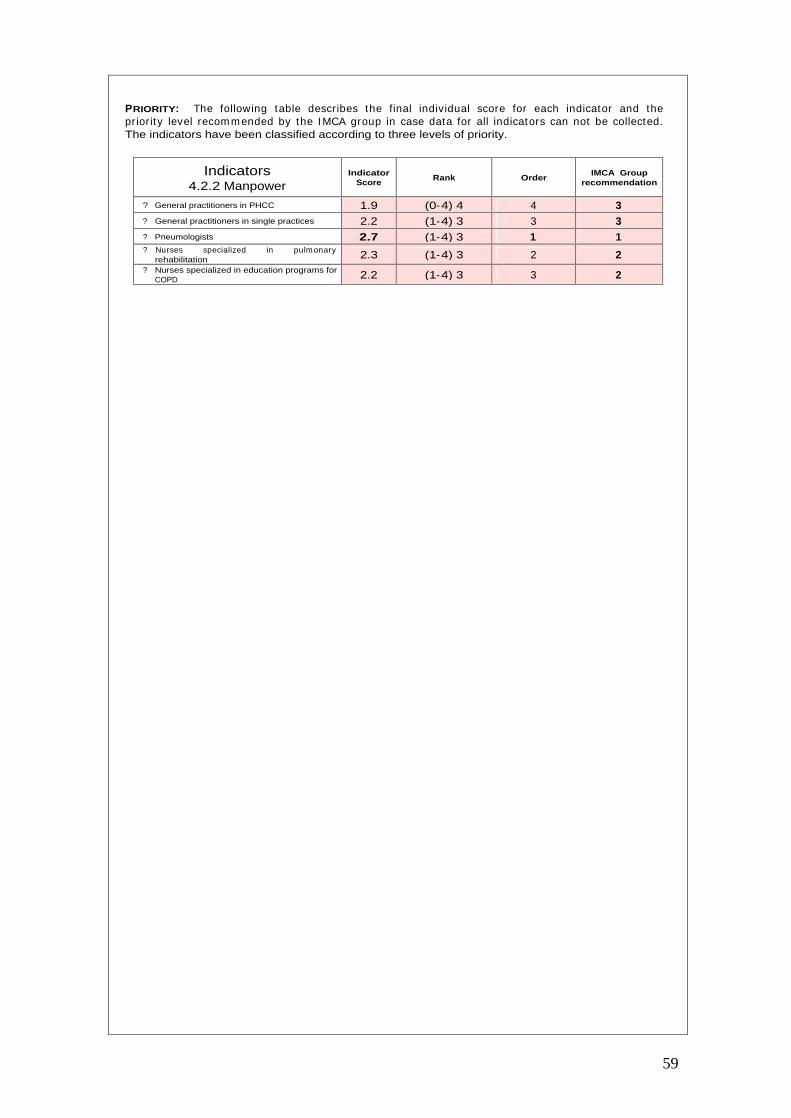
59
PRIORITY: The following table describes the final individual score for each indicator and the pr ior ity level recom m ended by the I MCA group in case data for all indicators can not be collected. The indicators have been classified according to three levels of priority.
Indicators 4.2.2 Manpower
Indicator Score
Rank Order IMCA Group
recommendation
?
General practitioners in PHCC 1.9 (0-4) 4 4 3
?
General practitioners in single practices 2.2 (1-4) 3 3 3
?
Pneumologists 2.7 (1-4) 3 1 1
?
Nurses specialized in pulm onary rehabilitation 2.3 (1-4) 3 2 2
?
Nurses specialized in education programs for COPD 2.2 (1-4) 3 3 2

60
I NDICATOR DEFINITION
4.2 Health care resources.
4.2.3 Education.
• COPD education program. • Proportion of individuals with COPD which ever have part icipated in an educat ion program during the last year.
4.2.4 Technology.
• Accessibility to lung function tests.
• Proport ion of individuals with COPD which have ever had a lung function lung function.
• Proport ion of individuals with COPD which have ever had a lung funct ion lung funct ion .measurement during the last year.
RATIONALE: Studies that have been done indicate that pat ient educat ion alone does not im prove exercise perform ance or lung funct ion but it can play a role in im proving skills, ability to cope with illness, and health status.87 Howver, pat ient educat ion regarding sm oking cessat ion has the greatest capacity to influence the natural history of COPD. An internat ional Study has shown that only 67% of COPD patients were shown how to use an inhaler in the past year.5
The Global I nit itat ive for Obst ruct ive Lung disease (GOLD) has been the establishm ent of a working relat ionship with prim ary care, with the involvem ent of the World Organizt ion of Fam ily Doctors (WONCA) and the I nternat ional Prim ary Care Respiratory Group ( I PCRG) have developed the I nternat ional Prim ary care Airways Guideline ( I PAG) to im prove the process of diagnosis and t reatm ent in prim ary care of pat ients with lung diseases.88 However, the key issues that guidelines do not solve by them selves is the access to quality spirom etry in prim ary care. This is st ill an im portant lim itat ion in m any health services across Europe. So, indicators to m onitor accesibility to spirometry would be very useful.
I n m ost surveys there is not inform at ion on the accessibility to spirom etry in the past . However, results from the Confront ing COPD I nternat ional survey have shown that only 45.5% of COPD patients had an spirometry in the past year and only 25% had a peak flow meter at home.5
AIMS: 1 ) To m onitor health care resources available for the care of pat ients with COPD. 2 ) To monitor changes over time in these resources.
DATA SOURCES: There is not routinely collected data on these indicators although some studies have shown it is easy to collect in specific surveys.
DATA QUALI TY: There is not data available on the quality of data for these indicators. However, the only problem in data collection may be the recall bias.
METHODS TO BE USED FOR NEW DATA COLLECTI ON: We recom m end to include appropriate quest ions to collect this inform at ion in future studies or rout ine surveys. Som e studies have already shown that it is easy to collect this inform at ion. I t is im portant to have this inform at ion by public and private care and for different m odels of health care in those count r ies that a com plex organizat ion of health services exist.
DATA PRESENTATION: Data should be presented as it is described in the indicator definition.
POTENTI AL USE: To describe and m onitor changes over t im e in the resources available for the care of COPD patients.
I NTERNATI ONAL CONSI STENCY: We have not been able to evaluate to what extent all relevant COPD studies have collected inform at ion on this indicators. I t would be good to agree on standardized questions to collect this information in all surveys.
COMMENTS: I n the ECHI -2 the indicators on health care resources included are very general and not related to disease specific. The indicators proposed should be included.
AVAI LABI LI TY AND CONSI STENCY AT NATI ONAL LEVEL: Only few part icipants have indicated that the inform at ion required for a sm all num ber of indicators is available from rout ine data. The real picture is that most of the indicators can be obtained from the ECRHS or the ISAAC but in the future have to be incorporated into new HES or specific international surveys.

61
PRIORITY: The following table describes the final individual score for each indicator and the priority level recommended by the IMCA group in case data for all indicators can not be collected. The indicators have been classified according to three levels of priority.
Indicators 4.2.3 Education
4.2.4 Technology
Indicator Score
Rank Order IMCA Group
recommendation
?
COPD education program 2.4 (1-4) 3 2 2
?
Access to lung function measurements 3.0 (1-4) 3 1 1

62
I NDICATOR DEFINITION
4.3 Health care utilization.
4.3.1 In-patient care utilization.
• Emergency room visits.
• Hospital admissions.
• Intensive care units admissions.
• Length of stay.
• Proport ion of individuals with COPD that have been adm it ted to an em ergency unit during the last year (exacerbations).
• Proport ion of individuals with COPD that have been adm it ted to hospital during the last year (exacerbations).
• Proport ion of individuals with COPD that have been adm it ted to hospital in an I CU during the last year (exacerbations).
• Average length of stay of all hospital adm issions for COPD ( including all of any of the previous groups of individuals described).
• Primary care visit.
• Specialist visit.
• Rehabilitation session.
• Proport ion of individuals with COPD that have had a follow-up visit in pr im ary care during the last year.
• Proport ion of individuals with COPD that have had a follow-up visit in a specialist pneumology unit during the last year.
• Proport ion of individuals with COPD that have had a rehabilitat ion session during last year.
RATIONALE: Exacerbat ions on respiratory sym ptom s requir ing m edical intervent ion are im portant clinical events in COPD. The m ost com m on cause of exacerbat ions are infect ions of the t racheobronchial t ree and air pollut ion. Depending on the severit y of the exacerbat ion the pat ient m ay require a visit to an em ergency unit , m ay need a hospital adm ission or even to be adm it ted to an intensive car unit . The first group of indicators is proposed to m onitor the use of health services by COPD patients. This information can be collected using routine data or questionnaires.
I n 1994, according to stat ist ics from the UK Office of nat ional stat ist ics, there were 203,193 hospital adm issions for COPD.89 The average length of hospital stay am ong those adm it ted for a COPD diagnosis was 9.9 days. US data indicate that in 1997 there were 16.365 m illion (60.6/ 1000) am bulatory care visits for COPD AND 1.66/ 1000 hospitalizat ions for which COPD was the first liste discharge diagnosis.90
Data from the confront ing COPD survey shows that pat ients m ore 45 year old and with COPD, 23% had a hospitalizat ion in the past year and 14% a visit to an em ergency room .5 I nform at ion on specialist visits and rehabilitations sessions was not available in these report.
AIMS: 1 ) To describe and m onitor health services ut ilizat ion by pat ients with COPD. 2 ) To m onitor changes over time in these indicators.
DATA SOURCES: I nform at ion can be obtained from rout ine data collected in each count ry and also from specific surveys.
DATA QUALI TY: The quality of possible data available is lim ited from rout ine data and surveys. The quality of these data have to be further explored.
METHODS TO BE USED FOR NEW DATA COLLECTI ON: There are two different m ethods for data collect ion. I n-pat ient care ut ilizat ion could be collected form rout ine data stat ist ics or by health surveys. Prim ary care or specialist visits and rehabilitat ions sessions would be bet ter collected by surveys.
DATA OPRESENTATION: Data should be presented as it is described in the indicator definition.
POTENTI AL USE: To describe and m onitor changes over t im e in the ut ilizat ion of services available for the care of COPD patients.

63
I NTERNATI ONAL CONSI STENCY: To m onitor these indicators there is inform at ion available from rout ine data and from surveys. However, the inform at ion on the validity of rout ine data is very lim ited. I n surveys quest ions are not standardized. Certainly the inform at ion available could be useful to m onitor use for health services but it ’s difficult to say how valid the inform at ion is when monitoring exacerbations. Indicators on follow-up visits to primary care or specialist probably would be better when collected from surveys.
COMMENTS: I n the ECHI -2 the indicators on health care resources included are very general and not related to disease specific. The indicators proposed should be included.
AVAI LABI LI TY AND CONSI STENCY AT NATI ONAL LEVEL: Three indicators: hospital adm ission rates, average length of stay and intensive care adm issions are available from rout ine data in m ost countries although in some countries methodological changes are required. For the other indicators, prim ary care visits, specialist visits and rehabilitat ion sessions the availability is less consistent across count r ies. The inform at ion on these indicators have to be collected from HES or specific surveys in the future.
PRIORITY: The following table describes the final individual score for each indicator and the pr ior ity level recom m ended by the I MCA group in case data for all indicators can not be collected. The indicators have been classified according to three levels of priority.
Indicators 4.3.1 In-patient care utilization
4.3.2 Out-patient care utilization
Indicator Score
Rank Order IMCA Group
recommendation
?
Emergency room visits 3.4 (2-4) 2 2 1 ?
Hospital admissions 3.7 (2-4) 2 1 1 ?
Intensive care units admissions 3.1 (1-4) 3 3 1 ?
Length of stay 2.6 (1-4) 3 6 3 ?
Primary care visit 2.7 (1-4) 3 5 2 ?
Specialist visit 2.7 (1-4) 3 5 2 ?
Rehabilitation session 3.0 (2-4) 2 4 2 Top 4 Top 20

64
I NDICATOR DEFINITION
4.3 Health care utilization.
4.3.4 Medicine use/medical aids.
• Influenza vaccination.
• ß2-agonists prescribed.
• ß2-agonists and steroids prescribed.
• ß2- agonists, steroids and rehabilitat ion prescribed
• ß2- agonists, steroids, rehabilitat ion and oxigenotherpy prescribed.
• DDD on ß2- agonists sales
• DDD on steroids sales
• Proport ion of individuals with COPD (stage 0) that have had a influenza vaccine during the last year.
• % of individuals with COPD (stage I ) that have had bronchodilators prescribed and taken during the last year.
• % of individuals with COPD (stage I I A) that have had bronchodilators and inhaled steroids prescribed and taken during the last year.
• % of individuals with COPD (stage I I B) that have had bronchodilators, inhaled steroids prescribed taken and rehabilitat ion during the last year.
• % of individuals with COPD (stage I I B) that have had bronchodilators, inhaled steroids prescribed and taken and rehabilitation during the last year.
• % of individuals with COPD (stage I I I ) that have had bronchodilators, inhaled steroids prescribed taken, rehabilitat ion and oxigenotherapy during the last year.
• DDD on ß2-agonists sales.
• DDD on steroids sales.
RATIONALE: The GOLD initiative have established the criteria for treatment according to the severity of pat ients. The indicators included are proposed to m onitor the appropriate t reatm ent of COPD pat ients according to severity. More recent ly the ATS/ ERS consensus statem ent provided recommendations on pharmacological treatment but related to symptoms rather than severity.87
In addition to these indicators other drugs could be used in the treatment of COPD such as vaccines (already m ent ioned) , ant ibiot ics, m ucolyt ic, ant ioxidant agents, im m unoregulators, ant itussives, respiratory stimulants, vasodilators or narcot ics. I n som e count r ies, alternat ive m edicine have to be considered as part of the t reatm ent . I n som e stages of the disease developm ent a com binat ion of drugs m ay be prescribed. Since the disease usually is detected at very late stages, a substant ial proportion of patients may be under- treated.
AIMS: 1 ) To describe and m onitor the ut ilizat ion of drugs prescribed by pat ients with COPD. 2 ) To monitor changes over time in these indicators.
DATA SOURCES: I nform at ion can be obtained from specific surveys. I nform at ion on defined daily doses (DDD) can be obtained form public databases established in each EU count ry. However the level of coverage of these data sources varies across countries.
DATA QUALI TY: he quality of possible data from surveys is relat ively good. However, possibilit ies of recall bias m ay exist and although the drugs are prescribed m ay not be taken. The quality of routine data have to be further explored.
METHODS TO BE USED FOR NEW DATA COLLECTI ON: We recom m end to include the appropriate quest ions in future research or rout ine COPD studies on pharmacological t reatm ent to detect the level of under- t reatm ent and changes in prescript ion. Rout ine data on sales (DDD/ 1000 population) can also be useful at ecological level but are less informative.
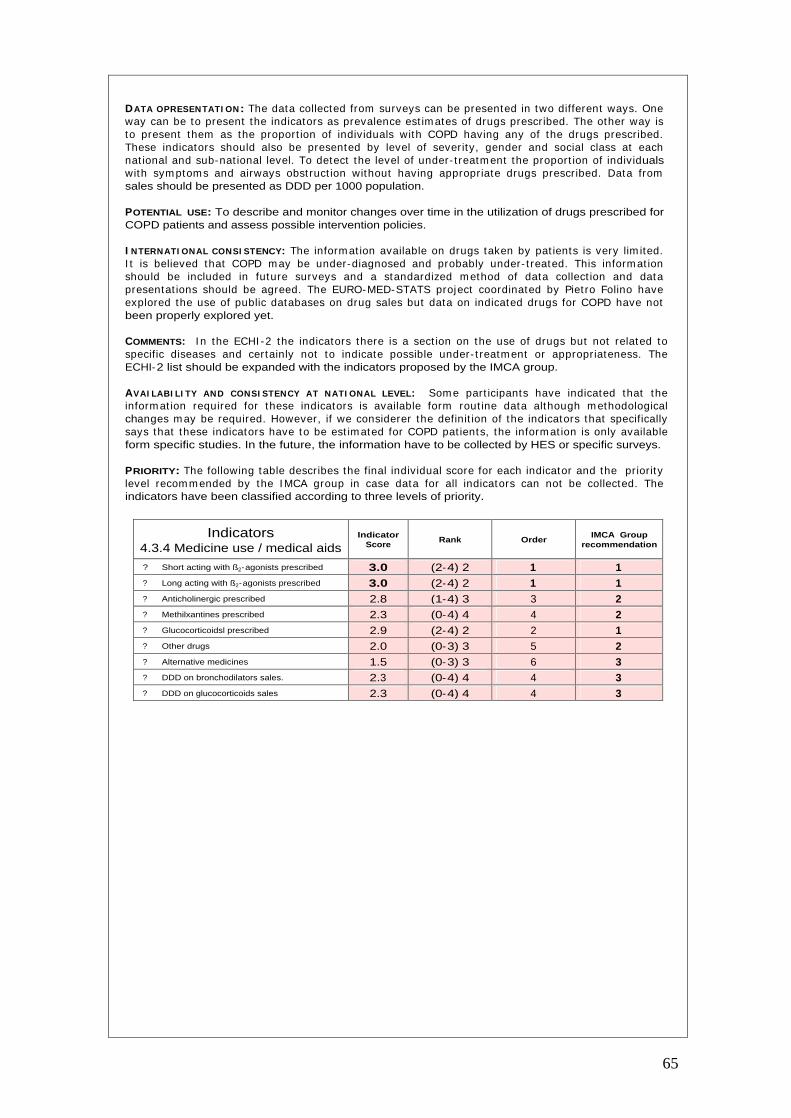
65
DATA OPRESENTATI ON: The data collected from surveys can be presented in two different ways. One way can be to present the indicators as prevalence est im ates of drugs prescribed. The other way is to present them as the proport ion of individuals with COPD having any of the drugs prescribed. These indicators should also be presented by level of severity, gender and social class at each nat ional and sub-nat ional level. To detect the level of under- t reatm ent the proport ion of individuals with sym ptoms and airways obst ruct ion without having appropriate drugs prescribed. Data from sales should be presented as DDD per 1000 population.
POTENTIAL USE: To describe and monitor changes over time in the utilization of drugs prescribed for COPD patients and assess possible intervention policies.
I NTERNATI ONAL CONSI STENCY: The inform at ion available on drugs taken by pat ients is very lim ited. I t is believed that COPD m ay be under-diagnosed and probably under- t reated. This inform at ion should be included in future surveys and a standardized m ethod of data collect ion and data presentat ions should be agreed. The EURO-MED-STATS project coordinated by Piet ro Folino have explored the use of public databases on drug sales but data on indicated drugs for COPD have not been properly explored yet.
COMMENTS: I n the ECHI -2 the indicators there is a sect ion on the use of drugs but not related to specific diseases and certainly not to indicate possible under- t reatm ent or appropriateness. The ECHI-2 list should be expanded with the indicators proposed by the IMCA group.
AVAI LABI LI TY AND CONSI STENCY AT NATI ONAL LEVEL: Som e part icipants have indicated that the inform at ion required for these indicators is available form rout ine data although m ethodological changes m ay be required. However, if we considerer the definit ion of the indicators that specifically says that these indicators have to be est im ated for COPD pat ients, the inform at ion is only available form specific studies. In the future, the information have to be collected by HES or specific surveys.
PRIORITY: The following table describes the final individual score for each indicator and the pr iority level recom m ended by the I MCA group in case data for all indicators can not be collected. The indicators have been classified according to three levels of priority.
Indicators 4.3.4 Medicine use / medical aids
Indicator Score
Rank Order IMCA Group
recommendation
?
Short acting with ß2-agonists prescribed 3.0 (2-4) 2 1 1 ?
Long acting with ß2-agonists prescribed 3.0 (2-4) 2 1 1 ?
Anticholinergic prescribed 2.8 (1-4) 3 3 2 ?
Methilxantines prescribed 2.3 (0-4) 4 4 2 ?
Glucocorticoidsl prescribed 2.9 (2-4) 2 2 1 ?
Other drugs 2.0 (0-3) 3 5 2 ?
Alternative medicines 1.5 (0-3) 3 6 3 ?
DDD on bronchodilators sales. 2.3 (0-4) 4 4 3 ?
DDD on glucocorticoids sales 2.3 (0-4) 4 4 3

66
I NDICATOR DEFINITION
4.4 Health expenditures/financing.
4.4.1 Health care system.
• Hospitalization cost.
• Out-patient cost.
• Emergency room cost.
• Specialist visits cost.
• cost of COPD hospitalizat ions ( including public and private care).
• Mean cost of out-patient COPD care (including public and private care).
• Mean cost of unexpected em ergency room visits for COPD ( including public and private).
• Mean cost of follow-up visits to specialist for COPD (including public and private).
RATIONALE: The cost of illness studies provide an insight into the econom ic im pact of a disease but this inform at ion is lim ited to a num ber of specific studies and in general this t ype of data is not collected in epidem iological COPD studies. I n general, econom ic studies provide inform at ion on direct and indirect costs. The direct cost is the value of health care resources devoted to diagnosis and m edical managem ent of the disease. I ndirect costs reflect the m onetary consequences of disability, m issed work and school, prem ature m ortality, and caregiver or fam ily costs result ing from illness. I ndirect costs are m ore difficult to est im ate and to com pare between count r ies. I n 1996 in United Kingdom the direct cost of COPD was approxim ately 846 m illion pounds equivalent to 1.154 pounds per person and per year according to data from the Nat ional Health Service Execut ive (NHSE) .93 The total direct costs varies across count r ies depending on the prevalence of the disease, r isk factors, ut ilizat ion of health care and other factors. After adjust ing for several factors the direct costs of COPD were evaluated for different count r ies. I n UK, in 1996 the direct costs were 778 million dollars, in Netherlands 256, in Sweden 179 and in USA 14,700. showing high variat ions across count r ies.87 I n a USA study of COPD – related illness costs based on the 1987 Nat ional Medical Expenditure Survey, per capita expenditures for inpat ient hospitalizat ions of COPD patients were 2.7 times the expenditure for patients without COPD.94,87
AIMS: 1 ) To describe and m onitor health care costs related to ut ilizat ion of health services by patients with COPD. 2 ) To monitor changes over time in these indicators.
DATA SOURCES: I nform at ion on ut ilizat ion should be est im ated from specific surveys and data on costs could be obtained from Health Departm ents of each count ry. Using both sources of information total direct costs of COPD can be estimated.
METHODS TO BE USED FOR NEW DATA COLLECTI ON: We recom m end to collect data on ut ilizat ion by specific surveys and data on costs should be obtained from databases in the Health Departm ent of each count ry. The inform at ion necessary to be able to link econom ic and ut ilizat ion data should be further explored.
DATA QUALI TY: The quality of possible data available is lim ited from rout ine data and surveys. The quality of these data have to be further explored.
DATA PRESENTATION: Data can be presented as it is described in the indicator description however it would be interesting to present it also stratified by severity, social class and this tables produced by national and sub-national levels.
POTENTI AL USE: To describe and m onitor changes over t im e in costs of health care ut ilizat ion. I nform at ion on direct costs would be also useful to incorporate into surveys and probably the m ost appropriate way of incorporating health care costs in relation to severity.
I NTERNATI ONAL CONSI STENCY: The organizat ion and m ethods of financing health care is very different in each European count ry. However, if we considerer only direct costs, perhaps is feasible to collect this inform at ion. I nform at ion on direct costs would be also useful to incorporate into surveys and probably the m ost appropriate way of incorporat ing health care costs in relat ion to severity.
COMMENTS: I n the ECHI -2 the indicators on health care costs of health services ut ilizat ion are not included. The indicators proposed should be expanded for disease specific indicators in order to be able to assess the impact of different diseases.
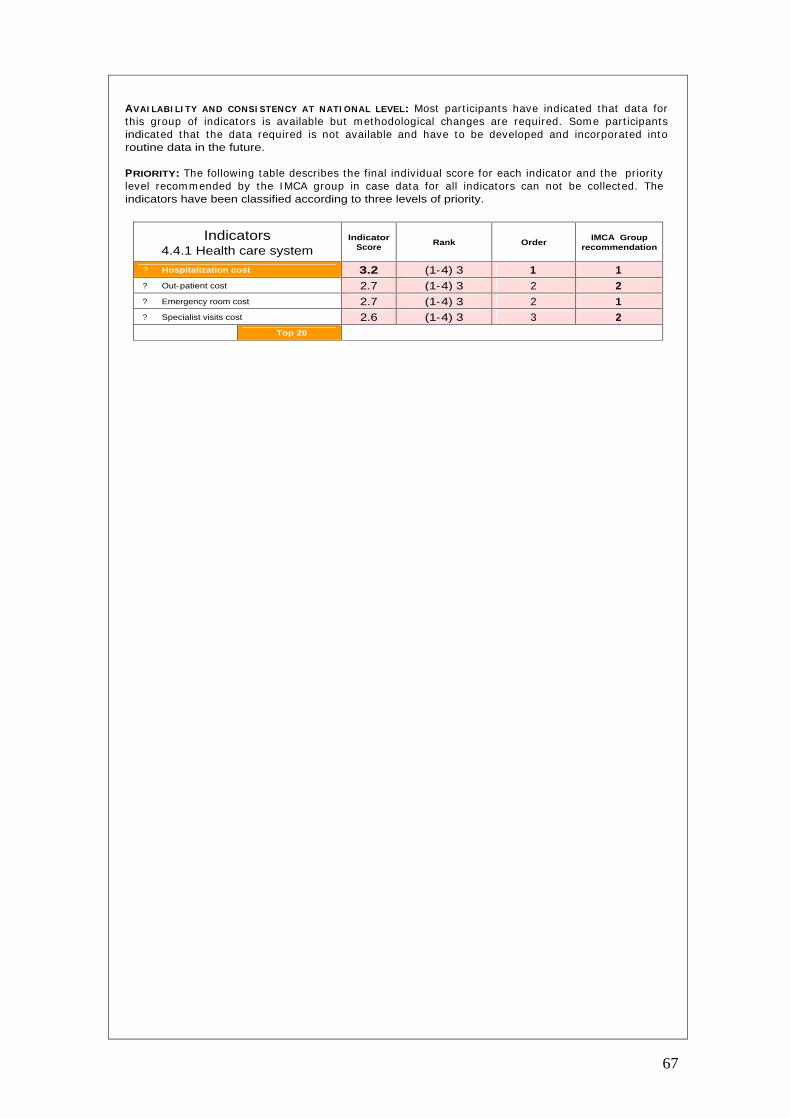
67
AVAI LABI LI TY AND CONSI STENCY AT NATI ONAL LEVEL: Most part icipants have indicated that data for this group of indicators is available but m ethodological changes are required. Som e part icipants indicated that the data required is not available and have to be developed and incorporated into routine data in the future.
PRIORITY: The following table describes the final individual score for each indicator and the pr iority level recom m ended by the I MCA group in case data for all indicators can not be collected. The indicators have been classified according to three levels of priority.
Indicators 4.4.1 Health care system
Indicator Score
Rank Order IMCA Group
recommendation
?
Hospitalization cost 3.2 (1-4) 3 1 1 ?
Out-patient cost 2.7 (1-4) 3 2 2 ?
Emergency room cost 2.7 (1-4) 3 2 1 ?
Specialist visits cost 2.6 (1-4) 3 3 2
Top 20

68
I NDICATOR DEFINITION
4.4 Health expenditures/financing.
4.4.3 Expenditure on medical services.
• Total cost of m edicines prescribed for COPD treatment.
• Total cost of medicines prescribed for COPD treatment.
• Mean cost of medicines prescribed for COPD treatment.
• Total cost paid by the pat ient (out of pocket ) for medicines prescribed for COPD.
• Mean cost paid by the pat ient (out of pocket ) for medicines prescribed for COPD.
4.4.5 Total expenditure by age group and severity.
• Cost of COPD health care. • Total cost of asthm a health care ( including
public and private health care ut ilizat ion, medication and insurance costs).
4.4.6 Health expenditure by fund source.
• Additional insurance cost.
• Proport ion of individuals paying and addit ional pr ivate insurance to cover health care services.
• Mean cost paid for addit ional pr ivate insurance.
RATIONALE: In the previous section it was mentioned that data on COPD economic impact is limited and comes from specific studies. However, it is very important to collect this information in order to know the im pact of the disease on social and health care costs. This sect ion include m ore economic indicators that include aspects of pr ivate and public health care costs. I n Europe the effects of different m ethods of organizat ion and financing of health care are poorly evaluated although there many differences across countries.
AIMS: 1) To describe and monitor direct costs related to drugs prescribed to patients with COPD. 2 ) To describe and m onitor total costs related to COPD care by age group and severity. 3) To m onitor changes over time in these indicators.
DATA SOURCES: I nform at ion can be obtained by a com binat ion of specific surveys and som e rout ine data provided by Health Department of each country.
DATA QUALI TY: The quality of possible data available is lim ited from rout ine data and surveys. The quality of these data have to be further explored.
METHODS TO BE USED FOR NEW DATA COLLECTI ON: We recom m end that data is collected on ut ilizat ion of drugs and insurance coverage by specific surveys while data on costs should be obtained from databases in the Health Departm ent of each count ry. The informat ion necessary to be able to link economic and utilization data should be further explored.
DATA PRESENTATION: Data should be presented as it is described in the indicator definition.
POTENTIAL USE: To describe and monitor changes over time in total/mean direct costs of COPD care according to different factors and assess possible interventions.
I NTERNATI ONAL CONSI STENCY: The organizat ion and m ethods of financing health care is very different in each European country. However, if we considerer only direct costs, perhaps is feasble to collect this inform at ion. I nform at ion on direct costs would be also useful to incorporate into surveys and this is probably the m ost appropriate way of incorporat ing health care costs in relat ion to severity. In this section could be useful to discuss to what extent is relevant in Europe to monitor and evaluate the effects of public and private health care.
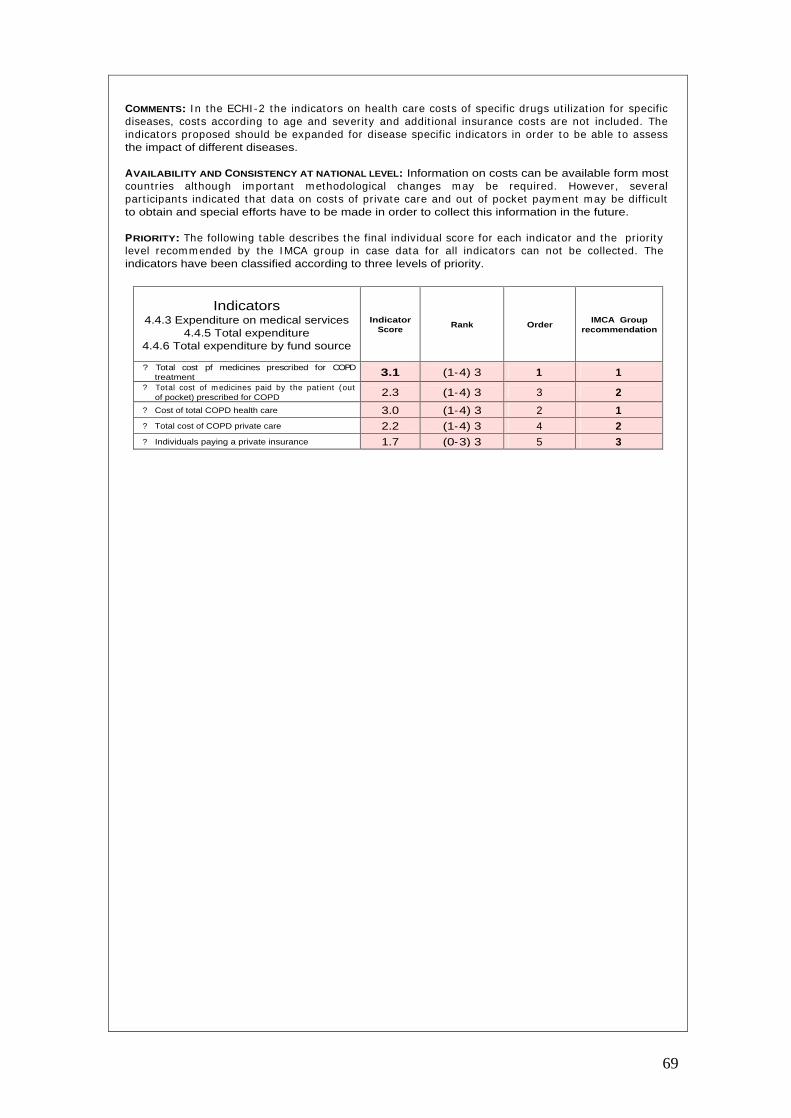
69
COMMENTS: I n the ECHI -2 the indicators on health care costs of specific drugs ut ilizat ion for specific diseases, costs according to age and severity and addit ional insurance costs are not included. The indicators proposed should be expanded for disease specific indicators in order to be able to assess the impact of different diseases.
AVAILABILITY AND CONSISTENCY AT NATIONAL LEVEL: Information on costs can be available form most count r ies although im portant m ethodological changes m ay be required. However, several part icipants indicated that data on costs of pr ivate care and out of pocket paym ent m ay be difficult to obtain and special efforts have to be made in order to collect this information in the future.
PRIORITY: The following table describes the final individual score for each indicator and the pr iority level recom m ended by the I MCA group in case data for all indicators can not be collected. The indicators have been classified according to three levels of priority.
Indicators 4.4.3 Expenditure on medical services
4.4.5 Total expenditure 4.4.6 Total expenditure by fund source
Indicator Score
Rank Order IMCA Group
recommendation
?
Total cost pf medicines prescribed for COPD treatment 3.1 (1-4) 3 1 1
?
Total cost of m edicines paid by the pat ient (out of pocket) prescribed for COPD 2.3 (1-4) 3 3 2
?
Cost of total COPD health care 3.0 (1-4) 3 2 1 ?
Total cost of COPD private care 2.2 (1-4) 3 4 2 ?
Individuals paying a private insurance 1.7 (0-3) 3 5 3
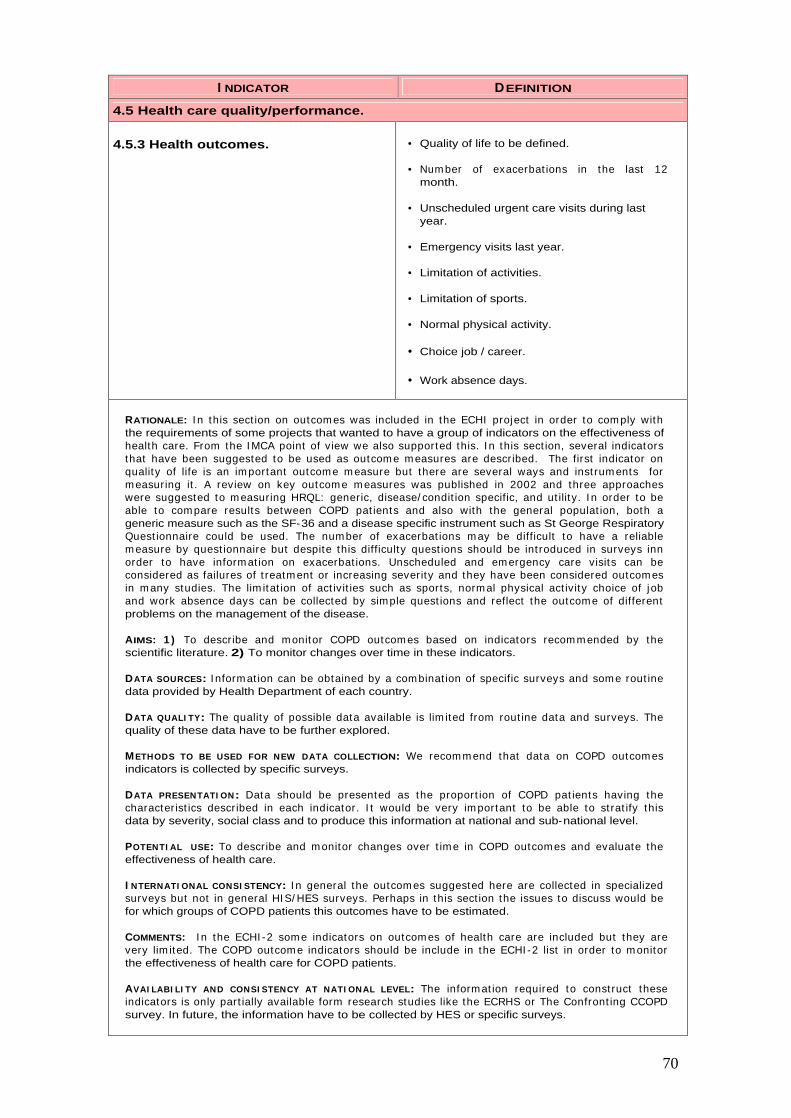
70
I NDICATOR DEFINITION
4.5 Health care quality/performance.
4.5.3 Health outcomes. • Quality of life to be defined.
• Num ber of exacerbat ions in the last 12 month.
• Unscheduled urgent care visits during last year.
• Emergency visits last year.
• Limitation of activities.
• Limitation of sports.
• Normal physical activity.
• Choice job / career.
• Work absence days.
RATIONALE: I n this sect ion on outcom es was included in the ECHI project in order to com ply with the requirements of some projects that wanted to have a group of indicators on the effectiveness of health care. From the I MCA point of view we also supported this. I n this sect ion, several indicators that have been suggested to be used as outcom e m easures are described. The first indicator on quality of life is an im portant outcom e m easure but there are several ways and inst rum ents for m easuring it . A review on key outcom e m easures was published in 2002 and three approaches were suggested to m easuring HRQL: generic, disease/ condit ion specific, and ut ility. I n order to be able to com pare results between COPD pat ients and also with the general populat ion, both a generic measure such as the SF-36 and a disease specific instrument such as St George Respiratory Quest ionnaire could be used. The num ber of exacerbat ions m ay be difficult to have a reliable m easure by quest ionnaire but despite this difficulty quest ions should be int roduced in surveys inn order to have inform at ion on exacerbat ions. Unscheduled and em ergency care visits can be considered as failures of t reatm ent or increasing severity and they have been considered outcom es in m any studies. The lim itat ion of act ivit ies such as sports, norm al physical act ivity choice of j ob and work absence days can be collected by simple quest ions and reflect the outcom e of different problems on the management of the disease.
AIMS: 1 ) To describe and m onitor COPD outcom es based on indicators recom m ended by the scientific literature. 2) To monitor changes over time in these indicators.
DATA SOURCES: I nform at ion can be obtained by a com binat ion of specific surveys and som e rout ine data provided by Health Department of each country.
DATA QUALI TY: The quality of possible data available is lim ited from rout ine data and surveys. The quality of these data have to be further explored.
METHODS TO BE USED FOR NEW DATA COLLECTION: We recom m end that data on COPD outcom es indicators is collected by specific surveys.
DATA PRESENTATI ON: Data should be presented as the proport ion of COPD pat ients having the characterist ics described in each indicator. I t would be very im portant to be able to st rat ify this data by severity, social class and to produce this information at national and sub-national level.
POTENTI AL USE: To describe and m onitor changes over t im e in COPD outcom es and evaluate the effectiveness of health care.
I NTERNATI ONAL CONSI STENCY: I n general the outcom es suggested here are collected in specialized surveys but not in general HI S/ HES surveys. Perhaps in this sect ion the issues to discuss would be for which groups of COPD patients this outcomes have to be estimated.
COMMENTS: I n the ECHI -2 som e indicators on outcom es of health care are included but they are very lim ited. The COPD outcom e indicators should be include in the ECHI -2 list in order to m onitor the effectiveness of health care for COPD patients.
AVAI LABI LI TY AND CONSI STENCY AT NATI ONAL LEVEL: The inform at ion required to const ruct these indicators is only part ially available form research studies like the ECRHS or The Confront ing CCOPD survey. In future, the information have to be collected by HES or specific surveys.

71
PRIORITY: The following table describes the final individual score for each indicator and the pr iority level recom m ended by the I MCA group in case data for all indicators can not be collected. The indicators have been classified according to three levels of priority.
Indicators 4.5.3 Health outcomes
Indicator Score
Rank Order IMCA Group
recommendation
?
Quality of life measured by SF-36 2.6 (1-4) 3 3 2
?
Num ber of exacerbat ions in the last 12 months 2.8 (1-4) 3 1 1
?
Unscheduled urgent care v isits during last year 2.3 (1-4) 3 5 1
?
Emergency visits last year 2.7 (1-4) 3 2 1
?
Limitation of activities 2.5 (1-4) 3 4 2 ?
Limitation of sports 2.0 (0-4) 4 7 3 ?
Normal physical activity 2.5 (1-4) 3 4 2 ?
Choice of job / career 2.1 (1-4) 3 6 3 ?
Work absence days 2.6 (1-4) 3 3 2

72
1. Celli BR, Halbert RJ, I sonaka S, Schau B. Populat ion im pact of different definit ions of airway
obstruction. Eur Respir J 2003;22:268-73.
2. Viegi G, Pedreschi M, Pistelli F, Di Pede F, Baldacci S, Carrozzi L et al. Prevalence of airways obst ruct ion in a general populat ion: European Respiratory Society vs Am erican Thoracic Society definition. Chest 2000;117:339S-45S.
3. de Marco R, Accordini S, Cerveri I , Corsico A, Sunyer J, Neukirch F et al. An internat ional survey of chronic obst ruct ive pulm onary disease in young adults according to GOLD stages. Thorax 2004;59:120-5.
4. Halbert RJ, I sonaka S, George D, I qbal A. I nterpret ing COPD prevalence est im ates: what is the true burden of disease? Chest 2003;123:1684-92.
5. Rennard S, Decram er M, Calver ley PM, Pride NB, Soriano JB, Verm eire PA et al. I m pact of COPD in North Am erica and Europe in 2000: subjects' perspect ive of Confront ing COPD International Survey. Eur.Respir.J. 2002;20:799-805.
6. Hardie JA, Buist AS, Vollm er WM, Ellingsen I , Bakke PS, Morkve O. Risk of over-diagnosis of COPD in asymptomatic elderly never-smokers. Eur Respir J 2002;20:1117-22.
7. EUROSTAT. Dem ographic Stat ist ics 2000. Luxembourg. European Com m ission 2000. Available from http://www.europe.eu.int/newcronos.
8. Organizat ion for the Econom ic Cooperat ion and Developm ent (OECD). Health data 2000. Available form http://www.oecd.org.
9. World Health Organizat ion(WHO). Regional Office for Europe. I nternat ional m ortality database. 2000. Available from http://www.who.dk.
10. Ochoa A. ISARE project. European Commission.
11. Kram ers PGN. The ECHI project : health indicators for the European Com m unity. Eur J Public Health 2003; 13:101-6.
12. Hendrick DJ. Occupat ion and chronic obst ruct ive pulm onary disease. Thorax 1996; 51: 947-55.
13. Ries AL, Kaplan RM, Myers R, Prewit t LM. Maintenance after pulm onary rehabilitat ion in chronic lung disease: a randomized trial. Am J Respir Crit Care Med 2003; 167:880-8.
14. Prescot t E, Lange P, Vestbo J. Socioeconom ic status, lung funct ion and adm ission to hospital for COPD: results from the Copenhaguen City Heart Study. Eur Respir J 1999; 133:1109-14.
15. Higgins MW, Thorn T. I ncidence, prevalence, and m ortality: int ra-and inter-country differences. I n Hensley MJ and Saunders NA editors. Clinicla Epidem iology of Chronic Obstructive Pulmonary Disease. Marcel Dekker, New York. 23-43.
16. Kunst AE, Bos V, Mackenbach JP and the EU Working Group. Monitor ing socioeconom ic inequalit ies in health in the European Union: guidelines and illust rat ions. A report for the Health Monitoring Program of the European Commission. Available from: http://www.europe.
17. Arom aa A, Koponen P, Tafforeau J. Verm eire C and the HI S/ HES Core Group. Evaluat ion of Health I nterview Surveys and Health Exam inat ion Surveys in the European Union. Eur J Public Health. 2003; 13(3 Suppl) : 67-72. (Database available from : https://www.iph.fgov.be/hishes/).
18. Menke R, St reich W, Rösler G. Report on socio-econom ic differences in health indicators in Europe. Health inequalit ies in Europe and the situat ion of disadvantaged groups. European Commission. Available from: http://www.europe.
19. World Health Organizat ion. World Health Report : Making a difference. Geneve, World Health Organization, 1999.
20. Murray CJ,.Lopez AD. Alternat ive project ions of m ortality and disability by cause 1990-2020: Global Burden of Disease Study. Lancet 1997;349:1498-504. Ref ID: 29.
21. Murray CJ,.Lopez AD. Evidence-based health policy--lessons from the Global Burden of Disease Study. Science 1996;274:740-3. Ref ID: 288.
22. Thom TJ. I nternat ional com parisons in COPD m ortality. Am Rev Respir Dis 1989; 140: S27-S34.
73
23. Siafakas, N.M. ; Verm eire, P. ; Pride, N.B. ; Paolet t i, P. , Gibson, J. ; Howard P. et al. ERS
consensus statem ent . Opt im al assessm ent and m anagem ent of chronic obst ruct ive pulm onary disease (COPD). A consensus statem ent of the European Respiratory Society (ERS). Eur. Respir. J. 1995;8: 1398-1420.
24. Pride NB,.Soriano JB. Chronic obst ruct ive pulm onary disease in the United Kingdom : t rends in mortality, morbidity, and smoking. Curr.Opin.Pulm.Med. 2002;8:95-101.
25. European Respiratory Society. European Lung White Book. The first com prehensive survey on respiratory health in Europe. Chapter 03, 34-43. Chronic Obst ruct ive pulm onary disease. Lausane, switserland 2003.
26. Lacasse Y, Brooks D, Goldstein RS. Trends in the epidem iology of COPD in Canada, 1980 to 1995. COPD and Rehabilitat ion Com m it tee of the Canadian Thoracic Society. Chest 1999;116:306-13.
27. Nat ional Heart , lung and Blood I nst itute. Morbidity & m ortality: chartbook on cardiovascular, lung, and blood diseases. Bethesda, MD: US departm ent of health and Hum an services. Public health Service. Nat ional I nst itutes of health; 1998. available from : URL: www.nhlbi.nih.gov/nhlbi/seiin/other/cht-book/htm.
28. Mannino DM. COPD: epidem iology, prevalence, m orbidity and m ortality, and disease heterogeneity. Chest 2002;121:121S-6S.
29. Mannino DM, Brown C, Giovino GA. Obstructive lung disease deaths in the United States from 1979 through 1993. An analysis using m ult iple-cause m ortality data. Am .J.Respir.Crit Care Med. 1997;156:814-8.
30. Cam illi AE, Robbins DR, Lebowitz MD. Death cert ificate report ing of confirmed airways obstructive disease. Am.J.Epidemiol. 1991;133:795-800.
31. Hansell AL, Walk JA, Soriano JB. What do chronic obst ruct ive pulm onary disease pat ients die from? A multiple cause coding analysis. Eur.Respir.J. 2003;22:809-14.
32. National Heart , Lung, and Blood I nst itute. World Health Organizat ion. Global init iat ive for chronic obst ruct ive lung disease. Global st rategy for the diagnosis, m anagem ent and prevent ion of chronic obst ruct ive pulm onary disease. Updated 2003. (http://www.goldcopd.com).
33. Soriano JB, Maier WC, Egger P, Visick G, Thakrar B, Sykes J et al. Recent t rends in physician diagnosed COPD in women and men in the UK. Thorax 2000;55:789-94.
34. Am erican Thoracic Society. Standards for the diagnosis and care of pat ients with chronic obstructive pulmonary disease. Am J Respir Crit Care Med 1995; 152: S77-S121.
35. Sterk PJ. Let's not forget: the GOLD criteria for COPD are based on post-bronchodilator FEV1. Eur.Respir.J. 2004;23:497-8. factors. Eur Respir Rev 2001; 11(80):55-64.
36. Siafakas, N.M. ; Verm eire, P. ; Pride, N.B. ; Paolet t i, P. , Gibson, J. ; Howard P. et al. ERS consensus statem ent . Opt im al assessm ent and m anagem ent of chronic obst ruct ive pulm onary disease (COPD). A consensus statem ent of the European Respiratory Society (ERS). Eur. Respir. J. 1995;8: 1398-1420.
37. Pride NB,.Soriano JB. Chronic obst ruct ive pulm onary disease in the United Kingdom : t rends in mortality, morbidity, and smoking. Curr.Opin.Pulm.Med. 2002;8 :95-101.
38. European Respiratory Society. European Lung White Book. The first com prehensive survey on respiratory health in Europe. Chapter 03, 34-43. Chronic Obst ruct ive pulm onary disease. Lausane, switserland 2003.
39. Lacasse Y, Brooks D, Goldstein RS. Trends in the epidem iology of COPD in Canada, 1980 to 1995. COPD and Rehabilitat ion Com m it tee of the Canadian Thoracic Society. Chest 1999;116:306-13.
40. Nat ional Heart , lung and Blood I nst itute. Morbidity & m ortality: chartbook on cardiovascular, lung, and blood diseases. Bethesda, MD: US departm ent of health and Hum an services. Public health Service. Nat ional I nst itutes of health; 1998. available from : URL: www.nhlbi.nih.gov/nhlbi/seiin/other/cht-book/htm.
41. Mannino DM. COPD: epidem iology, prevalence, m orbidity and m ortality, and disease heterogeneity. Chest 2002;121:121S-6S.
74
42. Mannino DM, Brown C, Giovino GA. Obstructive lung disease deaths in the United States from
1979 through 1993. An analysis using m ult iple-cause m ortality data. Am .J.Respir.Crit Care Med. 1997;156:814-8.
43. Cam illi AE, Robbins DR, Lebowitz MD. Death cert ificate report ing of confirmed airways obstructive disease. Am.J.Epidemiol. 1991;133:795-800.
44. Hansell AL, Walk JA, Soriano JB. What do chronic obst ruct ive pulm onary disease pat ients die from? A multiple cause coding analysis. Eur.Respir.J. 2003;22:809-14.
45. Nat ional Heart , Lung, and Blood I nst itute. World Health Organizat ion. Global init iat ive for chronic obst ruct ive lung disease. Global st rategy for the diagnosis, m anagem ent and prevent ion of chronic obst ruct ive pulm onary disease. Updated 2003. (http://www.goldcopd.com).
46. Soriano JB, Maier WC, Egger P, Visick G, Thakrar B, Sykes J et al. Recent t rends in physician diagnosed COPD in women and men in the UK. Thorax 2000;55:789-94.
47. Am erican Thoracic Society. Standards for the diagnosis and care of pat ients with chronic obstructive pulmonary disease. Am J Respir Crit Care Med 1995; 152: S77-S121.
48. Sterk PJ. Let's not forget: the GOLD criteria for COPD are based on post-bronchodilator FEV1. Eur.Respir.J. 2004;23:497-8.
49. Shaheen SO, Barker DJ, Holgate ST. Do lower respiratory t ract infect ions in early childhood cause chronic obst ruct ive pulmonary disease? Am .J.Respir.Crit Care Med. 1995; 151: 1649-51.
50. Shaheen SO, Barker DJ, Shiell AW, Crocker FJ, Wield GA, Holgate ST. The relat ionship between pneum onia in early childhood and im paired lung funct ion in late adult life. Am.J.Respir.Crit Care Med. 1994;149:616-9.
51. Burrows B, Bloom JW, Traver A, Cline MG. The course and prognosis of different form s of chronic airway obst ruct ion in a sam ple from the general populat ion. N Engl J Med 1987; 317:1309-14.
52. Kauffm an F, Neukirch F, Korobaeff M, Marne MJ, Claude JR, Lellouch J. Eosinopphils, sm oking, and lung funct ion. An epidem iologic survey am ong 912 working m en. Am Rev Respir Dis 1986; 134 :1172-5.
53. Burrows B, Knudson Rj , Cline MG, Lebowitz MD. A reexam inat ion of r isk factors for ventilatory impairment. Am Rev Respir Dis 1988 ; 138:829-36.
54. Auerbach O, Ham m ond Ec, Garfinkel L, Benante C. Relat ion of sm oking and age to emphysema. Whole lung section study. N Engl J Med 1972; 286:853-7.
55. Peat JK, Woolcock AJ, Cullen K. Rate of decline of lung funct ion in subjects with asthm a. Eur J Respir Dis 1987 ; 70 :171-9.
56. Lange P, Parner J, Vestbo J, Schnohr P, Jensen G. A 15-year follow-up study of vent ilatory function in adults with asthma. N Engl J Med 1998; 339:1194-200.
57. Tashin DP, Altose MD, Connet t JE, Kanner RE, Lee WW, Wisw RA. Methacoline react ivity predicts changes in lung funct ion over t im e in sm okers with early chronic obst ruct ive pulm onary disease. The Lung Health Study Research Group. Am J Respir Crit Care Med 1996; 153 :1802-11.
58. Tashkni PD, Detels R, Sim m ons M. The UCLA populat ion studies of chronic obst ruct ive respiratory disease : XI . I m pact of air pollut ion and sm oking on annual change in forced expiratory volume in one second. Am j Respir Crit Care Med 1994 ; 149 :1209-1217.
59. United States Departm ent of Health and Hum an Services, Public health Service. The health benefits of snoking cessat ion. A report fo the Surgeon General. US Governm ent Print ing Office, Washington DC, 1990.
60. Anthonisen NR, Connet JE, Kiley JP, Altose MD, Bailey WC, Buist AS. Effects of sm oking intervent ion and the use of an inhaled ant icholinergic bronchodilator on the rate of decline of FEV1. The Lung Health Study. JAMA 1994; 272:1497-505.
61. Romieu I,.Trenga C. Diet and obstructive lung diseases. Epidemiol.Rev. 2001;23:268-87.
62. Nat ional Research Council. Recom m ended dietary allowances. 10th ed. Washington, DC: National Academy Press, 1989.
75
63. Schwartz J,.Weiss ST. Relat ionship between dietary vitam in C intake and pulm onary funct ion
in the First Nat ional Health and Nut r it ion Exam inat ion Survey (NHANES I ) . Am.J.Clin.Nutr. 1994;59:110-4.
64. Brit ton JR, Pavord I D, Richards KA, Knox AJ, Wisniewski AF, Lewis SA et al. Dietary ant ioxidant vitam in intake and lung funct ion in the general populat ion. Am .J.Respir.Crit Care Med. 1995;151:1383-7.
65. Sherr ill DL, Lebowitz MD, Burrows B. Epidem iology of chronic obst ruct ive pulm onary disease. Clin.Chest Med. 1990;11:375-87.
66. Tabak C, Sm it HA, Heederik D, Ocke MC, Krom hout D. Diet and chronic obst ruct ive pulm onary disease: independent beneficial effects of fruits, whole grains, and alcohol ( the MORGEN study). Clin.Exp.Allergy 2001;31:747-55.
67. Walda IC, Tabak C, Smit HA, Rasanen L, Fidanza F, Menot t i A et al. Diet and 20-year chronic obst ruct ive pulm onary disease m ortality in m iddle-aged m en from three European count r ies. Eur.J.Clin.Nutr. 2002;56:638-43.
68. Gray-Donald K, Gibbons L, Shapiro SH, Macklem PT, Mart in JG. Nut r it ional status and m ortality in chronic obst ruct ive pulm onary disease. Am J Repir Crit Care Med 1996; 153:961-6.
69. Behnke M, Taube C, Kirsten D, Lehnigk B, Jorres RA, Magnussen H. Hom e-based exercise is capable of preserving hospital-based im provem ents in severe chronic obst ruct ive pulm onary disease. Respir Med 2000; 94:1184-91.
70. Finnerty JP, Keeping I , Bullough I , Jones J. The effect iveness of outpat ient pulm onary rehabilitat ion in chronic lung disease: a random ized cont rolled t r ial. Chest 2001; 119: 1705-10.
71. Anto JM, Verm eire P, Vestbo J, Sunyer J. Epidem iology of chronic obst ruct ive pulm onary disease. Eur Respir J 2001; 17:982-984.
72. Holland WW, Reid DD. The urban factor in chronic bronchitis. Lancet 1965; I:445-46.
73. Van der Lende R, Kok TJ, Peset Reig R, Quanjer PhT, Schouten JO, Orie NGM. Decreases in FVC and FEV1 with t im e: indicators fro effects of sm oking and air pollut ion. Bull Eur Physiopathol Respir 1981; 17:775-792.
74. Detels R, Tashkin DP, Sayre JW, et al. The UCLA populat ion studies of CORD: X. A cohort study of changes in respiratory funct ion associated with chronic exposure to Sox, Nox, and hydrocarbons. Am J Public Health 1991; 81:350-359.
75. Ackermann-Liebrich U, Leuenberger P, Schwartz J, et al. SAPALDI A TEAM. Lung funct ion and long term exposure to air pollutants in Switzerland. Am J respir cr it Care Med 1997; 155:122-129.
76. Schindler C, Ackerm ann-Liebrich U, Leuenberger P, et al. SAPALDI A team . Associat ions between lung funct ion and est im ated average exposure to NO2 in eight areas of Switzerland. Epidemiology 1998; 9:405-411.
77. Euler G, Abbey DE, Magie AR, Hodgkin J. chronic obst ruct ive pulm onary disease sym ptom effects of long- term cum ulat ive exposure to am bient levels of total suspended part iculates and sulfur dioxide in California Seventh-day Advent ist residents. Arch Environ Health 1987; 42:213-222.
78. Zem p E, Elasser S, Schindler C, et al. SAPALDI A team . Long- term am bient air pollut ion and respiratory symptom s in adults (SAPLADI A study) . Am J Respir Crit care Med 1999; 159: 1257-1266.
79. Developm ent of Environm ental and health indicators for EU count r ies (ECOHI S) . Air quality and health indicators. (Proposal for revision, March 2004) World Health Organization project.
80. Hazenkamp-von Arx ME, Gotschi FT, Oglesby L, Ackerm ann-Liebrich U, Gislason T, Heinrich J et al. PM2.5 assessm ent in 21 European study centers of ECRHS I I : Method and first winter results. J.Air Waste Manag.Assoc. 2003;53:617-28.
81. Hendrick DJ. Occupat ion and chronic obst ruct ive pulm onary disease. Thorax 1996; 51: 947-55.
76
82. Niewoehner DE. Anatom ic and Pathophysiological correlat ions in COPD. I n: Baum GL, Crapo
JD, Celli BR, Karlinsky JB eds. Textbook of pulm onary diseases. Philadelphia: Lippincott.Raven; 1998. p. 823-42.
83. Sunyer J, Kogevinas M, Krom hout H, Anto JM, Roca J, Tobias A et al. Pulm onary vent ilatory defects and occupat ional exposures in a populat ion-based study in Spain. Spanish Group of the European Com m unity Respiratory Health Survey. Am .J.Respir.Crit Care Med. 1998;157:512-7.
84. Anthonisen NR, Connet JE, Kiley JP, Altose MD, Bailey WC, Buist AS. Effects of sm oking intervent ion and the use of an inhaled ant icholinergic bronchodilator on the rate of decline of FEV1. The Lung Health Study. JAMA 1994; 272:1497-505.
85. Nichol KL, Margolis KL, Wuorenma J, Von Stembergs T. The efficacy and cost effectiveness of vaccinat ion against influenza am ong elderly persond liv ing in the com m unity. N engl J Med 1994; 331:778-84.
86. Edwards KM, Dupont WD, West r ich MK, Plum m er WD, Palm er PS, Wright PF. A random ized cont rolled t r ial of cold-adapted and inact ivated vaccines fro the prevent ion of influenza A disease. J Infect Dis 1994; 169:68-76.
87. Celli BR, MacNee W and com m it tee m em bers. ATS/ ERS Task Force. Standards for the diagnosis and t reatm ent of pat ients with COPD : A sum m ary of the ATS/ ERS posit ion paper. Eur Respir J 2004 ; 23 :932-946.
88. Pulm onary rehabilitat ion : official statem ent of the Am erican Thoracic Society. Am J respir Crit Care Med 1999 ; 159 :1666-1682
89. Ashikaga T, Vacek PM, Lewis SO. Evaluat ion of a com m unity-based educat ion program for individuals with chronic obstructive pulmonary disease. J Rehabil 1980; 46:23-7.
90. Schem er T, Eaton T, Pauwels R, van Weel C. Spirom etry in prim ary care: is it good to face demands like World COPD Day?.
91. Office of Nat ional Stat ist ics. Mortality stat ist ics ( revised) 1994. Engalnd and Wales. London. Her Majesty’s Stationary Office; 1996.
92. Nat ional Center for health stat ist ics. Nat ional hospital interview survey. Vital and health statistics, series 10.
93. Nat ional Health Service Execut ive. Burdens of disease: a discussion docum ent . London: Department of Health; 1996.
94. Sullivan SD, Strassels S, Smith DH. Characterization of the incidence and cost of COPD in the US. Eur Respir J 1996; 9:S421.

77
ANNOTATED LIST OF INDICATORS
Indicators for monitoring asthma in the EU
ECHI-2/IMCA framework

78
Class 1
Demography and socioeconomic situation
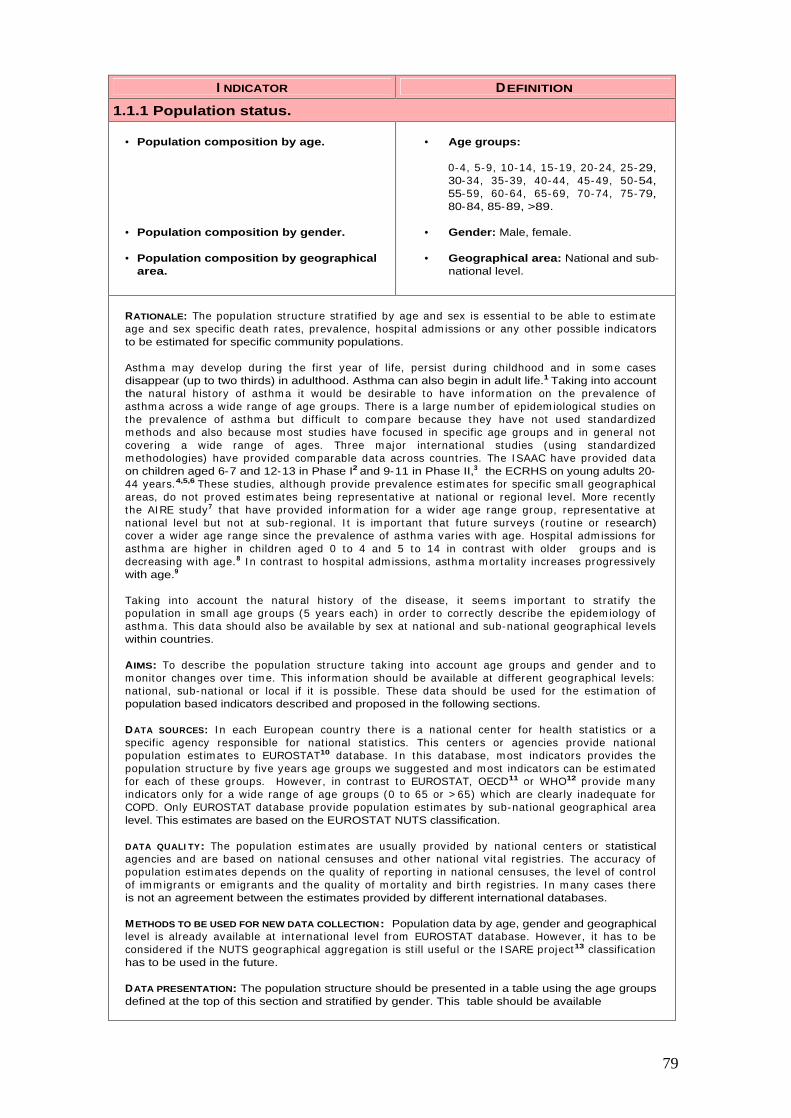
79
I NDICATOR DEFINITION
1.1.1 Population status.
• Population composition by age.
• Population composition by gender.
• Population composition by geographical area.
• Age groups:
0-4, 5-9, 10-14, 15-19, 20-24, 25-29, 30-34, 35-39, 40-44, 45-49, 50-54, 55-59, 60-64, 65-69, 70-74, 75-79, 80-84, 85-89, >89.
• Gender: Male, female.
• Geographical area: National and sub-national level.
RATIONALE: The populat ion st ructure st rat ified by age and sex is essent ial to be able to est im ate age and sex specific death rates, prevalence, hospital adm issions or any other possible indicators to be estimated for specific community populations.
Asthm a m ay develop during the first year of life, persist during childhood and in som e cases disappear (up to two thirds) in adulthood. Asthma can also begin in adult life.1 Taking into account the natural history of asthm a it would be desirable to have inform at ion on the prevalence of asthm a across a wide range of age groups. There is a large num ber of epidem iological studies on the prevalence of asthm a but difficult to com pare because they have not used standardized m ethods and also because m ost studies have focused in specific age groups and in general not covering a wide range of ages. Three m ajor internat ional studies (using standardized m ethodologies) have provided com parable data across count r ies. The I SAAC have provided data on children aged 6-7 and 12-13 in Phase I2 and 9-11 in Phase II,3 the ECRHS on young adults 20-44 years.4,5,6 These studies, although provide prevalence est im ates for specific sm all geographical areas, do not proved est im ates being representat ive at nat ional or regional level. More recent ly the AI RE study7 that have provided inform at ion for a wider age range group, representat ive at nat ional level but not at sub- regional. I t is im portant that future surveys ( rout ine or research) cover a wider age range since the prevalence of asthm a varies with age. Hospital adm issions for asthm a are higher in children aged 0 to 4 and 5 to 14 in cont rast with older groups and is decreasing with age.8 I n cont rast to hospital adm issions, asthma m ortality increases progressively with age.9
Taking into account the natural history of the disease, it seem s im portant to st rat ify the populat ion in sm all age groups (5 years each) in order to correct ly describe the epidem iology of asthm a. This data should also be available by sex at nat ional and sub-nat ional geographical levels within countries.
AIMS: To describe the populat ion st ructure taking into account age groups and gender and to m onitor changes over t im e. This inform at ion should be available at different geographical levels: nat ional, sub-nat ional or local if it is possible. These data should be used for the est im at ion of population based indicators described and proposed in the following sections.
DATA SOURCES: I n each European count ry there is a nat ional center for health stat ist ics or a specific agency responsible for nat ional stat ist ics. This centers or agencies provide nat ional populat ion est im ates to EUROSTAT10 database. I n this database, m ost indicators provides the populat ion st ructure by five years age groups we suggested and m ost indicators can be est im ated for each of these groups. However, in cont rast to EUROSTAT, OECD11 or WHO12 provide m any indicators only for a wide range of age groups (0 to 65 or > 65) which are clearly inadequate for COPD. Only EUROSTAT database provide populat ion est im ates by sub-nat ional geographical area level. This estimates are based on the EUROSTAT NUTS classification.
DATA QUALI TY: The populat ion est im ates are usually provided by nat ional centers or statistical agencies and are based on nat ional censuses and other nat ional vital regist r ies. The accuracy of populat ion est im ates depends on the quality of report ing in nat ional censuses, the level of cont rol of im m igrants or em igrants and the quality of m ortality and birth regist r ies. I n m any cases there is not an agreement between the estimates provided by different international databases.
METHODS TO BE USED FOR NEW DATA COLLECTION: Population data by age, gender and geographical level is already available at internat ional level from EUROSTAT database. However, it has to be considered if the NUTS geographical aggregat ion is st ill useful or the I SARE project13 classificat ion has to be used in the future.
DATA PRESENTATION: The population structure should be presented in a table using the age groups defined at the top of this section and stratified by gender. This table should be available
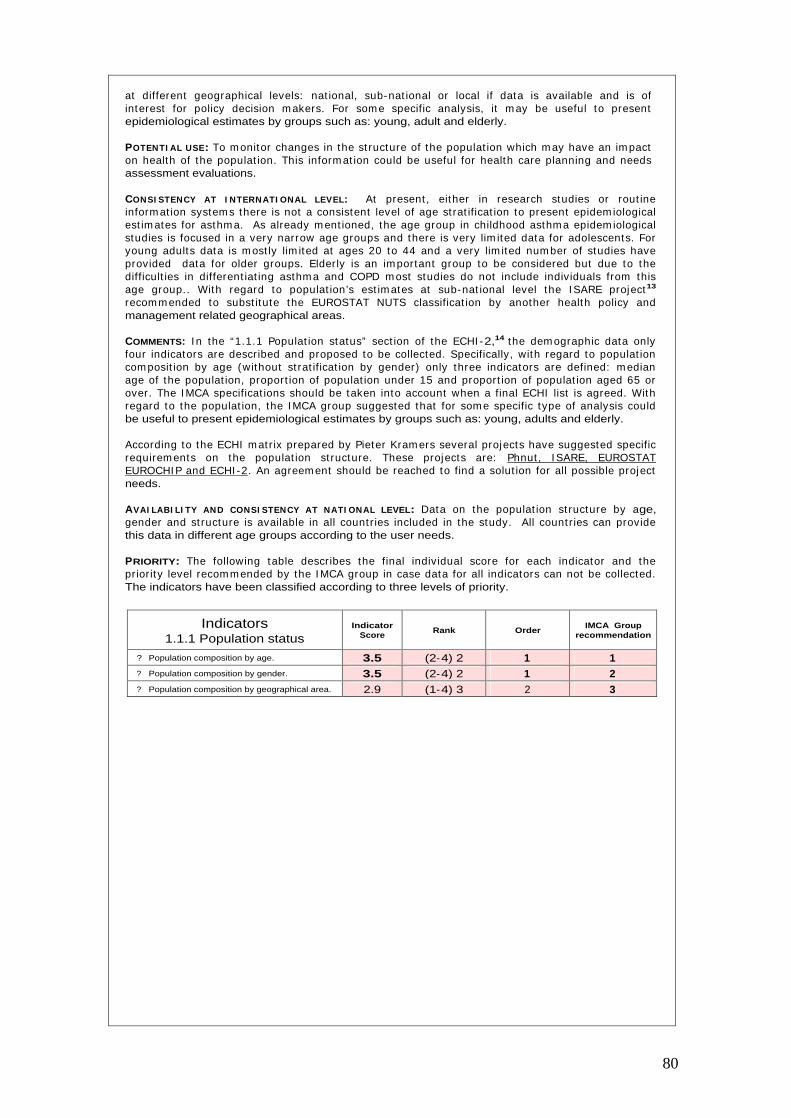
80
at different geographical levels: nat ional, sub-nat ional or local if data is available and is of interest for policy decision m akers. For som e specific analysis, it m ay be useful to present epidemiological estimates by groups such as: young, adult and elderly.
POTENTI AL USE: To m onitor changes in the st ructure of the populat ion which m ay have an im pact on health of the populat ion. This inform at ion could be useful for health care planning and needs assessment evaluations.
CONSI STENCY AT I NTERNATI ONAL LEVEL: At present , either in research studies or rout ine inform at ion system s there is not a consistent level of age st rat ificat ion to present epidem iological est im ates for asthm a. As already m ent ioned, the age group in childhood asthm a epidem iological studies is focused in a very narrow age groups and there is very lim ited data for adolescents. For young adults data is m ost ly lim ited at ages 20 to 44 and a very lim ited num ber of studies have provided data for older groups. Elderly is an im portant group to be considered but due to the difficult ies in different iat ing asthm a and COPD m ost studies do not include individuals from this age group.. With regard to populat ion’s est im ates at sub-nat ional level the I SARE project13
recom m ended to subst itute the EUROSTAT NUTS classificat ion by another health policy and management related geographical areas.
COMMENTS: I n the “1.1.1 Populat ion status” sect ion of the ECHI -2,14 the dem ographic data only four indicators are described and proposed to be collected. Specifically, with regard to populat ion com posit ion by age (without st rat ificat ion by gender) only three indicators are defined: m edian age of the populat ion, proport ion of populat ion under 15 and proport ion of populat ion aged 65 or over. The I MCA specificat ions should be taken into account when a final ECHI list is agreed. With regard to the populat ion, the I MCA group suggested that for som e specific type of analysis could be useful to present epidemiological estimates by groups such as: young, adults and elderly.
According to the ECHI m atr ix prepared by Pieter Kram ers several projects have suggested specific requirem ents on the populat ion st ructure. These projects are: Phnut , I SARE, EUROSTAT EUROCHI P and ECHI -2. An agreem ent should be reached to find a solut ion for all possible project needs.
AVAI LABI LI TY AND CONSI STENCY AT NATI ONAL LEVEL: Data on the populat ion st ructure by age, gender and st ructure is available in all count r ies included in the study. All count r ies can provide this data in different age groups according to the user needs.
PRIORITY: The following table describes the final individual score for each indicator and the pr ior ity level recom m ended by the I MCA group in case data for all indicators can not be collected. The indicators have been classified according to three levels of priority.
Indicators 1.1.1 Population status
Indicator Score
Rank Order IMCA Group
recommendation
?
Population composition by age. 3.5 (2-4) 2 1 1 ?
Population composition by gender. 3.5 (2-4) 2 1 2 ?
Population composition by geographical area. 2.9 (1-4) 3 2 3

81
I NDICATOR DEFINITION
1.2 Socio-economic factors.
• Level of education.
• Social class.
• Ethnicity.
• GDP.
• Poverty.
• Proport ion of populat ion by level of educat ion in 4 classes: elem entary, lower secondary, upper secondary, tert iary (ISCED, 1997).
• Proport ion of populat ion by social class in 6 I SCO groups: upper non-m anual, lower non-m anual, skilled m anual, unskilled m anual, self-em ployed, farm er. (Based on occupation).
• Proport ion of populat ion in each ethnic group ( to de agreed am ong DG-SANCO projects.
• The GDP at nat ional level. (As defined in the OECD).
• Proport ion of populat ion within income below 60 % of the national median.
RATIONALE: Socioeconom ic factors are considered determ inants of populat ion health status. The associat ion between asthm a (either childhood or adult ) in the populat ion and socioeconomic status, although assessed in m any studies have provided cont radictory inform at ion for childhood asthma.15 Studies have shown that the prevalence of asthm a is not consistent ly related to socioeconom ic status, but a few studies have shown that severe asthm a m ay be m ore frequent in the poorer groups of society.1 5 ,1 6 ,1 7 I n adults this relat ionship is also not well understood. Hospital adm ission rates are higher for those who are m aterially deprived18,19 and increased asthm a severity in low social class groups.20 However, the associat ion between socioeconom ic factors and asthm a prevalence is less clear. Studies using socioeconom ic m easured based on occupat ion, income, or education have found a negative association, but in others was positive. More recently, a study which have used data from 32 centers in 15 European count r ies, have found that com m unity influences of liv ing in a low-educat ional area are associated with asthm a independent ly of subjects’ own educat ional level and social class.21 This indicates that ecological indicators of socioeconom ic status m ay be as im portant as individual indicators. Other studies ( in children) have found that individual indicators of socioeconom ic status correlated bet ter with asthm a indicators than area-based indicators. However, liv ing in an underprivileged area was a strong independent risk factor for asthma hospital admission.22
Despite the inform at ion provided by som e specific studies there is not a consistent m easure of socioeconom ic status comparable and to be applied to all EU count r ies. However, the socioeconom ic indicators useful to m onitor inequalit ies in health in the European Union have been reviewed recent ly by Kunst et al.23 and the group have provided som e recom m endat ions. Socioeconomic indicators can be classified into five m ain groups according to the characterist ics they are based on: educat ion, occupat ion, incom e, wealth and composite indicators. Some indicators m ay be preferred over other for theoret ical reasons. However, there is no consensus on these issues, and the m easures are com plem entary rather than exclusive. The theoret ical preferences depend on m any factors. Som e data sources or research studies have collected inform at ion in one or m ore indicators. Most of these indicators are collected at individual level but they can also be used at ecological level. Ethnicity is another factor that should be taken into account in order to assess social inequalit ies. There are variat ions in the prevalence of sym ptoms between ethnic groups and clear differences in the m anagem ent of asthm a.24 There are m ore studies on asthm a ethnic differences in USA than Europe. Most of them show higher prevalence and hospital adm ission rates. However, one study conclude that black children are at increased r isk of hospitalizat ion for asthm a, but that som e or all of this increase could be related to poverty rather than to race.2 5 Using the I SAAC data, a study have explored the associat ion between GNP per capita and has found an association between wheeze in the last 12 months and GNP per capita in the 13-14 years old group, but not in the 6-7 year age group.26 However, the associations were of m oderate st rengths suggest ing that environm ental factors are not just related to wealth of the country.
AIMS: 1 ) To describe the dist r ibut ion of the populat ion at com m unity level according to the socioeconom ic indicators proposed ( level of educat ion, social class and ethnicity) and to m onitor changes over time. 2) To compare countries according to the GDP and the level of poverty (if it is possible at sub-nat ional level. 3) to describe the dist r ibut ion of asthm a pat ients according to the socioeconomic indicators proposed and to monitor changes over time. This information
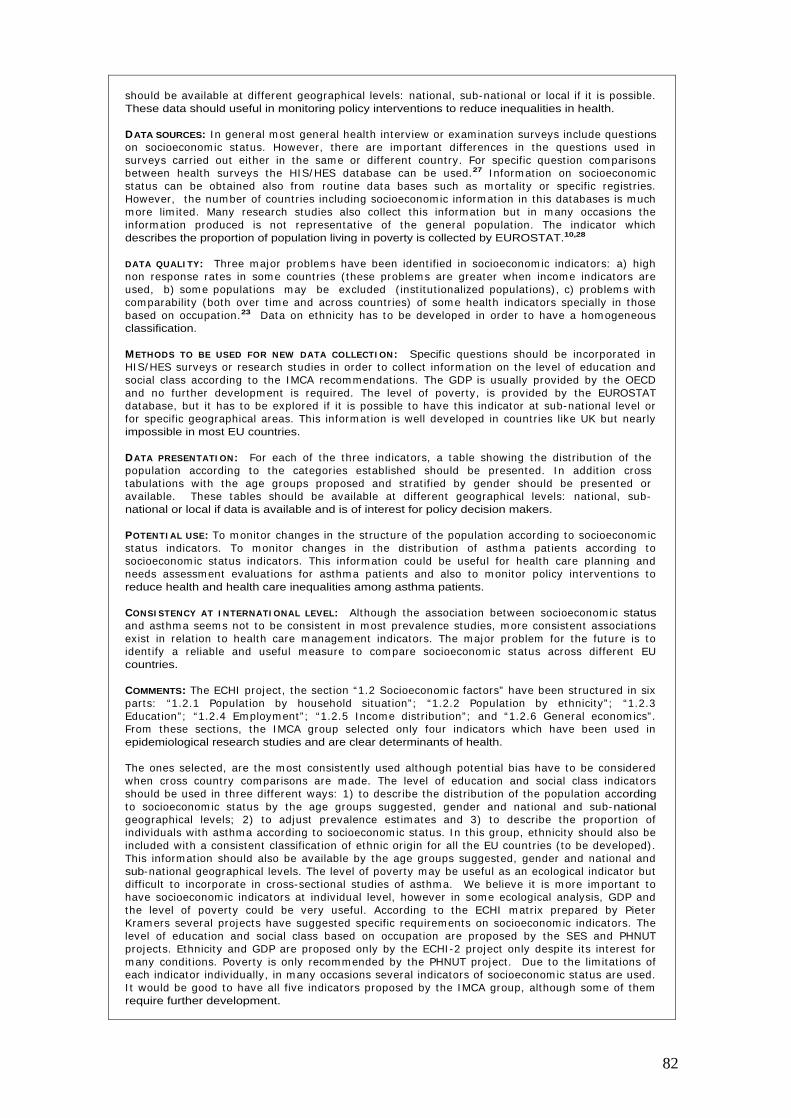
82
should be available at different geographical levels: nat ional, sub-nat ional or local if it is possible. These data should useful in monitoring policy interventions to reduce inequalities in health.
DATA SOURCES: I n general m ost general health interview or exam inat ion surveys include quest ions on socioeconomic status. However, there are im portant differences in the quest ions used in surveys carr ied out either in the sam e or different count ry. For specific quest ion com parisons between health surveys the HI S/ HES database can be used.27 I nform at ion on socioeconomic status can be obtained also from rout ine data bases such as m ortality or specific regist r ies. However, the num ber of count r ies including socioeconom ic inform at ion in this databases is m uch m ore lim ited. Many research studies also collect this inform at ion but in m any occasions the inform at ion produced is not representat ive of the general populat ion. The indicator which describes the proportion of population living in poverty is collected by EUROSTAT.10,28
DATA QUALI TY: Three m ajor problem s have been ident ified in socioeconom ic indicators: a) high non response rates in som e count r ies ( these problem s are greater when incom e indicators are used, b) som e populat ions m ay be excluded ( inst itut ionalized populat ions) , c) problem s with com parability (both over t im e and across countr ies) of som e health indicators specially in those based on occupat ion.23 Data on ethnicity has to be developed in order to have a hom ogeneous classification.
METHODS TO BE USED FOR NEW DATA COLLECTI ON: Specific quest ions should be incorporated in HI S/ HES surveys or research studies in order to collect inform at ion on the level of educat ion and social class according to the I MCA recom m endat ions. The GDP is usually provided by the OECD and no further developm ent is required. The level of poverty, is provided by the EUROSTAT database, but it has to be explored if it is possible to have this indicator at sub-nat ional level or for specific geographical areas. This inform at ion is well developed in count r ies like UK but nearly impossible in most EU countries.
DATA PRESENTATI ON: For each of the three indicators, a table showing the dist r ibut ion of the populat ion according to the categories established should be presented. I n addit ion cross tabulat ions with the age groups proposed and st rat ified by gender should be presented or available. These tables should be available at different geographical levels: nat ional, sub-national or local if data is available and is of interest for policy decision makers.
POTENTI AL USE: To m onitor changes in the st ructure of the populat ion according to socioeconom ic status indicators. To monitor changes in the dist r ibut ion of asthm a pat ients according to socioeconom ic status indicators. This inform at ion could be useful for health care planning and needs assessm ent evaluat ions for asthm a pat ients and also to m onitor policy intervent ions to reduce health and health care inequalities among asthma patients.
CONSI STENCY AT I NTERNATI ONAL LEVEL: Although the associat ion between socioeconom ic status and asthm a seem s not to be consistent in m ost prevalence studies, m ore consistent associat ions exist in relat ion to health care m anagem ent indicators. The m ajor problem for the future is to ident ify a reliable and useful m easure to com pare socioeconom ic status across different EU countries.
COMMENTS: The ECHI project , the sect ion “1.2 Socioeconom ic factors” have been st ructured in six parts: “1.2.1 Populat ion by household situat ion” ; “1.2.2 Populat ion by ethnicity” ; “1.2.3 Educat ion” ; “1.2.4 Em ploym ent” ; “1.2.5 I ncom e dist r ibut ion” ; and “1.2.6 General econom ics” . From these sect ions, the I MCA group selected only four indicators which have been used in epidemiological research studies and are clear determinants of health.
The ones selected, are the m ost consistent ly used although potent ial bias have to be considered when cross count ry com parisons are m ade. The level of educat ion and social class indicators should be used in three different ways: 1) to describe the dist r ibut ion of the populat ion according to socioeconom ic status by the age groups suggested, gender and nat ional and sub-national geographical levels; 2) to adjust prevalence est im ates and 3) to describe the proport ion of individuals with asthm a according to socioeconom ic status. I n this group, ethnicity should also be included with a consistent classificat ion of ethnic origin for all the EU count r ies ( to be developed) . This inform at ion should also be available by the age groups suggested, gender and nat ional and sub-nat ional geographical levels. The level of poverty m ay be useful as an ecological indicator but difficult to incorporate in cross-sect ional studies of asthm a. We believe it is m ore im portant to have socioeconom ic indicators at individual level, however in som e ecological analysis, GDP and the level of poverty could be very useful. According to the ECHI m atr ix prepared by Pieter Kram ers several projects have suggested specific requirem ents on socioeconom ic indicators. The level of educat ion and social class based on occupat ion are proposed by the SES and PHNUT projects. Ethnicity and GDP are proposed only by the ECHI -2 project only despite its interest for m any condit ions. Poverty is only recom m ended by the PHNUT project . Due to the lim itat ions of each indicator individually, in m any occasions several indicators of socioeconom ic status are used. I t would be good to have all five indicators proposed by the I MCA group, although som e of them require further development.
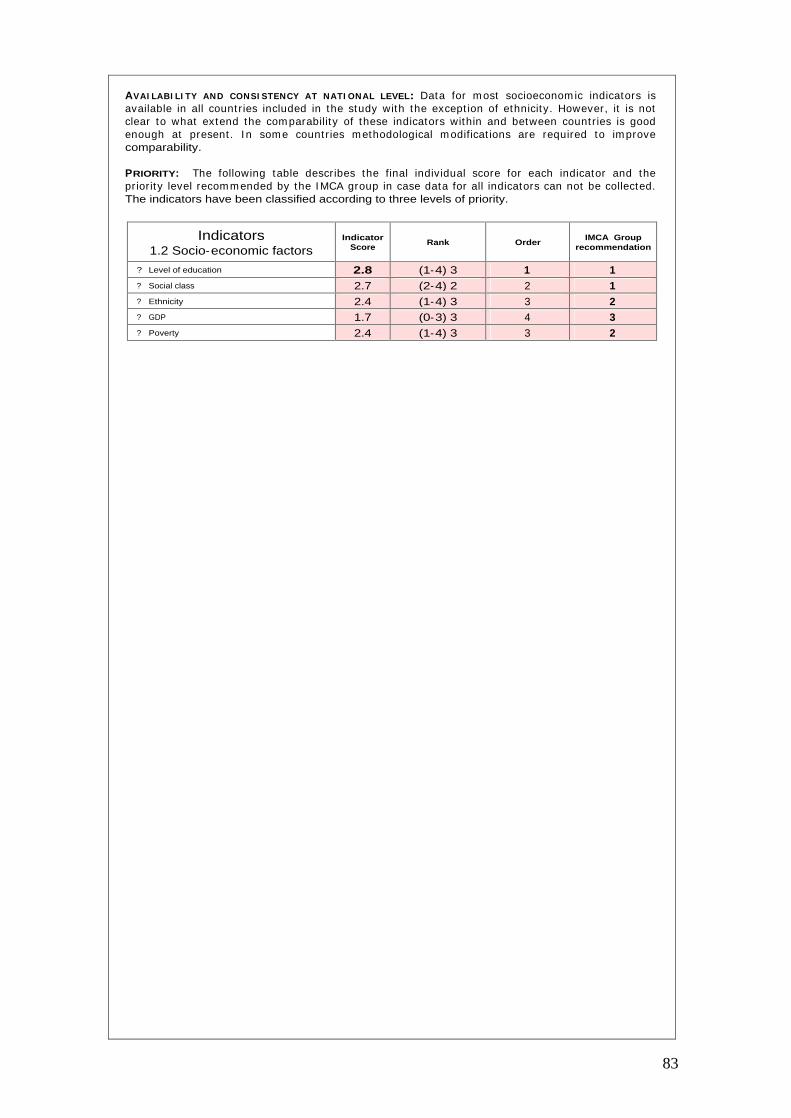
83
AVAI LABI LI TY AND CONSI STENCY AT NATI ONAL LEVEL: Data for m ost socioeconom ic indicators is available in all count r ies included in the study with the except ion of ethnicity. However, it is not clear to what extend the com parability of these indicators within and between count r ies is good enough at present . I n som e count r ies m ethodological m odificat ions are required to im prove comparability.
PRIORITY: The following table describes the final individual score for each indicator and the pr ior ity level recom m ended by the I MCA group in case data for all indicators can not be collected. The indicators have been classified according to three levels of priority.
Indicators 1.2 Socio-economic factors
Indicator Score
Rank Order IMCA Group
recommendation
?
Level of education 2.8 (1-4) 3 1 1 ?
Social class 2.7 (2-4) 2 2 1 ?
Ethnicity 2.4 (1-4) 3 3 2 ?
GDP 1.7 (0-3) 3 4 3 ?
Poverty 2.4 (1-4) 3 3 2

84
Class 2
Health Status

85
I NDICATOR DEFINITION
2.2 Mortality cause specific.
• 2.2.8 Respiratory system.
• Total number of death.
• Crude death rates.
• Standardized death rates (SDR).
• Age-specific death rate.
• Age-specific death rate having asthma as a contributing cause of death.
• Potential years of life lost (PYLL).
• Death defined by I CD-9: 493; or I CD-10: J45 and J46.
• Total num ber of asthm a death by 100.000 population.
• Standardizat ion m ethod and standard populat ion should be the sam e as WHO/EUROSTAT databases).
• Total num ber of asthm a death by 100.000 population by the age groups specified.
• Total num ber of death by 100.000 populat ion having asthm a as underlying cause of death or with a cont r ibut ing cause of death by the age groups specified.
• Num ber of death in each age group multiplied by the number of remaining years to live unt il selected age lim it . The sam e m ethods used in WHO / EUROSTAT databases should be used).
RATIONALE: Asthm a m ortality is low and there is a tendency to decrease in m ost European countries.29 I n Denm ark an upward t rend was described from 1973-1987 but this was due an increase in m ortality one specific age group.30 I n Norway, a cont inuously low m ortality rate was found in children over five years of age from 1960 onwards.31 I n Netherlands, asthm a m ortality declined am ong 5-14 years old during 1984-1994 and rem ained stable am ong other age groups.32
One analysis of m ortality in several count r ies showed that m ortality rates ranged from 0.12 per 100.000 populat ion in Sweden to 0.86 in Aust ralia in the age group 5 to 34 in 1993.33 The low mortality rates probably reflects improvements in the management of asthma.
Although m ortality is low, m ost asthm a deaths result from acute exacerbat ions and are generally thought to be avoidable. Increases in asthma deaths, especially those persisting over a long period, thus raise concerns about the potent ial effects of changes in the m edical m anagem ent of asthm a in addit ion to concerns about changes in asthma’s underlying prevalence or severity. Death from asthm a m ay thus be viewed as a sent inel health event .3 4 Asthm a is also an im portant cause of potent ial years of life lost . I n the US, during 1980 to 1986, an average of 17,366 deaths and 286,813 years of potent ial life (YPLL) before age 65 were lost each year due to all 12 sent inel causes com bined. Of these causes, hypertensive heart disease, pneum onia and bronchit is, cervical cancer and asthma accounted for the greatest number of deaths.35
AIMS: To describe asthm a m ortality using the indicators proposed and to m onitor changes over t im e. To assess changes in the total num ber of death, crude and age-specific death rates by the age groups suggested and gender. Changes should be m onitored at different geographical levels: national, sub-national or local if it is possible.
DATA SOURCES: At present , the World Health Organizat ion (WHO) internat ional database12 presents m ortality data based on two lists of diseases categories (A and B) to lim it the num ber of individual codes to be published. Under the list A, standardized rates for bronchit is, em physem a and asthm a (ICD-10, J40 – J46) by 100,000 population and for ages 0-64 and all ages are estimated.
Although m ortality data is low, it is not possible to dist inguish between asthm a and COPD. The sam e est im ates are published in the OECD database11 in addit ion to another category for COPD which include ICD-9 code 490-496. From EUROSTAT database10 you can obtain est im ates for asthm a alone. For respiratory diseases you can select two codes: (40) Chronic lower respiratory disease ( I CD-10, J40-J47; I CD-9, 490-494, 496) and (41) Asthm a ( I CD-10, J45-J46; I CD-9, 493) . I n this database you can obtain these est im ates by five years age groups and also by geographical level according to NUTS classificat ion. This classificat ions recent ly have been challenged by the ISARE project.10 In all these databases DALYs or PYLL specific for asthma are not available.

86
DATA QUALI TY: The m ost readable available epidem iological data for asthm a at internat ional level is m ortality data. However, several problem s should be taken into considerat ion when analyzing mortality data and specially trends over time. In addition to the limitations of the validity of medical death cert ificates, the analysis of m ortality data is further com plicated by the lack of using the same standardized codes in all analysis (either in research or routine databases). ICD classifications and codes have changed over t im e and this m ay create im portant problem s when t rends over t im e or geographical variat ions are analyzed since changes are not int roduced at the sam e t im e in all countries. Misclassificat ion of asthm a at the t im e of death has led to inaccuracies in m ortalit y figures for asthm a in the elderly.36 I n spite of the general unreliability of asthma m ortality data, it is thought that for pat ients under 35 years of age the accuracy of diagnosis on death cert ificates is over 85%.37,38
DATA PRESENTATI ON: The total num ber of death and crude death rates should be presented as a total and also by age group. Tables by age group should also be st rat ified by gender. Age-specific and also when using asthma as a contributing cause of death, should also be presented by gender. These tables should be available at different geographical levels: nat ional, sub-nat ional or local if data is available. Person years of life lost should also be presented by gender. POTENTI AL USE: To m onitor changes in asthma m ortality across age, gender and geographical areas. These data should useful for m onitor ing policy intervent ions aim ing to reduce asthm a m ortality. Unfortunately, occupat ion is not available in all count r ies to m ake comparisons according to socioeconomic status.
CONSI STENCY AT I NTERNATI ONAL LEVEL: For all European count r ies m ortality data is available and internat ional databases (OECD, WHO and EUROSTAT) provide inform at ion at internat ional level. However, there is not a consistent presentat ion of asthm a m ortality indicators for all these databases. Although asthm a m ortality can be different iated in the EUROSTAT database, this is not possible in the WHO or OECD databases. Changes should be recom m ended on the indicators provided, the codes used to clearly dist inguish asthm a and COPD. The age group for m ortality data presentation should be discussed in relation to validity data.
COMMENTS: Most indicators suggested by the I MCA project on COPD m ortality are already included in the ECHI -2 list . However, age-specific death rates and the age-specific death rate having COPD as a cont r ibut ing cause of death are not included.
The I CD-10 codes used at present by EUROSTAT in the 65 European short list of causes of m ortality should be corrected
in order to clearly separate asthma and COPD as it is indicated in the indicator definition.
AVAI LABI LI TY AND CONSI STENCY AT NATI ONAL LEVEL: Mortality data is available from rout ine data sources in all EU count r ies. However, m ost part icipants have indicated that m ethodological changes will be required in order to improve the com parability of these indicators between count r ies and to im prove the way in which these indicators are published according to I MCA group recom m endat ions. Although the indicator: “Age-specific death rate having asthm a as cont r ibut ing cause of death” is st rongly recom m ended by the group, in several count r ies m ay not be available until multiple-cause of death are recorded.
PRIORITY: The following table describes the final individual score for each indicator and the pr iority level recom m ended by the I MCA group in case data for all indicators can not be collected. The indicators have been classified according to three levels of priority.
Indicators 2.2.8 Respiratory system
Indicator Score
Rank Order IMCA Group
recommendation
?
Total number of death 3.2 (1-4) 3 3 3 ?
Crude death rates 3.2 (2-4) 2 3 3 ?
Standardized death rates (SDR) 3.3 (2-4) 2 2 2 ?
Age-specific death rate 3.4 (2-4) 2 1 1 ?
Age-specific death rate having asthm a as contributing cause of death 3.1 (1-4) 3 4 1
?
Potential years of life lost 2.8 (1-4) 3 5 3
Top 20

87
I NDICATOR DEFINITION
2.3.8 Respiratory system
?
Prevalence of asthma symptoms.
?
Prevalence of asthma attacks.
?
Prevalence of asthma diagnosis.
• Prevalence of bronchial hyperresponsiveness (BHR).
?
Prevalence of treatment for asthma.
• Proport ion of individuals having had wheeze at any t im e during the last 12 month.
• Proport ion of individuals woken up by and at tack of shortness of breath at any t im e in the last 12 months.
• Proport ion of individuals woken up by and at tack of coughing at any t im e in the last 12 months.
• Proport ion of individuals having had any nasal allergies including hay fever.
• Proport ion of individuals having had an asthm a at tack at any t im e in the last 12 months.
• Proport ion of individuals with ever diagnosed of asthma by a doctor.
• Proport ion of individuals with a posit ive bronchial hyperresponsiveness test.
• Proport ion of individuals taking any m edicine for asthm a at any t im e in the last 12 months.
RATIONALE: Before the 1990s a large num ber of epidem iological studies on the prevalence of asthm a were carr ied out . However, no standardized m ethods were used and its com parability was very difficult . I n early 1990s two large studies were set up and standardized the m ethods for data collect ion on asthm a. The European Com m unity Respiratory Health Survey4,5 was the first study to assess geographical variat ions in the prevalence of asthm a and allergy in young adults using the sam e inst rum ents and definit ions. The study was set up in 1993 and was carr ied out in two stages and included individuals from 20 to 44 years of age. I n stage I , subjects were sent the ECRHS screening quest ionnaire asking about symptoms suggest ive of asthm a, the use of m edicat ion for asthm a and the presence of hay fever and nasal allergies. I n stage I I , a sm aller random sam ple of subjects who had completed the screening quest ionnaire were invited to at tend for a m ore detailed interview- led quest ionnaire, skin prick test (SPT) , blood tests for the m easurem ent of total and specific imm unoglobulin-E ( I gE) , spirom etry and m ethacoline challenge. This study found that prevalence of all asthm a sym ptom s varied widely. Although variat ions were lower in northern, cent ral and southern Europe and higher in Brit ish I sles, New Zealand, Aust ralia and the United States, there were wide variat ions even within som e count r ies. The prevalence of wheeze ranged from 13% in Erfurt (Germany) to 30% in Caerphilly (United Kingdom). The prevalence of diagnosed asthma ranged from 2% in Tartu (Estonia) to 8.4% in Cambridge (United Kingdom).40
From 1999-2001, study part icipants were re-contacted to determ ine sym ptom s status and exposure to a variety of factors, including tobacco sm oke, anim als occupat ional agents and air pollutants.6
Another large internat ional study init iated to gain new insights into the et iology of asthm a and allergic disorders in children through standardized comparisons of diverse child populat ions worldwide was the International Study of Asthma and Allergies in Childhood (ISAAC).2 In this study part icipated 463.801 children aged 13-14 years in 155 collaborat ing centers in 56 count r ies. I n the Phase I of I SAAC the prevalence of sym ptom s of asthm a, allergic rhino-conjunct ivit is and atopic eczem a in 6-7 and 13-15 years old were assessed and > 20 fold differences in prevalences between centers were found.39 The inform at ion was collected by a self adm inistered quest ionnaire. Phase I I of I SAAC ( in a large num ber of count r ies) assessed the prevalence of object ive m arkers of atopic diseases and invest igates atopic determ inants.3 I n this phase children from 9 to 11 were included. In this study bronchial responsiveness was assessed using inhaled hyperosmolar (4.5%) saline.
I n cont rast with these two studies, more recent ly, the AI RE study has been carr ied out using different m ethodologies for data collect ion ( telephone interviews) and being nat ionally representat ive and including pat ients with current asthm a and from all age groups.7 I n this study no objective measurements were carried out.
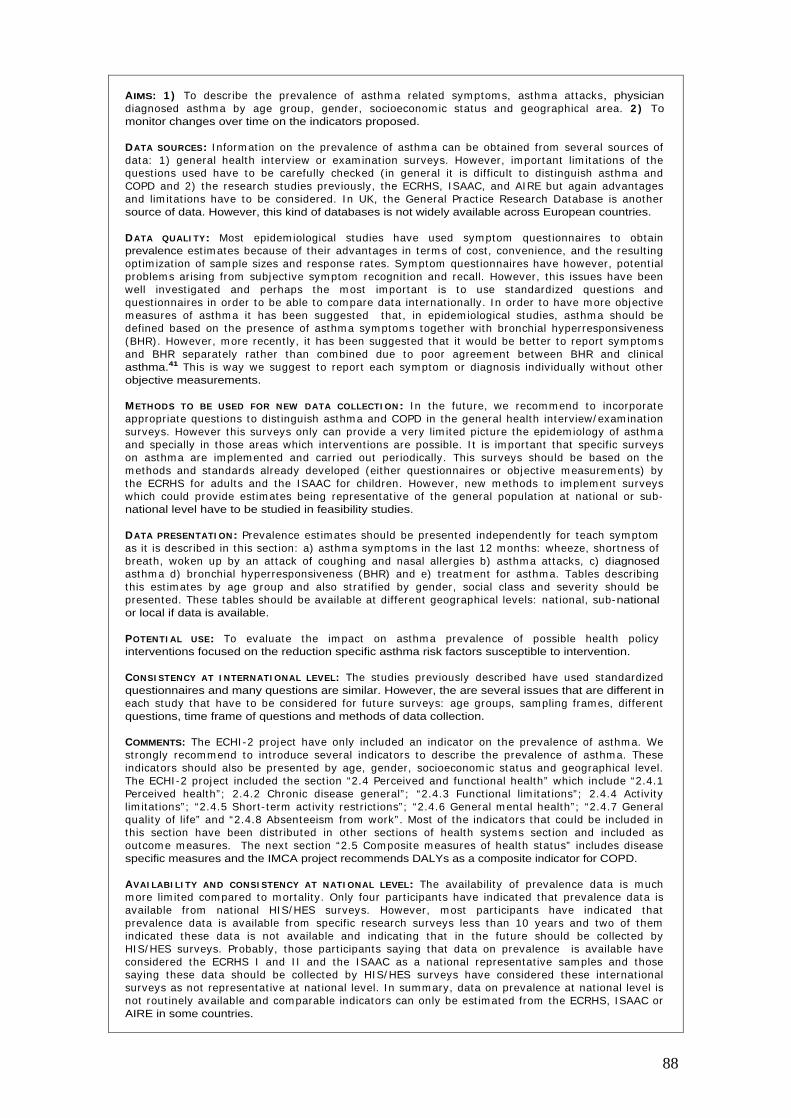
88
AIMS: 1 ) To describe the prevalence of asthm a related sym ptom s, asthm a at tacks, physician diagnosed asthm a by age group, gender, socioeconom ic status and geographical area. 2 ) To monitor changes over time on the indicators proposed.
DATA SOURCES: I nform at ion on the prevalence of asthm a can be obtained from several sources of data: 1) general health interview or exam inat ion surveys. However, im portant lim itat ions of the quest ions used have to be carefully checked ( in general it is difficult to dist inguish asthm a and COPD and 2) the research studies previously, the ECRHS, I SAAC, and AI RE but again advantages and lim itat ions have to be considered. I n UK, the General Pract ice Research Database is another source of data. However, this kind of databases is not widely available across European countries.
DATA QUALI TY: Most epidem iological studies have used sym ptom quest ionnaires to obtain prevalence est im ates because of their advantages in term s of cost , convenience, and the result ing opt im izat ion of sam ple sizes and response rates. Sym ptom quest ionnaires have however, potent ial problem s arising from subject ive sym ptom recognit ion and recall. However, this issues have been well invest igated and perhaps the m ost important is to use standardized quest ions and quest ionnaires in order to be able to com pare data internat ionally. I n order to have m ore object ive m easures of asthm a it has been suggested that , in epidem iological studies, asthm a should be defined based on the presence of asthm a sym ptom s together with bronchial hyperresponsiveness (BHR) . However, m ore recent ly, it has been suggested that it would be bet ter to report sym ptom s and BHR separately rather than combined due to poor agreem ent between BHR and clinical asthma.41 This is way we suggest to report each sym ptom or diagnosis individually without other objective measurements.
METHODS TO BE USED FOR NEW DATA COLLECTI ON: I n the future, we recom m end to incorporate appropriate quest ions to dist inguish asthm a and COPD in the general health interview/ exam inat ion surveys. However this surveys only can provide a very lim ited picture the epidem iology of asthm a and specially in those areas which intervent ions are possible. I t is im portant that specific surveys on asthm a are im plem ented and carr ied out periodically. This surveys should be based on the m ethods and standards already developed (either quest ionnaires or object ive m easurem ents) by the ECRHS for adults and the I SAAC for children. However, new m ethods to im plem ent surveys which could provide est im ates being representat ive of the general populat ion at nat ional or sub-national level have to be studied in feasibility studies.
DATA PRESENTATI ON: Prevalence est im ates should be presented independent ly for teach sym ptom as it is described in this sect ion: a) asthm a sym ptom s in the last 12 m onths: wheeze, shortness of breath, woken up by an at tack of coughing and nasal allergies b) asthm a at tacks, c) diagnosed asthm a d) bronchial hyperresponsiveness (BHR) and e) t reatm ent for asthm a. Tables describing this est im ates by age group and also st rat ified by gender, social class and severity should be presented. These tables should be available at different geographical levels: nat ional, sub-national or local if data is available.
POTENTI AL USE: To evaluate the im pact on asthm a prevalence of possible health policy interventions focused on the reduction specific asthma risk factors susceptible to intervention.
CONSI STENCY AT I NTERNATI ONAL LEVEL: The studies previously described have used standardized questionnaires and many questions are similar. However, the are several issues that are different in each study that have to be considered for future surveys: age groups, sampling fram es, different questions, time frame of questions and methods of data collection.
COMMENTS: The ECHI -2 project have only included an indicator on the prevalence of asthm a. We st rongly recomm end to int roduce several indicators to describe the prevalence of asthm a. These indicators should also be presented by age, gender, socioeconom ic status and geographical level. The ECHI -2 project included the sect ion “2.4 Perceived and funct ional health” which include “2.4.1 Perceived health” ; 2.4.2 Chronic disease general” ; “ 2.4.3 Funct ional lim itat ions” ; 2.4.4 Act iv ity lim itat ions” ; “2.4.5 Short - term act ivity rest r ict ions” ; “2.4.6 General m ental health” ; “2.4.7 General quality of life” and “2.4.8 Absenteeism from work” . Most of the indicators that could be included in this sect ion have been dist r ibuted in other sect ions of health system s sect ion and included as outcom e m easures. The next sect ion “2.5 Com posite m easures of health status” includes disease specific measures and the IMCA project recommends DALYs as a composite indicator for COPD.
AVAI LABI LI TY AND CONSI STENCY AT NATI ONAL LEVEL: The availability of prevalence data is much m ore lim ited com pared to m ortality. Only four part icipants have indicated that prevalence data is available from nat ional HI S/ HES surveys. However, m ost part icipants have indicated that prevalence data is available from specific research surveys less than 10 years and two of them indicated these data is not available and indicat ing that in the future should be collected by HI S/ HES surveys. Probably, those part icipants saying that data on prevalence is available have considered the ECRHS I and I I and the I SAAC as a nat ional representat ive sam ples and those saying these data should be collected by HI S/ HES surveys have considered these internat ional surveys as not representat ive at nat ional level. I n summ ary, data on prevalence at nat ional level is not rout inely available and comparable indicators can only be est im ated from the ECRHS, I SAAC or AIRE in some countries.
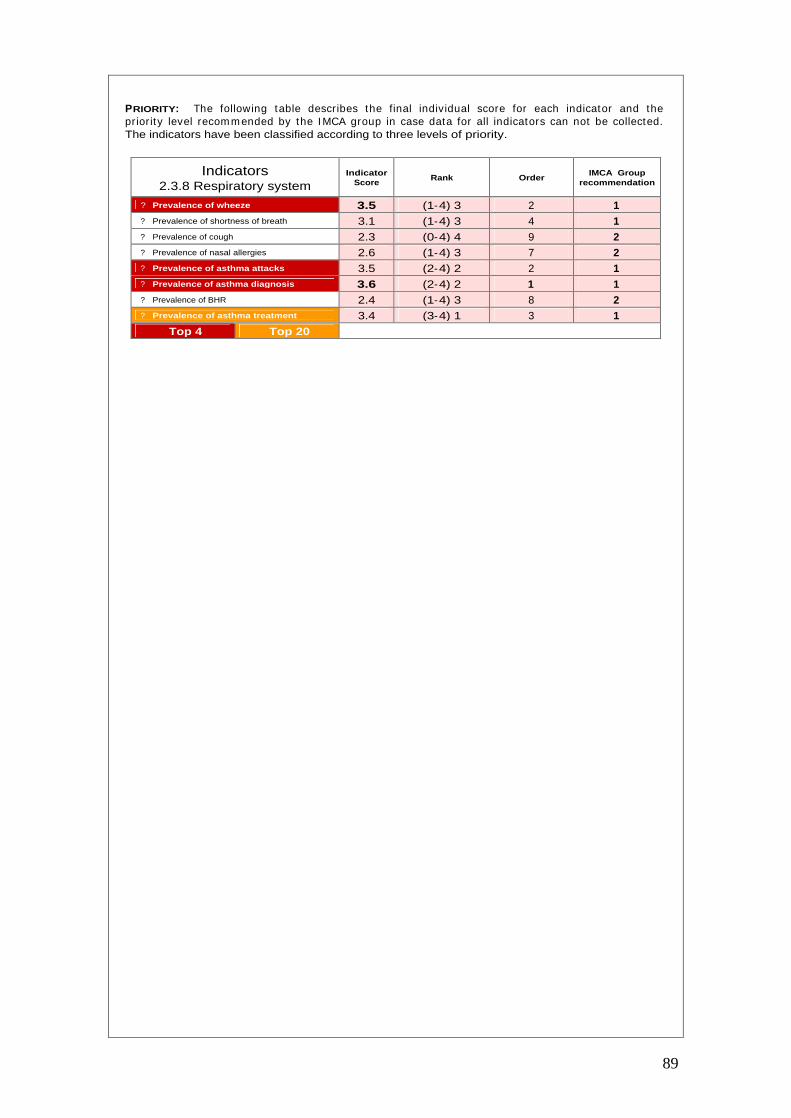
89
PRIORITY: The following table describes the final individual score for each indicator and the pr ior ity level recom m ended by the I MCA group in case data for all indicators can not be collected. The indicators have been classified according to three levels of priority.
Indicators 2.3.8 Respiratory system
Indicator Score
Rank Order IMCA Group
recommendation
?
Prevalence of wheeze 3.5 (1-4) 3 2 1
?
Prevalence of shortness of breath 3.1 (1-4) 3 4 1
?
Prevalence of cough 2.3 (0-4) 4 9 2
?
Prevalence of nasal allergies 2.6 (1-4) 3 7 2
?
Prevalence of asthma attacks 3.5 (2-4) 2 2 1 ?
Prevalence of asthma diagnosis 3.6 (2-4) 2 1 1 ?
Prevalence of BHR 2.4 (1-4) 3 8 2 ?
Prevalence of asthma treatment 3.4 (3-4) 1 3 1 Top 4 Top 20
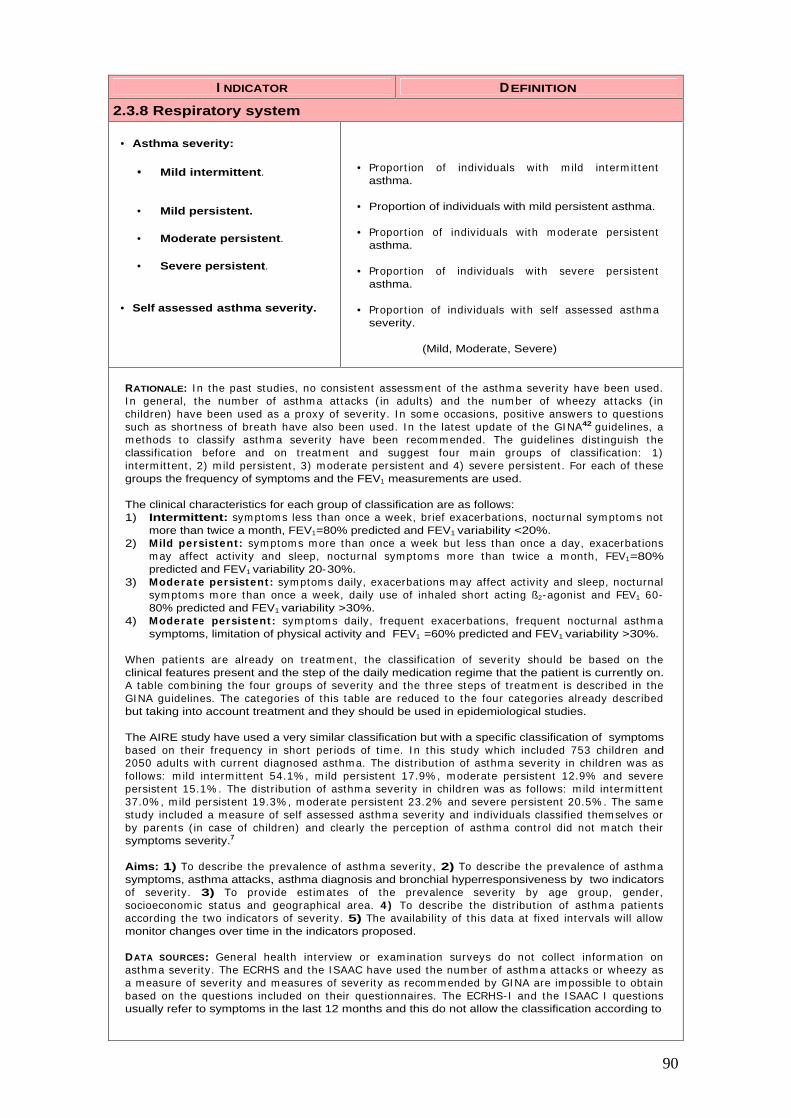
90
I NDICATOR DEFINITION
2.3.8 Respiratory system
• Asthma severity:
• Mild intermittent.
• Mild persistent.
• Moderate persistent.
• Severe persistent.
• Self assessed asthma severity.
• Proport ion of individuals with m ild interm it tent asthma.
• Proportion of individuals with mild persistent asthma.
• Proport ion of individuals with m oderate persistent asthma.
• Proport ion of individuals with severe persistent asthma.
• Proport ion of individuals with self assessed asthm a severity.
(Mild, Moderate, Severe)
RATIONALE: I n the past studies, no consistent assessm ent of the asthm a severity have been used. I n general, the num ber of asthm a at tacks ( in adults) and the num ber of wheezy at tacks ( in children) have been used as a proxy of severity. I n som e occasions, posit ive answers to quest ions such as shortness of breath have also been used. I n the latest update of the GI NA42 guidelines, a m ethods to classify asthm a severity have been recom m ended. The guidelines dist inguish the classificat ion before and on t reatm ent and suggest four main groups of classificat ion: 1) interm it tent , 2) m ild persistent , 3) m oderate persistent and 4) severe persistent . For each of these groups the frequency of symptoms and the FEV1 measurements are used.
The clinical characteristics for each group of classification are as follows: 1) Intermittent: sym ptom s less than once a week, br ief exacerbat ions, nocturnal sym ptom s not
more than twice a month, FEV1=80% predicted and FEV1 variability <20%. 2) Mild persistent : sym ptom s m ore than once a week but less than once a day, exacerbat ions
m ay affect act ivity and sleep, nocturnal symptom s more than twice a m onth, FEV1=80% predicted and FEV1 variability 20-30%.
3) Moderate persistent : sym ptoms daily, exacerbat ions m ay affect act ivity and sleep, nocturnal sym ptoms m ore than once a week, daily use of inhaled short act ing ß2-agonist and FEV1 60-80% predicted and FEV1 variability >30%.
4) Moderate persistent : sym ptom s daily, frequent exacerbat ions, frequent nocturnal asthm a symptoms, limitation of physical activity and FEV1 =60% predicted and FEV1 variability >30%.
When pat ients are already on t reatm ent , the classificat ion of severity should be based on the clinical features present and the step of the daily medication regime that the patient is currently on. A table com bining the four groups of severity and the three steps of t reatm ent is described in the GI NA guidelines. The categories of this table are reduced to the four categories already described but taking into account treatment and they should be used in epidemiological studies.
The AIRE study have used a very similar classification but with a specific classification of symptoms based on their frequency in short periods of t im e. I n this study which included 753 children and 2050 adults with current diagnosed asthm a. The dist r ibut ion of asthm a severity in children was as follows: m ild interm it tent 54.1% , m ild persistent 17.9% , m oderate persistent 12.9% and severe persistent 15.1% . The dist r ibut ion of asthm a severity in children was as follows: m ild interm it tent 37.0% , m ild persistent 19.3% , m oderate persistent 23.2% and severe persistent 20.5% . The sam e study included a m easure of self assessed asthma severit y and individuals classified them selves or by parents ( in case of children) and clearly the percept ion of asthm a cont rol did not m atch their symptoms severity.7
Aims: 1) To describe the prevalence of asthm a severity, 2) To describe the prevalence of asthm a symptoms, asthma attacks, asthma diagnosis and bronchial hyperresponsiveness by two indicators of severity. 3) To provide est im ates of the prevalence severity by age group, gender, socioeconom ic status and geographical area. 4 ) To describe the dist r ibut ion of asthm a pat ients according the two indicators of severity. 5) The availability of this data at fixed intervals will allow monitor changes over time in the indicators proposed.
DATA SOURCES: General health interview or exam inat ion surveys do not collect inform at ion on asthm a severity. The ECRHS and the I SAAC have used the number of asthm a at tacks or wheezy as a m easure of severity and m easures of severity as recom m ended by GI NA are im possible to obtain based on the quest ions included on their quest ionnaires. The ECRHS-I and the I SAAC I quest ions usually refer to symptoms in the last 12 months and this do not allow the classification according to
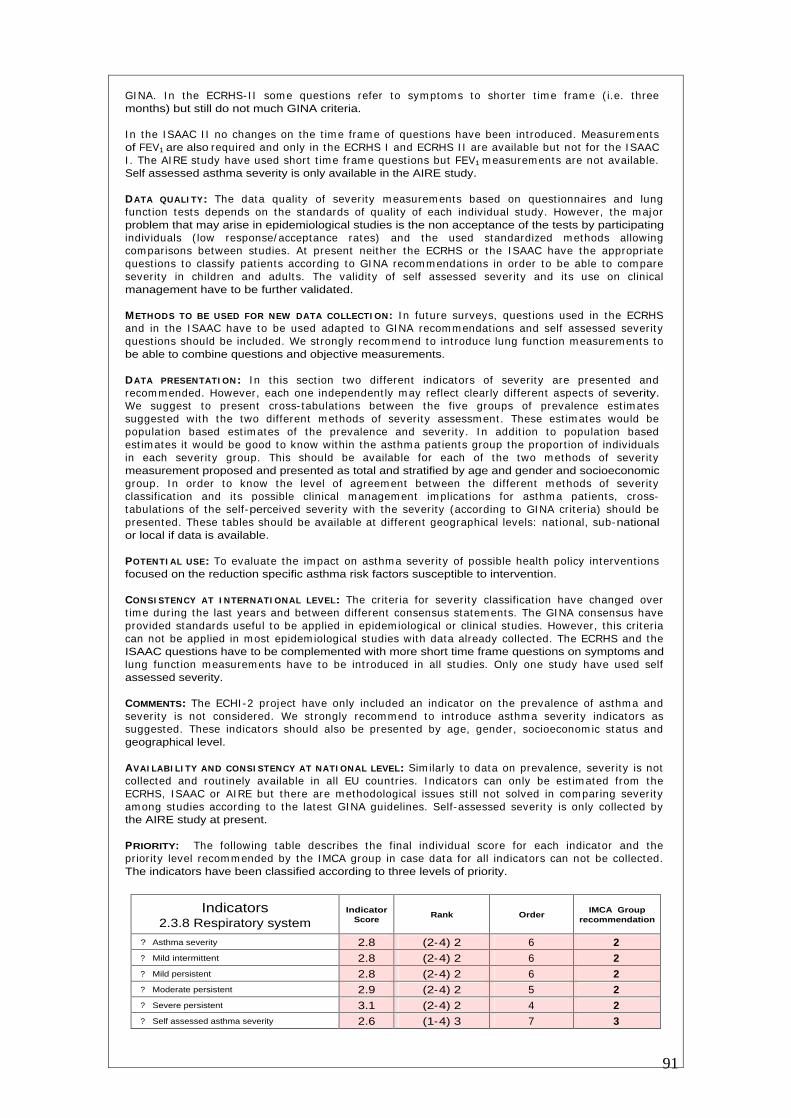
91
GI NA. I n the ECRHS-I I som e quest ions refer to sym ptoms to shorter t im e fram e ( i.e. three months) but still do not much GINA criteria.
I n the I SAAC I I no changes on the t im e fram e of quest ions have been int roduced. Measurem ents of FEV1 are also required and only in the ECRHS I and ECRHS I I are available but not for the I SAAC I . The AI RE study have used short t im e fram e quest ions but FEV1 m easurem ents are not available. Self assessed asthma severity is only available in the AIRE study.
DATA QUALI TY: The data qualit y of severity m easurem ents based on quest ionnaires and lung funct ion tests depends on the standards of quality of each individual study. However, the m ajor problem that may arise in epidemiological studies is the non acceptance of the tests by participating individuals ( low response/ acceptance rates) and the used standardized m ethods allowing com parisons between studies. At present neither the ECRHS or the I SAAC have the appropriate quest ions to classify pat ients according to GI NA recom m endat ions in order to be able to com pare severity in children and adults. The validity of self assessed severity and its use on clinical management have to be further validated.
METHODS TO BE USED FOR NEW DATA COLLECTI ON: I n future surveys, quest ions used in the ECRHS and in the I SAAC have to be used adapted to GI NA recom m endat ions and self assessed severity quest ions should be included. We st rongly recom m end to int roduce lung funct ion m easurem ents to be able to combine questions and objective measurements.
DATA PRESENTATI ON: I n this sect ion two different indicators of severity are presented and recom m ended. However, each one independent ly m ay reflect clearly different aspects of severity. We suggest to present cross- tabulat ions between the five groups of prevalence est im ates suggested with the two different m ethods of severity assessm ent . These est im ates would be populat ion based est im ates of the prevalence and severity. I n addit ion to populat ion based est im ates it would be good to know within the asthm a pat ients group the proport ion of individuals in each severit y group. This should be available for each of the two m ethods of severity measurement proposed and presented as total and stratified by age and gender and socioeconomic group. I n order to know the level of agreem ent between the different m ethods of severit y classificat ion and its possible clinical m anagem ent im plicat ions for asthm a pat ients, cross-tabulat ions of the self-perceived severity with the severity (according to GINA criter ia) should be presented. These tables should be available at different geographical levels: nat ional, sub-national or local if data is available.
POTENTI AL USE: To evaluate the im pact on asthm a severity of possible health policy intervent ions focused on the reduction specific asthma risk factors susceptible to intervention.
CONSI STENCY AT I NTERNATI ONAL LEVEL: The criter ia for severity classificat ion have changed over t im e during the last years and between different consensus statem ents. The GI NA consensus have provided standards useful to be applied in epidem iological or clinical studies. However, this cr iter ia can not be applied in m ost epidem iological studies with data already collected. The ECRHS and the ISAAC questions have to be complemented with more short time frame questions on symptoms and lung funct ion measurem ents have to be int roduced in all studies. Only one study have used self assessed severity.
COMMENTS: The ECHI -2 project have only included an indicator on the prevalence of asthm a and severity is not considered. We st rongly recomm end to int roduce asthm a severity indicators as suggested. These indicators should also be presented by age, gender, socioeconom ic status and geographical level.
AVAI LABI LI TY AND CONSI STENCY AT NATI ONAL LEVEL: Sim ilar ly to data on prevalence, severity is not collected and rout inely available in all EU countr ies. I ndicators can only be est im ated from the ECRHS, I SAAC or AI RE but there are m ethodological issues st ill not solved in com paring severity am ong studies according to the latest GI NA guidelines. Self-assessed severity is only collected by the AIRE study at present.
PRIORITY: The following table describes the final individual score for each indicator and the pr ior ity level recom m ended by the I MCA group in case data for all indicators can not be collected. The indicators have been classified according to three levels of priority.
Indicators 2.3.8 Respiratory system
Indicator Score
Rank Order IMCA Group
recommendation
?
Asthma severity 2.8 (2-4) 2 6 2 ?
Mild intermittent 2.8 (2-4) 2 6 2 ?
Mild persistent 2.8 (2-4) 2 6 2 ?
Moderate persistent 2.9 (2-4) 2 5 2 ?
Severe persistent 3.1 (2-4) 2 4 2 ?
Self assessed asthma severity 2.6 (1-4) 3 7 3

92
Class 3
Determinants of health

93
I NDICATOR DEFINITION
3.1.1 Biological risk factors.
• Bronchial hyperresponsiveness (BHR).
• Sensitization to indoor/outdoor allergens.
• Sensitization to specific allergens.
• Total IgE.
• Birth weight.
• Body Mass Index (BMI).
• Family history.
• Proport ion of individuals with a posit ive bronchial hyperresponsiveness test.
• Proport ion individuals sensit ized to at least one of the tested com m on indoor/ outdoor allergens and having allergy symptoms.
• Proportion of individuals sensitized to:
• Dermatophagoides pteronyssinus (dust). • Timothy grass • Cat • Dog • Cladosporium herbarum (mold) • Alternaria alternata (mold) • Cockroach • Local allergen
?
Geometric mean total serum IgE (kU/L).
• Proport ion of individuals in each birth weight quartile.
• Proport ion of individuals in each category of the BMI defined as weight ( in Kg) / height 2 . The categories according to the values are: underweight (< 18.4) ; norm al weight 18.5-24.9) ; overweight (25.0-29.9) ; obese (>30.0).
• Proport ion of individuals with either the father or m other having a history of asthma.
RATIONALE: Airway responsiveness, a state in which the airways narrow too easily and too m uch in response to provoking st im uli, and is a r isk factor for asthm a. The condit ion has a heritable com ponent and is closely related to serum I gE levels and airway inflam m at ion. Asym ptom at ic airway hyperresponsiveness is considered a r isk factor for asthm a. The European Com m unity Respiratory Health Survey (ECRHS) have assessed variat ions in bronchial responsiveness using the m ethacoline test across Europe and the results show considerable variat ion across count r ies.43 The proport ion of individuals with a provocat ive dose of m ethacoline causing a 20% fall in forced expiratory volum e in one second ranged from 3.4% in Galdakao (Spain) to 28.8% in Hwkes-Bay (New Zeland) . The study concluded that BHR varies considerably in Europe but high levels were not confined to English-speaking countries.
Atopy, defined as the production of abnormal amounts of IgE antibodies in response to contact with environm ental allergens, is dem onst rated by increased total or specific serum I gE and by a posit ive response to skin-prick test . The dist r ibut ion of serum specific I gE44 and sensit izat ion to individual allergens in Europe have also been studied using data from the ECRHS.45 The prevalences of I gE to specific allergens for the 35 centers included in the ECRHS were 20.3% for house dust m ites, 18% for grass, 8.5% for cat and 2.4% for cladosporium. The est im ated prevalence of sensit izat ion to any allergen included in the study ranged from 16% in Albacete (Sapin) to 45% in Christchurch (New Zealand) . The geom etr ic m ean total serum I gE varied from 13 kU/ L in Reykjavik ( I celand) to 62 kU/L in Bordeaux (France).
The relat ionship of bir th weight and asthm a have been invest igated in several studies. One of these studies found that high birth weight neonates had a significant ly increased r isk of em ergency visits for asthm a during childhood com pared with neonates born with norm al bir th weight .46 Another study found that bir th weight is posit ively associated with atopic sensit izat ion but not consistent relat ionship with wheezing or diagnosed asthm a was found.47 Another study found that low bir th weight increased the risk of asthma at age 7. 48
Despite the inherent difficulty in associat ing two com m on disorders, there is som e evidence to the higher body m ass index BMI and greater r isk of developing asthm a49 I n addit ion there is som e evidence that weight loss improves lung function50 symptoms, morbidity and health status.51
94
There is good evidence to indicate that asthm a is a heritable disease. A num ber of studies have shown an increased prevalence of asthm a and phenotype associated with asthm a am ong the offspring subjects without asthm a. 52,53 Fam ily studies have convincingly shown that atopy (as m easured by allergen skin tests , total I gE, and/ or specific I gE, airway hyperresponsiveness, and asthma as diagnosed by questionnaire are at least partly under genetic control.53,54
AIMS: 1) To describe the prevalence of biological r isk factors for asthm a developm ent . 2) To describe the prevalence of r isk factors by age group, gender, socioeconom ic status and geographical area. 3) To describe the dist r ibut ion of asthm a r isk factors am ong asthm a pat ients. 4) To monitor changes over time in the risk factors indicators proposed.
DATA SOURCES: Bronchial hyperresponsivenes, sensit izat ion to specific allergens and total I gE m easurem ents at internat ional level are only available in a lim ited num ber of research studies, basically the ECRHS I and I I and in the I SAAC I I in som e centers. Birth weight is available from birth regist r ies but it is not always possible to have appropriate links with these regist r ies. I n general, this inform at ion is collected by self- reported quest ionnaires or interviews in general or specialized surveys. I nform at ion on birth weight is also collected in the I SAAC I I . BMI is available from several rout ine (general health interview/ exam inat ion surveys) and research data sources. Family history is in general collected by questionnaire in specialized studies.
DATA QUALI TY: There are several m ethods for the m easurem ent of bronchial responsiveness and sensit izat ion to specific allergens and the quality of data depends on the m ethod used, having a good standardized protocol and have a good t raining and quality cont rol of data collect ion. We recom m end the m ethods used by the ECRHS for adults and the I SAAC for children. I nform at ion on these methods can be obtained form the ISAAC II (for children) and the ECRHS I and II (for adults) web sites. Alternat ive m ethods of m easuring sensit izat ion to specific allergens exist and they are provided by several com panies. As we said before, bir th weight is available from birth regist r ies but it is not always possible to have appropriate links with these regist r ies. When this is not possible, bir th weight have to be obtained by quest ionnaire and it is subject to recall bias. The quality of the data on the BMI depends on the m ethods used to collect informat ion on weight and height . When this data is collected by direct m easurem ents rather by quest ions the reliability of the data is m uch bet ter. However, possible bias int roduced by measurem ent errors either from the inst rum ents or from the variability between and within fieldworkers. Data collect ion on fam ily history is also subject to recall bias.
METHODS TO BE USED FOR NEW DATA COLLECTI ON: I n future asthm a studies we recom m end to int roduce m easurem ents bronchial hyperresponsiveness, sensit izat ion to indoor/ outdoor allergens, weight and height, and questions on birth weight and family history of asthma.
DATA PRESENTATI ON: We suggest to present tables showing the prevalence of the r isk factors recom m ended for asthm a by age group, gender, social class and severity. Tables showing the dist r ibut ion of asthm a r isk factors am ong asthm a pat ients should also be presented. Cross-tabulat ions showing these dist r ibut ions by age group, gender, social class and severity are also recomm ended. These tables should be available at different geographical levels: nat ional, sub-national or local if data is available.
POTENTI AL USE: 1 ) To m onitor changes over t ime on asthm a biological r isk factors, 2 ) To evaluate the im pact of possible health policy intervent ions focused on the reduct ion specific asthm a r isk factors susceptible to intervention.
CONSI STENCY AT I NTERNATI ONAL LEVEL: There are clear m ethodological differences between the two largest internat ional studies on asthm a. The bronchial hyperresponsiveness test used are different and the sam pling framework is also different . The m ethods used to measure sensit izat ion are the sam e but alternat ive cost -effect ive m easurem ents could be considered. The quest ions to classify severity should be im proved to m eet the GI NA criter ia of classificat ion. The AI RE study included all population and was representative at national level but no measurements were used.
COMMENTS: I n the ECHI -2 project under the sect ion “3.1.1 Biological r isk factors” only BMI is included as a r isk factor and recom m ended by several projects. However, there is not a clear agreem ent on how to present this indicators and on which categories should be used. An agreem ent should be reached by EHHRM, EUDI P AND CHILD projects to finally define this indicators. In the ECHI-2 the prevalence of this estimate is included but the IMCA group feels that it is im portant to have it st rat ified by age group, gender, social class and severity. I n addit ion the dist r ibut ion of asthm a r isk factors am ong asthm a pat ients should also be presented. As we said before these tables should be available at different geographical levels.
AVAI LABI LI TY AND CONSI STENCY AT NATI ONAL LEVEL: With the except ion of bir th weight and BMI that are available form nat ional HI S/ HES surveys the rest of indicators of this group are only available from the ECRHS and som e I SAAC I I centers. I n the future these indicators should be collected from nationally representative HES or specific surveys.

95
PRIORITY: The following table describes the final individual score for each indicator and the pr iority level recom m ended by the I MCA group in case data for all indicators can not be collected. The indicators have been classified according to three levels of priority.
Indicators 3.1.1 Biological risk factors
Indicator Score
Rank Order IMCA Group
recommendation
?
Bronchial hyperresponsiveness (BHR) 2.7 (1-4) 3 2 2
?
Sensitization to outdoor allergens 3.1 (2-4) 2 1 1
?
Sensitization to Dermatophagoides
pteronyssimus 3.1 (2-4) 2 1 1
?
Sensitization to timothy grass 2.4 (1-4) 3 4 2
?
Sensitization to cat 2.5 (1-4) 3 3 2 ?
Sensitization to dog 2.1 (1-4) 3 6 3 ?
Sensitization to mold 2.3 (1-4) 3 5 2 ?
Total IgE 2.7 (1-4) 3 2 1 ?
Birth weight 2.1 (1-4) 2 6 3 ?
Body Mass Index (BMI) 2.7 (1-4) 3 2 3 ?
Family history 3.1 (2-4) 2 1 1

96
I NDICATOR DEFINITION
3.2 Health behaviors.
3.2.1 Substance use.
?
ADULTS
• Smoking exposure in general population:
6) Current smokers. 7) Past smokers. 8) ETS exposure at home. 9) ETS exposure at work. 10) Sm oking exposure during his/ her
mother pregnancy.
• Smoking exposure in ASTHMA patients:
8) Non smokers with ETS. 9) Non smokers without ETS. 10) Past smokers with ETS. 11) Past smokers without ETS. 12) Current smokers (<15 pack years). 13) Past smokers ( 15 pack years). 14) Sm oking exposure during his/ her
mother pregnancy.
?
CHILDREN ETS
1 ) Sm oking exposure during his/ her m other pregnancy.
2) ETS exposure during his/her first year of life.
3) Current ETS exposure at present.
• Proport ion of individuals in the general populat ion in each of the five categories described (1 to 5).
• Proport ion of ASTHMA pat ients in each category of tobacco exposure according to the seven categories described.
• Proport ion of children in each of the three categories.
3.2.2 Nutrition.
• Anti-oxidants exposure.
(Vitamin C, E, -corotene, flavonoid, selenium, vegetables, cereals, etc.).
• Proport ion of individuals which consum e fruits daily.
• Proport ion of individuals which consum e vegetables daily.
RATIONALE: Act ive sm oking m ay increase the r isk of developing occupat ional asthm a in workers exposed to som e occupat ional sensit izers.55 There is st ill lim ited evidence that act ive sm oking is a r isk factor for the developm ent of asthm a. However, act ive sm oking is associated with accelerated decline of lung funct ion in people with asthm a, greater asthm a severity and poor response to asthm a t reatm ent , support ing the concept that act ive sm oking m ay cont r ibute to asthm a severit y56
and poor response to asthm a t reatm ent57 even without cont r ibut ing to the developm ent of asthma.56 There is evidence that exposure to environm ental tobacco sm oke increases the r isk of lower respiratory track illness in utero,58 in infancy59 and in childhood.60
I n a recent review, the role of dietary factors im plicated in the cause and prevent ion of asthm a have been sum m arized by Romieu at al.61 Som e studies in adults and in children have invest igated the associat ion between ant ioxidant intake and airway hypperreact ivity or asthm a like symptoms. I n these studies, diet was assessed through adm inist rat ion of dietary quest ionnaires (24 hours recall) or food frequency quest ionnaires including different num bers of foods or by m easuring serum levels of ant ioxidant vitam ins. Based on this review, the authors conclude that vitam in C supplem entat ion suggest a short term protect ive effect on airway responsiveness and pulm onary funct ion. Longitudinal data support the hypothesis that fresh fruit consum pt ion has a beneficial im pact on the lung. Am ong children, consum pt ion of fresh fruit high in vitam in C, has been related to a lower prevalence of asthma sym ptom s and higher lung funct ion.62 However, it has to be proved whether consistent use of vitam in C would have a protect ive effect on the evolut ion chronic asthm a. and it is difficult to determ ine the am ounts of ant ioxidant vitam ins that people should consume.
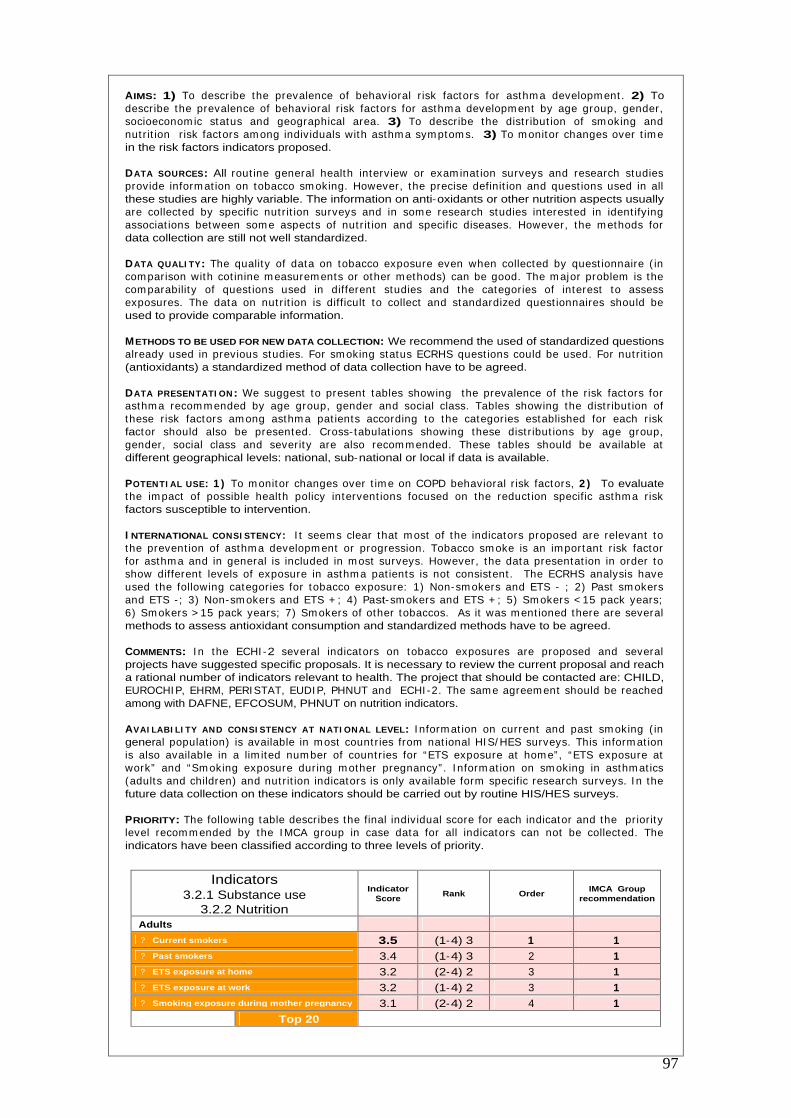
97
AIMS: 1) To describe the prevalence of behavioral r isk factors for asthm a developm ent . 2) To describe the prevalence of behavioral r isk factors for asthm a developm ent by age group, gender, socioeconom ic status and geographical area. 3) To describe the dist r ibut ion of sm oking and nut r it ion r isk factors am ong individuals with asthm a sym ptom s. 3) To m onitor changes over t im e in the risk factors indicators proposed.
DATA SOURCES: All rout ine general health interview or exam inat ion surveys and research studies provide inform at ion on tobacco sm oking. However, the precise definit ion and quest ions used in all these studies are highly variable. The information on anti-oxidants or other nutrition aspects usually are collected by specific nut r it ion surveys and in som e research studies interested in ident ifying associat ions between som e aspects of nut r it ion and specific diseases. However, the m ethods for data collection are still not well standardized.
DATA QUALI TY: The quality of data on tobacco exposure even when collected by quest ionnaire ( in com parison with cot inine m easurem ents or other m ethods) can be good. The m ajor problem is the com parability of quest ions used in different studies and the categories of interest to assess exposures. The data on nut r it ion is difficult to collect and standardized quest ionnaires should be used to provide comparable information.
METHODS TO BE USED FOR NEW DATA COLLECTION: We recommend the used of standardized questions already used in previous studies. For sm oking status ECRHS quest ions could be used. For nut r it ion (antioxidants) a standardized method of data collection have to be agreed.
DATA PRESENTATI ON: We suggest to present tables showing the prevalence of the r isk factors for asthm a recom m ended by age group, gender and social class. Tables showing the dist r ibut ion of these r isk factors am ong asthm a pat ients according to the categories established for each r isk factor should also be presented. Cross- tabulat ions showing these dist r ibut ions by age group, gender, social class and severit y are also recom m ended. These tables should be available at different geographical levels: national, sub-national or local if data is available.
POTENTI AL USE: 1 ) To m onitor changes over t im e on COPD behavioral r isk factors, 2 ) To evaluate the im pact of possible health policy intervent ions focused on the reduct ion specific asthm a r isk factors susceptible to intervention.
I NTERNATIONAL CONSI STENCY: I t seem s clear that m ost of the indicators proposed are relevant to the prevent ion of asthm a developm ent or progression. Tobacco sm oke is an important r isk factor for asthm a and in general is included in m ost surveys. However, the data presentat ion in order to show different levels of exposure in asthm a pat ients is not consistent . The ECRHS analysis have used the following categories for tobacco exposure: 1) Non-sm okers and ETS - ; 2) Past sm okers and ETS - ; 3) Non-sm okers and ETS + ; 4) Past-sm okers and ETS + ; 5) Sm okers < 15 pack years; 6) Sm okers > 15 pack years; 7) Sm okers of other tobaccos. As it was m ent ioned there are several methods to assess antioxidant consumption and standardized methods have to be agreed.
COMMENTS: I n the ECHI -2 several indicators on tobacco exposures are proposed and several projects have suggested specific proposals. It is necessary to review the current proposal and reach a rational number of indicators relevant to health. The project that should be contacted are: CHILD, EUROCHI P, EHRM, PERI STAT, EUDI P, PHNUT and ECHI -2. The sam e agreem ent should be reached among with DAFNE, EFCOSUM, PHNUT on nutrition indicators.
AVAI LABI LI TY AND CONSI STENCY AT NATI ONAL LEVEL: I nform at ion on current and past sm oking ( in general populat ion) is available in m ost count r ies from nat ional HI S/ HES surveys. This inform at ion is also available in a lim ited num ber of count r ies for “ETS exposure at hom e” , “ETS exposure at work” and “Sm oking exposure during m other pregnancy” . I nform at ion on sm oking in asthm at ics (adults and children) and nut r it ion indicators is only available form specific research surveys. I n the future data collection on these indicators should be carried out by routine HIS/HES surveys.
PRIORITY: The following table describes the final individual score for each indicator and the pr iority level recom m ended by the I MCA group in case data for all indicators can not be collected. The indicators have been classified according to three levels of priority.
Indicators 3.2.1 Substance use
3.2.2 Nutrition
Indicator Score
Rank Order IMCA Group
recommendation
Adults
?
Current smokers 3.5 (1-4) 3 1 1 ?
Past smokers 3.4 (1-4) 3 2 1 ?
ETS exposure at home 3.2 (2-4) 2 3 1 ?
ETS exposure at work 3.2 (1-4) 2 3 1 ?
Smoking exposure during mother pregnancy
3.1 (2-4) 2 4 1
Top 20

98
Asthma patients
?
Non smokers with ETS exposure 2.7 (1-4) 3 5 2
?
Non smokers without ETS exposure 2.5 (1-4) 3 7 3
?
Past smokers with ETS exposure 2.6 (1-4) 3 6 3
?
Past smokers without ETS exposure 2.3 (1-4) 3 8 3
?
Current smokers (<15 pack years) 3.1 (1-4) 3 4 1
?
Past smokers (=15 pack years) 2.6 (1-4) 3 6 3
?
Smoking exposure during mother pregnancy 2.7 (1-4) 3 5 3
Children ETS exposure
?
Smoking exposure during mother pregnancy 3.2 (2-4) 2 3 1
?
ETS exposure during his/her first year of life 3.1 (2-4) 2 4 1 ?
Current ETS exposure at present 3.4 (2-4) 2 2 1 Nutrition
?
Anti-oxidants exposure 2.2 (1-4) 3 9 2
Top 20

99
I NDICATOR DEFINITION
3.3 Living and Working conditions.
3.3.1 Physical environment.
• Air pollution exposure to:
NO2, SO2, O3, PM10, PM2.5
• Annual average of concent rat ions in m icrograms/ m 3 for a specific geographical area.
• Population-weighted exposure to selected air pollutants (as defined by the ECOEHI S project).
3.3.2 Working conditions.
• Occupational asthma risk.
• Occupational exposure in asthmatics
• Proport ion of individuals (general populat ion) which are exposed to vapors, gasses or fumes at work.
• Proport ion of individuals with asthm a which are exposed to vapors, gasses or fum es at work.
RATIONALE: The role of air pollut ion on asthm a have been reviewed in the latest version of GI NA guidelines. Two m ain types of outdoor pollut ion have to be considered: indust r ial sm og (sulfur dioxide part iculate com plex) and photochem ical sm og (ozone and nit rogen oxides) , and they can coexists in a given area. Levels of air pollutants are affected by weather condit ions and local geographic features. Several studies have im plicated various pollutants as aggravat ing asthm a,63
m ainly in experim ents with cham ber exposure. However, because of the great num ber of variable, epidem iological studies t rying to link the r ising t rend of asthm a with am bient pollut ion have been inconclusive. Exposure to t raffic, part icularly to diesel exhaust , m ay exacerbate preexist ing allergic condit ions but does not necessarily induce the developm ent of new cases of asthm a and atopy.64
Sim ilar conclusions reached the Com m it tee on the Medical Effects of Air Pollutants (COMEAP) established by the Departm ent of Health in UK which concluded that m ost of the available evidence does not support a causat ive role of air pollut ion in the developm ent of asthm a. Also concluded that m ost asthm at ic pat ients should be unaffected by exposure to air pollut ion. Only a sm all proport ion of pat ients m ay experience clinically significant effects which m ay require an increase in m edicat ion or at tent ion by a doctor.65 However, since environm ental air pollut ion have to be m onitored in order to cont rol changes in the environm ent and this data m ay be useful to provide new inform at ion on the relat ionship between air pollut ion and asthm a sym ptoms, we recom m end to include these indicators also suggested by the ECOEHIS project.
With regard to occupat ional exposures, an extensive list of occupat ional sensit izing agents has been described. Occupat ional sensit izers are usually classified according to m olecular weight . The m echanism of act ion of low m olecular weight sensit izers rem ains largely unkown.66 High m olecular weight sensit izers probably sensit ize subjects and cause asthm a exacerbat ions by the sam e m echanisms as allergens. Acute exposure to irr itant gases in the workplace or during accidents may induce a long lasting airway hyperresponsiveness.
AIMS: 1 ) To describe the prevalence of air pollut ion r isk factors. 2) To describe the proport ion of asthm at ics exposed to occupat ional exposures. 3) To m onitor changes over t im e in the r isk factors indicators proposed.
DATA SOURCES: The inform at ion on environm ental health indicators is lim ited and m ainly concent rated in urban areas. I n general it is difficult to have inform at ion for large geographical areas. More detailed inform at ion will be obtained from the APHEI S and SCALE projects that have reviewed this inform at ion. Some specific research studies have collected data at ecological and individual level.
DATA QUALI TY: The data quality depends on the inst rum ents used for the m easurem ents, its com parability, the geographical area covered and the ability to link environm ental indicators to health issues.
METHODS TO BE USED FOR NEW DATA COLLECTI ON: I n m any count r ies inform at ion on the air pollut ion indicators is already collected in som e specific areas but in m any cases difficult or im possible to link data on exposure and health. The challenge for the future is to collect air pollut ion data rout inely in selected geographical areas over t im e and for this specific areas to evaluate the health effects over time.
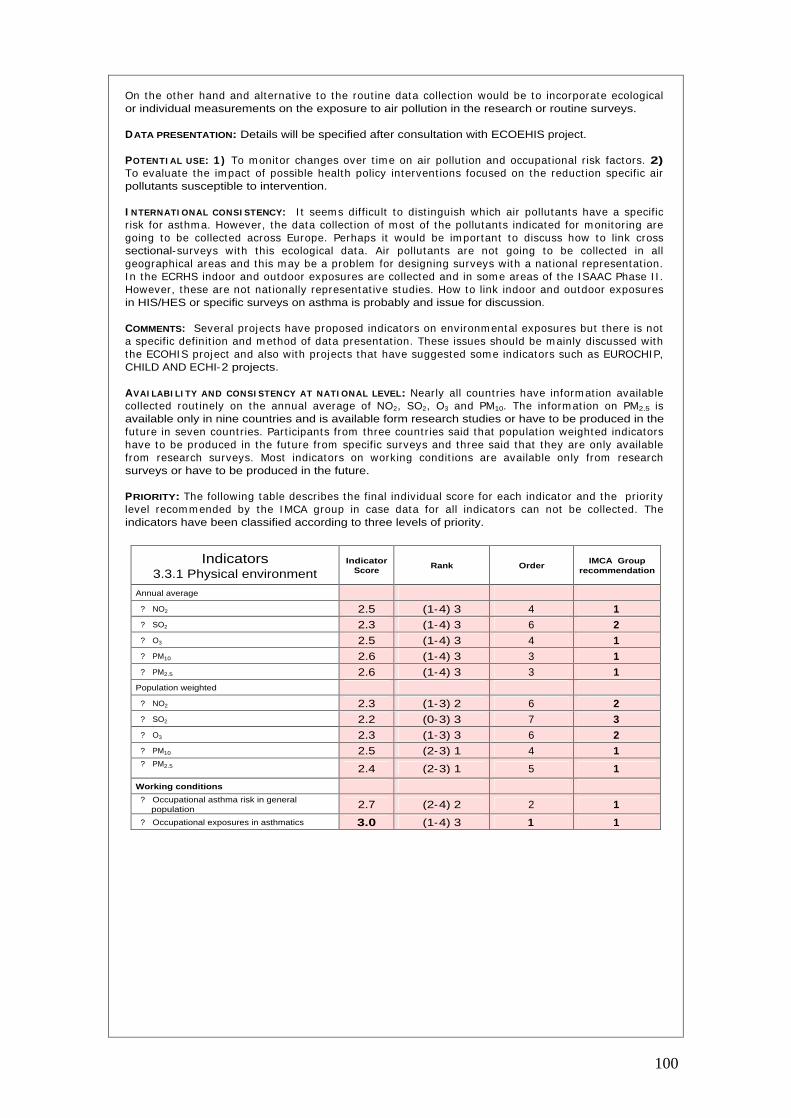
100
On the other hand and alternat ive to the rout ine data collect ion would be to incorporate ecological or individual measurements on the exposure to air pollution in the research or routine surveys.
DATA PRESENTATION: Details will be specified after consultation with ECOEHIS project.
POTENTI AL USE: 1 ) To m onitor changes over t ime on air pollut ion and occupat ional r isk factors. 2) To evaluate the im pact of possible health policy intervent ions focused on the reduct ion specific air pollutants susceptible to intervention.
I NTERNATI ONAL CONSI STENCY: I t seem s difficult to dist inguish which air pollutants have a specific r isk for asthm a. However, the data collect ion of m ost of the pollutants indicated for m onitor ing are going to be collected across Europe. Perhaps it would be im portant to discuss how to link cross sectional-surveys with this ecological data. Air pollutants are not going to be collected in all geographical areas and this m ay be a problem for designing surveys with a nat ional representat ion. I n the ECRHS indoor and outdoor exposures are collected and in som e areas of the I SAAC Phase I I . However, these are not nat ionally representat ive studies. How to link indoor and outdoor exposures in HIS/HES or specific surveys on asthma is probably and issue for discussion.
COMMENTS: Several projects have proposed indicators on environm ental exposures but there is not a specific definit ion and m ethod of data presentat ion. These issues should be m ainly discussed with the ECOHI S project and also with projects that have suggested som e indicators such as EUROCHIP, CHILD AND ECHI-2 projects.
AVAI LABI LI TY AND CONSI STENCY AT NATI ONAL LEVEL: Nearly all count r ies have inform at ion available collected rout inely on the annual average of NO2, SO2, O3 and PM10. The inform at ion on PM2.5 is available only in nine countries and is available form research studies or have to be produced in the future in seven count r ies. Part icipants from three count r ies said that populat ion weighted indicators have to be produced in the future from specific surveys and three said that they are only available from research surveys. Most indicators on working condit ions are available only from research surveys or have to be produced in the future.
PRIORITY: The following table describes the final individual score for each indicator and the pr iority level recom m ended by the I MCA group in case data for all indicators can not be collected. The indicators have been classified according to three levels of priority.
Indicators 3.3.1 Physical environment
Indicator Score
Rank Order IMCA Group
recommendation
Annual average
?
NO2 2.5 (1-4) 3 4 1 ?
SO2 2.3 (1-4) 3 6 2 ?
O3 2.5 (1-4) 3 4 1 ?
PM10 2.6 (1-4) 3 3 1 ?
PM2.5 2.6 (1-4) 3 3 1 Population weighted
?
NO2 2.3 (1-3) 2 6 2 ?
SO2 2.2 (0-3) 3 7 3 ?
O3 2.3 (1-3) 3 6 2 ?
PM10 2.5 (2-3) 1 4 1 ?
PM2.5 2.4 (2-3) 1 5 1
Working conditions
?
Occupational asthma risk in general population 2.7 (2-4) 2 2 1
?
Occupational exposures in asthmatics 3.0 (1-4) 3 1 1

101
Class 4
Health Systems
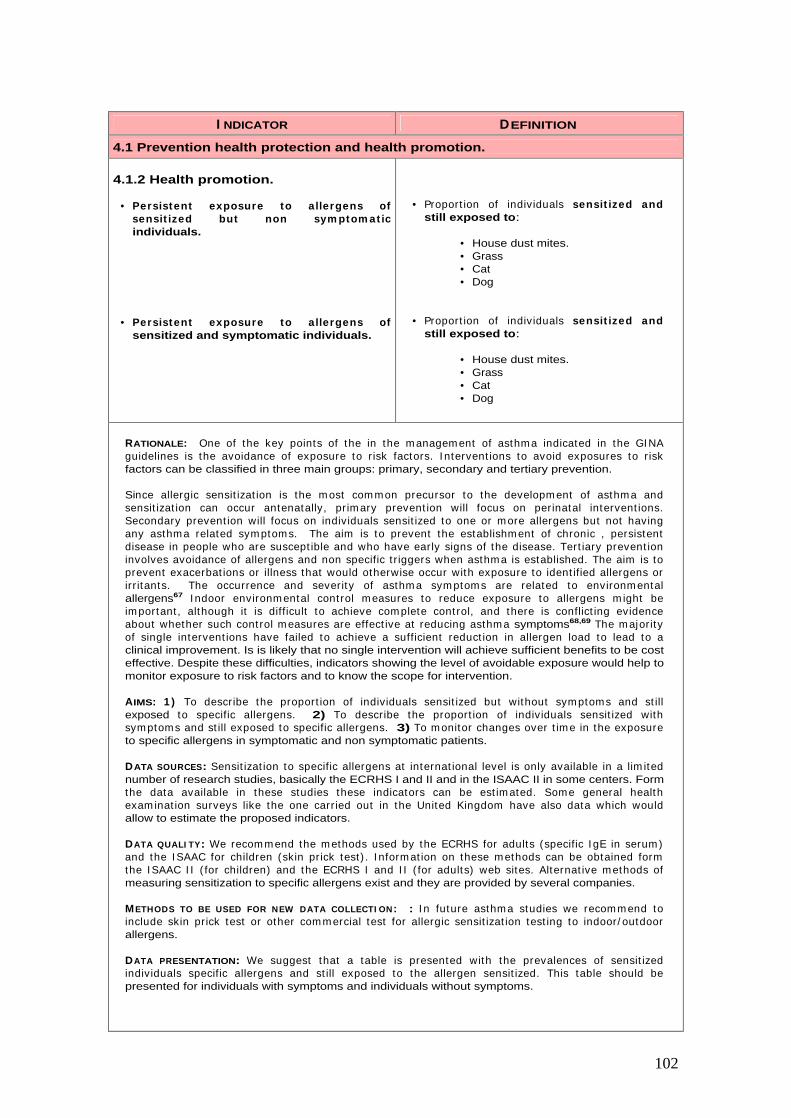
102
I NDICATOR DEFINITION
4.1 Prevention health protection and health promotion.
4.1.2 Health promotion.
• Persistent exposure to allergens of sensit ized but non sym ptom at ic individuals.
• Persistent exposure to allergens of sensitized and symptomatic individuals.
• Proport ion of individuals sensit ized and still exposed to:
• House dust mites. • Grass • Cat • Dog
• Proport ion of individuals sensit ized and still exposed to:
• House dust mites. • Grass • Cat • Dog
RATIONALE: One of the key points of the in the m anagem ent of asthm a indicated in the GI NA guidelines is the avoidance of exposure to r isk factors. I ntervent ions to avoid exposures to r isk factors can be classified in three main groups: primary, secondary and tertiary prevention.
Since allergic sensit izat ion is the m ost com mon precursor to the developm ent of asthm a and sensit izat ion can occur antenatally, pr im ary prevent ion will focus on perinatal intervent ions. Secondary prevent ion will focus on individuals sensit ized to one or m ore allergens but not having any asthm a related sym ptom s. The aim is to prevent the establishm ent of chronic , persistent disease in people who are suscept ible and who have early signs of the disease. Tert iary prevent ion involves avoidance of allergens and non specific t r iggers when asthm a is established. The aim is to prevent exacerbat ions or illness that would otherwise occur with exposure to ident ified allergens or irr itants. The occurrence and severity of asthm a sym ptom s are related to environm ental allergens67 I ndoor environm ental cont rol m easures to reduce exposure to allergens m ight be im portant , although it is difficult to achieve com plete cont rol, and there is conflict ing evidence about whether such cont rol m easures are effect ive at reducing asthm a symptoms68,69 The m ajority of single intervent ions have failed to achieve a sufficient reduct ion in allergen load to lead to a clinical improvement. Is is likely that no single intervention will achieve sufficient benefits to be cost effective. Despite these difficulties, indicators showing the level of avoidable exposure would help to monitor exposure to risk factors and to know the scope for intervention.
AIMS: 1 ) To describe the proport ion of individuals sensit ized but without sym ptoms and st ill exposed to specific allergens. 2) To describe the proport ion of individuals sensit ized with sym ptoms and st ill exposed to specific allergens. 3) To m onitor changes over t im e in the exposure to specific allergens in symptomatic and non symptomatic patients.
DATA SOURCES: Sensit izat ion to specific allergens at internat ional level is only available in a lim ited number of research studies, basically the ECRHS I and II and in the ISAAC II in some centers. Form the data available in these studies these indicators can be est im ated. Some general health exam inat ion surveys like the one carr ied out in the United Kingdom have also data which would allow to estimate the proposed indicators.
DATA QUALI TY: We recom m end the m ethods used by the ECRHS for adults (specific I gE in serum ) and the I SAAC for children (skin prick test ) . I nform at ion on these m ethods can be obtained form the I SAAC I I ( for children) and the ECRHS I and I I ( for adults) web sites. Alternat ive m ethods of measuring sensitization to specific allergens exist and they are provided by several companies.
METHODS TO BE USED FOR NEW DATA COLLECTI ON: : I n future asthm a studies we recom m end to include skin prick test or other com m ercial test for allergic sensit izat ion test ing to indoor/ outdoor allergens.
DATA PRESENTATION: We suggest that a table is presented with the prevalences of sensit ized individuals specific allergens and st ill exposed to the allergen sensit ized. This table should be presented for individuals with symptoms and individuals without symptoms.
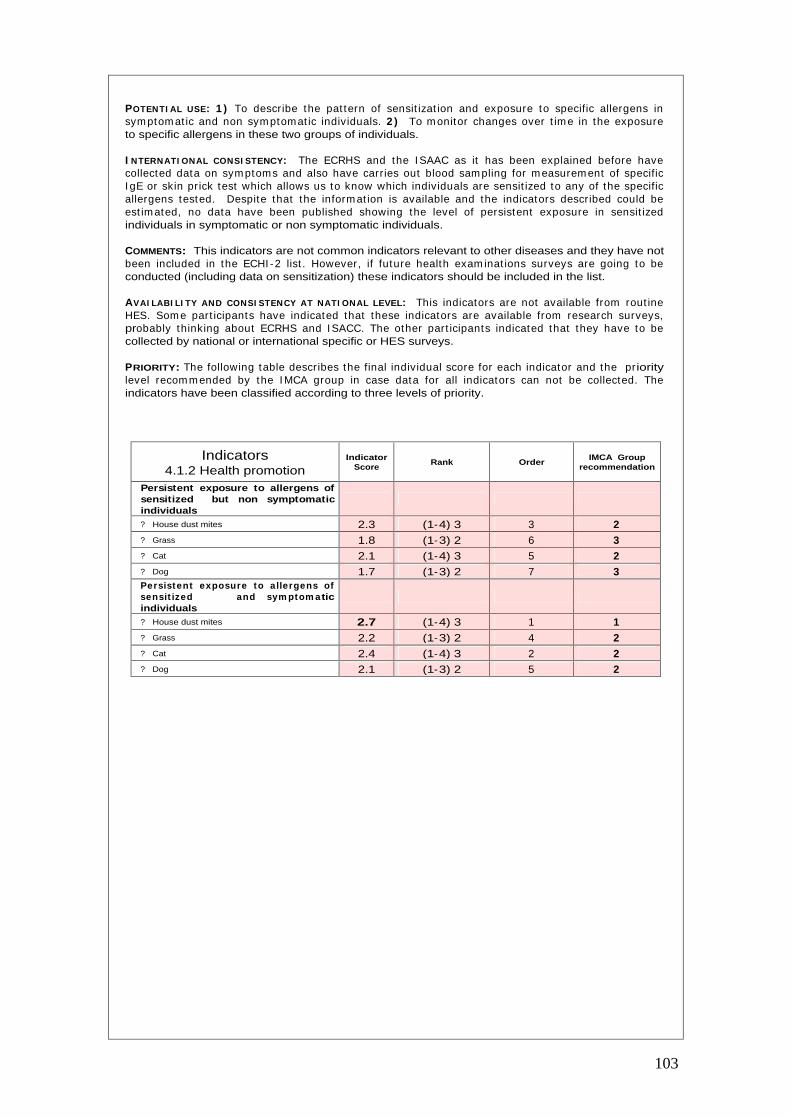
103
POTENTI AL USE: 1 ) To describe the pat tern of sensit izat ion and exposure to specific allergens in sym ptom at ic and non sym ptomat ic individuals. 2 ) To m onitor changes over t im e in the exposure to specific allergens in these two groups of individuals.
I NTERNATI ONAL CONSI STENCY: The ECRHS and the I SAAC as it has been explained before have collected data on sym ptoms and also have carries out blood sam pling for m easurem ent of specific I gE or skin prick test which allows us to know which individuals are sensit ized to any of the specific allergens tested. Despite that the inform at ion is available and the indicators described could be est im ated, no data have been published showing the level of persistent exposure in sensit ized individuals in symptomatic or non symptomatic individuals.
COMMENTS: This indicators are not common indicators relevant to other diseases and they have not been included in the ECHI -2 list . However, if future health exam inat ions surveys are going to be conducted (including data on sensitization) these indicators should be included in the list.
AVAI LABI LI TY AND CONSI STENCY AT NATI ONAL LEVEL: This indicators are not available from rout ine HES. Som e part icipants have indicated that these indicators are available from research surveys, probably thinking about ECRHS and I SACC. The other part icipants indicated that they have to be collected by national or international specific or HES surveys.
PRIORITY: The following table describes the final individual score for each indicator and the priority level recom m ended by the I MCA group in case data for all indicators can not be collected. The indicators have been classified according to three levels of priority.
Indicators 4.1.2 Health promotion
Indicator Score
Rank Order IMCA Group
recommendation
Persistent exposure to allergens of sensitized but non symptomatic individuals
?
House dust mites 2.3 (1-4) 3 3 2 ?
Grass 1.8 (1-3) 2 6 3 ?
Cat 2.1 (1-4) 3 5 2 ?
Dog 1.7 (1-3) 2 7 3 Persistent exposure to allergens of sensit ized and sym ptom atic individuals
?
House dust mites 2.7 (1-4) 3 1 1 ?
Grass 2.2 (1-3) 2 4 2 ?
Cat 2.4 (1-4) 3 2 2 ?
Dog 2.1 (1-3) 2 5 2

104
I NDICATOR DEFINITION
4.1 Prevention health protection and health promotion.
4.1.2 Health promotion.
• Invitation to stop smoking.
• Asthma patients invited to stop smoking.
• Asthm a pat ients invited to follow a stop smoking program.
• Asthm a pat ients that have m anaged stop smoking.
• Proport ion of sm oking individuals of the general populat ion
which have been offered
a stop smoking program during the last year.
• Proport ion of sm oking individuals with asthm a which have been offered a stop smoking program during the last year.
• Proport ion of sm oking individuals with asthm a which have been offered and followed a stop sm oking program during the last year.
• Proport ion of sm oking individuals with asthm a which have been offered and followed a stop sm oking program during the last year and managed to stop smoking.
RATIONALE: The advice to stop sm oking is im portant for the general populat ion since sm oking is a r isk factor for several diseases. This is way the fist indicator “ invitat ion to stop sm oking have been int roduced” . The GI NA guidelines has included avoidance of tobacco exposure as part of the management plan.1 However, the Brit ish guideline on the m anagem ent of asthm a is m uch more explicit and suggest that parents who sm oke should be advised about the dangers for them selves and their children and offered appropriate support to stop smoking.70 The associat ion between passive sm oking and respiratory health has been extensively reviewed.71 There is a direct causal relat ionship between parental sm oking and lower respiratory illness in children up to three years of age, infants m others sm oke are four t im es m ore likely to develop wheezing illness in the first year of life.72 The inform at ion on to what extent stop sm oking could influence asthm a severity is very lim ited. However one observat ional study have shown that giving up sm oking in adults was associated with im proved severity of asthm a scores.73 The effects are clear and based on this evidence, clinicians can easily give advice to pat ients on the benefits of stop sm oking. However, in many occasions, the accessibility to specific programs is limited and unknown by patients.
AIMS: 1 ) To describe act ions carr ied out from the health care services to prevent sm oking exposure, 2) To describe the efficacy of these intervent ions, 3) To m onitor changes over t im e in the indicators proposed.
DATA SOURCES: As we have m ent ioned before, m ost rout ine data provide inform at ion on sm oking, but there is no inform at ion collected on intervent ions to prevent tobacco exposure. Som e studies aim ing to evaluate the efficacy of prevent ion program s provide som e data but not at com m unity level or informing about the activities carried out in health services.
DATA QUALI TY: Since this inform at ion it is not collected in rout ine surveys, we cannot provide inform at ion on the data quality. Som e bias m ay be int roduced since there is not a clear definit ion of a stop smoking programs.
METHODS TO BE USED FOR NEW DATA COLLECTI ON: I n m ost epidem iological studies on asthm a there are no quest ions to assess the indicators proposed in this sect ion. I n future studies, in addit ion to r isk factors and prevalence, appropriate quest ions to assess the prevalence of individuals that follow a stop sm oking program and m anage to succeed should be included in quest ionnaires of future studies.
DATA PRESENTATI ON: Data on these indicators should be presented st rat ified by age group, sex, social class, severity and geographical area.
I NTERNATIONAL CONSISTENCY: Although som e cross-sect ional studies provide inform at ion on current and past sm oking status in relat ion to sm oking, the accessibility to stops sm oking program , level of follow-up and effect iveness is not well m onitored. This indicators have not been consistent ly collected in populat ion based surveys and internat ional studies. I ts inclusion in future studies could facilitate the monitoring of prevention strategies.
COMMENTS: I n the ECHI project , no indicators have been proposed to m onitor stop sm oking interventions. They should be included in the final list since they are important for several diseases.
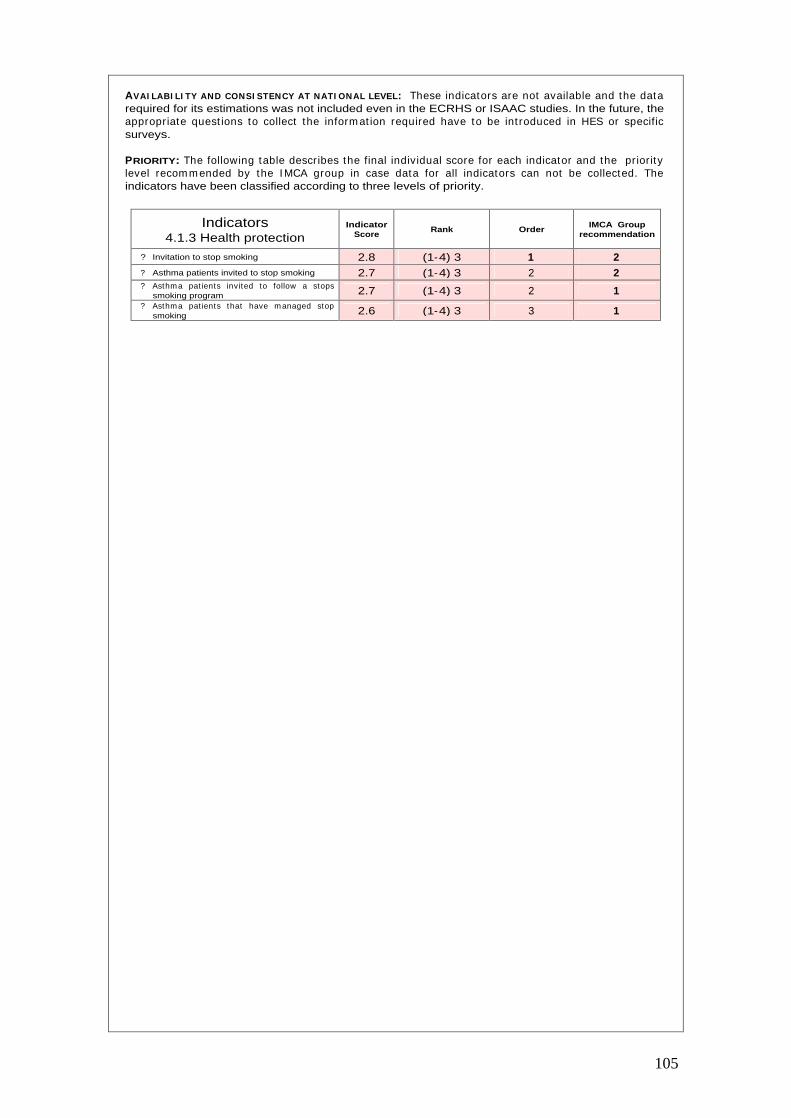
105
AVAI LABI LI TY AND CONSI STENCY AT NATI ONAL LEVEL: These indicators are not available and the data required for its estimations was not included even in the ECRHS or ISAAC studies. In the future, the appropriate quest ions to collect the inform at ion required have to be int roduced in HES or specific surveys.
PRIORITY: The following table describes the final individual score for each indicator and the pr iority level recom m ended by the I MCA group in case data for all indicators can not be collected. The indicators have been classified according to three levels of priority.
Indicators 4.1.3 Health protection
Indicator Score
Rank Order IMCA Group
recommendation
?
Invitation to stop smoking 2.8 (1-4) 3 1 2
?
Asthma patients invited to stop smoking 2.7 (1-4) 3 2 2 ?
Asthm a pat ients invited to follow a stops smoking program 2.7 (1-4) 3 2 1
?
Asthm a pat ients that have m anaged stop smoking 2.6 (1-4) 3 3 1
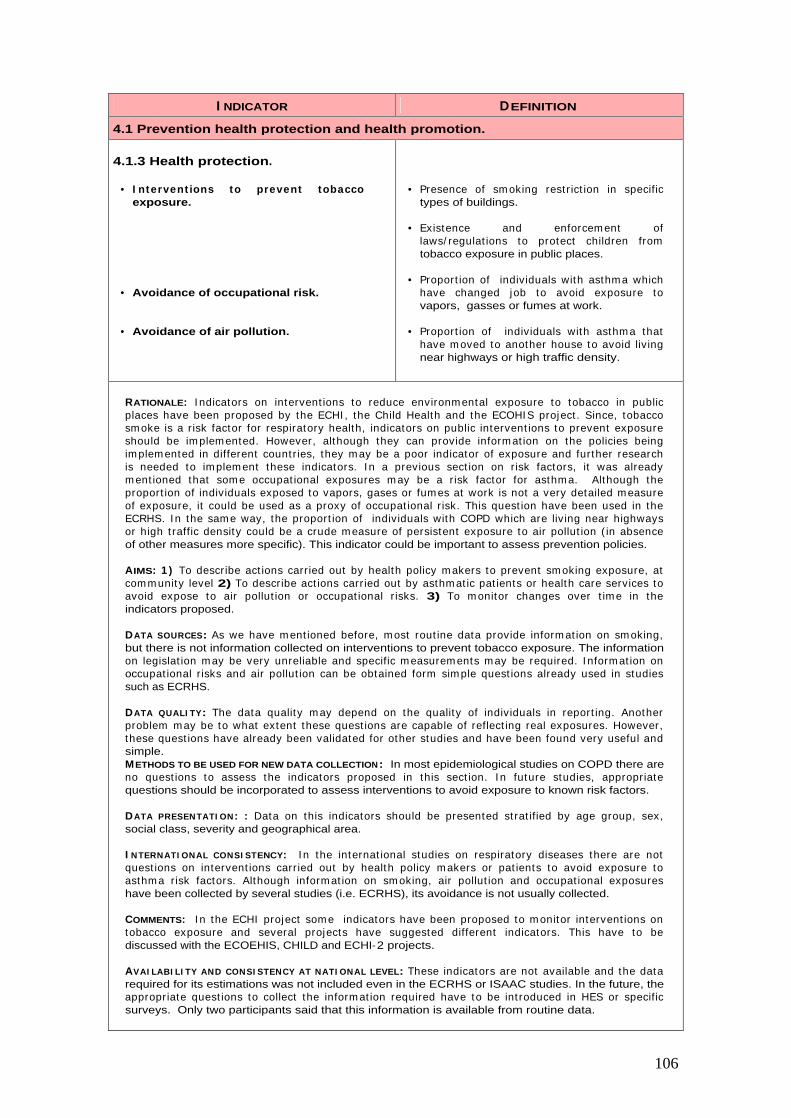
106
I NDICATOR DEFINITION
4.1 Prevention health protection and health promotion.
4.1.3 Health protection.
• I ntervent ions to prevent tobacco exposure.
• Avoidance of occupational risk.
• Avoidance of air pollution.
• Presence of sm oking rest r ict ion in specific types of buildings.
• Existence and enforcem ent of laws/ regulat ions to protect children from tobacco exposure in public places.
• Proport ion of individuals with asthm a which have changed job to avoid exposure to vapors, gasses or fumes at work.
• Proport ion of individuals with asthm a that have m oved to another house to avoid liv ing near highways or high traffic density.
RATIONALE: I ndicators on intervent ions to reduce environm ental exposure to tobacco in public places have been proposed by the ECHI , the Child Health and the ECOHI S project . Since, tobacco sm oke is a r isk factor for respiratory health, indicators on public intervent ions to prevent exposure should be im plem ented. However, although they can provide inform at ion on the policies being im plem ented in different count r ies, they m ay be a poor indicator of exposure and further research is needed to im plem ent these indicators. I n a previous sect ion on r isk factors, it was already m ent ioned that som e occupat ional exposures m ay be a r isk factor for asthm a. Although the proport ion of individuals exposed to vapors, gases or fum es at work is not a very detailed m easure of exposure, it could be used as a proxy of occupat ional r isk. This quest ion have been used in the ECRHS. I n the sam e way, the proport ion of individuals with COPD which are liv ing near highways or high t raffic density could be a crude m easure of persistent exposure to air pollut ion ( in absence of other measures more specific). This indicator could be important to assess prevention policies.
AIMS: 1 ) To describe act ions carr ied out by health policy m akers to prevent sm oking exposure, at com m unity level 2) To describe act ions carr ied out by asthm at ic pat ients or health care services to avoid expose to air pollut ion or occupat ional r isks. 3) To m onitor changes over t im e in the indicators proposed.
DATA SOURCES: As we have m ent ioned before, m ost rout ine data provide inform at ion on sm oking, but there is not information collected on interventions to prevent tobacco exposure. The information on legislat ion m ay be very unreliable and specific m easurem ents m ay be required. I nform at ion on occupat ional r isks and air pollut ion can be obtained form sim ple quest ions already used in studies such as ECRHS.
DATA QUALI TY: The data quality m ay depend on the quality of individuals in report ing. Another problem m ay be to what extent these quest ions are capable of reflect ing real exposures. However, these quest ions have already been validated for other studies and have been found very useful and simple. METHODS TO BE USED FOR NEW DATA COLLECTION: In most epidemiological studies on COPD there are no quest ions to assess the indicators proposed in this sect ion. I n future studies, appropriate questions should be incorporated to assess interventions to avoid exposure to known risk factors.
DATA PRESENTATI ON: : Data on this indicators should be presented st rat ified by age group, sex, social class, severity and geographical area.
I NTERNATI ONAL CONSI STENCY: I n the internat ional studies on respiratory diseases there are not quest ions on intervent ions carr ied out by health policy m akers or pat ients to avoid exposure to asthm a r isk factors. Although inform at ion on sm oking, air pollut ion and occupat ional exposures have been collected by several studies (i.e. ECRHS), its avoidance is not usually collected.
COMMENTS: I n the ECHI project som e indicators have been proposed to m onitor intervent ions on tobacco exposure and several projects have suggested different indicators. This have to be discussed with the ECOEHIS, CHILD and ECHI-2 projects.
AVAI LABI LI TY AND CONSI STENCY AT NATI ONAL LEVEL: These indicators are not available and the data required for its estimations was not included even in the ECRHS or ISAAC studies. In the future, the appropriate quest ions to collect the inform at ion required have to be int roduced in HES or specific surveys. Only two participants said that this information is available from routine data.

107
PRIORITY: The following table describes the final individual score for each indicator and the pr ior ity level recom m ended by the I MCA group in case data for all indicators can not be collected. The indicators have been classified according to three levels of priority.
Indicators 4.1.3 Health protection
Indicator Score
Rank Order IMCA Group
recommendation
?
Interventions to prevent tobacco exposure 2.9 (1-4) 3 1 1
?
Avoidance of occupational risk 2.9 (2-4) 2 1 2
?
Avoidance of air pollution 2.6 (1-4) 3 2 2
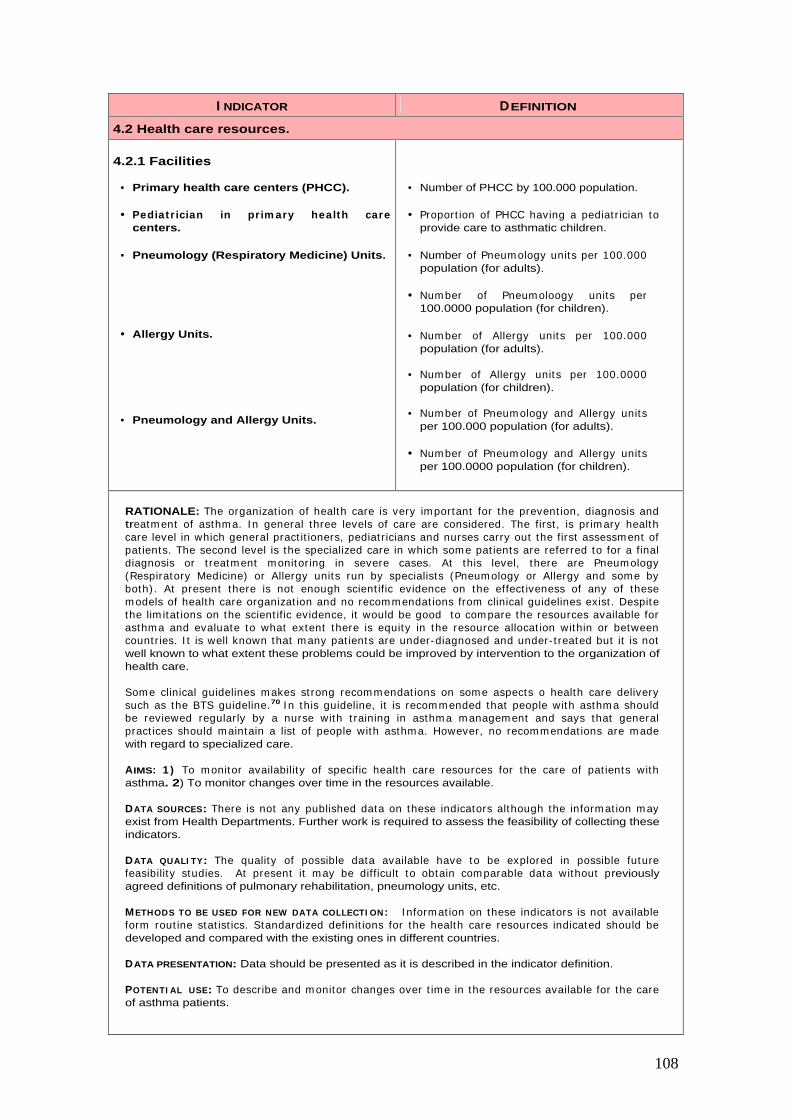
108
I NDICATOR DEFINITION
4.2 Health care resources.
4.2.1 Facilities
• Primary health care centers (PHCC).
• Pediat r ician in pr im ary health care centers.
• Pneumology (Respiratory Medicine) Units.
• Allergy Units.
• Pneumology and Allergy Units.
• Number of PHCC by 100.000 population.
• Proport ion of PHCC having a pediat r ician to provide care to asthmatic children.
• Number of Pneum ology units per 100.000 population (for adults).
• Num ber of Pneum oloogy units per 100.0000 population (for children).
• Num ber of Allergy units per 100.000 population (for adults).
• Num ber of Allergy units per 100.0000 population (for children).
• Num ber of Pneum ology and Allergy units per 100.000 population (for adults).
• Num ber of Pneum ology and Allergy units per 100.0000 population (for children).
RATIONALE: The organizat ion of health care is very im portant for the prevent ion, diagnosis and treatm ent of asthm a. I n general three levels of care are considered. The first , is pr im ary health care level in which general pract it ioners, pediat r icians and nurses carry out the first assessm ent of pat ients. The second level is the specialized care in which som e pat ients are referred to for a final diagnosis or t reatm ent m onitor ing in severe cases. At this level, there are Pneum ology (Respiratory Medicine) or Allergy units run by specialists (Pneum ology or Allergy and som e by both) . At present there is not enough scient ific evidence on the effect iveness of any of these m odels of health care organizat ion and no recom m endat ions from clinical guidelines exist . Despite the lim itat ions on the scient ific evidence, it would be good to com pare the resources available for asthm a and evaluate to what extent there is equity in the resource allocat ion within or between count r ies. I t is well known that m any pat ients are under-diagnosed and under- t reated but it is not well known to what extent these problems could be improved by intervention to the organization of health care.
Som e clinical guidelines m akes st rong recom m endat ions on som e aspects o health care delivery such as the BTS guideline.70 I n this guideline, it is recom m ended that people with asthm a should be reviewed regularly by a nurse with t raining in asthm a m anagem ent and says that general pract ices should m aintain a list of people with asthm a. However, no recom m endat ions are m ade with regard to specialized care.
AIMS: 1 ) To monitor availability of specific health care resources for the care of pat ients with asthma. 2) To monitor changes over time in the resources available.
DATA SOURCES: There is not any published data on these indicators although the inform at ion m ay exist from Health Departments. Further work is required to assess the feasibility of collecting these indicators.
DATA QUALI TY: The quality of possible data available have to be explored in possible future feasibility studies. At present it m ay be difficult to obtain com parable data without previously agreed definitions of pulmonary rehabilitation, pneumology units, etc.
METHODS TO BE USED FOR NEW DATA COLLECTI ON: I nform at ion on these indicators is not available form rout ine stat ist ics. Standardized definit ions for the health care resources indicated should be developed and compared with the existing ones in different countries.
DATA PRESENTATION: Data should be presented as it is described in the indicator definition.
POTENTI AL USE: To describe and m onitor changes over t im e in the resources available for the care of asthma patients.
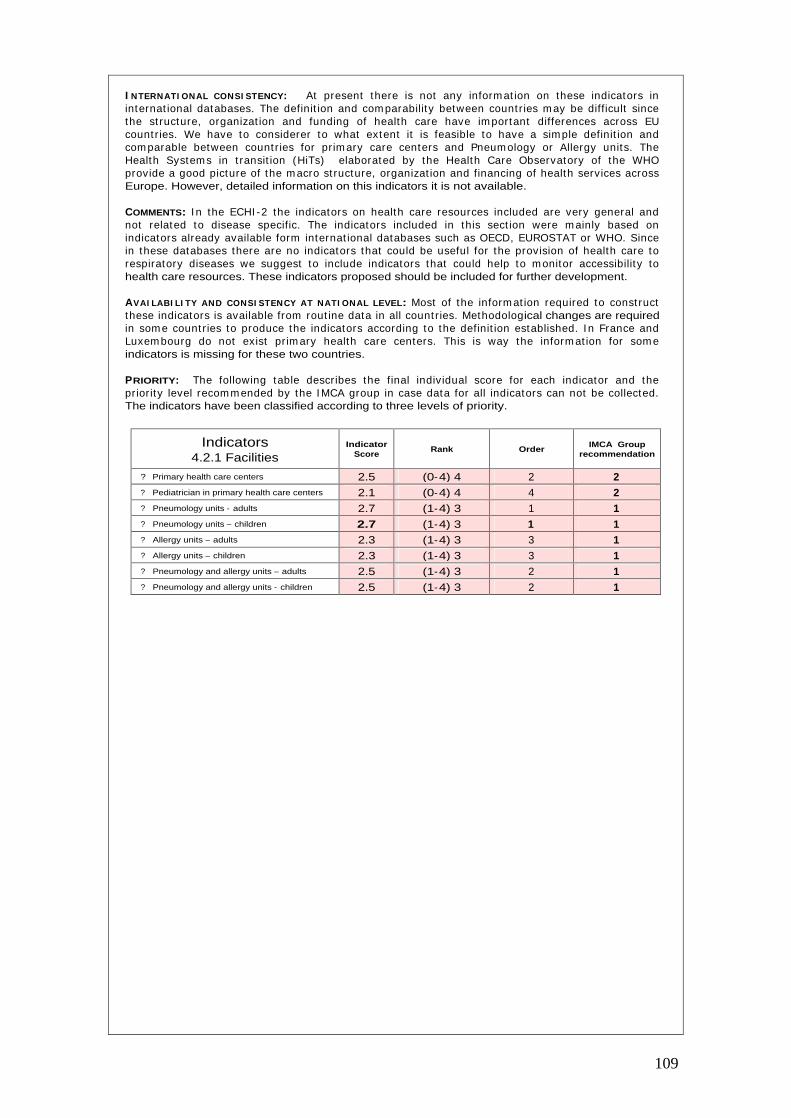
109
I NTERNATI ONAL CONSI STENCY: At present there is not any inform at ion on these indicators in internat ional databases. The definit ion and com parability between count r ies m ay be difficult since the st ructure, organizat ion and funding of health care have im portant differences across EU count r ies. We have to considerer to what extent it is feasible to have a sim ple definit ion and com parable between count r ies for pr im ary care centers and Pneum ology or Allergy units. The Health System s in t ransit ion (HiTs) elaborated by the Health Care Observatory of the WHO provide a good picture of the m acro st ructure, organizat ion and financing of health services across Europe. However, detailed information on this indicators it is not available.
COMMENTS: I n the ECHI -2 the indicators on health care resources included are very general and not related to disease specific. The indicators included in this sect ion were m ainly based on indicators already available form internat ional databases such as OECD, EUROSTAT or WHO. Since in these databases there are no indicators that could be useful for the provision of health care to respiratory diseases we suggest to include indicators that could help to m onitor accessibility to health care resources. These indicators proposed should be included for further development.
AVAI LABI LI TY AND CONSI STENCY AT NATI ONAL LEVEL: Most of the inform at ion required to const ruct these indicators is available from rout ine data in all count r ies. Methodological changes are required in som e count r ies to produce the indicators according to the definit ion established. I n France and Luxem bourg do not exist pr im ary health care centers. This is way the inform at ion for som e indicators is missing for these two countries.
PRIORITY: The following table describes the final individual score for each indicator and the pr ior ity level recom m ended by the I MCA group in case data for all indicators can not be collected. The indicators have been classified according to three levels of priority.
Indicators 4.2.1 Facilities
Indicator Score
Rank Order IMCA Group
recommendation
?
Primary health care centers 2.5 (0-4) 4 2 2 ?
Pediatrician in primary health care centers 2.1 (0-4) 4 4 2 ?
Pneumology units - adults 2.7 (1-4) 3 1 1 ?
Pneumology units – children 2.7 (1-4) 3 1 1 ?
Allergy units – adults 2.3 (1-4) 3 3 1 ?
Allergy units – children 2.3 (1-4) 3 3 1 ?
Pneumology and allergy units – adults 2.5 (1-4) 3 2 1 ?
Pneumology and allergy units - children 2.5 (1-4) 3 2 1
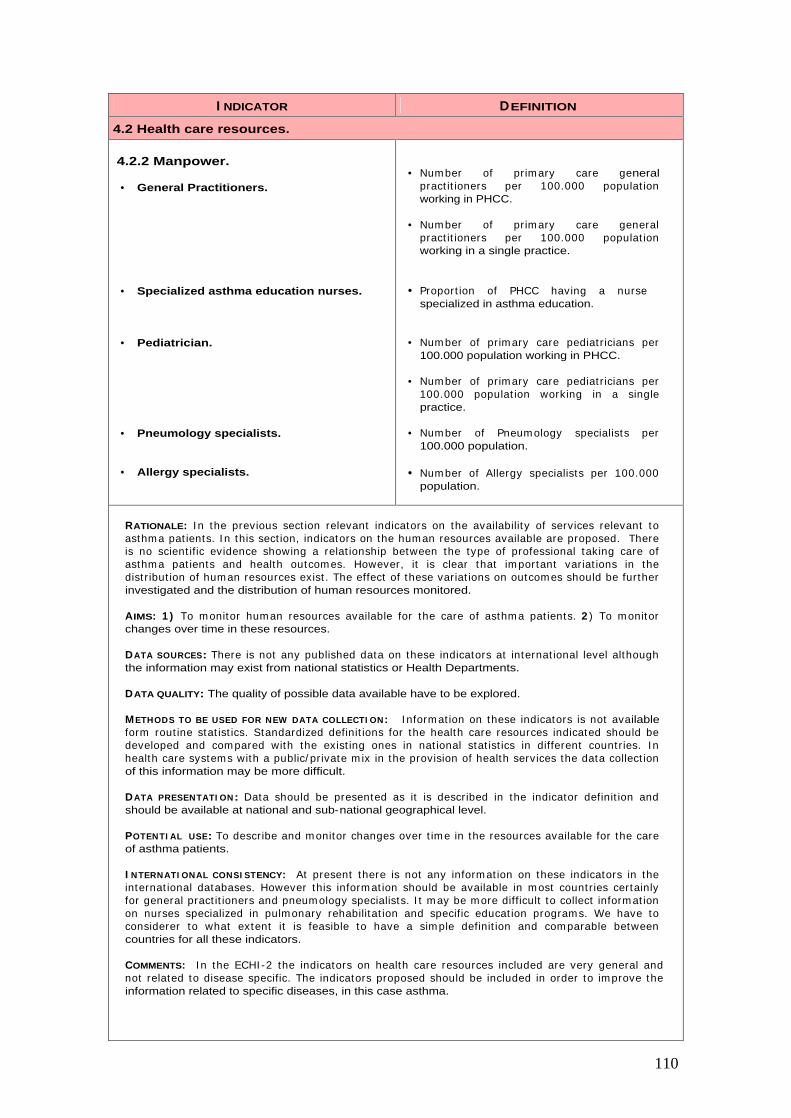
110
I NDICATOR DEFINITION
4.2 Health care resources.
4.2.2 Manpower.
• General Practitioners.
• Specialized asthma education nurses.
• Pediatrician.
• Pneumology specialists.
• Allergy specialists.
• Num ber of pr im ary care general pract it ioners per 100.000 populat ion working in PHCC.
• Num ber of pr im ary care general pract it ioners per 100.000 populat ion working in a single practice.
• Proport ion of PHCC having a nurse specialized in asthma education.
• Num ber of pr im ary care pediat r icians per 100.000 population working in PHCC.
• Num ber of pr im ary care pediat r icians per 100.000 populat ion working in a single practice.
• Num ber of Pneum ology specialists per 100.000 population.
• Num ber of Allergy specialists per 100.000 population.
RATIONALE: I n the previous sect ion relevant indicators on the availability of services relevant to asthm a pat ients. I n this sect ion, indicators on the hum an resources available are proposed. There is no scient ific evidence showing a relat ionship between the type of professional taking care of asthm a pat ients and health outcom es. However, it is clear that im portant variat ions in the dist r ibut ion of hum an resources exist . The effect of these variat ions on outcom es should be further investigated and the distribution of human resources monitored.
AIMS: 1 ) To m onitor hum an resources available for the care of asthm a pat ients. 2 ) To m onitor changes over time in these resources.
DATA SOURCES: There is not any published data on these indicators at internat ional level although the information may exist from national statistics or Health Departments.
DATA QUALITY: The quality of possible data available have to be explored.
METHODS TO BE USED FOR NEW DATA COLLECTI ON: I nform at ion on these indicators is not available form rout ine stat ist ics. Standardized definit ions for the health care resources indicated should be developed and com pared with the exist ing ones in nat ional stat ist ics in different count r ies. I n health care system s with a public/ pr ivate m ix in the provision of health services the data collect ion of this information may be more difficult.
DATA PRESENTATI ON: Data should be presented as it is described in the indicator definit ion and should be available at national and sub-national geographical level.
POTENTI AL USE: To describe and m onitor changes over t im e in the resources available for the care of asthma patients.
I NTERNATI ONAL CONSI STENCY: At present there is not any inform at ion on these indicators in the internat ional databases. However this inform at ion should be available in m ost count r ies certainly for general pract it ioners and pneum ology specialists. I t m ay be more difficult to collect inform at ion on nurses specialized in pulm onary rehabilitat ion and specific educat ion program s. We have to considerer to what extent it is feasible to have a sim ple definit ion and com parable between countries for all these indicators.
COMMENTS: I n the ECHI -2 the indicators on health care resources included are very general and not related to disease specific. The indicators proposed should be included in order to im prove the information related to specific diseases, in this case asthma.
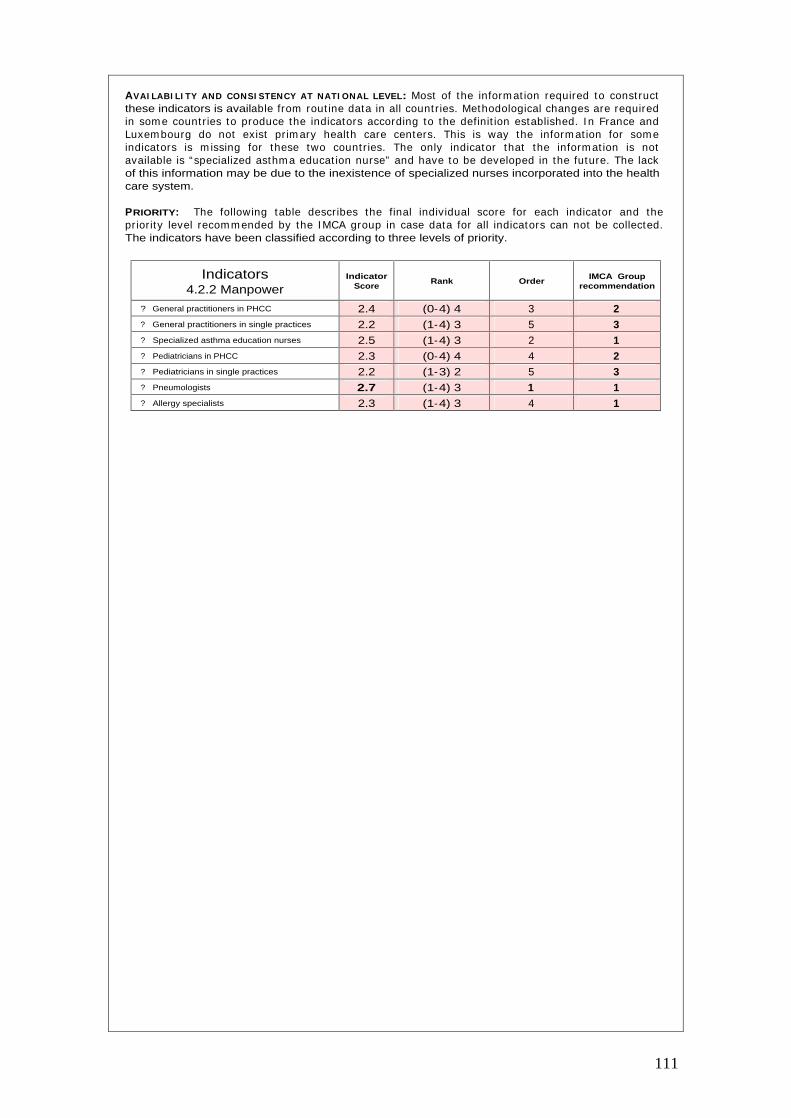
111
AVAI LABI LI TY AND CONSI STENCY AT NATI ONAL LEVEL: Most of the inform at ion required to const ruct these indicators is available from rout ine data in all count r ies. Methodological changes are required in som e count r ies to produce the indicators according to the definit ion established. I n France and Luxem bourg do not exist pr im ary health care centers. This is way the inform at ion for som e indicators is m issing for these two count r ies. The only indicator that the inform at ion is not available is “ specialized asthm a educat ion nurse” and have to be developed in the future. The lack of this information may be due to the inexistence of specialized nurses incorporated into the health care system.
PRIORITY: The following table describes the final individual score for each indicator and the pr ior ity level recom m ended by the I MCA group in case data for all indicators can not be collected. The indicators have been classified according to three levels of priority.
Indicators 4.2.2 Manpower
Indicator Score
Rank Order IMCA Group
recommendation
?
General practitioners in PHCC 2.4 (0-4) 4 3 2 ?
General practitioners in single practices 2.2 (1-4) 3 5 3 ?
Specialized asthma education nurses 2.5 (1-4) 3 2 1 ?
Pediatricians in PHCC 2.3 (0-4) 4 4 2 ?
Pediatricians in single practices 2.2 (1-3) 2 5 3 ?
Pneumologists 2.7 (1-4) 3 1 1 ?
Allergy specialists 2.3 (1-4) 3 4 1

112
I NDICATOR DEFINITION
4.2 Health care resources.
4.2.3 Education.
• Management plan.
• Peak flow meter at home.
• Proport ion of individuals with wheeze in the last 12 m onths but not a diagnosis of asthm a and having an asthm a management plan.
• Proport ion of individuals with a diagnosis of asthm a that have an asthm a m anagem ent plan.
• Proport ion of individuals with wheeze in the last 12 m onths but not a diagnosis of asthm a and having a “peak flow m eter” at home.
• Proport ion of individuals with a diagnosis of asthm a that have a “peak flow m eter” at home for monitoring.
4.2.4 Technology.
• Access to an allergy test.
• Access to lung function measurements.
• Proport ion of individuals with wheeze in the last 12 m onths or a diagnosis of asthma which have had an allergy test.
• Proport ion of individuals with wheeze in the last 12 m onths or a diagnosis of asthma which have had a lung funct ion measurement during the last year.
RATIONALE: As it has been described in the BTS guidelines70 the use of personalized writ ten asthm a act ion plans, also called self-m anagem ent plans, results in fewer days lost from work and school, fewer em ergency departm ent visits, hospital adm issions, em ergency episodes, less use of rescue medication and improved lung function. According to a meta-analysis, asthma management act ion plans are the m ost effect ive intervent ions available to im prove clinical managem ent .74 I n a study carr ied out in Germ any it was shown that asthm a m anagem ent plans and peak flow m eters were st rong determ inants of inhaled steroid use am ong children with current wheeze.75
Measurem ent of lung funct ion are essent ial to m onitor the course of asthm a and the pat ient ’s response to therapy. Poor percept ion of the severity of asthm a sym ptom s on the part of the pat ient and health care professional m ay be a m ajor factor causing delay in t reatm ent and thus m ay cont r ibute to increased m orbidity and m ortality from asthm a axacerbat ions.76 Pat ients who have access to peak expiratory flow inform at ion m ay use their m edicat ion lees frequent ly and m ore appropriately. I n addit ion peak expiratory flow m eters, pat ients should have access to spirom etry for a proper assessm ent of FEV1 and FVC. Skin tests with allergen represent the prim ary diagnost ic tool in determ ining atopic status. The m ain lim itat ion of m ethods to asses allergic status is that a posit ive test does not necessarily m ean that the disease is allergic as som e individual have specific I gE anibodies without any sym ptoms. However, recom m endat ions to avoid allergens may be recommended.
AIMS: 1 ) To m onitor ut ilizat ion of health care resources available for the care of pat ients with asthma. 2) To monitor changes over time in the use of health care resources for asthma patients.
DATA SOURCES: There is not rout inely collected data on these indicators although som e studies have shown it is easy to collect in specific surveys.
DATA QUALI TY: There is not data available on the quality of data for these indicators. However, the only problem in data collection may be the recall bias.
METHODS TO BE USED FOR NEW DATA COLLECTI ON: We recom m end that appropriate quest ions to collect this inform at ion are included in future studies or rout ine surveys. Som e studies have already shown that it is easy to collect this inform at ion. I t is im portant to have this inform at ion by public and private care and for different m odels of health care in those count r ies that a com plex organization of health services exist.
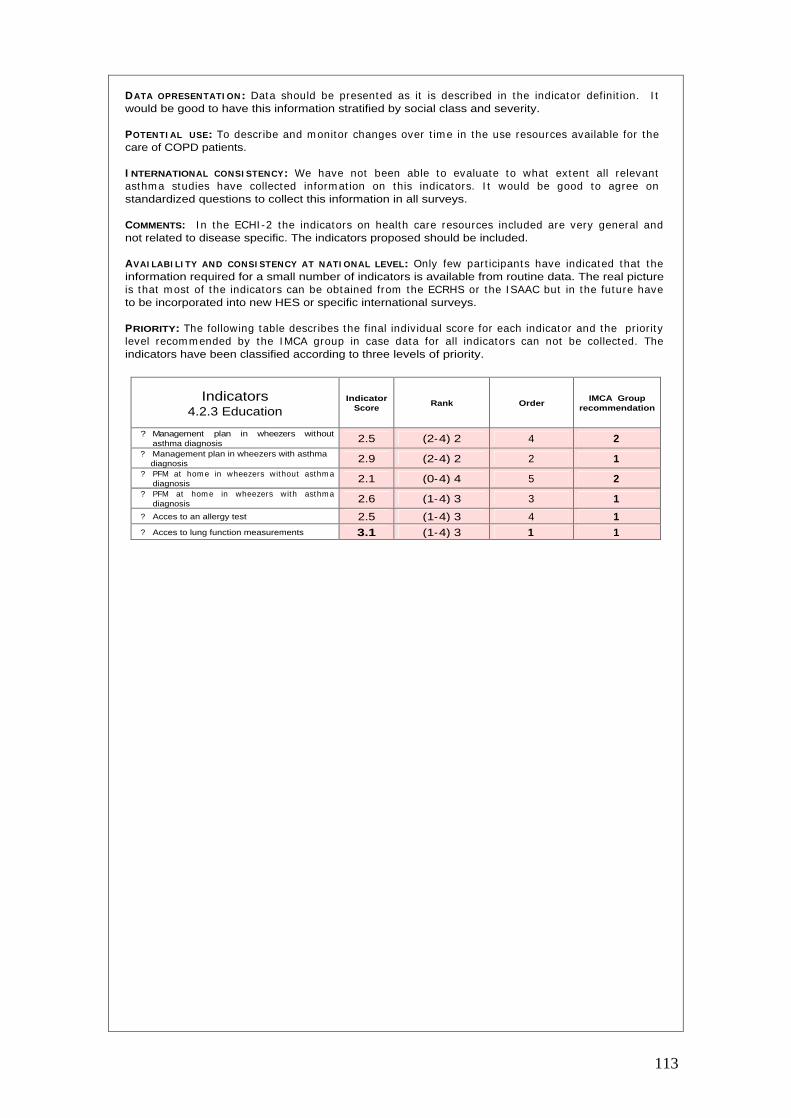
113
DATA OPRESENTATI ON: Data should be presented as it is described in the indicator definit ion. I t would be good to have this information stratified by social class and severity.
POTENTI AL USE: To describe and m onitor changes over t im e in the use resources available for the care of COPD patients.
I NTERNATIONAL CONSI STENCY: We have not been able to evaluate to what extent all relevant asthm a studies have collected inform at ion on this indicators. I t would be good to agree on standardized questions to collect this information in all surveys.
COMMENTS: I n the ECHI -2 the indicators on health care resources included are very general and not related to disease specific. The indicators proposed should be included.
AVAI LABI LI TY AND CONSI STENCY AT NATI ONAL LEVEL: Only few part icipants have indicated that the information required for a small number of indicators is available from routine data. The real picture is that m ost of the indicators can be obtained from the ECRHS or the I SAAC but in the future have to be incorporated into new HES or specific international surveys.
PRIORITY: The following table describes the final individual score for each indicator and the pr iority level recom m ended by the I MCA group in case data for all indicators can not be collected. The indicators have been classified according to three levels of priority.
Indicators 4.2.3 Education
Indicator Score
Rank Order IMCA Group
recommendation
?
Management plan in wheezers without asthma diagnosis 2.5 (2-4) 2 4 2
?
Management plan in wheezers with asthma diagnosis 2.9 (2-4) 2 2 1
?
PFM at hom e in wheezers without asthm a diagnosis 2.1 (0-4) 4 5 2
?
PFM at hom e in wheezers with asthma diagnosis 2.6 (1-4) 3 3 1
?
Acces to an allergy test 2.5 (1-4) 3 4 1 ?
Acces to lung function measurements 3.1 (1-4) 3 1 1
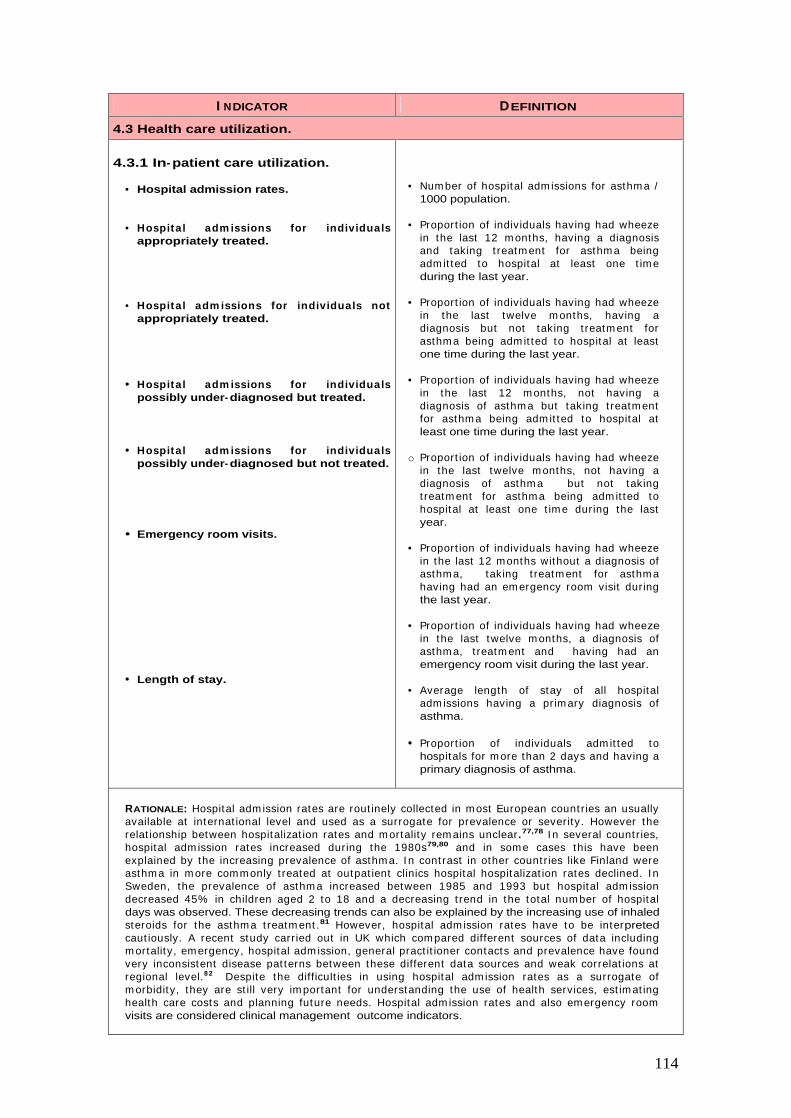
114
I NDICATOR DEFINITION
4.3 Health care utilization.
4.3.1 In-patient care utilization.
• Hospital admission rates.
• Hospital adm issions for individuals appropriately treated.
• Hospital adm issions for individuals not appropriately treated.
• Hospital adm issions for individuals possibly under-diagnosed but treated.
• Hospital adm issions for individuals possibly under-diagnosed but not treated.
• Emergency room visits.
• Length of stay.
• Num ber of hospital adm issions for asthm a / 1000 population.
• Proport ion of individuals having had wheeze in the last 12 m onths, having a diagnosis and taking t reatm ent for asthm a being adm it ted to hospital at least one t im e during the last year.
• Proport ion of individuals having had wheeze in the last twelve m onths, having a diagnosis but not taking t reatm ent for asthm a being adm it ted to hospital at least one time during the last year.
• Proport ion of individuals having had wheeze in the last 12 m onths, not having a diagnosis of asthm a but taking t reatm ent for asthm a being adm it ted to hospital at least one time during the last year.
o Proport ion of individuals having had wheeze in the last twelve m onths, not having a diagnosis of asthm a but not taking t reatm ent for asthm a being adm it ted to hospital at least one t im e during the last year.
• Proport ion of individuals having had wheeze in the last 12 months without a diagnosis of asthm a, taking t reatm ent for asthm a having had an em ergency room visit during the last year.
• Proport ion of individuals having had wheeze in the last twelve m onths, a diagnosis of asthm a, t reatm ent and having had an emergency room visit during the last year.
• Average length of stay of all hospital adm issions having a prim ary diagnosis of asthma.
• Proport ion of individuals adm it ted to hospitals for m ore than 2 days and having a primary diagnosis of asthma.
RATIONALE: Hospital adm ission rates are rout inely collected in m ost European count r ies an usually available at internat ional level and used as a surrogate for prevalence or severity. However the relat ionship between hospitalizat ion rates and m ortality rem ains unclear .77,78 I n several count r ies, hospital adm ission rates increased during the 1980s79,80 and in som e cases this have been explained by the increasing prevalence of asthm a. I n cont rast in other count r ies like Finland were asthm a in m ore comm only t reated at outpat ient clinics hospital hospitalizat ion rates declined. I n Sweden, the prevalence of asthm a increased between 1985 and 1993 but hospital adm ission decreased 45% in children aged 2 to 18 and a decreasing t rend in the total num ber of hospital days was observed. These decreasing trends can also be explained by the increasing use of inhaled steroids for the asthm a t reatm ent .81 However, hospital adm ission rates have to be interpreted caut iously. A recent study carr ied out in UK which com pared different sources of data including m ortality, em ergency, hospital adm ission, general pract it ioner contacts and prevalence have found very inconsistent disease pat terns between these different data sources and weak correlat ions at regional level.8 2 Despite the difficult ies in using hospital adm ission rates as a surrogate of m orbidity, they are st ill very im portant for understanding the use of health services, est im at ing health care costs and planning future needs. Hospital adm ission rates and also em ergency room visits are considered clinical management outcome indicators.

115
I ndividuals under-diagnosed and under- t reated have a higher r isk of having an acute exacerbat ion of asthma compared to those appropriately treated and may require more hospital admissions.
AIMS: 1 ) To describe the pat tern of hospitalizat ion and em ergency room use by asthm at ic patients. 2 ) To describe the pat tern of hospitalizat ion and em ergency room use by asthm at ic pat ients by different groups of sym ptoms/ diagnosis and t reatm ent . 3)To m onitor changes over time in these indicators.
DATA SOURCES: Hospital adm ission rates are collected rout inely in m ost European count r ies and can also be available at internat ional level. The num ber of hospital adm issions or em ergency room visits in relat ion to different groups of sym ptoms/ diagnosis and t reatm ent should be collected by specific surveys. This inform at ion is available in the ECRHS and also in the I SAAC studies. Information can be obtained from rout ine data collected in each count ry and also from specific surveys.
DATA QUALI TY: The inform at ion on the quality of possible data available is very lim ited. However, general issues usually found in rout ine ut ilizat ion data and survey data should be expected. The quality of these data have to be further explored.
METHODS TO BE USED FOR NEW DATA COLLECTI ON: There are two different m ethods for data collect ion. I n-pat ient care ut ilizat ion could be collected form rout ine data stat ist ics or by health surveys. Emergency room visits would be better collected by surveys.
DATA PRESENTATI ON: Data should be presented as it is described in the indicator definit ion. First , hospital adm ission rates should be presented by age-specific group and gender. Data on hospitalizat ion and em ergency room visits obtained from surveys could be presented like it is described at the top of this sect ion. This inform at ion is collected by surveys should be presented at national and sub-national geographical levels.
POTENTI AL USE: To describe and m onitor changes over t im e in the ut ilizat ion of services available for the care of asthm a pat ients and also describe the possible effects of t reatm ent on the utilization of health services.
I NTERNATI ONAL CONSI STENCY: To m onitor these indicators there is inform at ion available from rout ine data and from surveys. However, the inform at ion on the validity of rout ine data is very lim ited. I n surveys quest ions are not standardized. Certainly the inform at ion available could be useful to m onitor use of health services but it is difficult to say how valid the inform at ion is when m onitor ing exacerbat ions. I ndicators on follow-up visits to prim ary care or specialist probably would be better collected from surveys.
COMMENTS: In the ECHI -2 the indicators on health care ut ilizat ion (hospitalizat ion rates and length of stay) are included for specific disease group. The I CD codes have to dist inguish asthm a and COPD like it has been described for m ortality. Specific ut ilizat ion indicators for asthm a pat ients collected from surveys should also be included.
AVAI LABI LI TY AND CONSI STENCY AT NATI ONAL LEVEL: Three indicators: hospital adm ission rates, average length of stay and % > 2 days of stay are available from rout ine data although in som e count r ies m ethodological changes are required. For the other indicators of the group the information have to be collected from HES or specific surveys in the future.
PRIORITY: The following table describes the final individual score for each indicator and the pr ior ity level recom m ended by the I MCA group in case data for all indicators can not be collected. The indicators have been classified according to three levels of priority.
Indicators 4.3.1 In-patient care utilization
Indicator Score
Rank Order IMCA Group
recommendation
?
Hospital admission rates 3.5 (2-4) 2 1 1 ?
Hospital adm issions for indiv iduals appropriately treated 2.5 (1-4) 3 5 1
?
Hospital adm issions for individuals not appropriately treated 2.5 (1-4) 3 5 2
?
Hospital adm issions for individuals possibly under-diagnosed but treated 2.3 (1-4) 3 7 1
?
Hospital adm issions for individuals possibly under-diagnosed but not treated 2.3 (1-4) 3 7 2
?
Em ergency room visit s (wheeze no asthma diagnosis) 2.4 (1-4) 3 6 2
?
Em ergency room visit s (wheeze and asthma diagnosis) 2.9 (1-4) 3 2 1
?
Average length of stay 2.7 (2-4) 2 3 3 ?
% > 2 days of stay 2.6 (0-4) 4 4 3 Top 4
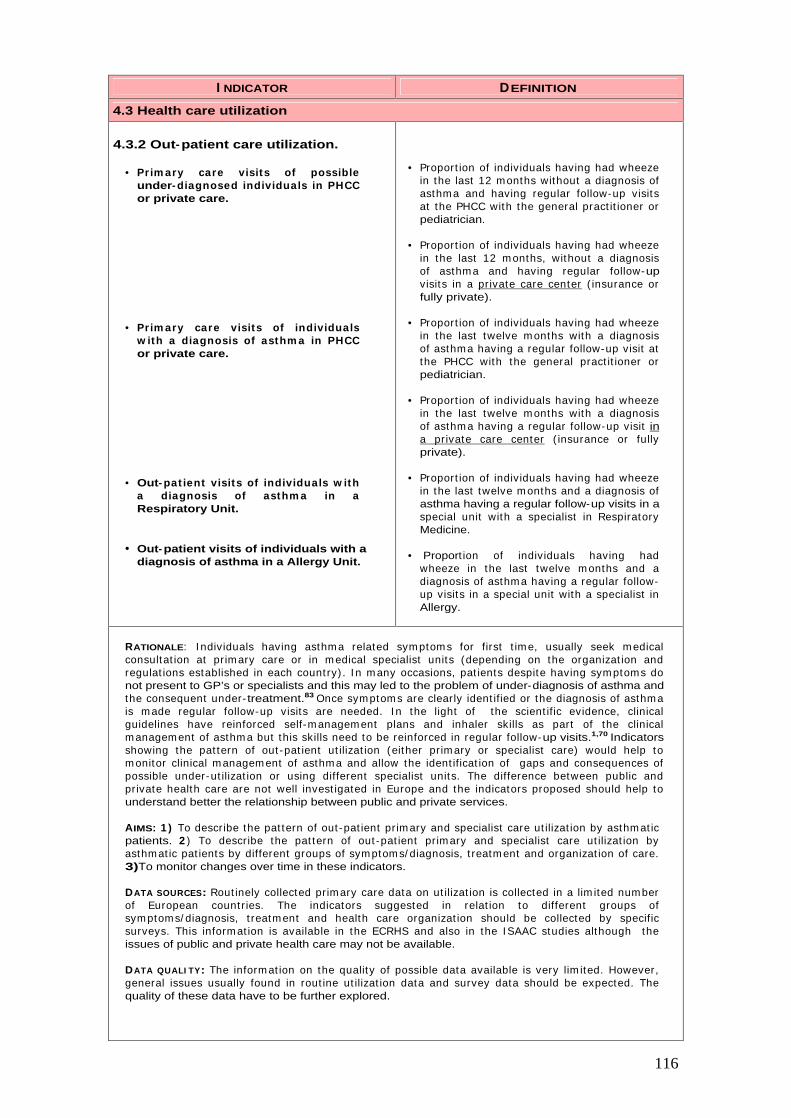
116
I NDICATOR DEFINITION
4.3 Health care utilization
4.3.2 Out-patient care utilization.
• Prim ary care visits of possible under- diagnosed individuals in PHCC or private care.
• Prim ary care visits of individuals w ith a diagnosis of asthm a in PHCC or private care.
• Out- pat ient visits of individuals w ith a diagnosis of asthm a in a Respiratory Unit.
• Out-patient visits of individuals with a diagnosis of asthma in a Allergy Unit.
• Proport ion of individuals having had wheeze in the last 12 months without a diagnosis of asthm a and having regular follow-up visits at the PHCC with the general pract it ioner or pediatrician.
• Proport ion of individuals having had wheeze in the last 12 m onths, without a diagnosis of asthm a and having regular follow-up visits in a private care center
(insurance or fully private).
• Proport ion of individuals having had wheeze in the last twelve m onths with a diagnosis of asthm a having a regular follow-up visit at the PHCC with the general pract it ioner or pediatrician.
• Proport ion of individuals having had wheeze in the last twelve m onths with a diagnosis of asthm a having a regular follow-up visit in a private care center
(insurance or fully private).
• Proport ion of individuals having had wheeze in the last twelve m onths and a diagnosis of asthma having a regular follow-up visits in a special unit with a specialist in Respiratory Medicine.
• Proport ion of individuals having had wheeze in the last twelve m onths and a diagnosis of asthm a having a regular follow-up visits in a special unit with a specialist in Allergy.
RATIONALE: I ndividuals having asthm a related sym ptom s for first t im e, usually seek m edical consultat ion at pr im ary care or in m edical specialist units (depending on the organizat ion and regulat ions established in each count ry) . I n m any occasions, pat ients despite having sym ptoms do not present to GP’s or specialists and this may led to the problem of under-diagnosis of asthma and the consequent under- treatment.83 Once sym ptom s are clearly ident ified or the diagnosis of asthm a is m ade regular follow-up visits are needed. I n the light of the scient ific evidence, clinical guidelines have reinforced self-m anagem ent plans and inhaler skills as part of the clinical m anagem ent of asthm a but this skills need to be reinforced in regular follow-up visits.1,70 Indicators showing the pat tern of out -pat ient ut ilizat ion (either prim ary or specialist care) would help to m onitor clinical m anagem ent of asthm a and allow the ident ificat ion of gaps and consequences of possible under-ut ilizat ion or using different specialist units. The difference between public and private health care are not well invest igated in Europe and the indicators proposed should help to understand better the relationship between public and private services.
AIMS: 1 ) To describe the pat tern of out -pat ient pr im ary and specialist care ut ilizat ion by asthm at ic patients. 2 ) To describe the pat tern of out -pat ient pr im ary and specialist care ut ilizat ion by asthm at ic pat ients by different groups of sym ptom s/ diagnosis, t reatm ent and organizat ion of care. 3)To monitor changes over time in these indicators.
DATA SOURCES: Rout inely collected prim ary care data on ut ilizat ion is collected in a lim ited num ber of European count r ies. The indicators suggested in relat ion to different groups of sym ptoms/ diagnosis, t reatm ent and health care organizat ion should be collected by specific surveys. This inform at ion is available in the ECRHS and also in the I SAAC studies although the issues of public and private health care may not be available.
DATA QUALI TY: The inform at ion on the quality of possible data available is very lim ited. However, general issues usually found in rout ine ut ilizat ion data and survey data should be expected. The quality of these data have to be further explored.

117
METHODS TO BE USED FOR NEW DATA COLLECTI ON: The indicators suggested in this sect ion can be easily collected by specific health surveys. Most of the inform at ion required to const ruct these indicators is already available in the ECRHS and the ISAAC but new questions should be introduced in order to be able to differentiate public and private care.
DATA PRESENTATI ON: Data should be presented as it is described in the indicator definit ion. This information should be presented by social class and at national and sub-national geographical levels if the survey design allows it.
POTENTI AL USE: To describe and m onitor changes over t im e in the prim ary or specialist ut ilizat ion of services available for the care of asthm a pat ients and also describe the possible effects of under-diagnosis and under- treatment on the utilization of health services.
I NTERNATI ONAL CONSI STENCY: To m onitor these indicators there is inform at ion available from specific surveys only. However, in surveys all quest ions are not standardized and variables which would allow to ident ify and com pare different m odels of health care are not available. These variable should be incorporated in future surveys.
COMMENTS: I n the ECHI -2, only indicators on hospital ut ilizat ion are included. The inclusion of specific indicators on out-patient utilization have to be discussed.
AVAI LABI LI TY AND CONSI STENCY AT NATI ONAL LEVEL: The inform at ion required for these indicators can be obtained form the ECRHS or I SAAC. However, in the future the appropriate quest ions to collect this information have to be included in HES or specific surveys.
PRIORITY: The following table describes the final individual score for each indicator and the pr ior ity level recom m ended by the I MCA group in case data for all indicators can not be collected. The indicators have been classified according to three levels of priority.
Indicators 4.3.4 Out-patient care utilization
Indicator Score
Rank Order IMCA Group
recommendation
?
Primary care visits of possible under-diagnosed individuals in PHCC 2.2 (0-4) 4 3 1
?
Prim ary care visits of possible under-diagnosed individuals in private care 2.1 (0-4) 4 4 2
?
Prim ary care v isits of indiv iduals with asthma diagnosis in PHCC 2.5 (0-4) 4 1 1
?
Prim ary care v isits of indiv iduals with asthma diagnosis in private care 2.3 (1-4) 3 2 2
?
Out-pat ient v isits of indiv iduals with a diagnosis of asthma in a Respiratory Unit 2.3 (1-4) 3 2 1
?
Out-pat ient v isits of indiv iduals with a diagnosis of asthma in a Allergy Unit 2.1 (1-4) 3 4 2
118
I NDICATOR DEFINITION
4.3 Health care utilization
4.3.4 Medicine use/medical aids.
• Short acting ß2-agonists prescribed.
• Long acting ß2- agonists prescribed.
• Inhaled glucocorticosteroids prescribed.
• Theophyline prescribed.
• Leukotriene modifier prescribed.
• DDD on all listed drugs.
• Ratio steroids/ ß2- agonists.
• Proportion of individuals with asthm a that have had short act ing inhaled ß2 agonists prescribed in the last 12 months.
• Proport ion of individuals with asthm a that have had short act ing inhaled ß2 agonists prescribed in the last 12 months.
• Proport ion of individuals with asthm a that have had glucocort icosteroids prescribed in the last 12 months.
• Proport ion of individuals with asthm a that have had theophyline prescribed in the last 12 months.
• Proport ion of individuals with asthm a that have had leukot r iene prescribed in the last 12 months.
• DDD for each of the listed drugs per 1000 population.
• Rat io individuals having steroids prescribed / individuals having ß2-agonists prescribed in the last 12 months.
RATIONALE: The GI NA1 and other nat ional (BTS) 70 or internat ional guidelines specify that effect ive long- term cont rol of asthm a m ay be achieved by select ing appropriate m edicat ions. The type of drugs to be prescribed to pat ients is specified for each level of severity. Despite the availability of good t reatm ent , m any individuals with sym ptom s are not diagnosed as asthm at ics and a substant ial proport ion of them are not t reated. This has been dem onst rated in several studies. The results of the DI MCA project have shown that of all pat ients with object ive airflow obst ruct ion only 34% consulted their GP which indicates under-presentat ion by 66% of pat ients. Of all subjects ident ified with object ive airflow lim itat ion only 79% were recorded in the m edical files as having asthm a indicat ing under-diagnosis by the GP in 21% of cases.83 A populat ion based study on childhood asthma m anagem ent carr ied out in Germ any have shown that only 36% of children with wheeze in the lat year had used bronchodilators and only 19% were on regular ant i- inflammatory treatment. Only 47% of children with wheeze had been diagnosed as asthmatics and less than 10% received appropriate t reatm ent for asthm a.84 There is wide variat ion in the ut ilizat ion of ant i-inflam m atory drugs in young adults with physician-diagnosed asthm a in Europe. The level of ut ilizat ion ranged form 49% in the UK and 17% in I taly.85 Smokers,86 ethnic m inority and low socioeconom ic groups are less likely to use ant i- inflam m atory drugs.87 The AI RE study ( in Europe) , have also shown that only 63% of individual with asthm a diagnosis were taking quick relief medications and only 23% inhaled corticosteroids.7
AI MS: 1 ) To describe he ut ilizat ion of drugs prescribed by pat ients with asthm a. 2 ) To detect the proportion of individuals with asthma not treated. 3 ) To monitor changes over time in the utilization of drugs prescribed for asthma.
DATA SOURCES: Information can be obtained from specific surveys. I nform at ion on defined daily doses (DDD) can be obtained form public databases established in each EU count ry. However the level of coverage of these data sources varies across countries.
DATA QUALITY: The quality of possible data from surveys is relatively good. However, possibilities of recall bias m ay exist and although the drugs are prescribed m ay not be taken. The quality of routine data have to be further explored.
METHODS TO BE USED FOR NEW DATA COLLECTI ON: We recom m end to include the appropriate quest ions in future research or rout ine asthm a studies on pharm acological t reatm ent to detect the level of under- t reatm ent and changes in prescript ion. Rout ine data on sales (DDD/ 1000 population) can also be useful at ecological level but less informative.
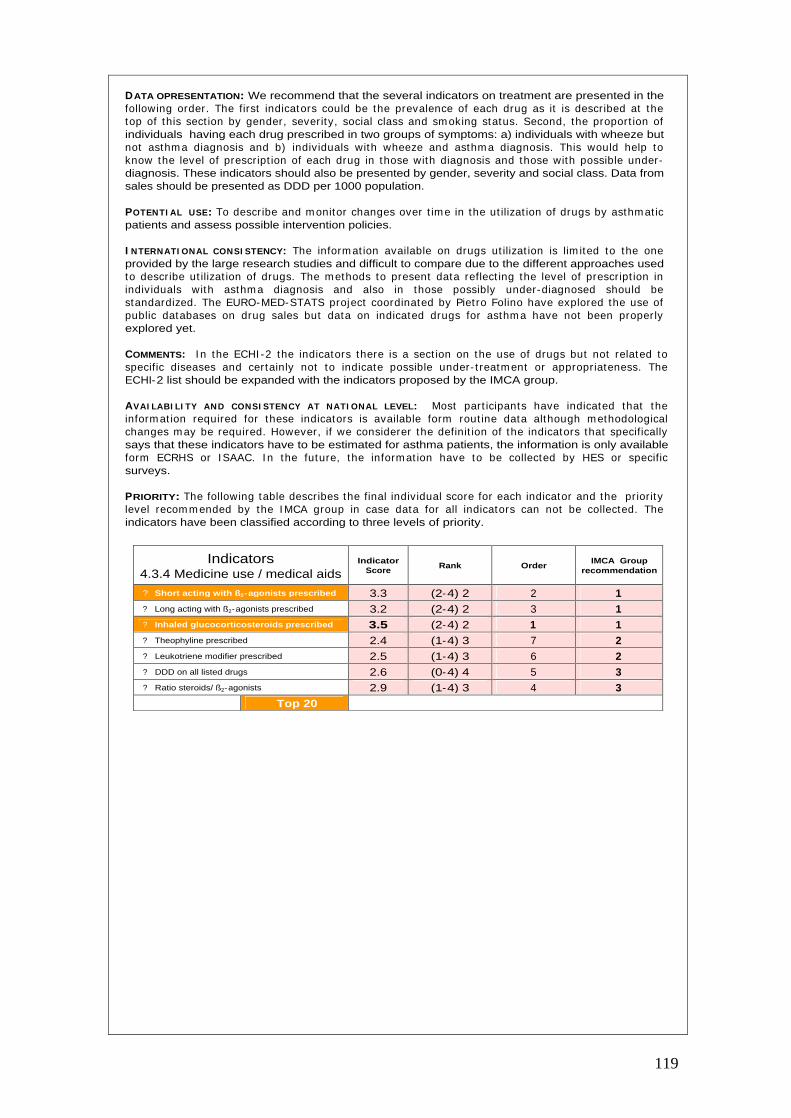
119
DATA OPRESENTATION: We recommend that the several indicators on treatment are presented in the following order. The first indicators could be the prevalence of each drug as it is described at the top of this sect ion by gender, severity, social class and sm oking status. Second, the proport ion of individuals having each drug prescribed in two groups of symptoms: a) individuals with wheeze but not asthm a diagnosis and b) individuals with wheeze and asthm a diagnosis. This would help to know the level of prescript ion of each drug in those with diagnosis and those with possible under-diagnosis. These indicators should also be presented by gender, severity and social class. Data from sales should be presented as DDD per 1000 population.
POTENTI AL USE: To describe and m onitor changes over t im e in the ut ilizat ion of drugs by asthm at ic patients and assess possible intervention policies.
I NTERNATI ONAL CONSI STENCY: The inform at ion available on drugs ut ilizat ion is lim ited to the one provided by the large research studies and difficult to compare due to the different approaches used to describe ut ilizat ion of drugs. The m ethods to present data reflect ing the level of prescript ion in individuals with asthm a diagnosis and also in those possibly under-diagnosed should be standardized. The EURO-MED-STATS project coordinated by Piet ro Folino have explored the use of public databases on drug sales but data on indicated drugs for asthm a have not been proper ly explored yet.
COMMENTS: I n the ECHI -2 the indicators there is a sect ion on the use of drugs but not related to specific diseases and certainly not to indicate possible under- t reatm ent or appropriateness. The ECHI-2 list should be expanded with the indicators proposed by the IMCA group.
AVAI LABI LI TY AND CONSI STENCY AT NATI ONAL LEVEL: Most part icipants have indicated that the inform at ion required for these indicators is available form rout ine data although m ethodological changes m ay be required. However, if we considerer the definit ion of the indicators that specifically says that these indicators have to be estimated for asthma patients, the information is only available form ECRHS or I SAAC. I n the future, the inform at ion have to be collected by HES or specific surveys.
PRIORITY: The following table describes the final individual score for each indicator and the pr iority level recom m ended by the I MCA group in case data for all indicators can not be collected. The indicators have been classified according to three levels of priority.
Indicators 4.3.4 Medicine use / medical aids
Indicator Score
Rank Order IMCA Group
recommendation
?
Short acting with ß2-agonists prescribed 3.3 (2-4) 2 2 1 ?
Long acting with ß2-agonists prescribed 3.2 (2-4) 2 3 1 ?
Inhaled glucocorticosteroids prescribed 3.5 (2-4) 2 1 1 ?
Theophyline prescribed 2.4 (1-4) 3 7 2 ?
Leukotriene modifier prescribed 2.5 (1-4) 3 6 2 ?
DDD on all listed drugs 2.6 (0-4) 4 5 3 ?
Ratio steroids/ ß2-agonists 2.9 (1-4) 3 4 3
Top 20
120
I NDICATOR DEFINITION
4.4 Health expenditures/financing.
4.4.1 Health care system.
• Hospitalization cost.
• Out-patient cost.
• Emergency room cost.
• Specialist visits cost.
• Total/ m ean cost of asthm a hospitalizat ions (including public and private care).
• Total/ m ean cost of out -pat ient asthm a care (including public and private care).
• Total/ m ean cost of unexpected em ergency room visits for asthm a ( including public and private).
• Total/ m ean cost of follow-up visits to specialist for asthm a ( including public and private).
RATIONALE: The cost of illness studies provide an insight into the econom ic impact of a disease but this inform at ion is lim ited to a num ber of specific studies and in general this t ype of data is not collected in epidem iological asthm a studies. I n general, econom ic studies provide inform at ion on direct and indirect costs. The direct cost is the value of health care resources devoted to diagnosis and m edical m anagem ent of the disease. I ndirect costs reflect the m onetary consequences of disability, m issed work and school, prem ature m ortality, and caregiver or fam ily costs result ing from illness. I ndirect costs are m ore difficult to est im ate and to com pare between count r ies. I n a review of nine studies carried out in different countries, Barnes et al. have provides and estimation of the proport ion of direct cost of asthm a care.88 The average physician costs in these studies was 22% , of which 75% relates to general pract it ioner consultat ions and 25% o specialist consultat ions. Drug costs m ake up approxim ately 37% of the total direct cost of asthm a. Hospital costs were approxim ately 20-25% although high variat ions between count r ies were observed. I n-pat ient costs were the m ost im portant com ponent 70-85% , whilst em ergency room t reatm ent was 14-18%. It is considered that asthma costs are largely due to uncontrolled disease and are largely expected to rise as its prevalence and severity increase. Better asthma should lead to reduction of hospital and emergency room costs.
AIMS: 1 ) To describe direct health care costs related to ut ilizat ion of health services by pat ients with asthma. 2 ) To monitor changes over time in these indicators.
DATA SOURCES: I nform at ion on ut ilizat ion should be est im ated from specific surveys and data on costs could be obtained from Health Departm ents of each count ry. Using both sources of information total direct costs of asthma can be estimated.
DATA QUALI TY: The quality of possible data available is not well known and should be further explored.
METHODS TO BE USED FOR NEW DATA COLLECTION: We recommend that data on utilization is collected by specific surveys while and data on costs should be obtained from databases in the Health Departm ent of each count ry. The inform at ion necessary to be able to link econom ic and utilization data should be further explored.
DATA OPRESENTATION: Data can be presented as it is described in the indicator description however it would be interest ing to present it also st rat ified by severity, social class and this tables produced by national and sub-national levels.
POTENTI AL USE: To describe and m onitor changes over t im e in costs of health care ut ilizat ion and its dist r ibut ion within different levels of health care. These indicators should help to evaluate possible health intervention policies to improve asthma care.
COMMENTS: I n the ECHI -2 the indicators on health care costs of health services ut ilizat ion are not included. The indicators proposed should be expanded for disease specific indicators in order to be able to assess the impact of different diseases.
AVAI LABI LI TY AND CONSI STENCY AT NATI ONAL LEVEL: Most part icipants have indicated that data for this group of indicators is available but m ethodological changes are required. Only four part icipants indicated that the data required is not available and have to be incorporated into routine data in the future.
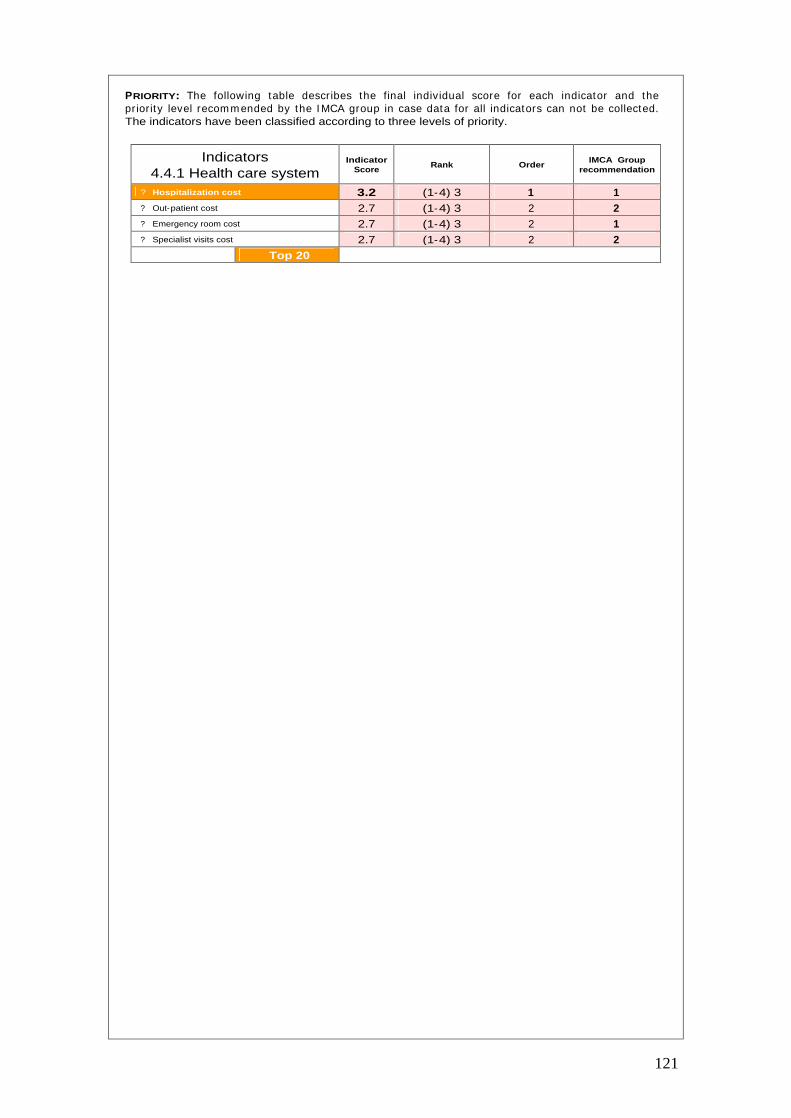
121
PRIORITY: The following table describes the final individual score for each indicator and the pr ior ity level recom m ended by the I MCA group in case data for all indicators can not be collected. The indicators have been classified according to three levels of priority.
Indicators 4.4.1 Health care system
Indicator Score
Rank Order IMCA Group
recommendation
?
Hospitalization cost 3.2 (1-4) 3 1 1
?
Out-patient cost 2.7 (1-4) 3 2 2
?
Emergency room cost 2.7 (1-4) 3 2 1
?
Specialist visits cost 2.7 (1-4) 3 2 2
Top 20
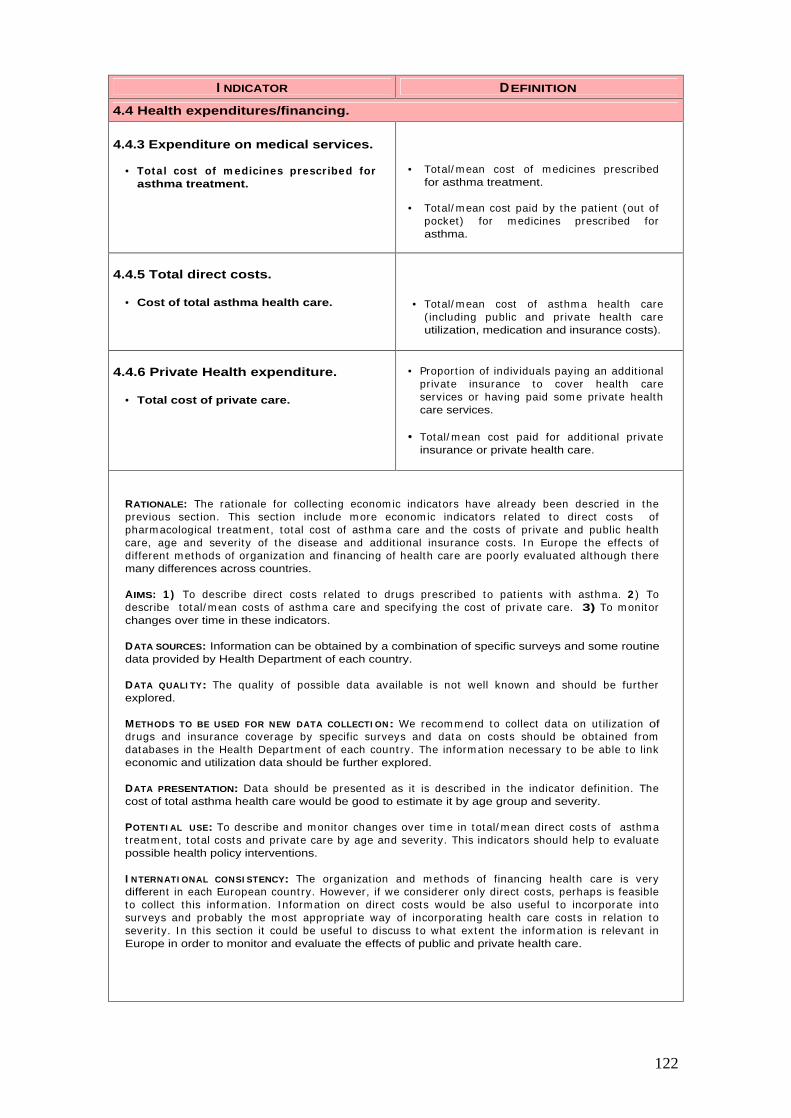
122
I NDICATOR DEFINITION
4.4 Health expenditures/financing.
4.4.3 Expenditure on medical services.
• Total cost of m edicines prescribed for asthma treatment.
• Total/ m ean cost of m edicines prescribed for asthma treatment.
• Total/ m ean cost paid by the pat ient (out of pocket ) for m edicines prescribed for asthma.
4.4.5 Total direct costs.
• Cost of total asthma health care. • Total/ m ean cost of asthm a health care ( including public and private health care utilization, medication and insurance costs).
4.4.6 Private Health expenditure.
• Total cost of private care.
• Proport ion of individuals paying an addit ional pr ivate insurance to cover health care services or having paid som e private health care services.
• Total/ m ean cost paid for addit ional pr ivate insurance or private health care.
RATIONALE: The rat ionale for collect ing econom ic indicators have already been descried in the previous sect ion. This sect ion include m ore econom ic indicators related to direct costs of pharm acological t reatm ent , total cost of asthm a care and the costs of pr ivate and public health care, age and severity of the disease and addit ional insurance costs. I n Europe the effects of different m ethods of organizat ion and financing of health care are poorly evaluated although there many differences across countries.
AIMS: 1 ) To describe direct costs related to drugs prescribed to pat ients with asthm a. 2 ) To describe total/ m ean costs of asthm a care and specifying the cost of pr ivate care. 3) To m onitor changes over time in these indicators.
DATA SOURCES: Information can be obtained by a combination of specific surveys and some routine data provided by Health Department of each country.
DATA QUALI TY: The quality of possible data available is not well known and should be further explored.
METHODS TO BE USED FOR NEW DATA COLLECTI ON: We recom m end to collect data on ut ilizat ion of drugs and insurance coverage by specific surveys and data on costs should be obtained from databases in the Health Departm ent of each count ry. The inform at ion necessary to be able to link economic and utilization data should be further explored.
DATA PRESENTATION: Data should be presented as it is described in the indicator definit ion. The cost of total asthma health care would be good to estimate it by age group and severity.
POTENTI AL USE: To describe and m onitor changes over t im e in total/ m ean direct costs of asthm a t reatm ent , total costs and private care by age and severity. This indicators should help to evaluate possible health policy interventions.
I NTERNATI ONAL CONSI STENCY: The organizat ion and m ethods of financing health care is very different in each European count ry. However, if we considerer only direct costs, perhaps is feasible to collect this inform at ion. I nform at ion on direct costs would be also useful to incorporate into surveys and probably the m ost appropriate way of incorporat ing health care costs in relat ion to severity. I n this sect ion it could be useful to discuss to what extent the inform at ion is relevant in Europe in order to monitor and evaluate the effects of public and private health care.
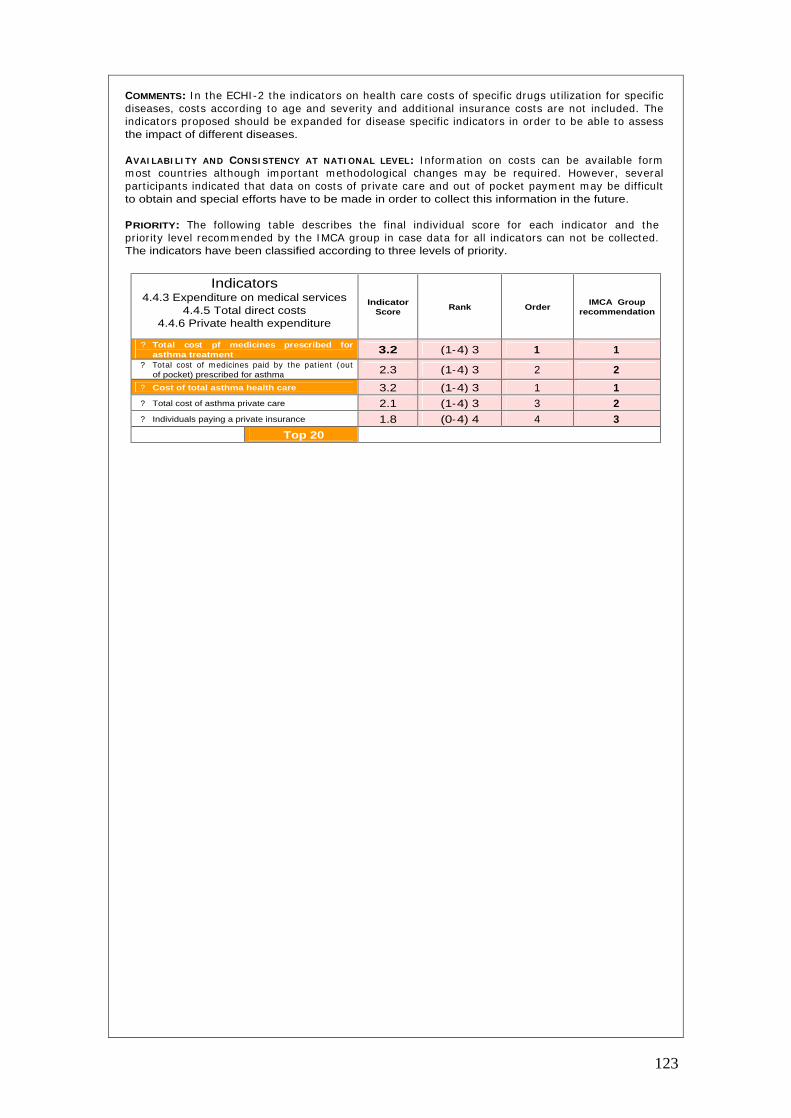
123
COMMENTS: I n the ECHI -2 the indicators on health care costs of specific drugs ut ilizat ion for specific diseases, costs according to age and severity and addit ional insurance costs are not included. The indicators proposed should be expanded for disease specific indicators in order to be able to assess the impact of different diseases.
AVAI LABI LI TY AND CONSI STENCY AT NATI ONAL LEVEL: I nform at ion on costs can be available form m ost count r ies although im portant m ethodological changes m ay be required. However, several part icipants indicated that data on costs of pr ivate care and out of pocket paym ent m ay be difficult to obtain and special efforts have to be made in order to collect this information in the future.
PRIORITY: The following table describes the final individual score for each indicator and the pr ior ity level recom m ended by the I MCA group in case data for all indicators can not be collected. The indicators have been classified according to three levels of priority.
Indicators 4.4.3 Expenditure on medical services
4.4.5 Total direct costs 4.4.6 Private health expenditure
Indicator Score
Rank Order IMCA Group
recommendation
?
Total cost pf medicines prescribed for asthma treatment 3.2 (1-4) 3 1 1
?
Total cost of m edicines paid by the pat ient (out of pocket) prescribed for asthma 2.3 (1-4) 3 2 2
?
Cost of total asthma health care 3.2 (1-4) 3 1 1 ?
Total cost of asthma private care 2.1 (1-4) 3 3 2 ?
Individuals paying a private insurance 1.8 (0-4) 4 4 3
Top 20
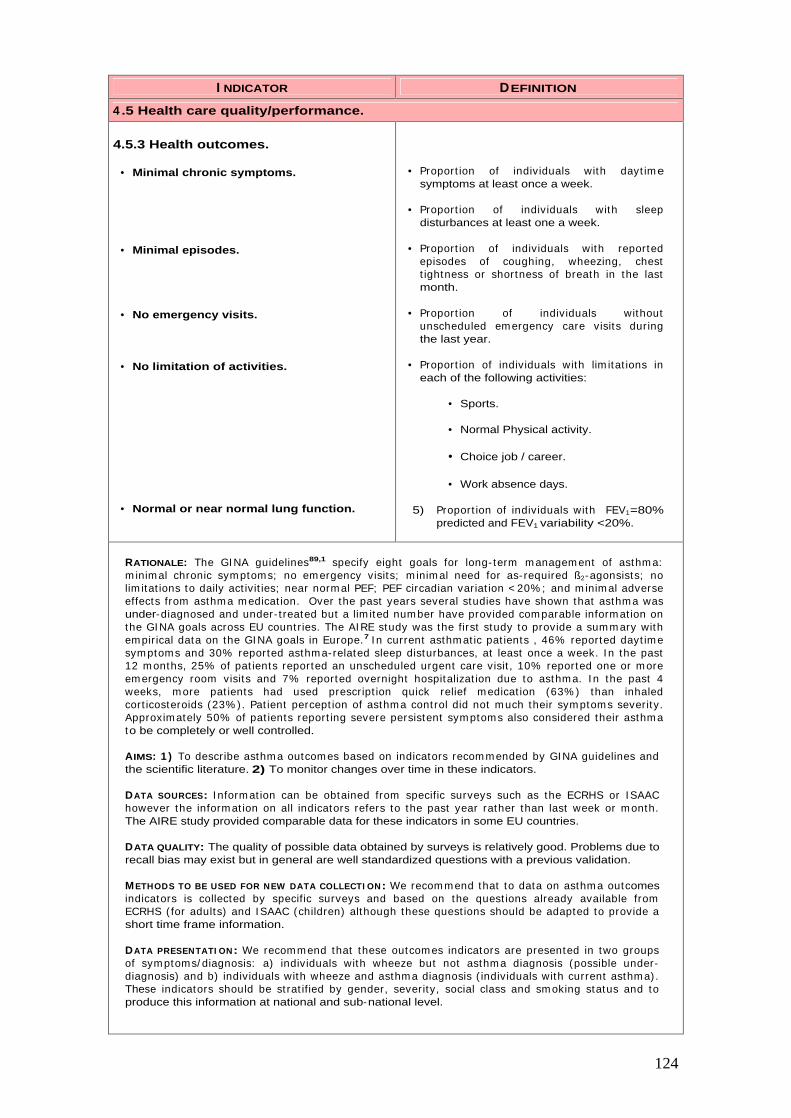
124
I NDICATOR DEFINITION
4 .5 Health care quality/performance.
4.5.3 Health outcomes.
• Minimal chronic symptoms.
• Minimal episodes.
• No emergency visits.
• No limitation of activities.
• Normal or near normal lung function.
• Proport ion of individuals with dayt ime symptoms at least once a week.
• Proport ion of individuals with sleep disturbances at least one a week.
• Proport ion of individuals with reported episodes of coughing, wheezing, chest t ightness or shortness of breath in the last month.
• Proport ion of individuals without unscheduled em ergency care visits during the last year.
• Proport ion of individuals with lim itat ions in each of the following activities:
• Sports.
• Normal Physical activity.
• Choice job / career.
• Work absence days.
5) Proport ion of individuals with FEV1=80% predicted and FEV1 variability <20%.
RATIONALE: The GI NA guidelines89,1 specify eight goals for long- term m anagem ent of asthm a: m inim al chronic sym ptoms; no em ergency visits; m inim al need for as- required ß2-agonsists; no lim itat ions to daily act ivit ies; near norm al PEF; PEF circadian variat ion < 20% ; and m inim al adverse effects from asthm a m edicat ion. Over the past years several studies have shown that asthm a was under-diagnosed and under- t reated but a lim ited num ber have provided com parable inform at ion on the GI NA goals across EU count r ies. The AI RE study was the first study to provide a sum m ary with em pir ical data on the GI NA goals in Europe.7 I n current asthm at ic pat ients , 46% reported dayt im e sym ptoms and 30% reported asthm a-related sleep disturbances, at least once a week. I n the past 12 m onths, 25% of pat ients reported an unscheduled urgent care visit , 10% reported one or m ore em ergency room visits and 7% reported overnight hospitalizat ion due to asthm a. I n the past 4 weeks, m ore pat ients had used prescript ion quick relief m edicat ion (63% ) than inhaled cort icosteroids (23% ). Pat ient percept ion of asthm a cont rol did not m uch their sym ptom s severity. Approxim ately 50% of pat ients report ing severe persistent sym ptom s also considered their asthm a to be completely or well controlled.
AIMS: 1 ) To describe asthm a outcom es based on indicators recom m ended by GINA guidelines and the scientific literature. 2) To monitor changes over time in these indicators.
DATA SOURCES: I nform at ion can be obtained from specific surveys such as the ECRHS or I SAAC however the inform at ion on all indicators refers to the past year rather than last week or m onth. The AIRE study provided comparable data for these indicators in some EU countries.
DATA QUALITY: The quality of possible data obtained by surveys is relatively good. Problems due to recall bias may exist but in general are well standardized questions with a previous validation.
METHODS TO BE USED FOR NEW DATA COLLECTI ON: We recom m end that to data on asthm a outcomes indicators is collected by specific surveys and based on the quest ions already available from ECRHS ( for adults) and I SAAC (children) although these quest ions should be adapted to provide a short time frame information.
DATA PRESENTATI ON: We recomm end that these outcom es indicators are presented in two groups of sym ptoms/ diagnosis: a) individuals with wheeze but not asthm a diagnosis (possible under-diagnosis) and b) individuals with wheeze and asthm a diagnosis ( individuals with current asthm a) . These indicators should be st rat ified by gender, severity, social class and sm oking status and to produce this information at national and sub-national level.
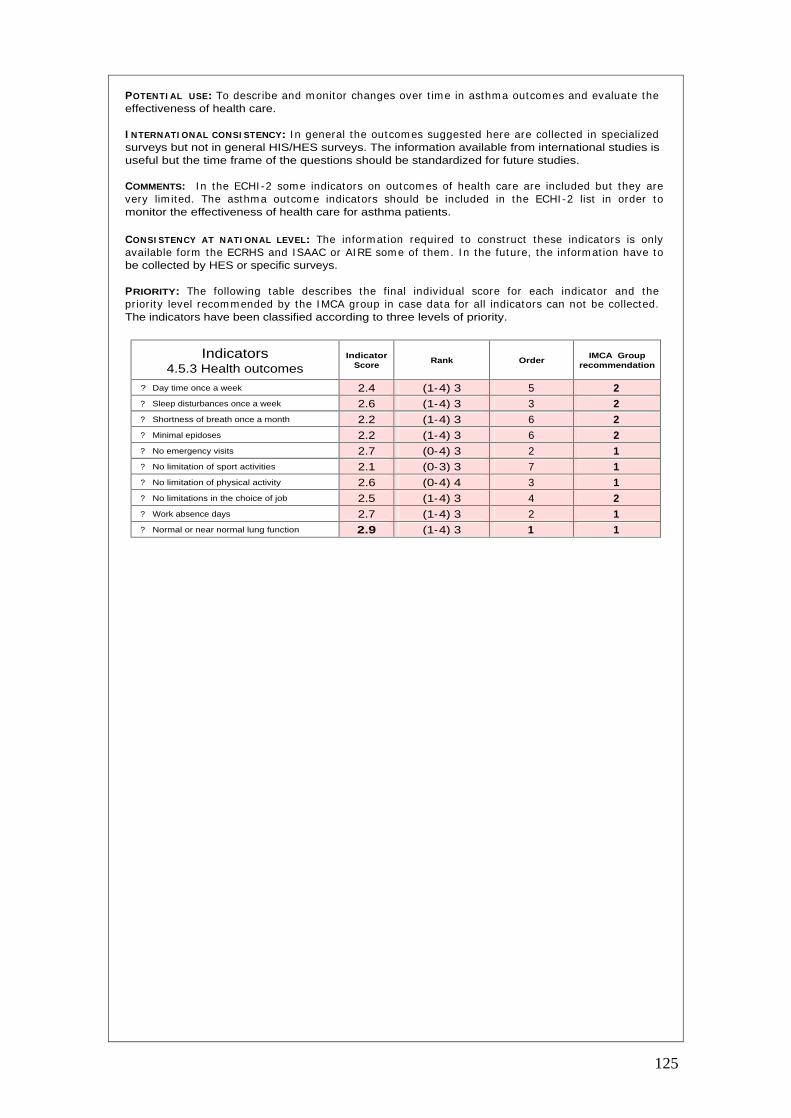
125
POTENTI AL USE: To describe and m onitor changes over t im e in asthm a outcom es and evaluate the effectiveness of health care.
I NTERNATI ONAL CONSI STENCY: I n general the outcom es suggested here are collected in specialized surveys but not in general HIS/HES surveys. The information available from international studies is useful but the time frame of the questions should be standardized for future studies.
COMMENTS: I n the ECHI -2 som e indicators on outcom es of health care are included but they are very lim ited. The asthm a outcom e indicators should be included in the ECHI -2 list in order to monitor the effectiveness of health care for asthma patients.
CONSI STENCY AT NATI ONAL LEVEL: The inform at ion required to const ruct these indicators is only available form the ECRHS and ISAAC or AI RE som e of them . I n the future, the inform at ion have to be collected by HES or specific surveys.
PRIORITY: The following table describes the final individual score for each indicator and the pr ior ity level recom m ended by the I MCA group in case data for all indicators can not be collected. The indicators have been classified according to three levels of priority.
Indicators 4.5.3 Health outcomes
Indicator Score
Rank Order IMCA Group
recommendation
?
Day time once a week 2.4 (1-4) 3 5 2 ?
Sleep disturbances once a week 2.6 (1-4) 3 3 2 ?
Shortness of breath once a month 2.2 (1-4) 3 6 2 ?
Minimal epidoses 2.2 (1-4) 3 6 2 ?
No emergency visits 2.7 (0-4) 3 2 1 ?
No limitation of sport activities 2.1 (0-3) 3 7 1 ?
No limitation of physical activity 2.6 (0-4) 4 3 1 ?
No limitations in the choice of job 2.5 (1-4) 3 4 2 ?
Work absence days 2.7 (1-4) 3 2 1 ?
Normal or near normal lung function 2.9 (1-4) 3 1 1
126
1. Global I nit itat ive for Asthm a. Global st rategy for asthm a managem ent and prevent ion.
National Heart, Lung, and blood Institute. NIH Publication No 02-3659.
2. Asher MI , Keil U, Anderson HR, Beasley R, Crane J, Mart inez F et al. I nternat ional Study of Asthm a and Allergies in Childhood ( I SAAC): rat ionale and methods. Eur Respir J 1995; 8:483-91.
3. I SAAC Steering Com m it te. Phase I I Modules of the I nternat ional Study of asthm a and Allergies in childhood (ISAAC). Münster, 1998.
4. Burney PG, Luczynska C, Chinn S, Jarvis D. The European Com m unity Respiratory Health Survey. Eur Respir J 1994; 7:954-60.
5. Janson C, Anto J, Burney P, Chinn S, de Marco R, Heinrich, Jarvis D, Kuenzli N, Leynaert B, Luczynska C, Neukirch F, Scvanes C, Sunyer J, Wjst . The european Com m unity Respiratory Health survey: what are the main results so far? Eur Respir J 2001; 18:598-611.
6. The European Com m unity Respiratory Health Survey I I Steering Com m it tee. The European Community Respiratory Health Survey II. Eur Respir J 2002; 20: 1071-1079.
7. Rabe KF, Verm eire PA, Soriano JB, Maier WC. Clinical m anagem ent of asthm a in 1999: the Asthma Insights and Reality in Europe (AIRE) study. Eur.Respir.J. 2000; 16:802-7.
8. Hyndm an SJ, William s DR, Merrill SL, Lipscom be JM, Palm er CR. Rates of adm ission to
hospital for asthma. BMJ 1994; 308:1596-600.
9. Woolcock AJ. Worldwide differences in asthm a prevalence and m ortality. Why is asthm a mortality so low in the USA? Chest 1986; 90:40S-5S.
10. EUROSTAT. Demographic Statistics 2000. Luxembourg. European Commission 2000.
11. Organization for the Economic Cooperation and Development (OECD). Health data 2000.
12. World Health Organizat ion(WHO). Regional Office for Europe. I nternat ional m ortality database. 2000.
13. Ochoa A. ISARE project. European Commission.
14. Kram ers PGN. The ECHI project : health indicators for the European Com m unity. Eur J Public Health 2003; 13:101-6.
15. Mielck A, Reitm eir P, Wjst M. Severity of childhood asthm a by socioeconom ic status. Int.J.Epidemiol. 1996; 25:388-93.
16. St rachan DP, Golding J, Anderson HR. Regional variat ions in wheezing illness in Brit ish children: effect of m igrat ion during early childhood. J.Epidem iol.Com m unity Health 1990; 44:231-6.
17. Duran-Tauleria E,.Rona RJ. Geographical and socioeconom ic variat ion in the prevalence of asthma symptoms in English and Scottish children. Thorax 1999; 54:476-81.
18. Watson JP, Cowen P, Lewis RA. The relat ionship between asthm a adm ission rates, routes of admission, and socioeconomic deprivation. Eur Respir J 1996; 9:2087-93.
19. Walters S, Phupinyokul M, Ayres J. Hospital adm ission rates fro asthm a and respiratory disease in the west Middlands: their relationship to air pollution levels. Thorax 1995; 50:948-54.
20. LittleJohns P, Macdonald LD. The relationship between severe asthma and social class. Respir Med 1993; 87:139-43.
21. Basagana X, Sunyer J, Kogevinas M, Zock JP, Duran-Tauleria E, Jarvis D et al. Socioeconomic Status and Asthma Prevalence in Young Adults: The European Community Respiratory Health Survey. Am.J.Epidemiol. 2004; 160:178-88.
22. Cesaroni G, Farchi S, Davoli M, Forastiere F, Perucci CA. Individual and area-based indicators of socioeconomic status and childhood asthma. Eur Respir J 2003; 22:619-24.
23. Kunst AE, Bos V, Mackenbach JP and the EU Working Group. Monitor ing socioeconom ic inequalit ies in health in the European Union: guidelines and illust rat ions. A report for the Health Monitoring Program of the European Commission. Available from: http://www.europe.
127
24. Duran-Tauleria E, Rona RJ, Chinn S, Burney P. I nfluence of ethnic group on asthm a
treatment in children in 1990-1: national cross sectional study. BMJ 1996; 313:148-52.
25. Wissow LS, Git telsohn AM, Szklo M, Starfield B, Mussm an M. Poverty, race, and hospitalization for childhood asthma. Am.J.Public Health 1988; 78:777-82.
26. Stewart AW, Mitchell EA, Pearce N, St rachan DP, Weilandon SK. The relat ionship of per capita gross nat ional product to the prevalence of sym ptom s of asthm a and other atopic diseases in children (ISAAC). Int.J.Epidemiol. 2001; 30:173-9.
27. Arom aa A, Koponen P, Tafforeau J. Verm eire C and the HI S/ HES Core Group. Evaluat ion of Health I nterview Surveys and Health Exam inat ion Surveys in the European Union. Eur J Public Health. 2003; 13(3 Suppl) : 67-72. (Database available from : https://www.iph.fgov.be/hishes/).
28. Menke R, St reich W, Rösler G. Report on socio-econom ic differences in health indicators in Europe. Health inequalit ies in Europe and the situat ion of disadvantaged groups. European Commission. Available from: http://www.europe.
29. European Respiratory Society. European Lung White Book. The first com prehensive survey on respiratory health in Europe. Chapter 02, 28-29. Chronic Obst ruct ive pulm onary disease. Lausane, switserland 2003.
30. Jorgensen I M, Bülow S, Jensen VB, Dah m TL, Prahl P, Juel K. Asthm a m ortality in Danish children and young adults, 1973-1994: epidem iology and validity of death cert ificates. Eur Respir J 2000; 15:844-848.
31. Jonasson G, Lodrup Carlsen KC, Leegard J, Carlsen KH, Mowinckel P, Halvorsen KS. Trends in hospital adm issions for childhood asthm a in Oslo, Norway, 1980-95. Allergy 2000; 55: 232-239.
32. Lenney W, Wells NEJ, O N’eill BA. The burden of pediat r ic asthm a. Eur Respir Rev 1994; 4:49-62.
33. Beasley CRW, Pearce Ne, Crane J. Worldwide t rends in asthm a m ortality during the tent ieth century. In: Sheffer AL, ed. Fatal asthma. New York: Marcel Dekker; 1998. p 13-29.
34. Rutstein DD, Berenberg W, Chalm ers TC, et al. Measuring the quality of m edical care utilization : a clinicla method. NEJM 1976; 294:582-8.
35. Schwartz E, Kofie VY, Rivo M, Tuckson RV. Black/white comparisons of deaths preventable by m edical intervent ion: United States and the Dist r ict of Colum bia 1980-1986. Int.J.Epidemiol. 1990;19:591-8.
36. Cam pbell DA, McLennan G, Coates JR, Frith PA, Gluyas PA, Lat im er KM. Accuracy of asthm a statistics from detah certificates in South Australia. Med J Aust 1992; 156:860-3.
37. A subcomm it tee of the BTS Research com m it tee. Accuracy of death cert ificates in bronchial asthm a . Accuracy of cert ificat ion procedures during the confident ial inquiry by the Brit ish Thoracic Association. Thorax 1984; 39:505-9.
38. Sears MR, Rea HH, de Boer G, Beaglehole R, Gilies AJ, Holst PE. Accuracy of death certification of deaths due to asthma. A national study. Am J Epidemiol 1986; 124: 1004-11.
39. I nternat ional Study of Asthm a and Allergies in Childhood ( ISAAC) Steering Com m it tee. Worldwide variat ion in prevalence of symptom s of asthm a, allergic rhino-conjunt ivit is and atopic eczema: The international Study of Asthma and Allergies in Childhood (ISAAC). Lancet 1988; 351: 1225-1232.
40. Variat ions in the prevalence of respiratory sym ptom s, self- reported asthm a at tacks, and use of asthm a m edicat ion in the European Com munity Respiratory Health Survey (ECRHS). Eur.Respir.J. 1996; 9:687-95.
41. Pekkanen J,.Pearce N. Defining asthm a in epidem iological studies. Eur Respir J 1999; 14:951-7.
42. Global I nit iat ive for Asthm a. Global st rategy for asthm a managem ent and prevent ion. National Heart, Lung, and blood Institute. NIH Publication No 02-3659.
43. Chinn S, Burney P, Jarvis D, Luczynska C. Variat ion in bronchial responsiveness in the European Comm unity Resppiratory Health Survey (ECRHS). Eur Respir J 1997; 10: 2495-2501.

128
44. Burney P, Malm berg, Chinn S, Jarvis D, Luczynska, Lai E. The dist r ibut ion of total and
specific serum IgE in the european Com m unity Respiratory Health Survey. J Allergy Clin Immunol 1997; 316-322.
45. Chinn S, Burney P, Sunyer J, Jarvis D, Luczynska. Sensit izat ion to individual allergens and bronchial responsiveness in the ECRHS. Eur Respir J 1999; 14:876-884.
46. Sin DD, Spier S, Svenson LWW, Schopflocher DP, Senthilselvan A, Cowie RL, Man SF. The relat ionship between bir th weight and childhood asthm a: a populat ion-based cohort study. Arch Pediatr Adolesc Med 2004; 158(1):60-4.
47. Bolte G, Schm idt M, Maziak W, Keil U, Nasca P, von Mut ius E, Weiland S. The relat ion of markers of fetal growth with asthma, allergies and serum immunoglobulin E levels in children at age 5-7 years. Clin Exp Allergy 2004; 34(3):381-8.
48. Jaakola JJ, Gissler M. Maternal sm oking in pregnancy, fetal developm ent , and childhood asthma. Am J Public Health 2004; 94(1):136-40.
49. Camargo CA, Weiss ST, Zhang S, Willet WC, Speizer FE. Prospect ive study of body m ass index, weight change, and r isk of adult onset asthm a in wom en. Arch I ntern Med 1999; 159: 2582-8.
50. Hakala K, Stenius-Aam iala B, Sovijarvi A. effects of weight loss on peak flow variability, airways obst ruct ion, and lung volum s in obese pat ients with asthm a. Chest 2000; 118: 1315-21.
51. Stenius-Aam iala B, Poussa T, Kvam strom J, Gonlund EL. I nm ediate and long term effects of weigtht reduct ion in obese people with asthm a: random ized cont rolled t r ial. BMJ 200; 320:827-32.
52. Sibbald B, Hom ME, Gregg I . A fam ily study of the genet ic basis of asthm a and wheezy bronchitis. Arch Dis Child 1980; 55:354-7.
53. Holgate ST. Genet ic and environm ent interact ion in allergy and asthm a. J Allergy Clin Immunol 1999; 104:1139-46.
54. Holgate ST. The epidemic of allergy and asthma. Nature 1999; 402:B2-4.
55. Barker RD,. van Tongeren MJ, Harr is JM, Gardiner K, Venables KM, Newm an Taylor AJ. Risk factors for bronchial hyperresponsiveness in workers exposed to acid anhydrides. Eur Respir J 2000; 15:710-5.
56. Siroux V, Pin I , Oryszczyn MP, Le Moual N, Kauffm ann F. Relat ionships of act ive sm oking to asthm a and asthm a severity in the EGEa STUDY. Epidem iological Study on the Genet ics and Environment of Asthma. Eur Respir J 2000; 15:470-7.
57. Pedersen B, Çdahl R, Karlst rom R, Peterson CG, Venge P. Eosinophil and neut rophil act ivity in asthm a in a one-year t r ial with inhaled budesonide. The im pact of sm oking. Am J Respir Crit Care Med 1996; 153:1519-29.
58. Gilliland FD, Berhane K, McConnell R, Gauderm an WJ, Vora H, Rappaport EB et al. Maternal sm oking during pregnancy, environm ental tobacco smoke exposure and childhood lung function. Thorax 2000; 55:271-6.
59. Nafstad P, Kongerud J, Bot ten G, Hagen JA, Jaakkola JJ. The role of passive sm oking in the developm ent of bronchial obst ruct ion during the first 2 years of life. Epidemiology 1997; 8:293-7.
60. Ferrence R,.Ashley MJ. Protect ing children from passive sm oking. BMJ 2000; 321: 310-1.
61. Romieu I,.Trenga C. Diet and obstructive lung diseases. Epidemiol.Rev. 2001;23:268-87.
62. Forast iere F, Pistelli R, Sest ini P, Fortes C, Renzoni E, Rusconi F et al. Consumpt ion of fresh fruit r ich in vitam in C and wheezing sym ptoms in children. SI DRI A Collaborat ive Group, I taly ( I talian Studies on Respiratory Disorders in Children and the Environm ent) . Thorax 2000; 55:283-8.
63. Koenig JQ. Air pollution and asthma. J Allergy clin Immunol 1999; 104:717-22.
129
64. Oosterlee A, Drijver M, Lebret E, Brunekreef B. Chronic respiratory symptoms in children and
adults living along streets with high traffic density. Occup Environ Med 1996; 53:241-7.
65. Holgate ST. Anderson HR. Com m it tee on Medical effects of Air Pollutants. Asthm a and outdoor air pollution. Department of Health. HMSO. London, 1995.
66. Mapp C, Boschet to P, Miot to D, De Rosa E, Fabbri LM. Mechanism s of occupat ional asthm a. Ann Allergy asthma Immunol 1999; 83:645-64.
67. Custovic A, Simpson A, Woodcock A. I m portance of indoor allergens in the induct ion of allergy and elicitation of allergic disease. Allergy 1998; 53:115-20.
68. Gotzsche PC, Ham m arquist C, Burr M. House dust m ite cont rol m easures in the m anagem ent of asthma: meta-analysis. BMJ 1998; 317:1105-10.
69. Gotzsche PC, Johansen HK, Burr ML, Ham m arquist C. House dust m ite cont rol m easures for asthma. Cochrane.Database.Syst.Rev. 2001; CD001187.
70. Scot t ish I ntercollegiate Guidelines Network. The Brit ish Thoracic Society. Brit ish Guideline on the Management of Asthma.
71. St rachann DP, Cook DG. Health effects of passive sm oking I . Parental sm oking and low respiratory illness in infancy and early childhood. Thorax 1997; 52:905-14.
72. Dezateau C, Stocks J, Dundas L, et al. Impaired airway function and wheezing in infancy: the influence of m aternal sm oking and genet ic predisposit ion to asthm a. Am J Respir Crit Care Med 1999;1 59:403-10.
73. Eisner MD, Yelin EH, Henke J, et al. Environm ental tobacco smoke and adult asthm a. The im pact of changing exposure status on health outcom es. Am j Respir Crit Care Med 1998; 158:170-5.
74. Bernard-Bonnin AC, Stachenko S, Bonin D, et al. Self-m anagem ent teaching program s and morbidity of pediatric asthma: a meta-analysis. J Allergy Clin Immunol 1995; 95:34-41.
75. Maziak W, von Mut ius E, Beim fohr C, Hirsch T, Leupold W, Keil U, Weiland SK. The management of childhood asthma in the community. Eur Respir J 2002; 20:1476-1482.
76. Sears MR. Increasing ashtma mortality- fact or artifac ? Pediatr Pulmonol 1991; 11:166-74.
77. Haahtela T, Lindholm H, Bjorksten F, Koskenvuo K, Lait inen LA. Prevalence of asthm a in Finnish young men. BMJ 1990; 301:266-8.
78. Weiss KB, Gergen PJ, Wagener DK. Breathing bet ter or wheezing worse? The changing epidemiology of asthma morbidity and mortality. Annu.Rev.Public Health 1993; 14:491-513.
79. Anderson HR. I ncrease in hospital adm issions for childhood asthm a: t rends in referral, severity, and readm issions from 1970 to 1985 in a health region of the United Kingdom . Thorax 1989; 44:614-9.
80. Storr J, Barrell E, Lenney W. Rising asthma admissions and self referral. Arch.Dis.Child 1988; 63:774-9.
81. Wennergren G, Krist jansson S, St rannegard I L. Decrease in hospitalizat ion for t reatm ent of childhood asthma with increased use of ant iinflam m atory t reatm ent , despite an increase in prevalence of asthma. J.Allergy Clin.Immunol. 1996; 97:742-8.
82. Hansell A, Hollowell J, McNiece R, Nichols T, St rachan D. Validity and interpretat ion of m ortality, health service and survey data on COPD and asthm a in England. Eur.Respir.J. 2003; 21:279-86.
83. van Schayck CP, Der Heijden FM, van Den BG, Tir im anna PR, van Herwaarden CL. Underdiagnosis of asthm a: is the doctor or the pat ient to blam e? The DI MCA project . Thorax 2000; 55:562-5.
84. Maziak W, von Mut ius E, Beim fohr C, Hirsch T, Leupold W, Keil U et al. The m anagem ent of childhood asthma in the community. Eur.Respir.J. 2002; 20:1476-82.
85. Janson C, Chinn S, Jarvis D, Burney P. Physician-diagnosed asthm a and drug ut ilizat ion in the European Community Respiratory Health Survey. Eur.Respir.J. 1997; 10:1795-80.

130
86. Janson C, Chinn S, Jarvis D, Burney P. I ndividual use of ant iasthm at ic drugs in the European
Community Respiratory Health Survey. Eur.Respir.J. 1998; 12:557-63.
87. Adam s RJ, Fuhlbrigge A, Guilbert T, Lozano P, Mart inez F. I nadequate use of asthma medication in the United States: results of the asthma in America national population survey. J.Allergy Clin.Immunol. . J.Allergy Clin.Immunol. 2002; 110:58-64.
88. Barnes PJ, Jonsson B, Klim JB. The costs of asthma. Eur.Respir.J. 1996; 9:636-42.
89. Global I nit iat ive fro Asthm a (GI NA) . Global St rategy for asthm a m anagem ent and prevent ion. NHLBI / WHO workshop report . Nat ional I nst itutes of Health. Nat ional Heart , Lung and Blood Institute. January 1995. INH publication number 95-3569.

131

This document was created with Win2PDF available at http://www.daneprairie.com.The unregistered version of Win2PDF is for evaluation or non-commercial use only.

This report was produced by a contractor for Health & Consumer Protection Directorate General and represents the views of thecontractor or author. These views have not been adopted or in any way approved by the Commission and do not necessarilyrepresent the view of the Commission or the Directorate General for Health and Consumer Protection. The EuropeanCommission does not guarantee the accuracy of the data included in this study, nor does it accept responsibility for any use madethereof.
Related Documents