WP-2020-015 India's Search for Link Language and Progress towards Bilingualism Leena Bhattacharya, S Chandrasekhar Indira Gandhi Institute of Development Research, Mumbai April 2020

Welcome message from author
This document is posted to help you gain knowledge. Please leave a comment to let me know what you think about it! Share it to your friends and learn new things together.
Transcript
WP-2020-015
India's Search for Link Language and Progress towards Bilingualism
Leena Bhattacharya, S Chandrasekhar
Indira Gandhi Institute of Development Research, MumbaiApril 2020
India's Search for Link Language and Progress towards Bilingualism
Leena Bhattacharya, S Chandrasekhar
Email(corresponding author): [email protected]
AbstractThe three language formula (3LF) is viewed as an instrument for achieving the objective of a
multilingual India. Possibly on account of lack of agreement on 3LF and politics of medium of
instruction, the pace of transition towards bilingualism is glacial. This paper is a quantitative
assessment of this transition. We analyse data from Census of India Language Tables for the years
1971, 2001 and 2011 and two recent NSSO surveys on education. We present estimates of probability
of two individuals drawn at random being able to converse in a common language and the extent to
which today's school going children and the youth are likely to be bilingual respectively.
Keywords: Bilingual, Trilingual, Link Language, India, Three Language Formula
JEL Code: Z1, Z13
Acknowledgements:
This paper benefitted from comments received from participants at the Conference on Political Economy of Migration organized
by Pune International Centre on December 13-14, 2019. We are grateful to Jayant Kumar Banthia and Ram B Bhagat for useful
conversations on the subject and to B.K.Bhoi for detailed comments on earlier drafts.
1
India's Search for Link Language and Progress towards Bilingualism
Leena Bhattacharya
S Chandrasekhar
Indira Gandhi Institute of Development Research, Mumbai
2
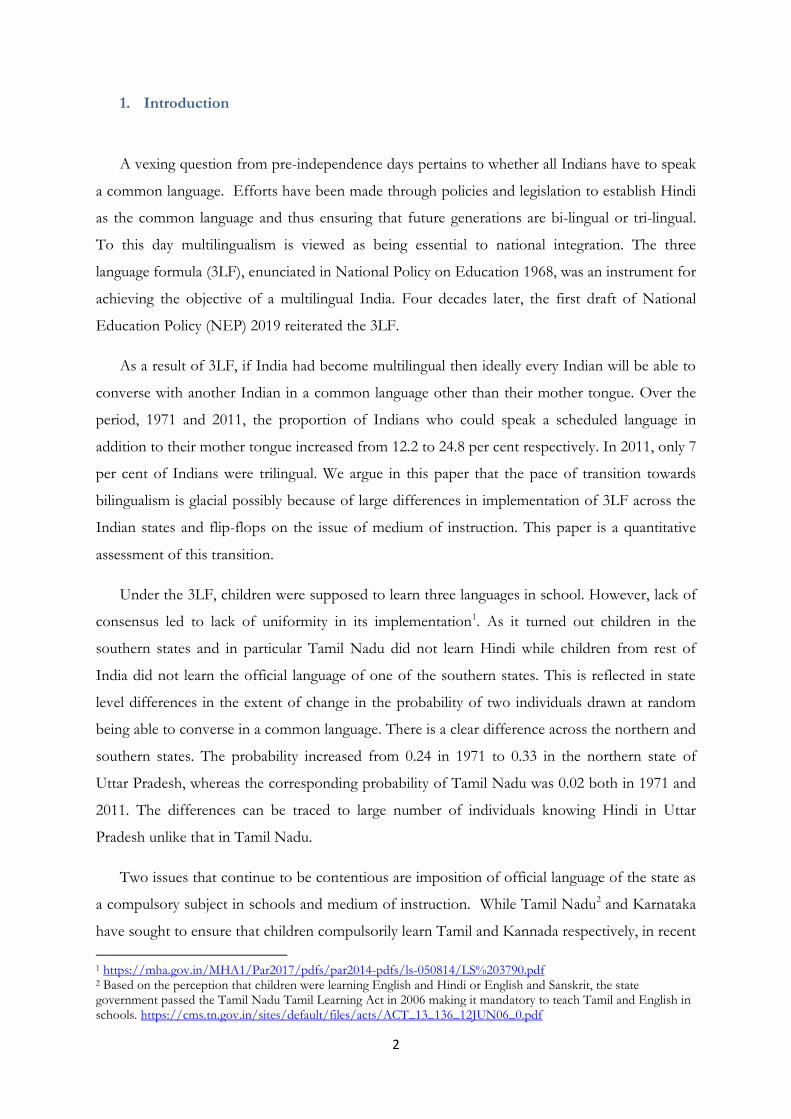
1. Introduction
A vexing question from pre-independence days pertains to whether all Indians have to speak
a common language. Efforts have been made through policies and legislation to establish Hindi
as the common language and thus ensuring that future generations are bi-lingual or tri-lingual.
To this day multilingualism is viewed as being essential to national integration. The three
language formula (3LF), enunciated in National Policy on Education 1968, was an instrument for
achieving the objective of a multilingual India. Four decades later, the first draft of National
Education Policy (NEP) 2019 reiterated the 3LF.
As a result of 3LF, if India had become multilingual then ideally every Indian will be able to
converse with another Indian in a common language other than their mother tongue. Over the
period, 1971 and 2011, the proportion of Indians who could speak a scheduled language in
addition to their mother tongue increased from 12.2 to 24.8 per cent respectively. In 2011, only 7
per cent of Indians were trilingual. We argue in this paper that the pace of transition towards
bilingualism is glacial possibly because of large differences in implementation of 3LF across the
Indian states and flip-flops on the issue of medium of instruction. This paper is a quantitative
assessment of this transition.
Under the 3LF, children were supposed to learn three languages in school. However, lack of
consensus led to lack of uniformity in its implementation1. As it turned out children in the
southern states and in particular Tamil Nadu did not learn Hindi while children from rest of
India did not learn the official language of one of the southern states. This is reflected in state
level differences in the extent of change in the probability of two individuals drawn at random
being able to converse in a common language. There is a clear difference across the northern and
southern states. The probability increased from 0.24 in 1971 to 0.33 in the northern state of
Uttar Pradesh, whereas the corresponding probability of Tamil Nadu was 0.02 both in 1971 and
2011. The differences can be traced to large number of individuals knowing Hindi in Uttar
Pradesh unlike that in Tamil Nadu.
Two issues that continue to be contentious are imposition of official language of the state as
a compulsory subject in schools and medium of instruction. While Tamil Nadu2 and Karnataka
have sought to ensure that children compulsorily learn Tamil and Kannada respectively, in recent
1 https://mha.gov.in/MHA1/Par2017/pdfs/par2014-pdfs/ls-050814/LS%203790.pdf 2 Based on the perception that children were learning English and Hindi or English and Sanskrit, the state government passed the Tamil Nadu Tamil Learning Act in 2006 making it mandatory to teach Tamil and English in schools. https://cms.tn.gov.in/sites/default/files/acts/ACT_13_136_12JUN06_0.pdf
3
years, among the states that have adopted such a policy are Maharashtra and Punjab. Such a
policy disregards the diversity in mother tongues and language spoken at home within these
states. In Maharashtra, the share of population reporting their mother tongue as Marathi
declined from 76 to 69 per cent over 1971-2011. Needless to say that making Marathi a
compulsory subject in school imposes a cost on children whose mother tongue is not Marathi.
On the issue of medium of instruction, Supreme Court of India3 has ruled that the decision
lies with the parents. Recognising that parents are opting for English medium schools for their
children, in recent years, Uttar Pradesh and Andhra Pradesh have sought to make the
government schools English medium. All India, between 2007-08 and 2017-18, the proportion
of children aged 6-14 years studying in English medium schools increased from 12 to 23 per
cent. This suggests that while Hindi will continue to be the dominant link language, English is
gaining strength across all income strata suggesting that it would be incorrect to equate English
with elitism.
This paper is structured as follows. Section 2 provides a selective and brief overview of the
debates. In Section 3, we provide estimates of bilingualism and trilingualism using data from
Census of India tables. The core of the paper is Sections 4 and 5 where we present estimates of
probability of two individuals drawn at random being able to converse in a common language
and the extent to which the school going children and the youth are likely to be bilingual
respectively. Section 6 concludes.
2. Muddling Through Bickering and Compromises
The pursuit of a link language for India can be traced back to the pre-independence era. In
early 1900s, Mahatma Gandhi spearheaded efforts to increase acceptance of Hindustani and its
use in conducting proceedings of Indian National Congress. He highlighted that out of India’s
population of 350 million only 38 million from the Madras Presidency could not understand
Hindustani. He argued that it would be easier for the 38 million people to learn Hindustani
rather than teach English to those who spoke or understood Hindustani. Gandhi backed up his
rhetoric by establishing the Dakshina Bharat Hindi Prachar Sabha in the year 1918 and the
Hindustani Prachar Sabha at Wardha, in 1942. It should not come as a surprise that in 1928, the
3 Section 29 (f) of Right of Children to Free and Compulsory Education Act 2009 (known as RTE) mandates that ‘medium of instructions shall, as far as practicable, be in child's mother tongue’. Hence, the judiciary has been called to interpret the provisions in the Constitution of India and RTE, and hence the validity of policies of state governments pertaining to medium of instruction and imposition of the official language of the state in the schools.
4
Motilal Nehru Report reflected Gandhi’s views and recommended the adoption of Hindustani as
the language of the Commonwealth of India. Among the notable but unsuccessful efforts made
to fructify Gandhi’s vision was the introduction of compulsory teaching of Hindi in the Madras
Presidency in 1937 by the Congress government led by C Rajagopalachari. The imposition of
Hindi led to the anti-Hindi agitation in 1937-40 (Forrester 1966, Lakshmanan 2001). For reasons
related to World War II, the Congress government resigned and the British later withdrew the
decision to make Hindi mandatory in the schools of Tamil Nadu.
By the time the Constituent Assembly began its deliberations, there was little by way of
consensus on making either Hindi or Hindustani an all-India language. The proposal for making
Hindi the national language of India was resisted and viewed as language imperialism. With little
headway made, two members of the assembly, K.M.Munshi and Gopalaswami Ayyangar were
tasked with the responsibility of finding an amicable solution4. Under what came to be known as
the Munshi-Ayyangar formula, the assembly agreed that there will be no mention of a national
language in Constitution of India. While Hindi became the official language, English would
continue to be used for all official purposes for a period of 15 years from the commencement of
the Constitution. This was enshrined in Article 343 in the Constitution of India. Not imposing
Hindi as the national language or the sole official language can be viewed as one of the many
compromises.
Today, there are 22 Scheduled Languages listed under the 8th Schedule of the Constitution of
India. Although inclusion of languages did not give these languages any added benefits, it gives
the speakers of these languages a sense of psychological security and sense of being recognized.
More for practical reasons, rather than solely a compromise, Article 348 (1) of Constitution of
India, requires the proceedings of the Supreme Court and High Courts to be conducted in
English. However, Article 348 (2) does permit proceeding in the High Courts in other languages
with the consent of the President of India. States have sought to permit the use of their official
languages in their respective High Courts. Today, in the High Court of four Indian states, viz.
Bihar, Uttar Pradesh, Rajasthan and Madhya Pradesh, the use of Hindi is permitted. However,
requests by state governments of Chhattisgarh, Gujarat, Tamil Nadu and Karnataka to permit
use of the regional languages in their respective High Courts were not permitted5. The Law
Commission of India6 in its report in 2008 deemed it infeasible to introduce Hindi as a
4 https://www.constitutionofindia.net/constitution_of_india/official_language/articles/Article%20343 5 http://loksabhaph.nic.in/Questions/QResult15.aspx?qref=33031&lsno=16 https://pib.gov.in/newsite/PrintRelease.aspx?relid=132952 6 http://lawcommissionofindia.nic.in/reports/report216.pdf
5
compulsory language in Supreme Court of India. It is only in 2019 that the Supreme Court of
India translated 100 important judgements into regional languages for the benefit of those who
do not know English. The translation of judgements into regional language marks the beginning
of a compromise on the exclusivity of English in Indian courts.
At the time of independence and later during linguistic reorganisation of states, the matter
pertaining to medium of instruction in schools appeared to be a done dusted issue. While
deliberating on linguistic reorganisation of Indian states, the issue of choice of medium of
instruction in schools was discussed. The authors of the Report of the State Reorganization
Commission 1955 opted to be guided by the resolution adopted at Conference of Provincial
Education Ministers held in 1949 and later approved by Government of India (para 775
Government of India 1955). The medium of instruction in the respective states was to be in the
official language of the state or the mother tongue of the child. This is consistent with Article
350A of Constitution of India and provisions in the RTE Act 2009. The Report of the State
Reorganization Commission 1955 took the stance that while the medium of instruction would be
in the regional language, it was equally important to encourage study of English. The Report also
recognised that English was already the medium of instruction for higher education throughout
India. However, the issue of medium of instruction did become a contested issue and the courts
have had to intervene. In 1994, Government of Karnataka decided that the medium of
instruction would be the mother tongue or Kannada in all Government recognised schools. This
was to be effective from the academic year 1994-957. This matter was contested in the courts.
Eventually in 2014, Supreme Court of India ruled on a set of five interrelated questions8
pertaining to mother tongue of children and medium of instruction in primary and secondary
aided and unaided schools. The Court ruled that parents have the right to choose the medium of
instruction irrespective of the mother tongue of the child.
Irrespective of the reason, the policy discourse continues to link medium of instruction and
language spoken at home or mother tongue. Echoes of the thinking from late 1940s and
National Policy on Education 1968 are still evident in NEP 2019 which states, “When possible,
the medium of instruction - at least until Grade 5 but preferably till at least Grade 8 - will be the
home language/mother tongue/local language” (p.80 Government of India 2019) . But, as we
point out later in the paper, this matter is moot today since many states are converting the
7 The Madras High Court struck down the decision of Tamil Nadu government to impose Tamil or the mother tongue of the child as the medium of instruction in primary schools (Pandian 2012). 8 https://main.sci.gov.in/jonew/judis/41504.pdf
6
government schools to English medium. This shift has been brought about by parents voting
with their feet and deciding to send their children to private sector English medium schools.
However, there is still another can of worms, viz. the languages taught in school. The
considered view in 1949 was that if the regional language of the state was different from that of
the mother tongue of the child it should not be introduced before Class III. In contrast, the
NEP 2019 advanced the view that children learned languages better during the ages of 3-8 years
(Government of India 2019). Irrespective of the policy posturing at the central level, the state
governments have formulated their own policies. The 3-LF was controversial in late 1960s and
continues to be so 6 decades later.
The southern states have opposed making Hindi compulsory in schools. The most
prominent example is the Tamil Nadu Tamil Learning Act in 2006 which makes it mandatory to
teach Tamil and English in schools. In 2014, the Government of Tamil Nadu decided to make
Tamil a compulsory subject in all schools in the state, irrespective of the board the school is
affiliated to. In recent years, Punjab, Maharashtra9, Kerala and Karnataka10 have made Punjabi,
Marathi, Malayalam and Kannada respectively as compulsory subjects for all children in classes 1
to 10. Similar to Tamil Nadu, the compulsory language criteria hold in all schools irrespective of
the board the school is affiliated to.
Despite Article 351 of Constitution of India which directs the Union to promote the spread
of the Hindi language, ensuring Hindi as the sole link language or as the medium of expression
for all Indians has proven to be an elusive quest. A measure of success or failure of 3-LF can be
is the extent to which Indians are bilingual or multilingual today and the ability of two Indians to
have a conversation in a common language.
3. Bilingualism in India
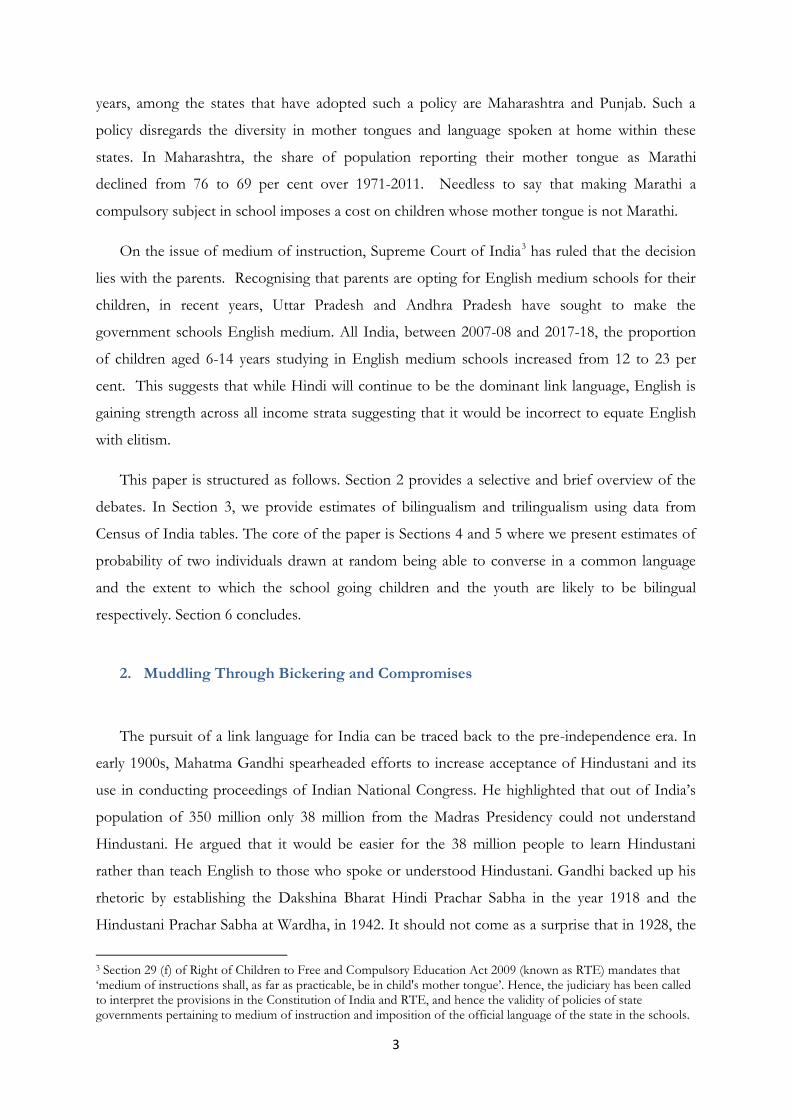
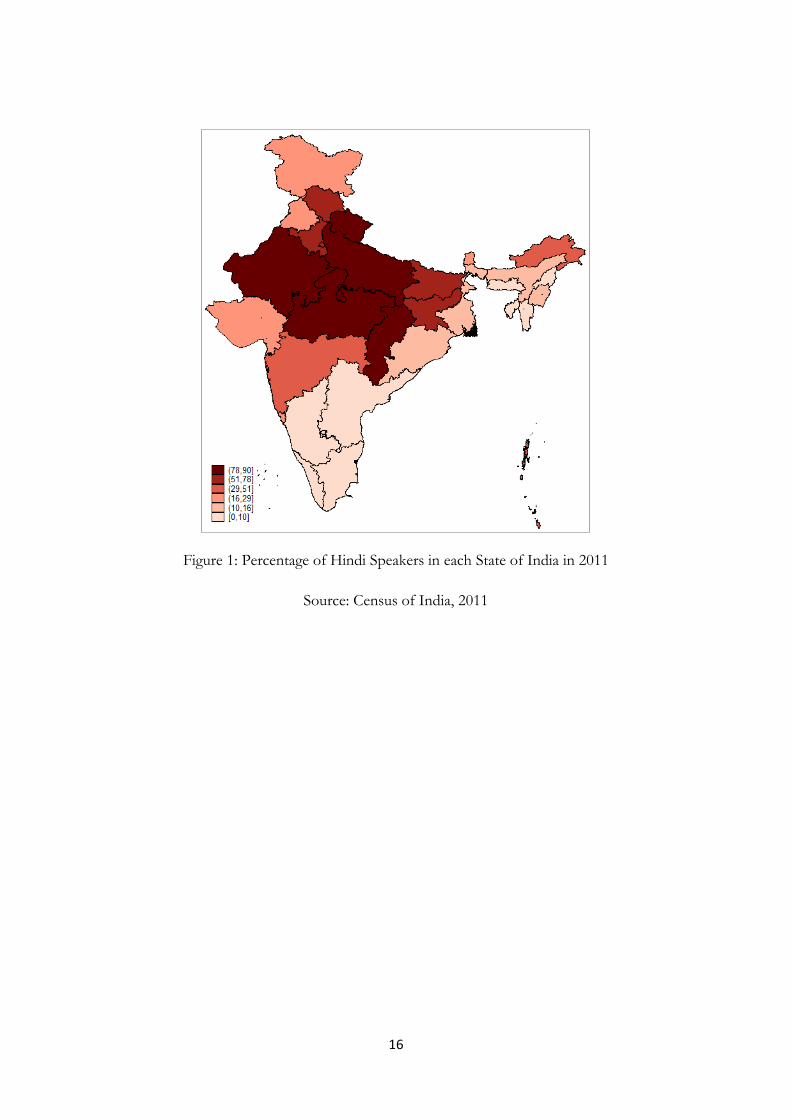
Gandhi pointed out that residents of Madras Presidency, who constituted 11 per cent of
India’s population, could not understand Hindustani. In 2011, the situation was no different.
There continues to be a north-south divide in the proportion of residents of a state who can
speak Hindi (Figure 1). In the four major southern states, viz. Andhra Pradesh, Karnataka,
Kerala and Tamil Nadu, the proportion of residents who spoke Hindi was 9, 8, 7, and 2 per cent
respectively. In contrast, in Chhattisgarh, Madhya Pradesh, Rajasthan, Uttarakhand, and Uttar
9 Maharashtra Compulsory Teaching and Learning of Marathi Language in Schools Bill, 2020 10 Kannada Language Learning Act, 2015
7
Pradesh over 80 per cent of people spoke Hindi. Unlike Hindi, the north-south difference in
distribution of English speakers is not so stark since the proportion of individuals speaking
English is in low double digits. In Andhra Pradesh, Karnataka, Kerala, Tamil Nadu, and Uttar
Pradesh the proportion of residents who spoke English is 10, 8, 15, 14 and 6 per cent
respectively.
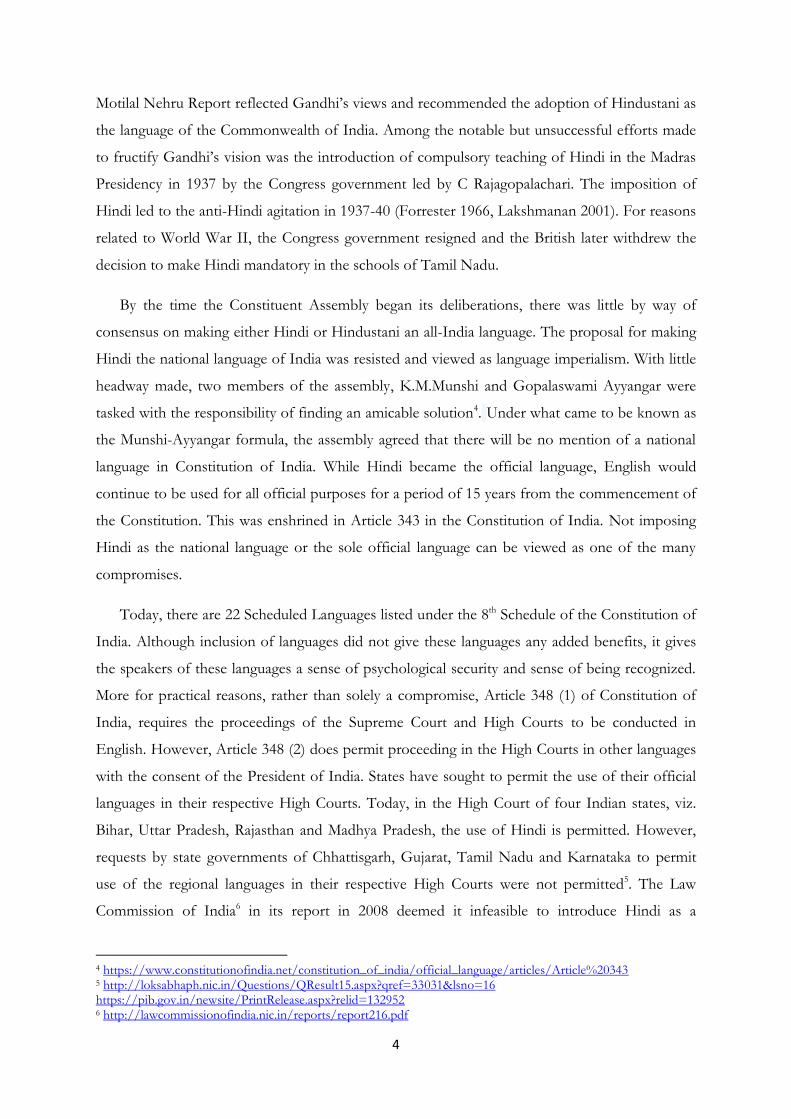
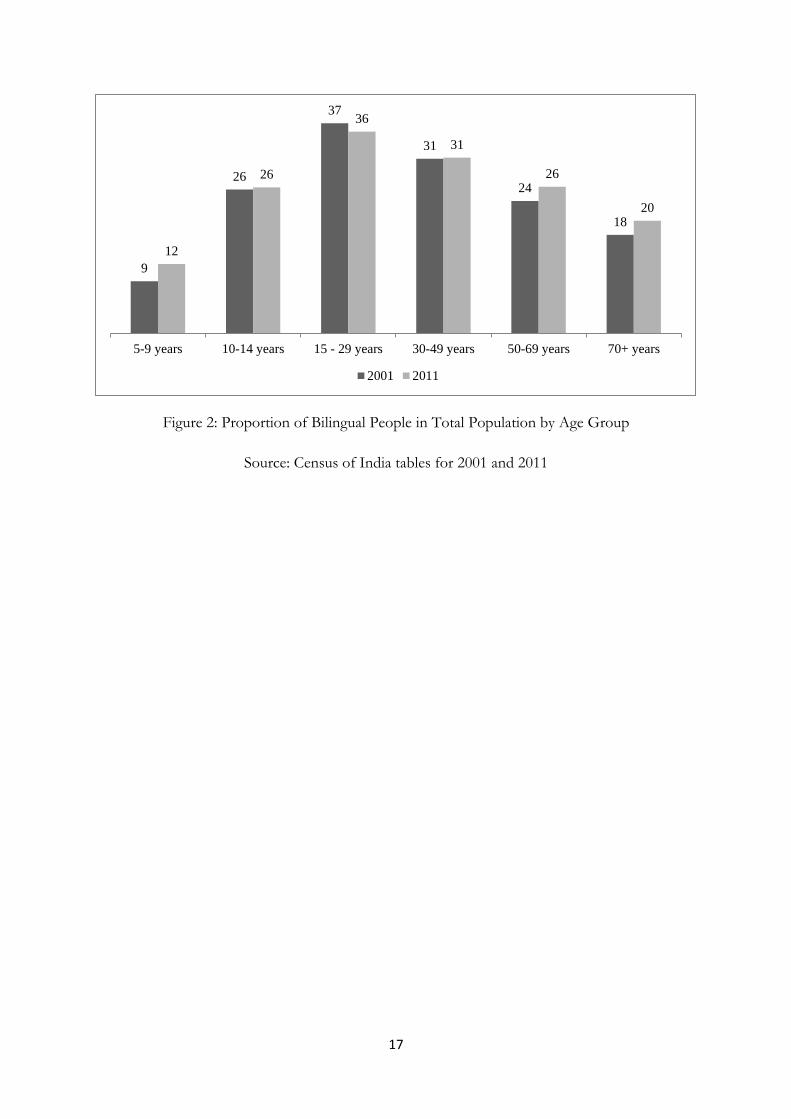
A comparison over time does suggest some interesting patterns. There has been an increase
in the share of bilinguals in the population. A comparison of data from 2001 and 2011 indicates
that the proportion of bilinguals is the highest in the age group 15-29 years (Figure 2). The
number of languages taught in school and the medium of instruction in schools will determine
the rate at which the current and next generation of Indian children will become bilingual or
trilingual. We come back to this issue later in this paper when we analyse data from NSSO’s
survey of education.
Taking a longer time frame, i.e. 1971 and 201111, we find that 12.2 and 24.8 per cent of the
population respectively could speak a scheduled language in addition to their mother tongue. In
1971, among those whose mother tongue is Hindi, 6.4 per cent were bilingual, while among
those whose mother tongue is not Hindi, 16 per cent were bilingual. In 2011, among those
whose mother tongue is Hindi (not Hindi), 11.5 (35.8) per cent were bilingual.
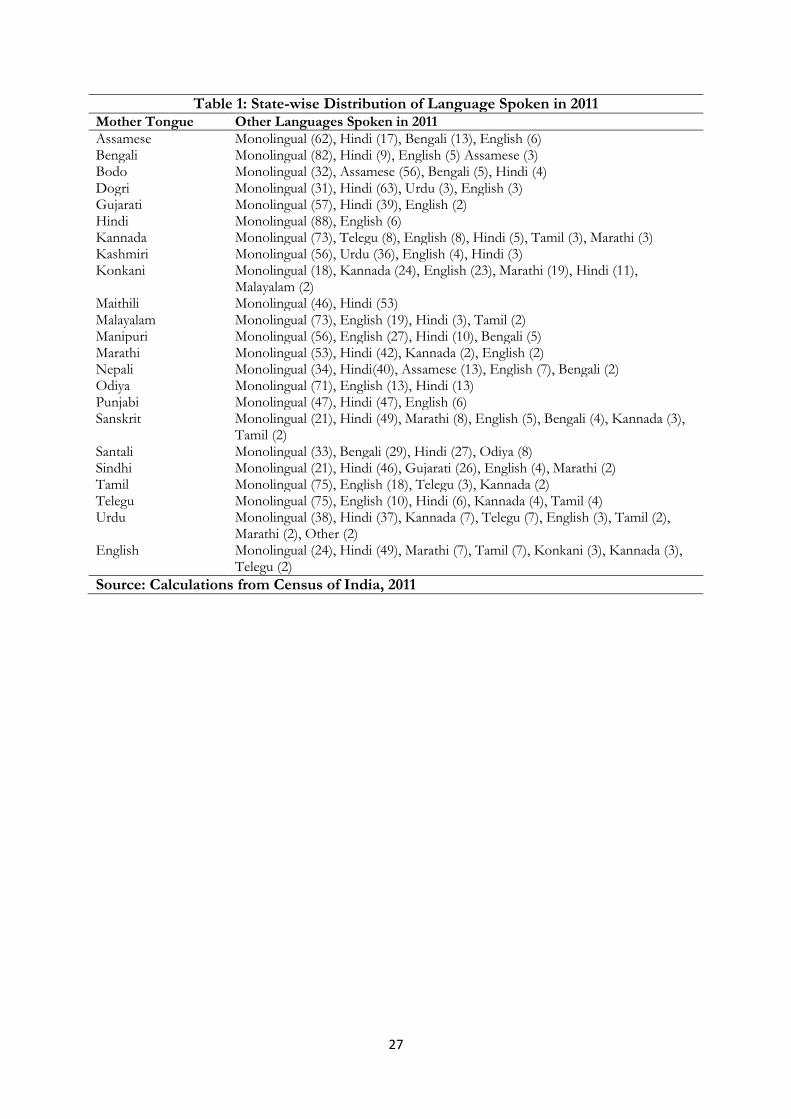
A question of interest is whether the individuals whose mother tongue is Hindi, fluent in
another Indian language or English? Similarly, among those whose mother tongue is not Hindi,
which are the languages spoken by them? In order to flesh out the answers to these questions we
calculate for each mother tongue the proportion of people who are monolingual and the other
languages spoken by those who are not monolingual (Table 1). The proportion of individuals
who are monolingual is over 80 per cent among those whose mother tongue is Bengali or Hindi.
Among those whose mother tongue is Kannada, Malayalam, Tamil and Telugu between 70–75
per cent of them are monolingual. English serves as an important link language for bilingual
people whose mother tongue is one of the four major languages from southern India. The
association of English and not Hindi with south Indian languages is not surprising as the
linguistic distance of a language from Hindi will determine whether individuals from that group
also speak Hindi.
11 There are differences in number of scheduled and non-scheduled languages across 1971 and 2011 censuses.
8
4. Probability of Conversing in a Common Language
As India is moving from being a monolingual to a bilingual country, to what extent has the
probability of two individuals having a conversation in a common language increased? We use
the information on the number of people in each state who speak each language in order to
compute the probability of two individuals drawn at random from population having a
conversation in a common language. The ability to communicate is important in the context of
internal migration, strengthening sub-national linkages and smooth functioning of labour
markets.
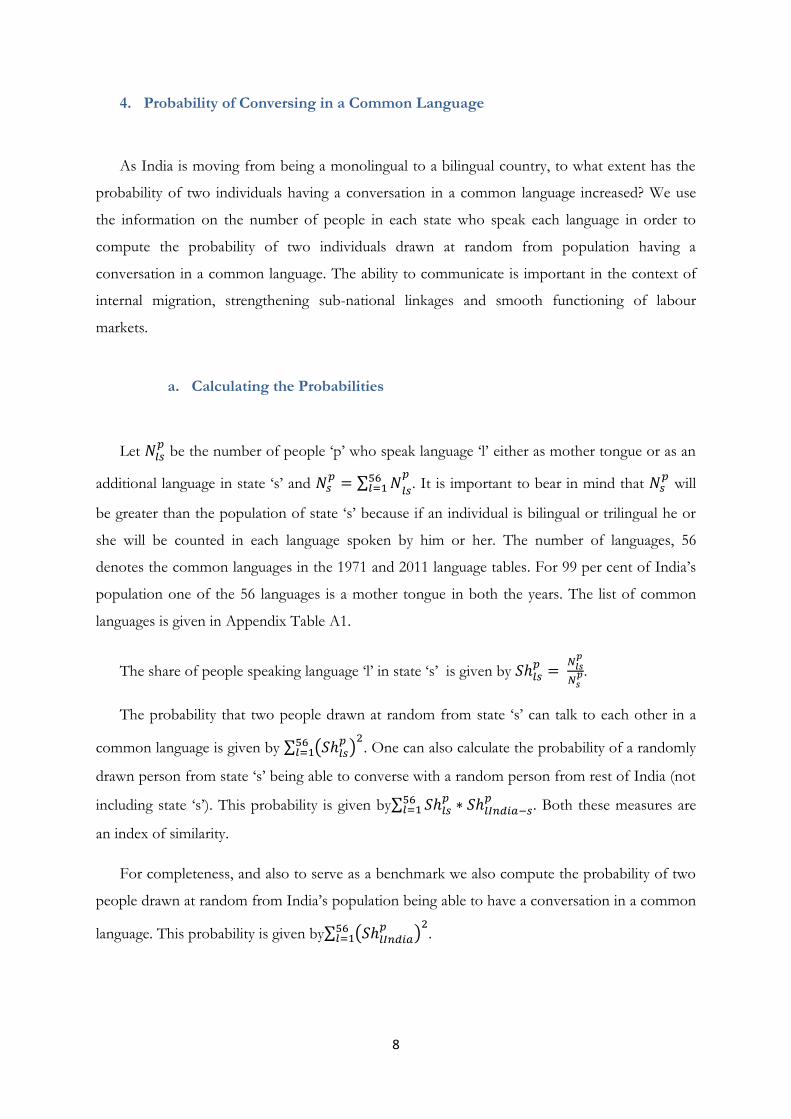
a. Calculating the Probabilities
Let
be the number of people ‘p’ who speak language ‘l’ either as mother tongue or as an
additional language in state ‘s’ and ∑
. It is important to bear in mind that
will
be greater than the population of state ‘s’ because if an individual is bilingual or trilingual he or
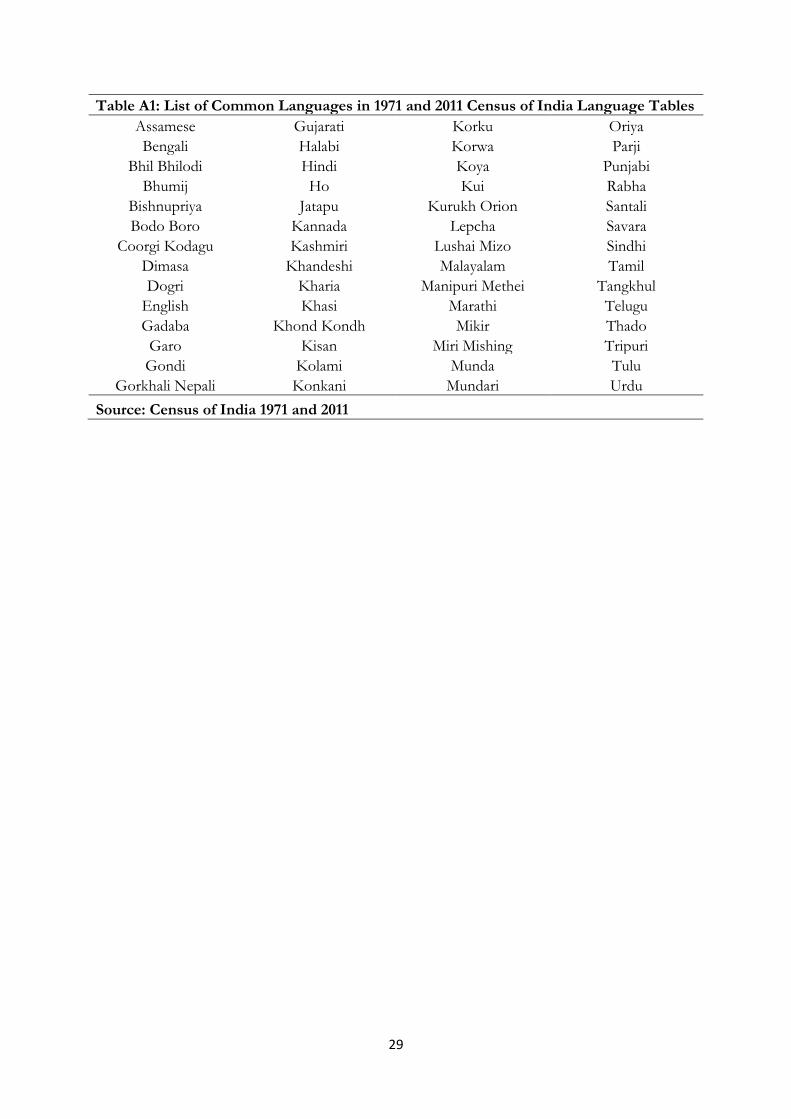
she will be counted in each language spoken by him or her. The number of languages, 56
denotes the common languages in the 1971 and 2011 language tables. For 99 per cent of India’s
population one of the 56 languages is a mother tongue in both the years. The list of common
languages is given in Appendix Table A1.
The share of people speaking language ‘l’ in state ‘s’ is given by
.
The probability that two people drawn at random from state ‘s’ can talk to each other in a
common language is given by ∑ ( )
. One can also calculate the probability of a randomly
drawn person from state ‘s’ being able to converse with a random person from rest of India (not
including state ‘s’). This probability is given by∑
. Both these measures are
an index of similarity.
For completeness, and also to serve as a benchmark we also compute the probability of two
people drawn at random from India’s population being able to have a conversation in a common
language. This probability is given by∑ ( )
.
9
b. Conversing in a Common Language
The probability of two people drawn at random from India’s population being able to
converse in a common language was 0.18 in 1971 and by 2011 it had increased to 0.23, i.e. an
increase of 5 percentage points.
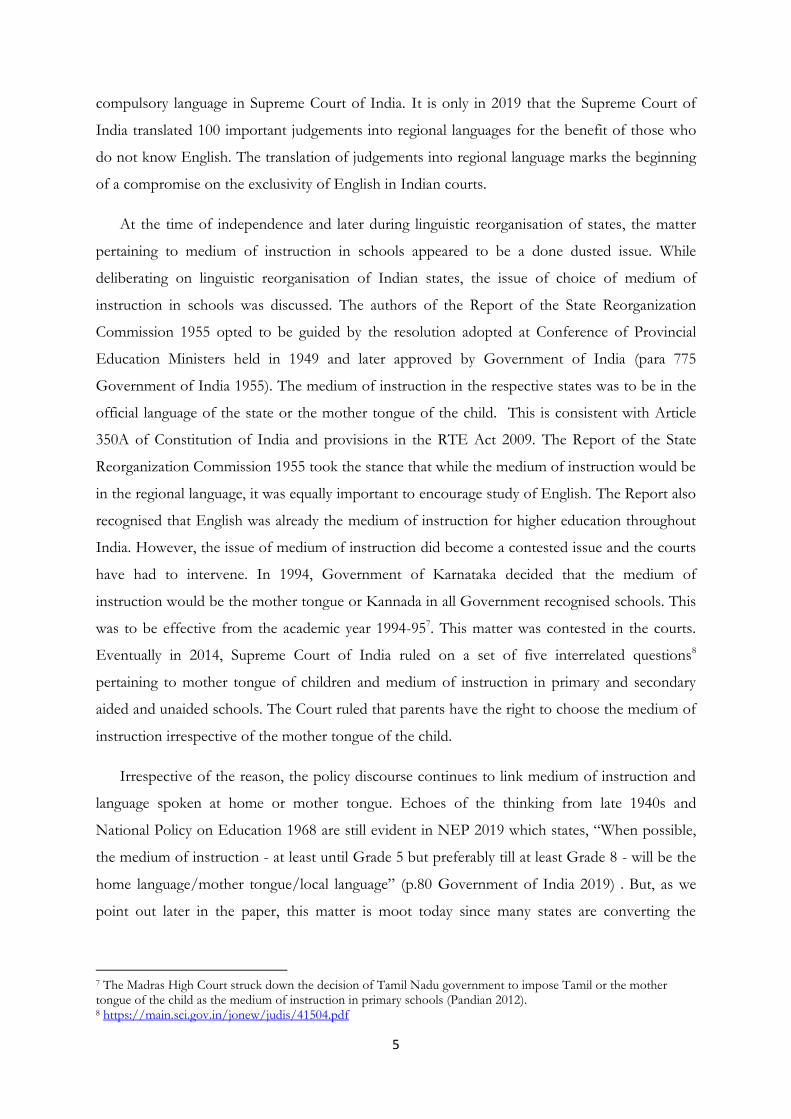
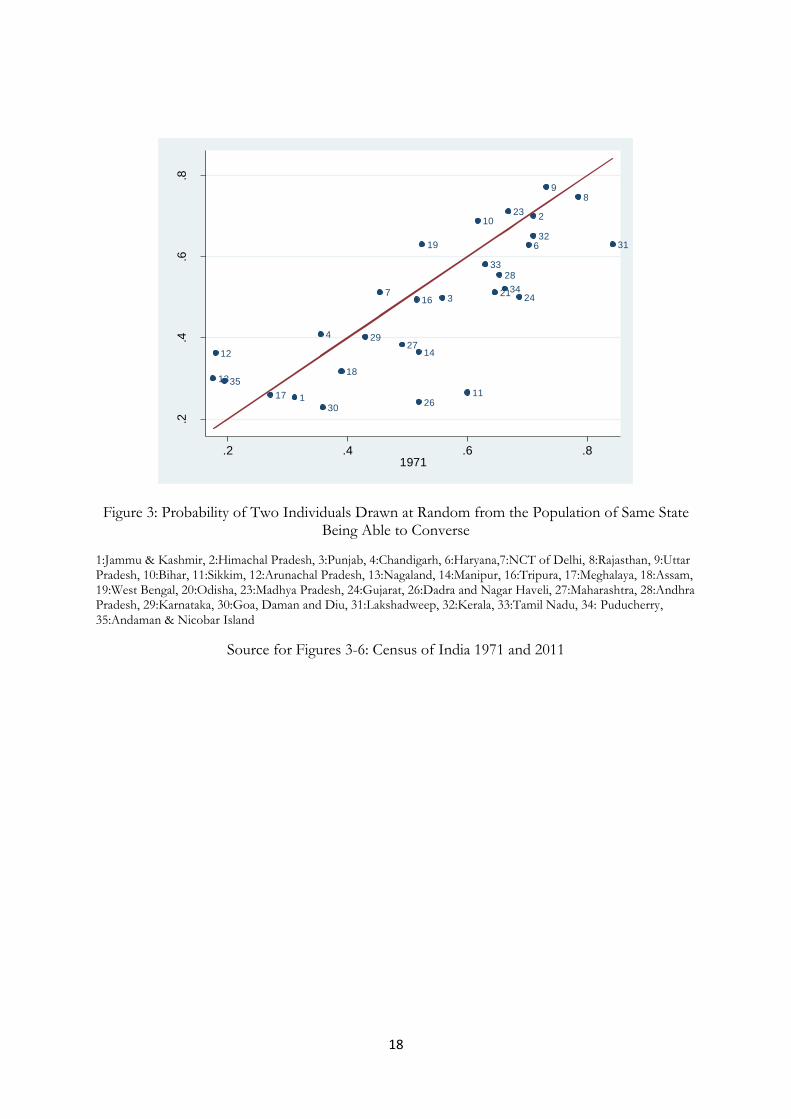
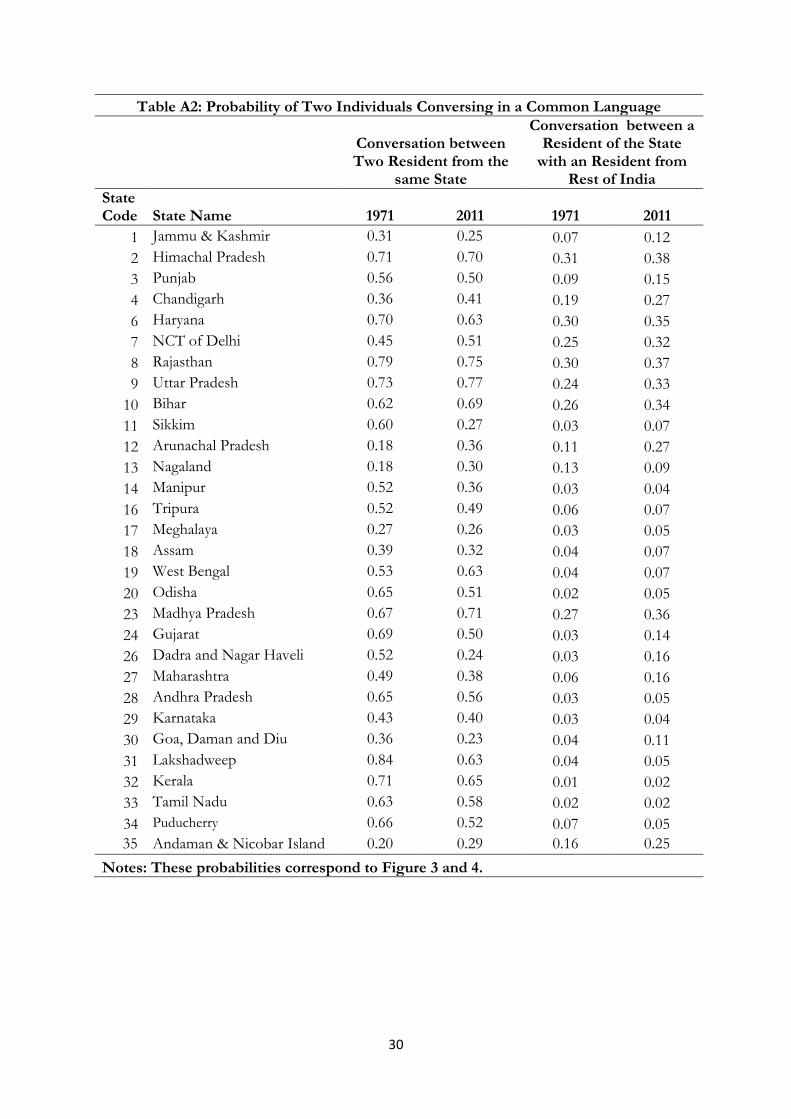
When we examine the sub-national picture some interesting patterns emerge. In Figure 3
(See Appendix Table A2 for actual values) we plot for each state the probability of two
individuals drawn at random from the population of same state being able to converse. On the
X-axis we have the probability for the year 1971 and on the Y-axis we have the probability for
the year 2011. For ease of interpretation, we have also drawn the 450 line. For a particular state, if
the point is above (below) the 450 line it implies that the probability has increased (decreased)
over the period 1971-2011.
Not surprisingly, in case of Bihar, Madhya Pradesh, and Uttar Pradesh, where Hindi is the
dominant language, the probability of a having a conversation between two residents is above 0.6
and it has gone up over time. Also notice that in case of states like Maharashtra, Gujarat, the
plots are below the 450 line, i.e. the probability of having a conversation has declined and the
decline between 1971 and 2011 is by 11 and 19 percentage points respectively. Among the
southern states too we see a decline. One plausible reason would be the inflow of out of state
migrants who have a different mother tongue than the official language of the state.
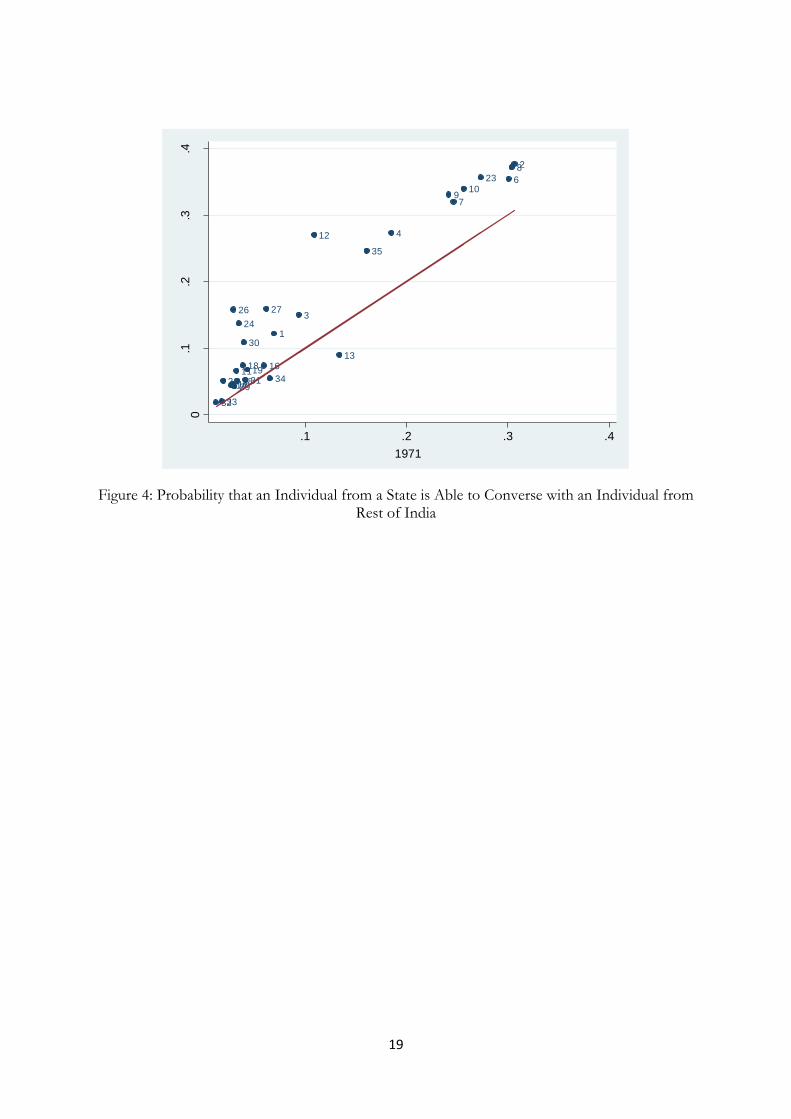
On account of an increase in bilingual population, which would be a by-product of
schooling, and inter-state migration, one should see an increase in the probability of a randomly
drawn person from state ‘s’ being able to converse with a random person from rest of India (not
including state ‘s’). Akin to Figure 3 we have plotted these probabilities in Figure 4 (See
Appendix Table A2 for actual values). We indeed find states moving up the 450 line. But what is
also apparent is a divide which depends on whether Hindi is the primary language or not. The
states where Hindi is not the primary language are clustered in the south-west quadrant, i.e.
closer to the origin.
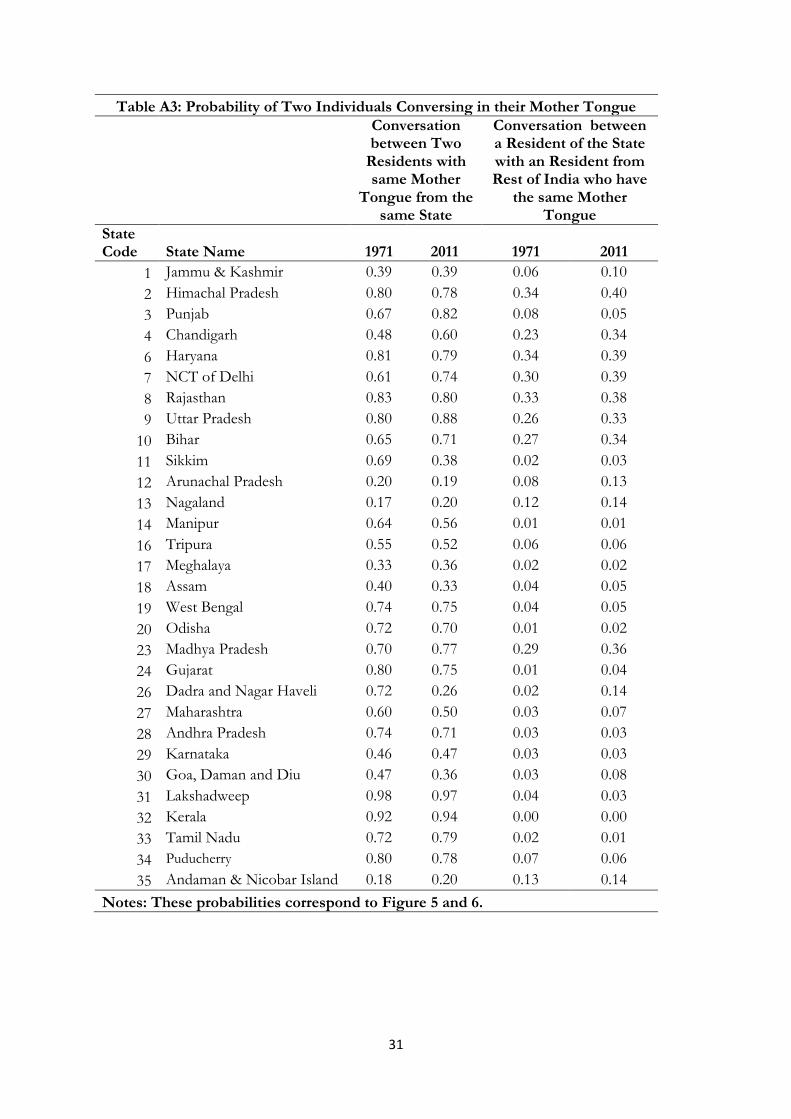
c. Conversing in Mother Tongue
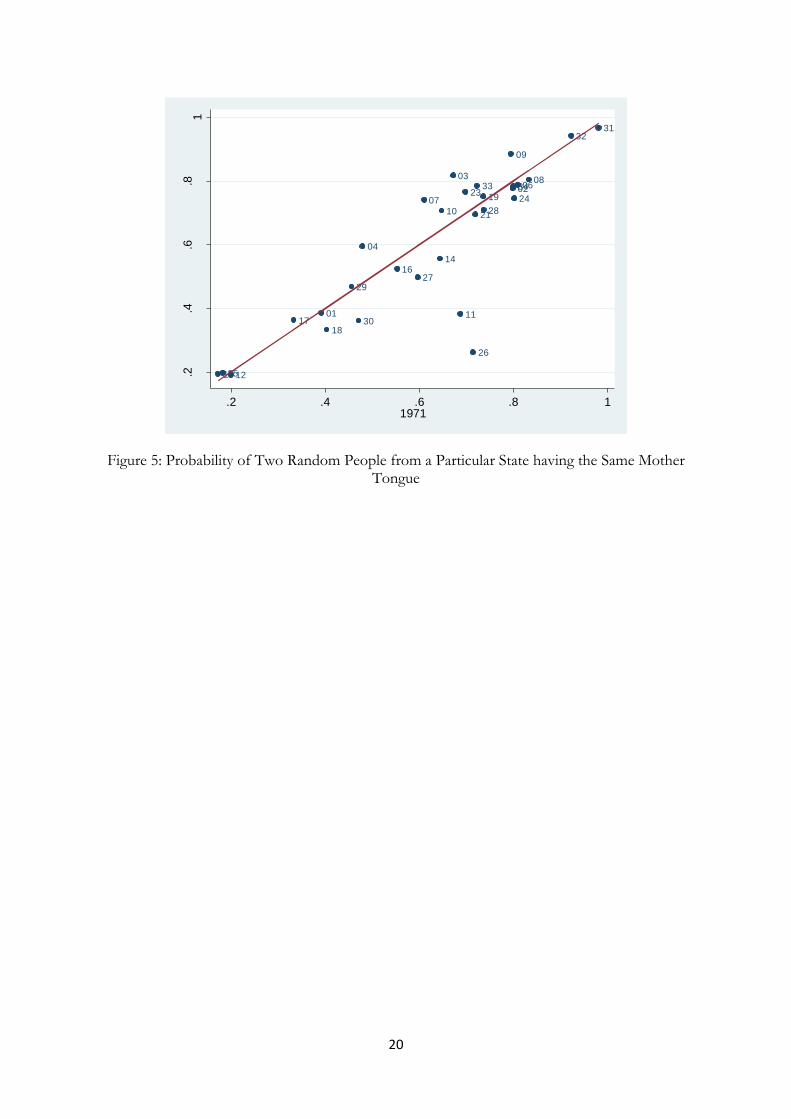
The distribution of mother tongue spoken in each state has changed over time. The changing
distribution of mother tongues will imply that the probability of two random people from a
10
particular state having the same mother tongue will decline. The change over the period 1971-
2011 is depicted in Figure 5 (Appendix Table A3). The pattern is not uniform across all the
major states. The probability of two randomly drawn individuals having a conversation in their
mother tongue in Maharashtra has declined by 10 percentage points from 0.5 to 0.4. In contrast,
in Bihar, Delhi, Madhya Pradesh, Punjab, Tamil Nadu, Uttar Pradesh and West Bengal the
probability of having a conversation between two residents in their mother tongue has increased.
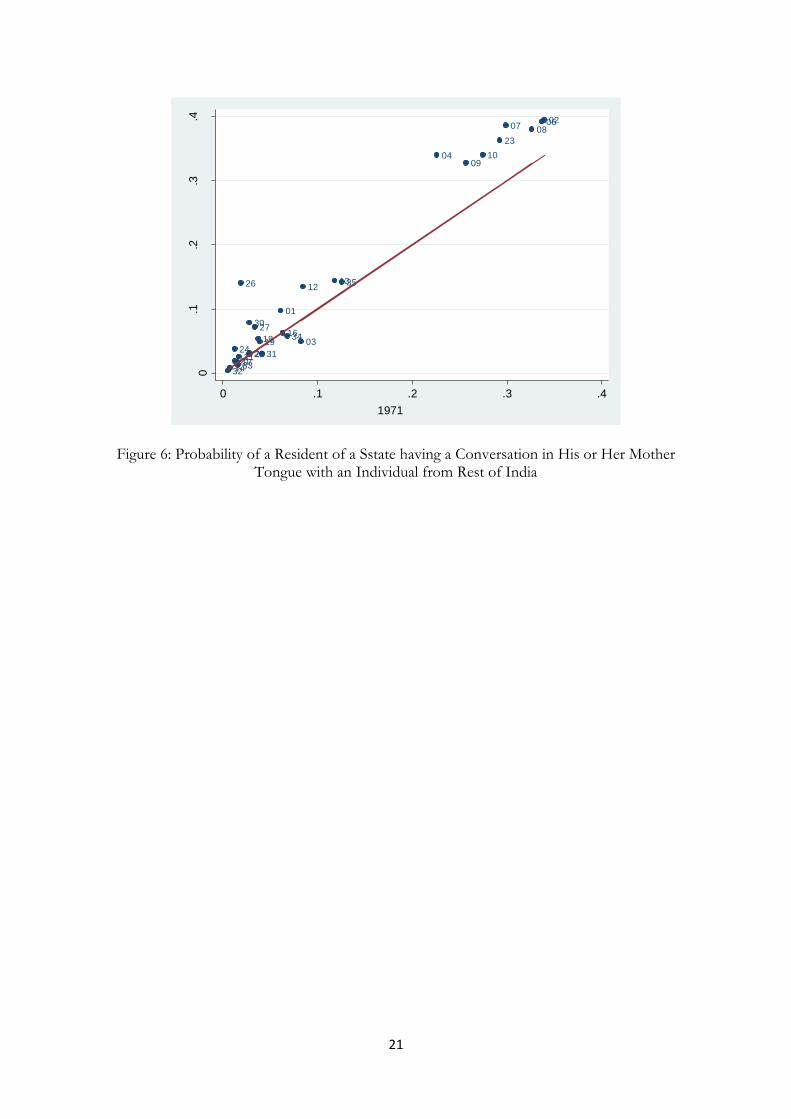
A follow up question of interest pertains to how the probability of a resident of a state
having a conversation in his or her mother tongue with an individual from rest of India has
changed. This is represented in Figure 6. In this case, we find a clear divide among the north
Indian states and the others in the rest of India. In the states forming the Hindi-speaking belt,
viz. Himachal Pradesh, Haryana, NCT Delhi, Rajasthan, Uttar Pradesh and Bihar, the probability
of a resident having a conversation with any random person from rest of India in their mother
tongue is over 0.33 per cent in 2011. The probability of having a conversation with a random
person from India has remained low in the other states of India.
d. Acknowledging Linguistic Diversity
While linguistic diversity, in terms of mother tongues and languages spoken, varies across
Indian states, it is also true that in each state and within each state the diversity has increased.
Maharashtra and West Bengal are contrasting examples. Maharashtra is India’s second most
populace state which attracts a large number of out of state migrants. In Maharashtra, while 76
per cent of population reported their mother tongue to be Marathi in 1971, four decades later, in
2011, only 69 per cent of the population reported their mother tongue to be Marathi. In contrast,
in West Bengal the share of population reporting Bengali as their mother tongue has hovered
around 85 per cent. So it is surprising that unlike Maharashtra, West Bengal has sought to
acknowledge those whose mother tongue is not Bengali. The state has the distinction of having
as many as 11 official languages, the maximum for any Indian state.
The West Bengal Official Language (Second Amendment) Act, 2012 states that if a district,
sub-division, block or municipality has more than 10 per cent population speaking Hindi, Odiya,
Punjabi, Santhali and Urdu, then that language will be adopted as the official language12. Such
12 https://sarthac.gov.in/view-act-file?file_id=2278
11
policies can ensure that language is not a barrier and hence reduce the non-monetary cost of
internal migration.
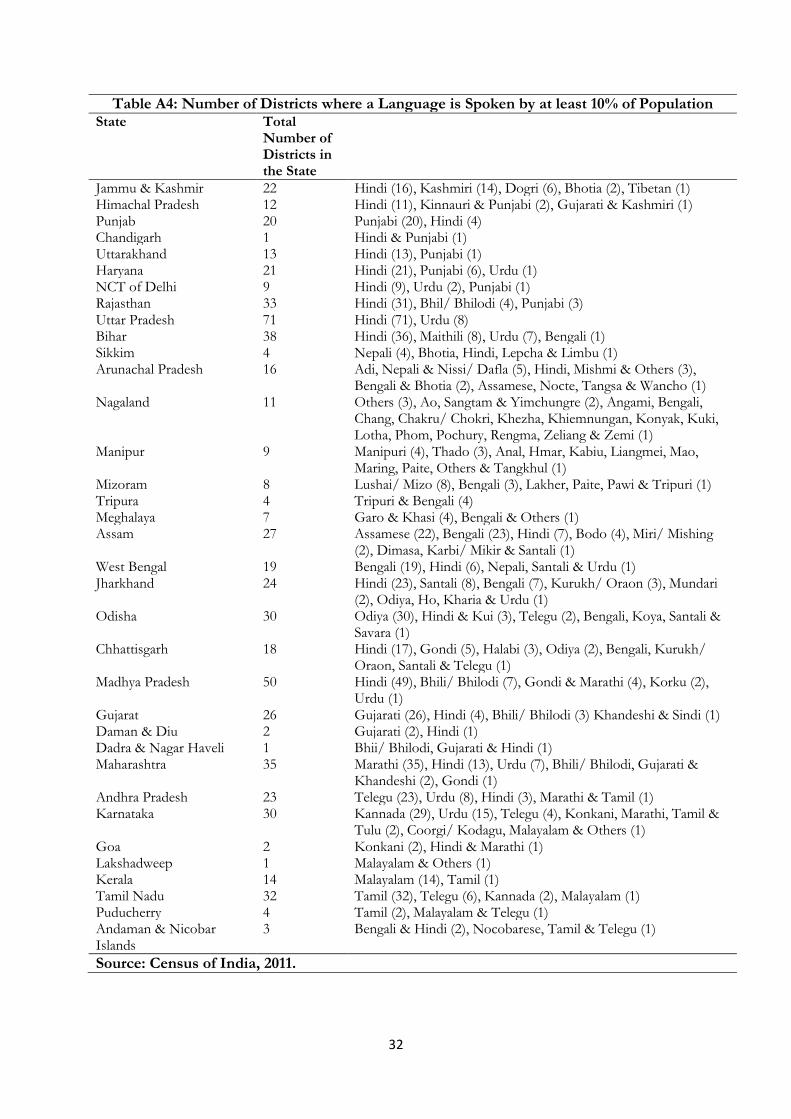
In order to gauge the linguistic diversity, for each state we focussed on the number of
districts where a specific language is spoken as the mother tongue by at least 10 per cent of the
population in 2011 (Appendix Table A4). Among the southern states, the distribution of
languages spoken in Kerala and Tamil Nadu look very different from Andhra Pradesh and
Karnataka. The latter two states have districts where at least 10 per cent of the population
reports their mother tongue as Hindi or Urdu, while the former do not. The two most populace
states, viz. Uttar Pradesh and Maharashtra are contrasts. Unlike Uttar Pradesh, where Hindi
dominates, in Maharashtra where Marathi is the official language, there are districts where over
10 per cent of population in many districts have Urdu and Hindi as their mother tongue.
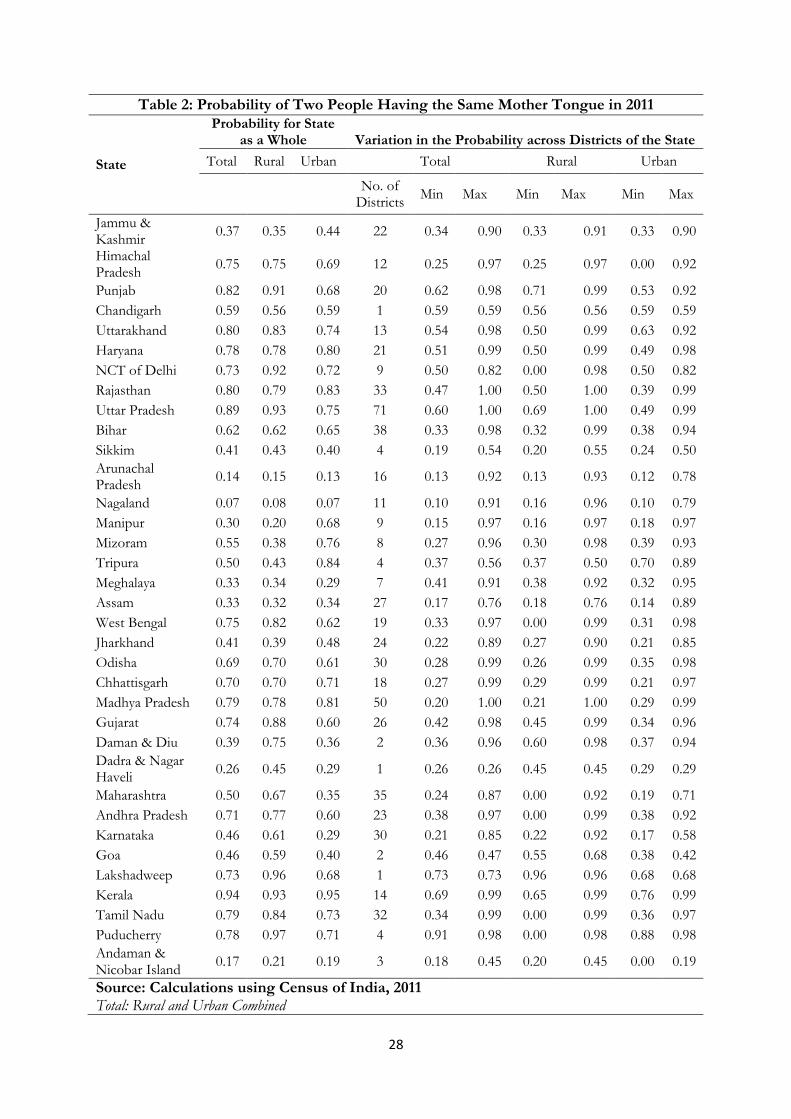
There is considerable heterogeneity in the distribution of mother tongues spoken within a
state as well (Table 2). For instance consider the case of Madhya Pradesh. The probability of two
people having the same mother tongue is 0.79 at the state level, whereas the probability varies
from 0.2 to 1 across districts. Such heterogeneity across districts is also observed in other major
states, viz. Andhra Pradesh, Bihar, Chhattisgarh, Himachal Pradesh, Odisha, Karnataka and
Tamil Nadu and West Bengal. On the other hand, if we consider the states of Kerala, Punjab and
Uttar Pradesh, the probability of two people in a district having a common mother tongue is at
least as high as 0.6. In general, within a state, the probability of two individuals having same
mother tongues is higher in rural areas than in urban areas. This should not come as a surprise
since urban areas attract out of state migrants. If out-of state migrants contribute to the language
diversity of a region, then cities should be more diverse than the state. In other words, the
probability of two people having a conversation in their mother tongue should be lower in a
district-city as compared to a state. We do find this to be true as is evident from the following
probabilities: Maharashtra 0.5 and Mumbai or Mumbai suburban 0.24, West Bengal 0.75 and
Kolkata 0.45, Ahmedabad 0.59 Surat 0.4 and Gujarat 0.74, Chennai 0.63 and Tamil Nadu 0.79,
Bangalore 0.26 and Karnataka 0.46, Hyderabad 0.38 and Andhra Pradesh 0.71.
Over seven decades after independence a pertinent question is whether there are compelling
reasons requiring Indian states to have more than one official language. However this is unlikely.
Meanwhile there is a case for making government documents, deliberations in the legislature, and
judgements delivered by the Indian courts, available in all the scheduled languages. A beginning
has been made with Supreme Court of India translating its important judgements into regional
12
language. A similar effort needs to be made by the state governments in terms making the
official documents available in languages other than the official language of the state.
5. Bilingualism in Next Generation
Notwithstanding the provision in the Constitution of India and RTE Act, in recent times,
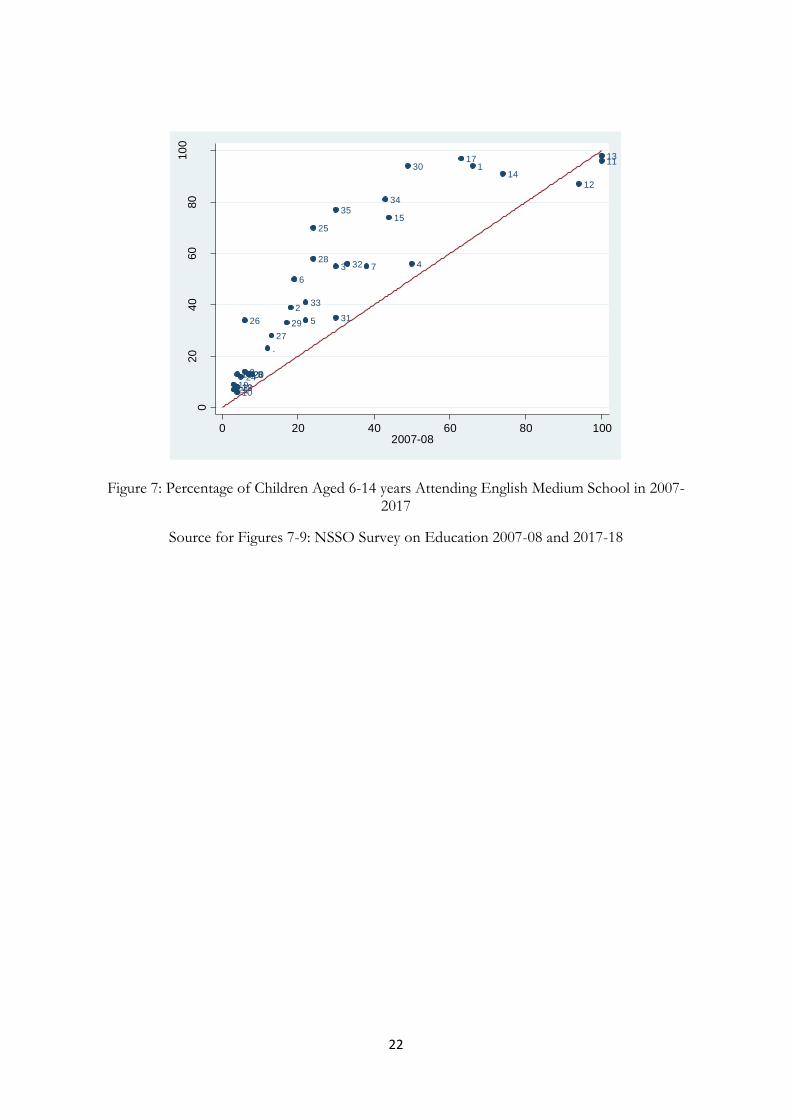
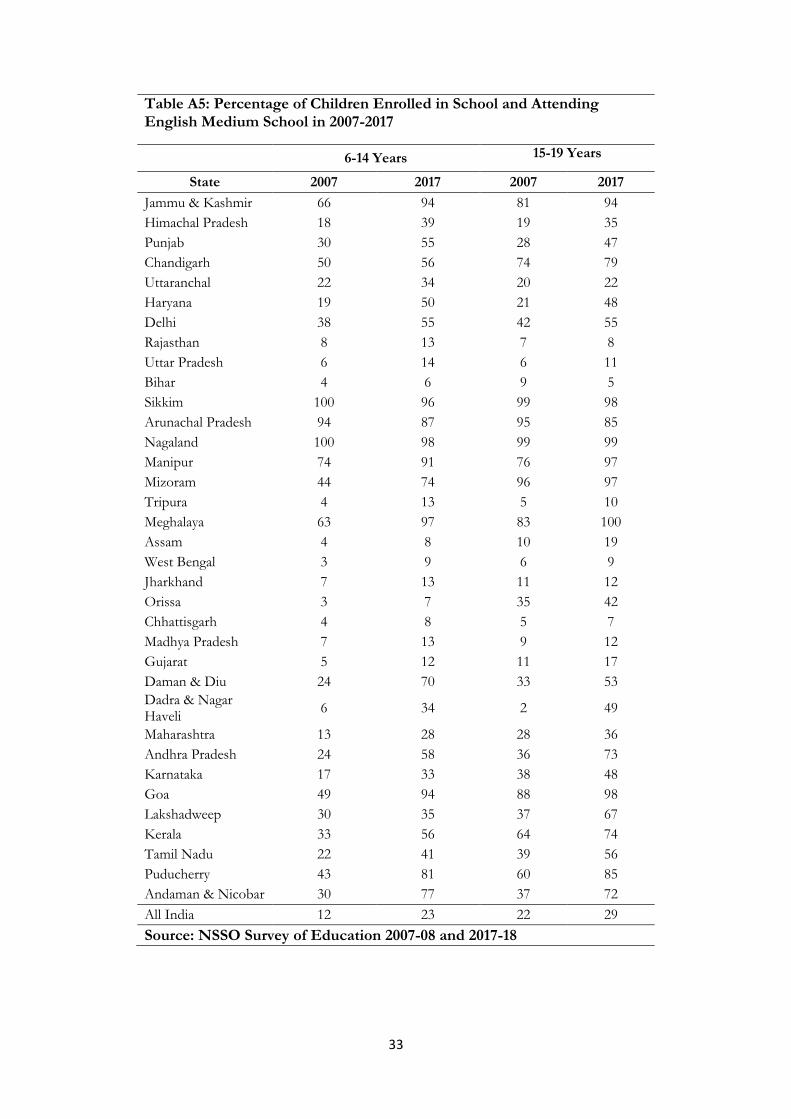
there has been a clear shift in proportion of children studying in English medium schools. Data
from NSSO’s survey of education 2007-08 and 2017-18 suggest that there has been an increase
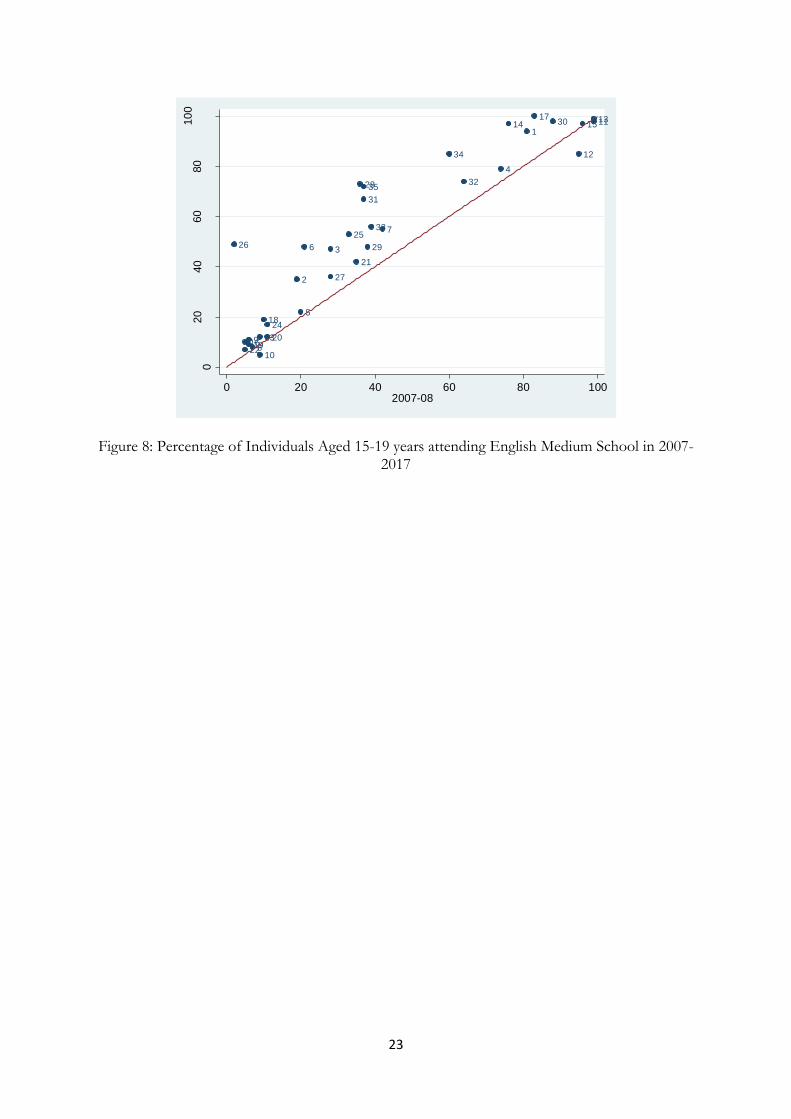
in proportion of those aged 6-14 years and 15-19 years studying in an English medium
institution (Figure 7 and 8 and Appendix Table A5). Among the major states where the
proportion of children aged 6-14 years and 15-19 years studying in English medium school is less
than 20 per cent are Assam, Bihar, Chhattisgarh, Gujarat, Jharkhand, Madhya Pradesh,
Rajasthan, Uttar Pradesh and West Bengal. This is not to suggest that these states have not seen
any increase in proportion of children enrolled in English medium schools between 2007-08 and
2017-18. It is just that they have not caught up with the other major states in terms of
proportion of children in English medium schools.
Parents are opting for private English medium schools because of higher returns to
education. The characterisation of the trend towards English as ‘unfortunate’ by NEP is
incorrect since there are higher returns to knowledge of English. Chakraborty and Bakshi (2016)
who estimate English skill premium in labour market find that a 10 per cent lower probability of
learning English in primary classes leads to a decline in weekly wages by 8 per cent.
Recent developments suggest that many state governments including Uttar Pradesh, and
Andhra Pradesh have recognised the emerging realities and sought to convert the medium of
instruction in many government schools to English. Over the period 2007-08 and 2017-18, in
Andhra Pradesh, Kerala, Punjab and Tamil Nadu we see a more than 5 per cent increase in
proportion of children aged 6-14 years enrolled in government English medium schools. While
the largest proportions of Indians are Hindi speaking, the fact that increasingly many of them are
opting to learn in English cannot be ignored. If at all a link language is gaining strength then it is
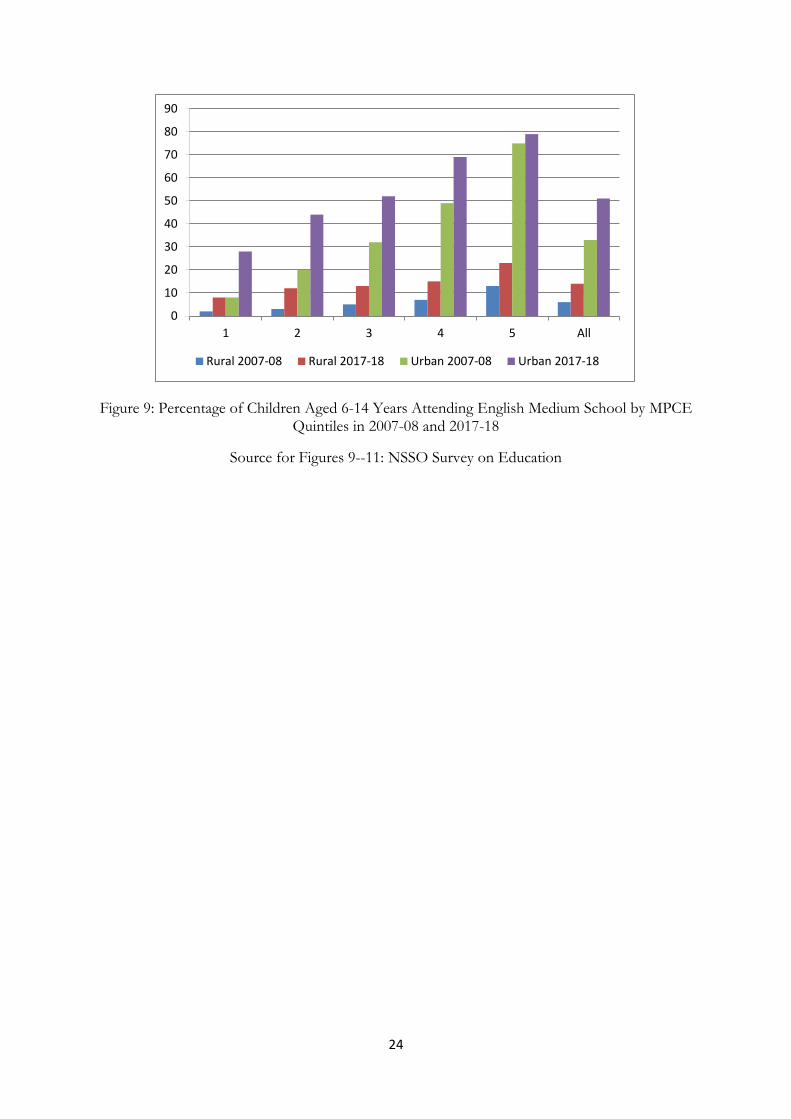
English. While NEP 2019 equates adoption of English with elitism, what is however evident
from NSSO data is that the increase in enrolment in English medium is evident across the entire
distribution of consumption expenditure (Figure 9).
13
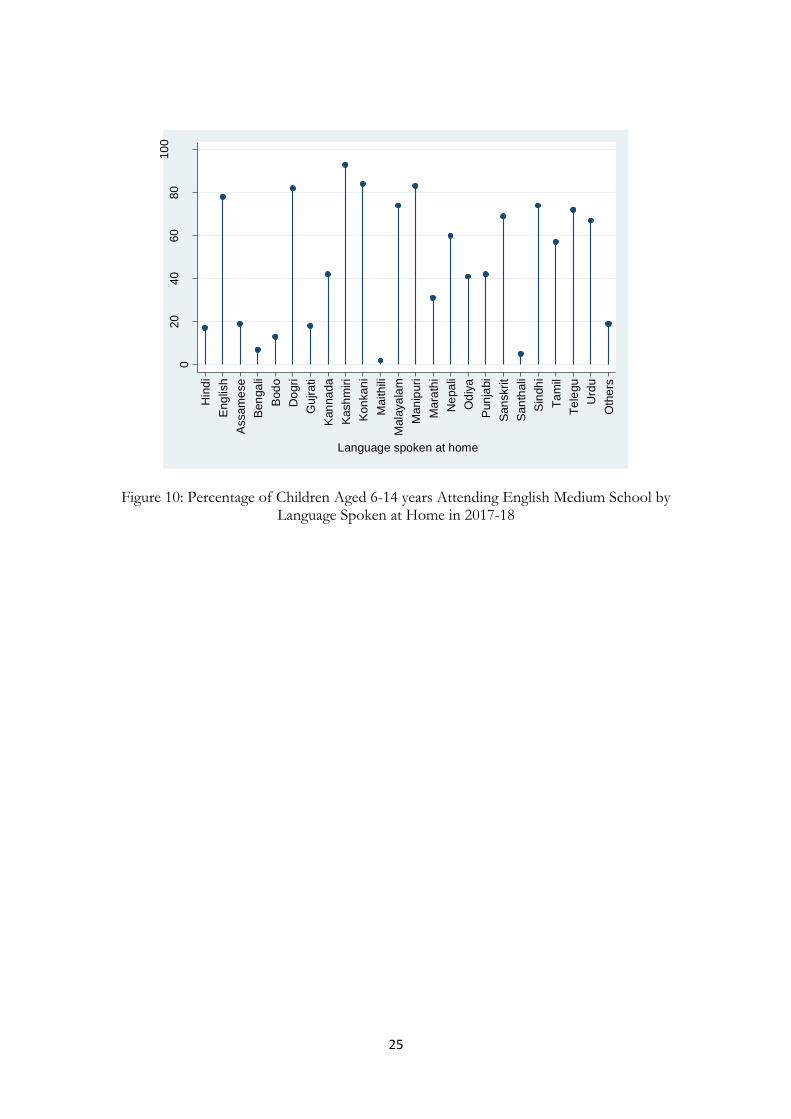
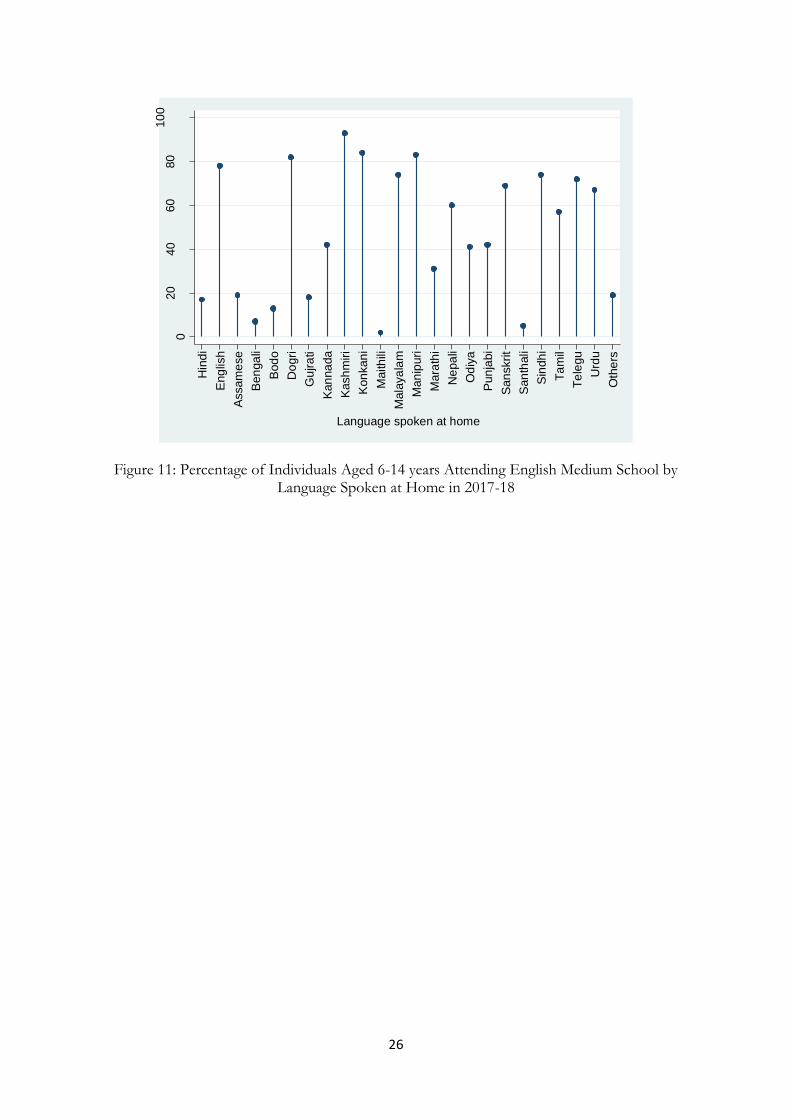
The data also suggests that the medium of instruction is not necessarily the language spoken
at home. In Figures 10 and 11, we plot for each mother tongue the proportion of children aged
6-14 years and youth aged 15-19 years studying in an English medium school. Children aged 6-14
years who speak Kannada, Malayalam, Punjabi, Tamil or Telugu at home are more likely to be
enrolled in English medium schools. This is also true in case of 15-19 year olds in households
which speak one of the above mentioned four languages identified with the southern states.
To what extent are the children and youth of India multilingual? It would have been ideal if
in addition to language spoken at home and medium of instruction in school NSSO’s survey had
asked a question on the languages learnt by a child or youth in school. This would have given a
precise estimate of diversity of languages learnt by children and youth. The best that we can do
with NSSO data is to classify an individual as monolingual if the language spoken at home is the
same as the medium of instruction in school and as a bilingual if the medium of instruction and
language spoken at home are different. We do recognize that the estimate thus derived is a lower
bound since it is likely that some individuals whose medium of instruction is the same as
language spoken at home could be conversant with another language.
We find that in the age group 6-14 and 15-29 years, 34 per cent and 41 per cent children are
respectively bilingual. Among those aged 6-14 years and whose language spoken at home is not
the same as the medium of instruction, the medium of instruction is Hindi for 23 per cent of
them and English for 67 per cent. Among those aged 15-29 years, the corresponding numbers
are 16 percent (Hindi) and 78 per cent (English). These estimates too are on the lower side since
even if the medium of the instruction is the same as the language spoken at home children still
learn English in schools.
Of relevance to our discussion, two important patterns emerge from the Eighth All India
School Education Survey. There has been an increase in the number of schools with two or
more medium of instruction. As per the estimates, at the primary, upper primary and secondary
stage, 13.51 per cent, 17.77 per cent and 21.69 per cent of schools respectively have two or more
medium of instruction. The proportion of Hindi and English medium also increased (National
NCERT 2016). All facts considered together, it would appear that Hindi and English serve as the
link languages and their importance will continue to become stronger in the coming decade.
14
6. Conclusion
The issue of language has proven to be both a political and emotive issue. Be it the framers
of the Constitution of India or educationist or politicians almost everyone has weighed in on the
issue of language. Gandhi believed that all Indians needed to be learn a common language, viz.
Hindi. He believed that a link language was central to integrating India. What we find is that the
probability of two Indians being able to converse in a common language has increased from 0.18
in 1971 to 0.23 in 2011. Whether it is the probability or the proportion of Indians who are
bilingual, the change has been at a glacial pace. This is because of the resistance among the
political class in the southern states to permit compulsory teaching of Hindi since they perceive
that this would dilute the dominance of the respective regional languages. In the north, there
really has never been a concerted effort to teach a language from the southern states in the
schools. Riding on the back of the wisdom of educationists, arguments have been advanced to
ensure that the medium of instruction is the language spoken at home. However, in recent times,
there has been clear shift in preference of parents since they are enrolling children in English
medium schools. This would suggest that English will emerge as a link language in the coming
generations. While there is a literature on labour markets returns to knowledge of English
language, a under researched area is the costs imposed on children on account of having the
official language of the state as a compulsory subject in school. The most recent instance is the
Maharashtra Compulsory Teaching and Learning of Marathi Language in Schools Bill, 2020.
Such costs can act as a barrier to internal migration of households.
Our ability to derive meaningful insights for informing debates on language policies is
constrained by the nature of data collected. At present, Census of India collects information
about the mother tongue of the individual and ability to speak any other language. It would be
useful to add a question on the ability to read and write, and for those who are working whether
there are language requirements at work place. Administrative data from school records can
provide useful insights. How many languages are taught in schools across the classes other than
the medium of instruction? This would not only help in understanding about the implementation
of 3LF in schools but also help in having a better understanding of bilingualism in the next
generation. Does India have enough teachers proficient in a language or able to teach the various
subjects in English or other languages?
Some additional questions need to be included in NSSO’s surveys. It would be important to
include in NSSO’s Periodic Labour Force Survey a question on language requirements at work.
15
The Survey of Education collects information about the language spoken at home. What we do
not know is anything about the proficiency of individuals in the language spoken at home. In
addition to the existing question, for those attending school, on medium of instruction, it would
be important to add a question on languages taught in school. This would help in understanding
if the next generation of Indians are becoming more integrated in terms of language.
References
Chakraborty T. & Bakshi, S. K. (2016) English language premium: Evidence from a policy
experiment in India. Economics of Education Review, 50, 1-16.
Forrester, D. (1966). The Madras Anti-Hindi Agitation, 1965: Political Protest and its Effects on
Language Policy in India. Pacific Affairs, 39(1/2), 19-36.
Government of India (1955) Report of the States Reorganisation Commission
Government of India (1968) National Policy on Education
Government of India (2019) Draft National Education Policy
Lakshmanan M (2001) Language and the Nationality Question in Tamil Nadu, 1938-42, Indian
Historical Review. Volume XXVIII. No 1-2 (January & July 2001). pp. 128-150.
NCERT (2016) Eighth All India School Education Survey: A Concise Report
Pandian M. S. S. (2012). Being 'Hindu' and Being 'Secular': Tamil 'Secularism' and Caste
Politics. Economic and Political Weekly, 61-67.
16
Figure 1: Percentage of Hindi Speakers in each State of India in 2011
Source: Census of India, 2011
17
Figure 2: Proportion of Bilingual People in Total Population by Age Group
Source: Census of India tables for 2001 and 2011
9
26
37
31
24
18
12
26
36
31
26
20
5-9 years 10-14 years 15 - 29 years 30-49 years 50-69 years 70+ years
2001 2011
18
Figure 3: Probability of Two Individuals Drawn at Random from the Population of Same State Being Able to Converse
1:Jammu & Kashmir, 2:Himachal Pradesh, 3:Punjab, 4:Chandigarh, 6:Haryana,7:NCT of Delhi, 8:Rajasthan, 9:Uttar Pradesh, 10:Bihar, 11:Sikkim, 12:Arunachal Pradesh, 13:Nagaland, 14:Manipur, 16:Tripura, 17:Meghalaya, 18:Assam, 19:West Bengal, 20:Odisha, 23:Madhya Pradesh, 24:Gujarat, 26:Dadra and Nagar Haveli, 27:Maharashtra, 28:Andhra Pradesh, 29:Karnataka, 30:Goa, Daman and Diu, 31:Lakshadweep, 32:Kerala, 33:Tamil Nadu, 34: Puducherry, 35:Andaman & Nicobar Island
Source for Figures 3-6: Census of India 1971 and 2011
1
2
3
4
6
7
89
10
11
12
13
14
16
17
18
19
21
23
24
26
27
28
29
30
3132
33
34
35
.2.4
.6.8
20
11
.2 .4 .6 .81971
19
Figure 4: Probability that an Individual from a State is Able to Converse with an Individual from Rest of India
1
2
3
4
6
7
8
910
11
12
13
14
16
17
1819
21
23
24
26 27
2829
30
31
3233
34
35
0.1
.2.3
.4
20
11
.1 .2 .3 .4
1971
20
Figure 5: Probability of Two Random People from a Particular State having the Same Mother Tongue
01
02
03
04
06
07
08
09
10
11
1213
1416
1718
19
21
2324
26
27
28
29
30
3132
33 34
35.2.4
.6.8
1
20
11
.2 .4 .6 .8 11971
21
Figure 6: Probability of a Resident of a Sstate having a Conversation in His or Her Mother Tongue with an Individual from Rest of India
01
02
03
04
0607 08
0910
11
1213
14
16
17
1819
21
23
24
26
27
2829
30
31
3233
34
35
0.1
.2.3
.4
20
11
0 .1 .2 .3 .4
1971
22
Figure 7: Percentage of Children Aged 6-14 years Attending English Medium School in 2007-2017
Source for Figures 7-9: NSSO Survey on Education 2007-08 and 2017-18
1
2
3 4
5
6
7
89
10
11
12
13
14
15
16
17
181920
2122
2324
25
26
27
28
29
30
31
32
33
3435
.
020
40
60
80
10
0
20
17
-18
0 20 40 60 80 1002007-08
23
Figure 8: Percentage of Individuals Aged 15-19 years attending English Medium School in 2007-2017
1
2
3
4
5
6
7
89
10
11
12
1314 15
16
17
18
1920
21
22
23
24
2526
27
28
29
30
31
32
33
34
35
020
40
60
80
10
0
20
17
-18
0 20 40 60 80 1002007-08
24
Figure 9: Percentage of Children Aged 6-14 Years Attending English Medium School by MPCE Quintiles in 2007-08 and 2017-18
Source for Figures 9--11: NSSO Survey on Education
0
10
20
30
40
50
60
70
80
90
1 2 3 4 5 All
Rural 2007-08 Rural 2017-18 Urban 2007-08 Urban 2017-18
25
Figure 10: Percentage of Children Aged 6-14 years Attending English Medium School by Language Spoken at Home in 2017-18
020
40
60
80
10
0
Hin
di
Eng
lish
Assam
ese
Ben
ga
li
Bod
o
Do
gri
Gu
jra
ti
Kan
na
da
Kash
miri
Kon
kan
i
Maith
ili
Mala
ya
lam
Man
ipuri
Mara
thi
Ne
pa
li
Od
iya
Pun
jabi
San
skrit
San
thali
Sin
dh
i
Ta
mil
Te
legu
Urd
u
Oth
ers
Language spoken at home
26
Figure 11: Percentage of Individuals Aged 6-14 years Attending English Medium School by Language Spoken at Home in 2017-18
020
40
60
80
10
0
Hin
di
Eng
lish
Assam
ese
Ben
ga
li
Bod
o
Do
gri
Gu
jra
ti
Kan
na
da
Kash
miri
Kon
kan
i
Maith
ili
Mala
ya
lam
Man
ipuri
Mara
thi
Ne
pa
li
Od
iya
Pun
jabi
San
skrit
San
thali
Sin
dh
i
Ta
mil
Te
legu
Urd
u
Oth
ers
Language spoken at home
27
Table 1: State-wise Distribution of Language Spoken in 2011
Mother Tongue Other Languages Spoken in 2011
Assamese Monolingual (62), Hindi (17), Bengali (13), English (6) Bengali Monolingual (82), Hindi (9), English (5) Assamese (3) Bodo Monolingual (32), Assamese (56), Bengali (5), Hindi (4) Dogri Monolingual (31), Hindi (63), Urdu (3), English (3) Gujarati Monolingual (57), Hindi (39), English (2) Hindi Monolingual (88), English (6) Kannada Monolingual (73), Telegu (8), English (8), Hindi (5), Tamil (3), Marathi (3) Kashmiri Monolingual (56), Urdu (36), English (4), Hindi (3) Konkani Monolingual (18), Kannada (24), English (23), Marathi (19), Hindi (11),
Malayalam (2) Maithili Monolingual (46), Hindi (53) Malayalam Monolingual (73), English (19), Hindi (3), Tamil (2) Manipuri Monolingual (56), English (27), Hindi (10), Bengali (5) Marathi Monolingual (53), Hindi (42), Kannada (2), English (2) Nepali Monolingual (34), Hindi(40), Assamese (13), English (7), Bengali (2) Odiya Monolingual (71), English (13), Hindi (13) Punjabi Monolingual (47), Hindi (47), English (6) Sanskrit Monolingual (21), Hindi (49), Marathi (8), English (5), Bengali (4), Kannada (3),
Tamil (2) Santali Monolingual (33), Bengali (29), Hindi (27), Odiya (8) Sindhi Monolingual (21), Hindi (46), Gujarati (26), English (4), Marathi (2) Tamil Monolingual (75), English (18), Telegu (3), Kannada (2) Telegu Monolingual (75), English (10), Hindi (6), Kannada (4), Tamil (4) Urdu Monolingual (38), Hindi (37), Kannada (7), Telegu (7), English (3), Tamil (2),
Marathi (2), Other (2) English Monolingual (24), Hindi (49), Marathi (7), Tamil (7), Konkani (3), Kannada (3),
Telegu (2)
Source: Calculations from Census of India, 2011
28
Table 2: Probability of Two People Having the Same Mother Tongue in 2011
State
Probability for State as a Whole Variation in the Probability across Districts of the State
Total Rural Urban Total Rural Urban
No. of
Districts Min Max Min Max Min Max
Jammu & Kashmir
0.37 0.35 0.44 22 0.34 0.90 0.33 0.91 0.33 0.90
Himachal Pradesh
0.75 0.75 0.69 12 0.25 0.97 0.25 0.97 0.00 0.92
Punjab 0.82 0.91 0.68 20 0.62 0.98 0.71 0.99 0.53 0.92
Chandigarh 0.59 0.56 0.59 1 0.59 0.59 0.56 0.56 0.59 0.59
Uttarakhand 0.80 0.83 0.74 13 0.54 0.98 0.50 0.99 0.63 0.92
Haryana 0.78 0.78 0.80 21 0.51 0.99 0.50 0.99 0.49 0.98
NCT of Delhi 0.73 0.92 0.72 9 0.50 0.82 0.00 0.98 0.50 0.82
Rajasthan 0.80 0.79 0.83 33 0.47 1.00 0.50 1.00 0.39 0.99
Uttar Pradesh 0.89 0.93 0.75 71 0.60 1.00 0.69 1.00 0.49 0.99
Bihar 0.62 0.62 0.65 38 0.33 0.98 0.32 0.99 0.38 0.94
Sikkim 0.41 0.43 0.40 4 0.19 0.54 0.20 0.55 0.24 0.50
Arunachal Pradesh
0.14 0.15 0.13 16 0.13 0.92 0.13 0.93 0.12 0.78
Nagaland 0.07 0.08 0.07 11 0.10 0.91 0.16 0.96 0.10 0.79
Manipur 0.30 0.20 0.68 9 0.15 0.97 0.16 0.97 0.18 0.97
Mizoram 0.55 0.38 0.76 8 0.27 0.96 0.30 0.98 0.39 0.93
Tripura 0.50 0.43 0.84 4 0.37 0.56 0.37 0.50 0.70 0.89
Meghalaya 0.33 0.34 0.29 7 0.41 0.91 0.38 0.92 0.32 0.95
Assam 0.33 0.32 0.34 27 0.17 0.76 0.18 0.76 0.14 0.89
West Bengal 0.75 0.82 0.62 19 0.33 0.97 0.00 0.99 0.31 0.98
Jharkhand 0.41 0.39 0.48 24 0.22 0.89 0.27 0.90 0.21 0.85
Odisha 0.69 0.70 0.61 30 0.28 0.99 0.26 0.99 0.35 0.98
Chhattisgarh 0.70 0.70 0.71 18 0.27 0.99 0.29 0.99 0.21 0.97
Madhya Pradesh 0.79 0.78 0.81 50 0.20 1.00 0.21 1.00 0.29 0.99
Gujarat 0.74 0.88 0.60 26 0.42 0.98 0.45 0.99 0.34 0.96
Daman & Diu 0.39 0.75 0.36 2 0.36 0.96 0.60 0.98 0.37 0.94
Dadra & Nagar Haveli
0.26 0.45 0.29 1 0.26 0.26 0.45 0.45 0.29 0.29
Maharashtra 0.50 0.67 0.35 35 0.24 0.87 0.00 0.92 0.19 0.71
Andhra Pradesh 0.71 0.77 0.60 23 0.38 0.97 0.00 0.99 0.38 0.92
Karnataka 0.46 0.61 0.29 30 0.21 0.85 0.22 0.92 0.17 0.58
Goa 0.46 0.59 0.40 2 0.46 0.47 0.55 0.68 0.38 0.42
Lakshadweep 0.73 0.96 0.68 1 0.73 0.73 0.96 0.96 0.68 0.68
Kerala 0.94 0.93 0.95 14 0.69 0.99 0.65 0.99 0.76 0.99
Tamil Nadu 0.79 0.84 0.73 32 0.34 0.99 0.00 0.99 0.36 0.97
Puducherry 0.78 0.97 0.71 4 0.91 0.98 0.00 0.98 0.88 0.98
Andaman & Nicobar Island
0.17 0.21 0.19 3 0.18 0.45 0.20 0.45 0.00 0.19
Source: Calculations using Census of India, 2011 Total: Rural and Urban Combined
29
Table A1: List of Common Languages in 1971 and 2011 Census of India Language Tables
Assamese Gujarati Korku Oriya
Bengali Halabi Korwa Parji
Bhil Bhilodi Hindi Koya Punjabi
Bhumij Ho Kui Rabha
Bishnupriya Jatapu Kurukh Orion Santali
Bodo Boro Kannada Lepcha Savara
Coorgi Kodagu Kashmiri Lushai Mizo Sindhi
Dimasa Khandeshi Malayalam Tamil
Dogri Kharia Manipuri Methei Tangkhul
English Khasi Marathi Telugu
Gadaba Khond Kondh Mikir Thado
Garo Kisan Miri Mishing Tripuri
Gondi Kolami Munda Tulu
Gorkhali Nepali Konkani Mundari Urdu
Source: Census of India 1971 and 2011
30
Table A2: Probability of Two Individuals Conversing in a Common Language
Conversation between Two Resident from the
same State
Conversation between a Resident of the State
with an Resident from Rest of India
State Code State Name 1971 2011 1971 2011
1 Jammu & Kashmir 0.31 0.25 0.07 0.12
2 Himachal Pradesh 0.71 0.70 0.31 0.38
3 Punjab 0.56 0.50 0.09 0.15
4 Chandigarh 0.36 0.41 0.19 0.27
6 Haryana 0.70 0.63 0.30 0.35
7 NCT of Delhi 0.45 0.51 0.25 0.32
8 Rajasthan 0.79 0.75 0.30 0.37
9 Uttar Pradesh 0.73 0.77 0.24 0.33
10 Bihar 0.62 0.69 0.26 0.34
11 Sikkim 0.60 0.27 0.03 0.07
12 Arunachal Pradesh 0.18 0.36 0.11 0.27
13 Nagaland 0.18 0.30 0.13 0.09
14 Manipur 0.52 0.36 0.03 0.04
16 Tripura 0.52 0.49 0.06 0.07
17 Meghalaya 0.27 0.26 0.03 0.05
18 Assam 0.39 0.32 0.04 0.07
19 West Bengal 0.53 0.63 0.04 0.07
20 Odisha 0.65 0.51 0.02 0.05
23 Madhya Pradesh 0.67 0.71 0.27 0.36
24 Gujarat 0.69 0.50 0.03 0.14
26 Dadra and Nagar Haveli 0.52 0.24 0.03 0.16
27 Maharashtra 0.49 0.38 0.06 0.16
28 Andhra Pradesh 0.65 0.56 0.03 0.05
29 Karnataka 0.43 0.40 0.03 0.04
30 Goa, Daman and Diu 0.36 0.23 0.04 0.11
31 Lakshadweep 0.84 0.63 0.04 0.05
32 Kerala 0.71 0.65 0.01 0.02
33 Tamil Nadu 0.63 0.58 0.02 0.02
34 Puducherry 0.66 0.52 0.07 0.05
35 Andaman & Nicobar Island 0.20 0.29 0.16 0.25
Notes: These probabilities correspond to Figure 3 and 4.
31
Table A3: Probability of Two Individuals Conversing in their Mother Tongue
Conversation between Two
Residents with same Mother
Tongue from the same State
Conversation between a Resident of the State with an Resident from Rest of India who have
the same Mother Tongue
State Code State Name 1971 2011 1971 2011
1 Jammu & Kashmir 0.39 0.39 0.06 0.10
2 Himachal Pradesh 0.80 0.78 0.34 0.40
3 Punjab 0.67 0.82 0.08 0.05
4 Chandigarh 0.48 0.60 0.23 0.34
6 Haryana 0.81 0.79 0.34 0.39
7 NCT of Delhi 0.61 0.74 0.30 0.39
8 Rajasthan 0.83 0.80 0.33 0.38
9 Uttar Pradesh 0.80 0.88 0.26 0.33
10 Bihar 0.65 0.71 0.27 0.34
11 Sikkim 0.69 0.38 0.02 0.03
12 Arunachal Pradesh 0.20 0.19 0.08 0.13
13 Nagaland 0.17 0.20 0.12 0.14
14 Manipur 0.64 0.56 0.01 0.01
16 Tripura 0.55 0.52 0.06 0.06
17 Meghalaya 0.33 0.36 0.02 0.02
18 Assam 0.40 0.33 0.04 0.05
19 West Bengal 0.74 0.75 0.04 0.05
20 Odisha 0.72 0.70 0.01 0.02
23 Madhya Pradesh 0.70 0.77 0.29 0.36
24 Gujarat 0.80 0.75 0.01 0.04
26 Dadra and Nagar Haveli 0.72 0.26 0.02 0.14
27 Maharashtra 0.60 0.50 0.03 0.07
28 Andhra Pradesh 0.74 0.71 0.03 0.03
29 Karnataka 0.46 0.47 0.03 0.03
30 Goa, Daman and Diu 0.47 0.36 0.03 0.08
31 Lakshadweep 0.98 0.97 0.04 0.03
32 Kerala 0.92 0.94 0.00 0.00
33 Tamil Nadu 0.72 0.79 0.02 0.01
34 Puducherry 0.80 0.78 0.07 0.06
35 Andaman & Nicobar Island 0.18 0.20 0.13 0.14
Notes: These probabilities correspond to Figure 5 and 6.
32
Table A4: Number of Districts where a Language is Spoken by at least 10% of Population State Total
Number of Districts in the State
Jammu & Kashmir 22 Hindi (16), Kashmiri (14), Dogri (6), Bhotia (2), Tibetan (1) Himachal Pradesh 12 Hindi (11), Kinnauri & Punjabi (2), Gujarati & Kashmiri (1) Punjab 20 Punjabi (20), Hindi (4) Chandigarh 1 Hindi & Punjabi (1) Uttarakhand 13 Hindi (13), Punjabi (1) Haryana 21 Hindi (21), Punjabi (6), Urdu (1) NCT of Delhi 9 Hindi (9), Urdu (2), Punjabi (1) Rajasthan 33 Hindi (31), Bhil/ Bhilodi (4), Punjabi (3) Uttar Pradesh 71 Hindi (71), Urdu (8) Bihar 38 Hindi (36), Maithili (8), Urdu (7), Bengali (1) Sikkim 4 Nepali (4), Bhotia, Hindi, Lepcha & Limbu (1) Arunachal Pradesh 16 Adi, Nepali & Nissi/ Dafla (5), Hindi, Mishmi & Others (3),
Bengali & Bhotia (2), Assamese, Nocte, Tangsa & Wancho (1) Nagaland 11 Others (3), Ao, Sangtam & Yimchungre (2), Angami, Bengali,
Chang, Chakru/ Chokri, Khezha, Khiemnungan, Konyak, Kuki, Lotha, Phom, Pochury, Rengma, Zeliang & Zemi (1)
Manipur 9 Manipuri (4), Thado (3), Anal, Hmar, Kabiu, Liangmei, Mao, Maring, Paite, Others & Tangkhul (1)
Mizoram 8 Lushai/ Mizo (8), Bengali (3), Lakher, Paite, Pawi & Tripuri (1) Tripura 4 Tripuri & Bengali (4) Meghalaya 7 Garo & Khasi (4), Bengali & Others (1) Assam 27 Assamese (22), Bengali (23), Hindi (7), Bodo (4), Miri/ Mishing
(2), Dimasa, Karbi/ Mikir & Santali (1) West Bengal 19 Bengali (19), Hindi (6), Nepali, Santali & Urdu (1) Jharkhand 24 Hindi (23), Santali (8), Bengali (7), Kurukh/ Oraon (3), Mundari
(2), Odiya, Ho, Kharia & Urdu (1) Odisha 30 Odiya (30), Hindi & Kui (3), Telegu (2), Bengali, Koya, Santali &
Savara (1) Chhattisgarh 18 Hindi (17), Gondi (5), Halabi (3), Odiya (2), Bengali, Kurukh/
Oraon, Santali & Telegu (1) Madhya Pradesh 50 Hindi (49), Bhili/ Bhilodi (7), Gondi & Marathi (4), Korku (2),
Urdu (1) Gujarat 26 Gujarati (26), Hindi (4), Bhili/ Bhilodi (3) Khandeshi & Sindi (1) Daman & Diu 2 Gujarati (2), Hindi (1) Dadra & Nagar Haveli 1 Bhii/ Bhilodi, Gujarati & Hindi (1) Maharashtra 35 Marathi (35), Hindi (13), Urdu (7), Bhili/ Bhilodi, Gujarati &
Khandeshi (2), Gondi (1) Andhra Pradesh 23 Telegu (23), Urdu (8), Hindi (3), Marathi & Tamil (1) Karnataka 30 Kannada (29), Urdu (15), Telegu (4), Konkani, Marathi, Tamil &
Tulu (2), Coorgi/ Kodagu, Malayalam & Others (1) Goa 2 Konkani (2), Hindi & Marathi (1) Lakshadweep 1 Malayalam & Others (1) Kerala 14 Malayalam (14), Tamil (1) Tamil Nadu 32 Tamil (32), Telegu (6), Kannada (2), Malayalam (1) Puducherry 4 Tamil (2), Malayalam & Telegu (1) Andaman & Nicobar Islands
3 Bengali & Hindi (2), Nocobarese, Tamil & Telegu (1)
Source: Census of India, 2011.
33
Table A5: Percentage of Children Enrolled in School and Attending English Medium School in 2007-2017
6-14 Years 15-19 Years
State 2007 2017 2007 2017
Jammu & Kashmir 66 94 81 94
Himachal Pradesh 18 39 19 35
Punjab 30 55 28 47
Chandigarh 50 56 74 79
Uttaranchal 22 34 20 22
Haryana 19 50 21 48
Delhi 38 55 42 55
Rajasthan 8 13 7 8
Uttar Pradesh 6 14 6 11
Bihar 4 6 9 5
Sikkim 100 96 99 98
Arunachal Pradesh 94 87 95 85
Nagaland 100 98 99 99
Manipur 74 91 76 97
Mizoram 44 74 96 97
Tripura 4 13 5 10
Meghalaya 63 97 83 100
Assam 4 8 10 19
West Bengal 3 9 6 9
Jharkhand 7 13 11 12
Orissa 3 7 35 42
Chhattisgarh 4 8 5 7
Madhya Pradesh 7 13 9 12
Gujarat 5 12 11 17
Daman & Diu 24 70 33 53
Dadra & Nagar Haveli
6 34 2 49
Maharashtra 13 28 28 36
Andhra Pradesh 24 58 36 73
Karnataka 17 33 38 48
Goa 49 94 88 98
Lakshadweep 30 35 37 67
Kerala 33 56 64 74
Tamil Nadu 22 41 39 56
Puducherry 43 81 60 85
Andaman & Nicobar 30 77 37 72
All India 12 23 22 29
Source: NSSO Survey of Education 2007-08 and 2017-18
Related Documents


![Development Of SATCOM Data Link for India's Rustom-II Unmanned Aerial Vehicle [UAV]](https://static.cupdf.com/doc/110x72/552cbd1e550346730f8b48a3/development-of-satcom-data-link-for-indias-rustom-ii-unmanned-aerial-vehicle-uav.jpg)


