© 2016 CRISIL Ltd. All rights reserved. India’s future prospects in apparel exports Ajay Srinivasan Director Research August 2016

Welcome message from author
This document is posted to help you gain knowledge. Please leave a comment to let me know what you think about it! Share it to your friends and learn new things together.
Transcript
No content below the line No content below the line
© 2
016 C
RIS
IL L
td.
All
rig
hts
reserv
ed.
India’s future prospects in apparel exports
Ajay Srinivasan
Director
Research
August 2016
No content below the line No content below the line
© 2
016 C
RIS
IL L
td.
All
rig
hts
reserv
ed.
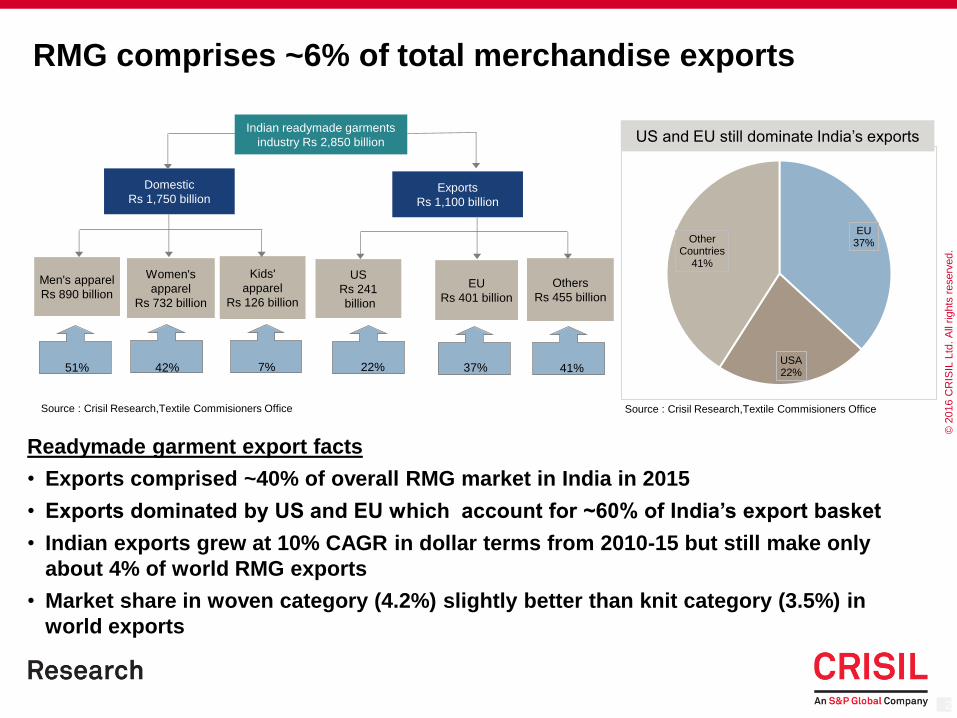
RMG comprises ~6% of total merchandise exports
Readymade garment export facts
• Exports comprised ~40% of overall RMG market in India in 2015
• Exports dominated by US and EU which account for ~60% of India’s export basket
• Indian exports grew at 10% CAGR in dollar terms from 2010-15 but still make only
about 4% of world RMG exports
• Market share in woven category (4.2%) slightly better than knit category (3.5%) in
world exports
2
51% 42% 7% 22% 37% 41%
Indian readymade garments
industry Rs 2,850 billion
Domestic
Rs 1,750 billion Exports
Rs 1,100 billion
Men's apparel
Rs 890 billion
Women's
apparel
Rs 732 billion
Kids'
apparel
Rs 126 billion
US
Rs 241
billion
EU
Rs 401 billion
Others
Rs 455 billion
Source : Crisil Research,Textile Commisioners Office
EU 37%
USA 22%
Other Countries
41%
US and EU still dominate India’s exports
Source : Crisil Research,Textile Commisioners Office
No content below the line No content below the line
© 2
016 C
RIS
IL L
td.
All
rig
hts
reserv
ed.
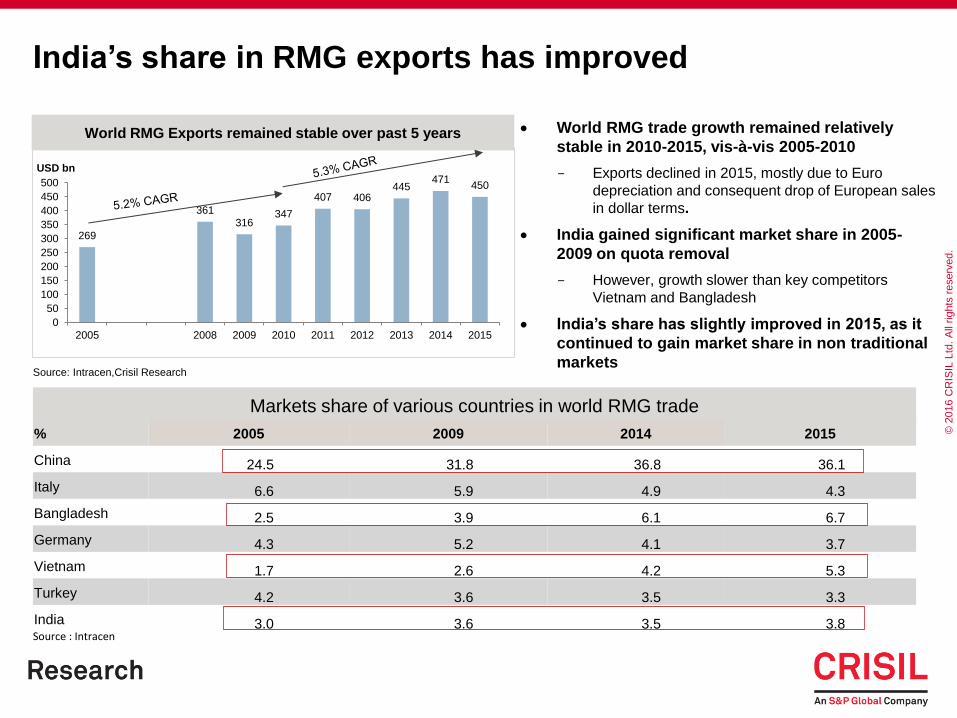
India’s share in RMG exports has improved
3
Source: Intracen,Crisil Research
World RMG Exports remained stable over past 5 years World RMG trade growth remained relatively
stable in 2010-2015, vis-à-vis 2005-2010
- Exports declined in 2015, mostly due to Euro
depreciation and consequent drop of European sales
in dollar terms.
India gained significant market share in 2005-
2009 on quota removal
- However, growth slower than key competitors
Vietnam and Bangladesh
India’s share has slightly improved in 2015, as it
continued to gain market share in non traditional
markets
Markets share of various countries in world RMG trade
% 2005 2009 2014 2015
China 24.5 31.8 36.8 36.1
Italy 6.6 5.9 4.9 4.3
Bangladesh 2.5 3.9 6.1 6.7
Germany 4.3 5.2 4.1 3.7
Vietnam 1.7 2.6 4.2 5.3
Turkey 4.2 3.6 3.5 3.3
India 3.0 3.6 3.5 3.8 Source : Intracen
269
361 316
347
407 406 445
471 450
0
50
100
150
200
250
300
350
400
450
500
2005 2008 2009 2010 2011 2012 2013 2014 2015
USD bn

No content below the line No content below the line
© 2
016 C
RIS
IL L
td.
All
rig
hts
reserv
ed.
India's knit exports accounted 3.5% of world exports in 2015
4
Indian knit exports dominated by T-shirts, Women suits and men shirts
Indian knit exports cater less to the Jerseys &Pullovers and Women Innerwear which account
for 29% of world knit export
India’s market share in Jerseys and Pullovers, which is the largest knit category, is ~0.5%
Source: Intracen ,CRISIL Research
Product
Share in World
Exports
Share in India's
exports
Tshirts 19% 37%
Women Suits 17% 9%
Jerseys and Pullovers 23% 4%
Women Innerwear 6% 1%
Men's Suits and Jackets 6% 5%
Women Bathrobes and Pyjamas 6% 7%
Mens Shirt 4% 10%
Babies Garment 3% 9%
Mens underpant 3% 6%
Garments 3% 8%
Total value (USD billion) in 2015 224 7.7
(Market Share in world)
2010 2015
5% 8%
2.2% 2.6%
0.5% 0.5%
3% 5%
4% 4%
6% 3%
7% 9%
6% 9%
5% 8%
3% 10%

No content below the line No content below the line
© 2
016 C
RIS
IL L
td.
All
rig
hts
reserv
ed.
United Arab Emirates
United Kingdom
France
Saudi Arabia
Canada
Poland
Afghanistan
Nigeria
-30
-20
-10
0
10
20
30
-15 -5 5 15 25 35
An
nu
al g
row
th o
f p
art
ne
r co
un
trie
s im
po
rts fro
m th
e
wo
rld
be
twe
en
20
11
-20
15
,%
Annual growth of India's exports to the partner countries between 2011-2015, %
Declining Markets
Growth Markets
Growth of world market for the selected product : 3%
India’s export
growth to
partner >
Partner
Import
growth from
the world
India’s export
growth to
partner <
Partner
Import
growth from
the world
Bubble size is
proportional to
share in the
world imports
of partner
countries
Description Criteria Countries
Slow markets where India performing well Growth in India exports > Partners Imports Germany, Spain , South Africa, France, Ireland
and United Kingdom
Growth markets where India performing
well
Growth in India exports > Partners Imports for the
category
UAE, Poland, Afghanistan, Mexico, Australia,
US
Growth markets where India not
performing well (share in the world imports
> 2%)
Growth in India exports < Partners Imports for the
category
Canada
Growth markets where India not
performing well(share in the world imports
< 2%)
Growth in India exports < Partners Imports for the
category
Saudi Arabia and Nigeria
Source: Intracen ,CRISIL Research
Opportunities for market diversification in knit segment
No content below the line No content below the line
© 2
016 C
RIS
IL L
td.
All
rig
hts
reserv
ed.
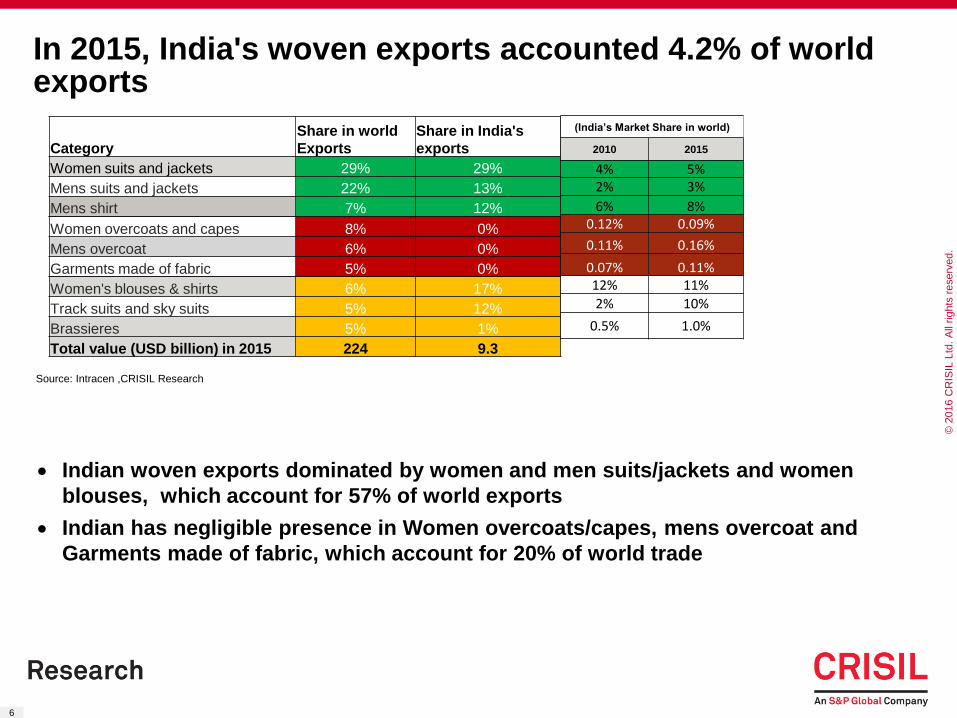
6
Indian woven exports dominated by women and men suits/jackets and women
blouses, which account for 57% of world exports
Indian has negligible presence in Women overcoats/capes, mens overcoat and
Garments made of fabric, which account for 20% of world trade
Source: Intracen ,CRISIL Research
In 2015, India's woven exports accounted 4.2% of world exports
Category
Share in world
Exports
Share in India's
exports
Women suits and jackets 29% 29%
Mens suits and jackets 22% 13%
Mens shirt 7% 12%
Women overcoats and capes 8% 0%
Mens overcoat 6% 0%
Garments made of fabric 5% 0%
Women's blouses & shirts 6% 17%
Track suits and sky suits 5% 12%
Brassieres 5% 1%
Total value (USD billion) in 2015 224 9.3
(India’s Market Share in world)
2010 2015
4% 5% 2% 3%
6% 8% 0.12% 0.09%
0.11% 0.16%
0.07% 0.11% 12% 11%
2% 10%
0.5% 1.0%
No content below the line No content below the line
© 2
016 C
RIS
IL L
td.
All
rig
hts
reserv
ed.
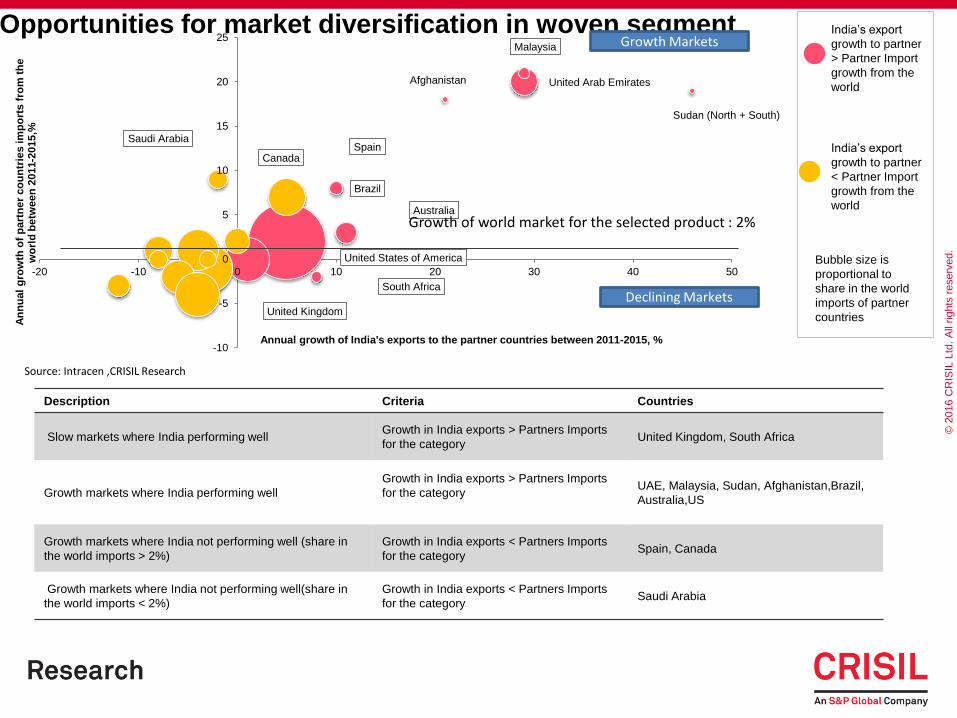
India’s export
growth to partner
> Partner Import
growth from the
world
India’s export
growth to partner
< Partner Import
growth from the
world
Bubble size is
proportional to
share in the world
imports of partner
countries
Description Criteria Countries
Slow markets where India performing well Growth in India exports > Partners Imports
for the category United Kingdom, South Africa
Growth markets where India performing well
Growth in India exports > Partners Imports
for the category
UAE, Malaysia, Sudan, Afghanistan,Brazil,
Australia,US
Growth markets where India not performing well (share in
the world imports > 2%)
Growth in India exports < Partners Imports
for the category Spain, Canada
Growth markets where India not performing well(share in
the world imports < 2%)
Growth in India exports < Partners Imports
for the category Saudi Arabia
United States of America
United Arab Emirates
United Kingdom
Spain Saudi Arabia
Canada
Brazil
Malaysia
Afghanistan
Australia
Sudan (North + South)
South Africa
-10
-5
0
5
10
15
20
25
-20 -10 0 10 20 30 40 50
An
nu
al
gro
wth
of
pa
rtn
er
co
un
trie
s im
po
rts
fro
m t
he
w
orl
d b
etw
ee
n 2
01
1-2
01
5,%
Annual growth of India's exports to the partner countries between 2011-2015, %
Opportunities for market diversification in woven segment Growth Markets
Declining Markets
Growth of world market for the selected product : 2%
Source: Intracen ,CRISIL Research

No content below the line No content below the line
© 2
016 C
RIS
IL L
td.
All
rig
hts
reserv
ed.
Textile package marginally positive for apparel exports
• Duty drawback on MMF fabric inputs to make India more cost competitive and boost MMF exports
• Flexible labour laws a significant structural change, which should help the industry scale up production based on market needs
Source : Ministry of Textiles, CRISIL Research
Textile package not a game changer but would support export growth
Special package for Textile exports
Increase in overtime caps on working hours (from 3
to 8 hrs a week)
EPF Scheme (Govt. to bear 12% of employers’ contribution for 3 yrs for employees earning
less than Rs 15,000 pm)
Additional incentives under ATUFS (Outcome based
incentives; increase in subsidy to 25% )
Enhanced duty drawback coverage (duty drawback
to enhance MMF capabilities)
Enhancing scope of 80 JJAA of Income Tax Act (provision
of 240 days relaxed to 150 days)
Introduction of fixed term employment

No content below the line No content below the line
© 2
016 C
RIS
IL L
td.
All
rig
hts
reserv
ed.
India less competitive than Bangladesh and Vietnam
India scores high on raw material availability, but loses out on machinery, market diversification
and mix by fabric. Absence of FTAs and low scale of operations also hamper India’s prospects
9
India’s moderate competitiveness in export market
Note: L: Low; M: Moderate; H: High
Source: CRISIL Research
• Bangladesh enjoys zero duty in EU; China has FTAs with many of its
markets; Vietnam has signed trade agreements with the EU and US
• China gets maximum support from its government
• India exports 59% to US & EU; China ships only 44%
• But shipments to non-US/non-EU markets growing at an impressive
pace
• Majority of RMG exports from India are cotton-based
• Smaller scale of operation and lower labour and machine productivity
hamper India’s efficiency.
• However, surplus cotton availability is a positive.
• China has the best infrastructure in among major textile exporters
Factors Ranking
Policy parameters
FTAs and access policies L
Government policies M
Market parameters
Diversification M
Growth in key markets M
Product diversification
(mix by fabric and range of offering) M
Efficiency parameters
Scale of operations L
Labour cost M
Exports infrastructure M
Raw material availability H
Final ranking M

No content below the line No content below the line
© 2
016 C
RIS
IL L
td.
All
rig
hts
reserv
ed.
10.7
13.8 12.9
14.4
16.7 17.2
23.0
-
5
10
15
20
25
2010 2011 2012 2013 2014 2015 2016P 2020P
Long term RMG export growth to be moderate
Exports growth in 2015 moderated to 3% as compared to 15% growth in 2014 due to
- Decline in demand from Europe due to sharp (~16%) Euro depreciation
- Deceleration of growth in Non US-EU markets (from 26% export growth in 2014 to 9% in 2015)
Lower export competitiveness to slowdown export growth to 5-7 % CAGR in the next
5 years
15
Growth in exports to moderate India’s market share relatively stable
P: Projected
Source: OTEXA; Eurostat; Ministry of Commerce; CRISIL Research Note: Data for US (in USD), data for EU (in Euro)
Source: OTEXA; Eurostat; CRISIL Research
% India's market shares
US EU Other mkts
2004 3.4 5.5 2.2
2010 4.4 6.8 2.6
2011 4.3 6.8 3.0
2013 4.1 6.2 3.9
2014 4.2 6.3 4.2
2015 4.3 6.3 4.6
2020P 4.2 6.0 6.0
Growth
driven by
prices
Growth Slowdown in 2015
(2013-12%, 2014-15%, 2015-3%)
No content below the line No content below the line
© 2
016 C
RIS
IL L
td.
All
rig
hts
reserv
ed.
16
About us
CRISIL Limited
CRISIL is a global analytical company providing ratings, research, and risk and policy advisory services. We are India's leading ratings agency. We are also the foremost provider of
high-end research to the world's largest banks and leading corporations.
CRISIL is majority owned by S&P Global Inc., a leading provider of transparent and independent ratings, benchmarks, analytics and data to the capital and commodity markets
worldwide.
CRISIL Research
CRISIL Research is India's largest independent integrated research house. We provide insights, opinion and analysis on the Indian economy, industry, capital markets and companies.
We also conduct training programs to financial sector professionals on a wide array of technical issues. We are India's most credible provider of economy and industry research. Our
industry research covers 86 sectors and is known for its rich insights and perspectives. Our analysis is supported by inputs from our network of more than 5,000 primary sources,
including industry experts, industry associations and trade channels. We play a key role in India's fixed income markets. We are the largest provider of valuation of fixed income
securities to the mutual fund, insurance and banking industries in the country. We are also the sole provider of debt and hybrid indices to India's mutual fund and life insurance
industries. We pioneered independent equity research in India, and are today the country's largest independent equity research house. Our defining trait is the ability to convert
information and data into expert judgements and forecasts with complete objectivity. We leverage our deep understanding of the macro-economy and our extensive sector coverage to
provide unique insights on micro-macro and cross-sectoral linkages. Our talent pool comprises economists, sector experts, company analysts and information management specialists.
CRISIL Privacy Notice
CRISIL respects your privacy. We use your contact information, such as your name, address, and email id, to fulfil your request and service your account and to provide you with
additional information from CRISIL and other parts of S&P Global Inc. and its subsidiaries (collectively, the “Company”) you may find of interest.
For further information, or to let us know your preferences with respect to receiving marketing materials, please visit http://www.crisil.com/privacy. You can view the Company’s
Customer Privacy at https://www.spglobal.com/privacy.
Last updated: April 2016
Disclaimer
CRISIL Research, a division of CRISIL Limited (CRISIL) has taken due care and caution in preparing this Report based on the information obtained by CRISIL from sources which it
considers reliable (Data). However, CRISIL does not guarantee the accuracy, adequacy or completeness of the Data / Report and is not responsible for any errors or omissions or for
the results obtained from the use of Data / Report. This Report is not a recommendation to invest / disinvest in any company covered in the Report. CRISIL especially states that it has
no financial liability whatsoever to the subscribers/ users/ transmitters/ distributors of this Report. CRISIL Research operates independently of, and does not have access to information
obtained by CRISIL’s Ratings Division / CRISIL Risk and Infrastructure Solutions Limited (CRIS), which may, in their regular operations, obtain information of a confidential nature. The
views expressed in this Report are that of CRISIL Research and not of CRISIL’s Ratings Division / CRIS. No part of this Report may be published / reproduced in any form without
CRISIL’s prior written approval.
No content below the line No content below the line
© 2
016 C
RIS
IL L
td.
All
rig
hts
reserv
ed.
Thank you
Ajay Srinivasan
Director
Related Documents