1 Indiana University-Purdue University Fort Wayne Department of Electrical and Computer Engineering ECE 406 Senior Engineering Design II Final Report Project Title: Electric Vehicle Project - Phase II Team Members: Aaron Liechty Eric Perrine Roberto Melendez-Amaya Rakib Uddin Siddique Faculty Advisor: Dr. Eroglu Dr. Oloomi Dr. Abu-Mulaweh Date: December 9, 2016

Welcome message from author
This document is posted to help you gain knowledge. Please leave a comment to let me know what you think about it! Share it to your friends and learn new things together.
Transcript
1
Indiana University-Purdue University Fort Wayne
Department of Electrical and Computer Engineering
ECE 406
Senior Engineering Design II
Final Report
Project Title: Electric Vehicle Project - Phase II
Team Members: Aaron Liechty
Eric Perrine
Roberto Melendez-Amaya
Rakib Uddin Siddique
Faculty Advisor: Dr. Eroglu
Dr. Oloomi
Dr. Abu-Mulaweh
Date: December 9, 2016
2
Table of Contents
Acknowledgement .............................................................................................................................. 5
Abstract ............................................................................................................................................... 6
Section I: Problem Statement ............................................................................................................. 7
Section 1.1: Requirements and Specifications .................................................................................. 8
Section 1.2: Given Parameters .......................................................................................................... 9
Section 1.3: Design Variables ............................................................................................................ 9
Section 1.4: Limitations and Constraints ......................................................................................... 10
Section 1.5: Additional Considerations ........................................................................................... 10
Section II: Detailed Design ................................................................................................................ 11
Section 2.1: Power Management Subsystem .................................................................................. 12
Solar Panel ................................................................................................................................... 12
Battery System ............................................................................................................................. 13
Battery location ........................................................................................................................... 15
Section 2.2: Powertrain Subsystem ................................................................................................. 15
Motor Coupling............................................................................................................................ 15
Continuously Variable Transmission ........................................................................................... 17
Gearbox ....................................................................................................................................... 18
Section 2.3: Speed Control Subsystem ............................................................................................ 19
Speed Control Functionality ......................................................................................................... 19
Throttle Position Sensor .............................................................................................................. 19
Speed Sensor ............................................................................................................................... 19
Location of Sensor ....................................................................................................................... 20
Cruise Control .............................................................................................................................. 20
Section 2.4: Temperature Control Subsystem ................................................................................. 20
Temperature Control Functionality ............................................................................................. 20
Temperature Sensor .................................................................................................................... 21
Cooling System ............................................................................................................................ 21
Section III: Design Modifications ...................................................................................................... 22
3
Section 3.1: Power Management ................................................................................................... 23
Solar Panels ................................................................................................................................. 23
Battery Connections and Low Voltage Supply ............................................................................ 23
Section 3.2: Power Train ................................................................................................................. 24
Continuously Variable Transmission (CVT) ................................................................................. 24
Motor Mounting Plate ................................................................................................................ 27
Section 3.3 Speed Control Design Modifications ............................................................................ 28
Throttle Position Sensor .............................................................................................................. 28
Speed Sensor ............................................................................................................................... 28
Mathematical modelling ............................................................................................................. 29
Section 3.4 Temperature Control Design Modifications ................................................................ 33
Temperature Sensor Location ..................................................................................................... 33
Mounting of Fans ........................................................................................................................ 34
Connecting Fins to Batteries ....................................................................................................... 34
Operation of Fans ........................................................................................................................ 35
Section IV: Testing ............................................................................................................................. 36
Section 4.1 Power Management Testing ........................................................................................ 37
Battery Life and Charging ............................................................................................................ 37
Section 4.2 Power Train Testing ..................................................................................................... 38
CVT Performance ........................................................................................................................ 38
Section 4.3 Speed Control Testing .................................................................................................. 39
Cruise Control .............................................................................................................................. 39
Section 4.4 Temperature Control Testing ....................................................................................... 40
Temperature Sensor Calibration .................................................................................................. 40
Filtering of Temperature Data .................................................................................................... 42
Fin Connection Test ..................................................................................................................... 43
Cooling System Test .................................................................................................................... 44
Section V: Cost Analysis .................................................................................................................... 46
Table 8: Cost Analysis .................................................................................................................. 47
Evaluation and Recommendations ................................................................................................... 50
Evaluations .................................................................................................................................. 51
4
Recommendations ...................................................................................................................... 51
References ........................................................................................................................................ 53
Appendix A: Arduino Code ................................................................................................................ 55
Arduino file: DueReadTempStringOut.ino ...................................................................................... 56
Arduino File: TFTGraphicDisplay01_01ReadTempString.ino .......................................................... 58
Appendix B: Safe Assembly and Disassembly of the Vehicle ........................................................... 66
Assembly and Disassembly of the Electric Vehicle ......................................................................... 67
Disassembling the vehicle for outside testing ............................................................................ 67
Assembly of the vehicle for outdoor testing ............................................................................... 68
Appendix C: Efficiency Calculations .................................................................................................. 70
Appendix D: Arduino Wiring Diagrams ............................................................................................. 72
LCD Arduino Wiring Diagram (interim shield and TFT shield installed).......................................... 73
Temperature Arduino Wiring Diagram (shield not shown) ............................................................ 74

5
Acknowledgement
We would like to thank our advisors Dr. Hossein Oloomi, Dr. Abdullah Eroglu, and Dr. Hosni Abu-Mulaweh who met with us each week of the semester, to give us their advice and knowledge. Their guidance was critical to the outcome of this project. We would also like to thank the IPFW Engineering department as well as the EV club for funding the project.
6
Abstract The Electric Vehicle Project - Phase II is an ongoing Indiana-Purdue University Fort Wayne (IPFW) capstone senior design project. The vehicle was acquired from a previous IPFW 2008 BAJA SAE competition in which the current frame was designed and constructed. A bidirectional DC-DC converter drive was then implemented on the vehicle in 2014, which took the battery voltage and matched it to the rated motor voltage. In 2015, phase I of the project began the transformation of the vehicle from internal combustion to electric power by replacing the gas motor and installing a 5,000W brushless DC motor, two 12V lead-acid batteries and an 87W solar panel. These changes made the idea of an electric vehicle possible and the aim of the second phase is to enhance this design.
The areas of improvement for the vehicle are the control systems, power management, the powertrain and the user interface. Control systems will allow for the user to implement cruise control while driving and maintain the temperature of the batteries through a thermal cooling system. The improved battery system will increase the amount of power available to the motor. The EV should be capable of achieving 15 mph with an overall efficiency of 70%. The powertrain was evaluated to reduce vibration levels. A user interface allows the driver to see system statuses such as speed of the vehicle, battery life and temperature of the batteries. The project budget is $1500.00. The ultimate goal of the IPFW Electric Vehicle is to compete against other electric vehicles in sanctioned competitions. The stated improvements have allowed the EV to move towards this goal. The design and implementation for the Electric Vehicle phase II was separated into two semesters. The focus of semester one was to develop and outline detailed concepts to allow improvements to be made to the vehicle subsystems. Semester two encompassed the integration of these improvements to the vehicle and each subsystem. Challenges faced and modifications are outlined below along with safety instructions for handling of the vehicle. Based on the improvements made and an evaluation of the system, recommendations have been included for improvements upon the current design.

7
Section I: Problem Statement
8
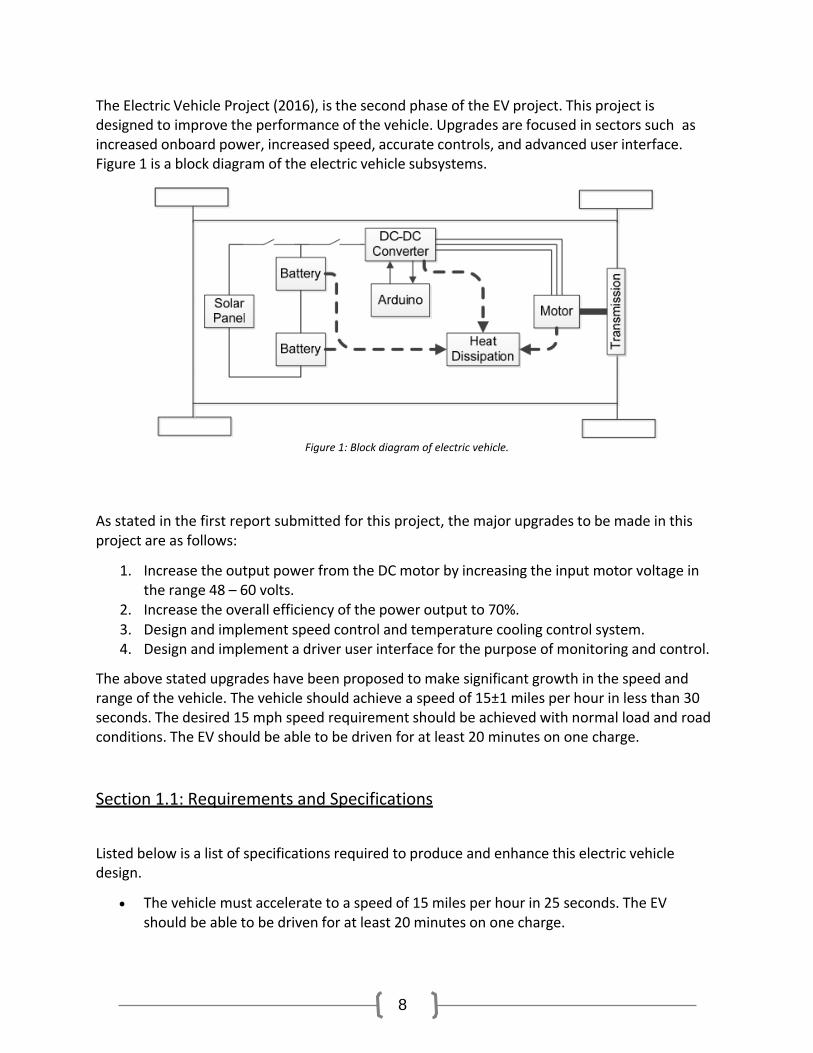
The Electric Vehicle Project (2016), is the second phase of the EV project. This project is designed to improve the performance of the vehicle. Upgrades are focused in sectors such as increased onboard power, increased speed, accurate controls, and advanced user interface. Figure 1 is a block diagram of the electric vehicle subsystems.
Figure 1: Block diagram of electric vehicle.
As stated in the first report submitted for this project, the major upgrades to be made in this project are as follows:
1. Increase the output power from the DC motor by increasing the input motor voltage in the range 48 – 60 volts.
2. Increase the overall efficiency of the power output to 70%. 3. Design and implement speed control and temperature cooling control system. 4. Design and implement a driver user interface for the purpose of monitoring and control.
The above stated upgrades have been proposed to make significant growth in the speed and range of the vehicle. The vehicle should achieve a speed of 15±1 miles per hour in less than 30 seconds. The desired 15 mph speed requirement should be achieved with normal load and road conditions. The EV should be able to be driven for at least 20 minutes on one charge.
Section 1.1: Requirements and Specifications
Listed below is a list of specifications required to produce and enhance this electric vehicle design.
• The vehicle must accelerate to a speed of 15 miles per hour in 25 seconds. The EV should be able to be driven for at least 20 minutes on one charge.
9
• Four to five 12V batteries must be installed that provide enough power to the motor to achieve the desired speed. Besides the motor, the batteries must also power up the electric components of the vehicle.
• Improve the effectiveness of the CVT to increase the overall efficiency of the power output to 70%.
• Install control systems that accurately outputs speed with ±1 mph error, temperature with ±2°C (3.6°F) error and refreshes every 5 seconds.
• User interface must be enhanced so that the driver can see system status such as vehicle speed, battery charge, temperature, etc. on a 7.0”, 800x480 pixel LCD display and interact with the vehicle using different modules to control forward, reverse and braking from the driver’s seat.
• The vehicle must include a charging network which allows it to charge from solar panels and via utility (wall plug). This charging network will be used when the vehicle is not in operation. The system must charge individual batteries in a balanced manner.
Section 1.2: Given Parameters
The design will enhance the following parameters.
Charging of the batteries must implement a photovoltaic (PV) module. • Charging system to the vehicle will also be powered by a 120 V AC, 15 A, 60 Hz utility. • The vehicle must use the current brushless DC motor, manufactured by Golden Motor,
model HPM5000B. • A total of two, 12V UB12500 batteries are available to power the motor. The number of
batteries will be increased as necessary to attain the 15 mph vehicle speed. The target input voltage is 48-60 V using 4-5 batteries.
• Vehicle must implement current frame, suspension, steering and alignment systems from the 2008 BAJA Project.
Section 1.3: Design Variables
The following parameters will be adjusted appropriately during the process of enhancement. The vehicle has many areas of improvement. Time, design choices and component performance will determine the degree of the vehicle enhancements.
• Control - The vehicle may allow for cruise control of the motor so the speed remains constant while in operation. The control panel will allow user to change between forward, reverse and braking modes.
• User interface – Display may show speed, battery temperature, and remaining charge with an upgraded module capable of touch or other input methods.

10
• Charging System – Components will be chosen to implement utility charge to the batteries.
• Motor Coupling – Current coupling from the motor to the continuously variable transmission (CVT) will be evaluated to determine whether it meets vibration requirements.
• Speed Control – Vehicle speed will be determined by user interface or mechanical throttle. Current system includes a Polaris shifter that allows changes between low and high gears, neutral and reverse.
Section 1.4: Limitations and Constraints
The enhancements to the vehicle are affected by limitations and constraints determined by cost, design complexity and time limitations.
• Cost – Designs and implementations may be less than or equal to $1500.00. • Size – The current frame must accommodate components to be added to the vehicle.
Components to be added must allow for normal operation of the vehicle. • Weight – Vehicle weight must not exceed motor manufacturer or frame limitations. The
present coupling must be capable of moving the vehicle forward up to required speed specified in previous section.
• Time – Project enhancement designs must be completed by May 2016 while enhancement installations and vehicle changes must be completed by December 2016.
Section 1.5: Additional Considerations
Factors affecting successful implementation of designs and enhancements must be accounted in design process.
• Safety – The system must contain fail-safe measures to prevent injury to the user as well as electrical components and controllers. Fail safe measures may prevent a majority of possible situations.
• Standards – The vehicle must comply with IEEE electrical standards which covers connectivity of solar panels and utility charging system, user interfacing and required connections throughout the electrical components.
• Accuracy – All measurements will have uncertainty, system implementations and controls need to operate within these uncertainties and provide accurate input and output.

11
Section II: Detailed Design

12
In order to implement the chosen conceptual designs, detailed analysis and calculations have been made. The following information provides a summary of the improvements analyzed in the first report submitted for this project. Section 2.1: Power Management Subsystem
Solar Panel
To increase the power output from the solar panel two larger panels were purchased along with two solar charge controllers. This panel in conjunction with the existing panel will generate a total to 387W to recharge the batteries. The panel shown in Figure 2 is the Renesola JC300M-24-Ab at a total price of $310.45. It will be mounted using quick disconnects that allow the panel to be put on and taken off quickly. The objective behind the quick disconnects, is to recharge the batteries while the vehicle is stationary. Once the batteries are recharged to a desired level, the panel can be removed to reduce the net weight of the vehicle by 64 pounds. Previously, the panel pivoted at the back end of the vehicle and can to be raised to a desired angle to optimize the energy derived from the sun. The flaw with this design is that it will increase drag when the EV is driven with the solar panel mounted on its roof, thus making the vehicle less efficient. To avoid this problem, the pivot will be placed at the front end of the vehicle making the design more aerodynamic.
Figure 2: Renesola JC300M-24-Ab solar panel.

13
Battery System
Based on the selected conceptual design, five 12V lead-acid batteries will be connected in series to drive the entire system. Calculations need to be done to find the battery capacity appropriate to meet the design goal. The minimum battery capacity required to accommodate the design load over the specified autonomy time can be calculated from Equation 1. This equation was selected to match the equation from the 2014 senior design team and various online sources [1].
Where:
is the minimum battery capacity (Ah)
(1)

14
is the design energy over the autonomy time (VAh)
is the nominal battery voltage (Vdc)
is a battery ageing factor (%)
is a temperature correction factor (%)
is a capacity rating factor (%)
is a system efficiency (%)
is the maximum depth of discharge (%)
For the battery type selected, reasonable values are as follows:
= Wattage at load times running time
5hp * 20min = 3728.5W * .33hr = 1230.41 (Vah)
= 12V * 5 batteries = 60 (Vdc)
= 25% (note use 1.25 as factor)
= operating near room temperature from IEEE 485 = 1
= same as used in DC-DC convertor project = 1.045
= 70% (coefficient .7) to match worst case efficiency
= 50% (manufacture recommended discharge)
= 76.53 Ah
This suggests that a 75 Ah battery could be workable under the stated conditions. However, at a 50% depth of discharge the battery life would be drastically shortened.
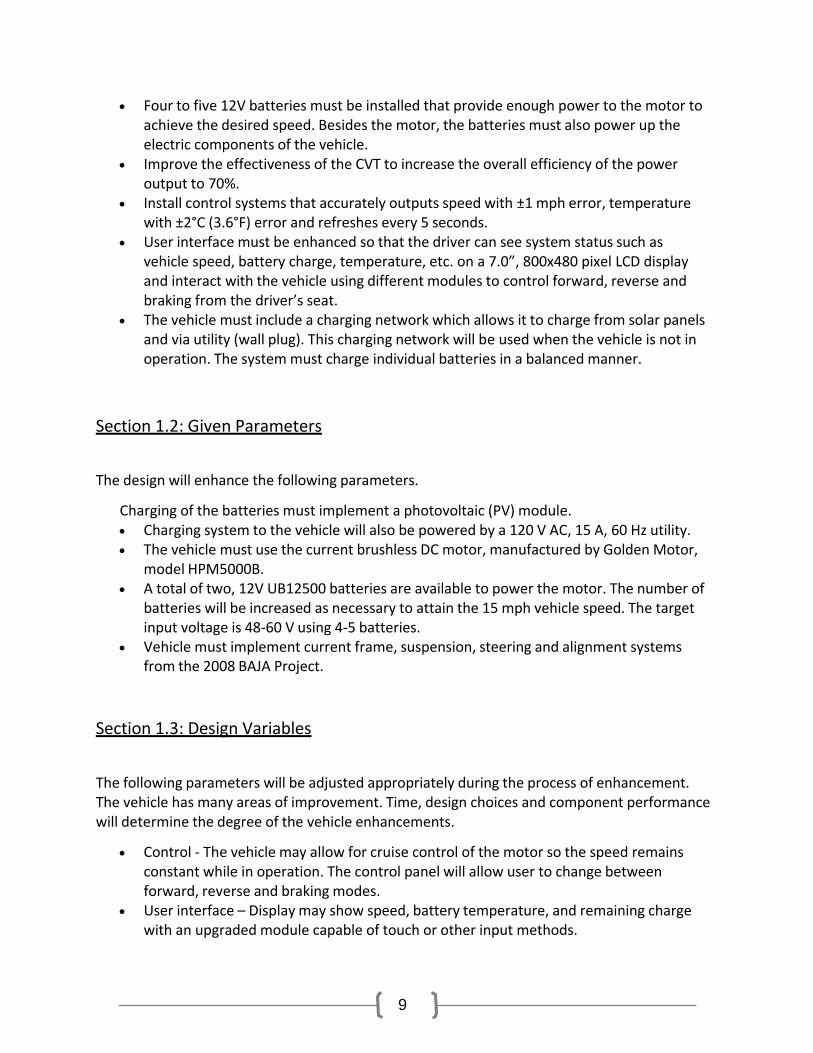
In order to make use of the work of previous design teams, 50 Ah replacement batteries were selected instead. Two operational UB12500 batteries, shown in Figure 3, are available from the previous senior design project. To achieve the goals stated in the conceptual design, three new UB12500 batteries will need to be purchased at a total of $299.70. This is expected to increase available power as well as make use of the existing battery racks. However, the overall run time may be diminished due to the reduced battery capacity. The advisors approved use of 50Ah batteries and were willing to compromise on the run time of the system.
15
Figure 3: UB12500 12V Lead-Acid battery.
Battery location
The design for the battery location will implement the existing setup. Four batteries will be mounted on the existing battery frame.
Section 2.2: Powertrain Subsystem
Motor Coupling
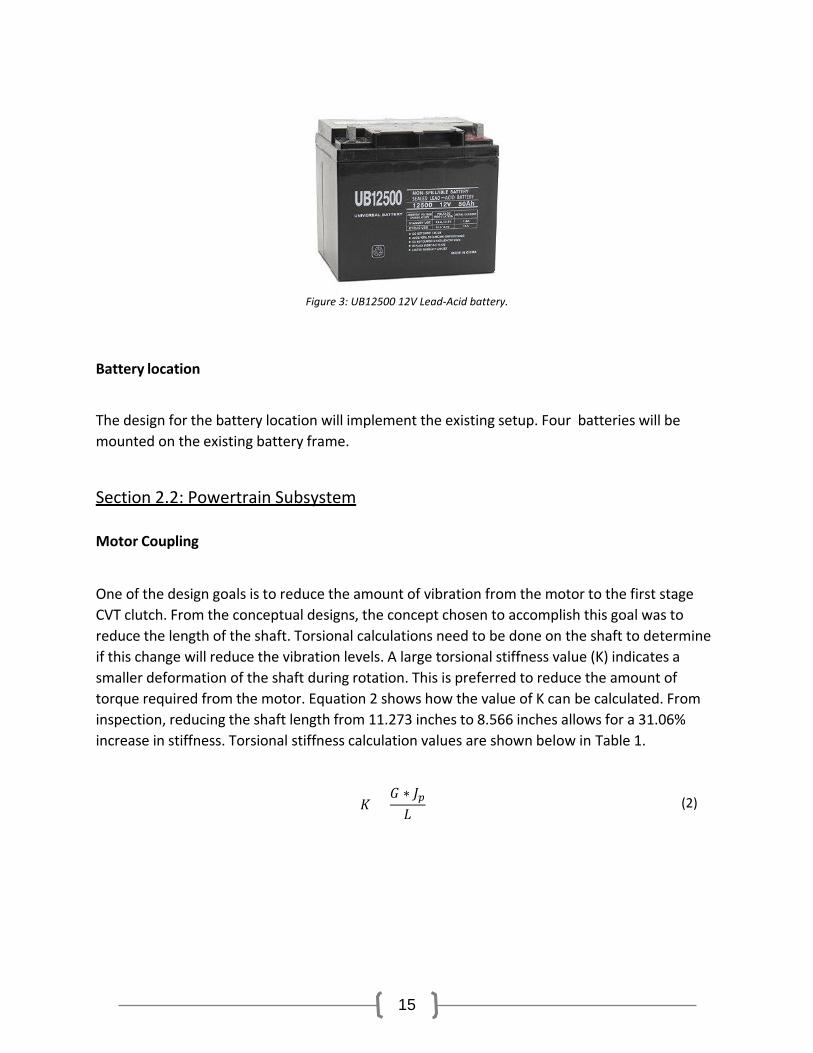
One of the design goals is to reduce the amount of vibration from the motor to the first stage CVT clutch. From the conceptual designs, the concept chosen to accomplish this goal was to reduce the length of the shaft. Torsional calculations need to be done on the shaft to determine if this change will reduce the vibration levels. A large torsional stiffness value (K) indicates a smaller deformation of the shaft during rotation. This is preferred to reduce the amount of torque required from the motor. Equation 2 shows how the value of K can be calculated. From inspection, reducing the shaft length from 11.273 inches to 8.566 inches allows for a 31.06% increase in stiffness. Torsional stiffness calculation values are shown below in Table 1.
𝐾𝐾 =𝐺𝐺 ∗ 𝐽𝐽𝑝𝑝𝐿𝐿
(2)

16
Table 1: Torsional Stiffness Calculations (K in in-lbs/rad)
Where:
K = Torsional Stiffness (in-lbs/rad)
Jp = Polar Moment of Inertia of a Cylinder. Value taken at smallest shaft size (7/8” motor shaft diameter). It is calculated using Equation 3.
𝐽𝐽𝑝𝑝 =𝜋𝜋𝑟𝑟4
2 (3)
G = Modulus of Rigidity, Cold-Rolled Steel is 10.9 MPsi
L = Total length of the shaft
r = Radius of smallest shaft Another value to take into consideration is the torsional deflection. This value determines the amount of rotation the surface of the solid undergoes during rotation. Theta (θ) is the deflection angle and can be found using Equation 4.
𝜃𝜃 =𝑇𝑇𝑚𝑚𝑚𝑚𝑚𝑚 ∗ 𝐿𝐿𝐽𝐽𝑝𝑝 ∗ 𝐺𝐺
(4)
From inspection, the deflection angle is reduced by 24.01% of the original value. These values are calculated in Table 2 below.
17
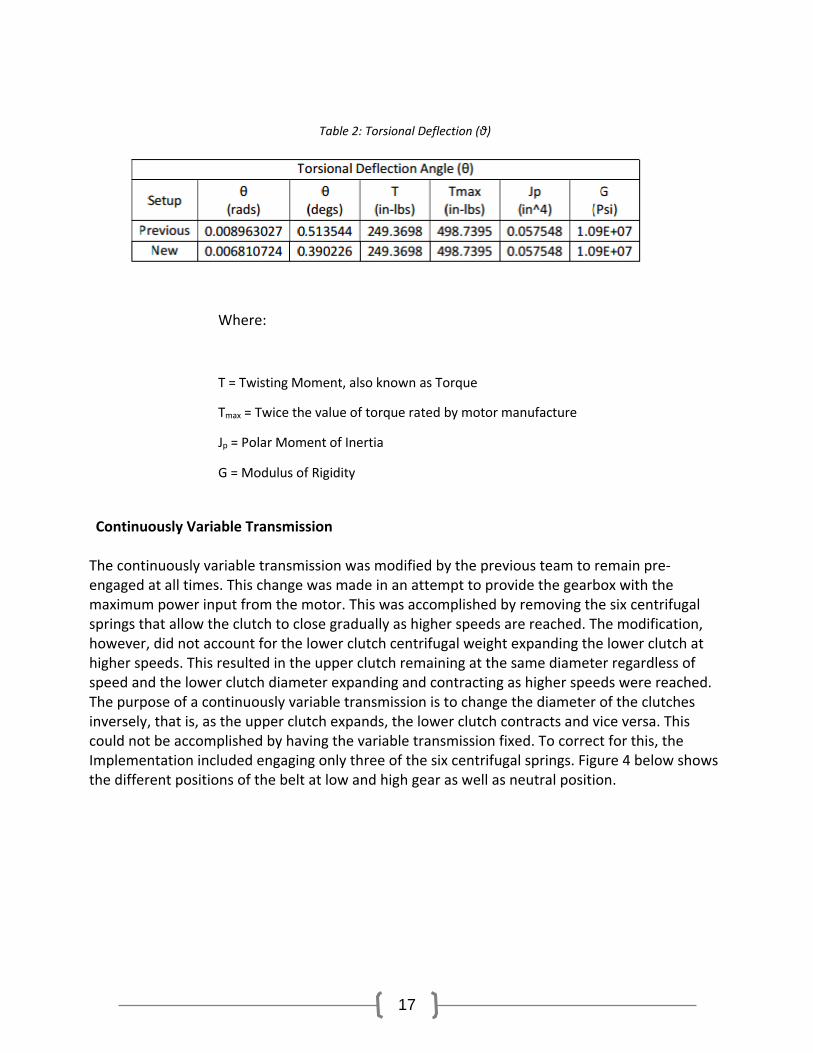
Table 2: Torsional Deflection (θ)
Where:
T = Twisting Moment, also known as Torque
Tmax = Twice the value of torque rated by motor manufacture
Jp = Polar Moment of Inertia
G = Modulus of Rigidity
Continuously Variable Transmission
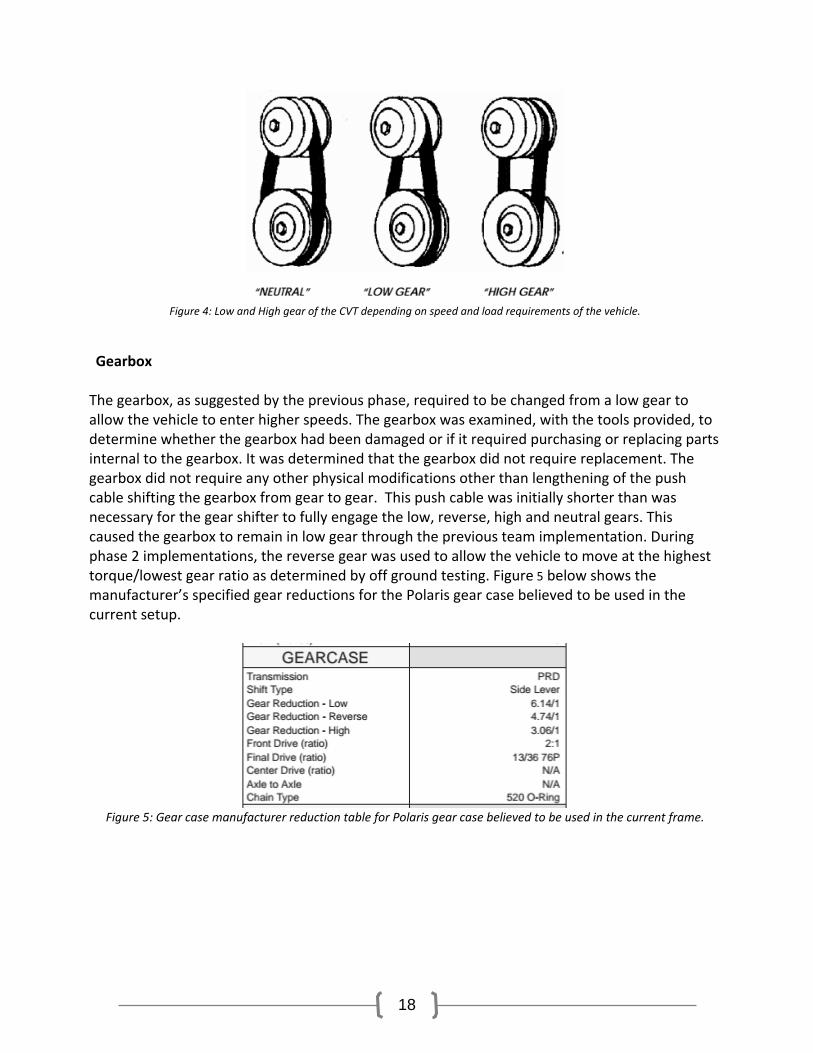
The continuously variable transmission was modified by the previous team to remain pre-engaged at all times. This change was made in an attempt to provide the gearbox with the maximum power input from the motor. This was accomplished by removing the six centrifugal springs that allow the clutch to close gradually as higher speeds are reached. The modification, however, did not account for the lower clutch centrifugal weight expanding the lower clutch at higher speeds. This resulted in the upper clutch remaining at the same diameter regardless of speed and the lower clutch diameter expanding and contracting as higher speeds were reached. The purpose of a continuously variable transmission is to change the diameter of the clutches inversely, that is, as the upper clutch expands, the lower clutch contracts and vice versa. This could not be accomplished by having the variable transmission fixed. To correct for this, the Implementation included engaging only three of the six centrifugal springs. Figure 4 below shows the different positions of the belt at low and high gear as well as neutral position.
18
Figure 4: Low and High gear of the CVT depending on speed and load requirements of the vehicle.
Gearbox
The gearbox, as suggested by the previous phase, required to be changed from a low gear to allow the vehicle to enter higher speeds. The gearbox was examined, with the tools provided, to determine whether the gearbox had been damaged or if it required purchasing or replacing parts internal to the gearbox. It was determined that the gearbox did not require replacement. The gearbox did not require any other physical modifications other than lengthening of the push cable shifting the gearbox from gear to gear. This push cable was initially shorter than was necessary for the gear shifter to fully engage the low, reverse, high and neutral gears. This caused the gearbox to remain in low gear through the previous team implementation. During phase 2 implementations, the reverse gear was used to allow the vehicle to move at the highest torque/lowest gear ratio as determined by off ground testing. Figure 5 below shows the manufacturer’s specified gear reductions for the Polaris gear case believed to be used in the current setup.
Figure 5: Gear case manufacturer reduction table for Polaris gear case believed to be used in the current frame.

19
Section 2.3: Speed Control Subsystem
Speed Control Functionality Speed control refers to the means by which the operator sets the speed, and the control system that maintains the speed.
Throttle Position Sensor
The position of the throttle, pressed by the operator to increase vehicle speed, will be determined by a potentiometer. The current design uses a rotary encoder to convert the angular position of the throttle shaft to a voltage signal. Visual tests were performed to test the effectiveness of both the rotary encoder and the potentiometer. The test results indicated that the motor took less to achieve high speed when controlled by a potentiometer.
The throttle potentiometer is an existing 10k variable resistor from the 2014 Bidirectional DC- DC Converter Drive System for Electric Vehicle senior design project. The potentiometer will be connected across a 5v source and will results in less than 2.5mW of power dissipation. The output voltage from the throttle potentiometer will be input into the Arduino where it will be quantized with a range of 0-5V corresponding linearly to values of 0 to 1023 based on a 10 bit analog to digital converter. The reading from the potentiometer will need to be scaled based on the maximum speed achieved by the EV.
Speed Sensor
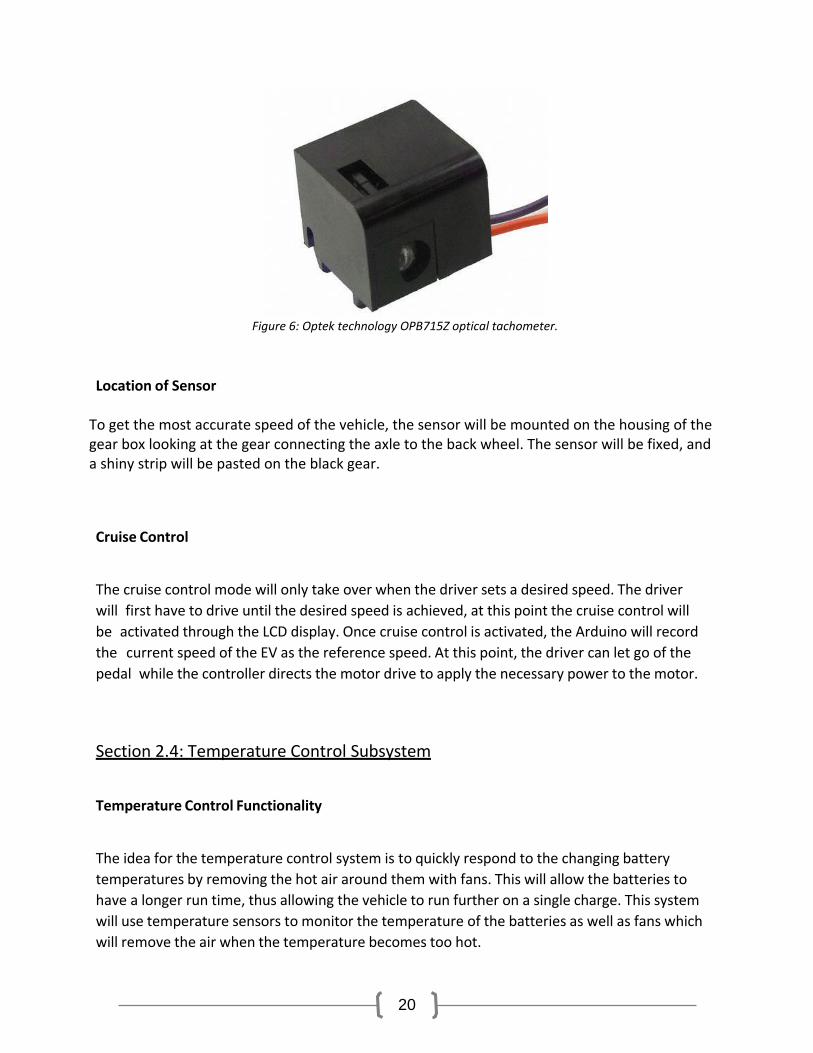
The speed sensor selected for speed control is the Optek Technology OPB715Z optical tachometer as shown in Figure 6. This sensor was selected because it has a long product life and is reliable. This sensor has an operating distance range of 0.5”, and is enclosed in a plastic case, protecting it from debris. The sensor will count the amount of time between each time the silver strip stuck on the disk passes by the optical tachometer. The sensor then sends a pulse to the micro controller which in turn will use that data and multiply it by a gain to display the current speed.
20
Figure 6: Optek technology OPB715Z optical tachometer.
Location of Sensor
To get the most accurate speed of the vehicle, the sensor will be mounted on the housing of the gear box looking at the gear connecting the axle to the back wheel. The sensor will be fixed, and a shiny strip will be pasted on the black gear. Cruise Control
The cruise control mode will only take over when the driver sets a desired speed. The driver will first have to drive until the desired speed is achieved, at this point the cruise control will be activated through the LCD display. Once cruise control is activated, the Arduino will record the current speed of the EV as the reference speed. At this point, the driver can let go of the pedal while the controller directs the motor drive to apply the necessary power to the motor.
Section 2.4: Temperature Control Subsystem
Temperature Control Functionality
The idea for the temperature control system is to quickly respond to the changing battery temperatures by removing the hot air around them with fans. This will allow the batteries to have a longer run time, thus allowing the vehicle to run further on a single charge. This system will use temperature sensors to monitor the temperature of the batteries as well as fans which will remove the air when the temperature becomes too hot.
21
Temperature Sensor
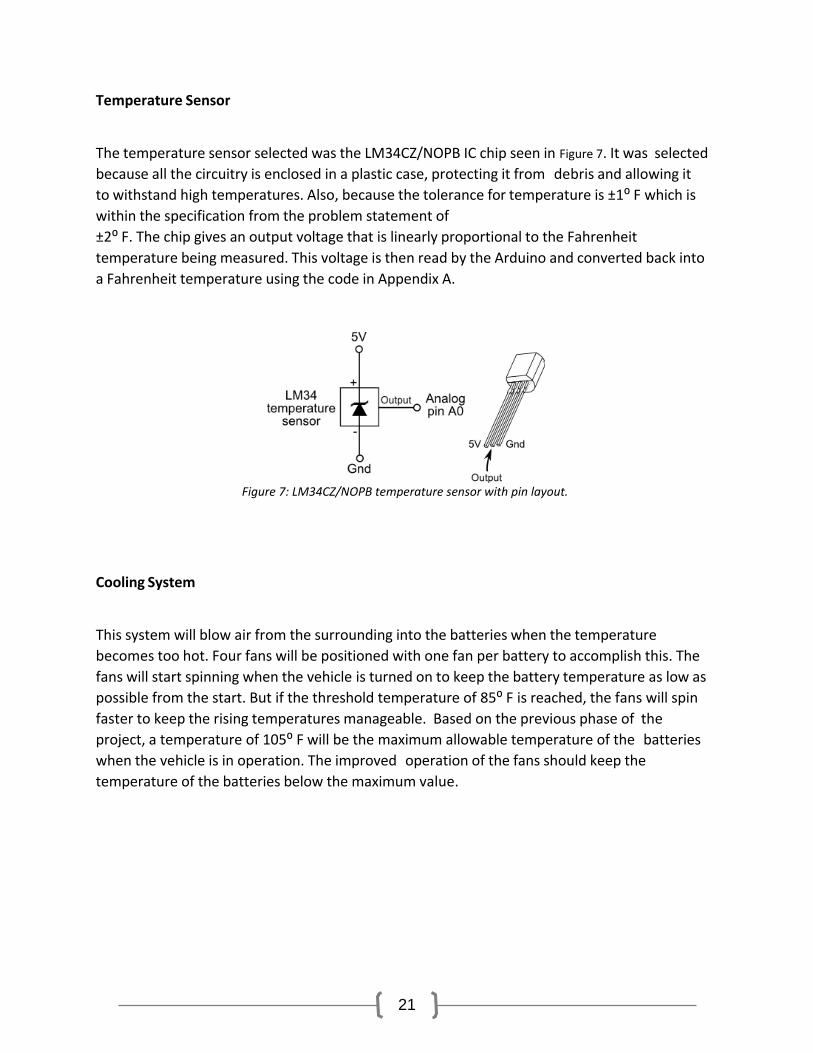
The temperature sensor selected was the LM34CZ/NOPB IC chip seen in Figure 7. It was selected because all the circuitry is enclosed in a plastic case, protecting it from debris and allowing it to withstand high temperatures. Also, because the tolerance for temperature is ±1⁰ F which is within the specification from the problem statement of ±2⁰ F. The chip gives an output voltage that is linearly proportional to the Fahrenheit temperature being measured. This voltage is then read by the Arduino and converted back into a Fahrenheit temperature using the code in Appendix A.
Figure 7: LM34CZ/NOPB temperature sensor with pin layout.
Cooling System
This system will blow air from the surrounding into the batteries when the temperature becomes too hot. Four fans will be positioned with one fan per battery to accomplish this. The fans will start spinning when the vehicle is turned on to keep the battery temperature as low as possible from the start. But if the threshold temperature of 85⁰ F is reached, the fans will spin faster to keep the rising temperatures manageable. Based on the previous phase of the project, a temperature of 105⁰ F will be the maximum allowable temperature of the batteries when the vehicle is in operation. The improved operation of the fans should keep the temperature of the batteries below the maximum value.

22
Section III: Design Modifications
23
Section 3.1: Power Management Solar Panels
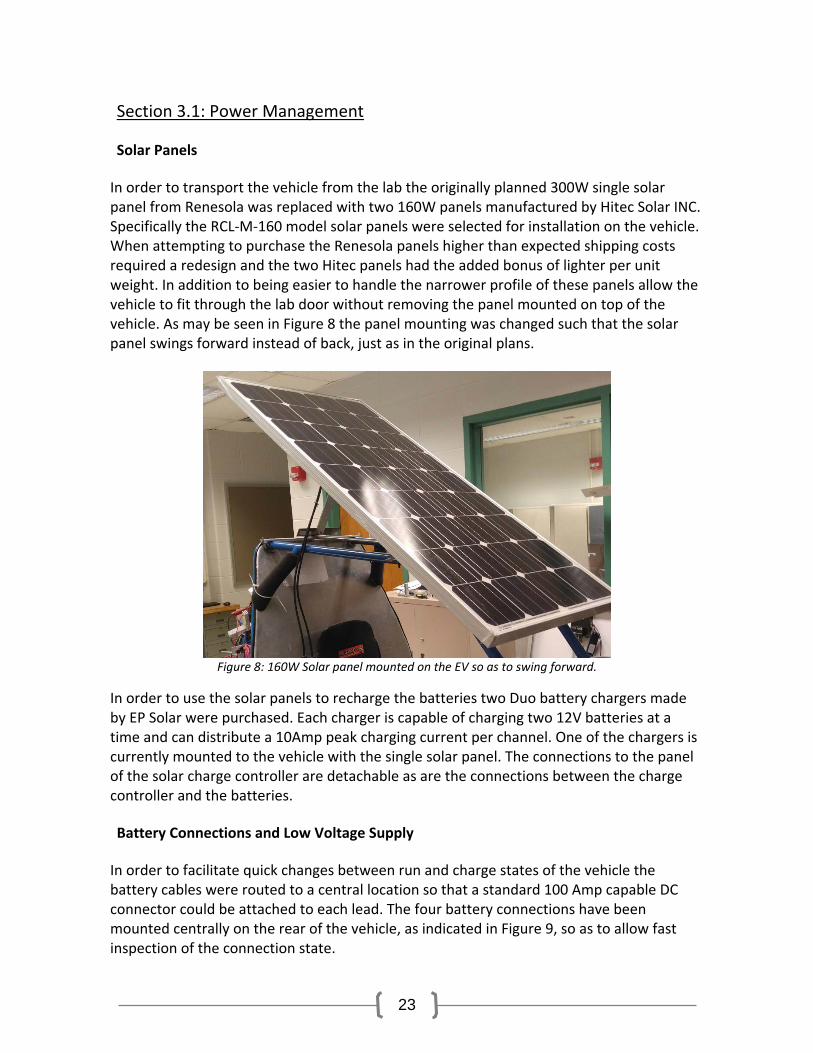
In order to transport the vehicle from the lab the originally planned 300W single solar panel from Renesola was replaced with two 160W panels manufactured by Hitec Solar INC. Specifically the RCL-M-160 model solar panels were selected for installation on the vehicle. When attempting to purchase the Renesola panels higher than expected shipping costs required a redesign and the two Hitec panels had the added bonus of lighter per unit weight. In addition to being easier to handle the narrower profile of these panels allow the vehicle to fit through the lab door without removing the panel mounted on top of the vehicle. As may be seen in Figure 8 the panel mounting was changed such that the solar panel swings forward instead of back, just as in the original plans.
Figure 8: 160W Solar panel mounted on the EV so as to swing forward.
In order to use the solar panels to recharge the batteries two Duo battery chargers made by EP Solar were purchased. Each charger is capable of charging two 12V batteries at a time and can distribute a 10Amp peak charging current per channel. One of the chargers is currently mounted to the vehicle with the single solar panel. The connections to the panel of the solar charge controller are detachable as are the connections between the charge controller and the batteries. Battery Connections and Low Voltage Supply
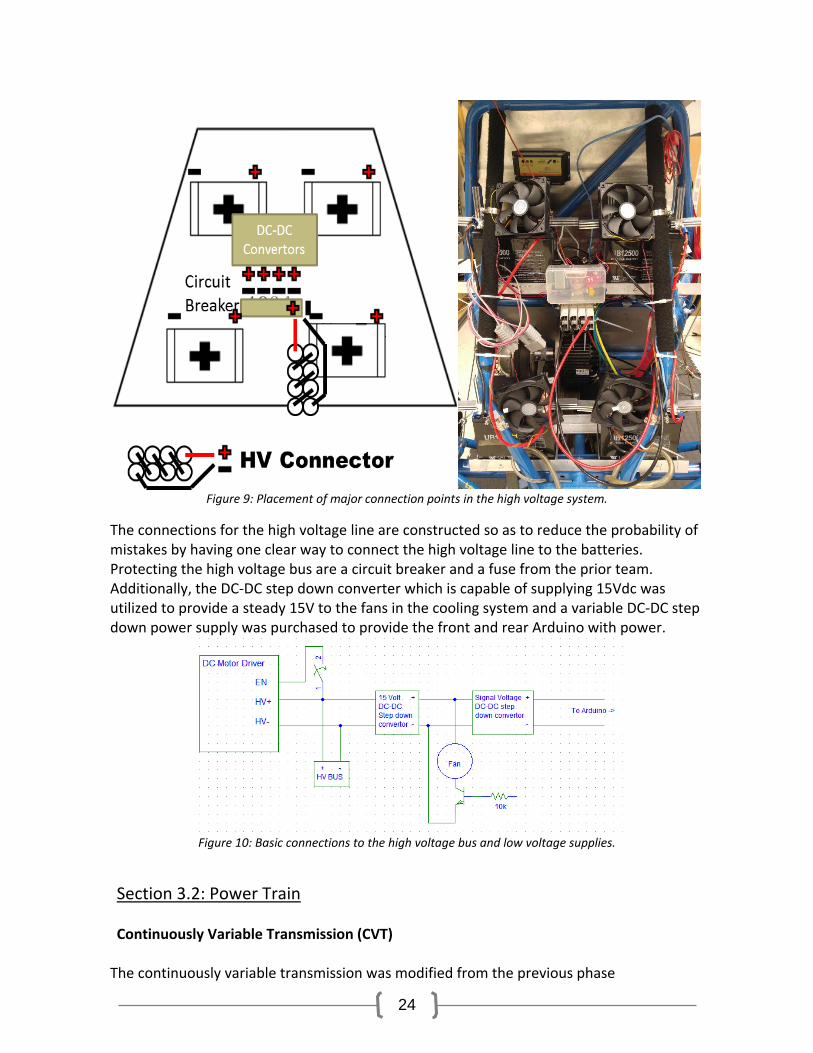
In order to facilitate quick changes between run and charge states of the vehicle the battery cables were routed to a central location so that a standard 100 Amp capable DC connector could be attached to each lead. The four battery connections have been mounted centrally on the rear of the vehicle, as indicated in Figure 9, so as to allow fast inspection of the connection state.
24
Figure 9: Placement of major connection points in the high voltage system.
The connections for the high voltage line are constructed so as to reduce the probability of mistakes by having one clear way to connect the high voltage line to the batteries. Protecting the high voltage bus are a circuit breaker and a fuse from the prior team. Additionally, the DC-DC step down converter which is capable of supplying 15Vdc was utilized to provide a steady 15V to the fans in the cooling system and a variable DC-DC step down power supply was purchased to provide the front and rear Arduino with power.
Figure 10: Basic connections to the high voltage bus and low voltage supplies.
Section 3.2: Power Train
Continuously Variable Transmission (CVT)
The continuously variable transmission was modified from the previous phase
25
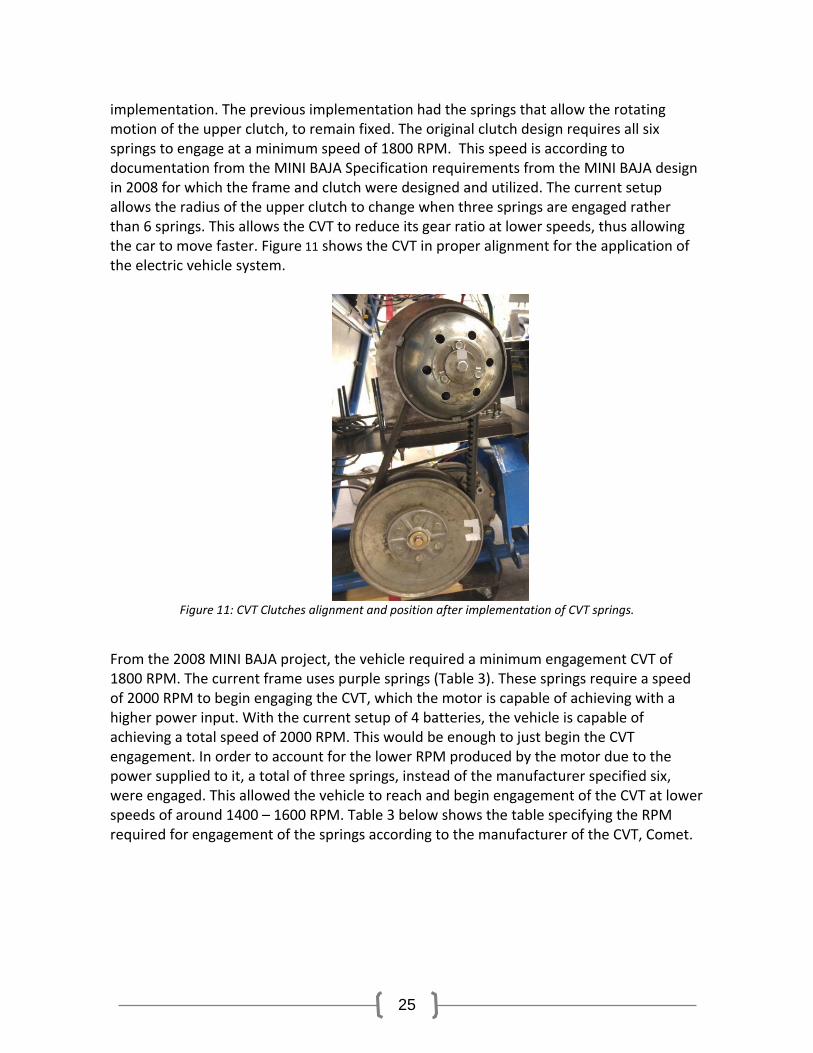
implementation. The previous implementation had the springs that allow the rotating motion of the upper clutch, to remain fixed. The original clutch design requires all six springs to engage at a minimum speed of 1800 RPM. This speed is according to documentation from the MINI BAJA Specification requirements from the MINI BAJA design in 2008 for which the frame and clutch were designed and utilized. The current setup allows the radius of the upper clutch to change when three springs are engaged rather than 6 springs. This allows the CVT to reduce its gear ratio at lower speeds, thus allowing the car to move faster. Figure 11 shows the CVT in proper alignment for the application of the electric vehicle system.
Figure 11: CVT Clutches alignment and position after implementation of CVT springs.
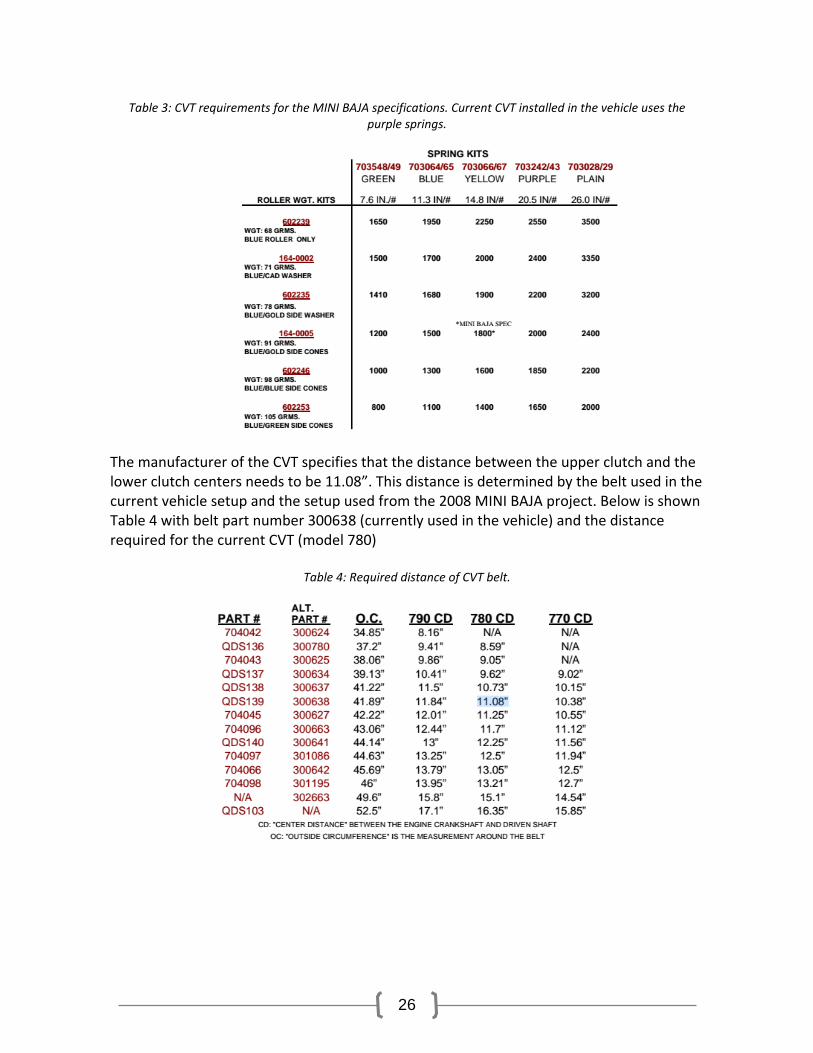
From the 2008 MINI BAJA project, the vehicle required a minimum engagement CVT of 1800 RPM. The current frame uses purple springs (Table 3). These springs require a speed of 2000 RPM to begin engaging the CVT, which the motor is capable of achieving with a higher power input. With the current setup of 4 batteries, the vehicle is capable of achieving a total speed of 2000 RPM. This would be enough to just begin the CVT engagement. In order to account for the lower RPM produced by the motor due to the power supplied to it, a total of three springs, instead of the manufacturer specified six, were engaged. This allowed the vehicle to reach and begin engagement of the CVT at lower speeds of around 1400 – 1600 RPM. Table 3 below shows the table specifying the RPM required for engagement of the springs according to the manufacturer of the CVT, Comet.
26
Table 3: CVT requirements for the MINI BAJA specifications. Current CVT installed in the vehicle uses the purple springs.
The manufacturer of the CVT specifies that the distance between the upper clutch and the lower clutch centers needs to be 11.08”. This distance is determined by the belt used in the current vehicle setup and the setup used from the 2008 MINI BAJA project. Below is shown Table 4 with belt part number 300638 (currently used in the vehicle) and the distance required for the current CVT (model 780)
Table 4: Required distance of CVT belt.
27
Motor Mounting Plate
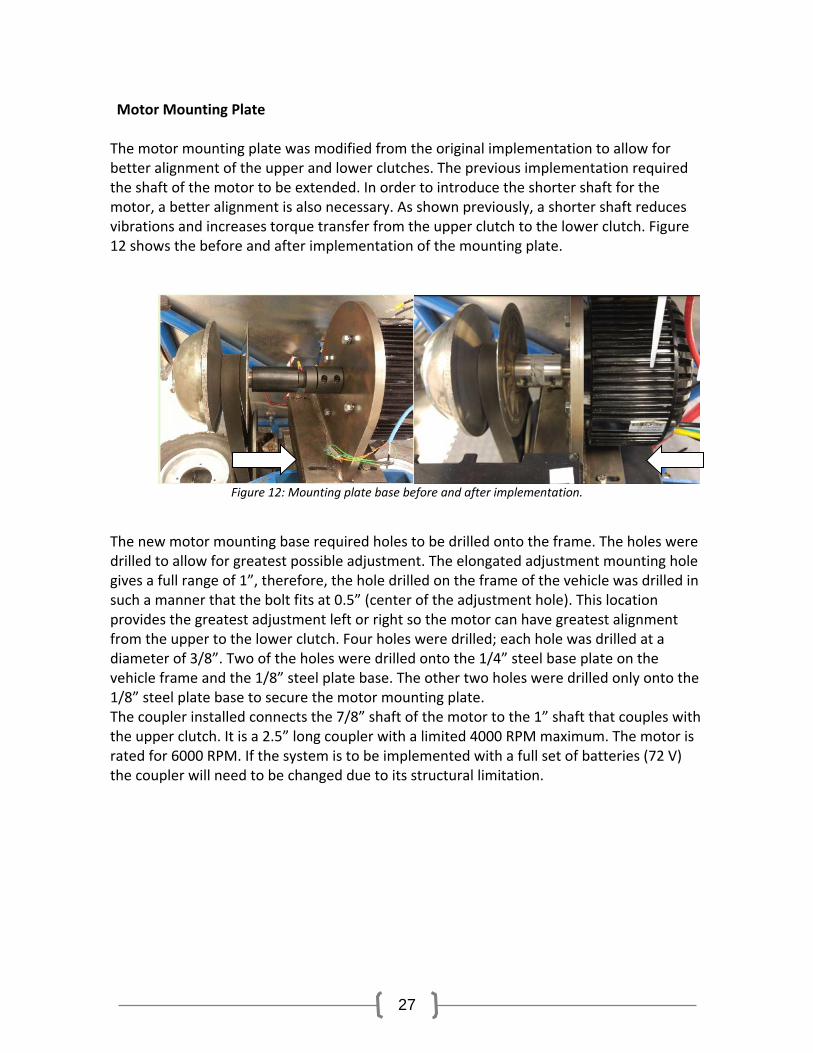
The motor mounting plate was modified from the original implementation to allow for better alignment of the upper and lower clutches. The previous implementation required the shaft of the motor to be extended. In order to introduce the shorter shaft for the motor, a better alignment is also necessary. As shown previously, a shorter shaft reduces vibrations and increases torque transfer from the upper clutch to the lower clutch. Figure 12 shows the before and after implementation of the mounting plate.
Figure 12: Mounting plate base before and after implementation.
The new motor mounting base required holes to be drilled onto the frame. The holes were drilled to allow for greatest possible adjustment. The elongated adjustment mounting hole gives a full range of 1”, therefore, the hole drilled on the frame of the vehicle was drilled in such a manner that the bolt fits at 0.5” (center of the adjustment hole). This location provides the greatest adjustment left or right so the motor can have greatest alignment from the upper to the lower clutch. Four holes were drilled; each hole was drilled at a diameter of 3/8”. Two of the holes were drilled onto the 1/4” steel base plate on the vehicle frame and the 1/8” steel plate base. The other two holes were drilled only onto the 1/8” steel plate base to secure the motor mounting plate. The coupler installed connects the 7/8” shaft of the motor to the 1” shaft that couples with the upper clutch. It is a 2.5” long coupler with a limited 4000 RPM maximum. The motor is rated for 6000 RPM. If the system is to be implemented with a full set of batteries (72 V) the coupler will need to be changed due to its structural limitation.
28
Section 3.3 Speed Control Design Modifications
Throttle Position Sensor
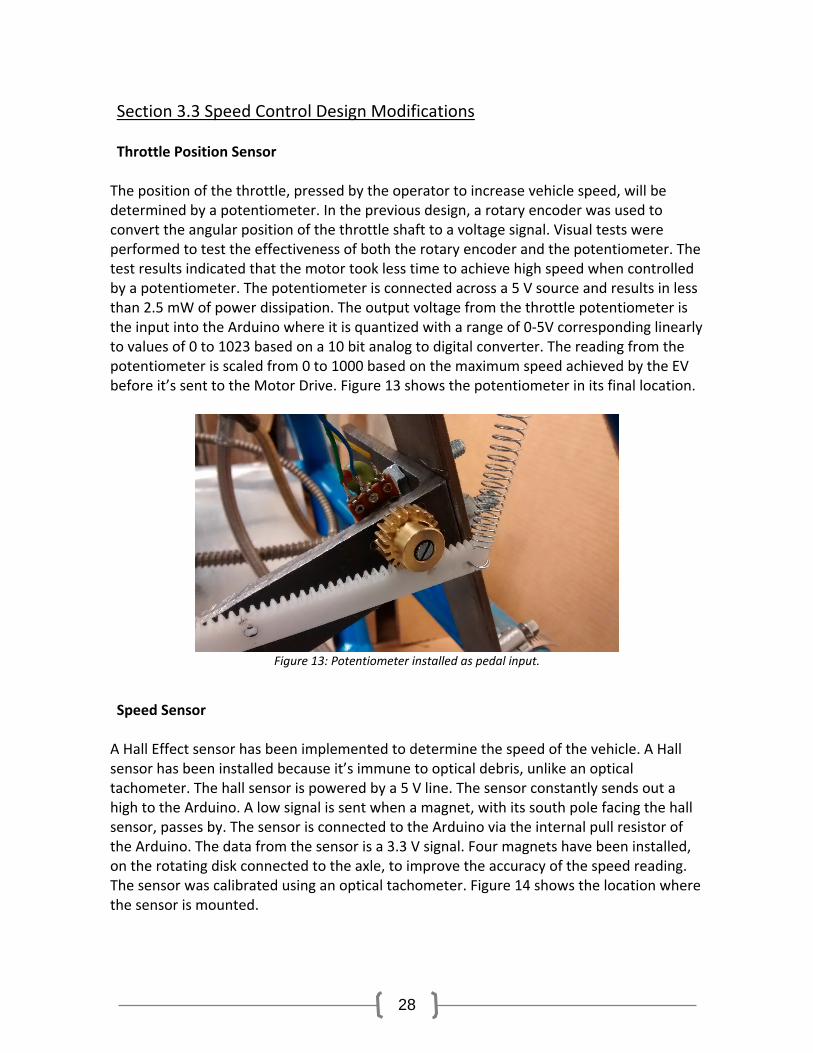
The position of the throttle, pressed by the operator to increase vehicle speed, will be determined by a potentiometer. In the previous design, a rotary encoder was used to convert the angular position of the throttle shaft to a voltage signal. Visual tests were performed to test the effectiveness of both the rotary encoder and the potentiometer. The test results indicated that the motor took less time to achieve high speed when controlled by a potentiometer. The potentiometer is connected across a 5 V source and results in less than 2.5 mW of power dissipation. The output voltage from the throttle potentiometer is the input into the Arduino where it is quantized with a range of 0-5V corresponding linearly to values of 0 to 1023 based on a 10 bit analog to digital converter. The reading from the potentiometer is scaled from 0 to 1000 based on the maximum speed achieved by the EV before it’s sent to the Motor Drive. Figure 13 shows the potentiometer in its final location.
Figure 13: Potentiometer installed as pedal input.
Speed Sensor
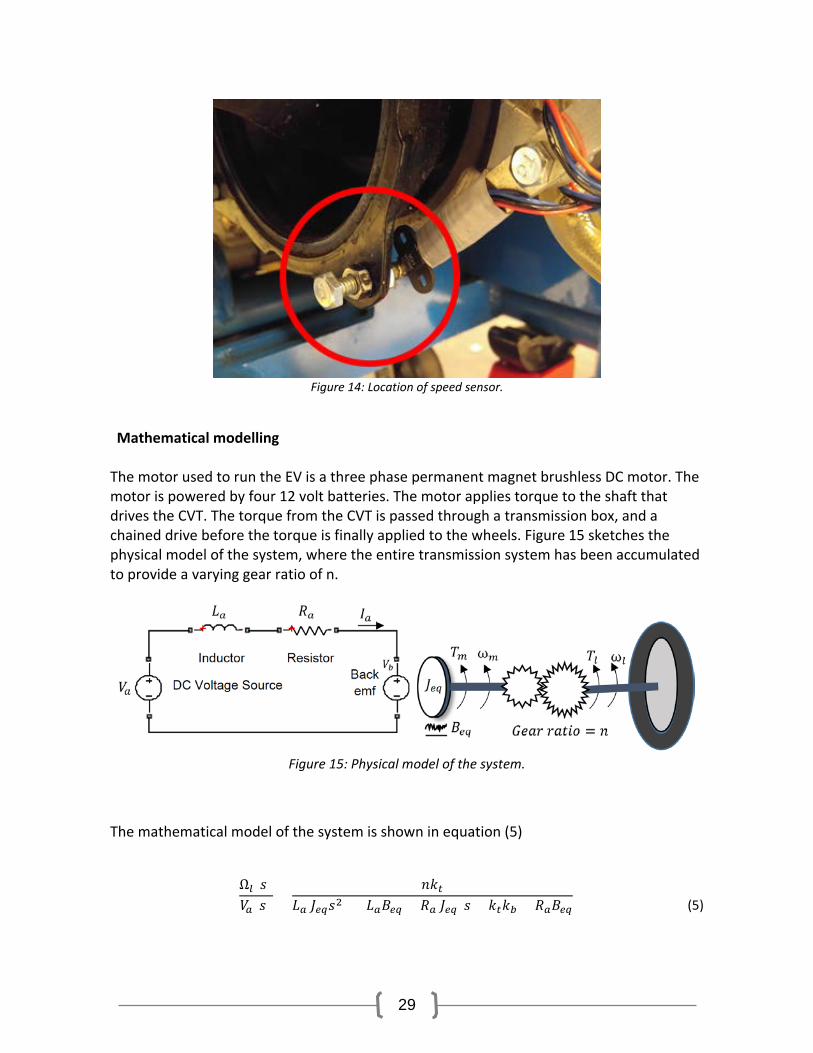
A Hall Effect sensor has been implemented to determine the speed of the vehicle. A Hall sensor has been installed because it’s immune to optical debris, unlike an optical tachometer. The hall sensor is powered by a 5 V line. The sensor constantly sends out a high to the Arduino. A low signal is sent when a magnet, with its south pole facing the hall sensor, passes by. The sensor is connected to the Arduino via the internal pull resistor of the Arduino. The data from the sensor is a 3.3 V signal. Four magnets have been installed, on the rotating disk connected to the axle, to improve the accuracy of the speed reading. The sensor was calibrated using an optical tachometer. Figure 14 shows the location where the sensor is mounted.
29
Figure 14: Location of speed sensor.
Mathematical modelling
The motor used to run the EV is a three phase permanent magnet brushless DC motor. The motor is powered by four 12 volt batteries. The motor applies torque to the shaft that drives the CVT. The torque from the CVT is passed through a transmission box, and a chained drive before the torque is finally applied to the wheels. Figure 15 sketches the physical model of the system, where the entire transmission system has been accumulated to provide a varying gear ratio of n.
Figure 15: Physical model of the system.
The mathematical model of the system is shown in equation (5)
Ω𝑙𝑙(𝑠𝑠)𝑉𝑉𝑚𝑚(𝑠𝑠)
=𝑛𝑛𝑘𝑘𝑡𝑡
𝐿𝐿𝑚𝑚 𝐽𝐽𝑒𝑒𝑒𝑒𝑠𝑠2 + (𝐿𝐿𝑚𝑚𝐵𝐵𝑒𝑒𝑒𝑒 + 𝑅𝑅𝑚𝑚 𝐽𝐽𝑒𝑒𝑒𝑒)𝑠𝑠 + 𝑘𝑘𝑡𝑡𝑘𝑘𝑏𝑏 + 𝑅𝑅𝑚𝑚𝐵𝐵𝑒𝑒𝑒𝑒
(5)
30
where 𝐵𝐵𝑒𝑒𝑒𝑒 = 𝐸𝐸𝐸𝐸𝐸𝐸𝐸𝐸𝐸𝐸𝐸𝐸𝐸𝐸𝐸𝐸𝑛𝑛𝐸𝐸 𝑐𝑐𝑐𝑐𝐸𝐸𝑐𝑐𝑐𝑐𝐸𝐸𝑐𝑐𝐸𝐸𝐸𝐸𝑛𝑛𝐸𝐸 𝑐𝑐𝑐𝑐 𝐸𝐸𝐸𝐸𝑠𝑠𝑐𝑐𝑐𝑐𝐸𝐸𝑠𝑠 𝑐𝑐𝑟𝑟𝐸𝐸𝑐𝑐𝐸𝐸𝐸𝐸𝑐𝑐𝑛𝑛
𝐽𝐽𝑒𝑒𝑒𝑒 = 𝐸𝐸𝐸𝐸. 𝐼𝐼𝑛𝑛𝐸𝐸𝑟𝑟𝐸𝐸𝐸𝐸𝐸𝐸 𝑘𝑘𝑡𝑡 = 𝑇𝑇𝑐𝑐𝑟𝑟𝐸𝐸𝐸𝐸𝐸𝐸 𝐶𝐶𝑐𝑐𝑛𝑛𝑠𝑠𝐸𝐸𝐸𝐸𝑛𝑛𝐸𝐸;𝑘𝑘𝑏𝑏 = 𝐵𝐵𝐸𝐸𝑐𝑐𝑘𝑘 𝐸𝐸𝑒𝑒𝑐𝑐 𝐶𝐶𝑐𝑐𝑛𝑛𝑠𝑠𝐸𝐸𝐸𝐸𝑛𝑛𝐸𝐸
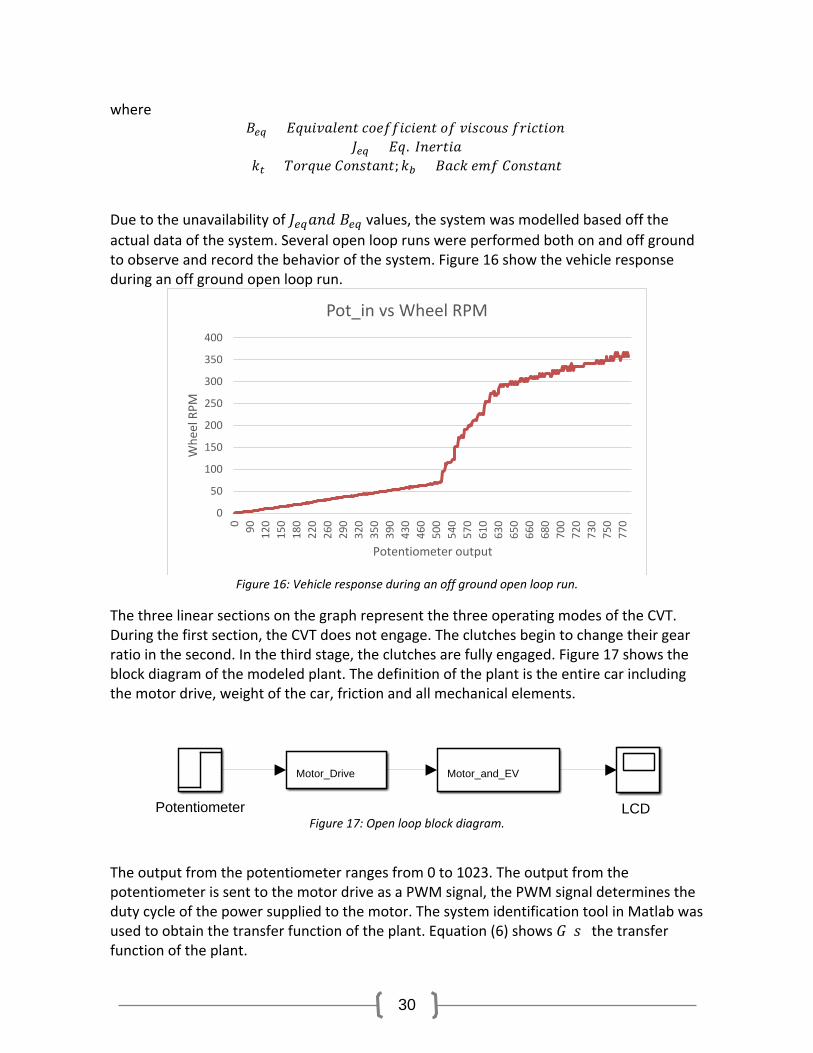
Due to the unavailability of 𝐽𝐽𝑒𝑒𝑒𝑒𝐸𝐸𝑛𝑛𝑎𝑎 𝐵𝐵𝑒𝑒𝑒𝑒 values, the system was modelled based off the actual data of the system. Several open loop runs were performed both on and off ground to observe and record the behavior of the system. Figure 16 show the vehicle response during an off ground open loop run.
Figure 16: Vehicle response during an off ground open loop run.
The three linear sections on the graph represent the three operating modes of the CVT. During the first section, the CVT does not engage. The clutches begin to change their gear ratio in the second. In the third stage, the clutches are fully engaged. Figure 17 shows the block diagram of the modeled plant. The definition of the plant is the entire car including the motor drive, weight of the car, friction and all mechanical elements.
Figure 17: Open loop block diagram.
The output from the potentiometer ranges from 0 to 1023. The output from the potentiometer is sent to the motor drive as a PWM signal, the PWM signal determines the duty cycle of the power supplied to the motor. The system identification tool in Matlab was used to obtain the transfer function of the plant. Equation (6) shows 𝐺𝐺(𝑠𝑠) the transfer function of the plant.
0
50
100
150
200
250
300
350
400
0 90 120
150
180
220
260
290
320
350
390
430
460
500
540
570
610
630
650
660
680
700
720
730
750
770
Whe
el R
PM
Potentiometer output
Pot_in vs Wheel RPM
Potentiometer
Motor_and_EV
Motor_Drive
LCD
31
𝑃𝑃𝐸𝐸𝐸𝐸𝑛𝑛𝐸𝐸 = 𝐺𝐺(𝑠𝑠) =0.145
𝑠𝑠 + 0.4672
(6)
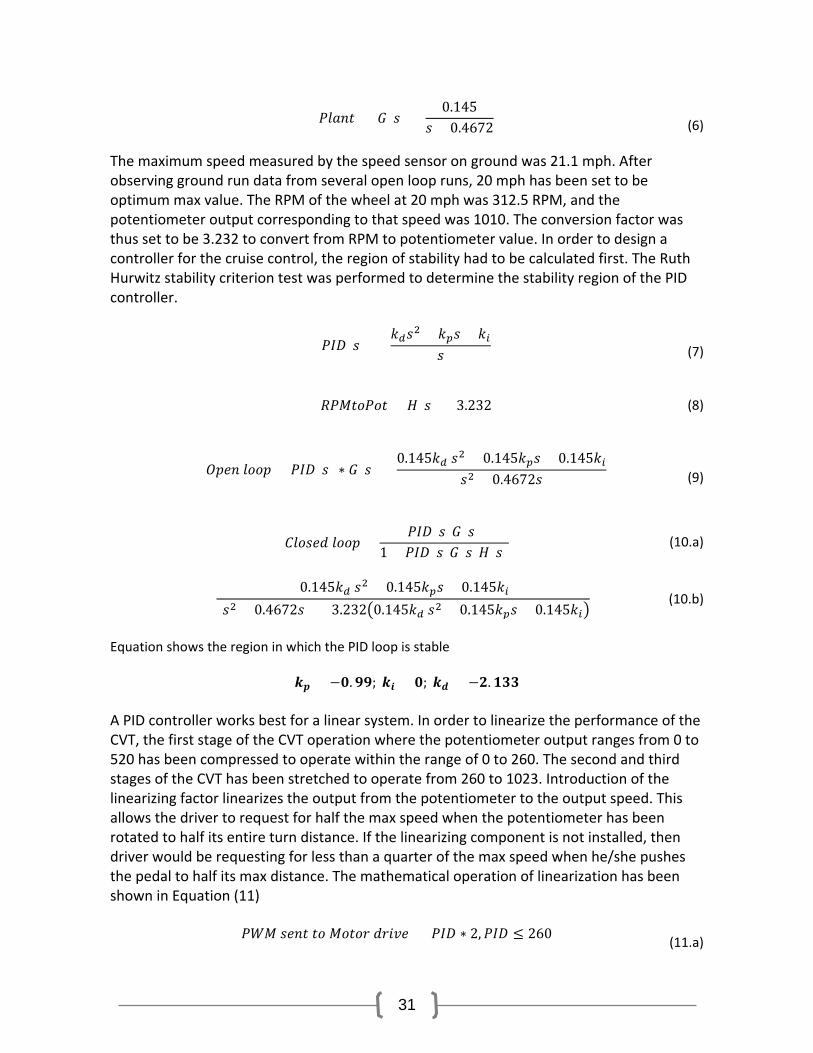
The maximum speed measured by the speed sensor on ground was 21.1 mph. After observing ground run data from several open loop runs, 20 mph has been set to be optimum max value. The RPM of the wheel at 20 mph was 312.5 RPM, and the potentiometer output corresponding to that speed was 1010. The conversion factor was thus set to be 3.232 to convert from RPM to potentiometer value. In order to design a controller for the cruise control, the region of stability had to be calculated first. The Ruth Hurwitz stability criterion test was performed to determine the stability region of the PID controller.
𝑃𝑃𝐼𝐼𝑃𝑃(𝑠𝑠) = 𝑘𝑘𝑑𝑑𝑠𝑠2 + 𝑘𝑘𝑝𝑝𝑠𝑠 + 𝑘𝑘𝑖𝑖
𝑠𝑠
(7)
𝑅𝑅𝑃𝑃𝑅𝑅𝐸𝐸𝑐𝑐𝑃𝑃𝑐𝑐𝐸𝐸 = 𝐻𝐻(𝑠𝑠) = 3.232 (8)
𝑂𝑂𝑂𝑂𝐸𝐸𝑛𝑛 𝐸𝐸𝑐𝑐𝑐𝑐𝑂𝑂 = 𝑃𝑃𝐼𝐼𝑃𝑃(𝑠𝑠) ∗ 𝐺𝐺(𝑠𝑠) =0.145𝑘𝑘𝑑𝑑 𝑠𝑠2 + 0.145𝑘𝑘𝑝𝑝𝑠𝑠 + 0.145𝑘𝑘𝑖𝑖
(𝑠𝑠2 + 0.4672𝑠𝑠)
(9)
𝐶𝐶𝐸𝐸𝑐𝑐𝑠𝑠𝐸𝐸𝑎𝑎 𝐸𝐸𝑐𝑐𝑐𝑐𝑂𝑂 =𝑃𝑃𝐼𝐼𝑃𝑃(𝑠𝑠)𝐺𝐺(𝑠𝑠)
1 + 𝑃𝑃𝐼𝐼𝑃𝑃(𝑠𝑠)𝐺𝐺(𝑠𝑠)𝐻𝐻(𝑠𝑠) (10.a)
= 0.145𝑘𝑘𝑑𝑑 𝑠𝑠2 + 0.145𝑘𝑘𝑝𝑝𝑠𝑠 + 0.145𝑘𝑘𝑖𝑖
(𝑠𝑠2 + 0.4672𝑠𝑠) + 3.2320.145𝑘𝑘𝑑𝑑 𝑠𝑠2 + 0.145𝑘𝑘𝑝𝑝𝑠𝑠 + 0.145𝑘𝑘𝑖𝑖 (10.b)
Equation shows the region in which the PID loop is stable
𝒌𝒌𝒑𝒑 > −𝟎𝟎.𝟗𝟗𝟗𝟗; 𝒌𝒌𝒊𝒊 > 𝟎𝟎; 𝒌𝒌𝒅𝒅 > −𝟐𝟐.𝟏𝟏𝟏𝟏𝟏𝟏 A PID controller works best for a linear system. In order to linearize the performance of the CVT, the first stage of the CVT operation where the potentiometer output ranges from 0 to 520 has been compressed to operate within the range of 0 to 260. The second and third stages of the CVT has been stretched to operate from 260 to 1023. Introduction of the linearizing factor linearizes the output from the potentiometer to the output speed. This allows the driver to request for half the max speed when the potentiometer has been rotated to half its entire turn distance. If the linearizing component is not installed, then driver would be requesting for less than a quarter of the max speed when he/she pushes the pedal to half its max distance. The mathematical operation of linearization has been shown in Equation (11)
𝑃𝑃𝑃𝑃𝑅𝑅 𝑠𝑠𝐸𝐸𝑛𝑛𝐸𝐸 𝐸𝐸𝑐𝑐 𝑅𝑅𝑐𝑐𝐸𝐸𝑐𝑐𝑟𝑟 𝑎𝑎𝑟𝑟𝐸𝐸𝐸𝐸𝐸𝐸 = 𝑃𝑃𝐼𝐼𝑃𝑃 ∗ 2,𝑃𝑃𝐼𝐼𝑃𝑃 ≤ 260 (11.a)
32
𝑃𝑃𝑃𝑃𝑅𝑅 𝑠𝑠𝐸𝐸𝑛𝑛𝐸𝐸 𝐸𝐸𝑐𝑐 𝑅𝑅𝑐𝑐𝐸𝐸𝑐𝑐𝑟𝑟 𝑎𝑎𝑟𝑟𝐸𝐸𝐸𝐸𝐸𝐸 = 𝑃𝑃𝐼𝐼𝑃𝑃 − 260 ∗ 500
1020 − 260+ 520 ,𝑃𝑃𝐼𝐼𝑃𝑃 > 260
(11.b)
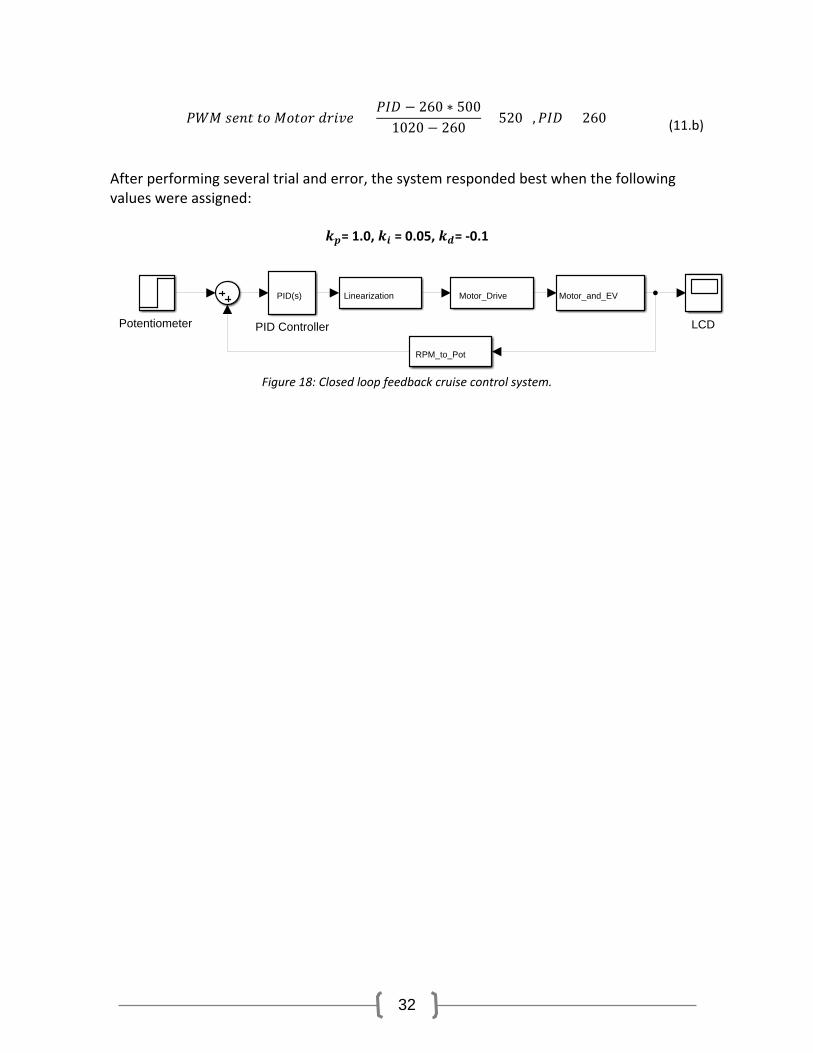
After performing several trial and error, the system responded best when the following values were assigned:
𝒌𝒌𝒑𝒑= 1.0, 𝒌𝒌𝒊𝒊 = 0.05, 𝒌𝒌𝒅𝒅= -0.1
Figure 18: Closed loop feedback cruise control system.
Potentiometer
Motor_and_EV
Motor_Drive
LCD
PID(s)
PID Controller
Linearization
RPM_to_Pot
Section 3.4 Temperature Control Design Modifications
Temperature Sensor Location
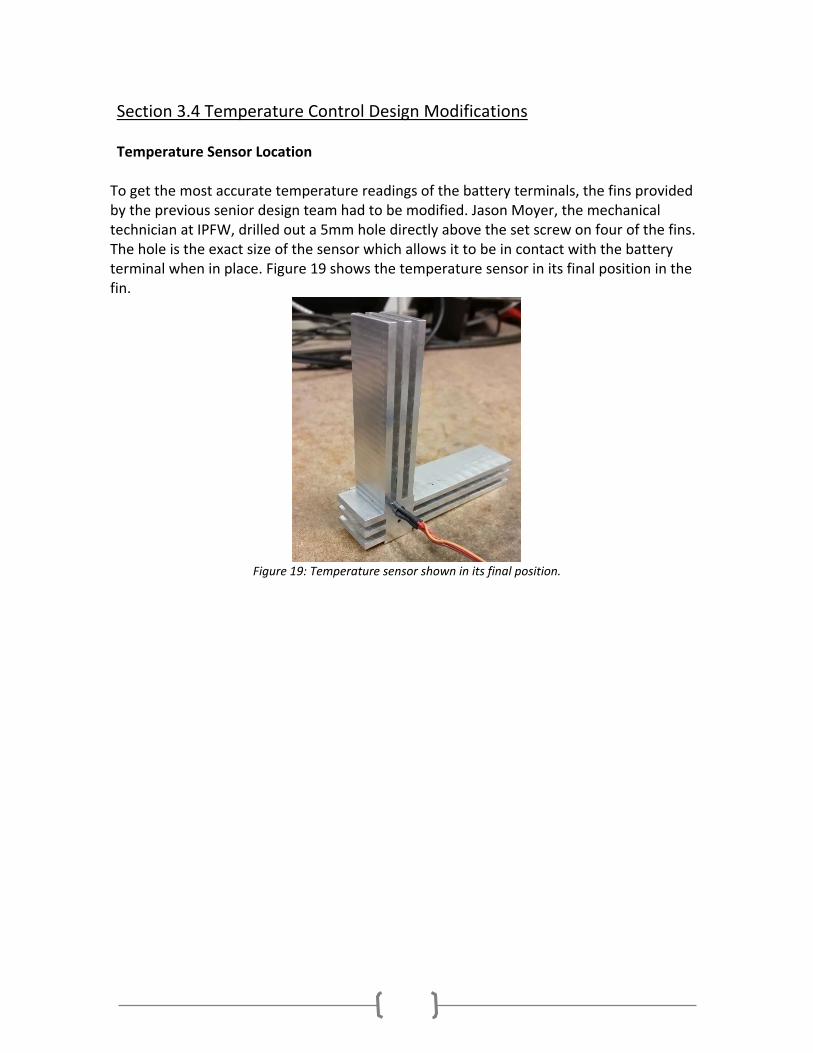
To get the most accurate temperature readings of the battery terminals, the fins provided by the previous senior design team had to be modified. Jason Moyer, the mechanical technician at IPFW, drilled out a 5mm hole directly above the set screw on four of the fins. The hole is the exact size of the sensor which allows it to be in contact with the battery terminal when in place. Figure 19 shows the temperature sensor in its final position in the fin.
Figure 19: Temperature sensor shown in its final position.
34
Mounting of Fans
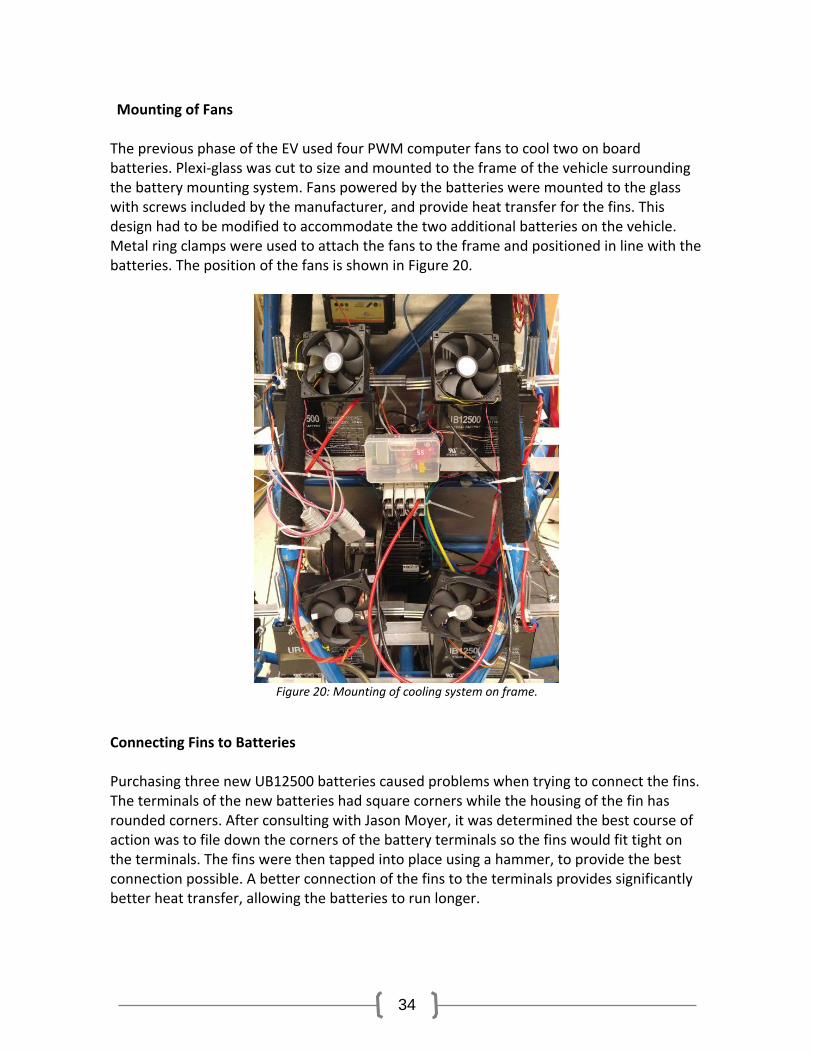
The previous phase of the EV used four PWM computer fans to cool two on board batteries. Plexi-glass was cut to size and mounted to the frame of the vehicle surrounding the battery mounting system. Fans powered by the batteries were mounted to the glass with screws included by the manufacturer, and provide heat transfer for the fins. This design had to be modified to accommodate the two additional batteries on the vehicle. Metal ring clamps were used to attach the fans to the frame and positioned in line with the batteries. The position of the fans is shown in Figure 20.
Figure 20: Mounting of cooling system on frame.
Connecting Fins to Batteries
Purchasing three new UB12500 batteries caused problems when trying to connect the fins. The terminals of the new batteries had square corners while the housing of the fin has rounded corners. After consulting with Jason Moyer, it was determined the best course of action was to file down the corners of the battery terminals so the fins would fit tight on the terminals. The fins were then tapped into place using a hammer, to provide the best connection possible. A better connection of the fins to the terminals provides significantly better heat transfer, allowing the batteries to run longer.

35
Operation of Fans
The original design of the cooling system was for the fans to turn on when the vehicle was on, and increase in speed when the temperature of the batteries exceeded 85° F. The properly connected fins do such an excellent job of removing heat from the system, they prevented the 85° F limit from being reached during testing. This means a new design for the operation of the cooling system was needed. The system implemented in the second phase of the EV project has the fans turn on when the temperature of the batteries exceeds 70° F and shuts down the entire system when the temperature exceeds 100° F. The 100° F value was determined based on the max operational temperature of the batteries being 113° F. To stay well under the max value, 100° F was chosen as the cutoff temperature.

36
Section IV: Testing

37
Section 4.1 Power Management Testing
Battery Life and Charging
In order to test the charging capabilities of the solar powered system the batteries were first discharged to safe levels then removed from the vehicle. An outside testing rig, shown in Figure 21 which held the solar panels facing sunward, was set up during the summer months and the charge controllers were connected to the panels. Once in place the charge controllers were connected to the batteries and the batteries were subsequently charged over time. Fully recharging the batteries in direct sunlight took approximately six hours for the deepest discharge tested.
Figure 21: Outdoor test rig for testing the time needed to charge the batteries off of solar energy.
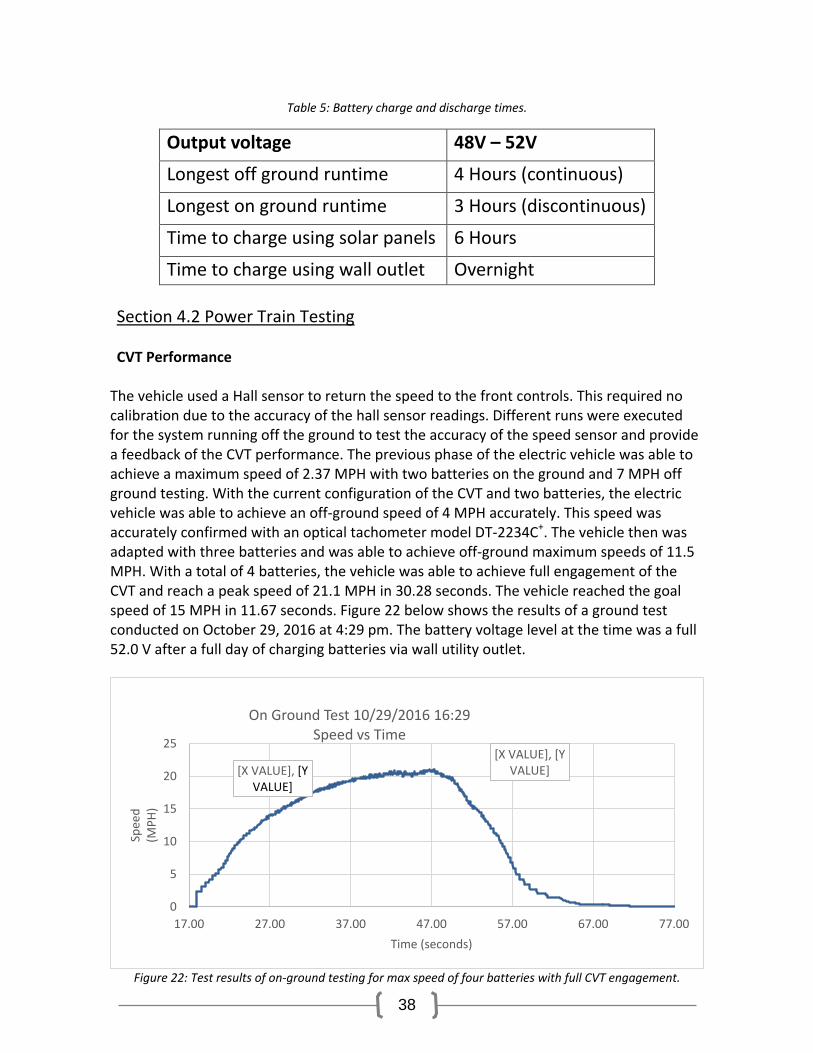
In order to measure the battery life of the vehicle the batteries were first fully charged and then the vehicle was driven on a flat surface such as cement or asphalt. The vehicle successfully drove for three hours including stops to take performance data. The batteries proved capable of running the motor under minimal load off the ground in for four hours. A summary of the charge and discharge times under various conditions may be found in Table 5. Of special note is that the wall outlet charging time is based on a single 12V battery charger which was borrowed to charge the batteries for testing.
38
Table 5: Battery charge and discharge times.
Output voltage 48V – 52V Longest off ground runtime 4 Hours (continuous) Longest on ground runtime 3 Hours (discontinuous) Time to charge using solar panels 6 Hours Time to charge using wall outlet Overnight
Section 4.2 Power Train Testing
CVT Performance
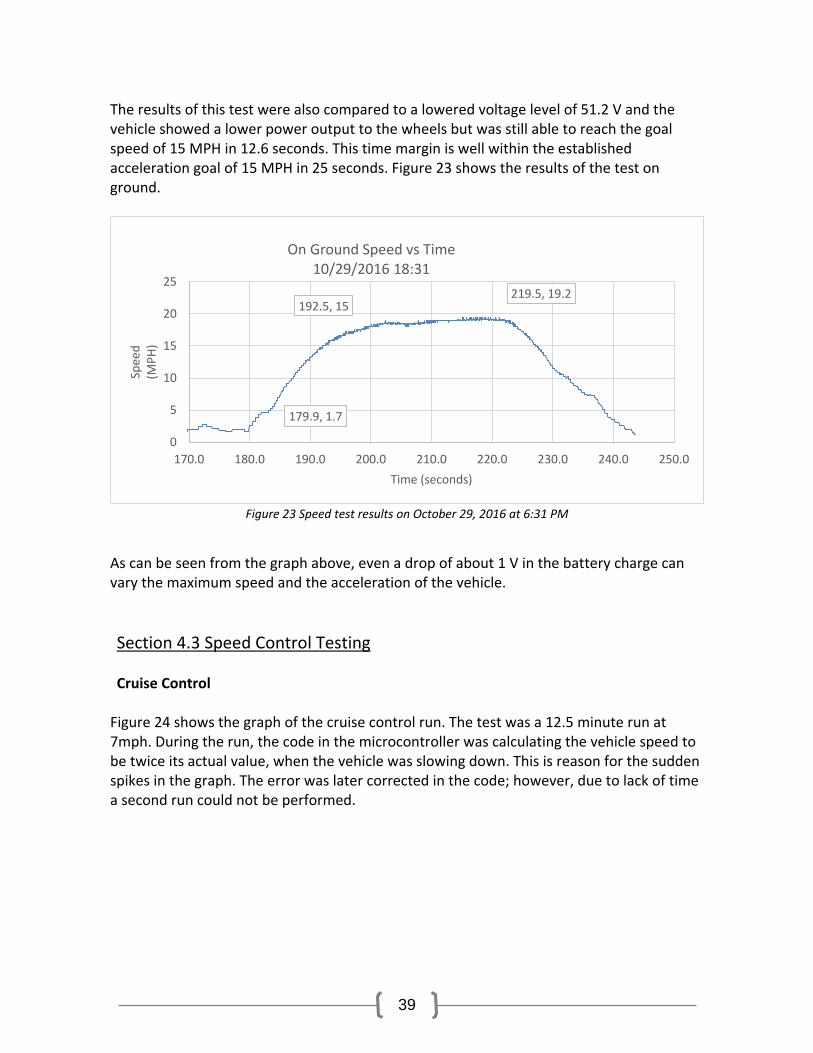
The vehicle used a Hall sensor to return the speed to the front controls. This required no calibration due to the accuracy of the hall sensor readings. Different runs were executed for the system running off the ground to test the accuracy of the speed sensor and provide a feedback of the CVT performance. The previous phase of the electric vehicle was able to achieve a maximum speed of 2.37 MPH with two batteries on the ground and 7 MPH off ground testing. With the current configuration of the CVT and two batteries, the electric vehicle was able to achieve an off-ground speed of 4 MPH accurately. This speed was accurately confirmed with an optical tachometer model DT-2234C+. The vehicle then was adapted with three batteries and was able to achieve off-ground maximum speeds of 11.5 MPH. With a total of 4 batteries, the vehicle was able to achieve full engagement of the CVT and reach a peak speed of 21.1 MPH in 30.28 seconds. The vehicle reached the goal speed of 15 MPH in 11.67 seconds. Figure 22 below shows the results of a ground test conducted on October 29, 2016 at 4:29 pm. The battery voltage level at the time was a full 52.0 V after a full day of charging batteries via wall utility outlet.
Figure 22: Test results of on-ground testing for max speed of four batteries with full CVT engagement.
[X VALUE], [Y VALUE]
[X VALUE], [Y VALUE]
0
5
10
15
20
25
17.00 27.00 37.00 47.00 57.00 67.00 77.00
Spee
d
(MPH
)
Time (seconds)
On Ground Test 10/29/2016 16:29 Speed vs Time
39
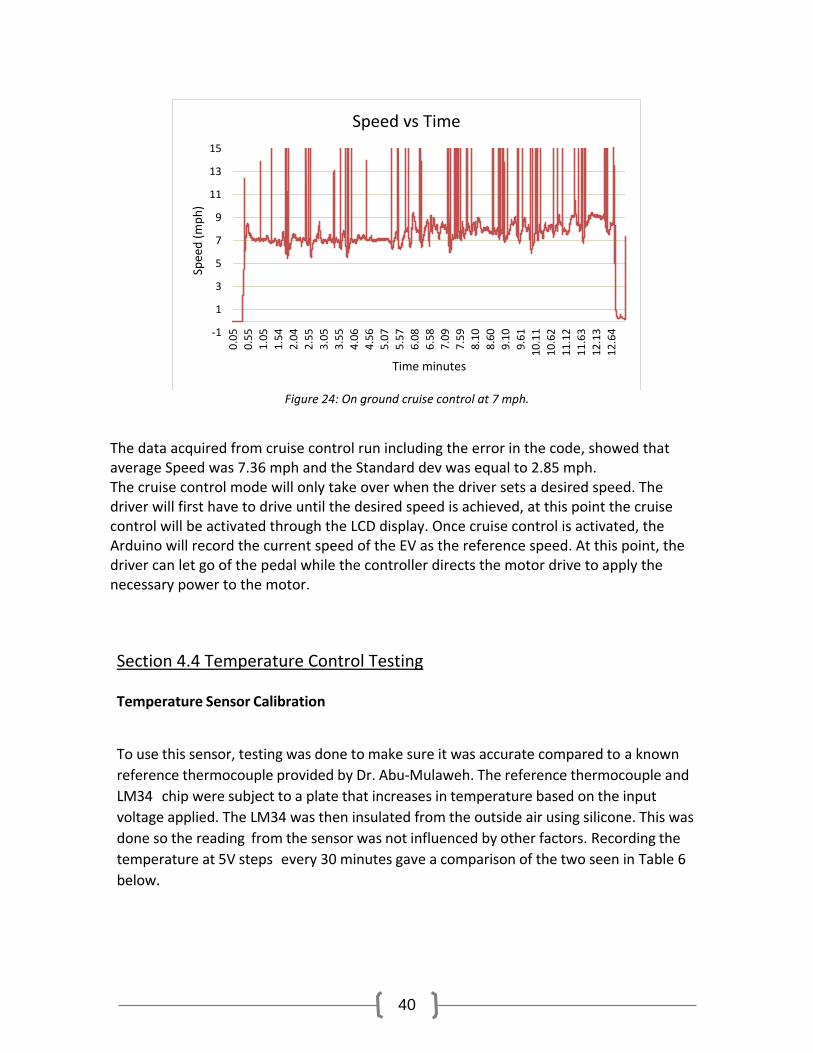
The results of this test were also compared to a lowered voltage level of 51.2 V and the vehicle showed a lower power output to the wheels but was still able to reach the goal speed of 15 MPH in 12.6 seconds. This time margin is well within the established acceleration goal of 15 MPH in 25 seconds. Figure 23 shows the results of the test on ground.
Figure 23 Speed test results on October 29, 2016 at 6:31 PM
As can be seen from the graph above, even a drop of about 1 V in the battery charge can vary the maximum speed and the acceleration of the vehicle. Section 4.3 Speed Control Testing
Cruise Control
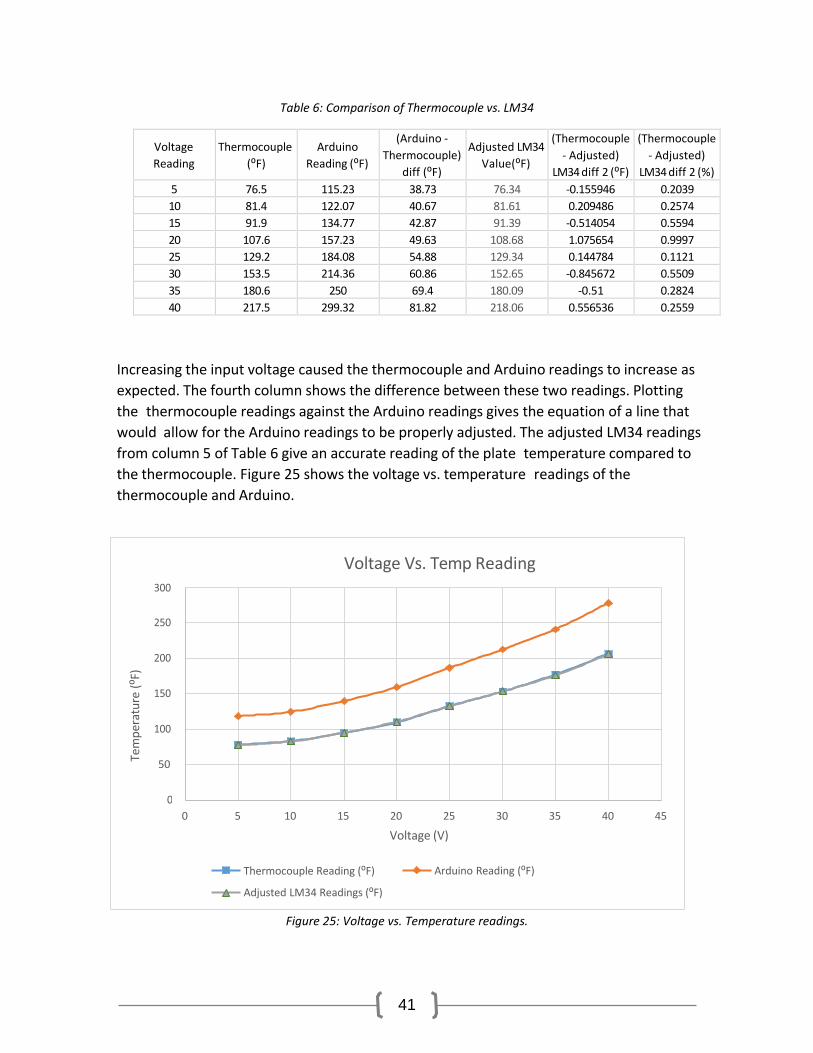
Figure 24 shows the graph of the cruise control run. The test was a 12.5 minute run at 7mph. During the run, the code in the microcontroller was calculating the vehicle speed to be twice its actual value, when the vehicle was slowing down. This is reason for the sudden spikes in the graph. The error was later corrected in the code; however, due to lack of time a second run could not be performed.
179.9, 1.7
192.5, 15 219.5, 19.2
0
5
10
15
20
25
170.0 180.0 190.0 200.0 210.0 220.0 230.0 240.0 250.0
Spee
d (M
PH)
Time (seconds)
On Ground Speed vs Time 10/29/2016 18:31
40
Figure 24: On ground cruise control at 7 mph.
The data acquired from cruise control run including the error in the code, showed that average Speed was 7.36 mph and the Standard dev was equal to 2.85 mph. The cruise control mode will only take over when the driver sets a desired speed. The driver will first have to drive until the desired speed is achieved, at this point the cruise control will be activated through the LCD display. Once cruise control is activated, the Arduino will record the current speed of the EV as the reference speed. At this point, the driver can let go of the pedal while the controller directs the motor drive to apply the necessary power to the motor.
Section 4.4 Temperature Control Testing
Temperature Sensor Calibration
To use this sensor, testing was done to make sure it was accurate compared to a known reference thermocouple provided by Dr. Abu-Mulaweh. The reference thermocouple and LM34 chip were subject to a plate that increases in temperature based on the input voltage applied. The LM34 was then insulated from the outside air using silicone. This was done so the reading from the sensor was not influenced by other factors. Recording the temperature at 5V steps every 30 minutes gave a comparison of the two seen in Table 6 below.
-1
1
3
5
7
9
11
13
15
0.05
0.55
1.05
1.54
2.04
2.55
3.05
3.55
4.06
4.56
5.07
5.57
6.08
6.58
7.09
7.59
8.10
8.60
9.10
9.61
10.1
110
.62
11.1
211
.63
12.1
312
.64
Spee
d (m
ph)
Time minutes
Speed vs Time
41
Table 6: Comparison of Thermocouple vs. LM34
Voltage Reading
Thermocouple (⁰F)
Arduino Reading (⁰F)
(Arduino - Thermocouple)
diff (⁰F)
Adjusted LM34 Value(⁰F)
(Thermocouple - Adjusted)
LM34 diff 2 (⁰F)
(Thermocouple - Adjusted)
LM34 diff 2 (%) 5 76.5 115.23 38.73 76.34 -0.155946 0.2039 10 81.4 122.07 40.67 81.61 0.209486 0.2574 15 91.9 134.77 42.87 91.39 -0.514054 0.5594 20 107.6 157.23 49.63 108.68 1.075654 0.9997 25 129.2 184.08 54.88 129.34 0.144784 0.1121 30 153.5 214.36 60.86 152.65 -0.845672 0.5509 35 180.6 250 69.4 180.09 -0.51 0.2824 40 217.5 299.32 81.82 218.06 0.556536 0.2559
Increasing the input voltage caused the thermocouple and Arduino readings to increase as expected. The fourth column shows the difference between these two readings. Plotting the thermocouple readings against the Arduino readings gives the equation of a line that would allow for the Arduino readings to be properly adjusted. The adjusted LM34 readings from column 5 of Table 6 give an accurate reading of the plate temperature compared to the thermocouple. Figure 25 shows the voltage vs. temperature readings of the thermocouple and Arduino.
Figure 25: Voltage vs. Temperature readings.
Voltage Vs. Temp Reading
50
0 5 10 15 20 25 30 35 40 45
Voltage (V)
Thermocouple Reading (⁰F)
Adjusted LM34 Readings (⁰F)
Arduino Reading (⁰F)
Tem
pera
ture
(⁰F)
42
From Figure 25 it is shown that the adjusted LM34 readings are comparable to that of the reference thermocouple. Column 6 of Table 6 also confirms this. The maximum difference between the thermocouple and the adjusted LM34 reading is 1.075° F which is within the specified limit for the temperature sensor.
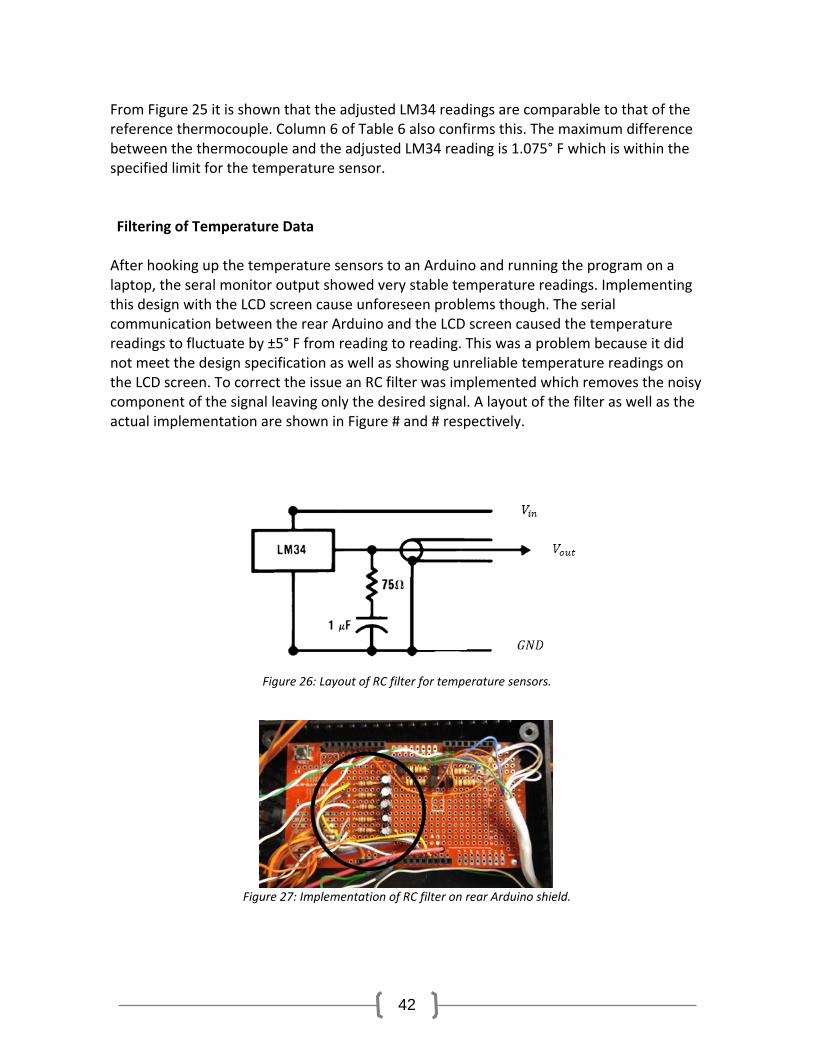
Filtering of Temperature Data
After hooking up the temperature sensors to an Arduino and running the program on a laptop, the seral monitor output showed very stable temperature readings. Implementing this design with the LCD screen cause unforeseen problems though. The serial communication between the rear Arduino and the LCD screen caused the temperature readings to fluctuate by ±5° F from reading to reading. This was a problem because it did not meet the design specification as well as showing unreliable temperature readings on the LCD screen. To correct the issue an RC filter was implemented which removes the noisy component of the signal leaving only the desired signal. A layout of the filter as well as the actual implementation are shown in Figure # and # respectively.
Figure 26: Layout of RC filter for temperature sensors.
Figure 27: Implementation of RC filter on rear Arduino shield.
43
A 75 Ω resistor in series with a 1 µF capacitor are placed across the Vout and GND lines for the filter to work. After the implementation of the RC filter, a test of the cooling system proved the effectiveness of the filter. During the 40 minute long test, the largest sample to sample difference in the temperature readings was ±2.2° F, only 0.2° F off of the requirement.
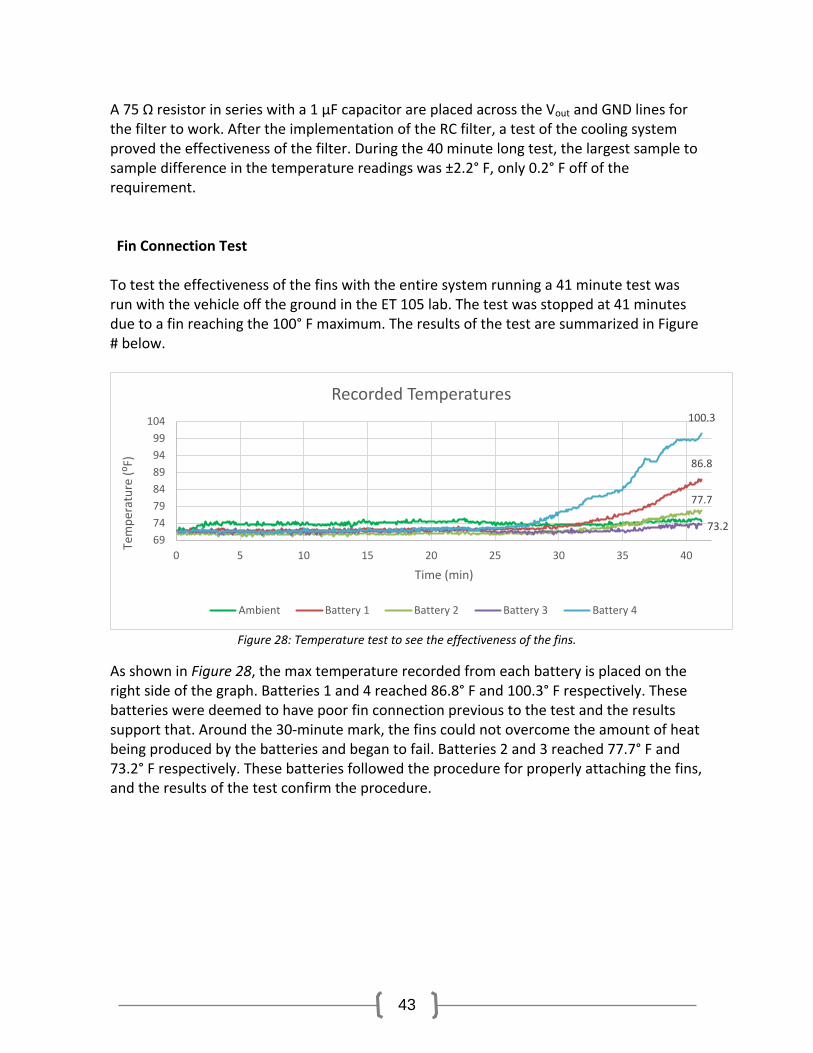
Fin Connection Test
To test the effectiveness of the fins with the entire system running a 41 minute test was run with the vehicle off the ground in the ET 105 lab. The test was stopped at 41 minutes due to a fin reaching the 100° F maximum. The results of the test are summarized in Figure # below.
Figure 28: Temperature test to see the effectiveness of the fins.
As shown in Figure 28, the max temperature recorded from each battery is placed on the right side of the graph. Batteries 1 and 4 reached 86.8° F and 100.3° F respectively. These batteries were deemed to have poor fin connection previous to the test and the results support that. Around the 30-minute mark, the fins could not overcome the amount of heat being produced by the batteries and began to fail. Batteries 2 and 3 reached 77.7° F and 73.2° F respectively. These batteries followed the procedure for properly attaching the fins, and the results of the test confirm the procedure.
86.8
77.7
73.2
100.3
69747984899499
104
0 5 10 15 20 25 30 35 40
Tem
pera
ture
(⁰F)
Time (min)
Recorded Temperatures
Ambient Battery 1 Battery 2 Battery 3 Battery 4
44
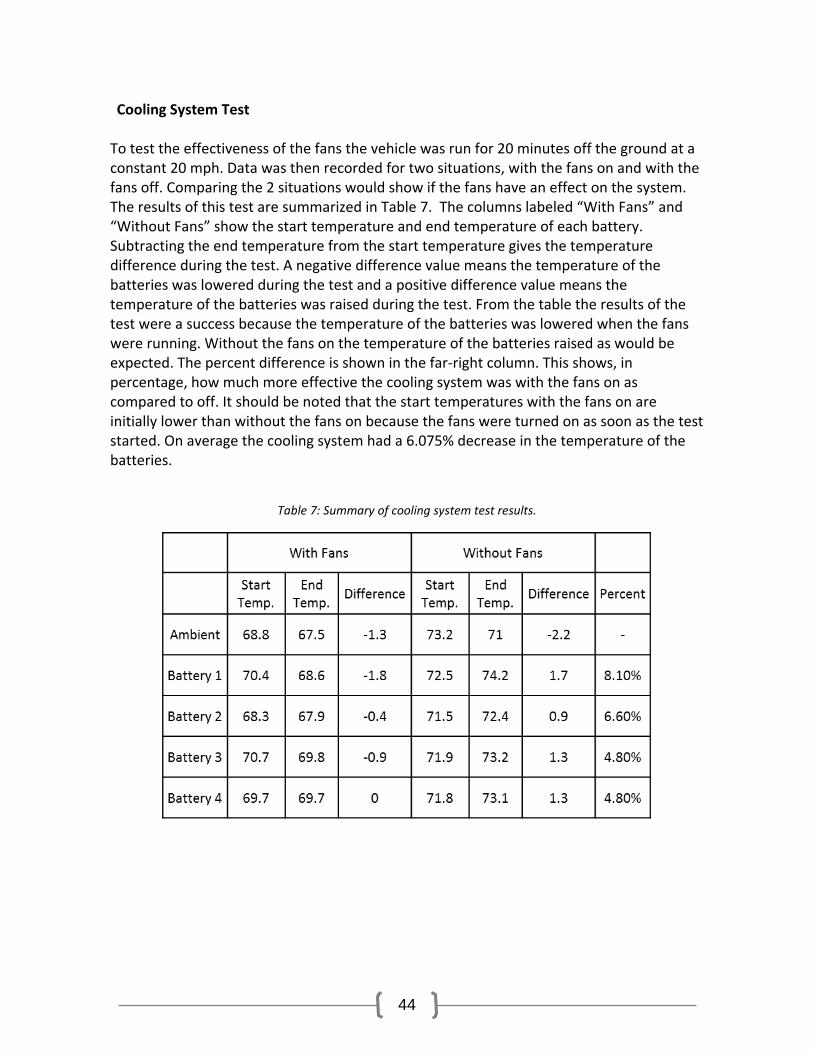
Cooling System Test
To test the effectiveness of the fans the vehicle was run for 20 minutes off the ground at a constant 20 mph. Data was then recorded for two situations, with the fans on and with the fans off. Comparing the 2 situations would show if the fans have an effect on the system. The results of this test are summarized in Table 7. The columns labeled “With Fans” and “Without Fans” show the start temperature and end temperature of each battery. Subtracting the end temperature from the start temperature gives the temperature difference during the test. A negative difference value means the temperature of the batteries was lowered during the test and a positive difference value means the temperature of the batteries was raised during the test. From the table the results of the test were a success because the temperature of the batteries was lowered when the fans were running. Without the fans on the temperature of the batteries raised as would be expected. The percent difference is shown in the far-right column. This shows, in percentage, how much more effective the cooling system was with the fans on as compared to off. It should be noted that the start temperatures with the fans on are initially lower than without the fans on because the fans were turned on as soon as the test started. On average the cooling system had a 6.075% decrease in the temperature of the batteries.
Table 7: Summary of cooling system test results.

45
Compliance with Problem Statement
From the problem statement, the temperature control system was to have an accuracy of ±2° F taken from sample to sample. Initial results from the temperature sensor calibration test were within the limit specified with the worst reading being ±1.07° F. After implementing the temperature sensors on the vehicle and using serial communication to display the temperatures on the screen, the accuracy of the readings was compromised at ±5° F from sample to sample. However, filtering the signal to the display caused the accuracy to increase to ±2.2° F from sample to sample. A value over the specified limit only appeared 3 times out of 1190 samples recorded and the average value of accuracy for the temperature control system was ±0.375° F.

46
Section V: Cost Analysis
47
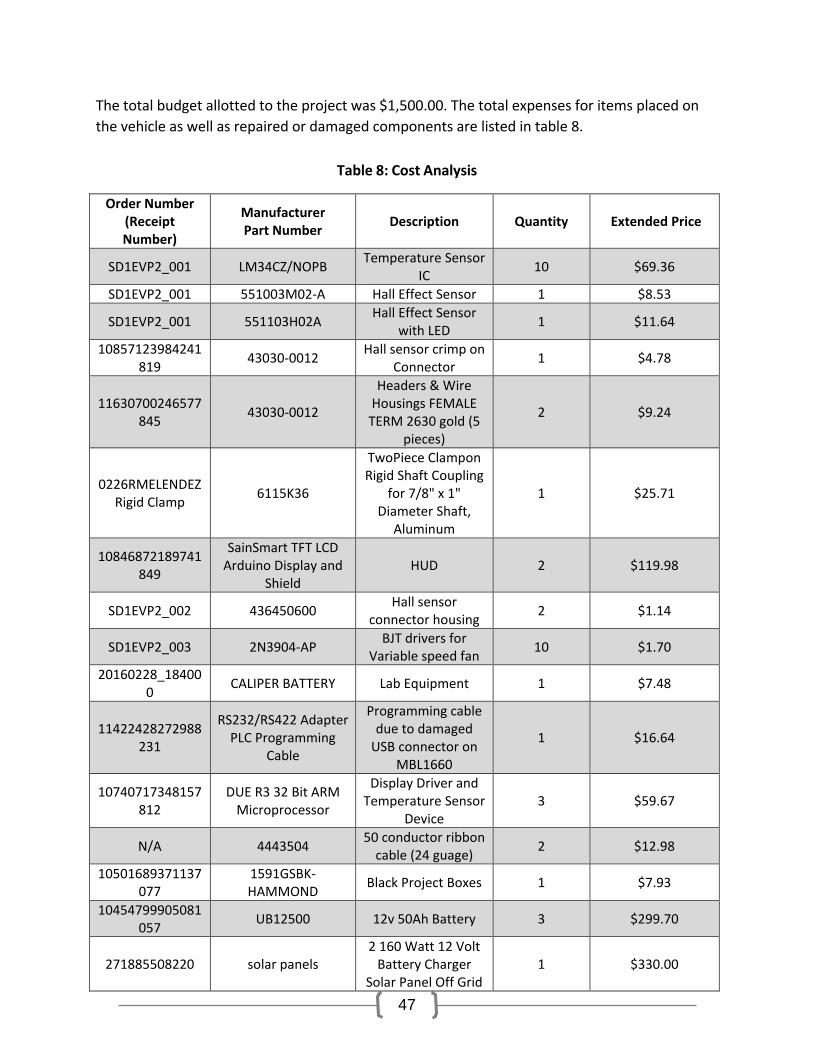
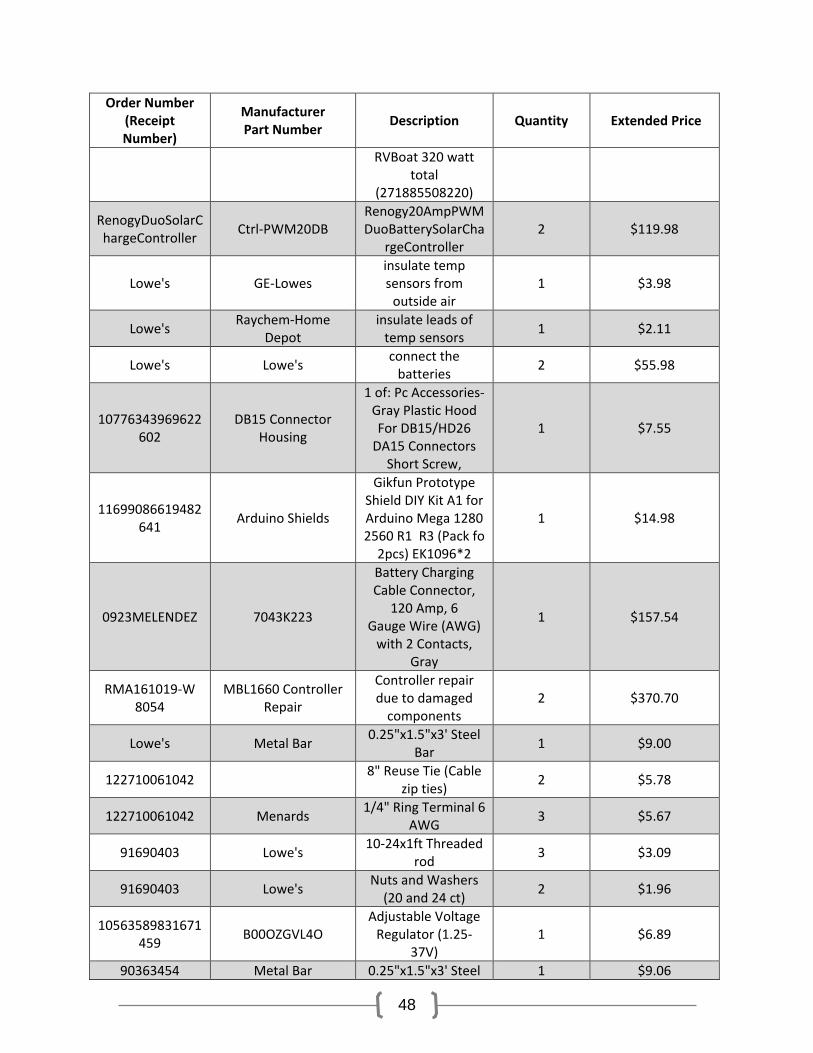
The total budget allotted to the project was $1,500.00. The total expenses for items placed on the vehicle as well as repaired or damaged components are listed in table 8.
Table 8: Cost Analysis
Order Number
(Receipt Number)
Manufacturer Part Number Description Quantity Extended Price
SD1EVP2_001 LM34CZ/NOPB Temperature Sensor IC 10 $69.36
SD1EVP2_001 551003M02-A Hall Effect Sensor 1 $8.53
SD1EVP2_001 551103H02A Hall Effect Sensor with LED 1 $11.64
10857123984241819 43030-0012 Hall sensor crimp on
Connector 1 $4.78
11630700246577845 43030-0012
Headers & Wire Housings FEMALE TERM 2630 gold (5
pieces)
2 $9.24
0226RMELENDEZ Rigid Clamp 6115K36
TwoPiece Clampon Rigid Shaft Coupling
for 7/8" x 1" Diameter Shaft,
Aluminum
1 $25.71
10846872189741849
SainSmart TFT LCD Arduino Display and
Shield HUD 2 $119.98
SD1EVP2_002 436450600 Hall sensor connector housing 2 $1.14
SD1EVP2_003 2N3904-AP BJT drivers for Variable speed fan 10 $1.70
20160228_184000 CALIPER BATTERY Lab Equipment 1 $7.48
11422428272988231
RS232/RS422 Adapter PLC Programming
Cable
Programming cable due to damaged
USB connector on MBL1660
1 $16.64
10740717348157812
DUE R3 32 Bit ARM Microprocessor
Display Driver and Temperature Sensor
Device 3 $59.67
N/A 4443504 50 conductor ribbon cable (24 guage) 2 $12.98
10501689371137077
1591GSBK-HAMMOND Black Project Boxes 1 $7.93
10454799905081057 UB12500 12v 50Ah Battery 3 $299.70
271885508220 solar panels 2 160 Watt 12 Volt
Battery Charger Solar Panel Off Grid
1 $330.00
48
Order Number (Receipt Number)
Manufacturer Part Number Description Quantity Extended Price
RVBoat 320 watt total
(271885508220)
RenogyDuoSolarChargeController Ctrl-PWM20DB
Renogy20AmpPWMDuoBatterySolarCha
rgeController 2 $119.98
Lowe's GE-Lowes insulate temp sensors from
outside air 1 $3.98
Lowe's Raychem-Home Depot
insulate leads of temp sensors 1 $2.11
Lowe's Lowe's connect the batteries 2 $55.98
10776343969622602
DB15 Connector Housing
1 of: Pc Accessories-Gray Plastic Hood For DB15/HD26
DA15 Connectors Short Screw,
1 $7.55
11699086619482641 Arduino Shields
Gikfun Prototype Shield DIY Kit A1 for Arduino Mega 1280 2560 R1 R3 (Pack fo
2pcs) EK1096*2
1 $14.98
0923MELENDEZ 7043K223
Battery Charging Cable Connector,
120 Amp, 6 Gauge Wire (AWG)
with 2 Contacts, Gray
1 $157.54
RMA161019-W 8054
MBL1660 Controller Repair
Controller repair due to damaged
components 2 $370.70
Lowe's Metal Bar 0.25"x1.5"x3' Steel Bar 1 $9.00
122710061042 8" Reuse Tie (Cable zip ties) 2 $5.78
122710061042 Menards 1/4" Ring Terminal 6 AWG 3 $5.67
91690403 Lowe's 10-24x1ft Threaded rod 3 $3.09
91690403 Lowe's Nuts and Washers (20 and 24 ct) 2 $1.96
10563589831671459 B00OZGVL4O
Adjustable Voltage Regulator (1.25-
37V) 1 $6.89
90363454 Metal Bar 0.25"x1.5"x3' Steel 1 $9.06

49
Order Number (Receipt Number)
Manufacturer Part Number Description Quantity Extended Price
Bar 90363454 Lowe's small screws 1 $0.98 90363454 Lowe's Washers and Nuts 2 $1.26 90363454 Lowe's Bolts 20 $1.40
90363454 Lowe's RJ45 Modular connector 1 $4.98
90363454 Lowe's RJ45 Jack connector 1 $15.97 11653377950445
066 ServoCity 20 Tooth 6mm Bore 32 Pitch Pinion Gear 1 $7.99
Total $1,793.33 The budget was $1,500.00, and the total spent funds toward the project was $1,793.33. The total spent funds exceeded the budget by a total of $293.33. This is due in part to two (2) repairs necessary to the MBL1660 DC controller due to grounding terminals, exposed wires, etc. These repairs totaled $370.70. This caused the budget to exceed the goal of $1,500.00.

50
Evaluation and Recommendations
51
The achieved results are compared against the requirements, specifications, limitations, and constraints. Recommendations for future improvements are given. Evaluations
The electric vehicle can accelerate to the target speed of 15 mph in 11.67 seconds, with a top speed of 21.1 mph in 30.28 seconds. This meets the specified speed (15 mph) and the specified runtime (20 minutes) required. The calculated efficiency of the vehicle was 42.9%. This value is well below the specified goal of 70%. This calculation may need to be looked at again after properly determining mechanical loses. The two solar panels can fully recharge four drained batteries in 16 hours. The temperature control system had an accuracy of ±2.2° F taken sample to sample. This is 0.2° F off from the specified goal. The cruise control system maintained the speed of the vehicle by ±2 mph which is 1 mph off of the specified goal. Due to an error in the cruise control code, the goal was not met. After correcting the code, the test could not be redone because of inclement weather. The cost of the vehicle slightly exceeded the $1,500 limit, coming to $1,793.33. This is due in part to unforeseen repairs of the DC controller. A 7” LCD touchscreen was installed on the vehicle, which allows the driver to read system statuses as well as implement cruise control. A charging network was developed that would allow operation of the vehicle, charging from solar and charging from utility at different times. This system is easy to switch from one to another and is contained on the vehicle. The project was completed by December 2016 according to plan. Recommendations
To achieve the maximum output from the motor, a new DC controller should be purchased or designed at 72 V 300 Amps to match the motor. This would allow a total of 5 on board batteries (60 Volts total ≈ 67.5V at max Lead Acid battery charge) to power the vehicle and reach the maximum RPM of the motor. If this recommendation is fulfilled a new shaft coupler will need to be purchased because the current one is only rated for 4000 RPM, while the maximum output RPM of the motor is 7000 RPM. The CVT will also need to be assessed as the current CVT mechanical limit as printed on the upper clutch is 5000 RPM.
52
The front wheels tend to toe-in when the vehicle is in operation. The toe-in of the wheels causes them to fight each other while the vehicle is in motion, thus reducing the overall speed of the vehicle. This should be fixed so the wheels are properly aligned. Phase 2 of the project was able to set the wheels to a point where toe-in was reduced but not eliminated. The camber of the wheels also needs to be examined as the front wheels tend to camber in more than could be accounted for due to the weight of the vehicle. At 27 mph the belt of the CVT begins to wobble, until a solution is found the vehicle should not exceed this speed on or off ground. There are currently no physical brakes implemented to stop the vehicle. However, if the gas pedal is released the motor will systematically slow down bringing the vehicle to a stop. Physical brakes should be added in order to safety stop the vehicle in a quicker manner. The design of the fins should be reevaluated to determine the best way of connecting them to the battery terminals. The battery terminals are a nut and bolt configuration. If the fins are designed to allow for the bolt to pass through the fins as well as the battery terminal, a better connection can be made both for heat dissipation and for electrical conductivity reducing the power loss in heat. Two 160 W solar panels were purchased during the second phase of the EV, with only one installed on the vehicle. The second panel should either be installed on the vehicle or used as the start of a solar charging station located on the IPFW campus. If two solar panels are to be installed on the vehicle, considerations must be made as the length of the panels is greater than a standard size door. A manner in which the panels can be removed easily and reinstalled to the vehicle with ease should also be evaluated.

53
References

54
[1] http://www.openelectrical.org/wiki/index.php?title=Battery_Sizing

55
Appendix A: Arduino Code

56
Code is also available via GitHub at: https://github.com/melroberto/SeniorDesign406
Arduino file: DueReadTempStringOut.ino
DueReadTempsStringOut.ino #include "Arduino.h" //#define DEBUG const int analogPins[] = A0, A1, A2, A3, A4; const int fanPins[] = 8,9,10,11; const int HIGH_TEMP_DIGITAL_PIN = 13; const float calibrationScale[5] = 0.4396, 0.4318, 0.4465, 0.4164, 0.4318;//0.328,0.328,0.328,0.328,0.328; const float calibrationOffset[5] = 27.459, 27.655, 29.452, 21.762, 26.181;//0,0,0,0,0;// const int MIN_TEMP_DIGITAL_VALUE = 240; const int MAX_TEMP_DIGITAL_VALUE = 265; //volatile int analogPin5 = A6; // outside leads to ground and +5V static int val[5] = 0; // variable to store the value read static int temperatures[5] = 0; int digitalValue = 0; float temperature = 0; int minTemperature = 124; int maxTemperature = 0; int output = 0; void setup() #ifdef DEBUG Serial.begin(115200); #endif Serial3.begin(115200); for (int i = 0; i < 5; i++) pinMode(analogPins[i], INPUT); for (int i = 0; i <= 4; i++) analogRead(analogPins[i]); val[i] = analogRead(analogPins[i]); temperatures[i] = val[i]; for (int i = 0; i < 4; i++) pinMode(fanPins[i], OUTPUT); for (int i = 0; i < 4; i++) digitalWrite(fanPins[i], LOW); pinMode(HIGH_TEMP_DIGITAL_PIN, OUTPUT); digitalWrite(HIGH_TEMP_DIGITAL_PIN, LOW); void loop() int inByte; maxTemperature = MIN_TEMP_DIGITAL_VALUE - 10;

57
for (int i = 0; i <= 4; i++) analogRead(analogPins[i]); val[i] = analogRead(analogPins[i]); val[i] += analogRead(analogPins[i]); val[i] += analogRead(analogPins[i]); val[i] += analogRead(analogPins[i]); val[i] += analogRead(analogPins[i]); val[i] += analogRead(analogPins[i]); val[i] += analogRead(analogPins[i]); val[i] += analogRead(analogPins[i]); val[i] >>= 3; temperatures[i] = val[i]; if (val[i] < minTemperature) minTemperature = val[i]; if (val[i] > MAX_TEMP_DIGITAL_VALUE) maxTemperature = val[i]; //Serial.println(maxTemperature); if (maxTemperature > MAX_TEMP_DIGITAL_VALUE) digitalWrite(HIGH_TEMP_DIGITAL_PIN, HIGH); output = HIGH; else digitalWrite(HIGH_TEMP_DIGITAL_PIN, LOW); output = LOW; // check if a temperature reading has been requested. #ifndef DEBUG if (Serial3.available()) inByte = Serial3.read(); #else if (Serial.available()) inByte = Serial.read(); #endif // if a reading was requested then get the desired temperature sensor and average over 16 readings if ((inByte == '0')) String temperature = ""; float temp; for (int i = 0; i < 5; i++) temp = (temperatures[i] * calibrationScale[i]) - calibrationOffset[i]; temperature += String(temp, 1); if (i < 4) temperature += String('\t');

58
#ifdef DEBUG Serial.print(temperature + '\n'); Serial.println(maxTemperature); #endif Serial3.print(temperature + '\n'); for(int i = 0; i < 4; i++) digitalWrite(fanPins[i], output);
Arduino File: TFTGraphicDisplay01_01ReadTempString.ino
TFTGraphicDisplay01_01ReadTempString.ino #include <SD.h> #include <SPI.h> #include <UTFT.h> #include <URTouch.h> #include <UTFT_Buttons.h> #define BASE_BUTTON1 0 #define BASE_BUTTON2 160 #define BASE_BUTTON3 320 #define BASE_BUTTON4 480 #define BASE_BUTTON5 640 #define WIDTH 159 #define HEIGHT 96 #define YSTART 383 #define TOUCH 1 //#define DEBUG extern uint8_t Ubuntu[]; UTFT myGLCD(CTE70, 25, 26, 27, 28); #ifdef TOUCH URTouch myTouch(6, 5, 32, 3, 2); UTFT_Buttons myButtons(&myGLCD, &myTouch); #endif int cruiseButton, incrementButton, decrementButton, forwardReverseButton, stopGoButton, recordDataButton, selected = -1; int potentiometerValue; int cruiseON = 0; uint32_t rc = 1; static int count = 0; static uint8_t recordData = 0; static int stopGo; static int fwdReverse = 1; volatile int pidValue = 0; static String temps; static int potValue = 0; char *ptr; char cruiseOn[] = "RUN"; char cruiseOff[] = "OFF";

59
char forward[] = "FWD"; char reverse[] = "REV"; char increment[] = "INC"; char decrement[] = "DEC"; char stopButton[] = "STOP"; char goButton[] = " GO "; char recON[] = "REC ON"; char recOFF[] = "REC OFF"; char RPMLabel[] = "RPM: "; char SpeedLabel[] = "Speed: "; char pedalInputLabel[] = "POT In: "; char commandOutputLabel[] = "CMD Out: "; char TEMPERATURES_LABEL[] = "TS0 TS1 TS2 TS3 TS4"; char HIGH_TEMP_LABEL[] = "HIGH TEMP!"; char BLANK_TEMP_LABEL[] = " "; const int POT_IN = A0; const int POT_OUT = 10; const int SAFE_STOP = 11; const int FWD_REVERSE = 9; const int RPM_InterruptPort = 8; const int TEMPERATURE_RESET = 12; const int MAGNET_MULTIPLIER = 15; //Value is proportional to number of magnets i.e. 4 magnets = 15, 2 magnets = 30 const int TIME_SCALE_MULTIPLIER = 1000;//time scaler for TC4 timer interrupt const int FREQUENCY_1000_RPM_INTERRUPT = 1000; const int FREQUENCY_100_PID_INTERRUPT = 100; const int HIGH_TEMP_STOP_PIN = 17; const int MIN_PWM_REQUEST = 60; const int MAX_PWM_REQUEST = 1020; const int TEMPERATURE_RESET_DELAY = 1000; volatile uint32_t milliseconds = 0; const float SPEED_CONVERSION_VALUE = 0.0641; const float RPM_TO_PWM_SCALE_FACTOR = 3.232; float Kp = 1.0, Ki = 0, Kd = 0, P = 0, I = 0, D = 0, PID = 0; float currentSpeed; volatile float currentRPM; float temperatures[5]; volatile float error; //signal comming from the sumer after adding ref input and sub feedback. void highTempStop(); void startTimer(Tc *tc, uint32_t channel, IRQn_Type irq, uint32_t frequency) pmc_set_writeprotect(false); //Disable write protection for register pmc_enable_periph_clk((uint32_t) irq); //enable clock for the channel TC_Configure(tc, channel, TC_CMR_WAVE | TC_CMR_WAVSEL_UP_RC | TC_CMR_TCCLKS_TIMER_CLOCK4); rc = VARIANT_MCK / 128 / frequency; //128 because we selected TIMER_CLOCK4 above TC_SetRA(tc, channel, rc / 2); //50% high, 50% low TC_SetRC(tc, channel, rc); TC_Start(tc, channel); tc->TC_CHANNEL[channel].TC_IER = TC_IER_CPCS; tc->TC_CHANNEL[channel].TC_IDR = ~TC_IER_CPCS; //pmc_set_writeprotect(true); NVIC_EnableIRQ(irq); void setup() #ifdef DEBUG

60
Serial.begin(115200); #endif Serial3.begin(115200); myGLCD.InitLCD(LANDSCAPE); myGLCD.clrScr(); myGLCD.setFont(Ubuntu); myGLCD.fillScr(VGA_WHITE); myGLCD.setColor(VGA_BLACK); myGLCD.setBackColor(VGA_WHITE); myGLCD.print(RPMLabel, 50, 72); myGLCD.print(SpeedLabel, 50, 144); myGLCD.print(TEMPERATURES_LABEL, 0, 286); myGLCD.print(pedalInputLabel, 375, 72); myGLCD.print(commandOutputLabel, 375, 145); #if TOUCH myTouch.InitTouch(LANDSCAPE); myTouch.setPrecision(PREC_HI); myButtons.setTextFont(Ubuntu); cruiseButton = myButtons.addButton(BASE_BUTTON1, YSTART, WIDTH, HEIGHT, cruiseOff); incrementButton = myButtons.addButton(BASE_BUTTON2, YSTART, WIDTH, HEIGHT, increment); decrementButton = myButtons.addButton(BASE_BUTTON3, YSTART, WIDTH, HEIGHT, decrement); forwardReverseButton = myButtons.addButton(BASE_BUTTON4, YSTART, WIDTH, HEIGHT, forward); stopGoButton = myButtons.addButton(BASE_BUTTON5, YSTART, WIDTH, HEIGHT, goButton); recordDataButton = myButtons.addButton(BASE_BUTTON5, YSTART - HEIGHT - 1, WIDTH, HEIGHT, recOFF); myButtons.drawButtons(); #endif startTimer(TC1, 1, TC4_IRQn, FREQUENCY_1000_RPM_INTERRUPT);//TC1, 1 is Timer 4. 1000 for frequency signifies an interrupt every 1ms. startTimer(TC1, 0, TC3_IRQn, FREQUENCY_100_PID_INTERRUPT); //TC1, 0 is Timer 3. 100 for frequency signifies an interrupt every 10ms. pinMode(RPM_InterruptPort, INPUT); analogWriteResolution(10); pinMode(POT_IN, INPUT); pinMode(POT_OUT, OUTPUT); pinMode(SAFE_STOP, OUTPUT); pinMode(FWD_REVERSE, OUTPUT); pinMode(TEMPERATURE_RESET, OUTPUT); pinMode(HIGH_TEMP_STOP_PIN, INPUT); delay(TEMPERATURE_RESET_DELAY); digitalWrite(TEMPERATURE_RESET, LOW); delay(TEMPERATURE_RESET_DELAY); digitalWrite(TEMPERATURE_RESET, HIGH); currentSpeed = 0; currentRPM = 0; potentiometerValue = 0; stopGo = 0; fwdReverse = 0; delay(TEMPERATURE_RESET_DELAY); attachInterrupt(digitalPinToInterrupt(HIGH_TEMP_STOP_PIN), highTempStop, HIGH);

61
void loop() myGLCD.printNumI(count++, 0, 10); myGLCD.printNumI(potValue, 675, 72, 4, ' '); myGLCD.printNumI(pidValue, 675, 145, 4, ' '); myGLCD.printNumF(currentRPM, 1, 218, 72, '.', 5, ' '); currentSpeed = (currentRPM * SPEED_CONVERSION_VALUE); myGLCD.printNumF(currentSpeed, 1, 218, 144, '.', 5, ' '); #if TOUCH if (myTouch.dataAvailable() == true) selected = myButtons.checkButtons(); if (selected == cruiseButton) if (cruiseON) ptr = cruiseOff; cruiseON = 0; else cruiseON = 1; potValue = currentRPM * RPM_TO_PWM_SCALE_FACTOR; if (potValue > MAX_PWM_REQUEST) potValue = MAX_PWM_REQUEST; else if (potValue < MIN_PWM_REQUEST) potValue = MIN_PWM_REQUEST; ptr = cruiseOn; myGLCD.print(ptr, 334, 216); if (selected == incrementButton) ptr = increment; if (cruiseON) //if safety stop off and cruise on, run command. potValue += 10; if (potValue > MAX_PWM_REQUEST) potValue = MAX_PWM_REQUEST; else if (potValue < MIN_PWM_REQUEST) potValue = MIN_PWM_REQUEST; if (selected == decrementButton) ptr = decrement; if (cruiseON) potValue -= 10; if (potValue < MIN_PWM_REQUEST) potValue = MIN_PWM_REQUEST; else if (potValue > MAX_PWM_REQUEST) potValue = MAX_PWM_REQUEST; if (selected == forwardReverseButton) if (fwdReverse) digitalWrite(FWD_REVERSE, HIGH); //Reverse fwdReverse = 0; ptr = reverse;

62
else digitalWrite(FWD_REVERSE, LOW); //Forward fwdReverse = 1; ptr = forward; if (selected == stopGoButton) if (stopGo) digitalWrite(SAFE_STOP, HIGH); //Stop myButtons.disableButton(cruiseButton, true); myButtons.disableButton(incrementButton, true); myButtons.disableButton(decrementButton, true); stopGo = 0; ptr = stopButton; cruiseON = 0; else digitalWrite(SAFE_STOP, LOW); //Go myButtons.enableButton(cruiseButton, true); myButtons.enableButton(incrementButton, true); myButtons.enableButton(decrementButton, true); stopGo = 1; ptr = goButton; if (selected == recordDataButton) //Will work as enable/disable button to record //to the SD card. if (recordData) recordData = 0; ptr = recOFF; else recordData = 1; ptr = recON; if (selected != -1) myButtons.relabelButton(selected, ptr, true); #endif if (!(count % 100)) temps = getTemperatures(); myGLCD.print(temps, 0, 335); #ifdef DEBUG //Data output for Testing purposes. String streamData = ""; streamData += String(milliseconds) + '\t'; streamData += String(temps) + '\t'; streamData += String(potValue) + '\t'; streamData += String(pidValue) + '\t'; streamData += String(currentRPM, 1) + '\t'; streamData += String(currentSpeed, 1) + '\t'; Serial.println(streamData); #endif // Can be implemented in the future for Data recording instead of the Serial output interface.

63
// Data can be recorded to the SD card on the CTE Shield for the TFT LCD Screen. // if (recordData) // // // /************************************************************************* * Temperature Request * Temperatures are received as a string with a new line terminator. The * temperatures are transferred with a tab delimiter but Ubuntu font does * not interpret a tab correctly. The tab is replaced by a space to display * properly on the screen. * ***********************************************************************/ String getTemperatures() static String temperatures; Serial3.write(48); //Send request for temperatures if (Serial3.available()) temperatures = Serial3.readStringUntil('\n');//Temperatures, formated as a string, are terminated by a new line character. temperatures.replace('\t', ' '); return temperatures; /************************************************************************* * Time Counter 3 * Timer will produce an interrupt every 100 ms. This timer interrupt will * send commands to the DC Controller as a PWM signal. The timer also * performs PID modifications to the analogWrite command value sent. * ***********************************************************************/ void TC3_Handler() static float oldRPM; static int potVals[10]; static int index = 0; if (!cruiseON) //if cruise off and safety stop off //allow reading on analog input analogRead(POT_IN); potentiometerValue = analogRead(POT_IN); if (index >= 9) index = 0; potValue = 0; for (int i = 0; i < 10; i++) potValue += potVals[i]; potValue /= 10; potVals[index++] = potentiometerValue; // clear out the record of error. I = currentRPM * RPM_TO_PWM_SCALE_FACTOR; // re-scale the input before sending to the motor if ((potValue) < 260) pidValue = floor((potValue) * 2); else pidValue = floor(((potValue - 260) * 500) / (1020 - 260) + 520); else

64
if (1 == stopGo) // not in emergency stop mode potentiometerValue = potValue; else // emergency stop mode, disable the output potentiometerValue = 0; if (potentiometerValue < 30) potentiometerValue = 0; //kill noise on the potentiometer Kp = 1.0; //KP_LOW; Ki = 0.05; //KI_LOW; Kd = -0.10; //KD_LOW; D = Kd * (potentiometerValue - (currentRPM * RPM_TO_PWM_SCALE_FACTOR) - error) * 10; error = potentiometerValue - (currentRPM * RPM_TO_PWM_SCALE_FACTOR); P = Kp * error; // only update the I in PID if we have speed data available if ((abs(oldRPM - currentRPM)) > 1) I += Ki * error * 0.1; if (I > 1020) I = 1020; if (I < 0) I = 0; // re-scale the input before sending to the motor if ((P + I + D) < 260) pidValue = floor((P + I + D) * 2); else pidValue = floor(((P + I + D - 260) * 500) / (1020 - 260) + 520); // Guard the output from out of range values. if (pidValue > 1010) pidValue = 1010; else if (pidValue < 5) pidValue = 0; analogWrite(POT_OUT, pidValue); //Write signal to the DC Controller TC_GetStatus(TC1, 0); //Resets timer TC3 interrupt /********************************************************************************* * Time Counter 4 * Timer will produce an interrupt every 1 ms. Digital pin 8 on Arduino Due is * checked for low level. This is due to the hall sensor connected to Digital * pin 8. Variable currentRPM is modified with every magnet pass. If the time * counter used by the timer is greater than the last pass, the vehicle is * slowing down. * *******************************************************************************/ void TC4_Handler() static uint32_t counter = 0; static uint32_t oldCounter = 0xFFFFFFFF; static uint32_t rev = 2; counter++; milliseconds++; if (!digitalRead(RPM_InterruptPort)) rev += 1;

65
else rev = 0; if (rev == 1) currentRPM = ((MAGNET_MULTIPLIER * TIME_SCALE_MULTIPLIER) / counter); oldCounter = counter; counter = 0; else if ((counter) > oldCounter) currentRPM = (MAGNET_MULTIPLIER * TIME_SCALE_MULTIPLIER / counter); TC_GetStatus(TC1, 1); //Resets TC4 Timer Interrupt /******************************************************************************* * High Temperature Interrupt * This function will trigger when the Temperatures Arduino sends a high signal * due to high temperatures detected on any of the battery terminals. At the moment * temperatures greater than 85 degrees Farenheit will trigger the high signal. * The signal works as a warning to the driver. If necessary, this interrupt can * be modified to stop the vehicle completely by writting a high signal to the * SAFE_STOP pin. * *******************************************************************************/ void highTempStop() if (digitalRead(HIGH_TEMP_STOP_PIN)) myGLCD.print(HIGH_TEMP_LABEL, 334, 216); else myGLCD.print(BLANK_TEMP_LABEL, 334, 216);

66
Appendix B: Safe Assembly and Disassembly of the Vehicle
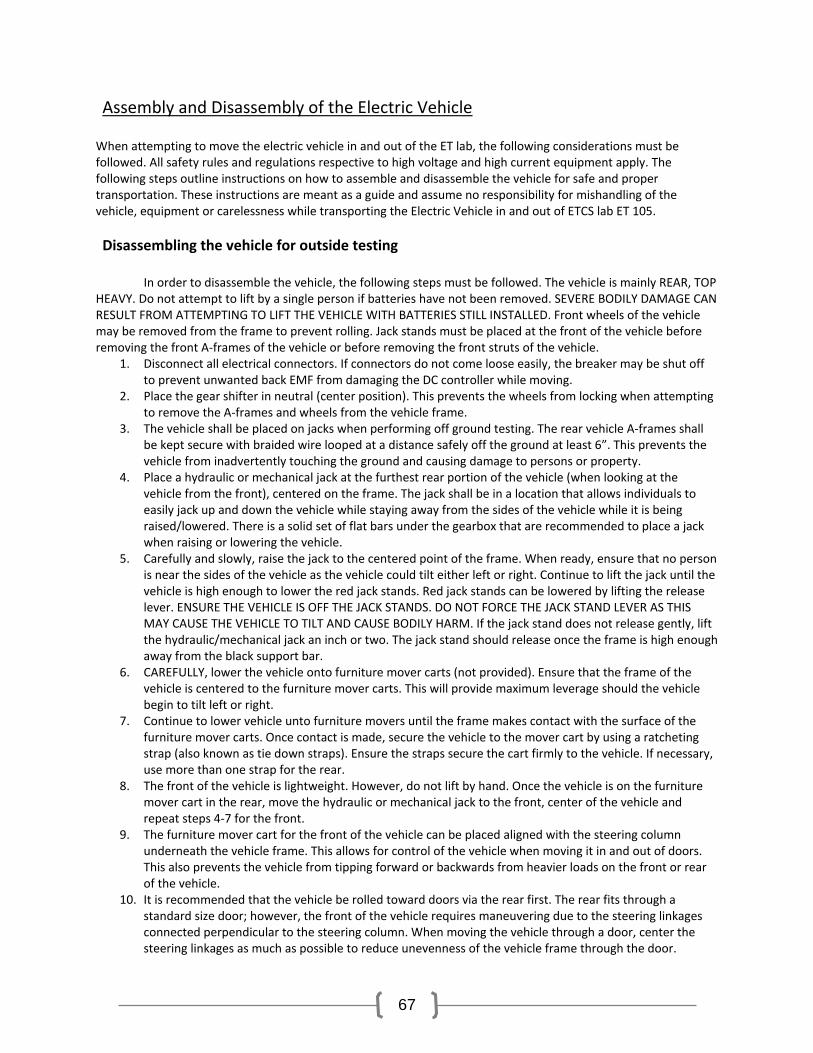
67
Assembly and Disassembly of the Electric Vehicle
When attempting to move the electric vehicle in and out of the ET lab, the following considerations must be followed. All safety rules and regulations respective to high voltage and high current equipment apply. The following steps outline instructions on how to assemble and disassemble the vehicle for safe and proper transportation. These instructions are meant as a guide and assume no responsibility for mishandling of the vehicle, equipment or carelessness while transporting the Electric Vehicle in and out of ETCS lab ET 105. Disassembling the vehicle for outside testing
In order to disassemble the vehicle, the following steps must be followed. The vehicle is mainly REAR, TOP HEAVY. Do not attempt to lift by a single person if batteries have not been removed. SEVERE BODILY DAMAGE CAN RESULT FROM ATTEMPTING TO LIFT THE VEHICLE WITH BATTERIES STILL INSTALLED. Front wheels of the vehicle may be removed from the frame to prevent rolling. Jack stands must be placed at the front of the vehicle before removing the front A-frames of the vehicle or before removing the front struts of the vehicle.
1. Disconnect all electrical connectors. If connectors do not come loose easily, the breaker may be shut off to prevent unwanted back EMF from damaging the DC controller while moving.
2. Place the gear shifter in neutral (center position). This prevents the wheels from locking when attempting to remove the A-frames and wheels from the vehicle frame.
3. The vehicle shall be placed on jacks when performing off ground testing. The rear vehicle A-frames shall be kept secure with braided wire looped at a distance safely off the ground at least 6”. This prevents the vehicle from inadvertently touching the ground and causing damage to persons or property.
4. Place a hydraulic or mechanical jack at the furthest rear portion of the vehicle (when looking at the vehicle from the front), centered on the frame. The jack shall be in a location that allows individuals to easily jack up and down the vehicle while staying away from the sides of the vehicle while it is being raised/lowered. There is a solid set of flat bars under the gearbox that are recommended to place a jack when raising or lowering the vehicle.
5. Carefully and slowly, raise the jack to the centered point of the frame. When ready, ensure that no person is near the sides of the vehicle as the vehicle could tilt either left or right. Continue to lift the jack until the vehicle is high enough to lower the red jack stands. Red jack stands can be lowered by lifting the release lever. ENSURE THE VEHICLE IS OFF THE JACK STANDS. DO NOT FORCE THE JACK STAND LEVER AS THIS MAY CAUSE THE VEHICLE TO TILT AND CAUSE BODILY HARM. If the jack stand does not release gently, lift the hydraulic/mechanical jack an inch or two. The jack stand should release once the frame is high enough away from the black support bar.
6. CAREFULLY, lower the vehicle onto furniture mover carts (not provided). Ensure that the frame of the vehicle is centered to the furniture mover carts. This will provide maximum leverage should the vehicle begin to tilt left or right.
7. Continue to lower vehicle unto furniture movers until the frame makes contact with the surface of the furniture mover carts. Once contact is made, secure the vehicle to the mover cart by using a ratcheting strap (also known as tie down straps). Ensure the straps secure the cart firmly to the vehicle. If necessary, use more than one strap for the rear.
8. The front of the vehicle is lightweight. However, do not lift by hand. Once the vehicle is on the furniture mover cart in the rear, move the hydraulic or mechanical jack to the front, center of the vehicle and repeat steps 4-7 for the front.
9. The furniture mover cart for the front of the vehicle can be placed aligned with the steering column underneath the vehicle frame. This allows for control of the vehicle when moving it in and out of doors. This also prevents the vehicle from tipping forward or backwards from heavier loads on the front or rear of the vehicle.
10. It is recommended that the vehicle be rolled toward doors via the rear first. The rear fits through a standard size door; however, the front of the vehicle requires maneuvering due to the steering linkages connected perpendicular to the steering column. When moving the vehicle through a door, center the steering linkages as much as possible to reduce unevenness of the vehicle frame through the door.

68
11. Move the right steering linkage so it mainly faces rear and the left steering linkage so it faces mainly forward. This will allow for the maneuvering to reduce the steering of the linkages while transporting.
12. When the vehicle has been passed through the door halfway, the rear needs to be shifter opposite to the steering linkage facing rear. This will allow for minimal damage to the door and the linkage when pulling the vehicle through the door. Ensure the linkage clears the frame of the door before continuing to move the vehicle through the door frame.
13. Once the steering linkage facing rear has fully passed the door frame, shift the vehicle rear in the opposite direction. This should allow full clearance for the steering linkage facing forward.
14. Repeat this process until the vehicle is outdoors for testing. Do not attempt to roll the furniture movers over loose carpet. This creates an undesired rolling of the carpet which can result in the inability to move the vehicle.
Assembly of the vehicle for outdoor testing When assembling the vehicle for outdoors testing, the following steps will minimize time assembling and optimize testing time. When assembling indoors for testing, the main difference is that the rear wheels need to be secured with braided wire instead of the struts. All steps still apply except instead of setting the vehicle on all four wheels, the vehicle will sit on four jack stands. This allows for minimal adjustment of the struts ensuring consistent testing of the frame and all components of the vehicle.
1. Ensure all electrical connections are either disconnected or turned off (main power breaker, LCD switch toward the front, low voltage rail switch (light up switch)).
2. Place a hydraulic or mechanical jack under the rear of the vehicle frame, away from the furniture mover cart. This will allow the jack to raise the vehicle and allow to remove the cart from underneath once the vehicle is safely assembled.
3. The rear wheels may be installed at this time. Prior to installing the rear wheels, place the gear shifter in neutral to prevent the gearbox from locking with the motor and producing undesired back EMF.
4. Align the rear wheel axle teeth with the rear axle shaft. There should be a spring inside the shaft as it is hollow. Ensure this spring is in position prior to installing the wheel into the axle.
5. Ensure the clevis pin passes through the securing linkages of the A-frame. There will be four (4) clevis pins securing each rear A-frame. There will be an extra two (2) clevis pins securing the rear struts to the top frame and A-frame.
6. Once all four (4) clevis pins have been placed in their respective securing points to the frame and each A-frame cannot be pulled off the vehicle, raise the mechanical jack. USE CAUTION, IF THE CLEVIS PINS ARE NOT PLACED CORRECTLY THE VEHICLE WEIGHT WILL CAUSE DAMAGE TO THE FRAME WHEN RESTED IMPROPERLY ONTO THE STRUTS. Raise the mechanical jack until the rear struts can be gently placed into position without need of excessive force. The clevis pins for the upper and lower securing points of the strut should slide easily into the frame and strut.
7. Secure all clevis pins by placing one cotter pin through each hole, one cotter pin per clevis pins. Place the cotter pin so it is perpendicular to the clevis pin shank. Do not insert the cotter pin all the way through. The cotter pin has a middle section that wraps around the half diameter of the clevis pin to prevent the clevis pin from shifting out of place.
8. Once all clevis pins on each side are placed securely and struts are securely attached to the frame, lower the mechanical jack until all weight of the vehicle is safely supported by the wheels and struts. USE CAUTION, IF THE CLEVIS PINS ARE NOT PLACED CORRECTLY THE VEHICLE WEIGHT WILL CAUSE DAMAGE TO THE FRAME WHEN RESTED IMPROPERLY ONTO THE STRUTS.
9. Repeat these steps for the front of the vehicle to prevent bodily damage to persons involved in assembly and disassembly.
This guide does not outline all possible scenarios and can be expanded upon if necessary. The move of the vehicle is solely at the discretion of team members or persons involved in the Electric Vehicle project. Any questions please contact Roberto Melendez at [email protected]. Please do not attempt to move the vehicle if

69
these instructions are unclear or there is doubt that the individuals assisting in the move of the vehicle are clear on all the steps involved. Neither, Mr. Melendez, the IPFW professors and staff, nor any of the previous team members of the Electric Vehicle project assume any responsibility for physical damages to persons, vehicles or other property due to improper handling and removal of the Electric Vehicle from the IPFW buildings and facilities.

70
Appendix C: Efficiency Calculations
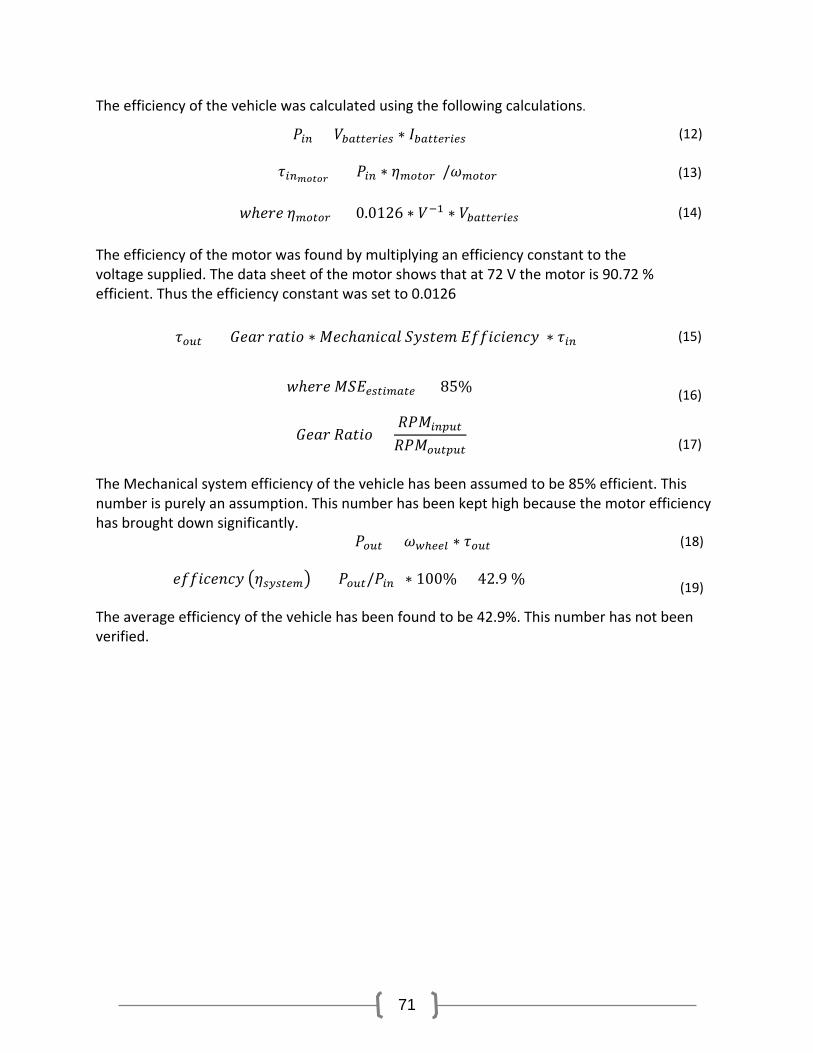
71
The efficiency of the vehicle was calculated using the following calculations.
𝑃𝑃𝑖𝑖𝑖𝑖 = 𝑉𝑉𝑏𝑏𝑚𝑚𝑡𝑡𝑡𝑡𝑒𝑒𝑏𝑏𝑖𝑖𝑒𝑒𝑏𝑏 ∗ 𝐼𝐼𝑏𝑏𝑚𝑚𝑡𝑡𝑡𝑡𝑒𝑒𝑏𝑏𝑖𝑖𝑒𝑒𝑏𝑏 (12)
𝜏𝜏𝑖𝑖𝑖𝑖𝑚𝑚𝑚𝑚𝑚𝑚𝑚𝑚𝑚𝑚 = (𝑃𝑃𝑖𝑖𝑖𝑖 ∗ 𝜂𝜂𝑚𝑚𝑚𝑚𝑡𝑡𝑚𝑚𝑏𝑏)/𝜔𝜔𝑚𝑚𝑚𝑚𝑡𝑡𝑚𝑚𝑏𝑏 (13)
𝑤𝑤ℎ𝐸𝐸𝑟𝑟𝐸𝐸 𝜂𝜂𝑚𝑚𝑚𝑚𝑡𝑡𝑚𝑚𝑏𝑏 = 0.0126 ∗ 𝑉𝑉−1 ∗ 𝑉𝑉𝑏𝑏𝑚𝑚𝑡𝑡𝑡𝑡𝑒𝑒𝑏𝑏𝑖𝑖𝑒𝑒𝑏𝑏 (14)
The efficiency of the motor was found by multiplying an efficiency constant to the voltage supplied. The data sheet of the motor shows that at 72 V the motor is 90.72 % efficient. Thus the efficiency constant was set to 0.0126
𝜏𝜏𝑚𝑚𝑜𝑜𝑡𝑡 = (𝐺𝐺𝐸𝐸𝐸𝐸𝑟𝑟 𝑟𝑟𝐸𝐸𝐸𝐸𝐸𝐸𝑐𝑐 ∗ 𝑅𝑅𝐸𝐸𝑐𝑐ℎ𝐸𝐸𝑛𝑛𝐸𝐸𝑐𝑐𝐸𝐸𝐸𝐸 𝑆𝑆𝑆𝑆𝑠𝑠𝐸𝐸𝐸𝐸𝑒𝑒 𝐸𝐸𝑐𝑐𝑐𝑐𝐸𝐸𝑐𝑐𝐸𝐸𝐸𝐸𝑛𝑛𝑐𝑐𝑆𝑆 ∗ 𝜏𝜏𝑖𝑖𝑖𝑖) (15)
𝑤𝑤ℎ𝐸𝐸𝑟𝑟𝐸𝐸 𝑅𝑅𝑆𝑆𝐸𝐸𝑒𝑒𝑏𝑏𝑡𝑡𝑖𝑖𝑚𝑚𝑚𝑚𝑡𝑡𝑒𝑒 = 85%
(16)
𝐺𝐺𝐸𝐸𝐸𝐸𝑟𝑟 𝑅𝑅𝐸𝐸𝐸𝐸𝐸𝐸𝑐𝑐 =𝑅𝑅𝑃𝑃𝑅𝑅𝑖𝑖𝑖𝑖𝑝𝑝𝑜𝑜𝑡𝑡
𝑅𝑅𝑃𝑃𝑅𝑅𝑚𝑚𝑜𝑜𝑡𝑡𝑝𝑝𝑜𝑜𝑡𝑡
(17)
The Mechanical system efficiency of the vehicle has been assumed to be 85% efficient. This number is purely an assumption. This number has been kept high because the motor efficiency has brought down significantly.
𝑃𝑃𝑚𝑚𝑜𝑜𝑡𝑡 = 𝜔𝜔𝑤𝑤ℎ𝑒𝑒𝑒𝑒𝑙𝑙 ∗ 𝜏𝜏𝑚𝑚𝑜𝑜𝑡𝑡 (18)
𝐸𝐸𝑐𝑐𝑐𝑐𝐸𝐸𝑐𝑐𝐸𝐸𝑛𝑛𝑐𝑐𝑆𝑆 𝜂𝜂𝑏𝑏𝑠𝑠𝑏𝑏𝑡𝑡𝑒𝑒𝑚𝑚 = (𝑃𝑃𝑚𝑚𝑜𝑜𝑡𝑡/𝑃𝑃𝑖𝑖𝑖𝑖) ∗ 100% = 42.9 %
(19)
The average efficiency of the vehicle has been found to be 42.9%. This number has not been verified.

72
Appendix D: Arduino Wiring Diagrams
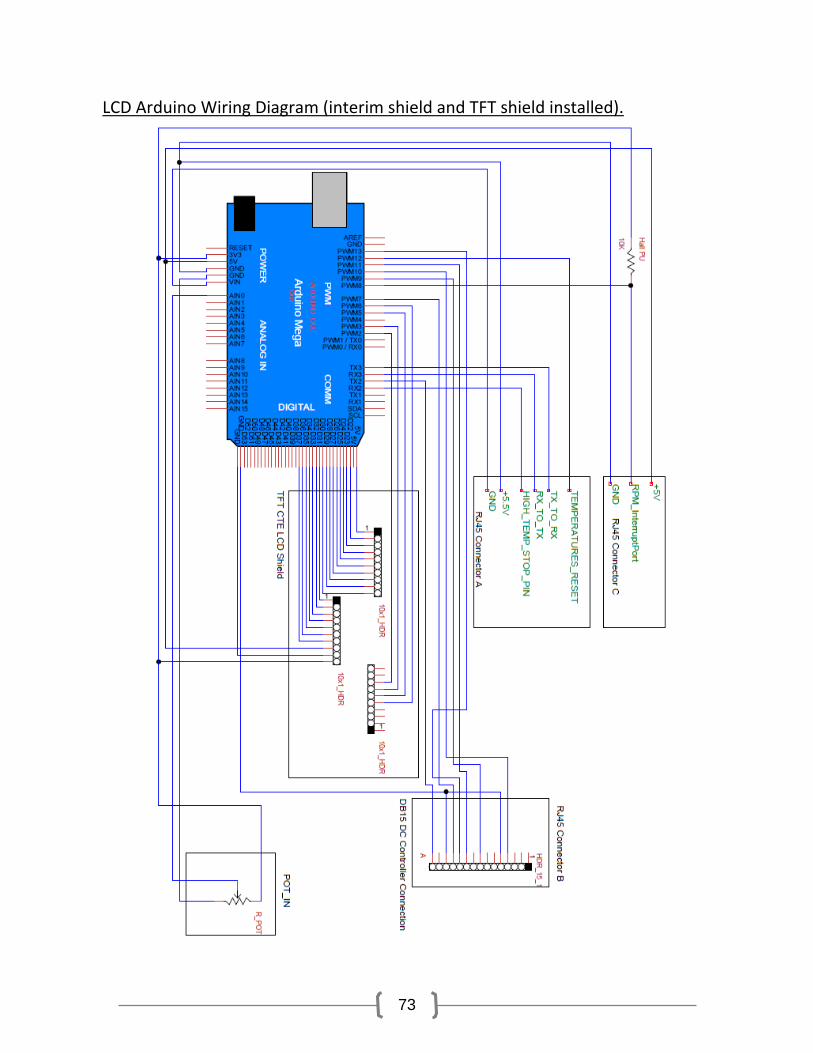
73
LCD Arduino Wiring Diagram (interim shield and TFT shield installed).
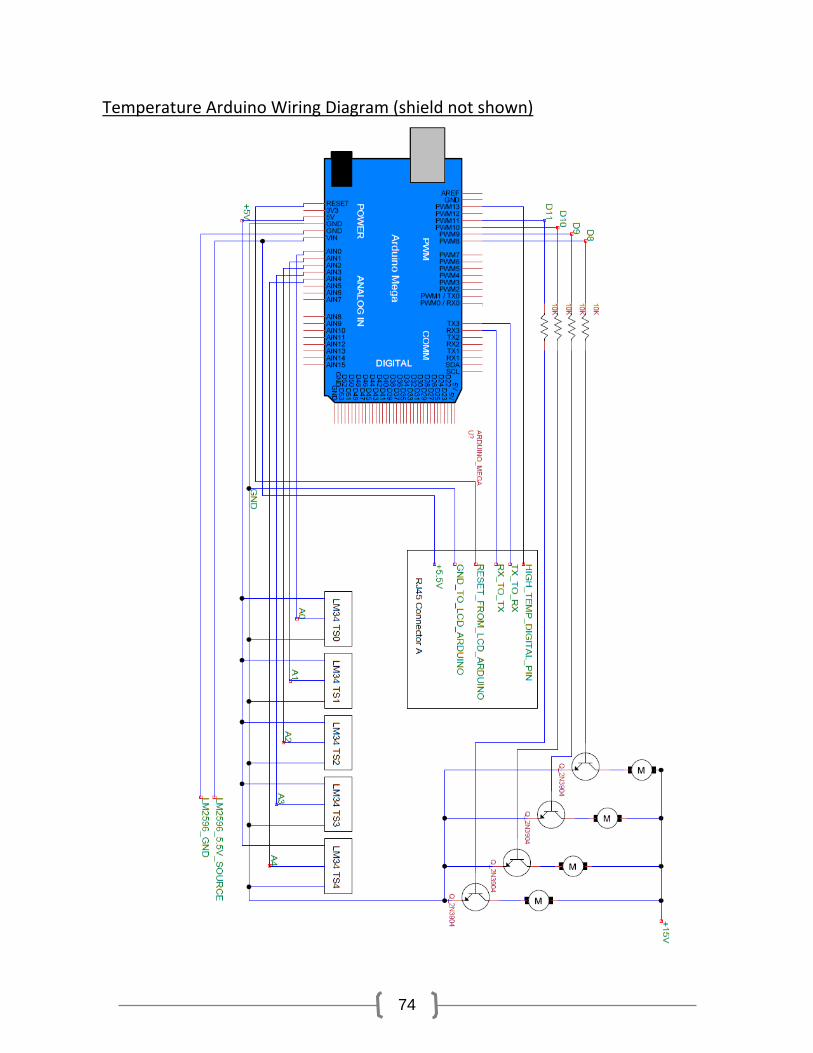
74
Temperature Arduino Wiring Diagram (shield not shown)
Related Documents