November 2, 2011 November 2 , 2011 Also Inside This Issue: National Investment And Manufacturing Zones vs SEZs Old Gold Mines To Re-open As Prices Near Record Highs Cos Opt For Ship-Breaking To Beat Low Freight Rates And Much, Much More Indian Steel Prices Up Despite Fall In Demand

Welcome message from author
This document is posted to help you gain knowledge. Please leave a comment to let me know what you think about it! Share it to your friends and learn new things together.
Transcript
November 2, 2011
November 2 , 2011
Also Inside This Issue:
National Investment And Manufacturing Zones vs SEZs
Old Gold Mines To Re-open As Prices Near Record Highs
Cos Opt For Ship-Breaking To Beat Low Freight Rates
And Much, Much More
Indian Steel Prices Up Despite Fall In Demand

November 2, 2011
Indian Steel Prices Rising Despite Fall In Demand
D omestic steel prices have continued to rise despite rising output and slowing consumption, according to latest data from the gov-
ernment. Rising output and slowing consumption growth should have ideally led to high inventory levels, but that has not hap-
pened, according to officials at key steel companies.
We, at PRU, try to analyse the dynamics of this industry and the factors that could have led to the domestic price increase.
Production And Demand Scenario
According to latest data provided by Joint Plant Committee, a government body that tracks steel metrics in India, steel output was 34.7
million tonnes in April-September, up 9.3% from a year ago, while demand grew a mere 1.8 % to 33.1 million tonne in the same period
(Table 1).
Rising interest rates have impacted steel user industries and this is reflected in the industrial growth rate numbers. Index of Industrial
Production for August was up 4.1% from a year ago, slightly up from July‗s 3.3%, which was a 21-month low.
Automobile sector, one of the key user industries, is going through tough times because of high inflation, sharp rise in interest rates and
spike in fuel prices. Sales growth of automobiles (excluding two‐wheelers) in April-August has declined to 9.7% on year-on-year basis
from 26% in the same period last year.
There has also been slowing order inflow to infrastructure companies,
another major steel consumer. The only major order inflow in July-
September period was that of GMR Infrastructure Ltd worth `7,200
crore from National Highway Authority of India. Demand from infra-
structure sector constitutes about 61% of total steel demand in India.
(Chart1)
However, steel production continues to grow at over 9%.
Steel Authority of India Ltd and Tata Steel Ltd — the major steel mak-
ers in India -- together posted a production growth of 2.9% in April-
September compared with a year ago. Incremental production due to
3.4 million tonnes capacity addition by Essar Steel during this period
also contributed to the healthy growth in production.
Table 1: Production , Consumption , Export and Import( Million Tonnes)
FY07 FY08 FY09 FY10 FY11 April-Sept 2010 April-Sept 2011
Production 50.2 52.7 53.5 60.6 66.0 31.8 34.7
% growth 13.1 5.0 1.5 13.3 8.9 4.9 9.3
Consumption 46.8 52.1 52.4 59.5 65.6 33.1 33.7
% growth 12.9 11.4 0.4 13.7 10.3 9.8 1.8
Import 4.9 7.0 5.8 7.3 7.1 4.49 2.8
%growth 14.4 42.7 -16.9 24.9 -2.1 32.6 -36.4
Exports 5.2 5.1 4.4 3.2 3.3 1.47 2.15
% growth 9.2 -3.1 -12.6 -27.1 1.5 -4.2 46.1
Source: JPC
November 2, 2011
Inventory
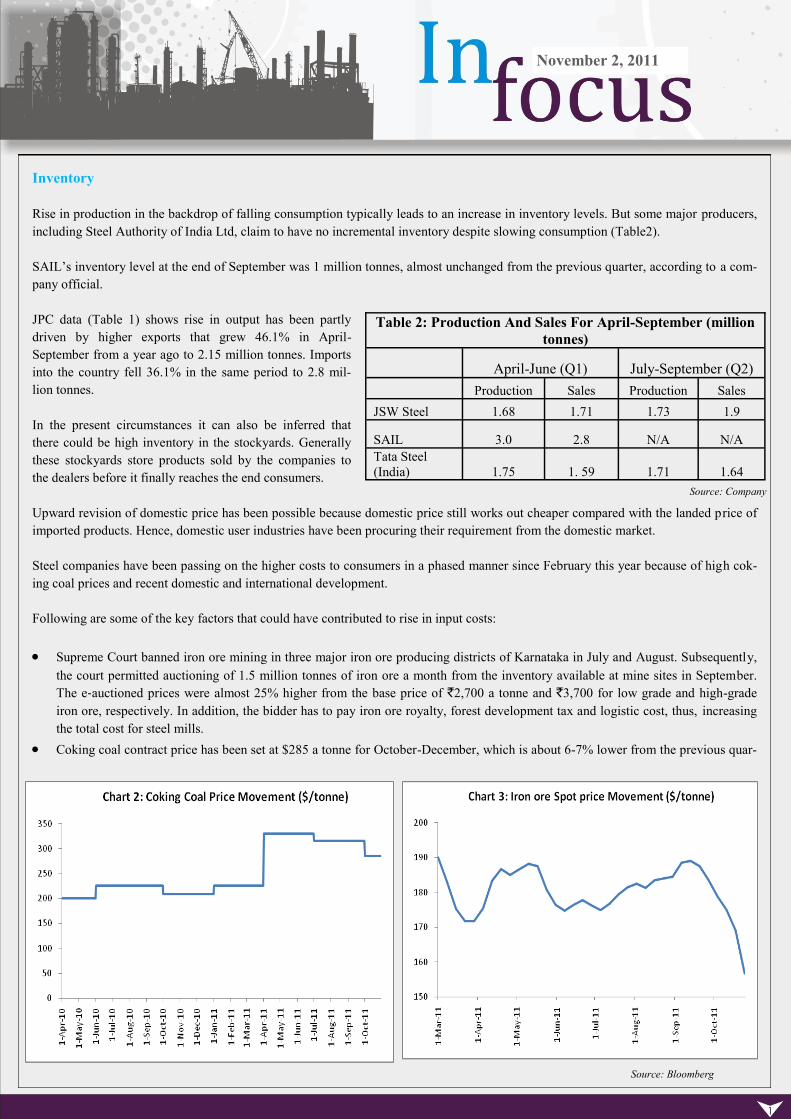
Rise in production in the backdrop of falling consumption typically leads to an increase in inventory levels. But some major producers,
including Steel Authority of India Ltd, claim to have no incremental inventory despite slowing consumption (Table2).
SAIL‘s inventory level at the end of September was 1 million tonnes, almost unchanged from the previous quarter, according to a com-
pany official.
JPC data (Table 1) shows rise in output has been partly
driven by higher exports that grew 46.1% in April-
September from a year ago to 2.15 million tonnes. Imports
into the country fell 36.1% in the same period to 2.8 mil-
lion tonnes.
In the present circumstances it can also be inferred that
there could be high inventory in the stockyards. Generally
these stockyards store products sold by the companies to
the dealers before it finally reaches the end consumers.
Upward revision of domestic price has been possible because domestic price still works out cheaper compared with the landed price of
imported products. Hence, domestic user industries have been procuring their requirement from the domestic market.
Steel companies have been passing on the higher costs to consumers in a phased manner since February this year because of high cok-
ing coal prices and recent domestic and international development.
Following are some of the key factors that could have contributed to rise in input costs:
Supreme Court banned iron ore mining in three major iron ore producing districts of Karnataka in July and August. Subsequently,
the court permitted auctioning of 1.5 million tonnes of iron ore a month from the inventory available at mine sites in September.
The e‐auctioned prices were almost 25% higher from the base price of `2,700 a tonne and `3,700 for low grade and high-grade
iron ore, respectively. In addition, the bidder has to pay iron ore royalty, forest development tax and logistic cost, thus, increasing
the total cost for steel mills.
Coking coal contract price has been set at $285 a tonne for October-December, which is about 6-7% lower from the previous quar-
Table 2: Production And Sales For April-September (million
tonnes)
April-June (Q1) July-September (Q2)
Production Sales Production Sales
JSW Steel 1.68 1.71 1.73 1.9
SAIL 3.0 2.8 N/A N/A
Tata Steel
(India) 1.75 1. 59 1.71 1.64
Source: Bloomberg
Source: Company
November 2, 2011
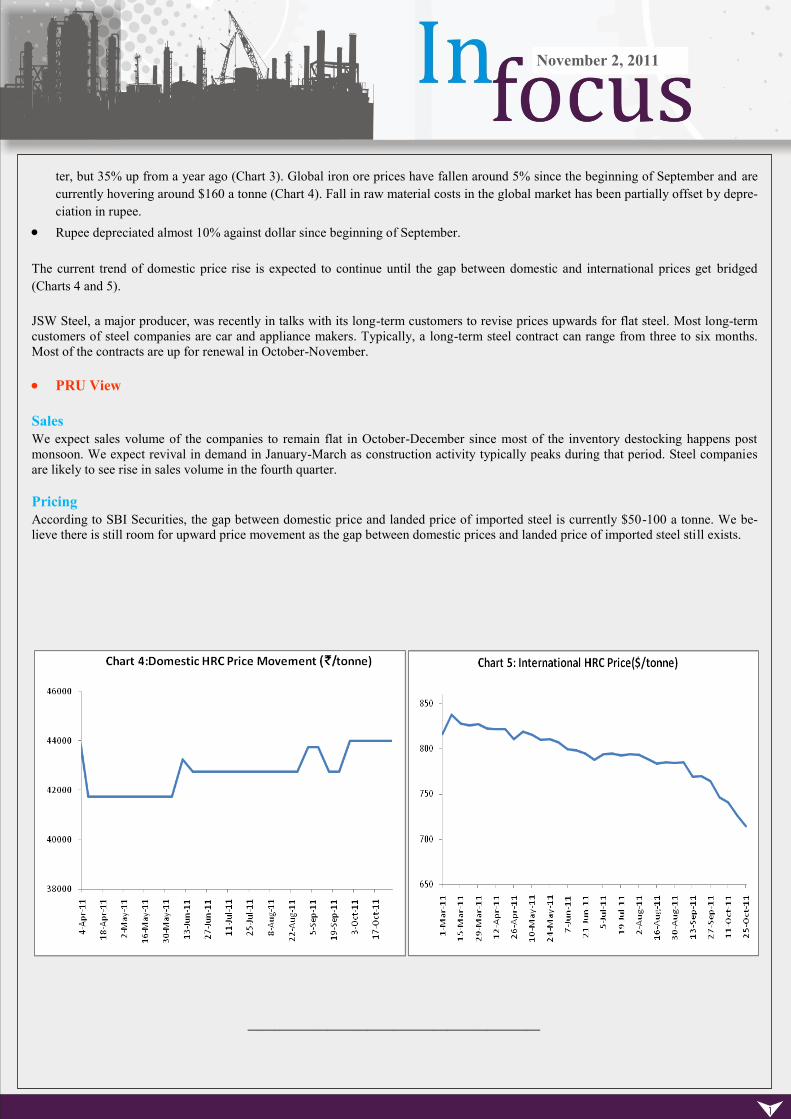
ter, but 35% up from a year ago (Chart 3). Global iron ore prices have fallen around 5% since the beginning of September and are
currently hovering around $160 a tonne (Chart 4). Fall in raw material costs in the global market has been partially offset by depre-
ciation in rupee.
Rupee depreciated almost 10% against dollar since beginning of September.
The current trend of domestic price rise is expected to continue until the gap between domestic and international prices get bridged
(Charts 4 and 5).
JSW Steel, a major producer, was recently in talks with its long-term customers to revise prices upwards for flat steel. Most long-term
customers of steel companies are car and appliance makers. Typically, a long-term steel contract can range from three to six months.
Most of the contracts are up for renewal in October-November.
PRU View
Sales
We expect sales volume of the companies to remain flat in October-December since most of the inventory destocking happens post
monsoon. We expect revival in demand in January-March as construction activity typically peaks during that period. Steel companies
are likely to see rise in sales volume in the fourth quarter.
Pricing
According to SBI Securities, the gap between domestic price and landed price of imported steel is currently $50-100 a tonne. We be-
lieve there is still room for upward price movement as the gap between domestic prices and landed price of imported steel still exists.
——————————————————————
November 2, 2011
National Investment and Manufacturing Zones vs SEZs
The Union Cabinet last week gave its green light to the revised National Manufacturing Policy. The decision comes on the back of
slowing manufacturing and industrial growth and amid views that government inaction has resulted in lack of growth enablers in the
economy. The new policy aims to create 100 million jobs in a decade and increase share of manufacturing in the country's gross domes-
tic product to 25% by 2022 from 15-16% now.
As a key step to promote manufacturing growth, the policy envisages developing industrial infrastructure through creation of large inte-
grated industrial townships called National Investment and Manufacturing Zones.
Although NIMZs have been broadly fashioned on the lines of the special economic zones, the new policy is expected to overcome the
shortcomings of the SEZ policy that kicked up a political maelstrom after it was implemented.
PRU explores the new policy stand on NIMZs and how its plans to tackle the issues of land acquisition and ownership, among others.
How is NIMZ different from SEZ?
Main Objective
One of the main objectives of the Special Economic Zone (SEZ) Act 2005 was promotion of exports of goods and ser-
vices and creation of related infrastructure.
According the SEZ Act, the special economic zone is a special export promotion scheme and therefore has a specific defi-
nition. A special economic zone is defined as a deemed foreign territory with special rules for facilitating foreign direct
investment for export-oriented production, and for purposes of trade and custom duties.
In case of NIMZ, the main objective is growth in manufacturing.
Ownership
A person or entity that intends to set up a special economic zone could identify any area of his or its choice and make a
proposal directly to the Board of Approval for setting up the same. The ownership of the area would then get transferred
to the private entity.
NIMZs will have a special purpose vehicle and it is left to state governments to adopt a model that it considers most
workable. State governments may retain ownership of the NIMZ solely or jointly or may transfer the same to a private
entity.
Land Acquisition
SEZs faced problem with regards to land acquisition. Concerns have also been expressed regarding acquisition of agricul-
tural land for setting up SEZs. There was no specific provision for acquisition of land for SEZs.
The new policy has made land acquisition the responsibility of state governments. It also states that NIMZs will be set up
on non-agricultural land, preferably barren and waste land and not in the vicinity of any ecologically fragile area and with
reasonable access to basic resources.
State governments will bear the costs, if any, of resettlement and rehabilitation of people whose lands have been acquired,
the policy states.
Labour
November 2, 2011
Labour laws that prevailed in SEZs were comparatively stringent.
The new policy will provide flexibility by removing rigidity in the labour market and will develop a comprehensive exit
policy in case of closure of sick units.
Selection Of Land
Unlike SEZs that were planned across the length and breadth of the country (there are more than 500 SEZs operational
and proposed across India – click here for list of SEZs), the government plans to set up NIMZs across seven proposed
industrial cities, or smart cities, on the Mumbai-Delhi corridor.
No Industry Clusters
The list of operational SEZs shows that a majority of the SEZs is like industrial clusters (set up before the SEZ Act 2005).
On the other hand, NIMZ promotes agglomeration and there are no incentives for individual industries.
Manufacturing Units
At least 30% of total land area proposed for NIMZs will be utilised for manufacturing units. There was no such specifica-
tion under the SEZ Act.
Funding
Funding of internal infrastructure in an NIMZ will be provided through Viability Gap Funding (maximum 20% of total
project cost), long-term soft loan from multilateral financial institutions and external commercial borrowings.
The following industry verticals will be given special attention:
Employment Intensive Industries: Includes textiles and garments; leather and footwear; gems and jewellery; and food
processing industries.
Capital Goods: Special focus will be given to machine tools, heavy electrical equipments, heavy transport, earth moving
and mining equipment.
Industries With Strategic Significance: Including aerospace, shipping, information technology hardware and electronics,
telecommunication equipment, defence equipment, and solar energy.
Competitive Advantage: Industries in which the country enjoys competitive advantage including automobiles, pharmaceu-
ticals and medical equipment.
Small and Medium Enterprises
Public Sector Enterprises
Old Gold Mines To Re-open As Prices Near Record Highs
Gold mines see action as prices soar; Hutti to reopen Chitradurga mine: As gold prices hover at all-time highs, companies are
about to re-open mines that were abandoned for various reasons. Hutti Gold Mines, India's lone gold miner, is reopening its closed Chi-
tradurga mine after a gap of six years because at current prices, even this low-grade ore is viable (The Economic Times, October 29,
2011).
PRU Analysis
Hutti Gold Mines Ltd, owned by the Karnataka government, is planning to reopen its Chitradurga gold mine that has been shut for six
years. The country‘s gold mines have been considered economically non-viable, but a persistent upwards spiral in gold prices over the
past five years appears to be the reason behind the Hutti Gold‘s latest move.
Gold mines in India have low grade ore that increases extraction cost. In India, 3-4 grams of gold is extracted from 1 tonne of ore com-
pared with mines in South Africa that can produce between 8-17 grams of gold from a tonne of ore.
November 2, 2011
According to the World Gold Council, total gold demand in India
reached 963 tonnes in 2010, accounting for about 25% of total
global demand. Gold has been an important part of Indian wed-
dings and traditions. Over the years, gold has slowly transformed
into a sophisticated investment instrument, besides its traditional
uses.
According to the latest data, in April-June, investment demand
that constitutes gold bars and coins surged 78% from a year ago
to 108.5 tonnes. Inflation concerns and relative under-
performance of other assets, such as domestic equity market and
property, continues to support investment demand for gold.
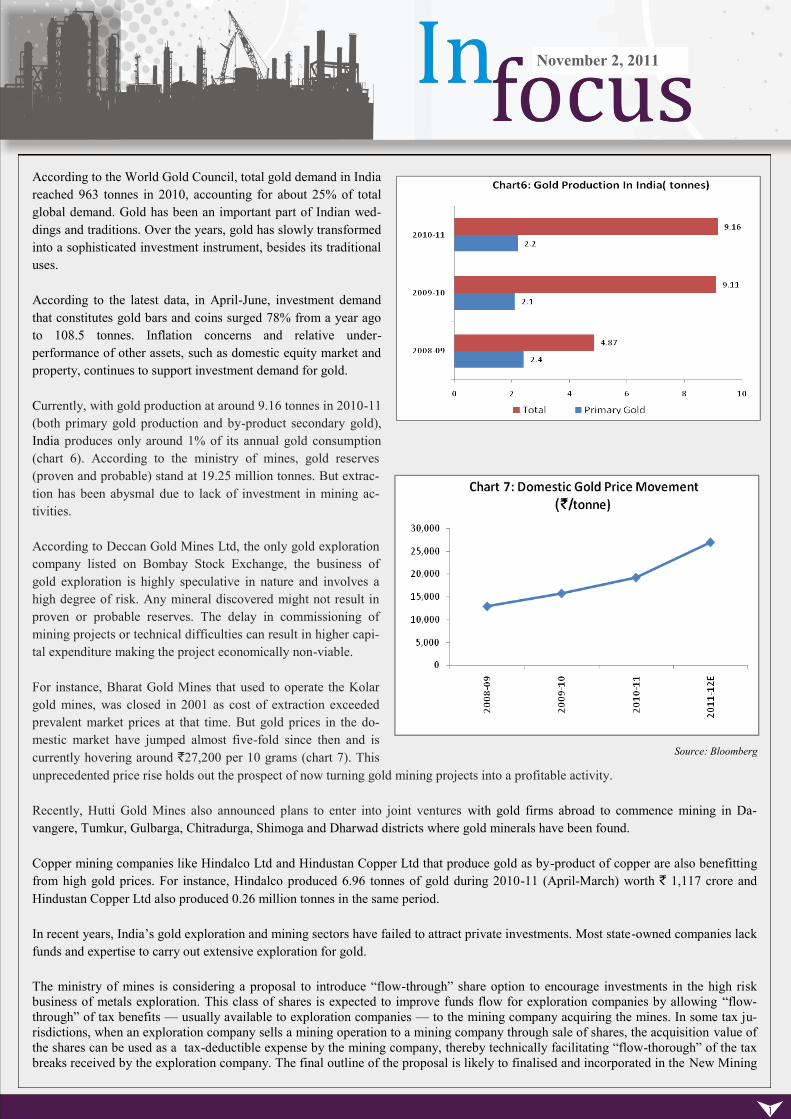
Currently, with gold production at around 9.16 tonnes in 2010-11
(both primary gold production and by-product secondary gold),
India produces only around 1% of its annual gold consumption
(chart 6). According to the ministry of mines, gold reserves
(proven and probable) stand at 19.25 million tonnes. But extrac-
tion has been abysmal due to lack of investment in mining ac-
tivities.
According to Deccan Gold Mines Ltd, the only gold exploration
company listed on Bombay Stock Exchange, the business of
gold exploration is highly speculative in nature and involves a
high degree of risk. Any mineral discovered might not result in
proven or probable reserves. The delay in commissioning of
mining projects or technical difficulties can result in higher capi-
tal expenditure making the project economically non-viable.
For instance, Bharat Gold Mines that used to operate the Kolar
gold mines, was closed in 2001 as cost of extraction exceeded
prevalent market prices at that time. But gold prices in the do-
mestic market have jumped almost five-fold since then and is
currently hovering around `27,200 per 10 grams (chart 7). This
unprecedented price rise holds out the prospect of now turning gold mining projects into a profitable activity.
Recently, Hutti Gold Mines also announced plans to enter into joint ventures with gold firms abroad to commence mining in Da-
vangere, Tumkur, Gulbarga, Chitradurga, Shimoga and Dharwad districts where gold minerals have been found.
Copper mining companies like Hindalco Ltd and Hindustan Copper Ltd that produce gold as by-product of copper are also benefitting
from high gold prices. For instance, Hindalco produced 6.96 tonnes of gold during 2010-11 (April-March) worth ` 1,117 crore and
Hindustan Copper Ltd also produced 0.26 million tonnes in the same period.
In recent years, India‘s gold exploration and mining sectors have failed to attract private investments. Most state-owned companies lack
funds and expertise to carry out extensive exploration for gold.
The ministry of mines is considering a proposal to introduce ―flow-through‖ share option to encourage investments in the high risk
business of metals exploration. This class of shares is expected to improve funds flow for exploration companies by allowing ―flow-
through‖ of tax benefits — usually available to exploration companies — to the mining company acquiring the mines. In some tax ju-
risdictions, when an exploration company sells a mining operation to a mining company through sale of shares, the acquisition value of
the shares can be used as a tax-deductible expense by the mining company, thereby technically facilitating ―flow-thorough‖ of the tax
breaks received by the exploration company. The final outline of the proposal is likely to finalised and incorporated in the New Mining
Source: Bloomberg
November 2, 2011
Bill that is expected to be tabled in the winter session of Parliament. Flow-through share option already in practice in Canada, Australia
and the US.
Cos Opt For Ship-Breaking To Beat Low Freight Rates
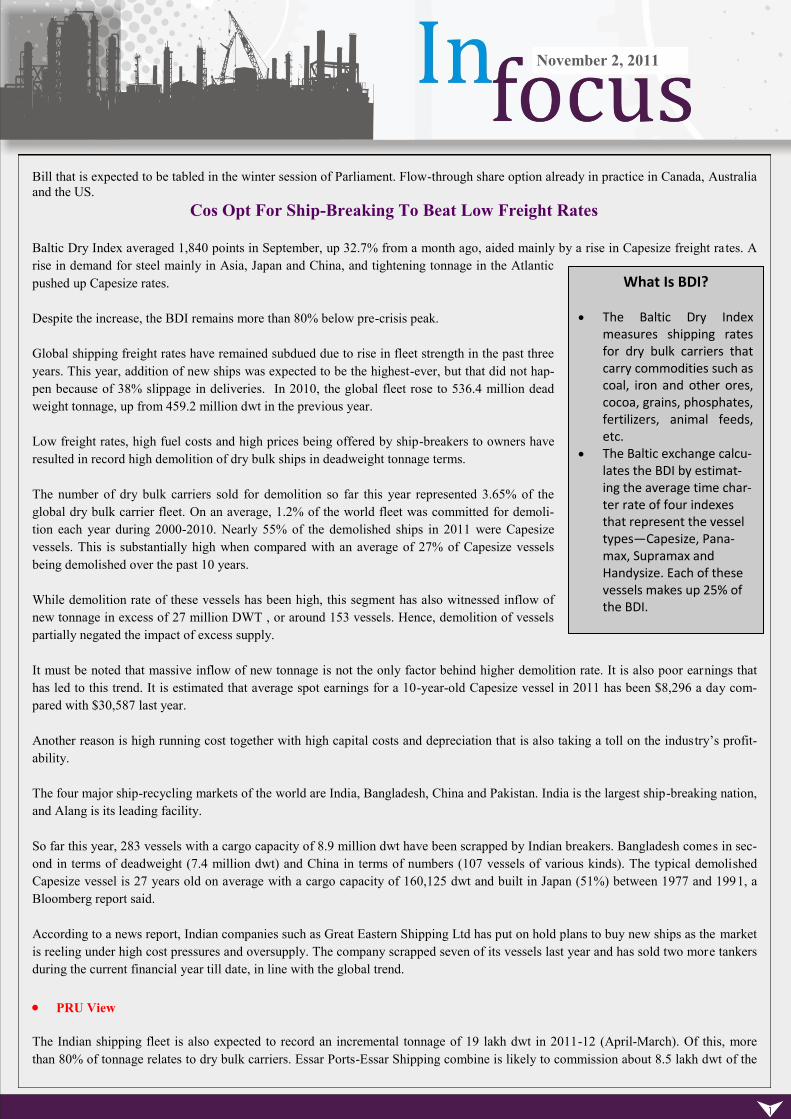
Baltic Dry Index averaged 1,840 points in September, up 32.7% from a month ago, aided mainly by a rise in Capesize freight rates. A
rise in demand for steel mainly in Asia, Japan and China, and tightening tonnage in the Atlantic
pushed up Capesize rates.
Despite the increase, the BDI remains more than 80% below pre-crisis peak.
Global shipping freight rates have remained subdued due to rise in fleet strength in the past three
years. This year, addition of new ships was expected to be the highest-ever, but that did not hap-
pen because of 38% slippage in deliveries. In 2010, the global fleet rose to 536.4 million dead
weight tonnage, up from 459.2 million dwt in the previous year.
Low freight rates, high fuel costs and high prices being offered by ship-breakers to owners have
resulted in record high demolition of dry bulk ships in deadweight tonnage terms.
The number of dry bulk carriers sold for demolition so far this year represented 3.65% of the
global dry bulk carrier fleet. On an average, 1.2% of the world fleet was committed for demoli-
tion each year during 2000-2010. Nearly 55% of the demolished ships in 2011 were Capesize
vessels. This is substantially high when compared with an average of 27% of Capesize vessels
being demolished over the past 10 years.
While demolition rate of these vessels has been high, this segment has also witnessed inflow of
new tonnage in excess of 27 million DWT , or around 153 vessels. Hence, demolition of vessels
partially negated the impact of excess supply.
It must be noted that massive inflow of new tonnage is not the only factor behind higher demolition rate. It is also poor earnings that
has led to this trend. It is estimated that average spot earnings for a 10-year-old Capesize vessel in 2011 has been $8,296 a day com-
pared with $30,587 last year.
Another reason is high running cost together with high capital costs and depreciation that is also taking a toll on the industry‘s profit-
ability.
The four major ship-recycling markets of the world are India, Bangladesh, China and Pakistan. India is the largest ship-breaking nation,
and Alang is its leading facility.
So far this year, 283 vessels with a cargo capacity of 8.9 million dwt have been scrapped by Indian breakers. Bangladesh comes in sec-
ond in terms of deadweight (7.4 million dwt) and China in terms of numbers (107 vessels of various kinds). The typical demolished
Capesize vessel is 27 years old on average with a cargo capacity of 160,125 dwt and built in Japan (51%) between 1977 and 1991, a
Bloomberg report said.
According to a news report, Indian companies such as Great Eastern Shipping Ltd has put on hold plans to buy new ships as the market
is reeling under high cost pressures and oversupply. The company scrapped seven of its vessels last year and has sold two more tankers
during the current financial year till date, in line with the global trend.
PRU View
The Indian shipping fleet is also expected to record an incremental tonnage of 19 lakh dwt in 2011-12 (April-March). Of this, more
than 80% of tonnage relates to dry bulk carriers. Essar Ports-Essar Shipping combine is likely to commission about 8.5 lakh dwt of the
What Is BDI? The Baltic Dry Index
measures shipping rates for dry bulk carriers that carry commodities such as coal, iron and other ores, cocoa, grains, phosphates, fertilizers, animal feeds, etc.
The Baltic exchange calcu-lates the BDI by estimat-ing the average time char-ter rate of four indexes that represent the vessel types—Capesize, Pana-max, Supramax and Handysize. Each of these vessels makes up 25% of the BDI.
November 2, 2011
total incremental tonnage in 2011-12.
Despite a rise in BDI, high charges for depreciation, port, and fuel are expected to keep the pressure on the profits of shipping compa-
nies in India. High order-book position also reflects that the squeeze on revenues would continue.
Tough Times Ahead For Tyre Makers
Slowing demand from the automobile industry together with
rising costs are likely to dent the profitability of Indian tyre-
makers in the coming quarters.
Low consumer confidence and uncertainty over income levels
in the future have led to a sharp deceleration in automobile
sales. Rising interest rates, high costs and fuel prices have also
contributed to the slowdown in sales.
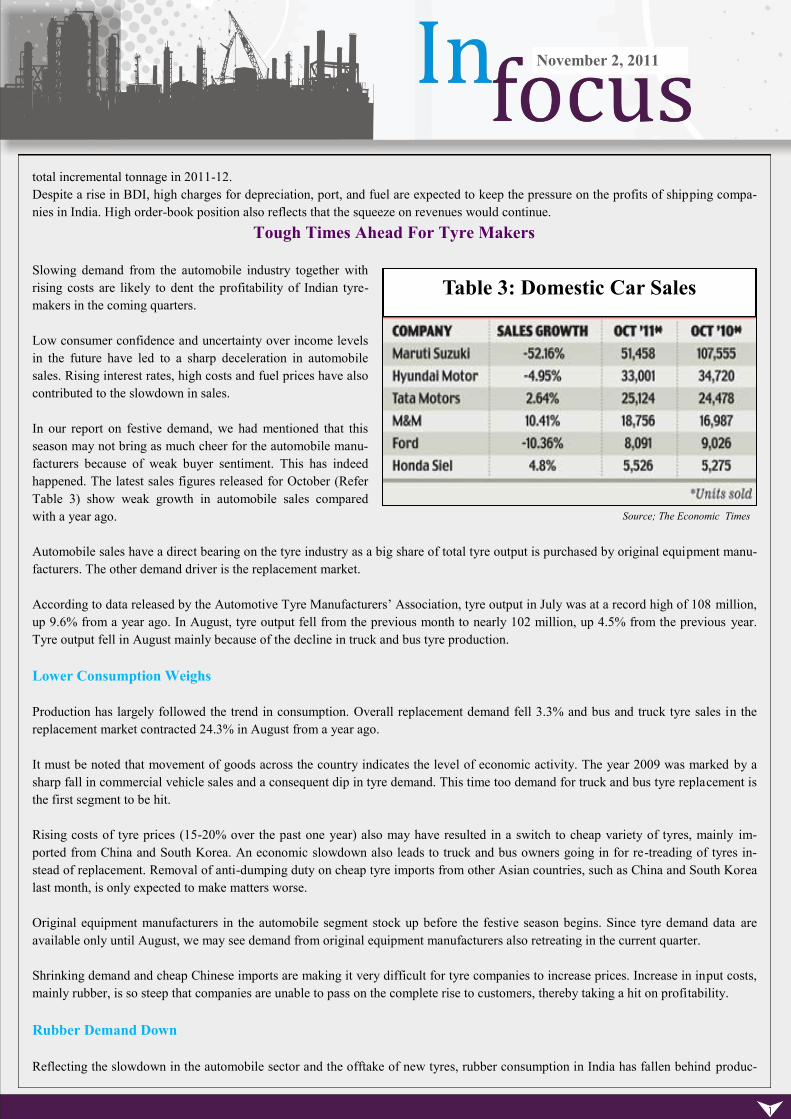
In our report on festive demand, we had mentioned that this
season may not bring as much cheer for the automobile manu-
facturers because of weak buyer sentiment. This has indeed
happened. The latest sales figures released for October (Refer
Table 3) show weak growth in automobile sales compared
with a year ago.
Automobile sales have a direct bearing on the tyre industry as a big share of total tyre output is purchased by original equipment manu-
facturers. The other demand driver is the replacement market.
According to data released by the Automotive Tyre Manufacturers‘ Association, tyre output in July was at a record high of 108 million,
up 9.6% from a year ago. In August, tyre output fell from the previous month to nearly 102 million, up 4.5% from the previous year.
Tyre output fell in August mainly because of the decline in truck and bus tyre production.
Lower Consumption Weighs
Production has largely followed the trend in consumption. Overall replacement demand fell 3.3% and bus and truck tyre sales in the
replacement market contracted 24.3% in August from a year ago.
It must be noted that movement of goods across the country indicates the level of economic activity. The year 2009 was marked by a
sharp fall in commercial vehicle sales and a consequent dip in tyre demand. This time too demand for truck and bus tyre replacement is
the first segment to be hit.
Rising costs of tyre prices (15-20% over the past one year) also may have resulted in a switch to cheap variety of tyres, mainly im-
ported from China and South Korea. An economic slowdown also leads to truck and bus owners going in for re-treading of tyres in-
stead of replacement. Removal of anti-dumping duty on cheap tyre imports from other Asian countries, such as China and South Korea
last month, is only expected to make matters worse.
Original equipment manufacturers in the automobile segment stock up before the festive season begins. Since tyre demand data are
available only until August, we may see demand from original equipment manufacturers also retreating in the current quarter.
Shrinking demand and cheap Chinese imports are making it very difficult for tyre companies to increase prices. Increase in input costs,
mainly rubber, is so steep that companies are unable to pass on the complete rise to customers, thereby taking a hit on profitability.
Rubber Demand Down
Reflecting the slowdown in the automobile sector and the offtake of new tyres, rubber consumption in India has fallen behind produc-
Table 3: Domestic Car Sales
Source; The Economic Times

November 2, 2011
tion. In September, favourable climate and increased
tapping intensity resulted in rubber production at
80,200 tonnes while consumption fell to 74,000 ton-
nes.
While slower demand growth in China has led to inter-
national rubber prices easing off a bit, it is depreciation
of Indian rupee that is expected to negate the positive
effect. Rubber prices are still ruling high around `200
a kilogram.
PRU View
The automobile slowdown has a ripple effect on sev-
eral aspects of the tyre industry. One, the tyre compa-
nies are sitting on a pile of high-cost inventory. Finished goods inventory remained high in July-September, as demand slowed. Easing
rubber prices will make it even more difficult for tyre makers to raise prices, thereby affecting profit margins.
Second, tyre production capacity is expected to go up to 188 million by March 2012 from 156 million a year ago, as companies — in-
cluding JK Tyres Ltd and Falcon Tyres Ltd — have planned capacity addition. With capacity increasing and demand slowing, bargain-
ing power of suppliers is expected to weaken. Also, anticipating slower demand, announcements of fresh capacity addition have re-
duced substantially.
Apparel Prices to Come Down To Factor In Weak Cotton Prices
Apparel Makers, Retailers Plan To Cut Prices 15%: Even as headline inflation is steadily climbing, apparel shoppers can now see
some signs of respite. Apparel manufacturers and retailers plan to cut merchandise prices for the upcoming spring-summer season,
which starts in February, by 10 to 15%. The reason: A drop in sales and a correction in raw material (cotton) prices (Business Standard,
October 27, 2011).
PRU Analysis
Apparel manufacturers and retailers plan to cut prices 10-15% from February to factor in fall in cotton prices. This move is expected to
boost consumer demand for apparel that has been hit in the last three to four months due to price hikes.
Garment makers were reeling under high raw material (cotton)
cost from June 2010 until April 2011. Prices of popular Shankar
6(LS) kadi more than doubled to `165 a kilogram in March from
`78 a kg a year ago on the back of robust demand and con-
strained supply because of unfavourable climatic conditions in
main producing countries like China, Pakistan and the US.
Imposition of 10% excise duty on branded garments since
March this year further added to the cost of apparel makers.
Hence, they had to hike prices 8-18% to pass on higher costs to
consumers. According to Clothing Manufacturers' Association
of India, this rise in apparel prices resulted in weakening de-
mand.
According to the Centre for Monitoring Indian Economy, ap-
parel industry witnessed a fall in sales in April-June and mar-
ginal rise in revenue was driven by higher realisation.
140
160
180
200
220
240
260
Jun-11 Jul-11 Aug-11 Sep-11 Oct-11
` per kg Chart 6: Natural Rubber Prices
Domestic Rubber (RSS-4) (Thailand)
Source: CMIE, Dhanbank PRU
Source: CMIE, Dhanbank PRU

November 2, 2011
The impact of weakening demand was reflected in the quarterly results of some of the major players in the industry.
For instance, net sale of Bombay Rayon Fashions Ltd in April-June had fallen 13.3% sequentially to `608 crore due to decline in sales
volume of the garment segment. Margins for this quarter shrank 67 basis points due to high cotton prices.
Cotton prices declined almost 50% to `88 a kg In June-July from peak prices but it didn‘t translate into cheap fabrics since spinning
mills had a huge pile-up of yarn produced from cotton procured earlier at high price. But now with major destocking of yarn inventory
taking place, the fall in cotton prices is likely to be reflected in the cost of yarn produced in the coming months.
Some companies, such as apparel maker and retailer Provogue, have already cut prices by 12-15% following the fall in cotton prices.
All Is Not Well With Industry: Core Sector Growth Hits A New Low
India‘s core infrastructure sector grew 2.3% in September, the slowest pace in 30 months. The latest numbers hint that industrial activ-
ity is slowing at a faster-than-expected pace. Core sector has a weightage of 37.9% in the Index of Industrial Production and comprises
coal, crude oil, natural gas, petroleum refinery products, fertilisers, steel, cement and electricity sectors.
Poor core sector growth in September was on a low base of 3.3% growth a year ago. Lower growth momentum has been due to fall in
output in coal, natural gas and fertiliser industries. Lower coal output has been due to flooding in the mines while natural gas output fell
because of low production in KG Basin.
Coal output has fallen sharply 17.8% from a year ago, natural gas was down 6.4% and fertilisers production dipped down 2.1%. Also,
lower cement output growth of 0.9% shows slower activity in the construction industry. Steel output growth slowing to 6.6% points to
broad-based moderation in the industry, especially in construction and capacity creation. Electricity registered an 8.9% output growth,
but on a low base of 2.2% last year.
In April-September, the eight core infrastructure industries registered a growth of 4.9% on a year-on-year basis, lower from 5.6% last
year.
Reserve Bank of India‘s second quarter macroeconomic review points to a slowdown in corporate investments and services and, there-
fore, points to risk to growth. Moderation has been visible in construction industry and in services, namely, community, social and per-
sonal services. The poor global economic environment is also expected to impact industrial growth further due to global linkages.
The slowing eight core industries leaves the onus on the already-burdened consumer goods to lift slowing industrial growth numbers.
High interest rates environment is impacting consumer goods growth. Capital goods growth has been volatile and thus renders it less
useful for estimates. In September, Diwali festivities restocking could lift the industry growth, which is otherwise on a downward trend.
Table 4: Core Sector Trends
% YoY Weights Sep-10 Jul-11 Aug-11 Sep-11
Apr-Sep
FY11
Apr-Sep
FY12
Core Sector 37.9 3.3 7.8 3.7 2.3 5.6 4.9
Coal 4.38 -1.8 2.4 -15.3 -17.8 0.2 -4.8
Crude Oil 5.22 12.5 1.4 1.6 0.1 10.2 5.1
Natural Gas 1.71 12.6 -8.2 -5.3 -6.4 25.2 -8.5
Refinery Products 5.94 -10.2 3.9 3.9 4.4 2.6 4.7
Fertilizers 1.25 0.3 -1.6 4.3 -2.1 -2.3 0.6
Steel 6.68 11.7 15.5 8 6.6 7.4 9.5
Cement 2.41 5.2 10.8 7.2 0.9 4.7 2.5
Electricity 10.32 2.1 13 9.4 8.9 4.1 9.3

November 2, 2011
Disclaimer Clause
This report is for customer ‘information’ only and does not constitute investment advice or an offer to purchase or subscribe for any investment.
This document is not intended to provide professional advice and should not be relied upon in that regard. Persons accessing this document are ad-
vised to obtain appropriate professional advice where necessary. This document is not directed to or intended for display, downloading, printing,
reproducing or for distribution to or use by any person or entity who is a citizen or resident or located in any locality, state, country or other juris-
diction where such distribution, publication, reproduction, availability or use would be contrary to law or regulation or would subject Dhanlaxmi
Bank Limited or its associates or group companies to any registration or licensing requirement within such jurisdiction. If this document is inadver-
tently sent or has reached any individual in such country, the same may be ignored and brought to the attention of the sender. This document may
not be reproduced, distributed or published for any purpose without prior written approval of Dhanlaxmi Bank Limited.
Related Documents


