INDIAN RIVER COUNTY COMMUNITY NEEDS ASSESSMENT 2020

Welcome message from author
This document is posted to help you gain knowledge. Please leave a comment to let me know what you think about it! Share it to your friends and learn new things together.
Transcript

INDIAN RIVER COUNTY COMMUNITY
NEEDS ASSESSMENT
2020
2 2019 IRC CNA
The creation of the Indian River County Community Needs Assessment was made possible by funding and support from the organizations below.

3 2019 IRC CNA
ACKNOWLEDGMENTS
Q-Q Research Consultants would like to thank the Indian River County community and Indian River Community
Foundation staff for helping to facilitate the research and evaluation process. Their participation helped to bring about
community participation and feedback regarding the needs of the community. A Community Needs Assessment
Advisory Committee guided this project and worked diligently to ensure that the final assessment was reflective of
the communities served. Additional support was also provided by the following:
Volunteer Organizations Responsible for Survey Distribution
Alzheimer & Parkinson Association
Big Brothers Big Sisters of St Lucie, Indian River,
and Okeechobee Counties
Boys & Girls Club of Indian River
Camp Haven
Childcare Resources of Indian River
Children’s Home Society
City of Fellsmere
Crossover Mission
Florida Department of Health in Indian River County
Dogs for Life
Early Learning Coalition of Indian River,
Martin, and Okeechobee Counties
Economic Opportunities Council of Indian
River County, Inc.
Environmental Learning Center
Every Dream Has A Price, Inc
Gifford Youth Achievement Center
Head, Heart, and Hands
Hibiscus Children’s Center
Highlands Community Center
Homeless Children’s Foundation
Hope For Families
Humane Society of Vero Beach & IRC
Indian River County Healthy Start Coalition
Indian River County Hospital District
Indian River Habitat for Humanity
Indian River State College
Kindergarten Readiness Collaborative
LifeBuilders of the Treasure Coast, Inc.
Literacy Services of IRC
Mental Health Association
Mental Health Collaborative
Progressive Civic League of Gifford, FL Inc
RCMA
Safe Space Inc
School District of Indian River County
School District of Indian River County (VPK & PreK Ese)
Senior Collaborative of Indian River County
Senior Resource Association
St Francis Manor
Substance Awareness Center of IRC
Suncoast Mental Health Center
Sunshine Physical Therapy Clinic
The Arc
The Buggy Bunch
The Learning Alliance
The Source
Treasure Coast Homeless Services Council
Tykes and Teens
United Against Poverty
United Way of Indian River County
Veteran’s Council of Indian River County
VNA and Hospice Foundation
West Wabasso Civic Club
Youth Guidance Mentoring Academy
Frida Flores, IRCF, Foundation Coordinator
Main Point of Contact for the CNA
Jeffrey R. Pickering, IRCF, President and CEO
CNA Advisory Committee Members
William Schutt, Chief of Long-Range Planning, Indian River County Community Development Department
Hope Woodhouse, Children’s Services Advisory Committee, President of John’s Island
Community Service League
Jeffrey R. Pickering, President, and CEO, Indian River Community Foundation
Julianne Price, Senior Mgmt. Analyst II, Florida Department of Health in Indian River County
Miranda Hawker, Health Administrator, Florida Department of Health in Indian River County
Meredith Egan, COO, United Way of Indian River
Michael Kint, CEO, United Way of Indian River
Larry Salustro, Board Designee, Head, Heart, and Hands of Indian River Club
Pat Brier, Vice President, John’s Island Foundation
Volunteers who Recruited
Participants and Hosted the Focus
Groups at their Facilities
Dr. Ane Larkey of United Against Poverty
Dr. Nivea Torres, Nikki Boswell, and Maria
Pantoja of the Kindergarten Readiness
Collaborative
Nancy McCurry of the Economic
Opportunities Council
William Schutt of Indian River
County Administration
Andrea Berry of the Healthy
Start Coalition
Dr. Diane Grossi of Hope for Families
Allison Sullivan of Childcare
Resource Center
Virginia Skov of Meals on Wheels
Bonnie Matz of Saint Francis Manor
Ongoing CNA Coordination Support

5 2019 IRC CNA
TABLE OF CONTENTS
INTRODUCTION .......................................................................................... 6
METHODS ......................................................................................................... 7
INDIAN RIVER COUNTY SNAPSHOT .............................................................. 10
CHILDREN ................................................................................................... 15
ECONOMIC OPPORTUNITY & EMPLOYMENT ............................................... 30
HEALTH ........................................................................................................................ 42
HOUSING ..................................................................................................... 61
SENIORS ........................................................................................................... 68
OTHER EMERGING THEMES .......................................................................... 73
CONCLUSIONS AND RECOMMENDATIONS ............................................ 75
REFERENCES ................................................................................................... 77
APPENDIX A: COMMUNITY RESOURCES……………………………………….81

6 2019 IRC CNA
INTRODUCTION
In early 2019, a group of key Indian River County
stakeholders convened to establish a process to conduct
a community needs assessment (CNA) with the goal of
understanding and addressing their community’s most
pressing challenges while exploring existing disparities.
Q-Q Research was retained to conduct the CNA and
funding was pooled from the key stakeholders to ensure
the process was supported. This CNA intends to gain
information to develop policy, along with systemic and
environmental changes to improve the quality of life of
Indian River County residents. This report is a compilation
of existing data collected about Indian River County,
along with an evaluation of the needs of current residents
captured through surveys and focus groups. The CNA
focuses on five main priority health issues: (1) children,
(2) economic opportunity, (3) health, (4) housing, and (5)
seniors.
The report is organized into four principal sections:
Introduction, Methods, Indian River County Snapshot, and
Major Findings. The Introduction section provides a brief
introduction to the primary goals and objectives of the
CNA and describes the overall structure of the report. The
Methods section contains key methodological details of
the CNA, and the Indian River County Snapshot describes
Indian River County, along with a demographic description
of its residents. The Major Findings section presents the
findings of the CNA organized into five health priorities:
(1) children, (2) economic opportunity, (3) health, (4)
housing, and (5) seniors. Each health priority presents
data at the County level and features disparities among
subgroups if warranted. Not every disparity is discussed;
just because a disparity is not mentioned does not mean
that disparity is non-existent or not important to address.
Decisions were made as to what to incorporate with
respect to disparities based on perceived importance by
community residents and stakeholders. Each health
priority section ends with “Key Points” that summarize
central themes in order to help the reader make sense of
the data.

7 2019 IRC CNA
METHODS
CNA PLANNING AND VISIONING
A community-based participatory approach was
implemented to design and conduct the Community
Needs Assessment to; 1) allow for feedback and input
regarding the needs assessment plan; 2) empower
stakeholders to voice their experience regarding the
needs of the community; and 3) ensure that the plan
was aligned with the vision and purpose of the
assessment. The CNA began with a planning meeting
and visioning session with the CNA Advisory Committee
to identify community stakeholders and relevant data
sources, and to discuss the goals of the needs
assessment. This group guided the entire CNA process
and was comprised of individuals representing the
following organizations: the Indian River Community
Foundation, United Way of Indian River, Florida
Department of Health in Indian River, Indian River County
Community Development Department, and the
Children’s Services Advisory Committee, John’s Island
Community Service League, John’s Island Foundation
and Indian River Club. The CNA Advisory Committee
approved the evaluation plan, focus group, and survey
questions, as well as coordinated the volunteers who
were trained to administer the survey and hosted the
focus groups.
Based on results from the visioning session, the following
health priorities were identified: (1) children, (2)
economic opportunity, (3) health, (4) housing, and (5)
seniors. Several subgroups of residents as populations of
interest, including low-income residents, seniors, and
parents or caregivers of children, were also identified.
The needs assessment plan was designed to assess
the needs and assets of the community related to the
five health priority issues, with additional attention
directed toward subgroups of interest specified in the
visioning section. A mixed-methods design employing a
variety of assessment methods to collect both qualitative
and quantitative data was utilized. Quantitative data
include primary data captured from a community
assessment survey and secondary data captured from
several sources. Qualitative data was captured through a
series of focus groups facilitated by the research team.
The following section provides a description of the
research design and data collection methodology.
RESEARCH DESIGN & DATA COLLECTION
A significant portion of the quantitative data in this report
comes from a Community Assessment Survey (CAS). The
CAS was developed by the research team in consultation
with an Advisory Committee and administered to those
who live and work in Indian River County. Additionally,
qualitative data was captured from 8 expert-led focus
groups facilitated by the research team. Altogether, the
focus groups were attended by 86 residents. In addition to
this, a series of secondary data sources were analyzed in
order to leverage existing information. The supplementary
data sources were included, through the assessment of 14
prior reports. For ease of reading, the source and year are
included in the text when the time frame is necessary for
understanding the data. Additionally, data was rounded to
improve readability. After a thorough review of all available
data sources through various analytic approaches, it was
noted that, in general, findings were consistent across
informants and sources. When multiple data sources from
varied approaches yield similar results, confidence in the
accuracy and strength of the findings is increased.
Survey Administration
The research team developed the CAS using structured
and open-ended questions that aimed to gather the
needs of the community. To quantify resident attitudes
and perceptions regarding their needs, questions were
created using the information provided by stakeholders
during the initial visioning session. For each priority
issue, residents agreed or disagreed with statements
regarding the existence of needs and services in their
neighborhood using a 5-point Likert scale and rated the
quality of services available to them also using a 5-point
Likert scale. Residents were also asked to comment on
what they believe is their community’s greatest strength
and whether they had any unmet needs. The final
section of the survey included demographic questions
to allow for analysis and comparison of subgroups. See
Appendix B for a full copy of the CAS survey.

8 2019 IRC CNA
The final approved IRC-CAS survey was made available to
Indian River County residents in two formats: online and
hard-copy. Any community member working or residing
in Indian River County wishing to complete the survey
online was able to do so. Participants were targeted using
a stratified convenience sampling approach using quota
method convenience sampling by zip code. Specifics
regarding sampling strategy along with information
regarding the demographics of the survey participants are
presented in Appendix B. The research team worked with
IRCF staff to develop a comprehensive list of locations
in each zip code to determine preferred locations for
hard-copy survey distribution. The research team trained
approximately 50 volunteers, representing 15 Indian River
community-based organizations to collect survey data.
These volunteers engaged residents in various locations
listed in Table 1 to reach community members who may
not have had access to, or have felt comfortable with, an
online version of the survey. Data collection began in June
2019 and ran through August 2019.
Fellsmere “Central Beach” Summer Place
Wabasso City of Vero Beach Florida Ridge
Roseland West Vero Beach Dixie Heights
Orchid Gifford Vero Beach
Windsor West Wabasso Sebastian
Oslo Park/Vero Highlands (“South County”) Winter Beach
Community Focus Groups
Eight focus group discussions were conducted to gather
stakeholders’ perspectives regarding the needs, issues,
assets, and trends of the community. Focus groups
were conducted by the research team and hosted by
community partners, including United Against Poverty,
Kindergarten Readiness Collaborative, Economic
Opportunities Council, County Administration, Healthy
Start Coalition, KRC Gifford, Hope for Families, and
Childcare Resource Center. Potential focus group
participants were selected based on their knowledge of
a given topic or because they represented a stakeholder
group in the community (e.g. older adults, parents,
etc.). Residents were informed of the CNA and were
invited to participate via email, flyers, and in-person. A
semi-structured focus group discussion guide was
developed to facilitate discussions. All focus groups
were 90 – 120 minutes in duration, and community
members received a $20 incentive for their participation.
Assessment of Prior Reports:
Secondary Data
An assortment of reports and assessments addressing
issues of concern had been completed by various
agencies and community partners within Indian River
County. As such, a review of the existing body of research
and reports was conducted to guarantee a more robust
and comprehensive analysis. Numerous data sets and
existing reports were submitted through cooperation with
community partners and county agencies. Others were
gathered through secondary research methods such as
internet and database searches. Reports in the analysis
were included if they met the following selection criteria:
• They included primary data collected from original
sources within Indian River County or if They included
secondary data specific to Indian River County,
• The primary data was collected in 2014 or later,
• The methods of data collection were discussed, and
• The foci of the report included one of the primary
identified issues examined in the current needs
assessment.
Table 1. List of Communities Reached through the Survey
9 2019 IRC CNA
In May of 2018, 24 reports were provided for possible
inclusion in the assessment of prior reports. Data
extraction and analysis included motivations for the
reports, the identification of community needs, as well as
a depiction of the populations included. The assessment
of prior reports included existing assessments that
engaged community partners and citizens, representing
a comprehensive range of Indian River County residents.
Q-Q Research staff members performed document
reviews. All reports were reviewed using the document
review checklist. If a report met the aforementioned
inclusionary criteria, a document review summary was
completed in full. For each report that met the inclusion
criteria, a data extraction form was completed.
Data Analyses
Quantitative survey data were analyzed using the SAS
statistical package. Frequencies and percentages were
calculated for all Likert Scale and demographic items.
Chi-square tests of independence were conducted to
evaluate associations between demographic factors,
including age, sex, race, and income, and survey
responses. Open-ended survey items were analyzed
using an inductive approach to identify key themes. Focus
group recordings were transcribed and also analyzed
for theme identification. The research team reviewed
and compiled secondary data from prior reports. Select
indicators were analyzed for trends and to augment and
provide context to survey and focus group data.
Most of the data presented in this CNA are presented
at the Indian River County level or are disaggregated
by the city and available in Appendix C by census tract.
Brief summaries that address the community priorities
of unique populations and neighborhoods have been
included when available. The current CNA takes a look
at resident needs and priorities by race/ethnicity and
socioeconomic status to determine if certain groups are
at an advantage or risk, or have better or worse access
to resources, etc. Such an analysis is essential for
prioritizing the provision of assistance efforts aimed at
reducing and eliminating disparities among particular
subgroup populations.
Limitations
There are a few methodological matters that should be
noted. The CAS survey data displayed in this report
represents raw/actual respondent data. Consequently,
among the limitations of the survey are the self-reported
nature of the data. Having said this, the quota sampling
strategies used did allow for reliable conclusions to be
made regarding the needs of the county residents
overall. Sample size limitations may have affected the
reliability of estimates for some of the subgroup
analyses with specific populations. As reports were
identified by working with IRCF staff and through
database and internet searches, it is expected that not
all eligible community reports and assessments were
included in the document review. This assessment of
prior reports includes all biases and limitations that were
fundamentally a part of the included prior reports, to
begin with, along with those introduced by the current
methodology. As such, findings should be interpreted
with care and in light of these methodological matters.

10 2019 IRC CNA
INDIAN RIVER COUNTY SNAPSHOT
With a population of approximately 150,000, Indian River County is centrally located on the East coast of Florida in an
area known as the Treasure Coast, with the county seat being located in Vero Beach. The County encompasses 502.6
square miles and is the 59th-largest county in Florida by area. Indian River County, Florida, is bordered by Osceola
County, St. Lucie County, Okeechobee County, and Brevard County.
POPULATION DATA: AGE AND ETHNICITY
Between 2010 and 2018, the population in Indian River
County grew from approximately 138,000 residents to
over 152,000 residents, making Indian River the 32nd
most populous county in Florida, with 0.7% of Florida’s
population.1 Since the 2010 census, the county has
experienced a population growth of 10%, which is
comparable to the overall rate in growth in Florida over
the same period (10.8%). It is estimated that in 2020, the
population will increase by another 3.5% to about 157,000
and by 2025 to 169,000 by another 7.7%.2
Figure 1 displays the numerical and percentage
breakdown of the county population by age and race/
ethnicity over time. One of the most important population
demographic characteristics to consider when planning
for a community’s needs is the age of its residents. For
example, a population in which the demographic shift
shows an aging population may have increasing
demands for healthcare systems and service needs as the
population continues to age. Conversely, a population in
which the demographic shifts show an influx of younger
residents may have increasing demands for education
and childcare services.
2018
2016
2014
152,079
Figure 1. Total Population of Indian River County by Age and Race/Ethnicity for 2014, 2016, and 2018.
Source: Florida Health Charts.3
147,163
141,468

11 2019 IRC CNA
Indian River County Population by Age Indian River County Population by Race/Ethnicity
2018
75,317 2018
3,406
2016
2014
73,363
71,607
2016
2014
9,615
5,039
Child Population:
0 - 4
Adult Population:
20 - 64
Child/Youth Population:
5 - 19
Senior Population:
65 and Up
Hispanic
White (Non-Hispanic)
Total Non-Hispanic
Black & Other
(Non Hispanic)
6,323 21,406
49,033
19,009 13
114,735 18,335
17,548
17,566
16,429
16,544
6,528 21,723
45,549
6,433 22,014
41,414

12 2019 IRC CNA
The population of Indian River county is considerably
older than that of the State of Florida. The median age
of the residents of Indian River County was 51.6 years
in 2018, while the median age of residents in the State
of Florida was 41.7 years.4 Approximately 4% of the
population is under the age of 5, while 14% are between
the ages of 5 and 19. About 50% percent of the
population is between the ages of 20 and 64. About 32%
of residents are over the age of 65.5 Since 2014, the under
18 population has decreased from 18% of the population
to 16% of the population, while the over 65 population has
increased from 29% of the population to 32% percent.
As the composition of Indian River County’s population
continues to shift toward the elderly, it can be expected
that service and health care industries will represent
growing sectors of the economy of Indian River County to
meet resident needs.
The greatest population growth in Indian River is
expected to be among the 65-plus age group. The
percentage of residents age 65 and over is expected to
increase from 32% of the total population in 2018 to 36%
by 2040, with the majority of this increase among people
age 80 and over. In comparison, the percentage of
residents 65 and over in Florida is expected to increase
from 17.3% to 25.5% by 2040. At the state and national
levels, the percentage of population 65 years and over
has also increased. When compared to the state, Indian
River County has a lower percentage of population under
18 years, but a higher percentage of the population 65
years and over.
Though Indian River County’s population is mostly White
Non-Hispanic, the county has a very diverse population
of residents, which has implications for the needs of the
community. About 75% of residents identify as White
Non-Hispanic/Latino. Hispanic/Latinos (of any race)
represent the largest minority group (12.5 %) followed by
Black/African Americans/Others 13% (i.e., 9.2% Black/
African American, 1.3% Asian, 1.9% Two or more races,
0.4% Native, 0.2% Other)6 (see Figure 1).
The rates of diverse populations are expected to increase
in the county. The Black population is expected to
increase by 2% to 10% by 2040, while the Hispanic/Latino
population is expected to increase by 6% to 18% of the
population by 2040. As the total population continues to
grow, net changes within racial/ethnic groups will
contribute to the county’s changing demographics.

Less than High 2014 13,515
School 2016 13,677
2018 14,094
2018 32,187
Some College 2014 23,284
2016 22,869
2018 27,703
Associate’s 2014
9,633
Degree 2016 10,413
2018 12,771
Bachelor’s 2014 17,760
Degree 2016 18,195
2018 23,478
Figure 2. Highest Educational Attainment in Indian River County. Source: United States Census Bureau.
EDUCATION
High School 2014 31,129
Graduate 2016 33,170

14 2019 IRC CNA
Socioeconomic Characteristics
Indian River County is one of the top 10 richest counties
in Florida. According to the Office of Economic and
Demographic Research, in 2018, the average per capita
personal income for Indian River County was $76,059,
which is more than $25,000 higher than Florida’s average
per capita income of residents ($50,070).8 In fact, according
to the most recent report available from the Economic
Policy Institute examining nationwide county-level data,
Indian River County had the 10th largest income gap
between the top 1% and the bottom 99% out of 3,061
counties nationwide. The top 1% in Indian River County
earn an average of over $2.9 million, and the bottom 99%
earn an average of $43,373, representing a top to bottom
ratio of 67.2.9 In communities where income inequality is
a concern, disparities may exist that primarily affect the
quality of life for lower-income residents in a variety of
areas, including health, well-being, education, and social
mobility. Additionally, such disparity skews the perception
of the overall income for Indian River County because of
the high level of income earned by the top 1%. Therefore,
median household income should be considered when
capturing the socioeconomic characteristics of Indian
River County because the median value will not be
skewed by extreme values that may lie within the top
1% or the bottom 99%. According to the Florida Office
of Economic and Demographic Research and the United
States Census Bureau, the median household income in
Indian River County in 2018 was $52,336 compared to
$53,267 for the State of Florida (adjusted for inflation).10
When considering median household income, levels of
earned income at the County and State level now appear
comparable (see Economic Opportunity section for more
details).
According to the MIT Living Wage Calculator, the required
annual income before taxes for a family of four (2 adults, 2
children) in Indian River County is $ $63,145. This estimate
takes into account food, childcare, medical expenses,
housing, transportation, taxes, and the cost of living in the
location. The living wage estimate is discussed in greater
detail in the Economic Opportunity section of the report.
The Federal Poverty Level (FPL) is a commonly used
measure to define poverty. The measure of income is
issued annually by the Department of Health and Human
Services (HHS) and is regularly used to establish eligibility
for public and social services. In 2018, FPL was $24,600
for a family of four. In 2018, it was estimated that 10.7% of
residents were below FPL.
KEY POINTS
• Indian River County is home to a diverse and growing population that is slowly becoming more ethnically and
racially mixed. By 2040, about 30% of the population is estimated to be made up of minority racial/ethnic groups.
• The County’s population is aging. Over the next decade, the need for health and social services for an aging
population, and demand for elderly care will increase.
• There is a large income gap between the richest and poorest residents of the county. Large segments of the
population earn six-figures while a considerable percentage (albeit a smaller percentage) live below the federal
poverty level.

15 2019 IRC CNA
CHILDREN
INTRODUCTION
The conditions of a child’s first few years of life have a significant impact on their potential for success and well-
being in their adult years, and in turn, on their families and communities. As such, many communities invest in child
development programs to promote children’s health and well-being, education, and to support children and families
by providing safe environments. Research has indicated that for each dollar invested in quality support programs,
there can be a long-term benefit of $7 in public savings.i This long-term benefit is thought to be achieved by improving
children’s educational and employment outcomes, thereby reducing reliance on government support services and
reducing the likelihood of criminal activity in adulthood. Exploring the challenges faced by children is a strategic
starting point in assessing the needs of a community as needs and challenges can translate into disparities and
chronic conditions in adulthood.ii For the Indian River County needs assessment, it was imperative to investigate
the perceptions that residents had regarding the services available to children. Data relating to child and maternal
health, quality of education, and services were included to illustrate the current context of child services and explore
potential ways to improve the future lives of residents.
DATA
Poverty Data
According to the 2018 census data, about 16.5% of Indian River County residents were children under the age of 18.iii
Figure 3. Child Population by Age Range in Indian River County. Source: United States Census Bureau.
Child Population: Age 0 - 4 Years Child Population: Age 5 - 9 Years
6.4%
5.5%
6.2% 6.0%
5.5% 5.4%
18.2%
15.1%
16.9%
16.5%
14.8%
4.5%
4.6%
4.3%
13.0%
12.4%
14.6%
12.2%
2014 2016 2018 2014 2016 2018
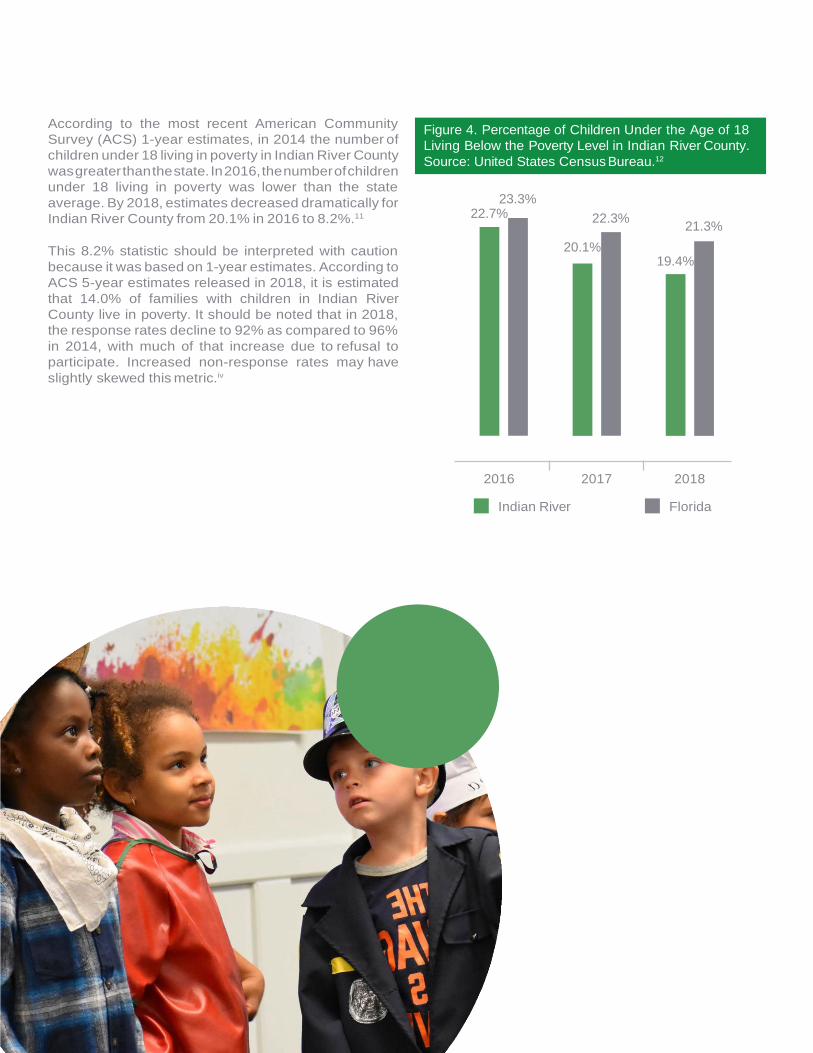
According to the most recent American Community
Survey (ACS) 1-year estimates, in 2014 the number of
children under 18 living in poverty in Indian River County
was greater than the state. In 2016, the number of children
under 18 living in poverty was lower than the state
average. By 2018, estimates decreased dramatically for
Indian River County from 20.1% in 2016 to 8.2%.11
This 8.2% statistic should be interpreted with caution
because it was based on 1-year estimates. According to
ACS 5-year estimates released in 2018, it is estimated
that 14.0% of families with children in Indian River
County live in poverty. It should be noted that in 2018,
the response rates decline to 92% as compared to 96%
in 2014, with much of that increase due to refusal to
participate. Increased non-response rates may have
slightly skewed this metric.iv
23.3%
22.7%
22.3%
20.1%
21.3%
19.4%
2016 2017 2018
Indian River Florida
Figure 4. Percentage of Children Under the Age of 18
Living Below the Poverty Level in Indian River County.
Source: United States Census Bureau.12

17 2019 IRC CNA
Birth Data
The total number of births annually in Indian River County has remained relatively stable between 2016 to 2018, with a
birth rate of 8.5 per 1,000, with 1,294 children being born in 2018, which is slightly lower than the rate in Florida.V
Total Births
2016 2017 2018
Indian
River
County
Florida
Birth Rate
8.5 per 1,000 of population (0.9%)
1,245 of 147,163
Birth Rate
11.1 per 1,000 of population (1.1%)
225,018 of 20,231,092
Birth Rate
8.5 per 1,000 of population (0.9%)
1,276 of 149,930
Birth Rate
10.9 per 1,000 of population (1.1%)
223,579 of 20,555,733
Birth Rate
8.5 per 1,000 of population (0.9%)
1,294 of 152,079
Birth Rate
10.6 per 1,000 of population (1.1%)
221,508 of 20,957,705
With respect to the health of children at birth, the percentage of children being born with low birth weights have
decreased slightly from 2016 to 2018, with the most recent estimates of low and very low birth weights being below the
state. That being said, there are higher rates of low birth weight among children born to Black mothers in Indian River
County, which is indicative of a health disparity.
Year
Count
Indian River
N
Percent
Count
Florida
N
Percent
2018 97 1,294 7.5 19,271 221,508 8.7
2017 129 1,276 10.1 19,699 223,579 8.8
2016 109 1,245 8.8 19,661 225,018 8.7
Youth Morbidity - Low Birth Weight Youth Morbidity - Very Low Birth Weight
2016 2017 2018
10.1%
2016 2017 2018
8.8% 8.7% 8.8% 7.5%
8.7%
1.8% 1.5%
1.3%
1.6%
1.3%
1.6%
Indian
River
County
Florida Indian
River
County
Florida Indian
River
County
Florida Indian
River
County
Florida Indian
River
County
Florida Indian
River
County
Florida
Figure 5. Total Births in Indian River County. Source: FL Health Charts.
Table 2. 2016 – 2018 Indian River County Levels of Low Birth Weight.13
Figure 6. Youth Morbidity by Birth Weight and Race for Indian River County.14

18 2019 IRC CNA
Low Birth Weight: by Race - in Indian River County Very Low Birth Weight: by Race - in Indian River County
2016
Black
Hispanic
Non-Hispanic
White
15.3% (31 of 202)
7.3% (21 of 287)
9.1% (87 of 956)
8.5% (65 of 769)
2016
Black
Hispanic
Non-Hispanic
White
5.4% (11 of 202)
1.4% (4 of 287)
2.0% (19 of 956)
1.4% (11 of 769)
2017
Black
Hispanic
Non-Hispanic
White
17.3% (40 of 231)
8.4% (22 of 261)
10.5% (106 of 1,013)
9.6% (79 of 827)
2017
Black
Hispanic
Non-Hispanic
White
3.9% (9 of 231)
0.8% (2 of 261)
1.4% (14 of 1,013)
0.8% (7 of 769)
Black
Hispanic
5.9% (15 of 253)
17.3% (39 of 226) Black
Hispanic
2.7% (6 of 226)
1.6% (4 of 253)
2018 Non-Hispanic
White
7.9% (82 of 1,040)
5.3% (52 of 975)
2018 Non-Hispanic
White
1.3% (13 of 1,040)
1.1% (11 of 975)
Births by Mothers’ Age, Ages 13-19
Indian River Florida
Year Count N Rate Count N Rate
2018 75 4,814 15.6 9,922 818,487 12.1
2017 72 4,835 14.9 10,810 804,214 13.4
2016 88 4,836 18.2 11,297 797,716 14.2
Regarding teen pregnancy, the rate of births to mothers
ages 13 to 19 has decreased steadily over the last 20
years. In 2018, the rate of births to teen mothers ages 13 to
19 in Indian River was 15.6% (n = 4,814), which was higher
than that of the state rate of 12.1%. It should be noted that
this rate has dropped considerably since 2010, in which
the rates for both Indian River and the State of Florida
were around 23%.vi
18.2
14.2
14.9
13.4
15.6
12.1
2016 2017 2018
Indian River Florida
Table 3. 2016 – 2018 Indian River County Births by Mothers’ Between Ages 13 – 19.15
Figure 7. County and State-level
Births by Mothers Between Ages 13 – 19.16
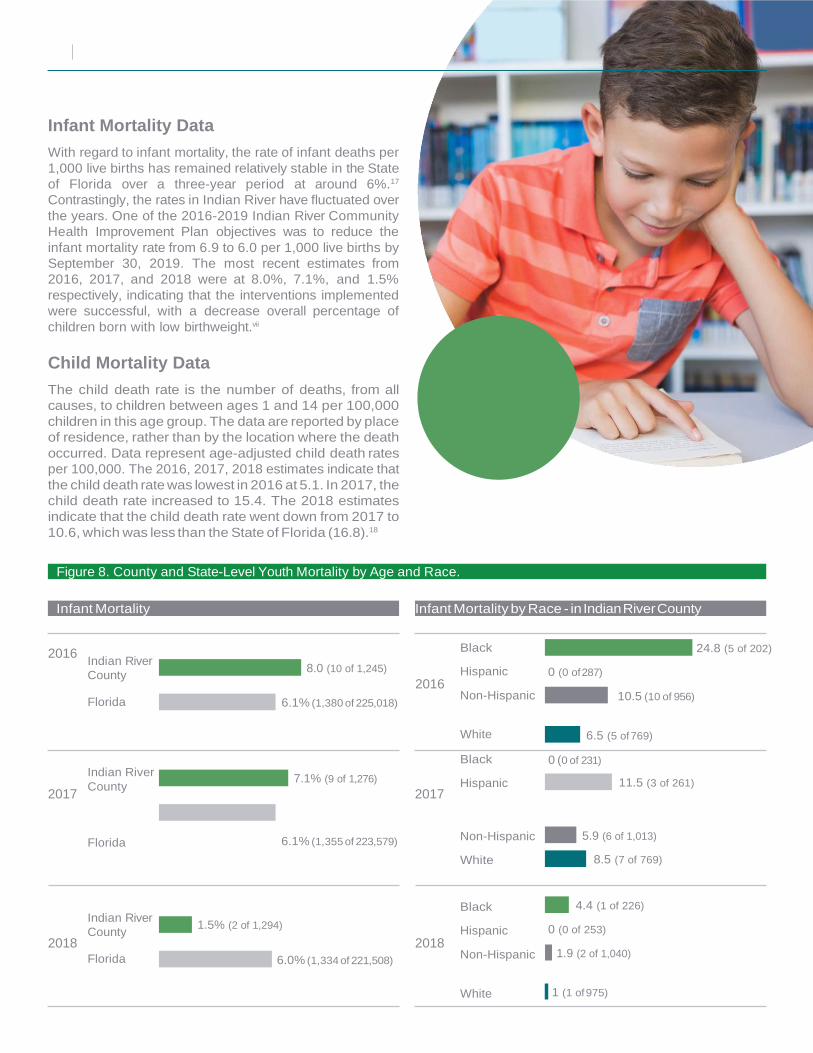
Infant Mortality Data
With regard to infant mortality, the rate of infant deaths per
1,000 live births has remained relatively stable in the State
of Florida over a three-year period at around 6%.17
Contrastingly, the rates in Indian River have fluctuated over
the years. One of the 2016-2019 Indian River Community
Health Improvement Plan objectives was to reduce the
infant mortality rate from 6.9 to 6.0 per 1,000 live births by
September 30, 2019. The most recent estimates from
2016, 2017, and 2018 were at 8.0%, 7.1%, and 1.5%
respectively, indicating that the interventions implemented
were successful, with a decrease overall percentage of
children born with low birthweight.vii
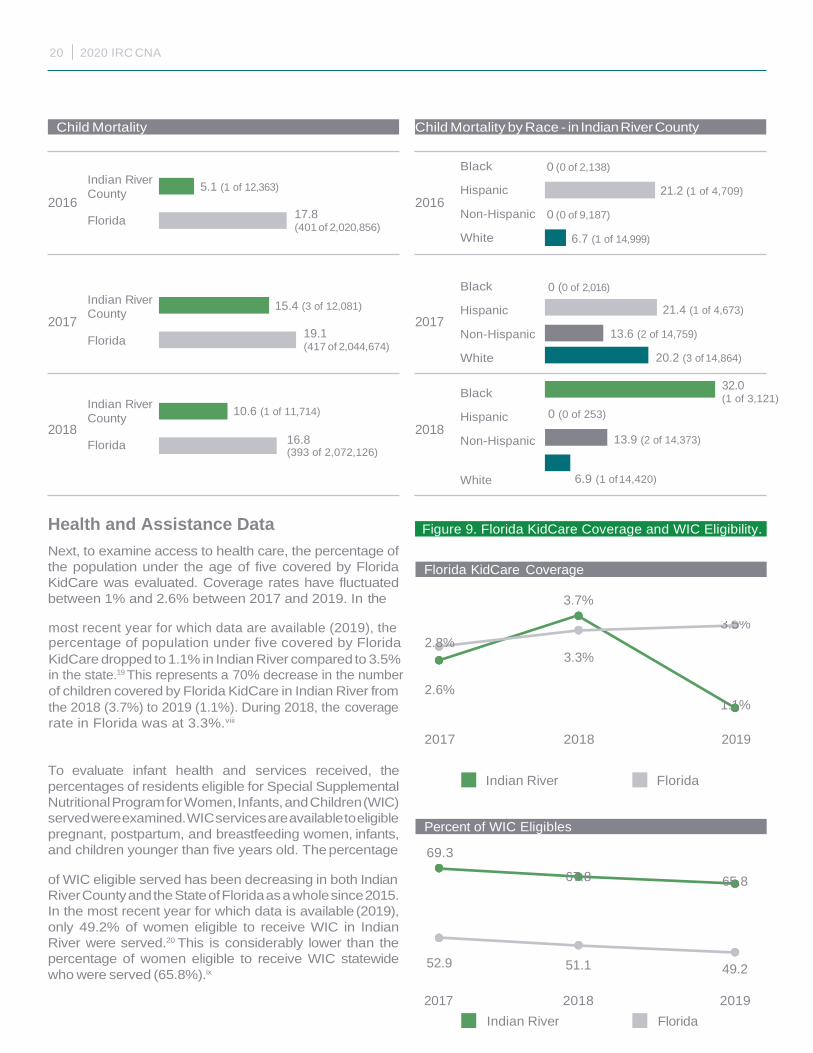
Child Mortality Data
The child death rate is the number of deaths, from all
causes, to children between ages 1 and 14 per 100,000
children in this age group. The data are reported by place
of residence, rather than by the location where the death
occurred. Data represent age-adjusted child death rates
per 100,000. The 2016, 2017, 2018 estimates indicate that
the child death rate was lowest in 2016 at 5.1. In 2017, the
child death rate increased to 15.4. The 2018 estimates
indicate that the child death rate went down from 2017 to
10.6, which was less than the State of Florida (16.8).18
Figure 8. County and State-Level Youth Mortality by Age and Race.
Infant Mortality Infant Mortality by Race - in Indian River County
2016 Indian River
County
Florida
8.0 (10 of 1,245)
6.1% (1,380 of 225,018)
2016
Black
Hispanic
Non-Hispanic
0 (0 of 287)
10.5 (10 of 956)
24.8 (5 of 202)
White 6.5 (5 of 769)
2017
Indian River
County
7.1% (9 of 1,276)
2017
Black
Hispanic
0 (0 of 231)
11.5 (3 of 261)
Florida 6.1% (1,355 of 223,579) Non-Hispanic
White
5.9 (6 of 1,013)
8.5 (7 of 769)
2018
Indian River
County
Florida
1.5% (2 of 1,294)
6.0% (1,334 of 221,508)
2018
Black
Hispanic
Non-Hispanic
4.4 (1 of 226)
0 (0 of 253)
1.9 (2 of 1,040)
White 1 (1 of 975)
20 2020 IRC CNA
Child Mortality Child Mortality by Race - in Indian River County
2016
Indian River
County
Florida
5.1 (1 of 12,363)
17.8 (401 of 2,020,856)
2016
Black
Hispanic
Non-Hispanic
White
0 (0 of 2,138)
0 (0 of 9,187)
6.7 (1 of 14,999)
21.2
(1 of 4,709)
2017
2018
Indian River
County
Florida
Indian River
County
Florida
15.4 (3 of 12,081)
19.1 (417 of 2,044,674)
10.6 (1 of 11,714)
16.8 (393 of 2,072,126)
2017
2018
Black
Hispanic
Non-Hispanic
White
Black
Hispanic
Non-Hispanic
0 (0 of 2,016)
0 (0 of 253)
21.4 (1 of 4,673)
13.6 (2 of 14,759)
20.2 (3 of 14,864)
32.0 (1 of 3,121)
13.9 (2 of 14,373)
White 6.9 (1 of 14,420)
Health and Assistance Data
Next, to examine access to health care, the percentage of
the population under the age of five covered by Florida
KidCare was evaluated. Coverage rates have fluctuated
between 1% and 2.6% between 2017 and 2019. In the
Figure 9. Florida KidCare Coverage and WIC Eligibility.
Florida KidCare Coverage
3.7%
most recent year for which data are available (2019), the 3.5%
percentage of population under five covered by Florida 2.8%
KidCare dropped to 1.1% in Indian River compared to 3.5% 3.3%
in the state.19 This represents a 70% decrease in the number
of children covered by Florida KidCare in Indian River from
the 2018 (3.7%) to 2019 (1.1%). During 2018, the coverage
2.6%
1.1%
rate in Florida was at 3.3%.viii
2017 2018 2019
To evaluate infant health and services received, the
percentages of residents eligible for Special Supplemental
Nutritional Program for Women, Infants, and Children (WIC)
served were examined. WIC services are available to eligible
pregnant, postpartum, and breastfeeding women, infants,
and children younger than five years old. The percentage
Indian River Florida
Percent of WIC Eligibles
69.3
of WIC eligible served has been decreasing in both Indian
River County and the State of Florida as a whole since 2015.
In the most recent year for which data is available (2019),
only 49.2% of women eligible to receive WIC in Indian
River were served.20 This is considerably lower than the
percentage of women eligible to receive WIC statewide
who were served (65.8%).ix
52.9
2017
67.8
51.1
2018
Indian River Florida
65.8
49.2
2019

21 2020 IRC CNA
Additionally, the graphic below illustrates the number of families receiving Temporary Assistance for Needy Families
(TANF) between 2014 and 2018. In Florida, TANF is referred to as Temporary Cash Assistance (TCA). The TCA program
provides cash assistance to families with children under the age of 18 or under age 19, if full-time secondary (high
school) school students meet the technical, income, and asset requirements. The program helps families become self-
supporting while allowing children to remain in their own homes. Pregnant women may also receive TCA, either in the
third trimester of pregnancy, if unable to work, or in the 9th month of pregnancy. Parents, children and minor siblings
who live together must apply together. The number of families receiving TANF has increased in Indian River County
since 2014, with 1,419 families being served in 2018.
2.5%
Foster Care Data
2014 2016
Year of ACS 1-Year Estimate
Indian River Florida
2018
Additionally, data were evaluated regarding the percentage
of children in Foster Care. Data indicate about 0.6% of
children reside in Foster Care in Indian River, which is
slightly higher than the state rate of 0.5%. In general, the
county rates have been slightly higher than the state rates
over the last few years.x
Black 2017 25
2018 29
2019 23
White 2017 96
2018 103
2019 87
Figure 10. 2014, 2016, 2018 Percent of Cash Public Assistance at County and State Level.21
2.2% 2.2%
2.2%
Figure 11. 2017-2019 Number of Children in Indian
River County Between Ages 0 – 17 in Out-of-Home
Care by Race.22
Perc
enta
ge o
f Ca
sh
Pu
blic
Assis
tan
ce
22 2020 IRC CNA
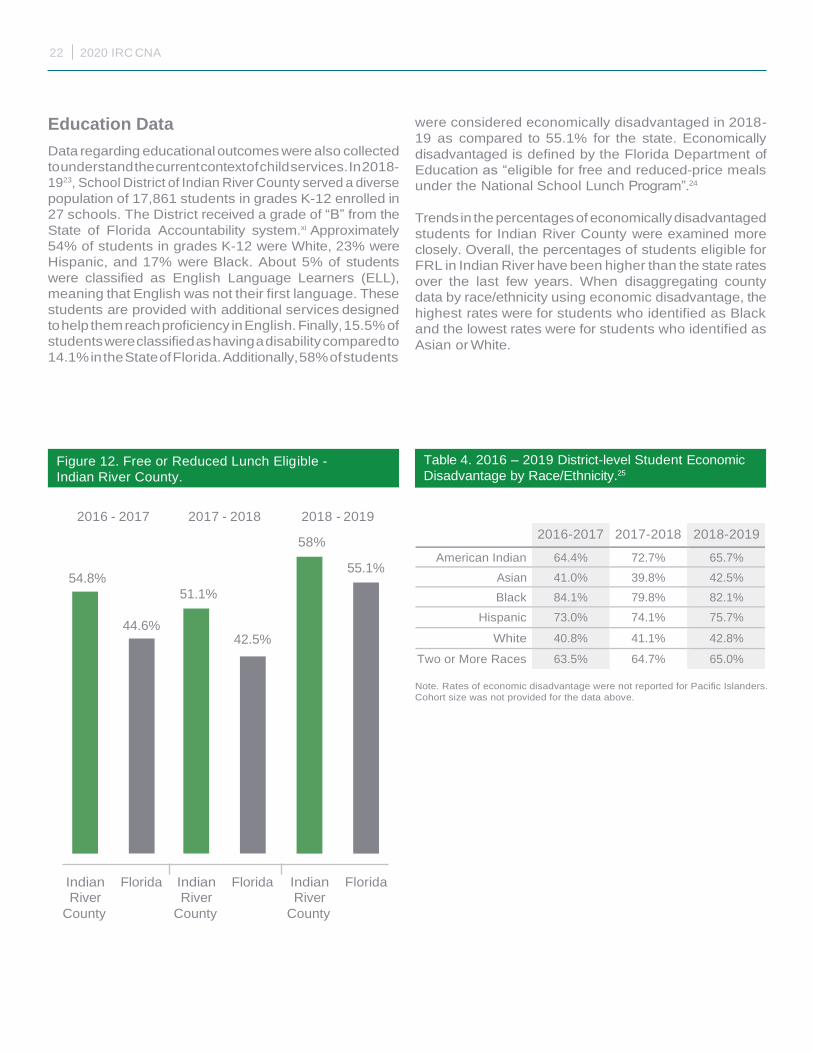
Education Data
Data regarding educational outcomes were also collected
to understand the current context of child services. In 2018-
1923, School District of Indian River County served a diverse
population of 17,861 students in grades K-12 enrolled in
27 schools. The District received a grade of “B” from the
State of Florida Accountability system.xi Approximately
54% of students in grades K-12 were White, 23% were
Hispanic, and 17% were Black. About 5% of students
were classified as English Language Learners (ELL),
meaning that English was not their first language. These
students are provided with additional services designed
to help them reach proficiency in English. Finally, 15.5% of
students were classified as having a disability compared to
14.1% in the State of Florida. Additionally, 58% of students
were considered economically disadvantaged in 2018-
19 as compared to 55.1% for the state. Economically
disadvantaged is defined by the Florida Department of
Education as “eligible for free and reduced-price meals
under the National School Lunch Program”.24
Trends in the percentages of economically disadvantaged
students for Indian River County were examined more
closely. Overall, the percentages of students eligible for
FRL in Indian River have been higher than the state rates
over the last few years. When disaggregating county
data by race/ethnicity using economic disadvantage, the
highest rates were for students who identified as Black
and the lowest rates were for students who identified as
Asian or White.
2016 - 2017 2017 - 2018 2018 - 2019
58%
54.8%
44.6%
51.1%
42.5%
55.1%
Note. Rates of economic disadvantage were not reported for Pacific Islanders.
Cohort size was not provided for the data above.
Indian River
County
Florida Indian River
County
Florida Indian River
County
Florida
Figure 12. Free or Reduced Lunch Eligible -
Indian River County.
Table 4. 2016 – 2019 District-level Student Economic
Disadvantage by Race/Ethnicity.25
2016-2017 2017-2018 2018-2019
American Indian 64.4% 72.7% 65.7%
Asian 41.0% 39.8% 42.5%
Black 84.1% 79.8% 82.1%
Hispanic 73.0% 74.1% 75.7%
White 40.8% 41.1% 42.8%
Two or More Races 63.5% 64.7% 65.0%

23 2020 IRC CNA
Kindergarten Readiness
Kindergarten readiness was examined as a measure of
educational success. The most recent data available for
this indicator from the Florida Department of Education
are from 2017 and 2018. All children in Florida are
assessed using the Florida Kindergarten Readiness
Screener (FLKRS). Data from 2018 show that the rate
of ‘kindergarten readiness’ among Indian River County
children was 54%, which was comparable to the state-
level estimate of 53%. This represents an improvement
from 2017 in which the rate of ‘kindergarten readiness’
among Indian River County children was 50%.
Third-Grade English Language
Arts Proficiency
The percentages of students obtaining proficiency on
statewide English Language Arts (ELA) assessments in
3rd grade were also examined. The percentage of 3rd
graders proficient in ELA has increased at both the state
and county levels. In the 2018-2019 academic year, 59.8%
of Indian River 3rd graders were categorized as Level 3+
readers, meeting the standards for satisfactory in ELA. As
a result, Indian River scored two percentage points above
the state rate of 57.6.
Indian River has made improvements with 3rd grade
ELA proficiency, from 55.9% in 2017-2018 to 59.8% in the
2018-2019 school year. In 2018-2019, Indian River (59.8%)
exceeded that of the state (57.6%).
Third Graders Scoring at a Level 1 for English
Language Arts Proficiency
Additionally, we examined the percentages of 3rd graders
scoring at a Level 1 on the FSA ELA assessment, as these
students are in danger of being retained. In 2018-19,
16.4% of 3rd graders scored at level 1, which was down
from 19.2% in the prior year.
Table 7. 2017-2019 Indian River County Third Grade
Level 1 English Language Arts Proficiency.27
Table 6. County and State-Wide Third Grade Level 3+
English Language Arts Proficiency.26
Table 5. 2017 – 2018 Comparison of ‘Kindergarten
Readiness’ Rates at County and State Level.
2017 2018
Indian River
County
Florida Indian River
County
Florida
50% 54% 54% 53%
2017 2018
Indian River County 55.9% 59.8%
Florida 56.9% 57.6%
2017-2018 2018-2019
19.2% 16.4%

24 2020 IRC CNA
When examining 3rd grade students who scored a Level 3 or above in 2018-2019, students identifying as Asian (76.2%)
had the highest ELA proficiency rates followed by students identifying as White (70.2%), two or more races (66.7%),
Hispanic (50.2%), and Black (38.7%). From 2016-2017 to 2018-2019, ELA proficiency rates in this category (i.e., Level
3+) increased the greatest for students identifying as Asian (55.6% vs. 76.2%), two or more races (41.5% vs. 66.7%), and
Hispanic (45.9% vs. 50.3%). The rates for students identifying as White (69.5% vs. 70.3%) and Black (38.8% vs. 38.3%)
remained relatively the same.xii
2016-2017 2017-2018 2018-2019
n % Level 3+ ELA
Proficiency
n % Level 3+ ELA
Proficiency
n % Level 3+ ELA
Proficiency
Asian 10 55.6% 8 61.5% 16 76.2%
Black 109 38.8% 76 31.4% 99 38.3%
Hispanic 164 45.9% 169 51.7% 149 50.3%
White 501 69.5% 486 66.2% 520 70.3%
Two or More Races 22 41.5% 27 45.0% 38 66.7%
When examining 3rd grade students who scored a Level 1 in 2018-2019, students identifying as Black (27.0%) had the
highest percentage rates followed by students identifying as Hispanic (21.3%), two or more races (14%), and White
(10.8%). From 2016-2017 to 2018-2019, ELA proficiency rates in this category (i.e., Level 1) decreased the greatest for
students identifying as White (-8.6%), Asian (-7.2%), and Hispanic (-3.9%). Students identifying as Black or two or more
races saw a 1.8% percentage point decrease.xiii
2016-2017 2017-2018 2018-2019
n % Level 1 ELA
Proficiency
n % Level 1 ELA
Proficiency
n % Level 1 ELA
Proficiency
% Change from
2016-2019
Asian 18 16.7% 13 30.8% 21 9.5% -7.2%
Black 281 28.8% 242 36.0% 256 27.0% -1.8%
Hispanic 357 25.2% 327 22.0% 296 21.3% -3.9%
White 721 12.3% 734 12.7% 740 10.8% -1.5%
Two or More Races 53 22.6% 60 18.3% 57 14.0% -8.6%
Note. Level 1 ELA is the lowest level for ELA and is defined by the FLDOE as “demonstrations of inadequate levels of success with the challenging content”30. Lower
amounts of White students qualified for Level 1 ELA than any other racial or ethnic group in 2016-2018, ultimately demonstrating higher levels of reading aptitude
within this group. From 2018-2019, Asian students demonstrated higher reading levels than any other group. Level 1 ELA rates were not reported for American Indian
and Pacific Islander students.
Table 8. 2016-2019 Indian River County Third Grade Level 3+ English Language Arts Proficiency.28
Table 9. 2017-2019 Indian River County Third Grade Level 1 English Language Arts Proficiency by Race/Ethnicity.29
25 2020 IRC CNA
Third Grade English Language
Arts Proficiency for Economically
Disadvantaged
In addition, 3rd grade proficiency rates were examined
for students classified as FRL. In 2018-19, 39.9% of 3rd
grade students identified as FRL scored as a level 3 in
reading proficiency on the FSA, while 76.3% of students
who did not qualify for FRL scored proficient.economic
disadvantage, the highest rates were for students who
identified as Black and the lowest rates were for students
who identified as Asian or White.
Third Grade English Language Proficiency
for Students with a Disability
In addition, 3rd grade proficiency rates were examined
for students classified as having a disability. In 2018-19,
only 27.0% of 3rd grade students identified as having a
disability scored as proficient in reading on the FSA (i.e.
level 3 and above), while 67.0% of students who did not
have a disability scored proficient.xiv
Table 11. 2018-2019 Indian River County Level 3+
English Language Arts Proficiency for Third Grade
Students with Disabilities.32
Table 10. 2018-2019 Indian River County Level 3+
English Language Arts Proficiency for Third Grade
Economically Disadvantaged Students.31
Economically
Disadvantaged (FRL)
(n = 504)
Non-Economically
Disadvantaged
(n = 817)
39.9% 76.3%
Students with
Disabilities (SWD)
(n =248)
Non-Students with
Disabilities (SWD)
(n = 761)
27.0% 67.0%

26 2020 IRC CNA
Eighth-Grade Math Proficiency
The percentages of students obtaining proficiency on statewide FSA and FSA EOC math assessments in 8th grade
were also examined. The percentage of 8th graders proficient in both FSA and FSA EOC math has increased at both
the state and county levels. In 2018-19, 64.3% of Indian River 8th graders were proficient in math, 1.9 percentage points
above the state rate of 62.4%. When disaggregating county data by race/ethnicity, 8th grade students identifying as
White (71.9%) had the highest math proficiency rates, followed by students identifying as Hispanic (58.4%), two or
more races (54.2%), and Black (33.5%).xv
2016-2017 2017-2018 2018-2019
n % Math Proficiency n % Math Proficiency n % Math Proficiency
Black 191 30.9% 197 42.6% 209 33.5%
Hispanic 325 54.2% 343 59.2% 315 58.4%
White 732 70.9% 670 74.0% 772 71.9%
Two or More Races 46 47.8% 53 67.9% 48 54.2%
Note. Proficiency in math qualifies as reaching a level 3 or above on the FSA34. American Indian, Asian, and Pacific Islander were not reported. Value of “n” represents
the total number of students identifying with ethnicity across all math proficiency levels.
In addition, 8th grade math combined proficiency rates were examined for students classified as FRL. In 2018-19, 53.1%
of 8th grade students identified as FRL scored as proficient in math on the FSA and FSA EOC, while 73.4% of students
who did not qualify for FRL scored proficient.
Economically
Disadvantaged (FRL)
(n = 772)
Non-Economically
Disadvantaged
(n = 609)
53.1% 73.4%
In addition, 8th grade math proficiency rates were examined for students classified as having a disability. In 2018-19,
only 33.8% of 8th grade students identified as having a disability scored as proficient in math on the FSA, while 66.7%
of students who did not have a disability scored proficient.xvi
Table 12. 2017-2019 Indian River County Eighth Grade Level 3+ Combined Math Proficiency by Race/Ethnicity.33
Table 13. 2018-2019 Indian River County Level
3+ Combined Math Proficiency for Eighth Grade
Economically Disadvantaged Students.35
Table 14. 2018-2019 Indian River County Level 3+ Math
Proficiency for Eighth Grade Students with Disabilities.36
Students with
Disabilities (SWD)
(n = 195)
Non-Students with
Disabilities (SWD)
(n = 1,186)
33.8% 66.7%
27 2020 IRC CNA
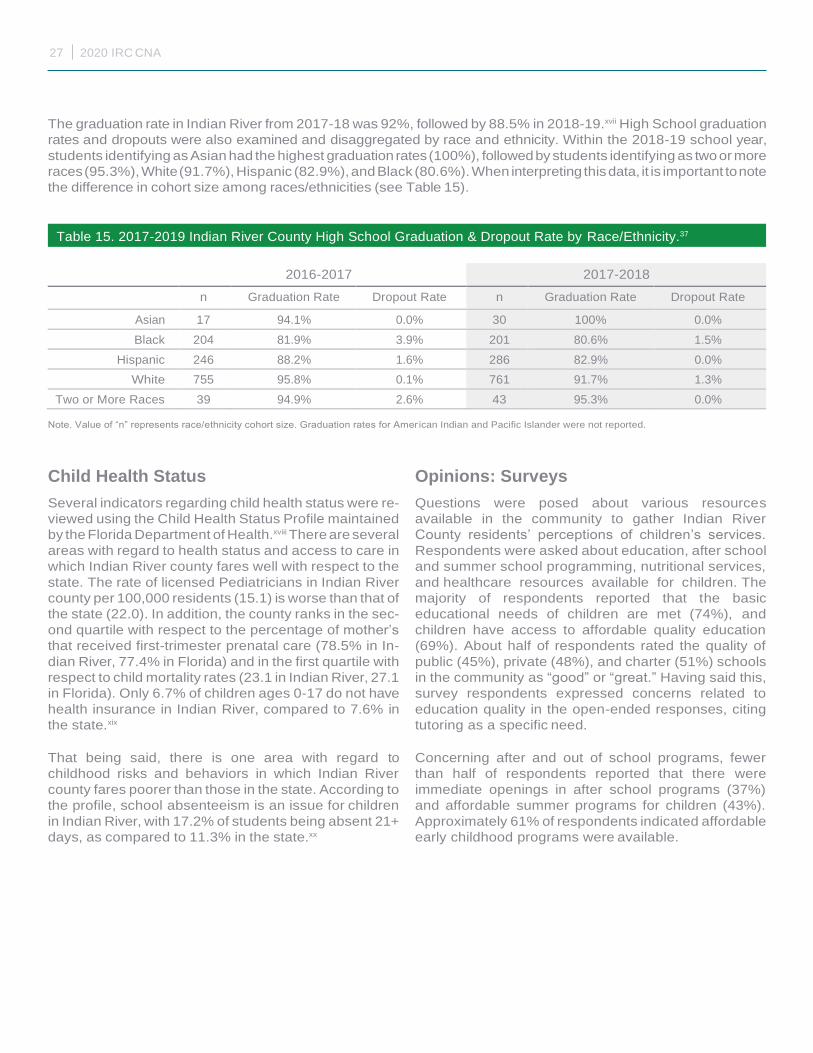
The graduation rate in Indian River from 2017-18 was 92%, followed by 88.5% in 2018-19.xvii High School graduation
rates and dropouts were also examined and disaggregated by race and ethnicity. Within the 2018-19 school year,
students identifying as Asian had the highest graduation rates (100%), followed by students identifying as two or more
races (95.3%), White (91.7%), Hispanic (82.9%), and Black (80.6%). When interpreting this data, it is important to note
the difference in cohort size among races/ethnicities (see Table 15).
2016-2017 2017-2018
n Graduation Rate Dropout Rate n Graduation Rate Dropout Rate
Asian 17 94.1% 0.0% 30 100% 0.0%
Black 204 81.9% 3.9% 201 80.6% 1.5%
Hispanic 246 88.2% 1.6% 286 82.9% 0.0%
White 755 95.8% 0.1% 761 91.7% 1.3%
Two or More Races 39 94.9% 2.6% 43 95.3% 0.0%
Note. Value of “n” represents race/ethnicity cohort size. Graduation rates for Amer ican Indian and Pacific Islander were not reported.
Child Health Status
Several indicators regarding child health status were re-
viewed using the Child Health Status Profile maintained
by the Florida Department of Health.xviii There are several
areas with regard to health status and access to care in
which Indian River county fares well with respect to the
state. The rate of licensed Pediatricians in Indian River
county per 100,000 residents (15.1) is worse than that of
the state (22.0). In addition, the county ranks in the sec-
ond quartile with respect to the percentage of mother’s
that received first-trimester prenatal care (78.5% in In-
dian River, 77.4% in Florida) and in the first quartile with
respect to child mortality rates (23.1 in Indian River, 27.1
in Florida). Only 6.7% of children ages 0-17 do not have
health insurance in Indian River, compared to 7.6% in
the state.xix
That being said, there is one area with regard to
childhood risks and behaviors in which Indian River
county fares poorer than those in the state. According to
the profile, school absenteeism is an issue for children
in Indian River, with 17.2% of students being absent 21+
days, as compared to 11.3% in the state.xx
Opinions: Surveys
Questions were posed about various resources
available in the community to gather Indian River
County residents’ perceptions of children’s services.
Respondents were asked about education, after school
and summer school programming, nutritional services,
and healthcare resources available for children. The
majority of respondents reported that the basic
educational needs of children are met (74%), and
children have access to affordable quality education
(69%). About half of respondents rated the quality of
public (45%), private (48%), and charter (51%) schools
in the community as “good” or “great.” Having said this,
survey respondents expressed concerns related to
education quality in the open-ended responses, citing
tutoring as a specific need.
Concerning after and out of school programs, fewer
than half of respondents reported that there were
immediate openings in after school programs (37%)
and affordable summer programs for children (43%).
Approximately 61% of respondents indicated affordable
early childhood programs were available.
Table 15. 2017-2019 Indian River County High School Graduation & Dropout Rate by Race/Ethnicity.37
28 2020 IRC CNA
Regarding basic needs and health, most respondents
reported that the basic food needs of children are met
(64%) and that school-aged children have access to
free meals over the summer (69%). Fewer respondents
reported that meals were available for children during
school breaks (43%).
Most responses indicated that the basic healthcare needs
of children are also met (65%) and that there are
affordable healthcare providers for children. About half of
the respondents reported that children have access to
affordable dental care (51%), but only 38% reported that
children have access to affordable mental healthcare
services. Primary medical care, dental care, and mental
healthcare services received poor quality ratings, with
44%, 40%, and 25% rating the quality of services
available to children as “good” or “great,” respectively. Of
note, respondents with Medicaid were more likely to
agree that children had access to affordable mental
healthcare services (76% vs. 46%), and to rate the quality
of affordable mental healthcare services (59% vs. 30%)
and dental services (68% vs. 42%) as “good” or “great”
than respondents who paid for healthcare via other
means. Non-white respondents were also more likely
than white respondents to agree that all children have
access to affordable mental healthcare services (72% vs.
44%).
Approximately 72% of respondents surveyed reported
that children can play safely in local parks and
recreational facilities. Only 38% of respondents rated
low-cost and free services available to children as
‘good’ or ‘great.’ Overall, respondents agreed that the
community is a good place to raise children (86%) and
acknowledged and were generally appreciative of a
plethora of services and resources available to youth.
Opinions: Focus Groups
During focus group discussions, most of the conversations
centered around education and children’s services, and
residents described several issues. Focus group
participants discussed variability in school quality, with
many agreeing that quality magnet and charter schools
perform better. Participants also noted that local middle
and high school options were particularly limited. A lack
of summer and after school programs were also cited
as a concern by participants. Focus group participants
expressed concerns regarding the kindergarten readiness
of community youth and discussed a lack of affordable
early childhood options as a potential cause.
Some participants described the need to advocate for
their children who experienced discrimination in school
or had special educational needs that were unaddressed.
Several participants described unreliable school bus
transportation as an additional concern. Overall, focus
group participants were pleased with higher education
and cited local colleges as a community strength.
Several residents cited the need for increased recreational
and cultural opportunities for youth. Many mentioned the
recent closure of Leisure Square Pool, a valued
community asset, as a significant loss. Others advocated
for the addition of a skatepark. Focus group participants
also emphasized the need for activities for low-income
youth specifically as well as neighborhood improvements,
such as lighting, to increase safety. When discussing out-
of-school programs, participants described understaffed
afterschool and recreational programs and complained
that youth were unsupervised.
Qualitative responses indicated the need for parental
awareness to access children’s services. Parents may
also need to be especially proactive due to limited
availability and extended wait times for some programs.
Other potential barriers to accessing community services
included transportation and cost. Finally, a major concern
discussed by parents in the focus group was related to a
lack of mental healthcare and specialty care for youth in
the area. Parents described the need to leave the
community to locate medical providers for their children
with complex healthcare needs.

29 2020 IRC CNA
KEY POINTS
• Percentages of children born with low birth weight and infant mortality rates have decreased due to community
efforts. These rates remain elevated in children born to Black mothers.
• The number of children 0-5 insured by Florida KidCare and the number of families receiving WIC services has
declined in the past year. Resident responses indicated the need for increased parental awareness to access
children’s services.
• In the past year, the county has made improvements with regards to the percentages of students that are
Kindergarten ready.
• Indian River has made improvements with 3rd grade reading satisfactory, from 55.9% in 2017-2018 to 59.8% in the
2018-2019 school year. In 2018-2019, Indian River (57.6%) exceeded that of the state (57.8%). Additionally, the
percentage of students scoring in a “Level 1” in English Language Proficiency dropped from 19.2% to 16.4%.
• Respondents cited a lack of middle and high school options as an educational concern. In general, parents noted
variability in available preschool and K-12 education programs that are of high quality. Additional summer and
afterschool childcare options were cited as an area of need.
• Chronic absenteeism is a problem in the school system, with rates in the county being higher than rates in the state.
• About half of the respondents reported that children have access to affordable dental care, but only 38% reported
that children have access to affordable mental healthcare services. Primary medical care, dental care, and mental
healthcare services received poor quality ratings, with 44%, 40%, and 25% rating the quality of services available
to children as “good” or “great,” respectively
• Residents are concerned with the lack of quality preschool and afterschool programs. Many residents turn to
unlicensed providers for this care if spots in quality programs are unavailable. Residents are concerned with high
teacher turnover, especially in middle school.
• 15.5% of students were classified as having a disability compared to 14.1% in the State of Florida.
• 53.2% of students were considered economically disadvantaged in 2018-19 as compared to 39.3% for the state.

30 2020 IRC CNA
ECONOMIC OPPORTUNITY & EMPLOYMENT INTRODUCTION
Income and assets are fundamental features influencing
a person’s perceptions and expectancies related to the
quality of life and happiness. A family’s income has
been correlated with child development outcomes and
has even been linked to a person’s overall relationship
satisfaction. As an example, Americans with a household
income of less than $50,000 report several difficulties
with securing resources necessary for daily life, such
as adequate housing and healthcare. These challenges
result in residents who are less optimistic and even more
likely to delay retirement. Research has demonstrated
that an area’s employment and economic opportunities
have a significant impact on the quality of life, health,
and the differences that exist among various groups. If
families are faced with limited resources due to
economic conditions that hinder their ability to have
their basic needs met, they end up having to make
difficult decisions on where to cut costs, which can lead
to negative outcomes.
Considering that Indian River County is among the
wealthiest counties in Florida, the needs assessment
sought to understand economic gaps existing in the
community. This Economic Opportunity and Employment
section of this needs assessment includes data related to
household income and assets, cost of living, how people
in Indian River County are employed, the unemployment
rate, and the labor market. The concerns shared by focus
group participants and survey respondents related to
these issues are presented in the analyses along with
secondary data gleaned from prior reports.
DATA
Income and Cost of Living
According to the Florida Office of Economic and
Demographic Research, the median household income in
Indian River County Florida for 2018 is $52,336, which is
close to the state’s average of $53,267 (both estimates
adjusted for inflation).38 The median household income is
comprised of all households in the County and includes
the income of the householder and/or all working and
retired adults (see Table 16). Differentially, median family
income comprises only the incomes of households with
more than one person occupying the home. Thus, median
family income tends to be larger than median household
income.39
The percentage of households living in poverty has
declined overall in the last several years (see Figure
13). Data has indicated that the percentages of children
living in poverty have historically been greater than that
percentage of adults and seniors living in poverty. The
poverty rates in 2018 declined considerably according to
estimates obtained by the ACS.40 It should be noted that
in 2018, the response rates declined to 92% as compared
24.6%
15.7%
8.7%
20.1%
12.3%
7.5%
12.6%
8.2%
5.8%
to 96% in 2014, with much of that increase being due to
refusal to participate. Increased non-response rates may
have slightly skewed this metric.
2014 ACS 1-Year 2016 ACS 1-Year 2018 ACS 1-Year
Children (under 18) Adults (18-64)
Seniors (65+)
Table 16. Median Income. Source: Florida Office of
Economic & Demographic Research.
Indian River
County
Florida
Median Household Income $52,336 $53,267
Median Family Income $67,305 $64,312

31 2020 IRC CNA
Estimate Margin of
Error
Percent Percent Margin
of Error
All people (X) (X) 14.40% +/-1.3
Under 18 years (X) (X) 23.10% +/-3.5
Related children of the householder under 18 years (X) (X) 22.70% +/-3.5
Related children of the householder under 5 years (X) (X) 24.70% +/-5.2
Related children of the householder 5 to 17 years (X) (X) 22.00% +/-3.6
18 years and over (X) (X) 12.50% +/-1.1
18 to 64 years (X) (X) 15.30% +/-1.4
65 years and over (X) (X) 7.50% +/-1.2
People in families (X) (X) 11.70% +/-1.5
Unrelated individuals 15 years and over (X) (X) 24.40% +/-2.2
Estimate Margin of
Error
Percent Percent Margin
of Error
All people (X) (X) 14.10% +/-1.3
Under 18 years (X) (X) 22.70% +/-3.6
Related children of the householder under 18 years (X) (X) 22.30% +/-3.6
Related children of the householder under 5 years (X) (X) 26.30% +/-5.5
Related children of the householder 5 to 17 years (X) (X) 20.90% +/-4.0
18 years and over (X) (X) 12.30% +/-1.1
18 to 64 years (X) (X) 15.10% +/-1.4
65 years and over (X) (X) 7.50% +/-1.1
People in families (X) (X) 11.40% +/-1.4
Unrelated individuals 15 years and over (X) (X) 24.40% +/-2.0
Table 17. Indian River County Percent Living in Poverty by Age Group in 2015. Source: United States Census Bureau.42
Table 18. Indian River County Percent Living in Poverty by Age Group in 2016. Source: United States Census Bureau.43

32 2020 IRC CNA
Estimate Margin of
Error
Percent Percent Margin
of Error
All people (X) (X) 12.70% +/-1.2
Under 18 years (X) (X) 20.10% +/-3.0
Related children of the householder under 18 years (X) (X) 19.70% +/-3.0
Related children of the householder under 5 years (X) (X) 19.00% +/-4.9
Related children of the householder 5 to 17 years (X) (X) 19.90% +/-3.4
18 years and over (X) (X) 11.20% +/-1.1
18 to 64 years (X) (X) 13.50% +/-1.5
65 years and over (X) (X) 7.30% +/-1.0
People in families (X) (X) 9.90% +/-1.4
Unrelated individuals 15 years and over (X) (X) 23.40% +/-2.
Cost of living in a community is an important factor to
consider when evaluating the quality of life available to
its residents as many of the basic costs of living are not
taken into consideration – nor is the location –when
calculating the Federal Poverty Level (FPL). As such
alternative measures of income and poverty are needed
to understand the economic conditions of residents in
a community. As the cost of living in an area increases,
lower-income families may have difficulty meeting their
basic needs if their wages do not rise to keep pace with
increasing costs. One such tool that can be used is the
MIT Living Wage Calculator. Its “living wage” estimate
can be used as an alternative measure of the minimum
income necessary for a household to meet basic needs.
This estimate provides a cost assessment of essentials
in a basic household budget signifying the absolute
minimum earnings necessary for self-sufficiency. This
is merely a step-up from poverty; families that meet this
threshold live paycheck to paycheck and cannot afford
what families consider to be necessities (e.g., eating at
restaurants, taking vacations/holidays, building savings/
retirement funds).
According to the MIT Living Wage Calculator, the required
hourly living wage for a single adult living in Indian River
County with no children working full time would be
$10.99 per hour, or $22,862 per year, which is well above
the Florida Minimum wage of $8.56 per hour or $17,804
per year. The required annual income before taxes for a
family of four (2 adults, 2 children, with both working) in
Indian River County is $63,145 or $15.18 hourly for both
adults. This estimate considers food, childcare, medical
expenses, housing, transportation, taxes, and the cost of
living in the location.
Another such alternate measure of income is the ALICE
Threshold, or AT, developed by the United Way in 2009.
ALICE is an acronym for “Asset Limited, Income
Constrained, Employed”. ALICE describes households
that earn more than the FPL mentioned above, but less
than the basic cost of living for a given region or county.
Using the AT measure, along with the measure for FPL,
can provide a more complete picture of the population
struggling to afford basic needs in any given community.
In other words, ALICE households typically earn more
than the FPL ($25,750 for a family of four in 2020) but less
than a living wage ($63,145 according to the MIT living
wage calculator).
Table 19. Indian River County Percent Living in Poverty by Age Group in 2017. Source: United States Census Bureau.44

33 2020 IRC CNA
60 K
Total Households
53,151
Total Households
58,950
Total Households
55,618
Total Households
55,427
50 K
40 K
30 K
20 K
10 K
0 K
2010 2012 2014 2016
Above ALICE ALICE Poverty
According to the most current ALICE Report published
in 2018, 40% of households in Indian River County were
considered ALICE households while another 11% were
below the FPL in 2016 (see Figure 14).45 This is above
the state average of 32% for ALICE and equal to the
state average of 11% for FPL. While the percentages of
households in poverty have remained relatively stable
over the last several years, the percentage of ALICE
families has steadily increased from 27% in 2010 to 40%
in 2016, representing a 48% increase over 6 years.
In Indian River County, there are significant disparities
in the percentages of households living below ALICE &
Poverty requirements by geographic area. The ALICE
report breaks down the total number of households in
various municipalities, census-designated places (CDPs),
and census county divisions (CCDs) and provides an
estimate of the percentage of households below ALICE
and Poverty thresholds in each area (see Table 20). Of
note, 90% of households in Fellsmere are below the
ALICE and Poverty thresholds, as are 67% of households
in Gifford CDP (see Table 20). On the other hand, several
communities have less than ¼ of residents living under
the ALICE and poverty thresholds.
Figure 14. ALICE Households, Indian River County, 2010-2016. Source: Florida ALICE Report (2018).
Nu
mb
er o
f Ho
use
ho
lds

34 2020 IRC CNA
TOWN TOTAL HOUSEHOLDS % ALICE & POVERTY
Fellsmere 1,127 90%
Fellsmere CCD 6,837 65%
Florida Ridge CDP 7,164 55%
Gifford CDP 3,658 67%
Indian River Shores 2,216 21%
Orchid 185 15%
Roseland CDP 754 43%
Sebastian 9,204 52%
South Beach CDP 1,650 19%
Vero Beach 7,127 57%
Vero Beach CCD 50,992 49%
Vero Beach South CDP 9,349 54%
Wabasso Beach CDP 868 21%
Wabasso CDP 213 49%
West Vero Corridor CDP 4,113 56%
Windsor CDP 139 20%
Winter Beach CDP 837 40%
Employment and Wages
According to the United States Census, unemployment is
defined as an individual 16 years of age or older who were
actively searching for work, waiting to hear back about a
job from which they had been laid off, were unavailable
to work due to temporary illness, or available to accept
a job within the survey period.46 Unemployment rate is
defined as the number of unemployed individuals as a
percentage of the total workforce population.47 Based on
the 2018 ACS 5-Year Estimate, unemployment rates in
Indian River County have remained higher than those in
Florida and the United States from 2014-2018.48 Specific
to 2018, unemployment was reported at 7.1% in Indian
River County, compared to 6.3% in the state of Florida
and 5.9% in the United States.49 Despite this higher level
of unemployment at the county level, the unemployment
rate within Indian River County has decreased in recent
years (see Figure 15).
2014 86% 14%
2016 90% 10%
2018 93% 7%
Employed
Unemployed
Estimates. Source: United States Census Bureau
Table 20. ALICE & Poverty Rates for Indian County River Communities. Source: ALICE Report, 2018.
Figure 15. Employment Status of Indian County River
Residents based on ACS 5-Year.
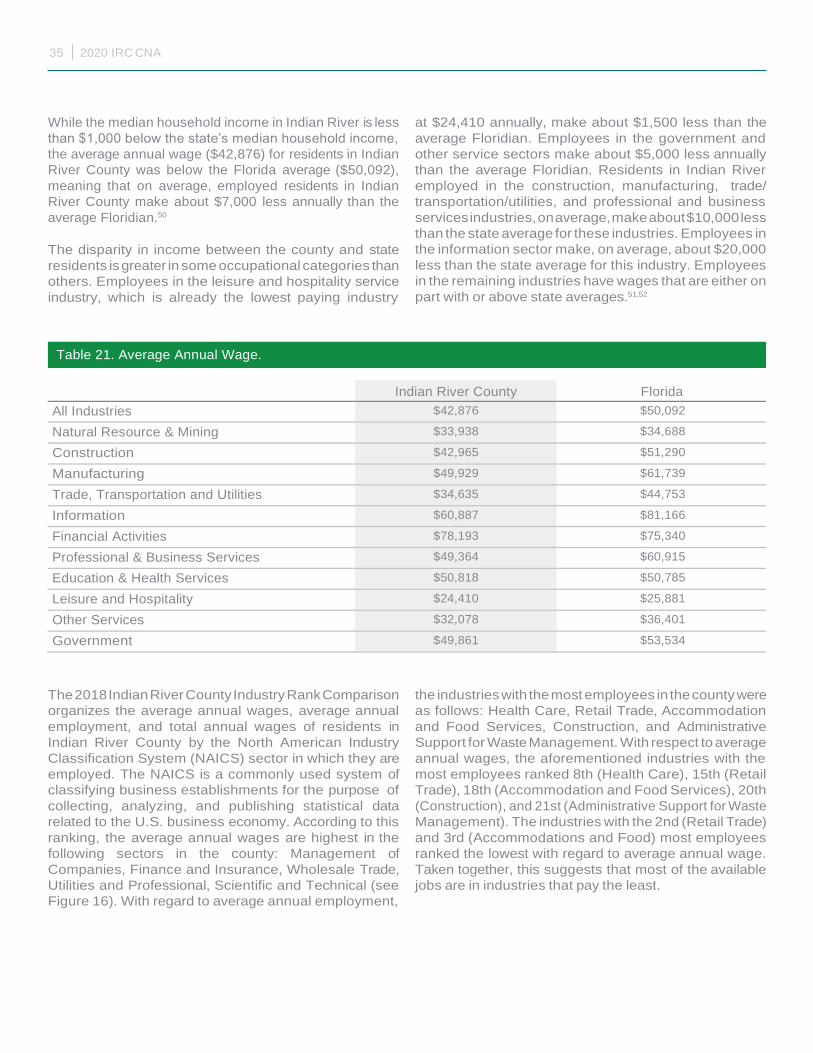
35 2020 IRC CNA
While the median household income in Indian River is less
than $1,000 below the state’s median household income,
the average annual wage ($42,876) for residents in Indian
River County was below the Florida average ($50,092),
meaning that on average, employed residents in Indian
River County make about $7,000 less annually than the
average Floridian.50
The disparity in income between the county and state
residents is greater in some occupational categories than
others. Employees in the leisure and hospitality service
industry, which is already the lowest paying industry
at $24,410 annually, make about $1,500 less than the
average Floridian. Employees in the government and
other service sectors make about $5,000 less annually
than the average Floridian. Residents in Indian River
employed in the construction, manufacturing, trade/
transportation/utilities, and professional and business
services industries, on average, make about $10,000 less
than the state average for these industries. Employees in
the information sector make, on average, about $20,000
less than the state average for this industry. Employees
in the remaining industries have wages that are either on
part with or above state averages.51,52
Indian River County Florida
All Industries $42,876 $50,092
Natural Resource & Mining $33,938 $34,688
Construction $42,965 $51,290
Manufacturing $49,929 $61,739
Trade, Transportation and Utilities $34,635 $44,753
Information $60,887 $81,166
Financial Activities $78,193 $75,340
Professional & Business Services $49,364 $60,915
Education & Health Services $50,818 $50,785
Leisure and Hospitality $24,410 $25,881
Other Services $32,078 $36,401
Government $49,861 $53,534
The 2018 Indian River County Industry Rank Comparison
organizes the average annual wages, average annual
employment, and total annual wages of residents in
Indian River County by the North American Industry
Classification System (NAICS) sector in which they are
employed. The NAICS is a commonly used system of
classifying business establishments for the purpose of
collecting, analyzing, and publishing statistical data
related to the U.S. business economy. According to this
ranking, the average annual wages are highest in the
following sectors in the county: Management of
Companies, Finance and Insurance, Wholesale Trade,
Utilities and Professional, Scientific and Technical (see
Figure 16). With regard to average annual employment,
the industries with the most employees in the county were
as follows: Health Care, Retail Trade, Accommodation
and Food Services, Construction, and Administrative
Support for Waste Management. With respect to average
annual wages, the aforementioned industries with the
most employees ranked 8th (Health Care), 15th (Retail
Trade), 18th (Accommodation and Food Services), 20th
(Construction), and 21st (Administrative Support for Waste
Management). The industries with the 2nd (Retail Trade)
and 3rd (Accommodations and Food) most employees
ranked the lowest with regard to average annual wage.
Taken together, this suggests that most of the available
jobs are in industries that pay the least.
Table 21. Average Annual Wage.
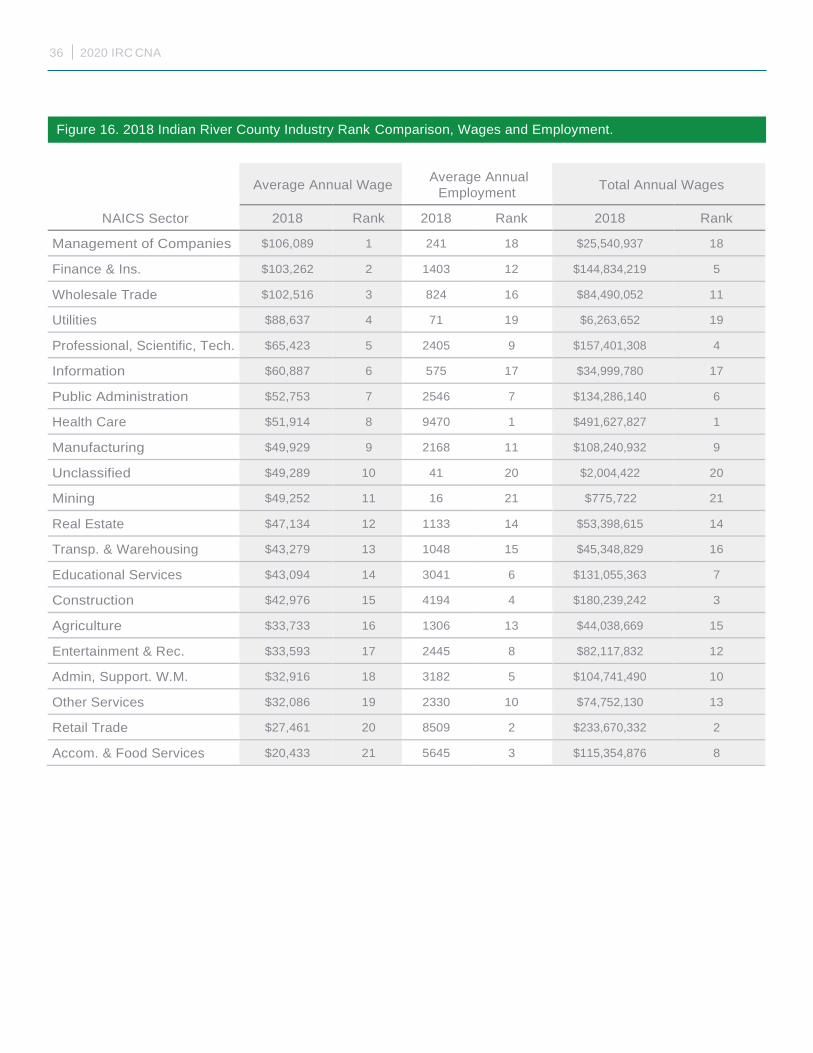
36 2020 IRC CNA
NAICS Sector
Average Annual Wage Average Annual
Employment
Total Annual Wages
2018 Rank 2018 Rank 2018 Rank
Management of Companies $106,089 1 241 18 $25,540,937 18
Finance & Ins. $103,262 2 1403 12 $144,834,219 5
Wholesale Trade $102,516 3 824 16 $84,490,052 11
Utilities $88,637 4 71 19 $6,263,652 19
Professional, Scientific, Tech. $65,423 5 2405 9 $157,401,308 4
Information $60,887 6 575 17 $34,999,780 17
Public Administration $52,753 7 2546 7 $134,286,140 6
Health Care $51,914 8 9470 1 $491,627,827 1
Manufacturing $49,929 9 2168 11 $108,240,932 9
Unclassified $49,289 10 41 20 $2,004,422 20
Mining $49,252 11 16 21 $775,722 21
Real Estate $47,134 12 1133 14 $53,398,615 14
Transp. & Warehousing $43,279 13 1048 15 $45,348,829 16
Educational Services $43,094 14 3041 6 $131,055,363 7
Construction $42,976 15 4194 4 $180,239,242 3
Agriculture $33,733 16 1306 13 $44,038,669 15
Entertainment & Rec. $33,593 17 2445 8 $82,117,832 12
Admin, Support. W.M. $32,916 18 3182 5 $104,741,490 10
Other Services $32,086 19 2330 10 $74,752,130 13
Retail Trade $27,461 20 8509 2 $233,670,332 2
Accom. & Food Services $20,433 21 5645 3 $115,354,876 8
Figure 16. 2018 Indian River County Industry Rank Comparison, Wages and Employment.

37 2020 IRC CNA
The 2019 Indian River County Economic Report Card
provides information regarding the employment and
wages in the county disaggregated by NAICS sector. This
report card highlights the five industry sectors in which
annual wages grew the most (higher than 18%) between
2014 and 2018. The average annual wage growth in the
Utilities industry, Real Estate industry, and Finance and
Insurance industry were all relatively high, with growth
rates larger than 30%. The report card also highlights the
five industry sectors in which annual wages grew the least
between 2014 and 2018. The average annual wage
growth in the Wholesale Trade industry, Management of
Companies industry, and Transportation and Warehousing
industry were negative, meaning that average annual
wages decreased over the 4-year period (see Figure 17).
In addition, the 2019 Indian River County Economic Report
Card highlights the industry sectors in which employment
opportunities grew the most (higher than 21%) between
2014 and 2018. The average annual employment growth
in the Utilities industry, Management of Companies
Industry, and Admin/Support/Waste Services industry
were all relatively high, all with growth rates larger than
39%. The industry with the largest increase in the number
of jobs was Construction, which had a 36% growth rate.
The report card also highlights the five industry sectors in
which annual employment grew the least between 2014
and 2018. The average annual employment growth in
the Agriculture industry was negative, with a decrease of
35.6% or 721 jobs (see Figure 17).
> 18% Change between 2014 and 2018
1. Utilities 129.4% increase
2. Real Estate 42.7% increase
3. Finance and Insurance 32.7% increase
4. Admin./Support/Waste Mgmt. 19.0% increase
5. Health Care 18.8% increase
> 21% Change between 2014 and 2018
1. Utilities 129.4% increase (+40 jobs)
2. Management of Companies 81.2% increase (+108 jobs)
3. Admin./Support/Waste Svcs. 39.1% increase (+895 jobs)
4. Construction 36.0% increase (+1,110 jobs)
5. Entertainment & Recreation 21.1% increase (+426 jobs)
< 5.6% Change between 2014 and 2018
1. Wholesale Trade 32.7% decrease
2. Mgmt. of Companies 18.6% decrease
3. Transp. & Warehousing 3.0% decrease
4. Manufacturing 3.3% increase
5. Information 5.5% increase
< 3.7% Change between 2014 and 2018
1. Agriculture 129,4% decrease (-721 jobs)
2. Information 1.9% decrease (-11 jobs)
3. Manufacturing 2.1% increase (+45 jobs)
4. Public Administration 2.8% increase (+69 jobs)
5. Retail Trade 3.6% increase (+293 jobs)
Figure 17. 2018 Indian River County Economic Report Card: Average Annual Wage and Average Annual Employment.
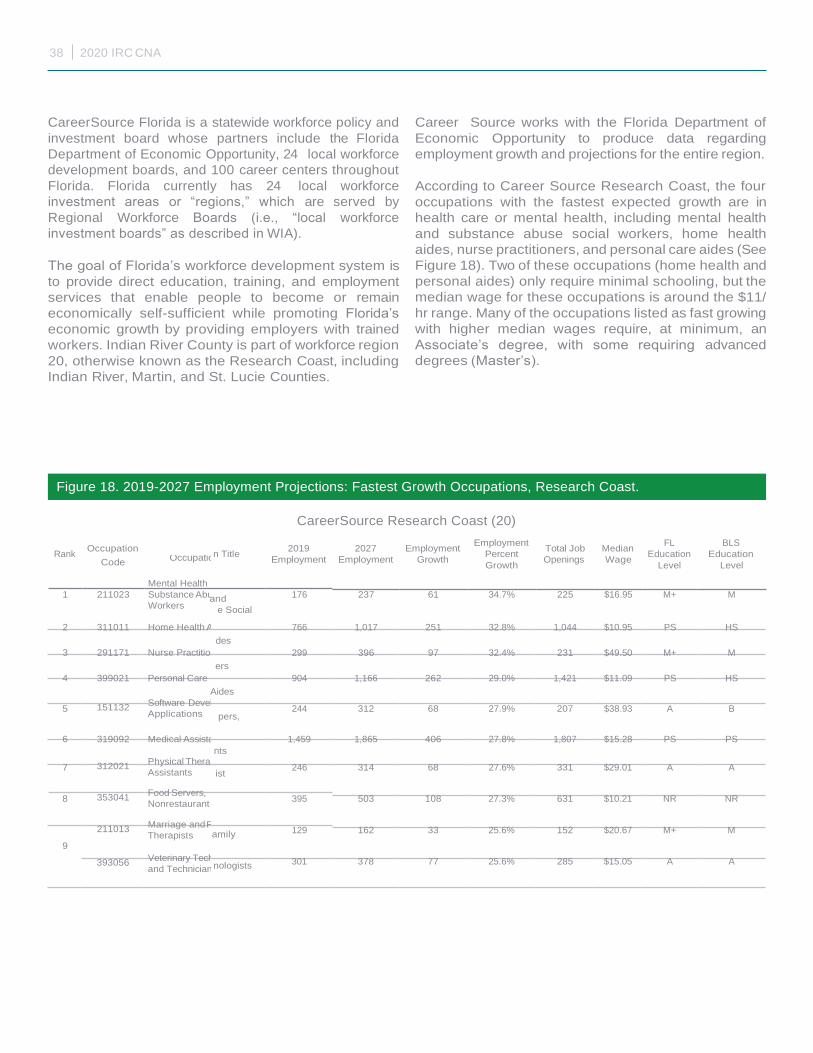
38 2020 IRC CNA
CareerSource Florida is a statewide workforce policy and
investment board whose partners include the Florida
Department of Economic Opportunity, 24 local workforce
development boards, and 100 career centers throughout
Florida. Florida currently has 24 local workforce
investment areas or “regions,” which are served by
Regional Workforce Boards (i.e., “local workforce
investment boards” as described in WIA).
The goal of Florida’s workforce development system is
to provide direct education, training, and employment
services that enable people to become or remain
economically self-sufficient while promoting Florida’s
economic growth by providing employers with trained
workers. Indian River County is part of workforce region
20, otherwise known as the Research Coast, including
Indian River, Martin, and St. Lucie Counties.
Career Source works with the Florida Department of
Economic Opportunity to produce data regarding
employment growth and projections for the entire region.
According to Career Source Research Coast, the four
occupations with the fastest expected growth are in
health care or mental health, including mental health
and substance abuse social workers, home health
aides, nurse practitioners, and personal care aides (See
Figure 18). Two of these occupations (home health and
personal aides) only require minimal schooling, but the
median wage for these occupations is around the $11/
hr range. Many of the occupations listed as fast growing
with higher median wages require, at minimum, an
Associate’s degree, with some requiring advanced
degrees (Master’s).
CareerSource Research Coast (20)
Rank
Occupation
n Title
2019
Employment
2027
Employment
Employment
Growth
Employment
Percent
Total Job
Openings
Median
Wage
FL
Education
BLS
Education
and
e Social
des
ers
Aides
pers,
nts
ist
amily
nologists
Figure 18. 2019-2027 Employment Projections: Fastest Growth Occupations, Research Coast.
Code Occupatio
1
Mental Health
211023 Substance Abus
Workers
2 311011 Home Health Ai
3 291171 Nurse Practition
4 399021 Personal Care
5 151132
Software Develo
Applications
6 319092 Medical Assista
7 312021 Physical Therap
Assistants
8 353041 Food Servers,
Nonrestaurant
9
211013 Marriage and F
Therapists
393056 Veterinary Tech
and Technicians
Growth Level Level
176
237
61
34.7%
225
$16.95
M+
M
766
1,017
251
32.8%
1,044
$10.95
PS
HS
299 396 97 32.4% 231 $49.50 M+ M
904 1,166 262 29.0% 1,421 $11.09 PS HS
244
312
68
27.9%
207
$38.93
A
B
1,459
1,865
406
27.8%
1,807
$15.28
PS
PS
246 314 68 27.6% 331 $29.01 A A
395
503
108
27.3%
631
$10.21
NR
NR
129
162
33
25.6%
152
$20.67
M+
M
301
378
77
25.6%
285
$15.05
A
A
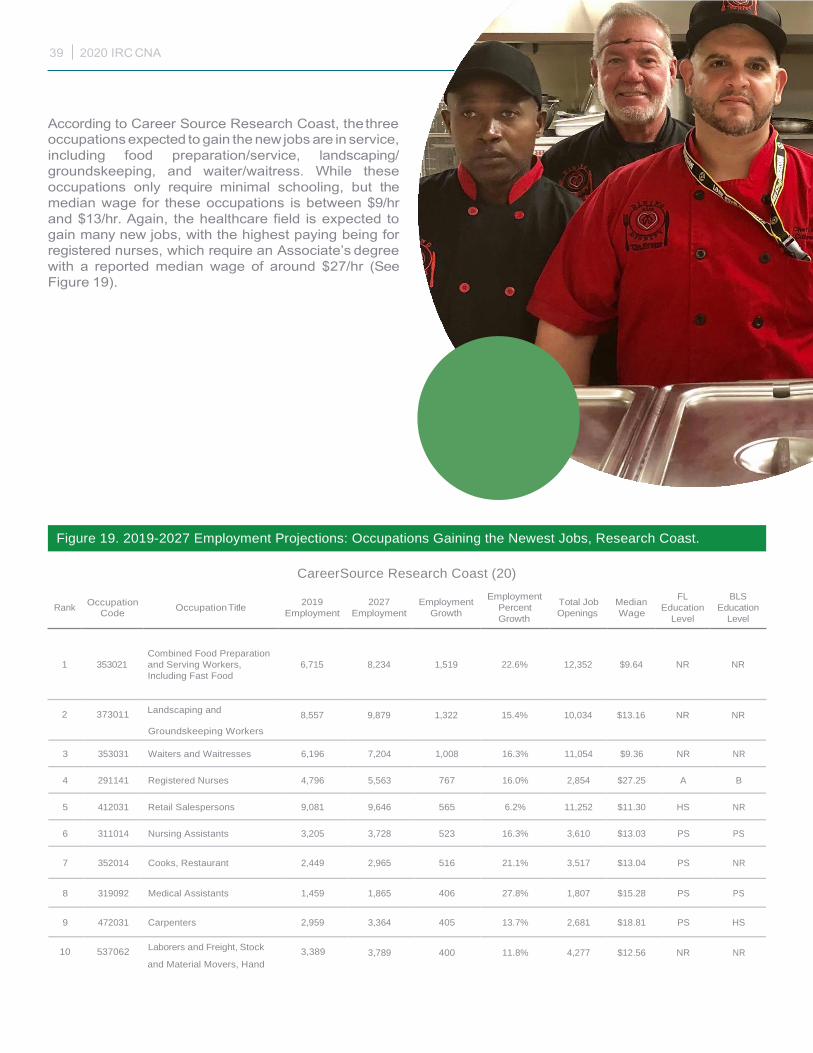
CareerSource Research Coast (20)
Rank
Occupation Occupation Title
Code
2019
Employment
2027
Employment
Employment
Growth
Employment
Percent
Growth
Total Job
Openings
Median
Wage
FL
Education
Level
BLS
Education
Level
1 353021
Combined Food Preparation
and Serving Workers,
Including Fast Food
6,715 8,234 1,519 22.6% 12,352 $9.64 NR NR
2 373011 Landscaping and
8,557 9,879 1,322 15.4% 10,034 $13.16 NR NR
and Material Movers, Hand
Figure 19. 2019-2027 Employment Projections: Occupations Gaining the Newest Jobs, Research Coast.
Groundskeeping Workers
3 353031 Waiters and Waitresses 6,196 7,204 1,008 16.3% 11,054 $9.36 NR NR
4 291141 Registered Nurses 4,796 5,563 767 16.0% 2,854 $27.25 A B
5 412031 Retail Salespersons 9,081 9,646 565 6.2% 11,252 $11.30 HS NR
6 311014 Nursing Assistants 3,205 3,728 523 16.3% 3,610 $13.03 PS PS
7
352014
Cooks, Restaurant
2,449
2,965
516
21.1%
3,517
$13.04
PS
NR
8
319092
Medical Assistants
1,459
1,865
406
27.8%
1,807
$15.28
PS
PS
9
472031
Carpenters
2,959
3,364
405
13.7%
2,681
$18.81
PS
HS
10 537062 Laborers and Freight, Stock
3,389
3,789
400
11.8%
4,277
$12.56
NR
NR

40 2020 IRC CNA
According to this data, while employment growth is
occurring, the growth is mainly arising in limited industry
fields, either those related to health care or the retail/
service industries. Many of the opportunities in the retail
and service sectors require minimal education. However,
the wages for these opportunities are likely too low for a
family to make a living wage. While the opportunities in
the health care industry have considerably higher wages,
they also require additional schooling.
It is important to recognize that the data presented
indicate that a large percentage of families in Indian River
County struggle to make ends meet while still being
employed. The surveys and focus groups administered
to the community through this CNA aimed to understand
the opinions and perspectives of residents regarding the
community’s economy and their satisfaction with the
opportunities available to them. The intent was to gauge
issues such as whether residents felt that their wages
were enough to sustain the cost of living in the county.
Opinions: Surveys
Indian River Residents were asked various questions
about the economic opportunities available for them in
their community, including questions regarding available
jobs, support for businesses, and opportunities for young
professionals in their community. Responses from
residents, in general, were mixed. About half of the
respondents indicated jobs were available for residents
year-round (51%). Few residents rated the quality of
available jobs as ‘good’ or ‘great’ (25%), and even fewer
said wages and salaries were sufficient to live comfortably
(24%).
With respect to the growth of business within the county,
half of the residents agreed business growth creates
jobs (51%), and that the local economy supports small
businesses (50%). Residents cited the need for increased
support for entrepreneurs and small businesses, as
well as workforce development in open-ended survey
responses.
About half of the residents reported that educational and
job training opportunities were available (50%). Only 45%
of residents stated that job opportunities were diverse
while 40% stated jobs were available to anyone who
wants one. Only 38% of survey respondents said that
there are career opportunities for young professionals
and recent graduates. Likewise, only 32% believed all
residents in their community had an equal opportunity to
prosper economically. Taken together, this indicates that
residents do sense some disparity in the opportunities
available to all residents.
When analyzing the data by geographic location, there
was some variation by neighborhood, with residents of
Fellsmere being more likely to agree that all residents
have access to equal opportunity (47% vs. 25%) and that
wages were sufficient (58% vs. 35%) when compared to
residents from other communities.
Residents were also asked a series of questions about
tourism, as this represents one of the growing industries
in the community. About 79% of residents said there are
things for visitors and tourists to do in the area. When
examining this data by race and community, it was of
note, white residents (87%) and higher-income residents
(88%) were more likely to agree with this statement than
non-white (62%) and lower-income (74%) residents,
while Gifford residents (61%) were less likely to agree
compared to residents of other neighborhoods (84%).
Taken together, residents do overall agree that the
community is appealing to tourists presenting
opportunities for economic growth.
Opinions: Focus Groups
Similar themes emerged during focus group discussions
with community members. Residents described difficulty
finding employment in the area and needing to work
multiple jobs to make ends meet, often only finding
temporary or part-time employment. Residents alluded
to a ‘middle class’ of working adults, who don’t qualify
for low-income services, struggle to pay for housing,
healthcare, and childcare.

41 2020 IRC CNA
According to focus group participants, employment opportunities for individuals with criminal records were especially
limited. Additionally, young professionals have few career prospects outside of specific industries.
With respect to the tourism industry, residents noted that the community’s appeal to tourists and retirees is a major
strength. However, some residents felt that the culture and way of life are being maintained at the expense of economic
development, speculating that large employers may not be attracted to the area due to workforce demographics
and/or lack of encouragement from local leadership.
KEY POINTS
• When households do not earn a living wage, families are typically forced to make tough decisions and forego
certain essentials substantially impacting the quality of life.
• Given the cost of living in Indian River County, and because about half of households are below the FPL and
ALICE thresholds, the number of families not earning enough to meet basic needs is cause for concern.
• Creating opportunities for residents to earn a wage that is equal to a living wage is key to improving the happiness
and quality of life of county residents. While unemployment is considerably lower than it has been in years, and
the economy is much improved, many of the current wages earned by residents in Indian River County have an
average wage below the amount needed for self-sufficiency. In addition, several industries in which many of the
residents are employed pay wages below that of the state average.

42 2020 IRC CNA
HEALTH
INTRODUCTION
Conditions, in which people are born, grow, live, and
work, play a role in health risks and outcomes. These con-
ditions, such as physical environment, education, so-
cioeconomic status, neighborhood, housing, access to
social services, etc., are also known as social determi-
nants of health (SDOH). The research literature supports
the importance of SDOH in improving the health of pop-
ulations. For example, communities with poor SDOH
such as unstable housing, low income, unsafe neigh-
borhoods or substandard education, are susceptible to
poor health outcomes.
DATA
In order to evaluate the overall health of the residents
of Indian River County, data was compiled from the
County Health Rankings & Roadmaps program, which
is a collaboration between the Robert Wood Johnson
Foundation and the University of
Wisconsin Population Health Institute and from Florida
Health Charts maintained by Florida’s Bureau of Vital
Statistics. Select findings from those sources are
presented below to discuss the health outcomes of
residents of Indian River County.
Mortality
The County Health Rankings are designed to quantify
the overall health of each county in all 50 states. They
consider a wide selection of factors that affect the health
of communities, such as “high school graduation rates,
access to healthy foods, rates of smoking, obesity, and
teen births”. Health outcomes in the County Health Rank-
ings are designed to measure length and quality of life
along with perceptions of how healthy residents feel. In
the 2019 rankings report, Indian River was ranked 21st
out of 67 Florida counties in health outcomes. This rank-
ing is made up of indicators that measure the length of
life (ranked 17th) and quality of life (ranked 25th).

43 2020 IRC CNA
The average life expectancy of Indian River County
residents was 83.7 years for females and 77.6 years for
males, which was on par with state averages (see Ta-
ble 22).53 Life expectancy for males and females has re-
mained relatively stable from 2005-2018.
Findings: Life Expectancy
Sex Indian River
County
Florida % change from
2005-2008
Female 83.7 82.5 -0.1
Male 77.6 76.9 0.2
life expectancy at birth (years), 2016-18
Table 23 provides data on the leading causes of death. Cancer and heart disease were the leading causes of death
for residents of Indian River County and the state. In Indian River County, those two diseases were the cause of 49%
of all deaths. In addition, Black residents had higher death rates from cancer, heart disease, stroke, and HIV/AIDS
than other races and ethnicities. Hispanic residents on average had lower death rates from all causes of death.
Mortality rates for lung cancer, melanoma, cirrhosis and liver disease, and suicide were all higher in Indian River
County for males than in the State of Florida (see Tables 25, 26, 27, and 28). In addition, the cirrhosis and liver disease
rate has increased by 4.3% for males between 1999 and 2018 (see Table 26), which is indicative of a significant public
health problem.
Selected Causes of Death, Indian River County, Florida 2016-2018
3-Year Age-Adjusted Resident
Death Rates
Data Year
County
White
Black
State
Hispanic
All Races
White
Black
Hispanic
All Races
Total Deaths
2016 - 2018
629
846.7
402.7
636.4
678.4
758.1
531.6
684.6
Cancer
2016 - 2018
159
214.3
120.4
158.4
149.4
153.9
116.9
149
Heart Disease 2016 - 2018 129 208.7 69.7 133.4 146.5 169.7 123.7 148.9
CLRD* 2016 - 2018 28.9 29.1 11.6 28.9 41.2 25.7 23.2 39.2
Stroke 2016 - 2018 26.3 48.9 18.9 27.5 37.5 57 38.8 39.7
Diabetes 2016 - 2018 14.4 25.1 14.8 15.2 18.2 38.8 19 20.4
Cirrhosis
2016 - 2018
15.5
4.7
8.7
14.3
13.2
6.1
8.2
11.9
Motor Vehicle Crashes
2016 - 2018
12.7
8.3
7.5
12.3
15.1
15.7
12.8
15
Pneumonia / Influenza
2016 - 2018
7.7
11.4
7.1
8.1
9.5
11.7
8.2
9.7
HIV / AIDS
2016 - 2018
1.2
13.2
1.9
2.2
1.6
13
2
3.3
Data Source: Florida Department of Health, Bureau of Vital Statistics
*Chronic Lower Respiratory Disease
Table 22. Change in Life Expectancy in Indian River
County, 2018. Source: Florida Health Charts.54
Table 23. Leading Causes of Death in Indian River County, 2016-2018. Source: Florida Department of Health.54

44 2020 IRC CNA
Note. *Age-Adjusted, per 100,000, 2018.55 Note. *Age-Adjusted, per 100,000, 2018.
Table 24. 2018 State and County Lung Cancer
Death Rate by Sex, Race, & Ethnicity.55
Table 25. 2018 State and County Melanoma Death
Rate by Sex, Race, & Ethnicity.55
Sex Indian
River
County
Florida % change from
1999-2018 for Indian
River County
Female 23.2 29.8 -31.1
Male 51.8 42.8 -27.8
Sex Indian
River
County
Florida % change from
1999-2018 for Indian
River County
Female 0.9 1.4 0.2
Male 7.2 3.4 2.4
Race Indian
River
County
Florida % change from
1999-2018 for Indian
River County
Black 41.1 29.0 -49.1
White 38.2 37.0 -24.9
Race Indian
River
County
Florida % change from
1999-2018 for Indian
River County
Black 0 0.2 0
White 4.6 2.6 2
Ethnicity Indian
River
County
Florida % change from
1999-2018 for Indian
River County
Hispanic 31.1 19.5 13.3
Non-Hispanic 37.2 39.0 -21.7
Ethnicity Indian
River
County
Florida % change from
1999-2018 for Indian
River County
Hispanic 0 0.7 0
Non-Hispanic 4.7 2.7 1.8

45 2020 IRC CNA
Note. *Age-Adjusted, per 100,000, 2018. Note. *Age-Adjusted, per 100,000, 2018.
Table 26. 2018 State and County Chronic Liver &
Cirrhosis Death Mortality Rate by Sex, Race, & Ethnicity.56
Table 27. 2018 State and County Suicide Rate
by Sex, Race, & Ethnicity.56
Sex Indian
River
County
Florida % change from
1999-2018 for Indian
River County
Female 7.5 8.6 0
Male 20.7 15.9 4.3
Sex Indian
River
County
Florida % change from
1999-2018 for Indian
River County
Female 10.2 6.6 6.2
Male 24.7 24.7 3
Race Indian Florida % change from River 1999-2018 for Indian County River County
Black 0.0 6.5 0.0
White 15.3 13.3 2.7
Race Indian
River
County
Florida % change from
1999-2018 for Indian
River County
Black 0.0 5.8 0.0
White 19.5 17.6 5.1
Ethnicity Indian
River
County
Florida % change from
1999-2018 for Indian
River County
Hispanic 13.9 8.3 -1.4
Non-Hispanic 14.7 13.1 -0.9
Ethnicity Indian
River
County
Florida % change from
1999-2018 for Indian
River County
Hispanic 15.9 8.8 8.5
Non-Hispanic 16.7 17.4 7
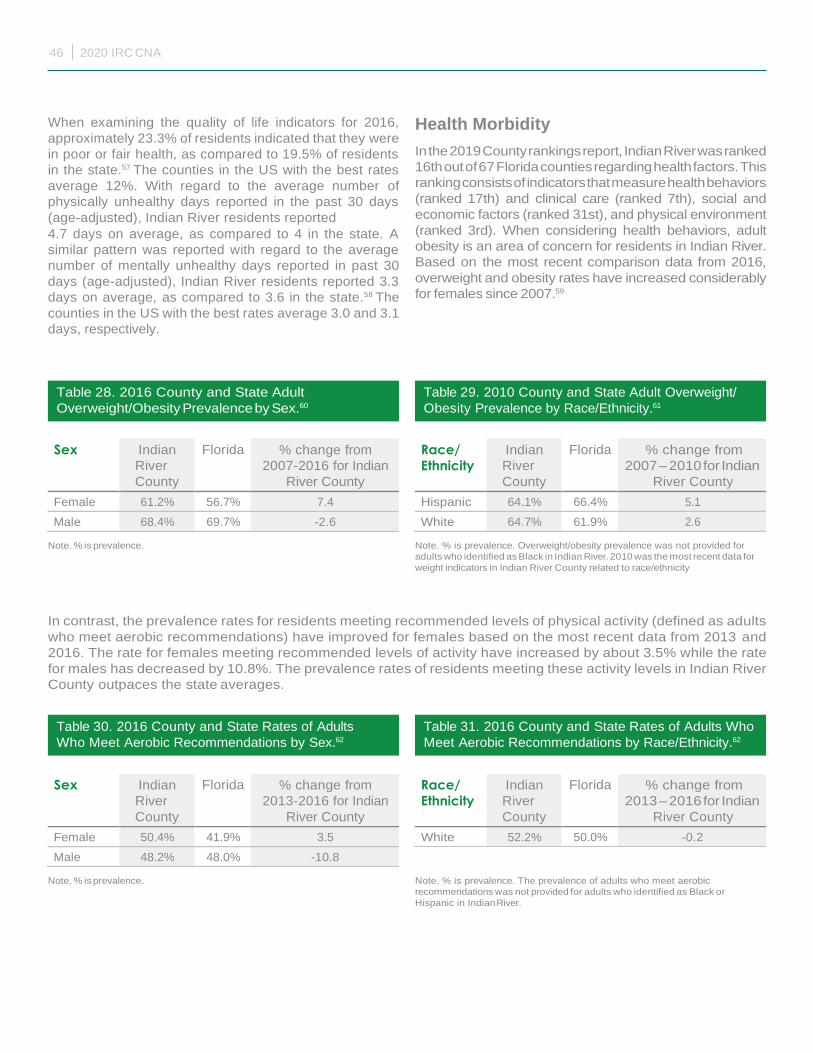
46 2020 IRC CNA
When examining the quality of life indicators for 2016,
approximately 23.3% of residents indicated that they were
in poor or fair health, as compared to 19.5% of residents
in the state.57 The counties in the US with the best rates
average 12%. With regard to the average number of
physically unhealthy days reported in the past 30 days
(age-adjusted), Indian River residents reported
4.7 days on average, as compared to 4 in the state. A
similar pattern was reported with regard to the average
number of mentally unhealthy days reported in past 30
days (age-adjusted), Indian River residents reported 3.3
days on average, as compared to 3.6 in the state.58 The
counties in the US with the best rates average 3.0 and 3.1
days, respectively.
Health Morbidity
In the 2019 County rankings report, Indian River was ranked
16th out of 67 Florida counties regarding health factors. This
ranking consists of indicators that measure health behaviors
(ranked 17th) and clinical care (ranked 7th), social and
economic factors (ranked 31st), and physical environment
(ranked 3rd). When considering health behaviors, adult
obesity is an area of concern for residents in Indian River.
Based on the most recent comparison data from 2016,
overweight and obesity rates have increased considerably
for females since 2007.59
Note. % is prevalence. Note. % is prevalence. Overweight/obesity prevalence was not provided for
adults who identified as Black in Indian River. 2010 was the most recent data for
weight indicators in Indian River County related to race/ethnicity
In contrast, the prevalence rates for residents meeting recommended levels of physical activity (defined as adults
who meet aerobic recommendations) have improved for females based on the most recent data from 2013 and
2016. The rate for females meeting recommended levels of activity have increased by about 3.5% while the rate
for males has decreased by 10.8%. The prevalence rates of residents meeting these activity levels in Indian River
County outpaces the state averages.
Note. % is prevalence. Note. % is prevalence. The prevalence of adults who meet aerobic
recommendations was not provided for adults who identified as Black or
Hispanic in Indian River.
Table 28. 2016 County and State Adult
Overweight/Obesity Prevalence by Sex.60
Table 29. 2010 County and State Adult Overweight/
Obesity Prevalence by Race/Ethnicity.61
Sex Indian
River
County
Florida % change from
2007-2016 for Indian
River County
Female 61.2% 56.7% 7.4
Male 68.4% 69.7% -2.6
Race/
Ethnicity
Indian
River
County
Florida % change from
2007 – 2010 for Indian
River County
Hispanic 64.1% 66.4% 5.1
White 64.7% 61.9% 2.6
Sex Indian
River
County
Florida % change from
2013-2016 for Indian
River County
Female 50.4% 41.9% 3.5
Male 48.2% 48.0% -10.8
Race/
Ethnicity
Indian
River
County
Florida % change from
2013 – 2016 for Indian
River County
White 52.2% 50.0% -0.2
Table 30. 2016 County and State Rates of Adults
Who Meet Aerobic Recommendations by Sex.62
Table 31. 2016 County and State Rates of Adults Who
Meet Aerobic Recommendations by Race/Ethnicity.62

47 2020 IRC CNA
With regard to risky behaviors, the prevalence rates for heavy or binge drinking and smoking for residents of
Indian River County are higher than the state averages. The rates of smoking behaviors have increased by about
6% for males from 2002 to 2016. The rates of heavy or binge drinking have increased by about 5% for females and
2% for males from 2002 to 2016.
Note. % is prevalence.
Note. % is prevalence.
Note. % is prevalence. The prevalence of adults who are current smokers was not
provided for adults who identified as Black in Indian River. Smoking prevalence
was only identified between 2007 – 2016 for adults who identify as Hispanic.
Race/
Ethnicity
Indian
River
County
Florida % change from
2002 – 2016 for Indian
River County
Hispanic 12.6% 16.1% 0.6
White 22.8% 19.6% 3.3
Note. % is prevalence. Prevalence adult heavy or binge drinking was not provided
for adults who identified as Black in Indian River. Rates of heavy/binge drinking
was only identified between 2002 – 2016 for adults who identify as Hispanic.
Table 35. 2016 County and State Rates of Adult
Heavy or Binge Drinking by Race/Ethnicity.64
Sex Indian
River
County
Florida % change from
2002-2016 for Indian
River County
Female 21.6% 13.3% 0.4
Male 21.9% 17.8% 5.7
Race/
Ethnicity
Indian
River
County
Florida % change from
2007 – 2016 for Indian
River County
Hispanic 8.4% 11.7% -3.7
White 22.6% 17.8% 1.4
Table 32. 2016 County and State Rates of Adults
Who Are Current Smokers by Sex.62
Table 33. 2016 County and State Rates of Adults
Who Are Current Smokers by Race/Ethnicity.62
Table 34. 2016 County and State Rates of Adult
Heavy or Binge Drinking by Sex.63
Sex Indian
River
County
Florida % change from
2002-2016 for Indian
River County
Female 19.0% 13.7% 5.7
Male 23.1% 21.7% 2

48 2020 IRC CNA
Figure 20 indicates that the percentage of adults engaging in heavy/binge drinking and smoking in Indian River
is on the rise, while the rates in the state have remained relatively stable. It should be noted that the increase in
these types of risky behaviors aligns with the higher rates of lung cancer and liver disease death in Indian River
County discussed previously.
Figure 20. Substance Abuse Rates in Indian River County, 2010-2016. Source: FL Health Charts BRFSS Indicator.
Alcohol Use: in Adults Tobacco Use: in Adults
25%
20%
15%
2010
16.5%
15%
2013
17.6%
14.3%
21%
2016
17.5%
25%
20%
15%
19%
2010
17.1%
2013
19.5%
16.8%
2016
21.7%
15.5%
10% 10%
5% 5%
0%
Indian
River
County
Florida
Indian
River
County
Florida
Indian
River
County
Florida
0%
Indian
River
County
Florida
Indian
River
County
Florida
Indian
River
County
Florida
As opioid use is a national topic of concern, the number of
opioid deaths and overdoses was evaluated. In 2018, there
were 27 opioid deaths in Indian River County.65 Additionally,
there were 92 reported non-fatal opioid-related overdoses
in the county in 2018, accounting for about 26.8% of all non-
fatal overdoses in the county.66 This rate is slightly lower than
that of the state; about 33.6% of all non-fatal overdoses in
Florida were due to opioid use.67
In addition to examining risky behaviors of adults, the
smoking and alcohol use behaviors of youth were also
examined. The Florida Youth Tobacco Survey (FYTS) tracks
indicators of tobacco use and exposure to secondhand
smoke among Florida public middle and high school
students in order to provide data for monitoring and
evaluating tobacco use among youth. Data were available
regarding the percentage of youth who have ever tried
tobacco products and the percentage of youth who are
currently using tobacco products for both the county and
the state.
Of note are the rising percentages of youth who have tried
vaping. In 2012, only 7% of youth in Indian River reported
having tried vaping while in 2018, 28.5% of youth reported
the same. The rates of vaping use in Indian River are slightly
higher than in the state. The rise in vaping is coupled with a
decrease in the percentages of youth who have ever tried
cigarettes, cigars, and smokeless tobacco. In 2012, 33.8% of
youth in Indian River reported having ever tried one of these
products, while in 2018, only 17.7% of youth reported having
ever tried one of these products. The percentage of youth
currently using tobacco products is slightly lower than the
percentage of youth who have ever tried tobacco products.
In 2018, 19.1% of youth in Indian River reported that they
are currently vaping, an almost 17% increase from 2012. In
addition, 22.3% of youth in Indian River reported that they
are currently using tobacco products, compared to 19.1%
of youth statewide. The increase in vaping is of concern
statewide. In 2019, there were 100 cases of E-cigarette or
Vaping use lung injuries statewide, along with 2 deaths.

49 2020 IRC CNA
Table 36. Youth Substance Abuse Rates in Indian River County, 2012-2018. Source: Florida Youth Survey (2018).
Percentage of Youth Who Have
2012
County State
2014
County State
2016
County State
2018
County State
Ever tried cigarettes 26.3% 21.6% 17.2% 17.5% 17.4% 13.7% 11.2% 11.4
Ever tried cigars 21.6% 16.2% 14.4% 12.8% 10.1% 9% 9.6% 8%
Ever tried smokeless tabacco 10.8% 7% 7.3% 6.1% 7.4% 5% 5.7% 4.4%
Ever tried hookah 6.6% 9.4% 13.1% 14.1% 10.4% 15.4% 7% 9.3%
Ever tried electronic vaping 7.1% 5.7% 14.2% 14.3% 27.6% 24.5% 28.5% 26.3%
Ever tried cigarettes, cigars, or smokeless tabacco 33.8% 27.6% 24.3% 23.4% 21.6% 18.5% 17.7% 16.6%
Ever tried cigarettes, cigars, smokeless, hookah or vaping 35.5% 30.2% 29.4% 30.7% 35.3% 32.8% 33.8% 33.1%
Percentage of Youth Who
Currently use cigarettes 8.3% 6.1% 4.8% 4.3% 4.3% 3% 2.5% 2.2%
Currently use cigars 10% 6.5% 6.4% 5.1% 3.9% 3.4% 3.4% 3%
Currently use smokeless tabacco 4% 3% 3.5% 3% 3.2% 2.2% 2.2% 1.7%
Currently use hookah 2.7% 4.1% 6.9% 7.1% 3% 4.8% 2.9% 3%
Currently use electronic vaping 2.5% 2.3% 7.9% 7.2% 11.9% 11.6% 19.1% 15.7%
Currently use cigarettes, cigars, or smokeless tabacco 16% 11% 10% 9% 8.1% 6.3% 6% 5.2%
Currently use cigarettes, cigars, smokeless, hookah or vaping 17.5% 13.1% 16.2% 15.3% 17.4% 16.3% 22.3% 19.1%
In addition, the Florida Youth Substance Abuse Survey is
administered annually as a collaborative effort between
the Florida departments of Health, Education, Children and
Families, Juvenile Justice, and the Governor’s Office of Drug
Control. The survey assesses assessing risk and protective
factors for substance abuse, in addition to substance abuse
prevalence. According to the most recent data released in
2018, 34.7% of youth surveyed in Indian River reported
using alcohol in their lifetime, compared to 36.5% of youth
statewide.68 In addition, 16.8 % of youth surveyed in Indian
River reported using marijuana in their lifetime, compared to
20.2% of youth statewide.
Youth were also asked about their alcohol and drug use in
the last 30 days. About 16.5% of youth surveyed in Indian
River reported using alcohol in the last month, compared
to 15.3% of youth statewide.69 In addition, 9% of youth
surveyed in Indian River reported using marijuana in the last
month, compared to 10.9 of youth statewide.
The mental health status of residents is yet another important
health factor in a community. According to the most recent
Florida Behavioral Risk Factor Surveillance System report,
about 18.4% of women in Indian River reported having a
depressive disorder, as compared to 8.3% of men. These
rates are comparable with that of the state and have
decreased since 2013.70 It is notable to note that depression
rates are highest among the poorest residents. The rates of
depression for residents making less than $25,000 per year
is 20.5%, which is significantly higher when compared to the
rates of those making between $25,000 and $49,999 and
those making $50,000 or more (9.8% and 11.8%
respectively).
Sex Indian
River
County
Florida % change from
2013-2016 for Indian
River County
Female 18.4% 17.8% -7.1
Male 8.3% 10.4% -1.1
Note. % is prevalence.
Table 37. 2016 County and State Rates of Adult
Diagnoses of Depressive Disorder By Sex.71

50 2020 IRC CNA
Race Indian
River
County
Florida % change from
2013 – 2016 for Indian
River County
Hispanic 2.1% 12.1% N/A
White 12.8% 16.6% -6.1
Note. % is prevalence. Adult depression diagnoses rates were not provided for
adults who identified as Black in Indian River County.
Sexual Health
Another important health factor in a community is sexual
health. When examining rates of diseases related to sexual
health, the rates of syphilis have increased dramatically in
Florida and Indian River County since 2006.72 In 2018, the
rate in Indian River County had increased to 28.9 per 100,000.
Data disaggregated by gender and ethnicity indicate that
rates of Syphilis are particularly high in the Black male
population and lowest in the White female population.73
The rates of Gonorrhea have fluctuated over time in Indian
River County since 2006, even though they have increased
statewide. In 2018, the rate in Indian River County was 85.5
per 100,000. Data disaggregated by gender and ethnicity
indicate that rates of Gonorrhea are particularly high in the
Black male and Black female populations.74
The rates of Chlamydia have remained relatively stable
over time in Indian River County since 2006, even though
they have increased statewide. In 2018, the rate in Indian
River County was 323.5 per 100,000. Data disaggregated by
gender and ethnicity indicate that rates of Chlamydia are
highest in the Black female population but are also relatively
high in the Black male population.75
The rates of Bacterial STDs have remained relatively stable
over time in Indian River County since 2006 even though
they have increased statewide. In 2018, the rate in Indian
River County was 437.9 per 100,000, compared to the state
at 708.8 per 100,000.76 Data disaggregated by gender and
ethnicity indicate that rates of Bacterial STDs are highest
in the Black female population but are also relatively high
in the Black male population. Taken together, the sexual
health data reveals a significant disparity in that the Black
population has the highest rates of STDs/STIs in the county.
Figure 21. Prevalence of Bacterial STDs in Indian River County, 2006-2018. Source: Florida Health Charts (2018).
Prevalence Rate of Bacterial STDs: IRC and Florida
Prevalence Rate of Bacterial STDs: by Race
700 6000
650
600
550
500
450
400
350
300
250
200
150
100
5500
5000
4500
4000
3500
3000
2500
2000
1500
1000
50 500
0 0 2006 2008 2010 2012 2014 2016 2018 2006 2008 2010 2012 2014 2016 2018
Florida Indian River Black Female
Black Male
Non-Hispanic
Hispanic
White Female
White Male
Table 38. 2016 County and State Rates of Adult
Diagnoses of Depressive Disorder By Race/Ethnicity.71
Ra
te p
er
100
,00
0
Ra
te p
er
100
,00
0
51 2020 IRC CNA
Similar to State-level trends, Indian River County has experienced a decrease in HIV cases from 2006 – 2018 (see
Table 40). In 2006, rates of HIV were 9.8 per 100,000. However, HIV levels decreased by 3.2% in 2018 to a rate of 6.6
per 100,000. Data disaggregated by gender and ethnicity for Indian River County indicate rates of HIV remain highest
in the male population. However, females experienced the largest decrease in HIV cases from 2006 – 2018. When
considering race/ethnicity, rates of HIV were highest among individuals who identify as Hispanic, followed by Black
identifying individuals. Notably, individuals identifying as Black had the largest decrease in HIV cases out of all racial/
ethnic groups (see Table 41).
Indian River Florida % change from 2006-2018 for Indian River County
6.6 23.4 -3.2
Sex Indian
River
County
Florida % change from
2006-2018 for Indian
River County
Female 3.8 9.5 -7.9
Male 9.6 38.0 1.8
Note. *represents cases per 100,000
Race/
Ethnicity*
Indian
River
County
Florida % change from 2006
– 2018 for Indian River
County
Black 14.6 59.0 -67.3
Hispanic 15.8 30.9 0
White 4.4 10.7 2.5
Note. *represents cases per 100,000
Table 39. 2018 County and State Rates of HIV Cases per 100,000 Population.77
Table 40. 2018 County and State Rates of HIV Cases
per 100,000 Population By Sex.78
Table 41. 2018 County and State Rates of HIV Cases
per 100,000 Population By Race/Ethnicty.78

52 2020 IRC CNA
Healthcare Access
Another important indicator of health in a community is
adequate clinical care. As one of the biggest barriers to
receiving adequate clinical care is lack of insurance
coverage, the percentage of insured residents residing
in Indian River County was examined between the years
2014 and 2018. Since 2014, the percentage of residents
with insurance coverage has increased steadily, with
87.9% of its adult population having health insurance in
2018. The insured rate is slightly higher than that of the
State of Florida’s rate of 86.5%.79 When comparing private
and public insurance coverage, residents under 65 are
more likely to have private coverage, while residents over
65 are more likely to have public coverage. Oral health
insurance coverage is separate from general health care
insurance coverage. Good oral health is also vital to
one’s overall health. In Indian River County, only 52.2% of
residents obtained oral health coverage, which is lower
than the rate of oral health coverage in Florida (60%). The
lack of insurance coverage in Indian River County paired
with other challenges in healthcare access, behavioral,
and environmental health may have a negative impact on
the quality of life of its residents.
All the Population
2014 2016 2018 95,922
Senior Population
2014 2016 2018
82,676
61,145
83,607
67,992
75,698
26,073
42,054
28,044
47,167
30,131
50,019
Private Public Private Public Private Public Private Public Private Public Private Public
(Seniors) (Seniors) (Seniors) (Seniors) (Seniors) (Seniors)
Indian River County Residents with Health Insurance
2014
2016
2018
88%
.1%
All Noninstitutionalized Residents Black Hispanic White (Non-Hispanic)
Figure 22. Insurance Status of Indian River County Residents, 2014-2018. Source: United States Census Bureau.80
83.5% 68.9%
64.4%
91.1%
90.5%
88.2% 75.9%
72.1%

53 2020 IRC CNA
With regard to the availability of clinical services, the County Health Rankings provide information on ratios of providers
to residents. The table below provides information on the ratios by provider type. The ratio of primary care physician
(PCP) providers and mental health providers to residents is worse in Indian River County than in Florida, while the
ratios of dentists to patients is better in Indian River than in Florida. In every case, the provider-patient ratios are worse
in the county and state than they are nationally (see Table 42).
Indian River Florida
Access to Mental Health Provider 1:840 1:700
Access to Primary Care Physician 1:1,440 1:1,380
Access to Dentists 1:1,530 1:1,730
Lastly, the prevalence rate of vaccines for preventable diseases from the period of 2016-2018 was examined. Overall,
the vaccination rates for flu in children under 5, Hepatitis B, both acute and chronic and pertussis, were lower in Indian
River than they were in the state. The rates of vaccinations for Strep and Chickenpox were higher in Indian River than
in the state.
Prevalence Rate of Vaccine Preventable Diseases (2016-18)
Haemophilus
influenzae in
children < 5
Hepatitis B, acute
Hepatitis B,
chronic
Meningococcal
disease
Pertussis
3- Year Rate per
100,000
3.4
0
3.6
3.1
0.1
0
13.1
23.7
Streptococcus
pnemoniae in
children < 6
Varicella
(Chickenpox)
8.6
5
Place
Florida Indian River
Table 42. 2018 County, State, and National Level Provider to Patient Ratio.81
Figure 23. Prevalence of Vaccine-Preventable
Diseases in Indian River County, 2016-2018.
Source: Florida Health Charts (2018).
5.1
3.6

54 2020 IRC CNA
Across the country, values for measures of length and quality of life for minorities and lower SES residents are
regularly worse than for Whites and higher SES residents. There is some evidence that this may be the case in
Indian River as well.
Regarding the unequal dispersion of wealth as measured by the GINI inequality index, Indian River County received
an index value of 0.53, which is higher than both the State of Florida (0.49) and the United States (0.48).82 The index
values within Indian River County vary from 0.35 in tract 506.06 to 0.62 in tract 504.02. However, the most wealth
disparity is reported for the city of Vero Beach in Indian River County with index values of 0.55, 0.47, and 0.62.
City Tract n GINI Inequality
509.03* 2,397 0.44
Fellsmere 509.04 1,904 0.37
508.02 3,474 0.36
508.05* 1,580 0.4
Sebastian 508.06 1,924 0.5
508.07 1,919 0.36
508.08 1,932 0.40
501 2,539 0.55
Vero Beach 502 1,549 0.47
504.02 1,217 0.62
Highlands 506.06 3,309 0.35
505.01 2,477 0.57
Indian River Shores 505.05 1,711 0.53
507.04 1,137 0.39
West Vero Corridor 507.05 2,700 0.44
509.03* 2,397 0.44
Gifford 503.02 2,191 0.51
507.02 2,071 0.46
Vero Beach South 507.03 3,291 0.41
506.01 1,245 0.55
508.04 2,134 0.43
Wabasso 508.05* 1,580 0.40
Note. “n” represents total households in the census tract. * denotes census tract overlap
Table 43. 2014-2018 Indian River Census Tract GINI Inequality.83

55 2020 IRC CNA
High levels of cost within households may also be a limitation for healthcare within Indian River County. According to
the U.S. Census Bureau, housing cost burden is when housing costs (e.g., mortgage/rent, utilities, taxes) exceed 30%
of the total household income.84 Within Indian River County, 29.62% of households were considered cost-burdened
compared to 35.50% in Florida and 31.55% in the United States.85 Although Indian River County reported a lower
level of cost burdened households when compared to Florida and the United States, disparities in housing costs are
present at the county level. The housing cost burden percentage within Indian River County varies from 15.55% in
tract 507.02 to 47.00 in tract 504.02. The highest concentration of housing cost burdened households is reported for
the city of Vero Beach in Indian River County (see Table 44).
City Tract n % Cost Burdened Households
509.03* 2,397 21.57
Fellsmere 509.04 1,904 42.02
508.02 3,474 21.01
508.05* 1,580 23.29
Sebastian 508.06 1,924 25.94
508.07 1,919 23.81
508.08 1,932 25.78
501 2,539 37.06
Vero Beach 502 1,549 37.90
504.02 1,217 47.00
Highlands 506.06 3,309 33.97
505.01 2,477 25.15
Indian River Shores 505.05 1,711 30.45
507.04 1,137 40.28
West Vero Corridor 507.05 2,700 30.52
509.03* 2,397 21.57
Gifford 503.02 2,191 37.97
507.02 2,071 15.55
Vero Beach South 507.03 3,291 21.88
506.01 1,245 40.96
508.04 2,134 18.09
Wabasso 508.05* 1,580 23.29
Note. “n” represents total households in the census tract. * denotes census tract overlap
Table 44. 2014-2018 Percent of Indian River Cost Burdened Households by Census Tract.86

56 2020 IRC CNA
Additionally, variations exist in food and vehicle access among Indian River County residents. When considering
vehicle access, 5.44% of households in Indian River County reported having no motor vehicle compared to 6.48%
in Florida and 8.71% in the United States.87 Although Indian River County reported fewer households without motor
vehicles than Florida and the United States, motor vehicle access disparities at the county level do exist. To illustrate,
the percentage of households without a motor vehicle in Indian River County varies from the lowest percentage
at 0.50% in tract 509.03 to the highest percentage at 24.19% in tract 507.04. However, the highest concentration of
households without motor vehicle access exists in the city of Vero Beach within Indian River County (see Table 45).
City Tract n % Households Without Vehicle
509.03* 2,397 0.50
Fellsmere 509.04 1,904 7.09
508.02 3,474 2.16
508.05* 1,580 4.62
Sebastian 508.06 1,924 1.40
508.07 1,919 4.06
508.08 1,932 1.19
501 2,539 11.58
Vero Beach 502 1,549 4.78
504.02 1,217 14.63
Highlands 506.06 3,309 4.02
505.01 2,477 1.25
Indian River Shores
505.05 1,711 3.57
507.04 1,137 24.19
West Vero Corridor 507.05 2,700 5.37
509.03* 2,397 0.50
Gifford 503.02 2,191 8.67
507.02 2,071 1.59
Vero Beach South 507.03 3,291 1.12
506.01 1,245 9.96
508.04 2,134 1.45
Wabasso 508.05* 1,580 4.62
Note. “n” represents total households in the census tract. * denotes census tract overlap
Table 45. 2014-2018 Percent of Indian River Households with No Car by Census Tract.88

57 2020 IRC CNA
When considering access to food, the USDA defines low food access as living more than ½ mile from sources of
healthy and affordable food (e.g., supermarkets; large grocery stores).89 Within Indian River County, 43.22% reported
low food access, which is higher than both the State of Florida (25.70%) and the United States (22.43%). Although
Indian River County reported a higher percentage of low food access, percentages of low food access range from
0.00% in tracts 508.08, 504.02, and 507.04 to 100.00% in tract 505.01 (see Table 46).
City Tract n % Low Food Access
509.03* 7,150 94.62
Fellsmere 509.04 7,218 0.88
508.02 8,580 49.24
508.05* 3,750 32.67
Sebastian 508.06 4,660 63.29
508.07 4,657 4.20
508.08 3,888 0.00
501 6,114 64.90
Vero Beach 502 2,329 55.12
504.02 2,281 0.00
Highlands 506.06 10,817 59.26
505.01 5,291 100.00
Indian River Shores 505.05 3,197 0.00
507.04 2,186 0.00
West Vero Corridor 507.05 4,860 79.51
509.03* 7,150 94.62
Gifford 503.02 5,354 86.87
507.02 5,149 38.19
Vero Beach South 507.03 8,751 6.57
506.01 2,354 24.25
508.04 4,956 88.39
Wabasso 508.05* 3,750 32.67
Note. “n” represents total households in the census tract. * denotes census tract overlap
Table 46. 2010- 2015 Percent of Indian River Households with Low Food Access by Census Tract.90

58 2020 IRC CNA
Social and economic factors, such as those highlighted in
Tables 43, 44, 45, and 46, may interact with health factors
to drive health inequity.91 For example, limited vehicle
access may impede one’s ability to access health-
related goods and services (e.g., healthy food, doctor
appointments). Moreover, those who are burdened by
cost and are unable to obtain affordable housing may
also be unable to afford health-related privileges such
as health insurance or quality medical care. Additionally,
individuals facing such challenges may also struggle to
maintain a healthy lifestyle due to a lack of affordable,
healthy food options within their vicinity. Thus, indicators
such as the ones highlighted should be considered.
Opinions: Surveys
In order to gather Indian River County residents’
perceptions of overall health and health care, a series
of questions were posed about access to medical,
dental and mental healthcare. 80% of residents reported
having a primary care provider, and 73% said emergency
services respond quickly. Residents reported challenges
accessing certain types of care, with low percentages
of residents reporting easy access to affordable mental
health services (30%) and dental care (38%) with slightly
better access to affordable medical care (46%). Only
29% of respondents indicated access to affordable
health insurance, with only 45% reporting that uninsured
residents have access to medical care. Residents also
described issues with the quality of affordable care. Only
about 33% rated the quality of affordable healthcare as
‘good’ or ‘great’.
Resident survey responses indicated substance abuse
is a significant unaddressed concern for the community.
About 59% reported issues with alcohol abuse, 59%
reported issues with prescription drug abuse, and 62%
reported issues with illegal drug abuse as affecting their
community. Residents are generally unaware of free or
affordable treatment options for substance abuse. Only
23% of residents surveyed said there were enough
treatment options available for residents struggling with
addiction.
Interestingly, lower-income residents were more likely
than higher-income residents to agree that residents had
access to affordable health insurance (47% vs. 34%), that
affordable mental health services are available to meet
the needs of residents (50% vs. 36%) and that enough
treatment options are available for residents struggling
with addiction (44% vs. 27%). Non-white residents were
also more likely to agree that addiction treatment options
were available compared to white residents (49% vs.
32%). However, white residents were more likely to agree
that emergency services respond quickly than non-white
residents (90% vs. 78%).
White residents were also more likely to agree that other
residents in their community were ‘generally healthy’
than non-white residents (77% vs. 60%) and to rate their
physical health as ‘good’ or ‘great’ (73% vs. 56%). Higher-
income residents were more likely than lower-income
residents to rate their physical health (79% vs. 57%) and
mental health (83% vs. 65%) as ‘good’ or ‘great’. There
was some variability in responses by community, with
residents of Fellsmere being less likely than residents of
other areas to say that prescription drug abuse was an
issue in their community (69% vs. 88%), and more likely
to say that affordable health insurance was available for
residents in their community (65% vs. 38%)
Most rated their physical (68%) and mental (74%) health
as ‘good’ or ‘great’ and said there were safe places to
exercise in their community (78%). 54% thought residents
in their community were generally healthy. Still, obesity
was mentioned as a health concern in many open-ended
responses, and residents called for community-level
changes to facilitate healthy living, including access to
healthy food, sidewalks for walking, and more spaces for
exercises.
Opinions: Focus Groups
During focus group discussions, residents described
several barriers to accessing healthcare in the
community. College-aged youth and underemployed
adults were identified as populations that have difficulty
affording coverage and qualifying for discounted
services. Residents report many providers in the area
will not accept uninsured or Medicaid patients. Mental,
dental, and specialty healthcare services were even more
difficult to access, and some community members travel
outside of the county to access needed care.

59 2020 IRC CNA
Residents mentioned multiple providers in the area who offer affordable or free services to uninsured and low-income
residents. However, residents noted that there were often long waiting lists for services or unaffordable sliding scales.
Insured residents also described unaffordable copays and limited provider availability. Residents felt that emergency
departments in the area might be overutilized as a result of limited access to primary care and preventative services.
Key community assets were noted, including Visiting Nurse Association mobile clinics, Healthy Start, Partners in
Women’s Health and Treasure Coast Community Health. Residents also hope the addition of the Cleveland Clinic will
help fill gaps in service availability. During focus groups, low-income residents described instances of discrimination,
feeling disrespected by providers, and poorly maintained facilities.
“ …with my daughter on Medicaid
here. I took her to a provider
here and it was so filthy and
disgusting. And they were the
only provider in the area. So we
had to drive down to Jupiter
to find another provider which
made it very difficult.”

60 2020 IRC CNA
KEY POINTS
• With regards to health care services, PCP to patient ratios and mental health provider to patient ratios lag behind
state and national averages, with mental health provider ratios being worse than PCP ratios. While there is a
sufficient supply of dental care providers, residents are concerned with the affordability of services, which limits
the use of dental care services.
• Residents felt that income determines both the access and quality of care one receives. The biggest disparities
in health and health care access are related to socio-economic status. Some residents are especially concerned
with the ability of college-aged youth and the underemployed receiving services. The majority of residents in the
community are insured, however, these groups would likely have greater difficulty obtaining coverage.
• Most of the community rated their overall mental and physical health as good to great and the county is ranked
in the top 25% in Florida with regards to health. However, the SDOH indicators illustrate pockets of poor physical
and mental health. Strategies to implement SDOH programs that focus on population health should be developed
and supported. (Examples: www.cdc.gov/socialdeterminants/tools/index.htm.)
• Nevertheless, there are some problem areas of concern, namely smoking and alcohol use among adults, and a
rise in vaping among teens. The increase in smoking and alcohol use is leading to serious health problems among
residents, as evidenced by a rise in mortality rates due to lung cancer and liver disease.
• Cancer and heart disease were the leading causes of death for residents of Indian River County and the state. In
Indian River County, those two diseases were the cause of 49% of all deaths. In addition, Black residents had
higher death rates from cancer, heart disease, stroke, and HIV/AIDS than other races and ethnicities.
• The rates of Bacterial STDs have remained relatively stable over time in Indian River County since 2006 even
though they have increased statewide.
• Bacterial STDs data disaggregated by gender and ethnicity indicate that rates are highest in the Black female
population but are also relatively high in the Black male population. Taken together, the sexual health data reveals
a significant disparity in that the Black population has the highest rates of STDs/STIs in the county.
• In 2006, rates of HIV were 9.8 per 100,000. However, HIV levels decreased by 3.2% in 2018 to a rate of 6.6 per
100,000.
• HIV data disaggregated by gender and ethnicity for Indian River County indicate rates remain highest in the male
population. However, females experienced the largest decrease in HIV cases from 2006 – 2018.
• HIV rates were highest among individuals who identify as Hispanic, followed by Black identifying individuals.
Individuals identifying as Black had the largest decrease in HIV cases out of all racial/ethnic groups.

61 2020 IRC CNA
HOUSING
INTRODUCTION
Having a secure, affordable home absent of structural and
environmental health problems (e.g. mold, leaking roof) is
considered a basic need that allows residents of a com-
munity the ability to tend to other areas of need.xxi Further,
the geographic location where a person lives can have a
considerable impact on their access to resources such
as jobs, services, education, recreation and transporta-
tion, all components that contribute to quality of life. Lack
of secure affordable housing can result in very low, low
and moderate income residents using too much of their
income for housing, which can force them to cut back
on other basic needs (e.g., food, transportation, cloth-
ing, and health care) in order to have housing stability.xxii
Lack of affordable housing can also cause lower income
residents to live in areas that lack resources such as
good-paying jobs, community services, and recreation-
al activities. Affordable housing in Indian River County is
problematic for many residents. As the population in the
County grows, thoughtful, informed housing growth will
be essential to develop livable communities with a high
quality of life for all.
DATA
Data presented in this section was obtained from the
Florida Housing Data Clearinghouse (FHDC)xxiii Indian
River County Community Development Department as
part of the research for the Indian River County Affordable
Housing Advisory Committee (AHAC) and the Treasure
Coast Homeless Services Council. The FHDC uses data
from the U.S. Census Bureau’s 2010 Census Data, 2013-
17 ACS 5-year summary data, projections from the
University of Florida Bureau of Economic and Business
Research. The Indian River County Community
Development used the same sources for its analysis plus
local projections and local project specific data.
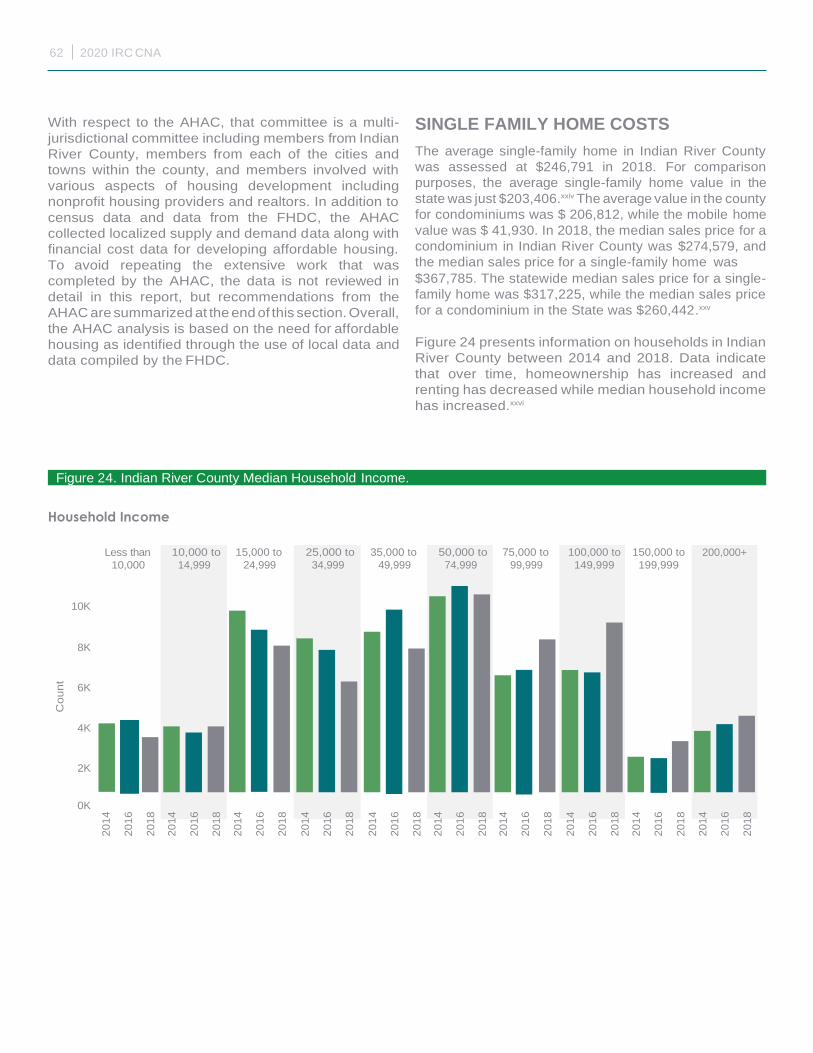
62 2020 IRC CNA
With respect to the AHAC, that committee is a multi-
jurisdictional committee including members from Indian
River County, members from each of the cities and
towns within the county, and members involved with
various aspects of housing development including
nonprofit housing providers and realtors. In addition to
census data and data from the FHDC, the AHAC
collected localized supply and demand data along with
financial cost data for developing affordable housing.
To avoid repeating the extensive work that was
completed by the AHAC, the data is not reviewed in
detail in this report, but recommendations from the
AHAC are summarized at the end of this section. Overall,
the AHAC analysis is based on the need for affordable
housing as identified through the use of local data and
data compiled by the FHDC.
SINGLE FAMILY HOME COSTS
The average single-family home in Indian River County
was assessed at $246,791 in 2018. For comparison
purposes, the average single-family home value in the
state was just $203,406.xxiv The average value in the county
for condominiums was $ 206,812, while the mobile home
value was $ 41,930. In 2018, the median sales price for a
condominium in Indian River County was $274,579, and
the median sales price for a single-family home was
$367,785. The statewide median sales price for a single-
family home was $317,225, while the median sales price
for a condominium in the State was $260,442.xxv
Figure 24 presents information on households in Indian
River County between 2014 and 2018. Data indicate
that over time, homeownership has increased and
renting has decreased while median household income
has increased.xxvi
Figure 24. Indian River County Median Household Income.
Household Income
Less than
10,000
15,000 to
24,999
35,000 to
49,999
75,000 to
99,999
150,000 to
199,999
10K
8K
6K
4K
2K
0K
200,000+ 100,000 to
149,999
50,000 to
74,999
25,000 to
34,999
10,000 to
14,999
Co
un
t
20
14
20
16
20
18
20
14
20
16
20
18
20
14
20
16
20
18
20
14
20
16
20
18
20
14
20
16
20
18
20
14
20
16
20
18
20
14
20
16
20
18
20
14
20
16
20
18
20
14
20
16
20
18
20
14
20
16
20
18

63 2020 IRC CNA
Estimates for 2014-2018, indicate that the median monthly
homeowner costs for residents with a mortgage were
$1,299 while monthly home costs without a mortgage
were $495.xxvii Median gross rent was $957 monthly in
Indian River County in 2018, compared to $1,128
statewide.xxviii According to the US Department of Housing
and Urban Development, the fair market monthly rent was
as follows based on unit size: a studio apartment: $617,
one-bedroom: $802, two-bedroom: $961, three-bedroom:
$1352, and four-bedroom: $1547.xxix
Indian River County’s Affordable Housing Advisory
Committee (AHAC) was tasked by the Board of County
Commissioners to review the issue of affordable housing
in 2019 and make recommendations to the board. As
stated in their initial presentation to the board, there are
two primary components to affordable housing: housing
costs and household income. Affordable housing can be
defined as having a monthly rent or mortgage payment,
including taxes and insurance, that does not exceed 30%
of a given household gross income.xxx In order to reduce
the cost burden of households, more affordable housing
units must be built or made available to lower-income
residents and /or household incomes must increase
(e.g., through higher wages). This 30% income threshold
is particularly important for lower-income households as
they need the majority of most of their remaining wages
to cover basic, non-discretionary needs such as food,
utilities, and healthcare. For higher-income households,
the 30% threshold is not as critical as these households
have additional disposable income above and beyond
what is needed to meet basic needs. Households
paying between 30% and 50% of income for housing
are considered to be cost-burdened; households paying
over 50% of income for housing are considered to be
severely cost-burdened.xxxi
According to the most recent data available from the
FHDC, in 2016, there were 64,930 total households. Of
those households, 21,351 households (33%) were paying
more than 30% of their income for housing and can be
considered cost-burdened. The ratio of cost-burdened
households to total households differed for renters and
owners, with 14 % of renter households paying more than
30% income for housing (n = 9,134) and 19% of owner-
occupied households paying more than 30% income for
housing (n =12,217). In addition, many of these households
can be considered to be severely cost-burdened. About
18% (n = 11,544) are paying more than 50% of their
income for housing costs.xxxii
Table 47. Indian River County Housing Cost Burden Based on Household Income.
All Households, Cost Burden by Income, 2016 Estimate (Summary)
Housing Cost Burden
Geography Household Income 30% or less 30.1 - 50% More than 50%
Indian River County 30% AMI or less 783 889 4937
Indian River County 30.1 - 50% AMI 2314 2863 3564
Indian River County 50.1 - 80% AMI 5288 3725 2086
Indian River County 80.1 - 120% AMI 8058 2330 957
Indian River County more than 120% AMI 23513 3000 623
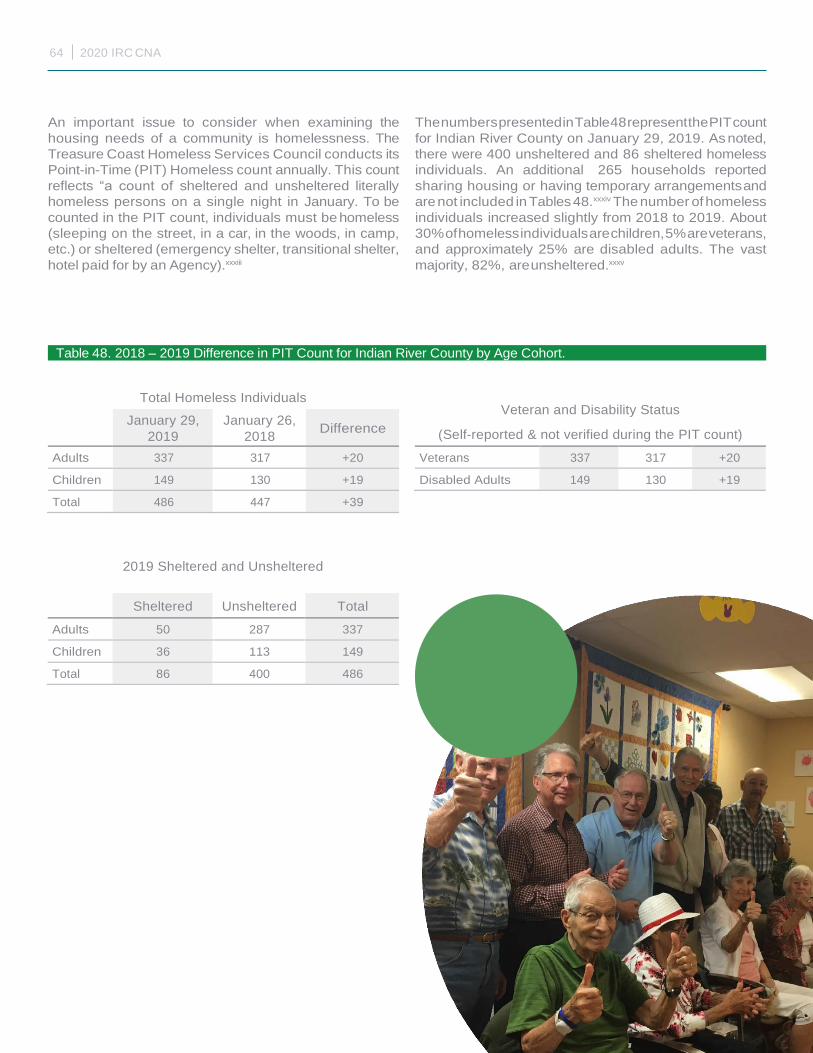
64 2020 IRC CNA
An important issue to consider when examining the
housing needs of a community is homelessness. The
Treasure Coast Homeless Services Council conducts its
Point-in-Time (PIT) Homeless count annually. This count
reflects “a count of sheltered and unsheltered literally
homeless persons on a single night in January. To be
counted in the PIT count, individuals must be homeless
(sleeping on the street, in a car, in the woods, in camp,
etc.) or sheltered (emergency shelter, transitional shelter,
hotel paid for by an Agency).xxxiii
The numbers presented in Table 48 represent the PIT count
for Indian River County on January 29, 2019. As noted,
there were 400 unsheltered and 86 sheltered homeless
individuals. An additional 265 households reported
sharing housing or having temporary arrangements and
are not included in Tables 48.xxxiv The number of homeless
individuals increased slightly from 2018 to 2019. About
30% of homeless individuals are children, 5% are veterans,
and approximately 25% are disabled adults. The vast
majority, 82%, are unsheltered.xxxv
Table 48. 2018 – 2019 Difference in PIT Count for Indian River County by Age Cohort.
Total Homeless Individuals
January 29,
2019
January 26,
2018 Difference
Adults 337 317 +20
Children 149 130 +19
Total 486 447 +39
2019 Sheltered and Unsheltered
Veteran and Disability Status
(Self-reported & not verified during the PIT count)
Veterans 337 317 +20
Disabled Adults 149 130 +19
Sheltered Unsheltered Total
Adults 50 287 337
Children 36 113 149
Total 86 400 486

65 2020 IRC CNA
Finally, in April of 2019, the AHAC reviewed data
regarding the number of residents on waiting lists for
housing assistance. At that time, 127 residents were on
a waiting list for Section 8 assistance (through rental
assistance), 786 residents were on a waiting list for a
unit at a subsidized housing project, and 61 residents
were on a waiting list for the County’s State Housing
Initiative Partnership (SHIP) program. Combined with
the homeless count, there are approximately 1,460
residents that have an immediate need for housing
assistance.
The AHAC also reviewed the Shimberg Center for
Affordable Housing cost burdened data for 2016 and
categorized and summarized resident needs into High
Impact, Medium Impact, and Immediate demand.
High Impact Needs households were defined as those
paying more than 50% of their income for housing (n
= 11,544). Medium Impact Needs households were
defined as those paying between 31%-50% of their
income for housing (n= 9,807). Immediate Demand
was classified as homeless plus persons/households
waiting for requested assistance (n =1,460).
AHAC RECOMMENDATIONS
On January 22, 2020, the AHAC completed studying
home ownership and rental challenges faced by
very low income (VLI), low income (LI) and moderate
income (MI) persons and families and developed a
list of recommendations to forward to the Board of
County Commissioners for consideration to increase
homeownership and rental opportunities for the VLI,
LI and MI groups. (Appendix D.) That list includes
recommendations for:
1. Setting affordable housing development targets
for the year 2025 and the year 2030;
2. Revising the County’s expedited
permitting process;
3. Modifying County Land Development
Regulations to further incentivize the
development of affordable housing;
4. Reducing or elimination impact fees for
affordable housing;
5. Encouraging (through public-private
partnership(s)) re-development of a
former apartment complex site for new
affordable housing;
6. Seeking ways to increase funding for affordable
housing and advocating for it (including through
established state and federal housing programs
– advocacy by all interested parties on the
AHAC);
7. Identifying available land for affordable housing
and analyzing if additional land should be re-
zoned for multi-family; and
8. Requesting municipalities within the County
to review and modify their regulations to
encourage affordable housing.
Opinions: Surveys
As there is a demonstrated relationship that exists
between housing quality and income, the CNA surveys
addressed topics such as housing affordability,
perceptions of safety, and homelessness to obtain a
better sense of the perceptions of residents with
regards to their housing needs.
Residents were asked about the availability,
affordability, and quality of housing in their community.
Although 79% said there is a mix of different types of
housing, only 68% said neighborhoods are safe, and
66% said houses are structurally sound. Only 35% of
residents said it is easy to find a good place to live and
just 26% of residents surveyed agreed that housing in
the community is affordable.
Survey findings suggest issues with the quality of
affordable housing; 18% of residents surveyed rated
the quality of affordable housing in the community as
‘good’ or ‘great.’ In addition, only 35% of residents said
they know where to find help with housing challenges.
Furthermore, 77% of those surveyed agreed that
homelessness is a problem in the community.
Residents of Fellsmere were less likely to agree that
homelessness was a problem than residents of other
communities (86% vs. 70%).
When examining survey responses by race, white
residents were more likely to agree that houses were
structurally sound in their community than non-white
residents (85% vs. 74%). White residents were also
more likely to agree that there was a mix of different
types of housing in their community than non-white
residents (81% vs. 67%).

66 2020 IRC CNA
Opinions: Focus Groups
Housing affordability was also a key theme identified in the focus group discussion. Focus group participants explained
that although affordable housing developments exist, there are often long waiting lists and strict eligibility criteria that may
prevent access. Residents described the need for more housing for young people, seniors, single mothers, veterans, and
disabled individuals.
Focus group findings also suggest issues with the quality of affordable housing. Participants described predatory practices
of landlords in low income and minority communities; many expressed a reluctance to report landlord violations out of fear
of retaliation. Residents questioned whether standards and codes for housing quality were being enforced, describing
issues with flooding, mold, and pests as well as concerns about neighborhood blight and abandoned properties.
Residents who could afford housing described
no issues with housing quality or the availability
in their communities, highlighting a disparity in
experiences by socio-economic status. Some
residents also expressed the need to balance
any further housing development with the need
to preserve the environment and/or Indian River
County way of life.
Many residents called for an increased role of local leadership in addressing housing concerns and drew connections between housing costs
and homelessness. In focus groups, residents
advocated for rent control, housing
subsidies, and affordable housing
development. Many also noted the need for
shelters and transitional housing. Move- in
costs and poor credit were identified as an additional barrier to establishing stable housing for renters. Habitat for Humanity was mentioned as a key community asset in helping low-income renters become homeowners, and many
residents also wanted support navigating the
path to homeownership.

67 2019 IRC CNA
KEY POINTS
• 33 % of Indian River County residents qualify as
“housing cost-burdened”, those who are paying
more than 30% of their monthly income on rent
or mortgage.
• Over 20,000 households in Indian River County
are considered housing cost-burdened.
• About 2% of the households in Indian River
County can be classified as having immediate
needs (i.e., homelessness/waiting lists for County
housing programs).
• High housing costs can lead to poor housing
conditions, which differentially impact lower-
income residents. This can result in substandard
housing, which was identified as a concern in
focus groups.
• Housing costs are a major component of the
overall cost of living for individuals and families in
Indian River County.
• The lack of affordable housing options has an
impact on the quality of life of lower-income
families.
• Wages are another major component of housing
cost burden in the County. As stated in the
Economic Opportunity section of this report, in
many occupations, wages in Indian River County
lag that of the state. Another way to alleviate the
housing cost burden is to increase wages.
• As outlined by the AHAC, there are numerous
actions that can occur by the County, State, cities,
and towns in the County, and affordable housing
private sector interested parties to increase the
development of affordable housing.
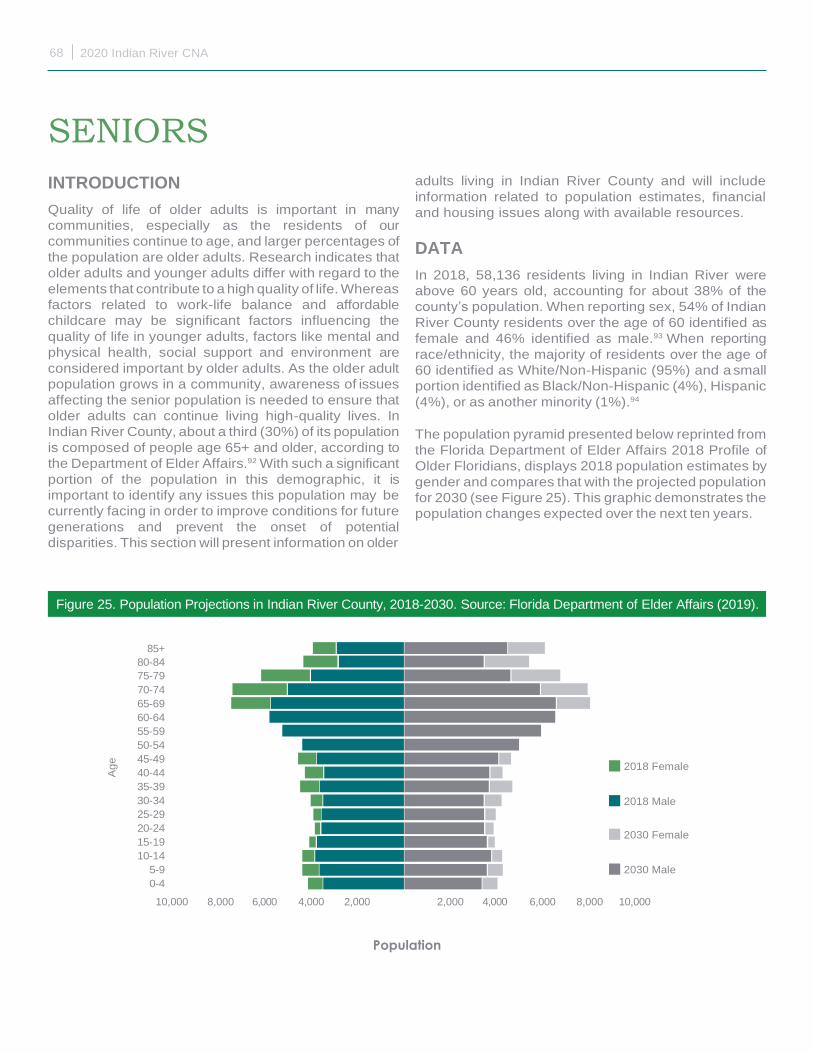
68 2020 Indian River CNA
SENIORS
INTRODUCTION
Quality of life of older adults is important in many
communities, especially as the residents of our
communities continue to age, and larger percentages of
the population are older adults. Research indicates that
older adults and younger adults differ with regard to the
elements that contribute to a high quality of life. Whereas
factors related to work-life balance and affordable
childcare may be significant factors influencing the
quality of life in younger adults, factors like mental and
physical health, social support and environment are
considered important by older adults. As the older adult
population grows in a community, awareness of issues
affecting the senior population is needed to ensure that
older adults can continue living high-quality lives. In
Indian River County, about a third (30%) of its population
is composed of people age 65+ and older, according to
the Department of Elder Affairs.92 With such a significant
portion of the population in this demographic, it is
important to identify any issues this population may be
currently facing in order to improve conditions for future
generations and prevent the onset of potential
disparities. This section will present information on older
adults living in Indian River County and will include
information related to population estimates, financial
and housing issues along with available resources.
DATA
In 2018, 58,136 residents living in Indian River were
above 60 years old, accounting for about 38% of the
county’s population. When reporting sex, 54% of Indian
River County residents over the age of 60 identified as
female and 46% identified as male.93 When reporting
race/ethnicity, the majority of residents over the age of
60 identified as White/Non-Hispanic (95%) and a small
portion identified as Black/Non-Hispanic (4%), Hispanic
(4%), or as another minority (1%).94
The population pyramid presented below reprinted from
the Florida Department of Elder Affairs 2018 Profile of
Older Floridians, displays 2018 population estimates by
gender and compares that with the projected population
for 2030 (see Figure 25). This graphic demonstrates the
population changes expected over the next ten years.
85+
80-84
75-79
70-74
65-69
60-64
55-59
50-54
45-49
40-44
35-39
30-34
25-29
20-24
15-19
10-14
5-9
0-4
10,000 8,000 6,000
4,000
2,000
2,000 4,000
6,000
2018 Female
2018 Male
2030 Female
2030 Male
8,000 10,000
Population
Figure 25. Population Projections in Indian River County, 2018-2030. Source: Florida Department of Elder Affairs (2019).
Ag
e

69 2020 Indian River CNA
The 2018 Profile of Older Floridians also provides a
snapshot of several other variables of interest in the older
adult (over 60) population that are summarized here. Half
(50%) of the older adult female population is married,
31% are widowed, and another 16% are divorced.
Comparatively, 75% of older adult males are married, 9%
are widowed, and 12% are divorced.95 About 23% of older
residents live alone. Females are more likely to live alone
than males; 68% of those living alone are female. Ninety
percent (90%) of the older adult population has at least a
high school diploma, with 39% having an Associate
degree or higher. About 45% of adults over 60 are still
driver license holders, but only 52% are registered to
vote.96
The Profile also includes a dependency ratio, which
“contrasts the number of working-age (15-64) individuals
compared to the number of individuals age 65+ and
older who are likely retired from the workforce” (see
Figure 26). These data present the availability of taxes
and wages that can be leveraged to sustain systems
and programs used by retirees and provide an index of
the availability individuals in the community that can
function as caregivers to older adults. The ratio of retired
age to working-age adults is expected to increase
through 2040, with the population in the county skewing
older. In addition, the Profile contains information related
to the financial circumstances of older adults in Indian
River County. About 20% of seniors are at or below 125%
of the poverty level. More detailed Federal Poverty Level
information is presented in Table 49.
180,000 Federal Poverty Level Value
160,000 Single-Person Household $12,140
140,000 Two-Person Household $16,460
120,000 Single-Person Household $15,175
100,000
80,000
Two-Person Household $20,575
Source: U.S. Department of Health & Human Services, 2018
60,000
40,000
20,000
Poverty Level Value Percent
At Poverty Level 4,644 8%
Below 125% of Poverty Level 6,794 12%
0 2018 2020 2030 2040 Minority At Poverty Level 929 2%
45,701 45,701 63,985 70,783 Minority Below 125% of Poverty Level 1,189 2%
84,183 84,183 89,776 96,383 Source: AGID 2012-16 ACS
Working-Age (15-64) Retired Age (65+)
Figure 26. Working vs. Retired Age Population, 2018.
Source: Florida Department of Elder Affairs (2018).
Table 49. Poverty Status of Senior Population in Indian
River County, 2018. Source: Florida Department of Elder
Affairs (2018).97

70 2020 Indian River CNA
The Profile also provides the Financial Conditions graphic below, which depicts the population distribution of those 65+
in relation to the federal poverty level, the cost of living based on homeownership status, and living conditions (single
vs. a couple; see Figure 27). The cost of living in the county is always above FPL, with the biggest challenges existing for
homeowners and couples.
Financial Conditions
$60,000
$50,000
$40,000
$30,000
Median Income Cost of Living Based on Conditions
$20,000
$10,000
$0
Overall
65+
Single Owner
Single Renter,
Single Owner
Couple Owner Couple Renter, Couple Owner
without
Mortgage
One Bedroom with Mortgage without
Mortgage
One Bedroom with Mortgage
FPL Single-Person Household FPL Two-Person Household
Cost of living is an index of how much income retired older adults require to meet their basic needs to live in their com munity without assistance
Several statistics were also available in the Profile that
speaks to the ability of the older adult population to
access available resources. Of the 65 and older
population, 12% are employed while only 4% are
unemployed (i.e., are a part of the labor force but do not
have a job). Another 78% of the 65+ population receive
Social Security Benefits, while 19% are Supplemental
Security Income recipients. While 6,794 senior residents
are potentially eligible for the Supplemental Nutrition
Assistance Program, only 60% (4,076) of those eligible
are participating. The majority of those 65 and over, do
have access to a vehicle (96% of owner-occupied
households, 72% of renter-occupied households), and
the majority also have internet access (79%). Moreover,
98.8% of the 65+ and older population has access to
health insurance.
According to the Florida Department of Health’s Aging in
Florida Profile, there were few areas in which seniors in
Indian River reported faring better health-wise than
seniors on average living in the State of Florida. A
majority (76.2%) of seniors 65+ living in Indian River,
76.2% reported good, very good, or excellent health
status as compared to 75.7% in the state. In addition,
54.5% of seniors in Indian River ages 65+ reported
meeting aerobic activity recommendations, and 34.8%
reported meeting muscle activity recommendations.
Figure 27. Working vs. Retired Age Population, 2018. Source: Florida Department of Elder Affairs (2018).
$49,009 $44,633
$36,756
$27,900 $27,192 $29,688
$18,336 $20,832

71 2020 Indian River CNA
There were several areas in which seniors in Indian River
fared worse than seniors on average in the state of
Florida. Concerning risky behaviors, 14.2% of seniors
ages 65+ in Indian River County reported being current
smokers, and 16.2% reported being heavy or binge
drinkers, as compared to rates of 8.4% and 8.7% in the
state, respectively. Additionally, only 85.8% of seniors in
Indian River reported having a personal doctor as
compared to 93.2% in the state.
Opinions: Surveys
Overall, the available data show there may be specific
needs for seniors that aren’t being currently met as
several seniors are living below the poverty level, and
there may be some unmet health needs. As such, several
questions were asked of seniors to examine further the
issues that Indian River County’s senior population is
facing. Some areas of interest were whether seniors felt
that there was adequate availability of transportation,
meal delivery, and in-home services. The availability of
recreational services and their general perception of their
community was also investigated. Most seniors reported
that the community is a good place for seniors to live
(87%). Seniors reported having access to free meal
services (77%), and affordable transportation (75%).
Seniors were less likely to agree that affordable in-home
services were available to assist with daily activities, such
as personal care and chores (41%). Residents
highlighted the need for in-home services in open-ended
responses as well and cited loneliness and food insecurity
as potential concerns for isolated seniors.

72 2020 Indian River CNA
Many seniors said they had access to recreational
facilities to stay social (66%) as well as important
informational services (61%) such as legal assistance,
benefits enrollment and navigation, and referral for local
services. However, low-income seniors were less likely to
agree that they had access to these services. The need for
accessible recreational facilities for low-income seniors
was also mentioned in open-ended responses. Open-
ended survey items highlighted the need for behavioral
and specialty care for low-income seniors with advanced
medical needs, especially. Overall, responses suggested
greater quality and availability of services to wealthy,
retired seniors. Higher-income seniors were more likely
than lower-income seniors to agree that recreational
facilities were available for them to stay active and social
in their community (83% vs. 64%). Additionally, only 26%
of seniors rated the quality of low-cost and free services
available to seniors as ‘good’ or ‘great’. Taken together,
disparities with regards to access to several services
exist along socio-economic lines with wealthier seniors
having access and low-income seniors lacking access.
Opinions: Focus Groups
Focus group participants were also asked questions
regarding the quality of life and available services for
seniors. Participants acknowledged greater availability of
community services for seniors compared to other
residents, but also noted a need for expansion and
improved quality of services in some areas. Participants
acknowledged that access to available services for
seniors might also be impacted by lack of awareness,
ability to navigate the system, or limited transportation.
Senior Resource Association (SRA) was mentioned as a
primary resource for seniors. Participants discussed
services offered through and or subsidized by SRA, such
as transportation, Meals on Wheels, and in-home care.
The reaction to the services provided by Meals on Wheels
was mixed. Some participants spoke to the value of the
service provided for homebound residents, while others
questioned the quality of the meals that were offered to
seniors as not being sufficient. The reactions to the in-
home services provided were mostly positive.
Participants also discussed issues related to housing for
seniors, including affordability and quality of assisted
living facilities and nursing homes. Residents explained
that housing costs were too high for seniors living on a
fixed income and Social Security. Residents commented
that if seniors were unable to stay in their homes, that
there would be nowhere for them to go, and they could
end up homeless as many of the retirement communities
cater to the wealthy.
Many participants commented that many assisted facilities and nursing home facilities that catered to lower-income
residents provided low-quality care and inadequate resources to residents and suffered from staffing issues.
Participants commented that the hospitals often receive admits who are seniors living in these facilities with obvious
signs of poor care.
73 2020 Indian River CNA
Participants commented that high-end facilities that catered to wealthier residents were available and of good quality.
In addition, participants remarked that adult daycare facilities were available for residents and mostly had a positive
reputation in the community.
KEY POINTS
• The average age of Indian River County residents is rising, and residents over 65 will make up a larger proportion
of the population by 2030.
• Overall, seniors living in Indian River County report being in good health, though some struggle with
addictive behaviors.
• Housing costs are a major component of the overall quality of life for seniors living in Indian River County. The
availability of affordable housing options has an impact on the quality of life of lower-income seniors.
• A lack of quality, affordable assisted living, residential options for the elderly is also problematic. Residents felt
that income determines both the access and quality of care one receives.

74 2020 Indian River CNA
OTHER EMERGING THEMES
A series of themes emerged from survey and focus group data that are worth mentioning. Residents reported
experiences of discrimination in multiple domains, including housing, education, employment, and healthcare.
For example, residents were concerned about the quality of healthcare for low-income residents, employment
opportunities for individuals with criminal records, treatment of Hispanic youth in schools, and the quality of housing
in minority communities. Residents also described the impact of discrimination on immigrants who may fear
accessing needed social services, healthcare out of fear of being taken into custody or deported.
Community members described transportation challenges in surveys and focus group discussions. Transportation
issues prevent residents from accessing healthcare and employment opportunities. Many residents who don’t own
cars take advantage of free public transportation provided by the Go Line. Still, the service has limited routes and
offers little service on weekends and evenings. Poor lighting and lack of sidewalks present safety concerns for those
walking and/or riding bicycles as a means of transportation.

75 2020 Indian River CNA
In 2016, there were 840 Nonprofits in Indian River County, according to the Nonprofit Market Report. Additionally,
the median giving ratio in Indian River County was 5.6%, higher than the median in the state (3.4%) and the country
(3%). Between 2008 and 2018, the Community Foundation has raised approximately $100 million in charitable
contributions and has awarded more than $50 million in grants, mostly to local philanthropic organizations (Measure
of our Mission Annual Report, 2018). Communities’ members recognized the work of charitable foundations and
described an array of valued services and organizations. However, residents pointed to the need for coordination
and communication of services among the numerous non-profits to improve access and quality. While appreciative
of philanthropic efforts, some residents felt their voices were not heard or respected in decision-making processes.
Others called for increased accountability for non-profits who receive funding to deliver services.
Community members described a lack of awareness of available programs and services as a key factor impacting
service utilization. When asked about the availability of free meals in the summer (21%), free meals during breaks
(38%), and affordable after school programs (27%), only small percentages of parents reported they were aware of
such service offerings. Additionally, only small percentages of seniors knew how to access information services (21%)
or affordable in-home assistance (29%) in their community. Small percentages of residents reported awareness of
educational and job training opportunities (23%) or access to medical care for uninsured residents (26%) as being
available.

76 2020 Indian River CNA
CONCLUSIONS AND RECOMMENDATIONS
The primary issue that repeatedly materialized across all
s in this needs assessment was related to the economic
barriers lower incomes residents in Indian River County
are facing. An ample income usually grants individuals
access to resources that allow for a high-quality life for
community residents — such as access to housing, health
care, quality schools, secure neighborhoods, and time
and money to enjoy recreational activities necessary for
well-being.
Throughout the needs assessment, residents expressed
concerns with economic issues related to the affordability
of basic needs like housing, health care, child care, and
senior care. Creating opportunities for employment that
allow residents to earn enough money to make ends meet,
which is equal to (or even above) a living wage, is key to
improving the lives of county residents. This will likely
involve developing employment opportunities with salaries
that allow residents to meet needs and enhancing training
programs and educational opportunities that align with
growth in higher-paying occupations. Below are several
recommendations that can assist the stakeholders within
the Indian River County community to address barriers and
close gaps.
Encourage collaboration to address
complex, systemic problems, improve
service quality and balance
competing priorities.
Residents identified multi-faceted community issues that
call for systemic changes and cross-sector collaborations,
and many called for organizations to work together to
enhance service quality. Funders can help cultivate
coordination and collaboration by promoting a collective
impact model. Core elements of the collective impact
model include a common goal, shared measurement
systems, mutually reinforcing activities, continuous
communication and backbone support. Within a collective
impact model, organizations can work together to agree
on desired outcomes, align activities, share best practices,
develop referral pathways, and maximize the efficiency of
service delivery. By engaging diverse stakeholders and
incorporating multiple perspectives, initiatives can develop
solutions that balance competing priorities, such as creating
jobs and housing without sacrificing community charm
and culture. Philanthropic organizations can leverage their
position as funders, conveners, and influential community
champions to support collective impact initiatives. For
example, foundations can work to build that capacity and
infrastructure for multiple organizations to work together by
investing in backbone organizations or promoting the use
of a shared measurement system and adopting a systemic,
problem-focused orientation as opposed to focusing on
individual grantees. Additionally, shifting to a long-term
investment strategy with long-term goals may also allow
sufficient time for system-level changes associated with
collective impact initiatives to materialize.
Advocate for a living wage.
A prominent theme of resident responses was the impact
of low wages at jobs available in the community on the
quality of life. Higher wages could help workers and
families afford medical care, health insurance, and quality
housing. According to the MIT Living Wage Calculator, the
hourly rate that an individual must earn to support him or
herself and their family in Indian River County is $10.99 for
a single adult with no children, $27.81 for a single adult with
two children, and $15.18 for two working adults with two
children. However, the current minimum hourly wage in
Florida is $8.46. Philanthropic organizations can leverage
their position as funders to encourage or enable local non-
profits to pay their employees a living wage. In 2016, 840
nonprofits employed a total of 4,484 individuals in Indian
River County, or 9% of the jobs countywide and the
nonprofit sector accounted for 11% of county-wide wages
or provide funding for a workers’ rights group or coalition to
advocate for living wages and other protections for workers.
Assess barriers and improve access to
community services.
Indian River County residents who were aware of
community services often had faced difficulties associated
with accessibility, suggesting the need for implementation
of strategies to help ensure all residents who need
community services can take advantage of them. Program
leaders should identify and eliminate barriers to access for
community services including, physical barriers such as
location & transportation, administrative barriers including
long waits and complicated forms, and social barriers like
stigma and lack of cultural competency.

77 2020 Indian River CNA
For example, according to the Florida Access and
Functional Needs Profile, only 51.1% of families eligible for
WIC were served in 2018, significantly lower than the 68%
served across the state. This suggests some WIC eligible
families may be experiencing barriers to enrollment, such
as distrust or limited literacy, that negatively impact WIC
intake. Many residents described instances of perceived
discrimination when accessing services, suggesting the
need for cultural competency and bias training for
teachers, healthcare providers, and other service delivery
professionals. Other strategies to enhance access to
services and programs include adjusting schedules and/or
location, providing communication assistance for speakers
of other languages, or streamlining program enrollment
procedures. Outreach can be used to increase awareness
of services or bring services directly to users. Outreach
efforts may be particularly important for supporting isolated
seniors. Program leaders can leverage widely recognized
programs that serve seniors, such as community coach or
meals on wheels, to identify isolated seniors, assess needs,
and spread awareness of other available services.
Increase housing stability and quality with
policy, codes enforcement, and resident
empowerment.
Housing quality and affordability issues were among the
top concerns identified in the survey and focus group
responses. Promising policies for a strong local housing
strategy such as the creation and preservation of affordable
housing units and promoting affordability by reducing
barriers to new housing supply should be considered.
Other policies and programs may help residents’ access
and afford private-market homes – such as enforcing fair
housing laws and implementing cost assistance or other
programs to help residents overcome obstacles to
homeownership. Strategies to protect residents against
displacement and poor housing conditions may include the
provision of financial assistance to help homeowners avoid
foreclosures or legal assistance to help renters resolve
conflicts with landlords. The creation and enforcement of
housing and building codes may ensure residential
properties meet minimum health and safety standards.
Housing strategies may be supported by complementary
strategies in the areas of health, education, transportation,
and the environment, such as cost-effective modifications
to the built environment and community infrastructure that
support the health and safety of residents. For example,
adoption or expansion of complete streets can support
residents in maintaining employment, safe routes to
school and help residents stay active and connected while
increasing assistance for home safety modifications may
result in increased improved housing quality as well as
safety for aging adults.
Improve access to healthcare through
expansion, integration, and innovation.
Access to behavioral and specialty care services was an
identified need for youth, seniors, and Indian River County
residents overall. Implementation or expansion of
telehealth may improve access to care for underserved
populations and residents of rural areas. The delivery of
health care through technology can help reduce barriers
for people who have difficulty locating providers or who
have transportation or mobility issues. Telehealth can also
help patients reduce the stigma of visiting certain providers,
such as substance abuse or mental health professionals.
Telehealth has potential applications across the spectrum of
the behavioral health continuum of care, including screening
and assessment, treatment, medication management,
monitoring, the continuation of care, or to deliver education
or facilitate collaboration for multi-disciplinary teams.
Additional strategies for improving care delivery may
include identifying opportunities to integrate primary and
behavioral care, such as developing a rural school-based
health center model and expansion of successful services
such as mobile clinics that deliver needed and valued care
to residents.
Use participatory approaches to build trust
and transparency.
Findings suggested the need for charitable organizations
and foundations to enhance trust and communication with
the constituencies they serve as many residents called for
greater accountability and transparency. Philanthropic
institutions can engage residents as respected
stakeholders in decision making by encouraging non-
grant makers to help set priorities and develop strategies
or inviting non-grant makers to participate in advisory
committees and boards or implementing approaches to
participatory grantmaking. These participatory approaches
to philanthropy may help to build trust, accountability, and
credibility for grantmaking organizations. Participation also
directly empowers communities and leverages the
experiences of residents who are often most affected by
issues. Participatory approaches can help to further the
mission of philanthropy by leading to better decisions and
outcomes, promoting social justice and equity, and
promoting civic and community engagement.

78 2020 Indian River CNA
REFERENCES
i. National League of Cities for Youth, Education, and Families. (2016). Supporting early childhood success action kit.
https://www.nlc.org/resource/supporting-early-childhood-success-action-kit
ii. National League of Cities for Youth, Education, and Families. (2016). Supporting early childhood success action kit.
https://www.nlc.org/resource/supporting-early-childhood-success-action-kit
iii. http://www.flhealthcharts.com/FLQUERY/Population/PopulationRpt.aspx
iv. https://data.census.gov/cedsci/table?q=demographic&g=&hidePreview=true&table=DP05&tid=ACSDP1Y2018.
DP05&lastDisplayedRow=17&vintage=2018&moe=false&mode=
v. http://www.flhealthcharts.com/charts/default.aspx
vi. http://www.flhealthcharts.com/charts/default.aspx
vii. http://www.flhealthcharts.com/charts/default.aspx
viii. http://www.flhealthcharts.com/charts/default.aspx
ix. http://www.flhealthcharts.com/charts/default.aspx
x. http://www.flhealthcharts.com/charts/default.aspx
xi. https://edudata.fldoe.org/ReportCards/Schools.html?school=0000&district=31
xii. https://edstats.fldoe.org/
xiii. https://edstats.fldoe.org/
xiv. https://edstats.fldoe.org/
xv. https://edudata.fldoe.org/ReportCards/Schools.html?school=0000&district=31
xvi. https://edstats.fldoe.org/
xvii. https://edudata.fldoe.org/ReportCards/Schools.html?school=0000&district=31
xviii. http://www.flhealthcharts.com/ChartsReports/rdPage.aspx?rdReport=ChartsProfiles.ChildHealthStatusProfile
xix. http://www.flhealthcharts.com/ChartsReports/rdPage.aspx?rdReport=ChartsProfiles.ChildHealthStatusProfile
xx. http://www.flhealthcharts.com/ChartsReports/rdPage.aspx?rdReport=ChartsProfiles.ChildHealthStatusProfile
xxi. Mulroy, E., & Ewalt, P. (1996). Editorial: Affordable Housing: A Basic Need and a Social Issue. Social Work, 41(3), 245-249.
Retrieved from http://www.jstor.org/stable/23718167.
xxii. Harvard University (2011). Joint Center for Housing Studies. America’s Rental Housing: Meeting Challenges, Building on Opportunities.
Retrieved from http://www.jchs.harvard.edu/ research/publications/americas-rental-housing-meeting-challenges-building-opportunities.
xxiii. Florida Housing Data Clearinghouse (2020). Retrieved from http://flhousingdata.shimberg.ufl.edu
xxiv. Florida Housing Data Clearinghouse (2020). Retrieved from http://flhousingdata.shimberg.ufl.edu
xxv. Florida Housing Data Clearinghouse (2020). Retrieved from http://flhousingdata.shimberg.ufl.edu
xxvi. Florida Housing Data Clearinghouse (2020). Retrieved from http://flhousingdata.shimberg.ufl.edu
xxvii. https://www.census.gov/quickfacts/indianrivercountyflorida
xxviii. Florida Housing Data Clearinghouse (2020). Retrieved from http://flhousingdata.shimberg.ufl.edu
xxix. Florida Housing Data Clearinghouse (2020). Retrieved from http://flhousingdata.shimberg.ufl.edu
xxx. Indian River Affordable Housing Advisory Committee Meeting Presentation (2019).
xxxi. Indian River Affordable Housing Advisory Committee Meeting Presentation (2019)
xxxii. Florida Housing Data Clearinghouse (2020). Retrieved from http://flhousingdata.shimberg.ufl.edu
xxxiii. http://www.tchelpspot.org/wordpress/wpcontent/uploads/2019/03/2019PIT.pdf
xxxiv. http://www.tchelpspot.org/wordpress/wpcontent/uploads/2019/03/2019PIT.pdf
xxxv. http://www.tchelpspot.org/wordpress/wpcontent/uploads/2019/03/2019PIT.pdf
1 http://edr.state.fl.us/Content/area-profiles/county/indianriver.pdf
2 http://edr.state.fl.us/Content/area-profiles/county/indianriver.pdf
3 http://www.flhealthcharts.com/FLQUERY/Population/PopulationRpt.aspx
4 http://edr.state.fl.us/Content/area-profiles/county/indianriver.pdf
5 http://www.flhealthcharts.com/FLQUERY/Population/PopulationRpt.aspx
6 http://www.flhealthcharts.com/FLQUERY/Population/PopulationRpt.aspx
7 https://bit.ly/35QXCTD
8 http://edr.state.fl.us/Content/area-profiles/county/indianriver.pdf
9 https://www.epi.org/publication/the-new-gilded-age-income-inequality-in-the-u-s-by-state-metropolitan-area-and-county/
10 http://edr.state.fl.us/Content/area-profiles/county/indianriver.pdf; https://www.census.gov/quickfacts/fact/table/indianrivercountyflorida/INC910218#INC910218
11 https://bit.ly/2zqltNZ
12 Selected Economic Characteristics. 2014, 2016, 2018
11 https://data.census.gov/cedsci/table?q=DP03%3A%20SELECTED%20ECONOMIC%20CHARACTERISTICS&table=DP03&tid=ACSDP1Y2016.
DP03&lastDisplayedRow=144&hidePreview=true&moe=false&g=0500000US12061_0400000US12_0100000US&vintage=2016&t=
12 Selected Economic Characteristics. 2014, 2016, 2018
ACS 1-Year Estimate Subject Tables (Table ID: DP03).
Retrieved from https://bit.ly/3fF3NPe
ACS 1-Year Estimate Subject Tables (Table ID: DP03).
Retrieved from https://bit.ly/3fF3NPe
13 http://www.flhealthcharts.com/Charts/DataViewer/BirthViewer/BirthViewer.aspx?cid=0021
14 http://www.flhealthcharts.com/Charts/DataViewer/BirthViewer/BirthViewer.aspx?cid=0021
15 http://www.flhealthcharts.com/Charts/DataViewer/BirthViewer/BirthViewer.aspx?cid=0021
16 http://www.flhealthcharts.com/Charts/DataViewer/BirthViewer/BirthViewer.aspx?cid=0021
17 http://www.flhealthcharts.com/Charts/DataViewer/BirthViewer/BirthViewer.aspx?cid=0021
18 http://www.flhealthcharts.com/Charts/DataViewer/DeathViewer/DeathViewer.aspx?indNumber=0269
19 http://www.flhealthcharts.com/Charts/OtherIndicators/NonVitalIndNoGrpDataViewer.aspx?cid=0666
20 http://www.flhealthcharts.com/Charts/OtherIndicators/NonVitalIndNoGrpDataViewer.aspx?cid=0065
21 https://bit.ly/3fF3NPe
22 https://www.myflfamilies.com/programs/childwelfare/dashboard/c-in-ooh.shtml
23 https://edudata.fldoe.org/ReportCards/Schools.html?school=0000&district=31
24 https://edstats.fldoe.org/portal%20pages/Documents/Definitions.pdf
25 https://edstats.fldoe.org/SASWebReportStudio/gotoReportPage.do?pageNumber=30&tocOpen=open
26 https://edstats.fldoe.org/SASWebReportStudio/gotoReportPage.do?pageNumber=30&tocOpen=open

79 2020 Indian River CNA
27 https://edstats.fldoe.org/SASWebReportStudio/gotoReportPage.do?pageNumber=30&tocOpen=open
28 https://edstats.fldoe.org/SASWebReportStudio/gotoReportPage.do?pageNumber=30&tocOpen=open
29 https://edstats.fldoe.org/SASWebReportStudio/gotoReportPage.do?pageNumber=30&tocOpen=open
30 https://edstats.fldoe.org/portal%20pages/Documents/Definitions.pdf
31 https://edstats.fldoe.org/SASWebReportStudio/gotoReportPage.do?pageNumber=30&tocOpen=open
32 https://edstats.fldoe.org/SASWebReportStudio/gotoReportPage.do?pageNumber=30&tocOpen=open
33 https://edstats.fldoe.org/SASWebReportStudio/gotoReportPage.do?pageNumber=30&tocOpen=open
34 https://edstats.fldoe.org/portal%20pages/Documents/Definitions.pdf
35 https://edstats.fldoe.org/SASWebReportStudio/gotoReportPage.do?pageNumber=30&tocOpen=open
36 https://edstats.fldoe.org/SASWebReportStudio/gotoReportPage.do?pageNumber=30&tocOpen=open
37 https://edstats.fldoe.org/SASWebReportStudio/gotoReportPage.do?pageNumber=30&tocOpen=open
38 http://edr.state.fl.us/Content/area-profiles/county/indianriver.pdf
39 http://edr.state.fl.us/Content/area-profiles/county/indianriver.pdf
40 Selected Economic Characteristics. (TableID: DP03). Retrieved from https://bit.ly/3fF3NPe
41 Selected Economic Characteristics. (TableID: DP03). Retrieved from https://bit.ly/3fF3NPe
42 Selected Economic Characteristics. (TableID: DP03). Retrieved from https://bit.ly/3fF3NPe
43 Selected Economic Characteristics. (TableID: DP03). Retrieved from https://bit.ly/3fF3NPe
44 Selected Economic Characteristics. (TableID: DP03). Retrieved from https://bit.ly/3fF3NPe
45 http://unitedwaymiami.org/wp-content/uploads/2019/02/18UW-ALICE-Report_COUNTY_FL_10.31.18.pdf
46 https://www.census.gov/glossary/#term_Unemployed
47 https://www.census.gov/glossary/#term_Unemploymentrate
48 Selected Economic Characteristics: 2014, 2016, 2018 ACS 5-Year Estimates Subject Tables (Table ID: DP03). Retrieved from https://bit.ly/2xVQLvU
49 Selected Economic Characteristics: 2014, 2016, 2018 ACS 5-Year Estimates Subject Tables (Table ID: DP03). Retrieved from https://bit.ly/2xVQLvU
50 http://edr.state.fl.us/Content/area-profiles/county/indianriver.pdf
51 http://edr.state.fl.us/Content/area-profiles/county/indianriver.pdf
52 http://edr.state.fl.us/Content/area-profiles/county/indianriver.pdf
53 http://www.flhealthcharts.com/ChartsReports/rdPage.aspx?rdReport=ChartsProfiles.LifeExpectancyProfile
54 http://www.flhealthcharts.com/ChartsReports/rdPage.aspx?rdReport=ChartsProfiles.LifeExpectancyProfile
55 http://www.flhealthcharts.com/charts/DataViewer/DeathViewer/DeathViewer.aspx?indNumber=0092
56 http://www.flhealthcharts.com/charts/DataViewer/DeathViewer/DeathViewer.aspx?indNumber=0092
57 http://www.flhealthcharts.com/ChartsReports/rdPage.aspx?rdReport=ChartsProfiles.CountyHealthProfile
58 http://www.flhealthcharts.com/ChartsReports/rdPage.aspx?rdReport=ChartsProfiles.CountyHealthProfile
59 http://www.flhealthcharts.com/charts/Brfss/DataViewer.aspx?bid=77
60 http://www.flhealthcharts.com/charts/Brfss/DataViewer.aspx?bid=77
61 http://www.flhealthcharts.com/charts/Brfss/DataViewer.aspx?bid=77
62 http://www.flhealthcharts.com/charts/Brfss/DataViewer.aspx?bid=77
63 http://www.flhealthcharts.com/charts/Brfss/DataViewer.aspx?bid=77
64 http://www.flhealthcharts.com/charts/Brfss/DataViewer.aspx?bid=77
65 http://www.flhealthcharts.com/ChartsReports/rdPage.aspx?rdReport=ChartsProfiles.OpioidUseDashboard
66 http://www.flhealthcharts.com/ChartsReports/rdPage.aspx?rdReport=ChartsProfiles.OpioidUseDashboard
67 http://www.flhealthcharts.com/ChartsReports/rdPage.aspx?rdReport=ChartsProfiles.OpioidUseDashboard
68 https://www.myflfamilies.com/service-programs/samh/prevention/fysas/2018/docs/county-tables/Indian%20River.pdf
69 https://www.myflfamilies.com/service-programs/samh/prevention/fysas/2018/docs/county-tables/Indian%20River.pdf
70 http://www.flhealthcharts.com/charts/Brfss/DataViewer.aspx?bid=77
71 http://www.flhealthcharts.com/charts/Brfss/DataViewer.aspx?bid=77
72 http://www.flhealthcharts.com/charts/OtherIndicators/NonVitalSTDDataViewer.aspx?cid=9767
73 http://www.flhealthcharts.com/charts/OtherIndicators/NonVitalSTDDataViewer.aspx?cid=9767
74 http://www.flhealthcharts.com/charts/OtherIndicators/NonVitalSTDDataViewer.aspx?cid=9767
75 http://www.flhealthcharts.com/charts/OtherIndicators/NonVitalSTDDataViewer.aspx?cid=9767
76 http://www.flhealthcharts.com/charts/OtherIndicators/NonVitalSTDDataViewer.aspx?cid=9767
77 http://www.flhealthcharts.com/ChartsReports/rdPage.aspx?rdReport=HIVAIDS.Dataviewer&rdRequestForwarding=Form
78 http://www.flhealthcharts.com/ChartsReports/rdPage.aspx?rdReport=HIVAIDS.Dataviewer&rdRequestForwarding=Form
79 http://www.flhealthcharts.com/Charts/OtherIndicators/NonVitalIndGrpDataViewer.aspx?cid=9835
79 http://www.flhealthcharts.com/Charts/OtherIndicators/NonVitalIndGrpDataViewer.aspx?cid=9835
80 Coverage Status: 2014, 2016, 2018 ACS 1-Year Estimates Subject Tables (Table ID: S2701); Private v. Public Health Insurance: 2014, 2016, 2018 ACS 1-Year Estimates Data
Profiles (Table ID: DP03). Retrieved from https://bit.ly/3bn5kGc
81 https://www.countyhealthrankings.org/app/florida/2018/rankings/indian-river/county/outcomes/overall/snapshot
82 CARES Engagement Network (2020). Community Health Needs Assessment Health Indicators Report [PDF file]. Retrieved from CHNA Report
83 CARES Engagement Network (2020). Community Health Needs Assessment Health Indicators Report [PDF file]. Retrieved from CHNA Report
84 See CARES Engagement Network (2020). Community Health Needs Assessment Health Indicators Report [PDF file]. Retrieved from CHNA Report
85 See CARES Engagement Network (2020). Community Health Needs Assessment Health Indicators Report [PDF file]. Retrieved from CHNA Report
86 See CARES Engagement Network (2020). Community Health Needs Assessment Health Indicators Report [PDF file]. Retrieved from CHNA Report
87 CARES Engagement Network (2020). Community Health Needs Assessment Health Indicators Report [PDF file]. Retrieved from CHNA Report
88 CARES Engagement Network (2020). Community Health Needs Assessment Health Indicators Report [PDF file]. Retrieved from CHNA Report
89 Rhone, A., Ploeg, M. V., Dicken, C., Williams, R., & Breneman, V. (January 2017). Low-Income and Low-Supermarket-Access Census Tracts, 2010-2015 [PDF file]. United States
Department of Agriculture, EIB-165, 1-17. Retrieved from https://www.ers.usda.gov/webdocs/publications/82101/eib-165.pdf?v=0
90 CARES Engagement Network (2020). Community Health Needs Assessment Health Indicators Report [PDF file]. Retrieved from CHNA Report
91 Rhone, A., Ploeg, M. V., Dicken, C., Williams, R., & Breneman, V. (January 2017). Low-Income and Low-Supermarket-Access Census Tracts, 2010-2015 [PDF file]. United States
Department of Agriculture, EIB-165, 1-17. Retrieved from https://www.ers.usda.gov/webdocs/publications/82101/eib-165.pdf?v=0
92 http://elderaffairs.state.fl.us/doea/pubs/stats/County_2018/Counties/Indian%20River.pdf
93 http://elderaffairs.state.fl.us/doea/pubs/stats/County_2018/Counties/Indian%20River.pdf
94 http://elderaffairs.state.fl.us/doea/pubs/stats/County_2018/Counties/Indian%20River.pdf
95 http://elderaffairs.state.fl.us/doea/pubs/stats/County_2018/Counties/Indian%20River.pdf
96 http://elderaffairs.state.fl.us/doea/pubs/stats/County_2018/Counties/Indian%20River.pdf
97 http://elderaffairs.state.fl.us/doea/pubs/stats/County_2018/Counties/Indian%20River.pdf
80 2020 Indian River CNA
National League of Cities for Youth, Education, and Families. (2016). Supporting early childhood success action kit. https://www.nlc.org/resource/supporting-
early-childhood-success-action-kit
National League of Cities for Youth, Education, and Families. (2016). Supporting early childhood success action kit. https://www.nlc.org/resource/supporting-
early-childhood-success-action-kit
http://www.flhealthcharts.com/FLQUERY/Population/PopulationRpt.aspx
https://data.census.gov/cedsci/table?q=demographic&g=&hidePreview=true&table=DP05&tid=ACSDP1Y2018.
DP05&lastDisplayedRow=17&vintage=2018&moe=false&mode=
http://www.flhealthcharts.com/charts/default.aspx
http://www.flhealthcharts.com/charts/default.aspx
http://www.flhealthcharts.com/charts/default.aspx
http://www.flhealthcharts.com/charts/default.aspx
http://www.flhealthcharts.com/charts/default.aspx
http://www.flhealthcharts.com/charts/default.aspx
https://edudata.fldoe.org/ReportCards/Schools.html?school=0000&district=31
https://edstats.fldoe.org/
https://edstats.fldoe.org/
https://edudata.fldoe.org/ReportCards/Schools.html?school=0000&district=31
https://edstats.fldoe.org/
https://edudata.fldoe.org/ReportCards/Schools.html?school=0000&district=31
http://www.flhealthcharts.com/ChartsReports/rdPage.aspx?rdReport=ChartsProfiles.ChildHealthStatusProfile
http://www.flhealthcharts.com/ChartsReports/rdPage.aspx?rdReport=ChartsProfiles.ChildHealthStatusProfile
http://www.flhealthcharts.com/ChartsReports/rdPage.aspx?rdReport=ChartsProfiles.ChildHealthStatusProfile

81 2020 Indian River CNA
Appendix A: Community Resource Examples
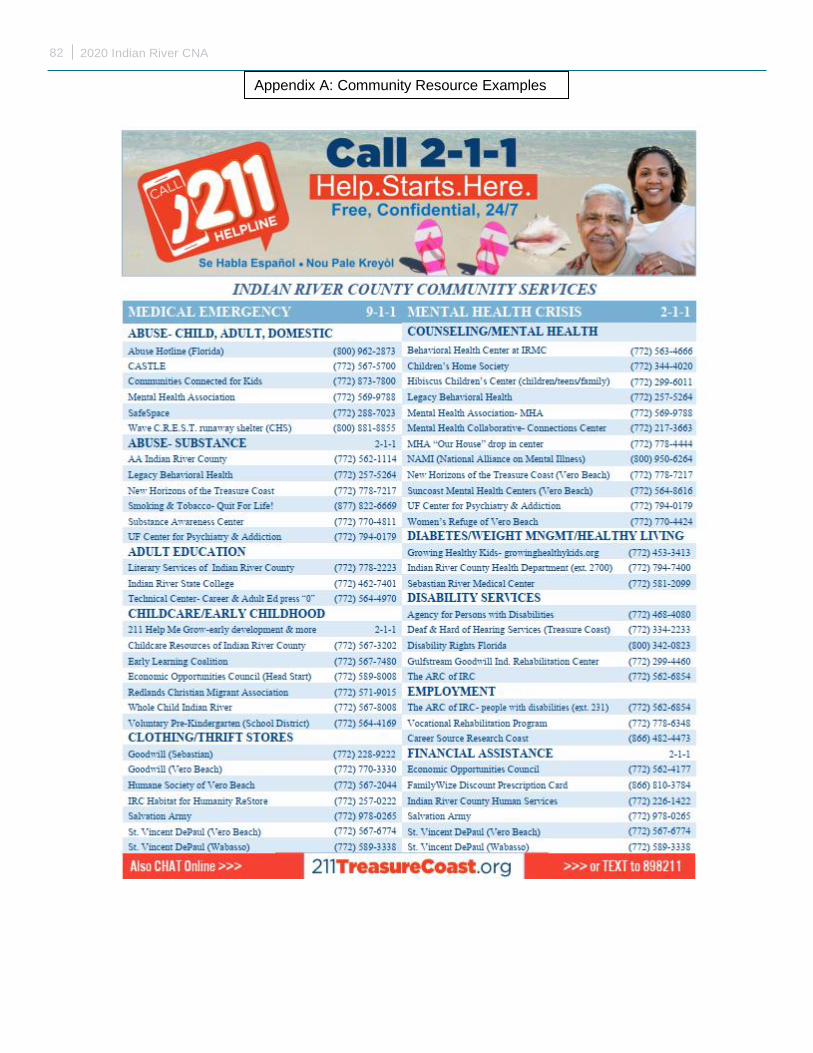
82 2020 Indian River CNA
Appendix A: Community Resource Examples

83 2020 Indian River CNA
Appendix A: Community Resource Examples

Q-Q Research Consultants 15495 Eagle Nest Ln, Suite 210 Miami Lakes, FL 33014
P 305-999-QQRC (7772)
www.qqresearchconsultants.com
Related Documents