ABSTRACT Title of Document: INDIAN MUSLIM WOMEN’S EDUCATION AND EMPLOYMENT IN THE CONTEXT OF MODERNIZATION, RELIGIOUS DISCRIMINATION AND DISADVANTAGE, AND THE RISE OF HINDU FUNDAMENTALISM AND MUSLIM IDENTITY POLITICS Sonya Rastogi, Doctor of Philosophy, 2007 Directed By: Associate Professor, Sonalde Desai, Department of Sociology Research on Muslim women in India has increased in recent years, but remains sparse. The few existing studies rarely examine the interplay of religion and gender on Muslim women, nor do they investigate the historical influences shaping Muslim women’s lives. Using the National Sample Survey (NSS), this dissertation seeks to make a unique contribution to the literature by examining Muslim women’s educational enrollment and wage employment in the context of three historical forces: modernization, religious discrimination and disadvantage, and the rise of Hindu fundamentalism and Muslim identity politics. We find that modernization has played an important role in increasing school enrollment for children ages 12 to 15. Modernizing forces have also influenced employment in India, modestly increasing wage employment. While Muslims have

Welcome message from author
This document is posted to help you gain knowledge. Please leave a comment to let me know what you think about it! Share it to your friends and learn new things together.
Transcript
ABSTRACT
Title of Document: INDIAN MUSLIM WOMEN’S EDUCATION
AND EMPLOYMENT IN THE CONTEXT OF MODERNIZATION, RELIGIOUS DISCRIMINATION AND DISADVANTAGE, AND THE RISE OF HINDU FUNDAMENTALISM AND MUSLIM IDENTITY POLITICS
Sonya Rastogi, Doctor of Philosophy, 2007 Directed By: Associate Professor, Sonalde Desai, Department
of Sociology
Research on Muslim women in India has increased in recent years, but
remains sparse. The few existing studies rarely examine the interplay of religion and
gender on Muslim women, nor do they investigate the historical influences shaping
Muslim women’s lives. Using the National Sample Survey (NSS), this dissertation
seeks to make a unique contribution to the literature by examining Muslim women’s
educational enrollment and wage employment in the context of three historical forces:
modernization, religious discrimination and disadvantage, and the rise of Hindu
fundamentalism and Muslim identity politics.
We find that modernization has played an important role in increasing school
enrollment for children ages 12 to 15. Modernizing forces have also influenced
employment in India, modestly increasing wage employment. While Muslims have
benefited from modernizing forces, they continue to face discrimination and
disadvantage in the educational system and labor market; therefore they have lower
levels of school enrollment and slightly lower engagement in wage employment
compared to non-scheduled caste Hindus. There is also evidence that the rise of
Hindu fundamentalism has had a negative impact on Muslim enrollment and wage
employment over time, however these effects appear greater for Muslim enrollment
compared to Muslim wage employment. Evidence suggests that enrollment for
Muslims above the poverty line may have been more affected by Hindu
fundamentalism relative to poorer Muslims from 1983 to 1987; however, wealthier
and poorer Muslims appear similarly affected by Hindu fundamentalism after 1987.
Contrary to expectations, results suggest that poorer Muslim’s wage employment is
more affected by the rise of Hindu fundamentalism relative to wealthier Muslims. As
expected, the interplay of religion and gender has affected Muslim women’s
enrollment and wage employment. Specifically, they experience lower levels of
enrollment and wage employment compared to Muslim men and Hindu men and
women. Muslim women have been further affected by the rise of Hindu
fundamentalism and Muslim identity politics in both enrollment and wage
employment. However, it appears that these factors have been relatively more
detrimental to Muslim women’s wage employment compared to their enrollment.
INDIAN MUSLIM WOMEN’S EDUCATION AND EMPLOYMENT IN THE CONTEXT OF MODERNIZATION, RELIGIOUS DISCRIMINATION AND DISADVANTAGE, AND THE RISE OF HINDU FUNDAMENTALISM AND
MUSLIM IDENTITY POLITICS
By
Sonya Rastogi
Dissertation submitted to the Faculty of the Graduate School of the University of Maryland, College Park, in partial fulfillment
of the requirements for the degree of Doctor of Philosophy
2007 Advisory Committee: Professor Sonalde Desai, Chair Professor Roger Betancourt Dr. Smita Jassal Professor Joan Kahn Professor Reeve D. Vanneman
© Copyright by Sonya Rastogi
2007
ii
Dedication
To Langston.
iii
Acknowledgements
I would like to thank my advisor Sonalde Desai for her guidance, insight, and support throughout my graduate career. I thank Reeve Vanneman and Joan Kahn for their support over the years. I thank my committee for their thoughtful comments and suggestions: Sonalde Desai, Reeve Vanneman, Joan Kahn, Smita Jassal, and Roger Betancourt. I thank my many friends and colleagues in graduate school: Kim Nguyen, Megan Klein Hattori, Melissa Scopilliti, Veena Kulkarni, Michelle Corbin, Vanessa Wight, Sophia Checha, Zsuzsa Daczo, Hannah Brenkert, Sandee Pyne, Aparna Sundaram, Mitali Sen, Lekha Subaiya, Sangeeta Parashar, James Noon, Lijuan Wu, Cecily Adams, Shyam KC, Diana Elliott, Chris Andrews, Tracy Roberts, Elena Fazio, Sara Raley, Tony Hatch, and countless others who have made an important impact on my graduate experience. I would like to thank the whole sociology staff, but particularly, for always making life easier, Gerry Todd. I thank Leslie and Lila Porter. I thank my parents Anil and Anjali Rastogi, sister and brother in law, Priya and Corey Leimer for their love and support through the years. I thank my beautiful nieces Mikayla and Sophia for being born. Finally, I would like to thank Langston C. Porter, for challenging, inspiring, and motivating me to become a better person and scholar, for staying up late at night reading papers and chapters, for making numerous sacrifices to enable me to pursue my Masters and PhD, and for innumerable other acts that helped me pursue this chapter in our lives. I love you.
iv
Table of Contents Dedication ii Acknowledgements iii Table of Contents iv List of Tables vi List of Figures x Introduction 1 Chapter 1: Communal Tensions and the Rise of Hindu Fundamentalism, Religion, And Patriarchy in India 6 Post-Colonial Communal Tensions and the Rise of Hindu Fundamentalism 6 Muslim Disadvantage and Discrimination in India 13 Patriarchy: Hindu and Muslim Women in India 18 Conclusion 24 Chapter 2: Modernization, Religious Disadvantage and Discrimination, and the Rise of Hindu Fundamentalism and Muslim Identity Politics 26 Modernization and Secular Changes 27 Modernization and Female Education and Employment 32 Muslim Education and Employment: Disadvantage, Discrimination, and Segmentation 39 Rising Tide of Fundamentalism and Identity Politics 46 Conclusion 52 Chapter 3: Conceptual Framework and Hypotheses 53 Conceptual Framework 53 Hypotheses 60 Chapter 4: Data; Dependent, Independent, and Control Variables; and Research Design and Methods 72 Data 72 Dependent Variables and Sample 73 Independent and Control Variables 82 Research Design and Methods 87 Chapter 5: Educational Enrollment in the Context of Modernization, Religious Disadvantage and Discrimination, and the Rise of Hindu Fundamentalism and Muslim Identity Politics 92 Modernization and Secular Changes 92 Religious Discrimination and Disadvantage 96 Gender and Religious Discrimination and Disadvantage 99 The Rise of Hindu Fundamentalism and Muslim Identity Politics 99 Conclusion 102 Chapter 6:Wage Employment in the Context of Modernization, Religious Disadvantage and Discrimination, and the Rise of Hindu Fundamentalism and Muslim Identity Politics 105 Modernization and Secular Changes 105 Religious Discrimination and Disadvantage 112 Gender and Religious Discrimination and Disadvantage 116
v
The Rise of Hindu Fundamentalism and Muslim Identity Politics 116 Conclusion 120 Chapter 7: Discussion and Conclusion: School Enrollment and Wage Employment in the Context of Modernization, Religious Disadvantage and Discrimination, and the Rise of Hindu Fundamentalism and Muslim Identity Politics 122 Modernization and Secular Changes 122 Religious Discrimination and Disadvantage 128 Gender and Religious Discrimination and Disadvantage 129 The Rise of Hindu Fundamentalism and Muslim Identity Politics 130
vi
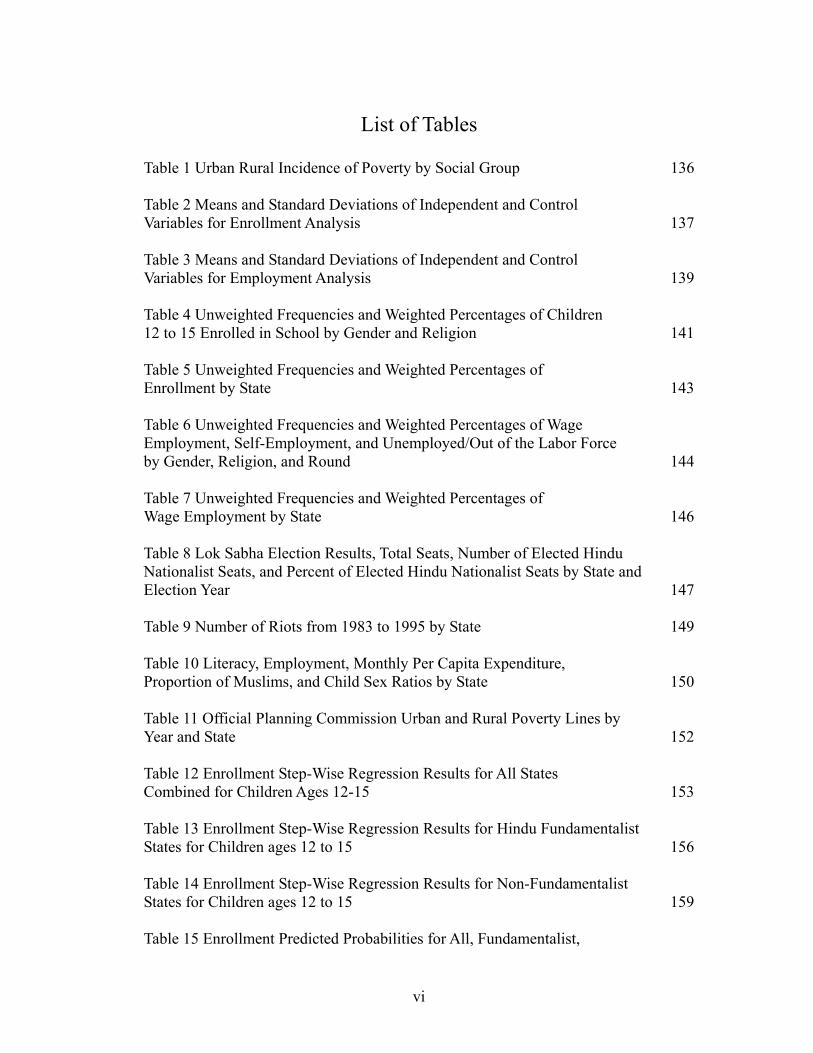
List of Tables Table 1 Urban Rural Incidence of Poverty by Social Group 136 Table 2 Means and Standard Deviations of Independent and Control Variables for Enrollment Analysis 137 Table 3 Means and Standard Deviations of Independent and Control Variables for Employment Analysis 139 Table 4 Unweighted Frequencies and Weighted Percentages of Children 12 to 15 Enrolled in School by Gender and Religion 141 Table 5 Unweighted Frequencies and Weighted Percentages of Enrollment by State 143 Table 6 Unweighted Frequencies and Weighted Percentages of Wage Employment, Self-Employment, and Unemployed/Out of the Labor Force by Gender, Religion, and Round 144 Table 7 Unweighted Frequencies and Weighted Percentages of Wage Employment by State 146 Table 8 Lok Sabha Election Results, Total Seats, Number of Elected Hindu Nationalist Seats, and Percent of Elected Hindu Nationalist Seats by State and Election Year 147 Table 9 Number of Riots from 1983 to 1995 by State 149 Table 10 Literacy, Employment, Monthly Per Capita Expenditure, Proportion of Muslims, and Child Sex Ratios by State 150 Table 11 Official Planning Commission Urban and Rural Poverty Lines by Year and State 152 Table 12 Enrollment Step-Wise Regression Results for All States Combined for Children Ages 12-15 153 Table 13 Enrollment Step-Wise Regression Results for Hindu Fundamentalist States for Children ages 12 to 15 156 Table 14 Enrollment Step-Wise Regression Results for Non-Fundamentalist States for Children ages 12 to 15 159 Table 15 Enrollment Predicted Probabilities for All, Fundamentalist,
vii
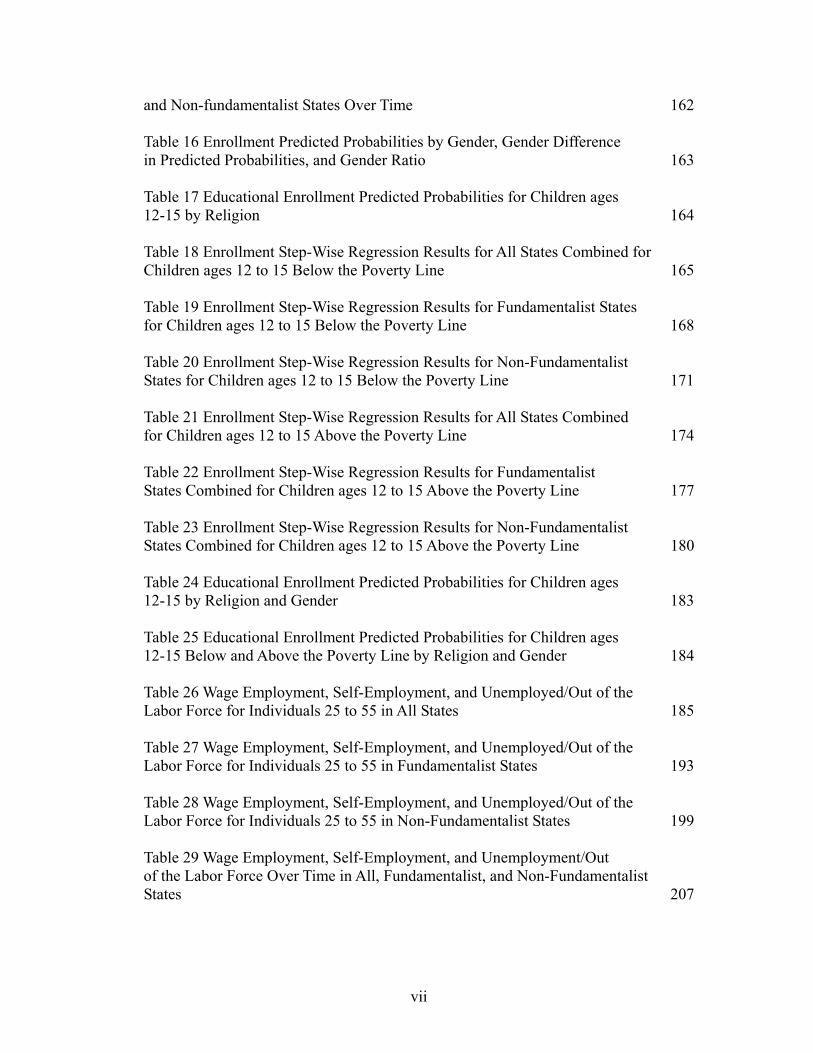
and Non-fundamentalist States Over Time 162 Table 16 Enrollment Predicted Probabilities by Gender, Gender Difference in Predicted Probabilities, and Gender Ratio 163 Table 17 Educational Enrollment Predicted Probabilities for Children ages 12-15 by Religion 164 Table 18 Enrollment Step-Wise Regression Results for All States Combined for Children ages 12 to 15 Below the Poverty Line 165 Table 19 Enrollment Step-Wise Regression Results for Fundamentalist States for Children ages 12 to 15 Below the Poverty Line 168 Table 20 Enrollment Step-Wise Regression Results for Non-Fundamentalist States for Children ages 12 to 15 Below the Poverty Line 171 Table 21 Enrollment Step-Wise Regression Results for All States Combined for Children ages 12 to 15 Above the Poverty Line 174 Table 22 Enrollment Step-Wise Regression Results for Fundamentalist States Combined for Children ages 12 to 15 Above the Poverty Line 177 Table 23 Enrollment Step-Wise Regression Results for Non-Fundamentalist States Combined for Children ages 12 to 15 Above the Poverty Line 180 Table 24 Educational Enrollment Predicted Probabilities for Children ages 12-15 by Religion and Gender 183 Table 25 Educational Enrollment Predicted Probabilities for Children ages 12-15 Below and Above the Poverty Line by Religion and Gender 184 Table 26 Wage Employment, Self-Employment, and Unemployed/Out of the Labor Force for Individuals 25 to 55 in All States 185 Table 27 Wage Employment, Self-Employment, and Unemployed/Out of the Labor Force for Individuals 25 to 55 in Fundamentalist States 193 Table 28 Wage Employment, Self-Employment, and Unemployed/Out of the Labor Force for Individuals 25 to 55 in Non-Fundamentalist States 199 Table 29 Wage Employment, Self-Employment, and Unemployment/Out of the Labor Force Over Time in All, Fundamentalist, and Non-Fundamentalist States 207
viii
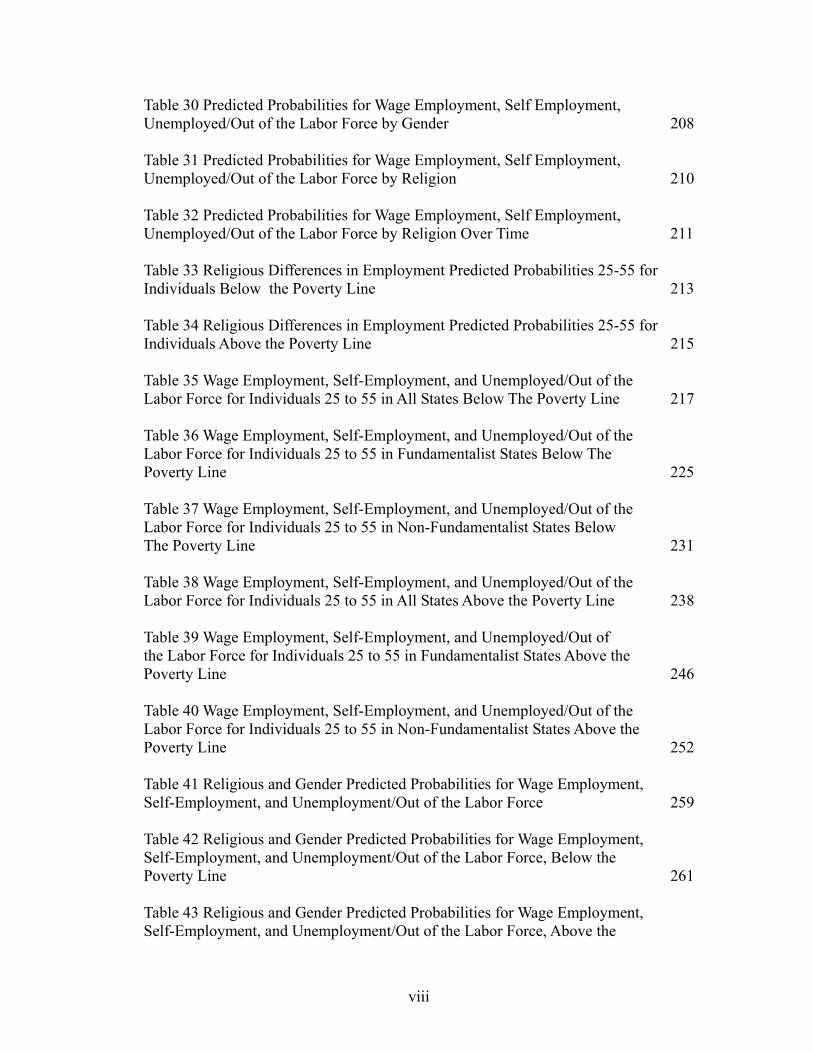
Table 30 Predicted Probabilities for Wage Employment, Self Employment, Unemployed/Out of the Labor Force by Gender 208 Table 31 Predicted Probabilities for Wage Employment, Self Employment, Unemployed/Out of the Labor Force by Religion 210 Table 32 Predicted Probabilities for Wage Employment, Self Employment, Unemployed/Out of the Labor Force by Religion Over Time 211 Table 33 Religious Differences in Employment Predicted Probabilities 25-55 for Individuals Below the Poverty Line 213 Table 34 Religious Differences in Employment Predicted Probabilities 25-55 for Individuals Above the Poverty Line 215 Table 35 Wage Employment, Self-Employment, and Unemployed/Out of the Labor Force for Individuals 25 to 55 in All States Below The Poverty Line 217 Table 36 Wage Employment, Self-Employment, and Unemployed/Out of the Labor Force for Individuals 25 to 55 in Fundamentalist States Below The Poverty Line 225 Table 37 Wage Employment, Self-Employment, and Unemployed/Out of the Labor Force for Individuals 25 to 55 in Non-Fundamentalist States Below The Poverty Line 231 Table 38 Wage Employment, Self-Employment, and Unemployed/Out of the Labor Force for Individuals 25 to 55 in All States Above the Poverty Line 238 Table 39 Wage Employment, Self-Employment, and Unemployed/Out of the Labor Force for Individuals 25 to 55 in Fundamentalist States Above the Poverty Line 246 Table 40 Wage Employment, Self-Employment, and Unemployed/Out of the Labor Force for Individuals 25 to 55 in Non-Fundamentalist States Above the Poverty Line 252 Table 41 Religious and Gender Predicted Probabilities for Wage Employment, Self-Employment, and Unemployment/Out of the Labor Force 259 Table 42 Religious and Gender Predicted Probabilities for Wage Employment, Self-Employment, and Unemployment/Out of the Labor Force, Below the Poverty Line 261 Table 43 Religious and Gender Predicted Probabilities for Wage Employment, Self-Employment, and Unemployment/Out of the Labor Force, Above the

ix
Poverty Line 263
x
List of Figures
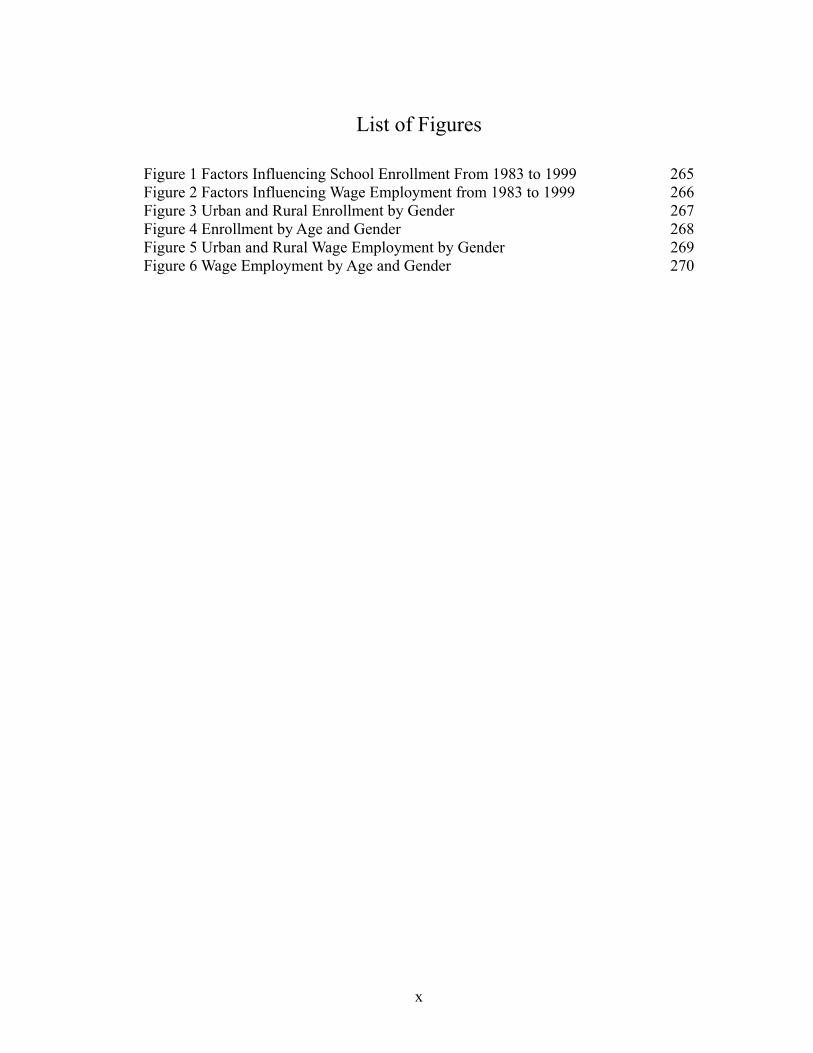
Figure 1 Factors Influencing School Enrollment From 1983 to 1999 265 Figure 2 Factors Influencing Wage Employment from 1983 to 1999 266 Figure 3 Urban and Rural Enrollment by Gender 267 Figure 4 Enrollment by Age and Gender 268 Figure 5 Urban and Rural Wage Employment by Gender 269 Figure 6 Wage Employment by Age and Gender 270
1
Introduction
Muslim women in India are a disadvantaged group often marginalized in
scholarly literature and policy interventions. Over the past few decades, researchers,
international agencies, and the Indian government have paid particular attention to
gender issues in India, however, explicitly and implicitly these issues tend to focus
primarily on Hindu women. This occurs in large part because Hindus are the majority
in India. Researchers focus on Hindu women because it is necessary to bring to light
the patriarchal obstacles facing the majority of women in India. In addition,
individuals in positions to conduct scholarly research or frame policy interventions
tend to overwhelmingly be Hindu, contributing to the bias towards research on Hindu
women. As a result, less is known about the experience of Muslim women in India.
Recently, there has been an increasing interest in the issues Muslims face, as
illustrated by the recent publication of The Social, Economic, and Educational Status
of the Muslim Community of India: a Report1, commissioned by the Indian Prime
Minister to address the dearth of information regarding Muslims in India. However,
literature on Muslims is still in its infancy and often looks at all Muslims, grouping
Muslim men and women together. While some scholars, particularly Zoya Hasan and
Ritu Menon (2005a, 2005b) have made considerable inroads in research on Indian
Muslim women, few studies contain a comprehensive framework centering on the
interplay of religion and gender on Muslim women, and virtually none focus on how
these relationships have been modified by historical forces. Moreover, little research
has empirically examined the effect of these forces on Muslim women’s lives. A
2
primary aim of this dissertation is to contribute to this nascent literature on Indian
Muslim women, focusing on changes in education and employment over the last two
decades of the 20th century.
Over the past thirty years, India has experienced tremendous social, political,
and economic change. Many of these changes have been salient to Muslim women’s
lives. This dissertation argues that three factors have influenced their experience:
modernizing forces, religious discrimination and disadvantage, and the intricate
relationship between the rise of Hindu fundamentalism and the Muslim community’s
response to this threat.
Modernization is a process, which involves economic growth, urbanization,
and industrialization. For developing countries, it also entails the diffusion of
Western ideas and systems. Modernization causes immense transformations in
societies such as changes in education, employment, gender roles, and ideologies
(Inglehart and Baker 2000). While these changes are not always positive, particularly
for women (Boserup 1970), this dissertation argues that modernization has expanded
education and employment opportunities for Hindu and Muslim men and women.
However, for Muslim men and women, modernizing forces are often
moderated by historical disadvantage and religious discrimination. Historically,
occupational and educational mobility in India has been limited. Influenced by an
occupationally based caste system, individuals have been generally expected to
remain in the same social and economic position as their parents and ancestors.
While this is changing for some disadvantaged groups, particularly scheduled castes
1 Otherwise known as the Sachar Committee Report.
3
and scheduled tribes2 who benefit from affirmative action programs in public
employment and education, Muslims are generally not afforded this assistance despite
the disadvantages they face. The disadvantage Muslims have experienced in the past
and continue to experience is in part a product of religious discrimination. Muslims
face considerable discrimination in both employment (Hasan 2005, Khandker 1992)
and education (Jeffery et. al. 2005). Evidence also suggests that discrimination
against Muslims is increasing (Basu 1997, Jeffery and Jeffery 2005). This
dissertation argues that Muslim men and women have lower levels of wage
employment and education because of past and current disadvantage and
discrimination. Moreover, this disadvantage may have intensified in recent decades
due to increased communal tensions.
India has been experiencing a deepening religious divide and a rise in Hindu
fundamentalism resulting in an increasingly defensive response from the Muslim
community. This may have a unique influence on Indian Muslim women. When
minority groups are threatened or attempt to gain previously denied social, political,
and economic resources, they often try to create unity among group members.
Various literatures argue that there are often negative implications for women within
these communities, particularly among groups defining their identity in religious
terms. However, literature discussing these issues primarily emerges from the field of
cultural studies and tends to lack an empirical basis. The impact of these forces on
women’s day to day experiences in such areas as education and employment
2 In 1950, the Indian Constitution gave special status to lower castes and tribes. Lower castes have been historically marginalized in the Indian caste system, working menial jobs with little chance for upward mobility, facing considerable discrimination. Tribes are indigenous ethnic minorities,
4
consequently have received little attention. This dissertation makes a unique
contribution to the literature by empirically analyzing changes in gender disparities in
education and employment among Muslims, and by comparing them to similar
changes among Hindus, in an era during which the rise of Hindu fundamentalism and
the Muslim community’s response to it has dominated the lives of Muslim men and
women.
While modernization, religious discrimination and disadvantage, and the
complex relationship between the rise of Hindu fundamentalism and the Muslim
community’s response are three potentially important features influencing Muslim
women’s lives, no study has examined these factors simultaneously. Using the
National Sample Survey (NSS), this dissertation seeks to broaden our understanding
of Indian Muslim women’s education and wage employment in the context of these
three important factors.
The first chapter of this dissertation addresses post-colonial Hindu-Muslim
communal tensions and the rise of Hindu fundamentalism; Muslim disadvantage and
discrimination; and patriarchal constraints Hindu and Muslim women experience.
The second chapter discusses modernization’s influence on education, and
employment; Muslim disadvantage and discrimination in employment and education;
and the potential impact of the rise of Hindu fundamentalism and the Muslim
community’s response on Muslim women. The third chapter describes my conceptual
framework and hypotheses. Chapter four describes the dependent, independent and
control variables; and research design and methods. The fifth and sixth chapters
generally living in remote hilly forest areas. The term schedule is used because the constitution listed castes and tribes eligible for this special status in schedules.
5
present the enrollment and wage employment analysis results respectively. Finally,
the seventh chapter discusses the enrollment and employment results and concludes
this dissertation.
6
Chapter 1: Communal Tensions and the Rise of Hindu Fundamentalism, Religion, and Patriarchy in India
Tensions between Hindus, the majority group in India making up 80.5 percent
of the population, and Muslims, the largest minority group comprising 13.4 percent of
the population (Census of India 2001)3, have escalated over the past several decades.
This recent outbreak of religious tensions has adverse consequences for all Muslims,
but may uniquely affect Muslim women. Muslim women experience the
disadvantage and discrimination that affect all Muslims and experience patriarchal
practices that all women face in India. In addition, Muslim women’s experience is
influenced by the intersection between their affiliation with a religious community
and their gender. This chapter provides a context for the Muslim experience in India,
focusing on both the Muslim community as a whole and Indian Muslim women. The
first section discusses the intricate relationship between Hindus and Muslims
highlighting post-colonial communal tensions and the rise of Hindu fundamentalism
in India. The second section addresses the disadvantage and discrimination that
Muslims face in India. Finally, the third section describes the patriarchal customs and
constraints experienced by Hindu and Muslim women.
Post-Colonial Communal Tensions and the Rise of Hindu Fundamentalism
Relations between Hindus and Muslims in India have changed over the years
depending on, among other factors, historical circumstances. There are many
instances in Indian history where Hindus and Muslims have lived peacefully with one
another and other horrific occurrences where events have culminated in communal
7
violence. Similar to many inter-group conflicts throughout the world, religious
identities have been exploited to create divisions between Hindus and Muslims in
India. A common idea propagated by the British colonial power, both Hindu and
Muslim communalists and a belief absorbed among the wider population is that
Hindu Muslim tensions are primordial and continuous (Thapar 2005). However, in
reality, the construction of Hindu-Muslim religious identities have depended on space
and time and are often related to the political interests of various groups. This section
discusses the variegated and complex relationship between Hindus and Muslims in
India, highlighting post-colonial Hindu and Muslim communal tensions and the rise
of Hindu fundamentalism.
While Hindu and Muslim relations were at times contentious during British
colonial rule, communal tensions reached an apex during the Partition of India in
1947, when East and West Pakistan4 were carved out of the Indian subcontinent. As
riots between Hindus and Muslims engulfed India, particularly the northwestern part
of the country, hundreds of thousands, and by some estimates, millions of people
were massacred (Collins and Lapierre 1975, Wolpert 1993). In the 20 years
following the partition, most Hindus left East and West Pakistan and migrated to
India, however, for Muslims, migration out of India proved relatively more difficult.
While many Muslims, particularly the middle class, migrated from India to Pakistan,
a substantial proportion of Muslims remained in India. After the separation of
Bangladesh from Pakistan in 1971, modern India became the home to the largest
3 Christians, Sikhs, Buddhists, Jains, and others make up about 6 percent of the Indian population. 4 Upon independence from Pakistan in 1971, East Pakistan became Bangladesh.
8
block of Muslims in South Asia. However, the partition served to create serious
divisions between Indian Muslims and their Hindu brethren.
After the Partition, although sectarian violence was subdued, tensions
continued to simmer. There was an upsurge in riots from 1964 to 1971. Hindu
nationalism rose during the Indo-Pakistan war of 1965, where Hindu mistrust of
Muslims is evident in the rhetoric claiming that Muslims are Pakistani spies who give
signals to Pakistani aircraft (Banerjee 1990). Religious tensions and violence
subsided from 1971 to the late 1970s, only to rise again with increasing Hindu
fundamentalism (Banerjee 1990).
While political Hinduism existed in the 1950s and 1960s, it was relatively
more prevalent among Hindu upper castes compared to other castes.5 Increasingly,
campaigns against Muslims and political maneuvers in the 1970s slowly led to the
spread of Hindu fundamentalism, bringing more moderate Hindus into the
fundamentalist fold, sowing the seeds for Hindu fundamentalism to intensify in the
1980s and 1990s. During the 1970s, the Rashtriya Swayamsevak Sangh (RSS), the
association of national volunteers, and Vishwa Hindu Parishad (VHP), two Hindu
political parties under the wider coalition of Sangh Parivar, meaning Family of
Associations, resumed the spread of negative stereotypes and propaganda about
Muslims. Fueled by the supposed mosque restorations funded by petro-dollars6,
campaigns to build Hindu temples were initiated. Propaganda also proliferated about
the Muslim population overtaking the Hindu population because of higher Muslim
fertility (Banerjee 1990).
5 Many upper caste Hindus had strong secular leanings, however those engaged in political Hinduism in the 1950s and 1960s tended to belong to upper castes.
9
However, the RSS and a newly founded Hindu nationalist party, the Bharatiya
Janata Party (BJP) did not have complete legitimacy among the majority of Hindus
until they became symbols of anti-authoritarianism (Banerjee 1990). In the 1970s,
Indira Gandhi was convicted of election fraud and was forced to resign, however,
instead of resigning, she suspended the constitution and called a national emergency
that lasted for 18 months (Keay 2000). In addition to inhumane slum removal and
birth control campaigns, numerous people were jailed and the press was censored. It
is in this context that the BJP and RSS became the antithesis of Indira Gandhi’s
authoritarian measures. They made gains politically in the 1977 elections by joining
the ruling coalition, Janata party (Banerjee 1990). When Indira Gandhi returned to
power in 1980, she did so by capitulating to the ever growing powerful Hindu
component, often by supporting the Hindu police and political parties involved in
Hindu-Muslim riots, denouncing minorities for not assimilating to India (Banerjee
1990), and stating that foreign interference from Pakistan is to blame for Hindu-
Muslim riots (Brass 2003).
The reach of Hindu fundamentalist parties continued to expand. New front
political organizations were created for lower castes who felt uncomfortable with the
upper caste dominated RSS and for those Hindus who did not want to be identified as
members of RSS (Banerjee 1990). Furthermore, the RSS tried to capture scheduled
caste7 allegiance by trying to cause conflict between scheduled castes and poor
minorities. To rally support for a fundamentalist agenda, the VHP and other
6 Money from oil rich Islamic countries in the Middle East. 7 In 1950, the Indian Constitution gave special status to lower castes. Lower castes have been historically marginalized in the Indian caste system, working menial jobs with little chance for upward
10
organizations used the issue of conversions from Hinduism to Islam to demonstrate
that Hinduism was under attack. These parties used the scheduled caste conversions
in Meenakshipuram, Tamil Nadu in January of 1981 to bolster their argument that
Hinduism is threatened by Islamic Fundamentalism and the power of petro-dollars
(Banerjee 1990). Not only were counter-conversions arranged, but campaigns, which
were particularly effective for mobilizing the middle and lower-middle classes, were
organized around the idea that “I am not ashamed to be a Hindu” (Banerjee 1990).
All of these activities led to the spread of Hindu fundamentalism from mid-sized
towns to small and large cities (Banerjee 1990).
Tensions between Hindus and Sikhs, a minority religious group in India
comprising 2 percent of the population, following the assassination of Indira Gandhi
by one of her Sikh bodyguards catapulted Hindu fundamentalist and nationalist
rhetoric at the forefront of politics (Banerjee 1990). Sikh political parties and the
Congress party battled for power, particularly in the state of Punjab, where the
majority of Sikhs reside. In June 1984, to route out Sikh militants, Indira Gandhi
initiated Operation Bluestar, a raid on an important temple that was a base for alleged
Sikh militants. This fueled the fire of Hindu and Sikh communalism culminating in
the assassination of Indira Gandhi by one of her Sikh bodyguards in November of
1984. Riots ensued or rather Hindus attacked Sikhs en masse, killing, maiming, and
burning down shops and homes of Sikhs.
This turn of events had a crucial impact on Indian politics. In the 1984 and
1985 elections, the mass media was influenced to promote a Hindu agenda, not by the
mobility, facing considerable discrimination. The term schedule is used because the constitution listed castes eligible for this special status in schedules.
11
usual suspects of Hindu fundamentalist parties, but by the Congress party (Banerjee
1990). Simultaneously, Hindu fundamentalist groups launched multiple campaigns to
promote Hinduism. Among the campaigns were calls for destroying the Babari
Masjid, a mosque built in 1528, claimed to stand on the birthplace of a Hindu God,
Ram. These parties also called for a uniform civil code to apply to all religious
groups, targeting Muslim Personal Law, codes that dictate rules for Muslims. The
Hindu rhetoric used by the normally moderate Congress party and campaigns led by
Hindu fundamentalist and nationalist groups deepened Hindu and Muslim tensions.
In 1989, campaigns to build a temple in place of the Babari Masjid involved
collecting bricks and money for the temple (Shah 1998). In 1992, the VHP called for
a holy war against Muslims to rally support for the destruction of the Babari Masjid.
Some of the following slogans and advertisements were used in newspapers and
rallies: “Everyone will be shown their place, Those who are sleeping in Delhi, Their
Sleep will be disturbed, We have to live in Hindustan with respect, we will pay for the
price for maintaining dignity” and “There is a dictate to murder Hindus, see, once
again Mughal rule has come to Delhi (Shah 1998).” The campaigns and rhetoric were
successful, the Babari Masjid was destroyed on December 6, 1992 by Hindus, while
Hindu police and government officials did nothing. Riots once again engulfed India
resulting in Hindu and Muslim neighbors murdering one another.
The campaigns to destroy the Babari Masjid and its eventual destruction
coincided with the BJP’s rise to power in the 1990s. While the Hindu nationalist and
fundamentalist agendas had considerable influence over the activities and beliefs of
many Hindus, resulting in worsening Hindu Muslim tensions, the early 1990s was the
12
first time an overtly Hindu nationalist party gained considerable political power. The
BJP gained many seats in western and northern India, particularly the states of Uttar
Pradesh, Maharashtra, Madhya Pradesh, Gujarat, and Rajastan from 1990 to 1995
(Chiriyankandath 1998). In 1996, they won enough seats to hold together a coalition
government for only 13 days. Another coalition government was formed by the BJP
in 1998, only lasting one year. Their power was finally solidified in 1999, where they
led a coalition government until 2004.
Thus, India has experienced a rapid spread of Hindu fundamentalism and
nationalism from the 1980s to the present. Hindu nationalism has become more
pervasive, eventually leading to the rise of the BJP to political power in the 1990s.
Contrary to Hindu nationalist propaganda, it was not Hindus that were under attack,
but Muslims. Evidence suggests that the rise of Hindu fundamentalism politically
and socially, the proliferation of negative stereotypes about Muslims, riots which are
often initiated by Hindus (Brass 2003, Mann 1992), state and police complicity and
often participation in anti-Muslim riots (Brass 2003), attacks on Muslim Personal
Law, and local ‘everyday’ communal interactions between Hindus and Muslims
(Jeffery and Jeffery 2005) have resulted in a more cohesive Muslim community
identity (Mann 1992). Mann (1992) finds that Muslim solidarity does not only occur
at the local level. When anti-Muslim riots occurred in the 1980s and early 1990s,
Muslims in the city of Aligarh went to aid those Muslims left homeless by the
violence (Mann 1992). Mann (1992) also finds that Hindu attacks on Muslim
Personal Law and the destruction of the Babri Masjid mosque further reinforced
Muslim community solidarity.
13
While communal tensions and the rise of Hindu fundamentalism is well
documented, there has been limited empirical examinations of their impact on the day
to day lives of Muslims, particularly on their employment and educational
opportunities. Furthermore, there has been scant empirical analysis of how these
communal tensions affect Muslim women’s education and employment. This
dissertation seeks to expand our understanding of the rise of Hindu fundamentalism
on the Muslim experience, with a particular focus on Muslim women.
Muslim Disadvantage and Discrimination in India
Although Muslims experience advantages in infant and child survival, child
sex ratios8, life expectancy, and maternal mortality (Government of India 2006),
Muslims continue to experience disadvantage in many socioeconomic arenas, despite
the considerable gains they have made. Several factors contribute to the current
disadvantage that Muslims experience in India. First, Muslims have faced substantial
discrimination at the hands of the Hindu majority since the Partition of India.
Additionally, most of the Muslims who left for Pakistan during the Partition were
from the middle and upper classes, leaving many poorer Muslims behind.
Furthermore, to escape the rigidities of the Hindu caste system and discrimination
from higher castes, there have been low caste conversions to Islam.9 The poorer
Muslims who stayed in India after the Partition and low caste converts to Islam have
not had the resources for educational, occupational, or income mobility, thus
8 Muslims experience higher child sex ratios compared to other groups, suggesting that Muslims discriminate less against girls than other groups. 9 With the hope of attaining greater equality and escape discrimination and disadvantage within the Hindu caste system, many individuals belonging to lower castes, particularly Dalits or untouchables, those of the lowest castes, converted to other religions in India such as Islam, Sikhism, Christianity, and Buddhism.
14
contributing to the disadvantage we observe among Muslims in India. This section
highlights some of the disadvantage and discrimination that Muslims face in Indian
society.
One area where Muslims experience disadvantage is literacy. The literacy rate
for Muslims was 59.1 in 2001, compared to 65.1 for Hindus (Census of India 2001).
Muslims also face considerable disadvantage in school enrollment (Kulkarni 2002,
Rastogi 2003, Shariff 1995) and educational achievement (Desai and Kulkarni 2005,
Kulkarni 2002, Unni 2001a). This is particularly surprising since a greater proportion
of Muslims live in urban areas, which have a better educational infrastructure than
rural areas: 35.7 percent of Muslims live in urban areas compared to 27.8 percent of
the general population (Government of India 2006). Kulkarni (2002) finds that these
disparities in education are partially due to past discrimination in education, income,
and residence, however, he also finds that there is an independent effect of religion
despite controls for family endowments suggesting that current discrimination plays a
role as well. The provision of government schools also contributes to lower levels of
enrollment and educational achievement. Districts with higher proportions of
Muslims also have fewer educational inputs compared to districts with higher
proportions of non-scheduled caste Hindus (Betancourt and Gleason 2000).
Moreover, government schools in or near villages with higher portions of Muslims
have fewer resources compared to non-scheduled caste Hindus (Jeffery and Jeffery
2005). Muslims also face discrimination in government and non-Muslim private
schools from predominantly Hindu teachers (Jeffery and Jeffery 1998). Teacher’s
lower expectations of Muslim children and lack of attention could negatively affect
15
Muslim children’s school performance and achievement. In addition, discrimination
from teachers and texts extolling the virtues of Hinduism (Sikand 2005) may result in
Muslim parents withdrawing their children from schools.
Muslim disadvantage is also illustrated by various socioeconomic factors,
such as poverty (Bhagat and Praharaj 2005, Unni 2001a), landownership (Kulkarni
2002, Shariff 1995), and earnings (Khandker 1992, Unni 2001a). Muslims
experience higher levels of poverty compared to the Indian population as a whole.
About 23 percent of India’s total population is poor compared to 31 percent of
Muslims (Government of India 2006). In urban areas (see Table 1), Muslims
experience the highest poverty rate (38.4) compared to scheduled castes and tribes
(36.4), other backward castes10 (25.1), upper caste Hindus (8.3) and other minorities
(12.2) (Government of India 2006). Muslims in rural areas are slightly better off,
experiencing the second highest poverty rate (26.9 percent). Scheduled castes and
tribes have the highest poverty rate (34.8), while other backward castes (19.5), upper
caste Hindus (9.0), and other minorities (14.3) experience considerably lower poverty
rates (Government of India 2006).
In rural areas, landownership is an important basis for material well-being.
There are more landless Muslims compared to Hindus. Among rural dwellers, 35
percent of Muslims are landless compared to 28 percent of Hindus (Shariff 1995).
When Muslims do own land, they own less than Hindus. For example, while 20
10 Other backward castes have faced exclusion and discrimination in India, resulting in low socioeconomic status. The majority of other backward castes are from the shudra caste, the lowest category out of the four varna caste system, higher only to Dalits, who have such low status that they are not included in the four varna system.
16
percent of Hindus in rural areas own five or more acres of land, the corresponding
figure is only 10 percent for Muslims (Shariff 1995).
There are also earnings and income gaps between Hindus and Muslims.
There is some evidence that Muslims earn less than Hindus, and have less income
mobility (Khandker 1992). Educational advances among Muslims do not appear to
aid in increasing their earnings, pointing to wage discrimination. Unni (2001a) finds
that among salaried and self-employed workers, Muslims do not receive any
significant returns to their education, while other disadvantaged groups such as
scheduled castes and tribes do experience educational returns in both salaried
employment and to a lesser extent self-employment.
Muslims also experience disadvantage in employment compared to Hindus.
The work participation rate, defined as the percentage of workers to the total
population, is 31.3 percent for Muslims compared to 40.4 for Hindus. Furthermore,
Muslims are underrepresented in both public and private sectors (Hasan 2005) and are
largely confined to non-farm self-employment (Das 2002). Muslims are also less
likely to be employed in the protected sector, and are therefore in more vulnerable
employment positions (Khandker 1992). It is important to note that wage employment
itself does not confer economic advantages and historically, Muslim participation in
self-employment has protected them somewhat from the dire poverty faced by
landless agricultural laborers, but their exclusion from regular employment reduces
their avenues for upward economic mobility, particularly in the current era where
rewards to white collar work have been rising.
17
Discrimination against Muslims is also evident in fertility rhetoric. Sadhavi
Saraswati, a well-known Hindu nationalist party member, can be heard on a widely
distributed tape proclaiming, “For every five children the Hindu’s have, the Muslims
have 50. And who feeds these 50 children? Hindus do! After Muslims divorce, the
waqf boards support the children with taxes we pay…Within 25 years you will be
living like a poor minority in this country (Basu 1997).” Another Hindu nationalist
referring to Muslims cried, “The state tells us Hindus to have only two or three
children. After a while they will say ‘do not have even one’. But what about those
who have six wives, 30-35 children, and breed like mosquitoes and flies (Basu
1997)?” This rhetoric also stereotypes Muslim men as being oversexed (Jeffery and
Jeffery 2005) and Muslim women as being over fertile (Sarkar 2002). These
pronouncements are what Jeffery and Jeffery (2005) call saffron demography, where
myths about Muslims are propagated. These myths are becoming ‘common wisdom’
to Hindus in India, proliferating beyond Hindu fundamentalist circles (Basu 1997,
Jeffery and Jeffery 2005).
Violence against Muslims and the state and police complicity in this violence
also demonstrates the discrimination Muslims face. While Hindu fundamentalist
rhetoric often paints Muslim men as aggressive and hot-blooded during communal
tensions, in reality the majority of riots consist of attacks on Muslims and are
provoked by Hindus (Brass 2003, Jeffery and Jeffery 2005). Government officials
and the police are often indirectly or directly involved in these riots. Government
officials and police are indirectly involved when they do nothing to stop the riots or
18
protect Muslims. They are directly involved when they give orders for the violence
or participate in the riots.
The disadvantages facing Muslims in India may be worsening with the rise
of Hindu fundamentalism. This may occur for two reasons. First, as negative
stereotypes about Muslims spread and communal tensions intensify, Muslim’s may
face greater discrimination in areas such as education, and employment. Second,
Muslims may withdraw from these arenas where they must interact with Hindus
because of safety concerns, fear of harassment, and distrust of the state apparatus,
which has failed to protect them in riots and in worst cases perpetrated the violence.
This dissertation seeks to illuminate our understanding of the Muslim experience in
education and employment, in the face of increasing communal tensions and
discrimination.
Patriarchy: Hindu and Muslim Women in India
In India, as in many societies, patriarchal ideologies and practices place a
lower value on females compared to males, resulting in, among other things, lower
access to education, health care, and employment. Furthermore, patriarchal beliefs
play an integral role in excess female child mortality and the increasing utilization of
sex selective abortions. This section discusses the complicated and often oppressive
patriarchal beliefs and practices in India that shape Hindu and Muslim women’s lives.
Social, economic, and cultural customs diminish women’s economic worth.
In India, sons make important economic contributions to their parents’ household. If
living in an extended family, sons typically reside in the same home as their parents
with their wives. In this situation, a son contributes his wages to the household, or
19
makes economic contributions by working on the farm or in a household business. In
contrast, a daughter moves in with her husband’s family. If a woman works for
wages, these wages are given to her husband’s household, not her natal family,
lowering women’s economic worth to her natal family.
Another factor related to the economic worth of women in India is their
exclusion from wage labor. Although Indian women make substantial contributions
to the Indian economy by working on family farms and in family businesses, they are
often excluded from wage labor and direct control of income earning enterprises,
making it difficult to make valued financial contributions to their natal family or
husband’s household. According to the 1991 Indian Census, only 23 percent of
women reported being employed (Desai 1994). When women are employed, they
make lower wages then men (Banerjee 1985, Khandker 1992). Constraints on their
labor force participation and lower wages if employed make it difficult for women to
make economic contributions to their natal family or husband’s family, reducing their
economic value, despite other important productive contributions they make to the
household.
Old age support practices also lower the economic worth of females and raise
the value of males. The majority of Indians do not have access to formal avenues of
old age support. Most people are not employed in jobs that give old age pensions and
the government does not provide social security. Therefore, the majority of Indians
must rely on other forms of financial support in their old age. Parents often rely on
their sons to provide for them in old age, thus bolstering the economic worth of sons
and devaluing daughters.
20
The economic worth of women in India affects all women, while certain
cultural practices affect mainly Hindu women. Dowry, a custom where the bride’s
family gives gifts and money to the groom’s family, also contributes to a woman’s
economic worth affecting primarily Hindu women. Historically, dowry often
consisted of a woman’s family preparing and giving goods, such as bedding and rugs,
to the groom’s family (Sharma cited in Desai 1994). However, dowry has become
more oriented towards monetary transactions and expensive consumer items, such as
refrigerators, televisions, and cars. Instead of producing relatively inexpensive items
such as bedding, households must save considerable amounts of money to provide an
adequate dowry for their daughters’ marriage. This is an economic drain on a family,
lowering the value of having daughters. Despite laws outlawing dowry, this practice
has become more commonplace and has even spread to communities, particularly in
the South, that traditionally paid a bride price whereby the groom’s family gives the
bride’s family money at that time of marriage (Rahman and Rao 2004). The
prevalence of dowry in Muslim communities in India is not well documented. Some
small-scale studies suggest that Muslim communities practice dowry (Fazalbhoy
2005), while others suggest that dowry is not practiced in the community (Lateef
1990). It is likely that there is considerable regional variation among Muslim
communities. Specifically, Muslim communities in areas where dowry is widespread
may be more likely to practice it.
The value of Hindu women is further diminished by religious prescriptions at
the time of death. Sons are valuable because they, not daughters, can perform
religious rites for their parents upon death. For Hindu women, particularly in the
21
north, kinship patterns also determine a woman’s worth in India. Communities that
practice village exogamy, require that marriage partners be unrelated and come from
different villages. Under this system, girls move away from their natal families and
village to live with their husband’s family in another village. This practice deprives
women of support from their natal kin and social networks leaving them at the mercy
of the husband’s family. Additionally, women from these communities are not able to
provide support to their natal families by virtue of distance. In contrast, the practice
of village endogamy, observed primarily in the south of India, entails marriage
partners often marrying cross cousins or girls marrying their maternal uncles (Bittles
1994). Furthermore, endogamy is characterized by marriage within the village,
whereby daughters remain in close proximity to their natal family, enjoying support
from their kin and existing social networks. This proximity also allows daughters to
provide support to their family. Therefore, the worth of women in communities that
practice village endogamy is greater than the worth of women belonging to
communities practicing village exogamy.
Relative to Hindu communities, particularly in northern India, which often
practice village exogamy, Muslim women reside closer to their natal homes and are
more often married into a household they have known for years (Bloom et. al. 2001).
Moreover, it is common for maternal cousins to marry in these communities (Bloom
et. al. 2001). Similar to other communities that practice village endogamy, this
feature of Muslim communities may enhance a Muslims woman’s worth.
Muslim women’s worth should also be bolstered by the rights conferred to
them by Islam; however, in practice these rights are not always observed. A practice
22
that is more similar to a bride price rather than dowry, mahr, in theory, should be a
potentially liberating force for Muslim women in India. According to Islamic law, a
man must give a woman mahr, money or goods promised at the time of their marriage
(Vatuk 2005) and women have the right to stipulate the amount (Engineer 1996).
Mahr can be given at the time of the wedding, but it is more common in India for it to
be ‘deferred’ to an agreed upon date (Vatuk 2005). In the event of divorce or death of
her husband, the woman is to receive the mahr she was promised (Vatuk 2005).
While Islamic law dictates that women should receive mahr, this does not necessarily
occur in practice among Muslims in India. It is common for women to give up their
mahr (Vatuk 2005). Moreover, if a couple divorces and the husband chooses not to
give his wife her mahr, she has few options. Legally, she could file a suit, but this is
not common (Vatuk 2005).
Widow remarriage is another area where Muslim women are granted rights
under Islam, however, Hindu customs of widow remarriage have influenced Muslims
and therefore Muslim women’s rights under Islam have been curtailed. Widow
remarriage is encouraged under Islamic law where widows have many social and
religious rights and are technically supposed to have higher status in society (Husain
1976). Following the example of Prophet Mohammad, marrying a widow and raising
her children as his own confers high status on a man. In contrast, among Hindus,
widow remarriage has been seen as a sign of lower status (Husain 1976). However,
Husain (1976) observes that Hindu custom has had a clear effect on the Muslim
community in India, where in reality widows are stigmatized and do not enjoy the
status or rights conferred upon them by Islamic law.
23
Inheritance of land and wealth is an area where Islamic law conferred greater
rights to Muslim women compared to Hindu women until the Hindu Code Bill of
1956 was passed (Lateef 1990). According to Islamic law, Muslim women have the
right to inherit property and wealth to secure their well-being, however they receive
less than men. Prior to the passage of the Hindu Code Bill of 1956, for Hindu
women, cultural practices dictated that any property or wealth a woman had or
obtained became that of her husband’s family. Therefore, parents willed their
property to their sons to diminish land and wealth fragmentation, thereby, increasing
the value of having sons, while reducing the value of women. While Hindu women
now have inheritance rights under the law, the cultural practices that were observed
before the Hindu Code Bill persist today. Moreover, the rights that Islamic law gives
Muslim women are generally not observed. Rather, there is evidence that Muslims in
India have assimilated to the inheritance practices of Hindus (Rathbone 1934 in
Lateef 1990). Therefore, while Hindu women have legal rights and Muslim women
have religious rights to inheritance, in practice both Hindu and Muslim women are
denied their rights.
Purdah or female seclusion, a practice where women’s sexuality is controlled,
is another patriarchal constraint affecting both Hindu and Muslim women. Beginning
at puberty, purdah imposes restrictions on women’s mobility, involves full or partial
veiling, and delineates ways in which men and women interact (Desai 1994, Jeffery
1979). Generally, women from poorer households do not strictly adhere to purdah
because their lower socioeconomic status requires them to seek employment. Since
they must work, they are not able to follow rules about mobility and interaction with
24
men. In contrast, purdah is commonly practiced among wealthier households where
women do not have to work (Desai 1994). This practice reduces women’s control
over social and material resources by curtailing women’s interactions with men
within and outside the household and restricting women’s movement outside the
household.
While Hindu women have ample legal rights and Muslim women have many
religious rights under Islam, in practice both Hindu and Muslim women experience
patriarchal controls and discrimination in India. However, Muslim women may be
more disadvantaged compared to their Hindu counterparts because of the intersection
of their gender and religion. This disadvantage which Muslim women experience
emanates from the discrimination and disadvantage that all Muslims face in Indian
society as well as patriarchy that all Indian women experience. Furthermore, Muslim
women may experience increasing disadvantage as the Muslim community tries to
preserve its identity in the face of rising Hindu fundamentalism.
Conclusion
The first section of this chapter highlighted post-colonial communal tensions
and the rise of Hindu fundamentalism. The communal tensions in the 1980s and
1990s, while not new, have taken on a different flavor. The spread of Hindu
fundamentalism and its eventual rise to political prominence during this period has
severely threatened the Muslim community. As section II has shown, Muslims
already face considerable disadvantage and discrimination in India. With the rise of
Hindu fundamentalism, they may experience even more discrimination from Hindus
and may withdraw from certain public arenas for fear of safety and harassment,
25
thereby worsening their disadvantage. Muslim women may be uniquely affected by
the increase of Hindu fundamentalism. Muslim women already face substantial
disadvantage through the interplay of religious membership and gender, however, the
rise of Hindu fundamentalism and the Muslim community’s sharp response to this
threat may exacerbate the disadvantage they experience.
26
Chapter 2: Modernization, Religious Disadvantage and Discrimination, and the Rise of Hindu Fundamentalism and Muslim Identity Politics Over the past 30 years in India, Muslim women’s education and wage
employment have been affected by a variety of influences including modernization
and globalization; religious discrimination and disadvantage; and the complex
relationship between increasing Hindu fundamentalism and the Muslim community’s
response to this threat. While critics of modernization theories have identified many
negative aspects of integration into the global economy, modernization is seen as
being synonymous with education, particularly Western education, and the
incorporation into a cash economy. Thus, when looked at in terms of education and
wage employment, modernization favorably influences the lives of all communities,
Hindus and Muslims, men and women. However, religious discrimination and
disadvantage may diminish the influence of modernization for Muslims. Moreover,
the rise of Hindu fundamentalism and the Muslim community’s response may
uniquely shape the lives of Muslim women. This chapter discusses the influence
these three factors have on various groups in India. The first section addresses
modernization issues pertaining to all Indians and then only females. The second
section focuses on the religious discrimination and disadvantage experienced by
Muslim men and women. Finally, the third section addresses how Muslim women
may be uniquely affected by Hindu fundamentalism and the Muslim community’s
response.
27
Modernization and Secular Changes
Modernization theory, once a dominant theory in the sociological and
development literature, contends that modernization, a process that involves
industrialization, economic growth, economic development, and urbanization, are not
unique processes to Western countries and that developing countries can emulate this
progress in the course of development. In recent years, this theory has been widely
criticized in the development literature and many of its central tenets have been called
into question. However, one aspect of this theory has remained; modernization
causes profound transformations in society such as changes in education,
employment, gender roles, and ideologies (Inglehart and Baker 2000).
Historically, modernization has had an important influence on education.
When Western countries began to industrialize in the late 1800s and early 1900s, a
more educated workforce was required to perform relatively more complex jobs, thus
mandatory education was instituted (Weiner 1991, Notestein 1953). Similarly, as
developing countries undergo development, their governments invest in education
and promote policies that increase educational levels. Increasingly, educational
provisions are now recognized as one of the central functions of government and a
major part of nation building projects (Meyer et. al. 1992).
Through colonization, imperialism, and globalization, western countries have
always had a profound influence on developing nations. These historical and
contemporary processes have resulted in the diffusion of western ideas and systems,
playing a vital role in increasing education in developing nations. Specifically, the
diffusion of western ideas and systems regarding the development of the nation state
28
and the role of education in that development has had a crucial effect on education
throughout the world (Meyer et. al. 1992). In particular, mass education increased
dramatically after World War II as the western model of the nation-state and the
centrality of mass education expanded and intensified (Meyer et. al. 1992).
In developing nations, the net enrollment ratio for primary school, which is
the number of children enrolled in primary school in the relevant age group as a
percentage of all children in that age group, increased from 48 percent to 77 percent
from 1960 to 1991 (United Nations 1996). The net enrollment ratio has also
increased for secondary school, from 35 percent to 47 percent for this same period
(United Nations 1996). There are exceptions, specifically some countries in Sub
Saharan Africa have experienced a decline in primary school enrollment in the
context of economic decline, however, overall, the trend has been upward. Looking
more specifically at India, it experienced economic growth from 1951 to 2001 and
made important gains in education. In particular, from 1951 to 2001 the gross
enrollment ratios, the total enrollment of the school age population divided by the
relevant age group, increased from 43 to 96 for primary school (I-V) and 13 to 60 for
upper primary school (VI-VIII) (Ministry of Education 2006).
Urban-rural differences in education also demonstrate the role of the modern
market and developmental forces in increasing education levels. Urban areas
represent greater levels of modernization and development and experience higher
levels of educational attainment compared to rural areas. Using literacy rates as a
proxy for advances in education, urban-rural differences in literacy rates illustrate that
development has an influence on education. In India, the literacy rate for the urban
29
population was 73 in 1991 compared to 45 in rural areas (Ministry of Education
2006). Furthermore, as economic growth progressed, these rates increased over a ten-
year span for both urban and rural areas. Specifically, in 2001, the literacy rate for
the urban population increased to 80 and the literacy rate in rural areas increased to
59 (Ministry of Education 2006).
While many modernizing forces increase enrollment and educational
attainment, other modernizing forces may have adverse consequences. Specifically,
structural adjustment and liberalization policies, adopted by many developing
countries to avoid a debt crisis, have potentially negative influences on education.
Some liberalization programs have increased the cost of schooling by instituting fees,
reduced government spending on education, and resulted in recession, increasing the
financial strain on many households. Households may have difficulties investing in
education if educational costs and financial strain increase. While India adopted
liberalization policies in the 1980s, and although these policies intensified in the
1990s, the government did not institute fees for government schools for children 6 to
14 and did not cut its investments in the educational system. Furthermore, India
experienced economic growth rather than recession. Therefore, it is unlikely that
liberalization policies have considerably hampered education in India.
In theory, a major part of the modernization process is economic growth,
which has a crucial impact on employment. Economic growth is the expansion of the
economy, where more goods and services are produced, resulting in more income per
person. When economic growth occurs, employment increases as more people are
needed to produce valued goods and services. Moreover, economic growth changes
30
the types of jobs that workers hold (World Bank 1995). In countries with low levels
of development, most of the working age population is engaged in agricultural work,
particularly agricultural self-employment. As a country experiences economic
growth, more opportunities are created in wage employment in services and industry
(World Bank 1995).
Modernization may not necessarily have this effect on employment in many
developing countries because they have been plagued by structural adjustment
policies. Evidence from numerous countries in Latin America, the Caribbean, and
Africa demonstrate that liberalization policies have slowed job creation, increased
informal employment particularly as public sector employment decreased, and
increased unemployment and underemployment (Baden 1993). In the 1980s, India
embarked on a series of economic reforms. In the early 1990s, facing an exchange
rate crisis, the Indian government was forced to adopt more drastic liberalization
policies. Many argue that these reforms were instrumental in generating economic
growth in the 1980s, and particularly in the 1990s (Delong 2001). The growth of the
Indian economy accelerated in the 1980s and continued to grow at a rapid pace,
making it one of the fastest growing economies in the 1990s (Delong 2001). From
1950 to 1980, India experienced a steady annual growth rate of 3.7 percent (Delong
2001). From 1980 to 1990, the annual rate of growth jumped to 5.9 percent and
continued to increase in the 1990s to 6.2 percent.
Contrary to expectations, the rapid growth experienced by India from 1980 to
2000 did not accelerate employment growth, instead, the rate of employment growth
declined. There appears to be two noticeable trends in employment during this period
31
of liberalization and economic growth. First, India experienced a casualization or
informalization of the labor force during this period, as the growth of organized or
formal employment declined and growth of informal employment increased (Sinha
and Adam 2004). Second, there has been a decline in self-employment. It appears
that the decline in self-employment was absorbed by casual wage work, contributing
to the casualization of the labor force. The percentage of workers engaged in self-
employment decreased from the early 1980s to 2000 from 57 to 53 percent, while
casual wage employment increased from 29 to 33 percent (Desai and Das 2004).
The influence of liberalization policies and economic growth on regular salary
employment trends is less clear. Duraisamy (2000) finds a slight decrease in regular
salary employment from the 1980s to 2000, which has been in part attributed to
public sector employment decline (Desai and Das 2004). Other estimates suggest that
regular salaried employment increased during this same period (Sundaram 2004).
However, Anant (2004) finds that regular salaried workers remained at 14 percent
from 1983 to 1999. Therefore, it is unclear what impact liberalization policies have
had on regular salaried employment.
Contrary to the experiences of many countries in Latin America, the
Caribbean and Africa, India did experience considerable economic growth while
adopting structural adjustment and liberalization policies. Despite this considerable
economic growth, India shares the experience of slow job growth and the
casualization of the labor force with these countries.
32
Modernization and Female Education and Employment
Thus far, we have discussed the broad influences of modernization on
education and employment. Now we will turn to the effects of modernization on
female education and employment. Development has an important influence on
women’s education. The level of economic development, measured by Gross National
Product (GNP), and its relationship to the gender gap in school enrollment illustrates
the importance of development on girls’ education. Hill and King (1993) find that
low-income countries have the largest gender gap in primary school enrollments,
lower-middle-income countries have a relatively smaller gender enrollment gap, and
upper-middle-income countries have the smallest gender gap. Furthermore, the
gender gap in enrollment decreases as regions develop over time. In Eastern Asia, a
region which has experienced considerable economic growth over the past few
decades, the gender gap in enrollment for individuals aged 6 to 23 was 16 percentage
points in 1960 and decreased to 5 percentage points in 1990 (Wils and Goujon 1998).
Southern Asia and Arab states have experienced more moderate declines in the gender
gap in enrollment. In Southern Asia and for Arab states, the gap decreased 3
percentage points from 1960 to 1990 for individuals aged 6-23 (Wils and Goujon
1998). These numbers conceal some of the progress that occurred for women in these
regions. For example, in Arab States and Southern Asia, only 14.7 and 14.2 percent
of girls aged 6-23 were enrolled in school in 1960, however, in 1990 enrollments
increased to 45.3 and 34.5 percent (Wils and Goujon 1998). While considerable
progress still needs to occur, modernizing influences have had a positive influence on
girls’ education and to a lesser extent on the gender gap in education.
33
Unfortunately in countries where economic growth stagnated, the benefits to
girls were far more limited as was the case for countries that adopted structural
adjustment policies uncritically. If structural adjustment policies increase financial
strain on households, households may choose to invest in boys’ education where the
returns to investment are higher. As mentioned above, structural adjustment policies
in India have likely not had a huge impact on education, therefore it is unlikely that
girls have been adversely affected by structural adjustment and liberalization policies.
In India, girls’ enrollment has been increasing and the gender gap in
enrollment has been narrowing. In 1983, 37 percent of girls ages 6 to 18 were
enrolled in school. This figure increased to 61 percent in 1999-2000 (National
Sample Survey Organization 1983-1999-2000). As a result of girls’ increasing school
enrollment, the gender gap in school enrollment has decreased. In 1983, the
difference between the percentage of boys and girls enrollment for ages 6 to 18 was
21 percentage points. By 1999-2000, the difference decreased to 12 percentage
points.
While the gender gap in education has been decreasing, there are several
factors that moderate modernizing influences. In particular, in the face of scarce
resources, households choose to invest in boys’ rather than girls’ education. This
occurs for several reasons. First, boys have considerably more economic
opportunities and greater returns to education relative to girls (Dreze and Saran 1995,
The Probe Team 1999). Furthermore, boys are expected to provide financial and old
age support to their parents (Dreze and Saran 1995, The Probe Team 1999), therefore
households have a direct stake in their sons’ education and employment opportunities.
34
Even if daughters are expected to work in the future, their husband’s family would
benefit from their employment, not their natal family, therefore their natal family has
little economic incentive to invest in their education. This is particularly true for
areas that practice village exogamy, a practice where daughters marry someone
outside their village, thus restricting the contact and support of their natal families.
Restrictions on girls’ movement at the age of menarche also negatively affect
girls’ enrollment. To ensure the purity of their daughters, households often put
restrictions on girls’ movement when they start menstruating. Therefore, it is
common for girls to drop out of school around the ages of 12 or 13 (Rastogi 2003).
The shortage of primary and middle schools, particularly girls only schools,
exacerbate this problem. While the supply of both primary and middle schools has
been expanding since the early 1990s, access to middle schools is still relatively
limited (Nayer 2002, The Probe Team 1999). Many villages may have a primary
school, however, children may have to travel to another village for middle school.
Parents are often reluctant to have their daughters travel the further distance (Nayer
2002, The Probe Team 1999). Both concerns over girls’ safety (Nayer 2002) and the
observance of purdah play a role in this reluctance.
Marriage markets also affect girls’ enrollment. It is believed, particularly
among disadvantaged castes, that higher levels of education encumber girls’ marriage
prospects and increases their dowry since they must marry men of similar education
(The Probe Team 1999). Higher castes feel that marriage prospects improve for
educated girls, as long as their education does not surpass the men in their community
(The Probe Team 1999). In addition, the gender division of labor in the household
35
requires women to perform most of the domestic chores, diminishing educational
attainment for girls. Older girls are often required to take care of younger siblings in
the household and help other women with domestic chores, leaving them little time to
attend school.
While these cultural factors dampen girls’ enrollment, it appears that
modernization has had an important impact. This is evident by increasing girls’
enrollment and the decreasing gender gap in enrollment, despite cultural factors that
negatively influence girls’ enrollment.
Modernization and development also play a role in female employment.
According to the World Bank (1995), development and female employment are
expected to have a U shaped relationship. When work is organized around the family,
which corresponds to lower levels of development, women’s participation in work is
high, particularly in agricultural activities. As economic growth and urbanization
occur, women’s work participation generally decreases as women stay at home while
men seek formal non-agricultural employment. This is partially related to the higher
wages that men receive compared to women (Goldin 1995). As development
progresses and employment opportunities expand, women’s formal nonagricultural
employment increases. Goldin (1995) argues that increases in girls’ secondary
schooling and the expansion of white-collar jobs facilitate the movement of female
labor force participation up the U shaped curve.
Modernizing forces also alter ideologies about gender roles and break down
barriers to women’s employment. Modernizing forces, through development,
diffusion of ideas, and active fertility campaigns, have reduced fertility in many
36
developing countries, potentially reducing the span of women’s reproductive
responsibilities, which often hinders women’s labor force participation. However,
modernizing forces such as structural adjustment policies may adversely affect
women’s employment, decreasing women’s participation if employment opportunities
worsen (Baden 1993).
Modernization and mechanization of agriculture in India further illustrates
potential negative consequences for women’s employment. From 1950 to 1991
women’s economic activity decreased. In 1950, 30.45 percent of women were
involved in economic activities, whereas in 1991 only 22.70 percent of women were
economically active (Datta 2002). Datta (2002) attributes this decline in women’s
economic activity to mechanization and modernization of agriculture. Specifically,
traditional modes of agricultural production were replaced by factories and mills,
which adversely affected women’s employment. However, it is not clear how
modernizing forces will affect the structure of women’s employment, specifically
women’s wage employment and self-employment.
In India, it is evident that women’s share of non-agricultural employment,
defined as being engaged in industry, trade or services, has been increasing (Unni
2001b). From 1971 to 1994, the share increased from 12 to 21 (Unni 2001b).
However, it appears that women’s labor force participation remained stagnant and
even decreased slightly from 1980 to 1995 (Das and Desai 2003). These
contradictory findings may be related to increased participation by women in non-
agricultural work and compensating declines in agricultural work, suggesting a need
to focus on non-familial work to determine the changes in wage work for women.
37
Several factors diminish female employment in India. Purdah can negatively
influence female labor force participation. Women practicing purdah have limited
interactions with non-related men and have restrictions on where they can go.
Generally, lower caste households cannot afford to practice purdah because scarce
resources in the household require women to work. Therefore, this practice tends to
be observed by upper castes. However, the trend of Sanscritization, a process where
lower castes emulate higher castes to attain higher status, may increase the prevalence
of purdah among lower castes (Srinivas 1966).
The gender division of labor also affects female employment. As in many
other countries, women are primarily responsible for domestic chores. Furthermore,
many do not have modern conveniences to shorten the time to complete these duties.
Therefore, preparing meals, taking care of children, collecting fuel wood or water in
rural areas, are all time consuming and arduous tasks, which may hinder female
employment. Discrimination in the labor market further dampens female labor force
participation. In many jobs, males are making hiring decisions and the prevalent
view is that males are superior workers, decreasing women’s employment
opportunities (Banerjee 1985).
Modernization and development influence female employment in
countervailing ways. Rising female educational attainment generally increases
female labor force participation (Sethuraman 1998 cited in Unni 2001b). However,
Das and Desai (2003) find that primary and post-primary education decreases
women’s employment opportunities in India. They argue that this is partly due to the
lack of employment opportunities for educated women in India. Despite these
38
constraints, female labor force participation in non-agricultural work does appear to
be increasing, particularly in informal employment. Unni (2001b) argues that
modernization is increasing in informal employment and the feminization of the
workforce in this type of employment (Unni 2001b). Modernizing forces have also
influenced legislation aimed to incorporate greater numbers of women into the labor
force. The government passed a law in 2005 allowing women to work night shifts,
shifts from 10 p.m. to 6 a.m. Teleworking is also being promoted to include women
in the labor force. Technological advances are also important modernizing influences
that affect women’s work. Technology, particularly in urban areas, reduces the time
women must devote to domestic chores. This is also true in rural areas. For example,
the installation of a village pump may reduce the time it takes women to fetch water,
potentially freeing up time for other productive activities. However, advances in
technology also have adverse effects on women’s employment. For example, when
rice mills and husking machines replaced women’s manual rice husking in India,
males dominated the new technological advances, decreasing women’s employment
in this arena (Mukherjee 1999).
In summary, modernizing forces are expected to increase overall enrollment
and girls’ enrollment in India. Modernizing forces will also likely increase wage
work as casual wage work increases. However, it is unclear how modernization will
influence female employment in India, an issue to be further explored in this
dissertation. We will now turn to factors that influence Muslim’s educational and
employment experiences in India.
39
Muslim Education and Employment: Disadvantage, Discrimination, and
Segmentation
Despite modernization’s positive influences, Muslims face continual
disadvantage and discrimination in education and employment in India. Although
enrollment has risen for both Hindus and Muslims, educational differences between
the two groups have persisted over time and even increased for secondary school and
college (Desai and Kulkarni 2005). This is particularly discouraging considering that
other disadvantaged groups, scheduled castes and scheduled tribes, have experienced
gains in education, resulting in a decline in the educational gap between these groups
and upper caste Hindus (Desai and Kulkarni 2005).
One site where discrimination against Muslims manifests itself is in the
allocation of publicly provided education. In their study of the Bijnor district in Uttar
Pradesh, Patricia and Roger Jeffery (1998) and Jeffery et. al. (2005) find that few
Muslim villages and Muslim dominant wards within large multi-caste villages have
government primary schools. The Muslim villages and wards with government
primary schools are of lower quality and have fewer resources. Specifically, these
schools serve larger populations, yet they are smaller, have less teachers, and
experience higher rates of teacher absenteeism. This qualitative analysis is
substantiated by a national study using district data conducted by Betancourt and
Gleason (2000). They find that there are less publicly provided educational inputs in
districts that have higher proportions of Muslims. This occurs despite high Muslim
demand for secular schooling, particularly among the middle and upper classes
(Engineer 2001, Mann 1994).
40
Government and private school partiality towards Hindus also affect Muslim
educational attainment. Jeffery et. al. (2005) find that Muslims perceive government
schools to be communal. They believe that government schools have mainly Hindu
teachers with a bias towards other Hindus. Specifically, Hindu students are more
likely to receive private tutoring and receive higher grades. Furthermore, government
school textbooks exalt Hinduism, while negatively portraying Muslims (Sikand
2005). These prejudices against Muslims in government and secular private schools
are likely to affect the decisions that Muslim households make about educating their
children in these institutions.
Discrimination in the labor market also has adverse consequences for Muslim
educational attainment. Since Muslims face considerable discrimination in the labor
market, limiting their opportunities in both the public and private sectors, they often
do not see the value of educating their children beyond a particular level (Mann 1994,
Sikand 2005).
Many authors argue that poverty and madrasa education, religious schools
focusing on Islamic scholarly teachings, negatively influence educational attainment
among Muslims. However, these claims are problematic. First, although many
wealthy Muslims did leave for Pakistan during Partition, leaving poorer Muslims
behind in India, and some Muslims are low caste converts, Muslims have higher
levels of urbanization compared to the rest of the population (Government of India
2006) and are therefore better off than many rural dwellers. Second, even though
there is a growing Muslim middle class and Muslims have high levels of
urbanization, relative to Hindus, Muslims do not have distinct class/caste differences
41
in education (Jeffery and Jeffery 1998). This suggests that poverty is not the driving
factor for low Muslim educational attainment, however it is likely that socioeconomic
status does play some role.
Other questionable claims are that most Muslim parents prefer to send their
children to madrasas, most Muslim children are enrolled in madrasas, and as a result
Muslims have difficulties transferring to upper level secular schools. In fact many
Muslim parents prefer to send their children to secular schools (Sikand 2005, Mann
1994) and they in fact do. Most Muslim children go to secular schools rather than
madrasas, even as madrasa facilities and enrollments expand (Sikand 2005).
Specifically, only 3 percent of school age Muslim children attend madrasas and of the
children that are enrolled in schools, only 4 percent are enrolled in madrasas
(Government of India 2006).
Research indicates that Muslims also face considerable disadvantage and
discrimination in the labor market. Das’s (2002) study, using nationally
representative data, suggests that Muslims are discriminated against in regular
salaried employment and therefore are concentrated in non-farm self employment as
owners of small businesses. In his case study of Bombay, Khandker (1992) finds that
the labor market is segmented according to gender, caste, and religion. He argues that
adjusting for human capital factors such as skill level and training will not breakdown
the discriminatory institutional barriers facing these disadvantaged groups. In
particular, Muslims are more likely to hold less secure jobs. Muslims are more likely
to be in the unprotected wage market and have fewer occupational and income
mobility opportunities.
42
Muslim disadvantage is also apparent in government employment (Hasan
2005, Singh 1980). Even though Muslims make up around 14 percent of the
population, they only make up 2.83 percent of elite Indian Administrative Service
(IAS) employment (Hasan 2005). While one would expect their share of IAS
employment to increase as educational levels increase, Muslim share of IAS
employment actually decreased from 2.98 percent in 1980 to 2.83 percent in 2000
(Hasan 2005).
While there are few affirmative action programs for Muslims, three states
have modest programs for poor Muslims, Kerala, Karnataka, and Tamil Nadu (Hasan
2005). Even though these affirmative action programs for poor Muslims in these three
states have been small in scale, they are purported to have made important strides
towards greater proportional representation of Muslims in public employment (Hasan
2005). The effectiveness of these programs illustrates the discrimination that
Muslims face in government employment and offers solutions for combating this
discrimination.
While Muslims have faced discrimination in education and the labor market,
there is little empirical data regarding whether religious differences in education and
wage employment have increased or worsened in the face of communal tensions.
Hindu-Muslim communal tensions have a long history in India, since the early 1980s
these tensions, with encouragement from state governments, have erupted into
renewed violence. On one hand, these tensions could worsen the discrimination that
Muslims face in education and the labor market. On the other hand, the tensions
could cause Muslims to choose not to assimilate or integrate with a hostile dominant
43
group, resulting in the withdrawal from secular schooling and wage employment. In
the case of education, Muslims already feel that government schools are biased
towards Hindus. In light of communal tensions, Muslims may feel that it is important
to send their children to madrasas, so their children can escape the discrimination they
face in school and preserve their heritage. The increase in communal tensions poses a
similar problem for wage employment. Hindus dominate wage employment and may
become more discriminatory in their hiring practices. Muslims already feel that they
are discriminated against in government jobs. This perception may be heightened
during communal tensions and Muslims may not pursue particular forms of wage
employment.
In addition, communal tensions may affect upper and lower class Muslims
differently. Evidence suggests that economic competition and increasing Muslim
prosperity contribute to communal tensions and the often resultant riots (Ahmad in
Sengupta 2006, Hasan 1982, Lateef 1990). For example, communal groups politicize
the threat of Muslim prosperity to Hindu dominance in many western Uttar Pradesh
cities, culminating into riots (Hasan 1982) that some suggest were, “aimed at the
economic base of the community (Lateef 1990).” Since they pose a greater threat to
Hindus, upper class Muslims may be more targeted during communal tensions and
riots, therefore they may be more affected by the rise of Hindu fundamentalism
compared to lower class Muslims.
Thus far, we have focused on the experience of all Muslims; now we turn to
the experience of Muslim women. As discussed above there are many factors, which
hinder girls’ educational attainment. Gender differences in economic opportunities,
44
gender differences in financial and old age support, the practice of purdah, marriage
markets, and the gender division of labor affect educational attainment for all girls.
However, because Muslim girls belong to a minority group, additional factors may
influence their educational attainment. First, marriage markets may negatively affect
Muslim girls more than Hindu girls. Households generally take into consideration
community norms for boys’ education when making decisions about their daughters’
education. Girls are expected to have lower educational levels than boys because of
concerns of finding a spouse and affording dowry (The Probe Team 1999).
Therefore, the lower educational attainment of Muslim men has a ceiling effect on the
educational attainment of Muslim women (Hasan and Menon 2005a).
Muslim women are further disadvantaged by the same factors that affect all
Muslims, namely discrimination in access to schools and within government and non-
Muslim private schools. Therefore, Muslim women face disadvantage through the
interplay of gender and religion. This results in lower levels of educational
attainment compared to Hindu men and women and Muslim men.
Muslim women are disadvantaged by gender and religion in wage
employment as well. As mentioned earlier, employment for all women in India is
influenced by the practice of purdah, the gender division of labor in the household,
and segmented labor markets. Muslim women face these constraints that all women
face and face constraints that Muslim men face. Similar to Muslim men, Muslim
women generally are employed in the unprotected wage market and have less chances
for occupational and income mobility (Khandker 1992).
45
Therefore, the low employment levels of Muslim women can be attributed to
the intersection of gender and religion. On one hand, similar to other women in India,
Muslim women are affected by patriarchal controls such as purdah, the gender
division of labor in the household, and markets segmented based on gender. On the
other hand, they also face discrimination and disadvantage in the labor market based
on their minority group status.
In summary, Muslims face considerable disadvantage in both education and
employment. There are fewer government schools placed in Muslim dominated areas
and when they are accessible to Muslims, they are of lower quality. Furthermore,
Muslim children face prejudice in government and non-Muslim private schools
through interactions with mainly Hindu teachers and textbooks that extol Hinduism
and deprecate Islam. Muslims also face disadvantage in the labor market. This is
evident by their confinement to non-farm self-employment (Das 2002) and vulnerable
jobs with limited occupational and income mobility (Khandar 1992). Muslim women
are likely to be negatively affected by the interplay of gender and religion.
Specifically, cultural factors that dampen educational attainment and wage
employment for all Indian women, affect Muslim women. Furthermore, Muslim
women’s education and wage employment are negatively affected by their minority
religious status. Additionally, communal tensions in India have worsened overtime,
which may result in more prejudice against Muslims in education and wage
employment. Evidence also suggests that upper class Muslims may be relatively
more affected by the rise of Hindu fundamentalism compared to lower class Muslims.
In this dissertation, we will examine Muslim enrollment and wage employment to see
46
how their experiences may have changed over the years, in the context of both
modernization and heightened communal tensions.
Rising Tide of Fundamentalism and Identity Politics
Muslim women’s education and wage employment must also be viewed in the
context of increasing religious tensions in India. As discussed in Chapter 1, the divide
between Hindus and Muslims has widened considerably in the past 30 years. Hindu
fundamentalism and propaganda regarding the “backwardness” of Muslim culture has
had a complex impact on the Muslim community in India.
Various literatures argue that women’s agency, empowerment, rights,
education, and employment are vulnerable in the context of religious politicization
(Hawley 1994, Jeffery and Basu 1998, Moghadam 1994). While these literatures use
different terminology such as identity politics, politicized religion, and religious
fundamentalism, all argue that women belonging to these communities are adversely
affected. I have chosen to use the terminology “religious identity politics” to refer to
the context in India, despite the numerous critiques of the term identity politics by
Marxists and post-structuralists (Heyes 2002).
Identity politics is a movement or discourse, which focuses on defining
identities, namely religious, nationalist, ethnic (Moghadam 1994), feminist, racial,
and sexual identities (Heyes 2002). Many identity politics movements attempt to
gain social, political, and economic resources that have been denied to a particular
group. Feminist movements, the United States Civil Rights Movement, and Gay and
Lesbian movements are examples of identity politics movements (Heyes 2002).
Religious identity politics movements may also try to gain resources that have been
47
previously denied to them, however these movements may also form if the groups’
culture is threatened by other religious groups, modernization, or Westernization.
Religious identity politics movements and discourses include: the New Right in the
United States (Klatch 1994), the pro-life movement in the United States (Papanek
1994), Iran under Khomeni (Papanek 1994), Gush Emunim in Israel (Tress 1994),
Orthodox Jewish women in The United States (Kaufman 1994) and Pakistan under
Zia ul Haq (Rouse 1998). In most circumstances, these discourses and movements
have negative implications for individuals who are less powerful in the group
(Papenek 1994). In particular, women are negatively affected in many religious
identity politics discourses and movements (Moghadam 1994).
Religious identity politics literature suggests that women may be negatively
affected by identity politics in two ways. First, to buttress the needs of the entire
subordinate group, women’s needs are often neglected. Specifically, women in
subordinate groups often experience oppression by the dominant group and by
patriarchal ideologies; however, the recognition of the intersection of their oppression
is often sacrificed to serve the needs of the entire subordinate community. Second,
women often become symbols for the community. Too often, this entails appeals for
a return to traditional gender roles, where women represent motherhood and
protectors of culture, resulting in demands for women to return to the home and
domestic sphere.
One way in which religious identity politics can be potentially harmful to
women is in the arena of women’s rights. The abortion debate in the United States
and the reinsertion of Sharia law in several countries are examples of religious
48
identity politics negatively affecting women’s rights. Adherents to the pro-life
movement in the United States often long for an idyllic past where female sexuality is
more controlled, men have more control in the family and society, and the family is
stable (Papanek 1994). The pro-life movement, in seeking to overturn Roe v. Wade,
attempts to restrict women’s right to choose to have an abortion and their control over
their bodies. The re-establishment of conservative interpretations of Islamic law is
another example of how women’s rights may potentially be harmed in the name of
religious identity politics. In several countries, the reintroduction and conservative
interpretations of Islamic law can potentially harm women in the areas of marriage,
divorce, and inheritance (Hale 1994), even though the Quran itself has modern views
about marriage, divorce, inheritance, child custody, and maintenance (Engineer
1996). For example, conservative interpretations of Islamic law allow a husband to
readily divorce his wife, but make it difficult for a woman to divorce her husband.
Furthermore, while Islamic law does grant Muslim women rights to inheritance and
wealth, women’s access to inheritance is more restricted compared to many secular
laws. Specifically, while Muslim women are granted the right to receive inheritance
and wealth, they receive less than males in the household.
In India, Muslim women’s rights have been affected by the interplay of Hindu
Fundamentalism and the resultant Muslim identity politics. The Shah Bano case
represents Muslim women’s rights and empowerment being sacrificed in the face of
threatened Muslim identity. Shah Bano, a Muslim woman, was divorced from her
husband in 1975. Her husband paid her maintenance of 200 rupees until 1978. In
1986, under article 125 of the India Code of Criminal Procedure, which requires
49
husbands to pay 500 rupees a month, Shah Bano sued her husband. The court, using
language that was inflammatory towards Muslims, ruled that her husband had to pay
25 rupees a month, increasing this amount to 180 rupees when Shah Bano petitioned
the court (Awn 1994). Muslim groups were outraged because the court was
interfering with the religious law of the Muslim community and threatening their
identity (Awn 1994). Hindu fundamentalists further threatened Muslim identity by
using this issue to paint Muslims and Islam as barbaric and harmful to women’s
status, ironically arguing that they would never treat Hindu women in this way.
Women’s groups legitimately concerned with the way in which Muslim Personal laws
adversely affected Muslim women, found themselves on the same side as Hindu
Fundamentalists (Chhachhi 1991) and were thus forced to let go of their demands.
The women’s movement’s withdrawal from this issue and Muslim resistance to the
threat to their identity resulted in the passage of the Muslim Women Protection of
Rights on Divorce Bill of 1986, which contrary to its name, restricts Muslim women’s
rights in terms of marriage, divorce, and child support relative to what is currently
sanctioned by law for other women in India.
Religious identity politics movements also have controlled women’s dress and
sexuality. For example, in Iran, during the revolution, it was made compulsory for
women to wear a veil and it was forbidden for women to wear make-up (Tavakoli-
Traghi 1994). There is evidence of religious identity political movements of Sikhs,
Vishva Hindu Parishad, the Tailban, and Pakistani government restricting women’s
movements and dress (Hawly and Proudfoot 1994).
50
The religious identity politics literature suggests that women’s education and
employment are affected by identity politics movements, however there is little
empirical research on these potential linkages. Even conceptually, these linkages have
not been fully developed. Religious identity politics may have different implications
for women’s education and wage employment. In religious identity politics
movements, education is valued in as far as it enhances the role of mother and wife
(Moghadam 1994). This argument for the education for women is not unique to
religious identity politics movements, for example, both Hindu and Muslim
households partially view girls’ education in the context of how it improves their
domestic role. This focus may enhance primary and middle school education but may
reduce higher levels of educational attainment, meaning that one needs domestic
skills which do not require high levels of education (Jeffery and Jeffery 1998).
Modernizing forces aid in changing these views about educating girls. If identity
politics movements seek to maintain these calls for educating girls only so they can
be better wives and mothers, modernizing forces may not penetrate the reinforcement
of these ideologies.
In addition, in India, Muslim households may be reluctant to send girls to
government and non-Muslim private schools, since females are given the
responsibility of being vessels of religion and teaching their children how to be good
Muslims. Government and non-Muslim private schools inhibit their ability to do this,
therefore Muslim households may feel compelled to send their daughters to madrasas
for religious instruction for a few years. Once children are sent to madrasas, it may
51
become difficult to transition into government and non-Islamic middle and secondary
schools. Therefore, Muslim women’s education may be curtailed.
Employment carries little redeeming value ascribed to education. Through
exalting women’s domestic roles and their responsibilities to be a good wife and
mother, religious identity politics movements often circumscribe women’s ability to
work, under the assumption that if a woman works, then time is taken away from her
children and husband, thus the woman cannot fulfil her duties to be a good mother
and wife and also work (Bouatta and Cherifati-Merabtine 1994). In such diverse
identity political movements as Khomeni’s Iran, Hitler’s Germany, and Sudan, there
were explicit calls for women not to work. In Iran, the state encouraged women not
to work through such policies as mandatory retirement, harassment, and incentives
for men whose wives do not work (Gerami 1994). Despite these sanctions against
women working, it seems to have mostly affected educated upper class women, rather
than lower class women (Moghadam 1988). Similarly, in Sudan, identity politics
movements called on women not to work unless they did not have children or if their
family was in need of income (Hale 1994).
In India, Muslim women’s wage work may be susceptible to these influences.
Furthermore, if the Muslim community perceives itself as being subject to hostile
Hindu influences, withdrawal from intensive contact with these groups, particularly
for women, may be one of the responses. Wage work frequently involves working in
factories, offices and shops under supervisors who are most likely Hindu. Fears of
harassment may lead to withdrawal from these work environments. In addition,
52
stereotypical images of Muslim women as being backward, unreliable and unable to
communicate may lead to employer discrimination and inability to secure work.
While the religious identity politics literature argues that women’s rights,
status and empowerment are vulnerable to religious identity politics, it is unclear if
religious identity politics movements actually depress women’s education and
employment. This dissertation makes a unique contribution to the literature by
examining empirical trends in Muslim women’s school enrollment and wage
employment in the context of intensifying Hindu fundamentalism and Muslim
identity politics.
Conclusion
This chapter has highlighted factors shaping Indian Muslim women’s lives.
Modernizing forces may positively affect enrollment and wage employment for all
Indians. Religious disadvantage and discrimination negatively influences enrollment
and wage employment for both Muslim men and women. In addition, there is
evidence that discrimination against Muslims has been increasing as a result of the
rise of Hindu fundamentalism, which would further depress enrollment and wage
employment for Muslims. Additionally, there is evidence that upper class Muslims
may be particularly affected by the rise of Hindu fundamentalism. Muslim women’s
lives may be further shaped by the rise of Hindu fundamentalism and Muslim identity
politics. This dissertation makes an important contribution to the literature on
Muslim women, by empirically testing these relationships.
53
Chapter 3: Conceptual Framework and Hypotheses
Over the past thirty years, India has experienced profound economic, political,
and social changes, greatly influencing Muslim women’s lives. The preceding
chapters highlight three primary trends, modernization, religious disadvantage and
discrimination, and the rise of Hindu fundamentalism and Muslim identity politics.
Despite the confluence of these trends and their potential impact on Muslim women,
they have never been simultaneously empirically examined. Utilizing the National
Sample Survey (NSS), this dissertation empirically tests these trends, focusing on
measurable outcomes, enrollment and wage employment. This chapter discusses the
conceptual framework and hypotheses.
Conceptual Framework
Enrollment
As Figure 1 illustrates, I hypothesize that modernization, discrimination and
disadvantage, and Hindu fundamentalism and Muslim identity politics have
influenced school enrollment from 1983 to 1999 primary through parental value and
demand for education.
Modernizing forces have increased the supply of schools, increased the
economic benefits of schooling and changed ideologies about the non-economic
benefits of schooling. Educational expenditure (Ministry of Education 2006) and the
provision of educational facilities have increased considerably (Govinda 2002),
granting greater access to education for larger portions of the population. Increased
supply of schools lowers many of the household level costs associated with
education. For example, children’s enrollment is hindered when they must travel long
54
distances to school, often on difficult terrain (The Probe Team 1999). If a child must
walk a long distance to attend school, there may be safety concerns and there are
opportunity costs associated with the time the child is away from home. Time
traveling to and from school may come at the expense of children’s household chores.
Safety concerns and domestic responsibilities particularly affect girls schooling.
Social distance poses another hindrance to schooling for disadvantaged groups (The
Probe Team 1999). Many schools are located in higher caste sections of villages.
Disadvantaged groups may not feel comfortable traveling to those schools because of
safety and harassment concerns. To the extent that more schools are built in areas
where disadvantaged groups reside, parental demand for education among
disadvantaged groups may increase. In particular, parental demand for Muslims may
increase as schools become more accessible.
Modernizing processes also increase the economic benefits of schooling
affecting parental value and demand for education. Development changes the
structure of the economy and the types of jobs that are available, requiring a more
skilled workforce. Additionally, these forces change the returns to education in terms
of attaining better jobs and higher earnings. Caldwell et. al. (1985) and The Probe
Team (1999) find that households increasingly view education as a venue to obtain
better paying jobs. Specifically, Caldwell et. al. (1985) find that parents in rural
India want to increase their children’s chances of obtaining non-farm, urban, or
government employment. Developmental processes have also changed the rural
economy, increasing parental demand for schooling (Caldwell et. al. 1985).
Decreasing farm sizes, changes in rural technologies, and changes in employment
55
relationships have resulted in less reliance on children’s labor. This reduction in the
need for children’s labor has played an important role in increasing school enrollment
(Caldwell et. al. 1985). Modernization also changes ideologies about the non-
economic benefits of schooling. Households increasingly view education as important
for literacy, numeracy, enlightenment, and a better ability to interact with the social
world (Caldwell et. al. 1985, The Probe Team 1999).
Discrimination and disadvantage also influence parental demand for
schooling. Low cultural and economic worth of women in Indian society influences
girls schooling. Households faced with scarce resources will choose to invest in
boys’ education over girls’ education because of the greater returns to boy’s
education. Furthermore, cultural practices such as purdah, restrictions on girls’
movement at menarchy, also hinder girls’ school enrollment. These societal and
community values about girls’ cultural and economic worth are enacted through
parental demand for girls’ education, depressing their education.
Muslims also face discrimination and disadvantage which influences parental
demand for schooling. The school climate may adversely affect Muslim school
enrollment. Textbooks and curriculums that have a pro-upper caste Hindu and anti-
Muslim biases, and hostilities from teachers and students may deter Muslim
children’s enrollment. Specifically, Muslim parents may not want to send their
children to schools where the school climate is hostile. As Hindu fundamentalism
increases, the school climate is likely to become more negative towards Muslims,
having further depressive effects on their enrollment. Moreover, if Muslim children
must travel in Hindu dominated areas to attend schools, Muslim parental concern for
56
their children’s safety may influence their children’s enrollment. Historical
discrimination and disadvantage may also adversely influence Muslim school
enrollment. Past discrimination and disadvantage have negatively affected Muslim
households’ educational attainment and economic opportunities, reducing the
socioeconomic resources they have to send their children to school. Present
discrimination in the labor market also influences Muslim parental demand for
schooling. Muslim parents may not see the value in investing heavily in education if
the returns to education in the labor market are lower for Muslims. Discrimination
and disadvantage in terms of the allocation of schools also negatively influences
Muslim children’s enrollment. Areas with high concentrations of Muslims have less
schools (Jeffery and Jeffery 1998, Jeffery et. al. 2005). Parents’ reluctance to send
their children to schools that are at a great distance, may hinder Muslim children’s
school enrollment.
Hindu fundamentalism and Muslim identity politics may have a unique
influence on Muslim girls. To the extent that Muslim women and girls have become
symbols for the Muslim community, in the face of rising Hindu fundamentalism, then
parental demand for girls education will likely decrease. More specifically, if the
Muslim community, as a reaction to Hindu fundamentalism, adopts more
conservative ideologies about gender roles, then parental demand for girls’ education
will decrease. The further delineation of gender roles, where women attend to
domestic duties while men engage in market work, devalue the importance of
education for girls, resulting in household’s choosing not to invest heavily in girls
education. Moreover, in religious identity politics movements, women are seen as
57
vessels for religion and must impart their religious knowledge to their children. This
may result in Muslim parents sending their girls to madrasas to receive religious
instruction. Madrasa schools often do not provide education at higher levels of
schooling and transitions to madrasas to government and non-Islamic private schools
can be difficult, potentially curtailing Muslim girls’ education when madrasa
education is no longer available. Furthermore, in the face of rising Hindu
fundamentalism, parents may fear for the safety of their daughters while traveling to
school, potentially restricting their education.
Thus far we have discussed how external forces have likely influenced
parental demand for enrollment. There are also important factors within the
household that affect children’s school enrollment. The economic resources of the
household determines who is able to go to school and for how long. Families that
have scarce economic resources will likely have a lower demand for education,
having to spend their resources on more basic needs. Furthermore, they may have a
greater demand for children’s help in the household. Additionally, scarce economic
resources hinder girls’ education more than boys, since households would choose to
send boys to school because of the greater returns to their education and because boys
will provide for their parents in old age. Girls’ education is further hindered by
responsibilities in the household, such as care of younger children.
Wage Employment
Figure 2 illustrates the factors that have influenced the wage employment
patterns of Hindu and Muslim men and women. Modernizing forces change the
structure of employment, decreasing self-employment and increasing opportunities in
58
wage employment. These forces also increase education and earnings and, in theory,
should change patriarchal ideologies. As often coveted wage employment,
educational, and earnings opportunities become more available, households will
increasingly attempt to gain access to these opportunities. To the extent that
modernization changes patriarchal ideologies, cultural practices that inhibit women’s
work, such as purdah, may be relaxed. These changes are likely to occur at both the
community and household level. At the household level, households may be attracted
to the earning potential of women, and relax cultural practices that limit women’s
wage work. In theory, modernization is also supposed to break down the importance
of ascriptive characteristics such as gender and race in the labor market, since it
becomes too costly for firms to discriminate. Therefore, modernizing forces should
decrease the effects of discrimination that women and Muslims face in the market
place.
While development may reduce the discrimination that women and Muslims
face in the labor market, discrimination in the labor market persists. Women face
discrimination in the labor market and are also encumbered by cultural practices that
inhibit their labor force participation. Labor force discrimination has a direct impact
on their access to jobs, while other cultural constraints operate through household
decision-making about women’s work. The delineation of strict gender roles, where
men are involved in market work and women tend to reproductive and domestic
responsibilities are broader ideologies of society which operate through labor force
opportunities and household decision-making about women’s work. Moreover,
cultural practices such as purdah also operate via household decision-making. Many
59
upper caste households observe purdah, this practice is becoming more prevalent as
other households emulate higher caste households and attempt to gain status through
the observance of purdah. However, households who have scarce resources are often
not in a financial position to practice purdah.
Muslims also face discrimination in the work place having a direct negative
influence on their wage employment. Employers, who tend to be Hindu, since
Hindus are the majority in India, may discriminate against Muslims resulting in not
hiring Muslims or relegating them to low paying jobs. Where Muslims do have jobs,
working primarily with Hindus, their work environment could be hostile and these
hostilities may worsen with the rise of Hindu fundamentalism, possibly resulting in
Muslims withdrawing from such work places. Moreover, the rise of Hindu
fundamentalism and resultant riots in many areas, have led many Muslims to leave
their homes to live in Muslim dominant areas (Government of India 2006). Muslim
dominant areas tend to have less resources (Government of India 2006) and may
result in Muslims living further away from lucrative job opportunities, curtailing their
wage employment.
Muslim women may be further affected by Hindu fundamentalism and
Muslim identity politics. If the Muslim community adopts more conservative
ideologies about gender roles, then households may decide to withdraw women from
wage employment. Religious identity politics movements often call for a further
delineation of gender roles. The increased demarcation of gender roles reinforces the
importance of women’s reproductive and domestic duties and denounces their
participation in market work. Market work conflicts with women being good wives
60
and mothers because it takes time away from their husbands and children (Bouatta
and Cherifati-Merabtine 1994). Muslim women’s market work may be further
depressed if Muslim households decide to curtail women’s contact with Hindus over
concerns for Muslim women’s welfare in an increasingly hostile environment.
There are also factors within the household that influence wage employment.
Economic resources within the household may determine whether women engage in
market work. Women from poorer households may have no choice but to engage in
market work. Children in the household, particularly young children are likely to
decrease women’s engagement in market work, since women are responsible for child
care duties.
Hypotheses
Hypothesis 1
Modernizing forces will increase overall school enrollment and wage employment
over time.
Economic growth and the diffusion of western ideas have been increasing
school enrollment in developing countries. As the economy grows, a more educated
workforce is needed to perform complex tasks (Notestien 1953), resulting in
government educational investment and promotion. Furthermore, colonial and post-
colonial relationships with Western countries have led developing nations to emulate
the western model of the nation-state and place importance on mass education (Meyer
et. al 1992). Thereby, increasing the commitment that developing nations have to
education.
61
In India, since Independence, there have been many factors that have
increased school enrollments. In order to enhance the development process, the
Indian government has made important commitments to raise school enrollment
levels, particularly by increasing access to schools. In addition, the changing
economic structure in India resulting in economic benefits to those who are more
educated has influenced household decision-making about school enrollment. Parents
are increasingly sending their children to school to raise their chances of obtaining
better employment opportunities (Caldwell et. al. 1985). Moreover, parents are
increasingly aware of the social benefits of schooling, such as enlightenment and a
better ability to interact with the social environment (Caldwell et. al 1985, The Probe
Team 1999). However, literature suggests that structural adjustment and
liberalization policies may reduce school enrollments due to lower expenditures on
education, the institution of fees, and recession. While India did undergo structural
adjustment and liberalization policies, the Indian government did not reduce
expenditures or institute fees, nor did India experience a recession. Therefore, we
expect total educational enrollment to increase over time.
Modernization also influences employment patterns. During early periods of
development, the family is the center of production (Notestein 1953). As
development progresses, outside forms of production develop, pulling household
members out of family production into jobs such as factory work (Notestien 1953).
As economic growth occurs, more people are needed to produce goods and services,
increasing service, manufacturing, and industrial wage employment opportunities
outside the household (Anderson and Leiserson 1980). However, these arguments
62
largely rely on the experience of developed nations and do not account for, among
other factors, the impact structural adjustment and liberalization policies have on
developing nations. As a result of structural adjustment and liberalization policies,
many developing countries experienced a slow down in job growth, casualization of
the labor force, and increased unemployment and underemployment.
From 1950 to 1980, India experienced slow and steady economic growth, with
a per capita economic growth rate of 1.7 (Rodrik and Subramanian 2005). The 1980s
ushered in a new era of economic growth. From 1980 to 2000 the per capita
economic growth rate increased to 3.8 percent (Rodrik and Subramanian 2005).
Contrary to expectations, but similar to the experience of many other developing
nations that underwent structural adjustment programs, the economic growth that
India experienced did not accelerate growth in employment, rather the employment
growth rate declined from the 1980s to 2000. However, this economic growth has
resulted in the reduction of self-employment, which partially reflects employment in
household enterprises. The percentage of workers engaged in self-employment
decreased from 59 percent in 1977-78 to 53 in 1999-2000 (Anant 2004). While
economic development decreased self-employment, wage work increased. Those
engaged in wage work are either regular salaried employees or casual wage laborers.
While the overall percentage of workers engaged in wage work increased during this
period, it is unclear whether regular salaried wage employment increased. Anant
(2004) finds that from 1977-78 to 1999-2000 regular salaried employment remained
stagnant, with roughly 14 percent of workers engaged in regular salaried employment
in both periods. However, other estimates indicate that regular salaried employment
63
increased (Sundaram 2004), while others (Duraisamy 2000) suggest a slight decrease
in regular salaried employment from the 1980s to 2000. There is more agreement
regarding the trend in casual wage employment, with many arguing that India is
experiencing a casualization of the labor force. The percentage of workers engaged
in causal wage employment has increased from 27 percent in 1977-78 to 33 percent in
1999-2000. It appears that much of the decrease in self-employment is associated
with the increase in casual wage work. In other words, it appears that those engaged
in self-employment are increasingly moving in to casual wage employment. Despite
the ambiguity surrounding the trends for regular salary employment, we expect that
as India experienced accelerated economic growth during the 1980s through 2000,
total wage work, encompassing both regular salaried employment and casual wage
labor will increase, largely driven by increases in casual wage employment.
Hypothesis 2
Modernizing forces will narrow the gender gap in enrollment in education. It is
unclear how modernizing forces will influence the gender gap in wage employment,
at least in the short run.
As development proceeds, gender gaps in enrollment decrease. Examining the
relationship between development and gender inequality in education, Hill and King
(1993) find that low-income countries tend to have the largest gender gaps in school
enrollments, while developed nations have the smallest gaps. The experiences of
urban and rural areas also demonstrate that development narrows gender differences
in enrollment. Urban areas are more developed than rural areas and experience lower
gender differentials in education. In addition, as governments actively promote
64
schooling and provide greater access to schools, girls benefit. Wils and Goujon’s
(1998) study of six world regions from 1960 to 1990 suggests that as enrollment
increases, the gender difference in enrollment decreases as girls’ enrollment catches
up to boys’ enrollment.
In India, education of women was dismal prior to Independence from Britain
(Basu 1999, Dreze and Sen 1995). The Indian government, recognizing that girls’
education was considerably lower than boy’s education, wrote a provision in the
constitution urging states to make special efforts to encourage girls’ education (Basu
1999). Over the years, educational commissions and the women’s movement called
for more substantial efforts to increase girls’ enrollment, resulting in special programs
and campaigns to enhance girls enrollment and literacy (Basu 1999).
Through these efforts and the government’s commitment to expand
educational facilities, girls’ access to education has increased. Since girls’ enrollment
is sensitive to proximity to schools, this has played a major role in increasing their
enrollment. Parents’ reluctance to send girls to schools outside their village or far
distances reduces girls’ enrollment (Nayer 2002, The Probe Team 1999).
Government expansion of educational facilities removes this barrier to girls’
education. Work by Rastogi et. al. (2004) substantiates this claim. They find that
gender inequality in education is reduced in districts with higher levels of school
quality, proxied by the number of teachers in a district.
However, supply of schools is not enough. A major hindrance to girls’
schooling is household demand. As discussed in Chapter 2, girls’ low economic and
cultural worth in India diminishes their school enrollment. Despite these barriers,
65
demand for girls’ schooling has been increasing since Independence. One factor that
has increased the demand for girls’ schooling is the importance of education in
marriage markets. Households increasingly want to educate their daughters to
enhance their marriage prospects (Caldwell et. al. 1985, The Probe Team 1999).
Households also believe that some education for girls is important to improve their
domestic abilities, accounting skills, and letter writing skills (The Probe Team 1999).
Increasingly, households are also indicating that they would like to educate their
daughters to increase their employment opportunities (Caldwell et. al. 1985, The
Probe Team 1999). Caldwell et. al. (1985) argue that this was not the case 15 years
before their study.
Another potential hindrance to girls’ schooling is structural adjustment
policies, however we do not expect that girls’ education in India has been affected by
these policies. The Indian government has invested considerably in education, has
not instituted any fees, and India has experienced significant economic growth.
Therefore, households do not feel additional financial constraints that would likely
hinder girls’ enrollment.
Increased school expansion, efforts of women’s groups and educational
commissions, campaigns directed at girls schooling and literacy, and the increasing
demand of girls schooling has had an important impact on girls schooling. As a
result, girls’ enrollment in India has increased at a faster rate compared to boys (Basu
1999, Nayer 2002). Therefore, we expect that modernizing forces have reduced the
gender gap in school enrollment over time.
66
Women’s labor force participation is expected to follow a U shaped curve. At
low levels of development, women’s work participation is high as both men and
women are engaged in economic activities based around the home. As development
proceeds, wage work outside the home pulls men into market work, while women
continue to work at home. As development further progresses, particularly when
there is a sufficient level of secondary schooling and white collar jobs (Goldin 1995),
women’s market work increases, and female labor force participation moves up the
curve of the U. However, it is unclear what threshold of development will
significantly propel women's labor force participation. Structural adjustment policies
may facilitate the increase of women’s market work, if household incomes decrease
requiring women to work outside the home. However, if the labor force does not
expand, then women’s market work may be curtailed.
The effect of modernizing influences on Indian women’s wage employment is
not clear because there are various potentially countervailing trends. There is
evidence that women’s wage employment has been increasing over time. In
particular, the percentage of women as agricultural wage laborers has increased since
1961 (Mukherjee 1999). Unni and Rani (2000) also find that women’s share of non-
agriculture employment is increasing, suggesting that women are increasingly
entering wage employment. However, there is also evidence that overall female labor
force participation rates have remained stagnant and even decreased from 1980 to
1995 (Das and Desai 2003). The pattern behind this stagnation and even labor force
decline for Indian women is unclear. Therefore, it is unclear how modernization will
influence women’s wage work in India.
67
Hypothesis 3
Discrimination and disadvantage adversely affect Muslim enrollment and wage
employment.
Discrimination and disadvantage that Muslims face in India influence both
their school enrollment and wage employment. There are several factors, which lead
to lower school enrollment among Muslims. First, there are fewer publicly provided
schools in wards, villages and districts that have higher proportion of Muslims
(Jeffery and Jeffery 1998, Jeffery et. al. 2005). Second, there is Hindu bias in
government and non-Islamic private schools. Teacher bias towards Hindus and
government texts which extol Hinduism, while deprecating Islam negatively
influences Muslim school enrollment. Absence of Urdu schools may further affect
enrollment, particularly in southern states where Muslims often use Urdu at home
which is very different from Kannada, Malyalam, Tamil and Telugu taught in schools.
Discrimination in the labor market also depresses Muslim school enrollment.
Muslims are discriminated against in both the public and private sectors. This reality
often discourages Muslim households from investing scarce resources in education,
when they will not be rewarded for these human capital investments (Mann 1994,
Sikand 2005). Therefore, we expect Muslim enrollment to be lower than Hindu
enrollment.
Muslims also face discrimination and disadvantage in the labor market.
Muslims face considerable discrimination in both the public and private sectors
(Hasan 2005). Muslims are largely confined to non-agricultural self-employment
(Das 2002), hold more vulnerable jobs, and have less occupational and income
68
mobility compared to Hindus (Khandker 1992). Therefore, we expect Muslim wage
employment to be lower than Hindu wage employment.
Hypothesis 4
As Hindu fundamentalism intensifies, discrimination against Muslims
increases, reducing growth in enrollment and wage employment for Muslims, thereby
increasing the enrollment and wage employment gap between Hindus and Muslims,
particularly in states where Hindu fundamentalist currents are strong.
As Chapter 1 documents, Hindu fundamentalism has been increasing since the
early 1980s, intensifying throughout the 1990s, resulting in the proliferation of
negative Muslim stereotypes and prejudice against Muslims. Increased prejudice
against Muslims may further depress Muslims enrollment and wage employment.
The propagation of negative stereotypes of Muslims, may further lower Hindu
teachers’ expectations of Muslim children affecting Muslim children’s performance
and progress in school. Children may find this environment frustrating and
unmotivating and as a result drop out. Parents often stop investing in their child’s
education when they are not making adequate progress (Caldwell et. al. 1985).
Households do not have enough resources to keep a child in school who is not
performing well because of the opportunity cost of lost labor and costs of schooling
such as textbooks, uniforms, and other fees (Caldwell et. al. 1985). Another potential
factor depressing Muslim school enrollments is that Muslim households may view
increased prejudice against Muslims in government and non-Muslim private schools
as detrimental to children’s wellbeing. In addition, in the face of rising Hindu
fundamentalism Muslim households may find it important to have their children
69
retain part of their religious heritage by sending them to madrasas. If Muslim
households increasingly choose to send their children to madrasas in the face of rising
Hindu fundamentalism, it becomes more difficult for children enrolled in these
schools to attend government secondary schools after madrasa education is no longer
available. Therefore, as Hindu fundamentalism increases, Muslim enrollment may
decrease.
Increased prejudice and discrimination towards Muslims will likely also
influence their wage employment. Since Muslims are predominantly in non-farm
small scale self-employment, hiring decisions for wage employment are in the
purview of Hindus. Even if Muslims were in wage work, they are only 13 percent of
the population so most will work for Hindu employers. As negative portrayals of and
prejudice against Muslims intensify, it will be even more difficult for them to find
jobs in wage employment. Therefore, wage employment is likely to decrease for all
Muslims in the face of increasing prejudice from Hindus.
Hypothesis 5
Upper class Muslims may be relatively more affected by the rise of Hindu
fundamentalism compared to poorer Muslims. If this is true, then we would expect
the enrollment and wage employment gaps between upper class Muslims and Hindus
to be larger than the gap between poorer Muslims and Hindus, particularly in states
where Hindu fundamentalism is strong.
There is evidence that communal groups have utilized the increasing
economic prosperity of Muslims in particular areas to incite communal tensions and
riots (Hasan 1982, Lateef 1990). As a result, upper class Muslims may be more
70
targeted during these tensions and riots and may also face more discrimination from
Hindus. Thus, potentially increasing the enrollment and wage employment gaps
between upper class Muslims and Hindus more than for poorer Muslims and Hindus.
Hypothesis 6
Similar to the relationship between Hindu females and males, Muslim females will
have lower levels of enrollment and wage employment compared to Muslim males
because of gender discrimination in schooling and the labor market.
Muslim females will experience similar disadvantages that Hindu females
face in school enrollment. In the face of scarce resources, households choose to
invest in boys’ education because they have more economic opportunities.
Furthermore, males provide future financial and old age support to their parents,
making investment in their education more crucial. In addition, the practice of
purdah, marriage markets, and the gender division of labor result in lower educational
levels for Muslim females compared to Muslim males. Moreover, Muslim females,
like Muslim males, face discrimination in government and non-Islamic private
schools. Therefore, due to the interplay of gender and religion, Muslim female
enrollment will be lower than Muslim male enrollment.
Similar to Hindu women, Muslim women’s wage employment is depressed by
the practice of purdah, the gender division of labor, and segmented labor markets.
Moreover, Muslim women face discrimination in the wage labor market because of
their religious affiliation. Therefore, the intersection between gender and religion
results in lower wage employment for Muslim women, compared to Muslim men.
71
Hypothesis 7
The rise in Hindu Fundamentalism and religious identity politics will increase the
Muslim gender gap in enrollment and wage employment over time, particularly in
states where Hindu fundamentalism is strong. Furthermore, these factors will have a
greater influence on Muslim women’s employment compared to their enrollment in
education.
Although Muslim women share gender discrimination with their Hindu
sisters, they are further affected by the way in which religion has been politicized in
India. Muslim women’s lives have been strongly affected by political currents in the
1980s and 1990s. The rising tide of Hindu fundamentalism and the resultant identity
politics among Muslim communities are likely to have an increasingly negative
impact on Muslim women’s education and wage employment.
Religious identity politics movements call for women to return to the
domestic sphere and for the reinforcement of the gender division of labor. Enrollment
in education, particularly at levels such as middle school and above, and participation
in wage employment are in opposition to the gender division of labor. While both
employment and enrollment contradict the appeals for women to return to the
domestic sphere, education is still somewhat appealing for identity movements, since
education seemly makes women good mothers. Therefore, if identity politics plays a
role in Muslim women’s lives, we do expect the gender gap in Muslim enrollment to
increase over time, but only moderately. In contrast, we expect the effect of identity
politics to be much greater on employment since wage employment is not tied to
motherhood or the domestic sphere.
72
Chapter 4 Data: Dependent, Independent, and Control Variables; and Research Design and Methods
This chapter discusses the data; describes the dependent, independent and
control variables; and explains the research design and methods.
Data
We employ the National Sample Surveys (NSS), allowing us to examine
enrollment and wage employment patterns over time. The NSS all-India household
surveys have been conducted by the National Sample Survey Organization (NNSO)
annually since 1950, collecting important cross-sectional employment and
consumption data. Starting in 1972, every five years, surveys with larger samples
have been collected called the quinquennial surveys. This paper utilizes the larger
sample sizes of the quinquennial surveys, using four NSS rounds, 38, 43, 50, and 55,
which were collected in 1983, 1987-1988, 1993-1994, and 1999-2000 respectively.
The quinquennial surveys use a multi-stage stratified sample design, conducting in-
person interviews from a sample of randomly selected households to collect data on
approximately 100,000 to 120,000 households or around 500,000 individuals per
round. For rounds 38, 43, 50, and 55, there were 120,921, 129,194, 115,409, and
120,309 households were interviewed respectively. Data was collected on 623,494,
667,848, 564,740, and 596,688 individuals for rounds 38, 43, 50, and 55 respectively.
An adult respondent answers questions about the household and individuals within
the household.
We will now turn to a discussion of the dependent variables and sample for
the enrollment and wage employment analyses. Tables 2 and 3 display the means and
73
standard deviations for independent and control variables for the enrollment and
employment analyses respectively.
Dependent Variables and Sample
The primary aim of this dissertation is to understand Muslim women’s school
enrollment and wage employment in light of several countervailing influences such as
modernization, religious disadvantage, and the rising tide of Hindu fundamentalism
and Muslim identity politics. These factors are crucial to understanding Muslim
women’s experience in India for a variety of reasons. First, both of these components
allow us to gauge the well-being of Muslim women in India and how it has changed
over time in the face of increasing Hindu fundamentalism. Second, the use of these
two factors allows us to make a unique contribution to the identity politics literature.
While many researchers argue that women’s status in the form of education and
employment is threatened by identity politics movements, it is has not been examined
empirically. Both of these factors also taps into a slightly different aspect of Muslim
women’s lives and this difference has interesting theoretical implications. Therefore, I
utilize two dependent variables for this analysis: school enrollment and wage
employment.
Education
India’s educational system consists of preprimary, primary, middle, secondary,
and higher education. Preprimary schools are similar to kindergarten in the United
States. Primary school is for children ages 6 to 11 and consists of grades 1 through 5.
Children 12 to 14 attend middle schools, grades 6 to 8. Children ages 15 to 18 attend
high school and junior college, grades 9 through 12. Higher education consists of
74
technical schools, colleges, and universities. There is also non-formal education for
children ages 6 to 14, who are not able to attend regular schools. While school ages
are designated for each level of education, in practice ages vary because children are
sent to school at different ages and can be held back. Also, there are some differences
in transition points between primary and middle and middle and high school across
states and whether grades 11 and 12 are located in high schools or in separate junior
colleges. By focusing on ages 12-15, this dissertation will focus on middle school
and the first year of secondary school, although some students who have started
school late or have been held back may be in primary school.
The dependent variable for education is enrollment of children 12 to 15 coded
1 if the respondent is enrolled and 0 if the respondent is not enrolled. The individuals
in the age group 12 to 15 could potentially be enrolled in primary, middle, or
secondary schooling, however they will mainly be enrolled in middle and the first
year of secondary school. While primary schooling is becoming increasingly
accessible to most groups, and inequalities are diminishing at this level, considerable
gaps between various groups in upper primary and secondary schooling still persist. I
expect the greatest differences between religious groups and males and females to be
in middle and secondary school enrollment, by looking at the age group 12 to 15 we
will be able to examine these differences. We have chosen the upper limit of 15 to
minimize the effects of selectivity issues of early age at first marriage on the gender
gap in enrollment. Once girls are married and move in with their husbands, their
education is often curtailed, augmenting the gender differences in education. If we
include these girls in our analysis then any household level control variables are
75
measuring characteristics of their husband’s family, not the characteristics of their
natal family, which heavily influences their educational attainment. The average age
at first marriage is rising in India, however it continues to be an issue. Sixty-five
percent of women aged 25 to 49 were married by the age of 18 (ORC Macro 2000).
In several states, Rajasthan, Madhya Pradesh, Uttar Pradesh, Bihar and Andhra
Pradesh about 80 percent of women aged 25 to 49 were married by the age of 18
(ORC Macro 2000). Moreover, for the cohort of women aged 20 to 24 in the 1998-
1999 National Family and Health Survey, 50 percent were married before the age of
18, among those married before 18, 24 percent were married before 15. The median
age of marriage and median age of first cohabitation are similar for this age group, 18
and 18.3 respectively, suggesting that many of these women who married at young
ages moved in with their husbands at that time (ORC Macro 2000).11
The total sample for the analysis of enrollment is 218,306 individuals ages 12
to 15. Due to missing values on various variables, 2,336 observations were dropped
from the analysis. Therefore, the sample size is 215,970. Excluding the dropped
observations, there are 56,948, 58,741, 47,565, and 52,716 individuals ages 12 to 15
in NSS rounds 38 (1983), 43 (1987-1988), 50 (1993-1994), and 55 (1999-2000)
respectively.
Table 4 shows total enrollment, enrollment by gender, and enrollment by
gender and religion by round. Fifty-eight percent of all children ages 12 to 15 are
enrolled in school for all rounds. As expected enrollment increases over time, 47
11 There are cultural practices, for example gauna in North India, where there is a lag between when a couple marries and when they cohabit, particularly for couples who marry at young ages.
76
percent of children aged 12-15 were enrolled in school in 1983, this figure increased
to 67 percent by 1999.
There is considerable variation in enrollment across states (see Table 5). For
all rounds combined Andhra Pradesh has the lowest level of enrollment, where 45
percent of children aged 12 to 15 for all rounds were enrolled in school. In contrast,
Mizoram has the highest levels of school enrollment, where 91 percent of children 12
to 15 were enrolled from 1983 to 1999.
Whether a child resides in an urban or rural setting influences their chances of
enrollment. Figure 3 shows urban and rural enrollment by gender. Urban enrollment
is considerably higher compared to rural enrollment. Seventy-three percent of urban
children aged 12 to 15 were enrolled in school for all rounds combined, while only 54
children residing in rural areas were enrolled. Similarly, enrollment for boys and girls
in urban areas is higher compared to rural areas. Seventy-eight percent of urban boys
were enrolled in school from 1983 to 1999, compared to 64 percent of rural boys.
Similarly, 69 percent of urban girls were enrolled in school for all rounds combined,
while only 42 percent of their counterparts were enrolled in rural areas.
Age is an important factor in determining school enrollment. Figure 4 shows
enrollment by age and gender for all rounds combined. Sixty-four percent of children
aged 12 are enrolled in school. Similarly, for children aged 13, 64 percent are
enrolled. However, as children age, their enrollment declines, 58 percent of children
aged 14 are enrolled in school, this figure declines to 47 percent for children aged 15.
Both boys and girls experience this decline. Seventy-one percent of boys aged 12 are
enrolled in school for all rounds combined, compared to 55 percent of boys aged 15.
77
Similarly, 53 percent of girls aged 12 are enrolled in school, declining to 36 percent
for girls aged 15.
Over time, enrollment by gender and religion has increased over time,
however differentials between groups persist (see Table 4). Both males and females
have experienced increases in school enrollment over time. Male enrollment
increased from 59 percent in 1983 to 73 in 1999. Female enrollment grew at a faster
rate than male enrollment, although female enrollment remains lower. Thirty-four
percent of females aged 12-15 were enrolled in 1983, increasing to 60 percent by
1999. Hindu and Muslim girls and boys all experienced increases in school
enrollment over time, however persistent differences remain. Hindu males
enrollment increased from 65 percent to 79 percent from 1983 to 1999, increasing 14
percentage points. Muslim males made similar gains, although their enrollment
remains lower than Hindu males. Muslim male enrollment increased from 49 percent
to 63 percent from 1983 to 1999, a 14 percentage point gain. Hindu females
experienced the greatest gains in school enrollment, even surpassing Muslim male
enrollment. Hindu females experienced a 29 percentage point gain in enrollment,
increasing from 39 percent in 1983 to 68 percent in 1999. Muslim females also made
important gains, although their enrollment remains the lowest compared to all other
groups. Muslim girls’ enrollment increased 25 percentage points from 29 percent to
54 percent from 1983 to 1999. Multivariate analysis will be used to test whether
patterns of school enrollment have been influenced by modernizing forces,
discrimination and disadvantage, and Hindu fundamentalism and Muslim identity
politics, which will be discussed in further depth below.
78
Employment
We utilized the ‘usual status’ variable in the NSS to create our wage
employment variable. The reference period for the ‘usual status’ variable is 365 days
prior to the survey. The ‘usual status’ variable measures the major activity which
individuals were engaged in over the past year: self-employment as own account
workers; helpers in a household enterprise; regular salaried or wage employees;
casual wage work; did not work but are seeking and available for work; attending
educational institutions; engaged in domestic work; landlords, pensioners, and
remittance recipients; not able to work due to disability, beggars and prostitutes, and
others. Some of these activities are self-evident, such as attending an educational
institution, while other activities require some explanation. Self-employed own
account workers run their own enterprises. Helpers in a household enterprise work
full or part time, assisting in but not running a household enterprise, receiving no
regular salary or wages. Regular salaried and wage workers work full or part-time in
others’ farm and non-farm enterprises, receiving a salary or wages on a regular basis
(National Sample Survey Organization 1983-2000). Similar to regular salary or wage
workers, casual wage workers work in others’ farm and non-farm enterprises,
however, they receive a daily or periodic wage.
For employment, the dependent variable is a three category variable coded 1 if
the respondent is employed in regular salaried work or casual wage labor, 2 if the
respondent is self-employed and 3 if the respondent is unemployed, or out of the
labor force. The sample is restricted to individuals ages 25 to 55. The upper bound of
55 is used because retirement is expected at this age and is mandatory for many
79
individuals working in formal organizations or the government. The sample does not
include individuals attending an educational institution or not working because of
disability.
We utilize a variable measuring wage employment because it represents
integration into the labor market. This type of employment is where Hindus and
Muslims must interact. Therefore, this type of employment allows us to better
examine the discrimination Muslims face in employment. Furthermore, it is this type
of employment where Muslim identity politics may affect Muslim women.
Unemployment is categorized with out of the labor force because in the context of
India, unemployment is very low (Visaria and Minhas 1991). When faced with
extreme poverty it is common for individuals to find some work (Desai and Das
2004), thus, fine distinctions between unemployed and out of labor force are not
meaningful in this context. Therefore, it is important to focus on the better quality
jobs rather than on whether an individual is employed or unemployed (Desai and Das
2004). While wage employment by itself does not imply better quality jobs, it does
indicate market integration and access to cash income.
The total sample for the wage employment analysis is 840,912 individuals
ages 25 to 55. There were 2,103 missing observations on a few independent
variables, therefore these observations were dropped. After dropping missing
observations, the sample size is 838,809 individuals aged 25 to 55. The samples for
round 38 (1983), 43 (1987-1988), 50 (1993-1994), and 55 (1999-2000) respectively
are 201,054, 223,646, 198,389, and 215,720.
80
Table 6 shows unweighted frequencies and weighted percentages of wage
employment, self-employment, and unemployment/out of the labor force by gender
and religion for each year. Thirty-four percent of men and women aged 25 to 55 are
engaged in wage employment for all rounds. Similarly, 34 percent are engaged in
self-employment. Largely driven by women not being in the labor force, 32 percent
of the sample is unemployed or out of the labor force. Wage employment has
increased modestly from 1983 to 1999, increasing from 33 percent to 35 percent.
There is considerable variation in wage employment by state. Table 7 shows
the unweighted frequencies and weighted percentages for individuals 25 to 55
engaged in wage employment. Manipur has the lowest levels of wage employment,
where 17 percent of individuals 25 to 55 are engaged in wage employment.
Chandigarh has the highest level of wage employment, 52 percent of individuals 25 to
55 are engaged in wage employment.
Wage employment varies by urban and rural setting and gender. Figure 5
shows that individuals living in urban areas are more likely to be employed in wage
employment, 37 percent of individuals aged 25 to 55 are engaged in wage
employment in urban areas, compared to 32 percent in rural areas. Men are more
likely to be engaged in wage work in urban areas compared to men in rural areas,
however, interestingly the opposite holds true for women. Fifty-nine percent of urban
men aged 25 to 55 are engaged in wage employment, compared to 44 percent of rural
men. Only 14 percent of urban women aged 25 to 55 are engaged in wage
employment, compared to 21 percent of rural women.
81
Figure 6 shows wage employment by age and gender. Individuals in younger
age groups are more likely to be engaged in wage work. For the age group 25 to 34,
34 percent are engaged in wage employment, compared to 36 percent for the age
group 35-44, and 31 percent for the age group 45 to 55. Men in the age groups 25 to
34 and 35 to 44 experience similar levels of engagement in wage employment, 49
percent of those aged 25 to 34 are engaged in wage work, compared to 50 percent in
the age group 35 to 44. Men in the age group 45 to 55 have lower levels of wage
employment, 44 percent of males in this age group are engaged in wage employment.
Women in the age group 25 to 34 and the age group 45 to 55 are slightly less engaged
in wage employment compared to women aged 34 to 44. Nineteen percent of women
aged 25 to 34 are employed in wage work compared to 21 percent of women aged 35
to 44 and 17 percent of women aged 45 to 55. Wage employment may be lower for
women in the age group 25 to 34 as they attend to reproductive and child-care
responsibilities. While women in the older age category are likely affected by low
labor force participation throughout their lives.
Patterns of wage employment vary by gender and religion over time (see
Table 6) Male engagement in wage employment increased slightly more than female
engagement in wage employment. Male wage employment increased from 46
percent to 49 from 1983 to 1999, a 3 percentage point increase, while females
experienced a 1 percentage point increase from 19 percent to 20 percent. Hindu
males are slightly less likely to be engaged in wage employment compared to Muslim
males, however, Hindu males experienced a slightly higher increase in wage
employment. Hindu male wage employment increased from 41 to 43 from 1983 to
82
1999, while Muslim male wage employment increased from 43 to 44. Hindu female
wage employment also increased moderately from 15 percent to 16 percent from
1983 to 1999. In contrast to the experience of all other groups, Muslim women
experienced a decline in wage employment from 10 percent in 1983 to 8 percent in
1999, suggesting that Hindu fundamentalism and Muslim identity politics may be
influencing their wage employment. While descriptive statistics indicate that Muslim
women may be adversely affected by Hindu fundamentalism and Muslim identity
politics, it is necessary to utilize multivariate analysis to evaluate the influence
historical factors have had on wage employment over time.
Independent and Control Variables Variables for Enrollment and Wage Employment Analyses
Historical Period The historical period captures the influence of modernization on education
and employment for all individuals in the sample. As indicated in the Data section,
this dissertation utilizes four rounds of NSS data. The historical period variable is
measured based on these four rounds. Historical period is coded as a series of
dummy variables for each period, 1983 (round 38) is the omitted category.
Male
The advantage that males enjoy in both education and employment are
captured by the variable male. It is coded 1 if the respondent is male and 0 if the
respondent is female.
83
Male*Historical Period
The interaction between the variables Male and Historical Period measures
female’s education and employment experience over time.
Muslim - Religion and Social Background
The disadvantage and discrimination Muslims face in education and
employment in India is captured by the variable Muslim. There are also dummy
variables, serving as controls, included in this analysis to measure groups from other
social backgrounds, even though comparisons between non-scheduled caste Hindus
and Muslims is the main focus of this dissertation. The variable Scheduled Caste
captures lower caste Hindus, Buddhists, and Sikhs. The variable Scheduled Tribes
captures any respondent that is from a scheduled tribe regardless of religion. Hindus
that are not in the Scheduled Caste or Scheduled Tribe category are the omitted
category.
Muslim*Historical Period
The interaction between the variables Muslim and Historical Period measures
the potential intensification of disadvantage and discrimination Muslims experience
in the context of rising Hindu fundamentalism.
Male*Muslim
The interaction between the variables Male and Muslim measures the
disadvantage that Muslim women face in enrollment and wage employment.
84
Male*Muslim*Historical Period
The three-way interaction between the variable Male, Muslim, and Historical
Period measures the potential impact of the rise of Hindu fundamentalism and
Muslim identity politics on Muslim women in enrollment and wage employment.
Control Variables
Age
For enrollment, age is a continuous variable representing 12 to 15 years olds.
For wage employment, age is a continuous variable measuring 25 to 55 year olds.
Age Squared
Age squared is included in the analysis because age may have a curvilinear
relationship with enrollment and wage employment.
Marital Status
The variable will only be used as a control in the analysis for wage
employment. Younger women who are not married may be more likely to work.
Similarly, divorced and widowed women may have to help support themselves and
their families, pushing them into the workforce. Two dummy variables measure
marital status. Never married is the first variable. The second variable captures
whether a woman has been divorced of widowed. The omitted category is currently
married.
Household Size
The size of the household may influence whether a child goes to school or not.
On one hand, a larger household size may have scarce resources and this may inhibit
a child going to school. On the other hand, larger households may have more
85
resources to pool together to send children to school. Household size may also
influence employment. If a household is burdened by many members, then more
individuals from that household may have to work. Household size is a continuous
variable.
Urban
Whether a locality is urban or rural influences wage employment and
enrollment opportunities. Therefore we control for Urban, which is coded 1 if the
location is urban and 0 if it is rural.
Number of Children in the Household
This variable is used as a control for the wage employment analysis. Since
women are primarily responsible for childcare, the number of children in the
household may influence women’s employment.
Completed Education
The variable completed education will only be used in the wage employment
analysis. One’s education has an important effect on employment opportunities.
Completed education is measured by two dummy variables, ‘Primary’ measures
whether the respondent completed primary or middle school, and ‘Secondary’
measures whether the respondent completed secondary and above. The omitted
category is Below Primary which captures individuals who did not complete primary
school or who are illiterate.
Consumption Index
The consumption index will only be used in the enrollment analysis.
Consumption is a proxy for the wealth of the household. Children from wealthy
86
families are more likely to be enrolled in school compared to poor families. The
consumption index will not be used in the wage employment analysis because
consumption is endogenous to wage employment.
State
States have different levels of development and economic growth, affecting
both enrollment and wage employment opportunities. Also, state governments play
an important role in education. Therefore, we control for state by a series of dummy
variables. The omitted category will vary depending on the analysis. As will be
discussed below, the models will be run on all states combined, states that have strong
Hindu fundamentalist leanings, and non-fundamentalist states. For all states
combined and fundamentalist states, Uttar Pradesh has the largest population and
therefore will be the omitted category. For non-fundamentalist states Bihar has the
largest population and is therefore the omitted category. As will be discussed in more
detail below, models are also run for individuals above the poverty line and below the
poverty line for all states combined, fundamentalist states, and non-fundamentalist
states. Therefore, particular states were combined with neighboring states to ensure
sufficient sample sizes of Muslims for these models. The state combinations are as
follows: Tamil Nadu, Pondicherry, and Andaman and Nicobar Islands; Kerela and
Lakshadweep; Gujarat and Dadra Nagar Haveli; Harayana, Chandigarh, Himachal
Pradesh, and Punjab; Sikkim, Nagaland, Mizoram, Meghalaya, Arunchal Pradesh,
Manipur, and Tripura; and Karnataka,Goa, and Daman and Dui. The remaining states
are not combined with any other states, Assam, Bihar, Jammu and Kashmir, Madhya
Pradesh, Maharashtra, Orissa, Rajasthan, West Bengal, and New Delhi. Even though
87
only the poverty analyses, particularly for enrollment since the sample size is much
smaller compared to employment, requires state combinations to secure sufficient
sample sizes for Muslims, we utilize these state combinations for all models to be
consistent across analyses.
Research Design and Methods
I have argued that Muslim women’s lives are affected by a variety of
processes including, modernization, religious discrimination and Muslim identity
politics. In order to examine how these processes shape Muslim women’s lives, I
have focused on three key sets of independent variables – gender, religion and
historical period. The role of gender and religion in determining education and wage
employment has been discussed in detail above. However, my hypotheses focus on
social changes over the past twenty years and hence, historical period plays an
important role in my analyses. I focus on four major effects: (1) The main effect of
historical period indicates the secular change in education and employment brought
about by the passing of time and increasing modernization; (2) The interaction
between historical period and gender indicates how these forces of modernization
further diminish gender inequality in Indian society; (3) The interaction between
historical period and religion is meant to capture increasing isolation and
marginalization of Muslims over time; (4) The interaction between gender, religion
and historical period uniquely captures the way in which rising fundamentalism and
identity politics differentially affect the social construction of gender in Muslim
communities.
88
To better tease out the influence of Hindu fundamentalism on all Muslims and
Muslim women, models are run on all states combined, states that are known to have
stronger elements of Hindu fundamentalism, and non-fundamentalist states. States
were deemed to have Hindu fundamentalist leanings if they were early and strong
supporters of the Hindu nationalist party, the BJP and are known to have considerable
communal tensions. As mentioned in Chapter 1, several western and northern Indian
states, Madhya Pradesh, Maharashtra, Uttar Pradesh, Gujarat and Rajastan, awarded
the BJP many seats in the early to mid-1990s, demonstrating their Hindu nationalist
leanings before the BJP’s power was solidified in the late 1990s (Chiriyankandath
1998). An analysis of Lok Sabha election data also revealed that New Delhi was an
early supporter of Hindu nationalist parties (see Table 8). In 1991, roughly 71 percent
or 5 of the 7 Lok Sabha seats went to the BJP or SHS, another Hindu nationalist party.
Moreover, an analysis of the Varshney-Wilkinson dataset on Hindu-Muslim Violence
in India 1950-1995, indicates that all of these states have experienced Hindu-Muslim
riots from 1982 to 1995 (see Table 9). Since these states were supporters of the BJP
during a time when the party was arguably the most overtly anti-Muslim and because
they also experienced Hindu-Muslim riots from 1982 to 1995, the following states
were selected to represent Hindu fundamentalist states for this dissertation: Madhya
Pradesh, Maharashtra, Rajasthan, New Delhi, Gujarat, and Uttar Pradesh.
Table 10 shows various socioeconomic and social characteristics by states and
the means of these characteristics by fundamentalist and non-fundamentalist states.
Three additional states besides the fundamentalist states are highlighted in this table.
Chhattisgarh and Uttaranchal are highlighted because they were formerly part of the
89
states of Madhya Pradesh and Uttar Pradesh repectively. Both of these states
achieved statehood in 2000, therefore for this dissertation they are a part of Madhya
Pradesh and Uttar Pradesh. Dadra and Nagar Haveli were combined with Gujart to
ensure an adequate number of Muslims in the poverty analysis, therefore Dadra and
Nagar Haveli is also highlighted.
Looking at the mean literacy rates12 of fundamentalist and non-fundamentalist
states, we see that fundamentalist states have a slightly lower level of literacy (66.9)
compared to non-fundamentalist states (70.5). This appears to be largely driven by
lower literacy rates of females in fundamentalist states. The literacy rate for females
in fundamentalist states is 54.2 compared to 61.9 in non-fundamentalist states. While
there is a difference in the female literacy rate for fundamentalist and non-
fundamentalist states, the literacy rates for males is similar in both state categories,
approximately 78 percent. Higher percentages of workers are engaged in agricultural
work in fundamentalist states relative to non-fundamentalist states. In fundamentalist
states, 36.1 percent of workers are cultivators13 and 18.7 percent are agricultural
laborers14 compared to 29.9 percent and 15.8 percent in non-fundamentalist states
respectively.
There are also differences in monthly per capita expenditure15 by
fundamentalist and non-fundamentalist states by rural and urban area.
12 The literacy rate is calculated for individuals aged 7 and above. A person is deemed literate if they can both read and write in any language (Census of India 2001 http://demotemp257.nic.in/httpdoc/Metadata/Metada.htm#2m. 13 Cultivators are individuals engaged in cultivation of Government owned land or land owned by private individuals or institutions (Census of India 2001 http://demotemp257.nic.in/httpdoc/Metadata/Metada.htm#2m). 14 Agricultural laborers are individuals who work on someone else’s land for payment of money , kind, or share (Census of India 2001 http://demotemp257.nic.in/httpdoc/Metadata/Metada.htm#2m) 15 The monthly per capita expenditure of households is based on a 7 day recall.
90
Fundamentalist states have a lower rural mean monthly per capita expenditure (572.9)
compared to non-fundamentalist states (646.1). However, the urban mean monthly
per capita expenditure for fundamentalist states (931.4) is higher than non-
fundamentalist states (901.9). There is considerable variation in the proportion of
Muslims among states. Mizoram has the lowest proportion of Muslims (1.1 percent),
while Lakshadweep has the highest proportion (95 percent). Fundamentalist states
(9.1 percent) have a lower mean proportion of Muslims compared to non-
fundamentalist states (14.3).
Child sex ratios along with female literacy rates indicate that there is more
discrimination towards females in fundamentalist states compared to non-
fundamentalist states. As mentioned above, the female literacy rate is lower in
fundamentalist states compared to non-fundamentalist states. Child sex ratios, the
number of females per 1000 males for children 0 to 6, are also lower in
fundamentalist states. The mean child sex ratio for fundamentalist states is 920.3
compared to 938.0 for non-fundamentalist states. This suggests that women are
discriminated against in both fundamentalist and non-fundamentalist states, but they
are relatively worse off in fundamentalist states.
In order to test the hypothesis that wealthier Muslims may be relatively more
affected by Hindu fundamentalism compared to poorer Muslims, we divide the
sample into those above the poverty line and those below the poverty and run models
separately for these groups. We use the Official Planning Commissions (Dubey and
Palmer-Jones 2007) poverty lines by year (round), state, and whether one resides in
an urban or rural area, since poverty lines vary by these factors (see Table 11). For
91
each round of NSS data, individuals are designated as below (or above) the poverty
line if per capita expenditure is below (or above) the Official Planning Commission’s
state urban/rural poverty line. The experience of Hindus and Muslims above the
poverty line and Hindus and Muslims below the poverty line are then evaluated in all
states, fundamentalist states, and non-fundamentalist states.
Enrollment is a dichotomous variable, therefore I will employ logistic
regression. Employment is a three category variable, thus multinomial logistic
regression will be used. The omitted category in the employment analysis is wage
employment. I will do a stepwise regression for these analyses. To correct for
correlation bias for siblings for the enrollment analysis and spouses in the
employment analysis, we correct the standard errors by using the cluster command in
STATA.
Coefficients and predicted probabilities from multivariate analysis are utilized
to examine our hypotheses. Predicted probabilities are calculated for each dependent
variable category for relevant models by using the prvalue command in STATA.
Depending on the hypothesis being tested, explanatory variables of interest are
assigned a 1, while the rest of the independent and control variables are held equal to
their means. If the explanatory variable of interest is a series of dummy variables,
then the category of interest is assigned a 1, while the other categories are assigned a
0.
92
Chapter 5: Educational Enrollment in the Context of Modernization, Religious Disadvantage and Discrimination, and the Rise of Hindu Fundamentalism and Muslim Identity Politics This chapter examines the influence of modernization, religious disadvantage
and discrimination, and the rise of Hindu fundamentalism and Muslim identity
politics on school enrollment from 1983 to 1999. As discussed in Chapter 4, we
utilize stepwise logistic regression to evaluate the impact of these historical processes
on school enrollment. Enrollment predicted probabilities are also used to help clarify
the logistic regression results when necessary.
Modernization and Secular Changes
Modernizing forces such as economic growth, development, and the diffusion
of western ideas regarding education have an important influence on educational
enrollment in developing nations. These forces have not only increased overall
enrollment in many developing countries, but they have also played an important role
in decreasing the gender gap in education.
Modernization influences both supply and demand of schooling, resulting in
increases in educational enrollment. The Indian government has made great strides in
providing both primary and secondary schools since the 1950s (Govinda 2002). In
particular, the 1990s was a period of time where the commitment to making schools
more accessible, particularly primary schooling, was paramount. By making schools
more accessible disadvantaged groups, such as girls, scheduled castes, and scheduled
tribes have all benefited.
Not only has the supply of schooling increased tremendously, but also
considerable demand for schooling has been generated (Caldwell et. al. 1985).
93
Parents increasingly want their children to have the opportunity to obtain better
employment (Caldwell et. al. 1985, The Probe Team 1999) and receive non-economic
benefits from schooling (Caldwell et. al. 1985).
For this dissertation, the influence of modernization on enrollment in India is
evaluated by looking at the variable “Historical Period.” Looking at Table 12, Model
1, we see that the coefficients for the years 1987, 1993, and 1999 are all positive and
significant. This suggests that relative to 1983, overall school enrollment increased
for all three years, indicating that enrollment has increased over time. This finding is
consistent across all models, Model 1 to Model 6. Predicted probabilities illustrate
this trend: in 1983 the probability of being enrolled for children aged 12 to 15 was
0.54, by 1999 this figure increased substantially to 0.75 (see Table 15).
In addition, we find that school enrollment increased over time for states that
have been defined as Hindu fundamentalist and non-fundamentalist (see Tables 13
and 14). Interestingly, the magnitude of the increase in school enrollment is greater
for Hindu fundamentalist states compared to non-fundamentalist states. This suggests
that while modernizing forces positively influence enrollment in both fundamentalist
and non-fundamentalist states, the growth has been somewhat higher in
fundamentalist states. Predicted probabilities of being enrolled in school further
illustrate this finding. Table 15 shows the predicted probabilities of being enrolled in
all states as well as in fundamentalist, and non-fundamentalist states by year.
Children in non-fundamentalist states have a higher probability of being enrolled
compared to children in fundamentalist states for all years. However, the enrollment
gap between fundamentalist states and non-fundamentalist states decreases over time.
94
Specifically, the probability of being enrolled in non-fundamentalist states was 0.06
higher than fundamentalist states in 1983, by 1999 this figure declined to 0.02.
Modernizing forces also have a vital impact on the gender gap in school
enrollment in many developing countries. In India, economic growth and
development, the commitment of the Indian government to make schools more
accessible, educational and literacy campaigns, and the educational commission’s and
women’s groups efforts have had a considerable impact on girls’ education. However,
there are also important cultural and economic barriers affecting household demand
for girls’ schooling, mitigating the effects of modernization and development on girls’
enrollment. Greater returns to boys’ schooling, males providing old age support to
their parents, girls’ domestic responsibilities, and restrictions on girls’ movement at
menarche are some factors that dampen school enrollment for girls.
Despite these barriers, demand for girls’ schooling has been increasing.
Households want to educate their daughters to improve their chances in the marriage
market (Caldwell et. al. 1985). In addition, households indicate that they would like
their daughters to enhance their domestic skills of letter writing and accounting (The
Probe Team 1999). More importantly, there has been a growing trend in household
desire to enhance girls’ economic opportunities (Caldwell et. al. 1985, The Probe
Team 1999).
We evaluate the influence of modernization on the gender gap in school
enrollment by examining the variables “Male,” and “Male*Historical Period”
interactions (Table 12, Model 2). The variable “Male” is positive and significant,
indicating that boys’ enrollment is higher than girls’ enrollment. The coefficients for
95
the variables “Male*1987,” “Male*1993,” and “Male*1999” are all negative and
significant, demonstrating that the gender gap in school enrollment decreased over
time. Predicted probabilities for enrollment illuminate this trend. Table 16 shows
male and female enrollment predicted probabilities, and the gender difference and
gender ratios for the predicted probabilities for all states combined, fundamentalist,
and non-fundamentalist states by year. Both males and females experience an
increase in the probability of enrollment over time. However, the gender difference
in the predicted probability declines from 0.30 in 1983 to 0.12 in 1999, illustrating
that the gender gap in school enrollment has declined over time in India. This trend
occurred in all, Hindu fundamentalist and non-fundamentalist states (See Tables 13
and 14 for Hindu fundamentalist and non-fundamentalist states respectively).
The magnitude of the coefficients and the gender difference in predicted
probabilities suggest that males in fundamentalist states have more of an advantage
over females compared to males in non-fundamentalist states. The coefficient for
males in fundamentalist states is 1.515 compared to 1.064 for boys in non-
fundamentalist states (Tables 13 and 14, Model 2). Looking at Table 16, in 1983, the
gender difference in predicted probabilities show that the probability of being
enrolled for boys in fundamentalist states was 0.36 higher than the probability of girls
being enrolled. In non-fundamentalist states, the probability of boys being enrolled
was only 0.26 higher than the probability of girls being enrolled. This larger gender
difference in predicted probabilities for fundamentalist states compared to non-
fundamentalist states persists over time, demonstrating that the gender gap in
enrollment is larger in fundamentalist states compared to non-fundamentalist states.
96
Religious Discrimination and Disadvantage
Muslims experience considerable discrimination and disadvantage in school
enrollment. One source of discrimination is the provision of public schools, which is
lower in areas with higher concentrations of Muslims (Jeffery and Jeffery 1998,
Jeffery et. al. 2005). Another source of discrimination is teacher bias towards Hindus
in public and non-Islamic private schools affecting Muslim educational outcomes.
Furthermore, labor market discrimination reduces the returns to Muslim schooling,
depressing Muslim enrollment. Therefore, we expect discrimination and historical
disadvantage to result in lower Muslim school enrollment relative to non-scheduled
caste Hindus.
The variable “Muslim” in Table 12, Model 4, is negative and significant,
substantiating our hypothesis that Muslims are less likely to be enrolled in school
compared to non-scheduled caste Hindus. Tables 13 and 14 display results for
fundamentalist states and non-fundamentalist states respectively. Looking at the
magnitude of the coefficient for “Muslim” in both Hindu fundamentalist and non-
fundamentalist states, the magnitude of the coefficient is larger in fundamentalist
states compared to non-fundamentalist states. Specifically, the coefficient for
“Muslim” in Model 4 in fundamentalist states is -1.086 and in non-fundamentalists
states it is -0.706. While Muslims are less likely to be enrolled in school compared to
non-scheduled caste Hindus in both Hindu fundamentalist and non-fundamentalist
states, the magnitude of the coefficients indicate that the effect is greater in Hindu
fundamentalist states. Predicted probabilities reveal a similar observation. Table 17
displays the predicted probabilities for enrollment for Hindus and Muslims over time
97
for all states combined, fundamentalist states, and non-fundamentalist states. The
Hindu Muslim difference in predicted probabilities of enrollment in fundamentalist
states is higher for every year compared to non-fundamentalist states. This finding
suggests that Muslims experience more discrimination and disadvantage in Hindu
fundamentalist states compared to non-fundamentalist states.
To examine whether the intensification of Hindu fundamentalism has a
negative effect on Muslim enrollment over time we examine “Muslim*Historical
Period” interactions. Looking at Table 12, Model 4, variable “Muslim*1987,” the
coefficient is negative and significant, indicating that compared to 1983, the Hindu-
Muslim gap in school enrollment increased. “Muslim*1993” and “Muslim*1999” are
both negative, but not significant, suggesting that the Hindu-Muslim enrollment gap
has not widened significantly in 1993 and 1999 compared to 1983. We find similar
results in both Hindu fundamentalist and non-fundamentalist states. Table 17
illustrates that the Hindu Muslim difference in predicted probabilities increases from
1983 to 1987 for all states combined, fundamentalist states, and non-fundamentalist
states. The difference in predicted probabilities decrease from 1983 compared to
1999, however, as the regression results indicate, this decrease is not significant.
The results suggest that discrimination against Muslims worsened in all,
Hindu fundamentalist, and non-fundamentalist states during a period where Hindu-
Muslim tensions were on the rise in the late 1980’s. Tensions between Muslims and
Hindus were simmering during the Shah Bano case, a hotly debated issue, with overt
anti-Muslim rhetoric. These tensions considerably worsened during the 1990s. At
the same time, the economic growth India experienced in the 1990s was
98
unprecedented and the Indian government made crucial strides in the provision of
education. Despite this strong economic growth and also important gains in school
accessibility, the enrollment gap between Hindus and Muslims did not diminish in
1993 and 1999 compared to 1983, suggesting that rise of Hindu fundamentalism and
anti-Muslim rhetoric played an important role in dampening school enrollment for
Muslims during this period.
Literature suggests that wealthier Muslims may be more affected by the
intensification of Hindu fundamentalism relative to poorer Muslims. Tables 18
through 23 show models for all, fundamentalist, and non-fundamentalist states for
those below the poverty line and those above the poverty line. Looking at Model 4,
the variable “Muslim” and the “Muslim*Historical Period” interactions, we see that
there is some evidence to support that wealthier Muslims are more affected by Hindu
fundamentalism compared to poorer Muslims. The enrollment gap between Muslims
and Hindus below the poverty line is not significantly different in 1987, 1993, and
1999 relative to 1983 (Table 18). For Muslims above the poverty line, the enrollment
gap between Hindus and Muslims increases from 1983 to 1987, then the enrollment
gap is not significantly different in 1993 and 1999 compared to 1983 (Table 21). This
suggests that Muslims above the poverty line may have been adversely affected by
Hindu fundamentalism from 1983 to 1987 compared to Muslims below the poverty
line, however, this is not the case after 1987. After 1987, for Muslims below and
above the poverty line, the differences in enrollment they experience compared to
non-scheduled caste Hindus remains the same in 1993 and 1999 relative to 1983.
99
Gender and Religious Discrimination and Disadvantage
Muslim females face similar discrimination in schooling compared to Hindu
women. Various cultural and economic factors inhibit girls’ schooling. Among these
factors are girls’ domestic duties, the practice of purdah around the age of menarche,
and the lower returns to education for girls compared to boys. Muslim girls also face
the same discrimination that Muslim boys face in school. Due to this interplay
between gender and religious discrimination, we expect Muslim girls’ enrollment to
be lower than Muslim boys’.
In Table 12, Model 5, the variables “Male,” “Muslim,” and “Muslim*Male”
suggest that Muslim women are less likely to be enrolled in school relative to Muslim
males. This is true for all states combined, fundamentalist states, and non-
fundamentalist states. Predicted probabilities demonstrate this finding. The predicted
probabilities for Muslim male and female enrollment are 0.63 and 0.37 respectively.
We also find that the Muslim gender difference in enrollment is greater in
fundamentalist states compared to non-fundamentalist states. The gender difference
in the predicted probabilities for fundamentalist states is 0.33 compared to 0.26 in
non-fundamentalist states.
The Rise of Hindu Fundamentalism and Muslim Identity Politics
We expect that as Hindu fundamentalism intensifies, the Muslim community
will respond by using Muslim women as symbols for the community. Literature
discussed in Chapter 2 suggests that in these circumstances women are idealized as
wives and mothers. These representations pull women back into the domestic sphere.
Modernizing forces will continue to have an important impact on enrollment for
100
Muslim women, however, we expect that if religious identity politics has an effect on
Muslim women’s enrollment, then the Muslim gender gap in enrollment will increase.
While we do not find an increase in the Muslim gender gap in enrollment, we find
evidence of religious identity politics by comparing the Muslim and non-scheduled
caste Hindu gender differences in predicted probabilities in all states combined,
fundamentalist, and non-fundamentalist states.
We first turn our attention to Table 24, which shows the enrollment predicted
probabilities for Muslim and non-scheduled caste Hindu males and females, and the
Muslim and Hindu predicted probability gender difference and ratio. The Muslim
and Hindu gender differences in predicted probabilities over time in all states,
fundamentalist, and non-fundamentalist states provides evidence for the Hindu
fundamentalism/Muslim identity politics hypothesis. In all, fundamentalist and non-
fundamentalist states, we find that the Muslim and Hindu gender difference in
predicted probabilities decreases over time. In all, fundamentalist, and non-
fundamentalist states we find the Muslim gender difference in predicted probabilities
is lower than the non-scheduled caste Hindu difference in 1983. While in 1999, the
Muslim gender difference in predicted probabilities remains lower than the non-
scheduled caste Hindu gender difference for all and non-fundamentalist states, this is
not true for fundamentalist states. In non-fundamentalist states, the Muslim gender
difference in predicted probabilities was 0.2140 in 1983, the same figure was 0.2482
for Hindus. By 1999, Muslims continued to have a smaller gender difference in
predicted probabilities of enrollment, 0.0346 compared to 0.0781 for non-scheduled
caste Hindus. In contrast, in fundamentalist states, while the Muslims gender
101
difference in predicted probabilities is lower than Hindus in 1983, by 1999 the gender
difference for Muslims is higher than Hindus. Specifically, in fundamentalist states,
the Muslim gender difference in predicted probabilities decreases from 0.2839 in
1983 to 0.1996 in 1999, the Hindu gender difference was 0.3556 in 1983 and
decreased to 0.1521 in 1999. This comparison between all states and non-
fundamentalist states versus fundamentalist states suggests that Hindu
fundamentalism/Muslim identity politics may adversely affect Muslim women’s
enrollment in fundamentalist states.
In Table 13, Model 5, the Wald test statistic for the addition of
Muslim*Male*Period, SC*Male*Period, and ST*Male*Period corroborates the story
that the predicted probabilities indicate. For all and non-fundamentalist states, the
addition of the three way interaction terms are not statistically significant, indicating
that adding these nine variables to the model does not improve model fit (Table 12
and 14). However, for fundamentalist states, the Wald test is significant for the
addition of these nine variables, indicating that these variables improve the fit of the
model (Table 13).
Interestingly, there is some evidence that the rise of Hindu fundamentalism
and Muslim identity politics may have a larger influence on wealthier Muslim women
compared to poorer Muslim women. Table 25 shows the predicted probabilities and
the gender difference of predicted probabilities for Muslims and Hindus below and
above the poverty line. In fundamentalist states, Muslims below the poverty line
experience a smaller gender gap in predicted probabilities compared to Hindus below
the poverty line from 1983 to 1999. In contrast, for Muslims and Hindus above the
102
poverty line in fundamentalist states, the Muslim gender difference in predicted
probabilities was lower than Hindus in 1983, however, we see that by 1999 Muslims
experience a larger gender gap in predicted probabilities compared to Non-scheduled
caste Hindus, 0.21 and 0.13 respectively. This suggests that Hindu fundamentalism
and Muslim identity politics may play a greater role for Muslim women above the
poverty line. However, the results are not statistically significant, nor do the Wald
tests indicate that the model fit is improved with the addition of
Muslim*Male*Historical Period interactions. Nevertheless, this observation is
interesting and warrants further examination.
Conclusion
Our findings suggest that modernization has increased overall enrollment
from 1983 to 1999. It appears that economic growth, the diffusion of ideas regarding
the importance of education, and efforts to make schooling more accessible have
influenced school enrollment in India. While modernization played an important role
in increasing educational enrollment in both fundamentalist and non-fundamentalist
states, these forces had a greater effect in fundamentalist states. Modernizing forces
also reduced the gender gap in education from 1983 to 1999.
Muslims in India have experienced considerable disadvantage and
discrimination. The rise of Hindu fundamentalism exacerbates the disadvantage and
discrimination that Muslims face. Muslims do have lower enrollment in education
compared to non-scheduled caste Hindus; pointing to the discrimination they face in
education. Moreover, Muslim enrollment relative to non-scheduled caste Hindu
enrollment is even lower in fundamentalist states, suggesting that fundamentalist
103
states are more discriminatory towards Muslims. The rise of Hindu fundamentalism
also has a negative impact on Muslims over time. Modernizing forces had a strong
influence on enrollment, particularly in fundamentalist states. However, the rise of
Hindu fundamentalism counteracted the influence of modernizing forces on Muslims.
Specifically, the religious gap in education increased from 1983 to 1987, then the gap
remained unchanged in 1993 and 1999 relative to 1983. This persistent religious gap
in school enrollment in the context of strong modernizing forces such as greater
school accessibility and significant economic growth, demonstrates the considerable
influence Hindu fundamentalism has on Muslim school enrollment. We do find some
evidence that Muslims above the poverty line are more affected by Hindu
fundamentalism than Muslims below the poverty line for the period of 1983 to 1987.
However, from 1993 to 1999 it appears that Muslims below and above the poverty
line were similarly affected by Hindu fundamentalism.
Muslim women face double disadvantage for being female and Muslim.
Similar to Hindu women they have lower levels of enrollment compared to men in
Indian society because of economic and cultural factors. Like Muslim men, they face
discrimination and disadvantage in schooling because of their religious affiliation. We
find that Muslim women are less likely to be enrolled in school compared to Muslim
men. Muslim women’s lives are also shaped by the rise of Hindu fundamentalism
and Muslim identity politics. The comparison of Muslim women’s experience in
fundamentalist and non-fundamentalist states reveals that Muslim women’s
enrollment is dampened by the complex relationship between Hindus and Muslims in
fundamentalist states. Interestingly, there is evidence that wealthier Muslim women
104
may be more affected by these religious tensions. However, our results are not
significant. Further refinement of models and examination of the hypothesis is
warranted.
105
Chapter 6:Wage Employment in the Context of Modernization, Religious Disadvantage and Discrimination, and the Rise of Hindu Fundamentalism and Muslim Identity Politics
This chapter examines wage employment in the context of three historical
forces: modernization, religious disadvantage and discrimination, and the rise of
Hindu fundamentalism and Muslim identity politics. Stepwise multinomial logistic
regression and employment predicted probabilities are utilized to evaluate the impact
of these historical processes on wage employment over time. As discussed in Chapter
4, the omitted category for the multinomial regressions is wage employment.
Modernization and Secular Changes
Literature suggests that economic growth increases overall employment and
changes the structure of employment, generating more wage work (World Bank
1995). India experienced economic growth from 1983 to 1999. The 1990s, in
particular, was a period of intense growth. Therefore, we expect modernizing forces
will increase overall wage employment over time in India.
The variable “Historical Period” is used to evaluate whether wage
employment has increased over time relative to self-employment and being out of the
labor force. Our findings support the hypothesis that modernizing forces increase
wage employment over time, although the increase has been modest. Looking at
Table 26, Model 1, the coefficients for 1987, 1993, and 1999 are negative and
significant indicating that self-employment has declined relative to wage employment
over time. In contrast to the clear self-employment trend over time, the trend for the
category “unemployed/out of the labor force” is mixed. From 1983 to 1987, there
106
was no change in unemployment/out of the labor force relative to wage employment.
For 1993, the coefficient is positive and significant, indicating that in 1993 compared
to 1983, being unemployed or out of the labor force increased relative to wage
employment. The coefficient for 1999 is negative and significant, suggesting that
compared to 1983, unemployment or being out of the labor force decreased relative to
wage employment. Employment predicted probabilities support and clarify these
assessments. Table 29 displays the predicted probabilities for wage employment,
self-employment, and unemployment/out of the labor force over time. In all states
combined, the probability of being employed in wage work increased from 1983 to
1999. The predicted probability of being employed in wage work was 0.38 in 1983
and increased to 0.41 in 1999. There was a corresponding decline in self-employment
during this period. The probability of being self-employed in 1983 is 0.44 and
declines to 0.41 in 1999. The probability of being unemployed or out of the labor
force increased slightly from 1983 to 1999, however, since wage employment
increased during the same period, relative to wage employment, the likelihood of
being unemployed or out of the labor force decreased. The increase in wage
employment and corresponding decrease in self-employment and
unemployment/being out of the labor force indicates that economic growth as well as
changes in the sectoral composition of the economy moderately shifted the structure
of jobs in India.
This trend is relatively more pronounced in fundamentalist states compared to
non-fundamentalist states. Tables 27 and 28 show multinomial regression
coefficients for fundamentalist and non-fundamentalist states respectively. Looking
107
at Model 1 in both tables, the sign, magnitude, and significance of the coefficients
reveal that self-employment declined relative to wage employment more dramatically
in fundamentalist states compared to non-fundamentalist states. Employment
predicted probabilities illustrate this trend. In 1983, in fundamentalist states, the
probability of being engaged in wage employment was 0.34. The probability
increases to 0.39 in 1999, an increase of 0.05. While non-fundamentalist states also
experienced an increase in wage employment from 1983 (0.40) to 1999 (0.43), the
probability of being employed in wage work increased 0.03 during this period.
Fundamentalist states also experience a greater decline in self-employment compared
to non-fundamentalist states. In fundamentalist states, the predicted probability of
self-employment declines from 0.52 in 1983 to 0.46 in 1999, a 0.06 decline. Non-
fundamentalist states also experience a decline, but it is considerably smaller. The
predicted probability of being self-employed in non-fundamentalist states is 0.39 in
1983 and declines to 0.38 in 1999, a 0.01 decline. For both fundamentalist and non-
fundamentalist states, the trend for being unemployed or out of the labor force is
mixed from period to period, however from the periods 1983 to 1999, both
fundamentalist and non-fundamentalist states experience a decrease in the
unemployment/being out of the labor force relative to wage employment (see Tables
27 and 28 Model 1).16 Thus, the trends of wage employment, self employment, and
unemployment/out of the labor force suggest that both fundamentalist and non-
16 Note that the predicted probability of being unemployed/out of the labor force declines slightly for fundamentalist states (0.1401 to 1499 from 1983 to 1999). Even though unemployment/out of the labor force increases slightly, it declines relative to wage employment from 1983 to 1999 because of the increase of wage employment during this period. The slight increase in the probability of being unemployed out of the labor force may be caused by individuals engaged in self employment moving to wage work and also moving into the unemployed/out of the labor force category.
108
fundamentalist states experience a modest increase in wage employment over time,
however, fundamentalist states experience a slightly greater increase compared to
non-fundamentalist states.
Modernizing forces may also play an important role in the gender gap in wage
employment. Modernization may break down economic and cultural practices, which
hinder women’s employment. Additionally, as modernizing forces increase
educational opportunities for women, this increase in human capital may increase
women’s opportunities in wage employment. Even if women’s wage employment
increases, the gender gap in wage employment may increase if men benefit more in
the labor market from modernizing forces than women. Moreover, cultural and
economic practices and norms hindering women’s employment may take time to
break down, dampening the growth of women’s wage employment relative to men.
To evaluate the trend in gender differences in wage employment over time we
look at the variables “Historical Period,” “Male,” and “Male*Historical Period”
interactions (Table 26 Model 2). Male self-employment declines relative to wage
employment, while women’s self employment first increases relative to wage
employment from 1983 to 1987, then decreases in 1993 and 1999. Overall, from
1983 to 1999, the gender gap in self-employment relative to wage employment
decreases. For men, unemployment increases slightly from 1983 to 1999 relative to
wage employment. For women, being unemployed or out of the labor forces
decreases slightly over time. Predicted probabilities for employment by gender and
the gender difference in predicted probabilities illustrate these findings (Table 30).
For all states combined, wage employment modestly increases for both men and
109
women over time. The probability of males being engaged in wage employment is
0.48 in 1983 and increases to 0.51 in 1999. Women’s engagement in wage
employment is considerably less than males, but women also experience a slight
increase in wage employment over time. The probability of being engaged in wage
work for women is 0.12 in 1983 and increases to 0.13 in 1999. These results suggest
that men experience a greater increase in wage employment compared to women
from 1983 to 1999. The gender difference in the predicted probability of wage
employment reflects this trend, increasing over time from 0.36 to 0.38. The
probability of men being engaged in self-employment decreases from 0.51 to 0.47
from 1983 to 1999. Women also experience a slight decline in the probability of
being self-employed, 0.15 in 1983 to 0.14 in 1999. Driven mostly by the decreases in
the probability of male’s being engaged in self-employment, the gender gap in self-
employment declines from 1983 to 1999. The probability of males’ being
unemployed or out of the labor force increases slightly from 0.0178 to 0.0200. For
women, this probability decreases slightly from 0.7342 to 0.7333. Males increase in
the probability of unemployment/out of the labor force and women’s decrease in this
probability results in a slight decrease in the gender gap for unemployment/being out
of the labor force.
Wage employment increases for both men and women in fundamentalist and
non-fundamentalist states, however men in fundamentalist states experience a greater
increase in wage employment. The probability of males being employed in wage
work is 0.41 in 1983 and increases to 0.48 in 1999 in fundamentalist states. Men in
non-fundamentalist states have a higher probability of being employed in wage work
110
compared to men in fundamentalist states, but they do not experience as great an
increase from 1983 to 1999. In non-fundamentalist states, the probability of males
being employed in wage work increases from 0.52 in 1983 to 0.53 in 1999. Women
in fundamentalist states have a slightly higher probability of being employed in wage
work compared to women in non-fundamentalist states. The probability of women
being engaged in wage work in fundamentalist states is 0.12 in 1983 and increases to
0.14 in 1999. Similarly, the probability of women being employed in wage work in
non-fundamentalist states is 0.11 in 1983 and increases to 0.13 in 1999. Since men in
fundamentalist states experience a more pronounced increase in wage employment,
the gender difference in the predicted probability of wage employment increases from
0.30 in 1983 to 0.34 in 1999. In contrast, in non-fundamentalist states, the gender
difference in the wage employment predicted probability does not change, remaining
at 0.40.
As wage employment increases for men in fundamentalist states, there is a
corresponding decrease in self-employment. The probability of men being engaged
in wage work is 0.57 in 1983 and decreases to 0.51 in 1999. Men in non-
fundamentalist states have a lower probability of being self-employed compared to
men in fundamentalist states and they experience only a slight decline in the
probability of being self employed. The probability of being self-employed for men
in non-fundamentalist states is 0.46 in 1983 and this figure decreases to 0.45 in 1999.
Women in fundamentalist states have a higher probability of being engaged in self-
employment compared to women in non-fundamentalist states. Furthermore, women
in fundamentalist states experience a decline in self-employment from 0.21 in 1983 to
111
0.17 in 1999, while the probability of self-employment for women in non-
fundamentalist states remains virtually unchanged, remaining at 0.12.
In both fundamentalist and non-fundamentalist states, relative to wage work,
the probability of being employed or out of the labor force increases slightly for men.
In fundamentalist states, for men, the probability of being unemployed or out of the
labor force is 0.0132 in 1983 and decreases to 0.0163 in 1999. Men in non-
fundamentalist states also experience a slight increase in being unemployed or out of
the labor force, the probability increases from 0.0210 in 1983 to 0.0219 in 1999. For
women, the unemployment/out of the labor force trend is different in fundamentalist
and non-fundamentalist states. In fundamentalist states, the probability of women
being unemployed or out of the labor force increases from 1983 (0.68) to 1999 (0.69).
In contrast, in non-fundamentalist states, this figure decreases for women from 0.77
in 1983 to 0.75 in 1999. Wald test statistics substantiate our findings for all states
combined, fundamentalist states and non-fundamentalist states. That is to say, adding
Male*Historical Period interactions to Model 2 improves the model fit for all states
combined, fundamentalist states and non-fundamentalist states and this improvement
is statistically significant at 0.000 level.
Overall, our results suggest that modernizing forces modestly increase wage
employment over time. These forces increase wage employment for both men and
women in fundamentalist and non-fundamentalist states. Men in fundamentalist
states experience more of an increase in wage employment over time, increasing the
gender difference in the predicted probability of wage employment. In non-
fundamentalist states, men and women experience a similar increase in wage
112
employment from 1983 to 1999, thus the gender difference in predicted probabilities
remains unchanged. Therefore, it appears that economic restructuring associated with
modernization has increased the gender gap in wage employment in fundamentalist
states, but has not had an impact on the gender gap in wage employment in non-
fundamentalist states.
Religious Discrimination and Disadvantage
Literature suggests that Muslims face substantial discrimination and
disadvantage in the labor market (Das 2002, Hasan 2005, Khandker 1992). The
disadvantage and discrimination that Muslims experience in education dampens their
opportunities in the labor market. However, even when human capital is taken into
account, Muslims continue to face disadvantage in the labor market compared to
Hindus (Khandker 1992).
As indicated in Model 4 of Table 26, the variable “Muslim” is significant and
negative for self-employment, suggesting that Muslims compared to Hindus are less
likely to be engaged in self-employment relative to wage employment. This
statement needs to be qualified in the context of other literature, which suggests that
Muslims are far more entrepreneurial and tend to be located in petty trade and
artisanal work. My models combine agricultural self-employment with petty trade
and other types of self-employment. Since Muslims are less likely to engage in
farming, overall they are somewhat less likely to be self-employed. The variable
“Muslim” is significant, positive, and large for unemployed/out of the labor force,
indicating that Muslims compared to non-scheduled caste Hindus, are more likely to
be unemployed/out of the labor force relative to being engaged in wage employment.
113
Predicted probabilities presented in Table 31 better illustrate the relationship between
employment and religious affiliation. The results suggest that Muslims are slightly
less likely to be employed in wage work compared to Hindus. The probability of
being employed in wage work for Muslims is 0.31, while the probability for Hindus is
0.33. Muslims are also less likely to be self-employed compared to non-scheduled
caste Hindus, the probability of Muslim self-employment is 0.41 compared to 0.47
for Non-scheduled caste Hindus. Furthermore, Muslims are more likely to be
unemployed/out of the labor force compared to non-scheduled caste Hindus. The
probability of Muslims being unemployed/out of the labor force is 0.28 compared to
0.19 for Non-scheduled caste Hindus. Note that is reflects the probabilities evaluated
at the mean value for all other variables.
As Hindu fundamentalism intensifies the disadvantage and discrimination
Muslims face will likely worsen. Table 32 displays predicted probabilities for wage,
self, and other employment for Hindus and Muslims over time. In all states
combined, both Hindus and Muslims experience an increase in wage employment.
The probability of wage employment for Hindus is 0.33 in 1983 and increases to 0.36
in 1999. Muslims also experience an increase in wage employment, in 1983 the
probability of being engaged in wage employment was 0.32 for Muslims, this figure
increases to 0.34 in 1999. The Hindu-Muslim difference in predicted probabilities
increases slightly during this period since Hindus experience a greater increase in
wage employment over time compared to Muslims. This trend provides some
evidence that Hindu fundamentalism may dampen Muslim progress in wage
employment relative to Hindus but the effect is small.
114
The experience of Muslims in fundamentalist states compared to non-
fundamentalist states provides further evidence that Muslim wage employment is
influenced by Hindu fundamentalism (see Table 32). In 1983, Muslims in
fundamentalist states appear to have a slight advantage over Hindus in wage
employment. However, Hindus experience a substantial increase in wage
employment compared to Muslims, increasing the difference in their predicted
probability of wage employment. In 1983, the probability of wage employment for
Hindus is 0.28, this figure increases to 0.33 in 1999. For Muslims, the probability of
being engaged in wage employment increases from 0.31 in 1983 to 0.32 in 1999. In
non-fundamentalist states, both Hindus and Muslims experience an increase in wage
employment. The probability of Hindu wage employment is 0.35 in 1983 increasing
to 0.38 in 1999. Muslims experience a similar increase, the probability of Muslims
being engaged in wage employment was 0.32 in 1983 increasing to 0.36 in 1999.
Since Muslims experienced a slightly higher increase, the wage employment gap
between Muslims and Hindus decreases slightly.
Literature suggests that wealthier Muslims may be more affected by the rise of
Hindu fundamentalism compared to poorer Muslims. Our results do not support this
hypothesis; in fact, we find the opposite is true. Tables 33 and 34 display the
predicted probabilities of wage employment, self-employment, and being
unemployed or out of the labor forces over time for all states combined,
fundamentalist, and non-fundamentalist states, for individuals below and above the
poverty line respectively. Muslims below the poverty line appear to be more
influenced by the rise of Hindu fundamentalism compared to Muslims above the
115
poverty line. In all states combined, fundamentalist and non-fundamentalist states,
non-scheduled caste Hindus experience an increase in the probability of being
engaged in wage employment, while Muslims experience a slight decrease from 1983
to 1999. For all states combined, for non-scheduled caste Hindus below the poverty
line, the probability of being engaged in wage employment increases from 0.37 in
1983 to 0.44 in 1999. In contrast to non-scheduled caste Hindus, the probability of
Muslims being engaged in wage employment decreases slightly, from 0.3855 in 1983
to 0.3841 in 1999. We see this same trend for non-scheduled caste Hindus and
Muslims in fundamentalist and non-fundamentalist states.
In contrast to the experience of non-scheduled caste Hindus and Muslims
below the poverty line, both non-scheduled caste Hindus and Muslims above the
poverty line experience an increase in wage employment over time in all states
combined, fundamentalist and non-fundamentalist states. In all states combined, the
probability of non-scheduled caste Hindus being engaged in wage employment
increases from 0.29 to 0.34. Muslims also experience an increase in the probability
of being engaged in wage employment, from 0.26 in 1983 to 0.33 in 1999. We see
similar trends for fundamentalist and non-fundamentalist states. Muslims below the
poverty line experience a slight decline in wage employment over time, while non-
scheduled caste Hindus below and above the poverty line and Muslims above the
poverty line experience an increase in wage employment over time, suggesting that
Muslims below the poverty line may be affected by the rise of Hindu fundamentalist
more than Muslims above the poverty line. It is important to note that these results on
poverty and change in the employment sector must be treated with caution since the
116
two are closely related, as the type of work determines income. Since the purpose of
this dissertation is to examine broad trends rather than ascribe causation, this
endogeneity may be acceptable.
Gender and Religious Discrimination and Disadvantage
Muslim women experience discrimination for being Muslim and, like their
Hindu sisters experience gender discrimination in the labor market. Therefore, we
expect Muslim women to have lower levels of wage employment compared to
Muslim men. Our hypothesis is substantiated by the results. The predicted
probability of wage employment is around 0.45 for Muslim men and about 0.06 for
Muslim women. In fundamentalist states, the predicted probability for Muslim men’s
wage employment is lower (0.40) than in non-fundamentalist states (0.48). Muslim
women in fundamentalist states (0.07) and non-fundamentalist states (0.06) have a
similar wage employment predicted probability.
The Rise of Hindu Fundamentalism and Muslim Identity Politics
The rise of Hindu fundamentalism and Muslim identity politics may have
adverse consequences for Muslim women. This complex relationship between
Hindus and Muslims may result in the Muslim community utilizing Muslim women
as symbols for the community. Literature suggests that under these circumstances
women represent motherhood and being a good wife, returning them to the domestic
sphere. This may have a negative influence on Muslim women’s employment.
We find evidence that identity politics is playing a role in Muslim women’s
employment. Looking at Table 41, the predicted probabilities for all states suggest
that Muslim women’s wage employment decreases over time, from 0.07 in 1983 to
117
0.06 in 1999. This differs from the experience of Muslim males, Hindu males, and
Hindu females, all of whom experience an increase in the probability of being
engaged in wage employment. The predicted probability of being engaged in wage
employment for Muslim males is 0.45 in 1983 and increases to 0.47 in 1999. Hindu
males experience a similar increase, 0.42 in 1983 increasing to 0.44 in 1999. The
probability of Hindu women being engaged in wage employment also increases from
0.09 in 1983 to 0.10 in 1999.
The gender differences in the predicted probabilities in Table 41 provide
further evidence for the influence of the rise of Hindu fundamentalism and Muslim
identity politics on Muslim women’s wage employment. The Muslim gender
difference in predicted probabilities increases from 1983 (0.38) to 1999 (0.41), while
the Hindu gender difference remains unchanged at 0.33 in both 1983 and 1999.
The different experience of Muslim women in fundamentalist states versus
non-fundamentalist states provides further evidence for our hypothesis that the
complex relationship between the rise of Hindu fundamentalism and Muslim identity
politics negatively affects Muslim women. We see similar trends for fundamentalist
states for wage employment as for the all states models. Muslim men, and non-
scheduled caste Hindu men and women’s wage employment increases over time,
while Muslim women’s wage employment decreases. Muslim men’s probability of
wage employment increases from 0.40 in 1983 to 0.42 in1999. Hindu men also
experience an increase in wage employment from 0.36 to 0.39 from 1983 to 1999.
Non-Scheduled caste Hindu women’s probability of wage employment also increased
from 0.0876 to 0.1043 from 1983 to 1999. However, Muslim women do not see these
118
gains in wage employment over time. The probability of Muslim women’s
employment actually decreases slightly from 0.0832 to 0.0659 from 1983 to 1999. In
contrast to fundamentalist states, in non-fundamentalist states, Muslim women
experience gains in wage employment over time like Muslim men and non-scheduled
caste Hindu men and women. In non-fundamentalist states, the probability of being
engaged in wage employment increases from 0.48 in 1983 to 0.50 in 1999. Non-
scheduled caste Hindu males experience a slight increase in the probability of being
engaged in wage employment, from 0.46 in 1983 to 0.47 in 1999. For non-scheduled
caste Hindu women the probability of being engaged in wage employment increases
slightly from 0.0922 in 1983 to 0.1062 in 1999. In contrast to fundamentalist states,
Muslim women experience an increase in the probability of being engaged in wage
employment from 0.0582 in 1983 to 0.0631 in 1999. The different employment
experience of Muslim women in fundamentalist and non-fundamentalist states
suggests that the rise of Hindu fundamentalism and Muslim identity politics may
influence Muslim women’s employment.
Further substantiating our findings, the Wald tests are significant for
Muslim*Male*Period interactions for Model 6 for all states combined,
fundamentalist, and non-fundamentalist states indicating the goodness of fit of the
model when these variables are added (Tables 26, 27, and 28).
Literature suggests that wealthier Muslims may be more affected by the rise of
Hindu fundamentalism relative to poorer Muslims. If this were the case, then we
would expect Muslim women above the poverty line to be more adversely affected by
the rise of Hindu fundamentalism and Muslim identity politics. We find evidence that
119
the rise of Hindu fundamentalism and Muslim identity politics affects both poor and
wealthy Muslim women, however poorer Muslim women may be affected more. In
fundamentalist states, poorer Muslim women’s wage employment decreases, while
the probability of wage employment increases for Muslim males, non-scheduled caste
Hindu males and females (Table 42). Poorer Muslim women’s wage employment
also decreases slightly in non-fundamentalist states. The probability of Muslim men’s
engagement in wage employment also decreases, while the probability of being
engaged in wage employment for non-scheduled caste Hindu men and women
increases from 1983 to 1999.
For wealthier Muslim women, they also experience a decrease in wage
employment over time in fundamentalist states, however, unlike poorer Muslim
women, they experience an increase in wage employment in non-fundamentalist
states (Table 43). Surprisingly, non-scheduled caste Hindu men experience a slight
decrease in wage employment in both fundamentalist and non-fundamentalist states,
while both Muslim men and non-scheduled caste Hindu women experience an
increase in wage employment.
Overall, it appears that poorer Muslim women have been more adversely
affected by the rise of Hindu fundamentalism and Muslim identity politics compared
to wealthier Muslims women. Poorer Muslim women experienced declines in wage
employment in both fundamentalist and non-fundamentalist states, while wealthier
Muslims also experienced a decline in wage employment in fundamentalist states, yet
they did not have this experience in non-fundamentalist states. This suggests that
both groups, Muslim women above and below the poverty line are influenced by the
120
rise of Hindu fundamentalism and Muslim identity politics, but poorer Muslim
women may be affected more.
Conclusion
We find that economic growth and modernization seems to have had some
impact on the likelihood of engaging in wage work in India. Over time economic
growth and other modernizing factors have modestly increased wage employment and
decreased self-employment, slowly changing the structure of the Indian economy.
These forces have had a greater impact on fundamentalist states relative to non-
fundamentalist states.
Men and women in fundamentalist and non-fundamentalist states experience
increases in wage employment. However, it appears that men have benefited more
from these forces than women in fundamentalist states. Men made greater gains in
wage employment compared to women, increasing the gender gap in wage
employment in fundamentalist states. In contrast, in non-fundamentalist states, the
gender gap in wage employment remained unchanged. While women have made
gains in wage employment, it appears that economic and cultural practices remain
obstacles for them even as modernization progresses.
Muslims face disadvantage in wage employment compared to Hindus. The
rise of Hindu fundamentalism further dampens Muslims disadvantage as illustrated
by the experience of Muslims in fundamentalist and non-fundamentalist states. In
fundamentalist states, Hindus experience a greater increase in wage employment
compared to Muslims, increasing the wage work gap. In contrast, the wage
employment gap between Hindus and Muslims decreases slightly in non-
121
fundamentalist states. Moreover, there is evidence that poorer Muslims may be more
affected by the rise of Hindu fundamentalism relative to wealthier Muslims.
As hypothesized, Muslim women experience lower levels of wage
employment compared to Muslim men. They experience both gender discrimination
and discrimination for being Muslim. Our findings also suggest that identity politics
has influenced Muslim women’s employment over time. In all states combined, we
find Muslim women’s employment decreases over time, as other groups experience
an increase in wage employment. The different experience of Muslim women in
fundamentalist versus non-fundamentalist states provides more evidence that the rise
of Hindu fundamentalism and Muslim identity politics has influenced Muslim
women’s wage work. Muslim women in fundamentalist states experience a decline in
wage employment, while Muslim men, Hindu men, and Hindu women all experience
an increase in wage employment over time. In contrast to fundamentalist states,
Muslim women in non -fundamentalist states experience an increase in wage
employment, just as other groups do. Furthermore, consistent with our finding that
poorer Muslims are more affected by the rise of Hindu fundamentalism compared to
wealthier Muslims, it appears that poorer Muslim women’s wage employment is more
influenced by the rise of Hindu fundamentalism and Muslim identity politics. While
both Muslim women below and above the poverty line appear to be affected by these
forces, poorer Muslim women appear to be more greatly affected.
122
Chapter 7: Discussion and Conclusion: School Enrollment and Wage Employment in the Context of Modernization, Religious Disadvantage and Discrimination, and the Rise of Hindu Fundamentalism and Muslim Identity Politics Modernization and Secular Changes Modernizing forces such as the diffusion of western notions of education,
economic growth and development, and government efforts to increase the supply of
schools has had an important impact on school enrollment in India. School
enrollment has increased considerably over time. Specifically, for children ages 12 to
15, the probability of being enrolled in school is 0.54 in 1983 and increases to 0.75 by
1999. Children in non-fundamentalist states have a higher probability of being
enrolled in school, however, interestingly, modernizing forces may have a greater
influence on enrollment in fundamentalist states. In particular, fundamentalist states
experienced greater gains in school enrollment from 1983 to 1999 compared to non-
fundamentalist states.
This is surprising because out of the six fundamentalist states, three of them
are among the worst performing in terms of education, Uttar Pradesh, Madhya
Pradesh, and Rajastan.17 It is possible that the educational experience of
Maharashtra, Gujarat and Delhi, the other three fundamentalist states, are driving the
greater gains in enrollment for fundamentalist states. A lower starting level may also
lead to greater gains as the other states begin to approach a ceiling in enrollment. It is
also possible that poor performing states are more sensitive to increases in the supply
of schools and national literacy and educational campaigns. Some non-
123
fundamentalist states in the south of India, such as Kerela, have had a long history of
promoting education, these states may not have been as sensitive to increases in
educational investments and educational campaigns in the 1990s as other states, such
as Uttar Pradesh, Madhya Pradesh or Rajastan. Furthermore, successful schemes
such as mid-day meals,18 pioneered and universalized in Tamil Nadu, a non-
fundamentalist state, in 1982, were adopted by many states in the 1990s (Govinda
2002). Since mid-day meals tend to boost the enrollment of poorer children, perhaps
enrollment is more sensitive to these types of schemes in poorer states such as Uttar
Pradesh. On the other hand, institutional and infra-structural problems may hinder
the progress of these schemes in poorer states.
Modernizing forces also had an influence on wage employment, but to a much
lesser extent. Literature suggests that economic growth and development changes the
structure of the economy, creating more wage work. Since India has been
experiencing economic development and growth over time, particularly in the 1990s,
one would expect wage work to increase considerably. However, we only find a
modest increase in wage work in all states combined. Individuals in non-
fundamentalist states have a higher probability of being employed in wage work
compared to individuals in fundamentalist states. However, fundamentalist states
experience a slightly greater increase in wage work compared to non-fundamentalist
states. It does appear that the structure of the economy has shifted slightly over time
17 Bihar, defined as a non-fundamentalist state for this dissertation, is also a poor-performing state in terms of education. 18 Mid-day meals were initially designed as lunch programs, where lunch is served to children at school. However, this varies according to state. Some states have mid-day meal schemes, which do not distribute hot meals at lunch, instead they distribute dry rations monthly or quarterly. Dry ration mid-day meal schemes are likely to boost enrollment, but they do not ensure attendance.

124
as individuals primarily move out of self-employment to wage work. However, there
may have been a series of factors that dampened employment growth as GNP
increased in the 1990s.
Some attribute the dampening of employment growth during the 1980s and
1990s to a rigid labor market, arguing that an inflexible labor market increases costs
for businesses and impedes investment and growth (Sharma 2006). While some labor
market rigidities exist, there is evidence that the labor market has become more
flexible as the organized sector declines and firms hire temporary workers (Sharma
2006). Others argue that increases in wages due to inflation and labor market
pressures dampened employment in the 1980s and 1990s (Ahluwalia 1992 cited in
Sharma 2006, ILO-ARTEP 1993 cited in Sharma 2006, Sundaram and Tendulkar
2002 cited in Sharma 2006), causing businesses to starting making adjustments and
investments in capital rather than labor (Ghose 1994 cited in Sharma 2006).
Additionally, India adopted liberalization policies in the 1990s likely also influencing
the labor market. Therefore, wages, labor market flexibility, investments in capital,
and liberalization policies may have adversely affected the labor market, hindering
wage employment growth.
Overall, it appears that enrollment is more positively affected by modernizing
factors compared to wage employment. While both school enrollment and wage
employment increased from 1983 to 1999, the increase in school enrollment has been
much more dramatic, while the increase in wage employment has been quite modest.
There are a myriad of factors that have affected enrollment and employment over
time, however, the differential role of the government in education and the labor
125
market during this period may have had an impact of the dissimilar trends in
enrollment and employment. The Indian government was directly involved in
shaping education by making important efforts to increase school enrollment through
increased supply of schools, educational and literacy campaigns, and educational
schemes such as mid-day meals. In contrast, the labor market, as was the rest of the
economy, was subject to less governmental guidance and control as India was forced
to adopt liberalization policies. While these policies may have outcomes widely
valued by many, such as GNP growth, these policies take away the power for the
government to help shape employment outcomes during immense economic change.
In addition, school enrollment does not appear to be as sensitive to economic
restructuring as the labor market. Therefore, the role of the government and the
process of liberalization may have differentially affected school enrollment and wage
employment from 1983 to 1999.
Modernizing forces also influence gender differences in enrollment and wage
employment. While cultural and economic obstacles continue to dampen girls’
enrollment, significant progress has been made as evidenced by the decreasing gender
difference in school enrollment over time. Girls’ school enrollment is sensitive to
access to schools, therefore the increased supply in schools has had an important
impact on girls schooling over time. Also, modernizing forces change ideologies
about gender, breaking down some of the cultural and economic barriers of education
for girls.
Both fundamentalist and non-fundamentalist states experience decreases in the
gender gap in enrollment for children ages 12 to 15, however, the gap remains larger
126
in fundamentalist states. While the gap is larger in fundamentalist states, they did
experience a slightly greater decline in the gender gap in enrollment compared to the
decline non-fundamentalist states experienced. However, the gap remains larger in
fundamentalist states because many of the fundamentalist states, such as Uttar
Pradesh, and Rajastan have more cultural and economic obstacles for girls’ education.
While many of the non-fundamentalist states such as Kerela, Karnataka, Tamil Nadu,
and Himachal Pradesh have less gender inequality in many realms.
Modernizing forces do increase women’s employment over time; however,
these factors do not decrease the gender gap in wage employment. In fundamentalist
states, both men and women experience an increase in wage employment over time,
however, men experience more gains in wage employment relative to women,
increasing the gender gap in wage employment. In non-fundamentalist states, men
and women experience a similar increase in wage employment over time; therefore,
gender differentials in wage employment remain the same over time.
Several factors could be contributing to the slight increase in women’s
employment over time. Modernization could break down ideologies about gender
roles, breaking down barriers to women’s employment. However, even if
modernizing forces break down obstacles for women’s employment, it appears that
modernizing forces benefit men more than women, increasing the gender gap in wage
employment. Literature suggests that liberalization or structural adjustment policies
have adverse effects on women’s employment. It may be that these policies
dampened women’s employment relative to men’s, increasing the gender gap in wage
employment. Goldin (1995), in discussing the U shaped female labor force function
127
to illustrate the relationship between development and female labor force
participation, argues that once a sufficient number of women complete secondary
schooling and the availability of white-collar employment increases, then married
women’s engagement in wage employment increases. In other words, once a
particular threshold has been reached for girls’ secondary schooling and white-collar
employment expansion, then female labor force participation will begin to follow the
rising portion of the U. While secondary schooling for girls and white-collar jobs
have been increasing it does not appear that sufficient gains have been made to
significantly boost wage employment for women.
It appears that modernizing forces differentially impact the gender gap in
school enrollment and wage employment. The gender gap in enrollment declined in
all states combined, fundamentalist and non-fundamentalist states. In contrast, the
gender gap in wage employment increased in fundamentalist states and persisted in
non-fundamentalist states. This indicates that modernizing forces are more effective
at breaking down barriers to girls’ schooling compared to barriers women face in the
labor market. This may be because efforts to increase the supply of schools have an
important impact on girls schooling, that is, households are more willing to send their
daughters to school if it is close. Additionally, many efforts have been made by the
government and non-governmental organizations (NGOs) to promote girls schooling.
While efforts have been made by NGOs and women’s organizations to promote
women’s employment, it appears these forces have not been as successful in this
arena as efforts to promote education. Perhaps ideologies about women and men’s
roles as they relate to the labor market are more difficult to break down. These
128
ideologies have a strong effect on both households and employers. Moreover, an
important difference between the enrollment experience of girls and women’s wage
employment experience is that the supply of schools increased, while the employment
growth rate declined.
Religious Discrimination and Disadvantage
Muslims face discrimination and disadvantage in both school enrollment and
wage employment. Muslims in India have lower levels of enrollment compared to
non-scheduled caste Hindus, reflecting past and present discrimination. Muslims are
even worse off in fundamentalist states compared to non-fundamentalist states,
experiencing a larger religious gap in school enrollment in fundamentalist states
compared to non-fundamentalist states. In all states combined, fundamentalist and
non-fundamentalist states, there is an increase in the religious gap in educational
enrollment from 1983 to 1999. For the years 1993 and 1999, the religious difference
in education is not significantly different from 1983, demonstrating that the school
enrollment gap between Muslims and non-scheduled caste Hindus has persisted over
time. This religious gap in enrollment has persisted despite major advances in
enrollment due to modernizing forces, further highlighting the extent of the
discrimination and disadvantage Muslims experience.
The comparison of the enrollment experience of girls’ and Muslims in India
over time sheds further light on the strength of Hindu fundamentalism in shaping
Muslims’ lives. Modernization theory posits that as development proceeds, ascriptive
qualities such as gender, race, and ethnicity will diminish in importance and
individual achievements will become more important. We see that indeed,
129
modernizing forces had a significant influence on the gender gap in enrollment over
time despite cultural and economic factors that hinder girls’ educational outcomes.
However, there is no corresponding effect in the ascriptive characteristic of being
Muslim. Rather, the religious gap in enrollment persists over time.
Muslims are slightly less likely than non-scheduled caste Hindus to be
engaged in wage employment. In fundamentalist states, non-scheduled caste Hindus
made greater gains in wage employment, increasing the religious gap in wage
employment over time. In contrast, in non-fundamentalist states, there is a slight
decline the religious gap in wage employment.
The religious gap in school enrollments is much larger than the gap in wage
employment. However, this does not necessarily mean that Muslims fair better in the
labor market. Being unemployed or out of the labor force is higher for Muslims.
Muslims who are a part of the labor force experience discrimination. Muslims are
less likely to be in the private and public organized sectors; instead, they tend to be in
the informal unprotected market (Government of India 2006). Therefore, seemingly
similar wage employment predicted probabilities for Muslims and non-scheduled
caste Hindus mask many of the inequalities that exist in the labor market.
Gender and Religious Discrimination and Disadvantage
Muslim women face discrimination and disadvantage in education and
employment. Similar to Hindu women relative to Hindu men, Muslim women are
less likely to be enrolled in school and to be engaged in wage employment compared
to Muslim men. Muslim women also face religious discrimination for being Muslim,
therefore compared to non-scheduled caste Hindu men and women and Muslim men,
130
Muslim women are the least likely out of the four groups to be enrolled in school or
to be engaged in wage employment.
The Rise of Hindu Fundamentalism and Muslim Identity Politics
Muslim women not only face a double disadvantage for their gender and
religion, but we also find evidence of the rise of Hindu fundamentalism and Muslim
identity politics adversely affecting Muslim women. Muslim women residing in
fundamentalist states appear to be negatively affected by the rise of Hindu
fundamentalism and Muslim identity politics. As discussed above, our results suggest
that all Muslims face considerable discrimination and disadvantage in all states, both
fundamentalist and non-fundamentalist, but Muslims face even more discrimination
in fundamentalist states. This has a corresponding influence on Muslim women in
fundamentalist states, where the complex relationship between Hindu
fundamentalism and Muslim identity politics further dampens their enrollment and
decreases wage employment.
As mentioned previously in relation to all Muslims, modernizing forces have a
greater influence on children’s enrollment in fundamentalist states compared to non-
fundamentalist states. Furthermore, modernizing forces have a greater impact on the
gender differences in school enrollment in fundamentalist states. Despite the
important role modernization has played in increasing school enrollment and reducing
gender differences in enrollment in fundamentalist states, it appears that Muslim girls
do not benefit from these forces as much as Hindu men and women and Muslim men.
In contrast to fundamentalist states, Muslim women in non-fundamentalist states do
make considerable gains in enrollment relative to other groups. Therefore, the
131
experience of Muslim girls in fundamentalist states compared to other groups and the
comparison between Muslim girls in fundamentalist states and non-fundamentalist
states suggests that Hindu fundamentalism and Muslim identity politics play an
important role in Muslim girls’ enrollment in fundamentalist states.
Evidence suggests that in the face of communal tensions, fearing for the safety
of their daughters, Muslim households are reluctant to send their daughters to school,
particularly middle schools that are further away from home (Government of India
2006). This could be a contributing factor to Muslim girls’ dampened enrollment
growth in fundamentalist states. Additionally, in the face of Hindu fundamentalism,
the Muslim community may use women as symbols and repositories for community
and tradition.
As discussed in Chapter 2, often in religious identity political movements,
education is valued in so far as it makes girls good wives and aids in their domestic
abilities. This may dampen Muslim girls’ enrollment, if it is viewed that girls do not
need to attend middle school to obtain the necessary domestic skills. Additionally,
communal tensions may result in Muslims households sending their daughters to
Madrasas. They may feel that Madrasa education would help preserve Muslim
heritage and tradition, which can be passed on to future generations. Due to
differences in language and curriculum, it is often difficult to transition to a
government or non-Islamic private school, thus potentially dampening girls’
secondary school enrollment.
There is also evidence that Hindu fundamentalism and Muslim identity
politics has influenced Muslim women’s wage employment. Similar to school
132
enrollment, the experience of Muslim women in fundamentalist and non-
fundamentalist states illustrates that Muslim women’s lives are affected by communal
tensions. Muslim women in fundamentalist states experience a decline in wage
employment over time. While the decline is small, it is still important in lieu of the
experiences of Muslim men, and Hindu men and women in fundamentalist states. All
three groups experience an increase in wage employment over time. Further weight
is added to this observation once we take into consideration the experience of Muslim
women in non-fundamentalist states. In contrast to their experience in fundamentalist
states, Muslim women experience an increase in wage employment, as do Muslim
men and non-scheduled caste Hindu men and women. These two different
experiences point to the influence of Hindu fundamentalism and Muslim identity
politics affecting Muslim women’s wage employment.
A hostile communal environment and fear of harassment may cause Muslim
women to withdraw from the labor force. Discrimination against Muslim women
may also intensify as communal tensions worsen. Muslim women may come to
represent the community, which often involves calls for women to return to the
domestic sphere and be good wives and mothers. This representation is at odds with
employment, which takes mothers and wives away from their domestic duties, their
children, and their husbands.
As expected, it appears that wage employment is more affected by Hindu
fundamentalism and Muslim identity politics compared to school enrollment.
Muslim women’s wage employment actually declines in fundamentalist states,
whereas Muslim girls’ enrollment has increased in fundamentalist states, but remains
133
dampened compared to other groups. While both enrollment and wage employment
are in opposition to women’s domestic roles, enrollment is still viewed as being
important for women to be good mothers, contributing to the greater influence that
Hindu Fundamentalism and Muslim identity politics have on Muslim women’s wage
employment compared to school enrollment.
In sum, modernizing forces had a more profound affect on enrollment
compared to wage employment. Not only have modernizing forces increased overall
enrollment, but they have also decreased the gender gap in school enrollment. In
contrast, modernizing forces have only modestly increased wage employment and the
gender gap has increased in fundamentalist states and persisted in non-fundamentalist
states.
Muslims face discrimination in the educational system and the labor market.
The religious gap in enrollment persists even though modernizing forces have clearly
benefited other disadvantaged groups such as girls. This persistence of the religious
gap in school enrollment, when there were crucial gains made in school enrollment
via increases in access to schools and educational campaigns indicates that the rise of
Hindu Fundamentalism has had an adverse affect on Muslim school enrollment.
Muslims do not appear to fair as badly in wage employment relative to school
enrollment, particularly in non-fundamentalist states, where the religious gap in wage
employment decreases slightly over time. In contrast to non-fundamentalist states,
the religious gap in wage employment increases in fundamentalist states.
Muslim women have the lowest levels of school enrollment and wage
employment compared to Muslim men and Non-scheduled caste Hindu men and
134
women. The rise of Hindu fundamentalism and Muslim identity politics further
disadvantage Muslim women in school enrollment and wage employment.
The findings of this dissertation indicate that communal tensions have been
detrimental to Muslims. While both Muslim men and women face discrimination and
disadvantage in school enrollment and wage employment and their experiences in
these arenas have worsened due to the rise of Hindu fundamentalism, Muslim women
are more adversely affected by these tensions.
It is important that more efforts are made to reveal and understand the true
plight of Muslims in India instead of relying on rhetoric based on communalism.
Recent efforts by scholars and the government are important steps toward
understanding the Muslim experience in India, however more concerted efforts are
necessary. The discrimination and disadvantage that Muslims face in India is
increasingly documented. It is now time for greater efforts to combat rampant
discrimination against Muslims. Furthermore, it is apparent that special efforts are
needed to focus on Muslim women.
These findings are not only relevant to current debates in India, but also to the
experience of Muslims in western countries. Historical discrimination against
Muslims in many western countries and now global events such as the “War on
Terror” have intensified negative rhetoric and discrimination against Muslims in
Western countries, threatening to further isolate Muslim communities. The debates
about veiling in England and France, riots in France set off by two boys being chased
to their death by police were the product of discontent from discrimination and
marginalization, the unusual intolerant rhetoric from the Netherlands after Theo Van
135
Gogh was stabbed by a Muslim, rhetoric utilized in immigration and the war on terror
debates, increasingly threaten Muslim communities in Western countries. Like in
India, this increased intolerance and racism towards Muslims, will have adverse
consequences for Muslims and may particularly affect Muslim women.
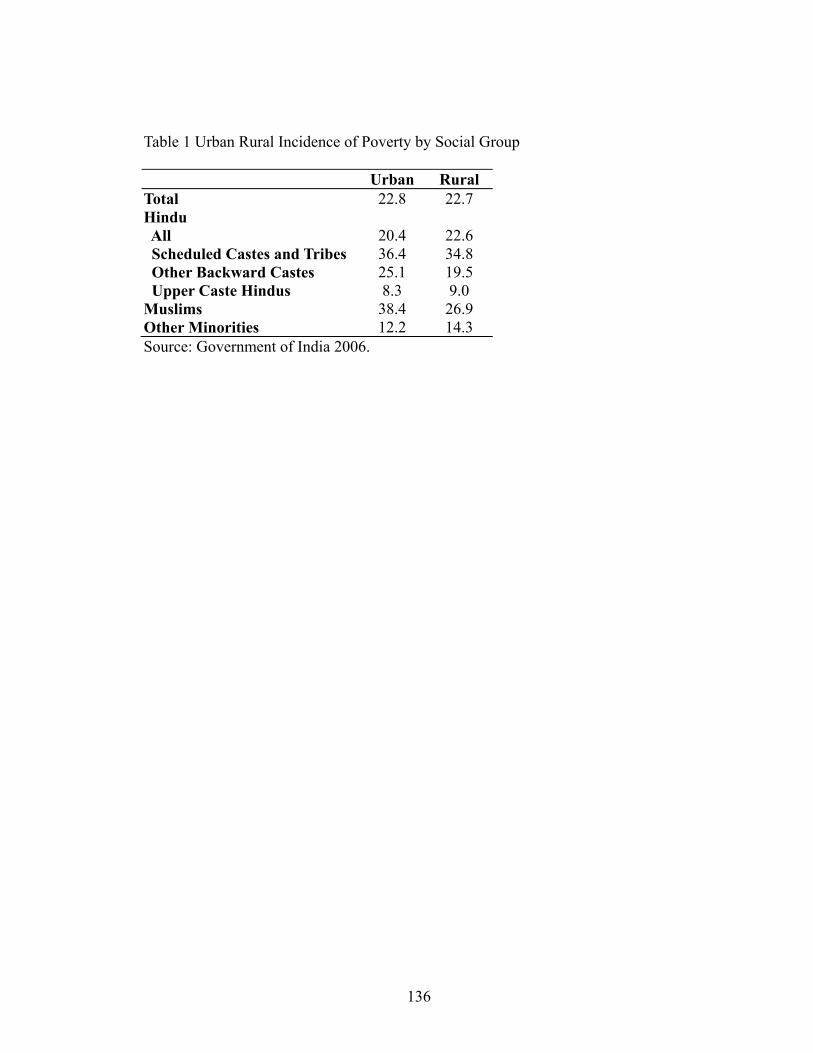
136
Table 1 Urban Rural Incidence of Poverty by Social Group
Urban Rural Total 22.8 22.7 Hindu All 20.4 22.6 Scheduled Castes and Tribes 36.4 34.8 Other Backward Castes 25.1 19.5 Upper Caste Hindus 8.3 9.0 Muslims 38.4 26.9 Other Minorities 12.2 14.3 Source: Government of India 2006.
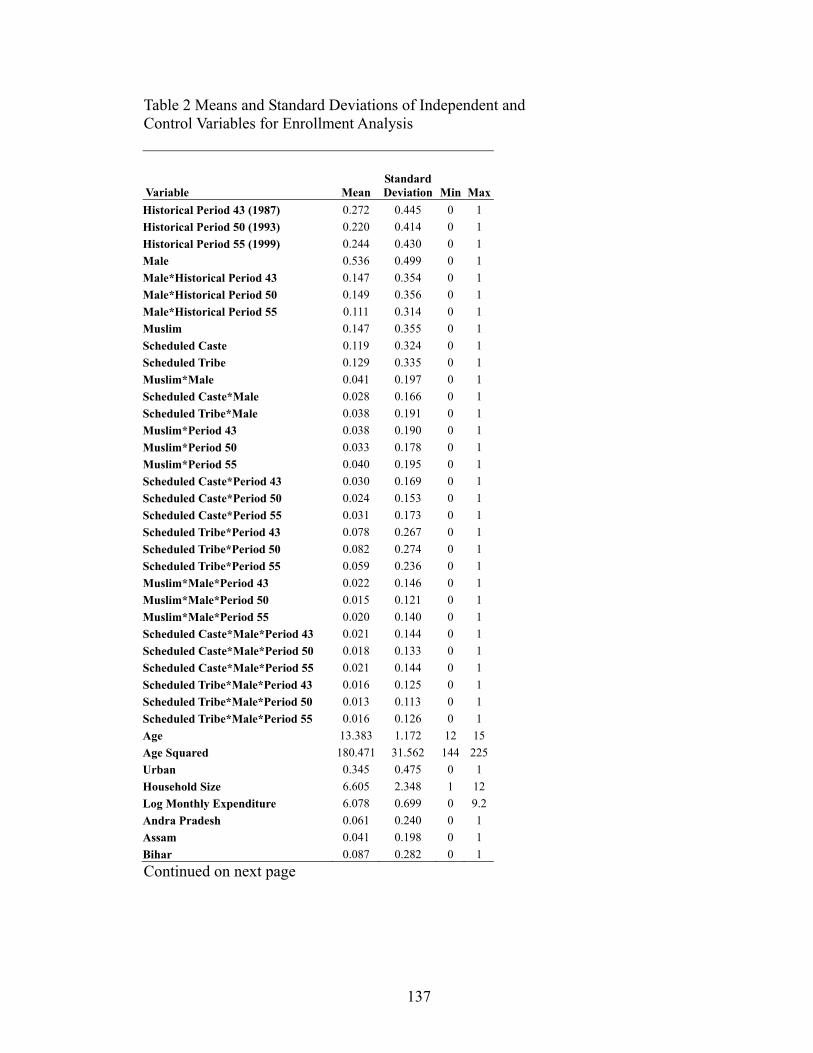
137
Table 2 Means and Standard Deviations of Independent and Control Variables for Enrollment Analysis
Variable Mean Standard Deviation Min Max
Historical Period 43 (1987) 0.272 0.445 0 1 Historical Period 50 (1993) 0.220 0.414 0 1 Historical Period 55 (1999) 0.244 0.430 0 1 Male 0.536 0.499 0 1 Male*Historical Period 43 0.147 0.354 0 1 Male*Historical Period 50 0.149 0.356 0 1 Male*Historical Period 55 0.111 0.314 0 1 Muslim 0.147 0.355 0 1 Scheduled Caste 0.119 0.324 0 1 Scheduled Tribe 0.129 0.335 0 1 Muslim*Male 0.041 0.197 0 1 Scheduled Caste*Male 0.028 0.166 0 1 Scheduled Tribe*Male 0.038 0.191 0 1 Muslim*Period 43 0.038 0.190 0 1 Muslim*Period 50 0.033 0.178 0 1 Muslim*Period 55 0.040 0.195 0 1 Scheduled Caste*Period 43 0.030 0.169 0 1 Scheduled Caste*Period 50 0.024 0.153 0 1 Scheduled Caste*Period 55 0.031 0.173 0 1 Scheduled Tribe*Period 43 0.078 0.267 0 1 Scheduled Tribe*Period 50 0.082 0.274 0 1 Scheduled Tribe*Period 55 0.059 0.236 0 1 Muslim*Male*Period 43 0.022 0.146 0 1 Muslim*Male*Period 50 0.015 0.121 0 1 Muslim*Male*Period 55 0.020 0.140 0 1 Scheduled Caste*Male*Period 43 0.021 0.144 0 1 Scheduled Caste*Male*Period 50 0.018 0.133 0 1 Scheduled Caste*Male*Period 55 0.021 0.144 0 1 Scheduled Tribe*Male*Period 43 0.016 0.125 0 1 Scheduled Tribe*Male*Period 50 0.013 0.113 0 1 Scheduled Tribe*Male*Period 55 0.016 0.126 0 1 Age 13.383 1.172 12 15 Age Squared 180.471 31.562 144 225Urban 0.345 0.475 0 1 Household Size 6.605 2.348 1 12 Log Monthly Expenditure 6.078 0.699 0 9.2 Andra Pradesh 0.061 0.240 0 1 Assam 0.041 0.198 0 1 Bihar 0.087 0.282 0 1 Continued on next page
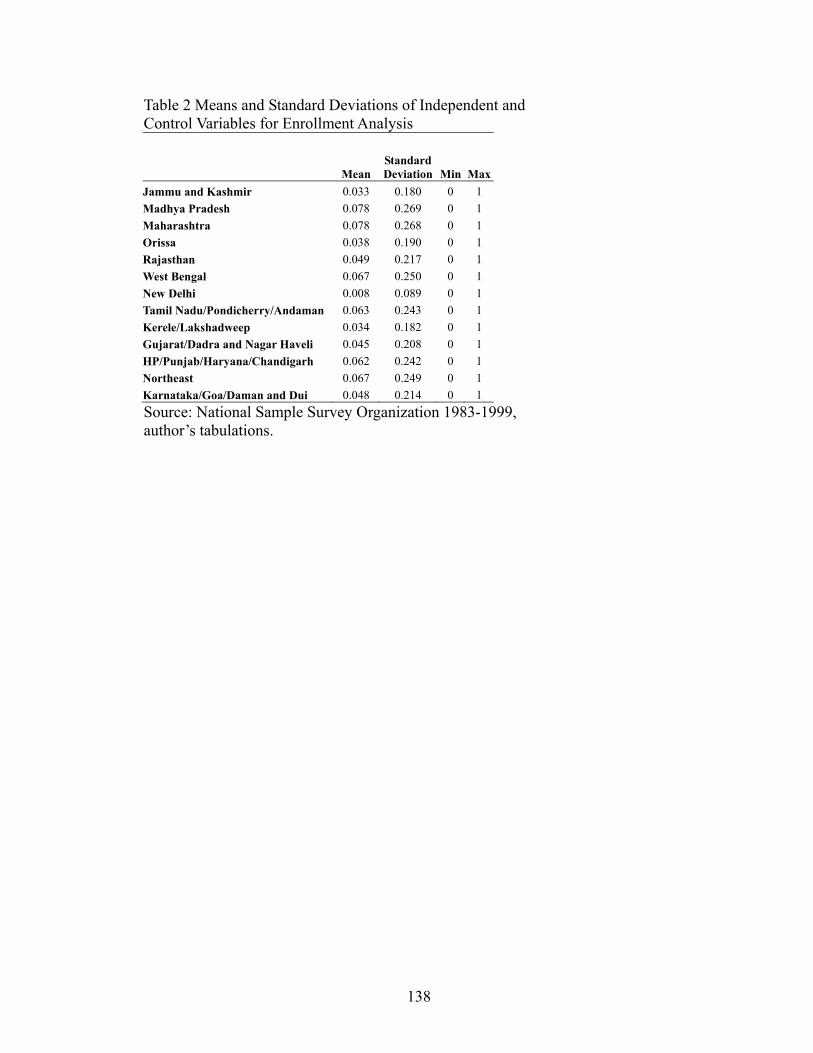
138
Table 2 Means and Standard Deviations of Independent and Control Variables for Enrollment Analysis
Mean Standard Deviation Min Max
Jammu and Kashmir 0.033 0.180 0 1 Madhya Pradesh 0.078 0.269 0 1 Maharashtra 0.078 0.268 0 1 Orissa 0.038 0.190 0 1 Rajasthan 0.049 0.217 0 1 West Bengal 0.067 0.250 0 1 New Delhi 0.008 0.089 0 1 Tamil Nadu/Pondicherry/Andaman 0.063 0.243 0 1 Kerele/Lakshadweep 0.034 0.182 0 1 Gujarat/Dadra and Nagar Haveli 0.045 0.208 0 1 HP/Punjab/Haryana/Chandigarh 0.062 0.242 0 1 Northeast 0.067 0.249 0 1 Karnataka/Goa/Daman and Dui 0.048 0.214 0 1 Source: National Sample Survey Organization 1983-1999, author’s tabulations.
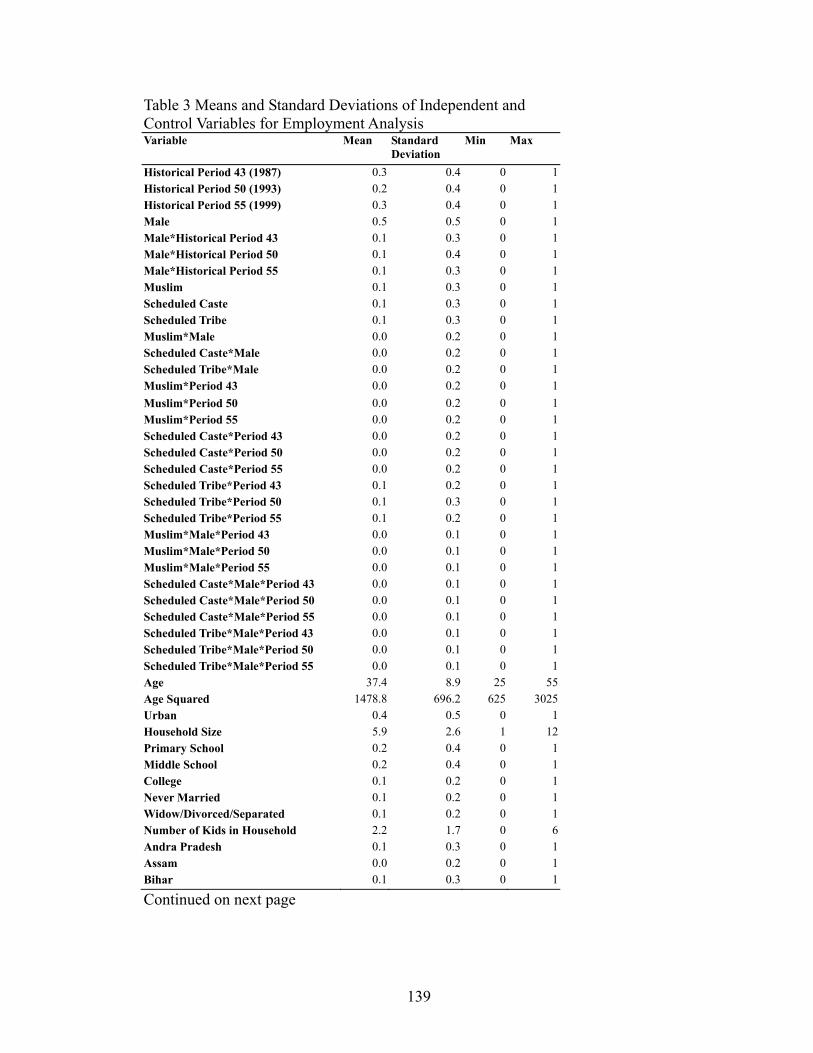
139
Table 3 Means and Standard Deviations of Independent and Control Variables for Employment Analysis Variable Mean Standard
Deviation Min Max
Historical Period 43 (1987) 0.3 0.4 0 1Historical Period 50 (1993) 0.2 0.4 0 1Historical Period 55 (1999) 0.3 0.4 0 1Male 0.5 0.5 0 1Male*Historical Period 43 0.1 0.3 0 1Male*Historical Period 50 0.1 0.4 0 1Male*Historical Period 55 0.1 0.3 0 1Muslim 0.1 0.3 0 1Scheduled Caste 0.1 0.3 0 1Scheduled Tribe 0.1 0.3 0 1Muslim*Male 0.0 0.2 0 1Scheduled Caste*Male 0.0 0.2 0 1Scheduled Tribe*Male 0.0 0.2 0 1Muslim*Period 43 0.0 0.2 0 1Muslim*Period 50 0.0 0.2 0 1Muslim*Period 55 0.0 0.2 0 1Scheduled Caste*Period 43 0.0 0.2 0 1Scheduled Caste*Period 50 0.0 0.2 0 1Scheduled Caste*Period 55 0.0 0.2 0 1Scheduled Tribe*Period 43 0.1 0.2 0 1Scheduled Tribe*Period 50 0.1 0.3 0 1Scheduled Tribe*Period 55 0.1 0.2 0 1Muslim*Male*Period 43 0.0 0.1 0 1Muslim*Male*Period 50 0.0 0.1 0 1Muslim*Male*Period 55 0.0 0.1 0 1Scheduled Caste*Male*Period 43 0.0 0.1 0 1Scheduled Caste*Male*Period 50 0.0 0.1 0 1Scheduled Caste*Male*Period 55 0.0 0.1 0 1Scheduled Tribe*Male*Period 43 0.0 0.1 0 1Scheduled Tribe*Male*Period 50 0.0 0.1 0 1Scheduled Tribe*Male*Period 55 0.0 0.1 0 1Age 37.4 8.9 25 55Age Squared 1478.8 696.2 625 3025Urban 0.4 0.5 0 1Household Size 5.9 2.6 1 12Primary School 0.2 0.4 0 1Middle School 0.2 0.4 0 1College 0.1 0.2 0 1Never Married 0.1 0.2 0 1Widow/Divorced/Separated 0.1 0.2 0 1Number of Kids in Household 2.2 1.7 0 6Andra Pradesh 0.1 0.3 0 1Assam 0.0 0.2 0 1Bihar 0.1 0.3 0 1
Continued on next page
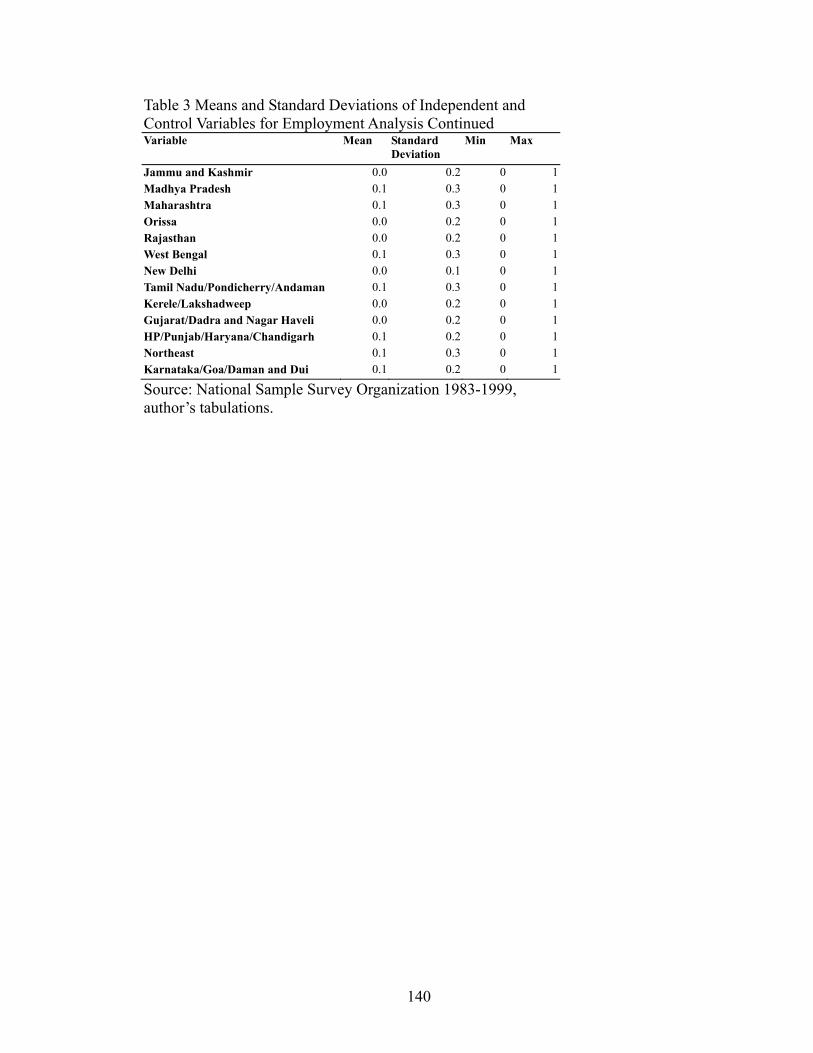
140
Table 3 Means and Standard Deviations of Independent and Control Variables for Employment Analysis Continued Variable Mean Standard
Deviation Min Max
Jammu and Kashmir 0.0 0.2 0 1Madhya Pradesh 0.1 0.3 0 1Maharashtra 0.1 0.3 0 1Orissa 0.0 0.2 0 1Rajasthan 0.0 0.2 0 1West Bengal 0.1 0.3 0 1New Delhi 0.0 0.1 0 1Tamil Nadu/Pondicherry/Andaman 0.1 0.3 0 1Kerele/Lakshadweep 0.0 0.2 0 1Gujarat/Dadra and Nagar Haveli 0.0 0.2 0 1HP/Punjab/Haryana/Chandigarh 0.1 0.2 0 1Northeast 0.1 0.3 0 1Karnataka/Goa/Daman and Dui 0.1 0.2 0 1
Source: National Sample Survey Organization 1983-1999, author’s tabulations.
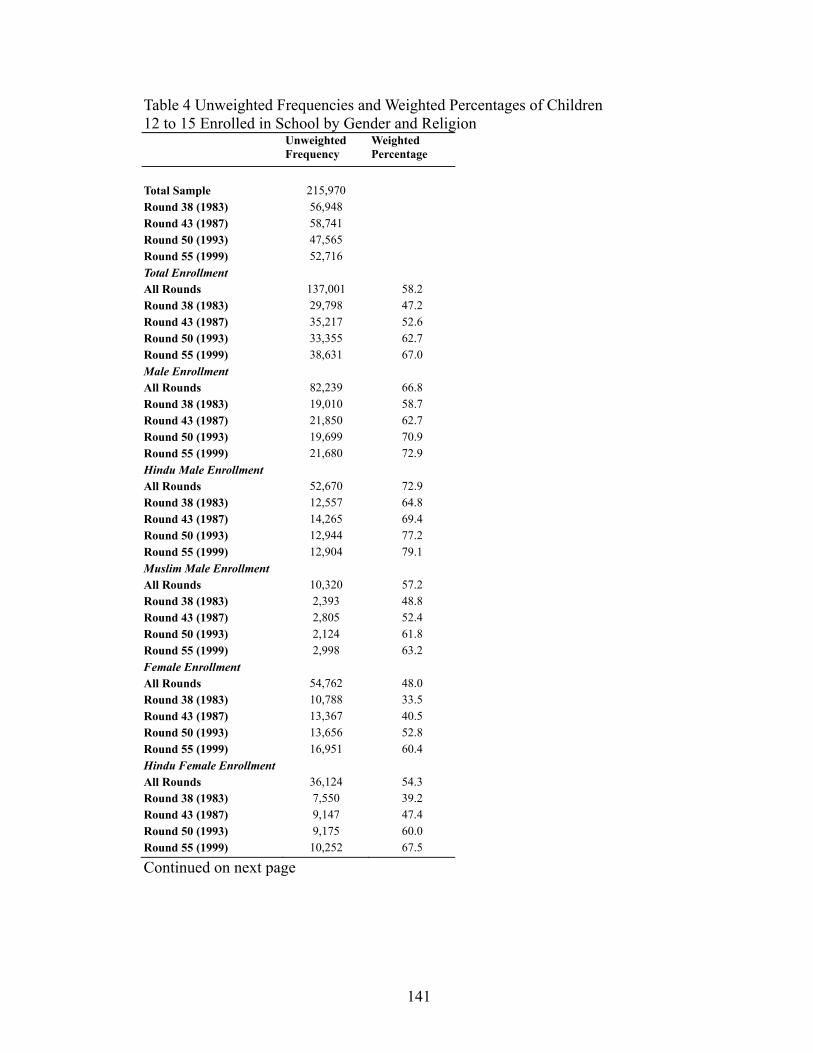
141
Table 4 Unweighted Frequencies and Weighted Percentages of Children 12 to 15 Enrolled in School by Gender and Religion
Unweighted Frequency
Weighted Percentage
Total Sample 215,970 Round 38 (1983) 56,948 Round 43 (1987) 58,741 Round 50 (1993) 47,565 Round 55 (1999) 52,716 Total Enrollment All Rounds 137,001 58.2 Round 38 (1983) 29,798 47.2 Round 43 (1987) 35,217 52.6 Round 50 (1993) 33,355 62.7 Round 55 (1999) 38,631 67.0 Male Enrollment All Rounds 82,239 66.8 Round 38 (1983) 19,010 58.7 Round 43 (1987) 21,850 62.7 Round 50 (1993) 19,699 70.9 Round 55 (1999) 21,680 72.9 Hindu Male Enrollment All Rounds 52,670 72.9 Round 38 (1983) 12,557 64.8 Round 43 (1987) 14,265 69.4 Round 50 (1993) 12,944 77.2 Round 55 (1999) 12,904 79.1 Muslim Male Enrollment All Rounds 10,320 57.2 Round 38 (1983) 2,393 48.8 Round 43 (1987) 2,805 52.4 Round 50 (1993) 2,124 61.8 Round 55 (1999) 2,998 63.2 Female Enrollment All Rounds 54,762 48.0 Round 38 (1983) 10,788 33.5 Round 43 (1987) 13,367 40.5 Round 50 (1993) 13,656 52.8 Round 55 (1999) 16,951 60.4 Hindu Female Enrollment All Rounds 36,124 54.3 Round 38 (1983) 7,550 39.2 Round 43 (1987) 9,147 47.4 Round 50 (1993) 9,175 60.0 Round 55 (1999) 10,252 67.5
Continued on next page
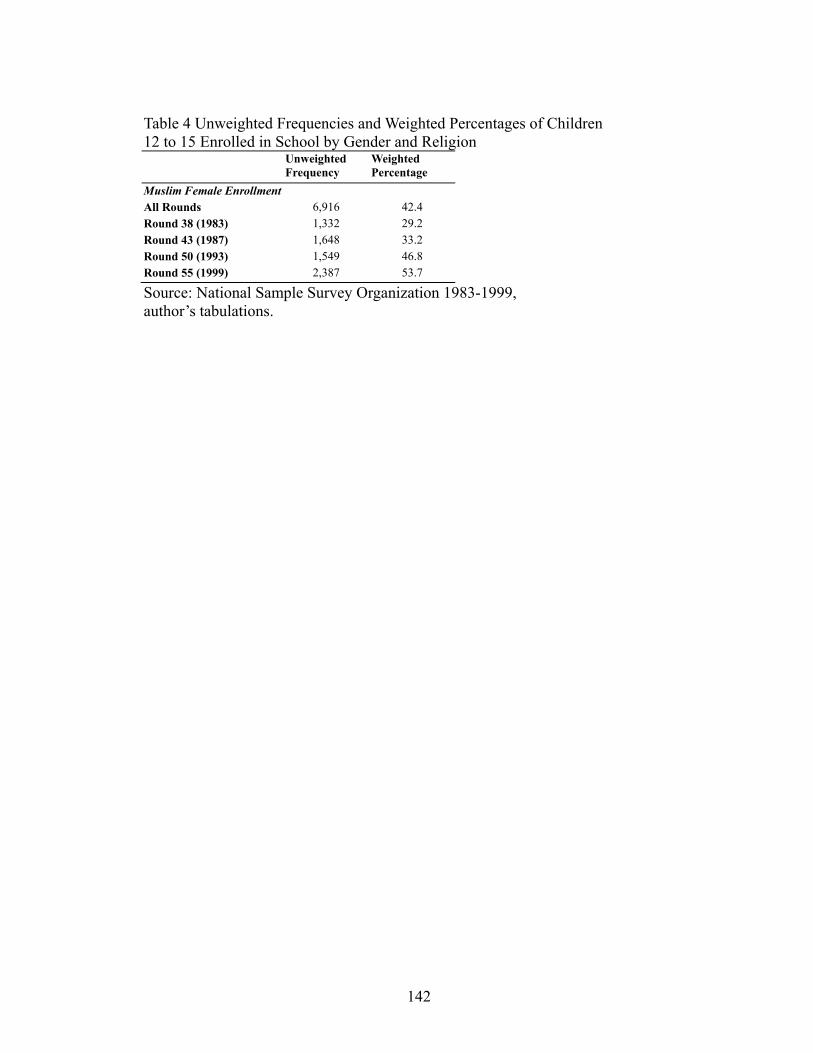
142
Table 4 Unweighted Frequencies and Weighted Percentages of Children 12 to 15 Enrolled in School by Gender and Religion
Unweighted Frequency
Weighted Percentage
Muslim Female Enrollment All Rounds 6,916 42.4 Round 38 (1983) 1,332 29.2 Round 43 (1987) 1,648 33.2 Round 50 (1993) 1,549 46.8 Round 55 (1999) 2,387 53.7
Source: National Sample Survey Organization 1983-1999, author’s tabulations.
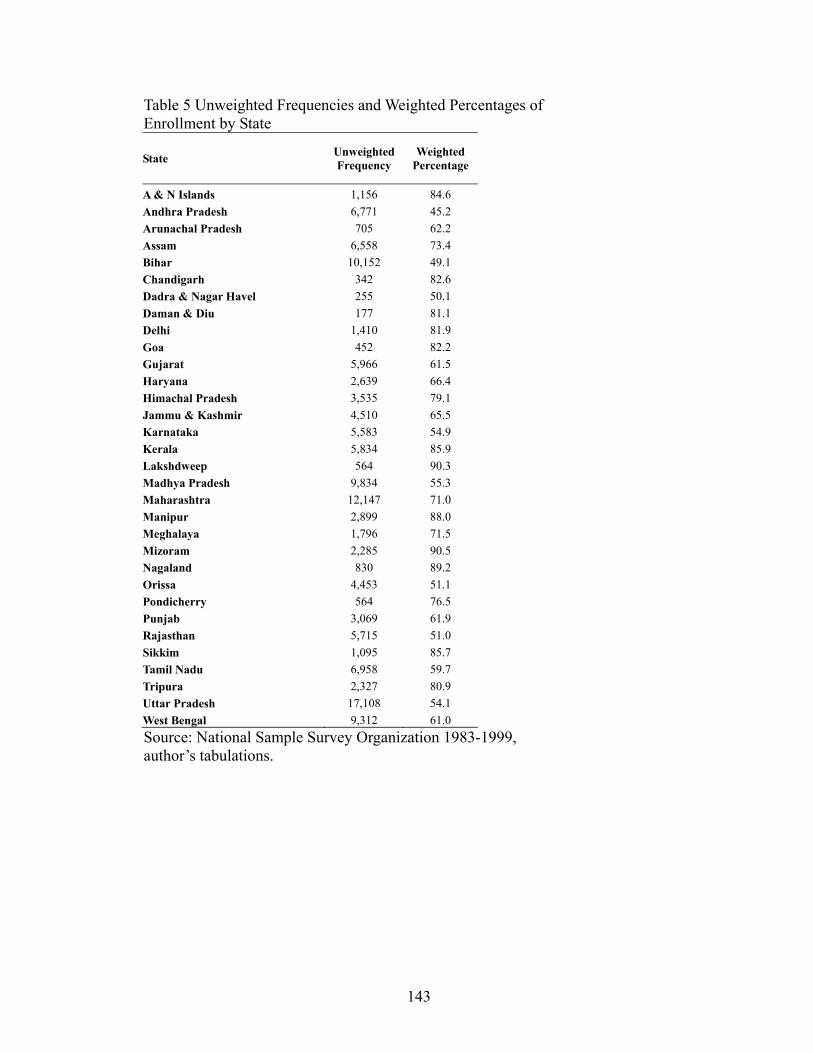
143
Table 5 Unweighted Frequencies and Weighted Percentages of Enrollment by State
State Unweighted Frequency
Weighted Percentage
A & N Islands 1,156 84.6 Andhra Pradesh 6,771 45.2 Arunachal Pradesh 705 62.2 Assam 6,558 73.4 Bihar 10,152 49.1 Chandigarh 342 82.6 Dadra & Nagar Havel 255 50.1 Daman & Diu 177 81.1 Delhi 1,410 81.9 Goa 452 82.2 Gujarat 5,966 61.5 Haryana 2,639 66.4 Himachal Pradesh 3,535 79.1 Jammu & Kashmir 4,510 65.5 Karnataka 5,583 54.9 Kerala 5,834 85.9 Lakshdweep 564 90.3 Madhya Pradesh 9,834 55.3 Maharashtra 12,147 71.0 Manipur 2,899 88.0 Meghalaya 1,796 71.5 Mizoram 2,285 90.5 Nagaland 830 89.2 Orissa 4,453 51.1 Pondicherry 564 76.5 Punjab 3,069 61.9 Rajasthan 5,715 51.0 Sikkim 1,095 85.7 Tamil Nadu 6,958 59.7 Tripura 2,327 80.9 Uttar Pradesh 17,108 54.1 West Bengal 9,312 61.0 Source: National Sample Survey Organization 1983-1999, author’s tabulations.
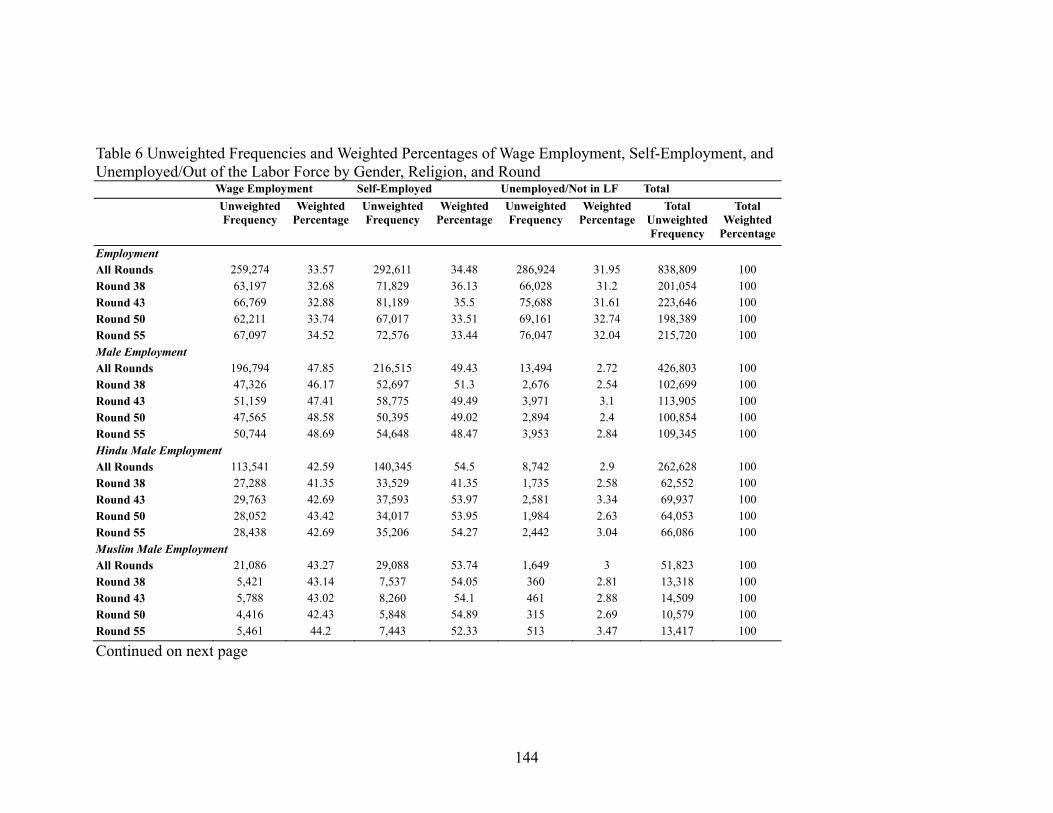
144
Table 6 Unweighted Frequencies and Weighted Percentages of Wage Employment, Self-Employment, and Unemployed/Out of the Labor Force by Gender, Religion, and Round
Wage Employment Self-Employed Unemployed/Not in LF Total Unweighted
Frequency Weighted
Percentage Unweighted Frequency
Weighted Percentage
Unweighted Frequency
Weighted Percentage
Total Unweighted Frequency
Total Weighted
Percentage
Employment All Rounds 259,274 33.57 292,611 34.48 286,924 31.95 838,809 100 Round 38 63,197 32.68 71,829 36.13 66,028 31.2 201,054 100 Round 43 66,769 32.88 81,189 35.5 75,688 31.61 223,646 100 Round 50 62,211 33.74 67,017 33.51 69,161 32.74 198,389 100 Round 55 67,097 34.52 72,576 33.44 76,047 32.04 215,720 100 Male Employment All Rounds 196,794 47.85 216,515 49.43 13,494 2.72 426,803 100 Round 38 47,326 46.17 52,697 51.3 2,676 2.54 102,699 100 Round 43 51,159 47.41 58,775 49.49 3,971 3.1 113,905 100 Round 50 47,565 48.58 50,395 49.02 2,894 2.4 100,854 100 Round 55 50,744 48.69 54,648 48.47 3,953 2.84 109,345 100 Hindu Male Employment All Rounds 113,541 42.59 140,345 54.5 8,742 2.9 262,628 100 Round 38 27,288 41.35 33,529 41.35 1,735 2.58 62,552 100 Round 43 29,763 42.69 37,593 53.97 2,581 3.34 69,937 100 Round 50 28,052 43.42 34,017 53.95 1,984 2.63 64,053 100 Round 55 28,438 42.69 35,206 54.27 2,442 3.04 66,086 100 Muslim Male Employment All Rounds 21,086 43.27 29,088 53.74 1,649 3 51,823 100 Round 38 5,421 43.14 7,537 54.05 360 2.81 13,318 100 Round 43 5,788 43.02 8,260 54.1 461 2.88 14,509 100 Round 50 4,416 42.43 5,848 54.89 315 2.69 10,579 100 Round 55 5,461 44.2 7,443 52.33 513 3.47 13,417 100
Continued on next page
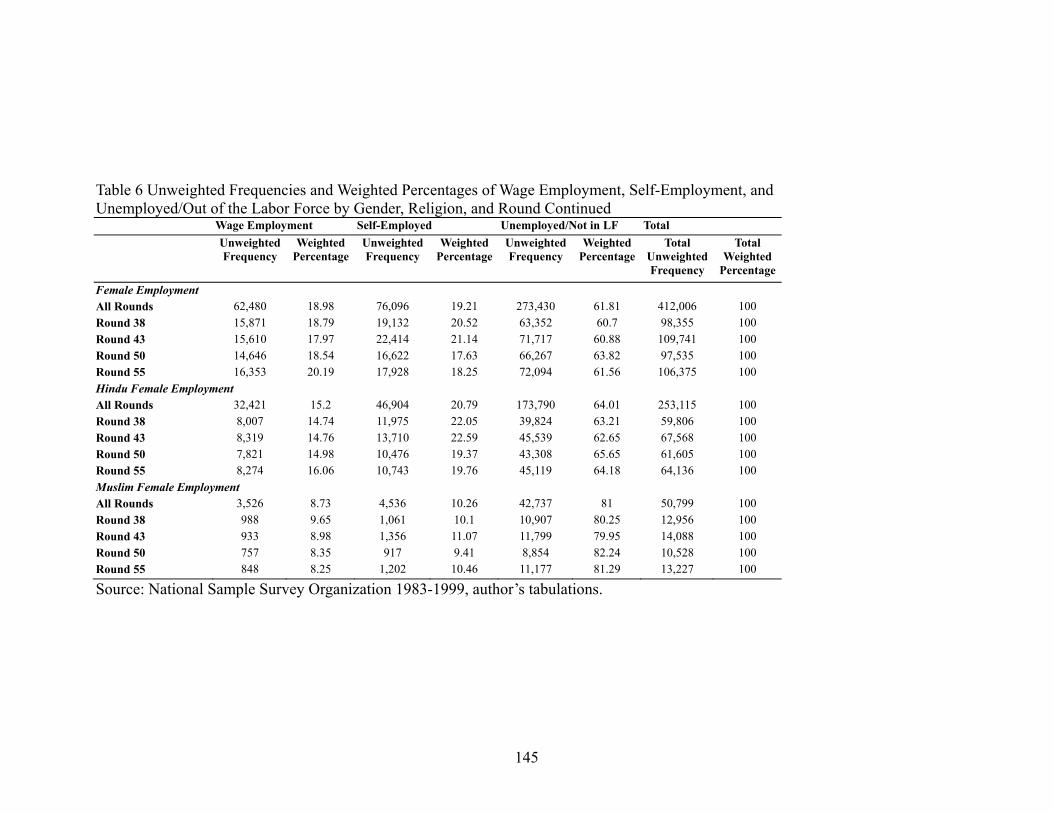
145
Table 6 Unweighted Frequencies and Weighted Percentages of Wage Employment, Self-Employment, and Unemployed/Out of the Labor Force by Gender, Religion, and Round Continued
Wage Employment Self-Employed Unemployed/Not in LF Total Unweighted
Frequency Weighted
Percentage Unweighted Frequency
Weighted Percentage
Unweighted Frequency
Weighted Percentage
Total Unweighted Frequency
Total Weighted
Percentage
Female Employment All Rounds 62,480 18.98 76,096 19.21 273,430 61.81 412,006 100 Round 38 15,871 18.79 19,132 20.52 63,352 60.7 98,355 100 Round 43 15,610 17.97 22,414 21.14 71,717 60.88 109,741 100 Round 50 14,646 18.54 16,622 17.63 66,267 63.82 97,535 100 Round 55 16,353 20.19 17,928 18.25 72,094 61.56 106,375 100 Hindu Female Employment All Rounds 32,421 15.2 46,904 20.79 173,790 64.01 253,115 100 Round 38 8,007 14.74 11,975 22.05 39,824 63.21 59,806 100 Round 43 8,319 14.76 13,710 22.59 45,539 62.65 67,568 100 Round 50 7,821 14.98 10,476 19.37 43,308 65.65 61,605 100 Round 55 8,274 16.06 10,743 19.76 45,119 64.18 64,136 100 Muslim Female Employment All Rounds 3,526 8.73 4,536 10.26 42,737 81 50,799 100 Round 38 988 9.65 1,061 10.1 10,907 80.25 12,956 100 Round 43 933 8.98 1,356 11.07 11,799 79.95 14,088 100 Round 50 757 8.35 917 9.41 8,854 82.24 10,528 100 Round 55 848 8.25 1,202 10.46 11,177 81.29 13,227 100
Source: National Sample Survey Organization 1983-1999, author’s tabulations.
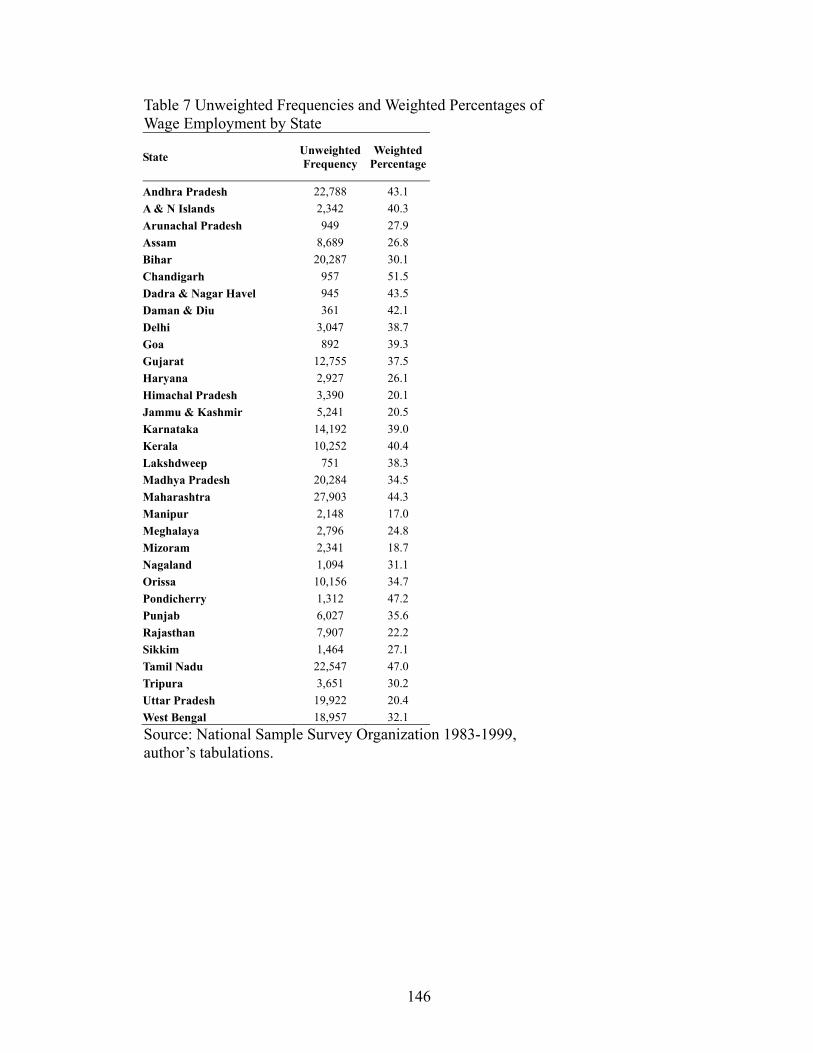
146
Table 7 Unweighted Frequencies and Weighted Percentages of Wage Employment by State
State Unweighted Frequency
Weighted Percentage
Andhra Pradesh 22,788 43.1 A & N Islands 2,342 40.3 Arunachal Pradesh 949 27.9 Assam 8,689 26.8 Bihar 20,287 30.1 Chandigarh 957 51.5 Dadra & Nagar Havel 945 43.5 Daman & Diu 361 42.1 Delhi 3,047 38.7 Goa 892 39.3 Gujarat 12,755 37.5 Haryana 2,927 26.1 Himachal Pradesh 3,390 20.1 Jammu & Kashmir 5,241 20.5 Karnataka 14,192 39.0 Kerala 10,252 40.4 Lakshdweep 751 38.3 Madhya Pradesh 20,284 34.5 Maharashtra 27,903 44.3 Manipur 2,148 17.0 Meghalaya 2,796 24.8 Mizoram 2,341 18.7 Nagaland 1,094 31.1 Orissa 10,156 34.7 Pondicherry 1,312 47.2 Punjab 6,027 35.6 Rajasthan 7,907 22.2 Sikkim 1,464 27.1 Tamil Nadu 22,547 47.0 Tripura 3,651 30.2 Uttar Pradesh 19,922 20.4 West Bengal 18,957 32.1 Source: National Sample Survey Organization 1983-1999, author’s tabulations.
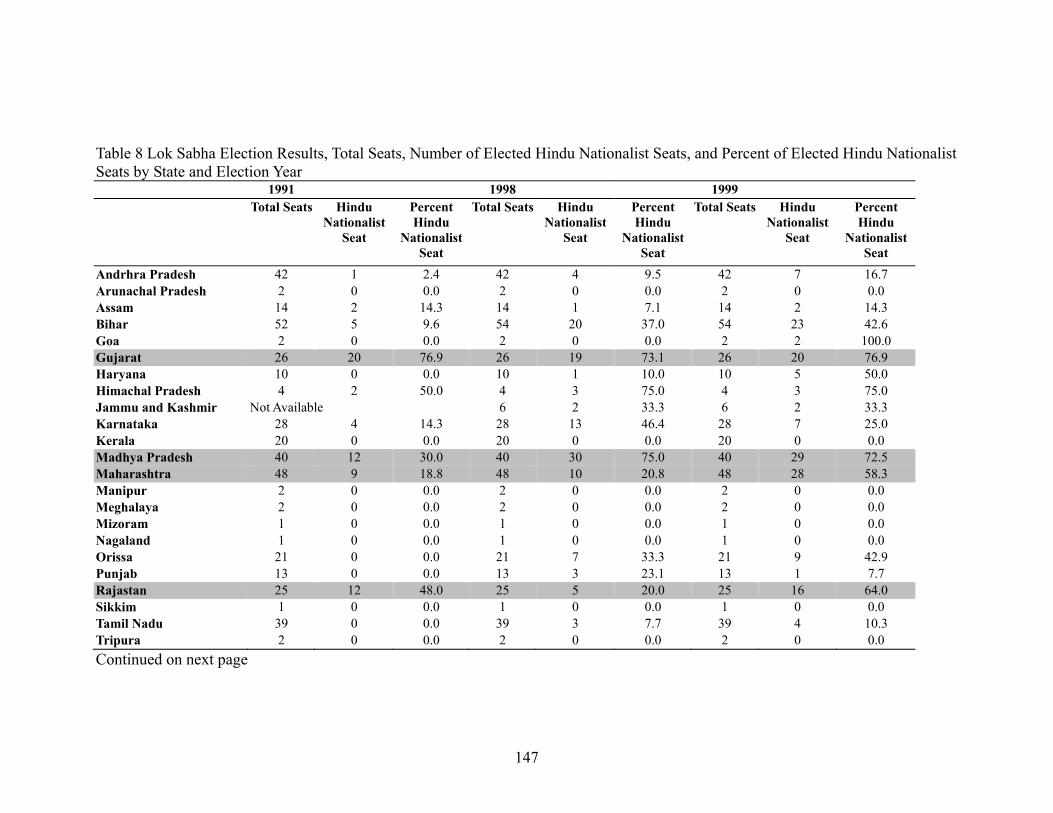
147
Table 8 Lok Sabha Election Results, Total Seats, Number of Elected Hindu Nationalist Seats, and Percent of Elected Hindu Nationalist Seats by State and Election Year
1991 1998 1999 Total Seats Hindu
Nationalist Seat
Percent Hindu
Nationalist Seat
Total Seats Hindu Nationalist
Seat
Percent Hindu
Nationalist Seat
Total Seats Hindu Nationalist
Seat
Percent Hindu
Nationalist Seat
Andrhra Pradesh 42 1 2.4 42 4 9.5 42 7 16.7 Arunachal Pradesh 2 0 0.0 2 0 0.0 2 0 0.0 Assam 14 2 14.3 14 1 7.1 14 2 14.3 Bihar 52 5 9.6 54 20 37.0 54 23 42.6 Goa 2 0 0.0 2 0 0.0 2 2 100.0 Gujarat 26 20 76.9 26 19 73.1 26 20 76.9 Haryana 10 0 0.0 10 1 10.0 10 5 50.0 Himachal Pradesh 4 2 50.0 4 3 75.0 4 3 75.0 Jammu and Kashmir Not Available 6 2 33.3 6 2 33.3 Karnataka 28 4 14.3 28 13 46.4 28 7 25.0 Kerala 20 0 0.0 20 0 0.0 20 0 0.0 Madhya Pradesh 40 12 30.0 40 30 75.0 40 29 72.5 Maharashtra 48 9 18.8 48 10 20.8 48 28 58.3 Manipur 2 0 0.0 2 0 0.0 2 0 0.0 Meghalaya 2 0 0.0 2 0 0.0 2 0 0.0 Mizoram 1 0 0.0 1 0 0.0 1 0 0.0 Nagaland 1 0 0.0 1 0 0.0 1 0 0.0 Orissa 21 0 0.0 21 7 33.3 21 9 42.9 Punjab 13 0 0.0 13 3 23.1 13 1 7.7 Rajastan 25 12 48.0 25 5 20.0 25 16 64.0 Sikkim 1 0 0.0 1 0 0.0 1 0 0.0 Tamil Nadu 39 0 0.0 39 3 7.7 39 4 10.3 Tripura 2 0 0.0 2 0 0.0 2 0 0.0 Continued on next page
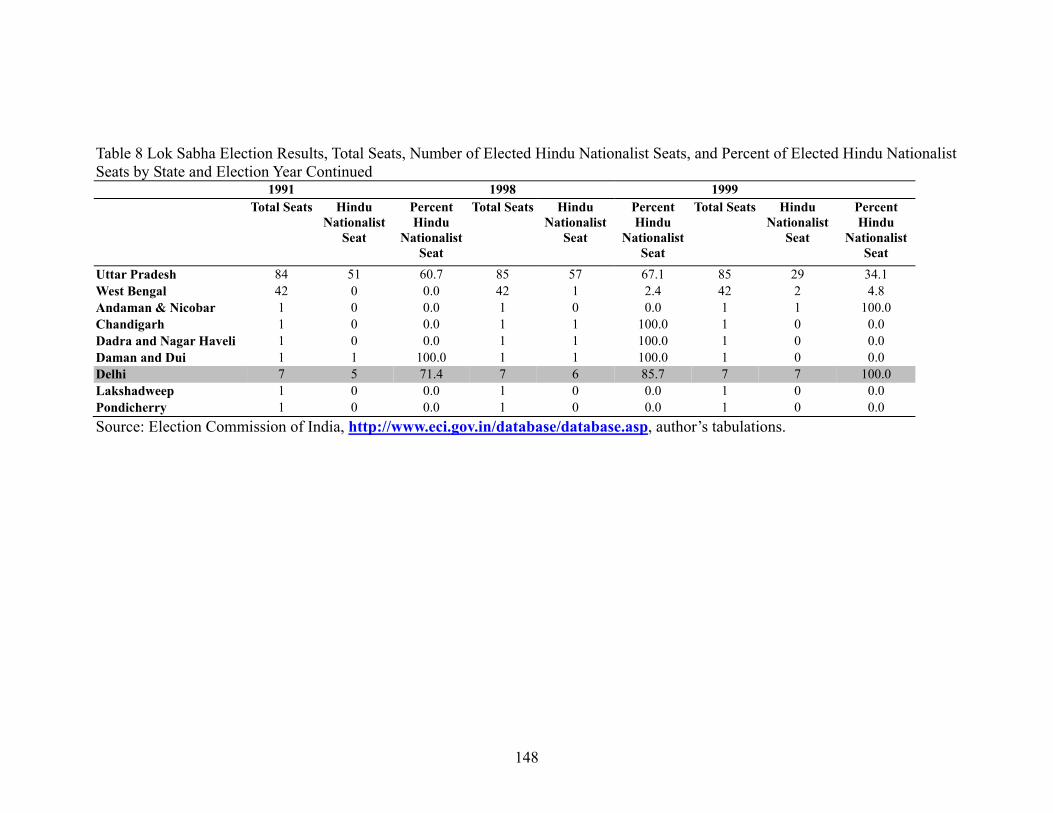
148
Table 8 Lok Sabha Election Results, Total Seats, Number of Elected Hindu Nationalist Seats, and Percent of Elected Hindu Nationalist Seats by State and Election Year Continued
1991 1998 1999 Total Seats Hindu
Nationalist Seat
Percent Hindu
Nationalist Seat
Total Seats Hindu Nationalist
Seat
Percent Hindu
Nationalist Seat
Total Seats Hindu Nationalist
Seat
Percent Hindu
Nationalist Seat
Uttar Pradesh 84 51 60.7 85 57 67.1 85 29 34.1 West Bengal 42 0 0.0 42 1 2.4 42 2 4.8 Andaman & Nicobar 1 0 0.0 1 0 0.0 1 1 100.0 Chandigarh 1 0 0.0 1 1 100.0 1 0 0.0 Dadra and Nagar Haveli 1 0 0.0 1 1 100.0 1 0 0.0 Daman and Dui 1 1 100.0 1 1 100.0 1 0 0.0 Delhi 7 5 71.4 7 6 85.7 7 7 100.0 Lakshadweep 1 0 0.0 1 0 0.0 1 0 0.0 Pondicherry 1 0 0.0 1 0 0.0 1 0 0.0 Source: Election Commission of India, http://www.eci.gov.in/database/database.asp, author’s tabulations.
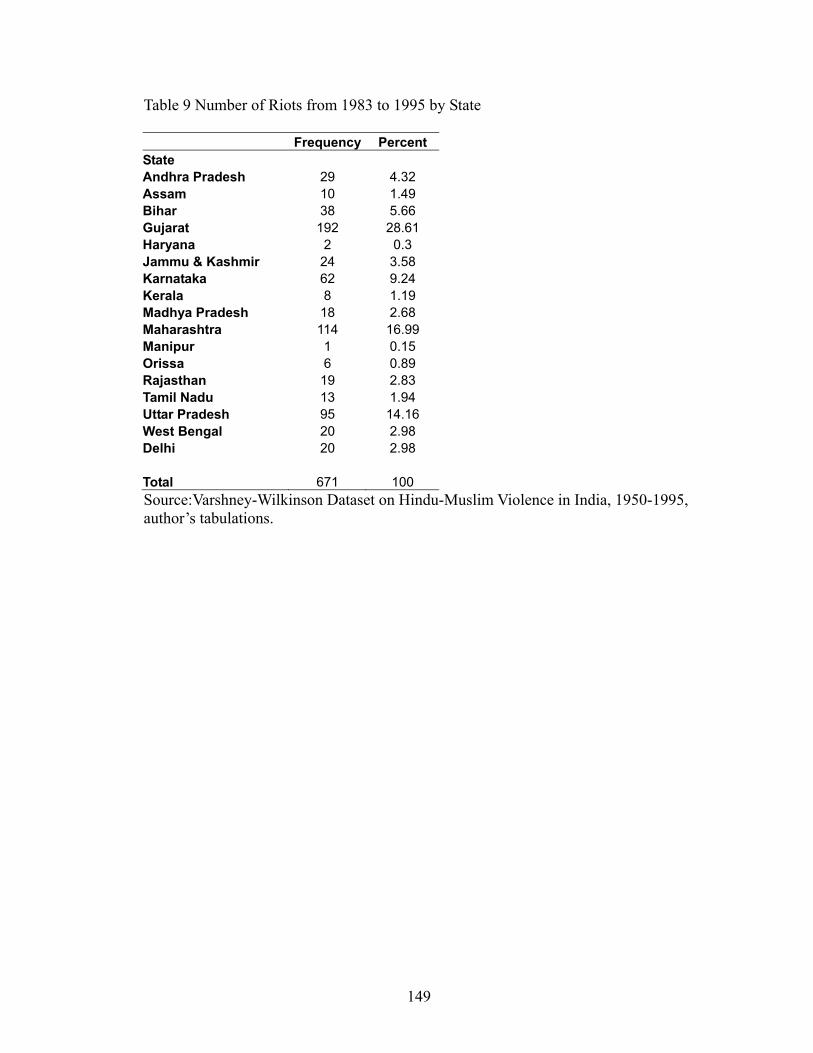
149
Table 9 Number of Riots from 1983 to 1995 by State Frequency Percent State Andhra Pradesh 29 4.32 Assam 10 1.49 Bihar 38 5.66 Gujarat 192 28.61 Haryana 2 0.3 Jammu & Kashmir 24 3.58 Karnataka 62 9.24 Kerala 8 1.19 Madhya Pradesh 18 2.68 Maharashtra 114 16.99 Manipur 1 0.15 Orissa 6 0.89 Rajasthan 19 2.83 Tamil Nadu 13 1.94 Uttar Pradesh 95 14.16 West Bengal 20 2.98 Delhi 20 2.98 Total 671 100 Source:Varshney-Wilkinson Dataset on Hindu-Muslim Violence in India, 1950-1995, author’s tabulations.
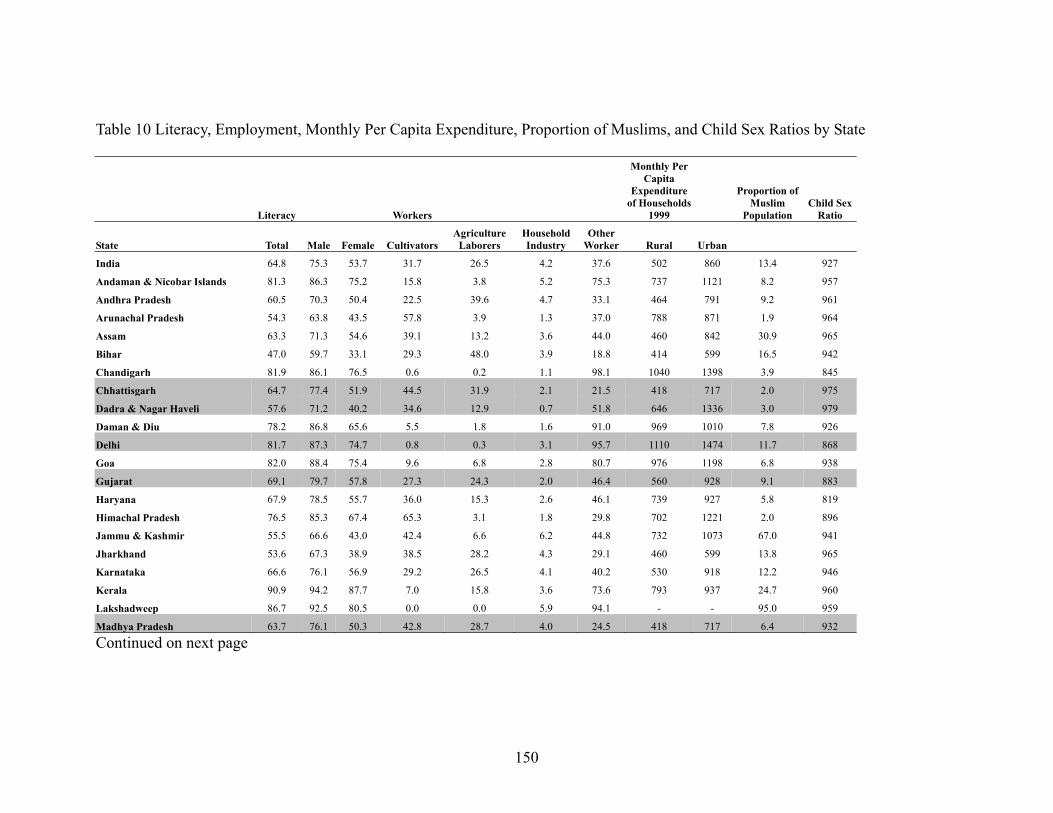
150
Table 10 Literacy, Employment, Monthly Per Capita Expenditure, Proportion of Muslims, and Child Sex Ratios by State
Literacy Workers
Monthly Per Capita
Expenditure of Households
1999
Proportion of Muslim
Population Child Sex
Ratio
State Total Male Female Cultivators Agriculture
Laborers Household Industry
Other Worker Rural Urban
India 64.8 75.3 53.7 31.7 26.5 4.2 37.6 502 860 13.4 927
Andaman & Nicobar Islands 81.3 86.3 75.2 15.8 3.8 5.2 75.3 737 1121 8.2 957
Andhra Pradesh 60.5 70.3 50.4 22.5 39.6 4.7 33.1 464 791 9.2 961
Arunachal Pradesh 54.3 63.8 43.5 57.8 3.9 1.3 37.0 788 871 1.9 964
Assam 63.3 71.3 54.6 39.1 13.2 3.6 44.0 460 842 30.9 965
Bihar 47.0 59.7 33.1 29.3 48.0 3.9 18.8 414 599 16.5 942
Chandigarh 81.9 86.1 76.5 0.6 0.2 1.1 98.1 1040 1398 3.9 845
Chhattisgarh 64.7 77.4 51.9 44.5 31.9 2.1 21.5 418 717 2.0 975
Dadra & Nagar Haveli 57.6 71.2 40.2 34.6 12.9 0.7 51.8 646 1336 3.0 979
Daman & Diu 78.2 86.8 65.6 5.5 1.8 1.6 91.0 969 1010 7.8 926
Delhi 81.7 87.3 74.7 0.8 0.3 3.1 95.7 1110 1474 11.7 868
Goa 82.0 88.4 75.4 9.6 6.8 2.8 80.7 976 1198 6.8 938
Gujarat 69.1 79.7 57.8 27.3 24.3 2.0 46.4 560 928 9.1 883
Haryana 67.9 78.5 55.7 36.0 15.3 2.6 46.1 739 927 5.8 819
Himachal Pradesh 76.5 85.3 67.4 65.3 3.1 1.8 29.8 702 1221 2.0 896
Jammu & Kashmir 55.5 66.6 43.0 42.4 6.6 6.2 44.8 732 1073 67.0 941
Jharkhand 53.6 67.3 38.9 38.5 28.2 4.3 29.1 460 599 13.8 965
Karnataka 66.6 76.1 56.9 29.2 26.5 4.1 40.2 530 918 12.2 946
Kerala 90.9 94.2 87.7 7.0 15.8 3.6 73.6 793 937 24.7 960
Lakshadweep 86.7 92.5 80.5 0.0 0.0 5.9 94.1 - - 95.0 959
Madhya Pradesh 63.7 76.1 50.3 42.8 28.7 4.0 24.5 418 717 6.4 932
Continued on next page
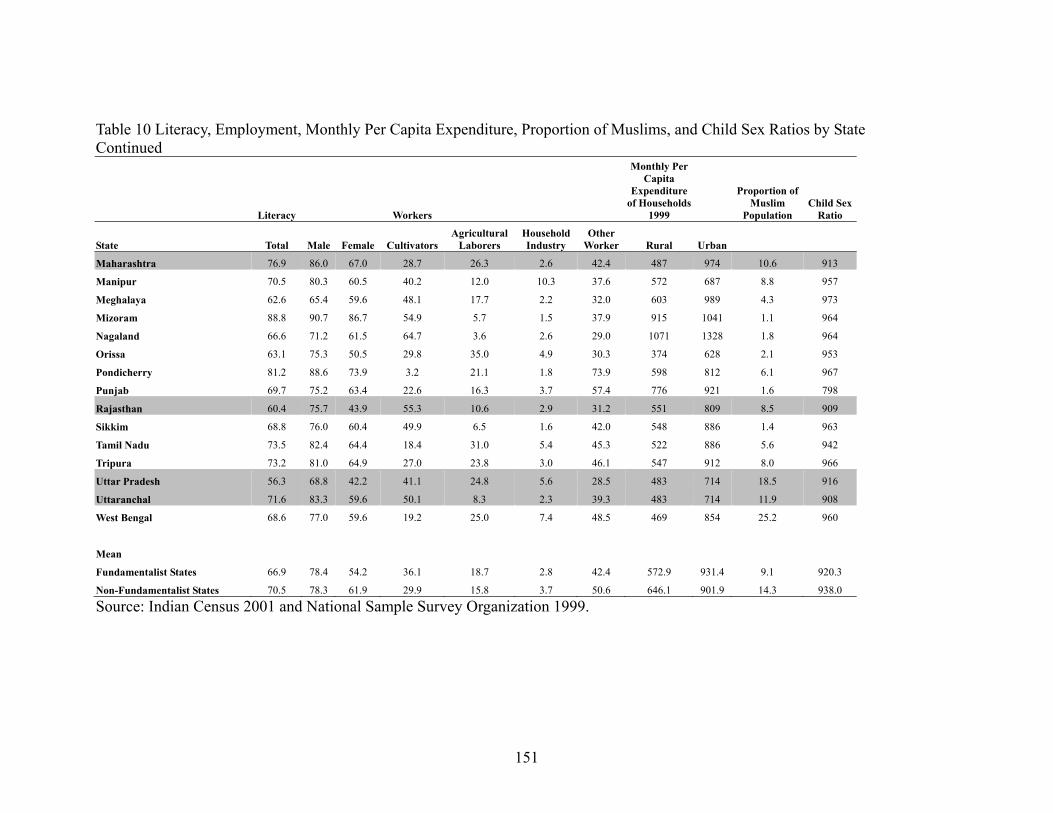
151
Table 10 Literacy, Employment, Monthly Per Capita Expenditure, Proportion of Muslims, and Child Sex Ratios by State Continued
Literacy Workers
Monthly Per Capita
Expenditure of Households
1999
Proportion of Muslim
Population Child Sex
Ratio
State Total Male Female Cultivators Agricultural
Laborers Household Industry
Other Worker Rural Urban
Maharashtra 76.9 86.0 67.0 28.7 26.3 2.6 42.4 487 974 10.6 913
Manipur 70.5 80.3 60.5 40.2 12.0 10.3 37.6 572 687 8.8 957
Meghalaya 62.6 65.4 59.6 48.1 17.7 2.2 32.0 603 989 4.3 973
Mizoram 88.8 90.7 86.7 54.9 5.7 1.5 37.9 915 1041 1.1 964
Nagaland 66.6 71.2 61.5 64.7 3.6 2.6 29.0 1071 1328 1.8 964
Orissa 63.1 75.3 50.5 29.8 35.0 4.9 30.3 374 628 2.1 953
Pondicherry 81.2 88.6 73.9 3.2 21.1 1.8 73.9 598 812 6.1 967
Punjab 69.7 75.2 63.4 22.6 16.3 3.7 57.4 776 921 1.6 798
Rajasthan 60.4 75.7 43.9 55.3 10.6 2.9 31.2 551 809 8.5 909
Sikkim 68.8 76.0 60.4 49.9 6.5 1.6 42.0 548 886 1.4 963
Tamil Nadu 73.5 82.4 64.4 18.4 31.0 5.4 45.3 522 886 5.6 942
Tripura 73.2 81.0 64.9 27.0 23.8 3.0 46.1 547 912 8.0 966
Uttar Pradesh 56.3 68.8 42.2 41.1 24.8 5.6 28.5 483 714 18.5 916
Uttaranchal 71.6 83.3 59.6 50.1 8.3 2.3 39.3 483 714 11.9 908
West Bengal 68.6 77.0 59.6 19.2 25.0 7.4 48.5 469 854 25.2 960
Mean
Fundamentalist States 66.9 78.4 54.2 36.1 18.7 2.8 42.4 572.9 931.4 9.1 920.3
Non-Fundamentalist States 70.5 78.3 61.9 29.9 15.8 3.7 50.6 646.1 901.9 14.3 938.0
Source: Indian Census 2001 and National Sample Survey Organization 1999.
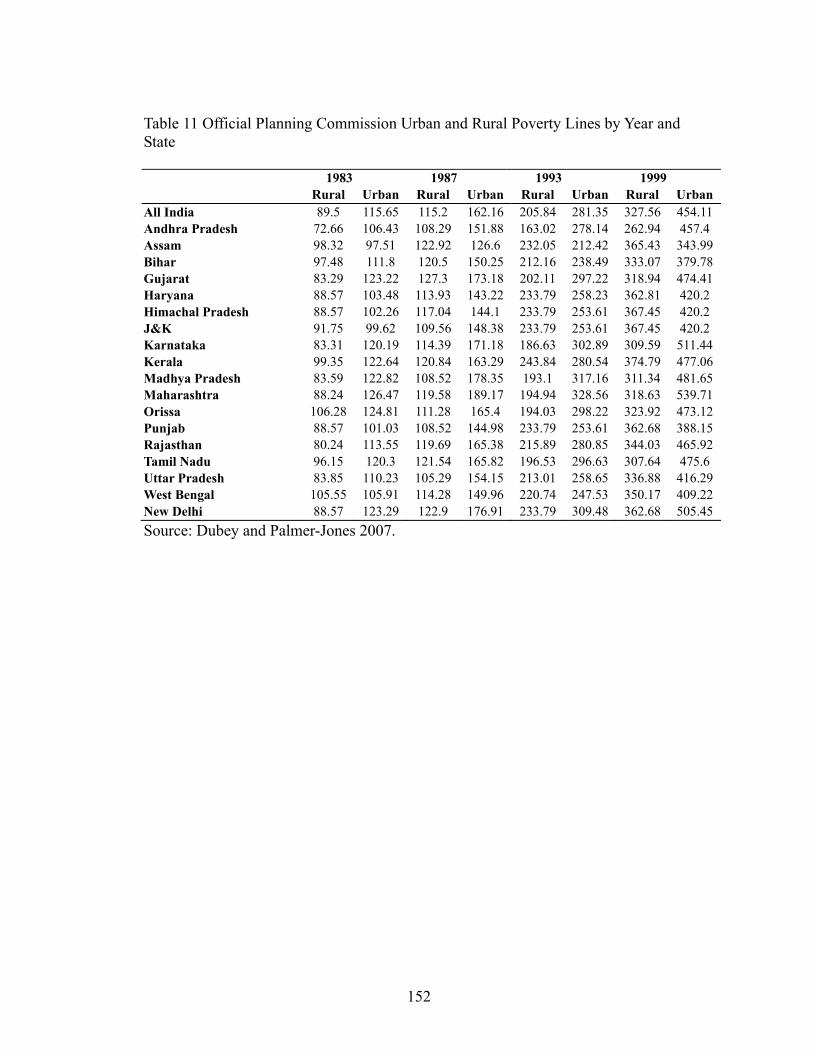
152
Table 11 Official Planning Commission Urban and Rural Poverty Lines by Year and State
1983 1987 1993 1999 Rural Urban Rural Urban Rural Urban Rural Urban
All India 89.5 115.65 115.2 162.16 205.84 281.35 327.56 454.11 Andhra Pradesh 72.66 106.43 108.29 151.88 163.02 278.14 262.94 457.4 Assam 98.32 97.51 122.92 126.6 232.05 212.42 365.43 343.99 Bihar 97.48 111.8 120.5 150.25 212.16 238.49 333.07 379.78 Gujarat 83.29 123.22 127.3 173.18 202.11 297.22 318.94 474.41 Haryana 88.57 103.48 113.93 143.22 233.79 258.23 362.81 420.2 Himachal Pradesh 88.57 102.26 117.04 144.1 233.79 253.61 367.45 420.2 J&K 91.75 99.62 109.56 148.38 233.79 253.61 367.45 420.2 Karnataka 83.31 120.19 114.39 171.18 186.63 302.89 309.59 511.44 Kerala 99.35 122.64 120.84 163.29 243.84 280.54 374.79 477.06 Madhya Pradesh 83.59 122.82 108.52 178.35 193.1 317.16 311.34 481.65 Maharashtra 88.24 126.47 119.58 189.17 194.94 328.56 318.63 539.71 Orissa 106.28 124.81 111.28 165.4 194.03 298.22 323.92 473.12 Punjab 88.57 101.03 108.52 144.98 233.79 253.61 362.68 388.15 Rajasthan 80.24 113.55 119.69 165.38 215.89 280.85 344.03 465.92 Tamil Nadu 96.15 120.3 121.54 165.82 196.53 296.63 307.64 475.6 Uttar Pradesh 83.85 110.23 105.29 154.15 213.01 258.65 336.88 416.29 West Bengal 105.55 105.91 114.28 149.96 220.74 247.53 350.17 409.22 New Delhi 88.57 123.29 122.9 176.91 233.79 309.48 362.68 505.45 Source: Dubey and Palmer-Jones 2007.
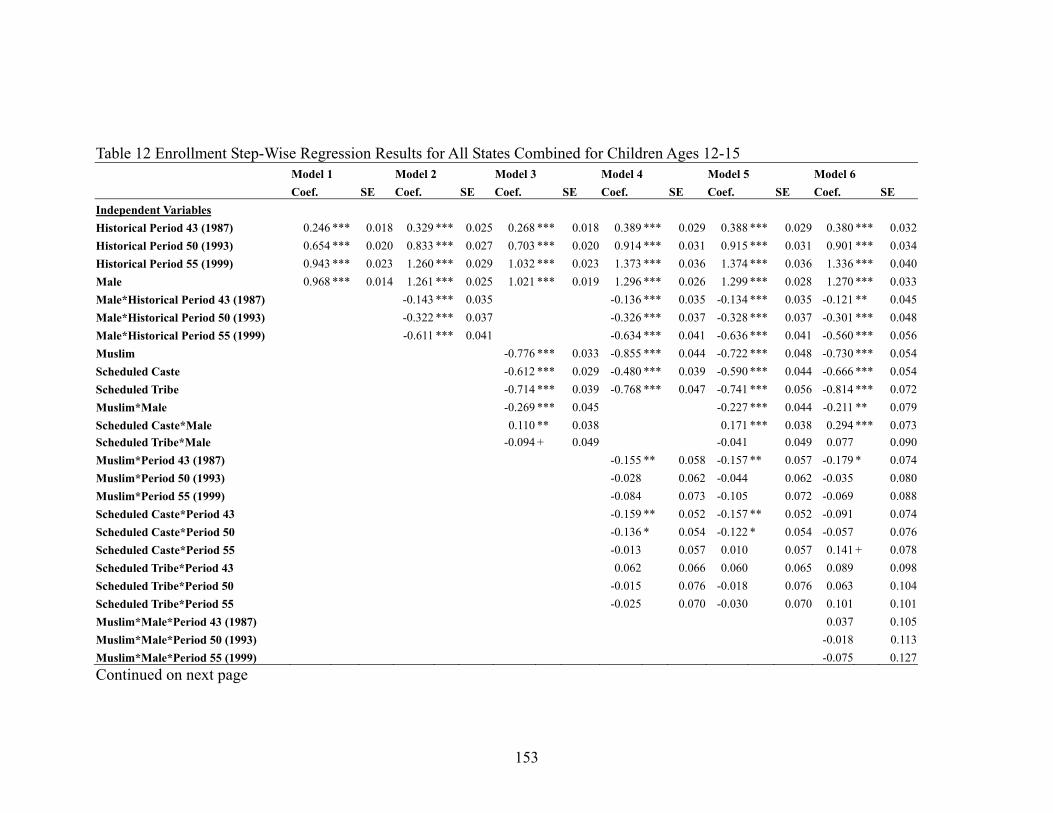
153
Table 12 Enrollment Step-Wise Regression Results for All States Combined for Children Ages 12-15 Model 1 Model 2 Model 3 Model 4 Model 5 Model 6 Coef. SE Coef. SE Coef. SE Coef. SE Coef. SE Coef. SE Independent Variables Historical Period 43 (1987) 0.246 *** 0.018 0.329 *** 0.025 0.268 *** 0.018 0.389 *** 0.029 0.388 *** 0.029 0.380 *** 0.032Historical Period 50 (1993) 0.654 *** 0.020 0.833 *** 0.027 0.703 *** 0.020 0.914 *** 0.031 0.915 *** 0.031 0.901 *** 0.034Historical Period 55 (1999) 0.943 *** 0.023 1.260 *** 0.029 1.032 *** 0.023 1.373 *** 0.036 1.374 *** 0.036 1.336 *** 0.040Male 0.968 *** 0.014 1.261 *** 0.025 1.021 *** 0.019 1.296 *** 0.026 1.299 *** 0.028 1.270 *** 0.033Male*Historical Period 43 (1987) -0.143 *** 0.035 -0.136 *** 0.035 -0.134 *** 0.035 -0.121 ** 0.045Male*Historical Period 50 (1993) -0.322 *** 0.037 -0.326 *** 0.037 -0.328 *** 0.037 -0.301 *** 0.048Male*Historical Period 55 (1999) -0.611 *** 0.041 -0.634 *** 0.041 -0.636 *** 0.041 -0.560 *** 0.056Muslim -0.776 *** 0.033 -0.855 *** 0.044 -0.722 *** 0.048 -0.730 *** 0.054Scheduled Caste -0.612 *** 0.029 -0.480 *** 0.039 -0.590 *** 0.044 -0.666 *** 0.054Scheduled Tribe -0.714 *** 0.039 -0.768 *** 0.047 -0.741 *** 0.056 -0.814 *** 0.072Muslim*Male -0.269 *** 0.045 -0.227 *** 0.044 -0.211 ** 0.079Scheduled Caste*Male 0.110 ** 0.038 0.171 *** 0.038 0.294 *** 0.073Scheduled Tribe*Male -0.094 + 0.049 -0.041 0.049 0.077 0.090Muslim*Period 43 (1987) -0.155 ** 0.058 -0.157 ** 0.057 -0.179 * 0.074Muslim*Period 50 (1993) -0.028 0.062 -0.044 0.062 -0.035 0.080Muslim*Period 55 (1999) -0.084 0.073 -0.105 0.072 -0.069 0.088Scheduled Caste*Period 43 -0.159 ** 0.052 -0.157 ** 0.052 -0.091 0.074Scheduled Caste*Period 50 -0.136 * 0.054 -0.122 * 0.054 -0.057 0.076Scheduled Caste*Period 55 -0.013 0.057 0.010 0.057 0.141 + 0.078Scheduled Tribe*Period 43 0.062 0.066 0.060 0.065 0.089 0.098Scheduled Tribe*Period 50 -0.015 0.076 -0.018 0.076 0.063 0.104Scheduled Tribe*Period 55 -0.025 0.070 -0.030 0.070 0.101 0.101Muslim*Male*Period 43 (1987) 0.037 0.105Muslim*Male*Period 50 (1993) -0.018 0.113Muslim*Male*Period 55 (1999) -0.075 0.127Continued on next page
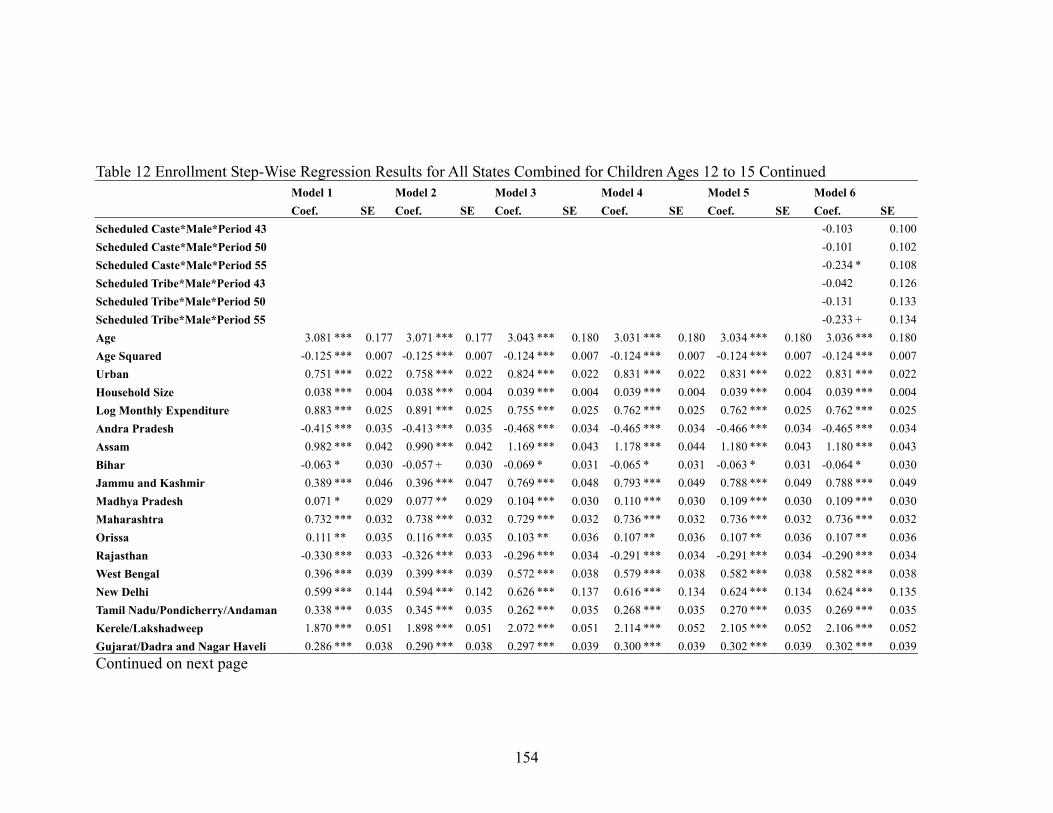
154
Table 12 Enrollment Step-Wise Regression Results for All States Combined for Children Ages 12 to 15 Continued Model 1 Model 2 Model 3 Model 4 Model 5 Model 6 Coef. SE Coef. SE Coef. SE Coef. SE Coef. SE Coef. SE Scheduled Caste*Male*Period 43 -0.103 0.100Scheduled Caste*Male*Period 50 -0.101 0.102Scheduled Caste*Male*Period 55 -0.234 * 0.108Scheduled Tribe*Male*Period 43 -0.042 0.126Scheduled Tribe*Male*Period 50 -0.131 0.133Scheduled Tribe*Male*Period 55 -0.233 + 0.134Age 3.081 *** 0.177 3.071 *** 0.177 3.043 *** 0.180 3.031 *** 0.180 3.034 *** 0.180 3.036 *** 0.180Age Squared -0.125 *** 0.007 -0.125 *** 0.007 -0.124 *** 0.007 -0.124 *** 0.007 -0.124 *** 0.007 -0.124 *** 0.007Urban 0.751 *** 0.022 0.758 *** 0.022 0.824 *** 0.022 0.831 *** 0.022 0.831 *** 0.022 0.831 *** 0.022Household Size 0.038 *** 0.004 0.038 *** 0.004 0.039 *** 0.004 0.039 *** 0.004 0.039 *** 0.004 0.039 *** 0.004Log Monthly Expenditure 0.883 *** 0.025 0.891 *** 0.025 0.755 *** 0.025 0.762 *** 0.025 0.762 *** 0.025 0.762 *** 0.025Andra Pradesh -0.415 *** 0.035 -0.413 *** 0.035 -0.468 *** 0.034 -0.465 *** 0.034 -0.466 *** 0.034 -0.465 *** 0.034Assam 0.982 *** 0.042 0.990 *** 0.042 1.169 *** 0.043 1.178 *** 0.044 1.180 *** 0.043 1.180 *** 0.043Bihar -0.063 * 0.030 -0.057 + 0.030 -0.069 * 0.031 -0.065 * 0.031 -0.063 * 0.031 -0.064 * 0.030Jammu and Kashmir 0.389 *** 0.046 0.396 *** 0.047 0.769 *** 0.048 0.793 *** 0.049 0.788 *** 0.049 0.788 *** 0.049Madhya Pradesh 0.071 * 0.029 0.077 ** 0.029 0.104 *** 0.030 0.110 *** 0.030 0.109 *** 0.030 0.109 *** 0.030Maharashtra 0.732 *** 0.032 0.738 *** 0.032 0.729 *** 0.032 0.736 *** 0.032 0.736 *** 0.032 0.736 *** 0.032Orissa 0.111 ** 0.035 0.116 *** 0.035 0.103 ** 0.036 0.107 ** 0.036 0.107 ** 0.036 0.107 ** 0.036Rajasthan -0.330 *** 0.033 -0.326 *** 0.033 -0.296 *** 0.034 -0.291 *** 0.034 -0.291 *** 0.034 -0.290 *** 0.034West Bengal 0.396 *** 0.039 0.399 *** 0.039 0.572 *** 0.038 0.579 *** 0.038 0.582 *** 0.038 0.582 *** 0.038New Delhi 0.599 *** 0.144 0.594 *** 0.142 0.626 *** 0.137 0.616 *** 0.134 0.624 *** 0.134 0.624 *** 0.135Tamil Nadu/Pondicherry/Andaman 0.338 *** 0.035 0.345 *** 0.035 0.262 *** 0.035 0.268 *** 0.035 0.270 *** 0.035 0.269 *** 0.035Kerele/Lakshadweep 1.870 *** 0.051 1.898 *** 0.051 2.072 *** 0.051 2.114 *** 0.052 2.105 *** 0.052 2.106 *** 0.052Gujarat/Dadra and Nagar Haveli 0.286 *** 0.038 0.290 *** 0.038 0.297 *** 0.039 0.300 *** 0.039 0.302 *** 0.039 0.302 *** 0.039Continued on next page
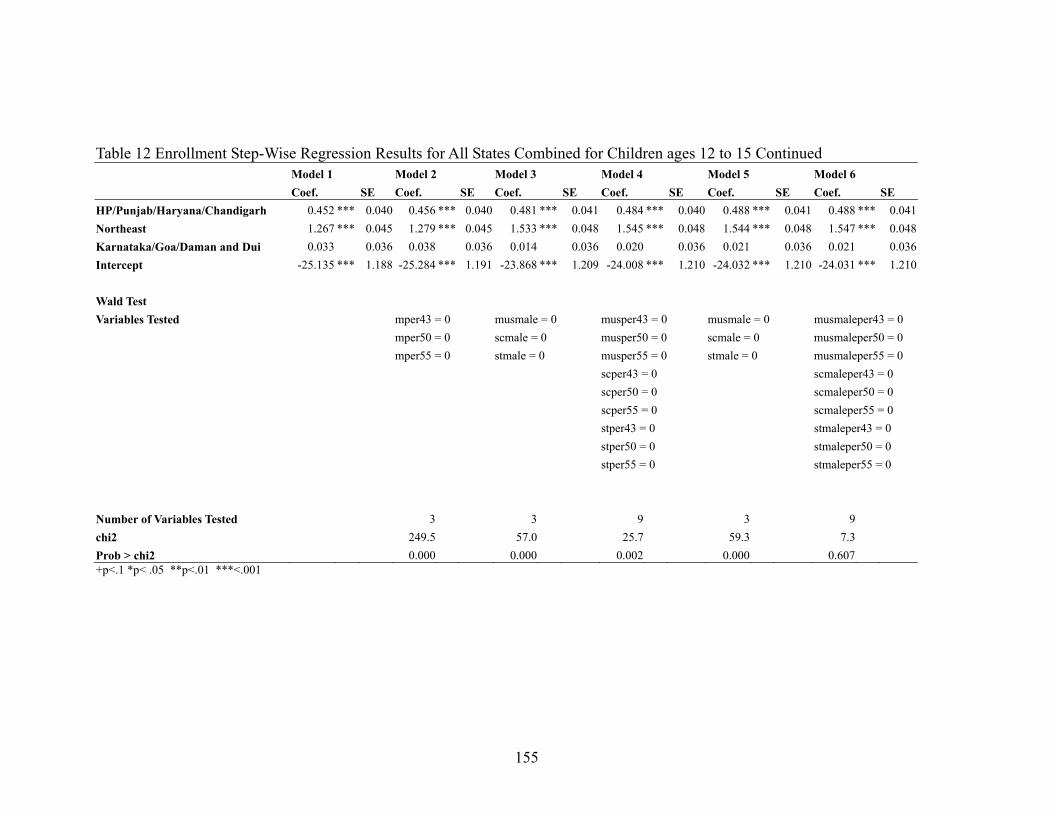
155
Table 12 Enrollment Step-Wise Regression Results for All States Combined for Children ages 12 to 15 Continued Model 1 Model 2 Model 3 Model 4 Model 5 Model 6 Coef. SE Coef. SE Coef. SE Coef. SE Coef. SE Coef. SE HP/Punjab/Haryana/Chandigarh 0.452 *** 0.040 0.456 *** 0.040 0.481 *** 0.041 0.484 *** 0.040 0.488 *** 0.041 0.488 *** 0.041Northeast 1.267 *** 0.045 1.279 *** 0.045 1.533 *** 0.048 1.545 *** 0.048 1.544 *** 0.048 1.547 *** 0.048Karnataka/Goa/Daman and Dui 0.033 0.036 0.038 0.036 0.014 0.036 0.020 0.036 0.021 0.036 0.021 0.036Intercept -25.135 *** 1.188 -25.284 *** 1.191 -23.868 *** 1.209 -24.008 *** 1.210 -24.032 *** 1.210 -24.031 *** 1.210 Wald Test Variables Tested mper43 = 0 musmale = 0 musper43 = 0 musmale = 0 musmaleper43 = 0 mper50 = 0 scmale = 0 musper50 = 0 scmale = 0 musmaleper50 = 0 mper55 = 0 stmale = 0 musper55 = 0 stmale = 0 musmaleper55 = 0 scper43 = 0 scmaleper43 = 0 scper50 = 0 scmaleper50 = 0 scper55 = 0 scmaleper55 = 0 stper43 = 0 stmaleper43 = 0 stper50 = 0 stmaleper50 = 0 stper55 = 0 stmaleper55 = 0 Number of Variables Tested 3 3 9 3 9 chi2 249.5 57.0 25.7 59.3 7.3 Prob > chi2 0.000 0.000 0.002 0.000 0.607 +p<.1 *p< .05 **p<.01 ***<.001

156
Table 13 Enrollment Step-Wise Regression Results for Hindu Fundamentalist States for Children ages 12 to 15 Model 1 Model 2 Model 3 Model 4 Model 5 Model 6 Coef. SE Coef. SE Coef. SE Coef. SE Coef. SE Coef. SE Independent Variables Historical Period 43 (1987) 0.273 *** 0.026 0.353 *** 0.038 0.283 *** 0.026 0.397 *** 0.042 0.396 *** 0.042 0.392 *** 0.045Historical Period 50 (1993) 0.647 *** 0.028 0.857 *** 0.039 0.693 *** 0.029 0.921 *** 0.044 0.920 *** 0.044 0.883 *** 0.048Historical Period 55 (1999) 1.018 *** 0.033 1.380 *** 0.043 1.104 *** 0.033 1.461 *** 0.050 1.460 *** 0.050 1.406 *** 0.055Male 1.181 *** 0.021 1.515 *** 0.036 1.253 *** 0.027 1.570 *** 0.037 1.572 *** 0.040 1.522 *** 0.045Male*Historical Period 43 (1987) -0.131 ** 0.050 -0.127 * 0.052 -0.125 * 0.052 -0.119 + 0.064Male*Historical Period 50 (1993) -0.364 *** 0.053 -0.378 *** 0.054 -0.376 *** 0.054 -0.303 *** 0.068Male*Historical Period 55 (1999) -0.694 *** 0.059 -0.728 *** 0.059 -0.726 *** 0.059 -0.614 *** 0.079Muslim -1.005 *** 0.051 -1.086 *** 0.064 -0.990 *** 0.074 -0.992 *** 0.088Scheduled Caste -0.642 *** 0.045 -0.526 *** 0.055 -0.656 *** 0.067 -0.821 *** 0.092Scheduled Tribe -0.659 *** 0.055 -0.866 *** 0.068 -0.750 *** 0.081 -0.852 *** 0.110Muslim*Male -0.211 *** 0.064 -0.150 * 0.065 -0.140 0.115Scheduled Caste*Male 0.114 + 0.058 0.191 *** 0.059 0.443 *** 0.114Scheduled Tribe*Male -0.233 *** 0.070 -0.168 * 0.071 -0.009 0.130Muslim*Period 43 (1987) -0.161 + 0.088 -0.163 + 0.087 -0.138 0.124Muslim*Period 50 (1993) -0.059 0.094 -0.074 0.093 -0.019 0.127Muslim*Period 55 (1999) 0.030 0.098 0.008 0.097 -0.024 0.131Scheduled Caste*Period 43 -0.167 * 0.077 -0.167 * 0.078 -0.169 0.127Scheduled Caste*Period 50 -0.124 0.080 -0.109 0.082 0.073 0.126Scheduled Caste*Period 55 0.052 0.084 0.084 0.085 0.377 ** 0.124Scheduled Tribe*Period 43 0.081 0.095 0.072 0.093 0.108 0.151Scheduled Tribe*Period 50 0.171 + 0.098 0.154 0.097 0.275 + 0.150
Scheduled Tribe*Period 55 0.056 0.100 0.031 0.099 0.200 0.148Muslim*Male*Period 43 -0.041 0.162Muslim*Male*Period 50 -0.113 0.168Muslim*Male*Period 55 0.054 0.178Continued on next page
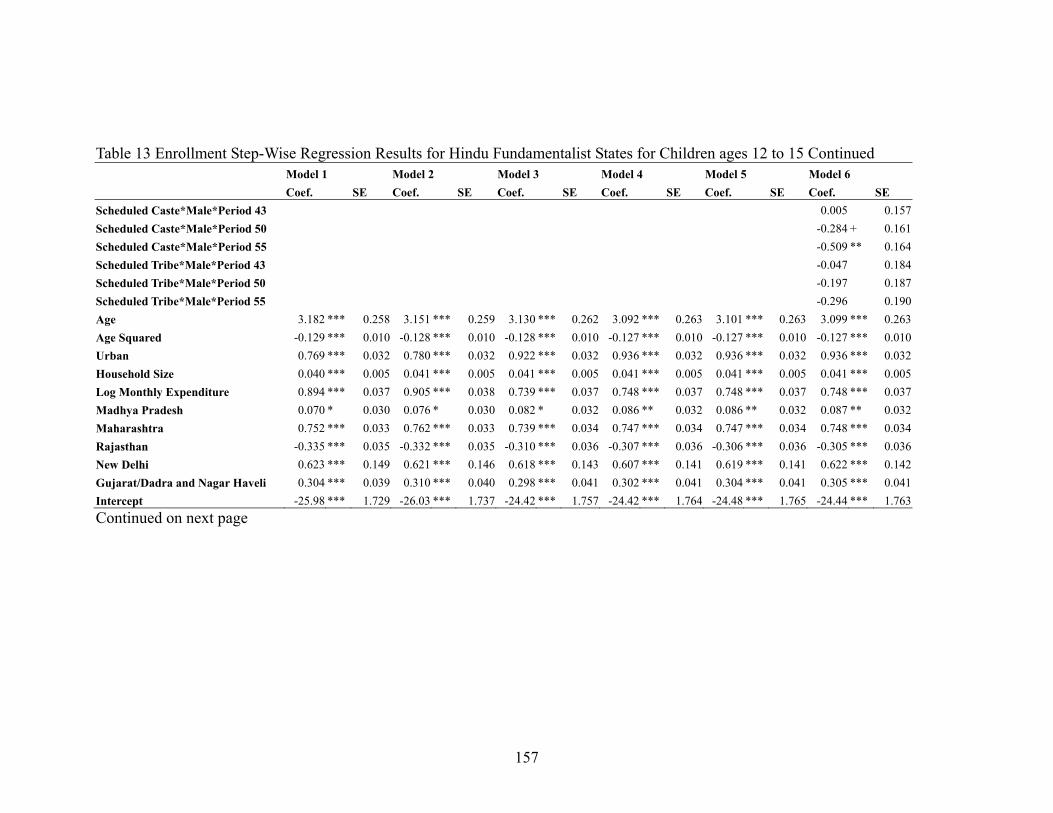
157
Table 13 Enrollment Step-Wise Regression Results for Hindu Fundamentalist States for Children ages 12 to 15 Continued Model 1 Model 2 Model 3 Model 4 Model 5 Model 6 Coef. SE Coef. SE Coef. SE Coef. SE Coef. SE Coef. SE Scheduled Caste*Male*Period 43 0.005 0.157Scheduled Caste*Male*Period 50 -0.284 + 0.161Scheduled Caste*Male*Period 55 -0.509 ** 0.164Scheduled Tribe*Male*Period 43 -0.047 0.184Scheduled Tribe*Male*Period 50 -0.197 0.187Scheduled Tribe*Male*Period 55 -0.296 0.190Age 3.182 *** 0.258 3.151 *** 0.259 3.130 *** 0.262 3.092 *** 0.263 3.101 *** 0.263 3.099 *** 0.263Age Squared -0.129 *** 0.010 -0.128 *** 0.010 -0.128 *** 0.010 -0.127 *** 0.010 -0.127 *** 0.010 -0.127 *** 0.010Urban 0.769 *** 0.032 0.780 *** 0.032 0.922 *** 0.032 0.936 *** 0.032 0.936 *** 0.032 0.936 *** 0.032Household Size 0.040 *** 0.005 0.041 *** 0.005 0.041 *** 0.005 0.041 *** 0.005 0.041 *** 0.005 0.041 *** 0.005Log Monthly Expenditure 0.894 *** 0.037 0.905 *** 0.038 0.739 *** 0.037 0.748 *** 0.037 0.748 *** 0.037 0.748 *** 0.037Madhya Pradesh 0.070 * 0.030 0.076 * 0.030 0.082 * 0.032 0.086 ** 0.032 0.086 ** 0.032 0.087 ** 0.032Maharashtra 0.752 *** 0.033 0.762 *** 0.033 0.739 *** 0.034 0.747 *** 0.034 0.747 *** 0.034 0.748 *** 0.034Rajasthan -0.335 *** 0.035 -0.332 *** 0.035 -0.310 *** 0.036 -0.307 *** 0.036 -0.306 *** 0.036 -0.305 *** 0.036New Delhi 0.623 *** 0.149 0.621 *** 0.146 0.618 *** 0.143 0.607 *** 0.141 0.619 *** 0.141 0.622 *** 0.142Gujarat/Dadra and Nagar Haveli 0.304 *** 0.039 0.310 *** 0.040 0.298 *** 0.041 0.302 *** 0.041 0.304 *** 0.041 0.305 *** 0.041Intercept -25.98 *** 1.729 -26.03 *** 1.737 -24.42 *** 1.757 -24.42 *** 1.764 -24.48 *** 1.765 -24.44 *** 1.763Continued on next page
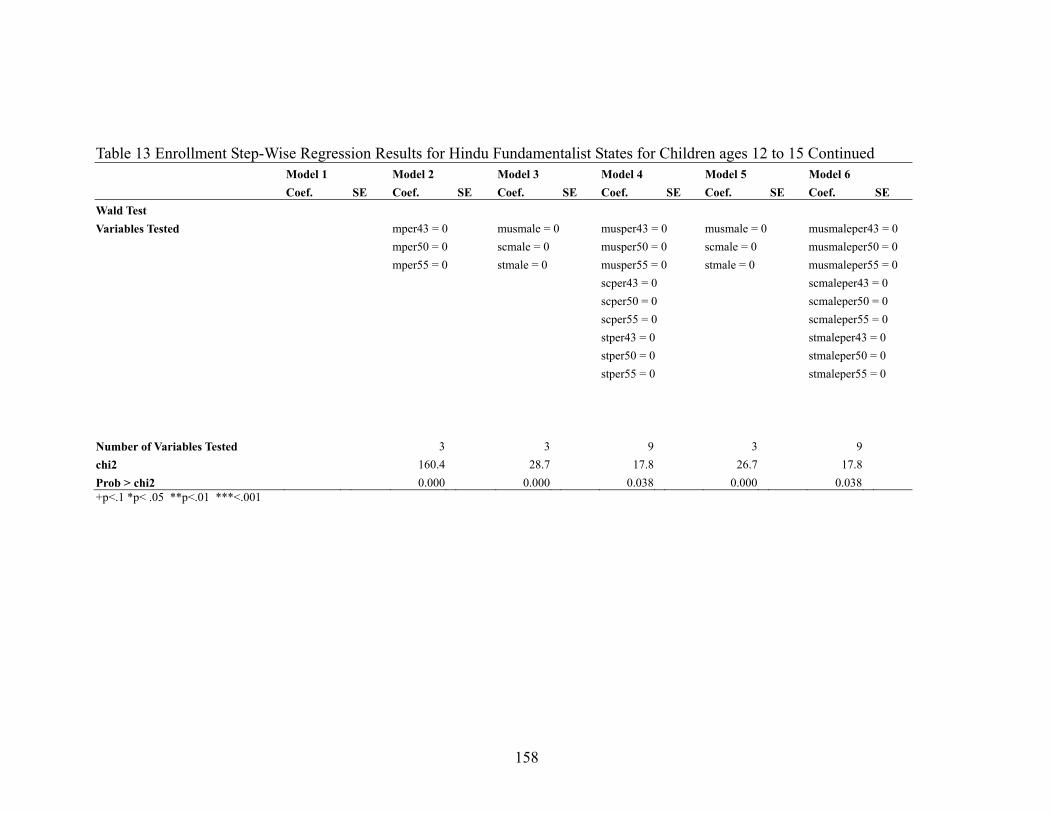
158
Table 13 Enrollment Step-Wise Regression Results for Hindu Fundamentalist States for Children ages 12 to 15 Continued Model 1 Model 2 Model 3 Model 4 Model 5 Model 6 Coef. SE Coef. SE Coef. SE Coef. SE Coef. SE Coef. SE Wald Test Variables Tested mper43 = 0 musmale = 0 musper43 = 0 musmale = 0 musmaleper43 = 0 mper50 = 0 scmale = 0 musper50 = 0 scmale = 0 musmaleper50 = 0 mper55 = 0 stmale = 0 musper55 = 0 stmale = 0 musmaleper55 = 0 scper43 = 0 scmaleper43 = 0 scper50 = 0 scmaleper50 = 0 scper55 = 0 scmaleper55 = 0 stper43 = 0 stmaleper43 = 0 stper50 = 0 stmaleper50 = 0 stper55 = 0 stmaleper55 = 0 Number of Variables Tested 3 3 9 3 9 chi2 160.4 28.7 17.8 26.7 17.8 Prob > chi2 0.000 0.000 0.038 0.000 0.038 +p<.1 *p< .05 **p<.01 ***<.001
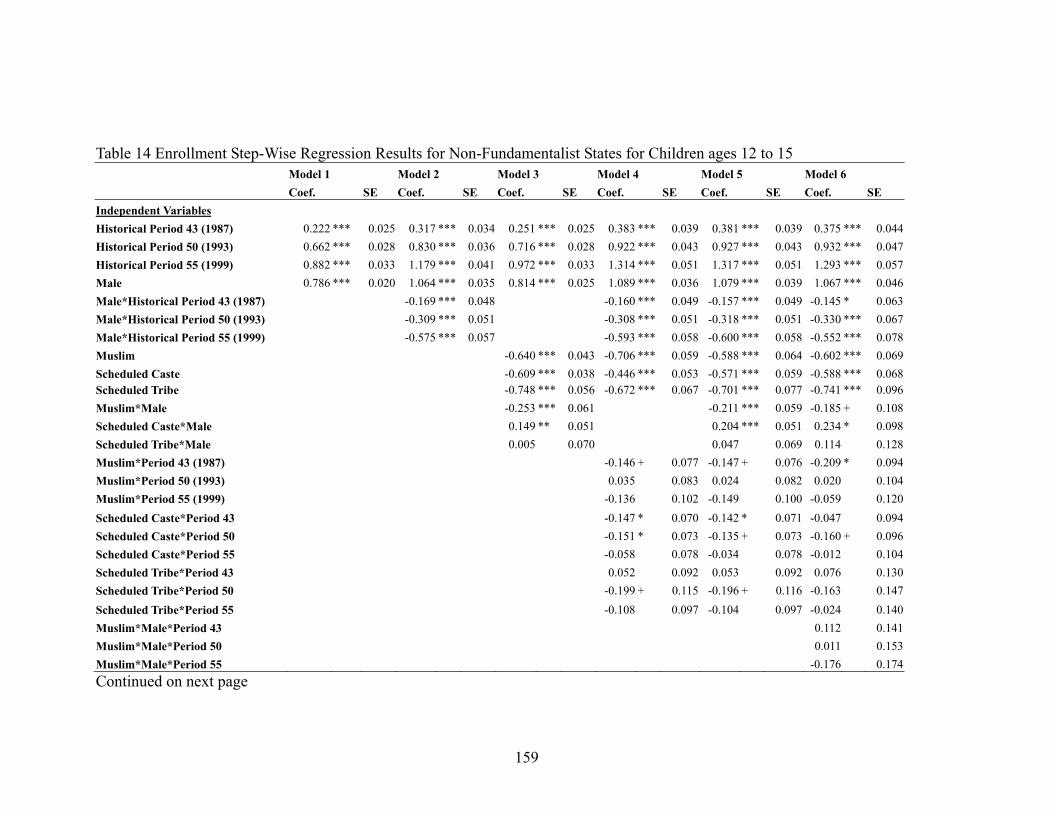
159
Table 14 Enrollment Step-Wise Regression Results for Non-Fundamentalist States for Children ages 12 to 15 Model 1 Model 2 Model 3 Model 4 Model 5 Model 6 Coef. SE Coef. SE Coef. SE Coef. SE Coef. SE Coef. SE Independent Variables Historical Period 43 (1987) 0.222 *** 0.025 0.317 *** 0.034 0.251 *** 0.025 0.383 *** 0.039 0.381 *** 0.039 0.375 *** 0.044Historical Period 50 (1993) 0.662 *** 0.028 0.830 *** 0.036 0.716 *** 0.028 0.922 *** 0.043 0.927 *** 0.043 0.932 *** 0.047Historical Period 55 (1999) 0.882 *** 0.033 1.179 *** 0.041 0.972 *** 0.033 1.314 *** 0.051 1.317 *** 0.051 1.293 *** 0.057Male 0.786 *** 0.020 1.064 *** 0.035 0.814 *** 0.025 1.089 *** 0.036 1.079 *** 0.039 1.067 *** 0.046Male*Historical Period 43 (1987) -0.169 *** 0.048 -0.160 *** 0.049 -0.157 *** 0.049 -0.145 * 0.063Male*Historical Period 50 (1993) -0.309 *** 0.051 -0.308 *** 0.051 -0.318 *** 0.051 -0.330 *** 0.067Male*Historical Period 55 (1999) -0.575 *** 0.057 -0.593 *** 0.058 -0.600 *** 0.058 -0.552 *** 0.078Muslim -0.640 *** 0.043 -0.706 *** 0.059 -0.588 *** 0.064 -0.602 *** 0.069Scheduled Caste -0.609 *** 0.038 -0.446 *** 0.053 -0.571 *** 0.059 -0.588 *** 0.068Scheduled Tribe -0.748 *** 0.056 -0.672 *** 0.067 -0.701 *** 0.077 -0.741 *** 0.096Muslim*Male -0.253 *** 0.061 -0.211 *** 0.059 -0.185 + 0.108Scheduled Caste*Male 0.149 ** 0.051 0.204 *** 0.051 0.234 * 0.098Scheduled Tribe*Male 0.005 0.070 0.047 0.069 0.114 0.128Muslim*Period 43 (1987) -0.146 + 0.077 -0.147 + 0.076 -0.209 * 0.094Muslim*Period 50 (1993) 0.035 0.083 0.024 0.082 0.020 0.104Muslim*Period 55 (1999) -0.136 0.102 -0.149 0.100 -0.059 0.120Scheduled Caste*Period 43 -0.147 * 0.070 -0.142 * 0.071 -0.047 0.094Scheduled Caste*Period 50 -0.151 * 0.073 -0.135 + 0.073 -0.160 + 0.096Scheduled Caste*Period 55 -0.058 0.078 -0.034 0.078 -0.012 0.104Scheduled Tribe*Period 43 0.052 0.092 0.053 0.092 0.076 0.130Scheduled Tribe*Period 50 -0.199 + 0.115 -0.196 + 0.116 -0.163 0.147Scheduled Tribe*Period 55 -0.108 0.097 -0.104 0.097 -0.024 0.140Muslim*Male*Period 43 0.112 0.141Muslim*Male*Period 50 0.011 0.153Muslim*Male*Period 55 -0.176 0.174Continued on next page
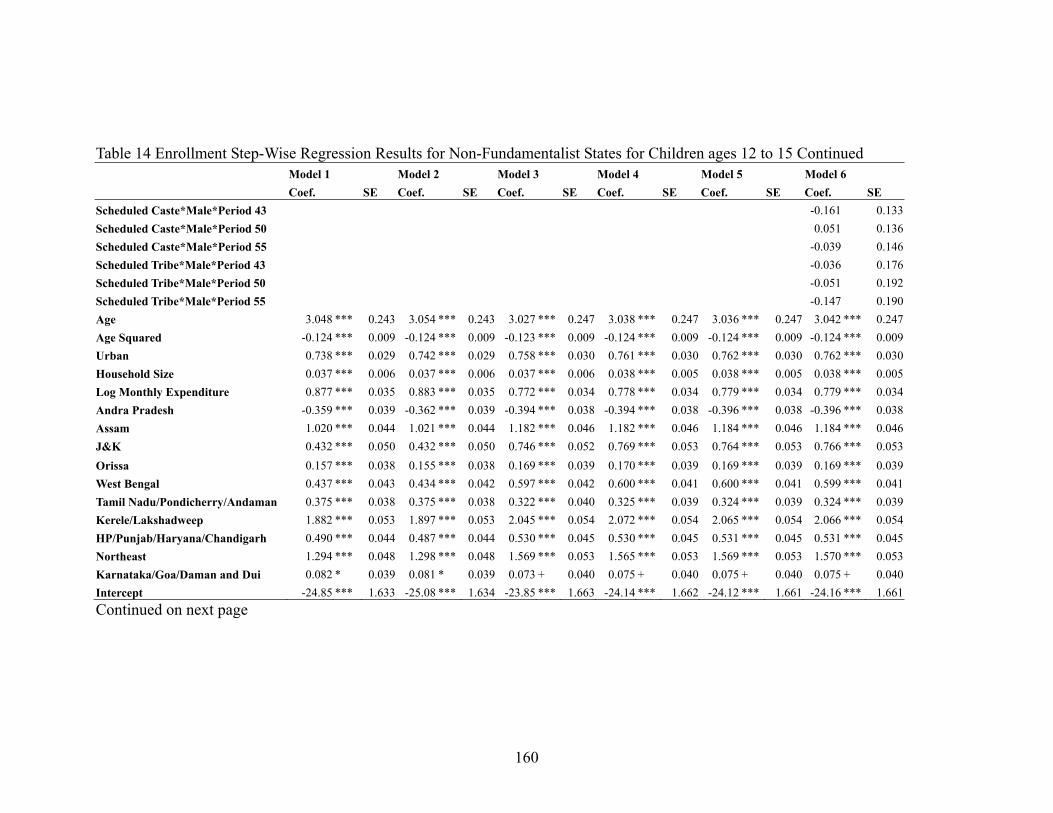
160
Table 14 Enrollment Step-Wise Regression Results for Non-Fundamentalist States for Children ages 12 to 15 Continued Model 1 Model 2 Model 3 Model 4 Model 5 Model 6 Coef. SE Coef. SE Coef. SE Coef. SE Coef. SE Coef. SE Scheduled Caste*Male*Period 43 -0.161 0.133Scheduled Caste*Male*Period 50 0.051 0.136Scheduled Caste*Male*Period 55 -0.039 0.146Scheduled Tribe*Male*Period 43 -0.036 0.176Scheduled Tribe*Male*Period 50 -0.051 0.192Scheduled Tribe*Male*Period 55 -0.147 0.190Age 3.048 *** 0.243 3.054 *** 0.243 3.027 *** 0.247 3.038 *** 0.247 3.036 *** 0.247 3.042 *** 0.247Age Squared -0.124 *** 0.009 -0.124 *** 0.009 -0.123 *** 0.009 -0.124 *** 0.009 -0.124 *** 0.009 -0.124 *** 0.009Urban 0.738 *** 0.029 0.742 *** 0.029 0.758 *** 0.030 0.761 *** 0.030 0.762 *** 0.030 0.762 *** 0.030Household Size 0.037 *** 0.006 0.037 *** 0.006 0.037 *** 0.006 0.038 *** 0.005 0.038 *** 0.005 0.038 *** 0.005Log Monthly Expenditure 0.877 *** 0.035 0.883 *** 0.035 0.772 *** 0.034 0.778 *** 0.034 0.779 *** 0.034 0.779 *** 0.034Andra Pradesh -0.359 *** 0.039 -0.362 *** 0.039 -0.394 *** 0.038 -0.394 *** 0.038 -0.396 *** 0.038 -0.396 *** 0.038Assam 1.020 *** 0.044 1.021 *** 0.044 1.182 *** 0.046 1.182 *** 0.046 1.184 *** 0.046 1.184 *** 0.046J&K 0.432 *** 0.050 0.432 *** 0.050 0.746 *** 0.052 0.769 *** 0.053 0.764 *** 0.053 0.766 *** 0.053Orissa 0.157 *** 0.038 0.155 *** 0.038 0.169 *** 0.039 0.170 *** 0.039 0.169 *** 0.039 0.169 *** 0.039West Bengal 0.437 *** 0.043 0.434 *** 0.042 0.597 *** 0.042 0.600 *** 0.041 0.600 *** 0.041 0.599 *** 0.041Tamil Nadu/Pondicherry/Andaman 0.375 *** 0.038 0.375 *** 0.038 0.322 *** 0.040 0.325 *** 0.039 0.324 *** 0.039 0.324 *** 0.039Kerele/Lakshadweep 1.882 *** 0.053 1.897 *** 0.053 2.045 *** 0.054 2.072 *** 0.054 2.065 *** 0.054 2.066 *** 0.054HP/Punjab/Haryana/Chandigarh 0.490 *** 0.044 0.487 *** 0.044 0.530 *** 0.045 0.530 *** 0.045 0.531 *** 0.045 0.531 *** 0.045Northeast 1.294 *** 0.048 1.298 *** 0.048 1.569 *** 0.053 1.565 *** 0.053 1.569 *** 0.053 1.570 *** 0.053Karnataka/Goa/Daman and Dui 0.082 * 0.039 0.081 * 0.039 0.073 + 0.040 0.075 + 0.040 0.075 + 0.040 0.075 + 0.040Intercept -24.85 *** 1.633 -25.08 *** 1.634 -23.85 *** 1.663 -24.14 *** 1.662 -24.12 *** 1.661 -24.16 *** 1.661Continued on next page
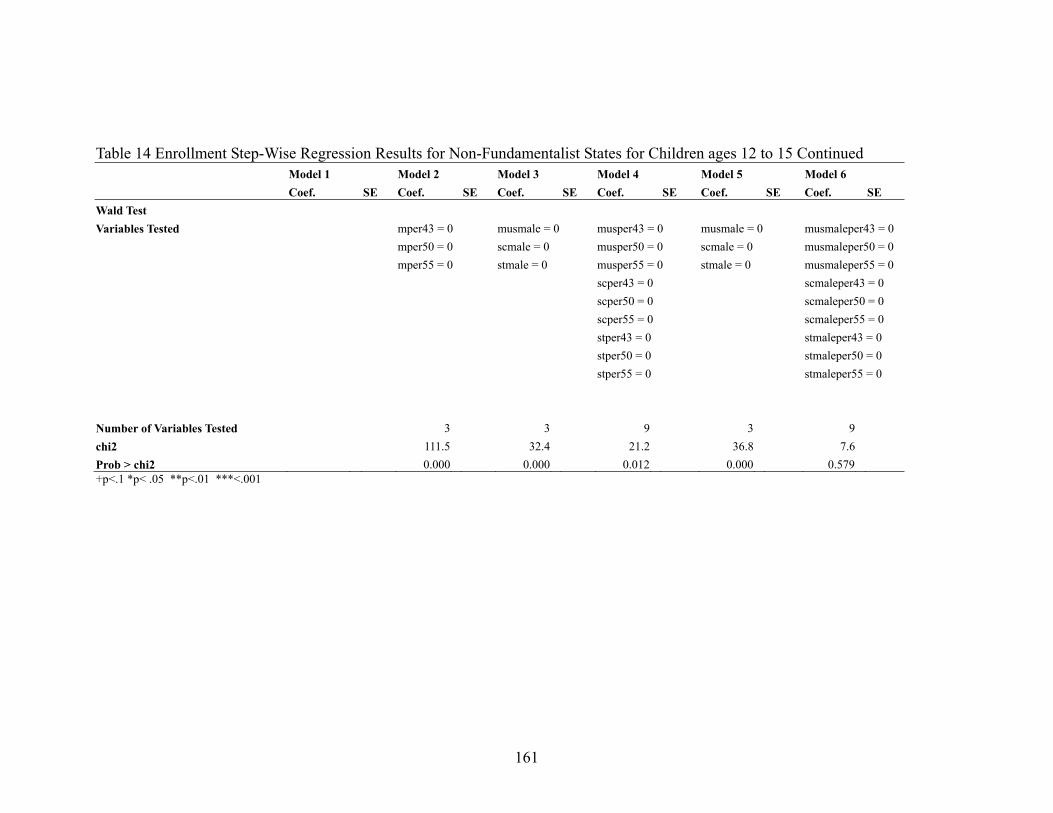
161
Table 14 Enrollment Step-Wise Regression Results for Non-Fundamentalist States for Children ages 12 to 15 Continued Model 1 Model 2 Model 3 Model 4 Model 5 Model 6 Coef. SE Coef. SE Coef. SE Coef. SE Coef. SE Coef. SE Wald Test Variables Tested mper43 = 0 musmale = 0 musper43 = 0 musmale = 0 musmaleper43 = 0 mper50 = 0 scmale = 0 musper50 = 0 scmale = 0 musmaleper50 = 0 mper55 = 0 stmale = 0 musper55 = 0 stmale = 0 musmaleper55 = 0 scper43 = 0 scmaleper43 = 0 scper50 = 0 scmaleper50 = 0 scper55 = 0 scmaleper55 = 0 stper43 = 0 stmaleper43 = 0 stper50 = 0 stmaleper50 = 0 stper55 = 0 stmaleper55 = 0 Number of Variables Tested 3 3 9 3 9 chi2 111.5 32.4 21.2 36.8 7.6 Prob > chi2 0.000 0.000 0.012 0.000 0.579 +p<.1 *p< .05 **p<.01 ***<.001
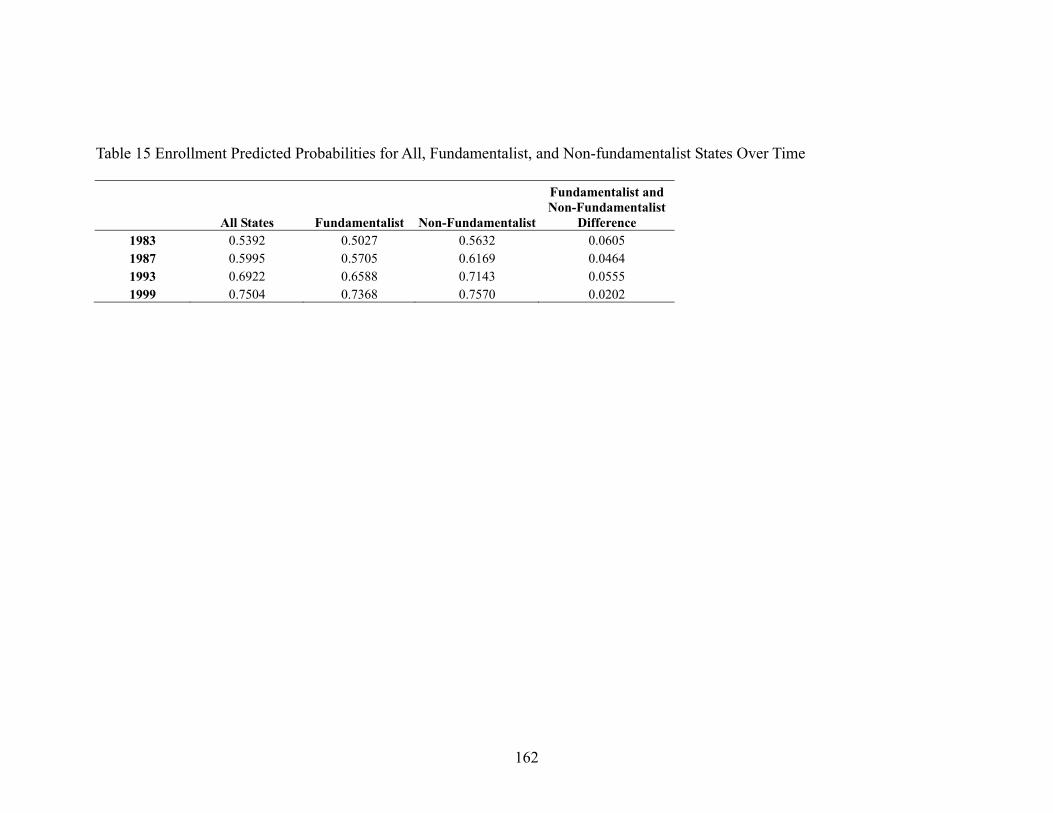
162
Table 15 Enrollment Predicted Probabilities for All, Fundamentalist, and Non-fundamentalist States Over Time
All States Fundamentalist Non-Fundamentalist
Fundamentalist and Non-Fundamentalist
Difference 1983 0.5392 0.5027 0.5632 0.0605 1987 0.5995 0.5705 0.6169 0.0464 1993 0.6922 0.6588 0.7143 0.0555 1999 0.7504 0.7368 0.7570 0.0202
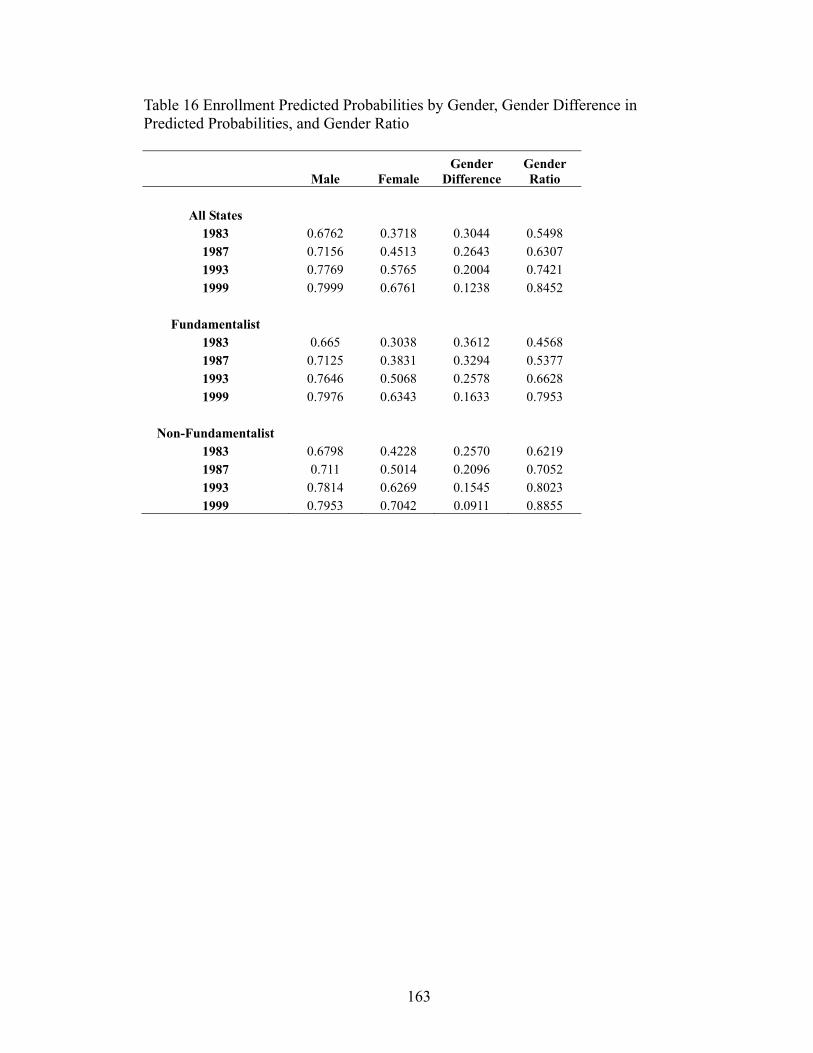
163
Table 16 Enrollment Predicted Probabilities by Gender, Gender Difference in Predicted Probabilities, and Gender Ratio
Male Female Gender
Difference Gender Ratio
All States
1983 0.6762 0.3718 0.3044 0.5498 1987 0.7156 0.4513 0.2643 0.6307 1993 0.7769 0.5765 0.2004 0.7421 1999 0.7999 0.6761 0.1238 0.8452
Fundamentalist
1983 0.665 0.3038 0.3612 0.4568 1987 0.7125 0.3831 0.3294 0.5377 1993 0.7646 0.5068 0.2578 0.6628 1999 0.7976 0.6343 0.1633 0.7953
Non-Fundamentalist
1983 0.6798 0.4228 0.2570 0.6219 1987 0.711 0.5014 0.2096 0.7052 1993 0.7814 0.6269 0.1545 0.8023 1999 0.7953 0.7042 0.0911 0.8855
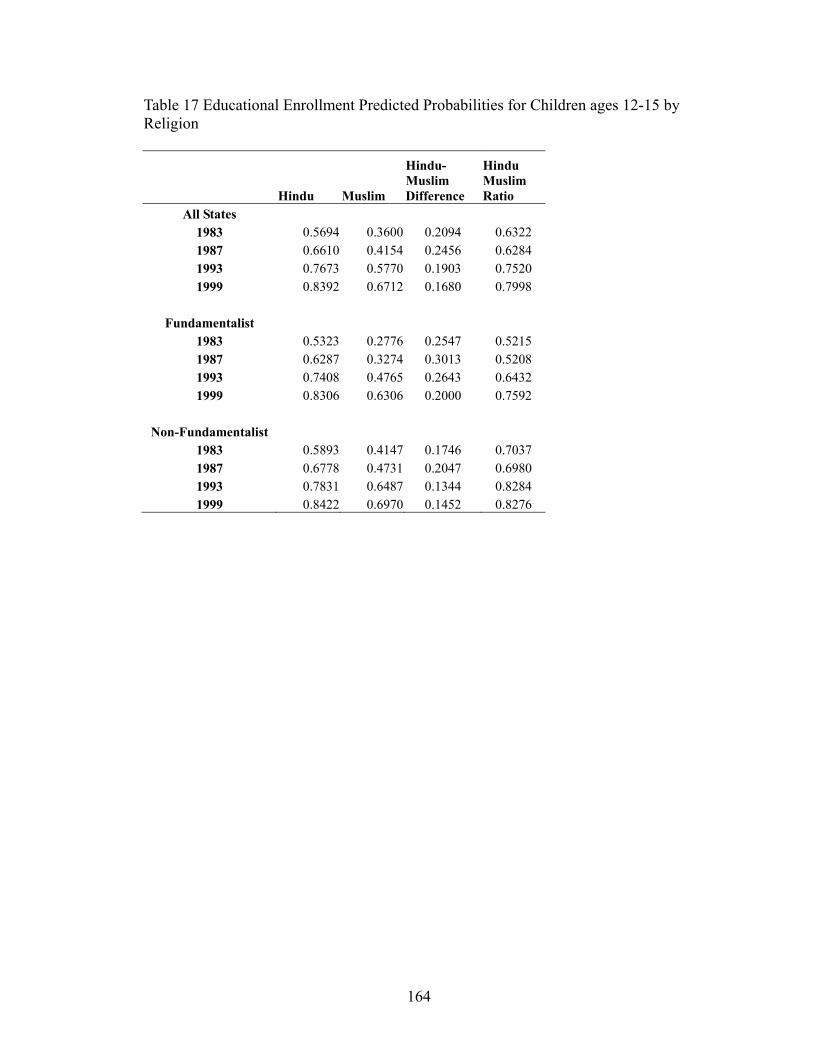
164
Table 17 Educational Enrollment Predicted Probabilities for Children ages 12-15 by Religion
Hindu Muslim
Hindu-Muslim Difference
Hindu Muslim Ratio
All States 1983 0.5694 0.3600 0.2094 0.6322 1987 0.6610 0.4154 0.2456 0.6284 1993 0.7673 0.5770 0.1903 0.7520 1999 0.8392 0.6712 0.1680 0.7998
Fundamentalist
1983 0.5323 0.2776 0.2547 0.5215 1987 0.6287 0.3274 0.3013 0.5208 1993 0.7408 0.4765 0.2643 0.6432 1999 0.8306 0.6306 0.2000 0.7592
Non-Fundamentalist
1983 0.5893 0.4147 0.1746 0.7037 1987 0.6778 0.4731 0.2047 0.6980 1993 0.7831 0.6487 0.1344 0.8284 1999 0.8422 0.6970 0.1452 0.8276
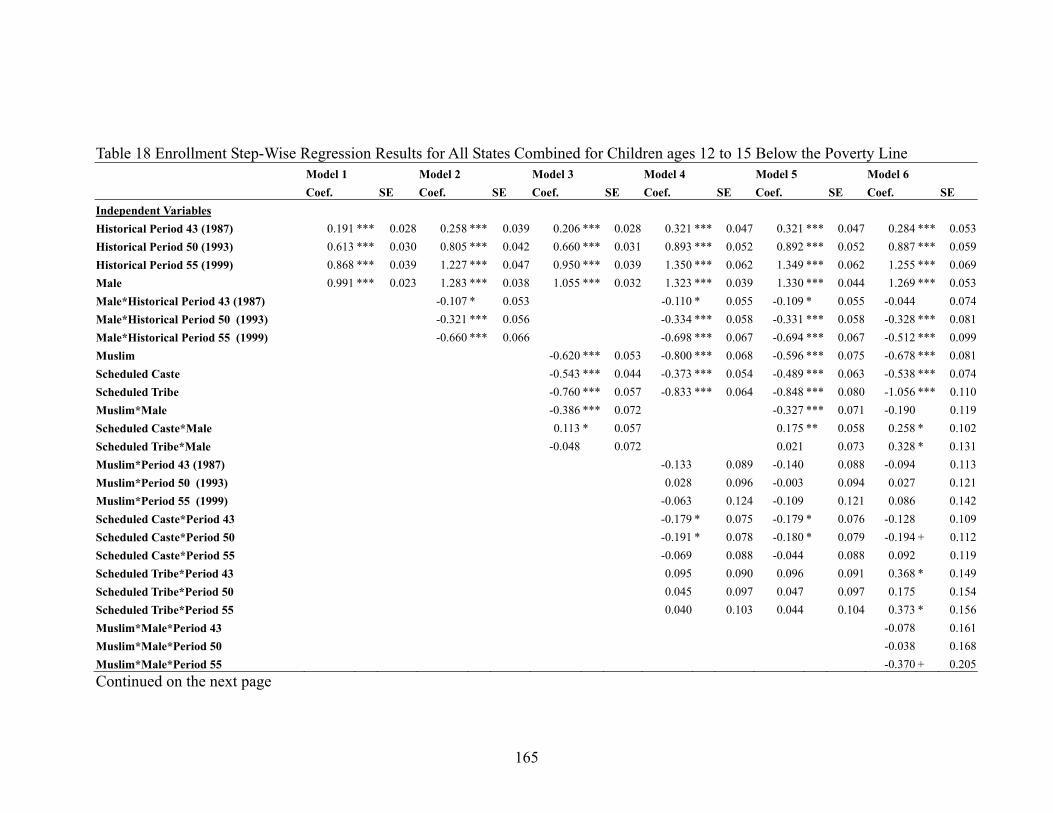
165
Table 18 Enrollment Step-Wise Regression Results for All States Combined for Children ages 12 to 15 Below the Poverty Line Model 1 Model 2 Model 3 Model 4 Model 5 Model 6 Coef. SE Coef. SE Coef. SE Coef. SE Coef. SE Coef. SE Independent Variables Historical Period 43 (1987) 0.191 *** 0.028 0.258 *** 0.039 0.206 *** 0.028 0.321 *** 0.047 0.321 *** 0.047 0.284 *** 0.053Historical Period 50 (1993) 0.613 *** 0.030 0.805 *** 0.042 0.660 *** 0.031 0.893 *** 0.052 0.892 *** 0.052 0.887 *** 0.059Historical Period 55 (1999) 0.868 *** 0.039 1.227 *** 0.047 0.950 *** 0.039 1.350 *** 0.062 1.349 *** 0.062 1.255 *** 0.069Male 0.991 *** 0.023 1.283 *** 0.038 1.055 *** 0.032 1.323 *** 0.039 1.330 *** 0.044 1.269 *** 0.053Male*Historical Period 43 (1987) -0.107 * 0.053 -0.110 * 0.055 -0.109 * 0.055 -0.044 0.074Male*Historical Period 50 (1993) -0.321 *** 0.056 -0.334 *** 0.058 -0.331 *** 0.058 -0.328 *** 0.081Male*Historical Period 55 (1999) -0.660 *** 0.066 -0.698 *** 0.067 -0.694 *** 0.067 -0.512 *** 0.099Muslim -0.620 *** 0.053 -0.800 *** 0.068 -0.596 *** 0.075 -0.678 *** 0.081Scheduled Caste -0.543 *** 0.044 -0.373 *** 0.054 -0.489 *** 0.063 -0.538 *** 0.074Scheduled Tribe -0.760 *** 0.057 -0.833 *** 0.064 -0.848 *** 0.080 -1.056 *** 0.110Muslim*Male -0.386 *** 0.072 -0.327 *** 0.071 -0.190 0.119Scheduled Caste*Male 0.113 * 0.057 0.175 ** 0.058 0.258 * 0.102Scheduled Tribe*Male -0.048 0.072 0.021 0.073 0.328 * 0.131Muslim*Period 43 (1987) -0.133 0.089 -0.140 0.088 -0.094 0.113Muslim*Period 50 (1993) 0.028 0.096 -0.003 0.094 0.027 0.121Muslim*Period 55 (1999) -0.063 0.124 -0.109 0.121 0.086 0.142Scheduled Caste*Period 43 -0.179 * 0.075 -0.179 * 0.076 -0.128 0.109Scheduled Caste*Period 50 -0.191 * 0.078 -0.180 * 0.079 -0.194 + 0.112Scheduled Caste*Period 55 -0.069 0.088 -0.044 0.088 0.092 0.119Scheduled Tribe*Period 43 0.095 0.090 0.096 0.091 0.368 * 0.149Scheduled Tribe*Period 50 0.045 0.097 0.047 0.097 0.175 0.154Scheduled Tribe*Period 55 0.040 0.103 0.044 0.104 0.373 * 0.156Muslim*Male*Period 43 -0.078 0.161Muslim*Male*Period 50 -0.038 0.168Muslim*Male*Period 55 -0.370 + 0.205Continued on the next page
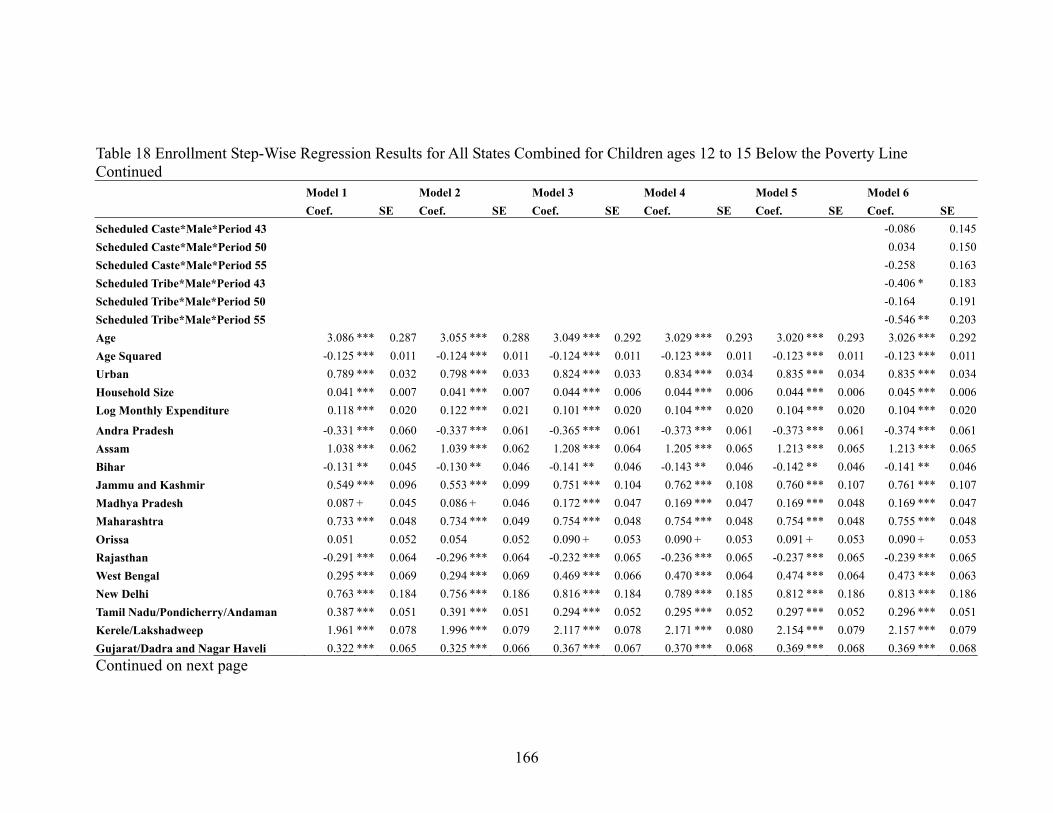
166
Table 18 Enrollment Step-Wise Regression Results for All States Combined for Children ages 12 to 15 Below the Poverty Line Continued Model 1 Model 2 Model 3 Model 4 Model 5 Model 6 Coef. SE Coef. SE Coef. SE Coef. SE Coef. SE Coef. SE Scheduled Caste*Male*Period 43 -0.086 0.145Scheduled Caste*Male*Period 50 0.034 0.150Scheduled Caste*Male*Period 55 -0.258 0.163Scheduled Tribe*Male*Period 43 -0.406 * 0.183Scheduled Tribe*Male*Period 50 -0.164 0.191Scheduled Tribe*Male*Period 55 -0.546 ** 0.203Age 3.086 *** 0.287 3.055 *** 0.288 3.049 *** 0.292 3.029 *** 0.293 3.020 *** 0.293 3.026 *** 0.292Age Squared -0.125 *** 0.011 -0.124 *** 0.011 -0.124 *** 0.011 -0.123 *** 0.011 -0.123 *** 0.011 -0.123 *** 0.011Urban 0.789 *** 0.032 0.798 *** 0.033 0.824 *** 0.033 0.834 *** 0.034 0.835 *** 0.034 0.835 *** 0.034Household Size 0.041 *** 0.007 0.041 *** 0.007 0.044 *** 0.006 0.044 *** 0.006 0.044 *** 0.006 0.045 *** 0.006Log Monthly Expenditure 0.118 *** 0.020 0.122 *** 0.021 0.101 *** 0.020 0.104 *** 0.020 0.104 *** 0.020 0.104 *** 0.020
Andra Pradesh -0.331 *** 0.060 -0.337 *** 0.061 -0.365 *** 0.061 -0.373 *** 0.061 -0.373 *** 0.061 -0.374 *** 0.061Assam 1.038 *** 0.062 1.039 *** 0.062 1.208 *** 0.064 1.205 *** 0.065 1.213 *** 0.065 1.213 *** 0.065Bihar -0.131 ** 0.045 -0.130 ** 0.046 -0.141 ** 0.046 -0.143 ** 0.046 -0.142 ** 0.046 -0.141 ** 0.046Jammu and Kashmir 0.549 *** 0.096 0.553 *** 0.099 0.751 *** 0.104 0.762 *** 0.108 0.760 *** 0.107 0.761 *** 0.107Madhya Pradesh 0.087 + 0.045 0.086 + 0.046 0.172 *** 0.047 0.169 *** 0.047 0.169 *** 0.048 0.169 *** 0.047Maharashtra 0.733 *** 0.048 0.734 *** 0.049 0.754 *** 0.048 0.754 *** 0.048 0.754 *** 0.048 0.755 *** 0.048Orissa 0.051 0.052 0.054 0.052 0.090 + 0.053 0.090 + 0.053 0.091 + 0.053 0.090 + 0.053Rajasthan -0.291 *** 0.064 -0.296 *** 0.064 -0.232 *** 0.065 -0.236 *** 0.065 -0.237 *** 0.065 -0.239 *** 0.065West Bengal 0.295 *** 0.069 0.294 *** 0.069 0.469 *** 0.066 0.470 *** 0.064 0.474 *** 0.064 0.473 *** 0.063New Delhi 0.763 *** 0.184 0.756 *** 0.186 0.816 *** 0.184 0.789 *** 0.185 0.812 *** 0.186 0.813 *** 0.186Tamil Nadu/Pondicherry/Andaman 0.387 *** 0.051 0.391 *** 0.051 0.294 *** 0.052 0.295 *** 0.052 0.297 *** 0.052 0.296 *** 0.051Kerele/Lakshadweep 1.961 *** 0.078 1.996 *** 0.079 2.117 *** 0.078 2.171 *** 0.080 2.154 *** 0.079 2.157 *** 0.079Gujarat/Dadra and Nagar Haveli 0.322 *** 0.065 0.325 *** 0.066 0.367 *** 0.067 0.370 *** 0.068 0.369 *** 0.068 0.369 *** 0.068Continued on next page
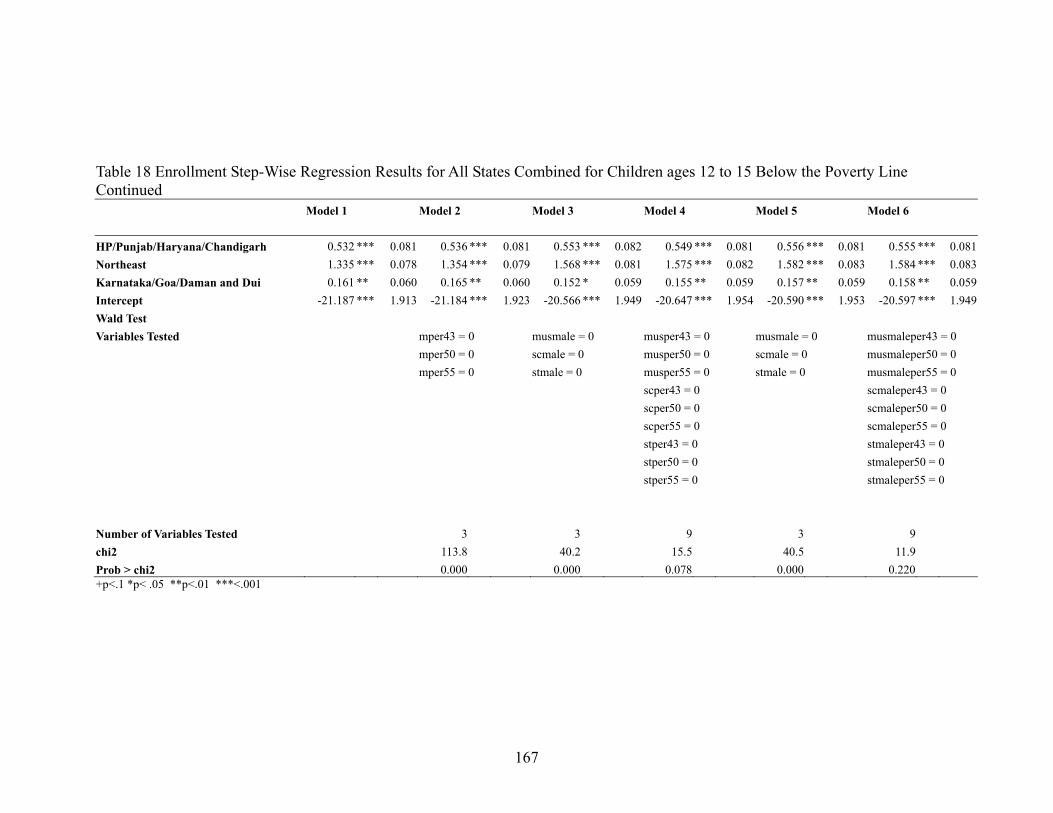
167
Table 18 Enrollment Step-Wise Regression Results for All States Combined for Children ages 12 to 15 Below the Poverty Line Continued Model 1 Model 2 Model 3 Model 4 Model 5 Model 6 HP/Punjab/Haryana/Chandigarh 0.532 *** 0.081 0.536 *** 0.081 0.553 *** 0.082 0.549 *** 0.081 0.556 *** 0.081 0.555 *** 0.081Northeast 1.335 *** 0.078 1.354 *** 0.079 1.568 *** 0.081 1.575 *** 0.082 1.582 *** 0.083 1.584 *** 0.083Karnataka/Goa/Daman and Dui 0.161 ** 0.060 0.165 ** 0.060 0.152 * 0.059 0.155 ** 0.059 0.157 ** 0.059 0.158 ** 0.059Intercept -21.187 *** 1.913 -21.184 *** 1.923 -20.566 *** 1.949 -20.647 *** 1.954 -20.590 *** 1.953 -20.597 *** 1.949Wald Test Variables Tested mper43 = 0 musmale = 0 musper43 = 0 musmale = 0 musmaleper43 = 0 mper50 = 0 scmale = 0 musper50 = 0 scmale = 0 musmaleper50 = 0 mper55 = 0 stmale = 0 musper55 = 0 stmale = 0 musmaleper55 = 0 scper43 = 0 scmaleper43 = 0 scper50 = 0 scmaleper50 = 0 scper55 = 0 scmaleper55 = 0 stper43 = 0 stmaleper43 = 0 stper50 = 0 stmaleper50 = 0 stper55 = 0 stmaleper55 = 0 Number of Variables Tested 3 3 9 3 9 chi2 113.8 40.2 15.5 40.5 11.9 Prob > chi2 0.000 0.000 0.078 0.000 0.220 +p<.1 *p< .05 **p<.01 ***<.001
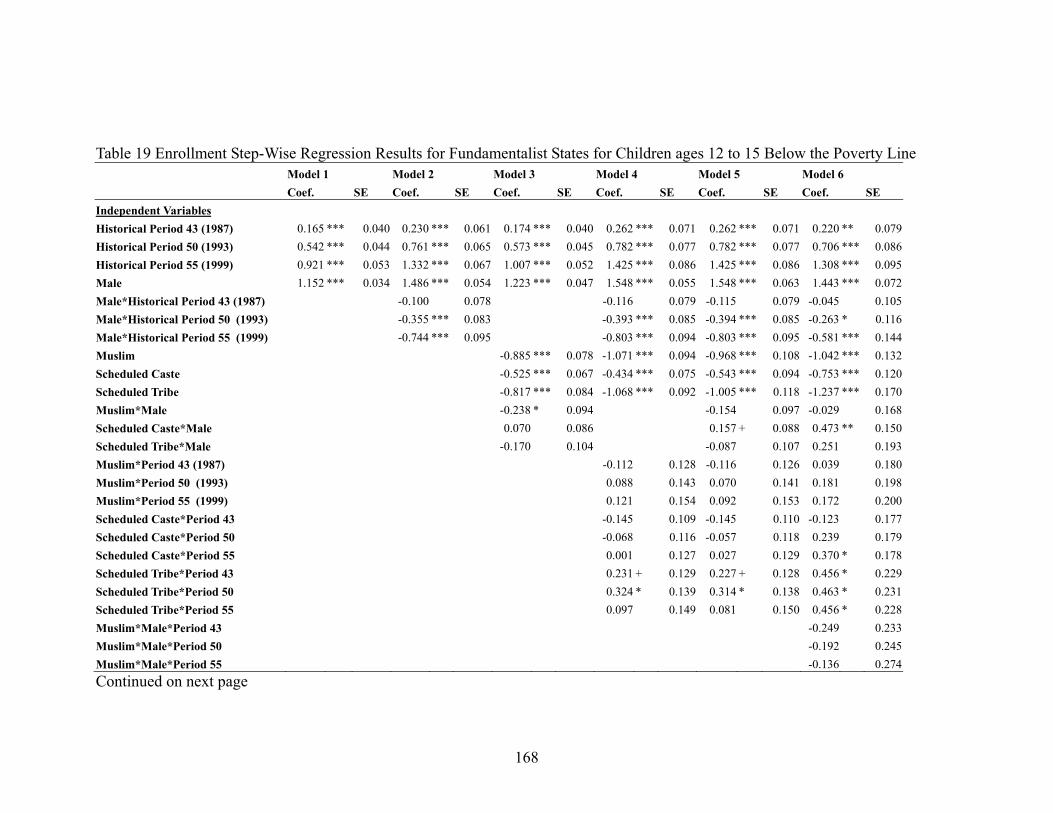
168
Table 19 Enrollment Step-Wise Regression Results for Fundamentalist States for Children ages 12 to 15 Below the Poverty Line Model 1 Model 2 Model 3 Model 4 Model 5 Model 6 Coef. SE Coef. SE Coef. SE Coef. SE Coef. SE Coef. SE Independent Variables Historical Period 43 (1987) 0.165 *** 0.040 0.230 *** 0.061 0.174 *** 0.040 0.262 *** 0.071 0.262 *** 0.071 0.220 ** 0.079Historical Period 50 (1993) 0.542 *** 0.044 0.761 *** 0.065 0.573 *** 0.045 0.782 *** 0.077 0.782 *** 0.077 0.706 *** 0.086Historical Period 55 (1999) 0.921 *** 0.053 1.332 *** 0.067 1.007 *** 0.052 1.425 *** 0.086 1.425 *** 0.086 1.308 *** 0.095Male 1.152 *** 0.034 1.486 *** 0.054 1.223 *** 0.047 1.548 *** 0.055 1.548 *** 0.063 1.443 *** 0.072Male*Historical Period 43 (1987) -0.100 0.078 -0.116 0.079 -0.115 0.079 -0.045 0.105Male*Historical Period 50 (1993) -0.355 *** 0.083 -0.393 *** 0.085 -0.394 *** 0.085 -0.263 * 0.116Male*Historical Period 55 (1999) -0.744 *** 0.095 -0.803 *** 0.094 -0.803 *** 0.095 -0.581 *** 0.144Muslim -0.885 *** 0.078 -1.071 *** 0.094 -0.968 *** 0.108 -1.042 *** 0.132Scheduled Caste -0.525 *** 0.067 -0.434 *** 0.075 -0.543 *** 0.094 -0.753 *** 0.120Scheduled Tribe -0.817 *** 0.084 -1.068 *** 0.092 -1.005 *** 0.118 -1.237 *** 0.170Muslim*Male -0.238 * 0.094 -0.154 0.097 -0.029 0.168Scheduled Caste*Male 0.070 0.086 0.157 + 0.088 0.473 ** 0.150Scheduled Tribe*Male -0.170 0.104 -0.087 0.107 0.251 0.193Muslim*Period 43 (1987) -0.112 0.128 -0.116 0.126 0.039 0.180Muslim*Period 50 (1993) 0.088 0.143 0.070 0.141 0.181 0.198Muslim*Period 55 (1999) 0.121 0.154 0.092 0.153 0.172 0.200Scheduled Caste*Period 43 -0.145 0.109 -0.145 0.110 -0.123 0.177Scheduled Caste*Period 50 -0.068 0.116 -0.057 0.118 0.239 0.179Scheduled Caste*Period 55 0.001 0.127 0.027 0.129 0.370 * 0.178Scheduled Tribe*Period 43 0.231 + 0.129 0.227 + 0.128 0.456 * 0.229Scheduled Tribe*Period 50 0.324 * 0.139 0.314 * 0.138 0.463 * 0.231Scheduled Tribe*Period 55 0.097 0.149 0.081 0.150 0.456 * 0.228Muslim*Male*Period 43 -0.249 0.233Muslim*Male*Period 50 -0.192 0.245Muslim*Male*Period 55 -0.136 0.274Continued on next page
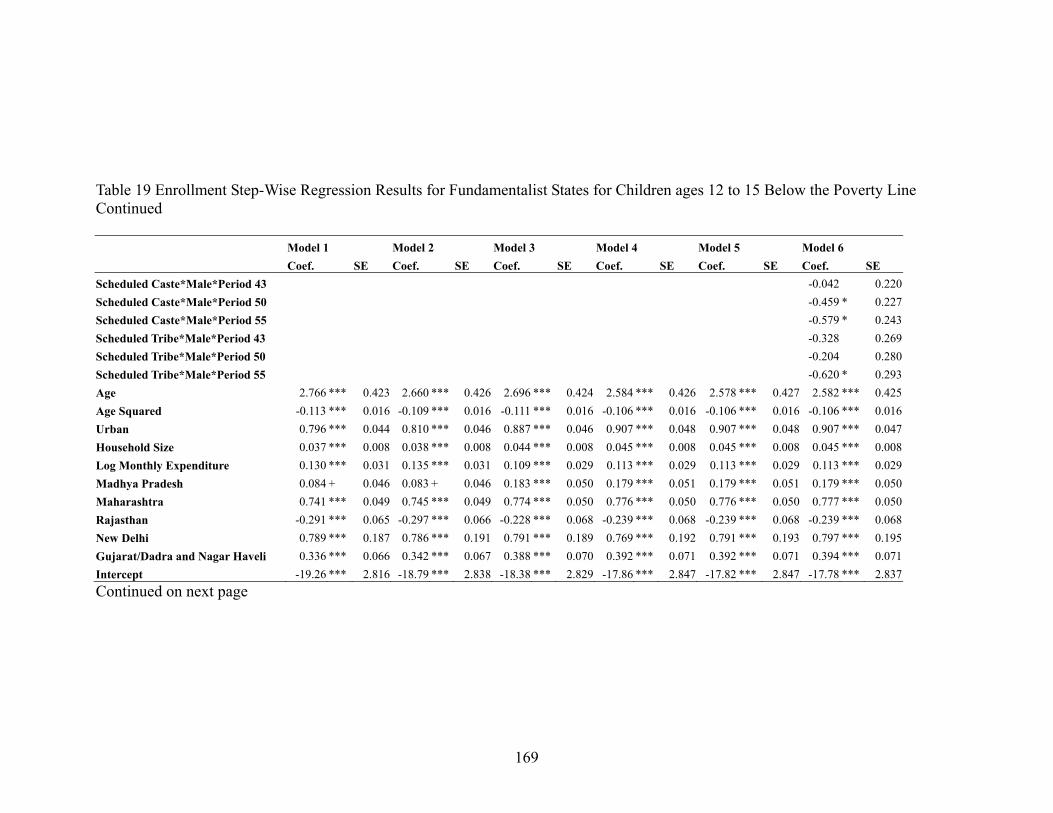
169
Table 19 Enrollment Step-Wise Regression Results for Fundamentalist States for Children ages 12 to 15 Below the Poverty Line Continued Model 1 Model 2 Model 3 Model 4 Model 5 Model 6 Coef. SE Coef. SE Coef. SE Coef. SE Coef. SE Coef. SE Scheduled Caste*Male*Period 43 -0.042 0.220Scheduled Caste*Male*Period 50 -0.459 * 0.227Scheduled Caste*Male*Period 55 -0.579 * 0.243Scheduled Tribe*Male*Period 43 -0.328 0.269Scheduled Tribe*Male*Period 50 -0.204 0.280Scheduled Tribe*Male*Period 55 -0.620 * 0.293Age 2.766 *** 0.423 2.660 *** 0.426 2.696 *** 0.424 2.584 *** 0.426 2.578 *** 0.427 2.582 *** 0.425Age Squared -0.113 *** 0.016 -0.109 *** 0.016 -0.111 *** 0.016 -0.106 *** 0.016 -0.106 *** 0.016 -0.106 *** 0.016Urban 0.796 *** 0.044 0.810 *** 0.046 0.887 *** 0.046 0.907 *** 0.048 0.907 *** 0.048 0.907 *** 0.047Household Size 0.037 *** 0.008 0.038 *** 0.008 0.044 *** 0.008 0.045 *** 0.008 0.045 *** 0.008 0.045 *** 0.008Log Monthly Expenditure 0.130 *** 0.031 0.135 *** 0.031 0.109 *** 0.029 0.113 *** 0.029 0.113 *** 0.029 0.113 *** 0.029Madhya Pradesh 0.084 + 0.046 0.083 + 0.046 0.183 *** 0.050 0.179 *** 0.051 0.179 *** 0.051 0.179 *** 0.050Maharashtra 0.741 *** 0.049 0.745 *** 0.049 0.774 *** 0.050 0.776 *** 0.050 0.776 *** 0.050 0.777 *** 0.050Rajasthan -0.291 *** 0.065 -0.297 *** 0.066 -0.228 *** 0.068 -0.239 *** 0.068 -0.239 *** 0.068 -0.239 *** 0.068New Delhi 0.789 *** 0.187 0.786 *** 0.191 0.791 *** 0.189 0.769 *** 0.192 0.791 *** 0.193 0.797 *** 0.195Gujarat/Dadra and Nagar Haveli 0.336 *** 0.066 0.342 *** 0.067 0.388 *** 0.070 0.392 *** 0.071 0.392 *** 0.071 0.394 *** 0.071Intercept -19.26 *** 2.816 -18.79 *** 2.838 -18.38 *** 2.829 -17.86 *** 2.847 -17.82 *** 2.847 -17.78 *** 2.837Continued on next page
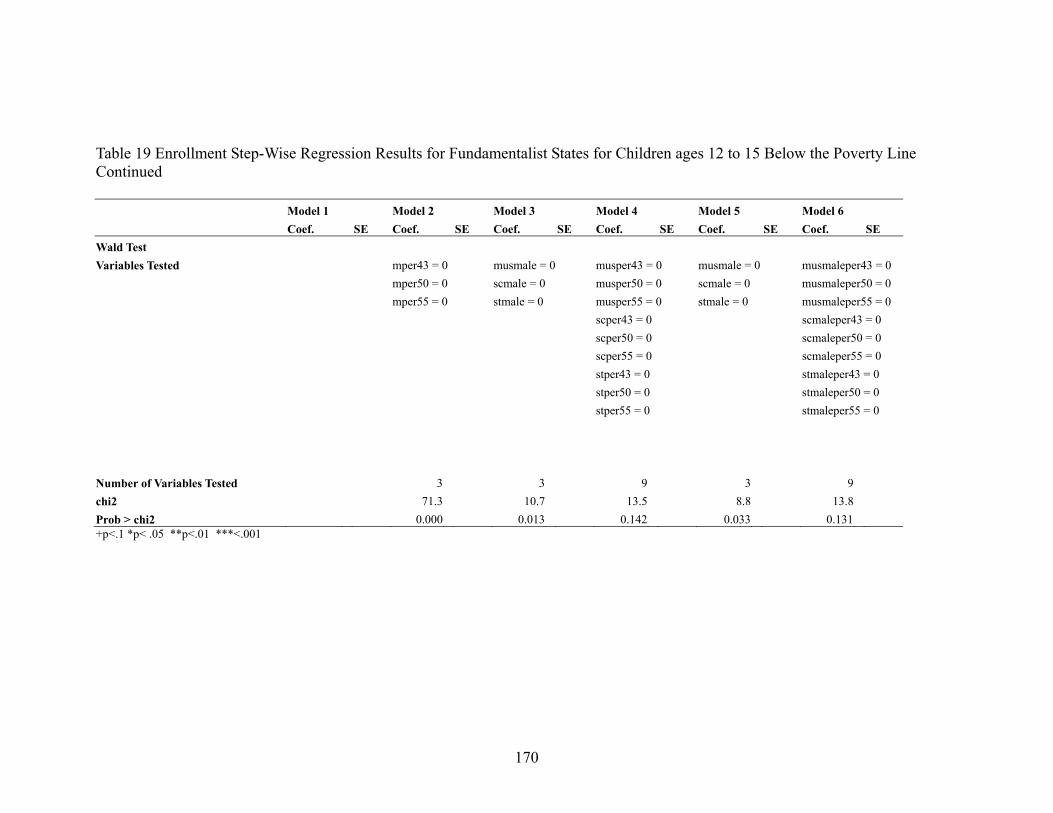
170
Table 19 Enrollment Step-Wise Regression Results for Fundamentalist States for Children ages 12 to 15 Below the Poverty Line Continued Model 1 Model 2 Model 3 Model 4 Model 5 Model 6 Coef. SE Coef. SE Coef. SE Coef. SE Coef. SE Coef. SE Wald Test Variables Tested mper43 = 0 musmale = 0 musper43 = 0 musmale = 0 musmaleper43 = 0 mper50 = 0 scmale = 0 musper50 = 0 scmale = 0 musmaleper50 = 0 mper55 = 0 stmale = 0 musper55 = 0 stmale = 0 musmaleper55 = 0 scper43 = 0 scmaleper43 = 0 scper50 = 0 scmaleper50 = 0 scper55 = 0 scmaleper55 = 0 stper43 = 0 stmaleper43 = 0 stper50 = 0 stmaleper50 = 0 stper55 = 0 stmaleper55 = 0 Number of Variables Tested 3 3 9 3 9 chi2 71.3 10.7 13.5 8.8 13.8 Prob > chi2 0.000 0.013 0.142 0.033 0.131 +p<.1 *p< .05 **p<.01 ***<.001
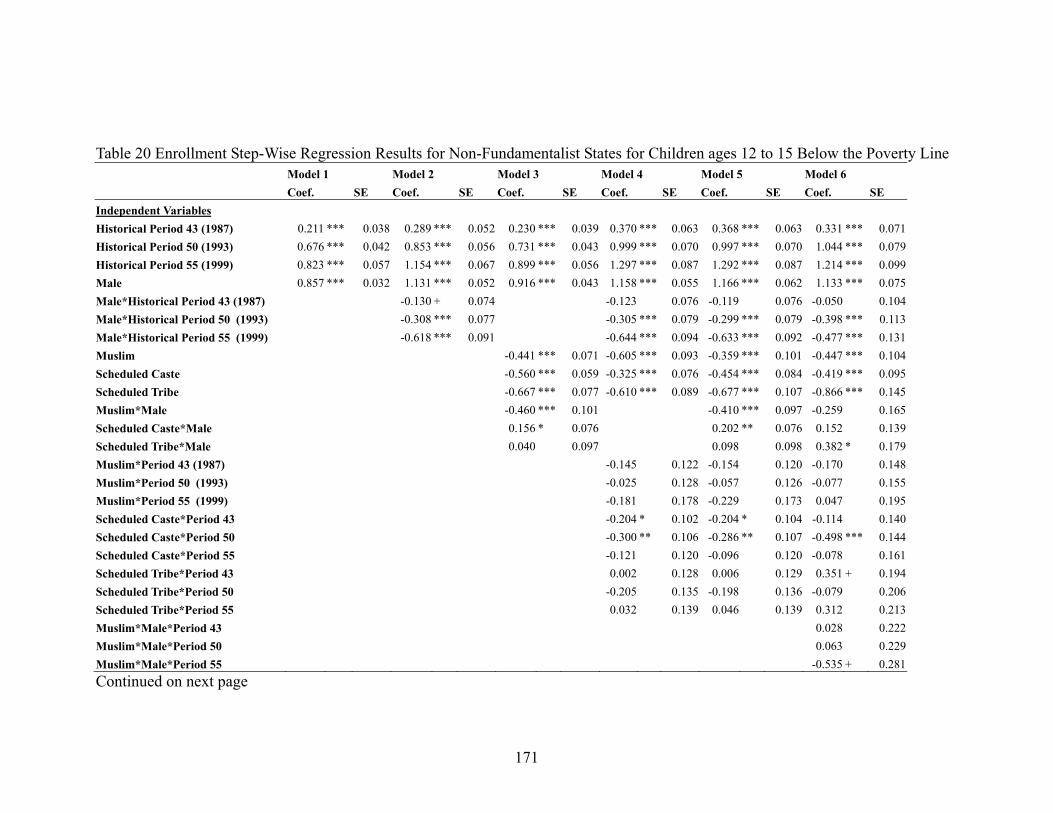
171
Table 20 Enrollment Step-Wise Regression Results for Non-Fundamentalist States for Children ages 12 to 15 Below the Poverty Line Model 1 Model 2 Model 3 Model 4 Model 5 Model 6 Coef. SE Coef. SE Coef. SE Coef. SE Coef. SE Coef. SE Independent Variables Historical Period 43 (1987) 0.211 *** 0.038 0.289 *** 0.052 0.230 *** 0.039 0.370 *** 0.063 0.368 *** 0.063 0.331 *** 0.071Historical Period 50 (1993) 0.676 *** 0.042 0.853 *** 0.056 0.731 *** 0.043 0.999 *** 0.070 0.997 *** 0.070 1.044 *** 0.079Historical Period 55 (1999) 0.823 *** 0.057 1.154 *** 0.067 0.899 *** 0.056 1.297 *** 0.087 1.292 *** 0.087 1.214 *** 0.099Male 0.857 *** 0.032 1.131 *** 0.052 0.916 *** 0.043 1.158 *** 0.055 1.166 *** 0.062 1.133 *** 0.075Male*Historical Period 43 (1987) -0.130 + 0.074 -0.123 0.076 -0.119 0.076 -0.050 0.104Male*Historical Period 50 (1993) -0.308 *** 0.077 -0.305 *** 0.079 -0.299 *** 0.079 -0.398 *** 0.113Male*Historical Period 55 (1999) -0.618 *** 0.091 -0.644 *** 0.094 -0.633 *** 0.092 -0.477 *** 0.131Muslim -0.441 *** 0.071 -0.605 *** 0.093 -0.359 *** 0.101 -0.447 *** 0.104Scheduled Caste -0.560 *** 0.059 -0.325 *** 0.076 -0.454 *** 0.084 -0.419 *** 0.095Scheduled Tribe -0.667 *** 0.077 -0.610 *** 0.089 -0.677 *** 0.107 -0.866 *** 0.145Muslim*Male -0.460 *** 0.101 -0.410 *** 0.097 -0.259 0.165Scheduled Caste*Male 0.156 * 0.076 0.202 ** 0.076 0.152 0.139Scheduled Tribe*Male 0.040 0.097 0.098 0.098 0.382 * 0.179Muslim*Period 43 (1987) -0.145 0.122 -0.154 0.120 -0.170 0.148Muslim*Period 50 (1993) -0.025 0.128 -0.057 0.126 -0.077 0.155Muslim*Period 55 (1999) -0.181 0.178 -0.229 0.173 0.047 0.195Scheduled Caste*Period 43 -0.204 * 0.102 -0.204 * 0.104 -0.114 0.140Scheduled Caste*Period 50 -0.300 ** 0.106 -0.286 ** 0.107 -0.498 *** 0.144Scheduled Caste*Period 55 -0.121 0.120 -0.096 0.120 -0.078 0.161Scheduled Tribe*Period 43 0.002 0.128 0.006 0.129 0.351 + 0.194Scheduled Tribe*Period 50 -0.205 0.135 -0.198 0.136 -0.079 0.206Scheduled Tribe*Period 55 0.032 0.139 0.046 0.139 0.312 0.213Muslim*Male*Period 43 0.028 0.222Muslim*Male*Period 50 0.063 0.229Muslim*Male*Period 55 -0.535 + 0.281Continued on next page
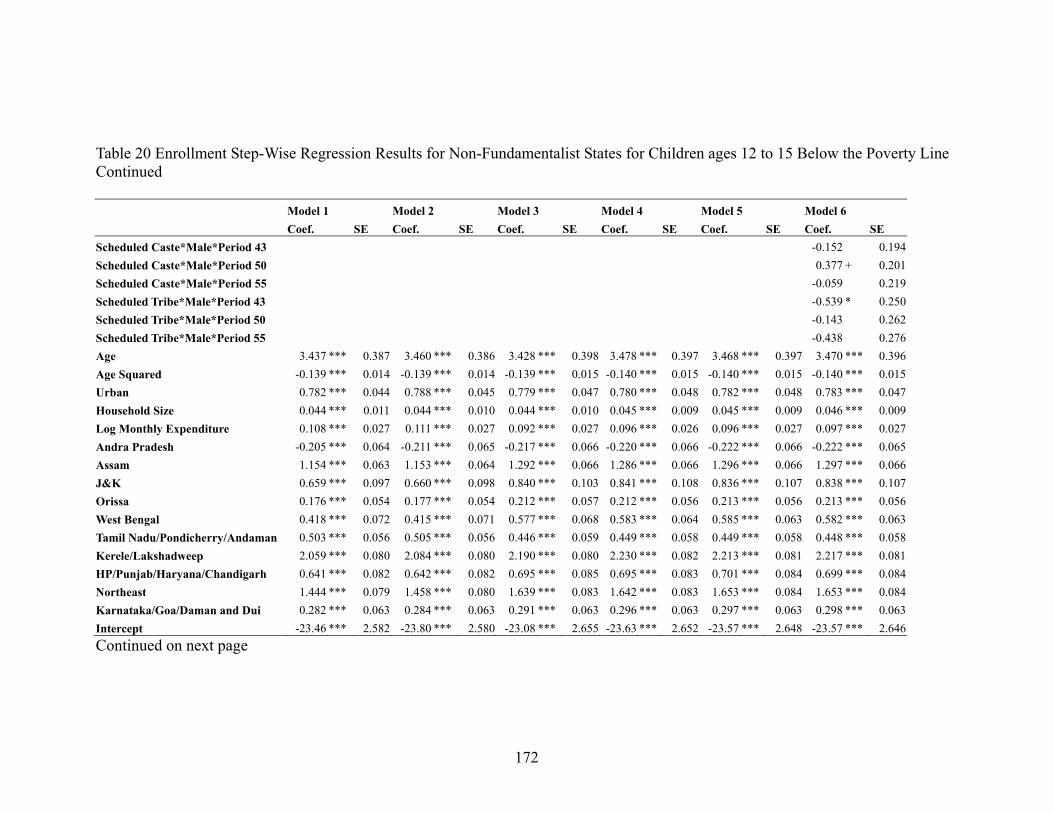
172
Table 20 Enrollment Step-Wise Regression Results for Non-Fundamentalist States for Children ages 12 to 15 Below the Poverty Line Continued Model 1 Model 2 Model 3 Model 4 Model 5 Model 6 Coef. SE Coef. SE Coef. SE Coef. SE Coef. SE Coef. SE Scheduled Caste*Male*Period 43 -0.152 0.194Scheduled Caste*Male*Period 50 0.377 + 0.201Scheduled Caste*Male*Period 55 -0.059 0.219Scheduled Tribe*Male*Period 43 -0.539 * 0.250Scheduled Tribe*Male*Period 50 -0.143 0.262Scheduled Tribe*Male*Period 55 -0.438 0.276Age 3.437 *** 0.387 3.460 *** 0.386 3.428 *** 0.398 3.478 *** 0.397 3.468 *** 0.397 3.470 *** 0.396Age Squared -0.139 *** 0.014 -0.139 *** 0.014 -0.139 *** 0.015 -0.140 *** 0.015 -0.140 *** 0.015 -0.140 *** 0.015Urban 0.782 *** 0.044 0.788 *** 0.045 0.779 *** 0.047 0.780 *** 0.048 0.782 *** 0.048 0.783 *** 0.047Household Size 0.044 *** 0.011 0.044 *** 0.010 0.044 *** 0.010 0.045 *** 0.009 0.045 *** 0.009 0.046 *** 0.009Log Monthly Expenditure 0.108 *** 0.027 0.111 *** 0.027 0.092 *** 0.027 0.096 *** 0.026 0.096 *** 0.027 0.097 *** 0.027Andra Pradesh -0.205 *** 0.064 -0.211 *** 0.065 -0.217 *** 0.066 -0.220 *** 0.066 -0.222 *** 0.066 -0.222 *** 0.065Assam 1.154 *** 0.063 1.153 *** 0.064 1.292 *** 0.066 1.286 *** 0.066 1.296 *** 0.066 1.297 *** 0.066J&K 0.659 *** 0.097 0.660 *** 0.098 0.840 *** 0.103 0.841 *** 0.108 0.836 *** 0.107 0.838 *** 0.107Orissa 0.176 *** 0.054 0.177 *** 0.054 0.212 *** 0.057 0.212 *** 0.056 0.213 *** 0.056 0.213 *** 0.056West Bengal 0.418 *** 0.072 0.415 *** 0.071 0.577 *** 0.068 0.583 *** 0.064 0.585 *** 0.063 0.582 *** 0.063Tamil Nadu/Pondicherry/Andaman 0.503 *** 0.056 0.505 *** 0.056 0.446 *** 0.059 0.449 *** 0.058 0.449 *** 0.058 0.448 *** 0.058Kerele/Lakshadweep 2.059 *** 0.080 2.084 *** 0.080 2.190 *** 0.080 2.230 *** 0.082 2.213 *** 0.081 2.217 *** 0.081HP/Punjab/Haryana/Chandigarh 0.641 *** 0.082 0.642 *** 0.082 0.695 *** 0.085 0.695 *** 0.083 0.701 *** 0.084 0.699 *** 0.084Northeast 1.444 *** 0.079 1.458 *** 0.080 1.639 *** 0.083 1.642 *** 0.083 1.653 *** 0.084 1.653 *** 0.084Karnataka/Goa/Daman and Dui 0.282 *** 0.063 0.284 *** 0.063 0.291 *** 0.063 0.296 *** 0.063 0.297 *** 0.063 0.298 *** 0.063Intercept -23.46 *** 2.582 -23.80 *** 2.580 -23.08 *** 2.655 -23.63 *** 2.652 -23.57 *** 2.648 -23.57 *** 2.646Continued on next page

173
Table 20 Enrollment Step-Wise Regression Results for Non-Fundamentalist States for Children ages 12 to 15 Below the Poverty Line Continued Model 1 Model 2 Model 3 Model 4 Model 5 Model 6 Coef. SE Coef. SE Coef. SE Coef. SE Coef. SE Coef. SE Wald Test mper43 = 0 musmale = 0 musper43 = 0 musmale = 0 musmaleper43 = 0 Variables Tested mper50 = 0 scmale = 0 musper50 = 0 scmale = 0 musmaleper50 = 0 mper55 = 0 stmale = 0 musper55 = 0 stmale = 0 musmaleper55 = 0 scper43 = 0 scmaleper43 = 0 scper50 = 0 scmaleper50 = 0 scper55 = 0 scmaleper55 = 0 stper43 = 0 stmaleper43 = 0 stper50 = 0 stmaleper50 = 0 stper55 = 0 stmaleper55 = 0 Number of Variables Tested 3 3 9 3 9 chi2 51.3 31.4 14.2 33.2 17.7 Prob > chi2 0.000 0.000 0.115 0.000 0.038 +p<.1 *p< .05 **p<.01 ***<.001
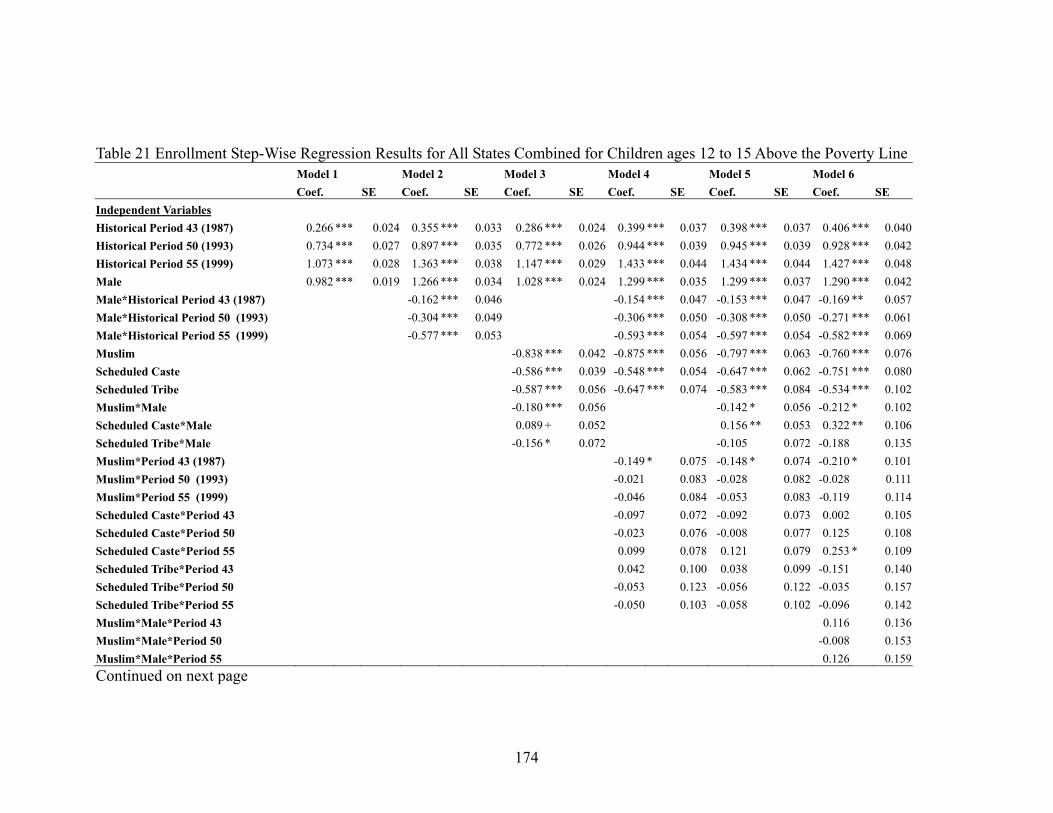
174
Table 21 Enrollment Step-Wise Regression Results for All States Combined for Children ages 12 to 15 Above the Poverty Line Model 1 Model 2 Model 3 Model 4 Model 5 Model 6 Coef. SE Coef. SE Coef. SE Coef. SE Coef. SE Coef. SE Independent Variables Historical Period 43 (1987) 0.266 *** 0.024 0.355 *** 0.033 0.286 *** 0.024 0.399 *** 0.037 0.398 *** 0.037 0.406 *** 0.040Historical Period 50 (1993) 0.734 *** 0.027 0.897 *** 0.035 0.772 *** 0.026 0.944 *** 0.039 0.945 *** 0.039 0.928 *** 0.042Historical Period 55 (1999) 1.073 *** 0.028 1.363 *** 0.038 1.147 *** 0.029 1.433 *** 0.044 1.434 *** 0.044 1.427 *** 0.048Male 0.982 *** 0.019 1.266 *** 0.034 1.028 *** 0.024 1.299 *** 0.035 1.299 *** 0.037 1.290 *** 0.042Male*Historical Period 43 (1987) -0.162 *** 0.046 -0.154 *** 0.047 -0.153 *** 0.047 -0.169 ** 0.057Male*Historical Period 50 (1993) -0.304 *** 0.049 -0.306 *** 0.050 -0.308 *** 0.050 -0.271 *** 0.061Male*Historical Period 55 (1999) -0.577 *** 0.053 -0.593 *** 0.054 -0.597 *** 0.054 -0.582 *** 0.069Muslim -0.838 *** 0.042 -0.875 *** 0.056 -0.797 *** 0.063 -0.760 *** 0.076Scheduled Caste -0.586 *** 0.039 -0.548 *** 0.054 -0.647 *** 0.062 -0.751 *** 0.080Scheduled Tribe -0.587 *** 0.056 -0.647 *** 0.074 -0.583 *** 0.084 -0.534 *** 0.102Muslim*Male -0.180 *** 0.056 -0.142 * 0.056 -0.212 * 0.102Scheduled Caste*Male 0.089 + 0.052 0.156 ** 0.053 0.322 ** 0.106Scheduled Tribe*Male -0.156 * 0.072 -0.105 0.072 -0.188 0.135Muslim*Period 43 (1987) -0.149 * 0.075 -0.148 * 0.074 -0.210 * 0.101Muslim*Period 50 (1993) -0.021 0.083 -0.028 0.082 -0.028 0.111Muslim*Period 55 (1999) -0.046 0.084 -0.053 0.083 -0.119 0.114Scheduled Caste*Period 43 -0.097 0.072 -0.092 0.073 0.002 0.105Scheduled Caste*Period 50 -0.023 0.076 -0.008 0.077 0.125 0.108Scheduled Caste*Period 55 0.099 0.078 0.121 0.079 0.253 * 0.109Scheduled Tribe*Period 43 0.042 0.100 0.038 0.099 -0.151 0.140Scheduled Tribe*Period 50 -0.053 0.123 -0.056 0.122 -0.035 0.157Scheduled Tribe*Period 55 -0.050 0.103 -0.058 0.102 -0.096 0.142Muslim*Male*Period 43 0.116 0.136Muslim*Male*Period 50 -0.008 0.153Muslim*Male*Period 55 0.126 0.159Continued on next page
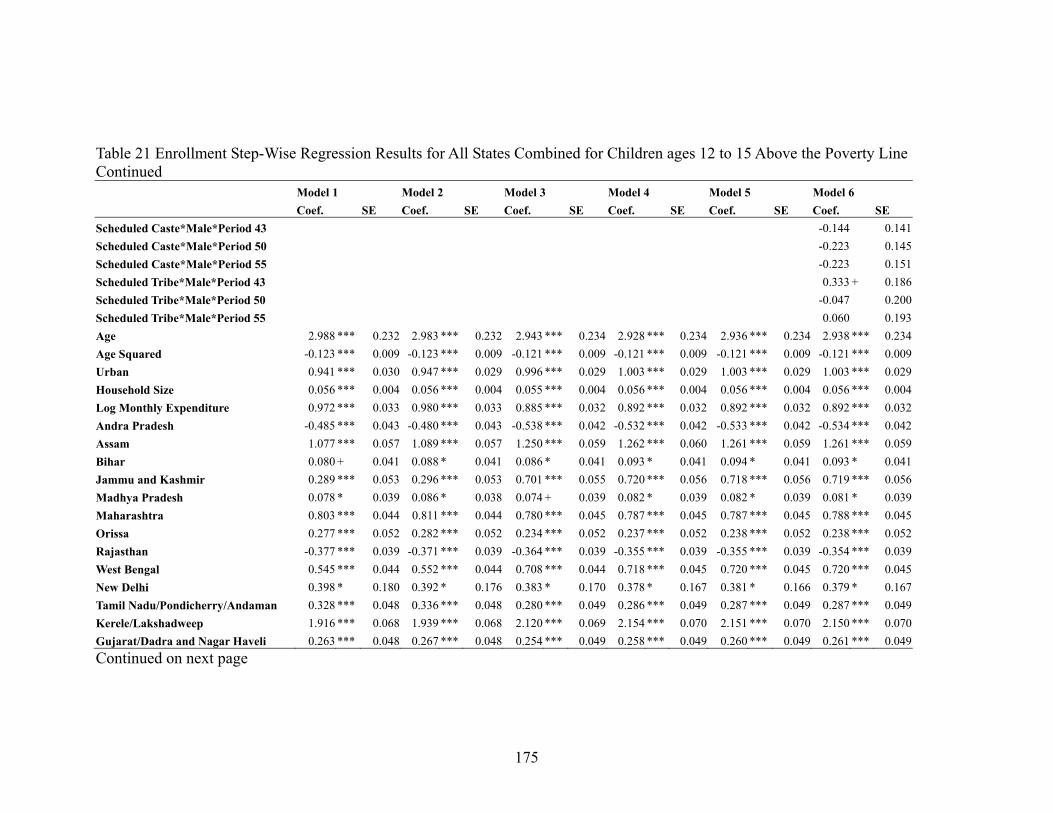
175
Table 21 Enrollment Step-Wise Regression Results for All States Combined for Children ages 12 to 15 Above the Poverty Line Continued Model 1 Model 2 Model 3 Model 4 Model 5 Model 6 Coef. SE Coef. SE Coef. SE Coef. SE Coef. SE Coef. SE Scheduled Caste*Male*Period 43 -0.144 0.141Scheduled Caste*Male*Period 50 -0.223 0.145Scheduled Caste*Male*Period 55 -0.223 0.151Scheduled Tribe*Male*Period 43 0.333 + 0.186Scheduled Tribe*Male*Period 50 -0.047 0.200Scheduled Tribe*Male*Period 55 0.060 0.193Age 2.988 *** 0.232 2.983 *** 0.232 2.943 *** 0.234 2.928 *** 0.234 2.936 *** 0.234 2.938 *** 0.234Age Squared -0.123 *** 0.009 -0.123 *** 0.009 -0.121 *** 0.009 -0.121 *** 0.009 -0.121 *** 0.009 -0.121 *** 0.009Urban 0.941 *** 0.030 0.947 *** 0.029 0.996 *** 0.029 1.003 *** 0.029 1.003 *** 0.029 1.003 *** 0.029Household Size 0.056 *** 0.004 0.056 *** 0.004 0.055 *** 0.004 0.056 *** 0.004 0.056 *** 0.004 0.056 *** 0.004Log Monthly Expenditure 0.972 *** 0.033 0.980 *** 0.033 0.885 *** 0.032 0.892 *** 0.032 0.892 *** 0.032 0.892 *** 0.032Andra Pradesh -0.485 *** 0.043 -0.480 *** 0.043 -0.538 *** 0.042 -0.532 *** 0.042 -0.533 *** 0.042 -0.534 *** 0.042Assam 1.077 *** 0.057 1.089 *** 0.057 1.250 *** 0.059 1.262 *** 0.060 1.261 *** 0.059 1.261 *** 0.059Bihar 0.080 + 0.041 0.088 * 0.041 0.086 * 0.041 0.093 * 0.041 0.094 * 0.041 0.093 * 0.041Jammu and Kashmir 0.289 *** 0.053 0.296 *** 0.053 0.701 *** 0.055 0.720 *** 0.056 0.718 *** 0.056 0.719 *** 0.056Madhya Pradesh 0.078 * 0.039 0.086 * 0.038 0.074 + 0.039 0.082 * 0.039 0.082 * 0.039 0.081 * 0.039Maharashtra 0.803 *** 0.044 0.811 *** 0.044 0.780 *** 0.045 0.787 *** 0.045 0.787 *** 0.045 0.788 *** 0.045Orissa 0.277 *** 0.052 0.282 *** 0.052 0.234 *** 0.052 0.237 *** 0.052 0.238 *** 0.052 0.238 *** 0.052Rajasthan -0.377 *** 0.039 -0.371 *** 0.039 -0.364 *** 0.039 -0.355 *** 0.039 -0.355 *** 0.039 -0.354 *** 0.039West Bengal 0.545 *** 0.044 0.552 *** 0.044 0.708 *** 0.044 0.718 *** 0.045 0.720 *** 0.045 0.720 *** 0.045New Delhi 0.398 * 0.180 0.392 * 0.176 0.383 * 0.170 0.378 * 0.167 0.381 * 0.166 0.379 * 0.167Tamil Nadu/Pondicherry/Andaman 0.328 *** 0.048 0.336 *** 0.048 0.280 *** 0.049 0.286 *** 0.049 0.287 *** 0.049 0.287 *** 0.049Kerele/Lakshadweep 1.916 *** 0.068 1.939 *** 0.068 2.120 *** 0.069 2.154 *** 0.070 2.151 *** 0.070 2.150 *** 0.070Gujarat/Dadra and Nagar Haveli 0.263 *** 0.048 0.267 *** 0.048 0.254 *** 0.049 0.258 *** 0.049 0.260 *** 0.049 0.261 *** 0.049Continued on next page
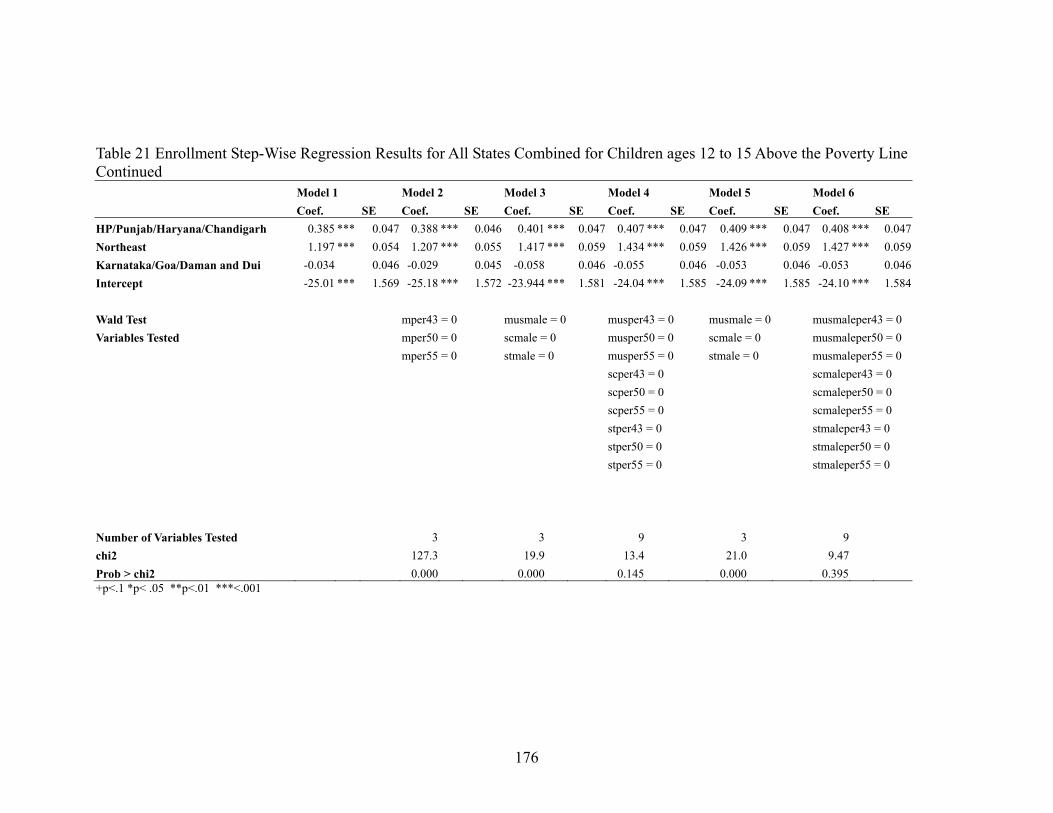
176
Table 21 Enrollment Step-Wise Regression Results for All States Combined for Children ages 12 to 15 Above the Poverty Line Continued Model 1 Model 2 Model 3 Model 4 Model 5 Model 6 Coef. SE Coef. SE Coef. SE Coef. SE Coef. SE Coef. SE HP/Punjab/Haryana/Chandigarh 0.385 *** 0.047 0.388 *** 0.046 0.401 *** 0.047 0.407 *** 0.047 0.409 *** 0.047 0.408 *** 0.047Northeast 1.197 *** 0.054 1.207 *** 0.055 1.417 *** 0.059 1.434 *** 0.059 1.426 *** 0.059 1.427 *** 0.059Karnataka/Goa/Daman and Dui -0.034 0.046 -0.029 0.045 -0.058 0.046 -0.055 0.046 -0.053 0.046 -0.053 0.046Intercept -25.01 *** 1.569 -25.18 *** 1.572 -23.944 *** 1.581 -24.04 *** 1.585 -24.09 *** 1.585 -24.10 *** 1.584 Wald Test mper43 = 0 musmale = 0 musper43 = 0 musmale = 0 musmaleper43 = 0 Variables Tested mper50 = 0 scmale = 0 musper50 = 0 scmale = 0 musmaleper50 = 0 mper55 = 0 stmale = 0 musper55 = 0 stmale = 0 musmaleper55 = 0 scper43 = 0 scmaleper43 = 0 scper50 = 0 scmaleper50 = 0 scper55 = 0 scmaleper55 = 0 stper43 = 0 stmaleper43 = 0 stper50 = 0 stmaleper50 = 0 stper55 = 0 stmaleper55 = 0 Number of Variables Tested 3 3 9 3 9 chi2 127.3 19.9 13.4 21.0 9.47 Prob > chi2 0.000 0.000 0.145 0.000 0.395 +p<.1 *p< .05 **p<.01 ***<.001

177
Table 22 Enrollment Step-Wise Regression Results for Fundamentalist States Combined for Children ages 12 to 15 Above the Poverty Line Model 1 Model 2 Model 3 Model 4 Model 5 Model 6 Coef. SE Coef. SE Coef. SE Coef. SE Coef. SE Coef. SE Independent Variables Historical Period 43 (1987) 0.341 *** 0.035 0.420 *** 0.049 0.349 *** 0.035 0.447 *** 0.053 0.446 *** 0.053 0.461 *** 0.057Historical Period 50 (1993) 0.768 *** 0.037 0.953 *** 0.051 0.810 *** 0.038 1.012 *** 0.056 1.010 *** 0.056 0.987 *** 0.060Historical Period 55 (1999) 1.160 *** 0.042 1.487 *** 0.056 1.227 *** 0.043 1.525 *** 0.062 1.525 *** 0.062 1.499 *** 0.066Male 1.240 *** 0.028 1.557 *** 0.049 1.304 *** 0.035 1.604 *** 0.050 1.602 *** 0.053 1.582 *** 0.058Male*Historical Period 43 (1987) -0.137 * 0.067 -0.124 + 0.068 -0.121 + 0.068 -0.151 + 0.081Male*Historical Period 50 (1993) -0.334 *** 0.071 -0.335 *** 0.073 -0.330 *** 0.073 -0.282 *** 0.087Male*Historical Period 55 (1999) -0.653 *** 0.076 -0.674 *** 0.077 -0.673 *** 0.077 -0.617 *** 0.097Muslim -1.046 *** 0.070 -1.068 *** 0.090 -0.993 *** 0.103 -0.968 *** 0.122Scheduled Caste -0.659 *** 0.060 -0.604 *** 0.080 -0.763 *** 0.098 -0.886 *** 0.145Scheduled Tribe -0.432 *** 0.075 -0.616 *** 0.104 -0.464 *** 0.118 -0.478 ** 0.153Muslim*Male -0.176 + 0.091 -0.123 0.091 -0.163 0.163Scheduled Caste*Male 0.154 + 0.080 0.240 ** 0.082 0.426 * 0.174Scheduled Tribe*Male -0.295 ** 0.098 -0.236 * 0.099 -0.211 0.186Muslim*Period 43 (1987) -0.150 0.125 -0.148 0.124 -0.205 0.178Muslim*Period 50 (1993) -0.153 0.130 -0.164 0.129 -0.105 0.174Muslim*Period 55 (1999) 0.003 0.132 -0.011 0.130 -0.087 0.179Scheduled Caste*Period 43 -0.095 0.109 -0.094 0.111 -0.094 0.188Scheduled Caste*Period 50 -0.056 0.114 -0.033 0.117 0.034 0.186Scheduled Caste*Period 55 0.188 0.116 0.229 + 0.120 0.477 ** 0.182Scheduled Tribe*Period 43 -0.002 0.145 -0.014 0.141 -0.163 0.212Scheduled Tribe*Period 50 0.055 0.148 0.041 0.144 0.188 0.211Scheduled Tribe*Period 55 0.033 0.144 0.006 0.142 0.031 0.204Muslim*Male*Period 43 0.099 0.231Muslim*Male*Period 50 -0.125 0.239Muslim*Male*Period 55 0.139 0.247Continued on next page
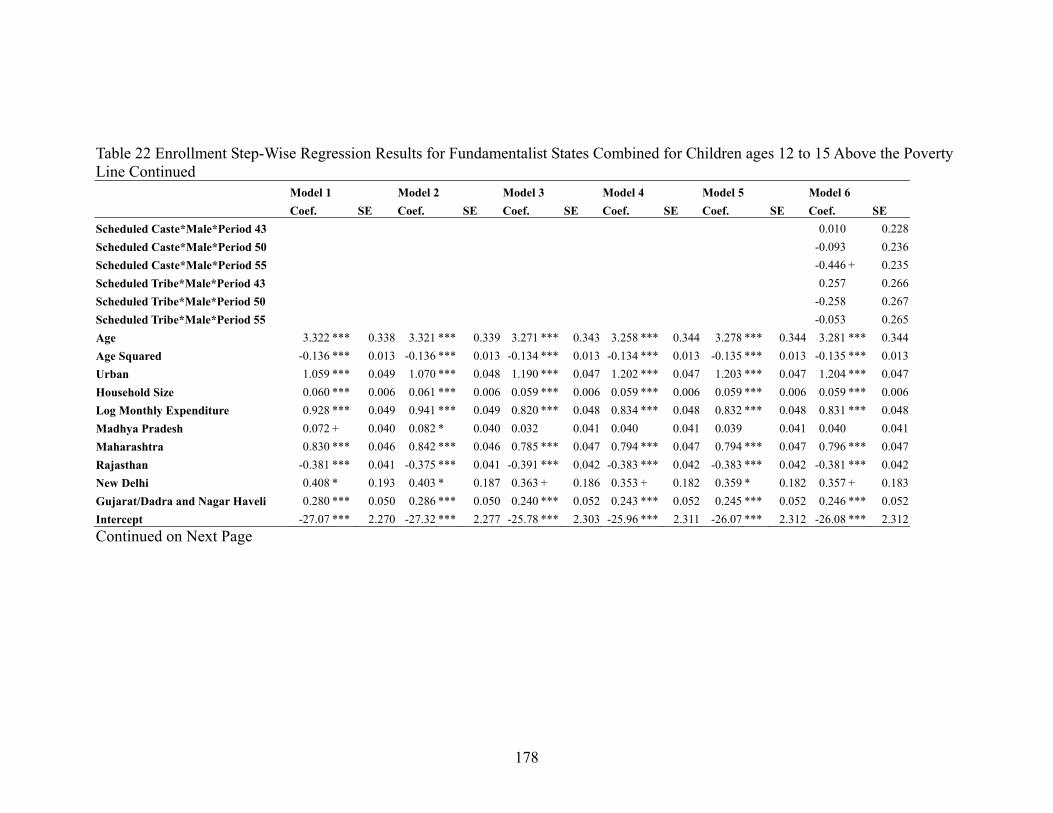
178
Table 22 Enrollment Step-Wise Regression Results for Fundamentalist States Combined for Children ages 12 to 15 Above the Poverty Line Continued Model 1 Model 2 Model 3 Model 4 Model 5 Model 6 Coef. SE Coef. SE Coef. SE Coef. SE Coef. SE Coef. SE Scheduled Caste*Male*Period 43 0.010 0.228Scheduled Caste*Male*Period 50 -0.093 0.236Scheduled Caste*Male*Period 55 -0.446 + 0.235Scheduled Tribe*Male*Period 43 0.257 0.266Scheduled Tribe*Male*Period 50 -0.258 0.267Scheduled Tribe*Male*Period 55 -0.053 0.265Age 3.322 *** 0.338 3.321 *** 0.339 3.271 *** 0.343 3.258 *** 0.344 3.278 *** 0.344 3.281 *** 0.344Age Squared -0.136 *** 0.013 -0.136 *** 0.013 -0.134 *** 0.013 -0.134 *** 0.013 -0.135 *** 0.013 -0.135 *** 0.013Urban 1.059 *** 0.049 1.070 *** 0.048 1.190 *** 0.047 1.202 *** 0.047 1.203 *** 0.047 1.204 *** 0.047Household Size 0.060 *** 0.006 0.061 *** 0.006 0.059 *** 0.006 0.059 *** 0.006 0.059 *** 0.006 0.059 *** 0.006Log Monthly Expenditure 0.928 *** 0.049 0.941 *** 0.049 0.820 *** 0.048 0.834 *** 0.048 0.832 *** 0.048 0.831 *** 0.048Madhya Pradesh 0.072 + 0.040 0.082 * 0.040 0.032 0.041 0.040 0.041 0.039 0.041 0.040 0.041Maharashtra 0.830 *** 0.046 0.842 *** 0.046 0.785 *** 0.047 0.794 *** 0.047 0.794 *** 0.047 0.796 *** 0.047Rajasthan -0.381 *** 0.041 -0.375 *** 0.041 -0.391 *** 0.042 -0.383 *** 0.042 -0.383 *** 0.042 -0.381 *** 0.042New Delhi 0.408 * 0.193 0.403 * 0.187 0.363 + 0.186 0.353 + 0.182 0.359 * 0.182 0.357 + 0.183Gujarat/Dadra and Nagar Haveli 0.280 *** 0.050 0.286 *** 0.050 0.240 *** 0.052 0.243 *** 0.052 0.245 *** 0.052 0.246 *** 0.052Intercept -27.07 *** 2.270 -27.32 *** 2.277 -25.78 *** 2.303 -25.96 *** 2.311 -26.07 *** 2.312 -26.08 *** 2.312Continued on Next Page
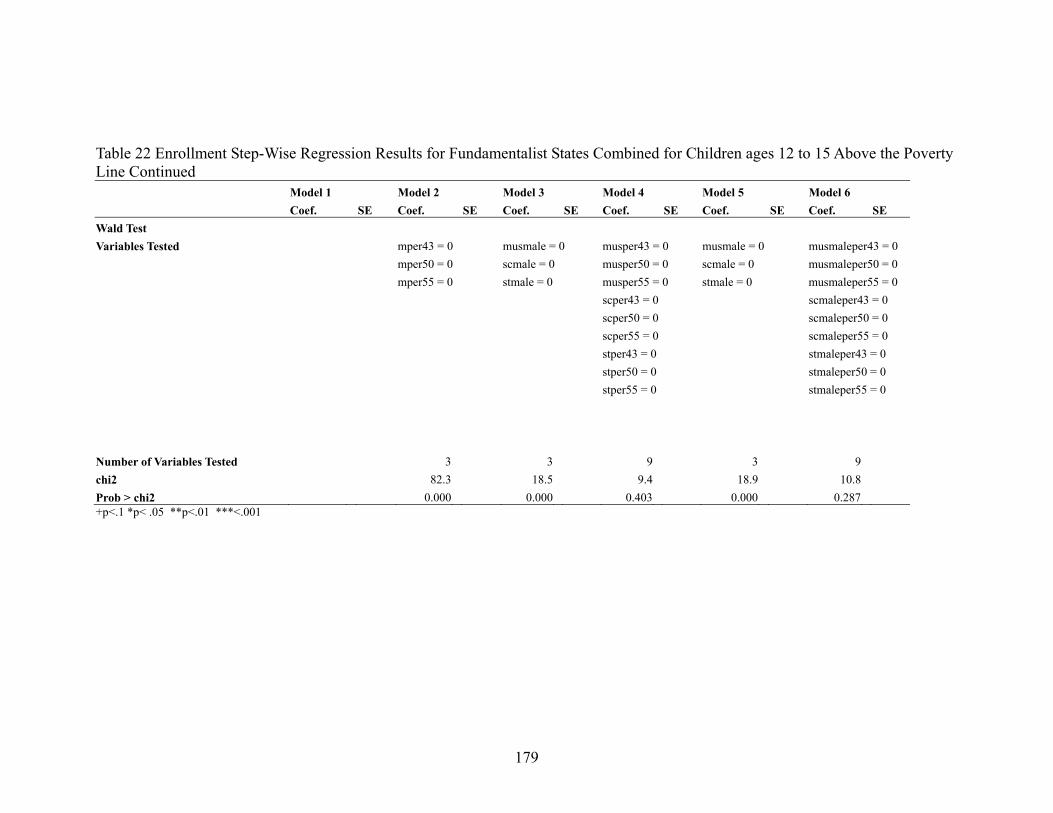
179
Table 22 Enrollment Step-Wise Regression Results for Fundamentalist States Combined for Children ages 12 to 15 Above the Poverty Line Continued Model 1 Model 2 Model 3 Model 4 Model 5 Model 6 Coef. SE Coef. SE Coef. SE Coef. SE Coef. SE Coef. SE Wald Test Variables Tested mper43 = 0 musmale = 0 musper43 = 0 musmale = 0 musmaleper43 = 0 mper50 = 0 scmale = 0 musper50 = 0 scmale = 0 musmaleper50 = 0 mper55 = 0 stmale = 0 musper55 = 0 stmale = 0 musmaleper55 = 0 scper43 = 0 scmaleper43 = 0 scper50 = 0 scmaleper50 = 0 scper55 = 0 scmaleper55 = 0 stper43 = 0 stmaleper43 = 0 stper50 = 0 stmaleper50 = 0 stper55 = 0 stmaleper55 = 0 Number of Variables Tested 3 3 9 3 9 chi2 82.3 18.5 9.4 18.9 10.8 Prob > chi2 0.000 0.000 0.403 0.000 0.287 +p<.1 *p< .05 **p<.01 ***<.001
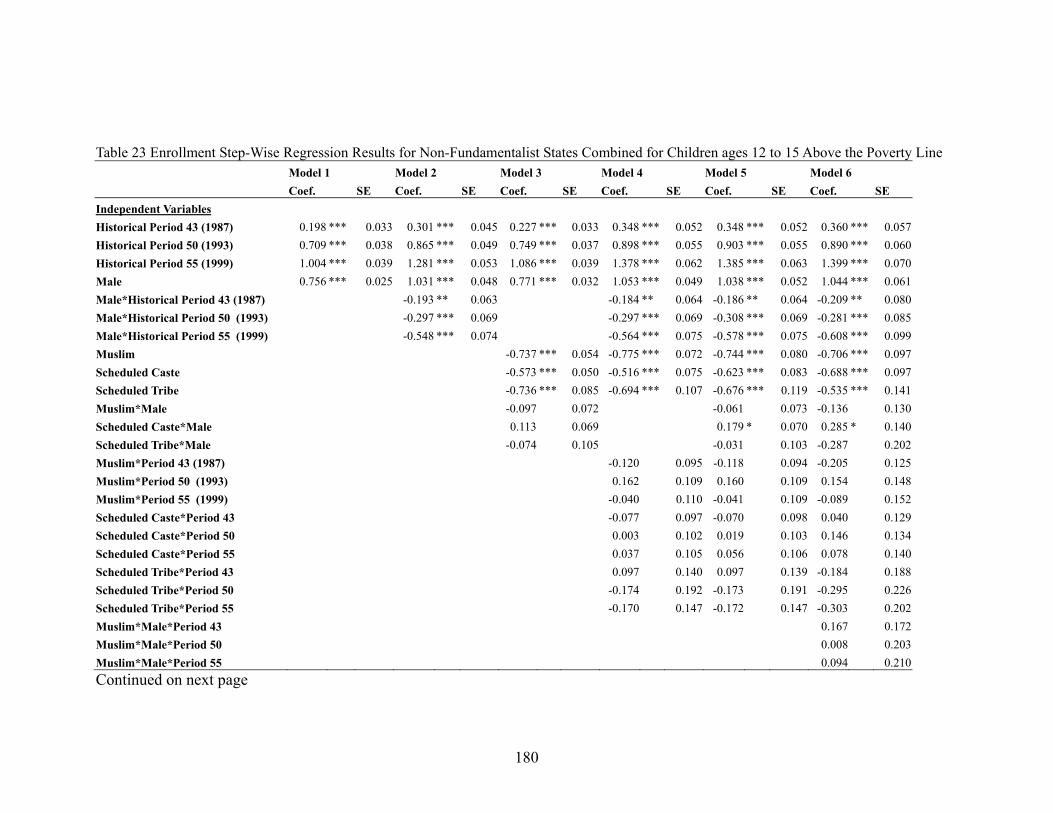
180
Table 23 Enrollment Step-Wise Regression Results for Non-Fundamentalist States Combined for Children ages 12 to 15 Above the Poverty Line Model 1 Model 2 Model 3 Model 4 Model 5 Model 6 Coef. SE Coef. SE Coef. SE Coef. SE Coef. SE Coef. SE Independent Variables Historical Period 43 (1987) 0.198 *** 0.033 0.301 *** 0.045 0.227 *** 0.033 0.348 *** 0.052 0.348 *** 0.052 0.360 *** 0.057Historical Period 50 (1993) 0.709 *** 0.038 0.865 *** 0.049 0.749 *** 0.037 0.898 *** 0.055 0.903 *** 0.055 0.890 *** 0.060Historical Period 55 (1999) 1.004 *** 0.039 1.281 *** 0.053 1.086 *** 0.039 1.378 *** 0.062 1.385 *** 0.063 1.399 *** 0.070Male 0.756 *** 0.025 1.031 *** 0.048 0.771 *** 0.032 1.053 *** 0.049 1.038 *** 0.052 1.044 *** 0.061Male*Historical Period 43 (1987) -0.193 ** 0.063 -0.184 ** 0.064 -0.186 ** 0.064 -0.209 ** 0.080Male*Historical Period 50 (1993) -0.297 *** 0.069 -0.297 *** 0.069 -0.308 *** 0.069 -0.281 *** 0.085Male*Historical Period 55 (1999) -0.548 *** 0.074 -0.564 *** 0.075 -0.578 *** 0.075 -0.608 *** 0.099Muslim -0.737 *** 0.054 -0.775 *** 0.072 -0.744 *** 0.080 -0.706 *** 0.097Scheduled Caste -0.573 *** 0.050 -0.516 *** 0.075 -0.623 *** 0.083 -0.688 *** 0.097Scheduled Tribe -0.736 *** 0.085 -0.694 *** 0.107 -0.676 *** 0.119 -0.535 *** 0.141Muslim*Male -0.097 0.072 -0.061 0.073 -0.136 0.130Scheduled Caste*Male 0.113 0.069 0.179 * 0.070 0.285 * 0.140Scheduled Tribe*Male -0.074 0.105 -0.031 0.103 -0.287 0.202Muslim*Period 43 (1987) -0.120 0.095 -0.118 0.094 -0.205 0.125Muslim*Period 50 (1993) 0.162 0.109 0.160 0.109 0.154 0.148Muslim*Period 55 (1999) -0.040 0.110 -0.041 0.109 -0.089 0.152Scheduled Caste*Period 43 -0.077 0.097 -0.070 0.098 0.040 0.129Scheduled Caste*Period 50 0.003 0.102 0.019 0.103 0.146 0.134Scheduled Caste*Period 55 0.037 0.105 0.056 0.106 0.078 0.140Scheduled Tribe*Period 43 0.097 0.140 0.097 0.139 -0.184 0.188Scheduled Tribe*Period 50 -0.174 0.192 -0.173 0.191 -0.295 0.226Scheduled Tribe*Period 55 -0.170 0.147 -0.172 0.147 -0.303 0.202Muslim*Male*Period 43 0.167 0.172Muslim*Male*Period 50 0.008 0.203Muslim*Male*Period 55 0.094 0.210Continued on next page
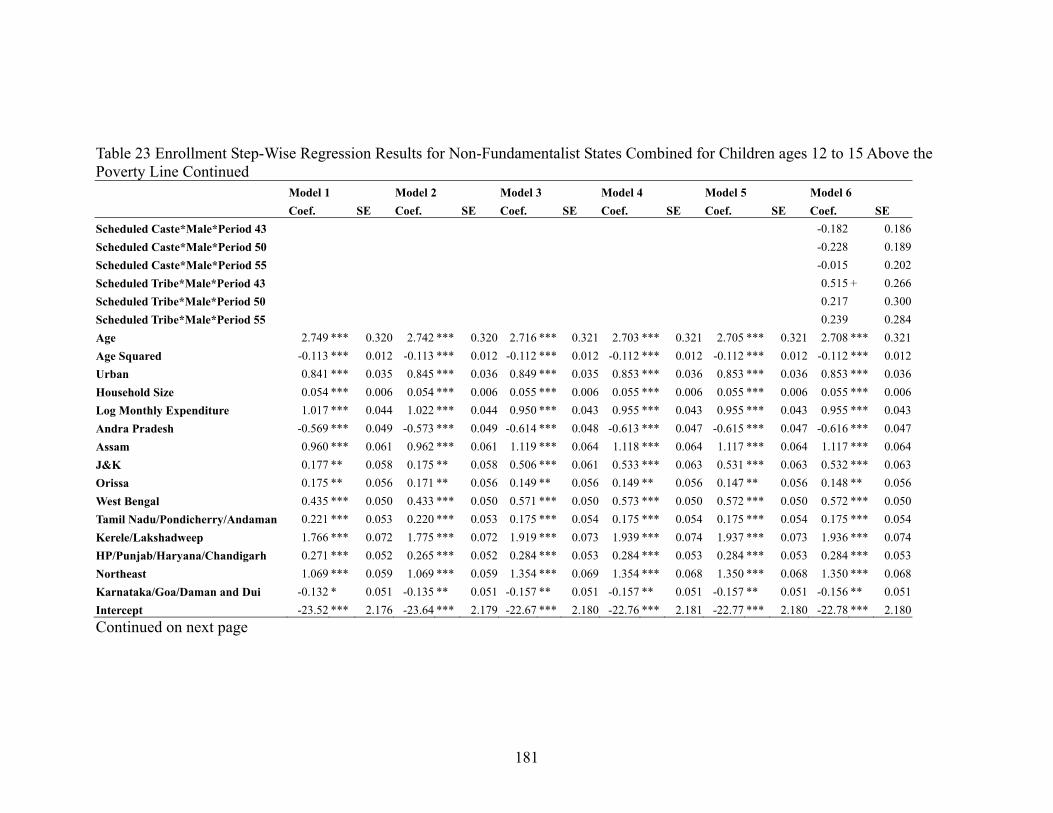
181
Table 23 Enrollment Step-Wise Regression Results for Non-Fundamentalist States Combined for Children ages 12 to 15 Above the Poverty Line Continued Model 1 Model 2 Model 3 Model 4 Model 5 Model 6 Coef. SE Coef. SE Coef. SE Coef. SE Coef. SE Coef. SE Scheduled Caste*Male*Period 43 -0.182 0.186Scheduled Caste*Male*Period 50 -0.228 0.189Scheduled Caste*Male*Period 55 -0.015 0.202Scheduled Tribe*Male*Period 43 0.515 + 0.266Scheduled Tribe*Male*Period 50 0.217 0.300Scheduled Tribe*Male*Period 55 0.239 0.284Age 2.749 *** 0.320 2.742 *** 0.320 2.716 *** 0.321 2.703 *** 0.321 2.705 *** 0.321 2.708 *** 0.321Age Squared -0.113 *** 0.012 -0.113 *** 0.012 -0.112 *** 0.012 -0.112 *** 0.012 -0.112 *** 0.012 -0.112 *** 0.012Urban 0.841 *** 0.035 0.845 *** 0.036 0.849 *** 0.035 0.853 *** 0.036 0.853 *** 0.036 0.853 *** 0.036Household Size 0.054 *** 0.006 0.054 *** 0.006 0.055 *** 0.006 0.055 *** 0.006 0.055 *** 0.006 0.055 *** 0.006Log Monthly Expenditure 1.017 *** 0.044 1.022 *** 0.044 0.950 *** 0.043 0.955 *** 0.043 0.955 *** 0.043 0.955 *** 0.043Andra Pradesh -0.569 *** 0.049 -0.573 *** 0.049 -0.614 *** 0.048 -0.613 *** 0.047 -0.615 *** 0.047 -0.616 *** 0.047Assam 0.960 *** 0.061 0.962 *** 0.061 1.119 *** 0.064 1.118 *** 0.064 1.117 *** 0.064 1.117 *** 0.064J&K 0.177 ** 0.058 0.175 ** 0.058 0.506 *** 0.061 0.533 *** 0.063 0.531 *** 0.063 0.532 *** 0.063Orissa 0.175 ** 0.056 0.171 ** 0.056 0.149 ** 0.056 0.149 ** 0.056 0.147 ** 0.056 0.148 ** 0.056West Bengal 0.435 *** 0.050 0.433 *** 0.050 0.571 *** 0.050 0.573 *** 0.050 0.572 *** 0.050 0.572 *** 0.050Tamil Nadu/Pondicherry/Andaman 0.221 *** 0.053 0.220 *** 0.053 0.175 *** 0.054 0.175 *** 0.054 0.175 *** 0.054 0.175 *** 0.054Kerele/Lakshadweep 1.766 *** 0.072 1.775 *** 0.072 1.919 *** 0.073 1.939 *** 0.074 1.937 *** 0.073 1.936 *** 0.074HP/Punjab/Haryana/Chandigarh 0.271 *** 0.052 0.265 *** 0.052 0.284 *** 0.053 0.284 *** 0.053 0.284 *** 0.053 0.284 *** 0.053Northeast 1.069 *** 0.059 1.069 *** 0.059 1.354 *** 0.069 1.354 *** 0.068 1.350 *** 0.068 1.350 *** 0.068Karnataka/Goa/Daman and Dui -0.132 * 0.051 -0.135 ** 0.051 -0.157 ** 0.051 -0.157 ** 0.051 -0.157 ** 0.051 -0.156 ** 0.051Intercept -23.52 *** 2.176 -23.64 *** 2.179 -22.67 *** 2.180 -22.76 *** 2.181 -22.77 *** 2.180 -22.78 *** 2.180Continued on next page
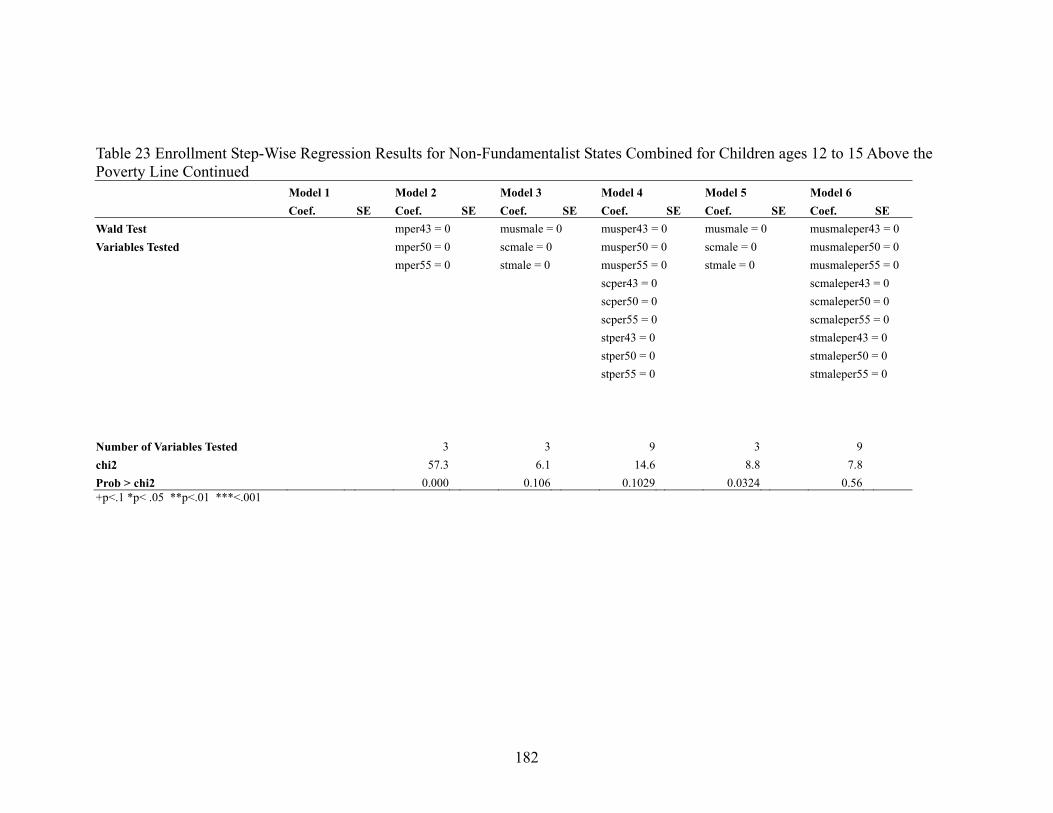
182
Table 23 Enrollment Step-Wise Regression Results for Non-Fundamentalist States Combined for Children ages 12 to 15 Above the Poverty Line Continued Model 1 Model 2 Model 3 Model 4 Model 5 Model 6 Coef. SE Coef. SE Coef. SE Coef. SE Coef. SE Coef. SE Wald Test mper43 = 0 musmale = 0 musper43 = 0 musmale = 0 musmaleper43 = 0 Variables Tested mper50 = 0 scmale = 0 musper50 = 0 scmale = 0 musmaleper50 = 0 mper55 = 0 stmale = 0 musper55 = 0 stmale = 0 musmaleper55 = 0 scper43 = 0 scmaleper43 = 0 scper50 = 0 scmaleper50 = 0 scper55 = 0 scmaleper55 = 0 stper43 = 0 stmaleper43 = 0 stper50 = 0 stmaleper50 = 0 stper55 = 0 stmaleper55 = 0 Number of Variables Tested 3 3 9 3 9 chi2 57.3 6.1 14.6 8.8 7.8 Prob > chi2 0.000 0.106 0.1029 0.0324 0.56 +p<.1 *p< .05 **p<.01 ***<.001
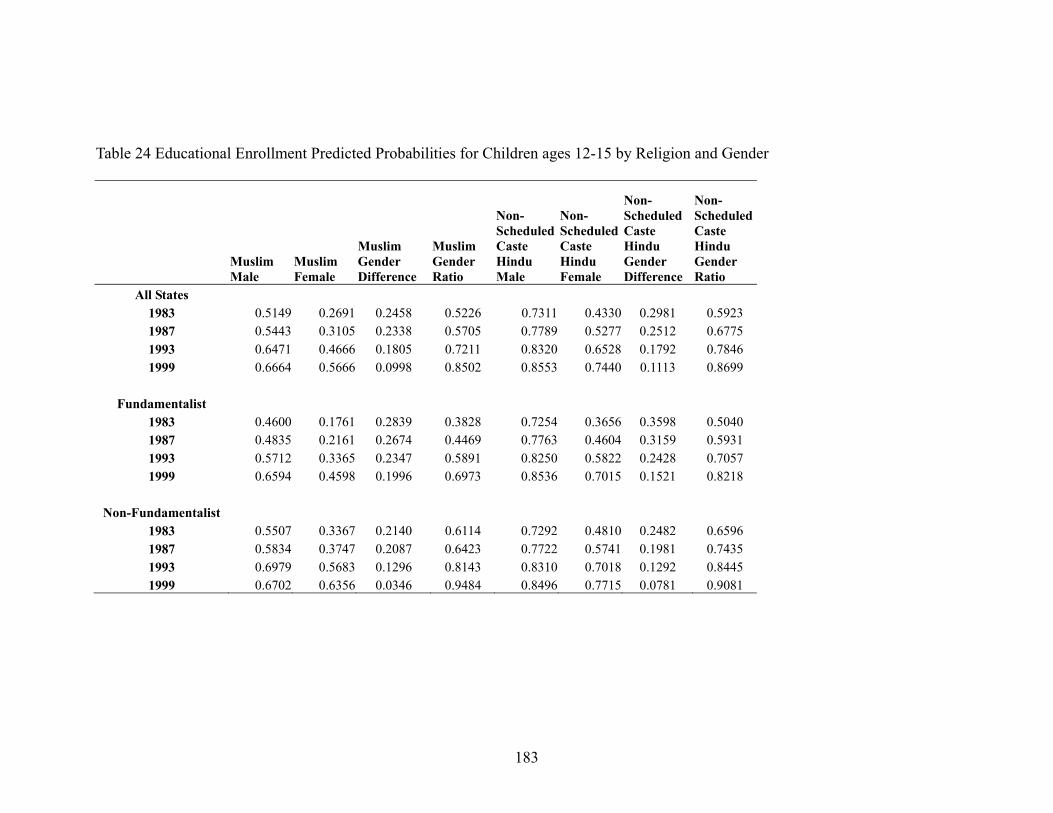
183
Table 24 Educational Enrollment Predicted Probabilities for Children ages 12-15 by Religion and Gender
Muslim Male
Muslim Female
Muslim Gender Difference
Muslim Gender Ratio
Non-Scheduled Caste Hindu Male
Non-Scheduled Caste Hindu Female
Non-Scheduled Caste Hindu Gender Difference
Non-Scheduled Caste Hindu Gender Ratio
All States 1983 0.5149 0.2691 0.2458 0.5226 0.7311 0.4330 0.2981 0.5923 1987 0.5443 0.3105 0.2338 0.5705 0.7789 0.5277 0.2512 0.6775 1993 0.6471 0.4666 0.1805 0.7211 0.8320 0.6528 0.1792 0.7846 1999 0.6664 0.5666 0.0998 0.8502 0.8553 0.7440 0.1113 0.8699
Fundamentalist
1983 0.4600 0.1761 0.2839 0.3828 0.7254 0.3656 0.3598 0.5040 1987 0.4835 0.2161 0.2674 0.4469 0.7763 0.4604 0.3159 0.5931 1993 0.5712 0.3365 0.2347 0.5891 0.8250 0.5822 0.2428 0.7057 1999 0.6594 0.4598 0.1996 0.6973 0.8536 0.7015 0.1521 0.8218
Non-Fundamentalist
1983 0.5507 0.3367 0.2140 0.6114 0.7292 0.4810 0.2482 0.6596 1987 0.5834 0.3747 0.2087 0.6423 0.7722 0.5741 0.1981 0.7435 1993 0.6979 0.5683 0.1296 0.8143 0.8310 0.7018 0.1292 0.8445 1999 0.6702 0.6356 0.0346 0.9484 0.8496 0.7715 0.0781 0.9081
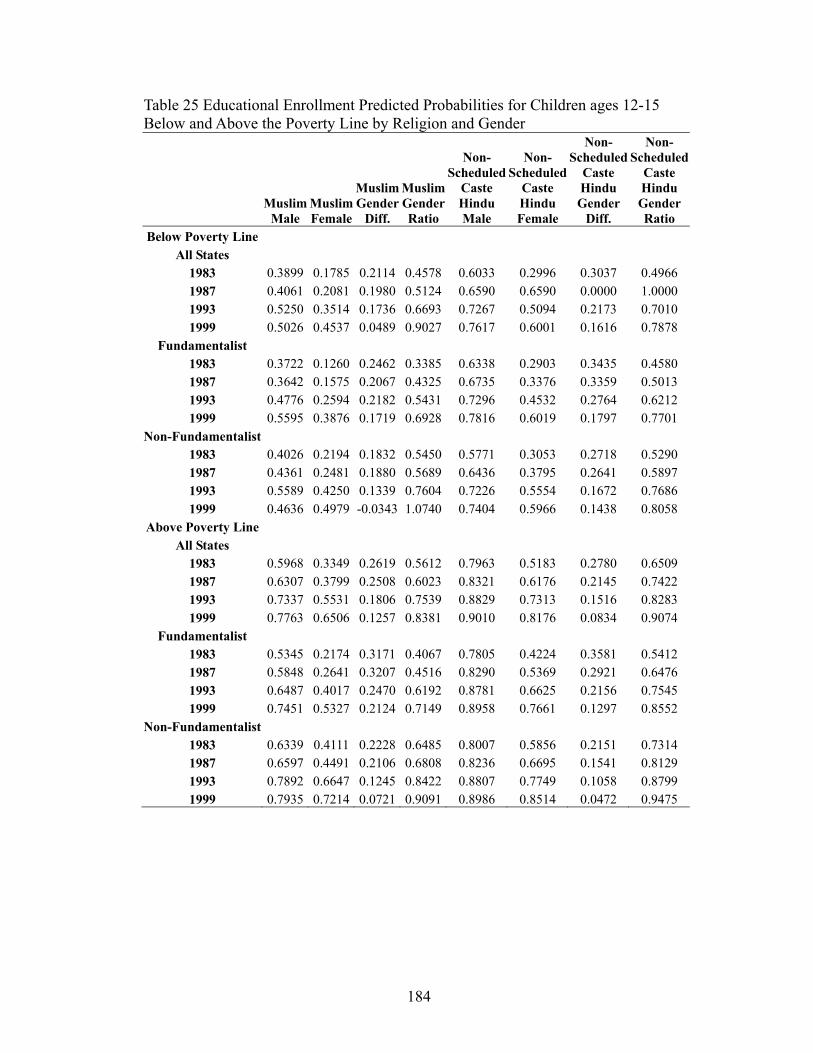
184
Table 25 Educational Enrollment Predicted Probabilities for Children ages 12-15 Below and Above the Poverty Line by Religion and Gender
Muslim
Male MuslimFemale
Muslim Gender
Diff.
Muslim Gender Ratio
Non-Scheduled
Caste Hindu Male
Non-Scheduled
Caste Hindu Female
Non-Scheduled
Caste Hindu Gender
Diff.
Non-Scheduled
Caste Hindu Gender Ratio
Below Poverty Line All States
1983 0.3899 0.1785 0.2114 0.4578 0.6033 0.2996 0.3037 0.4966 1987 0.4061 0.2081 0.1980 0.5124 0.6590 0.6590 0.0000 1.0000 1993 0.5250 0.3514 0.1736 0.6693 0.7267 0.5094 0.2173 0.7010 1999 0.5026 0.4537 0.0489 0.9027 0.7617 0.6001 0.1616 0.7878
Fundamentalist 1983 0.3722 0.1260 0.2462 0.3385 0.6338 0.2903 0.3435 0.4580 1987 0.3642 0.1575 0.2067 0.4325 0.6735 0.3376 0.3359 0.5013 1993 0.4776 0.2594 0.2182 0.5431 0.7296 0.4532 0.2764 0.6212 1999 0.5595 0.3876 0.1719 0.6928 0.7816 0.6019 0.1797 0.7701
Non-Fundamentalist 1983 0.4026 0.2194 0.1832 0.5450 0.5771 0.3053 0.2718 0.5290 1987 0.4361 0.2481 0.1880 0.5689 0.6436 0.3795 0.2641 0.5897 1993 0.5589 0.4250 0.1339 0.7604 0.7226 0.5554 0.1672 0.7686 1999 0.4636 0.4979 -0.0343 1.0740 0.7404 0.5966 0.1438 0.8058
Above Poverty Line All States
1983 0.5968 0.3349 0.2619 0.5612 0.7963 0.5183 0.2780 0.6509 1987 0.6307 0.3799 0.2508 0.6023 0.8321 0.6176 0.2145 0.7422 1993 0.7337 0.5531 0.1806 0.7539 0.8829 0.7313 0.1516 0.8283 1999 0.7763 0.6506 0.1257 0.8381 0.9010 0.8176 0.0834 0.9074
Fundamentalist 1983 0.5345 0.2174 0.3171 0.4067 0.7805 0.4224 0.3581 0.5412 1987 0.5848 0.2641 0.3207 0.4516 0.8290 0.5369 0.2921 0.6476 1993 0.6487 0.4017 0.2470 0.6192 0.8781 0.6625 0.2156 0.7545 1999 0.7451 0.5327 0.2124 0.7149 0.8958 0.7661 0.1297 0.8552
Non-Fundamentalist 1983 0.6339 0.4111 0.2228 0.6485 0.8007 0.5856 0.2151 0.7314 1987 0.6597 0.4491 0.2106 0.6808 0.8236 0.6695 0.1541 0.8129 1993 0.7892 0.6647 0.1245 0.8422 0.8807 0.7749 0.1058 0.8799 1999 0.7935 0.7214 0.0721 0.9091 0.8986 0.8514 0.0472 0.9475
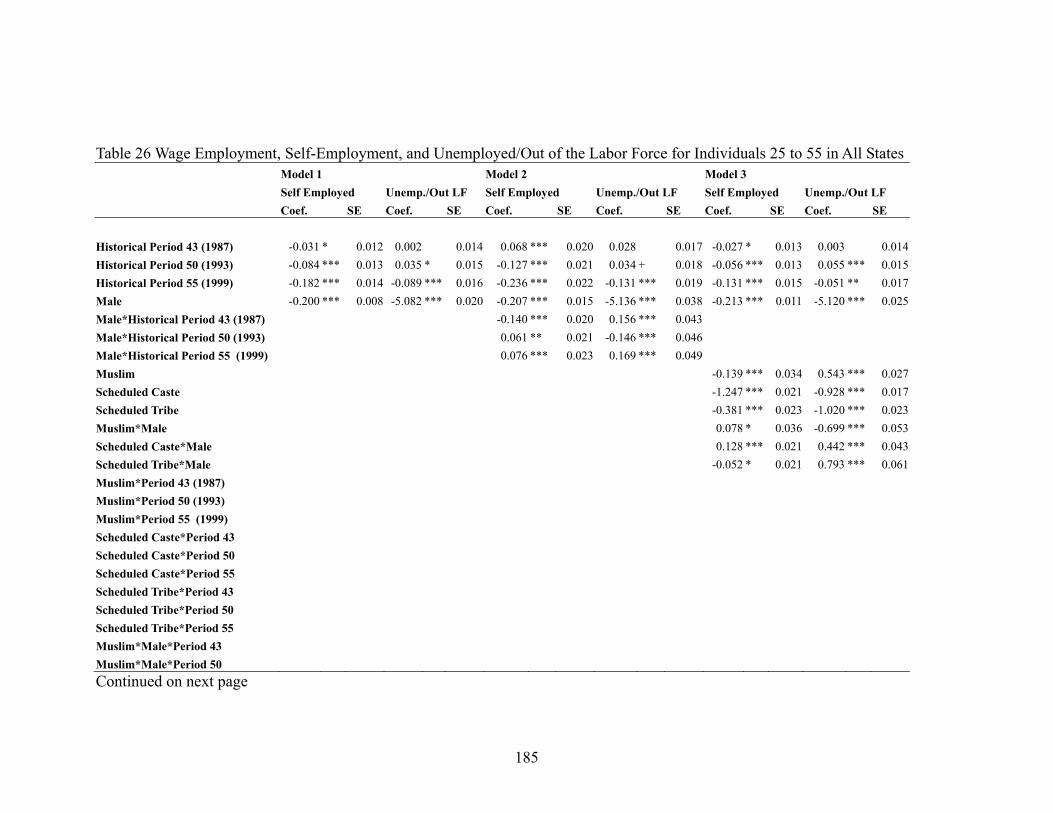
185
Table 26 Wage Employment, Self-Employment, and Unemployed/Out of the Labor Force for Individuals 25 to 55 in All States Model 1 Model 2 Model 3 Self Employed Unemp./Out LF Self Employed Unemp./Out LF Self Employed Unemp./Out LF Coef. SE Coef. SE Coef. SE Coef. SE Coef. SE Coef. SE Historical Period 43 (1987) -0.031 * 0.012 0.002 0.014 0.068 *** 0.020 0.028 0.017 -0.027 * 0.013 0.003 0.014Historical Period 50 (1993) -0.084 *** 0.013 0.035 * 0.015 -0.127 *** 0.021 0.034 + 0.018 -0.056 *** 0.013 0.055 *** 0.015Historical Period 55 (1999) -0.182 *** 0.014 -0.089 *** 0.016 -0.236 *** 0.022 -0.131 *** 0.019 -0.131 *** 0.015 -0.051 ** 0.017Male -0.200 *** 0.008 -5.082 *** 0.020 -0.207 *** 0.015 -5.136 *** 0.038 -0.213 *** 0.011 -5.120 *** 0.025Male*Historical Period 43 (1987) -0.140 *** 0.020 0.156 *** 0.043 Male*Historical Period 50 (1993) 0.061 ** 0.021 -0.146 *** 0.046 Male*Historical Period 55 (1999) 0.076 *** 0.023 0.169 *** 0.049 Muslim -0.139 *** 0.034 0.543 *** 0.027Scheduled Caste -1.247 *** 0.021 -0.928 *** 0.017Scheduled Tribe -0.381 *** 0.023 -1.020 *** 0.023Muslim*Male 0.078 * 0.036 -0.699 *** 0.053Scheduled Caste*Male 0.128 *** 0.021 0.442 *** 0.043Scheduled Tribe*Male -0.052 * 0.021 0.793 *** 0.061Muslim*Period 43 (1987) Muslim*Period 50 (1993) Muslim*Period 55 (1999) Scheduled Caste*Period 43 Scheduled Caste*Period 50 Scheduled Caste*Period 55 Scheduled Tribe*Period 43 Scheduled Tribe*Period 50 Scheduled Tribe*Period 55 Muslim*Male*Period 43 Muslim*Male*Period 50 Continued on next page
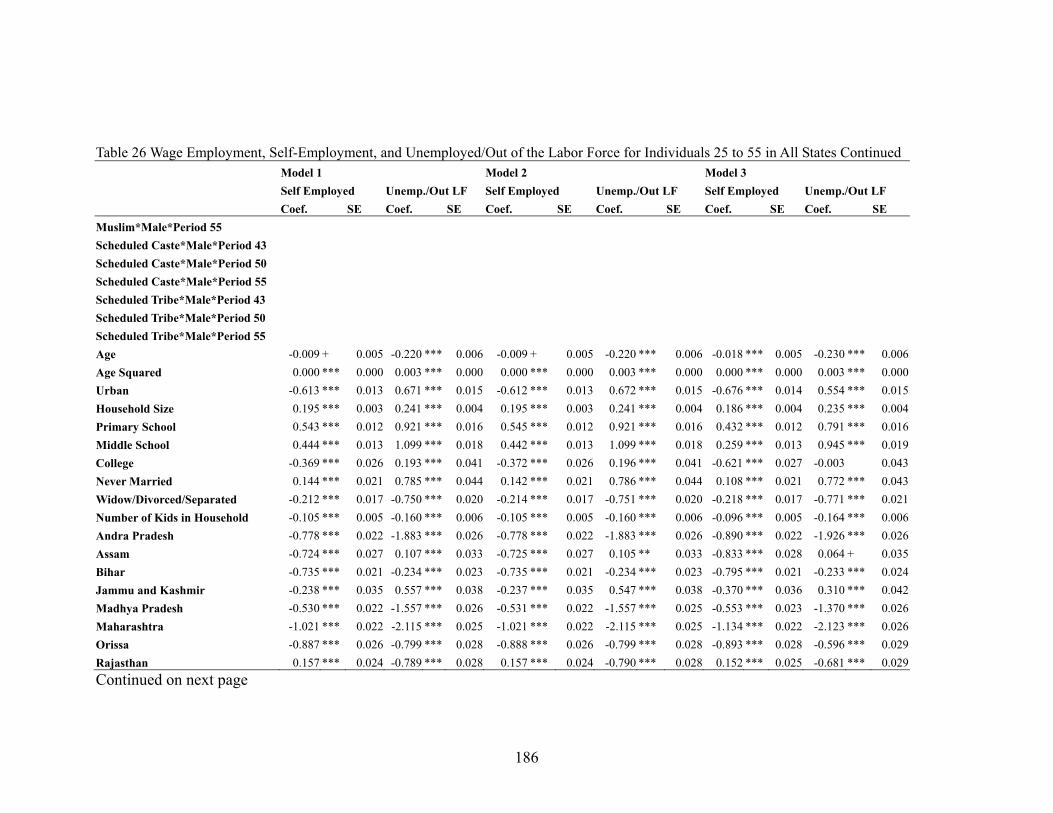
186
Table 26 Wage Employment, Self-Employment, and Unemployed/Out of the Labor Force for Individuals 25 to 55 in All States Continued Model 1 Model 2 Model 3 Self Employed Unemp./Out LF Self Employed Unemp./Out LF Self Employed Unemp./Out LF Coef. SE Coef. SE Coef. SE Coef. SE Coef. SE Coef. SE Muslim*Male*Period 55 Scheduled Caste*Male*Period 43 Scheduled Caste*Male*Period 50 Scheduled Caste*Male*Period 55 Scheduled Tribe*Male*Period 43 Scheduled Tribe*Male*Period 50 Scheduled Tribe*Male*Period 55 Age -0.009 + 0.005 -0.220 *** 0.006 -0.009 + 0.005 -0.220 *** 0.006 -0.018 *** 0.005 -0.230 *** 0.006Age Squared 0.000 *** 0.000 0.003 *** 0.000 0.000 *** 0.000 0.003 *** 0.000 0.000 *** 0.000 0.003 *** 0.000Urban -0.613 *** 0.013 0.671 *** 0.015 -0.612 *** 0.013 0.672 *** 0.015 -0.676 *** 0.014 0.554 *** 0.015Household Size 0.195 *** 0.003 0.241 *** 0.004 0.195 *** 0.003 0.241 *** 0.004 0.186 *** 0.004 0.235 *** 0.004Primary School 0.543 *** 0.012 0.921 *** 0.016 0.545 *** 0.012 0.921 *** 0.016 0.432 *** 0.012 0.791 *** 0.016Middle School 0.444 *** 0.013 1.099 *** 0.018 0.442 *** 0.013 1.099 *** 0.018 0.259 *** 0.013 0.945 *** 0.019College -0.369 *** 0.026 0.193 *** 0.041 -0.372 *** 0.026 0.196 *** 0.041 -0.621 *** 0.027 -0.003 0.043Never Married 0.144 *** 0.021 0.785 *** 0.044 0.142 *** 0.021 0.786 *** 0.044 0.108 *** 0.021 0.772 *** 0.043Widow/Divorced/Separated -0.212 *** 0.017 -0.750 *** 0.020 -0.214 *** 0.017 -0.751 *** 0.020 -0.218 *** 0.017 -0.771 *** 0.021Number of Kids in Household -0.105 *** 0.005 -0.160 *** 0.006 -0.105 *** 0.005 -0.160 *** 0.006 -0.096 *** 0.005 -0.164 *** 0.006Andra Pradesh -0.778 *** 0.022 -1.883 *** 0.026 -0.778 *** 0.022 -1.883 *** 0.026 -0.890 *** 0.022 -1.926 *** 0.026Assam -0.724 *** 0.027 0.107 *** 0.033 -0.725 *** 0.027 0.105 ** 0.033 -0.833 *** 0.028 0.064 + 0.035Bihar -0.735 *** 0.021 -0.234 *** 0.023 -0.735 *** 0.021 -0.234 *** 0.023 -0.795 *** 0.021 -0.233 *** 0.024Jammu and Kashmir -0.238 *** 0.035 0.557 *** 0.038 -0.237 *** 0.035 0.547 *** 0.038 -0.370 *** 0.036 0.310 *** 0.042Madhya Pradesh -0.530 *** 0.022 -1.557 *** 0.026 -0.531 *** 0.022 -1.557 *** 0.025 -0.553 *** 0.023 -1.370 *** 0.026Maharashtra -1.021 *** 0.022 -2.115 *** 0.025 -1.021 *** 0.022 -2.115 *** 0.025 -1.134 *** 0.022 -2.123 *** 0.026Orissa -0.887 *** 0.026 -0.799 *** 0.028 -0.888 *** 0.026 -0.799 *** 0.028 -0.893 *** 0.028 -0.596 *** 0.029Rajasthan 0.157 *** 0.024 -0.789 *** 0.028 0.157 *** 0.024 -0.790 *** 0.028 0.152 *** 0.025 -0.681 *** 0.029Continued on next page
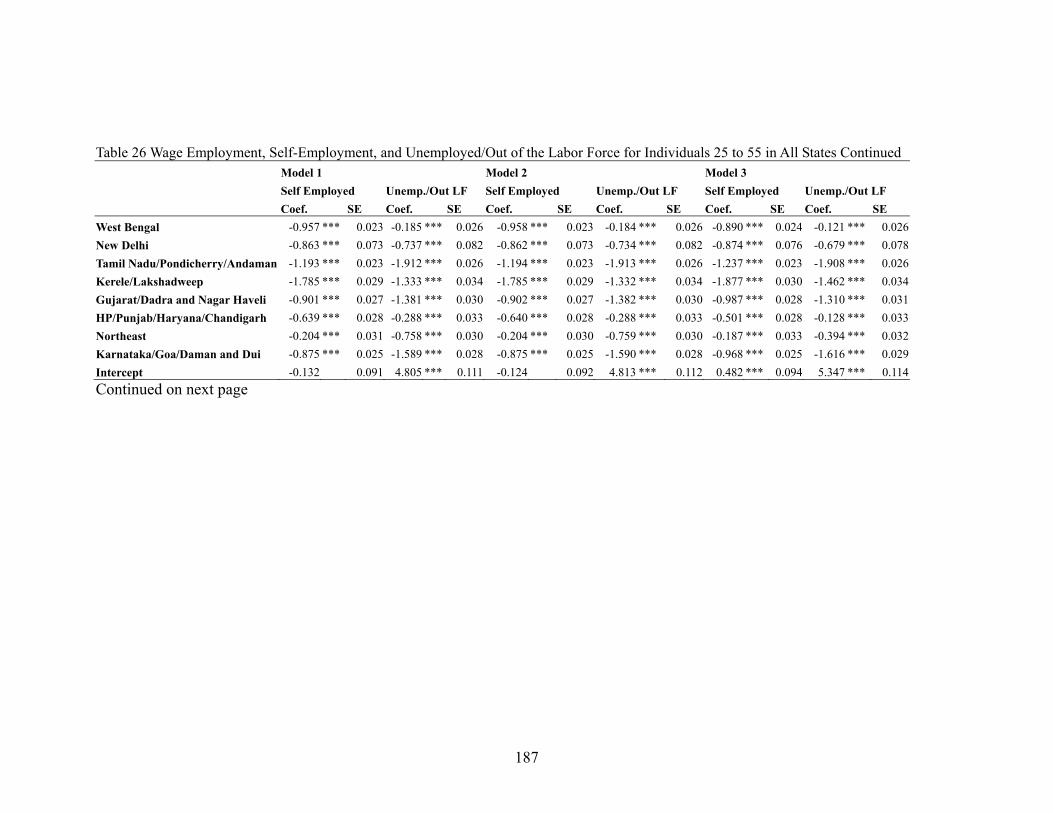
187
Table 26 Wage Employment, Self-Employment, and Unemployed/Out of the Labor Force for Individuals 25 to 55 in All States Continued Model 1 Model 2 Model 3 Self Employed Unemp./Out LF Self Employed Unemp./Out LF Self Employed Unemp./Out LF Coef. SE Coef. SE Coef. SE Coef. SE Coef. SE Coef. SE West Bengal -0.957 *** 0.023 -0.185 *** 0.026 -0.958 *** 0.023 -0.184 *** 0.026 -0.890 *** 0.024 -0.121 *** 0.026New Delhi -0.863 *** 0.073 -0.737 *** 0.082 -0.862 *** 0.073 -0.734 *** 0.082 -0.874 *** 0.076 -0.679 *** 0.078Tamil Nadu/Pondicherry/Andaman -1.193 *** 0.023 -1.912 *** 0.026 -1.194 *** 0.023 -1.913 *** 0.026 -1.237 *** 0.023 -1.908 *** 0.026Kerele/Lakshadweep -1.785 *** 0.029 -1.333 *** 0.034 -1.785 *** 0.029 -1.332 *** 0.034 -1.877 *** 0.030 -1.462 *** 0.034Gujarat/Dadra and Nagar Haveli -0.901 *** 0.027 -1.381 *** 0.030 -0.902 *** 0.027 -1.382 *** 0.030 -0.987 *** 0.028 -1.310 *** 0.031HP/Punjab/Haryana/Chandigarh -0.639 *** 0.028 -0.288 *** 0.033 -0.640 *** 0.028 -0.288 *** 0.033 -0.501 *** 0.028 -0.128 *** 0.033Northeast -0.204 *** 0.031 -0.758 *** 0.030 -0.204 *** 0.030 -0.759 *** 0.030 -0.187 *** 0.033 -0.394 *** 0.032Karnataka/Goa/Daman and Dui -0.875 *** 0.025 -1.589 *** 0.028 -0.875 *** 0.025 -1.590 *** 0.028 -0.968 *** 0.025 -1.616 *** 0.029Intercept -0.132 0.091 4.805 *** 0.111 -0.124 0.092 4.813 *** 0.112 0.482 *** 0.094 5.347 *** 0.114Continued on next page
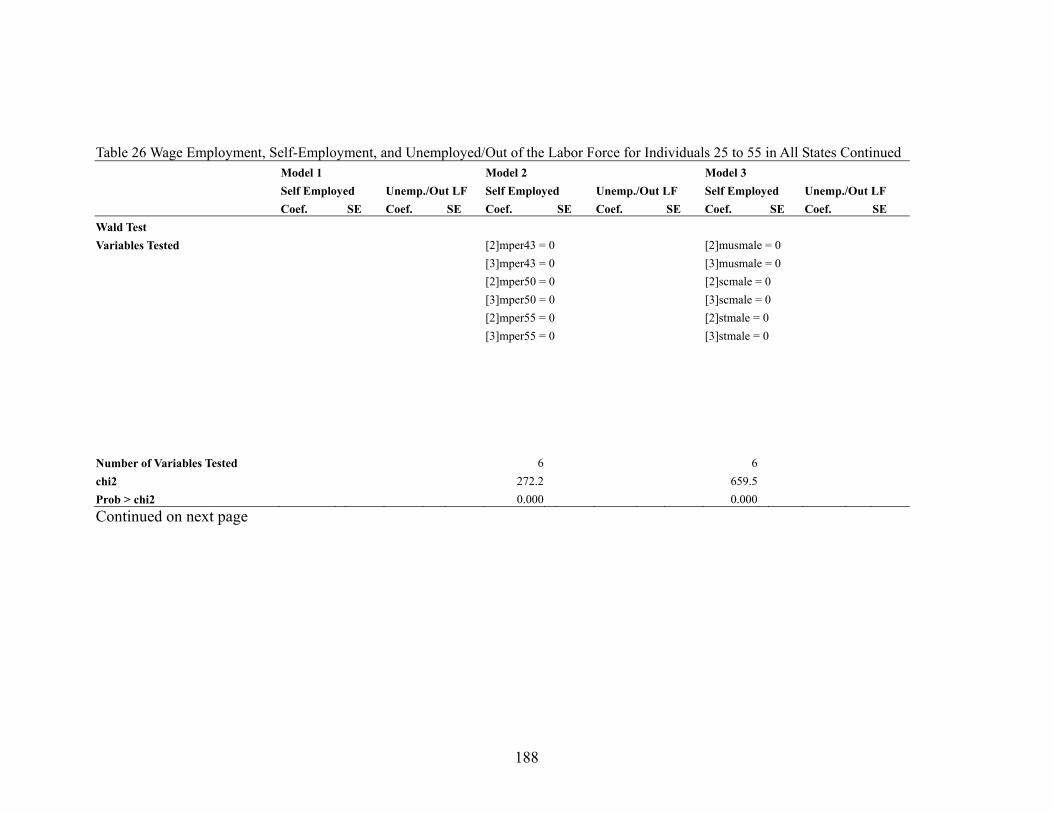
188
Table 26 Wage Employment, Self-Employment, and Unemployed/Out of the Labor Force for Individuals 25 to 55 in All States Continued Model 1 Model 2 Model 3 Self Employed Unemp./Out LF Self Employed Unemp./Out LF Self Employed Unemp./Out LF Coef. SE Coef. SE Coef. SE Coef. SE Coef. SE Coef. SE Wald Test Variables Tested [2]mper43 = 0 [2]musmale = 0 [3]mper43 = 0 [3]musmale = 0 [2]mper50 = 0 [2]scmale = 0 [3]mper50 = 0 [3]scmale = 0 [2]mper55 = 0 [2]stmale = 0 [3]mper55 = 0 [3]stmale = 0 Number of Variables Tested 6 6 chi2 272.2 659.5 Prob > chi2 0.000 0.000 Continued on next page
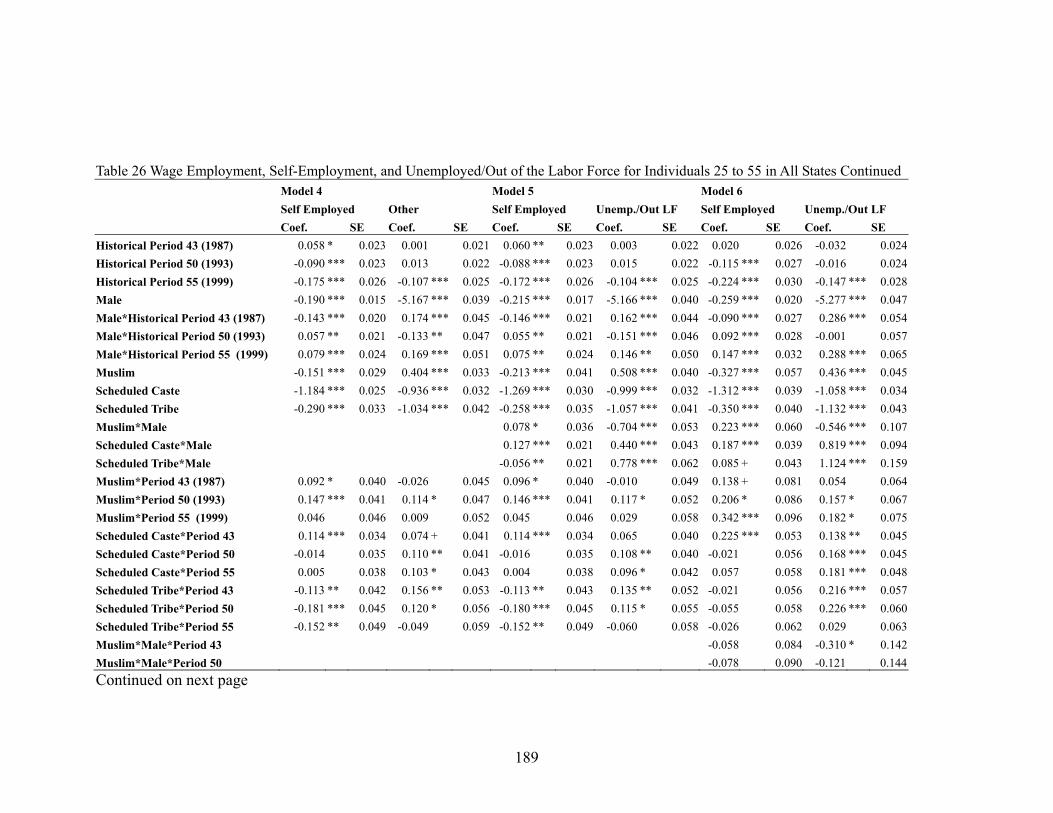
189
Table 26 Wage Employment, Self-Employment, and Unemployed/Out of the Labor Force for Individuals 25 to 55 in All States Continued Model 4 Model 5 Model 6 Self Employed Other Self Employed Unemp./Out LF Self Employed Unemp./Out LF Coef. SE Coef. SE Coef. SE Coef. SE Coef. SE Coef. SE Historical Period 43 (1987) 0.058 * 0.023 0.001 0.021 0.060 ** 0.023 0.003 0.022 0.020 0.026 -0.032 0.024Historical Period 50 (1993) -0.090 *** 0.023 0.013 0.022 -0.088 *** 0.023 0.015 0.022 -0.115 *** 0.027 -0.016 0.024Historical Period 55 (1999) -0.175 *** 0.026 -0.107 *** 0.025 -0.172 *** 0.026 -0.104 *** 0.025 -0.224 *** 0.030 -0.147 *** 0.028Male -0.190 *** 0.015 -5.167 *** 0.039 -0.215 *** 0.017 -5.166 *** 0.040 -0.259 *** 0.020 -5.277 *** 0.047Male*Historical Period 43 (1987) -0.143 *** 0.020 0.174 *** 0.045 -0.146 *** 0.021 0.162 *** 0.044 -0.090 *** 0.027 0.286 *** 0.054Male*Historical Period 50 (1993) 0.057 ** 0.021 -0.133 ** 0.047 0.055 ** 0.021 -0.151 *** 0.046 0.092 *** 0.028 -0.001 0.057Male*Historical Period 55 (1999) 0.079 *** 0.024 0.169 *** 0.051 0.075 ** 0.024 0.146 ** 0.050 0.147 *** 0.032 0.288 *** 0.065Muslim -0.151 *** 0.029 0.404 *** 0.033 -0.213 *** 0.041 0.508 *** 0.040 -0.327 *** 0.057 0.436 *** 0.045Scheduled Caste -1.184 *** 0.025 -0.936 *** 0.032 -1.269 *** 0.030 -0.999 *** 0.032 -1.312 *** 0.039 -1.058 *** 0.034Scheduled Tribe -0.290 *** 0.033 -1.034 *** 0.042 -0.258 *** 0.035 -1.057 *** 0.041 -0.350 *** 0.040 -1.132 *** 0.043Muslim*Male 0.078 * 0.036 -0.704 *** 0.053 0.223 *** 0.060 -0.546 *** 0.107Scheduled Caste*Male 0.127 *** 0.021 0.440 *** 0.043 0.187 *** 0.039 0.819 *** 0.094Scheduled Tribe*Male -0.056 ** 0.021 0.778 *** 0.062 0.085 + 0.043 1.124 *** 0.159Muslim*Period 43 (1987) 0.092 * 0.040 -0.026 0.045 0.096 * 0.040 -0.010 0.049 0.138 + 0.081 0.054 0.064Muslim*Period 50 (1993) 0.147 *** 0.041 0.114 * 0.047 0.146 *** 0.041 0.117 * 0.052 0.206 * 0.086 0.157 * 0.067Muslim*Period 55 (1999) 0.046 0.046 0.009 0.052 0.045 0.046 0.029 0.058 0.342 *** 0.096 0.182 * 0.075Scheduled Caste*Period 43 0.114 *** 0.034 0.074 + 0.041 0.114 *** 0.034 0.065 0.040 0.225 *** 0.053 0.138 ** 0.045Scheduled Caste*Period 50 -0.014 0.035 0.110 ** 0.041 -0.016 0.035 0.108 ** 0.040 -0.021 0.056 0.168 *** 0.045Scheduled Caste*Period 55 0.005 0.038 0.103 * 0.043 0.004 0.038 0.096 * 0.042 0.057 0.058 0.181 *** 0.048Scheduled Tribe*Period 43 -0.113 ** 0.042 0.156 ** 0.053 -0.113 ** 0.043 0.135 ** 0.052 -0.021 0.056 0.216 *** 0.057Scheduled Tribe*Period 50 -0.181 *** 0.045 0.120 * 0.056 -0.180 *** 0.045 0.115 * 0.055 -0.055 0.058 0.226 *** 0.060Scheduled Tribe*Period 55 -0.152 ** 0.049 -0.049 0.059 -0.152 ** 0.049 -0.060 0.058 -0.026 0.062 0.029 0.063Muslim*Male*Period 43 -0.058 0.084 -0.310 * 0.142Muslim*Male*Period 50 -0.078 0.090 -0.121 0.144Continued on next page
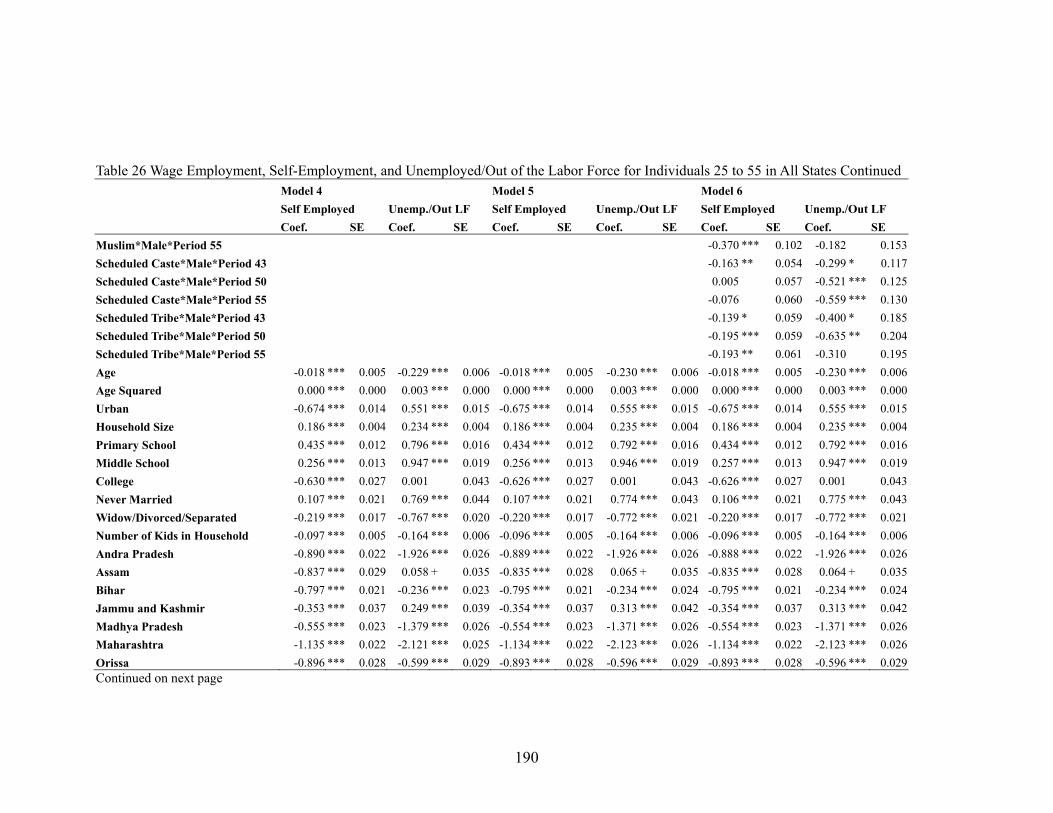
190
Table 26 Wage Employment, Self-Employment, and Unemployed/Out of the Labor Force for Individuals 25 to 55 in All States Continued Model 4 Model 5 Model 6 Self Employed Unemp./Out LF Self Employed Unemp./Out LF Self Employed Unemp./Out LF Coef. SE Coef. SE Coef. SE Coef. SE Coef. SE Coef. SE Muslim*Male*Period 55 -0.370 *** 0.102 -0.182 0.153Scheduled Caste*Male*Period 43 -0.163 ** 0.054 -0.299 * 0.117Scheduled Caste*Male*Period 50 0.005 0.057 -0.521 *** 0.125Scheduled Caste*Male*Period 55 -0.076 0.060 -0.559 *** 0.130Scheduled Tribe*Male*Period 43 -0.139 * 0.059 -0.400 * 0.185Scheduled Tribe*Male*Period 50 -0.195 *** 0.059 -0.635 ** 0.204Scheduled Tribe*Male*Period 55 -0.193 ** 0.061 -0.310 0.195Age -0.018 *** 0.005 -0.229 *** 0.006 -0.018 *** 0.005 -0.230 *** 0.006 -0.018 *** 0.005 -0.230 *** 0.006Age Squared 0.000 *** 0.000 0.003 *** 0.000 0.000 *** 0.000 0.003 *** 0.000 0.000 *** 0.000 0.003 *** 0.000Urban -0.674 *** 0.014 0.551 *** 0.015 -0.675 *** 0.014 0.555 *** 0.015 -0.675 *** 0.014 0.555 *** 0.015Household Size 0.186 *** 0.004 0.234 *** 0.004 0.186 *** 0.004 0.235 *** 0.004 0.186 *** 0.004 0.235 *** 0.004Primary School 0.435 *** 0.012 0.796 *** 0.016 0.434 *** 0.012 0.792 *** 0.016 0.434 *** 0.012 0.792 *** 0.016Middle School 0.256 *** 0.013 0.947 *** 0.019 0.256 *** 0.013 0.946 *** 0.019 0.257 *** 0.013 0.947 *** 0.019College -0.630 *** 0.027 0.001 0.043 -0.626 *** 0.027 0.001 0.043 -0.626 *** 0.027 0.001 0.043Never Married 0.107 *** 0.021 0.769 *** 0.044 0.107 *** 0.021 0.774 *** 0.043 0.106 *** 0.021 0.775 *** 0.043Widow/Divorced/Separated -0.219 *** 0.017 -0.767 *** 0.020 -0.220 *** 0.017 -0.772 *** 0.021 -0.220 *** 0.017 -0.772 *** 0.021Number of Kids in Household -0.097 *** 0.005 -0.164 *** 0.006 -0.096 *** 0.005 -0.164 *** 0.006 -0.096 *** 0.005 -0.164 *** 0.006Andra Pradesh -0.890 *** 0.022 -1.926 *** 0.026 -0.889 *** 0.022 -1.926 *** 0.026 -0.888 *** 0.022 -1.926 *** 0.026Assam -0.837 *** 0.029 0.058 + 0.035 -0.835 *** 0.028 0.065 + 0.035 -0.835 *** 0.028 0.064 + 0.035Bihar -0.797 *** 0.021 -0.236 *** 0.023 -0.795 *** 0.021 -0.234 *** 0.024 -0.795 *** 0.021 -0.234 *** 0.024Jammu and Kashmir -0.353 *** 0.037 0.249 *** 0.039 -0.354 *** 0.037 0.313 *** 0.042 -0.354 *** 0.037 0.313 *** 0.042Madhya Pradesh -0.555 *** 0.023 -1.379 *** 0.026 -0.554 *** 0.023 -1.371 *** 0.026 -0.554 *** 0.023 -1.371 *** 0.026Maharashtra -1.135 *** 0.022 -2.121 *** 0.025 -1.134 *** 0.022 -2.123 *** 0.026 -1.134 *** 0.022 -2.123 *** 0.026Orissa -0.896 *** 0.028 -0.599 *** 0.029 -0.893 *** 0.028 -0.596 *** 0.029 -0.893 *** 0.028 -0.596 *** 0.029Continued on next page
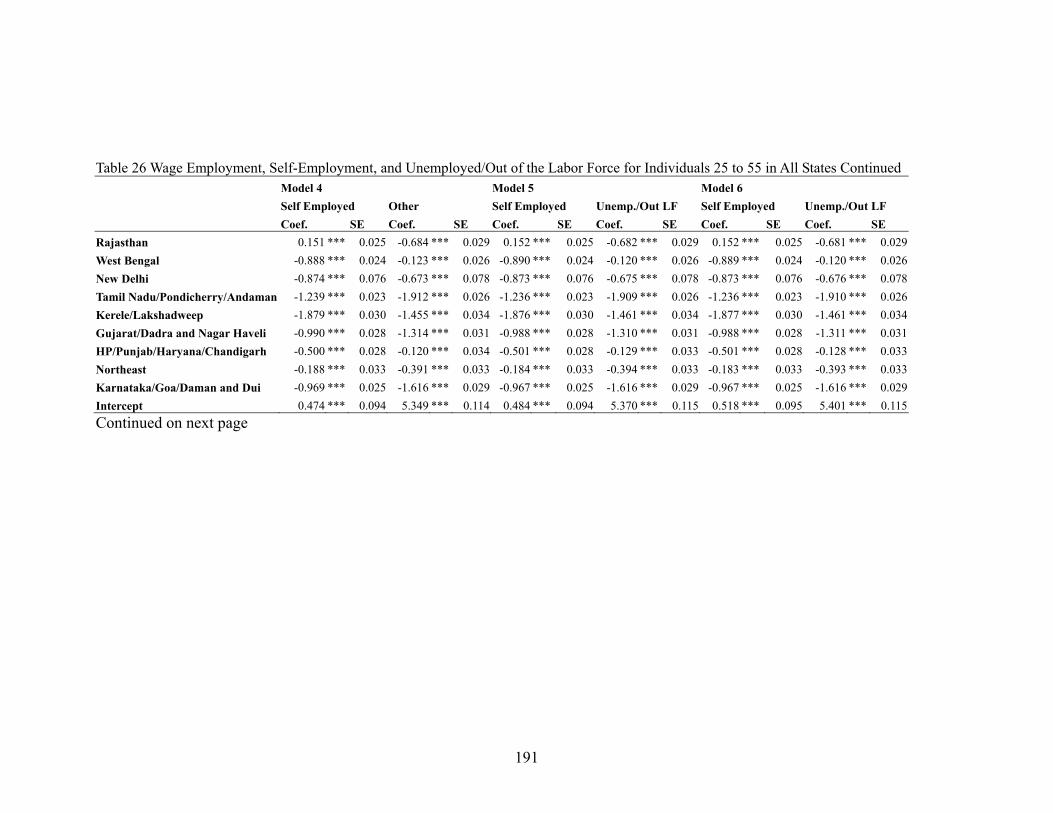
191
Table 26 Wage Employment, Self-Employment, and Unemployed/Out of the Labor Force for Individuals 25 to 55 in All States Continued Model 4 Model 5 Model 6 Self Employed Other Self Employed Unemp./Out LF Self Employed Unemp./Out LF Coef. SE Coef. SE Coef. SE Coef. SE Coef. SE Coef. SE Rajasthan 0.151 *** 0.025 -0.684 *** 0.029 0.152 *** 0.025 -0.682 *** 0.029 0.152 *** 0.025 -0.681 *** 0.029West Bengal -0.888 *** 0.024 -0.123 *** 0.026 -0.890 *** 0.024 -0.120 *** 0.026 -0.889 *** 0.024 -0.120 *** 0.026New Delhi -0.874 *** 0.076 -0.673 *** 0.078 -0.873 *** 0.076 -0.675 *** 0.078 -0.873 *** 0.076 -0.676 *** 0.078Tamil Nadu/Pondicherry/Andaman -1.239 *** 0.023 -1.912 *** 0.026 -1.236 *** 0.023 -1.909 *** 0.026 -1.236 *** 0.023 -1.910 *** 0.026Kerele/Lakshadweep -1.879 *** 0.030 -1.455 *** 0.034 -1.876 *** 0.030 -1.461 *** 0.034 -1.877 *** 0.030 -1.461 *** 0.034Gujarat/Dadra and Nagar Haveli -0.990 *** 0.028 -1.314 *** 0.031 -0.988 *** 0.028 -1.310 *** 0.031 -0.988 *** 0.028 -1.311 *** 0.031HP/Punjab/Haryana/Chandigarh -0.500 *** 0.028 -0.120 *** 0.034 -0.501 *** 0.028 -0.129 *** 0.033 -0.501 *** 0.028 -0.128 *** 0.033Northeast -0.188 *** 0.033 -0.391 *** 0.033 -0.184 *** 0.033 -0.394 *** 0.033 -0.183 *** 0.033 -0.393 *** 0.033Karnataka/Goa/Daman and Dui -0.969 *** 0.025 -1.616 *** 0.029 -0.967 *** 0.025 -1.616 *** 0.029 -0.967 *** 0.025 -1.616 *** 0.029Intercept 0.474 *** 0.094 5.349 *** 0.114 0.484 *** 0.094 5.370 *** 0.115 0.518 *** 0.095 5.401 *** 0.115Continued on next page
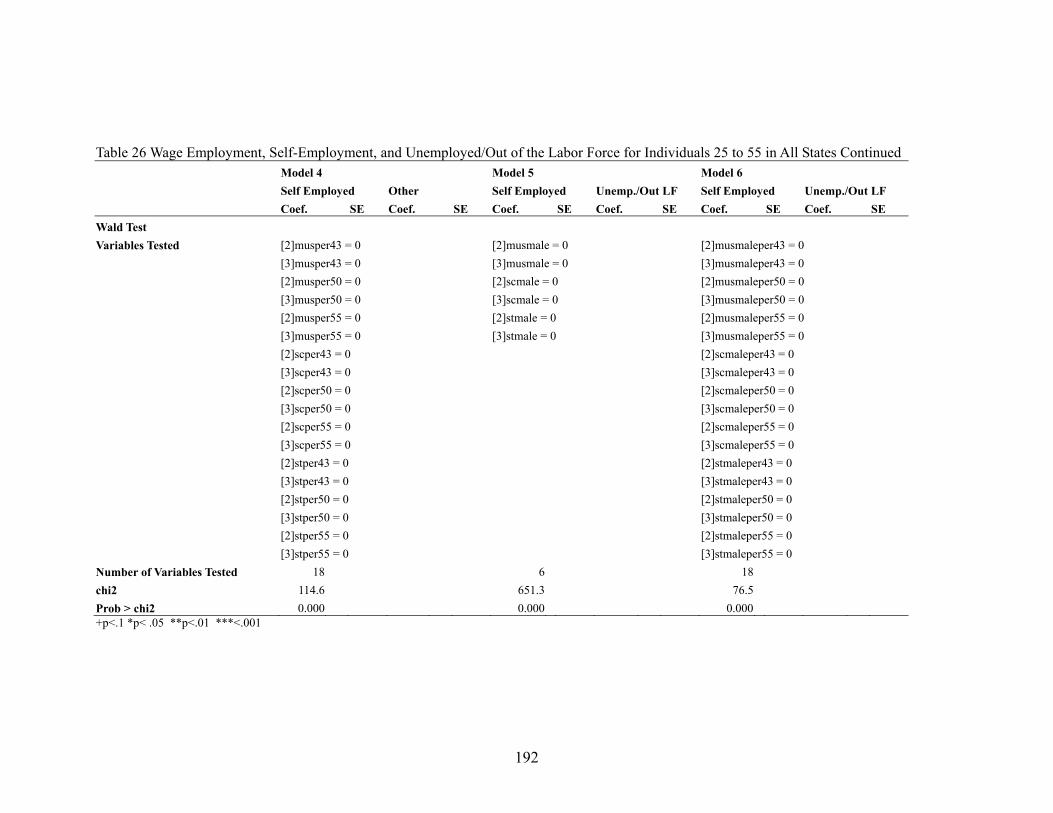
192
Table 26 Wage Employment, Self-Employment, and Unemployed/Out of the Labor Force for Individuals 25 to 55 in All States Continued Model 4 Model 5 Model 6 Self Employed Other Self Employed Unemp./Out LF Self Employed Unemp./Out LF Coef. SE Coef. SE Coef. SE Coef. SE Coef. SE Coef. SE Wald Test Variables Tested [2]musper43 = 0 [2]musmale = 0 [2]musmaleper43 = 0 [3]musper43 = 0 [3]musmale = 0 [3]musmaleper43 = 0 [2]musper50 = 0 [2]scmale = 0 [2]musmaleper50 = 0 [3]musper50 = 0 [3]scmale = 0 [3]musmaleper50 = 0 [2]musper55 = 0 [2]stmale = 0 [2]musmaleper55 = 0 [3]musper55 = 0 [3]stmale = 0 [3]musmaleper55 = 0 [2]scper43 = 0 [2]scmaleper43 = 0 [3]scper43 = 0 [3]scmaleper43 = 0 [2]scper50 = 0 [2]scmaleper50 = 0 [3]scper50 = 0 [3]scmaleper50 = 0 [2]scper55 = 0 [2]scmaleper55 = 0 [3]scper55 = 0 [3]scmaleper55 = 0 [2]stper43 = 0 [2]stmaleper43 = 0 [3]stper43 = 0 [3]stmaleper43 = 0 [2]stper50 = 0 [2]stmaleper50 = 0 [3]stper50 = 0 [3]stmaleper50 = 0 [2]stper55 = 0 [2]stmaleper55 = 0 [3]stper55 = 0 [3]stmaleper55 = 0 Number of Variables Tested 18 6 18 chi2 114.6 651.3 76.5 Prob > chi2 0.000 0.000 0.000 +p<.1 *p< .05 **p<.01 ***<.001
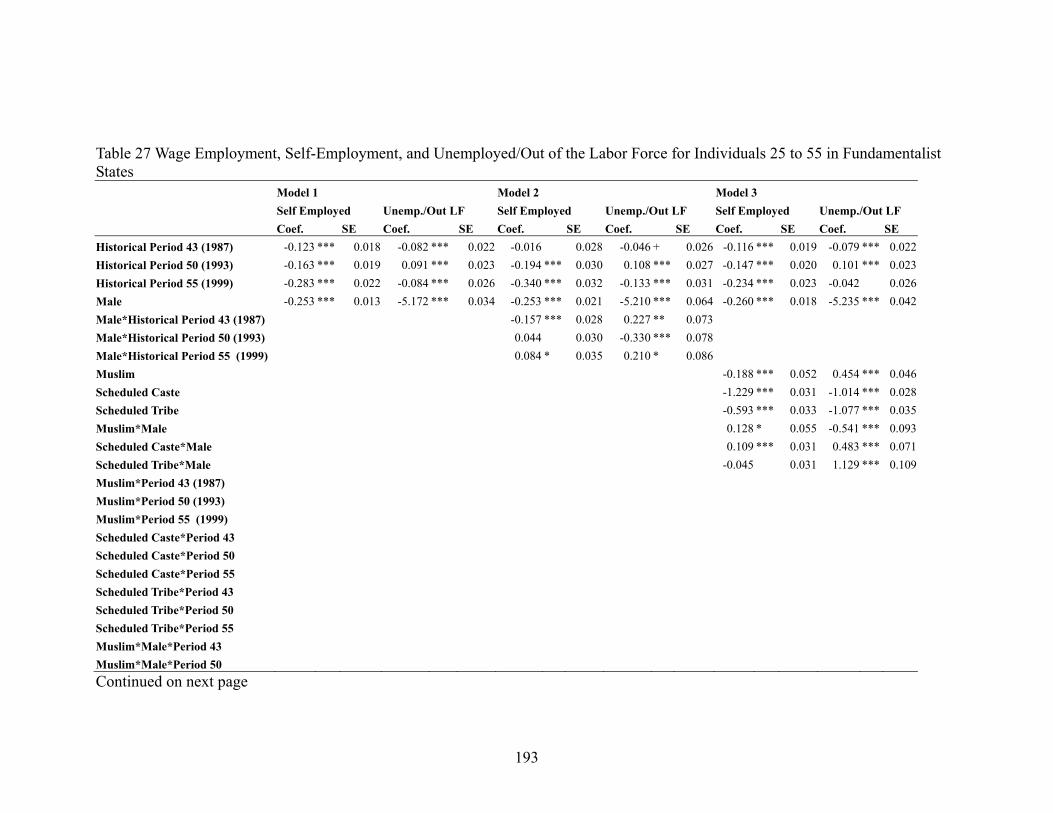
193
Table 27 Wage Employment, Self-Employment, and Unemployed/Out of the Labor Force for Individuals 25 to 55 in Fundamentalist States Model 1 Model 2 Model 3 Self Employed Unemp./Out LF Self Employed Unemp./Out LF Self Employed Unemp./Out LF Coef. SE Coef. SE Coef. SE Coef. SE Coef. SE Coef. SE Historical Period 43 (1987) -0.123 *** 0.018 -0.082 *** 0.022 -0.016 0.028 -0.046 + 0.026 -0.116 *** 0.019 -0.079 *** 0.022Historical Period 50 (1993) -0.163 *** 0.019 0.091 *** 0.023 -0.194 *** 0.030 0.108 *** 0.027 -0.147 *** 0.020 0.101 *** 0.023Historical Period 55 (1999) -0.283 *** 0.022 -0.084 *** 0.026 -0.340 *** 0.032 -0.133 *** 0.031 -0.234 *** 0.023 -0.042 0.026Male -0.253 *** 0.013 -5.172 *** 0.034 -0.253 *** 0.021 -5.210 *** 0.064 -0.260 *** 0.018 -5.235 *** 0.042Male*Historical Period 43 (1987) -0.157 *** 0.028 0.227 ** 0.073 Male*Historical Period 50 (1993) 0.044 0.030 -0.330 *** 0.078 Male*Historical Period 55 (1999) 0.084 * 0.035 0.210 * 0.086 Muslim -0.188 *** 0.052 0.454 *** 0.046Scheduled Caste -1.229 *** 0.031 -1.014 *** 0.028Scheduled Tribe -0.593 *** 0.033 -1.077 *** 0.035Muslim*Male 0.128 * 0.055 -0.541 *** 0.093Scheduled Caste*Male 0.109 *** 0.031 0.483 *** 0.071Scheduled Tribe*Male -0.045 0.031 1.129 *** 0.109Muslim*Period 43 (1987) Muslim*Period 50 (1993) Muslim*Period 55 (1999) Scheduled Caste*Period 43 Scheduled Caste*Period 50 Scheduled Caste*Period 55 Scheduled Tribe*Period 43 Scheduled Tribe*Period 50 Scheduled Tribe*Period 55 Muslim*Male*Period 43 Muslim*Male*Period 50 Continued on next page
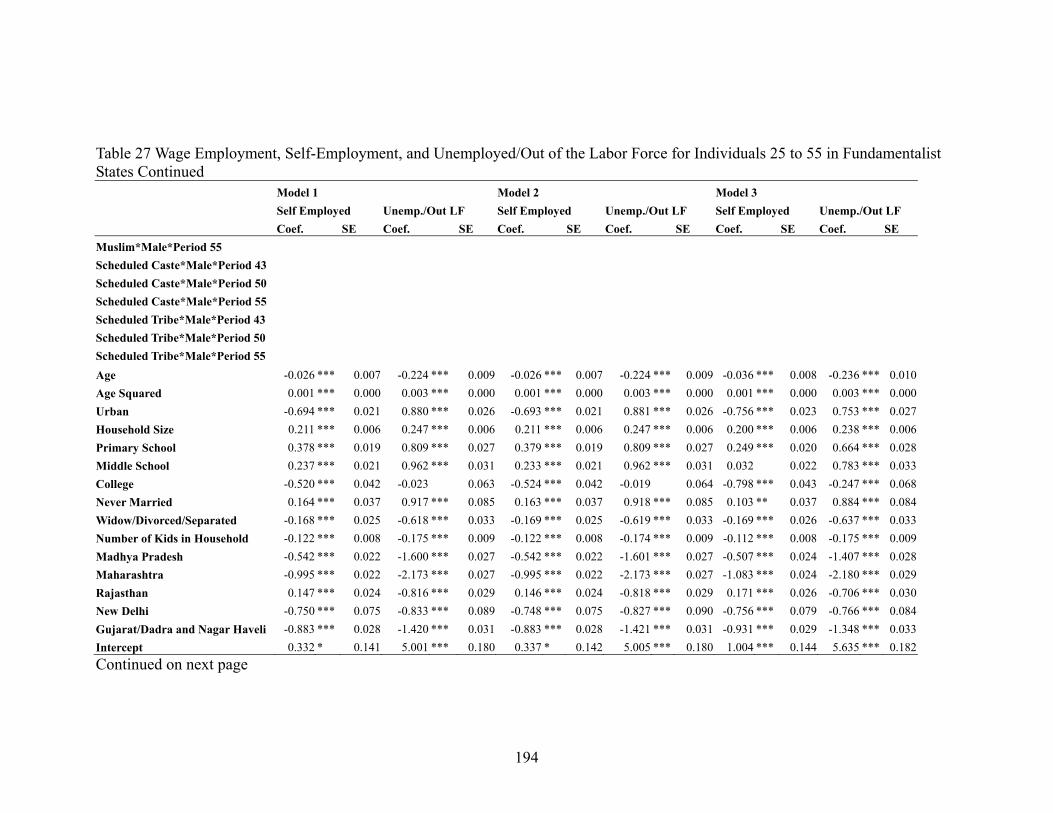
194
Table 27 Wage Employment, Self-Employment, and Unemployed/Out of the Labor Force for Individuals 25 to 55 in Fundamentalist States Continued Model 1 Model 2 Model 3 Self Employed Unemp./Out LF Self Employed Unemp./Out LF Self Employed Unemp./Out LF Coef. SE Coef. SE Coef. SE Coef. SE Coef. SE Coef. SE Muslim*Male*Period 55 Scheduled Caste*Male*Period 43 Scheduled Caste*Male*Period 50 Scheduled Caste*Male*Period 55 Scheduled Tribe*Male*Period 43 Scheduled Tribe*Male*Period 50 Scheduled Tribe*Male*Period 55 Age -0.026 *** 0.007 -0.224 *** 0.009 -0.026 *** 0.007 -0.224 *** 0.009 -0.036 *** 0.008 -0.236 *** 0.010Age Squared 0.001 *** 0.000 0.003 *** 0.000 0.001 *** 0.000 0.003 *** 0.000 0.001 *** 0.000 0.003 *** 0.000Urban -0.694 *** 0.021 0.880 *** 0.026 -0.693 *** 0.021 0.881 *** 0.026 -0.756 *** 0.023 0.753 *** 0.027Household Size 0.211 *** 0.006 0.247 *** 0.006 0.211 *** 0.006 0.247 *** 0.006 0.200 *** 0.006 0.238 *** 0.006Primary School 0.378 *** 0.019 0.809 *** 0.027 0.379 *** 0.019 0.809 *** 0.027 0.249 *** 0.020 0.664 *** 0.028Middle School 0.237 *** 0.021 0.962 *** 0.031 0.233 *** 0.021 0.962 *** 0.031 0.032 0.022 0.783 *** 0.033College -0.520 *** 0.042 -0.023 0.063 -0.524 *** 0.042 -0.019 0.064 -0.798 *** 0.043 -0.247 *** 0.068Never Married 0.164 *** 0.037 0.917 *** 0.085 0.163 *** 0.037 0.918 *** 0.085 0.103 ** 0.037 0.884 *** 0.084Widow/Divorced/Separated -0.168 *** 0.025 -0.618 *** 0.033 -0.169 *** 0.025 -0.619 *** 0.033 -0.169 *** 0.026 -0.637 *** 0.033Number of Kids in Household -0.122 *** 0.008 -0.175 *** 0.009 -0.122 *** 0.008 -0.174 *** 0.009 -0.112 *** 0.008 -0.175 *** 0.009Madhya Pradesh -0.542 *** 0.022 -1.600 *** 0.027 -0.542 *** 0.022 -1.601 *** 0.027 -0.507 *** 0.024 -1.407 *** 0.028Maharashtra -0.995 *** 0.022 -2.173 *** 0.027 -0.995 *** 0.022 -2.173 *** 0.027 -1.083 *** 0.024 -2.180 *** 0.029Rajasthan 0.147 *** 0.024 -0.816 *** 0.029 0.146 *** 0.024 -0.818 *** 0.029 0.171 *** 0.026 -0.706 *** 0.030New Delhi -0.750 *** 0.075 -0.833 *** 0.089 -0.748 *** 0.075 -0.827 *** 0.090 -0.756 *** 0.079 -0.766 *** 0.084Gujarat/Dadra and Nagar Haveli -0.883 *** 0.028 -1.420 *** 0.031 -0.883 *** 0.028 -1.421 *** 0.031 -0.931 *** 0.029 -1.348 *** 0.033Intercept 0.332 * 0.141 5.001 *** 0.180 0.337 * 0.142 5.005 *** 0.180 1.004 *** 0.144 5.635 *** 0.182Continued on next page
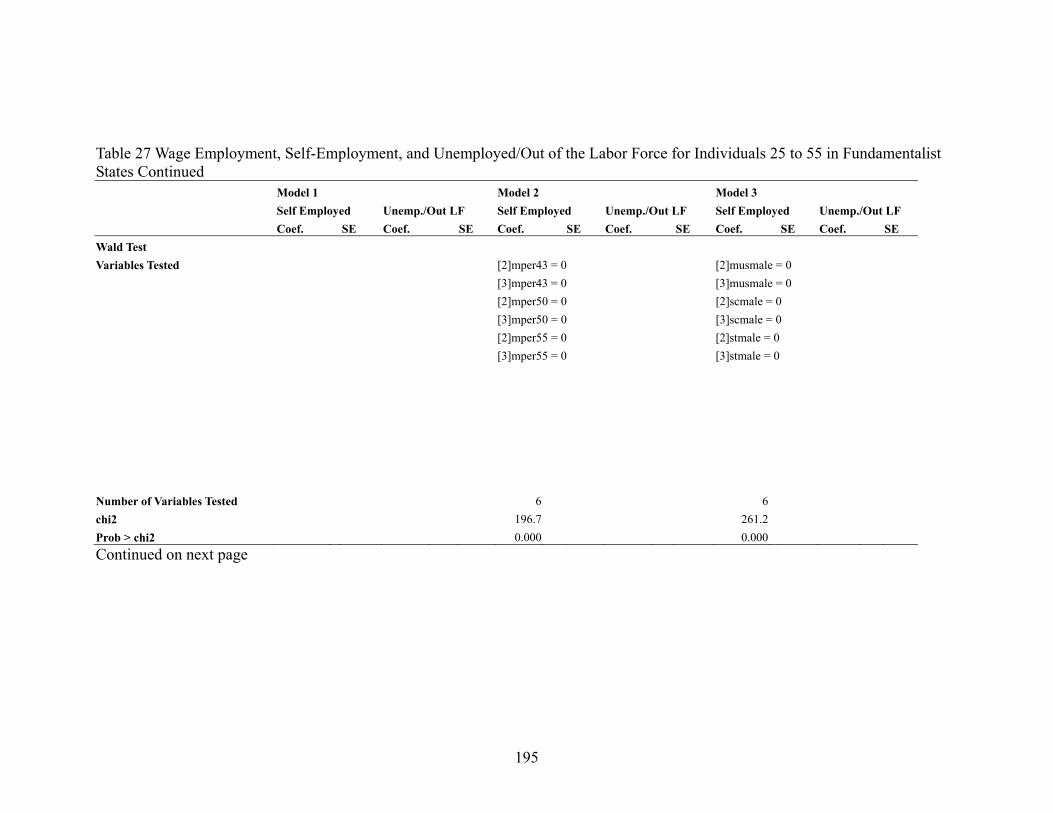
195
Table 27 Wage Employment, Self-Employment, and Unemployed/Out of the Labor Force for Individuals 25 to 55 in Fundamentalist States Continued Model 1 Model 2 Model 3 Self Employed Unemp./Out LF Self Employed Unemp./Out LF Self Employed Unemp./Out LF Coef. SE Coef. SE Coef. SE Coef. SE Coef. SE Coef. SE Wald Test Variables Tested [2]mper43 = 0 [2]musmale = 0 [3]mper43 = 0 [3]musmale = 0 [2]mper50 = 0 [2]scmale = 0 [3]mper50 = 0 [3]scmale = 0 [2]mper55 = 0 [2]stmale = 0 [3]mper55 = 0 [3]stmale = 0 Number of Variables Tested 6 6 chi2 196.7 261.2 Prob > chi2 0.000 0.000 Continued on next page
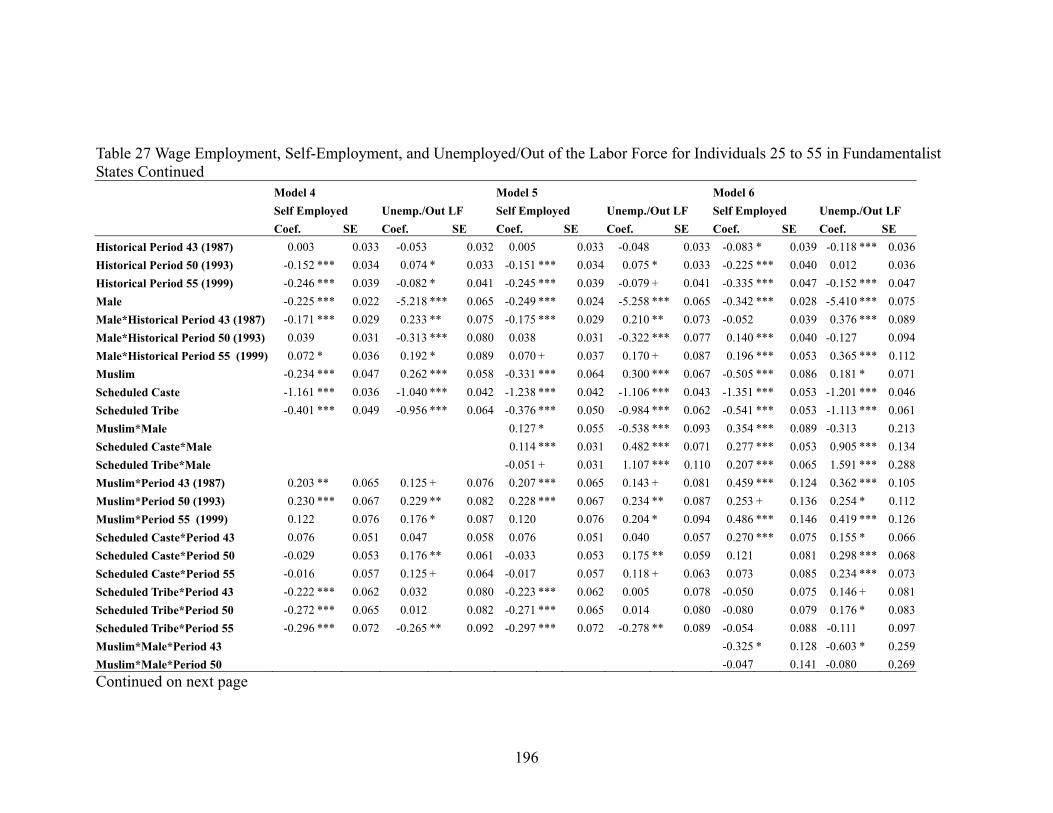
196
Table 27 Wage Employment, Self-Employment, and Unemployed/Out of the Labor Force for Individuals 25 to 55 in Fundamentalist States Continued Model 4 Model 5 Model 6 Self Employed Unemp./Out LF Self Employed Unemp./Out LF Self Employed Unemp./Out LF Coef. SE Coef. SE Coef. SE Coef. SE Coef. SE Coef. SE Historical Period 43 (1987) 0.003 0.033 -0.053 0.032 0.005 0.033 -0.048 0.033 -0.083 * 0.039 -0.118 *** 0.036Historical Period 50 (1993) -0.152 *** 0.034 0.074 * 0.033 -0.151 *** 0.034 0.075 * 0.033 -0.225 *** 0.040 0.012 0.036Historical Period 55 (1999) -0.246 *** 0.039 -0.082 * 0.041 -0.245 *** 0.039 -0.079 + 0.041 -0.335 *** 0.047 -0.152 *** 0.047Male -0.225 *** 0.022 -5.218 *** 0.065 -0.249 *** 0.024 -5.258 *** 0.065 -0.342 *** 0.028 -5.410 *** 0.075Male*Historical Period 43 (1987) -0.171 *** 0.029 0.233 ** 0.075 -0.175 *** 0.029 0.210 ** 0.073 -0.052 0.039 0.376 *** 0.089Male*Historical Period 50 (1993) 0.039 0.031 -0.313 *** 0.080 0.038 0.031 -0.322 *** 0.077 0.140 *** 0.040 -0.127 0.094Male*Historical Period 55 (1999) 0.072 * 0.036 0.192 * 0.089 0.070 + 0.037 0.170 + 0.087 0.196 *** 0.053 0.365 *** 0.112Muslim -0.234 *** 0.047 0.262 *** 0.058 -0.331 *** 0.064 0.300 *** 0.067 -0.505 *** 0.086 0.181 * 0.071Scheduled Caste -1.161 *** 0.036 -1.040 *** 0.042 -1.238 *** 0.042 -1.106 *** 0.043 -1.351 *** 0.053 -1.201 *** 0.046Scheduled Tribe -0.401 *** 0.049 -0.956 *** 0.064 -0.376 *** 0.050 -0.984 *** 0.062 -0.541 *** 0.053 -1.113 *** 0.061Muslim*Male 0.127 * 0.055 -0.538 *** 0.093 0.354 *** 0.089 -0.313 0.213Scheduled Caste*Male 0.114 *** 0.031 0.482 *** 0.071 0.277 *** 0.053 0.905 *** 0.134Scheduled Tribe*Male -0.051 + 0.031 1.107 *** 0.110 0.207 *** 0.065 1.591 *** 0.288Muslim*Period 43 (1987) 0.203 ** 0.065 0.125 + 0.076 0.207 *** 0.065 0.143 + 0.081 0.459 *** 0.124 0.362 *** 0.105Muslim*Period 50 (1993) 0.230 *** 0.067 0.229 ** 0.082 0.228 *** 0.067 0.234 ** 0.087 0.253 + 0.136 0.254 * 0.112Muslim*Period 55 (1999) 0.122 0.076 0.176 * 0.087 0.120 0.076 0.204 * 0.094 0.486 *** 0.146 0.419 *** 0.126Scheduled Caste*Period 43 0.076 0.051 0.047 0.058 0.076 0.051 0.040 0.057 0.270 *** 0.075 0.155 * 0.066Scheduled Caste*Period 50 -0.029 0.053 0.176 ** 0.061 -0.033 0.053 0.175 ** 0.059 0.121 0.081 0.298 *** 0.068Scheduled Caste*Period 55 -0.016 0.057 0.125 + 0.064 -0.017 0.057 0.118 + 0.063 0.073 0.085 0.234 *** 0.073Scheduled Tribe*Period 43 -0.222 *** 0.062 0.032 0.080 -0.223 *** 0.062 0.005 0.078 -0.050 0.075 0.146 + 0.081Scheduled Tribe*Period 50 -0.272 *** 0.065 0.012 0.082 -0.271 *** 0.065 0.014 0.080 -0.080 0.079 0.176 * 0.083Scheduled Tribe*Period 55 -0.296 *** 0.072 -0.265 ** 0.092 -0.297 *** 0.072 -0.278 ** 0.089 -0.054 0.088 -0.111 0.097Muslim*Male*Period 43 -0.325 * 0.128 -0.603 * 0.259Muslim*Male*Period 50 -0.047 0.141 -0.080 0.269Continued on next page
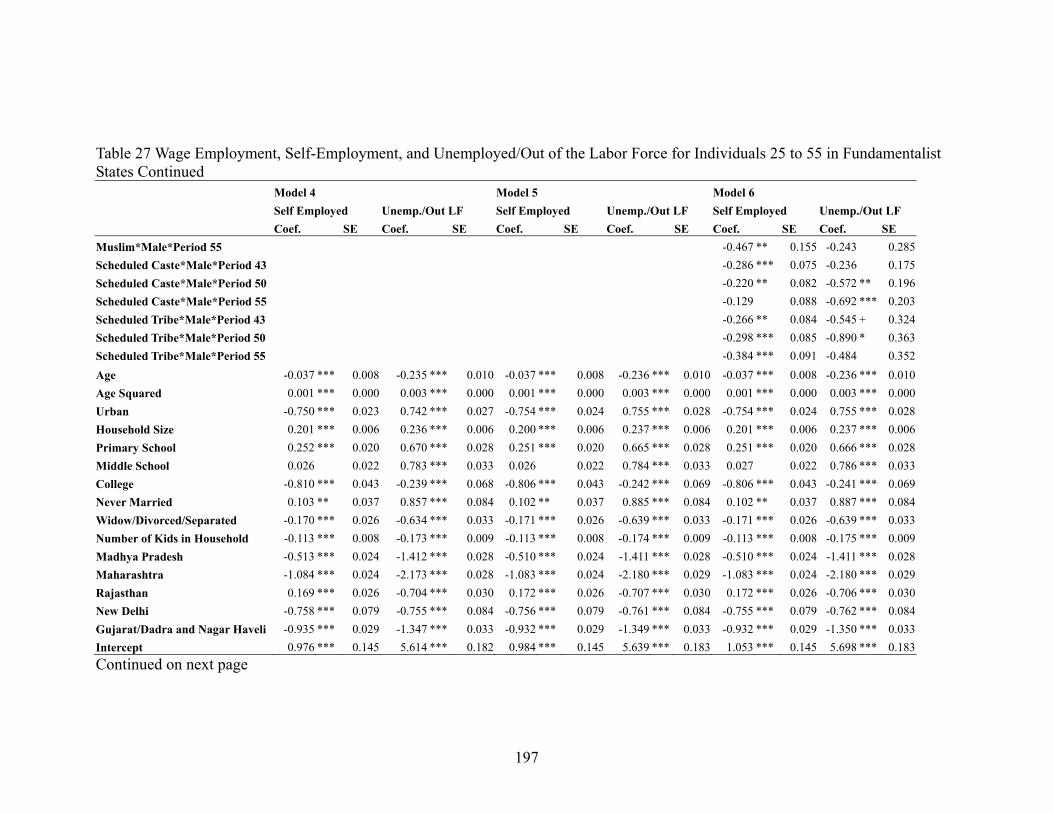
197
Table 27 Wage Employment, Self-Employment, and Unemployed/Out of the Labor Force for Individuals 25 to 55 in Fundamentalist States Continued Model 4 Model 5 Model 6 Self Employed Unemp./Out LF Self Employed Unemp./Out LF Self Employed Unemp./Out LF Coef. SE Coef. SE Coef. SE Coef. SE Coef. SE Coef. SE Muslim*Male*Period 55 -0.467 ** 0.155 -0.243 0.285Scheduled Caste*Male*Period 43 -0.286 *** 0.075 -0.236 0.175Scheduled Caste*Male*Period 50 -0.220 ** 0.082 -0.572 ** 0.196Scheduled Caste*Male*Period 55 -0.129 0.088 -0.692 *** 0.203Scheduled Tribe*Male*Period 43 -0.266 ** 0.084 -0.545 + 0.324Scheduled Tribe*Male*Period 50 -0.298 *** 0.085 -0.890 * 0.363Scheduled Tribe*Male*Period 55 -0.384 *** 0.091 -0.484 0.352Age -0.037 *** 0.008 -0.235 *** 0.010 -0.037 *** 0.008 -0.236 *** 0.010 -0.037 *** 0.008 -0.236 *** 0.010Age Squared 0.001 *** 0.000 0.003 *** 0.000 0.001 *** 0.000 0.003 *** 0.000 0.001 *** 0.000 0.003 *** 0.000Urban -0.750 *** 0.023 0.742 *** 0.027 -0.754 *** 0.024 0.755 *** 0.028 -0.754 *** 0.024 0.755 *** 0.028Household Size 0.201 *** 0.006 0.236 *** 0.006 0.200 *** 0.006 0.237 *** 0.006 0.201 *** 0.006 0.237 *** 0.006Primary School 0.252 *** 0.020 0.670 *** 0.028 0.251 *** 0.020 0.665 *** 0.028 0.251 *** 0.020 0.666 *** 0.028Middle School 0.026 0.022 0.783 *** 0.033 0.026 0.022 0.784 *** 0.033 0.027 0.022 0.786 *** 0.033College -0.810 *** 0.043 -0.239 *** 0.068 -0.806 *** 0.043 -0.242 *** 0.069 -0.806 *** 0.043 -0.241 *** 0.069Never Married 0.103 ** 0.037 0.857 *** 0.084 0.102 ** 0.037 0.885 *** 0.084 0.102 ** 0.037 0.887 *** 0.084Widow/Divorced/Separated -0.170 *** 0.026 -0.634 *** 0.033 -0.171 *** 0.026 -0.639 *** 0.033 -0.171 *** 0.026 -0.639 *** 0.033Number of Kids in Household -0.113 *** 0.008 -0.173 *** 0.009 -0.113 *** 0.008 -0.174 *** 0.009 -0.113 *** 0.008 -0.175 *** 0.009Madhya Pradesh -0.513 *** 0.024 -1.412 *** 0.028 -0.510 *** 0.024 -1.411 *** 0.028 -0.510 *** 0.024 -1.411 *** 0.028Maharashtra -1.084 *** 0.024 -2.173 *** 0.028 -1.083 *** 0.024 -2.180 *** 0.029 -1.083 *** 0.024 -2.180 *** 0.029Rajasthan 0.169 *** 0.026 -0.704 *** 0.030 0.172 *** 0.026 -0.707 *** 0.030 0.172 *** 0.026 -0.706 *** 0.030New Delhi -0.758 *** 0.079 -0.755 *** 0.084 -0.756 *** 0.079 -0.761 *** 0.084 -0.755 *** 0.079 -0.762 *** 0.084Gujarat/Dadra and Nagar Haveli -0.935 *** 0.029 -1.347 *** 0.033 -0.932 *** 0.029 -1.349 *** 0.033 -0.932 *** 0.029 -1.350 *** 0.033Intercept 0.976 *** 0.145 5.614 *** 0.182 0.984 *** 0.145 5.639 *** 0.183 1.053 *** 0.145 5.698 *** 0.183Continued on next page
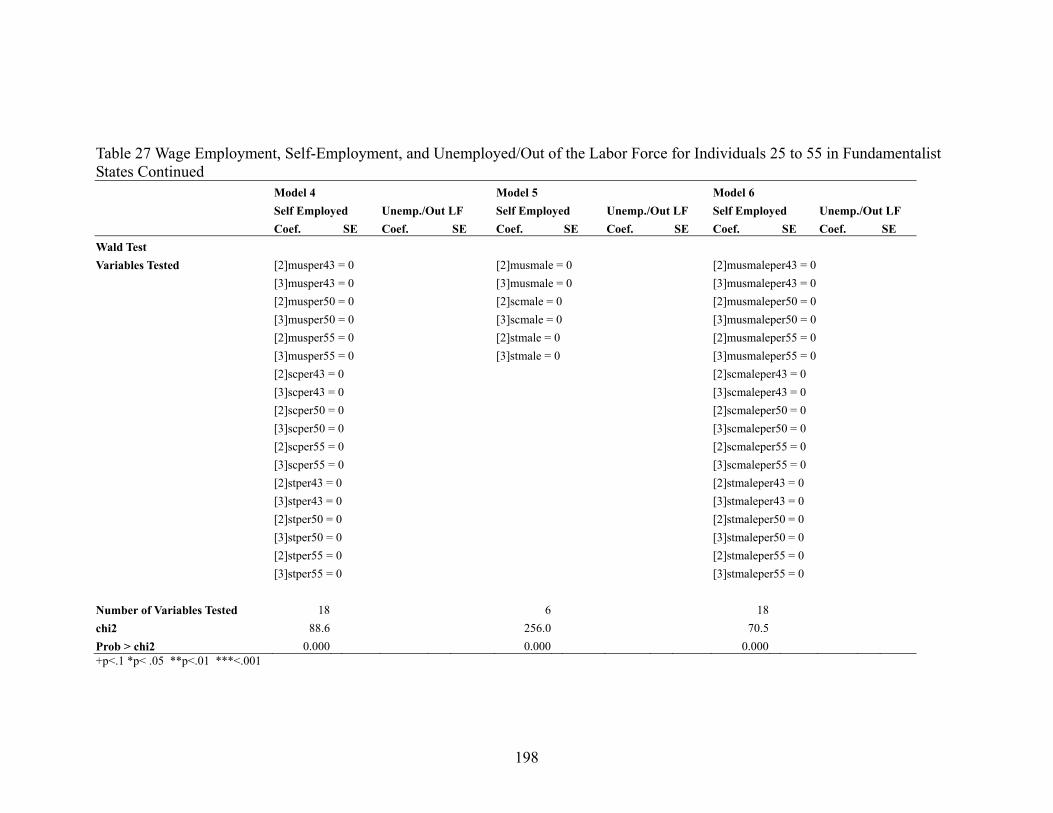
198
Table 27 Wage Employment, Self-Employment, and Unemployed/Out of the Labor Force for Individuals 25 to 55 in Fundamentalist States Continued Model 4 Model 5 Model 6 Self Employed Unemp./Out LF Self Employed Unemp./Out LF Self Employed Unemp./Out LF Coef. SE Coef. SE Coef. SE Coef. SE Coef. SE Coef. SE Wald Test Variables Tested [2]musper43 = 0 [2]musmale = 0 [2]musmaleper43 = 0 [3]musper43 = 0 [3]musmale = 0 [3]musmaleper43 = 0 [2]musper50 = 0 [2]scmale = 0 [2]musmaleper50 = 0 [3]musper50 = 0 [3]scmale = 0 [3]musmaleper50 = 0 [2]musper55 = 0 [2]stmale = 0 [2]musmaleper55 = 0 [3]musper55 = 0 [3]stmale = 0 [3]musmaleper55 = 0 [2]scper43 = 0 [2]scmaleper43 = 0 [3]scper43 = 0 [3]scmaleper43 = 0 [2]scper50 = 0 [2]scmaleper50 = 0 [3]scper50 = 0 [3]scmaleper50 = 0 [2]scper55 = 0 [2]scmaleper55 = 0 [3]scper55 = 0 [3]scmaleper55 = 0 [2]stper43 = 0 [2]stmaleper43 = 0 [3]stper43 = 0 [3]stmaleper43 = 0 [2]stper50 = 0 [2]stmaleper50 = 0 [3]stper50 = 0 [3]stmaleper50 = 0 [2]stper55 = 0 [2]stmaleper55 = 0 [3]stper55 = 0 [3]stmaleper55 = 0 Number of Variables Tested 18 6 18 chi2 88.6 256.0 70.5 Prob > chi2 0.000 0.000 0.000 +p<.1 *p< .05 **p<.01 ***<.001
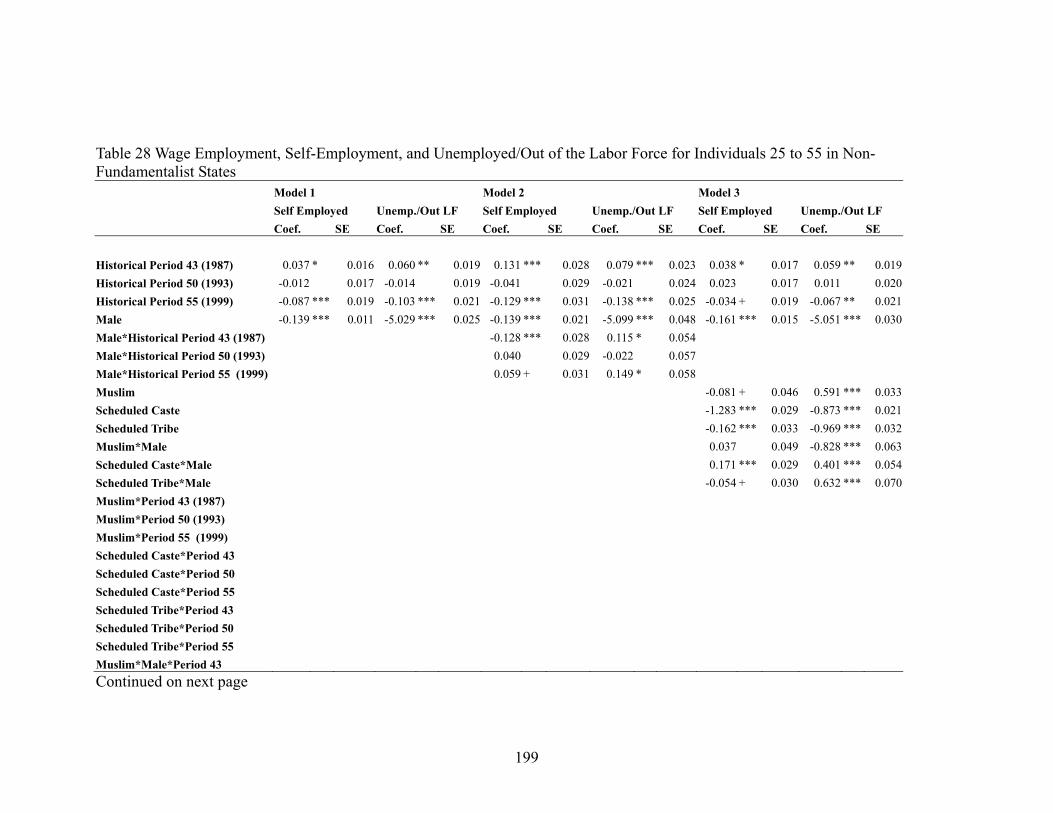
199
Table 28 Wage Employment, Self-Employment, and Unemployed/Out of the Labor Force for Individuals 25 to 55 in Non-Fundamentalist States Model 1 Model 2 Model 3 Self Employed Unemp./Out LF Self Employed Unemp./Out LF Self Employed Unemp./Out LF Coef. SE Coef. SE Coef. SE Coef. SE Coef. SE Coef. SE Historical Period 43 (1987) 0.037 * 0.016 0.060 ** 0.019 0.131 *** 0.028 0.079 *** 0.023 0.038 * 0.017 0.059 ** 0.019Historical Period 50 (1993) -0.012 0.017 -0.014 0.019 -0.041 0.029 -0.021 0.024 0.023 0.017 0.011 0.020Historical Period 55 (1999) -0.087 *** 0.019 -0.103 *** 0.021 -0.129 *** 0.031 -0.138 *** 0.025 -0.034 + 0.019 -0.067 ** 0.021Male -0.139 *** 0.011 -5.029 *** 0.025 -0.139 *** 0.021 -5.099 *** 0.048 -0.161 *** 0.015 -5.051 *** 0.030Male*Historical Period 43 (1987) -0.128 *** 0.028 0.115 * 0.054 Male*Historical Period 50 (1993) 0.040 0.029 -0.022 0.057 Male*Historical Period 55 (1999) 0.059 + 0.031 0.149 * 0.058 Muslim -0.081 + 0.046 0.591 *** 0.033Scheduled Caste -1.283 *** 0.029 -0.873 *** 0.021Scheduled Tribe -0.162 *** 0.033 -0.969 *** 0.032Muslim*Male 0.037 0.049 -0.828 *** 0.063Scheduled Caste*Male 0.171 *** 0.029 0.401 *** 0.054Scheduled Tribe*Male -0.054 + 0.030 0.632 *** 0.070Muslim*Period 43 (1987) Muslim*Period 50 (1993) Muslim*Period 55 (1999) Scheduled Caste*Period 43 Scheduled Caste*Period 50 Scheduled Caste*Period 55 Scheduled Tribe*Period 43 Scheduled Tribe*Period 50 Scheduled Tribe*Period 55 Muslim*Male*Period 43 Continued on next page

200
Table 28 Wage Employment, Self-Employment, and Unemployed/Out of the Labor Force for Individuals 25 to 55 in Non-Fundamentalist States Continued Model 1 Model 2 Model 3 Self Employed Unemp./Out LF Self Employed Unemp./Out LF Self Employed Unemp./Out LF Coef. SE Coef. SE Coef. SE Coef. SE Coef. SE Coef. SE Muslim*Male*Period 50 Muslim*Male*Period 55 Scheduled Caste*Male*Period 43 Scheduled Caste*Male*Period 50 Scheduled Caste*Male*Period 55 Scheduled Tribe*Male*Period 43 Scheduled Tribe*Male*Period 50 Scheduled Tribe*Male*Period 55 Age 0.002 0.006 -0.221 *** 0.007 0.002 0.006 -0.221 *** 0.007 -0.005 0.006 -0.229 *** 0.008Age Squared 0.000 * 0.000 0.003 *** 0.000 0.000 * 0.000 0.003 *** 0.000 0.000 *** 0.000 0.003 *** 0.000Urban -0.511 *** 0.015 0.490 *** 0.017 -0.510 *** 0.015 0.491 *** 0.017 -0.590 *** 0.015 0.388 *** 0.017Household Size 0.181 *** 0.004 0.238 *** 0.005 0.181 *** 0.004 0.238 *** 0.005 0.173 *** 0.004 0.234 *** 0.005Primary School 0.676 *** 0.015 0.988 *** 0.019 0.677 *** 0.015 0.989 *** 0.019 0.576 *** 0.015 0.868 *** 0.019Middle School 0.612 *** 0.016 1.195 *** 0.023 0.612 *** 0.016 1.195 *** 0.023 0.441 *** 0.017 1.054 *** 0.023College -0.214 *** 0.031 0.356 *** 0.053 -0.216 *** 0.031 0.358 *** 0.053 -0.443 *** 0.032 0.174 *** 0.053Never Married 0.107 *** 0.025 0.733 *** 0.050 0.106 *** 0.025 0.734 *** 0.050 0.084 *** 0.026 0.728 *** 0.050Widow/Divorced/Separated -0.210 *** 0.023 -0.823 *** 0.025 -0.212 *** 0.023 -0.825 *** 0.025 -0.226 *** 0.024 -0.847 *** 0.026Number of Kids in Household -0.091 *** 0.006 -0.149 *** 0.007 -0.091 *** 0.006 -0.149 *** 0.007 -0.082 *** 0.007 -0.157 *** 0.007Andra Pradesh -0.039 + 0.022 -1.605 *** 0.026 -0.039 + 0.022 -1.605 *** 0.026 -0.078 *** 0.022 -1.649 *** 0.026Assam -0.031 0.027 0.331 *** 0.033 -0.032 0.027 0.329 *** 0.033 -0.098 *** 0.028 0.291 *** 0.035Jammu and Kashmir 0.475 *** 0.036 0.784 *** 0.038 0.476 *** 0.036 0.780 *** 0.038 0.414 *** 0.037 0.543 *** 0.043Orissa -0.163 *** 0.026 -0.555 *** 0.028 -0.164 *** 0.026 -0.555 *** 0.028 -0.142 *** 0.027 -0.361 *** 0.028West Bengal -0.264 *** 0.023 0.060 * 0.026 -0.264 *** 0.023 0.061 * 0.026 -0.133 *** 0.024 0.115 *** 0.027Continued on next page
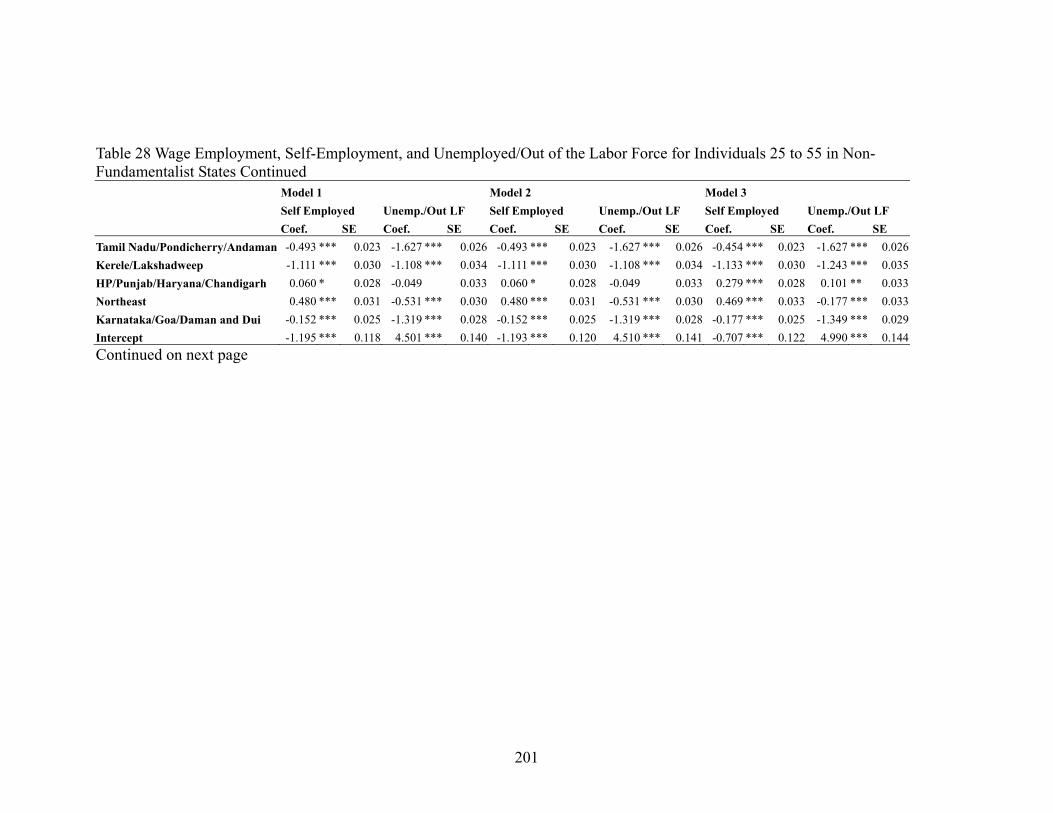
201
Table 28 Wage Employment, Self-Employment, and Unemployed/Out of the Labor Force for Individuals 25 to 55 in Non-Fundamentalist States Continued Model 1 Model 2 Model 3 Self Employed Unemp./Out LF Self Employed Unemp./Out LF Self Employed Unemp./Out LF Coef. SE Coef. SE Coef. SE Coef. SE Coef. SE Coef. SE Tamil Nadu/Pondicherry/Andaman -0.493 *** 0.023 -1.627 *** 0.026 -0.493 *** 0.023 -1.627 *** 0.026 -0.454 *** 0.023 -1.627 *** 0.026Kerele/Lakshadweep -1.111 *** 0.030 -1.108 *** 0.034 -1.111 *** 0.030 -1.108 *** 0.034 -1.133 *** 0.030 -1.243 *** 0.035HP/Punjab/Haryana/Chandigarh 0.060 * 0.028 -0.049 0.033 0.060 * 0.028 -0.049 0.033 0.279 *** 0.028 0.101 ** 0.033Northeast 0.480 *** 0.031 -0.531 *** 0.030 0.480 *** 0.031 -0.531 *** 0.030 0.469 *** 0.033 -0.177 *** 0.033Karnataka/Goa/Daman and Dui -0.152 *** 0.025 -1.319 *** 0.028 -0.152 *** 0.025 -1.319 *** 0.028 -0.177 *** 0.025 -1.349 *** 0.029Intercept -1.195 *** 0.118 4.501 *** 0.140 -1.193 *** 0.120 4.510 *** 0.141 -0.707 *** 0.122 4.990 *** 0.144Continued on next page
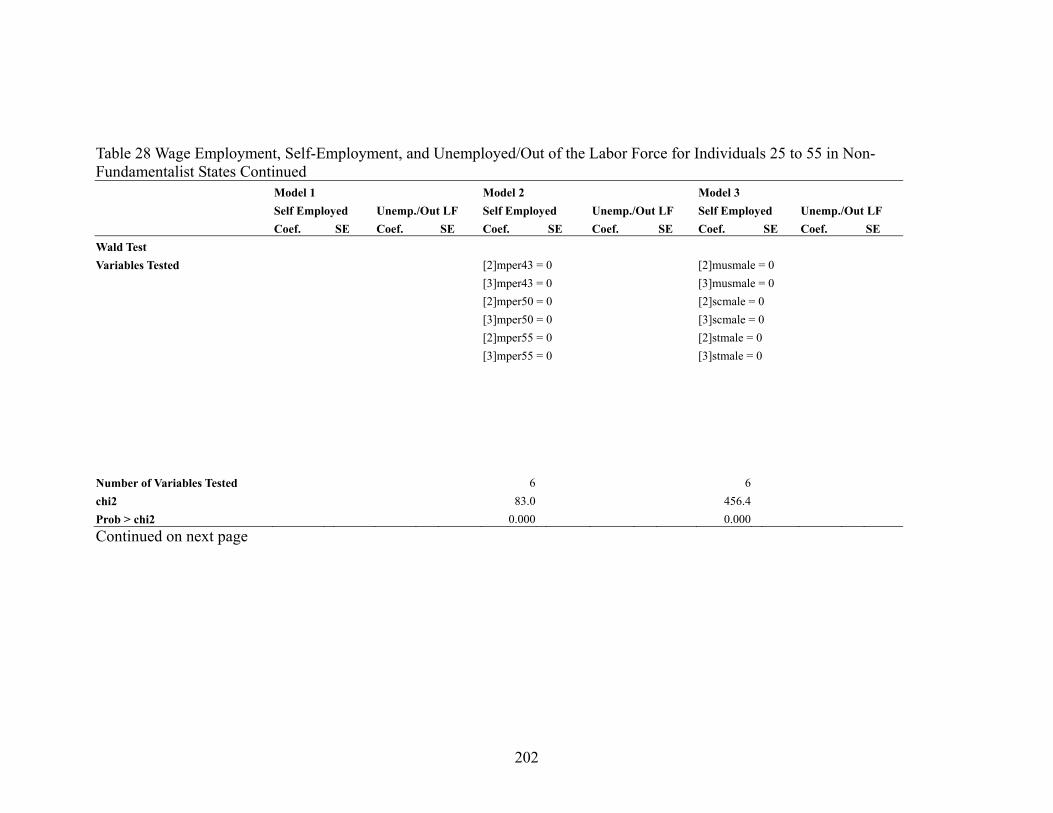
202
Table 28 Wage Employment, Self-Employment, and Unemployed/Out of the Labor Force for Individuals 25 to 55 in Non-Fundamentalist States Continued Model 1 Model 2 Model 3 Self Employed Unemp./Out LF Self Employed Unemp./Out LF Self Employed Unemp./Out LF Coef. SE Coef. SE Coef. SE Coef. SE Coef. SE Coef. SE Wald Test Variables Tested [2]mper43 = 0 [2]musmale = 0 [3]mper43 = 0 [3]musmale = 0 [2]mper50 = 0 [2]scmale = 0 [3]mper50 = 0 [3]scmale = 0 [2]mper55 = 0 [2]stmale = 0 [3]mper55 = 0 [3]stmale = 0 Number of Variables Tested 6 6 chi2 83.0 456.4 Prob > chi2 0.000 0.000 Continued on next page

203
Table 28 Wage Employment, Self-Employment, and Unemployed/Out of the Labor Force for Individuals 25 to 55 in Non-Fundamentalist States Continued Model 4 Model 5 Model 6 Self Employed Unemp./Out LF Self Employed Unemp./Out LF Self Employed Unemp./Out LF Coef. SE Coef. SE Coef. SE Coef. SE Coef. SE Coef. SE Historical Period 43 (1987) 0.094 ** 0.031 0.037 0.029 0.095 ** 0.031 0.037 0.029 0.087 * 0.036 0.020 0.031Historical Period 50 (1993) -0.012 0.032 -0.034 0.029 -0.010 0.032 -0.030 0.030 -0.012 0.037 -0.050 0.032Historical Period 55 (1999) -0.095 ** 0.035 -0.135 *** 0.032 -0.092 ** 0.035 -0.131 *** 0.032 -0.127 ** 0.041 -0.162 *** 0.035Male -0.131 *** 0.022 -5.146 *** 0.050 -0.161 *** 0.023 -5.118 *** 0.050 -0.178 *** 0.028 -5.210 *** 0.060Male*Historical Period 43 (1987) -0.122 *** 0.029 0.141 * 0.056 -0.124 *** 0.029 0.136 * 0.055 -0.113 ** 0.037 0.237 *** 0.058Male*Historical Period 50 (1993) 0.038 0.029 -0.016 0.059 0.035 0.029 -0.036 0.057 0.037 0.038 0.096 0.047Male*Historical Period 55 (1999) 0.069 * 0.031 0.160 ** 0.061 0.064 * 0.032 0.141 * 0.059 0.113 ** 0.041 0.255 *** 0.058Muslim -0.072 + 0.038 0.469 *** 0.040 -0.108 + 0.055 0.625 *** 0.050 -0.202 ** 0.078 0.572 *** 0.068Scheduled Caste -1.208 *** 0.036 -0.873 *** 0.044 -1.323 *** 0.042 -0.936 *** 0.044 -1.315 *** 0.056 -0.980 *** 0.071Scheduled Tribe -0.222 *** 0.042 -1.136 *** 0.052 -0.186 *** 0.048 -1.156 *** 0.053 -0.220 *** 0.060 -1.196 *** 0.075Muslim*Male 0.039 0.049 -0.832 *** 0.063 0.155 + 0.081 -0.710 *** 0.081Scheduled Caste*Male 0.166 *** 0.029 0.398 *** 0.054 0.157 ** 0.059 0.755 *** 0.085Scheduled Tribe*Male -0.058 + 0.030 0.618 *** 0.070 -0.007 0.056 0.876 *** 0.092Muslim*Period 43 (1987) 0.025 0.050 -0.116 * 0.055 0.028 0.050 -0.105 + 0.062 -0.041 0.109 -0.110 0.060Muslim*Period 50 (1993) 0.086 0.052 0.055 0.057 0.087 + 0.052 0.054 0.064 0.185 0.113 0.116 0.059Muslim*Period 55 (1999) -0.013 0.058 -0.083 0.065 -0.013 0.058 -0.075 0.073 0.274 * 0.130 0.056 0.062Scheduled Caste*Period 43 0.146 ** 0.047 0.100 + 0.056 0.146 ** 0.047 0.088 0.054 0.177 * 0.075 0.138 * 0.079Scheduled Caste*Period 50 0.015 0.048 0.069 0.055 0.013 0.048 0.066 0.054 -0.100 0.079 0.106 + 0.085Scheduled Caste*Period 55 0.031 0.051 0.096 + 0.058 0.030 0.051 0.088 0.056 0.071 0.082 0.162 ** 0.081Scheduled Tribe*Period 43 0.068 0.057 0.315 *** 0.069 0.070 0.057 0.298 *** 0.067 0.107 0.084 0.350 *** 0.115Scheduled Tribe*Period 50 -0.043 0.061 0.234 ** 0.076 -0.042 0.061 0.228 ** 0.074 0.034 0.087 0.305 *** 0.124Scheduled Tribe*Period 55 0.073 0.062 0.208 ** 0.072 0.074 0.061 0.198 ** 0.071 0.097 0.088 0.230 ** 0.152Muslim*Male*Period 43 0.082 0.114 -0.146 0.166Continued on next page
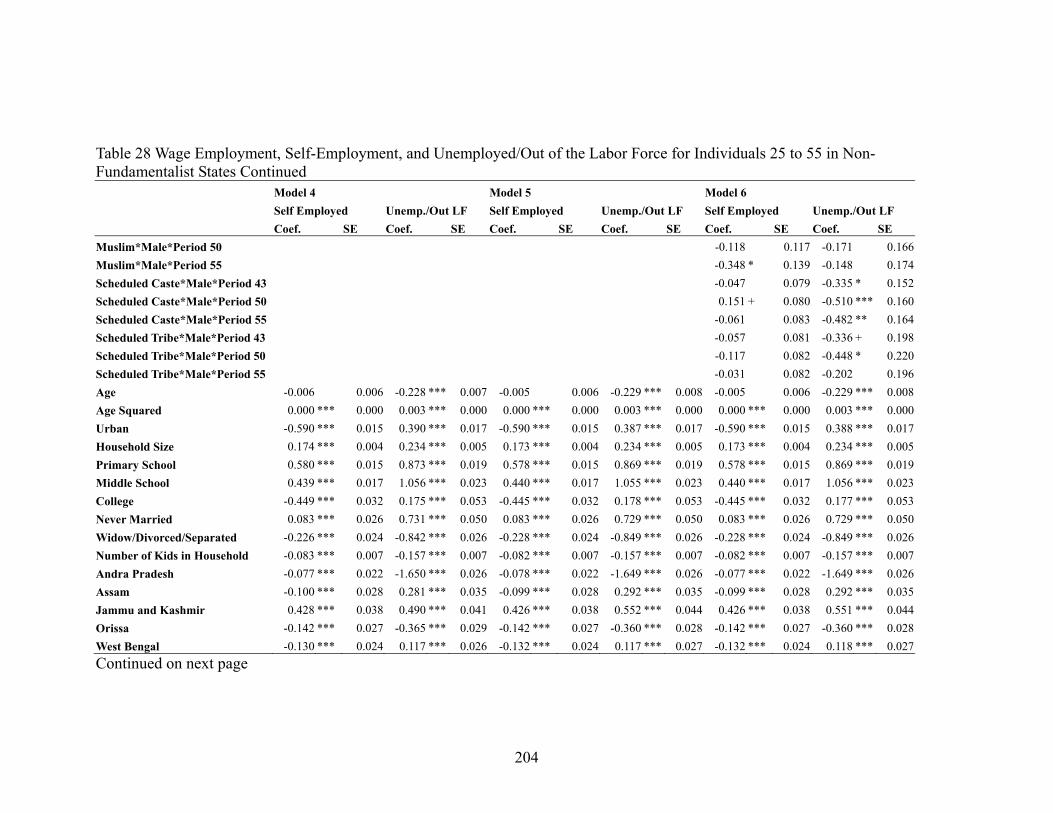
204
Table 28 Wage Employment, Self-Employment, and Unemployed/Out of the Labor Force for Individuals 25 to 55 in Non-Fundamentalist States Continued Model 4 Model 5 Model 6 Self Employed Unemp./Out LF Self Employed Unemp./Out LF Self Employed Unemp./Out LF Coef. SE Coef. SE Coef. SE Coef. SE Coef. SE Coef. SE Muslim*Male*Period 50 -0.118 0.117 -0.171 0.166Muslim*Male*Period 55 -0.348 * 0.139 -0.148 0.174Scheduled Caste*Male*Period 43 -0.047 0.079 -0.335 * 0.152Scheduled Caste*Male*Period 50 0.151 + 0.080 -0.510 *** 0.160Scheduled Caste*Male*Period 55 -0.061 0.083 -0.482 ** 0.164Scheduled Tribe*Male*Period 43 -0.057 0.081 -0.336 + 0.198Scheduled Tribe*Male*Period 50 -0.117 0.082 -0.448 * 0.220Scheduled Tribe*Male*Period 55 -0.031 0.082 -0.202 0.196Age -0.006 0.006 -0.228 *** 0.007 -0.005 0.006 -0.229 *** 0.008 -0.005 0.006 -0.229 *** 0.008Age Squared 0.000 *** 0.000 0.003 *** 0.000 0.000 *** 0.000 0.003 *** 0.000 0.000 *** 0.000 0.003 *** 0.000Urban -0.590 *** 0.015 0.390 *** 0.017 -0.590 *** 0.015 0.387 *** 0.017 -0.590 *** 0.015 0.388 *** 0.017Household Size 0.174 *** 0.004 0.234 *** 0.005 0.173 *** 0.004 0.234 *** 0.005 0.173 *** 0.004 0.234 *** 0.005Primary School 0.580 *** 0.015 0.873 *** 0.019 0.578 *** 0.015 0.869 *** 0.019 0.578 *** 0.015 0.869 *** 0.019Middle School 0.439 *** 0.017 1.056 *** 0.023 0.440 *** 0.017 1.055 *** 0.023 0.440 *** 0.017 1.056 *** 0.023College -0.449 *** 0.032 0.175 *** 0.053 -0.445 *** 0.032 0.178 *** 0.053 -0.445 *** 0.032 0.177 *** 0.053Never Married 0.083 *** 0.026 0.731 *** 0.050 0.083 *** 0.026 0.729 *** 0.050 0.083 *** 0.026 0.729 *** 0.050Widow/Divorced/Separated -0.226 *** 0.024 -0.842 *** 0.026 -0.228 *** 0.024 -0.849 *** 0.026 -0.228 *** 0.024 -0.849 *** 0.026Number of Kids in Household -0.083 *** 0.007 -0.157 *** 0.007 -0.082 *** 0.007 -0.157 *** 0.007 -0.082 *** 0.007 -0.157 *** 0.007Andra Pradesh -0.077 *** 0.022 -1.650 *** 0.026 -0.078 *** 0.022 -1.649 *** 0.026 -0.077 *** 0.022 -1.649 *** 0.026Assam -0.100 *** 0.028 0.281 *** 0.035 -0.099 *** 0.028 0.292 *** 0.035 -0.099 *** 0.028 0.292 *** 0.035Jammu and Kashmir 0.428 *** 0.038 0.490 *** 0.041 0.426 *** 0.038 0.552 *** 0.044 0.426 *** 0.038 0.551 *** 0.044Orissa -0.142 *** 0.027 -0.365 *** 0.029 -0.142 *** 0.027 -0.360 *** 0.028 -0.142 *** 0.027 -0.360 *** 0.028West Bengal -0.130 *** 0.024 0.117 *** 0.026 -0.132 *** 0.024 0.117 *** 0.027 -0.132 *** 0.024 0.118 *** 0.027Continued on next page

205
Table 28 Wage Employment, Self-Employment, and Unemployed/Out of the Labor Force for Individuals 25 to 55 in Non-Fundamentalist States Continued Model 4 Model 5 Model 6 Self Employed Unemp./Out LF Self Employed Unemp./Out LF Self Employed Unemp./Out LF Coef. SE Coef. SE Coef. SE Coef. SE Coef. SE Coef. SE Tamil Nadu/Pondicherry/Andaman -0.455 *** 0.023 -1.633 *** 0.026 -0.454 *** 0.023 -1.628 *** 0.026 -0.454 *** 0.023 -1.628 *** 0.026Kerele/Lakshadweep -1.136 *** 0.030 -1.232 *** 0.035 -1.134 *** 0.030 -1.242 *** 0.035 -1.134 *** 0.030 -1.242 *** 0.035HP/Punjab/Haryana/Chandigarh 0.282 *** 0.028 0.110 *** 0.033 0.279 *** 0.028 0.100 ** 0.033 0.279 *** 0.028 0.100 ** 0.033Northeast 0.466 *** 0.033 -0.187 *** 0.033 0.466 *** 0.033 -0.181 *** 0.033 0.467 *** 0.033 -0.181 *** 0.033Karnataka/Goa/Daman and Dui -0.176 *** 0.025 -1.349 *** 0.028 -0.176 *** 0.025 -1.349 *** 0.029 -0.176 *** 0.025 -1.349 *** 0.029Intercept -0.711 *** 0.123 5.001 *** 0.145 -0.694 *** 0.123 5.023 *** 0.146 -0.679 *** 0.124 5.042 *** 0.146Continued on next page
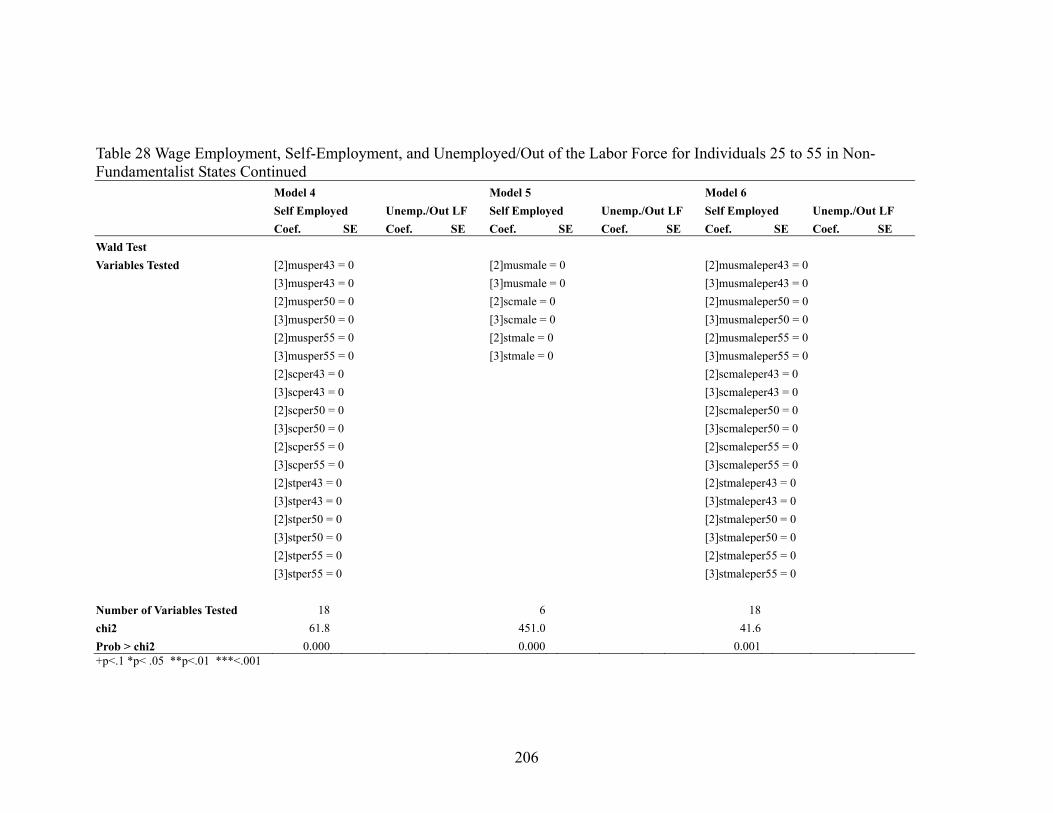
206
Table 28 Wage Employment, Self-Employment, and Unemployed/Out of the Labor Force for Individuals 25 to 55 in Non-Fundamentalist States Continued Model 4 Model 5 Model 6 Self Employed Unemp./Out LF Self Employed Unemp./Out LF Self Employed Unemp./Out LF Coef. SE Coef. SE Coef. SE Coef. SE Coef. SE Coef. SE Wald Test Variables Tested [2]musper43 = 0 [2]musmale = 0 [2]musmaleper43 = 0 [3]musper43 = 0 [3]musmale = 0 [3]musmaleper43 = 0 [2]musper50 = 0 [2]scmale = 0 [2]musmaleper50 = 0 [3]musper50 = 0 [3]scmale = 0 [3]musmaleper50 = 0 [2]musper55 = 0 [2]stmale = 0 [2]musmaleper55 = 0 [3]musper55 = 0 [3]stmale = 0 [3]musmaleper55 = 0 [2]scper43 = 0 [2]scmaleper43 = 0 [3]scper43 = 0 [3]scmaleper43 = 0 [2]scper50 = 0 [2]scmaleper50 = 0 [3]scper50 = 0 [3]scmaleper50 = 0 [2]scper55 = 0 [2]scmaleper55 = 0 [3]scper55 = 0 [3]scmaleper55 = 0 [2]stper43 = 0 [2]stmaleper43 = 0 [3]stper43 = 0 [3]stmaleper43 = 0 [2]stper50 = 0 [2]stmaleper50 = 0 [3]stper50 = 0 [3]stmaleper50 = 0 [2]stper55 = 0 [2]stmaleper55 = 0 [3]stper55 = 0 [3]stmaleper55 = 0 Number of Variables Tested 18 6 18 chi2 61.8 451.0 41.6 Prob > chi2 0.000 0.000 0.001 +p<.1 *p< .05 **p<.01 ***<.001
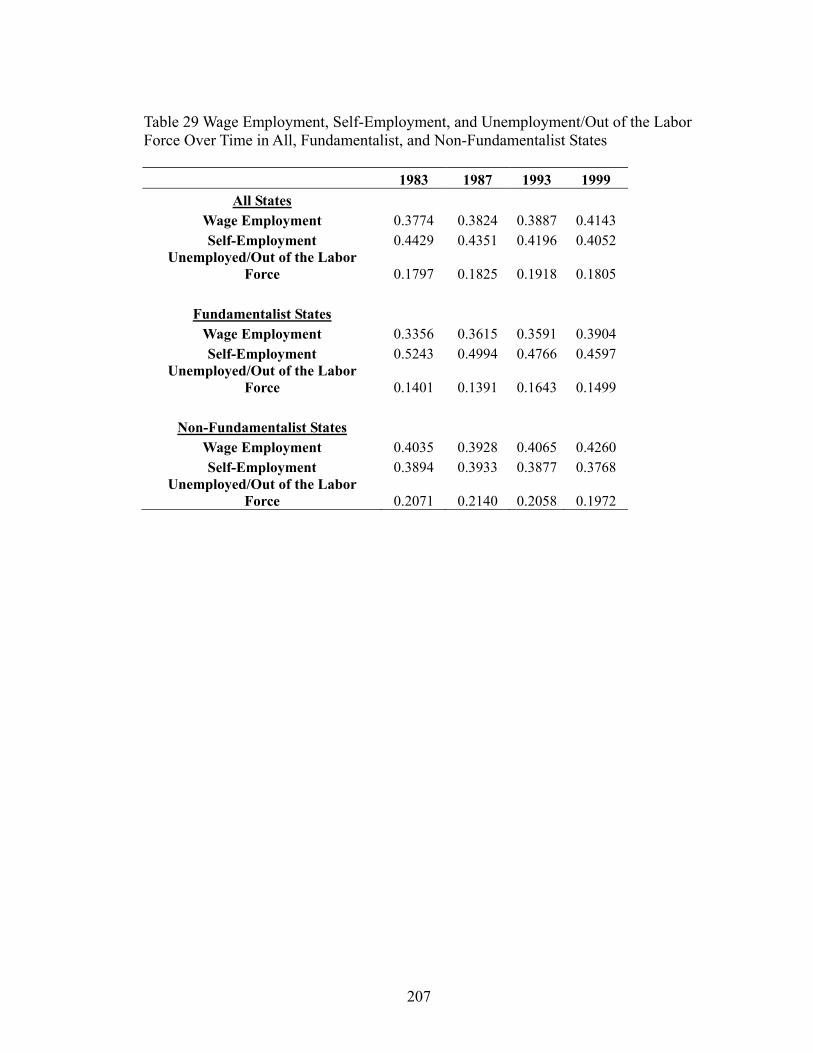
207
Table 29 Wage Employment, Self-Employment, and Unemployment/Out of the Labor Force Over Time in All, Fundamentalist, and Non-Fundamentalist States 1983 1987 1993 1999
All States Wage Employment 0.3774 0.3824 0.3887 0.4143 Self-Employment 0.4429 0.4351 0.4196 0.4052
Unemployed/Out of the Labor Force 0.1797 0.1825 0.1918 0.1805
Fundamentalist States
Wage Employment 0.3356 0.3615 0.3591 0.3904 Self-Employment 0.5243 0.4994 0.4766 0.4597
Unemployed/Out of the Labor Force 0.1401 0.1391 0.1643 0.1499
Non-Fundamentalist States
Wage Employment 0.4035 0.3928 0.4065 0.4260 Self-Employment 0.3894 0.3933 0.3877 0.3768
Unemployed/Out of the Labor Force 0.2071 0.2140 0.2058 0.1972
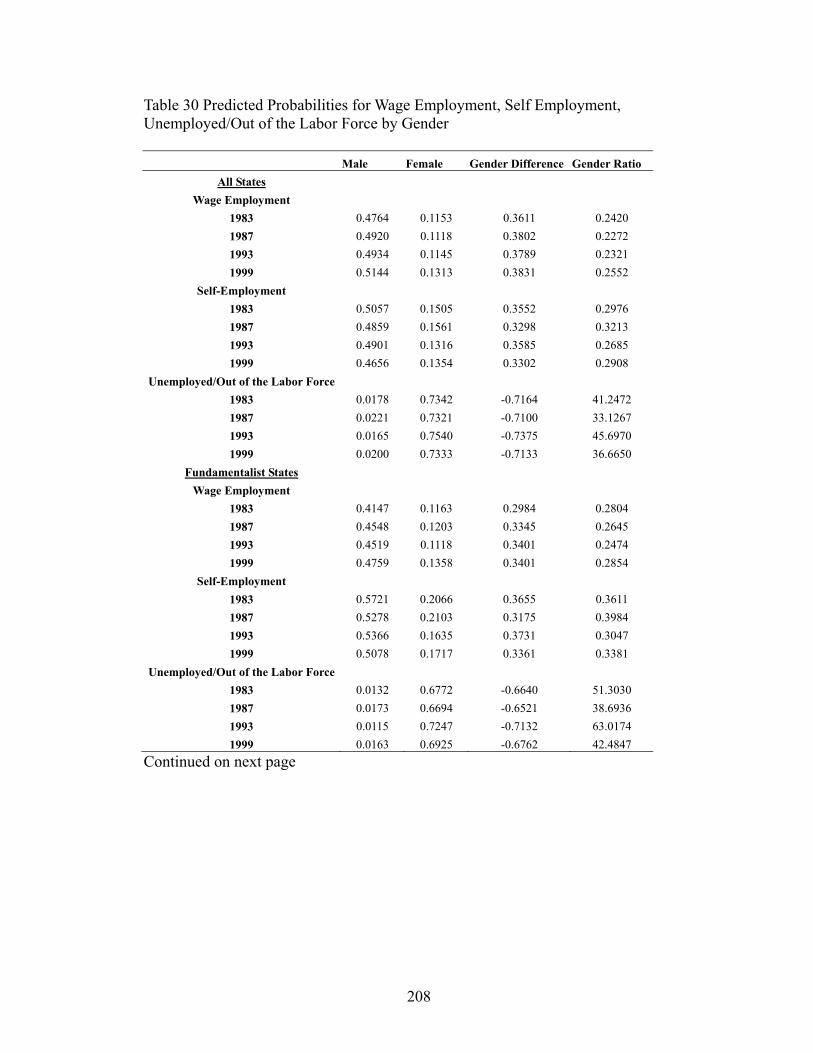
208
Table 30 Predicted Probabilities for Wage Employment, Self Employment, Unemployed/Out of the Labor Force by Gender Male Female Gender Difference Gender Ratio
All States Wage Employment
1983 0.4764 0.1153 0.3611 0.2420 1987 0.4920 0.1118 0.3802 0.2272 1993 0.4934 0.1145 0.3789 0.2321 1999 0.5144 0.1313 0.3831 0.2552
Self-Employment 1983 0.5057 0.1505 0.3552 0.2976 1987 0.4859 0.1561 0.3298 0.3213 1993 0.4901 0.1316 0.3585 0.2685 1999 0.4656 0.1354 0.3302 0.2908
Unemployed/Out of the Labor Force 1983 0.0178 0.7342 -0.7164 41.2472 1987 0.0221 0.7321 -0.7100 33.1267 1993 0.0165 0.7540 -0.7375 45.6970 1999 0.0200 0.7333 -0.7133 36.6650
Fundamentalist States Wage Employment
1983 0.4147 0.1163 0.2984 0.2804 1987 0.4548 0.1203 0.3345 0.2645 1993 0.4519 0.1118 0.3401 0.2474 1999 0.4759 0.1358 0.3401 0.2854
Self-Employment 1983 0.5721 0.2066 0.3655 0.3611 1987 0.5278 0.2103 0.3175 0.3984 1993 0.5366 0.1635 0.3731 0.3047 1999 0.5078 0.1717 0.3361 0.3381
Unemployed/Out of the Labor Force 1983 0.0132 0.6772 -0.6640 51.3030 1987 0.0173 0.6694 -0.6521 38.6936 1993 0.0115 0.7247 -0.7132 63.0174 1999 0.0163 0.6925 -0.6762 42.4847
Continued on next page
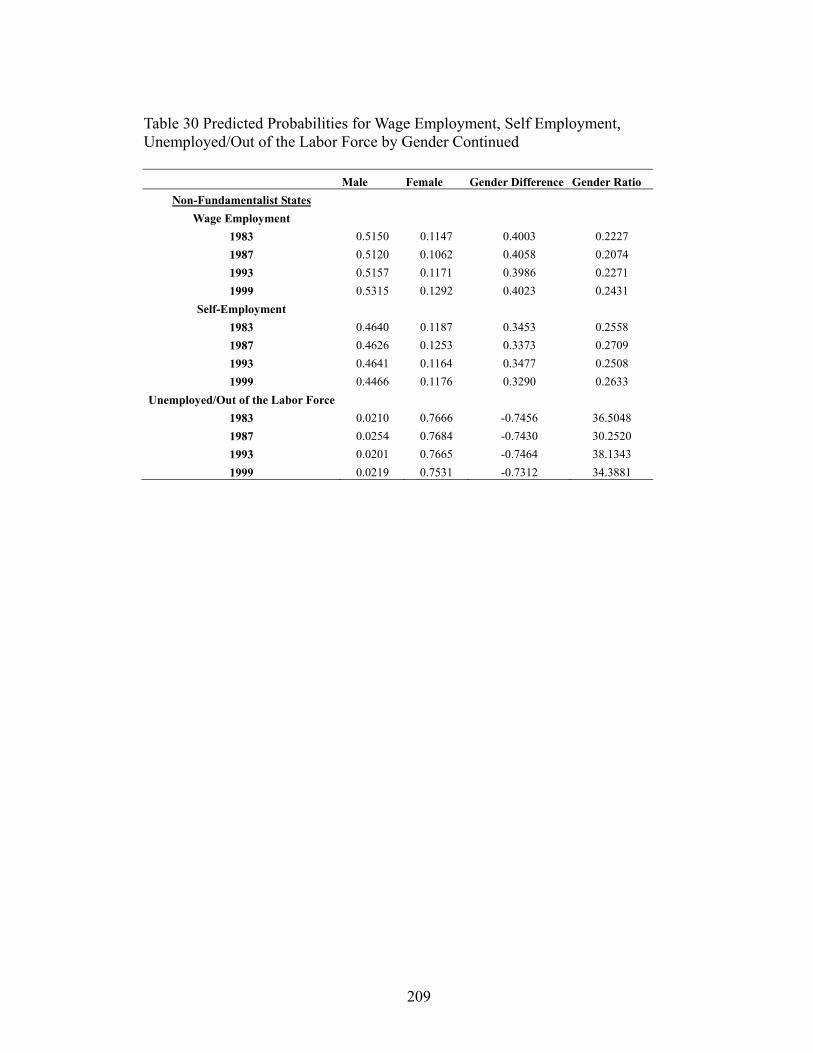
209
Table 30 Predicted Probabilities for Wage Employment, Self Employment, Unemployed/Out of the Labor Force by Gender Continued Male Female Gender Difference Gender Ratio
Non-Fundamentalist States Wage Employment
1983 0.5150 0.1147 0.4003 0.2227 1987 0.5120 0.1062 0.4058 0.2074 1993 0.5157 0.1171 0.3986 0.2271 1999 0.5315 0.1292 0.4023 0.2431
Self-Employment 1983 0.4640 0.1187 0.3453 0.2558 1987 0.4626 0.1253 0.3373 0.2709 1993 0.4641 0.1164 0.3477 0.2508 1999 0.4466 0.1176 0.3290 0.2633
Unemployed/Out of the Labor Force 1983 0.0210 0.7666 -0.7456 36.5048 1987 0.0254 0.7684 -0.7430 30.2520 1993 0.0201 0.7665 -0.7464 38.1343 1999 0.0219 0.7531 -0.7312 34.3881
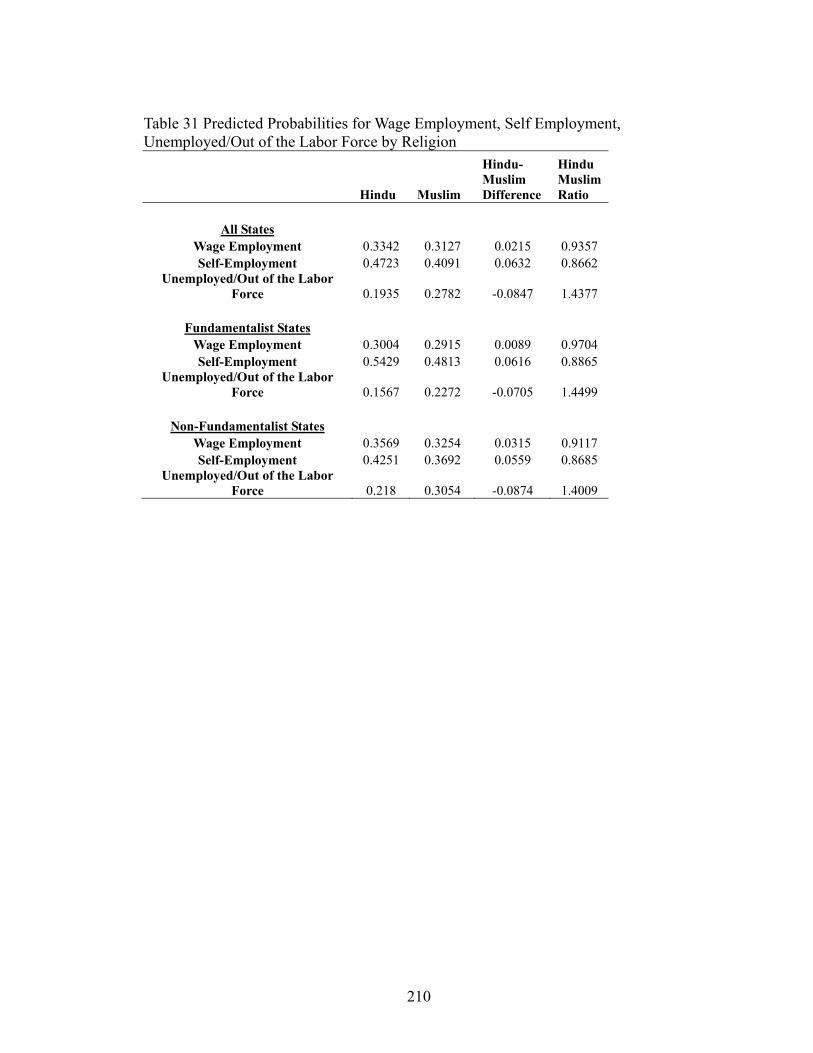
210
Table 31 Predicted Probabilities for Wage Employment, Self Employment, Unemployed/Out of the Labor Force by Religion
Hindu Muslim
Hindu-Muslim Difference
Hindu Muslim Ratio
All States Wage Employment 0.3342 0.3127 0.0215 0.9357 Self-Employment 0.4723 0.4091 0.0632 0.8662
Unemployed/Out of the Labor Force 0.1935 0.2782 -0.0847 1.4377
Fundamentalist States
Wage Employment 0.3004 0.2915 0.0089 0.9704 Self-Employment 0.5429 0.4813 0.0616 0.8865
Unemployed/Out of the Labor Force 0.1567 0.2272 -0.0705 1.4499
Non-Fundamentalist States
Wage Employment 0.3569 0.3254 0.0315 0.9117 Self-Employment 0.4251 0.3692 0.0559 0.8685
Unemployed/Out of the Labor Force 0.218 0.3054 -0.0874 1.4009
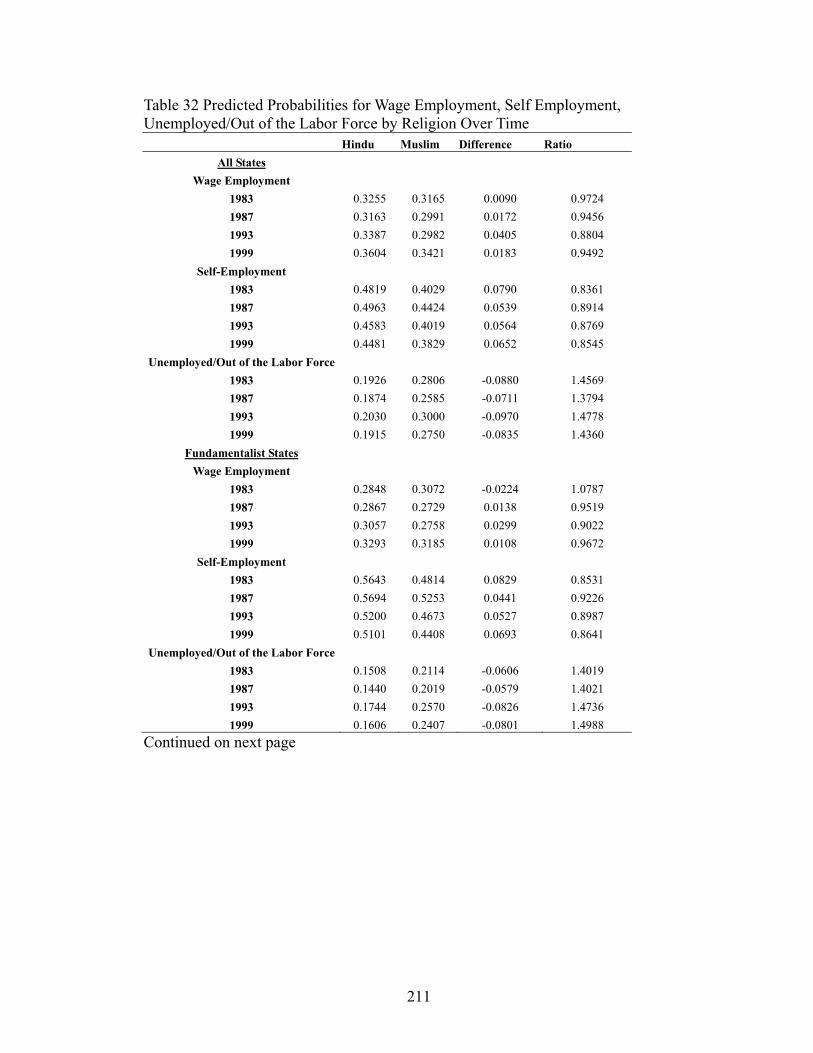
211
Table 32 Predicted Probabilities for Wage Employment, Self Employment, Unemployed/Out of the Labor Force by Religion Over Time
Hindu Muslim Difference Ratio All States
Wage Employment 1983 0.3255 0.3165 0.0090 0.9724 1987 0.3163 0.2991 0.0172 0.9456 1993 0.3387 0.2982 0.0405 0.8804 1999 0.3604 0.3421 0.0183 0.9492
Self-Employment 1983 0.4819 0.4029 0.0790 0.8361 1987 0.4963 0.4424 0.0539 0.8914 1993 0.4583 0.4019 0.0564 0.8769 1999 0.4481 0.3829 0.0652 0.8545
Unemployed/Out of the Labor Force 1983 0.1926 0.2806 -0.0880 1.4569 1987 0.1874 0.2585 -0.0711 1.3794 1993 0.2030 0.3000 -0.0970 1.4778 1999 0.1915 0.2750 -0.0835 1.4360
Fundamentalist States Wage Employment
1983 0.2848 0.3072 -0.0224 1.0787 1987 0.2867 0.2729 0.0138 0.9519 1993 0.3057 0.2758 0.0299 0.9022 1999 0.3293 0.3185 0.0108 0.9672
Self-Employment 1983 0.5643 0.4814 0.0829 0.8531 1987 0.5694 0.5253 0.0441 0.9226 1993 0.5200 0.4673 0.0527 0.8987 1999 0.5101 0.4408 0.0693 0.8641
Unemployed/Out of the Labor Force 1983 0.1508 0.2114 -0.0606 1.4019 1987 0.1440 0.2019 -0.0579 1.4021 1993 0.1744 0.2570 -0.0826 1.4736 1999 0.1606 0.2407 -0.0801 1.4988
Continued on next page
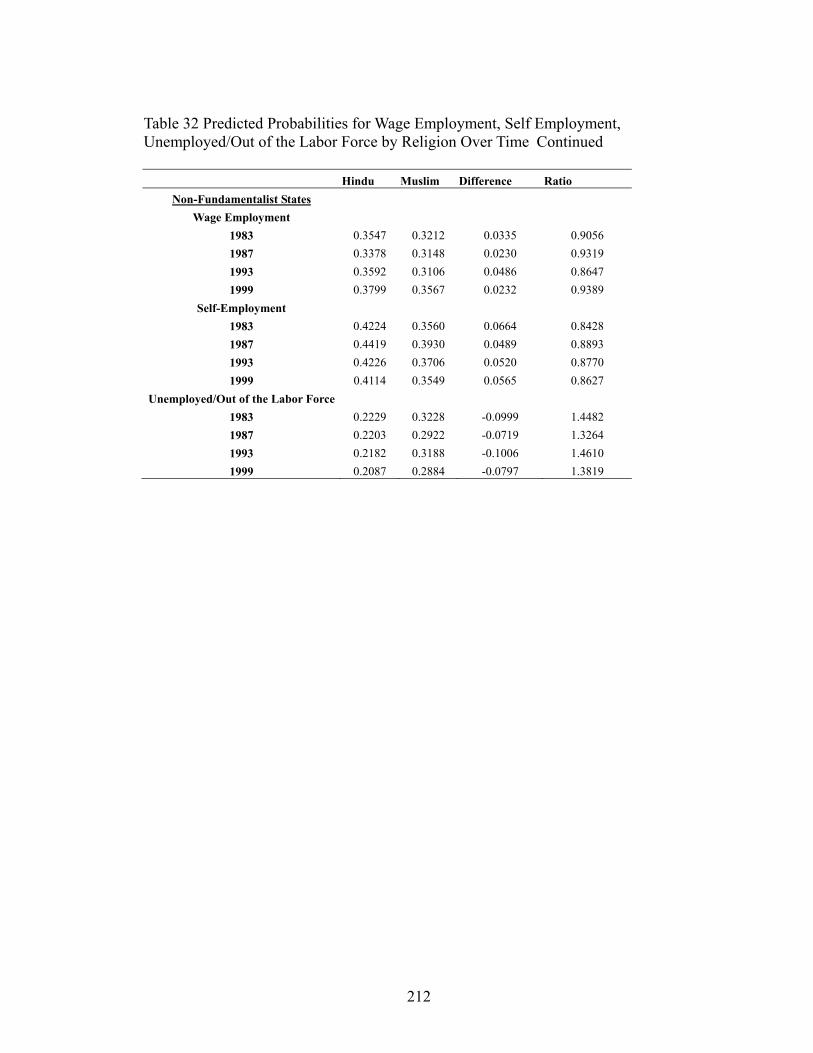
212
Table 32 Predicted Probabilities for Wage Employment, Self Employment, Unemployed/Out of the Labor Force by Religion Over Time Continued
Hindu Muslim Difference Ratio Non-Fundamentalist States
Wage Employment 1983 0.3547 0.3212 0.0335 0.9056 1987 0.3378 0.3148 0.0230 0.9319 1993 0.3592 0.3106 0.0486 0.8647 1999 0.3799 0.3567 0.0232 0.9389
Self-Employment 1983 0.4224 0.3560 0.0664 0.8428 1987 0.4419 0.3930 0.0489 0.8893 1993 0.4226 0.3706 0.0520 0.8770 1999 0.4114 0.3549 0.0565 0.8627
Unemployed/Out of the Labor Force 1983 0.2229 0.3228 -0.0999 1.4482 1987 0.2203 0.2922 -0.0719 1.3264 1993 0.2182 0.3188 -0.1006 1.4610 1999 0.2087 0.2884 -0.0797 1.3819
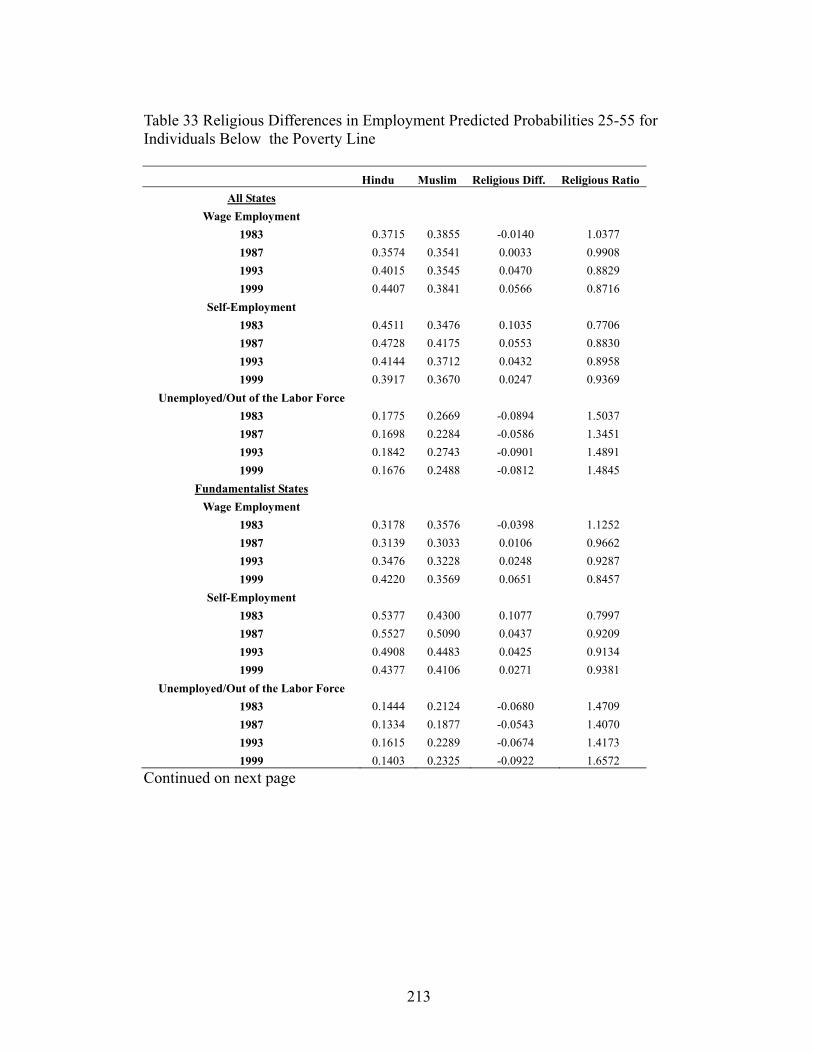
213
Table 33 Religious Differences in Employment Predicted Probabilities 25-55 for Individuals Below the Poverty Line
Hindu Muslim Religious Diff. Religious Ratio All States
Wage Employment 1983 0.3715 0.3855 -0.0140 1.0377 1987 0.3574 0.3541 0.0033 0.9908 1993 0.4015 0.3545 0.0470 0.8829 1999 0.4407 0.3841 0.0566 0.8716
Self-Employment 1983 0.4511 0.3476 0.1035 0.7706 1987 0.4728 0.4175 0.0553 0.8830 1993 0.4144 0.3712 0.0432 0.8958 1999 0.3917 0.3670 0.0247 0.9369
Unemployed/Out of the Labor Force 1983 0.1775 0.2669 -0.0894 1.5037 1987 0.1698 0.2284 -0.0586 1.3451 1993 0.1842 0.2743 -0.0901 1.4891 1999 0.1676 0.2488 -0.0812 1.4845
Fundamentalist States Wage Employment
1983 0.3178 0.3576 -0.0398 1.1252 1987 0.3139 0.3033 0.0106 0.9662 1993 0.3476 0.3228 0.0248 0.9287 1999 0.4220 0.3569 0.0651 0.8457
Self-Employment 1983 0.5377 0.4300 0.1077 0.7997 1987 0.5527 0.5090 0.0437 0.9209 1993 0.4908 0.4483 0.0425 0.9134 1999 0.4377 0.4106 0.0271 0.9381
Unemployed/Out of the Labor Force 1983 0.1444 0.2124 -0.0680 1.4709 1987 0.1334 0.1877 -0.0543 1.4070 1993 0.1615 0.2289 -0.0674 1.4173 1999 0.1403 0.2325 -0.0922 1.6572
Continued on next page
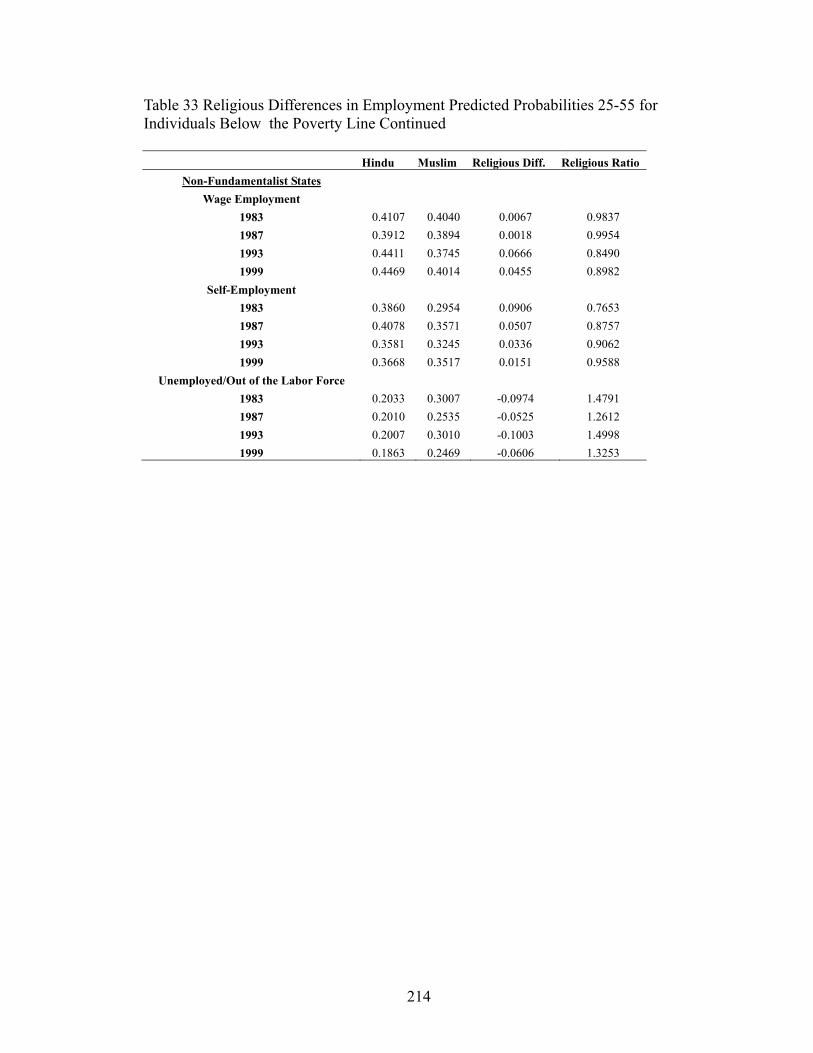
214
Table 33 Religious Differences in Employment Predicted Probabilities 25-55 for Individuals Below the Poverty Line Continued
Hindu Muslim Religious Diff. Religious Ratio Non-Fundamentalist States
Wage Employment 1983 0.4107 0.4040 0.0067 0.9837 1987 0.3912 0.3894 0.0018 0.9954 1993 0.4411 0.3745 0.0666 0.8490 1999 0.4469 0.4014 0.0455 0.8982
Self-Employment 1983 0.3860 0.2954 0.0906 0.7653 1987 0.4078 0.3571 0.0507 0.8757 1993 0.3581 0.3245 0.0336 0.9062 1999 0.3668 0.3517 0.0151 0.9588
Unemployed/Out of the Labor Force 1983 0.2033 0.3007 -0.0974 1.4791 1987 0.2010 0.2535 -0.0525 1.2612 1993 0.2007 0.3010 -0.1003 1.4998 1999 0.1863 0.2469 -0.0606 1.3253
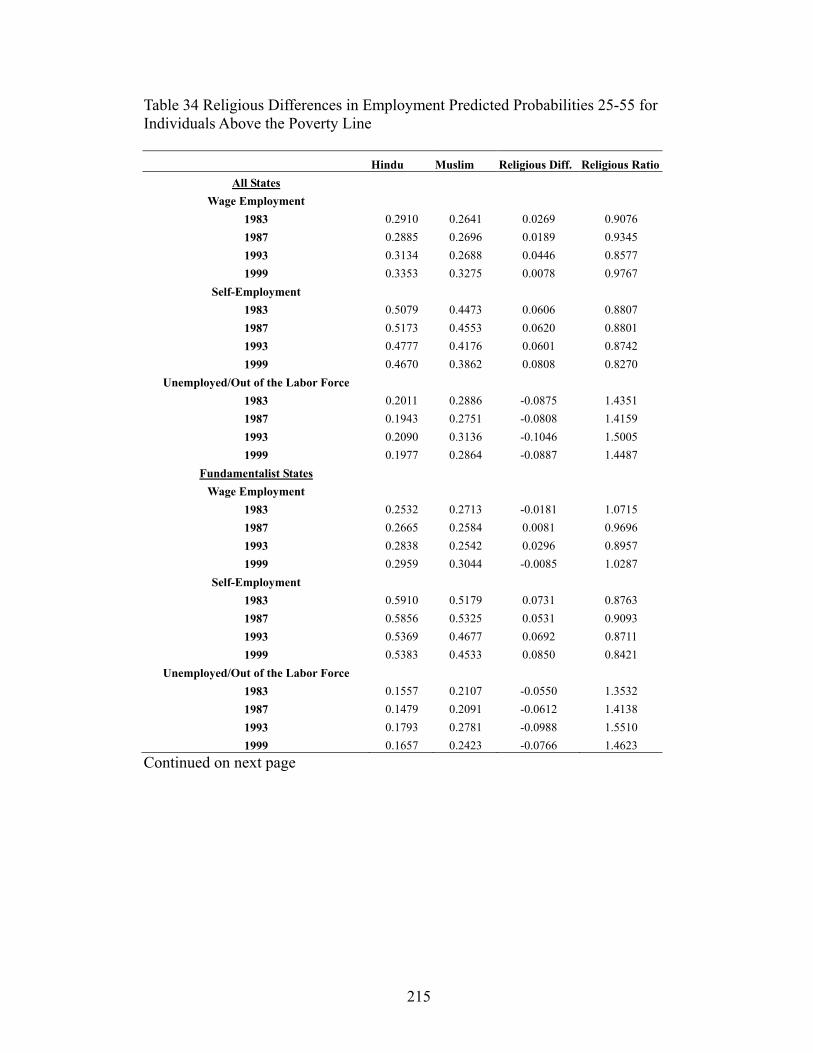
215
Table 34 Religious Differences in Employment Predicted Probabilities 25-55 for Individuals Above the Poverty Line
Hindu Muslim Religious Diff. Religious RatioAll States
Wage Employment 1983 0.2910 0.2641 0.0269 0.9076 1987 0.2885 0.2696 0.0189 0.9345 1993 0.3134 0.2688 0.0446 0.8577 1999 0.3353 0.3275 0.0078 0.9767
Self-Employment 1983 0.5079 0.4473 0.0606 0.8807 1987 0.5173 0.4553 0.0620 0.8801 1993 0.4777 0.4176 0.0601 0.8742 1999 0.4670 0.3862 0.0808 0.8270
Unemployed/Out of the Labor Force 1983 0.2011 0.2886 -0.0875 1.4351 1987 0.1943 0.2751 -0.0808 1.4159 1993 0.2090 0.3136 -0.1046 1.5005 1999 0.1977 0.2864 -0.0887 1.4487
Fundamentalist States Wage Employment
1983 0.2532 0.2713 -0.0181 1.0715 1987 0.2665 0.2584 0.0081 0.9696 1993 0.2838 0.2542 0.0296 0.8957 1999 0.2959 0.3044 -0.0085 1.0287
Self-Employment 1983 0.5910 0.5179 0.0731 0.8763 1987 0.5856 0.5325 0.0531 0.9093 1993 0.5369 0.4677 0.0692 0.8711 1999 0.5383 0.4533 0.0850 0.8421
Unemployed/Out of the Labor Force 1983 0.1557 0.2107 -0.0550 1.3532 1987 0.1479 0.2091 -0.0612 1.4138 1993 0.1793 0.2781 -0.0988 1.5510 1999 0.1657 0.2423 -0.0766 1.4623
Continued on next page
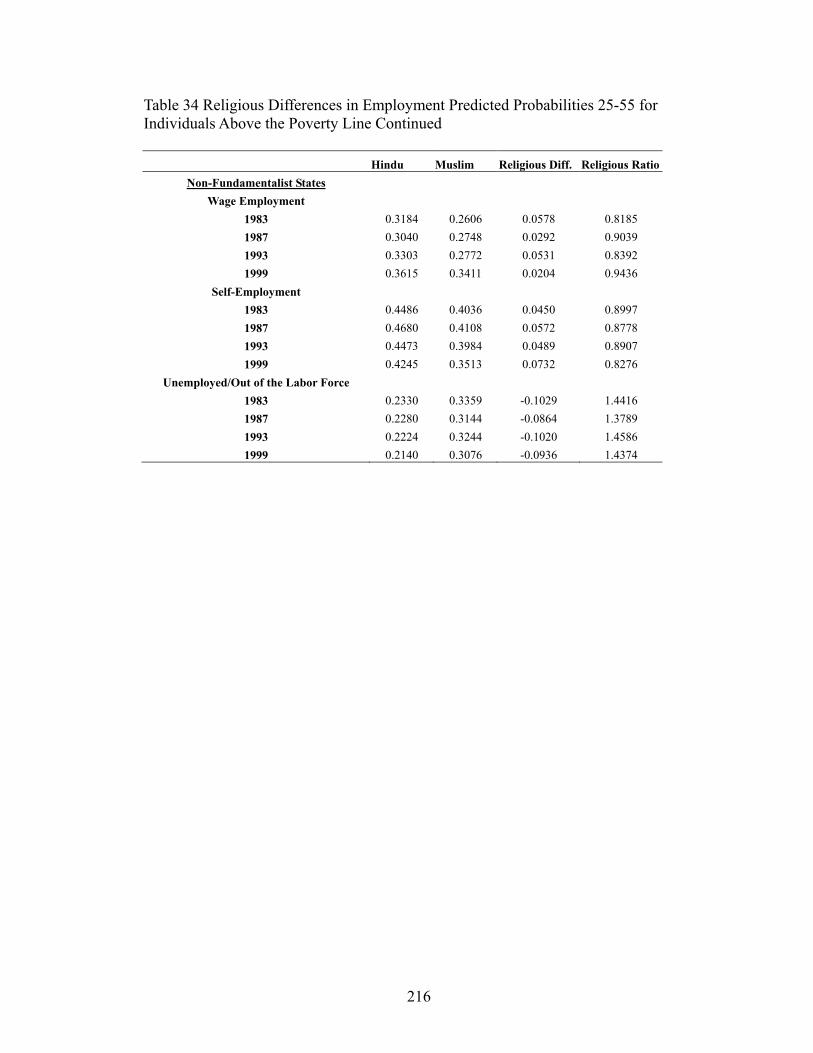
216
Table 34 Religious Differences in Employment Predicted Probabilities 25-55 for Individuals Above the Poverty Line Continued
Hindu Muslim Religious Diff. Religious RatioNon-Fundamentalist States
Wage Employment 1983 0.3184 0.2606 0.0578 0.8185 1987 0.3040 0.2748 0.0292 0.9039 1993 0.3303 0.2772 0.0531 0.8392 1999 0.3615 0.3411 0.0204 0.9436
Self-Employment 1983 0.4486 0.4036 0.0450 0.8997 1987 0.4680 0.4108 0.0572 0.8778 1993 0.4473 0.3984 0.0489 0.8907 1999 0.4245 0.3513 0.0732 0.8276
Unemployed/Out of the Labor Force 1983 0.2330 0.3359 -0.1029 1.4416 1987 0.2280 0.3144 -0.0864 1.3789 1993 0.2224 0.3244 -0.1020 1.4586 1999 0.2140 0.3076 -0.0936 1.4374

217
Table 35 Wage Employment, Self-Employment, and Unemployed/Out of the Labor Force for Individuals 25 to 55 in All States Below The Poverty Line Model 1 Model 2 Model 3 Self Employed Unemp./Out LF Self Employed Unemp./Out LF Self Employed Unemp./Out LF Coef. SE Coef. SE Coef. SE Coef. SE Coef. SE Coef. SE Historical Period 43 (1987) -0.072 *** 0.020 -0.012 0.022 0.090 ** 0.029 0.031 0.025 -0.070 *** 0.020 -0.012 0.023Historical Period 50 (1993) -0.193 *** 0.021 -0.036 0.023 -0.188 *** 0.032 -0.012 0.026 -0.164 *** 0.022 -0.022 0.024Historical Period 55 (1999) -0.337 *** 0.025 -0.195 *** 0.026 -0.310 *** 0.035 -0.187 *** 0.028 -0.289 *** 0.026 -0.163 *** 0.027Male -0.151 *** 0.013 -4.734 *** 0.034 -0.079 *** 0.022 -4.740 *** 0.061 -0.132 *** 0.018 -4.717 *** 0.046Male*Historical Period 43 (1987) -0.239 *** 0.030 0.175 * 0.072 Male*Historical Period 50 (1993) -0.009 0.032 -0.204 ** 0.076 Male*Historical Period 55 (1999) -0.040 0.037 0.031 0.095 Muslim 0.062 0.053 0.659 *** 0.039Scheduled Caste -1.069 *** 0.031 -0.741 *** 0.024Scheduled Tribe -0.091 ** 0.032 -0.790 *** 0.031Muslim*Male -0.179 *** 0.056 -0.938 *** 0.089Scheduled Caste*Male 0.022 0.032 0.286 *** 0.070Scheduled Tribe*Male -0.051 + 0.030 0.642 *** 0.098Muslim*Period 43 (1987) Muslim*Period 50 (1993) Muslim*Period 55 (1999) Scheduled Caste*Period 43 Scheduled Caste*Period 50 Scheduled Caste*Period 55 Scheduled Tribe*Period 43 Scheduled Tribe*Period 50 Scheduled Tribe*Period 55 Muslim*Male*Period 43 Continued on next page

218
Table 35 Wage Employment, Self-Employment, and Unemployed/Out of the Labor Force for Individuals 25 to 55 in All States Below The Poverty Line Continued Model 1 Model 2 Model 3 Self Employed Unemp./Out LF Self Employed Unemp./Out LF Self Employed Unemp./Out LF Coef. SE Coef. SE Coef. SE Coef. SE Coef. SE Coef. SE Muslim*Male*Period 50 Muslim*Male*Period 55 Scheduled Caste*Male*Period 43 Scheduled Caste*Male*Period 50 Scheduled Caste*Male*Period 55 Scheduled Tribe*Male*Period 43 Scheduled Tribe*Male*Period 50 Scheduled Tribe*Male*Period 55 Age -0.020 ** 0.008 -0.228 *** 0.009 -0.020 ** 0.008 -0.227 *** 0.009 -0.025 ** 0.008 -0.235 *** 0.010Age Squared 0.000 *** 0.000 0.003 *** 0.000 0.000 *** 0.000 0.003 *** 0.000 0.001 *** 0.000 0.003 *** 0.000Urban -0.169 *** 0.023 1.023 *** 0.022 -0.167 *** 0.023 1.020 *** 0.022 -0.218 *** 0.026 0.867 *** 0.023Household Size 0.183 *** 0.006 0.222 *** 0.006 0.183 *** 0.006 0.222 *** 0.006 0.174 *** 0.006 0.216 *** 0.006Primary School 0.420 *** 0.019 0.645 *** 0.027 0.420 *** 0.019 0.645 *** 0.026 0.350 *** 0.019 0.550 *** 0.027Middle School 0.572 *** 0.024 1.053 *** 0.043 0.569 *** 0.024 1.054 *** 0.043 0.471 *** 0.025 0.973 *** 0.043College 0.201 ** 0.073 1.385 *** 0.118 0.197 ** 0.073 1.393 *** 0.119 0.063 0.074 1.291 *** 0.121Never Married 0.030 0.041 0.666 *** 0.079 0.029 0.041 0.668 *** 0.080 -0.016 0.042 0.651 *** 0.080Widow/Divorced/Separated -0.196 *** 0.028 -0.738 *** 0.033 -0.197 *** 0.028 -0.738 *** 0.033 -0.205 *** 0.029 -0.771 *** 0.034Number of Kids in Household -0.052 *** 0.008 -0.103 *** 0.009 -0.052 *** 0.008 -0.103 *** 0.009 -0.049 *** 0.009 -0.118 *** 0.009Andra Pradesh -0.945 *** 0.040 -1.985 *** 0.044 -0.947 *** 0.040 -1.981 *** 0.044 -1.085 *** 0.041 -2.013 *** 0.044Assam -0.691 *** 0.046 0.308 *** 0.053 -0.692 *** 0.046 0.310 *** 0.053 -0.922 *** 0.048 0.167 ** 0.056Bihar -0.799 *** 0.031 -0.157 *** 0.031 -0.798 *** 0.031 -0.156 *** 0.031 -0.917 *** 0.032 -0.183 *** 0.032Jammu and Kashmir -0.050 0.080 0.811 *** 0.076 -0.048 0.080 0.802 *** 0.076 -0.163 * 0.081 0.642 *** 0.080Madhya Pradesh -0.581 *** 0.033 -1.634 *** 0.036 -0.581 *** 0.033 -1.632 *** 0.036 -0.728 *** 0.037 -1.466 *** 0.038Continued on next page

219
Table 35 Wage Employment, Self-Employment, and Unemployed/Out of the Labor Force for Individuals 25 to 55 in All States Below The Poverty Line Continued Model 1 Model 2 Model 3 Self Employed Unemp./Out LF Self Employed Unemp./Out LF Self Employed Unemp./Out LF Coef. SE Coef. SE Coef. SE Coef. SE Coef. SE Coef. SE Maharashtra -1.135 *** 0.036 -2.184 *** 0.038 -1.135 *** 0.036 -2.182 *** 0.037 -1.323 *** 0.038 -2.206 *** 0.038Orissa -0.714 *** 0.039 -0.698 *** 0.039 -0.714 *** 0.039 -0.698 *** 0.039 -0.853 *** 0.043 -0.525 *** 0.040Rajasthan 0.086 * 0.043 -0.872 *** 0.049 0.085 * 0.043 -0.869 *** 0.049 0.033 0.045 -0.741 *** 0.050West Bengal -0.996 *** 0.039 -0.020 0.039 -0.997 *** 0.039 -0.020 0.039 -1.000 *** 0.042 -0.016 0.041New Delhi -0.717 *** 0.170 -0.916 *** 0.174 -0.718 *** 0.170 -0.918 *** 0.174 -0.534 ** 0.181 -0.680 *** 0.179Tamil Nadu/Pondicherry/Andaman -1.237 *** 0.037 -1.804 *** 0.038 -1.237 *** 0.037 -1.802 *** 0.038 -1.297 *** 0.039 -1.788 *** 0.039Kerele/Lakshadweep -1.878 *** 0.056 -1.050 *** 0.058 -1.877 *** 0.056 -1.049 *** 0.058 -2.006 *** 0.057 -1.211 *** 0.059Gujarat/Dadra and Nagar Haveli -1.153 *** 0.055 -1.392 *** 0.053 -1.155 *** 0.055 -1.390 *** 0.053 -1.324 *** 0.056 -1.291 *** 0.054HP/Punjab/Haryana/Chandigarh -0.810 *** 0.067 -0.216 * 0.091 -0.811 *** 0.067 -0.216 * 0.091 -0.608 *** 0.064 -0.006 0.088Northeast 0.088 0.054 -0.193 *** 0.058 0.088 0.054 -0.193 *** 0.058 -0.075 0.058 0.081 0.061Karnataka/Goa/Daman and Dui -1.045 *** 0.043 -1.588 *** 0.045 -1.044 *** 0.043 -1.587 *** 0.045 -1.165 *** 0.045 -1.603 *** 0.047Intercept -0.329 * 0.147 4.462 *** 0.180 -0.375 * 0.148 4.441 *** 0.181 0.186 0.152 4.928 *** 0.186Continued on next page
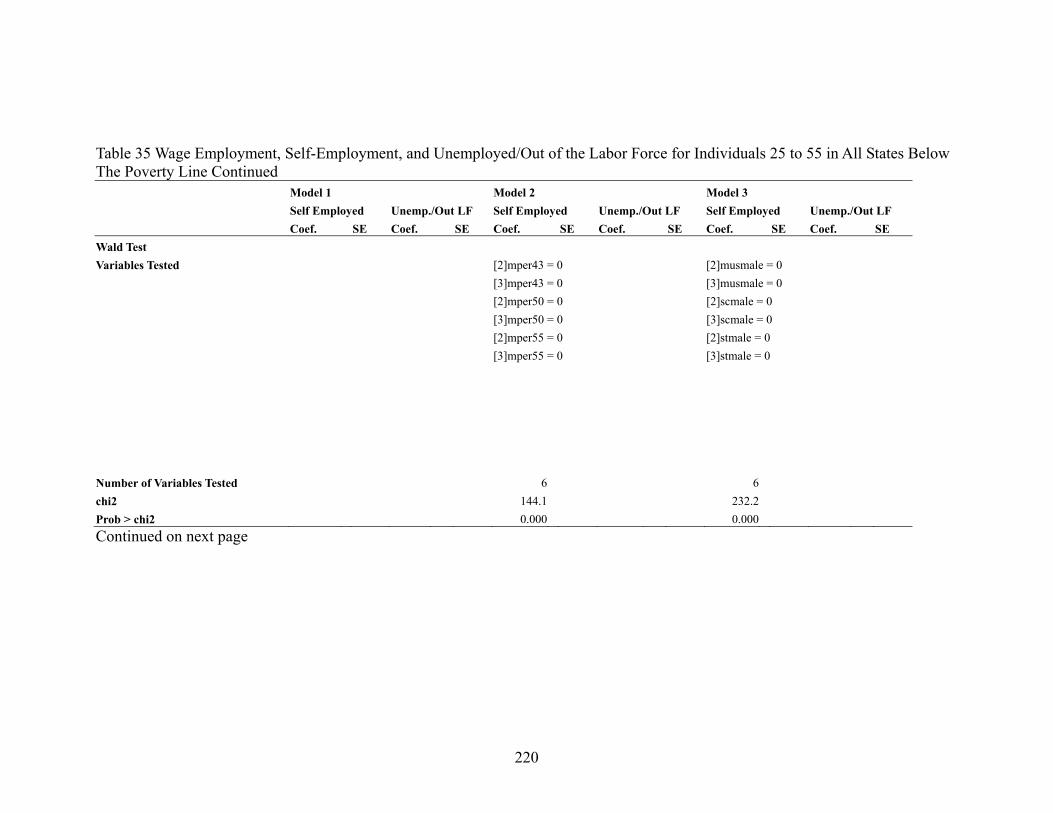
220
Table 35 Wage Employment, Self-Employment, and Unemployed/Out of the Labor Force for Individuals 25 to 55 in All States Below The Poverty Line Continued Model 1 Model 2 Model 3 Self Employed Unemp./Out LF Self Employed Unemp./Out LF Self Employed Unemp./Out LF Coef. SE Coef. SE Coef. SE Coef. SE Coef. SE Coef. SE Wald Test Variables Tested [2]mper43 = 0 [2]musmale = 0 [3]mper43 = 0 [3]musmale = 0 [2]mper50 = 0 [2]scmale = 0 [3]mper50 = 0 [3]scmale = 0 [2]mper55 = 0 [2]stmale = 0 [3]mper55 = 0 [3]stmale = 0 Number of Variables Tested 6 6 chi2 144.1 232.2 Prob > chi2 0.000 0.000 Continued on next page
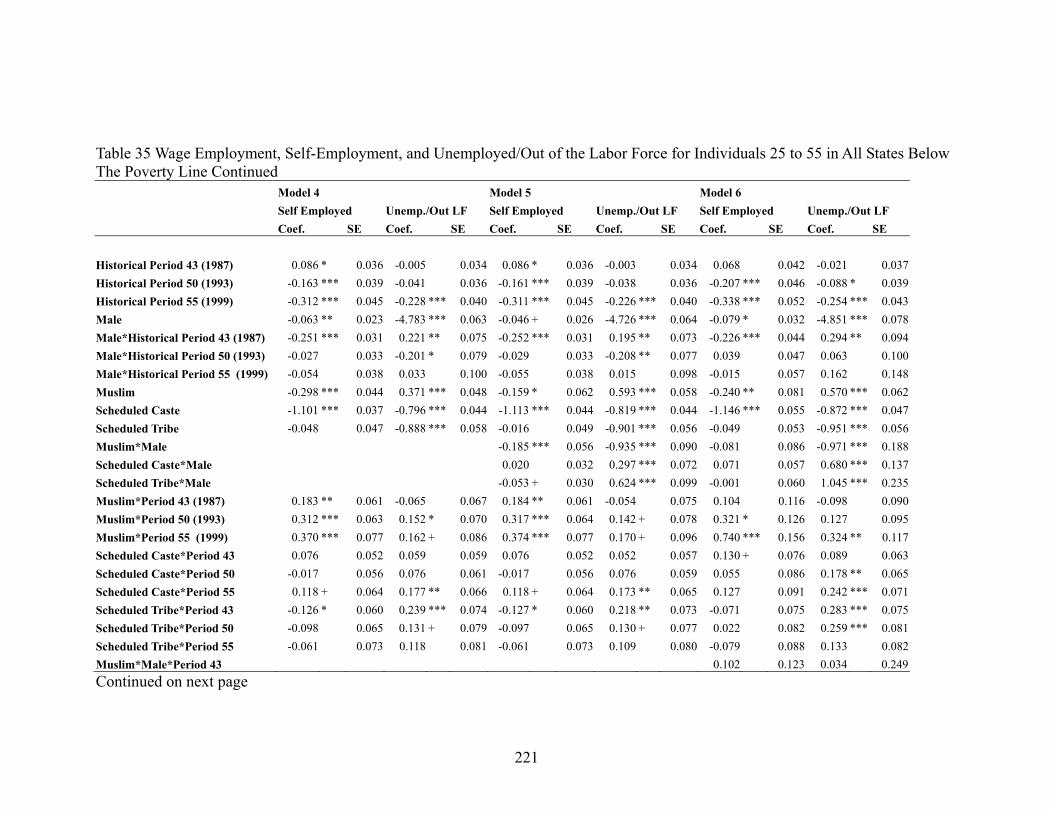
221
Table 35 Wage Employment, Self-Employment, and Unemployed/Out of the Labor Force for Individuals 25 to 55 in All States Below The Poverty Line Continued Model 4 Model 5 Model 6 Self Employed Unemp./Out LF Self Employed Unemp./Out LF Self Employed Unemp./Out LF Coef. SE Coef. SE Coef. SE Coef. SE Coef. SE Coef. SE Historical Period 43 (1987) 0.086 * 0.036 -0.005 0.034 0.086 * 0.036 -0.003 0.034 0.068 0.042 -0.021 0.037Historical Period 50 (1993) -0.163 *** 0.039 -0.041 0.036 -0.161 *** 0.039 -0.038 0.036 -0.207 *** 0.046 -0.088 * 0.039Historical Period 55 (1999) -0.312 *** 0.045 -0.228 *** 0.040 -0.311 *** 0.045 -0.226 *** 0.040 -0.338 *** 0.052 -0.254 *** 0.043Male -0.063 ** 0.023 -4.783 *** 0.063 -0.046 + 0.026 -4.726 *** 0.064 -0.079 * 0.032 -4.851 *** 0.078Male*Historical Period 43 (1987) -0.251 *** 0.031 0.221 ** 0.075 -0.252 *** 0.031 0.195 ** 0.073 -0.226 *** 0.044 0.294 ** 0.094Male*Historical Period 50 (1993) -0.027 0.033 -0.201 * 0.079 -0.029 0.033 -0.208 ** 0.077 0.039 0.047 0.063 0.100Male*Historical Period 55 (1999) -0.054 0.038 0.033 0.100 -0.055 0.038 0.015 0.098 -0.015 0.057 0.162 0.148Muslim -0.298 *** 0.044 0.371 *** 0.048 -0.159 * 0.062 0.593 *** 0.058 -0.240 ** 0.081 0.570 *** 0.062Scheduled Caste -1.101 *** 0.037 -0.796 *** 0.044 -1.113 *** 0.044 -0.819 *** 0.044 -1.146 *** 0.055 -0.872 *** 0.047Scheduled Tribe -0.048 0.047 -0.888 *** 0.058 -0.016 0.049 -0.901 *** 0.056 -0.049 0.053 -0.951 *** 0.056Muslim*Male -0.185 *** 0.056 -0.935 *** 0.090 -0.081 0.086 -0.971 *** 0.188Scheduled Caste*Male 0.020 0.032 0.297 *** 0.072 0.071 0.057 0.680 *** 0.137Scheduled Tribe*Male -0.053 + 0.030 0.624 *** 0.099 -0.001 0.060 1.045 *** 0.235Muslim*Period 43 (1987) 0.183 ** 0.061 -0.065 0.067 0.184 ** 0.061 -0.054 0.075 0.104 0.116 -0.098 0.090Muslim*Period 50 (1993) 0.312 *** 0.063 0.152 * 0.070 0.317 *** 0.064 0.142 + 0.078 0.321 * 0.126 0.127 0.095Muslim*Period 55 (1999) 0.370 *** 0.077 0.162 + 0.086 0.374 *** 0.077 0.170 + 0.096 0.740 *** 0.156 0.324 ** 0.117Scheduled Caste*Period 43 0.076 0.052 0.059 0.059 0.076 0.052 0.052 0.057 0.130 + 0.076 0.089 0.063Scheduled Caste*Period 50 -0.017 0.056 0.076 0.061 -0.017 0.056 0.076 0.059 0.055 0.086 0.178 ** 0.065Scheduled Caste*Period 55 0.118 + 0.064 0.177 ** 0.066 0.118 + 0.064 0.173 ** 0.065 0.127 0.091 0.242 *** 0.071Scheduled Tribe*Period 43 -0.126 * 0.060 0.239 *** 0.074 -0.127 * 0.060 0.218 ** 0.073 -0.071 0.075 0.283 *** 0.075Scheduled Tribe*Period 50 -0.098 0.065 0.131 + 0.079 -0.097 0.065 0.130 + 0.077 0.022 0.082 0.259 *** 0.081Scheduled Tribe*Period 55 -0.061 0.073 0.118 0.081 -0.061 0.073 0.109 0.080 -0.079 0.088 0.133 0.082Muslim*Male*Period 43 0.102 0.123 0.034 0.249Continued on next page

222
Table 35 Wage Employment, Self-Employment, and Unemployed/Out of the Labor Force for Individuals 25 to 55 in All States Below The Poverty Line Continued Model 4 Model 5 Model 6 Self Employed Unemp./Out LF Self Employed Unemp./Out LF Self Employed Unemp./Out LF Coef. SE Coef. SE Coef. SE Coef. SE Coef. SE Coef. SE Muslim*Male*Period 50 -0.015 0.132 0.049 0.241Muslim*Male*Period 55 -0.458 ** 0.170 0.009 0.279Scheduled Caste*Male*Period 43 -0.083 0.078 -0.210 0.172Scheduled Caste*Male*Period 50 -0.110 0.086 -0.768 *** 0.191Scheduled Caste*Male*Period 55 -0.017 0.093 -0.591 ** 0.227Scheduled Tribe*Male*Period 43 -0.089 0.082 -0.475 + 0.271Scheduled Tribe*Male*Period 50 -0.188 * 0.084 -1.065 *** 0.310Scheduled Tribe*Male*Period 55 0.036 0.090 -0.307 0.309Age -0.025 ** 0.008 -0.233 *** 0.010 -0.025 ** 0.008 -0.234 *** 0.010 -0.025 ** 0.008 -0.234 *** 0.010Age Squared 0.001 *** 0.000 0.003 *** 0.000 0.001 *** 0.000 0.003 *** 0.000 0.001 *** 0.000 0.003 *** 0.000Urban -0.215 *** 0.026 0.861 *** 0.023 -0.216 *** 0.026 0.865 *** 0.023 -0.217 *** 0.026 0.866 *** 0.023Household Size 0.174 *** 0.006 0.215 *** 0.006 0.174 *** 0.006 0.216 *** 0.006 0.174 *** 0.006 0.216 *** 0.006Primary School 0.352 *** 0.020 0.554 *** 0.027 0.350 *** 0.020 0.550 *** 0.027 0.350 *** 0.020 0.550 *** 0.027Middle School 0.473 *** 0.025 0.982 *** 0.043 0.470 *** 0.025 0.977 *** 0.043 0.470 *** 0.025 0.979 *** 0.043College 0.065 0.074 1.298 *** 0.121 0.061 0.074 1.301 *** 0.122 0.061 0.074 1.304 *** 0.122Never Married -0.014 0.042 0.652 *** 0.081 -0.017 0.042 0.654 *** 0.080 -0.017 0.042 0.653 *** 0.080Widow/Divorced/Separated -0.206 *** 0.029 -0.762 *** 0.033 -0.208 *** 0.029 -0.771 *** 0.034 -0.208 *** 0.029 -0.771 *** 0.034Number of Kids in Household -0.049 *** 0.009 -0.119 *** 0.009 -0.049 *** 0.009 -0.119 *** 0.009 -0.049 *** 0.009 -0.119 *** 0.009Andra Pradesh -1.091 *** 0.041 -2.006 *** 0.044 -1.090 *** 0.041 -2.010 *** 0.044 -1.090 *** 0.041 -2.011 *** 0.044Assam -0.940 *** 0.048 0.159 ** 0.055 -0.936 *** 0.048 0.168 ** 0.057 -0.935 *** 0.048 0.166 ** 0.056Bihar -0.918 *** 0.032 -0.179 *** 0.031 -0.918 *** 0.032 -0.182 *** 0.031 -0.918 *** 0.032 -0.182 *** 0.031Jammu and Kashmir -0.116 0.082 0.596 *** 0.076 -0.111 0.082 0.661 *** 0.079 -0.116 0.082 0.662 *** 0.080Madhya Pradesh -0.729 *** 0.037 -1.468 *** 0.037 -0.729 *** 0.037 -1.462 *** 0.038 -0.729 *** 0.037 -1.463 *** 0.038Continued on next page

223
Table 35 Wage Employment, Self-Employment, and Unemployed/Out of the Labor Force for Individuals 25 to 55 in All States Below The Poverty Line Continued Model 4 Model 5 Model 6 Self Employed Unemp./Out LF Self Employed Unemp./Out LF Self Employed Unemp./Out LF Coef. SE Coef. SE Coef. SE Coef. SE Coef. SE Coef. SE Maharashtra -1.329 *** 0.038 -2.199 *** 0.038 -1.328 *** 0.038 -2.205 *** 0.038 -1.328 *** 0.038 -2.206 *** 0.038Orissa -0.857 *** 0.043 -0.525 *** 0.040 -0.856 *** 0.043 -0.524 *** 0.040 -0.856 *** 0.043 -0.524 *** 0.040Rajasthan 0.028 0.046 -0.742 *** 0.050 0.028 0.045 -0.741 *** 0.050 0.029 0.045 -0.741 *** 0.050West Bengal -1.008 *** 0.042 -0.018 0.041 -1.006 *** 0.042 -0.016 0.041 -1.005 *** 0.042 -0.016 0.041New Delhi -0.538 ** 0.182 -0.665 *** 0.179 -0.539 ** 0.182 -0.680 *** 0.178 -0.537 ** 0.182 -0.685 *** 0.178Tamil Nadu/Pondicherry/Andaman -1.304 *** 0.039 -1.791 *** 0.039 -1.302 *** 0.039 -1.788 *** 0.039 -1.301 *** 0.039 -1.788 *** 0.039Kerele/Lakshadweep -2.003 *** 0.057 -1.197 *** 0.057 -2.002 *** 0.057 -1.208 *** 0.059 -2.002 *** 0.057 -1.207 *** 0.059Gujarat/Dadra and Nagar Haveli -1.332 *** 0.055 -1.291 *** 0.053 -1.331 *** 0.055 -1.290 *** 0.054 -1.331 *** 0.055 -1.289 *** 0.054HP/Punjab/Haryana/Chandigarh -0.610 *** 0.064 0.009 0.090 -0.612 *** 0.064 -0.007 0.088 -0.612 *** 0.064 -0.006 0.088Northeast -0.079 0.058 0.081 0.062 -0.077 0.058 0.076 0.061 -0.076 0.058 0.077 0.061Karnataka/Goa/Daman and Dui -1.169 *** 0.045 -1.599 *** 0.046 -1.168 *** 0.045 -1.601 *** 0.047 -1.168 *** 0.045 -1.602 *** 0.047Intercept 0.169 0.154 4.936 *** 0.188 0.155 0.154 4.940 *** 0.189 0.179 0.154 4.963 *** 0.189Continued on next page
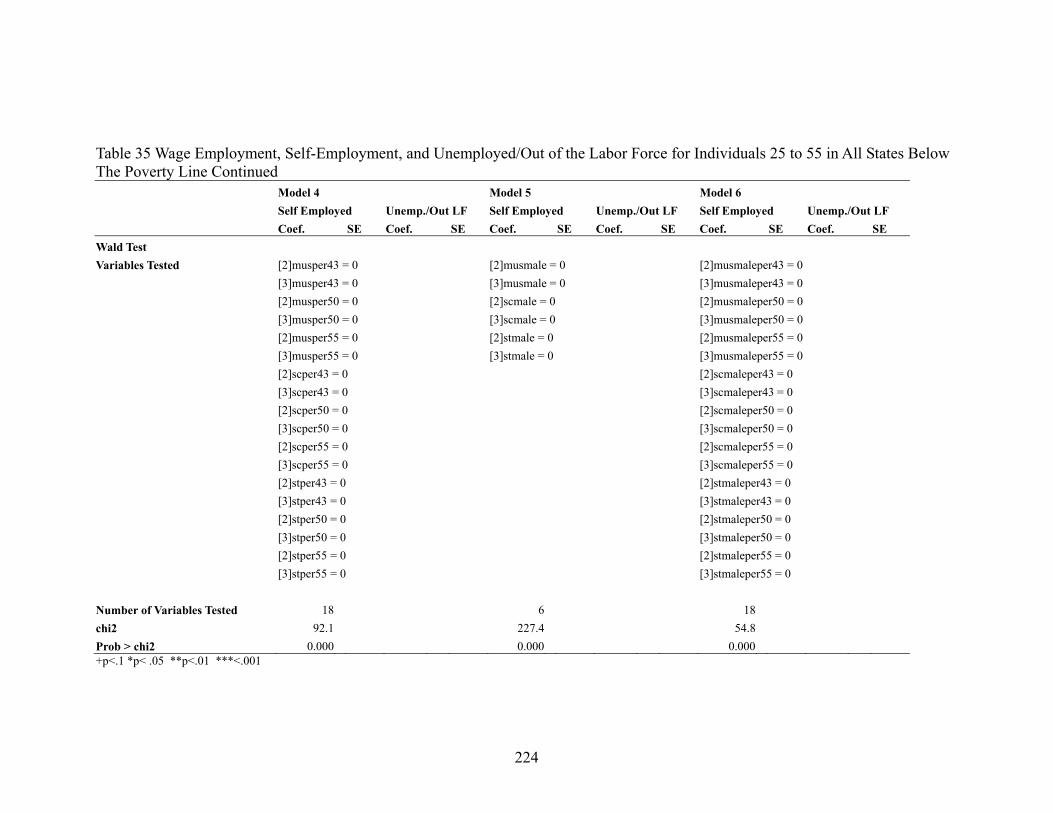
224
Table 35 Wage Employment, Self-Employment, and Unemployed/Out of the Labor Force for Individuals 25 to 55 in All States Below The Poverty Line Continued Model 4 Model 5 Model 6 Self Employed Unemp./Out LF Self Employed Unemp./Out LF Self Employed Unemp./Out LF Coef. SE Coef. SE Coef. SE Coef. SE Coef. SE Coef. SE Wald Test Variables Tested [2]musper43 = 0 [2]musmale = 0 [2]musmaleper43 = 0 [3]musper43 = 0 [3]musmale = 0 [3]musmaleper43 = 0 [2]musper50 = 0 [2]scmale = 0 [2]musmaleper50 = 0 [3]musper50 = 0 [3]scmale = 0 [3]musmaleper50 = 0 [2]musper55 = 0 [2]stmale = 0 [2]musmaleper55 = 0 [3]musper55 = 0 [3]stmale = 0 [3]musmaleper55 = 0 [2]scper43 = 0 [2]scmaleper43 = 0 [3]scper43 = 0 [3]scmaleper43 = 0 [2]scper50 = 0 [2]scmaleper50 = 0 [3]scper50 = 0 [3]scmaleper50 = 0 [2]scper55 = 0 [2]scmaleper55 = 0 [3]scper55 = 0 [3]scmaleper55 = 0 [2]stper43 = 0 [2]stmaleper43 = 0 [3]stper43 = 0 [3]stmaleper43 = 0 [2]stper50 = 0 [2]stmaleper50 = 0 [3]stper50 = 0 [3]stmaleper50 = 0 [2]stper55 = 0 [2]stmaleper55 = 0 [3]stper55 = 0 [3]stmaleper55 = 0 Number of Variables Tested 18 6 18 chi2 92.1 227.4 54.8 Prob > chi2 0.000 0.000 0.000 +p<.1 *p< .05 **p<.01 ***<.001
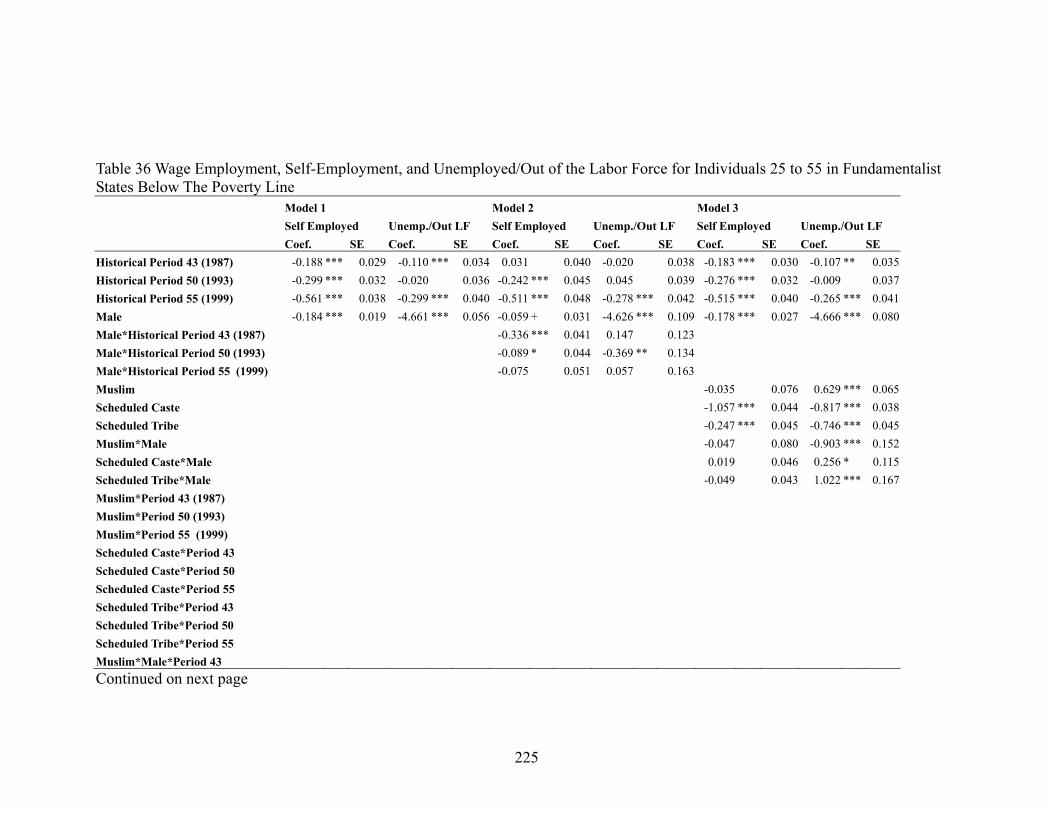
225
Table 36 Wage Employment, Self-Employment, and Unemployed/Out of the Labor Force for Individuals 25 to 55 in Fundamentalist States Below The Poverty Line Model 1 Model 2 Model 3 Self Employed Unemp./Out LF Self Employed Unemp./Out LF Self Employed Unemp./Out LF Coef. SE Coef. SE Coef. SE Coef. SE Coef. SE Coef. SE Historical Period 43 (1987) -0.188 *** 0.029 -0.110 *** 0.034 0.031 0.040 -0.020 0.038 -0.183 *** 0.030 -0.107 ** 0.035Historical Period 50 (1993) -0.299 *** 0.032 -0.020 0.036 -0.242 *** 0.045 0.045 0.039 -0.276 *** 0.032 -0.009 0.037Historical Period 55 (1999) -0.561 *** 0.038 -0.299 *** 0.040 -0.511 *** 0.048 -0.278 *** 0.042 -0.515 *** 0.040 -0.265 *** 0.041Male -0.184 *** 0.019 -4.661 *** 0.056 -0.059 + 0.031 -4.626 *** 0.109 -0.178 *** 0.027 -4.666 *** 0.080Male*Historical Period 43 (1987) -0.336 *** 0.041 0.147 0.123 Male*Historical Period 50 (1993) -0.089 * 0.044 -0.369 ** 0.134 Male*Historical Period 55 (1999) -0.075 0.051 0.057 0.163 Muslim -0.035 0.076 0.629 *** 0.065Scheduled Caste -1.057 *** 0.044 -0.817 *** 0.038Scheduled Tribe -0.247 *** 0.045 -0.746 *** 0.045Muslim*Male -0.047 0.080 -0.903 *** 0.152Scheduled Caste*Male 0.019 0.046 0.256 * 0.115Scheduled Tribe*Male -0.049 0.043 1.022 *** 0.167Muslim*Period 43 (1987) Muslim*Period 50 (1993) Muslim*Period 55 (1999) Scheduled Caste*Period 43 Scheduled Caste*Period 50 Scheduled Caste*Period 55 Scheduled Tribe*Period 43 Scheduled Tribe*Period 50 Scheduled Tribe*Period 55 Muslim*Male*Period 43 Continued on next page
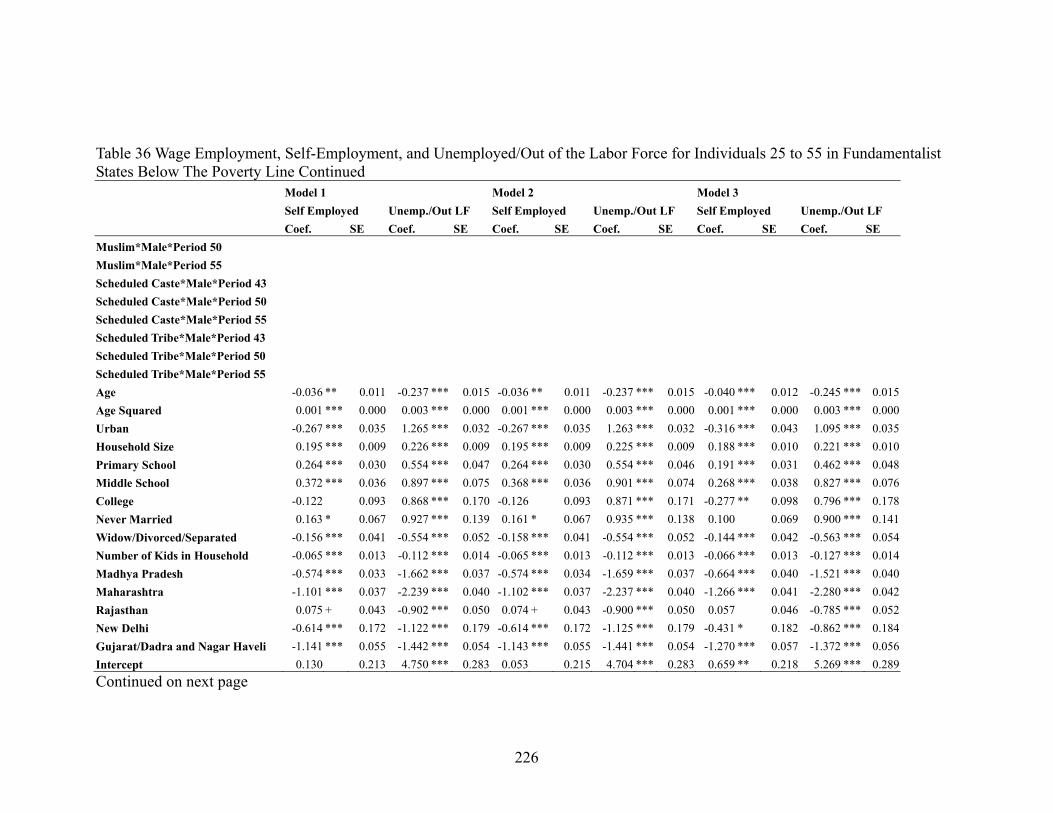
226
Table 36 Wage Employment, Self-Employment, and Unemployed/Out of the Labor Force for Individuals 25 to 55 in Fundamentalist States Below The Poverty Line Continued Model 1 Model 2 Model 3 Self Employed Unemp./Out LF Self Employed Unemp./Out LF Self Employed Unemp./Out LF Coef. SE Coef. SE Coef. SE Coef. SE Coef. SE Coef. SE Muslim*Male*Period 50 Muslim*Male*Period 55 Scheduled Caste*Male*Period 43 Scheduled Caste*Male*Period 50 Scheduled Caste*Male*Period 55 Scheduled Tribe*Male*Period 43 Scheduled Tribe*Male*Period 50 Scheduled Tribe*Male*Period 55 Age -0.036 ** 0.011 -0.237 *** 0.015 -0.036 ** 0.011 -0.237 *** 0.015 -0.040 *** 0.012 -0.245 *** 0.015Age Squared 0.001 *** 0.000 0.003 *** 0.000 0.001 *** 0.000 0.003 *** 0.000 0.001 *** 0.000 0.003 *** 0.000Urban -0.267 *** 0.035 1.265 *** 0.032 -0.267 *** 0.035 1.263 *** 0.032 -0.316 *** 0.043 1.095 *** 0.035Household Size 0.195 *** 0.009 0.226 *** 0.009 0.195 *** 0.009 0.225 *** 0.009 0.188 *** 0.010 0.221 *** 0.010Primary School 0.264 *** 0.030 0.554 *** 0.047 0.264 *** 0.030 0.554 *** 0.046 0.191 *** 0.031 0.462 *** 0.048Middle School 0.372 *** 0.036 0.897 *** 0.075 0.368 *** 0.036 0.901 *** 0.074 0.268 *** 0.038 0.827 *** 0.076College -0.122 0.093 0.868 *** 0.170 -0.126 0.093 0.871 *** 0.171 -0.277 ** 0.098 0.796 *** 0.178Never Married 0.163 * 0.067 0.927 *** 0.139 0.161 * 0.067 0.935 *** 0.138 0.100 0.069 0.900 *** 0.141Widow/Divorced/Separated -0.156 *** 0.041 -0.554 *** 0.052 -0.158 *** 0.041 -0.554 *** 0.052 -0.144 *** 0.042 -0.563 *** 0.054Number of Kids in Household -0.065 *** 0.013 -0.112 *** 0.014 -0.065 *** 0.013 -0.112 *** 0.013 -0.066 *** 0.013 -0.127 *** 0.014Madhya Pradesh -0.574 *** 0.033 -1.662 *** 0.037 -0.574 *** 0.034 -1.659 *** 0.037 -0.664 *** 0.040 -1.521 *** 0.040Maharashtra -1.101 *** 0.037 -2.239 *** 0.040 -1.102 *** 0.037 -2.237 *** 0.040 -1.266 *** 0.041 -2.280 *** 0.042Rajasthan 0.075 + 0.043 -0.902 *** 0.050 0.074 + 0.043 -0.900 *** 0.050 0.057 0.046 -0.785 *** 0.052New Delhi -0.614 *** 0.172 -1.122 *** 0.179 -0.614 *** 0.172 -1.125 *** 0.179 -0.431 * 0.182 -0.862 *** 0.184Gujarat/Dadra and Nagar Haveli -1.141 *** 0.055 -1.442 *** 0.054 -1.143 *** 0.055 -1.441 *** 0.054 -1.270 *** 0.057 -1.372 *** 0.056Intercept 0.130 0.213 4.750 *** 0.283 0.053 0.215 4.704 *** 0.283 0.659 ** 0.218 5.269 *** 0.289Continued on next page
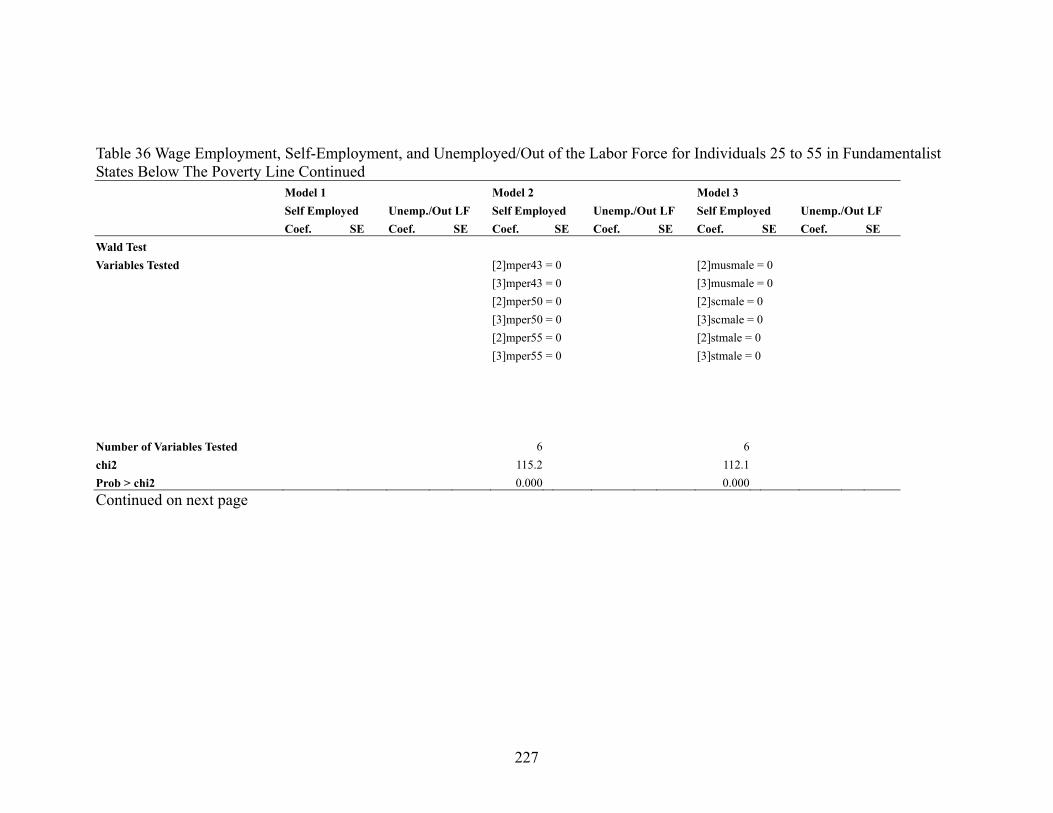
227
Table 36 Wage Employment, Self-Employment, and Unemployed/Out of the Labor Force for Individuals 25 to 55 in Fundamentalist States Below The Poverty Line Continued Model 1 Model 2 Model 3 Self Employed Unemp./Out LF Self Employed Unemp./Out LF Self Employed Unemp./Out LF Coef. SE Coef. SE Coef. SE Coef. SE Coef. SE Coef. SE Wald Test Variables Tested [2]mper43 = 0 [2]musmale = 0 [3]mper43 = 0 [3]musmale = 0 [2]mper50 = 0 [2]scmale = 0 [3]mper50 = 0 [3]scmale = 0 [2]mper55 = 0 [2]stmale = 0 [3]mper55 = 0 [3]stmale = 0 Number of Variables Tested 6 6 chi2 115.2 112.1 Prob > chi2 0.000 0.000 Continued on next page
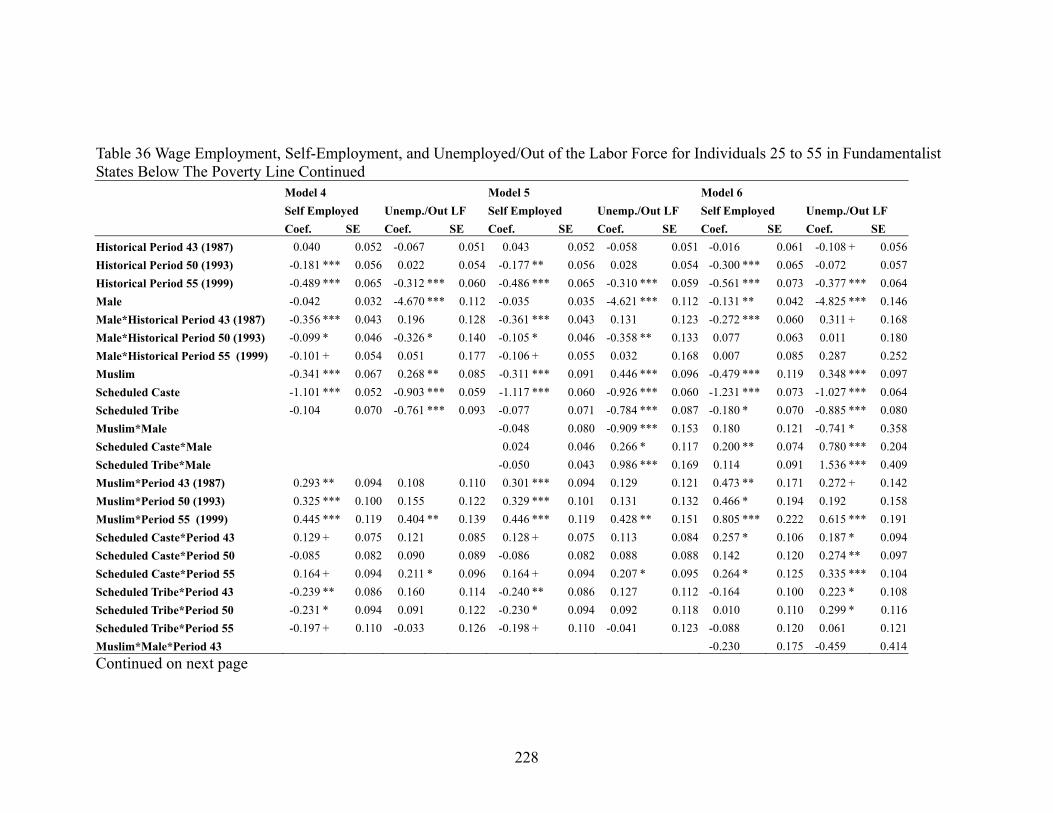
228
Table 36 Wage Employment, Self-Employment, and Unemployed/Out of the Labor Force for Individuals 25 to 55 in Fundamentalist States Below The Poverty Line Continued Model 4 Model 5 Model 6 Self Employed Unemp./Out LF Self Employed Unemp./Out LF Self Employed Unemp./Out LF Coef. SE Coef. SE Coef. SE Coef. SE Coef. SE Coef. SE Historical Period 43 (1987) 0.040 0.052 -0.067 0.051 0.043 0.052 -0.058 0.051 -0.016 0.061 -0.108 + 0.056Historical Period 50 (1993) -0.181 *** 0.056 0.022 0.054 -0.177 ** 0.056 0.028 0.054 -0.300 *** 0.065 -0.072 0.057Historical Period 55 (1999) -0.489 *** 0.065 -0.312 *** 0.060 -0.486 *** 0.065 -0.310 *** 0.059 -0.561 *** 0.073 -0.377 *** 0.064Male -0.042 0.032 -4.670 *** 0.112 -0.035 0.035 -4.621 *** 0.112 -0.131 ** 0.042 -4.825 *** 0.146Male*Historical Period 43 (1987) -0.356 *** 0.043 0.196 0.128 -0.361 *** 0.043 0.131 0.123 -0.272 *** 0.060 0.311 + 0.168Male*Historical Period 50 (1993) -0.099 * 0.046 -0.326 * 0.140 -0.105 * 0.046 -0.358 ** 0.133 0.077 0.063 0.011 0.180Male*Historical Period 55 (1999) -0.101 + 0.054 0.051 0.177 -0.106 + 0.055 0.032 0.168 0.007 0.085 0.287 0.252Muslim -0.341 *** 0.067 0.268 ** 0.085 -0.311 *** 0.091 0.446 *** 0.096 -0.479 *** 0.119 0.348 *** 0.097Scheduled Caste -1.101 *** 0.052 -0.903 *** 0.059 -1.117 *** 0.060 -0.926 *** 0.060 -1.231 *** 0.073 -1.027 *** 0.064Scheduled Tribe -0.104 0.070 -0.761 *** 0.093 -0.077 0.071 -0.784 *** 0.087 -0.180 * 0.070 -0.885 *** 0.080Muslim*Male -0.048 0.080 -0.909 *** 0.153 0.180 0.121 -0.741 * 0.358Scheduled Caste*Male 0.024 0.046 0.266 * 0.117 0.200 ** 0.074 0.780 *** 0.204Scheduled Tribe*Male -0.050 0.043 0.986 *** 0.169 0.114 0.091 1.536 *** 0.409Muslim*Period 43 (1987) 0.293 ** 0.094 0.108 0.110 0.301 *** 0.094 0.129 0.121 0.473 ** 0.171 0.272 + 0.142Muslim*Period 50 (1993) 0.325 *** 0.100 0.155 0.122 0.329 *** 0.101 0.131 0.132 0.466 * 0.194 0.192 0.158Muslim*Period 55 (1999) 0.445 *** 0.119 0.404 ** 0.139 0.446 *** 0.119 0.428 ** 0.151 0.805 *** 0.222 0.615 *** 0.191Scheduled Caste*Period 43 0.129 + 0.075 0.121 0.085 0.128 + 0.075 0.113 0.084 0.257 * 0.106 0.187 * 0.094Scheduled Caste*Period 50 -0.085 0.082 0.090 0.089 -0.086 0.082 0.088 0.088 0.142 0.120 0.274 ** 0.097Scheduled Caste*Period 55 0.164 + 0.094 0.211 * 0.096 0.164 + 0.094 0.207 * 0.095 0.264 * 0.125 0.335 *** 0.104Scheduled Tribe*Period 43 -0.239 ** 0.086 0.160 0.114 -0.240 ** 0.086 0.127 0.112 -0.164 0.100 0.223 * 0.108Scheduled Tribe*Period 50 -0.231 * 0.094 0.091 0.122 -0.230 * 0.094 0.092 0.118 0.010 0.110 0.299 * 0.116Scheduled Tribe*Period 55 -0.197 + 0.110 -0.033 0.126 -0.198 + 0.110 -0.041 0.123 -0.088 0.120 0.061 0.121Muslim*Male*Period 43 -0.230 0.175 -0.459 0.414Continued on next page
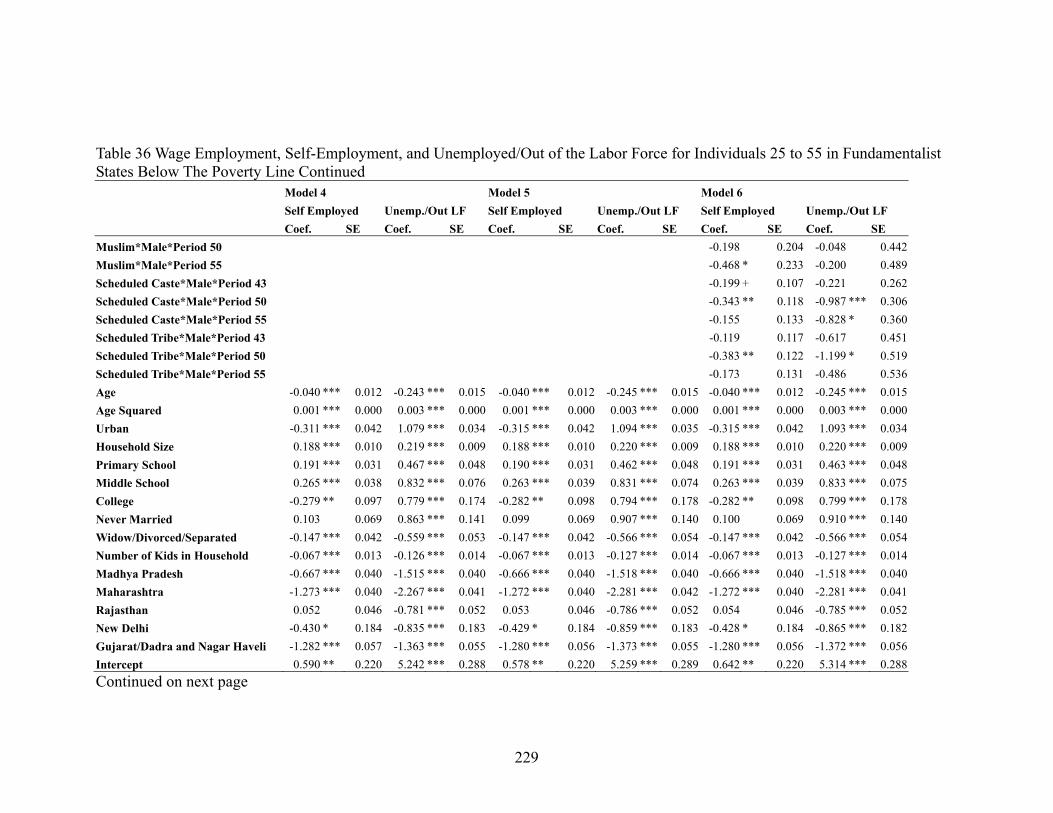
229
Table 36 Wage Employment, Self-Employment, and Unemployed/Out of the Labor Force for Individuals 25 to 55 in Fundamentalist States Below The Poverty Line Continued Model 4 Model 5 Model 6 Self Employed Unemp./Out LF Self Employed Unemp./Out LF Self Employed Unemp./Out LF Coef. SE Coef. SE Coef. SE Coef. SE Coef. SE Coef. SE Muslim*Male*Period 50 -0.198 0.204 -0.048 0.442Muslim*Male*Period 55 -0.468 * 0.233 -0.200 0.489Scheduled Caste*Male*Period 43 -0.199 + 0.107 -0.221 0.262Scheduled Caste*Male*Period 50 -0.343 ** 0.118 -0.987 *** 0.306Scheduled Caste*Male*Period 55 -0.155 0.133 -0.828 * 0.360Scheduled Tribe*Male*Period 43 -0.119 0.117 -0.617 0.451Scheduled Tribe*Male*Period 50 -0.383 ** 0.122 -1.199 * 0.519Scheduled Tribe*Male*Period 55 -0.173 0.131 -0.486 0.536Age -0.040 *** 0.012 -0.243 *** 0.015 -0.040 *** 0.012 -0.245 *** 0.015 -0.040 *** 0.012 -0.245 *** 0.015Age Squared 0.001 *** 0.000 0.003 *** 0.000 0.001 *** 0.000 0.003 *** 0.000 0.001 *** 0.000 0.003 *** 0.000Urban -0.311 *** 0.042 1.079 *** 0.034 -0.315 *** 0.042 1.094 *** 0.035 -0.315 *** 0.042 1.093 *** 0.034Household Size 0.188 *** 0.010 0.219 *** 0.009 0.188 *** 0.010 0.220 *** 0.009 0.188 *** 0.010 0.220 *** 0.009Primary School 0.191 *** 0.031 0.467 *** 0.048 0.190 *** 0.031 0.462 *** 0.048 0.191 *** 0.031 0.463 *** 0.048Middle School 0.265 *** 0.038 0.832 *** 0.076 0.263 *** 0.039 0.831 *** 0.074 0.263 *** 0.039 0.833 *** 0.075College -0.279 ** 0.097 0.779 *** 0.174 -0.282 ** 0.098 0.794 *** 0.178 -0.282 ** 0.098 0.799 *** 0.178Never Married 0.103 0.069 0.863 *** 0.141 0.099 0.069 0.907 *** 0.140 0.100 0.069 0.910 *** 0.140Widow/Divorced/Separated -0.147 *** 0.042 -0.559 *** 0.053 -0.147 *** 0.042 -0.566 *** 0.054 -0.147 *** 0.042 -0.566 *** 0.054Number of Kids in Household -0.067 *** 0.013 -0.126 *** 0.014 -0.067 *** 0.013 -0.127 *** 0.014 -0.067 *** 0.013 -0.127 *** 0.014Madhya Pradesh -0.667 *** 0.040 -1.515 *** 0.040 -0.666 *** 0.040 -1.518 *** 0.040 -0.666 *** 0.040 -1.518 *** 0.040Maharashtra -1.273 *** 0.040 -2.267 *** 0.041 -1.272 *** 0.040 -2.281 *** 0.042 -1.272 *** 0.040 -2.281 *** 0.041Rajasthan 0.052 0.046 -0.781 *** 0.052 0.053 0.046 -0.786 *** 0.052 0.054 0.046 -0.785 *** 0.052New Delhi -0.430 * 0.184 -0.835 *** 0.183 -0.429 * 0.184 -0.859 *** 0.183 -0.428 * 0.184 -0.865 *** 0.182Gujarat/Dadra and Nagar Haveli -1.282 *** 0.057 -1.363 *** 0.055 -1.280 *** 0.056 -1.373 *** 0.055 -1.280 *** 0.056 -1.372 *** 0.056Intercept 0.590 ** 0.220 5.242 *** 0.288 0.578 ** 0.220 5.259 *** 0.289 0.642 ** 0.220 5.314 *** 0.288Continued on next page
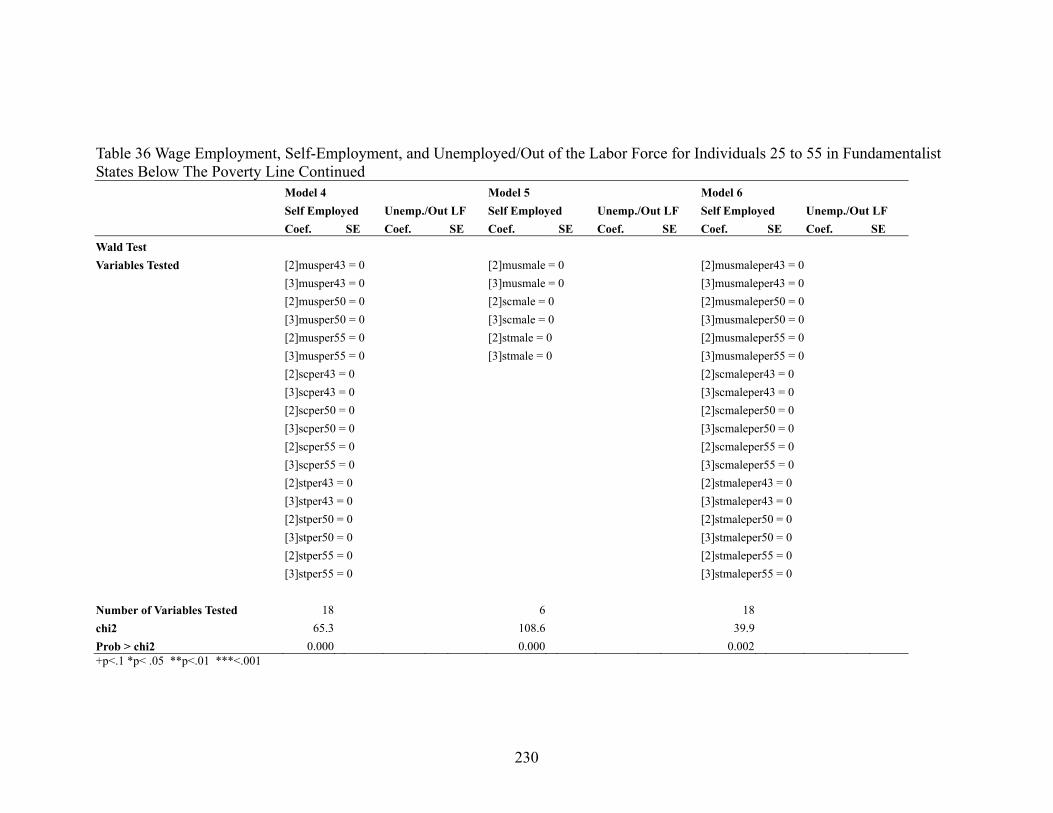
230
Table 36 Wage Employment, Self-Employment, and Unemployed/Out of the Labor Force for Individuals 25 to 55 in Fundamentalist States Below The Poverty Line Continued Model 4 Model 5 Model 6 Self Employed Unemp./Out LF Self Employed Unemp./Out LF Self Employed Unemp./Out LF Coef. SE Coef. SE Coef. SE Coef. SE Coef. SE Coef. SE Wald Test Variables Tested [2]musper43 = 0 [2]musmale = 0 [2]musmaleper43 = 0 [3]musper43 = 0 [3]musmale = 0 [3]musmaleper43 = 0 [2]musper50 = 0 [2]scmale = 0 [2]musmaleper50 = 0 [3]musper50 = 0 [3]scmale = 0 [3]musmaleper50 = 0 [2]musper55 = 0 [2]stmale = 0 [2]musmaleper55 = 0 [3]musper55 = 0 [3]stmale = 0 [3]musmaleper55 = 0 [2]scper43 = 0 [2]scmaleper43 = 0 [3]scper43 = 0 [3]scmaleper43 = 0 [2]scper50 = 0 [2]scmaleper50 = 0 [3]scper50 = 0 [3]scmaleper50 = 0 [2]scper55 = 0 [2]scmaleper55 = 0 [3]scper55 = 0 [3]scmaleper55 = 0 [2]stper43 = 0 [2]stmaleper43 = 0 [3]stper43 = 0 [3]stmaleper43 = 0 [2]stper50 = 0 [2]stmaleper50 = 0 [3]stper50 = 0 [3]stmaleper50 = 0 [2]stper55 = 0 [2]stmaleper55 = 0 [3]stper55 = 0 [3]stmaleper55 = 0 Number of Variables Tested 18 6 18 chi2 65.3 108.6 39.9 Prob > chi2 0.000 0.000 0.002 +p<.1 *p< .05 **p<.01 ***<.001

231
Table 37 Wage Employment, Self-Employment, and Unemployed/Out of the Labor Force for Individuals 25 to 55 in Non-Fundamentalist States Below The Poverty Line Model 1 Model 2 Model 3 Self Employed Unemp./Out LF Self Employed Unemp./Out LF Self Employed Unemp./Out LF Coef. SE Coef. SE Coef. SE Coef. SE Coef. SE Coef. SE Historical Period 43 (1987) 0.014 0.027 0.058 * 0.029 0.135 *** 0.042 0.070 * 0.034 0.011 0.027 0.056 + 0.030Historical Period 50 (1993) -0.100 *** 0.029 -0.054 + 0.031 -0.124 ** 0.046 -0.048 0.035 -0.070 * 0.029 -0.036 0.031Historical Period 55 (1999) -0.129 *** 0.032 -0.136 *** 0.034 -0.096 + 0.052 -0.122 *** 0.038 -0.081 * 0.033 -0.102 ** 0.035Male -0.098 *** 0.019 -4.793 *** 0.042 -0.051 0.032 -4.814 *** 0.071 -0.072 ** 0.025 -4.773 *** 0.051Male*Historical Period 43 (1987) -0.168 *** 0.043 0.204 * 0.088 Male*Historical Period 50 (1993) 0.031 0.046 -0.109 0.091 Male*Historical Period 55 (1999) -0.046 0.052 -0.034 0.099 Muslim 0.186 * 0.074 0.657 *** 0.049Scheduled Caste -1.112 *** 0.045 -0.705 *** 0.032Scheduled Tribe 0.065 0.047 -0.810 *** 0.043Muslim*Male -0.311 *** 0.080 -0.993 *** 0.106Scheduled Caste*Male 0.066 0.045 0.312 *** 0.086Scheduled Tribe*Male -0.058 0.043 0.439 *** 0.106Muslim*Period 43 (1987) Muslim*Period 50 (1993) Muslim*Period 55 (1999) Scheduled Caste*Period 43 Scheduled Caste*Period 50 Scheduled Caste*Period 55 Scheduled Tribe*Period 43 Scheduled Tribe*Period 50 Scheduled Tribe*Period 55 Muslim*Male*Period 43 Continued on next page
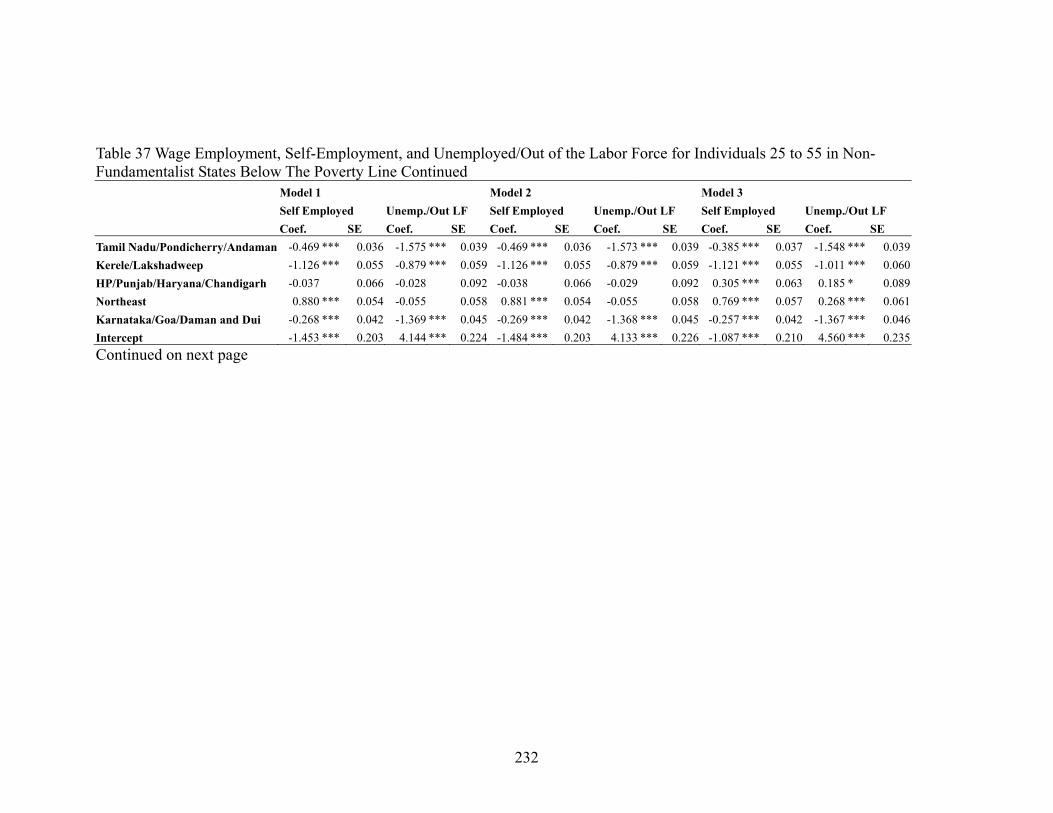
232
Table 37 Wage Employment, Self-Employment, and Unemployed/Out of the Labor Force for Individuals 25 to 55 in Non-Fundamentalist States Below The Poverty Line Continued Model 1 Model 2 Model 3 Self Employed Unemp./Out LF Self Employed Unemp./Out LF Self Employed Unemp./Out LF Coef. SE Coef. SE Coef. SE Coef. SE Coef. SE Coef. SE Tamil Nadu/Pondicherry/Andaman -0.469 *** 0.036 -1.575 *** 0.039 -0.469 *** 0.036 -1.573 *** 0.039 -0.385 *** 0.037 -1.548 *** 0.039Kerele/Lakshadweep -1.126 *** 0.055 -0.879 *** 0.059 -1.126 *** 0.055 -0.879 *** 0.059 -1.121 *** 0.055 -1.011 *** 0.060HP/Punjab/Haryana/Chandigarh -0.037 0.066 -0.028 0.092 -0.038 0.066 -0.029 0.092 0.305 *** 0.063 0.185 * 0.089Northeast 0.880 *** 0.054 -0.055 0.058 0.881 *** 0.054 -0.055 0.058 0.769 *** 0.057 0.268 *** 0.061Karnataka/Goa/Daman and Dui -0.268 *** 0.042 -1.369 *** 0.045 -0.269 *** 0.042 -1.368 *** 0.045 -0.257 *** 0.042 -1.367 *** 0.046Intercept -1.453 *** 0.203 4.144 *** 0.224 -1.484 *** 0.203 4.133 *** 0.226 -1.087 *** 0.210 4.560 *** 0.235Continued on next page
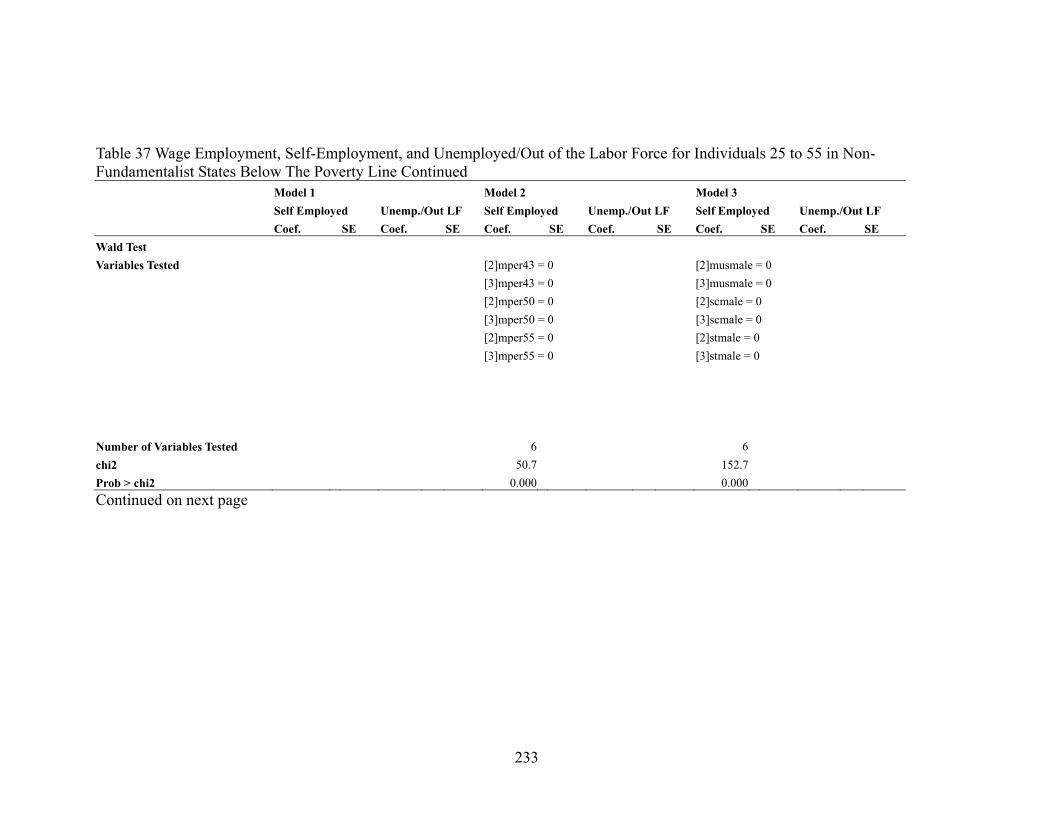
233
Table 37 Wage Employment, Self-Employment, and Unemployed/Out of the Labor Force for Individuals 25 to 55 in Non-Fundamentalist States Below The Poverty Line Continued Model 1 Model 2 Model 3 Self Employed Unemp./Out LF Self Employed Unemp./Out LF Self Employed Unemp./Out LF Coef. SE Coef. SE Coef. SE Coef. SE Coef. SE Coef. SE Wald Test Variables Tested [2]mper43 = 0 [2]musmale = 0 [3]mper43 = 0 [3]musmale = 0 [2]mper50 = 0 [2]scmale = 0 [3]mper50 = 0 [3]scmale = 0 [2]mper55 = 0 [2]stmale = 0 [3]mper55 = 0 [3]stmale = 0 Number of Variables Tested 6 6 chi2 50.7 152.7 Prob > chi2 0.000 0.000 Continued on next page

234
Table 37 Wage Employment, Self-Employment, and Unemployed/Out of the Labor Force for Individuals 25 to 55 in Non-Fundamentalist States Below The Poverty Line Continued Model 4 Model 5 Model 6 Self Employed Unemp./Out LF Self Employed Unemp./Out LF Self Employed Unemp./Out LF Coef. SE Coef. SE Coef. SE Coef. SE Coef. SE Coef. SE Historical Period 43 (1987) 0.104 * 0.050 0.038 0.045 0.101 * 0.050 0.036 0.045 0.118 * 0.058 0.036 0.049Historical Period 50 (1993) -0.146 ** 0.055 -0.084 + 0.048 -0.148 ** 0.055 -0.085 + 0.048 -0.136 * 0.066 -0.107 * 0.051Historical Period 55 (1999) -0.135 * 0.063 -0.172 *** 0.054 -0.139 * 0.062 -0.171 *** 0.053 -0.140 + 0.075 -0.178 ** 0.058Male -0.039 0.032 -4.863 *** 0.074 -0.019 0.037 -4.805 *** 0.075 -0.010 0.046 -4.881 *** 0.089Male*Historical Period 43 (1987) -0.174 *** 0.045 0.244 ** 0.091 -0.170 *** 0.045 0.237 ** 0.089 -0.193 ** 0.062 0.296 ** 0.112Male*Historical Period 50 (1993) 0.011 0.047 -0.131 0.095 0.013 0.047 -0.118 0.093 0.000 0.068 0.091 0.118Male*Historical Period 55 (1999) -0.050 0.053 -0.020 0.103 -0.046 0.053 -0.035 0.100 -0.043 0.075 0.022 0.133Muslim -0.251 *** 0.059 0.408 *** 0.057 -0.008 0.086 0.667 *** 0.071 -0.044 0.113 0.681 *** 0.081Scheduled Caste -1.115 *** 0.054 -0.740 *** 0.060 -1.156 *** 0.063 -0.772 *** 0.060 -1.107 *** 0.082 -0.797 *** 0.064Scheduled Tribe -0.070 0.060 -1.017 *** 0.070 -0.028 0.067 -1.020 *** 0.071 -0.009 0.081 -1.038 *** 0.076Muslim*Male -0.315 *** 0.080 -0.986 *** 0.107 -0.272 * 0.120 -1.158 *** 0.179Scheduled Caste*Male 0.060 0.045 0.326 *** 0.086 -0.004 0.086 0.625 *** 0.178Scheduled Tribe*Male -0.064 0.043 0.426 *** 0.106 -0.090 0.077 0.724 *** 0.213Muslim*Period 43 (1987) 0.123 0.081 -0.172 * 0.084 0.117 0.081 -0.165 + 0.094 -0.102 0.161 -0.294 * 0.114Muslim*Period 50 (1993) 0.316 *** 0.083 0.161 + 0.085 0.322 *** 0.083 0.161 + 0.095 0.225 0.168 0.104 0.120Muslim*Period 55 (1999) 0.316 ** 0.100 -0.019 0.109 0.321 *** 0.099 -0.022 0.122 0.726 *** 0.215 0.124 0.147Scheduled Caste*Period 43 0.038 0.073 0.035 0.078 0.039 0.073 0.028 0.076 -0.001 0.112 0.043 0.084Scheduled Caste*Period 50 0.069 0.077 0.071 0.081 0.069 0.077 0.075 0.079 0.007 0.124 0.131 0.085Scheduled Caste*Period 55 0.097 0.084 0.163 + 0.088 0.096 0.084 0.161 + 0.086 0.003 0.133 0.190 * 0.094Scheduled Tribe*Period 43 0.097 0.082 0.352 *** 0.095 0.097 0.082 0.337 *** 0.093 0.153 0.117 0.399 *** 0.106Scheduled Tribe*Period 50 0.107 0.088 0.187 + 0.100 0.108 0.088 0.187 + 0.099 0.122 0.124 0.258 * 0.110Scheduled Tribe*Period 55 0.186 * 0.092 0.323 ** 0.104 0.188 * 0.092 0.316 ** 0.102 0.075 0.129 0.278 * 0.113Muslim*Male*Period 43 0.283 0.172 0.322 0.288Continued on next page
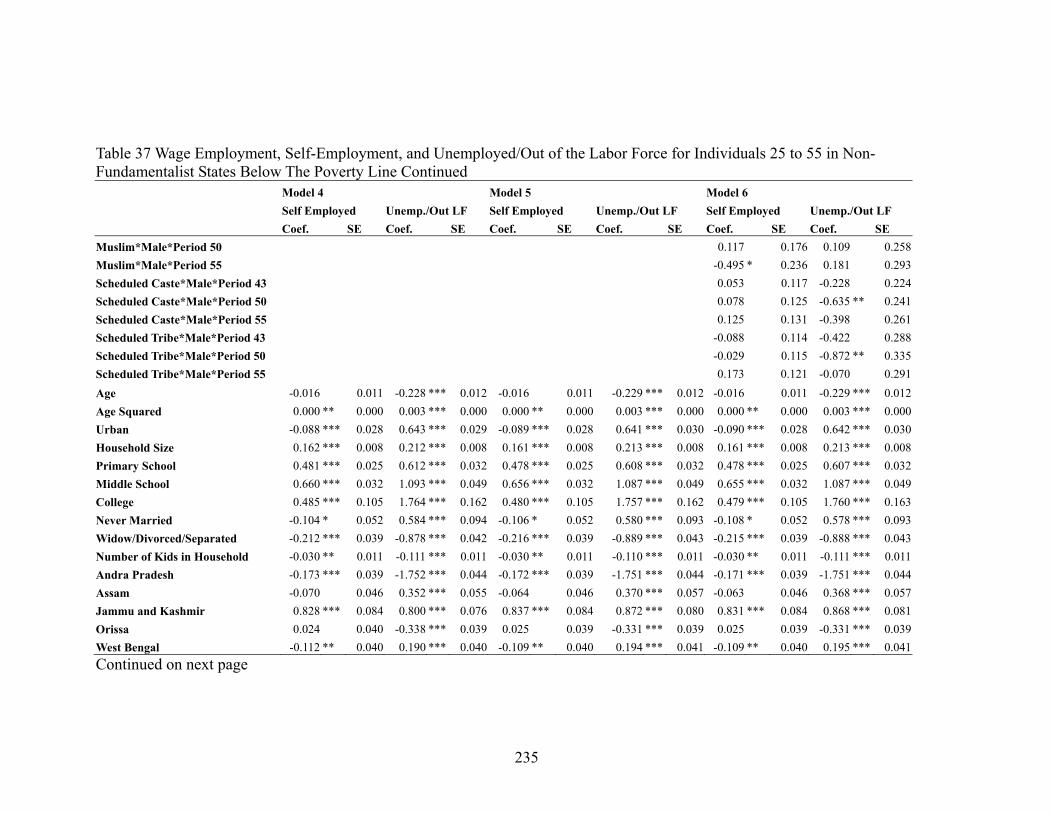
235
Table 37 Wage Employment, Self-Employment, and Unemployed/Out of the Labor Force for Individuals 25 to 55 in Non-Fundamentalist States Below The Poverty Line Continued Model 4 Model 5 Model 6 Self Employed Unemp./Out LF Self Employed Unemp./Out LF Self Employed Unemp./Out LF Coef. SE Coef. SE Coef. SE Coef. SE Coef. SE Coef. SE Muslim*Male*Period 50 0.117 0.176 0.109 0.258Muslim*Male*Period 55 -0.495 * 0.236 0.181 0.293Scheduled Caste*Male*Period 43 0.053 0.117 -0.228 0.224Scheduled Caste*Male*Period 50 0.078 0.125 -0.635 ** 0.241Scheduled Caste*Male*Period 55 0.125 0.131 -0.398 0.261Scheduled Tribe*Male*Period 43 -0.088 0.114 -0.422 0.288Scheduled Tribe*Male*Period 50 -0.029 0.115 -0.872 ** 0.335Scheduled Tribe*Male*Period 55 0.173 0.121 -0.070 0.291Age -0.016 0.011 -0.228 *** 0.012 -0.016 0.011 -0.229 *** 0.012 -0.016 0.011 -0.229 *** 0.012Age Squared 0.000 ** 0.000 0.003 *** 0.000 0.000 ** 0.000 0.003 *** 0.000 0.000 ** 0.000 0.003 *** 0.000Urban -0.088 *** 0.028 0.643 *** 0.029 -0.089 *** 0.028 0.641 *** 0.030 -0.090 *** 0.028 0.642 *** 0.030Household Size 0.162 *** 0.008 0.212 *** 0.008 0.161 *** 0.008 0.213 *** 0.008 0.161 *** 0.008 0.213 *** 0.008Primary School 0.481 *** 0.025 0.612 *** 0.032 0.478 *** 0.025 0.608 *** 0.032 0.478 *** 0.025 0.607 *** 0.032Middle School 0.660 *** 0.032 1.093 *** 0.049 0.656 *** 0.032 1.087 *** 0.049 0.655 *** 0.032 1.087 *** 0.049College 0.485 *** 0.105 1.764 *** 0.162 0.480 *** 0.105 1.757 *** 0.162 0.479 *** 0.105 1.760 *** 0.163Never Married -0.104 * 0.052 0.584 *** 0.094 -0.106 * 0.052 0.580 *** 0.093 -0.108 * 0.052 0.578 *** 0.093Widow/Divorced/Separated -0.212 *** 0.039 -0.878 *** 0.042 -0.216 *** 0.039 -0.889 *** 0.043 -0.215 *** 0.039 -0.888 *** 0.043Number of Kids in Household -0.030 ** 0.011 -0.111 *** 0.011 -0.030 ** 0.011 -0.110 *** 0.011 -0.030 ** 0.011 -0.111 *** 0.011Andra Pradesh -0.173 *** 0.039 -1.752 *** 0.044 -0.172 *** 0.039 -1.751 *** 0.044 -0.171 *** 0.039 -1.751 *** 0.044Assam -0.070 0.046 0.352 *** 0.055 -0.064 0.046 0.370 *** 0.057 -0.063 0.046 0.368 *** 0.057Jammu and Kashmir 0.828 *** 0.084 0.800 *** 0.076 0.837 *** 0.084 0.872 *** 0.080 0.831 *** 0.084 0.868 *** 0.081Orissa 0.024 0.040 -0.338 *** 0.039 0.025 0.039 -0.331 *** 0.039 0.025 0.039 -0.331 *** 0.039West Bengal -0.112 ** 0.040 0.190 *** 0.040 -0.109 ** 0.040 0.194 *** 0.041 -0.109 ** 0.040 0.195 *** 0.041Continued on next page

236
Table 37 Wage Employment, Self-Employment, and Unemployed/Out of the Labor Force for Individuals 25 to 55 in Non-Fundamentalist States Below The Poverty Line Continued Model 4 Model 5 Model 6 Self Employed Unemp./Out LF Self Employed Unemp./Out LF Self Employed Unemp./Out LF Coef. SE Coef. SE Coef. SE Coef. SE Coef. SE Coef. SE Tamil Nadu/Pondicherry/Andaman -0.393 *** 0.037 -1.559 *** 0.039 -0.390 *** 0.037 -1.550 *** 0.039 -0.388 *** 0.037 -1.550 *** 0.039Kerele/Lakshadweep -1.120 *** 0.055 -1.001 *** 0.059 -1.120 *** 0.055 -1.011 *** 0.060 -1.120 *** 0.055 -1.010 *** 0.060HP/Punjab/Haryana/Chandigarh 0.302 *** 0.063 0.196 * 0.091 0.299 *** 0.063 0.183 * 0.088 0.300 *** 0.063 0.184 * 0.088Northeast 0.767 *** 0.057 0.258 *** 0.061 0.768 *** 0.057 0.263 *** 0.060 0.768 *** 0.057 0.264 *** 0.061Karnataka/Goa/Daman and Dui -0.262 *** 0.042 -1.369 *** 0.046 -0.261 *** 0.042 -1.366 *** 0.046 -0.259 *** 0.042 -1.367 *** 0.046Intercept -1.068 *** 0.212 4.586 *** 0.238 -1.082 *** 0.211 4.581 *** 0.239 -1.085 *** 0.213 4.588 *** 0.240Continued on next page
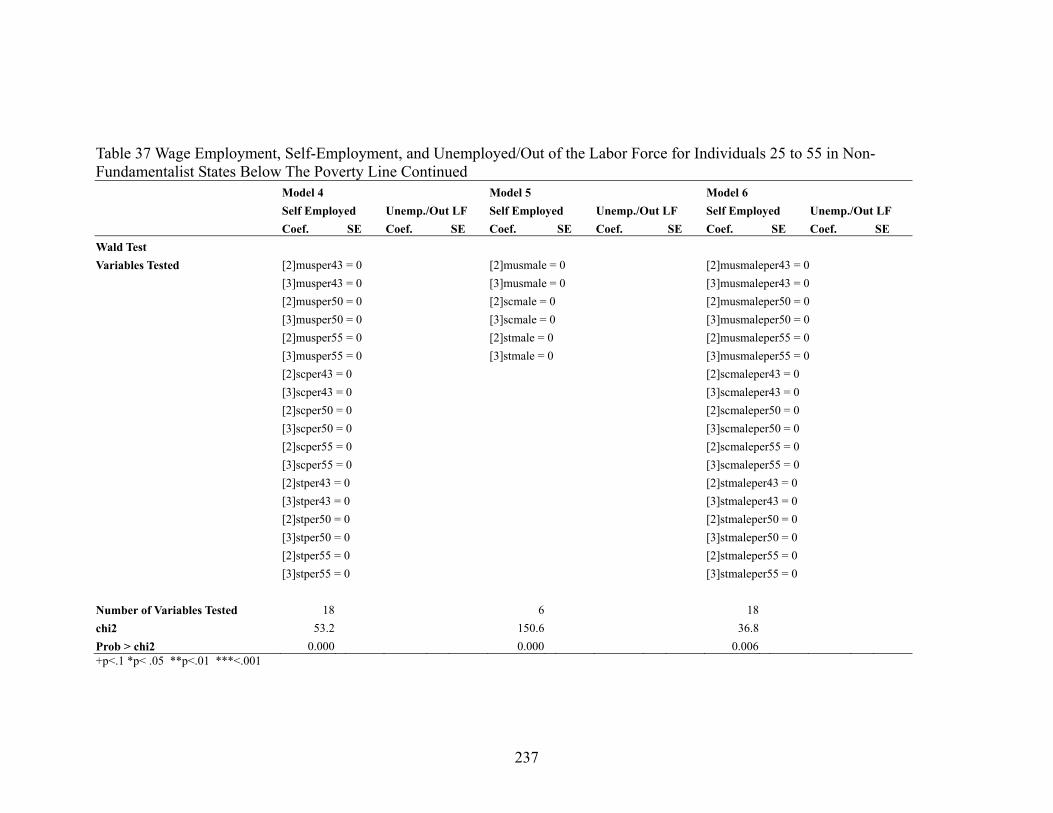
237
Table 37 Wage Employment, Self-Employment, and Unemployed/Out of the Labor Force for Individuals 25 to 55 in Non-Fundamentalist States Below The Poverty Line Continued Model 4 Model 5 Model 6 Self Employed Unemp./Out LF Self Employed Unemp./Out LF Self Employed Unemp./Out LF Coef. SE Coef. SE Coef. SE Coef. SE Coef. SE Coef. SE Wald Test Variables Tested [2]musper43 = 0 [2]musmale = 0 [2]musmaleper43 = 0 [3]musper43 = 0 [3]musmale = 0 [3]musmaleper43 = 0 [2]musper50 = 0 [2]scmale = 0 [2]musmaleper50 = 0 [3]musper50 = 0 [3]scmale = 0 [3]musmaleper50 = 0 [2]musper55 = 0 [2]stmale = 0 [2]musmaleper55 = 0 [3]musper55 = 0 [3]stmale = 0 [3]musmaleper55 = 0 [2]scper43 = 0 [2]scmaleper43 = 0 [3]scper43 = 0 [3]scmaleper43 = 0 [2]scper50 = 0 [2]scmaleper50 = 0 [3]scper50 = 0 [3]scmaleper50 = 0 [2]scper55 = 0 [2]scmaleper55 = 0 [3]scper55 = 0 [3]scmaleper55 = 0 [2]stper43 = 0 [2]stmaleper43 = 0 [3]stper43 = 0 [3]stmaleper43 = 0 [2]stper50 = 0 [2]stmaleper50 = 0 [3]stper50 = 0 [3]stmaleper50 = 0 [2]stper55 = 0 [2]stmaleper55 = 0 [3]stper55 = 0 [3]stmaleper55 = 0 Number of Variables Tested 18 6 18 chi2 53.2 150.6 36.8 Prob > chi2 0.000 0.000 0.006 +p<.1 *p< .05 **p<.01 ***<.001
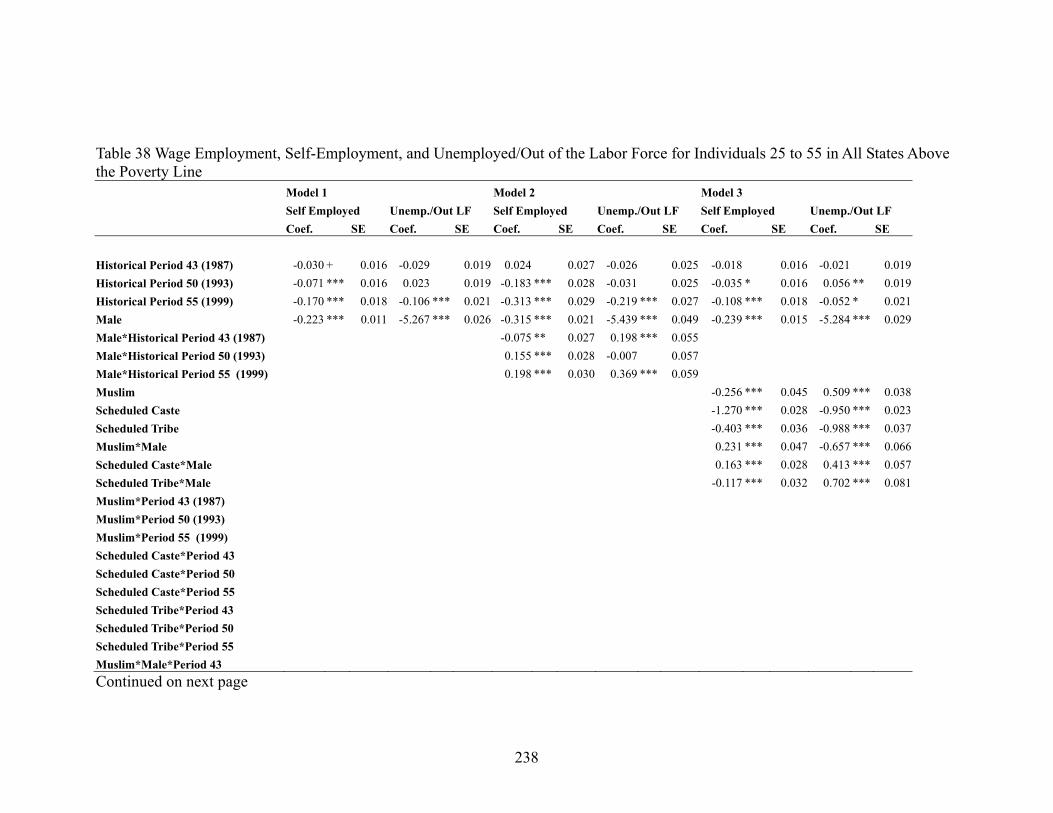
238
Table 38 Wage Employment, Self-Employment, and Unemployed/Out of the Labor Force for Individuals 25 to 55 in All States Above the Poverty Line Model 1 Model 2 Model 3 Self Employed Unemp./Out LF Self Employed Unemp./Out LF Self Employed Unemp./Out LF Coef. SE Coef. SE Coef. SE Coef. SE Coef. SE Coef. SE Historical Period 43 (1987) -0.030 + 0.016 -0.029 0.019 0.024 0.027 -0.026 0.025 -0.018 0.016 -0.021 0.019Historical Period 50 (1993) -0.071 *** 0.016 0.023 0.019 -0.183 *** 0.028 -0.031 0.025 -0.035 * 0.016 0.056 ** 0.019Historical Period 55 (1999) -0.170 *** 0.018 -0.106 *** 0.021 -0.313 *** 0.029 -0.219 *** 0.027 -0.108 *** 0.018 -0.052 * 0.021Male -0.223 *** 0.011 -5.267 *** 0.026 -0.315 *** 0.021 -5.439 *** 0.049 -0.239 *** 0.015 -5.284 *** 0.029Male*Historical Period 43 (1987) -0.075 ** 0.027 0.198 *** 0.055 Male*Historical Period 50 (1993) 0.155 *** 0.028 -0.007 0.057 Male*Historical Period 55 (1999) 0.198 *** 0.030 0.369 *** 0.059 Muslim -0.256 *** 0.045 0.509 *** 0.038Scheduled Caste -1.270 *** 0.028 -0.950 *** 0.023Scheduled Tribe -0.403 *** 0.036 -0.988 *** 0.037Muslim*Male 0.231 *** 0.047 -0.657 *** 0.066Scheduled Caste*Male 0.163 *** 0.028 0.413 *** 0.057Scheduled Tribe*Male -0.117 *** 0.032 0.702 *** 0.081Muslim*Period 43 (1987) Muslim*Period 50 (1993) Muslim*Period 55 (1999) Scheduled Caste*Period 43 Scheduled Caste*Period 50 Scheduled Caste*Period 55 Scheduled Tribe*Period 43 Scheduled Tribe*Period 50 Scheduled Tribe*Period 55 Muslim*Male*Period 43 Continued on next page
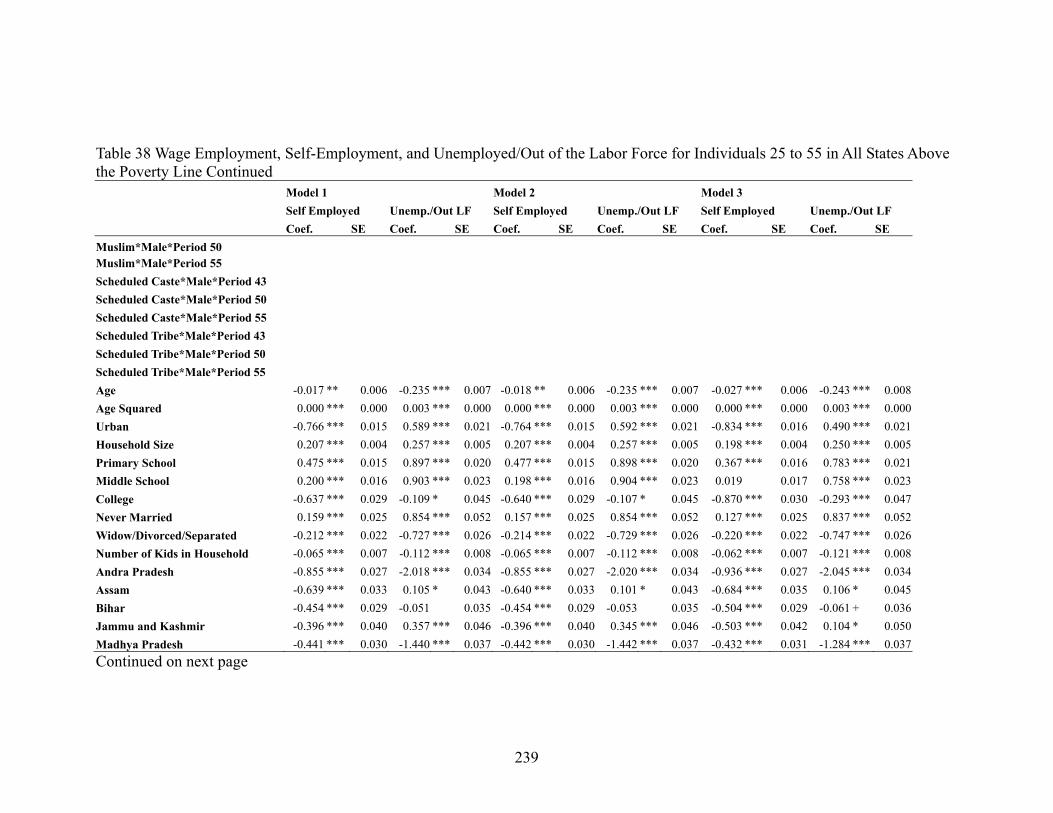
239
Table 38 Wage Employment, Self-Employment, and Unemployed/Out of the Labor Force for Individuals 25 to 55 in All States Above the Poverty Line Continued Model 1 Model 2 Model 3 Self Employed Unemp./Out LF Self Employed Unemp./Out LF Self Employed Unemp./Out LF Coef. SE Coef. SE Coef. SE Coef. SE Coef. SE Coef. SE Muslim*Male*Period 50 Muslim*Male*Period 55 Scheduled Caste*Male*Period 43 Scheduled Caste*Male*Period 50 Scheduled Caste*Male*Period 55 Scheduled Tribe*Male*Period 43 Scheduled Tribe*Male*Period 50 Scheduled Tribe*Male*Period 55 Age -0.017 ** 0.006 -0.235 *** 0.007 -0.018 ** 0.006 -0.235 *** 0.007 -0.027 *** 0.006 -0.243 *** 0.008Age Squared 0.000 *** 0.000 0.003 *** 0.000 0.000 *** 0.000 0.003 *** 0.000 0.000 *** 0.000 0.003 *** 0.000Urban -0.766 *** 0.015 0.589 *** 0.021 -0.764 *** 0.015 0.592 *** 0.021 -0.834 *** 0.016 0.490 *** 0.021Household Size 0.207 *** 0.004 0.257 *** 0.005 0.207 *** 0.004 0.257 *** 0.005 0.198 *** 0.004 0.250 *** 0.005Primary School 0.475 *** 0.015 0.897 *** 0.020 0.477 *** 0.015 0.898 *** 0.020 0.367 *** 0.016 0.783 *** 0.021Middle School 0.200 *** 0.016 0.903 *** 0.023 0.198 *** 0.016 0.904 *** 0.023 0.019 0.017 0.758 *** 0.023College -0.637 *** 0.029 -0.109 * 0.045 -0.640 *** 0.029 -0.107 * 0.045 -0.870 *** 0.030 -0.293 *** 0.047Never Married 0.159 *** 0.025 0.854 *** 0.052 0.157 *** 0.025 0.854 *** 0.052 0.127 *** 0.025 0.837 *** 0.052Widow/Divorced/Separated -0.212 *** 0.022 -0.727 *** 0.026 -0.214 *** 0.022 -0.729 *** 0.026 -0.220 *** 0.022 -0.747 *** 0.026Number of Kids in Household -0.065 *** 0.007 -0.112 *** 0.008 -0.065 *** 0.007 -0.112 *** 0.008 -0.062 *** 0.007 -0.121 *** 0.008Andra Pradesh -0.855 *** 0.027 -2.018 *** 0.034 -0.855 *** 0.027 -2.020 *** 0.034 -0.936 *** 0.027 -2.045 *** 0.034Assam -0.639 *** 0.033 0.105 * 0.043 -0.640 *** 0.033 0.101 * 0.043 -0.684 *** 0.035 0.106 * 0.045Bihar -0.454 *** 0.029 -0.051 0.035 -0.454 *** 0.029 -0.053 0.035 -0.504 *** 0.029 -0.061 + 0.036Jammu and Kashmir -0.396 *** 0.040 0.357 *** 0.046 -0.396 *** 0.040 0.345 *** 0.046 -0.503 *** 0.042 0.104 * 0.050Madhya Pradesh -0.441 *** 0.030 -1.440 *** 0.037 -0.442 *** 0.030 -1.442 *** 0.037 -0.432 *** 0.031 -1.284 *** 0.037Continued on next page
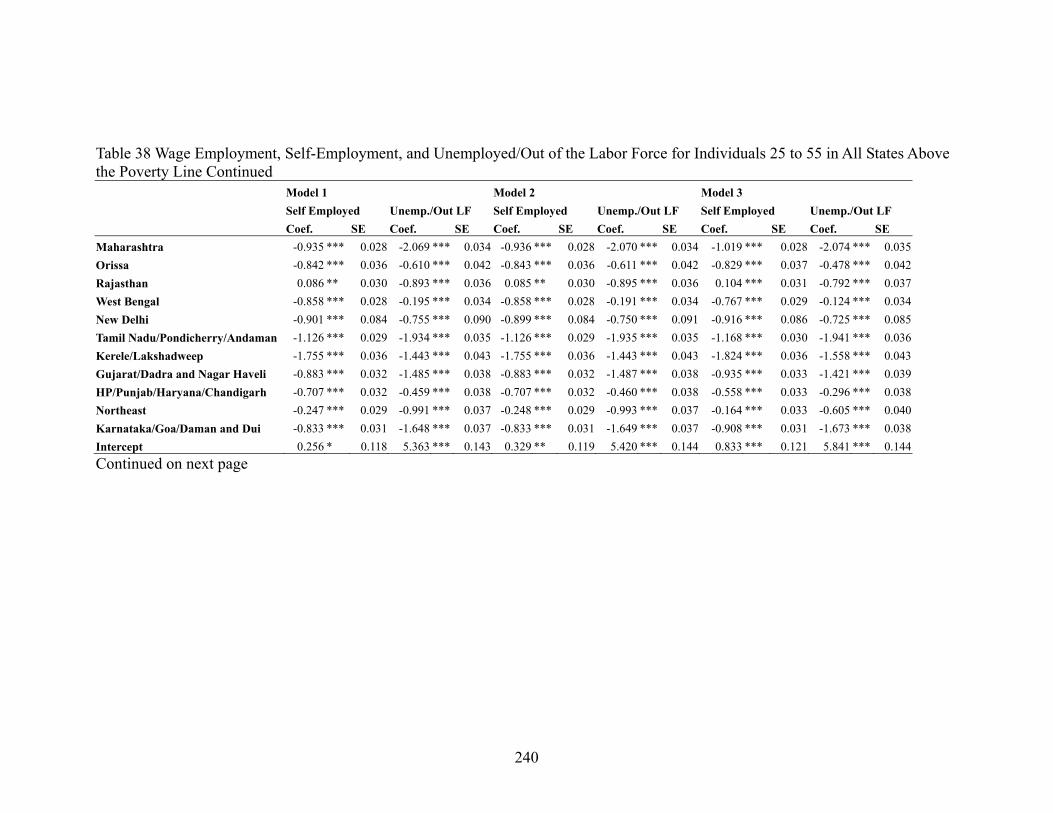
240
Table 38 Wage Employment, Self-Employment, and Unemployed/Out of the Labor Force for Individuals 25 to 55 in All States Above the Poverty Line Continued Model 1 Model 2 Model 3 Self Employed Unemp./Out LF Self Employed Unemp./Out LF Self Employed Unemp./Out LF Coef. SE Coef. SE Coef. SE Coef. SE Coef. SE Coef. SE Maharashtra -0.935 *** 0.028 -2.069 *** 0.034 -0.936 *** 0.028 -2.070 *** 0.034 -1.019 *** 0.028 -2.074 *** 0.035Orissa -0.842 *** 0.036 -0.610 *** 0.042 -0.843 *** 0.036 -0.611 *** 0.042 -0.829 *** 0.037 -0.478 *** 0.042Rajasthan 0.086 ** 0.030 -0.893 *** 0.036 0.085 ** 0.030 -0.895 *** 0.036 0.104 *** 0.031 -0.792 *** 0.037West Bengal -0.858 *** 0.028 -0.195 *** 0.034 -0.858 *** 0.028 -0.191 *** 0.034 -0.767 *** 0.029 -0.124 *** 0.034New Delhi -0.901 *** 0.084 -0.755 *** 0.090 -0.899 *** 0.084 -0.750 *** 0.091 -0.916 *** 0.086 -0.725 *** 0.085Tamil Nadu/Pondicherry/Andaman -1.126 *** 0.029 -1.934 *** 0.035 -1.126 *** 0.029 -1.935 *** 0.035 -1.168 *** 0.030 -1.941 *** 0.036Kerele/Lakshadweep -1.755 *** 0.036 -1.443 *** 0.043 -1.755 *** 0.036 -1.443 *** 0.043 -1.824 *** 0.036 -1.558 *** 0.043Gujarat/Dadra and Nagar Haveli -0.883 *** 0.032 -1.485 *** 0.038 -0.883 *** 0.032 -1.487 *** 0.038 -0.935 *** 0.033 -1.421 *** 0.039HP/Punjab/Haryana/Chandigarh -0.707 *** 0.032 -0.459 *** 0.038 -0.707 *** 0.032 -0.460 *** 0.038 -0.558 *** 0.033 -0.296 *** 0.038Northeast -0.247 *** 0.029 -0.991 *** 0.037 -0.248 *** 0.029 -0.993 *** 0.037 -0.164 *** 0.033 -0.605 *** 0.040Karnataka/Goa/Daman and Dui -0.833 *** 0.031 -1.648 *** 0.037 -0.833 *** 0.031 -1.649 *** 0.037 -0.908 *** 0.031 -1.673 *** 0.038Intercept 0.256 * 0.118 5.363 *** 0.143 0.329 ** 0.119 5.420 *** 0.144 0.833 *** 0.121 5.841 *** 0.144Continued on next page

241
Table 38 Wage Employment, Self-Employment, and Unemployed/Out of the Labor Force for Individuals 25 to 55 in All States Above the Poverty Line Continued Model 1 Model 2 Model 3 Self Employed Unemp./Out LF Self Employed Unemp./Out LF Self Employed Unemp./Out LF Coef. SE Coef. SE Coef. SE Coef. SE Coef. SE Coef. SE Wald Test Variables Tested [2]mper43 = 0 [2]musmale = 0 [3]mper43 = 0 [3]musmale = 0 [2]mper50 = 0 [2]scmale = 0 [3]mper50 = 0 [3]scmale = 0 [2]mper55 = 0 [2]stmale = 0 [3]mper55 = 0 [3]stmale = 0 Number of Variables Tested 6 6 chi2 202.1 455.0 Prob > chi2 0.000 0.000 Continued on next page
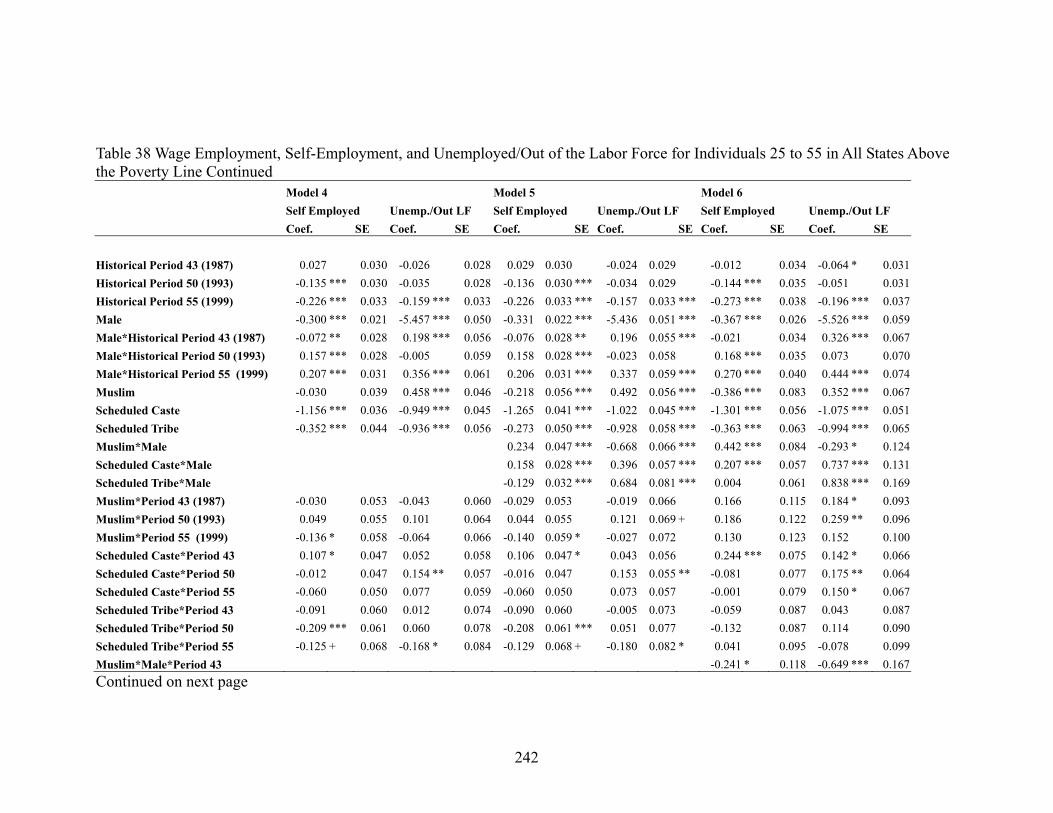
242
Table 38 Wage Employment, Self-Employment, and Unemployed/Out of the Labor Force for Individuals 25 to 55 in All States Above the Poverty Line Continued Model 4 Model 5 Model 6 Self Employed Unemp./Out LF Self Employed Unemp./Out LF Self Employed Unemp./Out LF Coef. SE Coef. SE Coef. SE Coef. SE Coef. SE Coef. SE Historical Period 43 (1987) 0.027 0.030 -0.026 0.028 0.029 0.030 -0.024 0.029 -0.012 0.034 -0.064 * 0.031Historical Period 50 (1993) -0.135 *** 0.030 -0.035 0.028 -0.136 0.030 *** -0.034 0.029 -0.144 *** 0.035 -0.051 0.031Historical Period 55 (1999) -0.226 *** 0.033 -0.159 *** 0.033 -0.226 0.033 *** -0.157 0.033 *** -0.273 *** 0.038 -0.196 *** 0.037Male -0.300 *** 0.021 -5.457 *** 0.050 -0.331 0.022 *** -5.436 0.051 *** -0.367 *** 0.026 -5.526 *** 0.059Male*Historical Period 43 (1987) -0.072 ** 0.028 0.198 *** 0.056 -0.076 0.028 ** 0.196 0.055 *** -0.021 0.034 0.326 *** 0.067Male*Historical Period 50 (1993) 0.157 *** 0.028 -0.005 0.059 0.158 0.028 *** -0.023 0.058 0.168 *** 0.035 0.073 0.070Male*Historical Period 55 (1999) 0.207 *** 0.031 0.356 *** 0.061 0.206 0.031 *** 0.337 0.059 *** 0.270 *** 0.040 0.444 *** 0.074Muslim -0.030 0.039 0.458 *** 0.046 -0.218 0.056 *** 0.492 0.056 *** -0.386 *** 0.083 0.352 *** 0.067Scheduled Caste -1.156 *** 0.036 -0.949 *** 0.045 -1.265 0.041 *** -1.022 0.045 *** -1.301 *** 0.056 -1.075 *** 0.051Scheduled Tribe -0.352 *** 0.044 -0.936 *** 0.056 -0.273 0.050 *** -0.928 0.058 *** -0.363 *** 0.063 -0.994 *** 0.065Muslim*Male 0.234 0.047 *** -0.668 0.066 *** 0.442 *** 0.084 -0.293 * 0.124Scheduled Caste*Male 0.158 0.028 *** 0.396 0.057 *** 0.207 *** 0.057 0.737 *** 0.131Scheduled Tribe*Male -0.129 0.032 *** 0.684 0.081 *** 0.004 0.061 0.838 *** 0.169Muslim*Period 43 (1987) -0.030 0.053 -0.043 0.060 -0.029 0.053 -0.019 0.066 0.166 0.115 0.184 * 0.093Muslim*Period 50 (1993) 0.049 0.055 0.101 0.064 0.044 0.055 0.121 0.069 + 0.186 0.122 0.259 ** 0.096Muslim*Period 55 (1999) -0.136 * 0.058 -0.064 0.066 -0.140 0.059 * -0.027 0.072 0.130 0.123 0.152 0.100Scheduled Caste*Period 43 0.107 * 0.047 0.052 0.058 0.106 0.047 * 0.043 0.056 0.244 *** 0.075 0.142 * 0.066Scheduled Caste*Period 50 -0.012 0.047 0.154 ** 0.057 -0.016 0.047 0.153 0.055 ** -0.081 0.077 0.175 ** 0.064Scheduled Caste*Period 55 -0.060 0.050 0.077 0.059 -0.060 0.050 0.073 0.057 -0.001 0.079 0.150 * 0.067Scheduled Tribe*Period 43 -0.091 0.060 0.012 0.074 -0.090 0.060 -0.005 0.073 -0.059 0.087 0.043 0.087Scheduled Tribe*Period 50 -0.209 *** 0.061 0.060 0.078 -0.208 0.061 *** 0.051 0.077 -0.132 0.087 0.114 0.090Scheduled Tribe*Period 55 -0.125 + 0.068 -0.168 * 0.084 -0.129 0.068 + -0.180 0.082 * 0.041 0.095 -0.078 0.099Muslim*Male*Period 43 -0.241 * 0.118 -0.649 *** 0.167Continued on next page

243
Table 38 Wage Employment, Self-Employment, and Unemployed/Out of the Labor Force for Individuals 25 to 55 in All States Above the Poverty Line Continued Model 4 Model 5 Model 6 Self Employed Unemp./Out LF Self Employed Unemp./Out LF Self Employed Unemp./Out LF Coef. SE Coef. SE Coef. SE Coef. SE Coef. SE Coef. SE Muslim*Male*Period 50 -0.173 0.125 -0.434 * 0.178Muslim*Male*Period 55 -0.332 ** 0.128 -0.348 + 0.181Scheduled Caste*Male*Period 43 -0.197 * 0.077 -0.371 * 0.163Scheduled Caste*Male*Period 50 0.091 0.079 -0.360 * 0.170Scheduled Caste*Male*Period 55 -0.081 0.081 -0.453 ** 0.168Scheduled Tribe*Male*Period 43 -0.041 0.086 -0.266 0.225Scheduled Tribe*Male*Period 50 -0.115 0.084 -0.208 0.239Scheduled Tribe*Male*Period 55 -0.258 ** 0.087 -0.102 0.224Age -0.027 *** 0.006 -0.243 *** 0.008 -0.027 0.006 *** -0.243 0.008 *** -0.027 *** 0.006 -0.243 *** 0.008Age Squared 0.000 *** 0.000 0.003 *** 0.000 0.000 0.000 *** 0.003 0.000 *** 0.000 *** 0.000 0.003 *** 0.000Urban -0.831 *** 0.016 0.489 *** 0.021 -0.832 0.016 *** 0.493 0.021 *** -0.833 *** 0.016 0.493 *** 0.021Household Size 0.199 *** 0.004 0.250 *** 0.005 0.198 0.004 *** 0.250 0.005 *** 0.198 *** 0.004 0.250 *** 0.005Primary School 0.372 *** 0.016 0.789 *** 0.021 0.371 0.016 *** 0.785 0.021 *** 0.371 *** 0.016 0.785 *** 0.021Middle School 0.016 0.017 0.763 *** 0.023 0.017 0.017 0.759 0.024 *** 0.017 0.017 0.760 *** 0.024College -0.879 *** 0.030 -0.283 *** 0.047 -0.875 0.030 *** -0.288 0.048 *** -0.874 *** 0.030 -0.288 *** 0.048Never Married 0.126 *** 0.025 0.836 *** 0.052 0.126 0.025 *** 0.837 0.052 *** 0.126 *** 0.025 0.838 *** 0.052Widow/Divorced/Separated -0.222 *** 0.022 -0.746 *** 0.026 -0.222 0.022 *** -0.749 0.026 *** -0.222 *** 0.022 -0.749 *** 0.026Number of Kids in Household -0.062 *** 0.007 -0.120 *** 0.008 -0.062 0.007 *** -0.121 0.008 *** -0.062 *** 0.007 -0.121 *** 0.008Andra Pradesh -0.936 *** 0.027 -2.049 *** 0.034 -0.933 0.027 *** -2.046 0.035 *** -0.933 *** 0.027 -2.046 *** 0.035Assam -0.685 *** 0.035 0.098 * 0.045 -0.684 0.035 *** 0.104 0.045 * -0.684 *** 0.035 0.104 * 0.045Bihar -0.505 *** 0.029 -0.066 + 0.036 -0.503 0.029 *** -0.063 0.036 + -0.503 *** 0.029 -0.063 + 0.036Jammu and Kashmir -0.479 *** 0.042 0.051 0.048 -0.485 0.042 *** 0.108 0.050 * -0.485 *** 0.042 0.105 * 0.050Madhya Pradesh -0.434 *** 0.031 -1.297 *** 0.037 -0.432 0.031 *** -1.288 0.037 *** -0.432 *** 0.031 -1.288 *** 0.037Continued on next page
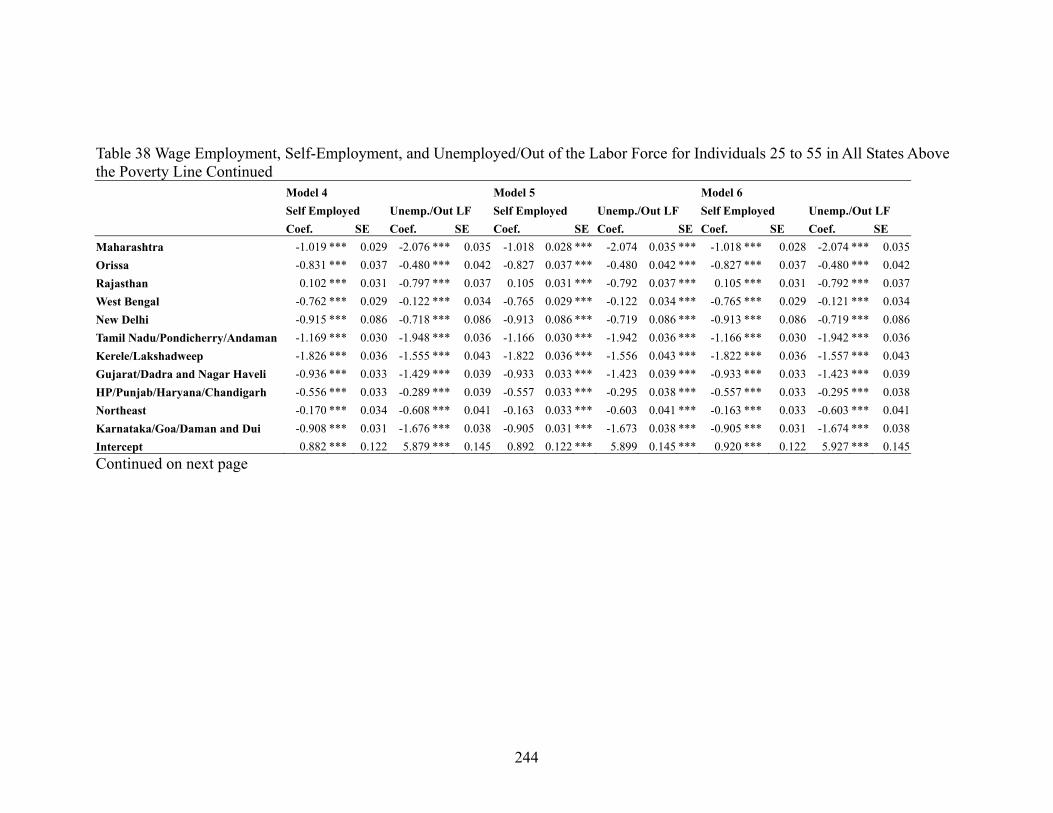
244
Table 38 Wage Employment, Self-Employment, and Unemployed/Out of the Labor Force for Individuals 25 to 55 in All States Above the Poverty Line Continued Model 4 Model 5 Model 6 Self Employed Unemp./Out LF Self Employed Unemp./Out LF Self Employed Unemp./Out LF Coef. SE Coef. SE Coef. SE Coef. SE Coef. SE Coef. SE Maharashtra -1.019 *** 0.029 -2.076 *** 0.035 -1.018 0.028 *** -2.074 0.035 *** -1.018 *** 0.028 -2.074 *** 0.035Orissa -0.831 *** 0.037 -0.480 *** 0.042 -0.827 0.037 *** -0.480 0.042 *** -0.827 *** 0.037 -0.480 *** 0.042Rajasthan 0.102 *** 0.031 -0.797 *** 0.037 0.105 0.031 *** -0.792 0.037 *** 0.105 *** 0.031 -0.792 *** 0.037West Bengal -0.762 *** 0.029 -0.122 *** 0.034 -0.765 0.029 *** -0.122 0.034 *** -0.765 *** 0.029 -0.121 *** 0.034New Delhi -0.915 *** 0.086 -0.718 *** 0.086 -0.913 0.086 *** -0.719 0.086 *** -0.913 *** 0.086 -0.719 *** 0.086Tamil Nadu/Pondicherry/Andaman -1.169 *** 0.030 -1.948 *** 0.036 -1.166 0.030 *** -1.942 0.036 *** -1.166 *** 0.030 -1.942 *** 0.036Kerele/Lakshadweep -1.826 *** 0.036 -1.555 *** 0.043 -1.822 0.036 *** -1.556 0.043 *** -1.822 *** 0.036 -1.557 *** 0.043Gujarat/Dadra and Nagar Haveli -0.936 *** 0.033 -1.429 *** 0.039 -0.933 0.033 *** -1.423 0.039 *** -0.933 *** 0.033 -1.423 *** 0.039HP/Punjab/Haryana/Chandigarh -0.556 *** 0.033 -0.289 *** 0.039 -0.557 0.033 *** -0.295 0.038 *** -0.557 *** 0.033 -0.295 *** 0.038Northeast -0.170 *** 0.034 -0.608 *** 0.041 -0.163 0.033 *** -0.603 0.041 *** -0.163 *** 0.033 -0.603 *** 0.041Karnataka/Goa/Daman and Dui -0.908 *** 0.031 -1.676 *** 0.038 -0.905 0.031 *** -1.673 0.038 *** -0.905 *** 0.031 -1.674 *** 0.038Intercept 0.882 *** 0.122 5.879 *** 0.145 0.892 0.122 *** 5.899 0.145 *** 0.920 *** 0.122 5.927 *** 0.145Continued on next page

245
Table 38 Wage Employment, Self-Employment, and Unemployed/Out of the Labor Force for Individuals 25 to 55 in All States Above the Poverty Line Continued Model 4 Model 5 Model 6 Self Employed Unemp./Out LF Self Employed Unemp./Out LF Self Employed Unemp./Out LF Coef. SE Coef. SE Coef. SE Coef. SE Coef. SE Coef. SE Wald Test Variables Tested [2]musper43 = 0 [2]musmale = 0 [2]musmaleper43 = 0 [3]musper43 = 0 [3]musmale = 0 [3]musmaleper43 = 0 [2]musper50 = 0 [2]scmale = 0 [2]musmaleper50 = 0 [3]musper50 = 0 [3]scmale = 0 [3]musmaleper50 = 0 [2]musper55 = 0 [2]stmale = 0 [2]musmaleper55 = 0 [3]musper55 = 0 [3]stmale = 0 [3]musmaleper55 = 0 [2]scper43 = 0 [2]scmaleper43 = 0 [3]scper43 = 0 [3]scmaleper43 = 0 [2]scper50 = 0 [2]scmaleper50 = 0 [3]scper50 = 0 [3]scmaleper50 = 0 [2]scper55 = 0 [2]scmaleper55 = 0 [3]scper55 = 0 [3]scmaleper55 = 0 [2]stper43 = 0 [2]stmaleper43 = 0 [3]stper43 = 0 [3]stmaleper43 = 0 [2]stper50 = 0 [2]stmaleper50 = 0 [3]stper50 = 0 [3]stmaleper50 = 0 [2]stper55 = 0 [2]stmaleper55 = 0 [3]stper55 = 0 [3]stmaleper55 = 0 Number of Variables Tested 18 6 18 chi2 70.1 457.7 53.4 Prob > chi2 0.000 0.000 0.000 +p<.1 *p< .05 **p<.01 ***<.001
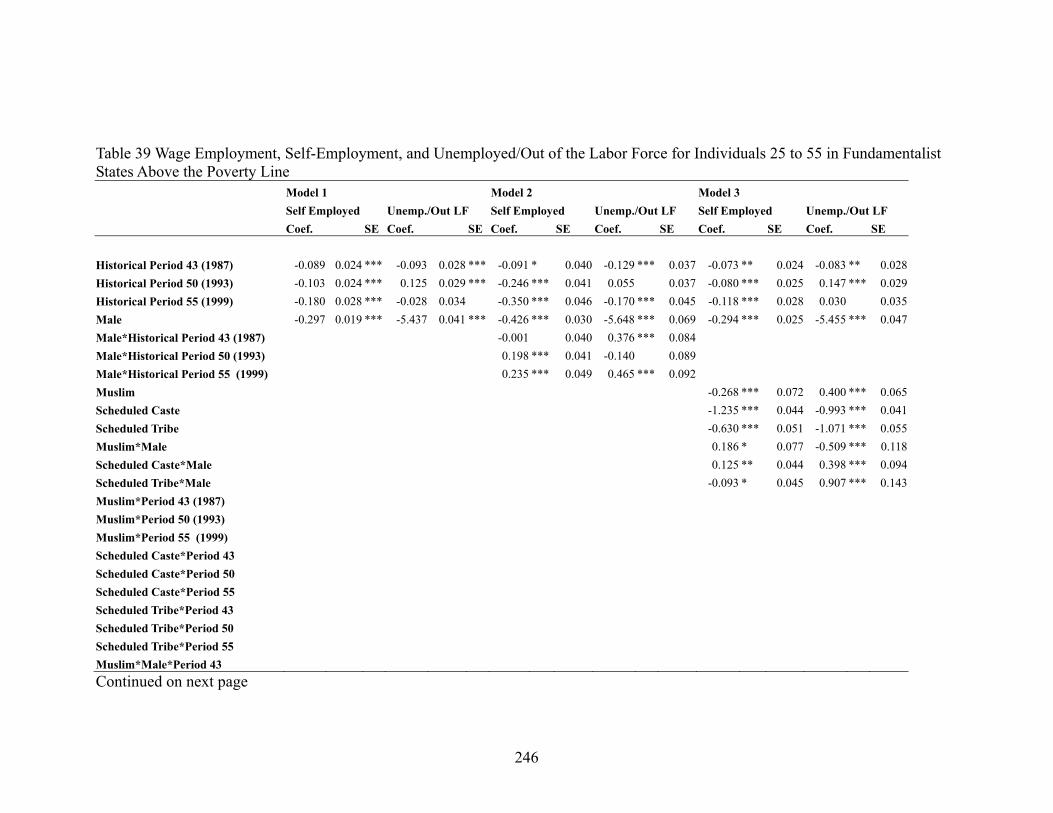
246
Table 39 Wage Employment, Self-Employment, and Unemployed/Out of the Labor Force for Individuals 25 to 55 in Fundamentalist States Above the Poverty Line Model 1 Model 2 Model 3 Self Employed Unemp./Out LF Self Employed Unemp./Out LF Self Employed Unemp./Out LF Coef. SE Coef. SE Coef. SE Coef. SE Coef. SE Coef. SE Historical Period 43 (1987) -0.089 0.024 *** -0.093 0.028 *** -0.091 * 0.040 -0.129 *** 0.037 -0.073 ** 0.024 -0.083 ** 0.028Historical Period 50 (1993) -0.103 0.024 *** 0.125 0.029 *** -0.246 *** 0.041 0.055 0.037 -0.080 *** 0.025 0.147 *** 0.029Historical Period 55 (1999) -0.180 0.028 *** -0.028 0.034 -0.350 *** 0.046 -0.170 *** 0.045 -0.118 *** 0.028 0.030 0.035Male -0.297 0.019 *** -5.437 0.041 *** -0.426 *** 0.030 -5.648 *** 0.069 -0.294 *** 0.025 -5.455 *** 0.047Male*Historical Period 43 (1987) -0.001 0.040 0.376 *** 0.084 Male*Historical Period 50 (1993) 0.198 *** 0.041 -0.140 0.089 Male*Historical Period 55 (1999) 0.235 *** 0.049 0.465 *** 0.092 Muslim -0.268 *** 0.072 0.400 *** 0.065Scheduled Caste -1.235 *** 0.044 -0.993 *** 0.041Scheduled Tribe -0.630 *** 0.051 -1.071 *** 0.055Muslim*Male 0.186 * 0.077 -0.509 *** 0.118Scheduled Caste*Male 0.125 ** 0.044 0.398 *** 0.094Scheduled Tribe*Male -0.093 * 0.045 0.907 *** 0.143Muslim*Period 43 (1987) Muslim*Period 50 (1993) Muslim*Period 55 (1999) Scheduled Caste*Period 43 Scheduled Caste*Period 50 Scheduled Caste*Period 55 Scheduled Tribe*Period 43 Scheduled Tribe*Period 50 Scheduled Tribe*Period 55 Muslim*Male*Period 43 Continued on next page
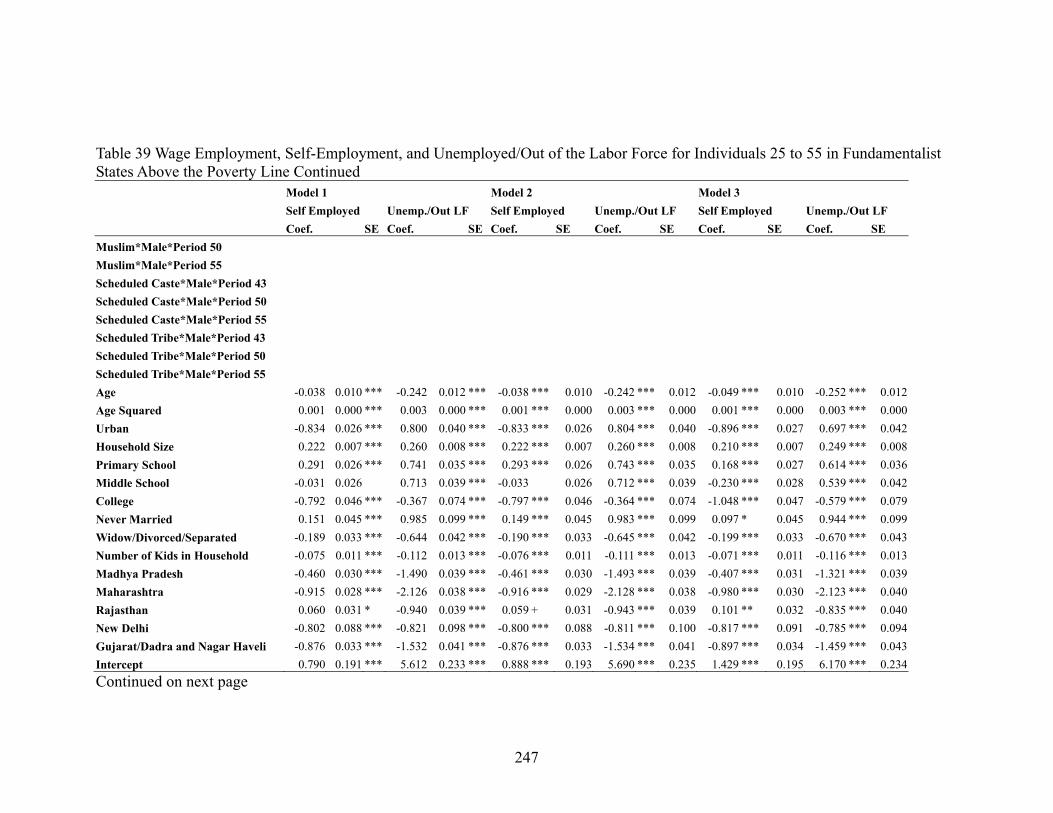
247
Table 39 Wage Employment, Self-Employment, and Unemployed/Out of the Labor Force for Individuals 25 to 55 in Fundamentalist States Above the Poverty Line Continued Model 1 Model 2 Model 3 Self Employed Unemp./Out LF Self Employed Unemp./Out LF Self Employed Unemp./Out LF Coef. SE Coef. SE Coef. SE Coef. SE Coef. SE Coef. SE Muslim*Male*Period 50 Muslim*Male*Period 55 Scheduled Caste*Male*Period 43 Scheduled Caste*Male*Period 50 Scheduled Caste*Male*Period 55 Scheduled Tribe*Male*Period 43 Scheduled Tribe*Male*Period 50 Scheduled Tribe*Male*Period 55 Age -0.038 0.010 *** -0.242 0.012 *** -0.038 *** 0.010 -0.242 *** 0.012 -0.049 *** 0.010 -0.252 *** 0.012Age Squared 0.001 0.000 *** 0.003 0.000 *** 0.001 *** 0.000 0.003 *** 0.000 0.001 *** 0.000 0.003 *** 0.000Urban -0.834 0.026 *** 0.800 0.040 *** -0.833 *** 0.026 0.804 *** 0.040 -0.896 *** 0.027 0.697 *** 0.042Household Size 0.222 0.007 *** 0.260 0.008 *** 0.222 *** 0.007 0.260 *** 0.008 0.210 *** 0.007 0.249 *** 0.008Primary School 0.291 0.026 *** 0.741 0.035 *** 0.293 *** 0.026 0.743 *** 0.035 0.168 *** 0.027 0.614 *** 0.036Middle School -0.031 0.026 0.713 0.039 *** -0.033 0.026 0.712 *** 0.039 -0.230 *** 0.028 0.539 *** 0.042College -0.792 0.046 *** -0.367 0.074 *** -0.797 *** 0.046 -0.364 *** 0.074 -1.048 *** 0.047 -0.579 *** 0.079Never Married 0.151 0.045 *** 0.985 0.099 *** 0.149 *** 0.045 0.983 *** 0.099 0.097 * 0.045 0.944 *** 0.099Widow/Divorced/Separated -0.189 0.033 *** -0.644 0.042 *** -0.190 *** 0.033 -0.645 *** 0.042 -0.199 *** 0.033 -0.670 *** 0.043Number of Kids in Household -0.075 0.011 *** -0.112 0.013 *** -0.076 *** 0.011 -0.111 *** 0.013 -0.071 *** 0.011 -0.116 *** 0.013Madhya Pradesh -0.460 0.030 *** -1.490 0.039 *** -0.461 *** 0.030 -1.493 *** 0.039 -0.407 *** 0.031 -1.321 *** 0.039Maharashtra -0.915 0.028 *** -2.126 0.038 *** -0.916 *** 0.029 -2.128 *** 0.038 -0.980 *** 0.030 -2.123 *** 0.040Rajasthan 0.060 0.031 * -0.940 0.039 *** 0.059 + 0.031 -0.943 *** 0.039 0.101 ** 0.032 -0.835 *** 0.040New Delhi -0.802 0.088 *** -0.821 0.098 *** -0.800 *** 0.088 -0.811 *** 0.100 -0.817 *** 0.091 -0.785 *** 0.094Gujarat/Dadra and Nagar Haveli -0.876 0.033 *** -1.532 0.041 *** -0.876 *** 0.033 -1.534 *** 0.041 -0.897 *** 0.034 -1.459 *** 0.043Intercept 0.790 0.191 *** 5.612 0.233 *** 0.888 *** 0.193 5.690 *** 0.235 1.429 *** 0.195 6.170 *** 0.234Continued on next page
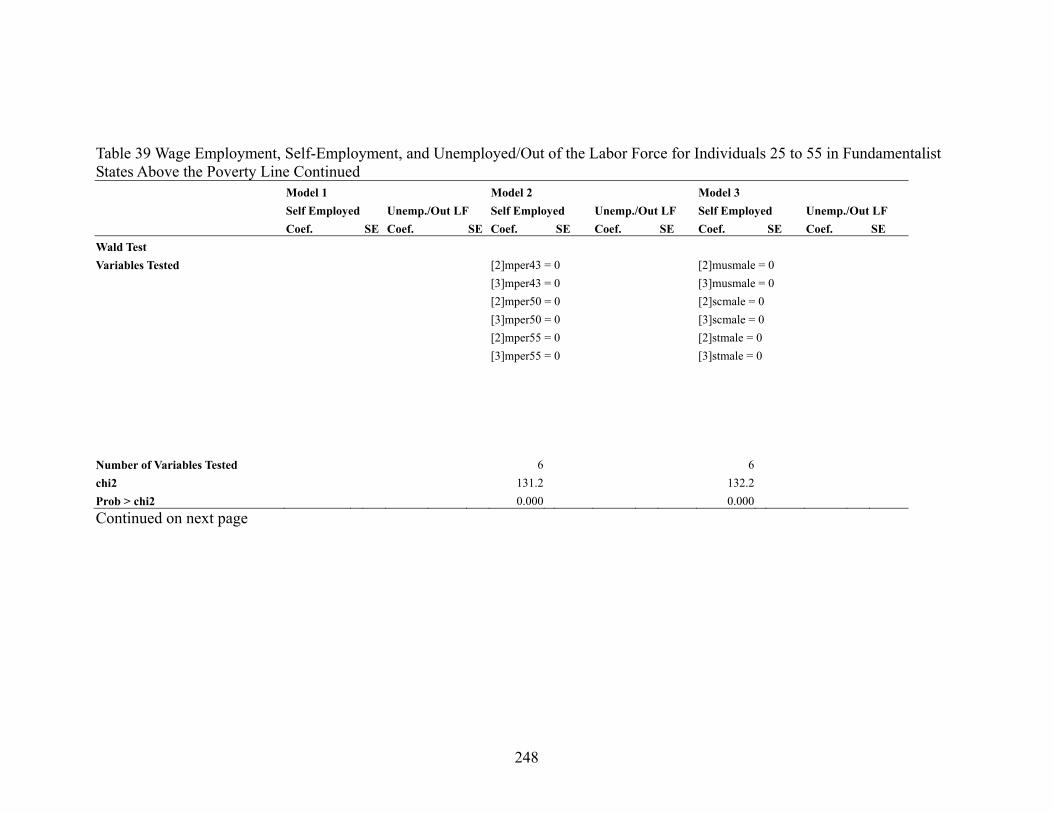
248
Table 39 Wage Employment, Self-Employment, and Unemployed/Out of the Labor Force for Individuals 25 to 55 in Fundamentalist States Above the Poverty Line Continued Model 1 Model 2 Model 3 Self Employed Unemp./Out LF Self Employed Unemp./Out LF Self Employed Unemp./Out LF Coef. SE Coef. SE Coef. SE Coef. SE Coef. SE Coef. SE Wald Test Variables Tested [2]mper43 = 0 [2]musmale = 0 [3]mper43 = 0 [3]musmale = 0 [2]mper50 = 0 [2]scmale = 0 [3]mper50 = 0 [3]scmale = 0 [2]mper55 = 0 [2]stmale = 0 [3]mper55 = 0 [3]stmale = 0 Number of Variables Tested 6 6 chi2 131.2 132.2 Prob > chi2 0.000 0.000 Continued on next page
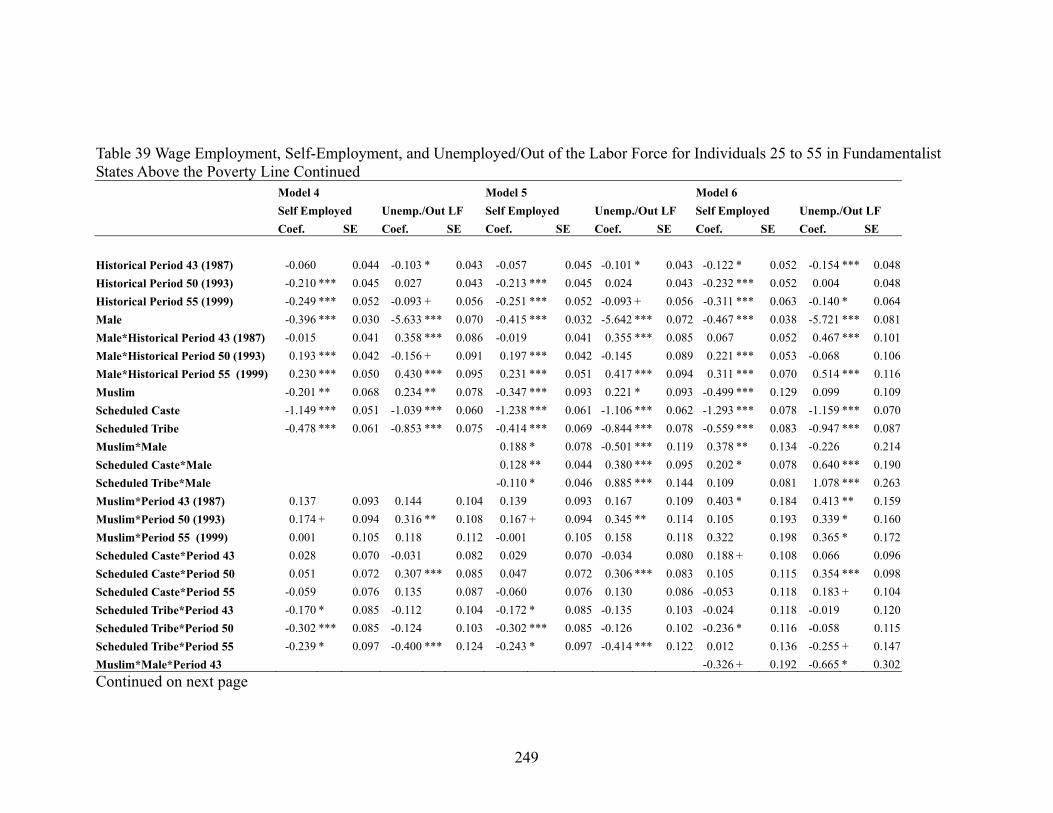
249
Table 39 Wage Employment, Self-Employment, and Unemployed/Out of the Labor Force for Individuals 25 to 55 in Fundamentalist States Above the Poverty Line Continued Model 4 Model 5 Model 6 Self Employed Unemp./Out LF Self Employed Unemp./Out LF Self Employed Unemp./Out LF Coef. SE Coef. SE Coef. SE Coef. SE Coef. SE Coef. SE Historical Period 43 (1987) -0.060 0.044 -0.103 * 0.043 -0.057 0.045 -0.101 * 0.043 -0.122 * 0.052 -0.154 *** 0.048Historical Period 50 (1993) -0.210 *** 0.045 0.027 0.043 -0.213 *** 0.045 0.024 0.043 -0.232 *** 0.052 0.004 0.048Historical Period 55 (1999) -0.249 *** 0.052 -0.093 + 0.056 -0.251 *** 0.052 -0.093 + 0.056 -0.311 *** 0.063 -0.140 * 0.064Male -0.396 *** 0.030 -5.633 *** 0.070 -0.415 *** 0.032 -5.642 *** 0.072 -0.467 *** 0.038 -5.721 *** 0.081Male*Historical Period 43 (1987) -0.015 0.041 0.358 *** 0.086 -0.019 0.041 0.355 *** 0.085 0.067 0.052 0.467 *** 0.101Male*Historical Period 50 (1993) 0.193 *** 0.042 -0.156 + 0.091 0.197 *** 0.042 -0.145 0.089 0.221 *** 0.053 -0.068 0.106Male*Historical Period 55 (1999) 0.230 *** 0.050 0.430 *** 0.095 0.231 *** 0.051 0.417 *** 0.094 0.311 *** 0.070 0.514 *** 0.116Muslim -0.201 ** 0.068 0.234 ** 0.078 -0.347 *** 0.093 0.221 * 0.093 -0.499 *** 0.129 0.099 0.109Scheduled Caste -1.149 *** 0.051 -1.039 *** 0.060 -1.238 *** 0.061 -1.106 *** 0.062 -1.293 *** 0.078 -1.159 *** 0.070Scheduled Tribe -0.478 *** 0.061 -0.853 *** 0.075 -0.414 *** 0.069 -0.844 *** 0.078 -0.559 *** 0.083 -0.947 *** 0.087Muslim*Male 0.188 * 0.078 -0.501 *** 0.119 0.378 ** 0.134 -0.226 0.214Scheduled Caste*Male 0.128 ** 0.044 0.380 *** 0.095 0.202 * 0.078 0.640 *** 0.190Scheduled Tribe*Male -0.110 * 0.046 0.885 *** 0.144 0.109 0.081 1.078 *** 0.263Muslim*Period 43 (1987) 0.137 0.093 0.144 0.104 0.139 0.093 0.167 0.109 0.403 * 0.184 0.413 ** 0.159Muslim*Period 50 (1993) 0.174 + 0.094 0.316 ** 0.108 0.167 + 0.094 0.345 ** 0.114 0.105 0.193 0.339 * 0.160Muslim*Period 55 (1999) 0.001 0.105 0.118 0.112 -0.001 0.105 0.158 0.118 0.322 0.198 0.365 * 0.172Scheduled Caste*Period 43 0.028 0.070 -0.031 0.082 0.029 0.070 -0.034 0.080 0.188 + 0.108 0.066 0.096Scheduled Caste*Period 50 0.051 0.072 0.307 *** 0.085 0.047 0.072 0.306 *** 0.083 0.105 0.115 0.354 *** 0.098Scheduled Caste*Period 55 -0.059 0.076 0.135 0.087 -0.060 0.076 0.130 0.086 -0.053 0.118 0.183 + 0.104Scheduled Tribe*Period 43 -0.170 * 0.085 -0.112 0.104 -0.172 * 0.085 -0.135 0.103 -0.024 0.118 -0.019 0.120Scheduled Tribe*Period 50 -0.302 *** 0.085 -0.124 0.103 -0.302 *** 0.085 -0.126 0.102 -0.236 * 0.116 -0.058 0.115Scheduled Tribe*Period 55 -0.239 * 0.097 -0.400 *** 0.124 -0.243 * 0.097 -0.414 *** 0.122 0.012 0.136 -0.255 + 0.147Muslim*Male*Period 43 -0.326 + 0.192 -0.665 * 0.302Continued on next page
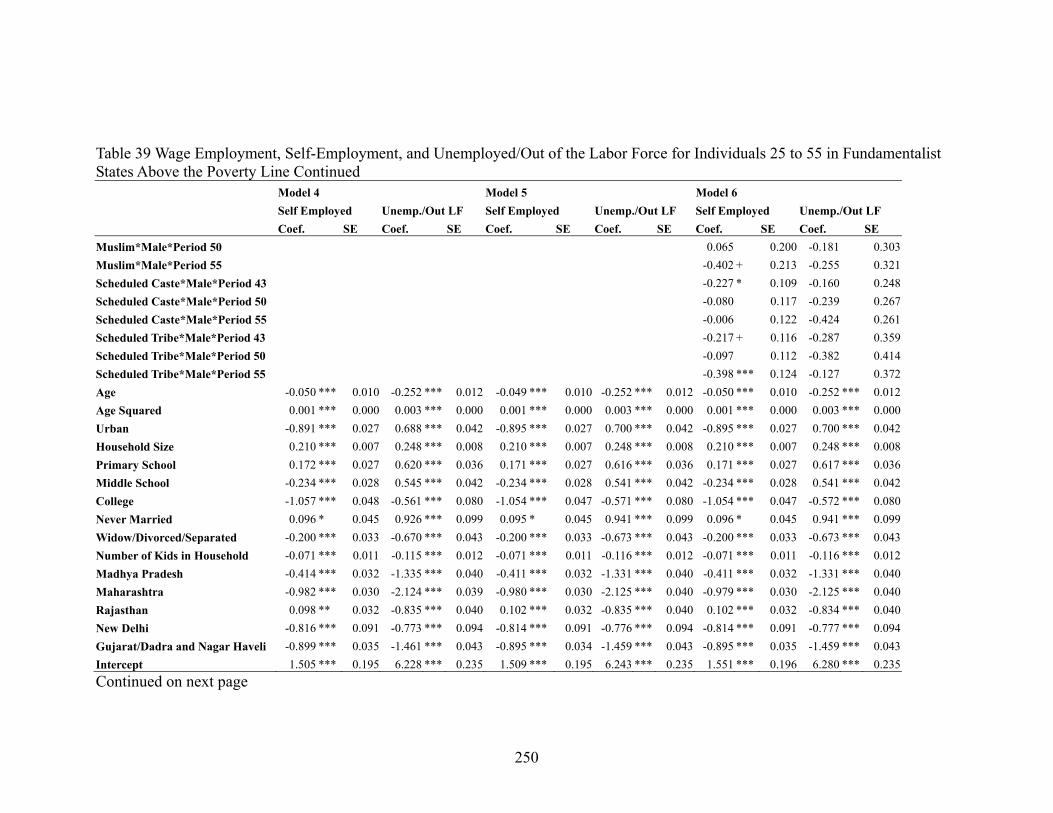
250
Table 39 Wage Employment, Self-Employment, and Unemployed/Out of the Labor Force for Individuals 25 to 55 in Fundamentalist States Above the Poverty Line Continued Model 4 Model 5 Model 6 Self Employed Unemp./Out LF Self Employed Unemp./Out LF Self Employed Unemp./Out LF Coef. SE Coef. SE Coef. SE Coef. SE Coef. SE Coef. SE Muslim*Male*Period 50 0.065 0.200 -0.181 0.303Muslim*Male*Period 55 -0.402 + 0.213 -0.255 0.321Scheduled Caste*Male*Period 43 -0.227 * 0.109 -0.160 0.248Scheduled Caste*Male*Period 50 -0.080 0.117 -0.239 0.267Scheduled Caste*Male*Period 55 -0.006 0.122 -0.424 0.261Scheduled Tribe*Male*Period 43 -0.217 + 0.116 -0.287 0.359Scheduled Tribe*Male*Period 50 -0.097 0.112 -0.382 0.414Scheduled Tribe*Male*Period 55 -0.398 *** 0.124 -0.127 0.372Age -0.050 *** 0.010 -0.252 *** 0.012 -0.049 *** 0.010 -0.252 *** 0.012 -0.050 *** 0.010 -0.252 *** 0.012Age Squared 0.001 *** 0.000 0.003 *** 0.000 0.001 *** 0.000 0.003 *** 0.000 0.001 *** 0.000 0.003 *** 0.000Urban -0.891 *** 0.027 0.688 *** 0.042 -0.895 *** 0.027 0.700 *** 0.042 -0.895 *** 0.027 0.700 *** 0.042Household Size 0.210 *** 0.007 0.248 *** 0.008 0.210 *** 0.007 0.248 *** 0.008 0.210 *** 0.007 0.248 *** 0.008Primary School 0.172 *** 0.027 0.620 *** 0.036 0.171 *** 0.027 0.616 *** 0.036 0.171 *** 0.027 0.617 *** 0.036Middle School -0.234 *** 0.028 0.545 *** 0.042 -0.234 *** 0.028 0.541 *** 0.042 -0.234 *** 0.028 0.541 *** 0.042College -1.057 *** 0.048 -0.561 *** 0.080 -1.054 *** 0.047 -0.571 *** 0.080 -1.054 *** 0.047 -0.572 *** 0.080Never Married 0.096 * 0.045 0.926 *** 0.099 0.095 * 0.045 0.941 *** 0.099 0.096 * 0.045 0.941 *** 0.099Widow/Divorced/Separated -0.200 *** 0.033 -0.670 *** 0.043 -0.200 *** 0.033 -0.673 *** 0.043 -0.200 *** 0.033 -0.673 *** 0.043Number of Kids in Household -0.071 *** 0.011 -0.115 *** 0.012 -0.071 *** 0.011 -0.116 *** 0.012 -0.071 *** 0.011 -0.116 *** 0.012Madhya Pradesh -0.414 *** 0.032 -1.335 *** 0.040 -0.411 *** 0.032 -1.331 *** 0.040 -0.411 *** 0.032 -1.331 *** 0.040Maharashtra -0.982 *** 0.030 -2.124 *** 0.039 -0.980 *** 0.030 -2.125 *** 0.040 -0.979 *** 0.030 -2.125 *** 0.040Rajasthan 0.098 ** 0.032 -0.835 *** 0.040 0.102 *** 0.032 -0.835 *** 0.040 0.102 *** 0.032 -0.834 *** 0.040New Delhi -0.816 *** 0.091 -0.773 *** 0.094 -0.814 *** 0.091 -0.776 *** 0.094 -0.814 *** 0.091 -0.777 *** 0.094Gujarat/Dadra and Nagar Haveli -0.899 *** 0.035 -1.461 *** 0.043 -0.895 *** 0.034 -1.459 *** 0.043 -0.895 *** 0.035 -1.459 *** 0.043Intercept 1.505 *** 0.195 6.228 *** 0.235 1.509 *** 0.195 6.243 *** 0.235 1.551 *** 0.196 6.280 *** 0.235Continued on next page
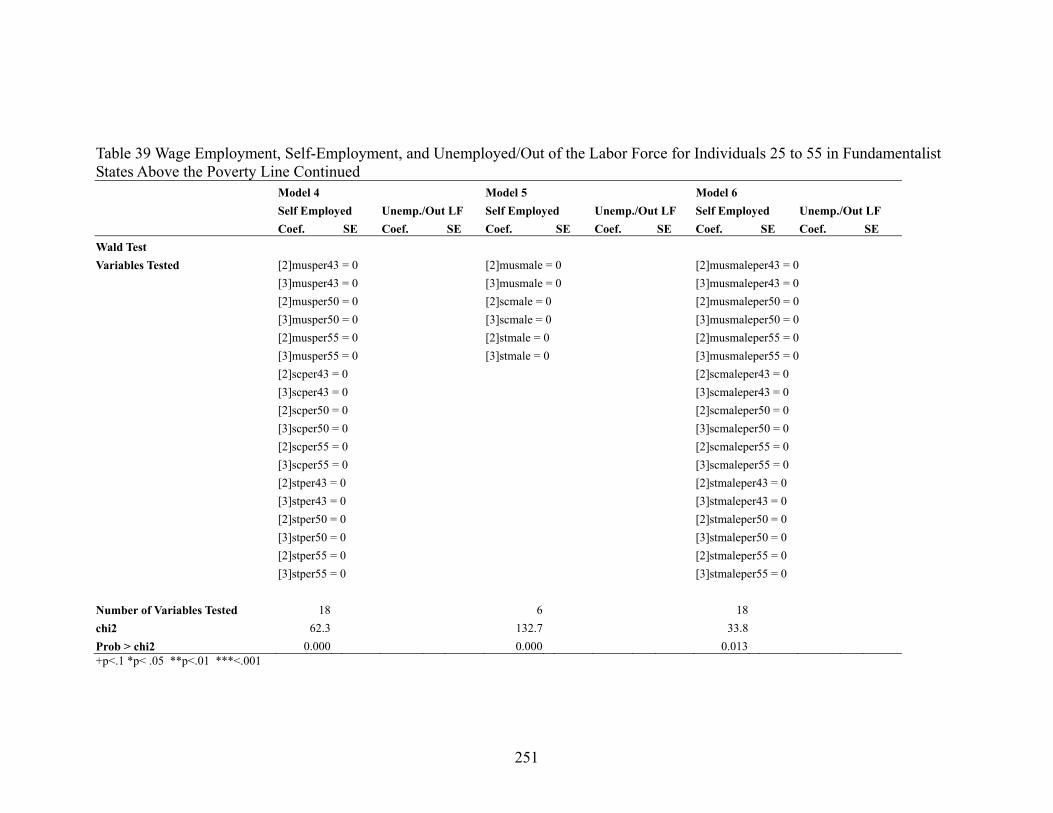
251
Table 39 Wage Employment, Self-Employment, and Unemployed/Out of the Labor Force for Individuals 25 to 55 in Fundamentalist States Above the Poverty Line Continued Model 4 Model 5 Model 6 Self Employed Unemp./Out LF Self Employed Unemp./Out LF Self Employed Unemp./Out LF Coef. SE Coef. SE Coef. SE Coef. SE Coef. SE Coef. SE Wald Test Variables Tested [2]musper43 = 0 [2]musmale = 0 [2]musmaleper43 = 0 [3]musper43 = 0 [3]musmale = 0 [3]musmaleper43 = 0 [2]musper50 = 0 [2]scmale = 0 [2]musmaleper50 = 0 [3]musper50 = 0 [3]scmale = 0 [3]musmaleper50 = 0 [2]musper55 = 0 [2]stmale = 0 [2]musmaleper55 = 0 [3]musper55 = 0 [3]stmale = 0 [3]musmaleper55 = 0 [2]scper43 = 0 [2]scmaleper43 = 0 [3]scper43 = 0 [3]scmaleper43 = 0 [2]scper50 = 0 [2]scmaleper50 = 0 [3]scper50 = 0 [3]scmaleper50 = 0 [2]scper55 = 0 [2]scmaleper55 = 0 [3]scper55 = 0 [3]scmaleper55 = 0 [2]stper43 = 0 [2]stmaleper43 = 0 [3]stper43 = 0 [3]stmaleper43 = 0 [2]stper50 = 0 [2]stmaleper50 = 0 [3]stper50 = 0 [3]stmaleper50 = 0 [2]stper55 = 0 [2]stmaleper55 = 0 [3]stper55 = 0 [3]stmaleper55 = 0 Number of Variables Tested 18 6 18 chi2 62.3 132.7 33.8 Prob > chi2 0.000 0.000 0.013 +p<.1 *p< .05 **p<.01 ***<.001
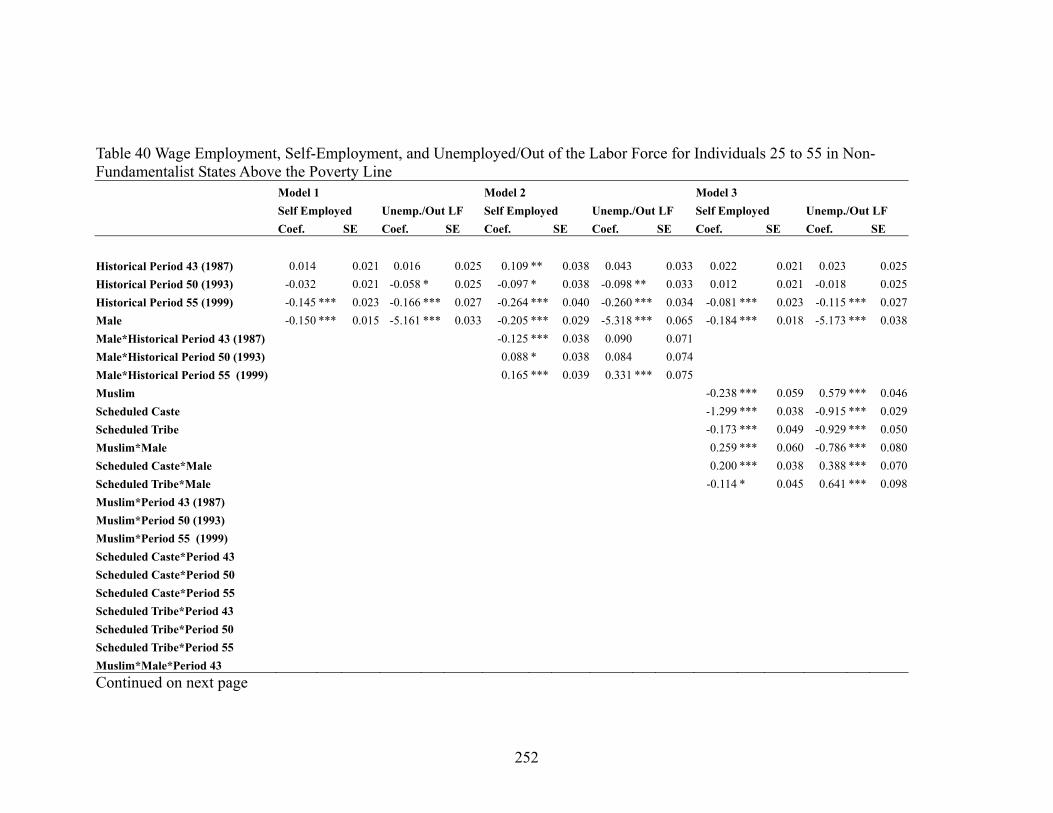
252
Table 40 Wage Employment, Self-Employment, and Unemployed/Out of the Labor Force for Individuals 25 to 55 in Non-Fundamentalist States Above the Poverty Line Model 1 Model 2 Model 3 Self Employed Unemp./Out LF Self Employed Unemp./Out LF Self Employed Unemp./Out LF Coef. SE Coef. SE Coef. SE Coef. SE Coef. SE Coef. SE Historical Period 43 (1987) 0.014 0.021 0.016 0.025 0.109 ** 0.038 0.043 0.033 0.022 0.021 0.023 0.025Historical Period 50 (1993) -0.032 0.021 -0.058 * 0.025 -0.097 * 0.038 -0.098 ** 0.033 0.012 0.021 -0.018 0.025Historical Period 55 (1999) -0.145 *** 0.023 -0.166 *** 0.027 -0.264 *** 0.040 -0.260 *** 0.034 -0.081 *** 0.023 -0.115 *** 0.027Male -0.150 *** 0.015 -5.161 *** 0.033 -0.205 *** 0.029 -5.318 *** 0.065 -0.184 *** 0.018 -5.173 *** 0.038Male*Historical Period 43 (1987) -0.125 *** 0.038 0.090 0.071 Male*Historical Period 50 (1993) 0.088 * 0.038 0.084 0.074 Male*Historical Period 55 (1999) 0.165 *** 0.039 0.331 *** 0.075 Muslim -0.238 *** 0.059 0.579 *** 0.046Scheduled Caste -1.299 *** 0.038 -0.915 *** 0.029Scheduled Tribe -0.173 *** 0.049 -0.929 *** 0.050Muslim*Male 0.259 *** 0.060 -0.786 *** 0.080Scheduled Caste*Male 0.200 *** 0.038 0.388 *** 0.070Scheduled Tribe*Male -0.114 * 0.045 0.641 *** 0.098Muslim*Period 43 (1987) Muslim*Period 50 (1993) Muslim*Period 55 (1999) Scheduled Caste*Period 43 Scheduled Caste*Period 50 Scheduled Caste*Period 55 Scheduled Tribe*Period 43 Scheduled Tribe*Period 50 Scheduled Tribe*Period 55 Muslim*Male*Period 43 Continued on next page

253
Table 40 Wage Employment, Self-Employment, and Unemployed/Out of the Labor Force for Individuals 25 to 55 in Non-Fundamentalist States Above the Poverty Line Continued Model 1 Model 2 Model 3 Self Employed Unemp./Out LF Self Employed Unemp./Out LF Self Employed Unemp./Out LF Coef. SE Coef. SE Coef. SE Coef. SE Coef. SE Coef. SE Tamil Nadu/Pondicherry/Andaman -0.695 *** 0.031 -1.833 *** 0.037 -0.695 *** 0.031 -1.833 *** 0.037 -0.668 *** 0.032 -1.830 *** 0.037Kerele/Lakshadweep -1.353 *** 0.037 -1.407 *** 0.045 -1.353 *** 0.037 -1.407 *** 0.045 -1.367 *** 0.038 -1.522 *** 0.046HP/Punjab/Haryana/Chandigarh -0.269 *** 0.034 -0.398 *** 0.039 -0.269 *** 0.034 -0.398 *** 0.039 -0.050 0.035 -0.225 *** 0.039Northeast 0.170 *** 0.031 -0.934 *** 0.038 0.170 *** 0.031 -0.935 *** 0.038 0.207 *** 0.035 -0.558 *** 0.042Karnataka/Goa/Daman and Dui -0.374 *** 0.032 -1.556 *** 0.039 -0.374 *** 0.032 -1.556 *** 0.039 -0.394 *** 0.033 -1.575 *** 0.039Intercept -0.579 *** 0.148 5.233 *** 0.182 -0.533 *** 0.150 5.275 *** 0.183 -0.120 0.151 5.647 *** 0.184Continued on next page

254
Table 40 Wage Employment, Self-Employment, and Unemployed/Out of the Labor Force for Individuals 25 to 55 in Non-Fundamentalist States Above the Poverty Line Continued Model 1 Model 2 Model 3 Self Employed Unemp./Out LF Self Employed Unemp./Out LF Self Employed Unemp./Out LF Coef. SE Coef. SE Coef. SE Coef. SE Coef. SE Coef. SE Wald Test Variables Tested [2]mper43 = 0 [2]musmale = 0 [3]mper43 = 0 [3]musmale = 0 [2]mper50 = 0 [2]scmale = 0 [3]mper50 = 0 [3]scmale = 0 [2]mper55 = 0 [2]stmale = 0 [3]mper55 = 0 [3]stmale = 0 Number of Variables Tested 6 6 chi2 86.2 352.3 Prob > chi2 0.000 0.000 Continued on next page
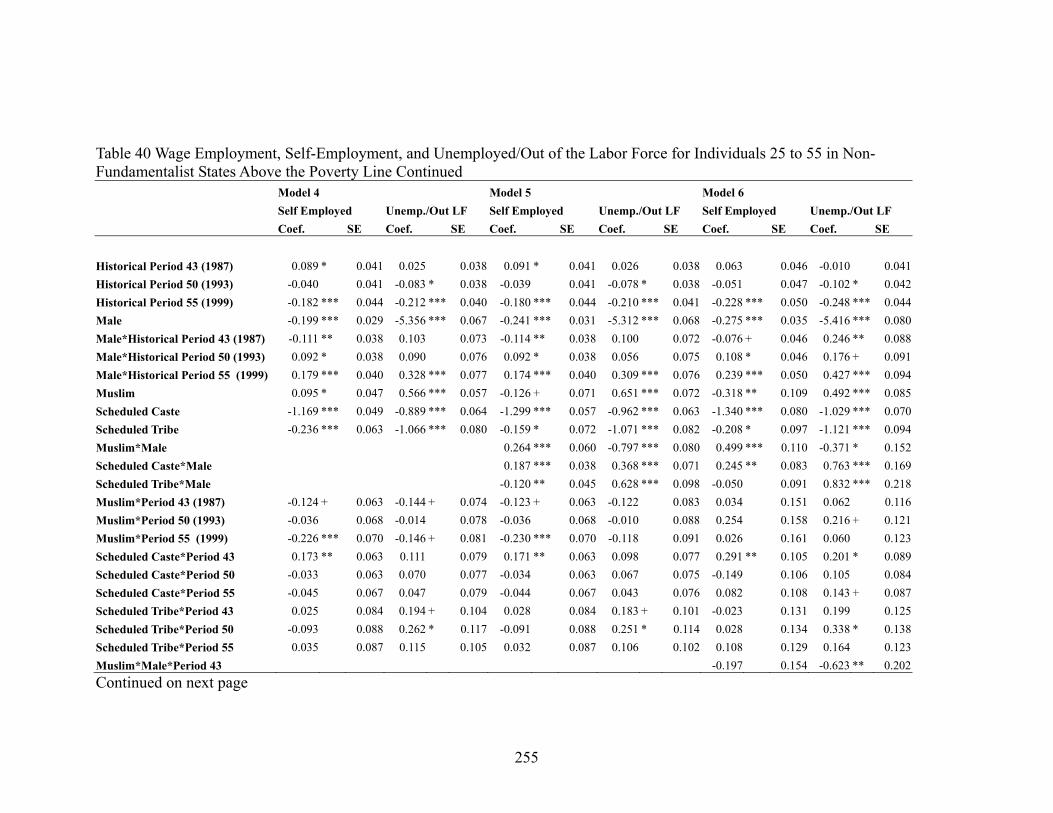
255
Table 40 Wage Employment, Self-Employment, and Unemployed/Out of the Labor Force for Individuals 25 to 55 in Non-Fundamentalist States Above the Poverty Line Continued Model 4 Model 5 Model 6 Self Employed Unemp./Out LF Self Employed Unemp./Out LF Self Employed Unemp./Out LF Coef. SE Coef. SE Coef. SE Coef. SE Coef. SE Coef. SE Historical Period 43 (1987) 0.089 * 0.041 0.025 0.038 0.091 * 0.041 0.026 0.038 0.063 0.046 -0.010 0.041Historical Period 50 (1993) -0.040 0.041 -0.083 * 0.038 -0.039 0.041 -0.078 * 0.038 -0.051 0.047 -0.102 * 0.042Historical Period 55 (1999) -0.182 *** 0.044 -0.212 *** 0.040 -0.180 *** 0.044 -0.210 *** 0.041 -0.228 *** 0.050 -0.248 *** 0.044Male -0.199 *** 0.029 -5.356 *** 0.067 -0.241 *** 0.031 -5.312 *** 0.068 -0.275 *** 0.035 -5.416 *** 0.080Male*Historical Period 43 (1987) -0.111 ** 0.038 0.103 0.073 -0.114 ** 0.038 0.100 0.072 -0.076 + 0.046 0.246 ** 0.088Male*Historical Period 50 (1993) 0.092 * 0.038 0.090 0.076 0.092 * 0.038 0.056 0.075 0.108 * 0.046 0.176 + 0.091Male*Historical Period 55 (1999) 0.179 *** 0.040 0.328 *** 0.077 0.174 *** 0.040 0.309 *** 0.076 0.239 *** 0.050 0.427 *** 0.094Muslim 0.095 * 0.047 0.566 *** 0.057 -0.126 + 0.071 0.651 *** 0.072 -0.318 ** 0.109 0.492 *** 0.085Scheduled Caste -1.169 *** 0.049 -0.889 *** 0.064 -1.299 *** 0.057 -0.962 *** 0.063 -1.340 *** 0.080 -1.029 *** 0.070Scheduled Tribe -0.236 *** 0.063 -1.066 *** 0.080 -0.159 * 0.072 -1.071 *** 0.082 -0.208 * 0.097 -1.121 *** 0.094Muslim*Male 0.264 *** 0.060 -0.797 *** 0.080 0.499 *** 0.110 -0.371 * 0.152Scheduled Caste*Male 0.187 *** 0.038 0.368 *** 0.071 0.245 ** 0.083 0.763 *** 0.169Scheduled Tribe*Male -0.120 ** 0.045 0.628 *** 0.098 -0.050 0.091 0.832 *** 0.218Muslim*Period 43 (1987) -0.124 + 0.063 -0.144 + 0.074 -0.123 + 0.063 -0.122 0.083 0.034 0.151 0.062 0.116Muslim*Period 50 (1993) -0.036 0.068 -0.014 0.078 -0.036 0.068 -0.010 0.088 0.254 0.158 0.216 + 0.121Muslim*Period 55 (1999) -0.226 *** 0.070 -0.146 + 0.081 -0.230 *** 0.070 -0.118 0.091 0.026 0.161 0.060 0.123Scheduled Caste*Period 43 0.173 ** 0.063 0.111 0.079 0.171 ** 0.063 0.098 0.077 0.291 ** 0.105 0.201 * 0.089Scheduled Caste*Period 50 -0.033 0.063 0.070 0.077 -0.034 0.063 0.067 0.075 -0.149 0.106 0.105 0.084Scheduled Caste*Period 55 -0.045 0.067 0.047 0.079 -0.044 0.067 0.043 0.076 0.082 0.108 0.143 + 0.087Scheduled Tribe*Period 43 0.025 0.084 0.194 + 0.104 0.028 0.084 0.183 + 0.101 -0.023 0.131 0.199 0.125Scheduled Tribe*Period 50 -0.093 0.088 0.262 * 0.117 -0.091 0.088 0.251 * 0.114 0.028 0.134 0.338 * 0.138Scheduled Tribe*Period 55 0.035 0.087 0.115 0.105 0.032 0.087 0.106 0.102 0.108 0.129 0.164 0.123Muslim*Male*Period 43 -0.197 0.154 -0.623 ** 0.202Continued on next page
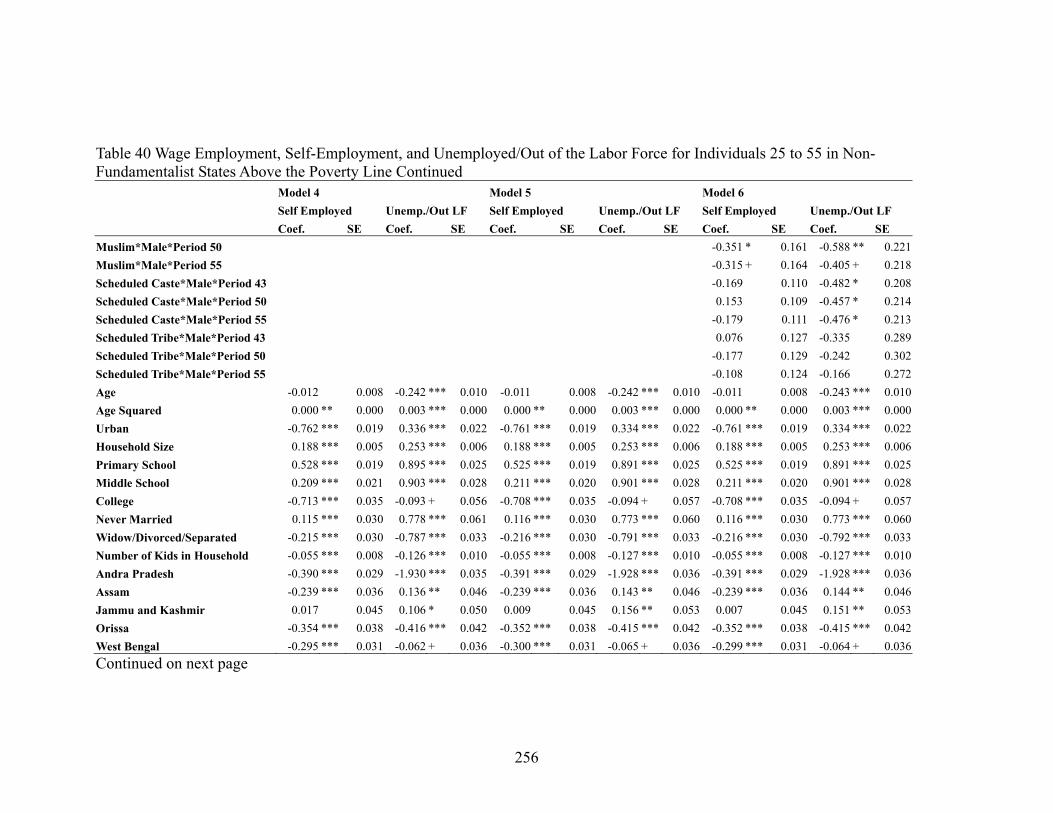
256
Table 40 Wage Employment, Self-Employment, and Unemployed/Out of the Labor Force for Individuals 25 to 55 in Non-Fundamentalist States Above the Poverty Line Continued Model 4 Model 5 Model 6 Self Employed Unemp./Out LF Self Employed Unemp./Out LF Self Employed Unemp./Out LF Coef. SE Coef. SE Coef. SE Coef. SE Coef. SE Coef. SE Muslim*Male*Period 50 -0.351 * 0.161 -0.588 ** 0.221Muslim*Male*Period 55 -0.315 + 0.164 -0.405 + 0.218Scheduled Caste*Male*Period 43 -0.169 0.110 -0.482 * 0.208Scheduled Caste*Male*Period 50 0.153 0.109 -0.457 * 0.214Scheduled Caste*Male*Period 55 -0.179 0.111 -0.476 * 0.213Scheduled Tribe*Male*Period 43 0.076 0.127 -0.335 0.289Scheduled Tribe*Male*Period 50 -0.177 0.129 -0.242 0.302Scheduled Tribe*Male*Period 55 -0.108 0.124 -0.166 0.272Age -0.012 0.008 -0.242 *** 0.010 -0.011 0.008 -0.242 *** 0.010 -0.011 0.008 -0.243 *** 0.010Age Squared 0.000 ** 0.000 0.003 *** 0.000 0.000 ** 0.000 0.003 *** 0.000 0.000 ** 0.000 0.003 *** 0.000Urban -0.762 *** 0.019 0.336 *** 0.022 -0.761 *** 0.019 0.334 *** 0.022 -0.761 *** 0.019 0.334 *** 0.022Household Size 0.188 *** 0.005 0.253 *** 0.006 0.188 *** 0.005 0.253 *** 0.006 0.188 *** 0.005 0.253 *** 0.006Primary School 0.528 *** 0.019 0.895 *** 0.025 0.525 *** 0.019 0.891 *** 0.025 0.525 *** 0.019 0.891 *** 0.025Middle School 0.209 *** 0.021 0.903 *** 0.028 0.211 *** 0.020 0.901 *** 0.028 0.211 *** 0.020 0.901 *** 0.028College -0.713 *** 0.035 -0.093 + 0.056 -0.708 *** 0.035 -0.094 + 0.057 -0.708 *** 0.035 -0.094 + 0.057Never Married 0.115 *** 0.030 0.778 *** 0.061 0.116 *** 0.030 0.773 *** 0.060 0.116 *** 0.030 0.773 *** 0.060Widow/Divorced/Separated -0.215 *** 0.030 -0.787 *** 0.033 -0.216 *** 0.030 -0.791 *** 0.033 -0.216 *** 0.030 -0.792 *** 0.033Number of Kids in Household -0.055 *** 0.008 -0.126 *** 0.010 -0.055 *** 0.008 -0.127 *** 0.010 -0.055 *** 0.008 -0.127 *** 0.010Andra Pradesh -0.390 *** 0.029 -1.930 *** 0.035 -0.391 *** 0.029 -1.928 *** 0.036 -0.391 *** 0.029 -1.928 *** 0.036Assam -0.239 *** 0.036 0.136 ** 0.046 -0.239 *** 0.036 0.143 ** 0.046 -0.239 *** 0.036 0.144 ** 0.046Jammu and Kashmir 0.017 0.045 0.106 * 0.050 0.009 0.045 0.156 ** 0.053 0.007 0.045 0.151 ** 0.053Orissa -0.354 *** 0.038 -0.416 *** 0.042 -0.352 *** 0.038 -0.415 *** 0.042 -0.352 *** 0.038 -0.415 *** 0.042West Bengal -0.295 *** 0.031 -0.062 + 0.036 -0.300 *** 0.031 -0.065 + 0.036 -0.299 *** 0.031 -0.064 + 0.036Continued on next page

257
Table 40 Wage Employment, Self-Employment, and Unemployed/Out of the Labor Force for Individuals 25 to 55 in Non-Fundamentalist States Above the Poverty Line Continued Model 4 Model 5 Model 6 Self Employed Unemp./Out LF Self Employed Unemp./Out LF Self Employed Unemp./Out LF Coef. SE Coef. SE Coef. SE Coef. SE Coef. SE Coef. SE Tamil Nadu/Pondicherry/Andaman -0.668 *** 0.032 -1.834 *** 0.037 -0.667 *** 0.032 -1.830 *** 0.037 -0.667 *** 0.032 -1.830 *** 0.037Kerele/Lakshadweep -1.371 *** 0.038 -1.514 *** 0.045 -1.368 *** 0.038 -1.522 *** 0.046 -1.368 *** 0.038 -1.523 *** 0.046HP/Punjab/Haryana/Chandigarh -0.049 0.035 -0.218 *** 0.040 -0.052 0.035 -0.226 *** 0.039 -0.052 0.035 -0.226 *** 0.039Northeast 0.202 *** 0.035 -0.571 *** 0.042 0.203 *** 0.035 -0.559 *** 0.042 0.203 *** 0.035 -0.558 *** 0.042Karnataka/Goa/Daman and Dui -0.392 *** 0.033 -1.575 *** 0.039 -0.393 *** 0.033 -1.575 *** 0.039 -0.393 *** 0.033 -1.575 *** 0.039Intercept -0.101 0.153 5.668 *** 0.185 -0.084 0.153 5.697 *** 0.185 -0.057 0.154 5.725 *** 0.186Continued on next page
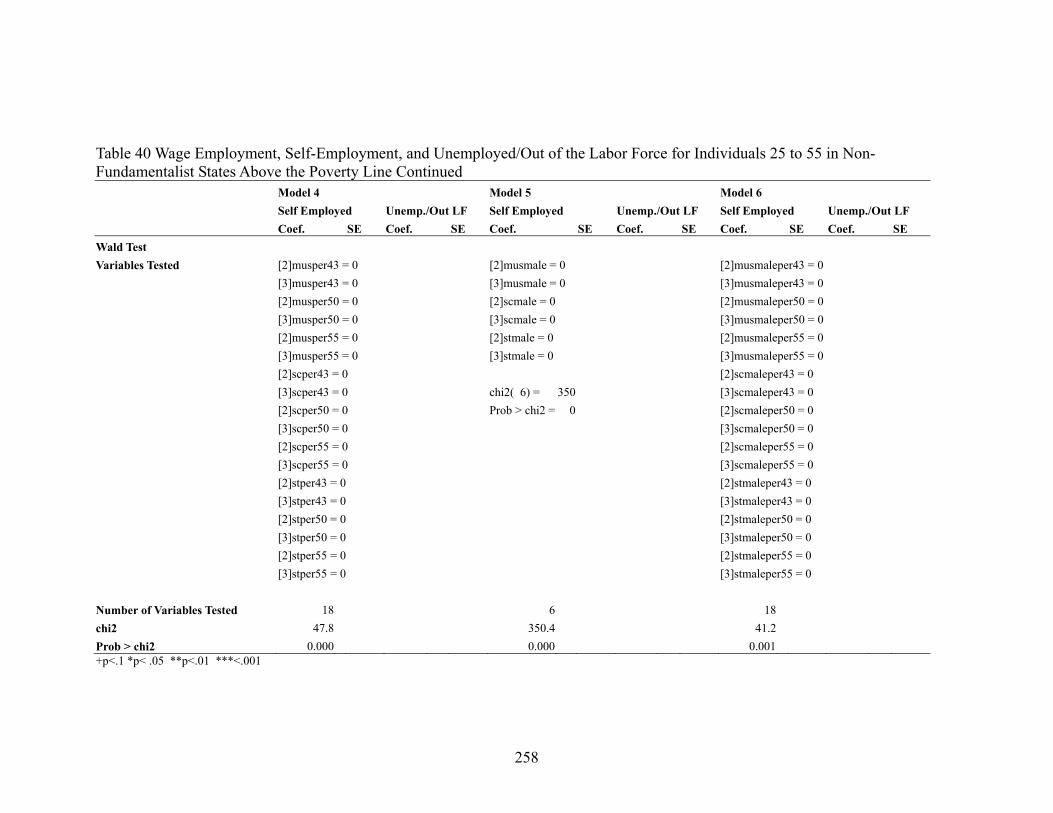
258
Table 40 Wage Employment, Self-Employment, and Unemployed/Out of the Labor Force for Individuals 25 to 55 in Non-Fundamentalist States Above the Poverty Line Continued Model 4 Model 5 Model 6 Self Employed Unemp./Out LF Self Employed Unemp./Out LF Self Employed Unemp./Out LF Coef. SE Coef. SE Coef. SE Coef. SE Coef. SE Coef. SE Wald Test Variables Tested [2]musper43 = 0 [2]musmale = 0 [2]musmaleper43 = 0 [3]musper43 = 0 [3]musmale = 0 [3]musmaleper43 = 0 [2]musper50 = 0 [2]scmale = 0 [2]musmaleper50 = 0 [3]musper50 = 0 [3]scmale = 0 [3]musmaleper50 = 0 [2]musper55 = 0 [2]stmale = 0 [2]musmaleper55 = 0 [3]musper55 = 0 [3]stmale = 0 [3]musmaleper55 = 0 [2]scper43 = 0 [2]scmaleper43 = 0 [3]scper43 = 0 chi2( 6) = 350 [3]scmaleper43 = 0 [2]scper50 = 0 Prob > chi2 = 0 [2]scmaleper50 = 0 [3]scper50 = 0 [3]scmaleper50 = 0 [2]scper55 = 0 [2]scmaleper55 = 0 [3]scper55 = 0 [3]scmaleper55 = 0 [2]stper43 = 0 [2]stmaleper43 = 0 [3]stper43 = 0 [3]stmaleper43 = 0 [2]stper50 = 0 [2]stmaleper50 = 0 [3]stper50 = 0 [3]stmaleper50 = 0 [2]stper55 = 0 [2]stmaleper55 = 0 [3]stper55 = 0 [3]stmaleper55 = 0 Number of Variables Tested 18 6 18 chi2 47.8 350.4 41.2 Prob > chi2 0.000 0.000 0.001 +p<.1 *p< .05 **p<.01 ***<.001
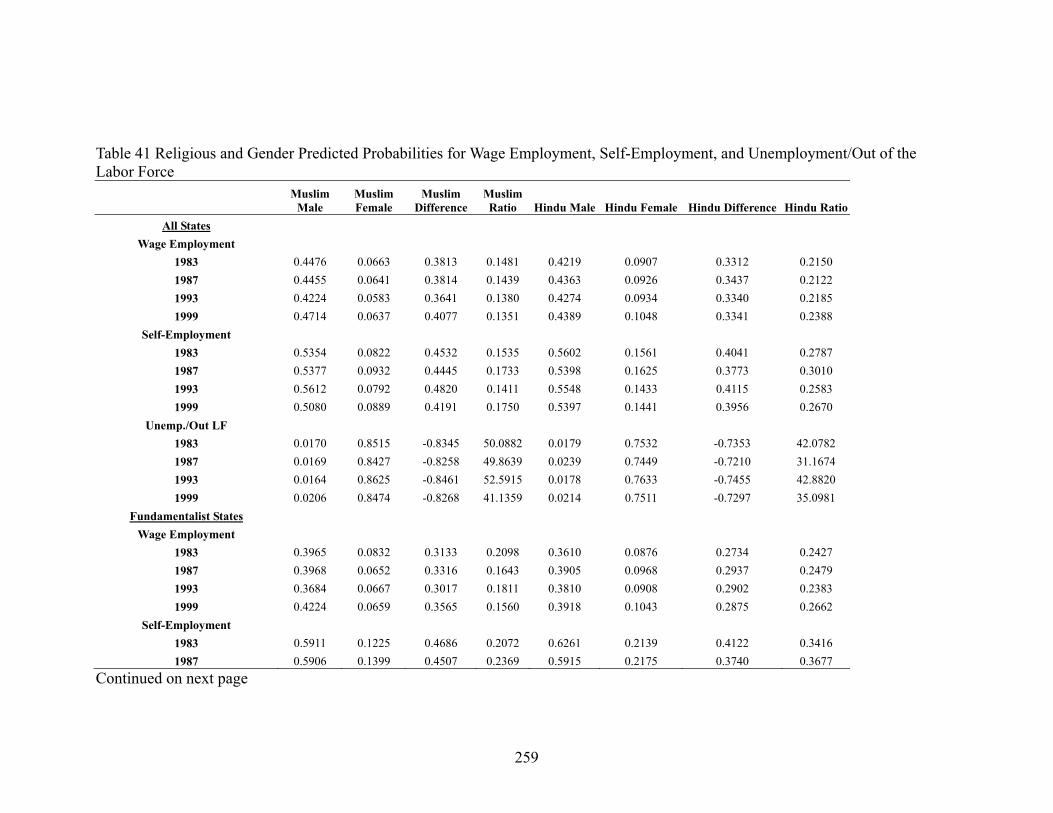
259
Table 41 Religious and Gender Predicted Probabilities for Wage Employment, Self-Employment, and Unemployment/Out of the Labor Force
Muslim
Male Muslim Female
Muslim Difference
Muslim Ratio Hindu Male Hindu Female Hindu Difference Hindu Ratio
All States Wage Employment
1983 0.4476 0.0663 0.3813 0.1481 0.4219 0.0907 0.3312 0.2150 1987 0.4455 0.0641 0.3814 0.1439 0.4363 0.0926 0.3437 0.2122 1993 0.4224 0.0583 0.3641 0.1380 0.4274 0.0934 0.3340 0.2185 1999 0.4714 0.0637 0.4077 0.1351 0.4389 0.1048 0.3341 0.2388
Self-Employment 1983 0.5354 0.0822 0.4532 0.1535 0.5602 0.1561 0.4041 0.2787 1987 0.5377 0.0932 0.4445 0.1733 0.5398 0.1625 0.3773 0.3010 1993 0.5612 0.0792 0.4820 0.1411 0.5548 0.1433 0.4115 0.2583 1999 0.5080 0.0889 0.4191 0.1750 0.5397 0.1441 0.3956 0.2670
Unemp./Out LF 1983 0.0170 0.8515 -0.8345 50.0882 0.0179 0.7532 -0.7353 42.0782 1987 0.0169 0.8427 -0.8258 49.8639 0.0239 0.7449 -0.7210 31.1674 1993 0.0164 0.8625 -0.8461 52.5915 0.0178 0.7633 -0.7455 42.8820 1999 0.0206 0.8474 -0.8268 41.1359 0.0214 0.7511 -0.7297 35.0981
Fundamentalist States Wage Employment
1983 0.3965 0.0832 0.3133 0.2098 0.3610 0.0876 0.2734 0.2427 1987 0.3968 0.0652 0.3316 0.1643 0.3905 0.0968 0.2937 0.2479 1993 0.3684 0.0667 0.3017 0.1811 0.3810 0.0908 0.2902 0.2383 1999 0.4224 0.0659 0.3565 0.1560 0.3918 0.1043 0.2875 0.2662
Self-Employment 1983 0.5911 0.1225 0.4686 0.2072 0.6261 0.2139 0.4122 0.3416 1987 0.5906 0.1399 0.4507 0.2369 0.5915 0.2175 0.3740 0.3677
Continued on next page
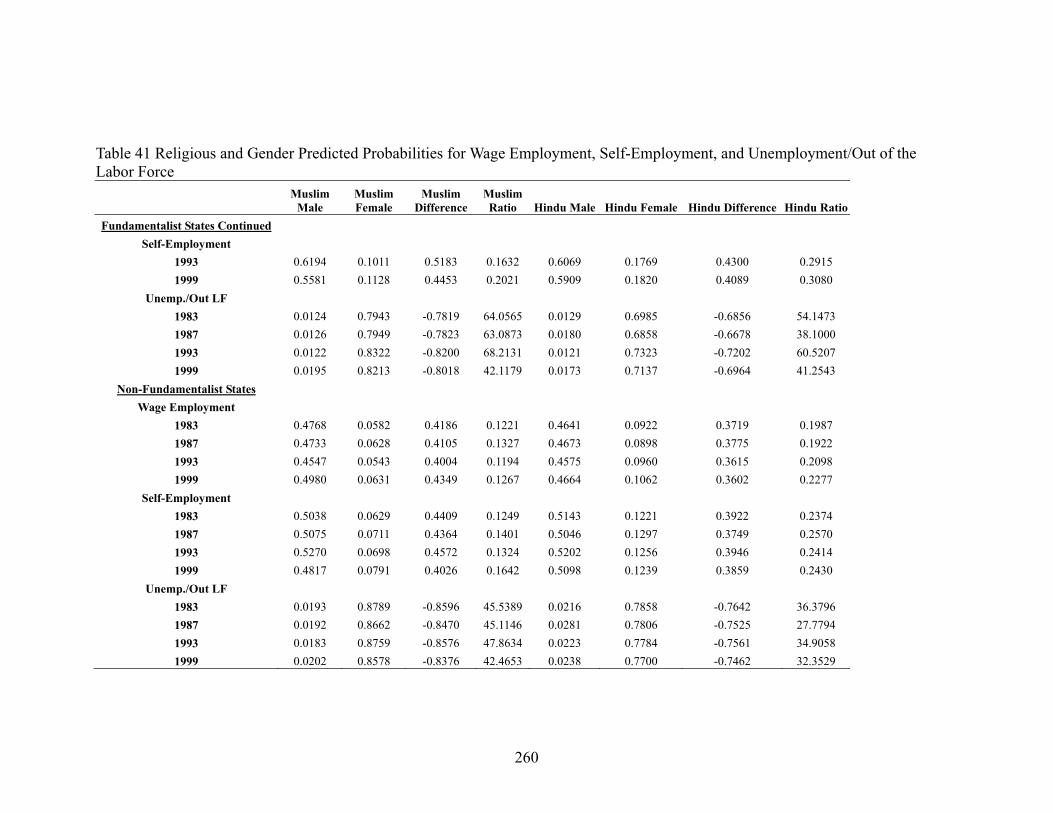
260
Table 41 Religious and Gender Predicted Probabilities for Wage Employment, Self-Employment, and Unemployment/Out of the Labor Force
Muslim
Male Muslim Female
Muslim Difference
Muslim Ratio Hindu Male Hindu Female Hindu Difference Hindu Ratio
Fundamentalist States Continued Self-Employment
1993 0.6194 0.1011 0.5183 0.1632 0.6069 0.1769 0.4300 0.2915 1999 0.5581 0.1128 0.4453 0.2021 0.5909 0.1820 0.4089 0.3080
Unemp./Out LF 1983 0.0124 0.7943 -0.7819 64.0565 0.0129 0.6985 -0.6856 54.1473 1987 0.0126 0.7949 -0.7823 63.0873 0.0180 0.6858 -0.6678 38.1000 1993 0.0122 0.8322 -0.8200 68.2131 0.0121 0.7323 -0.7202 60.5207 1999 0.0195 0.8213 -0.8018 42.1179 0.0173 0.7137 -0.6964 41.2543
Non-Fundamentalist States Wage Employment
1983 0.4768 0.0582 0.4186 0.1221 0.4641 0.0922 0.3719 0.1987 1987 0.4733 0.0628 0.4105 0.1327 0.4673 0.0898 0.3775 0.1922 1993 0.4547 0.0543 0.4004 0.1194 0.4575 0.0960 0.3615 0.2098 1999 0.4980 0.0631 0.4349 0.1267 0.4664 0.1062 0.3602 0.2277
Self-Employment 1983 0.5038 0.0629 0.4409 0.1249 0.5143 0.1221 0.3922 0.2374 1987 0.5075 0.0711 0.4364 0.1401 0.5046 0.1297 0.3749 0.2570 1993 0.5270 0.0698 0.4572 0.1324 0.5202 0.1256 0.3946 0.2414 1999 0.4817 0.0791 0.4026 0.1642 0.5098 0.1239 0.3859 0.2430
Unemp./Out LF 1983 0.0193 0.8789 -0.8596 45.5389 0.0216 0.7858 -0.7642 36.3796 1987 0.0192 0.8662 -0.8470 45.1146 0.0281 0.7806 -0.7525 27.7794 1993 0.0183 0.8759 -0.8576 47.8634 0.0223 0.7784 -0.7561 34.9058 1999 0.0202 0.8578 -0.8376 42.4653 0.0238 0.7700 -0.7462 32.3529
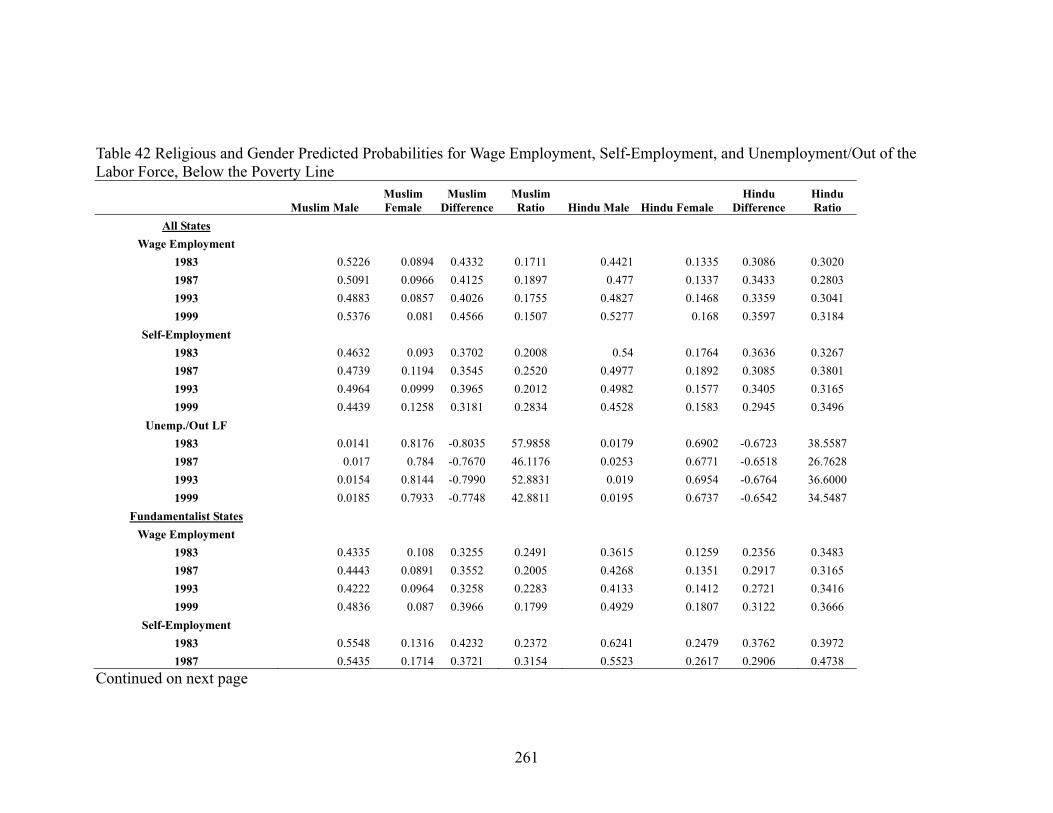
261
Table 42 Religious and Gender Predicted Probabilities for Wage Employment, Self-Employment, and Unemployment/Out of the Labor Force, Below the Poverty Line
Muslim Male Muslim Female
Muslim Difference
Muslim Ratio Hindu Male Hindu Female
Hindu Difference
Hindu Ratio
All States Wage Employment
1983 0.5226 0.0894 0.4332 0.1711 0.4421 0.1335 0.3086 0.3020 1987 0.5091 0.0966 0.4125 0.1897 0.477 0.1337 0.3433 0.2803 1993 0.4883 0.0857 0.4026 0.1755 0.4827 0.1468 0.3359 0.3041 1999 0.5376 0.081 0.4566 0.1507 0.5277 0.168 0.3597 0.3184
Self-Employment 1983 0.4632 0.093 0.3702 0.2008 0.54 0.1764 0.3636 0.3267 1987 0.4739 0.1194 0.3545 0.2520 0.4977 0.1892 0.3085 0.3801 1993 0.4964 0.0999 0.3965 0.2012 0.4982 0.1577 0.3405 0.3165 1999 0.4439 0.1258 0.3181 0.2834 0.4528 0.1583 0.2945 0.3496
Unemp./Out LF 1983 0.0141 0.8176 -0.8035 57.9858 0.0179 0.6902 -0.6723 38.5587 1987 0.017 0.784 -0.7670 46.1176 0.0253 0.6771 -0.6518 26.7628 1993 0.0154 0.8144 -0.7990 52.8831 0.019 0.6954 -0.6764 36.6000 1999 0.0185 0.7933 -0.7748 42.8811 0.0195 0.6737 -0.6542 34.5487
Fundamentalist States Wage Employment
1983 0.4335 0.108 0.3255 0.2491 0.3615 0.1259 0.2356 0.3483 1987 0.4443 0.0891 0.3552 0.2005 0.4268 0.1351 0.2917 0.3165 1993 0.4222 0.0964 0.3258 0.2283 0.4133 0.1412 0.2721 0.3416 1999 0.4836 0.087 0.3966 0.1799 0.4929 0.1807 0.3122 0.3666
Self-Employment 1983 0.5548 0.1316 0.4232 0.2372 0.6241 0.2479 0.3762 0.3972 1987 0.5435 0.1714 0.3721 0.3154 0.5523 0.2617 0.2906 0.4738
Continued on next page
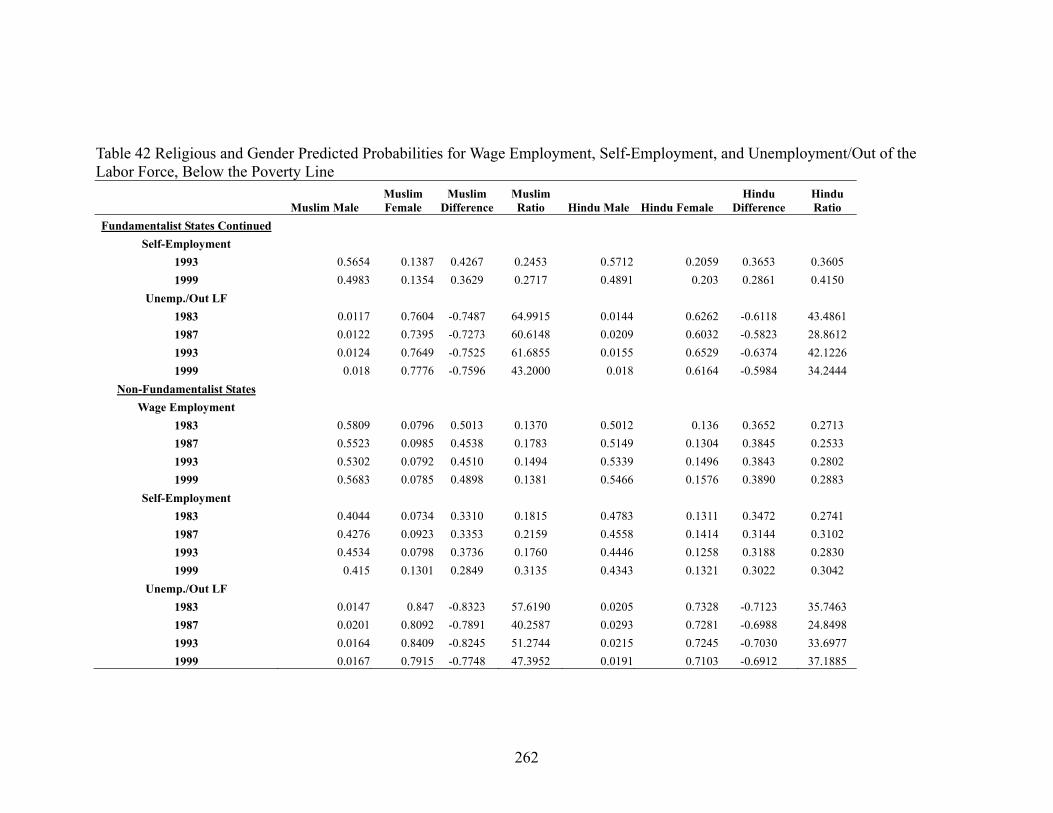
262
Table 42 Religious and Gender Predicted Probabilities for Wage Employment, Self-Employment, and Unemployment/Out of the Labor Force, Below the Poverty Line
Muslim Male Muslim Female
Muslim Difference
Muslim Ratio Hindu Male Hindu Female
Hindu Difference
Hindu Ratio
Fundamentalist States Continued Self-Employment
1993 0.5654 0.1387 0.4267 0.2453 0.5712 0.2059 0.3653 0.3605 1999 0.4983 0.1354 0.3629 0.2717 0.4891 0.203 0.2861 0.4150
Unemp./Out LF 1983 0.0117 0.7604 -0.7487 64.9915 0.0144 0.6262 -0.6118 43.4861 1987 0.0122 0.7395 -0.7273 60.6148 0.0209 0.6032 -0.5823 28.8612 1993 0.0124 0.7649 -0.7525 61.6855 0.0155 0.6529 -0.6374 42.1226 1999 0.018 0.7776 -0.7596 43.2000 0.018 0.6164 -0.5984 34.2444
Non-Fundamentalist States Wage Employment
1983 0.5809 0.0796 0.5013 0.1370 0.5012 0.136 0.3652 0.2713 1987 0.5523 0.0985 0.4538 0.1783 0.5149 0.1304 0.3845 0.2533 1993 0.5302 0.0792 0.4510 0.1494 0.5339 0.1496 0.3843 0.2802 1999 0.5683 0.0785 0.4898 0.1381 0.5466 0.1576 0.3890 0.2883
Self-Employment 1983 0.4044 0.0734 0.3310 0.1815 0.4783 0.1311 0.3472 0.2741 1987 0.4276 0.0923 0.3353 0.2159 0.4558 0.1414 0.3144 0.3102 1993 0.4534 0.0798 0.3736 0.1760 0.4446 0.1258 0.3188 0.2830 1999 0.415 0.1301 0.2849 0.3135 0.4343 0.1321 0.3022 0.3042
Unemp./Out LF 1983 0.0147 0.847 -0.8323 57.6190 0.0205 0.7328 -0.7123 35.7463 1987 0.0201 0.8092 -0.7891 40.2587 0.0293 0.7281 -0.6988 24.8498 1993 0.0164 0.8409 -0.8245 51.2744 0.0215 0.7245 -0.7030 33.6977 1999 0.0167 0.7915 -0.7748 47.3952 0.0191 0.7103 -0.6912 37.1885
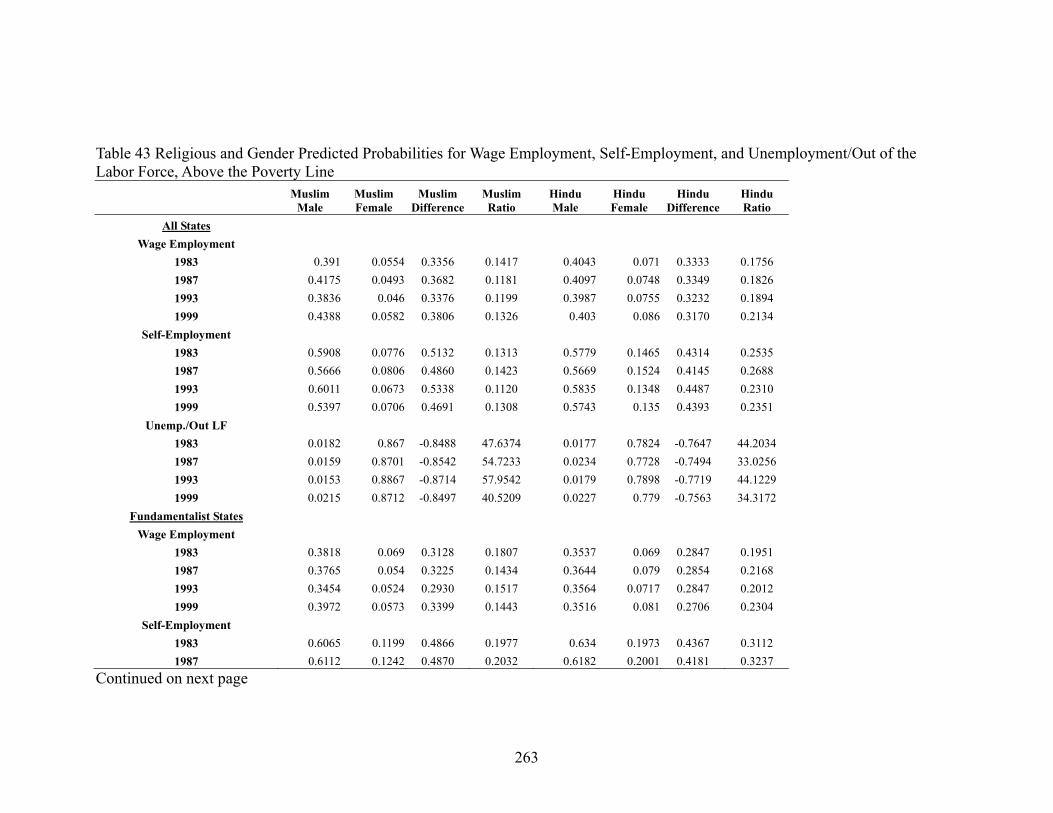
263
Table 43 Religious and Gender Predicted Probabilities for Wage Employment, Self-Employment, and Unemployment/Out of the Labor Force, Above the Poverty Line
Muslim
Male Muslim Female
Muslim Difference
Muslim Ratio
Hindu Male
Hindu Female
Hindu Difference
Hindu Ratio
All States Wage Employment
1983 0.391 0.0554 0.3356 0.1417 0.4043 0.071 0.3333 0.1756 1987 0.4175 0.0493 0.3682 0.1181 0.4097 0.0748 0.3349 0.1826 1993 0.3836 0.046 0.3376 0.1199 0.3987 0.0755 0.3232 0.1894 1999 0.4388 0.0582 0.3806 0.1326 0.403 0.086 0.3170 0.2134
Self-Employment 1983 0.5908 0.0776 0.5132 0.1313 0.5779 0.1465 0.4314 0.2535 1987 0.5666 0.0806 0.4860 0.1423 0.5669 0.1524 0.4145 0.2688 1993 0.6011 0.0673 0.5338 0.1120 0.5835 0.1348 0.4487 0.2310 1999 0.5397 0.0706 0.4691 0.1308 0.5743 0.135 0.4393 0.2351
Unemp./Out LF 1983 0.0182 0.867 -0.8488 47.6374 0.0177 0.7824 -0.7647 44.2034 1987 0.0159 0.8701 -0.8542 54.7233 0.0234 0.7728 -0.7494 33.0256 1993 0.0153 0.8867 -0.8714 57.9542 0.0179 0.7898 -0.7719 44.1229 1999 0.0215 0.8712 -0.8497 40.5209 0.0227 0.779 -0.7563 34.3172
Fundamentalist States Wage Employment
1983 0.3818 0.069 0.3128 0.1807 0.3537 0.069 0.2847 0.1951 1987 0.3765 0.054 0.3225 0.1434 0.3644 0.079 0.2854 0.2168 1993 0.3454 0.0524 0.2930 0.1517 0.3564 0.0717 0.2847 0.2012 1999 0.3972 0.0573 0.3399 0.1443 0.3516 0.081 0.2706 0.2304
Self-Employment 1983 0.6065 0.1199 0.4866 0.1977 0.634 0.1973 0.4367 0.3112 1987 0.6112 0.1242 0.4870 0.2032 0.6182 0.2001 0.4181 0.3237
Continued on next page
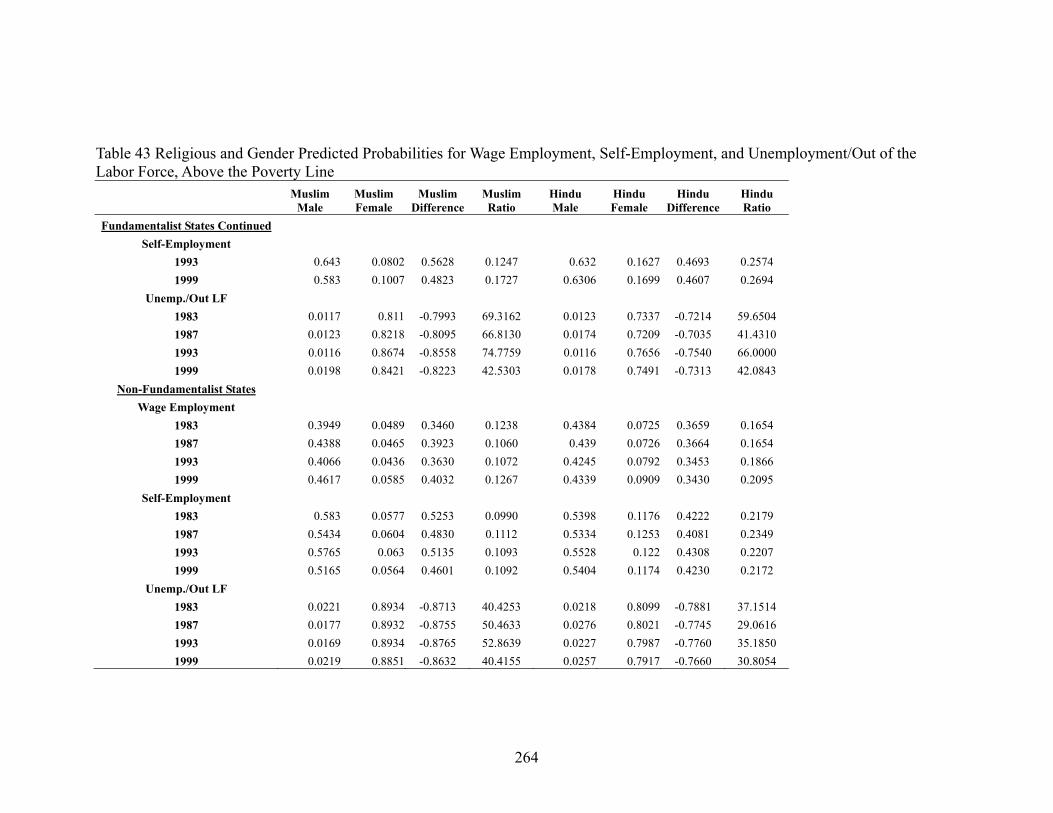
264
Table 43 Religious and Gender Predicted Probabilities for Wage Employment, Self-Employment, and Unemployment/Out of the Labor Force, Above the Poverty Line
Muslim
Male Muslim Female
Muslim Difference
Muslim Ratio
Hindu Male
Hindu Female
Hindu Difference
Hindu Ratio
Fundamentalist States Continued Self-Employment
1993 0.643 0.0802 0.5628 0.1247 0.632 0.1627 0.4693 0.2574 1999 0.583 0.1007 0.4823 0.1727 0.6306 0.1699 0.4607 0.2694
Unemp./Out LF 1983 0.0117 0.811 -0.7993 69.3162 0.0123 0.7337 -0.7214 59.6504 1987 0.0123 0.8218 -0.8095 66.8130 0.0174 0.7209 -0.7035 41.4310 1993 0.0116 0.8674 -0.8558 74.7759 0.0116 0.7656 -0.7540 66.0000 1999 0.0198 0.8421 -0.8223 42.5303 0.0178 0.7491 -0.7313 42.0843
Non-Fundamentalist States Wage Employment
1983 0.3949 0.0489 0.3460 0.1238 0.4384 0.0725 0.3659 0.1654 1987 0.4388 0.0465 0.3923 0.1060 0.439 0.0726 0.3664 0.1654 1993 0.4066 0.0436 0.3630 0.1072 0.4245 0.0792 0.3453 0.1866 1999 0.4617 0.0585 0.4032 0.1267 0.4339 0.0909 0.3430 0.2095
Self-Employment 1983 0.583 0.0577 0.5253 0.0990 0.5398 0.1176 0.4222 0.2179 1987 0.5434 0.0604 0.4830 0.1112 0.5334 0.1253 0.4081 0.2349 1993 0.5765 0.063 0.5135 0.1093 0.5528 0.122 0.4308 0.2207 1999 0.5165 0.0564 0.4601 0.1092 0.5404 0.1174 0.4230 0.2172
Unemp./Out LF 1983 0.0221 0.8934 -0.8713 40.4253 0.0218 0.8099 -0.7881 37.1514 1987 0.0177 0.8932 -0.8755 50.4633 0.0276 0.8021 -0.7745 29.0616 1993 0.0169 0.8934 -0.8765 52.8639 0.0227 0.7987 -0.7760 35.1850 1999 0.0219 0.8851 -0.8632 40.4155 0.0257 0.7917 -0.7660 30.8054
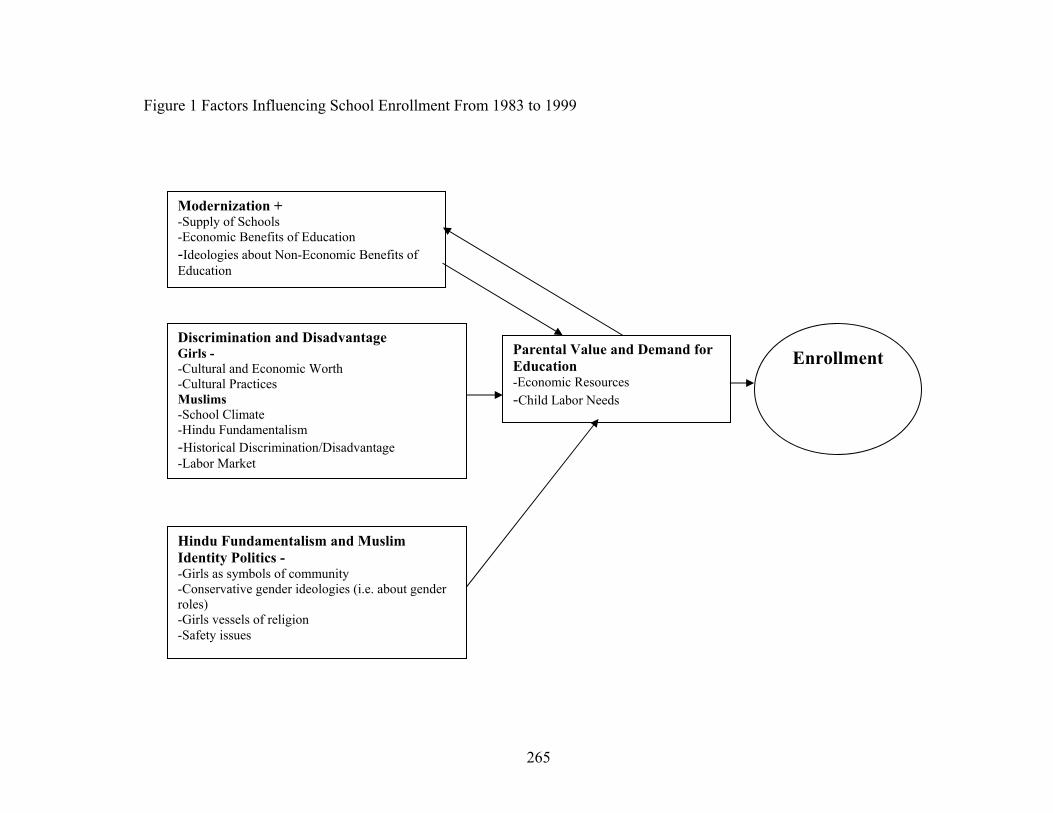
265
Figure 1 Factors Influencing School Enrollment From 1983 to 1999
Modernization + -Supply of Schools -Economic Benefits of Education -Ideologies about Non-Economic Benefits of Education
Discrimination and Disadvantage Girls - -Cultural and Economic Worth -Cultural Practices Muslims -School Climate -Hindu Fundamentalism -Historical Discrimination/Disadvantage -Labor Market
Hindu Fundamentalism and Muslim Identity Politics - -Girls as symbols of community -Conservative gender ideologies (i.e. about gender roles) -Girls vessels of religion -Safety issues
Parental Value and Demand for Education -Economic Resources -Child Labor Needs
Enrollment
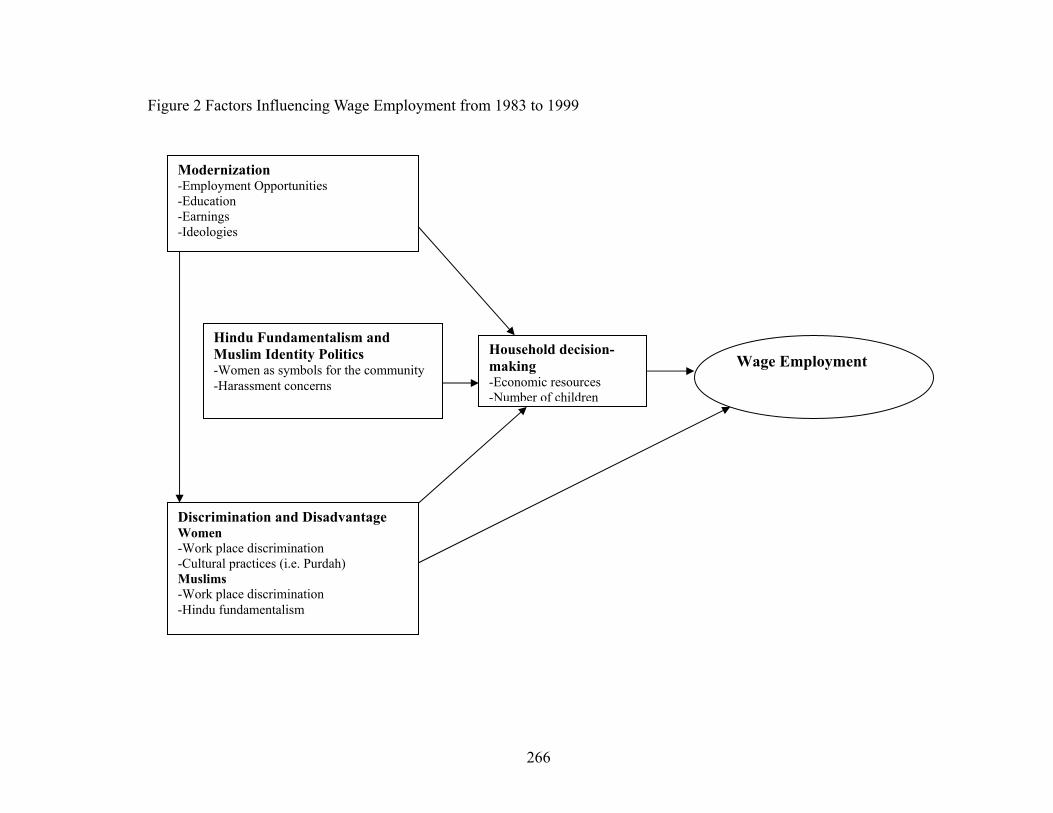
266
Figure 2 Factors Influencing Wage Employment from 1983 to 1999
Modernization -Employment Opportunities -Education -Earnings -Ideologies
Discrimination and Disadvantage Women -Work place discrimination -Cultural practices (i.e. Purdah) Muslims -Work place discrimination -Hindu fundamentalism
Hindu Fundamentalism and Muslim Identity Politics -Women as symbols for the community -Harassment concerns
Wage Employment Household decision-making -Economic resources -Number of children
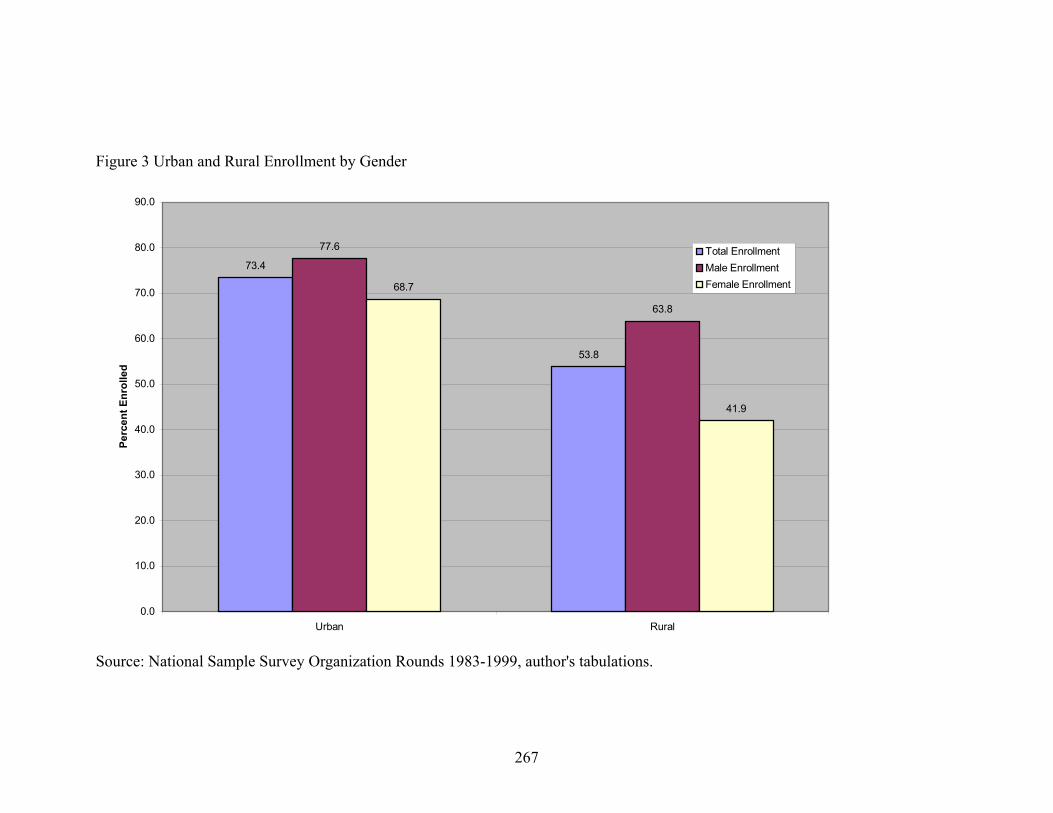
267
Figure 3 Urban and Rural Enrollment by Gender
73.4
53.8
77.6
63.8
68.7
41.9
0.0
10.0
20.0
30.0
40.0
50.0
60.0
70.0
80.0
90.0
Urban Rural
Perc
ent E
nrol
led
Total EnrollmentMale EnrollmentFemale Enrollment
Source: National Sample Survey Organization Rounds 1983-1999, author's tabulations.
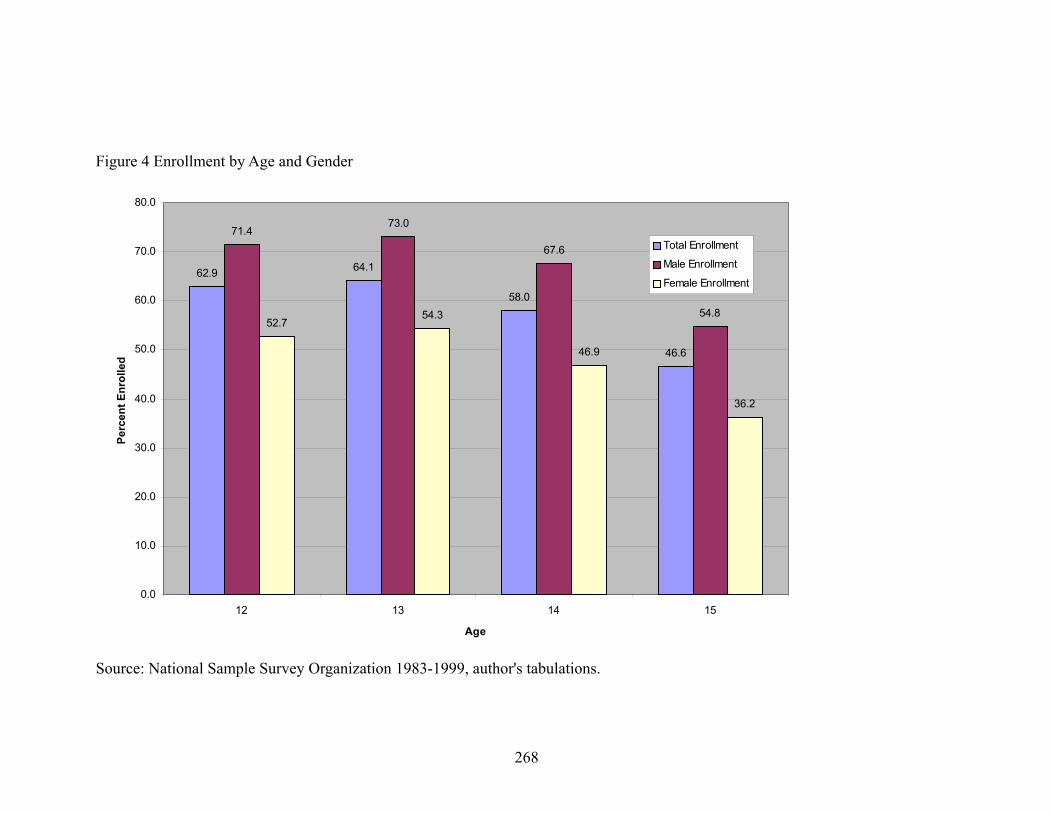
268
Figure 4 Enrollment by Age and Gender
62.9 64.1
58.0
46.6
71.473.0
67.6
54.852.7
54.3
46.9
36.2
0.0
10.0
20.0
30.0
40.0
50.0
60.0
70.0
80.0
12 13 14 15
Age
Perc
ent E
nrol
led
Total Enrollment
Male Enrollment
Female Enrollment
Source: National Sample Survey Organization 1983-1999, author's tabulations.
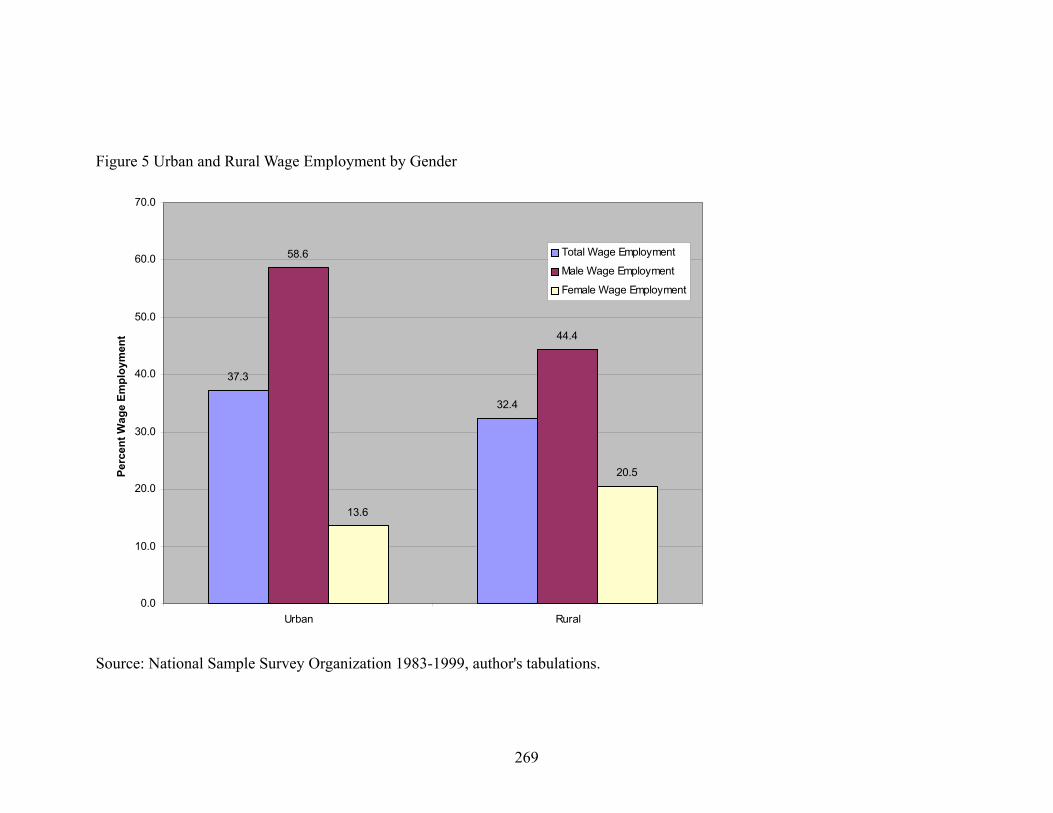
269
Figure 5 Urban and Rural Wage Employment by Gender
37.3
32.4
58.6
44.4
13.6
20.5
0.0
10.0
20.0
30.0
40.0
50.0
60.0
70.0
Urban Rural
Perc
ent W
age
Empl
oym
ent
Total Wage Employment
Male Wage Employment
Female Wage Employment
Source: National Sample Survey Organization 1983-1999, author's tabulations.
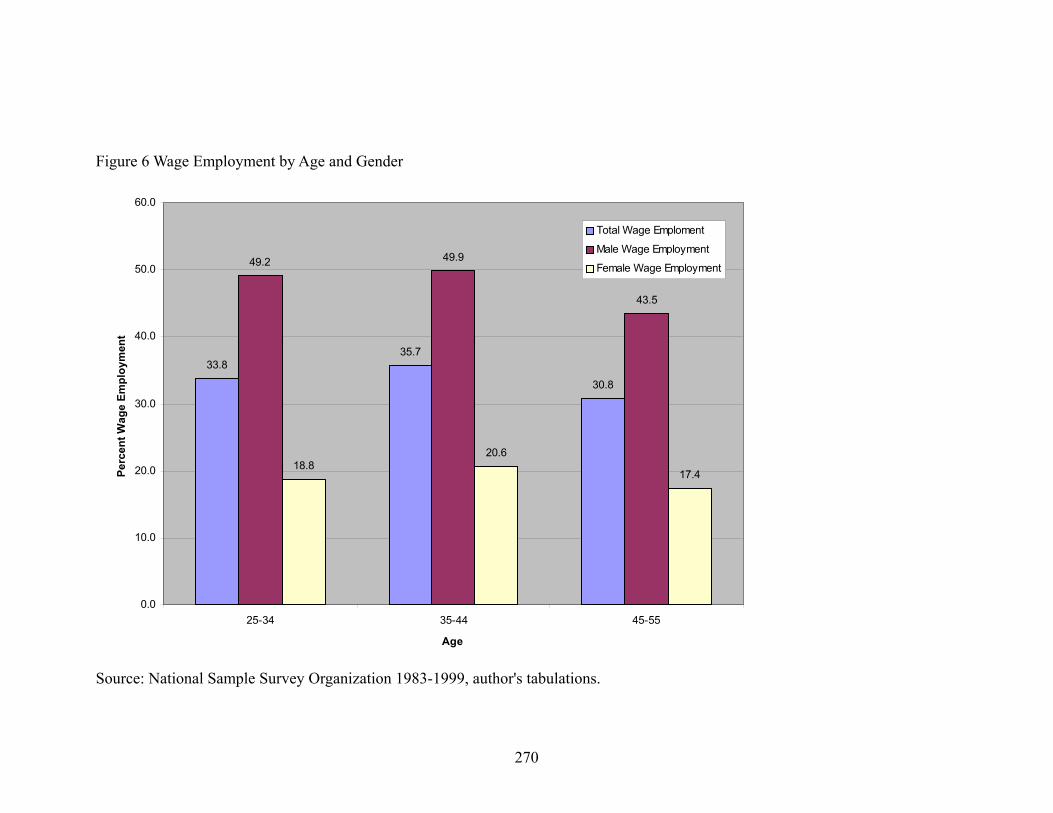
270
Figure 6 Wage Employment by Age and Gender
33.835.7
30.8
49.2 49.9
43.5
18.820.6
17.4
0.0
10.0
20.0
30.0
40.0
50.0
60.0
25-34 35-44 45-55
Age
Perc
ent W
age
Empl
oym
ent
Total Wage Emploment
Male Wage Employment
Female Wage Employment
Source: National Sample Survey Organization 1983-1999, author's tabulations.
271
Bibliography
Ahluwalia, Isher J. 1992. Productivity and Growth in Indian Manufacturing. Delhi: Oxford University Press.
Anant, T.C.A. 2004. “Labor Market Reforms in India: A Review,” http://www.gdnet.org/pdf2/gdn_library/annual_conferences/fifth_annual_conference/anant_paper.pdf
Anderson, Dennis and Mark W. Leiserson. 1980. "Rural Nonfarm Employment in Developing Countries," Economic Development and Cultural Change 28 (2): 227-248.
Ashman, Sam. 1997. "India: Imperialism, Partition, and Resistance," International Socialism (77).
Awn, Peter. 1994. “Indian Islam: The Shah Bano Affair,” In Fundamentalism and Gender. Edited by John S. Hawley. New York: Oxford University Press.
Baden, Sally. 1993. “The Impact of Recession and Structural Adjustment on Women’s Work in Selected Developing Countries,” Report No 15, BRIDGE development – gender, Institute of Development Studies.
Balk, Deborah. 1997. "Defying Gender Norms in Rural Bangladesh: A Social Demographic Analysis," Populations Studies 51 (2): 153-172.
Banerjee, Ashish. 1990. “'Comparative Curfew': Changing Dimensions of Communal Politics in India,” In Mirrors of Violence: Communities, Riots, and Survivors in South Asia. Edited by Veena Das. New Delhi: Oxford University Press.
Banerjee, Nirmala. 1985. “Women's Work and Discrimination,” In Tyranny of the Household: Investigative Essays on Women's Work. Edited by Devaki Jain and Nirmala Banerjee. New Delhi: Shakti Books.
Basu, Alaka. 1997. "The Politicization of Fertility to Achieve Non-Demographic Objectives," Population Studies 51: 5-18.
Basu, Aparna. 1999. “Women’s Education in India: Achievements and Challenges,” In From Independence Towards Freedom: Indian Women since 1947. Edited by Bharati Ray and Aparna Basu. Oxford: Oxford University Press.
Betancourt, Roger and Suzanne Gleason. 2000. "The Allocation of Publicly Provided Goods to Rural Households in India: On Some Consequences of Caste, Religion, and Democracy," World Development 28 (12): 2169-2182.
Bhagat, R. B. and Purujit Praharaj. 2005. "Hindu-Muslim Fertility Differentials,"
272
Economic and Political Weekly.
Bittles, A. H. 1994. “The Role and Significance of Consanguinty as a Demographic Variable,” Population and Development Review 20:561-584.
Bloom, Shelah, David Wypij, and Monica das Gupta. 2001. “Dimensions of Women’s Autonomy and the Influence on Maternal Heath Care Utilization in a North Indian City,” Demography 38(1).
Boserup, Ester. 1970. Women’s Role in Economic Development New York: St. Martin’s Press.
Brass, Paul H. 2003. The Production of Hindu-Muslim Violence in Contemporary India. Seattle: University of Washington Press.
Bouatta, Cherifa and Doria Cherifati-Merabtine. 1994. “The Social Representation of Women in Algeria’s Islamist Movement,” In Identity Politics & Women: Cultural Reassertions and Feminisms in International Perspective. Edited by Valentine M. Moghadam. Boulder: Westview Press.
Cain, Mead Syeda Rokeya Khanam and Shamsun Nahar. 1979. "Class, Patriarchy, and Women's Work in Bangladesh," Population and Development Review: 405-438.
Caldwell, John C. P. H. Reddy and Pat Caldwell. 1985. "Educational Transition in Rural South India," Population and Development Review 11 (1): 29-51.
Census of India. 2001. http://www.censusindia.net/
Chhachhi, Amrita. 1991.” Forced Identities: the State, Communalism, Fundamentalism and Women in India.” In Women, Islam, and the State. Edited by Deniz Kandiyoti. Philadelphia: Temple University Press.
Chiriyankandath, James. 1998. “Bounded Nationalism: Kerela and the Social and Regional Limits of Hindutva.” In The BJP and Compulsions of Politics in India. Edited by Thomas Blom Hansen and Christophe Jaffrelot. New Delhi: Oxford University Press.
Collins, Larry and Dominique Lapierre 1975 Freedom at Midnight. New York: Avon.
Das, Maitreyi Bordia. 2002. Employment and Social Inequality in India: How much do Caste and Religion Matter? Doctoral Dissertation, University of Maryland.
Das, Maitreyi Bordia and Sonalde Desai. 2003. “Are Educated Women Less Likely to be Employed in India?,” Social Protection Discussion Paper No 313. Washington D.C., World Bank.
Datta, Rekha. 2002. “The State, Development, and Empowerment in India,” In Women in Developing Countries: Assessing Strategies for Empowerment. Edited by
273
Rekha Datta and Judith Kornberg. Lynne Rienner Publishers: Boulder.
Delong, J. Bradford. 2001. “India Since Independence: An Analytic Growth Narrative,” http://ksghome.harvard.edu/~drodrik/Growth%20volume/DeLong-India.pdf
Desai, Sonalde. 1994. Gender Inequalities and Demographic Behavior. New York: The Population Council.
Desai, Sonalde and Maitreyi Bordia Das. 2004. "Is Employment Driving India's Growth Surge? A Reality Check," Economic and Political Weekly: 3045-3051.
Desai, Sonalde and Veena Kulkarni. 2005. “Changing Educational Inequalities in India in the context of Affirmative Action.”
Desai, Sonalde, Sonya Rastogi and Reeve D. Vanneman. 2005. “Gender Differences in Child Survival in India: What do we Know?”
Dreze, Jean and Mrinalini Saran. 1995. “Primary Education and Economic Development in China and India: Overview and Two case Studies,” In Choice, Welfare, and Development. Edited by P. Pattanaik and K. Suzumura K. Basu. Oxford: Clarendon Press.
Dreze, Jean and Amartya Sen. 1995. India: Economic Development and Social Opportunity. New Delhi: Oxford University Press.
Dubey, Amaresh and Richard Palmer-Jones. 2007. “Poverty in India since 1983: New Poverty Counts and Robust Poverty Comparisons,” forthcoming Artha Vijnana.
Duraisamy, P. 2000. "Changes in Returns to Education in India, 1983-94: By Gender, Age-Cohort, and Location," Economic Growth Center, Center Discussion Paper No. 815.
Engineer, Asghar Ali. 1996. The Rights of Women in Islam, Vangaurd Books, Lahore, Pakistan.
Engineer, Asghar Ali. 2002. "Gujarat Riots in the Light of History of Communal Violence," Economic and Political Weekly.
Engineer, Asghar Ali. 2001. "Muslims and Education," Economic and Political Weekly.
Fazalbhoy, Nasreen. 2005. “Muslim Women and Inheritance,” In In a Minority: Essays on Muslim Women in India. Edited by Zoya and Ritu Menon Hasan. Oxford: Oxford University Press.
Freitag, Sandria. 1989. Collective Action and Community: Public Arenas and the Emergence of Communalism in North India. Berkeley: University of California Press.
274
Germani, Shahin. 1994. “The Role, Place, and Power of Middle-Class Women in the Islamic Republic,” In Identity Politics & Women: Cultural Reassertions and Feminisms in International Perspective. Edited by Valentine M. Moghadam. Boulder: Westview Press.
Ghose, Ajit. 1994. “Employment in Organised Manufacturing in India,” Indian Jounal of Labor Economics, Vol 37, No.2.
Goldin, Claudia. 1995. “The U-Shaped Female Labor Force Function in Economic Development and Economic History,” In Investment in Women's Capital. Edited by T. Paul Schultz. Chicago: The University of Chicago Press.
Government of India. 2006. The Social, Economic, and Educational Status of the Muslim Community of India: a Report.
Govinda, R. 2002. “Providing Education for all in India: An Overview,” In Indian Education Report. Edited by R. Govinda. Oxford: Oxford University Press.
Hale, Sondra. 1994. “Gender, Religious Identity, and Political Mobilization in Sudan,” In Identity Politics & Women: Cultural Reassertions and Feminisms in International Perspective. Edited by Valentine M. Moghadam. Boulder: Westview Press.
Hardy, P. 1972. The Muslims of British India. Cambridge: Cambridge University Press.
Hasan, Zoya. 1982. “Communalism and Communal Violence in India,” Social Scientist 10(2).
Hasan, Zoya. 1994. “Minority Identity, State Policy and the Political Process,” In Forging Identities. Edited by Zoya Hasan. Boulder: Westview Press.
Hasan, Zoya. 2005. “Reservations for Muslims,” Seminar No. 549.
Hasan, Zoya and Ritu Menon. 2005a. Educating Muslim Girls A Comparison of Five Indian Cities. New Delhi: Women Unlimited.
Hasan, Zoya and Ritu Menon. 2005b. In a Minority Essays on Muslim Women in India. Oxford: Oxford University Press.
Hawley, John S. and Wayne Proudfoot. 1994. Introduction. In Fundamentalism and Gender. Edited by John S. Hawley. New York: Oxford University Press.
Heyes, Cressida. 2002. “Identity Politics,” http://plato.standford.edu/entries/identity-politics/
Hill, M. Anne and Elizabeth M. King. 1993. Women's Education in Developing Countries: An Overview. In Women's Education in Developing Countries. Edited by
275
Elizabeth M. King and M. Anne Hill . Baltimore: The Johns Hopkins University Press.
Husain, Sheikh Abrar. 1976. Marriage Customs Among Muslims in India. New Delhi: Sterling Publishers.
Inglehart, Ronald and Wayne E. Baker. 2000. "Modernization, Cultural Change, and the Persistence of Traditional Values," American Sociological Review 65: 19-51.
ILO-ARTEP. 1993. India, Employment, Poverty, and Labour Policies, New Delhi.
Jain, Ravindra K. 1970. South Indians on the Plantation Frontier in Malaya. New Haven, CT: Yale University Press.
Jalal, Ayesha. 1985. The Sole Spokesman: Jinnah, the Muslim League and the Demand for Pakistan. Cambridge: Cambridge University Press.
Jeffery, Patricia. 1979. Frogs in a Well. London: Zed Press.
Jeffery, Patricia and Amrita Basu. 1998. Appropriating Gender: Women’s Activism and Politicized Religion in South Asia New York: Routedge.
Jeffery, Patricia and Roger Jeffery. 1998. “Gender, Community, and the Local State in Bijnor, India,” In Appropriating Gender: Women’s Activism and Politicized Religion in South Asia. Edited by Patricia and Amrita Basu Jeffery. New York: Routledge.
Jeffery, Patricia Roger Jeffery and Craig Jeffery. 2006. “The First Madrasa: Learned Mawlawis and the Educated Mother,” In Islamic Education, Diversity, and National Identity: Dini Madaris in India Post 9/11. Edited by Jan-Peter and Helmut Reifeld Hartung. New Delhi: Sage Publications.
Jeffery, Patricia Roger Jeffery and Craig Jeffery. 2005. “The Mother’s Lap and the Civilizing Mission: Madrasa Education and Rural Muslim Girls in Western Uttar Pradesh,” In In a Minority: Essays on Muslim Women in India. Edited by Zoya and Ritu Menon Hasan. Oxford: Oxford University Press.
Jeffery, Roger and Patricia Jeffery. 2005. "Saffron Demography, Common Wisdom, Aspirations and Uneven Governmentalities," Economic and Political Weekly.
Kaufman, Debra Renee. 1994. “Paradoxical Politics: Gender Politics Among Newly Orthodox Jewish Women in the United States,” In Identity Politics & Women: Cultural Reassertions and Feminisms in International Perspective. Edited by Valentine M. Moghadam. Boulder: Westview Press.
Keay, John. 2000. India A History. New York: Grove Press.
Khandker, Shahidur. 1992. “Earnings, Occupational Choice, and Mobility in Segmented Labor Markets of India,” Washington, D.C., World Bank Discussion
276
Paper 154.
Kishor, Sunita and Lekha Subaiya. 2005. “Household Decision Making as Empowerment: A Methodological View.”
Klatch, Rebecca E. 1994. “Women of the New Right in the United States: Family, Feminism, and Politics,” In Identity Politics & Women: Cultural Reassertions and Feminisms in International Perspective. Edited by Valentine M. Moghadam. Boulder: Westview Press.
Kulkarni, P. M., 2002. "Inter-State Variations in Human Development Differentials among Social Groups in India," NCAER Working Paper, Working Paper Series No. 80.
Lateef, Shahida. 1990. Muslim Women in India Political and Private Realities: 1890s-1980s. London: Zed Books Ltd.
Malhotra, Anju and Mark Mather. 1997. "Do Schooling and Work Empower Women in Developing Countries? Gender and Domestic Decisions in Sri Lanka," Sociological Forum 12 (4): 599-630.
Mann, E. A. 1992. Boundaries and Identities: Muslims, Work, and Status in Aligarh. New Delhi: Sage Publications.
Mann, Elizabeth. 1994. Education, Money, and the Role of Women in Maintaining Minority Identity. In Forging Identities: Gender, Communities, and the State in India. Edited by Zoya Hasan. Boulder: Westview Press.
Mason, Karen. 1986. "The Status of Women: Conceptual and Methodological Issues in Demographic Studies," Sociological Forum 1 (2): 284-300.
Metcalf, Barbara D. 2004. Islamic Contestations: Essays on Muslims in India and Pakistan. Oxford: Oxford University Press.
Meyer, John W. Francisco O. Ramirez and Yasemin Nuhoglu Soysal. 1992. "World Expansion of Mass Education, 1870-1980," Sociology of Education 65 (2): 128-149.
Ministry of Education. 2006. Education Statistics. http://www.education.nic.in/
Moghadam, Val. 1988. "Women, Work, and Ideology in the Islamic Republic," International Journal of Middle east Studies 20: 221-243.
Moghadam, Valentine M. 1994. Introduction: Women and Identity Politics in Theoretical and Comparative Perspective. In Identity Politics & Women: Cultural Reassertions and Feminisms in International Perspective. Edited by Valentine M. Moghadam. Boulder: Westview Press.
Mukherjee, Mukul. 1999. Women and Work in India: A Collage from Five Decades of

277
Independence. In From Independence Towards Freedom: Indian Women Since 1947. Edited by Bharati Ray and Aparna Basu. New Delhi: Oxford University Press.
National Sample Survey Organization, 1983-1999, Government of India.
Nayer, Usha. 2002. Education of Girls in India: An Assessment. In Indian Education Report. Edited by R. Govinda. Oxford: Oxford University Press.
Notstein, Frank W. 1953. Economic Problems of Population Change. In Proceedings of the Eighth International Conference. London: Oxford University Press.
ORC Macro. 2000. India National Family Health Survey (NFHS-2) 1998-199.
Pandey, Gyanendra. 1990a. The Colonial Construction of 'Communalism': British Writings on Banaras in the Nineteenth Century. In Mirrors of Violence: Communities, Riots, and Survivors in South Asia. Edited by Veena Das. Delhi: Oxford University Press.
Pandey, Gyanendra. 1990b. The Construction of Communalism in Colonial North India. Delhi: Oxford University Press.
Papanek, Hanna. 1994. The Ideal Woman and the Ideal Society: Control and Autonomy in the Construction of Identity. In Identity Politics & Women: Cultural Reassertions and Feminisms in International Perspective. Edited by Valentine M. Moghadam. Boulder: Westview Press.
Papanek, Hannah and Gail Minault. Separate Worlds: Studies of Purdah in South Asia. Delhi: Chanakya.
Paul R. Brass. 2003. The production of Hindu-Muslim Violence In Contemporary India. Seattle: University of Washington Press.
Rahman, Lupin and Vijayendra Rao. 2004. "The Determinants of Gender Equity in India: Examining Dyson and Moore's Thesis with New Data," Population and Development Review 30 (2): 239-268.
Rastogi, Sonya. 2003. Gender Differentials in Education in India Thesis, University of Maryland.
Rastogi, Sonya, Aparna Sundaram and Reeve D. Vanneman. 2004. “Effects of Development on Gender Inequality in School Enrollment in India.”
Rathbone, Eleanor. 1934. Child Marriage: the Indian Minotaur London: George Allen and Unwin.
Rodrok, Dani and Arvind Subramanian. 2005. "From "Hindu Growth" to Productivity Surge: The Mystery of the Indian Growth Transition," IMP Staff Papers 52 (2).
278
Rouse, Shahnaz. 1998. “The Outsider(s) Within,” In Appropriating Gender: Women’s Activism and Politicized Religion in South Asia. Edited by Patricia and Amrita Basu Jeffery. New York: Routledge.
Sarkar, Tanika. 2002. "Semiotics of Terror," Economic and Poltical Weekly.
Sen, Mitali, Sonya Rastogi and Reeve D. Vanneman. 2006. “Disempowered by Whom? Gender vs. Generation in Family Decisions.”
Sengupta, Roshni. 2006. “Communal Violence in India: Perspectives on the Causative Factors,” http://www.sasnet.lu.se/EASASpapers/32RoshniSengupta.pdf
Sethuraman, S. V. 1998. Gender, Informality and Poverty: A Global Review. Washington, D.C.: The World Bank.
Shah, Ghanshyam. 1998. The BJP's Riddle in Gurjarat: caste, Dactionalism, and Hindutva. In The BJP and Compulsions of Politics in India. Edited by Thomas Blom Hansen and Christophe Jaffrelot. New Delhi: Oxford University Press.
Shariff, Abusaleh. 1995. "Socio-economic and Demographic Differentials between Hindus and Muslims in India," Economic and Political Weekly.
Sharma, Alakh N. 2006. “Flexibility, Employment and Labor Market Reforms,” Economic and Political Weekly.
Sharma, Ursula. 1980. Women, Work, and Property in North-West India. London: Tavistock.
Sikand, Yoginder. 2005. Bastions of the Believers. New Delhi: Penguin Books.
Singh, Gopal. 1980. 'Socio-economic Status of India's 150 Million Muslims,' Government of India.
Sinha, Anushree and Christopher Adam. 2004. “Reform and Informalization: What Lies Behind Jobless Growth in India,” Expert Group on Development Issues, Parallel Session 5.3, United Nations.
Srinivas, M. N. 1962. Caste in Modern India and Other Essays. Bombay: Asia Publishing House.
Srinivas, M. N. 1966. Social Change in Modern India. New Delhi: Orient Longman.
Sundaram, K. 2004."Growth of Work Opportunities In India: 1983---1999-2000," Centre for Development Economics, Working Paper no. 131.
Sundaram, K and S Tendulkar. 2002. The Working Poor in India: Employment-Poverty Linkages and Employment Policy Options, Discussion Paper 4, ILO, Geneva.
Tavakoli-Targhi, Mohamad. 1994. “Women of the West Imagined: The Farangi Other
279
and the Emergence of the Woman Question in Iran,” In Identity Politics & Women: Cultural Reassertions and Feminisms in International Perspective. Edited by Valentine M. Moghadam. Boulder: Westview Press.
Thapar, Romila. 2005. "Knowledge and Education," Frontline.
The Probe Team. 1999. Public Report on Basic Education in India. Oxford: Oxford University Press.
Thursby, G. R. 1975. Hindu-Muslim Relations in British India A Study of Controversy, Conflict, and Communal Movements in Northern India 1923-1928. Leiden: E.J. Brill.
Tress, Madeleine. 1994. “Halakha, Zionism, and Gender: the Case of Gush Emunim,” In Identity Politics & Women: Cultural Reassertions and Feminisms in International Perspective. Edited by Valentine M. Moghadam. Boulder: Westview Press.
United Nations. 1995. Human Development Report 1995: Gender and Human Development. United Nations.
United Nations. 1996. Human Development Report 1996: Economic Growth and Human Development. United Nations.
United Nations. 1999. "The United Nations on the Implementation of the Cairo Program of Action," Population and Development Review 25 (3): 613-634.
Unni, Jeemol. 2001a. "Earnings and Education among Ethnic Groups in Rural India," NCAER Working Papers, Working Paper Series No. 79.
Unni, Jeemol. 2001b. "Gender and Informality in Labour Market in South Asia," Economic and Political Weekly.
Unni, Jeemol and Uma Rani. 2000. “Women in Informal Employment in India.”
Varshney, Ashutosh, and Steven Wilkinson. Varshney-Wilkinson Data set on Hindu-Muslim Violence, 1950-1995.
Vatuk, Sylvia. 2005. Muslim Women and Personal Law. In In a Minority Essays on Muslim Women in India. Edited by Zoya Hasan and Ritu Menon. New Delhi: Oxford University Press.
Visaria, P. and B. S. Minhas. 1991. "Evolving an Employment Policy for the 1990s: What do the Data Tell us?," Economic and Political Weekly.
Weiner, Myron. 1991. The child and the state in India: child labor and education policy in comparative perspective. Princeton, New Jersey: Princeton University Press.
Wils, Annababette and Anne Goujon. 1998. "Diffusion of Education in Six World Regions, 1960-1990," Population and Development Review 24 (2): 357-368.
280
Wolpert, Stanley. 1993. A New History of India New York: Oxford University Press.
World Bank. 1995. World Development Report 1995: Workers in an Integrating World. Oxford, Oxford University Press
Related Documents