Price : Rs. 50.00 ITO - Yr Publtaf or S&N NO. W91-5871 INDIAN MEDICAL . 1 UR_NAL Monthly Scientific Journal of All India General Practitioners' Association NIG /BID / ICMR I JR 1233 dt.14.12.2012, INDEX MEDICUS, by NIC, New Delhi, Govt. of India F SW, 1906 Official Journal of AIGPA 15 August 2015 • Volume 109 • Number 8 , Nat/anal President: Prof. (Dr.) Ask Dos, MD. PhD (mecicino MNAMS (New Delhi) FASc (WE), MAMS (Vienna) SecretaryGeneral : Dr. Phiaid KUITICITG1011h, MBBS FIAGP. EX WBHHS Hony. Editor rn Chief: Prot (Dr.) Suitt K. Chaudhurl, MBBS, PhD 1

Welcome message from author
This document is posted to help you gain knowledge. Please leave a comment to let me know what you think about it! Share it to your friends and learn new things together.
Transcript
Price : Rs. 50.00
ITO- Yr Publtaf or
S&N NO. W91-5871
INDIAN MEDICAL .1 UR_NAL Monthly Scientific Journal of All India General Practitioners' Association NIG /BID / ICMR I JR 1233 dt.14.12.2012, INDEX MEDICUS, by NIC, New Delhi, Govt. of India
F
SW, 1906 Official Journal of AIGPA
15 August 2015 • Volume 109 • Number 8 ,
Nat/anal President: Prof. (Dr.) Ask Dos, MD. PhD (mecicino MNAMS (New Delhi) FASc (WE), MAMS (Vienna) SecretaryGeneral : Dr. Phiaid KUITICITG1011h, MBBS FIAGP. EX WBHHS
Hony. Editor rn Chief: Prot (Dr.) Suitt K. Chaudhurl, MBBS, PhD 1
'49
1 .. iv I 1 ' ' I l''.:-:1'. \ I a II
DISCUSSION 2.
INTRODUCTION
K ttIi f. IF we coronary neat tiisease, which includes genetic ía' diabetes mell itus, ltvpertetisi ii , 1i . oi ch ()Vienna, c iga rent! smoking en oronary heart disease is one Of the complications of diabetes mellitus. Untreated long continued diabetes mellitus produces three times more Mai rovas< tilar coronary artery disorder than in ninmal individuals (
Long continued hypertension its also one of the initH mom risk factors for coronary heart disease which is perhaps produced by the endothelial damage and atherosclerosis on the damaged tissue
AIMS AND OBJECTIVES
An attempt has been made to study the relationship of different age and sex on Cl-ID.
MATERIALS AND METHODS
Hundred cases of CHD of different age groups were selected for study from CCU and indoor medical wards of Katihar Medical College & Hospital with the permission of the competent authorities.
Only those cases of CHO were seiet Jed for study who don't show any ass, iiiated cardiac lesig al gin valvular heart disease or cat:die-Mitt ipathy etc.
I he diagnosis of I ID was established with W.H.0 criteria. If any of the two changes present was considered to be suffering from CND.
1. Chest pain.
2. 'ECG-changes. 3. Serum enzyme rise.
4. Standard 12 lead ECG was done and changes in ST segment, 't' wavti and presence of pathological 'Cl' wave were tit fled in different It ads.
5. Serum enzyme (I.DH) estimation
by king's method SCOT estimation by Reilmen& Franke method,
OBSERVATION
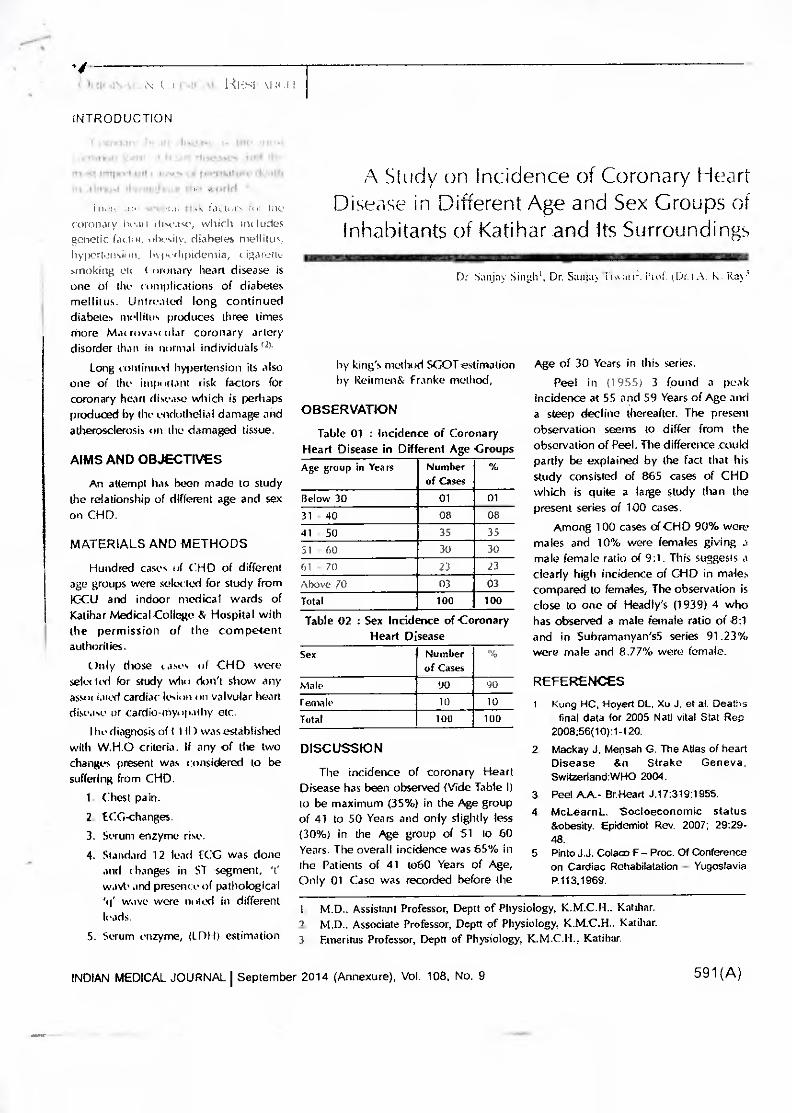
Table 01 : Incidence of Coronary Heart Disease in Different Age Croups Age group in Years Number
of Cases %
Below 30 01 01 31 - 40 08 08 41 - 50 35 35 51 - 60 30 30 61 - 70 23 23 Above 70 03 03 Total 100 100
Table 02 : Sex Incidence of Coronary Heart Disease
Sex Number of Cases
%
Male 90 90 Female 10 10 Total 100 100
The incidence of coronary Heart Disease has been observed (Vide Table I) to be maximum (35%) in the Age group of 41 to 50 Years and only slightly less (30%) in the Age group of 51 to 60 Years. The overall incidence was 65% in the Patients of 41 to60 Years of Age, Only 01 Case was recorded before the
Age of 30 Years in this series. Peel in (1955) 3 found a peak
incidence at 55 and 59 Years of Age and a steep decline thereafter. The present observation seems to differ from the observation of Peel. The difference could partly be explained by the fact that his study consisted of 865 cases of CHO which is quite a large study than the present series of 100 cases.
Among 100 cases of CHO 90% were males and 10% were females giving 3 male female ratio of 9:1. This suggests a clearly high incidence of Cl-ID in males compared to females, The observation is close to one of Headly's (1939) 4 who has observed a male female ratio of 8:1 and in Subramanyan's5 series 91.23% were male and 8.77% were female.
REFERENCES
Kong HC, Hayed DL, Xu J. et at. Deaths : final data for 2005 Nall vital Stet Rep 2008;56( 10):1-120. Mackay J. Mensah G. The Atlas of heart Disease &n Strake Geneva, Swilzedand:WHO 2004.
3. Peel A.A.- BrHeart J.17:319;1955. 4. McLearnL. Socioeconomic status
&obesity. Epidemic)! Rev. 2007; 29:29-48.
5 Pinto J.J. Coleco F— Proc. Of Conference on Cardiac Rehabilatation — Yugoslavia P.113,1969.
A Study on Incidence of Coronary Heart Disease in Different Age and Sex Groups of Inhabitants of Katihar and Its Surroundings
Di Sanjay Singh'. Dr. Stucim iiiarij. Prof (Dr. A. K. Ray'
I. M.D.. Assistant Professor, Deptt of Physiology, K.M.C.H., Katihar. 2. M.D.. Associate Professor, Deptt of Physiology, K.M.C.H.. Katihar. 3. Emeritus Professor, Deptt of Physiology, K.M.C.H., Katihar.
INDIAN MEDICAL JOURNAL I September 2014 (Annexure), Vol. 108, No. 9 591(A)
Comparative Study of the Various Risi< Factors in 70 Patients of Coronary Heart Disease in
different age groups at Katihar and Surrounding Areas in Bihar
Dr. Sanjay Singhl, Dr. Sanjay Tiwari2, Prof. (Dr.) A. K. Ray2
OBSERVATION
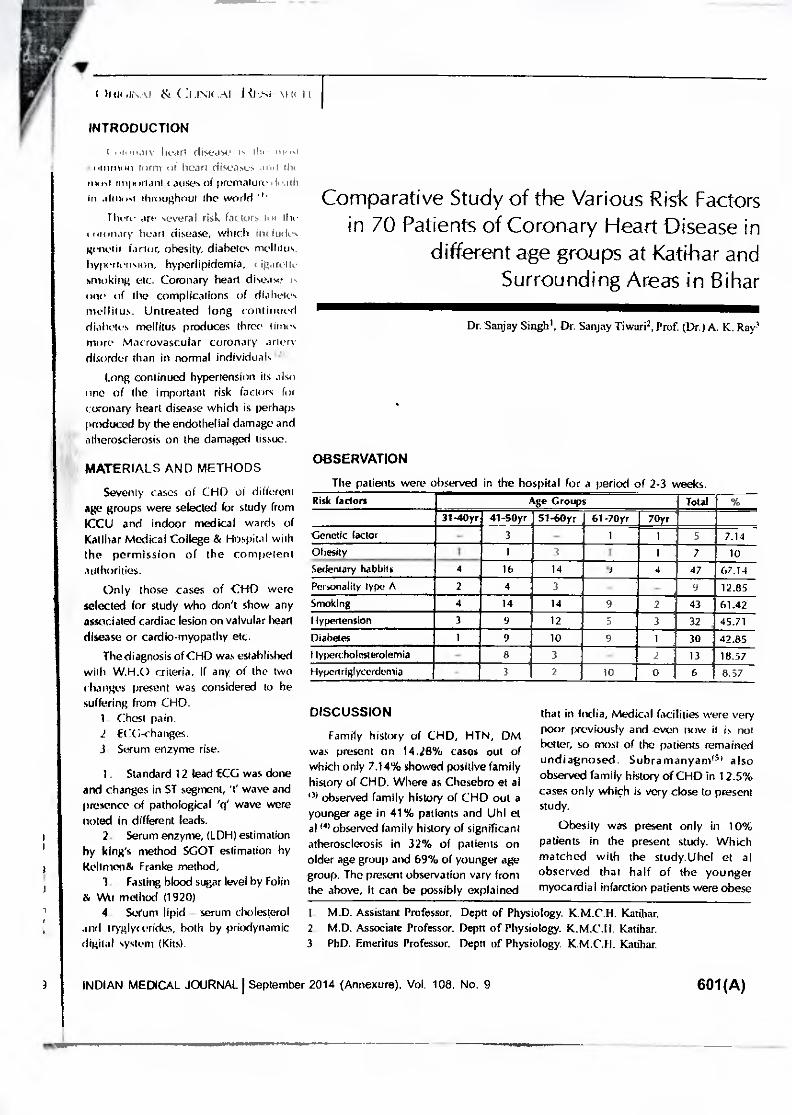
The patients were observed in the hospital for a period of 2-3 weeks. Risk faders Age Groups Total
31-40yr 41-50yr 51-60yr 61-70yr 70yr Genetic (actor - 3 - 1 1 5 7.14 Obesity 1
i 1 3 I 1 7 10
Sedentary babbitt 4 16 14 r 4 47 67.14 Personality type A 2 4 3 - 9 12.85 Smoking 4 14 14 9 2 43 61.42 Hypertension 3 9 12 5 3 32 : 45.71 Diabetes 1 9 10 9 1 30 42.85 I typercholiwerolemia - 8 3 - 2 13 18.57 Hypenriglycerdernia 3 2 10 0 6 8.37
I hot tr.u. ( ..1.1NU.Al. I st
INTRODUCTION
,t, hear! (lISecISC Olt
'111101 iII tom) cif heart disease; mut Is ist nig Pt aria Ili ( MISC.!, of premature ii
In almosi throughout the world There art • several risk factors Int the
oninary heart disease, which int Irides genetic factor, obesity, diabetes mellitus. hyilertension, hyperlipidemia, C igarotte smoking etc. Coronary heart disease I ne of the complications of diabetes mellitus. Untreated long continued diabetes mellitus produces three times more Macrovascular coronary ariery disorder than in normal individuals
Long continued hypertension its also one of the important risk factors for coronary heart disease which is perhaps produced by the endothelial damage and atherosclerosis on the damaged tissue.
1
MATERIALS AND METHODS
Seventy cases of CHD of different age groups were selected for study from ICCU and indoor medical wards of Katihar Medical College & Hospital with the permission of the competent authorities.
Only those cases of CHD were selected for study who don't show any associated cardiac lesion on valvular heart disease or cardio-myopathy etc.
The diagnosis of CHD was established with W.H.0 criteria. If any of the two changes present was considered to be suffering from CHD.
1. Chest pan. fCG-changes.
3. Serum enzyme rise.
1. Standard 12 lead ECG was done and changes in ST segment, 't' wave and presence of pathological 'ry' wave were noted in different leads.
2. Serum enzyme, (LDH) estimation by king's method SGOT estimation by keilmen& Franke method,
3. Fasting blood sugar level by Folk; & Wu method (1920)
4. Sceurn lipid - serum cholesterol and tryglyr (irides, both by priodynamic digital system (Kits).
DISCUSSION
Family history of CHD, HTN, DM was present on 14.28% cases out of which only 7.14% showed positive family history of CHD. Where as Chesebro et al 1)) observed family history of CND out a younger age in 41% patients and Uhl et al to observed family history of significant atherosclerosis in 32% of patients on older age group and 69% of younger age group. The present observation vary horn the above, It can be possibly explained
that in India, Medical facilities were very poor previously and even now it is not better, so most of the patients remained undiagnosed. Subramanyamis' also observed family history of CHD in 12.5% cases only which is very close to present study.
Obesity was present only in 10% patients in the present study. Which matched with the study.Uhel et al observed that half of the younger myocardial infarction patients were obese
I. M.D. Assistant Professor. Deptt of Physiology. K.M.C.H. Katihar. 2. M.D. Associate Professor. Deptt of Physiology. K.M.C.I I. Katihar. 3. PhD. Emeritus Professor. Deprt of Physiology. K.M.C.H. Katihar.
INDIAN MEDICAL JOURNAL I September 2014 (Annexure), Vol. 108, No. 9 601(A)
allaillININMONImmenumno=am=r"....,
is1111,• 2":. t1 idht ',Merits were ithest-, tlilfal11.111VO ill observed obecily inlv
I ; patients There are conflicting iYS rtstgardilic1tthesilY as on independent
ri.k factors, but it is usually associated with hyper( holesterolemia and hypertension. So obesity is probably an additive factors in patients with other risk factor'.
In the present series 47 patients (67.14%) showed minimum physical activity while 22 (31.43%) showed moderate activity both at work and leisure. These observations are in conformity with the observation of Morris IN et al 56) Kamnel WD 57) and American Health association committee. report (1980) on coronary risk factors that physical exercise may protect CHD.
Fully developed personality type A was found in 12.85% patients of CHD in present study. All the cases were below 60yrs of age. Subramanyam observed personality type A in 11.12% cases.This figture is close to present study and difference can he explained that the number of cases in his study was quite large in comparison with present study.
In the present study 61.42% patients of CHI) were smokers. Among them 43% patients smoked 20 cigarettes per day & 4 were hidi smokers. The findings are in harmony with most of the studies. Doyel 1.1 & Cordon, T found that after cessation of smoking cardiovascular risk begins to decline.
In the present study 32 (45.71%) were diagnosed hypertensive. Previously Subramanyaml8I observed hypertension in 22.06% patients in his series of cases. This variation may be due to his large number of cases. Various studies also observed hypertension to be the strongest predictive risk factor for CHD. Hypertension is less important in younger
en )up Man in older patients as slush, d by Libel el al. '
In the present sr Licy in persons !42 8570: were diabetir koon ei al I ntiS 11" observed ass'" I at between CH D
with in increasing level of hood sugar in both the sexes. Similar conclusion was also reached by Epstein et al 65. He also observed that the effect of hyperglycemia on arterial disease is independent of blood pressure and serum cholesterol. American health Association committee report on coronary risk factors suggested that hyperglycemia is associated with other risk factors as obesity, hyperlipidemia and hypertension and all these are associated with increased risk of CHD.
In the present study13 patients (18.57%) had significantly raised cholesterol level. framingham's study also found raised plasma cholesterol as major risk factor for CHD. His study supports the present study
In the present study 6 patients -(8.57%) showed increased Triglyceride (TG) level. Gotto et al ill) and Schaefer et al "2) also observed that serum IC level in their study was higher in CHD cases.
REFERENCES
1 Kung EiC Hoyen DL. XIJ J. er al Encatns final data for 2005 Nan vital Stat Rep
2008:56(10)1-120 2 Mackay J, Mensah G. The Atlas of heart
Disease &n Strake Geneva Switzerland. World health organization 2084
3. Julian, D.G. & Mathew. M.B. - in "Davidson's Principles and Practice of Medicine", ED By Macleod J. The ELBS & Churchill Livingston, Edinburg, 1981, 13th Edition, P. 145
4. Uhl GS, Farrel. W.- Myocardial infarction in young adults - risk factors and natural history. Am. Hart J. 105 : 648, 1983.
5. Pinto J.J. Coleco F - Proc. Of Conference on Cardiac Rehabilatation - Yugoslavia P. 113, 1969.
6 Rissenman AM -Familial Occurrence of Coronary Heart Disease . Effect of age at Diagnosis Am. J. cardio, 44: 60, 1979
7. Slack. J. Evan MA - The increased risk of death from Ischaemic heart disease in first degree relatives of 121 men and 96 Women with IHO. J.Med. Genet 3:239, 1966
8. Subramanaym G. Ramesh Battu B. Clinical profile of E-schaemic Heart Disease - A Study of 2579 cases J.A.P.1 - 32: 48: 1984
9. Uhl CS, Farrel.W.- Myocardial infarction in young adults- risk factors and natural history. Am. Nest J. 105: 648, 1983.
10. Koch Weser 3- Correlation of Pathology and Pharmacotherapy in primary hypertension. In hyper-tension manual edited by Laragh Jti. New York, Dun - Donnelley1973, p.759.
11 -Gotta. AM,ComyG.A.et at -Relationship between Plasma Lipid concentration and CHD IN 496 patients. Circulation 56:875,1977.
12 Schaefer E.J. Levy R.I.et al - Plasma Triglycerides in regulation of HDL - cholesterol level. Lancet II :391. 1978
CONLUSION
From our present study we may conclude that sedentary habits(67.14%) and smoking (61.42%) were the most common risk factors for C.4-ID followed by hypertension (45 .71%), diabetes( 4 2 . 8 5 hypercholesteremian 8.57%), personality type All 2.85%), obesity (10%), hypertriglyceredemia (8.57%).
Though 7.14% of patients showed no apparent risk factors apart from the genetic factor.
ACKNOWLEDGEMENT
We are very much grateful to Mr. A. A. Karim, Managing director, Katihar Medical College for his encouragement and full support.
602(A) INDIAN MEDICAL JOURNAL I September 2014 (Annexure), Vol. 108, No. 9
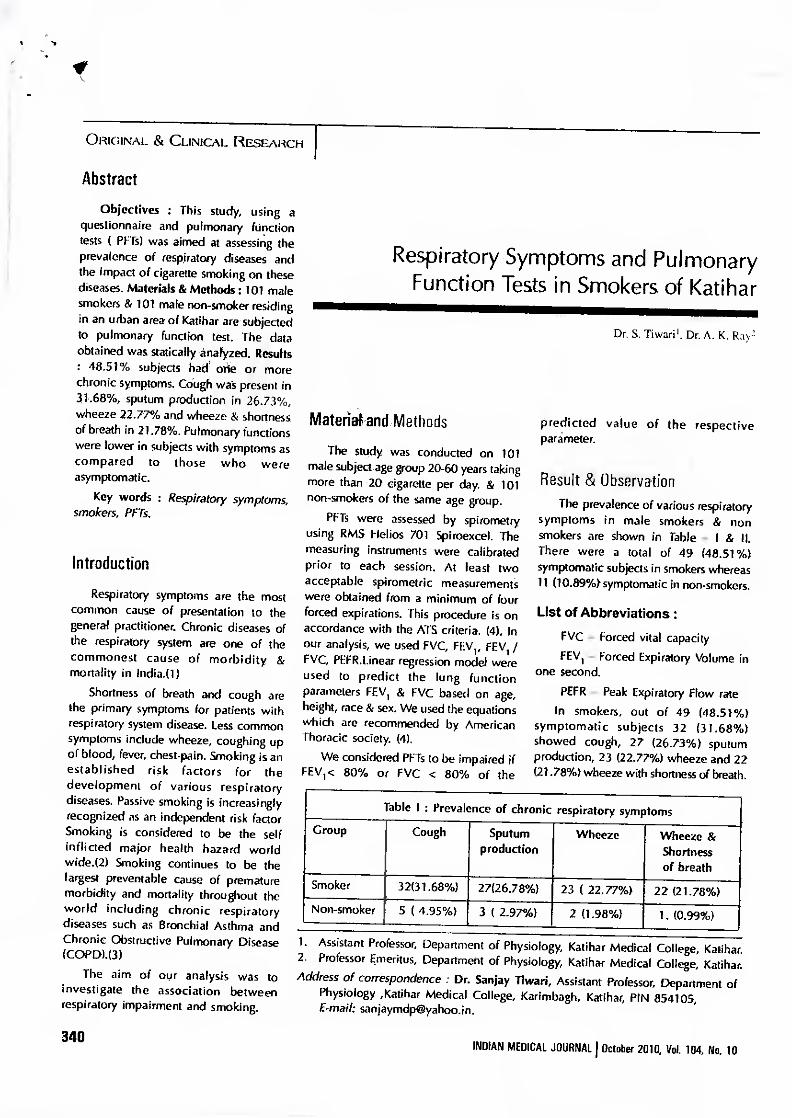
Respiratory Symptoms and Pulmonary Function Tests in Smokers of Katihar
Dr. S. Tiwarii. Dr. A. K. Ray2
Material and Methods
The study was conducted on 101 male subject age group 20-60 years taking more than 20 cigarette per day. & 101 non-smokers of the same age group.
PFTs were assessed by spirometry using RMS Helios 701 Spiroexcel. The measuring instruments were calibrated prior to each session. At least two acceptable spirometric measurements were obtained from a minimum of four forced expirations. [his procedure is on accordance with the ATS criteria. (4). In our analysis, we used FVC, FEVI, FEV, / FVC, PEFR.Linear regression model were used to predict the lung function parameters FEVI & FVC based on age, height, race & sex. We used the equations which are recommended by American Thoracic society. (4).
We considered PFTs to be impaired if FEVi< 80% or FVC < 80% of the
predicted value of the respective parameter.
Result & Observation The prevalence of various respiratory
symptoms in male smokers & non smokers are shown in Table — I & II. There were a total of 49 (48.51%) symptomatic subjects in smokers whereas 11 (10.891Qsymptomatic in non-smokers.
List of Abbreviations: FVC — Forced vital capacity FEVI — Forced Expiratory Volume in
one second. PEFR — Peak Expiratory Flow rate
In smokers, out of 49 (48.51%) symptomatic subjects 32 (31.68%) showed cough, 27 (26.73%) sputum production, 23 (22.77%) wheeze and 22 (21.78%) wheeze with shortness of breath.
Table I : Prevalence of chronic respiratory symptoms
Group Cough Sputum production
Wheeze Wheeze & Shortness of breath
Smoker 32(31.68%) 27(26.78%) 23 ( 22.77%) 22(21.78%) Non-smoker 5 ( 4.95%) 3 ( 2.97%) 2 (1.98%) 1. (0.99%)
1. Assistant Professor, Department of Physiology, Katihar Medical College, Katihar. 2. Professor Emeritus, Department of Physiology, Katihar Medical College, Katihar. Address of correspondence : Dr. Sanjay Tiwari, Assistant Professor, Department of
Physiology ,Katihar Medical College, Karimbagh, Katihar, PIN 854105, E-mail: [email protected].
ORIGINAL & CLINICAL RESEARCH
Abstract
Objectives : This study, using a questionnaire and pulmonary (Unction tests ( PFTs) was aimed at assessing the prevalence of respiratory diseases and the impact of cigarette smoking on these diseases. Materials & Methods: 101 male smokers & 101 male non-smoker residing in an urban area of Katihar are subjected to pulmonary function test. The data obtained was statically analyzed. Results : 48.51% subjects had one or more chronic symptoms. Cough was present in 31.68%, sputum production in 26.73%, wheeze 22.77% and wheeze & shortness of breath in 21.78%. Pulmonary functions were lower in subjects with symptoms as compared to those who were asymptomatic.
Key words : Respiratory symptoms, smokers, PFTs.
Introduction
Respiratory symptoms are the most common cause of presentation to the general practitioner. Chronic diseases of the respiratory system are one of the commonest cause of morbidity & mortality in India.(1)
Shortness of breath and cough are the primary symptoms for patients with respiratory system disease. Less common symptoms include wheeze, coughing up of blood, fever, chest-pain. Smoking is an established risk factors for the development of various respiratory diseases. Passive smoking is increasingly recognized as an independent risk factor Smoking is considered to be the self inflicted major health hazard world wide.(2) Smoking continues to be the largest preventable cause of premature morbidity and mortality throughout the world including chronic respiratory diseases such as Bronchial Asthma and Chronic Obstructive Pulmonary Disease (COPD).(3)
The aim of our analysis was to investigate the association between respiratory impairment and smoking.
340 INDIAN MEDICAL JOURNAL J October 2010, Vol. 104, No. 10
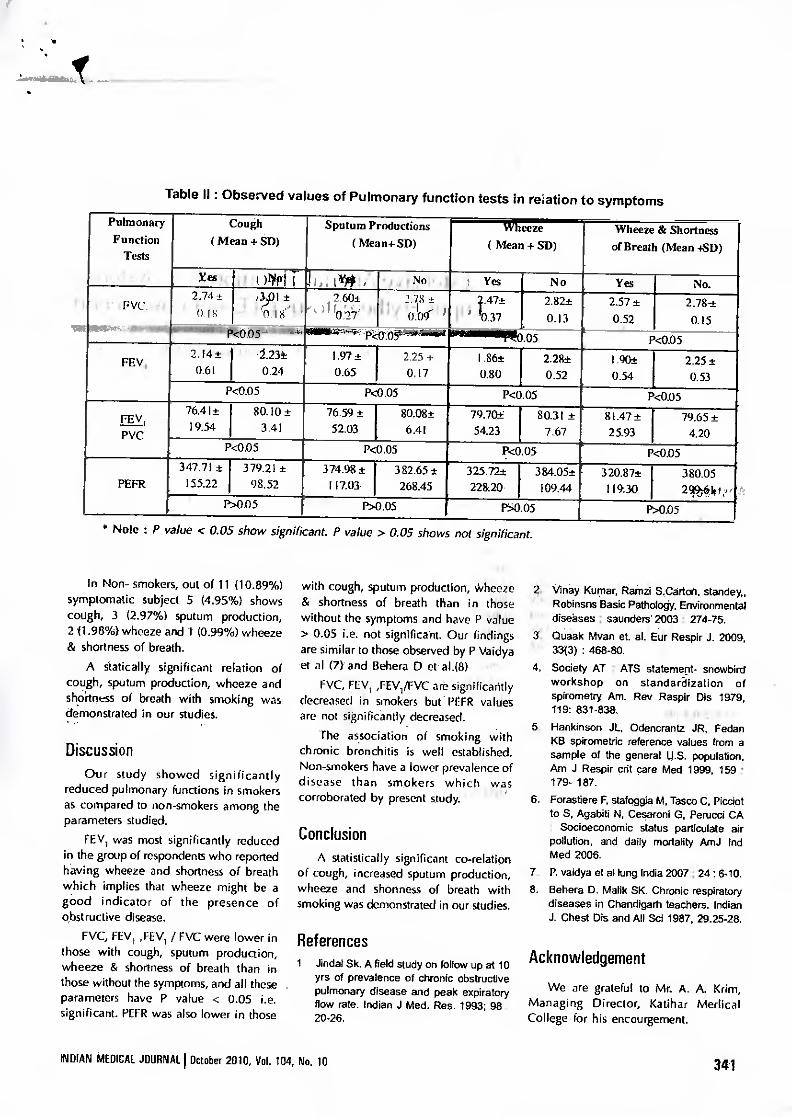
Table II : Observed values of Pulmonary function tests in reiation to symptoms
Pulmonary Function
Tests
Cough ( Mean + SD)
Sputum Productions ( Mea n+ SD)
Wheeze ( Mean + SD)
Wheeze & Shortness of Breath (Mean +SD)
Kes .' , i )11IPIT ,Iii; 1144!: No • Yes No Yes No.
GIN 2.74±33)1 ± .
r 0 it '
4 2.60± 2.78 -±
...` ) f rO:r1.71 . 0.09- ) 4.47±
V' TO.37 2.82± 0.13
2.57± 052
2.78-± 0.15
/1/40.05 - . . asstr.,-4-4,,,partgait .05 l
P<0.05
FEV, ' 2.14± .
0.61 2.23± 0.24
I.97± ' 0.65
2.25+ 0,17
1.86± 0.80
2.28± 0.52
1.90± 0.54
2.25± 0.53
P<0.05 P<0.05 P<0.05 P<0.05
FEV _, 76.41± 19.54
80.10± 3.41
76.59± 52.03
80.08± 6.41
79.70-±, 54.23
80.31 ± 7.67
t 81.47± 25.93
79.65± 4.20 PVC
P<0.05 . P4).05 P<0.05 P<0.05
PEFR 347.71 ±
155.22 379.21 ±
98.52 374.98±
117.03 r
382.65± 268.45
325.72± 22820•
- 384.05± 109.44
320.87t 11930
380.05 299j0.10 ,,
P>0.05 P>0.05 N0.05 NODS . • Note : P value < 0.05 show significant. P value > 0.05 shows not significant.
In Non- smokers, out of 11(10.89%) symptomatic subject 5 (4.95%) shows cough, 3 (2.97%) sputum production, 2 (1.98%) wheeze and 1(0.99%) wheeze & shortness of breath.
A statically significant relation of cough, sputum production, wheeze and shodness of breath with smoking was demonstrated in our studies.
Discussion Our study showed significantly
reduced pulmonary functions in smokers as compared to non-smokers among the parameters studied.
FEV, was most significantly reduced in the group of respondents who reported having wheeze and shortness of breath which implies that wheeze might be a good indicator of the presence of obstructive disease.
FVC, FEV, ,FEV, / FVC were lower in those with cough, sputum production, wheeze & shortness of breath than in those without the symptoms, and all these parameters have P value < 0.05 i.e. significant. PEFR was also lower in those
with cough, sputum production, Wheeze & shortness of breath than in those without the symptoms and have P value > 0.05 i.e. not significant. Our findings are similar to those observed by P Vaidya et al (7) and Behera D et al.(8) •
FVC, FIV„FEVI/FVC are significantly decreased in smokers but prrR values are not significantly decreased.
rhe association of smoking with chronic bronchitis is well established. Non-smokers have a lower prevalence of disease than smokers which was corroborated by present study.
Conclusion A statistically significant co-relation
of cough, increased sputum production, wheeze and shortness of breath with smoking was demonstrated in our studies.
References 1. Jindat Sk. A field study on follow up at 10
yrs of prevalence of chronic obstructive pulmonary disease and peak expiratory flow rate. Indian J Med. Res. 1993; 98 : 20-26.
2. Vinay Kurnar, Rainzi S.Carton, standey„ Robinsns Basic Pathology, Environmental diseases ; sounders 2003 : 274-75.
3. Quaak Mvan et. al. Eur Respir J. 2009, 33(3) : 468-80.
4. Society AT : ATS statement- snowbird workshop on standardization of spirometry Am. Rev Raspir Dis 1979, 119: 831-838.
5. Hankinson JL, Odencrantz JR, Fedan KB spirometric reference values from a sample of the general 14.5. population. Am J Respir crit care Med 1999, 159 : 179- 187.
6. Forastiere F, stafoggia M, Tosco C, Picciot to 5, Agabiti N, Cesaroni G, Perucci CA : Socioeconomic status particulate air pollution, and daily mortality AmJ Ind Med 2006.
7. P. vaidya et al lung India 2007 ; 24 : 6-10. 8. Behera D. Malik SK. Chronic respiratory
diseases in Chandigarh teachers. Indian J. Chest Dis and All Sc! 1987, 29.25-28.
Acknowledgement
We are grateful to Mr. A. A. Krim, Managing Director, Katihar Medical College for his encourgement.
INDIAN MEDICAL JOURNAL I October 2010, Vol. 104, No. 10 341
Prevalence ot Chronic renal disease in Spain Results of the EPIRCE study. Nairnlogo. 2010: 30(1)-78-86 Brooks O McClean M. Summary report. Boston Unwersity investigation of chrome kidney disease in Western Nicaragira, 2009-2012 [Internet]. Boston: Boston University School of Public Health: 2012 Aug [cited 2013 Oct 25]. 18 p. Cerdas M. Chronic kidney disease in Costa Rica Kidney lilt Suppl. 2005 Aug :( 97):S31-3.
0 Machiraju RS, Yaradi K, Govnishankar S. Edwards L. Altalud S, Miller F, et al.
Enidenlrology of Udhanam Endemic Neidarepattiy. J Am Sac Neptuol. 2009. 20 643A
11 LOpez-Mark L. Chwez V. Garcia XA. Ftores wM, Garcia YM. Herrera R et ai Histopathology of chronic kidney disease of unknown etiology in Salvadoran agricultural communities. MEDICC Rev. 2014 Apr, 16(2):49-54.
12 Wijkstrom J. Leiva R. Elinder GG, Leiva S. Trujillo Z, Trujillo L, et al. Clinical and pathological characterization of Mesoamerican Nephropathy: a new kidney disease in Central America. Mn J Kidney Dis. 2013 Now62(5):9013-18.
13 Pews-John Ri. WaTagasunya JK, VVickremasinghe AR. Dissanayake WP. et al. Exposure to acetylcholinesterase-inhibiting pesticides and chronic renal failure Ceylon Med J. 2006-51.42-3.
14 Levey AS, American Journal of Kidney Diseases. Vol 49, No 2 (February). 2007: pp 175-179
15 Rajapurkar MM, John GT. Kirpalani AL. Abraham G, Agarwal SK. Almeida AE, et tat. What do we know about chronic kidney disnage In India: first report of the Indian CKD registry. BMC Nephrol. 2012 Mar 6;13(10):2-8.
1 ORIGINAL & CLINICAL RESEARCH
NTRODUCTION
Leishmaniasis Ikala-azad is a group jxgotozoal diseases caused by parasites
4 the genus leishmania, and transmitted a man by the bite of female hlebotarnine sandfly. They are esponsible for various syndromes in lumens - kala-azar Of visceral eishmaniasis(VL), cutaneus eishinaniasis(CL), post kala-azar dermal eishmaniasis(EKDU etc'''. The visceral ype of disease. kala-azar, is still important lisease in India. The -majority of the eishmaniasis are zoonoses involving wild )r domestic mammals (rodents, canines). tome forms (e.g. Indian kala-azar) are :onsidered to be nonzoonotic nfectionsolleishmaniasis is endemic in nany countries in tropical and subtropical region, including Africa, central and south America, Asia and the mid terranean region. About 2 -4 Ian cases of VL are reported annually worldwide. Kala- azar is endemic in 52 districts in India. In Sib° r(31 ), lharkhand(4), West- Bengal(11)and Uttar Pradesh(4) districts are affected.
About 130million, population is at risk of the disease 1.33 The increase in leishmaniasis worldwide incidence is mainly attributed to the increase of several risk factors that are clearly man made and i nr I tide massive migration, deforestation, urbanization, irmn U TVS Upressi on. ma I nut UI ion a nil
A Study on Incidence of Kala-Azar in Different Age and Sex Group of Inhabitants of Katihar along with Haematological Alteratidns
Dr. SanjaySingh'. Dr.Sanjay Tiwari3. Prol(Dr.) A_ K.Rayl
treatment failurem.Kala-azar has been AIMS & OBJECTIVES known to occur endemically in the• eastern part of the Indian subcontinent, northern and eastern China, Africa and. the An attempt has been made to study Latin America'51. 1. Relationship of different age and
sex on kala-azar. VL is a chronic infectious diease. It Is 2. Haemoglobin alterations In
characterized by fever, hepatomegaly different age and sex groups spleenomegly, weight loss, pancytopenia . suffering from kala-azar. and hyperganenaglobulinent. Anaemia is the most common manifestation of VL. MATERIALS AND METHOD It may also be associated with
The study was conducted at the out- !cur open ia,t hromboc ytopeni a, patient department of katihar medical pancylopenia, haentopliagocytosis and college hospital (KMCH) with the disseminated inhavascular coagulation. permission of competent authorities.
Haematological improvement is noted Blood sample of 130 diagnosed kala-
within a week and complete azar patients were collected and haematological response occurs in 4-6
haemoglobin level was determined for weeks of treatment Relapses are rare data analysis. and increased risk of being diagnosed
with haematolymphoid malignancies on long term follow- up is not noted .
Sampling study way conducted on patients of age group 10yr In 60yr for data analysis of haemoglobin level of
I. MD. Associate Professor. Deptt. of Physiology. K.M.0 H, Katihrir. 2. MD. Associate Professor, Depth of Physiology, K.M.C.11. &Ohre. 3 PhD. Emeritus Professor. Deptt. of Physioloo KM C II, KthuIIlKr
8 INDIAN MEDICAL JOURNAL I March 2016, Vol 110. No. 3
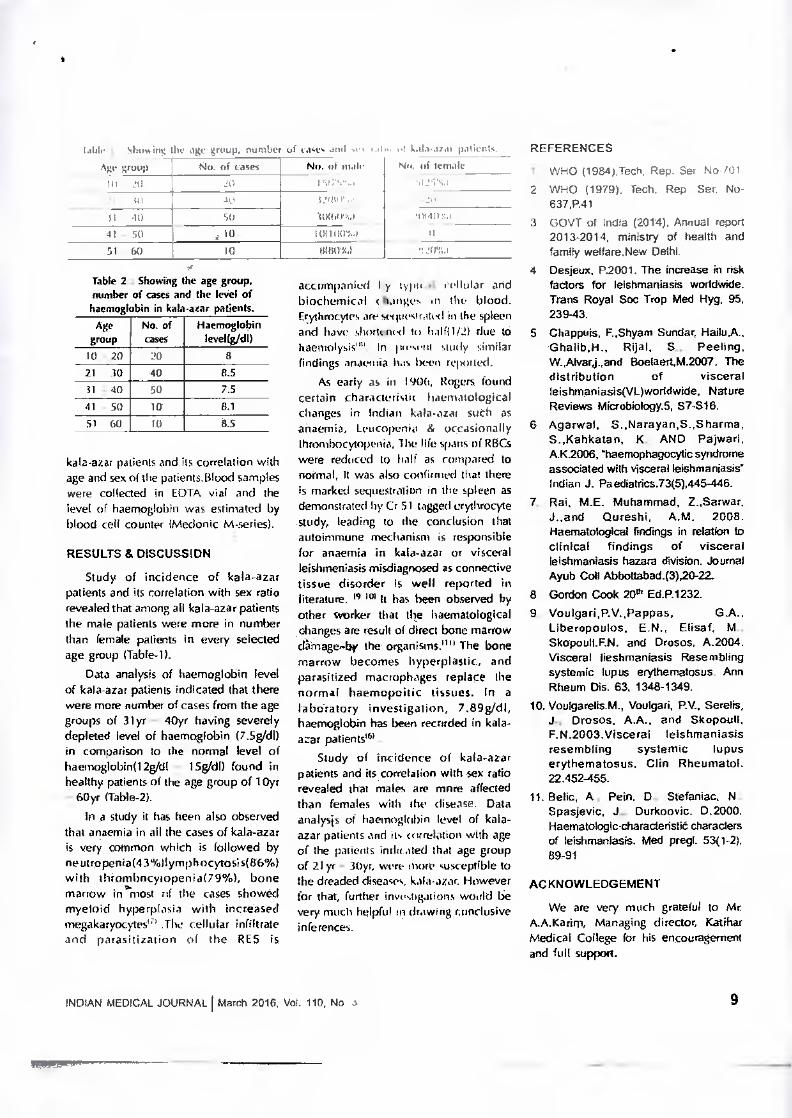
kata.a7,11 patient. REFERENCES tablr 1 shoGing tin age group, number of cwt. Anil 33 No. /if male
10R(03.4 1011(1034
Ago le
group No. of cases 40
21 40 SI 40 50 41 - 50 j 10. Si - GO 10
Table 2 : Showing the age group. number of cases and the level of haemoglobin in kala-azar patients.
Age group
No. of cases
Haemoglobin leveRgAll)
0- 20 20 8 21 - 30 40 8.5 31 - 40 50 7.5 41 -50 10 8.1 51 - GO TO 8.5
kala-azar pa ienis and its correlation with age and sex of the patients.Bloocl samples were collected in EOTA vial and the level of haemoglobin was estimated by blood cell counter (litecionic M-series).
RESULTS Es DISCUSSION
Study of incidence of kala-azar patients and its correlation with sex ratio revealed that among all kala-azar patients the male patients were more in number than female patients in every selected age group (Table-1).
Data analysis of haemoglobin level of kala-azar patients indicated that there were more number of cases from the age groups of 31yr - 40yr having severely depleted level of haemoglobin (7.5g/d1) M comparison to the normal level of haemoglobin(12g/d1 - 15g/dl) found in healthy patients of the age group of 10yr - 60yr (Table-2).
In a study it has been also observed that anaemia in all the cases of kala-azar is very common which is followed by neutropenia(43%llymphocytosis(86%) with thrombacylopenia(79%), bone marrow in'most of the cases showed myeloid hyperplasia with increased megakaryocytes11) .The cellular infiltrate and paratitization of the RES is
Nil Ili iernale
161101.4 _0201,4
accompanied by tHott 6 cellular and biochemical changes in the blood. Erythrocytes are seqp(slot(31 in the spleen and have shortened to litlf(1/2) due to haemolysit''. In nmsent study similar findings anaznia has bWell reported.
As early as in I 90b, Rogers found certain charactertsItt haematological changes in Indian kala.azat such as anaemia, Leucopunis & occasionally thrombocytopenia, Ille life spans of RBCs were reduced to half as compared to normal, It was also confirmed that there is marked sequestration in the spleen as demonstrated by Cr 51 tagged erythrocyte study, leading to the conclusion that autoirnmune mechanism is responsible for anaemia in kala-azar or visceral leishmeniasis misdiagnosed as connective tissue disorder is well reported in literature. N 1°1 It has been observed by other worker that the haematological changes are result of direct bone marrow damage-by the organisms." The bone marrow becomes hyperplastic, and parasitized macrophages replace the normal haemopoitic tissues. In a laboratory investigation, 7.89g/di, haemoglobin has been recorded in kala-azar patients .
Study of incidence of kala-azar patients and its correlation with sex ratio revealed that males are more affected than females with the disease. Data analysis of haemoglobin level of kala-azar patients and its correlation with age of the patients Wit ated that age group of 21 yr - 30yr, were more susceptible to the dreaded diseases, kala-azar. However for that, further investigations would be very much helpful in drawing conclusive inferences.
1 WHO (1984),Tech, Rep. Ser No /01 2. WHO (1979). Tech. Rep Ser. No-
637,P.41 3. GOVT of India (2014), Annual report
2013-2014, ministry of health and family wellare.New Delhi.
4. Desjeux. P.2001. The increase in nsk factors for leishmaniasis woddvoide. Trans Royal Soo Trap Med Hyg, 95, 239-43.
5. Chappuis, F.,Shyam Sundar, Ghalib,H., Rijal, S., Peeling, W.,Ahrarj.,and Boelaert,M.2007. The distribution of visceral leishmaniasis(VL)worldwide, Nature Reviews Miaobiology.5, 57-S16.
6. Agarwal, S.,Narayan,S.,Sherma, S.,Kahkatan, K; AND Pajwari. A.K2006, mhaemophagocytic syndrome associated with visceral lehmaniasis' Indian J. Paediatrics.73(5),445-446.
7. Rai, M.E. Muhammad, Z..Sarwar, J..and Qureshi, A.M. 2008. Haematological findings in relation to clinical findings of visceral leishmaniasis hazara division. Journal Ayub Coll Abbottabad.(3)20-22
8. Gordon Cook 20filEd.P.1232. 9. Voulgari,P.V.,Pappas,
Liberopoulos, EN.. Elisaf. M., Skopoull.F.N. and Drosos, A.2004. Visceral lieshmaniasis Resembling systemic lupus erylhematosus, Ann Rheum Dis. 63, 1348-1349.
10. Voulgarefis.M., Voulgari, RV., Serelis, J., Drosos. A.A., and Skopoull, F.N.2003.Visceral leishmaniasis resembling systemic lupus erythematosus. Clin Rheumatol. 22.452-455.
11. Belie, A., Pain. D., Stefaniac, N., Spaelevic, J., Durkoovic. 0.2000. Haematologic-characteristii characters of leishmaniasis. Med pregl. 53(1-2), 89-91
ACKNOWLEDGEMENT
We are very much grateful to Mc A.A.Karint, Managing director, Katihar Medical College for his encouragement and full support.
INDIAN MEDICAL JOURNAL I March 2016, Vol. 110, No 3 9
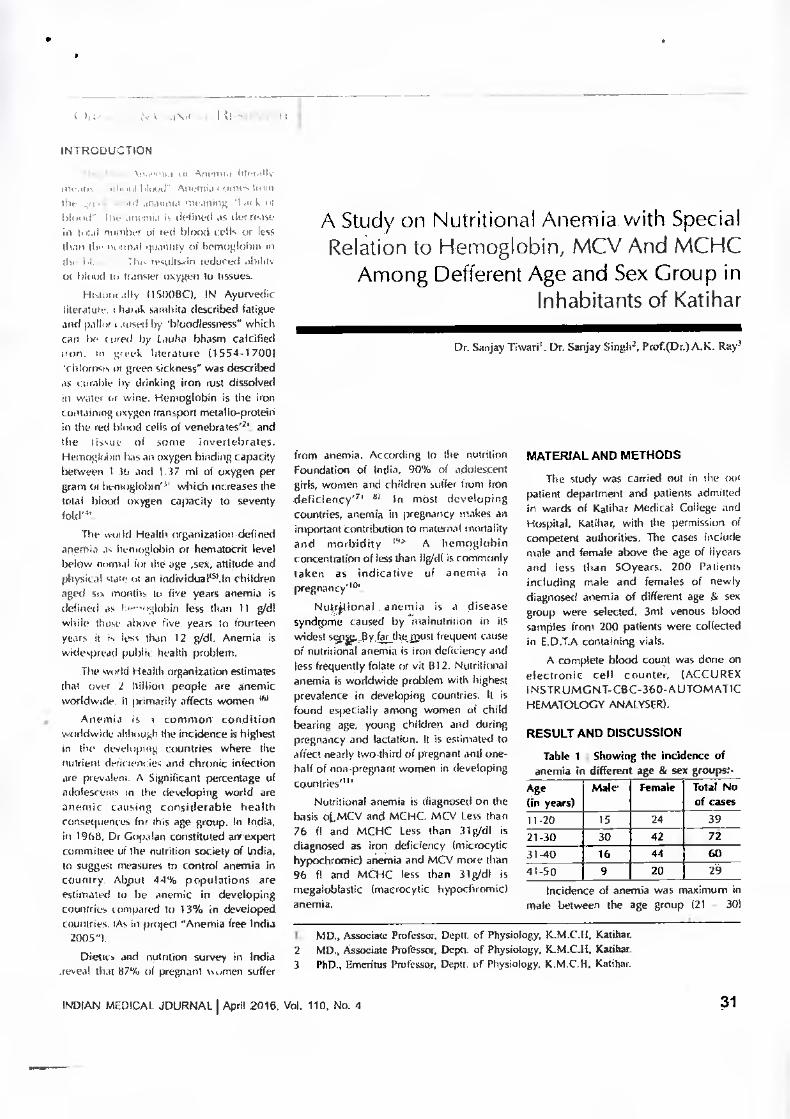
A Study on Nutritional Anemia vvith Special Relation to Hemoglobin, MCV And MCHC
Among Defferent Age and Sex Group in Inhabitants of Katihar
Dr. Sanjay Tiwarii. Dr. Sanjay Sing112, Prot(Dr)A.K. Ray3
•
INTRODUCTION
• ,. • Nedanna Armee., htntaltz ...II,! UI] l!IiPtl uip,rTii,i I LPItTh tiliiPl
Fit_Let L Lc. Lid anaimia meaning k blth id" 1102 ori•mia is defined as der mast. in I, nil number ui red blood cells or less than th. ILL 11111.11 of hemoelobin Iii the I.1 -.1 111,,• recoils...in !educed alga. ot blood to transfer oxyeen to tissues_
HhlL)111ii ly (151/013C), IN Ayurvedic literatIne I hal ak samhita described fatigue and path a / aused by "bloodlessness" which call 1)0 I tired by Lauha bhasm calcified iron. In greek literature (1554-1700) "chlorin,. In green sickness' was described as curable by drinking iron rust dissolved in wale' (or wine. Hemoglobin is the iron cuntaming oxygen transport metallo-protein in the red blood cells of venebrates'21, and the Iissue of some invertebrates. Hemoglolen has an oxygen binding capacity between 1 lb and 1.37 ml of oxygen per gram or lienniglobin''', which increases the total blood oxygen capacity to seventy fokl''.
The Mil Irl Health organization defined anenna a.; hemoglobin or hematotrit level below normal lot IIIC age ,sex, attitude and physical gate it an individua Pin children aged six month, to five years anemia is defined as Ile—,>slithin less than 11 g/c11 while those ab(np five years to fourteen years it is less than 12 01. Anemia is widespread public health problem.
The WI 'rid Health organization estimates that over 2 billion people are anemic worldwide. It primarily affects women 1m.
Anemia is a common condition worldw.ide 31111twh the incidence is highest in the developing countries where the Tuarient dent - wig ies and chronic infection are prevalent. A Significant percentage of adolescents in the developing world are anemic causing considerable health consequences for this age group. In India, in 1968, Dr Gopalan constituted arrexped committee of the nutrition society of Lndia, to suggest measures to control anemia in country Abput 44% populations are estimated to be anemic in developing countries compared to 13% in developed countries. As in project "Anemia free India - 20051.
Diettc. and nutrition survey in India .rmeal that 87% of pregnant lumen suffer
from anemia. According to the nutrition Foundation of India, 90% of adolescent girls, women and children stiffer from Iron deficiency'71 81. In most developing countries, anemia in pregnancy makes an important contribution to maternal mortality and morbidity 19>. A hemoglobin concentration of less than 11g/(11 is commonly taken as indicative of anemia in pregnancy''''.
Nutzitiona I . anemia is a disease syndrome caused by malnutrition in its widest sw..,111y.far thepost frequent cause of nutritional anemia is iron deficiency and less frequently fatale or vii 812. Nutritional anemia is worldwide problem with highest prevalence in developing countries. It is found especially among women of child bearing age, young children and during pregnancy and lactation. It is estimated to affect nearly two-third of pregnant ,bnd one-half of non-pregnant women in developing Countries'"'.
Nutritional anemia is diagnosed on the basis ot,MCV and MCHC. MCV Less than 76 fl and MCI-1C Less than 31g/d1 is diagnosed as iron deficiency lmicrocytic hypochmmic) anemia and MCV more than 96 fl and MCHC less than 31g/d1 is megaloblastic (macrocytic hypocbromic) anemia.
MATERIAL AND METHODS
The study was carried out in the mit patient department and patients admitted in wards of Sunhat Medical College and Hospital, gatilmr, with the permission of competent authorities. The cases include male and female above the age of lyears and less than 50years. 200 Patients including male and females of newly diagnosed anemia of different age & sex group were selected. 3m1 venous blood samples from 200 patients were collected in E.D.T.A containing vials.
A complete blood count was done on electronic cell counter, (ACCUREX INSTRUMGNT-C6C-360-AUTOMATIC HEMATOLOGY ANALYSER).
RESULT AND DISCUSSION
Table 1 : Showing the incidence of anemia in different age 8i se groups:.
Age (in years)
Male Female Total No of cases
11-20 15 24 39 21-30 30 42 72
31-90 16 44 60
41-50 9 20 29
Incidence of anemia was maximum in male between the age group (21 - 301
I. MD., Associate Professor. Deptt of physiology, ICM.C.II, Katihar. MD., Associate Professor, Deptt. of Physiology, K_M.Cli, Katihar.
3. PhD., Emeritus Professor, Deptt. of Physiology. K.M.C.I1, Katihar.
INDIAN MEDICAL JOURNAL I April 2016. Vol. 110, No. 4 31
• •
"1(14.-ne5 nyc rapIi hoe-Felerern. 441141 (hill114P
.111C1111.1 .141.1 r I ;054 are i1iario())1i)
In pot 'prang iniagalnirl.nticp anemia. Table 2 : Showing the int-Menet of microcytic hypochromic anemia in
different age groups:- Age (in years)
No. of cases
Percentage
I I -20 IS 111_75 21-30 50 r7.5 51-40 21 26.25 41-50 14 17.5
Max in m cases of microcytic hypodiromic anemia were found in age group 121 - 301 followed by age group 131 - 401.
Table 3 Showing the incidence of macrocytic hypoch omic anemia in
different age groups:- Age (in years)
No. of Percentage cases
11-20 18 30 21-30 24 40 31-40 10 16.6 41-50 8 13.3
Maximum number of macrocytic hypochomic anemia were found in age group 121 -301 followed by age group (11 - 20).
cases .114 hying ;1114114411
111( yht h ypcfri bromic
According it, sex wise incidence, microcytic hypochrumic anemia was maximum in both male and female.
A Study was clone among 280 health workers ranging 19-56years and found that microcytic hypochromic anemia was most common in both sexes#12 . In Our study too, microcric hypochromic anemia was most common 40% followed by inacrocric hypochromic 30% which is very much close to the above result. Highest incidence of nutritional anemia was found in age group 21-30 in our study in both sexes. Similar findings were observed by Napier and Das Gupta.
REFERENCES
1. Medicine net. corn-definition of anemia. Last editodal review 12/09/2000.
2. Melon, Antheajean Hopkins. Charles Williams MC LaugNn. Susan Johnson, Maryanng, Quon Warner, David Lattari, Jill D Mfg (1993) Human biology and heap.' Englewood cliffs, New Jersey. USA, Prongs hall. ISBN - 0 - 13 - 981176 - 1.
3 Domiaguez de Villata ED. Ruiz earmona MT, Rubio J.J, de Andres S (December 1981)
4 Costanzo, Linda. S (2007), physiology
a nI different ;eke:- Females
No. of cases
50 62.5 M) 70
Hagersiwon, M.D. Lippincott Whams and Wilkins -ISBN-0-7817-7311-3.
5 Blanc B. Pin& CA, Hallberg L. at al. Nutritional anemia. Report of a WHO Scientific Group. WHO Tech Rep ser. 1968; 405. 1-4.
6 Stott GJ, Lewis SM. Bulletin of the world Health Ontmization, 1995. 73:369-373.
7, Totega G Singh. P. Micronutrient deficiency disorders in 16 distdcts of India, Report of an CMR task force study. District Nutrition project Part -1 - 2001.
8. Kapur - D. Agrawal KN. Agrwal DK, Nutritional Anemia and Its control. Ind. J. Pediatrics 2002.69:607-616.
9. Van den Greek NR. Anemia in pregnancy in developing countries. Review British Journal of obstetrics and gynaecology, 1998,105: 385 - 390.
10. Nutritional anemia. Report of a WHO Group of Experts Geneva. world Health Organization, 1972 (WHO Technical Report sedes,No - 503).
11. K. Park, A textbook of preventive and community medicines 23:2015, 642.
12, Must A. Dalal.G.E. 1991. ACK1MOWLEDGEMEIMT:- We are very
much grateful to Mr. A.A./Carim, Managing director, /Caliber Medical College for his encouragement and full support.
i \\ 111.4 Ow in, lvr,tt if
Ijn id anemia --)
Nn. uf
Association News 248" CME programme will be held at NRS Medical College & Hospital at 2 PM held on 23rd April 21116. All hon'ble life members are requested to attend the meeting.
(Pinaki Kr. Ghosh) Secretary. General. AIGPA
32
INDIAN MEDICAL JOURNAL I April 2016, Vol. 110, No. 4
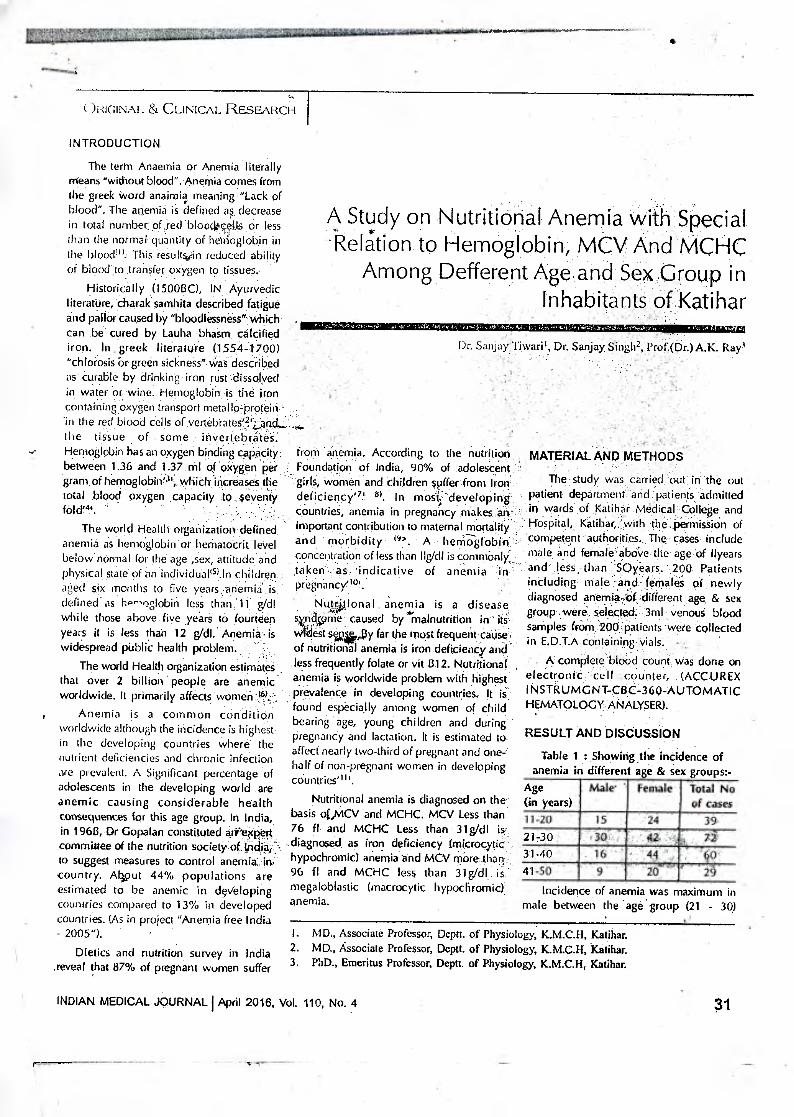
A Study on Nutritional Anemia vvith Special .Reltion to Hemoglobin, MCV And MCHC
Among Defferent Age and Sex Group in Inhabitants of Katihar
tr rrr
Dr. Sanjay Tiwaril, Dr. Sanjay Singh2, Prof.(Dr.)A.K. Ray'
& CLINICAL RESEARCH
INTRODUCTION
The term Anaemia or Anemia literally means 'without blood". Anemia comes from the greek Word anairnii meaning "Lack of
• blood". The anemia is defined as decrease
than the normal quantity of hemoglobin in in total number of „red 'blootifleils or less
• the blood" ): This resultsiin reduced ability
of blood transfet oxygen to tissues. Historically (15008C), IN Ayurvedic
literature, charak samhita described fatigue and pallor caused by "bloodlessness"-which can be cured by Lauha bhasm •calcified iron. in . greek literature. (1554-1700) "chlorosis 'or green sickness" Was described as curable by drinking iron rust .dissolyecl in water or. wine. Hemoglobin is .the iron containing Oxygen transport metalloproteiii iii the red blood cells of .venebrates'.3. 4L the tissue of some invertebrat6S. Hemoglobin has an oxygen binding capacity: between 1.36 and 1.37 nil of .oxygen Per gram of hemoglobin'3% whitkincreases the total blood oxygen capacity to ,.seventy fold "
The world Health organization defined anemia as hemoglobin or hernatocrit level below normal for the age ,sex, attitude and physical state of an individual'5),In children . aged six months to five years anemia' is • .
defined as less than 11 g/dI while those above five years to fourteen years it is less than 12 g/c1I. Anemia., is widespread pliblic health problem.
The world Health organization estimates . that over 2 billion people are anemic' worldwide. It primarily affects women
Anemia is a common condition worldwide although the incidence is highest in the developing Countries where' nutrient deficiencies and chronic infection are prevalent. A Significant percentage of adolescents in the developing world are anemic causing considerable health consequences for this age group. In India, in 1968, Dr Copalan constituted ari'e?cpeq committee of the nutrition society of to suggest measures to control anemia: in: country. Aboput 44% populations are estimated to be anemic in d9v'eloping countries compared to 13% in developed countries. {As in project "Anemia free India - 20051.
Dietics and nutrition survey in India .reveal that 87% of pregnant women suffer
• • NutStional anemia is a disease secliorne caused by malnutrition in its $.4.4 est swy far the most frequent cause, of nutritional anemia is iron deficiency and less frequently folate or vit 812. Nutritional , anemia is worldwide problem with highest prevalence in developing countries. It found especially among women of child bearing age, young children and during pregnancy and lactation. It is estimated to affect nearly two-third of pregnant and one-half of non-pregnant women in developing countries'' ".
Nutritional anemia is diagnosed on the basis of,MCV and MCHC. MCV Less than 76 fl and MCHC Less than 31g/d1 is diagnosed as iron deficiency (rnicrocytic hypochromic) anemia and MCV more than 96 fl and MCHC less than 31g/di is megaloblastic (macrocytic hypochromic) anemia.
MATERIAL AND METHODS
The study was carried out in the out patient department and patients admitted in wards of Katihar Medical College and Hospital, Katihar, with the permission of competent authorities. The cases include male and female above the age of Ilyears and less, than SOyears. 200 Patients including male and females of newly diagnosed anemia,of ,different age & sex group were selected. 3m1 venous blood samples from 200 patients were collected in E.D.T.A containing vials.
A complete blood count was done on electronic cell counter, • (AGCUREX INSTRUMGNT-C8C-360-AUTOMATIC HEMATOLOGY ANALYSER).
RESULT AND DISCUSSION
Table 1: Showing the incidence of anemia in different age & sex groups:-
Age (in years) la
Nia Total No of cases
11-20 imilmal 39, 21-30 '3 MIIM 72 31-40 Elm 0 41-50 9 29
Incidence of anemia was maximum in male between the age group (21 - 30)
from anemia. According to the nutrition Foundation of India, 90% of adolescent girls, women and children suffer from Iron deficiency'7' 8). In most developing countries, anemia in pregnancy makes .an important contribution to maternal mortality and morbidity '8'. A hemoglobin concentration of less than 1101 is commOnly, taken as indicative of anemia in pregnancyio' '.
I. MD, Associate Professor, Deptt. of Physiology, K.M.C.II, Katihar. 2. MD., Associate Professor, Deptt. of Physiology, K.M.C.H, sKatihar. 3. PD., Emeritus Professor, Dep. of Physiology, K.M.C.H, Katihar.
INDIAN MEDICAL JOURNAL I April 2016, Vol. 110, No. 4 31
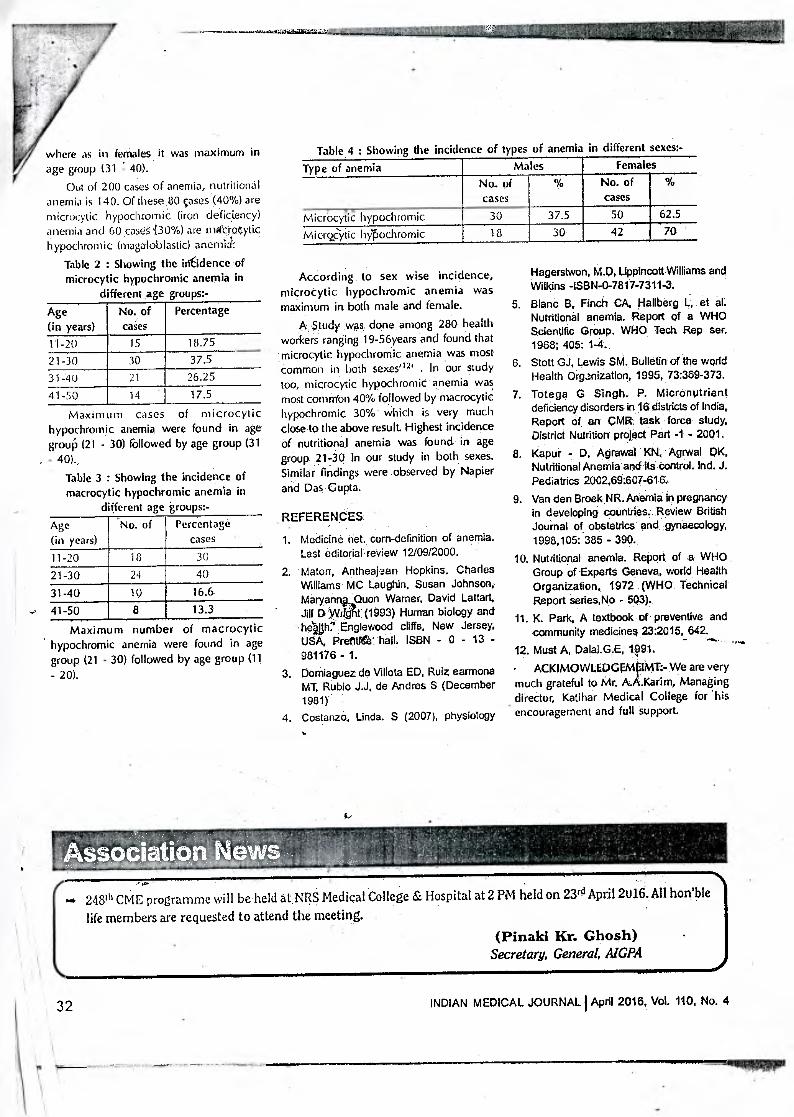
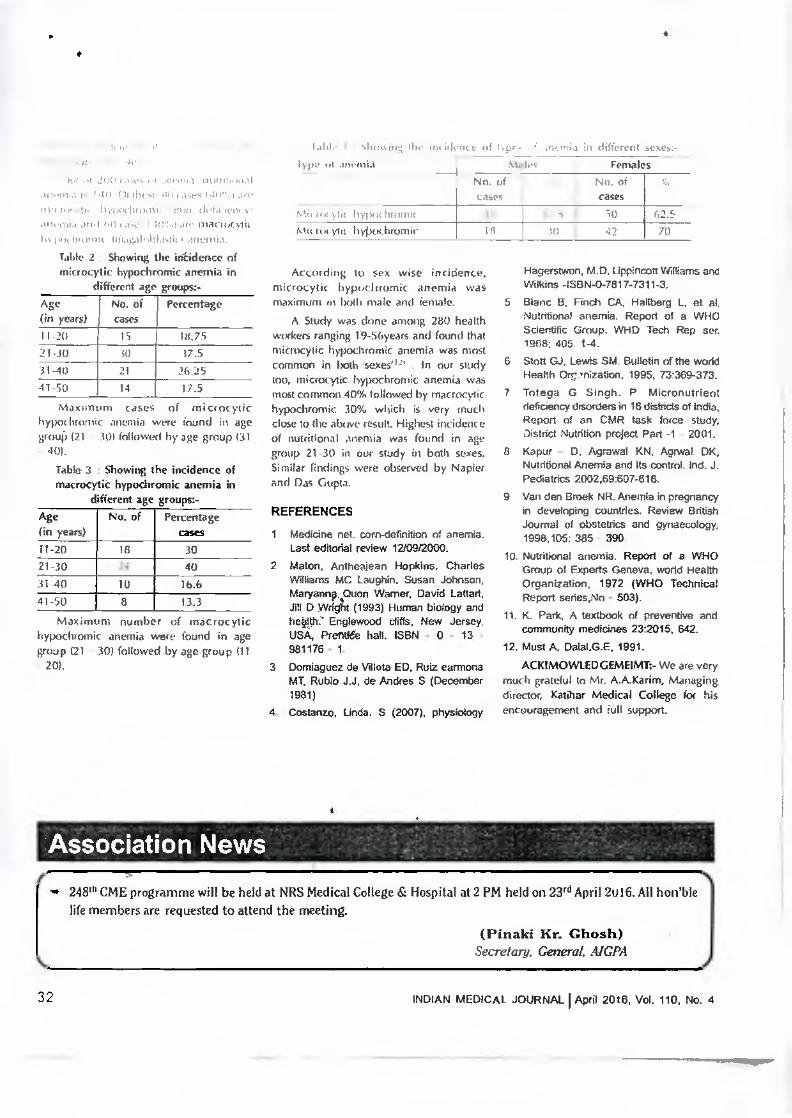
where as in females it was maximum in Table 4 : Showing the incidence of types of anemia in different sexes:- Type of anemia Males Females
No. of cases
% No. of cases
%
MiCfocytic hypochromic 30 37.5 50 62.5
Microcsytic hyPochromic 18 30 42 70
age group (31 : 40). Out of 200 cases of anemia, nutritional
anemia is 140. Of these .80 cases (40%) are microcytic hypochrornic (iron deficiency) anemia and 60 caseS.(30%) are rnac.raytic hypochromic (magaloblastic) anemid":
Table 2 : Showing the inCdence of microcytic hypochromic anemia in
different age groups:- Age (in years)
No. of cases
Percentage
11-20 15 18.75 21-30 30 37.5 31-40 21 26.25 41-50 14 17.5
Maxim im cases of microcytic hypochromic anemia were found in age grouP (21 - 30) followed by age group (31 - 40).,
Table 3 : Showing the incidence of macrocytic hypochromic anemia in
different age groups:- Age (in years)
No. of Percentage cases
11-20 18 30 21-30 24 40
31-40 10 16.6- 41-50 8 13.3
Maximum number of macrocytic hypochromic anemia were found in age group (21 - 30) followed by age group (11 - 20).
According to sex wise incidence, microcytic hypochromic anemia was maximum in both male and female.
A $tudy was done among 280 health workers ranging 19-56years and found that microcytic hypochromic anemia .was most common in both sexes'12 ' . In our study too, microcytic hypochromic anemia was most common 40% followed by macrocytic hypochronnic 30% - which is very much close to the above result. Highest incidence of nutritional anemia was found in age group 21-30 in our study in both sexes. Similar findings were observed by Napier and Das Gupta.
REFERENCES
1. Medicine net, corn-definition of anemia. Last editorial review 12/09/2000.
2. Maton, Antheajaan Hopkins, Charles Williams MC Laughin, Susan Johnson, Maryanngupuon Warner, David Lattart, Jill I) Witfit (1993) Human biology and heUh7 Englewood cliffs, New Jersey, USA, Pretiffee' hall. ISBN - 0 - 13 - 981176 - 1.
3. Domiaguez de Villota ED, Ruiz earmona MT, Rubio J.J, de Andres S (December 1981)
4. Costanzo, Linda. S (2007), physiology
Hagerstwon, M.Q, Lippincott Williams and Wilkins -ISBN-0-7817-7311-3.
5. Blanc B. Finch CA, Hallberg L, et al. Nutritional anemia. Report of a WHO Scientific Group. WHO Tech Rep sec. 1968; 405: 1-4.
6. Stott GJ, Lewis SM. Bulletin of the world Health Organization, 1995, 73:369-373.
7. Totega G Singh. P. Micronutrient deficiency disorders in 16 districts of India. Report of an ,CMR task force study, District Nutrition project Part -1 - 2001.
8. Kapur - D, Agrawal KN, Agrwal OK, Nutritional Anemia and Its control. Ind. J. Pediatrics 2002,69:607-616,
9. Van den Broek NR. Anemia in pregnancy in developing countries. Review British Journal of obstetrics and gynaecology, 1998,105: 385 - 390.
10. Nutritional anemia, Report of a WHO Group of Experts Geneva, world Health Organization, 1972 (WHO Technical Report series,No - 503).
11. K. Park, A textbook of preventive and community medicines 23:2015, 642.
12. Must A, Dalal.G.E, • ACKIMOWLEDGEMpMT:- We are very much grateful to Mr. A.A.Karim, Managing director, Katihar Medical College for his encouragement and full support.
248th CME programme will be held at NRS Medical College & Hospital at 2 PM held on 230 April 2016. All hon'ble
life members are requested to attend the meeting. (Pinaki Kr. Ghosh)
Secretary, General, AlGPA
32 INDIAN MEDICAL JOURNAL' April 2016, Vol. 110, No. 4
-
for treating prolapsing loop colostomy. Rosen liAJ, Cobb WS. : Laparoscopic versus open colostomy reversal. J. Gastrointest Surg. 2006 Jun; 10(6):895-
900. S. Ira .J kodner, Maingot's Abdominal
operations, 10th -vol.1 (12), 427-
439.
6. Kenneth R. itikCirrairl Current. Medical diagnosis andTreatnient, 3e edition (14).
7. Shahnam A.shar pour, Mehrarn peyvastei, Bahram Changai, Hazlir Javanenzadeh
(2012).
8. Sheikh MA, Aktitar .1, Abated S, :
Complication colostomy in infants children. J Coll Physicians Sung- P .
2006 Aug; 15(8)304.6-
9. T. Tsakulov, Stt Mantalkulov, Rahrnanov, S. Matkarimor (2010).
10. Tatiany case- Hopsital; Devendro, Ba Sunita (2013).
ORIGINAL & CLINICAL RESEARCH
-INTRODUCTION: An Evaluation of Prc,cribing Pattern of Private Practitioner Medically inapprnpri... rr-and ecenomicaay
inefficient use of medicines is A:A:nerved throi,e—,t thp world,Tooeioapires are rup.
marked in the developing countries like India.
use of medicines titt &Oita Kerne& Dc SatuaySuigle-Iff
elernent-to be achieved to improve quality-of . , , , 4,, , tr-totAtti,•?, to ) p,,,,,, I ,,
health and medical, care for the patients ap
the-community, Laing, 1990:. Medical science in general and
-therapeutics in-particular is -developing very quickly-under-going-fast-transition. Therefore it has beeorneimperativeto trainthephysicians for self-directed learning (tosht, 1 99.61. Prescribing, al:Ian:iodate...medicines:fora disease condition and proving related information in a zneartingful way to the patients should be-
-regarded as the key 'transferable skills' to be achieved through -pharmacology coursesi
.Sha,nicar et al; 2003). Generalized Presenc,e „ , irrationalities in Prescribing indicates„ tn,at -traditional teaching in medial schools---dots
-not adequately prepare students for .ratpana therapeutics. Prescribing behavior of he medical -graduates_ depends upon how and what-they-have-been taught andtrairmdialleit drugs during their undergraduate course
'
(Schwartz andGriffin, 198,6o1 /4 survey
recaled that medical students felt the -need
for more teaching of therapeutics (Ward and Miolzweski,2002). The current study was and attempt to evaluate prescribing, whether appropriate or rational.
MATERIALS-AND: ME-MODS...117p 4.1 ti,06ti, :,0-1
Prescriptions. of the i.egistexed 'rnysicians and speciaIits of differértdCt0nt of town r'aridorn within' a period bf-i.ito rnOittlis-irorn,
jurle 10 to august.201-6A,total - ,prescripilons were collected during this tow
--,.rnorath long prospective study frorrtth9 private clinics They were randomly approached either
•«;i5' ic‘ at - -Withaquehave their PreSCriptiOnS PhotocoPied.Therlinic.
-.Collect40 Prescriptions of Primate
Practitioners- were analysed -on-the basis-of
'following -parameters:
To' estiMitelitie:total nuniberof drugs
prescribed.' ;
(II) Generic Vs-brand-products. 010 --Comrn0nlyPresiaribes-drugs.t?ar..5 (IV) Total injectablePresparation.J''''-h!'",
(V). Prescription-:r .--rriormator-tre
. =. .
No _attempt has beervirriade_to: categorize the Prescriptions ;according_to patients, age,
sex or_disease prafile.liResultsAfter compiling_
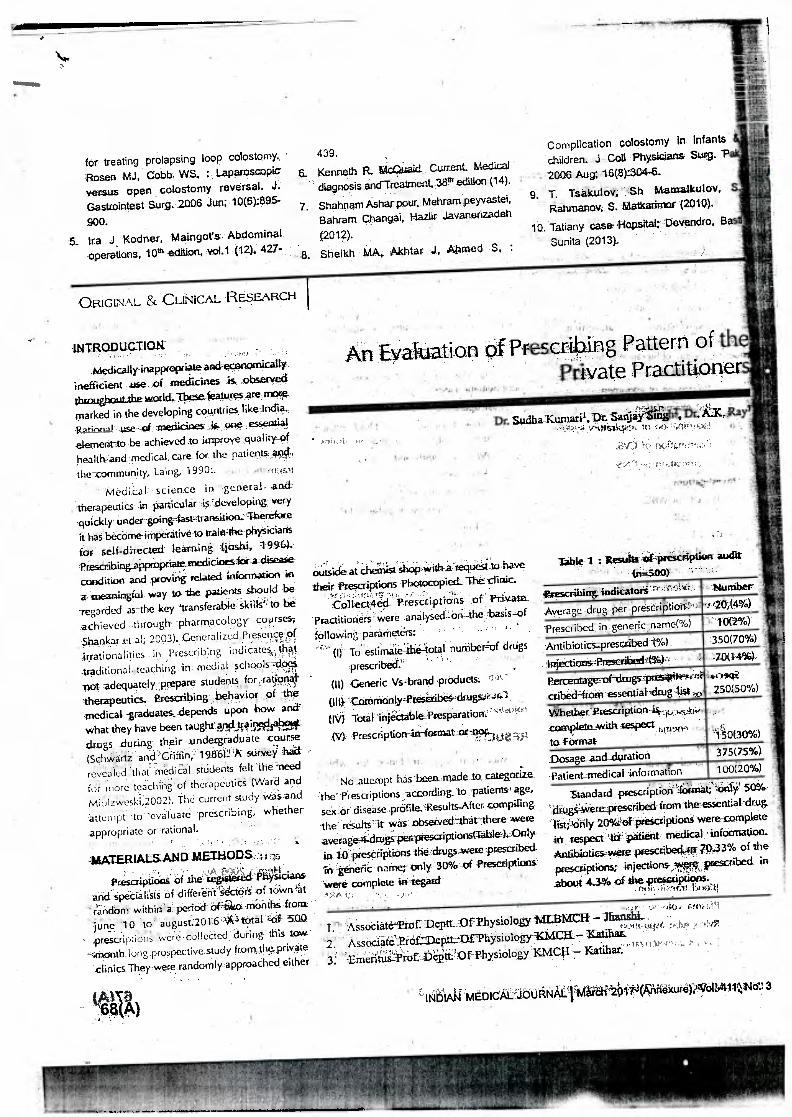
-the results' it was obsenizethat,there were average4--drugqierprescriptions(Table). Only in i0 ipresCriritions the drugsAvere prescribed.
hi -generic name only 30% of PrescriptiOns. were complete in-regard
Table 1 : Resulti irif-Treicription auctrt triL,300) '
treseribils indicators Average drug per prescription-I,.
"Prescribed in generic name(%) ,-10(2%)
-iniectionventscribeevAraibiotic-presaibedw%,) '3_:00((7-140%%)) ., •
Fincentagmf-strugszpreswirv-p,mk ,v7S1.4? .cribecWroni essential-drug A.ist 250(5.0%)
Whether. -PrescriptioA-414., complete=with lespect .
it0(30%1 to-format •
D 375(7S%)osage_aarLduration
Patient-rnedical-information 100(20%)
Standard proscriptioreldnitati'OnV 50%.
:ere_prescribed--from-the-es.Cential-drug,
20%ktfpreicriptions were complete in respect Id -patient medical information. Antiluiotics,were presctibeslar.1;4:03% of the prescriptkms; injections,rescribed in about 4.3% of -the iarigicdption.s.
. (Alla - 6E1 A)
-- rs.P.Ittv,:r,=?*=P. • . ,
--NUntber-
• 1. Associate-Prof: Deptt. -Of-Physiology IvELBMCEt -
Assodife' ..prcif.alepxt.:321f-Physiology
3: -Emerit'UlairOf. Physiolo -1(MC1-1- Kaiihar ' ' •
It(iiStAN mEoick)JouRNALttageitbilqiciiiikump!otmitm.No...,13 • z,
DISCUSSION
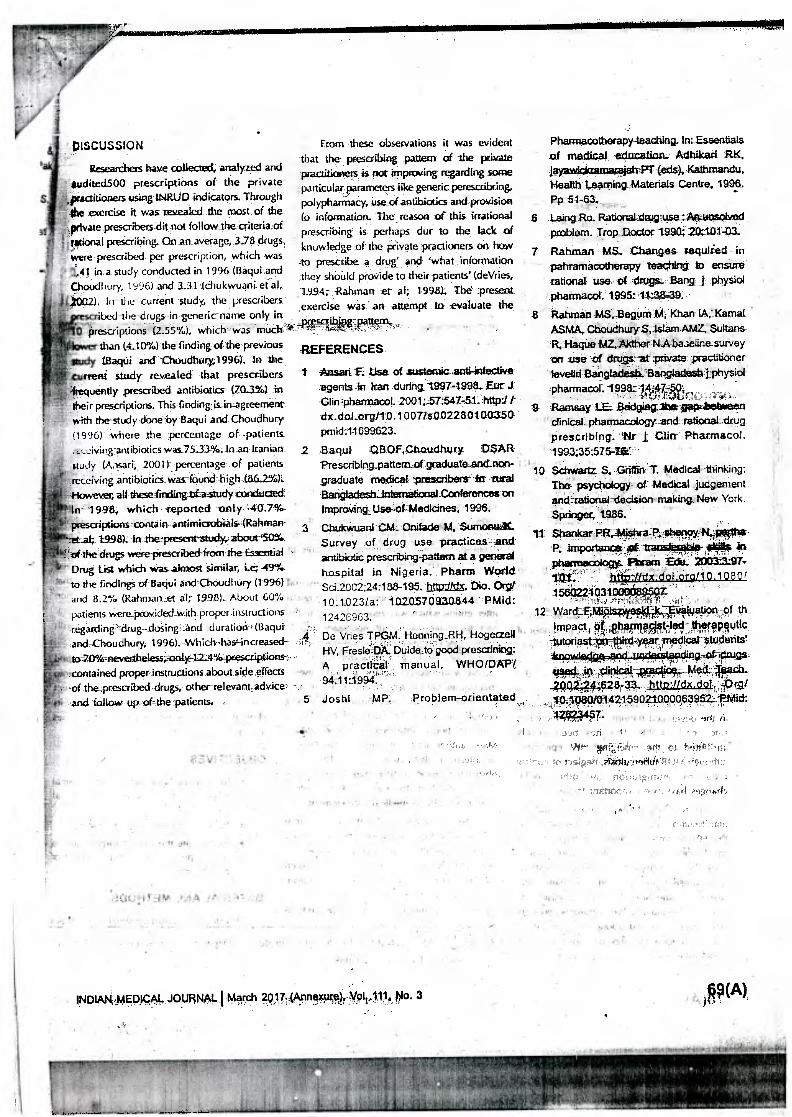
Researchers have collected, analyzed and iudited500 prescriptions of the private
,practitioners using IHRLID indicators. Through the exercise it WAS revealed the most of the fxlvate prescribers-dit not followthe criteria_of notional prescribing. On an average, 3.78 drugs were prescribed per prescription, which was .41 m a study conducted in 1996 (Baqui and
Choudhury, 1996) and 131 (chukwuani et al, 20:121. In the current study, the prescribers
ibed the drugs in generic name only in prescriptions (2.55%), which was much"
than (4.10%) the finding of the previous (tlaqui and Choudhury,1996). In the
rreni study re_v.ealed that prescribers 'frequently prescribed antibiotics (703%1 in their prescriptions. This finding is inagreernent with the study done by Baqui and Choudhury (1996) where the percentage of patients
eiving antibiotics was7.5:33%. In an Iranian study (A,- sari 2001) percentage of patients receiving antibiotics:wa.c-found high 016 n4. Howevizall thesfinding ofs_study rancho:Led In 1996, which -reported only '40.7%
' prescriptions contain -antimiaohials (Rahman-tet a4 1996). In the-present-study, ahour5.0%. of the drugs were prescribed "from the Essential - Drug List which was alut.tt similar, i.e 49% to the findings of °aqui and Choudhury (1996) and 8.2% (Rahman et al; 1998). About GO% patients vvere provided_with proper instructions regardirig"-drug -dosing and duration t (Baqui
-and--Choudhury, 1996). Which -hasincreased-10-70%-neveLthelins ,panly--1_14%-presicriprinns, contained proper instructions about side effects of the_prescribed drugs, otherrelevant advice and follow up of= the -patients.
From these observations it was evident that the prescribing pattern of the primate practitioners is not improving regarding some panicularparameters like generic perescribring, polyphannacy, useotantibiotics and provision fo information. The reason of this irrational prescribing is perhaps dur to the lack of knowledge of the private practioners on how to prescribe a drug' and 'what information they should provide to their patients' (deVries,
.19.94; -Rahman et at; 199/31. The present exercise was an attempt to -evaluate the
-REFERENCES
Ansaii-E Use of sustemic anti-infective agents in Iran during_ 1997-1998._ Er J Glin-phannacol. 2001;57:547-51--http:/-/-dx.dolorg/10.1 007/y0022.80100350 pmid:11699623.
2 Bactui OB OF, Choudhury MAR Prescribing pattermot graduate anthnon-graduate 'medical 'prescribers- in 'cora EtangladestLintemetional Conferences on Improving_ Use of-Medicines, 1996.
3 ChukviruartI_C.)L ()Made M. Sumonue1C. Survey of drug use practices and antibiotic prescribing-pattern at a general_ hospital in Nigeria. Pharm World Sci.2002:24:188-195. harri/dx. Dio. erg/ 10.1023/a: itwastosaw344 Pmict: 1242C363. Dc Vries TpGivl• - '- Henning RH Hogerzell , HV, FreskilnA. Duide to good prescrining: 7 A practical manual. WHOTDAP/.. • '3.. • ce,1 94,11:1994.,
5 Joshi MP.
Pharmacotherapy-teaching. In: Essentials of medical educatiorL Adhileari RI( jerawiciewmarajalzin(eds)., Kathmandu, Health Learning Materials Centre, 1996., Pp 51-63.
6 Laing Ro. RationalOwg_usezArrunsalved problem. Trop Doctor 1990: 2M133-03.
7 Rahman 649. Changes. rertulied in pahramacotherapy braithitq to ensure rational use of drugs. Bang) physiol pharmacol. 1995: 1138.39
B Rahman MS„Begurn M,Rhan IA, Kemal ASMA„ Choudhury S. Istarn.AMZ, Sultans R, Hague IC, A/ether-NA ba.:eline survey on .use of rfrugs-at:private practitioner /eyelid Bangladesh:Bangladesh 'physic( pharmacol 1998.7-141eWErlc.; Ramsay LE Bridging liarkgerfrbehmeten clinical pharmacology end -rational drug prescribing. Nrj, Cliff Pharmacol. 199335:5754W
10 -Scrwartz'S, griffin T.-Medical thinking: The -psYchology- of Medical judgenient snd=rationithOecision making. New York. Springer, 1986.
11 &hanker PRilMistlfa=1 -'stoMFt.-N : ,
P, Importance,.,411 transktsahfis-aibis,, In phatrecology...Plarem marasri-
- hitir.../idx.doi.org/10.1080/
12- -Ward'il.Plse r'Y:- 14.4triF -tatj rkW°1-th' PliPac.t4 ii,..eNTIVAilect.Aierg!pfivtic
. -IPtorios49-vt:4,1vp_u4ciiparstr6fiertts,
0,42,4/141/e8r ,:httn://dx.dolt,prai problem-arient.Ved,,, olkggict/6_1421-59021_0000,609S24.Mick_
••:> •. )r `44+' leirT;i;.-sr.- 90! c,s.
1-)510. faii-,em--: voleitiO3 .1! 4 , •
• r.• 1.1erfitAl ;
ut-i l.M ?AA 27. .-:
INDIANtNERPAL.JOURNA!- March 29.1.71iArin,),C9919/X9101:1f,. No 3
K . •
A Preliminary Study on Factors Affecting Drug Abuse in Medical Students in Medical College
and Hospital in Kolkata & Jhanshi
Dr. Sudha Kumaril, Dr. Sanjay Singh2, Dr. A.K.Ray3
101111
M111 11
1101
iu W
ON
( )ICHINAL & CLINICAL RESEARCH I
ABSTRACT
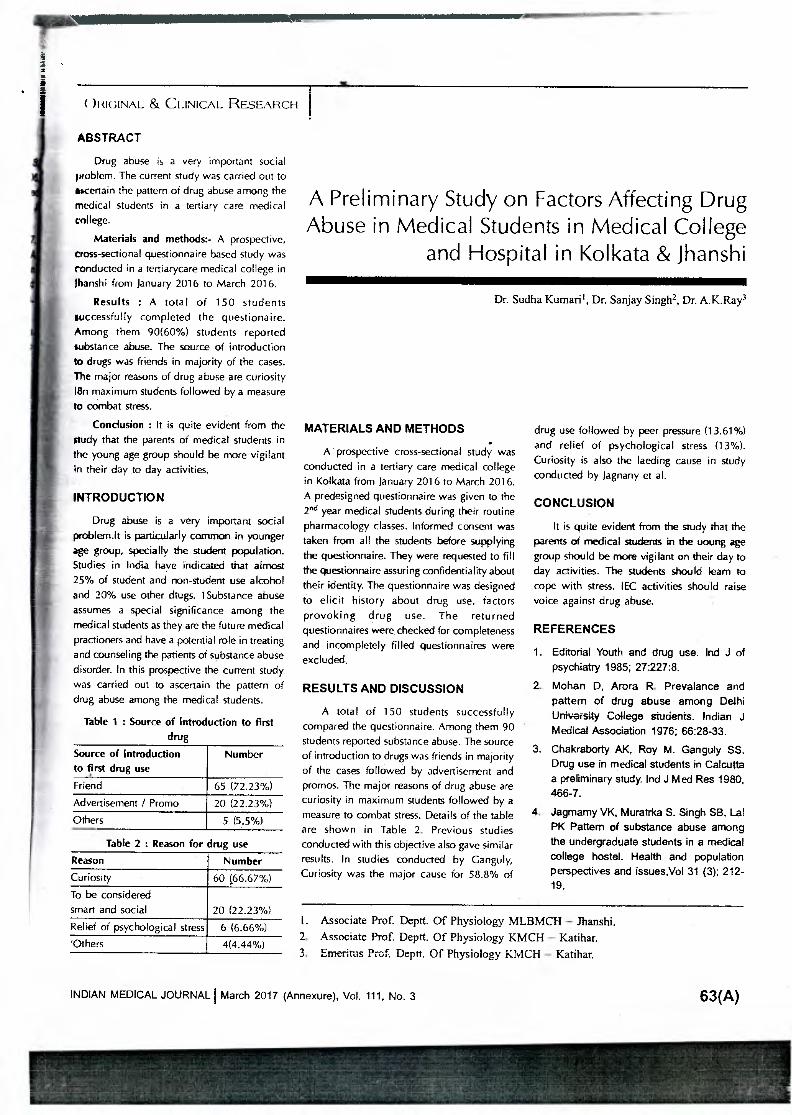
Drug abuse is a very important social problem. The current study was carried out to arcertain the pattern of drug abuse among the medical students in a tertiary care medical college.
Materials and methods:- A prospective, cross-sectional questionnaire based study was conducted in a tertiarycare medical college in Jhanshi from January 2016 to March 2016.
Results : A total of 150 students successfully completed the questionaire. Among them 90(60%) students reported substance abuse. The source of introduction to drugs was friends in majority of the cases. The major reasons of drug abuse are curiosity 18n maximum students followed by a measure to combat stress.
Conclusion : It is quite evident from the study that the parents of medical students in the young age group should be more vigilant in their day to day activities.
INTRODUCTION
Drug abuse is a very important social problern.lt is particularly common in younger age group, specially the student population. Studies in India have indicated that almost 25% of student and non-student use alcohol and 20% use other dtugs. 1Substance abuse assumes a special significance among the medical students as they are the future medical practioners and have a potential role in treating and counseling the patients of substance abuse disorder. In this prospective the current study was carried out to ascertain the pattern of drug abuse among the medical students.
Table 1 : Source of Introduction to first drug
Source of Introduction to first drug use
Number
Friend 65 (72.23%) Advertisement / Promo 20 (22.23%) Others 5 (5.5%)
Table 2 : Reason for drug use Reason Number Curiosity 60 (66.67%) To be considered smart and social 20 (22.23%) Relief of psychological stress 6 (6.66%) 'Others 4(4.44%)
MATERIALS AND METHODS
A prospective cross-sectional study was conducted in a tertiary care medical college in Kolkata from January 2016 to March 2016. A predesigned questionnaire was given to the rd year medical students during their routine pharmacology classes. Informed consent was taken from all the students before supplying the questionnaire. They were requested to fill the questionnaire assuring confidentiality about their identity. The questionnaire was designed to elicit history about drug use, factors provoking drug use. The returned questionnaires were checked for completeness and incompletely filled questionnaires were excluded.
RESULTS AND DISCUSSION
A total of 150 students successfully compared the questionnaire. Among them 90 students reported substance abuse. The source of introduction to drugs was friends in majority of the cases followed by advertisement and promos. The major reasons of drug abuse are curiosity in maximum students followed by a measure to combat stress. Details of the table are shown in Table 2. Previous studies conducted with this objective also gave similar results. In studies conducted by Ganguly, Curiosity was the major cause for 58.8% of
drug use followed by peer pressure (13.61%) and relief of psychological stress (13%). Curiosity is also the laeding cause in study conducted by Jagnany et al.
CONCLUSION
It is quite evident from the study that the parents of medical students in the uoung age group should be more vigilant on their day to day activities. The students should learn to cope with stress. IEC activities should raise voice against drug abuse.
REFERENCES
1. Editorial Youth and drug use. Ind J of psychiatry 1985; 27:227;8.
2. Mohan D, Arora R. Prevalence and pattern of drug abuse among Delhi University College stucients. Indian J Medical Association 1976; 66:28-33.
3. Chakraborty AK, Roy M. Ganguly SS. Drug use in medical students in Calcutta a preliminary study. Ind J Med Res 1980, 466-7.
4. Jagmamy VK, Muratrka S. Singh SB, Lal PK Pattern of substance abuse among the undergraduate students in a medical college hostel. Health and population perspectives and issues,Vol 31(3); 212-19.
1. Associate Prof. Deptt. Of Physiology MLBMCH — Jhanshi. 2. Associate Prof. Deptt. Of Physiology KMCH — Katihar. 3. Emeritus Prof. Deptt. Of Physiology KMCH — Katihar.
INDIAN MEDICAL JOURNAL I March 2017 (Annexure), Vol. 111, No. 3 63(A)
120 International Journal of Physiology, October-December 2019, Vol.7, No. 4
Association of ABO Blood Group with Breast Cancer: An Observational Study
Neelima Kumari1, Ashutosh Kumar2, Manish Kumar3
1Associate Professor, Department of Physiology, Katihar Medical College, Katihar, 2Associate Professor, Department of Microbiology, JLNMCH, Bhagalpur, 3Associate Professor, Department of Pharmacology,
IGIMS, Patna
AbstractIntroduction: The present study was conducted to analyse the relation of ABO blood groups with breast carcinoma.
Materials and Method: The study was conducted on 100 clinically diagnosed breast cancer patients. The standard agglutination test was used to determine the blood groups. Association of ABO blood groups and risk of breast cancers was found out with Odd Ratios (ORs) with 95% Confidence Interval (CI).
Results: Breast cancer was found minimum in blood group ‘AB’ and maximum in blood group ‘A’. It may be due to influence of blood group antigens on systemic inflammatory response which has been associated with the malignancies. The ABO antigen expressed on the surface of malignant cells appears to be different from the antigen expressed on normal tissue.
Conclusions: High frequency of breast cancer was found in blood group A followed by B and O strong relationship between blood group and breast cancer. The different expression of antigens on the surface of cancer cells might alter motility, apoptosis and immune escape. These mechanisms might influence the initiation and spread of malignancies.
Keywords: ABO blood group, Breast cancer.
tumor cells and endothelial cells of distant organs. [4] In many cancers, the deficiency of A or B epitope has been reported which is associated with accumulation of their precursor, which causes enhanced malignancy.
Material and Method: This observational study was conducted in the Department of Physiology, Surgery and Obstetrics & Gynaecology of Katihar Medical College, Katihar for a period of 12 months from May 2017 to April 2018.
A total of 100 newly and confirmed diagnosed breast cancer patients were taken for this study as cases. A written informed consent was obtained from all subjects before their participation. The data of age, sex, ABO blood group and pathological status of cancer were collected from the outdoor department.
Inclusion criteria:1. Female patients of any age group.2. Pathologically confirmed diagnosis of breast cancer
attending OPD.
IntroductionAbout one million new cases of breast cancer are
diagnosed every year. [1] In some tumors, alteration of ABO/Lewis-related antigens is associated with malignant transformation.[2] Blood group carbohydrate antigens on the surface of cancer cells can be regarded as an end product of tumor progression that can be used as useful prognostic and diagnostic markers. [3] ABO blood group genes are mapped at 9q34.2 region in which genetic alteration is common in many cancers. The loss or presence of blood group antigens can increase cellular motility or facilitate the interaction between
Corresponding Author: Dr. Neelima Kumari Associate Professor, Department of Physiology, Katihar Medical College, Katihar Mobile No-9934066846 e-mail: [email protected]
10.5958/2320-608X.2019.00152.5
International Journal of Physiology, October-December 2019, Vol.7, No. 4 121
Exclusion criteria:
1. Familial cancer history,
2. Patients on oral contraceptive pills,
3. Patients having menopause.
History taking, detailed physical examinations performed, routine radiological and laboratory investigations including complete blood count (CBC), tumor markers for breast cancer was done.
Blood samples were obtained into vacuum glass tubes containing EDTA. ABO blood typing was carried out with standard agglutination method. ABO blood groups were determined by using antiserum A and Antiserum B. [5]
Standard Agglutination Method: In agglutination test firstly, we prepare red cell suspension in a test tube and then in under aseptic precautions add a drop of blood. Then a drop of each antiserum (antiserum A, antiserum B) on is placed on glass slide with the help of dropper and a drop of isotonic saline (used as control) also placed on the slide. The slide is accordingly labelled as anti-A, anti-B and control. After 10 minutes, examined for the presence of agglutination (clumping of RBC) under low power microscope, if there is no agglutination (RBC remain separated and evenly distributed), and if agglutination occurs the RBC are massed together in clumps.
Statistical analysis: For each factor, we calculated the adjusted Odds Ratios (OR) and 95% confidence Interval (CI) using maximum likelihood estimation.
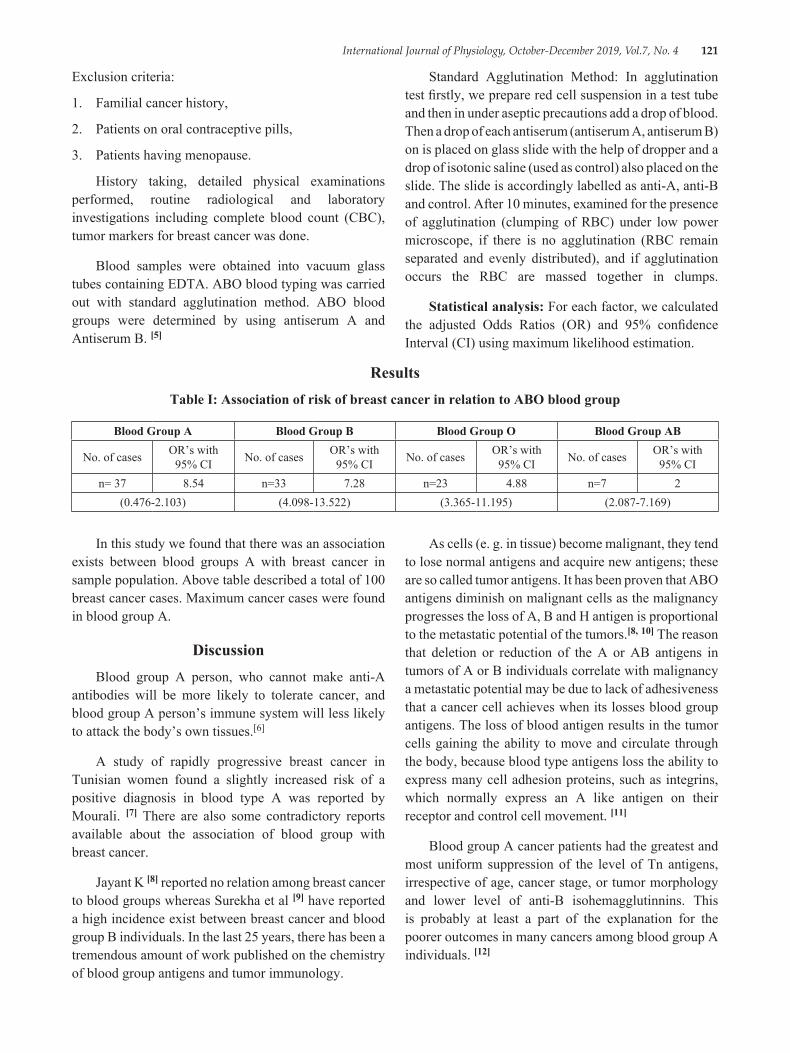
ResultsTable I: Association of risk of breast cancer in relation to ABO blood group
Blood Group A Blood Group B Blood Group O Blood Group AB
No. of cases OR’s with 95% CI No. of cases OR’s with
95% CI No. of cases OR’s with 95% CI No. of cases OR’s with
95% CIn= 37 8.54 n=33 7.28 n=23 4.88 n=7 2
(0.476-2.103) (4.098-13.522) (3.365-11.195) (2.087-7.169)
In this study we found that there was an association exists between blood groups A with breast cancer in sample population. Above table described a total of 100 breast cancer cases. Maximum cancer cases were found in blood group A.
DiscussionBlood group A person, who cannot make anti-A
antibodies will be more likely to tolerate cancer, and blood group A person’s immune system will less likely to attack the body’s own tissues.[6]
A study of rapidly progressive breast cancer in Tunisian women found a slightly increased risk of a positive diagnosis in blood type A was reported by Mourali. [7] There are also some contradictory reports available about the association of blood group with breast cancer.
Jayant K [8] reported no relation among breast cancer to blood groups whereas Surekha et al [9] have reported a high incidence exist between breast cancer and blood group B individuals. In the last 25 years, there has been a tremendous amount of work published on the chemistry of blood group antigens and tumor immunology.
As cells (e. g. in tissue) become malignant, they tend to lose normal antigens and acquire new antigens; these are so called tumor antigens. It has been proven that ABO antigens diminish on malignant cells as the malignancy progresses the loss of A, B and H antigen is proportional to the metastatic potential of the tumors.[8, 10] The reason that deletion or reduction of the A or AB antigens in tumors of A or B individuals correlate with malignancy a metastatic potential may be due to lack of adhesiveness that a cancer cell achieves when its losses blood group antigens. The loss of blood antigen results in the tumor cells gaining the ability to move and circulate through the body, because blood type antigens loss the ability to express many cell adhesion proteins, such as integrins, which normally express an A like antigen on their receptor and control cell movement. [11]
Blood group A cancer patients had the greatest and most uniform suppression of the level of Tn antigens, irrespective of age, cancer stage, or tumor morphology and lower level of anti-B isohemagglutinnins. This is probably at least a part of the explanation for the poorer outcomes in many cancers among blood group A individuals. [12]
122 International Journal of Physiology, October-December 2019, Vol.7, No. 4
Hakomori suggested that if the immune surveillance theory is correct and we recognize tumor antigens as foreign, leading to attack of the tumor, then the “A-like” properties of tumor antigens may not be recognized by group A patients. [13]
Tumor Immune Surveillance in the immune system can specifically identify and eliminate tumor cells on the basis of their expression of tumor specific antigens or molecules induced by cellular stress whereby immune system identifies the cancerous or precancerous cells and eliminates them before they can cause harm. [14] It would be interesting to know that the percentage of patients in this particular study were of Blood Group “A”. [15] It appears that a more integrated treatment protocol should be considered using conventional modalities as well as dietary modifications.
Blood Group “A” individuals have a very low immunologic response to T and Tn antigens because they share the same sugar (N-acetygalactosamine). This allows the cancer cells to bypass the immune system and replicate with little interference from the type A antibodies will have an effect on cancer survivorship. [15]
ConclusionSome studies on blood groups showed positive
association and others were negative. It appears that different blood groups are associated with breast cancer; Blood group A apparently increases the risk for cancer. This study concludes that, in case of breast cancer, high frequency of breast cancer was found in blood group A followed by B and O strong relationship between blood group and breast cancer.
Source of Funding: Self
Conflict of Interest: None
Ethical Clearance: Taken
References1. Ferlay J, Shin HR, Bray F, Forman D, Mathers
C, Parkin DM. Estimates of worldwide burden of cancer in 2008: GLOBOCAN 2008. Int J Cancer 2010; 127: 2893-2917
2. Su M, Lu SM, Tian DP, Zhao H, Li XY, et al. Relationship between ABO bloodgroups and carcinoma of esophagus and cardia in Chaosan inhabitants of China. World J Gastroenterol 2001; 7: 657-661
3. Ichikawa D, Handa K, Hakomori S. Histo-blood group A/B antigen deletion/reduction vs. continuous
expression in human tumor cells as correlated with their malignancy. Int J Cancer 1998; 76: 284-289
4. Pack SD, Karkera JD, Zhuang Z, Pak ED, Balan KV. Molecular cytogenetic fingerprinting of esophageal squamous cell carcinoma by comparative genomic hybridization reveals a consistent pattern of chromosomal alterations. Genes Chrom Cancer 1999; 25: 160-168.68 Saxena, Chawla, Gupta and Gaur Indian J Physiol Pharmacol 2015; 59 (1)
5. Jain AK. In: Manual of Practical Physiology for MBBS. Groups. Arya Publication, New Delhi. 2007; 43-45
6. Kawaguchi T. Adhesion molecules and carbohydrates in cancer si Byori 1996; 44: 1138-1146
7. Mourali, N, Muenz LR, Tabbane F, Belhassen S, Bahi J, Levine PH. Epidemiologic features of rapidly progressing breast cancer in Tunisia. Cancer 1980; 46: 2741-2746.
8. Garraty G. Blood groups and disease: a historical perspective. Transfus Med Rev 2000; 14: 291-301.
9. Surekha D, Shrinivasan A, Sailaja K, Rao D. Association of esterase D and AB0 blood group in breast cancer. In: Trends in Human Genetics, Biotechnology and Bioinformatics: Next 5 years. 29th Annual conference of Indian Society of Human Genetics, Bangalore. 2004; 122-123
10. Garratty G. Do blood groups have a biological role? En. Garratty G, ed. Immunobiology of transfusion Medicine. Newyork: Dekker 1994; 201-255
11. Ichikawa D, Handa K, Hakamori S. Histo-blood group AJ B antigen deletion/reduction vs. continuous expression in human tumor cells as correlated with their malignancy. Int J Cancer 1998; 76: 284-289
12. Kurtenkov O, Klaamas K, Miljukhina L. The cancer level of natural anti-Thomsen-Friedenriech antigen (TFA) agglutinins in sera of patients with gastric cancer related to ABO (H) blood group phenotype. Int J Cancer 1995; 60: 781-785
13. Hakomori S. Antigen structure and genetic basis of histoblood groups A, B and O: their changes associated with human cancer. Biochim Biophys Acta 1999; 1473 (1): 247-266
14. Dunn GP, Bruce AT, Ikeda H, Old LJ, Schreiber RD. Cancer immunoediting: from immunosurvillance to tumor escape. Nat Immunol 2002: 3:991-998
15. Bennett Malissa. Breast Cancer and Blood Type A. ed, Bennett M. Blood Group A cancer Immunologic Factors. Natural Health Blog, 30 October, 2008
International Journal of Physiology, October-December 2019, Vol.7, No. 4 123
Study of Minute Ventilation, Maximum Voluntary Ventilation and Dyspneic Index During Pregnancy: An Observational,
Prospective and Comparative Study
Neelima Kumari1, Ashutosh Kumar2, Manish Kumar3
1Associate Professor, Department of Physiology, Katihar Medical College, Katihar, 2Associate Professor, Department of Microbiology, JLNMCH, Bhagalpur, 3Associate Professor, Department of Pharmacology,
IGIMS, Patna
AbstractIntroduction: This study was designed to evaluate the Minute ventilation (MV). Maximum Voluntary Ventilation (MVV) & Dyspneic Index (DI) in different trimesters of pregnancy and compare the results with non pregnant control group.
Materials and Method: This study was carried out in 80 healthy women in the age range of 20-40 years with 20 subjects each in 1st, 2nd, 3rd trimesters of pregnancy and non-pregnant control group. The respiratory parameters were recorded in study and control groups. Statistical analysis was done by SPSS Software Package.
Results: It was observed that there was a significant decrease in MVV and dyspneic index (DI) in all trimesters of pregnancy and an insignificant variation in MV when compared to the control group. These changes are due to pressure of enlarging gravid uterus, elevating the diaphragm and restricting the movements of lungs thus hampering forceful expiration. The decrease seen in MVV in 1st trimester might be due to the effect of bronchoconstriction due to decreased alveolar Pco2.
Conclusions: Decrease in respiratory parameters was seen particularly in first trimester of pregnancy compared to 2nd & 3rd. The normal Minute Ventilation tries to maintain the respiratory need of pregnancy at rest. At increased physiological needs of respiration or during exercise the decreased Maximum Voluntary Ventilation makes pregnant female dyspneic.
Keywords: Pregnancy, Minute Ventilation, Maximum Voluntary Ventilation and Dyspneic Index.
uterus can have an effect. [1] In Pregnant women there is increases in minute ventilation (VE), tidal volume, alveolar ventilation and a reduction in arterial PCO2.[2, 3] There is renal excretion of bicarbonate, resulting in a state of partly compensated respiratory alkalosis (arterial pH 7.43-7.47). [4] These effects appear in the first trimester and may promote placental gas exchange before development of an effective fetal circulatory system. [4]
The aim of the study was to evaluate the effect of pregnancy on Static & dynamic lung volumes and capacities in the subjects of Indian pregnant women in the age range of 20-40 years in different trimesters of pregnancy and compare them with healthy age matched non-pregnant control group.
IntroductionThe changes that occur in thoracic cage are rise
in the diaphragm by four centimetres, widening of sub-costal angle increasing the transverse diameter by two centimetres & thoracic circumferences by six centimetres. These changes begin before the size of
Corresponding Author: Dr. Manish Kumar Associate Professor, Department of Pharmacology, Indira Gandhi Institute of Medical Sciences, Sheikhpura, Patna-800014, Bihar Mobile No.: 9304093698 e-mail: [email protected]
10.5958/2320-608X.2019.00153.7
124 International Journal of Physiology, October-December 2019, Vol.7, No. 4
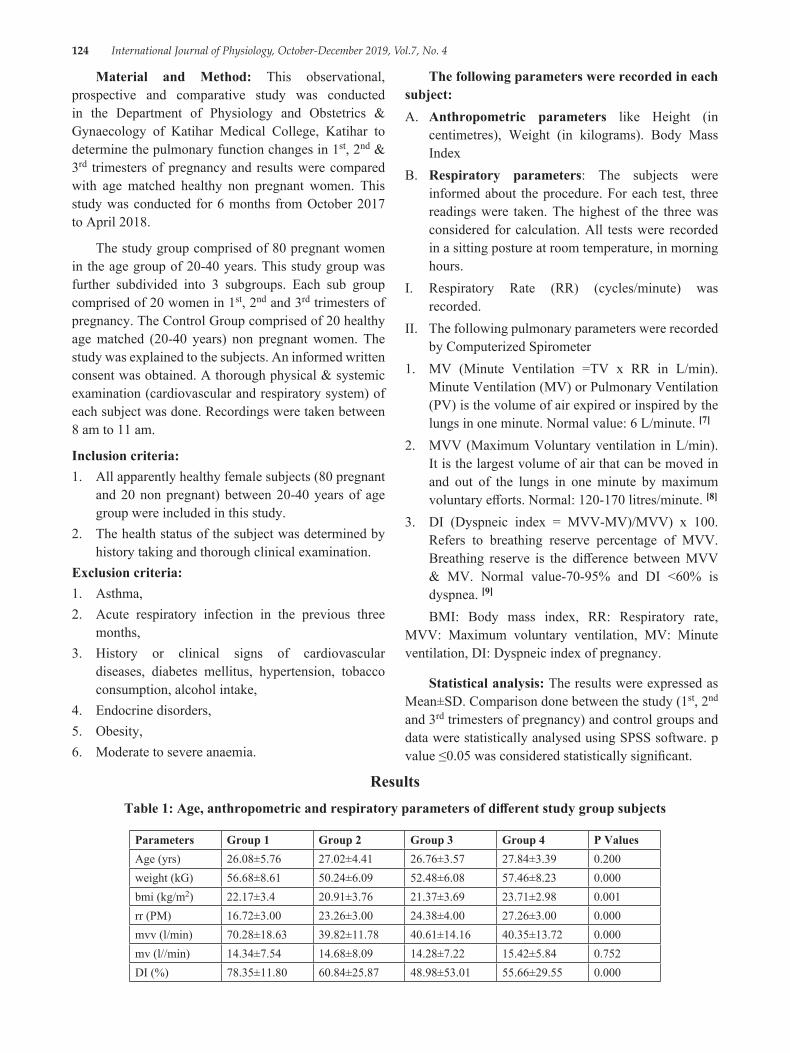
Material and Method: This observational, prospective and comparative study was conducted in the Department of Physiology and Obstetrics & Gynaecology of Katihar Medical College, Katihar to determine the pulmonary function changes in 1st, 2nd & 3rd trimesters of pregnancy and results were compared with age matched healthy non pregnant women. This study was conducted for 6 months from October 2017 to April 2018.
The study group comprised of 80 pregnant women in the age group of 20-40 years. This study group was further subdivided into 3 subgroups. Each sub group comprised of 20 women in 1st, 2nd and 3rd trimesters of pregnancy. The Control Group comprised of 20 healthy age matched (20-40 years) non pregnant women. The study was explained to the subjects. An informed written consent was obtained. A thorough physical & systemic examination (cardiovascular and respiratory system) of each subject was done. Recordings were taken between 8 am to 11 am.
Inclusion criteria:1. All apparently healthy female subjects (80 pregnant
and 20 non pregnant) between 20-40 years of age group were included in this study.
2. The health status of the subject was determined by history taking and thorough clinical examination.
Exclusion criteria:1. Asthma,2. Acute respiratory infection in the previous three
months,3. History or clinical signs of cardiovascular
diseases, diabetes mellitus, hypertension, tobacco consumption, alcohol intake,
4. Endocrine disorders,5. Obesity,6. Moderate to severe anaemia.
The following parameters were recorded in each subject:A. Anthropometric parameters like Height (in
centimetres), Weight (in kilograms). Body Mass Index
B. Respiratory parameters: The subjects were informed about the procedure. For each test, three readings were taken. The highest of the three was considered for calculation. All tests were recorded in a sitting posture at room temperature, in morning hours.
I. Respiratory Rate (RR) (cycles/minute) was recorded.
II. The following pulmonary parameters were recorded by Computerized Spirometer
1. MV (Minute Ventilation =TV x RR in L/min). Minute Ventilation (MV) or Pulmonary Ventilation (PV) is the volume of air expired or inspired by the lungs in one minute. Normal value: 6 L/minute. [7]
2. MVV (Maximum Voluntary ventilation in L/min). It is the largest volume of air that can be moved in and out of the lungs in one minute by maximum voluntary efforts. Normal: 120-170 litres/minute. [8]
3. DI (Dyspneic index = MVV-MV)/MVV) x 100. Refers to breathing reserve percentage of MVV. Breathing reserve is the difference between MVV & MV. Normal value-70-95% and DI <60% is dyspnea. [9]
BMI: Body mass index, RR: Respiratory rate, MVV: Maximum voluntary ventilation, MV: Minute ventilation, DI: Dyspneic index of pregnancy.
Statistical analysis: The results were expressed as Mean±SD. Comparison done between the study (1st, 2nd and 3rd trimesters of pregnancy) and control groups and data were statistically analysed using SPSS software. p value ≤0.05 was considered statistically significant.
ResultsTable 1: Age, anthropometric and respiratory parameters of different study group subjects
Parameters Group 1 Group 2 Group 3 Group 4 P ValuesAge (yrs) 26.08±5.76 27.02±4.41 26.76±3.57 27.84±3.39 0.200weight (kG) 56.68±8.61 50.24±6.09 52.48±6.08 57.46±8.23 0.000bmi (kg/m2) 22.17±3.4 20.91±3.76 21.37±3.69 23.71±2.98 0.001rr (PM) 16.72±3.00 23.26±3.00 24.38±4.00 27.26±3.00 0.000mvv (l/min) 70.28±18.63 39.82±11.78 40.61±14.16 40.35±13.72 0.000mv (l//min) 14.34±7.54 14.68±8.09 14.28±7.22 15.42±5.84 0.752DI (%) 78.35±11.80 60.84±25.87 48.98±53.01 55.66±29.55 0.000
International Journal of Physiology, October-December 2019, Vol.7, No. 4 125
Anthropometric parameters: The Mean±SD of age, weight, BMI have been shown in Table 1. All groups are similar by age. There was a decrease in weight in 1st & increase in 3rd trimester compared to control. BMI increased significantly in 3rd trimester compared to control
Respiratory parameters: The Mean±SD of RR. MVV, MV and DI have been presented in Table I. There was a gradual increase in RR from 1st to 3rd trimesters compared to control. There was no significant difference in the minute ventilation between the study and control groups. A highly significant decrease in MVV was observed in all trimesters with a maximum decrease in 1st trimester. DI was significantly reduced in all trimesters compared to control group with maximum decrease in 2nd trimester.
DiscussionThe present study showed a significant increase
in weight & BMI in 3rd trimester. [10] A significant increase in RR from 1st to 3rd trimester of pregnancy as compared to control group which is in agreement with Bernhard Heidemann, who stated that PaCO2 falls and then levels off at 4.1kPa (31 mmHg) by the end of the first trimester. This is caused by a 10% increase in the respiratory rate, secondary to progesterone mediated hypersensitivity to CO2, and an increase in alveolar and minute ventilation, secondary to increased respiratory rate and tidal volume.[11]
Present study showed insignificant increase in MV in all trimesters as compared to control group. A study by Emilia Kolarzyk showed increase in MV during pregnancy. The increase in MV was caused by a significant increase in tidal volume. [12] The study by Aaron P also showed increase in MV which is due to changes in osmolality, (SID) strong ion differences & angiotensin II levels, which have been implicated in the control of ventilation.[13]
There was a significant decrease in MVV in all trimesters compared to control group with maximum decrease in 1st trimester. The decline in the MVV in first trimester is due to morning sickness (lack of nutrition) and also due to lodging of trophoblast cell in the alveoli from the maternal uterine sinuses. In the 2nd and 3rd trimester, it may be due to mechanical pressure of enlarging gravid uterus, elevating the diaphragm and restricting the movements of lungs and thus hampering the forceful expiration and may also be due to
bronchoconstriction effect of decreased alveolar Pco2.[14] Present study also demonstrates a significant decrease in DI in all trimesters as compared to control group with maximum decrease in 2nd trimester. The decrease in the DI shows that pregnant women in all trimesters are dyspneic on exertion, [5] but some individuals showed negative DI indicating dyspnea at rest in all trimesters.
ConclusionThe normal Minute Ventilation tries to maintain
the respiratory need of pregnancy at rest. At increased physiological needs of respiration or during exercise the decreased Maximum Voluntary Ventilation makes her dyspneic. Further studies are needed to establish the cause for decrease in respiratory parameters particularly in first trimester of pregnancy compared to 2nd & 3rd.
Source of Funding: Self
Conflict of Interest: None
Ethical Clearance: Taken
References1. McAuliffe F, Kametasa N, Costellob J, Rafferty
GF, Greenough A, Nicolaidesa K. Respiratory function in singleton and twin pregnancy. Br J Obstet Gynaecol 2002; 109: 765-769.
2. Pivarnik JM, Lee. W, Spillman T. Maternal respiration and blood gases during aerobic exercise performed at moderate altitude. Med Sci Sports Exerc 1992; 24: 868-872
3. Wolfe LA, Walker RMC, Bonen A, McGrath MJ. Effects of pregnancy and chronic exercise on respiratory responses to graded exercise. J Appl Physiol 1994; 76: 1928-1936
4. Liberatore SM, Pistelli R, Patalano F, Moneta E, Incalzi RA, Ciappi C, Respiratory function during pregnancy. Respiration 1984; 46: 145-150
5. George RB, Light RW, Matthay MA, Matthay RA. Essentials of pulmonary a critical care medicine. In: Chest medicine. 2nd edition. New York: McGraw-Hill 2001; 101-122
6. Chhabra S, Nangia V, Ingley KN. Changes in respiratory function tests during pregnancy. Ind J Physiol Pharmacol 1988; 32: 56-60
7. Arthur John E. Respiratory system. In: Guyton & Hall Text book of Medical Physiology. 12th edition. Philadelphia: Saunders, 2011; 471
126 International Journal of Physiology, October-December 2019, Vol.7, No. 4
8. Pal GK. Pal P. Clinical examination of respiratory system. In: Textbook of Practical Physiology. 2nd edition. Chennai: Orient Longmann Pvt Ltd, 2005; 154-161
9. Khurana Indu. Respiratory system. In: Text of medical Physiology. 1st edition Anand Jha (eds). Elsevier India Private limited 2010; 468-482
10. Dutta DC. In: Text book of Obstetrics. 6th edition. Hiralala Konar (eds) Kolkata; New Central Book Agency Ltd. 2004; 50-344
11. Heidemann B. Changes in maternal physiology during pregnancy. Anaesthesia 2005; 20: 21-24
12. Kolarzyk E, Szot WM. Lyszczarz J. Lung function and breathing regulation parameters during pregnancy. Arch Gynecol Obstet 2005; 272: 53-58
13. Heehan PA. Wolfe AL. Plasma acid-base regulation above and below ventilator threshold in late gestation. J Appl Physiol 2000; 88: 149-157
14. Monga U. Kumari K. Pulmonary Function in Punjabi Pregnant Women. Ind J Phsiol Pharmacol 2000; 44: 115-116
104 International Journal of Physiology, April-June 2020, Vol. 8, No. 02
An Observational and Comparative Study of Diurnal Variation of Spirometry Test Parameters among First and Second Year
Normal and Healthy Medical Undergraduate Students
Neelima Kumari1, Ashutosh Kumar2, Manish Kumar3
1Associate Professor, Department of Physiology, Katihar Medical College, Katihar, 2Professor,Department of Microbiology, Patna Medical College & Hospital, Patna, 3Associate Professor,
Department of Pharmacology, IGIMS, Patna
AbstractIntroduction: This study was designed to assess and compare diurnal variability of FEF25, FEF50, FEF75, FEF25-75, PEF and FEV1 by measuring these parameters during morning and evening hours in normal healthy subjects.
Materials and Method: 190 students were enrolled and divided intogroupsof 8-10 students. Each group were directed to appear at different dates in Pulmonary Function Test (PFT) Laboratory at 7:30 AM and again at 5:00 PM for spirometry testing. Spirometry was performed with Spiro Excel 1.1 as per the ATS guidelines and by trained technician. Finally, data from 169 subjects was found to be complete and appropriate and was taken for the analysis.Diurnal variability in FEF25, FEF50, FEF75, FEF25-75, PEF and FEV1 were determined and compared.
Results: Allparameters were more in male than female. All the parameters were significantly high in evening tests as compared to morning tests except FVC. Diurnal variability among different spirometry parameters was significantly different (ANOVA, p<0.05) in morning and evening tests. The diurnal variability was highest in large airways as reflected by FEF75 and lowest in smaller airways as reflected by FEF25. The diurnal variability was lowest for FEV1%. It revealed that all parameters exhibit significant diurnal variability.
Conclusion: FEV1, FEF and PEF had shown diurnal variability which was directly related to the airway calibre. Greater variability was seen in PEF as compared to FEV1 i.e. proximal airways showed greater diurnal variation than distal airways.
Keywords: Spirometry test, Pulmonary Function Test, Diurnal variability, FEV1, PEF.
Corresponding Author: Dr. Manish Kumar Associate Professor, Department of Pharmacology, Indira Gandhi Institute of Medical Sciences, Patna-800014, Bihar Mobile No.: 9304093698 e-mail: [email protected]
IntroductionVariability in calibre of airways is a normal
physiological process in normal personsand this variability may become exaggerated in patients of asthmatic and chronic obstructive pulmonary disease (COPD).Measurement of bronchial hyper-reactivity and airways variability has always posed challenge performing experiments on pulmonary function. Variability in peak expiratory flow (PEF) has been suggested as indicator for bronchial hyper-reactivity.[1-8]
The phenomenon of nocturnal asthma has always perplexed clinician’s and researcher’s mind. Peak expiratory flow rate (PEFR) variability has been
International Journal of Physiology, April-June 2020, Vol. 8, No. 02 105
suggested as a marker for bronchial hyper-reactivity in asthmatic individuals.[9,10] PEFR variation has been widely advocated and used in clinical practice and asthma research. The National Heart Lung and Blood Institute (NHLBI) and others have recommended, a diurnal variation of 20% or more, as a diagnostic benchmark for asthma.[11,12]
Airway function exhibit variability over 24-h periods. This variability has a base that lung function gets worse at night in nocturnal asthma patients and to a lesser extent with COPD.[13-16] As nocturnal asthma is common and troublesome,[13,14,17] circadian variation in airway function has been of considerable interest in respiratory medicine. It has been recognized that diurnal variation in airway calibre occurs in healthy subjects as well.[18-20]
It has been suggested that diurnal variation of PEFR in excess of 20% can be used for diagnosis of bronchial asthma in remission where routine spirometry may not show any significant obstructive defect.[19,21]
Previous studies mentioned that PEFR shows time to time variation with respect to day and night cycle with specific pattern of lowest at early morning and highest at evening in normal as well as in asthmatics.[6,7,22] PEFR variation has been widely advocated and used in clinical practice and asthma research.
Several evidences suggest that airway variability exhibits a definite circadian pattern in which morning PEF levels are lower than daytime values, with a minimum in early morning and peak in evening. [6,7,22,23] The pattern of variability is exaggerated in smokers and in COPD and in asthmatic patients.[6]
The various spirometry indices reflect airflow characteristics of different airways. Forced expiratory flow (FEF), at 25% FVC, i.e. FEF25 reflects small airways, at 75% FVC (FEF75) reflects large airways and at 50% FVC (FEF50) reflects mid/small airways. FEF from 25% to 75% FVC (FEF25-75), reflects mid/small airways and is also known as mid expiratory flow. Forced expiratory volume in one second (FEV1) reflects the calibre of both large and small airways, whereas PEF is more a reflection of the calibre of large airways.[24,25] In general FEV1 is a more reliable indicator of airflow limitation than PEF. [26]
Unfortunately, most studies that describe diurnal variability in airways calibre in asthmatics have used PEF rather than FEV1. Moreover, the diurnal variability
of small, mid and large airways has not been studied systematically. This study was designed to assess and compare diurnal variability of FEF25, FEF50, FEF75, FEF25-75, PEF and FEV1 by measuring these parameters during morning and evening hours in normal healthy subjects.
Materials and MethodStudy Site/Place: This study was conducted in the
Department of Physiology of Katihar Medical College, Katihar.
Study Duration: September 2018 to February 2019 (Six months).
Inclusion Criteria:
1. First and second year MBBS students
2. 17 to 30 years of age and all the gender
3. Healthy students having almost similar daily routine
Exclusion Criteria:
1. Students have history of smoking.
2. History of severe chest trauma, with chest and spinal deformity.
3. Personal/family history of asthma, chronic obstructive pulmonary diseases and
4. Personal/family history of other cardiovascular and/or respiratory diseases.
Study Design: An observational and prospective study.
190 students,100 from first and 90 from second year MBBS batch students were selected for this study after considering inclusion and exclusion criteria. The study protocol was duly approved by Head of the Department of Physiology and Pharmacology. After enrolment students were explained about the study.A thorough clinical history was taken and anthropometric measurements (height and weight) were recorded. Brief clinical examination was done to rule out any obvious cardio-pulmonary compromise.
The Pulmonary Function Test was done using Digital Spirometer Machine (Spiro Excel 1.1 by Medicaid Systems). Parameters which had been interpreted like Forced Expiratory Volume in 1 second (FEV1), Peak Expiratory Flow(PEF), Forced Vital Capacity (FVC), Forced Expiratory Flow (FEF), Forced Expiratory Time (FET) and Flow/Volume Curves.
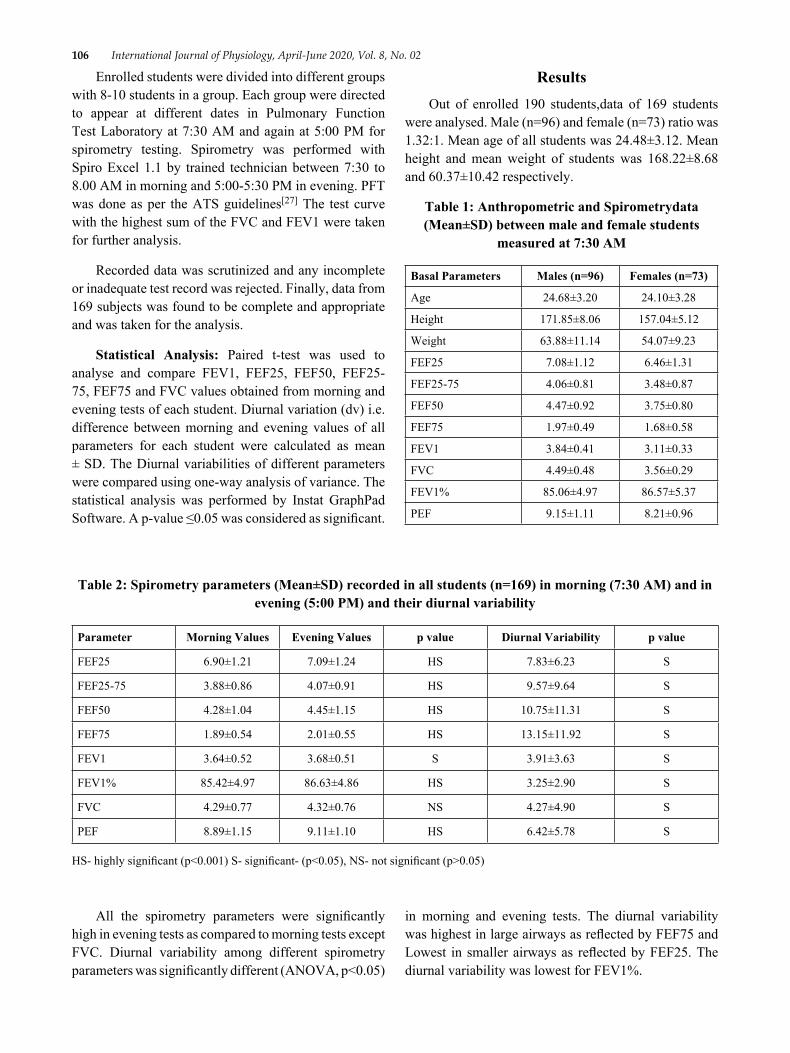
106 International Journal of Physiology, April-June 2020, Vol. 8, No. 02
Enrolled students were divided into different groups with 8-10 students in a group. Each group were directed to appear at different dates in Pulmonary Function Test Laboratory at 7:30 AM and again at 5:00 PM for spirometry testing. Spirometry was performed with Spiro Excel 1.1 by trained technician between 7:30 to 8.00 AM in morning and 5:00-5:30 PM in evening. PFT was done as per the ATS guidelines[27] The test curve with the highest sum of the FVC and FEV1 were taken for further analysis.
Recorded data was scrutinized and any incomplete or inadequate test record was rejected. Finally, data from 169 subjects was found to be complete and appropriate and was taken for the analysis.
Statistical Analysis: Paired t-test was used to analyse and compare FEV1, FEF25, FEF50, FEF25-75, FEF75 and FVC values obtained from morning and evening tests of each student. Diurnal variation (dv) i.e. difference between morning and evening values of all parameters for each student were calculated as mean ± SD. The Diurnal variabilities of different parameters were compared using one-way analysis of variance. The statistical analysis was performed by Instat GraphPad Software. A p-value ≤0.05 was considered as significant.
ResultsOut of enrolled 190 students,data of 169 students
were analysed. Male (n=96) and female (n=73) ratio was 1.32:1. Mean age of all students was 24.48±3.12. Mean height and mean weight of students was 168.22±8.68 and 60.37±10.42 respectively.
Table 1: Anthropometric and Spirometrydata (Mean±SD) between male and female students
measured at 7:30 AM
Basal Parameters Males (n=96) Females (n=73)
Age 24.68±3.20 24.10±3.28
Height 171.85±8.06 157.04±5.12
Weight 63.88±11.14 54.07±9.23
FEF25 7.08±1.12 6.46±1.31
FEF25-75 4.06±0.81 3.48±0.87
FEF50 4.47±0.92 3.75±0.80
FEF75 1.97±0.49 1.68±0.58
FEV1 3.84±0.41 3.11±0.33
FVC 4.49±0.48 3.56±0.29
FEV1% 85.06±4.97 86.57±5.37
PEF 9.15±1.11 8.21±0.96
Table 2: Spirometry parameters (Mean±SD) recorded in all students (n=169) in morning (7:30 AM) and in evening (5:00 PM) and their diurnal variability
Parameter Morning Values Evening Values p value Diurnal Variability p value
FEF25 6.90±1.21 7.09±1.24 HS 7.83±6.23 S
FEF25-75 3.88±0.86 4.07±0.91 HS 9.57±9.64 S
FEF50 4.28±1.04 4.45±1.15 HS 10.75±11.31 S
FEF75 1.89±0.54 2.01±0.55 HS 13.15±11.92 S
FEV1 3.64±0.52 3.68±0.51 S 3.91±3.63 S
FEV1% 85.42±4.97 86.63±4.86 HS 3.25±2.90 S
FVC 4.29±0.77 4.32±0.76 NS 4.27±4.90 S
PEF 8.89±1.15 9.11±1.10 HS 6.42±5.78 S
HS- highly significant (p˂0.001) S- significant- (p˂0.05), NS- not significant (p>0.05)
All the spirometry parameters were significantly high in evening tests as compared to morning tests except FVC. Diurnal variability among different spirometry parameters was significantly different (ANOVA, p<0.05)
in morning and evening tests. The diurnal variability was highest in large airways as reflected by FEF75 and Lowest in smaller airways as reflected by FEF25. The diurnal variability was lowest for FEV1%.
International Journal of Physiology, April-June 2020, Vol. 8, No. 02 107
DiscussionSpirometry parameters had shown gender variation.
All parameters were more in male than female. Showed a clear evidence that sex is a factor that affects PEF.[28]
Spirometry parameters exhibits circadian pattern andthey were less in morning compared to evening time. Diurnal variability may be seen due to variability in airway calibre during morning and evening time.[6,7,22,23]
Various studies have shown the diurnal variability of different spirometry parameters like Kondo S, Erban J et al. and Troyanov S et al. had demonstrated that spirometry parameters had significant difference during morning and evening time especially FEV1% and PEF and consistent with the results obtained from present study.[29-31]
Present study had made an attempt to differentiate the diurnal variability in spirometry test due to change in calibre of proximal and distal airway using PEF and FEV1. Present study results were consistent withthe study done by Hegewald MJ et al., who had exhibited that intrinsic variability in a single session (both morning and evening) spirometry test was higher for PEF than FEV1 also diurnal variability of PEF was higher than FEV1 in healthy subjects.[32]
Changes in proximal airway calibre results in changes in PEF while changes in FEV1 is related to calibre of proximal and peripheral airway.[24]
Studies have interpreted that the variability in proximal airways is largely due to changes in airway geometry. Fractional reduction in large airway calibre leads to greater decrease in flow compared to smaller airways. And it occurs due to a theory according to that flow rate or resistance is inversely proportional to the fourth power of radius. Also, it is a fact that the proximal and distal airways differ in smooth muscle content and nerve supply. The density of nerve supply and smooth muscle mass decreases as we proceed from proximal to distal airways.[33] This is why the diurnal variability in smaller airways is lower than larger airways.
Correlation between PEF and FEV1 and their diurnal variability was significant. This feature was representation of changes in proximal airways calibre corresponding to changes in distal airways calibre. Morning and evening mean of both PEF and FEV1 were significantly different and showed diurnal variability. Previous study also supported results of this study.[2,6,23]
FEV1 was clinically more suitable to know the diurnal variability because total variability was lowest and maximum variability seen was less than 10%. Clinical use of Mid Expiratory Flow was not justified because it showed high variability. FEV1 and PEF showed variability according to the previous study.
ConclusionFEV1, FEF and PEF has shown diurnal variability
which was directly related to the airway calibre.Proximal airways showed greater diurnal variation than distal airways due to in their calibre, reflected by greater variability in PEF as compared to FEV1. In this study only two readings were taken to investigate the diurnal variability. Further study with multiple recordings in 24-hour duration should be tried to better characterize the circadian pattern of spirometry parameters and exploring their physiological basis.
Source of Funding: Self
Conflict of Interest: None
Ethical Clearance: Taken
References1. Nunn AJ, Gregg I. New regression equations for
predicting peak expiratory flow in adults. BMJ. 1989 Apr 22;298(6680):1068-70.
2. Aggarwal AN, Gupta D, Chaganti S, Jindal SK. Diurnal variation in peak expiratory flow in healthy young adults. Indian J Chest Dis Allied Sci. 2000 Jan-Mar;42(1):15-9.
3. Siafakas NM, Vermeire P, Pride NB, Paoletti P, Gibson J, Howard P, Yernault JC, Decramer M, Higenbottam T, Postma DS, et al. Optimal assessment and management of chronic obstructive pulmonary disease (COPD). The European Respiratory Society Task Force. Eur Respir J. 1995 Aug;8(8):1398-420.
4. M R Hetzel. The pulmonary clock. Thorax. 1981 Jul; 36(7): 481–486. doi: 10.1136/thx.36.7.481.
5. Ryan G, Latimer KM, Dolovich J, Hargreave FE. Bronchial responsive ness to histamine: relationship to diurnal variation of peak flow rate, improvement after bronchodilator and airway calibre. Thorax 1982;37:423 9.
6. Casale R, Pasqualetti P. Cosinor analysis of circadian peak expiratory flow variability in normal
108 International Journal of Physiology, April-June 2020, Vol. 8, No. 02
subjects, passive smokers, heavy smokers, patients with chronic obstructive pulmonary disease and patients with interstitial lung disease Respiration 1997 64:251-56.
7. Thiadens HA, De Bock GH, Dekker FW, Value of measuring diurnal peak flow variability in the recognition of asthma: a study in general practice Eur Respir J 1998 12:842-47.
8. VanKeimpema AR, Ariaansz M, Tamminga JJ, Nauta JJ, Postmus PE, Nocturnal waking and morning dip of peak expiratory flow in clinically stable asthma patients during treatment. Occurrence and patient characteristics Respiration 1997 64: 29-34.
9. Higgins BG, Britton JR, Chinn S, Cooper S, Burney PG, Tattersfield AE, Comparison of bronchial reactivity and peak expiratory flow variability measurements for epidemiologic studies Am Rev Respir Dis 1992 145:588-93.
10. Neukirch F, Liard R, Segala C, Korobaeff M, Henry C, Cooreman J, Peak expiratory flow variability and bronchial responsiveness to methacholine. An epidemiologic study in 117 workers Am Rev Respir Dis 1992 146:71-75.
11. National Asthma Education and Prevention Program. Expert panel report 2: Guidelines for the diagnosis and management of asthma. Bethesda, MD.: National Institutes of Health, 1997. (NIH Publication no. 97–4051).
12. Kunzli N, Stutz EZ, Perruchoud AP, Brandli O, Tschopp JM, Bolognini G, Karrer W, Schindler C, Ackermann-Liebrich U, Leuenberger P. Peak flow variability in the SAPALDIA study and its validity in screening for asthma-related conditions. The SPALDIA Team. Am J Resp Crit Care Med 1999; 160: 427–434.
13. Turner-Warwick, M. 1984. The definition and recognition of nocturnal asthma (with discussion). In P. J. Barnes and J. Levy, editors. Nocturnal Asthma. Oxford University Press, Oxford. 3–9.
14. Turner-Warwick, M. 1988. The management of chronic asthma. In P. J. Barnes, I. W. Rodger and N. C. Thomson, editors. Asthma: Basic Mechanisms and Clinical Management. Academic Press Limited, London. 721–732.
15. Anonymous. 1983. Asthma at night (editorial). Lancet 1:220–222.
16. Bateman, J. R. M. and S. W. Clarke. 1979. Sudden
death in asthma. Thorax 34:40–44.17. Storms, W. W., S. F. Bodman, R. A. Nathan and P.
Byer. 1994. Nocturnal asthma symptoms may be more prevalent than we think. J. Asthma 31:313–318.
18. Guberan, E., M. K. Williams, J. Walford and M. M. Smith. 1969. Circadian variation of F.E.V. in shift workers. Br. J. Ind. Med. 26:121–125.
19. Hetzel, M. R. and T. J. H. Clark. 1980. Comparison of normal and asthmatic circadian rhythms in peak expiratory flow rate. Thorax 35:732–738.
20. Kerr, H. D. 1973. Diurnal variation of respiratory function independent of air quality: experience with an environmentally controlled expo) sure chamber for human subjects. Arch. Environ. Health 26:144–152.
21. Jamison JP, McKinley RK. Validity of peak expiratory flow rate variability for the diagnosis of asthma. Clin Sci (Lond) 1993;85:367-71.
22. Aggarwal AN, Gupta D, Kumar V, Jindal SK. Assessment of diurnal variability of peak expiratory flow in stable asthmatics. J Asthma 2002;39:487-91.
23. Goyal M, Goel A, Kumar P, Bajpai M, Verma NS, Kant S, Tiwari S, Circadian rhythm of peak expiratory flow rate in healthy north Indian men Indian J Physiol Pharmacol 2008 52:64-8.
24. Mead J, Problems in interpreting common tests of pulmonary mechanical function. In: Macklem P, Permutt S, editors The lung in transition between death and disease 1979 New York Marcel Dekker Inc.:43-51.
25. Ph.H Quanjer, G.J. Tammeling, J.E. Cotes, O.F. Pedersen, R. Peslin, J-C. Yernault. Lung volumes and forced ventilatory flows. European Respiratory Journal 1993 6: 5-40; DOI: 10.1183/09041950.005s1693
26. Thiadens HA, De Bock GH, Van Houwelingen JC, Dekker FW, DeWaal MW, Springer MP. Can peak expiratory flow measurements reliably identify the presence of airway obstruction and bronchodilator response as assessed by FEV (1) in primary care patients presenting with a persistent cough? Thorax 1999 54:1055-60.
27. M.R. MILLER ET AL. Standardisation of spirometry. Eur Respir J 2005; 26: 319–338. SERIES ‘‘ATS/ERS TASK FORCE: STANDARDISATION OF LUNG FUNCTION TESTING’’ Edited by V. Brusasco, R. Crapo and G. Viegi Number 2 in this
International Journal of Physiology, April-June 2020, Vol. 8, No. 02 109
Series. DOI: 10.1183/09031936.05.0003480528. Raju PS, Prasad KV, Ramana YV, Murthy KJ.
Pulmonary function tests in Indian girls – Prediction equations. Indian J Pediatr 2004;71:893-7.
29. Kondo S. The amplitude of circadian FEV1 variation suitable for phase determination by cosinor analysis in stable asthmatic children. Chest 1992 Sept; 102: 771-74.
30. Erban J, Adamec M, The occurrence of circadian rhythm in respiration in healthy persons and in patients with bronchial asthma Cas Lek Cesk 1989 Dec; 8:1584-86.
31. Troyanov S, Ghezzo H, Cartier A, Malo JL, Comparison of circadian variations using FEV1
and peak expiratory flow rates among normal and asthmatic subjects Thorax 1994 Aug; 49 (8): 775-80.
32. Hegewald MJ, Lefor MJ, Jensen RL, Crapo RO, Kritchevsky SB, Haggerty CL, Peak expiratory flow is not a quality indicator for spirometry: peak expiratory flow variability and FEV1 are poorly correlated in an elderly population Chest 2007 131:1494-99.
33. Larson SD, Schelegle ES, Hyde DM, Plopper CG. The three-dimensional distribution of nerves along the entire intrapulmonary airway tree of the adult rat and the anatomical relationship between nerves and neuroepithelial bodies Am J Respir Cell Mol Biol 2003 28:592-99.
Indian Journal of Clinical Anatomy and Physiology 2019;6(4):462–467
Content available at: iponlinejournal.com
Indian Journal of Clinical Anatomy and Physiology
Journal homepage: www.innovativepublication.com
Original Research Article
Comparison of cardiovascular, cognitive and stress parameters in presence and inabsence of examination among medical students: An observational andprospective study
Neelima Kumari1, Ashutosh Kumar2,*, Manish Kumar3
1Dept. of Physiology, Katihar Medical College, Katihar, Bihar, India2Dept. of Microbiology, Patna Medical College & Hospital, Patna, Bihar, India3Dept. of Pharmacology, Indira Gandhi Institute of Medical Sciences, Patna, Bihar, India
A R T I C L E I N F O
Article history:Received 04-10-2019Accepted 14-12-2019Available online 31-12-2019
Keywords:Cardiovascular parametersCognitive parametersStress scoresUndergraduate medical students
A B S T R A C T
Introduction: Medical student during undergraduate course of 4 12 years including 1-year internship study
hard, tirelessly for longer periods of day or night and often work beyond their mental threshold and physicalstrength resulting in stress. The present study was designed to evaluate and compare the stress status amongfirst and second year MBBS students.Materials and Methods: 160 (62 males and 98 females) first (n=90) and second (n=70) year healthyMBBS students were enrolled for this study. Cardiovascular parameters like pulse rate (PR), systolic bloodpressure (SBP), diastolic blood pressure (DBP), Cognitive function tests like auditory reaction time (ART)and visual reaction time (VRT) and Stress score (by stress questionnaire) was evaluated and compared inpresence of examination (pre-examination) and during absence examination (post-examination, 10-15 daysafter pre-examination). Data obtained from this study was analysed by Instat Graph Pad using paired t-test.Results: All parameters studied in this study were increased in almost all students during pre-examination.In females compared to males all parameters were significantly less in pre-examination except PR (i.e.less SBP, DBP, less cognition function that means high ART & VRT and less stress score). During post-examination study comparison between males and females, difference of means of parameters were notsignificant except VRT (Visual reaction time was high in females). Cognition function was less in femalesas compared to males in both pre as well post examination.Conclusion: Students were in stress with increased all cardiovascular parameters, cognitive parametersand stress score. This may affect the performance and can produce anxiety and/or depression subsequently.Students who are at risk of excessive stress should be identified and faculties should help them to deal theexamination stress, anxiety or depression effectively and the earliest.
© 2019 Published by Innovative Publication. This is an open access article under the CC BY-NC-NDlicense (https://creativecommons.org/licenses/by/4.0/)
1. Introduction
Medical curriculum is a vast and complex study course withtraining of four and half year with one year of internship.This long period of course includes heavy load of text booksand study materials, different ward or clinical postingsand numerous semester and university examinations. Toachieve good grades student study hard, tirelessly for longerperiods of day or night and often work beyond their mental
* Corresponding author.E-mail address: [email protected] (A. Kumar).
threshold and physical strength resulting in stress. Stressrefers to conditions that arouse anxiety or fear. The transientrise in systolic blood pressure during stress is a commonobservation.1–5
Several studies have shown correlation between chroniclife stress and cardiovascular disease.6 Psychological stressis a risk factor for hypertension7 and coronary artery disease(CAD).6 Different physiological studies have proved thatstress is linked with excessive sympathetic nervous systemactivation6 and thus influence the endocrine, haemopoietic
https://doi.org/10.18231/j.ijcap.2019.1012394-2118/© 2019 Innovative Publication, All rights reserved. 462
Kumari, Kumar and Kumar / Indian Journal of Clinical Anatomy and Physiology 2019;6(4):462–467 463
and immune systems.8 Cytokines and cortisol seem toplay an important role in the communication betweenthese systems.9 The well documented changes that occurare increase in erythrocytes, neutrophils and platelets,whereas lymphocytes, eosinophils and monocytes decreasein number. Lymphocytes and monocytes express receptorsfor several stress hormones, including norepinephrine andepinephrine,10 thus stressful events could alter immunefunction.
It has also been observed that female studentsrespond to examination situation with stronger anxietyand more intense stress related behavioural, metabolicand psychological changes. Menstrual cycles of femalesalso seem to get affected during the pre-examinationperiod owing to hormonal changes as observed in previousstudies.11
Cardiac parameters like pulse rate (PR), systolic bloodpressure (SBP), diastolic blood pressure (DBP), Cognitivefunction tests like auditory reaction time (ART) and visualreaction time (VRT), Stress score (by stress questionnaire),anxiety scale and cortisol level were evaluated andcompared before or at the time of examination amongmedical students in various studies.12–15
Some studies have compared the difference of reactiontime in male and females and thus evaluated stress (e.g.,environmental).16,17
Different factors may influence severity of stress onacademic performance like age, gender, ethnicity andmarital status.18
Anxiety may be potentiated by increase in glucocorticoidwhich directly effects on corticotrophin releasing hormonein limbic system.19,20
Distraction model (attentional control theory) is one ofthe models, developed to show effect of stress on cognitivefunction. In this model performance of movement execution(e.g., about the location of a target) become less accurateand more attempts or more time may be required tosuccessfully perform a certain task and this occurs whenperson is under anxiety.21,22 However, “execution focusmodel” argues that limited attentional resources cannotexplain the negative effects of anxiety upon performance.23
The alteration of reaction time occurs due to bothphysiological and pharmacological factors like stress,gender, and arousal. This alteration indicates theimpairment of sensory-motor association.24
In this study Cardiovascular parameters like pulse rate(PR), systolic blood pressure (SBP), diastolic blood pressure(DBP), Cognitive function tests like auditory reaction time(ART) and visual reaction time (VRT) and Stress Scorethrough questionnaire was evaluated and compared inpresence and during absence of examination among first andsecond year MBBS students.
2. Materials and Methods
2.1. Study site/place
This study was conducted in the Department of Physiologyand Pharmacology of Katihar Medical College, Katihar.
2.2. Study duration
January to July 2018 (Seven months)
2.3. Study design
An observational and prospective study
2.4. Inclusion criteria
1) First and second year MBBS students2) ≥ 17 years of age and all the gender3) Healthy students
2.5. Exclusion criteria
Students have history of neurological or psychiatricdisorders, taking of medicines affecting emotional statusand endocrinological disorder, any visual and auditorydisorder, addiction to tobacco or alcohol
160 students were selected from first and second yearMBBS batch before internal assessment theory examinationconsidering after inclusion and exclusion criteria. 80students were from first year and 70 students were fromsecond year MBBS batch. Following tests were done.
2.5.1. Cardiovascular parametersTests like PR (Pulse Rate - beats/min) and BP (BloodPressure- mm of Hg) were recorded in supine positionby palpating radial artery and sphygmomanometer respec-tively.
2.5.2. Cognitive parametersTest like ART (Auditory Reaction Time, in milliseconds)and VRT (Visual Reaction Time, in milliseconds) wererecorded by using Audio Visual Reaction Time Machine,in a well illuminated and quiet surrounding in Physiologyresearch laboratory. This instrument had two modes onefor Auditory and another for Visual reaction time. It hadthree frequencies i.e. 250Hz, 500Hz and 750Hz whichwere randomly used for auditory stimulus. Red, Yellowand Green flashing lights were used randomly for visualstimulus. Students were directed to press the responseswitch by the index finger of the dominant hand as soonas the response would be perceived. The reaction time wasdisplayed on the Reaction Time Machine and was recorded.
2.5.3. Stress statusStress status was assessed by a questionnaire. Whichcontained 20 questions with 0-4 points given to each
464 Kumari, Kumar and Kumar / Indian Journal of Clinical Anatomy and Physiology 2019;6(4):462–467
(i.e. no stress (Score=0) to extremely stressful (Score=4).Questionnaire was given to the students and collected after10min to assess stress score. The total score obtained fromthis questionnaire was analysed.14,25,26 According to scoresgiven by student, stress status was interpreted like
a. Score between 0-20: - Good control over stress,b. Score between 21- 40: - Low level of stress,c. Score between 41- 60: - Medium level of stress,d. Score between 60-80: - High level of stress.On following areas of stress producing scenario,
questions were framed like
1. Academic demands,2. Peer pressure,3. Lack of time for personal needs,4. Interpersonal relationships including those with
teaching and administrative staff.5. Inability to sleep well,6. Worrying,7. Feeling tense and8. Unhappy.
Anthropometric measurements like weight in kilogramsand height in centimetres were assessed using standardisedweighing machine and height measurement scale.
Studies were done for twice in following manner in allenrolled students.
2.6. Pre-examination study
All enrolled students were instructed to appear inPhysiology Research Laboratory 1.15 hours prior startingthe final internal examination without consuming any kindof caffeinated drinks like coffee or tea. Before startingthe experimental session, students were given rest of 15minutes. Experimental sessions were completed 10 minsbefore starting the theory examination.
2.7. Post-examination study
10 to 15 days after completion of final internal assessmenttheory examination i.e. when students were practically freeof examinations, once again all students were instructed toappear in Physiology Research Laboratory on different day.They were strictly instructed to appear without consumingany kind of caffeinated drinks like coffee or tea. Beforestarting the experimental session, students were given restof 15 minutes.
In 1st year students, pre-examination study wasperformed on 3 0 students each on 1st , 2nd and 3rd day(According to the three-subject examination in first year). In2nd year students, pre-examination study was performed on14 students each on 1st , 2nd , 3rd , 4th and 5th day (Accordingto the five-subject examination in second year)
2.8. Statistical analysis
Data obtained from this study was analysed by Instat GraphPad. The pre and post -examination data was analysedusing paired t-test. Results were tabulated and presentedas Mean+SD.
3. Results
All parameters like PR, SBP, DBP, VRT and Stress scorewere increased (extremely significant) in pre-examinationas compared to post- examination study.
Mean PR in female students was significantly morethan male students. Mean SBP and DBP in females weresignificantly less than males but the mean difference SBPwas significant and DBP was not significant. Mean ARTand VRT, both were significantly high (reaction time high)in females as compared to males. Mean stress score wasalso significantly less in females compared to males.
During post-examination study, mean difference of PR,SBP, DBP and stress score was not significant in malesand females. Compared to males, mean ART (differencenot significant) and VRT (very significant) were more infemales.
Delta PR (calculated by subtracting pre and post-examination study value) was increased in females ascompared to males irrespective of the study setting andthe difference was extremely significant. Mean differenceof delta SBP, DBP, ART, VRT and Stress score were notsignificant between males and females.
4. Discussion
In pre-examination compared to post-examination studyperiod irrespective of gender all parameters like PR,SBP, DBP ART, VRT and stress scores were increasedsignificantly. Most common cause may be due to increasein sympathetic stimulation that increases PR and BP(both systolic and diastolic blood pressure). ART andVRT may be increased due to release of epinephrineand glucocorticoid.26,27 Under stressful conditions, thecognitive system becomes overloaded thus reduces aperson’s attentional resources.28
Due to increased sympathetic nervous system and brain-pituitary-adrenocortical axis during stress acting eitherdirectly or indirectly can alter decision making andattention. In this study pre-examination compared to post-examination, stress score was increased significantly. Thishas similar result from previous study in which stress wascommon among first year medical students due to academicdemands.2,3,29
In this study PR, ART and VRT we re increased infemales as compared to males in pre-examination, butdifference in PR was more significant. These findings weresimilar with other study.12,30
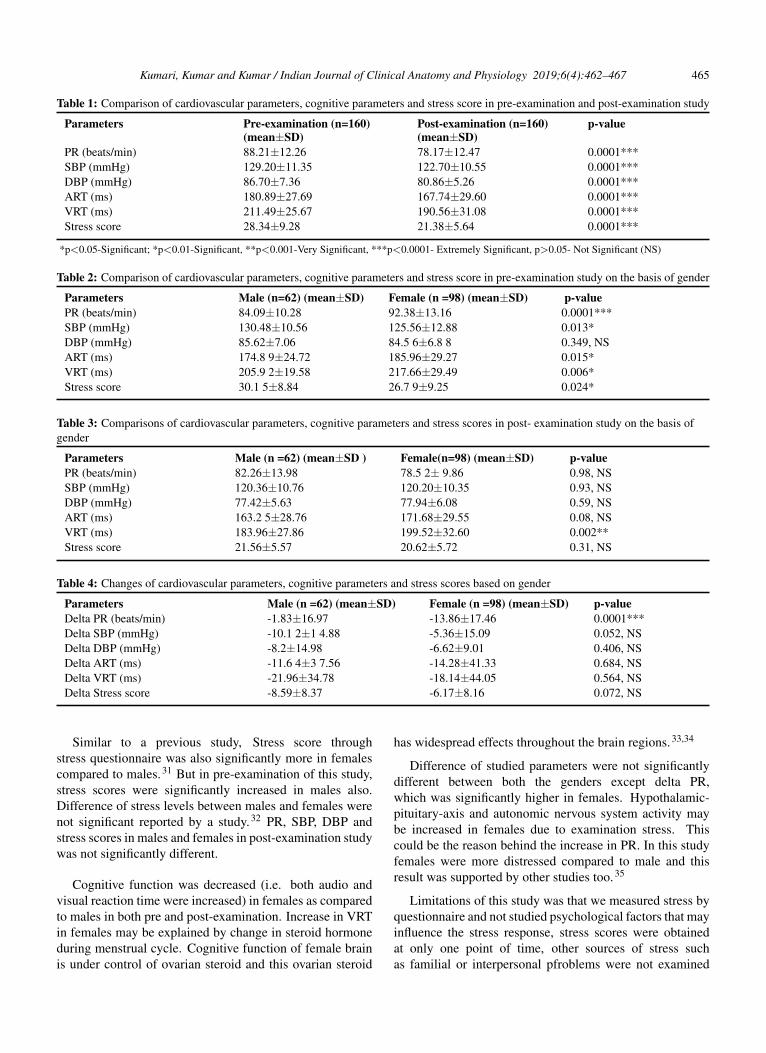
Kumari, Kumar and Kumar / Indian Journal of Clinical Anatomy and Physiology 2019;6(4):462–467 465
Table 1: Comparison of cardiovascular parameters, cognitive parameters and stress score in pre-examination and post-examination study
Parameters Pre-examination (n=160)(mean±SD)
Post-examination (n=160)(mean±SD)
p-value
PR (beats/min) 88.21±12.26 78.17±12.47 0.0001***SBP (mmHg) 129.20±11.35 122.70±10.55 0.0001***DBP (mmHg) 86.70±7.36 80.86±5.26 0.0001***ART (ms) 180.89±27.69 167.74±29.60 0.0001***VRT (ms) 211.49±25.67 190.56±31.08 0.0001***Stress score 28.34±9.28 21.38±5.64 0.0001***
*p<0.05-Significant; *p<0.01-Significant, **p<0.001-Very Significant, ***p<0.0001- Extremely Significant, p>0.05- Not Significant (NS)
Table 2: Comparison of cardiovascular parameters, cognitive parameters and stress score in pre-examination study on the basis of gender
Parameters Male (n=62) (mean±SD) Female (n =98) (mean±SD) p-valuePR (beats/min) 84.09±10.28 92.38±13.16 0.0001***SBP (mmHg) 130.48±10.56 125.56±12.88 0.013*DBP (mmHg) 85.62±7.06 84.5 6±6.8 8 0.349, NSART (ms) 174.8 9±24.72 185.96±29.27 0.015*VRT (ms) 205.9 2±19.58 217.66±29.49 0.006*Stress score 30.1 5±8.84 26.7 9±9.25 0.024*
Table 3: Comparisons of cardiovascular parameters, cognitive parameters and stress scores in post- examination study on the basis ofgender
Parameters Male (n =62) (mean±SD ) Female(n=98) (mean±SD) p-valuePR (beats/min) 82.26±13.98 78.5 2± 9.86 0.98, NSSBP (mmHg) 120.36±10.76 120.20±10.35 0.93, NSDBP (mmHg) 77.42±5.63 77.94±6.08 0.59, NSART (ms) 163.2 5±28.76 171.68±29.55 0.08, NSVRT (ms) 183.96±27.86 199.52±32.60 0.002**Stress score 21.56±5.57 20.62±5.72 0.31, NS
Table 4: Changes of cardiovascular parameters, cognitive parameters and stress scores based on gender
Parameters Male (n =62) (mean±SD) Female (n =98) (mean±SD) p-valueDelta PR (beats/min) -1.83±16.97 -13.86±17.46 0.0001***Delta SBP (mmHg) -10.1 2±1 4.88 -5.36±15.09 0.052, NSDelta DBP (mmHg) -8.2±14.98 -6.62±9.01 0.406, NSDelta ART (ms) -11.6 4±3 7.56 -14.28±41.33 0.684, NSDelta VRT (ms) -21.96±34.78 -18.14±44.05 0.564, NSDelta Stress score -8.59±8.37 -6.17±8.16 0.072, NS
Similar to a previous study, Stress score throughstress questionnaire was also significantly more in femalescompared to males.31 But in pre-examination of this study,stress scores were significantly increased in males also.Difference of stress levels between males and females werenot significant reported by a study.32 PR, SBP, DBP andstress scores in males and females in post-examination studywas not significantly different.
Cognitive function was decreased (i.e. both audio andvisual reaction time were increased) in females as comparedto males in both pre and post-examination. Increase in VRTin females may be explained by change in steroid hormoneduring menstrual cycle. Cognitive function of female brainis under control of ovarian steroid and this ovarian steroid
has widespread effects throughout the brain regions.33,34
Difference of studied parameters were not significantlydifferent between both the genders except delta PR,which was significantly higher in females. Hypothalamic-pituitary-axis and autonomic nervous system activity maybe increased in females due to examination stress. Thiscould be the reason behind the increase in PR. In this studyfemales were more distressed compared to male and thisresult was supported by other studies too.35
Limitations of this study was that we measured stress byquestionnaire and not studied psychological factors that mayinfluence the stress response, stress scores were obtainedat only one point of time, other sources of stress suchas familial or interpersonal pfroblems were not examined
466 Kumari, Kumar and Kumar / Indian Journal of Clinical Anatomy and Physiology 2019;6(4):462–467
and internal assessment scores of the students were notcorrelated in this study with pre-examination stress level.
5. Conclusion
Cardiovascular parameters, cognitive parameters and stressscores were increased in almost all of the studentsirrespective of gender in pre-examination study. Thismay negatively affect the performance of students and canproduce anxiety and/or depression subsequently. Studentswho are at risk of excessive stress should be identified andfaculties should help them to deal the examination stress,anxiety or depression effectively and the earliest.
6. Source of funding
None.
7. Conflict of interest
None.
References1. Rosenberg PP. Students perceptions and concerns during their first
year in medical school. J Med Educ. 1971;46:211–218.2. Miller P. McC The first year at medical school: some findings and
student perceptions. Med Educ J. 1994;28:5–7.3. Vitaliano PP, Russo J, Carr JE, Heerwagen JH. Medical school
pressures and their relationship to anxiety. J Nerv Ment Dis.1984;172(12):730–736.
4. Stewart SM, Betson C, Marshall I, Wong CM, Lee PWH, Lam TH.Stress and vulnerability in medical students. Med Educ. 1995;29:119–127.
5. Qureshi F, Alam J, Khan MA, Sheraz G. Effects of examination stresson blood cell parameters of students in a Pakistan medical college. JAyub Med Coll Abbottabad. 2002;14(1):20–22.
6. Rozanski A, Blumenthal JA, Kaplan J. Impact of psychological factorson the pathogenesis of cardiovascular disease and implications fortherapy. Circ. 1999;99:2192–2217.
7. Lucini D, Norbiato G, Clerici M, Pagani M. Hemodynamic andautonomic adjustments to real life stress conditions in humans.Hypertens. 2002;39:184–188.
8. Dorshkind K, Horseman NS. Anterior pituitary hormones, stress, andimmune system homeostasis. Bioessays. 2001;23:288–294.
9. Gurrero JM, Reiter RJ. A Brief Survey of Pineal Gland- ImmuneSystem Interrelationships. Endocr Res. 1992;18(2):91–113.
10. Marshall GD, Aqarwall SK. Stress, immune regulation, and immunity:applications for asthma. Allergy Asthma Proc. 2000;21(4):241–246.
11. Loucks AB, Redman LM. The effect of stress on menstrual function.Trends Endocrinol Metab. 2004;15(10):466–471.
12. Sharma B, Wavare R, Deshpande A, Nigam R, Chandorkar R. Astudy of academic stress and its effect on vital parameters in finalyear medical students at SAIMS Medical College. Biomed Res.2011;22(3):361–365.
13. Rizvi AH, Awaiz M, Ghanghro Z, Jafferi MA, Aziz S. Preexaminationstress in second year medical students in a government college. J AyubMed Coll Abbottabad. 2010;22(2):152–155.
14. Srinivasan K, Vaz M, Sucharita S. A study of stress and autonomicnervous function in first year undergraduate medical students Indian.J Physiol Pharmacol. 2006;50(3):257–264.
15. Singh R, Goyal M, Tiwari S, Ghildiyal A, Nattu SM, Shobha SD.Effect of examination stress on mood, performance and cortisol levelsin medical students. Indian J Physiol Pharmacol. 2012;56(1):48–65.
16. Karia RM, Ghuntla TP, Mehta HB, Gokhale PA, Shah CJ. Effect ofGender Difference on Visual Reaction Time: A Study On MedicalStudents Of Bhavnagar Region. IOSR J Pharm. 2012;2(3):4524–454.
17. Shenvi D, Balasubramanian P. A comparative study of visual andauditory reaction time in males and females. Ind J Physiol Pharmacol.1994;38(3):229–231.
18. Hammer LG, Grigsby TL. Woods S, the conflicting demands of work,family and school among students of an urban university. J Psychol.1998;132(2):220–227.
19. Grillon C, Duncko R, Covington MF, Kopperman L, Kling MA.Acute stress potentiates anxiety in humans. Biol Psychiatry.2007;62(10):1183–1186.
20. Ruprai RK, Kamble P, Kurwale M. Environmental stress and changesin a Anxiety Score and Reaction time: A comparative study amongday scholars and hostilities in first year MBBS students. GJISS2012;1(2):1–3.
21. Eysenck MW, Derakshan N, Santos R, Calvo MG. Anxietyand cognitive performance: Attentional control theory. Emotion.2007;7(2):336–353.
22. Behan M, Wilson MR. State anxiety and visual attention. The roleof the quiet eye period in aiming to a far target. J Sport Sci.2008;26(2):207–215.
23. Beilock SL, Carr TH. On the fragility of skilled performance:what governs choking under pressure? J Exp Psychol Gen.2001;130(4):701–725.
24. Misra N, Mahajan KK, Maini BK. Comparative study of visual andauditory reaction time of hands and feet in males and females. IndianJ Physiol Pharmacol. 1985;29(4):213–218.
25. Vitaliano PP, Maiuro RD, Mitchell ES, Russo J. Perceived stress inmedical school: resistors, persistors, adaptors and maladaptors. SocSci Med. 1989;28:1321–1329.
26. 26) Firth J. Levels and sources of stress in medical students. BMJ.1986;292:1177–1180.
27. Mcewen BS, Sapolsky RM. Stress and cognitive function. Curr OpinNeurobiol. 1995;5(2):205–216.
28. Chajut R, Algom D. Selective attention improves under stress:Implications for theories of social cognition. J Pers Soc Psychol.2003;85(2):231–248.
29. Jain P, Mahajan A, Jain P, Babbbar R. Effect of partial sleepdeprivation on auditory event related potential and reaction time inmedical students. J K Sci. 2010;12(1):19–22.
30. Zeller A, Handschin D, Gyr N, Martina B, Battegay E. Blood pressureand heart rate of students undergoing a medical licensing examination.Blood Press. 2004;13(1):20–24.
31. Shah M, Hasan S, Malik S, Reddy CTS. Perceived Stress, Sourcesand Severity of Stress among medical undergraduates in a PakistaniMedical School. BMC Med Educ. 2010;10(2):1–10.
32. Supe AN. A Study of Stress in Medical Students at Seth G S MedicalCollege. J Postgrad Med. 1998;44(1):1–6.
33. Asso D. The relationship between menstrual cycle changes in nervoussystem activity and psychological behaviour and physical variables.Biol Psychol. 1986;23(1):53–64.
34. Asso D, Braier JR. Changes with menstrual cycle in psychophysiolog-ical and self report measures of activation. Biol Psychol. 1982;15(1-2):95–107.
35. Kelly MM, Tyrka AR, Anderson GM, Price LH, Carpenter LL. Sexdifferences in emotional and physiological response to the Trier SocialStress Test. J Behav Ther Exp Psychiatric. 2007;39(1):87–98.
Author biography
Neelima Kumari Associate Professor
Ashutosh Kumar Professor
Manish Kumar Associate Professor

Kumari, Kumar and Kumar / Indian Journal of Clinical Anatomy and Physiology 2019;6(4):462–467 467
Cite this article: Kumari N, Kumar A, Kumar M. Comparison ofcardiovascular, cognitive and stress parameters in presence and inabsence of examination among medical students: An observational andprospective study. Indian J Clin Anat Physiol 2019;6(4):462-467.
Kumari Tanuja et al JMSCR Volume 06 Issue 01 January 2018 Page 32544
JMSCR Vol||06||Issue||01||Page 32544-32555||January 2018
Original Research Article
Study on Relationship between Foetus, Neonatal & Maternal Haemoglobin
Level
Authors
Kumari Tanuja1, Md Tanweer Usmani
2, Nishi Kant
3, Rajiv Ranjan
4
1,3,4Post Graduate Trainee, Department of Physiology, Katihar Medical College, Katihar, Bihar, India
2Assistant Professor, Department of Physiology, Katihar Medical College, Katihar, Bihar, India
Corresponding Author
Dr Md Tanweer Usmani
Assistant Professor, Department of Physiology, Katihar Medical College, Katihar, Bihar, India
Ph: +91 7549716116, Email: [email protected]
Abstract
Objectives: Our study was to find out the relationship between foetus, neonatal and maternal haemoglobin
level of non-anaemic and anaemic mothers and their new borns.
Methodology: A total of 100 full term pregnant women and their full term newborn were enrolled in this
study. A detail history, dietary pattern, clinical examination and relevant investigation were performed.
Maternal blood and cord blood of newborns were examined. Haemoglobin level was estimated by Sahli’s
acid haematin method.
Results: Data was analyzed by using SPSS software. Mean, standard deviation and t value were observed.
P value was taken ≤ 0.05 for significant differences.
Conclusions: Our study concluded that if the mother suffers from anemia, i.e. low hemoglobin level, the
baby born to will also have low cord hemoglobin. Maternal anemia has a definite bearing on neonatal
hemoglobin level.
Keywords: Anaemia, Pregnancy, Maternal blood, cord blood, Haemoglobin.
Introduction
Anaemia is a common medical problem in
pregnancy. The extent up to which maternal
anaemia affects maternal and neonatal health is
still uncertain[1]
. India has reported high
prevalence of anaemia in pregnancy. In one of the
studies conducted on a large population, it was
estimated that 87% of the Indian population of the
Indian women are anemia[2]
.
Anemia is defined as the most common
hematological disorder during pregnancy having
decreased hemoglobin level or circulating red
blood cells[3]
. The World Health Organization
(WHO) has estimated that prevalence of anemia in
pregnant women was found 14% in developed,
51% in developing countries and 65-75% in India.
Prevalence of anemia in all the groups is higher in
India as compared to other developing countries.
WHO recommends that hemoglobin ideally
should be maintained at or above 11.0 g/dl in the
second trimester[4]
.
www.jmscr.igmpublication.org
Impact Factor 5.84
Index Copernicus Value: 71.58
ISSN (e)-2347-176x ISSN (p) 2455-0450
DOI: https://dx.doi.org/10.18535/jmscr/v6i1.23
Kumari Tanuja et al JMSCR Volume 06 Issue 01 January 2018 Page 32545
JMSCR Vol||06||Issue||01||Page 32544-32555||January 2018
Hematology of newborn recently represented as
area of study that focusing in study of umbilical
cord blood and its elements in general.[5]
Umbilical cord blood count at birth shows that
there is an increased in hemoglobin, hematocrit,
mean corpuscular volume, leukocyte count,
reticulocyte count and nucleated red blood cells
with presence of occasional immature white blood
cells or left-shifted in peripheral blood of healthy
infants, with variable degree in immature sick
newborns.[6]
The mean cord hemoglobin value
varies approximately between 16.6 and 17.1 gm/dl
of blood.[7]
The average hematocrit level
approximately 0.55 L/L (55%) at birth.[8]
The total
white blood cell count at birth generally high in
ranges between 9 and 30 x 109 / liter.[9]
Reticulocyte number at birth about 4% to 6% and
reflected the activity of the red cell formation in
fetal life.[10]
Variable number of platelets during
neonatal period was reported; figure reported at
time of birth ranges from 150 x 109/liter to 350 x
109/liter.[11]
Intrauterine fetus is maternal
dependent from embryonic stage, fetal hood up to
birth; hence anemia during pregnancy play a
major role in causes of fatal life threatening to the
mother and her fetus, and considered to make
serious complications resulting from lower
oxygen delivery, elevation of erythropoietin level,
reticulocyte counts, and nucleated red blood cells
of valuable inspections of neonatal healthy
status.[12]
Hence Increased erythropoietin level of
cord blood at time of birth used as indicator
markers for fetal hypoxia.[13]
Maternal and child health is an important problem
of public health, influencing the development of
the family and the community. Mother and infant
protection is a priority in the health field because
these population groups are the most exposed to
the sickness and death, consequently to their low
reactivity to the environmental factors and to their
high responsiveness to the disorders[14]
.
Objectives of our study was to assess and
determine the maternal haemoglobin (Hb) level on
pregnancy outcome and to find out the association
between maternal Hb level and its effect on
neonates.
Materials and Methods
The present study was carried out on 100 full term
pregnant women and their full term newborn
admitted in the department of Obstetrics and
Gynaecology, Katihar Medical College &
Hospital, Katihar, Bihar, India during a period
from January 2016 to December 2017. The
attendants of entire subjects signed an inform
consent approved by institutional ethical
committee of Katihar Medical College, Katihar,
Bihar was sought. The relevant investigations
were carried out in the department of Physiology
and upgraded department of Obstetrics and
Gynaecology, Katihar Medical College, Katihar,
Bihar.
Pregnant mothers without complications and their
single born term normal neonates delivered
spontaneously by vaginal route were considered
for this study. Detail history of the mothers was
noted and complete physical examination of them
and their newborns was carried out.
Determination of hemoglobin level, P.C.V and
total W.B.C count of mothers at the time of onset
of labour was carried out. Same investigations
were carried out on the cord blood of the
newborns of these mothers.
Pregnant women with hemoglobin level of more
than 12.0 gm/dl constituted the normal non-
anaemic control group or group I. Pregnant
women with hemoglobin level of less than 12.0
gm/dl were further divided into three anemic
groups or case group (group II, III & IV). Group
II: included pregnant women were with
hemoglobin level of 9.1 to 12.0 gm/dl. Group III:
included pregnant women with hemoglobin level
of 6.1 to 9.0 gm/dl. Group IV: included pregnant
women with hemoglobin level of less than 6.0
gm/dl. On the same pattern babies were assigned
to their respective mother groups. A total of 100
pregnant women were enrolled in this study.
Among 100 pregnant women, 25 pregnant non-
anaemic women were in group I, 30 pregnant
Kumari Tanuja et al JMSCR Volume 06 Issue 01 January 2018 Page 32546
JMSCR Vol||06||Issue||01||Page 32544-32555||January 2018
anaemic women were in group II, 30 pregnant
anaemic women were in group III and 15 pregnant
anaemic women were in group IV.
Methods
Detail assessment and clinical examination were
performed to all case like identification: name,
address, age, religion, occupation, gravida, parity,
Presenting complaints, menstrual history,
obstetrical history, history of past illness, family
history, personal history, socioeconomic status.
General examination: Appearance, built, state of
nutrition, height and weight, pallor, cyanosis,
jaundice, pulse, respiration, temperature, blood
pressure, tongue, gums, clubbing, koilonychias,
thyroid, lymphodenopathy, any other specific
nutrition deficiency sign.
Systemic examination: Abdominal and pelvic
examination: size of uterus interms of weeks,
uterine contraction, lie and presentation of foetus,
foetal heart sound. mothers cardiovascular system,
respiratory system, digestive system and central
nervous system.
Examination of newborn: Apgar scoring,
weight, length, skin, heart, chest, abdomen, cord,
rectum and genitilia, reflexes, circumference of
head and circumference of chest.
Blood samples: Mothers venous blood and the
cord blood of respective newborns were collected.
Mother’s blood was collected from antecubital
vein 2-48 hours before delivery. Newborns blood
was collected from umbilical cord just after
delivery, when cord pulsation has ceased but
before the placental separation.
Investigation done on maternal and cord
blood: Estimation of Haemoglobin level, total
R.B.C count, P.C.V. estimation, calculation of
M.C.H and M.C.H.C.
Estimation of Haemoglobin
Haemoglobin estimation of both maternal and
cord blood was done by Sahli’s acid haematin
method.
Principle: Anticoagulated blood is added to the
0.1 N HCl and kept for 5-7 minutes to form acid
haematin. The color of this acid haematin should
be matched with the solution, present in the
calibration tube. Distilled water is added to the
acid haematin until the color matches and the final
reading is directly noted from the graduation in
the calibration tube. [Please note that 100 percent
on the scale corresponds to 14.5gm % to 15gm
%].
Requirements: Sahli's haemoglobinometer,
Hydrochloric acid, distilled water.
Procedure: Place N/10 HCL in diluting tube up to
the mark 20. Take blood in the haemoglobin
pipette up to 20-cubic-mm-mark and blow it into
diluting tube and rinse well. After 10 minutes add
distilled water in drops and mix the tube until it
has exactly the same color as the comparison
standards. Note the reading, which indicates the
percentage of haemoglobin.
Precautions: i. Pipetting of blood should be done
cautiously. ii. Mix the blood properly with HCl by
using stirrer. iii. Match the color cautiously.
Determination of total R.B.C count:
Principles: A known volume of blood is diluted
(200 times) with an isotonic solution containing
anticoagulant. R.B.C. in a known volume of blood
are counted in special counting chamber and
number of R.B.C. per cu mm of blood is
calculated there from.
Materials and Instruments
a) Whole blood, using EDTA or heparin as
an anticoagulant. Using capillary blood.
b) Hayem’s solution:Hgcl2 0.05g, NaSO4
2.5g, NaCl 0.5g and distilled water 100ml.
c) RBC pipette
d) Hemocytometer (Neubauer’s counting
chamber) with coverslip.
e) Microscope.
f) Lancet.
g) Alcohol 70%.
h) Pipette rotator
i. Aspirator connected to a faucet with
running water.
Procedure
a) Wipe finger with cotton soaked with
alcohol, with a sterile lancet do small prick
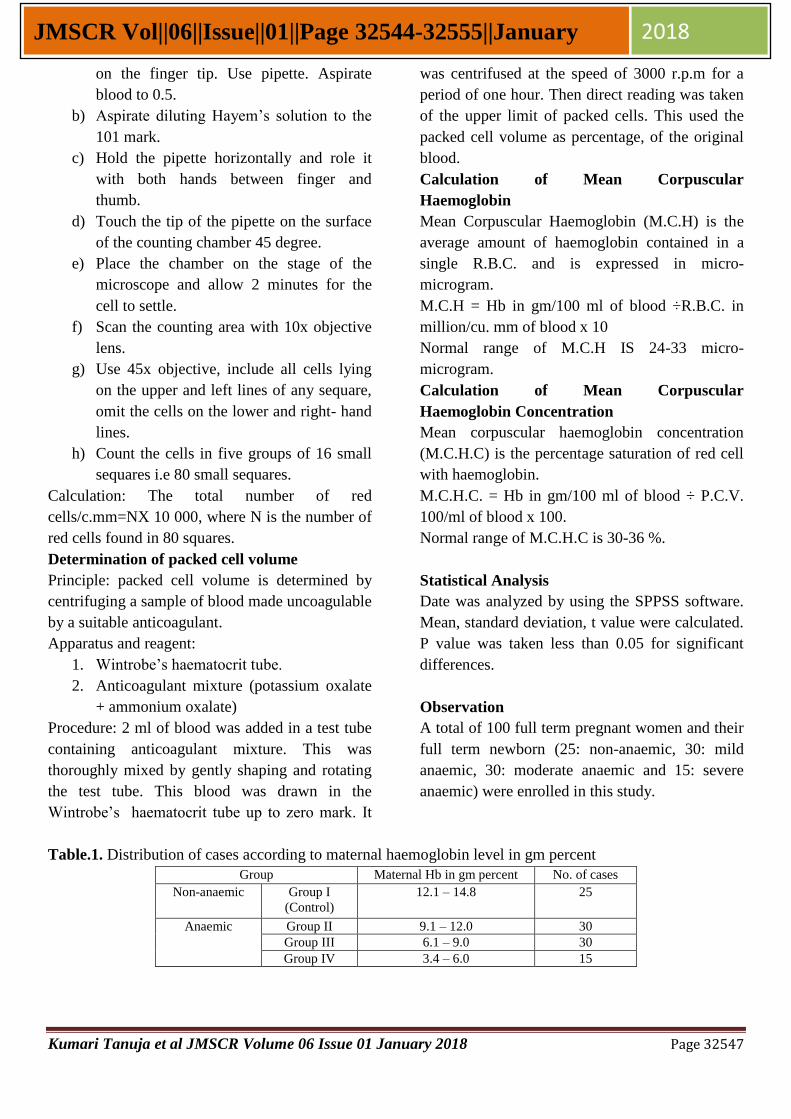
Kumari Tanuja et al JMSCR Volume 06 Issue 01 January 2018 Page 32547
JMSCR Vol||06||Issue||01||Page 32544-32555||January 2018
on the finger tip. Use pipette. Aspirate
blood to 0.5.
b) Aspirate diluting Hayem’s solution to the
101 mark.
c) Hold the pipette horizontally and role it
with both hands between finger and
thumb.
d) Touch the tip of the pipette on the surface
of the counting chamber 45 degree.
e) Place the chamber on the stage of the
microscope and allow 2 minutes for the
cell to settle.
f) Scan the counting area with 10x objective
lens.
g) Use 45x objective, include all cells lying
on the upper and left lines of any sequare,
omit the cells on the lower and right- hand
lines.
h) Count the cells in five groups of 16 small
sequares i.e 80 small sequares.
Calculation: The total number of red
cells/c.mm=NX 10 000, where N is the number of
red cells found in 80 squares.
Determination of packed cell volume
Principle: packed cell volume is determined by
centrifuging a sample of blood made uncoagulable
by a suitable anticoagulant.
Apparatus and reagent:
1. Wintrobe’s haematocrit tube.
2. Anticoagulant mixture (potassium oxalate
+ ammonium oxalate)
Procedure: 2 ml of blood was added in a test tube
containing anticoagulant mixture. This was
thoroughly mixed by gently shaping and rotating
the test tube. This blood was drawn in the
Wintrobe’s haematocrit tube up to zero mark. It
was centrifused at the speed of 3000 r.p.m for a
period of one hour. Then direct reading was taken
of the upper limit of packed cells. This used the
packed cell volume as percentage, of the original
blood.
Calculation of Mean Corpuscular
Haemoglobin
Mean Corpuscular Haemoglobin (M.C.H) is the
average amount of haemoglobin contained in a
single R.B.C. and is expressed in micro-
microgram.
M.C.H = Hb in gm/100 ml of blood ÷R.B.C. in
million/cu. mm of blood x 10
Normal range of M.C.H IS 24-33 micro-
microgram.
Calculation of Mean Corpuscular
Haemoglobin Concentration
Mean corpuscular haemoglobin concentration
(M.C.H.C) is the percentage saturation of red cell
with haemoglobin.
M.C.H.C. = Hb in gm/100 ml of blood ÷ P.C.V.
100/ml of blood x 100.
Normal range of M.C.H.C is 30-36 %.
Statistical Analysis
Date was analyzed by using the SPPSS software.
Mean, standard deviation, t value were calculated.
P value was taken less than 0.05 for significant
differences.
Observation
A total of 100 full term pregnant women and their
full term newborn (25: non-anaemic, 30: mild
anaemic, 30: moderate anaemic and 15: severe
anaemic) were enrolled in this study.
Table.1. Distribution of cases according to maternal haemoglobin level in gm percent
Group Maternal Hb in gm percent No. of cases
Non-anaemic Group I
(Control)
12.1 – 14.8 25
Anaemic Group II 9.1 – 12.0 30
Group III 6.1 – 9.0 30
Group IV 3.4 – 6.0 15
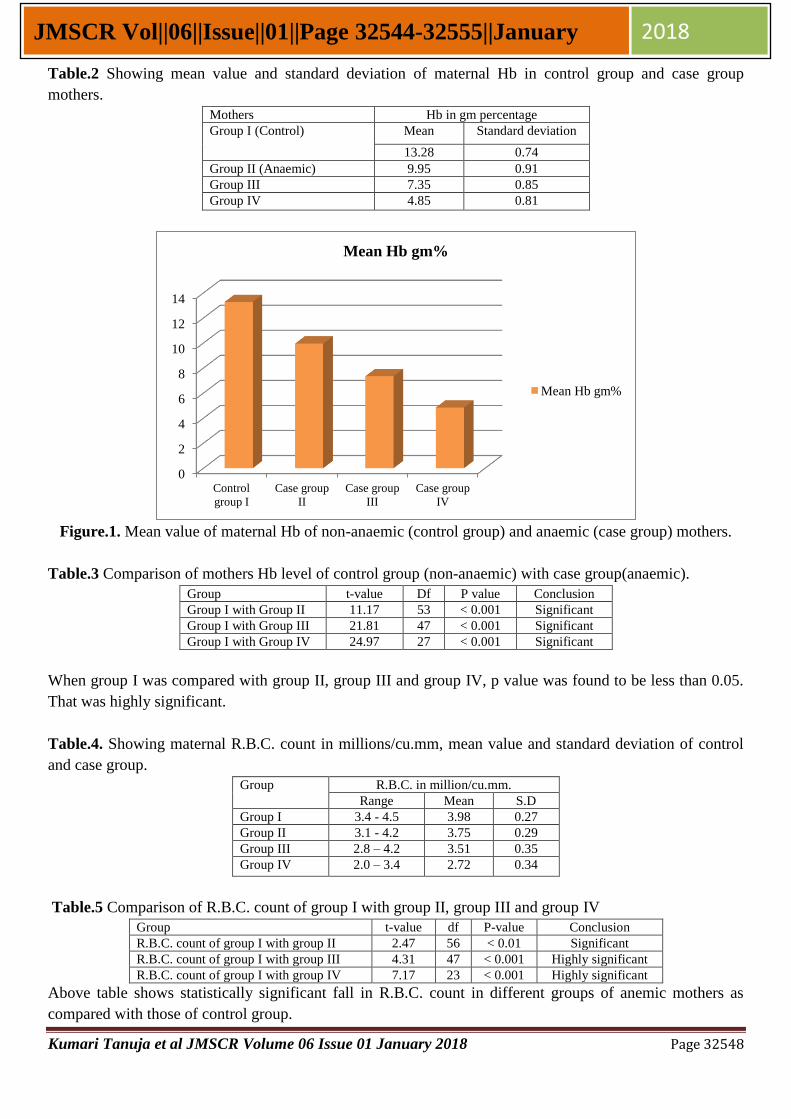
Kumari Tanuja et al JMSCR Volume 06 Issue 01 January 2018 Page 32548
JMSCR Vol||06||Issue||01||Page 32544-32555||January 2018
Table.2 Showing mean value and standard deviation of maternal Hb in control group and case group
mothers.
Mothers Hb in gm percentage
Group I (Control) Mean Standard deviation
13.28 0.74
Group II (Anaemic) 9.95 0.91
Group III 7.35 0.85
Group IV 4.85 0.81
Figure.1. Mean value of maternal Hb of non-anaemic (control group) and anaemic (case group) mothers.
Table.3 Comparison of mothers Hb level of control group (non-anaemic) with case group(anaemic).
Group t-value Df P value Conclusion
Group I with Group II 11.17 53 < 0.001 Significant
Group I with Group III 21.81 47 < 0.001 Significant
Group I with Group IV 24.97 27 < 0.001 Significant
When group I was compared with group II, group III and group IV, p value was found to be less than 0.05.
That was highly significant.
Table.4. Showing maternal R.B.C. count in millions/cu.mm, mean value and standard deviation of control
and case group.
Group
R.B.C. in million/cu.mm.
Range Mean S.D
Group I 3.4 - 4.5 3.98 0.27
Group II 3.1 - 4.2 3.75 0.29
Group III 2.8 – 4.2 3.51 0.35
Group IV 2.0 – 3.4 2.72 0.34
Table.5 Comparison of R.B.C. count of group I with group II, group III and group IV
Group t-value df P-value Conclusion
R.B.C. count of group I with group II 2.47 56 < 0.01 Significant
R.B.C. count of group I with group III 4.31 47 < 0.001 Highly significant
R.B.C. count of group I with group IV 7.17 23 < 0.001 Highly significant
Above table shows statistically significant fall in R.B.C. count in different groups of anemic mothers as
compared with those of control group.
0
2
4
6
8
10
12
14
Control
group I
Case group
II
Case group
III
Case group
IV
Mean Hb gm%
Mean Hb gm%
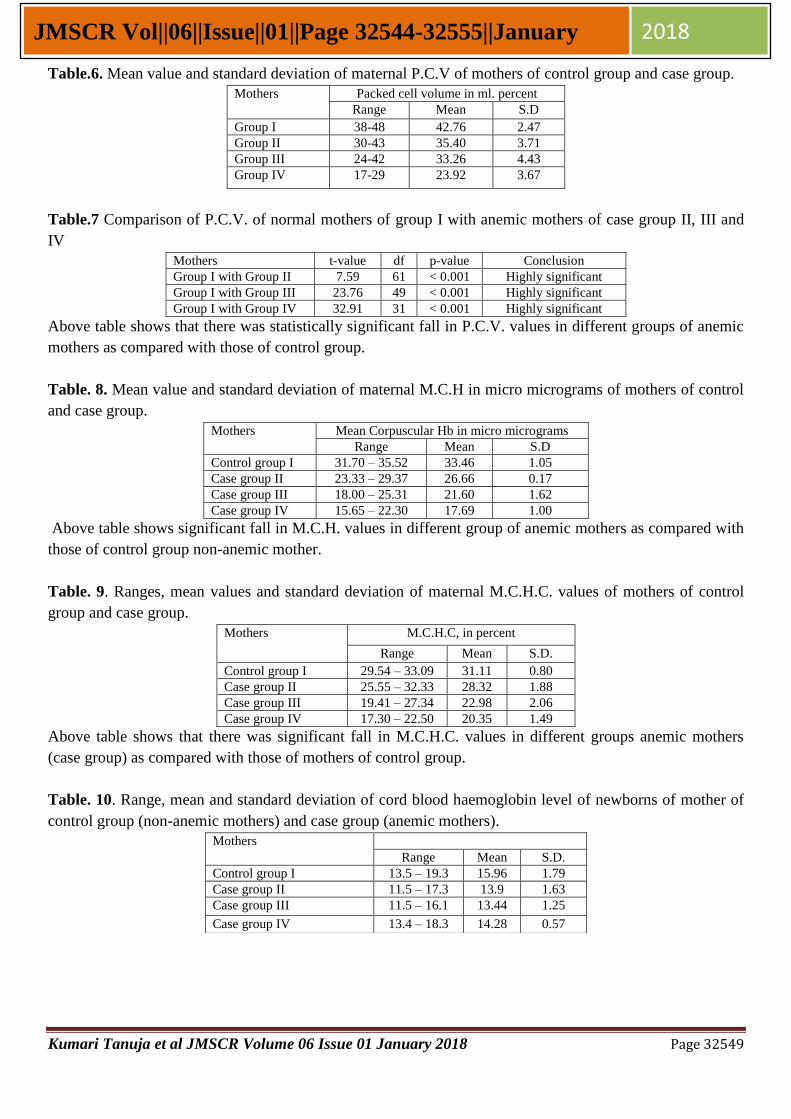
Kumari Tanuja et al JMSCR Volume 06 Issue 01 January 2018 Page 32549
JMSCR Vol||06||Issue||01||Page 32544-32555||January 2018
Table.6. Mean value and standard deviation of maternal P.C.V of mothers of control group and case group.
Mothers Packed cell volume in ml. percent
Range Mean S.D
Group I 38-48 42.76 2.47
Group II 30-43 35.40 3.71
Group III 24-42 33.26 4.43
Group IV 17-29 23.92 3.67
Table.7 Comparison of P.C.V. of normal mothers of group I with anemic mothers of case group II, III and
IV
Mothers t-value df p-value Conclusion
Group I with Group II 7.59 61 < 0.001 Highly significant
Group I with Group III 23.76 49 < 0.001 Highly significant
Group I with Group IV 32.91 31 < 0.001 Highly significant
Above table shows that there was statistically significant fall in P.C.V. values in different groups of anemic
mothers as compared with those of control group.
Table. 8. Mean value and standard deviation of maternal M.C.H in micro micrograms of mothers of control
and case group.
Mothers Mean Corpuscular Hb in micro micrograms
Range Mean S.D
Control group I 31.70 – 35.52 33.46 1.05
Case group II 23.33 – 29.37 26.66 0.17
Case group III 18.00 – 25.31 21.60 1.62
Case group IV 15.65 – 22.30 17.69 1.00
Above table shows significant fall in M.C.H. values in different group of anemic mothers as compared with
those of control group non-anemic mother.
Table. 9. Ranges, mean values and standard deviation of maternal M.C.H.C. values of mothers of control
group and case group.
Above table shows that there was significant fall in M.C.H.C. values in different groups anemic mothers
(case group) as compared with those of mothers of control group.
Table. 10. Range, mean and standard deviation of cord blood haemoglobin level of newborns of mother of
control group (non-anemic mothers) and case group (anemic mothers).
Mothers M.C.H.C, in percent
Range Mean S.D.
Control group I 29.54 – 33.09 31.11 0.80
Case group II 25.55 – 32.33 28.32 1.88
Case group III 19.41 – 27.34 22.98 2.06
Case group IV 17.30 – 22.50 20.35 1.49
Mothers
Range Mean S.D.
Control group I 13.5 – 19.3 15.96 1.79
Case group II 11.5 – 17.3 13.9 1.63
Case group III 11.5 – 16.1 13.44 1.25
Case group IV 13.4 – 18.3 14.28 0.57
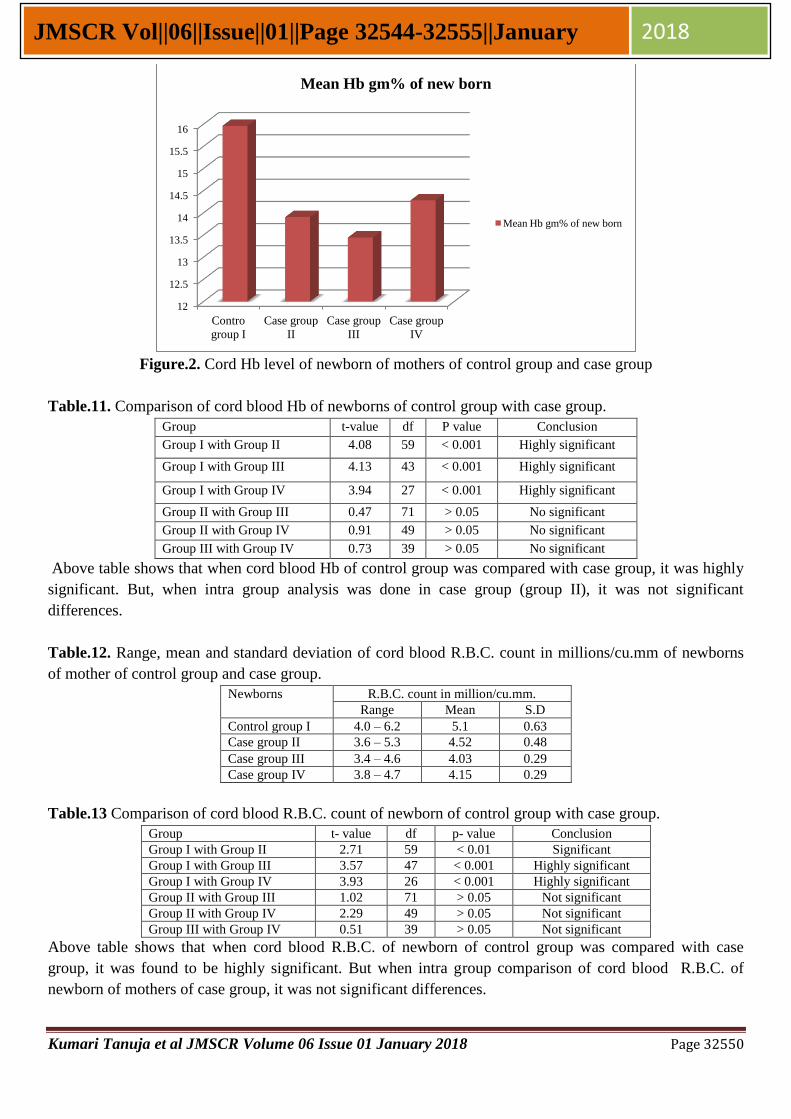
Kumari Tanuja et al JMSCR Volume 06 Issue 01 January 2018 Page 32550
JMSCR Vol||06||Issue||01||Page 32544-32555||January 2018
Figure.2. Cord Hb level of newborn of mothers of control group and case group
Table.11. Comparison of cord blood Hb of newborns of control group with case group.
Group t-value df P value Conclusion
Group I with Group II 4.08 59 < 0.001 Highly significant
Group I with Group III 4.13 43 < 0.001 Highly significant
Group I with Group IV 3.94 27 < 0.001 Highly significant
Group II with Group III 0.47 71 > 0.05 No significant
Group II with Group IV 0.91 49 > 0.05 No significant
Group III with Group IV 0.73 39 > 0.05 No significant
Above table shows that when cord blood Hb of control group was compared with case group, it was highly
significant. But, when intra group analysis was done in case group (group II), it was not significant
differences.
Table.12. Range, mean and standard deviation of cord blood R.B.C. count in millions/cu.mm of newborns
of mother of control group and case group.
Newborns R.B.C. count in million/cu.mm.
Range Mean S.D
Control group I 4.0 – 6.2 5.1 0.63
Case group II 3.6 – 5.3 4.52 0.48
Case group III 3.4 – 4.6 4.03 0.29
Case group IV 3.8 – 4.7 4.15 0.29
Table.13 Comparison of cord blood R.B.C. count of newborn of control group with case group.
Group t- value df p- value Conclusion
Group I with Group II 2.71 59 < 0.01 Significant
Group I with Group III 3.57 47 < 0.001 Highly significant
Group I with Group IV 3.93 26 < 0.001 Highly significant
Group II with Group III 1.02 71 > 0.05 Not significant
Group II with Group IV 2.29 49 > 0.05 Not significant
Group III with Group IV 0.51 39 > 0.05 Not significant
Above table shows that when cord blood R.B.C. of newborn of control group was compared with case
group, it was found to be highly significant. But when intra group comparison of cord blood R.B.C. of
newborn of mothers of case group, it was not significant differences.
12
12.5
13
13.5
14
14.5
15
15.5
16
Contro
group I
Case group
II
Case group
III
Case group
IV
Mean Hb gm% of new born
Mean Hb gm% of new born
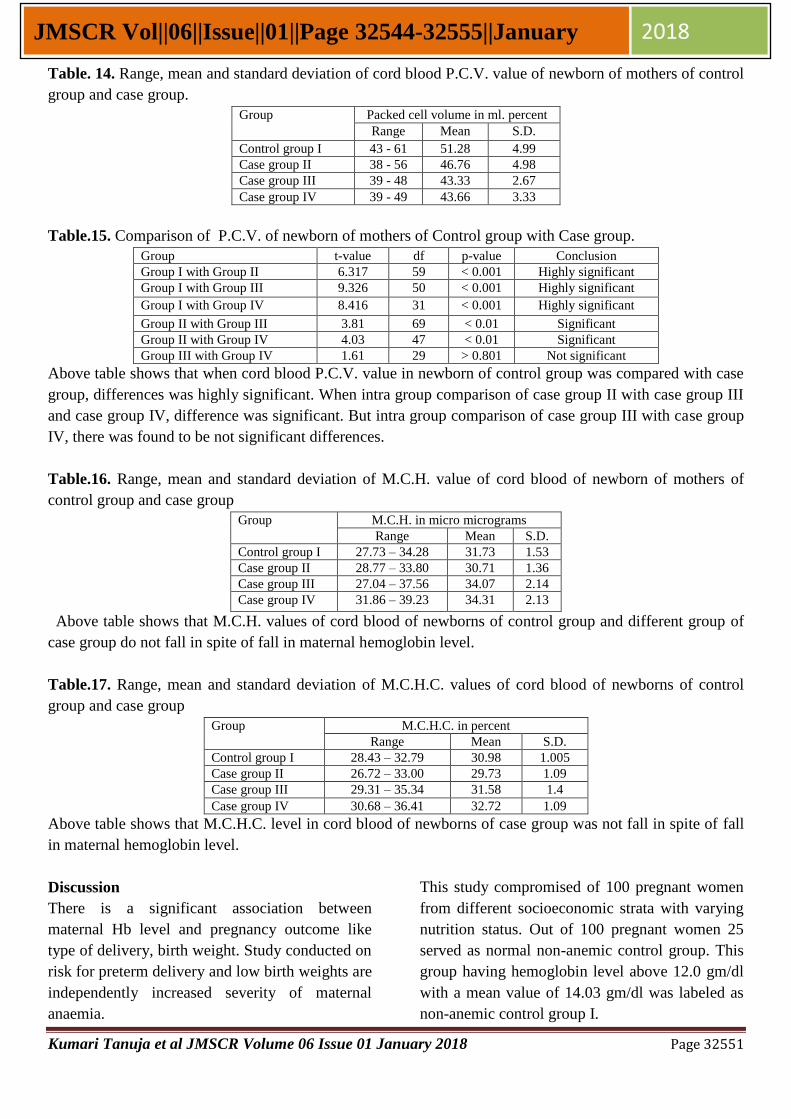
Kumari Tanuja et al JMSCR Volume 06 Issue 01 January 2018 Page 32551
JMSCR Vol||06||Issue||01||Page 32544-32555||January 2018
Table. 14. Range, mean and standard deviation of cord blood P.C.V. value of newborn of mothers of control
group and case group.
Group Packed cell volume in ml. percent
Range Mean S.D.
Control group I 43 - 61 51.28 4.99
Case group II 38 - 56 46.76 4.98
Case group III 39 - 48 43.33 2.67
Case group IV 39 - 49 43.66 3.33
Table.15. Comparison of P.C.V. of newborn of mothers of Control group with Case group.
Group t-value df p-value Conclusion
Group I with Group II 6.317 59 < 0.001 Highly significant
Group I with Group III 9.326 50 < 0.001 Highly significant
Group I with Group IV 8.416 31 < 0.001 Highly significant
Group II with Group III 3.81 69 < 0.01 Significant
Group II with Group IV 4.03 47 < 0.01 Significant
Group III with Group IV 1.61 29 > 0.801 Not significant
Above table shows that when cord blood P.C.V. value in newborn of control group was compared with case
group, differences was highly significant. When intra group comparison of case group II with case group III
and case group IV, difference was significant. But intra group comparison of case group III with case group
IV, there was found to be not significant differences.
Table.16. Range, mean and standard deviation of M.C.H. value of cord blood of newborn of mothers of
control group and case group
Group M.C.H. in micro micrograms
Range Mean S.D.
Control group I 27.73 – 34.28 31.73 1.53
Case group II 28.77 – 33.80 30.71 1.36
Case group III 27.04 – 37.56 34.07 2.14
Case group IV 31.86 – 39.23 34.31 2.13
Above table shows that M.C.H. values of cord blood of newborns of control group and different group of
case group do not fall in spite of fall in maternal hemoglobin level.
Table.17. Range, mean and standard deviation of M.C.H.C. values of cord blood of newborns of control
group and case group
Group M.C.H.C. in percent
Range Mean S.D.
Control group I 28.43 – 32.79 30.98 1.005
Case group II 26.72 – 33.00 29.73 1.09
Case group III 29.31 – 35.34 31.58 1.4
Case group IV 30.68 – 36.41 32.72 1.09
Above table shows that M.C.H.C. level in cord blood of newborns of case group was not fall in spite of fall
in maternal hemoglobin level.
Discussion
There is a significant association between
maternal Hb level and pregnancy outcome like
type of delivery, birth weight. Study conducted on
risk for preterm delivery and low birth weights are
independently increased severity of maternal
anaemia.
This study compromised of 100 pregnant women
from different socioeconomic strata with varying
nutrition status. Out of 100 pregnant women 25
served as normal non-anemic control group. This
group having hemoglobin level above 12.0 gm/dl
with a mean value of 14.03 gm/dl was labeled as
non-anemic control group I.
Kumari Tanuja et al JMSCR Volume 06 Issue 01 January 2018 Page 32552
JMSCR Vol||06||Issue||01||Page 32544-32555||January 2018
Remaining 75 pregnant women with hemoglobin
level bellow 12.0 gm/dl were designated as
anemic case group. This case group was further
divided into three groups. Group II: Included 30
pregnant women with hemoglobin ranges from 9.1
gm/dl to 12.0 gm/dl. Group III: included 30
pregnant women with hemoglobin ranges from 6.1
gm/dl to 9.0 gm/dl. Group IV: included 15
pregnant women with hemoglobin level of 6.0
gm/dl and bellow (table 1).
This arbitrary grouping of the degree of maternal
anemic on the basis of their hemoglobin content
was done in accordance with the line adopted
Goswami et al (2014).[15]
The anemic pregnant mothers (case group) with
hemoglobin bellow 12 gm/dl were suffering from
iron deficiency anemia by the presence of low
hemoglobin level, low R.B.C. count, decreased
P.C.V., M.C.H. and M.C.H.C. values.
The mean hemoglobin level of Group I mothers
serving as control was 13.28 gm/dl, with a range
of 12.1-14.0 gm/dl, standard deviation ± 0.74. The
mean hemoglobin level of group II mothers was
9.96 gm/dl with a range of 9.1-12.0 gm/dl,
standard deviation being ± 0.91. This value for
group III and group IV mothers was 7.35 gm/dl
(ranges 6.1-9.0 gm/dl, S.D. ± 0.85) and 4.85 gm/dl
(range 3.4-6.0 gm/dl, S.D. ± 0.81) respectively.
The R.B.C. count of control group I mothers
ranges from 3.4 - 4.5 millions/cu.mm. with a
mean value of 3.98 millions/cu.mm., S.D.± 0.27.
in case group II mothers R.B.C. count was ranging
from 3.1 - 4.2 million/cu.mm with a mean value
of 3.75 million/cu.mm., S.D. ± 0.29. In group III
mothers the R.B.C. count ranges from 2.8 – 4.2
million/cu.mm with a mean value of 3.5
million/cu.mm., S.D. ± 0.35. The R.B.C. count of
case group IV mothers ranged from 2.1 – 3.4
million/cu.mm with a mean value of 2.72
millions/cu.mm., S.D. ± 0.34.
The P.C.V. of control group I ranged from 38 –
48% with a mean value of 42.76, S.D. ± 2.47.
While that of group II mothers ranged from 30-43
% with a mean value of 35.40 %, S.D. ± 3.71. In
group III mothers the ranged of P.C.V. values was
24 – 42 % with a mean value of 33.26%, S.D. ±
4.43 and in group IV mothers this values was
ranging 17 – 29% with a mean value of 23.92%,
S.D. ± 3.67.
The maternal M.C.H. value for control group I
was 31.7 – 35.52 micro microgram with a mean of
33.46 micro microgram, S.D. ±1.05. The M.C.H.
level of group II mothers ranged from 23.33 –
29.37 micro microgram with a mean value of
26.66 micro microgram, S.D. ± 0.71. In group III
mothers the M.C.H. value was 18.00 – 25.31
micro microgram with a mean value of 21.60
micro microgram, S.D. ± 1.62. In group IV
mothers the M.C.H. values was 15.65 – 22.30
micro microgram with a mean value of 17.69
micro microgram, S.D. ± 1.80.
The M.C.H.C. of control group I mothers was in
the range of 29.54 – 33.09 % with a mean value of
31.11 %, S.D. ± 0.8. In group II mothers M.C.H.C
ranged from 25.55 – 32.33% with a mean value of
28.32%, S.D. ± 1.88. The M.C.H.C. of group III
mothers ranged from 19.41 – 27.24 % with a
mean value of 22.98%, S.D. ± 2.86. In group IV
mothers the M.C.H.C. value ranged from 17.30 –
22.50 % with a mean value 0f 20.35%, S.D. ±
1.49.
On subjecting the above data to statistical analysis
in differences in the mean hemoglobin, R.B.C.
count and P.C.V. of control group I and anemic
group II, III and IV were found to statistically
significant, p value < 0.001. Similarly, M.C.H.
and M.C.H.C. values also showed statistically
significant.
The cord hemoglobin level of newborns to control
group I was in the range of 13.5 – 19.3 gm/dl with
a mean value of 15.96 gm/dl, S.D. ± 1.79. The
newborns to group II mothers had cord
hemoglobin level ranging from 11.5 – 17.3 gm/dl,
with a mean value of 13.9 gm/dl, S.D. ± 1.63. the
babies born to group III mothers had cord
hemoglobin level ranging from 11.5 – 16.1 gm/dl
with a mean value of 13.44 gm/dl, S.D. ± 1.25.
The cord hemoglobin level of babies born to
group IV mothers ranged from 13.4 – 15.3 gm/dl
with a mean value of 14.28 gm/dl, S.D. ± 0.57. On
Kumari Tanuja et al JMSCR Volume 06 Issue 01 January 2018 Page 32553
JMSCR Vol||06||Issue||01||Page 32544-32555||January 2018
subjecting these data to statistical analysis the
cord hemoglobin of newborn to non-anemic
control group I was found to be significantly
higher than those belonging to anemic case group
II, III and IV. On the other hand it was also
observed that the difference between cord
hemoglobin of neonates delivered to group II, III
and IV mothers were not statistically significant
with the p value being more than 0.05.
A drop in maternal hemoglobin level from a mean
value of 13.28 gm/dl to 9.95 gm/dl resulted in a
significant fall of cord blood hemoglobin level
with p value being less than 0.001. However,
further fall in maternal hemoglobin to 7.35 gm/dl
and 4.85 gm/dl did not result in any significant
decline in hemoglobin level of the cord blood of
babies born to those mothers.
The mean value of total R.B.C. count in control
group I mothers was 5.1 millions/cu.mm, S.D. ±
0.63 with a range of 4.0 – 6.2 millions/cu.mm. In
case group II mothers the means total R.B.C.
count was 4.52 millions/cu.mm, S.D. ± 0.48 with
a range of 3.6 – 5.3 millions/cu.mm. The mean
total R.B.C. count of the cord blood of newborns
of group III was 4.03 millions/cu.mm, S.D. ± 0.29
with a range of 3.4 – 4.6 millions/cu.mm. In group
IV newborns the total R.B.C. count in cord blood
ranged from 3.8 – 4.7 millions/cu.mm with a
mean value of 4.13 millions/cu.mm, S.D. ± 0.29.
On statistical analysis a significant differences
was observed between total R.B.C. count of cord
blood of babies born to case group(anemic) and
control group (non-anemic) mothers. It was
further observed that a fall in maternal
hemoglobin level from 13.20 to 9.95 gm/dl
resulted in a significant fall in cord blood total
R.B.C. count of the babies. However, further
lowering of maternal hemoglobin level failed to
produce any significant lowering of R.B.C. count
in respective cord blood.
The P.C.V. value of babies born to non-anemic
control group I mothers was in the range of 43 –
61% with a mean value of 51.28%, S.D. ± 4.99. In
the cord blood of babies born to group II, III and
IV mothers, the P.C.V. values ranged from 38 to
51%, 39 to 48% and 39 to 49% with the mean
value of 46.76 ± 4.98, 43.33 ± 2.67 and 43.66 ±
3.33 respectively. The P.C.V. values also showed
similar pattern on statistical analysis, i.e.
significant difference was noted in P.C.V, values
of babies born to anemic and non-anemic mothers.
The M.C.H. value of babies born to non-anemic
control group I ranged from 27.73 – 34.28 micro
microgram with a mean value of 31.73, S.D. ±
1.53. This value in cord blood of babies born to
case group II, III and IV mothers were in the
range of 28.77 – 33.80 micro micrograms, 27.04 -
37.56 micro micrograms and 31.86 – 39.23 micro
micrograms with the mean value of 30.71 ± 1.36,
34.07 ± 2.14 and 34.31 ± 2.13 respectively. On
statistical analysis it was seen that fall in maternal
hemoglobin level does not produce any significant
decline in M.C.H. value of cord blood of babies
born to such mothers.
Elgari and Waggiallah et al (2013) was studied on
anaemic and anaemic mothers and their neonates,
their findings supported the findings of our
study.[16]
Summary & Conclusion
Investigations were conducted on one hundred full
term pregnant women with uneventful gestation
and their single born full term normal babies to
elucidate the effect of maternal low hemoglobin
level on the hemoglobin level of the newborns.
All the babies were born spontaneously through
vaginal route.
A series of haematological investigations namely
haemoglobin estimation, R.B.C. count, P.C.V.
estimation and calculation of M.C.H. and
M.C.H.C. were done 2 – 48 hours before delivery
on maternal blood with a purpose of establishing
the presence or otherwise of iron deficiency
anemia and to determine its severity.
The normal non-anemic controls designated as
group I compromised of 25 pregnant women
having a hemoglobin level of more than 12.0
gm/dl. The remaining 75 pregnant women having
hemoglobin level below 12.0 gm/dl were regarded
as anemic case group and were further devided
Kumari Tanuja et al JMSCR Volume 06 Issue 01 January 2018 Page 32554
JMSCR Vol||06||Issue||01||Page 32544-32555||January 2018
into three groups (group II: Hb range 9.1 – 12.0
gm/dl, group III: Hb range 6.1 – 9.0 gm/dl and
group IV: Hb range 6.0 gm/dl or less).
After delivery, the newborns were assigned to
their mothers group. These newborns were
subjected to the same set of investigations which
were carried out on their mothers prior to delivery.
The results of these investigations were analyzed
statistically and the level of their significance was
determined.
For group I, II, III and IV newborns, the mean
hemoglobin value was 15.96 gm/dl, 13.9 gm/dl,
13.44 gm/dl and 14.26 gm/dl respectively.
When maternal hemoglobin falls from the level
above 12.0 gm/dl to a range between 9.1 to 12.0
gm/dl, there occurs a significant fall (p<0.001) in
cord blood hemoglobin level. However, a further
fall in maternal hemoglobin does not result in any
significant fall (p<0.05) in cord blood hemoglobin
level of the respective newborn.
Values of R.B.C. count, P.C.V., M.C.H., and
M.C.H.C., of mothers belonging to various groups
and their newborns cord blood, more or less
similar results were obtained.
Thus, it could be propounded that interrelationship
between maternal and neonatal hemoglobin level
is more complex than ordinarily conceived.
However, it can be concluded from this study that
maternal anemia has a definite bearing on
neonatal hemoglobin level.
Hence we concluded that, if the mother suffers
from anemia, i.e. low hemoglobin level, the baby
born to will also have low cord hemoglobin level
and it may also be the cause of anemia in further
stages of his growth as an individual.
Relevance to Cinical Practice
In our country, anemia associated with
malnutrition is very common, especially among
poor socio-economic groups. Furthermore, in our
country, anemia antedates pregnancy and gets
aggravated during pregnancy and labour. It is
further propounded by successive pregnancies and
lactation. Therefore, it is essential to improve the
nutritional status of women by combating faulty
dietary habits arising from poverty, ignorance of
food values, illiteracy and superstitions.
We can be safely recommended that public health
programs should give top priorities to program to
ensuring adequate hemoglobin level by proper
screening program and nourishment to expectant
mothers.
References
1. Muhammad Owais Ahmad, Umay
Kalsoom, Ume Sughra, Usman Hadi,
Muhammad Imran. Effect of maternal
anaemia on birth weight. J Ayub Med Coll
Abbottabad 2011; 23(1):77-79.
2. Jagdishkumar K, Asha N, Shrinivasa
Murthy D, Sujatha MS and Manjunath
VG. Maternal Anaemia in Various
Trimesters and its Effect on Newborn
Weight and Maturity: An Observational
Study. Int J Prev Med. 2013 February;
4(2): 193–199.
3. Gautam CS, Saha L, Sekhri K, Saha PK;
Iron deficiency in pregnancy and
rationality of iron supplements prescribed
during pregnancy. Medscape J Med.,
2008; 10(12): 283.
4. Mayer EM, Tegman A; Prevalence of
Anemia in the World. World Health Organ
Qlty., 1998; 38: 302-316.
5. Purves E. Neonatal hematologic disorders.
J Pediatr Oncol Nurs 2005; 22:168-175.
6. Dijxhoorn MJ, Visser GH, Fidler VJ,
Touwen BC, Huisjes HJ. Apgar score,
meconium and acidaemia at birth in
relation to neonatal neurological morbidity
in term infants. Br J Obstet Gynaecol
1986; 93:217-222.
7. Guest GM, Brown EW. Erythrocytes and
hemoglobin of the blood in infancy and
childhood. III. Factors in variability,
statistical studies. Am J Dis Child 1957;
93:486–509.
8. Gatti RA. Hematocrit values of capillary
blood in the newborn infants. J Pediatr
1967; 70:117-118.
Kumari Tanuja et al JMSCR Volume 06 Issue 01 January 2018 Page 32555
JMSCR Vol||06||Issue||01||Page 32544-32555||January 2018
9. Lanzkowsk P. Manual of pediateric
hematology and oncology. 4th ed. Elsevier
Academic Press; 2005.
10. Miller DR, Baehner RL, Miller LP,
editors. Blood diseases of infancy and
childhood. 6th ed. St. Louis, Philadelphia:
CV Mosby Company; 1990. p. 428-63.
11. Zipursky A. Symposium on perinatal
hematology: Clinics in perinatology.
Philadelphia, Pa: W.B. Saunders; 1984:11.
p. 249-513.
12. Badole CM, Tyagi NK, Agarwal M. Fetal
growth: Association with maternal dietary
intake, hemoglobin and antenatal care in
rural area. J of Obstet Gynecol 1991; 1:32-
37.
13. Dennis J, Johnson A, Mutch L, Yudkin P,
Johnson P. Acid-base status at birth and
neurodevelopmental outcome at four and
one-half years. Am J Obstet Gynecol
1989; 161:213-220.
14. Enăchescu D, Marcu M.G. Sănătate
publică şi management sanitar. Editura
All, Bucureşti, 106, 1994.
15. Dr. Tolar M. Goswami, Dr. Vaishali N.
Patel, Dr. Neha H. Pandya, Dr. Amita K.
Mevada, Dr. Kinner Desai and Kalpesh B.
Solanki. Maternal anaemia during
pregnancy and its impact on perinatal
outcome. IJBAR 2014; 05: 02.
16. Mahmoud Mohamed Elgari, Hisham Ali
Waggiallah. Assessment of hematological
parameters of neonatal cord blood in
anemic and non-anemic mothers. Journal
of Clinical & Experimental Research.
May-August 2013; 1:2.
Md Tanweer Ushmani et al JMSCR Volume 05 Issue 11 November 2017 Page 30937
JMSCR Vol||05||Issue||11||Page 30937-30948||November 2017
Original Research Article
A Study on the Correlation of Serum uric acid and Dyslipidemia with
Glycaemic Status in Type 2 Diabetes Mellitus
Authors
Md Tanweer Ushmani1, Rajiv Ranjan
2, Kumari Tanuja
3
1Assistant Professor, Department of Physiology, Katihar Medical College, Katihar, Bihar, India
2,3Post Graduate Trainee, Department of Physiology, Katihar Medical College, Katihar, Bihar, India
Corresponding Author
Dr Md Tanweer Ushmani
Assistant Professor, Department of Physiology, Katihar Medical College, Katihar, Bihar, India
Ph: +91 8521667405
Abstract
Objectives: Our study was to detect the correlation of serum uric acid level with glycaemic status and with
lipid profile. And also evaluate the various biochemical parameters, anthropometric measurements, blood
pressure, serum uric acid level and associated factors.
Methodology: A 100 subjects with type 2 diabetes mellitus as a case and 100 subjects with non diabetics as
control with age group greater than 40 years were enrolled in this study. A detail history, dietary pattern,
clinical examination and relevant investigation were performed. Anthropometric examination like as
measurement of BMI, measurement of waist-hip ratio and biochemical investigations like as blood glucose,
Serum HbA1C estimation, Serum uric acid and Serum lipid profile were performed to all subjects.
Results: Data was analyzed by using SPSS software (Version 17). Mean ± SD was observed. One way
analysis of variance (ANOVA) with post hock analysis using Tukey’s multiple comparison test and Pearson
correlation coefficient (r) was applied. P value was taken ≤ 0.05 for significant differences.
Conclusions: Type 2 diabetes mellitus patients is a strong negative correlation between blood glucose level
and serum uric acid level. So that serum uric acid can be used as an important parameter to assess future
cardiovascular risk in a type2 diabetes mellitus patient.
Keywords: Type 2 diabetes mellitus, anthropometric examination, Serum uric acid, serum lipid profile
Introduction
Diabetes mellitus (DM) is a hereditary, chronic
and endocrine metabolic disorder.[1]
It may be
associated with a number of complications
including microangiopathies e.g. nephropathy,
neuropathy, retinopathy, dermopathy and
macroangiopathies e.g. coronary artery disease
(CAD), cerebrovascular disease, peripheral
vascular disease.
India, a developing Asian country with fast
industrialization and a modern lifestyle is facing a
grave problem in having the largest number of
people with diabetes[2,3]
which is estimated to
reach 80 million by the year 2030.[4,5]
It is close to
becoming the diabetic capital of the world. The
age of the diabetic patients play a significant role
in the risk of developing type 2 DM especially
after 40yrs.[6]
Type 2 DM is caused by relatively
www.jmscr.igmpublication.org
Impact Factor 5.84
Index Copernicus Value: 71.58
ISSN (e)-2347-176x ISSN (p) 2455-0450
DOI: https://dx.doi.org/10.18535/jmscr/v5i11.191
Md Tanweer Ushmani et al JMSCR Volume 05 Issue 11 November 2017 Page 30938
JMSCR Vol||05||Issue||11||Page 30937-30948||November 2017
impaired insulin secretion and peripheral insulin
resistance.[7,8]
Lack of insulin or relatively low
insulin levels affects the metabolism of
carbohydrate, protein, fat, water and electrolyte
balance resulting in diabetes.[9]
Several distinct types of diabetes mellitus exists
and are caused by a complex interaction of
genetics, environmental factors and most
importantly on lifestyles. There is a very
important role of diet on both causation and
treatment of diabetes mellitus. Depending on the
etiology of the diabetes mellitus factors
contributing to hyperglycemia may include
reduced insulin secretion, decreased glucose
utilization and increased glucose production. The
metabolic dysregulation associated with diabetes
mellitus causes secondary pathophysiologic
changes in multiple organ systems that impose a
tremendous burden on the individual with diabetes
as well as on the health care system. The
incidence of cardiovascular disease is increased in
individuals with type 2 diabetes mellitus. The
Framingham Heart study revealed a marked
increase in coronary artery disease, myocardial
infarction and sudden cardiac death in diabetes
mellitus patients. The absence of chest pain (silent
ischaemia) is also very common in patients of
diabetes mellitus. So, to avoid such catastrophies
various biochemical blood parameters,
cardiological investigations should be done as a
part of follow up in a diabetes mellitus patients.
Plasma uric acid, an end product of purine
metabolism, is related to the purine bases of the
nucleic acids. Its levels are genetically
determined, but are influenced by multiple
environmental factors. Previously it had been
thought to be a metabolically inert end product
without any physiological significance. Recently,
it has been shown that there is a definite
relationship between hyperglycemia and uric acid
levels. Studies done so far have shown that, in the
early stages of diabetes, the levels were high and
as the diabetic status progresses, there is a gradual
decline of uric acid levels in many patients.
Studies showed that uric acid can act as an
important water soluble antioxidant.[10,11]
Urate,
the soluble form of uric acid, can scavenge the
superoxide and the hydroxyl radical and it also
can chelate the transition metals.[12]
In a study by
J. Fang, M.H. Alderman on serum uric acid and
cardiovascular mortality it has been shown that
serum uric acid level has a continuous,
independent, specific and significant negative
relationship with cardiovascular mortality.[13]
Studies have shown that serum uric acid level is
negatively correlated with serum total cholesterol,
LDL-cholesterol and triglyceride level, and
positively correlated with serum HDL-cholesterol
level. This dyslipidemia is also a cause of
cardiovascular mortality.[14]
There are evidences to suggest that low serum uric
acid levels may precede the onset of diabetic
retinopathy. It has been reported that
hypouricemia may also predict the future
progression and hence be an indicator of incipient
nephropathy in Type 2 DM.[15]
Dyslipidemia is
elevation of plasma cholesterol, triglycerides
(TGs), or both, or a low high-density lipoprotein-
Cholesterol (HDL-C) level that contributes to the
development of atherosclerosis, which may be
primary (genetic) or secondary and diagnosed by
measuring plasma levels of total cholesterol (TC),
TGs, and individual lipoproteins. It is traditionally
classified by patterns of elevation in lipids and
lipoproteins.[16]
Patients with type 2 DM are at
greater risk of developing vascular diseases
because of lipid changes. Aims of our study was
to detect the correlation of serum uric acid level
with glycaemic status as well as with lipid profile,
and to find out various biochemical parameters,
anthropometric measurements, blood pressure,
measure the serum uric acid level and evaluate the
association, if any, between the serum uric acid
level and the factors measured of subjects.
Materials & Methods
A descriptive case –control study was conducted
on the basis of inclusion and exclusion criteria, in
department of Physiology, with the help of
department of Medicine, Katihar Medical College,
Md Tanweer Ushmani et al JMSCR Volume 05 Issue 11 November 2017 Page 30939
JMSCR Vol||05||Issue||11||Page 30937-30948||November 2017
Katihar, Bihar during period of June 2016 to July
2017.
A 100 diagnosed type 2 diabetes mellitus patients
were enrolled in this study and 100 nondiabetes
healthy individuals age and sex matched were
taken as control. Male and female ratio was same.
Entire subjects signed an informed consent
approved by institutional ethical committee of
Katihar Medical College, Katihar, Bihar, India
was sought. Data was collected using random
sampling.
Inclusion criteria of this study were subjects with
age more than 40 years, diagnosed type II diabetes
mellitus with no previous history of diabetic keto
acidosis or pancreatitis. Exclusion criteria were
patients suffering from Kidney disease, hepatic
disorder, patients on diuretic therapy (mainly
thiazides), history of alcoholism, suffering from
myeloproliferative disorders, lymphoproliferative
disorders and patients suffering from Psoriasis.
Methods
A detailed history was taken about their dietary
pattern. Subjects were demonstrated steps of
investigations properly. Next they were undergone
investigations. All the reports of investigations
and any altered status were explained to the
patients.
History
A case data sheet was used to assess the clinical
history, including past and present diseases both
acute and chronic from all the subjects. The
subjects were asked about their diet pattern.
Emphasis was given on occupation, family history
of diabetes mellitus, coronary artery diseases,
musculoskeletal disorders, arthropathy. Their
family income, history of addiction and level of
physical activity was assessed.
Regarding present illness of the cases a
meticulous history was taken about the chief
complaints, symptoms of diabetes mellitus,
duration of diabetes, symptoms of diabetes related
complications e.g. decreased vision, pedal edema,
chest pain, calf muscle pain, respiratory distress,
increased frequency of micturation. Treatment
history, both for diabetes and its complications, in
the form of drugs, dietary modification, lifestyle
modification were also carefully noted.
Clinical assessment: It was started with general
survey followed by systemic examinations.
General survey: Built, decubitus, anaemia,
jaundice, cyanosis, clubbing, oedema, pulse, blood
pressure, neck veins, neck glands, skin changes,
height, weight.
Systemic examination: Emphasis was given upon
the examination of cardiovascular system and
endocrinal system. Other systems were also
examined in brief.
Anthropometric measurements: Body mass
index and waist- hip ratio.
Study tools was used in our study had stadiometer,
measuring tape, weighing machine, Mercury
sphygmomanometer.
Measurement of BMI: Height of subjects was
measured with the help of a stadiometer. Weight
was measured by the help of a weighing machine.
BMI was calculated by dividing the weight of
subjects in kilograms by the square of the height
in meters. [17]
Measurement of waist-hip ratio: Waist
circumference was measured (in centimetres)
around the narrowest point between the lowest rib
and hip when viewed from the front after
exhaling. Hip circumference was measured (in
centimetres) at the point where buttock is
maximally extended, when viewed from the side.
The ratio was calculated.[18]
Biochemical Investigations
Plasma Glucose was estimated by GOD-POD
Method, End Point Assay and Kinetic Assay. [19]
Glycosylated Haemoglobin was estimated by ion
exchanged resin method for quantitative
determination of glycohaemoglobin in blood. [20]
Serum uric acid was estimated by Uricase / PAP
method.[21]
LDL Cholesterol was estimated by
direct determination of LDL Cholesterol.[22]
HDL
Cholesterol was found by direct enzymatic
method.[23]
Triglycerides estimation was done by
GPO / PAP method.[24]
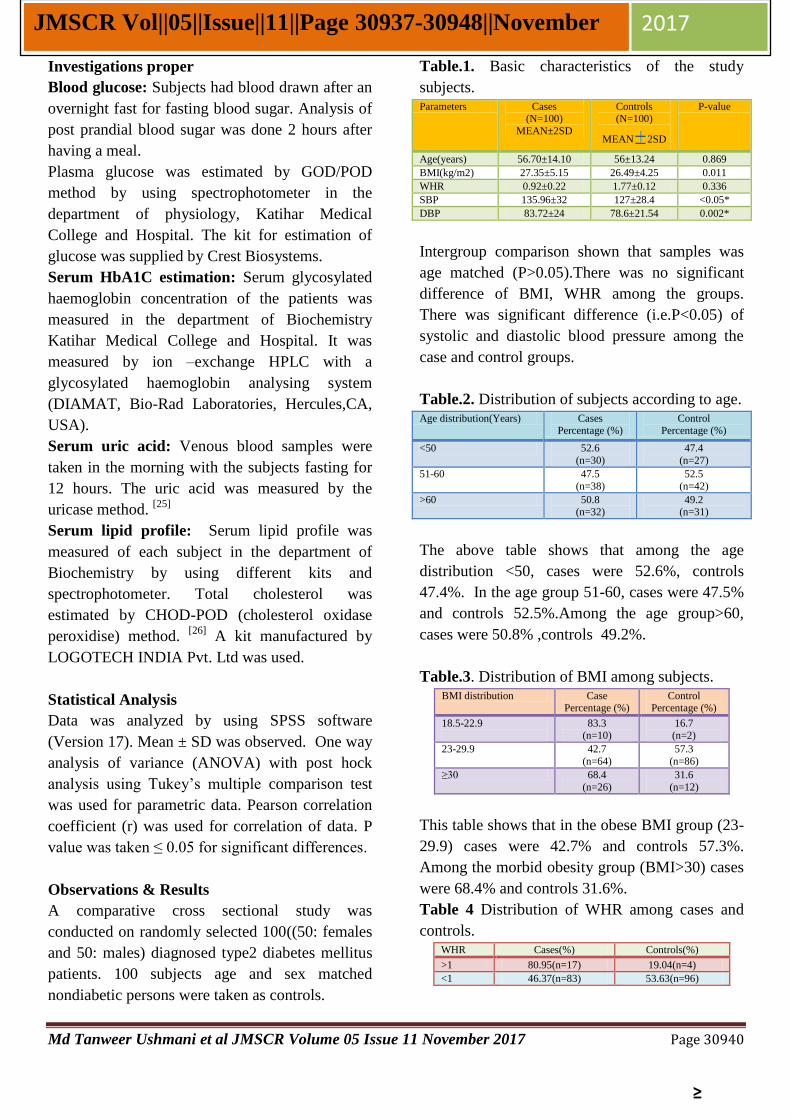
Md Tanweer Ushmani et al JMSCR Volume 05 Issue 11 November 2017 Page 30940
JMSCR Vol||05||Issue||11||Page 30937-30948||November 2017
Investigations proper
Blood glucose: Subjects had blood drawn after an
overnight fast for fasting blood sugar. Analysis of
post prandial blood sugar was done 2 hours after
having a meal.
Plasma glucose was estimated by GOD/POD
method by using spectrophotometer in the
department of physiology, Katihar Medical
College and Hospital. The kit for estimation of
glucose was supplied by Crest Biosystems.
Serum HbA1C estimation: Serum glycosylated
haemoglobin concentration of the patients was
measured in the department of Biochemistry
Katihar Medical College and Hospital. It was
measured by ion –exchange HPLC with a
glycosylated haemoglobin analysing system
(DIAMAT, Bio-Rad Laboratories, Hercules,CA,
USA).
Serum uric acid: Venous blood samples were
taken in the morning with the subjects fasting for
12 hours. The uric acid was measured by the
uricase method. [25]
Serum lipid profile: Serum lipid profile was
measured of each subject in the department of
Biochemistry by using different kits and
spectrophotometer. Total cholesterol was
estimated by CHOD-POD (cholesterol oxidase
peroxidise) method. [26]
A kit manufactured by
LOGOTECH INDIA Pvt. Ltd was used.
Statistical Analysis
Data was analyzed by using SPSS software
(Version 17). Mean ± SD was observed. One way
analysis of variance (ANOVA) with post hock
analysis using Tukey’s multiple comparison test
was used for parametric data. Pearson correlation
coefficient (r) was used for correlation of data. P
value was taken ≤ 0.05 for significant differences.
Observations & Results
A comparative cross sectional study was
conducted on randomly selected 100((50: females
and 50: males) diagnosed type2 diabetes mellitus
patients. 100 subjects age and sex matched
nondiabetic persons were taken as controls.
Table.1. Basic characteristics of the study
subjects. Parameters Cases
(N=100)
MEAN±2SD
Controls (N=100)
MEAN 2SD
P-value
Age(years) 56.70±14.10 56±13.24 0.869
BMI(kg/m2) 27.35±5.15 26.49±4.25 0.011
WHR 0.92±0.22 1.77±0.12 0.336
SBP 135.96±32 127±28.4 <0.05*
DBP 83.72±24 78.6±21.54 0.002*
Intergroup comparison shown that samples was
age matched (P>0.05).There was no significant
difference of BMI, WHR among the groups.
There was significant difference (i.e.P<0.05) of
systolic and diastolic blood pressure among the
case and control groups.
Table.2. Distribution of subjects according to age. Age distribution(Years) Cases
Percentage (%) Control
Percentage (%)
<50 52.6
(n=30)
47.4
(n=27)
51-60 47.5
(n=38)
52.5
(n=42)
>60 50.8 (n=32)
49.2 (n=31)
The above table shows that among the age
distribution <50, cases were 52.6%, controls
47.4%. In the age group 51-60, cases were 47.5%
and controls 52.5%.Among the age group>60,
cases were 50.8% ,controls 49.2%.
Table.3. Distribution of BMI among subjects. BMI distribution Case
Percentage (%) Control
Percentage (%)
18.5-22.9
83.3
(n=10)
16.7
(n=2)
23-29.9 42.7
(n=64)
57.3
(n=86)
≥30 68.4
(n=26)
31.6
(n=12)
This table shows that in the obese BMI group (23-
29.9) cases were 42.7% and controls 57.3%.
Among the morbid obesity group (BMI>30) cases
were 68.4% and controls 31.6%.
Table 4 Distribution of WHR among cases and
controls. WHR Cases(%) Controls(%)
>1 80.95(n=17) 19.04(n=4)
<1 46.37(n=83) 53.63(n=96)
≥
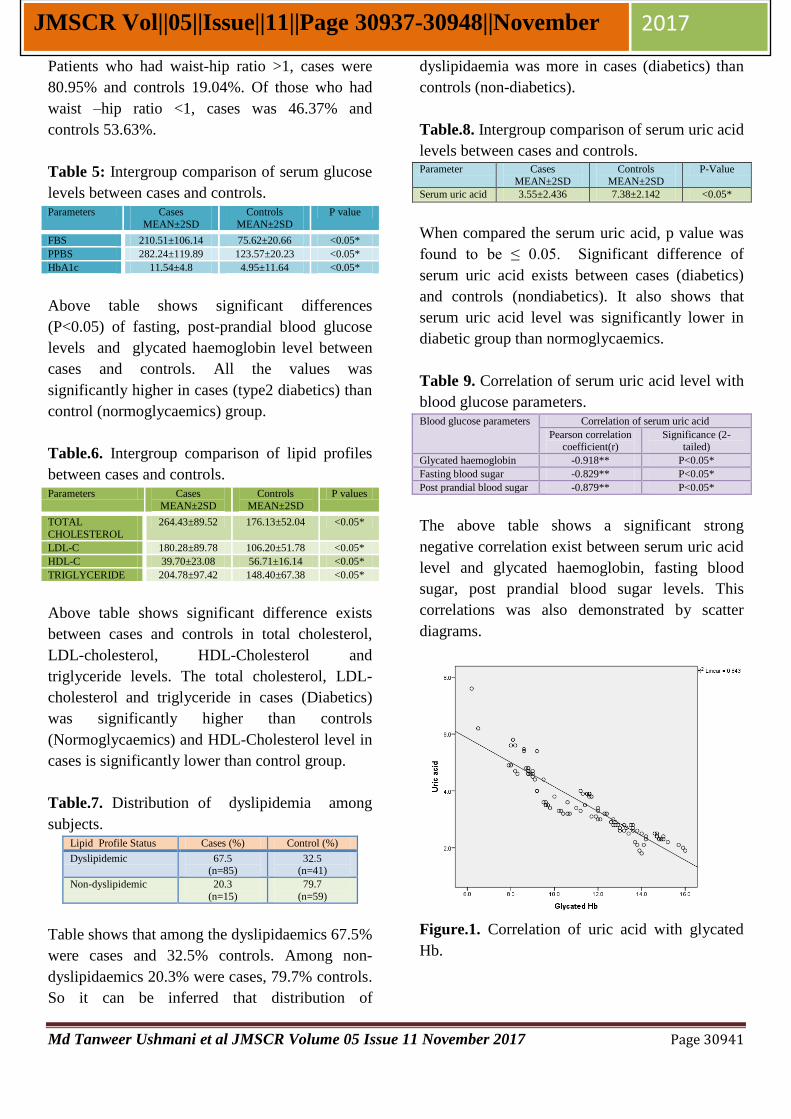
Md Tanweer Ushmani et al JMSCR Volume 05 Issue 11 November 2017 Page 30941
JMSCR Vol||05||Issue||11||Page 30937-30948||November 2017
Patients who had waist-hip ratio >1, cases were
80.95% and controls 19.04%. Of those who had
waist –hip ratio <1, cases was 46.37% and
controls 53.63%.
Table 5: Intergroup comparison of serum glucose
levels between cases and controls. Parameters Cases
MEAN±2SD
Controls
MEAN±2SD
P value
FBS 210.51±106.14 75.62±20.66 <0.05*
PPBS 282.24±119.89 123.57±20.23 <0.05*
HbA1c 11.54±4.8 4.95±11.64 <0.05*
Above table shows significant differences
(P<0.05) of fasting, post-prandial blood glucose
levels and glycated haemoglobin level between
cases and controls. All the values was
significantly higher in cases (type2 diabetics) than
control (normoglycaemics) group.
Table.6. Intergroup comparison of lipid profiles
between cases and controls. Parameters Cases
MEAN±2SD
Controls
MEAN±2SD
P values
TOTAL
CHOLESTEROL
264.43±89.52 176.13±52.04 <0.05*
LDL-C 180.28±89.78 106.20±51.78 <0.05*
HDL-C 39.70±23.08 56.71±16.14 <0.05*
TRIGLYCERIDE 204.78±97.42 148.40±67.38 <0.05*
Above table shows significant difference exists
between cases and controls in total cholesterol,
LDL-cholesterol, HDL-Cholesterol and
triglyceride levels. The total cholesterol, LDL-
cholesterol and triglyceride in cases (Diabetics)
was significantly higher than controls
(Normoglycaemics) and HDL-Cholesterol level in
cases is significantly lower than control group.
Table.7. Distribution of dyslipidemia among
subjects. Lipid Profile Status Cases (%) Control (%)
Dyslipidemic 67.5 (n=85)
32.5 (n=41)
Non-dyslipidemic 20.3
(n=15)
79.7
(n=59)
Table shows that among the dyslipidaemics 67.5%
were cases and 32.5% controls. Among non-
dyslipidaemics 20.3% were cases, 79.7% controls.
So it can be inferred that distribution of
dyslipidaemia was more in cases (diabetics) than
controls (non-diabetics).
Table.8. Intergroup comparison of serum uric acid
levels between cases and controls. Parameter Cases
MEAN±2SD
Controls
MEAN±2SD
P-Value
Serum uric acid 3.55±2.436 7.38±2.142 <0.05*
When compared the serum uric acid, p value was
found to be ≤ 0.05. Significant difference of
serum uric acid exists between cases (diabetics)
and controls (nondiabetics). It also shows that
serum uric acid level was significantly lower in
diabetic group than normoglycaemics.
Table 9. Correlation of serum uric acid level with
blood glucose parameters. Blood glucose parameters Correlation of serum uric acid
Pearson correlation coefficient(r)
Significance (2-tailed)
Glycated haemoglobin -0.918** P<0.05*
Fasting blood sugar -0.829** P<0.05*
Post prandial blood sugar -0.879** P<0.05*
The above table shows a significant strong
negative correlation exist between serum uric acid
level and glycated haemoglobin, fasting blood
sugar, post prandial blood sugar levels. This
correlations was also demonstrated by scatter
diagrams.
Figure.1. Correlation of uric acid with glycated
Hb.
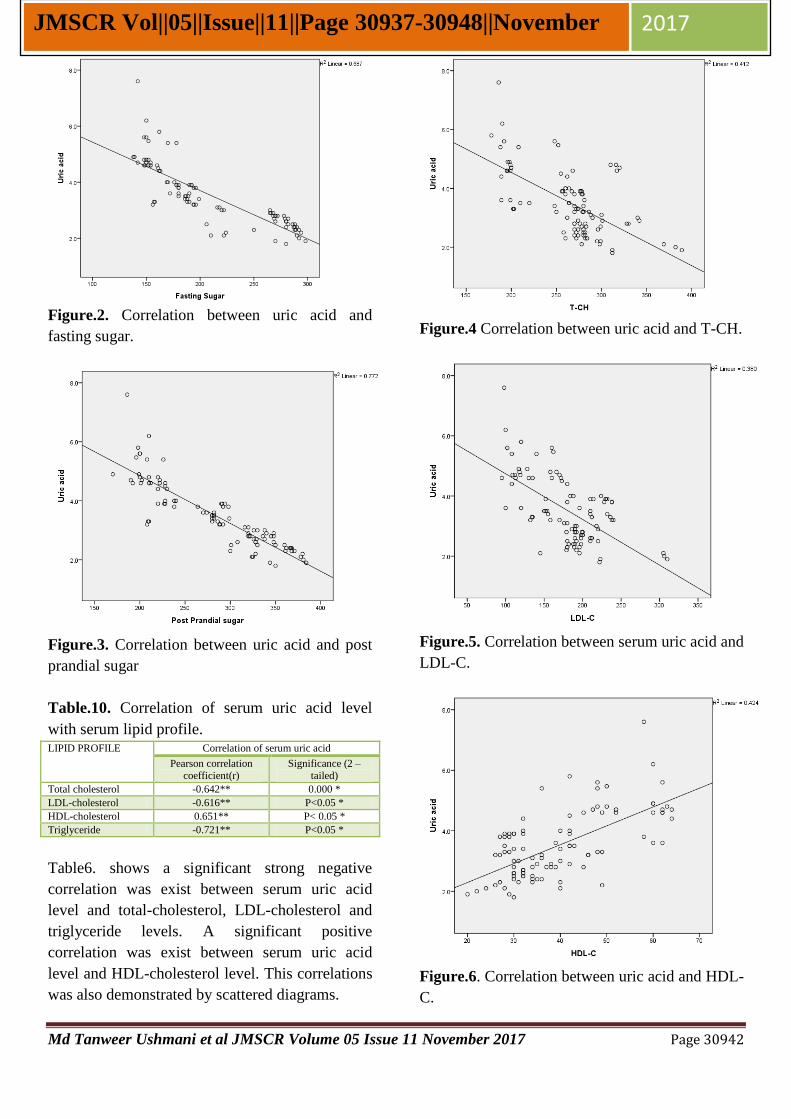
Md Tanweer Ushmani et al JMSCR Volume 05 Issue 11 November 2017 Page 30942
JMSCR Vol||05||Issue||11||Page 30937-30948||November 2017
Figure.2. Correlation between uric acid and
fasting sugar.
Figure.3. Correlation between uric acid and post
prandial sugar
Table.10. Correlation of serum uric acid level
with serum lipid profile. LIPID PROFILE Correlation of serum uric acid
Pearson correlation coefficient(r)
Significance (2 –tailed)
Total cholesterol -0.642** 0.000 *
LDL-cholesterol -0.616** P<0.05 *
HDL-cholesterol 0.651** P< 0.05 *
Triglyceride -0.721** P<0.05 *
Table6. shows a significant strong negative
correlation was exist between serum uric acid
level and total-cholesterol, LDL-cholesterol and
triglyceride levels. A significant positive
correlation was exist between serum uric acid
level and HDL-cholesterol level. This correlations
was also demonstrated by scattered diagrams.
Figure.4 Correlation between uric acid and T-CH.
Figure.5. Correlation between serum uric acid and
LDL-C.
Figure.6. Correlation between uric acid and HDL-
C.
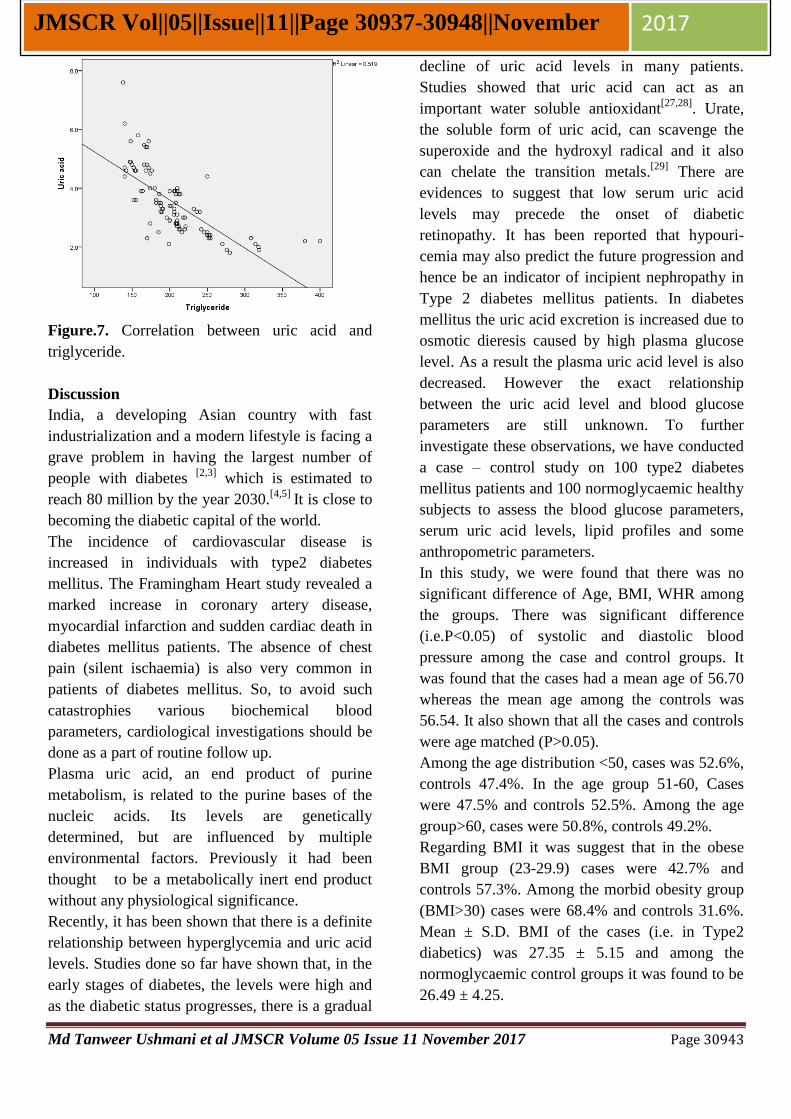
Md Tanweer Ushmani et al JMSCR Volume 05 Issue 11 November 2017 Page 30943
JMSCR Vol||05||Issue||11||Page 30937-30948||November 2017
Figure.7. Correlation between uric acid and
triglyceride.
Discussion
India, a developing Asian country with fast
industrialization and a modern lifestyle is facing a
grave problem in having the largest number of
people with diabetes [2,3]
which is estimated to
reach 80 million by the year 2030.[4,5]
It is close to
becoming the diabetic capital of the world.
The incidence of cardiovascular disease is
increased in individuals with type2 diabetes
mellitus. The Framingham Heart study revealed a
marked increase in coronary artery disease,
myocardial infarction and sudden cardiac death in
diabetes mellitus patients. The absence of chest
pain (silent ischaemia) is also very common in
patients of diabetes mellitus. So, to avoid such
catastrophies various biochemical blood
parameters, cardiological investigations should be
done as a part of routine follow up.
Plasma uric acid, an end product of purine
metabolism, is related to the purine bases of the
nucleic acids. Its levels are genetically
determined, but are influenced by multiple
environmental factors. Previously it had been
thought to be a metabolically inert end product
without any physiological significance.
Recently, it has been shown that there is a definite
relationship between hyperglycemia and uric acid
levels. Studies done so far have shown that, in the
early stages of diabetes, the levels were high and
as the diabetic status progresses, there is a gradual
decline of uric acid levels in many patients.
Studies showed that uric acid can act as an
important water soluble antioxidant[27,28]
. Urate,
the soluble form of uric acid, can scavenge the
superoxide and the hydroxyl radical and it also
can chelate the transition metals.[29]
There are
evidences to suggest that low serum uric acid
levels may precede the onset of diabetic
retinopathy. It has been reported that hypouri-
cemia may also predict the future progression and
hence be an indicator of incipient nephropathy in
Type 2 diabetes mellitus patients. In diabetes
mellitus the uric acid excretion is increased due to
osmotic dieresis caused by high plasma glucose
level. As a result the plasma uric acid level is also
decreased. However the exact relationship
between the uric acid level and blood glucose
parameters are still unknown. To further
investigate these observations, we have conducted
a case – control study on 100 type2 diabetes
mellitus patients and 100 normoglycaemic healthy
subjects to assess the blood glucose parameters,
serum uric acid levels, lipid profiles and some
anthropometric parameters.
In this study, we were found that there was no
significant difference of Age, BMI, WHR among
the groups. There was significant difference
(i.e.P<0.05) of systolic and diastolic blood
pressure among the case and control groups. It
was found that the cases had a mean age of 56.70
whereas the mean age among the controls was
56.54. It also shown that all the cases and controls
were age matched (P>0.05).
Among the age distribution <50, cases was 52.6%,
controls 47.4%. In the age group 51-60, Cases
were 47.5% and controls 52.5%. Among the age
group>60, cases were 50.8%, controls 49.2%.
Regarding BMI it was suggest that in the obese
BMI group (23-29.9) cases were 42.7% and
controls 57.3%. Among the morbid obesity group
(BMI>30) cases were 68.4% and controls 31.6%.
Mean ± S.D. BMI of the cases (i.e. in Type2
diabetics) was 27.35 ± 5.15 and among the
normoglycaemic control groups it was found to be
26.49 ± 4.25.
Md Tanweer Ushmani et al JMSCR Volume 05 Issue 11 November 2017 Page 30944
JMSCR Vol||05||Issue||11||Page 30937-30948||November 2017
In this study, who had waist-hip ratio >1, cases
were 80.95% and controls 19.04%. Of those who
had waist –hip ratio <1, cases were 46.37% and
controls 53.63%. It was found that mean ± S.D,
waist-hip ratio of the cases were 0.92 ± 0.22 and
among the control group it was 1.77 ± 0.12.
Intergroup comparison of various blood glucose
parameters between cases and controls: It was
seen that fasting, post prandial blood sugar and
glycated haemoglobin levels in cases were
210.51±106.14, 282 ± 119.89 and 11.54 ±4.8, and
in controls were 75.62 ± 20.66, 123.57 ± 20.23
and 4.95 ±1.64 respectively. It was seen that all
the blood glucose parameters were significantly
higher in cases than control groups (p<0.05). All
these data confirms the selection of diabetics as
cases.
Inter comparison of total cholesterol, LDL-
cholesterol, HDL-cholesterol and triglyceride
levels between cases and controls: It was shown
significant difference exists between cases and
controls in total cholesterol, LDL-cholesterol,
HDL-Cholesterol and triglyceride levels. The total
cholesterol, LDL-cholesterol and triglyceride in
cases (Diabetics) was significantly higher than
controls (Normoglycaemics) and HDL-
Cholesterol level in cases was significantly lower
than control group(p<0.05).
Distribution of dyslipidaemia among cases and
controls: It was shown that among the
dyslipidaemics 67.5% and 32.5% cases were in
controls. Among non-dyslipidaemics 20.3% and
79.7% cases were in controls. So it could be
inferred that distribution of dyslipidaemia was
more in cases (diabetics) than controls (non-
diabetics). There were various studies shown that
high blood glucose level is associated with
dyslipidaemia. One of the recent studies
published in Indian Journal of Clin Biochem done
by Mullugeta Y, Chawla R,KebedeT, in the year
2012 on 165 type2 diabetics were classified as
good glycaemic control (group1) and poor
glycaemic control (group2) on the basis of their
blood HbA1C values.[30]
The group2 was
characterized with serum triglyceride (190.46±
15.20mg/dl), total cholesterol (175.3±6.31mg/dl),
as well as high LDL-cholesterol levels
(109.0±5.88mg/dl). Significant correlations was
exists between HbA1c and dyslipidaemia,
particularly serum TG (r=0.28,p<0.05), and
between HbA1C and total cholesterol (r=0.310,
p<0.05). So it can be said that our finding
corroborates with the previous study results.
Intergroup comparison of serum uric acid level
between cases and control groups: It was found
that significant difference of serum uric acid level
exists between cases (diabetics) and controls
(nondiabetics). It was also shown that serum uric
acid level was significantly lower in diabetic
group than normoglycaemics. The mean and
standard deviation of serum uric acid level in
cases was 3.55 ±2.436 and 7.38(±2.142).The p
value was <0.05.
In previous studies, Godfredsen et al [31]
showed
that diabetics had a 42% increase in renal
uric acid excretion rate compared with
normal. Diabetics had significantly lower mean
serum uric acid concentrations. 17% of the
diabetic patients had serum concentrations below
the normal mean ± 2 standard deviations.
In a study in Israel by Herman and goldbourt in
the year 1982 showed that prediabetic subjects
had higher uric acid level s than non diabetics and
that overt (clinically diagnosed) diabetics had
lower uric acid levels than non diabetics.[25]
Their finding of a negative association at the
highest extreme of the glucose distribution was
further supported by another study done by Derek
G.Cook, A.G.Shaper, D.S.Thelle and T.P.
Whitehead on 7735 British men aged 40-59 in
British regional heart centre.[26]
The findings of
our present study also agree with the findings of
the previous studies.
In our study significant strong negative correlation
exist between serum uric acid level and glycated
haemoglobin, fasting blood sugar, post prandial
blood sugar levels (p<0.05). The pearson’s
correlation coefficient (r) were -0.918,-0.829,-
0.879 respectively.
Md Tanweer Ushmani et al JMSCR Volume 05 Issue 11 November 2017 Page 30945
JMSCR Vol||05||Issue||11||Page 30937-30948||November 2017
In a study by Eiji Odda, Ryu Kawai et al on 2449
Japanese men and 1448 Japanese women the
prevalence of metabolic syndrome and diabetes
was calculated by the quartiles of serum level of
uric acid levels. The results showed that
prevalence of diabetes in third quartile was
significantly lower than that in first quartile
(lowest quartile) and the prevalence of diabetes in
forth quartile was significantly lower than that in
first and second quartile in men. The prevalence
of diabetes was not significantly different among
the quartiles of uric acid in women. They
concluded that serum uric acid level is negatively
associated with diabetes in Japanese men.[32]
In a study conducted by Quingdao Diabetes
epidemiology study group, Quingdao, China over
a total of 1288 men and 2344 women showed that
serum uric acid levels declined with increasing
fasting plasma glucose levels in individuals with
diabetes mellitus, with standardized coefficient of
– 0.26 in men and – 0.20 in women. [33]
A recent study published in international journal
of endocrinology in the year 2011, done by Pavani
Bandaru and Anoop Shankar, showed the
association between serum uric acid levels and
diabetes mellitus in participants from the
NHANES (n=18,825,52.5% women). Serum uric
acid was divided into quartilers . In multivariate
logistic regression models, they found that higher
serum acid levels were inversely associated with
diabetes mellitus after adjusting for age, sex, race,
smoking, alcohol intake, body mass intake,
hypertension and serum cholesterol level.
Compared to quartile 1 of serum uric acid ,the
odd’s ratio (95% confidence interval )of diabetes
mellitus was 0.48 (0.35-0.66;P trend<0.0001).
They concluded that higher serum uric acid levels
were inversely associated with diabetes mellitus in
a representative sample of US adults.[34]
Our
findings agree with the results of the previous
studies.
In our study, the correlation of serum uric acid
levels with the total cholesterol, LDL-cholesterol,
HDL-cholesterol and triglyceride levels were
performed. It shown a significant strong negative
correlation exists between serum uric acid level
and total-cholesterol, LDL-cholesterol and
triglyceride levels. A significant positive
correlation was existed between serum uric acid
level and HDL-cholesterol level. The pearson’s
correlation coefficients were -0.642,-0.616,0.651,-
0.721 respectively.
In a study by J. Fang, M.H. Alderman on serum
uric acid and cardiovascular mortality it shown
that serum uric acid level had a continuous,
independent, specific and significant negative
relationship with cardiovascular mortality.[13]
Serum uric acid level was negatively correlated
with serum total cholesterol, LDL-cholesterol and
triglyceride level, and positively correlated with
serum HDL-cholesterol level. Finding of our
study results was simillar with the findings of
previous study.
In hyperglycemic state, the increasing glucose
reabsorption may impair the tubular reabsorption
of uric acid, as both glucose as well as
filtered uric acid are reabsorbed at the same site,
the proximal convoluted tubule. Continued
hyperexcretion of uric acid due to hyperglycemia
could deplete the uric acid pool and gradually
reduce serum uric acid levels. Geoffrey Boner
and Rieselbach[35,36]
concluded that the presence
of glucose in the renal tubule lumen at a site distal
to that of normal glucose reabsorption inhibits the
tubular reabsorption of uric acid. Later in 1987,
Schichiri et al emphasized that there is a
possible mechanism of glomerular hyperfiltr-
ation, which brought about the increased renal
clearance of urate and ultimately results in low
serum uric acid level.
Limitation
1) The study population was small.
2) This was a cross sectional study with no
follow up.
3) Study period was only one year.
4) The other parameters of nephrological and
cardiological complications should be
assessed (i.e. eGFR, ECG changes e.t.c.).
That was not done in our study.
Md Tanweer Ushmani et al JMSCR Volume 05 Issue 11 November 2017 Page 30946
JMSCR Vol||05||Issue||11||Page 30937-30948||November 2017
Summary & Conclusion
We were conducted a case –control study on 100
type 2 diabetes mellitus patients (taken as cases)
with 100 non diabetic subjects(taken as controls)
to assess whether there are any correlation
between the serum uric acid level and the blood
glucose parameters and the lipid profile, the serum
uric acid level between the cases and controls are
also compared. After inclusion of cases and
controls, the whole procedure was explained to
every subject and consent forms were duly signed.
After that they underwent history taking, proper
clinical examination, and special investigations
(serum uric acid, blood glucose parameters, serum
lipid profile). Then the data were collected and
epilated on SPSS (Version-17) software and
statistical analysis were done. Following results
were obtained:
Among the age distribution <50 years,
52.6% cases were in case group, and
47.4% in control group. In the age group
51-60 years, cases were 47.5% and
controls were 52.5%. Among the age
group>60 years, cases were 50.8%,
controls were 49.2%.
Regarding BMI, it was suggested that in
the obese BMI group (23-29.9) case were
42.7% and controls were 57.3%. Among
the morbid obesity group (BMI>30) cases
were 68.4% and controls were 31.6%.
BMI of the cases (i.e. in type2 diabetics)
was 27.35 ±5.15 and among the
normoglycaemic control groups was
26.49±4.25.
Those who have waist-hip ratio >1, cases
was 80.95% and controls was 19.04%.Of
those who had waist –hip ratio <1, cases
was 46.37% and controls was 53.63%.
Mean ± S.D) waist-hip ratio of the cases
was 0.92±0.22 and among the control
group it was 1.77±0.12.
The inter group comparison of total
cholesterol, LDL-cholesterol, HDL-
cholesterol and triglyceride levels between
cases and controls shown significant
difference between cases and controls in
total cholesterol, LDL-cholesterol, HDL-
Cholesterol and triglyceride levels. The
total cholesterol, LDL-cholesterol and
triglyceride in cases (diabetics) were
significantly higher than controls
(Normoglycaemics) and HDL-Cholesterol
level in cases was significantly lower than
control group (p<0.05).It also shown that
among the dyslipidaemics 67.5% subjects
was cases and 32.5% subjects were
controls. Among non-dyslipidaemics
20.3% were cases and 79.7% were
controls. So it can be inferred that
distribution of dyslipidaemia was more in
cases (diabetics) than controls (non-
diabetics).
A significant difference of serum uric acid
level was exists between cases (diabetics)
and controls (nondiabetics). It shown that
serum uric acid level was significantly
lower in diabetic group than in
normoglycaemics. The mean ± S.D. Serum
uric acid level in cases was 3.55±2.436
and in cases was 7.38±2.142.The p value
was <0.05.
There was a significant strong negative
correlation exist between serum uric acid
level and glycated haemoglobin, fasting
blood sugar, post prandial blood sugar
levels (p<0.05). The pearson’s correlation
coefficient (r) were -0.918,-0.829,-0.879
respectively.
A significant strong negative correlation
was existed between serum uric acid level
and total-cholesterol, LDL-cholesterol and
triglyceride levels. A significant positive
correlation was existed between serum uric
acid level and HDL-cholesterol level. The
pearson’s correlation coefficients were -
0.642,-0.616,0.651,-0.721 respectively.
Conclusion
Our study concluded that type 2 diabetes mellitus
patients is a strong negative correlation between
Md Tanweer Ushmani et al JMSCR Volume 05 Issue 11 November 2017 Page 30947
JMSCR Vol||05||Issue||11||Page 30937-30948||November 2017
blood glucose level and serum uric acid level. So
it can be said that as the blood glucose level
increases the serum uric acid level decreases. As
the serum uric acid is an important water soluble
antioxidant, low serum uric acid may give rise to
much further oxidative damage to mainly small
and large blood vessels. Serum uric acid level
decreases the lipid profile worsens, which can
give rise to cardiovascular complications in future.
So, that serum uric acid level can be used as an
important parameter to assess future
cardiovascular risk in a type2 diabetes mellitus
patient.
Bibliography
1. Faghilimnai S, Hashemipour M, Kelishadi
B; The lipid profile of children with type 1
disbetes as compared to the controls.
ARYA J. 2006; 2(1): 36 – 38.
2. King H, Aubert RE Herman WH; The
global burden of diabetes (1995 – 2025),
and its prevalence, numerical estimates
and projection. Diabetes Care, 1998;
21(9):1414-31.
3. Fall CH; The non-industrialized countries
and affluence. Br Med Bull., 2001;60: 33-
50.
4. Bjork S, Kapur A, King H, Nair J,
Ramachandran A; The global policy
aspects of diabetes in India. Health Policy,
2003;66(1):61-72.
5. Rao CR, Kamath VG, Shetty A, Kamath
A; Astudy on the prevalence of type 2
diabetes in coastal Karmataka. Int J
Diabetes Dev Ctries., 2010; 30(2):80-85.
6. Tagoe DNA, Amo-Kodieh P; Type 2
diabetes mellitus influences lipid profile of
diabetic patients. Ann Biol Res., 2013;
4(6): 88-92.
7. Van Dam RM; The epidemiology of
lifestyle and risk for type 2 diabetes. Eur J
Epidemiol., 2003; 18(12): 1115-1125.
8. CA Burtis, ER Ashwood, Burns DE;
Clinical Chemistry and Molecular
Diagnostics. 4th
edition, 2004:853-854.
9. Barroso I, Luan J, Middelberg RPS
Harding AH, Franks PW, Jakes RW et al.;
Candidate gene associated study in type 2
diabetes indicates a role for genes involved
in β-cell function as well as insulin action.
Plos Biology, 2003;1(1):41-55.
10. Peter A Mayes,PhD,Dsc,Lipids pf
physiological significance, Harper’s
Biochemistry,24th
Edition,145-157.
11. Patterson RA,Horsley E,Leake DS,The
prooxidant and the antioxidant properties
of the human serum ultrafiltrates towards
LDL:the important role of uric acid;J Lipid
Res,2003,44(3):512-521.
12. Ames BN,Cathcart R,Schwiers E,
Hochstein P, Uric acid provides an
antioxidant defence mechanism in humans
against oxidants and radicals which cause
aging and cancer: A hypothesis;Proc
Natl.Acad science,1981;78:6858-62.
13. J.Fang and M.H.Alderman ,Serum uric
acid and cardiovascular mortality :the
NHANES 1 Epidemiologic follow up
study ,1971-1992; Journal of the American
Medical Association,2000,vol.283,no.-
18,pp 2404-2410.
14. I.Zavanni,S.Mazza,M.Fantuzzi et al.
Changes in insulin and lipid metabolism in
males with asymptomatic hypouricaemia.
Journal Of Internal Medicine,1993,
Vol.234(1),25-30.
15. Shichiri M,Iwamoto H,Marumo F,Diabetic
hypouricaemia as an indicator of clinical
nephropathy.Am J
Nephrol.1990;10(2):115-122.
16. The Merck manual for health care
professionals. Available from
http://www.merckmanuals.com/profession
al/endocrine and metabolic-disorders/lipid-
disorders/dyslipidemia. html accessed on
18/04/2013.
17. International Children’s Centre, Paris
(1984).Children in the Tropics.No.151.
18. WHO(2003),Tech. Rep. Ser. NO.916.
Md Tanweer Ushmani et al JMSCR Volume 05 Issue 11 November 2017 Page 30948
JMSCR Vol||05||Issue||11||Page 30937-30948||November 2017
19. Fossati P,Prencipe L,Clin
Chem,1980;26:227.
20. Meittini F, Prencipe L,Bardelli F .The 4-
hydroxybenzoate/4-aminophenazone
chromogenic system used in the enzymatic
determination of serum cholesterol.Clin
Chem 1978;24:2161-65.
21. Trinder P.Ann Clin. Biochem. 1969;6:24.
22. Bucolo G and David H.Quantititive
determination of serum triglycerides by
use of enzymes.Clin Chem 1973;19:476-
482.
23. Fossati P,Prencipe L,serum triglycerides
determined colorimetrically with an
enzyme that produces hydrogen peroxide.
.Clin Chem.1982;28:2077-80.
24. Isezaki M, Shirahata K,Seto H et al.J Clin.
Lab. Inst. Reag1996;19:349-353
25. Herman J B, Goldbourt U.Uric acid and
diabetes: Observations in a population
study. Lancet 1982;2:240.
26. Derek G Cook,A G Shaper,DS Thelle et
al. Serum uric acid, serum glucose and
diabetes:relationships in a population
study. Postgraduate Medical Journal
,1986;62:1001-1006.
27. Peter A Mayes,PhD,Dsc,Lipids pf
physiological significance, Harper’s
Biochemistry,24th
Edition,145-157.
28. Patterson RA,Horsley E,Leake DS,The
prooxidant and the antioxidant properties
of the human serum ultrafiltrates towards
LDL:the important role of uric acid;J Lipid
Res,2003,44(3):512-521.
29. Ames BN,Cathcart R,Schwiers E,
Hochstein P, Uric acid provides an
antioxidant defence mechanism in humans
against oxidants and radicals which cause
aging and cancer: A hypothesis;Proc
Natl.Acad science,1981;78:6858-62.
30. Adlija Causeric, Sabina Semiz et al.
Relevance of uric acid in progression of
type2 diabetes mellitus. Bosnian j of basic
medical sciences 2010;10(1):54-9.
31. Yano K,Rhoads GG,Kagan A.
Epidemiology of serum uric acid among
8000 Japanese American men in Hawaii.
Journal of chronic diseases,1977;30:171.
32. E.Odda,R.Kawai,V.Sukumaran et al. Uric
acid is positively associated with
metabolic syndrome but negatively
associated with diabetes in Japanese men.
Internal Medicine,2009;48(20):1785-91.
33. H.Nan,Y.Dong,W.Gao et al. Diabetes
associated with a low serum uric acid level
in a general Chinese population. Diabetes
research and clinical practice
2007;76(1):68-74.
34. Pavani Bandaru,Anoop Shankar.
Association between serum uric acid levels
and diabetes mellitus. International journal
of endocrinology 2011;6:715-8.
35. Boner G,Rieselback RE,The effect of
glucose upon reabsorptive transport of
urate by the kidney. Advances in
experimental medicine and
biology.1974;41:781-3.
36. So A,Thorens B.Uric acid transport and
disease. Journal of clinical
investigation,2010;120(6):1791-1799.
Related Documents