ISSN 0019-5723 INDIAN LABOUR JOURNAL (A MONTHLY PUBLICATION) Volume 56 April 2015 No. 4 GOVERNMENT OF INDIA MINISTRY OF LABOUR AND EMPLOYMENT LABOUR BUREAU SHIMLA/CHANDIGARH

Welcome message from author
This document is posted to help you gain knowledge. Please leave a comment to let me know what you think about it! Share it to your friends and learn new things together.
Transcript
ISSN 0019-5723
INDIAN LABOUR JOURNAL (A MONTHLY PUBLICATION)
Volume 56 April 2015 No. 4
GOVERNMENT OF INDIA
MINISTRY OF LABOUR AND EMPLOYMENT
LABOUR BUREAU
SHIMLA/CHANDIGARH
EDITORIAL COMMITTEE
Chairman Dr. M. Mathisekaran
Editor I.S.Negi
Associate Editor R.C.Jarial
Staff Writers
Laxmi Kant
Ravinder Kumar
NOTE TO CONTRIBUTORS
Non-controversial articles on labour matters of topical interest (e.g. labour and
wage policy; industrial relations; industrial management; trade union movement; labour
welfare; workers‘ participation in management; employment/ unemployment; labour
research of empirical value and of general interest etc.) are accepted for publication in
the Journal. The articles generally not exceeding ten thousand words may be sent in a
floppy diskette of 3.5‖ or C.D in Microsoft Word only with a print out in double space
on one side foolscap paper, addressed to the Director General, Labour Bureau,
‗Cleremont‘, Shimla -171 004 alongwith a declaration by the author that the article has
neither been published nor submitted for publication elsewhere. All references and
footnotes, may be given only at the end of the articles.
Authors are solely responsible for the factual accuracy and the opinion
expressed in their signed articles. The Labour Bureau, however, reserves the right to
edit, amend and delete any portion of the article with a view to make it more
presentable and to reject any article, if not found suitable. The articles which are
rejected will not be returned and no correspondence will be entertained on the articles
which are rejected by the Editorial Committee.
A copy of the Journal, in which the article appears, is supplied to the author.
An honorarium up to Rs. 1,000 is also payable as per rules for each article published.
Our address: The Director General, Labour Bureau ‘Cleremont’, Shimla 171 004
Fax No: 0177-2655253 Website: http://labourbureau.nic.in E-mail [email protected], [email protected]
PREFACE
―The Indian Labour Journal‖ earlier known as ―Indian Labour Gazette‖ is a monthly publication being brought out since July, 1943. This publication is the only official publication of its kind in the country disseminating latest labour statistics and research in the field of labour which has immense utility for diverse stakeholders such as Employers‘ and Employees‘ Organizations, Research Scholars, Central and State Governments, Autonomous Bodies, Courts, Universities etc.
The Journal normally contains matters of interest on labour such as Labour Activities, News about Indian & Foreign Labour, Labour Decisions, Labour Literature and Labour Statistics. But, at times, non controversial articles on labour matters of topical interest and the gist of the Reports, Enquiries & Studies conducted by Labour Bureau are also published.
Suggestions for further improvement of the publication are welcome.
DR. M. MATHISEKARAN
DIRECTOR GENERAL
LABOUR BUREAU,
SHIMLA-171004

INDIAN LABOUR JOURNAL
Published Monthly by
LABOUR BUREAU SHIMLA/CHANDIGARH
(First Published in July, 1943 as Indian Labour Gazette)
Vol.56 April, 2015 No 4
CONTENTS Page
SPECIAL ARTICLE
Transforming the Working and Living Conditions of Workers in India 339
REPORTS ENQUIRIES AND STUDIES
Report on the Working of the Motor Transport Workers act, 1961 for the year 2012 347
LABOUR ACTIVITIES
Labour Situation 362
Industrial Disputes 362
NEWS IN BRIEF
(a) INDIAN LABOUR
Amend Act to Aid Unorganised Workers 364
Government to bring Bill for Social Security to Unorganised Workers 364
NHRC asks DOT to Probe Delay in a Retired Employee's Payment 364
We Need 10 Lakh Skilled Workers in Aviation 365
EPFO Plans Medical Schemes for 46L Pensioners 365
Telangana Plans 1 Million ICT Jobs in 3 Years 365
Tata Motors Announces VRS for 16K Workers Across India 365
Economic Survey Moots Three-Point Action Plan to Realise ‗Make in India‘ Dream 366
Industries/Services declared Public Utility Services under the Industrial Disputes Act 1947 366
Consumer Price Index Numbers for Industrial Workers 367
Consumer Price Index Numbers for Agricultural Labourers and Rural Labourers 367
( b) FOREIGN LABOUR
India's Social Security Pact with Norway comes into Force 368
U.S. Gains 257,000 Jobs 368
Japan Emerges from Recession, Growth Subdued 368
Indian Workers Win $14M in US Labour Trafficking Case 368
Work Permits for Spouses of H-1B Visa Holders 369
Britain Misses Targets on Immigration Control 369
LABOUR DECISIONS
Pension and Gratuity is not a Bounty but Valuable Rights and Property of the Employee 370
Indian Labour Journal, April 2015
338
LABOUR LITERATURE
Important Articles of Labour Interest Published in the Periodicals Received in the Labour
Bureau
371
STATISTICS
Section A- Monthly Statistics 375
Section B- Serial Statistics 419
ANY REPRODUCTION FROM THE JOURNAL SHOULD BE SUITABLY ACKNOWLEDGED
Subscription and complaints, if any, regarding the distribution of the Indian
Labour Journal should be sent only to
THE CONTROLLER OF PUBLICATIONS, CIVIL LINES, DELHI 110054
Pre-payable subscription rates for the Indian Labour Journal
Annual Rate of Subscription Rs.1200.00
Sale per copy Rs.100.00
Indian Labour Journal, April 2015
339
SPECIAL ARTICLE
Transforming the Working and Living Conditions of Workers in India
Surendra Pratap
1 and A.J.C. Bose
2
Abstract:
In this paper we highlight the viewpoint that unless policies from above are changed in terms of moving away from export-led model of development in favour of domestic-demand led growth in the institutional framework of new labour legislation in conjunction with labour policies from below in terms of new strategies for strengthening labour movement, development judged in terms of worker well-being cannot come into existence. Accordingly, in Section 1, we argue why we must say no to export-led development; in Section 2, we make the case for new labour legislation and finally in Section 3, we suggest that the labour politics in India must change by taking on certain new strategies. The policy shift on these lines from above as also below will go a long way in removing the confusions, frictions and conflicts among the policy makers, labour administrators, labour leaders and working people with regard to achieving economic development along with labour welfare.
1. Introduction
There is voluminous literature about how creation of ‗self-regulating markets‘ in land, labour and money under the auspices of neoliberal-imperial globalization has lead to catastrophic capitalist crisis as reflected in despoiling of nature, rupturing of communities and destruction of livelihoods all over the world and especially in the developing world so much so that some social scientists are still wondering as to how to find out a conceptual framework to understand all this leave alone the question of how to find the emancipatory ways out of the murky socio-economic mess (see Fraser, 2015).
In light of this, it is useful now to underline what Lowe (2014) has remarked thus: ―Laissez-faire has failed. It has failed us here in the West and it continues to fail communities across the globe. It‘s high time our rules and regulations were amended to reflect that.‖ Taking cue from this advocacy, in this paper, we focus narrowly on worker well-being and we project the view that, since self-regulation has failed, worker well-being in India or elsewhere will not be promoted unless policy making from above moves away from the framework of ―Washington Consensus‖ or ―neoliberal-imperial globalization‖ in favour of domestic-demand-led growth model that respects worker rights ensured through new labour legislation and unless policy making from below changes in terms of the emergence of labour politics based on new empowerment strategies. In what follows, we elaborate on this argumentation.
2. Say No to Export Led Development
There are many problems with the export led model of development. These are excellently discussed in Palley (2002) and Bhaduri (1996), for example, on the basis of which the case for the alternative in terms of internal market led development is made. Reviewing all these arguments is not the concern of this paper.
However, what we want to reckon with here is the large scale propaganda done that the export led model of development is the only way to create employment opportunities even as it has clearly destroyed more employment than created due to destruction of traditional
1Centre for Workers Education, New Delhi 2Department of Economics, Shri Ram College of Commerce, Delhi
Indian Labour Journal, April 2015
340
occupations and industries. This is not all. Actually, it has transformed the whole spectrum of employment into unsustainable precarious employment (informalisation of workforce). Furthermore, this model does not really suit the Indian realities. In India most of the workforce is self employed, especially in rural areas, and as such the promotion of destruction of traditional occupations and industries in rural and urban informal sectors is a cruel joke. The real strategy to fight the employment problem may be to help and extend support to the self employed workers and make their livelihoods sustainable through rural development. This strategy may not only reduce the intensity of unemployment and underemployment but also bring multifarious positive impacts in the economy as a whole in terms of expansion of markets for industrial goods thereby promoting industrial growth long with new job growth in such a way as also to increase the collective bargaining power of labour by reducing the reserve army of labour in rural areas. This strategy demands bold policy initiatives as follows. First, land reforms need to be done by way of redistribution of land to increase the average size of land holdings of small and marginal farmers and provision of land to landless workers. Extending and broadening the rights of self employed producers and communities on the resources on which their occupations are based, for example, in terms of the right of fish workers on water bodies and the right of forest workers on forests etc. is part and parcel of this strategy. Promoting and extending support for integration of small and marginal farmers and other self employed producers (fish workers, forest workers, pottery workers, handloom workers, etc) in organizations like cooperatives, and extending subsidized inputs to them to reduce the cost of production and providing an institutional mechanism to increase their collectivity and collective bargaining power is also part and parcel of this strategy. Promoting and extending support for integration of other self employed workers engaged in various kinds of services in organizations like cooperatives in order to reduce their operational costs, enable them to benefit from economies of scale, and provide an institutional mechanism to increase their collectivity and collective bargaining power is also part and parcel of this strategy. Promoting and extending support for integration of home based workers engaged in various industries and providing an institutional mechanism to increase their collectivity and collective bargaining power to be able to compel the national and international companies for whom they work, to insure better wages and working conditions for them is also part and parcel of this strategy.
3. Say Yes to New Labour Legislation
Accompanied with the above initiatives, labour reforms are needed with a wider perspective to improve the living and working conditions of all workers and reduce the uncertainties and vulnerabilities in various occupations.
A new comprehensive labour legislation system needs to be instituted with five labour
laws: (a) Labour Relations Law; (b) Working Conditions Law; (c) Wage (Determination, Increment and Payment) Law; (d) Social Security Law; and (e) Welfare Cess Law. These laws must be simple and with universal applicability of their provisions in all occupations and to all workers without any exception. There may be differences in how and in what form various provisions can be implemented in various industries--for example, if there is only one female worker in a factory, on this ground it cannot be argued that the provision of creche is not applicable to such factory; even if there may not be in-house creche facility, the employer must be liable to pay to the woman concerned the real expenses of putting the child in a day care. Another example may be of canteen and subsidized food wherein if there is only one worker with an employer, it cannot be argued that this provision may not apply. Again evenif there may not be in-house canteen facility, the employer must provide subsidized food and drinking water and a safe and clean space for dining to the worker concerned.
No exemptions and no self certifications under labour laws may be allowed in any
case. The labour law enforcement machinery must be sufficiently staffed and equipped with facilities and powers to insure labour standards. Labour adjudication machinery must also be
Indian Labour Journal, April 2015
341
sufficiently staffed to stop the dynamics of delay in justice which practically amounts to no justice at all. A public charter for labour law enforcement machinery and labour adjudication machinery must be declared so that there is a clear-cut time frame for taking action on complaints and deciding the cases filed by labour.
List of hazardous substances and hazardous industries must be updated by a specialist
institution and a simple and clear procedure must be made for claims to include new hazardous substances and industries. Similarly list of occupational diseases must be updated and institutions and clear procedures must be made for claims to include new occupational diseases. The employer-employee relationship must be ensured to all workers except for casual workers engaged for less than a week. If any worker is engaged by any employer for more than 5 days in a month, there must be a formal employment relationship and engaging workers without any formal contract must be considered as a crime inviting severe punishment. The labour relations law needs an explicit direction that the proportion of regular workers can never be less than 90 percent of workers. Engaging workers through contractors or agencies may be completely prohibited. Temporary workers (who may never form more than 15 percent of the workforce) may be engaged with short term contracts of 3 months to a year, or project based contracts, and as casual workers engaged not more than 8 hours in a week and 5 days in a month. Apprentices must be considered as workers with short term contracts for all practical purposes and must be extended all social security and labour rights including right to association and collective bargaining. There must be compulsory provision for a severance payment equal to one month‘s wages to all workers engaged with short term contracts including apprentices, if they are not absorbed as regular workers and thrown out after expiry of their contracts.
It is worth mentioning here that the large scale propaganda of employers on the need for flexibility of labour force is a farce in most of the industries, including auto industry and electronics. According to our fieldwork observations in the industrial landscapes of Delhi NCR, the Original Equipment Manufacturers (OEMs) plus the first and second tier supplying industries that make up the formal sector in these industries generally employ the same number of total workers including contract workers and there is no change in the workforce if there is no expansion of business. Instances during which about 10 percent workers are discontinued are very rare. This much flexibility can be easily managed and covered by lay off and by paying the workers lay off wages for such periods. In lower ladders of the value chain particularly in small scale industries there are more instances of fluctuations of employment, but this is not due to any slump in the industries but it is systematically created by the OEMs and first tier suppliers. They do not make any formal long term relationship with their small scale vendors and they actually list multiple vendors for same products and keep on shifting their orders from one vendor to another vendor in order to intensify competition among them and compel them to accept lower prices. Therefore, this situation is due to lack of any laws and lack of any collective bargaining power of small scale units to compel the larger companies to make long term formal relationship with small scale suppliers. The issue of flexibility emerges as a serious problem only in the sectors where orders fluctuate drastically, for example, as in the garment sector. However, if we look at the picture in totality, this also emerges as a systematically created problem by the foreign garment brands and they are also using the same strategy of having multiple suppliers at various locations and they keep on shifting their orders from one location to another in order to intensify competition among supplier companies in various locations and compel them for cost cutting and accepting lower prices. It is ironic to see that small-small factories work for 5-10 transnational brands with small-small amounts of orders, and the orders may be very high for some periods and very low for some months. In such situations, the workforce also keeps on fluctuating. However, the fluctuations in the workforce are generally never more than 30 percent. But the employers in garment industry run with almost completely flexible workforce, and this is not based on any operational compulsions so much so that it is nothing but a strategy to reduce the labour costs and thereby increase their
Indian Labour Journal, April 2015
342
profit margins. Moreover, it is also observed that many times the brands do not revise the prices for years even if costs are increasing and the suppliers dare not raise a strong voice in fear of losing the orders. In such situations, the suppliers further intensify the exploitation of workers in order to maintain their own profit margins.
The above situations demand that the labour relations law must include a section on
outsourcing and responsibility of insuring labour standards across the value chains, with clear provisions as follows: (a) Brands or other first and second tier customer companies must make yearly contracts with supplier companies (rather than only order based contracts), and the cost of total orders in a year must include (apart from the cost of other factors and profit margins of suppliers) total cost of wages, social security contributions, cost of occupational health and safety, layoff wages and severance payment to workers if the orders are discontinued after a year (in case the supplier company is working for multiple brands and other customer companies then the above total cost may be distributed among them accordingly); (b) the above cost breakup of the work orders showing the component of wages must be declared by the supplier companies on their website so that accountability can be insured, and in case of violations the brands and suppliers can be made responsible and punished; (c) The law must clearly state that the brands and other customer companies, whether national or foreign, are equally responsible for ensuring compliance of labour standards across their value chains and share its costs, and in case of any violations reported in their value chains the brands may be made equally responsible and punished. These initiatives may make it feasible to engage 90 percent of workforce as regular workers in those industries as well where the work orders keep on drastically fluctuating. This law may remove the vulnerabilities of the supplier companies as well as the workers engaged in them. Moreover, this will end the space for excuses by suppliers for non compliance of labour standards and for engaging large numbers of unreported workers and thereby actually robbing their lifeforce. In overall terms this will increase the collectivity and collective bargaining power of workers in particular industries.
The wage law must contain clear criteria for determination of minimum wages, annual
increments and mode of payment and this must be the same for all workers and it must apply to all wage workers and home based workers, without any exception. It must be made mandatory to provide a proper wage slip to all workers showing all payments made in a month including the overtime wages (except casual workers engaged for not more than 8 hours in a week and 5 days in a month). The current criteria on minimum wage determination includes: (i) three consumption units for one earner, (ii) minimum food requirements of 2700 calories per average Indian adult, (iii) clothing requirements of 72 yards per annum per family, (iv) rent corresponding to the minimum area provided for under the government's Industrial Housing Scheme, (v) fuel, lighting and other miscellaneous items of expenditure to constitute 20 percent of the total Minimum Wages, (vi) children‘s education, medical requirement, minimum recreation including festivals/ceremonies and provision for old age, marriage, etc. should further constitute 25 percent of the total minimum wage, (vii) local conditions and other factors influencing the wage rate. It is necessary to revise these criteria to consider 4 consumption units in place of three, to consider the actual rent of a two room flat or equal to at least 30 percent of wages, the cost of children education, medical etc may also be revised to make it 30 percent of wages, and to include one more component, viz. (viii) travel and communication. The law of wages must clearly declare that the minimum wages apply to only workers without any work experience. After an experience of six months their wages must cross the minimum wages and they must get an increment and further years of experience must be reflected in their wage increments. Dearness allowance must be added to their wages every six months. The procedure of determination of wages must be transparent and wages so fixed must be declared with their detailed break up so as to enable the workers to see whether allocations to all factors are properly considered. The Minimum Wages Act as it exists currently, does not clearly define the categories of unskilled, semi-skilled, skilled and highly skilled workers and therefore it all
Indian Labour Journal, April 2015
343
depends on the whims and fancies of employers to put a worker in any of these categories. The new wage law must clearly define these categories--for example: (a) unskilled: non ITI fresh workers without any experience; semiskilled: non ITI Workers with one year experience in any factory in the same industry or related industry; skilled: workers with fresh ITI degree and no experience or non ITI workers with two years experience; highly skilled: workers with ITI degree and one year experience or non ITI workers with three years experience. Minimum wages of any of these categories must be 30 percent more than the preceding skill category. Even if only the government accepted criteria of determining the minimum wages is followed transparently, the minimum wages in any part of India and in any sector may not be less than Rs 15000 per month; however, the minimum wages declared by the governments are nowhere more than 10000 per month, and in most states it is less than 6000 per month! What a cruel joke!
Home based workers working for companies may be treated as wage labourers for all
practical purposes and must be part of industry wide collective bargaining in particular industries.
The labour relations law must contain a provision for compulsory collective bargaining
at industry and/or unit/company level, and for an automatic registration of a trade union after filing an online application. There may be a provision that the registrar of trade unions may challenge and file a case for cancellation of registration if he/she finds some problems in the application. The problem of multiplicity of trade unions may be resolved by a compulsory provision and clear procedures for election of a collective bargaining union and collective bargaining councils. The problem of weakness of unions in small and medium sized industries may be resolved by a compulsory industry wide collective bargaining. There must be no limit of size of industries for applicability of industry wide bargaining.
The social security law must be universally applicable and it must contain two aspects:
(a) basic social security for reducing and stopping the contingencies; and (b) contingent social security to address the contingencies. There are five broad categories of workers: (i) wage workers including home based workers with formal contracts, (ii) wage workers without formal contracts or with short term formal contracts, casual workers and unemployed workers, (iii) self employed producers; (iv) self employed workers engaged in various services and (v) those retired from the workforce, unemployed youth, those with disabilities and orphans. The social security structure of various above categories must be the same; however, there may be specific provisions for specific occupations depending on the need and nature of vulnerabilities and contingencies of the workers, and benefits may vary with the level of contributions of workers. All the same, in any case the social security contributions may not be less than that which applies to a wage worker earning the minimum wages. In case of regular wage workers, the contribution of workers may be totally deposited by the workers themselves, but in case of other workers, the workers may be required to contribute a minimum amount and the rest may be deposited by the welfare boards in particular sectors. The employers‘ contribution in such sectors may be ensured by way of extending welfare and cess act in all the sectors and that may be the major source of funds of the welfare boards.
For wage workers (including home based workers) with formal employment contracts,
the basic social security may be insured by compliance of labour standards and ensuring right to association and compulsory collective bargaining. The contingent social security may also be effectively addressed by extending applicability of employees state insurance (ESI), provident fund (PF) and workmen‘s compensation and other related laws to all wage workers irrespective of size of establishment, and making it compulsory for all enterprises irrespective of their size to take permission from the government before attempting to retrenchments, closures and layoff, and the amount of compensations may be increased.
Indian Labour Journal, April 2015
344
To address the social security needs of other sections of workers including wage workers without formal contracts or with short term formal contracts, casual workers and self employed workers, separate welfare boards based on occupations may be created in line with fish workers welfare board in Kerala and Mathadi workers welfare board in Maharashtra, depending on the conditions in particular occupations. The boards may be tripartite in nature and financed by contributions of employers, workers and the government, with major share coming from industrialists, traders and other business houses in particular sectors based on progressive taxation. The basic social security extended by the welfare boards must focus on: (a) regulating the labour market and working conditions of wage workers and home workers, with a similar dynamics as created by the Mathadi board in Maharashtra, and (b) regulation of market relations of self employed producers including home based workers with traders and industrialists to insure proper remuneration to workers, (c) ensuring ESI and PF contributions for all workers including the self employed at the level applicable to wage workers earning a minimum wage, from the welfare fund collected by welfare boards (d) helping and supporting the self employed workers in making their livelihoods sustainable, and (e) enhancement of skills of workers and education to the children of workers. The contingent social security may cover those contingencies that are not covered by the ESI--for example, intermittent period of unemployment of wage workers, and losses incurred by self employed producers due to accidents and natural disasters, etc. Extending applicability of PF and ESI to all occupations and all workers (including the self employed) by way of welfare boards may significantly improve the life of workers in terms of better health facilities, wages during illness and maternity benefits, and better pensions, etc. Therefore, a greater focus is needed to improve the facilities and expand the networks of ESI hospitals in all areas in accordance with the population of workforce.
In the light of the above, the PF and ESI gets an added relevance, and it becomes urgent to strongly oppose the new policies of government targeted to privatize the health insurance and pension schemes and handing over the pension and PF funds to private fund managers for earning profits. The new pension scheme is based on defined contributions but no defined benefits must be abolished and the pension scheme based on defined benefits and family coverage must be restored. The PF and pension funds must remain in the hands of tripartite boards and used to finance the cooperatives of workers in various occupations, rather than making it a source of profit for national and foreign corporates.
The welfare and cess act must be made applicable in all occupations to ensure the
contributions from industrialists, traders and other business houses in particular sectors for financing the welfare boards of various sectors.
4. Say Yes to New Strategies for Strengthening the Labour Movement
At the grassroots level, labour politics in India must change by factoring in the following wider horizons and new tasks.
With the integration of Indian industries in the global value chains (Pratap, 2014; Bose, 2012), it is increasingly becoming evident that solidarity across the value chain in particular country and international solidarity across the value chain in particular industries are important determinants of the strength and effectiveness of the workers‘ struggles. International solidarity is one of the most effective weapons in the hands of working class to challenge the disastrous movements of capital. However, in a situation when the weapon of international capital mobility is increasingly used to divide the workers on nationalist lines, both in the developed and developing countries, a false consciousness is systematically created in workers to make them understand and articulate the issues on nationalist lines, in a way as if workers in various countries are competing with each other for jobs. But, despite all the currently observed limitations, the international solidarity among workers is no doubt an increasing trend.
Indian Labour Journal, April 2015
345
With global value chains extending up to self employed workers and home based workers, it is a compelling need to expand the organizational base of unions to these sections of workers and institutionalize a practice of industry wide collective bargaining that includes these sections of workers as well. This will also require as well as facilitate the trade unions to expand their bases in the society and address the issues that the workers face in the society. Moreover, the trade unions need to transform their structure and functioning to provide insured spaces for voices of women workers and other socially excluded sections, in order to strengthen the unity among the working classes. Institutionalizing the practice of industry wide collective bargaining will bring a dynamics that may effectively stop any tendencies of corruption in unions and wipe out those unions that are transformed into professional consultancy firms (particularly in those sectors where informal workers form a majority and factory level unions do not exist), along with gradually insuring a better space for factory level collective bargaining beyond the minimum standards set by the industry wide bargaining.
The organizing and collective bargaining was comparatively simpler when the
industries were largely local and producing largely for home markets, and self employed sectors were largely the subsistence economies. With integration of economies in global value chains, and emergence of other related dynamics, it no more remains a simple case. For developing successful organizing and collective bargaining strategies in new conditions, the activists need to understand the dynamics of global value chains in their particular sectors, and related politico-economic dynamics. Without an exposure and linkage with the broader labour movement at country level, and at international or at least regional level, it is impossible to build sectoral and international solidarity that becomes important for winning the struggles in new situations. Therefore, training and education of activists, as well as providing them exposure to regional labour movements emerges as an important area of focus for the labour movement.
Increasing corporatization and monopolization of media and their systematically built-in anti-labour agenda has created a situation wherein the labour becomes invisible, and their actions are by and large made ineffective. For example, in a series of general strikes after 2000 in India millions of workers participated, and in many labour demonstrations tens of thousands of workers marched in the capital city of Delhi, but media never provided them a significant space, and many a time completely ignored them, thereby reducing the effectiveness of labour actions to the extent that the majority of population did not even know about it. In these situations, it is becoming increasingly important for labour movement to create its own national media.
The neoliberal-imperial globalization is the most aggressive phase of capitalism wherein capital is not ready to accept barrier of any kind that restricts/blocks the expansion and accumulation of capital. In the absence of any effective political opposition from the workers, the state appears to be fully transformed as the corporate agent rather than a neutral agent. Under these circumstances any broader change in life and working conditions of workers is not possible without the political role of workers in every sphere of life and strong political power of the working class. Moving towards this direction requires initiatives including (i) merger or building united platforms of trade unions in particular industries (even with maintaining their affiliation with various central or state unions), (ii) a political platform of labour with a common minimum program by integrating all trade unions and other working class organizations, (iii) demanding representation of largest worker‘s organization in all relevant policy making/implementing bodies at all levels--central, state, district and local bodies by way of verification of membership of all organizations submitting membership returns at all levels (and not only of central trade unions as is currently done). Integration of workers movement and its emergence as political force also depends on its ability to resolve the political and ideological crisis that the working class movement is currently facing, by being able to propose an agenda with comprehensive set of alternative policies and strategies.
Indian Labour Journal, April 2015
346
The political integration of labour movement and practising of a mass movement model based on Sangharsh and Nirman (struggle for rights and building of social and economic institutions to transform the life and work of workers in such a way that increases the collective consciousness of workers, reduces the pains of their life, as well as increases the sustainability of their livelihoods) as successfully experimented by the Chhattisgarh Mukti Morcha under the leadership of the late Shankar Guha Niyogi, may constitute the major aspects of the future model of the labour movement. These strategies provide enough strength to resolve various problems (including the socio-political, organizational and financial problems) that the movements are currently facing.
5. Concluding Remarks
The ‗Washington Consensus‘ emphasizes five key policies: (a) trade liberalization and export-led growth; (b) financial market liberalization and financial capital mobility; (c) fiscal and monetary austerity; (d) privatization; and (e) labour market flexibility. By contrast, the alternative of domestic demand-led growth rests on four pillars: (a) improved income distribution; (b) good governance; (c) financial stability and space for counter-cyclical stabilization policy; and (d) an adequate, fairly priced supply of development finance. These four pillars are put in place with three policies: (a) labour and democratic rights; (b) appropriate reform and regulation of the financial architecture; and (c) a combination of debt relief, increased foreign aid, and increased development assistance provided through expanded SDRs. It is not the concern of this paper to rigorously evaluate the policy configurations of these two opposing models of development.
All that this paper has done is that from the narrow perspective of promoting worker well-being alongside economic growth, the dichotomous policy options in terms of export led model in conjunction with labour market flexibility (i.e. informalisation of employment via garbage labour contracts with labour rights deficits) on the one hand and internal market-led development associated with employment stability and worker rights on the other need to be recognized. And, moreover, labour politics from below needs to be redefined for empowering the working people at large. Now that the former model has failed, there is need for choosing the latter model as the only alternative. Whether this indeed will be done is a matter of political choices for ―another world is possible‖ (a la the World Social Forum) the examination of which is beyond this paper. Moving on these lines is the way forward for achieving development with the understanding that after all the working people are the real wealth of the nations.
References
Bose. Annavajhula J.C. (2012), Labour Relations in a Liberalized Industry: A Study of Indian
Automobile Workers, Unpublished PhD Thesis submitted to Department of Economics, B.R.
Ambedkar Bihar University, Muzaffarpur
(https://gurgaonworkersnews.files.wordpress.com/2012/09/full-thesis-in-pdf.pdf).
Bhaduri, Amit (1996), ―Employment, Labour Market Flexibility and Economic Liberalisation in
India‖, The Indian Journal of Labour Economics, Vol.39, No.1, January-March.
Fraser, Nancy (2014), ―Can Society be Commodities all the Way Down? Post-Polanyian
Reflections on Capitalist Crisis, Economy and Society‖, Economy and Society, Vol.45, No.4,
November.
Lowe, Samuel (2015), ―African Land Grabs: We Cannot Expect Companies and Financers to
Regulate Themselves‖, Global Development Professionals Network, The Guardian, March 13.
Palley, Thomas I. (2002), ― A New Development Paradigm Domestic Demand-led Growth Why
It is Needed and How to Make It Happen‖, Discussion Paper, Foreign Policy in Focus,
September.
Pratap, Surendra (2014), Emerging Trends in Factory Asia, Asia Monitor Resource Centre,
Hong Kong.
Indian Labour Journal, April 2015
347
REPORTS ENQUIRIES AND STUDIES
Report on the Working of the Motor Transport Workers act, 1961
for the year 2012
1. Scope, Objective and Main Provisions
The Motor Transport Workers Act, 1961 which came into force in March,
1962 is intended to take care of the welfare of the motor transport workers and to regulate the
conditions of their work. It applies to every motor transport undertaking employing five or more
workers in all the States / Union Territories in the country. The State Governments are,
however, empowered to apply all or any of the provisions of this Act to any motor transport
undertaking employing less than five workers. In Delhi, the Motor Transport Undertakings are
covered under the Shops and Commercial Establishments Act.
The main provisions of the Act, inter-alia, relate to (i) welfare and health; (ii) hours of
work; (iii) employment of young persons; and (iv) wages, over-time payment and leave.
2. Administration of the Act
The Act, which makes it obligatory for every employer of a motor transport
undertaking, to which the Act is applicable, to have the undertaking registered under the Act, is
administered by the State Governments.
It also makes obligatory for the employers to provide every reasonable facility to the
Inspectorate Staff for making any inspection, examination or inquiry, as it deemed fit, so as to
ensure the scrupulous implementation of the provisions of the Act or the Rules made there-
under.
Besides, the Act also provides for appointment of qualified medical practitioners as
―Certifying Surgeons‖ by the State Governments for the examination and certification of motor
transport workers and to exercise medical supervision on the employment of adolescents.
3. Distribution of Motor Transport Undertakings
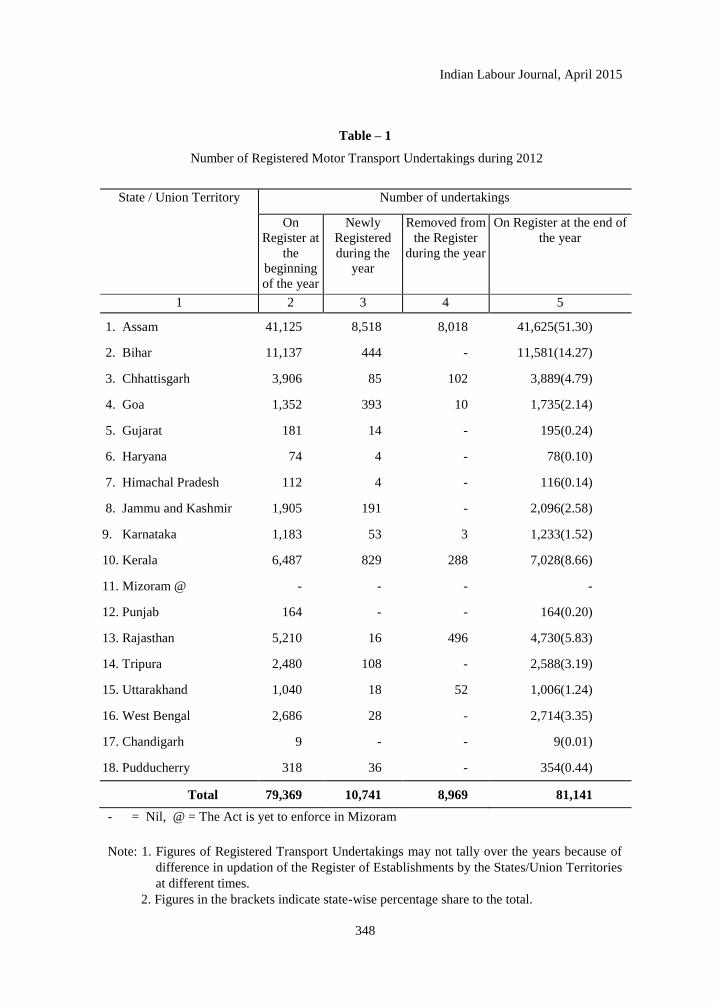
The details of the number of registered motor transport undertakings during the year
2012 are presented in Table-1. The Table shows that a total of 81,141 Motor Transport
Undertakings were registered as on 31st December, 2012, of which 10,741 were registered
during 2012. Of the total registered motor transport undertakings, Assam has the highest share
of 51.30% (41,625), followed by Bihar 14.27% and Kerala 8.66%.
Indian Labour Journal, April 2015
348
Table – 1
Number of Registered Motor Transport Undertakings during 2012
State / Union Territory Number of undertakings
On
Register at
the
beginning
of the year
Newly
Registered
during the
year
Removed from
the Register
during the year
On Register at the end of
the year
1 2 3 4 5
1. Assam 41,125 8,518 8,018 41,625(51.30)
2. Bihar 11,137 444 - 11,581(14.27)
3. Chhattisgarh 3,906 85 102 3,889(4.79)
4. Goa 1,352 393 10 1,735(2.14)
5. Gujarat 181 14 - 195(0.24)
6. Haryana 74 4 - 78(0.10)
7. Himachal Pradesh 112 4 - 116(0.14)
8. Jammu and Kashmir 1,905 191 - 2,096(2.58)
9. Karnataka 1,183 53 3 1,233(1.52)
10. Kerala 6,487 829 288 7,028(8.66)
11. Mizoram @ - - - -
12. Punjab 164 - - 164(0.20)
13. Rajasthan 5,210 16 496 4,730(5.83)
14. Tripura 2,480 108 - 2,588(3.19)
15. Uttarakhand 1,040 18 52 1,006(1.24)
16. West Bengal 2,686 28 - 2,714(3.35)
17. Chandigarh 9 - - 9(0.01)
18. Pudducherry 318 36 - 354(0.44)
Total 79,369 10,741 8,969 81,141
- = Nil, @ = The Act is yet to enforce in Mizoram
Note: 1. Figures of Registered Transport Undertakings may not tally over the years because of
difference in updation of the Register of Establishments by the States/Union Territories
at different times.
2. Figures in the brackets indicate state-wise percentage share to the total.
Indian Labour Journal, April 2015
349
4. Employment
As per the Act a motor transport worker is one who is employed in a motor transport
undertaking directly or through any agency, whether for wages or not, to work in a professional
capacity on a transport vehicle or to attend to duties in connection with the arrival, departure,
loading or unloading of such transport vehicle and includes a driver, conductor, cleaner, station
staff, line checking staff, booking clerk, cash clerk, depot clerk, time-keeper, watchman or
attendant. It does not include (a) any such person who is employed in a factory as defined in the
Factories Act, 1948 and (b) any such person to whom the provisions of any law for the time
being in force regulating the conditions of service of persons employed in Shops or Commercial
Establishments apply.
The Act prohibits the employment of a person who has not completed his fifteenth
year. Adolescents (i.e., those who have completed their fifteenth year but have not completed
their eighteenth year) are also not allowed to work as motor transport workers unless a
certificate of fitness is granted by a Certifying Surgeon and the same is kept in the custody of
the employer. The concerned adolescent is also required to carry a token to this effect while at
work. The certificate of fitness so granted is valid only for a period of 12 months and can be
renewed again.
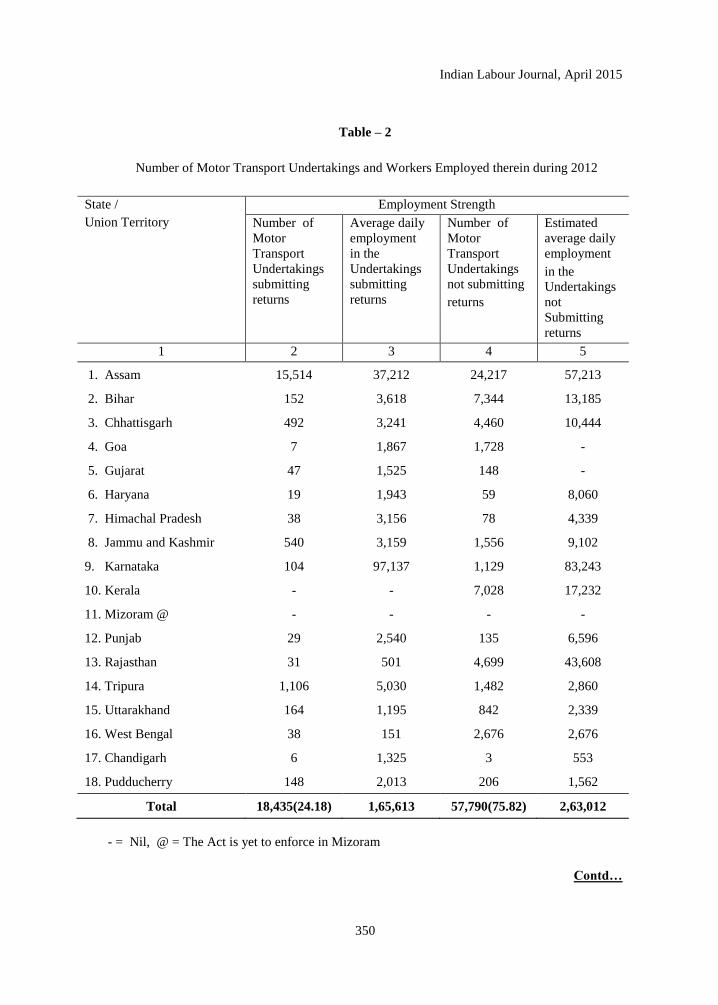
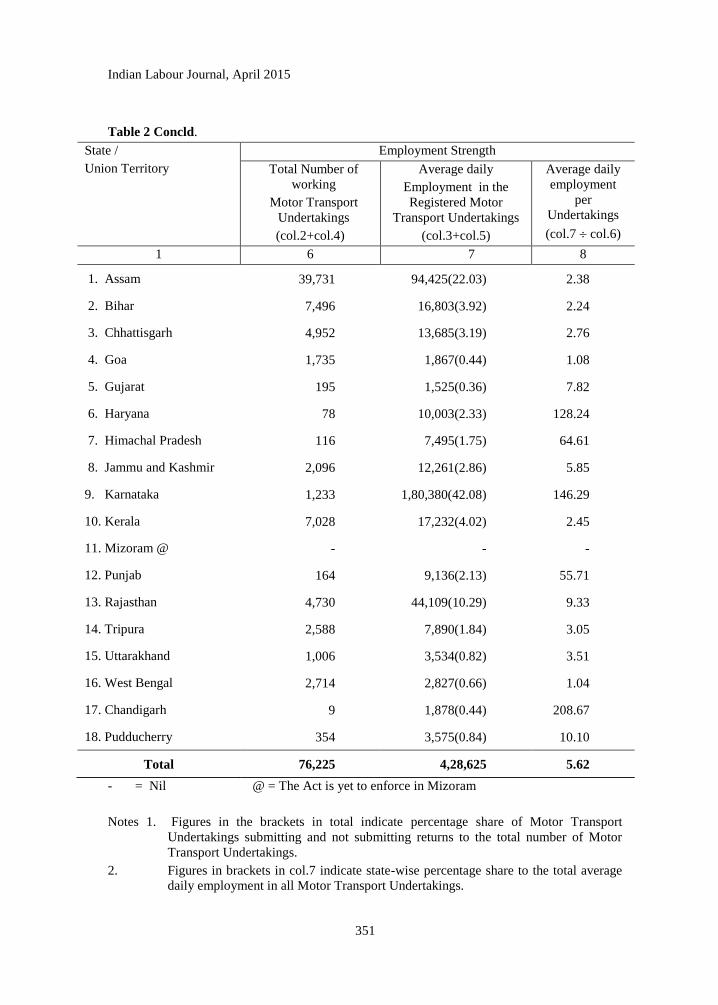
State-wise information on the number of registered motor transport undertakings and
average daily employment therein during 2012 is presented in Table-2. The Table shows that
out of the 76,225 registered working undertakings, only 24.18% units submitted their annual
returns. The employment figures for the units not submitting returns have however been
estimated by the concerned agencies from the following sources in order of their preference:
i) Recent inspection report,
ii) Previous year‘s employment data and
iii) Employment figures indicated in the application for registration or grant or
renewal of license.
The total average daily employment in the motor transport industry in a state has been
derived by adding up the estimated average daily employment in the units not submitting returns
with the employment figures of undertakings submitting returns. Of the total number of
4,28,625 motor transport workers during 2012, Karnataka accounted for the highest number of
workers i.e., 1,80,380 (42.08%) followed by Assam 94,425 (22.03%) and Rajasthan 44,109
(10.29%). These three states taken together accounted for 74 per cent of the total average daily
employment in motor transport undertakings. Though the all-India average daily employment
per undertaking was 5.62, it varied from state to state. Chandigarh(UT) was on the top with an
average daily employment per undertaking of 208.67 workers in 9 Motor Transport Undertaking
whereas Goa was at the bottom with 1.08 workers employed on an average in 1,867 Motor
Transport Undertakings.
Indian Labour Journal, April 2015
350
Table – 2
Number of Motor Transport Undertakings and Workers Employed therein during 2012
State /
Union Territory
Employment Strength
Number of
Motor
Transport
Undertakings
submitting
returns
Average daily
employment
in the
Undertakings
submitting
returns
Number of
Motor
Transport
Undertakings
not submitting
returns
takings not submitting returns
Estimated
average daily
employment
in the
Undertakings
not
Submitting
returns
1 2 3 4 5
1. Assam 15,514 37,212 24,217 57,213
2. Bihar 152 3,618 7,344 13,185
3. Chhattisgarh 492 3,241 4,460 10,444
4. Goa 7 1,867 1,728 -
5. Gujarat 47 1,525 148 -
6. Haryana 19 1,943 59 8,060
7. Himachal Pradesh 38 3,156 78 4,339
8. Jammu and Kashmir 540 3,159 1,556 9,102
9. Karnataka 104 97,137 1,129 83,243
10. Kerala - - 7,028 17,232
11. Mizoram @ - - - -
12. Punjab 29 2,540 135 6,596
13. Rajasthan 31 501 4,699 43,608
14. Tripura 1,106 5,030 1,482 2,860
15. Uttarakhand 164 1,195 842 2,339
16. West Bengal 38 151 2,676 2,676
17. Chandigarh 6 1,325 3 553
18. Pudducherry 148 2,013 206 1,562
Total 18,435(24.18) 1,65,613 57,790(75.82) 2,63,012
- = Nil, @ = The Act is yet to enforce in Mizoram
Contd…
Indian Labour Journal, April 2015
351
Table 2 Concld.
State /
Union Territory
Employment Strength
Total Number of
working
Motor Transport
Undertakings
(col.2+col.4)
Average daily
Employment in the
Registered Motor
Transport Undertakings
(col.3+col.5)
Average daily
employment
per
Undertakings
(col.7 col.6)
1 6 7 8
1. Assam 39,731 94,425(22.03) 2.38
2. Bihar 7,496 16,803(3.92) 2.24
3. Chhattisgarh 4,952 13,685(3.19) 2.76
4. Goa 1,735 1,867(0.44) 1.08
5. Gujarat 195 1,525(0.36) 7.82
6. Haryana 78 10,003(2.33) 128.24
7. Himachal Pradesh 116 7,495(1.75) 64.61
8. Jammu and Kashmir 2,096 12,261(2.86) 5.85
9. Karnataka 1,233 1,80,380(42.08) 146.29
10. Kerala 7,028 17,232(4.02) 2.45
11. Mizoram @ - - -
12. Punjab 164 9,136(2.13) 55.71
13. Rajasthan 4,730 44,109(10.29) 9.33
14. Tripura 2,588 7,890(1.84) 3.05
15. Uttarakhand 1,006 3,534(0.82) 3.51
16. West Bengal 2,714 2,827(0.66) 1.04
17. Chandigarh 9 1,878(0.44) 208.67
18. Pudducherry 354 3,575(0.84) 10.10
Total 76,225 4,28,625 5.62
- = Nil @ = The Act is yet to enforce in Mizoram
Notes 1. Figures in the brackets in total indicate percentage share of Motor Transport
Undertakings submitting and not submitting returns to the total number of Motor
Transport Undertakings.
2. Figures in brackets in col.7 indicate state-wise percentage share to the total average
daily employment in all Motor Transport Undertakings.
Indian Labour Journal, April 2015
352
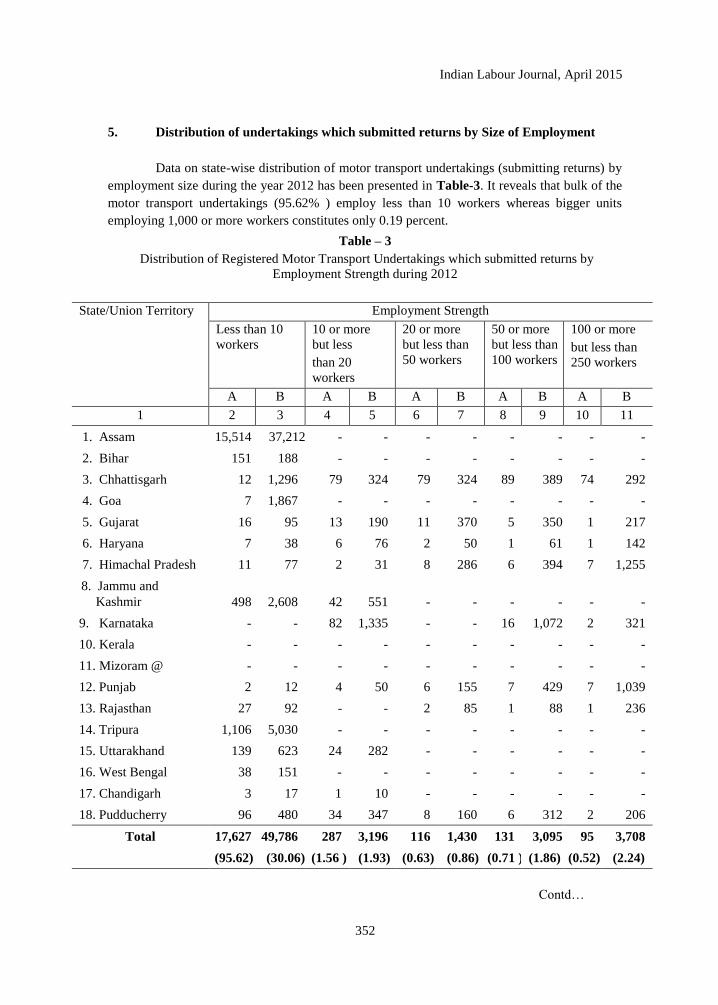
5. Distribution of undertakings which submitted returns by Size of Employment
Data on state-wise distribution of motor transport undertakings (submitting returns) by
employment size during the year 2012 has been presented in Table-3. It reveals that bulk of the
motor transport undertakings (95.62% ) employ less than 10 workers whereas bigger units
employing 1,000 or more workers constitutes only 0.19 percent.
Table – 3
Distribution of Registered Motor Transport Undertakings which submitted returns by
Employment Strength during 2012
State/Union Territory Employment Strength
Less than 10
workers
10 or more
but less
than 20
workers
20 or more
but less than
50 workers
50 or more
but less than
100 workers
100 or more
but less than
250 workers
A B A B A B A B A B
1 2 3 4 5 6 7 8 9 10 11
1. Assam 15,514 37,212 - - - - - - - -
2. Bihar 151 188 - - - - - - - -
3. Chhattisgarh 12 1,296 79 324 79 324 89 389 74 292
4. Goa 7 1,867 - - - - - - - -
5. Gujarat 16 95 13 190 11 370 5 350 1 217
6. Haryana 7 38 6 76 2 50 1 61 1 142
7. Himachal Pradesh 11 77 2 31 8 286 6 394 7 1,255
8. Jammu and
Kashmir 498 2,608 42 551 - - - - - -
9. Karnataka - - 82 1,335 - - 16 1,072 2 321
10. Kerala - - - - - - - - - -
11. Mizoram @ - - - - - - - - - -
12. Punjab 2 12 4 50 6 155 7 429 7 1,039
13. Rajasthan 27 92 - - 2 85 1 88 1 236
14. Tripura 1,106 5,030 - - - - - - - -
15. Uttarakhand 139 623 24 282 - - - - - -
16. West Bengal 38 151 - - - - - - - -
17. Chandigarh 3 17 1 10 - - - - - -
18. Pudducherry 96 480 34 347 8 160 6 312 2 206
Total 17,627 49,786 287 3,196 116 1,430 131 3,095 95 3,708
(95.62) (30.06) (1.56 ) (1.93) (0.63) (0.86) (0.71 ) (1.86) (0.52) (2.24)
Contd…
Indian Labour Journal, April 2015
353
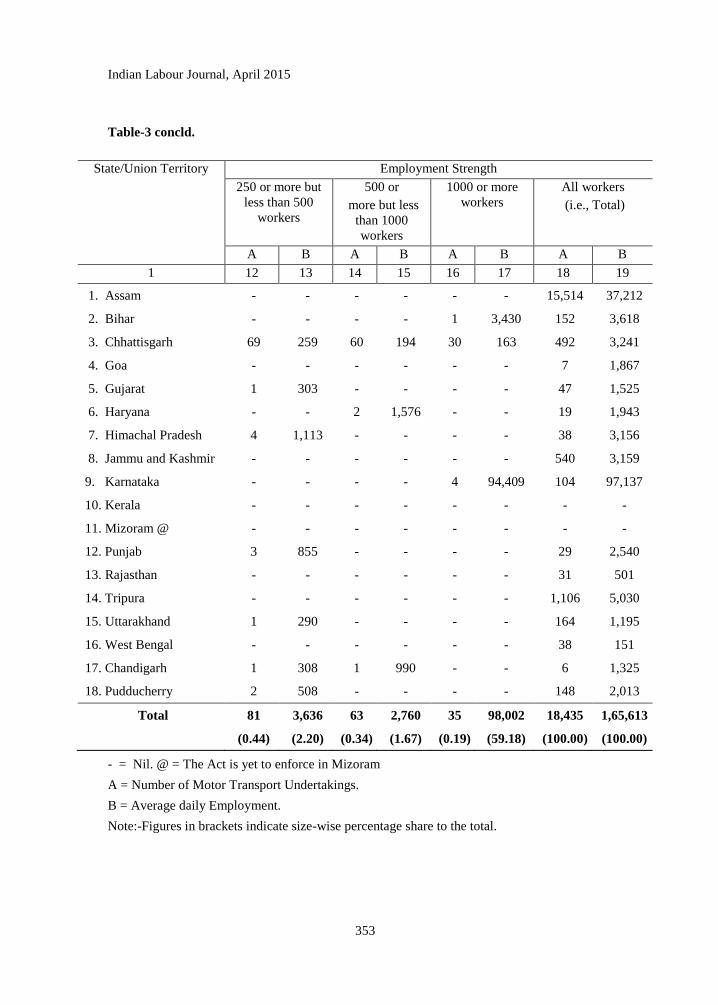
Table-3 concld.
State/Union Territory Employment Strength
250 or more but
less than 500
workers
500 or
more but less
than 1000
workers
1000 or more
workers
All workers
(i.e., Total)
A B A B A B A B
1 12 13 14 15 16 17 18 19
1. Assam - - - - - - 15,514 37,212
2. Bihar - - - - 1 3,430 152 3,618
3. Chhattisgarh 69 259 60 194 30 163 492 3,241
4. Goa - - - - - - 7 1,867
5. Gujarat 1 303 - - - - 47 1,525
6. Haryana - - 2 1,576 - - 19 1,943
7. Himachal Pradesh 4 1,113 - - - - 38 3,156
8. Jammu and Kashmir - - - - - - 540 3,159
9. Karnataka - - - - 4 94,409 104 97,137
10. Kerala - - - - - - - -
11. Mizoram @ - - - - - - - -
12. Punjab 3 855 - - - - 29 2,540
13. Rajasthan - - - - - - 31 501
14. Tripura - - - - - - 1,106 5,030
15. Uttarakhand 1 290 - - - - 164 1,195
16. West Bengal - - - - - - 38 151
17. Chandigarh 1 308 1 990 - - 6 1,325
18. Pudducherry 2 508 - - - - 148 2,013
Total 81 3,636 63 2,760 35 98,002 18,435 1,65,613
(0.44) (2.20) (0.34) (1.67) (0.19) (59.18) (100.00) (100.00)
- = Nil. @ = The Act is yet to enforce in Mizoram
A = Number of Motor Transport Undertakings.
B = Average daily Employment.
Note:-Figures in brackets indicate size-wise percentage share to the total.
Indian Labour Journal, April 2015
354
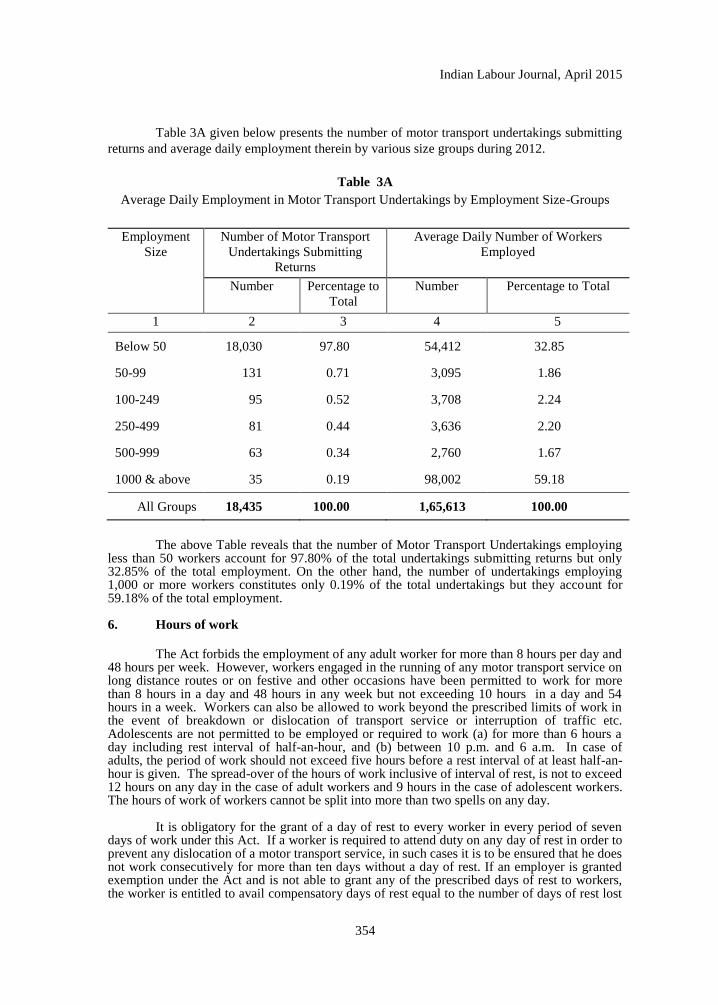
Table 3A given below presents the number of motor transport undertakings submitting
returns and average daily employment therein by various size groups during 2012.
Table 3A
Average Daily Employment in Motor Transport Undertakings by Employment Size-Groups
Employment
Size
Number of Motor Transport
Undertakings Submitting
Returns
Average Daily Number of Workers
Employed
Number Percentage to
Total
Number Percentage to Total
1 2 3 4 5
Below 50 18,030 97.80 54,412 32.85
50-99 131 0.71 3,095 1.86
100-249 95 0.52 3,708 2.24
250-499 81 0.44 3,636 2.20
500-999 63 0.34 2,760 1.67
1000 & above 35 0.19 98,002 59.18
All Groups 18,435 100.00 1,65,613 100.00
The above Table reveals that the number of Motor Transport Undertakings employing less than 50 workers account for 97.80% of the total undertakings submitting returns but only 32.85% of the total employment. On the other hand, the number of undertakings employing 1,000 or more workers constitutes only 0.19% of the total undertakings but they account for 59.18% of the total employment. 6. Hours of work
The Act forbids the employment of any adult worker for more than 8 hours per day and 48 hours per week. However, workers engaged in the running of any motor transport service on long distance routes or on festive and other occasions have been permitted to work for more than 8 hours in a day and 48 hours in any week but not exceeding 10 hours in a day and 54 hours in a week. Workers can also be allowed to work beyond the prescribed limits of work in the event of breakdown or dislocation of transport service or interruption of traffic etc. Adolescents are not permitted to be employed or required to work (a) for more than 6 hours a day including rest interval of half-an-hour, and (b) between 10 p.m. and 6 a.m. In case of adults, the period of work should not exceed five hours before a rest interval of at least half-an-hour is given. The spread-over of the hours of work inclusive of interval of rest, is not to exceed 12 hours on any day in the case of adult workers and 9 hours in the case of adolescent workers. The hours of work of workers cannot be split into more than two spells on any day. It is obligatory for the grant of a day of rest to every worker in every period of seven days of work under this Act. If a worker is required to attend duty on any day of rest in order to prevent any dislocation of a motor transport service, in such cases it is to be ensured that he does not work consecutively for more than ten days without a day of rest. If an employer is granted exemption under the Act and is not able to grant any of the prescribed days of rest to workers, the worker is entitled to avail compensatory days of rest equal to the number of days of rest lost
Indian Labour Journal, April 2015
355
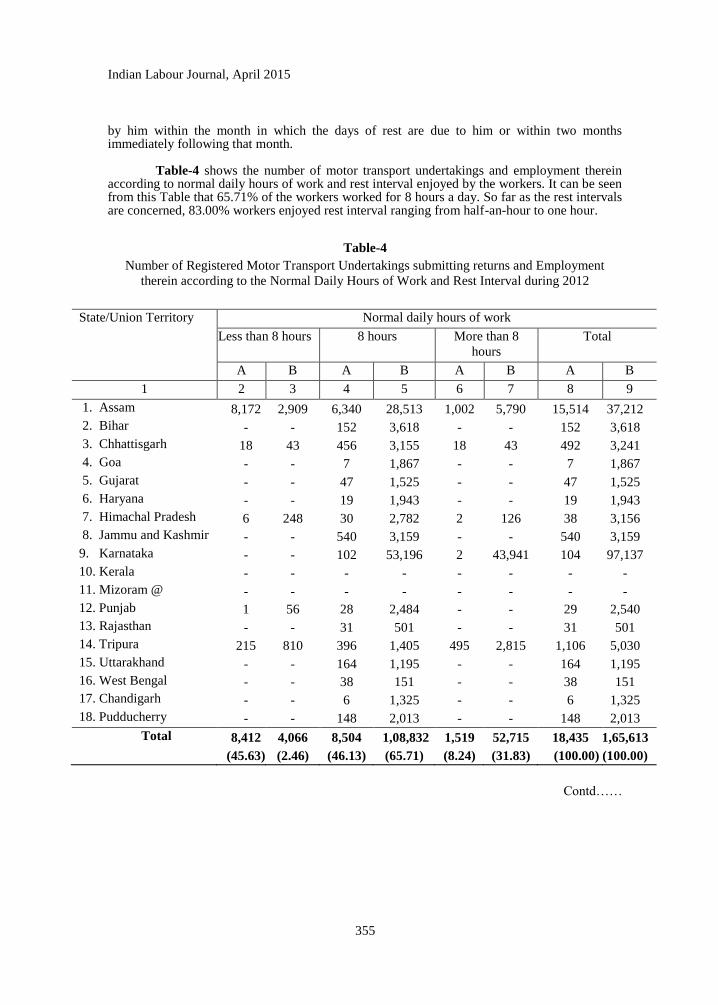
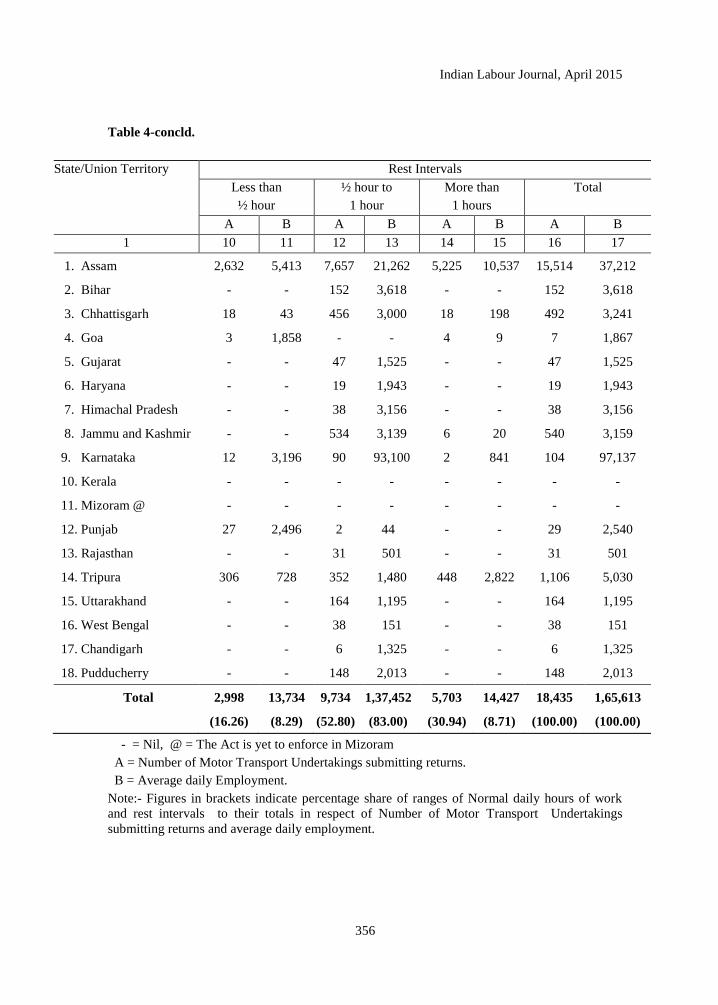
by him within the month in which the days of rest are due to him or within two months immediately following that month. Table-4 shows the number of motor transport undertakings and employment therein according to normal daily hours of work and rest interval enjoyed by the workers. It can be seen from this Table that 65.71% of the workers worked for 8 hours a day. So far as the rest intervals are concerned, 83.00% workers enjoyed rest interval ranging from half-an-hour to one hour.
Table-4
Number of Registered Motor Transport Undertakings submitting returns and Employment
therein according to the Normal Daily Hours of Work and Rest Interval during 2012
State/Union Territory Normal daily hours of work
Less than 8 hours 8 hours More than 8
hours
Total
A B A B A B A B
1 2 3 4 5 6 7 8 9
1. Assam 8,172 2,909 6,340 28,513 1,002 5,790 15,514 37,212
2. Bihar - - 152 3,618 - - 152 3,618
3. Chhattisgarh 18 43 456 3,155 18 43 492 3,241
4. Goa - - 7 1,867 - - 7 1,867
5. Gujarat - - 47 1,525 - - 47 1,525
6. Haryana - - 19 1,943 - - 19 1,943
7. Himachal Pradesh 6 248 30 2,782 2 126 38 3,156
8. Jammu and Kashmir - - 540 3,159 - - 540 3,159
9. Karnataka - - 102 53,196 2 43,941 104 97,137
10. Kerala - - - - - - - -
11. Mizoram @ - - - - - - - -
12. Punjab 1 56 28 2,484 - - 29 2,540
13. Rajasthan - - 31 501 - - 31 501
14. Tripura 215 810 396 1,405 495 2,815 1,106 5,030
15. Uttarakhand - - 164 1,195 - - 164 1,195
16. West Bengal - - 38 151 - - 38 151
17. Chandigarh - - 6 1,325 - - 6 1,325
18. Pudducherry - - 148 2,013 - - 148 2,013
Total 8,412 4,066 8,504 1,08,832 1,519 52,715 18,435 1,65,613
(45.63) (2.46) (46.13) (65.71) (8.24) (31.83) (100.00) (100.00)
Contd……
Indian Labour Journal, April 2015
356
Table 4-concld.
State/Union Territory Rest Intervals
Less than
½ hour
½ hour to
1 hour
More than
1 hours
Total
A B A B A B A B
1 10 11 12 13 14 15 16 17
1. Assam 2,632 5,413 7,657 21,262 5,225 10,537 15,514 37,212
2. Bihar - - 152 3,618 - - 152 3,618
3. Chhattisgarh 18 43 456 3,000 18 198 492 3,241
4. Goa 3 1,858 - - 4 9 7 1,867
5. Gujarat - - 47 1,525 - - 47 1,525
6. Haryana - - 19 1,943 - - 19 1,943
7. Himachal Pradesh - - 38 3,156 - - 38 3,156
8. Jammu and Kashmir - - 534 3,139 6 20 540 3,159
9. Karnataka 12 3,196 90 93,100 2 841 104 97,137
10. Kerala - - - - - - - -
11. Mizoram @ - - - - - - - -
12. Punjab 27 2,496 2 44 - - 29 2,540
13. Rajasthan - - 31 501 - - 31 501
14. Tripura 306 728 352 1,480 448 2,822 1,106 5,030
15. Uttarakhand - - 164 1,195 - - 164 1,195
16. West Bengal - - 38 151 - - 38 151
17. Chandigarh - - 6 1,325 - - 6 1,325
18. Pudducherry - - 148 2,013 - - 148 2,013
Total 2,998 13,734 9,734 1,37,452 5,703 14,427 18,435 1,65,613
(16.26) (8.29) (52.80) (83.00) (30.94) (8.71) (100.00) (100.00)
- = Nil, @ = The Act is yet to enforce in Mizoram
A = Number of Motor Transport Undertakings submitting returns.
B = Average daily Employment.
Note:- Figures in brackets indicate percentage share of ranges of Normal daily hours of work
and rest intervals to their totals in respect of Number of Motor Transport Undertakings
submitting returns and average daily employment.
Indian Labour Journal, April 2015
357
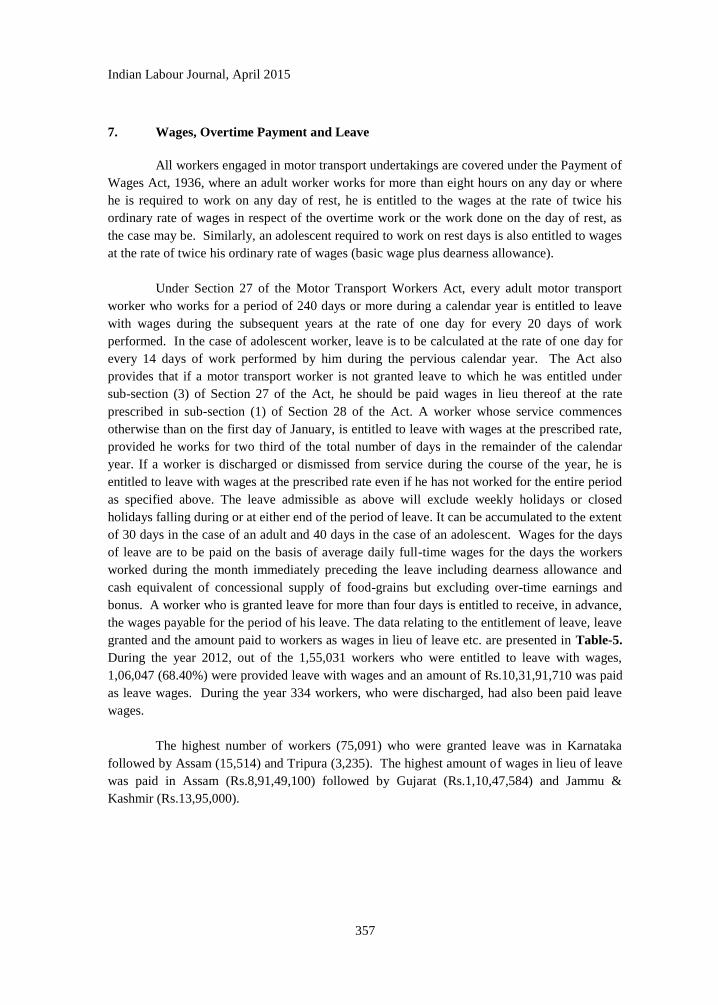
7. Wages, Overtime Payment and Leave
All workers engaged in motor transport undertakings are covered under the Payment of
Wages Act, 1936, where an adult worker works for more than eight hours on any day or where
he is required to work on any day of rest, he is entitled to the wages at the rate of twice his
ordinary rate of wages in respect of the overtime work or the work done on the day of rest, as
the case may be. Similarly, an adolescent required to work on rest days is also entitled to wages
at the rate of twice his ordinary rate of wages (basic wage plus dearness allowance).
Under Section 27 of the Motor Transport Workers Act, every adult motor transport
worker who works for a period of 240 days or more during a calendar year is entitled to leave
with wages during the subsequent years at the rate of one day for every 20 days of work
performed. In the case of adolescent worker, leave is to be calculated at the rate of one day for
every 14 days of work performed by him during the pervious calendar year. The Act also
provides that if a motor transport worker is not granted leave to which he was entitled under
sub-section (3) of Section 27 of the Act, he should be paid wages in lieu thereof at the rate
prescribed in sub-section (1) of Section 28 of the Act. A worker whose service commences
otherwise than on the first day of January, is entitled to leave with wages at the prescribed rate,
provided he works for two third of the total number of days in the remainder of the calendar
year. If a worker is discharged or dismissed from service during the course of the year, he is
entitled to leave with wages at the prescribed rate even if he has not worked for the entire period
as specified above. The leave admissible as above will exclude weekly holidays or closed
holidays falling during or at either end of the period of leave. It can be accumulated to the extent
of 30 days in the case of an adult and 40 days in the case of an adolescent. Wages for the days
of leave are to be paid on the basis of average daily full-time wages for the days the workers
worked during the month immediately preceding the leave including dearness allowance and
cash equivalent of concessional supply of food-grains but excluding over-time earnings and
bonus. A worker who is granted leave for more than four days is entitled to receive, in advance,
the wages payable for the period of his leave. The data relating to the entitlement of leave, leave
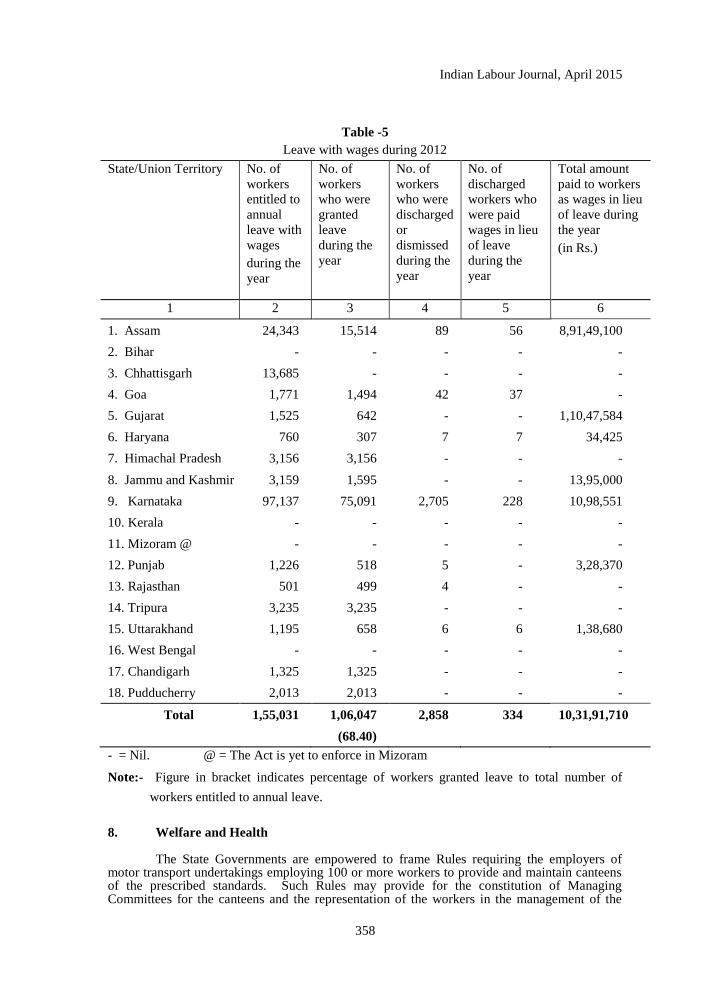
granted and the amount paid to workers as wages in lieu of leave etc. are presented in Table-5.
During the year 2012, out of the 1,55,031 workers who were entitled to leave with wages,
1,06,047 (68.40%) were provided leave with wages and an amount of Rs.10,31,91,710 was paid
as leave wages. During the year 334 workers, who were discharged, had also been paid leave
wages.
The highest number of workers (75,091) who were granted leave was in Karnataka
followed by Assam (15,514) and Tripura (3,235). The highest amount of wages in lieu of leave
was paid in Assam (Rs.8,91,49,100) followed by Gujarat (Rs.1,10,47,584) and Jammu &
Kashmir (Rs.13,95,000).
Indian Labour Journal, April 2015
358
Table -5
Leave with wages during 2012
State/Union Territory No. of
workers
entitled to
annual
leave with
wages
during the
year
No. of
workers
who were
granted
leave
during the
year
No. of
workers
who were
discharged
or
dismissed
during the
year
No. of
discharged
workers who
were paid
wages in lieu
of leave
during the
year
Total amount
paid to workers
as wages in lieu
of leave during
the year
(in Rs.)
1 2 3 4 5 6
1. Assam 24,343 15,514 89 56 8,91,49,100
2. Bihar - - - - -
3. Chhattisgarh 13,685 - - - -
4. Goa 1,771 1,494 42 37 -
5. Gujarat 1,525 642 - - 1,10,47,584
6. Haryana 760 307 7 7 34,425
7. Himachal Pradesh 3,156 3,156 - - -
8. Jammu and Kashmir 3,159 1,595 - - 13,95,000
9. Karnataka 97,137 75,091 2,705 228 10,98,551
10. Kerala - - - - -
11. Mizoram @ - - - - -
12. Punjab 1,226 518 5 - 3,28,370
13. Rajasthan 501 499 4 - -
14. Tripura 3,235 3,235 - - -
15. Uttarakhand 1,195 658 6 6 1,38,680
16. West Bengal - - - - -
17. Chandigarh 1,325 1,325 - - -
18. Pudducherry 2,013 2,013 - - -
Total 1,55,031 1,06,047 2,858 334 10,31,91,710
(68.40)
- = Nil. @ = The Act is yet to enforce in Mizoram
Note:- Figure in bracket indicates percentage of workers granted leave to total number of
workers entitled to annual leave.
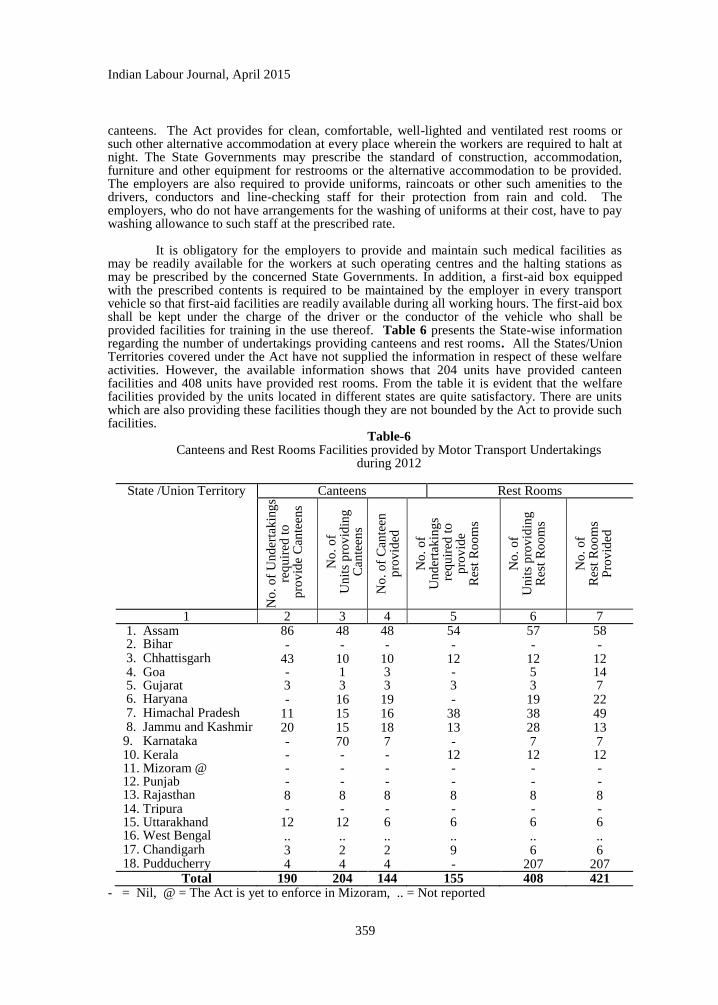
8. Welfare and Health
The State Governments are empowered to frame Rules requiring the employers of motor transport undertakings employing 100 or more workers to provide and maintain canteens of the prescribed standards. Such Rules may provide for the constitution of Managing Committees for the canteens and the representation of the workers in the management of the
Indian Labour Journal, April 2015
359
canteens. The Act provides for clean, comfortable, well-lighted and ventilated rest rooms or such other alternative accommodation at every place wherein the workers are required to halt at night. The State Governments may prescribe the standard of construction, accommodation, furniture and other equipment for restrooms or the alternative accommodation to be provided. The employers are also required to provide uniforms, raincoats or other such amenities to the drivers, conductors and line-checking staff for their protection from rain and cold. The employers, who do not have arrangements for the washing of uniforms at their cost, have to pay washing allowance to such staff at the prescribed rate.
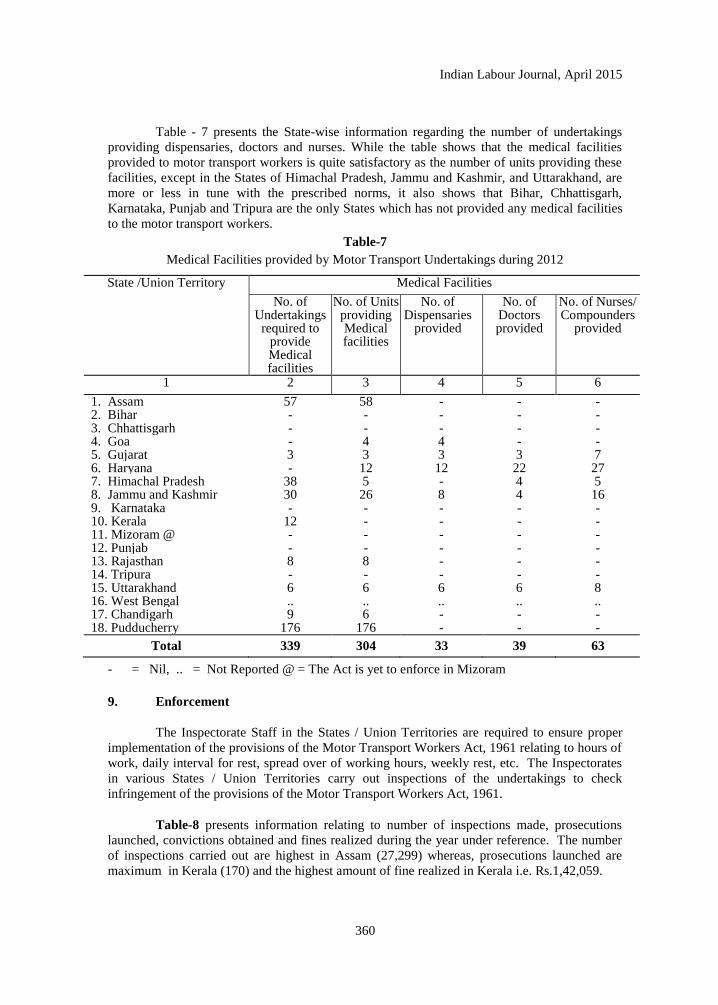
It is obligatory for the employers to provide and maintain such medical facilities as
may be readily available for the workers at such operating centres and the halting stations as may be prescribed by the concerned State Governments. In addition, a first-aid box equipped with the prescribed contents is required to be maintained by the employer in every transport vehicle so that first-aid facilities are readily available during all working hours. The first-aid box shall be kept under the charge of the driver or the conductor of the vehicle who shall be provided facilities for training in the use thereof. Table 6 presents the State-wise information regarding the number of undertakings providing canteens and rest rooms. All the States/Union Territories covered under the Act have not supplied the information in respect of these welfare activities. However, the available information shows that 204 units have provided canteen facilities and 408 units have provided rest rooms. From the table it is evident that the welfare facilities provided by the units located in different states are quite satisfactory. There are units which are also providing these facilities though they are not bounded by the Act to provide such facilities.
Table-6 Canteens and Rest Rooms Facilities provided by Motor Transport Undertakings
during 2012
State /Union Territory Canteens Rest Rooms
No
. o
f U
nd
erta
kin
gs
req
uir
ed t
o
pro
vid
e C
ante
ens
No
. o
f
Un
its
pro
vid
ing
Can
teen
s
No
. o
f C
ante
en
pro
vid
ed
No
. o
f
Un
der
tak
ing
s r
equ
ired
to
p
rov
ide
R
est
Ro
om
s
No
. o
f
Un
its
pro
vid
ing
Res
t R
oo
ms
No
. o
f
Res
t R
oo
ms
P
rov
ided
1 2 3 4 5 6 7
1. Assam 86 48 48 54 57 58 2. Bihar - - - - - - 3. Chhattisgarh 43 10 10 12 12 12 4. Goa - 1 3 - 5 14 5. Gujarat 3 3 3 3 3 7 6. Haryana - 16 19 - 19 22 7. Himachal Pradesh 11 15 16 38 38 49 8. Jammu and Kashmir 20 15 18 13 28 13 9. Karnataka - 70 7 - 7 7 10. Kerala - - - 12 12 12 11. Mizoram @ - - - - - - 12. Punjab - - - - - - 13. Rajasthan 8 8 8 8 8 8 14. Tripura - - - - - - 15. Uttarakhand 12 12 6 6 6 6 16. West Bengal .. .. .. .. .. .. 17. Chandigarh 3 2 2 9 6 6 18. Pudducherry 4 4 4 - 207 207
Total 190 204 144 155 408 421 - = Nil, @ = The Act is yet to enforce in Mizoram, .. = Not reported
Indian Labour Journal, April 2015
360
Table - 7 presents the State-wise information regarding the number of undertakings
providing dispensaries, doctors and nurses. While the table shows that the medical facilities
provided to motor transport workers is quite satisfactory as the number of units providing these
facilities, except in the States of Himachal Pradesh, Jammu and Kashmir, and Uttarakhand, are
more or less in tune with the prescribed norms, it also shows that Bihar, Chhattisgarh,
Karnataka, Punjab and Tripura are the only States which has not provided any medical facilities
to the motor transport workers.
Table-7
Medical Facilities provided by Motor Transport Undertakings during 2012
State /Union Territory Medical Facilities
No. of Undertakings
required to provide Medical facilities
No. of Units providing Medical facilities
No. of Dispensaries
provided
No. of Doctors provided
No. of Nurses/ Compounders
provided
1 2 3 4 5 6
1. Assam 57 58 - - - 2. Bihar - - - - - 3. Chhattisgarh - - - - - 4. Goa - 4 4 - - 5. Gujarat 3 3 3 3 7 6. Haryana - 12 12 22 27 7. Himachal Pradesh 38 5 - 4 5 8. Jammu and Kashmir 30 26 8 4 16 9. Karnataka - - - - - 10. Kerala 12 - - - - 11. Mizoram @ - - - - - 12. Punjab - - - - - 13. Rajasthan 8 8 - - - 14. Tripura - - - - - 15. Uttarakhand 6 6 6 6 8 16. West Bengal .. .. .. .. .. 17. Chandigarh 9 6 - - - 18. Pudducherry 176 176 - - -
Total 339 304 33 39 63
- = Nil, .. = Not Reported @ = The Act is yet to enforce in Mizoram
9. Enforcement
The Inspectorate Staff in the States / Union Territories are required to ensure proper
implementation of the provisions of the Motor Transport Workers Act, 1961 relating to hours of
work, daily interval for rest, spread over of working hours, weekly rest, etc. The Inspectorates
in various States / Union Territories carry out inspections of the undertakings to check
infringement of the provisions of the Motor Transport Workers Act, 1961.
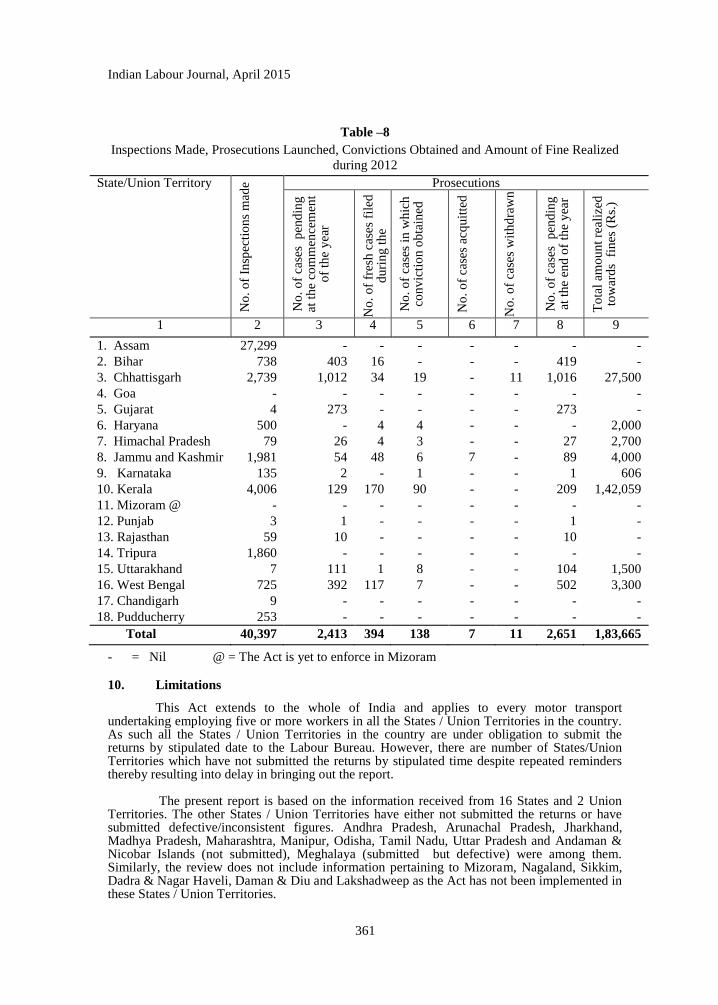
Table-8 presents information relating to number of inspections made, prosecutions
launched, convictions obtained and fines realized during the year under reference. The number
of inspections carried out are highest in Assam (27,299) whereas, prosecutions launched are
maximum in Kerala (170) and the highest amount of fine realized in Kerala i.e. Rs.1,42,059.
Indian Labour Journal, April 2015
361
Table –8
Inspections Made, Prosecutions Launched, Convictions Obtained and Amount of Fine Realized
during 2012
State/Union Territory
No
. o
f In
spec
tio
ns
mad
e Prosecutions
No
. o
f ca
ses
pen
din
g
at t
he
com
men
cem
ent
o
f th
e y
ear
No
. o
f fr
esh
cas
es f
iled
d
uri
ng t
he
y
ear
No
. o
f ca
ses
in w
hic
h
con
vic
tio
n o
bta
ined
No
. o
f ca
ses
acq
uit
ted
No
. o
f ca
ses
wit
hd
raw
n
No
. o
f ca
ses
pen
din
g
at t
he
end
of
the
yea
r
To
tal
amo
un
t re
aliz
ed
tow
ard
s f
ines
(R
s.)
1 2 3 4 5 6 7 8 9
1. Assam 27,299 - - - - - - -
2. Bihar 738 403 16 - - - 419 -
3. Chhattisgarh 2,739 1,012 34 19 - 11 1,016 27,500
4. Goa - - - - - - - -
5. Gujarat 4 273 - - - - 273 -
6. Haryana 500 - 4 4 - - - 2,000
7. Himachal Pradesh 79 26 4 3 - - 27 2,700
8. Jammu and Kashmir 1,981 54 48 6 7 - 89 4,000
9. Karnataka 135 2 - 1 - - 1 606
10. Kerala 4,006 129 170 90 - - 209 1,42,059
11. Mizoram @ - - - - - - - -
12. Punjab 3 1 - - - - 1 -
13. Rajasthan 59 10 - - - - 10 -
14. Tripura 1,860 - - - - - - -
15. Uttarakhand 7 111 1 8 - - 104 1,500
16. West Bengal 725 392 117 7 - - 502 3,300
17. Chandigarh 9 - - - - - - -
18. Pudducherry 253 - - - - - - -
Total 40,397 2,413 394 138 7 11 2,651 1,83,665
- = Nil @ = The Act is yet to enforce in Mizoram
10. Limitations
This Act extends to the whole of India and applies to every motor transport undertaking employing five or more workers in all the States / Union Territories in the country. As such all the States / Union Territories in the country are under obligation to submit the returns by stipulated date to the Labour Bureau. However, there are number of States/Union Territories which have not submitted the returns by stipulated time despite repeated reminders thereby resulting into delay in bringing out the report.
The present report is based on the information received from 16 States and 2 Union
Territories. The other States / Union Territories have either not submitted the returns or have submitted defective/inconsistent figures. Andhra Pradesh, Arunachal Pradesh, Jharkhand, Madhya Pradesh, Maharashtra, Manipur, Odisha, Tamil Nadu, Uttar Pradesh and Andaman & Nicobar Islands (not submitted), Meghalaya (submitted but defective) were among them. Similarly, the review does not include information pertaining to Mizoram, Nagaland, Sikkim, Dadra & Nagar Haveli, Daman & Diu and Lakshadweep as the Act has not been implemented in these States / Union Territories.
Indian Labour Journal, April 2015
362
LABOUR ACTIVITIES
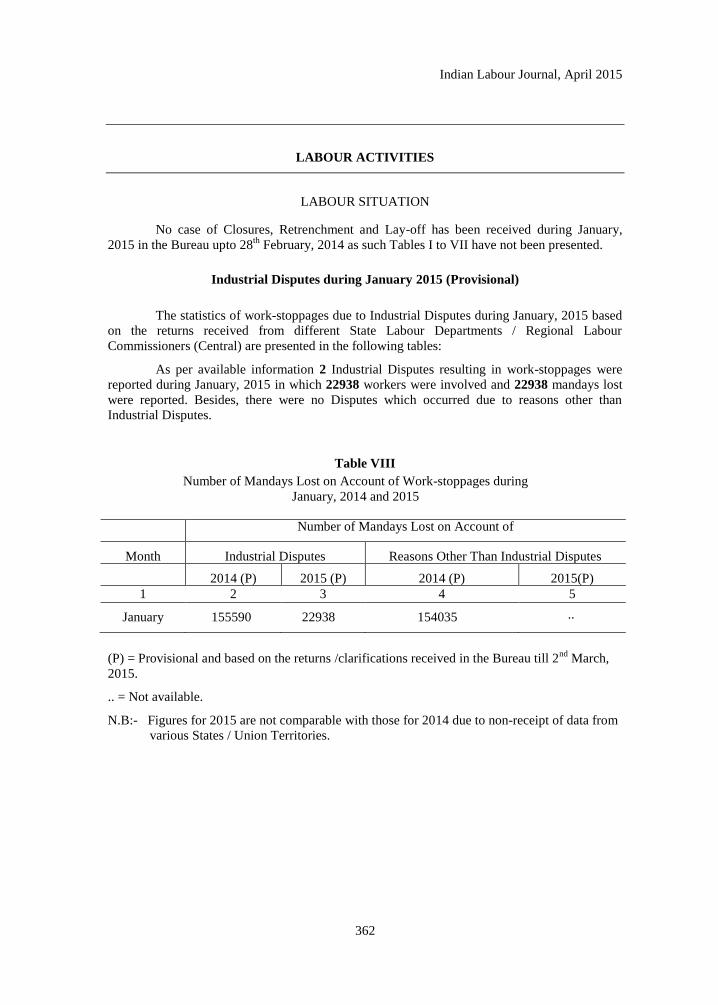
LABOUR SITUATION
No case of Closures, Retrenchment and Lay-off has been received during January,
2015 in the Bureau upto 28th
February, 2014 as such Tables I to VII have not been presented.
Industrial Disputes during January 2015 (Provisional)
The statistics of work-stoppages due to Industrial Disputes during January, 2015 based
on the returns received from different State Labour Departments / Regional Labour
Commissioners (Central) are presented in the following tables:
As per available information 2 Industrial Disputes resulting in work-stoppages were
reported during January, 2015 in which 22938 workers were involved and 22938 mandays lost
were reported. Besides, there were no Disputes which occurred due to reasons other than
Industrial Disputes.
Table VIII
Number of Mandays Lost on Account of Work-stoppages during
January, 2014 and 2015
Number of Mandays Lost on Account of
Month Industrial Disputes Reasons Other Than Industrial Disputes
2014 (P) 2015 (P) 2014 (P) 2015(P)
1 2 3 4 5
January 155590 22938 154035 ..
(P) = Provisional and based on the returns /clarifications received in the Bureau till 2nd
March,
2015.
.. = Not available.
N.B:- Figures for 2015 are not comparable with those for 2014 due to non-receipt of data from
various States / Union Territories.
Indian Labour Journal, April 2015
363
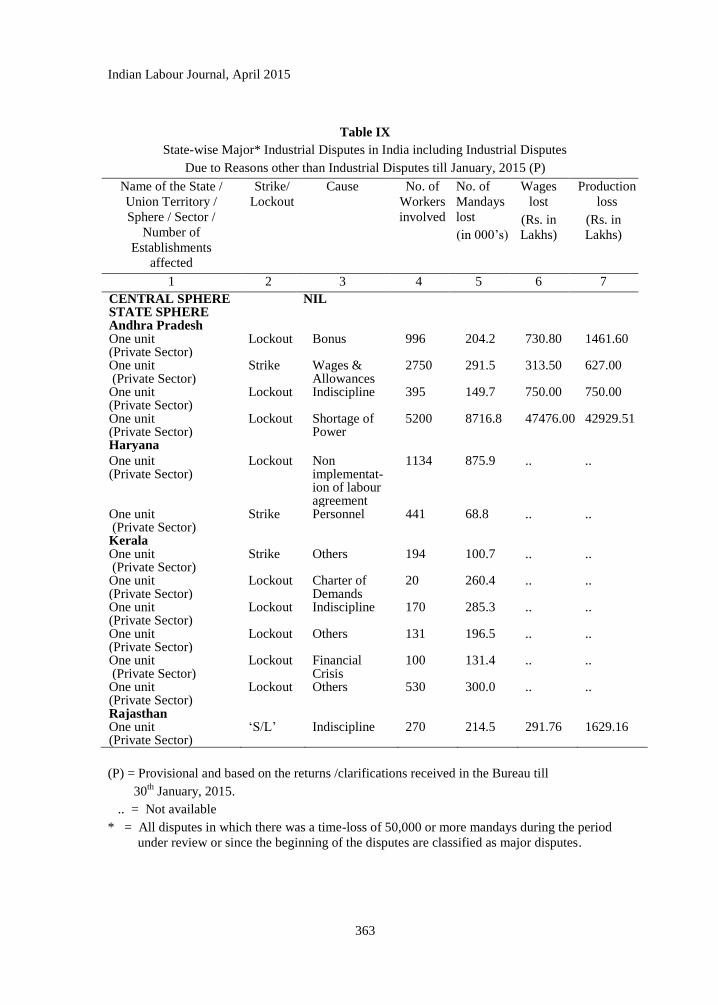
Table IX
State-wise Major* Industrial Disputes in India including Industrial Disputes
Due to Reasons other than Industrial Disputes till January, 2015 (P)
Name of the State /
Union Territory /
Sphere / Sector /
Number of
Establishments
affected
Strike/
Lockout
Cause No. of
Workers
involved
No. of
Mandays
lost
(in 000‘s)
Wages
lost
(Rs. in
Lakhs)
Production
loss
(Rs. in
Lakhs)
1 2 3 4 5 6 7
CENTRAL SPHERE NIL STATE SPHERE Andhra Pradesh One unit (Private Sector)
Lockout Bonus 996 204.2 730.80 1461.60
One unit (Private Sector)
Strike Wages & Allowances
2750 291.5 313.50 627.00
One unit (Private Sector)
Lockout Indiscipline 395 149.7 750.00 750.00
One unit (Private Sector)
Lockout Shortage of Power
5200 8716.8 47476.00 42929.51
Haryana
One unit (Private Sector)
Lockout Non implementat-ion of labour agreement
1134 875.9 .. ..
One unit (Private Sector)
Strike Personnel 441 68.8 .. ..
Kerala One unit (Private Sector)
Strike Others 194 100.7 .. ..
One unit (Private Sector)
Lockout Charter of Demands
20 260.4 .. ..
One unit (Private Sector)
Lockout Indiscipline 170 285.3 .. ..
One unit (Private Sector)
Lockout Others 131 196.5 .. ..
One unit (Private Sector)
Lockout Financial Crisis
100 131.4 .. ..
One unit (Private Sector)
Lockout Others 530 300.0 .. ..
Rajasthan One unit (Private Sector)
‗S/L‘ Indiscipline 270 214.5 291.76 1629.16
(P) = Provisional and based on the returns /clarifications received in the Bureau till
30th
January, 2015.
.. = Not available
* = All disputes in which there was a time-loss of 50,000 or more mandays during the period
under review or since the beginning of the disputes are classified as major disputes.
Indian Labour Journal, April 2015
364
NEWS IN BRIEF
(a) INDIAN LABOUR The news items reported below have been gleaned from various official and unofficial
sources. Hence, the Labour Bureau is not in a position to vouchsafe the authenticity of the unofficial news items.
Amend Act to Aid Unorganised Workers - The labour ministry has suggested an amendment to the Unorganised Workers' Social Security Act to remove a limitation that prohibits extending social security benefits to unorganised workers in the organised or formal sector. The ministry has proposed doing away with a provision in the Act that prevents unorganised workers covered under the Industrial Disputes Act of 1947 from availing key benefits such as insurance, provident fund, gratuity and pension. According to industry estimates, out of the 397.4 million Indian workforce, 49.7 million are employed in the formal sector, while 347.7 million are in the informal sector. Of the nearly 50 million employed in the formal sector, 28.8 million are temporary workers, who are often deprived of these benefits. "The amendment to the Unorganised Workers' Social Security Act, 2008, mooted by labour ministry, was discussed at the meeting with state labour secretaries on January 13 for states to take a view on this, so that the proposed changes could be firmed up over the next few months," a senior government official, who was part of this meeting, said. The other proposed changes include inclusion of Union Territories (UTs) in the mandate of the Act. In its present form, the Act extends to the whole of India but has no specific mention of UTs, as a result of which, unorganised workers in the UTs are left out of the purview of the Act. There are 10 social security benefits available under the Unorganised Workers' Social Security Act, which include the Indira Gandhi National Old Age Pension Scheme, the Aam Admi Bima Yojana, the Rashtriya Swasthya Bima Yojana and the Janani Suraksha Yojana.
(The Economic Times, 03.02.2015) Government to bring Bill for Social Security to Unorganised Workers - Government has assured labour unions that it will bring a Bill aimed at providing social security benefits like health services, insurance, pension and banking for workers in the unorganised sector. "He (Labour Minister Bandaru Dattatreya) promised that Bill for Social Security for Unorganised Sector workers will be brought in," said a press release. The minister made this promise during a tripartite meeting between employer representatives, government and unions on proposed amendments to Employees' Provident Funds and Miscellaneous Provisions Act 1952. He also announced that smart cards will be provided to unorganised sector workers and one house will be provided to every family of the contributing member. He also stressed the need to reduce the threshold limit to 10 employees from existing 20 employees for coverage under the EPF & MP Act, 1952. At present, all those firms employing 20 or more are covered under the social security legislation. It is estimated that the proposed amendment to reduce the threshold limit to 10 will bring in 50 lakh more workers under the social security net of the Employees' Provident Fund Organisation (EPFO). The EPFO has a subscriber base of over five crore. It is managing a corpus of Rs 6.5 lakh crore and receives incremental deposits of around Rs 70,000 crore every year.
(The Economic Times, 12.02.2015) NHRC asks DOT to Probe Delay in a Retired Employee's Payment - Taking a "serious view" over delay in payment of retirement dues to a BSNL employee, the National Human Rights Commission (NHRC) directed the department of telecommunication (DoT) to thoroughly enquire the case and fix responsibility of the officials concerned. "The Commission, taking a serious view of the delay in disbursement of retirement benefits, including pension and gratuity to a retired BSNL employee, has asked the DoT secretary to get this matter thoroughly enquired and fix the responsibility of delinquent officers," a NHRC release said. The wife of the retired official, who belongs to a Scheduled Tribe, in her complaint to the NHRC informed that her husband worked with BSNL for nearly 40 years and had retired March 31, 2014 but his
Indian Labour Journal, April 2015
365
terminal benefits were withheld by the chief general manager, BSNL Jaipur. In her complaint, the woman said that she and her husband were facing financial constraints because of their bad health, so they approached NHRC for their intervention in the matter.
(Business Standard, 17.02.2015) We Need 10 Lakh Skilled Workers in Aviation - A million fresh skilled workforce will be needed in the aviation sector over the next decade, according to Rajiv Pratap Rudy, Union minister for skill development and entrepreneurship. Rudy, addressing the media at Aero India 2015 in Bengaluru said that there is great urgency in addressing the skill gaps in every sector, including the aviation and the aerospace sectors. Speaking specifically about the aviation sector, Rudy said that nearly 80% of the skilled jobs that will be needed over the next 10 years will be in the operations and MRO segments. The balance would be in research and development, manufacturing and maintenance. ―We are on an average talking about 100,000 skill-based jobs a year in the aviation/aero space sector over the next 10 years,‖ he said. The minister said that the Skill Policy 2015 over which consultations are underway among various stakeholders should be ready over the next two months.
(The Financial Express, 20.02.2015) EPFO Plans Medical Schemes for 46L Pensioners - Retirement fund body EPFO is planning to provide medical benefits under its pension scheme through the Employees' State Insurance Corporation, a move which would immediately benefit around 46 lakh pensioners. The Employees' Provident Fund Organisation's (EPFO) Pension & EDLI Implementation Committee (PEIC) has recently concluded in its meeting held on January 30 that the pensioners should be extended the facility of medical benefits. "..medical benefit as an extra benefit should be recommended to Labour Ministry," the committee concluded as per the minutes of the committee's meeting held last month. It was suggested that the surplus in Employees' Deposit Linked Insurance scheme could be used for extending medical benefits through ESIC. It was also pointed out in the meeting that retired government employees are provided medical benefits under the Central Government Health Services and even unorganised workers are covered under the Rashtriya Swasthya Bima Yojana (RSBY) but there is no such facility for EPFO pensioners. A senior official said, "If EPFO chooses the ESIC for extending health benefits to its pensioners then they would be able to use the OPD (out patient department) facility of ESIC hospitals and dispensaries as well as other health benefits provided by it to insured persons."
(The Economic Times, 23.02.2015) Telangana Plans 1 Million ICT Jobs in 3 Years - In tune with its vision to make the state a preferred destination for investors, the Telangana government plans to achieve an export target of about Rs 1 lakh crore from the current Rs 60,000 crore in the next three years as well as create 1 million job opportunities in the information and communications technology (ICT) and electronics sector. At present, the ICT sector employs over 3.25 lakh IT professionals, while the electronics sector has already surpassed exports worth $1 billion. KT Rama Rao, minister for panchayat raj and information technology, Telangana, said the government was giving due importance to the IT sector to drive employment generation in the state. Consequently, the state government would continue to create a business-friendly ecosystem. ―Hyderabad has rightly emerged as a contender to become the ICT capital of India. With a large pool of talented IT professionals and as the base for leading MNCs, Hyderabad has the reputation of being the destination of choice for businesses across industries,‖ the minister said.
(The Financial Express, 26.02.2015)
Tata Motors Announces VRS for 16K Workers Across India - India‘s largest automaker Tata Motors announced a voluntary retirement scheme for an estimated 16,000 workers across its factories that produce both passenger and commercial vehicles, in a bid to trim its workforce and increase efficiency in operations. The domestic division of the firm has been straddling with losses that stood at Rs.3,575 crore for the period between April-December 2014. The VRS, which is the first such offer in well over a decade, is applicable only to shop floor workers
Indian Labour Journal, April 2015
366
above 40 years of age. An estimated 2,000 employees, or a little over 12% of the workforce, is expected to avail of the offer. ―In continuation of its steps to respond to an increasingly competitive business environment and macro-economic pressures that have resulted in depressed growth of the commercial vehicle and passenger car businesses in India, Tata Motors has announced new initiatives designed to enhance competitiveness,‖ the company said in a statement. A company spokesperson added that instead of offering a lump sum amount, workers who opt for the offer will get a monthly payout till the age of 60. ―This will ensure an assured monthly income as opposed to just a one-time payment of a single amount,‖ the spokesperson said. ―Further, there is also a provision for medical insurance cover for a period of 10 years post separation.‖
(Hindustan Times, 28.02.2015) Economic Survey Moots Three-Point Action Plan to Realise ‘Make in India’ Dream - The Economic Survey of 2014-15 has suggested three initiatives in the decreasing order of effectiveness and the increasing order of controversy to realise the ‗Make in India‘ dream. The non-controversial response lies in improving the business environment by making regulations and taxes less onerous, building infrastructure, reforming labour laws, and enabling connectivity. ―All these will reduce the cost of doing business, increase profitability, and, hence, encourage the private sector, both domestic and foreign, to increase investments,‖ the Survey said. The next response could be in the form of ‗industrial policy‘. This could focus on promoting manufacturing by providing subsidies, lowering the cost of capital, and creating special economic zones (SEZs) for manufacturing activity. And then, it suggested a ‗protectionist‘ response. Essentially, this would focus on the tradability of manufacturing intended to shield domestic manufacturing from foreign competition via tariffs, local content requirements, and export-related incentives. ―The effectiveness of these actions is open to debate given past experience. Moreover, they could run up against India‘s external obligations under the WTO and other free trade agreements, and also undermine India‘s openness credentials,‖ the Survey said
(The Hindu, 28.02.2015)
Industries/Services Declared/Granted Extension as Public Utility Services under the
Industrial Disputes Act, 1947– As per the information received in the Bureau, the following
Industries/Services have been declared Public Utility Services for a period of six months with
effect from the date mentioned against them.
Sl. No.
Authority Making Declaration
Industry/Service Date of Declaration/ Extension
1 Central Government I. Services in the Copper Mining Industry 26.02.2015
II. Services in ‗Industrial Establishments manufacturing or producing Nuclear Fuel and Components, Heavy Water and Allied Chemicals and Atomic Energy‘
14.03.2015
III. Services in ‗Any Oil Field‘ 16.03.2015
Indian Labour Journal, April 2015
367
Consumer Price Index Numbers for Industrial Workers (CPI-IW) on base 2001=100 and Agricultural and Rural Labourers on base 1986-87=100 for the month February, 2015
Consumer Price Index Numbers for Industrial Workers - The All-India CPI-IW for February, 2015 decreased by 1 point and pegged at 253 (two hundred and fifty three). On 1-month percentage change, it decreased by (-) 0.39 per cent between January, 2015 and February, 2015 when compared with the increase of (+) 0.42 per cent between the same two months a year ago.The maximum downward pressure to the change in current index came from Food group contributing (-) 0.66 percentage points to the total change. At item level, Rice, Eggs (Hen), Fish Fresh, Onion, Vegetable items, Sugar, Petrol, Flower/Flower Garlands, etc. are responsible for the decrease in index. However, this decrease was neutralised by Wheat, Wheat Atta, Arhar Dal, Groundnut Oil, Goat Meat, Tea (Readymade), etc., putting upward pressure on the index.The year-on-year inflation measured by monthly CPI-IW stood at 6.30 per cent for February, 2015 as compared to 7.17 per cent for the previous month and 6.73 per cent during the corresponding month of the previous year. Similarly, the Food inflation stood at 7.42 per cent against 7.81 per cent of the previous month and 7.56 per cent during the corresponding month of the previous year. At centre level, Tiruchirapally recorded the highest decline of 7 points followed by Guntur (4 points), Mysore, Chhindwara, Siliguri and Puducherry (3 Points each). Among others, 2 points decrease was observed in 15 centres and 1 point in 18 centres. On the contrary, Belgaum and Kodarma centres reported a highest increase of 3 points each followed by Kanpur, Bokaro and Doom-Dooma Tinsukia (2 points each). Among others 1 point increase was observed in 13 centres. Rest of the 21 centres‘ indices remained stationary.The indices of 37 centres are above All India Index and other 40 centres‘ indices are below national average. The index of Vishakhapathnam centre remained at par with all-India index.
(Labour Bureau) Consumer Price Index Numbers for Agricultural Labourers and Rural Labourers - The All-India Consumer Price Index Numbers for Agricultural Labourers and Rural Labourers (Base: 1986-87=100) for February, 2015 decreased by 1 and 2 points to stand at 803 (Eight hundred and three) points and 806 (Eight hundred and six) points respectively. The fall/rise in index varied from State to State. In case of Agricultural Labourers, it recorded a decrease between 1 to 15 points in 11 states and an increase between 2 to 5 points in 6 states while it remained stationary in 3 states. Haryana with 899 points topped the index table whereas Himachal Pradesh with the index level of 658 points stood at the bottom. In case of Rural Labourers, it recorded a decrease between 1 to 16 points in 11 States and an increase between 1 to 5 points in 7 States while it remained stationary in 2 States. Haryana with 894 points topped the index table whereas Himachal Pradesh with the index level of 688 points stood at the bottom. The Consumer Price Index Numbers for Agricultural Labourers and Rural Labourers in respect of Assam State registered the maximum decrease of 15 and 16 points respectively due to decrease in the prices of rice, onion, chillies green, vegetables & fruits and firewood. Whereas the Index Numbers for Agricultural Labourers in respect of Karnataka and Uttar Pradesh States registered the maximum increase of 5 points and for Rural Labourers, Uttar Pradesh State registered the maximum increase of 5 points mainly due to increase in the prices of wheat, wheat-atta, jowar, ragi, pulses, onion, chillies green, chillies dry, fish fresh, pan leaf, shirting cloth and anacin. Point to point rate of inflation based on the CPI-AL and CPI-RL decreased from 6.21% and 6.46% in January, 2015 to 6.08% and 6.19% in February, 2015. Inflation based on food index of CPI-AL and CPI-RL is 5.32% and 5.58% respectively during February, 2015.
(Labour Bureau)
Indian Labour Journal, April 2015
368
(b) FOREIGN LABOUR
India's Social Security Pact with Norway comes into Force - Now the employees posted by
Indian establishments in Norway on a predetermined duration of up to 60 months are not
required to contribute towards social security schemes there. Similarly, the Norwegian
employees posted in India would enjoy the same benefit after producing a certificate of
coverage certifying that they are contributing towards social security schemes such as PF and
pension in their country. "In pursuance of the social security agreement (SSA) signed with
Norway, Government of India has notified it...(it) has come into force with effect from January
1, 2015," the Employees Provident Fund Organisation's office order said. As per the order, the
SSA provides for detachment, totalisation and portability. Under the detachment clause, the
employees of one country deputed by their employers to other country for short-term
assignments are exempted from social security contributions up to a period of 60 months. The
clause would enable Indian as well as Norwegian employees to avoid double social security
contribution and enhance competitiveness of their products and services. As per the government
notification, EPFO has been identified as the agency to implement this SSA in India. It has also
been authorised to issue certificate of coverage to employees of Indian establishment posted to
Norway. At present, social security agreements are operational with 12 countries - Belgium,
Germany, Switzerland, Denmark, Luxembourg, France, South Korea, the Netherlands, North
Korea, the Czech Republic, Finland and Hungary.
(The Economic Times, 04.02.2015)
U.S. Gains 257,000 Jobs - U.S. employers hired at a stellar pace last month, wages rose by the
most in six years, and Americans responded by streaming into the job market to find work. The
Labor Department said that the economy gained a seasonally adjusted 257,000 jobs in January,
and added far more in previous months than originally estimated. Businesses added 414,000
jobs in November, the government now says, the most in 17 years. Total job gains in December
were also revised higher, to 329,000, up from 252,000. Average hourly wages, meanwhile,
jumped 12 cents to $24.75, the biggest gain since September, 2008. In the past year, hourly pay
has increased 2.2 per cent. The unemployment rate rose to 5.7 per cent from 5.6 per cent. But
that‘s not necessarily a bad thing. More Americans began looking for jobs, though not all found
work. Their job hunting suggests they are more confident about their prospects.
(The Hindu, 07.02.2015)
Japan Emerges from Recession, Growth Subdued - Japan's economy rebounded from
recession in the final quarter of last year but growth was weaker than expected as household and
corporate spending disappointed, underlining the challenge premier Shinzo Abe faces in shaking
off decades of stagnation. The annualised 2.2 per cent expansion in October-December was
smaller than a 3.7 per cent increase forecast in a Reuters poll, suggesting a fragile recovery as
the hangover from last year's sales tax hike lingered. The preliminary reading for gross domestic
product (GDP), which translates into a quarter-on-quarter increase of 0.6 per cent, follows two
straight quarters of contraction, data by the Cabinet Office showed. Economic Minister Akira
Amari told reporters after the data's release that the economy was on track for a recovery with
signs consumer sentiment is picking up.
(The Economic Times, 17.02.2015)
Indian Workers Win $14M in US Labour Trafficking Case - A New Orleans jury awarded
$14 million to five Indian men who were lured to the United States and forced to work under
inhumane conditions after Hurricane Katrina by a U.S. ship repair firm and its co-defendants.
After a four-week trial, the U.S. District Court jury ruled that Alabama-based Signal
Indian Labour Journal, April 2015
369
International was guilty of labour trafficking, fraud, racketeering and discrimination and ordered
it to pay $12 million. Its co-defendants, a New Orleans lawyer and an India-based recruiter,
were also found guilty and ordered to pay an additional $915,000 each. The trial was the first in
more than a dozen related lawsuits with over 200 plaintiffs that together comprise one of the
largest labour trafficking cases in U.S. history. Signal recruited about 500 Indian men as guest
workers to repair oil rigs and facilities damaged by Hurricane Katrina in 2005, according to
plaintiffs. "The workers each paid the labour recruiters and a lawyer between $10,000 and
$20,000 or more in recruitment fees and other costs after recruiters promised good jobs, green
cards and permanent U.S. residency for them and their families," according to the American
Civil Liberties Union in a statement.
(The Financial Express, 20.02.2015)
Work Permits for Spouses of H-1B Visa Holders - The U.S. government has confirmed that
effective May 26, 2015, some holders of the H-4 visa, who are spouses of high-skilled workers
on the H-1B visa, will be eligible for work authorisation, a potential boon for approximately
179,600 individuals in the first year alone. The move has particular relevance to India, as 76 per
cent of the 96,753 people who received an H-4 in 2013 were from South Asia, many from India,
a natural consequence of the fact that a large proportion of H-1B visas are also given to Indians.
Underscoring that an estimated 55,000 H-4 spouses will be eligible to apply in subsequent
years, South Asian Americans Leading Together, a key community organisation here said that it
welcomed the move, but that it was only the ―first step,‖ as it limited work eligibility for H-4
visa holders to only those whose spouses were in line for a green card. Spelling out the details
this week, the U.S. Citizenship and Immigration Services (USCIS) Department said that
finalising the H-4 employment eligibility was ―an important element of the immigration
executive actions President Obama announced in November 2014,‖ and the move aimed to
―modernise, improve and clarify visa programs to grow the U.S. economy and create jobs.‖ The
Department of Homeland Security (DHS) added that it expected this change would ―reduce the
economic burden and stress on H-1B non-immigrants and their families during the transition
from non-immigrant to lawful permanent resident status.
(The Hindu, 25.02.2015)
Britain Misses Targets on Immigration Control - The British government has missed its
targets on immigration control, which was a key pledge by Prime Minister David Cameron. He
had promised in 2011 to cap immigration at 100,000 by the end of the current Parliament. The
figure for net migration (inflows minus outflows) stood at 298,000 for the year 2014 till
September, according to figures released by the Office of National Statistics. According to
opinion polls, immigration has emerged as a key issue for voters — ahead of the National
Health Service, the economy, unemployment and crime — in the run-up to a closely-fought
general elections this May. However, while immigration into the United Kingdom has
substantially risen, there is no evidence to suggest that this has had a negative impact on jobs,
wages, housing and other public services for the U.K.-born. This are the findings of a study
done on the latest U.K. immigration statistics by the Centre for Economic Performance (CEP)of
the London School of Economics, and the first in a series of background briefings by the CEP
on important policy issues in the run up to the general elections. The report ‗Immigration and
the U.K. Labour Market‘ by author Professor Jonathan Wadsworth finds that rising immigration
in the last 20 years means that there are now around 7.8 million individuals – and 6.5 million
adults of working age – living in the U.K. who were born abroad. ―This is a large, but not
unprecedented, rise in the U.K. population,‖ he states.
(The Hindu, 27.02.2015)
Indian Labour Journal, April 2015
370
LABOUR DECISION
Pension and Gratuity is not a Bounty but Valuable Rights and Property of the Employee - In this case, the appellant, who was in charge of transformers, retired from service on
superannuation from the Uttar Haryana Bijli Vitran Nigam Ltd. On his retirement, the retiral
benefits of the appellant were withheld by the respondents on the alleged ground that some
amount was due to the employer. As the disciplinary proceedings were not pending against the
appellant on the date of his retirement, the appellant approached the High Court seeking for
issuance of a direction to the respondents regarding payment of pension and release of the
gratuity amount with an interest at the rate of 18% on the delayed payments. The learned single
Judge has allowed the Writ Petition, after setting aside the action of the respondents in
withholding the amount of gratuity and directing the respondents to release the withheld amount
of gratuity within three months without awarding interest as claimed by the appellant. The High
Court has adverted to the judgments of the apex Court particularly, in the case of State of Kerala
& Ors. Vs. M. Padmanabhan Nair, wherein the apex Court reiterated its earlier view holding
that the pension and gratuity are no longer any bounty to be distributed by the Government to its
employees on their retirement, but, have become, under the decisions of the apex Court,
valuable rights and property in their hands and any culpable delay in settlement and
disbursement thereof must be dealt with the penalty of payment of interest at the current market
rate till actual payment to the employees. This aspect of the matter was adverted to in the
judgment of the learned single Judge without assigning any reason for not awarding the interest
as claimed by the appellant. That is why that portion of the judgment of the learned single Judge
was aggrieved of by the appellant and he had filed L.P.A. before Division Bench of the High
Court. However, the Division Bench did not find fault with the judgment of the learned single
Judge in the appeal and the Letters Patent Appeal was dismissed. Hence, the present appeal.
After hearing the Counsel on behalf of the parties, the apex Court observed that in the present
case the apex Court had to exercise its appellate jurisdiction as there is a miscarriage of justice
in denying the interest to be paid or payable by the employer from the date of the entitlement of
the employee till the date of payment as per the aforesaid legal principle laid down by the apex
Court in the judgment referred to supra. It is also mentioned that the respondents have
erroneously withheld payment of gratuity amount for which the appellants are entitled in law for
payment of penal amount on the delayed payment of gratuity under the provisions of the
Payment of Gratuity Act, 1972. In view of above, the apex Court directed the respondents to pay
interest at the rate of 9% on the delayed payment of pension and gratuity amount from the date
of entitlement till the date of the actual payment within six weeks from the date of receipt of a
copy of the order, if not paid the same shall carry interest at the rate of 18% per annum from the
date of amount falls due to the employee. With the above directions, this appeal was allowed.
(D.D. Tewari (D) thr. LRs.Vs. Uttar Haryana Bijli Vitran Nigam Ltd. & Ors., All India Services
Law Journal, Volume-117, Part-II, October, 2014, pp.118-120)
Indian Labour Journal, April 2015
371
LABOUR LITERATURE
IMPORTANT ARTICLES OF LABOUR INTEREST PUBLISHED IN THE PERIODICALS AND NEWSPAPERS RECEIVED IN THE LABOUR BUREAU
CHILD LABOUR
V. Mohan Rao Child Labour: A View; Southern Economist, Vol. 53, No.16, December 15, 2014; pp. 7-8.
EMPLOYMENT AND
UNEMPLOYMENT
Yukie Hori Japan‘s ―Lost Generation‖ Today: From a Survey on 30s‘Working Styles in Tokyo; Japan Labor Review, Vol.11, No.4, Autumn 2014; pp 104-117.
K. Vetrivel and G. Ragunath Socio-economic Conditions of MGNREGP Beneficiaries in Tamil Nadu; Southern Economist, Vol. 53, No.16, December 15, 2014; pp. 30-37.
Jayati Ghosh The Curious Case of the Jobs that did not Appear: Structural Change, Employment and Social Patterns in India; The Indian Journal of Labour Economics, Vol. 57, No.1, January-March, 2014; pp. 1-18.
Chandrajit Banerjee Prioritise Investment and Jobs; The Financial Express, dated the 19
th February, 2015; p. 7.
LABOUR LAWS AND REGULATIONS
Eri Kasagi Family Formation and the Social Law; Japan Labor Review, Vol.11, No.4, Autumn 2014; pp 86-103.
Simon Deakin Labour Law and Inclusive Development; The Indian Journal of Labour Economics, Vol. 57, No.1, January-March, 2014; pp. 19-34.
OCCUPATIONAL HEALTH AND SAFETY
Mathew Soeberg, Nico van Zandwijk The Ticking Time-bomb of Asbestos Consumption in the Asian Region; Asian-Pacific Newsletter; Vol. 21, No.2, November, 2014; pp. 24-27.
Fleur E. Champion de Crespigny, Ewan MacFarlane, Paula Laws, Malcolm R. Sim
Mesothelioma in Australia – Monitoring Disease Incidence and Past Asbestos Exposure with the Australian Mesothelioma Registry; ibid. pp. 28-32.
Gurumurthy Ramachandran Occupational Health and Safety in India: The Need for Reform; Economic & Political Weekly, Vol. XLIX, No.47, pp. 26-28.
Indian Labour Journal, April 2015
372
WOMEN EMPLOYEES
Yuko Tanaka The Family in Human Resource Management; Japan Labor Review, Vol.11, No.4, Autumn 2014; pp.67-85.
Prem Chowdhry Masculine Spaces: Rural Male Culture in North India; Economic & Political Weekly, Vol. XLIX, No.47, pp.41-49.
Neetha N Crisis in Female Employment: Analysis Across Social Groups; ibid. pp. 50-59.
Ina GANGULI, Ricardo HAUSMANN and Martina VIARENGO
Closing the Gender Gap in Education: What is the State of Gaps in Labour Force Participation for Women, Wives and Mothers? International Labour Review; Vol. 153/2, June, 2014; pp. 173-207.
Anja Karlsson FRANCK and Jerry OLSSON
Missing Women? The Under-Recording and Under-Reporting of Women‘s Work in Malaysia; ibid. pp. 209-221.
MISCELLANEOUS
Kazuo Sugeno, Keiichi Yamakoshi Dismissals in Japan: Part Two: How Frequently Do Employers Dismiss Employees? Japan Labor Review, Vol.11, No.4, Autumn 2014; pp 118-137.
Jeemol Unni Rural Livelihoods in Transition: Whither Labour? The Indian Journal of Labour Economics, Vol. 57, No.1, January-March, 2014; pp.35-52.
Manuel ABRANTES What about the Numbers? A Quantitative Contribution to the Study of Domestic Services in Europe, International Labour Review; Vol. 153/2, June, 2014; pp. 223-243.
William Pesek Are Emerging Markets Losing their Appeal? The Financial Express, dated 20
th February,
2015; p.6.
Sachin Adhikari Turning India into a Skilled Economy; The Financial Express, dated 23
rd February, 2015; p.
12.
So long as you do not achieve social liberty, whatever freedom is
provided by the law is of no avail to you.
-B.R.Ambedkar
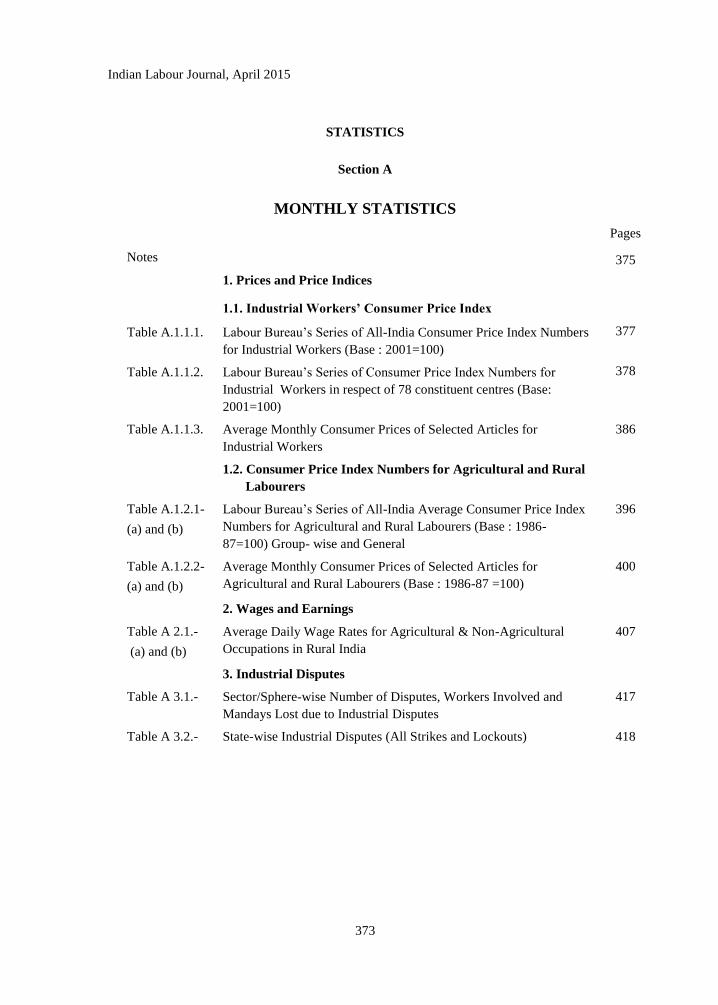
Indian Labour Journal, April 2015
373
STATISTICS
Section A
MONTHLY STATISTICS
Pages
Notes 375
1. Prices and Price Indices
1.1. Industrial Workers’ Consumer Price Index
Table A.1.1.1. Labour Bureau‘s Series of All-India Consumer Price Index Numbers
for Industrial Workers (Base : 2001=100)
377
Table A.1.1.2. Labour Bureau‘s Series of Consumer Price Index Numbers for
Industrial Workers in respect of 78 constituent centres (Base:
2001=100)
378
Table A.1.1.3. Average Monthly Consumer Prices of Selected Articles for
Industrial Workers
386
1.2. Consumer Price Index Numbers for Agricultural and Rural
Labourers
Table A.1.2.1-
(a) and (b)
Labour Bureau‘s Series of All-India Average Consumer Price Index
Numbers for Agricultural and Rural Labourers (Base : 1986-
87=100) Group- wise and General
396
Table A.1.2.2-
(a) and (b)
Average Monthly Consumer Prices of Selected Articles for
Agricultural and Rural Labourers (Base : 1986-87 =100)
400
2. Wages and Earnings
Table A 2.1.-
(a) and (b)
Average Daily Wage Rates for Agricultural & Non-Agricultural
Occupations in Rural India
407
3. Industrial Disputes
Table A 3.1.- Sector/Sphere-wise Number of Disputes, Workers Involved and
Mandays Lost due to Industrial Disputes
417
Table A 3.2.- State-wise Industrial Disputes (All Strikes and Lockouts) 418
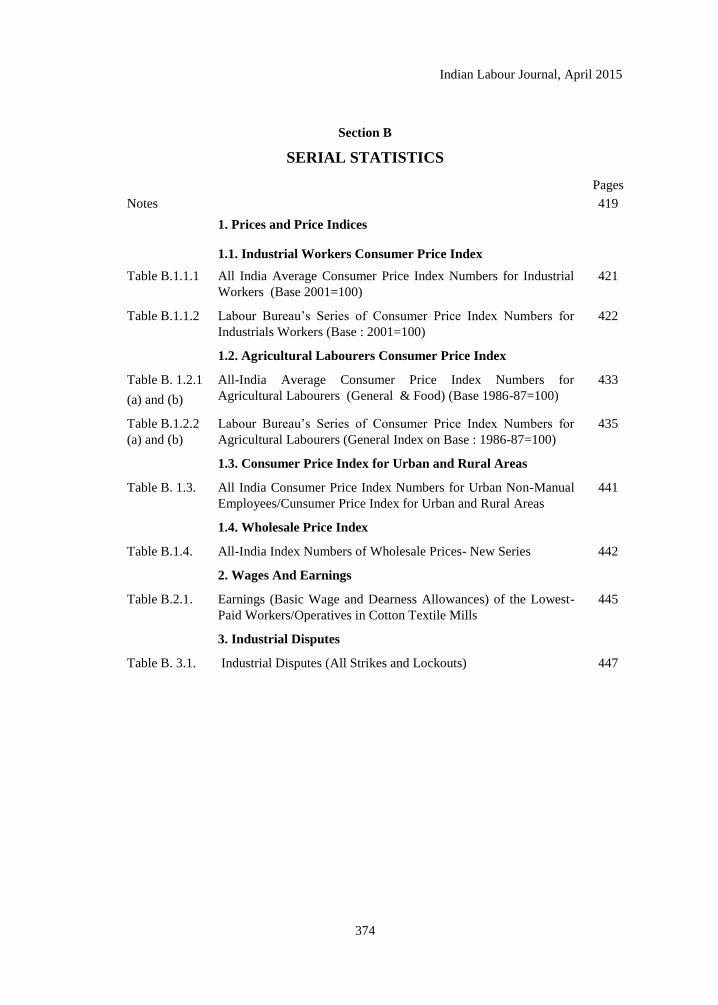
Indian Labour Journal, April 2015
374
Section B
SERIAL STATISTICS
Pages
Notes 419
1. Prices and Price Indices
1.1. Industrial Workers Consumer Price Index
Table B.1.1.1 All India Average Consumer Price Index Numbers for Industrial
Workers (Base 2001=100)
421
Table B.1.1.2 Labour Bureau‘s Series of Consumer Price Index Numbers for
Industrials Workers (Base : 2001=100)
422
1.2. Agricultural Labourers Consumer Price Index
Table B. 1.2.1
(a) and (b)
All-India Average Consumer Price Index Numbers for
Agricultural Labourers (General & Food) (Base 1986-87=100)
433
Table B.1.2.2
(a) and (b)
Labour Bureau‘s Series of Consumer Price Index Numbers for
Agricultural Labourers (General Index on Base : 1986-87=100)
435
1.3. Consumer Price Index for Urban and Rural Areas
Table B. 1.3. All India Consumer Price Index Numbers for Urban Non-Manual
Employees/Cunsumer Price Index for Urban and Rural Areas
441
1.4. Wholesale Price Index
Table B.1.4. All-India Index Numbers of Wholesale Prices- New Series 442
2. Wages And Earnings
Table B.2.1. Earnings (Basic Wage and Dearness Allowances) of the Lowest-
Paid Workers/Operatives in Cotton Textile Mills
445
3. Industrial Disputes
Table B. 3.1. Industrial Disputes (All Strikes and Lockouts) 447
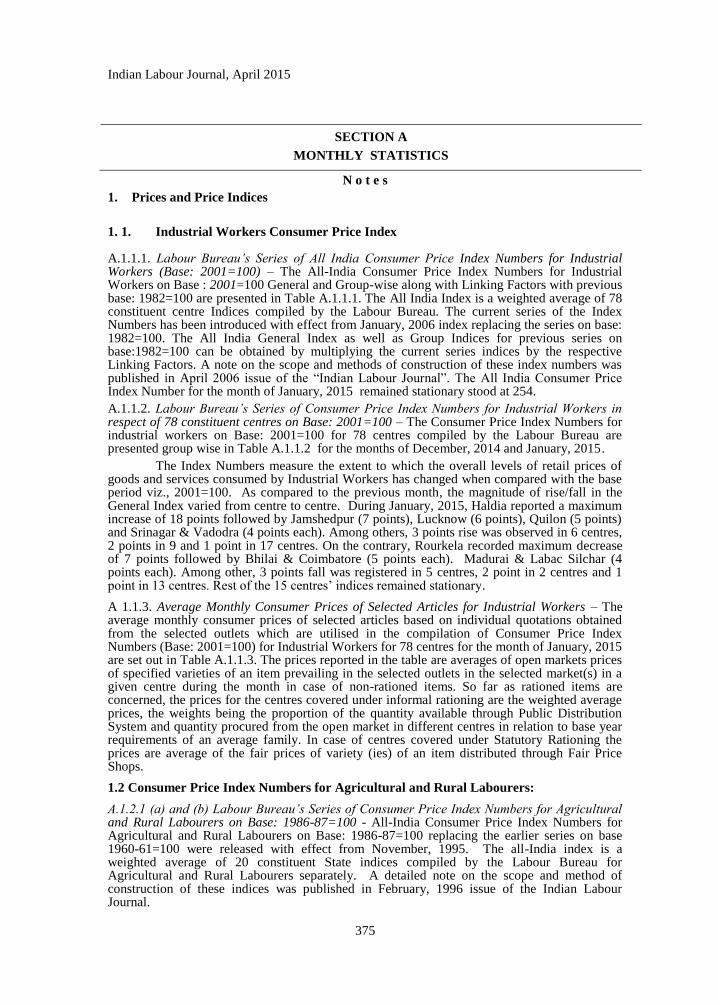
Indian Labour Journal, April 2015
375
SECTION A
MONTHLY STATISTICS
N o t e s
1. Prices and Price Indices
1. 1. Industrial Workers Consumer Price Index A.1.1.1. Labour Bureau’s Series of All India Consumer Price Index Numbers for Industrial Workers (Base: 2001=100) – The All-India Consumer Price Index Numbers for Industrial Workers on Base : 2001=100 General and Group-wise along with Linking Factors with previous base: 1982=100 are presented in Table A.1.1.1. The All India Index is a weighted average of 78 constituent centre Indices compiled by the Labour Bureau. The current series of the Index Numbers has been introduced with effect from January, 2006 index replacing the series on base: 1982=100. The All India General Index as well as Group Indices for previous series on base:1982=100 can be obtained by multiplying the current series indices by the respective Linking Factors. A note on the scope and methods of construction of these index numbers was published in April 2006 issue of the ―Indian Labour Journal‖. The All India Consumer Price Index Number for the month of January, 2015 remained stationary stood at 254.
A.1.1.2. Labour Bureau’s Series of Consumer Price Index Numbers for Industrial Workers in respect of 78 constituent centres on Base: 2001=100 – The Consumer Price Index Numbers for industrial workers on Base: 2001=100 for 78 centres compiled by the Labour Bureau are presented group wise in Table A.1.1.2 for the months of December, 2014 and January, 2015.
The Index Numbers measure the extent to which the overall levels of retail prices of goods and services consumed by Industrial Workers has changed when compared with the base period viz., 2001=100. As compared to the previous month, the magnitude of rise/fall in the General Index varied from centre to centre. During January, 2015, Haldia reported a maximum increase of 18 points followed by Jamshedpur (7 points), Lucknow (6 points), Quilon (5 points) and Srinagar & Vadodra (4 points each). Among others, 3 points rise was observed in 6 centres, 2 points in 9 and 1 point in 17 centres. On the contrary, Rourkela recorded maximum decrease of 7 points followed by Bhilai & Coimbatore (5 points each). Madurai & Labac Silchar (4 points each). Among other, 3 points fall was registered in 5 centres, 2 point in 2 centres and 1 point in 13 centres. Rest of the 15 centres‘ indices remained stationary.
A 1.1.3. Average Monthly Consumer Prices of Selected Articles for Industrial Workers – The average monthly consumer prices of selected articles based on individual quotations obtained from the selected outlets which are utilised in the compilation of Consumer Price Index Numbers (Base: 2001=100) for Industrial Workers for 78 centres for the month of January, 2015 are set out in Table A.1.1.3. The prices reported in the table are averages of open markets prices of specified varieties of an item prevailing in the selected outlets in the selected market(s) in a given centre during the month in case of non-rationed items. So far as rationed items are concerned, the prices for the centres covered under informal rationing are the weighted average prices, the weights being the proportion of the quantity available through Public Distribution System and quantity procured from the open market in different centres in relation to base year requirements of an average family. In case of centres covered under Statutory Rationing the prices are average of the fair prices of variety (ies) of an item distributed through Fair Price Shops.
1.2 Consumer Price Index Numbers for Agricultural and Rural Labourers:
A.1.2.1 (a) and (b) Labour Bureau’s Series of Consumer Price Index Numbers for Agricultural and Rural Labourers on Base: 1986-87=100 - All-India Consumer Price Index Numbers for Agricultural and Rural Labourers on Base: 1986-87=100 replacing the earlier series on base 1960-61=100 were released with effect from November, 1995. The all-India index is a weighted average of 20 constituent State indices compiled by the Labour Bureau for Agricultural and Rural Labourers separately. A detailed note on the scope and method of construction of these indices was published in February, 1996 issue of the Indian Labour Journal.
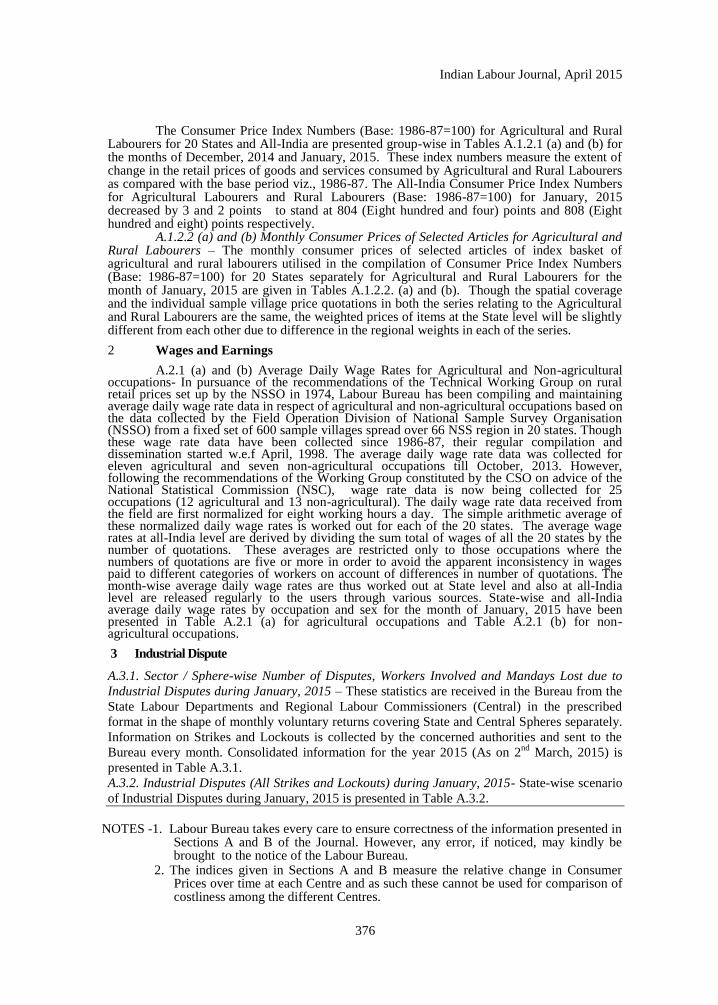
Indian Labour Journal, April 2015
376
The Consumer Price Index Numbers (Base: 1986-87=100) for Agricultural and Rural Labourers for 20 States and All-India are presented group-wise in Tables A.1.2.1 (a) and (b) for the months of December, 2014 and January, 2015. These index numbers measure the extent of change in the retail prices of goods and services consumed by Agricultural and Rural Labourers as compared with the base period viz., 1986-87. The All-India Consumer Price Index Numbers for Agricultural Labourers and Rural Labourers (Base: 1986-87=100) for January, 2015 decreased by 3 and 2 points to stand at 804 (Eight hundred and four) points and 808 (Eight hundred and eight) points respectively.
A.1.2.2 (a) and (b) Monthly Consumer Prices of Selected Articles for Agricultural and Rural Labourers – The monthly consumer prices of selected articles of index basket of agricultural and rural labourers utilised in the compilation of Consumer Price Index Numbers (Base: 1986-87=100) for 20 States separately for Agricultural and Rural Labourers for the month of January, 2015 are given in Tables A.1.2.2. (a) and (b). Though the spatial coverage and the individual sample village price quotations in both the series relating to the Agricultural and Rural Labourers are the same, the weighted prices of items at the State level will be slightly different from each other due to difference in the regional weights in each of the series.
2 Wages and Earnings
A.2.1 (a) and (b) Average Daily Wage Rates for Agricultural and Non-agricultural occupations- In pursuance of the recommendations of the Technical Working Group on rural retail prices set up by the NSSO in 1974, Labour Bureau has been compiling and maintaining average daily wage rate data in respect of agricultural and non-agricultural occupations based on the data collected by the Field Operation Division of National Sample Survey Organisation (NSSO) from a fixed set of 600 sample villages spread over 66 NSS region in 20 states. Though these wage rate data have been collected since 1986-87, their regular compilation and dissemination started w.e.f April, 1998. The average daily wage rate data was collected for eleven agricultural and seven non-agricultural occupations till October, 2013. However, following the recommendations of the Working Group constituted by the CSO on advice of the National Statistical Commission (NSC), wage rate data is now being collected for 25 occupations (12 agricultural and 13 non-agricultural). The daily wage rate data received from the field are first normalized for eight working hours a day. The simple arithmetic average of these normalized daily wage rates is worked out for each of the 20 states. The average wage rates at all-India level are derived by dividing the sum total of wages of all the 20 states by the number of quotations. These averages are restricted only to those occupations where the numbers of quotations are five or more in order to avoid the apparent inconsistency in wages paid to different categories of workers on account of differences in number of quotations. The month-wise average daily wage rates are thus worked out at State level and also at all-India level are released regularly to the users through various sources. State-wise and all-India average daily wage rates by occupation and sex for the month of January, 2015 have been presented in Table A.2.1 (a) for agricultural occupations and Table A.2.1 (b) for non-agricultural occupations.
3 Industrial Dispute
A.3.1. Sector / Sphere-wise Number of Disputes, Workers Involved and Mandays Lost due to
Industrial Disputes during January, 2015 – These statistics are received in the Bureau from the
State Labour Departments and Regional Labour Commissioners (Central) in the prescribed
format in the shape of monthly voluntary returns covering State and Central Spheres separately.
Information on Strikes and Lockouts is collected by the concerned authorities and sent to the
Bureau every month. Consolidated information for the year 2015 (As on 2nd
March, 2015) is
presented in Table A.3.1.
A.3.2. Industrial Disputes (All Strikes and Lockouts) during January, 2015- State-wise scenario
of Industrial Disputes during January, 2015 is presented in Table A.3.2.
NOTES -1. Labour Bureau takes every care to ensure correctness of the information presented in
Sections A and B of the Journal. However, any error, if noticed, may kindly be brought to the notice of the Labour Bureau.
2. The indices given in Sections A and B measure the relative change in Consumer Prices over time at each Centre and as such these cannot be used for comparison of costliness among the different Centres.
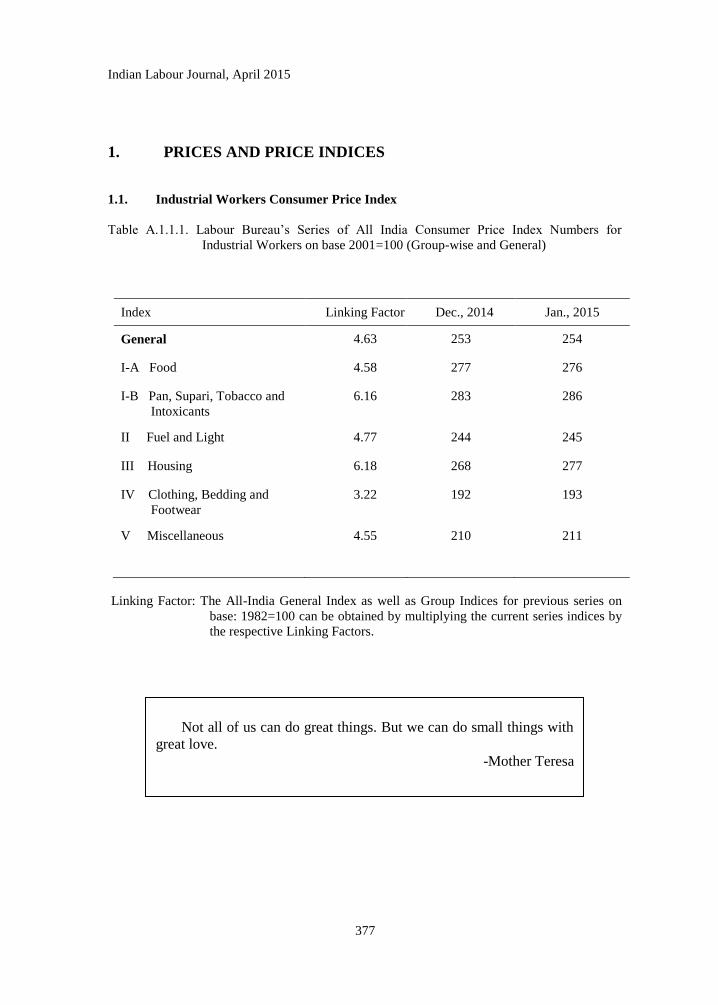
Indian Labour Journal, April 2015
377
1. PRICES AND PRICE INDICES
1.1. Industrial Workers Consumer Price Index
Table A.1.1.1. Labour Bureau‘s Series of All India Consumer Price Index Numbers for
Industrial Workers on base 2001=100 (Group-wise and General)
Index Linking Factor Dec., 2014 Jan., 2015
General 4.63 253 254
I-A Food 4.58 277 276
I-B Pan, Supari, Tobacco and
Intoxicants
6.16 283 286
II Fuel and Light 4.77 244 245
III Housing 6.18 268 277
IV Clothing, Bedding and
Footwear
3.22 192 193
V Miscellaneous 4.55 210 211
Linking Factor: The All-India General Index as well as Group Indices for previous series on
base: 1982=100 can be obtained by multiplying the current series indices by
the respective Linking Factors.
Not all of us can do great things. But we can do small things with
great love.
-Mother Teresa
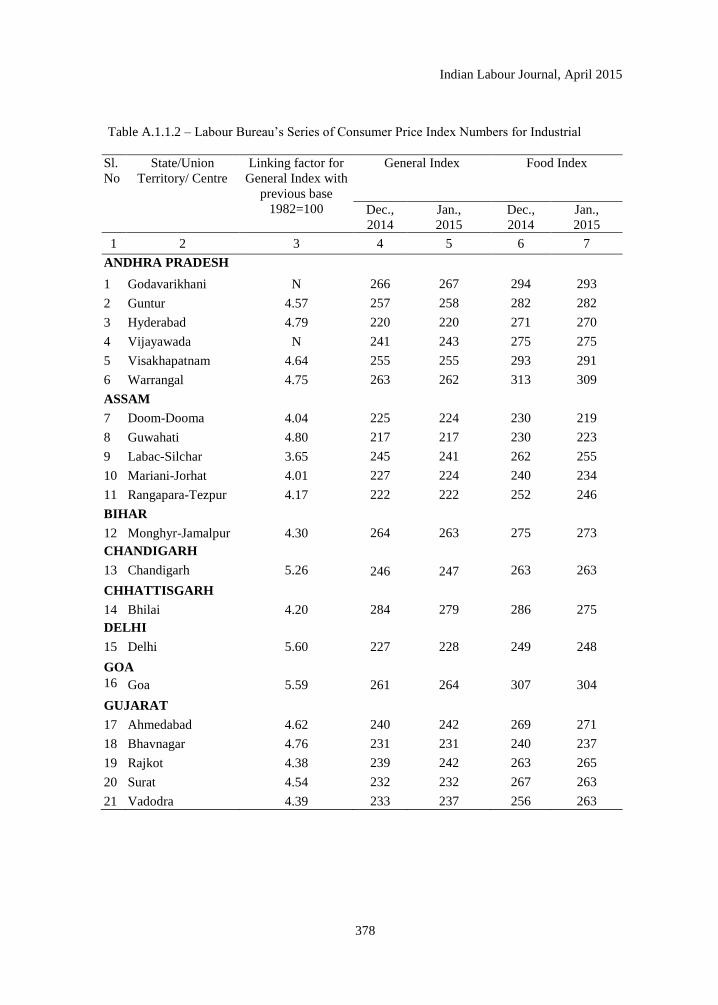
Indian Labour Journal, April 2015
378
Table A.1.1.2 – Labour Bureau‘s Series of Consumer Price Index Numbers for Industrial
Sl.
No
State/Union
Territory/ Centre
Linking factor for
General Index with
previous base
1982=100
General Index Food Index
Dec.,
2014
Jan.,
2015
Dec.,
2014
Jan.,
2015
1 2 3 4 5 6 7
ANDHRA PRADESH
1 Godavarikhani N 266 267 294 293
2 Guntur 4.57 257 258 282 282
3 Hyderabad 4.79 220 220 271 270
4 Vijayawada N 241 243 275 275
5 Visakhapatnam 4.64 255 255 293 291
6 Warrangal 4.75 263 262 313 309
ASSAM
7 Doom-Dooma
Tinsukia
4.04 225 224 230 219
8 Guwahati 4.80 217 217 230 223
9 Labac-Silchar 3.65 245 241 262 255
10 Mariani-Jorhat 4.01 227 224 240 234
11 Rangapara-Tezpur 4.17 222 222 252 246
BIHAR
12 Monghyr-Jamalpur 4.30 264 263 275 273
CHANDIGARH
13 Chandigarh 5.26 246 247 263 263
CHHATTISGARH
14 Bhilai 4.20 284 279 286 275
DELHI
15 Delhi 5.60 227 228 249 248
GOA
16 Goa 5.59 261 264 307 304
GUJARAT
17 Ahmedabad 4.62 240 242 269 271
18 Bhavnagar 4.76 231 231 240 237
19 Rajkot 4.38 239 242 263 265
20 Surat 4.54 232 232 267 263
21 Vadodra 4.39 233 237 256 263
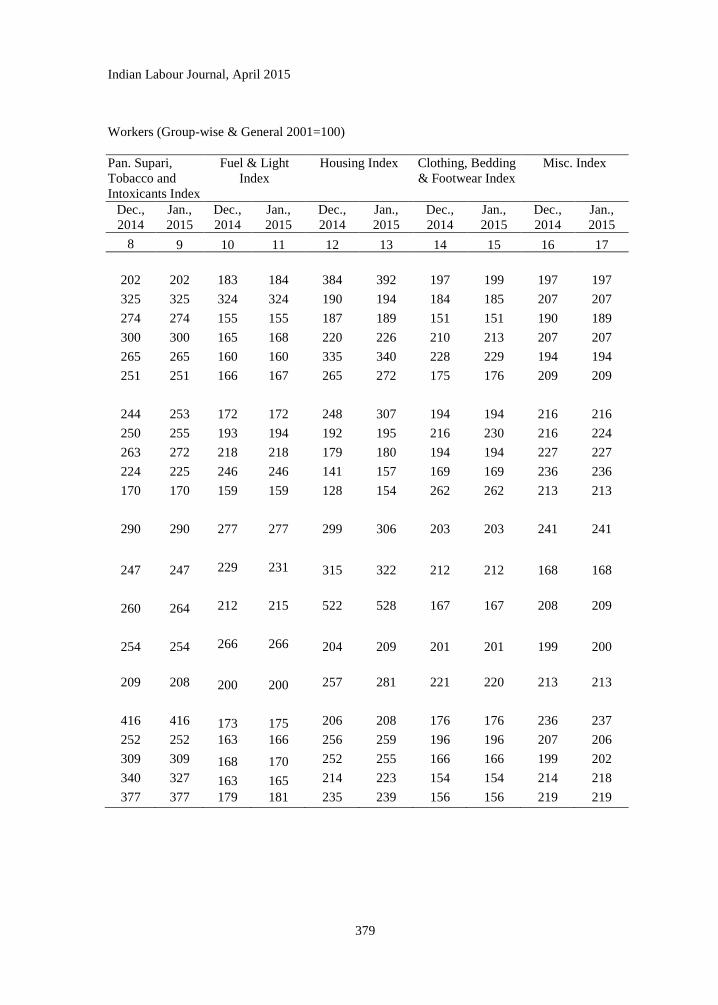
Indian Labour Journal, April 2015
379
Workers (Group-wise & General 2001=100)
Pan. Supari,
Tobacco and
Intoxicants Index
Fuel & Light
Index
Housing Index Clothing, Bedding
& Footwear Index
Misc. Index
Dec.,
2014
Jan.,
2015
Dec.,
2014
Jan.,
2015
Dec.,
2014
Jan.,
2015
Dec.,
2014
Jan.,
2015
Dec.,
2014
Jan.,
2015
8 9 10 11 12 13 14 15 16 17
202 202 183 184 384 392 197 199 197 197
325 325 324 324 190 194 184 185 207 207
274 274 155 155 187 189 151 151 190 189
300 300 165 168 220 226 210 213 207 207
265 265 160 160 335 340 228 229 194 194
251 251 166 167 265 272 175 176 209 209
244 253 172 172 248 307 194 194 216 216
250 255 193 194 192 195 216 230 216 224
263 272 218 218 179 180 194 194 227 227
224 225 246 246 141 157 169 169 236 236
170 170 159 159 128 154 262 262 213 213
290 290 277 277 299 306 203 203 241 241
247 247 229 231 315 322 212 212 168 168
260 264 212 215 522 528 167 167 208 209
254 254 266 266 204 209 201 201 199 200
209 208 200 200 257 281 221 220 213 213
416 416 173 175 206 208 176 176 236 237
252 252 163 166 256 259 196 196 207 206
309 309 168 170 252 255 166 166 199 202
340 327 163 165 214 223 154 154 214 218
377 377 179 181 235 239 156 156 219 219
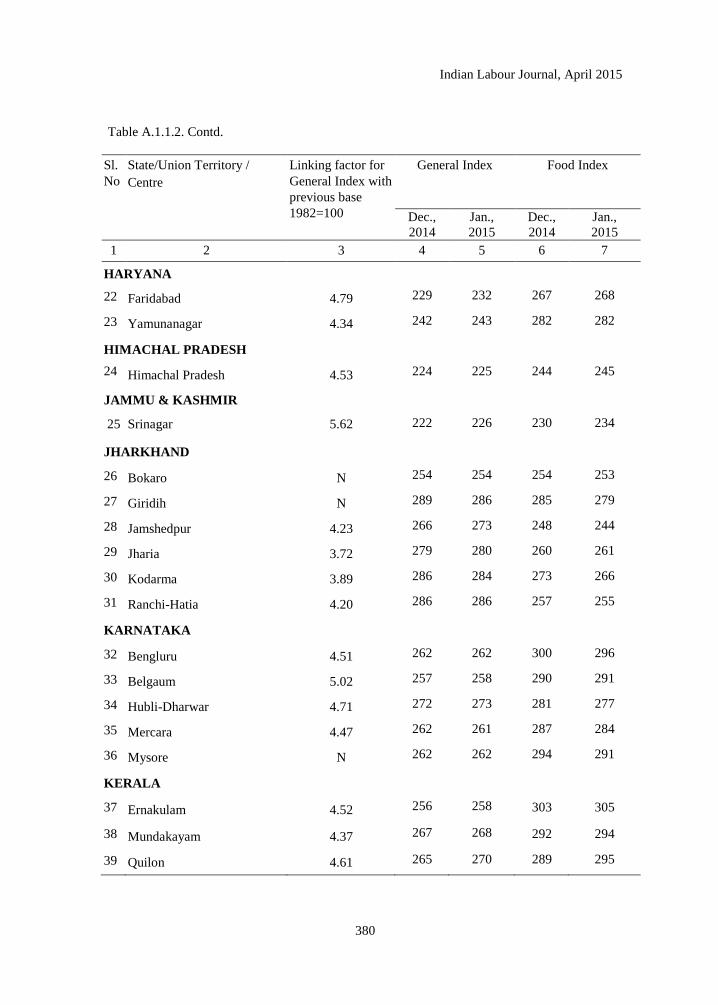
Indian Labour Journal, April 2015
380
Table A.1.1.2. Contd.
Sl.
No
State/Union Territory /
Centre
Linking factor for
General Index with
previous base
1982=100
General Index Food Index
Dec.,
2014
Jan.,
2015
Dec.,
2014
Jan.,
2015
1 2 3 4 5 6 7
HARYANA
22 Faridabad 4.79 229 232 267 268
23 Yamunanagar 4.34 242 243 282 282
HIMACHAL PRADESH
24 Himachal Pradesh 4.53 224 225 244 245
JAMMU & KASHMIR
25 Srinagar 5.62 222 226 230 234
JHARKHAND
26 Bokaro N 254 254 254 253
27 Giridih N 289 286 285 279
28 Jamshedpur 4.23 266 273 248 244
29 Jharia 3.72 279 280 260 261
30 Kodarma 3.89 286 284 273 266
31 Ranchi-Hatia 4.20 286 286 257 255
KARNATAKA
32 Bengluru 4.51 262 262 300 296
33 Belgaum 5.02 257 258 290 291
34 Hubli-Dharwar 4.71 272 273 281 277
35 Mercara 4.47 262 261 287 284
36 Mysore N 262 262 294 291
KERALA
37 Ernakulam 4.52 256 258 303 305
38 Mundakayam 4.37 267 268 292 294
39 Quilon 4.61 265 270 289 295
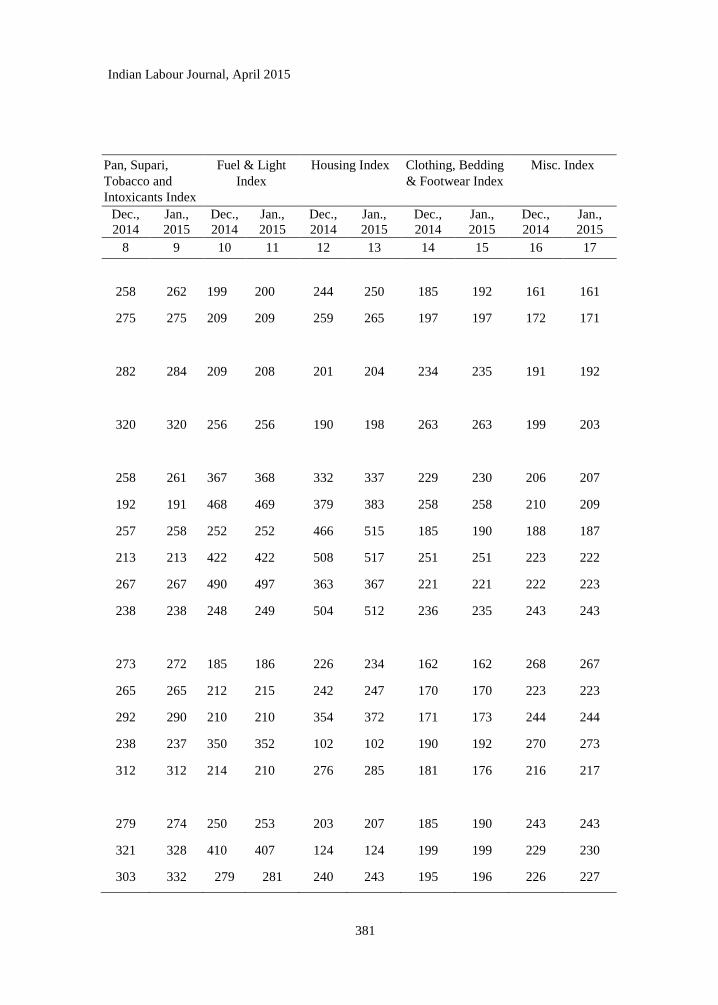
Indian Labour Journal, April 2015
381
Pan, Supari,
Tobacco and
Intoxicants Index
Fuel & Light
Index
Housing Index Clothing, Bedding
& Footwear Index
Misc. Index
Dec.,
2014
Jan.,
2015
Dec.,
2014
Jan.,
2015
Dec.,
2014
Jan.,
2015
Dec.,
2014
Jan.,
2015
Dec.,
2014
Jan.,
2015
8 9 10 11 12 13 14 15 16 17
258 262 199 200 244 250 185 192 161 161
275 275 209 209 259 265 197 197 172 171
282 284 209 208 201 204 234 235 191 192
320 320 256 256 190 198 263 263 199 203
258 261 367 368 332 337 229 230 206 207
192 191 468 469 379 383 258 258 210 209
257 258 252 252 466 515 185 190 188 187
213 213 422 422 508 517 251 251 223 222
267 267 490 497 363 367 221 221 222 223
238 238 248 249 504 512 236 235 243 243
273 272 185 186 226 234 162 162 268 267
265 265 212 215 242 247 170 170 223 223
292 290 210 210 354 372 171 173 244 244
238 237 350 352 102 102 190 192 270 273
312 312 214 210 276 285 181 176 216 217
279 274 250 253 203 207 185 190 243 243
321 328 410 407 124 124 199 199 229 230
303 332 279 281 240 243 195 196 226 227
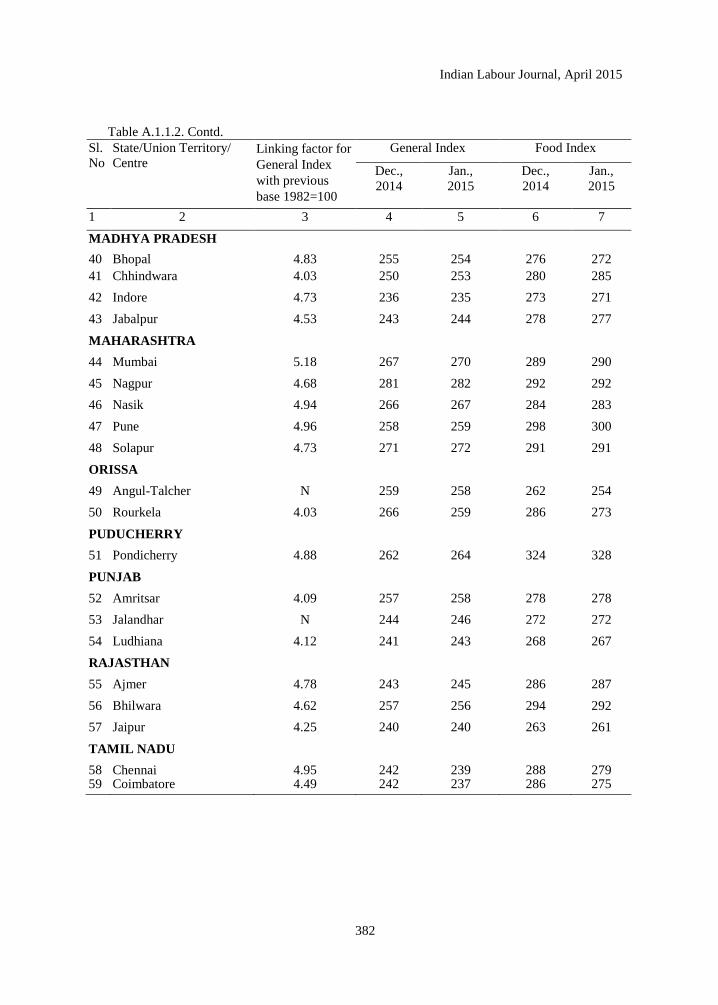
Indian Labour Journal, April 2015
382
Table A.1.1.2. Contd.
Sl.
No
State/Union Territory/
Centre Linking factor for
General Index
with previous
base 1982=100
General Index Food Index
Dec.,
2014
Jan.,
2015
Dec.,
2014
Jan.,
2015
1 2 3 4 5 6 7
MADHYA PRADESH
40 Bhopal 4.83 255 254 276 272
41 Chhindwara 4.03 250 253 280 285
42 Indore 4.73 236 235 273 271
43 Jabalpur 4.53 243 244 278 277
MAHARASHTRA
44 Mumbai 5.18 267 270 289 290
45 Nagpur 4.68 281 282 292 292
46 Nasik 4.94 266 267 284 283
47 Pune 4.96 258 259 298 300
48 Solapur 4.73 271 272 291 291
ORISSA
49 Angul-Talcher N 259 258 262 254
50 Rourkela 4.03 266 259 286 273
PUDUCHERRY
51 Pondicherry 4.88 262 264 324 328
PUNJAB
52 Amritsar 4.09 257 258 278 278
53 Jalandhar N 244 246 272 272
54 Ludhiana 4.12 241 243 268 267
RAJASTHAN
55 Ajmer 4.78 243 245 286 287
56 Bhilwara 4.62 257 256 294 292
57 Jaipur 4.25 240 240 263 261
TAMIL NADU
58 Chennai 4.95 242 239 288 279 59 Coimbatore 4.49 242 237 286 275
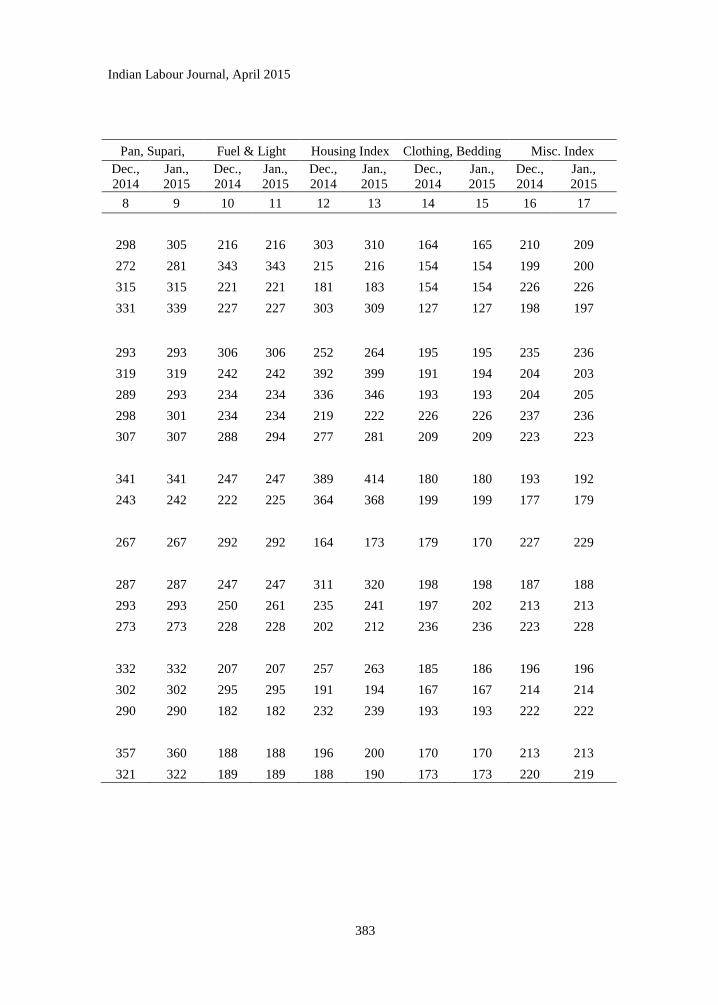
Indian Labour Journal, April 2015
383
Pan, Supari,
Tobacco and
Intoxicants Index
Fuel & Light
Index
Housing Index Clothing, Bedding
& Footwear Index
Misc. Index
Dec.,
2014
Jan.,
2015
Dec.,
2014
Jan.,
2015
Dec.,
2014
Jan.,
2015
Dec.,
2014
Jan.,
2015
Dec.,
2014
Jan.,
2015
8 9 10 11 12 13 14 15 16 17
298 305 216 216 303 310 164 165 210 209
272 281 343 343 215 216 154 154 199 200
315 315 221 221 181 183 154 154 226 226
331 339 227 227 303 309 127 127 198 197
293 293 306 306 252 264 195 195 235 236
319 319 242 242 392 399 191 194 204 203
289 293 234 234 336 346 193 193 204 205
298 301 234 234 219 222 226 226 237 236
307 307 288 294 277 281 209 209 223 223
341 341 247 247 389 414 180 180 193 192
243 242 222 225 364 368 199 199 177 179
267 267 292 292 164 173 179 170 227 229
287 287 247 247 311 320 198 198 187 188
293 293 250 261 235 241 197 202 213 213
273 273 228 228 202 212 236 236 223 228
332 332 207 207 257 263 185 186 196 196
302 302 295 295 191 194 167 167 214 214
290 290 182 182 232 239 193 193 222 222
357 360 188 188 196 200 170 170 213 213
321 322 189 189 188 190 173 173 220 219
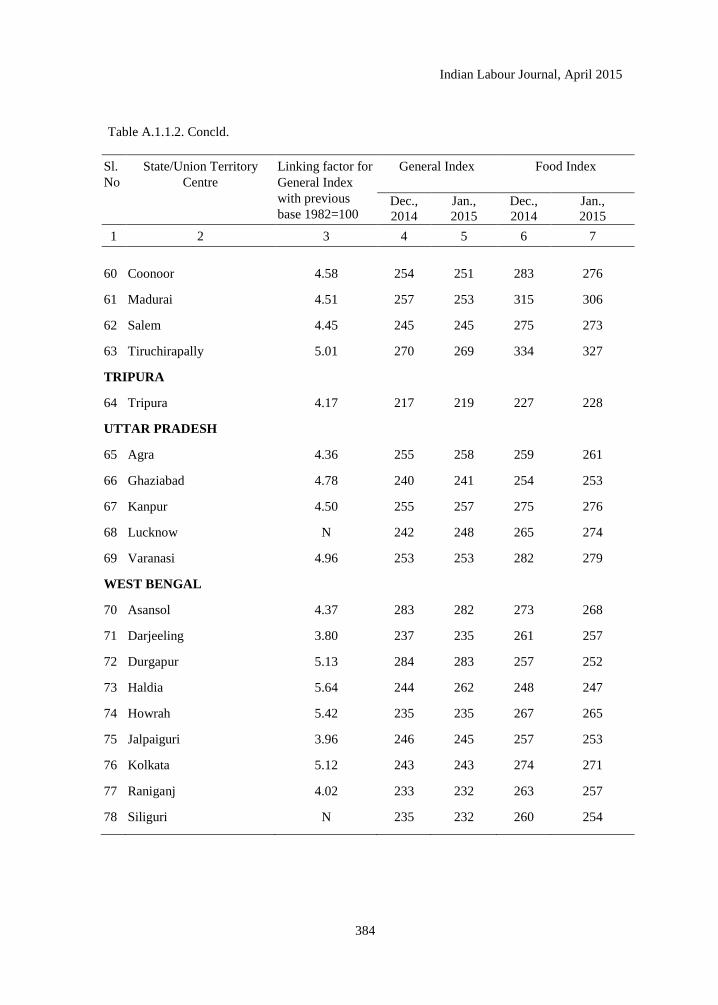
Indian Labour Journal, April 2015
384
Table A.1.1.2. Concld.
Sl.
No
State/Union Territory
Centre
Linking factor for
General Index
with previous
base 1982=100
General Index Food Index
Dec.,
2014
Jan.,
2015
Dec.,
2014
Jan.,
2015
1 2 3 4 5 6 7
60 Coonoor 4.58 254 251 283 276
61 Madurai 4.51 257 253 315 306
62 Salem 4.45 245 245 275 273
63 Tiruchirapally 5.01 270 269 334 327
TRIPURA
64 Tripura 4.17 217 219 227 228
UTTAR PRADESH
65 Agra 4.36 255 258 259 261
66 Ghaziabad 4.78 240 241 254 253
67 Kanpur 4.50 255 257 275 276
68 Lucknow N 242 248 265 274
69 Varanasi 4.96 253 253 282 279
WEST BENGAL
70 Asansol 4.37 283 282 273 268
71 Darjeeling 3.80 237 235 261 257
72 Durgapur 5.13 284 283 257 252
73 Haldia 5.64 244 262 248 247
74 Howrah 5.42 235 235 267 265
75 Jalpaiguri 3.96 246 245 257 253
76 Kolkata 5.12 243 243 274 271
77 Raniganj 4.02 233 232 263 257
78 Siliguri N 235 232 260 254
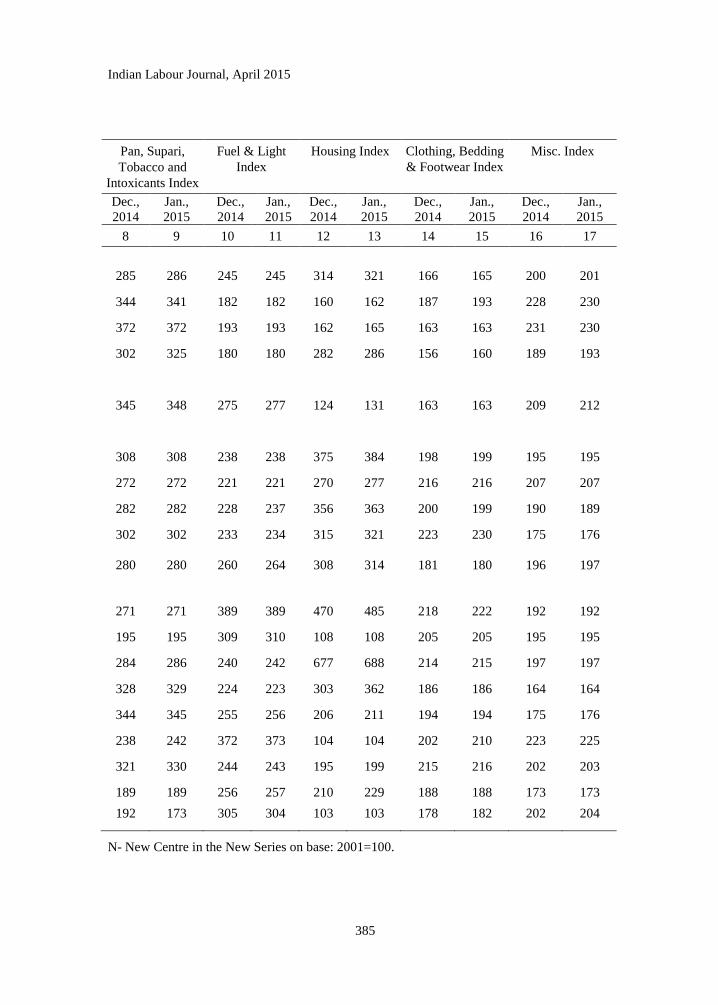
Indian Labour Journal, April 2015
385
Pan, Supari,
Tobacco and
Intoxicants Index
Fuel & Light
Index
Housing Index Clothing, Bedding
& Footwear Index
Misc. Index
Dec.,
2014
Jan.,
2015
Dec.,
2014
Jan.,
2015
Dec.,
2014
Jan.,
2015
Dec.,
2014
Jan.,
2015
Dec.,
2014
Jan.,
2015
8 9 10 11 12 13 14 15 16 17
285 286 245 245 314 321 166 165 200 201
344 341 182 182 160 162 187 193 228 230
372 372 193 193 162 165 163 163 231 230
302 325 180 180 282 286 156 160 189 193
345 348 275 277 124 131 163 163 209 212
308 308 238 238 375 384 198 199 195 195
272 272 221 221 270 277 216 216 207 207
282 282 228 237 356 363 200 199 190 189
302 302 233 234 315 321 223 230 175 176
280 280 260 264 308 314 181 180 196 197
271 271 389 389 470 485 218 222 192 192
195 195 309 310 108 108 205 205 195 195
284 286 240 242 677 688 214 215 197 197
328 329 224 223 303 362 186 186 164 164
344 345 255 256 206 211 194 194 175 176
238 242 372 373 104 104 202 210 223 225
321 330 244 243 195 199 215 216 202 203
189 189 256 257 210 229 188 188 173 173
192 173 305 304 103 103 178 182 202 204
N- New Centre in the New Series on base: 2001=100.
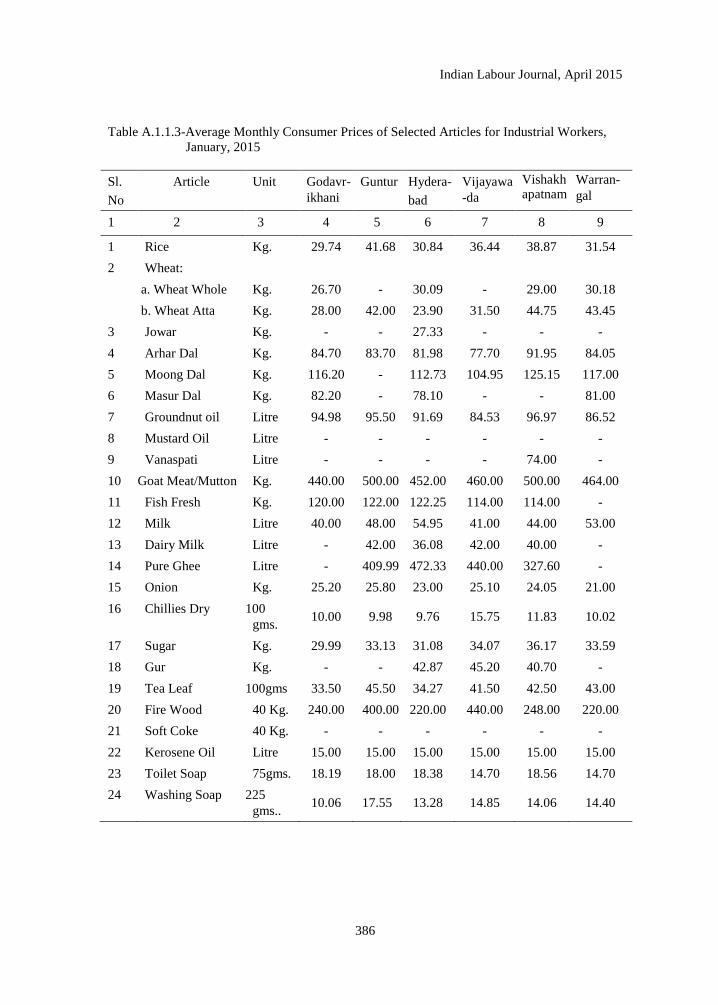
Indian Labour Journal, April 2015
386
Table A.1.1.3-Average Monthly Consumer Prices of Selected Articles for Industrial Workers,
January, 2015
Sl.
No
Article Unit Godavr-
ikhani
Guntur Hydera-
bad
Vijayawa
-da
Vishakhapatnam
Warran-
gal
1 2 3 4 5 6 7 8 9
1 Rice Kg. 29.74 41.68 30.84 36.44 38.87 31.54
2 Wheat:
a. Wheat Whole Kg. 26.70 - 30.09 - 29.00 30.18
b. Wheat Atta Kg. 28.00 42.00 23.90 31.50 44.75 43.45
3 Jowar Kg. - - 27.33 - - -
4 Arhar Dal Kg. 84.70 83.70 81.98 77.70 91.95 84.05
5 Moong Dal Kg. 116.20 - 112.73 104.95 125.15 117.00
6 Masur Dal Kg. 82.20 - 78.10 - - 81.00
7 Groundnut oil Litre 94.98 95.50 91.69 84.53 96.97 86.52
8 Mustard Oil Litre - - - - - -
9 Vanaspati Litre - - - - 74.00 -
10 Goat Meat/Mutton Kg. 440.00 500.00 452.00 460.00 500.00 464.00
11 Fish Fresh Kg. 120.00 122.00 122.25 114.00 114.00 -
12 Milk Litre 40.00 48.00 54.95 41.00 44.00 53.00
13 Dairy Milk Litre - 42.00 36.08 42.00 40.00 -
14 Pure Ghee Litre - 409.99 472.33 440.00 327.60 -
15 Onion Kg. 25.20 25.80 23.00 25.10 24.05 21.00
16 Chillies Dry 100
gms. 10.00 9.98 9.76 15.75 11.83 10.02
17 Sugar Kg. 29.99 33.13 31.08 34.07 36.17 33.59
18 Gur Kg. - - 42.87 45.20 40.70 -
19 Tea Leaf 100gms 33.50 45.50 34.27 41.50 42.50 43.00
20 Fire Wood 40 Kg. 240.00 400.00 220.00 440.00 248.00 220.00
21 Soft Coke 40 Kg. - - - - - -
22 Kerosene Oil Litre 15.00 15.00 15.00 15.00 15.00 15.00
23 Toilet Soap 75gms. 18.19 18.00 18.38 14.70 18.56 14.70
24 Washing Soap 225
gms.. 10.06 17.55 13.28 14.85 14.06 14.40
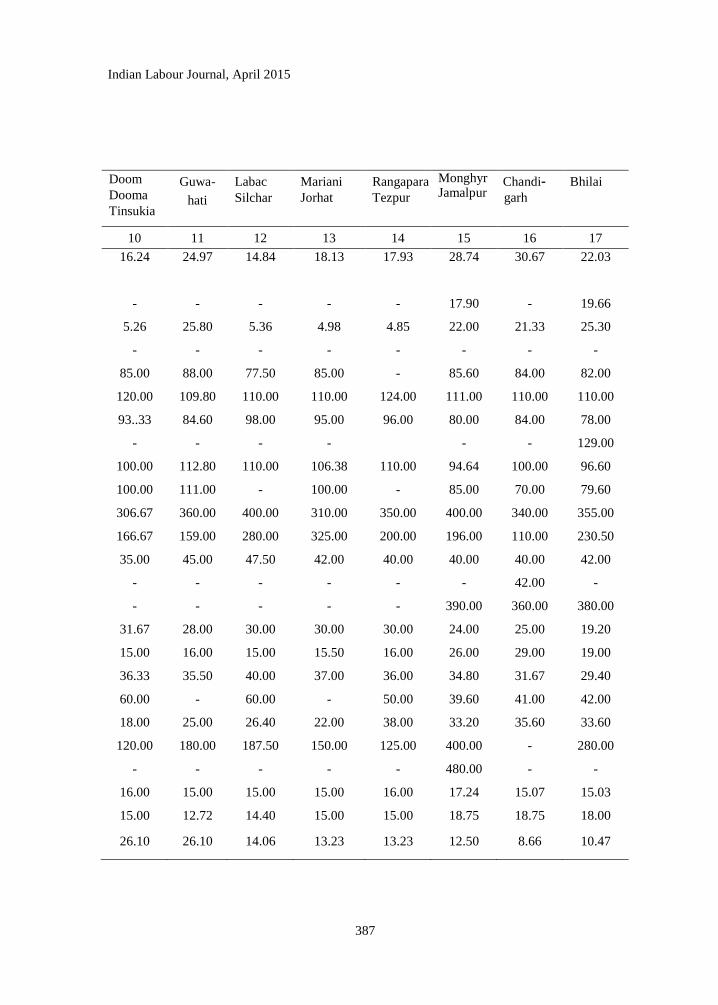
Indian Labour Journal, April 2015
387
Doom
Dooma
Tinsukia
Guwa-
hati
Labac
Silchar
Mariani
Jorhat
Rangapara
Tezpur
Monghyr Jamalpur
Chandi-garh
Bhilai
10 11 12 13 14 15 16 17
16.24 24.97 14.84 18.13 17.93 28.74 30.67 22.03
- - - - - 17.90 - 19.66
5.26 25.80 5.36 4.98 4.85 22.00 21.33 25.30
- - - - - - - -
85.00 88.00 77.50 85.00 - 85.60 84.00 82.00
120.00 109.80 110.00 110.00 124.00 111.00 110.00 110.00
93..33 84.60 98.00 95.00 96.00 80.00 84.00 78.00
- - - - - - 129.00
100.00 112.80 110.00 106.38 110.00 94.64 100.00 96.60
100.00 111.00 - 100.00 - 85.00 70.00 79.60
306.67 360.00 400.00 310.00 350.00 400.00 340.00 355.00
166.67 159.00 280.00 325.00 200.00 196.00 110.00 230.50
35.00 45.00 47.50 42.00 40.00 40.00 40.00 42.00
- - - - - - 42.00 -
- - - - - 390.00 360.00 380.00
31.67 28.00 30.00 30.00 30.00 24.00 25.00 19.20
15.00 16.00 15.00 15.50 16.00 26.00 29.00 19.00
36.33 35.50 40.00 37.00 36.00 34.80 31.67 29.40
60.00 - 60.00 - 50.00 39.60 41.00 42.00
18.00 25.00 26.40 22.00 38.00 33.20 35.60 33.60
120.00 180.00 187.50 150.00 125.00 400.00 - 280.00
- - - - - 480.00 - -
16.00 15.00 15.00 15.00 16.00 17.24 15.07 15.03
15.00 12.72 14.40 15.00 15.00 18.75 18.75 18.00
26.10 26.10 14.06 13.23 13.23 12.50 8.66 10.47
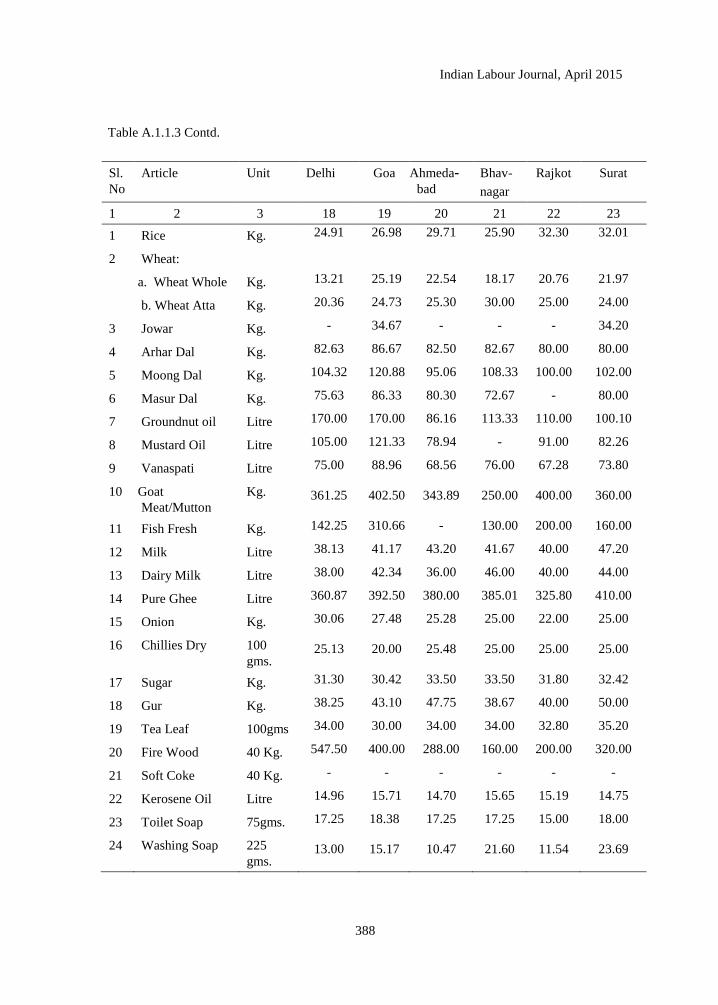
Indian Labour Journal, April 2015
388
Table A.1.1.3 Contd.
Sl.
No
Article Unit Delhi Goa Ahmeda-bad
Bhav-
nagar
Rajkot Surat
1 2 3 18 19 20 21 22 23
1 Rice Kg. 24.91 26.98 29.71 25.90 32.30 32.01
2 Wheat:
a. Wheat Whole Kg. 13.21 25.19 22.54 18.17 20.76 21.97
b. Wheat Atta Kg. 20.36 24.73 25.30 30.00 25.00 24.00
3 Jowar Kg. - 34.67 - - - 34.20
4 Arhar Dal Kg. 82.63 86.67 82.50 82.67 80.00 80.00
5 Moong Dal Kg. 104.32 120.88 95.06 108.33 100.00 102.00
6 Masur Dal Kg. 75.63 86.33 80.30 72.67 - 80.00
7 Groundnut oil Litre 170.00 170.00 86.16 113.33 110.00 100.10
8 Mustard Oil Litre 105.00 121.33 78.94 - 91.00 82.26
9 Vanaspati Litre 75.00 88.96 68.56 76.00 67.28 73.80
10 Goat
Meat/Mutton
Kg. 361.25 402.50 343.89 250.00 400.00 360.00
11 Fish Fresh Kg. 142.25 310.66 - 130.00 200.00 160.00
12 Milk Litre 38.13 41.17 43.20 41.67 40.00 47.20
13 Dairy Milk Litre 38.00 42.34 36.00 46.00 40.00 44.00
14 Pure Ghee Litre 360.87 392.50 380.00 385.01 325.80 410.00
15 Onion Kg. 30.06 27.48 25.28 25.00 22.00 25.00
16 Chillies Dry 100
gms. 25.13 20.00 25.48 25.00 25.00 25.00
17 Sugar Kg. 31.30 30.42 33.50 33.50 31.80 32.42
18 Gur Kg. 38.25 43.10 47.75 38.67 40.00 50.00
19 Tea Leaf 100gms 34.00 30.00 34.00 34.00 32.80 35.20
20 Fire Wood 40 Kg. 547.50 400.00 288.00 160.00 200.00 320.00
21 Soft Coke 40 Kg. - - - - - -
22 Kerosene Oil Litre 14.96 15.71 14.70 15.65 15.19 14.75
23 Toilet Soap 75gms. 17.25 18.38 17.25 17.25 15.00 18.00
24 Washing Soap 225
gms. 13.00 15.17 10.47 21.60 11.54 23.69
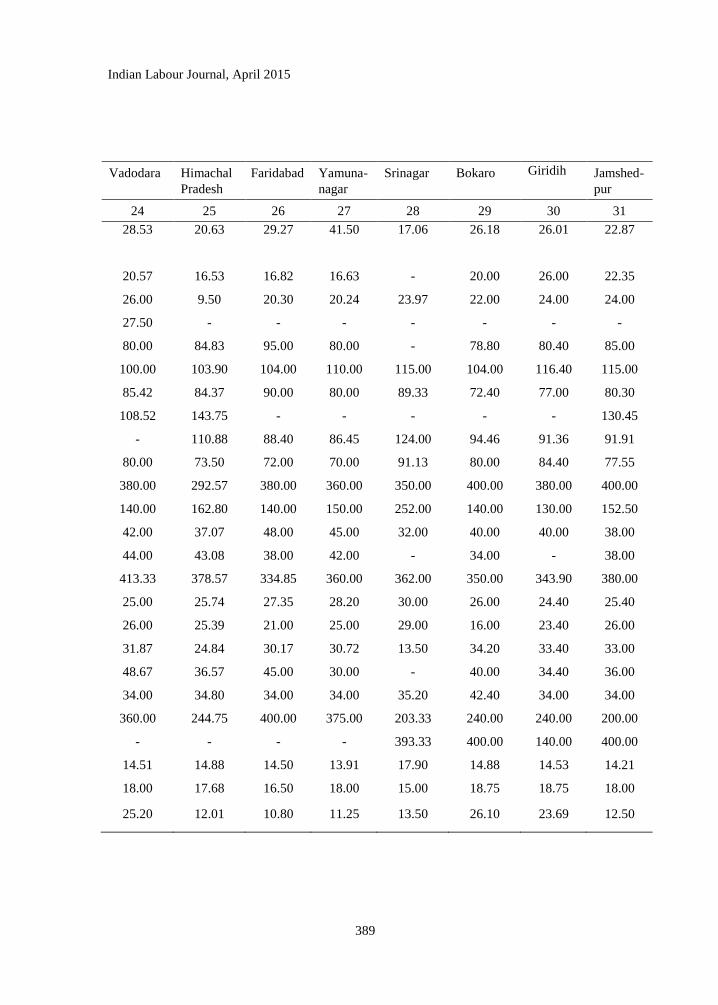
Indian Labour Journal, April 2015
389
Vadodara Himachal
Pradesh
Faridabad Yamuna-
nagar
Srinagar Bokaro Giridih Jamshed-
pur
24 25 26 27 28 29 30 31
28.53 20.63 29.27 41.50 17.06 26.18 26.01 22.87
20.57 16.53 16.82 16.63 - 20.00 26.00 22.35
26.00 9.50 20.30 20.24 23.97 22.00 24.00 24.00
27.50 - - - - - - -
80.00 84.83 95.00 80.00 - 78.80 80.40 85.00
100.00 103.90 104.00 110.00 115.00 104.00 116.40 115.00
85.42 84.37 90.00 80.00 89.33 72.40 77.00 80.30
108.52 143.75 - - - - - 130.45
- 110.88 88.40 86.45 124.00 94.46 91.36 91.91
80.00 73.50 72.00 70.00 91.13 80.00 84.40 77.55
380.00 292.57 380.00 360.00 350.00 400.00 380.00 400.00
140.00 162.80 140.00 150.00 252.00 140.00 130.00 152.50
42.00 37.07 48.00 45.00 32.00 40.00 40.00 38.00
44.00 43.08 38.00 42.00 - 34.00 - 38.00
413.33 378.57 334.85 360.00 362.00 350.00 343.90 380.00
25.00 25.74 27.35 28.20 30.00 26.00 24.40 25.40
26.00 25.39 21.00 25.00 29.00 16.00 23.40 26.00
31.87 24.84 30.17 30.72 13.50 34.20 33.40 33.00
48.67 36.57 45.00 30.00 - 40.00 34.40 36.00
34.00 34.80 34.00 34.00 35.20 42.40 34.00 34.00
360.00 244.75 400.00 375.00 203.33 240.00 240.00 200.00
- - - - 393.33 400.00 140.00 400.00
14.51 14.88 14.50 13.91 17.90 14.88 14.53 14.21
18.00 17.68 16.50 18.00 15.00 18.75 18.75 18.00
25.20 12.01 10.80 11.25 13.50 26.10 23.69 12.50
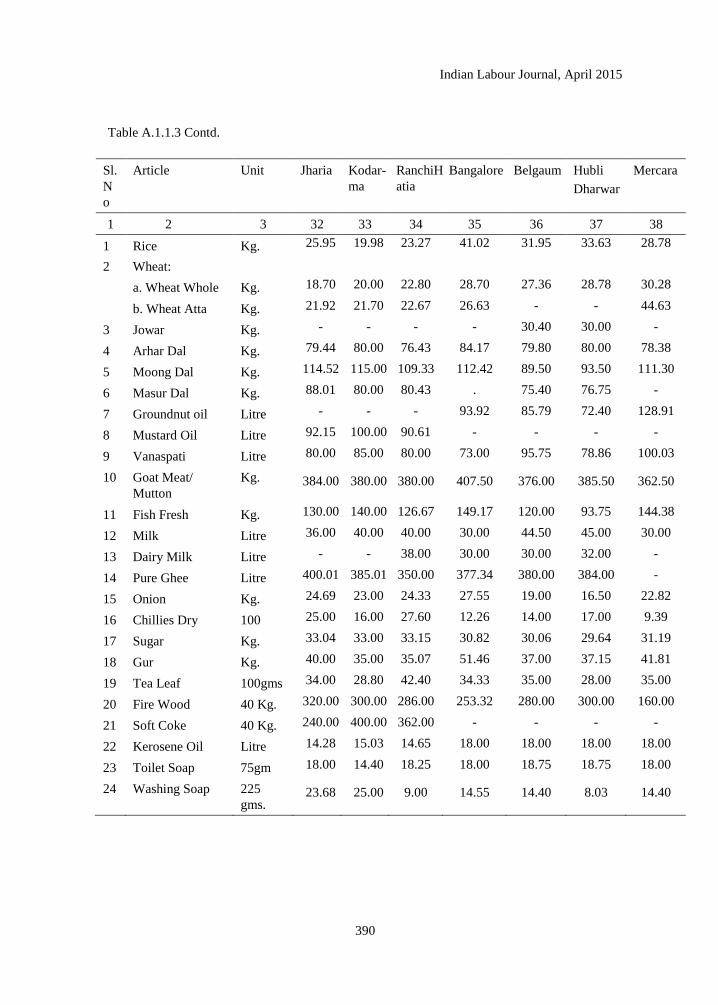
Indian Labour Journal, April 2015
390
Table A.1.1.3 Contd.
Sl.
N
o
Article Unit Jharia Kodar-
ma
RanchiH
atia
Bangalore Belgaum Hubli
Dharwar
Mercara
1 2 3 32 33 34 35 36 37 38
1 Rice Kg. 25.95 19.98 23.27 41.02 31.95 33.63 28.78
2 Wheat:
a. Wheat Whole Kg. 18.70 20.00 22.80 28.70 27.36 28.78 30.28
b. Wheat Atta Kg. 21.92 21.70 22.67 26.63 - - 44.63
3 Jowar Kg. - - - - 30.40 30.00 -
4 Arhar Dal Kg. 79.44 80.00 76.43 84.17 79.80 80.00 78.38
5 Moong Dal Kg. 114.52 115.00 109.33 112.42 89.50 93.50 111.30
6 Masur Dal Kg. 88.01 80.00 80.43 . 75.40 76.75 -
7 Groundnut oil Litre - - - 93.92 85.79 72.40 128.91
8 Mustard Oil Litre 92.15 100.00 90.61 - - - -
9 Vanaspati Litre 80.00 85.00 80.00 73.00 95.75 78.86 100.03
10 Goat Meat/
Mutton
Kg. 384.00 380.00 380.00 407.50 376.00 385.50 362.50
11 Fish Fresh Kg. 130.00 140.00 126.67 149.17 120.00 93.75 144.38
12 Milk Litre 36.00 40.00 40.00 30.00 44.50 45.00 30.00
13 Dairy Milk Litre - - 38.00 30.00 30.00 32.00 -
14 Pure Ghee Litre 400.01 385.01 350.00 377.34 380.00 384.00 -
15 Onion Kg. 24.69 23.00 24.33 27.55 19.00 16.50 22.82
16 Chillies Dry 100
gms.
25.00 16.00 27.60 12.26 14.00 17.00 9.39
17 Sugar Kg. 33.04 33.00 33.15 30.82 30.06 29.64 31.19
18 Gur Kg. 40.00 35.00 35.07 51.46 37.00 37.15 41.81
19 Tea Leaf 100gms 34.00 28.80 42.40 34.33 35.00 28.00 35.00
20 Fire Wood 40 Kg. 320.00 300.00 286.00 253.32 280.00 300.00 160.00
21 Soft Coke 40 Kg. 240.00 400.00 362.00 - - - -
22 Kerosene Oil Litre 14.28 15.03 14.65 18.00 18.00 18.00 18.00
23 Toilet Soap 75gm 18.00 14.40 18.25 18.00 18.75 18.75 18.00
24 Washing Soap 225
gms. 23.68 25.00 9.00 14.55 14.40 8.03 14.40
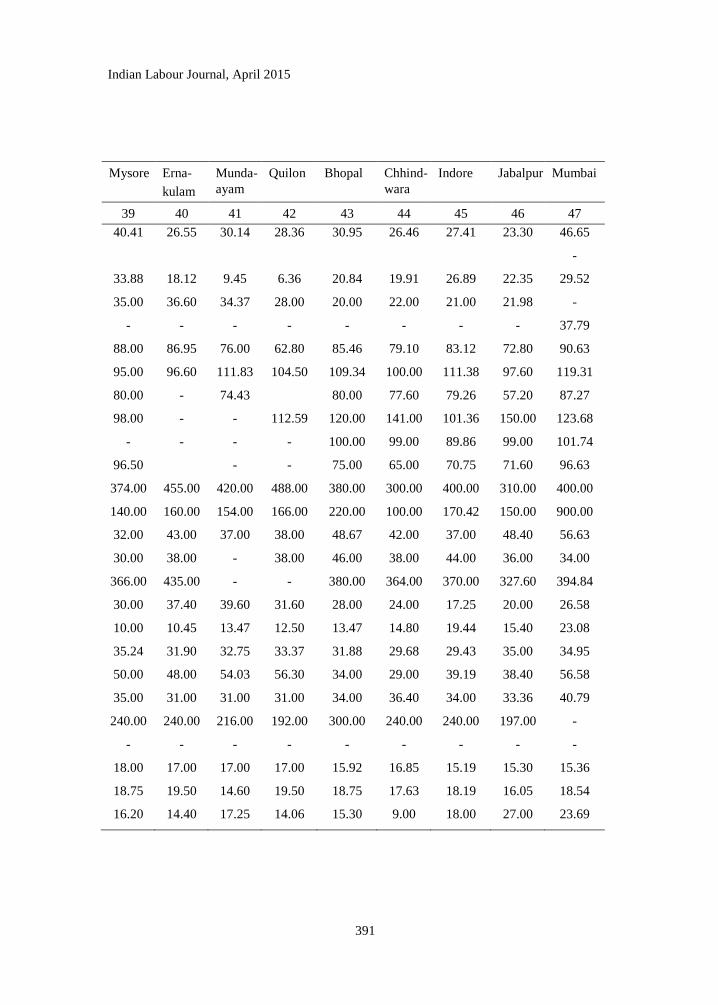
Indian Labour Journal, April 2015
391
Mysore Erna-
kulam
Munda-
ayam
Quilon Bhopal Chhind-
wara
Indore Jabalpur Mumbai
39 40 41 42 43 44 45 46 47
40.41 26.55 30.14 28.36 30.95 26.46 27.41 23.30 46.65
-
33.88 18.12 9.45 6.36 20.84 19.91 26.89 22.35 29.52
35.00 36.60 34.37 28.00 20.00 22.00 21.00 21.98 -
- - - - - - - - 37.79
88.00 86.95 76.00 62.80 85.46 79.10 83.12 72.80 90.63
95.00 96.60 111.83 104.50 109.34 100.00 111.38 97.60 119.31
80.00 - 74.43 80.00 77.60 79.26 57.20 87.27
98.00 - - 112.59 120.00 141.00 101.36 150.00 123.68
- - - - 100.00 99.00 89.86 99.00 101.74
96.50 - - 75.00 65.00 70.75 71.60 96.63
374.00 455.00 420.00 488.00 380.00 300.00 400.00 310.00 400.00
140.00 160.00 154.00 166.00 220.00 100.00 170.42 150.00 900.00
32.00 43.00 37.00 38.00 48.67 42.00 37.00 48.40 56.63
30.00 38.00 - 38.00 46.00 38.00 44.00 36.00 34.00
366.00 435.00 - - 380.00 364.00 370.00 327.60 394.84
30.00 37.40 39.60 31.60 28.00 24.00 17.25 20.00 26.58
10.00 10.45 13.47 12.50 13.47 14.80 19.44 15.40 23.08
35.24 31.90 32.75 33.37 31.88 29.68 29.43 35.00 34.95
50.00 48.00 54.03 56.30 34.00 29.00 39.19 38.40 56.58
35.00 31.00 31.00 31.00 34.00 36.40 34.00 33.36 40.79
240.00 240.00 216.00 192.00 300.00 240.00 240.00 197.00 -
- - - - - - - - -
18.00 17.00 17.00 17.00 15.92 16.85 15.19 15.30 15.36
18.75 19.50 14.60 19.50 18.75 17.63 18.19 16.05 18.54
16.20 14.40 17.25 14.06 15.30 9.00 18.00 27.00 23.69
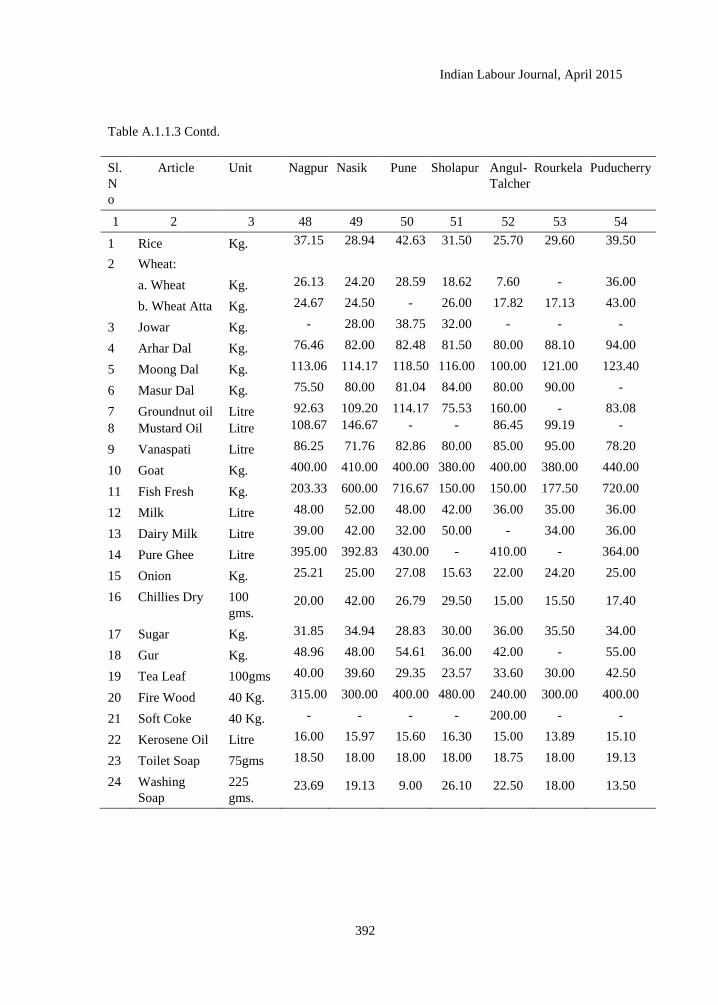
Indian Labour Journal, April 2015
392
Table A.1.1.3 Contd.
Sl.
N
o
Article Unit Nagpur Nasik Pune Sholapur Angul-
Talcher
Rourkela Puducherry
1 2 3 48 49 50 51 52 53 54
1 Rice Kg. 37.15 28.94 42.63 31.50 25.70 29.60 39.50
2 Wheat:
a. Wheat
Whole
Kg. 26.13 24.20 28.59 18.62 7.60 - 36.00
b. Wheat Atta Kg. 24.67 24.50 - 26.00 17.82 17.13 43.00
3 Jowar Kg. - 28.00 38.75 32.00 - - -
4 Arhar Dal Kg. 76.46 82.00 82.48 81.50 80.00 88.10 94.00
5 Moong Dal Kg. 113.06 114.17 118.50 116.00 100.00 121.00 123.40
6 Masur Dal Kg. 75.50 80.00 81.04 84.00 80.00 90.00 -
7 Groundnut oil Litre 92.63 109.20 114.17 75.53 160.00 - 83.08
8 Mustard Oil Litre 108.67 146.67 - - 86.45 99.19 -
9 Vanaspati Litre 86.25 71.76 82.86 80.00 85.00 95.00 78.20
10 Goat
Meat/Mutton
Kg. 400.00 410.00 400.00 380.00 400.00 380.00 440.00
11 Fish Fresh Kg. 203.33 600.00 716.67 150.00 150.00 177.50 720.00
12 Milk Litre 48.00 52.00 48.00 42.00 36.00 35.00 36.00
13 Dairy Milk Litre 39.00 42.00 32.00 50.00 - 34.00 36.00
14 Pure Ghee Litre 395.00 392.83 430.00 - 410.00 - 364.00
15 Onion Kg. 25.21 25.00 27.08 15.63 22.00 24.20 25.00
16 Chillies Dry 100
gms. 20.00 42.00 26.79 29.50 15.00 15.50 17.40
17 Sugar Kg. 31.85 34.94 28.83 30.00 36.00 35.50 34.00
18 Gur Kg. 48.96 48.00 54.61 36.00 42.00 - 55.00
19 Tea Leaf 100gms 40.00 39.60 29.35 23.57 33.60 30.00 42.50
20 Fire Wood 40 Kg. 315.00 300.00 400.00 480.00 240.00 300.00 400.00
21 Soft Coke 40 Kg. - - - - 200.00 - -
22 Kerosene Oil Litre 16.00 15.97 15.60 16.30 15.00 13.89 15.10
23 Toilet Soap 75gms 18.50 18.00 18.00 18.00 18.75 18.00 19.13
24 Washing
Soap
225
gms. 23.69 19.13 9.00 26.10 22.50 18.00 13.50
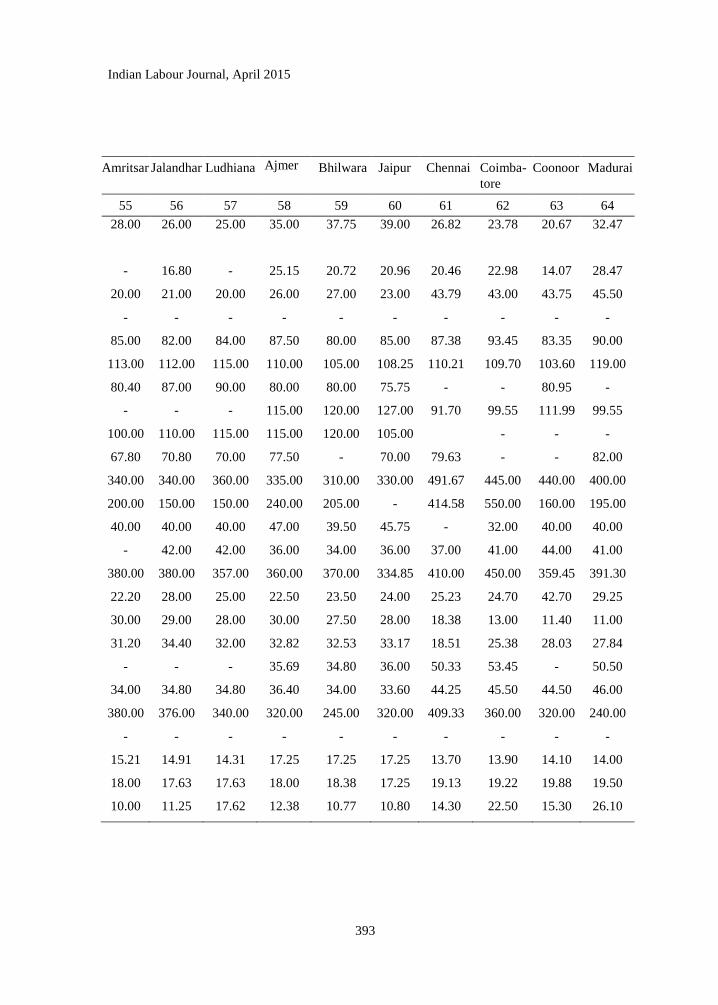
Indian Labour Journal, April 2015
393
Amritsar Jalandhar Ludhiana Ajmer Bhilwara Jaipur Chennai Coimba-
tore
Coonoor Madurai
55 56 57 58 59 60 61 62 63 64
28.00 26.00 25.00 35.00 37.75 39.00 26.82 23.78 20.67 32.47
- 16.80 - 25.15 20.72 20.96 20.46 22.98 14.07 28.47
20.00 21.00 20.00 26.00 27.00 23.00 43.79 43.00 43.75 45.50
- - - - - - - - - -
85.00 82.00 84.00 87.50 80.00 85.00 87.38 93.45 83.35 90.00
113.00 112.00 115.00 110.00 105.00 108.25 110.21 109.70 103.60 119.00
80.40 87.00 90.00 80.00 80.00 75.75 - - 80.95 -
- - - 115.00 120.00 127.00 91.70 99.55 111.99 99.55
100.00 110.00 115.00 115.00 120.00 105.00 - - -
67.80 70.80 70.00 77.50 - 70.00 79.63 - - 82.00
340.00 340.00 360.00 335.00 310.00 330.00 491.67 445.00 440.00 400.00
200.00 150.00 150.00 240.00 205.00 - 414.58 550.00 160.00 195.00
40.00 40.00 40.00 47.00 39.50 45.75 - 32.00 40.00 40.00
- 42.00 42.00 36.00 34.00 36.00 37.00 41.00 44.00 41.00
380.00 380.00 357.00 360.00 370.00 334.85 410.00 450.00 359.45 391.30
22.20 28.00 25.00 22.50 23.50 24.00 25.23 24.70 42.70 29.25
30.00 29.00 28.00 30.00 27.50 28.00 18.38 13.00 11.40 11.00
31.20 34.40 32.00 32.82 32.53 33.17 18.51 25.38 28.03 27.84
- - - 35.69 34.80 36.00 50.33 53.45 - 50.50
34.00 34.80 34.80 36.40 34.00 33.60 44.25 45.50 44.50 46.00
380.00 376.00 340.00 320.00 245.00 320.00 409.33 360.00 320.00 240.00
- - - - - - - - - -
15.21 14.91 14.31 17.25 17.25 17.25 13.70 13.90 14.10 14.00
18.00 17.63 17.63 18.00 18.38 17.25 19.13 19.22 19.88 19.50
10.00 11.25 17.62 12.38 10.77 10.80 14.30 22.50 15.30 26.10
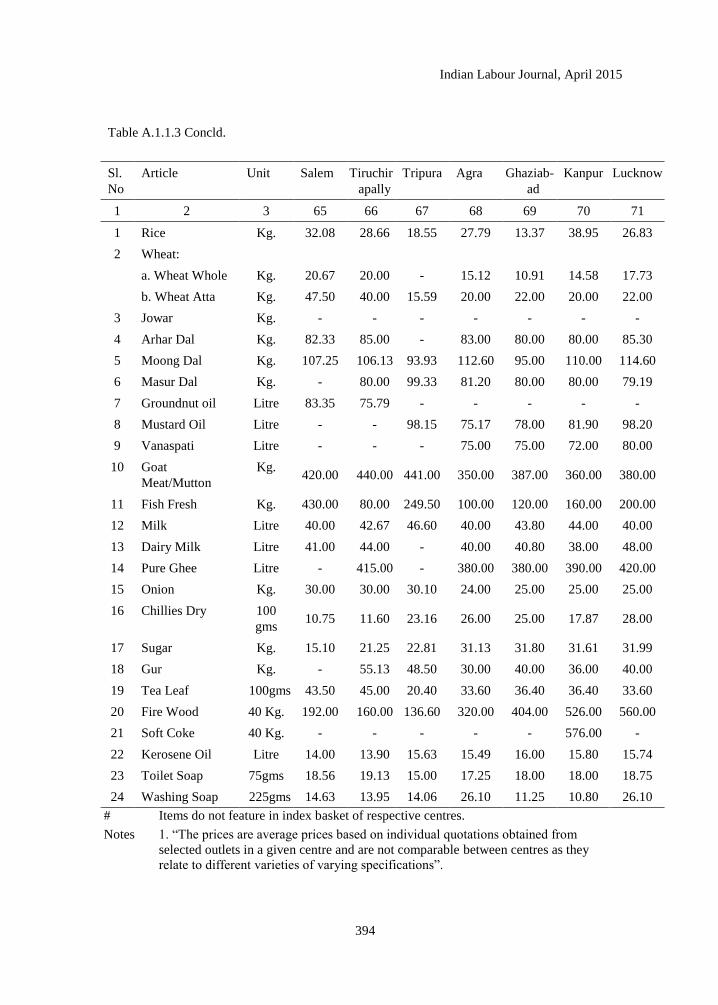
Indian Labour Journal, April 2015
394
Table A.1.1.3 Concld.
Sl.
No
Article Unit Salem Tiruchir
apally
Tripura Agra Ghaziab-
ad
Kanpur Lucknow
1 2 3 65 66 67 68 69 70 71
1 Rice Kg. 32.08 28.66 18.55 27.79 13.37 38.95 26.83
2 Wheat:
a. Wheat Whole Kg. 20.67 20.00 - 15.12 10.91 14.58 17.73
b. Wheat Atta Kg. 47.50 40.00 15.59 20.00 22.00 20.00 22.00
3 Jowar Kg. - - - - - - -
4 Arhar Dal Kg. 82.33 85.00 - 83.00 80.00 80.00 85.30
5 Moong Dal Kg. 107.25 106.13 93.93 112.60 95.00 110.00 114.60
6 Masur Dal Kg. - 80.00 99.33 81.20 80.00 80.00 79.19
7 Groundnut oil Litre 83.35 75.79 - - - - -
8 Mustard Oil Litre - - 98.15 75.17 78.00 81.90 98.20
9 Vanaspati Litre - - - 75.00 75.00 72.00 80.00
10 Goat
Meat/Mutton
Kg. 420.00 440.00 441.00 350.00 387.00 360.00 380.00
11 Fish Fresh Kg. 430.00 80.00 249.50 100.00 120.00 160.00 200.00
12 Milk Litre 40.00 42.67 46.60 40.00 43.80 44.00 40.00
13 Dairy Milk Litre 41.00 44.00 - 40.00 40.80 38.00 48.00
14 Pure Ghee Litre - 415.00 - 380.00 380.00 390.00 420.00
15 Onion Kg. 30.00 30.00 30.10 24.00 25.00 25.00 25.00
16 Chillies Dry 100
gms 10.75 11.60 23.16 26.00 25.00 17.87 28.00
17 Sugar Kg. 15.10 21.25 22.81 31.13 31.80 31.61 31.99
18 Gur Kg. - 55.13 48.50 30.00 40.00 36.00 40.00
19 Tea Leaf 100gms 43.50 45.00 20.40 33.60 36.40 36.40 33.60
20 Fire Wood 40 Kg. 192.00 160.00 136.60 320.00 404.00 526.00 560.00
21 Soft Coke 40 Kg. - - - - - 576.00 -
22 Kerosene Oil Litre 14.00 13.90 15.63 15.49 16.00 15.80 15.74
23 Toilet Soap 75gms 18.56 19.13 15.00 17.25 18.00 18.00 18.75
24 Washing Soap 225gms 14.63 13.95 14.06 26.10 11.25 10.80 26.10
# Items do not feature in index basket of respective centres.
Notes 1. ―The prices are average prices based on individual quotations obtained from
selected outlets in a given centre and are not comparable between centres as they
relate to different varieties of varying specifications‖.
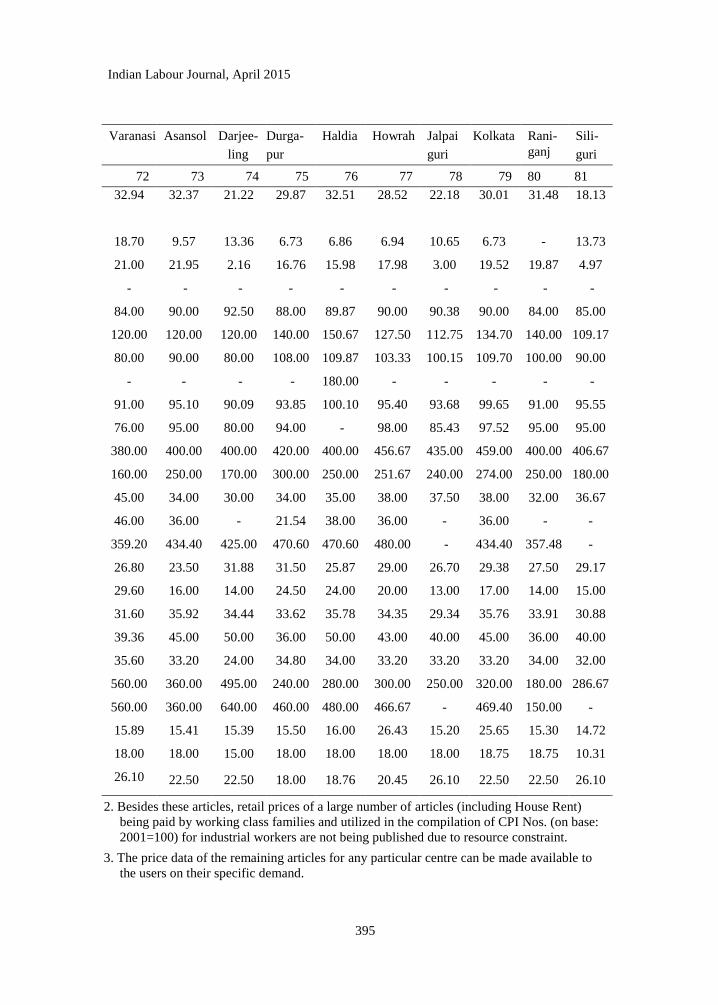
Indian Labour Journal, April 2015
395
Varanasi Asansol Darjee-
ling
Durga-
pur
Haldia Howrah Jalpai
guri
Kolkata Rani-
ganj
Sili-
guri
72 73 74 75 76 77 78 79 80 81
32.94 32.37 21.22 29.87 32.51 28.52 22.18 30.01 31.48 18.13
18.70 9.57 13.36 6.73 6.86 6.94 10.65 6.73 - 13.73
21.00 21.95 2.16 16.76 15.98 17.98 3.00 19.52 19.87 4.97
- - - - - - - - - -
84.00 90.00 92.50 88.00 89.87 90.00 90.38 90.00 84.00 85.00
120.00 120.00 120.00 140.00 150.67 127.50 112.75 134.70 140.00 109.17
80.00 90.00 80.00 108.00 109.87 103.33 100.15 109.70 100.00 90.00
- - - - 180.00 - - - - -
91.00 95.10 90.09 93.85 100.10 95.40 93.68 99.65 91.00 95.55
76.00 95.00 80.00 94.00 - 98.00 85.43 97.52 95.00 95.00
380.00 400.00 400.00 420.00 400.00 456.67 435.00 459.00 400.00 406.67
160.00 250.00 170.00 300.00 250.00 251.67 240.00 274.00 250.00 180.00
45.00 34.00 30.00 34.00 35.00 38.00 37.50 38.00 32.00 36.67
46.00 36.00 - 21.54 38.00 36.00 - 36.00 - -
359.20 434.40 425.00 470.60 470.60 480.00 - 434.40 357.48 -
26.80 23.50 31.88 31.50 25.87 29.00 26.70 29.38 27.50 29.17
29.60 16.00 14.00 24.50 24.00 20.00 13.00 17.00 14.00 15.00
31.60 35.92 34.44 33.62 35.78 34.35 29.34 35.76 33.91 30.88
39.36 45.00 50.00 36.00 50.00 43.00 40.00 45.00 36.00 40.00
35.60 33.20 24.00 34.80 34.00 33.20 33.20 33.20 34.00 32.00
560.00 360.00 495.00 240.00 280.00 300.00 250.00 320.00 180.00 286.67
560.00 360.00 640.00 460.00 480.00 466.67 - 469.40 150.00 -
15.89 15.41 15.39 15.50 16.00 26.43 15.20 25.65 15.30 14.72
18.00 18.00 15.00 18.00 18.00 18.00 18.00 18.75 18.75 10.31
26.10 22.50 22.50 18.00 18.76 20.45 26.10 22.50 22.50 26.10
2. Besides these articles, retail prices of a large number of articles (including House Rent)
being paid by working class families and utilized in the compilation of CPI Nos. (on base:
2001=100) for industrial workers are not being published due to resource constraint.
3. The price data of the remaining articles for any particular centre can be made available to
the users on their specific demand.
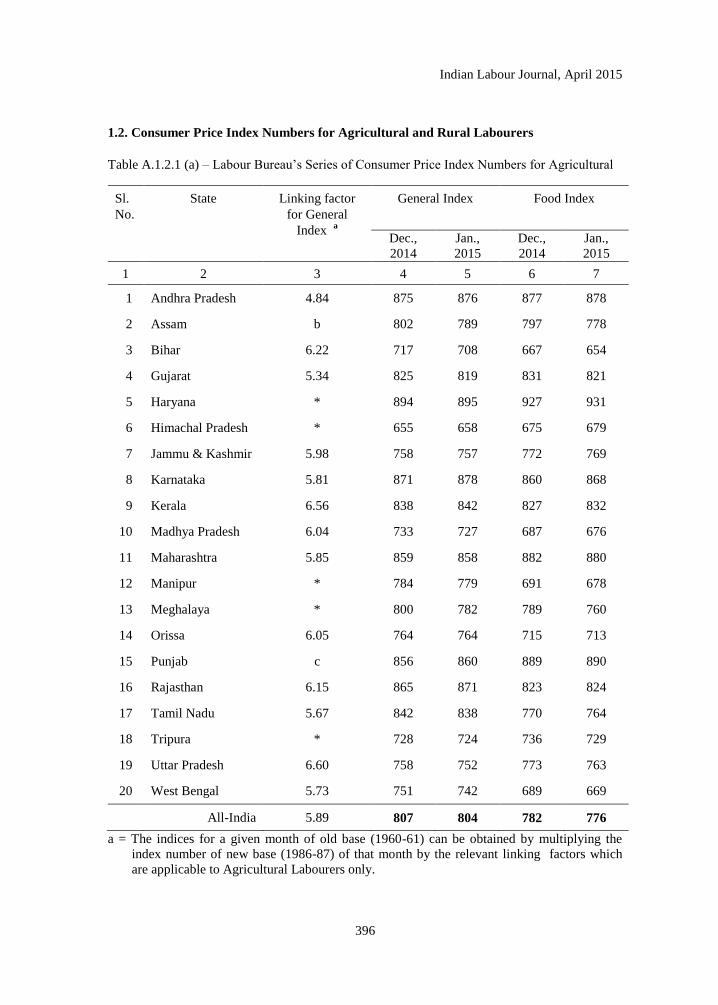
Indian Labour Journal, April 2015
396
1.2. Consumer Price Index Numbers for Agricultural and Rural Labourers
Table A.1.2.1 (a) – Labour Bureau‘s Series of Consumer Price Index Numbers for Agricultural
Sl.
No.
State
Linking factor
for General
Index a
General Index Food Index
Dec.,
2014
Jan.,
2015
Dec.,
2014
Jan.,
2015
1 2 3 4 5 6 7
1 Andhra Pradesh 4.84 875 876 877 878
2 Assam b 802 789 797 778
3 Bihar 6.22 717 708 667 654
4 Gujarat 5.34 825 819 831 821
5 Haryana * 894 895 927 931
6 Himachal Pradesh * 655 658 675 679
7 Jammu & Kashmir 5.98 758 757 772 769
8 Karnataka 5.81 871 878 860 868
9 Kerala 6.56 838 842 827 832
10 Madhya Pradesh 6.04 733 727 687 676
11 Maharashtra 5.85 859 858 882 880
12 Manipur * 784 779 691 678
13 Meghalaya * 800 782 789 760
14 Orissa 6.05 764 764 715 713
15 Punjab c 856 860 889 890
16 Rajasthan 6.15 865 871 823 824
17 Tamil Nadu 5.67 842 838 770 764
18 Tripura * 728 724 736 729
19 Uttar Pradesh 6.60 758 752 773 763
20 West Bengal 5.73 751 742 689 669
All-India 5.89 807 804 782 776
a = The indices for a given month of old base (1960-61) can be obtained by multiplying the
index number of new base (1986-87) of that month by the relevant linking factors which
are applicable to Agricultural Labourers only.
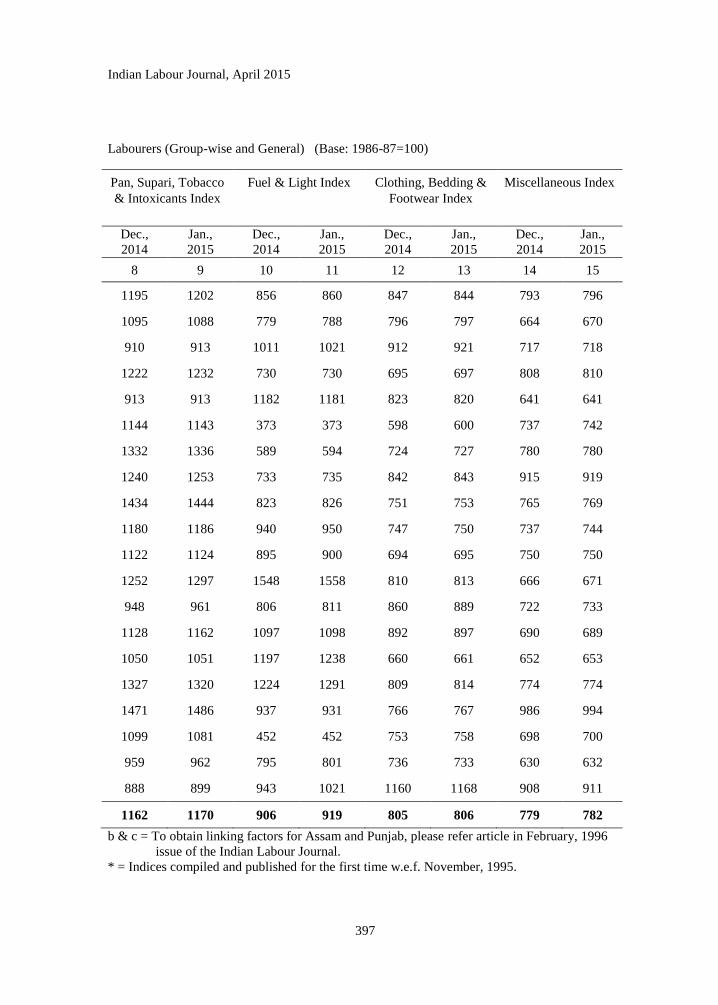
Indian Labour Journal, April 2015
397
Labourers (Group-wise and General) (Base: 1986-87=100)
Pan, Supari, Tobacco
& Intoxicants Index
Fuel & Light Index Clothing, Bedding &
Footwear Index
Miscellaneous Index
Dec.,
2014
Jan.,
2015
Dec.,
2014
Jan.,
2015
Dec.,
2014
Jan.,
2015
Dec.,
2014
Jan.,
2015
8 9 10 11 12 13 14 15
1195 1202 856 860 847 844 793 796
1095 1088 779 788 796 797 664 670
910 913 1011 1021 912 921 717 718
1222 1232 730 730 695 697 808 810
913 913 1182 1181 823 820 641 641
1144 1143 373 373 598 600 737 742
1332 1336 589 594 724 727 780 780
1240 1253 733 735 842 843 915 919
1434 1444 823 826 751 753 765 769
1180 1186 940 950 747 750 737 744
1122 1124 895 900 694 695 750 750
1252 1297 1548 1558 810 813 666 671
948 961 806 811 860 889 722 733
1128 1162 1097 1098 892 897 690 689
1050 1051 1197 1238 660 661 652 653
1327 1320 1224 1291 809 814 774 774
1471 1486 937 931 766 767 986 994
1099 1081 452 452 753 758 698 700
959 962 795 801 736 733 630 632
888 899 943 1021 1160 1168 908 911
1162 1170 906 919 805 806 779 782
b & c = To obtain linking factors for Assam and Punjab, please refer article in February, 1996
issue of the Indian Labour Journal.
* = Indices compiled and published for the first time w.e.f. November, 1995.
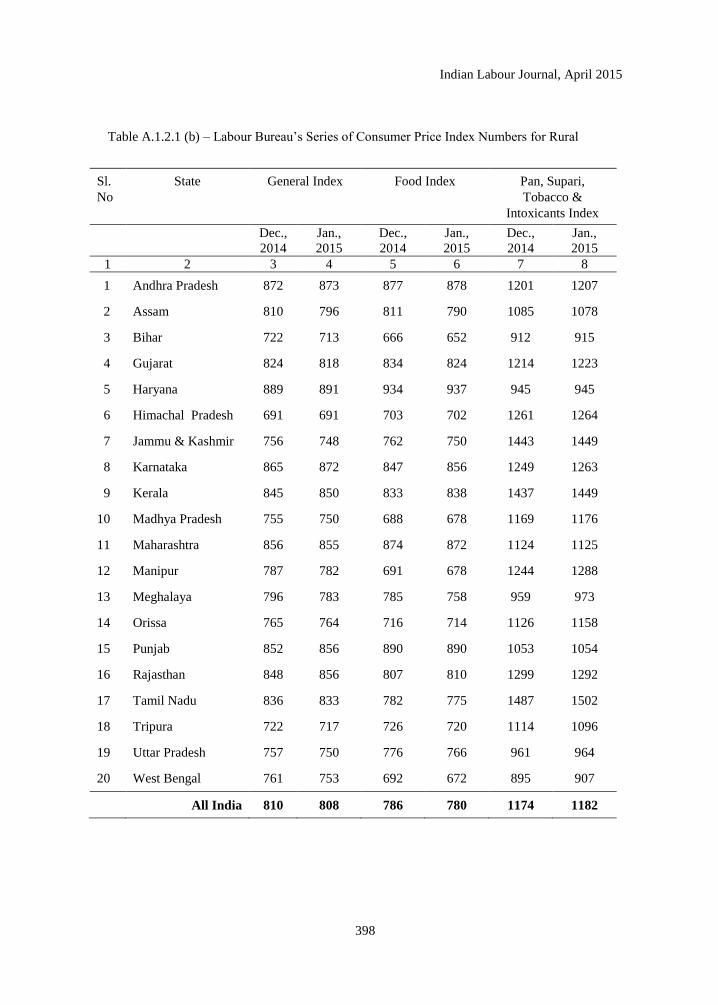
Indian Labour Journal, April 2015
398
Table A.1.2.1 (b) – Labour Bureau‘s Series of Consumer Price Index Numbers for Rural
Sl.
No
State General Index Food Index Pan, Supari,
Tobacco &
Intoxicants Index
Dec.,
2014
Jan.,
2015
Dec.,
2014
Jan.,
2015
Dec.,
2014
Jan.,
2015
1 2 3 4 5 6 7 8
1 Andhra Pradesh 872 873 877 878 1201 1207
2 Assam 810 796 811 790 1085 1078
3 Bihar 722 713 666 652 912 915
4 Gujarat 824 818 834 824 1214 1223
5 Haryana 889 891 934 937 945 945
6 Himachal Pradesh 691 691 703 702 1261 1264
7 Jammu & Kashmir 756 748 762 750 1443 1449
8 Karnataka 865 872 847 856 1249 1263
9 Kerala 845 850 833 838 1437 1449
10 Madhya Pradesh 755 750 688 678 1169 1176
11 Maharashtra 856 855 874 872 1124 1125
12 Manipur 787 782 691 678 1244 1288
13 Meghalaya 796 783 785 758 959 973
14 Orissa 765 764 716 714 1126 1158
15 Punjab 852 856 890 890 1053 1054
16 Rajasthan 848 856 807 810 1299 1292
17 Tamil Nadu 836 833 782 775 1487 1502
18 Tripura 722 717 726 720 1114 1096
19 Uttar Pradesh 757 750 776 766 961 964
20 West Bengal 761 753 692 672 895 907
All India 810 808 786 780 1174 1182
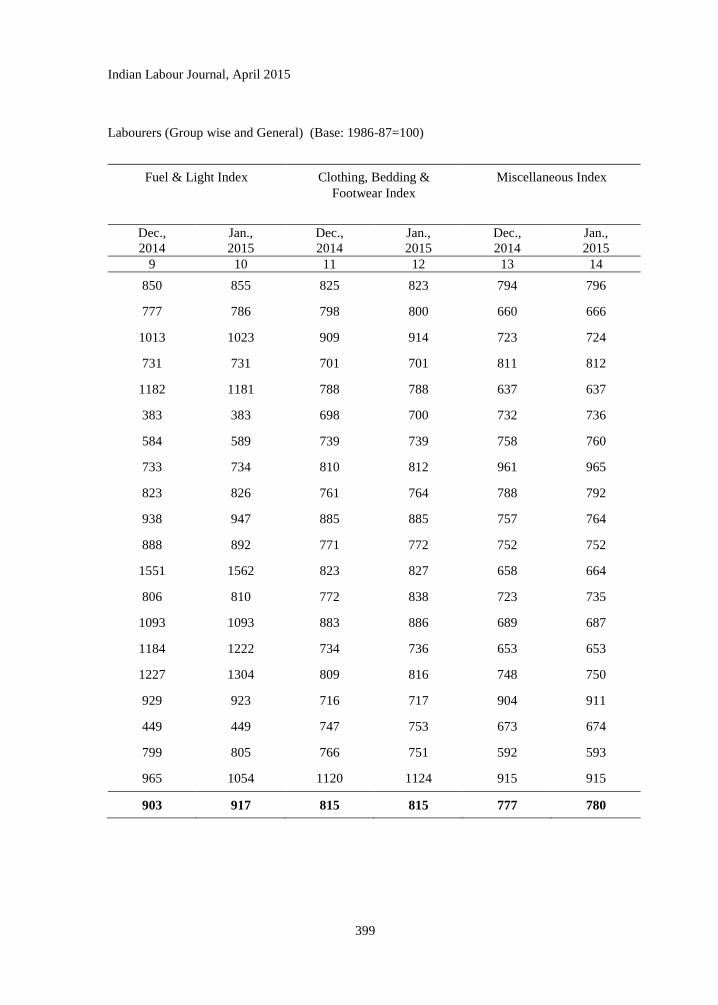
Indian Labour Journal, April 2015
399
Labourers (Group wise and General) (Base: 1986-87=100)
Fuel & Light Index Clothing, Bedding &
Footwear Index
Miscellaneous Index
Dec.,
2014
Jan.,
2015
Dec.,
2014
Jan.,
2015
Dec.,
2014
Jan.,
2015
9 10 11 12 13 14
850 855 825 823 794 796
777 786 798 800 660 666
1013 1023 909 914 723 724
731 731 701 701 811 812
1182 1181 788 788 637 637
383 383 698 700 732 736
584 589 739 739 758 760
733 734 810 812 961 965
823 826 761 764 788 792
938 947 885 885 757 764
888 892 771 772 752 752
1551 1562 823 827 658 664
806 810 772 838 723 735
1093 1093 883 886 689 687
1184 1222 734 736 653 653
1227 1304 809 816 748 750
929 923 716 717 904 911
449 449 747 753 673 674
799 805 766 751 592 593
965 1054 1120 1124 915 915
903 917 815 815 777 780
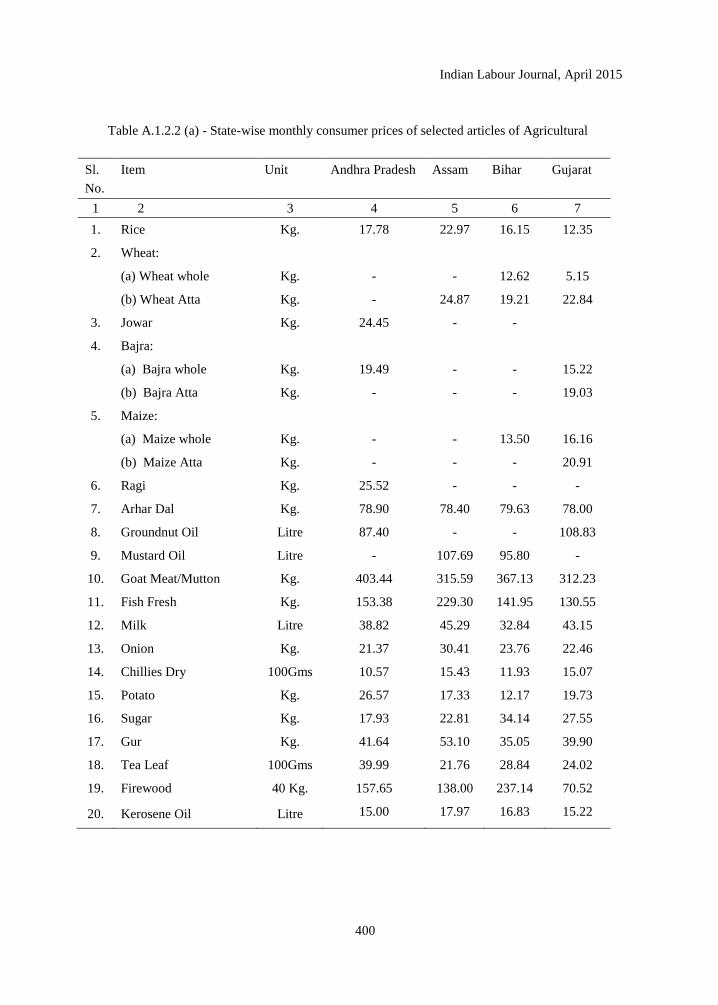
Indian Labour Journal, April 2015
400
Table A.1.2.2 (a) - State-wise monthly consumer prices of selected articles of Agricultural
Sl.
No.
Item Unit Andhra Pradesh Assam Bihar Gujarat
1 2 3 4 5 6 7
1. Rice Kg. 17.78 22.97 16.15 12.35
2. Wheat:
(a) Wheat whole Kg. - - 12.62 5.15
(b) Wheat Atta Kg. - 24.87 19.21 22.84
3. Jowar Kg. 24.45 - -
4. Bajra:
(a) Bajra whole Kg. 19.49 - - 15.22
(b) Bajra Atta Kg. - - - 19.03
5. Maize:
(a) Maize whole Kg. - - 13.50 16.16
(b) Maize Atta Kg. - - - 20.91
6. Ragi Kg. 25.52 - - -
7. Arhar Dal Kg. 78.90 78.40 79.63 78.00
8. Groundnut Oil Litre 87.40 - - 108.83
9. Mustard Oil Litre - 107.69 95.80 -
10. Goat Meat/Mutton Kg. 403.44 315.59 367.13 312.23
11. Fish Fresh Kg. 153.38 229.30 141.95 130.55
12. Milk Litre 38.82 45.29 32.84 43.15
13. Onion Kg. 21.37 30.41 23.76 22.46
14. Chillies Dry 100Gms 10.57 15.43 11.93 15.07
15. Potato Kg. 26.57 17.33 12.17 19.73
16. Sugar Kg. 17.93 22.81 34.14 27.55
17. Gur Kg. 41.64 53.10 35.05 39.90
18. Tea Leaf 100Gms 39.99 21.76 28.84 24.02
19. Firewood 40 Kg. 157.65 138.00 237.14 70.52
20. Kerosene Oil Litre 15.00 17.97 16.83 15.22
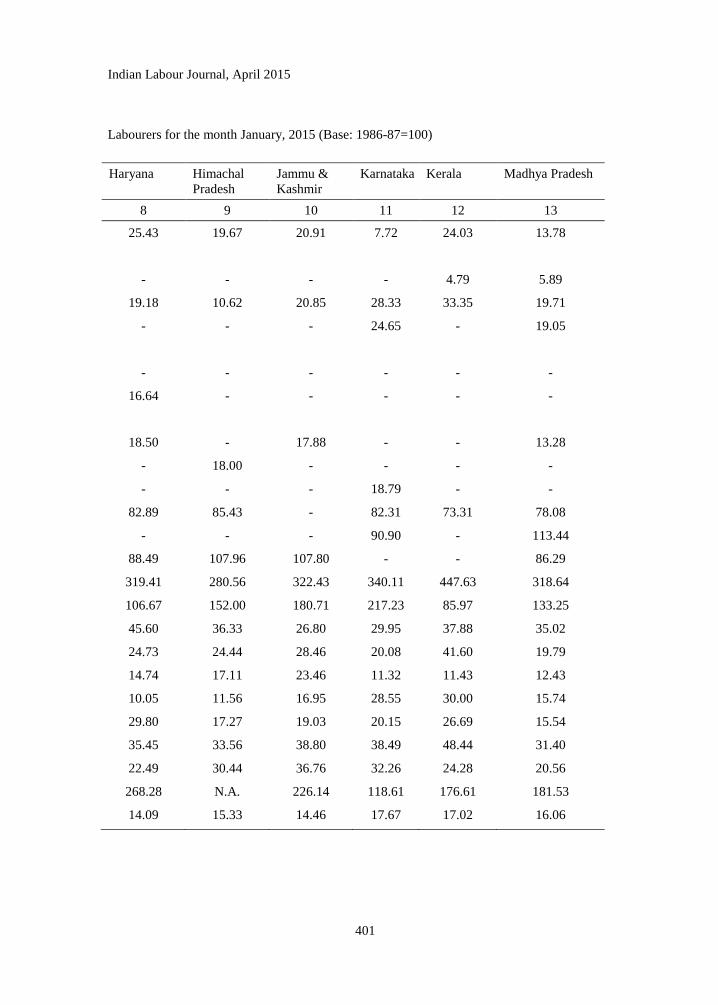
Indian Labour Journal, April 2015
401
Labourers for the month January, 2015 (Base: 1986-87=100)
Haryana Himachal
Pradesh
Jammu &
Kashmir
Karnataka Kerala Madhya Pradesh
8 9 10 11 12 13
25.43 19.67 20.91 7.72 24.03 13.78
- - - - 4.79 5.89
19.18 10.62 20.85 28.33 33.35 19.71
- - - 24.65 - 19.05
- - - - - -
16.64 - - - - -
18.50 - 17.88 - - 13.28
- 18.00 - - - -
- - - 18.79 - -
82.89 85.43 - 82.31 73.31 78.08
- - - 90.90 - 113.44
88.49 107.96 107.80 - - 86.29
319.41 280.56 322.43 340.11 447.63 318.64
106.67 152.00 180.71 217.23 85.97 133.25
45.60 36.33 26.80 29.95 37.88 35.02
24.73 24.44 28.46 20.08 41.60 19.79
14.74 17.11 23.46 11.32 11.43 12.43
10.05 11.56 16.95 28.55 30.00 15.74
29.80 17.27 19.03 20.15 26.69 15.54
35.45 33.56 38.80 38.49 48.44 31.40
22.49 30.44 36.76 32.26 24.28 20.56
268.28 N.A. 226.14 118.61 176.61 181.53
14.09 15.33 14.46 17.67 17.02 16.06
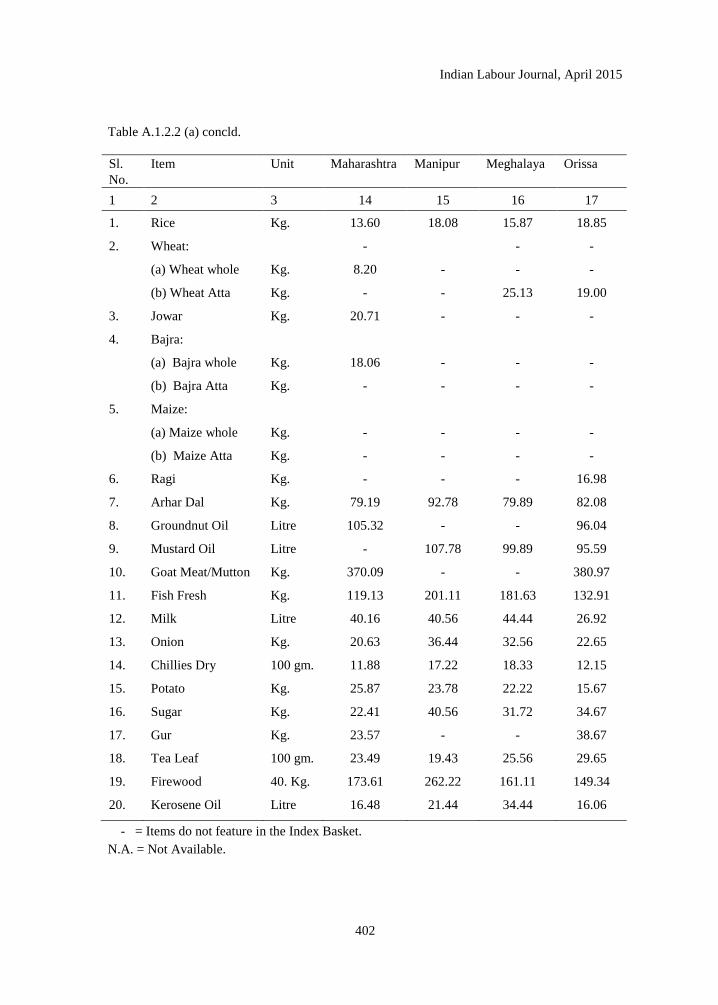
Indian Labour Journal, April 2015
402
Table A.1.2.2 (a) concld.
Sl.
No.
Item Unit Maharashtra Manipur Meghalaya Orissa
1 2 3 14 15 16 17
1. Rice Kg. 13.60 18.08 15.87 18.85
2. Wheat: - - -
(a) Wheat whole Kg. 8.20 - - -
(b) Wheat Atta Kg. - - 25.13 19.00
3. Jowar Kg. 20.71 - - -
4. Bajra:
(a) Bajra whole Kg. 18.06 - - -
(b) Bajra Atta Kg. - - - -
5. Maize:
(a) Maize whole Kg. - - - -
(b) Maize Atta Kg. - - - -
6. Ragi Kg. - - - 16.98
7. Arhar Dal Kg. 79.19 92.78 79.89 82.08
8. Groundnut Oil Litre 105.32 - - 96.04
9. Mustard Oil Litre - 107.78 99.89 95.59
10. Goat Meat/Mutton Kg. 370.09 - - 380.97
11. Fish Fresh Kg. 119.13 201.11 181.63 132.91
12. Milk Litre 40.16 40.56 44.44 26.92
13. Onion Kg. 20.63 36.44 32.56 22.65
14. Chillies Dry 100 gm. 11.88 17.22 18.33 12.15
15. Potato Kg. 25.87 23.78 22.22 15.67
16. Sugar Kg. 22.41 40.56 31.72 34.67
17. Gur Kg. 23.57 - - 38.67
18. Tea Leaf 100 gm. 23.49 19.43 25.56 29.65
19. Firewood 40. Kg. 173.61 262.22 161.11 149.34
20. Kerosene Oil Litre 16.48 21.44 34.44 16.06
- = Items do not feature in the Index Basket.
N.A. = Not Available.
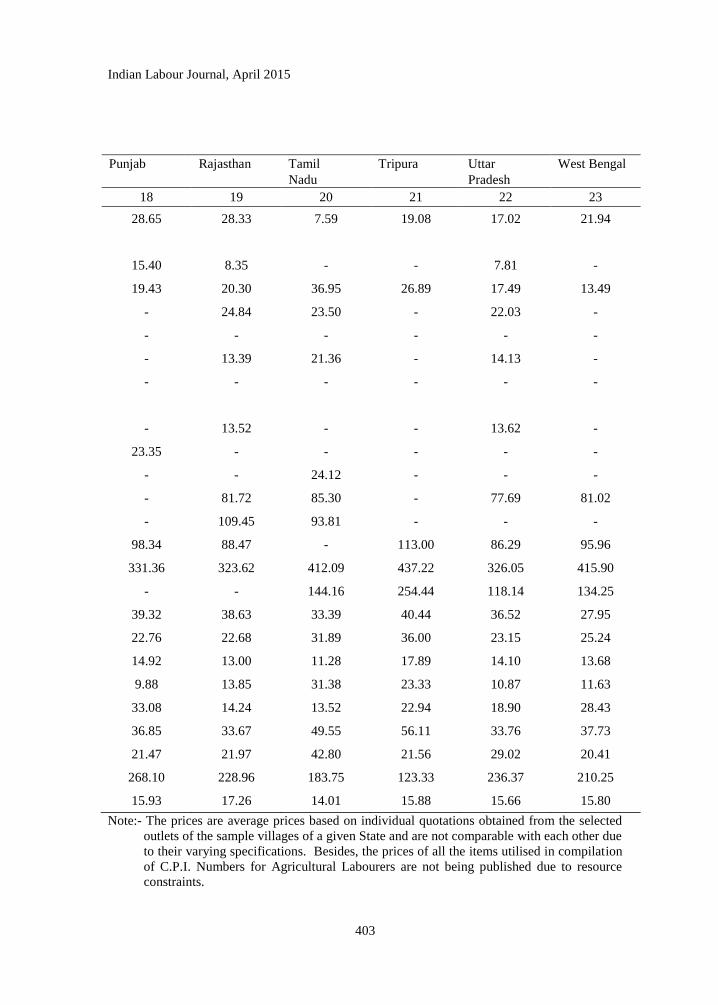
Indian Labour Journal, April 2015
403
Punjab Rajasthan Tamil
Nadu
Tripura Uttar
Pradesh
West Bengal
18 19 20 21 22 23
28.65 28.33 7.59 19.08 17.02 21.94
15.40 8.35 - - 7.81 -
19.43 20.30 36.95 26.89 17.49 13.49
- 24.84 23.50 - 22.03 -
- - - - - -
- 13.39 21.36 - 14.13 -
- - - - - -
- 13.52 - - 13.62 -
23.35 - - - - -
- - 24.12 - - -
- 81.72 85.30 - 77.69 81.02
- 109.45 93.81 - - -
98.34 88.47 - 113.00 86.29 95.96
331.36 323.62 412.09 437.22 326.05 415.90
- - 144.16 254.44 118.14 134.25
39.32 38.63 33.39 40.44 36.52 27.95
22.76 22.68 31.89 36.00 23.15 25.24
14.92 13.00 11.28 17.89 14.10 13.68
9.88 13.85 31.38 23.33 10.87 11.63
33.08 14.24 13.52 22.94 18.90 28.43
36.85 33.67 49.55 56.11 33.76 37.73
21.47 21.97 42.80 21.56 29.02 20.41
268.10 228.96 183.75 123.33 236.37 210.25
15.93 17.26 14.01 15.88 15.66 15.80
Note:- The prices are average prices based on individual quotations obtained from the selected
outlets of the sample villages of a given State and are not comparable with each other due
to their varying specifications. Besides, the prices of all the items utilised in compilation
of C.P.I. Numbers for Agricultural Labourers are not being published due to resource
constraints.
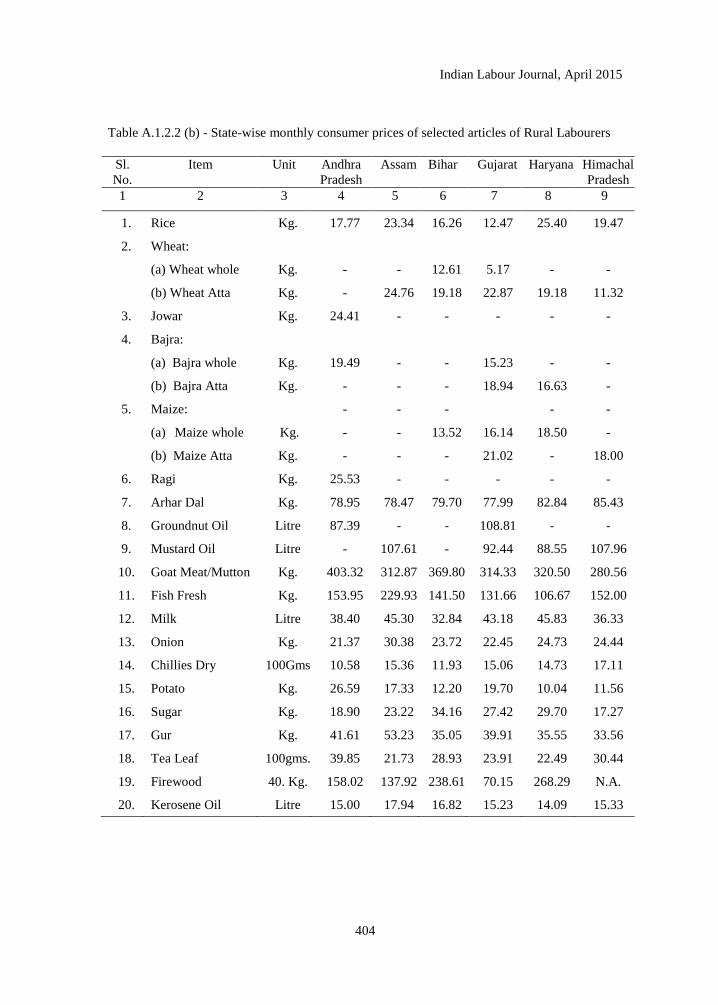
Indian Labour Journal, April 2015
404
Table A.1.2.2 (b) - State-wise monthly consumer prices of selected articles of Rural Labourers
Sl.
No.
Item Unit Andhra
Pradesh
Assam Bihar Gujarat Haryana Himachal
Pradesh
1 2 3 4 5 6 7 8 9
1. Rice Kg. 17.77 23.34 16.26 12.47 25.40 19.47
2. Wheat:
(a) Wheat whole Kg. - - 12.61 5.17 - -
(b) Wheat Atta Kg. - 24.76 19.18 22.87 19.18 11.32
3. Jowar Kg. 24.41 - - - - -
4. Bajra:
(a) Bajra whole Kg. 19.49 - - 15.23 - -
(b) Bajra Atta Kg. - - - 18.94 16.63 -
5. Maize: - - - - -
(a) Maize whole Kg. - - 13.52 16.14 18.50 -
(b) Maize Atta Kg. - - - 21.02 - 18.00
6. Ragi Kg. 25.53 - - - - -
7. Arhar Dal Kg. 78.95 78.47 79.70 77.99 82.84 85.43
8. Groundnut Oil Litre 87.39 - - 108.81 - -
9. Mustard Oil Litre - 107.61 - 92.44 88.55 107.96
10. Goat Meat/Mutton Kg. 403.32 312.87 369.80 314.33 320.50 280.56
11. Fish Fresh Kg. 153.95 229.93 141.50 131.66 106.67 152.00
12. Milk Litre 38.40 45.30 32.84 43.18 45.83 36.33
13. Onion Kg. 21.37 30.38 23.72 22.45 24.73 24.44
14. Chillies Dry 100Gms 10.58 15.36 11.93 15.06 14.73 17.11
15. Potato Kg. 26.59 17.33 12.20 19.70 10.04 11.56
16. Sugar Kg. 18.90 23.22 34.16 27.42 29.70 17.27
17. Gur Kg. 41.61 53.23 35.05 39.91 35.55 33.56
18. Tea Leaf 100gms. 39.85 21.73 28.93 23.91 22.49 30.44
19. Firewood 40. Kg. 158.02 137.92 238.61 70.15 268.29 N.A.
20. Kerosene Oil Litre 15.00 17.94 16.82 15.23 14.09 15.33
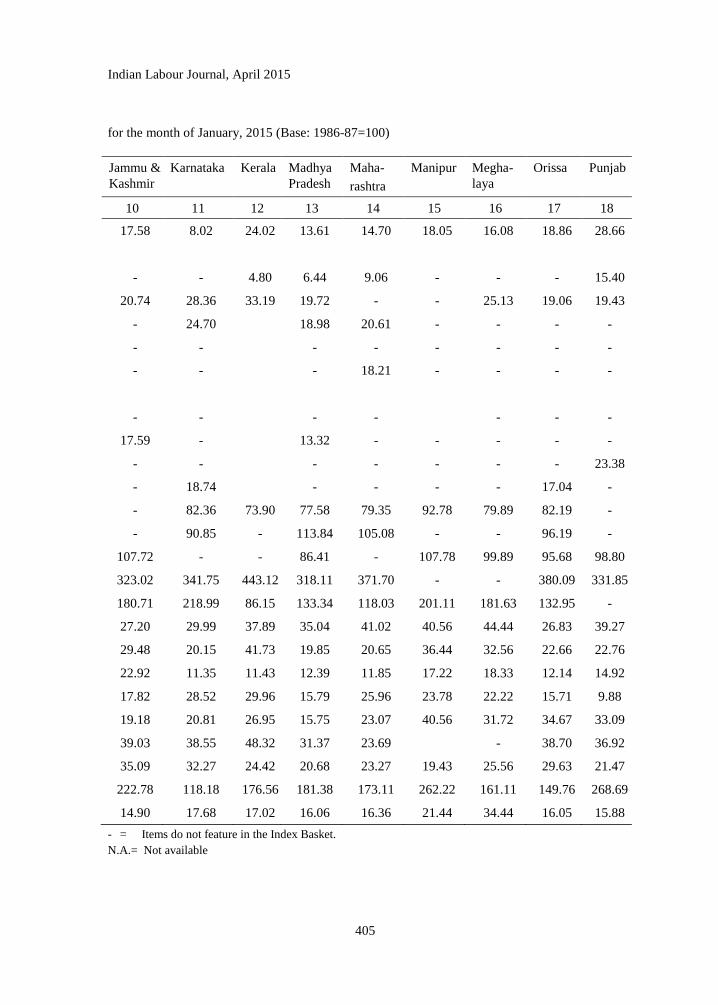
Indian Labour Journal, April 2015
405
for the month of January, 2015 (Base: 1986-87=100)
Jammu &
Kashmir
Karnataka Kerala Madhya
Pradesh
Maha-
rashtra
Manipur Megha-
laya
Orissa Punjab
10 11 12 13 14 15 16 17 18
17.58 8.02 24.02 13.61 14.70 18.05 16.08 18.86 28.66
- - 4.80 6.44 9.06 - - - 15.40
20.74 28.36 33.19 19.72 - - 25.13 19.06 19.43
- 24.70 18.98 20.61 - - - -
- - - - - - - -
- - - 18.21 - - - -
- - - - - - -
17.59 - 13.32 - - - - -
- - - - - - - 23.38
- 18.74 - - - - 17.04 -
- 82.36 73.90 77.58 79.35 92.78 79.89 82.19 -
- 90.85 - 113.84 105.08 - - 96.19 -
107.72 - - 86.41 - 107.78 99.89 95.68 98.80
323.02 341.75 443.12 318.11 371.70 - - 380.09 331.85
180.71 218.99 86.15 133.34 118.03 201.11 181.63 132.95 -
27.20 29.99 37.89 35.04 41.02 40.56 44.44 26.83 39.27
29.48 20.15 41.73 19.85 20.65 36.44 32.56 22.66 22.76
22.92 11.35 11.43 12.39 11.85 17.22 18.33 12.14 14.92
17.82 28.52 29.96 15.79 25.96 23.78 22.22 15.71 9.88
19.18 20.81 26.95 15.75 23.07 40.56 31.72 34.67 33.09
39.03 38.55 48.32 31.37 23.69 - 38.70 36.92
35.09 32.27 24.42 20.68 23.27 19.43 25.56 29.63 21.47
222.78 118.18 176.56 181.38 173.11 262.22 161.11 149.76 268.69
14.90 17.68 17.02 16.06 16.36 21.44 34.44 16.05 15.88
- = Items do not feature in the Index Basket.
N.A.= Not available
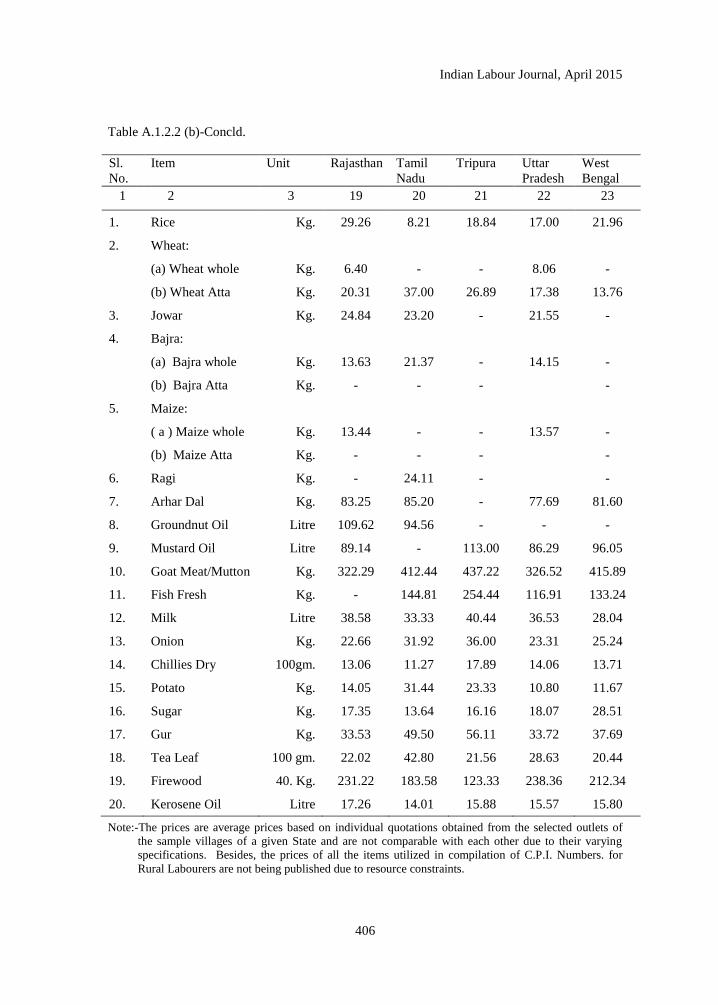
Indian Labour Journal, April 2015
406
Table A.1.2.2 (b)-Concld.
Sl.
No.
Item Unit Rajasthan Tamil
Nadu
Tripura Uttar
Pradesh
West
Bengal
1 2 3 19 20 21 22 23
1. Rice Kg. 29.26 8.21 18.84 17.00 21.96
2. Wheat:
(a) Wheat whole Kg. 6.40 - - 8.06 -
(b) Wheat Atta Kg. 20.31 37.00 26.89 17.38 13.76
3. Jowar Kg. 24.84 23.20 - 21.55 -
4. Bajra:
(a) Bajra whole Kg. 13.63 21.37 - 14.15 -
(b) Bajra Atta Kg. - - - -
5. Maize:
( a ) Maize whole Kg. 13.44 - - 13.57 -
(b) Maize Atta Kg. - - - -
6. Ragi Kg. - 24.11 - -
7. Arhar Dal Kg. 83.25 85.20 - 77.69 81.60
8. Groundnut Oil Litre 109.62 94.56 - - -
9. Mustard Oil Litre 89.14 - 113.00 86.29 96.05
10. Goat Meat/Mutton Kg. 322.29 412.44 437.22 326.52 415.89
11. Fish Fresh Kg. - 144.81 254.44 116.91 133.24
12. Milk Litre 38.58 33.33 40.44 36.53 28.04
13. Onion Kg. 22.66 31.92 36.00 23.31 25.24
14. Chillies Dry 100gm. 13.06 11.27 17.89 14.06 13.71
15. Potato Kg. 14.05 31.44 23.33 10.80 11.67
16. Sugar Kg. 17.35 13.64 16.16 18.07 28.51
17. Gur Kg. 33.53 49.50 56.11 33.72 37.69
18. Tea Leaf 100 gm. 22.02 42.80 21.56 28.63 20.44
19. Firewood 40. Kg. 231.22 183.58 123.33 238.36 212.34
20. Kerosene Oil Litre 17.26 14.01 15.88 15.57 15.80
Note:-The prices are average prices based on individual quotations obtained from the selected outlets of
the sample villages of a given State and are not comparable with each other due to their varying
specifications. Besides, the prices of all the items utilized in compilation of C.P.I. Numbers. for
Rural Labourers are not being published due to resource constraints.
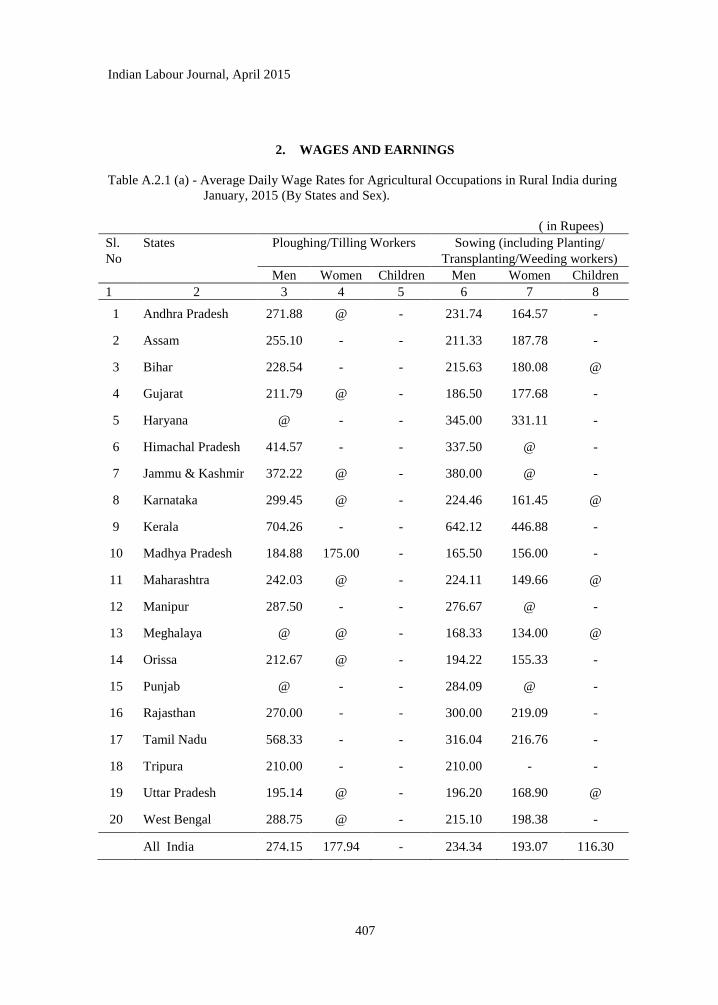
Indian Labour Journal, April 2015
407
2. WAGES AND EARNINGS
Table A.2.1 (a) - Average Daily Wage Rates for Agricultural Occupations in Rural India during
January, 2015 (By States and Sex).
( in Rupees)
Sl.
No
States Ploughing/Tilling Workers Sowing (including Planting/
Transplanting/Weeding workers)
Men Women Children Men Women Children
1 2 3 4 5 6 7 8
1 Andhra Pradesh 271.88 @ - 231.74 164.57 -
2 Assam 255.10 - - 211.33 187.78 -
3 Bihar 228.54 - - 215.63 180.08 @
4 Gujarat 211.79 @ - 186.50 177.68 -
5 Haryana @ - - 345.00 331.11 -
6 Himachal Pradesh 414.57 - - 337.50 @ -
7 Jammu & Kashmir 372.22 @ - 380.00 @ -
8 Karnataka 299.45 @ - 224.46 161.45 @
9 Kerala 704.26 - - 642.12 446.88 -
10 Madhya Pradesh 184.88 175.00 - 165.50 156.00 -
11 Maharashtra 242.03 @ - 224.11 149.66 @
12 Manipur 287.50 - - 276.67 @ -
13 Meghalaya @ @ - 168.33 134.00 @
14 Orissa 212.67 @ - 194.22 155.33 -
15 Punjab @ - - 284.09 @ -
16 Rajasthan 270.00 - - 300.00 219.09 -
17 Tamil Nadu 568.33 - - 316.04 216.76 -
18 Tripura 210.00 - - 210.00 - -
19 Uttar Pradesh 195.14 @ - 196.20 168.90 @
20 West Bengal 288.75 @ - 215.10 198.38 -
All India 274.15 177.94 - 234.34 193.07 116.30
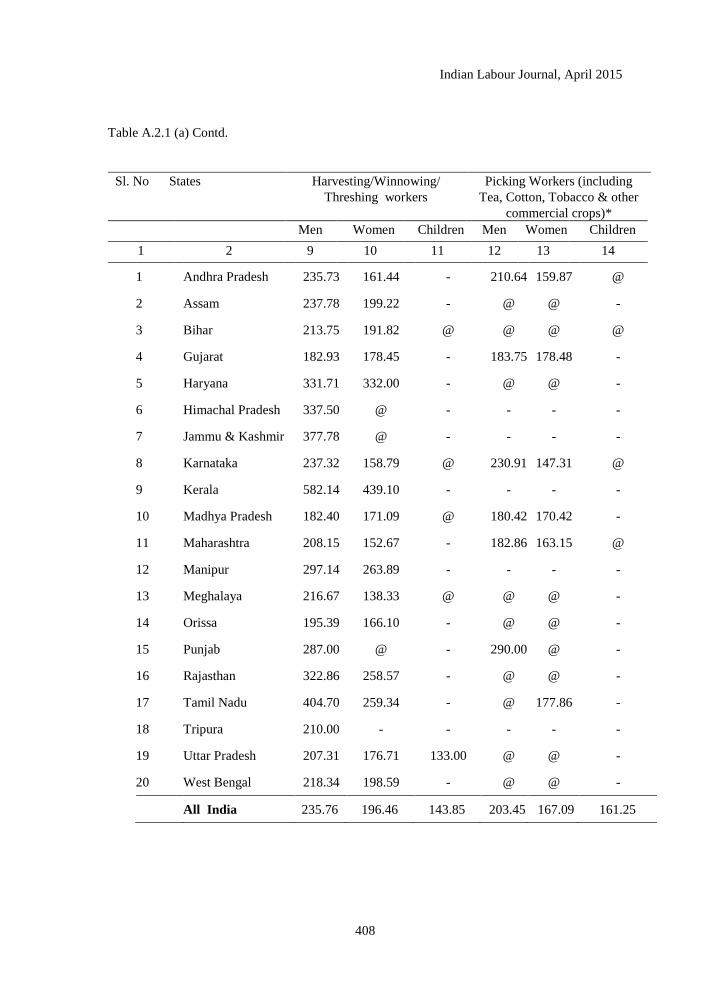
Indian Labour Journal, April 2015
408
Table A.2.1 (a) Contd.
Sl. No States Harvesting/Winnowing/
Threshing workers
Picking Workers (including
Tea, Cotton, Tobacco & other
commercial crops)*
Men Women Children Men Women Children
1 2 9 10 11 12 13 14
1 Andhra Pradesh 235.73 161.44 - 210.64 159.87 @
2 Assam 237.78 199.22 - @ @ -
3 Bihar 213.75 191.82 @ @ @ @
4 Gujarat 182.93 178.45 - 183.75 178.48 -
5 Haryana 331.71 332.00 - @ @ -
6 Himachal Pradesh 337.50 @ - - - -
7 Jammu & Kashmir 377.78 @ - - - -
8 Karnataka 237.32 158.79 @ 230.91 147.31 @
9 Kerala 582.14 439.10 - - - -
10 Madhya Pradesh 182.40 171.09 @ 180.42 170.42 -
11 Maharashtra 208.15 152.67 - 182.86 163.15 @
12 Manipur 297.14 263.89 - - - -
13 Meghalaya 216.67 138.33 @ @ @ -
14 Orissa 195.39 166.10 - @ @ -
15 Punjab 287.00 @ - 290.00 @ -
16 Rajasthan 322.86 258.57 - @ @ -
17 Tamil Nadu 404.70 259.34 - @ 177.86 -
18 Tripura 210.00 - - - - -
19 Uttar Pradesh 207.31 176.71 133.00 @ @ -
20 West Bengal 218.34 198.59 - @ @ -
All India 235.76 196.46 143.85 203.45 167.09 161.25
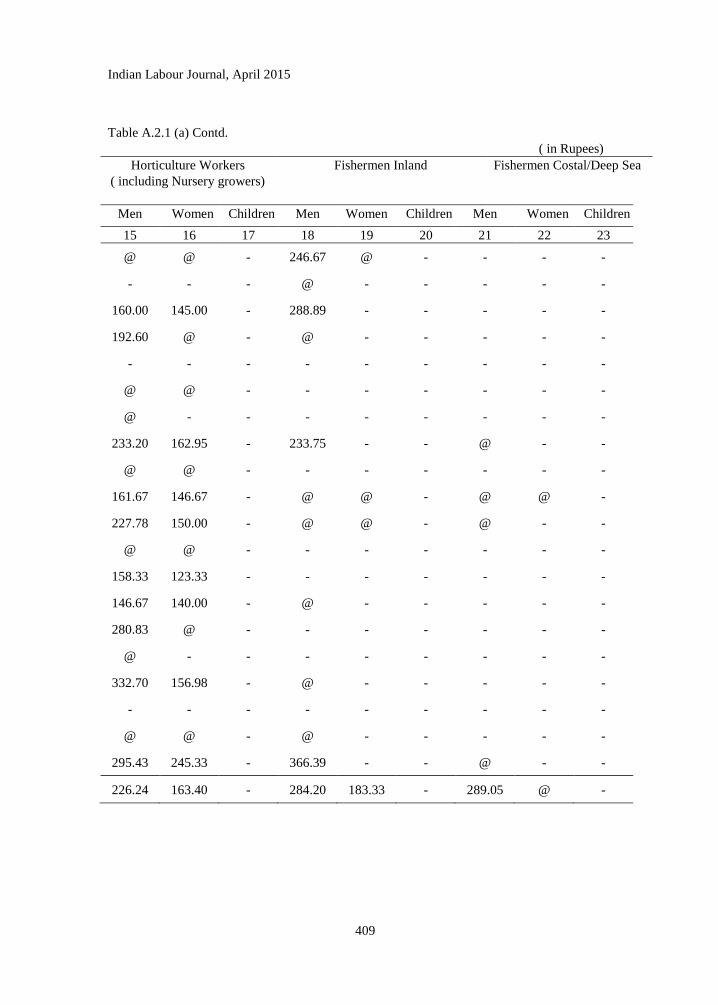
Indian Labour Journal, April 2015
409
Table A.2.1 (a) Contd.
( in Rupees)
Horticulture Workers
( including Nursery growers)
Fishermen Inland Fishermen Costal/Deep Sea
Men Women Children Men Women Children Men Women Children
15 16 17 18 19 20 21 22 23
@ @ - 246.67 @ - - - -
- - - @ - - - - -
160.00 145.00 - 288.89 - - - - -
192.60 @ - @ - - - - -
- - - - - - - - -
@ @ - - - - - - -
@ - - - - - - - -
233.20 162.95 - 233.75 - - @ - -
@ @ - - - - - - -
161.67 146.67 - @ @ - @ @ -
227.78 150.00 - @ @ - @ - -
@ @ - - - - - - -
158.33 123.33 - - - - - - -
146.67 140.00 - @ - - - - -
280.83 @ - - - - - - -
@ - - - - - - - -
332.70 156.98 - @ - - - - -
- - - - - - - - -
@ @ - @ - - - - -
295.43 245.33 - 366.39 - - @ - -
226.24 163.40 - 284.20 183.33 - 289.05 @ -
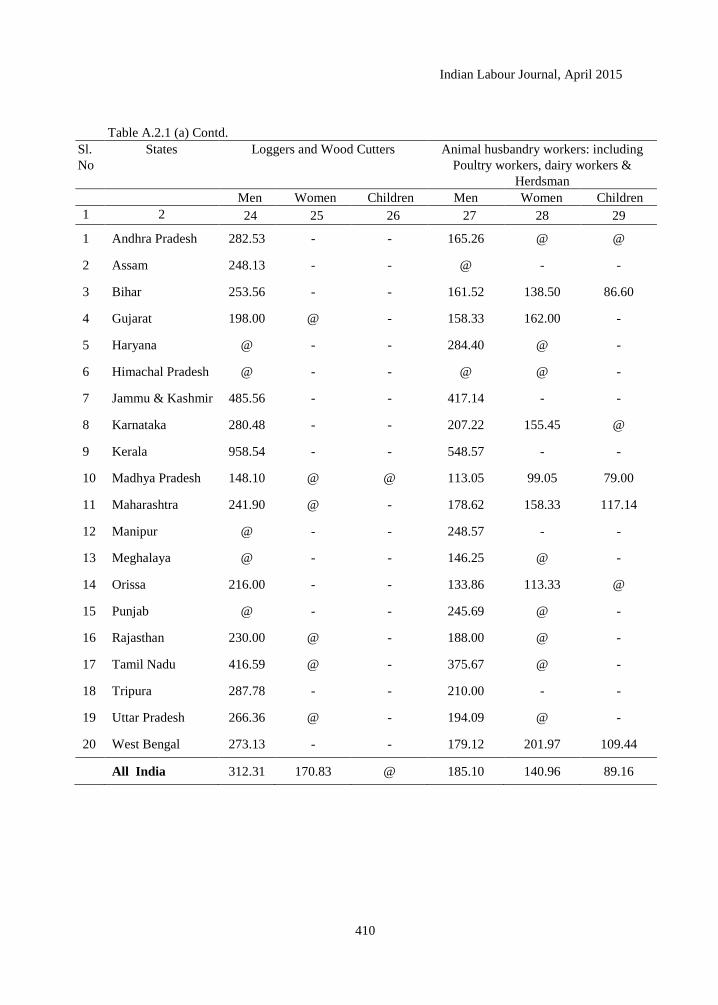
Indian Labour Journal, April 2015
410
Table A.2.1 (a) Contd.
Sl.
No
States Loggers and Wood Cutters Animal husbandry workers: including
Poultry workers, dairy workers &
Herdsman
Men Women Children Men Women Children
1 2 24 25 26 27 28 29
1 Andhra Pradesh 282.53 - - 165.26 @ @
2 Assam 248.13 - - @ - -
3 Bihar 253.56 - - 161.52 138.50 86.60
4 Gujarat 198.00 @ - 158.33 162.00 -
5 Haryana @ - - 284.40 @ -
6 Himachal Pradesh @ - - @ @ -
7 Jammu & Kashmir 485.56 - - 417.14 - -
8 Karnataka 280.48 - - 207.22 155.45 @
9 Kerala 958.54 - - 548.57 - -
10 Madhya Pradesh 148.10 @ @ 113.05 99.05 79.00
11 Maharashtra 241.90 @ - 178.62 158.33 117.14
12 Manipur @ - - 248.57 - -
13 Meghalaya @ - - 146.25 @ -
14 Orissa 216.00 - - 133.86 113.33 @
15 Punjab @ - - 245.69 @ -
16 Rajasthan 230.00 @ - 188.00 @ -
17 Tamil Nadu 416.59 @ - 375.67 @ -
18 Tripura 287.78 - - 210.00 - -
19 Uttar Pradesh 266.36 @ - 194.09 @ -
20 West Bengal 273.13 - - 179.12 201.97 109.44
All India 312.31 170.83 @ 185.10 140.96 89.16
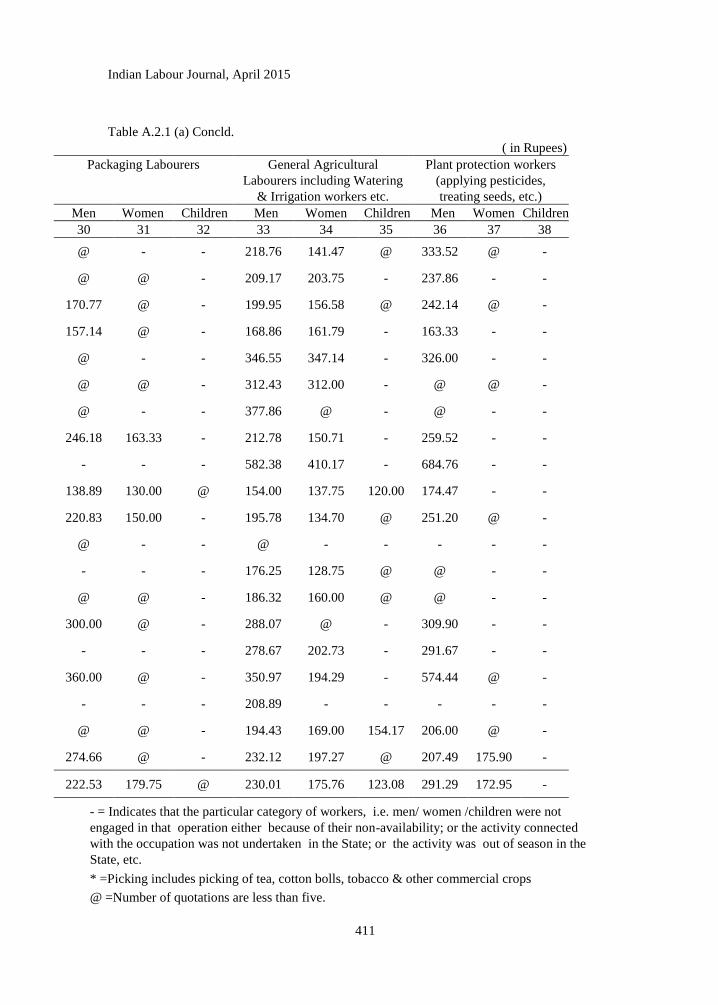
Indian Labour Journal, April 2015
411
Table A.2.1 (a) Concld.
( in Rupees)
Packaging Labourers General Agricultural
Labourers including Watering
& Irrigation workers etc.
Plant protection workers
(applying pesticides,
treating seeds, etc.)
Men Women Children Men Women Children Men Women Children
30 31 32 33 34 35 36 37 38
@ - - 218.76 141.47 @ 333.52 @ -
@ @ - 209.17 203.75 - 237.86 - -
170.77 @ - 199.95 156.58 @ 242.14 @ -
157.14 @ - 168.86 161.79 - 163.33 - -
@ - - 346.55 347.14 - 326.00 - -
@ @ - 312.43 312.00 - @ @ -
@ - - 377.86 @ - @ - -
246.18 163.33 - 212.78 150.71 - 259.52 - -
- - - 582.38 410.17 - 684.76 - -
138.89 130.00 @ 154.00 137.75 120.00 174.47 - -
220.83 150.00 - 195.78 134.70 @ 251.20 @ -
@ - - @ - - - - -
- - - 176.25 128.75 @ @ - -
@ @ - 186.32 160.00 @ @ - -
300.00 @ - 288.07 @ - 309.90 - -
- - - 278.67 202.73 - 291.67 - -
360.00 @ - 350.97 194.29 - 574.44 @ -
- - - 208.89 - - - - -
@ @ - 194.43 169.00 154.17 206.00 @ -
274.66 @ - 232.12 197.27 @ 207.49 175.90 -
222.53 179.75 @ 230.01 175.76 123.08 291.29 172.95 -
- = Indicates that the particular category of workers, i.e. men/ women /children were not
engaged in that operation either because of their non-availability; or the activity connected
with the occupation was not undertaken in the State; or the activity was out of season in the
State, etc.
* =Picking includes picking of tea, cotton bolls, tobacco & other commercial crops
@ =Number of quotations are less than five.
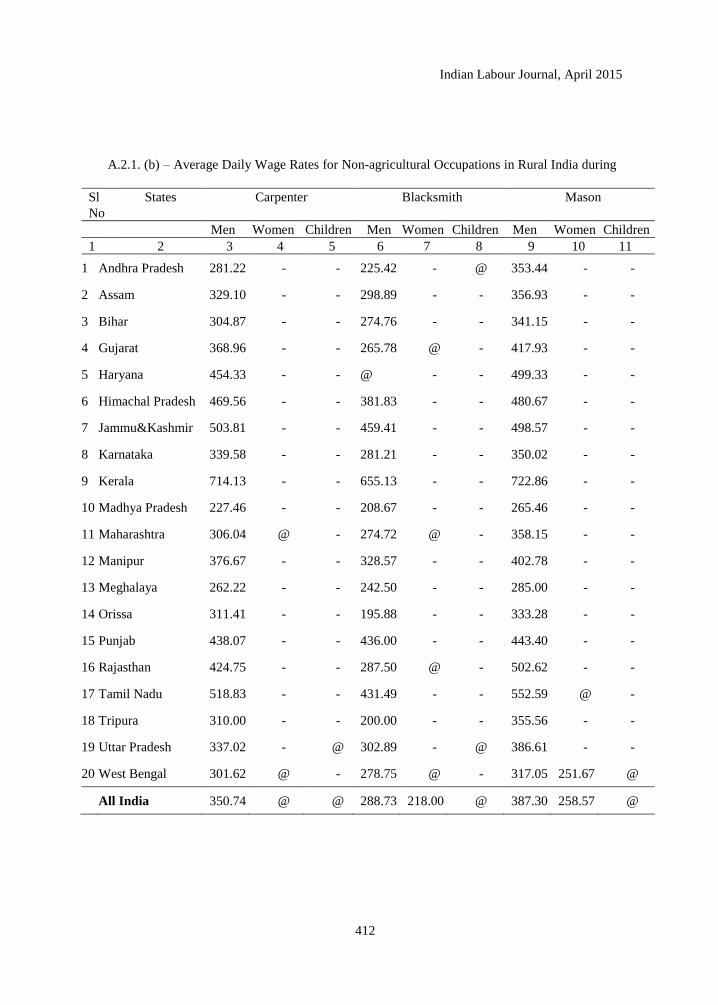
Indian Labour Journal, April 2015
412
A.2.1. (b) – Average Daily Wage Rates for Non-agricultural Occupations in Rural India during
Sl
No
States Carpenter Blacksmith Mason
Men Women Children Men Women Children Men Women Children
1 2 3 4 5 6 7 8 9 10 11
1 Andhra Pradesh 281.22 - - 225.42 - @ 353.44 - -
2 Assam 329.10 - - 298.89 - - 356.93 - -
3 Bihar 304.87 - - 274.76 - - 341.15 - -
4 Gujarat 368.96 - - 265.78 @ - 417.93 - -
5 Haryana 454.33 - - @ - - 499.33 - -
6 Himachal Pradesh 469.56 - - 381.83 - - 480.67 - -
7 Jammu&Kashmir 503.81 - - 459.41 - - 498.57 - -
8 Karnataka 339.58 - - 281.21 - - 350.02 - -
9 Kerala 714.13 - - 655.13 - - 722.86 - -
10 Madhya Pradesh 227.46 - - 208.67 - - 265.46 - -
11 Maharashtra 306.04 @ - 274.72 @ - 358.15 - -
12 Manipur 376.67 - - 328.57 - - 402.78 - -
13 Meghalaya 262.22 - - 242.50 - - 285.00 - -
14 Orissa 311.41 - - 195.88 - - 333.28 - -
15 Punjab 438.07 - - 436.00 - - 443.40 - -
16 Rajasthan 424.75 - - 287.50 @ - 502.62 - -
17 Tamil Nadu 518.83 - - 431.49 - - 552.59 @ -
18 Tripura 310.00 - - 200.00 - - 355.56 - -
19 Uttar Pradesh 337.02 - @ 302.89 - @ 386.61 - -
20 West Bengal 301.62 @ - 278.75 @ - 317.05 251.67 @
All India 350.74 @ @ 288.73 218.00 @ 387.30 258.57 @
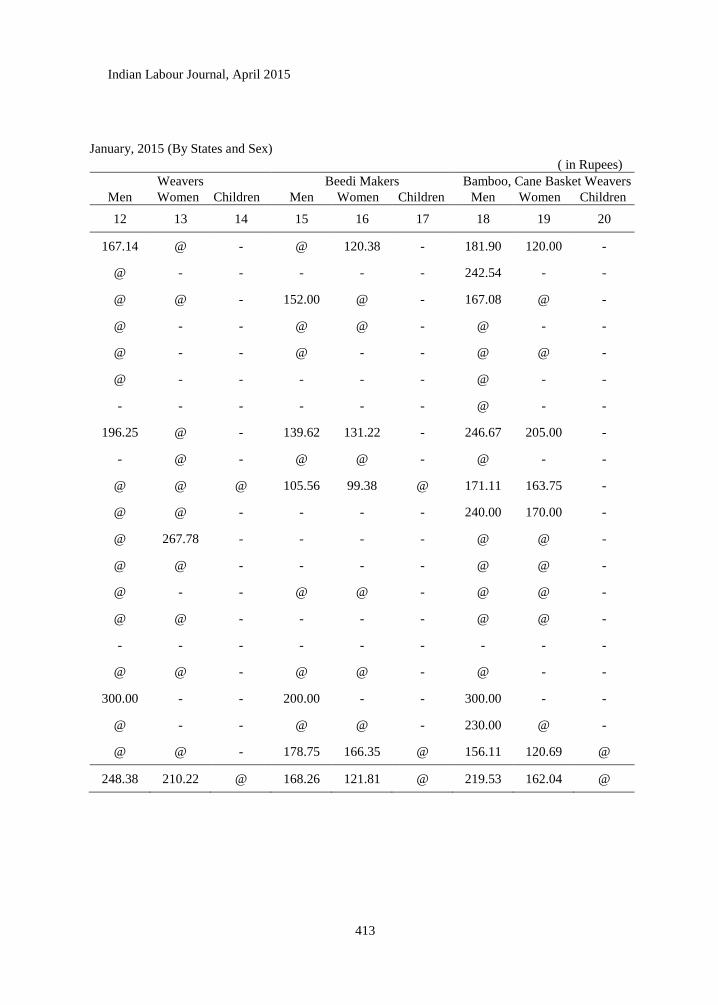
Indian Labour Journal, April 2015
413
January, 2015 (By States and Sex)
( in Rupees)
Weavers Beedi Makers Bamboo, Cane Basket Weavers
Men Women Children Men Women Children Men Women Children
12 13 14 15 16 17 18 19 20
167.14 @ - @ 120.38 - 181.90 120.00 -
@ - - - - - 242.54 - -
@ @ - 152.00 @ - 167.08 @ -
@ - - @ @ - @ - -
@ - - @ - - @ @ -
@ - - - - - @ - -
- - - - - - @ - -
196.25 @ - 139.62 131.22 - 246.67 205.00 -
- @ - @ @ - @ - -
@ @ @ 105.56 99.38 @ 171.11 163.75 -
@ @ - - - - 240.00 170.00 -
@ 267.78 - - - - @ @ -
@ @ - - - - @ @ -
@ - - @ @ - @ @ -
@ @ - - - - @ @ -
- - - - - - - - -
@ @ - @ @ - @ - -
300.00 - - 200.00 - - 300.00 - -
@ - - @ @ - 230.00 @ -
@ @ - 178.75 166.35 @ 156.11 120.69 @
248.38 210.22 @ 168.26 121.81 @ 219.53 162.04 @
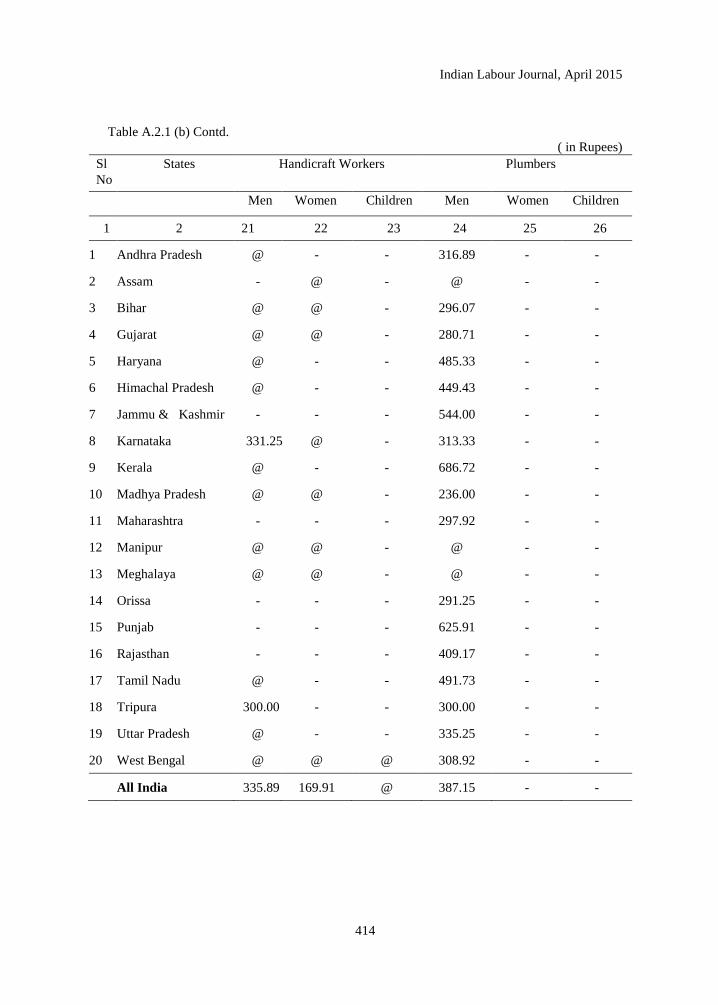
Indian Labour Journal, April 2015
414
Table A.2.1 (b) Contd.
( in Rupees)
Sl
No
States Handicraft Workers Plumbers
Men Women Children Men Women Children
1 2 21 22 23 24 25 26
1 Andhra Pradesh @ - - 316.89 - -
2 Assam - @ - @ - -
3 Bihar @ @ - 296.07 - -
4 Gujarat @ @ - 280.71 - -
5 Haryana @ - - 485.33 - -
6 Himachal Pradesh @ - - 449.43 - -
7 Jammu & Kashmir - - - 544.00 - -
8 Karnataka 331.25 @ - 313.33 - -
9 Kerala @ - - 686.72 - -
10 Madhya Pradesh @ @ - 236.00 - -
11 Maharashtra - - - 297.92 - -
12 Manipur @ @ - @ - -
13 Meghalaya @ @ - @ - -
14 Orissa - - - 291.25 - -
15 Punjab - - - 625.91 - -
16 Rajasthan - - - 409.17 - -
17 Tamil Nadu @ - - 491.73 - -
18 Tripura 300.00 - - 300.00 - -
19 Uttar Pradesh @ - - 335.25 - -
20 West Bengal @ @ @ 308.92 - -
All India 335.89 169.91 @ 387.15 - -

Indian Labour Journal, April 2015
415
Table A.2.1 (b) Contd.
( in Rupees)
Electrician Construction Workers (for roads,
dams, industrial & project
construction work & well diggers
LMV & Tractors drivers
Men Women Children Men Women Children Men Women Children
27 28 29 30 31 32 33 34 35
303.48 - - 245.48 182.38 - 269.17 - -
296.25 - - 251.39 @ - 294.69 - -
308.89 - - 231.90 192.00 - 253.03 - -
283.15 - - 236.92 192.78 - 219.09 - -
465.20 - - 369.27 361.67 - 393.20 - -
465.14 - - 309.14 - - 287.48 - -
557.86 - - 417.50 @ - 388.33 - -
315.56 - - 287.12 197.32 - 295.94 - -
679.58 - - 798.23 @ - 738.33 - -
232.56 - - 178.85 162.70 133.33 221.95 @ -
318.59 - - 273.91 196.25 - 283.33 - -
366.67 - - 317.86 @ - 447.78 - -
@ - - 235.71 @ - @ - -
265.00 - - 201.66 162.92 - 254.52 - -
501.39 - - 308.00 246.00 - 304.71 - -
418.33 - - 309.00 275.77 - 359.41 - -
483.31 - - 383.00 247.19 - 470.42 - -
305.56 - - 200.00 - - 300.00 - -
350.19 - - 218.09 186.58 @ 253.09 - -
344.55 - - 233.32 206.96 - 305.00 - -
372.63 - - 279.49 200.75 133.75 301.15 @ -
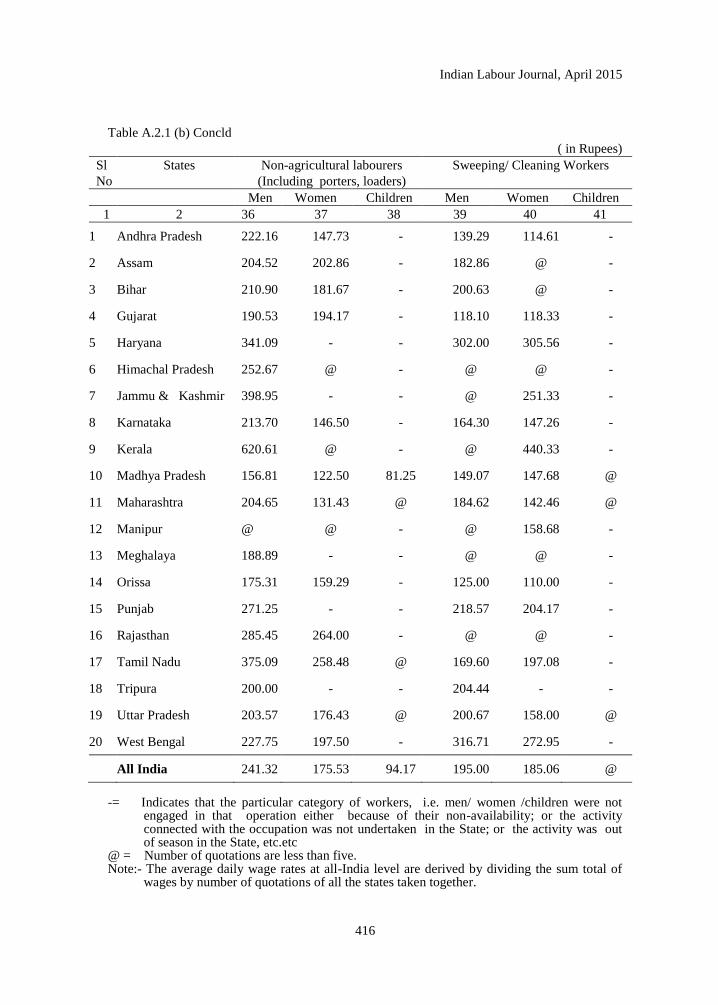
Indian Labour Journal, April 2015
416
Table A.2.1 (b) Concld
( in Rupees)
Sl
No
States Non-agricultural labourers
(Including porters, loaders)
Sweeping/ Cleaning Workers
Men Women Children Men Women Children
1 2 36 37 38 39 40 41
1 Andhra Pradesh 222.16 147.73 - 139.29 114.61 -
2 Assam 204.52 202.86 - 182.86 @ -
3 Bihar 210.90 181.67 - 200.63 @ -
4 Gujarat 190.53 194.17 - 118.10 118.33 -
5 Haryana 341.09 - - 302.00 305.56 -
6 Himachal Pradesh 252.67 @ - @ @ -
7 Jammu & Kashmir 398.95 - - @ 251.33 -
8 Karnataka 213.70 146.50 - 164.30 147.26 -
9 Kerala 620.61 @ - @ 440.33 -
10 Madhya Pradesh 156.81 122.50 81.25 149.07 147.68 @
11 Maharashtra 204.65 131.43 @ 184.62 142.46 @
12 Manipur @ @ - @ 158.68 -
13 Meghalaya 188.89 - - @ @ -
14 Orissa 175.31 159.29 - 125.00 110.00 -
15 Punjab 271.25 - - 218.57 204.17 -
16 Rajasthan 285.45 264.00 - @ @ -
17 Tamil Nadu 375.09 258.48 @ 169.60 197.08 -
18 Tripura 200.00 - - 204.44 - -
19 Uttar Pradesh 203.57 176.43 @ 200.67 158.00 @
20 West Bengal 227.75 197.50 - 316.71 272.95 -
All India 241.32 175.53 94.17 195.00 185.06 @
-= Indicates that the particular category of workers, i.e. men/ women /children were not
engaged in that operation either because of their non-availability; or the activity connected with the occupation was not undertaken in the State; or the activity was out of season in the State, etc.etc
@ = Number of quotations are less than five. Note:- The average daily wage rates at all-India level are derived by dividing the sum total of
wages by number of quotations of all the states taken together.
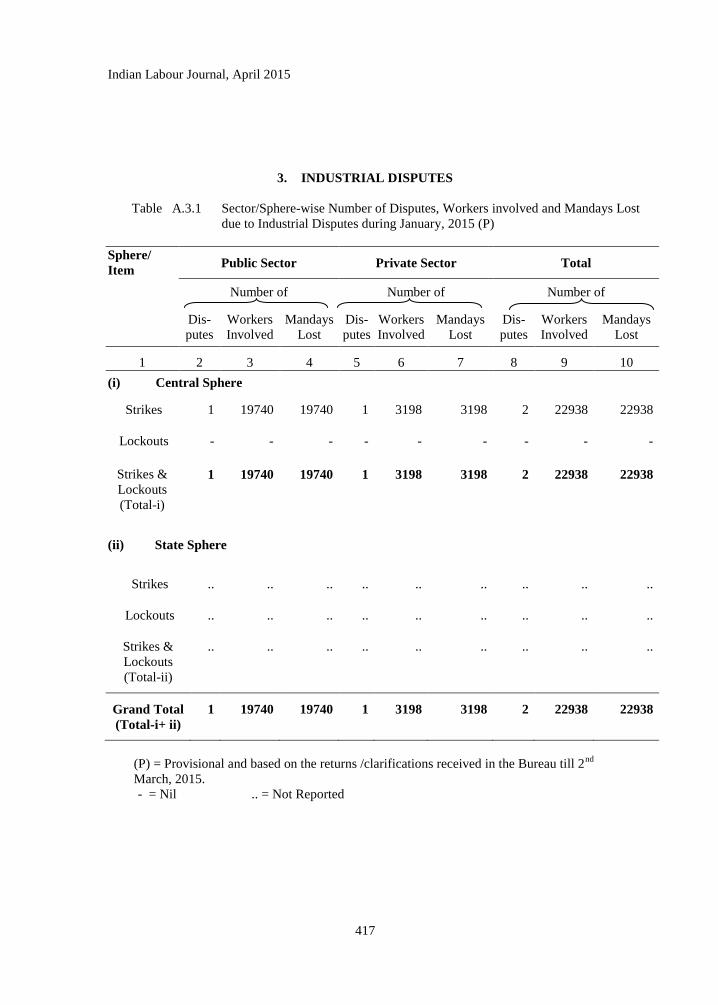
Indian Labour Journal, April 2015
417
3. INDUSTRIAL DISPUTES
Table A.3.1 Sector/Sphere-wise Number of Disputes, Workers involved and Mandays Lost
due to Industrial Disputes during January, 2015 (P)
Sphere/
Item Public Sector Private Sector Total
Number of Number of Number of
Dis-
putes
Workers
Involved
Mandays
Lost
Dis-
putes
Workers
Involved
Mandays
Lost
Dis-
putes
Workers
Involved
Mandays
Lost
1 2 3 4 5 6 7 8 9 10
(i) Central Sphere
Strikes 1 19740 19740 1 3198 3198 2 22938 22938
Lockouts - - - - - - - - -
Strikes &
Lockouts
(Total-i)
1 19740 19740 1 3198 3198 2 22938 22938
(ii) State Sphere
Strikes .. .. .. .. .. .. .. .. ..
Lockouts .. .. .. .. .. .. .. .. ..
Strikes &
Lockouts
(Total-ii)
.. .. .. .. .. .. .. .. ..
Grand Total
(Total-i+ ii)
1 19740 19740 1 3198 3198 2 22938 22938
(P) = Provisional and based on the returns /clarifications received in the Bureau till 2nd
March, 2015.
- = Nil .. = Not Reported
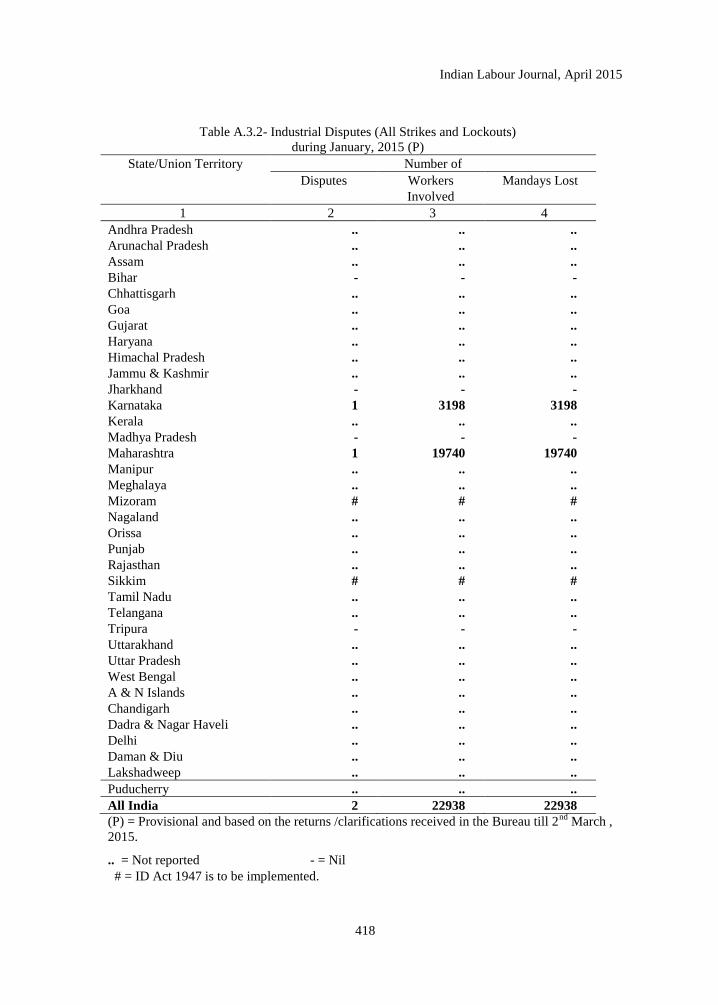
Indian Labour Journal, April 2015
418
Table A.3.2- Industrial Disputes (All Strikes and Lockouts)
during January, 2015 (P)
State/Union Territory Number of
Disputes Workers
Involved
Mandays Lost
1 2 3 4
Andhra Pradesh .. .. ..
Arunachal Pradesh .. .. ..
Assam .. .. ..
Bihar - - -
Chhattisgarh .. .. ..
Goa .. .. ..
Gujarat .. .. ..
Haryana .. .. ..
Himachal Pradesh .. .. ..
Jammu & Kashmir .. .. ..
Jharkhand - - -
Karnataka 1 3198 3198
Kerala .. .. ..
Madhya Pradesh - - -
Maharashtra 1 19740 19740
Manipur .. .. ..
Meghalaya .. .. ..
Mizoram # # #
Nagaland .. .. ..
Orissa .. .. ..
Punjab .. .. ..
Rajasthan .. .. ..
Sikkim # # #
Tamil Nadu .. .. ..
Telangana .. .. ..
Tripura - - -
Uttarakhand .. .. ..
Uttar Pradesh .. .. ..
West Bengal .. .. ..
A & N Islands .. .. ..
Chandigarh .. .. ..
Dadra & Nagar Haveli .. .. ..
Delhi .. .. ..
Daman & Diu .. .. ..
Lakshadweep .. .. ..
Puducherry .. .. ..
All India 2 22938 22938
(P) = Provisional and based on the returns /clarifications received in the Bureau till 2nd
March ,
2015.
.. = Not reported - = Nil
# = ID Act 1947 is to be implemented.
Indian Labour Journal, April 2015
419
SECTION B
SERIAL STATISTICS
N O T E
1 Prices and Price Indices
1.1. Industrial Worker’s Consumer Price Index
B.1.1.1. All-India Consumer Price Index Numbers for Industrial Workers – The All India
Consumer Price Index Numbers (General and Food) on base 1982=100 were being published
since their first release with effect from October, 1988 index replacing the old series on base:
1960=100. The Labour Bureau has released the new series of Consumer Price Index Numbers
for Industrial Workers on base: 2001=100 with the index of January, 2006 which has replaced
the previous series on base: 1982=100. The indices for the old base (1960=100) series can be
derived by multiplying the 1982 series indices by the Linking Factors, which are 4.93 for the
general index and 4.98 for the food index. Similarly, the indices for 1982 series can be derived
by multiplying the 2001 series indices by the Linking factors, which are 4.63 and 4.58 for
General and Food group respectively. The Annual Average (Calendar year 1992 to 2013 as well
as Financial year 1992-93 to 2013-2014) and monthly All India Index Numbers (General&
Food) from January, 2014 to January, 2015 have been presented in Table B.1.1.1.
B.1.1.2. Labour Bureau’s Series of Consumer Price Index Numbers for Industrial Workers – Serial Statistics in respect of Consumer Price Index Numbers for Industrial Workers on base 1982=100 and new series on base: 2001=100 (General Index only) for 78 centres are set out in Table B.1.1.2.
1.2 Consumer Price Index Numbers for Agricultural Labourers
B.1.2.1(a) and (b). All-India Consumer Price Index Numbers for Agricultural and Rural
Labourers (Base: 1986-87=100) – Serial statistics relating to the All-India Consumer Price
Index Numbers (General and Food) for Agricultural and Rural Labourers on base 1986-87=100
separately for Agricultural Years from 1995-96 to 2012-13, Financial Years from 1995-96 to
2013-14 and Calendar Years from 1995 to 2013, along with month-wise indices and 12-
monthly moving averages from January, 2014 to January, 2015 are presented in Tables B.1.2.1
(a) and (b) respectively.
B.1.2.2 (a) and (b) Labour Bureau’s Series of Consumer Price Index Numbers for Agricultural
Labourers and Rural Labourers on Base: 1986-87=100 – Serial statistics in respect of
Consumer Price Index Numbers (General Index) for Agricultural Labourers and Rural
Labourers (Base: 1986-87=100) for 20 States are given in Tables B.1.2.2 (a) and (b)
respectively.
Indian Labour Journal, April 2015
420
1.3. Urban Non-Manual Employees Consumer Price Index / Consumer Price Index for Urban and Rural Areas
B.1.3. Consumer Price Index Numbers for Urban Non-Manual Employees (Base:1984-85=100); Consumer Price Index for Urban and Rural Areas on base: 2010=100 and on base 2012=100
Consumer Price Index for Urban Non-Manual Employees on base: 1984-85=100 were compiled and published by the Central Statistical Organisation (CSO), New Delhi. The Price collection for CPI (UNME) was discontinued with effect from April, 2008. As decided by the National Statistical Commission, linked all-India CPI (UNME) numbers for the year 2008 to 2010 are given in Serial Statistics.
The Central Statistics Office (CSO) releases Consumer Price Indices (CPI) on base 2010=100 for all-India and States/UTs separately for rural, urban and combined every month with effect from January, 2011. Consumer Price Index for Urban and Rural areas for the period January, 2014 to January, 2015 have been presented in Table B.1.3.
1.4. Wholesale Price Index
B.1.4. All India Index Numbers of Wholesale prices (Base: 2004-05=100) – The current series of Index Numbers of Wholesale Prices in India on base 2004-05=100 was released w.e.f. September, 2010 by replacing the earlier series. These Index Numbers are compiled and published by the Office of the Economic Adviser, Ministry of Commerce & Industry, Govt. of India, New Delhi. The indices for the period 1992 to 2013 (Annual Averages) January, 2014 to January, 2015 (Monthly Figures) are set out in Table B.1.4.
2. Wages and Earnings
B.2.1. Earnings(Basic Wage and Dearness Allowance) of the Lowest-paid Workers/Operatives in Cotton Textile Mills – The information concerning earnings of cotton producing Centres/States received from the State Governments, Employers‘ Associations and Individual Units is presented in Table B.2.1. The earnings of workers include minimum basic wage and dearness Allowance by whatever name called. The dearness allowance is linked to the Working Class Consumer Price Index Numbers of different Centres and varies from month to month according to the variation in the index.
3. Industrial Disputes
B.3.1. Industrial Disputes (All Strikes and Lockouts) – Industrial Disputes Statistics for the Years 2006 to 2015 are presented in Table B.3.1
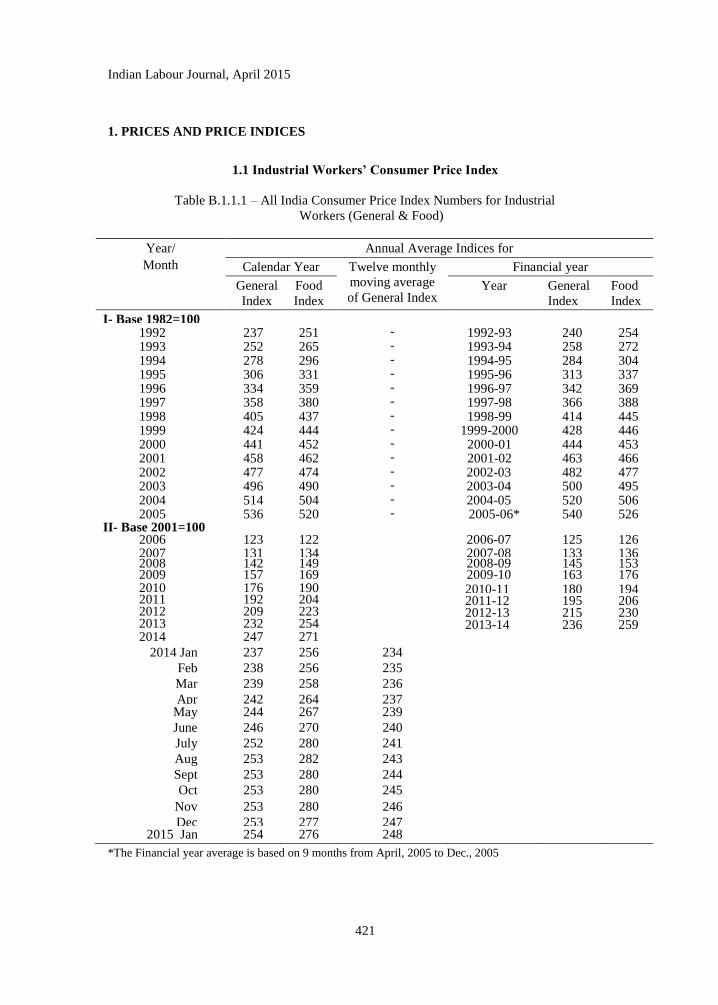
Indian Labour Journal, April 2015
421
1. PRICES AND PRICE INDICES
1.1 Industrial Workers’ Consumer Price Index
Table B.1.1.1 – All India Consumer Price Index Numbers for Industrial
Workers (General & Food)
Year/
Month
Annual Average Indices for
Calendar Year Twelve monthly
moving average
of General Index
Financial year
General
Index
Food
Index
Year General
Index
Food
Index
I- Base 1982=100 1992 237 251 - 1992-93 240 254 1993 252 265 - 1993-94 258 272 1994 278 296 - 1994-95 284 304 1995 306 331 - 1995-96 313 337 1996 334 359 - 1996-97 342 369 1997 358 380 - 1997-98 366 388 1998 405 437 - 1998-99 414 445 1999 424 444 - 1999-2000 428 446 2000 441 452 - 2000-01 444 453 2001 458 462 - 2001-02 463 466 2002 477 474 - 2002-03 482 477 2003 496 490 - 2003-04 500 495 2004 514 504 - 2004-05 520 506 2005
536 520 - 2005-06* 540 526 II- Base 2001=100
2006 123 122 2006-07 125 126 2007 131 134 2007-08 133 136 2008 142 149 2008-09 145 153 2009 157 169 2009-10 163 176 2010 176 190 2010-11 180 194 2011 192 204 2011-12 195 206 2012 209 223 2012-13 215 230 2013 232 254 2013-14 236 259 2014 247 271
2014 Jan 237 256 234
Feb 238 256 235
Mar 239 258 236
Apr 242 264 237 May 244 267 239
June 246 270 240
July 252 280 241
Aug 253 282 243
Sept 253 280 244
Oct 253 280 245
Nov 253 280 246
Dec 253 277 247 2015 Jan 254 276 248
*The Financial year average is based on 9 months from April, 2005 to Dec., 2005
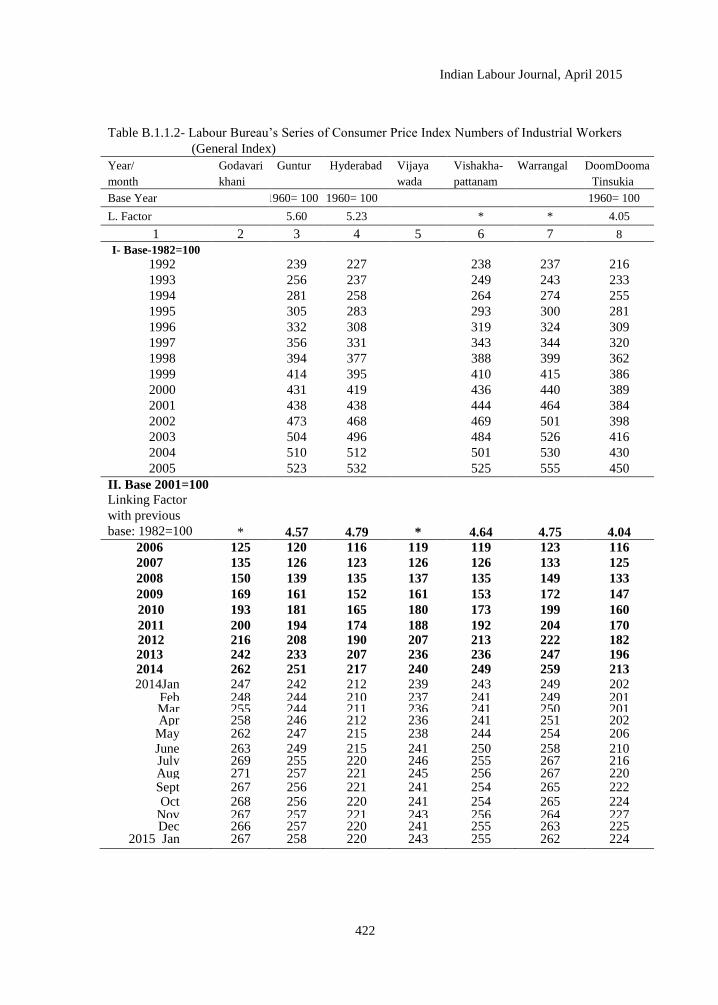
Indian Labour Journal, April 2015
422
Table B.1.1.2- Labour Bureau‘s Series of Consumer Price Index Numbers of Industrial Workers
(General Index)
Year/
month
Godavari
khani
Guntur Hyderabad Vijaya
wada
Vishakha-
pattanam
Warrangal DoomDooma
Tinsukia
Base Year 1960= 100 1960= 100 1960= 100
L. Factor 5.60 5.23 * * 4.05
1 2 3 4 5 6 7 8
I- Base-1982=100
1992 239 227 238 237 216
1993 256 237 249 243 233
1994 281 258 264 274 255
1995 305 283 293 300 281
1996 332 308 319 324 309
1997 356 331 343 344 320
1998 394 377 388 399 362
1999 414 395 410 415 386
2000 431 419 436 440 389
2001 438 438 444 464 384
2002 473 468 469 501 398
2003 504 496 484 526 416
2004 510 512 501 530 430
2005 523 532 525 555 450
II. Base 2001=100 Linking Factor
with previous
base: 1982=100 * 4.57 4.79 * 4.64 4.75 4.04
2006 125 120 116 119 119 123 116
2007 135 126 123 126 126 133 125
2008 150 139 135 137 135 149 133
2009 169 161 152 161 153 172 147
2010 193 181 165 180 173 199 160
2011 200 194 174 188 192 204 170 2012 216 208 190 207 213 222 182
2013 242 233 207 236 236 247 196 2014 262 251 217 240 249 259 213
2014Jan 247 242 212 239 243 249 202 Feb 248 244 210 237 241 249 201 Mar 255 244 211 236 241 250 201 Apr 258 246 212 236 241 251 202
May 262 247 215 238 244 254 206 June 263 249 215 241 250 258 210 July 269 255 220 246 255 267 216 Aug 271 257 221 245 256 267 220 Sept 267 256 221 241 254 265 222 Oct 268 256 220 241 254 265 224
Nov 267 257 221 243 256 264 227 Dec 266 257 220 241 255 263 225
2015 Jan 267 258 220 243 255 262 224
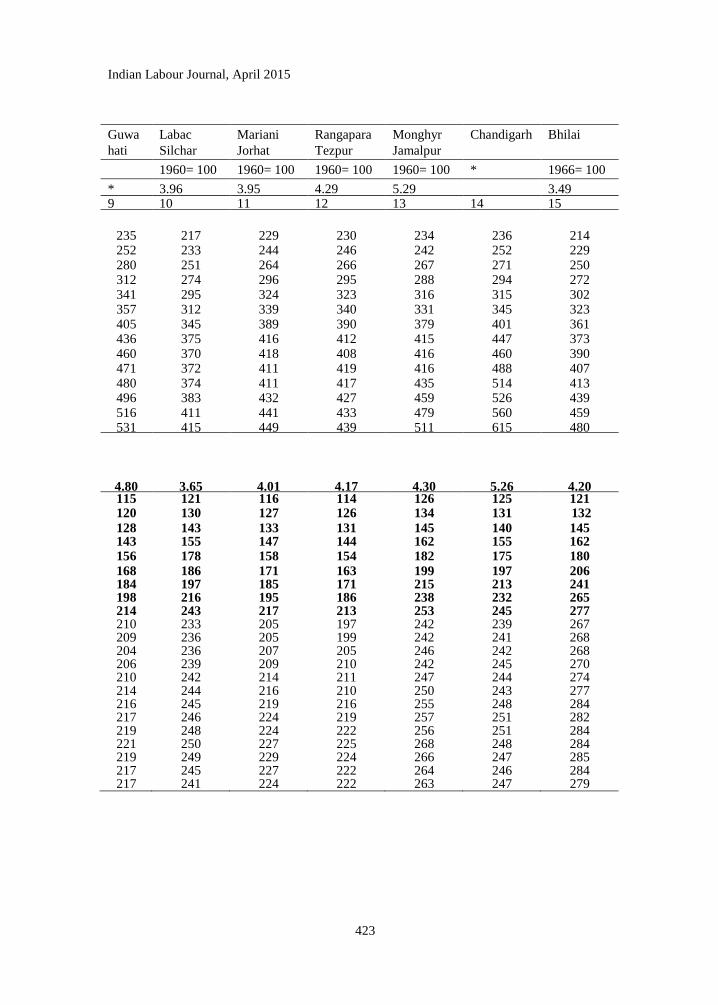
Indian Labour Journal, April 2015
423
Guwa
hati
Labac
Silchar
Mariani
Jorhat
Rangapara
Tezpur
Monghyr
Jamalpur
Chandigarh Bhilai
1960= 100 1960= 100 1960= 100 1960= 100 * 1966= 100
* 3.96 3.95 4.29 5.29 3.49 9 10 11 12 13 14 15
235 217 229 230 234 236 214 252 233 244 246 242 252 229 280 251 264 266 267 271 250 312 274 296 295 288 294 272 341 295 324 323 316 315 302 357 312 339 340 331 345 323 405 345 389 390 379 401 361 436 375 416 412 415 447 373 460 370 418 408 416 460 390 471 372 411 419 416 488 407 480 374 411 417 435 514 413 496 383 432 427 459 526 439 516 411 441 433 479 560 459 531 415 449 439 511 615 480
4.80 3.65 4.01 4.17 4.30 5.26 4.20 115 121 116 114 126 125 121 120 130 127 126 134 131 132
128 143 133 131 145 140 145 143 155 147 144 162 155 162 156 178 158 154 182 175 180
168 186 171 163 199 197 206 184 197 185 171 215 213 241 198 216 195 186 238 232 265 214 243 217 213 253 245 277 210 233 205 197 242 239 267 209 236 205 199 242 241 268 204 236 207 205 246 242 268 206 239 209 210 242 245 270 210 242 214 211 247 244 274 214 244 216 210 250 243 277 216 245 219 216 255 248 284 217 246 224 219 257 251 282 219 248 224 222 256 251 284 221 250 227 225 268 248 284 219 249 229 224 266 247 285 217 245 227 222 264 246 284 217 241 224 222 263 247 279
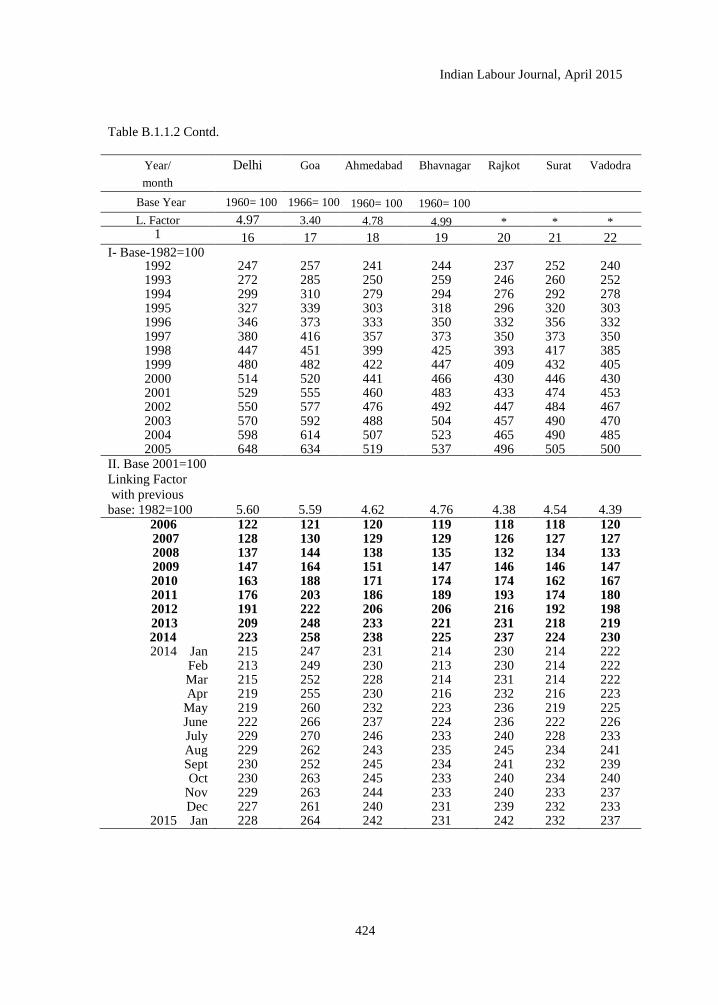
Indian Labour Journal, April 2015
424
Table B.1.1.2 Contd.
Year/
month
Delhi Goa Ahmedabad
Bhavnagar Rajkot Surat Vadodra
Base Year 1960= 100 1966= 100 1960= 100 1960= 100
L. Factor 4.97 3.40 4.78 4.99 * * * 1 16 17 18 19 20 21 22
I- Base-1982=100 1992 247 257 241 244 237 252 240 1993 272 285 250 259 246 260 252 1994 299 310 279 294 276 292 278 1995 327 339 303 318 296 320 303 1996 346 373 333 350 332 356 332 1997 380 416 357 373 350 373 350 1998 447 451 399 425 393 417 385 1999 480 482 422 447 409 432 405 2000 514 520 441 466 430 446 430 2001 529 555 460 483 433 474 453 2002 550 577 476 492 447 484 467 2003 570 592 488 504 457 490 470 2004 598 614 507 523 465 490 485 2005 648 634 519 537 496 505 500
II. Base 2001=100
Linking Factor
with previous
base: 1982=100 5.60 5.59 4.62 4.76 4.38 4.54 4.39 2006 122 121 120 119 118 118 120
2007 128 130 129 129 126 127 127 2008 137 144 138 135 132 134 133 2009 147 164 151 147 146 146 147
2010 163 188 171 174 174 162 167 2011 176 203 186 189 193 174 180 2012 191 222 206 206 216 192 198 2013 209 248 233 221 231 218 219
2014 223 258 238 225 237 224 230 2014 Jan 215 247 231 214 230 214 222
Feb 213 249 230 213 230 214 222 Mar 215 252 228 214 231 214 222 Apr 219 255 230 216 232 216 223
May 219 260 232 223 236 219 225 June 222 266 237 224 236 222 226 July 229 270 246 233 240 228 233 Aug 229 262 243 235 245 234 241 Sept 230 252 245 234 241 232 239 Oct 230 263 245 233 240 234 240
Nov 229 263 244 233 240 233 237 Dec 227 261 240 231 239 232 233
2015 Jan 228 264 242 231 242 232 237
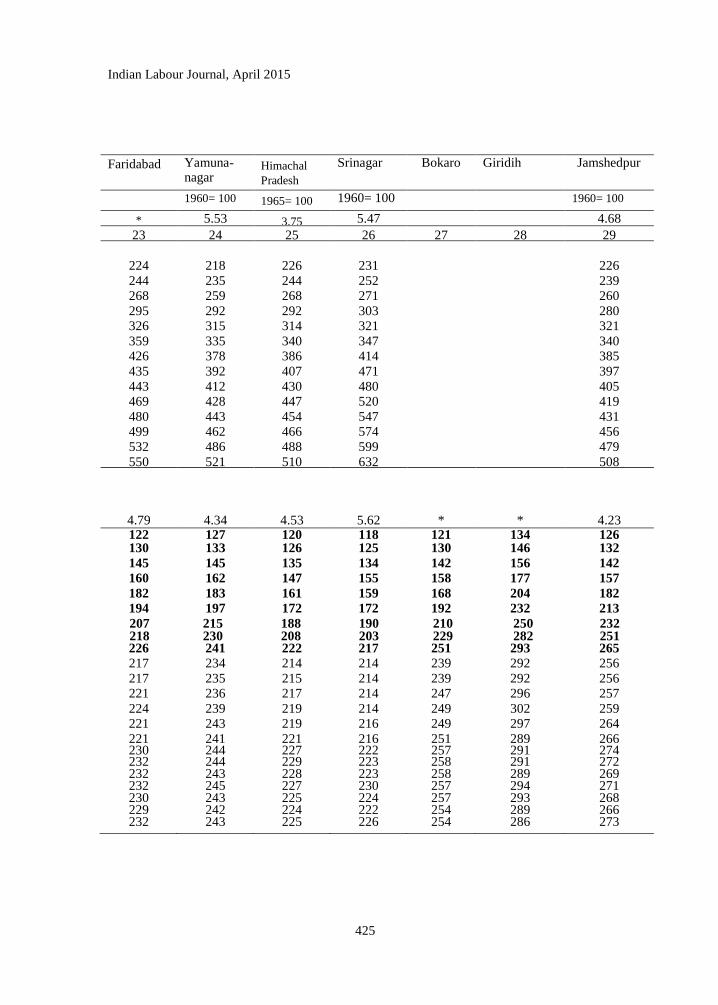
Indian Labour Journal, April 2015
425
Faridabad Yamuna-nagar
Himachal
Pradesh
Srinagar Bokaro Giridih Jamshedpur
1960= 100 1965= 100 1960= 100 1960= 100
* 5.53 3.75 5.47 4.68
23 24 25 26 27 28 29
224 218 226 231 226
244 235 244 252 239 268 259 268 271 260
295 292 292 303 280 326 315 314 321 321
359 335 340 347 340 426 378 386 414 385
435 392 407 471 397
443 412 430 480 405 469 428 447 520 419
480 443 454 547 431 499 462 466 574 456
532 486 488 599 479
550 521 510 632 508
4.79 4.34 4.53 5.62 * * 4.23 122 127 120 118 121 134 126 130 133 126 125 130 146 132
145 145 135 134 142 156 142
160 162 147 155 158 177 157
182 183 161 159 168 204 182
194 197 172 172 192 232 213
207 215 188 190 210 250 232 218 230 208 203 229 282 251 226 241 222 217 251 293 265
217 234 214 214 239 292 256
217 235 215 214 239 292 256 221 236 217 214 247 296 257
224 239 219 214 249 302 259 221 243 219 216 249 297 264
221 241 221 216 251 289 266 230 244 227 222 257 291 274 232 244 229 223 258 291 272 232 243 228 223 258 289 269 232 245 227 230 257 294 271 230 243 225 224 257 293 268 229 242 224 222 254 289 266 232 243 225 226 254 286 273
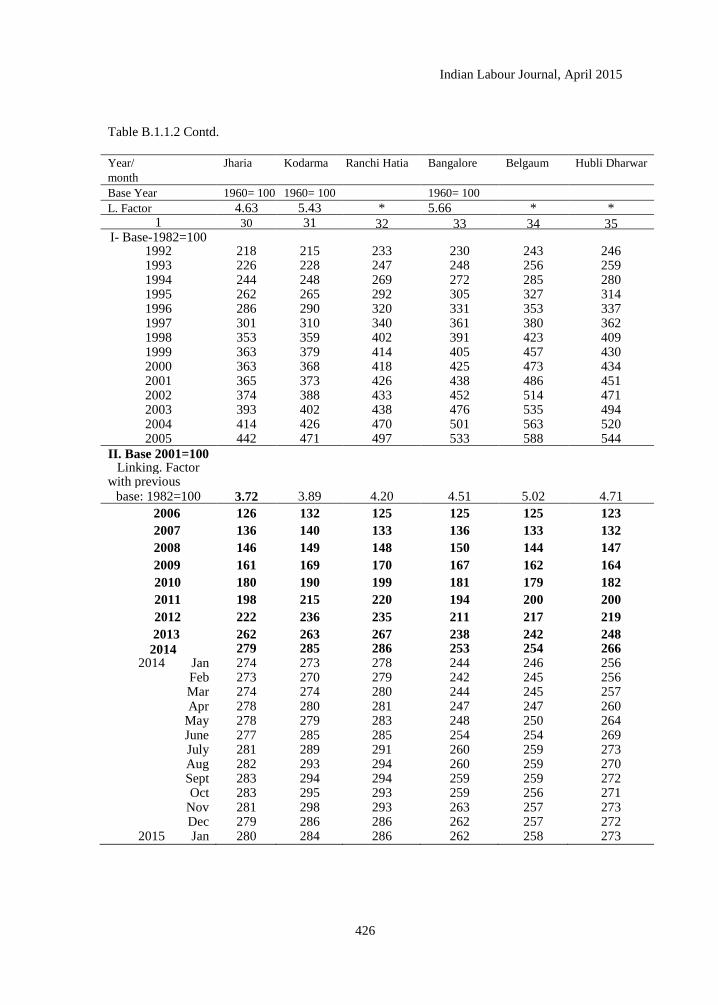
Indian Labour Journal, April 2015
426
Table B.1.1.2 Contd.
Year/
month
Jharia Kodarma Ranchi Hatia Bangalore Belgaum Hubli Dharwar
Base Year 1960= 100 1960= 100 1960= 100
L. Factor 4.63 5.43 * 5.66 * * 1 30 31 32 33 34 35
I- Base-1982=100 1992 218 215 233 230 243 246 1993 226 228 247 248 256 259 1994 244 248 269 272 285 280 1995 262 265 292 305 327 314 1996 286 290 320 331 353 337 1997 301 310 340 361 380 362 1998 353 359 402 391 423 409 1999 363 379 414 405 457 430 2000 363 368 418 425 473 434 2001 365 373 426 438 486 451 2002 374 388 433 452 514 471 2003 393 402 438 476 535 494 2004 414 426 470 501 563 520 2005 442 471 497 533 588 544
II. Base 2001=100 Linking. Factor
with previous base: 1982=100 3.72 3.89 4.20 4.51 5.02 4.71
2006 126 132 125 125 125 123
2007 136 140 133 136 133 132
2008 146 149 148 150 144 147
2009 161 169 170 167 162 164
2010 180 190 199 181 179 182
2011 198 215 220 194 200 200
2012 222 236 235 211 217 219
2013 262 263 267 238 242 248
2014 279 285 286 253 254 266 2014 Jan 274 273 278 244 246 256
Feb 273 270 279 242 245 256 Mar 274 274 280 244 245 257 Apr 278 280 281 247 247 260
May 278 279 283 248 250 264 June 277 285 285 254 254 269 July 281 289 291 260 259 273 Aug 282 293 294 260 259 270 Sept 283 294 294 259 259 272 Oct 283 295 293 259 256 271
Nov 281 298 293 263 257 273 Dec 279 286 286 262 257 272
2015 Jan 280 284 286 262 258 273
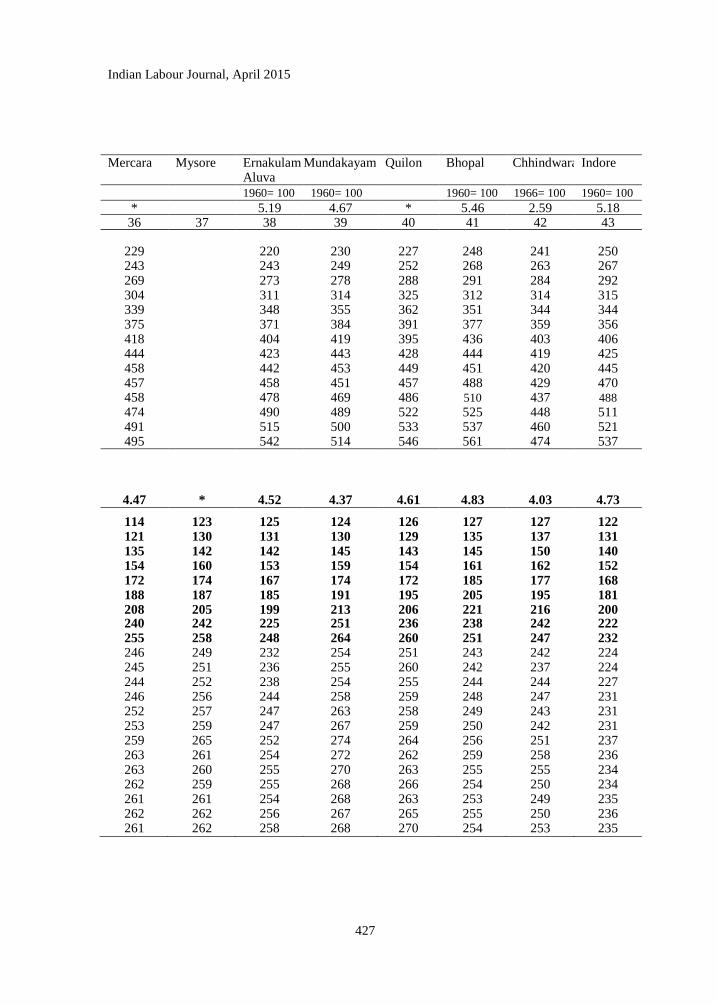
Indian Labour Journal, April 2015
427
Mercara Mysore ErnakulamAluva
Mundakayam Quilon Bhopal
Chhindwara Indore
1960= 100 1960= 100 1960= 100 1966= 100 1960= 100
* 5.19 4.67 * 5.46 2.59 5.18 36 37 38 39 40 41 42 43
229 220 230 227 248 241 250 243 243 249 252 268 263 267 269 273 278 288 291 284 292 304 311 314 325 312 314 315 339 348 355 362 351 344 344 375 371 384 391 377 359 356 418 404 419 395 436 403 406 444 423 443 428 444 419 425 458 442 453 449 451 420 445 457 458 451 457 488 429 470 458 478 469 486 510 437 488
474 490 489 522 525 448 511 491 515 500 533 537 460 521 495 542 514 546 561 474 537
4.47 * 4.52 4.37 4.61 4.83 4.03 4.73
114 123 125 124 126 127 127 122 121 130 131 130 129 135 137 131 135 142 142 145 143 145 150 140 154 160 153 159 154 161 162 152 172 174 167 174 172 185 177 168 188 187 185 191 195 205 195 181 208 205 199 213 206 221 216 200 240 242 225 251 236 238 242 222 255 258 248 264 260 251 247 232 246 249 232 254 251 243 242 224 245 251 236 255 260 242 237 224 244 252 238 254 255 244 244 227 246 256 244 258 259 248 247 231 252 257 247 263 258 249 243 231 253 259 247 267 259 250 242 231 259 265 252 274 264 256 251 237 263 261 254 272 262 259 258 236 263 260 255 270 263 255 255 234 262 259 255 268 266 254 250 234 261 261 254 268 263 253 249 235 262 262 256 267 265 255 250 236 261 262 258 268 270 254 253 235
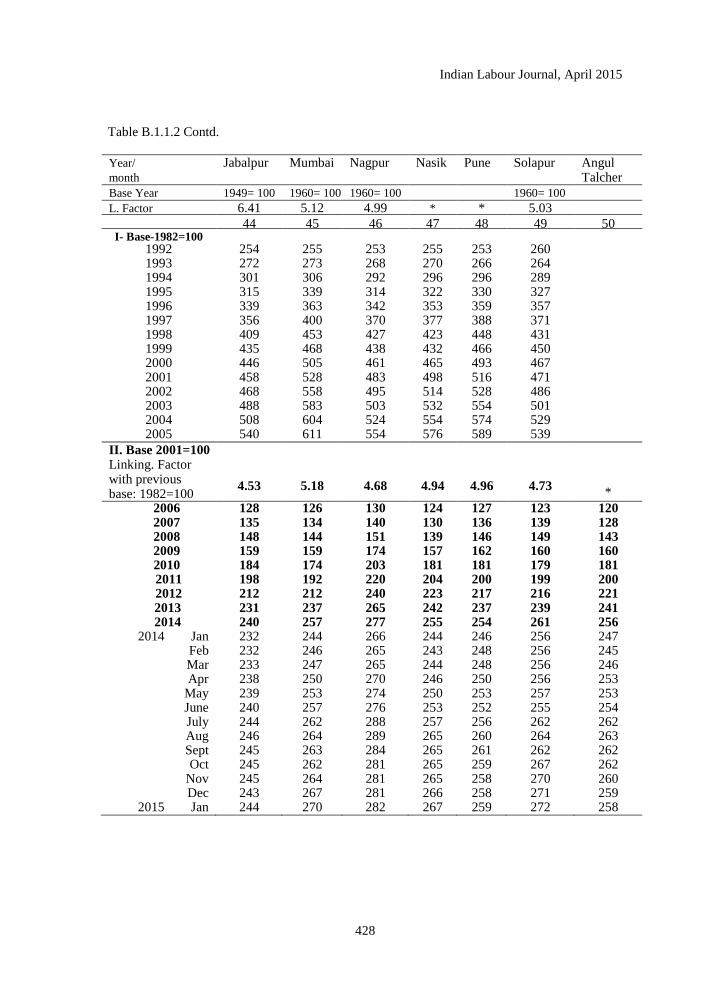
Indian Labour Journal, April 2015
428
Table B.1.1.2 Contd.
Year/
month
Jabalpur Mumbai Nagpur Nasik Pune Solapur Angul Talcher
Base Year 1949= 100 1960= 100 1960= 100 1960= 100
L. Factor 6.41 5.12 4.99 * * 5.03 44 45 46 47 48 49 50 I- Base-1982=100
1992 254 255 253 255 253 260 1993 272 273 268 270 266 264 1994 301 306 292 296 296 289 1995 315 339 314 322 330 327 1996 339 363 342 353 359 357 1997 356 400 370 377 388 371 1998 409 453 427 423 448 431 1999 435 468 438 432 466 450 2000 446 505 461 465 493 467 2001 458 528 483 498 516 471 2002 468 558 495 514 528 486 2003 488 583 503 532 554 501 2004 508 604 524 554 574 529 2005 540 611 554 576 589 539
II. Base 2001=100 Linking. Factor with previous base: 1982=100
4.53 5.18 4.68 4.94 4.96 4.73 *
2006 128 126 130 124 127 123 120 2007 135 134 140 130 136 139 128 2008 148 144 151 139 146 149 143 2009 159 159 174 157 162 160 160
2010 184 174 203 181 181 179 181 2011 198 192 220 204 200 199 200 2012 212 212 240 223 217 216 221
2013 231 237 265 242 237 239 241 2014 240 257 277 255 254 261 256
2014 Jan 232 244 266 244 246 256 247 Feb 232 246 265 243 248 256 245
Mar 233 247 265 244 248 256 246 Apr 238 250 270 246 250 256 253
May 239 253 274 250 253 257 253 June 240 257 276 253 252 255 254 July 244 262 288 257 256 262 262 Aug 246 264 289 265 260 264 263 Sept 245 263 284 265 261 262 262 Oct 245 262 281 265 259 267 262
Nov 245 264 281 265 258 270 260 Dec 243 267 281 266 258 271 259
2015 Jan 244 270 282 267 259 272 258
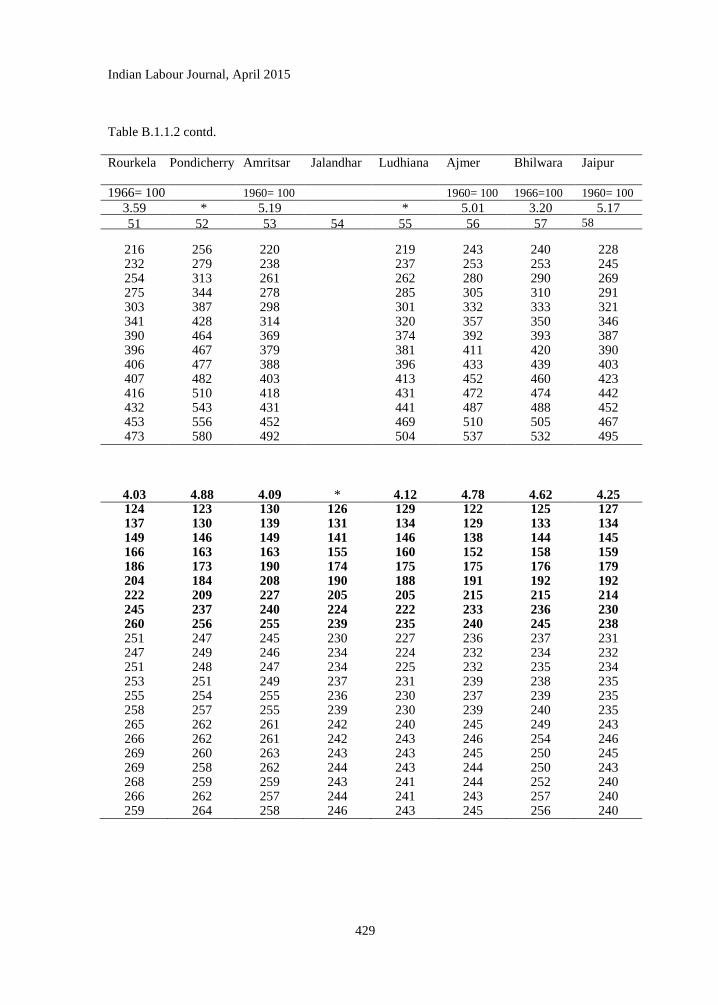
Indian Labour Journal, April 2015
429
Table B.1.1.2 contd.
Rourkela Pondicherry Amritsar Jalandhar Ludhiana Ajmer Bhilwara Jaipur
1966= 100 1960= 100 1960= 100 1966=100 1960= 100
3.59 * 5.19 * 5.01 3.20 5.17
51 52 53 54 55 56 57 58
216 256 220 219 243 240 228 232 279 238 237 253 253 245 254 313 261 262 280 290 269 275 344 278 285 305 310 291 303 387 298 301 332 333 321 341 428 314 320 357 350 346 390 464 369 374 392 393 387 396 467 379 381 411 420 390 406 477 388 396 433 439 403 407 482 403 413 452 460 423 416 510 418 431 472 474 442 432 543 431 441 487 488 452 453 556 452 469 510 505 467 473 580 492 504 537 532 495
4.03 4.88 4.09 * 4.12 4.78 4.62 4.25 124 123 130 126 129 122 125 127 137 130 139 131 134 129 133 134 149 146 149 141 146 138 144 145 166 163 163 155 160 152 158 159 186 173 190 174 175 175 176 179 204 184 208 190 188 191 192 192 222 209 227 205 205 215 215 214 245 237 240 224 222 233 236 230 260 256 255 239 235 240 245 238 251 247 245 230 227 236 237 231 247 249 246 234 224 232 234 232 251 248 247 234 225 232 235 234 253 251 249 237 231 239 238 235 255 254 255 236 230 237 239 235 258 257 255 239 230 239 240 235 265 262 261 242 240 245 249 243 266 262 261 242 243 246 254 246 269 260 263 243 243 245 250 245 269 258 262 244 243 244 250 243 268 259 259 243 241 244 252 240 266 262 257 244 241 243 257 240 259 264 258 246 243 245 256 240
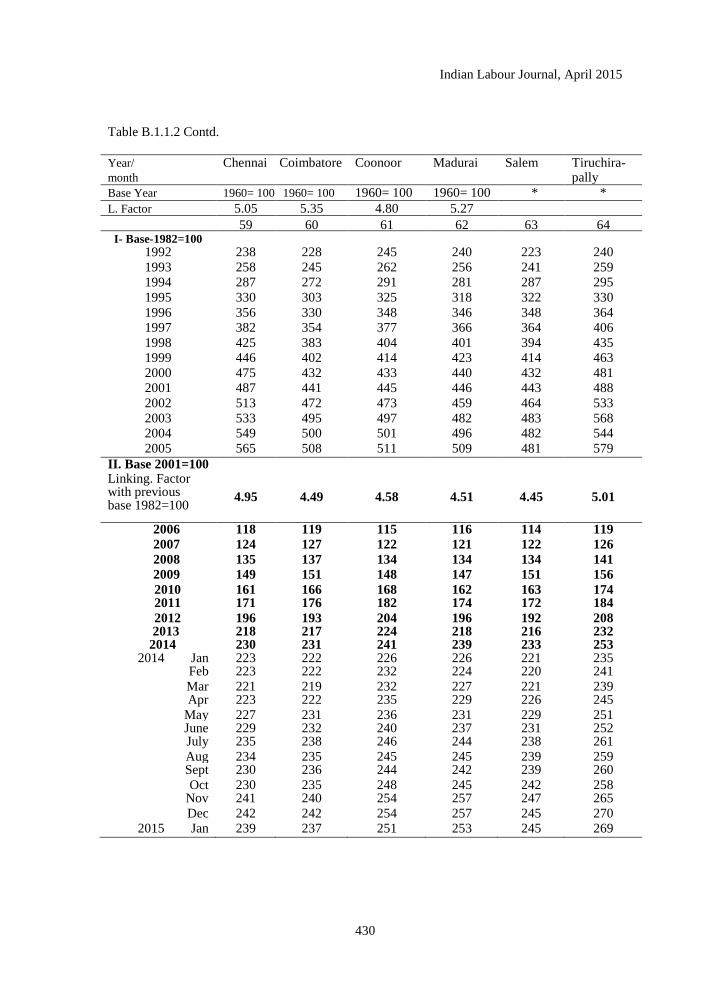
Indian Labour Journal, April 2015
430
Table B.1.1.2 Contd.
Year/
month
Chennai
Coimbatore Coonoor
Madurai Salem Tiruchira-pally
Base Year 1960= 100 1960= 100 1960= 100 1960= 100 * *
L. Factor 5.05 5.35 4.80 5.27 59 60 61 62 63 64
I- Base-1982=100 1992 238 228 245 240 223 240
1993 258 245 262 256 241 259 1994 287 272 291 281 287 295
1995 330 303 325 318 322 330
1996 356 330 348 346 348 364 1997 382 354 377 366 364 406
1998 425 383 404 401 394 435 1999 446 402 414 423 414 463
2000 475 432 433 440 432 481 2001 487 441 445 446 443 488
2002 513 472 473 459 464 533
2003 533 495 497 482 483 568 2004 549 500 501 496 482 544
2005 565 508 511 509 481 579
II. Base 2001=100 Linking. Factor with previous base 1982=100
4.95 4.49 4.58 4.51 4.45 5.01
2006 118 119 115 116 114 119
2007 124 127 122 121 122 126
2008 135 137 134 134 134 141
2009 149 151 148 147 151 156
2010 161 166 168 162 163 174 2011 171 176 182 174 172 184
2012 196 193 204 196 192 208 2013 218 217 224 218 216 232 2014 230 231 241 239 233 253
2014 Jan 223 222 226 226 221 235 Feb 223 222 232 224 220 241
Mar 221 219 232 227 221 239 Apr 223 222 235 229 226 245
May 227 231 236 231 229 251 June 229 232 240 237 231 252 July 235 238 246 244 238 261
Aug 234 235 245 245 239 259 Sept 230 236 244 242 239 260
Oct 230 235 248 245 242 258 Nov 241 240 254 257 247 265
Dec 242 242 254 257 245 270 2015 Jan 239 237 251 253 245 269
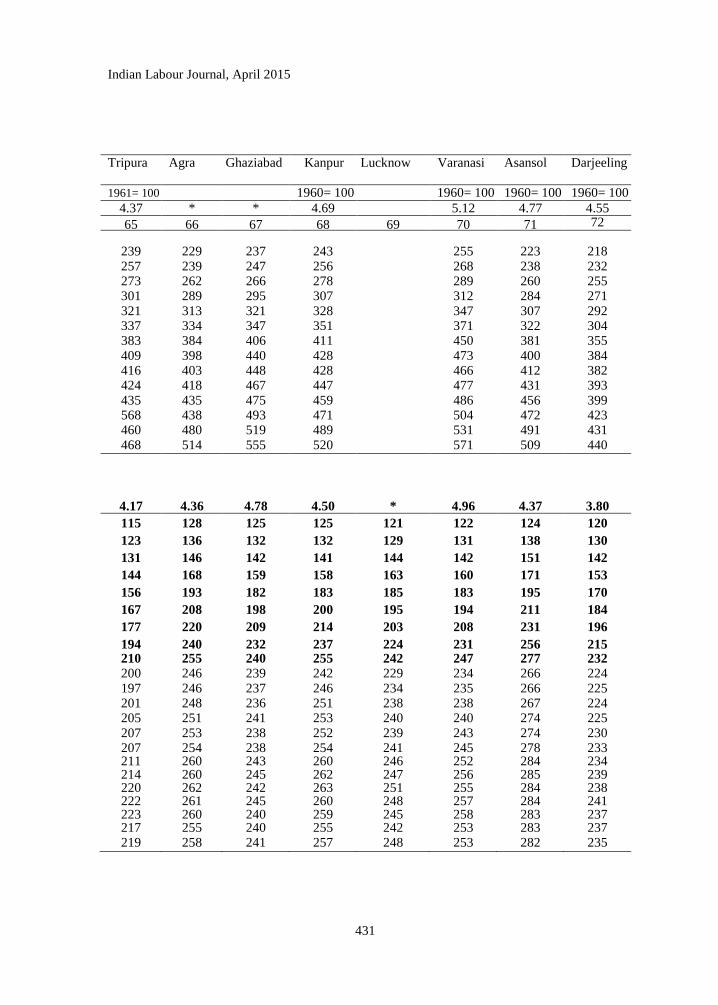
Indian Labour Journal, April 2015
431
Tripura Agra Ghaziabad Kanpur Lucknow Varanasi Asansol
Darjeeling
1961= 100 1960= 100 1960= 100 1960= 100 1960= 100
4.37 * * 4.69 5.12 4.77 4.55
65 66 67 68 69 70 71 72
239 229 237 243 255 223 218 257 239 247 256 268 238 232 273 262 266 278 289 260 255 301 289 295 307 312 284 271 321 313 321 328 347 307 292 337 334 347 351 371 322 304 383 384 406 411 450 381 355 409 398 440 428 473 400 384 416 403 448 428 466 412 382 424 418 467 447 477 431 393 435 435 475 459 486 456 399 568 438 493 471 504 472 423 460 480 519 489 531 491 431 468 514 555 520 571 509 440
4.17 4.36 4.78 4.50 * 4.96 4.37 3.80
115 128 125 125 121 122 124 120
123 136 132 132 129 131 138 130
131 146 142 141 144 142 151 142
144 168 159 158 163 160 171 153
156 193 182 183 185 183 195 170
167 208 198 200 195 194 211 184
177 220 209 214 203 208 231 196
194 240 232 237 224 231 256 215 210 255 240 255 242 247 277 232
200 246 239 242 229 234 266 224 197 246 237 246 234 235 266 225 201 248 236 251 238 238 267 224 205 251 241 253 240 240 274 225 207 253 238 252 239 243 274 230 207 254 238 254 241 245 278 233 211 260 243 260 246 252 284 234 214 260 245 262 247 256 285 239 220 262 242 263 251 255 284 238 222 261 245 260 248 257 284 241 223 260 240 259 245 258 283 237 217 255 240 255 242 253 283 237 219 258 241 257 248 253 282 235
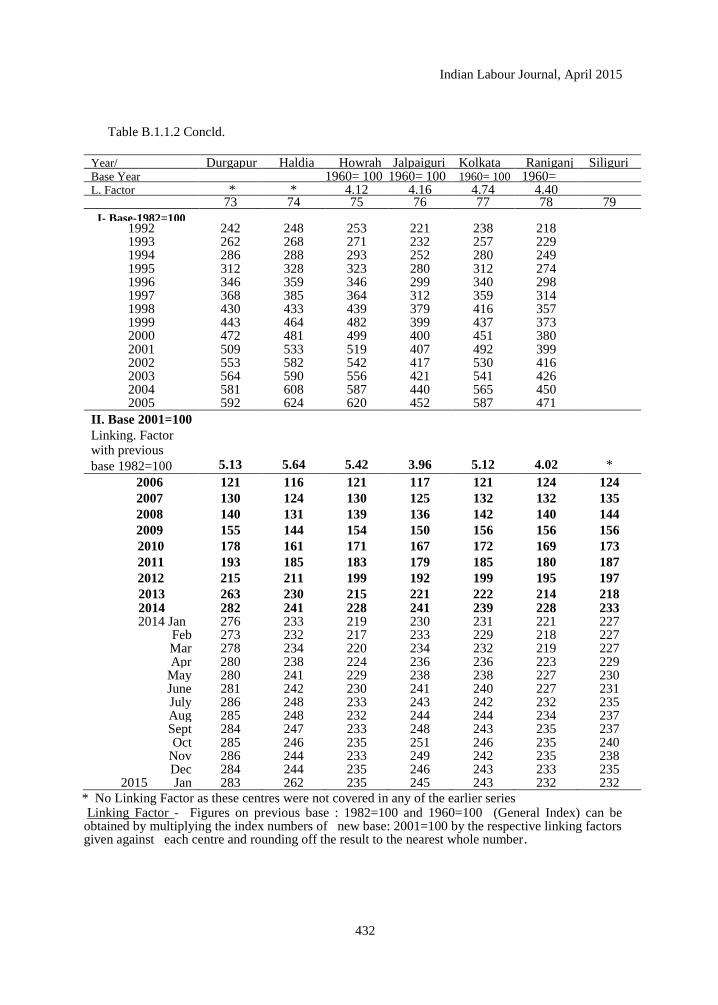
Indian Labour Journal, April 2015
432
Table B.1.1.2 Concld.
Year/
month
Durgapur
Haldia Howrah Jalpaiguri Kolkata Raniganj Siliguri Base Year 1960= 100 1960= 100 1960= 100 1960=
100
L. Factor * * 4.12 4.16 4.74 4.40 73 74 75 76 77 78 79
I- Base-1982=100 1992 242 248 253 221 238 218 1993 262 268 271 232 257 229 1994 286 288 293 252 280 249 1995 312 328 323 280 312 274 1996 346 359 346 299 340 298 1997 368 385 364 312 359 314 1998 430 433 439 379 416 357 1999 443 464 482 399 437 373 2000 472 481 499 400 451 380 2001 509 533 519 407 492 399 2002 553 582 542 417 530 416 2003 564 590 556 421 541 426 2004 581 608 587 440 565 450 2005 592 624 620 452 587 471
II. Base 2001=100
Linking. Factor with previous
base 1982=100 5.13 5.64 5.42 3.96 5.12 4.02 *
2006 121 116 121 117 121 124 124
2007 130 124 130 125 132 132 135
2008 140 131 139 136 142 140 144
2009 155 144 154 150 156 156 156
2010 178 161 171 167 172 169 173
2011 193 185 183 179 185 180 187
2012 215 211 199 192 199 195 197
2013 263 230 215 221 222 214 218 2014 282 241 228 241 239 228 233 2014 Jan 276 233 219 230 231 221 227
Feb 273 232 217 233 229 218 227 Mar 278 234 220 234 232 219 227 Apr 280 238 224 236 236 223 229
May 280 241 229 238 238 227 230 June 281 242 230 241 240 227 231 July 286 248 233 243 242 232 235 Aug 285 248 232 244 244 234 237 Sept 284 247 233 248 243 235 237 Oct 285 246 235 251 246 235 240
Nov 286 244 233 249 242 235 238 Dec 284 244 235 246 243 233 235
2015 Jan 283 262 235 245 243 232 232
* No Linking Factor as these centres were not covered in any of the earlier series Linking Factor - Figures on previous base : 1982=100 and 1960=100 (General Index) can be obtained by multiplying the index numbers of new base: 2001=100 by the respective linking factors given against each centre and rounding off the result to the nearest whole number.
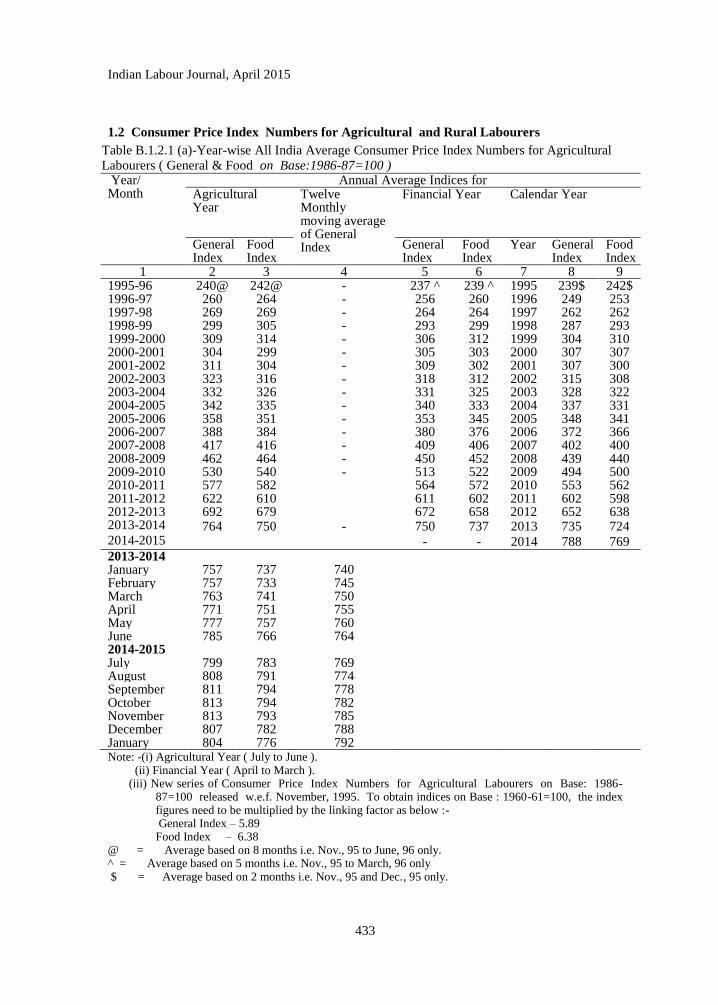
Indian Labour Journal, April 2015
433
1.2 Consumer Price Index Numbers for Agricultural and Rural Labourers
Table B.1.2.1 (a)-Year-wise All India Average Consumer Price Index Numbers for Agricultural
Labourers ( General & Food on Base:1986-87=100 ) Year/ Month
Annual Average Indices for Agricultural Year
Twelve Monthly moving average of General Index
Financial Year Calendar Year
General Index
Food Index
General Index
Food Index
Year General Index
Food Index
1 2 3 4 5 6 7 8 9 1995-96 240@ 242@ - 237 ^ 239 ^ 1995 239$ 242$ 1996-97 260 264 - 256 260 1996 249 253 1997-98 269 269 - 264 264 1997 262 262 1998-99 299 305 - 293 299 1998 287 293 1999-2000 309 314 - 306 312 1999 304 310 2000-2001 304 299 - 305 303 2000 307 307 2001-2002 311 304 - 309 302 2001 307 300 2002-2003 2003-2004
323 332
316 326
- -
318 331
312 325
2002 2003
315 328
308 322
2004-2005 342 335 - 340 333 2004 337 331 2005-2006 358 351 - 353 345 2005 348 341 2006-2007 388 384 - 380 376 2006 372 366 2007-2008 2008-2009
417 462
416 464
- -
409 450
406 452
2007 2008
402 439
400 440
2009-2010 530 540 - 513 522 2009 494 500 2010-2011 577 582 564 572 2010 553 562 2011-2012 622 610 611 602 2011 602 598 2012-2013 692 679 672 658 2012 652 638 2013-2014 764 750 - 750 737 2013 735 724 2014-2015 - - 2014 788 769 2013-2014 January 757 737 740 February 757 733 745 March 763 741 750 April 771 751 755 May 777 757 760 June 785 766 764 2014-2015 July 799 783 769 August 808 791 774 September 811 794 778 October 813 794 782 November 813 793 785 December 807 782 788 January 804 776 792 Note: -(i) Agricultural Year ( July to June ). (ii) Financial Year ( April to March ). (iii) New series of Consumer Price Index Numbers for Agricultural Labourers on Base: 1986-
87=100 released w.e.f. November, 1995. To obtain indices on Base : 1960-61=100, the index figures need to be multiplied by the linking factor as below :-
General Index – 5.89 Food Index – 6.38 @ = Average based on 8 months i.e. Nov., 95 to June, 96 only. ^ = Average based on 5 months i.e. Nov., 95 to March, 96 only $ = Average based on 2 months i.e. Nov., 95 and Dec., 95 only.
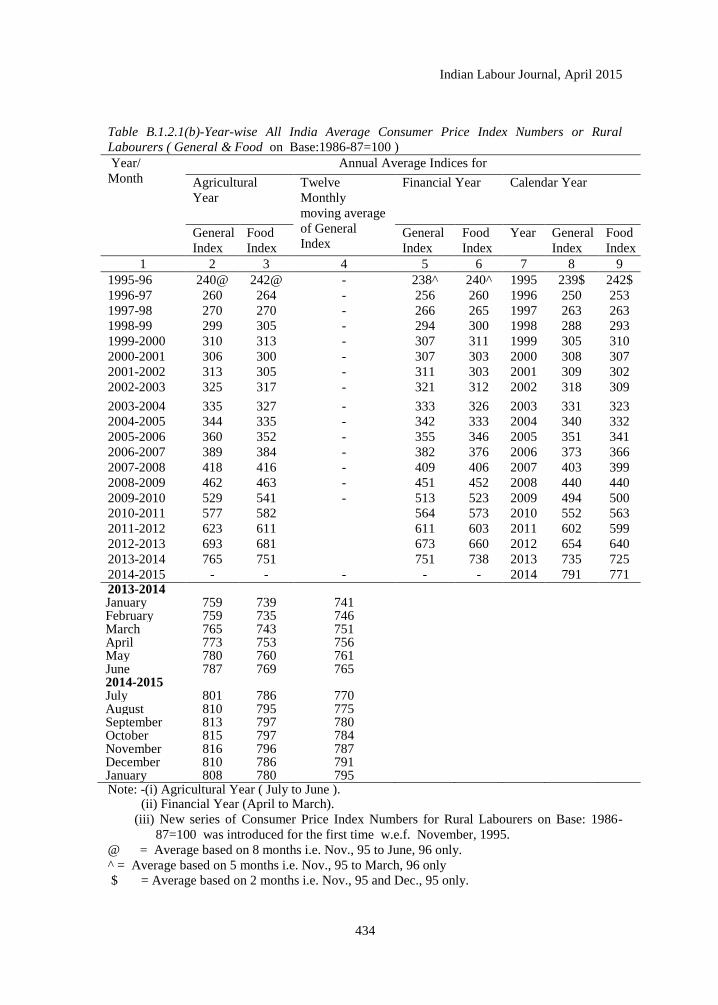
Indian Labour Journal, April 2015
434
Table B.1.2.1(b)-Year-wise All India Average Consumer Price Index Numbers or Rural
Labourers ( General & Food on Base:1986-87=100 )
Year/
Month
Annual Average Indices for
Agricultural
Year
Twelve
Monthly
moving average
of General
Index
Financial Year Calendar Year
General
Index
Food
Index
General
Index
Food
Index
Year General
Index
Food
Index
1 2 3 4 5 6 7 8 9
1995-96 240@ 242@ - 238^ 240^ 1995 239$ 242$
1996-97 260 264 - 256 260 1996 250 253
1997-98 270 270 - 266 265 1997 263 263
1998-99 299 305 - 294 300 1998 288 293
1999-2000 310 313 - 307 311 1999 305 310
2000-2001 306 300 - 307 303 2000 308 307
2001-2002 313 305 - 311 303 2001 309 302
2002-2003 325 317 - 321 312 2002 318 309
2003-2004 335 327 - 333 326 2003 331 323
2004-2005 344 335 - 342 333 2004 340 332
2005-2006 360 352 - 355 346 2005 351 341
2006-2007
2007-2008
2008-2009
2009-2010
2010-2011
2011-2012
2012-2013
2013-2014
389
418
462
529
577
623
693
765
384
416
463
541
582
611
681
751
-
-
-
-
382
409
451
513
564
611
673
751
376
406
452
523
573
603
660
738
2006
2007
2008
2009
2010
2011
2012
2013
373
403
440
494
552
602
654
735
366
399
440
500
563
599
640
725
2014-2015 - - - - - 2014 791 771 2013-2014 January 759 739 741 February 759 735 746 March 765 743 751 April 773 753 756 May 780 760 761 June 787 769 765 2014-2015 July 801 786 770 August 810 795 775 September 813 797 780 October 815 797 784 November 816 796 787 December 810 786 791 January 808 780 795 Note: -(i) Agricultural Year ( July to June ). (ii) Financial Year (April to March).
(iii) New series of Consumer Price Index Numbers for Rural Labourers on Base: 1986-
87=100 was introduced for the first time w.e.f. November, 1995.
@ = Average based on 8 months i.e. Nov., 95 to June, 96 only.
^ = Average based on 5 months i.e. Nov., 95 to March, 96 only
$ = Average based on 2 months i.e. Nov., 95 and Dec., 95 only.
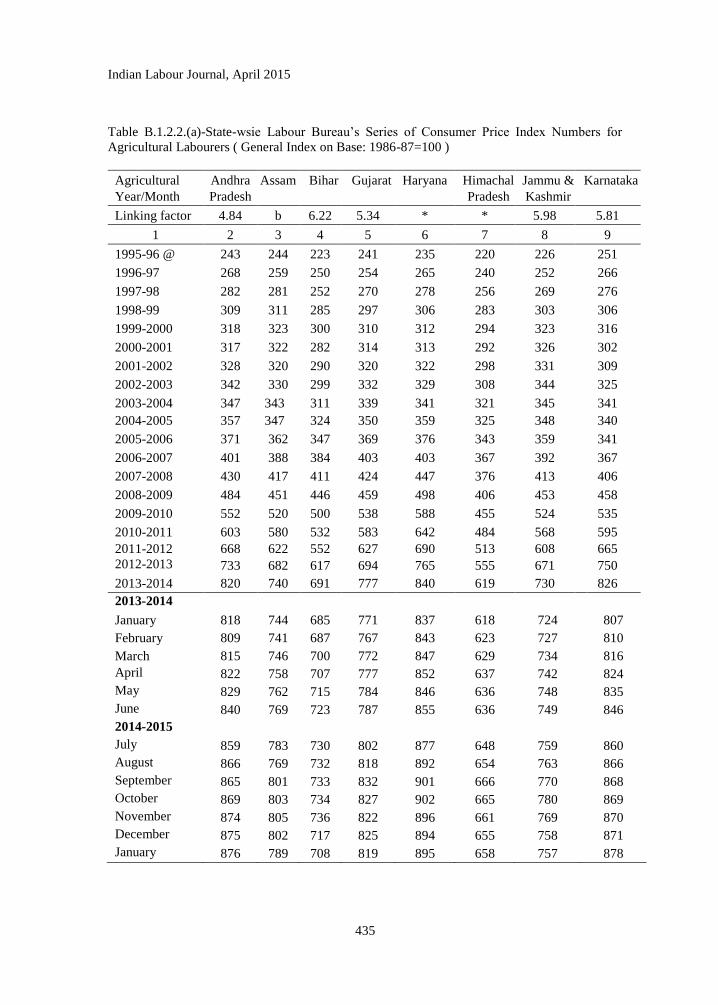
Indian Labour Journal, April 2015
435
Table B.1.2.2.(a)-State-wsie Labour Bureau‘s Series of Consumer Price Index Numbers for
Agricultural Labourers ( General Index on Base: 1986-87=100 )
Agricultural
Year/Month
Andhra
Pradesh
Assam Bihar Gujarat Haryana Himachal
Pradesh
Jammu &
Kashmir
Karnataka
Linking factor 4.84 b 6.22 5.34 * * 5.98 5.81
1 2 3 4 5 6 7 8 9
1995-96 @ 243 244 223 241 235 220 226 251
1996-97 268 259 250 254 265 240 252 266
1997-98 282 281 252 270 278 256 269 276
1998-99 309 311 285 297 306 283 303 306
1999-2000 318 323 300 310 312 294 323 316
2000-2001 317 322 282 314 313 292 326 302
2001-2002 328 320 290 320 322 298 331 309
2002-2003 342 330 299 332 329 308 344 325
2003-2004
2004-2005
347
357
343
347
311
324
339
350
341
359
321
325
345
348
341
340
2005-2006 371 362 347 369 376 343 359 341
2006-2007 401 388 384 403 403 367 392 367
2007-2008 430 417 411 424 447 376 413 406
2008-2009 484 451 446 459 498 406 453 458
2009-2010 552 520 500 538 588 455 524 535
2010-2011 603 580 532 583 642 484 568 595
2011-2012 668 622 552 627 690 513 608 665
2012-2013 733 682 617 694 765 555 671 750
2013-2014 820 740 691 777 840 619 730 826
2013-2014
January 818 744 685 771 837 618 724 807
February 809 741 687 767 843 623 727 810
March 815 746 700 772 847 629 734 816
April 822 758 707 777 852 637 742 824
May 829 762 715 784 846 636 748 835
June 840 769 723 787 855 636 749 846
2014-2015
July 859 783 730 802 877 648 759 860
August 866 769 732 818 892 654 763 866
September 865 801 733 832 901 666 770 868
October 869 803 734 827 902 665 780 869
November 874 805 736 822 896 661 769 870
December 875 802 717 825 894 655 758 871
January 876 789 708 819 895 658 757 878
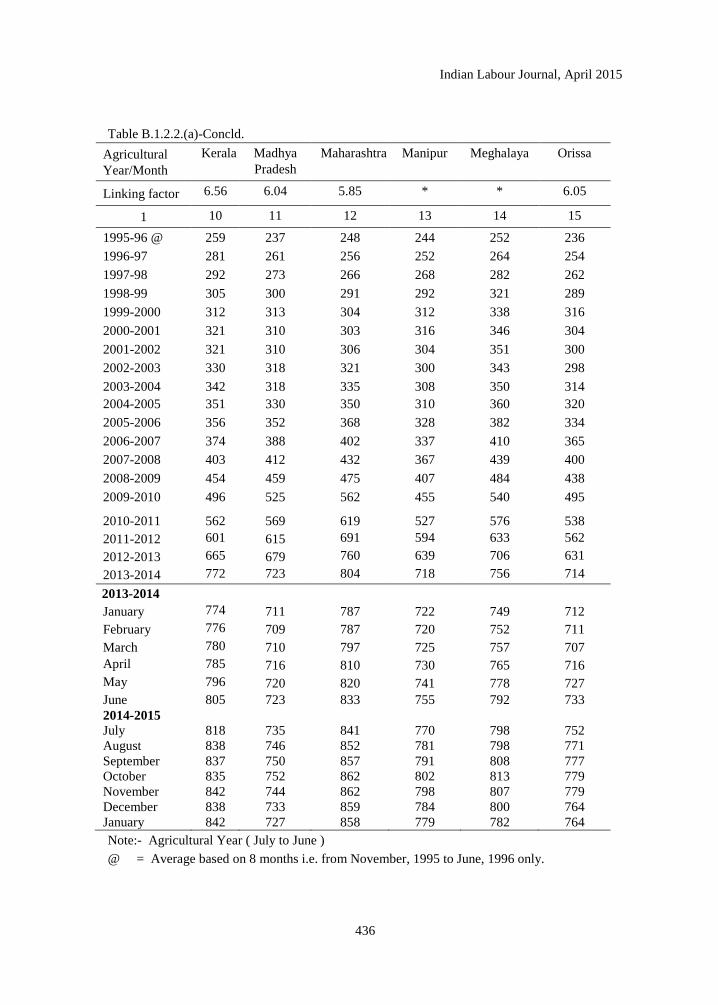
Indian Labour Journal, April 2015
436
Table B.1.2.2.(a)-Concld.
Agricultural
Year/Month
Kerala Madhya
Pradesh
Maharashtra Manipur Meghalaya Orissa
Linking factor 6.56 6.04 5.85 * * 6.05
1 10 11 12 13 14 15
1995-96 @ 259 237 248 244 252 236
1996-97 281 261 256 252 264 254
1997-98 292 273 266 268 282 262
1998-99 305 300 291 292 321 289
1999-2000 312 313 304 312 338 316
2000-2001 321 310 303 316 346 304
2001-2002 321 310 306 304 351 300
2002-2003 330 318 321 300 343 298
2003-2004
2004-2005
342
351
318
330
335
350
308
310
350
360
314
320
2005-2006 356 352 368 328 382 334
2006-2007 374 388 402 337 410 365
2007-2008 403 412 432 367 439 400
2008-2009 454 459 475 407 484 438
2009-2010 496 525 562 455 540 495
2010-2011 562 569 619 527 576 538
2011-2012 601 615 691 594 633 562
2012-2013 665 679 760 639 706 631
2013-2014 772 723 804 718 756 714
2013-2014
January 774 711 787 722 749 712
February 776 709 787 720 752 711
March 780 710 797 725 757 707
April 785 716 810 730 765 716
May 796 720 820 741 778 727
June 805 723 833 755 792 733
2014-2015
July 818 735 841 770 798 752
August 838 746 852 781 798 771
September 837 750 857 791 808 777
October 835 752 862 802 813 779
November 842 744 862 798 807 779
December 838 733 859 784 800 764
January 842 727 858 779 782 764
Note:- Agricultural Year ( July to June )
@ = Average based on 8 months i.e. from November, 1995 to June, 1996 only.
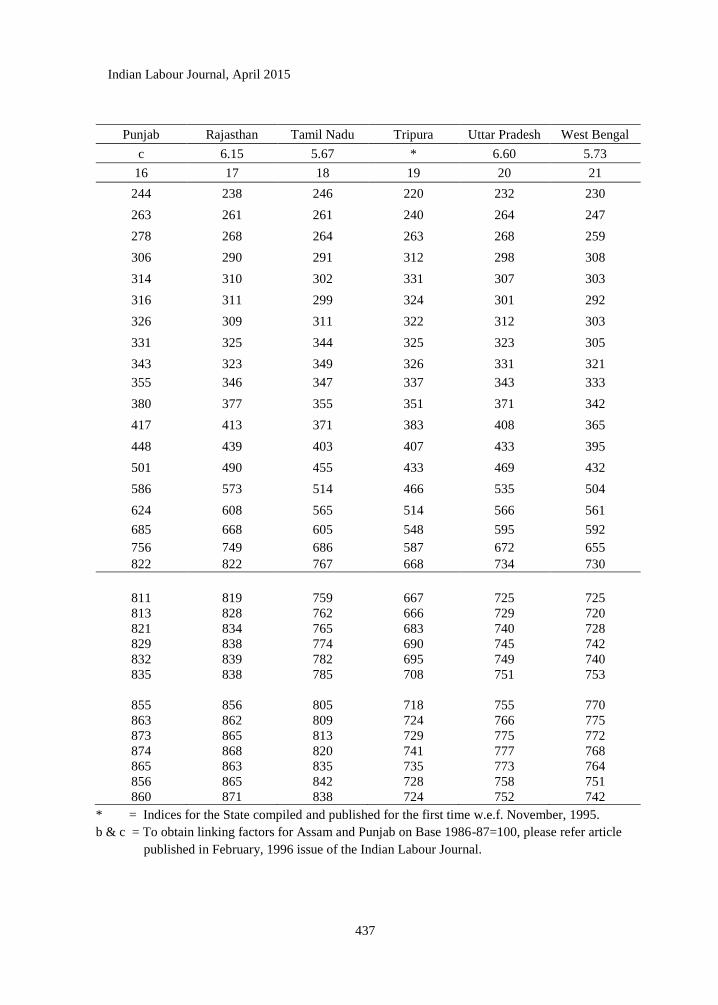
Indian Labour Journal, April 2015
437
Punjab Rajasthan Tamil Nadu Tripura Uttar Pradesh West Bengal
c 6.15 5.67 * 6.60 5.73
16 17 18 19 20 21
244 238 246 220 232 230
263 261 261 240 264 247
278 268 264 263 268 259
306 290 291 312 298 308
314 310 302 331 307 303
316 311 299 324 301 292
326 309 311 322 312 303
331 325 344 325 323 305
343
355
323
346
349
347
326
337
331
343
321
333
380 377 355 351 371 342
417 413 371 383 408 365
448 439 403 407 433 395
501 490 455 433 469 432
586 573 514 466 535 504
624 608 565 514 566 561
685 668 605 548 595 592
756 749 686 587 672 655
822 822 767 668 734 730
811 819 759 667 725 725
813 828 762 666 729 720
821 834 765 683 740 728
829 838 774 690 745 742
832 839 782 695 749 740
835 838 785 708 751 753
855 856 805 718 755 770
863 862 809 724 766 775
873 865 813 729 775 772
874 868 820 741 777 768
865 863 835 735 773 764
856 865 842 728 758 751
860 871 838 724 752 742
* = Indices for the State compiled and published for the first time w.e.f. November, 1995.
b & c = To obtain linking factors for Assam and Punjab on Base 1986-87=100, please refer article
published in February, 1996 issue of the Indian Labour Journal.
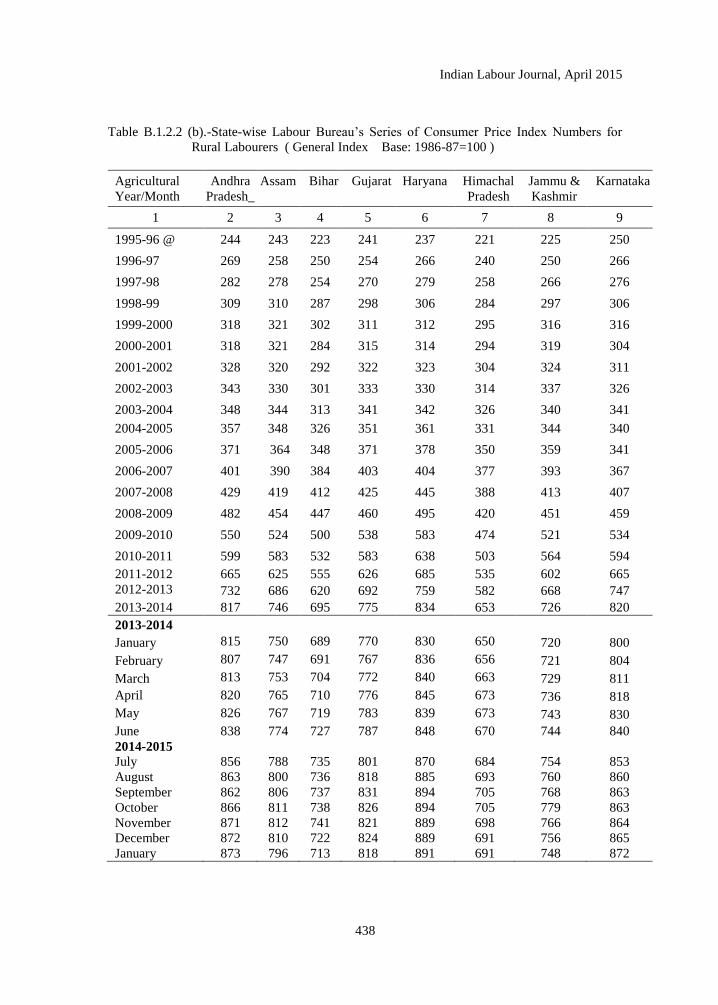
Indian Labour Journal, April 2015
438
Table B.1.2.2 (b).-State-wise Labour Bureau‘s Series of Consumer Price Index Numbers for
Rural Labourers ( General Index Base: 1986-87=100 )
Agricultural
Year/Month
Andhra
Pradesh_
Assam Bihar Gujarat Haryana Himachal
Pradesh
Jammu &
Kashmir
Karnataka
1 2 3 4 5 6 7 8 9
1995-96 @ 244 243 223 241 237 221 225 250
1996-97 269 258 250 254 266 240 250 266
1997-98 282 278 254 270 279 258 266 276
1998-99 309 310 287 298 306 284 297 306
1999-2000 318 321 302 311 312 295 316 316
2000-2001 318 321 284 315 314 294 319 304
2001-2002 328 320 292 322 323 304 324 311
2002-2003 343 330 301 333 330 314 337 326
2003-2004
2004-2005
348
357
344
348
313
326
341
351
342
361
326
331
340
344
341
340
2005-2006 371 364 348 371 378 350 359 341
2006-2007 401 390 384 403 404 377 393 367
2007-2008 429 419 412 425 445 388 413 407
2008-2009 482 454 447 460 495 420 451 459
2009-2010 550 524 500 538 583 474 521 534
2010-2011 599 583 532 583 638 503 564 594
2011-2012 665 625 555 626 685 535 602 665
2012-2013 732 686 620 692 759 582 668 747
2013-2014 817 746 695 775 834 653 726 820
2013-2014
January 815 750 689 770 830 650 720 800
February 807 747 691 767 836 656 721 804
March 813 753 704 772 840 663 729 811
April 820 765 710 776 845 673 736 818
May 826 767 719 783 839 673 743 830
June 838 774 727 787 848 670 744 840
2014-2015
July 856 788 735 801 870 684 754 853
August 863 800 736 818 885 693 760 860
September 862 806 737 831 894 705 768 863
October 866 811 738 826 894 705 779 863
November 871 812 741 821 889 698 766 864
December 872 810 722 824 889 691 756 865
January 873 796 713 818 891 691 748 872
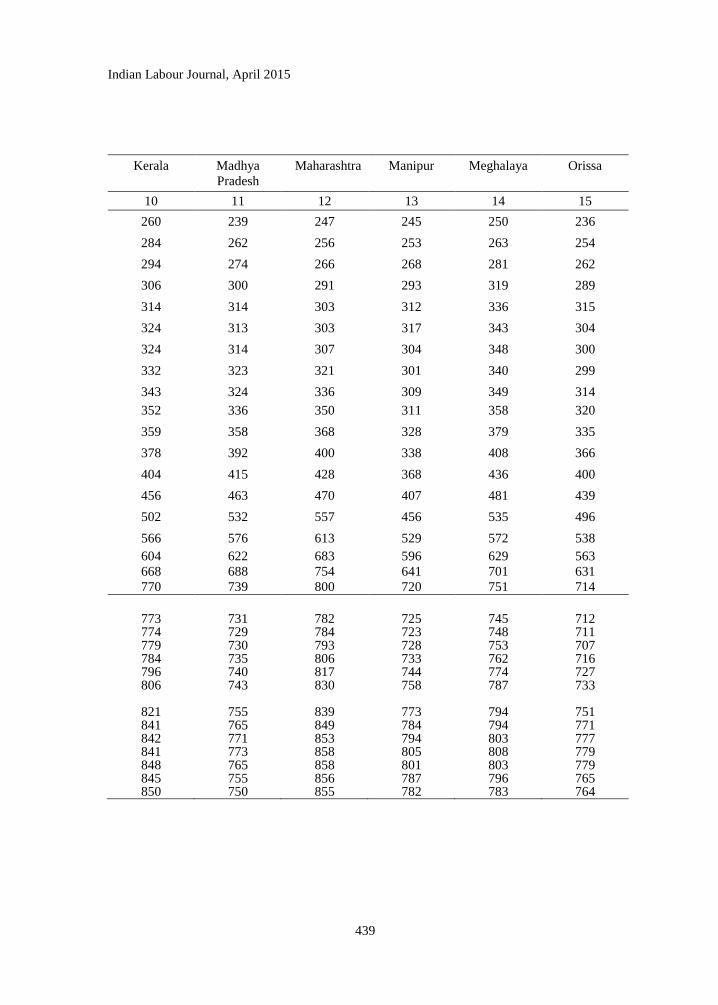
Indian Labour Journal, April 2015
439
Kerala Madhya
Pradesh
Maharashtra Manipur Meghalaya Orissa
10 11 12 13 14 15
260 239 247 245 250 236
284 262 256 253 263 254
294 274 266 268 281 262
306 300 291 293 319 289
314 314 303 312 336 315
324 313 303 317 343 304
324 314 307 304 348 300
332 323 321 301 340 299
343
352
324
336
336
350
309
311
349
358
314
320
359 358 368 328 379 335
378 392 400 338 408 366
404 415 428 368 436 400
456 463 470 407 481 439
502 532 557 456 535 496
566 576 613 529 572 538
604 622 683 596 629 563
668 688 754 641 701 631
770 739 800 720 751 714
773 731 782 725 745 712 774 729 784 723 748 711 779 730 793 728 753 707 784 735 806 733 762 716 796 740 817 744 774 727 806 743 830 758 787 733
821 755 839 773 794 751 841 765 849 784 794 771 842 771 853 794 803 777 841 773 858 805 808 779 848 765 858 801 803 779 845 755 856 787 796 765 850 750 855 782 783 764
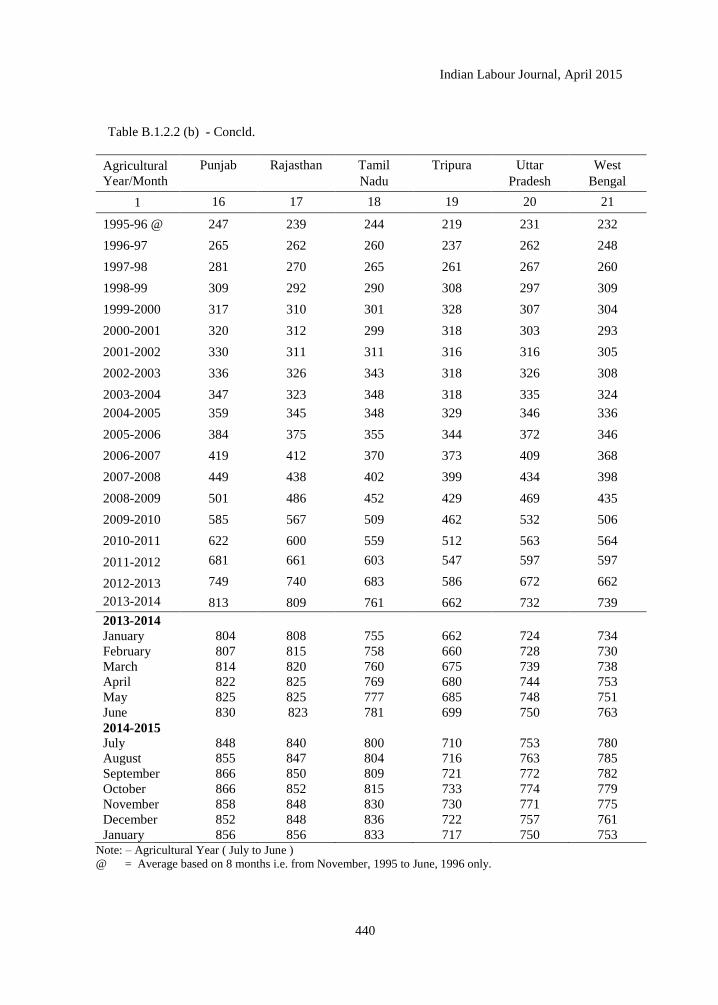
Indian Labour Journal, April 2015
440
Table B.1.2.2 (b) - Concld.
Agricultural
Year/Month
Punjab Rajasthan Tamil
Nadu
Tripura Uttar
Pradesh
West
Bengal
1 16 17 18 19 20 21
1995-96 @ 247 239 244 219 231 232
1996-97 265 262 260 237 262 248
1997-98 281 270 265 261 267 260
1998-99 309 292 290 308 297 309
1999-2000 317 310 301 328 307 304
2000-2001 320 312 299 318 303 293
2001-2002 330 311 311 316 316 305
2002-2003 336 326 343 318 326 308
2003-2004
2004-2005
347
359
323
345
348
348
318
329
335
346
324
336
2005-2006 384 375 355 344 372 346
2006-2007 419 412 370 373 409 368
2007-2008 449 438 402 399 434 398
2008-2009 501 486 452 429 469 435
2009-2010 585 567 509 462 532 506
2010-2011 622 600 559 512 563 564
2011-2012 681 661 603 547 597 597
2012-2013 749 740 683 586 672 662
2013-2014 813 809 761 662 732 739
2013-2014
January 804 808 755 662 724 734
February 807 815 758 660 728 730
March 814 820 760 675 739 738
April 822 825 769 680 744 753
May 825 825 777 685 748 751
June 830 823 781 699 750 763
2014-2015
July 848 840 800 710 753 780
August 855 847 804 716 763 785
September 866 850 809 721 772 782
October 866 852 815 733 774 779
November 858 848 830 730 771 775
December 852 848 836 722 757 761
January 856 856 833 717 750 753 Note: – Agricultural Year ( July to June )
@ = Average based on 8 months i.e. from November, 1995 to June, 1996 only.
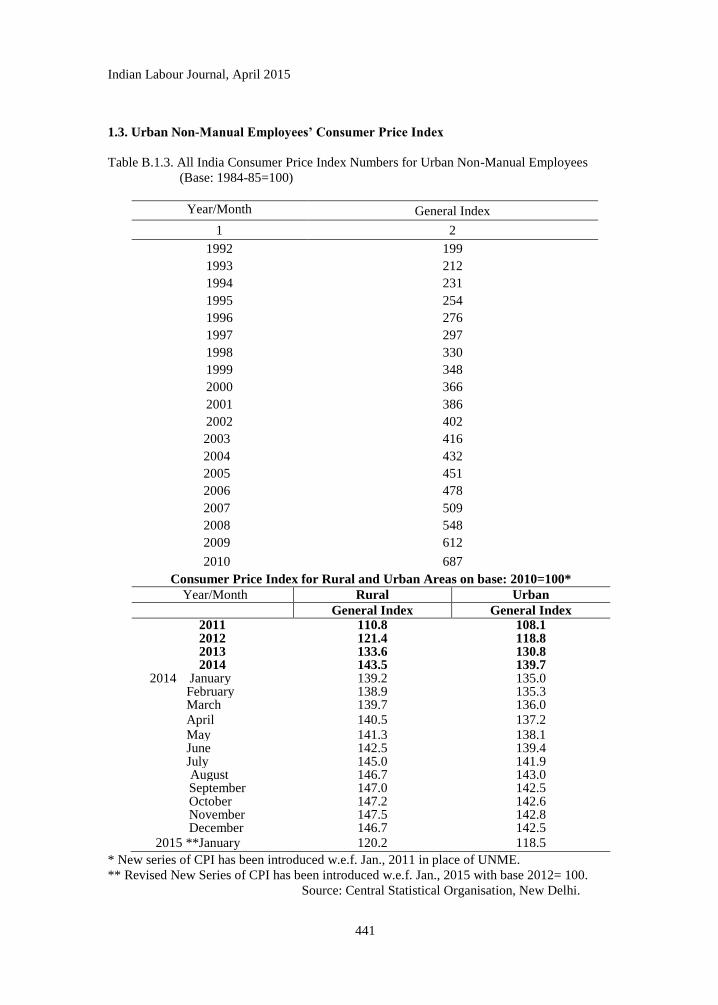
Indian Labour Journal, April 2015
441
1.3. Urban Non-Manual Employees’ Consumer Price Index
Table B.1.3. All India Consumer Price Index Numbers for Urban Non-Manual Employees
(Base: 1984-85=100)
Year/Month General Index
1 2
1992 199
1993 212
1994 231
1995 254
1996 276
1997 297
1998 330
1999 348
2000 366
2001 386
2002 402
2003 416
2004 432
2005 451
2006 478
2007 509
2008 548
2009 612
2010 687
Consumer Price Index for Rural and Urban Areas on base: 2010=100*
Year/Month Rural Urban
General Index General Index 2011 110.8 108.1 2012 121.4 118.8 2013 133.6 130.8 2014 143.5 139.7
2014 January 139.2 135.0 February 138.9 135.3 March 139.7 136.0 April 140.5 137.2 May 141.3 138.1 June 142.5 139.4 July 145.0 141.9
August 146.7 143.0 September 147.0 142.5 October 147.2 142.6 November 147.5 142.8 December 146.7 142.5
2015 **January 120.2 118.5
* New series of CPI has been introduced w.e.f. Jan., 2011 in place of UNME.
** Revised New Series of CPI has been introduced w.e.f. Jan., 2015 with base 2012= 100.
Source: Central Statistical Organisation, New Delhi.
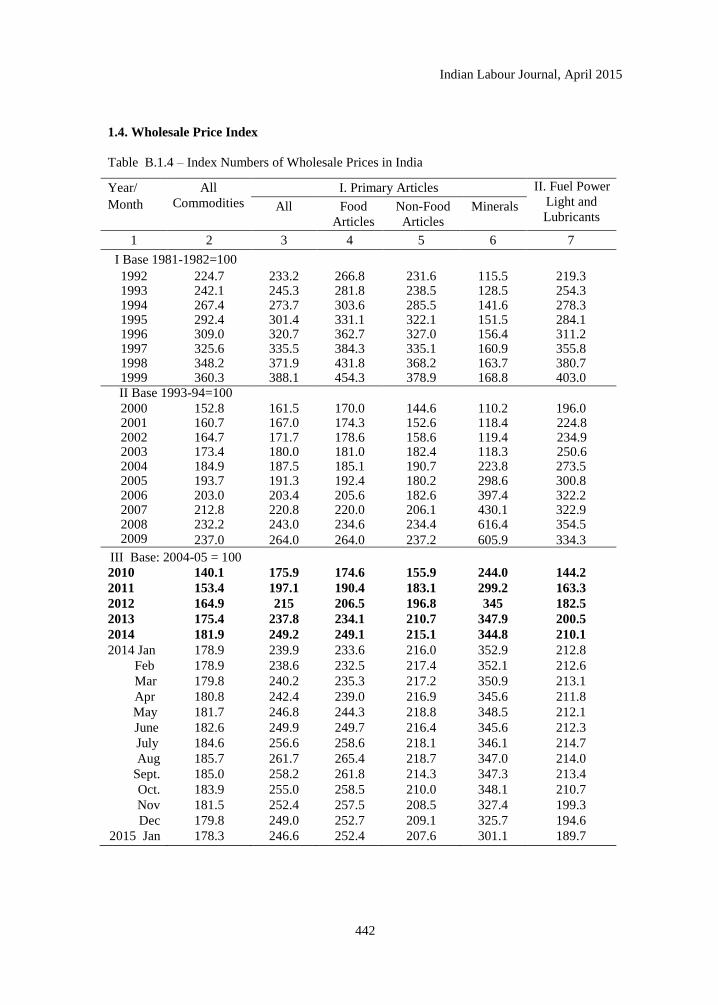
Indian Labour Journal, April 2015
442
1.4. Wholesale Price Index
Table B.1.4 – Index Numbers of Wholesale Prices in India
Year/
Month
All
Commodities
I. Primary Articles II. Fuel Power
Light and
Lubricants All Food
Articles
Non-Food
Articles
Minerals
1 2 3 4 5 6 7
I Base 1981-1982=100
1992 224.7 233.2 266.8 231.6 115.5 219.3 1993 242.1 245.3 281.8 238.5 128.5 254.3 1994 267.4 273.7 303.6 285.5 141.6 278.3 1995 292.4 301.4 331.1 322.1 151.5 284.1 1996 309.0 320.7 362.7 327.0 156.4 311.2 1997 325.6 335.5 384.3 335.1 160.9 355.8 1998 348.2 371.9 431.8 368.2 163.7 380.7 1999 360.3 388.1 454.3 378.9 168.8 403.0
II Base 1993-94=100
2000 152.8 161.5 170.0 144.6 110.2 196.0 2001 160.7 167.0 174.3 152.6 118.4 224.8 2002 164.7 171.7 178.6 158.6 119.4 234.9 2003 173.4 180.0 181.0 182.4 118.3 250.6 2004 184.9 187.5 185.1 190.7 223.8 273.5 2005 193.7 191.3 192.4 180.2 298.6 300.8 2006 203.0 203.4 205.6 182.6 397.4 322.2 2007 212.8 220.8 220.0 206.1 430.1 322.9 2008 232.2 243.0 234.6 234.4 616.4 354.5 2009 237.0 264.0 264.0 237.2 605.9 334.3
III Base: 2004-05 = 100
2010 140.1 175.9 174.6 155.9 244.0 144.2
2011 153.4 197.1 190.4 183.1 299.2 163.3
2012 164.9 215 206.5 196.8 345 182.5
2013 175.4 237.8 234.1 210.7 347.9 200.5
2014 181.9 249.2 249.1 215.1 344.8 210.1
2014 Jan 178.9 239.9 233.6 216.0 352.9 212.8
Feb 178.9 238.6 232.5 217.4 352.1 212.6
Mar 179.8 240.2 235.3 217.2 350.9 213.1
Apr 180.8 242.4 239.0 216.9 345.6 211.8
May 181.7 246.8 244.3 218.8 348.5 212.1
June 182.6 249.9 249.7 216.4 345.6 212.3
July 184.6 256.6 258.6 218.1 346.1 214.7
Aug 185.7 261.7 265.4 218.7 347.0 214.0
Sept. 185.0 258.2 261.8 214.3 347.3 213.4
Oct. 183.9 255.0 258.5 210.0 348.1 210.7
Nov 181.5 252.4 257.5 208.5 327.4 199.3
Dec 179.8 249.0 252.7 209.1 325.7 194.6
2015 Jan 178.3 246.6 252.4 207.6 301.1 189.7
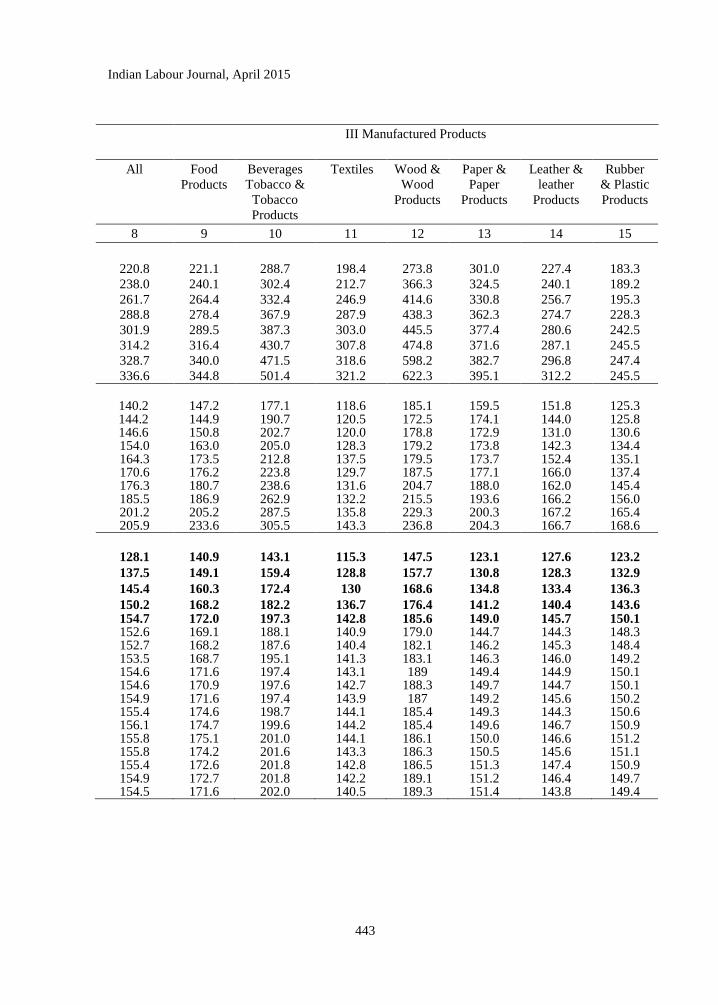
Indian Labour Journal, April 2015
443
III Manufactured Products
All Food
Products
Beverages
Tobacco &
Tobacco
Products
Textiles Wood &
Wood
Products
Paper &
Paper
Products
Leather &
leather
Products
Rubber
& Plastic
Products
8 9 10 11 12 13 14 15
220.8 221.1 288.7 198.4 273.8 301.0 227.4 183.3
238.0 240.1 302.4 212.7 366.3 324.5 240.1 189.2
261.7 264.4 332.4 246.9 414.6 330.8 256.7 195.3
288.8 278.4 367.9 287.9 438.3 362.3 274.7 228.3
301.9 289.5 387.3 303.0 445.5 377.4 280.6 242.5
314.2 316.4 430.7 307.8 474.8 371.6 287.1 245.5
328.7 340.0 471.5 318.6 598.2 382.7 296.8 247.4
336.6 344.8 501.4 321.2 622.3 395.1 312.2 245.5
140.2 147.2 177.1 118.6 185.1 159.5 151.8 125.3 144.2 144.9 190.7 120.5 172.5 174.1 144.0 125.8 146.6 150.8 202.7 120.0 178.8 172.9 131.0 130.6
154.0 163.0 205.0 128.3 179.2 173.8 142.3 134.4 164.3 173.5 212.8 137.5 179.5 173.7 152.4 135.1 170.6 176.2 223.8 129.7 187.5 177.1 166.0 137.4 176.3 180.7 238.6 131.6 204.7 188.0 162.0 145.4 185.5 186.9 262.9 132.2 215.5 193.6 166.2 156.0 201.2 205.2 287.5 135.8 229.3 200.3 167.2 165.4 205.9 233.6 305.5 143.3 236.8 204.3 166.7 168.6
128.1 140.9 143.1 115.3 147.5 123.1 127.6 123.2
137.5 149.1 159.4 128.8 157.7 130.8 128.3 132.9
145.4 160.3 172.4 130 168.6 134.8 133.4 136.3
150.2 168.2 182.2 136.7 176.4 141.2 140.4 143.6 154.7 172.0 197.3 142.8 185.6 149.0 145.7 150.1 152.6 169.1 188.1 140.9 179.0 144.7 144.3 148.3 152.7 168.2 187.6 140.4 182.1 146.2 145.3 148.4 153.5 168.7 195.1 141.3 183.1 146.3 146.0 149.2 154.6 171.6 197.4 143.1 189 149.4 144.9 150.1 154.6 170.9 197.6 142.7 188.3 149.7 144.7 150.1 154.9 171.6 197.4 143.9 187 149.2 145.6 150.2 155.4 174.6 198.7 144.1 185.4 149.3 144.3 150.6 156.1 174.7 199.6 144.2 185.4 149.6 146.7 150.9 155.8 175.1 201.0 144.1 186.1 150.0 146.6 151.2 155.8 174.2 201.6 143.3 186.3 150.5 145.6 151.1 155.4 172.6 201.8 142.8 186.5 151.3 147.4 150.9 154.9 172.7 201.8 142.2 189.1 151.2 146.4 149.7 154.5 171.6 202.0 140.5 189.3 151.4 143.8 149.4
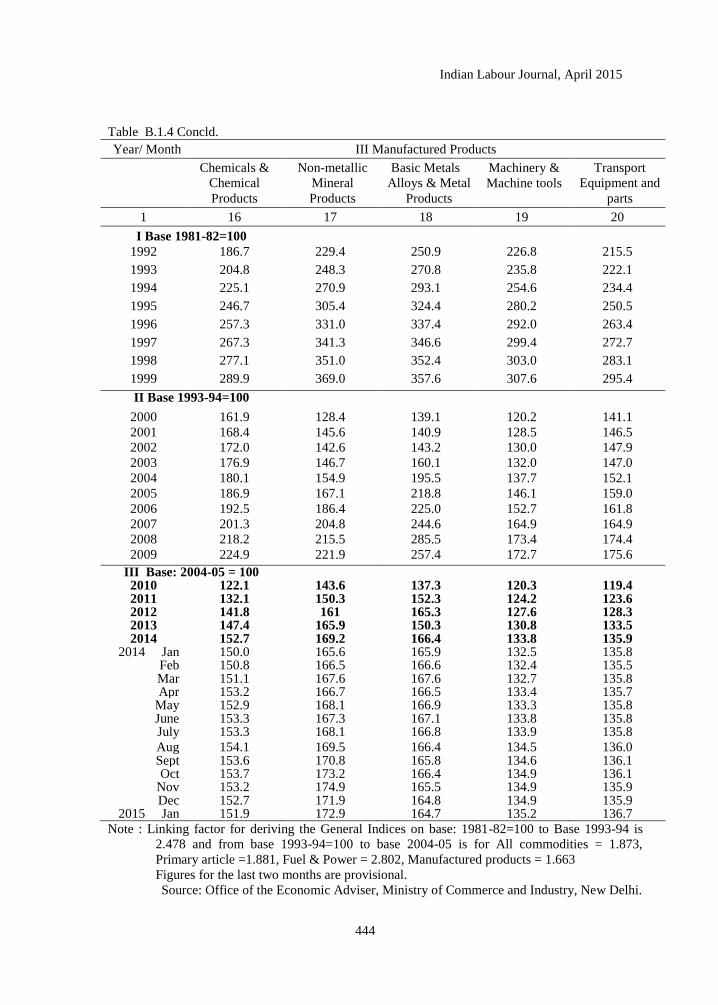
Indian Labour Journal, April 2015
444
Table B.1.4 Concld.
Year/ Month III Manufactured Products
Chemicals &
Chemical
Products
Non-metallic
Mineral
Products
Basic Metals
Alloys & Metal
Products
Machinery &
Machine tools
Transport
Equipment and
parts
1 16 17 18 19 20
I Base 1981-82=100
1992 186.7 229.4 250.9 226.8 215.5
1993 204.8 248.3 270.8 235.8 222.1
1994 225.1 270.9 293.1 254.6 234.4
1995 246.7 305.4 324.4 280.2 250.5
1996 257.3 331.0 337.4 292.0 263.4
1997 267.3 341.3 346.6 299.4 272.7
1998 277.1 351.0 352.4 303.0 283.1
1999 289.9 369.0 357.6 307.6 295.4
II Base 1993-94=100
2000 161.9 128.4 139.1 120.2 141.1
2001 168.4 145.6 140.9 128.5 146.5
2002 172.0 142.6 143.2 130.0 147.9
2003 176.9 146.7 160.1 132.0 147.0
2004 180.1 154.9 195.5 137.7 152.1
2005 186.9 167.1 218.8 146.1 159.0
2006 192.5 186.4 225.0 152.7 161.8
2007 201.3 204.8 244.6 164.9 164.9
2008 218.2 215.5 285.5 173.4 174.4
2009 224.9 221.9 257.4 172.7 175.6
III Base: 2004-05 = 100 2010 122.1 143.6 137.3 120.3 119.4 2011 132.1 150.3 152.3 124.2 123.6 2012 141.8 161 165.3 127.6 128.3 2013 147.4 165.9 150.3 130.8 133.5 2014 152.7 169.2 166.4 133.8 135.9
2014 Jan 150.0 165.6 165.9 132.5 135.8 Feb 150.8 166.5 166.6 132.4 135.5 Mar 151.1 167.6 167.6 132.7 135.8 Apr 153.2 166.7 166.5 133.4 135.7
May 152.9 168.1 166.9 133.3 135.8 June 153.3 167.3 167.1 133.8 135.8 July 153.3 168.1 166.8 133.9 135.8
Aug 154.1 169.5 166.4 134.5 136.0 Sept 153.6 170.8 165.8 134.6 136.1 Oct 153.7 173.2 166.4 134.9 136.1
Nov 153.2 174.9 165.5 134.9 135.9 Dec 152.7 171.9 164.8 134.9 135.9
2015 Jan 151.9 172.9 164.7 135.2 136.7
Note : Linking factor for deriving the General Indices on base: 1981-82=100 to Base 1993-94 is
2.478 and from base 1993-94=100 to base 2004-05 is for All commodities = 1.873,
Primary article =1.881, Fuel & Power = 2.802, Manufactured products = 1.663
Figures for the last two months are provisional.
Source: Office of the Economic Adviser, Ministry of Commerce and Industry, New Delhi.
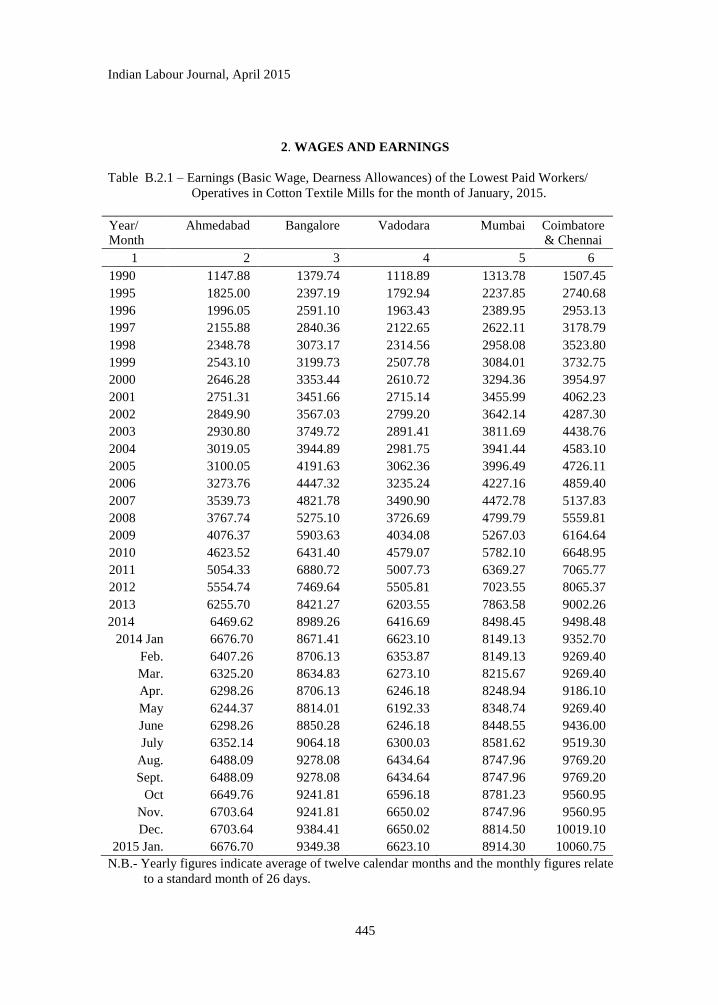
Indian Labour Journal, April 2015
445
2. WAGES AND EARNINGS
Table B.2.1 – Earnings (Basic Wage, Dearness Allowances) of the Lowest Paid Workers/
Operatives in Cotton Textile Mills for the month of January, 2015.
Year/ Month
Ahmedabad Bangalore Vadodara Mumbai Coimbatore & Chennai
1 2 3 4 5 6
1990 1147.88 1379.74 1118.89 1313.78 1507.45
1995 1825.00 2397.19 1792.94 2237.85 2740.68
1996 1996.05 2591.10 1963.43 2389.95 2953.13
1997 2155.88 2840.36 2122.65 2622.11 3178.79
1998 2348.78 3073.17 2314.56 2958.08 3523.80
1999 2543.10 3199.73 2507.78 3084.01 3732.75
2000 2646.28 3353.44 2610.72 3294.36 3954.97
2001 2751.31 3451.66 2715.14 3455.99 4062.23
2002 2849.90 3567.03 2799.20 3642.14 4287.30
2003 2930.80 3749.72 2891.41 3811.69 4438.76
2004 3019.05 3944.89 2981.75 3941.44 4583.10
2005 3100.05 4191.63 3062.36 3996.49 4726.11
2006 3273.76 4447.32 3235.24 4227.16 4859.40
2007 3539.73 4821.78 3490.90 4472.78 5137.83
2008 3767.74 5275.10 3726.69 4799.79 5559.81
2009 4076.37 5903.63 4034.08 5267.03 6164.64
2010 4623.52 6431.40 4579.07 5782.10 6648.95
2011 5054.33 6880.72 5007.73 6369.27 7065.77
2012 5554.74 7469.64 5505.81 7023.55 8065.37
2013 6255.70 8421.27 6203.55 7863.58 9002.26
2014 6469.62 8989.26 6416.69 8498.45 9498.48
2014 Jan 6676.70 8671.41 6623.10 8149.13 9352.70
Feb. 6407.26 8706.13 6353.87 8149.13 9269.40
Mar. 6325.20 8634.83 6273.10 8215.67 9269.40
Apr. 6298.26 8706.13 6246.18 8248.94 9186.10
May 6244.37 8814.01 6192.33 8348.74 9269.40
June 6298.26 8850.28 6246.18 8448.55 9436.00
July 6352.14 9064.18 6300.03 8581.62 9519.30
Aug. 6488.09 9278.08 6434.64 8747.96 9769.20
Sept. 6488.09 9278.08 6434.64 8747.96 9769.20
Oct 6649.76 9241.81 6596.18 8781.23 9560.95
Nov. 6703.64 9241.81 6650.02 8747.96 9560.95
Dec. 6703.64 9384.41 6650.02 8814.50 10019.10
2015 Jan. 6676.70 9349.38 6623.10 8914.30 10060.75
N.B.- Yearly figures indicate average of twelve calendar months and the monthly figures relate
to a standard month of 26 days.
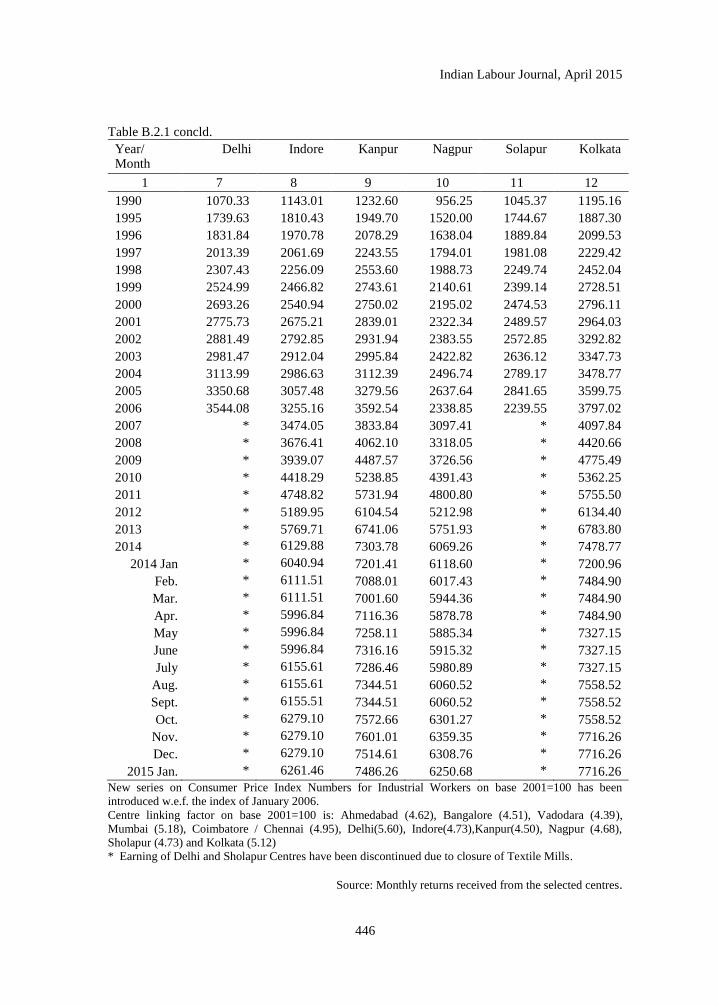
Indian Labour Journal, April 2015
446
Table B.2.1 concld.
Year/ Month
Delhi Indore Kanpur Nagpur Solapur Kolkata
1 7 8 9 10 11 12
1990 1070.33 1143.01 1232.60 956.25 1045.37 1195.16
1995 1739.63 1810.43 1949.70 1520.00 1744.67 1887.30
1996 1831.84 1970.78 2078.29 1638.04 1889.84 2099.53
1997 2013.39 2061.69 2243.55 1794.01 1981.08 2229.42
1998 2307.43 2256.09 2553.60 1988.73 2249.74 2452.04
1999 2524.99 2466.82 2743.61 2140.61 2399.14 2728.51
2000 2693.26 2540.94 2750.02 2195.02 2474.53 2796.11
2001 2775.73 2675.21 2839.01 2322.34 2489.57 2964.03
2002 2881.49 2792.85 2931.94 2383.55 2572.85 3292.82
2003 2981.47 2912.04 2995.84 2422.82 2636.12 3347.73
2004 3113.99 2986.63 3112.39 2496.74 2789.17 3478.77
2005 3350.68 3057.48 3279.56 2637.64 2841.65 3599.75
2006 3544.08 3255.16 3592.54 2338.85 2239.55 3797.02
2007 * 3474.05 3833.84 3097.41 * 4097.84
2008 * 3676.41 4062.10 3318.05 * 4420.66
2009 * 3939.07 4487.57 3726.56 * 4775.49
2010 * 4418.29 5238.85 4391.43 * 5362.25
2011 * 4748.82 5731.94 4800.80 * 5755.50
2012 * 5189.95 6104.54 5212.98 * 6134.40
2013 * 5769.71 6741.06 5751.93 * 6783.80
2014 * 6129.88 7303.78 6069.26 * 7478.77
2014 Jan * 6040.94 7201.41 6118.60 * 7200.96
Feb. * 6111.51 7088.01 6017.43 * 7484.90
Mar. * 6111.51 7001.60 5944.36 * 7484.90
Apr. * 5996.84 7116.36 5878.78 * 7484.90
May * 5996.84 7258.11 5885.34 * 7327.15
June * 5996.84 7316.16 5915.32 * 7327.15
July * 6155.61 7286.46 5980.89 * 7327.15
Aug. * 6155.61 7344.51 6060.52 * 7558.52
Sept. * 6155.51 7344.51 6060.52 * 7558.52
Oct. * 6279.10 7572.66 6301.27 * 7558.52
Nov. * 6279.10 7601.01 6359.35 * 7716.26
Dec. * 6279.10 7514.61 6308.76 * 7716.26
2015 Jan. * 6261.46 7486.26 6250.68 * 7716.26
New series on Consumer Price Index Numbers for Industrial Workers on base 2001=100 has been
introduced w.e.f. the index of January 2006.
Centre linking factor on base 2001=100 is: Ahmedabad (4.62), Bangalore (4.51), Vadodara (4.39),
Mumbai (5.18), Coimbatore / Chennai (4.95), Delhi(5.60), Indore(4.73),Kanpur(4.50), Nagpur (4.68),
Sholapur (4.73) and Kolkata (5.12)
* Earning of Delhi and Sholapur Centres have been discontinued due to closure of Textile Mills.
Source: Monthly returns received from the selected centres.
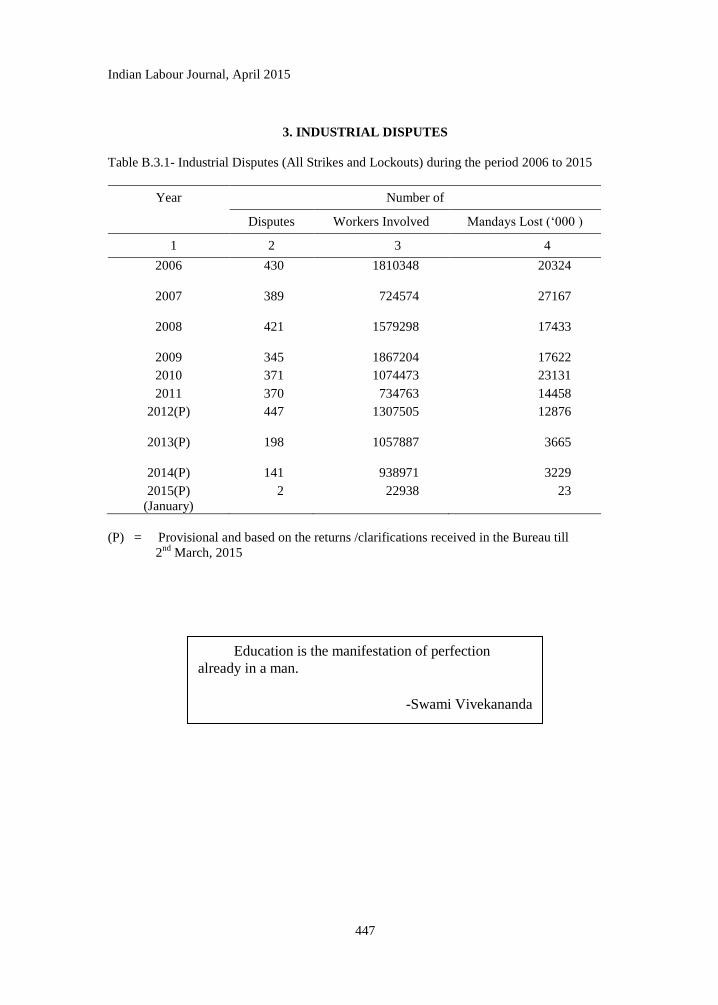
Indian Labour Journal, April 2015
447
3. INDUSTRIAL DISPUTES
Table B.3.1- Industrial Disputes (All Strikes and Lockouts) during the period 2006 to 2015
Year Number of
Disputes Workers Involved Mandays Lost (‗000 )
1 2 3 4
2006
430 1810348 20324
2007
389 724574 27167
2008
421 1579298 17433
2009 345 1867204 17622
2010 371 1074473 23131
2011 370 734763 14458
2012(P)
447 1307505 12876
2013(P)
198 1057887 3665
2014(P) 141 938971 3229
2015(P)
(January)
2 22938 23
(P) = Provisional and based on the returns /clarifications received in the Bureau till
2nd
March, 2015
Education is the manifestation of perfection
already in a man.
-Swami Vivekananda

Indian Labour Journal, April 2015
448
THINKING SHOULD BECOME YOUR CAPITAL
ASSET, NO MATTER WHATEVER UPS AND DOWNS YOU
COME ACROSS IN YOUR LIFE.
-APJ ABDUL KALAM
Indian Labour Journal, April 2015
449
Priced publications of the Labour Bureau
1. ANNUAL SURVEY OF INDUSTRIES 2011-12 (VOL. I)
Statistics on Employment and Labour Cost
The publication presents statistics on Employment and Labour Cost for the year 2011-
12 and is based on Block-E of Part-I of the ASI Schedule.
Symbol: PCSO 33-2011-12 (Vol.I) 120-2013 (DSK-III)
Price : Rs. 241.00
2. ANNUAL SURVEY OF INDUSTRIES 2011-12 (VOL. II) Report on Absenteeism, Labour Turnover, Employment and Labour Cost
The report presents statistics on Absenteeism, Labour Turnover, Employment, Labour
Cost and Earnings for the year 2011-12 and is based on Block-E of Part-I and Block-2 of Part-II of the ASI Schedule.
Symbol: PCSO 33-2011-12 (Vol.II) 120-2013 (DSK-III)
Price : Rs. 156.00
3. OCCUPATIONAL WAGE SURVEY SIXTH ROUND 2009
(Report on Nine Engineering Industries)
The Sixth round of Occupational Wage Survey report on Nine Engineering Industries presents statistics on Employment Structure, Wage Rates, Dearness Allowance and Average Daily Earnings by Occupational and Stratum. The report also makes an attempt to meet the statutory obligation pertaining to Article 8 or part-II (Average Earnings and Wage Structure & Distribution) of the ILO Convention No. 160 on Labour Statistics. The data presented in this Report would prove useful to the users and the policy maker.
Symbol: PDLB 640 176-2010 (DSK-II)
Price : Rs. 176.00
4. REPORT ON THE SURVEY ON SOCIO ECONOMIC CONDITIONS OF LICENSED RAILWAY PORTERS AT FIVE SELECTED CENTRES, 2004
The report contains data on demographic particulars, earnings, expenditure, assets, consumption habits, indebtedness, health, availability of welfare facilities and industrial relations etc. in respect of Licensed Railway Porters working at the five selected centres.
Symbol: PDLB – 508 (E) 250-2004(DSK-II)
Price : Rs. 65.00
All the priced publications brought out by the Labour Bureau can be obtained from the Controller of
Publications, Civil Lines, Delhi-110054 by remitting the price in advance. Kindly quote the Symbol
number of the publication to facilitate its delivery.
Indian Labour Journal, April 2015
450
5. RURAL LABOUR ENQUIRY REPORT ON WAGES & EARNINGS OF RURAL LABOUR HOUSEHOLDS – 2004-2005
The report contains data on Wages & Earnings of Rural labour Households collected
by the National Sample Survey Organisation during its 61st round (2004-2005) of survey. It
gives information on Wages & Earnings of Rural as well as Agricultural labour Households by States and Categories of Households, in the country, for various agricultural occupations. The data is of immense use to the planners, researchers and policy framers.
Symbol: PDLB - 638 250-2010 (DSK-II)
Price : Rs. 105.00
6. RURAL LABOUR ENQUIRY REPORT ON GENERAL CHARACTERISTICS OF RURAL LABOUR HOUSEHOLDS – 2004-2005
The report contains data on general characteristics of rural labour households, viz.,
demographic structure of labour households; size of households; land holding pattern of households; and number of agricultural and non-agricultural households, etc. – a mine of information on the said subject, which would be of immense value to the researchers, economic planners and policy framers.
Symbol: PDLB – 652 200-2011 (DSK-II)
Price : Rs. 90.00
7. RURAL LABOUR ENQUIRY REPORT ON INDEBTEDNESS AMONG
RURAL LABOUR HOUSEHOLDS – 2004-2005
The report analyses the magnitude and incidence of indebtedness among labour
households in the country on the basis of the results of data collected by National Sample Survey Organisation during its 61
st round (2004-2005) of survey. The data is of immense use to
the planners, researchers and policy framers.
Symbol: PDLB – 645 250-2010 (DSK-II)
Price : Rs. 143.00
8. RURAL LABOUR ENQUIRY REPORT ON CONSUMPTION EXPENDITURE OF RURAL LABOUR HOUSEHOLDS - 2004-2005
The report presents analysis of data on consumption expenditure of the rural labour
households collected by the National Sample Survey Organisation during the 61st round (2004-
05) of the survey. It is hoped that the present publication will prove to be very useful for planning, administration and research purposes in the area.
Symbol: PDLB – 659 260-2012 (DSK-II)
Price : Rs. 140.00
9. RURAL LABOUR ENQUIRY REPORT ON EMPLOYMENT & UNEMPLOYMENT
OF RURAL LABOUR HOUSEHOLDS - 2004-2005
The report presents analysis of data on employment & unemployment of rural labour households on the basis of the results of data collected by National Sample Survey Organisation during its 61
st round (2004-05) of survey. This report has been brought out in two volumes.
Vol.-I presents the main findings whereas Vol.-II contains ‗appendices‘ in which detailed data have been presented. The data is of immense use to the planners, researchers and policy framers.
Symbol: PDLB – 631 250-2008 (DSK-II)
Price (per set) : Rs. 525.00
Indian Labour Journal, April 2015
451
10. CONSUMER PRICE INDEX NUMBERS FOR AGRICULTURAL AND RURAL
LABOURERS 1986-87=100) Annual Report- 2012-13 (Agricultural Year)
This publication, 16th
in the series, contains detailed information on Consumer price Index Numbers for Agricultural and Rural Labourers ( Base: 1986-87=100) for the period July, 2012 to June, 2013. These index numbers, and especially the CPI (AL), play an important role in fixing/revising the minimum wages of agricultural workers.
Symbol: PDL – 562 150-2013 (DSK-II)
Price: Rs. 105.00
11. CONSUMER PRICE INDEX NUMBERS
(for Industrial Workers) 2001=100 Annual Report- 2013
The publication presents serial statistics on Consumer Price Index Number for Industrial Workers with Base: 2001=100 for 78 industrial centres and also for all India. It also contains major group-wise (food, pan, supari, tobacco and intoxicants, fuel and light, housing, clothing, bedding and footwear and miscellaneous) and subgroups wise indices alongwith Linking Factors for conversion of the index to old base (1982=100).
Symbol: PDL – 563 300-2014 (DSK-II)
Price: Rs. 230.00
12. WAGE RATES IN RURAL INDIA
2012-2013 (Agricultural Year)
The publication, 16th
in the series, contains daily wage rate data in respect of 11 Agricultural and 7 Non-Agricultural Occupations for the period July, 2012 to June, 2013. The data on wage rates play an important role in the calculation of State/National Income, drawing up and implementation of wage policy as well as in fixation/revision of support prices of agricultural crops.
Symbol: PDLB – 663 200-2013 (DSK-II)
Price: Rs.115.00
13. TENTH DIGEST OF INDIAN LABOUR RESEARCH (2008-2011)
The publication present an annotated bibliography of research studies undertaken by various Universities, Government Departments (Central/State), Social Research Institutes, Employers‘ and Workers‘‘ organizations and individual researchers in the field of labour and labour related issues.
Symbol: PDLB – 666 60-2014 (DSK-II)
Price : Rs. 119.00
14. TRADE UNIONS IN INDIA 2010
Trade Unions in India is a biennial publication. It presents information in respect of
Workers and Employers Unions, on Registered Trade Unions submitting returns by their sex-wise membership. Besides, it also presents data of income and expenditure of Workers as well as Employers Unions.
Symbol: PDLB -662 100-2013(DSK-II)
Price : Rs. 94.00
Indian Labour Journal, April 2015
452
15. STATISTICAL PROFILE ON WOMEN LABOUR 2012-13
The publication provides comprehensive and recent most statistics on important aspects of Women Labour in India at one place and helps the researchers to study the gender variations in the population, employment, employment services and training, wages/earnings, participation in trade union movement, social security.
Symbol: PDLB -665 70-2014 (DSK-II)
Price : Rs. 264.00
16. REPORT ON THE WORKING OF MINIMUM WAGES ACT, 1948 FOR THE YEAR 2012
The report covers information on employment added, employments in which the
Minimum Wages were fixed for the first time, the Minimum Wages in different scheduled employments prevalent during the year, the range of Minimum Wages, comparative Minimum Wage Rates prevailing in scheduled employments and number of Inspections. Etc.
Symbol: PDLB .664 90-2013 (DSK-II)
Price : Rs. 178.00
17. INDIAN LABOUR YEAR BOOK 2009 and 2010
The Indian Labour Year Book provides, in a compact volume, a general description of
various topics, alongwith the latest available data in the field of labour such as Employment, Wages, Levels of Living and Consumer Price Index Numbers, Industrial Relation, Welfare, Housing, Health, Labour Legislation, Labour Administration etc., alongwith relevant supporting statistics and synopsis of Labour Bureau Publications.
Symbol: PDLB .19.2009-2010 (combined) 400-2011 (DSK-III)
Price : Rs. 175.00
18. INDIAN LABOUR STATISTICS 2012 and 2013 (Bilingual)
A bilingual publication containing serial statistics relating to labour. It presents data on
employment in Factories, Mines, Plantation, Railways, Employment Service and Training, Wages and Earnings, Price Indices, Trade Unions, Industrial Injuries, Absenteeism and Labour Turnover, Social Security, Industrial Disputes and International statistics pertaining to Labour.
Symbol: PDLB – 30-2012-13 (bilingual) 175-2014 (DSK-III)
Price: Rs. 145.00
19. POCKET BOOK OF LABOUR STATISTICS 2012 (Bilingual)
Pocket Book of Labour Statistics presents in a concise form serial statistical data in
respect of various important aspects of Labour. These statistics cover Employment and Training, Wages Earning, Prices, Industrial Disputes, Accidents, Absenteeism, Social Security, etc. Key indicators for India and other countries have also been presented.
Symbol: PDLB – 163-2012 (Bilingual) 250-2013 (DSK-III)
Price: Rs.90.00
Indian Labour Journal, April 2015
453
INDIAN BOOK EXCHANGE
Registration No. ―G 3/DL(N)-04/0008/2003-05‖
Printed by the Printing Unit of Labour Bureau, Shimla
Editor I.S.Negi, Labour Bureau, Shimla and published by
Controller of Publications, Government of India,
Civil Lines, Delhi-110054
Related Documents