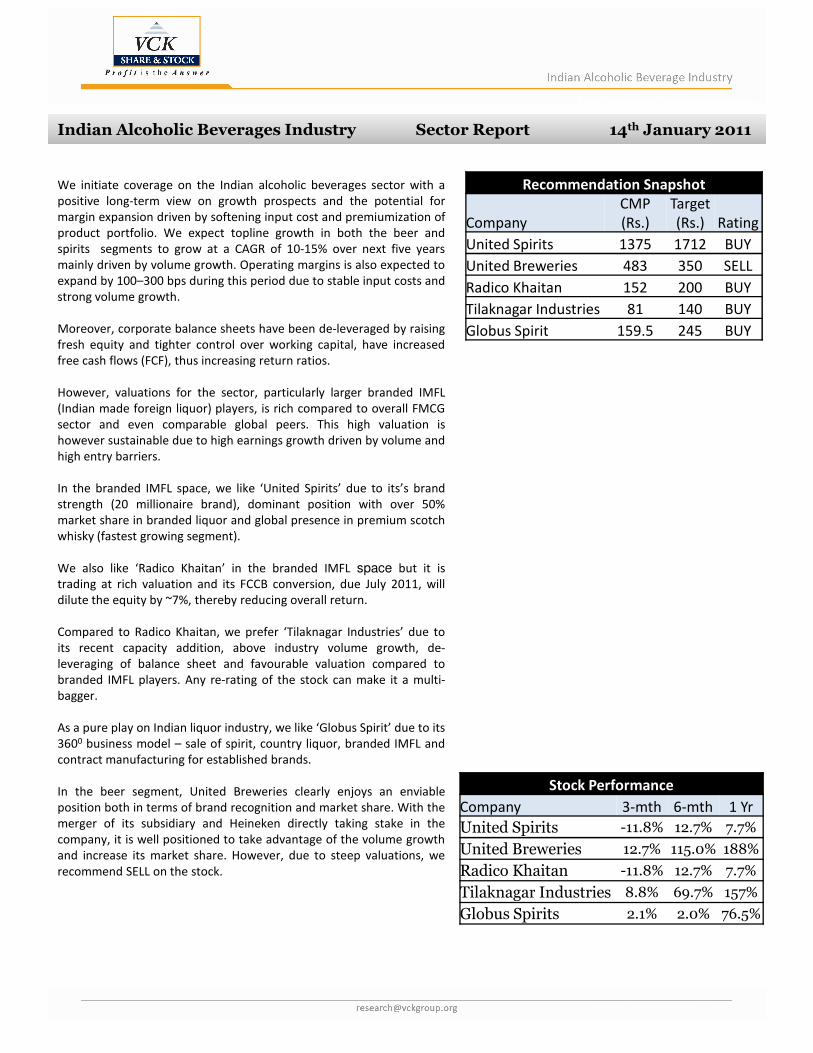
For Private Circulation only For Private Circulation only Indian Alcoholic Beverages Industry Sector Report 14 th January 2011 Indian Alcoholic Beverages Industry Sector Report 14 th January 2011 We initiate coverage on the Indian alcoholic beverages sector with a positive long-term view on growth prospects and the potential for margin expansion driven by softening input cost and premiumization of product portfolio. We expect topline growth in both the beer and spirits segments to grow at a CAGR of 10-15% over next five years mainly driven by volume growth. Operating margins is also expected to expand by 100–300 bps during this period due to stable input costs and strong volume growth. Moreover, corporate balance sheets have been de-leveraged by raising fresh equity and tighter control over working capital, have increased free cash flows (FCF), thus increasing return ratios. However, valuations for the sector, particularly larger branded IMFL (Indian made foreign liquor) players, is rich compared to overall FMCG sector and even comparable global peers. This high valuation is however sustainable due to high earnings growth driven by volume and high entry barriers. In the branded IMFL space, we like ‘United Spirits’ due to its’s brand strength (20 millionaire brand), dominant position with over 50% market share in branded liquor and global presence in premium scotch Recommendation Snapshot Company CMP (Rs.) Target (Rs.) Rating United Spirits 1375 1712 BUY United Breweries 483 350 SELL Radico Khaitan 152 200 BUY Tilaknagar Industries 81 140 BUY Globus Spirit 159.5 245 BUY whisky (fastest growing segment). We also like ‘Radico Khaitan’ in the branded IMFL space but it is trading at rich valuation and its FCCB conversion, due July 2011, will dilute the equity by ~7%, thereby reducing overall return. Compared to Radico Khaitan, we prefer ‘Tilaknagar Industries’ due to its recent capacity addition, above industry volume growth, de- leveraging of balance sheet and favourable valuation compared to branded IMFL players. Any re-rating of the stock can make it a multi- bagger. As a pure play on Indian liquor industry, we like ‘Globus Spirit’ due to its 360 0 business model – sale of spirit, country liquor, branded IMFL and contract manufacturing for established brands. In the beer segment, United Breweries clearly enjoys an enviable position both in terms of brand recognition and market share. With the merger of its subsidiary and Heineken directly taking stake in the company, it is well positioned to take advantage of the volume growth and increase its market share. However, due to steep valuations, we recommend SELL on the stock. Stock Performance Company 3-mth 6-mth 1 Yr United Spirits -11.8% 12.7% 7.7% United Breweries 12.7% 115.0% 188% Radico Khaitan -11.8% 12.7% 7.7% Tilaknagar Industries 8.8% 69.7% 157% Globus Spirits 2.1% 2.0% 76.5%

Welcome message from author
This document is posted to help you gain knowledge. Please leave a comment to let me know what you think about it! Share it to your friends and learn new things together.
Transcript
For Private Circulation only
For Private Circulation only
Indian Alcoholic Beverages Industry Sector Report 14th January 2011Indian Alcoholic Beverages Industry Sector Report 14th January 2011
We initiate coverage on the Indian alcoholic beverages sector with a
positive long-term view on growth prospects and the potential for
margin expansion driven by softening input cost and premiumization of
product portfolio. We expect topline growth in both the beer and
spirits segments to grow at a CAGR of 10-15% over next five years
mainly driven by volume growth. Operating margins is also expected to
expand by 100–300 bps during this period due to stable input costs and
strong volume growth.
Moreover, corporate balance sheets have been de-leveraged by raising
fresh equity and tighter control over working capital, have increased
free cash flows (FCF), thus increasing return ratios.
However, valuations for the sector, particularly larger branded IMFL
(Indian made foreign liquor) players, is rich compared to overall FMCG
sector and even comparable global peers. This high valuation is
however sustainable due to high earnings growth driven by volume and
high entry barriers.
In the branded IMFL space, we like ‘United Spirits’ due to its’s brand
strength (20 millionaire brand), dominant position with over 50%
market share in branded liquor and global presence in premium scotch
Recommendation Snapshot
Company
CMP
(Rs.)
Target
(Rs.) Rating
United Spirits 1375 1712 BUY
United Breweries 483 350 SELL
Radico Khaitan 152 200 BUY
Tilaknagar Industries 81 140 BUY
Globus Spirit 159.5 245 BUY
market share in branded liquor and global presence in premium scotch
whisky (fastest growing segment).
We also like ‘Radico Khaitan’ in the branded IMFL space but it is
trading at rich valuation and its FCCB conversion, due July 2011, will
dilute the equity by ~7%, thereby reducing overall return.
Compared to Radico Khaitan, we prefer ‘Tilaknagar Industries’ due to
its recent capacity addition, above industry volume growth, de-
leveraging of balance sheet and favourable valuation compared to
branded IMFL players. Any re-rating of the stock can make it a multi-
bagger.
As a pure play on Indian liquor industry, we like ‘Globus Spirit’ due to its
3600 business model – sale of spirit, country liquor, branded IMFL and
contract manufacturing for established brands.
In the beer segment, United Breweries clearly enjoys an enviable
position both in terms of brand recognition and market share. With the
merger of its subsidiary and Heineken directly taking stake in the
company, it is well positioned to take advantage of the volume growth
and increase its market share. However, due to steep valuations, we
recommend SELL on the stock.
Stock Performance
Company 3-mth 6-mth 1 Yr
United Spirits -11.8% 12.7% 7.7%
United Breweries 12.7% 115.0% 188%
Radico Khaitan -11.8% 12.7% 7.7%
Tilaknagar Industries 8.8% 69.7% 157%
Globus Spirits 2.1% 2.0% 76.5%
For Private Circulation only
For Private Circulation only
Section Page No.
Indian Alcohol Beverage Industry Overview 1-2
Indian Alcohol Beveragemarket Size & Growth 3
Trend in Indian Alcohol Beverage Industry 4-5
Drivers of Indian Alcohol Beverage Industry 5-7
Manufacturing Process 8-9
Companies
Contents
United Spirits Ltd 11-14
United Breweries Ltd 15-16
Radico Khaitan Ltd 17-20
Tilaknagar Industries Ltd 21-23
Globus Spirit Ltd 24-27
For Private Circulation only
For Private Circulation only
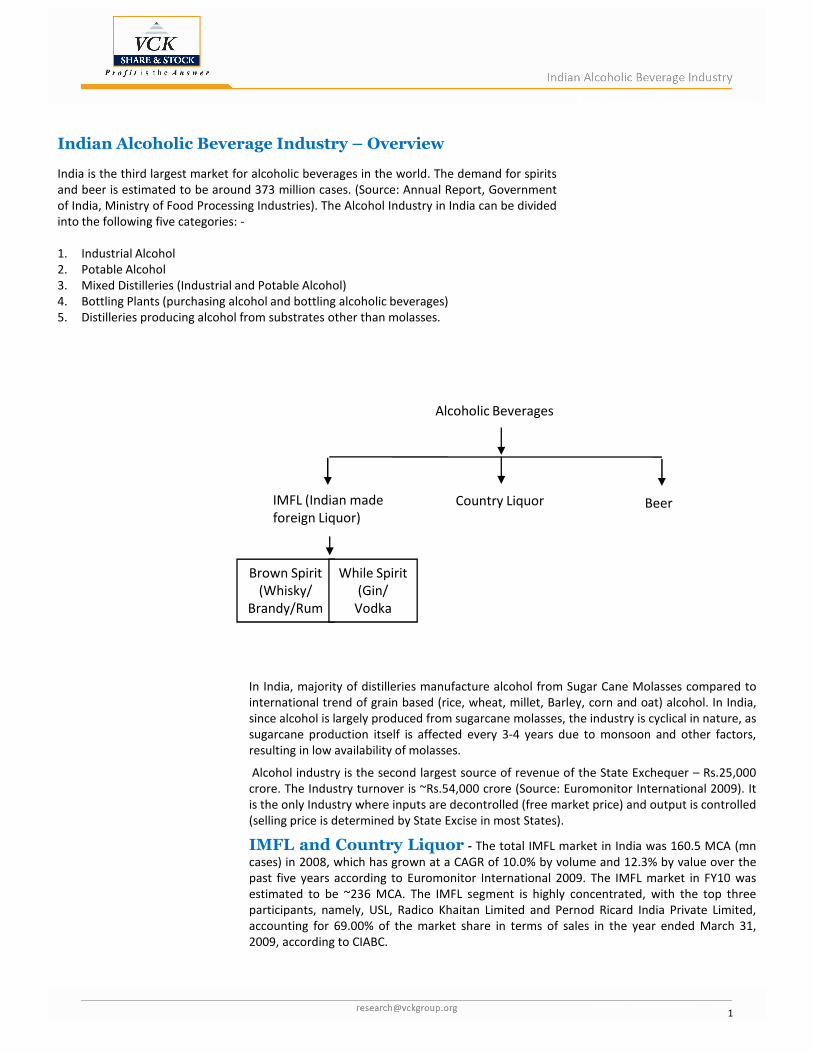
Indian Alcoholic Beverage Industry – Overview
India is the third largest market for alcoholic beverages in the world. The demand for spirits
and beer is estimated to be around 373 million cases. (Source: Annual Report, Government
of India, Ministry of Food Processing Industries). The Alcohol Industry in India can be divided
into the following five categories: -
1. Industrial Alcohol
2. Potable Alcohol
3. Mixed Distilleries (Industrial and Potable Alcohol)
4. Bottling Plants (purchasing alcohol and bottling alcoholic beverages)
5. Distilleries producing alcohol from substrates other than molasses.
Alcoholic Beverages
BeerCountry LiquorIMFL (Indian made
foreign Liquor)
Brown Spirit
(Whisky/
Brandy/Rum
While Spirit
(Gin/
Vodka
In India, majority of distilleries manufacture alcohol from Sugar Cane Molasses compared to
international trend of grain based (rice, wheat, millet, Barley, corn and oat) alcohol. In India,
since alcohol is largely produced from sugarcane molasses, the industry is cyclical in nature, as
sugarcane production itself is affected every 3-4 years due to monsoon and other factors,
resulting in low availability of molasses.
Alcohol industry is the second largest source of revenue of the State Exchequer – Rs.25,000
crore. The Industry turnover is ~Rs.54,000 crore (Source: Euromonitor International 2009). It
is the only Industry where inputs are decontrolled (free market price) and output is controlled
(selling price is determined by State Excise in most States).
IMFL and Country Liquor - The total IMFL market in India was 160.5 MCA (mn
cases) in 2008, which has grown at a CAGR of 10.0% by volume and 12.3% by value over the
past five years according to Euromonitor International 2009. The IMFL market in FY10 was
estimated to be ~236 MCA. The IMFL segment is highly concentrated, with the top three
participants, namely, USL, Radico Khaitan Limited and Pernod Ricard India Private Limited,
accounting for 69.00% of the market share in terms of sales in the year ended March 31,
2009, according to CIABC.
1
For Private Circulation only
For Private Circulation only The country liquor market is distinguished as a regional market with a
large number of small manufacturers spread across the country. The
country liquor market is estimated to be 175 MCA to 200 MCA in 2008
according to Euromonitor International 2009. However, the growth has
remained largely stagnant over the past few years. The IMFL market is
the fastest growing in terms of volumes and most profitable segment
within the Indian spirits industry.
A few southern states in India, including Kerala, Andhra Pradesh,
Karnataka and Tamil Nadu, have banned homemade country liquor,
which has lead to a consumption growth for IMFL in these states. With
increased purchasing power as the economy grows and disposable
income rises, consumers are expected to move from low-end country
liquor to IMFL.
High Tax structure - The Indian spirits industry is entirely
controlled by state commissioned governing bodies and as a result is one
of the most highly taxed industries in India. State entities have
recognized the revenue generating opportunity within the spirits
industry, and have frequently levied new and higher taxes on
manufacturing and the sale of spirits. State governments have levied
various taxes on the industry and taxes could represent up to 60% of the
sale prices. In some States, the duty is as high as 200%. Market sources
feel that since States are strapped for funds, adverse changes in policies
for the alcohol industry are unlikely to happen.
Distribution Channel - Various states in India follow different
dynamics for spirits sales in India. A few of the states in India follow the
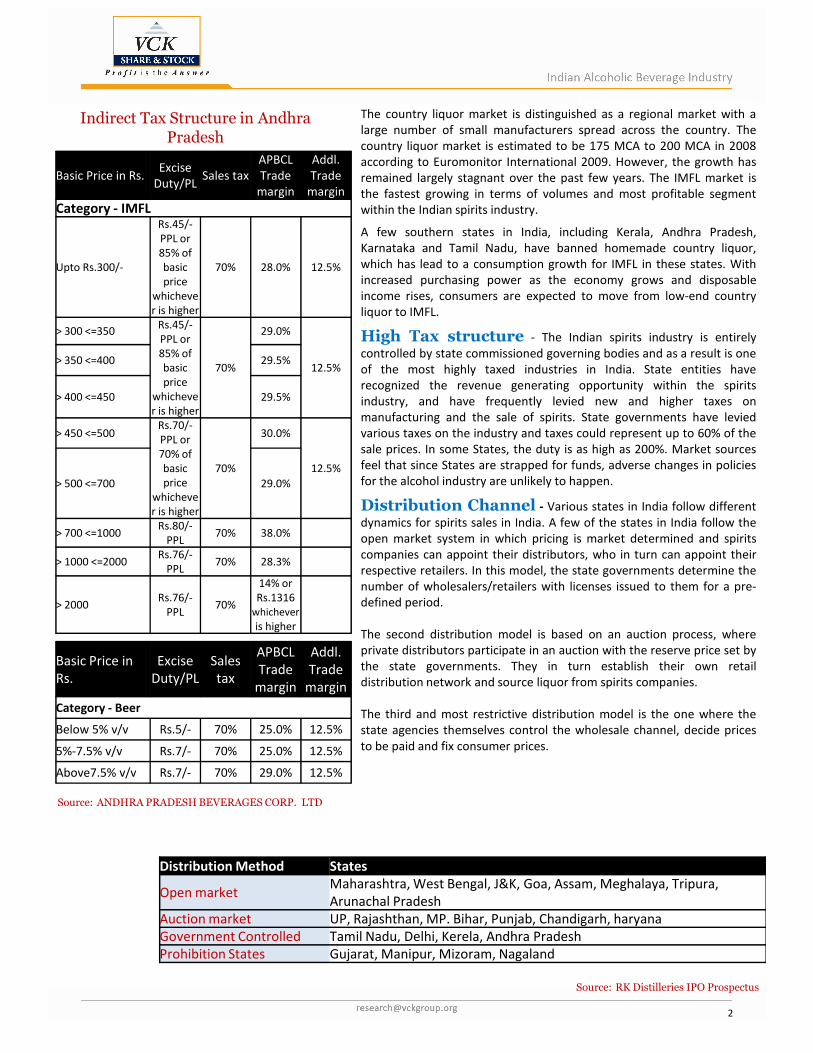
Indirect Tax Structure in Andhra Pradesh
Basic Price in Rs.Excise
Duty/PLSales tax
APBCL
Trade
margin
Addl.
Trade
margin
Category - IMFL
Upto Rs.300/-
Rs.45/-
PPL or
85% of
basic
price
whicheve
r is higher
70% 28.0% 12.5%
> 300 <=350Rs.45/-
PPL or
85% of
basic
price
whicheve
r is higher
70%
29.0%
12.5%> 350 <=400 29.5%
> 400 <=450 29.5%
> 450 <=500Rs.70/-
PPL or
70% of
basic
price
whicheve
r is higher
70%
30.0%
12.5%
> 500 <=700 29.0%
> 700 <=1000Rs.80/-
70% 38.0%dynamics for spirits sales in India. A few of the states in India follow the
open market system in which pricing is market determined and spirits
companies can appoint their distributors, who in turn can appoint their
respective retailers. In this model, the state governments determine the
number of wholesalers/retailers with licenses issued to them for a pre-
defined period.
The second distribution model is based on an auction process, where
private distributors participate in an auction with the reserve price set by
the state governments. They in turn establish their own retail
distribution network and source liquor from spirits companies.
The third and most restrictive distribution model is the one where the
state agencies themselves control the wholesale channel, decide prices
to be paid and fix consumer prices.
Distribution Method States
Open marketMaharashtra, West Bengal, J&K, Goa, Assam, Meghalaya, Tripura,
Arunachal Pradesh
Auction market UP, Rajashthan, MP. Bihar, Punjab, Chandigarh, haryana
Government Controlled Tamil Nadu, Delhi, Kerela, Andhra Pradesh
Prohibition States Gujarat, Manipur, Mizoram, Nagaland
Source: ANDHRA PRADESH BEVERAGES CORP. LTD
Source: RK Distilleries IPO Prospectus
> 700 <=1000Rs.80/-
PPL70% 38.0%
> 1000 <=2000Rs.76/-
PPL70% 28.3%
> 2000Rs.76/-
PPL70%
14% or
Rs.1316
whichever
is higher
Basic Price in
Rs.
Excise
Duty/PL
Sales
tax
APBCL
Trade
margin
Addl.
Trade
margin
Category - Beer
Below 5% v/v Rs.5/- 70% 25.0% 12.5%
5%-7.5% v/v Rs.7/- 70% 25.0% 12.5%
Above7.5% v/v Rs.7/- 70% 29.0% 12.5%
2
For Private Circulation only
For Private Circulation only
Indian Spirits Market Size and Growth
The Indian spirits market has grown rapidly owing to rapid economic growth, rising
disposable incomes, favorable demographics and greater social acceptability of alcohol
consumption in India. In particular, according to Euromonitor International 2009, the
sales volume of spirits products is expected to reach 2.2 billion liters by 2013. India has
traditionally been among the world’s lowest per capita consumers of foreign spirits
such as whisky, rum, brandy, vodka and gin. Indian Made Foreign Liquor (IMFL) is an
industry term of art in India used to describe these foreign spirits that are now made in
India, which are distinguished from traditional country liquor, historically manufactured
in India. In addition, IMFL is distinguished from beer and wine.
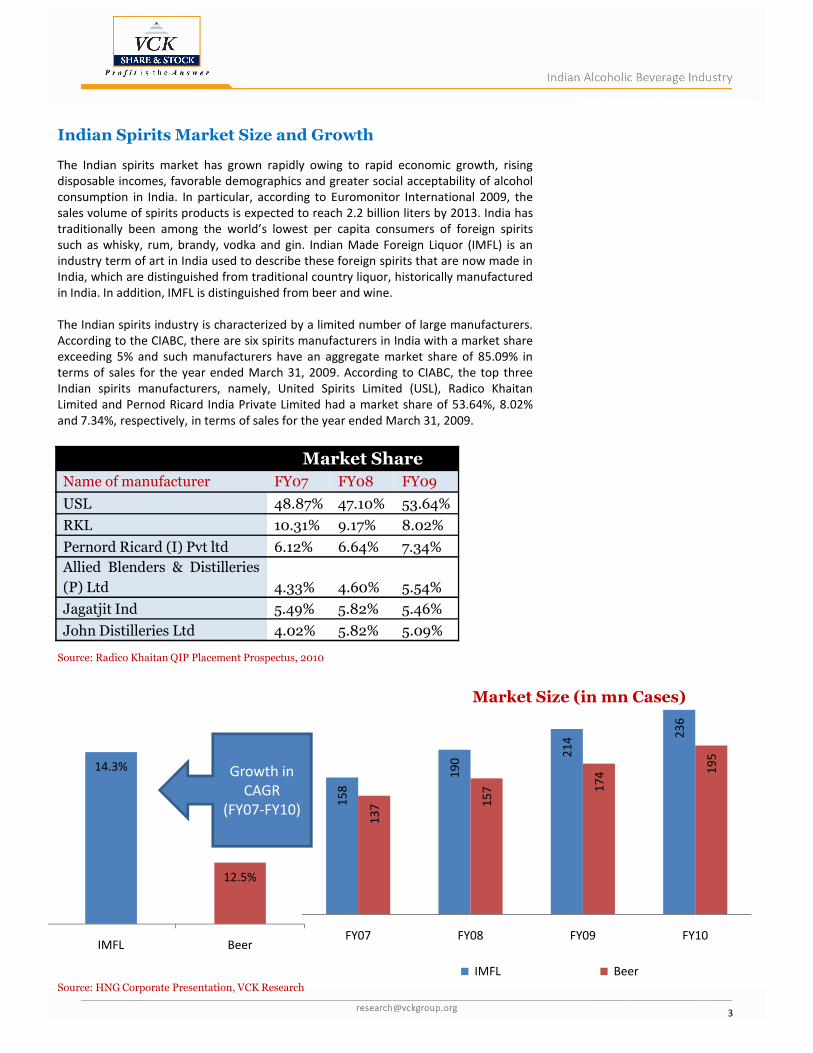
The Indian spirits industry is characterized by a limited number of large manufacturers.
According to the CIABC, there are six spirits manufacturers in India with a market share
exceeding 5% and such manufacturers have an aggregate market share of 85.09% in
terms of sales for the year ended March 31, 2009. According to CIABC, the top three
Indian spirits manufacturers, namely, United Spirits Limited (USL), Radico Khaitan
Limited and Pernod Ricard India Private Limited had a market share of 53.64%, 8.02%
and 7.34%, respectively, in terms of sales for the year ended March 31, 2009.
Market Share
Name of manufacturer FY07 FY08 FY09
USL 48.87% 47.10% 53.64%
RKL 10.31% 9.17% 8.02%RKL 10.31% 9.17% 8.02%
Pernord Ricard (I) Pvt ltd 6.12% 6.64% 7.34%
Allied Blenders & Distilleries
(P) Ltd 4.33% 4.60% 5.54%
Jagatjit Ind 5.49% 5.82% 5.46%
John Distilleries Ltd 4.02% 5.82% 5.09%
Market Size (in mn Cases)
15
8
19
0
21
4 23
6
13
7 15
7 17
4 19
5
FY07 FY08 FY09 FY10
IMFL Beer
14.3%
12.5%
IMFL Beer
Growth in
CAGR
(FY07-FY10)
Source: HNG Corporate Presentation, VCK Research
Source: Radico Khaitan QIP Placement Prospectus, 2010
3
For Private Circulation only
For Private Circulation only
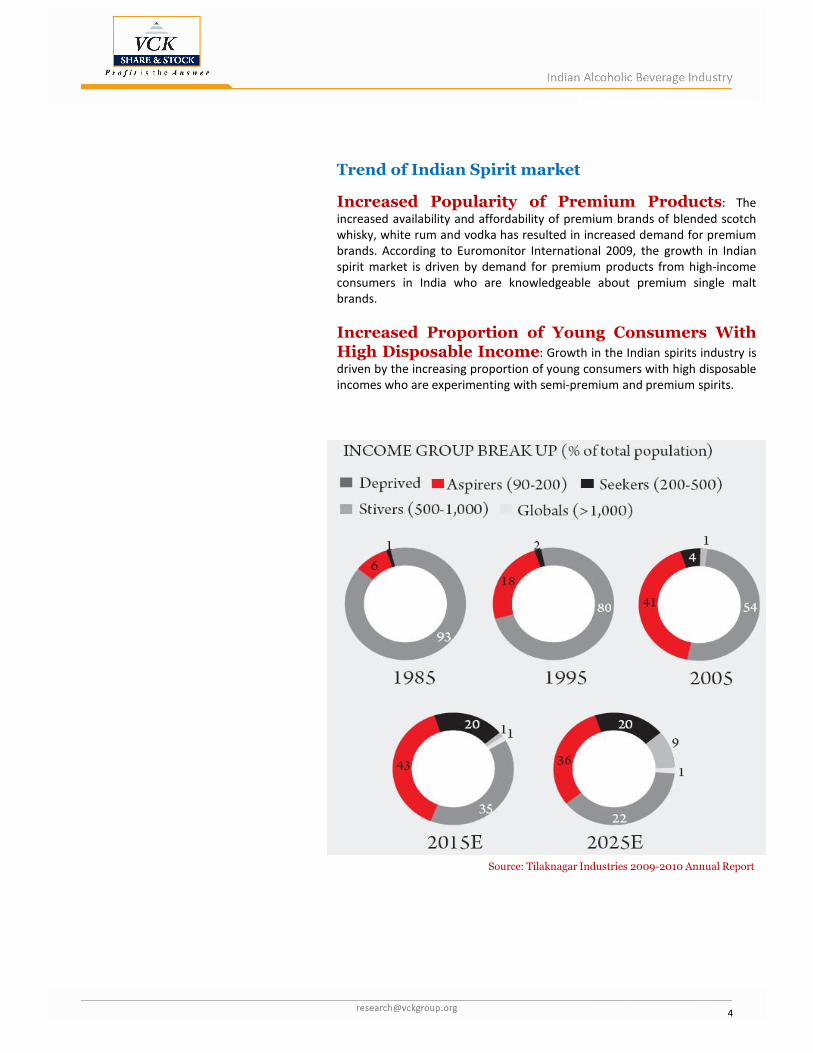
Trend of Indian Spirit market
Increased Popularity of Premium Products: The
increased availability and affordability of premium brands of blended scotch
whisky, white rum and vodka has resulted in increased demand for premium
brands. According to Euromonitor International 2009, the growth in Indian
spirit market is driven by demand for premium products from high-income
consumers in India who are knowledgeable about premium single malt
brands.
Increased Proportion of Young Consumers WithHigh Disposable Income: Growth in the Indian spirits industry is
driven by the increasing proportion of young consumers with high disposable
incomes who are experimenting with semi-premium and premium spirits.
Source: Tilaknagar Industries 2009-2010 Annual Report
4
For Private Circulation only
For Private Circulation only
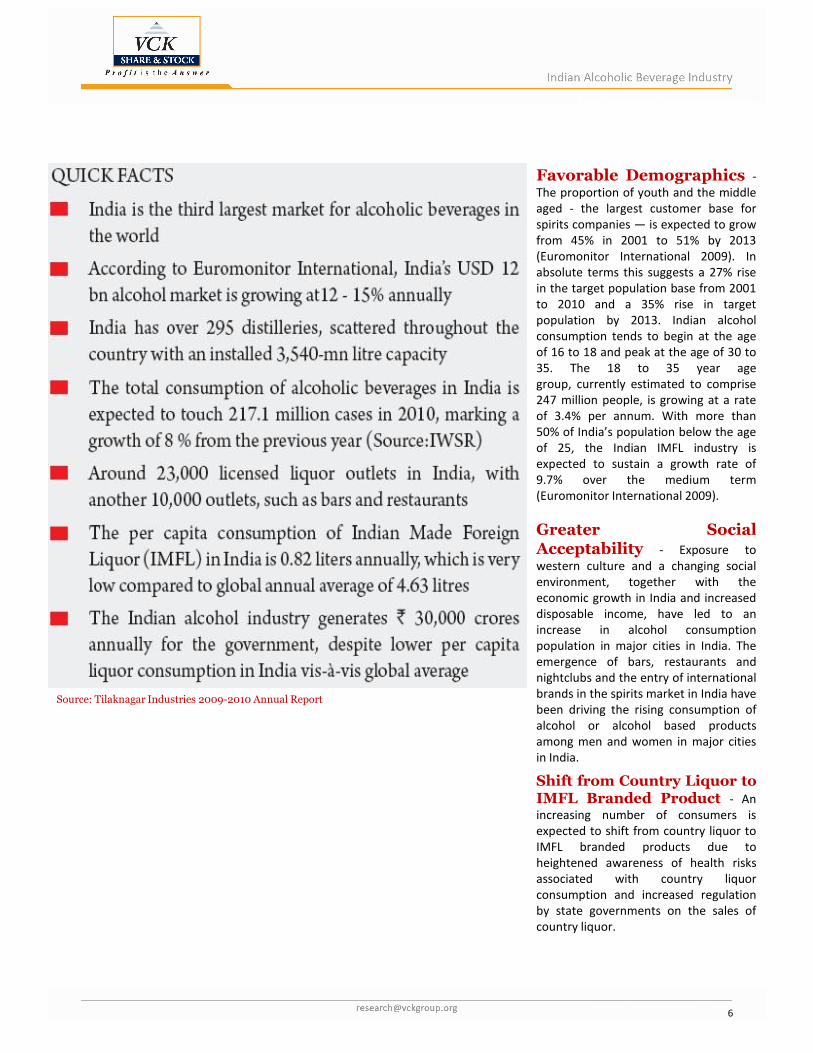
Increased Demand for Vodka: According to Euromonitor International
2009, vodka sales volume grew at a rate of 34% in 2008. Engagement of entertainment
celebrities as brand ambassadors helped to portray vodka as a trendy drink and
contributed to increased demand for vodka among young consumers.
Increased Demand for Products at Attractive Prices:
According to Euromonitor International 2009, the demand for products targeting
certain price points that are less expensive than imported international brands is
expected to increase.
Brandy Sales in India are Dominated by Domestic Brands:
The consumers of brandy are typically brand-loyal. Imported brandy is only available in
select five-star hotels and restaurants catering to high-end or tourist clientele. As a
result, brandy sales in India are dominated by domestic brands.
Drivers of Indian Spirit market
Rapid Economic Growth - Economic growth in recent years has created a
large base of youth with high income levels and changing lifestyles in most cities and
towns. There is a 485 million population that belongs to the legal drinking age group
and a further 150 million is expected to become a part of this group in the next five
years (Euromonitor International 2009). The shift to higher consumption is expected to
continue with increased alcohol affordability, availability and popularity.
Rising Disposable Income - The number of Indian alcohol consumersRising Disposable Income - The number of Indian alcohol consumers
continues to grow along with the Indian economy and income per household is
expected to increase with 58% of the population set to be included in the ‘Consuming’
or ‘Very Rich’ class by 2012 (Euromonitor International 2009), those classes having an
income range per household of U.S.$975-U.S.$4,675 and over U.S.$4,675 respectively.
Rising disposable income has prompted consumers to move towards the consumption
of premium products across all spirits product categories.
5
For Private Circulation only
For Private Circulation only
Favorable Demographics -
The proportion of youth and the middle
aged - the largest customer base for
spirits companies — is expected to grow
from 45% in 2001 to 51% by 2013
(Euromonitor International 2009). In
absolute terms this suggests a 27% rise
in the target population base from 2001
to 2010 and a 35% rise in target
population by 2013. Indian alcohol
consumption tends to begin at the age
of 16 to 18 and peak at the age of 30 to
35. The 18 to 35 year age
group, currently estimated to comprise
247 million people, is growing at a rate
of 3.4% per annum. With more than
50% of India’s population below the age
of 25, the Indian IMFL industry is
expected to sustain a growth rate of
9.7% over the medium term
(Euromonitor International 2009).
Greater SocialGreater SocialAcceptability - Exposure to
western culture and a changing social
environment, together with the
economic growth in India and increased
disposable income, have led to an
increase in alcohol consumption
population in major cities in India. The
emergence of bars, restaurants and
nightclubs and the entry of international
brands in the spirits market in India have
been driving the rising consumption of
alcohol or alcohol based products
among men and women in major cities
in India.
Shift from Country Liquor toIMFL Branded Product - An
increasing number of consumers is
expected to shift from country liquor to
IMFL branded products due to
heightened awareness of health risks
associated with country liquor
consumption and increased regulation
by state governments on the sales of
country liquor.
Source: Tilaknagar Industries 2009-2010 Annual Report
6
For Private Circulation only
For Private Circulation only
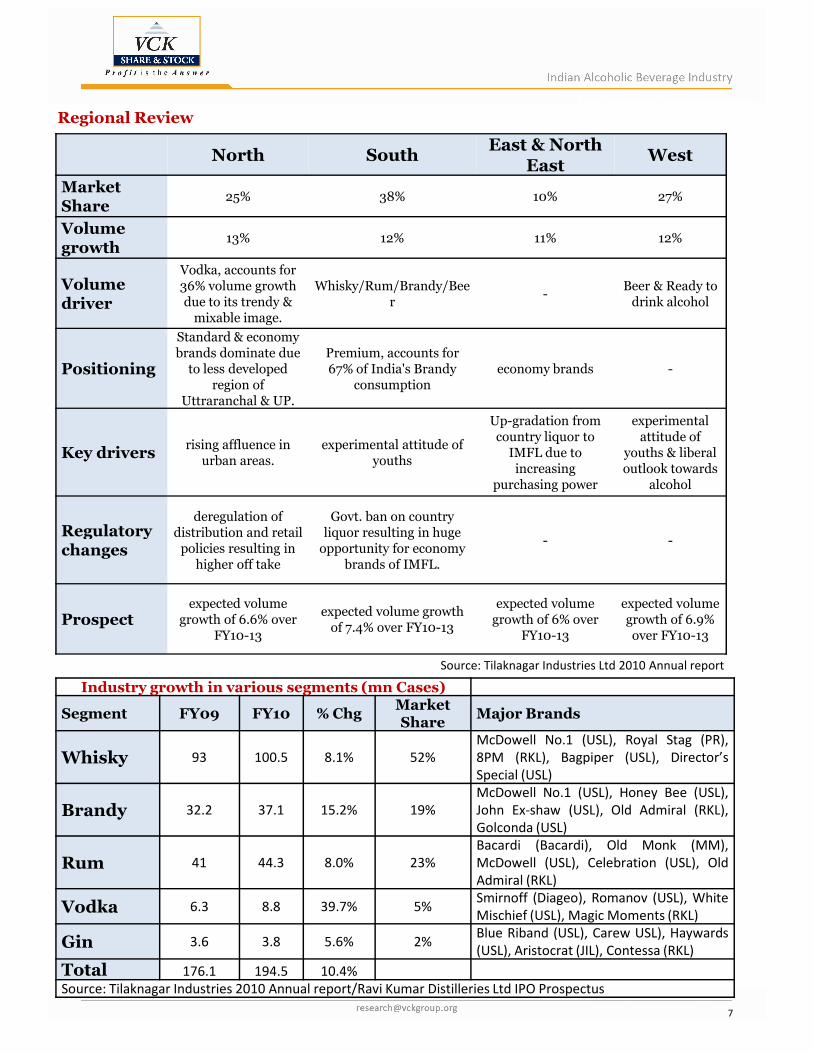
North SouthEast & North
EastWest
Market Share
25% 38% 10% 27%
Volume growth
13% 12% 11% 12%
Volume driver
Vodka, accounts for 36% volume growth due to its trendy & mixable image.
Whisky/Rum/Brandy/Beer
-Beer & Ready to drink alcohol
Positioning
Standard & economy brands dominate due to less developed
region of Uttraranchal & UP.
Premium, accounts for 67% of India's Brandy
consumptioneconomy brands -
Key driversrising affluence in
urban areas.experimental attitude of
youths
Up-gradation from country liquor to IMFL due to increasing
purchasing power
experimental attitude of
youths & liberal outlook towards
alcohol
Regulatory deregulation of
distribution and retail Govt. ban on country
liquor resulting in huge
Regional Review
Source: Tilaknagar Industries Ltd 2010 Annual report
Regulatory changes
distribution and retail policies resulting in
higher off take
liquor resulting in huge opportunity for economy
brands of IMFL.
- -
Prospectexpected volume
growth of 6.6% over FY10-13
expected volume growth of 7.4% over FY10-13
expected volume growth of 6% over
FY10-13
expected volume growth of 6.9% over FY10-13
Industry growth in various segments (mn Cases)
Segment FY09 FY10 % ChgMarket Share
Major Brands
Whisky 93 100.5 8.1% 52%
McDowell No.1 (USL), Royal Stag (PR),
8PM (RKL), Bagpiper (USL), Director’s
Special (USL)
Brandy 32.2 37.1 15.2% 19%
McDowell No.1 (USL), Honey Bee (USL),
John Ex-shaw (USL), Old Admiral (RKL),
Golconda (USL)
Rum 41 44.3 8.0% 23%
Bacardi (Bacardi), Old Monk (MM),
McDowell (USL), Celebration (USL), Old
Admiral (RKL)
Vodka 6.3 8.8 39.7% 5%Smirnoff (Diageo), Romanov (USL), White
Mischief (USL), Magic Moments (RKL)
Gin 3.6 3.8 5.6% 2%Blue Riband (USL), Carew USL), Haywards
(USL), Aristocrat (JIL), Contessa (RKL)
Total 176.1 194.5 10.4%
Source: Tilaknagar Industries 2010 Annual report/Ravi Kumar Distilleries Ltd IPO Prospectus
7
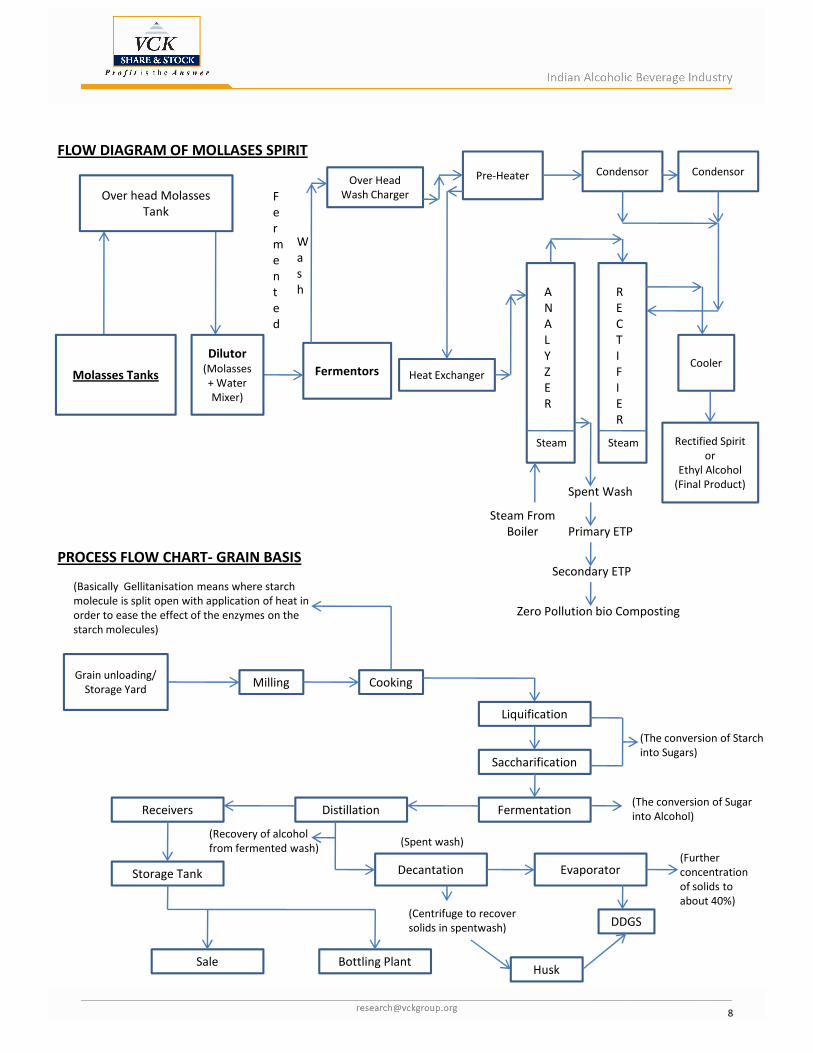
Over Head
Wash Charger
Fermentors Heat Exchanger
Pre-Heater
Molasses Tanks
Dilutor
(Molasses
+ Water
Mixer)
Cooler
Condensor Condensor
Rectified Spirit
or
Ethyl Alcohol
(Final Product)
A
N
A
L
Y
Z
E
R
R
E
C
T
I
F
I
E
R
Steam Steam
Over head Molasses
Tank
Spent Wash
Steam From
Boiler Primary ETP
F
e
r
m
e
n
t
e
d
W
a
s
h
FLOW DIAGRAM OF MOLLASES SPIRIT
Boiler Primary ETP
Secondary ETP
Zero Pollution bio Composting
Grain unloading/
Storage YardMilling Cooking
Liquification
Saccharification
FermentationDistillationReceivers
Storage Tank
Sale Bottling Plant
Decantation Evaporator
Husk
DDGS(Centrifuge to recover
solids in spentwash)
(Further
concentration
of solids to
about 40%)
(Recovery of alcohol
from fermented wash)
(The conversion of Sugar
into Alcohol)
(The conversion of Starch
into Sugars)
(Spent wash)
(Basically Gellitanisation means where starch
molecule is split open with application of heat in
order to ease the effect of the enzymes on the
starch molecules)
PROCESS FLOW CHART- GRAIN BASIS
8
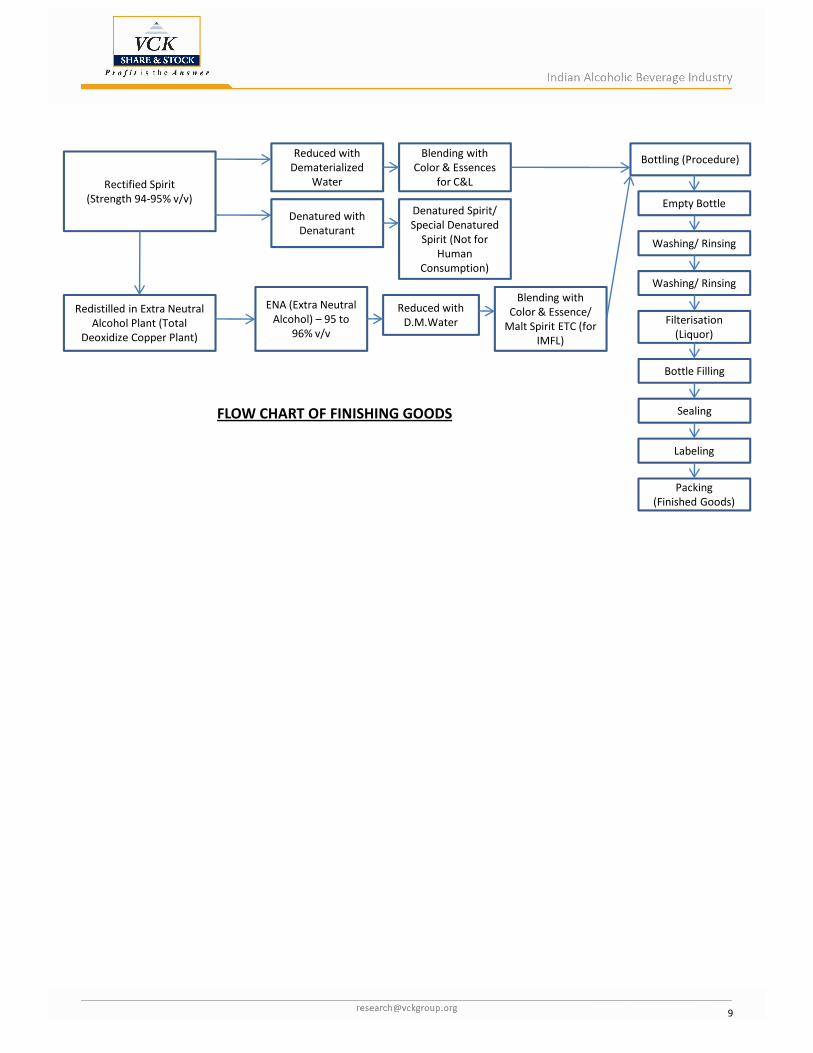
Rectified Spirit
(Strength 94-95% v/v)
Redistilled in Extra Neutral
Alcohol Plant (Total
Deoxidize Copper Plant)
Reduced with
Dematerialized
Water
ENA (Extra Neutral
Alcohol) – 95 to
96% v/v
Denatured with
Denaturant
Reduced with
D.M.Water
Blending with
Color & Essences
for C&L
Denatured Spirit/
Special Denatured
Spirit (Not for
Human
Consumption)
Blending with
Color & Essence/
Malt Spirit ETC (for
IMFL)
Bottling (Procedure)
Empty Bottle
Washing/ Rinsing
Washing/ Rinsing
Filterisation
(Liquor)
Labeling
Packing
(Finished Goods)
Bottle Filling
SealingFLOW CHART OF FINISHING GOODS
9
For Private Circulation only
For Private Circulation only
Companies
10
For Private Circulation only
For Private Circulation only United Spirits Ltd (USL) Initiating Coverage 14th January 2011 United Spirits Ltd (USL) Initiating Coverage 14th January 2011
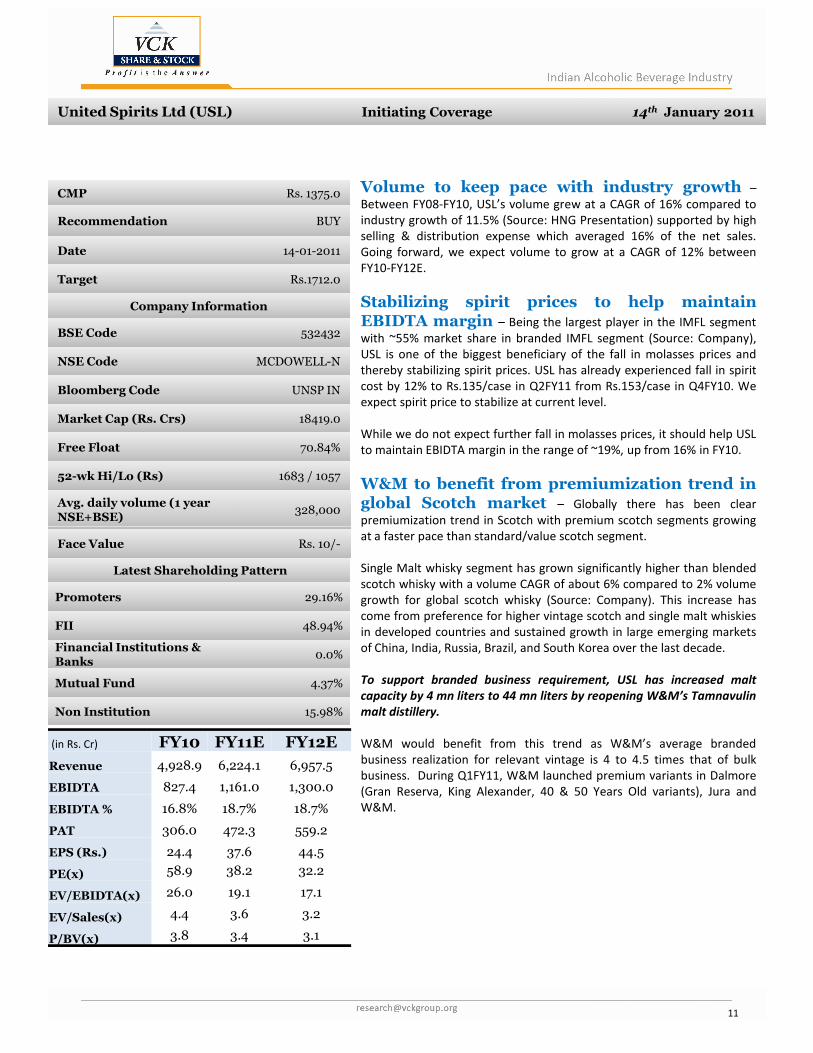
CMP Rs. 1375.0
Recommendation BUY
Date 14-01-2011
Target Rs.1712.0
Company Information
BSE Code 532432
NSE Code MCDOWELL-N
Bloomberg Code UNSP IN
Market Cap (Rs. Crs) 18419.0
Free Float 70.84%
52-wk Hi/Lo (Rs) 1683 / 1057
Avg. daily volume (1 year NSE+BSE)
328,000
Volume to keep pace with industry growth –
Between FY08-FY10, USL’s volume grew at a CAGR of 16% compared to
industry growth of 11.5% (Source: HNG Presentation) supported by high
selling & distribution expense which averaged 16% of the net sales.
Going forward, we expect volume to grow at a CAGR of 12% between
FY10-FY12E.
Stabilizing spirit prices to help maintainEBIDTA margin – Being the largest player in the IMFL segment
with ~55% market share in branded IMFL segment (Source: Company),
USL is one of the biggest beneficiary of the fall in molasses prices and
thereby stabilizing spirit prices. USL has already experienced fall in spirit
cost by 12% to Rs.135/case in Q2FY11 from Rs.153/case in Q4FY10. We
expect spirit price to stabilize at current level.
While we do not expect further fall in molasses prices, it should help USL
to maintain EBIDTA margin in the range of ~19%, up from 16% in FY10.
W&M to benefit from premiumization trend inglobal Scotch market – Globally there has been clear
premiumization trend in Scotch with premium scotch segments growing
Face Value Rs. 10/-
Latest Shareholding Pattern
Promoters 29.16%
FII 48.94%
Financial Institutions & Banks
0.0%
Mutual Fund 4.37%
Non Institution 15.98%
premiumization trend in Scotch with premium scotch segments growing
at a faster pace than standard/value scotch segment.
Single Malt whisky segment has grown significantly higher than blended
scotch whisky with a volume CAGR of about 6% compared to 2% volume
growth for global scotch whisky (Source: Company). This increase has
come from preference for higher vintage scotch and single malt whiskies
in developed countries and sustained growth in large emerging markets
of China, India, Russia, Brazil, and South Korea over the last decade.
To support branded business requirement, USL has increased malt
capacity by 4 mn liters to 44 mn liters by reopening W&M’s Tamnavulin
malt distillery.
W&M would benefit from this trend as W&M’s average branded
business realization for relevant vintage is 4 to 4.5 times that of bulk
business. During Q1FY11, W&M launched premium variants in Dalmore
(Gran Reserva, King Alexander, 40 & 50 Years Old variants), Jura and
W&M.
(in Rs. Cr) FY10 FY11E FY12E
Revenue 4,928.9 6,224.1 6,957.5
EBIDTA 827.4 1,161.0 1,300.0
EBIDTA % 16.8% 18.7% 18.7%
PAT 306.0 472.3 559.2
EPS (Rs.) 24.4 37.6 44.5
PE(x) 58.9 38.2 32.2
EV/EBIDTA(x) 26.0 19.1 17.1
EV/Sales(x) 4.4 3.6 3.2
P/BV(x) 3.8 3.4 3.1
11
For Private Circulation only
For Private Circulation only
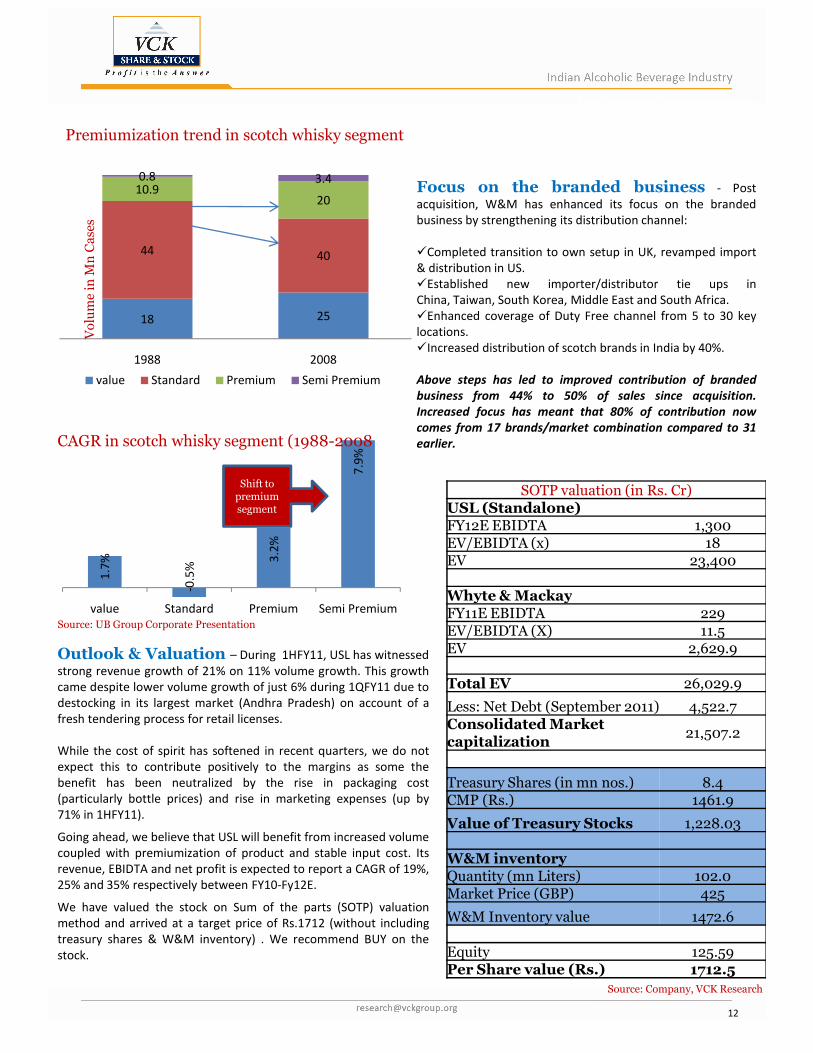
Focus on the branded business - Post
acquisition, W&M has enhanced its focus on the branded
business by strengthening its distribution channel:
�Completed transition to own setup in UK, revamped import
& distribution in US.
�Established new importer/distributor tie ups in
China, Taiwan, South Korea, Middle East and South Africa.
�Enhanced coverage of Duty Free channel from 5 to 30 key
locations.
�Increased distribution of scotch brands in India by 40%.
Above steps has led to improved contribution of branded
business from 44% to 50% of sales since acquisition.
Increased focus has meant that 80% of contribution now
comes from 17 brands/market combination compared to 31
earlier.
SOTP valuation (in Rs. Cr)USL (Standalone)FY12E EBIDTA 1,300
18 25
44 40
10.920
0.8 3.4
1988 2008
value Standard Premium Semi Premium
7.9
%
Premiumization trend in scotch whisky segment
CAGR in scotch whisky segment (1988-2008
Shift to premium segment
Volume in M
nCases
FY12E EBIDTA 1,300EV/EBIDTA (x) 18EV 23,400
Whyte & MackayFY11E EBIDTA 229EV/EBIDTA (X) 11.5EV 2,629.9
Total EV 26,029.9
Less: Net Debt (September 2011) 4,522.7Consolidated Market capitalization
21,507.2
Treasury Shares (in mn nos.) 8.4CMP (Rs.) 1461.9
Value of Treasury Stocks 1,228.03
W&M inventoryQuantity (mn Liters) 102.0Market Price (GBP) 425
W&M Inventory value 1472.6
Equity 125.59Per Share value (Rs.) 1712.5
Outlook & Valuation – During 1HFY11, USL has witnessed
strong revenue growth of 21% on 11% volume growth. This growth
came despite lower volume growth of just 6% during 1QFY11 due to
destocking in its largest market (Andhra Pradesh) on account of a
fresh tendering process for retail licenses.
While the cost of spirit has softened in recent quarters, we do not
expect this to contribute positively to the margins as some the
benefit has been neutralized by the rise in packaging cost
(particularly bottle prices) and rise in marketing expenses (up by
71% in 1HFY11).
Going ahead, we believe that USL will benefit from increased volume
coupled with premiumization of product and stable input cost. Its
revenue, EBIDTA and net profit is expected to report a CAGR of 19%,
25% and 35% respectively between FY10-Fy12E.
We have valued the stock on Sum of the parts (SOTP) valuation
method and arrived at a target price of Rs.1712 (without including
treasury shares & W&M inventory) . We recommend BUY on the
stock.
1.7
%
-0.5
%
3.2
%
value Standard Premium Semi Premium
Source: UB Group Corporate Presentation
Source: Company, VCK Research
12
For Private Circulation only
For Private Circulation only
About United Spirits Ltd
United Spirit is the largest spirits company in India – 20 ‘Millionaire’ brands (those that
sell more than 1 Mn cases p.a.) with a market share in excess of 55% in first line brands.
USL sold 100 Mn cases during FY 2010 to become the 2nd largest spirits marketer in the
world. Growing at robust double digit rates.
Several of USL’s brands occupy leading market positions in India and globally
a) McDowell No. 1 family is the largest spirits brand in the world with sales of over 35
mn cases in FY 2010 across 3 flavors (Whisky, Brandy and Rum)
b) McDowell’s No. 1 Brandy continues to be the largest selling brandy in the world
c) McDowell’s No. 1 Celebration Rum is the 3rd largest rum with sales over 12 mn cases
in FY 2010
d) Bagpiper Whisky is world’s largest selling spirits brand with sales of over 16 mn
cases during FY 2010.
Its portfolio of approximately 80 active brands includes recognized Indian names as Black
Dog, Scotch Whisky, Signature Rare Whisky, Royal Challenge Whisky, Antiquity
Whisky, McDowell’s No. 1 Whisky, Bagpiper Whisky, Director’s Special
Whisky, Haywards Fine Whisky, McDowell’s Green Label Whisky, McDowell’s No. 1Whisky, Haywards Fine Whisky, McDowell’s Green Label Whisky, McDowell’s No. 1
Brandy, Celebration XXX Rum, Blue Riband Gin, Romanov Vodka and White Mischief
Vodka.
Acquisition of Whyte & Mackay - Pursuant to acquisitions of Whyte and
Mackay, USL have gained access to a stock of Scotch whisky which is a critical raw
material for production of spirits, as well as access to the established brands of
Dalmore Single Highland Malt, Fettercairn, Glayva, Jura single-malt Scotch and
Vladivar.
USL’s acquisition of Bouvet Ladubay has also allowed us to expand into the wine market
with such brands as Bouvet Tresor Blanc, Bouvet Brut, Bouvet Rubis Demi-Sec, Bouvet
Brut Rosé and Anjou Rouge Nonpariels.
13
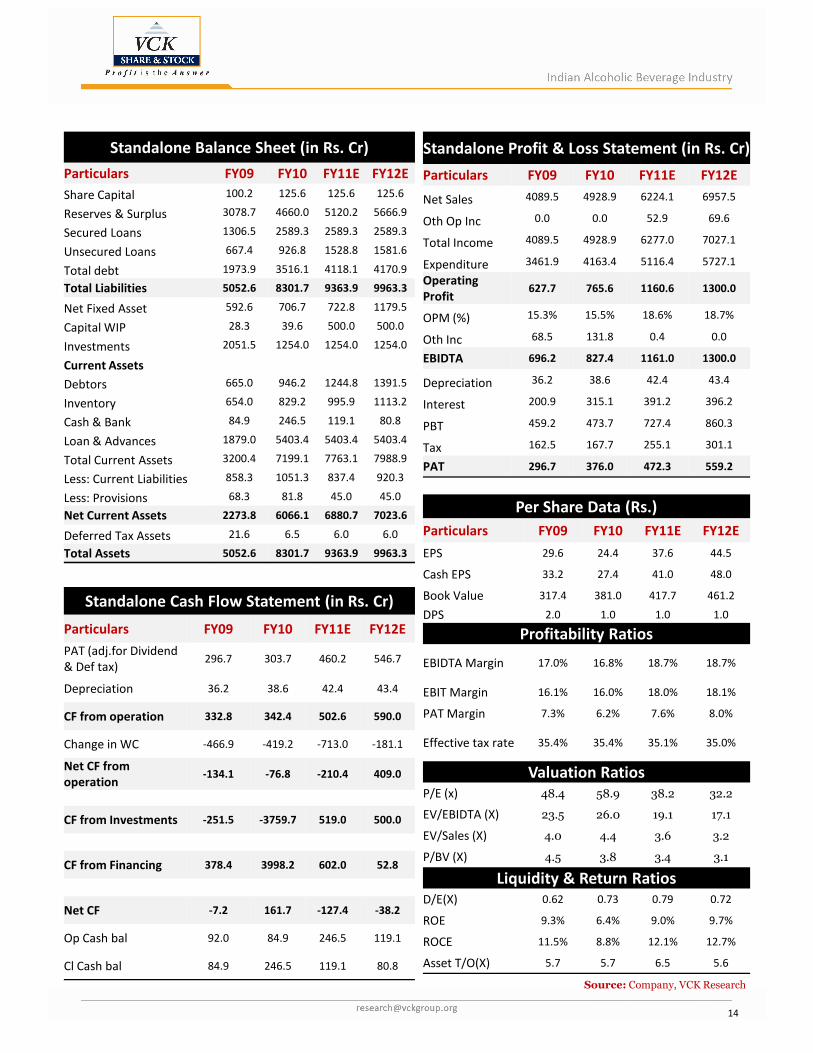
Standalone Balance Sheet (in Rs. Cr)
Particulars FY09 FY10 FY11E FY12E
Share Capital 100.2 125.6 125.6 125.6
Reserves & Surplus 3078.7 4660.0 5120.2 5666.9
Secured Loans 1306.5 2589.3 2589.3 2589.3
Unsecured Loans 667.4 926.8 1528.8 1581.6
Total debt 1973.9 3516.1 4118.1 4170.9
Total Liabilities 5052.6 8301.7 9363.9 9963.3
Net Fixed Asset 592.6 706.7 722.8 1179.5
Capital WIP 28.3 39.6 500.0 500.0
Investments 2051.5 1254.0 1254.0 1254.0
Current Assets
Debtors 665.0 946.2 1244.8 1391.5
Inventory 654.0 829.2 995.9 1113.2
Cash & Bank 84.9 246.5 119.1 80.8
Loan & Advances 1879.0 5403.4 5403.4 5403.4
Total Current Assets 3200.4 7199.1 7763.1 7988.9
Less: Current Liabilities 858.3 1051.3 837.4 920.3
Less: Provisions 68.3 81.8 45.0 45.0
Net Current Assets 2273.8 6066.1 6880.7 7023.6
Standalone Profit & Loss Statement (in Rs. Cr)
Particulars FY09 FY10 FY11E FY12E
Net Sales 4089.5 4928.9 6224.1 6957.5
Oth Op Inc 0.0 0.0 52.9 69.6
Total Income 4089.5 4928.9 6277.0 7027.1
Expenditure 3461.9 4163.4 5116.4 5727.1
Operating
Profit627.7 765.6 1160.6 1300.0
OPM (%) 15.3% 15.5% 18.6% 18.7%
Oth Inc 68.5 131.8 0.4 0.0
EBIDTA 696.2 827.4 1161.0 1300.0
Depreciation 36.2 38.6 42.4 43.4
Interest 200.9 315.1 391.2 396.2
PBT 459.2 473.7 727.4 860.3
Tax 162.5 167.7 255.1 301.1
PAT 296.7 376.0 472.3 559.2
Per Share Data (Rs.)
Particulars FY09 FY10 FY11E FY12EDeferred Tax Assets 21.6 6.5 6.0 6.0
Total Assets 5052.6 8301.7 9363.9 9963.3
Standalone Cash Flow Statement (in Rs. Cr)
Particulars FY09 FY10 FY11E FY12E
PAT (adj.for Dividend
& Def tax)296.7 303.7 460.2 546.7
Depreciation 36.2 38.6 42.4 43.4
CF from operation 332.8 342.4 502.6 590.0
Change in WC -466.9 -419.2 -713.0 -181.1
Net CF from
operation-134.1 -76.8 -210.4 409.0
CF from Investments -251.5 -3759.7 519.0 500.0
CF from Financing 378.4 3998.2 602.0 52.8
Net CF -7.2 161.7 -127.4 -38.2
Op Cash bal 92.0 84.9 246.5 119.1
Cl Cash bal 84.9 246.5 119.1 80.8
Particulars FY09 FY10 FY11E FY12E
EPS 29.6 24.4 37.6 44.5
Cash EPS 33.2 27.4 41.0 48.0
Book Value 317.4 381.0 417.7 461.2
DPS 2.0 1.0 1.0 1.0
Profitability Ratios
EBIDTA Margin 17.0% 16.8% 18.7% 18.7%
EBIT Margin 16.1% 16.0% 18.0% 18.1%
PAT Margin 7.3% 6.2% 7.6% 8.0%
Effective tax rate 35.4% 35.4% 35.1% 35.0%
Valuation Ratios
P/E (x) 48.4 58.9 38.2 32.2
EV/EBIDTA (X) 23.5 26.0 19.1 17.1
EV/Sales (X) 4.0 4.4 3.6 3.2
P/BV (X) 4.5 3.8 3.4 3.1
Liquidity & Return Ratios
D/E(X) 0.62 0.73 0.79 0.72
ROE 9.3% 6.4% 9.0% 9.7%
ROCE 11.5% 8.8% 12.1% 12.7%
Asset T/O(X) 5.7 5.7 6.5 5.6
Source: Company, VCK Research
14
For Private Circulation only
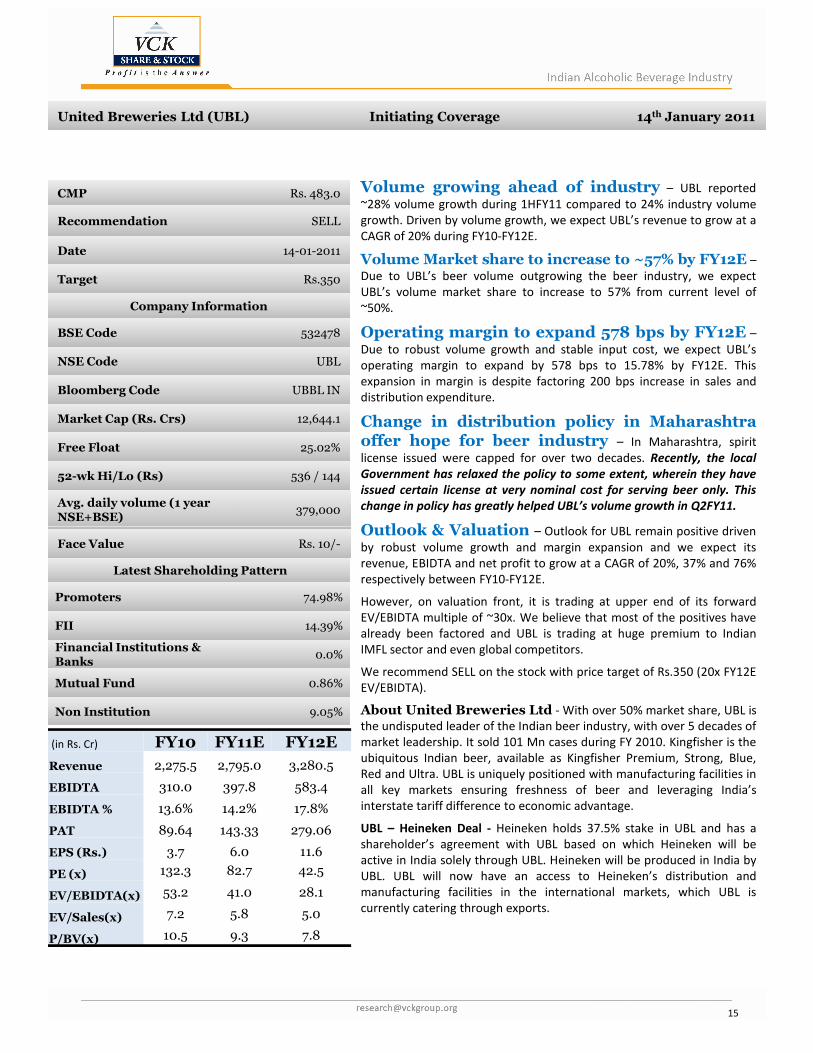
For Private Circulation only United Breweries Ltd (UBL) Initiating Coverage 14th January 2011 United Breweries Ltd (UBL) Initiating Coverage 14th January 2011
CMP Rs. 483.0
Recommendation SELL
Date 14-01-2011
Target Rs.350
Company Information
BSE Code 532478
NSE Code UBL
Bloomberg Code UBBL IN
Market Cap (Rs. Crs) 12,644.1
Free Float 25.02%
52-wk Hi/Lo (Rs) 536 / 144
Avg. daily volume (1 year NSE+BSE)
379,000
Volume growing ahead of industry – UBL reported
~28% volume growth during 1HFY11 compared to 24% industry volume
growth. Driven by volume growth, we expect UBL’s revenue to grow at a
CAGR of 20% during FY10-FY12E.
Volume Market share to increase to ~57% by FY12E –
Due to UBL’s beer volume outgrowing the beer industry, we expect
UBL’s volume market share to increase to 57% from current level of
~50%.
Operating margin to expand 578 bps by FY12E –
Due to robust volume growth and stable input cost, we expect UBL’s
operating margin to expand by 578 bps to 15.78% by FY12E. This
expansion in margin is despite factoring 200 bps increase in sales and
distribution expenditure.
Change in distribution policy in Maharashtraoffer hope for beer industry – In Maharashtra, spirit
license issued were capped for over two decades. Recently, the local
Government has relaxed the policy to some extent, wherein they have
issued certain license at very nominal cost for serving beer only. This
change in policy has greatly helped UBL’s volume growth in Q2FY11.
Outlook & Valuation – Outlook for UBL remain positive drivenFace Value Rs. 10/-
Latest Shareholding Pattern
Promoters 74.98%
FII 14.39%
Financial Institutions & Banks
0.0%
Mutual Fund 0.86%
Non Institution 9.05%
Outlook & Valuation – Outlook for UBL remain positive driven
by robust volume growth and margin expansion and we expect its
revenue, EBIDTA and net profit to grow at a CAGR of 20%, 37% and 76%
respectively between FY10-FY12E.
However, on valuation front, it is trading at upper end of its forward
EV/EBIDTA multiple of ~30x. We believe that most of the positives have
already been factored and UBL is trading at huge premium to Indian
IMFL sector and even global competitors.
We recommend SELL on the stock with price target of Rs.350 (20x FY12E
EV/EBIDTA).
About United Breweries Ltd - With over 50% market share, UBL is
the undisputed leader of the Indian beer industry, with over 5 decades of
market leadership. It sold 101 Mn cases during FY 2010. Kingfisher is the
ubiquitous Indian beer, available as Kingfisher Premium, Strong, Blue,
Red and Ultra. UBL is uniquely positioned with manufacturing facilities in
all key markets ensuring freshness of beer and leveraging India’s
interstate tariff difference to economic advantage.
UBL – Heineken Deal - Heineken holds 37.5% stake in UBL and has a
shareholder’s agreement with UBL based on which Heineken will be
active in India solely through UBL. Heineken will be produced in India by
UBL. UBL will now have an access to Heineken’s distribution and
manufacturing facilities in the international markets, which UBL is
currently catering through exports.
(in Rs. Cr) FY10 FY11E FY12E
Revenue 2,275.5 2,795.0 3,280.5
EBIDTA 310.0 397.8 583.4
EBIDTA % 13.6% 14.2% 17.8%
PAT 89.64 143.33 279.06
EPS (Rs.) 3.7 6.0 11.6
PE (x) 132.3 82.7 42.5
EV/EBIDTA(x) 53.2 41.0 28.1
EV/Sales(x) 7.2 5.8 5.0
P/BV(x) 10.5 9.3 7.8
15
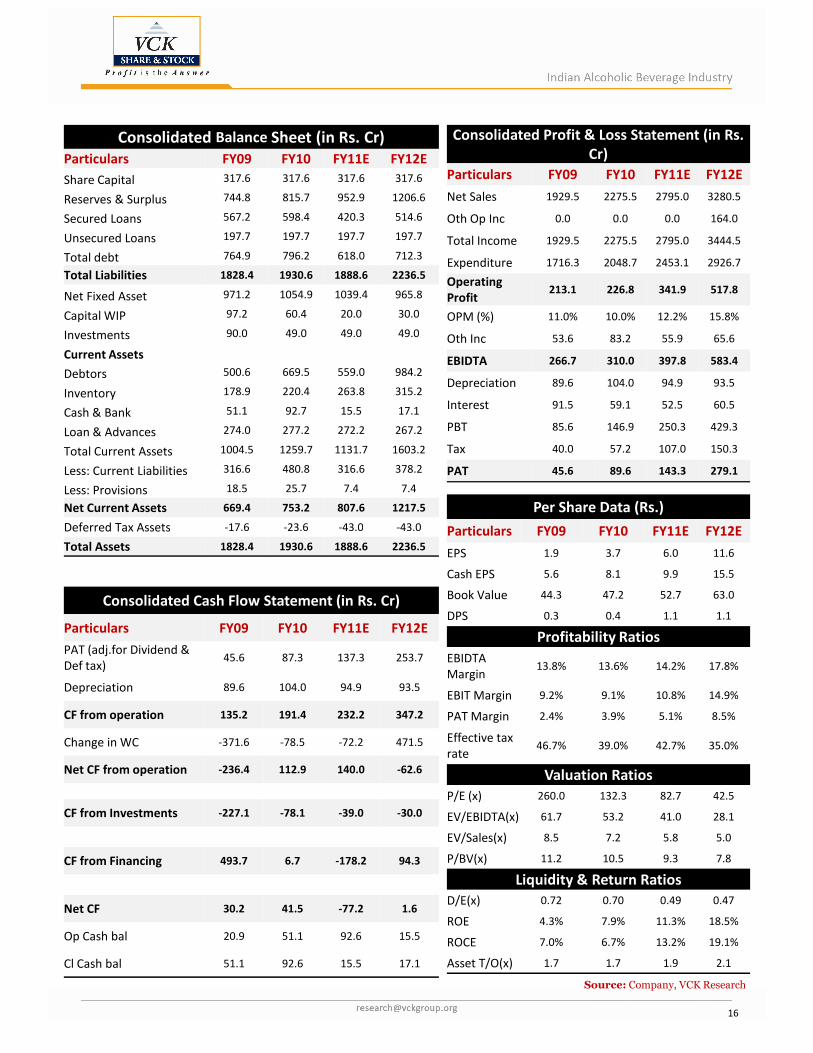
Consolidated Profit & Loss Statement (in Rs.
Cr)
Particulars FY09 FY10 FY11E FY12E
Net Sales 1929.5 2275.5 2795.0 3280.5
Oth Op Inc 0.0 0.0 0.0 164.0
Total Income 1929.5 2275.5 2795.0 3444.5
Expenditure 1716.3 2048.7 2453.1 2926.7
Operating
Profit213.1 226.8 341.9 517.8
OPM (%) 11.0% 10.0% 12.2% 15.8%
Oth Inc 53.6 83.2 55.9 65.6
EBIDTA 266.7 310.0 397.8 583.4
Depreciation 89.6 104.0 94.9 93.5
Interest 91.5 59.1 52.5 60.5
PBT 85.6 146.9 250.3 429.3
Tax 40.0 57.2 107.0 150.3
PAT 45.6 89.6 143.3 279.1
Per Share Data (Rs.)
Particulars FY09 FY10 FY11E FY12E
Consolidated Balance Sheet (in Rs. Cr)
Particulars FY09 FY10 FY11E FY12E
Share Capital 317.6 317.6 317.6 317.6
Reserves & Surplus 744.8 815.7 952.9 1206.6
Secured Loans 567.2 598.4 420.3 514.6
Unsecured Loans 197.7 197.7 197.7 197.7
Total debt 764.9 796.2 618.0 712.3
Total Liabilities 1828.4 1930.6 1888.6 2236.5
Net Fixed Asset 971.2 1054.9 1039.4 965.8
Capital WIP 97.2 60.4 20.0 30.0
Investments 90.0 49.0 49.0 49.0
Current Assets
Debtors 500.6 669.5 559.0 984.2
Inventory 178.9 220.4 263.8 315.2
Cash & Bank 51.1 92.7 15.5 17.1
Loan & Advances 274.0 277.2 272.2 267.2
Total Current Assets 1004.5 1259.7 1131.7 1603.2
Less: Current Liabilities 316.6 480.8 316.6 378.2
Less: Provisions 18.5 25.7 7.4 7.4
Net Current Assets 669.4 753.2 807.6 1217.5
Deferred Tax Assets -17.6 -23.6 -43.0 -43.0
Consolidated Cash Flow Statement (in Rs. Cr)
Particulars FY09 FY10 FY11E FY12E
PAT (adj.for Dividend &
Def tax)45.6 87.3 137.3 253.7
Depreciation 89.6 104.0 94.9 93.5
CF from operation 135.2 191.4 232.2 347.2
Change in WC -371.6 -78.5 -72.2 471.5
Net CF from operation -236.4 112.9 140.0 -62.6
CF from Investments -227.1 -78.1 -39.0 -30.0
CF from Financing 493.7 6.7 -178.2 94.3
Net CF 30.2 41.5 -77.2 1.6
Op Cash bal 20.9 51.1 92.6 15.5
Cl Cash bal 51.1 92.6 15.5 17.1
Particulars FY09 FY10 FY11E FY12E
EPS 1.9 3.7 6.0 11.6
Cash EPS 5.6 8.1 9.9 15.5
Book Value 44.3 47.2 52.7 63.0
DPS 0.3 0.4 1.1 1.1
Profitability Ratios
EBIDTA
Margin13.8% 13.6% 14.2% 17.8%
EBIT Margin 9.2% 9.1% 10.8% 14.9%
PAT Margin 2.4% 3.9% 5.1% 8.5%
Effective tax
rate46.7% 39.0% 42.7% 35.0%
Valuation Ratios
P/E (x) 260.0 132.3 82.7 42.5
EV/EBIDTA(x) 61.7 53.2 41.0 28.1
EV/Sales(x) 8.5 7.2 5.8 5.0
P/BV(x) 11.2 10.5 9.3 7.8
Liquidity & Return Ratios
D/E(x) 0.72 0.70 0.49 0.47
ROE 4.3% 7.9% 11.3% 18.5%
ROCE 7.0% 6.7% 13.2% 19.1%
Asset T/O(x) 1.7 1.7 1.9 2.1
Deferred Tax Assets -17.6 -23.6 -43.0 -43.0
Total Assets 1828.4 1930.6 1888.6 2236.5
Source: Company, VCK Research
16
For Private Circulation only
For Private Circulation only
Radico Khaitan Ltd (RKL) Initiating Coverage 14th January 2011Radico Khaitan Ltd (RKL) Initiating Coverage 14th January 2011
CMP Rs. 152
Recommendation BUY
Date 14-01-2011
Target Rs.200
Company Information
BSE Code 532497
NSE Code RADICO
Bloomberg Code RDCK IN
Market Cap (Rs. Crs) 2098.5
Free Float 62.26%
52-wk Hi/Lo (Rs) 185 / 108
Avg. daily volume (1 year NSE+BSE)
339,000
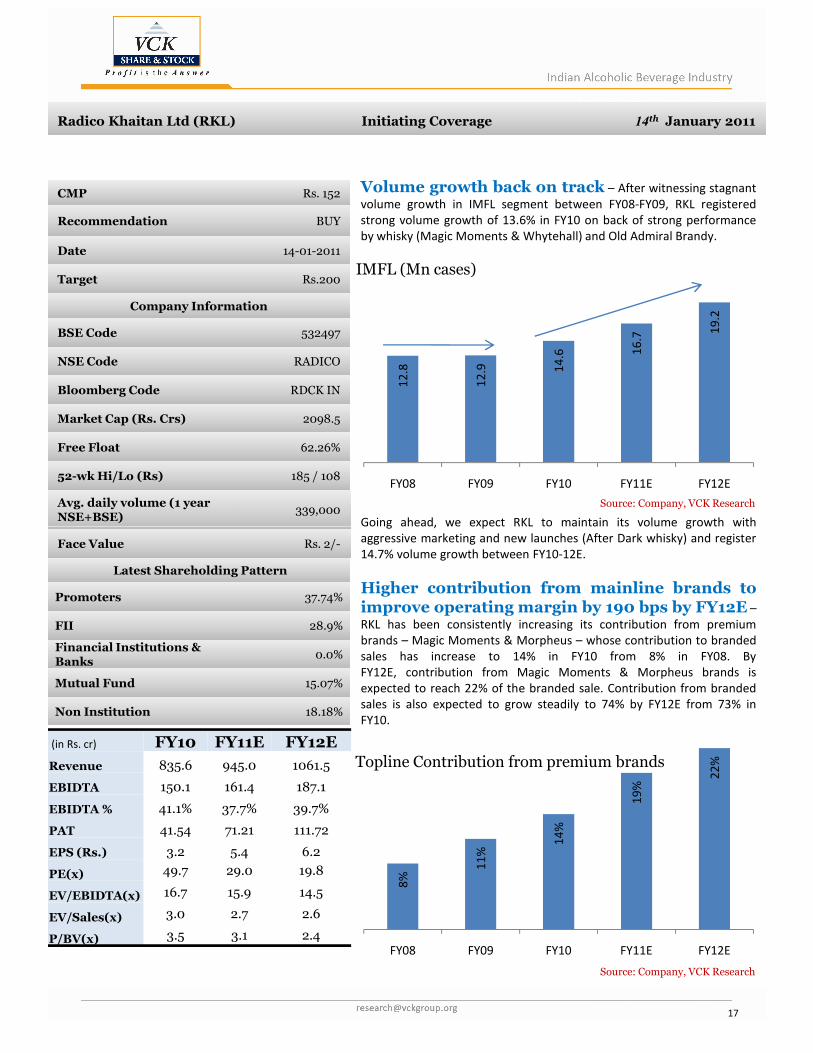
Volume growth back on track – After witnessing stagnant
volume growth in IMFL segment between FY08-FY09, RKL registered
strong volume growth of 13.6% in FY10 on back of strong performance
by whisky (Magic Moments & Whytehall) and Old Admiral Brandy.
12
.8
12
.9 14
.6 16
.7
19
.2
FY08 FY09 FY10 FY11E FY12E
IMFL (Mn cases)
Going ahead, we expect RKL to maintain its volume growth with
Source: Company, VCK Research
Face Value Rs. 2/-
Latest Shareholding Pattern
Promoters 37.74%
FII 28.9%
Financial Institutions & Banks
0.0%
Mutual Fund 15.07%
Non Institution 18.18%
(in Rs. cr) FY10 FY11E FY12E
Revenue 835.6 945.0 1061.5
EBIDTA 150.1 161.4 187.1
EBIDTA % 41.1% 37.7% 39.7%
PAT 41.54 71.21 111.72
EPS (Rs.) 3.2 5.4 6.2
PE(x) 49.7 29.0 19.8
EV/EBIDTA(x) 16.7 15.9 14.5
EV/Sales(x) 3.0 2.7 2.6
P/BV(x) 3.5 3.1 2.4
Going ahead, we expect RKL to maintain its volume growth with
aggressive marketing and new launches (After Dark whisky) and register
14.7% volume growth between FY10-12E.
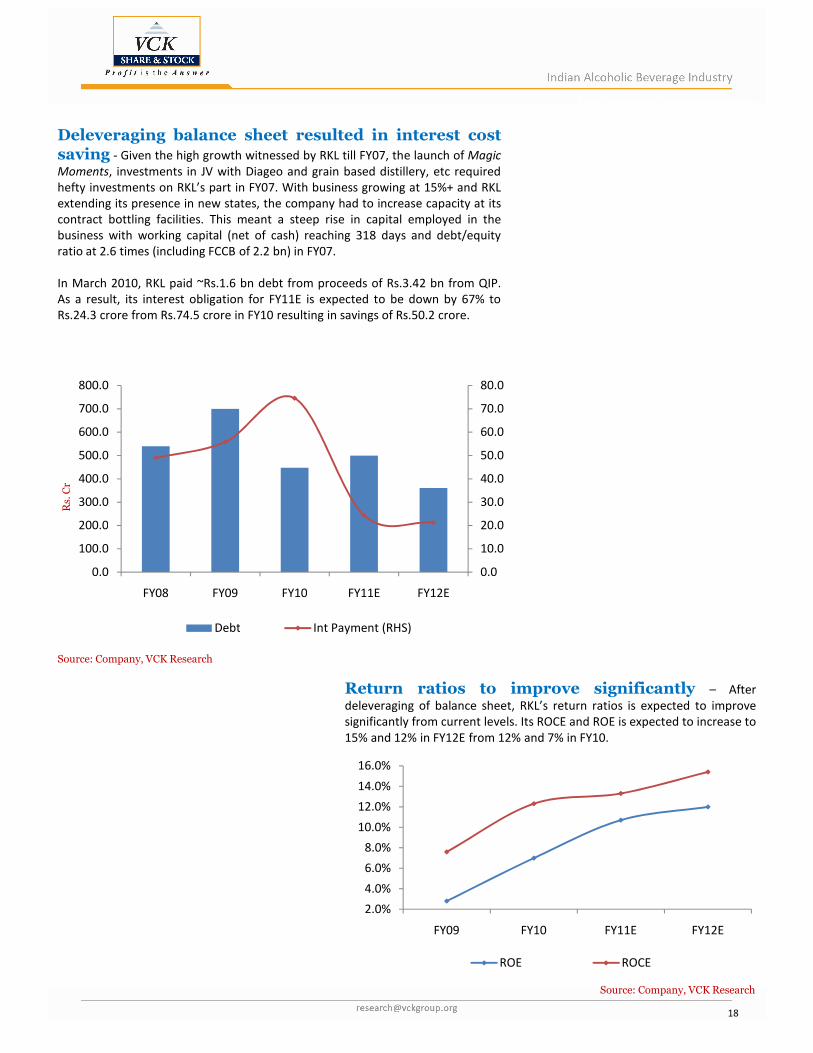
Higher contribution from mainline brands toimprove operating margin by 190 bps by FY12E –
RKL has been consistently increasing its contribution from premium
brands – Magic Moments & Morpheus – whose contribution to branded
sales has increase to 14% in FY10 from 8% in FY08. By
FY12E, contribution from Magic Moments & Morpheus brands is
expected to reach 22% of the branded sale. Contribution from branded
sales is also expected to grow steadily to 74% by FY12E from 73% in
FY10.
8%
11
%
14
%
19
%
22
%
FY08 FY09 FY10 FY11E FY12E
Topline Contribution from premium brands
Source: Company, VCK Research
17
For Private Circulation only
For Private Circulation only
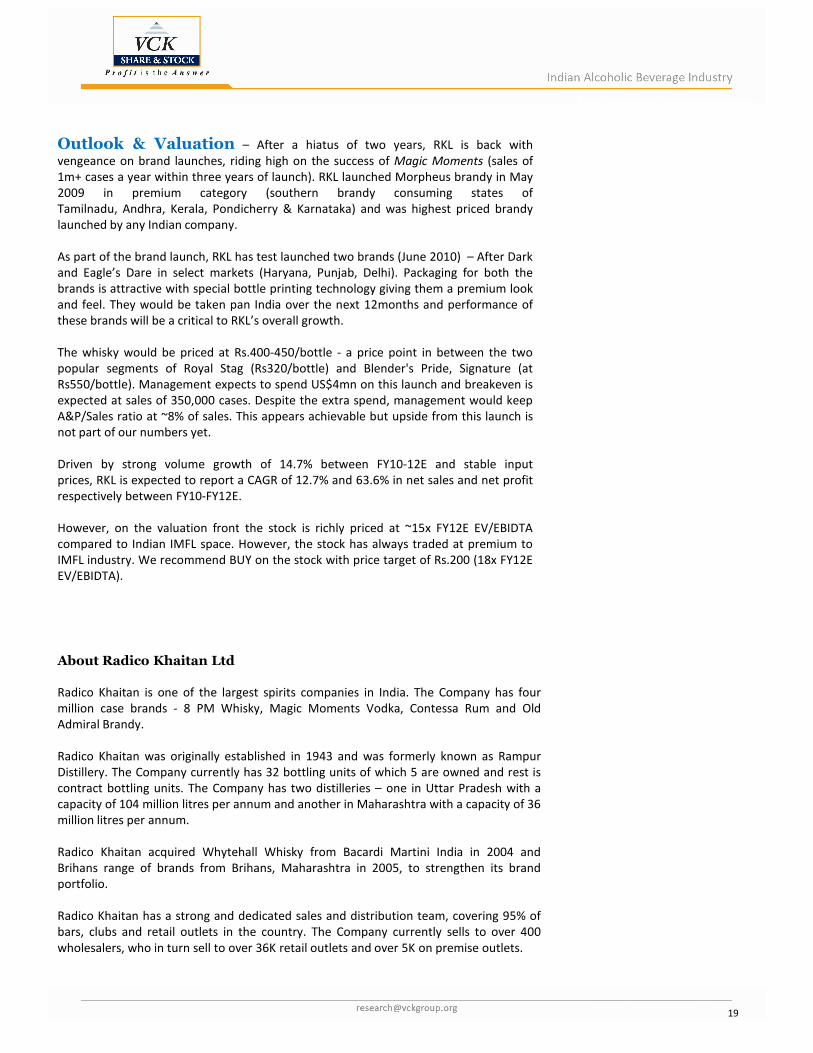
Deleveraging balance sheet resulted in interest costsaving - Given the high growth witnessed by RKL till FY07, the launch of Magic
Moments, investments in JV with Diageo and grain based distillery, etc required
hefty investments on RKL’s part in FY07. With business growing at 15%+ and RKL
extending its presence in new states, the company had to increase capacity at its
contract bottling facilities. This meant a steep rise in capital employed in the
business with working capital (net of cash) reaching 318 days and debt/equity
ratio at 2.6 times (including FCCB of 2.2 bn) in FY07.
In March 2010, RKL paid ~Rs.1.6 bn debt from proceeds of Rs.3.42 bn from QIP.
As a result, its interest obligation for FY11E is expected to be down by 67% to
Rs.24.3 crore from Rs.74.5 crore in FY10 resulting in savings of Rs.50.2 crore.
20.0
30.0
40.0
50.0
60.0
70.0
80.0
200.0
300.0
400.0
500.0
600.0
700.0
800.0
Rs. Cr
0.0
10.0
20.0
0.0
100.0
200.0
FY08 FY09 FY10 FY11E FY12E
Debt Int Payment (RHS)
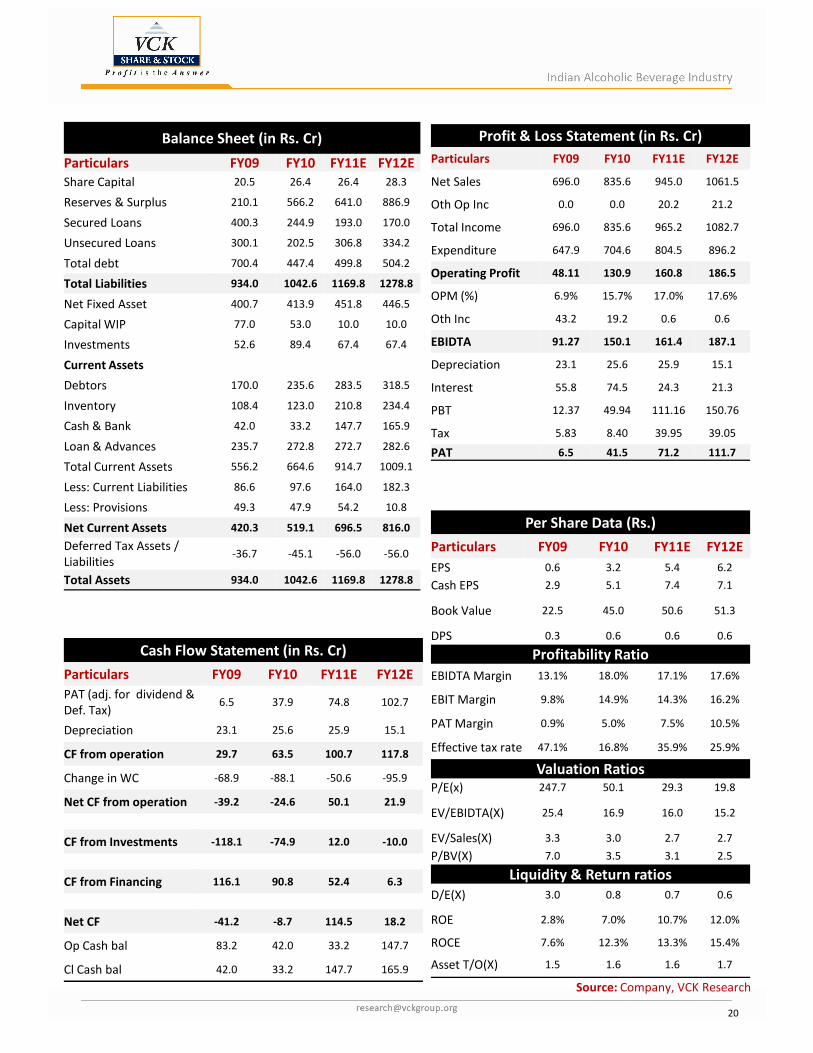
Return ratios to improve significantly – After
deleveraging of balance sheet, RKL’s return ratios is expected to improve
significantly from current levels. Its ROCE and ROE is expected to increase to
15% and 12% in FY12E from 12% and 7% in FY10.
2.0%
4.0%
6.0%
8.0%
10.0%
12.0%
14.0%
16.0%
FY09 FY10 FY11E FY12E
ROE ROCE
Source: Company, VCK Research
Source: Company, VCK Research
18
For Private Circulation only
For Private Circulation only
Outlook & Valuation – After a hiatus of two years, RKL is back with
vengeance on brand launches, riding high on the success of Magic Moments (sales of
1m+ cases a year within three years of launch). RKL launched Morpheus brandy in May
2009 in premium category (southern brandy consuming states of
Tamilnadu, Andhra, Kerala, Pondicherry & Karnataka) and was highest priced brandy
launched by any Indian company.
As part of the brand launch, RKL has test launched two brands (June 2010) – After Dark
and Eagle’s Dare in select markets (Haryana, Punjab, Delhi). Packaging for both the
brands is attractive with special bottle printing technology giving them a premium look
and feel. They would be taken pan India over the next 12months and performance of
these brands will be a critical to RKL’s overall growth.
The whisky would be priced at Rs.400-450/bottle - a price point in between the two
popular segments of Royal Stag (Rs320/bottle) and Blender's Pride, Signature (at
Rs550/bottle). Management expects to spend US$4mn on this launch and breakeven is
expected at sales of 350,000 cases. Despite the extra spend, management would keep
A&P/Sales ratio at ~8% of sales. This appears achievable but upside from this launch is
not part of our numbers yet.
Driven by strong volume growth of 14.7% between FY10-12E and stable input
prices, RKL is expected to report a CAGR of 12.7% and 63.6% in net sales and net profit
respectively between FY10-FY12E.
However, on the valuation front the stock is richly priced at ~15x FY12E EV/EBIDTAHowever, on the valuation front the stock is richly priced at ~15x FY12E EV/EBIDTA
compared to Indian IMFL space. However, the stock has always traded at premium to
IMFL industry. We recommend BUY on the stock with price target of Rs.200 (18x FY12E
EV/EBIDTA).
About Radico Khaitan Ltd
Radico Khaitan is one of the largest spirits companies in India. The Company has four
million case brands - 8 PM Whisky, Magic Moments Vodka, Contessa Rum and Old
Admiral Brandy.
Radico Khaitan was originally established in 1943 and was formerly known as Rampur
Distillery. The Company currently has 32 bottling units of which 5 are owned and rest is
contract bottling units. The Company has two distilleries – one in Uttar Pradesh with a
capacity of 104 million litres per annum and another in Maharashtra with a capacity of 36
million litres per annum.
Radico Khaitan acquired Whytehall Whisky from Bacardi Martini India in 2004 and
Brihans range of brands from Brihans, Maharashtra in 2005, to strengthen its brand
portfolio.
Radico Khaitan has a strong and dedicated sales and distribution team, covering 95% of
bars, clubs and retail outlets in the country. The Company currently sells to over 400
wholesalers, who in turn sell to over 36K retail outlets and over 5K on premise outlets.
19
Balance Sheet (in Rs. Cr)
Particulars FY09 FY10 FY11E FY12E
Share Capital 20.5 26.4 26.4 28.3
Reserves & Surplus 210.1 566.2 641.0 886.9
Secured Loans 400.3 244.9 193.0 170.0
Unsecured Loans 300.1 202.5 306.8 334.2
Total debt 700.4 447.4 499.8 504.2
Total Liabilities 934.0 1042.6 1169.8 1278.8
Net Fixed Asset 400.7 413.9 451.8 446.5
Capital WIP 77.0 53.0 10.0 10.0
Investments 52.6 89.4 67.4 67.4
Current Assets
Debtors 170.0 235.6 283.5 318.5
Inventory 108.4 123.0 210.8 234.4
Cash & Bank 42.0 33.2 147.7 165.9
Loan & Advances 235.7 272.8 272.7 282.6
Total Current Assets 556.2 664.6 914.7 1009.1
Less: Current Liabilities 86.6 97.6 164.0 182.3
Less: Provisions 49.3 47.9 54.2 10.8
Net Current Assets 420.3 519.1 696.5 816.0 Per Share Data (Rs.)
Profit & Loss Statement (in Rs. Cr)
Particulars FY09 FY10 FY11E FY12E
Net Sales 696.0 835.6 945.0 1061.5
Oth Op Inc 0.0 0.0 20.2 21.2
Total Income 696.0 835.6 965.2 1082.7
Expenditure 647.9 704.6 804.5 896.2
Operating Profit 48.11 130.9 160.8 186.5
OPM (%) 6.9% 15.7% 17.0% 17.6%
Oth Inc 43.2 19.2 0.6 0.6
EBIDTA 91.27 150.1 161.4 187.1
Depreciation 23.1 25.6 25.9 15.1
Interest 55.8 74.5 24.3 21.3
PBT 12.37 49.94 111.16 150.76
Tax 5.83 8.40 39.95 39.05
PAT 6.5 41.5 71.2 111.7
Net Current Assets 420.3 519.1 696.5 816.0
Deferred Tax Assets /
Liabilities-36.7 -45.1 -56.0 -56.0
Total Assets 934.0 1042.6 1169.8 1278.8
Cash Flow Statement (in Rs. Cr)
Particulars FY09 FY10 FY11E FY12E
PAT (adj. for dividend &
Def. Tax)6.5 37.9 74.8 102.7
Depreciation 23.1 25.6 25.9 15.1
CF from operation 29.7 63.5 100.7 117.8
Change in WC -68.9 -88.1 -50.6 -95.9
Net CF from operation -39.2 -24.6 50.1 21.9
CF from Investments -118.1 -74.9 12.0 -10.0
CF from Financing 116.1 90.8 52.4 6.3
Net CF -41.2 -8.7 114.5 18.2
Op Cash bal 83.2 42.0 33.2 147.7
Cl Cash bal 42.0 33.2 147.7 165.9
Per Share Data (Rs.)
Particulars FY09 FY10 FY11E FY12E
EPS 0.6 3.2 5.4 6.2
Cash EPS 2.9 5.1 7.4 7.1
Book Value 22.5 45.0 50.6 51.3
DPS 0.3 0.6 0.6 0.6
Profitability Ratio
EBIDTA Margin 13.1% 18.0% 17.1% 17.6%
EBIT Margin 9.8% 14.9% 14.3% 16.2%
PAT Margin 0.9% 5.0% 7.5% 10.5%
Effective tax rate 47.1% 16.8% 35.9% 25.9%
Valuation Ratios
P/E(x) 247.7 50.1 29.3 19.8
EV/EBIDTA(X) 25.4 16.9 16.0 15.2
EV/Sales(X) 3.3 3.0 2.7 2.7
P/BV(X) 7.0 3.5 3.1 2.5
Liquidity & Return ratios
D/E(X) 3.0 0.8 0.7 0.6
ROE 2.8% 7.0% 10.7% 12.0%
ROCE 7.6% 12.3% 13.3% 15.4%
Asset T/O(X) 1.5 1.6 1.6 1.7
Source: Company, VCK Research
20
For Private Circulation only
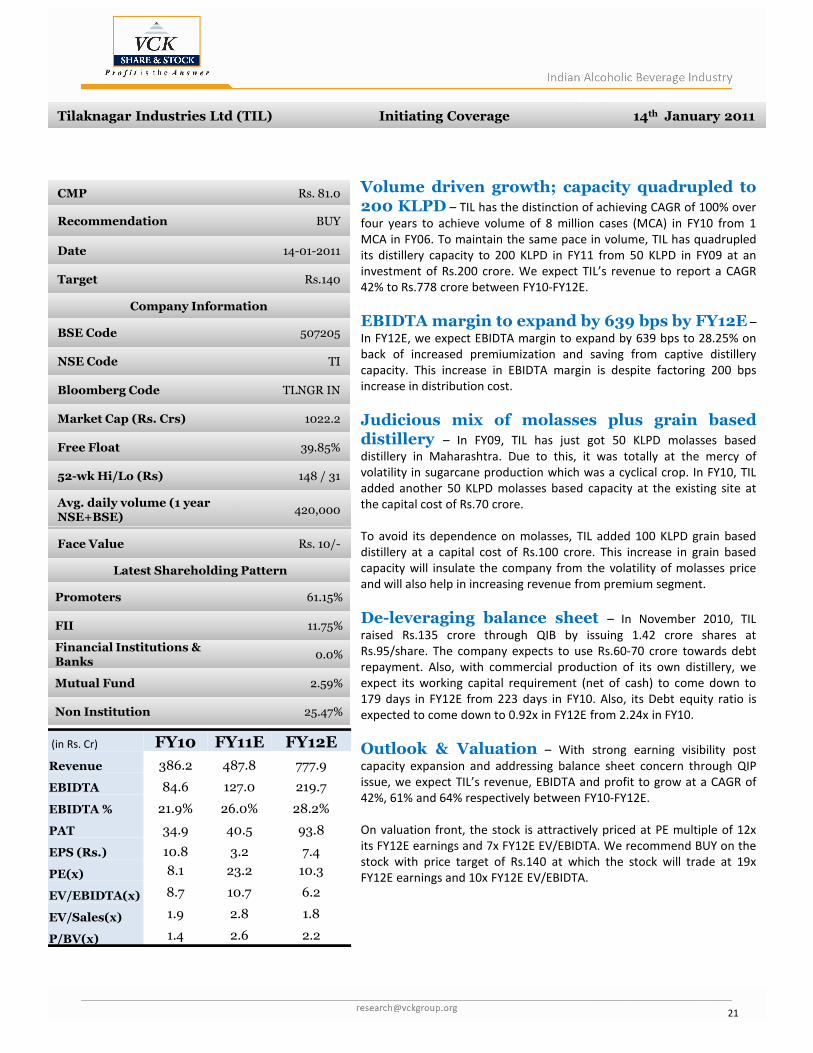
For Private Circulation only Tilaknagar Industries Ltd (TIL) Initiating Coverage 14th January 2011 Tilaknagar Industries Ltd (TIL) Initiating Coverage 14th January 2011
CMP Rs. 81.0
Recommendation BUY
Date 14-01-2011
Target Rs.140
Company Information
BSE Code 507205
NSE Code TI
Bloomberg Code TLNGR IN
Market Cap (Rs. Crs) 1022.2
Free Float 39.85%
52-wk Hi/Lo (Rs) 148 / 31
Avg. daily volume (1 year NSE+BSE)
420,000
Volume driven growth; capacity quadrupled to200 KLPD – TIL has the distinction of achieving CAGR of 100% over
four years to achieve volume of 8 million cases (MCA) in FY10 from 1
MCA in FY06. To maintain the same pace in volume, TIL has quadrupled
its distillery capacity to 200 KLPD in FY11 from 50 KLPD in FY09 at an
investment of Rs.200 crore. We expect TIL’s revenue to report a CAGR
42% to Rs.778 crore between FY10-FY12E.
EBIDTAmargin to expand by 639 bps by FY12E –
In FY12E, we expect EBIDTA margin to expand by 639 bps to 28.25% on
back of increased premiumization and saving from captive distillery
capacity. This increase in EBIDTA margin is despite factoring 200 bps
increase in distribution cost.
Judicious mix of molasses plus grain baseddistillery – In FY09, TIL has just got 50 KLPD molasses based
distillery in Maharashtra. Due to this, it was totally at the mercy of
volatility in sugarcane production which was a cyclical crop. In FY10, TIL
added another 50 KLPD molasses based capacity at the existing site at
the capital cost of Rs.70 crore.
Face Value Rs. 10/-
Latest Shareholding Pattern
Promoters 61.15%
FII 11.75%
Financial Institutions & Banks
0.0%
Mutual Fund 2.59%
Non Institution 25.47%
To avoid its dependence on molasses, TIL added 100 KLPD grain based
distillery at a capital cost of Rs.100 crore. This increase in grain based
capacity will insulate the company from the volatility of molasses price
and will also help in increasing revenue from premium segment.
De-leveraging balance sheet – In November 2010, TIL
raised Rs.135 crore through QIB by issuing 1.42 crore shares at
Rs.95/share. The company expects to use Rs.60-70 crore towards debt
repayment. Also, with commercial production of its own distillery, we
expect its working capital requirement (net of cash) to come down to
179 days in FY12E from 223 days in FY10. Also, its Debt equity ratio is
expected to come down to 0.92x in FY12E from 2.24x in FY10.
Outlook & Valuation – With strong earning visibility post
capacity expansion and addressing balance sheet concern through QIP
issue, we expect TIL’s revenue, EBIDTA and profit to grow at a CAGR of
42%, 61% and 64% respectively between FY10-FY12E.
On valuation front, the stock is attractively priced at PE multiple of 12x
its FY12E earnings and 7x FY12E EV/EBIDTA. We recommend BUY on the
stock with price target of Rs.140 at which the stock will trade at 19x
FY12E earnings and 10x FY12E EV/EBIDTA.
(in Rs. Cr) FY10 FY11E FY12E
Revenue 386.2 487.8 777.9
EBIDTA 84.6 127.0 219.7
EBIDTA % 21.9% 26.0% 28.2%
PAT 34.9 40.5 93.8
EPS (Rs.) 10.8 3.2 7.4
PE(x) 8.1 23.2 10.3
EV/EBIDTA(x) 8.7 10.7 6.2
EV/Sales(x) 1.9 2.8 1.8
P/BV(x) 1.4 2.6 2.2
21
For Private Circulation only
For Private Circulation only
About Tilaknagar Industries
Tilaknagar Distilleries & Industries Ltd. was promoted as a 100 per cent
subsidiary of The Maharashtra Sugar Mills Ltd. The year 1973 saw TIL
diversifying into the businesses of Industrial Alcohol, Indian Made
Foreign Liquor (IMFL) and Sugar Cubes. Both Maharashtra Sugar Mills
Ltd. and Tilaknagar Distilleries & Industries Ltd have been merged to
form Tilaknagar Industries Ltd. with effect from August 6, 1993. Since
then TIL has been engaged in the business of manufacture and
distribution of spirit and Indian Made Foreign Liquor (IMFL).
A key player in the South, TI’s flagship brand Mansion House Brandy
leads the markets in the premium brandy segment across various
markets. With a market share of 56% in Andhra Pradesh, 78% in
Kerala, 97% in Karnataka, 42% in Tamil Nadu, 78% in Puducherry, and
almost 100% in Goa, Mansion House Brandy enjoys clear leadership
position.
It has got 2 million case brands - Mansion House Brandy and Madira XXX
Rock Rum. Overall it has ~4% market share and its market share in
brandy is 14.1%.
TIL achieved a major breakthrough with the acquisition of seven brands
from Alcobrew Distilleries India Pvt. Ltd. to gain traction in the Canteen
Stores Department (CSD) markets. The brands acquired comprise White
House, White House Premium Whisky, Black Colt, Bachelor Deluxe FineHouse, White House Premium Whisky, Black Colt, Bachelor Deluxe Fine
Whisky, Negro He-Mans XXX Rum and Golden Chariot.
22
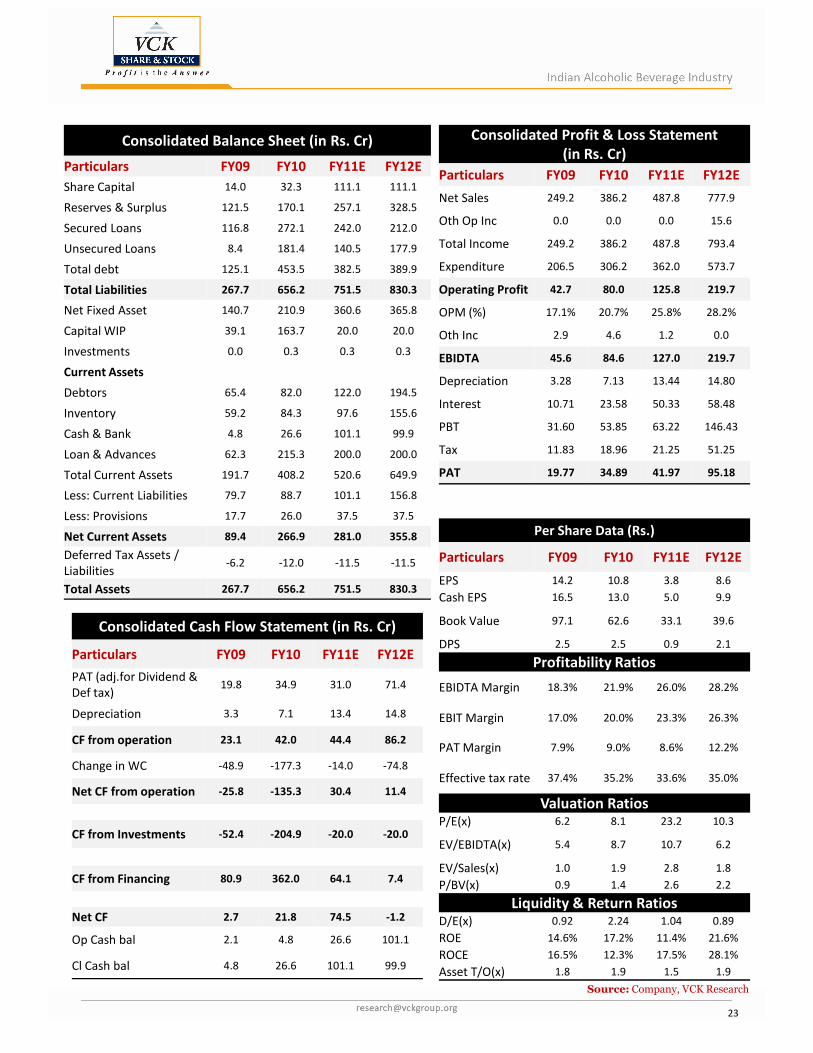
Consolidated Balance Sheet (in Rs. Cr)
Particulars FY09 FY10 FY11E FY12E
Share Capital 14.0 32.3 111.1 111.1
Reserves & Surplus 121.5 170.1 257.1 328.5
Secured Loans 116.8 272.1 242.0 212.0
Unsecured Loans 8.4 181.4 140.5 177.9
Total debt 125.1 453.5 382.5 389.9
Total Liabilities 267.7 656.2 751.5 830.3
Net Fixed Asset 140.7 210.9 360.6 365.8
Capital WIP 39.1 163.7 20.0 20.0
Investments 0.0 0.3 0.3 0.3
Current Assets
Debtors 65.4 82.0 122.0 194.5
Inventory 59.2 84.3 97.6 155.6
Cash & Bank 4.8 26.6 101.1 99.9
Loan & Advances 62.3 215.3 200.0 200.0
Total Current Assets 191.7 408.2 520.6 649.9
Less: Current Liabilities 79.7 88.7 101.1 156.8
Less: Provisions 17.7 26.0 37.5 37.5
Consolidated Profit & Loss Statement
(in Rs. Cr)
Particulars FY09 FY10 FY11E FY12E
Net Sales 249.2 386.2 487.8 777.9
Oth Op Inc 0.0 0.0 0.0 15.6
Total Income 249.2 386.2 487.8 793.4
Expenditure 206.5 306.2 362.0 573.7
Operating Profit 42.7 80.0 125.8 219.7
OPM (%) 17.1% 20.7% 25.8% 28.2%
Oth Inc 2.9 4.6 1.2 0.0
EBIDTA 45.6 84.6 127.0 219.7
Depreciation 3.28 7.13 13.44 14.80
Interest 10.71 23.58 50.33 58.48
PBT 31.60 53.85 63.22 146.43
Tax 11.83 18.96 21.25 51.25
PAT 19.77 34.89 41.97 95.18
Per Share Data (Rs.)Net Current Assets 89.4 266.9 281.0 355.8
Deferred Tax Assets /
Liabilities-6.2 -12.0 -11.5 -11.5
Total Assets 267.7 656.2 751.5 830.3
Per Share Data (Rs.)
Particulars FY09 FY10 FY11E FY12E
EPS 14.2 10.8 3.8 8.6
Cash EPS 16.5 13.0 5.0 9.9
Book Value 97.1 62.6 33.1 39.6
DPS 2.5 2.5 0.9 2.1
Profitability Ratios
EBIDTA Margin 18.3% 21.9% 26.0% 28.2%
EBIT Margin 17.0% 20.0% 23.3% 26.3%
PAT Margin 7.9% 9.0% 8.6% 12.2%
Effective tax rate 37.4% 35.2% 33.6% 35.0%
Valuation RatiosP/E(x) 6.2 8.1 23.2 10.3
EV/EBIDTA(x) 5.4 8.7 10.7 6.2
EV/Sales(x) 1.0 1.9 2.8 1.8
P/BV(x) 0.9 1.4 2.6 2.2
Liquidity & Return RatiosD/E(x) 0.92 2.24 1.04 0.89
ROE 14.6% 17.2% 11.4% 21.6%
ROCE 16.5% 12.3% 17.5% 28.1%
Asset T/O(x) 1.8 1.9 1.5 1.9
Source: Company, VCK Research
Consolidated Cash Flow Statement (in Rs. Cr)
Particulars FY09 FY10 FY11E FY12E
PAT (adj.for Dividend &
Def tax)19.8 34.9 31.0 71.4
Depreciation 3.3 7.1 13.4 14.8
CF from operation 23.1 42.0 44.4 86.2
Change in WC -48.9 -177.3 -14.0 -74.8
Net CF from operation -25.8 -135.3 30.4 11.4
CF from Investments -52.4 -204.9 -20.0 -20.0
CF from Financing 80.9 362.0 64.1 7.4
Net CF 2.7 21.8 74.5 -1.2
Op Cash bal 2.1 4.8 26.6 101.1
Cl Cash bal 4.8 26.6 101.1 99.9
23
For Private Circulation only
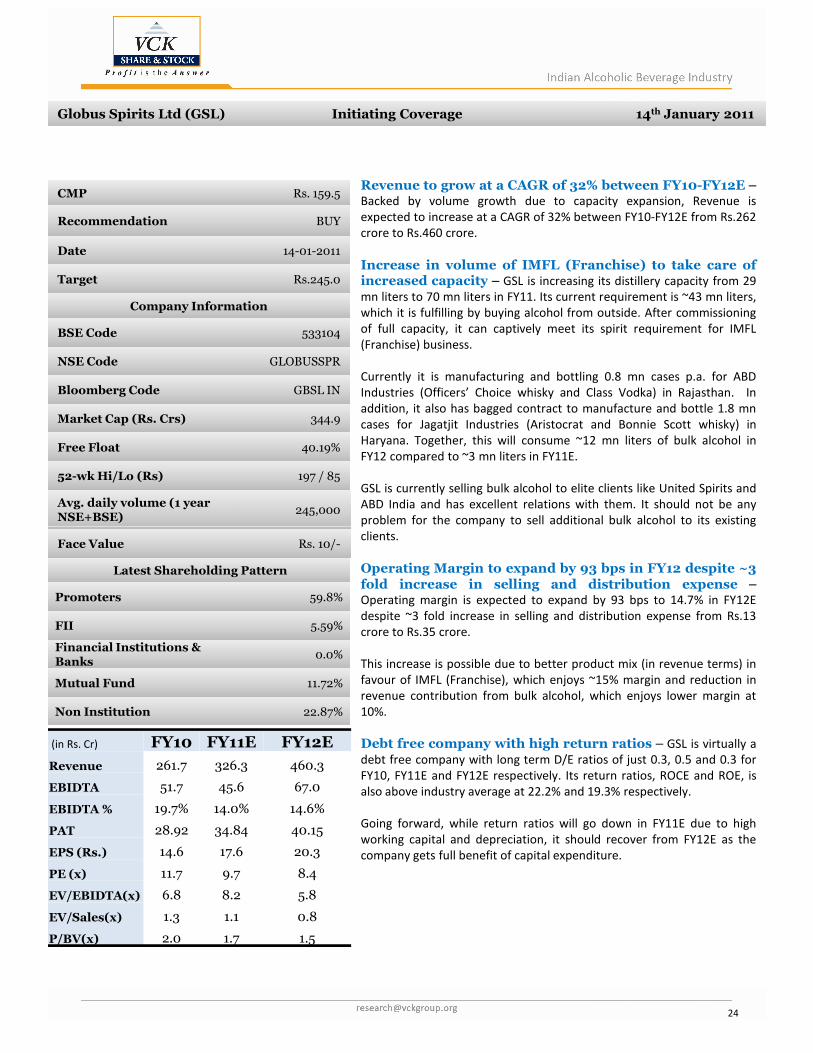
For Private Circulation only Globus Spirits Ltd (GSL) Initiating Coverage 14th January 2011 Globus Spirits Ltd (GSL) Initiating Coverage 14th January 2011
CMP Rs. 159.5
Recommendation BUY
Date 14-01-2011
Target Rs.245.0
Company Information
BSE Code 533104
NSE Code GLOBUSSPR
Bloomberg Code GBSL IN
Market Cap (Rs. Crs) 344.9
Free Float 40.19%
52-wk Hi/Lo (Rs) 197 / 85
Avg. daily volume (1 year NSE+BSE)
245,000
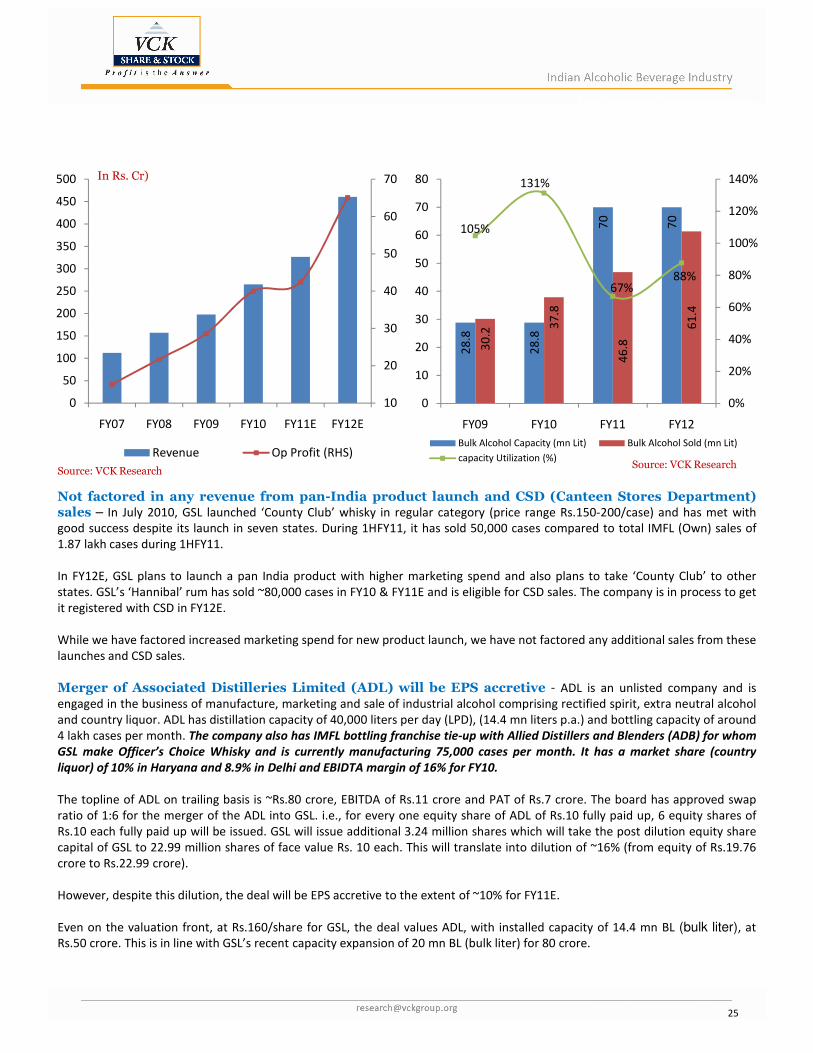
Revenue to grow at a CAGR of 32% between FY10-FY12E –Backed by volume growth due to capacity expansion, Revenue is
expected to increase at a CAGR of 32% between FY10-FY12E from Rs.262
crore to Rs.460 crore.
Increase in volume of IMFL (Franchise) to take care ofincreased capacity – GSL is increasing its distillery capacity from 29
mn liters to 70 mn liters in FY11. Its current requirement is ~43 mn liters,
which it is fulfilling by buying alcohol from outside. After commissioning
of full capacity, it can captively meet its spirit requirement for IMFL
(Franchise) business.
Currently it is manufacturing and bottling 0.8 mn cases p.a. for ABD
Industries (Officers’ Choice whisky and Class Vodka) in Rajasthan. In
addition, it also has bagged contract to manufacture and bottle 1.8 mn
cases for Jagatjit Industries (Aristocrat and Bonnie Scott whisky) in
Haryana. Together, this will consume ~12 mn liters of bulk alcohol in
FY12 compared to ~3 mn liters in FY11E.
GSL is currently selling bulk alcohol to elite clients like United Spirits and
ABD India and has excellent relations with them. It should not be any
problem for the company to sell additional bulk alcohol to its existing
Face Value Rs. 10/-
Latest Shareholding Pattern
Promoters 59.8%
FII 5.59%
Financial Institutions & Banks
0.0%
Mutual Fund 11.72%
Non Institution 22.87%
problem for the company to sell additional bulk alcohol to its existing
clients.
Operating Margin to expand by 93 bps in FY12 despite ~3fold increase in selling and distribution expense –Operating margin is expected to expand by 93 bps to 14.7% in FY12E
despite ~3 fold increase in selling and distribution expense from Rs.13
crore to Rs.35 crore.
This increase is possible due to better product mix (in revenue terms) in
favour of IMFL (Franchise), which enjoys ~15% margin and reduction in
revenue contribution from bulk alcohol, which enjoys lower margin at
10%.
Debt free company with high return ratios – GSL is virtually a
debt free company with long term D/E ratios of just 0.3, 0.5 and 0.3 for
FY10, FY11E and FY12E respectively. Its return ratios, ROCE and ROE, is
also above industry average at 22.2% and 19.3% respectively.
Going forward, while return ratios will go down in FY11E due to high
working capital and depreciation, it should recover from FY12E as the
company gets full benefit of capital expenditure.
(in Rs. Cr) FY10 FY11E FY12E
Revenue 261.7 326.3 460.3
EBIDTA 51.7 45.6 67.0
EBIDTA % 19.7% 14.0% 14.6%
PAT 28.92 34.84 40.15
EPS (Rs.) 14.6 17.6 20.3
PE (x) 11.7 9.7 8.4
EV/EBIDTA(x) 6.8 8.2 5.8
EV/Sales(x) 1.3 1.1 0.8
P/BV(x) 2.0 1.7 1.5
24
For Private Circulation only
For Private Circulation only
Not factored in any revenue from pan-India product launch and CSD (Canteen Stores Department)sales – In July 2010, GSL launched ‘County Club’ whisky in regular category (price range Rs.150-200/case) and has met with
good success despite its launch in seven states. During 1HFY11, it has sold 50,000 cases compared to total IMFL (Own) sales of
10
20
30
40
50
60
70
0
50
100
150
200
250
300
350
400
450
500
FY07 FY08 FY09 FY10 FY11E FY12E
Revenue Op Profit (RHS)2
8.8
28
.8
70
70
30
.2
37
.8
46
.8
61
.4
105%
131%
67%88%
0%
20%
40%
60%
80%
100%
120%
140%
0
10
20
30
40
50
60
70
80
FY09 FY10 FY11 FY12
Bulk Alcohol Capacity (mn Lit) Bulk Alcohol Sold (mn Lit)
capacity Utilization (%)
In Rs. Cr)
Source: VCK ResearchSource: VCK Research
good success despite its launch in seven states. During 1HFY11, it has sold 50,000 cases compared to total IMFL (Own) sales of
1.87 lakh cases during 1HFY11.
In FY12E, GSL plans to launch a pan India product with higher marketing spend and also plans to take ‘County Club’ to other
states. GSL’s ‘Hannibal’ rum has sold ~80,000 cases in FY10 & FY11E and is eligible for CSD sales. The company is in process to get
it registered with CSD in FY12E.
While we have factored increased marketing spend for new product launch, we have not factored any additional sales from these
launches and CSD sales.
Merger of Associated Distilleries Limited (ADL) will be EPS accretive - ADL is an unlisted company and is
engaged in the business of manufacture, marketing and sale of industrial alcohol comprising rectified spirit, extra neutral alcohol
and country liquor. ADL has distillation capacity of 40,000 liters per day (LPD), (14.4 mn liters p.a.) and bottling capacity of around
4 lakh cases per month. The company also has IMFL bottling franchise tie-up with Allied Distillers and Blenders (ADB) for whom
GSL make Officer’s Choice Whisky and is currently manufacturing 75,000 cases per month. It has a market share (country
liquor) of 10% in Haryana and 8.9% in Delhi and EBIDTA margin of 16% for FY10.
The topline of ADL on trailing basis is ~Rs.80 crore, EBITDA of Rs.11 crore and PAT of Rs.7 crore. The board has approved swap
ratio of 1:6 for the merger of the ADL into GSL. i.e., for every one equity share of ADL of Rs.10 fully paid up, 6 equity shares of
Rs.10 each fully paid up will be issued. GSL will issue additional 3.24 million shares which will take the post dilution equity share
capital of GSL to 22.99 million shares of face value Rs. 10 each. This will translate into dilution of ~16% (from equity of Rs.19.76
crore to Rs.22.99 crore).
However, despite this dilution, the deal will be EPS accretive to the extent of ~10% for FY11E.
Even on the valuation front, at Rs.160/share for GSL, the deal values ADL, with installed capacity of 14.4 mn BL (bulk liter), at
Rs.50 crore. This is in line with GSL’s recent capacity expansion of 20 mn BL (bulk liter) for 80 crore.
25
For Private Circulation only
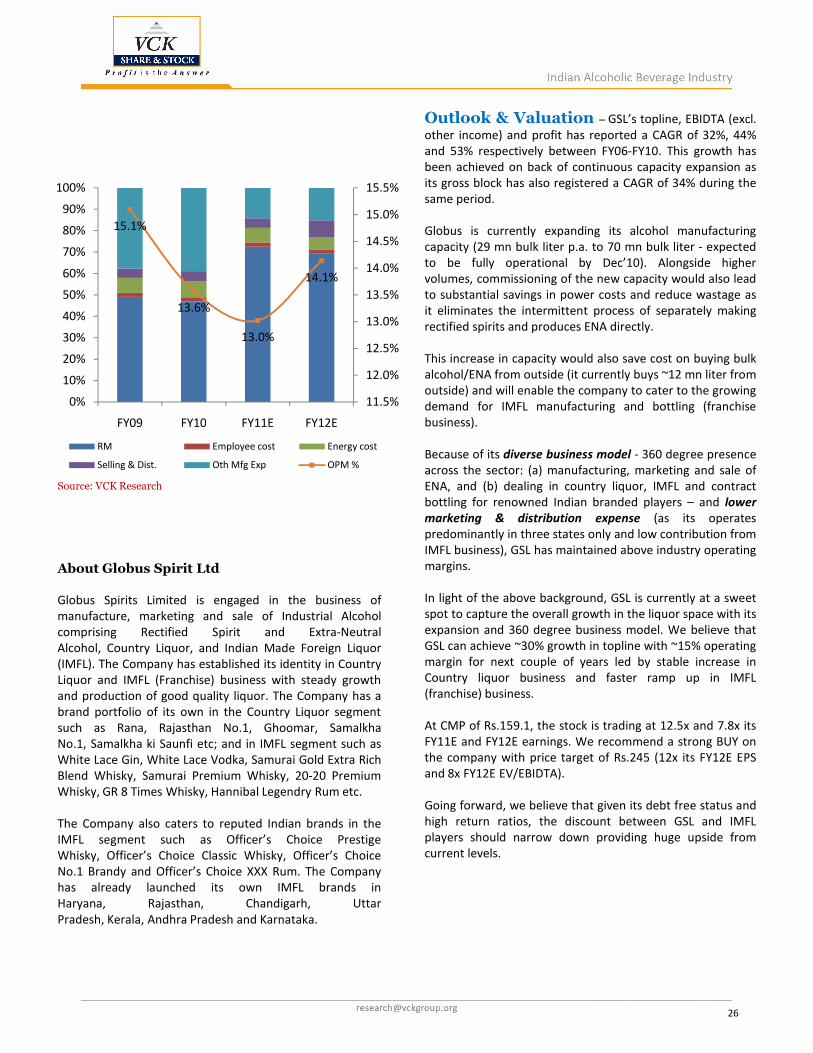
For Private Circulation only Outlook & Valuation – GSL’s topline, EBIDTA (excl.
other income) and profit has reported a CAGR of 32%, 44%
and 53% respectively between FY06-FY10. This growth has
been achieved on back of continuous capacity expansion as
its gross block has also registered a CAGR of 34% during the
same period.
Globus is currently expanding its alcohol manufacturing
capacity (29 mn bulk liter p.a. to 70 mn bulk liter - expected
to be fully operational by Dec’10). Alongside higher
volumes, commissioning of the new capacity would also lead
to substantial savings in power costs and reduce wastage as
it eliminates the intermittent process of separately making
rectified spirits and produces ENA directly.
This increase in capacity would also save cost on buying bulk
alcohol/ENA from outside (it currently buys ~12 mn liter from
outside) and will enable the company to cater to the growing
demand for IMFL manufacturing and bottling (franchise
business).
Because of its diverse business model - 360 degree presence
across the sector: (a) manufacturing, marketing and sale of
ENA, and (b) dealing in country liquor, IMFL and contract
bottling for renowned Indian branded players – and lower
marketing & distribution expense (as its operates
predominantly in three states only and low contribution from
15.1%
13.6%
13.0%
14.1%
11.5%
12.0%
12.5%
13.0%
13.5%
14.0%
14.5%
15.0%
15.5%
0%
10%
20%
30%
40%
50%
60%
70%
80%
90%
100%
FY09 FY10 FY11E FY12E
RM Employee cost Energy cost
Selling & Dist. Oth Mfg Exp OPM %
Source: VCK Research
predominantly in three states only and low contribution from
IMFL business), GSL has maintained above industry operating
margins.
In light of the above background, GSL is currently at a sweet
spot to capture the overall growth in the liquor space with its
expansion and 360 degree business model. We believe that
GSL can achieve ~30% growth in topline with ~15% operating
margin for next couple of years led by stable increase in
Country liquor business and faster ramp up in IMFL
(franchise) business.
At CMP of Rs.159.1, the stock is trading at 12.5x and 7.8x its
FY11E and FY12E earnings. We recommend a strong BUY on
the company with price target of Rs.245 (12x its FY12E EPS
and 8x FY12E EV/EBIDTA).
Going forward, we believe that given its debt free status and
high return ratios, the discount between GSL and IMFL
players should narrow down providing huge upside from
current levels.
About Globus Spirit Ltd
Globus Spirits Limited is engaged in the business of
manufacture, marketing and sale of Industrial Alcohol
comprising Rectified Spirit and Extra-Neutral
Alcohol, Country Liquor, and Indian Made Foreign Liquor
(IMFL). The Company has established its identity in Country
Liquor and IMFL (Franchise) business with steady growth
and production of good quality liquor. The Company has a
brand portfolio of its own in the Country Liquor segment
such as Rana, Rajasthan No.1, Ghoomar, Samalkha
No.1, Samalkha ki Saunfi etc; and in IMFL segment such as
White Lace Gin, White Lace Vodka, Samurai Gold Extra Rich
Blend Whisky, Samurai Premium Whisky, 20-20 Premium
Whisky, GR 8 Times Whisky, Hannibal Legendry Rum etc.
The Company also caters to reputed Indian brands in the
IMFL segment such as Officer’s Choice Prestige
Whisky, Officer’s Choice Classic Whisky, Officer’s Choice
No.1 Brandy and Officer’s Choice XXX Rum. The Company
has already launched its own IMFL brands in
Haryana, Rajasthan, Chandigarh, Uttar
Pradesh, Kerala, Andhra Pradesh and Karnataka.
26
Profit & Loss Statement (in Rs. Cr)
Particulars FY09 FY10 FY11E FY12E
Net Sales 195.2 261.7 326.3 460.3
Oth Op Inc 0 0 11.3 23.0
Total Income 195.2 261.7 337.6 483.3
Expenditure 171.9 228.3 292.4 416.3
RM 83.4 105.4 210.8 284.7
Employee cost 3.1 4.5 5.9 8.3
Selling & Dist. 7.3 10.5 13.1 32.2
Oth Mfg Exp 64.0 87.4 41.3 62.1
Gen & Adm Exp 3.9 5.0 4.5 6.9
Operating
Profit26.0 36.7 45.3 67.0
OPM (%) 13.3% 14.0% 13.9% 14.6%
Oth Inc 2.7 15.0 0.4 0.0
EBIDTA 28.7 51.7 45.6 67.0
Depreciation 5.7 4.4 5.4 9.0
Interest 2.9 1.4 1.8 4.5
PBT 20.0 45.9 38.4 53.5
Balance Sheet (in Rs. Cr)
Particulars FY09 FY10 FY11E FY12E
Share Capital 12.3 19.8 19.8 19.8
Reserves & Surplus 47.5 141.6 167.6 203.7
Secured Loans 16.4 5.5 10.0 6.0
Unsecured Loans 0.9 8.2 25.6 43.9
Total debt 17.3 13.7 35.6 49.9
Total Liabilities 77.1 175.1 222.9 273.3
Net Fixed Asset 56.3 89.4 149.9 141.4
Capital WIP 0.4 46.9 0.5 0.5
Investments 0.3 0.3 0.3 0.3
Current Assets
Debtors 25.8 28.0 65.3 138.1
Inventory 23.3 27.2 52.7 71.2
Cash & Bank 2.4 20.4 25.8 15.5
Loan & Advances 11.0 35.5 10.0 10.0
Total Current Assets 64.3 112.9 127.9 219.3
Less: Current Liabilities 36.9 56.1 63.2 85.4
Net Current Assets 27.4 56.8 64.7 133.9
Deferred Tax Assets / Liabilities -7.6 -18.4 -18.5 -18.5
Total Assets 77.1 175.1 222.7 273.3PBT 20.0 45.9 38.4 53.5
Tax 7.0 16.9 9.8 13.4
PAT 13.0 28.9 28.7 40.2
Cash Flow Statement (in Rs. Cr)
Particulars FY09 FY10 FY11E FY12E
PAT (adj.for Dividend
& Def tax)- 26.6 26.8 38.2
Depreciation - 4.4 5.4 9.0
CF from operation - 31.0 32.2 47.2
Change in WC - -19.9 -28.3 -69.1
Net CF from
operation- 11.1 3.9 -22.0
-
CF from Investments - -68.9 -19.5 -0.5
-
CF from Financing - 75.7 21.9 14.3
-
Net CF - 17.9 6.3 -8.2
Op Cash bal - 2.4 20.4 26.7
Cl Cash bal - 20.4 26.7 18.4
Per Share Data (Rs.)
Particulars FY09 FY10 FY11E FY12E
EPS 10.6 14.6 17.6 20.3
Cash EPS 15.3 16.9 20.3 24.9
Book Value 50.9 84.7 98.3 117.6
DPS - 1.1 1.0 1.0
Profitability Ratios
EBIDTA Margin 14.7% 19.7% 14.0% 14.6%
EBIT Margin 11.8% 18.1% 12.3% 12.6%
PAT Margin 6.7% 11.1% 10.7% 8.7%
Effective tax rate 35.0% 37.0% 9.3% 25.0%
Valuation RatiosP/E(x) 16.4 11.9 9.9 8.6
EV/EBIDTA(x) 8.0 6.9 8.3 5.9
EV/Sales(x) 1.2 1.4 1.2 0.9
P/BV(x) 3.4 2.1 1.8 1.5
Liquidity & Return RatiosD/E(x) 0.29 0.08 0.19 0.22
ROE 25.0% 19.3% 17.9% 17.3%
ROCE 29.6% 22.2% 19.6% 22.0%
Asset T/O(x) 2.7 2.6 2.3 2.6
Source: Company, VCK Research
27
Related Documents