India UPS Market P1F6-27 November 2008

india uninterruptible power supply market.pdf
Dec 14, 2015
Welcome message from author
This document is posted to help you gain knowledge. Please leave a comment to let me know what you think about it! Share it to your friends and learn new things together.
Transcript

India UPS Market
P1F6-27November 2008

2P1F6-27
Disclaimer
• Frost & Sullivan takes no responsibility for the incorrect information supplied to us by suppliers or users
• Quantitative market information is based primarily on interviews and therefore, is subject to fluctuation
• Frost & Sullivan Research Services are limited publications containing valuable market information provided to a select group of customers in response to orders. Our customers acknowledge, when ordering, that Frost & Sullivan Research Services are for customers’ internal use and not for general publication or disclosure to third parties
• No part of this Research Service may be given, lent, resold or disclosed to non-customers without written permission
• Furthermore, no part may be reproduced, stored in a retrieval system, or transmitted in any form or by any means, electronic, mechanical, photocopying, recording or otherwise, without the permission of the publisher
• For information regarding permission, write to:
Frost & Sullivan (India) Private Limited,
Tower 6, Unit 641-642
Solitaire Corporate Park,
M Vasanji Marg, Chakala, Andheri (East),
Mumbai – 400093
India
© 2008 Frost & Sullivan. All rights reserved. This document contains highly confidential information and is the sole property of Frost & Sullivan. No part of it may be circulated, quoted, copied or otherwise reproduced without the written approval of Frost & Sullivan.

3P1F6-27
Certification
• We hereby certify that the views expressed in this research service accurately reflect our views based on primary and secondary research with market participants, market experts, end users, regulatory organizations, financial and investment community, and other related sources
• In addition to the above, our robust in- house forecast and benchmarking models along with the Frost & Sullivan Decision Support Databases have been instrumental in the completion and publishing of this research service
• We also certify that no part of our analyst compensation was, is or will be, directly or indirectly, related to the specific recommendations or views expressed in this service

4P1F6-27
Table of Contents
Chapter 1 Executive Summary Slide No
1.1 Indian Economy Snapshot 101.2 Market Overview 111.3 Research Scope and Objectives 121.4 Competitive Analysis 131.5 Major Research Findings 151.6 Conclusion 16
Chapter 2 Total Indian UPS Market
2.1 Market Overview and Definitions 182.2 Market Engineering Measurement Analysis 252.3 Industry Challenges 262.4 Market Drivers and Restraints 292.5 Total Market Analysis 35

5P1F6-27
2.6 Demand Analysis 372.7 Market and Technology Trends 392.8 Pricing Trends 432.9 Market Share Analysis 452.10 Distribution Channel Analysis 522.11 Conclusion and Recommendations 54
Chapter 3 Less than 1kVA UPS Market
3.1 Market Overview 563.2 Market Engineering Measurement Analysis 573.3 Market Drivers and Restraints 583.4 Revenue Forecasts 613.5 Demand Analysis 633.6 Market and Technology Trends 643.7 Pricing Trends 663.8 Market Share Analysis 67
Table of Contents (Contd…)

6P1F6-27
Chapter 4 1-5kVA UPS Market
4.1 Market Overview 694.2 Market Engineering Measurement Analysis 704.3 Market Drivers and Restraints 714.4 Revenue Forecasts 744.5 Demand Analysis 764.6 Market and Technology Trends 784.7 Pricing Trends 804.8 Market Share Analysis 81
Chapter 5 5.1-20kVA UPS Market
5.1 Market Overview 835.2 Market Engineering Measurement Analysis 845.3 Market Drivers and Restraints 855.4 Revenue Forecasts 885.5 Demand Analysis 905.6 Market and Technology Trends 91
Table of Contents (Contd…)

7P1F6-27
5.7 Pricing Trends 935.8 Market Share Analysis 94
Chapter 6 20.1-60kVA UPS Market
6.1 Market Overview 966.2 Market Engineering Measurement Analysis 976.3 Market Drivers and Restraints 986.4 Revenue Forecasts 1016.5 Demand Analysis 1036.6 Market and Technology Trends 1046.7 Pricing Trends 1066.8 Market Share Analysis 107
Chapter 7 60.1-200kVA UPS Market
7.1 Market Overview 1097.2 Market Engineering Measurement Analysis 1107.3 Market Drivers and Restraints 1117.4 Revenue Forecasts 114
Table of Contents (Contd…)
8P1F6-27
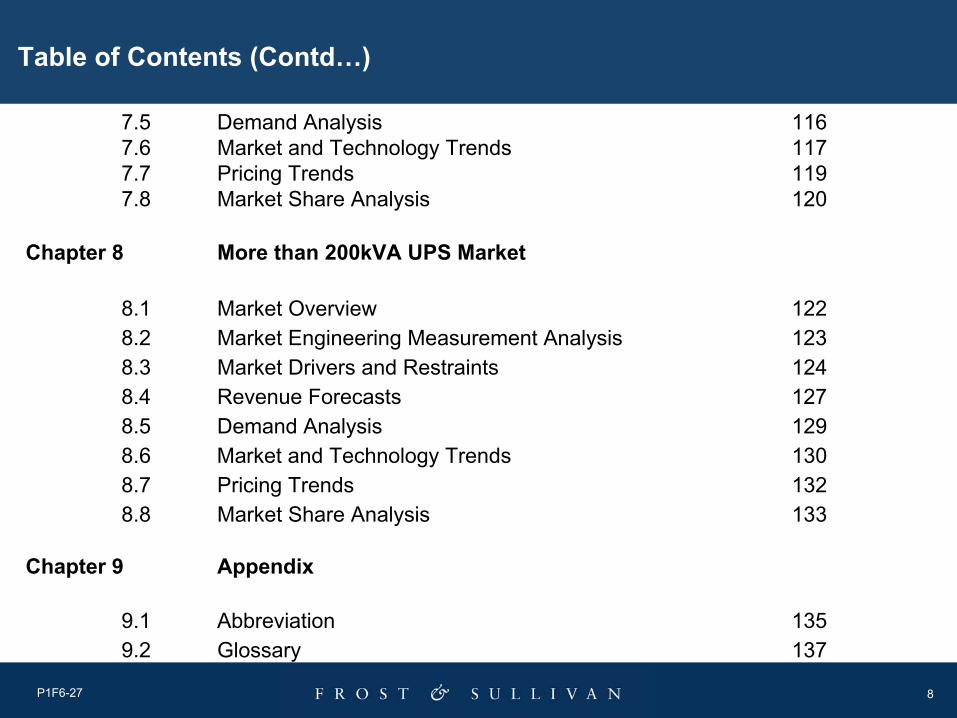
7.5 Demand Analysis 1167.6 Market and Technology Trends 1177.7 Pricing Trends 1197.8 Market Share Analysis 120
Chapter 8 More than 200kVA UPS Market
8.1 Market Overview 1228.2 Market Engineering Measurement Analysis 1238.3 Market Drivers and Restraints 1248.4 Revenue Forecasts 1278.5 Demand Analysis 1298.6 Market and Technology Trends 1308.7 Pricing Trends 1328.8 Market Share Analysis 133
Chapter 9 Appendix
9.1 Abbreviation 1359.2 Glossary 137
Table of Contents (Contd…)

9
Chapter 1
Executive Summary

10P1F6-27
1.1 Indian Economy Snapshot
ECONOMIC GROWTH INDICATORS
• GDP by PPP (2007-08) - USD 4.7 trillion
• GDP @ Market Exchange Rates (2007-08) - USD1.2 trillion
• Expected GDP Growth Rate (2008-09) - 7.5-8.0 percent
• Population - 1.1 billion
• Inflation Rate( August’ 2008) - 12.0 percent
• Foreign Investment (2007-08) - USD18.0 billion
• Foreign Exchange Reserves - USD275.0 billion
Note: All the above mentioned figures are approximate figures
The major sectors/segments which will witness high growth rates in the next five years are
• Banking Financial Services and Insurance (BFSI) Sector• Telecom Sector • Retail Sector• Information Technology (IT) / Information Technology Enabled
Services (ITES) Sector• Manufacturing Sector • Real Estate• Infrastructure etc
Apart from these, both state and central government would be spending huge amounts on new purchases for its various initiatives and schemes
The Gross Domestic Product (GDP) growth rate for FY 2007-08 was 8.5
percent. The GDP growth rate is expected to be in the range of 7-8
percent till FY 2011-12, making India one of the very few economies to
have a continuous high GDP growth rate. This sustained high growth rate
in GDP is having a positive cascading effect on all the industries,
segments, and verticals; of which Uninterruptible Power Supply (UPS) is
not an exception.
Source: Ministry of Commerce & Industry (GOI)
FDI Inflow in India (USD Million)
18,000
2,6343,759
5,546
15,726
0
2,000
4,000
6,000
8,000
10,000
12,000
14,000
16,000
18,000
20,000
2003-04 2004-05 2005-06 2006-07 2007-08Year
Inflo
w(U
SD
Mill
ion)

11P1F6-27
1.2 Market Overview
• The total Indian Static UPS market was worth USD 544.4 million in 2007The growth rate in the base year 2007 was 33.7 percent
• The market is expected to witness a Compound Annual Growth Rate (CAGR) of 13.4 percent from 2007 to 2014
• The Indian UPS market is a combination of Indian as well as multinational suppliers
UPS Market: Revenue Forecasts (India), 2004-2014
0.0
200.0
400.0
600.0
800.0
1,000.0
1,200.0
1,400.0
2004 2005 2006 2007 2008 2009 2010 2011 2012 2013 2014
Year
Rev
enue
s ($
Milli
on)
0.0
5.0
10.0
15.0
20.0
25.0
30.0
35.0
40.0
Rev
enue
Gro
wth
Rat
e (%
)
Revenues($ Million) Revenue Growth Rate (%)
Note: All figures are rounded; the base year is 2007. Source: Frost & Sullivan

12P1F6-27
1.3 Research Scope and Objectives
This research study highlights opportunities and challenges present in the Indian UPS market with the following objectives :
• To determine the current market size and assess the future growth rates of the UPS market in India by power range
• To identify and analyze the key market drivers and restraints that are expected to shape the market
• To assess and identify market opportunities for UPS systems in India through end-user analysis and forecasts of key vertical markets
• To discuss and analyze the key market changes and challenges that have an impact on the UPS sales
• To provide market share analysis by power range and discussion on the key competitive factors for the UPS market

13P1F6-27
1.4 Competitive Analysis
• The Indian UPS market is a highly competitive, fragmented, and growing market with both multinational and Indian suppliers competing for space
• The competitiveness in the market is increasing with less barriers for the entry of new participants, especially in the low end power range (up to 20kVA)
• The market has seen the exit of both multinational (Mitsubishi, Siemens) and Indian suppliers (TVS Electronics Limited) in the last few years primarily due to intense price pressure and a need or desire or strategic decision to focus on its core areas
• Price, after-sales service, and delivery are becoming the key differentiating factors in addressing the demand of the market
• The higher power range segment, especially more than 60kVA onwards is dominated by the multinational companies with very few Indian suppliers operating in this space
• Some Indian suppliers who are operating in the low end power range segment (up to 20kVA ) are forming Joint Ventures (JV) or technical tie-ups or distribution tie-ups to cater to the mid-end and high-end power ranges (20 kVA onwards) with multinational companies, especially from Europe, which do not have direct presence in India. This is basically done by the Indian suppliers to widen their product range and also to increase their margins, which are higher when compared to those in the low-end power range (up to 20kVA ). Unitek Power Solutions India Ltd has recently formed a JV with Borri S. p. A., Italy

14P1F6-27
Competitive Analysis (Contd…)
• Offline, Line-Interactive and Online UPS, especially up to 10kVA, are sold primarily through resellers channel partners. From 10kVA to 60kVA, many Online UPS are sold through Value-Added Resellers (VAR), in addition to being sold by the direct sales team of suppliers. From 60kVA onwards, products are generally sold by direct sales team of suppliers
• To offset the increase in the cost of raw materials and other overheads, UPS suppliers are strengthening their raw material sourcing processes, making their supply chains more efficient and expanding their distribution networks in order to remain competitive in the market
15P1F6-27
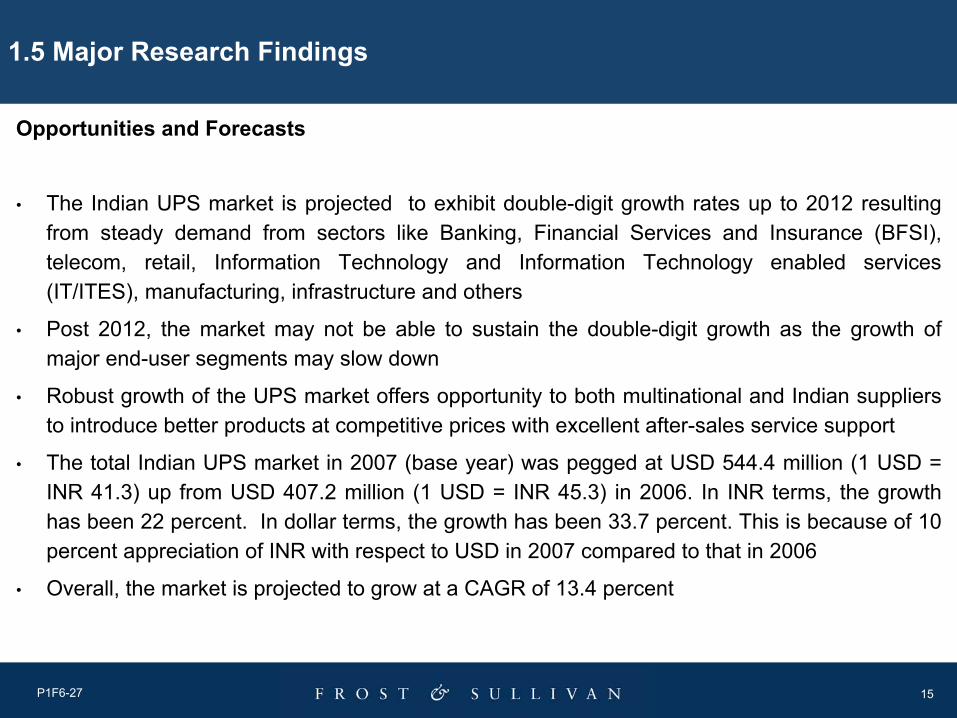
1.5 Major Research Findings
Opportunities and Forecasts
• The Indian UPS market is projected to exhibit double-digit growth rates up to 2012 resulting from steady demand from sectors like Banking, Financial Services and Insurance (BFSI), telecom, retail, Information Technology and Information Technology enabled services(IT/ITES), manufacturing, infrastructure and others
• Post 2012, the market may not be able to sustain the double-digit growth as the growth of major end-user segments may slow down
• Robust growth of the UPS market offers opportunity to both multinational and Indian suppliers to introduce better products at competitive prices with excellent after-sales service support
• The total Indian UPS market in 2007 (base year) was pegged at USD 544.4 million (1 USD = INR 41.3) up from USD 407.2 million (1 USD = INR 45.3) in 2006. In INR terms, the growth has been 22 percent. In dollar terms, the growth has been 33.7 percent. This is because of 10 percent appreciation of INR with respect to USD in 2007 compared to that in 2006
• Overall, the market is projected to grow at a CAGR of 13.4 percent

16P1F6-27
1.6 Conclusion
• The increase in the costs of manpower and some key components are putting pressure on the margins of the UPS suppliers
• Servicing of especially the larger kVA UPS systems, which is an essential consideration for the end users, offers UPS suppliers a good opportunity for creating a loyal customer base, thereby increasing chances for repeat sales in the future
• UPS systems over the years have been increasing in complexity, and require specialized know-how and technical knowledge for both sales and services

17
Chapter 2
Total Indian UPS Market

18P1F6-27
2.1 Market Overview and Definitions
Market Overview
• The Indian UPS market is a highly competitive, fragmented, and growing market with both multinational and Indian suppliers competing for space
• More than 300 suppliers are present in the market
• Suppliers can be broadly classified or tierized into three categories:
Tier 1 suppliers are those who have a pan India presence. For example, Emerson Network Power (India) Private Limited , Numeric Power Systems Limited, APC-MGE and others. They cater to about 60 percent of the market
Tier 2 participants are those who have a regional sales and services presence in two or three regions of the country. For example, Uniline Energy Systems Pvt Ltd, Tritronics (India) Pvt Ltd and others
Tier 3 participants are those who have presence in pockets (two or three cities or in a particular state only). They could be present in a single region of the country as well, though that is rare
19P1F6-27
Market Overview and Definitions (Contd…)
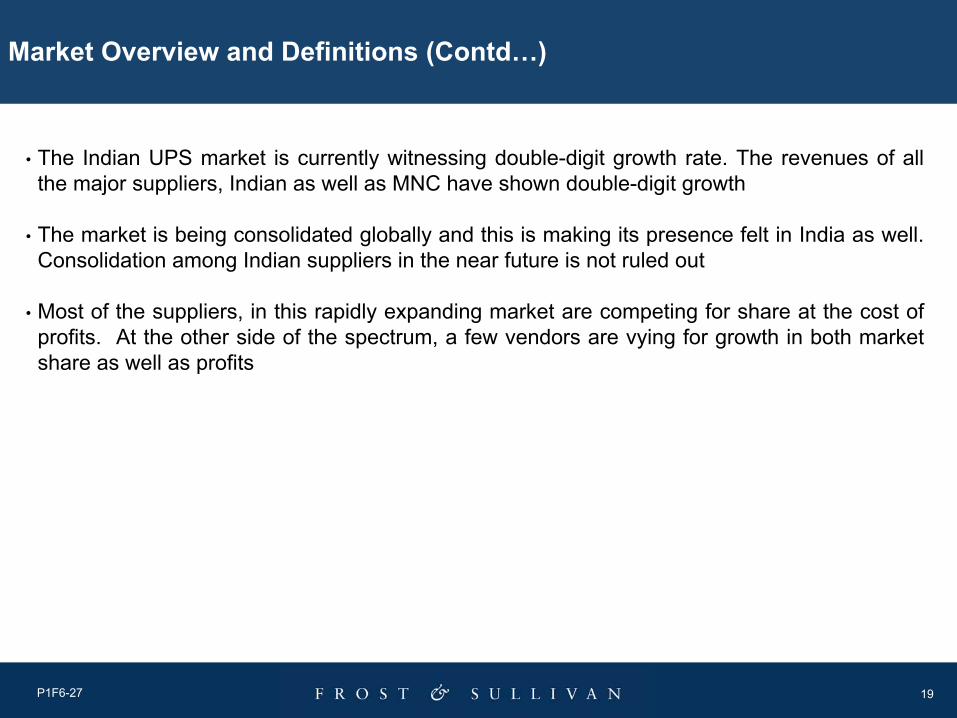
• The Indian UPS market is currently witnessing double-digit growth rate. The revenues of all the major suppliers, Indian as well as MNC have shown double-digit growth
• The market is being consolidated globally and this is making its presence felt in India as well. Consolidation among Indian suppliers in the near future is not ruled out
• Most of the suppliers, in this rapidly expanding market are competing for share at the cost of profits. At the other side of the spectrum, a few vendors are vying for growth in both market share as well as profits

20P1F6-27
Market Overview and Definitions (Contd…)
Definitions
A UPS is a device or a network of devices that serves as a form of backup power ensuring a continuous supply of electrical power to various electronic devices. The power supplied can last anywhere from a few minutes to several hours, depending on the setup of the system and the equipment.
By deploying these systems, users are expected to be able to conduct the following:
• Have sufficient power to keep the equipment running during the time taken to start a backup generator after a power failure
• Minimize the downtime of a power outage by allowing sufficient time to conduct a proper backup and shut down of networks and computer systems, so as to prevent losss of important information and data
• Adequate power to keep mission-critical applications running during power outages
21P1F6-27
Market Overview and Definitions (Contd…)
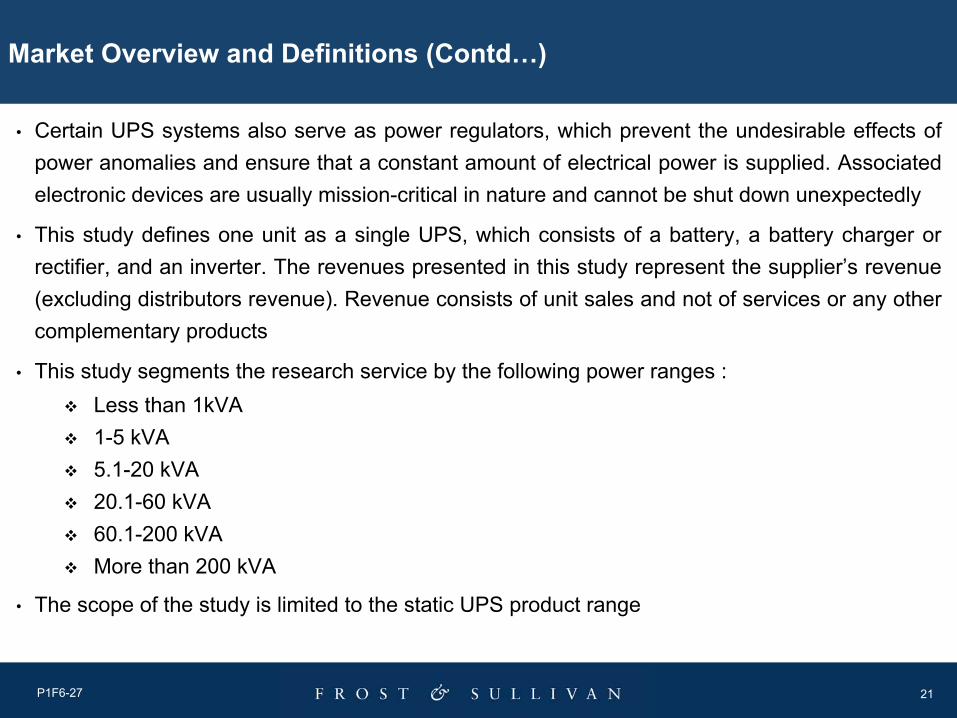
• Certain UPS systems also serve as power regulators, which prevent the undesirable effects of power anomalies and ensure that a constant amount of electrical power is supplied. Associated electronic devices are usually mission-critical in nature and cannot be shut down unexpectedly
• This study defines one unit as a single UPS, which consists of a battery, a battery charger orrectifier, and an inverter. The revenues presented in this study represent the supplier’s revenue (excluding distributors revenue). Revenue consists of unit sales and not of services or any other complementary products
• This study segments the research service by the following power ranges : Less than 1kVA 1-5 kVA 5.1-20 kVA20.1-60 kVA60.1-200 kVAMore than 200 kVA
• The scope of the study is limited to the static UPS product range

22P1F6-27
Market Overview and Definitions (Contd…)
41.3 (For the forecast period, the rates of 2007 have been taken) 2008-14
41.32007
45.32006
44.12005
45.32004
INRYear
The measurements here are given in US dollars and the currency conversion rate is the average conversion rate for a full calendar year (1st January to 31st December)
The base year has been taken as 2007 (1st January’07 to 31st December’07). Calendar years have been considered in this research service
Forecast has been given for the next seven years, that is, up to 2014
Conversions from INR to 1 USD in this study are at the rates given below

23P1F6-27
Market Overview and Definitions (Contd…)
Standby or Offline UPS—Standby UPS systems are one of most commonly used UPS systems. They are usually used for running the less mission-critical applications. Electrical power flows from the power grid into the application, and at the same time, charges the battery. When not in use, the battery remains idle and does not interfere with the running of the application. When utility power fails, UPS system is kick-started and power flows from the battery into the application, keeping it running even though it does not receive power from the power grid. Applications include personal desktops, printers , small servers and others. The topology of the Standby (Offline) UPS system is available in the below 5 kVA range.
Line Interactive UPS—Most commonly found in small businesses and small server applications. Electrical power flows from the power grid through a transfer switch and into an inverter, which is connected to the output of the UPS system. When power from the power grid fails, the transfer switch is opened and power flows from the battery to the application. Line interactive UPS system also provides additional filtering and protection. This topology of UPS systems dominates the UPS types in the 0.5 to 5 kVA range, although it is also available in the below 20 kVA range.

24P1F6-27
Market Overview and Definitions (Contd…)
Online UPS—Online UPS systems are generally more expensive than the other two and are mainly sold in the 3 kVA and above power range. In an online UPS system, the primary power path is to the inverter instead of from the power grid. The battery, along with a rectifier plays the major role in powering the application, even under normal situations. Using a double conversion topology, the power from the grid is converted from AC to DC and then to AC again, thus effectively reducing all noises and harmonics that might be generated due to an unstable power supply. This provides a near ideal electrical performance.
Standby or Offline and Line-Interactive UPS together contribute approximately 14-16 percent andOnline UPS, the balance amount by revenue of the total Indian UPS market

25P1F6-27
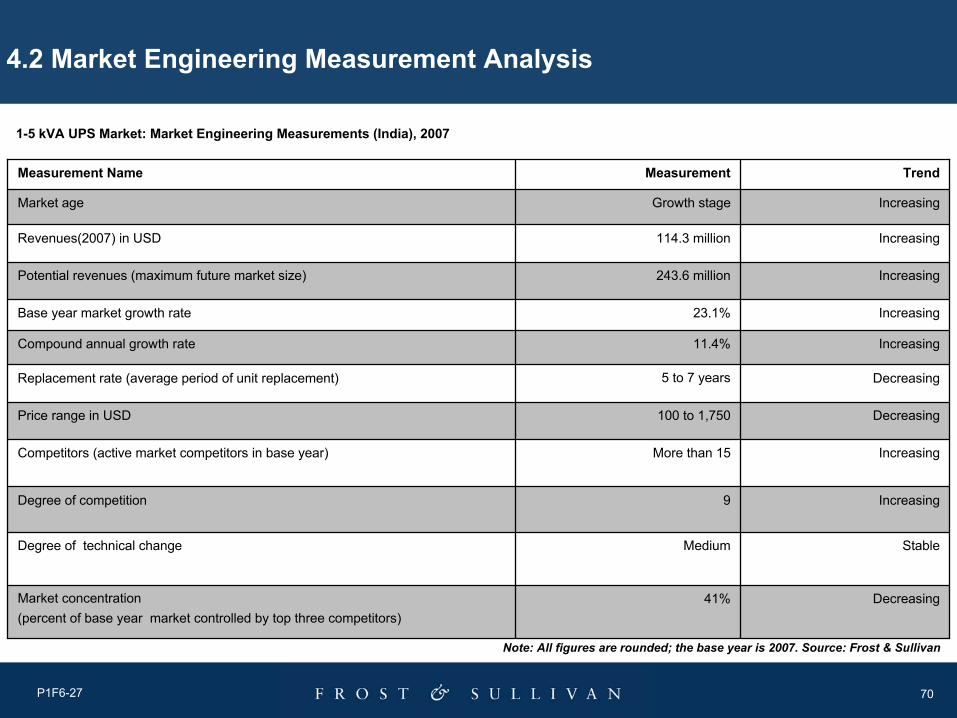
2.2 Market Engineering Measurement Analysis
Total UPS Market: Market Engineering Measurements (India), 2007
IncreasingMore than 20Competitors (active market competitors in base year)
Increasing9Degree of competition
IncreasingHighDegree of technical change
Stable41%Market concentration (percent of base year market controlled by top three competitors)
Decreasing35 to 200,000Price range in USD
Increasing33.7%Base year market growth rate
Decreasing 3 to 10 yearsReplacement rate ( average period of unit replacement)
Increasing13.4%Compound annual growth rate
Increasing1,316.5 millionPotential revenues (maximum future market size)
Increasing544.4 millionRevenues (2007) in USD
IncreasingGrowth stageMarket age
TrendMeasurementMeasurement Name
Note: All figures are rounded; the base year is 2007. Source: Frost & Sullivan
26P1F6-27
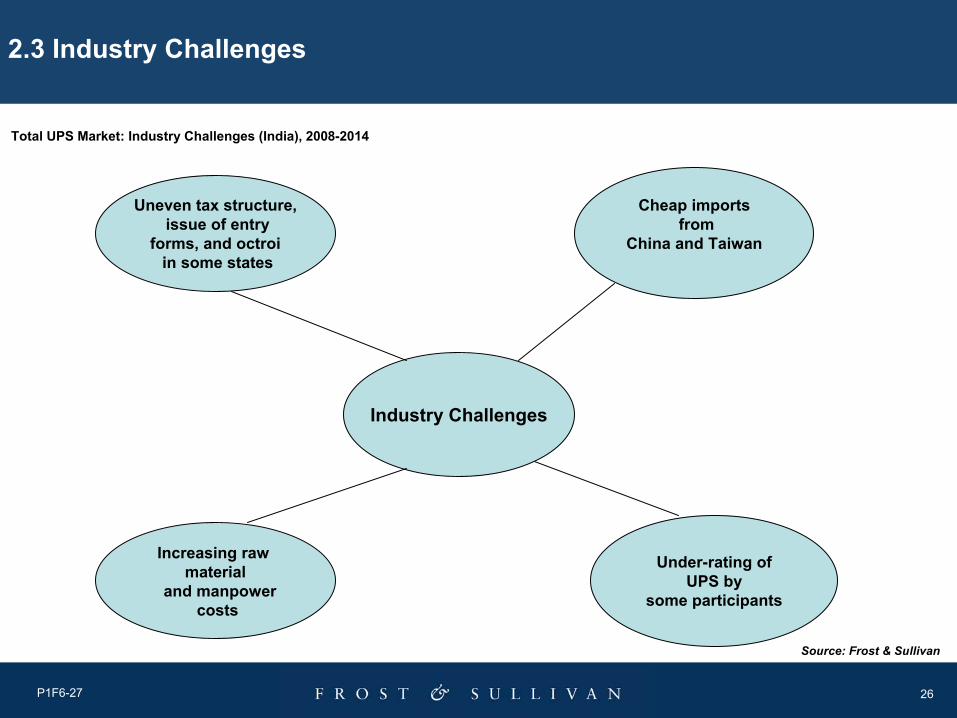
Industry Challenges
Cheap importsfrom
China and Taiwan
Increasing raw material
and manpowercosts
Under-rating ofUPS by
some participants
Uneven tax structure,issue of entry
forms, and octroi in some states
Source: Frost & Sullivan
2.3 Industry Challenges
Total UPS Market: Industry Challenges (India), 2008-2014
27P1F6-27
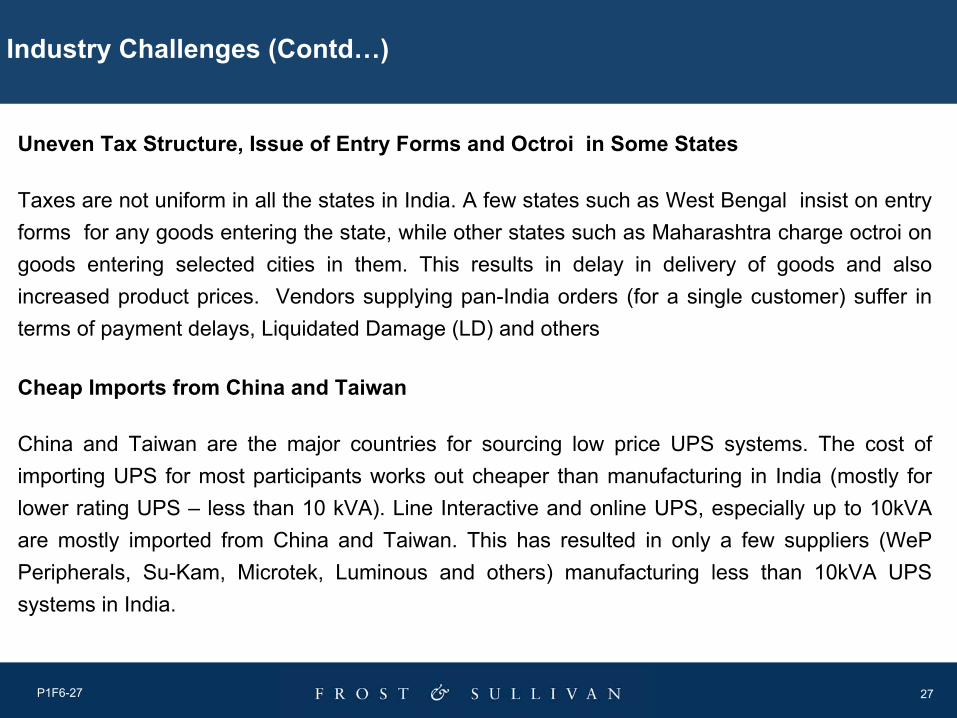
Uneven Tax Structure, Issue of Entry Forms and Octroi in Some States
Taxes are not uniform in all the states in India. A few states such as West Bengal insist on entry forms for any goods entering the state, while other states such as Maharashtra charge octroi on goods entering selected cities in them. This results in delay in delivery of goods and also increased product prices. Vendors supplying pan-India orders (for a single customer) suffer in terms of payment delays, Liquidated Damage (LD) and others
Cheap Imports from China and Taiwan
China and Taiwan are the major countries for sourcing low price UPS systems. The cost of importing UPS for most participants works out cheaper than manufacturing in India (mostly for lower rating UPS – less than 10 kVA). Line Interactive and online UPS, especially up to 10kVA are mostly imported from China and Taiwan. This has resulted in only a few suppliers (WePPeripherals, Su-Kam, Microtek, Luminous and others) manufacturing less than 10kVA UPS systems in India.
Industry Challenges (Contd…)

28P1F6-27
Increasing Raw Material Prices and Manpower Costs
Raw material prices have increased drastically in the last 2-3 years apart from the sharp increase in battery prices (due to increase in lead prices). This has resulted in UPS suppliers struggling to maintain their margins
Underrated Sales of UPS by Some Participants
Some suppliers sell underrated UPS in the market to gain higher margins. This affects other suppliers in the market selling UPS as per their correct rating. This trend is prominent in the less than 1kVA UPS and to some extent in the 1-5kVA UPS power range
Industry Challenges (Contd…)
29P1F6-27
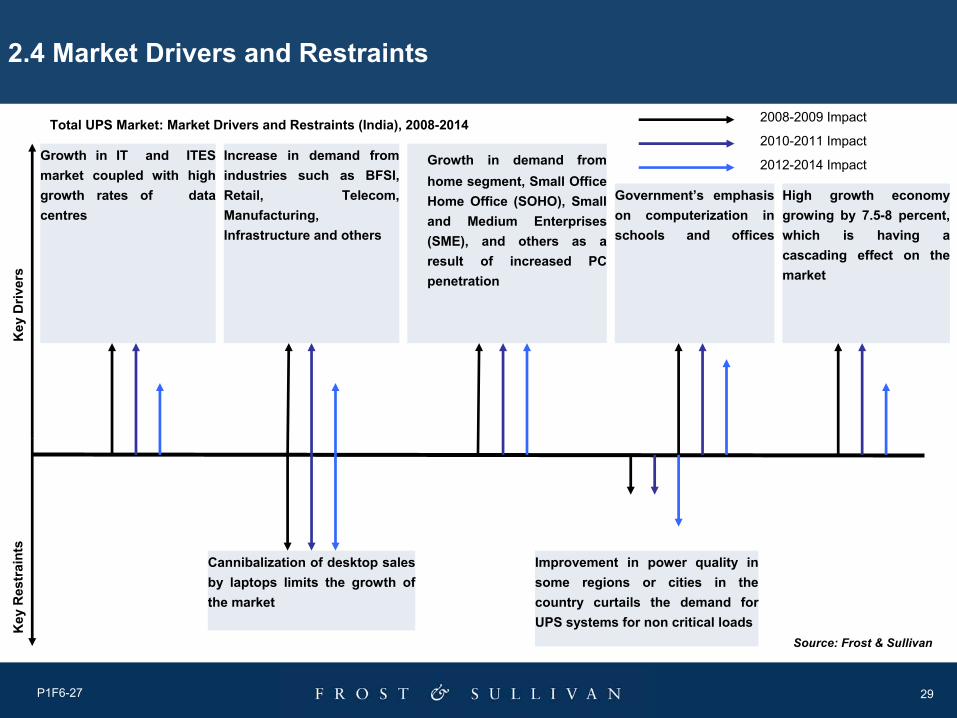
2.4 Market Drivers and Restraints
Total UPS Market: Market Drivers and Restraints (India), 2008-2014 2008-2009 Impact
2010-2011 Impact
2012-2014 Impact
Key
Driv
ers
Key
Res
trai
nts
Growth in demand from home segment, Small Office Home Office (SOHO), Small and Medium Enterprises (SME), and others as a result of increased PC penetration
Government’s emphasis on computerization in schools and offices
Increase in demand from industries such as BFSI, Retail, Telecom, Manufacturing, Infrastructure and others
Growth in IT and ITES market coupled with high growth rates of data centres
High growth economy growing by 7.5-8 percent,which is having a cascading effect on the market
Cannibalization of desktop sales by laptops limits the growth of the market
Source: Frost & Sullivan
Improvement in power quality in some regions or cities in the country curtails the demand for UPS systems for non critical loads

30P1F6-27
Total UPS Market: Market Drivers Ranked in Order of Impact (India), 2008-2014
MediumHighHighGovernment’s emphasis on computerization in schools and offices
4
MediumHighHighGrowth in demand from home segment, SOHO, SMEs and others as a result of increased PC penetration
3
MediumHighHighIncrease in demand from industries such as BFSI, retail, telecom, manufacturing, infrastructure and others
2
MediumHighHigh
High growth economy growing by 7.5-8 percent, which is having a cascading effect on the market 5
MediumHighHighGrowth in IT and ITES sector coupled with high growth in data centres
1
5 - 7 Years3 - 4 Years1 - 2 YearsDriverRank
Source: Frost & Sullivan
Market Drivers

31P1F6-27
Market Drivers (Contd…)
Growth in IT and ITES Sector Coupled with High Growth in Data Centers
The IT and ITES sector accounts for about 5 percent of India’s GDP and is expected to touch 7 percent GDP by 2010. The market is growing by 25-30 percent year on year. This segment is one of the major drivers of UPS market growth. UPS systems of rating more than 20kVA onward typically find application in this segment
Increase in Demand from Industries like BFSI, Retail, Telecom, Manufacturing, Infrastructure and Others
Retail and telecom sector is witnessing steady growth along with BFSI, manufacturing and infrastructure segments, leading to increased UPS demand
Growth in Demand from Home Segment, SOHO, SMEs and Others as a Result of Increased PC Penetration
As of 2007, the number of SOHO companies in India is estimated to be more than 1.5 million. Each SOHO setup has 1-10 PCs. This segment is witnessing steady growth. This apart
32P1F6-27
Market Drivers (Contd…)
from the home segment is likely to be a major growth enabler in the lower power range of the UPS market
Government’s Emphasis on Computerization in Schools and Offices
Both the state and central government are emphasizing the need for computerization in schools and government offices, which automatically creates demand for UPS. Apart from that, the various e-governance initiatives by the government are having a positive effect on the market
High Growth Economy which is growing by 7.5-8 percent, which is having a Cascading Effect on the Market
Indian economy has witnessed 8.5-9 percent growth rate for the last two to three years. The forecast for growth is above 7.5 percent for the next three to four years. This high growth rate in the economy is expected to have a positive cascading effect on all the industry segments including the UPS market

33P1F6-27
Source: Frost & Sullivan
Total UPS Market: Market Restraints Ranked in Order of Impact (India), 2008-2014
Market Restraints
MediumLow Low Improvement in power quality in some regions or cities in the country curtails the demand for UPS systems for non critical loads
2
HighHighHighCannibalization of desktop sales by laptops limits the growth of the market
1
5 - 7 Years3 - 4 Years1 - 2 YearsRestraintRank

34P1F6-27
Market Restraints (Contd…)
Cannibalization of Desktop Sales by Laptops Limits the Growth of the Market
As laptops are gaining popularity over desktops, the sales of UPS in less than 1 kVA and 1-5 kVA is getting hit. Laptops have an internal battery and do not require an UPS. These two power ranges are catering to the desktop PCs.
Improvement in Power Quality in Some Regions or Cities in the Country Curtails the Demand for UPS Systems for Non critical Loads
Privatization of power distribution network in some regions or cities such as New Delhi, Mumbai, Kolkata and others have resulted in improved power quality with lesser power outages, burnouts,and voltage fluctuations. This has had a minor impact on the UPS market for 1 kVA and the 1-5 kVA range, typically serving the home, SOHO and SME / SMB segment (UPS used for protection of non-critical IT equipment)

35P1F6-27
2.5 Total Market Analysis
Total UPS Market: Revenue Forecasts (India), 2004-2014
* 10% appreciation of INR with respect to USD in 2007 compared to 2006
Compound Annual Growth Rate (2007-2014) – 13.4%
6.91,316.52014
7.91,230.42013
9.91,139.22012
13.11,035.72011
14.9916.52010
20.0797.02009
22.0664.12008
33.7*544.42007
16.8407.22006
18.2348.72005
---295.02004
Revenue
Growth Rate (%)
Revenues
($ Million)Year
Note: All figures are rounded; the base year is 2007. Source: Frost & Sullivan
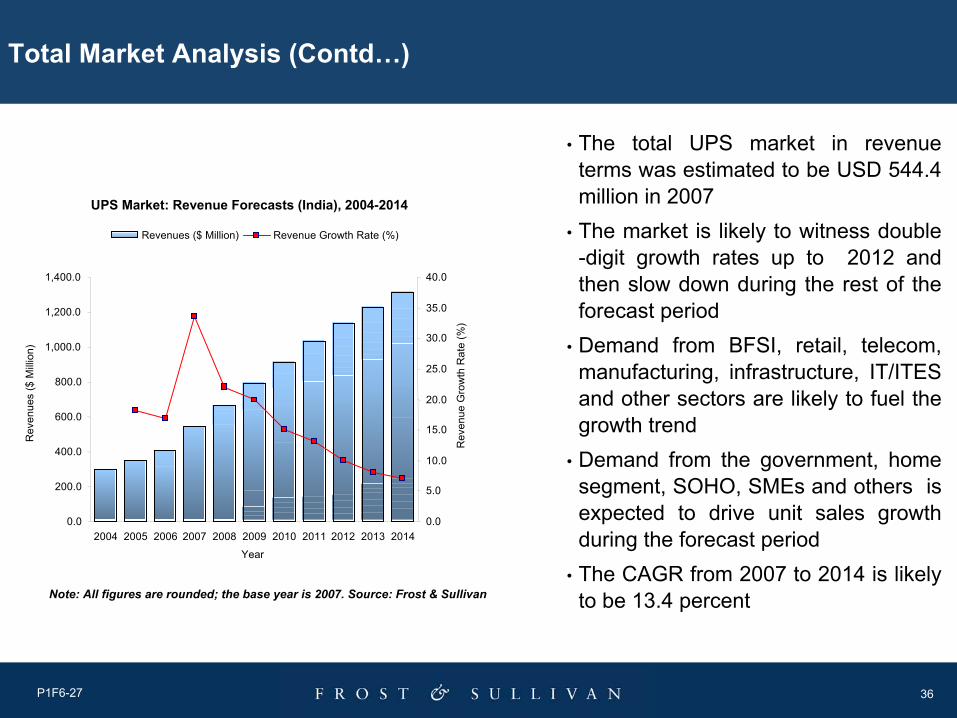
36P1F6-27
Total Market Analysis (Contd…)
• The total UPS market in revenue terms was estimated to be USD 544.4 million in 2007
• The market is likely to witness double -digit growth rates up to 2012 and then slow down during the rest of the forecast period
• Demand from BFSI, retail, telecom, manufacturing, infrastructure, IT/ITES and other sectors are likely to fuel the growth trend
• Demand from the government, home segment, SOHO, SMEs and others is expected to drive unit sales growth during the forecast period
• The CAGR from 2007 to 2014 is likely to be 13.4 percent
UPS Market: Revenue Forecasts (India), 2004-2014
0.0
200.0
400.0
600.0
800.0
1,000.0
1,200.0
1,400.0
2004 2005 2006 2007 2008 2009 2010 2011 2012 2013 2014
Year
Rev
enue
s ($
Milli
on)
0.0
5.0
10.0
15.0
20.0
25.0
30.0
35.0
40.0
Rev
enue
Gro
wth
Rat
e (%
)
Revenues ($ Million) Revenue Growth Rate (%)
Note: All figures are rounded; the base year is 2007. Source: Frost & Sullivan

37P1F6-27
2.6 Demand Analysis
• In 2007, the 5.1-20kVA and above 200kVA range UPS was the largest and the smallest contributor, respectively, to the market in revenue terms
• Contribution of less than 1kVA,1-5kVA, and 5.1-20kVA power range in the overall market is expected to decrease during the forecast period
• The share of 20.1-60kVA, 60.1-200kVA and above 200kVA power range in the overall market is expected to increase during the forecast period
• The maximum growth among all power ranges is likely to be in theabove 200kVA category, where the CAGR is likely to be 20.8 percent
Total UPS Market: Percent of Revenue by Power Range (India), 2007
20.1 - 60 KVA11.0%
60.1 - 200 KVA18.7%
Above 200 KVA9.0%
5.1 - 20 KVA25.8%
Less than 1 KVA
14.5%
1 - 5 KVA21.0%
Note: All figures are rounded; the base year is 2007. Source: Frost & Sullivan

38P1F6-27
Demand Analysis (Contd…)
14.022.013.021.218.511.32014
13.521.5 13.021.519.011.52013
13.021.013.021.719.511.82012
12.720.513.021.820.012.02011
12.220.512.522.020.312.52010
11.520.512.022.720.313.02009
10.519.5 11.524.020.514.02008
9.018.711.025.8 21.014.52007
7.717.010.527.022.815.02006
7.216.510.3 27.523.015.52005
6.516.010.028.023.516.02004
Above 200kVA
(%)
60.1-200kVA
(%)
20.1-60kVA
(%)
5.1-20kVA
(%)
1-5kVA
(%)
Less than 1kVA
(%) Year
Note: All figures are rounded; the base year is 2007. Source: Frost & Sullivan
Total UPS Market: Percent of Revenues by Power Ranges (India), 2004-2014
39P1F6-27
2.7 Market and Technology Trends
Market Trends
• The Indian UPS market has witnessed double-digit growth in the last two years and is projected to exhibit double-digit growth rates up to 2012. Post 2012, the market may not be able to sustain the double-digit growth as the growth of major end-user segments may slow down
• End users are gradually shifting from less than 1kVA range to the next higher power range (1 -5) kVA
• SOHO/SMEs, major end users of less than 1 kVA range UPS are gradually shifting from standalone UPS to small centralized UPS, automatically moving to the 1-5 and 5.1-20 kVA range
• Less than 1 kVA segment was historically dependent on the home segment and it is likely tocontinue to remain so
• Increased usage of laptop sales at the cost of desktop sales has affected the less than 1 kVA segment. Suppliers are countering this trend by focusing more on the smaller cities (tier 2 and tier 3) where mostly the desktops are sold these days
• A major chunk of less than 1 kVA UPS is imported from China and Taiwan. This trend is also observed in the 1-10 kVA online range but to a lesser extent

40P1F6-27
Market and Technology Trends (Contd…)
• Modular UPS systems are gradually gaining acceptance in the market primarily because of hot swapping features and the flexibility they offer in terms of redundancy
• The demand for more than 200 kVA power range, especially from the manufacturing sector is driving the sales for rotary UPS in India, affecting the static UPS market in the more than 200kVA power range
• The contribution of 20.1-60kVA, 60.1-200 kVA, and above 200 kVA power range is likely to increase to 13 percent, 22 percent, and 14 percent respectively of the total UPS revenue by 2014, from 11 percent, 18.7 percent, and 9 percent respectively in 2007 as a result of steady increase in demand from BFSI, telecom, IT/ITES sector and others
• The contribution of less than 1kVA, 1-5 kVA, and 5.1-20 kVA is likely to decrease to 11.3 percent, 18.5 percent, and 21.2 percent respectively, of the total UPS revenue by 2014 from 14.5 percent, 21 percent, and 25.8 percent respectively, in 2007
• 5.1-20 kVA is a competitive power range with both Indian as well as MNCs operating in this space. The competition is tough with shrinking margins. Indian UPS suppliers not having a major focus on the 20 kVA power range are expected to migrate to the rapidly growing more than 20 kVA range, to avoid the cutthroat competition and shrinking margins
• Suppliers, in order to meet end-users’ preference on reducing downtime, increased energy savings, and system efficiency, are making efforts to incorporate the same in their product offerings

41P1F6-27
Market and Technology Trends (Contd…)
• Some UPS suppliers are planning to replace the lead acid batteries by Ni-Cad or Lithium-ion batteries in the long run, since the lead acid battery cost is prohibitively high at present. Ni-Cad batteries have been in use for a long time but are not preferred by the suppliers
• To counter the increasing battery costs, suppliers are planning to launch solar powered UPS
42P1F6-27
Market and Technology Trends (Contd…)
Technology Trends
• Modular UPS systems are gradually gaining prominence and are replacing conventional UPS systems, primarily due to hot swapping features and the flexibility they offer in terms of redundancy
• Currently, end users prefer UPS with higher backup and online UPS with isolation transformers. Suppliers have started providing solutions for the same
• Use of Insulated Gas Bipolar Transistor (IGBT) rectifiers is gradually increasing • End users’ preference for multilevel redundancies right from grid to the load point has made the
leading suppliers look for a viable solution for the end-users’ preference

43P1F6-27
2.8 Pricing Trends
• Prices of UPS systems across all power ranges have reduced in the last two to three years due to intense price competition and cheaper imports from China and Taiwan
• Prices of 600 VA UPS, one of the highest selling category in less than 1 kVA power range, vary between USD35-70 for Line-Interactive topology. Price for an online UPS of the same rating is in the range of USD200-250
• The table below indicates approximate price reduction across various UPS power ranges
10-15 %More than 200kVA
15-20 %Less than 1kVA
10-12 %5.1-20kVA
10-15 %1-5kVA
10-15 %60.1-200kVA
12-15 %20.1-60kVA
Price Drop (2004-07) (%)Power Range
44P1F6-27
Pricing Trends (Contd…)
• Prices of UPS are expected to drop further due to intense competition leading to price war
• The cost of batteries has increased recently, putting pressure on the margins of UPS suppliers The major reason has been the steep increase in the price of lead

45P1F6-27
2.9 Market Share Analysis
Indian and MNC suppliers, both are present in the Indian UPS marketThe major Indian suppliers are :
• Numeric Power Systems Limited• DB Power Electronics Private Limited (Chloride Group plc has taken a strategic share in the
company) • Uniline Energy Systems (P) Ltd• Aplab Limited• Hi-Rel Electronics Limited • Tritronics (India) Pvt Ltd• Microtek Power Controls Private Limited• Power-One Micro Systems (P) Ltd • Su-Kam Power Systems Limited • WeP Peripherals Ltd• Consul Consolidated Pvt Ltd • Luminous Power Technologies (Private) Limited• Hita Technology Pvt. Ltd • Asia Powercom Pvt. Ltd

46P1F6-27
Market Share Analysis (Contd…)
Global Majors ( MNCs) operating in the Indian UPS market are :
• Emerson Network Power (India) Private Limited
• APC-MGE
• Eaton Power Quality Pvt Ltd
• GE Digital Energy
• Socomec UPS India Private Limited
• Delta Energy Systems (India) Private Limited
• Other MNCs such as Aros, Tripp Lite Power Protection and others are also present in India through their national distributors, PCI Limited and Rajdeep Energy Private Limited, respectively
• Two of the major rotary UPS suppliers namely Piller Power Systems and Hitech Power Protection are present in India through their national distributors PCI Limited and Hi-Rel, Electronics Limited respectively
47P1F6-27
Market Share Analysis (Contd…)
• The Indian suppliers control approximately 60 percent of the market, and they typically operate across all power ranges except for more than 200 kVA range, where DB Power/Chloride is the only supplier
• Indian suppliers have a sizeable presence in less than 1 kVA, 1 – 5 kVA, and 5.1-20 kVA power ranges. Less than 1 kVA power range includes predominantly Indian suppliers selling products imported from China and Taiwan, APC-MGE being the only formidable MNC competing in the less than 1 kVA space
• Indian suppliers, armed with a very well-oiled distribution network across Tier 1,Tier 2, and Tier 3 cities are competing with MNCs by offering customized products and better after-sales service
• MNCs control 40 percent of the Indian UPS market and they are present across all power ranges except for the less than 1 kVA range, wherein APC-MGE is a major participant. Other global majors such as Emerson Network Power also operate in the less than 1kVA space, but their share is low
48P1F6-27
Market Share Analysis (Contd…)
• MNCs dominate the more than 60 kVA range, wherein product quality and technology is very important
• All the major multinational companies are present in India directly. The ones who are represented by their distributors are expected to have a direct presence in the next couple of years to tap the growing Indian market
49P1F6-27
Market Share Analysis (Contd…)
Trip Lite
Aros
Delta
Socomec
GE
Eaton
APC-MGE
Emerson
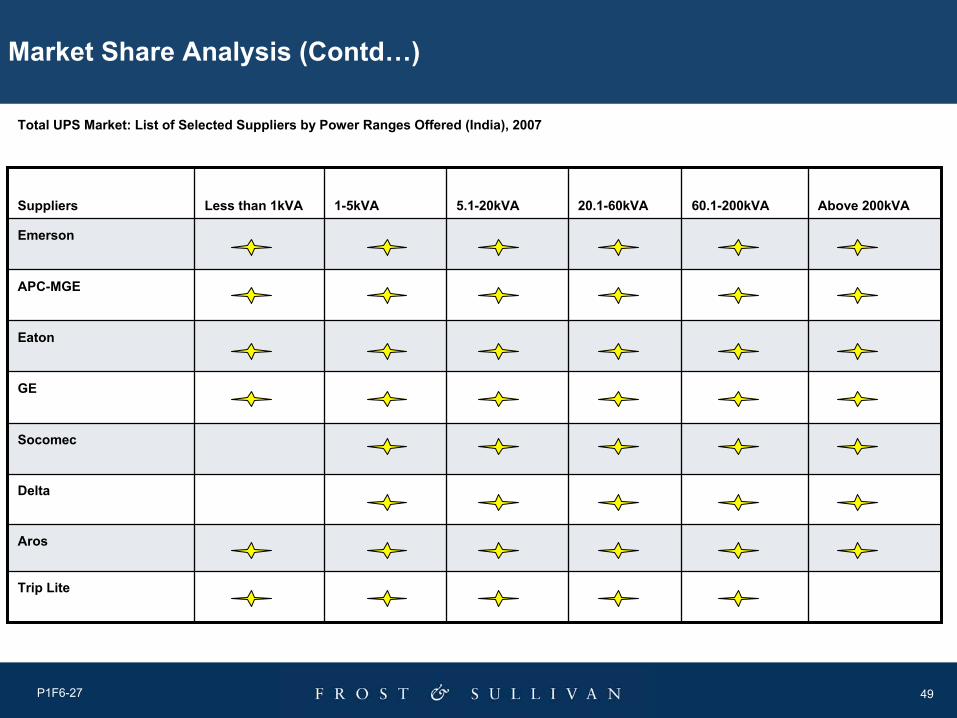
Above 200kVA60.1-200kVA20.1-60kVA5.1-20kVA1-5kVA Less than 1kVA Suppliers
Total UPS Market: List of Selected Suppliers by Power Ranges Offered (India), 2007
50P1F6-27
Market Share Analysis (Contd…)
Luminous
Consul
Asia Powercom
Hita
Wep
Sukam
PowerOne
Microtek
Tritronics
Hi-Rel
Aplab
Uniline
DB Power
Numeric
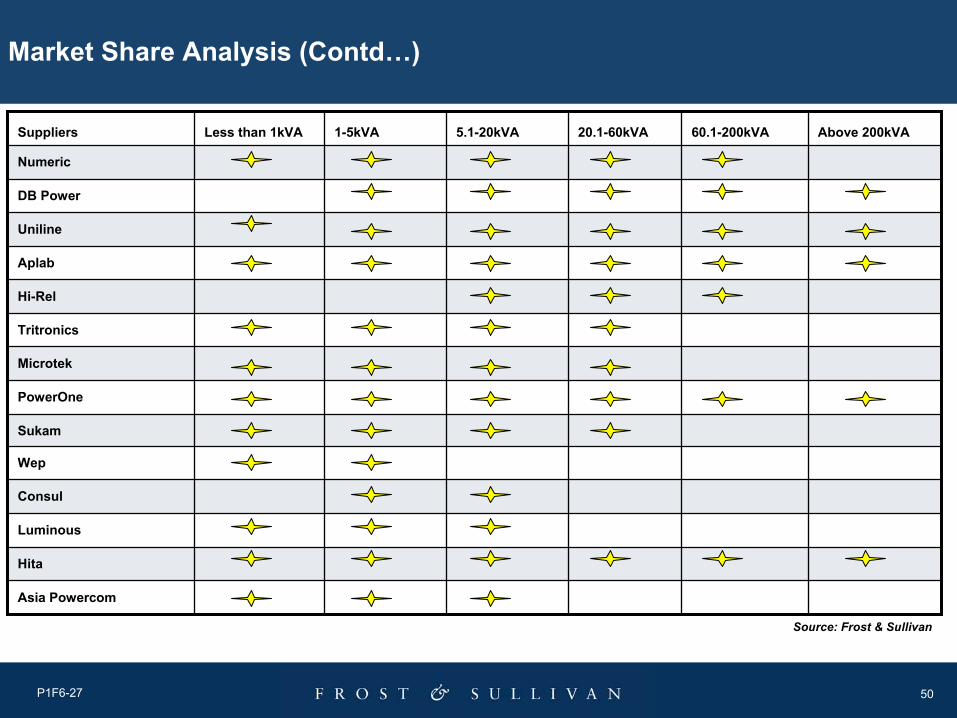
Above 200kVA60.1-200kVA20.1-60kVA5.1-20kVA1-5kVA Less than 1kVA Suppliers
Source: Frost & Sullivan
51P1F6-27
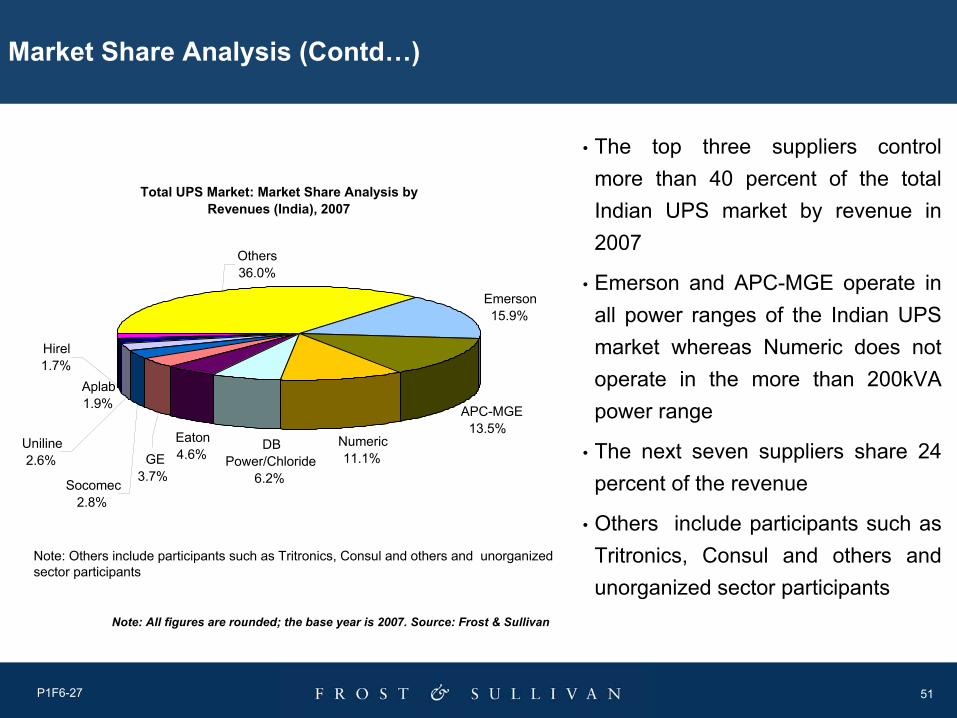
Market Share Analysis (Contd…)
Note: Others include participants such as Tritronics, Consul and others and unorganized sector participants
• The top three suppliers control more than 40 percent of the total Indian UPS market by revenue in 2007
• Emerson and APC-MGE operate in all power ranges of the Indian UPS market whereas Numeric does notoperate in the more than 200kVA power range
• The next seven suppliers share 24 percent of the revenue
• Others include participants such as Tritronics, Consul and others and unorganized sector participants
Total UPS Market: Market Share Analysis by Revenues (India), 2007
Aplab1.9%
Socomec2.8%
Hirel1.7%
Uniline2.6%
Others36.0%
GE 3.7%
Eaton 4.6%
DB Power/Chloride
6.2%
APC-MGE13.5%
Emerson 15.9%
Numeric 11.1%
Note: All figures are rounded; the base year is 2007. Source: Frost & Sullivan

52P1F6-27
2.10 Distribution Channel Analysis
Smaller kVA UPS systems mostly in the range of less than 1kVA , 1-5kVA , 5.1-20kVA, and to some extent 20.1-60kVA are sold or distributed through resellers or retailers. A huge chunk of the less than 1kVA UPS are also sold through the desktop suppliers who bundle the UPS along with their desktops. The desktop suppliers generally import the UPS from China or Taiwan. Some UPS suppliers supply directly to end users. A few Indian suppliers Uniline Energy Systems (P) Ltd, Tritronics (India) Pvt Ltd., and others have the Directorate General of Supplies and Disposal (DGSD) Rate Contract (RC) for supplying to the government establishments and defence sector. This RC is limited up to the 30kVA segment
Smaller kVA Power Range UPS systems (Less than 1kVA to 60kVA)
UPS suppliers Resellers/Retailers End User
PC suppliersUPS sold to PC suppliers UPS comes along with the PC
Some UPS suppliers supply UPS (more than 1 kVA) directly to end user
53P1F6-27
Distribution Channel Analysis (Contd…)
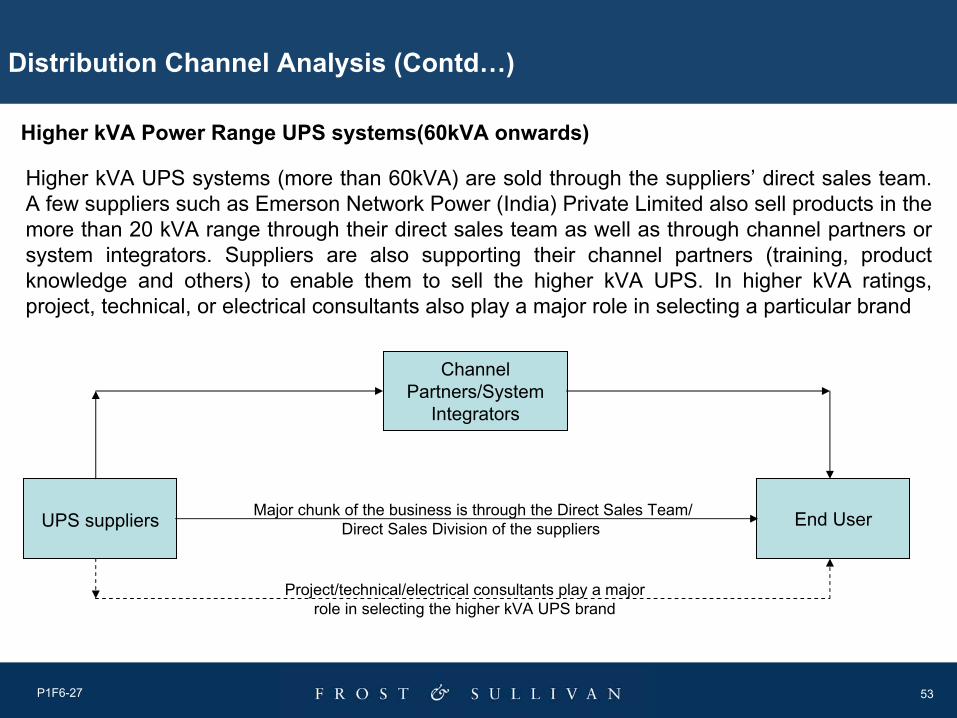
Higher kVA Power Range UPS systems(60kVA onwards)
Higher kVA UPS systems (more than 60kVA) are sold through the suppliers’ direct sales team. A few suppliers such as Emerson Network Power (India) Private Limited also sell products in the more than 20 kVA range through their direct sales team as well as through channel partners or system integrators. Suppliers are also supporting their channel partners (training, product knowledge and others) to enable them to sell the higher kVA UPS. In higher kVA ratings, project, technical, or electrical consultants also play a major role in selecting a particular brand
UPS suppliers
Channel Partners/System
Integrators
End UserMajor chunk of the business is through the Direct Sales Team/Direct Sales Division of the suppliers
Project/technical/electrical consultants play a majorrole in selecting the higher kVA UPS brand

54P1F6-27
2.11 Conclusion and Recomendations
• The Indian UPS market is witnessing double-digit growth rate and is expected to witness similar growth (up to 2012) as a result of steady demand from various end-user segments
• The market is being consolidated globally and this is making its presence felt in India as well. Consolidation among Indian suppliers in the near future is not ruled out
• Indian suppliers, to stay ahead in the market, are exploring opportunities for collaboration with MNCs by forming JVs or technical tie-ups or distribution tie-ups. This could lead to a win-win situation for both Indian as well as MNC suppliers
• Different end users have specific applications and different requirements. They require product customization to suit their requirements. It is important for suppliers to offer customized solutions to end-user groups to survive and sustain higher growth in this fiercely competitive market

55
Chapter 3
Less than 1kVA UPS Market
56P1F6-27
3.1 Market Overview
• The less than 1 kVA power range is characterized by the presence of all three different UPS topologies - Offline, Line-Interactive, and Online UPS. Previously, this power range was dominated by Offline UPS topology. Currently, the demand for Offline UPS is being replaced by line-interactive UPS, which is technically a better product with low price variation as compared to the Offline UPS
• The major application for the less than 1kVA UPS system are desktop computers apart from small power-consuming devices such as printers, small servers , Point Of Sales (POS) Machines and others
• Major end-user segments are the home segment, SOHO,SME/SMB and others
• The market for less than 1kVA power range in India for 2007 was estimated at USD78.9 million with the segment contributing about 14.5 percent of the total UPS market for 2007
• The market for this segment is projected to clock revenues worth USD148.8 million by 2014 with a CAGR of 9.4 percent

57P1F6-27
3.2 Market Engineering Measurement Analysis
Less than 1 kVA UPS Market: Market Engineering Measurements (India), 2007
Decreasing35 to 350 Price range in USD
IncreasingMore than 20Competitors (active market competitors in base year)
Increasing10Degree of competition
StableMediumDegree of technical change
Decreasing32%Market concentration (percent of base year market controlled by top three competitors)
Increasing29.2%Base year market growth rate
Decreasing3 to 7 yearsReplacement rate (average period of unit replacement)
Increasing9.4 %Compound annual growth rate
Increasing148.8 millionPotential revenue (maximum future market size)
Increasing78.9 millionRevenues (2007) in USD
StableMature stageMarket age
TrendMeasurementMeasurement Name
Note: All figures are rounded; the base year is 2007. Source: Frost & Sullivan
58P1F6-27
3.3 Market Drivers and Restraints
2008-2009 Impact
2010-2011 Impact
2012-2014 Impact
Key
Driv
ers
Key
Res
trai
nts
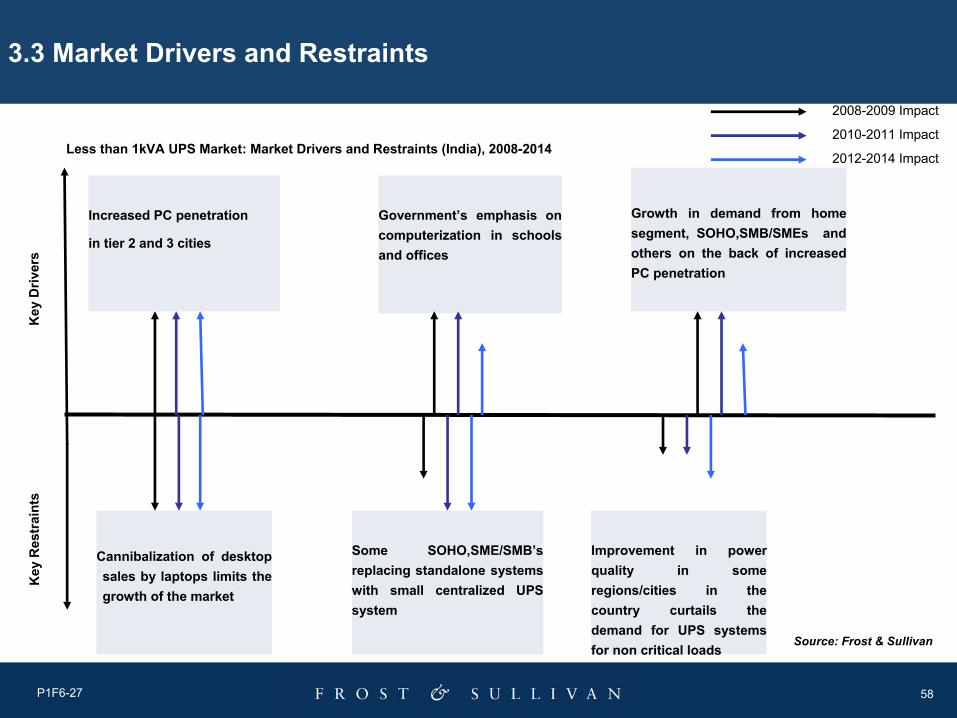
Less than 1kVA UPS Market: Market Drivers and Restraints (India), 2008-2014
Growth in demand from home segment, SOHO,SMB/SMEs and others on the back of increased PC penetration
Government’s emphasis on computerization in schools and offices
Cannibalization of desktop sales by laptops limits the growth of the market
Increased PC penetration
in tier 2 and 3 cities
Some SOHO,SME/SMB’s replacing standalone systems with small centralized UPS system
Improvement in power quality in some regions/cities in the country curtails the demand for UPS systems for non critical loads
Source: Frost & Sullivan

59P1F6-27
Market Drivers
MediumHighHighGovernment’s emphasis on computerization in schools and offices
2
HighHighHighIncreased PC penetration in tier 2 and 3 cities 1
MediumHighHighGrowth in demand from home segment,SOHO,SME’s etc on the back of increased PC penetration
3
5 - 7 Years3 - 4 Years1 - 2 YearsDriverRank
Source: Frost & Sullivan
Less than 1kVA UPS Market: Market Drivers Ranked in Order of Impact (India), 2008-2014

60P1F6-27
MediumLowLowImprovement in power quality in some regions or cities in the country curtails the demand for UPS systems for non critical loads
3
HighHighMediumSome SOHO,SME/SMBs replacing standalone systems with small centralized UPS system
2
HighHighHighCannibalization of desktop sales by laptops limits the growth of the market
1
5 - 7 Years3 - 4 Years1 - 2 YearsRestraintRank
Source: Frost & Sullivan
Less than 1kVA UPS Market: Market Restraints Ranked in Order of Impact (India), 2008-2014
Market Restraints

61P1F6-27
Compound Annual Growth Rate(2007-2014) – 9.4%
5.1148.82014
5.3141.52013
8.2134.42012
8.5124.32011
10.6114.62010
11.4103.62009
17.893.02008
29.278.92007
13.061.12006
14.554.02005
---47.22004
Revenue
Growth Rate (%)
Revenues
($ Million)Year
3.4 Revenue Forecasts
Less than 1 kVA UPS Market: Revenue Forecasts (India), 2004-2014
Note: All figures are rounded; the base year is 2007. Source: Frost & Sullivan
62P1F6-27
Revenue Forecasts (Contd…)
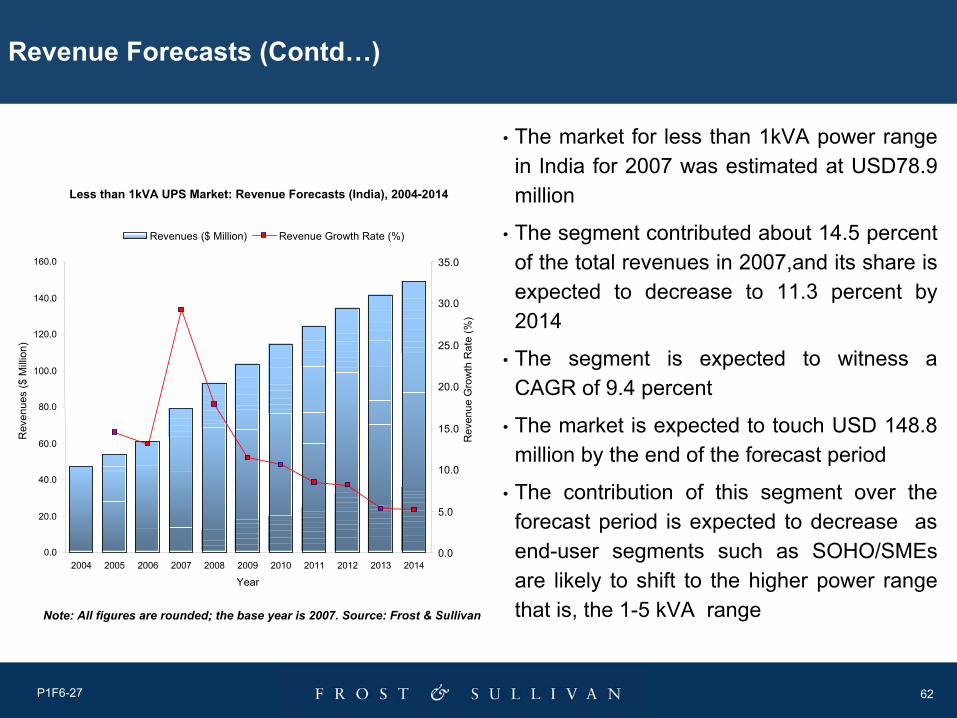
• The market for less than 1kVA power range in India for 2007 was estimated at USD78.9 million
• The segment contributed about 14.5 percent of the total revenues in 2007,and its share is expected to decrease to 11.3 percent by 2014
• The segment is expected to witness a CAGR of 9.4 percent
• The market is expected to touch USD 148.8 million by the end of the forecast period
• The contribution of this segment over the forecast period is expected to decrease as end-user segments such as SOHO/SMEs are likely to shift to the higher power rangethat is, the 1-5 kVA range
Less than 1kVA UPS Market: Revenue Forecasts (India), 2004-2014
0.0
20.0
40.0
60.0
80.0
100.0
120.0
140.0
160.0
2004 2005 2006 2007 2008 2009 2010 2011 2012 2013 2014
Year
Rev
enue
s ($
Milli
on)
0.0
5.0
10.0
15.0
20.0
25.0
30.0
35.0
Rev
enue
Gro
wth
Rat
e (%
)
Revenues ($ Million) Revenue Growth Rate (%)
Note: All figures are rounded; the base year is 2007. Source: Frost & Sullivan

63P1F6-27
3.5 Demand Analysis
• Sizeable demand from home segment, SOHO, SME/SMBs, government department and others is expected to drive demand for the less than 1 kVA UPS systems
• Increased penetration of desktops in Tier 2 and 3 cities is also fueling the growth of the less than 1kVA UPS systems

64P1F6-27
3.6 Market and Technology Trends
Market Trend
• Less than 1kVA segment is witnessing the entry of new participants who are basically importing from China and Taiwan and selling them under their brand name. The new entrants are typically suppliers having complimentary products such as personal computers, networking devices, PC peripherals and others in their product basket
• Since the majority of the less than 1kVA UPS are sold through the resellers or retailers who also sell the other products of the new entrant, for a new supplier it is just extension of their product range and using the same distribution network for their UPS range
• Typical warranty period of one year for UPS systems in this range are being extended for a two-year period to create a loyal customer base. Besides, the suppliers currently offer a one-year warranty for batteries. This is, in addition to the onsite service being offered within city limits for the end users
• Suppliers operating in this are facing margin pressures due to intense competition
65P1F6-27
Market and Technology Trends (Contd…)
Technology Trend
• Less than 1 kVA UPS systems are mostly of the Line-Interactive topology
• Online UPS in the 500/600VA and 800VA range are slowly gaining prominence; they are generally plain-vanilla systems comprising plug and play features
• Maintenance of UPS systems in this power range is generally hassle free
• Suppliers are offering more battery backup than the normal 15 minutes generally seen in this power range
• Suppliers are making efforts to offer some unique features to differentiate themselves in this highly ‘commodised’ segment. The unique features vary from battery discharge protection, full charge to overcharge, and overload protection
• Wide input frequency range UPS are also being designed to ensure compatibility with generators
66P1F6-27
3.7 Pricing Trends
• The price of less than 1 kVA UPS is decreasing every year • Suppliers are struggling to maintain their margins, which are the lowest in this power range
among all the power ranges, through product differentiation

67P1F6-27
3.8 Market Share Analysis
• This is a highly fragmented segment, with the maximum number of participants
• Indian suppliers dominate the less than 1 kVA segment
• APC–MGE is the only major MNC supplier
• Others include suppliers such as Asia Powercom, Champion and others
Less Than 1kVA UPS Market: Market Share Analysis by Revenues (India), 2007
Microtek7.0%
APC-MGE14.0%
Numeric 11.0%
WeP6.0%Sukam
4.0%
Luminous4.0%
Others54.0%
Note: All figures are rounded; the base year is 2007. Source: Frost & Sullivan
Note: Others include suppliers such as Asia Powercom, Champion and others

68
Chapter 4
1-5kVA UPS Market
69P1F6-27
4.1 Market Overview
• 1-5 kVA power range is the second largest segment in the Indian UPS market contributing about 21 percent of the market in terms of revenue
• The market for 1-5 kVA power range in India for 2007 is estimated at USD114.3 million; the segment is expected to witness a CAGR of 11.4 percent
• UPS in this power range is of Offline, Line-Interactive, and Online topology
• The major application for 1-5 kVA UPS system is for desktop computers, bank ATMs, telecom equipment, servers, medical equipment, and others
• The major end-user segments are the SOHO, Small and Medium Enterprises (SME)/Small and Medium Business (SMB), Banking Financial Services and Insurance (BFSI), state and central government and others
70P1F6-27
4.2 Market Engineering Measurement Analysis
Decreasing5 to 7 yearsReplacement rate (average period of unit replacement)
Decreasing100 to 1,750 Price range in USD
IncreasingMore than 15Competitors (active market competitors in base year)
Increasing9Degree of competition
StableMediumDegree of technical change
Decreasing41%Market concentration (percent of base year market controlled by top three competitors)
Increasing23.1%Base year market growth rate
Increasing11.4%Compound annual growth rate
Increasing243.6 millionPotential revenues (maximum future market size)
Increasing114.3 millionRevenues(2007) in USD
IncreasingGrowth stageMarket age
TrendMeasurementMeasurement Name
1-5 kVA UPS Market: Market Engineering Measurements (India), 2007
Note: All figures are rounded; the base year is 2007. Source: Frost & Sullivan

71P1F6-27
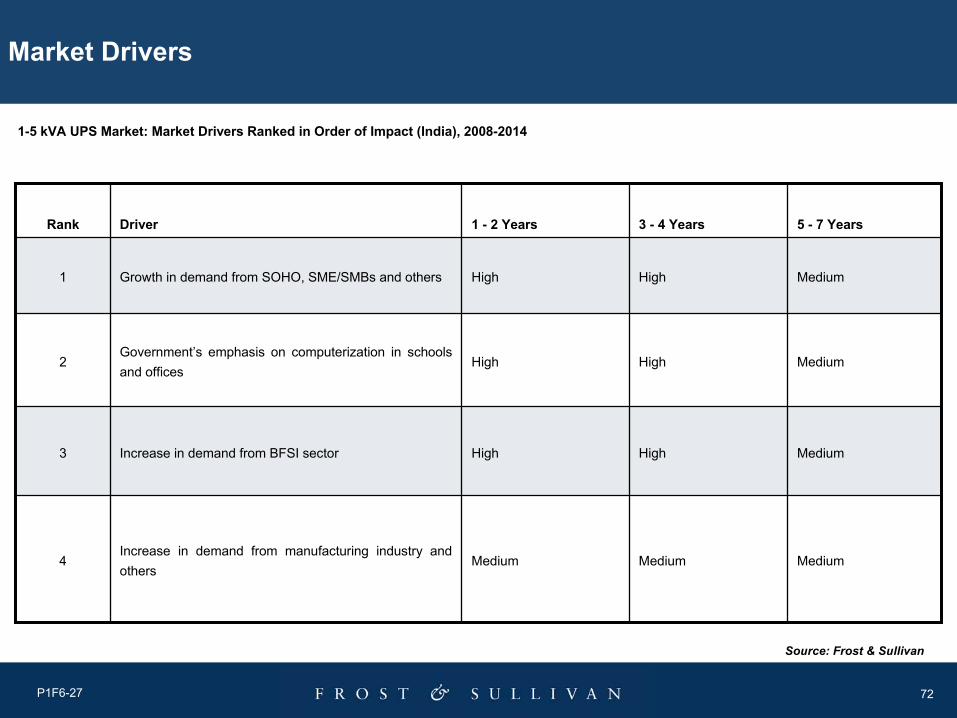
4.3 Market Drivers and RestraintsK
ey D
river
sK
ey R
estr
aint
s
1-5 kVA UPS Market: Market Drivers and Restraints (India), 2008-2014
2008-2009 Impact
2010-2011 Impact
2012-2014 Impact
Growth in demand from SOHO,SME/SMBs and others
Government’s emphasis on computerization in schools and offices
Cannibalization of desktop sales by laptops limits the growth of the market
Increase in demand from BFSI sector
Improvement in power quality in some regions orcities in the country curtails the demand for UPS systems for non critical loads
Increase in demand from manufacturing industry and others
Source: Frost & Sullivan
72P1F6-27
Market Drivers
MediumMediumMediumIncrease in demand from manufacturing industry and others
4
MediumHighHighIncrease in demand from BFSI sector3
MediumHighHighGovernment’s emphasis on computerization in schools and offices
2
MediumHighHighGrowth in demand from SOHO, SME/SMBs and others1
5 - 7 Years3 - 4 Years1 - 2 YearsDriverRank
Source: Frost & Sullivan
1-5 kVA UPS Market: Market Drivers Ranked in Order of Impact (India), 2008-2014
73P1F6-27
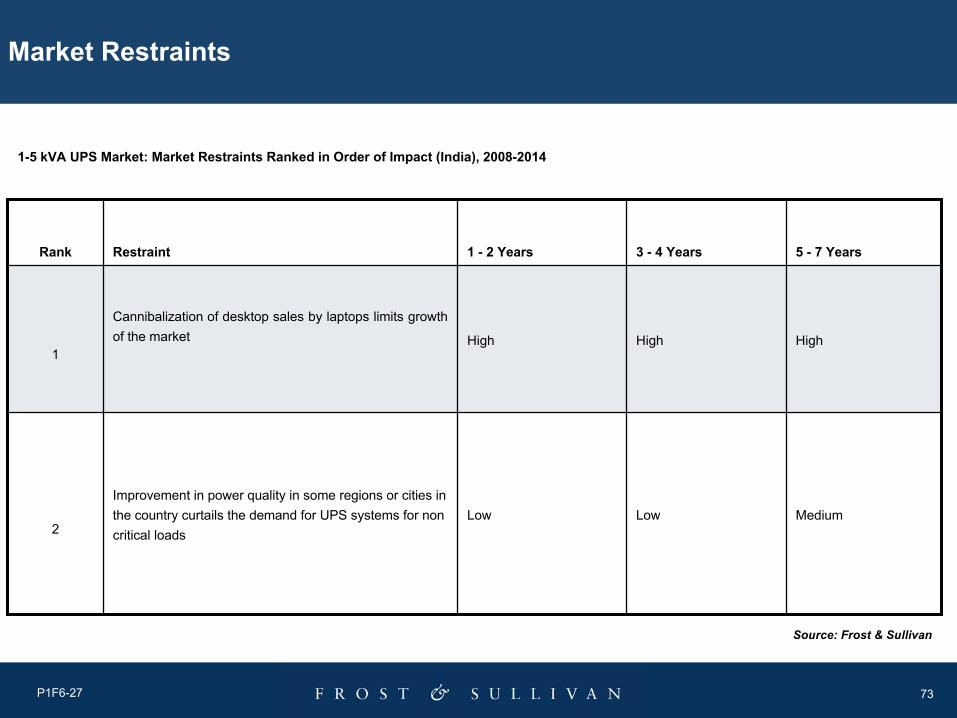
Market Restraints
MediumLowLow Improvement in power quality in some regions or cities in the country curtails the demand for UPS systems for non critical loads2
HighHighHigh
Cannibalization of desktop sales by laptops limits growth of the market
1
5 - 7 Years3 - 4 Years1 - 2 YearsRestraintRank
Source: Frost & Sullivan
1-5 kVA UPS Market: Market Restraints Ranked in Order of Impact (India), 2008-2014

74P1F6-27
Compound Annual Growth Rate (2007-2014) – 11.4%
4.2243.62014
5.2233.82013
7.3222.12012
11.3207.12011
15.0186.12010
18.8161.82009
19.1136.12008
23.1114.32007
15.892.82006
15.780.22005
-69.32004
Revenue
Growth Rate (%)
Revenues
($ Million)Year
4.4 Revenue Forecasts
1-5 kVA UPS Market: Revenue Forecasts (India), 2004-2014
Note: All figures are rounded; the base year is 2007. Source: Frost & Sullivan

75P1F6-27
Revenue Forecasts (Contd…)
• The market for 1-5 kVA power range in India for 2007 was estimated at USD 114.3 million
• The segment contributed about 21 percent of the total revenues for 2007 and its share is expected to decrease to 18.5 percent by 2014
• The segment is expected to witness a CAGR of 11.4 percent as a result of steady demand from SOHO,SMB/SMEs, government sector, BFSIs and others
• The market is expected to reach USD 243.6 million by the end of the forecast period
1-5kVA UPS Market: Revenue Forecasts (India), 2004-2014
0.0
50.0
100.0
150.0
200.0
250.0
300.0
2004 2005 2006 2007 2008 2009 2010 2011 2012 2013 2014Year
Rev
enue
s ($
Milli
on)
0.0
5.0
10.0
15.0
20.0
25.0
Rev
enue
Gro
wth
Rat
e (%
)
Revenues ($ Million) Revenue Growth Rate (%)
Note: All figures are rounded; the base year is 2007. Source: Frost & Sullivan

76P1F6-27
4.5 Demand Analysis
• Huge demand from SOHO,SMB/SMEs, government sector, BFSIs and others are expected to drive the demand in the 1-5 kVA UPS segment
• Demand from SOHO, SMB/SMEs is due to the increased PC penetration, IT infrastructure investments, IT network upgrades and others. There has been a gradual shift in this sector from a small standalone system to an entry level centralized UPS system
• The various computerization initiatives of both the central and state governments have fuelled the demand for UPS in this power range. This trend is likely to continue
• BFSI market has also fuelled the demand in a major way. Bank ATMs, which increased rapidly over the last three to four years have been one of the major end users of UPS in the power range of 1-5kVA. Recently, Reserve Bank of India (RBI), the central bank in India, has recommended ATM sharing among the various banks. This may lead to a lesser number of new ATMs being rolled out, which is likely to affect the market growth of this segment in the short term. Co-operative banks, which have not invested substantially in their IT infrastructure to-date, are gradually investing in improving the same

77P1F6-27
Demand Analysis (Contd…)
• Increase in demand arising from specialized applications such as telecommunications and medical devices
• India has recently been promoting itself as a “Health Tourism Destination”. This has led to an increased demand for UPS for mission-critical medical devices
78P1F6-27
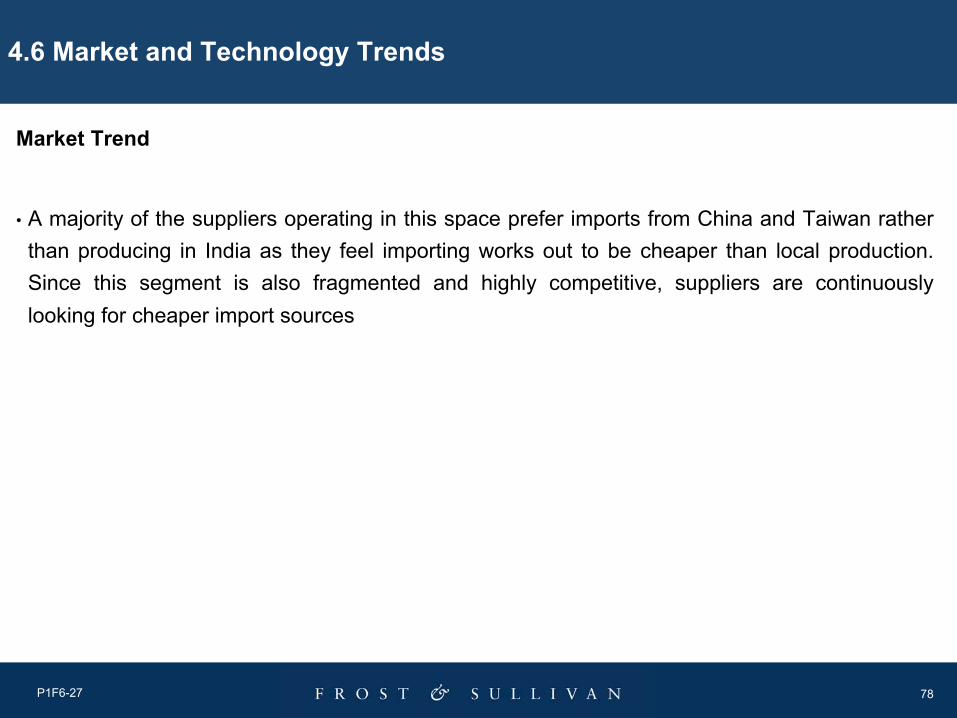
4.6 Market and Technology Trends
Market Trend
• A majority of the suppliers operating in this space prefer imports from China and Taiwan rather than producing in India as they feel importing works out to be cheaper than local production. Since this segment is also fragmented and highly competitive, suppliers are continuously looking for cheaper import sources

79P1F6-27
Market and Technology Trends (Contd…)
Technology Trend
• 1-5 kVA UPS systems can be Offline or Standby, Line-Interactive, or of Online topology
• However, offline and Line-Interactive are the prominent topologies
• Suppliers are trying to differentiate themselves in this market, which is slowly becoming a ‘commoditized’ segment

80P1F6-27
4.7 Pricing Trends
• The prices of 1-5 kVA UPS systems have reduced by approximately 10 to 15 percent over the last two to three years
• Key reason for the price decline has been the intense competition due to increasing number of suppliers in this segment of the market
• Recent increase in battery costs has led to shrinking margins of suppliers

81P1F6-27
4.8 Market Share Analysis
• This is a highly fragmented segment, with both Indian as well as MNCs competing for market share
• Indian suppliers dominate the 1-5 kVA segment
• Emerson and APC–MGE are the two global majors, well entrenched in this segment
• Others include suppliers such as GE, Delta, Eaton and othersNote: Others include suppliers such as GE, Delta, Eaton and others
1-5kVA UPS Market: Market Share Analysis by Revenues (India), 2007
Others51.0%
Uniline8.0%
APC-MGE12.0%
Numeric 20.0%
Emerson9.0%
Note: All figures are rounded; the base year is 2007. Source: Frost & Sullivan

82
Chapter 5
5.1-20kVA UPS Market
83P1F6-27
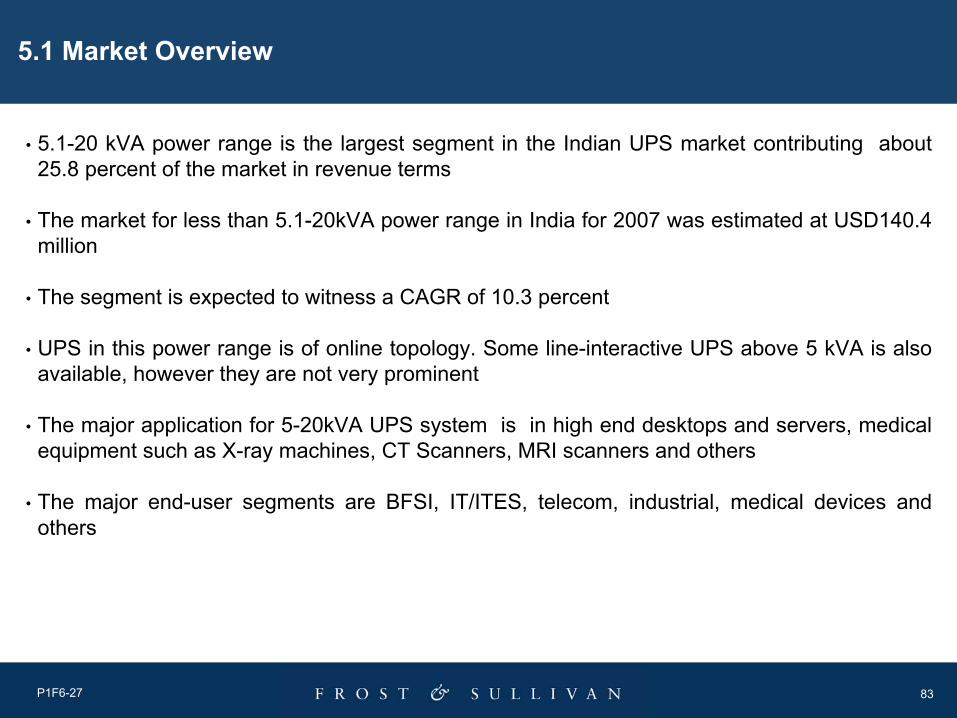
5.1 Market Overview
• 5.1-20 kVA power range is the largest segment in the Indian UPS market contributing about 25.8 percent of the market in revenue terms
• The market for less than 5.1-20kVA power range in India for 2007 was estimated at USD140.4 million
• The segment is expected to witness a CAGR of 10.3 percent
• UPS in this power range is of online topology. Some line-interactive UPS above 5 kVA is also available, however they are not very prominent
• The major application for 5-20kVA UPS system is in high end desktops and servers, medical equipment such as X-ray machines, CT Scanners, MRI scanners and others
• The major end-user segments are BFSI, IT/ITES, telecom, industrial, medical devices and others
84P1F6-27
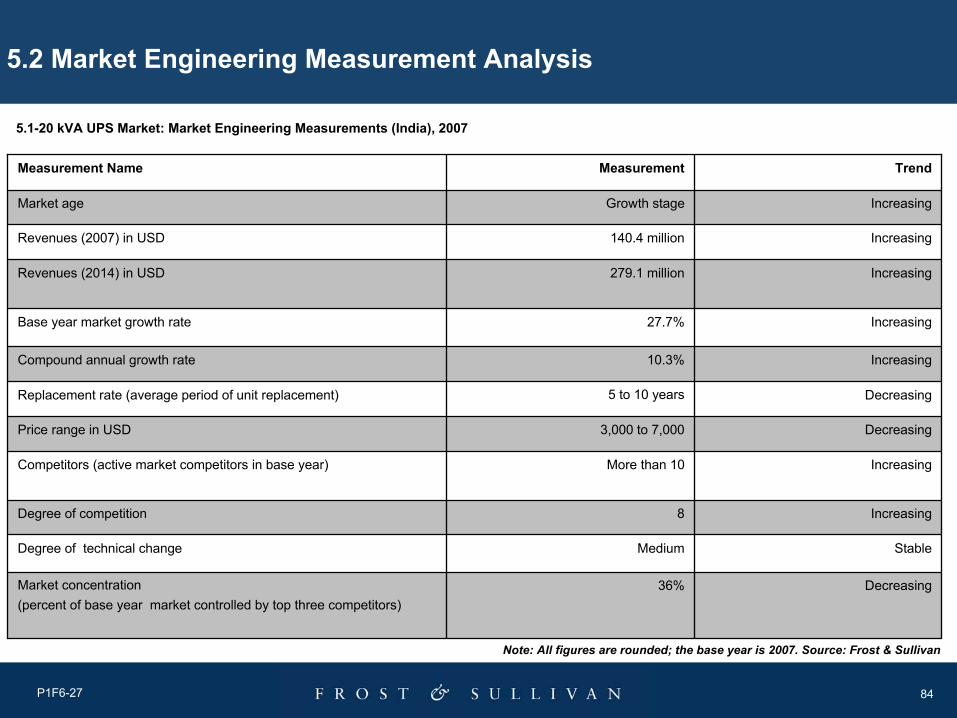
5.2 Market Engineering Measurement Analysis
5.1-20 kVA UPS Market: Market Engineering Measurements (India), 2007
Decreasing5 to 10 yearsReplacement rate (average period of unit replacement)
Decreasing3,000 to 7,000 Price range in USD
IncreasingMore than 10Competitors (active market competitors in base year)
Increasing8Degree of competition
StableMediumDegree of technical change
Decreasing36%Market concentration (percent of base year market controlled by top three competitors)
Increasing27.7%Base year market growth rate
Increasing10.3%Compound annual growth rate
Increasing279.1 millionRevenues (2014) in USD
Increasing140.4 millionRevenues (2007) in USD
IncreasingGrowth stageMarket age
TrendMeasurementMeasurement Name
Note: All figures are rounded; the base year is 2007. Source: Frost & Sullivan

85P1F6-27
5.3 Market Drivers and Restraints
2008-2009 Impact
2010-2011 Impact
2012-2014 Impact
Key
Driv
ers
Key
Res
trai
nts
5.1-20 kVA UPS Market: Market Drivers and Restraints (India), 2008-2014
Growth in demand from Telecom and IT/ITES sector
Government’s stress on computerization in offices
Increase in demand from BFSI sector
Slow replacement rate affecting new sales
Increase in demand from manufacturing industry etc
Source: Frost & Sullivan
86P1F6-27
Market Drivers
MediumMediumMediumIncrease in demand from manufacturing industry etc4
MediumHighHighGovernment’s stress on computerization in offices3
MediumHighHighGrowth in demand from Telecom, IT/ITES etc 2
MediumHighHighIncrease in demand from BFSI sector1
5 - 7 Years3 - 4 Years1 - 2 YearsDriverRank
Source: Frost & Sullivan
5.1-20 kVA UPS Market: Market Drivers Ranked in Order of Impact (India), 2008-2014

87P1F6-27
Market Restraints
MediumMediumHighSlow replacement rate affecting new sales1
5 - 7 Years3 - 4 Years1 - 2 YearsRestraintRank
Source: Frost & Sullivan
5.1-20 kVA UPS Market: Market Restraints Ranked in Order of Impact (India), 2008-2014
88P1F6-27
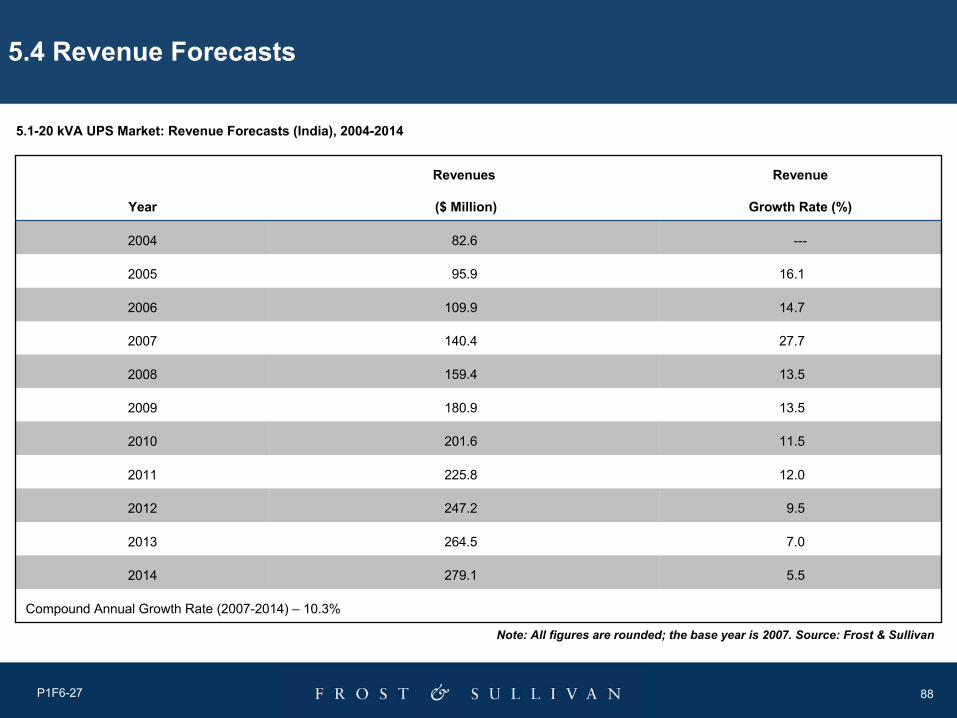
Compound Annual Growth Rate (2007-2014) – 10.3%
5.5279.12014
7.0264.52013
9.5247.22012
12.0225.82011
11.5201.62010
13.5180.92009
13.5159.42008
27.7140.42007
14.7109.92006
16.195.92005
---82.62004
Revenue
Growth Rate (%)
Revenues
($ Million)Year
5.4 Revenue Forecasts
5.1-20 kVA UPS Market: Revenue Forecasts (India), 2004-2014
Note: All figures are rounded; the base year is 2007. Source: Frost & Sullivan
89P1F6-27
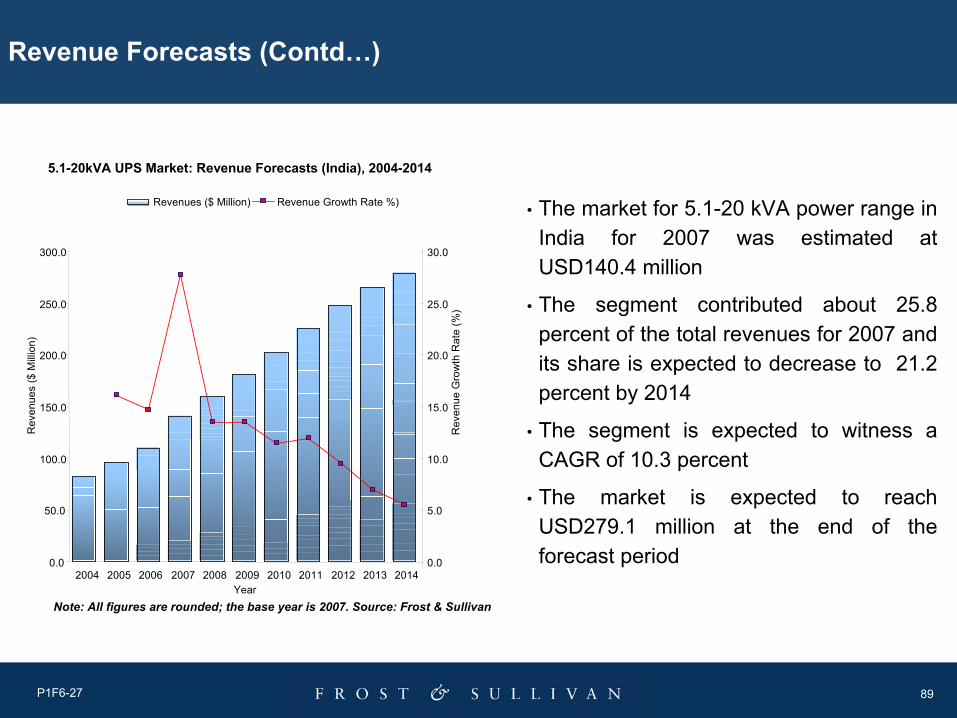
Revenue Forecasts (Contd…)
• The market for 5.1-20 kVA power range in India for 2007 was estimated at USD140.4 million
• The segment contributed about 25.8 percent of the total revenues for 2007 and its share is expected to decrease to 21.2 percent by 2014
• The segment is expected to witness a CAGR of 10.3 percent
• The market is expected to reach USD279.1 million at the end of the forecast period
5.1-20kVA UPS Market: Revenue Forecasts (India), 2004-2014
0.0
50.0
100.0
150.0
200.0
250.0
300.0
2004 2005 2006 2007 2008 2009 2010 2011 2012 2013 2014Year
Rev
enue
s ($
Milli
on)
0.0
5.0
10.0
15.0
20.0
25.0
30.0
Rev
enue
Gro
wth
Rat
e (%
)
Revenues ($ Million) Revenue Growth Rate %)
Note: All figures are rounded; the base year is 2007. Source: Frost & Sullivan
90P1F6-27
5.5 Demand Analysis
• Steady demand from BFSI,IT/ITES , telecom, medical devices market, industrial segment and others is expected to drive the demand in the 5-20kVA UPS segment
• BFSI in India is investing heavily in IT infrastructure to provide better service to end users and also to comply with the various government regulations
• The IT/ITES market is witnessing a steady growth rate, which also drives the demand for 5-20kVA power range UPS
• Growth in the telecom sector is also fuelling the growth of the market
• India projecting itself as a “Health Tourism Destination” is creating a sizeable demand for themedical devices market
• High growth of the machine tool sector is adding to the increased demand
91P1F6-27
5.6 Market and Technology Trends
Market Trend
• Suppliers operating in this space, typically have their own UPS manufacturing capabilities
• However, a few suppliers also occasionally import complete systems when a customer’s huge requirements are to be delivered over a shorter time frame

92P1F6-27
Market and Technology Trends (Contd…)
Technology Trend
• 5.1-20 kVA UPS systems are usually single- phase UPS with some three-phase UPS also being sold in this segment
• A majority of the UPS sold in this power range are of online topology with some line - interactive UPS also being available in the market

93P1F6-27
5.7 Pricing Trends
• The prices of 5.1-20 kVA UPS systems have reduced by about 10-12 percent in the last 2-3 years
• The price of three-phase UPS is more than single-phase UPS

94P1F6-27
5.8 Market Share Analysis
• The largest segment in the Indian UPS market, in terms of revenue contribution – 25.8 percent, in 2007
• Both Indian companies as well as MNCs compete for market share
• Numeric leads the market in this segment with a share of approx 12.8 percent in 2007, closely followed by APC-MGE and Emerson Network Power
• The top five suppliers control approximately 51 percent of the segment market size, in revenue terms
• Others include suppliers like Delta, Consul and others
Note: Others include suppliers such as Delta, Consul and others
5.1-20kVA UPS Market: Market Share Analysis by Revenues (India), 2007
Others44.6%
Aplab5.0%
Eaton7.0%
DB Power/Chloride7.9%
APC-MGE11.9%
Numeric 12.8%
Emerson10.8%
Note: All figures are rounded; the base year is 2007. Source: Frost & Sullivan

95
Chapter 6
20.1-60kVA UPS Market

96P1F6-27
6.1 Market Overview
• 20.1-60 kVA power range contributes about 11 percent of the revenues in the Indian UPS market
• Only online topology UPS is sold in this category due to high power load and criticality of the equipment.
• The major application for 20.1-60 kVA UPS system is in high precision industrial equipment such as CNC lathes, CNC drills, CNC milling machines, automation equipment such as PLC controls, medical equipment such as CT scanners, MRI scanners and others
• The major end-user segment is BFSI, IT/ITES, telecom, government (research labs, defense applications and others), medical devices sector, manufacturing sector and others
• The market in India for 2007 was estimated at USD59.9 million; the segment is expected to witness a CAGR of 16.1 percent

97P1F6-27
6.2 Market Engineering Measurement Analysis
20.1-60 kVA UPS Market: Market Engineering Measurements (India), 2007
Decreasing5 to 10 yearsReplacement rate (average period of unit replacement)
Decreasing7,000 to 12,000 Price range in USD
IncreasingMore than 10Competitors (active market competitors in base year)
Stable8Degree of competition
IncreasingHighDegree of technical change
Stable52%Market concentration (percent of base year market controlled by top three competitors)
Increasing40.0%Base year market growth rate
Increasing16.1%Compound annual growth rate
Increasing171.1 millionPotential revenues (maximum future market size)
Increasing59.9 millionRevenues(2007) in USD
IncreasingGrowth stageMarket age
TrendMeasurementMeasurement Name
Note: All figures are rounded; the base year is 2007. Source: Frost & Sullivan
98P1F6-27
6.3 Market Drivers and RestraintsK
ey D
river
sK
ey R
estr
aint
s
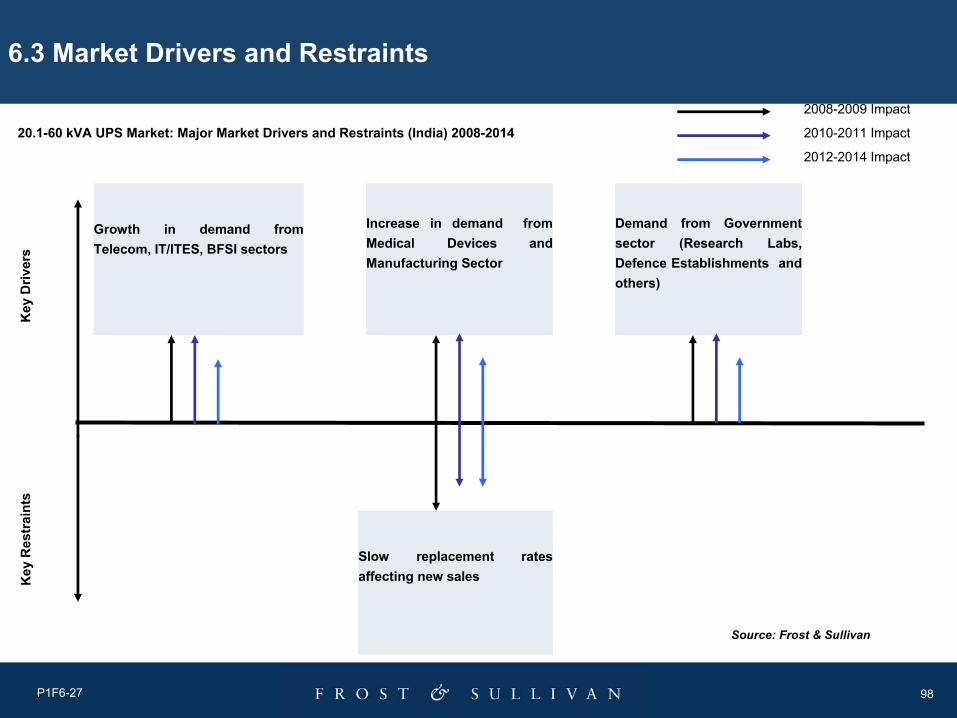
20.1-60 kVA UPS Market: Major Market Drivers and Restraints (India) 2008-2014
2008-2009 Impact
2010-2011 Impact
2012-2014 Impact
Growth in demand from Telecom, IT/ITES, BFSI sectors
Demand from Government sector (Research Labs, Defence Establishments and others)
Increase in demand from Medical Devices and Manufacturing Sector
Slow replacement rates affecting new sales
Source: Frost & Sullivan
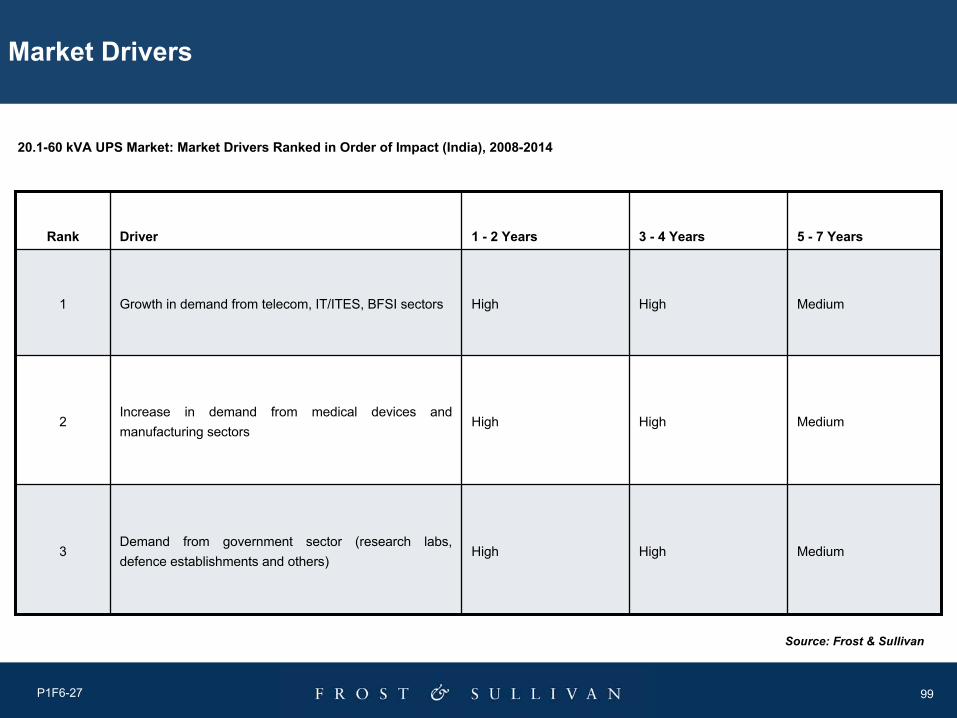
99P1F6-27
Market Drivers
MediumHighHigh Demand from government sector (research labs, defence establishments and others)
3
MediumHighHighIncrease in demand from medical devices and manufacturing sectors
2
MediumHighHighGrowth in demand from telecom, IT/ITES, BFSI sectors 1
5 - 7 Years3 - 4 Years1 - 2 YearsDriverRank
Source: Frost & Sullivan
20.1-60 kVA UPS Market: Market Drivers Ranked in Order of Impact (India), 2008-2014

100P1F6-27
Market Restraints
MediumMediumHighSlow replacement rates affecting new sales1
5 - 7 Years3 - 4 Years1 - 2 YearsRestraintRank
Source: Frost & Sullivan
20.1-60 kVA UPS Market: Market Restraints Ranked in Order of Impact (India), 2008-2014

101P1F6-27
Compound Annual Growth Rate (2007-2014) – 16.1%
7.0171.12014
8.0159.92013
10.0148.12012
17.5134.62011
19.8114.62010
25.295.62009
27.576.42008
40.059.92007
19.142.82006
21.735.92005
-29.52004
Revenue
Growth Rate (%)
Revenues
($ Million)Year
6.4 Revenue Forecasts
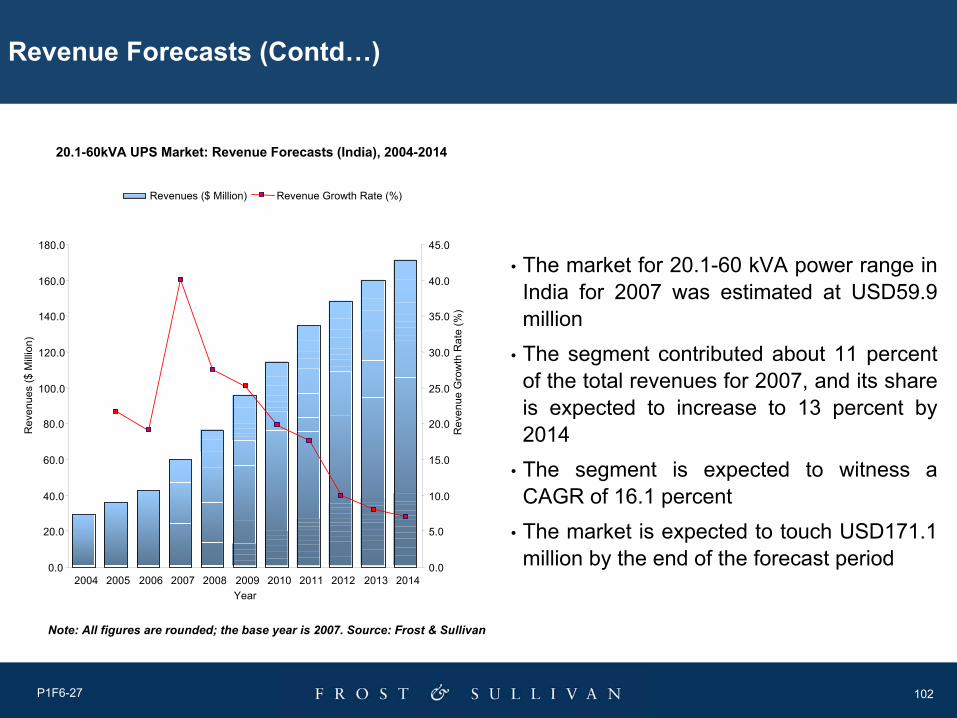
20.1-60 kVA UPS Market: Revenue Forecasts (India), 2004-2014
Note: All figures are rounded; the base year is 2007. Source: Frost & Sullivan
102P1F6-27
Revenue Forecasts (Contd…)
• The market for 20.1-60 kVA power range in India for 2007 was estimated at USD59.9 million
• The segment contributed about 11 percent of the total revenues for 2007, and its share is expected to increase to 13 percent by 2014
• The segment is expected to witness a CAGR of 16.1 percent
• The market is expected to touch USD171.1 million by the end of the forecast period
20.1-60kVA UPS Market: Revenue Forecasts (India), 2004-2014
0.0
20.0
40.0
60.0
80.0
100.0
120.0
140.0
160.0
180.0
2004 2005 2006 2007 2008 2009 2010 2011 2012 2013 2014Year
Rev
enue
s ($
Milli
on)
0.0
5.0
10.0
15.0
20.0
25.0
30.0
35.0
40.0
45.0
Rev
enue
Gro
wth
Rat
e (%
)
Note: All figures are rounded; the base year is 2007. Source: Frost & Sullivan
Revenues ($ Million) Revenue Growth Rate (%)
103P1F6-27
6.5 Demand Analysis
• Steady demand from BFSI, IT/ITES, telecom, medical devices market, industrial segment and others is expected to drive the demand in the 20.1-60 kVA UPS segment
• BFSI sector in India is investing heavily in IT infrastructure to provide better service to the end users and also to comply with the various government regulations
• IT/ITES sector is witnessing a steady growth, which also drives the demand for 20.1-60 kVA power range UPS
• Growth in the telecom sector is also fuelling the growth of the market
• India projecting itself as a “Health Tourism Destination” is creating a sizeable demand from medical devices sector
• High growth of the machine tool sector is leading to the increased demand
104P1F6-27
6.6 Market and Technology Trends
Market Trend
• Suppliers opt for OEM tie-ups, especially with medical devices companies for CT scanners, MRI scanners and others. Since majority of the high-end medical devices are supplied by MNCs, they have global tie-ups with selected UPS suppliers (Socomec’s global tie-up with Philips Medical and others). The UPS is bundled with the medical device. In a few cases, some medical devices suppliers leave the decision of procuring UPS to their local counterparts, that accordingly tie up with a local vendor. The local counterparts of multi-national medical devices suppliers sign rate contract with UPS suppliers, valid for a fixed period of time
• Some UPS suppliers also have a tie-up with machine tool OEMs

105P1F6-27
Market and Technology Trends (Contd…)
Technology Trend
• 20.1-60 kVA UPS is of online topology
• Single-phase and three-phase UPS are the two major types of UPS in this segment of the market
• Key features of UPS systems in this segment include:
Redundancy capabilities
High scalability
High power factor correction
IGBT technology
Ease of maintenance and servicing and others

106P1F6-27
6.7 Pricing Trends
• The prices of 20.1-60 kVA UPS systems have reduced by approximately 12 to 15 percent in the last two to three years
107P1F6-27
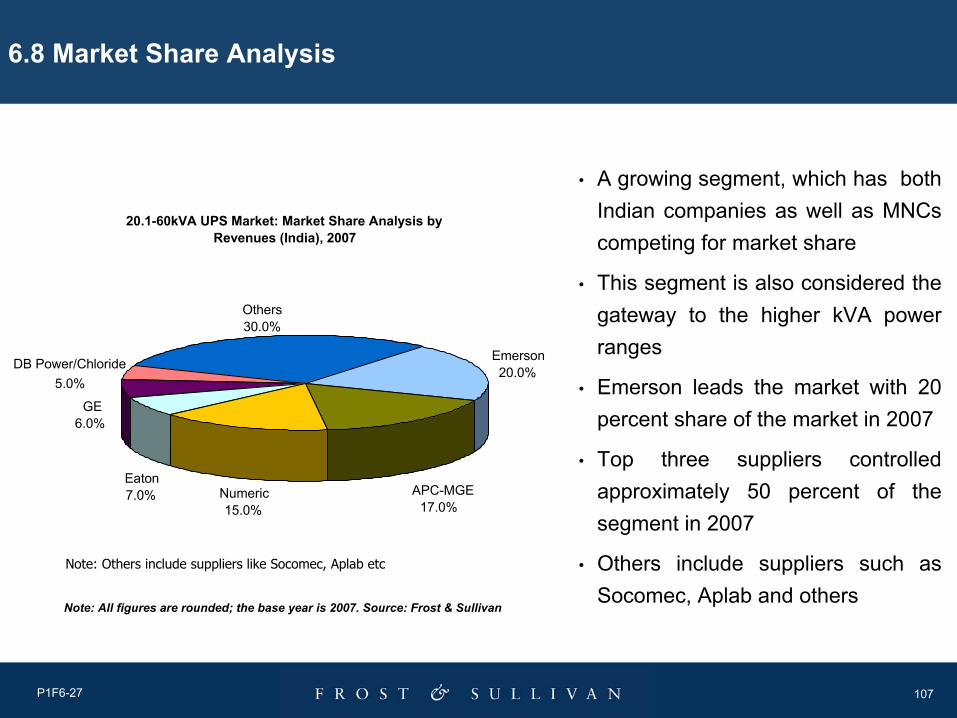
6.8 Market Share Analysis
• A growing segment, which has both Indian companies as well as MNCs competing for market share
• This segment is also considered the gateway to the higher kVA power ranges
• Emerson leads the market with 20 percent share of the market in 2007
• Top three suppliers controlled approximately 50 percent of the segment in 2007
• Others include suppliers such as Socomec, Aplab and others
Note: Others include suppliers like Socomec, Aplab etc
20.1-60kVA UPS Market: Market Share Analysis by Revenues (India), 2007
Others30.0%
DB Power/Chloride5.0%
GE6.0%
Eaton7.0% APC-MGE
17.0%
Emerson20.0%
Numeric 15.0%
Note: All figures are rounded; the base year is 2007. Source: Frost & Sullivan

108
Chapter 7
60.1-200kVA UPS Market

109P1F6-27
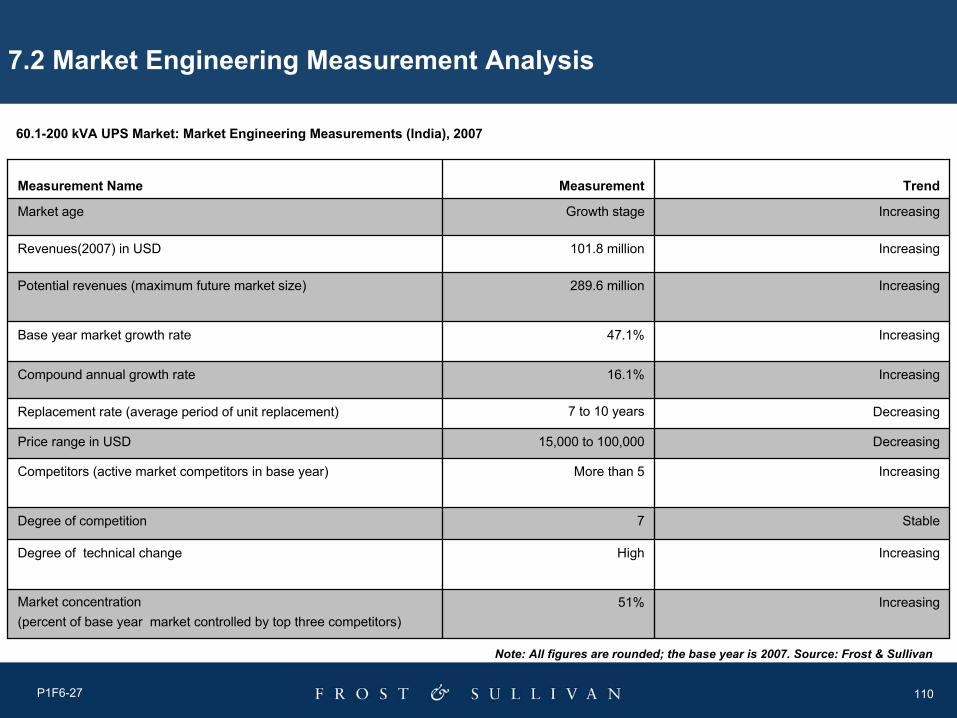
7.1 Market Overview
• 60.1-200 kVA power range contributes about 18.7 percent of the Indian UPS market in revenue terms
• UPS systems in this power range are of online topology
• A majority of the UPS systems sold in this segment are three-phase UPS, with some single-phase industrial UPS also being sold. UPS in these power ranges are used for mission-critical applications
• The major end-user segments are IT/ITES, telecom, government (research labs, defence applications and others ), medical devices sector, manufacturing and process industry and others
• The market in India for 2007 was estimated at USD101.8 million; the segment is expected to witness a CAGR of 16.1 percent
110P1F6-27
7.2 Market Engineering Measurement Analysis
60.1-200 kVA UPS Market: Market Engineering Measurements (India), 2007
Decreasing7 to 10 yearsReplacement rate (average period of unit replacement)
Decreasing15,000 to 100,000 Price range in USD
IncreasingMore than 5Competitors (active market competitors in base year)
Stable7Degree of competition
IncreasingHighDegree of technical change
Increasing51%Market concentration (percent of base year market controlled by top three competitors)
Increasing47.1%Base year market growth rate
Increasing16.1%Compound annual growth rate
Increasing289.6 millionPotential revenues (maximum future market size)
Increasing101.8 millionRevenues(2007) in USD
IncreasingGrowth stageMarket age
TrendMeasurementMeasurement Name
Note: All figures are rounded; the base year is 2007. Source: Frost & Sullivan

111P1F6-27
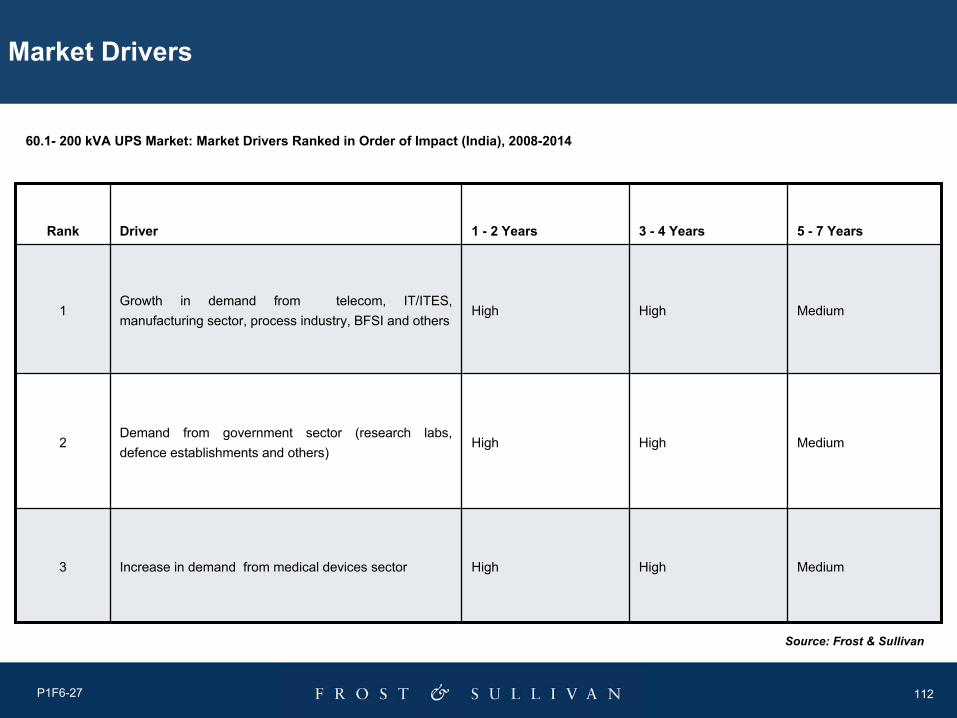
7.3 Market Drivers and Restraints
60.1- 200 kVA UPS Market: Market Drivers and Restraints (India), 2008-20142008-2009 Impact
2010-2011 Impact
2012-2014 Impact
Growth in demand from telecom, IT/ITES, manufacturing sector, process sector, BFSI and others
Demand from Government sector (Research Labs,Defence Establishments and others)
Key
Driv
ers
Key
Res
trai
nts
Increase in demand from medical devices sector
Slow replacement rates
affecting new salesSource: Frost & Sullivan
112P1F6-27
Market Drivers
MediumHighHighIncrease in demand from medical devices sector3
MediumHighHighDemand from government sector (research labs, defence establishments and others)
2
MediumHighHighGrowth in demand from telecom, IT/ITES, manufacturing sector, process industry, BFSI and others
1
5 - 7 Years3 - 4 Years1 - 2 YearsDriverRank
Source: Frost & Sullivan
60.1- 200 kVA UPS Market: Market Drivers Ranked in Order of Impact (India), 2008-2014

113P1F6-27
Market Restraints
MediumMediumHighSlow replacement rates affecting new sales1
5 - 7 Years3 - 4 Years1 - 2 YearsRestraintRank
Source: Frost & Sullivan
60.1- 200 kVA UPS Market: Market Restraints Ranked in Order of Impact (India), 2008-2014

114P1F6-27
Compound Annual Growth Rate(2007-2014) – 16.1%
9.5289.62014
10.6264.52013
12.7239.22012
13.0212.32011
15.0187.92010
26.2163.42009
27.2129.52008
47.1101.82007
20.369.22006
21.957.52005
---47.22004
Revenue
Growth Rate (%)
Revenues
($ Million)Year
7.4 Revenue Forecasts
60.1-200 kVA UPS Market: Revenue Forecasts (India), 2004-2014
Note: All figures are rounded; the base year is 2007. Source: Frost & Sullivan

115P1F6-27
Revenue Forecasts (Contd…)
• The market for 60.1-200 kVA power range in India for 2007 was estimated at USD101.8 million
• The segment contributed about 18.7 percent of the total UPS market for 2007, in revenue terms and its share is expected to increase to 22 percent by 2014
• The segment is expected to witness a CAGR of 16.1 percent. The market is expected to touch USD289.6 million by the end of the forecast period
60.1-200kVA UPS Market: Revenue Forecasts (India), 2004-2014
0.0
50.0
100.0
150.0
200.0
250.0
300.0
350.0
2004 2005 2006 2007 2008 2009 2010 2011 2012 2013 2014Year
Rev
enue
s ($
Milli
on)
0.0
5.0
10.0
15.0
20.0
25.0
30.0
35.0
40.0
45.0
50.0
Rev
enue
Gro
wth
Rat
e (%
)
Revenues ($ Million) Revenue Growth Rate (%)
Note: All figures are rounded; the base year is 2007. Source: Frost & Sullivan
116P1F6-27
7.5 Demand Analysis
• Steady demand from IT/ITES, telecom, government (research labs, defence applications and others), medical devices market, manufacturing and process industries are expected to drive the demand in the 60.1-200 kVA UPS segment
• The IT/ITES and telecom sector are witnessing a steady growth, which also drives the demand for 60.1-200 kVA power range UPS for their various applications
• Research Labs, defence and others for their mission critical applications are also one of the major end users of UPS used in this segment
• Medical devices sector is also a major consumer but the application is more or less limited up to 100kVA
• Manufacturing and process industries, especially oil and gas sectors also contribute to the demand in this power range
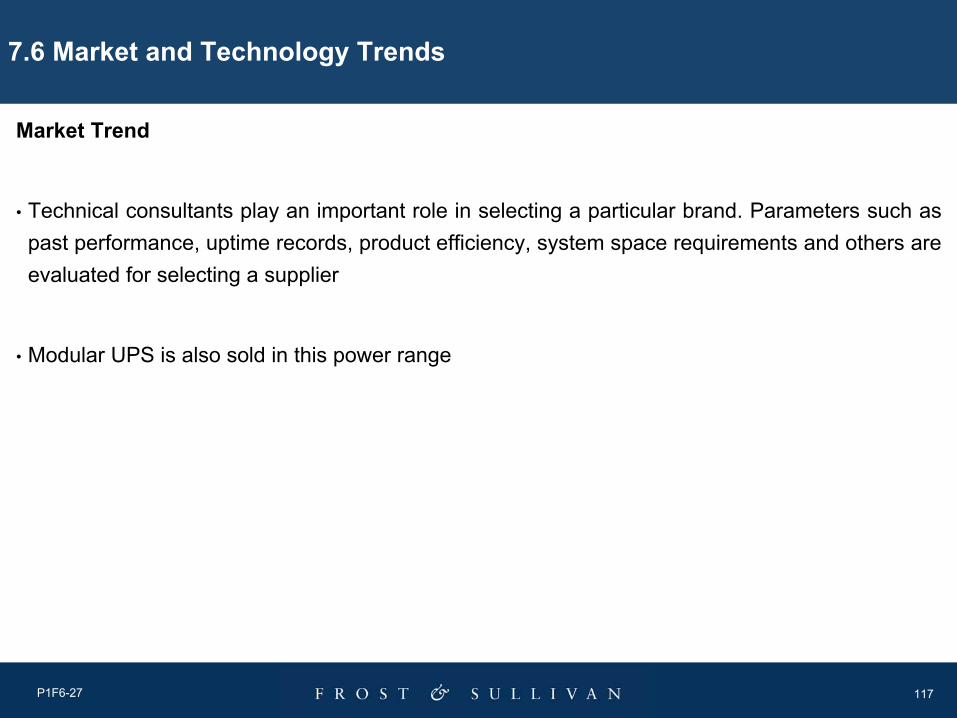
117P1F6-27
7.6 Market and Technology Trends
Market Trend
• Technical consultants play an important role in selecting a particular brand. Parameters such as past performance, uptime records, product efficiency, system space requirements and others are evaluated for selecting a supplier
• Modular UPS is also sold in this power range
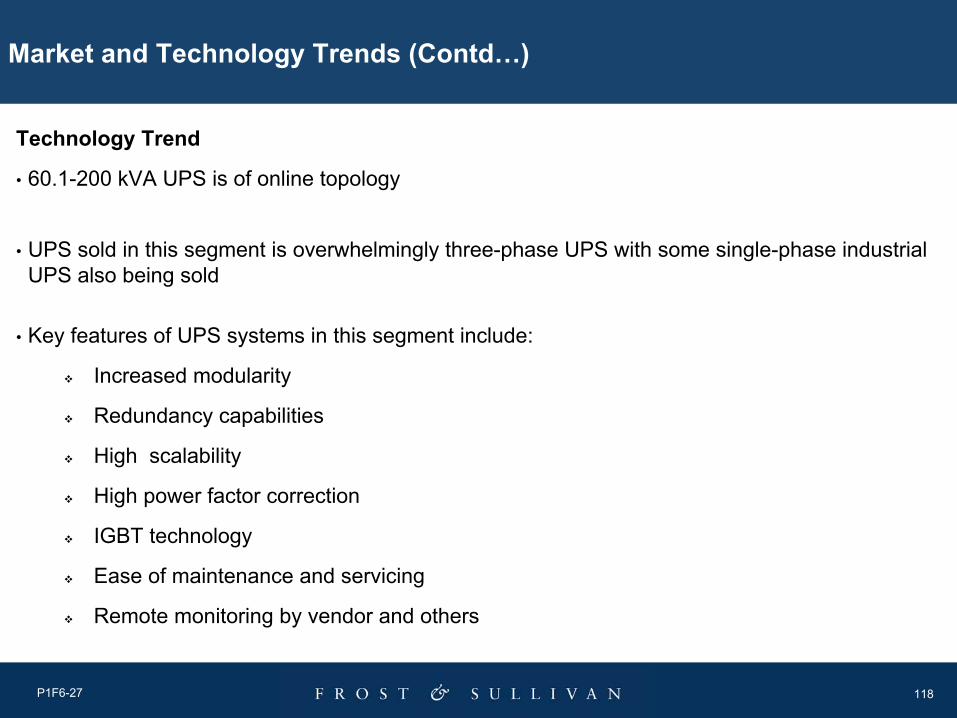
118P1F6-27
Market and Technology Trends (Contd…)
Technology Trend
• 60.1-200 kVA UPS is of online topology
• UPS sold in this segment is overwhelmingly three-phase UPS with some single-phase industrial UPS also being sold
• Key features of UPS systems in this segment include:
Increased modularity
Redundancy capabilities
High scalability
High power factor correction
IGBT technology
Ease of maintenance and servicing
Remote monitoring by vendor and others
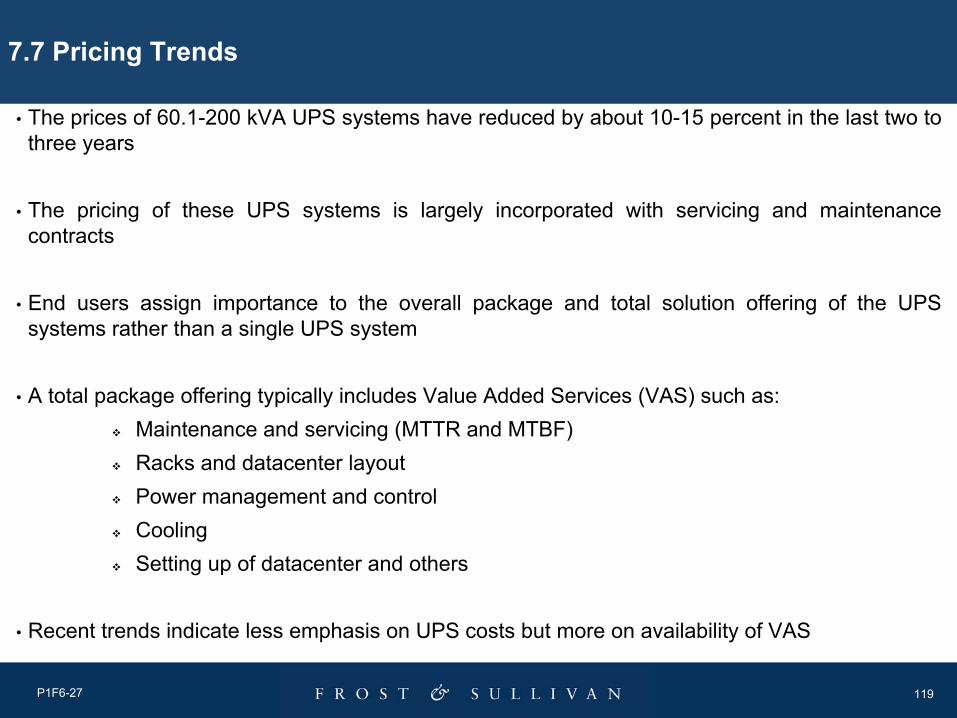
119P1F6-27
7.7 Pricing Trends
• The prices of 60.1-200 kVA UPS systems have reduced by about 10-15 percent in the last two to three years
• The pricing of these UPS systems is largely incorporated with servicing and maintenance contracts
• End users assign importance to the overall package and total solution offering of the UPS systems rather than a single UPS system
• A total package offering typically includes Value Added Services (VAS) such as: Maintenance and servicing (MTTR and MTBF)Racks and datacenter layoutPower management and controlCoolingSetting up of datacenter and others
• Recent trends indicate less emphasis on UPS costs but more on availability of VAS

120P1F6-27
7.8 Market Share Analysis
• A fast growing segment dominated by MNCs with low presence of Indian suppliers
• DB Power Electronics Private Limited is the only Indian supplier among the top three suppliers in this segment
• Emerson leads the market with a share of 25 percent in 2007, in revenue terms
• The top six suppliers control about 75 percent of the segment
• Others include suppliers like Numeric, Aplab and others
Note: Others include suppliers such as Numeric, Aplab and others
60.1-200kVA UPS Market: Market Share Analysis by Revenues (India), 2007
Others25.0%
GE7.0%
Socomec8.0%
Eaton9.0% APC-MGE
15.0%
Emerson25.0%
DB Power/Chloride11.0%
Note: All figures are rounded; the base year is 2007. Source: Frost & Sullivan

121
Chapter 8
More than 200kVA UPS Market

122P1F6-27
8.1 Market Overview
• More than 200 kVA power range contributed about 9 percent of the market in 2007, in revenue terms
• UPS in this power range is of online topology
• Historically, static UPS was the sole type of UPS sold in India, in the more than 200 kVA power range. Penetration of rotary UPS in this segment is gradually increasing due to its increased usage by large industrial units
• Two of the major rotary UPS participants worldwide, Piller Power Systems and Hitech Power Protection, are present in the Indian market through their national distributors PCI Limited and Hi-Rel Electronics Limited, respectively
• The major end segments are IT/ITES (Large Data Centers), Telecom (Various applications including Data Centers), Large Industrial Units, Process industries and others
• Limited suppliers operate in this space
• The market for more than 200kVA power range in India for 2007 was estimated at USD49.0 million
• The segment is expected to witness a CAGR of 20.8 percent

123P1F6-27
8.2 Market Engineering Measurement Analysis
More than 200 kVA UPS Market: Market Engineering Measurements (India), 2007
Decreasing7 to 10 yearsReplacement rate (average period of unit replacement)
Decreasing25,000 to 200,000 Price range in USD
StableMore than 3Competitors (active market competitors in base year)
Stable7Degree of competition
IncreasingHighDegree of technical change
Increasing68%Market concentration (percent of base year market controlled by top three competitors)
Increasing56.3%Base year market growth rate
Increasing20.8%Compound annual growth rate
Increasing184.3 millionPotential revenues (maximum future market size)
Increasing49.0 millionRevenues(2007) in USD
IncreasingGrowth stageMarket age
TrendMeasurementMeasurement Names
Note: All figures are rounded; the base year is 2007. Source: Frost & Sullivan
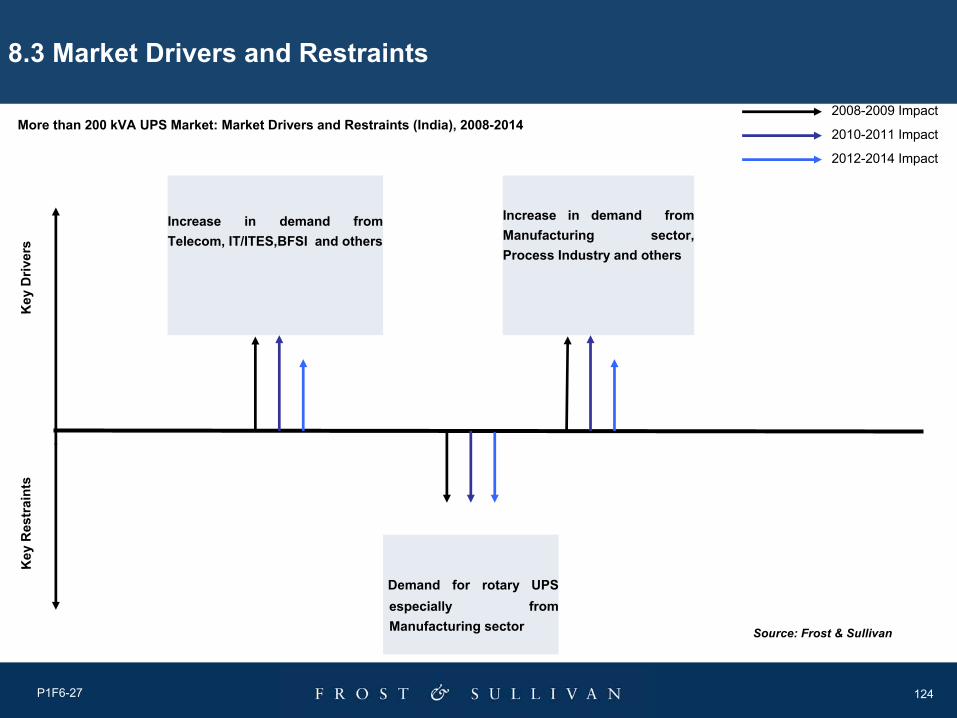
124P1F6-27
8.3 Market Drivers and Restraints
2008-2009 Impact
2010-2011 Impact
2012-2014 Impact
More than 200 kVA UPS Market: Market Drivers and Restraints (India), 2008-2014
Key
Driv
ers
Key
Res
trai
nts
Increase in demand from Telecom, IT/ITES,BFSI and others
Increase in demand from Manufacturing sector, Process Industry and others
Demand for rotary UPS especially from Manufacturing sector Source: Frost & Sullivan
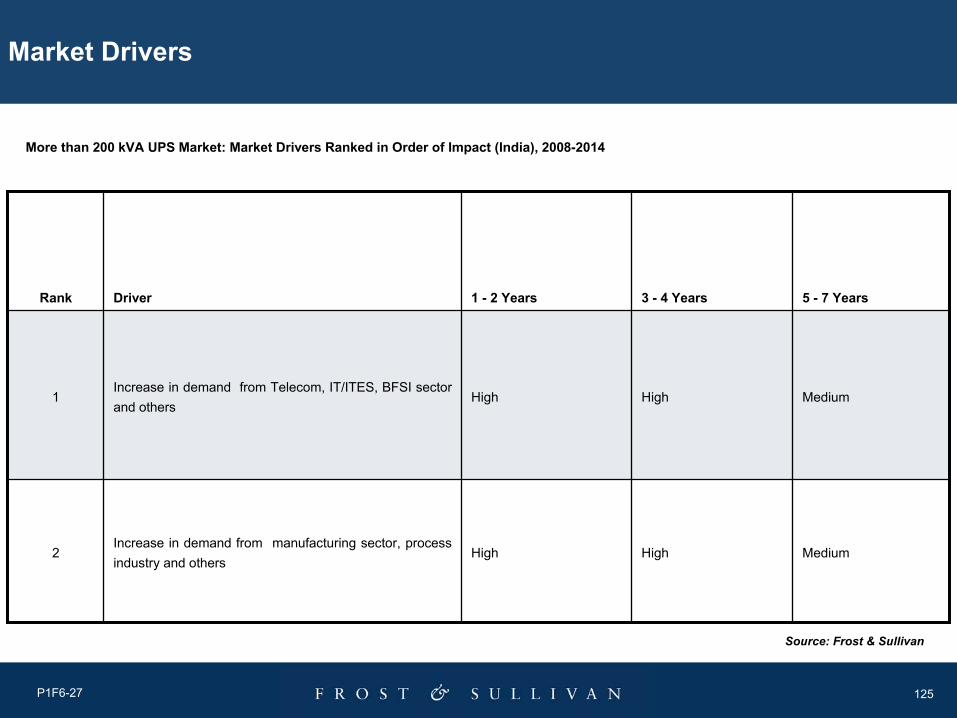
125P1F6-27
Market Drivers
MediumHighHighIncrease in demand from manufacturing sector, process industry and others
2
MediumHighHighIncrease in demand from Telecom, IT/ITES, BFSI sector and others
1
5 - 7 Years3 - 4 Years1 - 2 YearsDriverRank
Source: Frost & Sullivan
More than 200 kVA UPS Market: Market Drivers Ranked in Order of Impact (India), 2008-2014

126P1F6-27
Market Restraints
MediumMediumMediumDemand for Rotary UPS, especially from the manufacturing sector 1
5 - 7 Years3 - 4 Years1 - 2 YearsRestraintRank
Source: Frost & Sullivan
More than 200 kVA UPS Market: Market Restraints Ranked in Order of Impact (India), 2008-2014

127P1F6-27
Compound Annual Growth Rate(2007-2014) – 20.8%
11.0184.32014
12.2166.1 2013
12.6148.12012
17.6131.52011
22.0111.82010
31.491.72009
42.369.72008
56.349.02007
24.931.42006
30.925.12005
---19.22004
Revenue
Growth Rate (%)
Revenues
($ Million)Year
8.4 Revenue Forecasts
More than 200 kVA UPS Market: Revenue Forecasts (India), 2004-2014
Note: All figures are rounded; the base year is 2007. Source: Frost & Sullivan
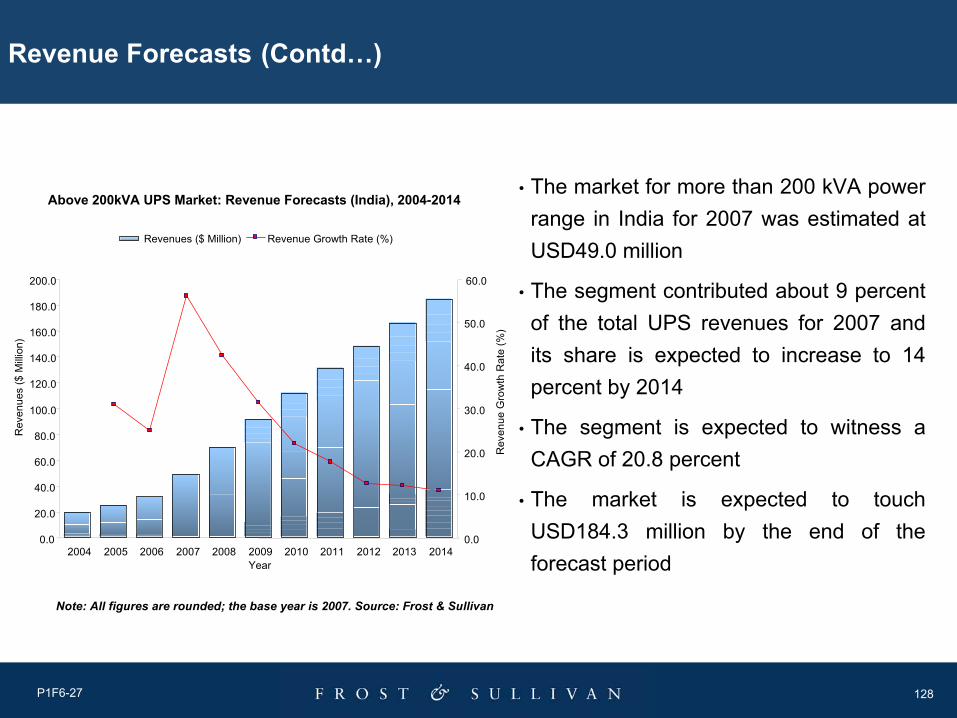
128P1F6-27
Revenue Forecasts (Contd…)
• The market for more than 200 kVA power range in India for 2007 was estimated at USD49.0 million
• The segment contributed about 9 percent of the total UPS revenues for 2007 and its share is expected to increase to 14 percent by 2014
• The segment is expected to witness a CAGR of 20.8 percent
• The market is expected to touch USD184.3 million by the end of the forecast period
Above 200kVA UPS Market: Revenue Forecasts (India), 2004-2014
0.0
20.0
40.0
60.0
80.0
100.0
120.0
140.0
160.0
180.0
200.0
2004 2005 2006 2007 2008 2009 2010 2011 2012 2013 2014Year
Rev
enue
s ($
Milli
on)
0.0
10.0
20.0
30.0
40.0
50.0
60.0
Rev
enue
Gro
wth
Rat
e (%
)
Revenues ($ Million) Revenue Growth Rate (%)
Note: All figures are rounded; the base year is 2007. Source: Frost & Sullivan

129P1F6-27
8.5 Demand Analysis
• Steady demand from IT/ITES, telecom, large industrial units, process industries and others is expected to drive the demand in the more than 200kVA UPS segment
• IT/ITES market remains one of the major demand drivers in this power range. The major application is for their large data centers, which form the core of their operations
• Telecom sector is another major consumer, which is also fuelling the demand
• Large industrial units and process industries, due to the criticality of their operations, are also driving the demand
• This power range is expected to witness the maximum growth over the forecast period among all power ranges
130P1F6-27
8.6 Market and Technology Trends
Market Trend
• Technical consultants play an important role in selecting a particular brand
• Parameters such as past performance, uptime records, product efficiency, system space requirements and others are evaluated for selecting a supplier
131P1F6-27
Market and Technology Trends (Contd…)
Technology Trend
• More than 200 kVA UPS is of online topology
• UPS sold in this segment is only three-phase
• Key features of UPS systems in this segment include:
Increased modularity
Redundancy capabilities
High scalability
High power factor correction
IGBT technology
Ease of maintenance and servicing
Remote monitoring by vendor and others

132P1F6-27
8.7 Pricing Trends
• The prices of more than 200 kVA UPS systems have reduced by approximately 10 to 15 percent in the last two to three years
• The pricing of these UPS systems is largely incorporated with servicing and maintenance contracts
• End users assign importance to the overall package and total solution offering of the UPS systems rather than a single UPS system
• A total package offering typically includes VAS such as: Maintenance and servicing (MTTR and MTBF)Racks and datacenter layoutPower management and controlCoolingSetting up of datacenter and others
• Recent trends indicate less emphasis on UPS costs, but more on VAS offerings
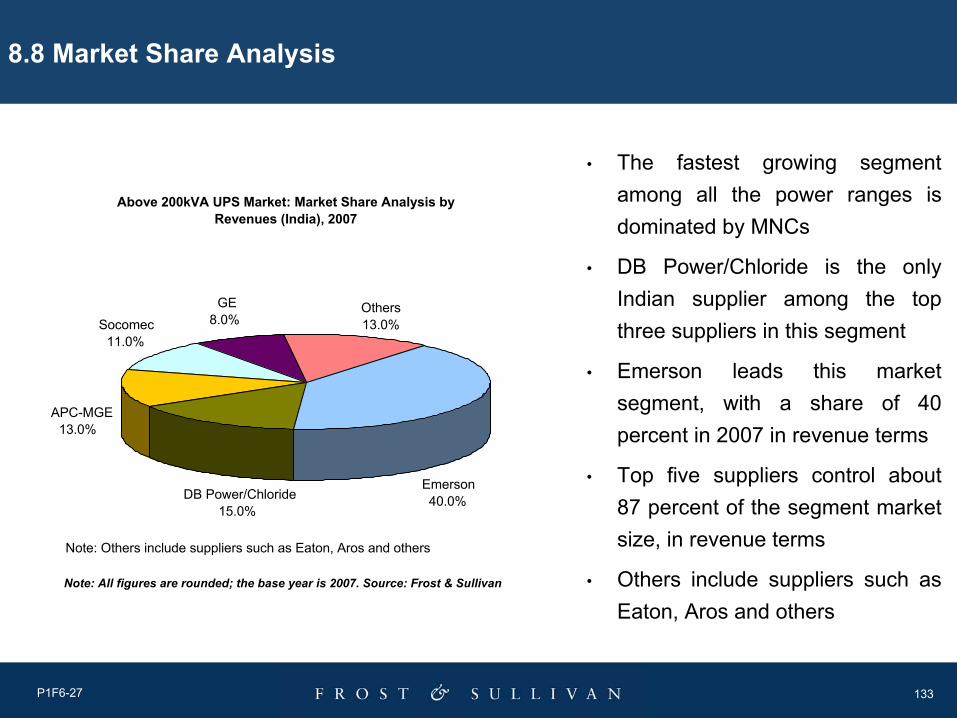
133P1F6-27
8.8 Market Share Analysis
• The fastest growing segment among all the power ranges is dominated by MNCs
• DB Power/Chloride is the only Indian supplier among the top three suppliers in this segment
• Emerson leads this market segment, with a share of 40 percent in 2007 in revenue terms
• Top five suppliers control about 87 percent of the segment market size, in revenue terms
• Others include suppliers such as Eaton, Aros and others
Note: Others include suppliers such as Eaton, Aros and others
Above 200kVA UPS Market: Market Share Analysis by Revenues (India), 2007
APC-MGE13.0%
Emerson40.0%DB Power/Chloride
15.0%
Socomec11.0%
GE8.0%
Others13.0%
Note: All figures are rounded; the base year is 2007. Source: Frost & Sullivan
134
Chapter 9
Appendix
135P1F6-27
9.1 Abbreviation
Multi National CompanyMNC
Kilo Volt-amperekVA
Information Technology Enabled ServicesITES
Joint VentureJV
Information TechnologyIT
Compound Annual Growth RateCAGR
Direct CurrentDC
Insulated Gate Bipolar TransistorIGBT
Gross Domestic ProductGDP
Directorate General of Supplies and DisposalDGSD
Automated Teller MachineATM
Alternating CurrentAC
Computer Numerical ControlCNC
Banking Financial Services & InsuranceBFSI

136P1F6-27
Mean Time Between FailuresMTBF
Mean Time To Recovery MTTR
U S DollarsUSD
Original Equipment ManufacturersOEM
Purchasing Power ParityPPP
Reserve Bank of IndiaRBI
Programmable Logic ControllerPLC
Personal ComputerPC
Small and Medium BusinessSMB
Small and Medium EnterprisesSME
Small Office Home OfficeSOHO
Uninterruptible Power SuppliesUPS
Volt AmpereVA
Abbreviation (Contd…)
137P1F6-27
9.2 Glossary
Electrical current that flows in only one direction Direct Current (DC)
Time during which the UPS can supply the rated load while the mains are down
Backup Time
Device associated with the rectifier and used to supply the battery with the electrical power to recharge the battery
Charger
A flywheel driven rotary UPS is used for applications requiring back-up power for short duration power system outages. The flywheel driven rotary UPS typically does not include batteries,
Flywheel/Rotary UPS
The flow of electricity expressed in amperes, referring to the quantity or intensity of electrical flow
Current
A low-voltage condition over an extended period. Other term used is under voltage
Brownout
A total loss of electrical power Blackout
Quantitative unit of measurement of electrical current Amp or Ampere (A)
Electrical current that continually reverses direction. The change in direction is expressed in hertz, or cycles per second
Alternating Current (AC)
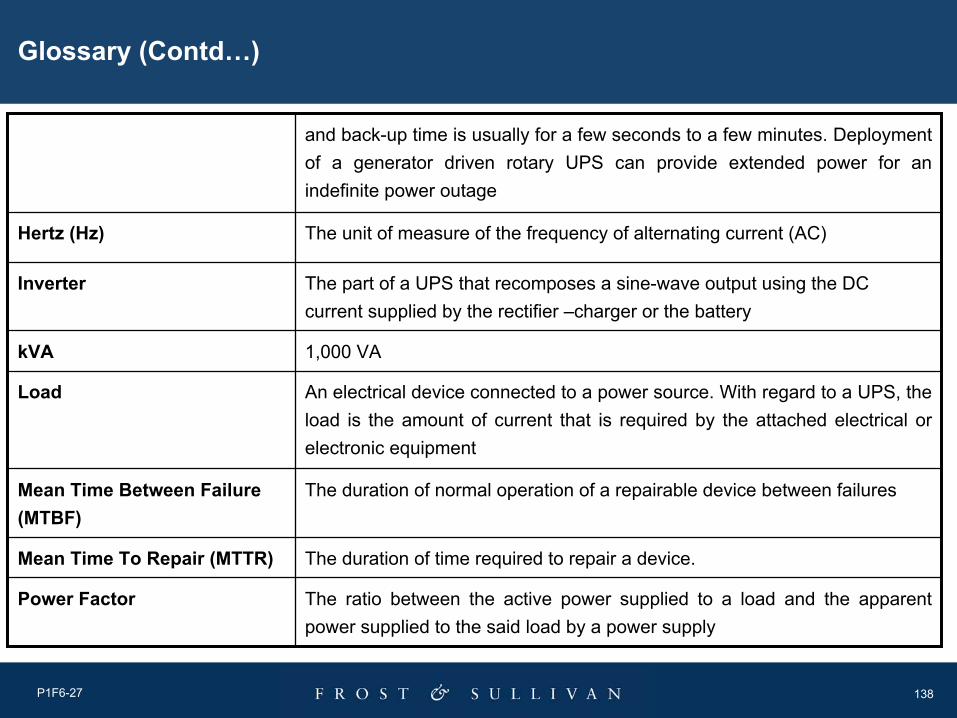
138P1F6-27
Glossary (Contd…)
The ratio between the active power supplied to a load and the apparent power supplied to the said load by a power supply
Power Factor
The duration of normal operation of a repairable device between failures Mean Time Between Failure (MTBF)
The duration of time required to repair a device. Mean Time To Repair (MTTR)
An electrical device connected to a power source. With regard to a UPS, the load is the amount of current that is required by the attached electrical or electronic equipment
Load
1,000 VA kVA
The part of a UPS that recomposes a sine-wave output using the DC current supplied by the rectifier –charger or the battery
Inverter
The unit of measure of the frequency of alternating current (AC)Hertz (Hz)
and back-up time is usually for a few seconds to a few minutes. Deployment of a generator driven rotary UPS can provide extended power for an indefinite power outage

139P1F6-27
An abnormally high voltage lasting for a short period Surge
Single-phase power systems are defined by having an AC source with onlyone voltage waveform
Single-phase Power Systems
A sudden increase in voltage, which can damage electronic equipment, and corrupt and/or destroy data
Spike
UPS which uses battery to provide continuous source of electrical powerStatic UPS
It is a UPS configuration in which one or several UPS units operate on stand by, with no load or only a partial load, and can back up a faulty UPS unit
Redundancy (Passive)
It is a parallel UPS configuration in which several UPS units with equal outputs are parallel connected and share the load. In the event of one UPS unit failing, the other units pick up its share without any interruption in the supply of power to the load
Redundancy (Active)
That part of a UPS, which converts the incoming AC utility power to DC power for driving the inverter and charging the batteries
Rectifier
Glossary (Contd…)

140P1F6-27
The quantitative measure describing electrical force or potential Volt
The unit of measure of actual power Watt
The unit of measure of apparent power Volt-ampere (VA)
A device that provides constant or near-constant output voltage even when input voltage fluctuates
Voltage Regulator
In a three-phase system, three circuit conductors carry three alternating currents,(of the same frequency) which are offset from one another by 120 degrees
The generation of AC electric power is commonly three phase
Three-phase Power System
The time taken by a Standby UPS to switch from utility output to inverter output after the UPS senses a power interruption, normally expressed in milliseconds
Switching Time
Glossary (Contd…)
Related Documents


