Ministry of Health and Family Welfare Government of India INDIA TB REPORT 2022 Coming Together to End TB Altogether

Welcome message from author
This document is posted to help you gain knowledge. Please leave a comment to let me know what you think about it! Share it to your friends and learn new things together.
Transcript
Ministry of Health and Family WelfareGovernment of India
INDIA TB REPORT 2022
Coming Together to End TB Altogether
TB Mukt Bharat @TbdivisionNTEPEndsTB
Central TB Division3, Sansad Marg, Janpath, New Delhi – 110001
www.tbcindia.gov.in
PB i
© Central TB Division, Ministry of Health and Family Welfare
This publication can be obtained from:
Central TB DivisionMinistry of Health and Family Welfare,3, Sansad Marg, Janpath, New Delhi – 110001http://www.tbcindia.gov.inMarch 2022
ii iii
*The data is as of 03rd January 2022.
iv v
vi vii
viii ix
x xi
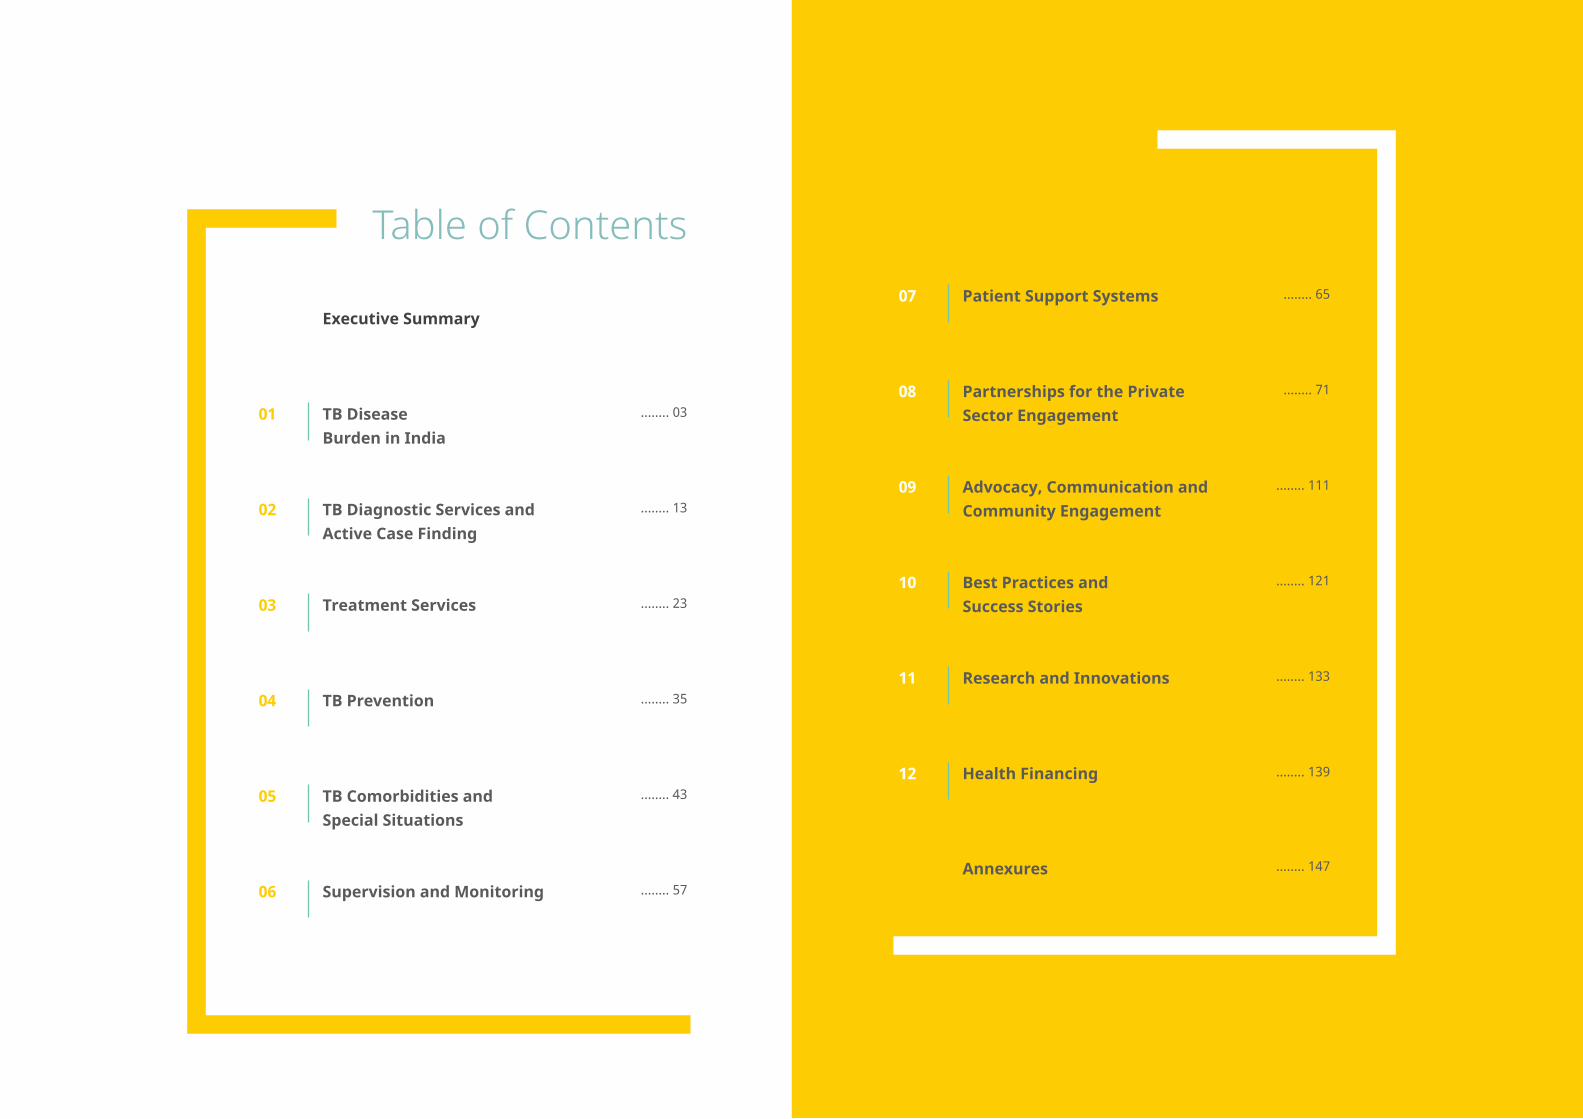
Table of Contents
Executive Summary
TB Disease Burden in India
01
TB Diagnostic Services and Active Case Finding
02
Treatment Services 03
........ 35TB Prevention04
........ 43TB Comorbidities and Special Situations
05
........ 57Supervision and Monitoring06
07 ........ 65
........ 71Partnerships for the Private Sector Engagement
08
........ 111Advocacy, Communication and Community Engagement
09
........ 121Best Practices and Success Stories
10
........ 133Research and Innovations11
........ 139
........ 147
Health Financing
Annexures
12
Patient Support Systems
........ 03
........ 13
........ 23
xiv xv
While the world was still reeling with the unsparing effects of the COVID-19 pandemic in 2020-ravaging lives, uprooting livelihoods, crippling national economies, and debilitating health infrastructure, the pandemic continued wreaking its havoc in 2021. Admittedly, the fight against Tuberculosis (TB) encountered setbacks in decades of gains. However, the pandemic also forged pathways to ingenious solutions, health-system strengthening, and the ever-expanding reach of the public health programme delivery.
EXECUTIVE SUMMARY
for First-Line LPA, and out of these, 61 are additionally certified for Second-Line LPA.
The momentum to improve TB diagnostic services does not end here. The programme division has developed an Annotation tool for LPA result interpretation through Machine Learning (ML). Moreover, besides the 19 laboratories NABL accredited till 2021 under the NTEP, in 2022, 15 additional laboratories have been accredited with the NABL.
Early identification of people with a high probability of having active TB is crucial for breaking the chain of transmission. To achieve that, it is imperative to reach the unreached and targeted groups through Active case finding (ACF) for early detection of TB cases and initiating treatment promptly. ACF has been systematically conducted across
all the States/UTs in India since 2017. A special campaign was introduced in January 2021 for active case finding among risk groups: diabetes, chronic kidney and liver disease, patients on immunosuppressants, etc. In addition, to mitigate the impact of COVID-19 on TB services, a special ACF drive was launched to screen influenza-like illness (ILI) and severe acute respiratory infections (SARI) cases for TB. Accordingly, in 2021, 34 States/UTs have conducted ACF activities/campaigns at the state and district level, leading to the screening of 2.23 crore people, out of which 17,52,903 samples were tested for TB, and 73,772 additional TB patients were identified. The NTEP has made 81 Mobile TB Diagnostic Vans available to the States for conducting ACF in remote and hard-to-reach areas.
◄ TB DISEASE BURDEN IN INDIA
Despite the brief decline in TB notifications observed around the months corresponding to India’s two major COVID-19 waves, the National Tuberculosis Elimination Programme (NTEP) reclaimed these numbers. Accordingly, 2021 witnessed a 19% increase from the previous year in TB patients’ notification—the total number of incident TB patients (new and relapse) notified during 2021 were 19,33,381 as opposed to that of 16,28,161 in 2020. In 2021, the vision of the National Strategic Plan
for Elimination of Tuberculosis (NSP 2017-25) permeated to state and district levels yet again to encompass more objectives. Eighteen States have committed to Ending TB by 2025 by formally implementing State-specific Strategic Plans and have gone a step ahead to devise a District-specific Strategic Plan, which shall serve as a guiding tool for the programme managers and staff at the district and sub-district level towards the elimination of Tuberculosis.
◄ TB DIAGNOSTIC SERVICES AND ACTIVE CASE FINDING
Free of cost laboratory services to patients attending public health facilities and those referred from the private sector has been the programmatic ethos since its inception. Over the years, the programme has evinced one of the most extensive TB diagnostic networks globally, spanning all health system tiers. Staying true to its history of ever-increasing spread in both public and private sector and up-gradation to newer diagnostic technologies,
by the end of 2021, 80 laboratories are equipped to support liquid culture system, of which 60 are certified for First-Line Liquid Culture Drug Susceptibility Testing (FL LCDST), and 49 are certified for Second-Line Liquid Culture Drug Susceptibility Testing (SL LCDST). Moreover, Liquid culture-based DST has been expanded to include Linezolid and Pyrazinamide. Concerning Line Probe Assay (LPA), 74 Laboratories are certified
◄ TREATMENT SERVICES
The NTEP has been agile in adopting and adapting newer drugs and treatment modalities. In recent years, the country has made far-reaching progress in the management of TB. For example, an injection-free treatment regimen for Drug-sensitive TB (DS-TB) was implemented across the country. Similarly, the programme introduced a comprehensive package for differentiated care of TB patients to identify the patients requiring referral or hospitalisation to reduce TB mortality and rapidly reduce preventable mortality among TB patients. In terms of DS-TB treatment performance, in 2021, among 21,35,830 patients diagnosed, 20,30,509 (95%) patients were put on treatment. While the disaggregated treatment success rate of patients notified from the public and private sectors are 83% and 82%, respectively.
Further, the NTEP has been unwavering in curtailing the impediments in managing drug-resistant TB (DR-TB) patients. To offer the last-mile service delivery for better access and quality care to TB patients, including DRTB patients and their close contacts, the programme has decentralised TB services to the Ayushman Bharat – Health and Wellness Centres (AB-HWC). The “Guidelines for Programmatic Management of Drug-resistant TB (PMDT) in India - 2021” were also released. Moreover, a Shorter oral Bedaquiline (Bdq)-containing MDR/RR-TB regimen was introduced and scaled up across the country. Likewise, access to drugs, including newer drugs, to patients seeking care in the private sector is free. Regarding DR-TB treatment performance, in 2021, 48,232 MDR/RR-TB patients were diagnosed and 43,380 (90%)
xvi xvii
were put on treatment. 8455 Pre-XDR-TB, 376 XDR-TB and 13724 H mono/poly patients were diagnosed and 7562 (89%), 333 (89%) and 12008 (87%) were put on treatment respectively. A total of 1939 patients were
initiated on a shorter oral Bdq-containing MDR/RR-TB regimen, 23,889 on longer M/XDR-TB regimen, and 25,235 patients were initiated on the shorter injection-containing MDR-TB regimen.
Acknowledging the consequences of alcoholism and tobacco smoking among TB patients, the programme offers services like counselling, linkages to de-addiction centres, and social support systems to people struggling with alcoholism. In 2021, the data was captured for 72% of total notified patients, out of which 7% admitted to alcohol usage. Similarly, out of the 74% of the known tobacco usage among all TB patients, 12% of TB patients were reported to be tobacco users. Among those screened, 30% were linked to tobacco cessation services.
Provider Initiated Testing and Counselling (PITC) initiative continued making headways for early detection of HIV among presumptive TB patients. In 2021, 95% of the notified TB patients knew their HIV status, while more than 2,5 lakhs PLHIV were given access to rapid molecular testing via CBNAAT/TrueNat for TB diagnosis. Likewise, single-window TB and HIV services are being implemented through existing ART centres. More than 96% of PLHIV visiting the ART centres every month are screened for TB symptoms.
Similarly, the programme has been steadfast in adapting its strategy to address the pandemic. The country-wide implementation of bidirectional screening of TB and COVID-19, i.e., COVID-19 screening for all diagnosed TB patients and TB screening for all suspected and confirmed COVID-19 patients, expanded its reach. In addition to repurposing the resources from then ongoing National TB Prevalence survey and Nikshay Sampark (national TB call centre) to serve as COVID-19 helpline, the programme also provides services like symptomatic screening for TB and inclusion during surveillance in the community; home sample collection
of sputum samples in COVID containment zones; and establishing linkages for diagnosis and management for TB at all COVID-19 Care Centres, and dedicated COVID-19 Health Centres and Hospitals. Furthermore, in line with the new scientific evidence, the NTEP recognises TB as a comorbidity for COVID-19 and its impacts on the progression and severity of the disease and has foreseen measures to ensure early detection and timely detection effective management of TB and COVID-19. For example, screening for TB will also be conducted among post-COVID patients at six-monthly intervals for two years.
In India, childhood Tuberculosis remains a staggering problem, contributing to approximately 31% of the global burden. Over the last decade, consistently, children constitute 6-7% of all the patients treated under NTEP annually, pointing to a gap of 4-5% in total notification against the estimated incidence. To that end, inter-sectoral coordination is critical for ensuring wide-reach of the programme to remedy this gap. To establish pathways of early detection of children with TB symptoms and track them for early diagnosis and treatment initiation, the programme, in collaboration with the Rashtriya Bal Swasthya Karyakram (RBSK) and Rashtriya Kishor Swasthya Karyakram (RKSK), launched the “Collaborative Framework to Address the Burden of Tuberculosis among Children and Adolescents.” This integrated framework endeavours to enhance community awareness on childhood TB, generate demand, and promote disease prevention and early health-seeking.
The programme has child-friendly formulations of drugs to manage paediatric drug-sensitive TB and procures child-friendly formulations
◄ TB COMORBIDITIES AND SPECIAL SITUATIONS
Comorbidities like malnutrition, diabetes, HIV, tobacco smoking, and alcohol impact a person with TB in predisposition and severity. To combat these, the programme brought in a multitude of initiatives.
Cognizant of the bidirectional relationship of TB and undernutrition, in addition to the Nutrition-TB App (N-TB App) that facilitates the implementation of the technical aspects of the nutritional assessment and appropriate supplementation, the programme
collaborated with the Ministry of Women and Child Development (MoWCD). To support the NTEP’s objective of successful treatment and improved nutritional status among TB patients, the programme and the MoWCD have ensured the holistic development of women and children by providing additional nutrition support to TB patients. In addition, TB awareness generation also became a part of the annual ‘Poshan Mah’ to address malnutrition at the population level.
◄ TB PREVENTION
‘Prevent’ is one of the four critical pillars (Detect – Treat – Prevent – Build) of India’s National Strategic Plan for Elimination of Tuberculosis (NSP 2017-25) that focuses on preventing the emergence of TB in a vulnerable population. The program has offered TB Preventive Therapy (TPT) for more than a decade, albeit limitedly to children below the age of six years and People living with HIV/AIDS (PLHIV) for the past few years. However, to reinforce the goal of Ending TB by 2025 by accelerating preventive measures like the TPT, the NTEP has taken a monumental leap in 2021 by expanding the policy to offer TPT to all household contacts (HHC) of index pulmonary TB patients irrespective of their age, and other risk groups. Moreover, to overcome the challenges a long treatment entails, a new shorter TPT regimen with
three months of weekly Rifapentine and Isoniazid (3HP) has been recommended as an alternative to six months of daily life Isoniazid regimen (6H). These policy decisions and their implementation are summated with the release of The Guidelines for Programmatic Management of TB Preventive Treatment (PMTPT) in India. In 2021, more than 2 lakh PLHIV on active care and 1.20 lakh HHC of pulmonary bacteriologically confirmed TB patients were initiated on TB Preventive Treatment. Furthermore, the programme has introduced TPT in contacts of DR-TB patients in 12 States (Andhra Pradesh, Telangana, Delhi, Gujarat, Himachal Pradesh, Karnataka, Kerala, Maharashtra, Meghalaya, Odisha, Punjab, and Assam) to gain programmatic evidence and experience for further scale-up.
xviii xix
for DR-TB. Similarly, the programme has mandated upfront molecular diagnostics for all paediatric TB samples to address the common diagnostic challenges in paediatric TB, including DR-TB. Lastly, Bedaquiline has been approved for use in children above five years of age, offering a shorter and safer treatment regimen.
In 2020, through its National Framework for A Gender-Responsive Approach to TB, India became one of the first countries to adopt
the Communities, Human Rights and Gender Tools. This year, the programme started gearing up the programme managers to acquire skills for gender-responsive analysis and interventions along the Detect-Treat-Prevent-Build continuum by designing a training module. A national-level Training of Trainers of facilitators has been conducted, and regional-level training has been scheduled to enable the stakeholders to implement gender-sensitive approaches across differentiated TB patient care.
Two districts (each with high and low TB Index scores) were selected from each State/UT for the JSSM. The team provided extensive recommendations to the state officials for solidifying TB response. Furthermore, the programme division is strengthening the Nikshay portal by incorporating advanced analytical tools to provide regular feedback to the States on important indicators, which will help them take necessary and timely actions.
In 2021, Ayushman Bharat Health Account was enabled within Nikshay to uniquely identify persons, authenticate them and digitally share
one’s health records enabling interoperability within the digital health ecosystem. Moreover, the TB Aarogya Sathi application has been released for people with TB with multi-language support, TB screening tool, self-reporting bank account, and treatment adherence feature. In addition, new modules like Diagnostic, Sample Tracking, and Drug Dispensation have been incorporated into Nikshay. Similarly, the Adverse Event Module is available to record adverse events for patients, add causality, and declare outcomes for events.
◄ SUPERVISION AND MONITORING
Field-level supervision exercises over the past two years have been significantly impacted in the wake of the COVID-19 pandemic. Consequently, to identify the technical and
administrative challenges faced by the States/UTs and provide course-correction, a nation-wide Joint Supportive Supervision Mission (JSSM) was conducted across 34 States/UTs.
◄ PARTNERSHIPS FOR THE PRIVATE SECTOR ENGAGEMENT
Despite the disruption and turmoil of the COVID-19 pandemic, private sector commitments and undertaking of the pre-COVID era endured. Several partners and varied stakeholders have been threaded on a single strand of India’s fight to eliminate TB, bringing numerous innovative approaches and diverse strategies. The programme has established a National Technical Support Unit at the central level to strengthen the private sector and inter-sectoral engagement. Likewise, Multi-disciplinary Technical Support
Units have been formed in nine high priority States, contributing to more than 75% of National TB notifications. Not only the existing partnerships across the States have been systematically mapped, thereby providing a clear need-based road map for the future, engagement of interphase agencies in the form of Patient-Provider Support Agency (PPSA) to promote private sector engagement has also been scaled up to more than 170 districts.
◄ ADVOCACY, COMMUNICATION, AND COMMUNITY ENGAGEMENT
Since its inception, Advocacy, Communication, and Community Engagement (ACSM) have been bolstering the programme’s foundation by solidifying the measures across all aspects of TB care. 2021 was punctuated by the highest political commitment towards TB Mukt Bharat Abhiyaan by Hon’ble Governors at the 51st Conference of Governors chaired by the President of India—a first of its kind and juxtaposed with the lowest administrative unit—exemplified by the inclusion of the TB module in the Gram Pradhans induction for mobilising TB Free Panchayats. Also, a “Guidance Document on Community Engagement” has been developed to guide the States/ UTs in planning, designing, and monitoring the activities under community engagement. While, national Training of Trainers on Community Engagement for
Northern, Western and Eastern States have been completed. Moreover, a certificate course titled “Self-learning course for TB Champions” has been developed and hosted on multiple e-platforms to empower TB survivors with the basic knowledge on TB and the provision of various services offered by the NTEP.
Also, a strategy document to incorporate stigma reduction across all TB interventions, develop a comprehensive communication strategy, and actively engage the TB affected community to foster non-stigmatising and non-discriminatory behaviours in the society—”Strategy on Addressing Stigma Associated with Tuberculosis” was released in 2021. Entwining all the ACSM strategies together, a 360-degree mass media campaign has been ongoing across the country under TB Mukt Bharat Abhiyaan.
◄ PATIENT SUPPORT SYSTEMS
The significant burden of TB in India is compounded by the dual existence of food insecurity and undernutrition, signifying the necessity of facilitating nutritional support to TB patients. Direct Benefit Transfer (DBT) into the beneficiary’s bank account under the NTEP continued its exemplary reach in 2021. Approximately INR 1488 crores have been paid to 57.33 lakh TB patients under Nikshay Poshan Yojana (NPY) from April 2018 to February 2022.
Effecting new patient-supportive pathways in the aftermath of COVID-19 pandemic-led challenges, the programme brought about flexibility to provide the DBT benefit through the existing bank account of a blood relative of a TB patient to ensure that all patients can avail themselves of the NPY scheme. The programme is in the process of operationalisation of e-RUPI vouchers for DBT schemes.
xx xxi
For accelerated action towards TB elimination in the mission mode, a Multisectoral response has been given utmost priority to ensure meaningful engagement of key stakeholders, including Ministries/ Departments both at the central and state-level, industries of public and private sectors, corporate, and business associations. A ‘National Inter-Ministerial Task Force on Tuberculosis (NIMTF-TB)’ has been proposed by the MoHFW to engage with 23 key line Ministries of the GoI of India for policy and programme convergence. The programme coordinated with ministries like
M/o Rural Development, M/o Consumer Affairs, M/o of Statistics and Program Implementation, M/o of Electronics & Information Technology, M/o Road Transport & Highways, M/o Panchyati Raj, M/o of Heavy Industries, M/o Small, Micro & Medium Enterprises, M/o Youth Affairs & Sports, M/o Labour & Employment, North Eastern Council, to name a few, for strengthening inter-ministerial collaboration. Lastly, 138 corporates joined Corporate TB Pledge (CTP), including 10 Business Associations.
◄ TB RESEARCH & INNOVATIONS
Drawing from the third pillar of the NSP 2017-25 on research & innovations, the NTEP is collaborating with various national entities towards augmenting the development of new tools, reinforcing not only the rapid uptake of available tools and products but also to expedite our battle to end TB. To that end, a multi-state validation study of C-Tb skin test to detect TB infection has been completed with the support of Indian Council of Medical Research - Department of Health Research (ICMR-DHR). Likewise, India is participating and contributing to the BRICS multi-country project on “Epidemiological impact and intersection of the COVID-19
and tuberculosis pandemics in Brazil, Russia, India and South Africa” (IMPAC19TB). The project aims to understand the impact of COVID-19 and related response measures on the epidemiology and provision of healthcare services for TB and develop innovative and pragmatic solutions to overcome the adverse consequences. Furthermore, capitalising on Artificial Intelligence (AI) for improving healthcare delivery, increasing diagnostic accuracy, and screening for disease, an AI solution is being developed to screen for TB from cough sounds and voices with the support of WIAI.
◄ BEST PRACTICES & SUCCESS STORIES
The NTEP has consistently boosted its capacity to address TB. The programme has encapsulated best practices and success stories designed and implemented at various
levels of healthcare delivery, whether as a response to a particular health outcome or addressing a programmatic dimension required for improved performance.
◄ HEALTH FINANCING
The Programme Implementation Plan (PIP) of NTEP is an integral part of the NHM. It is the most crucial instrument by which States submit their costed plans and propose strategies and activities, to receive resources under the NHM. The NTEP PIP support to States/UTs—aligned with the NHM PIP template, has been developed and disseminated. For 2020-21, about Rs 2516.82 crores had been recommended, while an additional Rs 25.48 crores were recommended in the Supplementary PIP for four States.
The NTEP has constantly been evolving, buttressing innovations, and reinforcing strategies at all levels—mandatory notification of all TB cases, integration of the programme
with the general health services, expansion of diagnostics services, amplifying the Nikshay ecosystem, provision of DBT, employing newer treatment modalities, scaling up of DRTB management and last-mile support, and TPT, catering bidirectional screening of TB and COVID-19, providing single-window service for TB-HIV cases, strategizing national TB prevalence survey, synthesising integration across sectors and ministries, bridging the divide of the public and private sector, collaborating with corporates and national institutes, facilitating research of new tools, and anticipating various dimensions of health systems challenges—both unfinished and emerging.
1 INDIA TB REPORT 2022 2INDIA TB REPORT 2022
TB DISEASE BURDEN IN INDIA
01
Meaningful health information to inform TB policy
3 INDIA TB REPORT 2022 4INDIA TB REPORT 2022
Estimation of TB BurdenScientific evidence is key to improving global public health, because National and International health policies should be based on accurate and meaningful health information and this requires the generation of valid scientific evidence. However, health data from epidemiological studies may have limited scope or only convey information partially,
thus requiring complex methodologies to derive estimates. Estimates of the burden of disease caused by TB measured in terms of incidence, prevalence and mortality are produced annually by WHO using information gathered through surveillance systems (patient notifications and death registrations), special studies (including surveys of the
TB Disease Burden in India
prevalence of disease), mortality surveys, inventory studies of under-reporting of detected TB, in-depth analysis of surveillance and other data, expert opinion and consultations with countries1.
1Glaziou P, Dodd PJ, Dean A, Floyd K. Methods used by WHO to estimate the global burden of TB disease. Geneva: World Health Organization; 2020 (https://www.who.int/tb/publications/global_ report/TB20_Technical_Appendix_20201014.pdf)
Incidence Estimation Methods Mortality Estimation Methods
Incidence estimates are derived from one of the following four methods:
• Results from TB prevalence surveys,
• Notifications in high-income countries adjusted by a standard factor to account for under-reporting and underdiagnosis,
• National inventory studies,
• Patient notification data combined with expert opinion about case detection gaps.
Mortality estimates are obtained from the either of the following two methods:
• National vital registration systems of mortality surveys,
• Indirectly derived from incidence and case fatality ratio.
However, for the 2021 estimations, methodology was modified considering the impact of disruptions due to pandemic across various countries worldwide. The updates in the methodology adopted were as follows:
◄ WHO developed dynamic country-specific models for 16 countries (Angola, Bangladesh, Brazil, China, India, Indonesia, Kenya, Myanmar, Pakistan, Peru, Philippines, Russian Federation, South Africa, Uganda, Ukraine and Vietnam), which contributed to a 93% drop in the notifications between 2019 and 2020.
◄ The key assumptions based on which the model was built were as follows:
Reductions in TB patient notifications in 2020 relative to the expected number-based on extrapolation of pre-2020 trends, were attributable to delays in diagnosis of TB and initiation of TB treatment.
◄ A 50% reduction (uncertainty interval, 25–75%) in TB transmission during periods of lockdown,country-specific based on the data on duration of lockdown availability.
TB Burden in IndiaTB Incidence
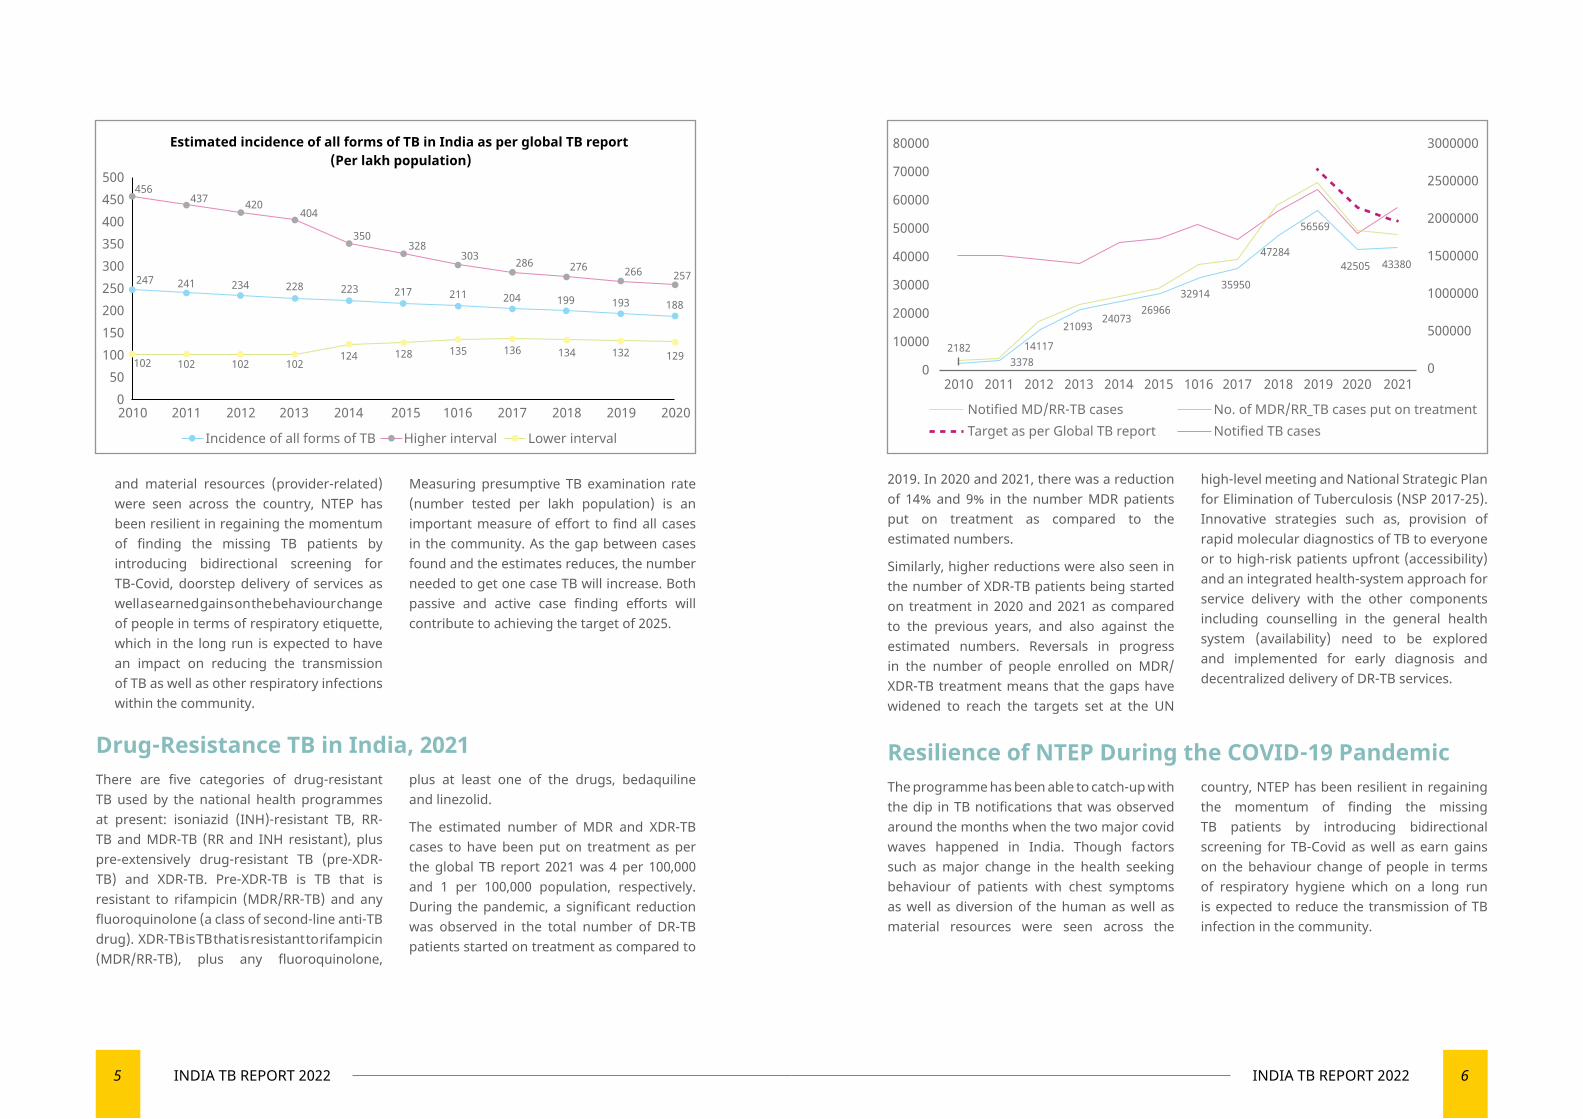
As per the Global TB Report 2021, the estimated incidence of all forms of TB in India for the year 2020 was 188 per 100,000 population (129-257 per 100,000 population).
The total number of incident TB patients (new & relapse) notified during 2021 was
19,33,381 which was 19% higher than that of 2020 (16,28,161). The programme had been able to catch-up with the dip in TB notifications that was observed around the months when the two major covid waves happened in India. Though factors such as changes in the health seeking behaviour of patients with chest symptoms (patient-related) as well as diversion of the human
5 INDIA TB REPORT 2022 6INDIA TB REPORT 2022
2019. In 2020 and 2021, there was a reduction of 14% and 9% in the number MDR patients put on treatment as compared to the estimated numbers.
Similarly, higher reductions were also seen in the number of XDR-TB patients being started on treatment in 2020 and 2021 as compared to the previous years, and also against the estimated numbers. Reversals in progress in the number of people enrolled on MDR/XDR-TB treatment means that the gaps have widened to reach the targets set at the UN
high-level meeting and National Strategic Plan for Elimination of Tuberculosis (NSP 2017-25). Innovative strategies such as, provision of rapid molecular diagnostics of TB to everyone or to high-risk patients upfront (accessibility) and an integrated health-system approach for service delivery with the other components including counselling in the general health system (availability) need to be explored and implemented for early diagnosis and decentralized delivery of DR-TB services.
Resilience of NTEP During the COVID-19 PandemicThe programme has been able to catch-up with the dip in TB notifications that was observed around the months when the two major covid waves happened in India. Though factors such as major change in the health seeking behaviour of patients with chest symptoms as well as diversion of the human as well as material resources were seen across the
country, NTEP has been resilient in regaining the momentum of finding the missing TB patients by introducing bidirectional screening for TB-Covid as well as earn gains on the behaviour change of people in terms of respiratory hygiene which on a long run is expected to reduce the transmission of TB infection in the community.
and material resources (provider-related) were seen across the country, NTEP has been resilient in regaining the momentum of finding the missing TB patients by introducing bidirectional screening for TB-Covid, doorstep delivery of services as well as earned gains on the behaviour change of people in terms of respiratory etiquette, which in the long run is expected to have an impact on reducing the transmission of TB as well as other respiratory infections within the community.
Measuring presumptive TB examination rate (number tested per lakh population) is an important measure of effort to find all cases in the community. As the gap between cases found and the estimates reduces, the number needed to get one case TB will increase. Both passive and active case finding efforts will contribute to achieving the target of 2025.
Drug-Resistance TB in India, 2021There are five categories of drug-resistant TB used by the national health programmes at present: isoniazid (INH)-resistant TB, RR-TB and MDR-TB (RR and INH resistant), plus pre-extensively drug-resistant TB (pre-XDR-TB) and XDR-TB. Pre-XDR-TB is TB that is resistant to rifampicin (MDR/RR-TB) and any fluoroquinolone (a class of second-line anti-TB drug). XDR-TB is TB that is resistant to rifampicin (MDR/RR-TB), plus any fluoroquinolone,
plus at least one of the drugs, bedaquiline and linezolid.
The estimated number of MDR and XDR-TB cases to have been put on treatment as per the global TB report 2021 was 4 per 100,000 and 1 per 100,000 population, respectively. During the pandemic, a significant reduction was observed in the total number of DR-TB patients started on treatment as compared to
2010 2011 2012 2013 2014 2015 1016 2017 2018 2019 2020
500450400350300250200150100
500
Estimated incidence of all forms of TB in India as per global TB report (Per lakh population)
456437 420
404
350328
303 286 276 266 257247 234 228 223 217 211 204 199 193 188
241
102 102 102 102124 128 135 136 134 132 129
Incidence of all forms of TB Higher interval Lower interval
2010 2011 2012 2013 2014 2015 1016 2017 2018 2019 2020 2021
80000
70000
60000
50000
40000
30000
20000
10000
0
3000000
2500000
2000000
1500000
1000000
500000
02182
337814117
2109324073
2696632914
35950
47284
56569
42505 43380
Notified MD/RR-TB cases No. of MDR/RR_TB cases put on treatmentNotified TB casesTarget as per Global TB report
7 INDIA TB REPORT 2022 8INDIA TB REPORT 2022
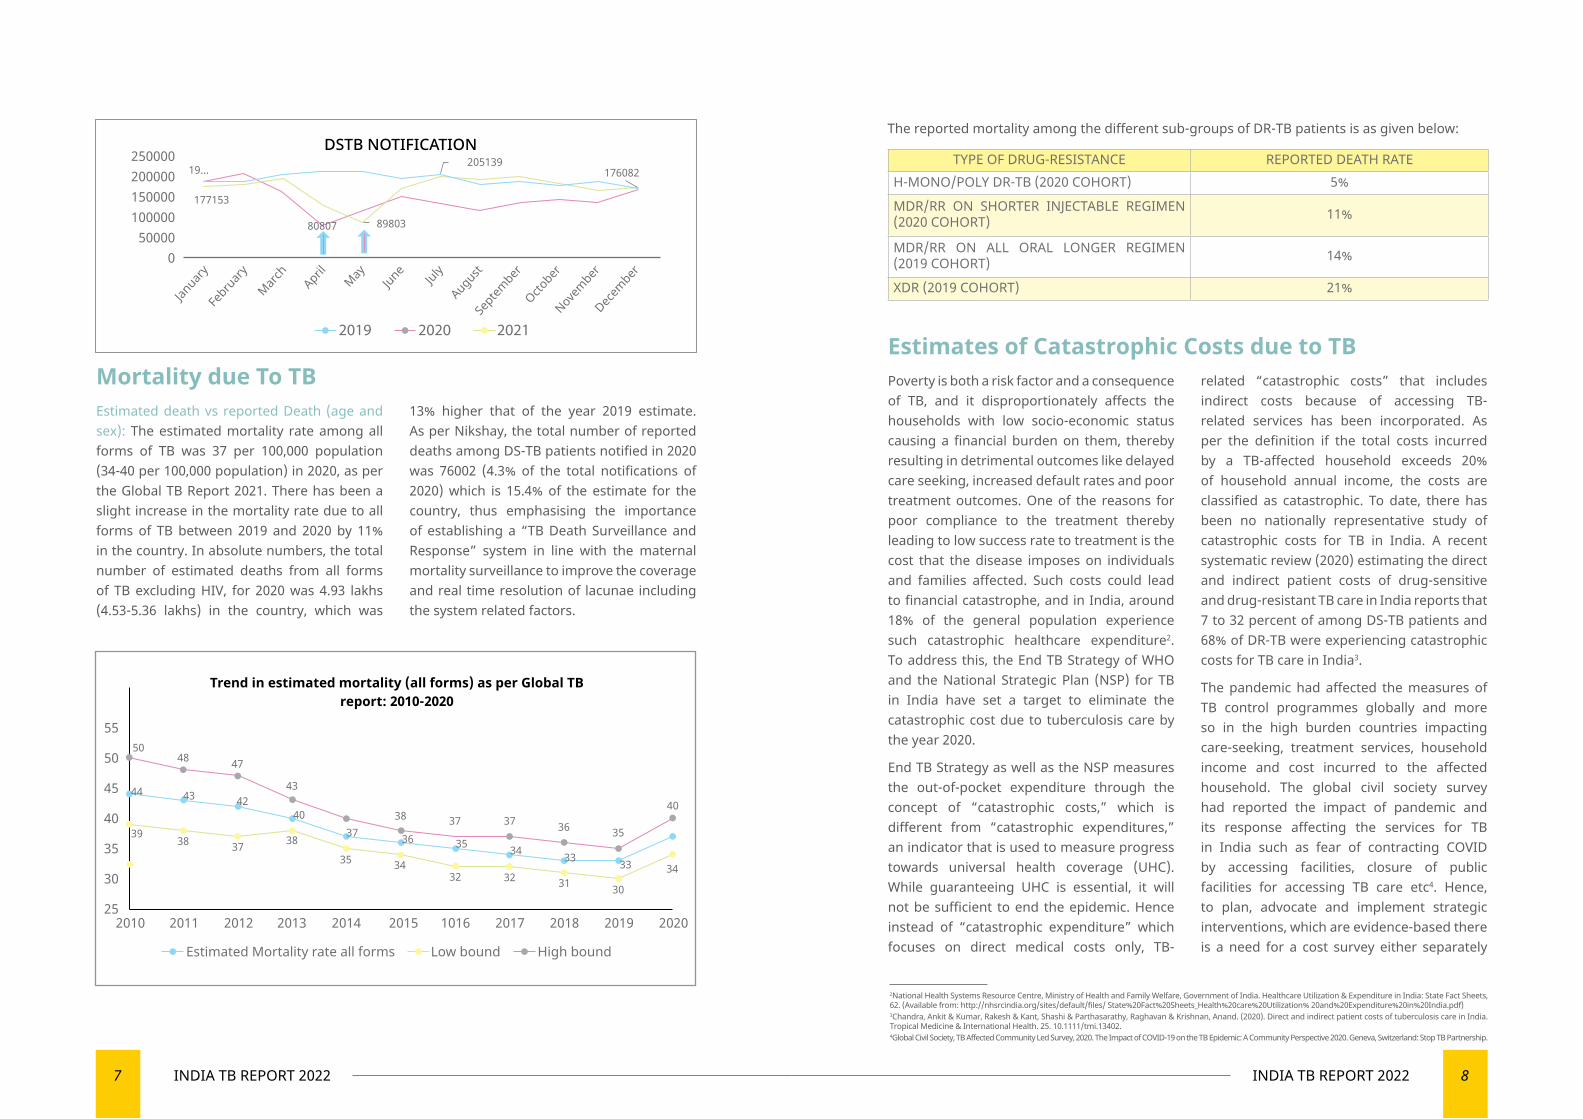
Mortality due To TBEstimated death vs reported Death (age and sex): The estimated mortality rate among all forms of TB was 37 per 100,000 population (34-40 per 100,000 population) in 2020, as per the Global TB Report 2021. There has been a slight increase in the mortality rate due to all forms of TB between 2019 and 2020 by 11% in the country. In absolute numbers, the total number of estimated deaths from all forms of TB excluding HIV, for 2020 was 4.93 lakhs (4.53-5.36 lakhs) in the country, which was
13% higher that of the year 2019 estimate. As per Nikshay, the total number of reported deaths among DS-TB patients notified in 2020 was 76002 (4.3% of the total notifications of 2020) which is 15.4% of the estimate for the country, thus emphasising the importance of establishing a “TB Death Surveillance and Response” system in line with the maternal mortality surveillance to improve the coverage and real time resolution of lacunae including the system related factors.
TYPE OF DRUG-RESISTANCE REPORTED DEATH RATEH-MONO/POLY DR-TB (2020 COHORT) 5%
MDR/RR ON SHORTER INJECTABLE REGIMEN (2020 COHORT) 11%
MDR/RR ON ALL ORAL LONGER REGIMEN (2019 COHORT) 14%
XDR (2019 COHORT) 21%
Estimates of Catastrophic Costs due to TBPoverty is both a risk factor and a consequence of TB, and it disproportionately affects the households with low socio-economic status causing a financial burden on them, thereby resulting in detrimental outcomes like delayed care seeking, increased default rates and poor treatment outcomes. One of the reasons for poor compliance to the treatment thereby leading to low success rate to treatment is the cost that the disease imposes on individuals and families affected. Such costs could lead to financial catastrophe, and in India, around 18% of the general population experience such catastrophic healthcare expenditure2. To address this, the End TB Strategy of WHO and the National Strategic Plan (NSP) for TB in India have set a target to eliminate the catastrophic cost due to tuberculosis care by the year 2020.
End TB Strategy as well as the NSP measures the out-of-pocket expenditure through the concept of “catastrophic costs,” which is different from “catastrophic expenditures,” an indicator that is used to measure progress towards universal health coverage (UHC). While guaranteeing UHC is essential, it will not be sufficient to end the epidemic. Hence instead of “catastrophic expenditure” which focuses on direct medical costs only, TB-
related “catastrophic costs” that includes indirect costs because of accessing TB-related services has been incorporated. As per the definition if the total costs incurred by a TB-affected household exceeds 20% of household annual income, the costs are classified as catastrophic. To date, there has been no nationally representative study of catastrophic costs for TB in India. A recent systematic review (2020) estimating the direct and indirect patient costs of drug-sensitive and drug-resistant TB care in India reports that 7 to 32 percent of among DS-TB patients and 68% of DR-TB were experiencing catastrophic costs for TB care in India3.
The pandemic had affected the measures of TB control programmes globally and more so in the high burden countries impacting care-seeking, treatment services, household income and cost incurred to the affected household. The global civil society survey had reported the impact of pandemic and its response affecting the services for TB in India such as fear of contracting COVID by accessing facilities, closure of public facilities for accessing TB care etc4. Hence, to plan, advocate and implement strategic interventions, which are evidence-based there is a need for a cost survey either separately
The reported mortality among the different sub-groups of DR-TB patients is as given below:
2National Health Systems Resource Centre, Ministry of Health and Family Welfare, Government of India. Healthcare Utilization & Expenditure in India: State Fact Sheets, 62. (Available from: http://nhsrcindia.org/sites/default/files/ State%20Fact%20Sheets_Health%20care%20Utilization% 20and%20Expenditure%20in%20India.pdf)3Chandra, Ankit & Kumar, Rakesh & Kant, Shashi & Parthasarathy, Raghavan & Krishnan, Anand. (2020). Direct and indirect patient costs of tuberculosis care in India. Tropical Medicine & International Health. 25. 10.1111/tmi.13402.4Global Civil Society, TB Affected Community Led Survey, 2020. The Impact of COVID-19 on the TB Epidemic: A Community Perspective 2020. Geneva, Switzerland: Stop TB Partnership.
5048 47
43
38 37 37 36 35
40
2010 2011 2012 2013 2014 2015 1016 2017 2018 2019 2020
Trend in estimated mortality (all forms) as per Global TBreport: 2010-2020
Estimated Mortality rate all forms Low bound High bound
55
50
45
40
35
30
25
33333435363740
424344
39 38 37 38
35 3432 32 31 30
34
Janua
ryFebrua
ryMarc
h
April
May
June
July
Augu
stSept
embe
rOcto
ber
Novemb
erDe
cemb
er
DSTB NOTIFICATION250000200000150000100000
500000
19...
177153
80807 89803
205139176082
2019 20212020
9 INDIA TB REPORT 2022 10INDIA TB REPORT 2022
or combined with health surveys at national and state level to understand the new baseline burden in the affected households, thereby
aiding in tracking the progress towards the goal of achieving zero catastrophic cost due to TB.
Devising Strategic Plan for Elimination of TuberculosisThe National Strategic Plan for Elimination of Tuberculosis 2017-25 was approved on the 8th of May 2017 and has been operational since then in the entire country with the goal of Ending TB by 2025. This NSP addresses requirements for achieving the SDG and End TB targets for India and is driven by the DETECT - TREAT - PREVENT - BUILD approach.
The focus is on early diagnosis of all the TB patients, prompt treatment with the right drugs and regimens along with suitable patient support systems including financial and nutritional support. This is supplemented by prevention strategies including TB vaccines and TB Preventive Treatment.
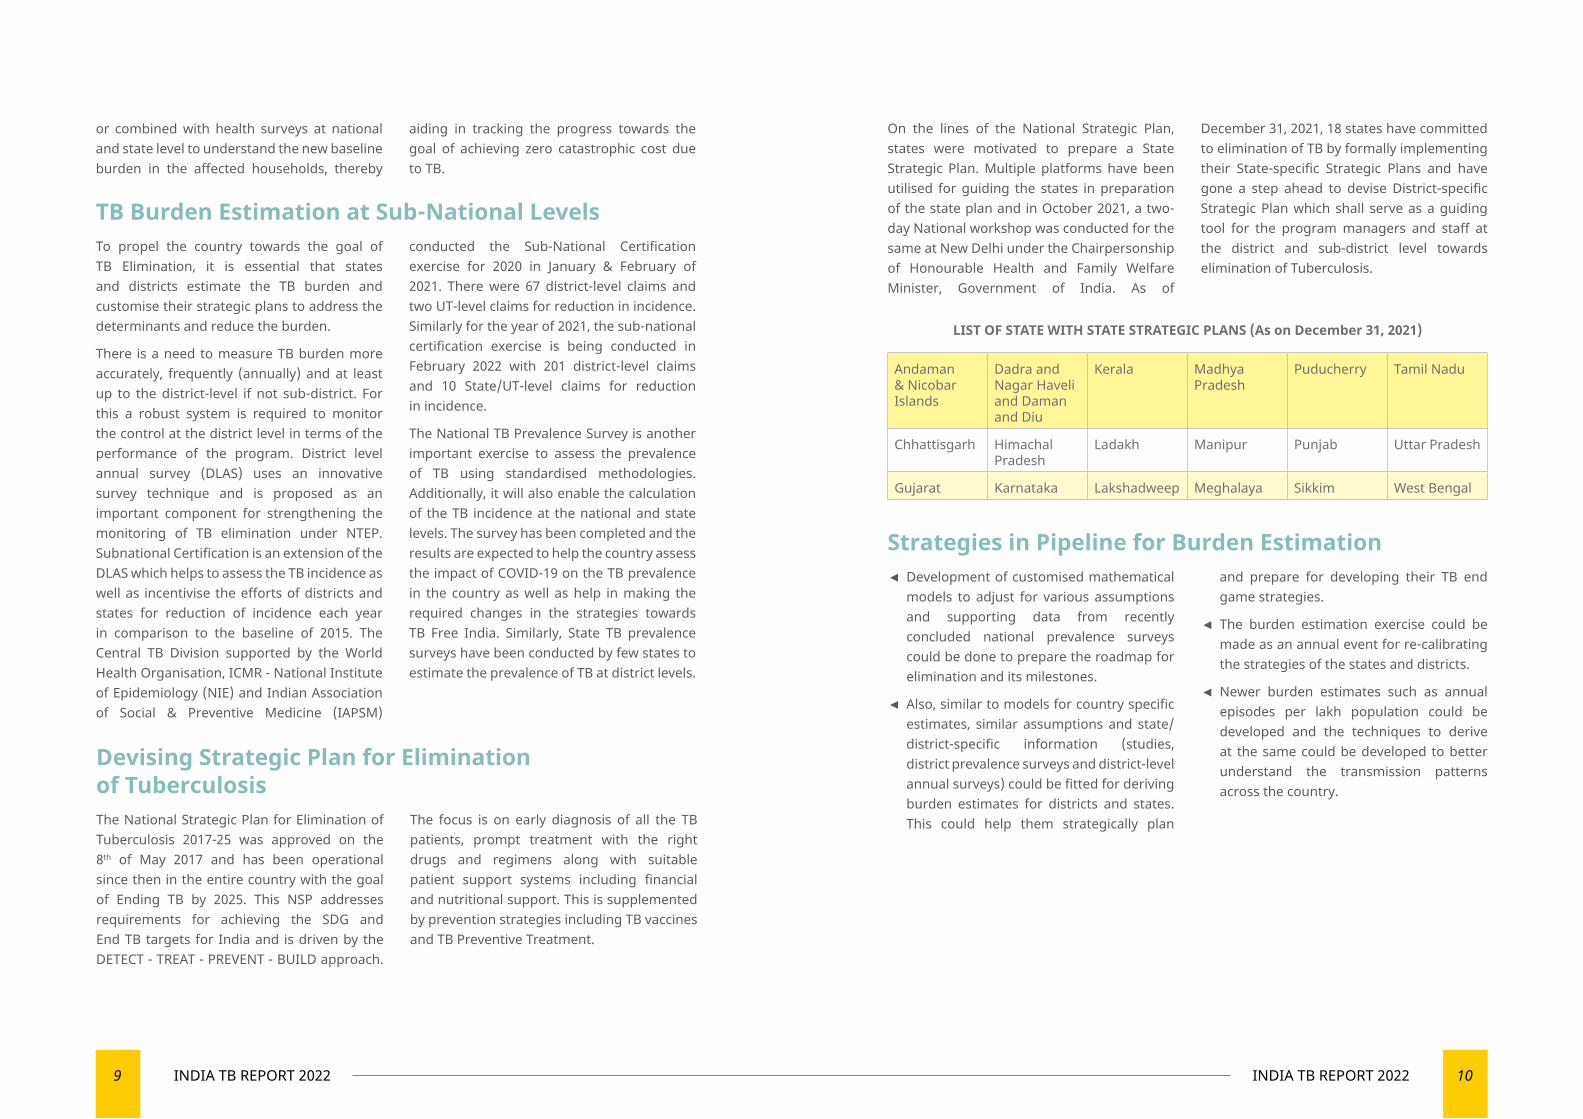
On the lines of the National Strategic Plan, states were motivated to prepare a State Strategic Plan. Multiple platforms have been utilised for guiding the states in preparation of the state plan and in October 2021, a two-day National workshop was conducted for the same at New Delhi under the Chairpersonship of Honourable Health and Family Welfare Minister, Government of India. As of
December 31, 2021, 18 states have committed to elimination of TB by formally implementing their State-specific Strategic Plans and have gone a step ahead to devise District-specific Strategic Plan which shall serve as a guiding tool for the program managers and staff at the district and sub-district level towards elimination of Tuberculosis.
Andaman & Nicobar Islands
Dadra and Nagar Haveli and Daman and Diu
Kerala Madhya Pradesh
Puducherry Tamil Nadu
Chhattisgarh Himachal Pradesh
Ladakh Manipur Punjab Uttar Pradesh
Gujarat Karnataka Lakshadweep Meghalaya Sikkim West Bengal
LIST OF STATE WITH STATE STRATEGIC PLANS (As on December 31, 2021)
Strategies in Pipeline for Burden Estimation ◄ Development of customised mathematical models to adjust for various assumptions and supporting data from recently concluded national prevalence surveys could be done to prepare the roadmap for elimination and its milestones.
◄ Also, similar to models for country specific estimates, similar assumptions and state/district-specific information (studies, district prevalence surveys and district-level annual surveys) could be fitted for deriving burden estimates for districts and states. This could help them strategically plan
and prepare for developing their TB end game strategies.
◄ The burden estimation exercise could be made as an annual event for re-calibrating the strategies of the states and districts.
◄ Newer burden estimates such as annual episodes per lakh population could be developed and the techniques to derive at the same could be developed to better understand the transmission patterns across the country.
TB Burden Estimation at Sub-National Levels To propel the country towards the goal of TB Elimination, it is essential that states and districts estimate the TB burden and customise their strategic plans to address the determinants and reduce the burden.
There is a need to measure TB burden more accurately, frequently (annually) and at least up to the district-level if not sub-district. For this a robust system is required to monitor the control at the district level in terms of the performance of the program. District level annual survey (DLAS) uses an innovative survey technique and is proposed as an important component for strengthening the monitoring of TB elimination under NTEP. Subnational Certification is an extension of the DLAS which helps to assess the TB incidence as well as incentivise the efforts of districts and states for reduction of incidence each year in comparison to the baseline of 2015. The Central TB Division supported by the World Health Organisation, ICMR - National Institute of Epidemiology (NIE) and Indian Association of Social & Preventive Medicine (IAPSM)
conducted the Sub-National Certification exercise for 2020 in January & February of 2021. There were 67 district-level claims and two UT-level claims for reduction in incidence. Similarly for the year of 2021, the sub-national certification exercise is being conducted in February 2022 with 201 district-level claims and 10 State/UT-level claims for reduction in incidence.
The National TB Prevalence Survey is another important exercise to assess the prevalence of TB using standardised methodologies. Additionally, it will also enable the calculation of the TB incidence at the national and state levels. The survey has been completed and the results are expected to help the country assess the impact of COVID-19 on the TB prevalence in the country as well as help in making the required changes in the strategies towards TB Free India. Similarly, State TB prevalence surveys have been conducted by few states to estimate the prevalence of TB at district levels.
TB DIAGNOSTIC SERVICES AND ACTIVE CASE FINDING
02
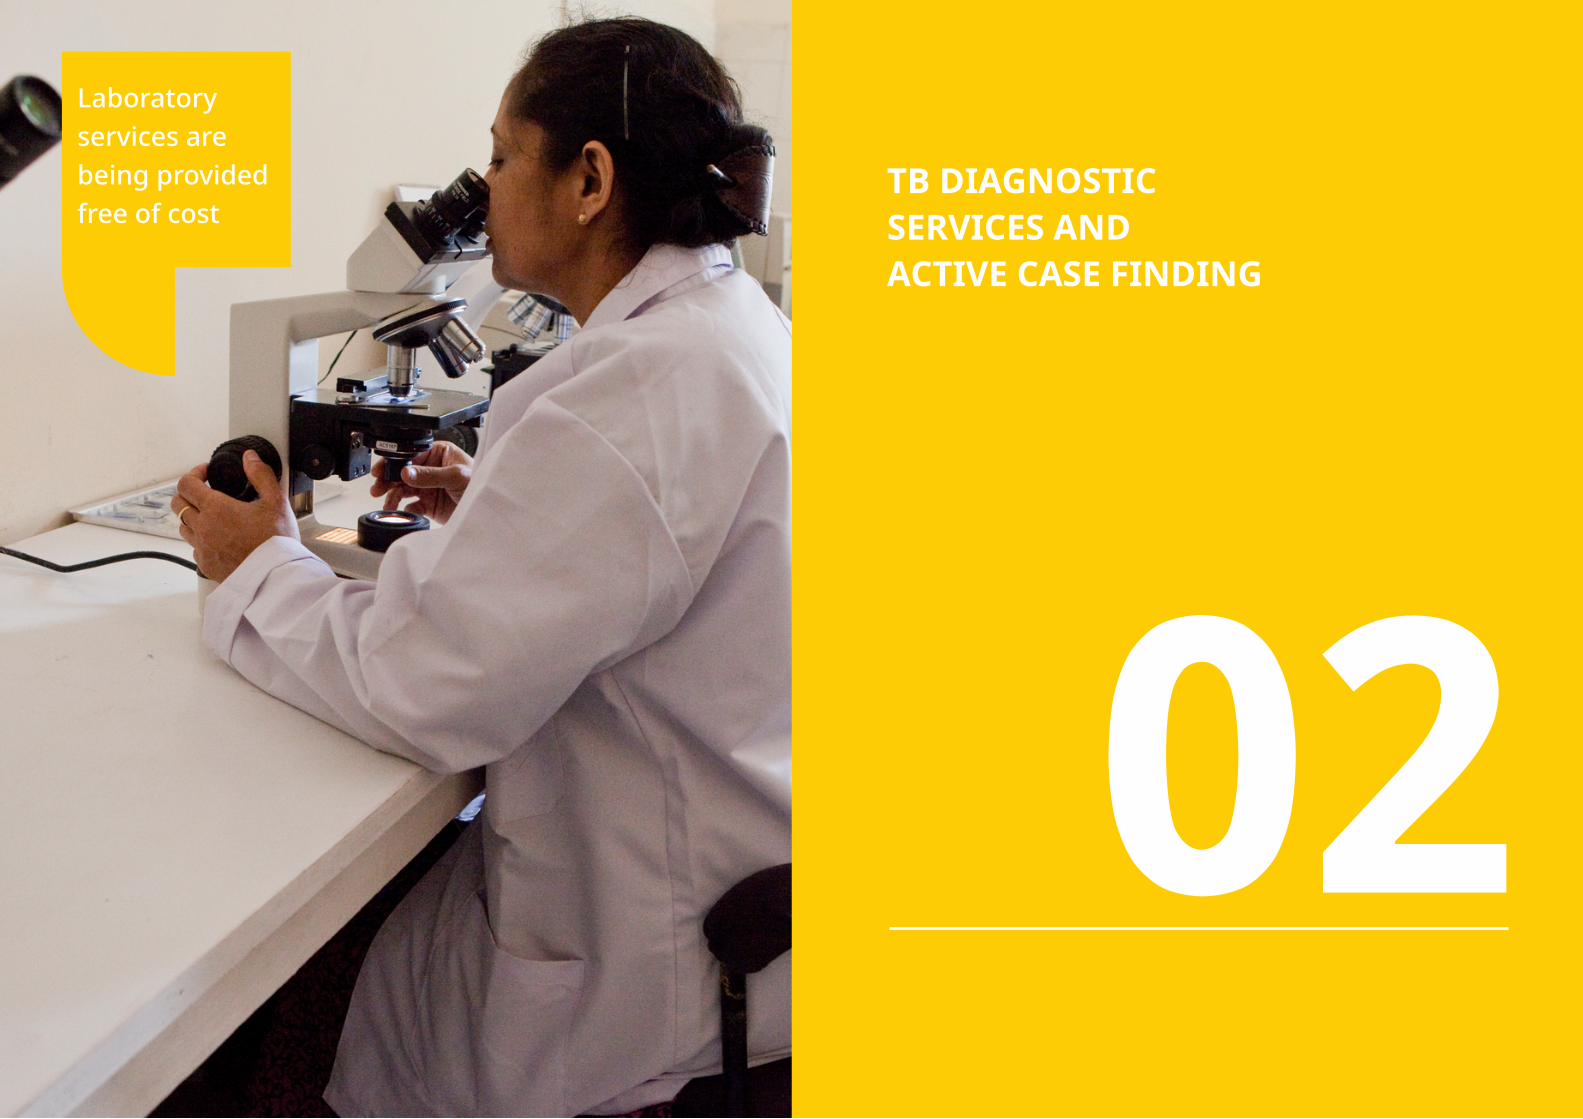
Laboratory services are being provided free of cost
13 INDIA TB REPORT 2022 14INDIA TB REPORT 2022
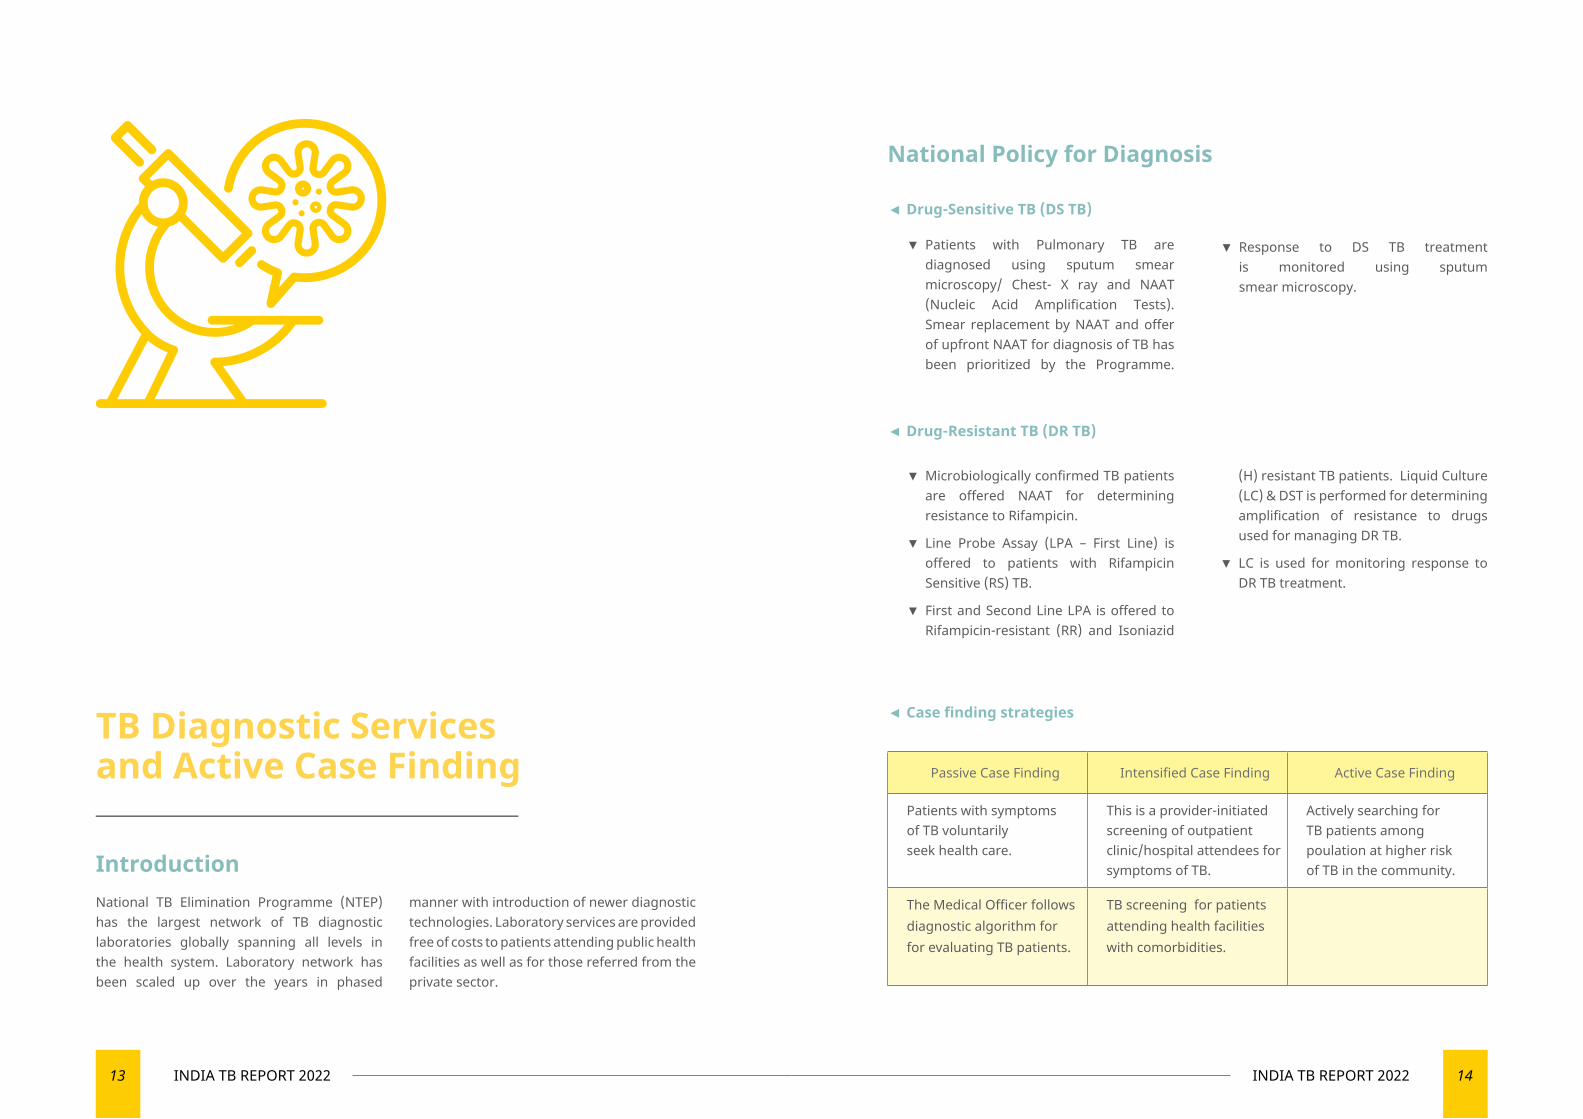
TB Diagnostic Services and Active Case Finding
IntroductionNational TB Elimination Programme (NTEP) has the largest network of TB diagnostic laboratories globally spanning all levels in the health system. Laboratory network has been scaled up over the years in phased
manner with introduction of newer diagnostic technologies. Laboratory services are provided free of costs to patients attending public health facilities as well as for those referred from the private sector.
◄ Case finding strategies
Passive Case Finding Intensified Case Finding Active Case Finding
Patients with symptoms of TB voluntarily seek health care.
This is a provider-initiated screening of outpatient clinic/hospital attendees for symptoms of TB.
Actively searching for TB patients among poulation at higher risk of TB in the community.
The Medical Officer follows diagnostic algorithm for for evaluating TB patients.
TB screening for patients attending health facilities with comorbidities.
National Policy for Diagnosis
◄ Drug-Sensitive TB (DS TB)
▼ Patients with Pulmonary TB are diagnosed using sputum smear microscopy/ Chest- X ray and NAAT (Nucleic Acid Amplification Tests). Smear replacement by NAAT and offer of upfront NAAT for diagnosis of TB has been prioritized by the Programme.
◄ Drug-Resistant TB (DR TB)
▼ Response to DS TB treatment is monitored using sputum smear microscopy.
▼ Microbiologically confirmed TB patients are offered NAAT for determining resistance to Rifampicin.
▼ Line Probe Assay (LPA – First Line) is offered to patients with Rifampicin Sensitive (RS) TB.
▼ First and Second Line LPA is offered to Rifampicin-resistant (RR) and Isoniazid
(H) resistant TB patients. Liquid Culture (LC) & DST is performed for determining amplification of resistance to drugs used for managing DR TB.
▼ LC is used for monitoring response to DR TB treatment.
15 INDIA TB REPORT 2022 16INDIA TB REPORT 2022
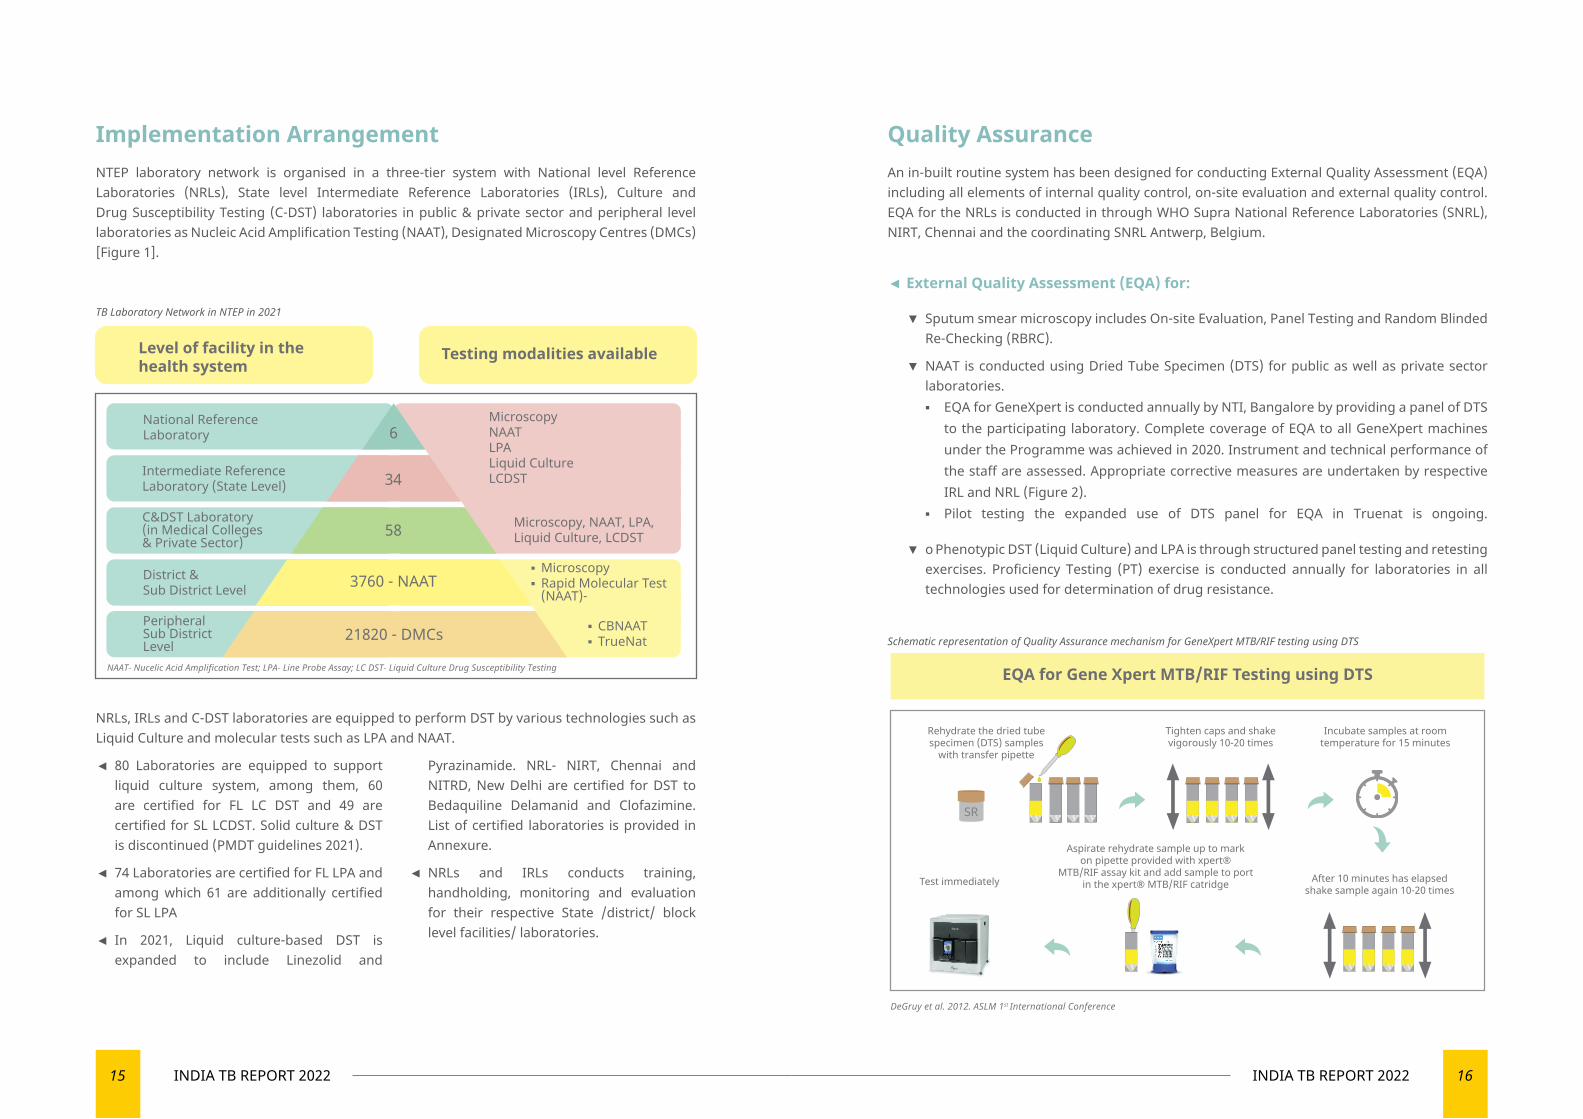
Implementation ArrangementNTEP laboratory network is organised in a three-tier system with National level Reference Laboratories (NRLs), State level Intermediate Reference Laboratories (IRLs), Culture and Drug Susceptibility Testing (C-DST) laboratories in public & private sector and peripheral level laboratories as Nucleic Acid Amplification Testing (NAAT), Designated Microscopy Centres (DMCs) [Figure 1].
NRLs, IRLs and C-DST laboratories are equipped to perform DST by various technologies such as Liquid Culture and molecular tests such as LPA and NAAT.
◄ 80 Laboratories are equipped to support liquid culture system, among them, 60 are certified for FL LC DST and 49 are certified for SL LCDST. Solid culture & DST is discontinued (PMDT guidelines 2021).
◄ 74 Laboratories are certified for FL LPA and among which 61 are additionally certified for SL LPA
◄ In 2021, Liquid culture-based DST is expanded to include Linezolid and
Pyrazinamide. NRL- NIRT, Chennai and NITRD, New Delhi are certified for DST to Bedaquiline Delamanid and Clofazimine. List of certified laboratories is provided in Annexure.
◄ NRLs and IRLs conducts training, handholding, monitoring and evaluation for their respective State /district/ block level facilities/ laboratories.
Quality AssuranceAn in-built routine system has been designed for conducting External Quality Assessment (EQA) including all elements of internal quality control, on-site evaluation and external quality control. EQA for the NRLs is conducted in through WHO Supra National Reference Laboratories (SNRL), NIRT, Chennai and the coordinating SNRL Antwerp, Belgium.
◄ External Quality Assessment (EQA) for:
▼ Sputum smear microscopy includes On-site Evaluation, Panel Testing and Random Blinded Re-Checking (RBRC).
▼ NAAT is conducted using Dried Tube Specimen (DTS) for public as well as private sector laboratories. ▪ EQA for GeneXpert is conducted annually by NTI, Bangalore by providing a panel of DTS
to the participating laboratory. Complete coverage of EQA to all GeneXpert machines under the Programme was achieved in 2020. Instrument and technical performance of the staff are assessed. Appropriate corrective measures are undertaken by respective IRL and NRL (Figure 2).
▪ Pilot testing the expanded use of DTS panel for EQA in Truenat is ongoing.
▼ o Phenotypic DST (Liquid Culture) and LPA is through structured panel testing and retesting exercises. Proficiency Testing (PT) exercise is conducted annually for laboratories in all technologies used for determination of drug resistance.
TB Laboratory Network in NTEP in 2021
6
34
58
3760 - NAAT
21820 - DMCs
Level of facility in thehealth system
Testing modalities available
National ReferenceLaboratory
District & Sub District Level
Peripheral Sub DistrictLevel
Intermediate ReferenceLaboratory (State Level)
C&DST Laboratory (in Medical Colleges & Private Sector)
MicroscopyNAATLPALiquid CultureLCDST
Microscopy, NAAT, LPA,Liquid Culture, LCDST
NAAT‐ Nucelic Acid Amplification Test; LPA‐ Line Probe Assay; LC DST‐ Liquid Culture Drug Susceptibility Testing
▪ Microscopy▪ Rapid Molecular Test (NAAT)-
▪ CBNAAT▪ TrueNat Schematic representation of Quality Assurance mechanism for GeneXpert MTB/RIF testing using DTS
EQA for Gene Xpert MTB/RIF Testing using DTS
Incubate samples at roomtemperature for 15 minutes
After 10 minutes has elapsedshake sample again 10-20 times
Tighten caps and shakevigorously 10-20 times
Rehydrate the dried tubespecimen (DTS) samples
with transfer pipette
Aspirate rehydrate sample up to markon pipette provided with xpert®
MTB/RIF assay kit and add sample to portin the xpert® MTB/RIF catridgeTest immediately
SR
DeGruy et al. 2012. ASLM 1st International Conference
17 INDIA TB REPORT 2022 18INDIA TB REPORT 2022
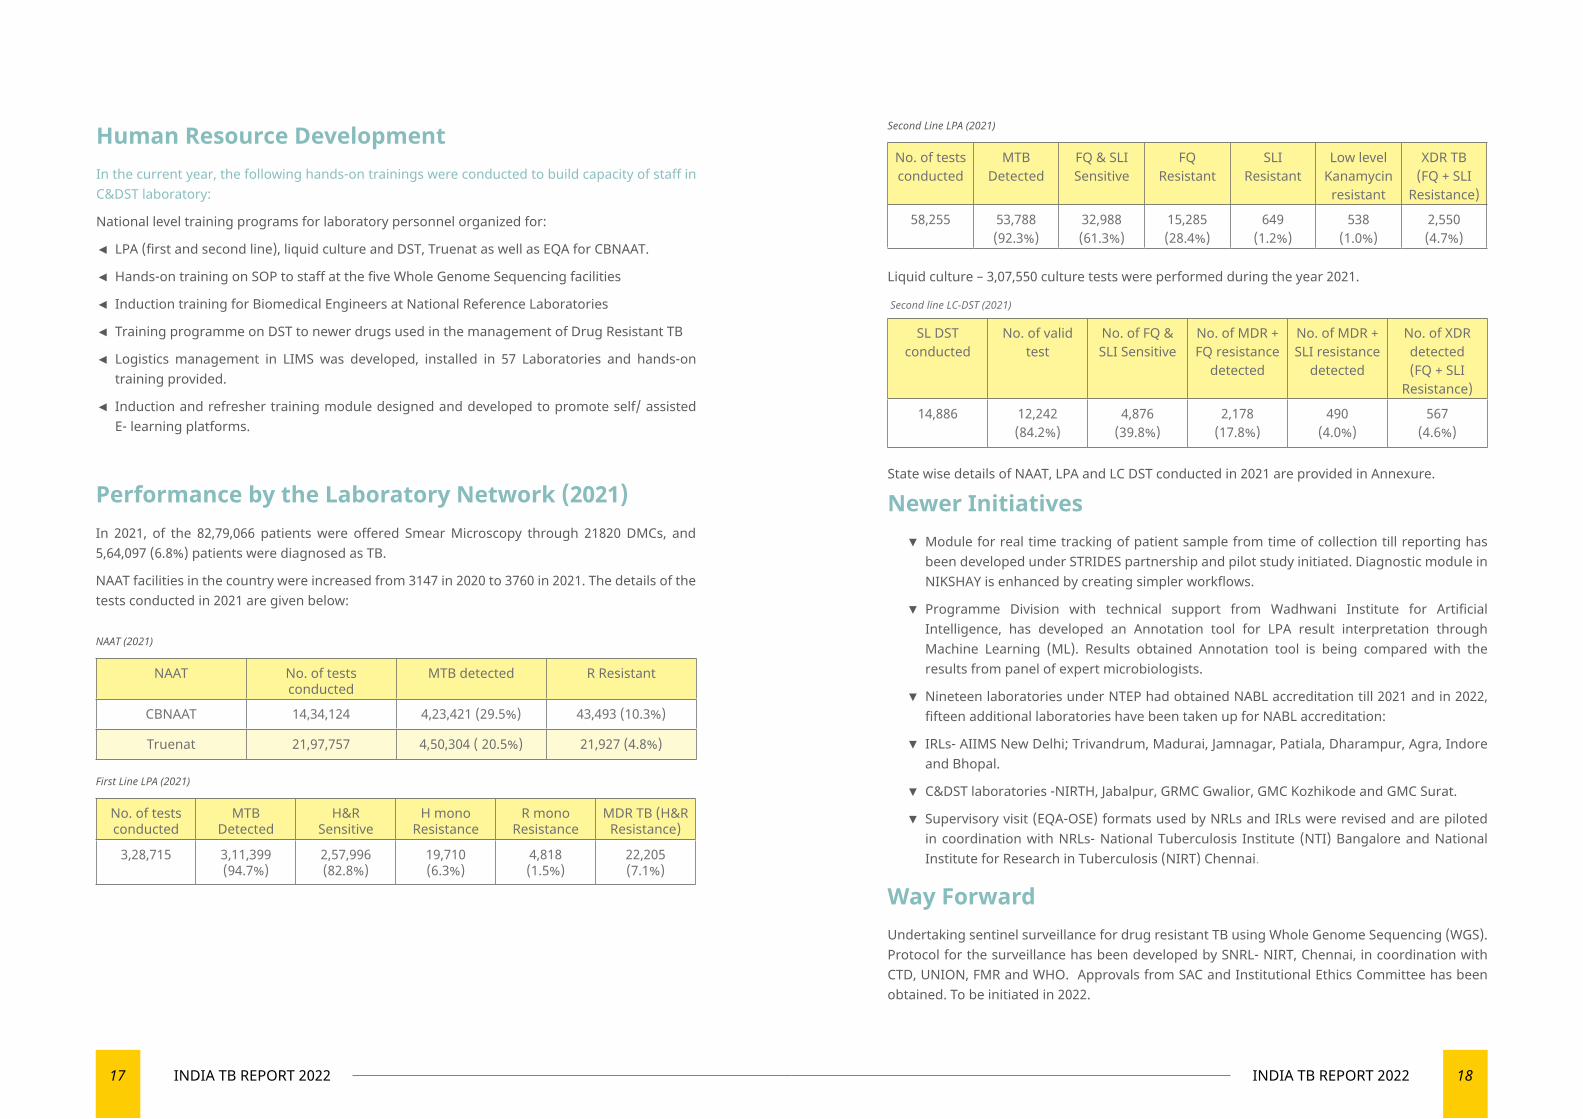
Human Resource Development In the current year, the following hands-on trainings were conducted to build capacity of staff in C&DST laboratory:
National level training programs for laboratory personnel organized for:
◄ LPA (first and second line), liquid culture and DST, Truenat as well as EQA for CBNAAT.
◄ Hands-on training on SOP to staff at the five Whole Genome Sequencing facilities
◄ Induction training for Biomedical Engineers at National Reference Laboratories
◄ Training programme on DST to newer drugs used in the management of Drug Resistant TB
◄ Logistics management in LIMS was developed, installed in 57 Laboratories and hands-on training provided.
◄ Induction and refresher training module designed and developed to promote self/ assisted E- learning platforms.
Performance by the Laboratory Network (2021)In 2021, of the 82,79,066 patients were offered Smear Microscopy through 21820 DMCs, and 5,64,097 (6.8%) patients were diagnosed as TB.
NAAT facilities in the country were increased from 3147 in 2020 to 3760 in 2021. The details of the tests conducted in 2021 are given below: NAAT (2021)
NAAT No. of tests conducted
MTB detected R Resistant
CBNAAT 14,34,124 4,23,421 (29.5%) 43,493 (10.3%)
Truenat 21,97,757 4,50,304 ( 20.5%) 21,927 (4.8%)
First Line LPA (2021)
No. of tests conducted
MTB Detected
H&R Sensitive
H mono Resistance
R mono Resistance
MDR TB (H&R Resistance)
3,28,715 3,11,399 (94.7%)
2,57,996 (82.8%)
19,710 (6.3%)
4,818 (1.5%)
22,205 (7.1%)
Second Line LPA (2021)
No. of tests conducted
MTB Detected
FQ & SLI Sensitive
FQ Resistant
SLI Resistant
Low level Kanamycin
resistant
XDR TB (FQ + SLI
Resistance)
58,255 53,788 (92.3%)
32,988 (61.3%)
15,285 (28.4%)
649 (1.2%)
538 (1.0%)
2,550 (4.7%)
Liquid culture – 3,07,550 culture tests were performed during the year 2021.
Second line LC-DST (2021)
SL DST conducted
No. of valid test
No. of FQ & SLI Sensitive
No. of MDR + FQ resistance
detected
No. of MDR + SLI resistance
detected
No. of XDR detected (FQ + SLI
Resistance)
14,886 12,242 (84.2%)
4,876 (39.8%)
2,178 (17.8%)
490 (4.0%)
567 (4.6%)
State wise details of NAAT, LPA and LC DST conducted in 2021 are provided in Annexure.
Newer Initiatives ▼ Module for real time tracking of patient sample from time of collection till reporting has been developed under STRIDES partnership and pilot study initiated. Diagnostic module in NIKSHAY is enhanced by creating simpler workflows.
▼ Programme Division with technical support from Wadhwani Institute for Artificial Intelligence, has developed an Annotation tool for LPA result interpretation through Machine Learning (ML). Results obtained Annotation tool is being compared with the results from panel of expert microbiologists.
▼ Nineteen laboratories under NTEP had obtained NABL accreditation till 2021 and in 2022, fifteen additional laboratories have been taken up for NABL accreditation:
▼ IRLs- AIIMS New Delhi; Trivandrum, Madurai, Jamnagar, Patiala, Dharampur, Agra, Indore and Bhopal.
▼ C&DST laboratories -NIRTH, Jabalpur, GRMC Gwalior, GMC Kozhikode and GMC Surat.
▼ Supervisory visit (EQA-OSE) formats used by NRLs and IRLs were revised and are piloted in coordination with NRLs- National Tuberculosis Institute (NTI) Bangalore and National Institute for Research in Tuberculosis (NIRT) Chennai.
Way ForwardUndertaking sentinel surveillance for drug resistant TB using Whole Genome Sequencing (WGS). Protocol for the surveillance has been developed by SNRL- NIRT, Chennai, in coordination with CTD, UNION, FMR and WHO. Approvals from SAC and Institutional Ethics Committee has been obtained. To be initiated in 2022.
19 INDIA TB REPORT 2022 20INDIA TB REPORT 2022
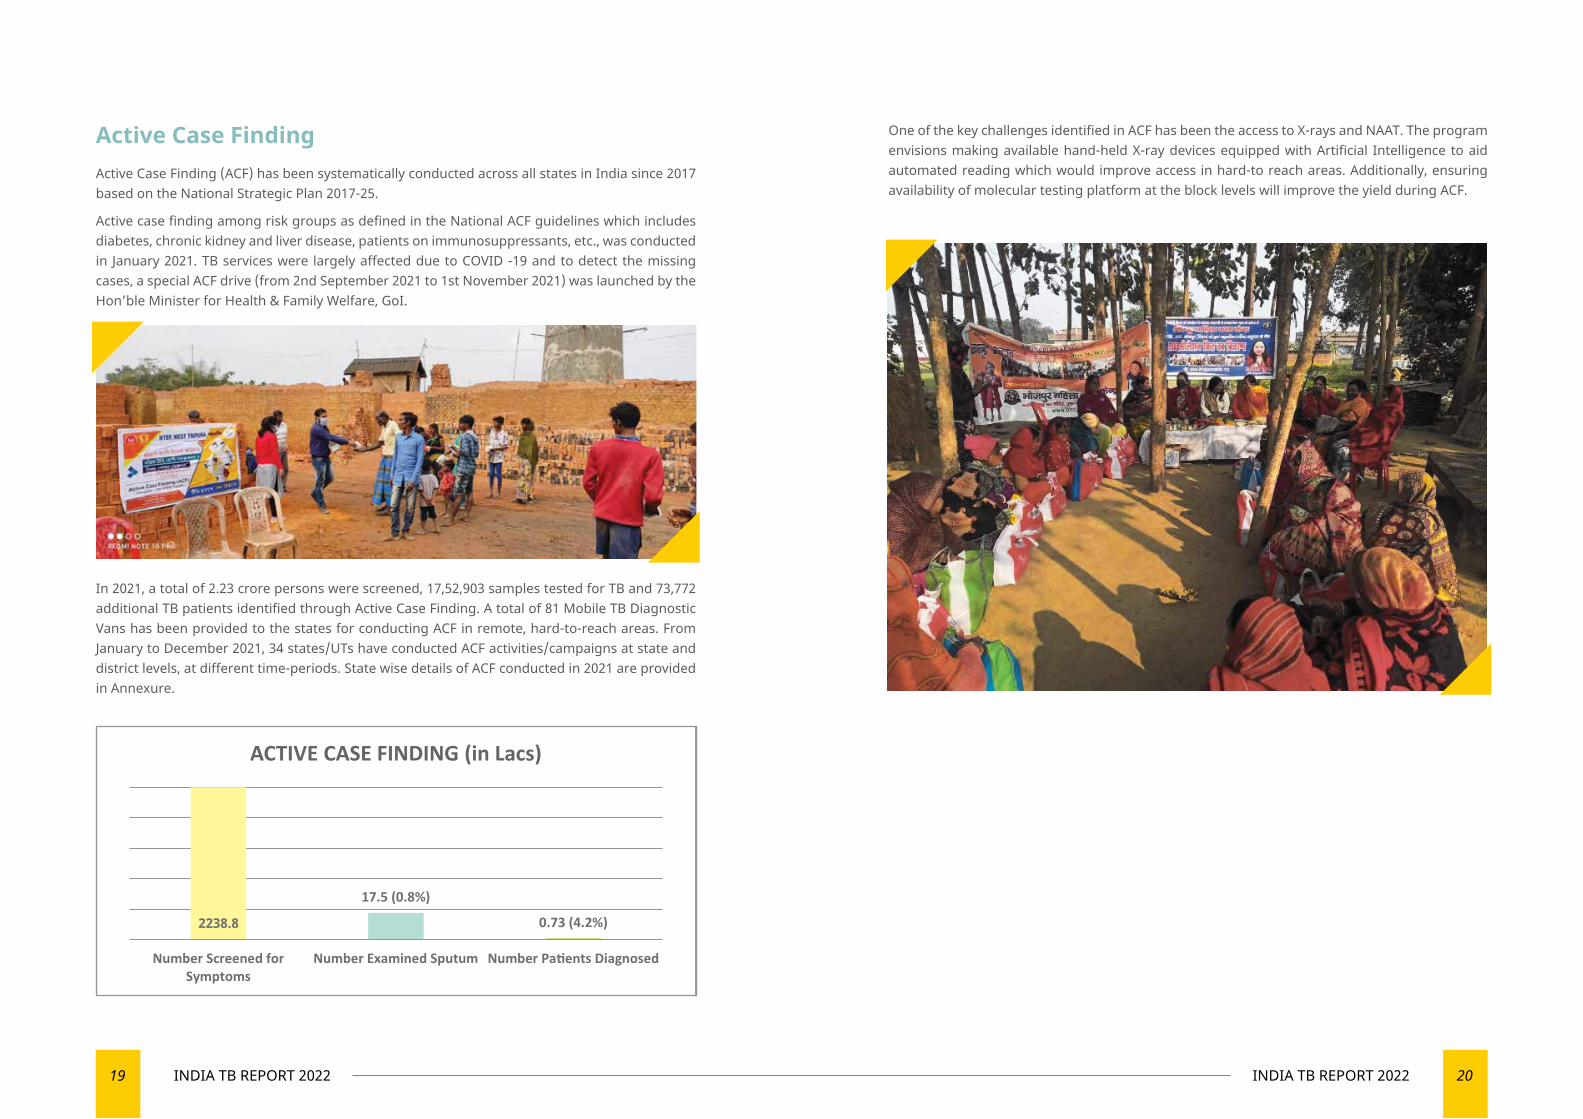
Active Case FindingActive Case Finding (ACF) has been systematically conducted across all states in India since 2017 based on the National Strategic Plan 2017-25.
Active case finding among risk groups as defined in the National ACF guidelines which includes diabetes, chronic kidney and liver disease, patients on immunosuppressants, etc., was conducted in January 2021. TB services were largely affected due to COVID -19 and to detect the missing cases, a special ACF drive (from 2nd September 2021 to 1st November 2021) was launched by the Hon’ble Minister for Health & Family Welfare, GoI.
In 2021, a total of 2.23 crore persons were screened, 17,52,903 samples tested for TB and 73,772 additional TB patients identified through Active Case Finding. A total of 81 Mobile TB Diagnostic Vans has been provided to the states for conducting ACF in remote, hard-to-reach areas. From January to December 2021, 34 states/UTs have conducted ACF activities/campaigns at state and district levels, at different time-periods. State wise details of ACF conducted in 2021 are provided in Annexure.
One of the key challenges identified in ACF has been the access to X-rays and NAAT. The program envisions making available hand-held X-ray devices equipped with Artificial Intelligence to aid automated reading which would improve access in hard-to reach areas. Additionally, ensuring availability of molecular testing platform at the block levels will improve the yield during ACF.
2238.8
TREATMENT SERVICES
03
Managing TB with world class treatment solutions
23 INDIA TB REPORT 2022 24INDIA TB REPORT 2022
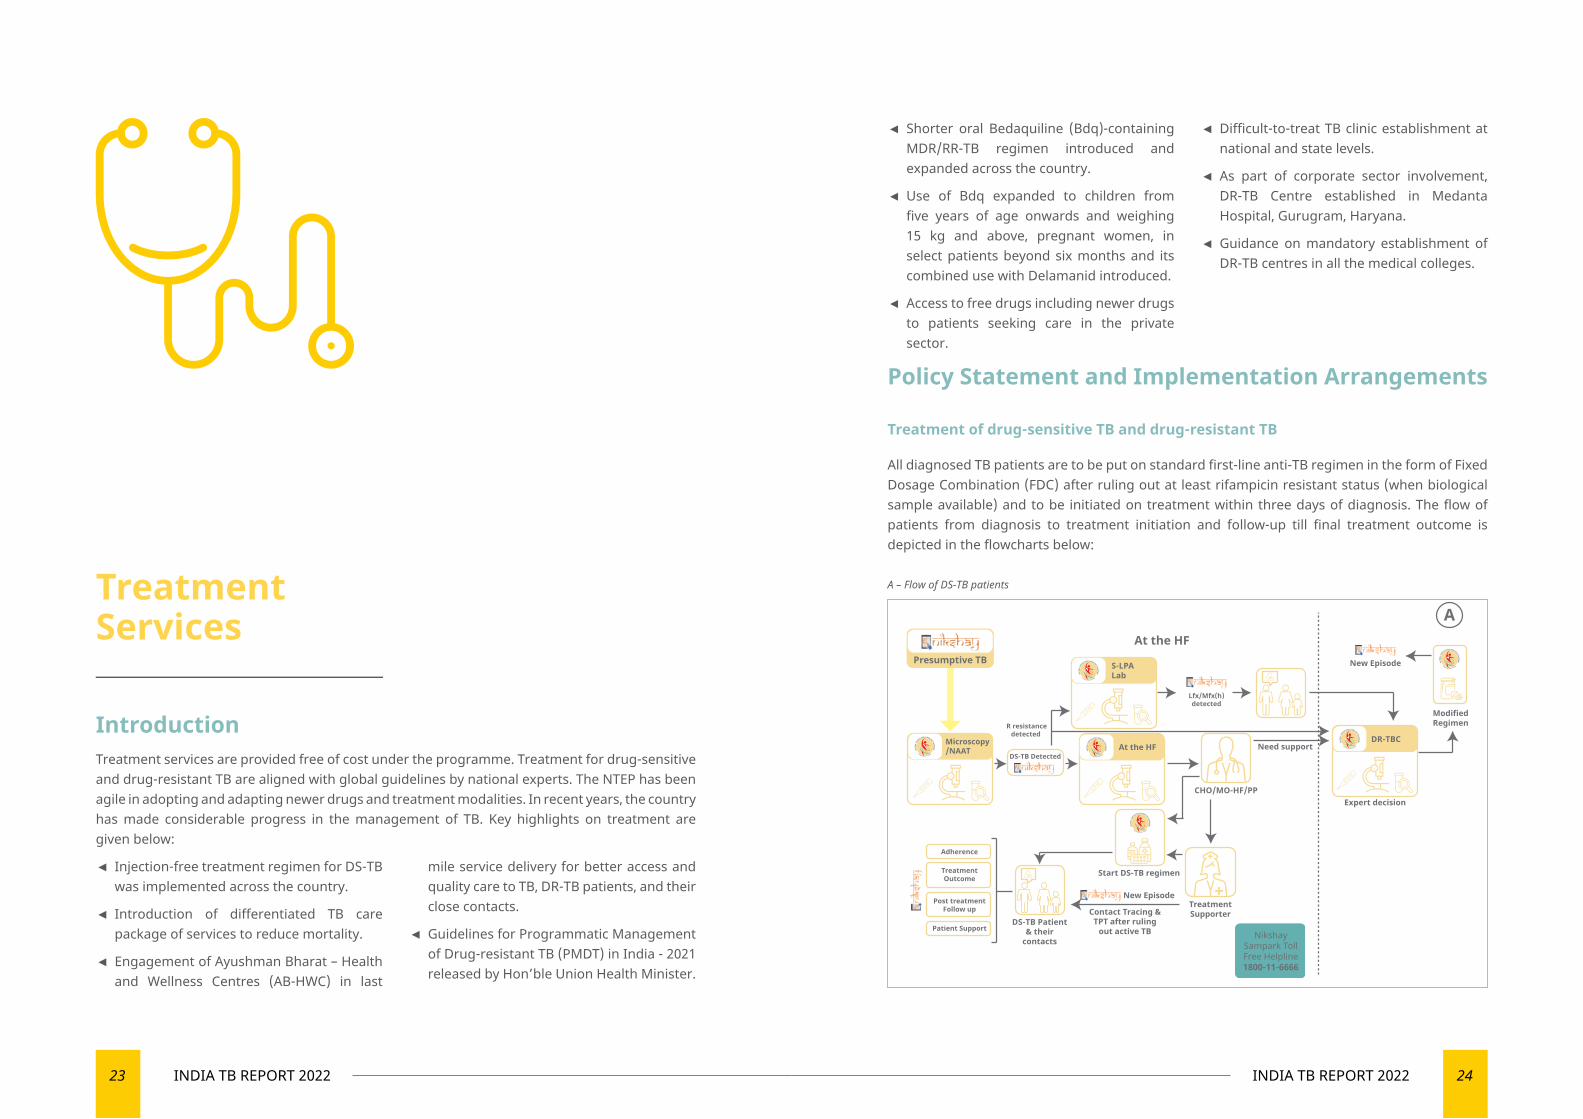
Introduction Treatment services are provided free of cost under the programme. Treatment for drug-sensitive and drug-resistant TB are aligned with global guidelines by national experts. The NTEP has been agile in adopting and adapting newer drugs and treatment modalities. In recent years, the country has made considerable progress in the management of TB. Key highlights on treatment are given below:
◄ Injection-free treatment regimen for DS-TB was implemented across the country.
◄ Introduction of differentiated TB care package of services to reduce mortality.
◄ Engagement of Ayushman Bharat – Health and Wellness Centres (AB-HWC) in last
mile service delivery for better access and quality care to TB, DR-TB patients, and their close contacts.
◄ Guidelines for Programmatic Management of Drug-resistant TB (PMDT) in India - 2021 released by Hon’ble Union Health Minister.
Policy Statement and Implementation Arrangements
Treatment of drug-sensitive TB and drug-resistant TB
All diagnosed TB patients are to be put on standard first-line anti-TB regimen in the form of Fixed Dosage Combination (FDC) after ruling out at least rifampicin resistant status (when biological sample available) and to be initiated on treatment within three days of diagnosis. The flow of patients from diagnosis to treatment initiation and follow-up till final treatment outcome is depicted in the flowcharts below:
◄ Shorter oral Bedaquiline (Bdq)-containing MDR/RR-TB regimen introduced and expanded across the country.
◄ Use of Bdq expanded to children from five years of age onwards and weighing 15 kg and above, pregnant women, in select patients beyond six months and its combined use with Delamanid introduced.
◄ Access to free drugs including newer drugs to patients seeking care in the private sector.
Treatment Services
A – Flow of DS-TB patients
At the HF
R resistancedetected
New Episode
ModifiedRegimen
Presumptive TB
Lfx/Mfx(h)detected
A
Expert decision
DS-TB Detected
DS-TB Patient& their
contacts
Need support
NikshaySampark TollFree Helpline1800-11-6666
New Episode
Contact Tracing &TPT after ruling
out active TB
Microscopy/NAAT
S-LPALab
DR-TBC
CHO/MO-HF/PP
TreatmentSupporter
At the HF
Adherence
TreatmentOutcome
Post treatmentFollow up
Patient Support
Start DS-TB regimen
◄ Difficult-to-treat TB clinic establishment at national and state levels.
◄ As part of corporate sector involvement, DR-TB Centre established in Medanta Hospital, Gurugram, Haryana.
◄ Guidance on mandatory establishment of DR-TB centres in all the medical colleges.
25 INDIA TB REPORT 2022 26INDIA TB REPORT 2022
DS-TB patientFollow up Positive/ Failure/Clinical Non responder
Repeat NAAT
S-LPALab
At the HFF-LPA Lab
At the HF
NikshaySampark TollFree Helpline1800-11-6666
R resistance not detected
Lfx/Mfx(h)detected
H ResistanceDetected
Need support
CHO/MO-HF/PP
H Mono/PolyPatient & their
contacts
New Episode
Contact Tracing &TPT after ruling out
active TB
New Episode
ModifiedRegimen
B
Expert decision
DR-TBC
TreatmentSupporter
Start H Mono/Poly DR-TB regimen
Patient and Family
Replacement
Extension
Adherence
TreatmentOutcome
Post treatmentFollow up
Patient Support
Z & M
fx(h) can’t be used
Lzd can’t be used
Z or Mfx(h) can’t be used
Lfx Resistant
Rif Resistant
NDR-TBCCounsellor
Any two of Lzd Cfz or Cs and R E Z
Shorter Oral orAll Oral Longer
Cfz Cs R E Z
Lzd R E Z
Mfxh R E Z
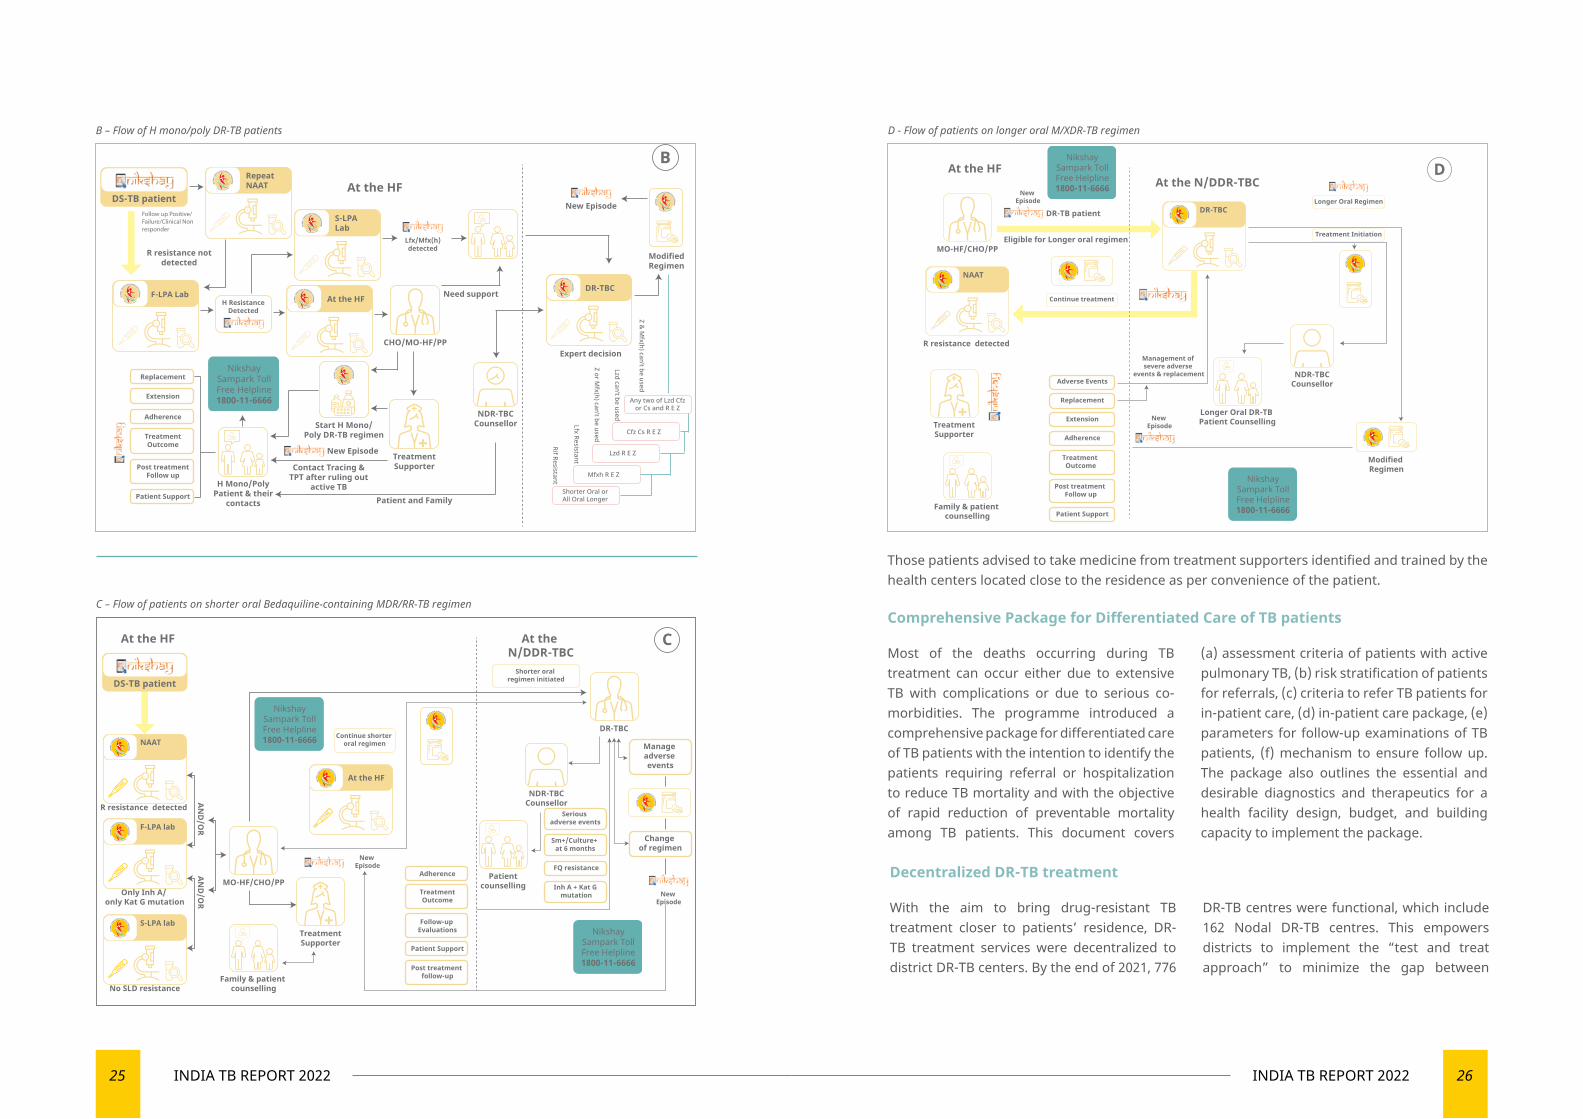
Those patients advised to take medicine from treatment supporters identified and trained by the health centers located close to the residence as per convenience of the patient.
B – Flow of H mono/poly DR-TB patients D - Flow of patients on longer oral M/XDR-TB regimen
C – Flow of patients on shorter oral Bedaquiline-containing MDR/RR-TB regimenComprehensive Package for Differentiated Care of TB patients
Most of the deaths occurring during TB treatment can occur either due to extensive TB with complications or due to serious co-morbidities. The programme introduced a comprehensive package for differentiated care of TB patients with the intention to identify the patients requiring referral or hospitalization to reduce TB mortality and with the objective of rapid reduction of preventable mortality among TB patients. This document covers
(a) assessment criteria of patients with active pulmonary TB, (b) risk stratification of patients for referrals, (c) criteria to refer TB patients for in-patient care, (d) in-patient care package, (e) parameters for follow-up examinations of TB patients, (f) mechanism to ensure follow up. The package also outlines the essential and desirable diagnostics and therapeutics for a health facility design, budget, and building capacity to implement the package.
C
DS-TB patient
At the HF At the N/DDR-TBC
New Episode
New Episode
R resistance detected
Only Inh A/ only Kat G mutation
No SLD resistance
NikshaySampark TollFree Helpline1800-11-6666
NikshaySampark TollFree Helpline1800-11-6666NAAT
F-LPA lab
S-LPA lab
MO-HF/CHO/PP
TreatmentSupporter
At the HF
Family & patient counselling
Continue shorter oral regimen
Shorter oral regimen initiated
Adherence
TreatmentOutcome
Post treatment follow-up
Follow-up Evaluations
Patient Support
Manage adverse events
Change of regimen
Serious adverse events
Sm+/Culture+ at 6 months
Inh A + Kat G mutation
FQ resistance
DR-TBC
NDR-TBCCounsellor
Patient counselling
AND
/OR
AND
/OR
DAt the HFAt the N/DDR-TBC
Eligible for Longer oral regimen
New Episode
DR-TB patient
New Episode
NikshaySampark TollFree Helpline1800-11-6666
NikshaySampark TollFree Helpline1800-11-6666
R resistance detected
NAAT
DR-TBC
MO-HF/CHO/PP
TreatmentSupporter
Family & patient counselling
Longer Oral DR-TB Patient Counselling
NDR-TBCCounsellor
Modified Regimen
Adverse Events
Replacement
Extension
Adherence
Patient Support
Treatment Outcome
Post treatment Follow up
Continue treatment
Treatment Initiation
Longer Oral Regimen
Management of severe adverse
events & replacement
Decentralized DR-TB treatment
With the aim to bring drug-resistant TB treatment closer to patients’ residence, DR-TB treatment services were decentralized to district DR-TB centers. By the end of 2021, 776
DR-TB centres were functional, which include 162 Nodal DR-TB centres. This empowers districts to implement the “test and treat approach” to minimize the gap between
27 INDIA TB REPORT 2022 28INDIA TB REPORT 2022
diagnosis and treatment initiation, reduce cost of travel, and expedite early care of MDR/RR-TB patients within their respective district.
To strengthen the involvement of medical colleges in DR-TB care, National Medical Commission (NMC erstwhile Medical Council of
India) made it mandatory to have a facility for the management of MDR-TB in every medical college by the time of 3rd renewal (admission of 4th batch of MBBS students). By the end of 2021, 290/565 (51%) of medical colleges are providing services to DR-TB patients.
National Training of Trainers (ToT) in Guidelines for PMDT in India – 2021
Owing to the current pandemic restrictions, a virtual training course was planned and conducted on WHO India’s Swasth e-Gurukul platform on a webinar mode with in-build assessments. Total of 442 participants from all states/UTs across the country were enrolled (average participation 369 per day for all five days). Out of them, 361 (82%) had successfully completed the training (scored >60% in post-test) and auto-generated their training certificate.
Following this, states have started cascade trainings of district and sub-district levels staff using standard training materials developed by CTD. The Swasth e-Gurukul provided assessment platform for the trainings planned physically/ virtually on webinar mode. Total 18 states/ UTs used the Swasth e-Gurukul platform to conduct and assess the state-level cascade trainings.
Launch of self-learning module on Guidelines for PMDT in India – 2021
Using the video recordings of National ToT, self- learning module for the medical officers, private practitioners, and others with the aim to allow participants to learn at their own convenience and pace was developed
on Swasth e-Gurukul platform and launched by the Hon’ble Union Health Minister in October 2021. More than 1100 participants enrolled for the self-learning module on the Swasth e-Gurukul.
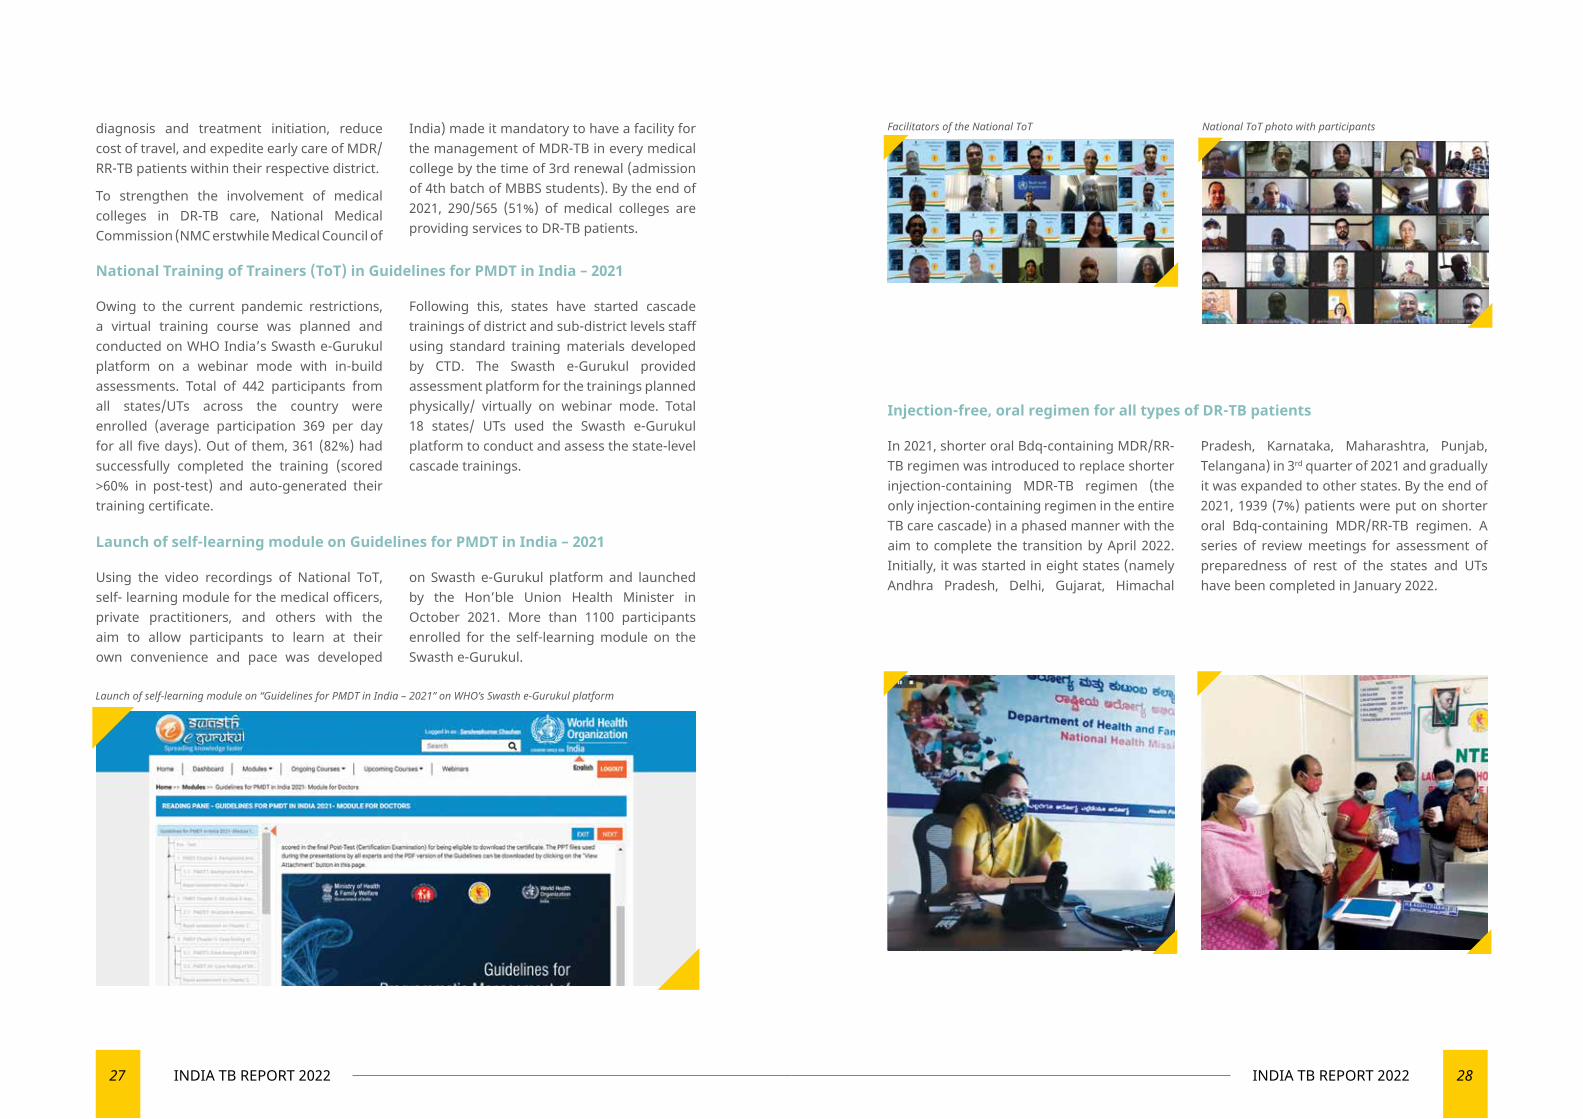
Launch of self-learning module on “Guidelines for PMDT in India – 2021” on WHO’s Swasth e-Gurukul platform
Facilitators of the National ToT National ToT photo with participants
Injection-free, oral regimen for all types of DR-TB patients
In 2021, shorter oral Bdq-containing MDR/RR-TB regimen was introduced to replace shorter injection-containing MDR-TB regimen (the only injection-containing regimen in the entire TB care cascade) in a phased manner with the aim to complete the transition by April 2022. Initially, it was started in eight states (namely Andhra Pradesh, Delhi, Gujarat, Himachal
Pradesh, Karnataka, Maharashtra, Punjab, Telangana) in 3rd quarter of 2021 and gradually it was expanded to other states. By the end of 2021, 1939 (7%) patients were put on shorter oral Bdq-containing MDR/RR-TB regimen. A series of review meetings for assessment of preparedness of rest of the states and UTs have been completed in January 2022.
29 INDIA TB REPORT 2022 30INDIA TB REPORT 2022
National PerformanceDS-TB performance analysis of 2021
In 2021, among 21,35,830 patients diagnosed, 20,30,509 (95%) patients were put on treatment. 61% were male and 39% were female among the patients put on treatment. Among the total notification, 6% patients were in paediatric age group. Among 17,51,437 TB patients notified in 2020, 83% were successfully treated while 4% died during treatment. Disaggregated treatment success rate of patients notified from public and private sector are 83% and 82% respectively (Refer Annexure)
DR-TB performance analysis of 2021
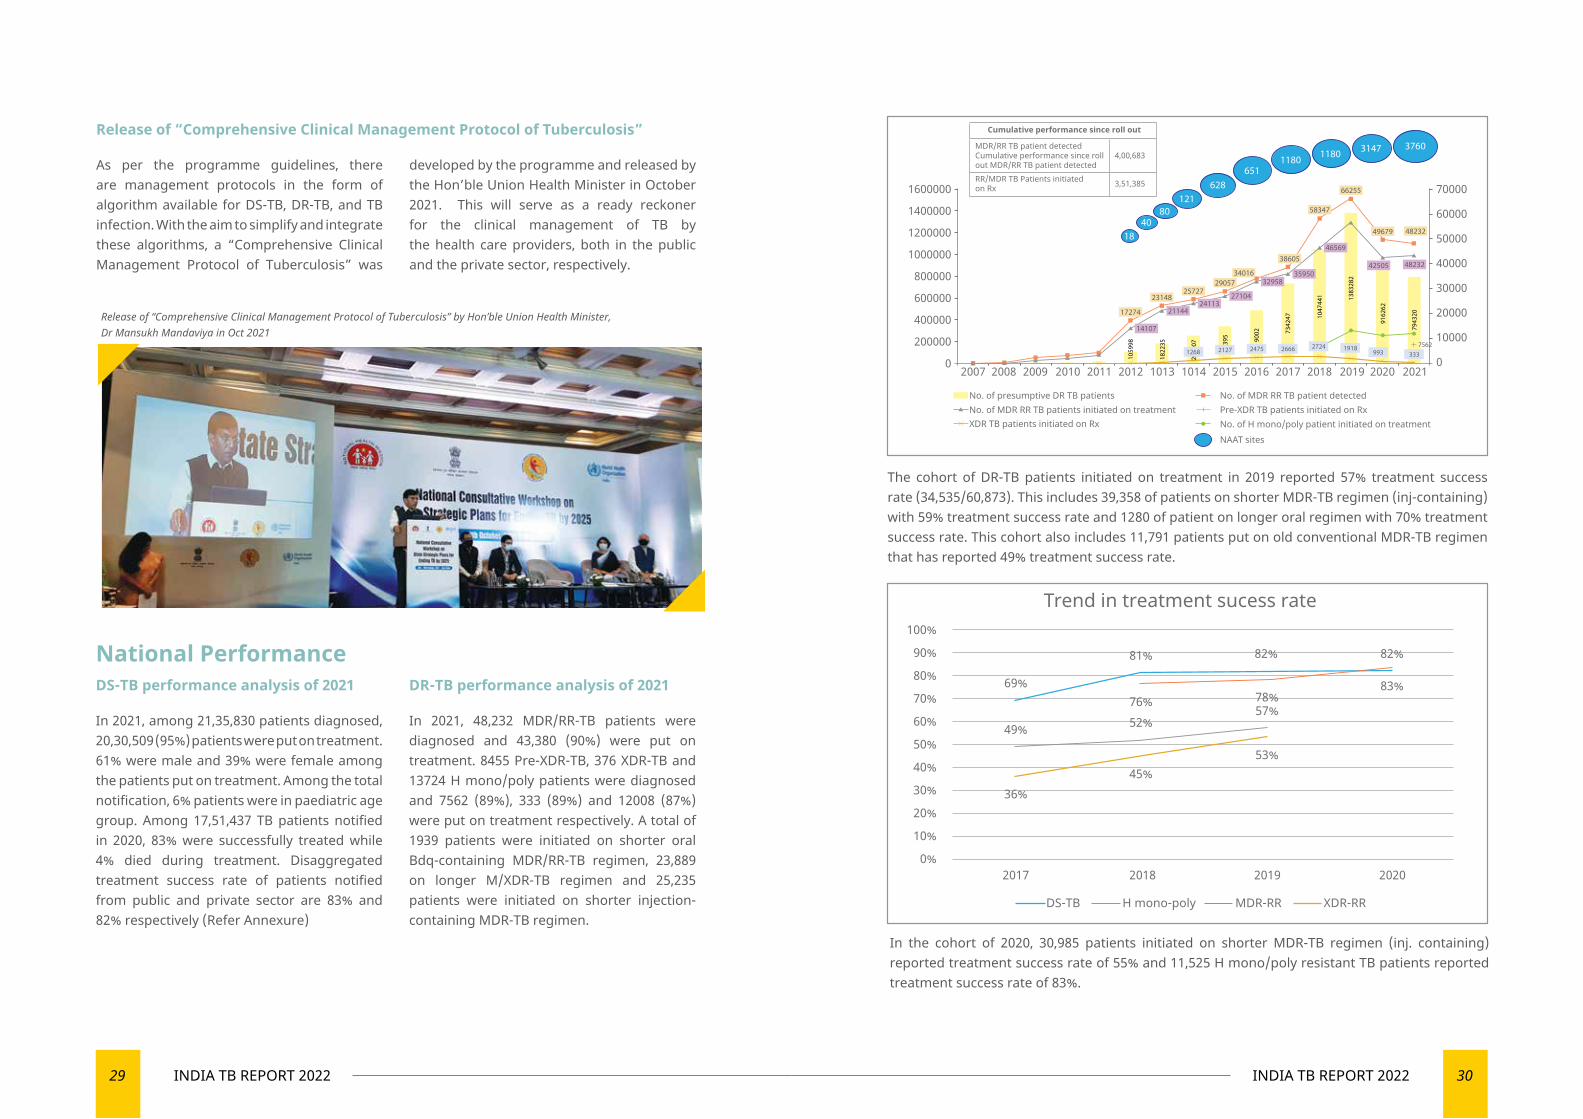
In 2021, 48,232 MDR/RR-TB patients were diagnosed and 43,380 (90%) were put on treatment. 8455 Pre-XDR-TB, 376 XDR-TB and 13724 H mono/poly patients were diagnosed and 7562 (89%), 333 (89%) and 12008 (87%) were put on treatment respectively. A total of 1939 patients were initiated on shorter oral Bdq-containing MDR/RR-TB regimen, 23,889 on longer M/XDR-TB regimen and 25,235 patients were initiated on shorter injection-containing MDR-TB regimen.
Release of “Comprehensive Clinical Management Protocol of Tuberculosis”
As per the programme guidelines, there are management protocols in the form of algorithm available for DS-TB, DR-TB, and TB infection. With the aim to simplify and integrate these algorithms, a “Comprehensive Clinical Management Protocol of Tuberculosis” was
developed by the programme and released by the Hon’ble Union Health Minister in October 2021. This will serve as a ready reckoner for the clinical management of TB by the health care providers, both in the public and the private sector, respectively.
Release of “Comprehensive Clinical Management Protocol of Tuberculosis” by Hon’ble Union Health Minister, Dr Mansukh Mandaviya in Oct 2021
The cohort of DR-TB patients initiated on treatment in 2019 reported 57% treatment success rate (34,535/60,873). This includes 39,358 of patients on shorter MDR-TB regimen (inj-containing) with 59% treatment success rate and 1280 of patient on longer oral regimen with 70% treatment success rate. This cohort also includes 11,791 patients put on old conventional MDR-TB regimen that has reported 49% treatment success rate.
In the cohort of 2020, 30,985 patients initiated on shorter MDR-TB regimen (inj. containing) reported treatment success rate of 55% and 11,525 H mono/poly resistant TB patients reported treatment success rate of 83%.
1600000
1400000
1200000
1000000
800000
600000
400000
200000
0
70000
60000
50000
40000
30000
20000
10000
0 2007 2008 2009 2010 2011 2012 1013 1014 2015 2016 2017 2018 2019 2020 2021
1840
80121
628651
1180 3147 37601180
17274
2314825727
2905734016
38605
58347
66255
49679 48232
4823242505
46569
3595032958
2710424113
21144
14107
1059
98
1822
35
2000
07
1268 2127 2475 2666
395 90
02 7342
47
7943
20
9162
62
1383
282
1047
441
No. of presumptive DR TB patients No. of MDR RR TB patient detectedPre-XDR TB patients initiated on RxNo. of H mono/poly patient initiated on treatment
No. of MDR RR TB patients initiated on treatmentXDR TB patients initiated on Rx
NAAT sites
2724 1918993 333
7562
Cumulative performance since roll out
4,00,683
RR/MDR TB Patients initiated on Rx 3,51,385
MDR/RR TB patient detected Cumulative performance since roll out MDR/RR TB patient detected
100%
90%
80%
70%
60%
50%
40%
30%
20%
10%
0%2017 2018 2019 2020
DS-TB H mono-poly MDR-RR XDR-RR
81% 82% 82%
83%78%57%
53%45%
52%76%
69%
49%
36%
Trend in treatment sucess rate
31 INDIA TB REPORT 2022 32INDIA TB REPORT 2022
Newer Interventions/ Additional Activities
Difficult-To-Treat TB Clinic
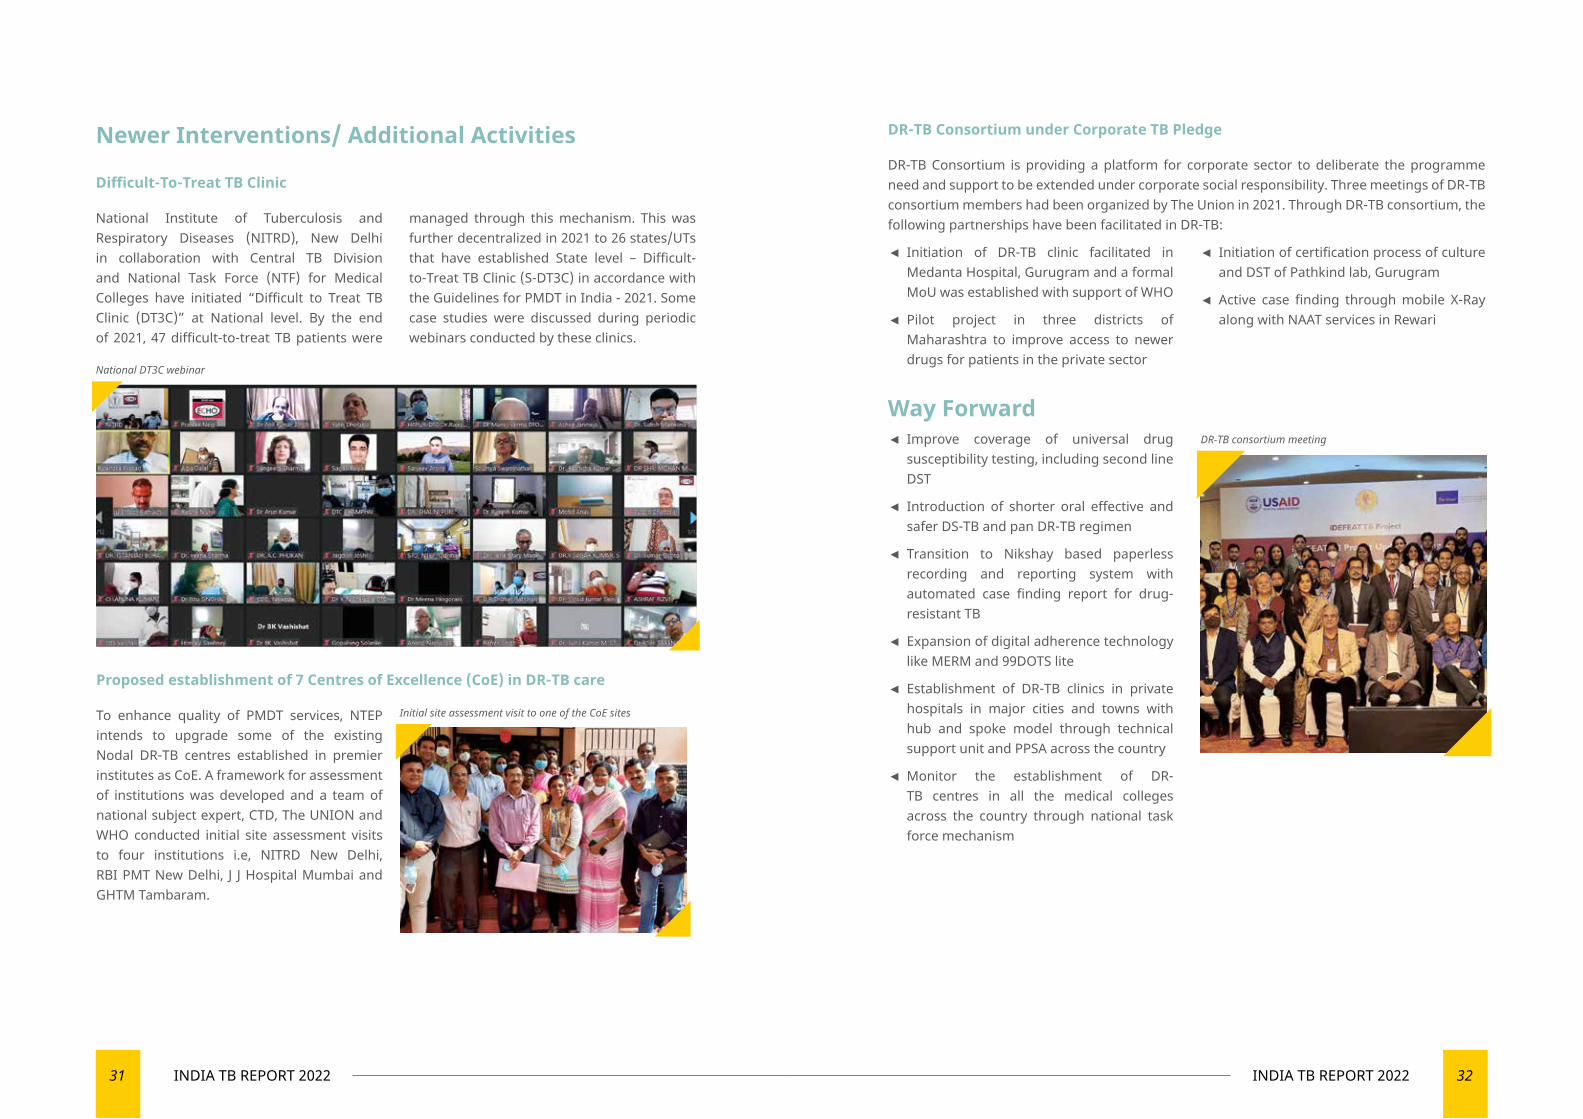
National Institute of Tuberculosis and Respiratory Diseases (NITRD), New Delhi in collaboration with Central TB Division and National Task Force (NTF) for Medical Colleges have initiated “Difficult to Treat TB Clinic (DT3C)” at National level. By the end of 2021, 47 difficult-to-treat TB patients were
managed through this mechanism. This was further decentralized in 2021 to 26 states/UTs that have established State level – Difficult-to-Treat TB Clinic (S-DT3C) in accordance with the Guidelines for PMDT in India - 2021. Some case studies were discussed during periodic webinars conducted by these clinics.
DR-TB Consortium under Corporate TB Pledge
DR-TB Consortium is providing a platform for corporate sector to deliberate the programme need and support to be extended under corporate social responsibility. Three meetings of DR-TB consortium members had been organized by The Union in 2021. Through DR-TB consortium, the following partnerships have been facilitated in DR-TB:
◄ Initiation of DR-TB clinic facilitated in Medanta Hospital, Gurugram and a formal MoU was established with support of WHO
◄ Pilot project in three districts of Maharashtra to improve access to newer drugs for patients in the private sector
◄ Initiation of certification process of culture and DST of Pathkind lab, Gurugram
◄ Active case finding through mobile X-Ray along with NAAT services in Rewari
Way Forward ◄ Improve coverage of universal drug susceptibility testing, including second line DST
◄ Introduction of shorter oral effective and safer DS-TB and pan DR-TB regimen
◄ Transition to Nikshay based paperless recording and reporting system with automated case finding report for drug-resistant TB
◄ Expansion of digital adherence technology like MERM and 99DOTS lite
◄ Establishment of DR-TB clinics in private hospitals in major cities and towns with hub and spoke model through technical support unit and PPSA across the country
◄ Monitor the establishment of DR-TB centres in all the medical colleges across the country through national task force mechanism
National DT3C webinar
Proposed establishment of 7 Centres of Excellence (CoE) in DR-TB care
To enhance quality of PMDT services, NTEP intends to upgrade some of the existing Nodal DR-TB centres established in premier institutes as CoE. A framework for assessment of institutions was developed and a team of national subject expert, CTD, The UNION and WHO conducted initial site assessment visits to four institutions i.e, NITRD New Delhi, RBI PMT New Delhi, J J Hospital Mumbai and GHTM Tambaram.
Initial site assessment visit to one of the CoE sites
DR-TB consortium meeting
33 INDIA TB REPORT 2022 34INDIA TB REPORT 2022
04
TBPREVENTION
Prevention at the core of TB management
35 INDIA TB REPORT 2022 36INDIA TB REPORT 2022
◄ TPT in PLHIV
TPT scale up has been taken up on mission mode since 2020 as a collaborative effort by NACP and NTEP. As a result, India has been able to counsel the majority of PLHIV on active care and offer them six months of isoniazid based TPT.
▼ 2,10,171 PLHIV on active care were offered TPT after ruling out active TB in the year 2021.
◄ TPT in children less than five years who are household contacts of pulmonary TB patients
The health workers are conducting every patient’s home visit within a week of TB notification. As per Nikshay reporting:
▪ A home visit for contact investigation was conducted in 84% of PBCT patients.
▪ 48% of eligible children <5 years in contacts of PBCT patients were provided TPT.
◄ TPT expansion in household contact of children less than five years, adolescent, adult and other risk groups
The Central TB Division had issued a policy guidance in June 2021 based on the recommendations of NTEG for initiating the preparations for expansion of TPT coverage to the additional population.
in next few years, NTEP has taken a huge leap in 2021 by expanding the policy to offer TPT to all household contacts of index pulmonary TB (prioritize in pulmonary bacteriologically confirmed TB [PBCT]) patients and other risk groups beyond the existing policy for PLHIV and HHC children <5 years. Also, it has strengthened the air-borne infection control measures in N/DDR-TBC and C&DST laboratories.
TB Prevention
‘Prevent’ is one of the four critical pillars (Detect – Treat – Prevent – Build) in India’s national strategic plan (2015-25) for ending TB by 2025 which aim towards preventing the emergence of TB in vulnerable population of India. It entails scale-up of air-borne infection control measures at health care facilities, treatment for TB infection and addressing the social determinant through an intersectoral approach. To accelerate prevention and as a result, the anticipated decline of TB incidence
TB Preventive Treatment (TPT) PolicyFor more than a decade, NTEP has the policy of providing TPT (erstwhile isoniazid chemoprophylaxis) to the eligible children <6 years who are household contacts (HHC) of TB patients. The policy of providing TPT (erstwhile isoniazid preventive therapy (IPT)) in People living with HIV/AIDS (PLHIV) since 2017.
In 2021, the eligibility for TPT has been expanded to all HHC of pulmonary TB (prioritizing in PBCT) patients irrespective
of age and other risk groups such as patient with silicosis or undergoing dialysis, on immunosuppressant or anti-TNF treatment and patients proposed for organ transplant. High TB transmission settings (such as health care workers, prisons, mines, slums, tribal, migrant labourers etc.) are being prioritized for TPT interventions guided by differential TB epidemiology by the State TPT Committee.
37 INDIA TB REPORT 2022 38INDIA TB REPORT 2022
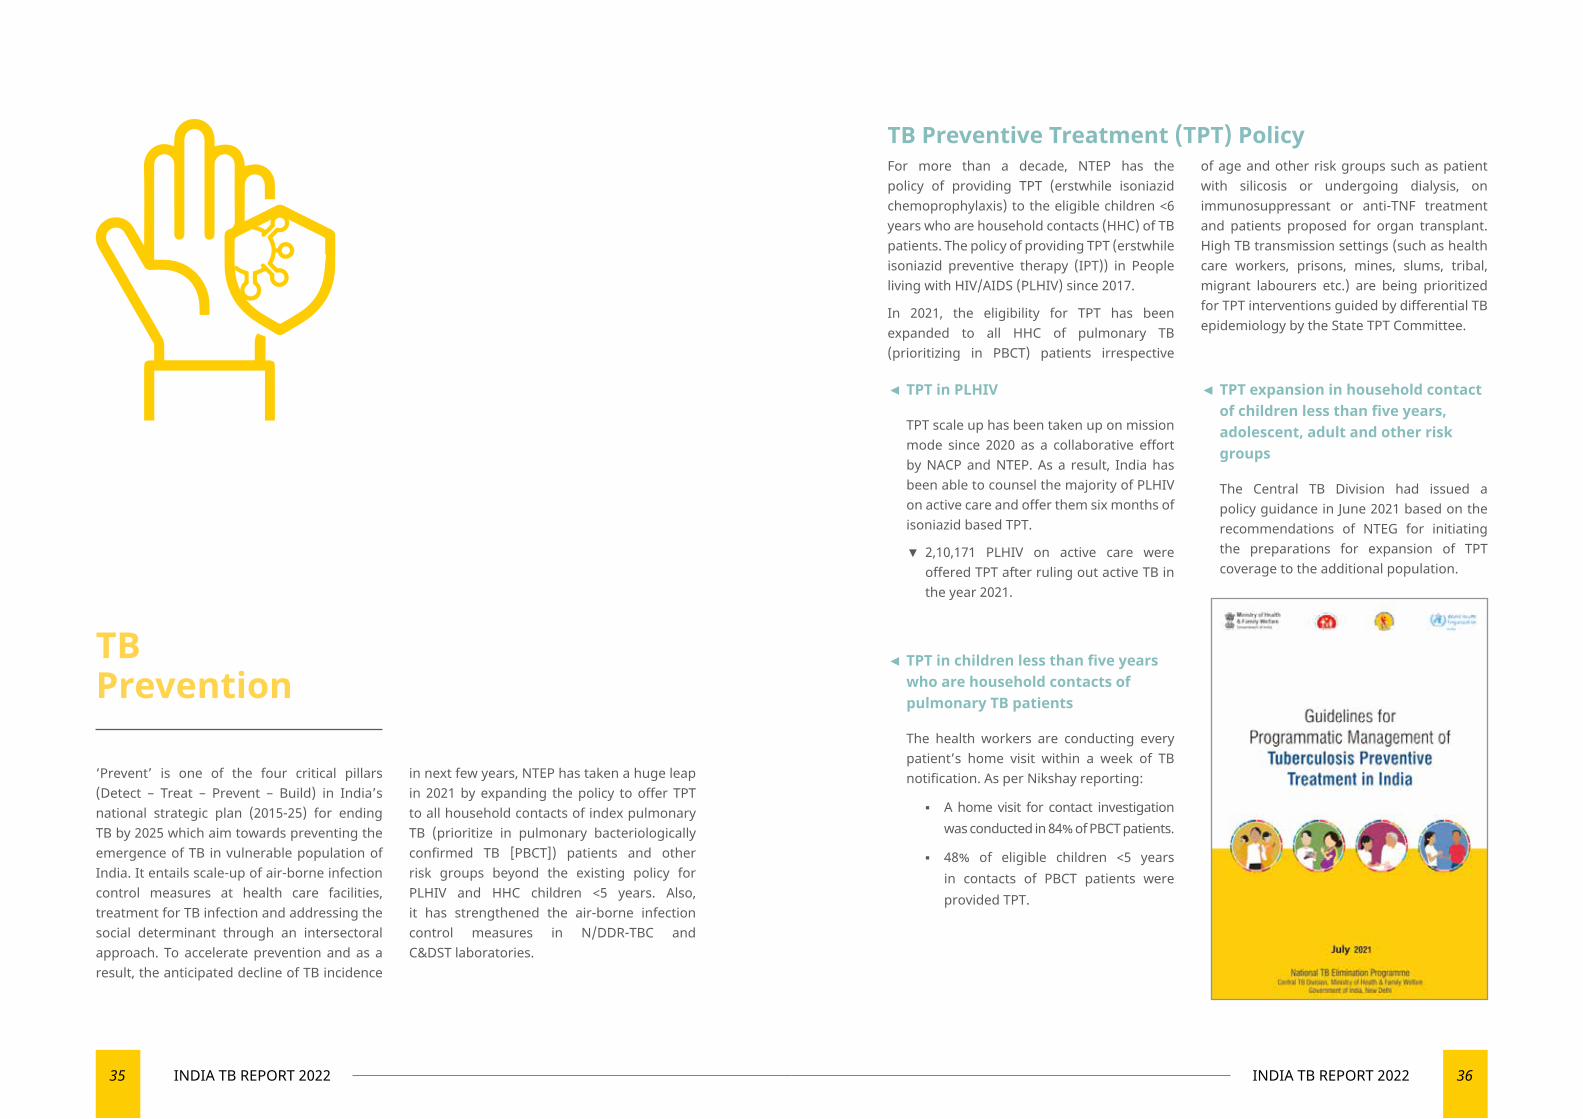
Release of the Guidelines for programmatic management of TB preventive treatment (PMTPT) in India
National Task Force for guideline development prepared the guidelines of TPT as per the recommendation of National Technical Working Group (NTEG) after a series of deliberations and review of global recommendations and in country evidence. The Guidelines of PMTPT in India (2021) were released by the Hon’ble Union Health Minister on 6th August 2021.
Capacity building on Guidelines for PMTPT in India on WHO’s Swasth e-gurukul knowledge platform
Owing to the restrictions imposed due to the prevailing COVID-19 pandemic,
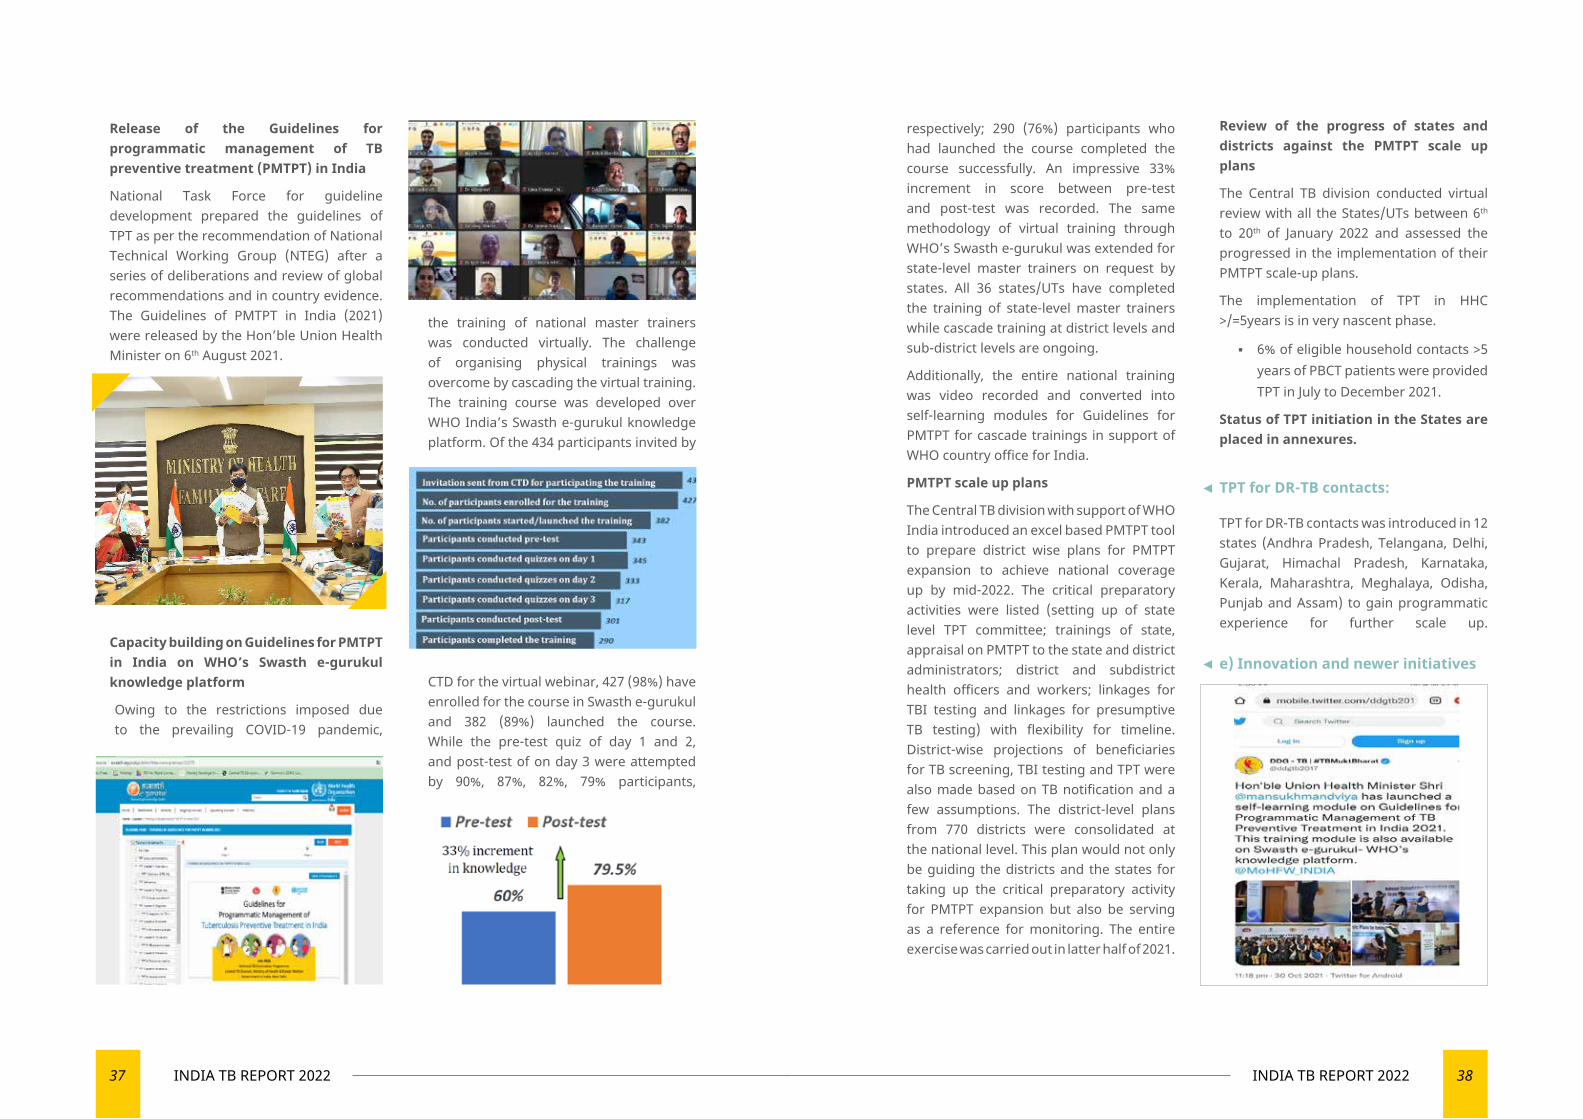
the training of national master trainers was conducted virtually. The challenge of organising physical trainings was overcome by cascading the virtual training. The training course was developed over WHO India’s Swasth e-gurukul knowledge platform. Of the 434 participants invited by
CTD for the virtual webinar, 427 (98%) have enrolled for the course in Swasth e-gurukul and 382 (89%) launched the course. While the pre-test quiz of day 1 and 2, and post-test of on day 3 were attempted by 90%, 87%, 82%, 79% participants,
respectively; 290 (76%) participants who had launched the course completed the course successfully. An impressive 33% increment in score between pre-test and post-test was recorded. The same methodology of virtual training through WHO’s Swasth e-gurukul was extended for state-level master trainers on request by states. All 36 states/UTs have completed the training of state-level master trainers while cascade training at district levels and sub-district levels are ongoing.
Additionally, the entire national training was video recorded and converted into self-learning modules for Guidelines for PMTPT for cascade trainings in support of WHO country office for India.
PMTPT scale up plans
The Central TB division with support of WHO India introduced an excel based PMTPT tool to prepare district wise plans for PMTPT expansion to achieve national coverage up by mid-2022. The critical preparatory activities were listed (setting up of state level TPT committee; trainings of state, appraisal on PMTPT to the state and district administrators; district and subdistrict health officers and workers; linkages for TBI testing and linkages for presumptive TB testing) with flexibility for timeline. District-wise projections of beneficiaries for TB screening, TBI testing and TPT were also made based on TB notification and a few assumptions. The district-level plans from 770 districts were consolidated at the national level. This plan would not only be guiding the districts and the states for taking up the critical preparatory activity for PMTPT expansion but also be serving as a reference for monitoring. The entire exercise was carried out in latter half of 2021.
Review of the progress of states and districts against the PMTPT scale up plans
The Central TB division conducted virtual review with all the States/UTs between 6th to 20th of January 2022 and assessed the progressed in the implementation of their PMTPT scale-up plans.
The implementation of TPT in HHC >/=5years is in very nascent phase.
▪ 6% of eligible household contacts >5 years of PBCT patients were provided TPT in July to December 2021.
Status of TPT initiation in the States are placed in annexures.
◄ TPT for DR-TB contacts:
TPT for DR-TB contacts was introduced in 12 states (Andhra Pradesh, Telangana, Delhi, Gujarat, Himachal Pradesh, Karnataka, Kerala, Maharashtra, Meghalaya, Odisha, Punjab and Assam) to gain programmatic experience for further scale up.
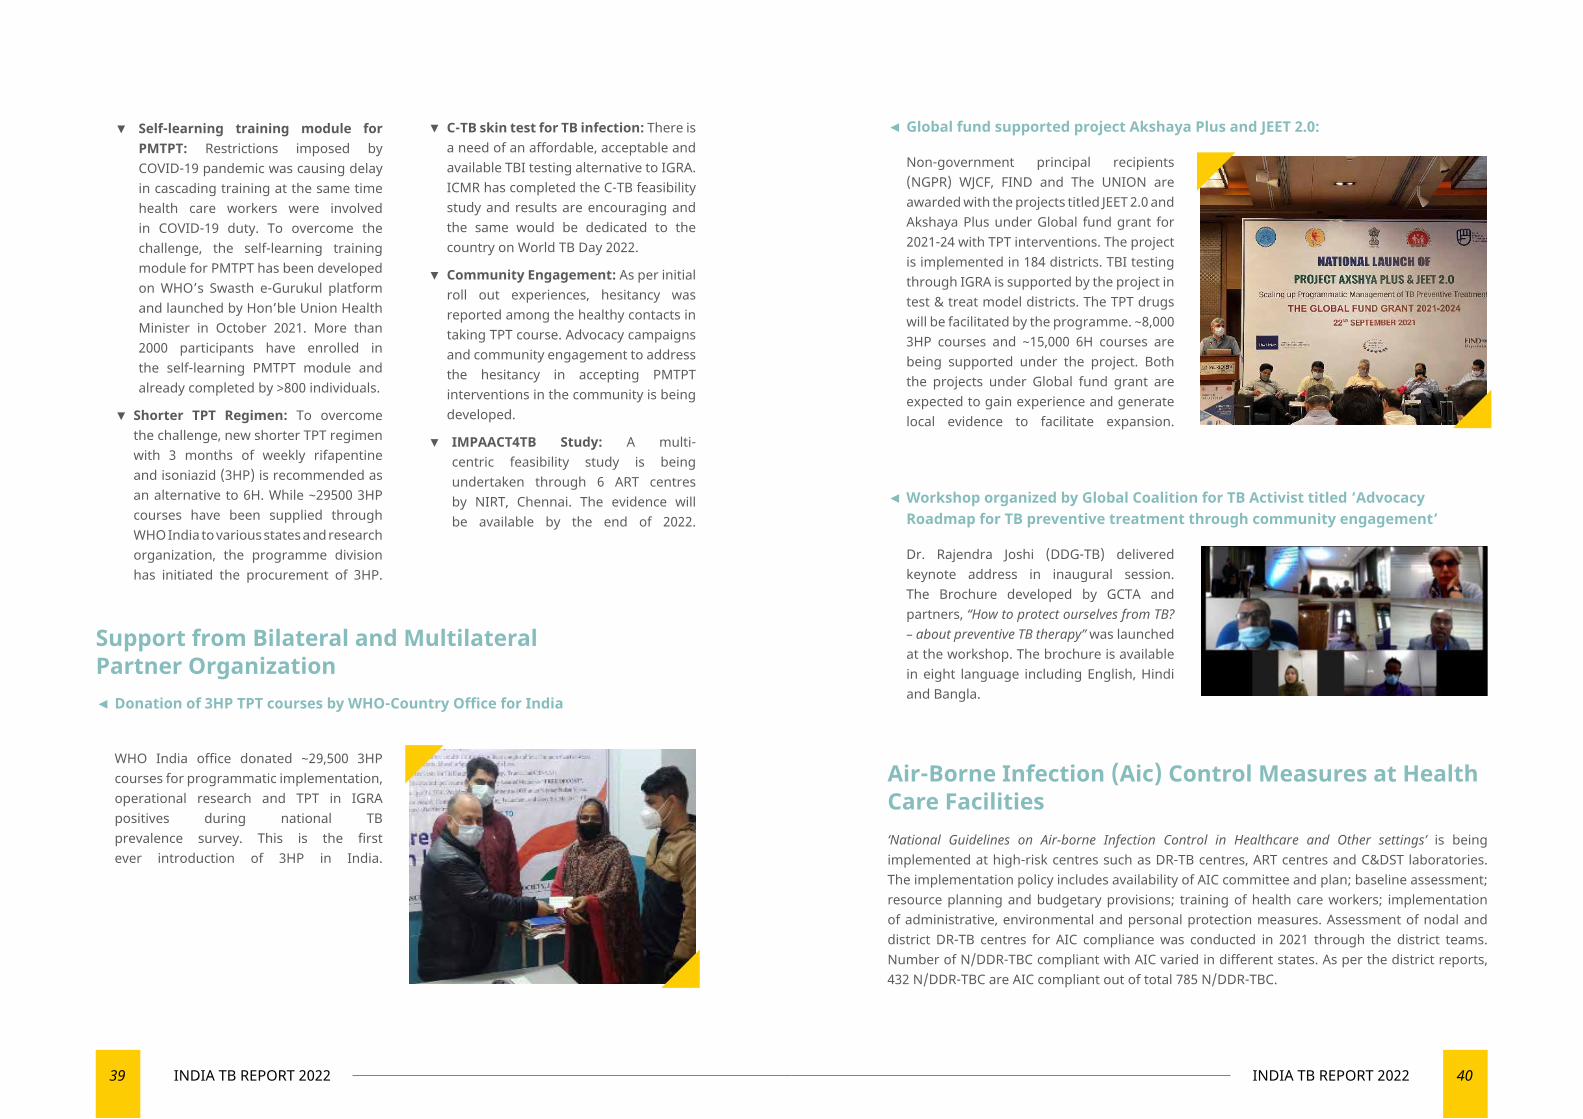
◄ e) Innovation and newer initiatives
39 INDIA TB REPORT 2022 40INDIA TB REPORT 2022
◄ Global fund supported project Akshaya Plus and JEET 2.0:
Non-government principal recipients (NGPR) WJCF, FIND and The UNION are awarded with the projects titled JEET 2.0 and Akshaya Plus under Global fund grant for 2021-24 with TPT interventions. The project is implemented in 184 districts. TBI testing through IGRA is supported by the project in test & treat model districts. The TPT drugs will be facilitated by the programme. ~8,000 3HP courses and ~15,000 6H courses are being supported under the project. Both the projects under Global fund grant are expected to gain experience and generate local evidence to facilitate expansion.
Support from Bilateral and Multilateral Partner Organization
◄ Donation of 3HP TPT courses by WHO-Country Office for India
WHO India office donated ~29,500 3HP courses for programmatic implementation, operational research and TPT in IGRA positives during national TB prevalence survey. This is the first ever introduction of 3HP in India.
◄ Workshop organized by Global Coalition for TB Activist titled ‘Advocacy Roadmap for TB preventive treatment through community engagement’
Dr. Rajendra Joshi (DDG-TB) delivered keynote address in inaugural session. The Brochure developed by GCTA and partners, “How to protect ourselves from TB? – about preventive TB therapy” was launched at the workshop. The brochure is available in eight language including English, Hindi and Bangla.
Air-Borne Infection (Aic) Control Measures at Health Care Facilities‘National Guidelines on Air-borne Infection Control in Healthcare and Other settings’ is being implemented at high-risk centres such as DR-TB centres, ART centres and C&DST laboratories. The implementation policy includes availability of AIC committee and plan; baseline assessment; resource planning and budgetary provisions; training of health care workers; implementation of administrative, environmental and personal protection measures. Assessment of nodal and district DR-TB centres for AIC compliance was conducted in 2021 through the district teams. Number of N/DDR-TBC compliant with AIC varied in different states. As per the district reports, 432 N/DDR-TBC are AIC compliant out of total 785 N/DDR-TBC.
▼ Self-learning training module for PMTPT: Restrictions imposed by COVID-19 pandemic was causing delay in cascading training at the same time health care workers were involved in COVID-19 duty. To overcome the challenge, the self-learning training module for PMTPT has been developed on WHO’s Swasth e-Gurukul platform and launched by Hon’ble Union Health Minister in October 2021. More than 2000 participants have enrolled in the self-learning PMTPT module and already completed by >800 individuals.
▼ Shorter TPT Regimen: To overcome the challenge, new shorter TPT regimen with 3 months of weekly rifapentine and isoniazid (3HP) is recommended as an alternative to 6H. While ~29500 3HP courses have been supplied through WHO India to various states and research organization, the programme division has initiated the procurement of 3HP.
▼ C-TB skin test for TB infection: There is a need of an affordable, acceptable and available TBI testing alternative to IGRA. ICMR has completed the C-TB feasibility study and results are encouraging and the same would be dedicated to the country on World TB Day 2022.
▼ Community Engagement: As per initial roll out experiences, hesitancy was reported among the healthy contacts in taking TPT course. Advocacy campaigns and community engagement to address the hesitancy in accepting PMTPT interventions in the community is being developed.
▼ IMPAACT4TB Study: A multi-centric feasibility study is being undertaken through 6 ART centres by NIRT, Chennai. The evidence will be available by the end of 2022.
TB COMORBIDITIES AND SPECIAL SITUATIONS
Comorbidities are important contributors to the TB burden
05
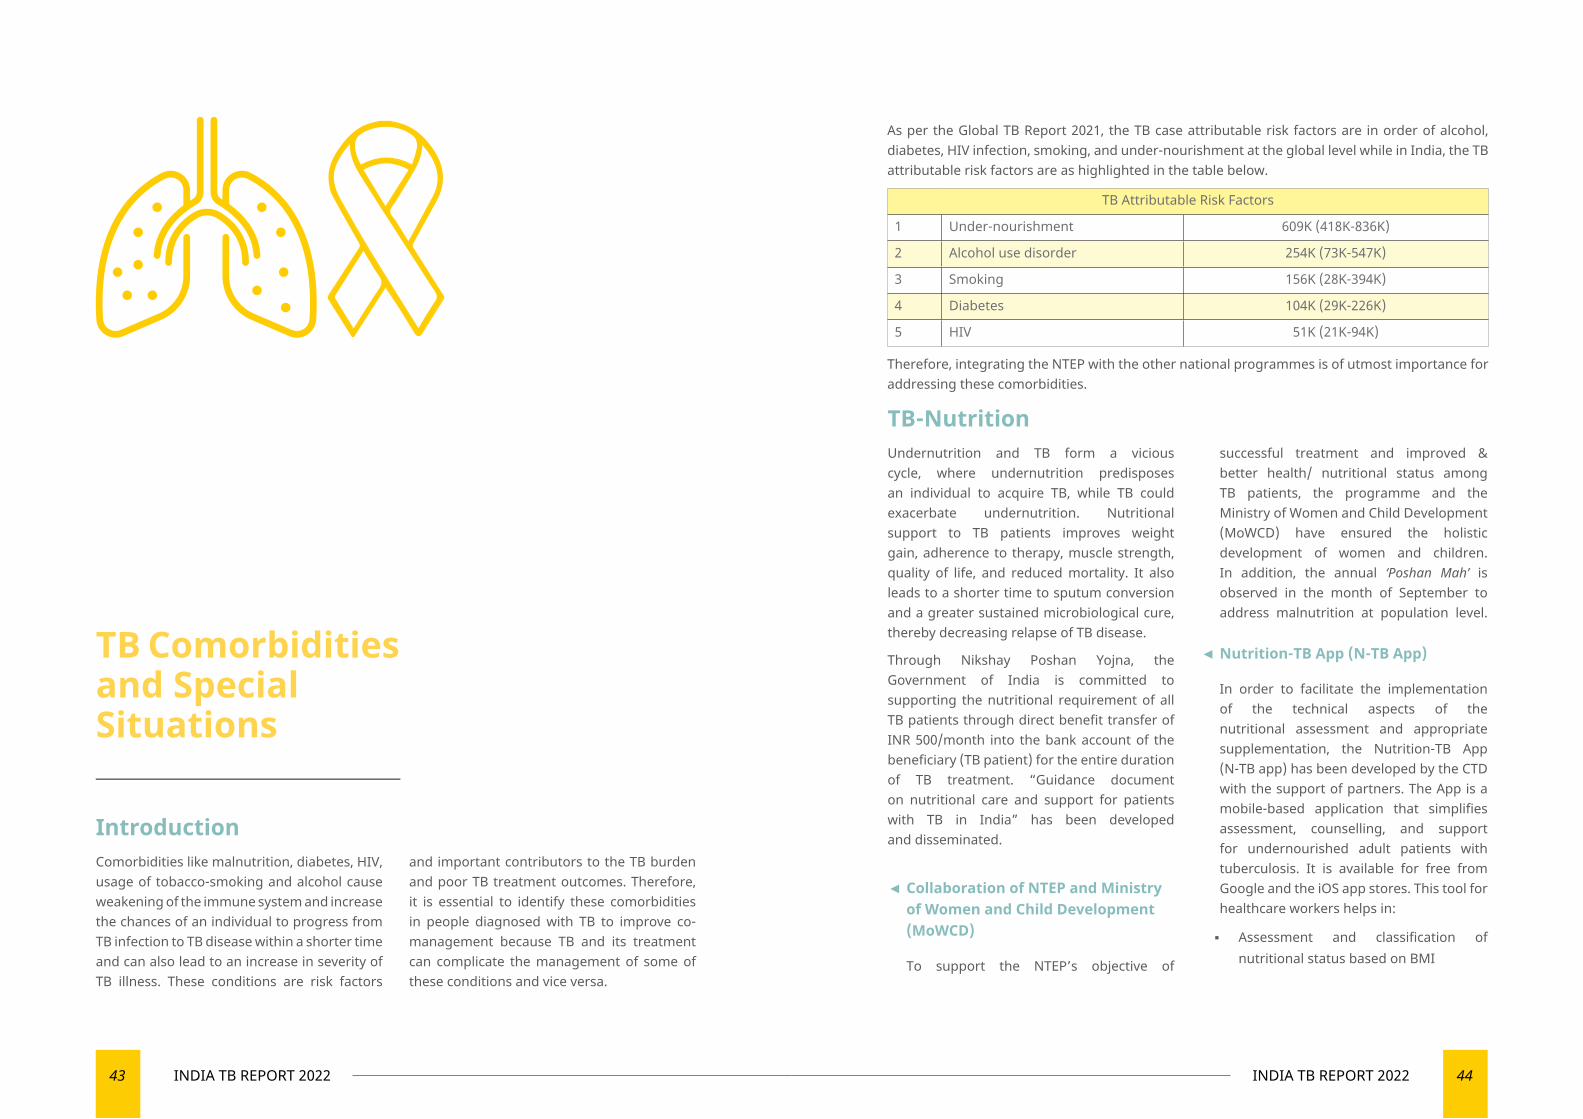
43 INDIA TB REPORT 2022 44INDIA TB REPORT 2022
TB Comorbidities and Special Situations
As per the Global TB Report 2021, the TB case attributable risk factors are in order of alcohol, diabetes, HIV infection, smoking, and under-nourishment at the global level while in India, the TB attributable risk factors are as highlighted in the table below.
TB Attributable Risk Factors
1 Under-nourishment 609K (418K-836K)
2 Alcohol use disorder 254K (73K-547K)
3 Smoking 156K (28K-394K)
4 Diabetes 104K (29K-226K)
5 HIV 51K (21K-94K)
Therefore, integrating the NTEP with the other national programmes is of utmost importance for addressing these comorbidities.
IntroductionComorbidities like malnutrition, diabetes, HIV, usage of tobacco-smoking and alcohol cause weakening of the immune system and increase the chances of an individual to progress from TB infection to TB disease within a shorter time and can also lead to an increase in severity of TB illness. These conditions are risk factors
and important contributors to the TB burden and poor TB treatment outcomes. Therefore, it is essential to identify these comorbidities in people diagnosed with TB to improve co-management because TB and its treatment can complicate the management of some of these conditions and vice versa.
TB-NutritionUndernutrition and TB form a vicious cycle, where undernutrition predisposes an individual to acquire TB, while TB could exacerbate undernutrition. Nutritional support to TB patients improves weight gain, adherence to therapy, muscle strength, quality of life, and reduced mortality. It also leads to a shorter time to sputum conversion and a greater sustained microbiological cure, thereby decreasing relapse of TB disease.
Through Nikshay Poshan Yojna, the Government of India is committed to supporting the nutritional requirement of all TB patients through direct benefit transfer of INR 500/month into the bank account of the beneficiary (TB patient) for the entire duration of TB treatment. “Guidance document on nutritional care and support for patients with TB in India” has been developed and disseminated.
◄ Collaboration of NTEP and Ministry of Women and Child Development (MoWCD)
To support the NTEP’s objective of
successful treatment and improved & better health/ nutritional status among TB patients, the programme and the Ministry of Women and Child Development (MoWCD) have ensured the holistic development of women and children. In addition, the annual ‘Poshan Mah’ is observed in the month of September to address malnutrition at population level.
◄ Nutrition-TB App (N-TB App)
In order to facilitate the implementation of the technical aspects of the nutritional assessment and appropriate supplementation, the Nutrition-TB App (N-TB app) has been developed by the CTD with the support of partners. The App is a mobile-based application that simplifies assessment, counselling, and support for undernourished adult patients with tuberculosis. It is available for free from Google and the iOS app stores. This tool for healthcare workers helps in:
▪ Assessment and classification of nutritional status based on BMI
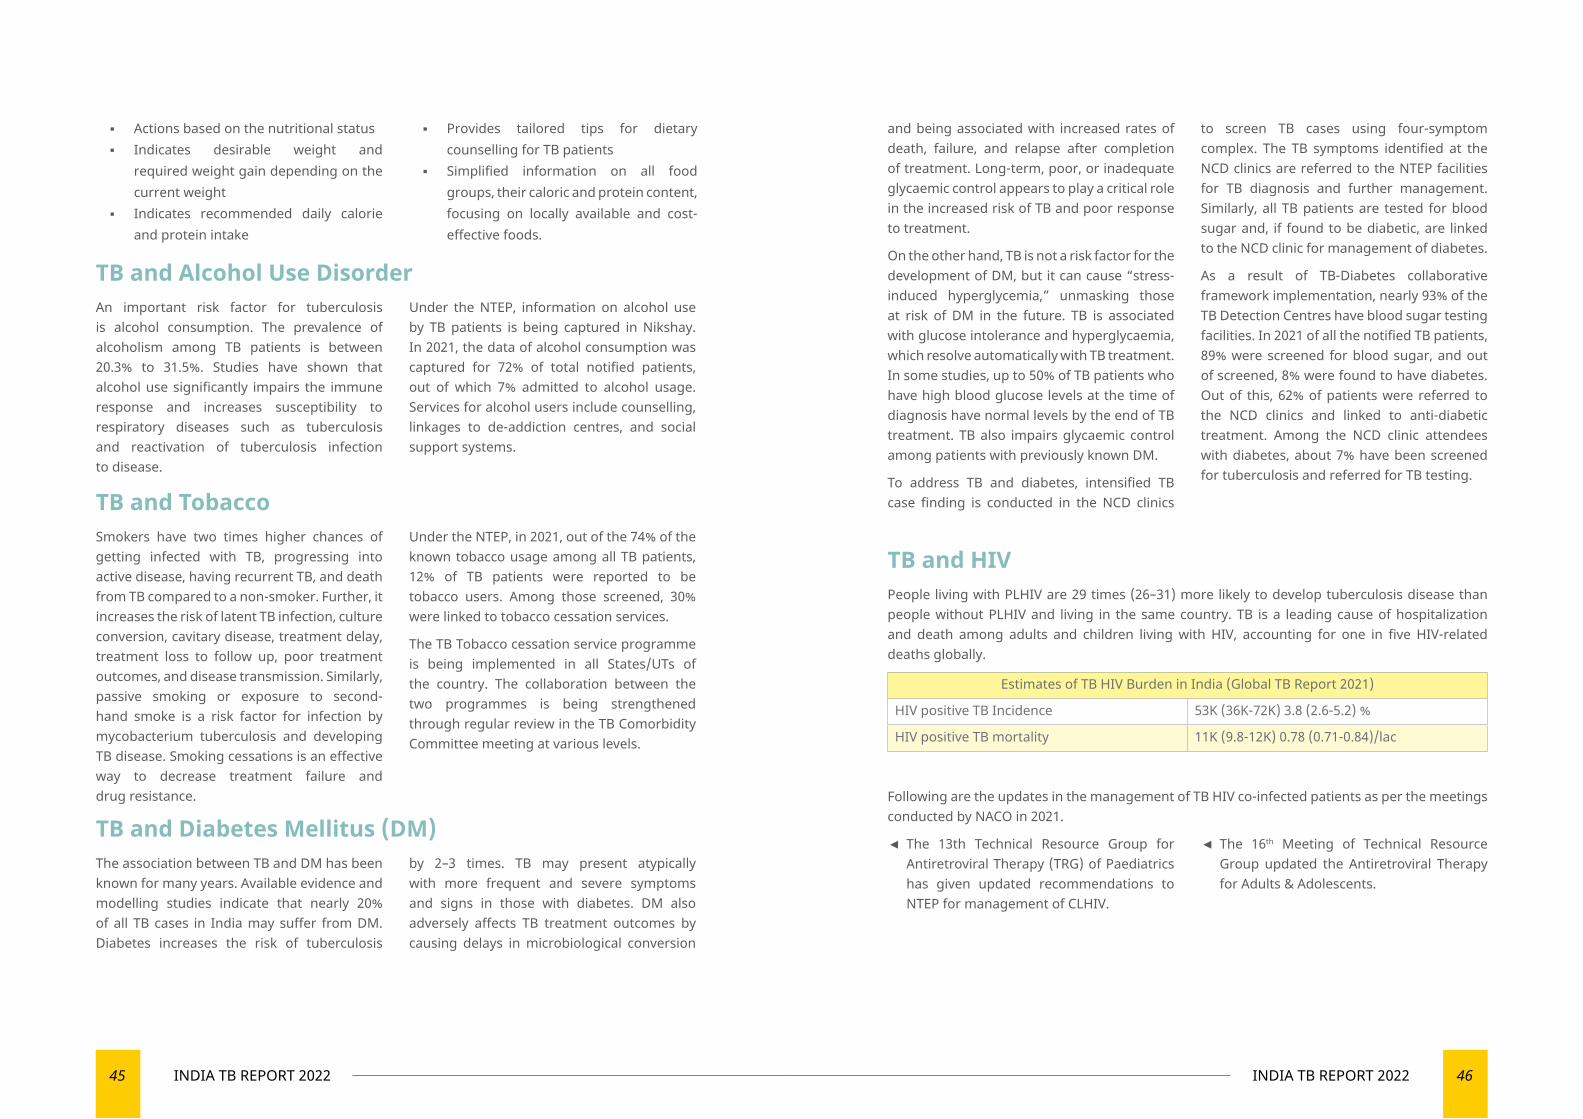
45 INDIA TB REPORT 2022 46INDIA TB REPORT 2022
TB and Alcohol Use DisorderAn important risk factor for tuberculosis is alcohol consumption. The prevalence of alcoholism among TB patients is between 20.3% to 31.5%. Studies have shown that alcohol use significantly impairs the immune response and increases susceptibility to respiratory diseases such as tuberculosis and reactivation of tuberculosis infection to disease.
Under the NTEP, information on alcohol use by TB patients is being captured in Nikshay. In 2021, the data of alcohol consumption was captured for 72% of total notified patients, out of which 7% admitted to alcohol usage. Services for alcohol users include counselling, linkages to de-addiction centres, and social support systems.
TB and TobaccoSmokers have two times higher chances of getting infected with TB, progressing into active disease, having recurrent TB, and death from TB compared to a non-smoker. Further, it increases the risk of latent TB infection, culture conversion, cavitary disease, treatment delay, treatment loss to follow up, poor treatment outcomes, and disease transmission. Similarly, passive smoking or exposure to second-hand smoke is a risk factor for infection by mycobacterium tuberculosis and developing TB disease. Smoking cessations is an effective way to decrease treatment failure and drug resistance.
Under the NTEP, in 2021, out of the 74% of the known tobacco usage among all TB patients, 12% of TB patients were reported to be tobacco users. Among those screened, 30% were linked to tobacco cessation services.
The TB Tobacco cessation service programme is being implemented in all States/UTs of the country. The collaboration between the two programmes is being strengthened through regular review in the TB Comorbidity Committee meeting at various levels.
TB and Diabetes Mellitus (DM)The association between TB and DM has been known for many years. Available evidence and modelling studies indicate that nearly 20% of all TB cases in India may suffer from DM. Diabetes increases the risk of tuberculosis
by 2–3 times. TB may present atypically with more frequent and severe symptoms and signs in those with diabetes. DM also adversely affects TB treatment outcomes by causing delays in microbiological conversion
and being associated with increased rates of death, failure, and relapse after completion of treatment. Long-term, poor, or inadequate glycaemic control appears to play a critical role in the increased risk of TB and poor response to treatment.
On the other hand, TB is not a risk factor for the development of DM, but it can cause “stress-induced hyperglycemia,” unmasking those at risk of DM in the future. TB is associated with glucose intolerance and hyperglycaemia, which resolve automatically with TB treatment. In some studies, up to 50% of TB patients who have high blood glucose levels at the time of diagnosis have normal levels by the end of TB treatment. TB also impairs glycaemic control among patients with previously known DM.
To address TB and diabetes, intensified TB case finding is conducted in the NCD clinics
to screen TB cases using four-symptom complex. The TB symptoms identified at the NCD clinics are referred to the NTEP facilities for TB diagnosis and further management. Similarly, all TB patients are tested for blood sugar and, if found to be diabetic, are linked to the NCD clinic for management of diabetes.
As a result of TB-Diabetes collaborative framework implementation, nearly 93% of the TB Detection Centres have blood sugar testing facilities. In 2021 of all the notified TB patients, 89% were screened for blood sugar, and out of screened, 8% were found to have diabetes. Out of this, 62% of patients were referred to the NCD clinics and linked to anti-diabetic treatment. Among the NCD clinic attendees with diabetes, about 7% have been screened for tuberculosis and referred for TB testing.
TB and HIVPeople living with PLHIV are 29 times (26–31) more likely to develop tuberculosis disease than people without PLHIV and living in the same country. TB is a leading cause of hospitalization and death among adults and children living with HIV, accounting for one in five HIV-related deaths globally.
Estimates of TB HIV Burden in India (Global TB Report 2021)
HIV positive TB Incidence 53K (36K-72K) 3.8 (2.6-5.2) %
HIV positive TB mortality 11K (9.8-12K) 0.78 (0.71-0.84)/lac
Following are the updates in the management of TB HIV co-infected patients as per the meetings conducted by NACO in 2021.
◄ The 13th Technical Resource Group for Antiretroviral Therapy (TRG) of Paediatrics has given updated recommendations to NTEP for management of CLHIV.
◄ The 16th Meeting of Technical Resource Group updated the Antiretroviral Therapy for Adults & Adolescents.
▪ Actions based on the nutritional status ▪ Indicates desirable weight and
required weight gain depending on the current weight
▪ Indicates recommended daily calorie and protein intake
▪ Provides tailored tips for dietary counselling for TB patients
▪ Simplified information on all food groups, their caloric and protein content, focusing on locally available and cost-effective foods.
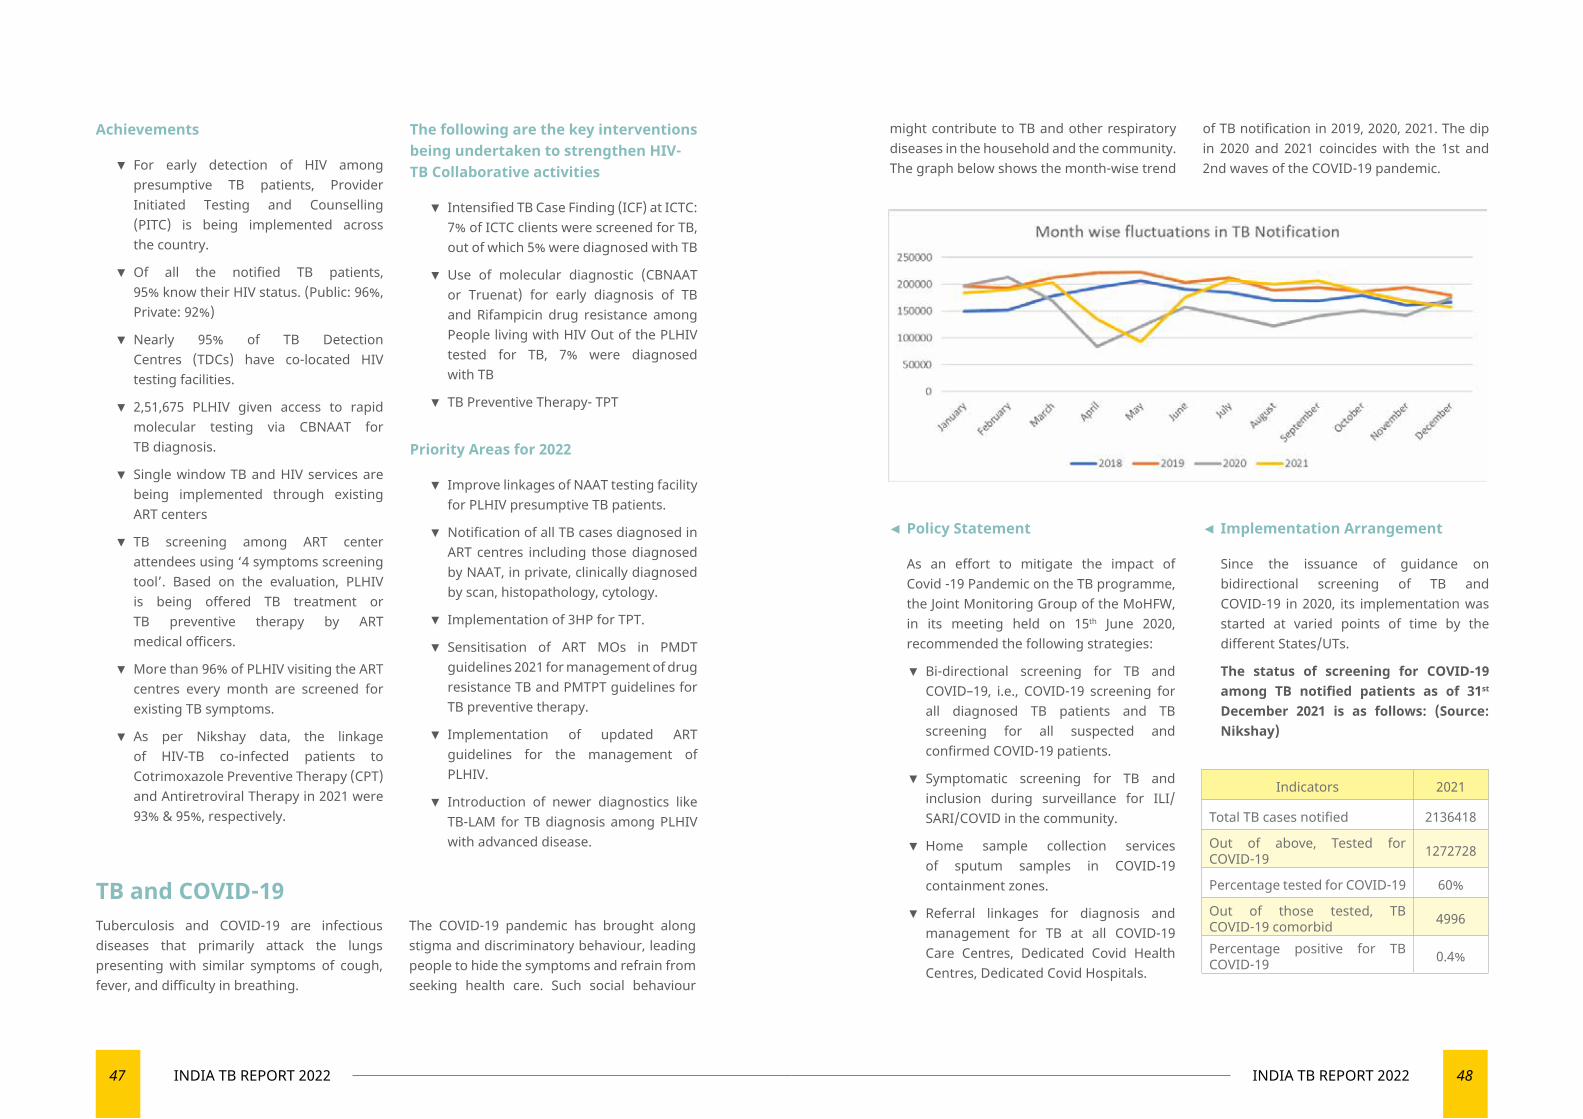
47 INDIA TB REPORT 2022 48INDIA TB REPORT 2022
Achievements
▼ For early detection of HIV among presumptive TB patients, Provider Initiated Testing and Counselling (PITC) is being implemented across the country.
▼ Of all the notified TB patients, 95% know their HIV status. (Public: 96%, Private: 92%)
▼ Nearly 95% of TB Detection Centres (TDCs) have co-located HIV testing facilities.
▼ 2,51,675 PLHIV given access to rapid molecular testing via CBNAAT for TB diagnosis.
▼ Single window TB and HIV services are being implemented through existing ART centers
▼ TB screening among ART center attendees using ‘4 symptoms screening tool’. Based on the evaluation, PLHIV is being offered TB treatment or TB preventive therapy by ART medical officers.
▼ More than 96% of PLHIV visiting the ART centres every month are screened for existing TB symptoms.
▼ As per Nikshay data, the linkage of HIV-TB co-infected patients to Cotrimoxazole Preventive Therapy (CPT) and Antiretroviral Therapy in 2021 were 93% & 95%, respectively.
The following are the key interventions being undertaken to strengthen HIV-TB Collaborative activities
▼ Intensified TB Case Finding (ICF) at ICTC: 7% of ICTC clients were screened for TB, out of which 5% were diagnosed with TB
▼ Use of molecular diagnostic (CBNAAT or Truenat) for early diagnosis of TB and Rifampicin drug resistance among People living with HIV Out of the PLHIV tested for TB, 7% were diagnosed with TB
▼ TB Preventive Therapy- TPT
Priority Areas for 2022
▼ Improve linkages of NAAT testing facility for PLHIV presumptive TB patients.
▼ Notification of all TB cases diagnosed in ART centres including those diagnosed by NAAT, in private, clinically diagnosed by scan, histopathology, cytology.
▼ Implementation of 3HP for TPT.
▼ Sensitisation of ART MOs in PMDT guidelines 2021 for management of drug resistance TB and PMTPT guidelines for TB preventive therapy.
▼ Implementation of updated ART guidelines for the management of PLHIV.
▼ Introduction of newer diagnostics like TB-LAM for TB diagnosis among PLHIV with advanced disease.
TB and COVID-19Tuberculosis and COVID-19 are infectious diseases that primarily attack the lungs presenting with similar symptoms of cough, fever, and difficulty in breathing.
The COVID-19 pandemic has brought along stigma and discriminatory behaviour, leading people to hide the symptoms and refrain from seeking health care. Such social behaviour
◄ Policy Statement
As an effort to mitigate the impact of Covid -19 Pandemic on the TB programme, the Joint Monitoring Group of the MoHFW, in its meeting held on 15th June 2020, recommended the following strategies:
▼ Bi-directional screening for TB and COVID–19, i.e., COVID-19 screening for all diagnosed TB patients and TB screening for all suspected and confirmed COVID-19 patients.
▼ Symptomatic screening for TB and inclusion during surveillance for ILI/SARI/COVID in the community.
▼ Home sample collection services of sputum samples in COVID-19 containment zones.
▼ Referral linkages for diagnosis and management for TB at all COVID-19 Care Centres, Dedicated Covid Health Centres, Dedicated Covid Hospitals.
◄ Implementation Arrangement
Since the issuance of guidance on bidirectional screening of TB and COVID-19 in 2020, its implementation was started at varied points of time by the different States/UTs.
The status of screening for COVID-19 among TB notified patients as of 31st December 2021 is as follows: (Source: Nikshay)
Indicators 2021
Total TB cases notified 2136418
Out of above, Tested for COVID-19 1272728
Percentage tested for COVID-19 60%
Out of those tested, TB COVID-19 comorbid 4996
Percentage positive for TB COVID-19 0.4%
might contribute to TB and other respiratory diseases in the household and the community.The graph below shows the month-wise trend
of TB notification in 2019, 2020, 2021. The dip in 2020 and 2021 coincides with the 1st and 2nd waves of the COVID-19 pandemic.
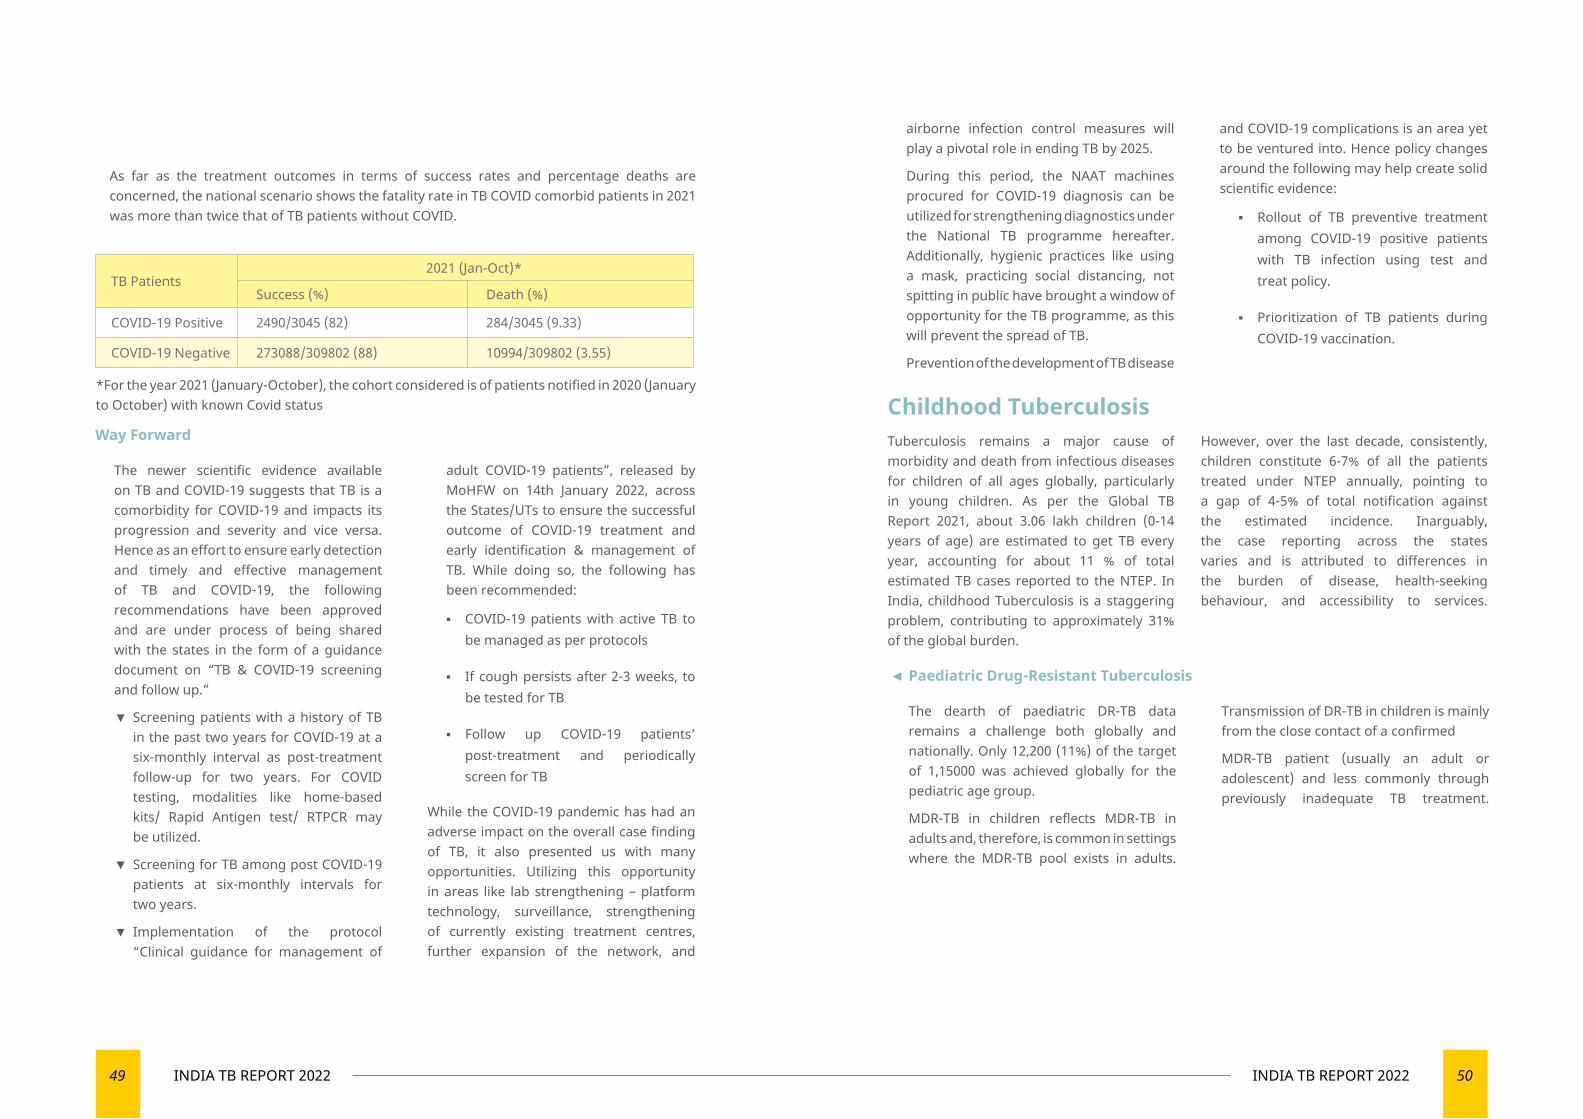
49 INDIA TB REPORT 2022 50INDIA TB REPORT 2022
As far as the treatment outcomes in terms of success rates and percentage deaths are concerned, the national scenario shows the fatality rate in TB COVID comorbid patients in 2021 was more than twice that of TB patients without COVID.
TB Patients2021 (Jan-Oct)*
Success (%) Death (%)
COVID-19 Positive 2490/3045 (82) 284/3045 (9.33)
COVID-19 Negative 273088/309802 (88) 10994/309802 (3.55)
*For the year 2021 (January-October), the cohort considered is of patients notified in 2020 (January to October) with known Covid status
airborne infection control measures will play a pivotal role in ending TB by 2025.
During this period, the NAAT machines procured for COVID-19 diagnosis can be utilized for strengthening diagnostics under the National TB programme hereafter. Additionally, hygienic practices like using a mask, practicing social distancing, not spitting in public have brought a window of opportunity for the TB programme, as this will prevent the spread of TB.
Prevention of the development of TB disease
and COVID-19 complications is an area yet to be ventured into. Hence policy changes around the following may help create solid scientific evidence:
▪ Rollout of TB preventive treatment among COVID-19 positive patients with TB infection using test and treat policy.
▪ Prioritization of TB patients during COVID-19 vaccination.
Way Forward
The newer scientific evidence available on TB and COVID-19 suggests that TB is a comorbidity for COVID-19 and impacts its progression and severity and vice versa. Hence as an effort to ensure early detection and timely and effective management of TB and COVID-19, the following recommendations have been approved and are under process of being shared with the states in the form of a guidance document on “TB & COVID-19 screening and follow up.”
▼ Screening patients with a history of TB in the past two years for COVID-19 at a six-monthly interval as post-treatment follow-up for two years. For COVID testing, modalities like home-based kits/ Rapid Antigen test/ RTPCR may be utilized.
▼ Screening for TB among post COVID-19 patients at six-monthly intervals for two years.
▼ Implementation of the protocol “Clinical guidance for management of
adult COVID-19 patients”, released by MoHFW on 14th January 2022, across the States/UTs to ensure the successful outcome of COVID-19 treatment and early identification & management of TB. While doing so, the following has been recommended:
▪ COVID-19 patients with active TB to be managed as per protocols
▪ If cough persists after 2-3 weeks, to be tested for TB
▪ Follow up COVID-19 patients’ post-treatment and periodically screen for TB
While the COVID-19 pandemic has had an adverse impact on the overall case finding of TB, it also presented us with many opportunities. Utilizing this opportunity in areas like lab strengthening – platform technology, surveillance, strengthening of currently existing treatment centres, further expansion of the network, and
Childhood TuberculosisTuberculosis remains a major cause of morbidity and death from infectious diseases for children of all ages globally, particularly in young children. As per the Global TB Report 2021, about 3.06 lakh children (0-14 years of age) are estimated to get TB every year, accounting for about 11 % of total estimated TB cases reported to the NTEP. In India, childhood Tuberculosis is a staggering problem, contributing to approximately 31% of the global burden.
However, over the last decade, consistently, children constitute 6-7% of all the patients treated under NTEP annually, pointing to a gap of 4-5% of total notification against the estimated incidence. Inarguably, the case reporting across the states varies and is attributed to differences in the burden of disease, health-seeking behaviour, and accessibility to services.
◄ Paediatric Drug-Resistant Tuberculosis
The dearth of paediatric DR-TB data remains a challenge both globally and nationally. Only 12,200 (11%) of the target of 1,15000 was achieved globally for the pediatric age group.
MDR-TB in children reflects MDR-TB in adults and, therefore, is common in settings where the MDR-TB pool exists in adults.
Transmission of DR-TB in children is mainly from the close contact of a confirmed
MDR-TB patient (usually an adult or adolescent) and less commonly through previously inadequate TB treatment.
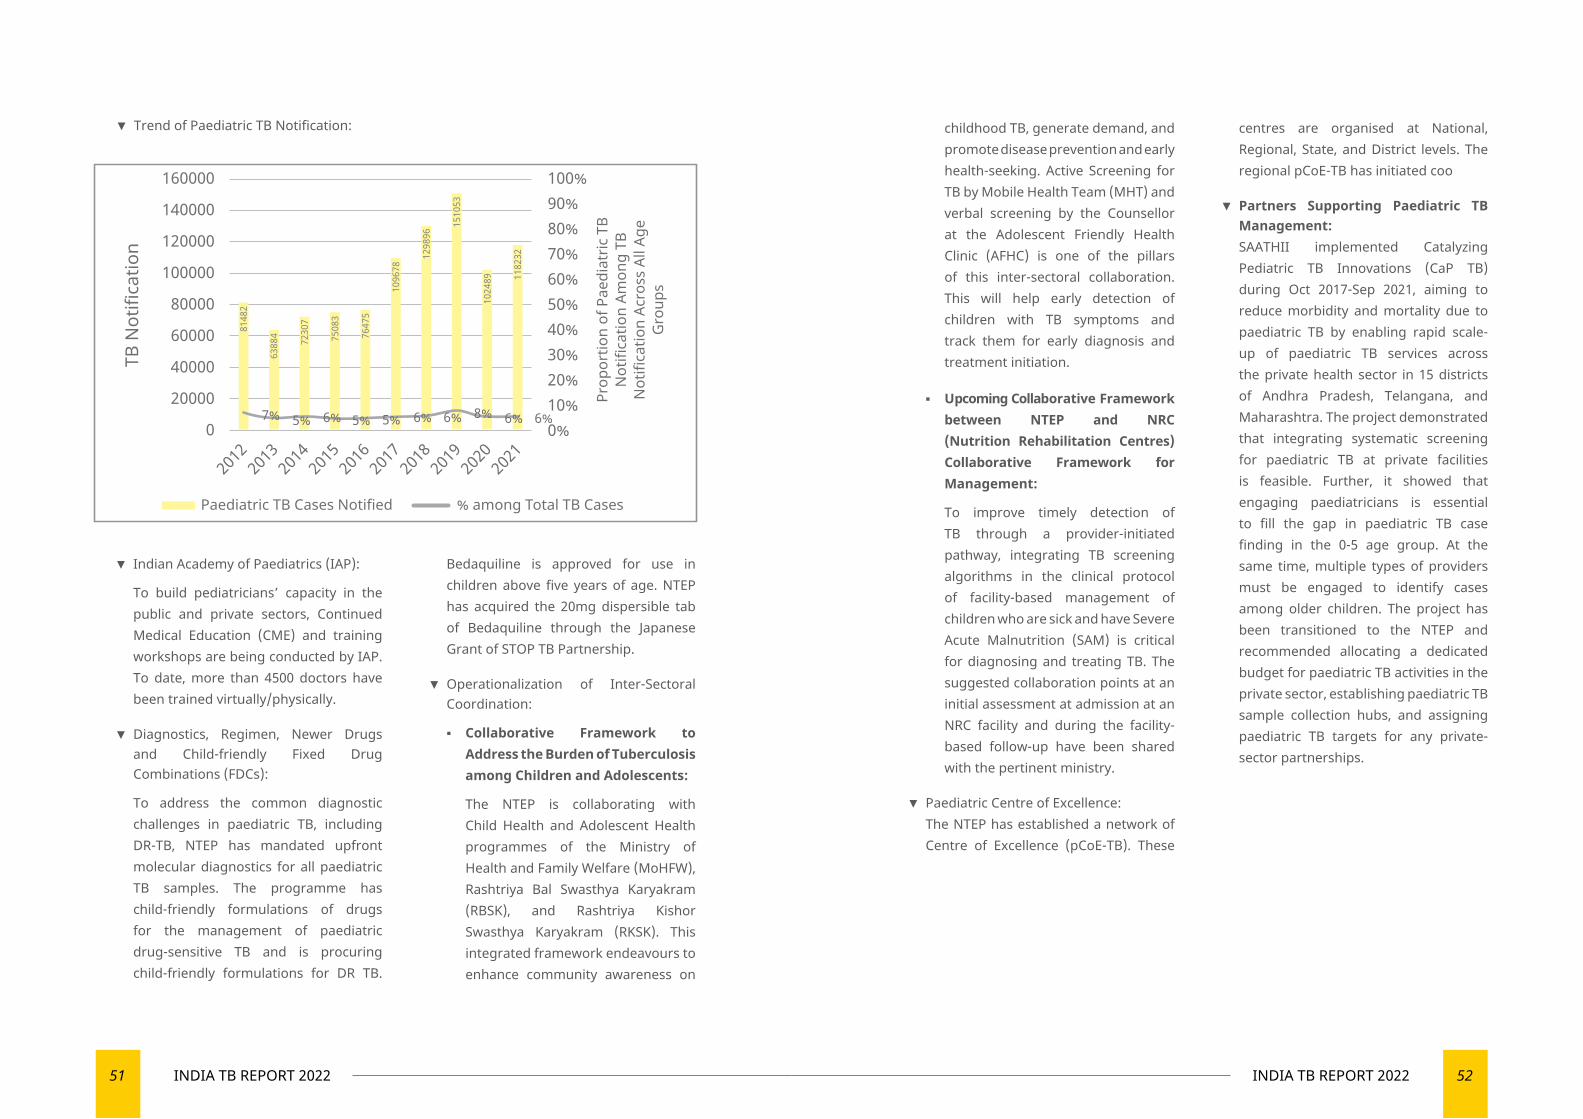
51 INDIA TB REPORT 2022 52INDIA TB REPORT 2022
▼ Trend of Paediatric TB Notification: childhood TB, generate demand, and promote disease prevention and early health-seeking. Active Screening for TB by Mobile Health Team (MHT) and verbal screening by the Counsellor at the Adolescent Friendly Health Clinic (AFHC) is one of the pillars of this inter-sectoral collaboration. This will help early detection of children with TB symptoms and track them for early diagnosis and treatment initiation.
▪ Upcoming Collaborative Framework between NTEP and NRC (Nutrition Rehabilitation Centres) Collaborative Framework for Management:
To improve timely detection of TB through a provider-initiated pathway, integrating TB screening algorithms in the clinical protocol of facility-based management of children who are sick and have Severe Acute Malnutrition (SAM) is critical for diagnosing and treating TB. The suggested collaboration points at an initial assessment at admission at an NRC facility and during the facility-based follow-up have been shared with the pertinent ministry.
▼ Paediatric Centre of Excellence:The NTEP has established a network of Centre of Excellence (pCoE-TB). These
centres are organised at National, Regional, State, and District levels. The regional pCoE-TB has initiated coo
▼ Partners Supporting Paediatric TB Management:SAATHII implemented Catalyzing Pediatric TB Innovations (CaP TB) during Oct 2017-Sep 2021, aiming to reduce morbidity and mortality due to paediatric TB by enabling rapid scale-up of paediatric TB services across the private health sector in 15 districts of Andhra Pradesh, Telangana, and Maharashtra. The project demonstrated that integrating systematic screening for paediatric TB at private facilities is feasible. Further, it showed that engaging paediatricians is essential to fill the gap in paediatric TB case finding in the 0-5 age group. At the same time, multiple types of providers must be engaged to identify cases among older children. The project has been transitioned to the NTEP and recommended allocating a dedicated budget for paediatric TB activities in the private sector, establishing paediatric TB sample collection hubs, and assigning paediatric TB targets for any private-sector partnerships.
2012
2013
2014
2015
2016
2017
2018
2019
2020
2021
100%90%80%70%60%50%40%30%20%10%0%
160000
140000
120000
100000
80000
60000
40000
20000
0
Paediatric TB Cases Notified % among Total TB Cases
TB N
otifi
catio
n
Prop
ortio
n of
Pae
diat
ric T
BN
otifi
catio
n Am
ong
TBN
otifi
catio
n Ac
ross
All
Age
Gro
ups
7% 5% 6% 5% 5% 6% 6% 8% 6% 6%
8148
2
6388
4
7230
7
7508
3
7647
5
1096
78
1298
96
1510
53
1024
89 1182
32
▼ Indian Academy of Paediatrics (IAP):
To build pediatricians’ capacity in the public and private sectors, Continued Medical Education (CME) and training workshops are being conducted by IAP. To date, more than 4500 doctors have been trained virtually/physically.
▼ Diagnostics, Regimen, Newer Drugs and Child-friendly Fixed Drug Combinations (FDCs):
To address the common diagnostic challenges in paediatric TB, including DR-TB, NTEP has mandated upfront molecular diagnostics for all paediatric TB samples. The programme has child-friendly formulations of drugs for the management of paediatric drug-sensitive TB and is procuring child-friendly formulations for DR TB.
Bedaquiline is approved for use in children above five years of age. NTEP has acquired the 20mg dispersible tab of Bedaquiline through the Japanese Grant of STOP TB Partnership.
▼ Operationalization of Inter-Sectoral Coordination:
▪ Collaborative Framework to Address the Burden of Tuberculosis among Children and Adolescents:
The NTEP is collaborating with Child Health and Adolescent Health programmes of the Ministry of Health and Family Welfare (MoHFW), Rashtriya Bal Swasthya Karyakram (RBSK), and Rashtriya Kishor Swasthya Karyakram (RKSK). This integrated framework endeavours to enhance community awareness on
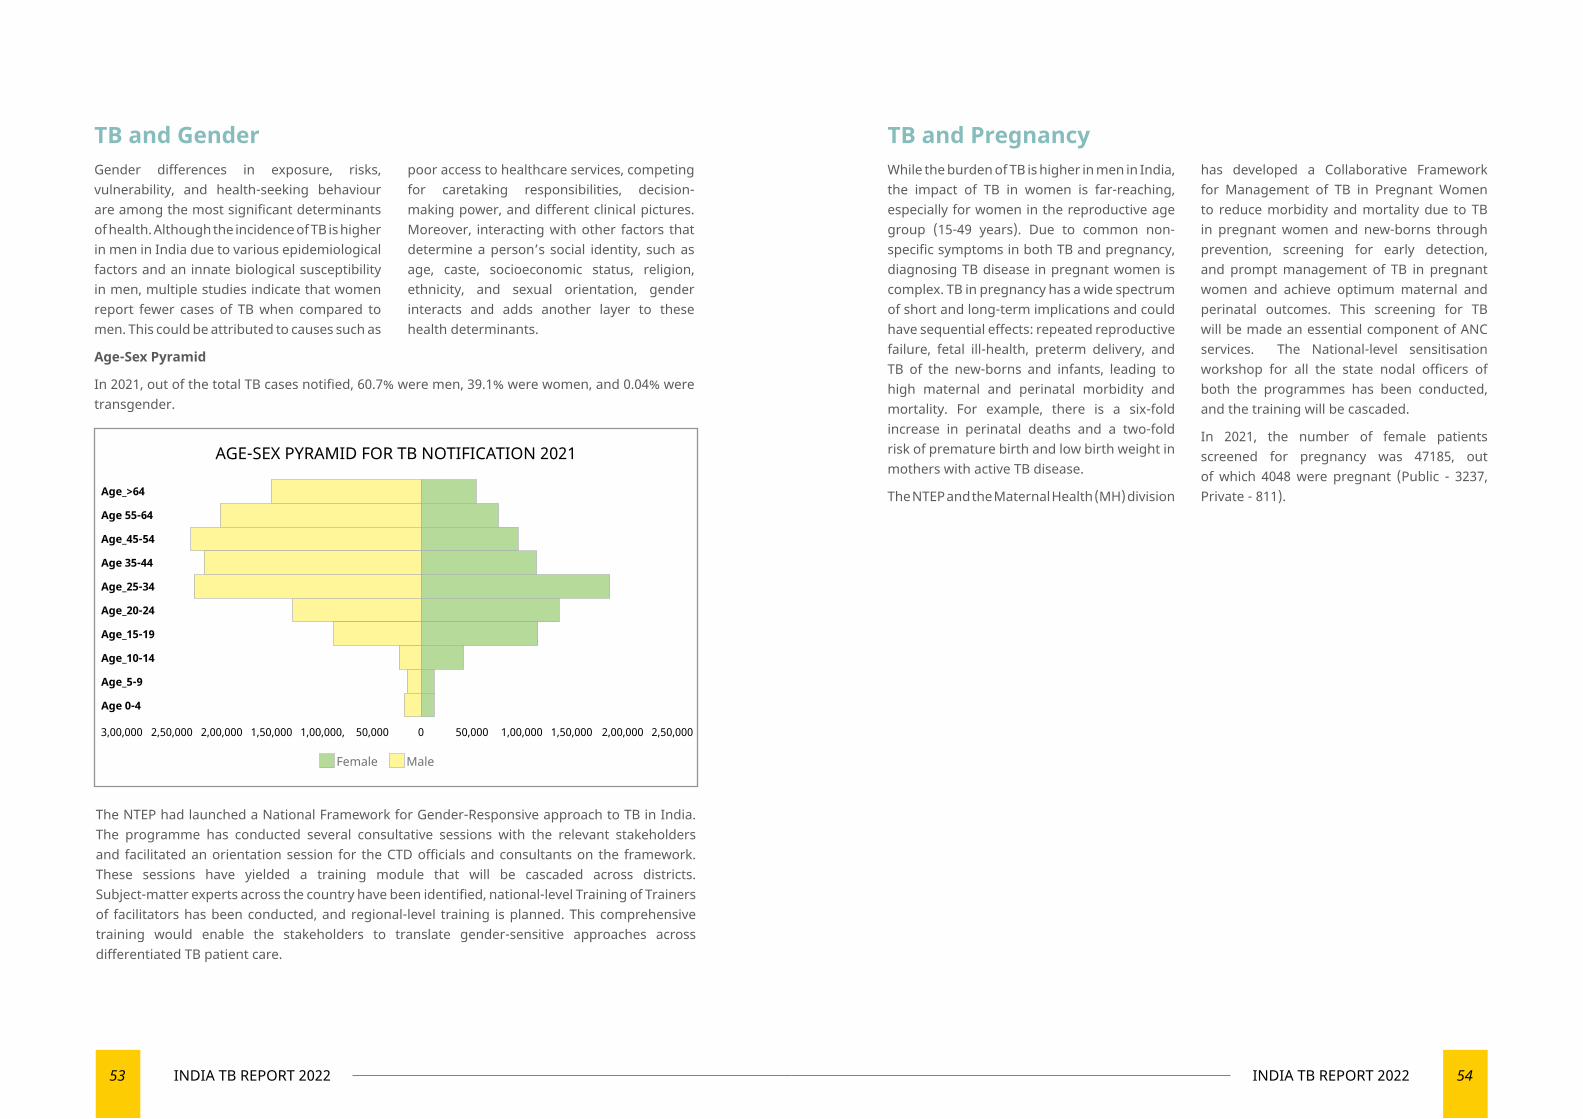
53 INDIA TB REPORT 2022 54INDIA TB REPORT 2022
TB and GenderGender differences in exposure, risks, vulnerability, and health-seeking behaviour are among the most significant determinants of health. Although the incidence of TB is higher in men in India due to various epidemiological factors and an innate biological susceptibility in men, multiple studies indicate that women report fewer cases of TB when compared to men. This could be attributed to causes such as
poor access to healthcare services, competing for caretaking responsibilities, decision-making power, and different clinical pictures. Moreover, interacting with other factors that determine a person’s social identity, such as age, caste, socioeconomic status, religion, ethnicity, and sexual orientation, gender interacts and adds another layer to these health determinants.
Age-Sex Pyramid
In 2021, out of the total TB cases notified, 60.7% were men, 39.1% were women, and 0.04% were transgender.
TB and PregnancyWhile the burden of TB is higher in men in India, the impact of TB in women is far-reaching, especially for women in the reproductive age group (15-49 years). Due to common non-specific symptoms in both TB and pregnancy, diagnosing TB disease in pregnant women is complex. TB in pregnancy has a wide spectrum of short and long-term implications and could have sequential effects: repeated reproductive failure, fetal ill-health, preterm delivery, and TB of the new-borns and infants, leading to high maternal and perinatal morbidity and mortality. For example, there is a six-fold increase in perinatal deaths and a two-fold risk of premature birth and low birth weight in mothers with active TB disease.
The NTEP and the Maternal Health (MH) division
The NTEP had launched a National Framework for Gender-Responsive approach to TB in India. The programme has conducted several consultative sessions with the relevant stakeholders and facilitated an orientation session for the CTD officials and consultants on the framework. These sessions have yielded a training module that will be cascaded across districts. Subject-matter experts across the country have been identified, national-level Training of Trainers of facilitators has been conducted, and regional-level training is planned. This comprehensive training would enable the stakeholders to translate gender-sensitive approaches across differentiated TB patient care.
has developed a Collaborative Framework for Management of TB in Pregnant Women to reduce morbidity and mortality due to TB in pregnant women and new-borns through prevention, screening for early detection, and prompt management of TB in pregnant women and achieve optimum maternal and perinatal outcomes. This screening for TB will be made an essential component of ANC services. The National-level sensitisation workshop for all the state nodal officers of both the programmes has been conducted, and the training will be cascaded.
In 2021, the number of female patients screened for pregnancy was 47185, out of which 4048 were pregnant (Public - 3237, Private - 811).
AGE-SEX PYRAMID FOR TB NOTIFICATION 2021
Female Male
3,00,000 2,50,000 2,00,000 1,50,000 1,00,000, 50,000 0 50,000 1,00,000 1,50,000 2,00,000 2,50,000
Age_>64
Age 55-64
Age_45-54
Age 35-44
Age_25-34
Age_20-24
Age_15-19
Age_10-14
Age_5-9
Age 0-4
06
SUPERVISION AND MONITORING
Enhancing skills to create a healthier tomorrow
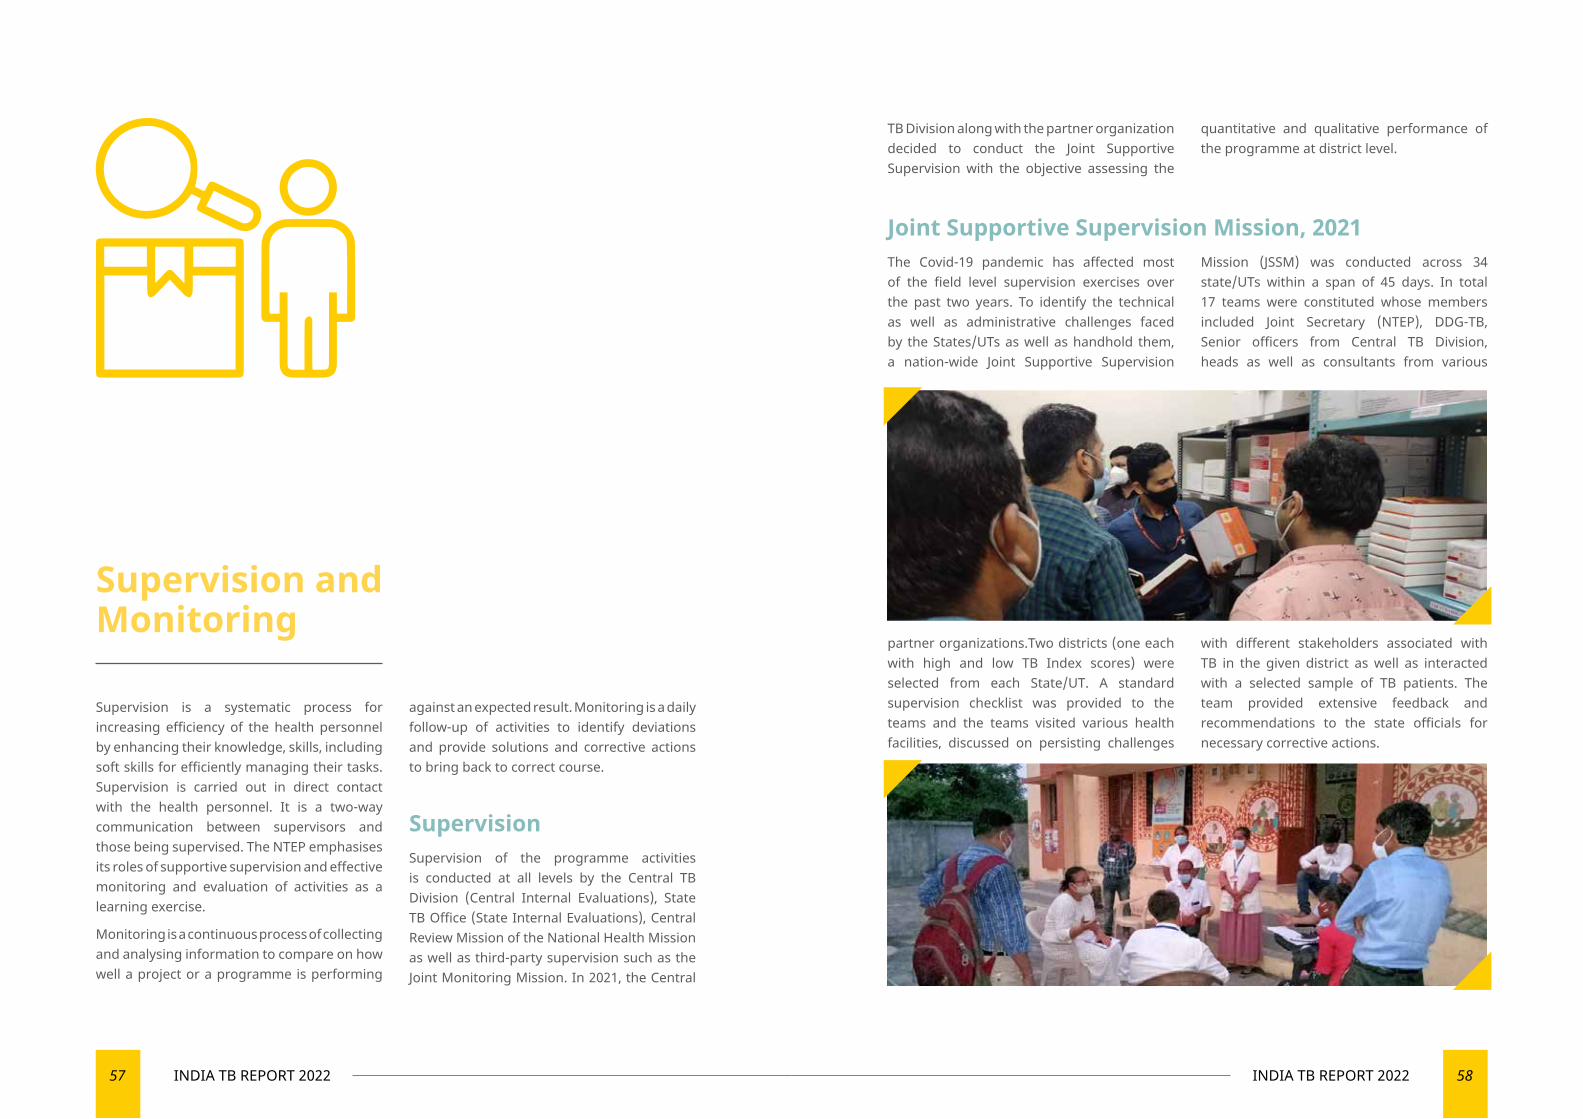
57 INDIA TB REPORT 2022 58INDIA TB REPORT 2022
Supervision is a systematic process for increasing efficiency of the health personnel by enhancing their knowledge, skills, including soft skills for efficiently managing their tasks. Supervision is carried out in direct contact with the health personnel. It is a two-way communication between supervisors and those being supervised. The NTEP emphasises its roles of supportive supervision and effective monitoring and evaluation of activities as a learning exercise.
Monitoring is a continuous process of collecting and analysing information to compare on how well a project or a programme is performing
against an expected result. Monitoring is a daily follow-up of activities to identify deviations and provide solutions and corrective actions to bring back to correct course.
Supervision Supervision of the programme activities is conducted at all levels by the Central TB Division (Central Internal Evaluations), State TB Office (State Internal Evaluations), Central Review Mission of the National Health Mission as well as third-party supervision such as the Joint Monitoring Mission. In 2021, the Central
Supervision and Monitoring
Joint Supportive Supervision Mission, 2021The Covid-19 pandemic has affected most of the field level supervision exercises over the past two years. To identify the technical as well as administrative challenges faced by the States/UTs as well as handhold them, a nation-wide Joint Supportive Supervision
Mission (JSSM) was conducted across 34 state/UTs within a span of 45 days. In total 17 teams were constituted whose members included Joint Secretary (NTEP), DDG-TB, Senior officers from Central TB Division, heads as well as consultants from various
partner organizations.Two districts (one each with high and low TB Index scores) were selected from each State/UT. A standard supervision checklist was provided to the teams and the teams visited various health facilities, discussed on persisting challenges
with different stakeholders associated with TB in the given district as well as interacted with a selected sample of TB patients. The team provided extensive feedback and recommendations to the state officials for necessary corrective actions.
TB Division along with the partner organization decided to conduct the Joint Supportive Supervision with the objective assessing the
quantitative and qualitative performance of the programme at district level.
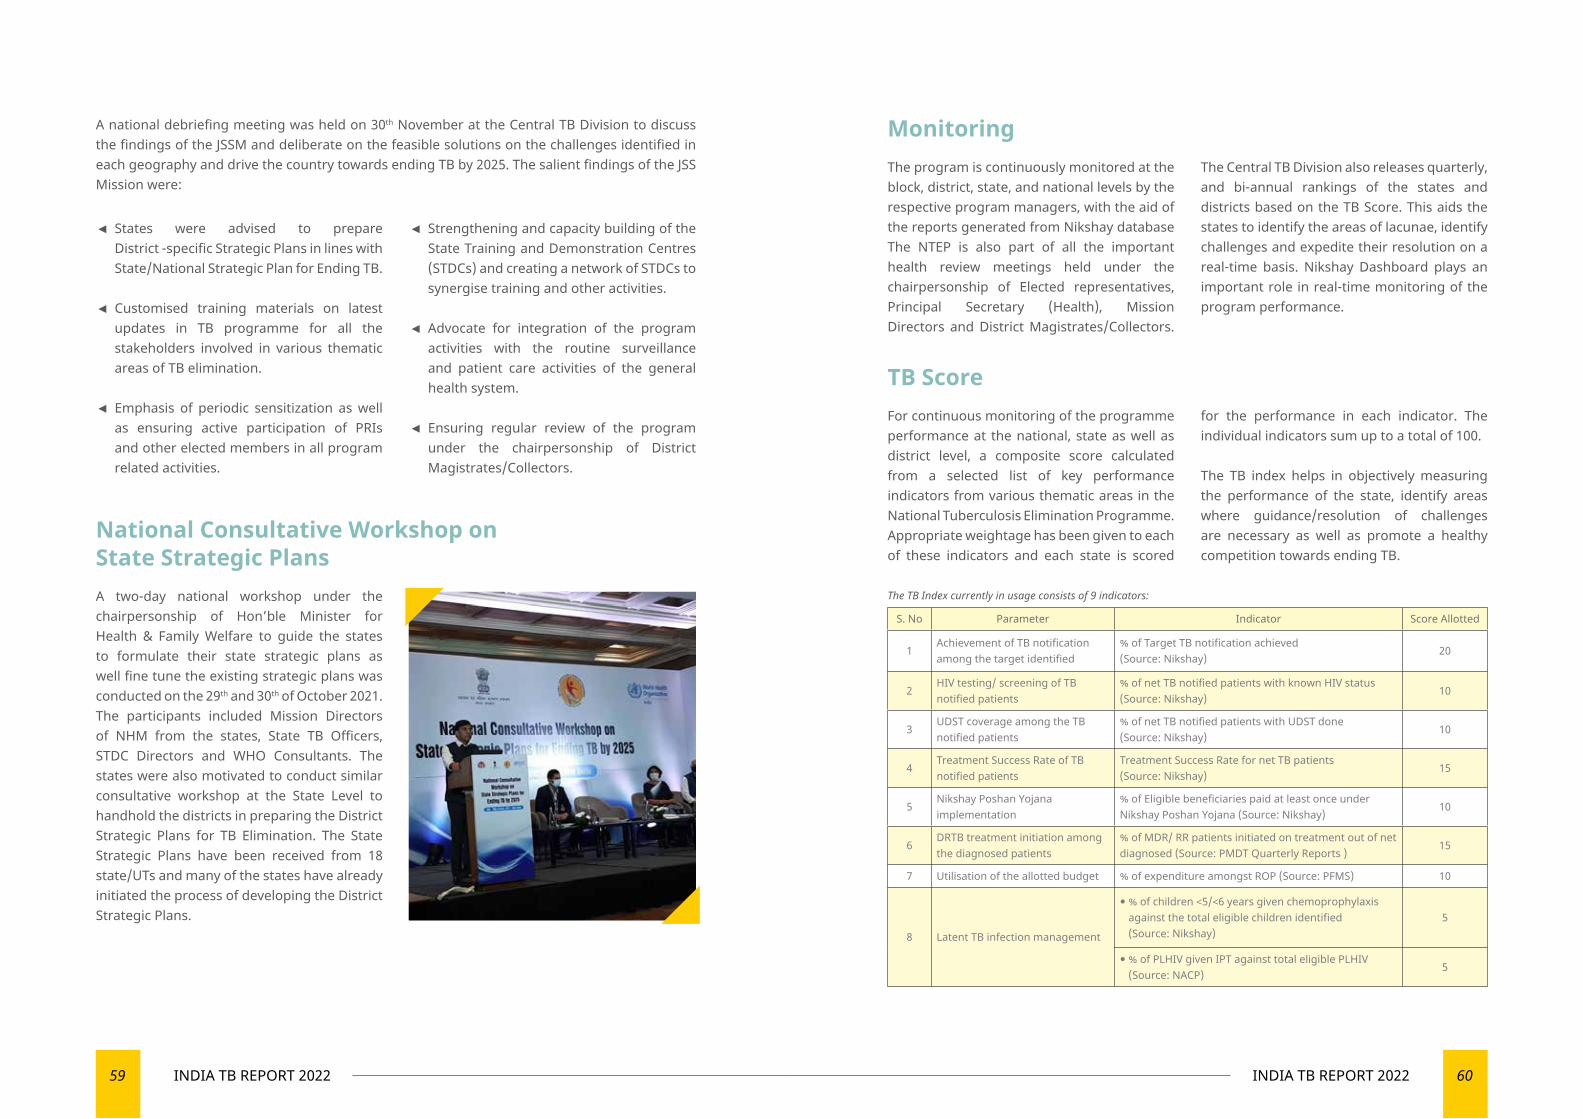
59 INDIA TB REPORT 2022 60INDIA TB REPORT 2022
A national debriefing meeting was held on 30th November at the Central TB Division to discuss the findings of the JSSM and deliberate on the feasible solutions on the challenges identified in each geography and drive the country towards ending TB by 2025. The salient findings of the JSS Mission were:
◄ States were advised to prepare District -specific Strategic Plans in lines with State/National Strategic Plan for Ending TB.
◄ Customised training materials on latest updates in TB programme for all the stakeholders involved in various thematic areas of TB elimination.
◄ Emphasis of periodic sensitization as well as ensuring active participation of PRIs and other elected members in all program related activities.
◄ Strengthening and capacity building of the State Training and Demonstration Centres (STDCs) and creating a network of STDCs to synergise training and other activities.
◄ Advocate for integration of the program activities with the routine surveillance and patient care activities of the general health system.
◄ Ensuring regular review of the program under the chairpersonship of District Magistrates/Collectors.
National Consultative Workshop on State Strategic PlansA two-day national workshop under the chairpersonship of Hon’ble Minister for Health & Family Welfare to guide the states to formulate their state strategic plans as well fine tune the existing strategic plans was conducted on the 29th and 30th of October 2021. The participants included Mission Directors of NHM from the states, State TB Officers, STDC Directors and WHO Consultants. The states were also motivated to conduct similar consultative workshop at the State Level to handhold the districts in preparing the District Strategic Plans for TB Elimination. The State Strategic Plans have been received from 18 state/UTs and many of the states have already initiated the process of developing the District Strategic Plans.
Monitoring
TB Score
The program is continuously monitored at the block, district, state, and national levels by the respective program managers, with the aid of the reports generated from Nikshay database The NTEP is also part of all the important health review meetings held under the chairpersonship of Elected representatives, Principal Secretary (Health), Mission Directors and District Magistrates/Collectors.
The Central TB Division also releases quarterly, and bi-annual rankings of the states and districts based on the TB Score. This aids the states to identify the areas of lacunae, identify challenges and expedite their resolution on a real-time basis. Nikshay Dashboard plays an important role in real-time monitoring of the program performance.
For continuous monitoring of the programme performance at the national, state as well as district level, a composite score calculated from a selected list of key performance indicators from various thematic areas in the National Tuberculosis Elimination Programme. Appropriate weightage has been given to each of these indicators and each state is scored
for the performance in each indicator. The individual indicators sum up to a total of 100.
The TB index helps in objectively measuring the performance of the state, identify areas where guidance/resolution of challenges are necessary as well as promote a healthy competition towards ending TB.
S. No Parameter Indicator Score Allotted
1Achievement of TB notification among the target identified
% of Target TB notification achieved (Source: Nikshay)
20
2HIV testing/ screening of TB notified patients
% of net TB notified patients with known HIV status (Source: Nikshay)
10
3UDST coverage among the TB notified patients
% of net TB notified patients with UDST done (Source: Nikshay)
10
4Treatment Success Rate of TB notified patients
Treatment Success Rate for net TB patients (Source: Nikshay)
15
5Nikshay Poshan Yojana implementation
% of Eligible beneficiaries paid at least once under Nikshay Poshan Yojana (Source: Nikshay)
10
6DRTB treatment initiation among the diagnosed patients
% of MDR/ RR patients initiated on treatment out of net diagnosed (Source: PMDT Quarterly Reports )
15
7 Utilisation of the allotted budget % of expenditure amongst ROP (Source: PFMS) 10
8 Latent TB infection management
% of children <5/<6 years given chemoprophylaxis against the total eligible children identified (Source: Nikshay)
5
% of PLHIV given IPT against total eligible PLHIV (Source: NACP)
5
The TB Index currently in usage consists of 9 indicators:
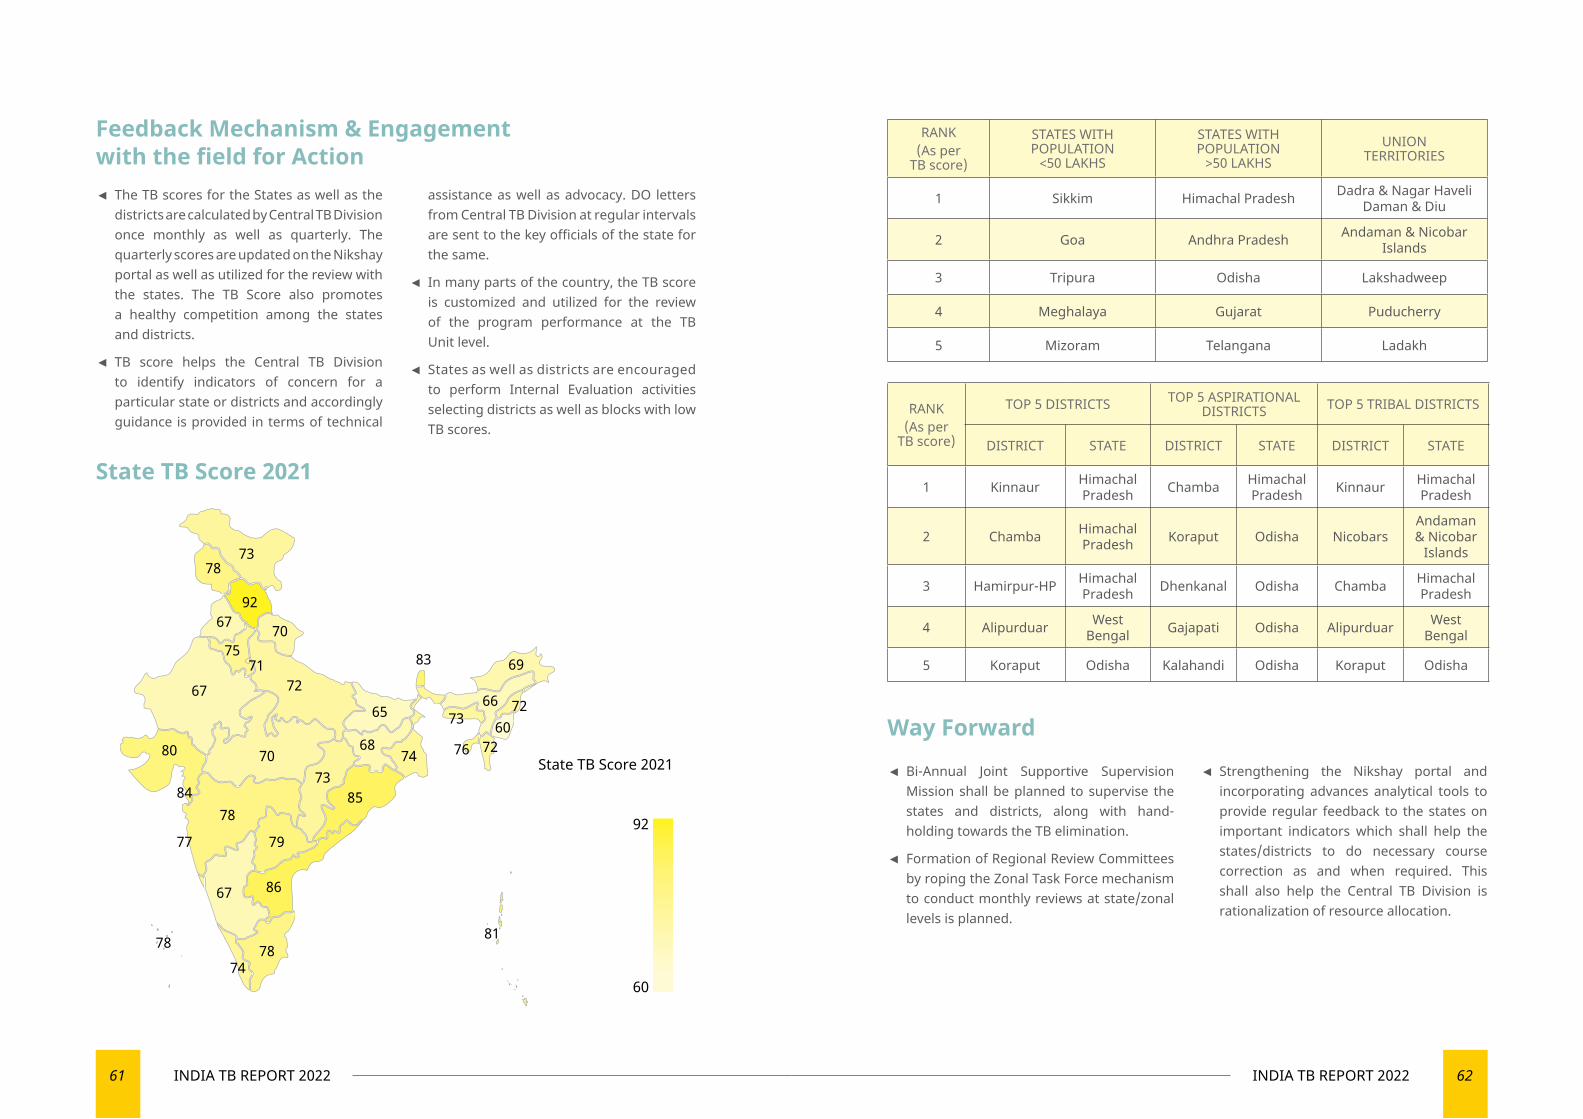
61 INDIA TB REPORT 2022 62INDIA TB REPORT 2022
Feedback Mechanism & Engagement with the field for Action
Way Forward
State TB Score 2021
◄ The TB scores for the States as well as the districts are calculated by Central TB Division once monthly as well as quarterly. The quarterly scores are updated on the Nikshay portal as well as utilized for the review with the states. The TB Score also promotes a healthy competition among the states and districts.
◄ TB score helps the Central TB Division to identify indicators of concern for a particular state or districts and accordingly guidance is provided in terms of technical
assistance as well as advocacy. DO letters from Central TB Division at regular intervals are sent to the key officials of the state for the same.
◄ In many parts of the country, the TB score is customized and utilized for the review of the program performance at the TB Unit level.
◄ States as well as districts are encouraged to perform Internal Evaluation activities selecting districts as well as blocks with low TB scores.
RANK(As per
TB score)
STATES WITH POPULATION
<50 LAKHS
STATES WITH POPULATION
>50 LAKHSUNION
TERRITORIES
1 Sikkim Himachal Pradesh Dadra & Nagar Haveli Daman & Diu
2 Goa Andhra Pradesh Andaman & Nicobar Islands
3 Tripura Odisha Lakshadweep
4 Meghalaya Gujarat Puducherry
5 Mizoram Telangana Ladakh
RANK(As per
TB score)
TOP 5 DISTRICTS TOP 5 ASPIRATIONAL DISTRICTS TOP 5 TRIBAL DISTRICTS
DISTRICT STATE DISTRICT STATE DISTRICT STATE
1 Kinnaur Himachal Pradesh Chamba Himachal
Pradesh Kinnaur Himachal Pradesh
2 Chamba Himachal Pradesh Koraput Odisha Nicobars
Andaman & Nicobar
Islands
3 Hamirpur-HP Himachal Pradesh Dhenkanal Odisha Chamba Himachal
Pradesh
4 Alipurduar West Bengal Gajapati Odisha Alipurduar West
Bengal
5 Koraput Odisha Kalahandi Odisha Koraput Odisha
◄ Bi-Annual Joint Supportive Supervision Mission shall be planned to supervise the states and districts, along with hand-holding towards the TB elimination.
◄ Formation of Regional Review Committees by roping the Zonal Task Force mechanism to conduct monthly reviews at state/zonal levels is planned.
◄ Strengthening the Nikshay portal and incorporating advances analytical tools to provide regular feedback to the states on important indicators which shall help the states/districts to do necessary course correction as and when required. This shall also help the Central TB Division is rationalization of resource allocation.
92
70
7267
68
83 69
65
80
84
77
78
79
7073
67 86
81
85
74
7372
607276
66
7478
7378
67
7571
78
State TB Score 2021
92
60
07
PATIENT SUPPORT SYSTEMS
Creating holistic patient support systems
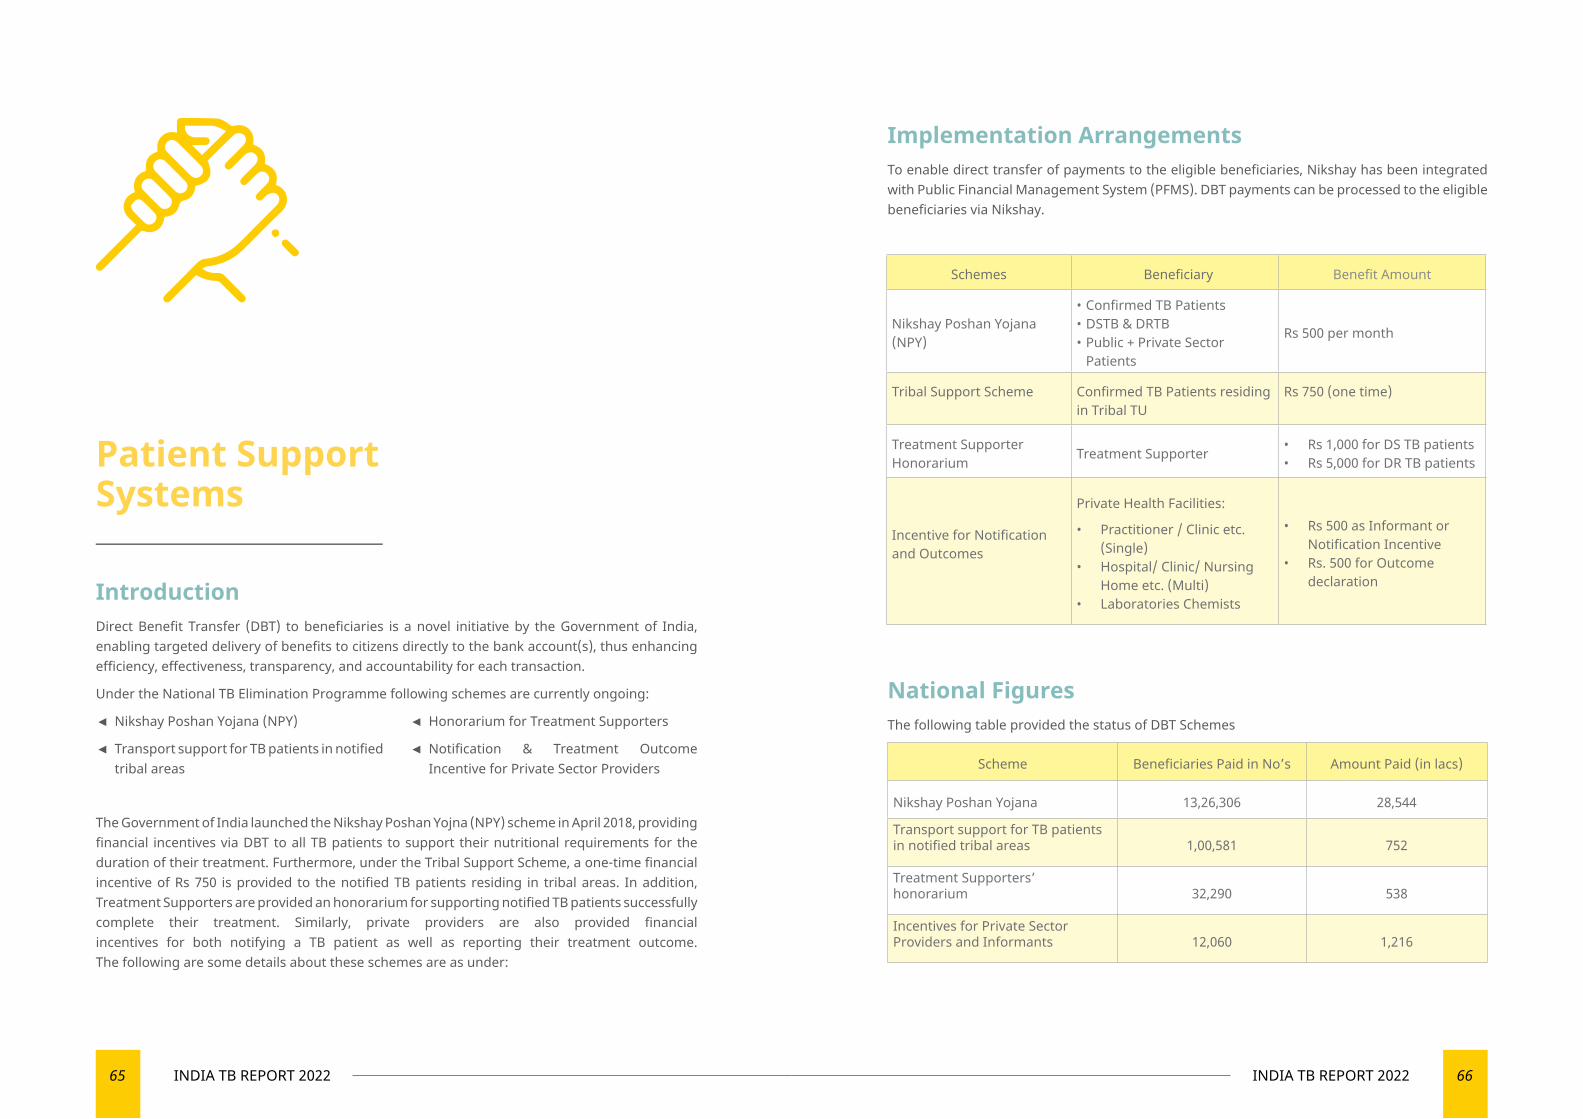
65 INDIA TB REPORT 2022 66INDIA TB REPORT 2022
Patient Support Systems
IntroductionDirect Benefit Transfer (DBT) to beneficiaries is a novel initiative by the Government of India, enabling targeted delivery of benefits to citizens directly to the bank account(s), thus enhancing efficiency, effectiveness, transparency, and accountability for each transaction.
Under the National TB Elimination Programme following schemes are currently ongoing:
◄ Nikshay Poshan Yojana (NPY)
◄ Transport support for TB patients in notified tribal areas
◄ Honorarium for Treatment Supporters
◄ Notification & Treatment Outcome Incentive for Private Sector Providers
The Government of India launched the Nikshay Poshan Yojna (NPY) scheme in April 2018, providing financial incentives via DBT to all TB patients to support their nutritional requirements for the duration of their treatment. Furthermore, under the Tribal Support Scheme, a one-time financial incentive of Rs 750 is provided to the notified TB patients residing in tribal areas. In addition, Treatment Supporters are provided an honorarium for supporting notified TB patients successfully complete their treatment. Similarly, private providers are also provided financial incentives for both notifying a TB patient as well as reporting their treatment outcome. The following are some details about these schemes are as under:
Implementation ArrangementsTo enable direct transfer of payments to the eligible beneficiaries, Nikshay has been integrated with Public Financial Management System (PFMS). DBT payments can be processed to the eligible beneficiaries via Nikshay.
Schemes Beneficiary Benefit Amount
Nikshay Poshan Yojana (NPY)
• Confirmed TB Patients• DSTB & DRTB• Public + Private Sector
Patients
Rs 500 per month
Tribal Support Scheme Confirmed TB Patients residing in Tribal TU
Rs 750 (one time)
Treatment Supporter Honorarium Treatment Supporter • Rs 1,000 for DS TB patients
• Rs 5,000 for DR TB patients
Incentive for Notification and Outcomes
Private Health Facilities:
• Practitioner / Clinic etc. (Single)
• Hospital/ Clinic/ Nursing Home etc. (Multi)
• Laboratories Chemists
• Rs 500 as Informant or Notification Incentive
• Rs. 500 for Outcome declaration
National FiguresThe following table provided the status of DBT Schemes
Scheme Beneficiaries Paid in No’s Amount Paid (in lacs)
Nikshay Poshan Yojana 13,26,306 28,544
Transport support for TB patients in notified tribal areas 1,00,581 752
Treatment Supporters’ honorarium 32,290 538
Incentives for Private Sector Providers and Informants 12,060 1,216
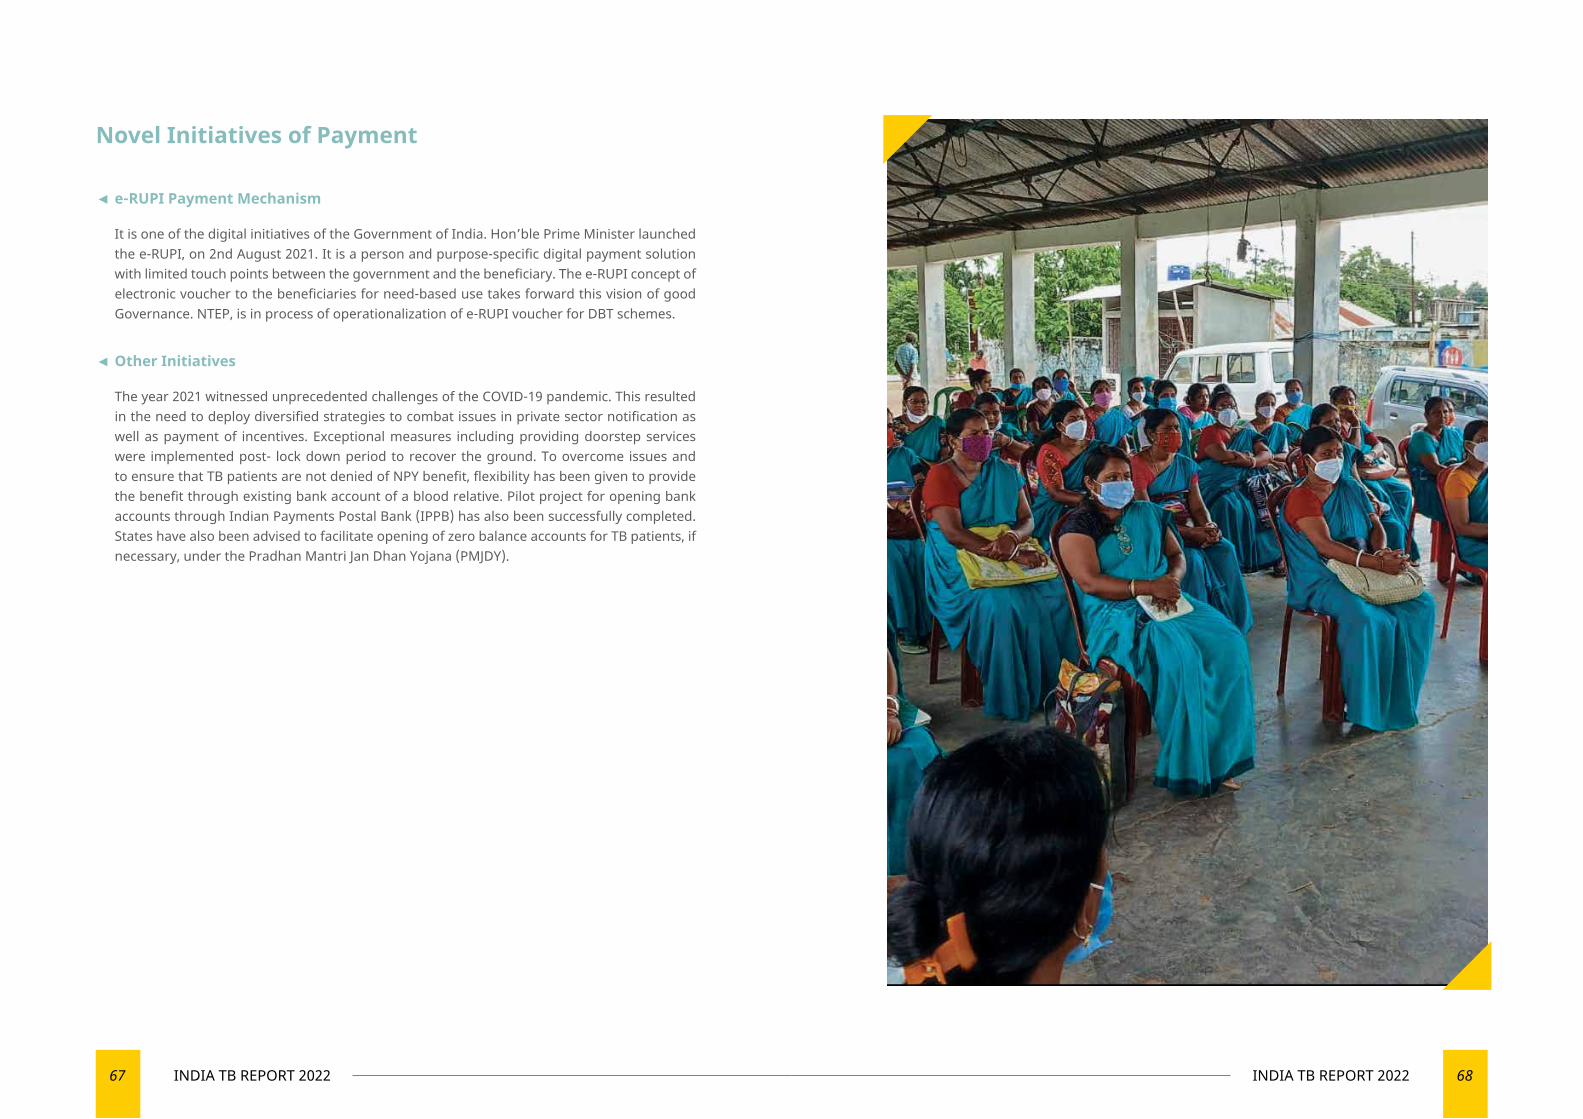
67 INDIA TB REPORT 2022 68INDIA TB REPORT 2022
Novel Initiatives of Payment
◄ e-RUPI Payment Mechanism
It is one of the digital initiatives of the Government of India. Hon’ble Prime Minister launched the e-RUPI, on 2nd August 2021. It is a person and purpose-specific digital payment solution with limited touch points between the government and the beneficiary. The e-RUPI concept of electronic voucher to the beneficiaries for need-based use takes forward this vision of good Governance. NTEP, is in process of operationalization of e-RUPI voucher for DBT schemes.
◄ Other Initiatives
The year 2021 witnessed unprecedented challenges of the COVID-19 pandemic. This resulted in the need to deploy diversified strategies to combat issues in private sector notification as well as payment of incentives. Exceptional measures including providing doorstep services were implemented post- lock down period to recover the ground. To overcome issues and to ensure that TB patients are not denied of NPY benefit, flexibility has been given to provide the benefit through existing bank account of a blood relative. Pilot project for opening bank accounts through Indian Payments Postal Bank (IPPB) has also been successfully completed. States have also been advised to facilitate opening of zero balance accounts for TB patients, if necessary, under the Pradhan Mantri Jan Dhan Yojana (PMJDY).
08
PARTNERSHIPS FOR THE PRIVATE SECTOR ENGAGEMENT
Boosting private sector engagements through active partnerships
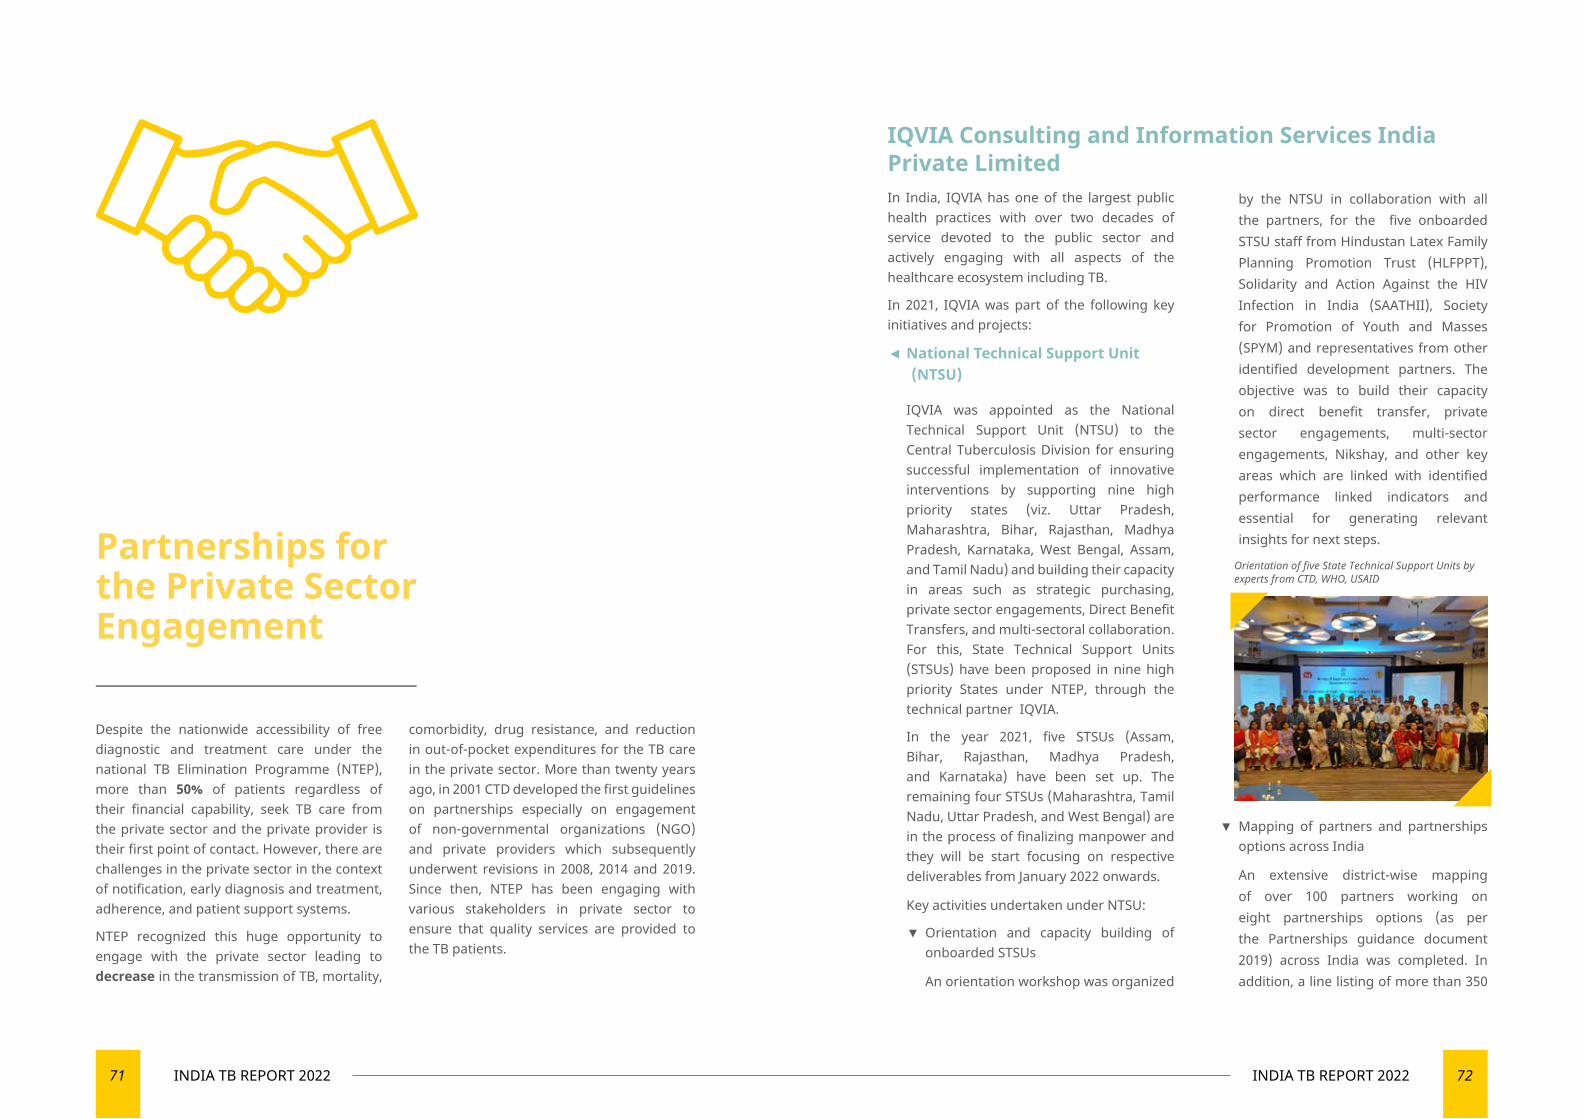
71 INDIA TB REPORT 2022 72INDIA TB REPORT 2022
Despite the nationwide accessibility of free diagnostic and treatment care under the national TB Elimination Programme (NTEP), more than 50% of patients regardless of their financial capability, seek TB care from the private sector and the private provider is their first point of contact. However, there are challenges in the private sector in the context of notification, early diagnosis and treatment, adherence, and patient support systems.
NTEP recognized this huge opportunity to engage with the private sector leading to decrease in the transmission of TB, mortality,
comorbidity, drug resistance, and reduction in out-of-pocket expenditures for the TB care in the private sector. More than twenty years ago, in 2001 CTD developed the first guidelines on partnerships especially on engagement of non-governmental organizations (NGO) and private providers which subsequently underwent revisions in 2008, 2014 and 2019. Since then, NTEP has been engaging with various stakeholders in private sector to ensure that quality services are provided to the TB patients.
Partnerships for the Private Sector Engagement
IQVIA Consulting and Information Services India Private LimitedIn India, IQVIA has one of the largest public health practices with over two decades of service devoted to the public sector and actively engaging with all aspects of the healthcare ecosystem including TB.
In 2021, IQVIA was part of the following key initiatives and projects:
◄ National Technical Support Unit (NTSU)
IQVIA was appointed as the National Technical Support Unit (NTSU) to the Central Tuberculosis Division for ensuring successful implementation of innovative interventions by supporting nine high priority states (viz. Uttar Pradesh, Maharashtra, Bihar, Rajasthan, Madhya Pradesh, Karnataka, West Bengal, Assam, and Tamil Nadu) and building their capacity in areas such as strategic purchasing, private sector engagements, Direct Benefit Transfers, and multi-sectoral collaboration. For this, State Technical Support Units (STSUs) have been proposed in nine high priority States under NTEP, through the technical partner IQVIA.
In the year 2021, five STSUs (Assam, Bihar, Rajasthan, Madhya Pradesh, and Karnataka) have been set up. The remaining four STSUs (Maharashtra, Tamil Nadu, Uttar Pradesh, and West Bengal) are in the process of finalizing manpower and they will be start focusing on respective deliverables from January 2022 onwards.
Key activities undertaken under NTSU:
▼ Orientation and capacity building of onboarded STSUs
An orientation workshop was organized
by the NTSU in collaboration with all the partners, for the five onboarded STSU staff from Hindustan Latex Family Planning Promotion Trust (HLFPPT), Solidarity and Action Against the HIV Infection in India (SAATHII), Society for Promotion of Youth and Masses (SPYM) and representatives from other identified development partners. The objective was to build their capacity on direct benefit transfer, private sector engagements, multi-sector engagements, Nikshay, and other key areas which are linked with identified performance linked indicators and essential for generating relevant insights for next steps.
▼ Mapping of partners and partnerships options across India
An extensive district-wise mapping of over 100 partners working on eight partnerships options (as per the Partnerships guidance document 2019) across India was completed. In addition, a line listing of more than 350
Orientation of five State Technical Support Units by experts from CTD, WHO, USAID
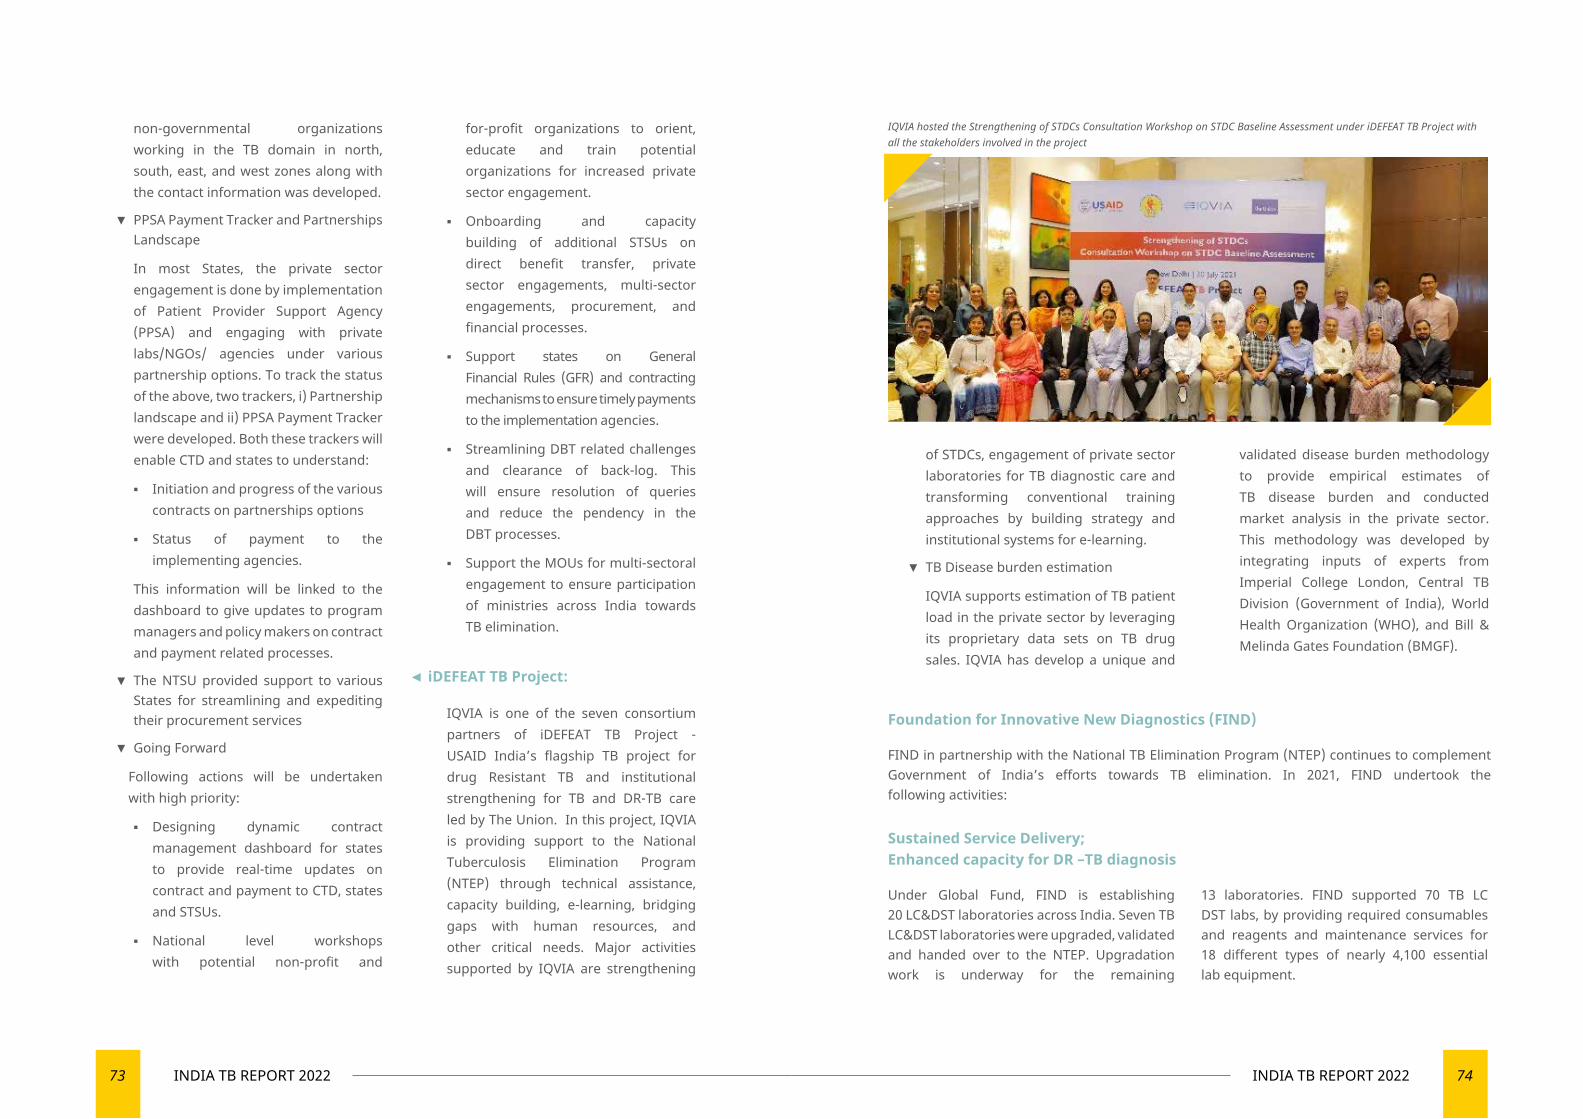
73 INDIA TB REPORT 2022 74INDIA TB REPORT 2022
non-governmental organizations working in the TB domain in north, south, east, and west zones along with the contact information was developed.
▼ PPSA Payment Tracker and Partnerships Landscape
In most States, the private sector engagement is done by implementation of Patient Provider Support Agency (PPSA) and engaging with private labs/NGOs/ agencies under various partnership options. To track the status of the above, two trackers, i) Partnership landscape and ii) PPSA Payment Tracker were developed. Both these trackers will enable CTD and states to understand:
▪ Initiation and progress of the various contracts on partnerships options
▪ Status of payment to the implementing agencies.
This information will be linked to the dashboard to give updates to program managers and policy makers on contract and payment related processes.
▼ The NTSU provided support to various States for streamlining and expediting their procurement services
▼ Going Forward
Following actions will be undertaken with high priority:
▪ Designing dynamic contract management dashboard for states to provide real-time updates on contract and payment to CTD, states and STSUs.
▪ National level workshops with potential non-profit and
for-profit organizations to orient, educate and train potential organizations for increased private sector engagement.
▪ Onboarding and capacity building of additional STSUs on direct benefit transfer, private sector engagements, multi-sector engagements, procurement, and financial processes.
▪ Support states on General Financial Rules (GFR) and contracting mechanisms to ensure timely payments to the implementation agencies.
▪ Streamlining DBT related challenges and clearance of back-log. This will ensure resolution of queries and reduce the pendency in the DBT processes.
▪ Support the MOUs for multi-sectoral engagement to ensure participation of ministries across India towards TB elimination.
◄ iDEFEAT TB Project:
IQVIA is one of the seven consortium partners of iDEFEAT TB Project - USAID India’s flagship TB project for drug Resistant TB and institutional strengthening for TB and DR-TB care led by The Union. In this project, IQVIA is providing support to the National Tuberculosis Elimination Program (NTEP) through technical assistance, capacity building, e-learning, bridging gaps with human resources, and other critical needs. Major activities supported by IQVIA are strengthening
of STDCs, engagement of private sector laboratories for TB diagnostic care and transforming conventional training approaches by building strategy and institutional systems for e-learning.
▼ TB Disease burden estimation
IQVIA supports estimation of TB patient load in the private sector by leveraging its proprietary data sets on TB drug sales. IQVIA has develop a unique and
validated disease burden methodology to provide empirical estimates of TB disease burden and conducted market analysis in the private sector. This methodology was developed by integrating inputs of experts from Imperial College London, Central TB Division (Government of India), World Health Organization (WHO), and Bill & Melinda Gates Foundation (BMGF).
IQVIA hosted the Strengthening of STDCs Consultation Workshop on STDC Baseline Assessment under iDEFEAT TB Project with all the stakeholders involved in the project
Sustained Service Delivery; Enhanced capacity for DR –TB diagnosis
Under Global Fund, FIND is establishing 20 LC&DST laboratories across India. Seven TB LC&DST laboratories were upgraded, validated and handed over to the NTEP. Upgradation work is underway for the remaining
13 laboratories. FIND supported 70 TB LC DST labs, by providing required consumables and reagents and maintenance services for 18 different types of nearly 4,100 essential lab equipment.
Foundation for Innovative New Diagnostics (FIND)
FIND in partnership with the National TB Elimination Program (NTEP) continues to complement Government of India’s efforts towards TB elimination. In 2021, FIND undertook the following activities:
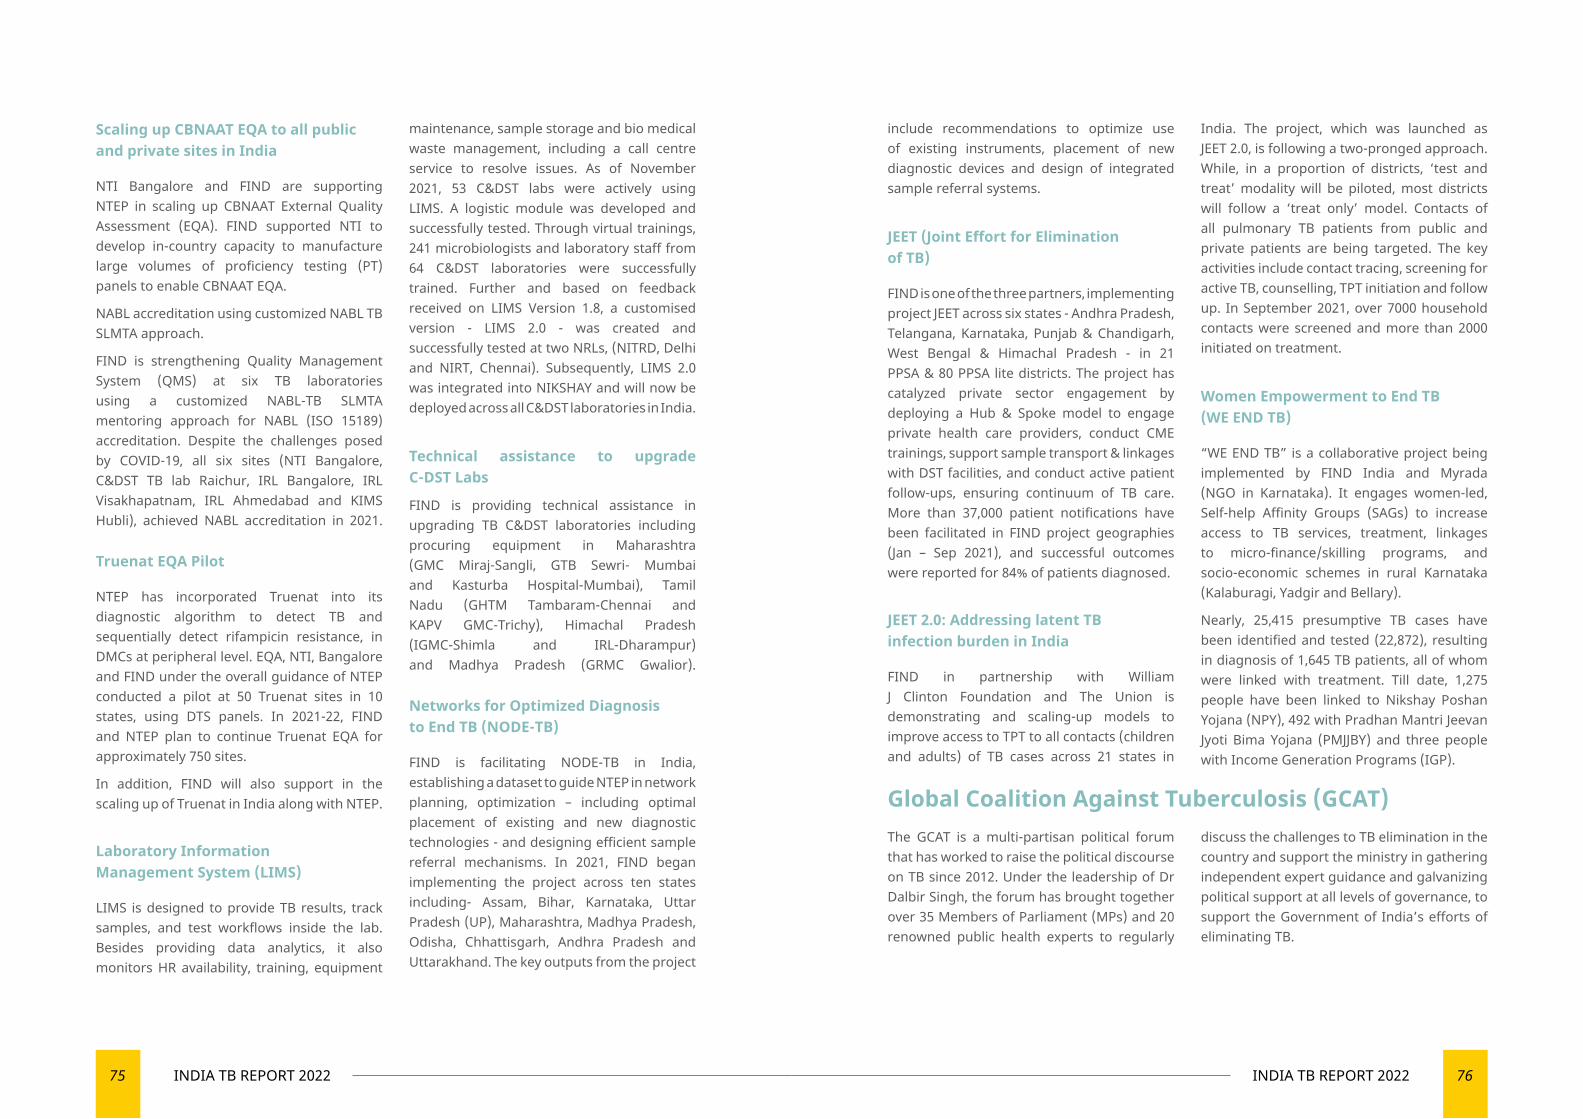
75 INDIA TB REPORT 2022 76INDIA TB REPORT 2022
include recommendations to optimize use of existing instruments, placement of new diagnostic devices and design of integrated sample referral systems.
JEET (Joint Effort for Elimination of TB)
FIND is one of the three partners, implementing project JEET across six states - Andhra Pradesh, Telangana, Karnataka, Punjab & Chandigarh, West Bengal & Himachal Pradesh - in 21 PPSA & 80 PPSA lite districts. The project has catalyzed private sector engagement by deploying a Hub & Spoke model to engage private health care providers, conduct CME trainings, support sample transport & linkages with DST facilities, and conduct active patient follow-ups, ensuring continuum of TB care. More than 37,000 patient notifications have been facilitated in FIND project geographies (Jan – Sep 2021), and successful outcomes were reported for 84% of patients diagnosed.
JEET 2.0: Addressing latent TB infection burden in India
FIND in partnership with William J Clinton Foundation and The Union is demonstrating and scaling-up models to improve access to TPT to all contacts (children and adults) of TB cases across 21 states in
India. The project, which was launched as JEET 2.0, is following a two-pronged approach. While, in a proportion of districts, ‘test and treat’ modality will be piloted, most districts will follow a ‘treat only’ model. Contacts of all pulmonary TB patients from public and private patients are being targeted. The key activities include contact tracing, screening for active TB, counselling, TPT initiation and follow up. In September 2021, over 7000 household contacts were screened and more than 2000 initiated on treatment.
Women Empowerment to End TB (WE END TB)
“WE END TB” is a collaborative project being implemented by FIND India and Myrada (NGO in Karnataka). It engages women-led, Self-help Affinity Groups (SAGs) to increase access to TB services, treatment, linkages to micro-finance/skilling programs, and socio-economic schemes in rural Karnataka (Kalaburagi, Yadgir and Bellary).
Nearly, 25,415 presumptive TB cases have been identified and tested (22,872), resulting in diagnosis of 1,645 TB patients, all of whom were linked with treatment. Till date, 1,275 people have been linked to Nikshay Poshan Yojana (NPY), 492 with Pradhan Mantri Jeevan Jyoti Bima Yojana (PMJJBY) and three people with Income Generation Programs (IGP).
Scaling up CBNAAT EQA to all public and private sites in India
NTI Bangalore and FIND are supporting NTEP in scaling up CBNAAT External Quality Assessment (EQA). FIND supported NTI to develop in-country capacity to manufacture large volumes of proficiency testing (PT) panels to enable CBNAAT EQA.
NABL accreditation using customized NABL TB SLMTA approach.
FIND is strengthening Quality Management System (QMS) at six TB laboratories using a customized NABL-TB SLMTA mentoring approach for NABL (ISO 15189) accreditation. Despite the challenges posed by COVID-19, all six sites (NTI Bangalore, C&DST TB lab Raichur, IRL Bangalore, IRL Visakhapatnam, IRL Ahmedabad and KIMS Hubli), achieved NABL accreditation in 2021.
Truenat EQA Pilot
NTEP has incorporated Truenat into its diagnostic algorithm to detect TB and sequentially detect rifampicin resistance, in DMCs at peripheral level. EQA, NTI, Bangalore and FIND under the overall guidance of NTEP conducted a pilot at 50 Truenat sites in 10 states, using DTS panels. In 2021-22, FIND and NTEP plan to continue Truenat EQA for approximately 750 sites.
In addition, FIND will also support in the scaling up of Truenat in India along with NTEP.
Laboratory Information Management System (LIMS)
LIMS is designed to provide TB results, track samples, and test workflows inside the lab. Besides providing data analytics, it also monitors HR availability, training, equipment
maintenance, sample storage and bio medical waste management, including a call centre service to resolve issues. As of November 2021, 53 C&DST labs were actively using LIMS. A logistic module was developed and successfully tested. Through virtual trainings, 241 microbiologists and laboratory staff from 64 C&DST laboratories were successfully trained. Further and based on feedback received on LIMS Version 1.8, a customised version - LIMS 2.0 - was created and successfully tested at two NRLs, (NITRD, Delhi and NIRT, Chennai). Subsequently, LIMS 2.0 was integrated into NIKSHAY and will now be deployed across all C&DST laboratories in India.
Technical assistance to upgrade C-DST Labs
FIND is providing technical assistance in upgrading TB C&DST laboratories including procuring equipment in Maharashtra (GMC Miraj-Sangli, GTB Sewri- Mumbai and Kasturba Hospital-Mumbai), Tamil Nadu (GHTM Tambaram-Chennai and KAPV GMC-Trichy), Himachal Pradesh (IGMC-Shimla and IRL-Dharampur) and Madhya Pradesh (GRMC Gwalior).
Networks for Optimized Diagnosis to End TB (NODE-TB)
FIND is facilitating NODE-TB in India, establishing a dataset to guide NTEP in network planning, optimization – including optimal placement of existing and new diagnostic technologies - and designing efficient sample referral mechanisms. In 2021, FIND began implementing the project across ten states including- Assam, Bihar, Karnataka, Uttar Pradesh (UP), Maharashtra, Madhya Pradesh, Odisha, Chhattisgarh, Andhra Pradesh and Uttarakhand. The key outputs from the project
Global Coalition Against Tuberculosis (GCAT)The GCAT is a multi-partisan political forum that has worked to raise the political discourse on TB since 2012. Under the leadership of Dr Dalbir Singh, the forum has brought together over 35 Members of Parliament (MPs) and 20 renowned public health experts to regularly
discuss the challenges to TB elimination in the country and support the ministry in gathering independent expert guidance and galvanizing political support at all levels of governance, to support the Government of India’s efforts of eliminating TB.
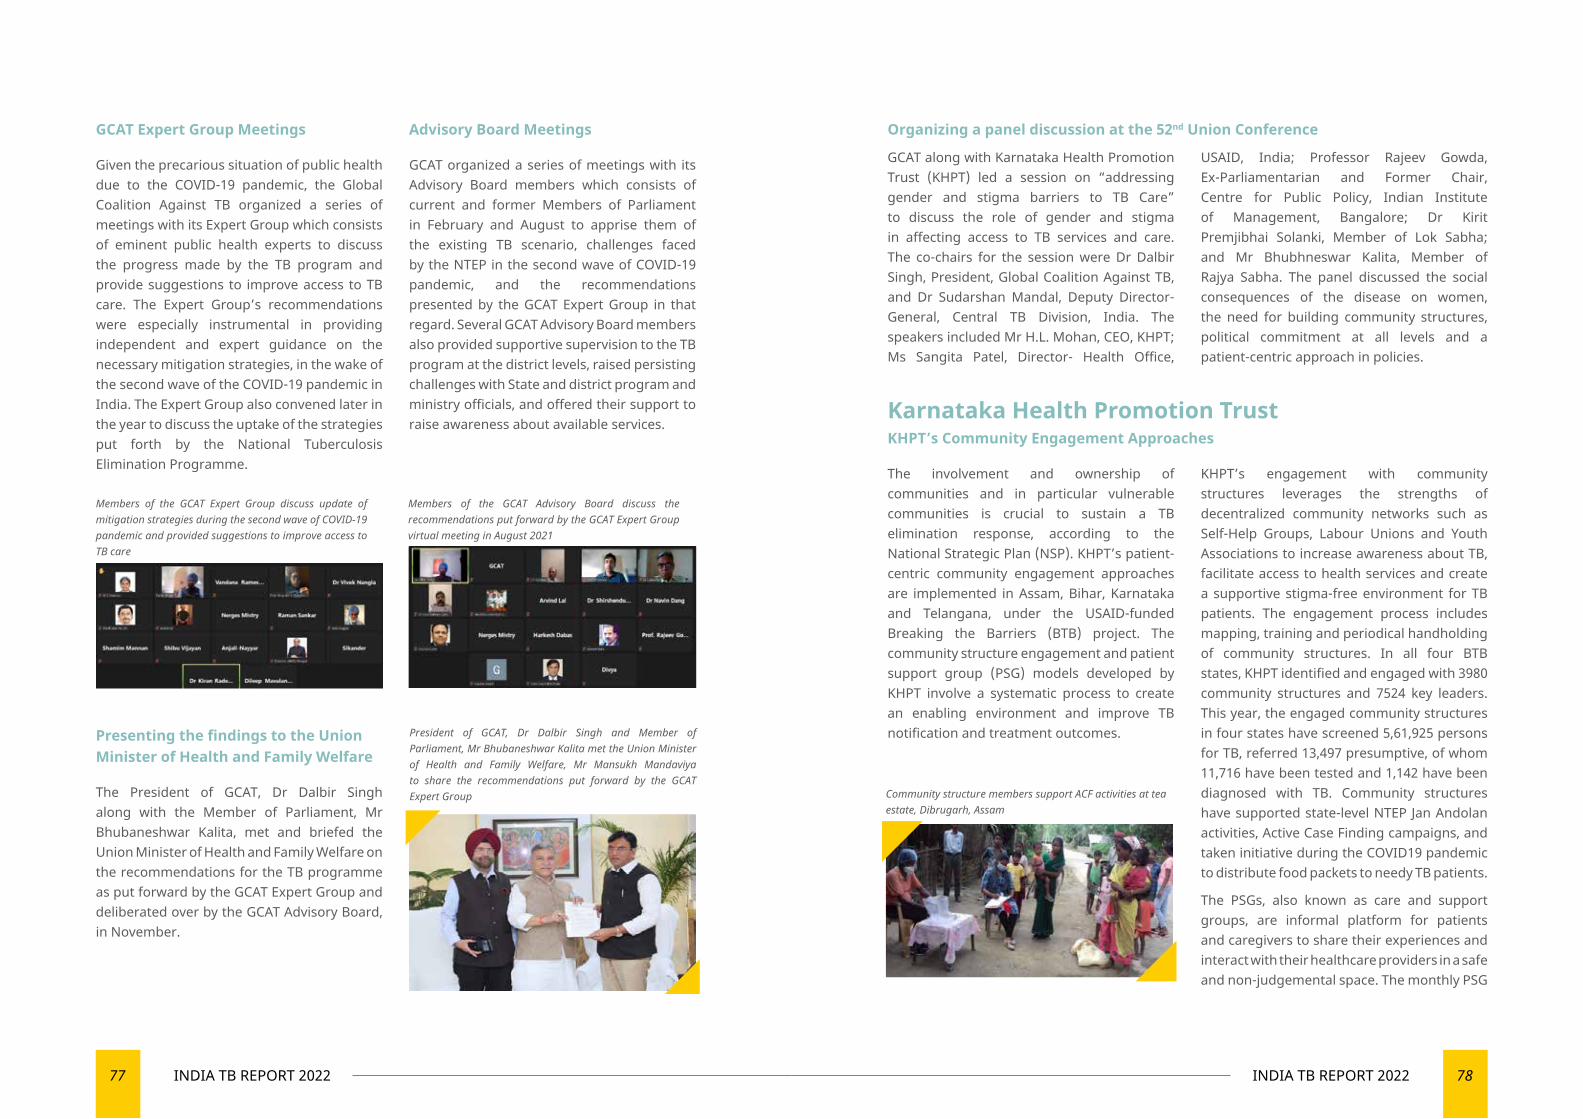
77 INDIA TB REPORT 2022 78INDIA TB REPORT 2022
Organizing a panel discussion at the 52nd Union Conference
GCAT along with Karnataka Health Promotion Trust (KHPT) led a session on “addressing gender and stigma barriers to TB Care” to discuss the role of gender and stigma in affecting access to TB services and care. The co-chairs for the session were Dr Dalbir Singh, President, Global Coalition Against TB, and Dr Sudarshan Mandal, Deputy Director-General, Central TB Division, India. The speakers included Mr H.L. Mohan, CEO, KHPT; Ms Sangita Patel, Director- Health Office,
USAID, India; Professor Rajeev Gowda, Ex-Parliamentarian and Former Chair, Centre for Public Policy, Indian Institute of Management, Bangalore; Dr Kirit Premjibhai Solanki, Member of Lok Sabha; and Mr Bhubhneswar Kalita, Member of Rajya Sabha. The panel discussed the social consequences of the disease on women, the need for building community structures, political commitment at all levels and a patient-centric approach in policies.
Members of the GCAT Advisory Board discuss the recommendations put forward by the GCAT Expert Group virtual meeting in August 2021
Members of the GCAT Expert Group discuss update of mitigation strategies during the second wave of COVID-19 pandemic and provided suggestions to improve access to TB care
GCAT Expert Group Meetings
Given the precarious situation of public health due to the COVID-19 pandemic, the Global Coalition Against TB organized a series of meetings with its Expert Group which consists of eminent public health experts to discuss the progress made by the TB program and provide suggestions to improve access to TB care. The Expert Group’s recommendations were especially instrumental in providing independent and expert guidance on the necessary mitigation strategies, in the wake of the second wave of the COVID-19 pandemic in India. The Expert Group also convened later in the year to discuss the uptake of the strategies put forth by the National Tuberculosis Elimination Programme.
Advisory Board Meetings
GCAT organized a series of meetings with its Advisory Board members which consists of current and former Members of Parliament in February and August to apprise them of the existing TB scenario, challenges faced by the NTEP in the second wave of COVID-19 pandemic, and the recommendations presented by the GCAT Expert Group in that regard. Several GCAT Advisory Board members also provided supportive supervision to the TB program at the district levels, raised persisting challenges with State and district program and ministry officials, and offered their support to raise awareness about available services.
President of GCAT, Dr Dalbir Singh and Member of Parliament, Mr Bhubaneshwar Kalita met the Union Minister of Health and Family Welfare, Mr Mansukh Mandaviya to share the recommendations put forward by the GCAT Expert Group
Presenting the findings to the Union Minister of Health and Family Welfare
The President of GCAT, Dr Dalbir Singh along with the Member of Parliament, Mr Bhubaneshwar Kalita, met and briefed the Union Minister of Health and Family Welfare on the recommendations for the TB programme as put forward by the GCAT Expert Group and deliberated over by the GCAT Advisory Board, in November.
Karnataka Health Promotion TrustKHPT’s Community Engagement Approaches
The involvement and ownership of communities and in particular vulnerable communities is crucial to sustain a TB elimination response, according to the National Strategic Plan (NSP). KHPT’s patient-centric community engagement approaches are implemented in Assam, Bihar, Karnataka and Telangana, under the USAID-funded Breaking the Barriers (BTB) project. The community structure engagement and patient support group (PSG) models developed by KHPT involve a systematic process to create an enabling environment and improve TB notification and treatment outcomes.
KHPT’s engagement with community structures leverages the strengths of decentralized community networks such as Self-Help Groups, Labour Unions and Youth Associations to increase awareness about TB, facilitate access to health services and create a supportive stigma-free environment for TB patients. The engagement process includes mapping, training and periodical handholding of community structures. In all four BTB states, KHPT identified and engaged with 3980 community structures and 7524 key leaders. This year, the engaged community structures in four states have screened 5,61,925 persons for TB, referred 13,497 presumptive, of whom 11,716 have been tested and 1,142 have been diagnosed with TB. Community structures have supported state-level NTEP Jan Andolan activities, Active Case Finding campaigns, and taken initiative during the COVID19 pandemic to distribute food packets to needy TB patients.
The PSGs, also known as care and support groups, are informal platform for patients and caregivers to share their experiences and interact with their healthcare providers in a safe and non-judgemental space. The monthly PSG
Community structure members support ACF activities at tea estate, Dibrugarh, Assam
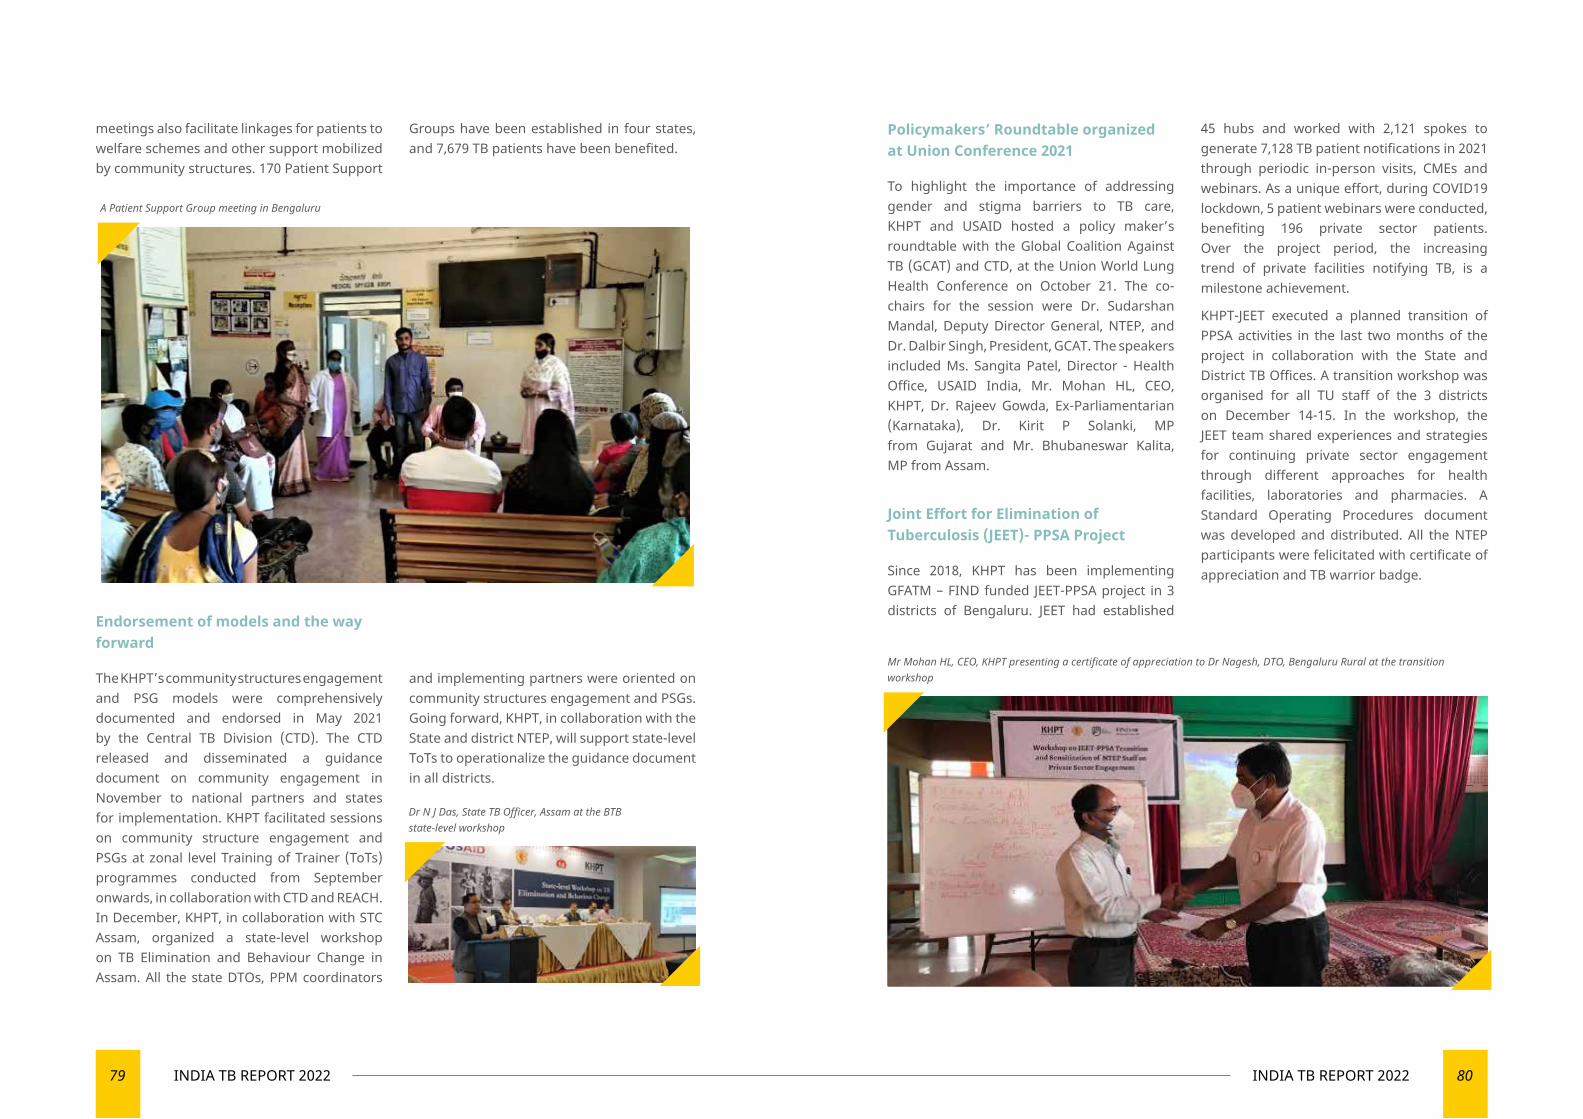
79 INDIA TB REPORT 2022 80INDIA TB REPORT 2022
Endorsement of models and the way forward
The KHPT’s community structures engagement and PSG models were comprehensively documented and endorsed in May 2021 by the Central TB Division (CTD). The CTD released and disseminated a guidance document on community engagement in November to national partners and states for implementation. KHPT facilitated sessions on community structure engagement and PSGs at zonal level Training of Trainer (ToTs) programmes conducted from September onwards, in collaboration with CTD and REACH. In December, KHPT, in collaboration with STC Assam, organized a state-level workshop on TB Elimination and Behaviour Change in Assam. All the state DTOs, PPM coordinators
and implementing partners were oriented on community structures engagement and PSGs. Going forward, KHPT, in collaboration with the State and district NTEP, will support state-level ToTs to operationalize the guidance document in all districts.
Policymakers’ Roundtable organized at Union Conference 2021
To highlight the importance of addressing gender and stigma barriers to TB care, KHPT and USAID hosted a policy maker’s roundtable with the Global Coalition Against TB (GCAT) and CTD, at the Union World Lung Health Conference on October 21. The co-chairs for the session were Dr. Sudarshan Mandal, Deputy Director General, NTEP, and Dr. Dalbir Singh, President, GCAT. The speakers included Ms. Sangita Patel, Director - Health Office, USAID India, Mr. Mohan HL, CEO, KHPT, Dr. Rajeev Gowda, Ex-Parliamentarian (Karnataka), Dr. Kirit P Solanki, MP from Gujarat and Mr. Bhubaneswar Kalita, MP from Assam.
Joint Effort for Elimination of Tuberculosis (JEET)- PPSA Project
Since 2018, KHPT has been implementing GFATM – FIND funded JEET-PPSA project in 3 districts of Bengaluru. JEET had established
45 hubs and worked with 2,121 spokes to generate 7,128 TB patient notifications in 2021 through periodic in-person visits, CMEs and webinars. As a unique effort, during COVID19 lockdown, 5 patient webinars were conducted, benefiting 196 private sector patients. Over the project period, the increasing trend of private facilities notifying TB, is a milestone achievement.
KHPT-JEET executed a planned transition of PPSA activities in the last two months of the project in collaboration with the State and District TB Offices. A transition workshop was organised for all TU staff of the 3 districts on December 14-15. In the workshop, the JEET team shared experiences and strategies for continuing private sector engagement through different approaches for health facilities, laboratories and pharmacies. A Standard Operating Procedures document was developed and distributed. All the NTEP participants were felicitated with certificate of appreciation and TB warrior badge.
Dr N J Das, State TB Officer, Assam at the BTB state-level workshop
Mr Mohan HL, CEO, KHPT presenting a certificate of appreciation to Dr Nagesh, DTO, Bengaluru Rural at the transition workshop
A Patient Support Group meeting in Bengaluru
meetings also facilitate linkages for patients to welfare schemes and other support mobilized by community structures. 170 Patient Support
Groups have been established in four states, and 7,679 TB patients have been benefited.
81 INDIA TB REPORT 2022 82INDIA TB REPORT 2022
World Health Partners (WHP) follow-up form and adherence, and DAT-related workflows. The Project conducts a comprehensive assessment of TB patients’ quality of life (physical, mental, social, and financial status) experiences and plans to develop a model to improve the patient care experience by establishing the feedback mechanism.
▼ Centralised Control Center (CCC)
One of the key features of the WHP’s people-centric care is to make key health information and assistance available to all. An easy to remember number enables general population and other individuals or family members suffering from TB/COVID/Mental health to call for tele-consultation, counselling and referral services. This model is particularly useful for populations that require aggressive follow-up over long periods as in tuberculosis, mental health, antenatal care etc. During the Year 2021, the CCC has provided its services to over 100,000 callers for tele-counselling and tele-consultations.
▼ Patient Provider Support Agency (PPSA)
Patient Provider Support Agency (PPSA) project is being implemented to support
this initiative across allotted high priority districts under the guidance of National TB Elimination Programme (NTEP). WHP is implementing PPSA project with the extensive government support in 11 districts of three states – Bihar, Punjab and Odisha.
Despite COVID-19 pandemic, travel restrictions and lockdown during the year, all three PPSAs have achieved considerable notifications and engaged many new private sector doctors.
As part of its interventions, “Closing the Gap in TB Care Cascade (CGC)” led by World Health Partners (WHP) and supported by USAID, provides counselling support to under treatment TB patients including mental health support and referral services.
To address the challenge, the CGC project administers a Patient Health Questionnaire – 4 (PHQ-4) questionnaire to assess the mental health status of TB patients. As part the strategy, CGC Care Coordinator meets the patient and completes the process in four different phases through home visits and provides them counselling on a weekly. During the first phase, enable the patient to identify triggers and coping skills. During the second phase, pathways (social skills) are discussed. Phase 3 of the counselling includes behaviour-focused strategies (adapting skills) and finally, during the fourth phase, Constructive thought pattern strategies [Relapse prevention Skills].
WHP, a non-profit Indian organization has been providing operational, technical and analytical support to address the TB burden through various projects in select districts of Gujarat, Jharkhand, Bihar, Punjab and Odisha.
Closing the Gaps in TB Care Cascade (CGC)
CGC is a four-year (2020-2024) project funded by the United States Agency for International Development (USAID)
In 2021, the CGC project focused on
▼ Increasing case finding by engaging with private health care providers (iSMART X-ray)
The project engaged 1,098 (70% of total mapped) providers from 1,615 mapped in the intervention geographies. Out of 189 X-ray facilities engaged with 56 (30%) to provide free CXR.
▼ Improving adherence management with Digital Adherence Technology (DAT)
The team followed up with 9,610 TB patients, of which 7,263 (75.7%) used 99 DOTS, 394 (4%) were enrolled on Medication Event Reminder Monitoring (MERM) device and 1,953 (20.3%) patients used 99 DOTS Lite.
▼ Improving treatment outcomes with effective mental health and wellness interventions
6,453 patients were followed up for mental health assessment. Out of these 11.4% patients were screened with mild mental health disorders, 1.3% with moderate and 0.65% were screened with severe mental health disorders who were referred for institutional care. Among these patients, 7% were diagnosed with depression, and 7.3% were diagnosed with anxiety. The project counselled mild MH disorder patient with four counselling sessions.
▼ Implementation of post-treatment follow-up
44,139 TB patients were followed up during Oct 2020 to Oct 2021 and the rate of recurrence found was 4% and fatality rate 5%.
▼ Contributions to the improvement of NTEP processes
With successful demonstration and learning the project transferred the knowledge process to the State NTEP Cell to scale-up MERM devices in Jharkhand, trained NTEP staffs on post-treatment treatment follow-up in 7 additional states. Conceptualized and developed the Nikshay Setu App that offers one-stop solutions to the public and private health staff to learn, manage and assess anti-TB processes. The project supported CTD in developing the Adverse Event Module, TB Preventive Therapy Module, post-treatment 99 DOTS Lite 99 DOTS Lite MERM
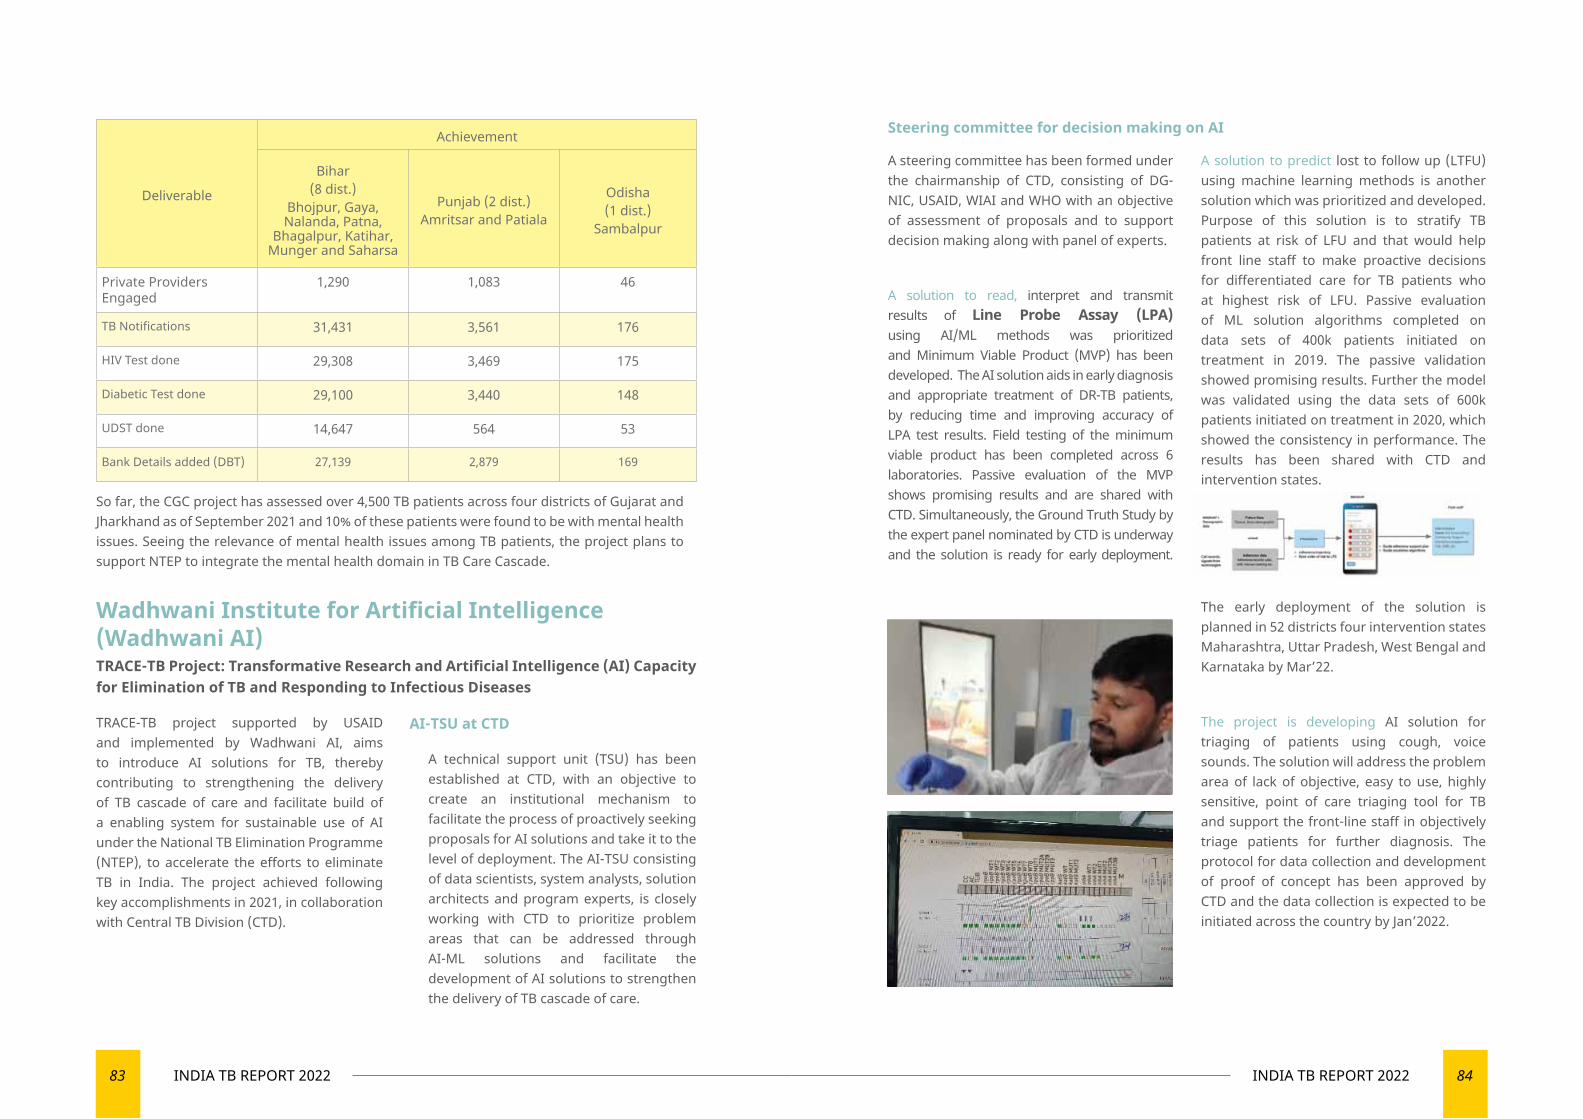
83 INDIA TB REPORT 2022 84INDIA TB REPORT 2022
Deliverable
Achievement
Bihar(8 dist.)
Bhojpur, Gaya, Nalanda, Patna,
Bhagalpur, Katihar, Munger and Saharsa
Punjab (2 dist.) Amritsar and Patiala
Odisha (1 dist.)
Sambalpur
Private Providers Engaged
1,290 1,083 46
TB Notifications 31,431 3,561 176
HIV Test done 29,308 3,469 175
Diabetic Test done 29,100 3,440 148
UDST done 14,647 564 53
Bank Details added (DBT) 27,139 2,879 169
Wadhwani Institute for Artificial Intelligence (Wadhwani AI)TRACE-TB Project: Transformative Research and Artificial Intelligence (AI) Capacity for Elimination of TB and Responding to Infectious Diseases
TRACE-TB project supported by USAID and implemented by Wadhwani AI, aims to introduce AI solutions for TB, thereby contributing to strengthening the delivery of TB cascade of care and facilitate build of a enabling system for sustainable use of AI under the National TB Elimination Programme (NTEP), to accelerate the efforts to eliminate TB in India. The project achieved following key accomplishments in 2021, in collaboration with Central TB Division (CTD).
AI-TSU at CTD
A technical support unit (TSU) has been established at CTD, with an objective to create an institutional mechanism to facilitate the process of proactively seeking proposals for AI solutions and take it to the level of deployment. The AI-TSU consisting of data scientists, system analysts, solution architects and program experts, is closely working with CTD to prioritize problem areas that can be addressed through AI-ML solutions and facilitate the development of AI solutions to strengthen the delivery of TB cascade of care.
A steering committee has been formed under the chairmanship of CTD, consisting of DG-NIC, USAID, WIAI and WHO with an objective of assessment of proposals and to support decision making along with panel of experts.
A solution to read, interpret and transmit results of Line Probe Assay (LPA) using AI/ML methods was prioritized and Minimum Viable Product (MVP) has been developed. The AI solution aids in early diagnosis and appropriate treatment of DR-TB patients, by reducing time and improving accuracy of LPA test results. Field testing of the minimum viable product has been completed across 6 laboratories. Passive evaluation of the MVP shows promising results and are shared with CTD. Simultaneously, the Ground Truth Study by the expert panel nominated by CTD is underway and the solution is ready for early deployment.
Steering committee for decision making on AI
So far, the CGC project has assessed over 4,500 TB patients across four districts of Gujarat and Jharkhand as of September 2021 and 10% of these patients were found to be with mental health issues. Seeing the relevance of mental health issues among TB patients, the project plans to support NTEP to integrate the mental health domain in TB Care Cascade.
A solution to predict lost to follow up (LTFU) using machine learning methods is another solution which was prioritized and developed. Purpose of this solution is to stratify TB patients at risk of LFU and that would help front line staff to make proactive decisions for differentiated care for TB patients who at highest risk of LFU. Passive evaluation of ML solution algorithms completed on data sets of 400k patients initiated on treatment in 2019. The passive validation showed promising results. Further the model was validated using the data sets of 600k patients initiated on treatment in 2020, which showed the consistency in performance. The results has been shared with CTD and intervention states.
The early deployment of the solution is planned in 52 districts four intervention states Maharashtra, Uttar Pradesh, West Bengal and Karnataka by Mar’22.
The project is developing AI solution for triaging of patients using cough, voice sounds. The solution will address the problem area of lack of objective, easy to use, highly sensitive, point of care triaging tool for TB and support the front-line staff in objectively triage patients for further diagnosis. The protocol for data collection and development of proof of concept has been approved by CTD and the data collection is expected to be initiated across the country by Jan’2022.
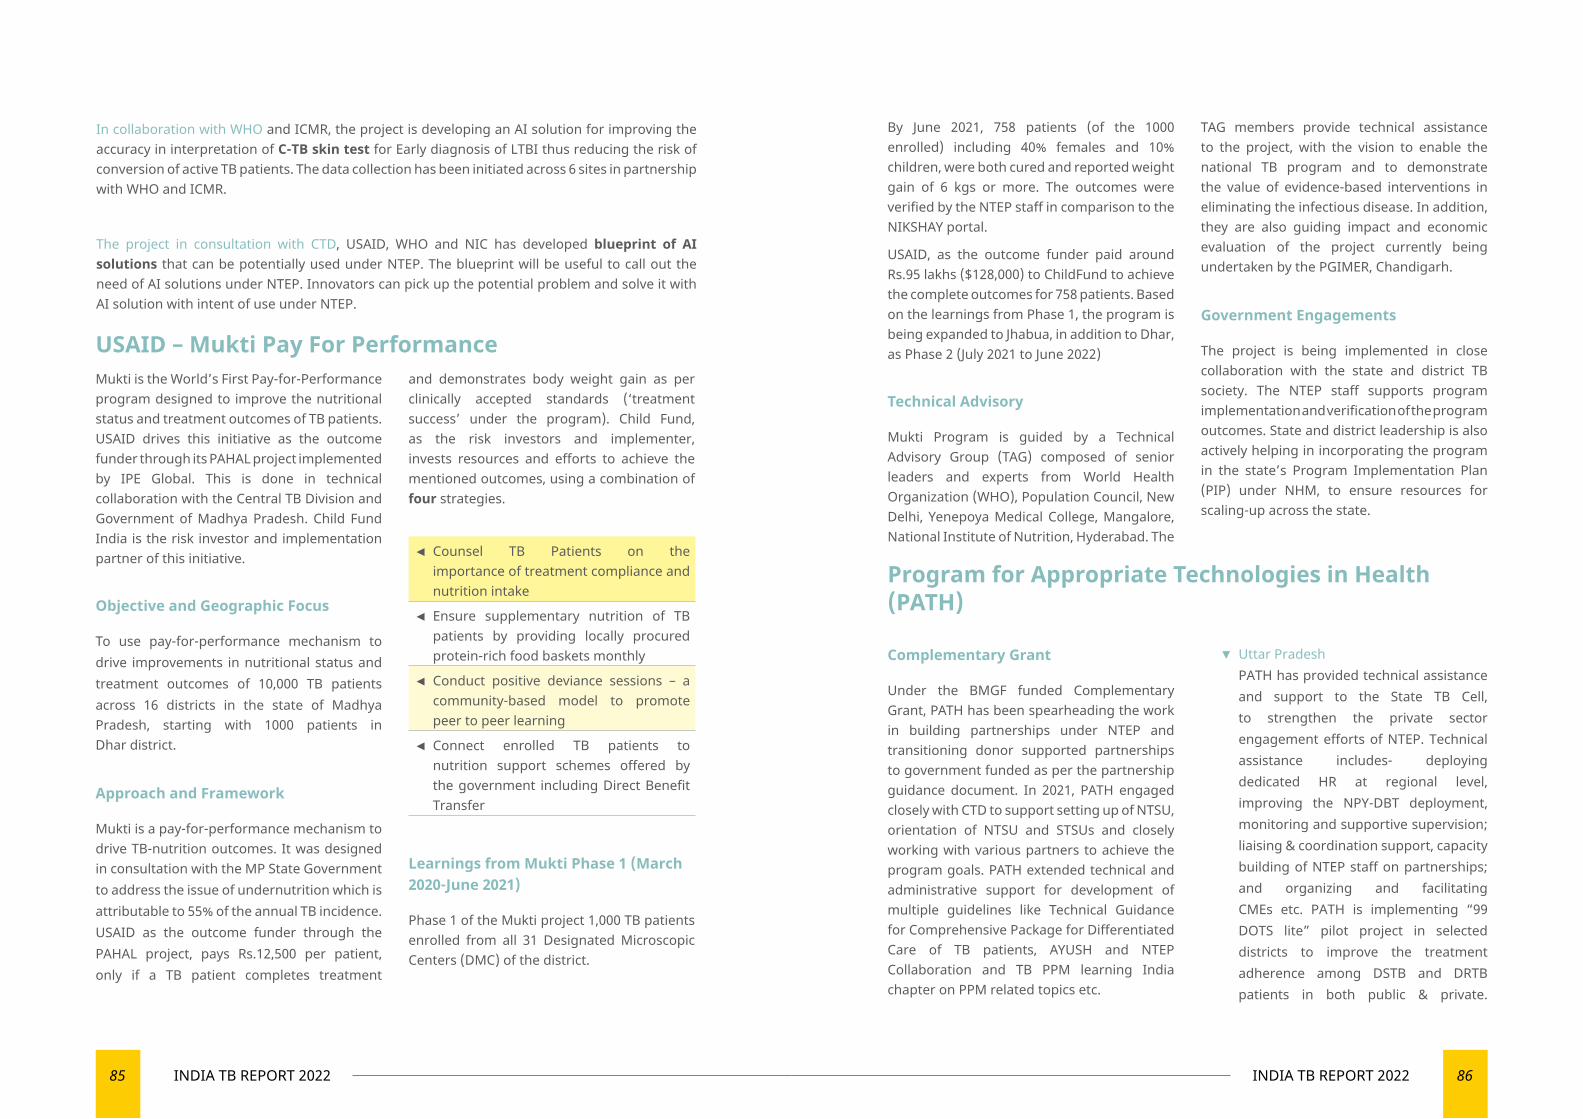
85 INDIA TB REPORT 2022 86INDIA TB REPORT 2022
In collaboration with WHO and ICMR, the project is developing an AI solution for improving the accuracy in interpretation of C-TB skin test for Early diagnosis of LTBI thus reducing the risk of conversion of active TB patients. The data collection has been initiated across 6 sites in partnership with WHO and ICMR.
The project in consultation with CTD, USAID, WHO and NIC has developed blueprint of AI solutions that can be potentially used under NTEP. The blueprint will be useful to call out the need of AI solutions under NTEP. Innovators can pick up the potential problem and solve it with AI solution with intent of use under NTEP.
USAID – Mukti Pay For PerformanceMukti is the World’s First Pay-for-Performance program designed to improve the nutritional status and treatment outcomes of TB patients. USAID drives this initiative as the outcome funder through its PAHAL project implemented by IPE Global. This is done in technical collaboration with the Central TB Division and Government of Madhya Pradesh. Child Fund India is the risk investor and implementation partner of this initiative.
Objective and Geographic Focus
To use pay-for-performance mechanism to drive improvements in nutritional status and treatment outcomes of 10,000 TB patients across 16 districts in the state of Madhya Pradesh, starting with 1000 patients in Dhar district.
Approach and Framework
Mukti is a pay-for-performance mechanism to drive TB-nutrition outcomes. It was designed in consultation with the MP State Government to address the issue of undernutrition which is attributable to 55% of the annual TB incidence. USAID as the outcome funder through the PAHAL project, pays Rs.12,500 per patient, only if a TB patient completes treatment
and demonstrates body weight gain as per clinically accepted standards (‘treatment success’ under the program). Child Fund, as the risk investors and implementer, invests resources and efforts to achieve the mentioned outcomes, using a combination of four strategies.
◄ Counsel TB Patients on the importance of treatment compliance and nutrition intake
◄ Ensure supplementary nutrition of TB patients by providing locally procured protein-rich food baskets monthly
◄ Conduct positive deviance sessions – a community-based model to promote peer to peer learning
◄ Connect enrolled TB patients to nutrition support schemes offered by the government including Direct Benefit Transfer
Learnings from Mukti Phase 1 (March 2020-June 2021)
Phase 1 of the Mukti project 1,000 TB patients enrolled from all 31 Designated Microscopic Centers (DMC) of the district.
By June 2021, 758 patients (of the 1000 enrolled) including 40% females and 10% children, were both cured and reported weight gain of 6 kgs or more. The outcomes were verified by the NTEP staff in comparison to the NIKSHAY portal.
USAID, as the outcome funder paid around Rs.95 lakhs ($128,000) to ChildFund to achieve the complete outcomes for 758 patients. Based on the learnings from Phase 1, the program is being expanded to Jhabua, in addition to Dhar, as Phase 2 (July 2021 to June 2022)
Technical Advisory
Mukti Program is guided by a Technical Advisory Group (TAG) composed of senior leaders and experts from World Health Organization (WHO), Population Council, New Delhi, Yenepoya Medical College, Mangalore, National Institute of Nutrition, Hyderabad. The
TAG members provide technical assistance to the project, with the vision to enable the national TB program and to demonstrate the value of evidence-based interventions in eliminating the infectious disease. In addition, they are also guiding impact and economic evaluation of the project currently being undertaken by the PGIMER, Chandigarh.
Government Engagements
The project is being implemented in close collaboration with the state and district TB society. The NTEP staff supports program implementation and verification of the program outcomes. State and district leadership is also actively helping in incorporating the program in the state’s Program Implementation Plan (PIP) under NHM, to ensure resources for scaling-up across the state.
Program for Appropriate Technologies in Health (PATH)
Complementary Grant
Under the BMGF funded Complementary Grant, PATH has been spearheading the work in building partnerships under NTEP and transitioning donor supported partnerships to government funded as per the partnership guidance document. In 2021, PATH engaged closely with CTD to support setting up of NTSU, orientation of NTSU and STSUs and closely working with various partners to achieve the program goals. PATH extended technical and administrative support for development of multiple guidelines like Technical Guidance for Comprehensive Package for Differentiated Care of TB patients, AYUSH and NTEP Collaboration and TB PPM learning India chapter on PPM related topics etc.
▼ Uttar PradeshPATH has provided technical assistance and support to the State TB Cell, to strengthen the private sector engagement efforts of NTEP. Technical assistance includes- deploying dedicated HR at regional level, improving the NPY-DBT deployment, monitoring and supportive supervision; liaising & coordination support, capacity building of NTEP staff on partnerships; and organizing and facilitating CMEs etc. PATH is implementing “99 DOTS lite” pilot project in selected districts to improve the treatment adherence among DSTB and DRTB patients in both public & private.
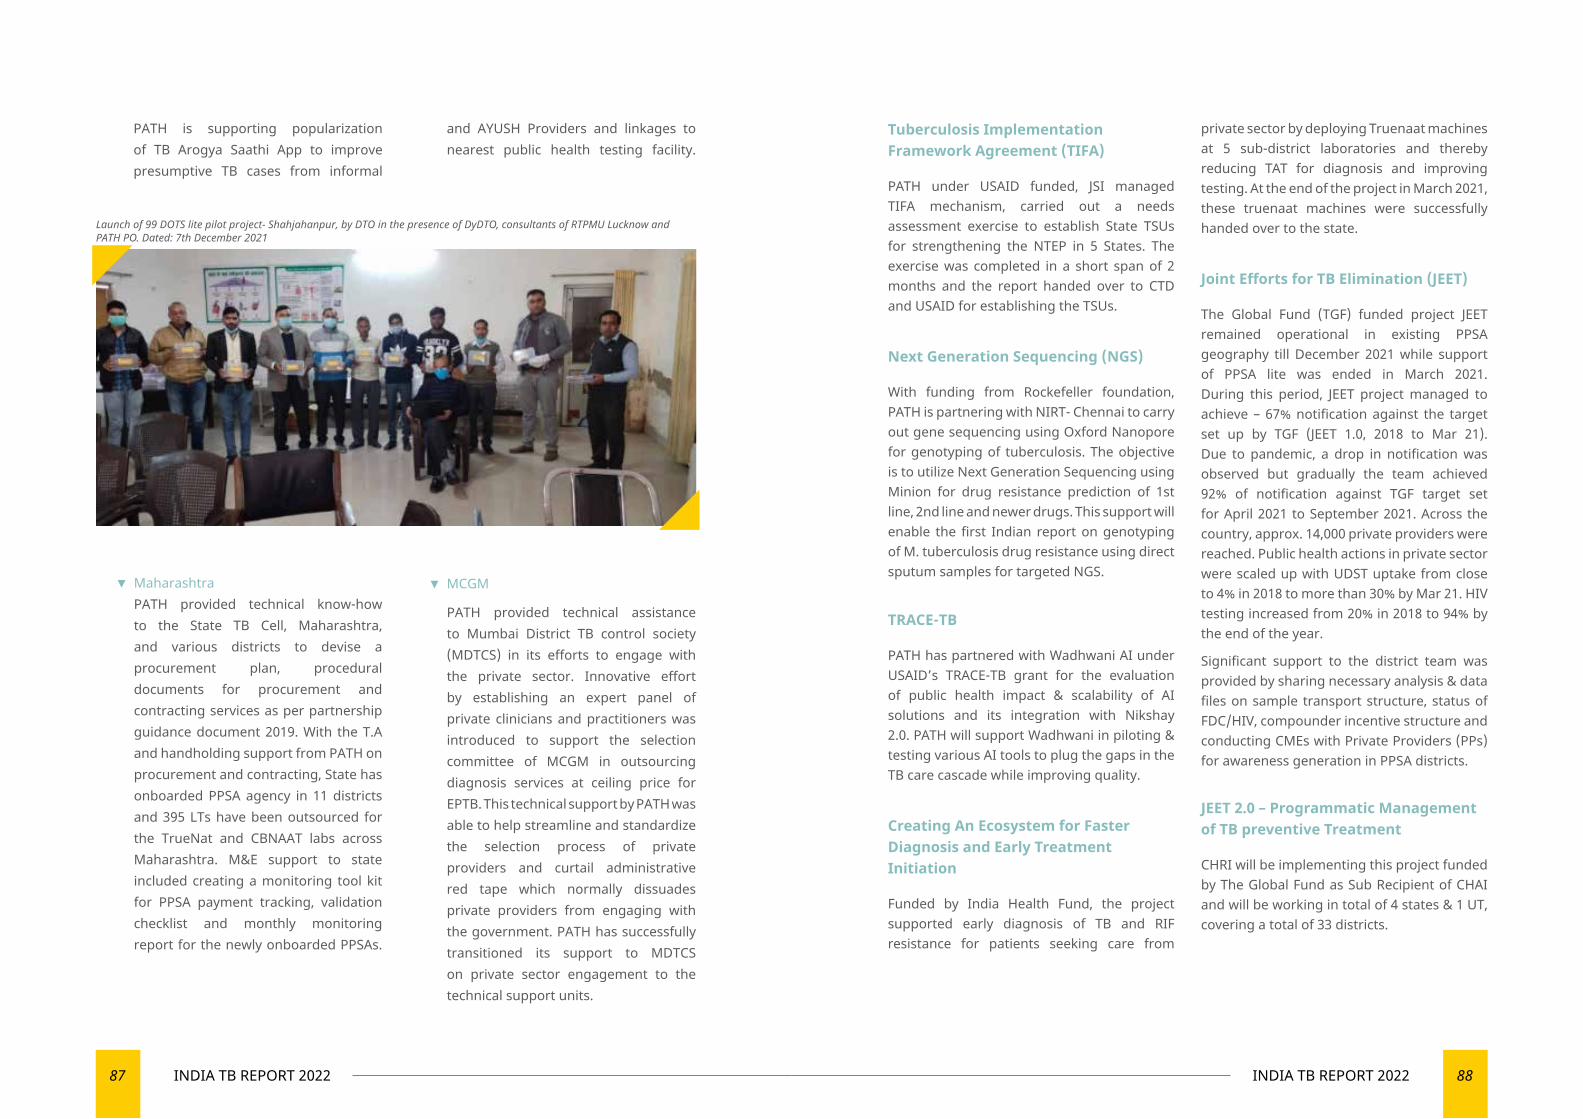
87 INDIA TB REPORT 2022 88INDIA TB REPORT 2022
▼ MaharashtraPATH provided technical know-how to the State TB Cell, Maharashtra, and various districts to devise a procurement plan, procedural documents for procurement and contracting services as per partnership guidance document 2019. With the T.A and handholding support from PATH on procurement and contracting, State has onboarded PPSA agency in 11 districts and 395 LTs have been outsourced for the TrueNat and CBNAAT labs across Maharashtra. M&E support to state included creating a monitoring tool kit for PPSA payment tracking, validation checklist and monthly monitoring report for the newly onboarded PPSAs.
Tuberculosis Implementation Framework Agreement (TIFA)
PATH under USAID funded, JSI managed TIFA mechanism, carried out a needs assessment exercise to establish State TSUs for strengthening the NTEP in 5 States. The exercise was completed in a short span of 2 months and the report handed over to CTD and USAID for establishing the TSUs.
Next Generation Sequencing (NGS)
With funding from Rockefeller foundation, PATH is partnering with NIRT- Chennai to carry out gene sequencing using Oxford Nanopore for genotyping of tuberculosis. The objective is to utilize Next Generation Sequencing using Minion for drug resistance prediction of 1st line, 2nd line and newer drugs. This support will enable the first Indian report on genotyping of M. tuberculosis drug resistance using direct sputum samples for targeted NGS.
TRACE-TB
PATH has partnered with Wadhwani AI under USAID’s TRACE-TB grant for the evaluation of public health impact & scalability of AI solutions and its integration with Nikshay 2.0. PATH will support Wadhwani in piloting & testing various AI tools to plug the gaps in the TB care cascade while improving quality.
Creating An Ecosystem for Faster Diagnosis and Early Treatment Initiation
Funded by India Health Fund, the project supported early diagnosis of TB and RIF resistance for patients seeking care from
private sector by deploying Truenaat machines at 5 sub-district laboratories and thereby reducing TAT for diagnosis and improving testing. At the end of the project in March 2021, these truenaat machines were successfully handed over to the state.
Joint Efforts for TB Elimination (JEET)
The Global Fund (TGF) funded project JEET remained operational in existing PPSA geography till December 2021 while support of PPSA lite was ended in March 2021. During this period, JEET project managed to achieve – 67% notification against the target set up by TGF (JEET 1.0, 2018 to Mar 21). Due to pandemic, a drop in notification was observed but gradually the team achieved 92% of notification against TGF target set for April 2021 to September 2021. Across the country, approx. 14,000 private providers were reached. Public health actions in private sector were scaled up with UDST uptake from close to 4% in 2018 to more than 30% by Mar 21. HIV testing increased from 20% in 2018 to 94% by the end of the year.
Significant support to the district team was provided by sharing necessary analysis & data files on sample transport structure, status of FDC/HIV, compounder incentive structure and conducting CMEs with Private Providers (PPs) for awareness generation in PPSA districts.
JEET 2.0 – Programmatic Management of TB preventive Treatment
CHRI will be implementing this project funded by The Global Fund as Sub Recipient of CHAI and will be working in total of 4 states & 1 UT, covering a total of 33 districts.
PATH is supporting popularization of TB Arogya Saathi App to improve presumptive TB cases from informal
and AYUSH Providers and linkages to nearest public health testing facility.
▼ MCGM
PATH provided technical assistance to Mumbai District TB control society (MDTCS) in its efforts to engage with the private sector. Innovative effort by establishing an expert panel of private clinicians and practitioners was introduced to support the selection committee of MCGM in outsourcing diagnosis services at ceiling price for EPTB. This technical support by PATH was able to help streamline and standardize the selection process of private providers and curtail administrative red tape which normally dissuades private providers from engaging with the government. PATH has successfully transitioned its support to MDTCS on private sector engagement to the technical support units.
Launch of 99 DOTS lite pilot project- Shahjahanpur, by DTO in the presence of DyDTO, consultants of RTPMU Lucknow and PATH PO. Dated: 7th December 2021
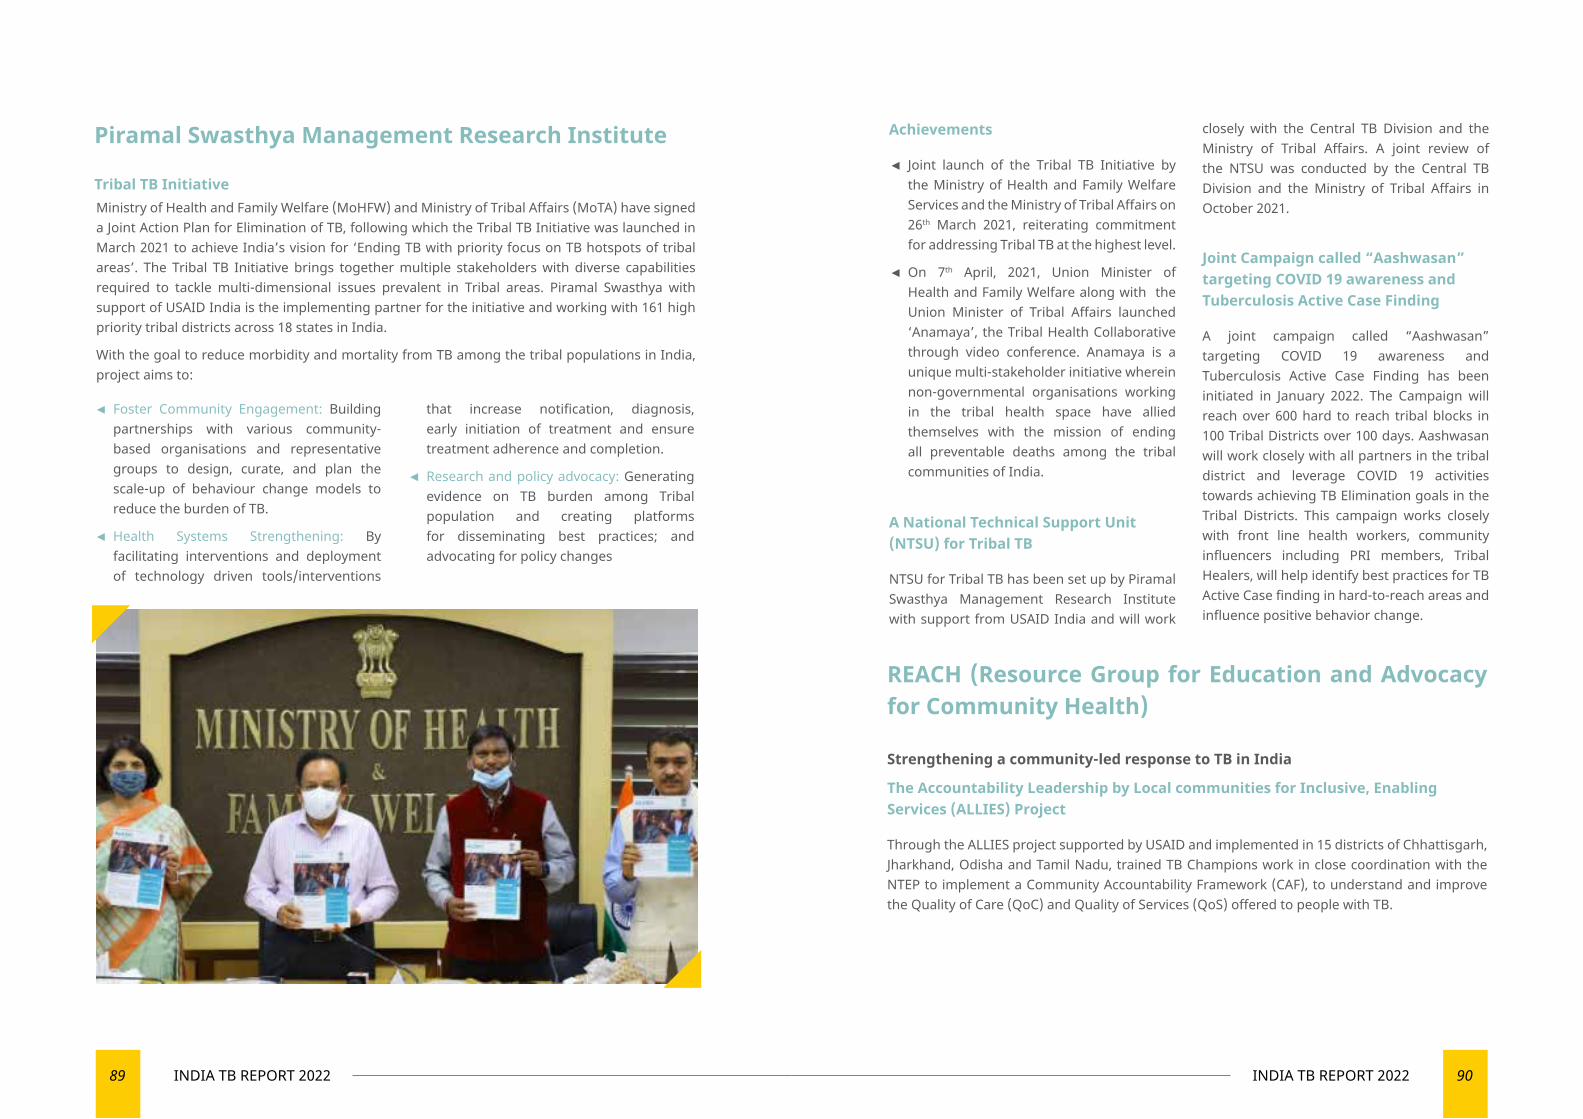
89 INDIA TB REPORT 2022 90INDIA TB REPORT 2022
◄ Foster Community Engagement: Building partnerships with various community-based organisations and representative groups to design, curate, and plan the scale-up of behaviour change models to reduce the burden of TB.
◄ Health Systems Strengthening: By facilitating interventions and deployment of technology driven tools/interventions
that increase notification, diagnosis, early initiation of treatment and ensure treatment adherence and completion.
◄ Research and policy advocacy: Generating evidence on TB burden among Tribal population and creating platforms for disseminating best practices; and advocating for policy changes
Achievements
◄ Joint launch of the Tribal TB Initiative by the Ministry of Health and Family Welfare Services and the Ministry of Tribal Affairs on 26th March 2021, reiterating commitment for addressing Tribal TB at the highest level.
◄ On 7th April, 2021, Union Minister of Health and Family Welfare along with the Union Minister of Tribal Affairs launched ‘Anamaya’, the Tribal Health Collaborative through video conference. Anamaya is a unique multi-stakeholder initiative wherein non-governmental organisations working in the tribal health space have allied themselves with the mission of ending all preventable deaths among the tribal communities of India.
A National Technical Support Unit (NTSU) for Tribal TB
NTSU for Tribal TB has been set up by Piramal Swasthya Management Research Institute with support from USAID India and will work
closely with the Central TB Division and the Ministry of Tribal Affairs. A joint review of the NTSU was conducted by the Central TB Division and the Ministry of Tribal Affairs in October 2021.
Joint Campaign called “Aashwasan” targeting COVID 19 awareness and Tuberculosis Active Case Finding
A joint campaign called “Aashwasan” targeting COVID 19 awareness and Tuberculosis Active Case Finding has been initiated in January 2022. The Campaign will reach over 600 hard to reach tribal blocks in 100 Tribal Districts over 100 days. Aashwasan will work closely with all partners in the tribal district and leverage COVID 19 activities towards achieving TB Elimination goals in the Tribal Districts. This campaign works closely with front line health workers, community influencers including PRI members, Tribal Healers, will help identify best practices for TB Active Case finding in hard-to-reach areas and influence positive behavior change.
Piramal Swasthya Management Research Institute Tribal TB InitiativeMinistry of Health and Family Welfare (MoHFW) and Ministry of Tribal Affairs (MoTA) have signed a Joint Action Plan for Elimination of TB, following which the Tribal TB Initiative was launched in March 2021 to achieve India’s vision for ‘Ending TB with priority focus on TB hotspots of tribal areas’. The Tribal TB Initiative brings together multiple stakeholders with diverse capabilities required to tackle multi-dimensional issues prevalent in Tribal areas. Piramal Swasthya with support of USAID India is the implementing partner for the initiative and working with 161 high priority tribal districts across 18 states in India.
With the goal to reduce morbidity and mortality from TB among the tribal populations in India, project aims to:
REACH (Resource Group for Education and Advocacy for Community Health)
Strengthening a community-led response to TB in India
The Accountability Leadership by Local communities for Inclusive, Enabling Services (ALLIES) Project
Through the ALLIES project supported by USAID and implemented in 15 districts of Chhattisgarh, Jharkhand, Odisha and Tamil Nadu, trained TB Champions work in close coordination with the NTEP to implement a Community Accountability Framework (CAF), to understand and improve the Quality of Care (QoC) and Quality of Services (QoS) offered to people with TB.
91 INDIA TB REPORT 2022 92INDIA TB REPORT 2022
Key achievements in 2021:
◄ CAF model refined through a national-level consultative meeting in March 2021; 225 TB Champions trained on CAF met with 7766 people with TB from 120 TB Units to assess aspects of QoC and QoS
◄ Over 240 Block Action Plans developed by TB Champions to resolve gaps identified through CAF
◄ 258 healthcare workers trained on the Achieving Excellence in TB Care and Services curriculum, designed to support NTEP staff to adopt person-centred approaches
◄ Stigma assessment tool administered by trained TB Champions to measure stigma among people with TB, families, healthcare workers and the general community
◄ Unique Art Skilling workshop held for TB Champions, with a focus on using art to address TB-related stigma
◄ Two new state-level survivor-led networks established in Tamil Nadu and Sikkim; existing networks strengthened through livelihood training and Learn to Lead knowledge series
◄ 16 journalists from across India selected for Fellowship programme to report on TB
◄ 281 elected representatives, including MLAs, Ward Counsellors, Mayors and PRI members, sensitised on TB
◄ Technical support provided to CTD in development of curriculum and modules for roll out of rapid scale-up of TB Champions training and to operationalise the Framework for a gender-responsive approach to TB
Unite to ACT - Scaling up the TB Survivor - TB Champion Model
In 2021, building on results from previous engagement of TB Champions, REACH began implementing the Unite to ACT project with support from the Global Fund through The Foundation for Innovative New Diagnostics (FIND) India as the PR. The goal of the Unite to ACT (Amplifying Community action for TB) project is to accelerate efforts towards TB elimination in India by unifying and scaling up community action for TB. The project is being implemented in ten states by REACH, with MAMTA and World Vision India as sub-sub-recipients. In addition, REACH provides technical support in 15 other states and union territories.
Key achievements in 2021:
◄ Revision and updating of the TB survivors to TB Champion training curriculum, through a consultative process with NTEP and TB Champions
◄ ToT of 77 Master trainers - including NTEP staff and TB Champions - on community engagement through
◄ 464 new TB survivors trained as TB Champions through 16 state and district-level workshops in Delhi, Bihar, Uttarakhand, Rajasthan and Madhya Pradesh
◄ Announcement of Uttarakhand TB Mukt Network by newly trained TB Champions in the state
◄ Technical assistance to Himachal Pradesh for commencement of structured process of training and engaging TB Champions and sensitising NTEP staff
Strengthening TB survivor-led networks
In November 2021, REACH concluded an 18-month intervention to support and strengthen TB Mukt Vahini (TMV), Bihar’s survivor-led network, with support from the Stop TB Partnership through the Challenge Facility for Civil Society mechanism. To mitigate the impact on TB during the COVID-19 pandemic, REACH and TMV worked in collaboration with the state NTEP to establish a peer support mechanism for people with TB through structured telecounseling and real-time coordination to identify and resolve any issues that emerged.
Key achievements in 2021:
◄ 10 district chapters of TB Mukt Vahini formed
◄ A first-of-its-kind Leadership training for TB Champions developed
◄ 75 TB Champions led anti-stigma campaigns for World TB Day, reaching 2800 people in the community. Campaign formally launched by Bihar Deputy Chief Minister, Smt Renu Devi and concluded with Bihar’s Health Minister Shri Mangal Pandey taking the anti-stigma pledge with TMV members
◄ 44 TB Champions from 22 districts provided peer support through telecounseling to over 9500 people with TB; over 8500 people counselled on COVID-19 appropriate behaviours and encouraged to get vaccinated.
Empowering women for enhanced TB case-finding
In December 2021, REACH concluded the Mentors for Community Health project, supported by the Stop TB Partnership through
a TB REACH Wave 7 grant. A strategic effort to integrate the empowerment of women in the community with TB care and prevention efforts, the project was implemented in four districts of Tamilnadu. The project had two key arms - one led by a cadre of trained Women TB Leaders who fast-tracked screening at health facilities for enhanced case finding and the second led by Community Health Mentors (CHMs) who were involved in organising community meetings to create awareness on TB and reduce stigma. REACH partnered with GramVaani to offer a comprehensive audio-based training package on health for women through an IVRS-based channel called ‘Saadhikka Vaa Penne’ (‘come on women, let’s achieve’).
Key achievements in 2021:
◄ Over 9.2 lakh people screened for TB; over 65,000 identified with symptoms of TB and over 2300 diagnosed with TB
◄ Over 82% of those identified with symptoms underwent any one test for TB
◄ Health facilities without TB-specific staff benefited more from the facility-based screening; WTLs supported bi-directional screening for TB-COVID-19
◄ Over 1000 women completed at least 6 of 14 audio modules
◄ WTLs and CHMs empowered to use knowledge for action for themselves, their families and their communities
Engaging the private sector through an integrated TB-NCD approach
Building on the successful private sector engagement model in Chennai, REACH provides integrated screening for Non-Communicable Diseases (NCDs) for people seeking care for TB in the private sector.
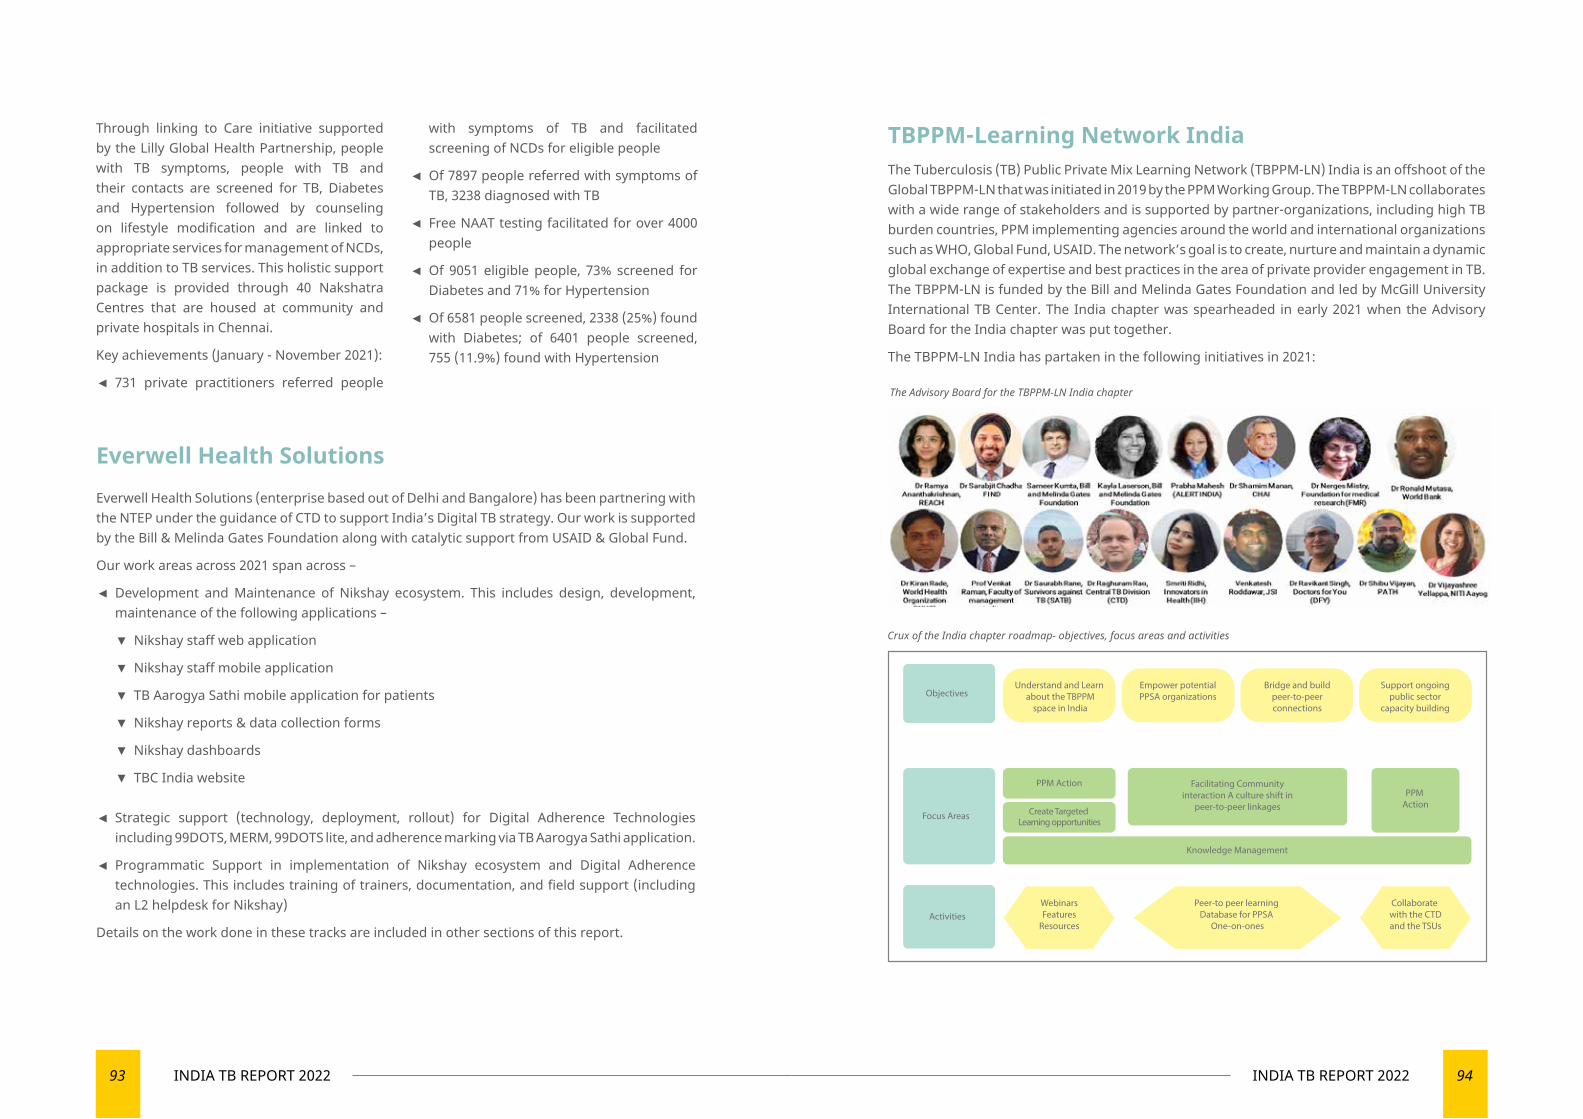
93 INDIA TB REPORT 2022 94INDIA TB REPORT 2022
Through linking to Care initiative supported by the Lilly Global Health Partnership, people with TB symptoms, people with TB and their contacts are screened for TB, Diabetes and Hypertension followed by counseling on lifestyle modification and are linked to appropriate services for management of NCDs, in addition to TB services. This holistic support package is provided through 40 Nakshatra Centres that are housed at community and private hospitals in Chennai.
Key achievements (January - November 2021):
◄ 731 private practitioners referred people
with symptoms of TB and facilitated screening of NCDs for eligible people
◄ Of 7897 people referred with symptoms of TB, 3238 diagnosed with TB
◄ Free NAAT testing facilitated for over 4000 people
◄ Of 9051 eligible people, 73% screened for Diabetes and 71% for Hypertension
◄ Of 6581 people screened, 2338 (25%) found with Diabetes; of 6401 people screened, 755 (11.9%) found with Hypertension
Everwell Health Solutions (enterprise based out of Delhi and Bangalore) has been partnering with the NTEP under the guidance of CTD to support India’s Digital TB strategy. Our work is supported by the Bill & Melinda Gates Foundation along with catalytic support from USAID & Global Fund.
Our work areas across 2021 span across –
◄ Development and Maintenance of Nikshay ecosystem. This includes design, development, maintenance of the following applications –
▼ Nikshay staff web application
▼ Nikshay staff mobile application
▼ TB Aarogya Sathi mobile application for patients
▼ Nikshay reports & data collection forms
▼ Nikshay dashboards
▼ TBC India website
◄ Strategic support (technology, deployment, rollout) for Digital Adherence Technologies including 99DOTS, MERM, 99DOTS lite, and adherence marking via TB Aarogya Sathi application.
◄ Programmatic Support in implementation of Nikshay ecosystem and Digital Adherence technologies. This includes training of trainers, documentation, and field support (including an L2 helpdesk for Nikshay)
Details on the work done in these tracks are included in other sections of this report.
The Advisory Board for the TBPPM-LN India chapter
Everwell Health Solutions
TBPPM-Learning Network India The Tuberculosis (TB) Public Private Mix Learning Network (TBPPM-LN) India is an offshoot of the Global TBPPM-LN that was initiated in 2019 by the PPM Working Group. The TBPPM-LN collaborates with a wide range of stakeholders and is supported by partner-organizations, including high TB burden countries, PPM implementing agencies around the world and international organizations such as WHO, Global Fund, USAID. The network’s goal is to create, nurture and maintain a dynamic global exchange of expertise and best practices in the area of private provider engagement in TB. The TBPPM-LN is funded by the Bill and Melinda Gates Foundation and led by McGill University International TB Center. The India chapter was spearheaded in early 2021 when the Advisory Board for the India chapter was put together.
The TBPPM-LN India has partaken in the following initiatives in 2021:
Crux of the India chapter roadmap- objectives, focus areas and activities
WebinarsFeatures
Resources
Understand and Learn about the TBPPM
space in India
Empower potentialPPSA organizations
Bridge and buildpeer-to-peerconnections
Support ongoingpublic sector
capacity building
Collaborate with the CTDand the TSUs
PPM Action
PPM Action
Create Targeted Learning opportunities
Peer-to peer learning Database for PPSA
One-on-ones
Facilitating Community interaction A culture shift in
peer-to-peer linkages
Objectives
Activities
Focus Areas
Knowledge Management
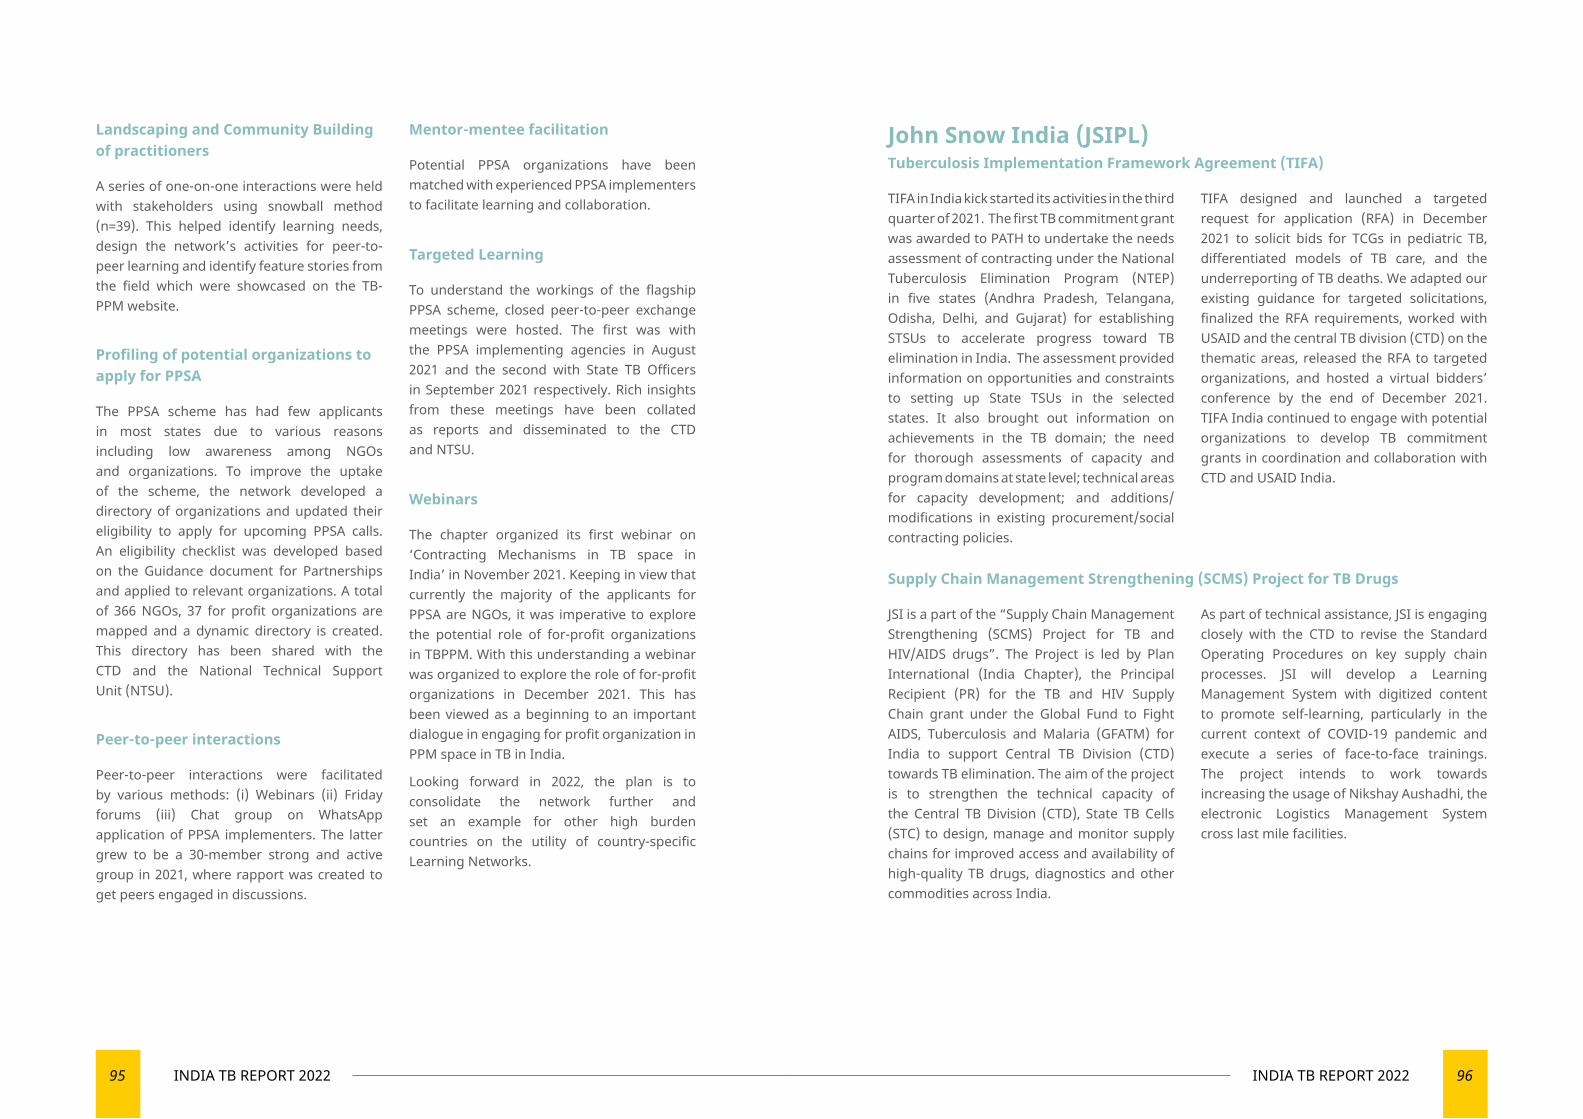
95 INDIA TB REPORT 2022 96INDIA TB REPORT 2022
Landscaping and Community Building of practitioners
A series of one-on-one interactions were held with stakeholders using snowball method (n=39). This helped identify learning needs, design the network’s activities for peer-to-peer learning and identify feature stories from the field which were showcased on the TB-PPM website.
Profiling of potential organizations to apply for PPSA
The PPSA scheme has had few applicants in most states due to various reasons including low awareness among NGOs and organizations. To improve the uptake of the scheme, the network developed a directory of organizations and updated their eligibility to apply for upcoming PPSA calls. An eligibility checklist was developed based on the Guidance document for Partnerships and applied to relevant organizations. A total of 366 NGOs, 37 for profit organizations are mapped and a dynamic directory is created. This directory has been shared with the CTD and the National Technical Support Unit (NTSU).
Peer-to-peer interactions
Peer-to-peer interactions were facilitated by various methods: (i) Webinars (ii) Friday forums (iii) Chat group on WhatsApp application of PPSA implementers. The latter grew to be a 30-member strong and active group in 2021, where rapport was created to get peers engaged in discussions.
Mentor-mentee facilitation
Potential PPSA organizations have been matched with experienced PPSA implementers to facilitate learning and collaboration.
Targeted Learning
To understand the workings of the flagship PPSA scheme, closed peer-to-peer exchange meetings were hosted. The first was with the PPSA implementing agencies in August 2021 and the second with State TB Officers in September 2021 respectively. Rich insights from these meetings have been collated as reports and disseminated to the CTD and NTSU.
Webinars
The chapter organized its first webinar on ‘Contracting Mechanisms in TB space in India’ in November 2021. Keeping in view that currently the majority of the applicants for PPSA are NGOs, it was imperative to explore the potential role of for-profit organizations in TBPPM. With this understanding a webinar was organized to explore the role of for-profit organizations in December 2021. This has been viewed as a beginning to an important dialogue in engaging for profit organization in PPM space in TB in India.
Looking forward in 2022, the plan is to consolidate the network further and set an example for other high burden countries on the utility of country-specific Learning Networks.
John Snow India (JSIPL) Tuberculosis Implementation Framework Agreement (TIFA)
TIFA in India kick started its activities in the third quarter of 2021. The first TB commitment grant was awarded to PATH to undertake the needs assessment of contracting under the National Tuberculosis Elimination Program (NTEP) in five states (Andhra Pradesh, Telangana, Odisha, Delhi, and Gujarat) for establishing STSUs to accelerate progress toward TB elimination in India. The assessment provided information on opportunities and constraints to setting up State TSUs in the selected states. It also brought out information on achievements in the TB domain; the need for thorough assessments of capacity and program domains at state level; technical areas for capacity development; and additions/modifications in existing procurement/social contracting policies.
TIFA designed and launched a targeted request for application (RFA) in December 2021 to solicit bids for TCGs in pediatric TB, differentiated models of TB care, and the underreporting of TB deaths. We adapted our existing guidance for targeted solicitations, finalized the RFA requirements, worked with USAID and the central TB division (CTD) on the thematic areas, released the RFA to targeted organizations, and hosted a virtual bidders’ conference by the end of December 2021. TIFA India continued to engage with potential organizations to develop TB commitment grants in coordination and collaboration with CTD and USAID India.
Supply Chain Management Strengthening (SCMS) Project for TB Drugs
JSI is a part of the “Supply Chain Management Strengthening (SCMS) Project for TB and HIV/AIDS drugs”. The Project is led by Plan International (India Chapter), the Principal Recipient (PR) for the TB and HIV Supply Chain grant under the Global Fund to Fight AIDS, Tuberculosis and Malaria (GFATM) for India to support Central TB Division (CTD) towards TB elimination. The aim of the project is to strengthen the technical capacity of the Central TB Division (CTD), State TB Cells (STC) to design, manage and monitor supply chains for improved access and availability of high-quality TB drugs, diagnostics and other commodities across India.
As part of technical assistance, JSI is engaging closely with the CTD to revise the Standard Operating Procedures on key supply chain processes. JSI will develop a Learning Management System with digitized content to promote self-learning, particularly in the current context of COVID-19 pandemic and execute a series of face-to-face trainings. The project intends to work towards increasing the usage of Nikshay Aushadhi, the electronic Logistics Management System cross last mile facilities.
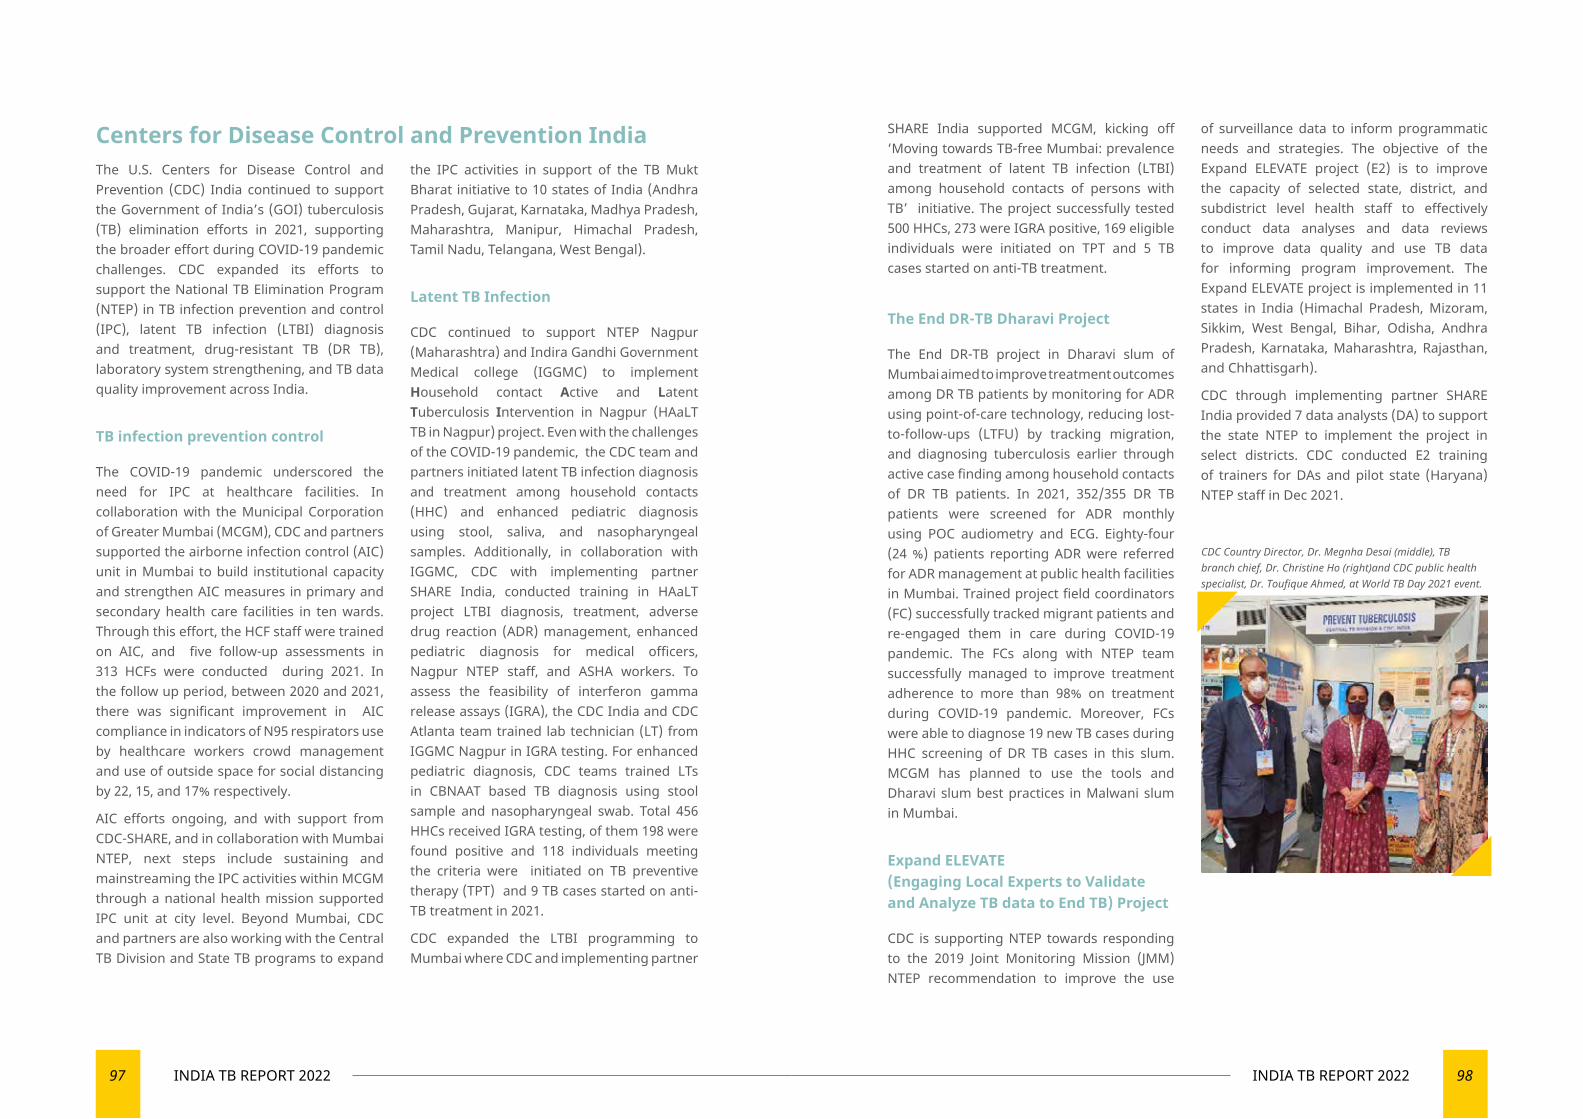
97 INDIA TB REPORT 2022 98INDIA TB REPORT 2022
Centers for Disease Control and Prevention IndiaThe U.S. Centers for Disease Control and Prevention (CDC) India continued to support the Government of India’s (GOI) tuberculosis (TB) elimination efforts in 2021, supporting the broader effort during COVID-19 pandemic challenges. CDC expanded its efforts to support the National TB Elimination Program (NTEP) in TB infection prevention and control (IPC), latent TB infection (LTBI) diagnosis and treatment, drug-resistant TB (DR TB), laboratory system strengthening, and TB data quality improvement across India.
TB infection prevention control
The COVID-19 pandemic underscored the need for IPC at healthcare facilities. In collaboration with the Municipal Corporation of Greater Mumbai (MCGM), CDC and partners supported the airborne infection control (AIC) unit in Mumbai to build institutional capacity and strengthen AIC measures in primary and secondary health care facilities in ten wards. Through this effort, the HCF staff were trained on AIC, and five follow-up assessments in 313 HCFs were conducted during 2021. In the follow up period, between 2020 and 2021, there was significant improvement in AIC compliance in indicators of N95 respirators use by healthcare workers crowd management and use of outside space for social distancing by 22, 15, and 17% respectively.
AIC efforts ongoing, and with support from CDC-SHARE, and in collaboration with Mumbai NTEP, next steps include sustaining and mainstreaming the IPC activities within MCGM through a national health mission supported IPC unit at city level. Beyond Mumbai, CDC and partners are also working with the Central TB Division and State TB programs to expand
the IPC activities in support of the TB Mukt Bharat initiative to 10 states of India (Andhra Pradesh, Gujarat, Karnataka, Madhya Pradesh, Maharashtra, Manipur, Himachal Pradesh, Tamil Nadu, Telangana, West Bengal).
Latent TB Infection
CDC continued to support NTEP Nagpur (Maharashtra) and Indira Gandhi Government Medical college (IGGMC) to implement Household contact Active and Latent Tuberculosis Intervention in Nagpur (HAaLT TB in Nagpur) project. Even with the challenges of the COVID-19 pandemic, the CDC team and partners initiated latent TB infection diagnosis and treatment among household contacts (HHC) and enhanced pediatric diagnosis using stool, saliva, and nasopharyngeal samples. Additionally, in collaboration with IGGMC, CDC with implementing partner SHARE India, conducted training in HAaLT project LTBI diagnosis, treatment, adverse drug reaction (ADR) management, enhanced pediatric diagnosis for medical officers, Nagpur NTEP staff, and ASHA workers. To assess the feasibility of interferon gamma release assays (IGRA), the CDC India and CDC Atlanta team trained lab technician (LT) from IGGMC Nagpur in IGRA testing. For enhanced pediatric diagnosis, CDC teams trained LTs in CBNAAT based TB diagnosis using stool sample and nasopharyngeal swab. Total 456 HHCs received IGRA testing, of them 198 were found positive and 118 individuals meeting the criteria were initiated on TB preventive therapy (TPT) and 9 TB cases started on anti-TB treatment in 2021.
CDC expanded the LTBI programming to Mumbai where CDC and implementing partner
SHARE India supported MCGM, kicking off ‘Moving towards TB-free Mumbai: prevalence and treatment of latent TB infection (LTBI) among household contacts of persons with TB’ initiative. The project successfully tested 500 HHCs, 273 were IGRA positive, 169 eligible individuals were initiated on TPT and 5 TB cases started on anti-TB treatment.
The End DR-TB Dharavi Project
The End DR-TB project in Dharavi slum of Mumbai aimed to improve treatment outcomes among DR TB patients by monitoring for ADR using point-of-care technology, reducing lost-to-follow-ups (LTFU) by tracking migration, and diagnosing tuberculosis earlier through active case finding among household contacts of DR TB patients. In 2021, 352/355 DR TB patients were screened for ADR monthly using POC audiometry and ECG. Eighty-four (24 %) patients reporting ADR were referred for ADR management at public health facilities in Mumbai. Trained project field coordinators (FC) successfully tracked migrant patients and re-engaged them in care during COVID-19 pandemic. The FCs along with NTEP team successfully managed to improve treatment adherence to more than 98% on treatment during COVID-19 pandemic. Moreover, FCs were able to diagnose 19 new TB cases during HHC screening of DR TB cases in this slum. MCGM has planned to use the tools and Dharavi slum best practices in Malwani slum in Mumbai.
Expand ELEVATE (Engaging Local Experts to Validate and Analyze TB data to End TB) Project
CDC is supporting NTEP towards responding to the 2019 Joint Monitoring Mission (JMM) NTEP recommendation to improve the use
of surveillance data to inform programmatic needs and strategies. The objective of the Expand ELEVATE project (E2) is to improve the capacity of selected state, district, and subdistrict level health staff to effectively conduct data analyses and data reviews to improve data quality and use TB data for informing program improvement. The Expand ELEVATE project is implemented in 11 states in India (Himachal Pradesh, Mizoram, Sikkim, West Bengal, Bihar, Odisha, Andhra Pradesh, Karnataka, Maharashtra, Rajasthan, and Chhattisgarh).
CDC through implementing partner SHARE India provided 7 data analysts (DA) to support the state NTEP to implement the project in select districts. CDC conducted E2 training of trainers for DAs and pilot state (Haryana) NTEP staff in Dec 2021.
CDC Country Director, Dr. Megnha Desai (middle), TB branch chief, Dr. Christine Ho (right)and CDC public health specialist, Dr. Toufique Ahmed, at World TB Day 2021 event.
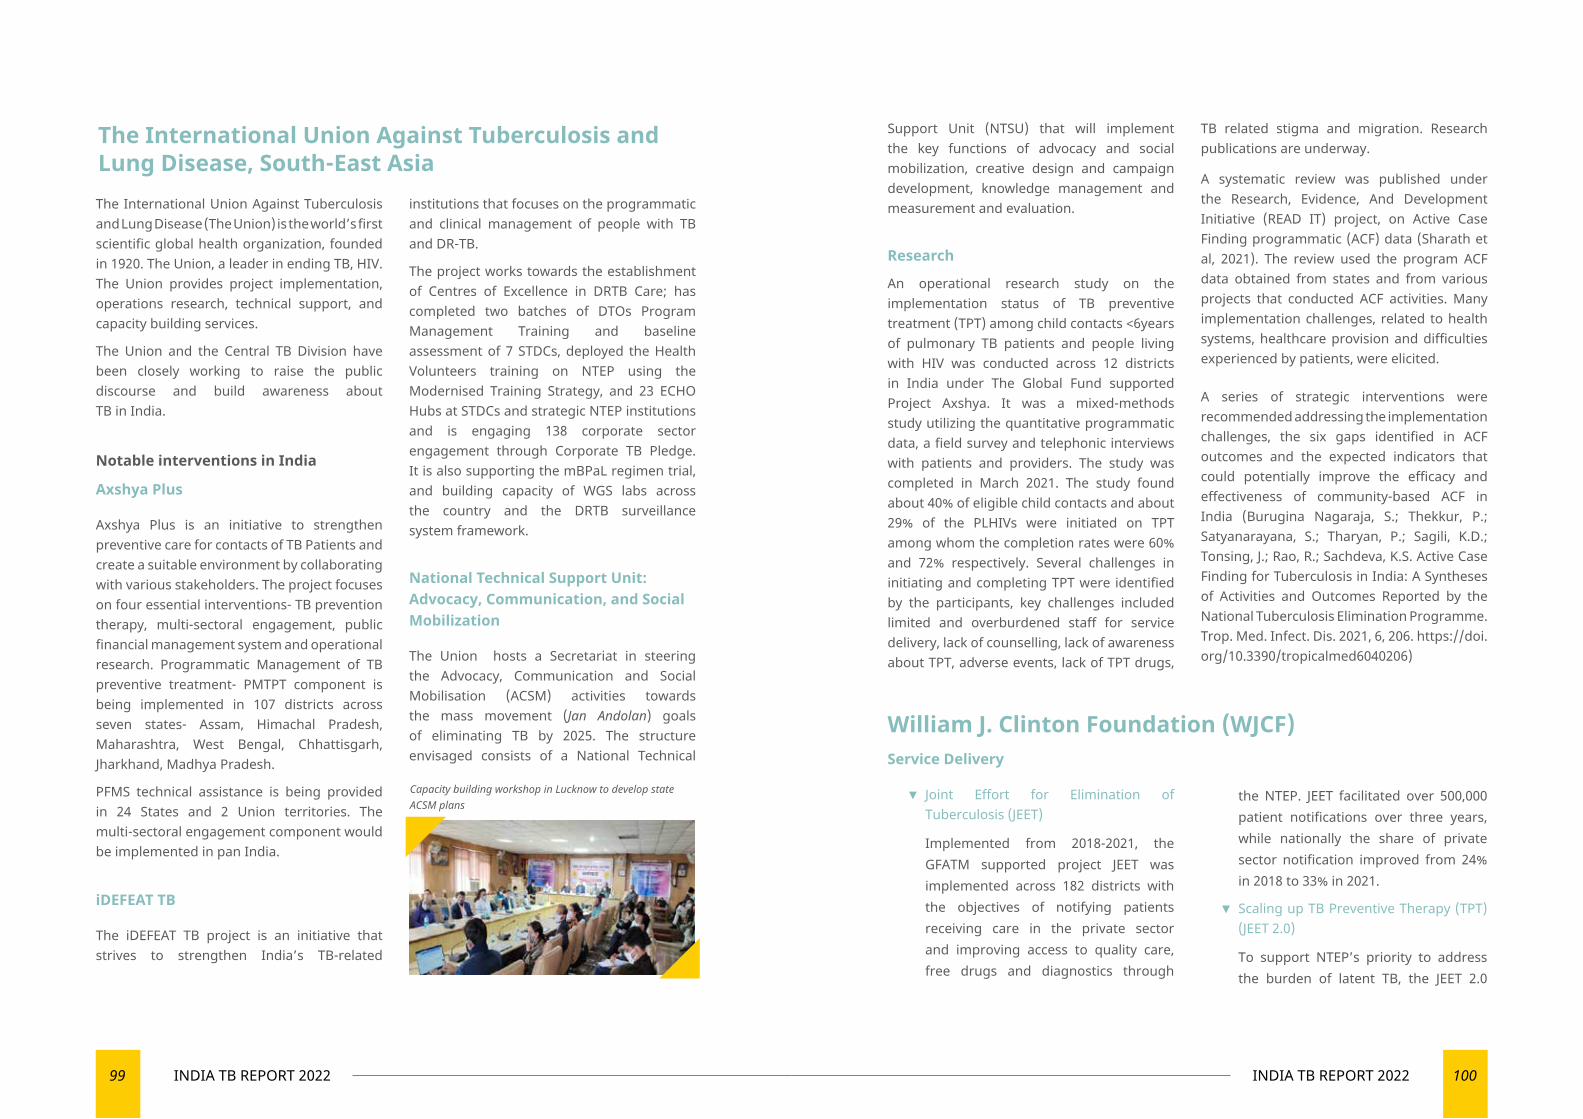
99 INDIA TB REPORT 2022 100INDIA TB REPORT 2022
The International Union Against Tuberculosis and Lung Disease (The Union) is the world’s first scientific global health organization, founded in 1920. The Union, a leader in ending TB, HIV. The Union provides project implementation, operations research, technical support, and capacity building services.
The Union and the Central TB Division have been closely working to raise the public discourse and build awareness about TB in India.
Notable interventions in India
Axshya Plus
Axshya Plus is an initiative to strengthen preventive care for contacts of TB Patients and create a suitable environment by collaborating with various stakeholders. The project focuses on four essential interventions- TB prevention therapy, multi-sectoral engagement, public financial management system and operational research. Programmatic Management of TB preventive treatment- PMTPT component is being implemented in 107 districts across seven states- Assam, Himachal Pradesh, Maharashtra, West Bengal, Chhattisgarh, Jharkhand, Madhya Pradesh.
PFMS technical assistance is being provided in 24 States and 2 Union territories. The multi-sectoral engagement component would be implemented in pan India.
iDEFEAT TB
The iDEFEAT TB project is an initiative that strives to strengthen India’s TB-related
institutions that focuses on the programmatic and clinical management of people with TB and DR-TB.
The project works towards the establishment of Centres of Excellence in DRTB Care; has completed two batches of DTOs Program Management Training and baseline assessment of 7 STDCs, deployed the Health Volunteers training on NTEP using the Modernised Training Strategy, and 23 ECHO Hubs at STDCs and strategic NTEP institutions and is engaging 138 corporate sector engagement through Corporate TB Pledge. It is also supporting the mBPaL regimen trial, and building capacity of WGS labs across the country and the DRTB surveillance system framework.
National Technical Support Unit: Advocacy, Communication, and Social Mobilization
The Union hosts a Secretariat in steering the Advocacy, Communication and Social Mobilisation (ACSM) activities towards the mass movement (Jan Andolan) goals of eliminating TB by 2025. The structure envisaged consists of a National Technical
Support Unit (NTSU) that will implement the key functions of advocacy and social mobilization, creative design and campaign development, knowledge management and measurement and evaluation.
Research
An operational research study on the implementation status of TB preventive treatment (TPT) among child contacts <6years of pulmonary TB patients and people living with HIV was conducted across 12 districts in India under The Global Fund supported Project Axshya. It was a mixed-methods study utilizing the quantitative programmatic data, a field survey and telephonic interviews with patients and providers. The study was completed in March 2021. The study found about 40% of eligible child contacts and about 29% of the PLHIVs were initiated on TPT among whom the completion rates were 60% and 72% respectively. Several challenges in initiating and completing TPT were identified by the participants, key challenges included limited and overburdened staff for service delivery, lack of counselling, lack of awareness about TPT, adverse events, lack of TPT drugs,
TB related stigma and migration. Research publications are underway.
A systematic review was published under the Research, Evidence, And Development Initiative (READ IT) project, on Active Case Finding programmatic (ACF) data (Sharath et al, 2021). The review used the program ACF data obtained from states and from various projects that conducted ACF activities. Many implementation challenges, related to health systems, healthcare provision and difficulties experienced by patients, were elicited.
A series of strategic interventions were recommended addressing the implementation challenges, the six gaps identified in ACF outcomes and the expected indicators that could potentially improve the efficacy and effectiveness of community-based ACF in India (Burugina Nagaraja, S.; Thekkur, P.; Satyanarayana, S.; Tharyan, P.; Sagili, K.D.; Tonsing, J.; Rao, R.; Sachdeva, K.S. Active Case Finding for Tuberculosis in India: A Syntheses of Activities and Outcomes Reported by the National Tuberculosis Elimination Programme. Trop. Med. Infect. Dis. 2021, 6, 206. https://doi.org/10.3390/tropicalmed6040206)
Service Delivery
▼ Joint Effort for Elimination of Tuberculosis (JEET)
Implemented from 2018-2021, the GFATM supported project JEET was implemented across 182 districts with the objectives of notifying patients receiving care in the private sector and improving access to quality care, free drugs and diagnostics through
the NTEP. JEET facilitated over 500,000 patient notifications over three years, while nationally the share of private sector notification improved from 24% in 2018 to 33% in 2021.
▼ Scaling up TB Preventive Therapy (TPT) (JEET 2.0)
To support NTEP’s priority to address the burden of latent TB, the JEET 2.0
William J. Clinton Foundation (WJCF)
The International Union Against Tuberculosis and Lung Disease, South-East Asia
Capacity building workshop in Lucknow to develop state ACSM plans
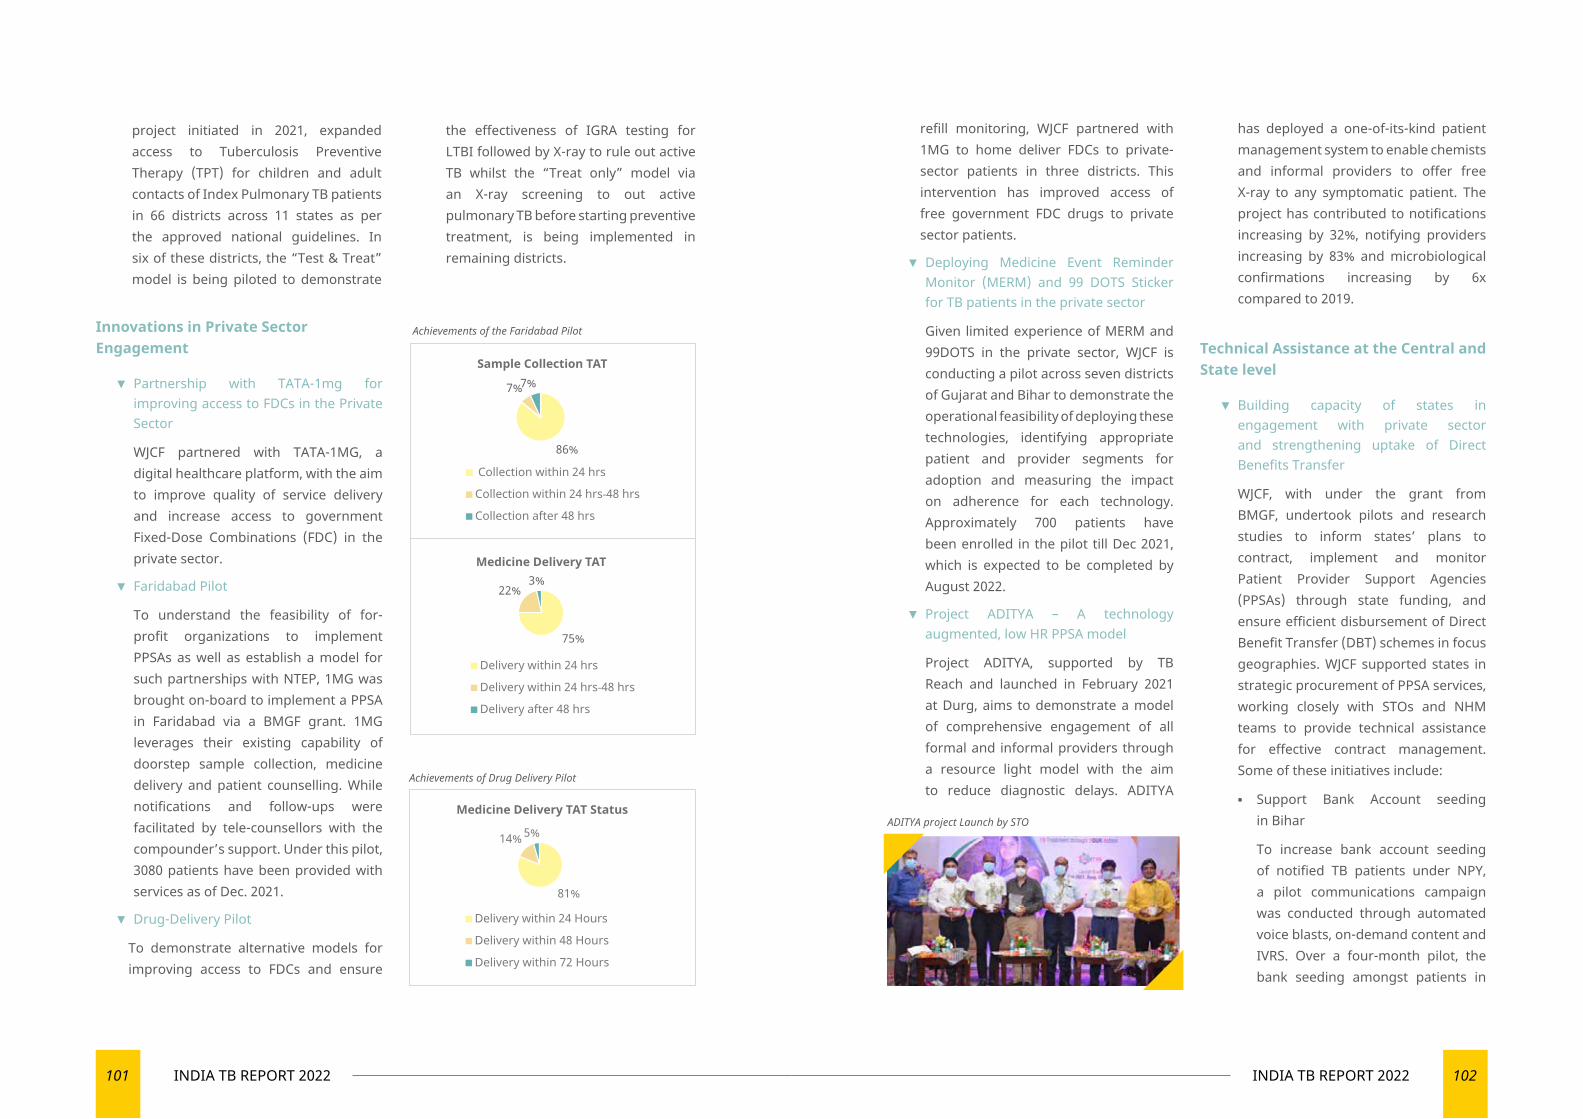
101 INDIA TB REPORT 2022 102INDIA TB REPORT 2022
Innovations in Private Sector Engagement
▼ Partnership with TATA-1mg for improving access to FDCs in the Private Sector
WJCF partnered with TATA-1MG, a digital healthcare platform, with the aim to improve quality of service delivery and increase access to government Fixed-Dose Combinations (FDC) in the private sector.
▼ Faridabad Pilot
To understand the feasibility of for-profit organizations to implement PPSAs as well as establish a model for such partnerships with NTEP, 1MG was brought on-board to implement a PPSA in Faridabad via a BMGF grant. 1MG leverages their existing capability of doorstep sample collection, medicine delivery and patient counselling. While notifications and follow-ups were facilitated by tele-counsellors with the compounder’s support. Under this pilot, 3080 patients have been provided with services as of Dec. 2021.
▼ Drug-Delivery Pilot
To demonstrate alternative models for improving access to FDCs and ensure
refill monitoring, WJCF partnered with 1MG to home deliver FDCs to private-sector patients in three districts. This intervention has improved access of free government FDC drugs to private sector patients.
▼ Deploying Medicine Event Reminder Monitor (MERM) and 99 DOTS Sticker for TB patients in the private sector
Given limited experience of MERM and 99DOTS in the private sector, WJCF is conducting a pilot across seven districts of Gujarat and Bihar to demonstrate the operational feasibility of deploying these technologies, identifying appropriate patient and provider segments for adoption and measuring the impact on adherence for each technology. Approximately 700 patients have been enrolled in the pilot till Dec 2021, which is expected to be completed by August 2022.
▼ Project ADITYA – A technology augmented, low HR PPSA model
Project ADITYA, supported by TB Reach and launched in February 2021 at Durg, aims to demonstrate a model of comprehensive engagement of all formal and informal providers through a resource light model with the aim to reduce diagnostic delays. ADITYA
has deployed a one-of-its-kind patient management system to enable chemists and informal providers to offer free X-ray to any symptomatic patient. The project has contributed to notifications increasing by 32%, notifying providers increasing by 83% and microbiological confirmations increasing by 6x compared to 2019.
Technical Assistance at the Central and State level
▼ Building capacity of states in engagement with private sector and strengthening uptake of Direct Benefits Transfer
WJCF, with under the grant from BMGF, undertook pilots and research studies to inform states’ plans to contract, implement and monitor Patient Provider Support Agencies (PPSAs) through state funding, and ensure efficient disbursement of Direct Benefit Transfer (DBT) schemes in focus geographies. WJCF supported states in strategic procurement of PPSA services, working closely with STOs and NHM teams to provide technical assistance for effective contract management. Some of these initiatives include:
▪ Support Bank Account seeding in Bihar
To increase bank account seeding of notified TB patients under NPY, a pilot communications campaign was conducted through automated voice blasts, on-demand content and IVRS. Over a four-month pilot, the bank seeding amongst patients in
project initiated in 2021, expanded access to Tuberculosis Preventive Therapy (TPT) for children and adult contacts of Index Pulmonary TB patients in 66 districts across 11 states as per the approved national guidelines. In six of these districts, the “Test & Treat” model is being piloted to demonstrate
the effectiveness of IGRA testing for LTBI followed by X-ray to rule out active TB whilst the “Treat only” model via an X-ray screening to out active pulmonary TB before starting preventive treatment, is being implemented in remaining districts.
Achievements of the Faridabad Pilot
86%
7%7%Sample Collection TAT
Collection within 24 hrs
Collection within 24 hrs-48 hrs
Collection after 48 hrs
75%
22%3%
Medicine Delivery TAT
Delivery within 24 hrs
Delivery within 24 hrs-48 hrs
Delivery after 48 hrs
Achievements of Drug Delivery Pilot
Medicine Delivery TAT Status
Delivery within 24 Hours
Delivery within 48 Hours
Delivery within 72 Hours
81%
14% 5%ADITYA project Launch by STO
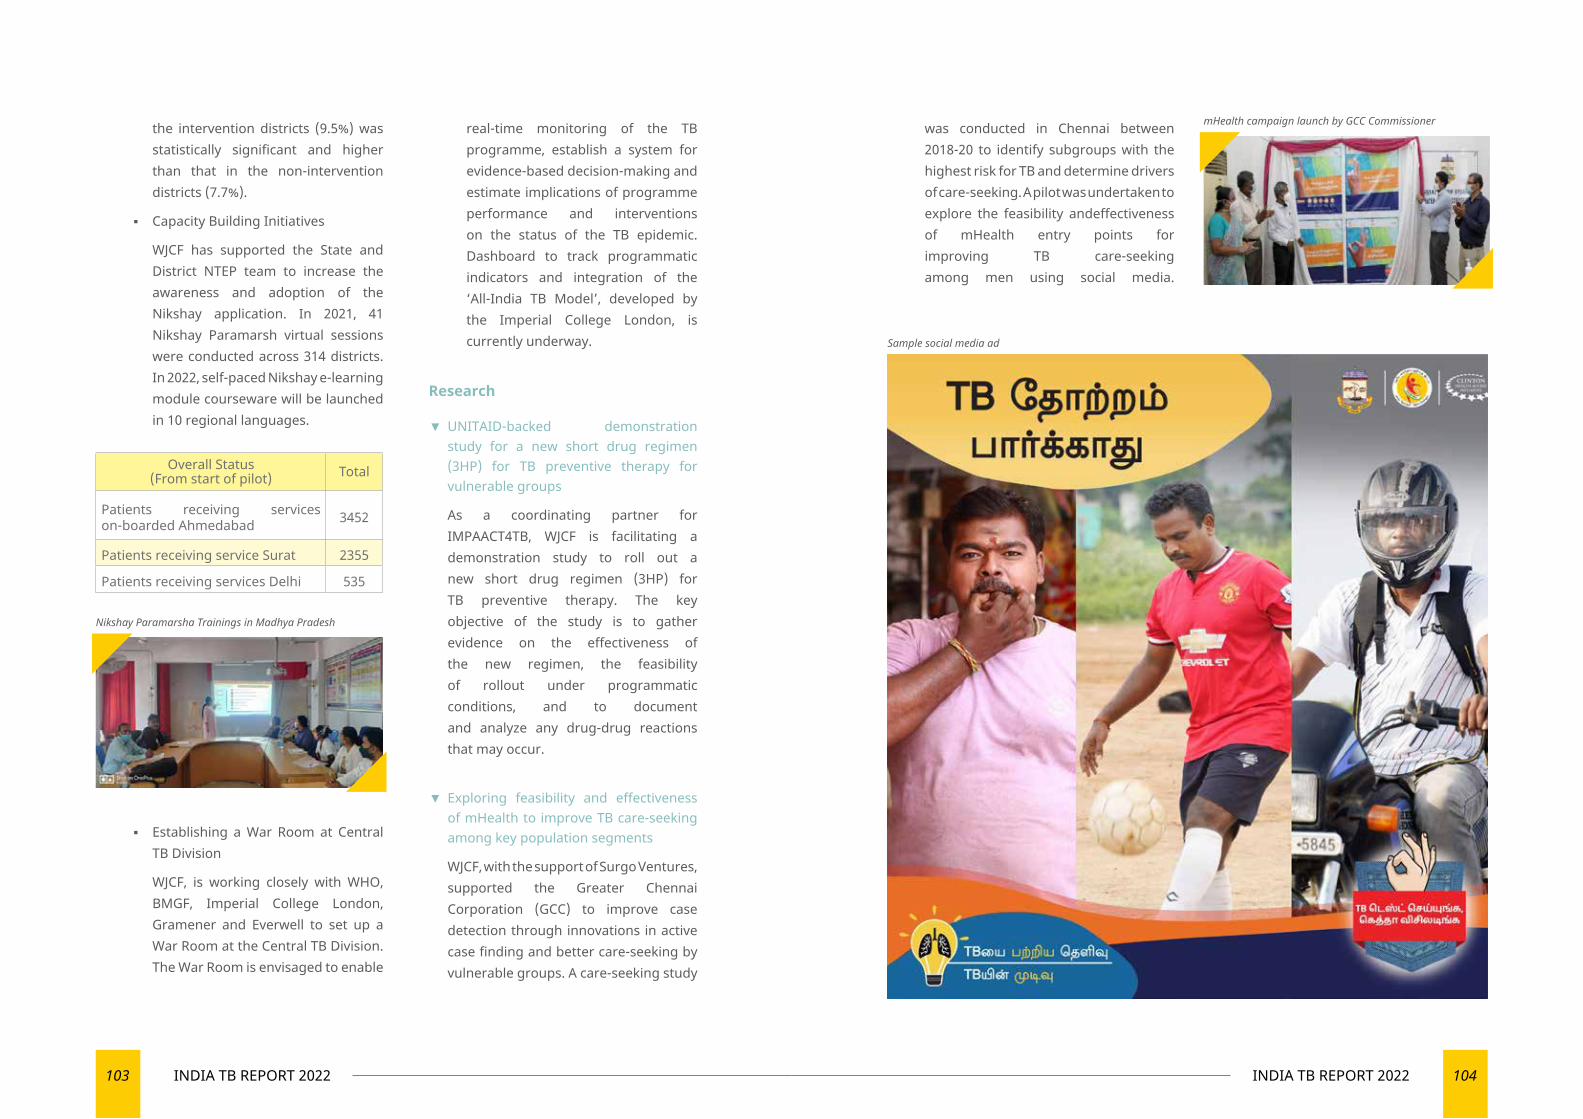
103 INDIA TB REPORT 2022 104INDIA TB REPORT 2022
the intervention districts (9.5%) was statistically significant and higher than that in the non-intervention districts (7.7%).
▪ Capacity Building Initiatives
WJCF has supported the State and District NTEP team to increase the awareness and adoption of the Nikshay application. In 2021, 41 Nikshay Paramarsh virtual sessions were conducted across 314 districts. In 2022, self-paced Nikshay e-learning module courseware will be launched in 10 regional languages.
▪ Establishing a War Room at Central TB Division
WJCF, is working closely with WHO, BMGF, Imperial College London, Gramener and Everwell to set up a War Room at the Central TB Division. The War Room is envisaged to enable
real-time monitoring of the TB programme, establish a system for evidence-based decision-making and estimate implications of programme performance and interventions on the status of the TB epidemic. Dashboard to track programmatic indicators and integration of the ‘All-India TB Model’, developed by the Imperial College London, is currently underway.
Research
▼ UNITAID-backed demonstration study for a new short drug regimen (3HP) for TB preventive therapy for vulnerable groups
As a coordinating partner for IMPAACT4TB, WJCF is facilitating a demonstration study to roll out a new short drug regimen (3HP) for TB preventive therapy. The key objective of the study is to gather evidence on the effectiveness of the new regimen, the feasibility of rollout under programmatic conditions, and to document and analyze any drug-drug reactions that may occur.
▼ Exploring feasibility and effectiveness of mHealth to improve TB care-seeking among key population segments
WJCF, with the support of Surgo Ventures, supported the Greater Chennai Corporation (GCC) to improve case detection through innovations in active case finding and better care-seeking by vulnerable groups. A care-seeking study
Overall Status (From start of pilot) Total
Patients receiving services on-boarded Ahmedabad 3452
Patients receiving service Surat 2355
Patients receiving services Delhi 535
was conducted in Chennai between 2018-20 to identify subgroups with the highest risk for TB and determine drivers of care-seeking. A pilot was undertaken to explore the feasibility andeffectiveness of mHealth entry points for improving TB care-seeking among men using social media.
Sample social media ad
Nikshay Paramarsha Trainings in Madhya Pradesh
mHealth campaign launch by GCC Commissioner
105 INDIA TB REPORT 2022 106INDIA TB REPORT 2022
Program Implementation (07 July), M/o of Electronics & Information Technology (22 July), M/o Road Transport & Highways (10 Aug), M/o Panchyati Raj (11 Aug), M/o of Heavy Industries (12 Aug), M/o Small, Micro & Medium Enterprises, M/o Youth Affairs & Sports etc.
▼ Meetings with North-Eastern Council (NEC)
A meeting under the Chairmanship of Shri C.H. Kharshiing, Planning Adviser & I/C Adviser (Health), North Eastern Council (NEC), was held to discuss and develop an action plan for implementation of activities as laid out in the Memorandum of Understanding (MOU) signed between North Eastern Council and Central TB Division on 8th October 2020. The meeting was attended, among others, by the representatives of Central TB Division (CTD), State Tuberculosis Officer (STO) Meghalaya and Consultant WHO-NTEP.
The Action Plan has been developed and shared with the North Eastern Council. Action points with tentative timelines have been prioritised in sync with activities laid out in the signed MoU between NEC and CTD.
▼ Ministry of Labour & Employment
The Policy Framework to address TB, related co-morbidities and HIV in the World of Work developed by the Ministry of Labour & Employment and CTD has been shared with major Corporates, industries of public and private sector and business associations. State Governments have been encouraged to adopt TB Workplace Policy in sync with the national policy framework. The
‘Workplace policy on TB and related Comorbidities including Occupational Lung Diseases’ developed by Govt. of Jharkhand has been shared with all State TB Cells to develop similar workplace policy for their respective States/UTs. It will influence and engage industries and workplaces to ensure access to information and services related to TB at workplaces. In this regard, the necessary communications were sent to industries/ corporates and Principal Secretary (Health) of all States/UTs in November 2021.
▼ Ministry of Railways
Coordination and follow-up meetings were held with the Ministry of Railways to implement activities as laid out in the signed MoU with CTD. Further state-level coordination meetings were held to enrol health facilities under M/o Railways in NIKSHAY. State and district level coordination has been expedited for mapping Peripheral Health Institutions (PHIs) and registration in NIKSHAY.
Corporate Sector Engagement
Ministry of Health and Family Welfare, Government of India, launched the Corporate TB Pledge (CTP) initiative to galvanise corporates to jointly work towards a shared vision of eliminating TB in India. The initiative was launched in April 2019 and offered a tiered based approach for corporates to use their resources (human and financial) to combat TB, raise awareness on TB as a curable disease, and ultimately improve TB health outcomes. CTP, an initiative under NTEP, aims to engage corporate, industries and business associations to work jointly as a shared
Multi-sectoral Convergence for TB EliminationThe multisectoral collaboration aims to strengthen the national response against Tuberculosis elimination through a “Whole of Government” approach and engagement of key corporate sectors to achieve the targets of ending TB by 2025. It has become an integral part of NTEP to take convergent action and reach out to the key population served by various Ministries/ Public Sector Undertakings, civil society and other key stakeholders.
Mission ‘End TB by 2025’ needs concerted and collaborative action to address TB challenges as the disease is driven by the number of socio-economic factors, and ending TB requires a multi-sectoral approach that includes active participation of Ministries, PSUs, Corporates and other several organisations with shared responsibilities.
The convergent and integrated response for strengthening national response against TB through;
▼ Integrating TB service in the health facilities under various Ministries/ PSEs.
▼ Reaching out to the masses with awareness & prevention activities and information on TB care and related services.
▼ Adoption of TB free workplace policy and workplace intervention
▼ Addressing socio-economic determinants of TB and reducing stigma & discrimination against people infected and affected by tuberculosis.
▼ Promoting local action for Active Case Finding (ACF).
Several activities have been undertaken to engage various Ministries, Public Sector Enterprises, corporates & business
associations and other key stakeholders for collaborative action on vulnerability reduction, integration of TB related services in existing health infrastructure and social protection for TB patients and affected families.
Formation of National Inter-Ministerial Task Force on Tuberculosis (NIMTE-TB)
The MoH&FW has proposed ‘National Inter-Ministerial Task Force on Tuberculosis (NIMTF-TB) for the engagement of all key Ministries of Govt. of India for meaningful partnership and convergence at policy programme and scheme for accelerated action towards TB elimination in the mission mode. For inter-ministerial collaboration, 23 key ministries have been targeted, and communications have been sent to ensure commitment and action at the highest level.
Partnership with Key Ministries of GoI for Multi-sectoral collaboration, efforts have been made to
◄ strengthen partnership and formulation of Joint Working Group where MoUs are already in place;
◄ follow up with Ministries where partnership/MoUs are already proposed, and
◄ explore collaboration and engagement with new Ministries/PSUs.
Several meetings were organised in the virtual platforms and physical follow-up meetings. These meetings were attended by senior officials, consultants and nodal officers identified by Ministries. E.g., Meetings were conducted with M/o Rural Development (28 June), M/o Consumer Affairs (01 July), M/o of Statistics and
107 INDIA TB REPORT 2022 108INDIA TB REPORT 2022
in the private sector was also approved by NTEP; the project is expected to start soon.
◄ Integration of DR-TB in corporate-led testing initiatives including Apollo Tyres, APPL, Goodricke, BEST Mumbai etc.
◄ DR-TB Consortium under Corporate TB Pledge
DR-TB Consortium is providing a platform for the corporate sector to deliberate the programme need and support to be extended under corporate social responsibility. Three meetings of DR-TB consortium members were organized by the Union in 2021. Through DR-TB consortium, following partnerships have been facilitated in DR-TB:
• Initiation of DR-TB clinic facilitated in Medanta Hospital, Gurugram and a formal MoU was established with support of WHO
• Pilot project in three districts of Maharashtra to improve access to newer drugs for patients in the private sector
• Initiation of certification process of culture and DST of Pathkind lab, Gurugram
• Active case finding through mobile X-Ray along with NAAT services in Rewari
State Level engagement
The Corporate TB Pledge secretariat engages with State TB Cells for providing technical support for corporate engagement at the state level. Support extended for TB workplace policy, organising state consultations for corporate engagement, workplace intervention, training for DTOs and PPM coordinators etc. Focus states are Haryana, Uttarakhand, Telangana, Assam, Gujarat, Mumbai and Maharashtra.
responsibility of TB elimination in the country. Currently, there are 138 members under the corporate TB Pledge, including 10 Business Associations.
In the last one year, through various corporate supported initiatives, more than five lac TB screening and facilitating TB testing for over 18,000 people have been carried out. About 1500 TB patients were identified through CTP efforts in the last one year.
Key CSR projects/activities initiated/implemented by CTP members during the last one year are:
◄ Fujifilm launched the Mobile X-ray van initiative; the van with portable digital X-ray will cover around nine lac people in selected north and east India pockets, focusing on truckers, migrants, and slum dwellers.
◄ RITES Limited – One mobile X-Ray Van donated by RITES was flagged off by the honourable Chief Minister of Haryana
◄ Dow Chemical ACF project- Dow Chemical launched a pilot project associated with NTEP in Malad Mumbai to screen 50,000 people from slum areas.
◄ Nayara Energy extended its nutrition support initiative for TB patients to Jamnagar district Gujarat. The project was first launched in Devbhumi Dwarka district of Gujarat.
◄ Seven new DMCs were launched by Apollo Tyres Foundation to improve access for truckers and migrants. Apollo Tyres Foundation, in association with NTEP, also implemented two rounds of campaigns (ATF TB Free Transshipment campaign – Mar 2021 and Sep 2021). More than 1,30,000 people were screened, 3556 TB testing were facilitated to identify around 150
TB patients.
◄ Jubilant Bhartia Foundation started screening and nutrition support project among the elderly population in one block of Gajraula (UP)
◄ Ambuja Cement – Extended its TB services under the community engagement project to three more locations in the country.
Workplace intervention
Ten workplace interventions were initiated
◄ Adani – TB and Workplace intervention initiated at its Mundra port location targeting over 10,000 workforces. Adani formed a TB and workplace committee and signed a statement on a stigma-free workplace.
◄ Welspun Foundation. Started TB and workplace intervention by organising training of trainer’s program in Gandhidham.
◄ FOKIA- formed a TB and workplace committee and adopted a statement of commitment
◄ Parry Agro, McLeod Russel, Goodricke and APPL – Tea sector-focused TB free Workplace interventions initiated in Assam.
◄ BATA – Initiated Workplace intervention at its Patna plant.
◄ Effectual services organised TB and workplace awareness activities
◄ Apollo Tyres Foundation - Initiated Workplace intervention at its Kerala plants.
◄ BEST, Mumbai – was recognised for their TB and workplace intervention.
DR-TB
◄ Vitaris/Mylan supported project on improving access to new drugs for patients
Other Achievements
◄ Online platform- To service the increasing number of corporate TB pledge members more effectively, the CTP secretariat developed and launched a comprehensive CTP online platform (www.corporatetbpledge.org) in March 2021. The platform aims to serve as an informative and interactive channel for existing and new members and provide access to TB resources like a menu of CSR investment opportunities, best practices and campaigns materials etc., to the Corporate TB Pledge members.
◄ Recognition of CTP members- Four CTP members were felicitated by the MoHFW on the occasion of World TB Day in March 2021 for their exceptional work in TB.
◄ Cluster-based screening – Pilot intervention on cluster-based screening in Kutch district with Adani and Welspun is being implemented.
◄ First Regional Workshop on TB and Workplace organised in Assam focusing on the tea sector.
◄ Business Associations Engagement-
▼ The Union signed MoU with ASSOCHAM to mobilise member companies to work on TB.
▼ NTEP and The Union organised TB and workplace training programs with 15 companies associated with Ranjan Gaon Industries association in Pune.
▼ Federation of Kutch Industries Association (FOKIA) signed LoI with The Union to promote corporate engagement in TB.
▼ NTEP and The Union organised corporate consultation in Ahmedabad in association with PHD Chamber.
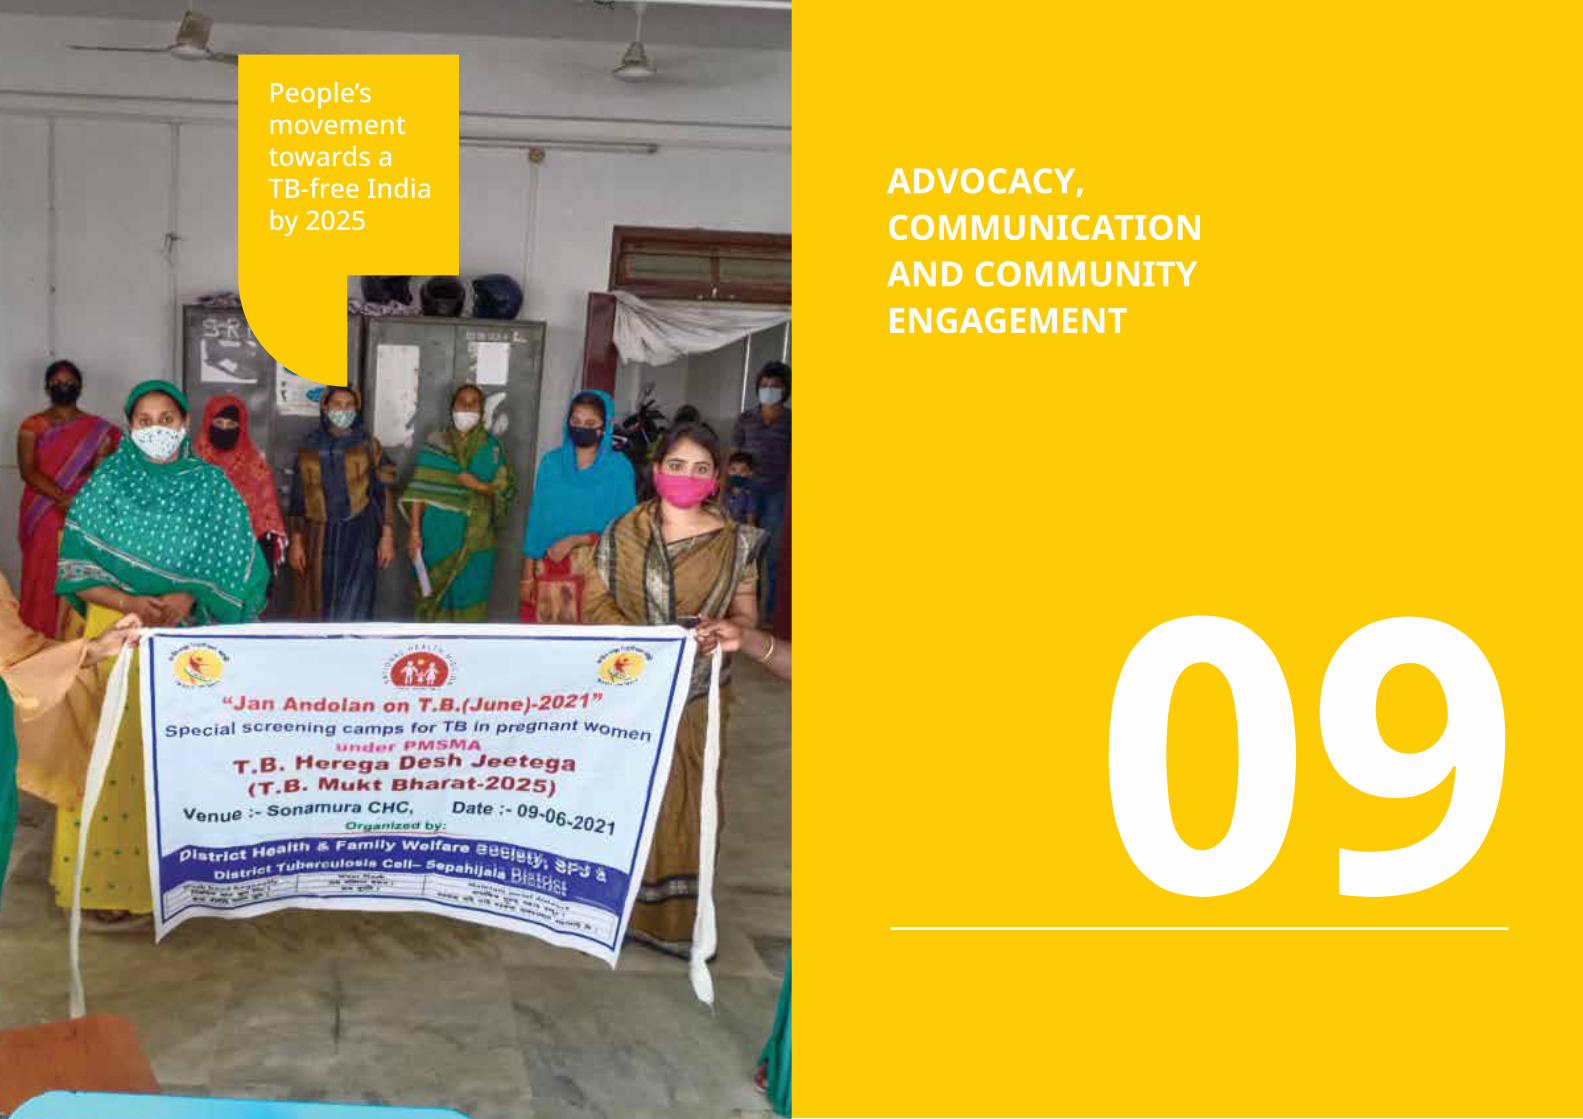
109 INDIA TB REPORT 2022 110INDIA TB REPORT 2022
ADVOCACY, COMMUNICATION AND COMMUNITY ENGAGEMENT
People’s movement towards a TB-free India by 2025
0905
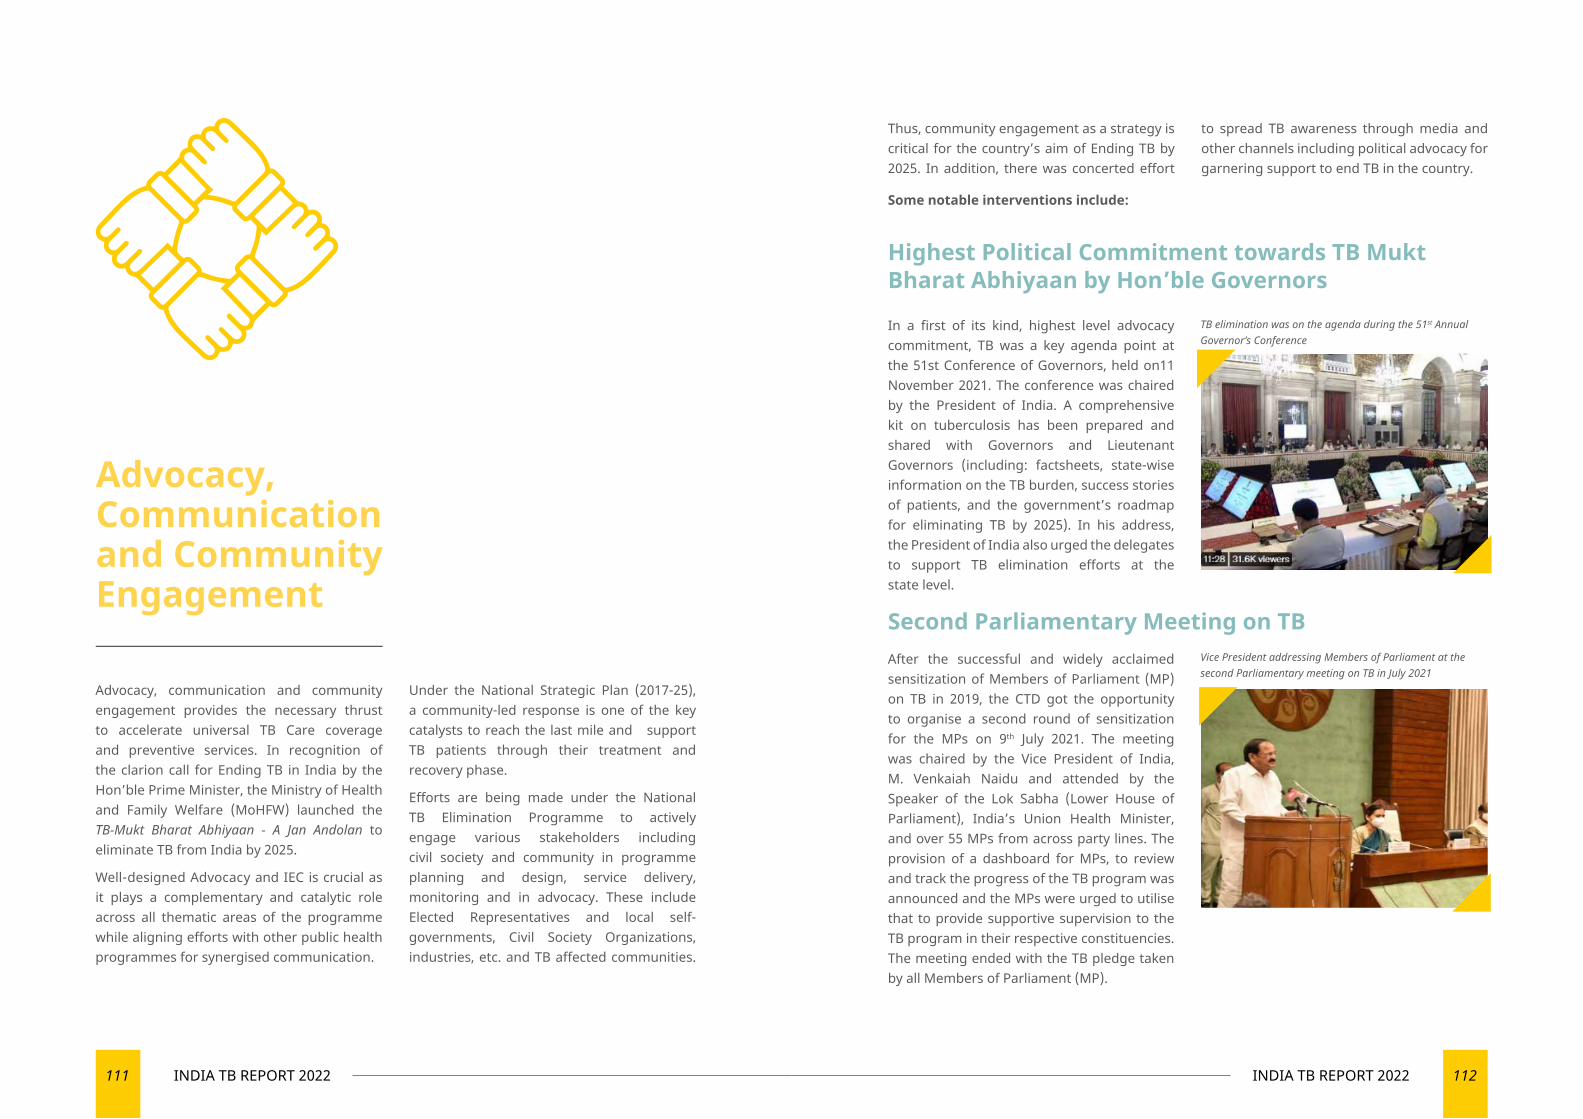
111 INDIA TB REPORT 2022 112INDIA TB REPORT 2022
Advocacy, Communication and Community Engagement
Thus, community engagement as a strategy is critical for the country’s aim of Ending TB by 2025. In addition, there was concerted effort
to spread TB awareness through media and other channels including political advocacy for garnering support to end TB in the country.
Some notable interventions include:
Highest Political Commitment towards TB Mukt Bharat Abhiyaan by Hon’ble Governors
In a first of its kind, highest level advocacy commitment, TB was a key agenda point at the 51st Conference of Governors, held on11 November 2021. The conference was chaired by the President of India. A comprehensive kit on tuberculosis has been prepared and shared with Governors and Lieutenant Governors (including: factsheets, state-wise information on the TB burden, success stories of patients, and the government’s roadmap for eliminating TB by 2025). In his address, the President of India also urged the delegates to support TB elimination efforts at the state level.
After the successful and widely acclaimed sensitization of Members of Parliament (MP) on TB in 2019, the CTD got the opportunity to organise a second round of sensitization for the MPs on 9th July 2021. The meeting was chaired by the Vice President of India, M. Venkaiah Naidu and attended by the Speaker of the Lok Sabha (Lower House of Parliament), India’s Union Health Minister, and over 55 MPs from across party lines. The provision of a dashboard for MPs, to review and track the progress of the TB program was announced and the MPs were urged to utilise that to provide supportive supervision to the TB program in their respective constituencies. The meeting ended with the TB pledge taken by all Members of Parliament (MP).
Second Parliamentary Meeting on TB
Advocacy, communication and community engagement provides the necessary thrust to accelerate universal TB Care coverage and preventive services. In recognition of the clarion call for Ending TB in India by the Hon’ble Prime Minister, the Ministry of Health and Family Welfare (MoHFW) launched the TB-Mukt Bharat Abhiyaan - A Jan Andolan to eliminate TB from India by 2025.
Well-designed Advocacy and IEC is crucial as it plays a complementary and catalytic role across all thematic areas of the programme while aligning efforts with other public health programmes for synergised communication.
Under the National Strategic Plan (2017-25), a community-led response is one of the key catalysts to reach the last mile and support TB patients through their treatment and recovery phase.
Efforts are being made under the National TB Elimination Programme to actively engage various stakeholders including civil society and community in programme planning and design, service delivery, monitoring and in advocacy. These include Elected Representatives and local self-governments, Civil Society Organizations, industries, etc. and TB affected communities.
TB elimination was on the agenda during the 51st Annual Governor’s Conference
Vice President addressing Members of Parliament at the second Parliamentary meeting on TB in July 2021
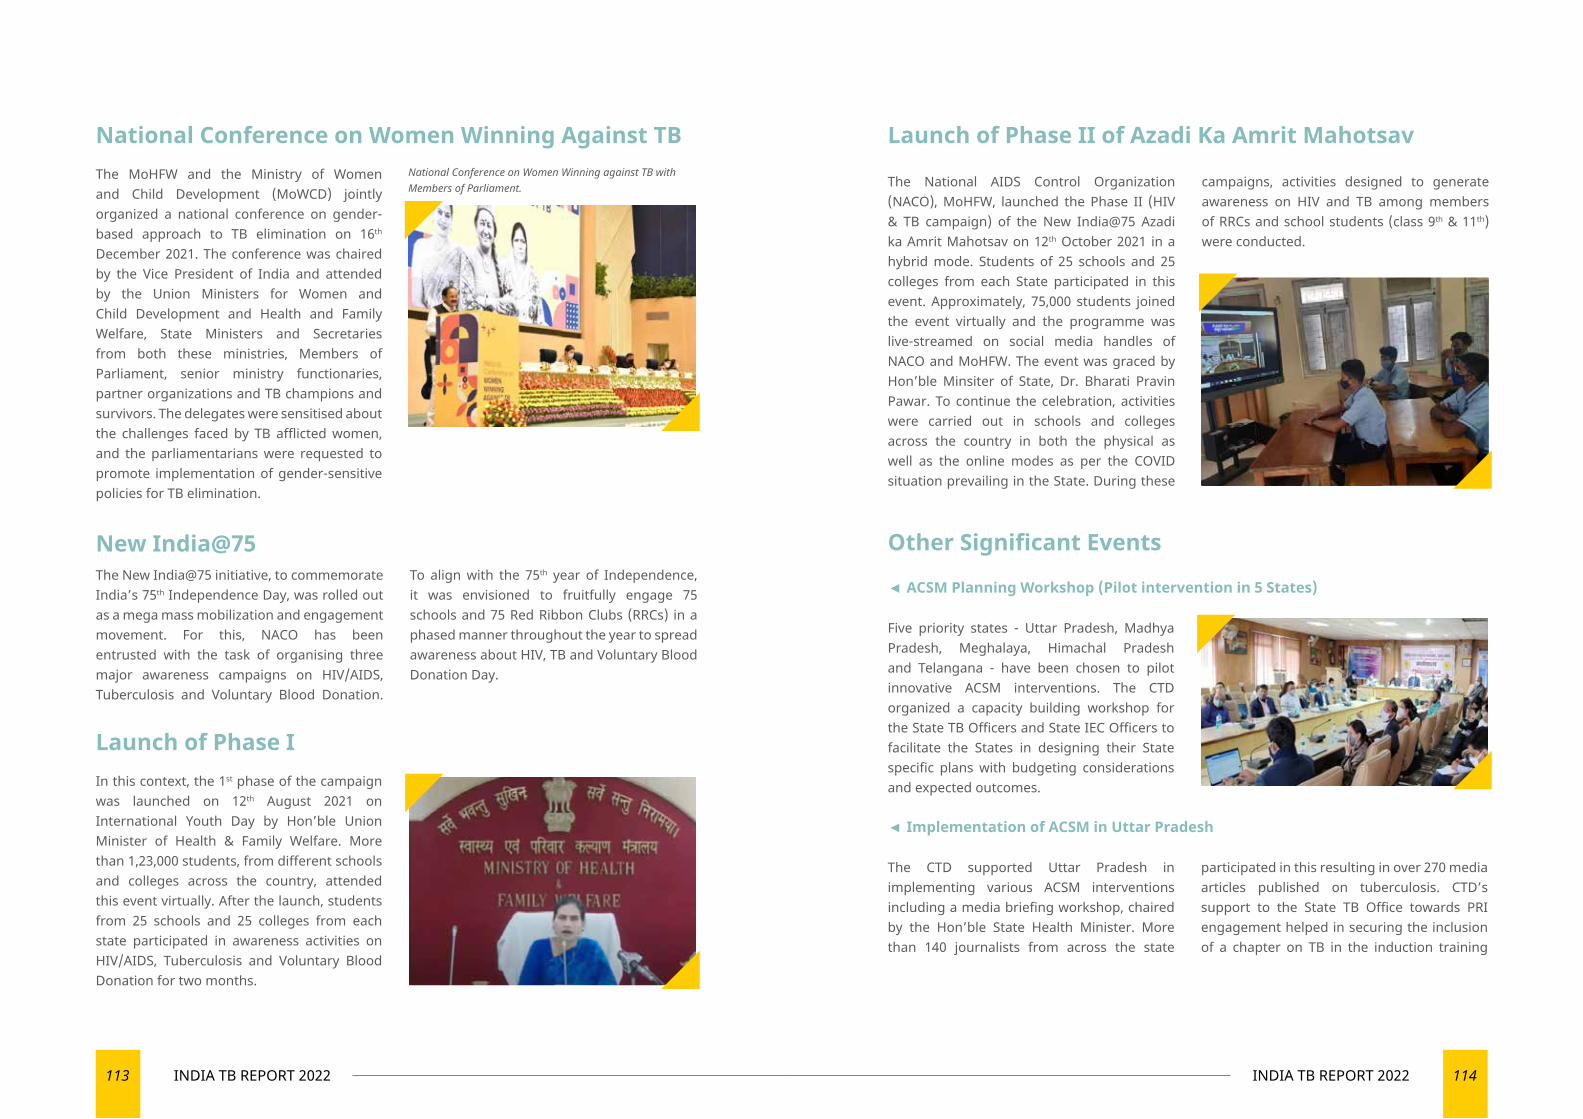
113 INDIA TB REPORT 2022 114INDIA TB REPORT 2022
The National AIDS Control Organization (NACO), MoHFW, launched the Phase II (HIV & TB campaign) of the New India@75 Azadi ka Amrit Mahotsav on 12th October 2021 in a hybrid mode. Students of 25 schools and 25 colleges from each State participated in this event. Approximately, 75,000 students joined the event virtually and the programme was live-streamed on social media handles of NACO and MoHFW. The event was graced by Hon’ble Minsiter of State, Dr. Bharati Pravin Pawar. To continue the celebration, activities were carried out in schools and colleges across the country in both the physical as well as the online modes as per the COVID situation prevailing in the State. During these
campaigns, activities designed to generate awareness on HIV and TB among members of RRCs and school students (class 9th & 11th) were conducted.
National Conference on Women Winning Against TB
Launch of Phase I
Launch of Phase II of Azadi Ka Amrit Mahotsav
Other Significant Events
◄ ACSM Planning Workshop (Pilot intervention in 5 States)
◄ Implementation of ACSM in Uttar Pradesh
New India@75
The MoHFW and the Ministry of Women and Child Development (MoWCD) jointly organized a national conference on gender-based approach to TB elimination on 16th December 2021. The conference was chaired by the Vice President of India and attended by the Union Ministers for Women and Child Development and Health and Family Welfare, State Ministers and Secretaries from both these ministries, Members of Parliament, senior ministry functionaries, partner organizations and TB champions and survivors. The delegates were sensitised about the challenges faced by TB afflicted women, and the parliamentarians were requested to promote implementation of gender-sensitive policies for TB elimination.
In this context, the 1st phase of the campaign was launched on 12th August 2021 on International Youth Day by Hon’ble Union Minister of Health & Family Welfare. More than 1,23,000 students, from different schools and colleges across the country, attended this event virtually. After the launch, students from 25 schools and 25 colleges from each state participated in awareness activities on HIV/AIDS, Tuberculosis and Voluntary Blood Donation for two months.
The New India@75 initiative, to commemorate India’s 75th Independence Day, was rolled out as a mega mass mobilization and engagement movement. For this, NACO has been entrusted with the task of organising three major awareness campaigns on HIV/AIDS, Tuberculosis and Voluntary Blood Donation.
To align with the 75th year of Independence, it was envisioned to fruitfully engage 75 schools and 75 Red Ribbon Clubs (RRCs) in a phased manner throughout the year to spread awareness about HIV, TB and Voluntary Blood Donation Day.
Five priority states - Uttar Pradesh, Madhya Pradesh, Meghalaya, Himachal Pradesh and Telangana - have been chosen to pilot innovative ACSM interventions. The CTD organized a capacity building workshop for the State TB Officers and State IEC Officers to facilitate the States in designing their State specific plans with budgeting considerations and expected outcomes.
The CTD supported Uttar Pradesh in implementing various ACSM interventions including a media briefing workshop, chaired by the Hon’ble State Health Minister. More than 140 journalists from across the state
participated in this resulting in over 270 media articles published on tuberculosis. CTD’s support to the State TB Office towards PRI engagement helped in securing the inclusion of a chapter on TB in the induction training
National Conference on Women Winning against TB with Members of Parliament.
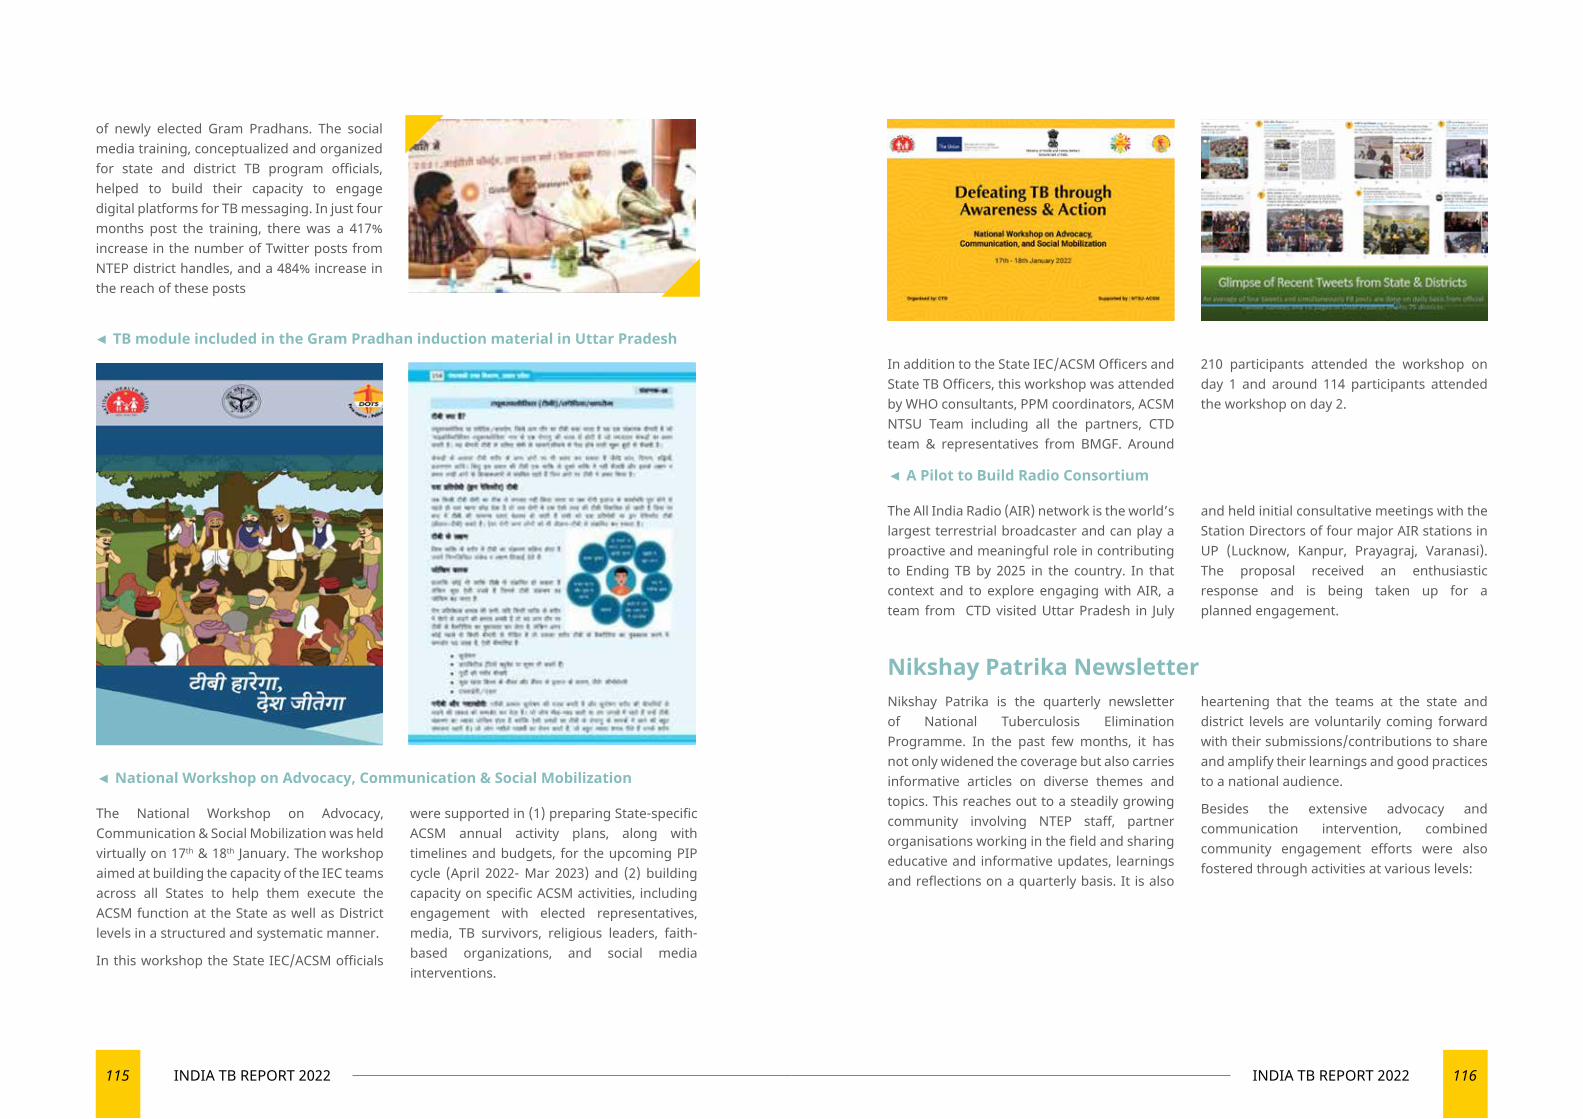
115 INDIA TB REPORT 2022 116INDIA TB REPORT 2022
In addition to the State IEC/ACSM Officers and State TB Officers, this workshop was attended by WHO consultants, PPM coordinators, ACSM NTSU Team including all the partners, CTD team & representatives from BMGF. Around
210 participants attended the workshop on day 1 and around 114 participants attended the workshop on day 2.
◄ A Pilot to Build Radio Consortium
The All India Radio (AIR) network is the world’s largest terrestrial broadcaster and can play a proactive and meaningful role in contributing to Ending TB by 2025 in the country. In that context and to explore engaging with AIR, a team from CTD visited Uttar Pradesh in July
and held initial consultative meetings with the Station Directors of four major AIR stations in UP (Lucknow, Kanpur, Prayagraj, Varanasi). The proposal received an enthusiastic response and is being taken up for a planned engagement.
Nikshay Patrika NewsletterNikshay Patrika is the quarterly newsletter of National Tuberculosis Elimination Programme. In the past few months, it has not only widened the coverage but also carries informative articles on diverse themes and topics. This reaches out to a steadily growing community involving NTEP staff, partner organisations working in the field and sharing educative and informative updates, learnings and reflections on a quarterly basis. It is also
heartening that the teams at the state and district levels are voluntarily coming forward with their submissions/contributions to share and amplify their learnings and good practices to a national audience.
Besides the extensive advocacy and communication intervention, combined community engagement efforts were also fostered through activities at various levels:
of newly elected Gram Pradhans. The social media training, conceptualized and organized for state and district TB program officials, helped to build their capacity to engage digital platforms for TB messaging. In just four months post the training, there was a 417% increase in the number of Twitter posts from NTEP district handles, and a 484% increase in the reach of these posts
◄ TB module included in the Gram Pradhan induction material in Uttar Pradesh
◄ National Workshop on Advocacy, Communication & Social Mobilization
The National Workshop on Advocacy, Communication & Social Mobilization was held virtually on 17th & 18th January. The workshop aimed at building the capacity of the IEC teams across all States to help them execute the ACSM function at the State as well as District levels in a structured and systematic manner.
In this workshop the State IEC/ACSM officials
were supported in (1) preparing State-specific ACSM annual activity plans, along with timelines and budgets, for the upcoming PIP cycle (April 2022- Mar 2023) and (2) building capacity on specific ACSM activities, including engagement with elected representatives, media, TB survivors, religious leaders, faith-based organizations, and social media interventions.
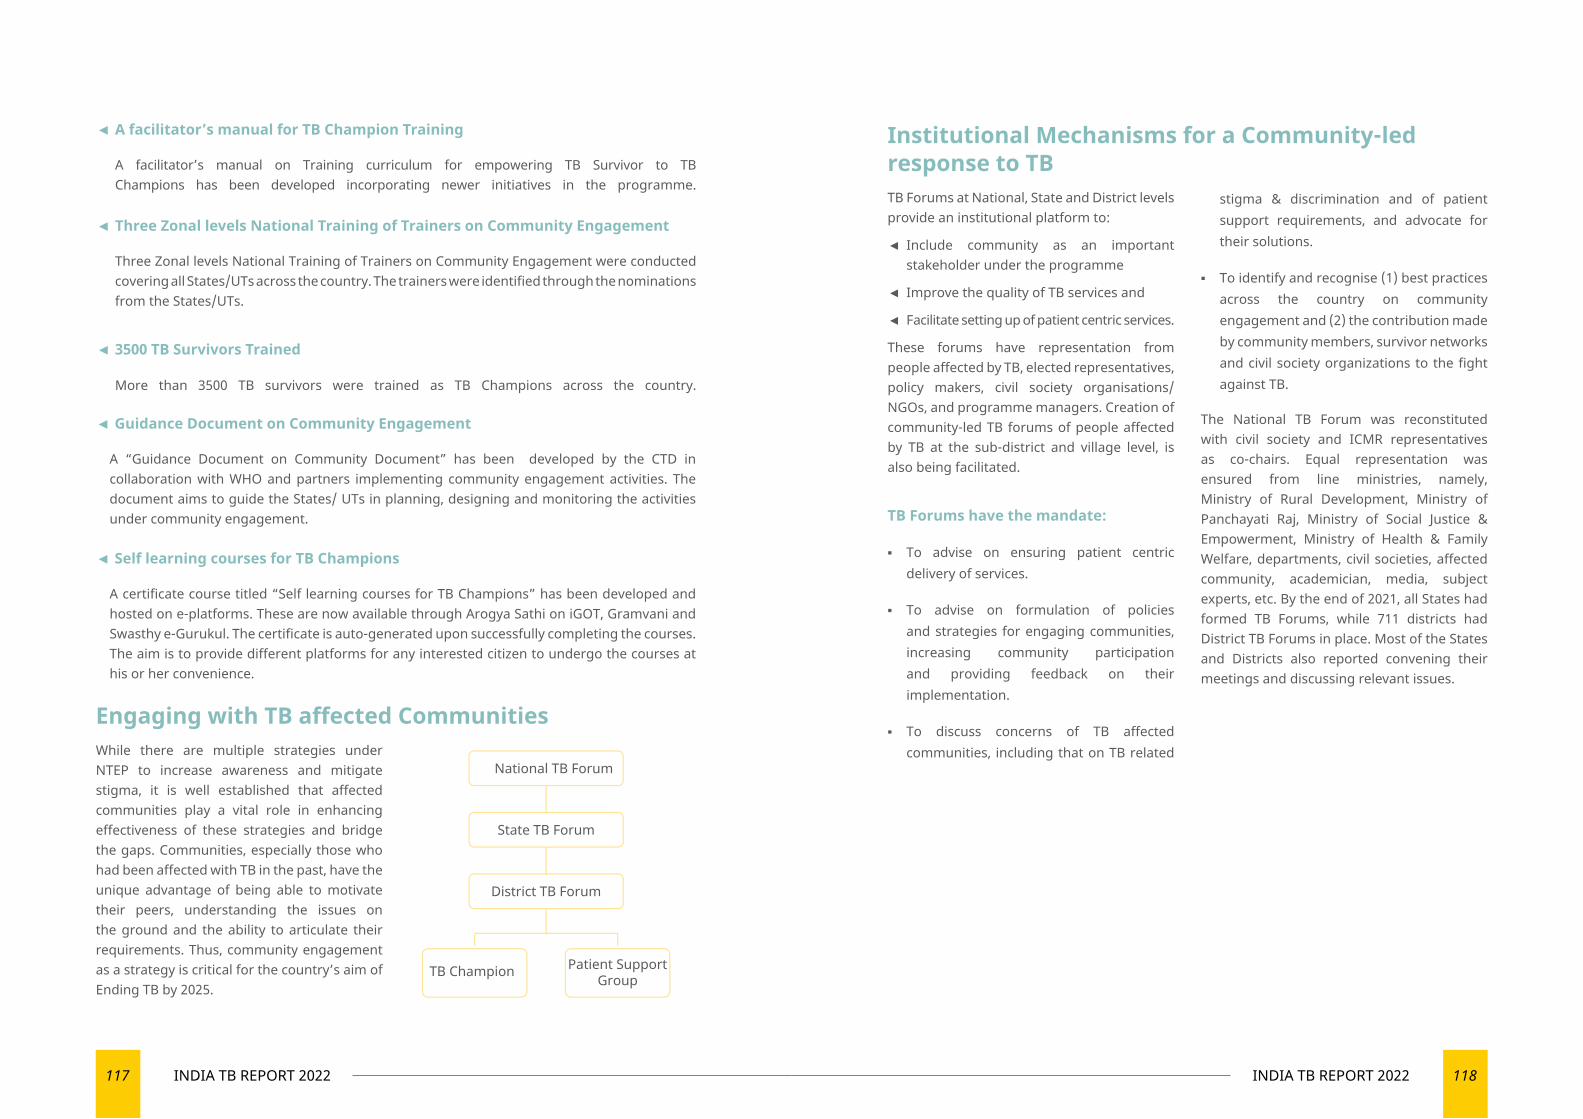
117 INDIA TB REPORT 2022 118INDIA TB REPORT 2022
◄ Guidance Document on Community Engagement
A “Guidance Document on Community Document” has been developed by the CTD in collaboration with WHO and partners implementing community engagement activities. The document aims to guide the States/ UTs in planning, designing and monitoring the activities under community engagement.
Institutional Mechanisms for a Community-led response to TB TB Forums at National, State and District levels provide an institutional platform to:
◄ Include community as an important stakeholder under the programme
◄ Improve the quality of TB services and
◄ Facilitate setting up of patient centric services.
These forums have representation from people affected by TB, elected representatives, policy makers, civil society organisations/NGOs, and programme managers. Creation of community-led TB forums of people affected by TB at the sub-district and village level, is also being facilitated.
TB Forums have the mandate:
▪ To advise on ensuring patient centric delivery of services.
▪ To advise on formulation of policies and strategies for engaging communities, increasing community participation and providing feedback on their implementation.
▪ To discuss concerns of TB affected communities, including that on TB related
stigma & discrimination and of patient support requirements, and advocate for their solutions.
▪ To identify and recognise (1) best practices across the country on community engagement and (2) the contribution made by community members, survivor networks and civil society organizations to the fight against TB.
The National TB Forum was reconstituted with civil society and ICMR representatives as co-chairs. Equal representation was ensured from line ministries, namely, Ministry of Rural Development, Ministry of Panchayati Raj, Ministry of Social Justice & Empowerment, Ministry of Health & Family Welfare, departments, civil societies, affected community, academician, media, subject experts, etc. By the end of 2021, all States had formed TB Forums, while 711 districts had District TB Forums in place. Most of the States and Districts also reported convening their meetings and discussing relevant issues.
◄ A facilitator’s manual for TB Champion Training
A facilitator’s manual on Training curriculum for empowering TB Survivor to TB Champions has been developed incorporating newer initiatives in the programme.
◄ Three Zonal levels National Training of Trainers on Community Engagement
Three Zonal levels National Training of Trainers on Community Engagement were conducted covering all States/UTs across the country. The trainers were identified through the nominations from the States/UTs.
◄ 3500 TB Survivors Trained
More than 3500 TB survivors were trained as TB Champions across the country.
◄ Self learning courses for TB Champions
A certificate course titled “Self learning courses for TB Champions” has been developed and hosted on e-platforms. These are now available through Arogya Sathi on iGOT, Gramvani and Swasthy e-Gurukul. The certificate is auto-generated upon successfully completing the courses. The aim is to provide different platforms for any interested citizen to undergo the courses at his or her convenience.
Engaging with TB affected CommunitiesWhile there are multiple strategies under NTEP to increase awareness and mitigate stigma, it is well established that affected communities play a vital role in enhancing effectiveness of these strategies and bridge the gaps. Communities, especially those who had been affected with TB in the past, have the unique advantage of being able to motivate their peers, understanding the issues on the ground and the ability to articulate their requirements. Thus, community engagement as a strategy is critical for the country’s aim of Ending TB by 2025.
National TB Forum
State TB Forum
District TB Forum
TB Champion Patient SupportGroup

10
BEST PRACTICES AND SUCCESS STORIES
Promoting holistic well-being through best practices and success stories
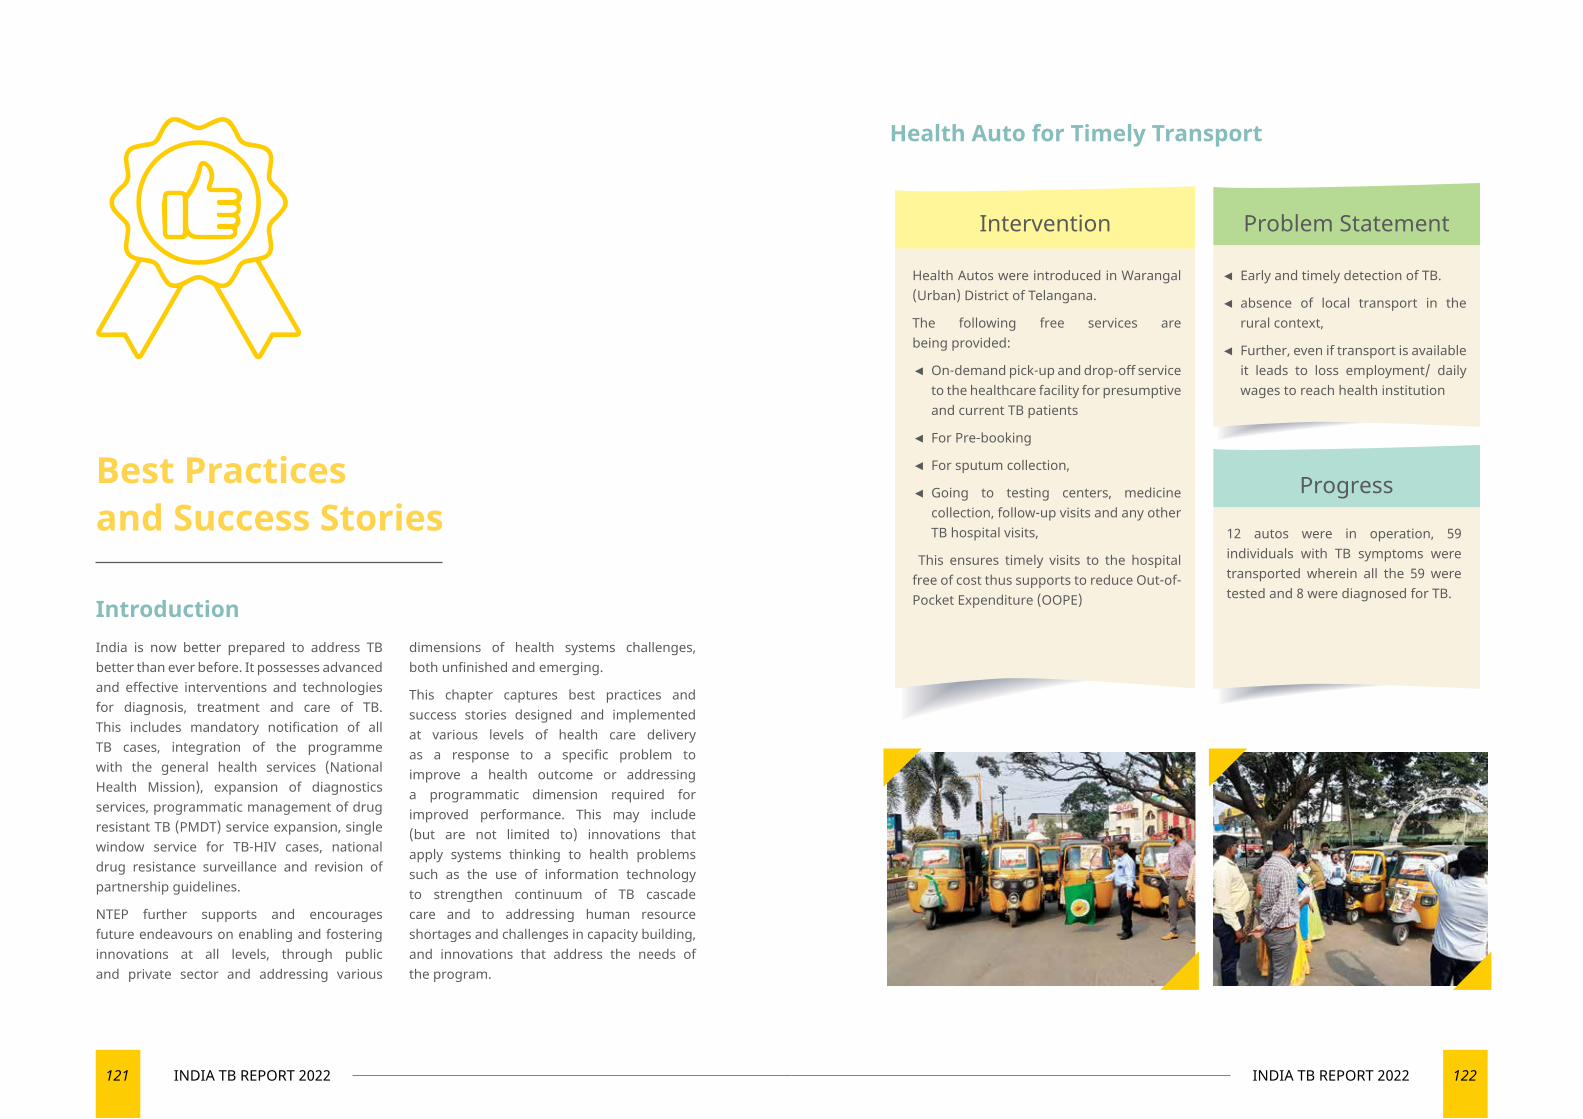
121 INDIA TB REPORT 2022 122INDIA TB REPORT 2022
Best Practices and Success Stories
IntroductionIndia is now better prepared to address TB better than ever before. It possesses advanced and effective interventions and technologies for diagnosis, treatment and care of TB. This includes mandatory notification of all TB cases, integration of the programme with the general health services (National Health Mission), expansion of diagnostics services, programmatic management of drug resistant TB (PMDT) service expansion, single window service for TB-HIV cases, national drug resistance surveillance and revision of partnership guidelines.
NTEP further supports and encourages future endeavours on enabling and fostering innovations at all levels, through public and private sector and addressing various
dimensions of health systems challenges, both unfinished and emerging.
This chapter captures best practices and success stories designed and implemented at various levels of health care delivery as a response to a specific problem to improve a health outcome or addressing a programmatic dimension required for improved performance. This may include (but are not limited to) innovations that apply systems thinking to health problems such as the use of information technology to strengthen continuum of TB cascade care and to addressing human resource shortages and challenges in capacity building, and innovations that address the needs of the program.
Health Auto for Timely Transport
Intervention Problem Statement
Progress
Health Autos were introduced in Warangal (Urban) District of Telangana.
The following free services are being provided:
◄ On-demand pick-up and drop-off service to the healthcare facility for presumptive and current TB patients
◄ For Pre-booking
◄ For sputum collection,
◄ Going to testing centers, medicine collection, follow-up visits and any other TB hospital visits,
This ensures timely visits to the hospital free of cost thus supports to reduce Out-of-Pocket Expenditure (OOPE)
◄ Early and timely detection of TB.
◄ absence of local transport in the rural context,
◄ Further, even if transport is available it leads to loss employment/ daily wages to reach health institution
12 autos were in operation, 59 individuals with TB symptoms were transported wherein all the 59 were tested and 8 were diagnosed for TB.
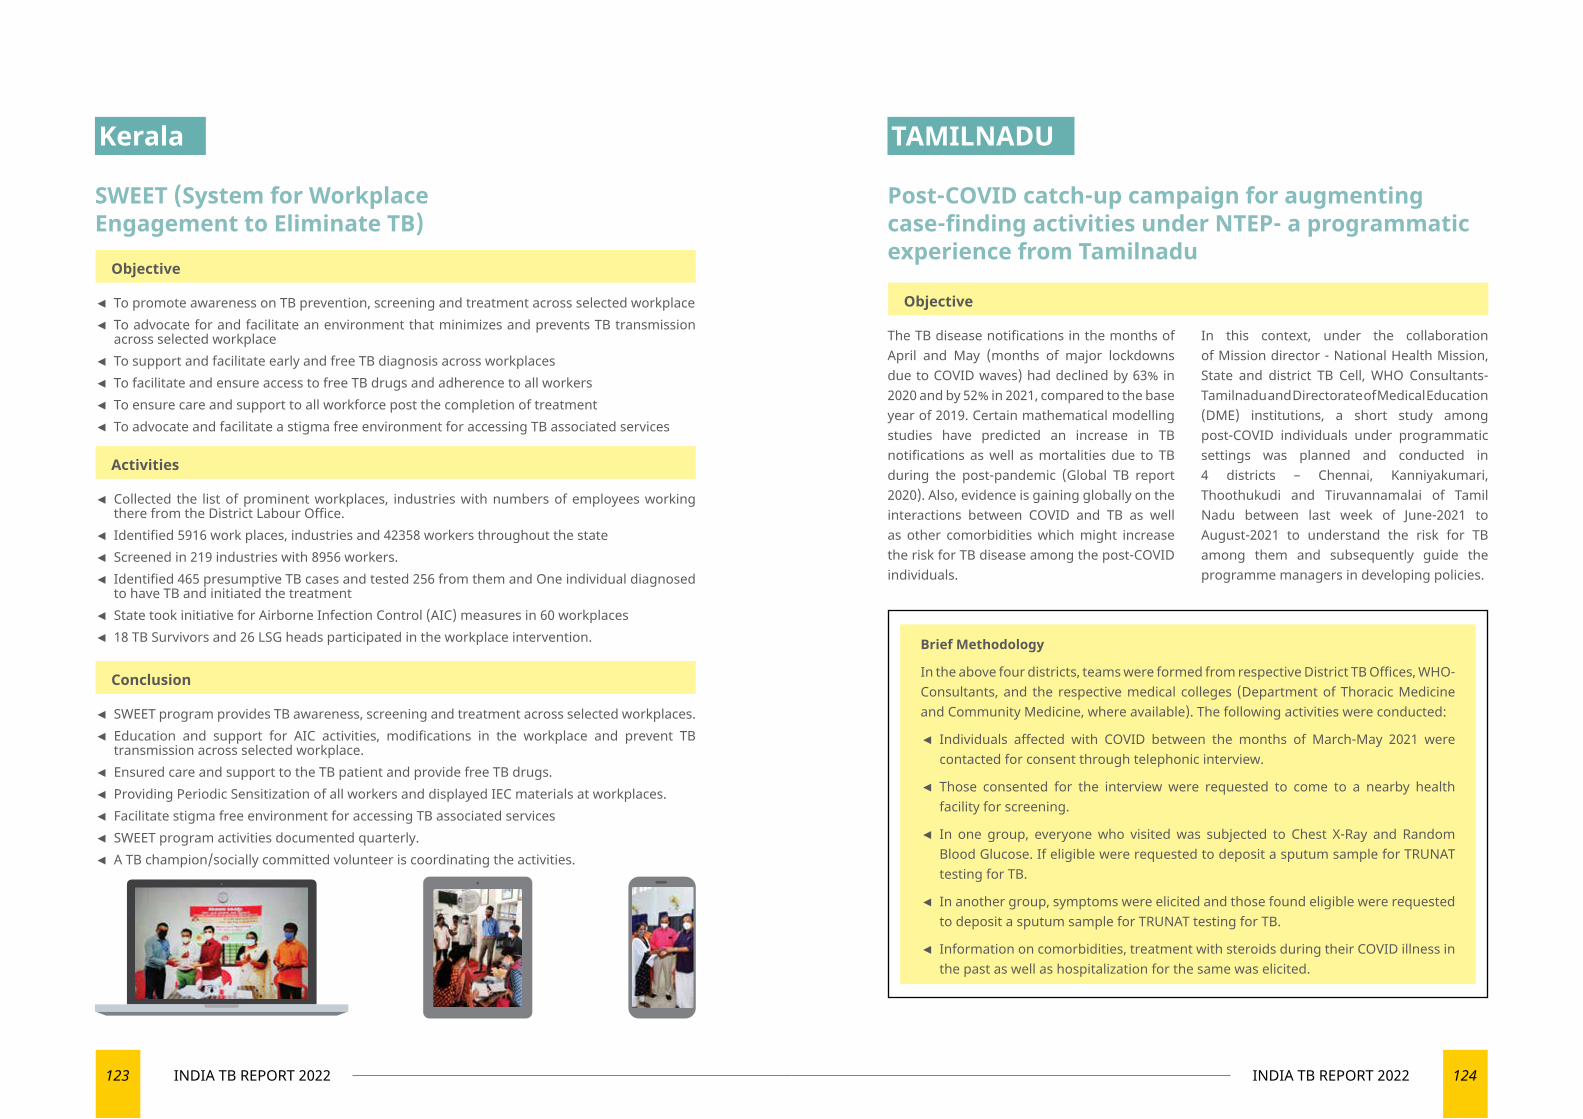
123 INDIA TB REPORT 2022 124INDIA TB REPORT 2022
Kerala TAMILNADU
Objective
Objective
Activities
Conclusion
SWEET (System for Workplace Engagement to Eliminate TB)
◄ To promote awareness on TB prevention, screening and treatment across selected workplace ◄ To advocate for and facilitate an environment that minimizes and prevents TB transmission across selected workplace
◄ To support and facilitate early and free TB diagnosis across workplaces ◄ To facilitate and ensure access to free TB drugs and adherence to all workers ◄ To ensure care and support to all workforce post the completion of treatment ◄ To advocate and facilitate a stigma free environment for accessing TB associated services
The TB disease notifications in the months of April and May (months of major lockdowns due to COVID waves) had declined by 63% in 2020 and by 52% in 2021, compared to the base year of 2019. Certain mathematical modelling studies have predicted an increase in TB notifications as well as mortalities due to TB during the post-pandemic (Global TB report 2020). Also, evidence is gaining globally on the interactions between COVID and TB as well as other comorbidities which might increase the risk for TB disease among the post-COVID individuals.
In this context, under the collaboration of Mission director - National Health Mission, State and district TB Cell, WHO Consultants- Tamilnadu and Directorate of Medical Education (DME) institutions, a short study among post-COVID individuals under programmatic settings was planned and conducted in 4 districts – Chennai, Kanniyakumari, Thoothukudi and Tiruvannamalai of Tamil Nadu between last week of June-2021 to August-2021 to understand the risk for TB among them and subsequently guide the programme managers in developing policies.
◄ Collected the list of prominent workplaces, industries with numbers of employees working there from the District Labour Office.
◄ Identified 5916 work places, industries and 42358 workers throughout the state ◄ Screened in 219 industries with 8956 workers. ◄ Identified 465 presumptive TB cases and tested 256 from them and One individual diagnosed to have TB and initiated the treatment
◄ State took initiative for Airborne Infection Control (AIC) measures in 60 workplaces ◄ 18 TB Survivors and 26 LSG heads participated in the workplace intervention.
◄ SWEET program provides TB awareness, screening and treatment across selected workplaces. ◄ Education and support for AIC activities, modifications in the workplace and prevent TB transmission across selected workplace.
◄ Ensured care and support to the TB patient and provide free TB drugs. ◄ Providing Periodic Sensitization of all workers and displayed IEC materials at workplaces. ◄ Facilitate stigma free environment for accessing TB associated services ◄ SWEET program activities documented quarterly. ◄ A TB champion/socially committed volunteer is coordinating the activities.
Post-COVID catch-up campaign for augmenting case-finding activities under NTEP- a programmatic experience from Tamilnadu
Brief Methodology
In the above four districts, teams were formed from respective District TB Offices, WHO-Consultants, and the respective medical colleges (Department of Thoracic Medicine and Community Medicine, where available). The following activities were conducted:
◄ Individuals affected with COVID between the months of March-May 2021 were contacted for consent through telephonic interview.
◄ Those consented for the interview were requested to come to a nearby health facility for screening.
◄ In one group, everyone who visited was subjected to Chest X-Ray and Random Blood Glucose. If eligible were requested to deposit a sputum sample for TRUNAT testing for TB.
◄ In another group, symptoms were elicited and those found eligible were requested to deposit a sputum sample for TRUNAT testing for TB.
◄ Information on comorbidities, treatment with steroids during their COVID illness in the past as well as hospitalization for the same was elicited.
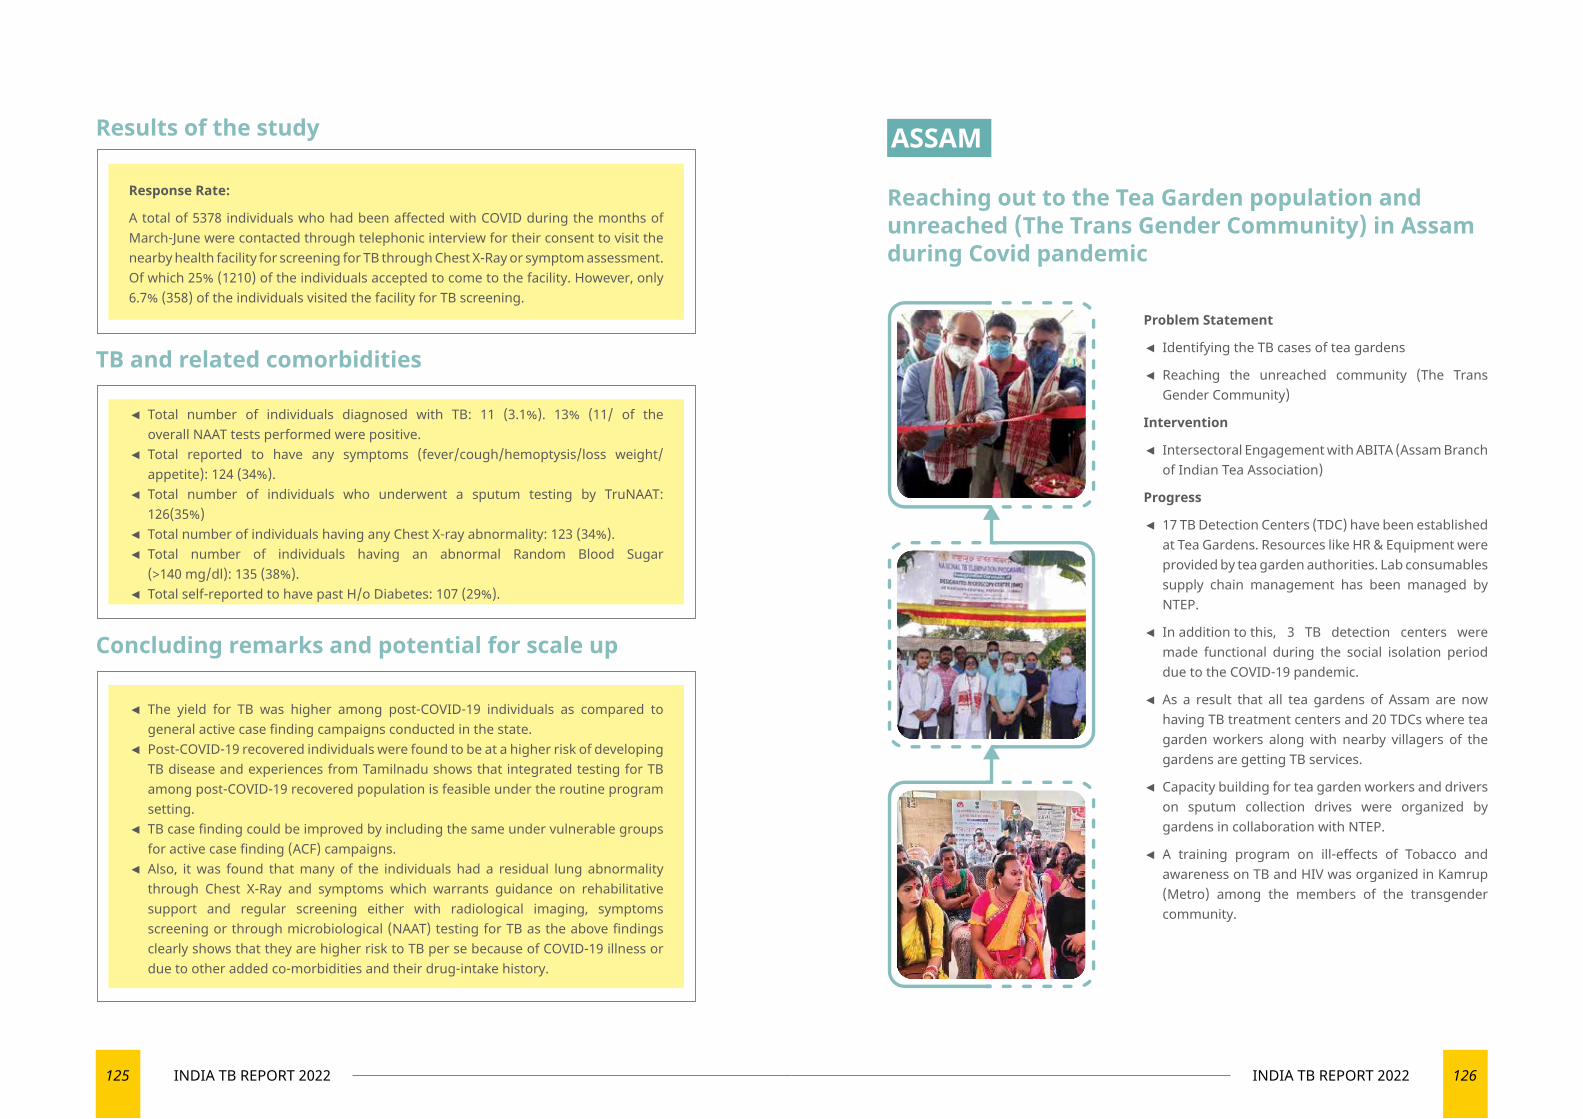
125 INDIA TB REPORT 2022 126INDIA TB REPORT 2022
Results of the study
TB and related comorbidities
Concluding remarks and potential for scale up
Response Rate:
A total of 5378 individuals who had been affected with COVID during the months of March-June were contacted through telephonic interview for their consent to visit the nearby health facility for screening for TB through Chest X-Ray or symptom assessment. Of which 25% (1210) of the individuals accepted to come to the facility. However, only 6.7% (358) of the individuals visited the facility for TB screening.
◄ Total number of individuals diagnosed with TB: 11 (3.1%). 13% (11/ of the overall NAAT tests performed were positive.
◄ Total reported to have any symptoms (fever/cough/hemoptysis/loss weight/appetite): 124 (34%).
◄ Total number of individuals who underwent a sputum testing by TruNAAT: 126(35%)
◄ Total number of individuals having any Chest X-ray abnormality: 123 (34%). ◄ Total number of individuals having an abnormal Random Blood Sugar (>140 mg/dl): 135 (38%).
◄ Total self-reported to have past H/o Diabetes: 107 (29%).
◄ The yield for TB was higher among post-COVID-19 individuals as compared to general active case finding campaigns conducted in the state.
◄ Post-COVID-19 recovered individuals were found to be at a higher risk of developing TB disease and experiences from Tamilnadu shows that integrated testing for TB among post-COVID-19 recovered population is feasible under the routine program setting.
◄ TB case finding could be improved by including the same under vulnerable groups for active case finding (ACF) campaigns.
◄ Also, it was found that many of the individuals had a residual lung abnormality through Chest X-Ray and symptoms which warrants guidance on rehabilitative support and regular screening either with radiological imaging, symptoms screening or through microbiological (NAAT) testing for TB as the above findings clearly shows that they are higher risk to TB per se because of COVID-19 illness or due to other added co-morbidities and their drug-intake history.
ASSAM
Reaching out to the Tea Garden population and unreached (The Trans Gender Community) in Assam during Covid pandemic
Problem Statement
◄ Identifying the TB cases of tea gardens
◄ Reaching the unreached community (The Trans Gender Community)
Intervention
◄ Intersectoral Engagement with ABITA (Assam Branch of Indian Tea Association)
Progress
◄ 17 TB Detection Centers (TDC) have been established at Tea Gardens. Resources like HR & Equipment were provided by tea garden authorities. Lab consumables supply chain management has been managed by NTEP.
◄ In addition to this, 3 TB detection centers were made functional during the social isolation period due to the COVID-19 pandemic.
◄ As a result that all tea gardens of Assam are now having TB treatment centers and 20 TDCs where tea garden workers along with nearby villagers of the gardens are getting TB services.
◄ Capacity building for tea garden workers and drivers on sputum collection drives were organized by gardens in collaboration with NTEP.
◄ A training program on ill-effects of Tobacco and awareness on TB and HIV was organized in Kamrup (Metro) among the members of the transgender community.
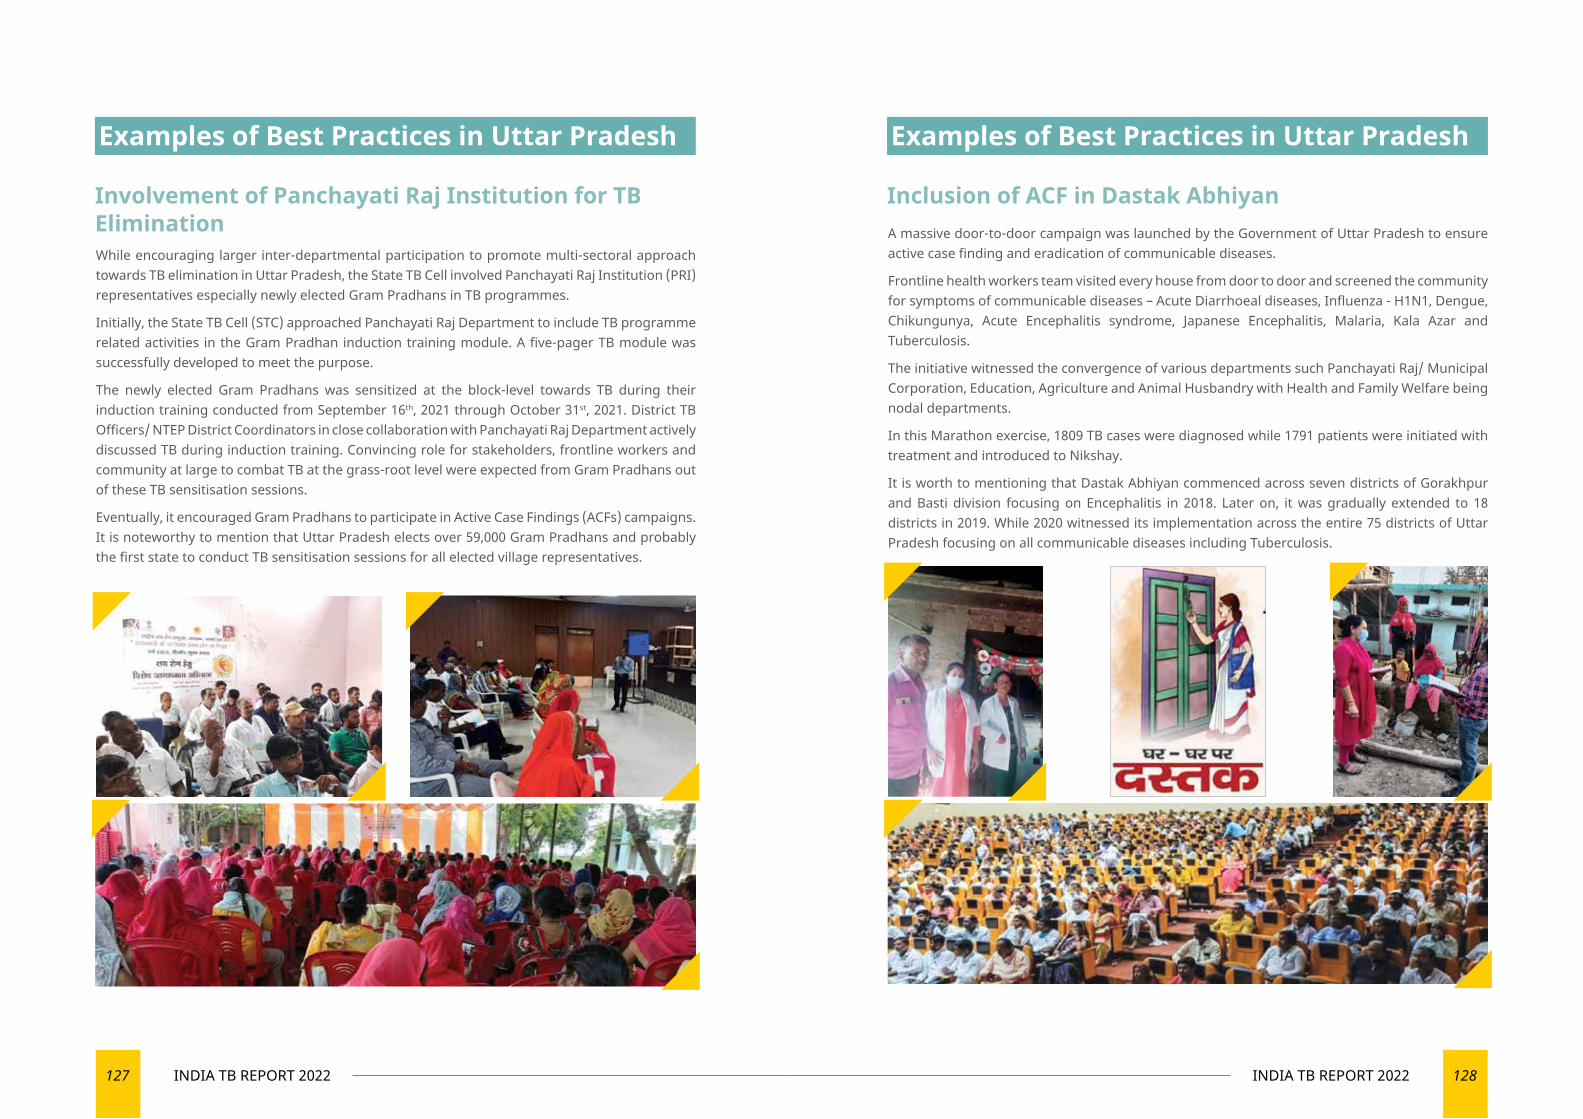
127 INDIA TB REPORT 2022 128INDIA TB REPORT 2022
Examples of Best Practices in Uttar Pradesh
Involvement of Panchayati Raj Institution for TB EliminationWhile encouraging larger inter-departmental participation to promote multi-sectoral approach towards TB elimination in Uttar Pradesh, the State TB Cell involved Panchayati Raj Institution (PRI) representatives especially newly elected Gram Pradhans in TB programmes.
Initially, the State TB Cell (STC) approached Panchayati Raj Department to include TB programme related activities in the Gram Pradhan induction training module. A five-pager TB module was successfully developed to meet the purpose.
The newly elected Gram Pradhans was sensitized at the block-level towards TB during their induction training conducted from September 16th, 2021 through October 31st, 2021. District TB Officers/ NTEP District Coordinators in close collaboration with Panchayati Raj Department actively discussed TB during induction training. Convincing role for stakeholders, frontline workers and community at large to combat TB at the grass-root level were expected from Gram Pradhans out of these TB sensitisation sessions.
Eventually, it encouraged Gram Pradhans to participate in Active Case Findings (ACFs) campaigns. It is noteworthy to mention that Uttar Pradesh elects over 59,000 Gram Pradhans and probably the first state to conduct TB sensitisation sessions for all elected village representatives.
Examples of Best Practices in Uttar Pradesh
Inclusion of ACF in Dastak AbhiyanA massive door-to-door campaign was launched by the Government of Uttar Pradesh to ensure active case finding and eradication of communicable diseases.
Frontline health workers team visited every house from door to door and screened the community for symptoms of communicable diseases – Acute Diarrhoeal diseases, Influenza - H1N1, Dengue, Chikungunya, Acute Encephalitis syndrome, Japanese Encephalitis, Malaria, Kala Azar and Tuberculosis.
The initiative witnessed the convergence of various departments such Panchayati Raj/ Municipal Corporation, Education, Agriculture and Animal Husbandry with Health and Family Welfare being nodal departments.
In this Marathon exercise, 1809 TB cases were diagnosed while 1791 patients were initiated with treatment and introduced to Nikshay.
It is worth to mentioning that Dastak Abhiyan commenced across seven districts of Gorakhpur and Basti division focusing on Encephalitis in 2018. Later on, it was gradually extended to 18 districts in 2019. While 2020 witnessed its implementation across the entire 75 districts of Uttar Pradesh focusing on all communicable diseases including Tuberculosis.
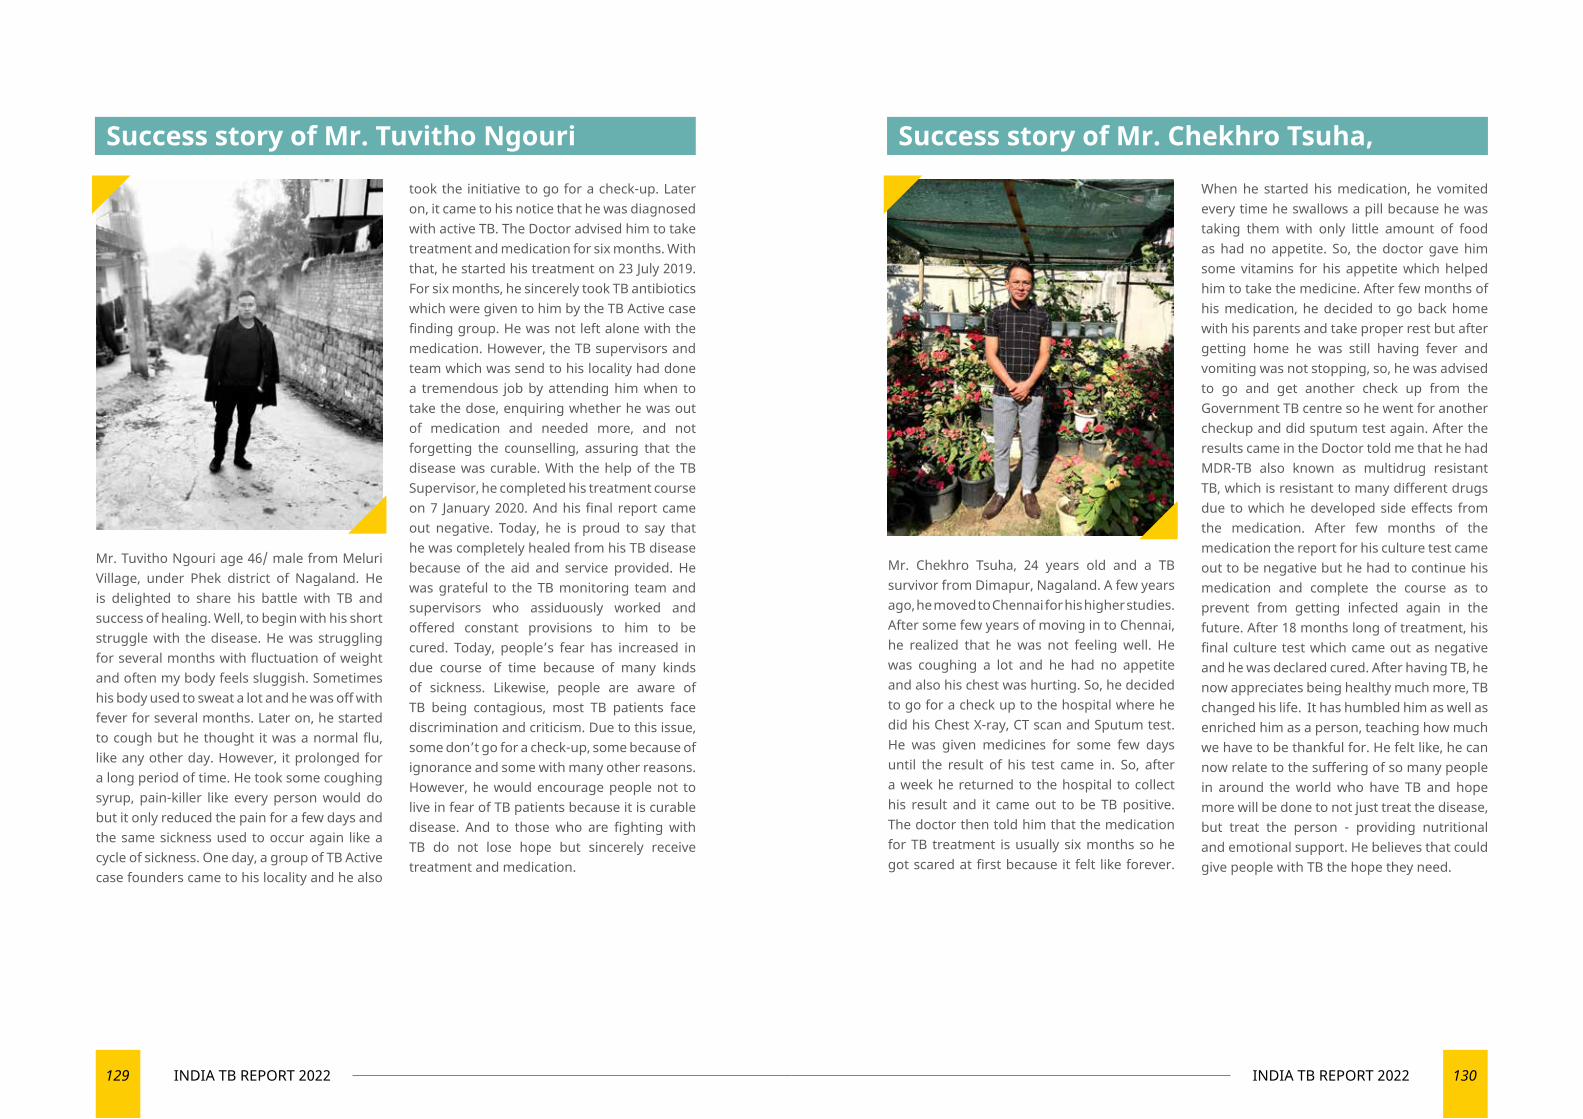
129 INDIA TB REPORT 2022 130INDIA TB REPORT 2022
Mr. Chekhro Tsuha, 24 years old and a TB survivor from Dimapur, Nagaland. A few years ago, he moved to Chennai for his higher studies. After some few years of moving in to Chennai, he realized that he was not feeling well. He was coughing a lot and he had no appetite and also his chest was hurting. So, he decided to go for a check up to the hospital where he did his Chest X-ray, CT scan and Sputum test. He was given medicines for some few days until the result of his test came in. So, after a week he returned to the hospital to collect his result and it came out to be TB positive. The doctor then told him that the medication for TB treatment is usually six months so he got scared at first because it felt like forever.
When he started his medication, he vomited every time he swallows a pill because he was taking them with only little amount of food as had no appetite. So, the doctor gave him some vitamins for his appetite which helped him to take the medicine. After few months of his medication, he decided to go back home with his parents and take proper rest but after getting home he was still having fever and vomiting was not stopping, so, he was advised to go and get another check up from the Government TB centre so he went for another checkup and did sputum test again. After the results came in the Doctor told me that he had MDR-TB also known as multidrug resistant TB, which is resistant to many different drugs due to which he developed side effects from the medication. After few months of the medication the report for his culture test came out to be negative but he had to continue his medication and complete the course as to prevent from getting infected again in the future. After 18 months long of treatment, his final culture test which came out as negative and he was declared cured. After having TB, he now appreciates being healthy much more, TB changed his life. It has humbled him as well as enriched him as a person, teaching how much we have to be thankful for. He felt like, he can now relate to the suffering of so many people in around the world who have TB and hope more will be done to not just treat the disease, but treat the person - providing nutritional and emotional support. He believes that could give people with TB the hope they need.
Success story of Mr. Tuvitho Ngouri
Mr. Tuvitho Ngouri age 46/ male from Meluri Village, under Phek district of Nagaland. He is delighted to share his battle with TB and success of healing. Well, to begin with his short struggle with the disease. He was struggling for several months with fluctuation of weight and often my body feels sluggish. Sometimes his body used to sweat a lot and he was off with fever for several months. Later on, he started to cough but he thought it was a normal flu, like any other day. However, it prolonged for a long period of time. He took some coughing syrup, pain-killer like every person would do but it only reduced the pain for a few days and the same sickness used to occur again like a cycle of sickness. One day, a group of TB Active case founders came to his locality and he also
took the initiative to go for a check-up. Later on, it came to his notice that he was diagnosed with active TB. The Doctor advised him to take treatment and medication for six months. With that, he started his treatment on 23 July 2019. For six months, he sincerely took TB antibiotics which were given to him by the TB Active case finding group. He was not left alone with the medication. However, the TB supervisors and team which was send to his locality had done a tremendous job by attending him when to take the dose, enquiring whether he was out of medication and needed more, and not forgetting the counselling, assuring that the disease was curable. With the help of the TB Supervisor, he completed his treatment course on 7 January 2020. And his final report came out negative. Today, he is proud to say that he was completely healed from his TB disease because of the aid and service provided. He was grateful to the TB monitoring team and supervisors who assiduously worked and offered constant provisions to him to be cured. Today, people’s fear has increased in due course of time because of many kinds of sickness. Likewise, people are aware of TB being contagious, most TB patients face discrimination and criticism. Due to this issue, some don’t go for a check-up, some because of ignorance and some with many other reasons. However, he would encourage people not to live in fear of TB patients because it is curable disease. And to those who are fighting with TB do not lose hope but sincerely receive treatment and medication.
Success story of Mr. Chekhro Tsuha,
131 INDIA TB REPORT 2022 132INDIA TB REPORT 2022
11
RESEARCH AND INNOVATIONS
Technological breakthroughs to reduce TB incidence rates
133 INDIA TB REPORT 2022 134INDIA TB REPORT 2022
Research and Innovations
Keeping in view the recommendations of the Joint Monitoring Mission (JMM) 2019 with respect to the third pillar of NSP 2017-25 on research & innovations, the programme is collaborating with the different stakeholders like ICMR, DBT, DST & SERB-DST towards augmenting development of additional new tools required to end TB as well as reinforcing the rapid uptake of available tools and products. These can be varied – such as simple triage/screening, use of non-sputum clinical specimens for accurate bacteriologic diagnosis of extrapulmonary and pediatric TB, simpler/safer/shorter universal curative TB treatment regimens and rapid scale up of available tools, such as novel specific skin tests (e.g., C-TB) for diagnosing latent TB, automated digital chest x-ray interpretation and newer drugs/regimens, all of which in line with and based on the latest global guidance.
IntroductionTuberculosis research and development are critical for meeting the global TB targets set out in the United Nations’ Sustainable Development Goals (SDGs) and the World Health Organization’s End TB Strategy. A substantial technological breakthrough will be necessary to dramatically accelerate the rate at which tuberculosis incidence reduces relative to previous levels. “Intensified research and innovation” are the third pillar of the End TB Strategy. SDG 3b calls for funding research on new vaccines and medicines for communicable and non-communicable diseases that disproportionately affectdeveloping nations.
Collaboration with other stakeholders (ICMR, DBT, DST, SERB-DST)Various National entities such as Indian Council of Medical Research (ICMR) through India TB Research Consortium (ITRC), Department of Biotechnology (DBT), Department of Science & Technology (DST) and Science and
Engineering Research Board (SERB-DST) are actively engaged in research based on the priorities articulated by NTEP.Key research activities undertaken in the year 2020-21 are as follows:
To end the TB epidemic in India, we need:
◄ Affordable and accessible diagnostics, which are rapid point-of-care tests for detecting TB infection and disease, including presence of drug resistance if any.
◄ Shorter, safer, and more effective regimens for treating TB infection, drug-susceptible TB, and drug-resistant TB
National Operational Research Committee (NORC)A National OR Committee meeting was held under the Chairmanship of Dr D.C.S. Reddy (Chairman National OR Committee) from 7th to 9th December 2021 consequent to the OR call given out in November 2020. 65 proposals were received of, which 36 were considered based on NTEP priorities, scoring and selection criteria.
Implementation ArrangementsThe National TB Elimination Programme supports Operational Research (OR) under the guidance of a task force mechanism at State and National levels. The Global scientific evidence as well as evidence from the in country OR studies help bring in periodical changes in policies and programme management practices.
◄ A TB vaccine that is effective before and after exposure, as well as across a wide-range of age groups and geographical settings and
◄ Innovative strategies to address broader determinants of TB infection and disease.
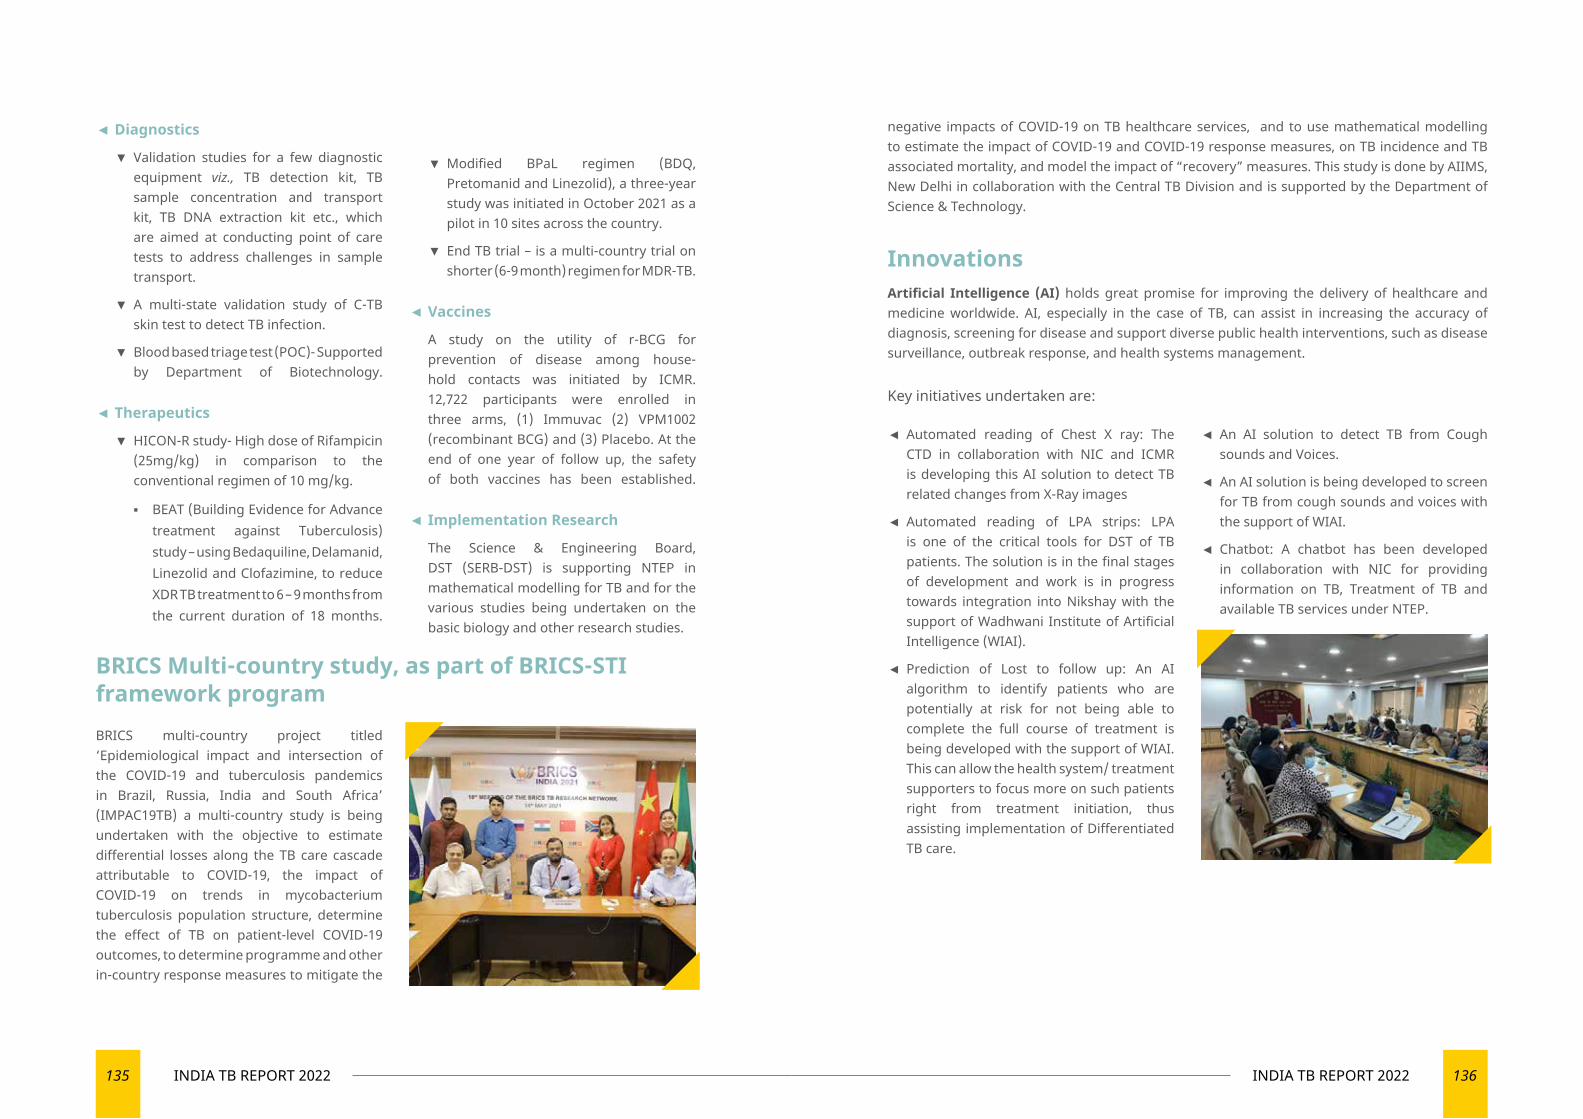
135 INDIA TB REPORT 2022 136INDIA TB REPORT 2022
◄ Diagnostics
▼ Validation studies for a few diagnostic equipment viz., TB detection kit, TB sample concentration and transport kit, TB DNA extraction kit etc., which are aimed at conducting point of care tests to address challenges in sample transport.
▼ A multi-state validation study of C-TB skin test to detect TB infection.
▼ Blood based triage test (POC)- Supported by Department of Biotechnology.
◄ Therapeutics
▼ HICON-R study- High dose of Rifampicin (25mg/kg) in comparison to the conventional regimen of 10 mg/kg.
▪ BEAT (Building Evidence for Advance treatment against Tuberculosis) study – using Bedaquiline, Delamanid, Linezolid and Clofazimine, to reduce XDR TB treatment to 6 – 9 months from the current duration of 18 months.
▼ Modified BPaL regimen (BDQ, Pretomanid and Linezolid), a three-year study was initiated in October 2021 as a pilot in 10 sites across the country.
▼ End TB trial – is a multi-country trial on shorter (6-9 month) regimen for MDR-TB.
◄ Vaccines
A study on the utility of r-BCG for prevention of disease among house-hold contacts was initiated by ICMR. 12,722 participants were enrolled in three arms, (1) Immuvac (2) VPM1002 (recombinant BCG) and (3) Placebo. At the end of one year of follow up, the safety of both vaccines has been established.
◄ Implementation Research
The Science & Engineering Board, DST (SERB-DST) is supporting NTEP in mathematical modelling for TB and for the various studies being undertaken on the basic biology and other research studies.
negative impacts of COVID-19 on TB healthcare services, and to use mathematical modelling to estimate the impact of COVID-19 and COVID-19 response measures, on TB incidence and TB associated mortality, and model the impact of “recovery” measures. This study is done by AIIMS, New Delhi in collaboration with the Central TB Division and is supported by the Department of Science & Technology.
Innovations Artificial Intelligence (AI) holds great promise for improving the delivery of healthcare and medicine worldwide. AI, especially in the case of TB, can assist in increasing the accuracy of diagnosis, screening for disease and support diverse public health interventions, such as disease surveillance, outbreak response, and health systems management.
Key initiatives undertaken are:
◄ Automated reading of Chest X ray: The CTD in collaboration with NIC and ICMR is developing this AI solution to detect TB related changes from X-Ray images
◄ Automated reading of LPA strips: LPA is one of the critical tools for DST of TB patients. The solution is in the final stages of development and work is in progress towards integration into Nikshay with the support of Wadhwani Institute of Artificial Intelligence (WIAI).
◄ Prediction of Lost to follow up: An AI algorithm to identify patients who are potentially at risk for not being able to complete the full course of treatment is being developed with the support of WIAI. This can allow the health system/ treatment supporters to focus more on such patients right from treatment initiation, thus assisting implementation of Differentiated TB care.
◄ An AI solution to detect TB from Cough sounds and Voices.
◄ An AI solution is being developed to screen for TB from cough sounds and voices with the support of WIAI.
◄ Chatbot: A chatbot has been developed in collaboration with NIC for providing information on TB, Treatment of TB and available TB services under NTEP.
BRICS Multi-country study, as part of BRICS-STI framework programBRICS multi-country project titled ‘Epidemiological impact and intersection of the COVID-19 and tuberculosis pandemics in Brazil, Russia, India and South Africa’ (IMPAC19TB) a multi-country study is being undertaken with the objective to estimate differential losses along the TB care cascade attributable to COVID-19, the impact of COVID-19 on trends in mycobacterium tuberculosis population structure, determine the effect of TB on patient-level COVID-19 outcomes, to determine programme and other in-country response measures to mitigate the
12
HEALTH FINANCING
Putting proper financial management at the forefront of health policies
139 INDIA TB REPORT 2022 140INDIA TB REPORT 2022
Health Financing
Institutional Arrangements The Central TB Division, being a part of the National Health Mission (NHM) holds the overall responsibility of the financial management of the program. Similarly, at
the State and district levels, the State TB Cell and the District TB Centre are responsible respectively.
IntroductionNational TB Elimination Programme is a centrally sponsored scheme under NHM to implement the programme activities as envisaged under NSP 2017-25 as per NTEP guidelines.
The procedures for the financial management are being followed as per the manuals and
guidelines available on the programme website (Financial Manual for NTEP). The financial management arrangements to account for and report on program funds, includes both Domestic Budgetary Support (DBS) and External Aided Component (EAC). The arrangements are as follows:
BudgetProgram expenditures are budgeted under the Demand for Grants of the MoHFW Flexible Pool for Communicable Diseases funding arrangement. These are reflected in two separate budget lines- General Component (GC) and Externally Aided Component (EAC).
◄ Fund Flow and Releases: The fund flow remains within the existing financial management system of the MoHFW, which operates through the centralized Pay and Accounts office. Release of funds to States is done in installments through State Treasury.
◄ Sanctions & Approvals: All procurements of commodities are processed by the Central Medical Services Society (CMSS), an autonomous society under MoHFW, the Government of India approved by the Cabinet. All fund releases for commodity advances for approved contracts are routed through the Integrated Finance Division (IFD) and processed by the Drawing and Disbursing Office (DDO) and Pay and Accounts Office (PAO). All the program expenditures follow the standard government systems of the PAO and are subject to control as per the General Financial Rules (GFR) of the Government of India. Payments are made through electronic funds transfer through treasury since the financial year 2014-2015.
◄ Accounting: The accounting records for all payments are made against approved budget. Budget lines are maintained by the Principal Accounts Officer and compiled by the Controller General of Accounts (CGA). The compiled monthly accounts are reconciled with the CTD record of transactions.
◄ Financial Reporting: A financial report is submitted by the CTD to MoHFW and the donors like The Global Fund and World Bank on periodic intervals based on the compiled monthly accounts and the CTD’s own record of expenditures.
◄ External Audit: The audits are being conducted as per the standard terms of reference. The audit reports are being made available to all donors as per the agreement. At State-level audits are being done as per State NHM manual and guidance for audit by empaneled chartered accountancy firms. All the States are required to submit the annual audit report to CTD by 30th September.
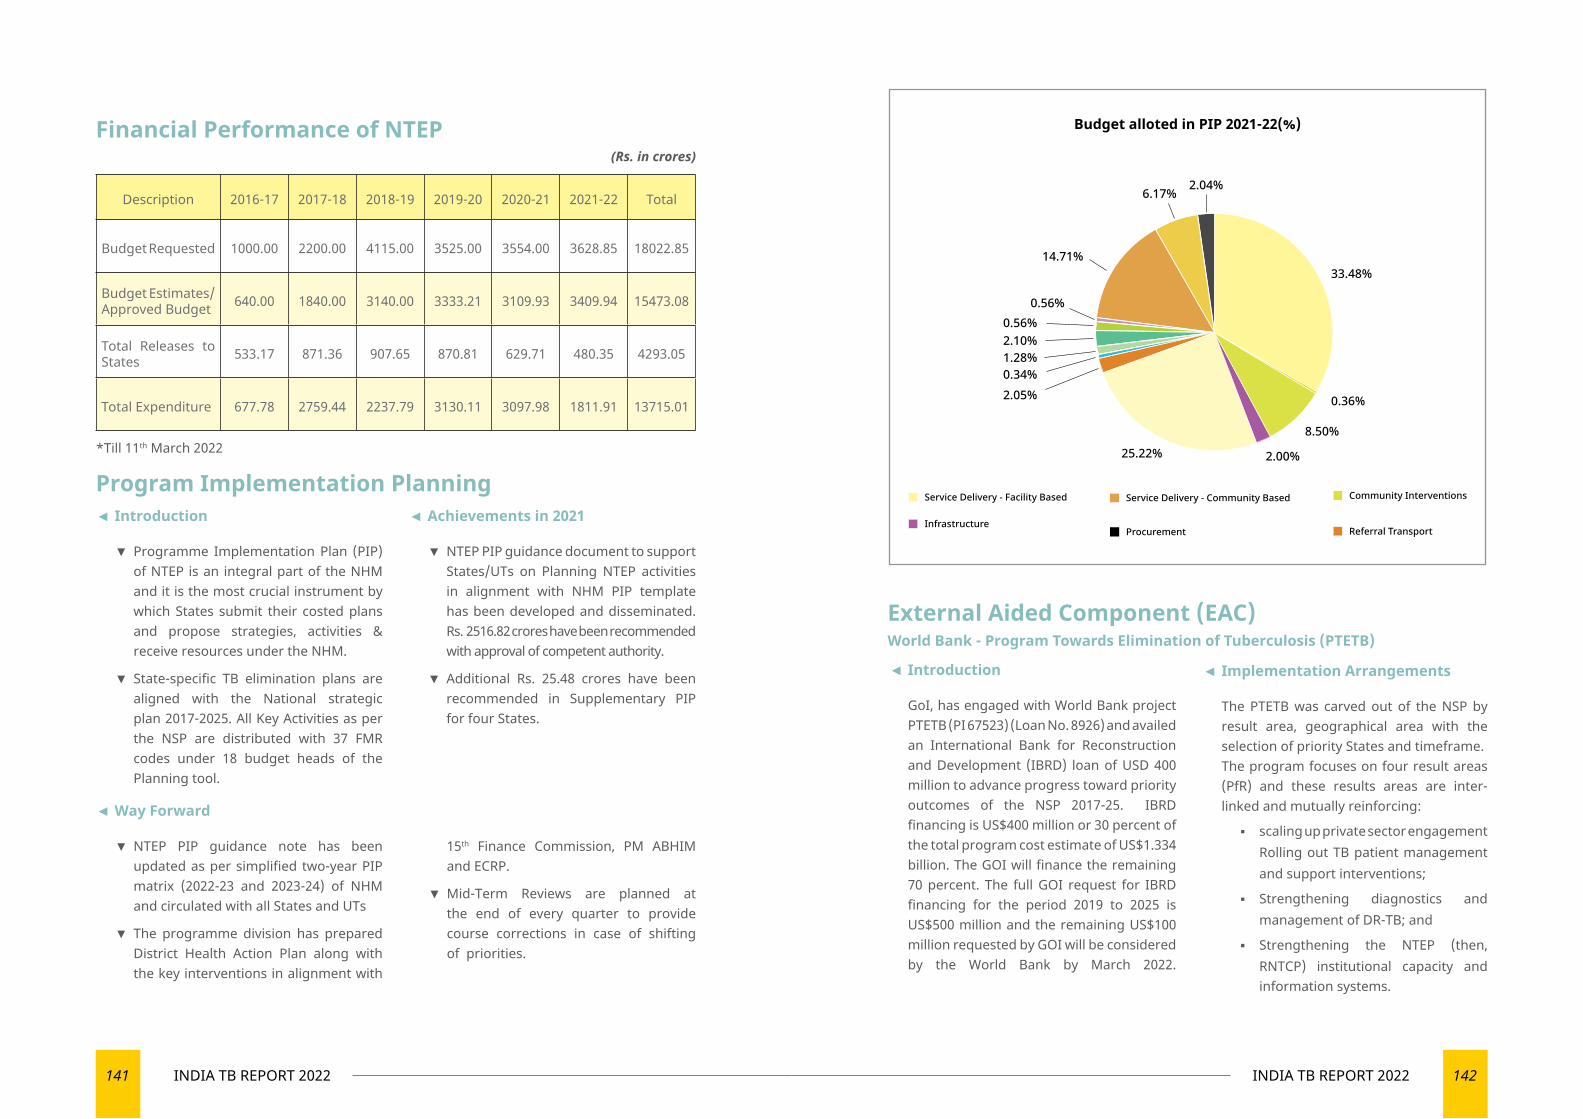
141 INDIA TB REPORT 2022 142INDIA TB REPORT 2022
*Till 11th March 2022
Program Implementation Planning
External Aided Component (EAC)World Bank - Program Towards Elimination of Tuberculosis (PTETB)
◄ Introduction
▼ Programme Implementation Plan (PIP) of NTEP is an integral part of the NHM and it is the most crucial instrument by which States submit their costed plans and propose strategies, activities & receive resources under the NHM.
▼ State-specific TB elimination plans are aligned with the National strategic plan 2017-2025. All Key Activities as per the NSP are distributed with 37 FMR codes under 18 budget heads of the Planning tool.
◄ Achievements in 2021
▼ NTEP PIP guidance document to support States/UTs on Planning NTEP activities in alignment with NHM PIP template has been developed and disseminated. Rs. 2516.82 crores have been recommended with approval of competent authority.
▼ Additional Rs. 25.48 crores have been recommended in Supplementary PIP for four States.
Financial Performance of NTEP(Rs. in crores)
Description 2016-17 2017-18 2018-19 2019-20 2020-21 2021-22 Total
Budget Requested 1000.00 2200.00 4115.00 3525.00 3554.00 3628.85 18022.85
Budget Estimates/Approved Budget 640.00 1840.00 3140.00 3333.21 3109.93 3409.94 15473.08
Total Releases to States 533.17 871.36 907.65 870.81 629.71 480.35 4293.05
Total Expenditure 677.78 2759.44 2237.79 3130.11 3097.98 1811.91 13715.01
Budget alloted in PIP 2021-22(%)
2.04%6.17%
14.71%
0.56%0.56%2.10%1.28%0.34%
25.22% 2.00%
8.50%
0.36%
33.48%
2.05%
◄ Way Forward
▼ NTEP PIP guidance note has been updated as per simplified two-year PIP matrix (2022-23 and 2023-24) of NHM and circulated with all States and UTs
▼ The programme division has prepared District Health Action Plan along with the key interventions in alignment with
15th Finance Commission, PM ABHIM and ECRP.
▼ Mid-Term Reviews are planned at the end of every quarter to provide course corrections in case of shifting of priorities.
◄ Introduction
GoI, has engaged with World Bank project PTETB (PI 67523) (Loan No. 8926) and availed an International Bank for Reconstruction and Development (IBRD) loan of USD 400 million to advance progress toward priority outcomes of the NSP 2017-25. IBRD financing is US$400 million or 30 percent of the total program cost estimate of US$1.334 billion. The GOI will finance the remaining 70 percent. The full GOI request for IBRD financing for the period 2019 to 2025 is US$500 million and the remaining US$100 million requested by GOI will be considered by the World Bank by March 2022.
◄ Implementation Arrangements
The PTETB was carved out of the NSP by result area, geographical area with the selection of priority States and timeframe. The program focuses on four result areas (PfR) and these results areas are inter-linked and mutually reinforcing:
▪ scaling up private sector engagement Rolling out TB patient management and support interventions;
▪ Strengthening diagnostics and management of DR-TB; and
▪ Strengthening the NTEP (then, RNTCP) institutional capacity and information systems.
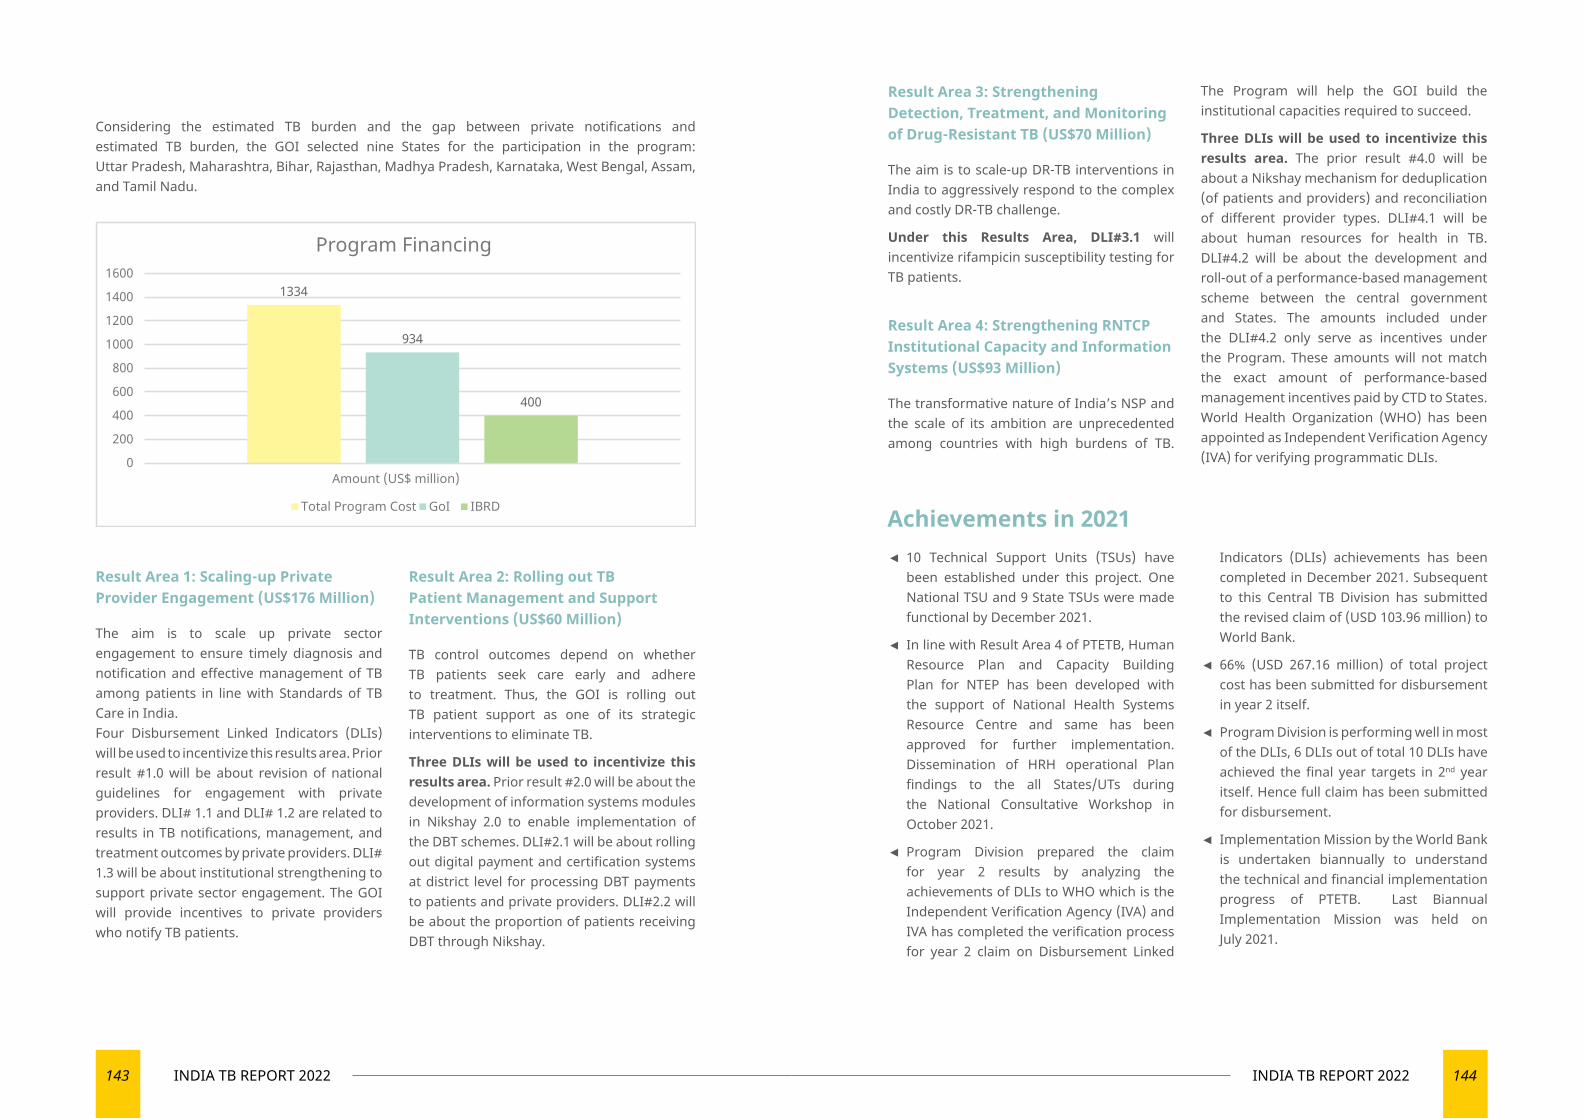
143 INDIA TB REPORT 2022 144INDIA TB REPORT 2022
Result Area 3: Strengthening Detection, Treatment, and Monitoring of Drug-Resistant TB (US$70 Million)
The aim is to scale-up DR-TB interventions in India to aggressively respond to the complex and costly DR-TB challenge.
Under this Results Area, DLI#3.1 will incentivize rifampicin susceptibility testing for TB patients.
Result Area 4: Strengthening RNTCP Institutional Capacity and Information Systems (US$93 Million)
The transformative nature of India’s NSP and the scale of its ambition are unprecedented among countries with high burdens of TB.
The Program will help the GOI build the institutional capacities required to succeed.
Three DLIs will be used to incentivize this results area. The prior result #4.0 will be about a Nikshay mechanism for deduplication (of patients and providers) and reconciliation of different provider types. DLI#4.1 will be about human resources for health in TB. DLI#4.2 will be about the development and roll-out of a performance-based management scheme between the central government and States. The amounts included under the DLI#4.2 only serve as incentives under the Program. These amounts will not match the exact amount of performance-based management incentives paid by CTD to States. World Health Organization (WHO) has been appointed as Independent Verification Agency (IVA) for verifying programmatic DLIs.
Considering the estimated TB burden and the gap between private notifications and estimated TB burden, the GOI selected nine States for the participation in the program: Uttar Pradesh, Maharashtra, Bihar, Rajasthan, Madhya Pradesh, Karnataka, West Bengal, Assam, and Tamil Nadu.
Result Area 1: Scaling-up Private Provider Engagement (US$176 Million)
The aim is to scale up private sector engagement to ensure timely diagnosis and notification and effective management of TB among patients in line with Standards of TB Care in India.Four Disbursement Linked Indicators (DLIs) will be used to incentivize this results area. Prior result #1.0 will be about revision of national guidelines for engagement with private providers. DLI# 1.1 and DLI# 1.2 are related to results in TB notifications, management, and treatment outcomes by private providers. DLI# 1.3 will be about institutional strengthening to support private sector engagement. The GOI will provide incentives to private providers who notify TB patients.
Result Area 2: Rolling out TB Patient Management and Support Interventions (US$60 Million)
TB control outcomes depend on whether TB patients seek care early and adhere to treatment. Thus, the GOI is rolling out TB patient support as one of its strategic interventions to eliminate TB.
Three DLIs will be used to incentivize this results area. Prior result #2.0 will be about the development of information systems modules in Nikshay 2.0 to enable implementation of the DBT schemes. DLI#2.1 will be about rolling out digital payment and certification systems at district level for processing DBT payments to patients and private providers. DLI#2.2 will be about the proportion of patients receiving DBT through Nikshay.
1334
934
400
0
200
400
600
800
1000
1200
1400
1600
Amount (US$ million)
Program Financing
Total Program Cost GoI IBRD
◄ 10 Technical Support Units (TSUs) have been established under this project. One National TSU and 9 State TSUs were made functional by December 2021.
◄ In line with Result Area 4 of PTETB, Human Resource Plan and Capacity Building Plan for NTEP has been developed with the support of National Health Systems Resource Centre and same has been approved for further implementation. Dissemination of HRH operational Plan findings to the all States/UTs during the National Consultative Workshop in October 2021.
◄ Program Division prepared the claim for year 2 results by analyzing the achievements of DLIs to WHO which is the Independent Verification Agency (IVA) and IVA has completed the verification process for year 2 claim on Disbursement Linked
Indicators (DLIs) achievements has been completed in December 2021. Subsequent to this Central TB Division has submitted the revised claim of (USD 103.96 million) to World Bank.
◄ 66% (USD 267.16 million) of total project cost has been submitted for disbursement in year 2 itself.
◄ Program Division is performing well in most of the DLIs, 6 DLIs out of total 10 DLIs have achieved the final year targets in 2nd year itself. Hence full claim has been submitted for disbursement.
◄ Implementation Mission by the World Bank is undertaken biannually to understand the technical and financial implementation progress of PTETB. Last Biannual Implementation Mission was held on July 2021.
Achievements in 2021
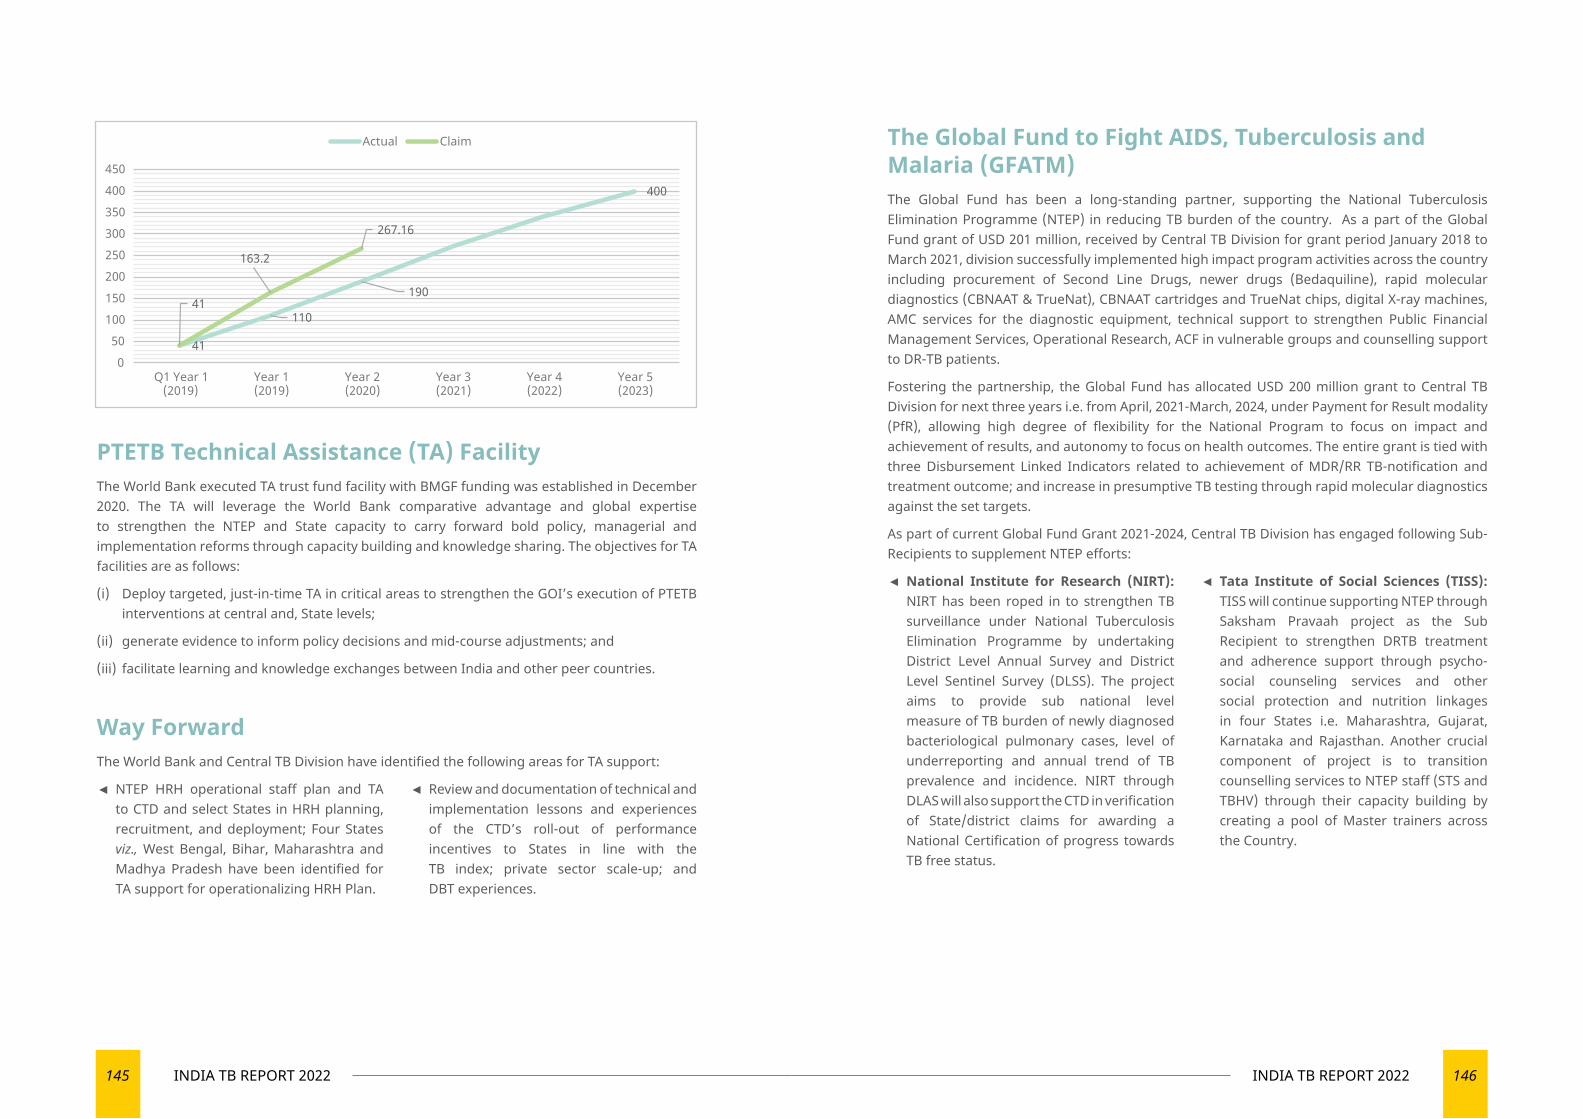
145 INDIA TB REPORT 2022 146INDIA TB REPORT 2022
PTETB Technical Assistance (TA) FacilityThe World Bank executed TA trust fund facility with BMGF funding was established in December 2020. The TA will leverage the World Bank comparative advantage and global expertise to strengthen the NTEP and State capacity to carry forward bold policy, managerial and implementation reforms through capacity building and knowledge sharing. The objectives for TA facilities are as follows:
(i) Deploy targeted, just-in-time TA in critical areas to strengthen the GOI’s execution of PTETB interventions at central and, State levels;
(ii) generate evidence to inform policy decisions and mid-course adjustments; and
(iii) facilitate learning and knowledge exchanges between India and other peer countries.
41110
190
400
41
163.2
267.16
050
100150
200250300350400
450
Q1 Year 1(2019)
Year 1(2019)
Year 2(2020)
Year 3(2021)
Year 4(2022)
Year 5(2023)
Actual Claim
Way ForwardThe World Bank and Central TB Division have identified the following areas for TA support:
◄ NTEP HRH operational staff plan and TA to CTD and select States in HRH planning, recruitment, and deployment; Four States viz., West Bengal, Bihar, Maharashtra and Madhya Pradesh have been identified for TA support for operationalizing HRH Plan.
◄ Review and documentation of technical and implementation lessons and experiences of the CTD’s roll-out of performance incentives to States in line with the TB index; private sector scale-up; and DBT experiences.
The Global Fund to Fight AIDS, Tuberculosis and Malaria (GFATM)The Global Fund has been a long-standing partner, supporting the National Tuberculosis Elimination Programme (NTEP) in reducing TB burden of the country. As a part of the Global Fund grant of USD 201 million, received by Central TB Division for grant period January 2018 to March 2021, division successfully implemented high impact program activities across the country including procurement of Second Line Drugs, newer drugs (Bedaquiline), rapid molecular diagnostics (CBNAAT & TrueNat), CBNAAT cartridges and TrueNat chips, digital X-ray machines, AMC services for the diagnostic equipment, technical support to strengthen Public Financial Management Services, Operational Research, ACF in vulnerable groups and counselling support to DR-TB patients.
Fostering the partnership, the Global Fund has allocated USD 200 million grant to Central TB Division for next three years i.e. from April, 2021-March, 2024, under Payment for Result modality (PfR), allowing high degree of flexibility for the National Program to focus on impact and achievement of results, and autonomy to focus on health outcomes. The entire grant is tied with three Disbursement Linked Indicators related to achievement of MDR/RR TB-notification and treatment outcome; and increase in presumptive TB testing through rapid molecular diagnostics against the set targets.
As part of current Global Fund Grant 2021-2024, Central TB Division has engaged following Sub-Recipients to supplement NTEP efforts:
◄ National Institute for Research (NIRT): NIRT has been roped in to strengthen TB surveillance under National Tuberculosis Elimination Programme by undertaking District Level Annual Survey and District Level Sentinel Survey (DLSS). The project aims to provide sub national level measure of TB burden of newly diagnosed bacteriological pulmonary cases, level of underreporting and annual trend of TB prevalence and incidence. NIRT through DLAS will also support the CTD in verification of State/district claims for awarding a National Certification of progress towards TB free status.
◄ Tata Institute of Social Sciences (TISS): TISS will continue supporting NTEP through Saksham Pravaah project as the Sub Recipient to strengthen DRTB treatment and adherence support through psycho-social counseling services and other social protection and nutrition linkages in four States i.e. Maharashtra, Gujarat, Karnataka and Rajasthan. Another crucial component of project is to transition counselling services to NTEP staff (STS and TBHV) through their capacity building by creating a pool of Master trainers across the Country.
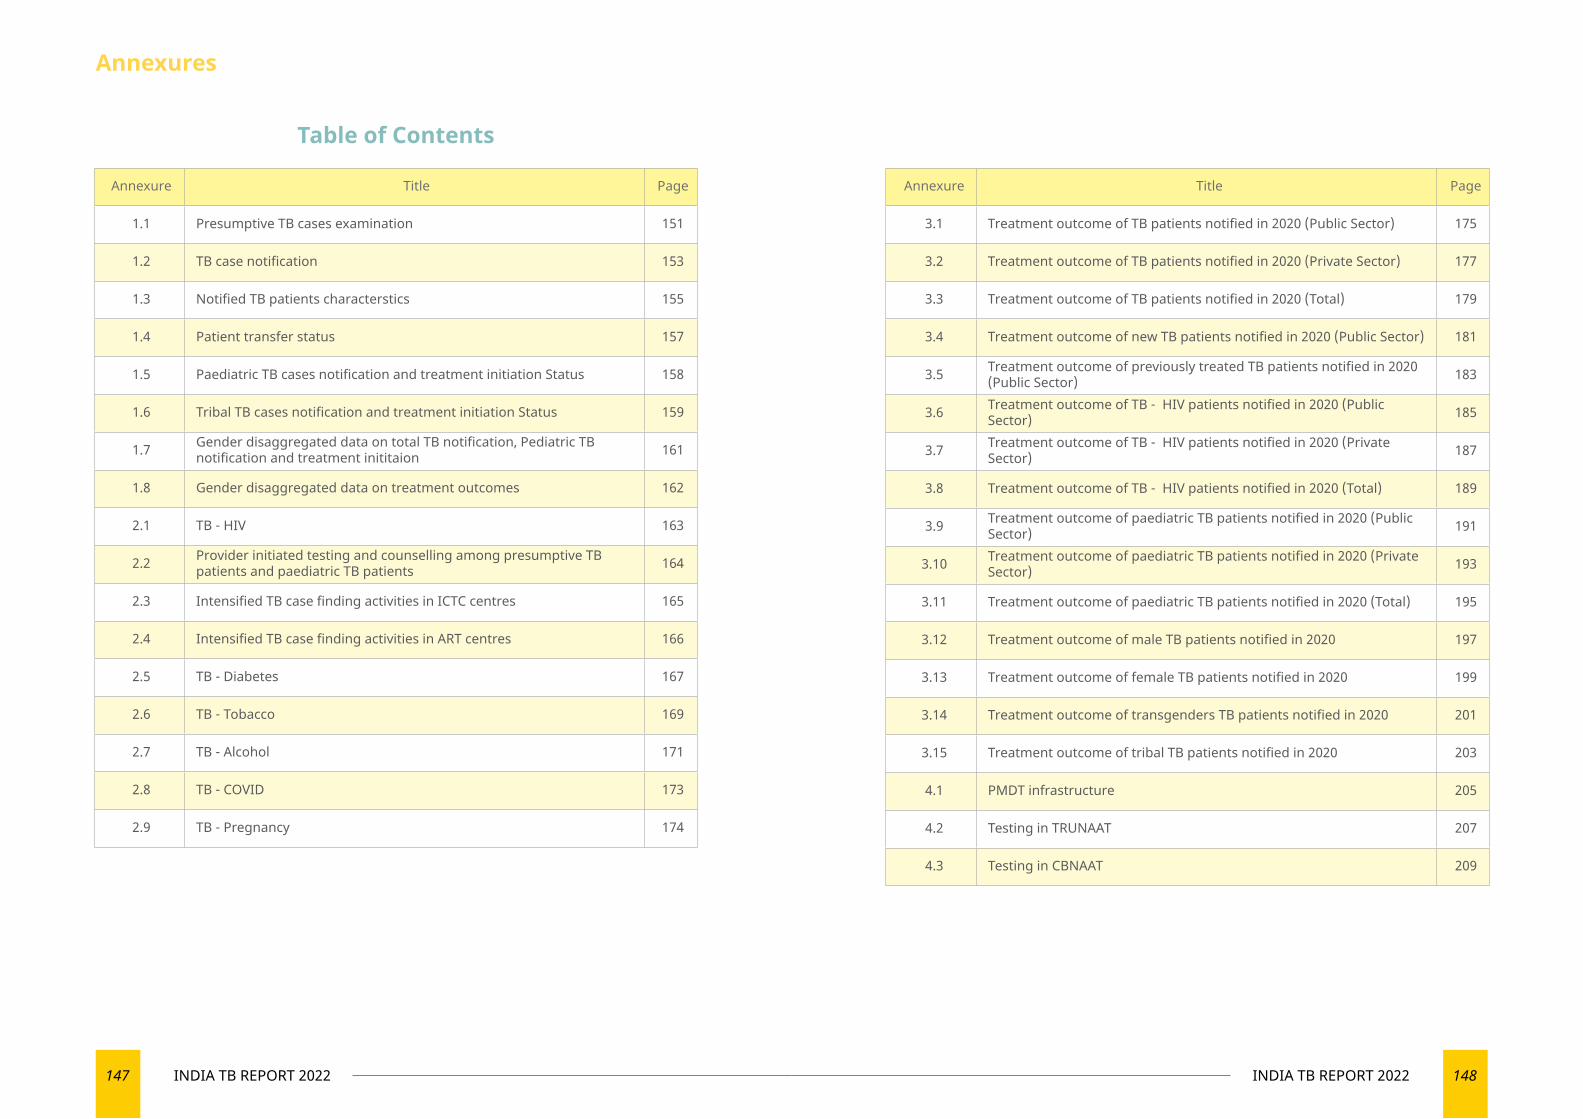
147 INDIA TB REPORT 2022 148INDIA TB REPORT 2022
Annexure Title Page
1.1 Presumptive TB cases examination 151
1.2 TB case notification 153
1.3 Notified TB patients characterstics 155
1.4 Patient transfer status 157
1.5 Paediatric TB cases notification and treatment initiation Status 158
1.6 Tribal TB cases notification and treatment initiation Status 159
1.7 Gender disaggregated data on total TB notification, Pediatric TB notification and treatment inititaion 161
1.8 Gender disaggregated data on treatment outcomes 162
2.1 TB - HIV 163
2.2 Provider initiated testing and counselling among presumptive TB patients and paediatric TB patients 164
2.3 Intensified TB case finding activities in ICTC centres 165
2.4 Intensified TB case finding activities in ART centres 166
2.5 TB - Diabetes 167
2.6 TB - Tobacco 169
2.7 TB - Alcohol 171
2.8 TB - COVID 173
2.9 TB - Pregnancy 174
Annexure Title Page
3.1 Treatment outcome of TB patients notified in 2020 (Public Sector) 175
3.2 Treatment outcome of TB patients notified in 2020 (Private Sector) 177
3.3 Treatment outcome of TB patients notified in 2020 (Total) 179
3.4 Treatment outcome of new TB patients notified in 2020 (Public Sector) 181
3.5 Treatment outcome of previously treated TB patients notified in 2020 (Public Sector) 183
3.6 Treatment outcome of TB - HIV patients notified in 2020 (Public Sector) 185
3.7 Treatment outcome of TB - HIV patients notified in 2020 (Private Sector) 187
3.8 Treatment outcome of TB - HIV patients notified in 2020 (Total) 189
3.9 Treatment outcome of paediatric TB patients notified in 2020 (Public Sector) 191
3.10 Treatment outcome of paediatric TB patients notified in 2020 (Private Sector) 193
3.11 Treatment outcome of paediatric TB patients notified in 2020 (Total) 195
3.12 Treatment outcome of male TB patients notified in 2020 197
3.13 Treatment outcome of female TB patients notified in 2020 199
3.14 Treatment outcome of transgenders TB patients notified in 2020 201
3.15 Treatment outcome of tribal TB patients notified in 2020 203
4.1 PMDT infrastructure 205
4.2 Testing in TRUNAAT 207
4.3 Testing in CBNAAT 209
Annexures
Table of Contents
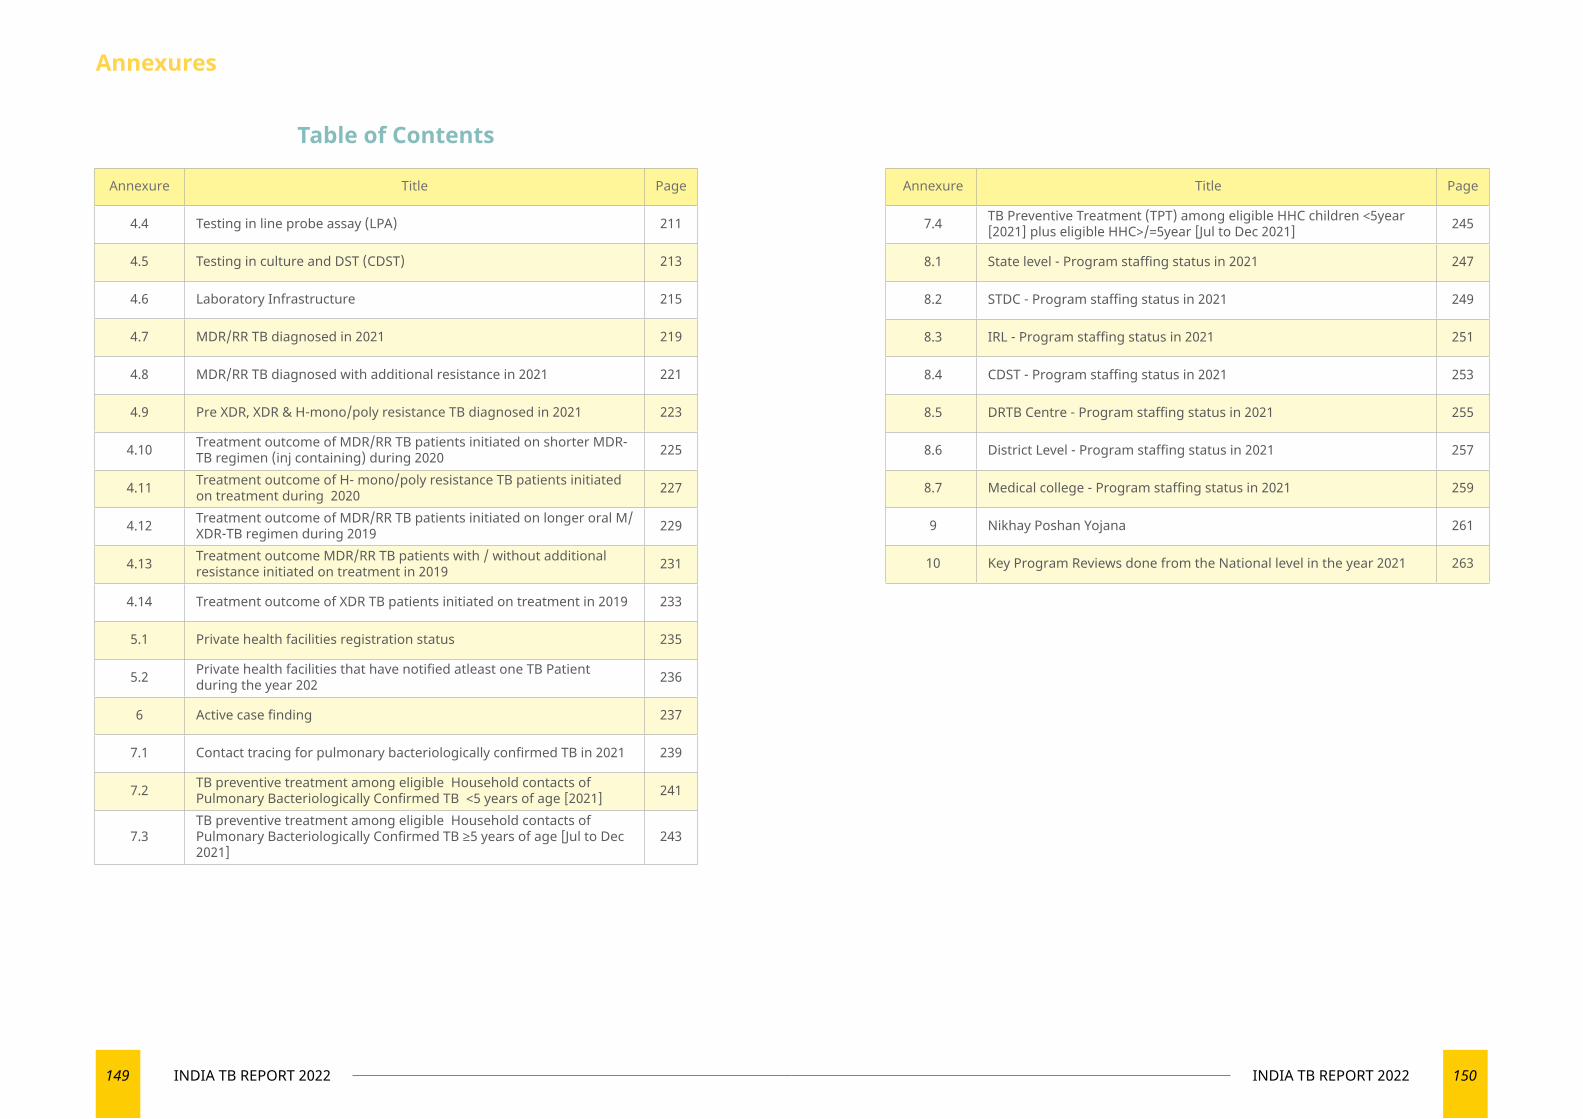
149 INDIA TB REPORT 2022 150INDIA TB REPORT 2022
Annexure Title Page
4.4 Testing in line probe assay (LPA) 211
4.5 Testing in culture and DST (CDST) 213
4.6 Laboratory Infrastructure 215
4.7 MDR/RR TB diagnosed in 2021 219
4.8 MDR/RR TB diagnosed with additional resistance in 2021 221
4.9 Pre XDR, XDR & H-mono/poly resistance TB diagnosed in 2021 223
4.10 Treatment outcome of MDR/RR TB patients initiated on shorter MDR-TB regimen (inj containing) during 2020 225
4.11 Treatment outcome of H- mono/poly resistance TB patients initiated on treatment during 2020 227
4.12 Treatment outcome of MDR/RR TB patients initiated on longer oral M/XDR-TB regimen during 2019 229
4.13 Treatment outcome MDR/RR TB patients with / without additional resistance initiated on treatment in 2019 231
4.14 Treatment outcome of XDR TB patients initiated on treatment in 2019 233
5.1 Private health facilities registration status 235
5.2 Private health facilities that have notified atleast one TB Patient during the year 202 236
6 Active case finding 237
7.1 Contact tracing for pulmonary bacteriologically confirmed TB in 2021 239
7.2 TB preventive treatment among eligible Household contacts of Pulmonary Bacteriologically Confirmed TB <5 years of age [2021] 241
7.3TB preventive treatment among eligible Household contacts of Pulmonary Bacteriologically Confirmed TB ≥5 years of age [Jul to Dec 2021]
243
Annexure Title Page
7.4 TB Preventive Treatment (TPT) among eligible HHC children <5year [2021] plus eligible HHC>/=5year [Jul to Dec 2021] 245
8.1 State level - Program staffing status in 2021 247
8.2 STDC - Program staffing status in 2021 249
8.3 IRL - Program staffing status in 2021 251
8.4 CDST - Program staffing status in 2021 253
8.5 DRTB Centre - Program staffing status in 2021 255
8.6 District Level - Program staffing status in 2021 257
8.7 Medical college - Program staffing status in 2021 259
9 Nikhay Poshan Yojana 261
10 Key Program Reviews done from the National level in the year 2021 263
Annexures
Table of Contents
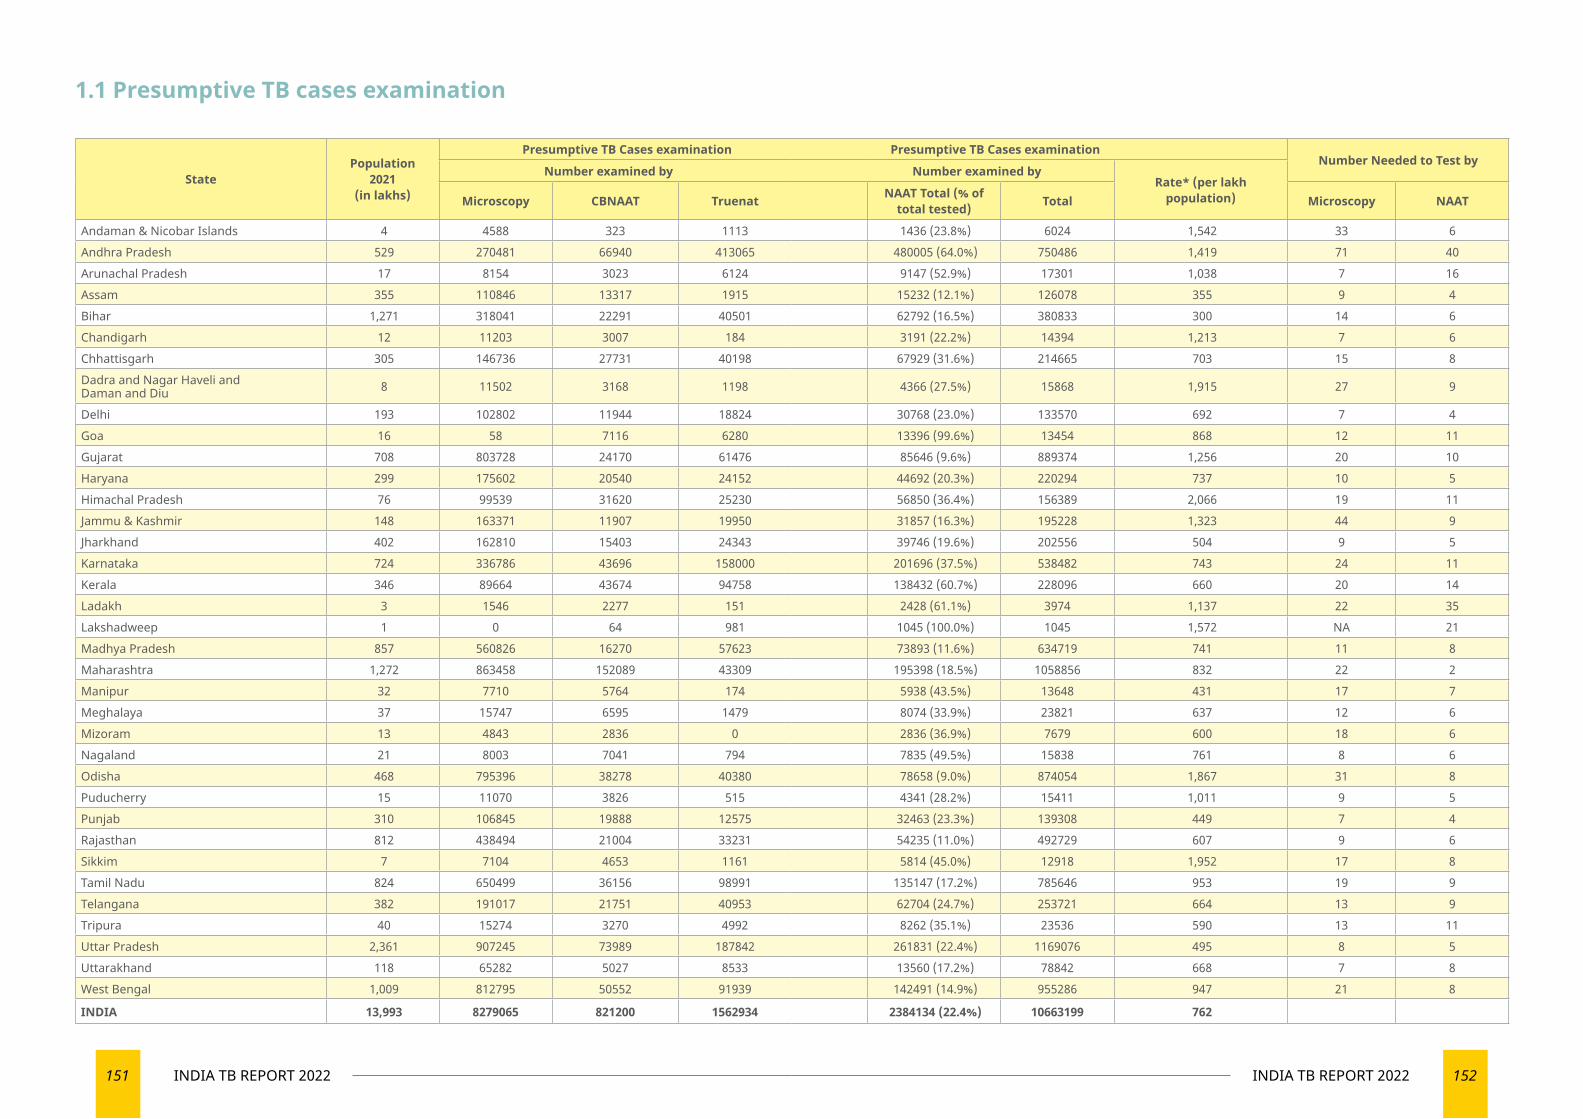
151 INDIA TB REPORT 2022 152INDIA TB REPORT 2022
1.1 Presumptive TB cases examination
StatePopulation
2021 (in lakhs)
Presumptive TB Cases examination Presumptive TB Cases examinationNumber Needed to Test by
Number examined by Number examined byRate* (per lakh
population)Microscopy CBNAAT Truenat NAAT Total (% of total tested) Total Microscopy NAAT
Andaman & Nicobar Islands 4 4588 323 1113 1436 (23.8%) 6024 1,542 33 6Andhra Pradesh 529 270481 66940 413065 480005 (64.0%) 750486 1,419 71 40Arunachal Pradesh 17 8154 3023 6124 9147 (52.9%) 17301 1,038 7 16Assam 355 110846 13317 1915 15232 (12.1%) 126078 355 9 4Bihar 1,271 318041 22291 40501 62792 (16.5%) 380833 300 14 6Chandigarh 12 11203 3007 184 3191 (22.2%) 14394 1,213 7 6Chhattisgarh 305 146736 27731 40198 67929 (31.6%) 214665 703 15 8Dadra and Nagar Haveli and Daman and Diu 8 11502 3168 1198 4366 (27.5%) 15868 1,915 27 9
Delhi 193 102802 11944 18824 30768 (23.0%) 133570 692 7 4Goa 16 58 7116 6280 13396 (99.6%) 13454 868 12 11Gujarat 708 803728 24170 61476 85646 (9.6%) 889374 1,256 20 10Haryana 299 175602 20540 24152 44692 (20.3%) 220294 737 10 5Himachal Pradesh 76 99539 31620 25230 56850 (36.4%) 156389 2,066 19 11Jammu & Kashmir 148 163371 11907 19950 31857 (16.3%) 195228 1,323 44 9Jharkhand 402 162810 15403 24343 39746 (19.6%) 202556 504 9 5Karnataka 724 336786 43696 158000 201696 (37.5%) 538482 743 24 11Kerala 346 89664 43674 94758 138432 (60.7%) 228096 660 20 14Ladakh 3 1546 2277 151 2428 (61.1%) 3974 1,137 22 35Lakshadweep 1 0 64 981 1045 (100.0%) 1045 1,572 NA 21Madhya Pradesh 857 560826 16270 57623 73893 (11.6%) 634719 741 11 8Maharashtra 1,272 863458 152089 43309 195398 (18.5%) 1058856 832 22 2Manipur 32 7710 5764 174 5938 (43.5%) 13648 431 17 7Meghalaya 37 15747 6595 1479 8074 (33.9%) 23821 637 12 6Mizoram 13 4843 2836 0 2836 (36.9%) 7679 600 18 6Nagaland 21 8003 7041 794 7835 (49.5%) 15838 761 8 6Odisha 468 795396 38278 40380 78658 (9.0%) 874054 1,867 31 8Puducherry 15 11070 3826 515 4341 (28.2%) 15411 1,011 9 5Punjab 310 106845 19888 12575 32463 (23.3%) 139308 449 7 4Rajasthan 812 438494 21004 33231 54235 (11.0%) 492729 607 9 6Sikkim 7 7104 4653 1161 5814 (45.0%) 12918 1,952 17 8Tamil Nadu 824 650499 36156 98991 135147 (17.2%) 785646 953 19 9Telangana 382 191017 21751 40953 62704 (24.7%) 253721 664 13 9Tripura 40 15274 3270 4992 8262 (35.1%) 23536 590 13 11Uttar Pradesh 2,361 907245 73989 187842 261831 (22.4%) 1169076 495 8 5Uttarakhand 118 65282 5027 8533 13560 (17.2%) 78842 668 7 8West Bengal 1,009 812795 50552 91939 142491 (14.9%) 955286 947 21 8
INDIA 13,993 8279065 821200 1562934 2384134 (22.4%) 10663199 762
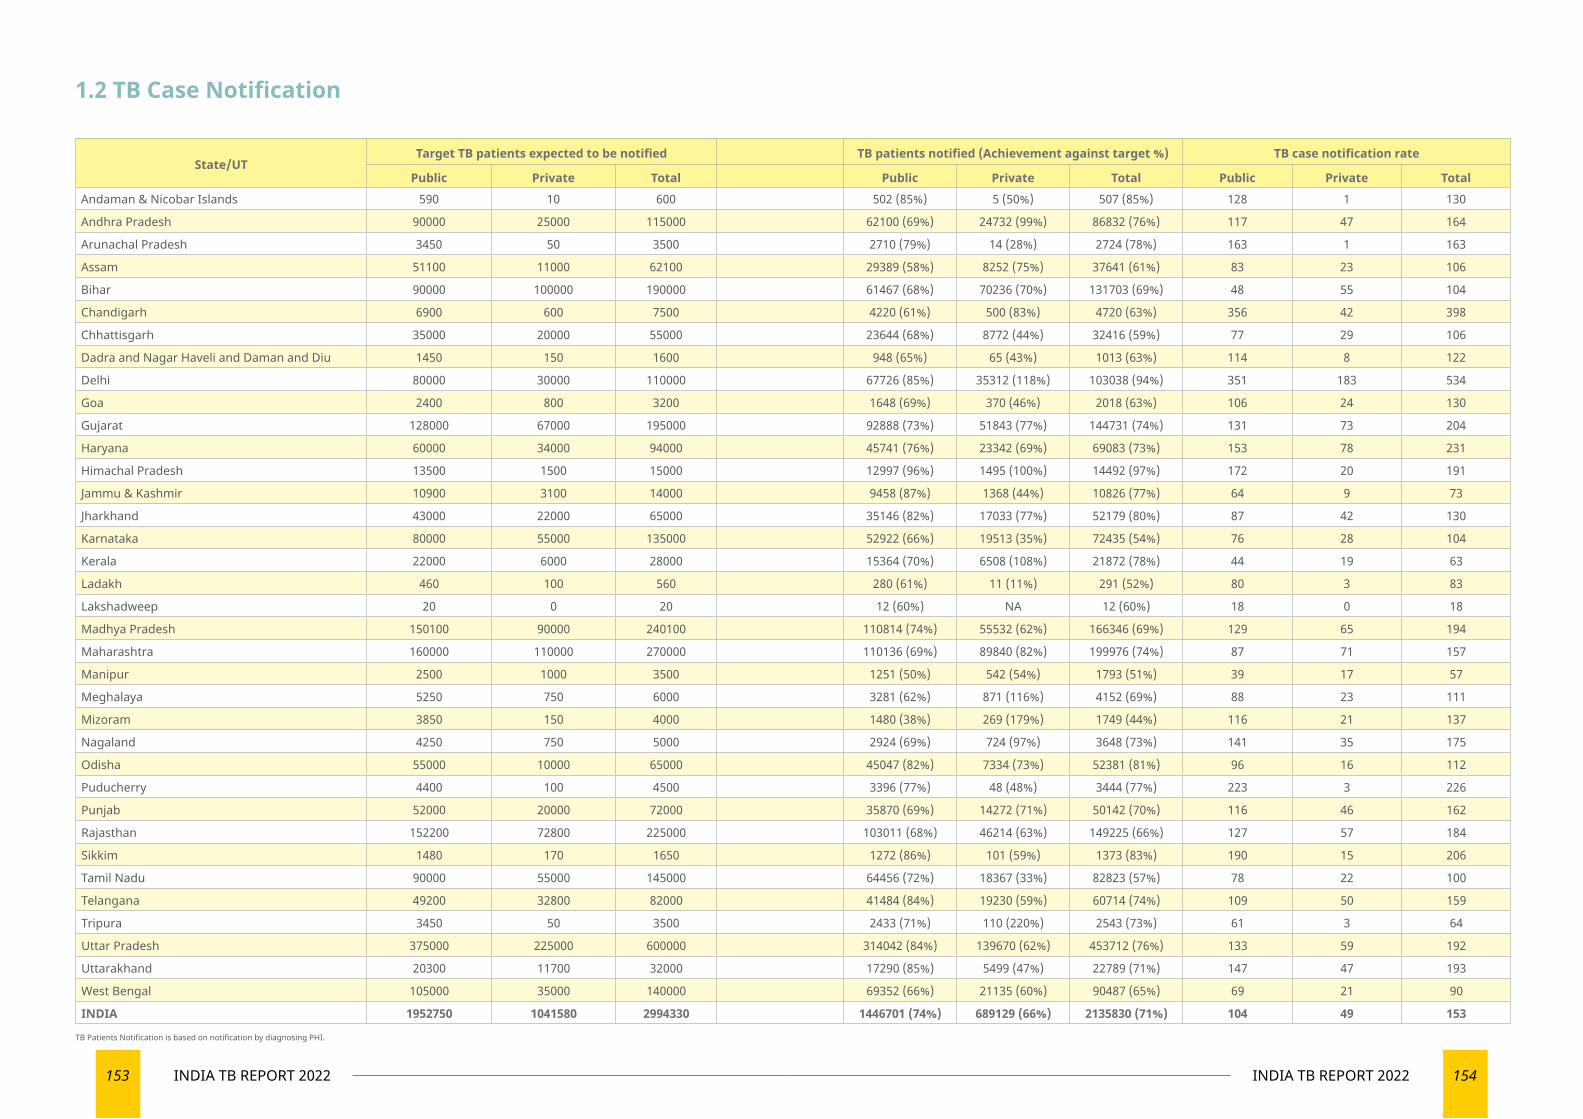
153 INDIA TB REPORT 2022 154INDIA TB REPORT 2022
1.2 TB Case Notification
State/UTTarget TB patients expected to be notified TB patients notified (Achievement against target %) TB case notification rate
Public Private Total Public Private Total Public Private TotalAndaman & Nicobar Islands 590 10 600 502 (85%) 5 (50%) 507 (85%) 128 1 130
Andhra Pradesh 90000 25000 115000 62100 (69%) 24732 (99%) 86832 (76%) 117 47 164
Arunachal Pradesh 3450 50 3500 2710 (79%) 14 (28%) 2724 (78%) 163 1 163
Assam 51100 11000 62100 29389 (58%) 8252 (75%) 37641 (61%) 83 23 106
Bihar 90000 100000 190000 61467 (68%) 70236 (70%) 131703 (69%) 48 55 104
Chandigarh 6900 600 7500 4220 (61%) 500 (83%) 4720 (63%) 356 42 398
Chhattisgarh 35000 20000 55000 23644 (68%) 8772 (44%) 32416 (59%) 77 29 106
Dadra and Nagar Haveli and Daman and Diu 1450 150 1600 948 (65%) 65 (43%) 1013 (63%) 114 8 122
Delhi 80000 30000 110000 67726 (85%) 35312 (118%) 103038 (94%) 351 183 534
Goa 2400 800 3200 1648 (69%) 370 (46%) 2018 (63%) 106 24 130
Gujarat 128000 67000 195000 92888 (73%) 51843 (77%) 144731 (74%) 131 73 204
Haryana 60000 34000 94000 45741 (76%) 23342 (69%) 69083 (73%) 153 78 231
Himachal Pradesh 13500 1500 15000 12997 (96%) 1495 (100%) 14492 (97%) 172 20 191
Jammu & Kashmir 10900 3100 14000 9458 (87%) 1368 (44%) 10826 (77%) 64 9 73
Jharkhand 43000 22000 65000 35146 (82%) 17033 (77%) 52179 (80%) 87 42 130
Karnataka 80000 55000 135000 52922 (66%) 19513 (35%) 72435 (54%) 76 28 104
Kerala 22000 6000 28000 15364 (70%) 6508 (108%) 21872 (78%) 44 19 63
Ladakh 460 100 560 280 (61%) 11 (11%) 291 (52%) 80 3 83
Lakshadweep 20 0 20 12 (60%) NA 12 (60%) 18 0 18
Madhya Pradesh 150100 90000 240100 110814 (74%) 55532 (62%) 166346 (69%) 129 65 194
Maharashtra 160000 110000 270000 110136 (69%) 89840 (82%) 199976 (74%) 87 71 157
Manipur 2500 1000 3500 1251 (50%) 542 (54%) 1793 (51%) 39 17 57
Meghalaya 5250 750 6000 3281 (62%) 871 (116%) 4152 (69%) 88 23 111
Mizoram 3850 150 4000 1480 (38%) 269 (179%) 1749 (44%) 116 21 137
Nagaland 4250 750 5000 2924 (69%) 724 (97%) 3648 (73%) 141 35 175
Odisha 55000 10000 65000 45047 (82%) 7334 (73%) 52381 (81%) 96 16 112
Puducherry 4400 100 4500 3396 (77%) 48 (48%) 3444 (77%) 223 3 226
Punjab 52000 20000 72000 35870 (69%) 14272 (71%) 50142 (70%) 116 46 162
Rajasthan 152200 72800 225000 103011 (68%) 46214 (63%) 149225 (66%) 127 57 184
Sikkim 1480 170 1650 1272 (86%) 101 (59%) 1373 (83%) 190 15 206
Tamil Nadu 90000 55000 145000 64456 (72%) 18367 (33%) 82823 (57%) 78 22 100
Telangana 49200 32800 82000 41484 (84%) 19230 (59%) 60714 (74%) 109 50 159
Tripura 3450 50 3500 2433 (71%) 110 (220%) 2543 (73%) 61 3 64
Uttar Pradesh 375000 225000 600000 314042 (84%) 139670 (62%) 453712 (76%) 133 59 192
Uttarakhand 20300 11700 32000 17290 (85%) 5499 (47%) 22789 (71%) 147 47 193
West Bengal 105000 35000 140000 69352 (66%) 21135 (60%) 90487 (65%) 69 21 90
INDIA 1952750 1041580 2994330 1446701 (74%) 689129 (66%) 2135830 (71%) 104 49 153
TB Patients Notification is based on notification by diagnosing PHI.
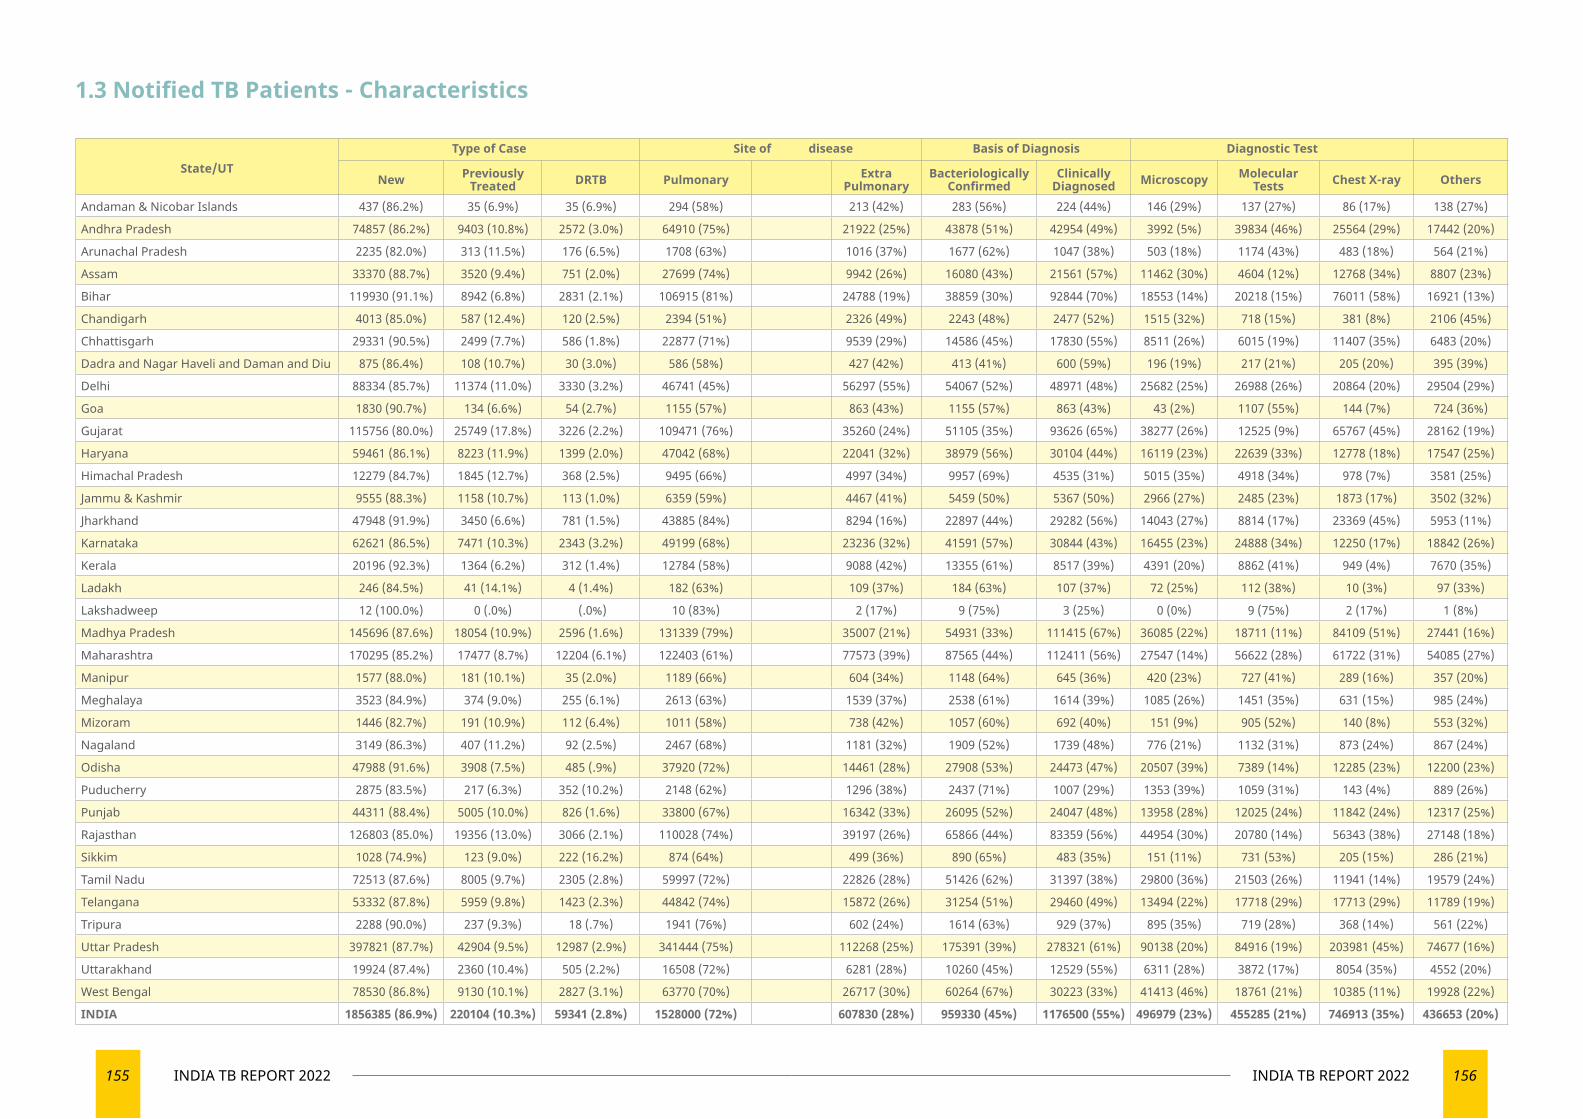
155 INDIA TB REPORT 2022 156INDIA TB REPORT 2022
1.3 Notified TB Patients - Characteristics
State/UTType of Case Site of disease Basis of Diagnosis Diagnostic Test
New Previously Treated DRTB Pulmonary Extra
PulmonaryBacteriologically
ConfirmedClinically
Diagnosed Microscopy Molecular Tests Chest X-ray Others
Andaman & Nicobar Islands 437 (86.2%) 35 (6.9%) 35 (6.9%) 294 (58%) 213 (42%) 283 (56%) 224 (44%) 146 (29%) 137 (27%) 86 (17%) 138 (27%)
Andhra Pradesh 74857 (86.2%) 9403 (10.8%) 2572 (3.0%) 64910 (75%) 21922 (25%) 43878 (51%) 42954 (49%) 3992 (5%) 39834 (46%) 25564 (29%) 17442 (20%)
Arunachal Pradesh 2235 (82.0%) 313 (11.5%) 176 (6.5%) 1708 (63%) 1016 (37%) 1677 (62%) 1047 (38%) 503 (18%) 1174 (43%) 483 (18%) 564 (21%)
Assam 33370 (88.7%) 3520 (9.4%) 751 (2.0%) 27699 (74%) 9942 (26%) 16080 (43%) 21561 (57%) 11462 (30%) 4604 (12%) 12768 (34%) 8807 (23%)
Bihar 119930 (91.1%) 8942 (6.8%) 2831 (2.1%) 106915 (81%) 24788 (19%) 38859 (30%) 92844 (70%) 18553 (14%) 20218 (15%) 76011 (58%) 16921 (13%)
Chandigarh 4013 (85.0%) 587 (12.4%) 120 (2.5%) 2394 (51%) 2326 (49%) 2243 (48%) 2477 (52%) 1515 (32%) 718 (15%) 381 (8%) 2106 (45%)
Chhattisgarh 29331 (90.5%) 2499 (7.7%) 586 (1.8%) 22877 (71%) 9539 (29%) 14586 (45%) 17830 (55%) 8511 (26%) 6015 (19%) 11407 (35%) 6483 (20%)
Dadra and Nagar Haveli and Daman and Diu 875 (86.4%) 108 (10.7%) 30 (3.0%) 586 (58%) 427 (42%) 413 (41%) 600 (59%) 196 (19%) 217 (21%) 205 (20%) 395 (39%)
Delhi 88334 (85.7%) 11374 (11.0%) 3330 (3.2%) 46741 (45%) 56297 (55%) 54067 (52%) 48971 (48%) 25682 (25%) 26988 (26%) 20864 (20%) 29504 (29%)
Goa 1830 (90.7%) 134 (6.6%) 54 (2.7%) 1155 (57%) 863 (43%) 1155 (57%) 863 (43%) 43 (2%) 1107 (55%) 144 (7%) 724 (36%)
Gujarat 115756 (80.0%) 25749 (17.8%) 3226 (2.2%) 109471 (76%) 35260 (24%) 51105 (35%) 93626 (65%) 38277 (26%) 12525 (9%) 65767 (45%) 28162 (19%)
Haryana 59461 (86.1%) 8223 (11.9%) 1399 (2.0%) 47042 (68%) 22041 (32%) 38979 (56%) 30104 (44%) 16119 (23%) 22639 (33%) 12778 (18%) 17547 (25%)
Himachal Pradesh 12279 (84.7%) 1845 (12.7%) 368 (2.5%) 9495 (66%) 4997 (34%) 9957 (69%) 4535 (31%) 5015 (35%) 4918 (34%) 978 (7%) 3581 (25%)
Jammu & Kashmir 9555 (88.3%) 1158 (10.7%) 113 (1.0%) 6359 (59%) 4467 (41%) 5459 (50%) 5367 (50%) 2966 (27%) 2485 (23%) 1873 (17%) 3502 (32%)
Jharkhand 47948 (91.9%) 3450 (6.6%) 781 (1.5%) 43885 (84%) 8294 (16%) 22897 (44%) 29282 (56%) 14043 (27%) 8814 (17%) 23369 (45%) 5953 (11%)
Karnataka 62621 (86.5%) 7471 (10.3%) 2343 (3.2%) 49199 (68%) 23236 (32%) 41591 (57%) 30844 (43%) 16455 (23%) 24888 (34%) 12250 (17%) 18842 (26%)
Kerala 20196 (92.3%) 1364 (6.2%) 312 (1.4%) 12784 (58%) 9088 (42%) 13355 (61%) 8517 (39%) 4391 (20%) 8862 (41%) 949 (4%) 7670 (35%)
Ladakh 246 (84.5%) 41 (14.1%) 4 (1.4%) 182 (63%) 109 (37%) 184 (63%) 107 (37%) 72 (25%) 112 (38%) 10 (3%) 97 (33%)
Lakshadweep 12 (100.0%) 0 (.0%) (.0%) 10 (83%) 2 (17%) 9 (75%) 3 (25%) 0 (0%) 9 (75%) 2 (17%) 1 (8%)
Madhya Pradesh 145696 (87.6%) 18054 (10.9%) 2596 (1.6%) 131339 (79%) 35007 (21%) 54931 (33%) 111415 (67%) 36085 (22%) 18711 (11%) 84109 (51%) 27441 (16%)
Maharashtra 170295 (85.2%) 17477 (8.7%) 12204 (6.1%) 122403 (61%) 77573 (39%) 87565 (44%) 112411 (56%) 27547 (14%) 56622 (28%) 61722 (31%) 54085 (27%)
Manipur 1577 (88.0%) 181 (10.1%) 35 (2.0%) 1189 (66%) 604 (34%) 1148 (64%) 645 (36%) 420 (23%) 727 (41%) 289 (16%) 357 (20%)
Meghalaya 3523 (84.9%) 374 (9.0%) 255 (6.1%) 2613 (63%) 1539 (37%) 2538 (61%) 1614 (39%) 1085 (26%) 1451 (35%) 631 (15%) 985 (24%)
Mizoram 1446 (82.7%) 191 (10.9%) 112 (6.4%) 1011 (58%) 738 (42%) 1057 (60%) 692 (40%) 151 (9%) 905 (52%) 140 (8%) 553 (32%)
Nagaland 3149 (86.3%) 407 (11.2%) 92 (2.5%) 2467 (68%) 1181 (32%) 1909 (52%) 1739 (48%) 776 (21%) 1132 (31%) 873 (24%) 867 (24%)
Odisha 47988 (91.6%) 3908 (7.5%) 485 (.9%) 37920 (72%) 14461 (28%) 27908 (53%) 24473 (47%) 20507 (39%) 7389 (14%) 12285 (23%) 12200 (23%)
Puducherry 2875 (83.5%) 217 (6.3%) 352 (10.2%) 2148 (62%) 1296 (38%) 2437 (71%) 1007 (29%) 1353 (39%) 1059 (31%) 143 (4%) 889 (26%)
Punjab 44311 (88.4%) 5005 (10.0%) 826 (1.6%) 33800 (67%) 16342 (33%) 26095 (52%) 24047 (48%) 13958 (28%) 12025 (24%) 11842 (24%) 12317 (25%)
Rajasthan 126803 (85.0%) 19356 (13.0%) 3066 (2.1%) 110028 (74%) 39197 (26%) 65866 (44%) 83359 (56%) 44954 (30%) 20780 (14%) 56343 (38%) 27148 (18%)
Sikkim 1028 (74.9%) 123 (9.0%) 222 (16.2%) 874 (64%) 499 (36%) 890 (65%) 483 (35%) 151 (11%) 731 (53%) 205 (15%) 286 (21%)
Tamil Nadu 72513 (87.6%) 8005 (9.7%) 2305 (2.8%) 59997 (72%) 22826 (28%) 51426 (62%) 31397 (38%) 29800 (36%) 21503 (26%) 11941 (14%) 19579 (24%)
Telangana 53332 (87.8%) 5959 (9.8%) 1423 (2.3%) 44842 (74%) 15872 (26%) 31254 (51%) 29460 (49%) 13494 (22%) 17718 (29%) 17713 (29%) 11789 (19%)
Tripura 2288 (90.0%) 237 (9.3%) 18 (.7%) 1941 (76%) 602 (24%) 1614 (63%) 929 (37%) 895 (35%) 719 (28%) 368 (14%) 561 (22%)
Uttar Pradesh 397821 (87.7%) 42904 (9.5%) 12987 (2.9%) 341444 (75%) 112268 (25%) 175391 (39%) 278321 (61%) 90138 (20%) 84916 (19%) 203981 (45%) 74677 (16%)
Uttarakhand 19924 (87.4%) 2360 (10.4%) 505 (2.2%) 16508 (72%) 6281 (28%) 10260 (45%) 12529 (55%) 6311 (28%) 3872 (17%) 8054 (35%) 4552 (20%)
West Bengal 78530 (86.8%) 9130 (10.1%) 2827 (3.1%) 63770 (70%) 26717 (30%) 60264 (67%) 30223 (33%) 41413 (46%) 18761 (21%) 10385 (11%) 19928 (22%)
INDIA 1856385 (86.9%) 220104 (10.3%) 59341 (2.8%) 1528000 (72%) 607830 (28%) 959330 (45%) 1176500 (55%) 496979 (23%) 455285 (21%) 746913 (35%) 436653 (20%)
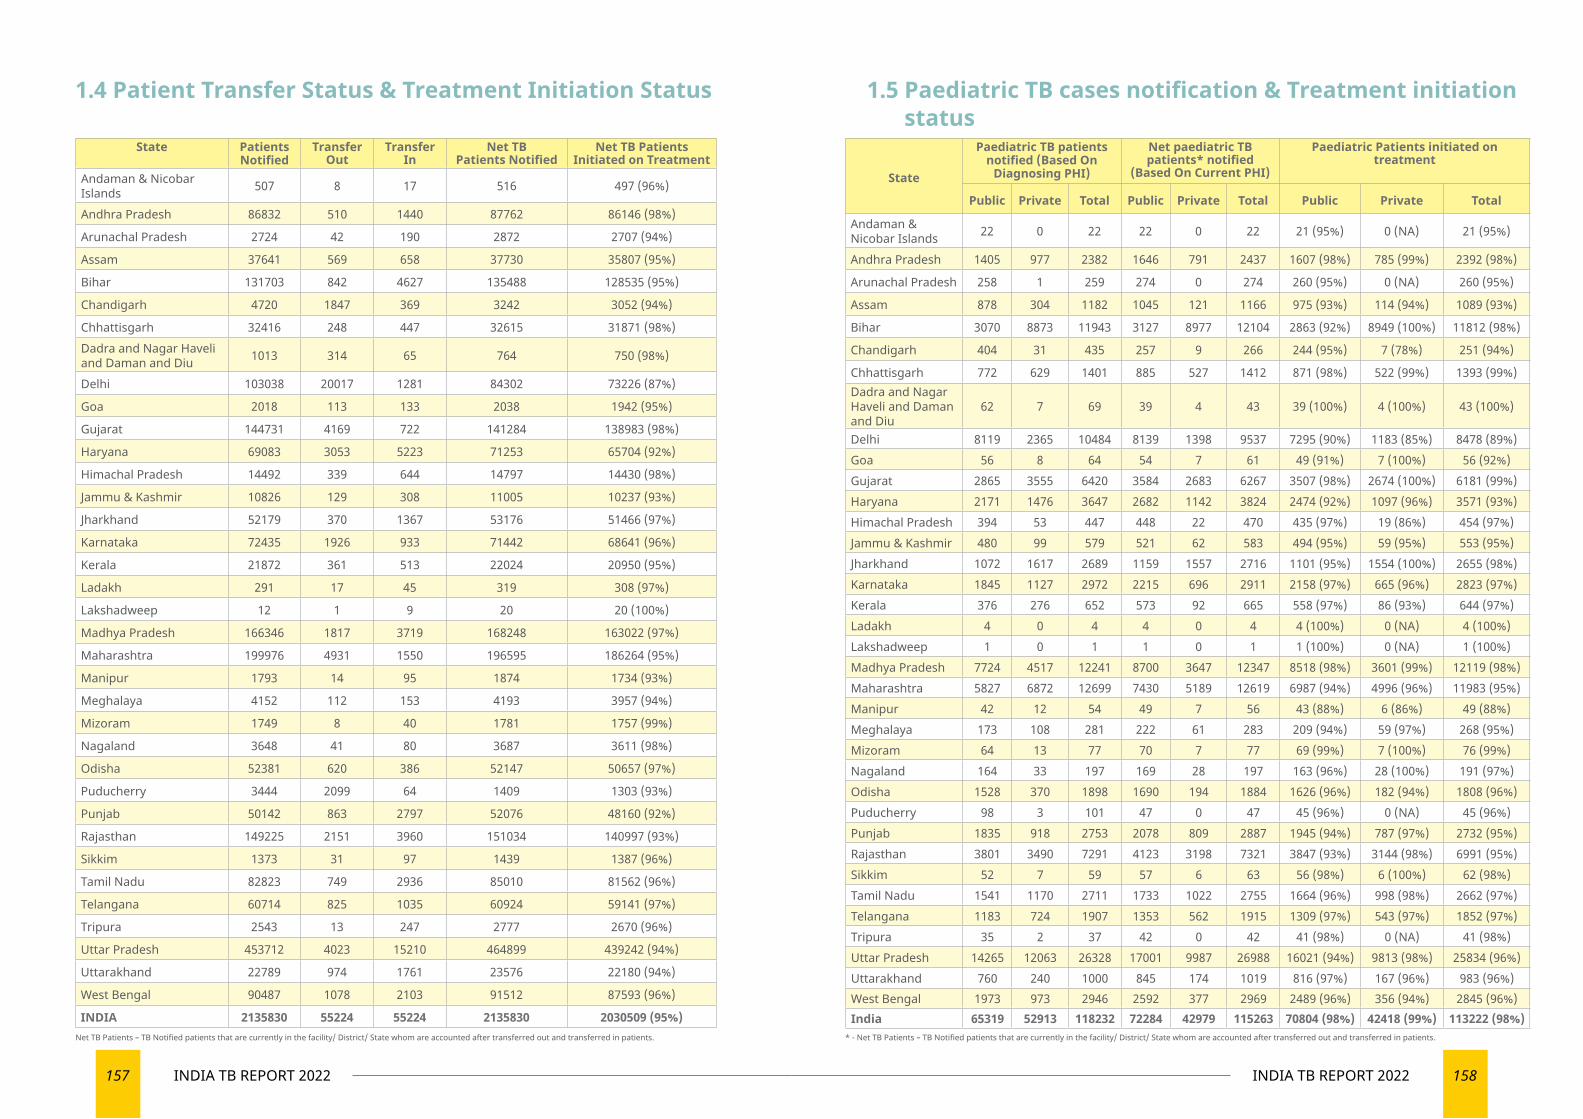
157 INDIA TB REPORT 2022 158INDIA TB REPORT 2022
State Patients Notified
Transfer Out
Transfer In
Net TB Patients Notified
Net TB Patients Initiated on Treatment
Andaman & Nicobar Islands 507 8 17 516 497 (96%)
Andhra Pradesh 86832 510 1440 87762 86146 (98%)
Arunachal Pradesh 2724 42 190 2872 2707 (94%)
Assam 37641 569 658 37730 35807 (95%)
Bihar 131703 842 4627 135488 128535 (95%)
Chandigarh 4720 1847 369 3242 3052 (94%)
Chhattisgarh 32416 248 447 32615 31871 (98%)Dadra and Nagar Haveli and Daman and Diu 1013 314 65 764 750 (98%)
Delhi 103038 20017 1281 84302 73226 (87%)
Goa 2018 113 133 2038 1942 (95%)
Gujarat 144731 4169 722 141284 138983 (98%)
Haryana 69083 3053 5223 71253 65704 (92%)
Himachal Pradesh 14492 339 644 14797 14430 (98%)
Jammu & Kashmir 10826 129 308 11005 10237 (93%)
Jharkhand 52179 370 1367 53176 51466 (97%)
Karnataka 72435 1926 933 71442 68641 (96%)
Kerala 21872 361 513 22024 20950 (95%)
Ladakh 291 17 45 319 308 (97%)
Lakshadweep 12 1 9 20 20 (100%)
Madhya Pradesh 166346 1817 3719 168248 163022 (97%)
Maharashtra 199976 4931 1550 196595 186264 (95%)
Manipur 1793 14 95 1874 1734 (93%)
Meghalaya 4152 112 153 4193 3957 (94%)
Mizoram 1749 8 40 1781 1757 (99%)
Nagaland 3648 41 80 3687 3611 (98%)
Odisha 52381 620 386 52147 50657 (97%)
Puducherry 3444 2099 64 1409 1303 (93%)
Punjab 50142 863 2797 52076 48160 (92%)
Rajasthan 149225 2151 3960 151034 140997 (93%)
Sikkim 1373 31 97 1439 1387 (96%)
Tamil Nadu 82823 749 2936 85010 81562 (96%)
Telangana 60714 825 1035 60924 59141 (97%)
Tripura 2543 13 247 2777 2670 (96%)
Uttar Pradesh 453712 4023 15210 464899 439242 (94%)
Uttarakhand 22789 974 1761 23576 22180 (94%)
West Bengal 90487 1078 2103 91512 87593 (96%)
INDIA 2135830 55224 55224 2135830 2030509 (95%)
State
Paediatric TB patients notified (Based On
Diagnosing PHI)
Net paediatric TB patients* notified
(Based On Current PHI)
Paediatric Patients initiated on treatment
Public Private Total Public Private Total Public Private Total
Andaman & Nicobar Islands 22 0 22 22 0 22 21 (95%) 0 (NA) 21 (95%)
Andhra Pradesh 1405 977 2382 1646 791 2437 1607 (98%) 785 (99%) 2392 (98%)
Arunachal Pradesh 258 1 259 274 0 274 260 (95%) 0 (NA) 260 (95%)
Assam 878 304 1182 1045 121 1166 975 (93%) 114 (94%) 1089 (93%)
Bihar 3070 8873 11943 3127 8977 12104 2863 (92%) 8949 (100%) 11812 (98%)
Chandigarh 404 31 435 257 9 266 244 (95%) 7 (78%) 251 (94%)
Chhattisgarh 772 629 1401 885 527 1412 871 (98%) 522 (99%) 1393 (99%)Dadra and Nagar Haveli and Daman and Diu
62 7 69 39 4 43 39 (100%) 4 (100%) 43 (100%)
Delhi 8119 2365 10484 8139 1398 9537 7295 (90%) 1183 (85%) 8478 (89%)Goa 56 8 64 54 7 61 49 (91%) 7 (100%) 56 (92%)Gujarat 2865 3555 6420 3584 2683 6267 3507 (98%) 2674 (100%) 6181 (99%)Haryana 2171 1476 3647 2682 1142 3824 2474 (92%) 1097 (96%) 3571 (93%)Himachal Pradesh 394 53 447 448 22 470 435 (97%) 19 (86%) 454 (97%)Jammu & Kashmir 480 99 579 521 62 583 494 (95%) 59 (95%) 553 (95%)Jharkhand 1072 1617 2689 1159 1557 2716 1101 (95%) 1554 (100%) 2655 (98%)Karnataka 1845 1127 2972 2215 696 2911 2158 (97%) 665 (96%) 2823 (97%)Kerala 376 276 652 573 92 665 558 (97%) 86 (93%) 644 (97%)Ladakh 4 0 4 4 0 4 4 (100%) 0 (NA) 4 (100%)Lakshadweep 1 0 1 1 0 1 1 (100%) 0 (NA) 1 (100%)Madhya Pradesh 7724 4517 12241 8700 3647 12347 8518 (98%) 3601 (99%) 12119 (98%)Maharashtra 5827 6872 12699 7430 5189 12619 6987 (94%) 4996 (96%) 11983 (95%)Manipur 42 12 54 49 7 56 43 (88%) 6 (86%) 49 (88%)Meghalaya 173 108 281 222 61 283 209 (94%) 59 (97%) 268 (95%)Mizoram 64 13 77 70 7 77 69 (99%) 7 (100%) 76 (99%)Nagaland 164 33 197 169 28 197 163 (96%) 28 (100%) 191 (97%)Odisha 1528 370 1898 1690 194 1884 1626 (96%) 182 (94%) 1808 (96%)Puducherry 98 3 101 47 0 47 45 (96%) 0 (NA) 45 (96%)Punjab 1835 918 2753 2078 809 2887 1945 (94%) 787 (97%) 2732 (95%)Rajasthan 3801 3490 7291 4123 3198 7321 3847 (93%) 3144 (98%) 6991 (95%)Sikkim 52 7 59 57 6 63 56 (98%) 6 (100%) 62 (98%)Tamil Nadu 1541 1170 2711 1733 1022 2755 1664 (96%) 998 (98%) 2662 (97%)Telangana 1183 724 1907 1353 562 1915 1309 (97%) 543 (97%) 1852 (97%)Tripura 35 2 37 42 0 42 41 (98%) 0 (NA) 41 (98%)Uttar Pradesh 14265 12063 26328 17001 9987 26988 16021 (94%) 9813 (98%) 25834 (96%)Uttarakhand 760 240 1000 845 174 1019 816 (97%) 167 (96%) 983 (96%)West Bengal 1973 973 2946 2592 377 2969 2489 (96%) 356 (94%) 2845 (96%)India 65319 52913 118232 72284 42979 115263 70804 (98%) 42418 (99%) 113222 (98%)
1.4 Patient Transfer Status & Treatment Initiation Status 1.5 Paediatric TB cases notification & Treatment initiation status
Net TB Patients – TB Notified patients that are currently in the facility/ District/ State whom are accounted after transferred out and transferred in patients. * - Net TB Patients – TB Notified patients that are currently in the facility/ District/ State whom are accounted after transferred out and transferred in patients.
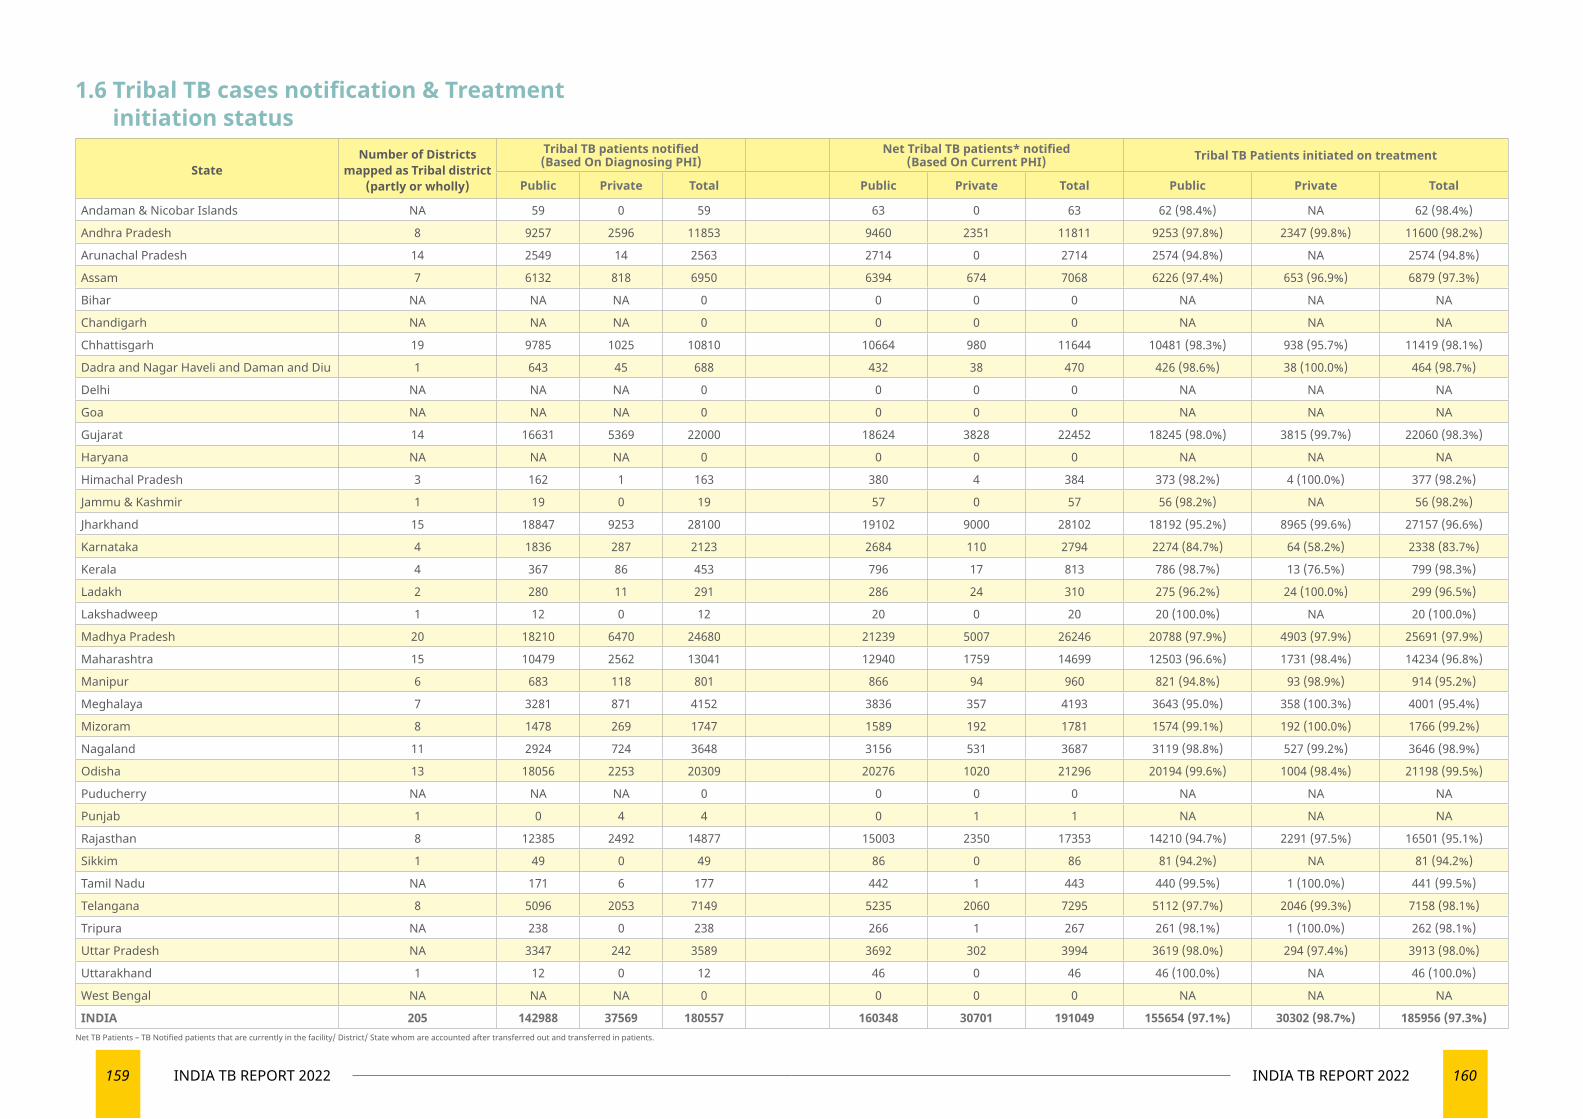
159 INDIA TB REPORT 2022 160INDIA TB REPORT 2022
1.6 Tribal TB cases notification & Treatment initiation status
StateNumber of Districts
mapped as Tribal district (partly or wholly)
Tribal TB patients notified (Based On Diagnosing PHI)
Net Tribal TB patients* notified (Based On Current PHI) Tribal TB Patients initiated on treatment
Public Private Total Public Private Total Public Private Total
Andaman & Nicobar Islands NA 59 0 59 63 0 63 62 (98.4%) NA 62 (98.4%)
Andhra Pradesh 8 9257 2596 11853 9460 2351 11811 9253 (97.8%) 2347 (99.8%) 11600 (98.2%)
Arunachal Pradesh 14 2549 14 2563 2714 0 2714 2574 (94.8%) NA 2574 (94.8%)
Assam 7 6132 818 6950 6394 674 7068 6226 (97.4%) 653 (96.9%) 6879 (97.3%)
Bihar NA NA NA 0 0 0 0 NA NA NA
Chandigarh NA NA NA 0 0 0 0 NA NA NA
Chhattisgarh 19 9785 1025 10810 10664 980 11644 10481 (98.3%) 938 (95.7%) 11419 (98.1%)
Dadra and Nagar Haveli and Daman and Diu 1 643 45 688 432 38 470 426 (98.6%) 38 (100.0%) 464 (98.7%)
Delhi NA NA NA 0 0 0 0 NA NA NA
Goa NA NA NA 0 0 0 0 NA NA NA
Gujarat 14 16631 5369 22000 18624 3828 22452 18245 (98.0%) 3815 (99.7%) 22060 (98.3%)
Haryana NA NA NA 0 0 0 0 NA NA NA
Himachal Pradesh 3 162 1 163 380 4 384 373 (98.2%) 4 (100.0%) 377 (98.2%)
Jammu & Kashmir 1 19 0 19 57 0 57 56 (98.2%) NA 56 (98.2%)
Jharkhand 15 18847 9253 28100 19102 9000 28102 18192 (95.2%) 8965 (99.6%) 27157 (96.6%)
Karnataka 4 1836 287 2123 2684 110 2794 2274 (84.7%) 64 (58.2%) 2338 (83.7%)
Kerala 4 367 86 453 796 17 813 786 (98.7%) 13 (76.5%) 799 (98.3%)
Ladakh 2 280 11 291 286 24 310 275 (96.2%) 24 (100.0%) 299 (96.5%)
Lakshadweep 1 12 0 12 20 0 20 20 (100.0%) NA 20 (100.0%)
Madhya Pradesh 20 18210 6470 24680 21239 5007 26246 20788 (97.9%) 4903 (97.9%) 25691 (97.9%)
Maharashtra 15 10479 2562 13041 12940 1759 14699 12503 (96.6%) 1731 (98.4%) 14234 (96.8%)
Manipur 6 683 118 801 866 94 960 821 (94.8%) 93 (98.9%) 914 (95.2%)
Meghalaya 7 3281 871 4152 3836 357 4193 3643 (95.0%) 358 (100.3%) 4001 (95.4%)
Mizoram 8 1478 269 1747 1589 192 1781 1574 (99.1%) 192 (100.0%) 1766 (99.2%)
Nagaland 11 2924 724 3648 3156 531 3687 3119 (98.8%) 527 (99.2%) 3646 (98.9%)
Odisha 13 18056 2253 20309 20276 1020 21296 20194 (99.6%) 1004 (98.4%) 21198 (99.5%)
Puducherry NA NA NA 0 0 0 0 NA NA NA
Punjab 1 0 4 4 0 1 1 NA NA NA
Rajasthan 8 12385 2492 14877 15003 2350 17353 14210 (94.7%) 2291 (97.5%) 16501 (95.1%)
Sikkim 1 49 0 49 86 0 86 81 (94.2%) NA 81 (94.2%)
Tamil Nadu NA 171 6 177 442 1 443 440 (99.5%) 1 (100.0%) 441 (99.5%)
Telangana 8 5096 2053 7149 5235 2060 7295 5112 (97.7%) 2046 (99.3%) 7158 (98.1%)
Tripura NA 238 0 238 266 1 267 261 (98.1%) 1 (100.0%) 262 (98.1%)
Uttar Pradesh NA 3347 242 3589 3692 302 3994 3619 (98.0%) 294 (97.4%) 3913 (98.0%)
Uttarakhand 1 12 0 12 46 0 46 46 (100.0%) NA 46 (100.0%)
West Bengal NA NA NA 0 0 0 0 NA NA NA
INDIA 205 142988 37569 180557 160348 30701 191049 155654 (97.1%) 30302 (98.7%) 185956 (97.3%)Net TB Patients – TB Notified patients that are currently in the facility/ District/ State whom are accounted after transferred out and transferred in patients.
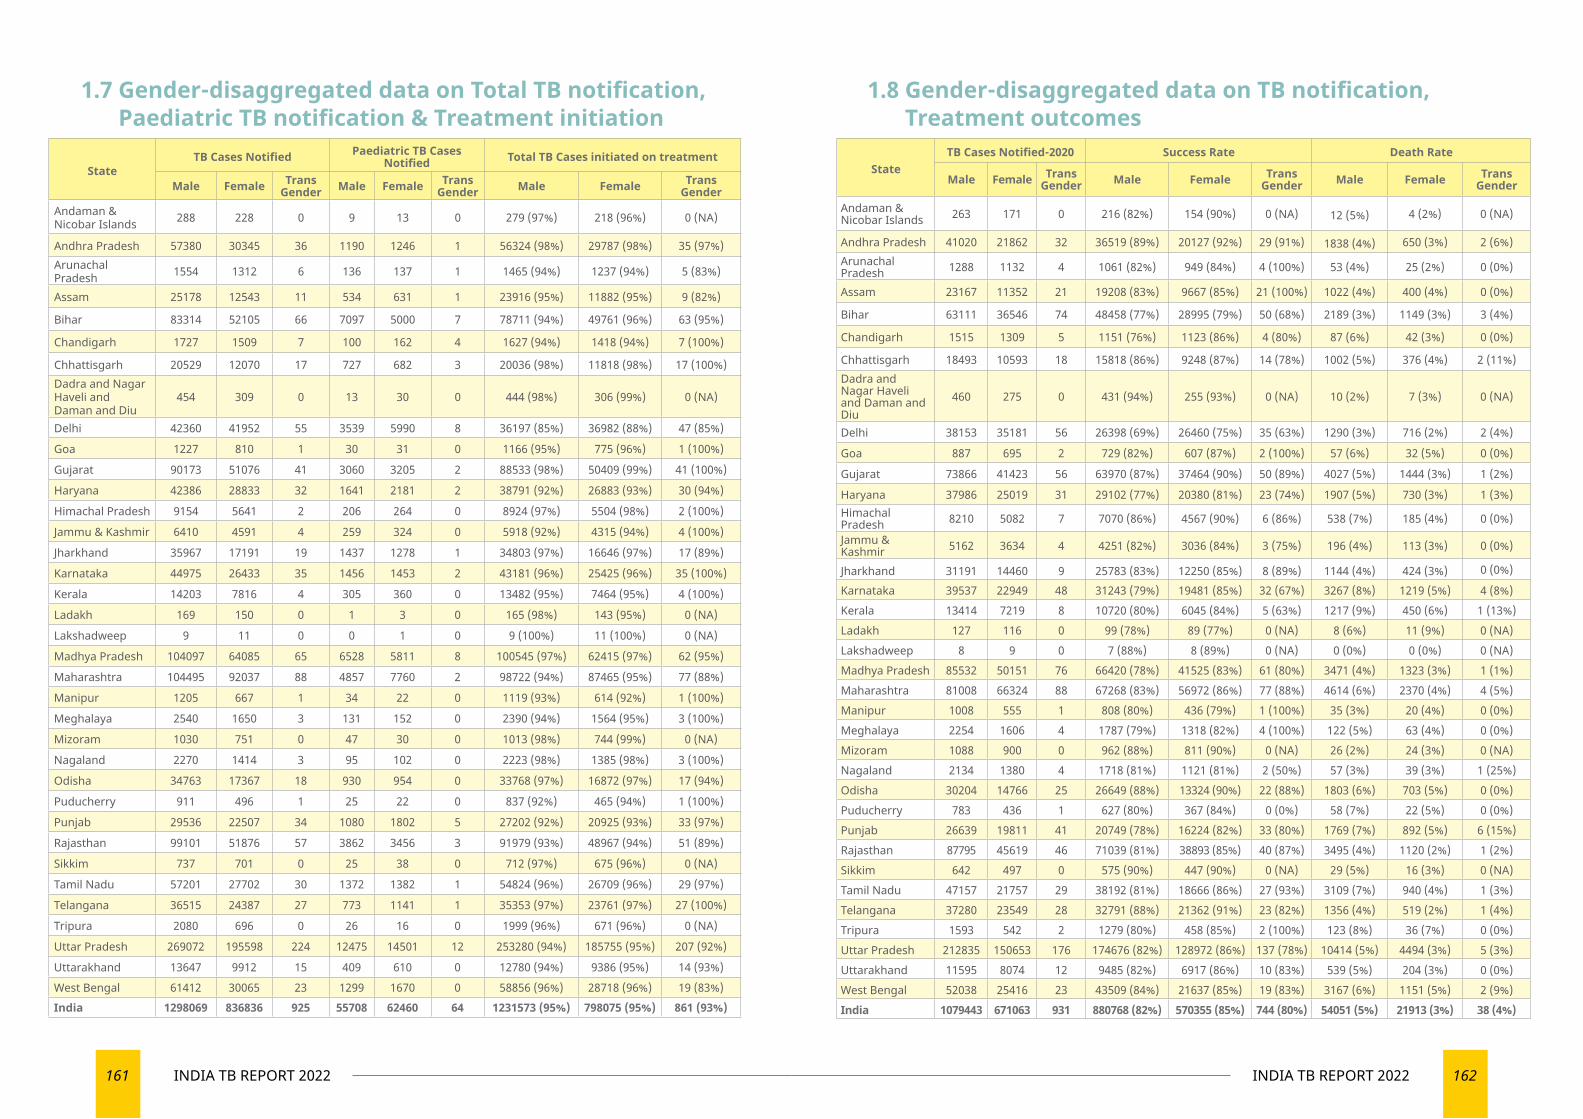
161 INDIA TB REPORT 2022 162INDIA TB REPORT 2022
StateTB Cases Notified Paediatric TB Cases
Notified Total TB Cases initiated on treatment
Male Female Trans Gender Male Female Trans
Gender Male Female Trans Gender
Andaman & Nicobar Islands 288 228 0 9 13 0 279 (97%) 218 (96%) 0 (NA)
Andhra Pradesh 57380 30345 36 1190 1246 1 56324 (98%) 29787 (98%) 35 (97%)Arunachal Pradesh 1554 1312 6 136 137 1 1465 (94%) 1237 (94%) 5 (83%)
Assam 25178 12543 11 534 631 1 23916 (95%) 11882 (95%) 9 (82%)
Bihar 83314 52105 66 7097 5000 7 78711 (94%) 49761 (96%) 63 (95%)
Chandigarh 1727 1509 7 100 162 4 1627 (94%) 1418 (94%) 7 (100%)
Chhattisgarh 20529 12070 17 727 682 3 20036 (98%) 11818 (98%) 17 (100%)Dadra and Nagar Haveli and Daman and Diu
454 309 0 13 30 0 444 (98%) 306 (99%) 0 (NA)
Delhi 42360 41952 55 3539 5990 8 36197 (85%) 36982 (88%) 47 (85%)
Goa 1227 810 1 30 31 0 1166 (95%) 775 (96%) 1 (100%)
Gujarat 90173 51076 41 3060 3205 2 88533 (98%) 50409 (99%) 41 (100%)
Haryana 42386 28833 32 1641 2181 2 38791 (92%) 26883 (93%) 30 (94%)
Himachal Pradesh 9154 5641 2 206 264 0 8924 (97%) 5504 (98%) 2 (100%)
Jammu & Kashmir 6410 4591 4 259 324 0 5918 (92%) 4315 (94%) 4 (100%)
Jharkhand 35967 17191 19 1437 1278 1 34803 (97%) 16646 (97%) 17 (89%)
Karnataka 44975 26433 35 1456 1453 2 43181 (96%) 25425 (96%) 35 (100%)
Kerala 14203 7816 4 305 360 0 13482 (95%) 7464 (95%) 4 (100%)
Ladakh 169 150 0 1 3 0 165 (98%) 143 (95%) 0 (NA)
Lakshadweep 9 11 0 0 1 0 9 (100%) 11 (100%) 0 (NA)
Madhya Pradesh 104097 64085 65 6528 5811 8 100545 (97%) 62415 (97%) 62 (95%)
Maharashtra 104495 92037 88 4857 7760 2 98722 (94%) 87465 (95%) 77 (88%)
Manipur 1205 667 1 34 22 0 1119 (93%) 614 (92%) 1 (100%)
Meghalaya 2540 1650 3 131 152 0 2390 (94%) 1564 (95%) 3 (100%)
Mizoram 1030 751 0 47 30 0 1013 (98%) 744 (99%) 0 (NA)
Nagaland 2270 1414 3 95 102 0 2223 (98%) 1385 (98%) 3 (100%)
Odisha 34763 17367 18 930 954 0 33768 (97%) 16872 (97%) 17 (94%)
Puducherry 911 496 1 25 22 0 837 (92%) 465 (94%) 1 (100%)
Punjab 29536 22507 34 1080 1802 5 27202 (92%) 20925 (93%) 33 (97%)
Rajasthan 99101 51876 57 3862 3456 3 91979 (93%) 48967 (94%) 51 (89%)
Sikkim 737 701 0 25 38 0 712 (97%) 675 (96%) 0 (NA)
Tamil Nadu 57201 27702 30 1372 1382 1 54824 (96%) 26709 (96%) 29 (97%)
Telangana 36515 24387 27 773 1141 1 35353 (97%) 23761 (97%) 27 (100%)
Tripura 2080 696 0 26 16 0 1999 (96%) 671 (96%) 0 (NA)
Uttar Pradesh 269072 195598 224 12475 14501 12 253280 (94%) 185755 (95%) 207 (92%)
Uttarakhand 13647 9912 15 409 610 0 12780 (94%) 9386 (95%) 14 (93%)
West Bengal 61412 30065 23 1299 1670 0 58856 (96%) 28718 (96%) 19 (83%)India 1298069 836836 925 55708 62460 64 1231573 (95%) 798075 (95%) 861 (93%)
StateTB Cases Notified-2020 Success Rate Death Rate
Male Female Trans Gender Male Female Trans
Gender Male Female Trans Gender
Andaman & Nicobar Islands 263 171 0 216 (82%) 154 (90%) 0 (NA) 12 (5%) 4 (2%) 0 (NA)
Andhra Pradesh 41020 21862 32 36519 (89%) 20127 (92%) 29 (91%) 1838 (4%) 650 (3%) 2 (6%)Arunachal Pradesh 1288 1132 4 1061 (82%) 949 (84%) 4 (100%) 53 (4%) 25 (2%) 0 (0%)
Assam 23167 11352 21 19208 (83%) 9667 (85%) 21 (100%) 1022 (4%) 400 (4%) 0 (0%)
Bihar 63111 36546 74 48458 (77%) 28995 (79%) 50 (68%) 2189 (3%) 1149 (3%) 3 (4%)
Chandigarh 1515 1309 5 1151 (76%) 1123 (86%) 4 (80%) 87 (6%) 42 (3%) 0 (0%)
Chhattisgarh 18493 10593 18 15818 (86%) 9248 (87%) 14 (78%) 1002 (5%) 376 (4%) 2 (11%)Dadra and Nagar Haveli and Daman and Diu
460 275 0 431 (94%) 255 (93%) 0 (NA) 10 (2%) 7 (3%) 0 (NA)
Delhi 38153 35181 56 26398 (69%) 26460 (75%) 35 (63%) 1290 (3%) 716 (2%) 2 (4%)
Goa 887 695 2 729 (82%) 607 (87%) 2 (100%) 57 (6%) 32 (5%) 0 (0%)
Gujarat 73866 41423 56 63970 (87%) 37464 (90%) 50 (89%) 4027 (5%) 1444 (3%) 1 (2%)
Haryana 37986 25019 31 29102 (77%) 20380 (81%) 23 (74%) 1907 (5%) 730 (3%) 1 (3%)Himachal Pradesh 8210 5082 7 7070 (86%) 4567 (90%) 6 (86%) 538 (7%) 185 (4%) 0 (0%)
Jammu & Kashmir 5162 3634 4 4251 (82%) 3036 (84%) 3 (75%) 196 (4%) 113 (3%) 0 (0%)
Jharkhand 31191 14460 9 25783 (83%) 12250 (85%) 8 (89%) 1144 (4%) 424 (3%) 0 (0%)
Karnataka 39537 22949 48 31243 (79%) 19481 (85%) 32 (67%) 3267 (8%) 1219 (5%) 4 (8%)Kerala 13414 7219 8 10720 (80%) 6045 (84%) 5 (63%) 1217 (9%) 450 (6%) 1 (13%)Ladakh 127 116 0 99 (78%) 89 (77%) 0 (NA) 8 (6%) 11 (9%) 0 (NA)Lakshadweep 8 9 0 7 (88%) 8 (89%) 0 (NA) 0 (0%) 0 (0%) 0 (NA)Madhya Pradesh 85532 50151 76 66420 (78%) 41525 (83%) 61 (80%) 3471 (4%) 1323 (3%) 1 (1%)Maharashtra 81008 66324 88 67268 (83%) 56972 (86%) 77 (88%) 4614 (6%) 2370 (4%) 4 (5%)Manipur 1008 555 1 808 (80%) 436 (79%) 1 (100%) 35 (3%) 20 (4%) 0 (0%)Meghalaya 2254 1606 4 1787 (79%) 1318 (82%) 4 (100%) 122 (5%) 63 (4%) 0 (0%)Mizoram 1088 900 0 962 (88%) 811 (90%) 0 (NA) 26 (2%) 24 (3%) 0 (NA)Nagaland 2134 1380 4 1718 (81%) 1121 (81%) 2 (50%) 57 (3%) 39 (3%) 1 (25%)Odisha 30204 14766 25 26649 (88%) 13324 (90%) 22 (88%) 1803 (6%) 703 (5%) 0 (0%)Puducherry 783 436 1 627 (80%) 367 (84%) 0 (0%) 58 (7%) 22 (5%) 0 (0%)Punjab 26639 19811 41 20749 (78%) 16224 (82%) 33 (80%) 1769 (7%) 892 (5%) 6 (15%)Rajasthan 87795 45619 46 71039 (81%) 38893 (85%) 40 (87%) 3495 (4%) 1120 (2%) 1 (2%)Sikkim 642 497 0 575 (90%) 447 (90%) 0 (NA) 29 (5%) 16 (3%) 0 (NA)Tamil Nadu 47157 21757 29 38192 (81%) 18666 (86%) 27 (93%) 3109 (7%) 940 (4%) 1 (3%)Telangana 37280 23549 28 32791 (88%) 21362 (91%) 23 (82%) 1356 (4%) 519 (2%) 1 (4%)Tripura 1593 542 2 1279 (80%) 458 (85%) 2 (100%) 123 (8%) 36 (7%) 0 (0%)Uttar Pradesh 212835 150653 176 174676 (82%) 128972 (86%) 137 (78%) 10414 (5%) 4494 (3%) 5 (3%)Uttarakhand 11595 8074 12 9485 (82%) 6917 (86%) 10 (83%) 539 (5%) 204 (3%) 0 (0%)West Bengal 52038 25416 23 43509 (84%) 21637 (85%) 19 (83%) 3167 (6%) 1151 (5%) 2 (9%)India 1079443 671063 931 880768 (82%) 570355 (85%) 744 (80%) 54051 (5%) 21913 (3%) 38 (4%)
1.7 Gender-disaggregated data on Total TB notification, Paediatric TB notification & Treatment initiation
1.8 Gender-disaggregated data on TB notification, Treatment outcomes
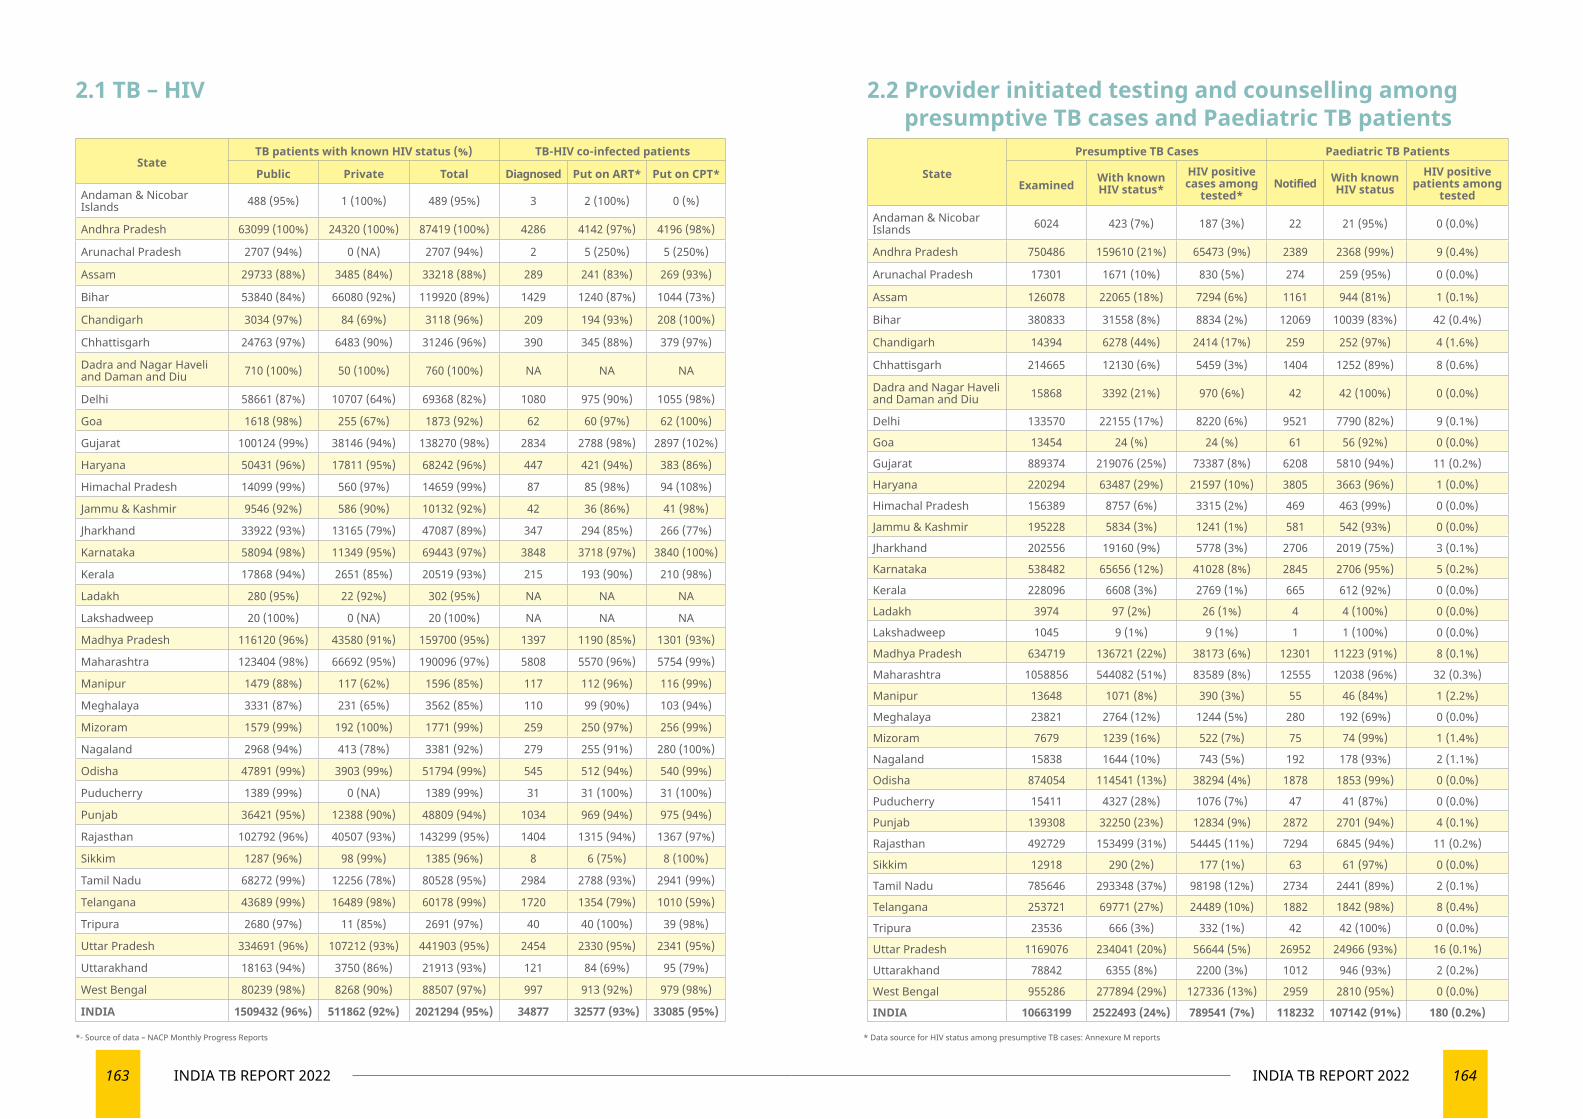
163 INDIA TB REPORT 2022 164INDIA TB REPORT 2022
StateTB patients with known HIV status (%) TB-HIV co-infected patients
Public Private Total Diagnosed Put on ART* Put on CPT*
Andaman & Nicobar Islands 488 (95%) 1 (100%) 489 (95%) 3 2 (100%) 0 (%)
Andhra Pradesh 63099 (100%) 24320 (100%) 87419 (100%) 4286 4142 (97%) 4196 (98%)
Arunachal Pradesh 2707 (94%) 0 (NA) 2707 (94%) 2 5 (250%) 5 (250%)
Assam 29733 (88%) 3485 (84%) 33218 (88%) 289 241 (83%) 269 (93%)
Bihar 53840 (84%) 66080 (92%) 119920 (89%) 1429 1240 (87%) 1044 (73%)
Chandigarh 3034 (97%) 84 (69%) 3118 (96%) 209 194 (93%) 208 (100%)
Chhattisgarh 24763 (97%) 6483 (90%) 31246 (96%) 390 345 (88%) 379 (97%)
Dadra and Nagar Haveli and Daman and Diu 710 (100%) 50 (100%) 760 (100%) NA NA NA
Delhi 58661 (87%) 10707 (64%) 69368 (82%) 1080 975 (90%) 1055 (98%)
Goa 1618 (98%) 255 (67%) 1873 (92%) 62 60 (97%) 62 (100%)
Gujarat 100124 (99%) 38146 (94%) 138270 (98%) 2834 2788 (98%) 2897 (102%)
Haryana 50431 (96%) 17811 (95%) 68242 (96%) 447 421 (94%) 383 (86%)
Himachal Pradesh 14099 (99%) 560 (97%) 14659 (99%) 87 85 (98%) 94 (108%)
Jammu & Kashmir 9546 (92%) 586 (90%) 10132 (92%) 42 36 (86%) 41 (98%)
Jharkhand 33922 (93%) 13165 (79%) 47087 (89%) 347 294 (85%) 266 (77%)
Karnataka 58094 (98%) 11349 (95%) 69443 (97%) 3848 3718 (97%) 3840 (100%)
Kerala 17868 (94%) 2651 (85%) 20519 (93%) 215 193 (90%) 210 (98%)
Ladakh 280 (95%) 22 (92%) 302 (95%) NA NA NA
Lakshadweep 20 (100%) 0 (NA) 20 (100%) NA NA NA
Madhya Pradesh 116120 (96%) 43580 (91%) 159700 (95%) 1397 1190 (85%) 1301 (93%)
Maharashtra 123404 (98%) 66692 (95%) 190096 (97%) 5808 5570 (96%) 5754 (99%)
Manipur 1479 (88%) 117 (62%) 1596 (85%) 117 112 (96%) 116 (99%)
Meghalaya 3331 (87%) 231 (65%) 3562 (85%) 110 99 (90%) 103 (94%)
Mizoram 1579 (99%) 192 (100%) 1771 (99%) 259 250 (97%) 256 (99%)
Nagaland 2968 (94%) 413 (78%) 3381 (92%) 279 255 (91%) 280 (100%)
Odisha 47891 (99%) 3903 (99%) 51794 (99%) 545 512 (94%) 540 (99%)
Puducherry 1389 (99%) 0 (NA) 1389 (99%) 31 31 (100%) 31 (100%)
Punjab 36421 (95%) 12388 (90%) 48809 (94%) 1034 969 (94%) 975 (94%)
Rajasthan 102792 (96%) 40507 (93%) 143299 (95%) 1404 1315 (94%) 1367 (97%)
Sikkim 1287 (96%) 98 (99%) 1385 (96%) 8 6 (75%) 8 (100%)
Tamil Nadu 68272 (99%) 12256 (78%) 80528 (95%) 2984 2788 (93%) 2941 (99%)
Telangana 43689 (99%) 16489 (98%) 60178 (99%) 1720 1354 (79%) 1010 (59%)
Tripura 2680 (97%) 11 (85%) 2691 (97%) 40 40 (100%) 39 (98%)
Uttar Pradesh 334691 (96%) 107212 (93%) 441903 (95%) 2454 2330 (95%) 2341 (95%)
Uttarakhand 18163 (94%) 3750 (86%) 21913 (93%) 121 84 (69%) 95 (79%)
West Bengal 80239 (98%) 8268 (90%) 88507 (97%) 997 913 (92%) 979 (98%)
INDIA 1509432 (96%) 511862 (92%) 2021294 (95%) 34877 32577 (93%) 33085 (95%)
State
Presumptive TB Cases Paediatric TB Patients
Examined With known HIV status*
HIV positive cases among
tested*Notified With known
HIV statusHIV positive
patients among tested
Andaman & Nicobar Islands 6024 423 (7%) 187 (3%) 22 21 (95%) 0 (0.0%)
Andhra Pradesh 750486 159610 (21%) 65473 (9%) 2389 2368 (99%) 9 (0.4%)
Arunachal Pradesh 17301 1671 (10%) 830 (5%) 274 259 (95%) 0 (0.0%)
Assam 126078 22065 (18%) 7294 (6%) 1161 944 (81%) 1 (0.1%)
Bihar 380833 31558 (8%) 8834 (2%) 12069 10039 (83%) 42 (0.4%)
Chandigarh 14394 6278 (44%) 2414 (17%) 259 252 (97%) 4 (1.6%)
Chhattisgarh 214665 12130 (6%) 5459 (3%) 1404 1252 (89%) 8 (0.6%)
Dadra and Nagar Haveli and Daman and Diu 15868 3392 (21%) 970 (6%) 42 42 (100%) 0 (0.0%)
Delhi 133570 22155 (17%) 8220 (6%) 9521 7790 (82%) 9 (0.1%)
Goa 13454 24 (%) 24 (%) 61 56 (92%) 0 (0.0%)
Gujarat 889374 219076 (25%) 73387 (8%) 6208 5810 (94%) 11 (0.2%)
Haryana 220294 63487 (29%) 21597 (10%) 3805 3663 (96%) 1 (0.0%)
Himachal Pradesh 156389 8757 (6%) 3315 (2%) 469 463 (99%) 0 (0.0%)
Jammu & Kashmir 195228 5834 (3%) 1241 (1%) 581 542 (93%) 0 (0.0%)
Jharkhand 202556 19160 (9%) 5778 (3%) 2706 2019 (75%) 3 (0.1%)
Karnataka 538482 65656 (12%) 41028 (8%) 2845 2706 (95%) 5 (0.2%)
Kerala 228096 6608 (3%) 2769 (1%) 665 612 (92%) 0 (0.0%)
Ladakh 3974 97 (2%) 26 (1%) 4 4 (100%) 0 (0.0%)
Lakshadweep 1045 9 (1%) 9 (1%) 1 1 (100%) 0 (0.0%)
Madhya Pradesh 634719 136721 (22%) 38173 (6%) 12301 11223 (91%) 8 (0.1%)
Maharashtra 1058856 544082 (51%) 83589 (8%) 12555 12038 (96%) 32 (0.3%)
Manipur 13648 1071 (8%) 390 (3%) 55 46 (84%) 1 (2.2%)
Meghalaya 23821 2764 (12%) 1244 (5%) 280 192 (69%) 0 (0.0%)
Mizoram 7679 1239 (16%) 522 (7%) 75 74 (99%) 1 (1.4%)
Nagaland 15838 1644 (10%) 743 (5%) 192 178 (93%) 2 (1.1%)
Odisha 874054 114541 (13%) 38294 (4%) 1878 1853 (99%) 0 (0.0%)
Puducherry 15411 4327 (28%) 1076 (7%) 47 41 (87%) 0 (0.0%)
Punjab 139308 32250 (23%) 12834 (9%) 2872 2701 (94%) 4 (0.1%)
Rajasthan 492729 153499 (31%) 54445 (11%) 7294 6845 (94%) 11 (0.2%)
Sikkim 12918 290 (2%) 177 (1%) 63 61 (97%) 0 (0.0%)
Tamil Nadu 785646 293348 (37%) 98198 (12%) 2734 2441 (89%) 2 (0.1%)
Telangana 253721 69771 (27%) 24489 (10%) 1882 1842 (98%) 8 (0.4%)
Tripura 23536 666 (3%) 332 (1%) 42 42 (100%) 0 (0.0%)
Uttar Pradesh 1169076 234041 (20%) 56644 (5%) 26952 24966 (93%) 16 (0.1%)
Uttarakhand 78842 6355 (8%) 2200 (3%) 1012 946 (93%) 2 (0.2%)
West Bengal 955286 277894 (29%) 127336 (13%) 2959 2810 (95%) 0 (0.0%)
INDIA 10663199 2522493 (24%) 789541 (7%) 118232 107142 (91%) 180 (0.2%)
2.1 TB – HIV 2.2 Provider initiated testing and counselling among presumptive TB cases and Paediatric TB patients
*- Source of data – NACP Monthly Progress Reports * Data source for HIV status among presumptive TB cases: Annexure M reports
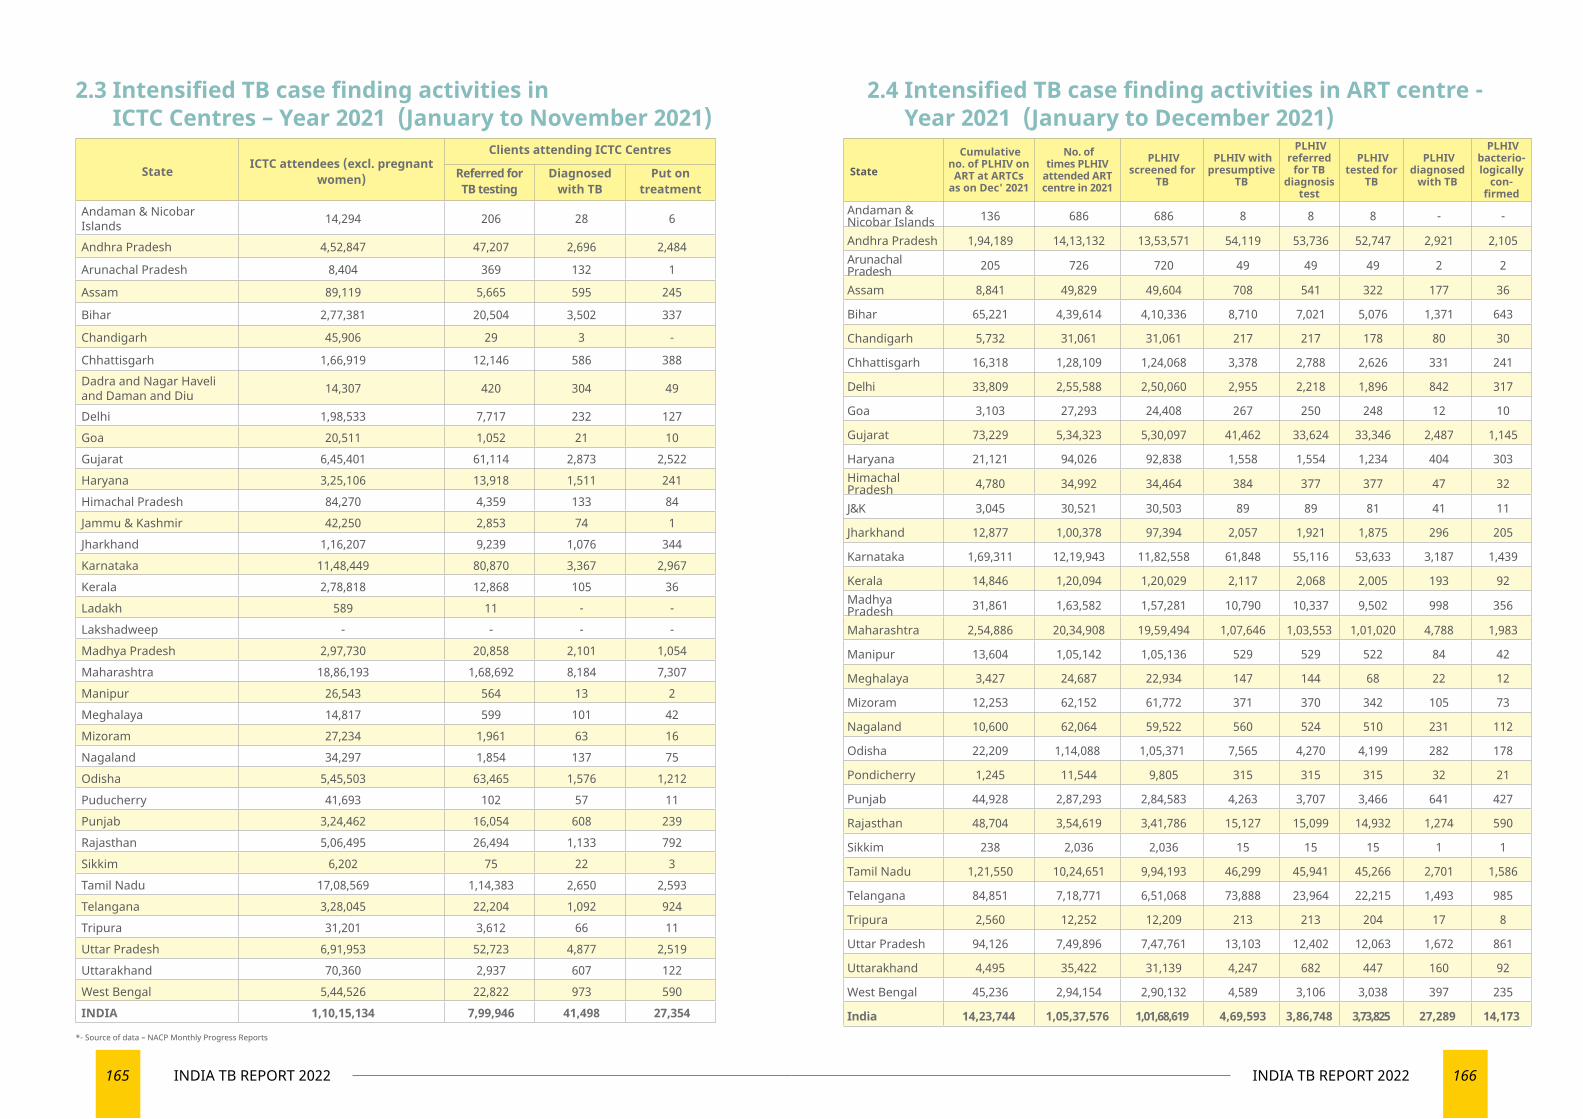
165 INDIA TB REPORT 2022 166INDIA TB REPORT 2022
State ICTC attendees (excl. pregnant women)
Clients attending ICTC Centres
Referred for TB testing
Diagnosed with TB
Put on treatment
Andaman & Nicobar Islands 14,294 206 28 6
Andhra Pradesh 4,52,847 47,207 2,696 2,484
Arunachal Pradesh 8,404 369 132 1
Assam 89,119 5,665 595 245
Bihar 2,77,381 20,504 3,502 337
Chandigarh 45,906 29 3 -
Chhattisgarh 1,66,919 12,146 586 388 Dadra and Nagar Haveli and Daman and Diu 14,307 420 304 49
Delhi 1,98,533 7,717 232 127 Goa 20,511 1,052 21 10 Gujarat 6,45,401 61,114 2,873 2,522 Haryana 3,25,106 13,918 1,511 241 Himachal Pradesh 84,270 4,359 133 84 Jammu & Kashmir 42,250 2,853 74 1 Jharkhand 1,16,207 9,239 1,076 344 Karnataka 11,48,449 80,870 3,367 2,967 Kerala 2,78,818 12,868 105 36 Ladakh 589 11 - - Lakshadweep - - - - Madhya Pradesh 2,97,730 20,858 2,101 1,054 Maharashtra 18,86,193 1,68,692 8,184 7,307 Manipur 26,543 564 13 2 Meghalaya 14,817 599 101 42 Mizoram 27,234 1,961 63 16 Nagaland 34,297 1,854 137 75 Odisha 5,45,503 63,465 1,576 1,212 Puducherry 41,693 102 57 11 Punjab 3,24,462 16,054 608 239 Rajasthan 5,06,495 26,494 1,133 792 Sikkim 6,202 75 22 3 Tamil Nadu 17,08,569 1,14,383 2,650 2,593 Telangana 3,28,045 22,204 1,092 924 Tripura 31,201 3,612 66 11 Uttar Pradesh 6,91,953 52,723 4,877 2,519 Uttarakhand 70,360 2,937 607 122 West Bengal 5,44,526 22,822 973 590 INDIA 1,10,15,134 7,99,946 41,498 27,354
2.3 Intensified TB case finding activities in ICTC Centres – Year 2021 (January to November 2021)
*- Source of data – NACP Monthly Progress Reports
State
Cumulative no. of PLHIV on
ART at ARTCs as on Dec' 2021
No. of times PLHIV
attended ART centre in 2021
PLHIV screened for
TB
PLHIV with presumptive
TB
PLHIV referred
for TB diagnosis
test
PLHIV tested for
TB
PLHIV diagnosed
with TB
PLHIV bacterio-logically
con-firmed
Andaman & Nicobar Islands 136 686 686 8 8 8 - -
Andhra Pradesh 1,94,189 14,13,132 13,53,571 54,119 53,736 52,747 2,921 2,105 Arunachal Pradesh 205 726 720 49 49 49 2 2
Assam 8,841 49,829 49,604 708 541 322 177 36
Bihar 65,221 4,39,614 4,10,336 8,710 7,021 5,076 1,371 643
Chandigarh 5,732 31,061 31,061 217 217 178 80 30
Chhattisgarh 16,318 1,28,109 1,24,068 3,378 2,788 2,626 331 241
Delhi 33,809 2,55,588 2,50,060 2,955 2,218 1,896 842 317
Goa 3,103 27,293 24,408 267 250 248 12 10
Gujarat 73,229 5,34,323 5,30,097 41,462 33,624 33,346 2,487 1,145
Haryana 21,121 94,026 92,838 1,558 1,554 1,234 404 303 Himachal Pradesh 4,780 34,992 34,464 384 377 377 47 32
J&K 3,045 30,521 30,503 89 89 81 41 11
Jharkhand 12,877 1,00,378 97,394 2,057 1,921 1,875 296 205
Karnataka 1,69,311 12,19,943 11,82,558 61,848 55,116 53,633 3,187 1,439
Kerala 14,846 1,20,094 1,20,029 2,117 2,068 2,005 193 92 Madhya Pradesh 31,861 1,63,582 1,57,281 10,790 10,337 9,502 998 356
Maharashtra 2,54,886 20,34,908 19,59,494 1,07,646 1,03,553 1,01,020 4,788 1,983
Manipur 13,604 1,05,142 1,05,136 529 529 522 84 42
Meghalaya 3,427 24,687 22,934 147 144 68 22 12
Mizoram 12,253 62,152 61,772 371 370 342 105 73
Nagaland 10,600 62,064 59,522 560 524 510 231 112
Odisha 22,209 1,14,088 1,05,371 7,565 4,270 4,199 282 178
Pondicherry 1,245 11,544 9,805 315 315 315 32 21
Punjab 44,928 2,87,293 2,84,583 4,263 3,707 3,466 641 427
Rajasthan 48,704 3,54,619 3,41,786 15,127 15,099 14,932 1,274 590
Sikkim 238 2,036 2,036 15 15 15 1 1
Tamil Nadu 1,21,550 10,24,651 9,94,193 46,299 45,941 45,266 2,701 1,586
Telangana 84,851 7,18,771 6,51,068 73,888 23,964 22,215 1,493 985
Tripura 2,560 12,252 12,209 213 213 204 17 8
Uttar Pradesh 94,126 7,49,896 7,47,761 13,103 12,402 12,063 1,672 861
Uttarakhand 4,495 35,422 31,139 4,247 682 447 160 92
West Bengal 45,236 2,94,154 2,90,132 4,589 3,106 3,038 397 235
India 14,23,744 1,05,37,576 1,01,68,619 4,69,593 3,86,748 3,73,825 27,289 14,173
2.4 Intensified TB case finding activities in ART centre - Year 2021 (January to December 2021)
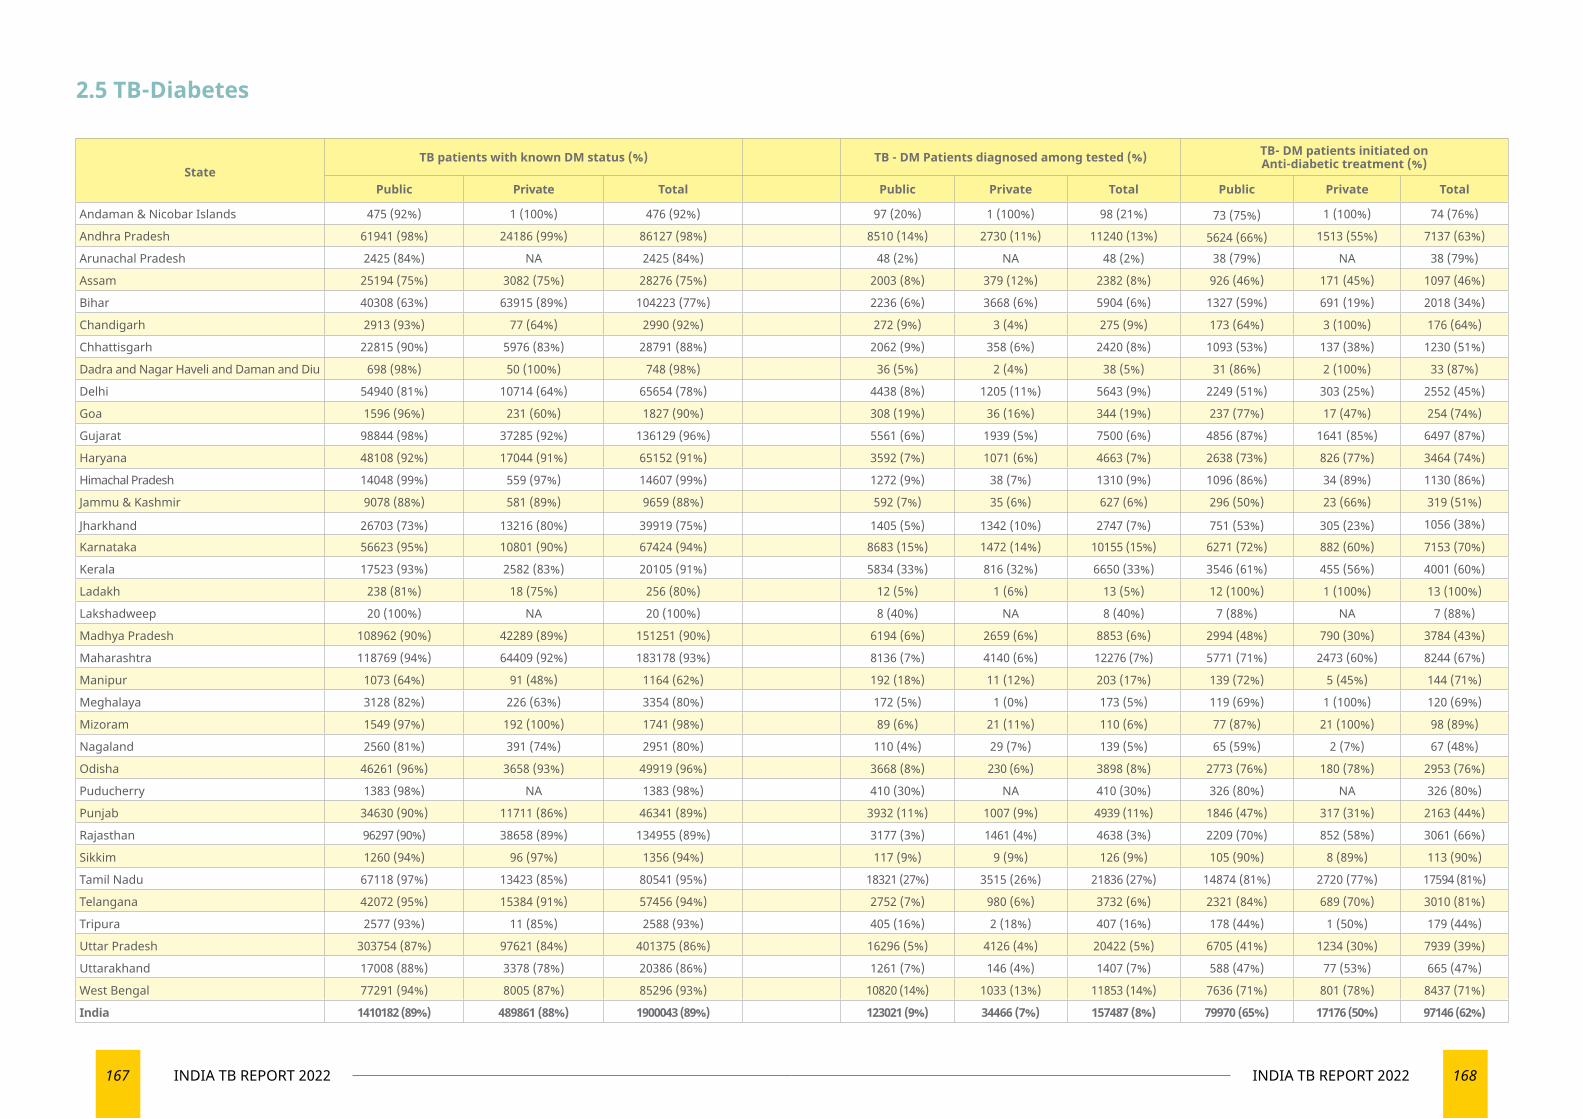
167 INDIA TB REPORT 2022 168INDIA TB REPORT 2022
StateTB patients with known DM status (%) TB - DM Patients diagnosed among tested (%) TB- DM patients initiated on
Anti-diabetic treatment (%)
Public Private Total Public Private Total Public Private Total
Andaman & Nicobar Islands 475 (92%) 1 (100%) 476 (92%) 97 (20%) 1 (100%) 98 (21%) 73 (75%) 1 (100%) 74 (76%)
Andhra Pradesh 61941 (98%) 24186 (99%) 86127 (98%) 8510 (14%) 2730 (11%) 11240 (13%) 5624 (66%) 1513 (55%) 7137 (63%)
Arunachal Pradesh 2425 (84%) NA 2425 (84%) 48 (2%) NA 48 (2%) 38 (79%) NA 38 (79%)
Assam 25194 (75%) 3082 (75%) 28276 (75%) 2003 (8%) 379 (12%) 2382 (8%) 926 (46%) 171 (45%) 1097 (46%)
Bihar 40308 (63%) 63915 (89%) 104223 (77%) 2236 (6%) 3668 (6%) 5904 (6%) 1327 (59%) 691 (19%) 2018 (34%)
Chandigarh 2913 (93%) 77 (64%) 2990 (92%) 272 (9%) 3 (4%) 275 (9%) 173 (64%) 3 (100%) 176 (64%)
Chhattisgarh 22815 (90%) 5976 (83%) 28791 (88%) 2062 (9%) 358 (6%) 2420 (8%) 1093 (53%) 137 (38%) 1230 (51%)
Dadra and Nagar Haveli and Daman and Diu 698 (98%) 50 (100%) 748 (98%) 36 (5%) 2 (4%) 38 (5%) 31 (86%) 2 (100%) 33 (87%)
Delhi 54940 (81%) 10714 (64%) 65654 (78%) 4438 (8%) 1205 (11%) 5643 (9%) 2249 (51%) 303 (25%) 2552 (45%)
Goa 1596 (96%) 231 (60%) 1827 (90%) 308 (19%) 36 (16%) 344 (19%) 237 (77%) 17 (47%) 254 (74%)
Gujarat 98844 (98%) 37285 (92%) 136129 (96%) 5561 (6%) 1939 (5%) 7500 (6%) 4856 (87%) 1641 (85%) 6497 (87%)
Haryana 48108 (92%) 17044 (91%) 65152 (91%) 3592 (7%) 1071 (6%) 4663 (7%) 2638 (73%) 826 (77%) 3464 (74%)
Himachal Pradesh 14048 (99%) 559 (97%) 14607 (99%) 1272 (9%) 38 (7%) 1310 (9%) 1096 (86%) 34 (89%) 1130 (86%)
Jammu & Kashmir 9078 (88%) 581 (89%) 9659 (88%) 592 (7%) 35 (6%) 627 (6%) 296 (50%) 23 (66%) 319 (51%)
Jharkhand 26703 (73%) 13216 (80%) 39919 (75%) 1405 (5%) 1342 (10%) 2747 (7%) 751 (53%) 305 (23%) 1056 (38%)
Karnataka 56623 (95%) 10801 (90%) 67424 (94%) 8683 (15%) 1472 (14%) 10155 (15%) 6271 (72%) 882 (60%) 7153 (70%)
Kerala 17523 (93%) 2582 (83%) 20105 (91%) 5834 (33%) 816 (32%) 6650 (33%) 3546 (61%) 455 (56%) 4001 (60%)
Ladakh 238 (81%) 18 (75%) 256 (80%) 12 (5%) 1 (6%) 13 (5%) 12 (100%) 1 (100%) 13 (100%)
Lakshadweep 20 (100%) NA 20 (100%) 8 (40%) NA 8 (40%) 7 (88%) NA 7 (88%)
Madhya Pradesh 108962 (90%) 42289 (89%) 151251 (90%) 6194 (6%) 2659 (6%) 8853 (6%) 2994 (48%) 790 (30%) 3784 (43%)
Maharashtra 118769 (94%) 64409 (92%) 183178 (93%) 8136 (7%) 4140 (6%) 12276 (7%) 5771 (71%) 2473 (60%) 8244 (67%)
Manipur 1073 (64%) 91 (48%) 1164 (62%) 192 (18%) 11 (12%) 203 (17%) 139 (72%) 5 (45%) 144 (71%)
Meghalaya 3128 (82%) 226 (63%) 3354 (80%) 172 (5%) 1 (0%) 173 (5%) 119 (69%) 1 (100%) 120 (69%)
Mizoram 1549 (97%) 192 (100%) 1741 (98%) 89 (6%) 21 (11%) 110 (6%) 77 (87%) 21 (100%) 98 (89%)
Nagaland 2560 (81%) 391 (74%) 2951 (80%) 110 (4%) 29 (7%) 139 (5%) 65 (59%) 2 (7%) 67 (48%)
Odisha 46261 (96%) 3658 (93%) 49919 (96%) 3668 (8%) 230 (6%) 3898 (8%) 2773 (76%) 180 (78%) 2953 (76%)
Puducherry 1383 (98%) NA 1383 (98%) 410 (30%) NA 410 (30%) 326 (80%) NA 326 (80%)
Punjab 34630 (90%) 11711 (86%) 46341 (89%) 3932 (11%) 1007 (9%) 4939 (11%) 1846 (47%) 317 (31%) 2163 (44%)
Rajasthan 96297 (90%) 38658 (89%) 134955 (89%) 3177 (3%) 1461 (4%) 4638 (3%) 2209 (70%) 852 (58%) 3061 (66%)
Sikkim 1260 (94%) 96 (97%) 1356 (94%) 117 (9%) 9 (9%) 126 (9%) 105 (90%) 8 (89%) 113 (90%)
Tamil Nadu 67118 (97%) 13423 (85%) 80541 (95%) 18321 (27%) 3515 (26%) 21836 (27%) 14874 (81%) 2720 (77%) 17594 (81%)
Telangana 42072 (95%) 15384 (91%) 57456 (94%) 2752 (7%) 980 (6%) 3732 (6%) 2321 (84%) 689 (70%) 3010 (81%)
Tripura 2577 (93%) 11 (85%) 2588 (93%) 405 (16%) 2 (18%) 407 (16%) 178 (44%) 1 (50%) 179 (44%)
Uttar Pradesh 303754 (87%) 97621 (84%) 401375 (86%) 16296 (5%) 4126 (4%) 20422 (5%) 6705 (41%) 1234 (30%) 7939 (39%)
Uttarakhand 17008 (88%) 3378 (78%) 20386 (86%) 1261 (7%) 146 (4%) 1407 (7%) 588 (47%) 77 (53%) 665 (47%)
West Bengal 77291 (94%) 8005 (87%) 85296 (93%) 10820 (14%) 1033 (13%) 11853 (14%) 7636 (71%) 801 (78%) 8437 (71%)
India 1410182 (89%) 489861 (88%) 1900043 (89%) 123021 (9%) 34466 (7%) 157487 (8%) 79970 (65%) 17176 (50%) 97146 (62%)
2.5 TB-Diabetes
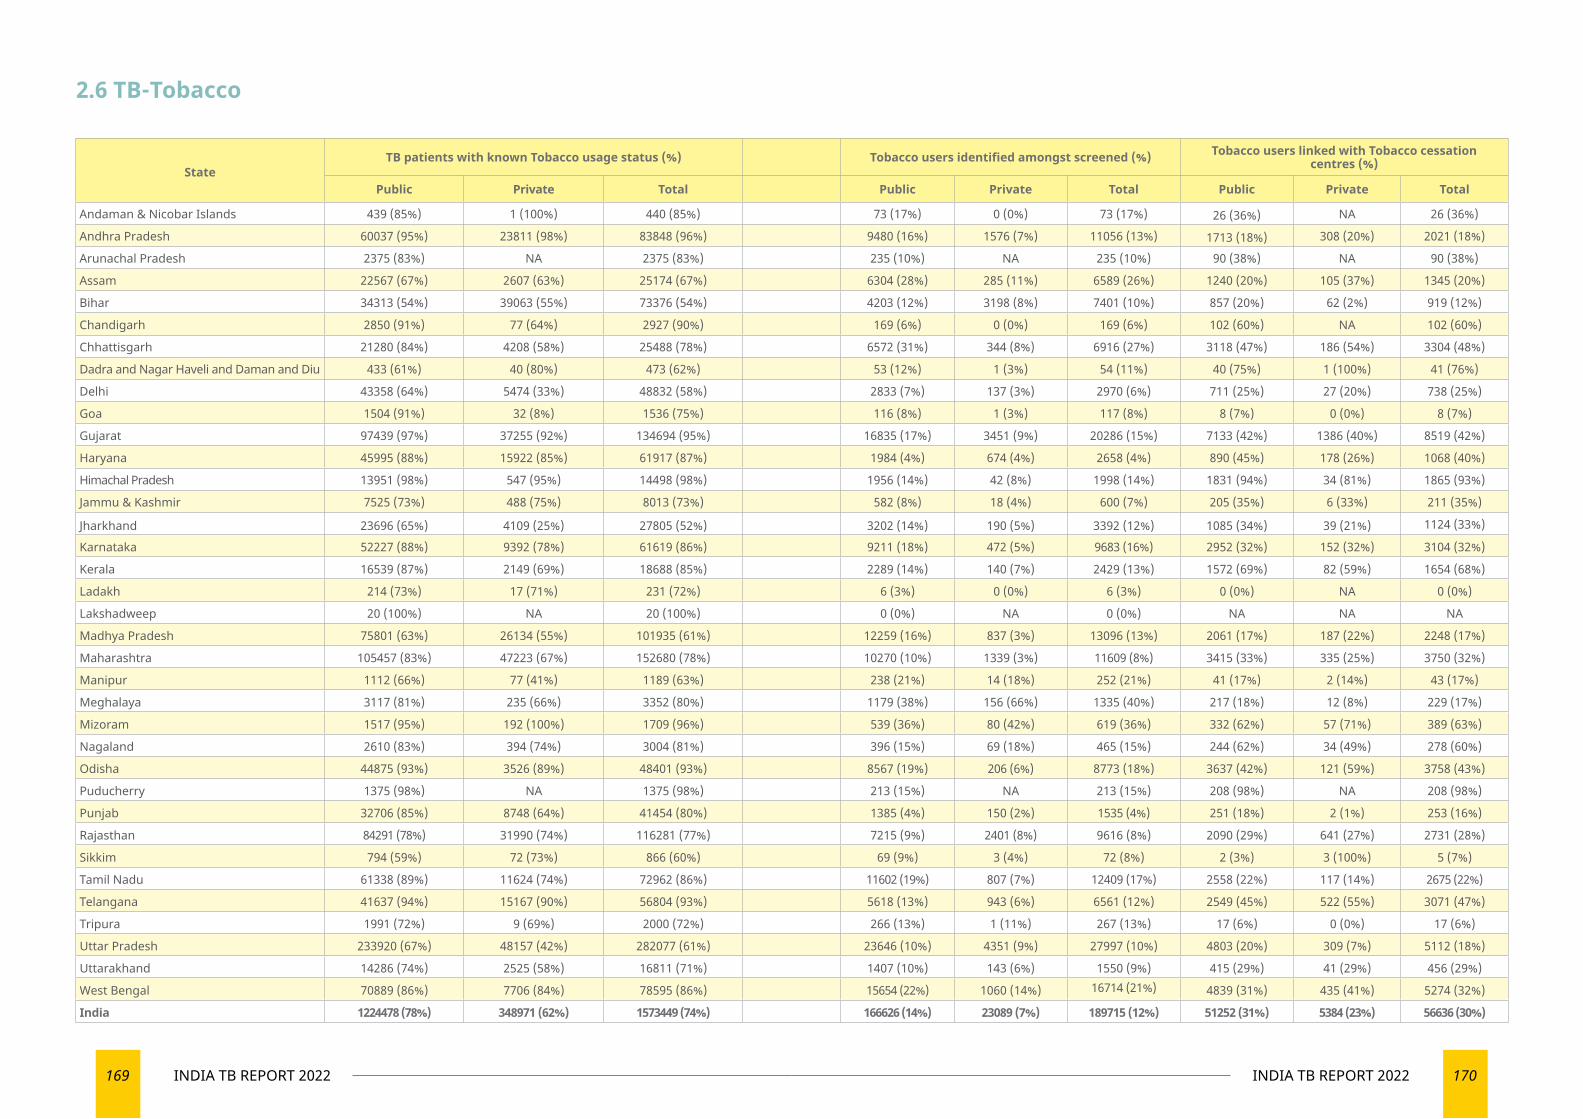
169 INDIA TB REPORT 2022 170INDIA TB REPORT 2022
StateTB patients with known Tobacco usage status (%) Tobacco users identified amongst screened (%) Tobacco users linked with Tobacco cessation
centres (%)
Public Private Total Public Private Total Public Private Total
Andaman & Nicobar Islands 439 (85%) 1 (100%) 440 (85%) 73 (17%) 0 (0%) 73 (17%) 26 (36%) NA 26 (36%)
Andhra Pradesh 60037 (95%) 23811 (98%) 83848 (96%) 9480 (16%) 1576 (7%) 11056 (13%) 1713 (18%) 308 (20%) 2021 (18%)
Arunachal Pradesh 2375 (83%) NA 2375 (83%) 235 (10%) NA 235 (10%) 90 (38%) NA 90 (38%)
Assam 22567 (67%) 2607 (63%) 25174 (67%) 6304 (28%) 285 (11%) 6589 (26%) 1240 (20%) 105 (37%) 1345 (20%)
Bihar 34313 (54%) 39063 (55%) 73376 (54%) 4203 (12%) 3198 (8%) 7401 (10%) 857 (20%) 62 (2%) 919 (12%)
Chandigarh 2850 (91%) 77 (64%) 2927 (90%) 169 (6%) 0 (0%) 169 (6%) 102 (60%) NA 102 (60%)
Chhattisgarh 21280 (84%) 4208 (58%) 25488 (78%) 6572 (31%) 344 (8%) 6916 (27%) 3118 (47%) 186 (54%) 3304 (48%)
Dadra and Nagar Haveli and Daman and Diu 433 (61%) 40 (80%) 473 (62%) 53 (12%) 1 (3%) 54 (11%) 40 (75%) 1 (100%) 41 (76%)
Delhi 43358 (64%) 5474 (33%) 48832 (58%) 2833 (7%) 137 (3%) 2970 (6%) 711 (25%) 27 (20%) 738 (25%)
Goa 1504 (91%) 32 (8%) 1536 (75%) 116 (8%) 1 (3%) 117 (8%) 8 (7%) 0 (0%) 8 (7%)
Gujarat 97439 (97%) 37255 (92%) 134694 (95%) 16835 (17%) 3451 (9%) 20286 (15%) 7133 (42%) 1386 (40%) 8519 (42%)
Haryana 45995 (88%) 15922 (85%) 61917 (87%) 1984 (4%) 674 (4%) 2658 (4%) 890 (45%) 178 (26%) 1068 (40%)
Himachal Pradesh 13951 (98%) 547 (95%) 14498 (98%) 1956 (14%) 42 (8%) 1998 (14%) 1831 (94%) 34 (81%) 1865 (93%)
Jammu & Kashmir 7525 (73%) 488 (75%) 8013 (73%) 582 (8%) 18 (4%) 600 (7%) 205 (35%) 6 (33%) 211 (35%)
Jharkhand 23696 (65%) 4109 (25%) 27805 (52%) 3202 (14%) 190 (5%) 3392 (12%) 1085 (34%) 39 (21%) 1124 (33%)
Karnataka 52227 (88%) 9392 (78%) 61619 (86%) 9211 (18%) 472 (5%) 9683 (16%) 2952 (32%) 152 (32%) 3104 (32%)
Kerala 16539 (87%) 2149 (69%) 18688 (85%) 2289 (14%) 140 (7%) 2429 (13%) 1572 (69%) 82 (59%) 1654 (68%)
Ladakh 214 (73%) 17 (71%) 231 (72%) 6 (3%) 0 (0%) 6 (3%) 0 (0%) NA 0 (0%)
Lakshadweep 20 (100%) NA 20 (100%) 0 (0%) NA 0 (0%) NA NA NA
Madhya Pradesh 75801 (63%) 26134 (55%) 101935 (61%) 12259 (16%) 837 (3%) 13096 (13%) 2061 (17%) 187 (22%) 2248 (17%)
Maharashtra 105457 (83%) 47223 (67%) 152680 (78%) 10270 (10%) 1339 (3%) 11609 (8%) 3415 (33%) 335 (25%) 3750 (32%)
Manipur 1112 (66%) 77 (41%) 1189 (63%) 238 (21%) 14 (18%) 252 (21%) 41 (17%) 2 (14%) 43 (17%)
Meghalaya 3117 (81%) 235 (66%) 3352 (80%) 1179 (38%) 156 (66%) 1335 (40%) 217 (18%) 12 (8%) 229 (17%)
Mizoram 1517 (95%) 192 (100%) 1709 (96%) 539 (36%) 80 (42%) 619 (36%) 332 (62%) 57 (71%) 389 (63%)
Nagaland 2610 (83%) 394 (74%) 3004 (81%) 396 (15%) 69 (18%) 465 (15%) 244 (62%) 34 (49%) 278 (60%)
Odisha 44875 (93%) 3526 (89%) 48401 (93%) 8567 (19%) 206 (6%) 8773 (18%) 3637 (42%) 121 (59%) 3758 (43%)
Puducherry 1375 (98%) NA 1375 (98%) 213 (15%) NA 213 (15%) 208 (98%) NA 208 (98%)
Punjab 32706 (85%) 8748 (64%) 41454 (80%) 1385 (4%) 150 (2%) 1535 (4%) 251 (18%) 2 (1%) 253 (16%)
Rajasthan 84291 (78%) 31990 (74%) 116281 (77%) 7215 (9%) 2401 (8%) 9616 (8%) 2090 (29%) 641 (27%) 2731 (28%)
Sikkim 794 (59%) 72 (73%) 866 (60%) 69 (9%) 3 (4%) 72 (8%) 2 (3%) 3 (100%) 5 (7%)
Tamil Nadu 61338 (89%) 11624 (74%) 72962 (86%) 11602 (19%) 807 (7%) 12409 (17%) 2558 (22%) 117 (14%) 2675 (22%)
Telangana 41637 (94%) 15167 (90%) 56804 (93%) 5618 (13%) 943 (6%) 6561 (12%) 2549 (45%) 522 (55%) 3071 (47%)
Tripura 1991 (72%) 9 (69%) 2000 (72%) 266 (13%) 1 (11%) 267 (13%) 17 (6%) 0 (0%) 17 (6%)
Uttar Pradesh 233920 (67%) 48157 (42%) 282077 (61%) 23646 (10%) 4351 (9%) 27997 (10%) 4803 (20%) 309 (7%) 5112 (18%)
Uttarakhand 14286 (74%) 2525 (58%) 16811 (71%) 1407 (10%) 143 (6%) 1550 (9%) 415 (29%) 41 (29%) 456 (29%)
West Bengal 70889 (86%) 7706 (84%) 78595 (86%) 15654 (22%) 1060 (14%) 16714 (21%) 4839 (31%) 435 (41%) 5274 (32%)
India 1224478 (78%) 348971 (62%) 1573449 (74%) 166626 (14%) 23089 (7%) 189715 (12%) 51252 (31%) 5384 (23%) 56636 (30%)
2.6 TB-Tobacco
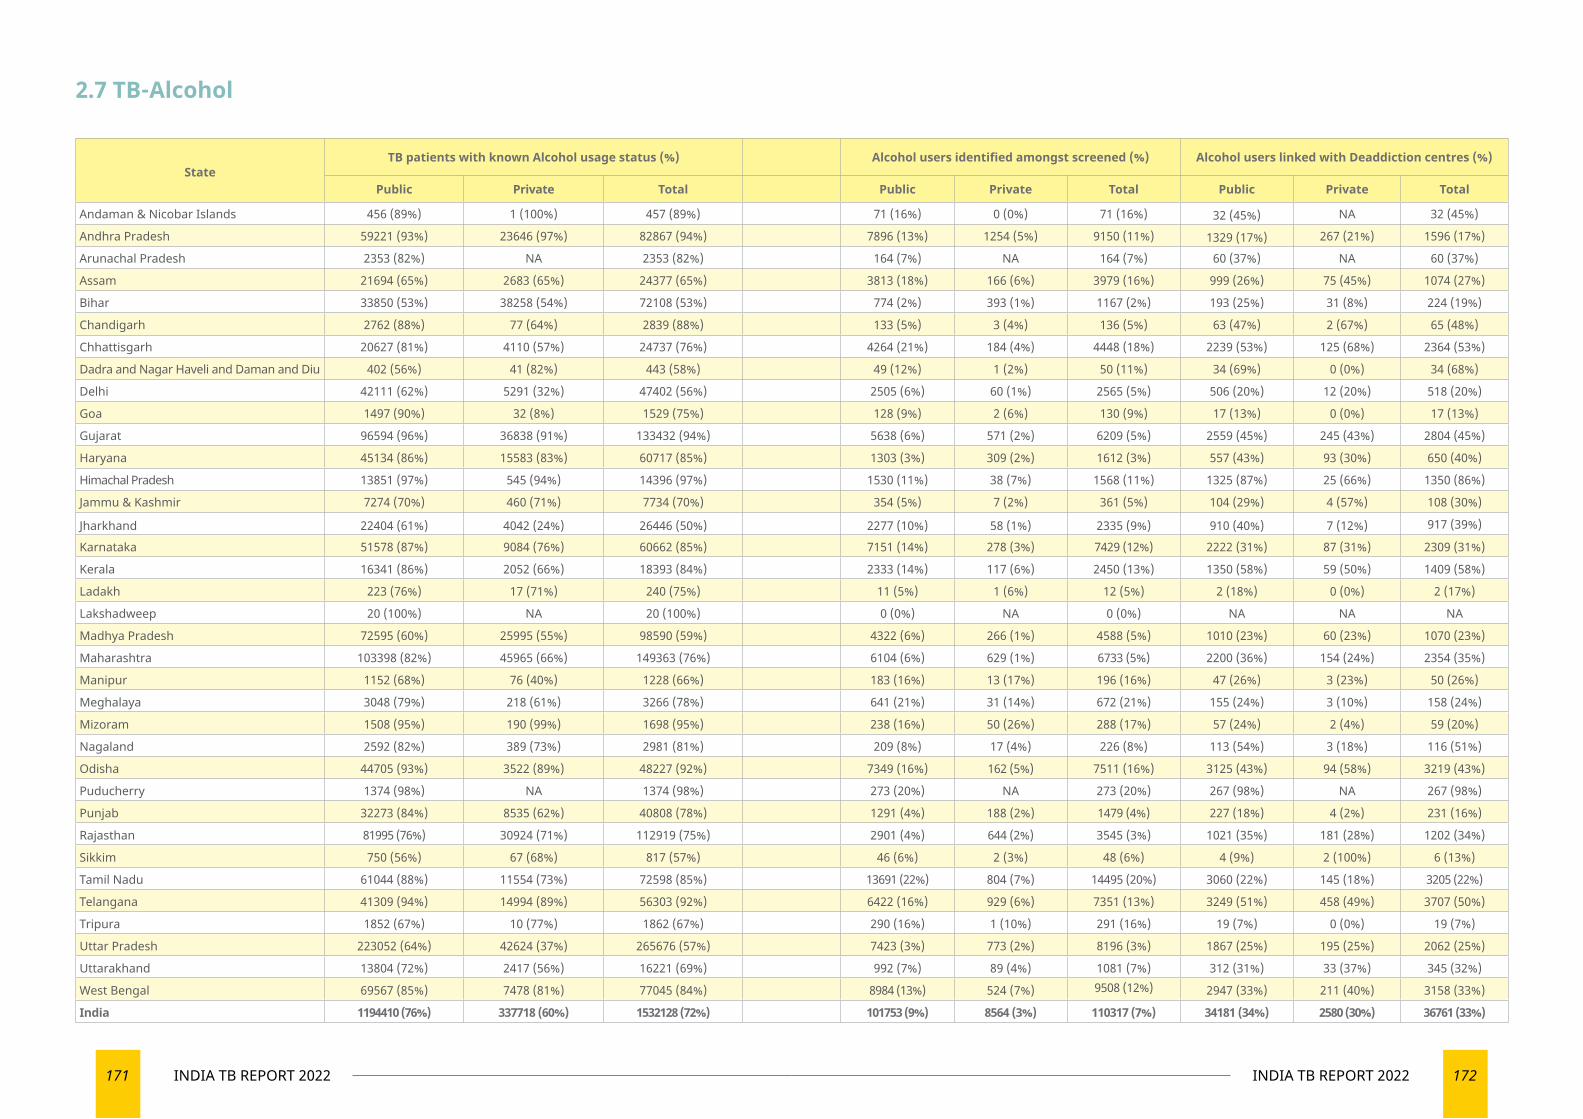
171 INDIA TB REPORT 2022 172INDIA TB REPORT 2022
2.7 TB-Alcohol
StateTB patients with known Alcohol usage status (%) Alcohol users identified amongst screened (%) Alcohol users linked with Deaddiction centres (%)
Public Private Total Public Private Total Public Private Total
Andaman & Nicobar Islands 456 (89%) 1 (100%) 457 (89%) 71 (16%) 0 (0%) 71 (16%) 32 (45%) NA 32 (45%)
Andhra Pradesh 59221 (93%) 23646 (97%) 82867 (94%) 7896 (13%) 1254 (5%) 9150 (11%) 1329 (17%) 267 (21%) 1596 (17%)
Arunachal Pradesh 2353 (82%) NA 2353 (82%) 164 (7%) NA 164 (7%) 60 (37%) NA 60 (37%)
Assam 21694 (65%) 2683 (65%) 24377 (65%) 3813 (18%) 166 (6%) 3979 (16%) 999 (26%) 75 (45%) 1074 (27%)
Bihar 33850 (53%) 38258 (54%) 72108 (53%) 774 (2%) 393 (1%) 1167 (2%) 193 (25%) 31 (8%) 224 (19%)
Chandigarh 2762 (88%) 77 (64%) 2839 (88%) 133 (5%) 3 (4%) 136 (5%) 63 (47%) 2 (67%) 65 (48%)
Chhattisgarh 20627 (81%) 4110 (57%) 24737 (76%) 4264 (21%) 184 (4%) 4448 (18%) 2239 (53%) 125 (68%) 2364 (53%)
Dadra and Nagar Haveli and Daman and Diu 402 (56%) 41 (82%) 443 (58%) 49 (12%) 1 (2%) 50 (11%) 34 (69%) 0 (0%) 34 (68%)
Delhi 42111 (62%) 5291 (32%) 47402 (56%) 2505 (6%) 60 (1%) 2565 (5%) 506 (20%) 12 (20%) 518 (20%)
Goa 1497 (90%) 32 (8%) 1529 (75%) 128 (9%) 2 (6%) 130 (9%) 17 (13%) 0 (0%) 17 (13%)
Gujarat 96594 (96%) 36838 (91%) 133432 (94%) 5638 (6%) 571 (2%) 6209 (5%) 2559 (45%) 245 (43%) 2804 (45%)
Haryana 45134 (86%) 15583 (83%) 60717 (85%) 1303 (3%) 309 (2%) 1612 (3%) 557 (43%) 93 (30%) 650 (40%)
Himachal Pradesh 13851 (97%) 545 (94%) 14396 (97%) 1530 (11%) 38 (7%) 1568 (11%) 1325 (87%) 25 (66%) 1350 (86%)
Jammu & Kashmir 7274 (70%) 460 (71%) 7734 (70%) 354 (5%) 7 (2%) 361 (5%) 104 (29%) 4 (57%) 108 (30%)
Jharkhand 22404 (61%) 4042 (24%) 26446 (50%) 2277 (10%) 58 (1%) 2335 (9%) 910 (40%) 7 (12%) 917 (39%)
Karnataka 51578 (87%) 9084 (76%) 60662 (85%) 7151 (14%) 278 (3%) 7429 (12%) 2222 (31%) 87 (31%) 2309 (31%)
Kerala 16341 (86%) 2052 (66%) 18393 (84%) 2333 (14%) 117 (6%) 2450 (13%) 1350 (58%) 59 (50%) 1409 (58%)
Ladakh 223 (76%) 17 (71%) 240 (75%) 11 (5%) 1 (6%) 12 (5%) 2 (18%) 0 (0%) 2 (17%)
Lakshadweep 20 (100%) NA 20 (100%) 0 (0%) NA 0 (0%) NA NA NA
Madhya Pradesh 72595 (60%) 25995 (55%) 98590 (59%) 4322 (6%) 266 (1%) 4588 (5%) 1010 (23%) 60 (23%) 1070 (23%)
Maharashtra 103398 (82%) 45965 (66%) 149363 (76%) 6104 (6%) 629 (1%) 6733 (5%) 2200 (36%) 154 (24%) 2354 (35%)
Manipur 1152 (68%) 76 (40%) 1228 (66%) 183 (16%) 13 (17%) 196 (16%) 47 (26%) 3 (23%) 50 (26%)
Meghalaya 3048 (79%) 218 (61%) 3266 (78%) 641 (21%) 31 (14%) 672 (21%) 155 (24%) 3 (10%) 158 (24%)
Mizoram 1508 (95%) 190 (99%) 1698 (95%) 238 (16%) 50 (26%) 288 (17%) 57 (24%) 2 (4%) 59 (20%)
Nagaland 2592 (82%) 389 (73%) 2981 (81%) 209 (8%) 17 (4%) 226 (8%) 113 (54%) 3 (18%) 116 (51%)
Odisha 44705 (93%) 3522 (89%) 48227 (92%) 7349 (16%) 162 (5%) 7511 (16%) 3125 (43%) 94 (58%) 3219 (43%)
Puducherry 1374 (98%) NA 1374 (98%) 273 (20%) NA 273 (20%) 267 (98%) NA 267 (98%)
Punjab 32273 (84%) 8535 (62%) 40808 (78%) 1291 (4%) 188 (2%) 1479 (4%) 227 (18%) 4 (2%) 231 (16%)
Rajasthan 81995 (76%) 30924 (71%) 112919 (75%) 2901 (4%) 644 (2%) 3545 (3%) 1021 (35%) 181 (28%) 1202 (34%)
Sikkim 750 (56%) 67 (68%) 817 (57%) 46 (6%) 2 (3%) 48 (6%) 4 (9%) 2 (100%) 6 (13%)
Tamil Nadu 61044 (88%) 11554 (73%) 72598 (85%) 13691 (22%) 804 (7%) 14495 (20%) 3060 (22%) 145 (18%) 3205 (22%)
Telangana 41309 (94%) 14994 (89%) 56303 (92%) 6422 (16%) 929 (6%) 7351 (13%) 3249 (51%) 458 (49%) 3707 (50%)
Tripura 1852 (67%) 10 (77%) 1862 (67%) 290 (16%) 1 (10%) 291 (16%) 19 (7%) 0 (0%) 19 (7%)
Uttar Pradesh 223052 (64%) 42624 (37%) 265676 (57%) 7423 (3%) 773 (2%) 8196 (3%) 1867 (25%) 195 (25%) 2062 (25%)
Uttarakhand 13804 (72%) 2417 (56%) 16221 (69%) 992 (7%) 89 (4%) 1081 (7%) 312 (31%) 33 (37%) 345 (32%)
West Bengal 69567 (85%) 7478 (81%) 77045 (84%) 8984 (13%) 524 (7%) 9508 (12%) 2947 (33%) 211 (40%) 3158 (33%)
India 1194410 (76%) 337718 (60%) 1532128 (72%) 101753 (9%) 8564 (3%) 110317 (7%) 34181 (34%) 2580 (30%) 36761 (33%)
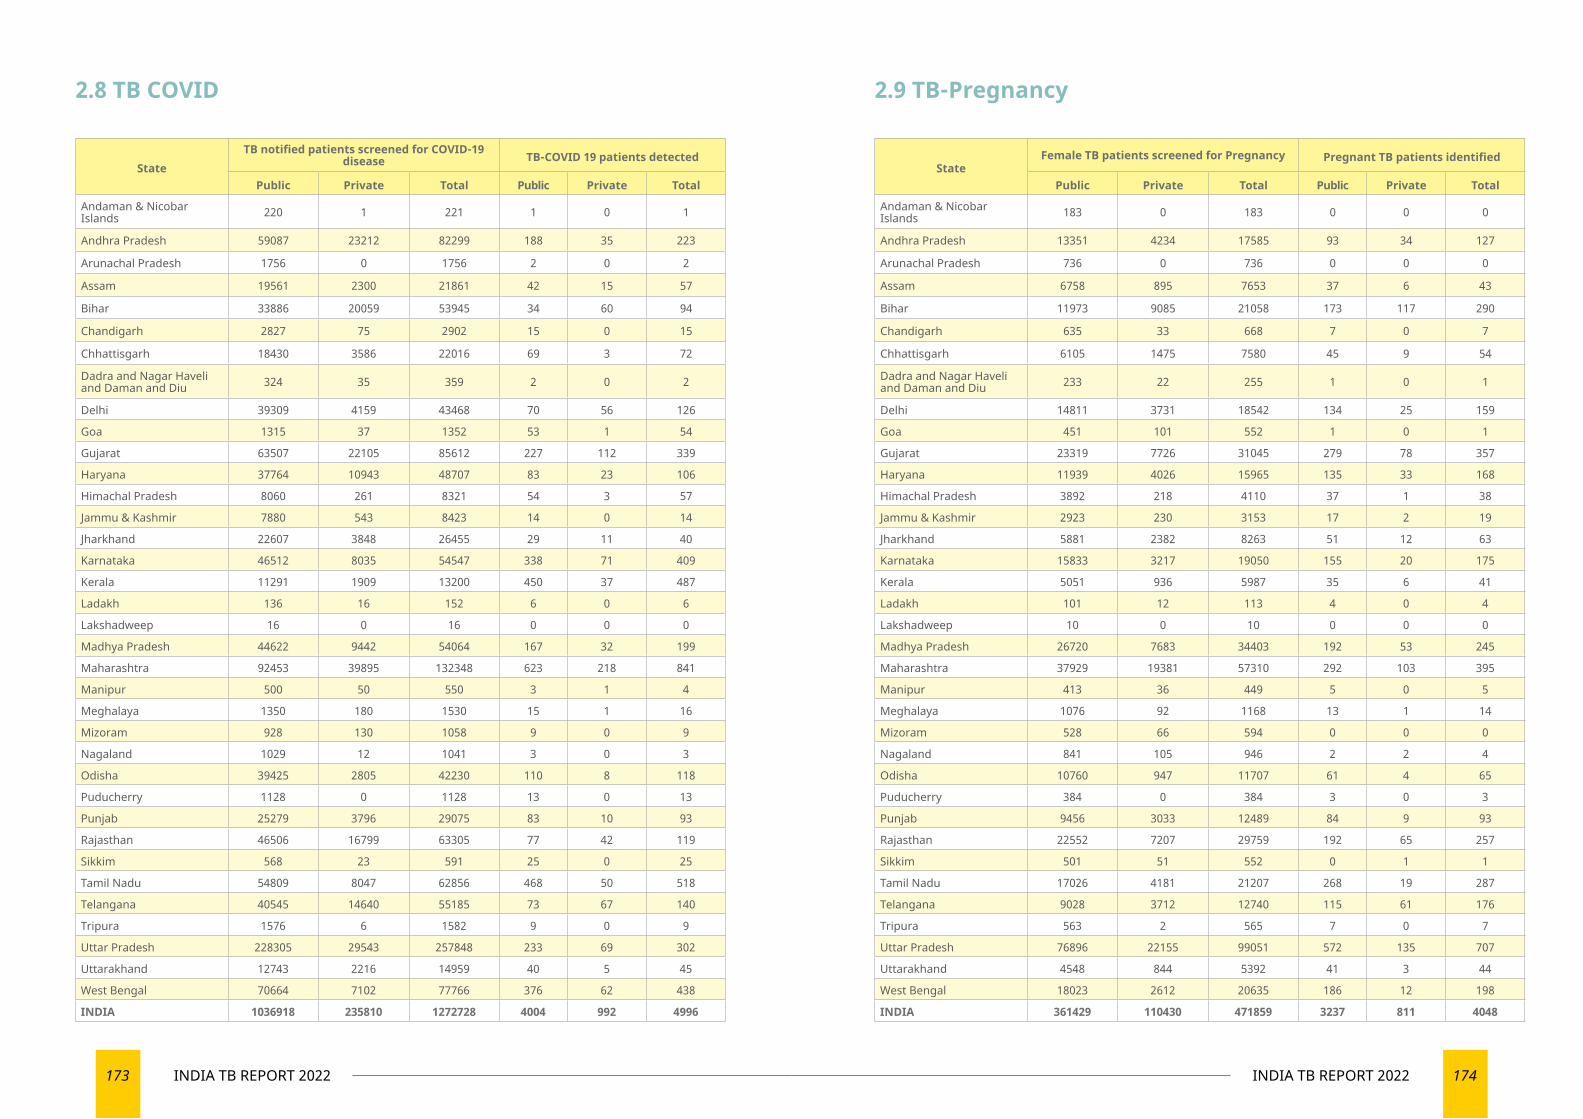
173 INDIA TB REPORT 2022 174INDIA TB REPORT 2022
StateFemale TB patients screened for Pregnancy Pregnant TB patients identified
Public Private Total Public Private Total
Andaman & Nicobar Islands 183 0 183 0 0 0
Andhra Pradesh 13351 4234 17585 93 34 127
Arunachal Pradesh 736 0 736 0 0 0
Assam 6758 895 7653 37 6 43
Bihar 11973 9085 21058 173 117 290
Chandigarh 635 33 668 7 0 7
Chhattisgarh 6105 1475 7580 45 9 54
Dadra and Nagar Haveli and Daman and Diu 233 22 255 1 0 1
Delhi 14811 3731 18542 134 25 159
Goa 451 101 552 1 0 1
Gujarat 23319 7726 31045 279 78 357
Haryana 11939 4026 15965 135 33 168
Himachal Pradesh 3892 218 4110 37 1 38
Jammu & Kashmir 2923 230 3153 17 2 19
Jharkhand 5881 2382 8263 51 12 63
Karnataka 15833 3217 19050 155 20 175
Kerala 5051 936 5987 35 6 41
Ladakh 101 12 113 4 0 4
Lakshadweep 10 0 10 0 0 0
Madhya Pradesh 26720 7683 34403 192 53 245
Maharashtra 37929 19381 57310 292 103 395
Manipur 413 36 449 5 0 5
Meghalaya 1076 92 1168 13 1 14
Mizoram 528 66 594 0 0 0
Nagaland 841 105 946 2 2 4
Odisha 10760 947 11707 61 4 65
Puducherry 384 0 384 3 0 3
Punjab 9456 3033 12489 84 9 93
Rajasthan 22552 7207 29759 192 65 257
Sikkim 501 51 552 0 1 1
Tamil Nadu 17026 4181 21207 268 19 287
Telangana 9028 3712 12740 115 61 176
Tripura 563 2 565 7 0 7
Uttar Pradesh 76896 22155 99051 572 135 707
Uttarakhand 4548 844 5392 41 3 44
West Bengal 18023 2612 20635 186 12 198
INDIA 361429 110430 471859 3237 811 4048
2.9 TB-Pregnancy
StateTB notified patients screened for COVID-19
disease TB-COVID 19 patients detected
Public Private Total Public Private Total
Andaman & Nicobar Islands 220 1 221 1 0 1
Andhra Pradesh 59087 23212 82299 188 35 223
Arunachal Pradesh 1756 0 1756 2 0 2
Assam 19561 2300 21861 42 15 57
Bihar 33886 20059 53945 34 60 94
Chandigarh 2827 75 2902 15 0 15
Chhattisgarh 18430 3586 22016 69 3 72
Dadra and Nagar Haveli and Daman and Diu 324 35 359 2 0 2
Delhi 39309 4159 43468 70 56 126
Goa 1315 37 1352 53 1 54
Gujarat 63507 22105 85612 227 112 339
Haryana 37764 10943 48707 83 23 106
Himachal Pradesh 8060 261 8321 54 3 57
Jammu & Kashmir 7880 543 8423 14 0 14
Jharkhand 22607 3848 26455 29 11 40
Karnataka 46512 8035 54547 338 71 409
Kerala 11291 1909 13200 450 37 487
Ladakh 136 16 152 6 0 6
Lakshadweep 16 0 16 0 0 0
Madhya Pradesh 44622 9442 54064 167 32 199
Maharashtra 92453 39895 132348 623 218 841
Manipur 500 50 550 3 1 4
Meghalaya 1350 180 1530 15 1 16
Mizoram 928 130 1058 9 0 9
Nagaland 1029 12 1041 3 0 3
Odisha 39425 2805 42230 110 8 118
Puducherry 1128 0 1128 13 0 13
Punjab 25279 3796 29075 83 10 93
Rajasthan 46506 16799 63305 77 42 119
Sikkim 568 23 591 25 0 25
Tamil Nadu 54809 8047 62856 468 50 518
Telangana 40545 14640 55185 73 67 140
Tripura 1576 6 1582 9 0 9
Uttar Pradesh 228305 29543 257848 233 69 302
Uttarakhand 12743 2216 14959 40 5 45
West Bengal 70664 7102 77766 376 62 438
INDIA 1036918 235810 1272728 4004 992 4996
2.8 TB COVID
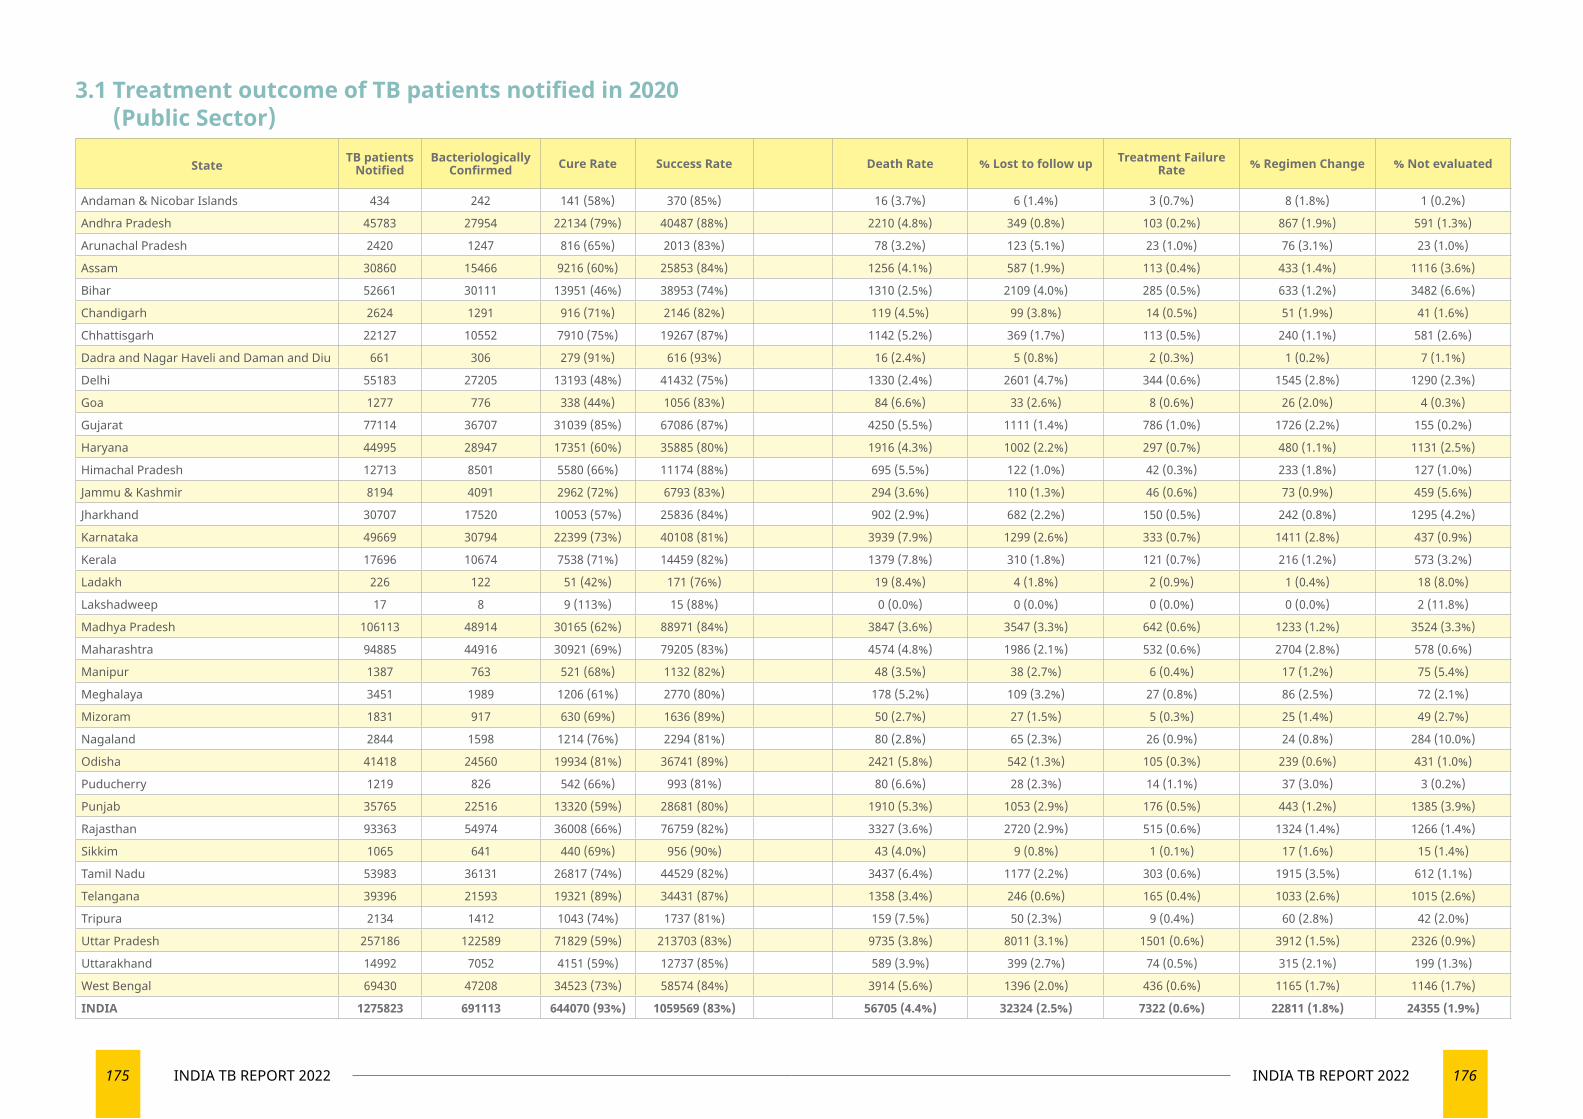
175 INDIA TB REPORT 2022 176INDIA TB REPORT 2022
State TB patients Notified
Bacteriologically Confirmed Cure Rate Success Rate Death Rate % Lost to follow up Treatment Failure
Rate % Regimen Change % Not evaluated
Andaman & Nicobar Islands 434 242 141 (58%) 370 (85%) 16 (3.7%) 6 (1.4%) 3 (0.7%) 8 (1.8%) 1 (0.2%)
Andhra Pradesh 45783 27954 22134 (79%) 40487 (88%) 2210 (4.8%) 349 (0.8%) 103 (0.2%) 867 (1.9%) 591 (1.3%)
Arunachal Pradesh 2420 1247 816 (65%) 2013 (83%) 78 (3.2%) 123 (5.1%) 23 (1.0%) 76 (3.1%) 23 (1.0%)
Assam 30860 15466 9216 (60%) 25853 (84%) 1256 (4.1%) 587 (1.9%) 113 (0.4%) 433 (1.4%) 1116 (3.6%)
Bihar 52661 30111 13951 (46%) 38953 (74%) 1310 (2.5%) 2109 (4.0%) 285 (0.5%) 633 (1.2%) 3482 (6.6%)
Chandigarh 2624 1291 916 (71%) 2146 (82%) 119 (4.5%) 99 (3.8%) 14 (0.5%) 51 (1.9%) 41 (1.6%)
Chhattisgarh 22127 10552 7910 (75%) 19267 (87%) 1142 (5.2%) 369 (1.7%) 113 (0.5%) 240 (1.1%) 581 (2.6%)
Dadra and Nagar Haveli and Daman and Diu 661 306 279 (91%) 616 (93%) 16 (2.4%) 5 (0.8%) 2 (0.3%) 1 (0.2%) 7 (1.1%)
Delhi 55183 27205 13193 (48%) 41432 (75%) 1330 (2.4%) 2601 (4.7%) 344 (0.6%) 1545 (2.8%) 1290 (2.3%)
Goa 1277 776 338 (44%) 1056 (83%) 84 (6.6%) 33 (2.6%) 8 (0.6%) 26 (2.0%) 4 (0.3%)
Gujarat 77114 36707 31039 (85%) 67086 (87%) 4250 (5.5%) 1111 (1.4%) 786 (1.0%) 1726 (2.2%) 155 (0.2%)
Haryana 44995 28947 17351 (60%) 35885 (80%) 1916 (4.3%) 1002 (2.2%) 297 (0.7%) 480 (1.1%) 1131 (2.5%)
Himachal Pradesh 12713 8501 5580 (66%) 11174 (88%) 695 (5.5%) 122 (1.0%) 42 (0.3%) 233 (1.8%) 127 (1.0%)
Jammu & Kashmir 8194 4091 2962 (72%) 6793 (83%) 294 (3.6%) 110 (1.3%) 46 (0.6%) 73 (0.9%) 459 (5.6%)
Jharkhand 30707 17520 10053 (57%) 25836 (84%) 902 (2.9%) 682 (2.2%) 150 (0.5%) 242 (0.8%) 1295 (4.2%)
Karnataka 49669 30794 22399 (73%) 40108 (81%) 3939 (7.9%) 1299 (2.6%) 333 (0.7%) 1411 (2.8%) 437 (0.9%)
Kerala 17696 10674 7538 (71%) 14459 (82%) 1379 (7.8%) 310 (1.8%) 121 (0.7%) 216 (1.2%) 573 (3.2%)
Ladakh 226 122 51 (42%) 171 (76%) 19 (8.4%) 4 (1.8%) 2 (0.9%) 1 (0.4%) 18 (8.0%)
Lakshadweep 17 8 9 (113%) 15 (88%) 0 (0.0%) 0 (0.0%) 0 (0.0%) 0 (0.0%) 2 (11.8%)
Madhya Pradesh 106113 48914 30165 (62%) 88971 (84%) 3847 (3.6%) 3547 (3.3%) 642 (0.6%) 1233 (1.2%) 3524 (3.3%)
Maharashtra 94885 44916 30921 (69%) 79205 (83%) 4574 (4.8%) 1986 (2.1%) 532 (0.6%) 2704 (2.8%) 578 (0.6%)
Manipur 1387 763 521 (68%) 1132 (82%) 48 (3.5%) 38 (2.7%) 6 (0.4%) 17 (1.2%) 75 (5.4%)
Meghalaya 3451 1989 1206 (61%) 2770 (80%) 178 (5.2%) 109 (3.2%) 27 (0.8%) 86 (2.5%) 72 (2.1%)
Mizoram 1831 917 630 (69%) 1636 (89%) 50 (2.7%) 27 (1.5%) 5 (0.3%) 25 (1.4%) 49 (2.7%)
Nagaland 2844 1598 1214 (76%) 2294 (81%) 80 (2.8%) 65 (2.3%) 26 (0.9%) 24 (0.8%) 284 (10.0%)
Odisha 41418 24560 19934 (81%) 36741 (89%) 2421 (5.8%) 542 (1.3%) 105 (0.3%) 239 (0.6%) 431 (1.0%)
Puducherry 1219 826 542 (66%) 993 (81%) 80 (6.6%) 28 (2.3%) 14 (1.1%) 37 (3.0%) 3 (0.2%)
Punjab 35765 22516 13320 (59%) 28681 (80%) 1910 (5.3%) 1053 (2.9%) 176 (0.5%) 443 (1.2%) 1385 (3.9%)
Rajasthan 93363 54974 36008 (66%) 76759 (82%) 3327 (3.6%) 2720 (2.9%) 515 (0.6%) 1324 (1.4%) 1266 (1.4%)
Sikkim 1065 641 440 (69%) 956 (90%) 43 (4.0%) 9 (0.8%) 1 (0.1%) 17 (1.6%) 15 (1.4%)
Tamil Nadu 53983 36131 26817 (74%) 44529 (82%) 3437 (6.4%) 1177 (2.2%) 303 (0.6%) 1915 (3.5%) 612 (1.1%)
Telangana 39396 21593 19321 (89%) 34431 (87%) 1358 (3.4%) 246 (0.6%) 165 (0.4%) 1033 (2.6%) 1015 (2.6%)
Tripura 2134 1412 1043 (74%) 1737 (81%) 159 (7.5%) 50 (2.3%) 9 (0.4%) 60 (2.8%) 42 (2.0%)
Uttar Pradesh 257186 122589 71829 (59%) 213703 (83%) 9735 (3.8%) 8011 (3.1%) 1501 (0.6%) 3912 (1.5%) 2326 (0.9%)
Uttarakhand 14992 7052 4151 (59%) 12737 (85%) 589 (3.9%) 399 (2.7%) 74 (0.5%) 315 (2.1%) 199 (1.3%)
West Bengal 69430 47208 34523 (73%) 58574 (84%) 3914 (5.6%) 1396 (2.0%) 436 (0.6%) 1165 (1.7%) 1146 (1.7%)
INDIA 1275823 691113 644070 (93%) 1059569 (83%) 56705 (4.4%) 32324 (2.5%) 7322 (0.6%) 22811 (1.8%) 24355 (1.9%)
3.1 Treatment outcome of TB patients notified in 2020 (Public Sector)
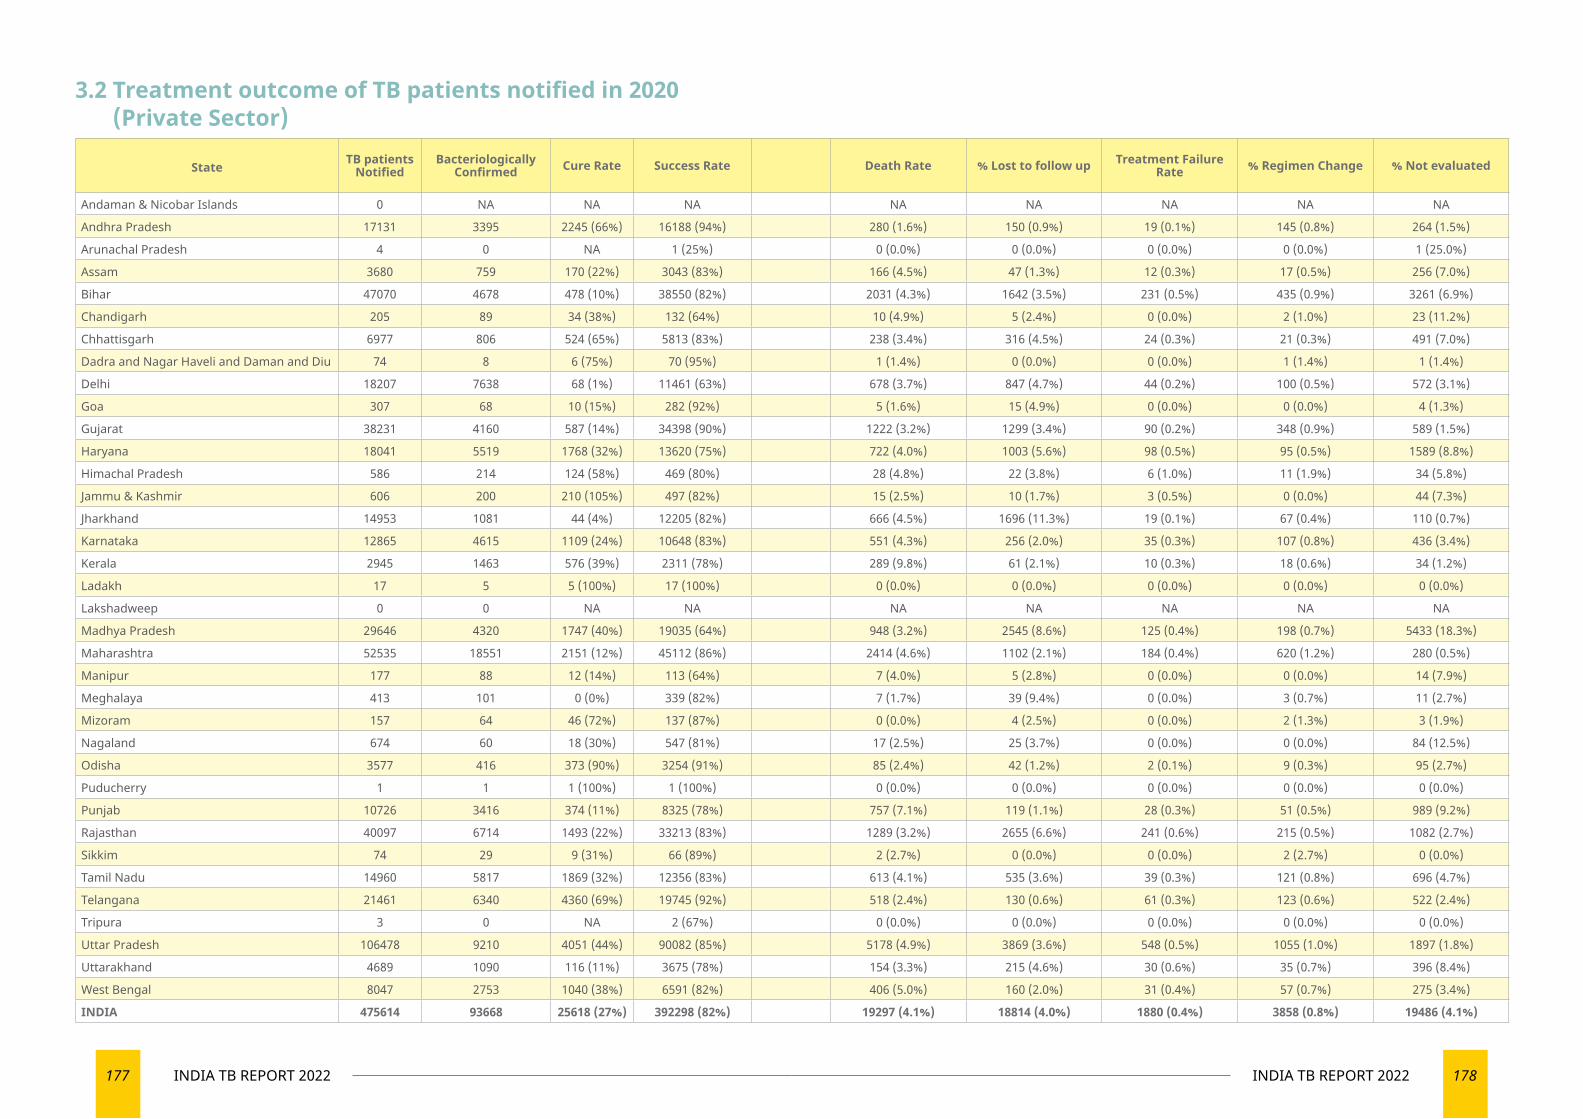
177 INDIA TB REPORT 2022 178INDIA TB REPORT 2022
3.2 Treatment outcome of TB patients notified in 2020 (Private Sector)
State TB patients Notified
Bacteriologically Confirmed Cure Rate Success Rate Death Rate % Lost to follow up Treatment Failure
Rate % Regimen Change % Not evaluated
Andaman & Nicobar Islands 0 NA NA NA NA NA NA NA NA
Andhra Pradesh 17131 3395 2245 (66%) 16188 (94%) 280 (1.6%) 150 (0.9%) 19 (0.1%) 145 (0.8%) 264 (1.5%)
Arunachal Pradesh 4 0 NA 1 (25%) 0 (0.0%) 0 (0.0%) 0 (0.0%) 0 (0.0%) 1 (25.0%)
Assam 3680 759 170 (22%) 3043 (83%) 166 (4.5%) 47 (1.3%) 12 (0.3%) 17 (0.5%) 256 (7.0%)
Bihar 47070 4678 478 (10%) 38550 (82%) 2031 (4.3%) 1642 (3.5%) 231 (0.5%) 435 (0.9%) 3261 (6.9%)
Chandigarh 205 89 34 (38%) 132 (64%) 10 (4.9%) 5 (2.4%) 0 (0.0%) 2 (1.0%) 23 (11.2%)
Chhattisgarh 6977 806 524 (65%) 5813 (83%) 238 (3.4%) 316 (4.5%) 24 (0.3%) 21 (0.3%) 491 (7.0%)
Dadra and Nagar Haveli and Daman and Diu 74 8 6 (75%) 70 (95%) 1 (1.4%) 0 (0.0%) 0 (0.0%) 1 (1.4%) 1 (1.4%)
Delhi 18207 7638 68 (1%) 11461 (63%) 678 (3.7%) 847 (4.7%) 44 (0.2%) 100 (0.5%) 572 (3.1%)
Goa 307 68 10 (15%) 282 (92%) 5 (1.6%) 15 (4.9%) 0 (0.0%) 0 (0.0%) 4 (1.3%)
Gujarat 38231 4160 587 (14%) 34398 (90%) 1222 (3.2%) 1299 (3.4%) 90 (0.2%) 348 (0.9%) 589 (1.5%)
Haryana 18041 5519 1768 (32%) 13620 (75%) 722 (4.0%) 1003 (5.6%) 98 (0.5%) 95 (0.5%) 1589 (8.8%)
Himachal Pradesh 586 214 124 (58%) 469 (80%) 28 (4.8%) 22 (3.8%) 6 (1.0%) 11 (1.9%) 34 (5.8%)
Jammu & Kashmir 606 200 210 (105%) 497 (82%) 15 (2.5%) 10 (1.7%) 3 (0.5%) 0 (0.0%) 44 (7.3%)
Jharkhand 14953 1081 44 (4%) 12205 (82%) 666 (4.5%) 1696 (11.3%) 19 (0.1%) 67 (0.4%) 110 (0.7%)
Karnataka 12865 4615 1109 (24%) 10648 (83%) 551 (4.3%) 256 (2.0%) 35 (0.3%) 107 (0.8%) 436 (3.4%)
Kerala 2945 1463 576 (39%) 2311 (78%) 289 (9.8%) 61 (2.1%) 10 (0.3%) 18 (0.6%) 34 (1.2%)
Ladakh 17 5 5 (100%) 17 (100%) 0 (0.0%) 0 (0.0%) 0 (0.0%) 0 (0.0%) 0 (0.0%)
Lakshadweep 0 0 NA NA NA NA NA NA NA
Madhya Pradesh 29646 4320 1747 (40%) 19035 (64%) 948 (3.2%) 2545 (8.6%) 125 (0.4%) 198 (0.7%) 5433 (18.3%)
Maharashtra 52535 18551 2151 (12%) 45112 (86%) 2414 (4.6%) 1102 (2.1%) 184 (0.4%) 620 (1.2%) 280 (0.5%)
Manipur 177 88 12 (14%) 113 (64%) 7 (4.0%) 5 (2.8%) 0 (0.0%) 0 (0.0%) 14 (7.9%)
Meghalaya 413 101 0 (0%) 339 (82%) 7 (1.7%) 39 (9.4%) 0 (0.0%) 3 (0.7%) 11 (2.7%)
Mizoram 157 64 46 (72%) 137 (87%) 0 (0.0%) 4 (2.5%) 0 (0.0%) 2 (1.3%) 3 (1.9%)
Nagaland 674 60 18 (30%) 547 (81%) 17 (2.5%) 25 (3.7%) 0 (0.0%) 0 (0.0%) 84 (12.5%)
Odisha 3577 416 373 (90%) 3254 (91%) 85 (2.4%) 42 (1.2%) 2 (0.1%) 9 (0.3%) 95 (2.7%)
Puducherry 1 1 1 (100%) 1 (100%) 0 (0.0%) 0 (0.0%) 0 (0.0%) 0 (0.0%) 0 (0.0%)
Punjab 10726 3416 374 (11%) 8325 (78%) 757 (7.1%) 119 (1.1%) 28 (0.3%) 51 (0.5%) 989 (9.2%)
Rajasthan 40097 6714 1493 (22%) 33213 (83%) 1289 (3.2%) 2655 (6.6%) 241 (0.6%) 215 (0.5%) 1082 (2.7%)
Sikkim 74 29 9 (31%) 66 (89%) 2 (2.7%) 0 (0.0%) 0 (0.0%) 2 (2.7%) 0 (0.0%)
Tamil Nadu 14960 5817 1869 (32%) 12356 (83%) 613 (4.1%) 535 (3.6%) 39 (0.3%) 121 (0.8%) 696 (4.7%)
Telangana 21461 6340 4360 (69%) 19745 (92%) 518 (2.4%) 130 (0.6%) 61 (0.3%) 123 (0.6%) 522 (2.4%)
Tripura 3 0 NA 2 (67%) 0 (0.0%) 0 (0.0%) 0 (0.0%) 0 (0.0%) 0 (0.0%)
Uttar Pradesh 106478 9210 4051 (44%) 90082 (85%) 5178 (4.9%) 3869 (3.6%) 548 (0.5%) 1055 (1.0%) 1897 (1.8%)
Uttarakhand 4689 1090 116 (11%) 3675 (78%) 154 (3.3%) 215 (4.6%) 30 (0.6%) 35 (0.7%) 396 (8.4%)
West Bengal 8047 2753 1040 (38%) 6591 (82%) 406 (5.0%) 160 (2.0%) 31 (0.4%) 57 (0.7%) 275 (3.4%)
INDIA 475614 93668 25618 (27%) 392298 (82%) 19297 (4.1%) 18814 (4.0%) 1880 (0.4%) 3858 (0.8%) 19486 (4.1%)
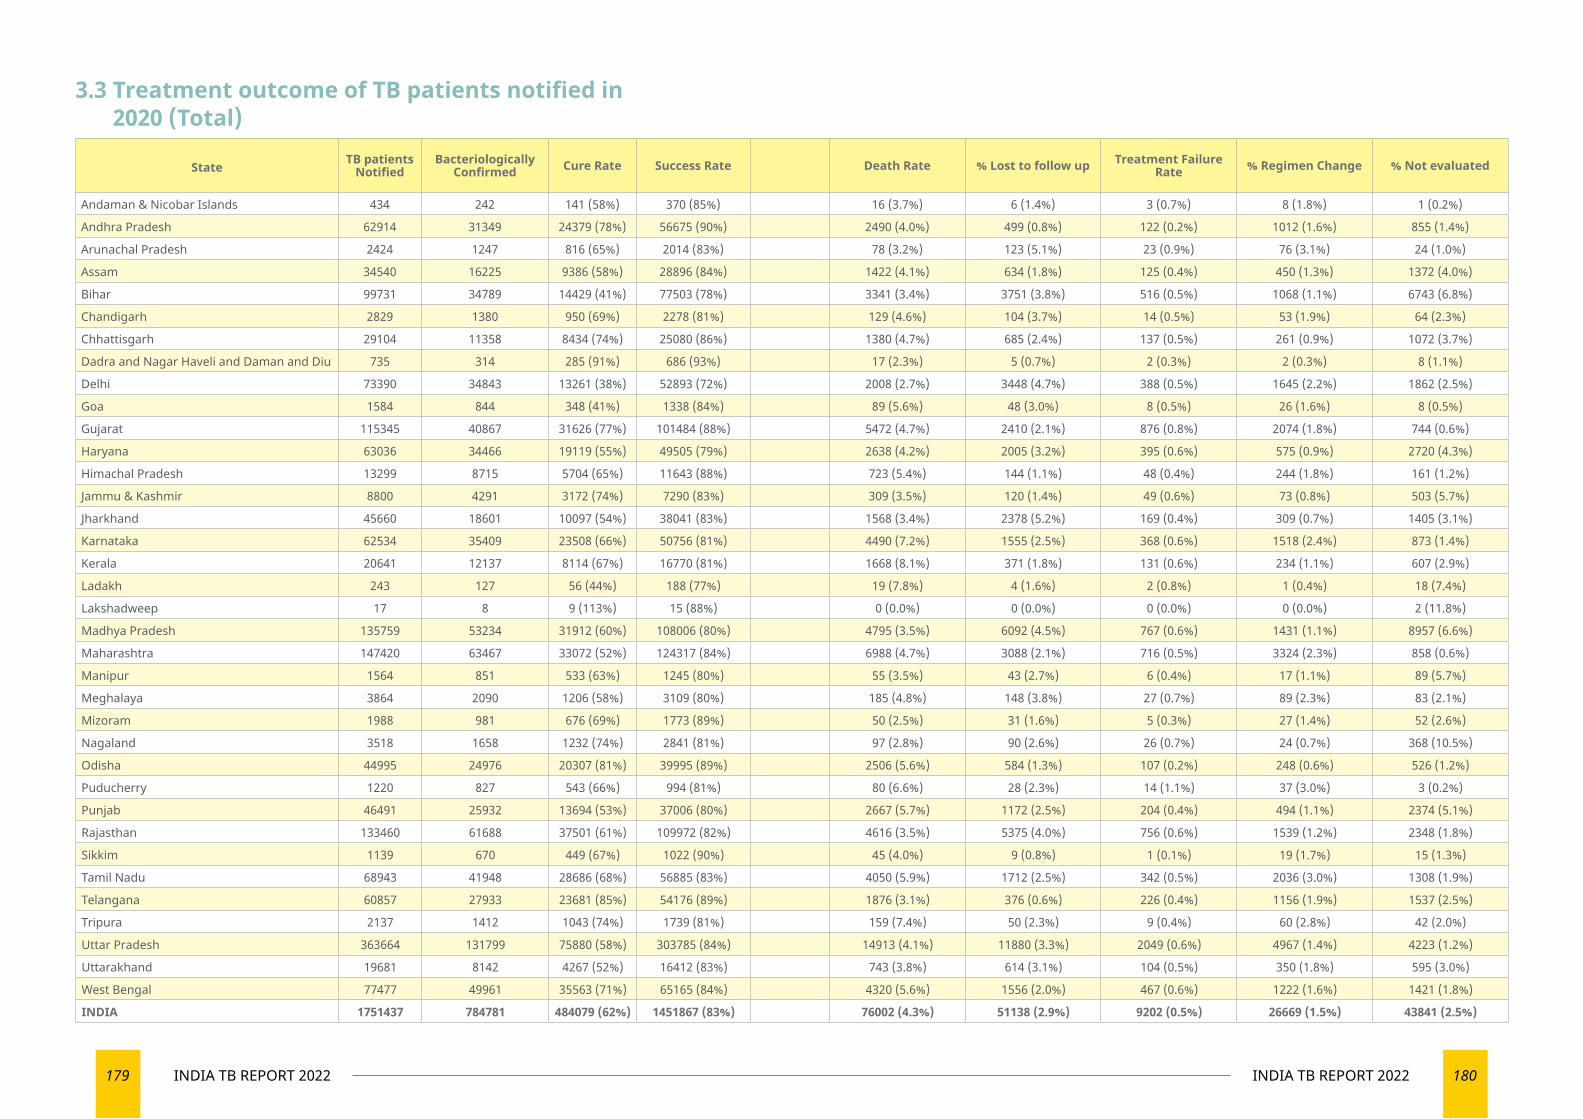
179 INDIA TB REPORT 2022 180INDIA TB REPORT 2022
3.3 Treatment outcome of TB patients notified in 2020 (Total)
State TB patients Notified
Bacteriologically Confirmed Cure Rate Success Rate Death Rate % Lost to follow up Treatment Failure
Rate % Regimen Change % Not evaluated
Andaman & Nicobar Islands 434 242 141 (58%) 370 (85%) 16 (3.7%) 6 (1.4%) 3 (0.7%) 8 (1.8%) 1 (0.2%)
Andhra Pradesh 62914 31349 24379 (78%) 56675 (90%) 2490 (4.0%) 499 (0.8%) 122 (0.2%) 1012 (1.6%) 855 (1.4%)
Arunachal Pradesh 2424 1247 816 (65%) 2014 (83%) 78 (3.2%) 123 (5.1%) 23 (0.9%) 76 (3.1%) 24 (1.0%)
Assam 34540 16225 9386 (58%) 28896 (84%) 1422 (4.1%) 634 (1.8%) 125 (0.4%) 450 (1.3%) 1372 (4.0%)
Bihar 99731 34789 14429 (41%) 77503 (78%) 3341 (3.4%) 3751 (3.8%) 516 (0.5%) 1068 (1.1%) 6743 (6.8%)
Chandigarh 2829 1380 950 (69%) 2278 (81%) 129 (4.6%) 104 (3.7%) 14 (0.5%) 53 (1.9%) 64 (2.3%)
Chhattisgarh 29104 11358 8434 (74%) 25080 (86%) 1380 (4.7%) 685 (2.4%) 137 (0.5%) 261 (0.9%) 1072 (3.7%)
Dadra and Nagar Haveli and Daman and Diu 735 314 285 (91%) 686 (93%) 17 (2.3%) 5 (0.7%) 2 (0.3%) 2 (0.3%) 8 (1.1%)
Delhi 73390 34843 13261 (38%) 52893 (72%) 2008 (2.7%) 3448 (4.7%) 388 (0.5%) 1645 (2.2%) 1862 (2.5%)
Goa 1584 844 348 (41%) 1338 (84%) 89 (5.6%) 48 (3.0%) 8 (0.5%) 26 (1.6%) 8 (0.5%)
Gujarat 115345 40867 31626 (77%) 101484 (88%) 5472 (4.7%) 2410 (2.1%) 876 (0.8%) 2074 (1.8%) 744 (0.6%)
Haryana 63036 34466 19119 (55%) 49505 (79%) 2638 (4.2%) 2005 (3.2%) 395 (0.6%) 575 (0.9%) 2720 (4.3%)
Himachal Pradesh 13299 8715 5704 (65%) 11643 (88%) 723 (5.4%) 144 (1.1%) 48 (0.4%) 244 (1.8%) 161 (1.2%)
Jammu & Kashmir 8800 4291 3172 (74%) 7290 (83%) 309 (3.5%) 120 (1.4%) 49 (0.6%) 73 (0.8%) 503 (5.7%)
Jharkhand 45660 18601 10097 (54%) 38041 (83%) 1568 (3.4%) 2378 (5.2%) 169 (0.4%) 309 (0.7%) 1405 (3.1%)
Karnataka 62534 35409 23508 (66%) 50756 (81%) 4490 (7.2%) 1555 (2.5%) 368 (0.6%) 1518 (2.4%) 873 (1.4%)
Kerala 20641 12137 8114 (67%) 16770 (81%) 1668 (8.1%) 371 (1.8%) 131 (0.6%) 234 (1.1%) 607 (2.9%)
Ladakh 243 127 56 (44%) 188 (77%) 19 (7.8%) 4 (1.6%) 2 (0.8%) 1 (0.4%) 18 (7.4%)
Lakshadweep 17 8 9 (113%) 15 (88%) 0 (0.0%) 0 (0.0%) 0 (0.0%) 0 (0.0%) 2 (11.8%)
Madhya Pradesh 135759 53234 31912 (60%) 108006 (80%) 4795 (3.5%) 6092 (4.5%) 767 (0.6%) 1431 (1.1%) 8957 (6.6%)
Maharashtra 147420 63467 33072 (52%) 124317 (84%) 6988 (4.7%) 3088 (2.1%) 716 (0.5%) 3324 (2.3%) 858 (0.6%)
Manipur 1564 851 533 (63%) 1245 (80%) 55 (3.5%) 43 (2.7%) 6 (0.4%) 17 (1.1%) 89 (5.7%)
Meghalaya 3864 2090 1206 (58%) 3109 (80%) 185 (4.8%) 148 (3.8%) 27 (0.7%) 89 (2.3%) 83 (2.1%)
Mizoram 1988 981 676 (69%) 1773 (89%) 50 (2.5%) 31 (1.6%) 5 (0.3%) 27 (1.4%) 52 (2.6%)
Nagaland 3518 1658 1232 (74%) 2841 (81%) 97 (2.8%) 90 (2.6%) 26 (0.7%) 24 (0.7%) 368 (10.5%)
Odisha 44995 24976 20307 (81%) 39995 (89%) 2506 (5.6%) 584 (1.3%) 107 (0.2%) 248 (0.6%) 526 (1.2%)
Puducherry 1220 827 543 (66%) 994 (81%) 80 (6.6%) 28 (2.3%) 14 (1.1%) 37 (3.0%) 3 (0.2%)
Punjab 46491 25932 13694 (53%) 37006 (80%) 2667 (5.7%) 1172 (2.5%) 204 (0.4%) 494 (1.1%) 2374 (5.1%)
Rajasthan 133460 61688 37501 (61%) 109972 (82%) 4616 (3.5%) 5375 (4.0%) 756 (0.6%) 1539 (1.2%) 2348 (1.8%)
Sikkim 1139 670 449 (67%) 1022 (90%) 45 (4.0%) 9 (0.8%) 1 (0.1%) 19 (1.7%) 15 (1.3%)
Tamil Nadu 68943 41948 28686 (68%) 56885 (83%) 4050 (5.9%) 1712 (2.5%) 342 (0.5%) 2036 (3.0%) 1308 (1.9%)
Telangana 60857 27933 23681 (85%) 54176 (89%) 1876 (3.1%) 376 (0.6%) 226 (0.4%) 1156 (1.9%) 1537 (2.5%)
Tripura 2137 1412 1043 (74%) 1739 (81%) 159 (7.4%) 50 (2.3%) 9 (0.4%) 60 (2.8%) 42 (2.0%)
Uttar Pradesh 363664 131799 75880 (58%) 303785 (84%) 14913 (4.1%) 11880 (3.3%) 2049 (0.6%) 4967 (1.4%) 4223 (1.2%)
Uttarakhand 19681 8142 4267 (52%) 16412 (83%) 743 (3.8%) 614 (3.1%) 104 (0.5%) 350 (1.8%) 595 (3.0%)
West Bengal 77477 49961 35563 (71%) 65165 (84%) 4320 (5.6%) 1556 (2.0%) 467 (0.6%) 1222 (1.6%) 1421 (1.8%)
INDIA 1751437 784781 484079 (62%) 1451867 (83%) 76002 (4.3%) 51138 (2.9%) 9202 (0.5%) 26669 (1.5%) 43841 (2.5%)
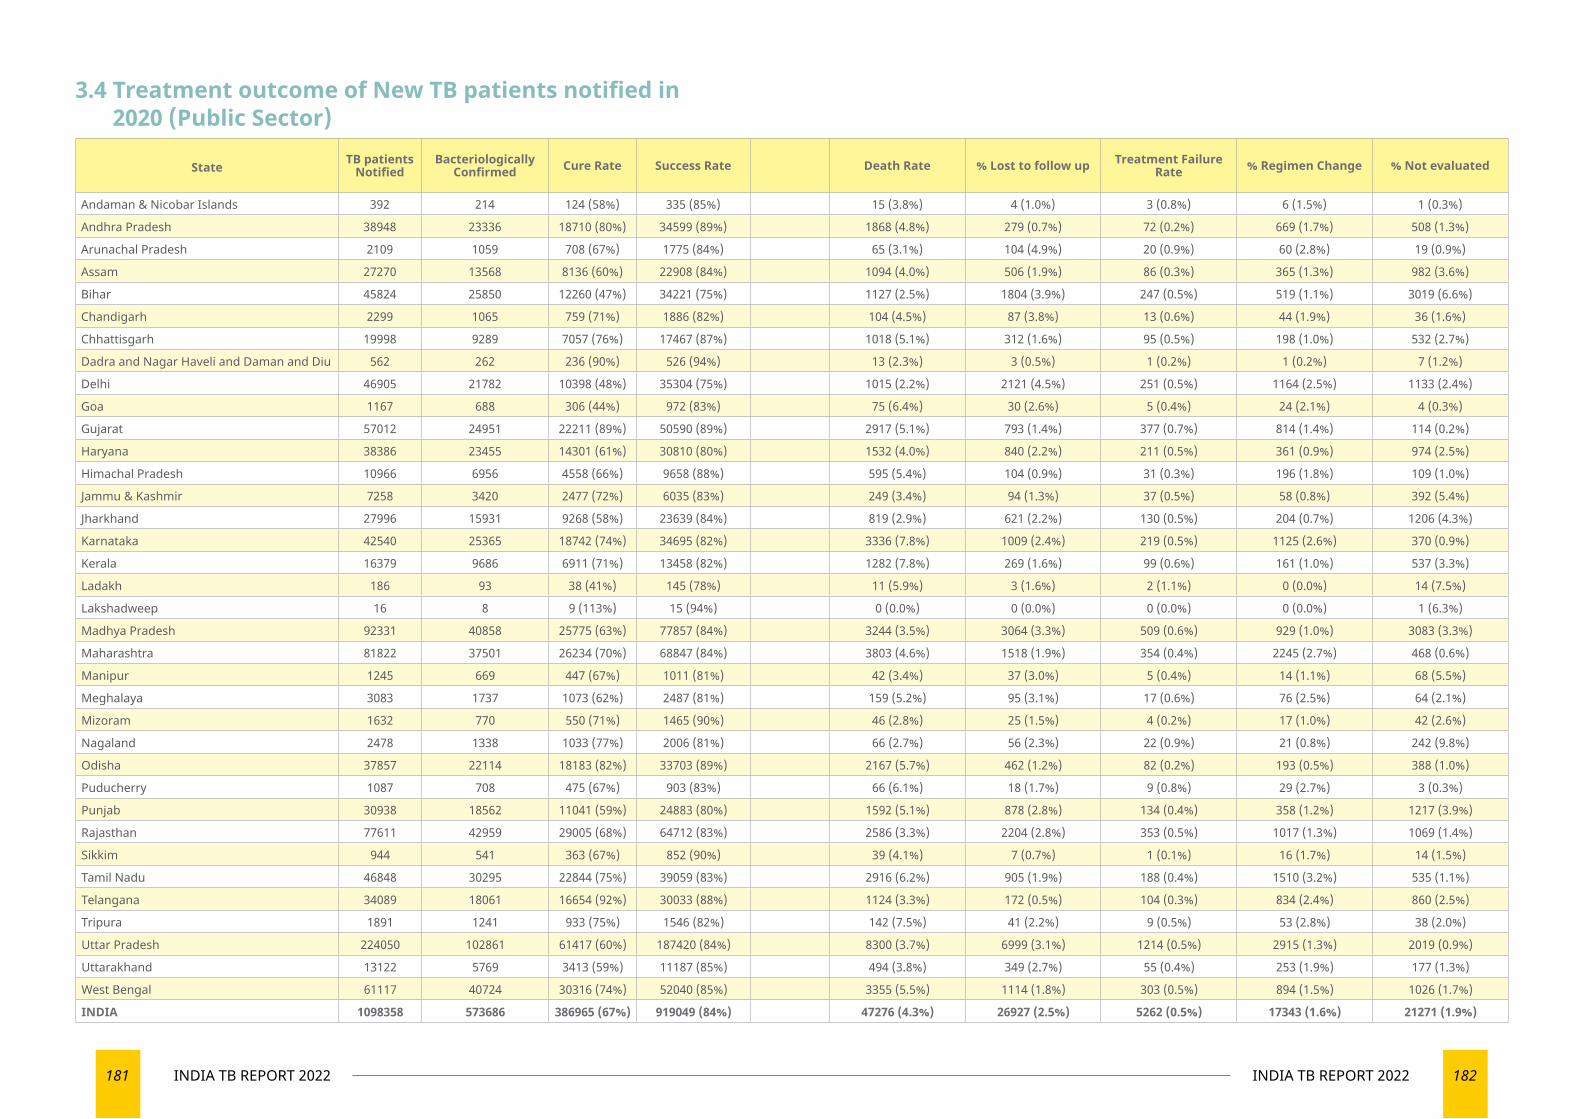
181 INDIA TB REPORT 2022 182INDIA TB REPORT 2022
3.4 Treatment outcome of New TB patients notified in 2020 (Public Sector)
State TB patients Notified
Bacteriologically Confirmed Cure Rate Success Rate Death Rate % Lost to follow up Treatment Failure
Rate % Regimen Change % Not evaluated
Andaman & Nicobar Islands 392 214 124 (58%) 335 (85%) 15 (3.8%) 4 (1.0%) 3 (0.8%) 6 (1.5%) 1 (0.3%)
Andhra Pradesh 38948 23336 18710 (80%) 34599 (89%) 1868 (4.8%) 279 (0.7%) 72 (0.2%) 669 (1.7%) 508 (1.3%)
Arunachal Pradesh 2109 1059 708 (67%) 1775 (84%) 65 (3.1%) 104 (4.9%) 20 (0.9%) 60 (2.8%) 19 (0.9%)
Assam 27270 13568 8136 (60%) 22908 (84%) 1094 (4.0%) 506 (1.9%) 86 (0.3%) 365 (1.3%) 982 (3.6%)
Bihar 45824 25850 12260 (47%) 34221 (75%) 1127 (2.5%) 1804 (3.9%) 247 (0.5%) 519 (1.1%) 3019 (6.6%)
Chandigarh 2299 1065 759 (71%) 1886 (82%) 104 (4.5%) 87 (3.8%) 13 (0.6%) 44 (1.9%) 36 (1.6%)
Chhattisgarh 19998 9289 7057 (76%) 17467 (87%) 1018 (5.1%) 312 (1.6%) 95 (0.5%) 198 (1.0%) 532 (2.7%)
Dadra and Nagar Haveli and Daman and Diu 562 262 236 (90%) 526 (94%) 13 (2.3%) 3 (0.5%) 1 (0.2%) 1 (0.2%) 7 (1.2%)
Delhi 46905 21782 10398 (48%) 35304 (75%) 1015 (2.2%) 2121 (4.5%) 251 (0.5%) 1164 (2.5%) 1133 (2.4%)
Goa 1167 688 306 (44%) 972 (83%) 75 (6.4%) 30 (2.6%) 5 (0.4%) 24 (2.1%) 4 (0.3%)
Gujarat 57012 24951 22211 (89%) 50590 (89%) 2917 (5.1%) 793 (1.4%) 377 (0.7%) 814 (1.4%) 114 (0.2%)
Haryana 38386 23455 14301 (61%) 30810 (80%) 1532 (4.0%) 840 (2.2%) 211 (0.5%) 361 (0.9%) 974 (2.5%)
Himachal Pradesh 10966 6956 4558 (66%) 9658 (88%) 595 (5.4%) 104 (0.9%) 31 (0.3%) 196 (1.8%) 109 (1.0%)
Jammu & Kashmir 7258 3420 2477 (72%) 6035 (83%) 249 (3.4%) 94 (1.3%) 37 (0.5%) 58 (0.8%) 392 (5.4%)
Jharkhand 27996 15931 9268 (58%) 23639 (84%) 819 (2.9%) 621 (2.2%) 130 (0.5%) 204 (0.7%) 1206 (4.3%)
Karnataka 42540 25365 18742 (74%) 34695 (82%) 3336 (7.8%) 1009 (2.4%) 219 (0.5%) 1125 (2.6%) 370 (0.9%)
Kerala 16379 9686 6911 (71%) 13458 (82%) 1282 (7.8%) 269 (1.6%) 99 (0.6%) 161 (1.0%) 537 (3.3%)
Ladakh 186 93 38 (41%) 145 (78%) 11 (5.9%) 3 (1.6%) 2 (1.1%) 0 (0.0%) 14 (7.5%)
Lakshadweep 16 8 9 (113%) 15 (94%) 0 (0.0%) 0 (0.0%) 0 (0.0%) 0 (0.0%) 1 (6.3%)
Madhya Pradesh 92331 40858 25775 (63%) 77857 (84%) 3244 (3.5%) 3064 (3.3%) 509 (0.6%) 929 (1.0%) 3083 (3.3%)
Maharashtra 81822 37501 26234 (70%) 68847 (84%) 3803 (4.6%) 1518 (1.9%) 354 (0.4%) 2245 (2.7%) 468 (0.6%)
Manipur 1245 669 447 (67%) 1011 (81%) 42 (3.4%) 37 (3.0%) 5 (0.4%) 14 (1.1%) 68 (5.5%)
Meghalaya 3083 1737 1073 (62%) 2487 (81%) 159 (5.2%) 95 (3.1%) 17 (0.6%) 76 (2.5%) 64 (2.1%)
Mizoram 1632 770 550 (71%) 1465 (90%) 46 (2.8%) 25 (1.5%) 4 (0.2%) 17 (1.0%) 42 (2.6%)
Nagaland 2478 1338 1033 (77%) 2006 (81%) 66 (2.7%) 56 (2.3%) 22 (0.9%) 21 (0.8%) 242 (9.8%)
Odisha 37857 22114 18183 (82%) 33703 (89%) 2167 (5.7%) 462 (1.2%) 82 (0.2%) 193 (0.5%) 388 (1.0%)
Puducherry 1087 708 475 (67%) 903 (83%) 66 (6.1%) 18 (1.7%) 9 (0.8%) 29 (2.7%) 3 (0.3%)
Punjab 30938 18562 11041 (59%) 24883 (80%) 1592 (5.1%) 878 (2.8%) 134 (0.4%) 358 (1.2%) 1217 (3.9%)
Rajasthan 77611 42959 29005 (68%) 64712 (83%) 2586 (3.3%) 2204 (2.8%) 353 (0.5%) 1017 (1.3%) 1069 (1.4%)
Sikkim 944 541 363 (67%) 852 (90%) 39 (4.1%) 7 (0.7%) 1 (0.1%) 16 (1.7%) 14 (1.5%)
Tamil Nadu 46848 30295 22844 (75%) 39059 (83%) 2916 (6.2%) 905 (1.9%) 188 (0.4%) 1510 (3.2%) 535 (1.1%)
Telangana 34089 18061 16654 (92%) 30033 (88%) 1124 (3.3%) 172 (0.5%) 104 (0.3%) 834 (2.4%) 860 (2.5%)
Tripura 1891 1241 933 (75%) 1546 (82%) 142 (7.5%) 41 (2.2%) 9 (0.5%) 53 (2.8%) 38 (2.0%)
Uttar Pradesh 224050 102861 61417 (60%) 187420 (84%) 8300 (3.7%) 6999 (3.1%) 1214 (0.5%) 2915 (1.3%) 2019 (0.9%)
Uttarakhand 13122 5769 3413 (59%) 11187 (85%) 494 (3.8%) 349 (2.7%) 55 (0.4%) 253 (1.9%) 177 (1.3%)
West Bengal 61117 40724 30316 (74%) 52040 (85%) 3355 (5.5%) 1114 (1.8%) 303 (0.5%) 894 (1.5%) 1026 (1.7%)
INDIA 1098358 573686 386965 (67%) 919049 (84%) 47276 (4.3%) 26927 (2.5%) 5262 (0.5%) 17343 (1.6%) 21271 (1.9%)
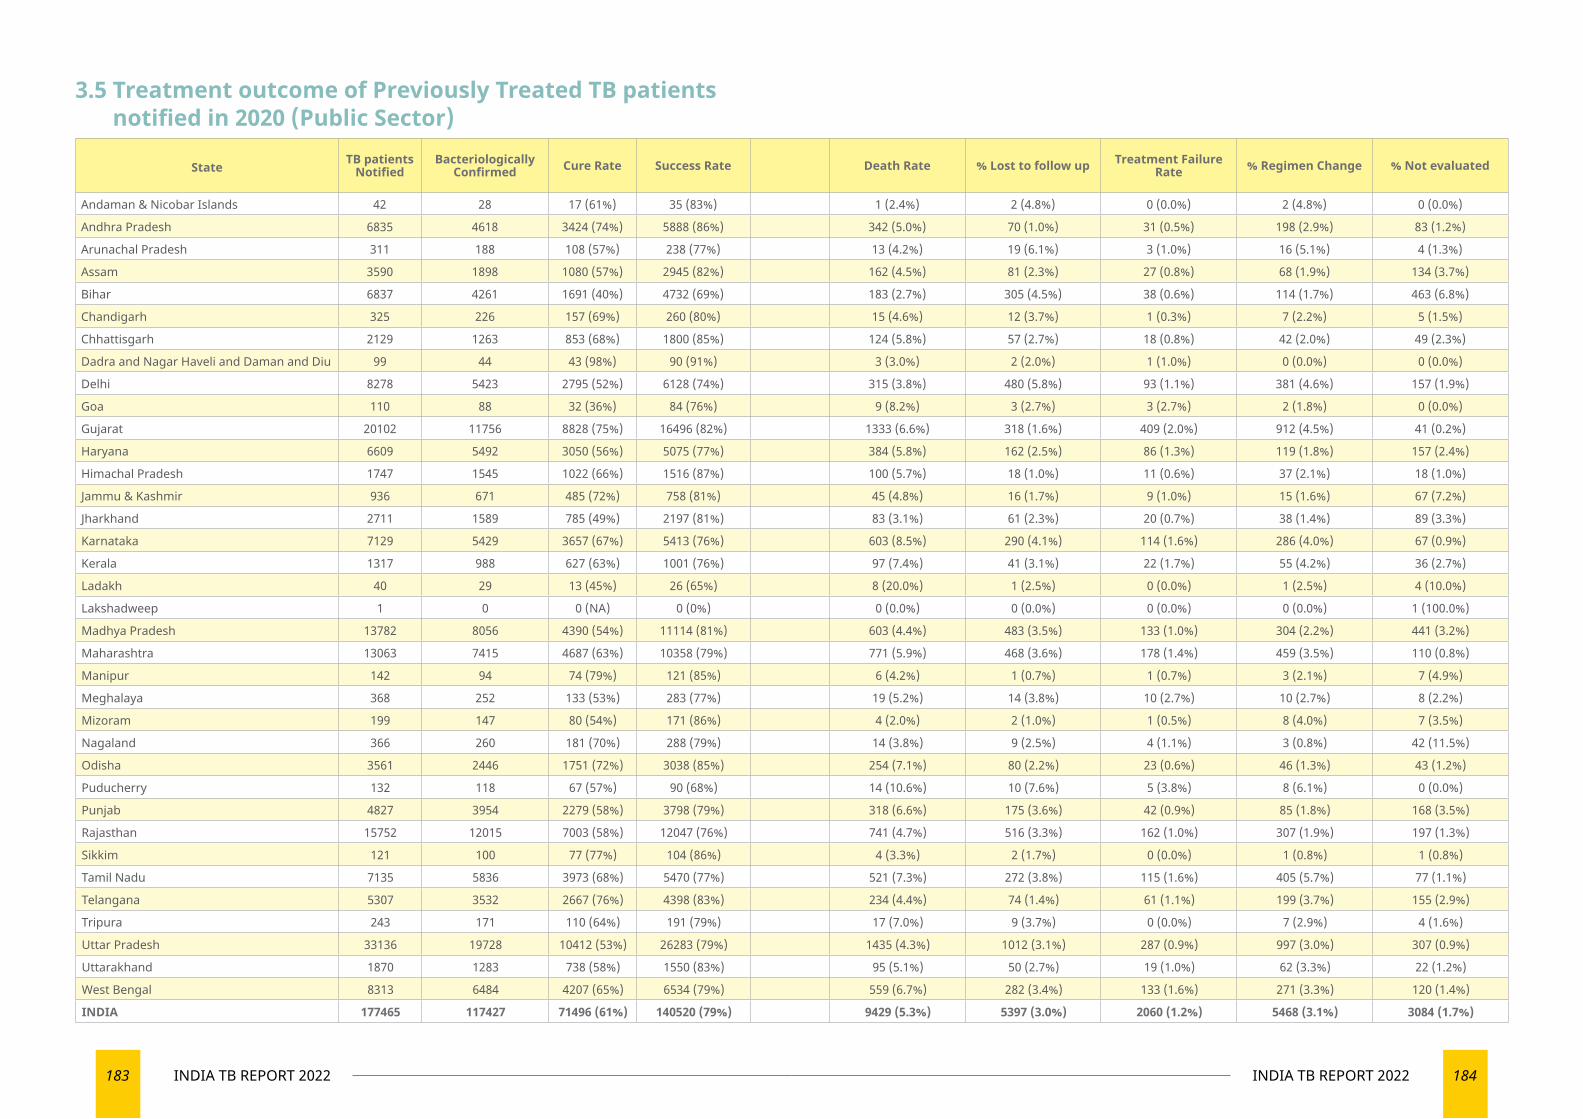
183 INDIA TB REPORT 2022 184INDIA TB REPORT 2022
3.5 Treatment outcome of Previously Treated TB patients notified in 2020 (Public Sector)
State TB patients Notified
Bacteriologically Confirmed Cure Rate Success Rate Death Rate % Lost to follow up Treatment Failure
Rate % Regimen Change % Not evaluated
Andaman & Nicobar Islands 42 28 17 (61%) 35 (83%) 1 (2.4%) 2 (4.8%) 0 (0.0%) 2 (4.8%) 0 (0.0%)
Andhra Pradesh 6835 4618 3424 (74%) 5888 (86%) 342 (5.0%) 70 (1.0%) 31 (0.5%) 198 (2.9%) 83 (1.2%)
Arunachal Pradesh 311 188 108 (57%) 238 (77%) 13 (4.2%) 19 (6.1%) 3 (1.0%) 16 (5.1%) 4 (1.3%)
Assam 3590 1898 1080 (57%) 2945 (82%) 162 (4.5%) 81 (2.3%) 27 (0.8%) 68 (1.9%) 134 (3.7%)
Bihar 6837 4261 1691 (40%) 4732 (69%) 183 (2.7%) 305 (4.5%) 38 (0.6%) 114 (1.7%) 463 (6.8%)
Chandigarh 325 226 157 (69%) 260 (80%) 15 (4.6%) 12 (3.7%) 1 (0.3%) 7 (2.2%) 5 (1.5%)
Chhattisgarh 2129 1263 853 (68%) 1800 (85%) 124 (5.8%) 57 (2.7%) 18 (0.8%) 42 (2.0%) 49 (2.3%)
Dadra and Nagar Haveli and Daman and Diu 99 44 43 (98%) 90 (91%) 3 (3.0%) 2 (2.0%) 1 (1.0%) 0 (0.0%) 0 (0.0%)
Delhi 8278 5423 2795 (52%) 6128 (74%) 315 (3.8%) 480 (5.8%) 93 (1.1%) 381 (4.6%) 157 (1.9%)
Goa 110 88 32 (36%) 84 (76%) 9 (8.2%) 3 (2.7%) 3 (2.7%) 2 (1.8%) 0 (0.0%)
Gujarat 20102 11756 8828 (75%) 16496 (82%) 1333 (6.6%) 318 (1.6%) 409 (2.0%) 912 (4.5%) 41 (0.2%)
Haryana 6609 5492 3050 (56%) 5075 (77%) 384 (5.8%) 162 (2.5%) 86 (1.3%) 119 (1.8%) 157 (2.4%)
Himachal Pradesh 1747 1545 1022 (66%) 1516 (87%) 100 (5.7%) 18 (1.0%) 11 (0.6%) 37 (2.1%) 18 (1.0%)
Jammu & Kashmir 936 671 485 (72%) 758 (81%) 45 (4.8%) 16 (1.7%) 9 (1.0%) 15 (1.6%) 67 (7.2%)
Jharkhand 2711 1589 785 (49%) 2197 (81%) 83 (3.1%) 61 (2.3%) 20 (0.7%) 38 (1.4%) 89 (3.3%)
Karnataka 7129 5429 3657 (67%) 5413 (76%) 603 (8.5%) 290 (4.1%) 114 (1.6%) 286 (4.0%) 67 (0.9%)
Kerala 1317 988 627 (63%) 1001 (76%) 97 (7.4%) 41 (3.1%) 22 (1.7%) 55 (4.2%) 36 (2.7%)
Ladakh 40 29 13 (45%) 26 (65%) 8 (20.0%) 1 (2.5%) 0 (0.0%) 1 (2.5%) 4 (10.0%)
Lakshadweep 1 0 0 (NA) 0 (0%) 0 (0.0%) 0 (0.0%) 0 (0.0%) 0 (0.0%) 1 (100.0%)
Madhya Pradesh 13782 8056 4390 (54%) 11114 (81%) 603 (4.4%) 483 (3.5%) 133 (1.0%) 304 (2.2%) 441 (3.2%)
Maharashtra 13063 7415 4687 (63%) 10358 (79%) 771 (5.9%) 468 (3.6%) 178 (1.4%) 459 (3.5%) 110 (0.8%)
Manipur 142 94 74 (79%) 121 (85%) 6 (4.2%) 1 (0.7%) 1 (0.7%) 3 (2.1%) 7 (4.9%)
Meghalaya 368 252 133 (53%) 283 (77%) 19 (5.2%) 14 (3.8%) 10 (2.7%) 10 (2.7%) 8 (2.2%)
Mizoram 199 147 80 (54%) 171 (86%) 4 (2.0%) 2 (1.0%) 1 (0.5%) 8 (4.0%) 7 (3.5%)
Nagaland 366 260 181 (70%) 288 (79%) 14 (3.8%) 9 (2.5%) 4 (1.1%) 3 (0.8%) 42 (11.5%)
Odisha 3561 2446 1751 (72%) 3038 (85%) 254 (7.1%) 80 (2.2%) 23 (0.6%) 46 (1.3%) 43 (1.2%)
Puducherry 132 118 67 (57%) 90 (68%) 14 (10.6%) 10 (7.6%) 5 (3.8%) 8 (6.1%) 0 (0.0%)
Punjab 4827 3954 2279 (58%) 3798 (79%) 318 (6.6%) 175 (3.6%) 42 (0.9%) 85 (1.8%) 168 (3.5%)
Rajasthan 15752 12015 7003 (58%) 12047 (76%) 741 (4.7%) 516 (3.3%) 162 (1.0%) 307 (1.9%) 197 (1.3%)
Sikkim 121 100 77 (77%) 104 (86%) 4 (3.3%) 2 (1.7%) 0 (0.0%) 1 (0.8%) 1 (0.8%)
Tamil Nadu 7135 5836 3973 (68%) 5470 (77%) 521 (7.3%) 272 (3.8%) 115 (1.6%) 405 (5.7%) 77 (1.1%)
Telangana 5307 3532 2667 (76%) 4398 (83%) 234 (4.4%) 74 (1.4%) 61 (1.1%) 199 (3.7%) 155 (2.9%)
Tripura 243 171 110 (64%) 191 (79%) 17 (7.0%) 9 (3.7%) 0 (0.0%) 7 (2.9%) 4 (1.6%)
Uttar Pradesh 33136 19728 10412 (53%) 26283 (79%) 1435 (4.3%) 1012 (3.1%) 287 (0.9%) 997 (3.0%) 307 (0.9%)
Uttarakhand 1870 1283 738 (58%) 1550 (83%) 95 (5.1%) 50 (2.7%) 19 (1.0%) 62 (3.3%) 22 (1.2%)
West Bengal 8313 6484 4207 (65%) 6534 (79%) 559 (6.7%) 282 (3.4%) 133 (1.6%) 271 (3.3%) 120 (1.4%)
INDIA 177465 117427 71496 (61%) 140520 (79%) 9429 (5.3%) 5397 (3.0%) 2060 (1.2%) 5468 (3.1%) 3084 (1.7%)
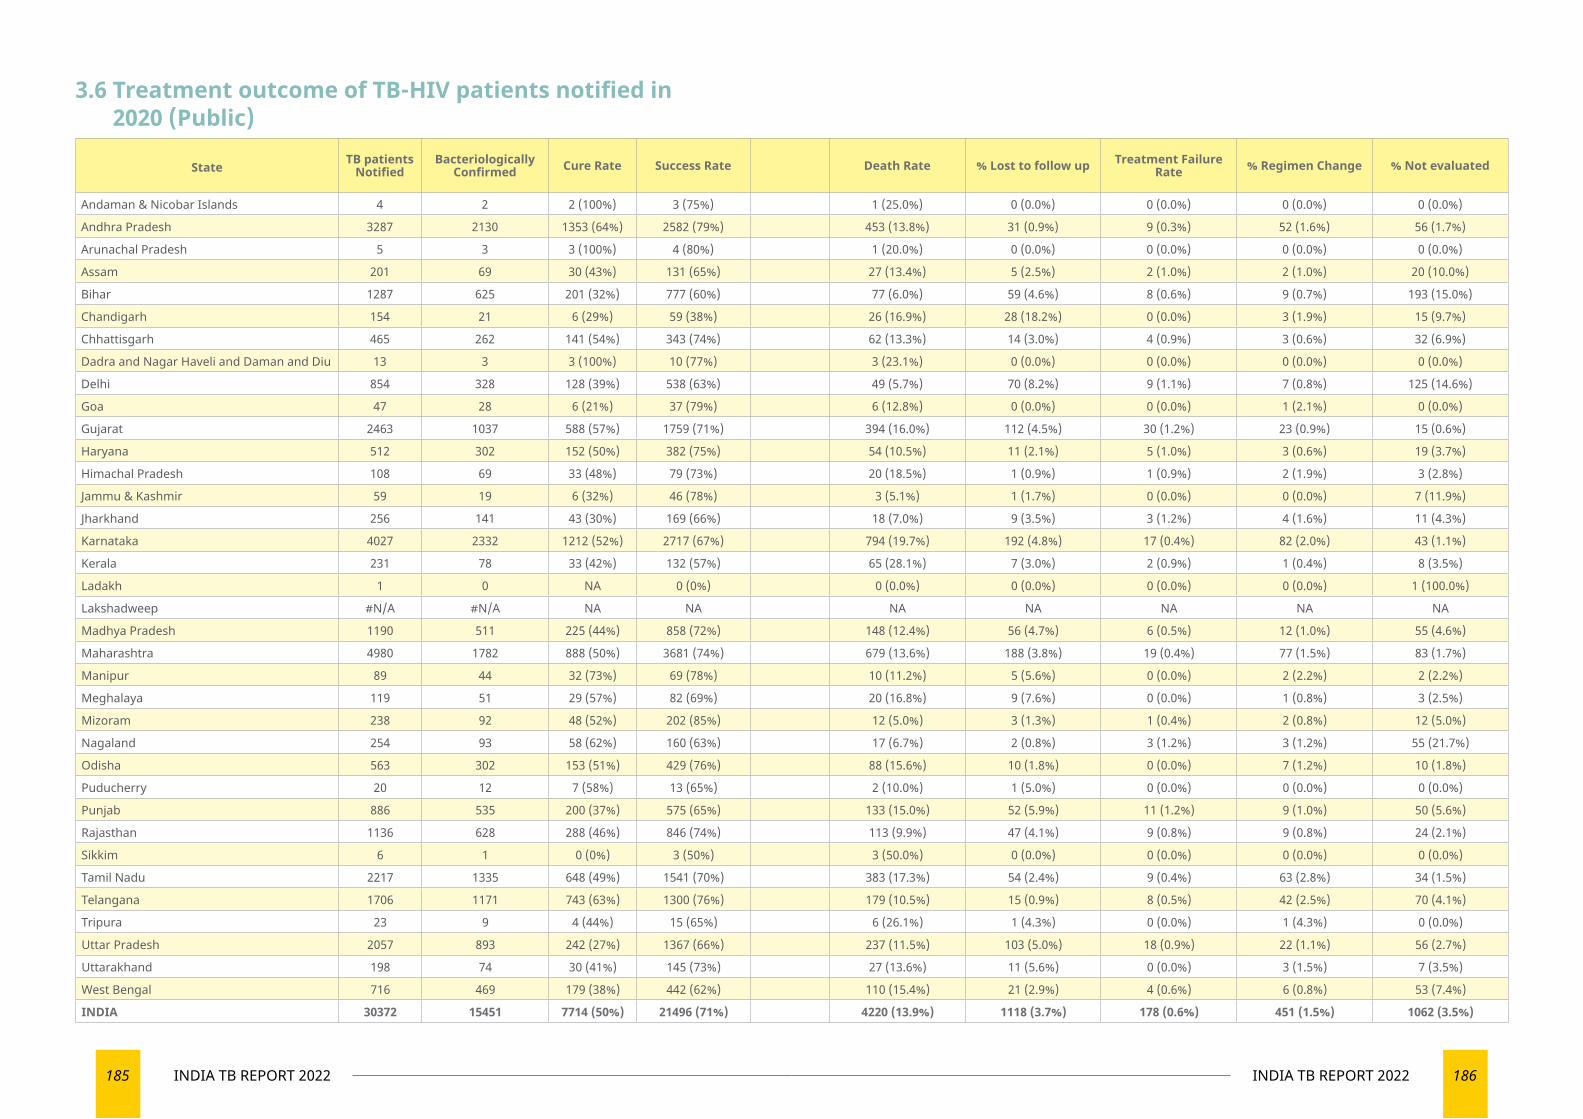
185 INDIA TB REPORT 2022 186INDIA TB REPORT 2022
3.6 Treatment outcome of TB-HIV patients notified in 2020 (Public)
State TB patients Notified
Bacteriologically Confirmed Cure Rate Success Rate Death Rate % Lost to follow up Treatment Failure
Rate % Regimen Change % Not evaluated
Andaman & Nicobar Islands 4 2 2 (100%) 3 (75%) 1 (25.0%) 0 (0.0%) 0 (0.0%) 0 (0.0%) 0 (0.0%)
Andhra Pradesh 3287 2130 1353 (64%) 2582 (79%) 453 (13.8%) 31 (0.9%) 9 (0.3%) 52 (1.6%) 56 (1.7%)
Arunachal Pradesh 5 3 3 (100%) 4 (80%) 1 (20.0%) 0 (0.0%) 0 (0.0%) 0 (0.0%) 0 (0.0%)
Assam 201 69 30 (43%) 131 (65%) 27 (13.4%) 5 (2.5%) 2 (1.0%) 2 (1.0%) 20 (10.0%)
Bihar 1287 625 201 (32%) 777 (60%) 77 (6.0%) 59 (4.6%) 8 (0.6%) 9 (0.7%) 193 (15.0%)
Chandigarh 154 21 6 (29%) 59 (38%) 26 (16.9%) 28 (18.2%) 0 (0.0%) 3 (1.9%) 15 (9.7%)
Chhattisgarh 465 262 141 (54%) 343 (74%) 62 (13.3%) 14 (3.0%) 4 (0.9%) 3 (0.6%) 32 (6.9%)
Dadra and Nagar Haveli and Daman and Diu 13 3 3 (100%) 10 (77%) 3 (23.1%) 0 (0.0%) 0 (0.0%) 0 (0.0%) 0 (0.0%)
Delhi 854 328 128 (39%) 538 (63%) 49 (5.7%) 70 (8.2%) 9 (1.1%) 7 (0.8%) 125 (14.6%)
Goa 47 28 6 (21%) 37 (79%) 6 (12.8%) 0 (0.0%) 0 (0.0%) 1 (2.1%) 0 (0.0%)
Gujarat 2463 1037 588 (57%) 1759 (71%) 394 (16.0%) 112 (4.5%) 30 (1.2%) 23 (0.9%) 15 (0.6%)
Haryana 512 302 152 (50%) 382 (75%) 54 (10.5%) 11 (2.1%) 5 (1.0%) 3 (0.6%) 19 (3.7%)
Himachal Pradesh 108 69 33 (48%) 79 (73%) 20 (18.5%) 1 (0.9%) 1 (0.9%) 2 (1.9%) 3 (2.8%)
Jammu & Kashmir 59 19 6 (32%) 46 (78%) 3 (5.1%) 1 (1.7%) 0 (0.0%) 0 (0.0%) 7 (11.9%)
Jharkhand 256 141 43 (30%) 169 (66%) 18 (7.0%) 9 (3.5%) 3 (1.2%) 4 (1.6%) 11 (4.3%)
Karnataka 4027 2332 1212 (52%) 2717 (67%) 794 (19.7%) 192 (4.8%) 17 (0.4%) 82 (2.0%) 43 (1.1%)
Kerala 231 78 33 (42%) 132 (57%) 65 (28.1%) 7 (3.0%) 2 (0.9%) 1 (0.4%) 8 (3.5%)
Ladakh 1 0 NA 0 (0%) 0 (0.0%) 0 (0.0%) 0 (0.0%) 0 (0.0%) 1 (100.0%)
Lakshadweep #N/A #N/A NA NA NA NA NA NA NA
Madhya Pradesh 1190 511 225 (44%) 858 (72%) 148 (12.4%) 56 (4.7%) 6 (0.5%) 12 (1.0%) 55 (4.6%)
Maharashtra 4980 1782 888 (50%) 3681 (74%) 679 (13.6%) 188 (3.8%) 19 (0.4%) 77 (1.5%) 83 (1.7%)
Manipur 89 44 32 (73%) 69 (78%) 10 (11.2%) 5 (5.6%) 0 (0.0%) 2 (2.2%) 2 (2.2%)
Meghalaya 119 51 29 (57%) 82 (69%) 20 (16.8%) 9 (7.6%) 0 (0.0%) 1 (0.8%) 3 (2.5%)
Mizoram 238 92 48 (52%) 202 (85%) 12 (5.0%) 3 (1.3%) 1 (0.4%) 2 (0.8%) 12 (5.0%)
Nagaland 254 93 58 (62%) 160 (63%) 17 (6.7%) 2 (0.8%) 3 (1.2%) 3 (1.2%) 55 (21.7%)
Odisha 563 302 153 (51%) 429 (76%) 88 (15.6%) 10 (1.8%) 0 (0.0%) 7 (1.2%) 10 (1.8%)
Puducherry 20 12 7 (58%) 13 (65%) 2 (10.0%) 1 (5.0%) 0 (0.0%) 0 (0.0%) 0 (0.0%)
Punjab 886 535 200 (37%) 575 (65%) 133 (15.0%) 52 (5.9%) 11 (1.2%) 9 (1.0%) 50 (5.6%)
Rajasthan 1136 628 288 (46%) 846 (74%) 113 (9.9%) 47 (4.1%) 9 (0.8%) 9 (0.8%) 24 (2.1%)
Sikkim 6 1 0 (0%) 3 (50%) 3 (50.0%) 0 (0.0%) 0 (0.0%) 0 (0.0%) 0 (0.0%)
Tamil Nadu 2217 1335 648 (49%) 1541 (70%) 383 (17.3%) 54 (2.4%) 9 (0.4%) 63 (2.8%) 34 (1.5%)
Telangana 1706 1171 743 (63%) 1300 (76%) 179 (10.5%) 15 (0.9%) 8 (0.5%) 42 (2.5%) 70 (4.1%)
Tripura 23 9 4 (44%) 15 (65%) 6 (26.1%) 1 (4.3%) 0 (0.0%) 1 (4.3%) 0 (0.0%)
Uttar Pradesh 2057 893 242 (27%) 1367 (66%) 237 (11.5%) 103 (5.0%) 18 (0.9%) 22 (1.1%) 56 (2.7%)
Uttarakhand 198 74 30 (41%) 145 (73%) 27 (13.6%) 11 (5.6%) 0 (0.0%) 3 (1.5%) 7 (3.5%)
West Bengal 716 469 179 (38%) 442 (62%) 110 (15.4%) 21 (2.9%) 4 (0.6%) 6 (0.8%) 53 (7.4%)
INDIA 30372 15451 7714 (50%) 21496 (71%) 4220 (13.9%) 1118 (3.7%) 178 (0.6%) 451 (1.5%) 1062 (3.5%)
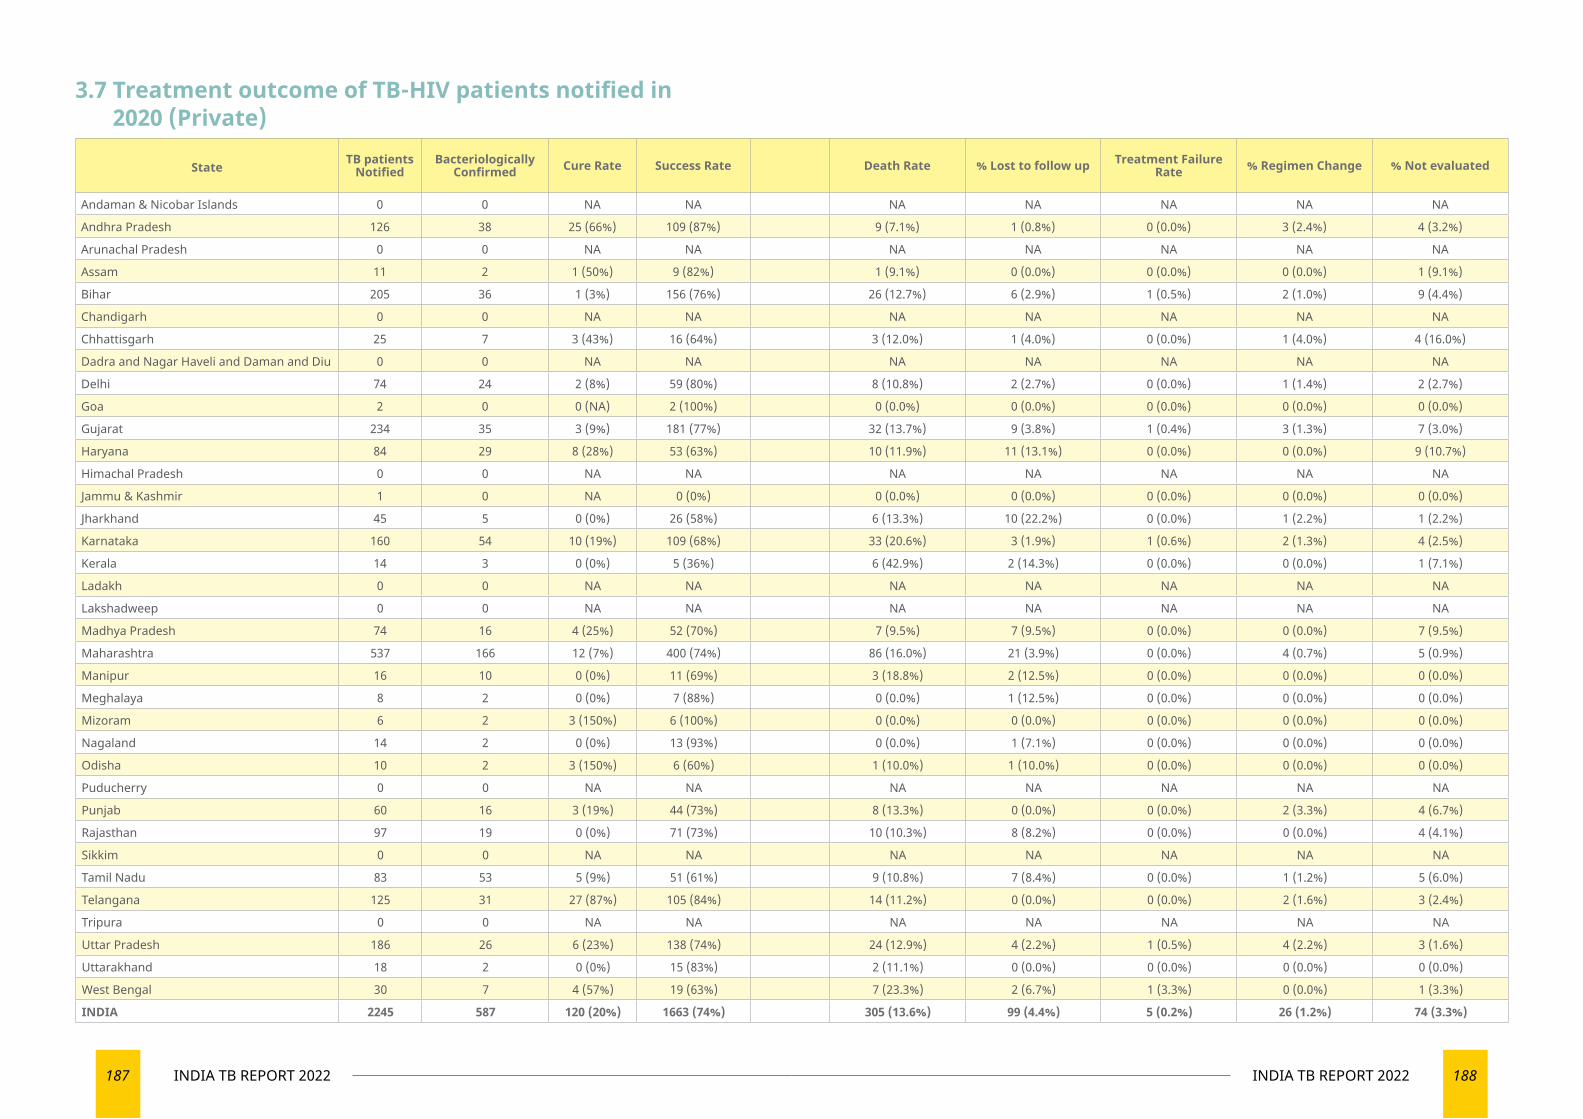
187 INDIA TB REPORT 2022 188INDIA TB REPORT 2022
3.7 Treatment outcome of TB-HIV patients notified in 2020 (Private)
State TB patients Notified
Bacteriologically Confirmed Cure Rate Success Rate Death Rate % Lost to follow up Treatment Failure
Rate % Regimen Change % Not evaluated
Andaman & Nicobar Islands 0 0 NA NA NA NA NA NA NA
Andhra Pradesh 126 38 25 (66%) 109 (87%) 9 (7.1%) 1 (0.8%) 0 (0.0%) 3 (2.4%) 4 (3.2%)
Arunachal Pradesh 0 0 NA NA NA NA NA NA NA
Assam 11 2 1 (50%) 9 (82%) 1 (9.1%) 0 (0.0%) 0 (0.0%) 0 (0.0%) 1 (9.1%)
Bihar 205 36 1 (3%) 156 (76%) 26 (12.7%) 6 (2.9%) 1 (0.5%) 2 (1.0%) 9 (4.4%)
Chandigarh 0 0 NA NA NA NA NA NA NA
Chhattisgarh 25 7 3 (43%) 16 (64%) 3 (12.0%) 1 (4.0%) 0 (0.0%) 1 (4.0%) 4 (16.0%)
Dadra and Nagar Haveli and Daman and Diu 0 0 NA NA NA NA NA NA NA
Delhi 74 24 2 (8%) 59 (80%) 8 (10.8%) 2 (2.7%) 0 (0.0%) 1 (1.4%) 2 (2.7%)
Goa 2 0 0 (NA) 2 (100%) 0 (0.0%) 0 (0.0%) 0 (0.0%) 0 (0.0%) 0 (0.0%)
Gujarat 234 35 3 (9%) 181 (77%) 32 (13.7%) 9 (3.8%) 1 (0.4%) 3 (1.3%) 7 (3.0%)
Haryana 84 29 8 (28%) 53 (63%) 10 (11.9%) 11 (13.1%) 0 (0.0%) 0 (0.0%) 9 (10.7%)
Himachal Pradesh 0 0 NA NA NA NA NA NA NA
Jammu & Kashmir 1 0 NA 0 (0%) 0 (0.0%) 0 (0.0%) 0 (0.0%) 0 (0.0%) 0 (0.0%)
Jharkhand 45 5 0 (0%) 26 (58%) 6 (13.3%) 10 (22.2%) 0 (0.0%) 1 (2.2%) 1 (2.2%)
Karnataka 160 54 10 (19%) 109 (68%) 33 (20.6%) 3 (1.9%) 1 (0.6%) 2 (1.3%) 4 (2.5%)
Kerala 14 3 0 (0%) 5 (36%) 6 (42.9%) 2 (14.3%) 0 (0.0%) 0 (0.0%) 1 (7.1%)
Ladakh 0 0 NA NA NA NA NA NA NA
Lakshadweep 0 0 NA NA NA NA NA NA NA
Madhya Pradesh 74 16 4 (25%) 52 (70%) 7 (9.5%) 7 (9.5%) 0 (0.0%) 0 (0.0%) 7 (9.5%)
Maharashtra 537 166 12 (7%) 400 (74%) 86 (16.0%) 21 (3.9%) 0 (0.0%) 4 (0.7%) 5 (0.9%)
Manipur 16 10 0 (0%) 11 (69%) 3 (18.8%) 2 (12.5%) 0 (0.0%) 0 (0.0%) 0 (0.0%)
Meghalaya 8 2 0 (0%) 7 (88%) 0 (0.0%) 1 (12.5%) 0 (0.0%) 0 (0.0%) 0 (0.0%)
Mizoram 6 2 3 (150%) 6 (100%) 0 (0.0%) 0 (0.0%) 0 (0.0%) 0 (0.0%) 0 (0.0%)
Nagaland 14 2 0 (0%) 13 (93%) 0 (0.0%) 1 (7.1%) 0 (0.0%) 0 (0.0%) 0 (0.0%)
Odisha 10 2 3 (150%) 6 (60%) 1 (10.0%) 1 (10.0%) 0 (0.0%) 0 (0.0%) 0 (0.0%)
Puducherry 0 0 NA NA NA NA NA NA NA
Punjab 60 16 3 (19%) 44 (73%) 8 (13.3%) 0 (0.0%) 0 (0.0%) 2 (3.3%) 4 (6.7%)
Rajasthan 97 19 0 (0%) 71 (73%) 10 (10.3%) 8 (8.2%) 0 (0.0%) 0 (0.0%) 4 (4.1%)
Sikkim 0 0 NA NA NA NA NA NA NA
Tamil Nadu 83 53 5 (9%) 51 (61%) 9 (10.8%) 7 (8.4%) 0 (0.0%) 1 (1.2%) 5 (6.0%)
Telangana 125 31 27 (87%) 105 (84%) 14 (11.2%) 0 (0.0%) 0 (0.0%) 2 (1.6%) 3 (2.4%)
Tripura 0 0 NA NA NA NA NA NA NA
Uttar Pradesh 186 26 6 (23%) 138 (74%) 24 (12.9%) 4 (2.2%) 1 (0.5%) 4 (2.2%) 3 (1.6%)
Uttarakhand 18 2 0 (0%) 15 (83%) 2 (11.1%) 0 (0.0%) 0 (0.0%) 0 (0.0%) 0 (0.0%)
West Bengal 30 7 4 (57%) 19 (63%) 7 (23.3%) 2 (6.7%) 1 (3.3%) 0 (0.0%) 1 (3.3%)
INDIA 2245 587 120 (20%) 1663 (74%) 305 (13.6%) 99 (4.4%) 5 (0.2%) 26 (1.2%) 74 (3.3%)
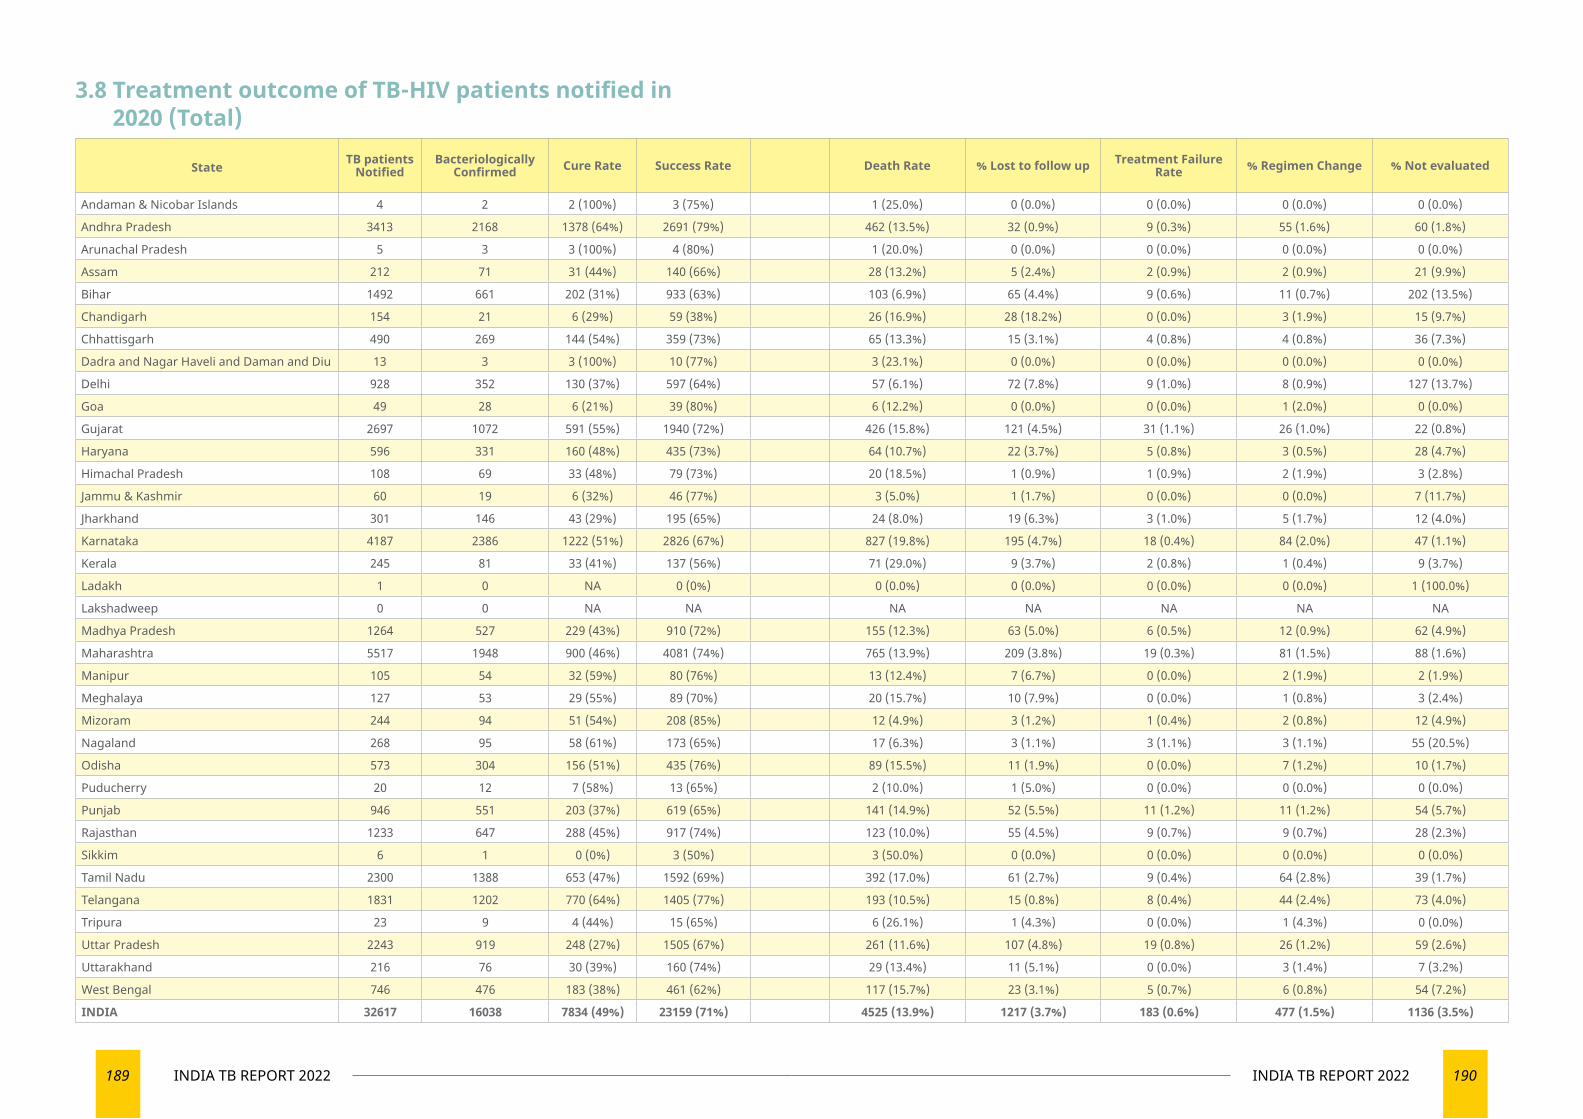
189 INDIA TB REPORT 2022 190INDIA TB REPORT 2022
3.8 Treatment outcome of TB-HIV patients notified in 2020 (Total)
State TB patients Notified
Bacteriologically Confirmed Cure Rate Success Rate Death Rate % Lost to follow up Treatment Failure
Rate % Regimen Change % Not evaluated
Andaman & Nicobar Islands 4 2 2 (100%) 3 (75%) 1 (25.0%) 0 (0.0%) 0 (0.0%) 0 (0.0%) 0 (0.0%)
Andhra Pradesh 3413 2168 1378 (64%) 2691 (79%) 462 (13.5%) 32 (0.9%) 9 (0.3%) 55 (1.6%) 60 (1.8%)
Arunachal Pradesh 5 3 3 (100%) 4 (80%) 1 (20.0%) 0 (0.0%) 0 (0.0%) 0 (0.0%) 0 (0.0%)
Assam 212 71 31 (44%) 140 (66%) 28 (13.2%) 5 (2.4%) 2 (0.9%) 2 (0.9%) 21 (9.9%)
Bihar 1492 661 202 (31%) 933 (63%) 103 (6.9%) 65 (4.4%) 9 (0.6%) 11 (0.7%) 202 (13.5%)
Chandigarh 154 21 6 (29%) 59 (38%) 26 (16.9%) 28 (18.2%) 0 (0.0%) 3 (1.9%) 15 (9.7%)
Chhattisgarh 490 269 144 (54%) 359 (73%) 65 (13.3%) 15 (3.1%) 4 (0.8%) 4 (0.8%) 36 (7.3%)
Dadra and Nagar Haveli and Daman and Diu 13 3 3 (100%) 10 (77%) 3 (23.1%) 0 (0.0%) 0 (0.0%) 0 (0.0%) 0 (0.0%)
Delhi 928 352 130 (37%) 597 (64%) 57 (6.1%) 72 (7.8%) 9 (1.0%) 8 (0.9%) 127 (13.7%)
Goa 49 28 6 (21%) 39 (80%) 6 (12.2%) 0 (0.0%) 0 (0.0%) 1 (2.0%) 0 (0.0%)
Gujarat 2697 1072 591 (55%) 1940 (72%) 426 (15.8%) 121 (4.5%) 31 (1.1%) 26 (1.0%) 22 (0.8%)
Haryana 596 331 160 (48%) 435 (73%) 64 (10.7%) 22 (3.7%) 5 (0.8%) 3 (0.5%) 28 (4.7%)
Himachal Pradesh 108 69 33 (48%) 79 (73%) 20 (18.5%) 1 (0.9%) 1 (0.9%) 2 (1.9%) 3 (2.8%)
Jammu & Kashmir 60 19 6 (32%) 46 (77%) 3 (5.0%) 1 (1.7%) 0 (0.0%) 0 (0.0%) 7 (11.7%)
Jharkhand 301 146 43 (29%) 195 (65%) 24 (8.0%) 19 (6.3%) 3 (1.0%) 5 (1.7%) 12 (4.0%)
Karnataka 4187 2386 1222 (51%) 2826 (67%) 827 (19.8%) 195 (4.7%) 18 (0.4%) 84 (2.0%) 47 (1.1%)
Kerala 245 81 33 (41%) 137 (56%) 71 (29.0%) 9 (3.7%) 2 (0.8%) 1 (0.4%) 9 (3.7%)
Ladakh 1 0 NA 0 (0%) 0 (0.0%) 0 (0.0%) 0 (0.0%) 0 (0.0%) 1 (100.0%)
Lakshadweep 0 0 NA NA NA NA NA NA NA
Madhya Pradesh 1264 527 229 (43%) 910 (72%) 155 (12.3%) 63 (5.0%) 6 (0.5%) 12 (0.9%) 62 (4.9%)
Maharashtra 5517 1948 900 (46%) 4081 (74%) 765 (13.9%) 209 (3.8%) 19 (0.3%) 81 (1.5%) 88 (1.6%)
Manipur 105 54 32 (59%) 80 (76%) 13 (12.4%) 7 (6.7%) 0 (0.0%) 2 (1.9%) 2 (1.9%)
Meghalaya 127 53 29 (55%) 89 (70%) 20 (15.7%) 10 (7.9%) 0 (0.0%) 1 (0.8%) 3 (2.4%)
Mizoram 244 94 51 (54%) 208 (85%) 12 (4.9%) 3 (1.2%) 1 (0.4%) 2 (0.8%) 12 (4.9%)
Nagaland 268 95 58 (61%) 173 (65%) 17 (6.3%) 3 (1.1%) 3 (1.1%) 3 (1.1%) 55 (20.5%)
Odisha 573 304 156 (51%) 435 (76%) 89 (15.5%) 11 (1.9%) 0 (0.0%) 7 (1.2%) 10 (1.7%)
Puducherry 20 12 7 (58%) 13 (65%) 2 (10.0%) 1 (5.0%) 0 (0.0%) 0 (0.0%) 0 (0.0%)
Punjab 946 551 203 (37%) 619 (65%) 141 (14.9%) 52 (5.5%) 11 (1.2%) 11 (1.2%) 54 (5.7%)
Rajasthan 1233 647 288 (45%) 917 (74%) 123 (10.0%) 55 (4.5%) 9 (0.7%) 9 (0.7%) 28 (2.3%)
Sikkim 6 1 0 (0%) 3 (50%) 3 (50.0%) 0 (0.0%) 0 (0.0%) 0 (0.0%) 0 (0.0%)
Tamil Nadu 2300 1388 653 (47%) 1592 (69%) 392 (17.0%) 61 (2.7%) 9 (0.4%) 64 (2.8%) 39 (1.7%)
Telangana 1831 1202 770 (64%) 1405 (77%) 193 (10.5%) 15 (0.8%) 8 (0.4%) 44 (2.4%) 73 (4.0%)
Tripura 23 9 4 (44%) 15 (65%) 6 (26.1%) 1 (4.3%) 0 (0.0%) 1 (4.3%) 0 (0.0%)
Uttar Pradesh 2243 919 248 (27%) 1505 (67%) 261 (11.6%) 107 (4.8%) 19 (0.8%) 26 (1.2%) 59 (2.6%)
Uttarakhand 216 76 30 (39%) 160 (74%) 29 (13.4%) 11 (5.1%) 0 (0.0%) 3 (1.4%) 7 (3.2%)
West Bengal 746 476 183 (38%) 461 (62%) 117 (15.7%) 23 (3.1%) 5 (0.7%) 6 (0.8%) 54 (7.2%)
INDIA 32617 16038 7834 (49%) 23159 (71%) 4525 (13.9%) 1217 (3.7%) 183 (0.6%) 477 (1.5%) 1136 (3.5%)
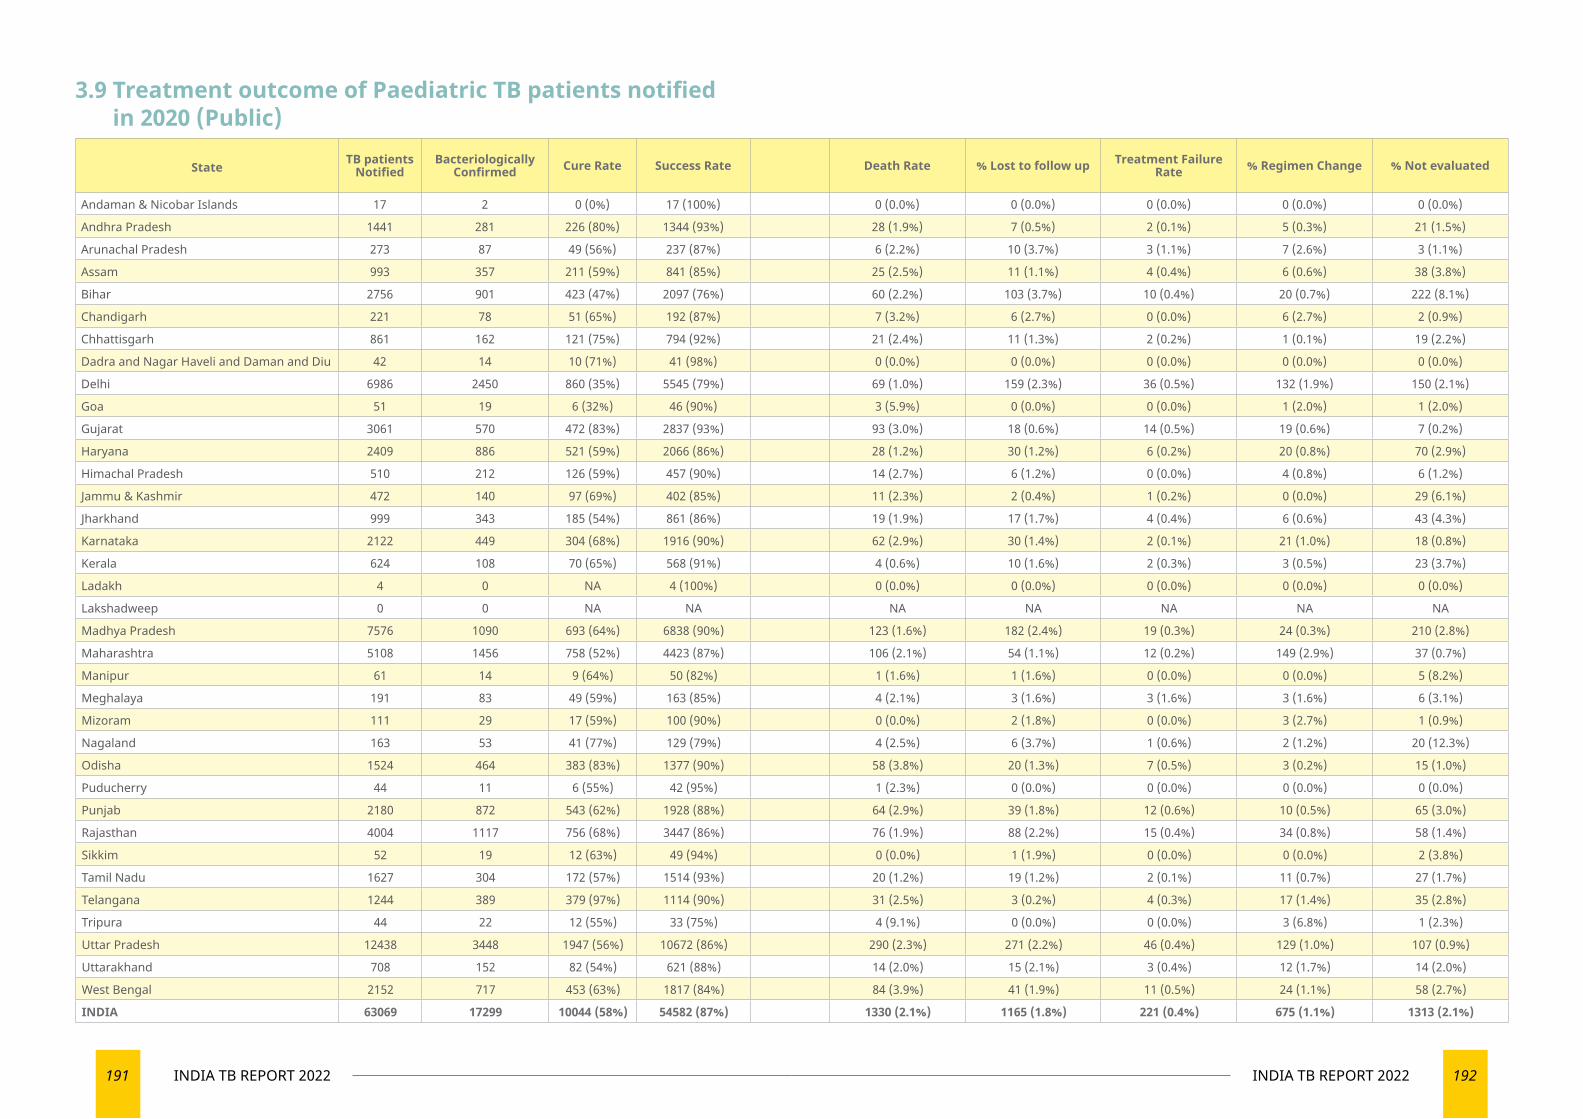
191 INDIA TB REPORT 2022 192INDIA TB REPORT 2022
3.9 Treatment outcome of Paediatric TB patients notified in 2020 (Public)
State TB patients Notified
Bacteriologically Confirmed Cure Rate Success Rate Death Rate % Lost to follow up Treatment Failure
Rate % Regimen Change % Not evaluated
Andaman & Nicobar Islands 17 2 0 (0%) 17 (100%) 0 (0.0%) 0 (0.0%) 0 (0.0%) 0 (0.0%) 0 (0.0%)
Andhra Pradesh 1441 281 226 (80%) 1344 (93%) 28 (1.9%) 7 (0.5%) 2 (0.1%) 5 (0.3%) 21 (1.5%)
Arunachal Pradesh 273 87 49 (56%) 237 (87%) 6 (2.2%) 10 (3.7%) 3 (1.1%) 7 (2.6%) 3 (1.1%)
Assam 993 357 211 (59%) 841 (85%) 25 (2.5%) 11 (1.1%) 4 (0.4%) 6 (0.6%) 38 (3.8%)
Bihar 2756 901 423 (47%) 2097 (76%) 60 (2.2%) 103 (3.7%) 10 (0.4%) 20 (0.7%) 222 (8.1%)
Chandigarh 221 78 51 (65%) 192 (87%) 7 (3.2%) 6 (2.7%) 0 (0.0%) 6 (2.7%) 2 (0.9%)
Chhattisgarh 861 162 121 (75%) 794 (92%) 21 (2.4%) 11 (1.3%) 2 (0.2%) 1 (0.1%) 19 (2.2%)
Dadra and Nagar Haveli and Daman and Diu 42 14 10 (71%) 41 (98%) 0 (0.0%) 0 (0.0%) 0 (0.0%) 0 (0.0%) 0 (0.0%)
Delhi 6986 2450 860 (35%) 5545 (79%) 69 (1.0%) 159 (2.3%) 36 (0.5%) 132 (1.9%) 150 (2.1%)
Goa 51 19 6 (32%) 46 (90%) 3 (5.9%) 0 (0.0%) 0 (0.0%) 1 (2.0%) 1 (2.0%)
Gujarat 3061 570 472 (83%) 2837 (93%) 93 (3.0%) 18 (0.6%) 14 (0.5%) 19 (0.6%) 7 (0.2%)
Haryana 2409 886 521 (59%) 2066 (86%) 28 (1.2%) 30 (1.2%) 6 (0.2%) 20 (0.8%) 70 (2.9%)
Himachal Pradesh 510 212 126 (59%) 457 (90%) 14 (2.7%) 6 (1.2%) 0 (0.0%) 4 (0.8%) 6 (1.2%)
Jammu & Kashmir 472 140 97 (69%) 402 (85%) 11 (2.3%) 2 (0.4%) 1 (0.2%) 0 (0.0%) 29 (6.1%)
Jharkhand 999 343 185 (54%) 861 (86%) 19 (1.9%) 17 (1.7%) 4 (0.4%) 6 (0.6%) 43 (4.3%)
Karnataka 2122 449 304 (68%) 1916 (90%) 62 (2.9%) 30 (1.4%) 2 (0.1%) 21 (1.0%) 18 (0.8%)
Kerala 624 108 70 (65%) 568 (91%) 4 (0.6%) 10 (1.6%) 2 (0.3%) 3 (0.5%) 23 (3.7%)
Ladakh 4 0 NA 4 (100%) 0 (0.0%) 0 (0.0%) 0 (0.0%) 0 (0.0%) 0 (0.0%)
Lakshadweep 0 0 NA NA NA NA NA NA NA
Madhya Pradesh 7576 1090 693 (64%) 6838 (90%) 123 (1.6%) 182 (2.4%) 19 (0.3%) 24 (0.3%) 210 (2.8%)
Maharashtra 5108 1456 758 (52%) 4423 (87%) 106 (2.1%) 54 (1.1%) 12 (0.2%) 149 (2.9%) 37 (0.7%)
Manipur 61 14 9 (64%) 50 (82%) 1 (1.6%) 1 (1.6%) 0 (0.0%) 0 (0.0%) 5 (8.2%)
Meghalaya 191 83 49 (59%) 163 (85%) 4 (2.1%) 3 (1.6%) 3 (1.6%) 3 (1.6%) 6 (3.1%)
Mizoram 111 29 17 (59%) 100 (90%) 0 (0.0%) 2 (1.8%) 0 (0.0%) 3 (2.7%) 1 (0.9%)
Nagaland 163 53 41 (77%) 129 (79%) 4 (2.5%) 6 (3.7%) 1 (0.6%) 2 (1.2%) 20 (12.3%)
Odisha 1524 464 383 (83%) 1377 (90%) 58 (3.8%) 20 (1.3%) 7 (0.5%) 3 (0.2%) 15 (1.0%)
Puducherry 44 11 6 (55%) 42 (95%) 1 (2.3%) 0 (0.0%) 0 (0.0%) 0 (0.0%) 0 (0.0%)
Punjab 2180 872 543 (62%) 1928 (88%) 64 (2.9%) 39 (1.8%) 12 (0.6%) 10 (0.5%) 65 (3.0%)
Rajasthan 4004 1117 756 (68%) 3447 (86%) 76 (1.9%) 88 (2.2%) 15 (0.4%) 34 (0.8%) 58 (1.4%)
Sikkim 52 19 12 (63%) 49 (94%) 0 (0.0%) 1 (1.9%) 0 (0.0%) 0 (0.0%) 2 (3.8%)
Tamil Nadu 1627 304 172 (57%) 1514 (93%) 20 (1.2%) 19 (1.2%) 2 (0.1%) 11 (0.7%) 27 (1.7%)
Telangana 1244 389 379 (97%) 1114 (90%) 31 (2.5%) 3 (0.2%) 4 (0.3%) 17 (1.4%) 35 (2.8%)
Tripura 44 22 12 (55%) 33 (75%) 4 (9.1%) 0 (0.0%) 0 (0.0%) 3 (6.8%) 1 (2.3%)
Uttar Pradesh 12438 3448 1947 (56%) 10672 (86%) 290 (2.3%) 271 (2.2%) 46 (0.4%) 129 (1.0%) 107 (0.9%)
Uttarakhand 708 152 82 (54%) 621 (88%) 14 (2.0%) 15 (2.1%) 3 (0.4%) 12 (1.7%) 14 (2.0%)
West Bengal 2152 717 453 (63%) 1817 (84%) 84 (3.9%) 41 (1.9%) 11 (0.5%) 24 (1.1%) 58 (2.7%)
INDIA 63069 17299 10044 (58%) 54582 (87%) 1330 (2.1%) 1165 (1.8%) 221 (0.4%) 675 (1.1%) 1313 (2.1%)
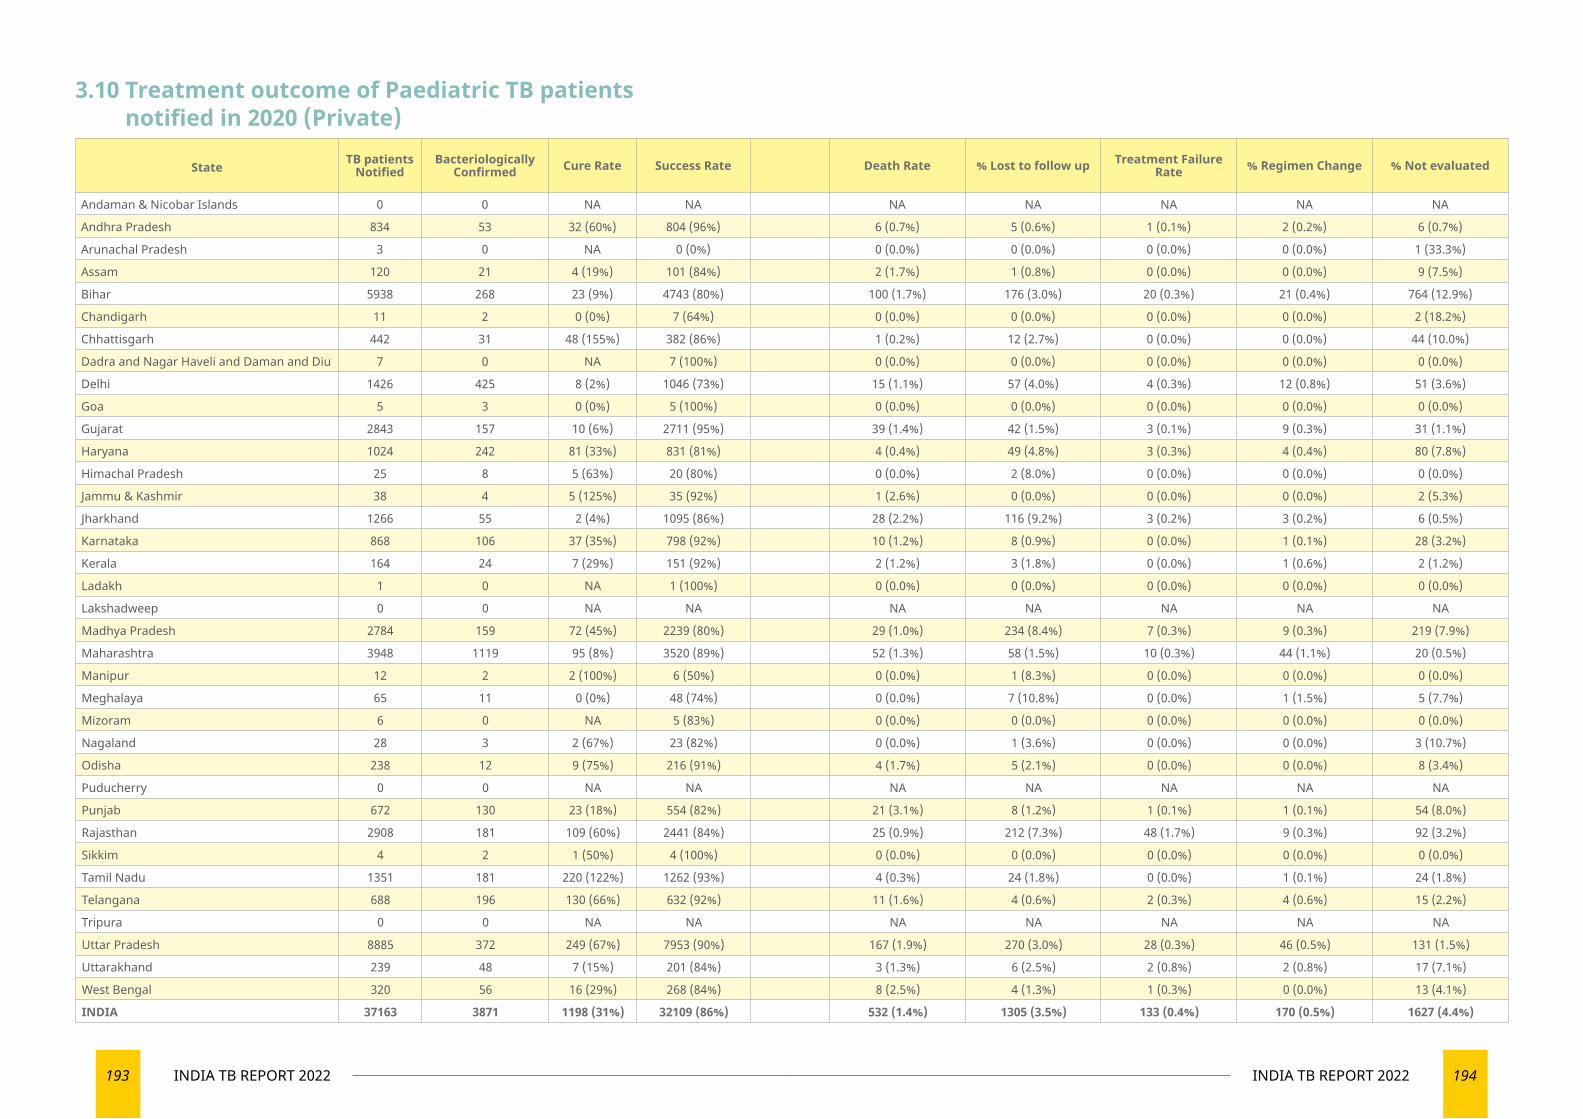
193 INDIA TB REPORT 2022 194INDIA TB REPORT 2022
3.10 Treatment outcome of Paediatric TB patients notified in 2020 (Private)
State TB patients Notified
Bacteriologically Confirmed Cure Rate Success Rate Death Rate % Lost to follow up Treatment Failure
Rate % Regimen Change % Not evaluated
Andaman & Nicobar Islands 0 0 NA NA NA NA NA NA NA
Andhra Pradesh 834 53 32 (60%) 804 (96%) 6 (0.7%) 5 (0.6%) 1 (0.1%) 2 (0.2%) 6 (0.7%)
Arunachal Pradesh 3 0 NA 0 (0%) 0 (0.0%) 0 (0.0%) 0 (0.0%) 0 (0.0%) 1 (33.3%)
Assam 120 21 4 (19%) 101 (84%) 2 (1.7%) 1 (0.8%) 0 (0.0%) 0 (0.0%) 9 (7.5%)
Bihar 5938 268 23 (9%) 4743 (80%) 100 (1.7%) 176 (3.0%) 20 (0.3%) 21 (0.4%) 764 (12.9%)
Chandigarh 11 2 0 (0%) 7 (64%) 0 (0.0%) 0 (0.0%) 0 (0.0%) 0 (0.0%) 2 (18.2%)
Chhattisgarh 442 31 48 (155%) 382 (86%) 1 (0.2%) 12 (2.7%) 0 (0.0%) 0 (0.0%) 44 (10.0%)
Dadra and Nagar Haveli and Daman and Diu 7 0 NA 7 (100%) 0 (0.0%) 0 (0.0%) 0 (0.0%) 0 (0.0%) 0 (0.0%)
Delhi 1426 425 8 (2%) 1046 (73%) 15 (1.1%) 57 (4.0%) 4 (0.3%) 12 (0.8%) 51 (3.6%)
Goa 5 3 0 (0%) 5 (100%) 0 (0.0%) 0 (0.0%) 0 (0.0%) 0 (0.0%) 0 (0.0%)
Gujarat 2843 157 10 (6%) 2711 (95%) 39 (1.4%) 42 (1.5%) 3 (0.1%) 9 (0.3%) 31 (1.1%)
Haryana 1024 242 81 (33%) 831 (81%) 4 (0.4%) 49 (4.8%) 3 (0.3%) 4 (0.4%) 80 (7.8%)
Himachal Pradesh 25 8 5 (63%) 20 (80%) 0 (0.0%) 2 (8.0%) 0 (0.0%) 0 (0.0%) 0 (0.0%)
Jammu & Kashmir 38 4 5 (125%) 35 (92%) 1 (2.6%) 0 (0.0%) 0 (0.0%) 0 (0.0%) 2 (5.3%)
Jharkhand 1266 55 2 (4%) 1095 (86%) 28 (2.2%) 116 (9.2%) 3 (0.2%) 3 (0.2%) 6 (0.5%)
Karnataka 868 106 37 (35%) 798 (92%) 10 (1.2%) 8 (0.9%) 0 (0.0%) 1 (0.1%) 28 (3.2%)
Kerala 164 24 7 (29%) 151 (92%) 2 (1.2%) 3 (1.8%) 0 (0.0%) 1 (0.6%) 2 (1.2%)
Ladakh 1 0 NA 1 (100%) 0 (0.0%) 0 (0.0%) 0 (0.0%) 0 (0.0%) 0 (0.0%)
Lakshadweep 0 0 NA NA NA NA NA NA NA
Madhya Pradesh 2784 159 72 (45%) 2239 (80%) 29 (1.0%) 234 (8.4%) 7 (0.3%) 9 (0.3%) 219 (7.9%)
Maharashtra 3948 1119 95 (8%) 3520 (89%) 52 (1.3%) 58 (1.5%) 10 (0.3%) 44 (1.1%) 20 (0.5%)
Manipur 12 2 2 (100%) 6 (50%) 0 (0.0%) 1 (8.3%) 0 (0.0%) 0 (0.0%) 0 (0.0%)
Meghalaya 65 11 0 (0%) 48 (74%) 0 (0.0%) 7 (10.8%) 0 (0.0%) 1 (1.5%) 5 (7.7%)
Mizoram 6 0 NA 5 (83%) 0 (0.0%) 0 (0.0%) 0 (0.0%) 0 (0.0%) 0 (0.0%)
Nagaland 28 3 2 (67%) 23 (82%) 0 (0.0%) 1 (3.6%) 0 (0.0%) 0 (0.0%) 3 (10.7%)
Odisha 238 12 9 (75%) 216 (91%) 4 (1.7%) 5 (2.1%) 0 (0.0%) 0 (0.0%) 8 (3.4%)
Puducherry 0 0 NA NA NA NA NA NA NA
Punjab 672 130 23 (18%) 554 (82%) 21 (3.1%) 8 (1.2%) 1 (0.1%) 1 (0.1%) 54 (8.0%)
Rajasthan 2908 181 109 (60%) 2441 (84%) 25 (0.9%) 212 (7.3%) 48 (1.7%) 9 (0.3%) 92 (3.2%)
Sikkim 4 2 1 (50%) 4 (100%) 0 (0.0%) 0 (0.0%) 0 (0.0%) 0 (0.0%) 0 (0.0%)
Tamil Nadu 1351 181 220 (122%) 1262 (93%) 4 (0.3%) 24 (1.8%) 0 (0.0%) 1 (0.1%) 24 (1.8%)
Telangana 688 196 130 (66%) 632 (92%) 11 (1.6%) 4 (0.6%) 2 (0.3%) 4 (0.6%) 15 (2.2%)
Tripura 0 0 NA NA NA NA NA NA NA
Uttar Pradesh 8885 372 249 (67%) 7953 (90%) 167 (1.9%) 270 (3.0%) 28 (0.3%) 46 (0.5%) 131 (1.5%)
Uttarakhand 239 48 7 (15%) 201 (84%) 3 (1.3%) 6 (2.5%) 2 (0.8%) 2 (0.8%) 17 (7.1%)
West Bengal 320 56 16 (29%) 268 (84%) 8 (2.5%) 4 (1.3%) 1 (0.3%) 0 (0.0%) 13 (4.1%)
INDIA 37163 3871 1198 (31%) 32109 (86%) 532 (1.4%) 1305 (3.5%) 133 (0.4%) 170 (0.5%) 1627 (4.4%)
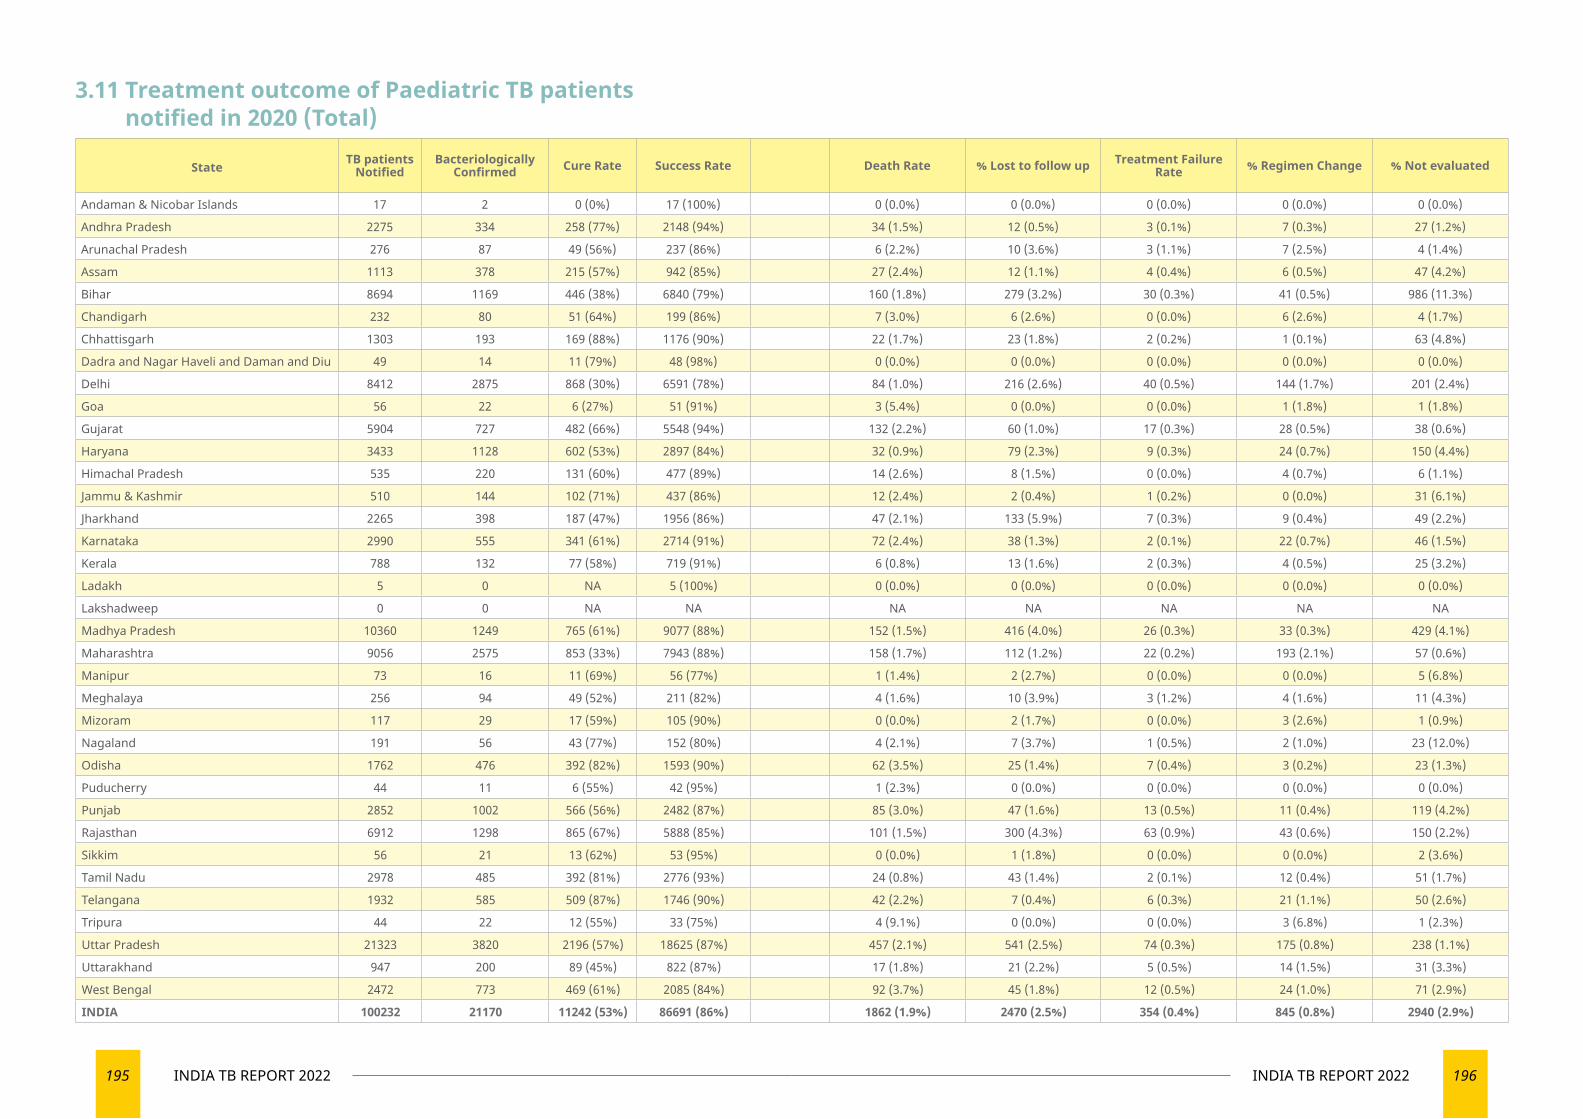
195 INDIA TB REPORT 2022 196INDIA TB REPORT 2022
3.11 Treatment outcome of Paediatric TB patients notified in 2020 (Total)
State TB patients Notified
Bacteriologically Confirmed Cure Rate Success Rate Death Rate % Lost to follow up Treatment Failure
Rate % Regimen Change % Not evaluated
Andaman & Nicobar Islands 17 2 0 (0%) 17 (100%) 0 (0.0%) 0 (0.0%) 0 (0.0%) 0 (0.0%) 0 (0.0%)
Andhra Pradesh 2275 334 258 (77%) 2148 (94%) 34 (1.5%) 12 (0.5%) 3 (0.1%) 7 (0.3%) 27 (1.2%)
Arunachal Pradesh 276 87 49 (56%) 237 (86%) 6 (2.2%) 10 (3.6%) 3 (1.1%) 7 (2.5%) 4 (1.4%)
Assam 1113 378 215 (57%) 942 (85%) 27 (2.4%) 12 (1.1%) 4 (0.4%) 6 (0.5%) 47 (4.2%)
Bihar 8694 1169 446 (38%) 6840 (79%) 160 (1.8%) 279 (3.2%) 30 (0.3%) 41 (0.5%) 986 (11.3%)
Chandigarh 232 80 51 (64%) 199 (86%) 7 (3.0%) 6 (2.6%) 0 (0.0%) 6 (2.6%) 4 (1.7%)
Chhattisgarh 1303 193 169 (88%) 1176 (90%) 22 (1.7%) 23 (1.8%) 2 (0.2%) 1 (0.1%) 63 (4.8%)
Dadra and Nagar Haveli and Daman and Diu 49 14 11 (79%) 48 (98%) 0 (0.0%) 0 (0.0%) 0 (0.0%) 0 (0.0%) 0 (0.0%)
Delhi 8412 2875 868 (30%) 6591 (78%) 84 (1.0%) 216 (2.6%) 40 (0.5%) 144 (1.7%) 201 (2.4%)
Goa 56 22 6 (27%) 51 (91%) 3 (5.4%) 0 (0.0%) 0 (0.0%) 1 (1.8%) 1 (1.8%)
Gujarat 5904 727 482 (66%) 5548 (94%) 132 (2.2%) 60 (1.0%) 17 (0.3%) 28 (0.5%) 38 (0.6%)
Haryana 3433 1128 602 (53%) 2897 (84%) 32 (0.9%) 79 (2.3%) 9 (0.3%) 24 (0.7%) 150 (4.4%)
Himachal Pradesh 535 220 131 (60%) 477 (89%) 14 (2.6%) 8 (1.5%) 0 (0.0%) 4 (0.7%) 6 (1.1%)
Jammu & Kashmir 510 144 102 (71%) 437 (86%) 12 (2.4%) 2 (0.4%) 1 (0.2%) 0 (0.0%) 31 (6.1%)
Jharkhand 2265 398 187 (47%) 1956 (86%) 47 (2.1%) 133 (5.9%) 7 (0.3%) 9 (0.4%) 49 (2.2%)
Karnataka 2990 555 341 (61%) 2714 (91%) 72 (2.4%) 38 (1.3%) 2 (0.1%) 22 (0.7%) 46 (1.5%)
Kerala 788 132 77 (58%) 719 (91%) 6 (0.8%) 13 (1.6%) 2 (0.3%) 4 (0.5%) 25 (3.2%)
Ladakh 5 0 NA 5 (100%) 0 (0.0%) 0 (0.0%) 0 (0.0%) 0 (0.0%) 0 (0.0%)
Lakshadweep 0 0 NA NA NA NA NA NA NA
Madhya Pradesh 10360 1249 765 (61%) 9077 (88%) 152 (1.5%) 416 (4.0%) 26 (0.3%) 33 (0.3%) 429 (4.1%)
Maharashtra 9056 2575 853 (33%) 7943 (88%) 158 (1.7%) 112 (1.2%) 22 (0.2%) 193 (2.1%) 57 (0.6%)
Manipur 73 16 11 (69%) 56 (77%) 1 (1.4%) 2 (2.7%) 0 (0.0%) 0 (0.0%) 5 (6.8%)
Meghalaya 256 94 49 (52%) 211 (82%) 4 (1.6%) 10 (3.9%) 3 (1.2%) 4 (1.6%) 11 (4.3%)
Mizoram 117 29 17 (59%) 105 (90%) 0 (0.0%) 2 (1.7%) 0 (0.0%) 3 (2.6%) 1 (0.9%)
Nagaland 191 56 43 (77%) 152 (80%) 4 (2.1%) 7 (3.7%) 1 (0.5%) 2 (1.0%) 23 (12.0%)
Odisha 1762 476 392 (82%) 1593 (90%) 62 (3.5%) 25 (1.4%) 7 (0.4%) 3 (0.2%) 23 (1.3%)
Puducherry 44 11 6 (55%) 42 (95%) 1 (2.3%) 0 (0.0%) 0 (0.0%) 0 (0.0%) 0 (0.0%)
Punjab 2852 1002 566 (56%) 2482 (87%) 85 (3.0%) 47 (1.6%) 13 (0.5%) 11 (0.4%) 119 (4.2%)
Rajasthan 6912 1298 865 (67%) 5888 (85%) 101 (1.5%) 300 (4.3%) 63 (0.9%) 43 (0.6%) 150 (2.2%)
Sikkim 56 21 13 (62%) 53 (95%) 0 (0.0%) 1 (1.8%) 0 (0.0%) 0 (0.0%) 2 (3.6%)
Tamil Nadu 2978 485 392 (81%) 2776 (93%) 24 (0.8%) 43 (1.4%) 2 (0.1%) 12 (0.4%) 51 (1.7%)
Telangana 1932 585 509 (87%) 1746 (90%) 42 (2.2%) 7 (0.4%) 6 (0.3%) 21 (1.1%) 50 (2.6%)
Tripura 44 22 12 (55%) 33 (75%) 4 (9.1%) 0 (0.0%) 0 (0.0%) 3 (6.8%) 1 (2.3%)
Uttar Pradesh 21323 3820 2196 (57%) 18625 (87%) 457 (2.1%) 541 (2.5%) 74 (0.3%) 175 (0.8%) 238 (1.1%)
Uttarakhand 947 200 89 (45%) 822 (87%) 17 (1.8%) 21 (2.2%) 5 (0.5%) 14 (1.5%) 31 (3.3%)
West Bengal 2472 773 469 (61%) 2085 (84%) 92 (3.7%) 45 (1.8%) 12 (0.5%) 24 (1.0%) 71 (2.9%)
INDIA 100232 21170 11242 (53%) 86691 (86%) 1862 (1.9%) 2470 (2.5%) 354 (0.4%) 845 (0.8%) 2940 (2.9%)
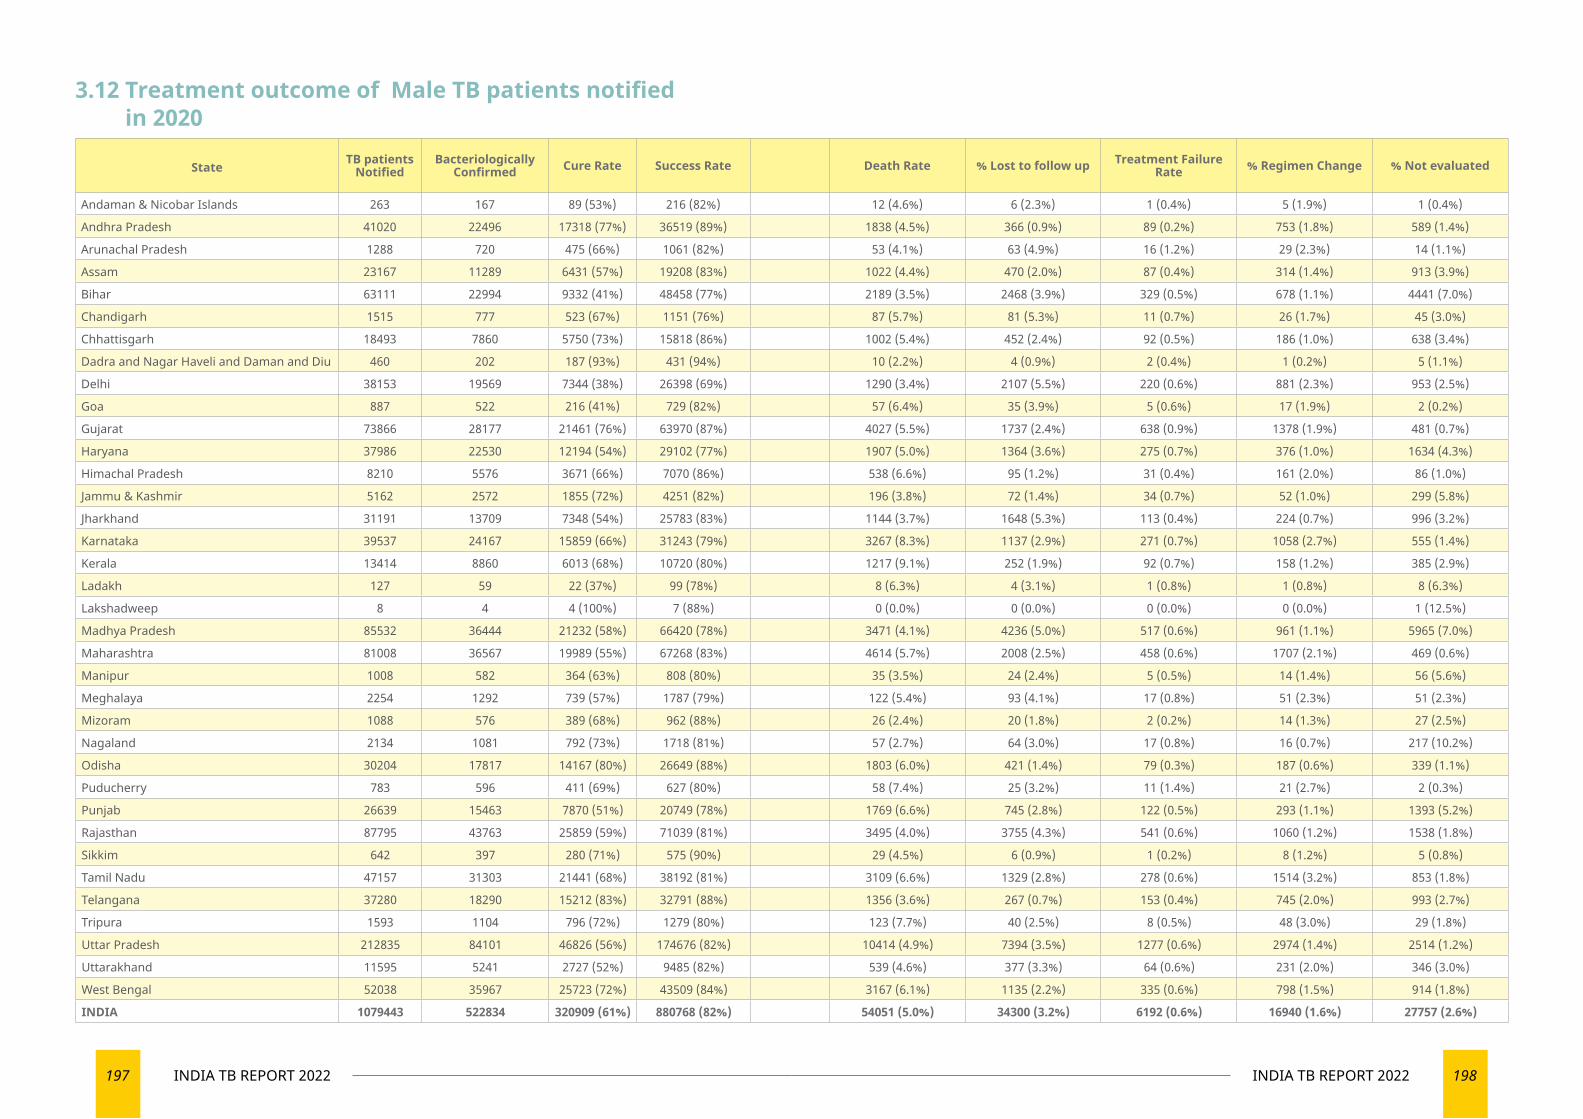
197 INDIA TB REPORT 2022 198INDIA TB REPORT 2022
3.12 Treatment outcome of Male TB patients notified in 2020
State TB patients Notified
Bacteriologically Confirmed Cure Rate Success Rate Death Rate % Lost to follow up Treatment Failure
Rate % Regimen Change % Not evaluated
Andaman & Nicobar Islands 263 167 89 (53%) 216 (82%) 12 (4.6%) 6 (2.3%) 1 (0.4%) 5 (1.9%) 1 (0.4%)
Andhra Pradesh 41020 22496 17318 (77%) 36519 (89%) 1838 (4.5%) 366 (0.9%) 89 (0.2%) 753 (1.8%) 589 (1.4%)
Arunachal Pradesh 1288 720 475 (66%) 1061 (82%) 53 (4.1%) 63 (4.9%) 16 (1.2%) 29 (2.3%) 14 (1.1%)
Assam 23167 11289 6431 (57%) 19208 (83%) 1022 (4.4%) 470 (2.0%) 87 (0.4%) 314 (1.4%) 913 (3.9%)
Bihar 63111 22994 9332 (41%) 48458 (77%) 2189 (3.5%) 2468 (3.9%) 329 (0.5%) 678 (1.1%) 4441 (7.0%)
Chandigarh 1515 777 523 (67%) 1151 (76%) 87 (5.7%) 81 (5.3%) 11 (0.7%) 26 (1.7%) 45 (3.0%)
Chhattisgarh 18493 7860 5750 (73%) 15818 (86%) 1002 (5.4%) 452 (2.4%) 92 (0.5%) 186 (1.0%) 638 (3.4%)
Dadra and Nagar Haveli and Daman and Diu 460 202 187 (93%) 431 (94%) 10 (2.2%) 4 (0.9%) 2 (0.4%) 1 (0.2%) 5 (1.1%)
Delhi 38153 19569 7344 (38%) 26398 (69%) 1290 (3.4%) 2107 (5.5%) 220 (0.6%) 881 (2.3%) 953 (2.5%)
Goa 887 522 216 (41%) 729 (82%) 57 (6.4%) 35 (3.9%) 5 (0.6%) 17 (1.9%) 2 (0.2%)
Gujarat 73866 28177 21461 (76%) 63970 (87%) 4027 (5.5%) 1737 (2.4%) 638 (0.9%) 1378 (1.9%) 481 (0.7%)
Haryana 37986 22530 12194 (54%) 29102 (77%) 1907 (5.0%) 1364 (3.6%) 275 (0.7%) 376 (1.0%) 1634 (4.3%)
Himachal Pradesh 8210 5576 3671 (66%) 7070 (86%) 538 (6.6%) 95 (1.2%) 31 (0.4%) 161 (2.0%) 86 (1.0%)
Jammu & Kashmir 5162 2572 1855 (72%) 4251 (82%) 196 (3.8%) 72 (1.4%) 34 (0.7%) 52 (1.0%) 299 (5.8%)
Jharkhand 31191 13709 7348 (54%) 25783 (83%) 1144 (3.7%) 1648 (5.3%) 113 (0.4%) 224 (0.7%) 996 (3.2%)
Karnataka 39537 24167 15859 (66%) 31243 (79%) 3267 (8.3%) 1137 (2.9%) 271 (0.7%) 1058 (2.7%) 555 (1.4%)
Kerala 13414 8860 6013 (68%) 10720 (80%) 1217 (9.1%) 252 (1.9%) 92 (0.7%) 158 (1.2%) 385 (2.9%)
Ladakh 127 59 22 (37%) 99 (78%) 8 (6.3%) 4 (3.1%) 1 (0.8%) 1 (0.8%) 8 (6.3%)
Lakshadweep 8 4 4 (100%) 7 (88%) 0 (0.0%) 0 (0.0%) 0 (0.0%) 0 (0.0%) 1 (12.5%)
Madhya Pradesh 85532 36444 21232 (58%) 66420 (78%) 3471 (4.1%) 4236 (5.0%) 517 (0.6%) 961 (1.1%) 5965 (7.0%)
Maharashtra 81008 36567 19989 (55%) 67268 (83%) 4614 (5.7%) 2008 (2.5%) 458 (0.6%) 1707 (2.1%) 469 (0.6%)
Manipur 1008 582 364 (63%) 808 (80%) 35 (3.5%) 24 (2.4%) 5 (0.5%) 14 (1.4%) 56 (5.6%)
Meghalaya 2254 1292 739 (57%) 1787 (79%) 122 (5.4%) 93 (4.1%) 17 (0.8%) 51 (2.3%) 51 (2.3%)
Mizoram 1088 576 389 (68%) 962 (88%) 26 (2.4%) 20 (1.8%) 2 (0.2%) 14 (1.3%) 27 (2.5%)
Nagaland 2134 1081 792 (73%) 1718 (81%) 57 (2.7%) 64 (3.0%) 17 (0.8%) 16 (0.7%) 217 (10.2%)
Odisha 30204 17817 14167 (80%) 26649 (88%) 1803 (6.0%) 421 (1.4%) 79 (0.3%) 187 (0.6%) 339 (1.1%)
Puducherry 783 596 411 (69%) 627 (80%) 58 (7.4%) 25 (3.2%) 11 (1.4%) 21 (2.7%) 2 (0.3%)
Punjab 26639 15463 7870 (51%) 20749 (78%) 1769 (6.6%) 745 (2.8%) 122 (0.5%) 293 (1.1%) 1393 (5.2%)
Rajasthan 87795 43763 25859 (59%) 71039 (81%) 3495 (4.0%) 3755 (4.3%) 541 (0.6%) 1060 (1.2%) 1538 (1.8%)
Sikkim 642 397 280 (71%) 575 (90%) 29 (4.5%) 6 (0.9%) 1 (0.2%) 8 (1.2%) 5 (0.8%)
Tamil Nadu 47157 31303 21441 (68%) 38192 (81%) 3109 (6.6%) 1329 (2.8%) 278 (0.6%) 1514 (3.2%) 853 (1.8%)
Telangana 37280 18290 15212 (83%) 32791 (88%) 1356 (3.6%) 267 (0.7%) 153 (0.4%) 745 (2.0%) 993 (2.7%)
Tripura 1593 1104 796 (72%) 1279 (80%) 123 (7.7%) 40 (2.5%) 8 (0.5%) 48 (3.0%) 29 (1.8%)
Uttar Pradesh 212835 84101 46826 (56%) 174676 (82%) 10414 (4.9%) 7394 (3.5%) 1277 (0.6%) 2974 (1.4%) 2514 (1.2%)
Uttarakhand 11595 5241 2727 (52%) 9485 (82%) 539 (4.6%) 377 (3.3%) 64 (0.6%) 231 (2.0%) 346 (3.0%)
West Bengal 52038 35967 25723 (72%) 43509 (84%) 3167 (6.1%) 1135 (2.2%) 335 (0.6%) 798 (1.5%) 914 (1.8%)
INDIA 1079443 522834 320909 (61%) 880768 (82%) 54051 (5.0%) 34300 (3.2%) 6192 (0.6%) 16940 (1.6%) 27757 (2.6%)

199 INDIA TB REPORT 2022 200INDIA TB REPORT 2022
3.13 Treatment outcome of Female TB patients notified in 2020
State TB patients Notified
Bacteriologically Confirmed Cure Rate Success Rate Death Rate % Lost to follow up Treatment Failure
Rate % Regimen Change % Not evaluated
Andaman & Nicobar Islands 171 75 52 (69%) 154 (90%) 4 (2.3%) 0 (0.0%) 2 (1.2%) 3 (1.8%) 0 (0.0%)
Andhra Pradesh 21862 8840 7051 (80%) 20127 (92%) 650 (3.0%) 133 (0.6%) 33 (0.2%) 259 (1.2%) 265 (1.2%)
Arunachal Pradesh 1132 526 340 (65%) 949 (84%) 25 (2.2%) 60 (5.3%) 7 (0.6%) 47 (4.2%) 10 (0.9%)
Assam 11352 4931 2951 (60%) 9667 (85%) 400 (3.5%) 164 (1.4%) 38 (0.3%) 136 (1.2%) 459 (4.0%)
Bihar 36546 11769 5086 (43%) 28995 (79%) 1149 (3.1%) 1277 (3.5%) 187 (0.5%) 389 (1.1%) 2295 (6.3%)
Chandigarh 1309 599 424 (71%) 1123 (86%) 42 (3.2%) 23 (1.8%) 3 (0.2%) 26 (2.0%) 19 (1.5%)
Chhattisgarh 10593 3491 2677 (77%) 9248 (87%) 376 (3.5%) 233 (2.2%) 43 (0.4%) 75 (0.7%) 434 (4.1%)
Dadra and Nagar Haveli and Daman and Diu 275 112 98 (88%) 255 (93%) 7 (2.5%) 1 (0.4%) 0 (0.0%) 1 (0.4%) 3 (1.1%)
Delhi 35181 15249 5909 (39%) 26460 (75%) 716 (2.0%) 1337 (3.8%) 168 (0.5%) 763 (2.2%) 908 (2.6%)
Goa 695 321 132 (41%) 607 (87%) 32 (4.6%) 13 (1.9%) 3 (0.4%) 9 (1.3%) 6 (0.9%)
Gujarat 41423 12671 10150 (80%) 37464 (90%) 1444 (3.5%) 672 (1.6%) 238 (0.6%) 695 (1.7%) 261 (0.6%)
Haryana 25019 11924 6918 (58%) 20380 (81%) 730 (2.9%) 641 (2.6%) 120 (0.5%) 199 (0.8%) 1082 (4.3%)
Himachal Pradesh 5082 3135 2031 (65%) 4567 (90%) 185 (3.6%) 49 (1.0%) 17 (0.3%) 82 (1.6%) 75 (1.5%)
Jammu & Kashmir 3634 1717 1315 (77%) 3036 (84%) 113 (3.1%) 48 (1.3%) 15 (0.4%) 21 (0.6%) 203 (5.6%)
Jharkhand 14460 4889 2749 (56%) 12250 (85%) 424 (2.9%) 730 (5.0%) 56 (0.4%) 85 (0.6%) 409 (2.8%)
Karnataka 22949 11216 7634 (68%) 19481 (85%) 1219 (5.3%) 415 (1.8%) 97 (0.4%) 459 (2.0%) 318 (1.4%)
Kerala 7219 3273 2099 (64%) 6045 (84%) 450 (6.2%) 118 (1.6%) 39 (0.5%) 76 (1.1%) 222 (3.1%)
Ladakh 116 68 34 (50%) 89 (77%) 11 (9.5%) 0 (0.0%) 1 (0.9%) 0 (0.0%) 10 (8.6%)
Lakshadweep 9 4 5 (125%) 8 (89%) 0 (0.0%) 0 (0.0%) 0 (0.0%) 0 (0.0%) 1 (11.1%)
Madhya Pradesh 50151 16765 10664 (64%) 41525 (83%) 1323 (2.6%) 1851 (3.7%) 250 (0.5%) 470 (0.9%) 2987 (6.0%)
Maharashtra 66324 26862 13064 (49%) 56972 (86%) 2370 (3.6%) 1077 (1.6%) 258 (0.4%) 1617 (2.4%) 389 (0.6%)
Manipur 555 269 169 (63%) 436 (79%) 20 (3.6%) 19 (3.4%) 1 (0.2%) 3 (0.5%) 33 (5.9%)
Meghalaya 1606 797 467 (59%) 1318 (82%) 63 (3.9%) 55 (3.4%) 10 (0.6%) 38 (2.4%) 32 (2.0%)
Mizoram 900 405 287 (71%) 811 (90%) 24 (2.7%) 11 (1.2%) 3 (0.3%) 13 (1.4%) 25 (2.8%)
Nagaland 1380 576 439 (76%) 1121 (81%) 39 (2.8%) 26 (1.9%) 9 (0.7%) 8 (0.6%) 150 (10.9%)
Odisha 14766 7147 6130 (86%) 13324 (90%) 703 (4.8%) 163 (1.1%) 28 (0.2%) 61 (0.4%) 184 (1.2%)
Puducherry 436 230 132 (57%) 367 (84%) 22 (5.0%) 3 (0.7%) 3 (0.7%) 16 (3.7%) 1 (0.2%)
Punjab 19811 10441 5812 (56%) 16224 (82%) 892 (4.5%) 427 (2.2%) 81 (0.4%) 201 (1.0%) 981 (5.0%)
Rajasthan 45619 17906 11627 (65%) 38893 (85%) 1120 (2.5%) 1618 (3.5%) 215 (0.5%) 479 (1.1%) 810 (1.8%)
Sikkim 497 273 169 (62%) 447 (90%) 16 (3.2%) 3 (0.6%) 0 (0.0%) 11 (2.2%) 10 (2.0%)
Tamil Nadu 21757 10627 7237 (68%) 18666 (86%) 940 (4.3%) 383 (1.8%) 64 (0.3%) 521 (2.4%) 455 (2.1%)
Telangana 23549 9632 8461 (88%) 21362 (91%) 519 (2.2%) 109 (0.5%) 73 (0.3%) 410 (1.7%) 542 (2.3%)
Tripura 542 307 245 (80%) 458 (85%) 36 (6.6%) 10 (1.8%) 1 (0.2%) 12 (2.2%) 13 (2.4%)
Uttar Pradesh 150653 47621 29007 (61%) 128972 (86%) 4494 (3.0%) 4482 (3.0%) 771 (0.5%) 1989 (1.3%) 1704 (1.1%)
Uttarakhand 8074 2898 1538 (53%) 6917 (86%) 204 (2.5%) 236 (2.9%) 40 (0.5%) 118 (1.5%) 249 (3.1%)
West Bengal 25416 13979 9828 (70%) 21637 (85%) 1151 (4.5%) 421 (1.7%) 131 (0.5%) 423 (1.7%) 507 (2.0%)
INDIA 671063 261545 162931 (62%) 570355 (85%) 21913 (3.3%) 16808 (2.5%) 3005 (0.4%) 9715 (1.4%) 16052 (2.4%)
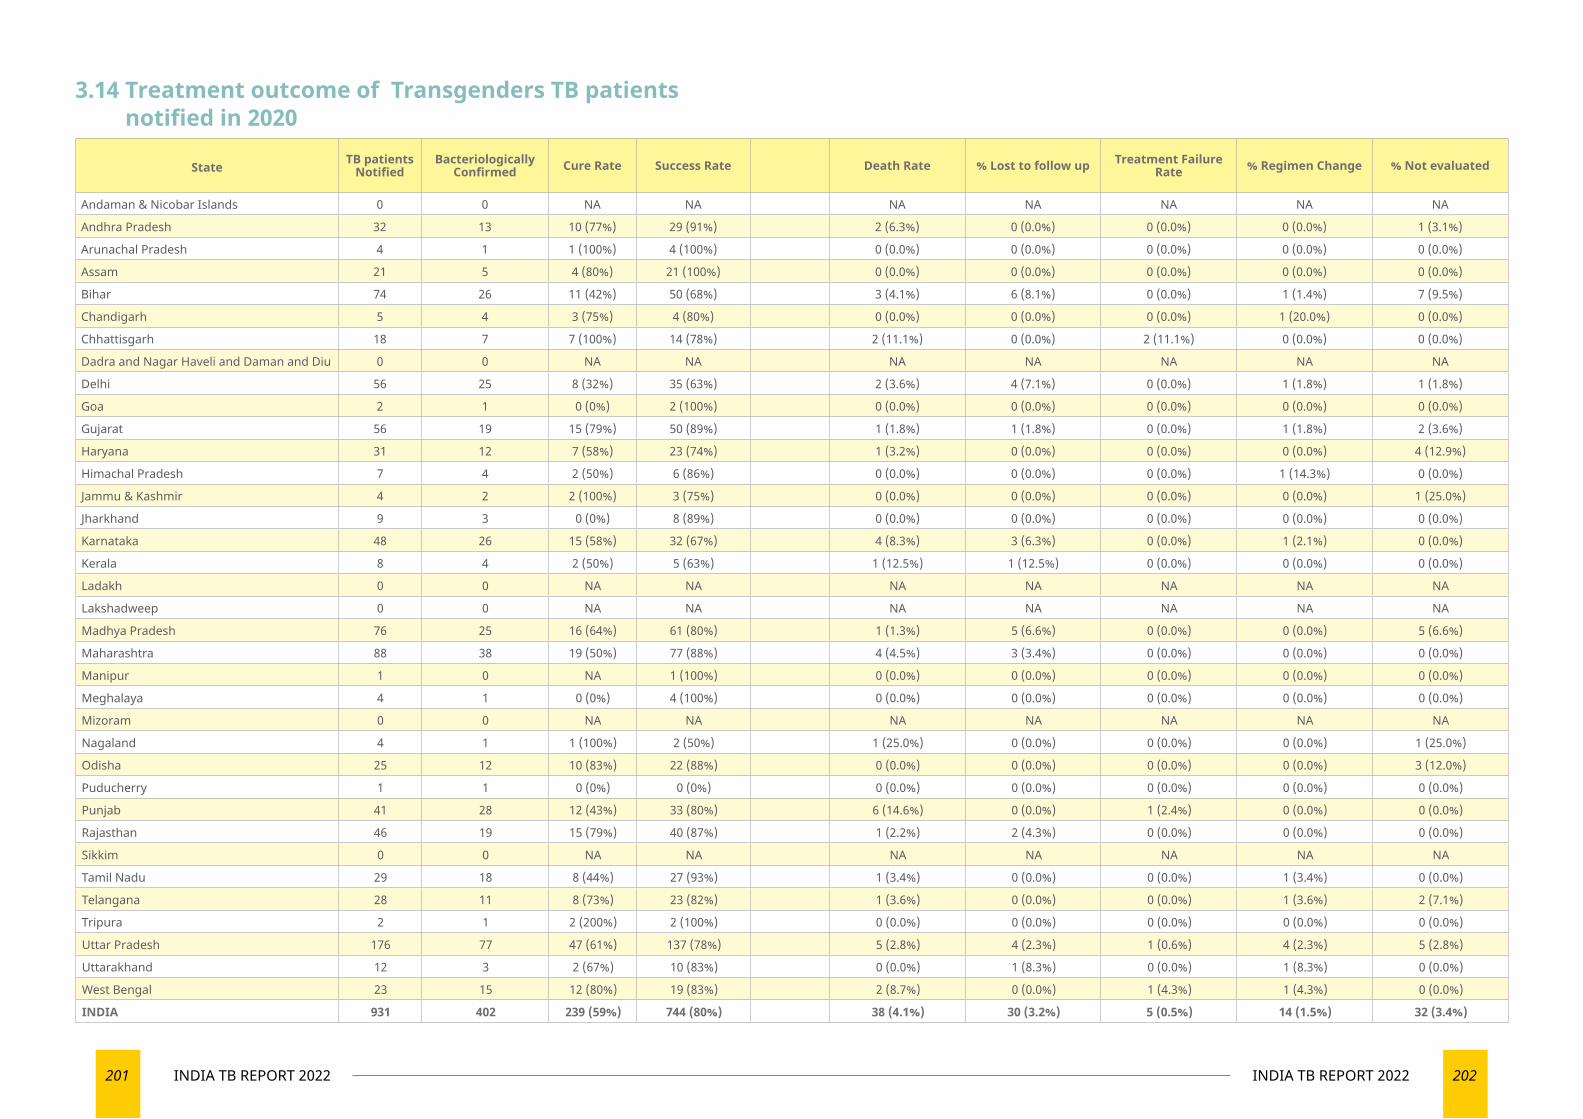
201 INDIA TB REPORT 2022 202INDIA TB REPORT 2022
3.14 Treatment outcome of Transgenders TB patients notified in 2020
State TB patients Notified
Bacteriologically Confirmed Cure Rate Success Rate Death Rate % Lost to follow up Treatment Failure
Rate % Regimen Change % Not evaluated
Andaman & Nicobar Islands 0 0 NA NA NA NA NA NA NA
Andhra Pradesh 32 13 10 (77%) 29 (91%) 2 (6.3%) 0 (0.0%) 0 (0.0%) 0 (0.0%) 1 (3.1%)
Arunachal Pradesh 4 1 1 (100%) 4 (100%) 0 (0.0%) 0 (0.0%) 0 (0.0%) 0 (0.0%) 0 (0.0%)
Assam 21 5 4 (80%) 21 (100%) 0 (0.0%) 0 (0.0%) 0 (0.0%) 0 (0.0%) 0 (0.0%)
Bihar 74 26 11 (42%) 50 (68%) 3 (4.1%) 6 (8.1%) 0 (0.0%) 1 (1.4%) 7 (9.5%)
Chandigarh 5 4 3 (75%) 4 (80%) 0 (0.0%) 0 (0.0%) 0 (0.0%) 1 (20.0%) 0 (0.0%)
Chhattisgarh 18 7 7 (100%) 14 (78%) 2 (11.1%) 0 (0.0%) 2 (11.1%) 0 (0.0%) 0 (0.0%)
Dadra and Nagar Haveli and Daman and Diu 0 0 NA NA NA NA NA NA NA
Delhi 56 25 8 (32%) 35 (63%) 2 (3.6%) 4 (7.1%) 0 (0.0%) 1 (1.8%) 1 (1.8%)
Goa 2 1 0 (0%) 2 (100%) 0 (0.0%) 0 (0.0%) 0 (0.0%) 0 (0.0%) 0 (0.0%)
Gujarat 56 19 15 (79%) 50 (89%) 1 (1.8%) 1 (1.8%) 0 (0.0%) 1 (1.8%) 2 (3.6%)
Haryana 31 12 7 (58%) 23 (74%) 1 (3.2%) 0 (0.0%) 0 (0.0%) 0 (0.0%) 4 (12.9%)
Himachal Pradesh 7 4 2 (50%) 6 (86%) 0 (0.0%) 0 (0.0%) 0 (0.0%) 1 (14.3%) 0 (0.0%)
Jammu & Kashmir 4 2 2 (100%) 3 (75%) 0 (0.0%) 0 (0.0%) 0 (0.0%) 0 (0.0%) 1 (25.0%)
Jharkhand 9 3 0 (0%) 8 (89%) 0 (0.0%) 0 (0.0%) 0 (0.0%) 0 (0.0%) 0 (0.0%)
Karnataka 48 26 15 (58%) 32 (67%) 4 (8.3%) 3 (6.3%) 0 (0.0%) 1 (2.1%) 0 (0.0%)
Kerala 8 4 2 (50%) 5 (63%) 1 (12.5%) 1 (12.5%) 0 (0.0%) 0 (0.0%) 0 (0.0%)
Ladakh 0 0 NA NA NA NA NA NA NA
Lakshadweep 0 0 NA NA NA NA NA NA NA
Madhya Pradesh 76 25 16 (64%) 61 (80%) 1 (1.3%) 5 (6.6%) 0 (0.0%) 0 (0.0%) 5 (6.6%)
Maharashtra 88 38 19 (50%) 77 (88%) 4 (4.5%) 3 (3.4%) 0 (0.0%) 0 (0.0%) 0 (0.0%)
Manipur 1 0 NA 1 (100%) 0 (0.0%) 0 (0.0%) 0 (0.0%) 0 (0.0%) 0 (0.0%)
Meghalaya 4 1 0 (0%) 4 (100%) 0 (0.0%) 0 (0.0%) 0 (0.0%) 0 (0.0%) 0 (0.0%)
Mizoram 0 0 NA NA NA NA NA NA NA
Nagaland 4 1 1 (100%) 2 (50%) 1 (25.0%) 0 (0.0%) 0 (0.0%) 0 (0.0%) 1 (25.0%)
Odisha 25 12 10 (83%) 22 (88%) 0 (0.0%) 0 (0.0%) 0 (0.0%) 0 (0.0%) 3 (12.0%)
Puducherry 1 1 0 (0%) 0 (0%) 0 (0.0%) 0 (0.0%) 0 (0.0%) 0 (0.0%) 0 (0.0%)
Punjab 41 28 12 (43%) 33 (80%) 6 (14.6%) 0 (0.0%) 1 (2.4%) 0 (0.0%) 0 (0.0%)
Rajasthan 46 19 15 (79%) 40 (87%) 1 (2.2%) 2 (4.3%) 0 (0.0%) 0 (0.0%) 0 (0.0%)
Sikkim 0 0 NA NA NA NA NA NA NA
Tamil Nadu 29 18 8 (44%) 27 (93%) 1 (3.4%) 0 (0.0%) 0 (0.0%) 1 (3.4%) 0 (0.0%)
Telangana 28 11 8 (73%) 23 (82%) 1 (3.6%) 0 (0.0%) 0 (0.0%) 1 (3.6%) 2 (7.1%)
Tripura 2 1 2 (200%) 2 (100%) 0 (0.0%) 0 (0.0%) 0 (0.0%) 0 (0.0%) 0 (0.0%)
Uttar Pradesh 176 77 47 (61%) 137 (78%) 5 (2.8%) 4 (2.3%) 1 (0.6%) 4 (2.3%) 5 (2.8%)
Uttarakhand 12 3 2 (67%) 10 (83%) 0 (0.0%) 1 (8.3%) 0 (0.0%) 1 (8.3%) 0 (0.0%)
West Bengal 23 15 12 (80%) 19 (83%) 2 (8.7%) 0 (0.0%) 1 (4.3%) 1 (4.3%) 0 (0.0%)
INDIA 931 402 239 (59%) 744 (80%) 38 (4.1%) 30 (3.2%) 5 (0.5%) 14 (1.5%) 32 (3.4%)
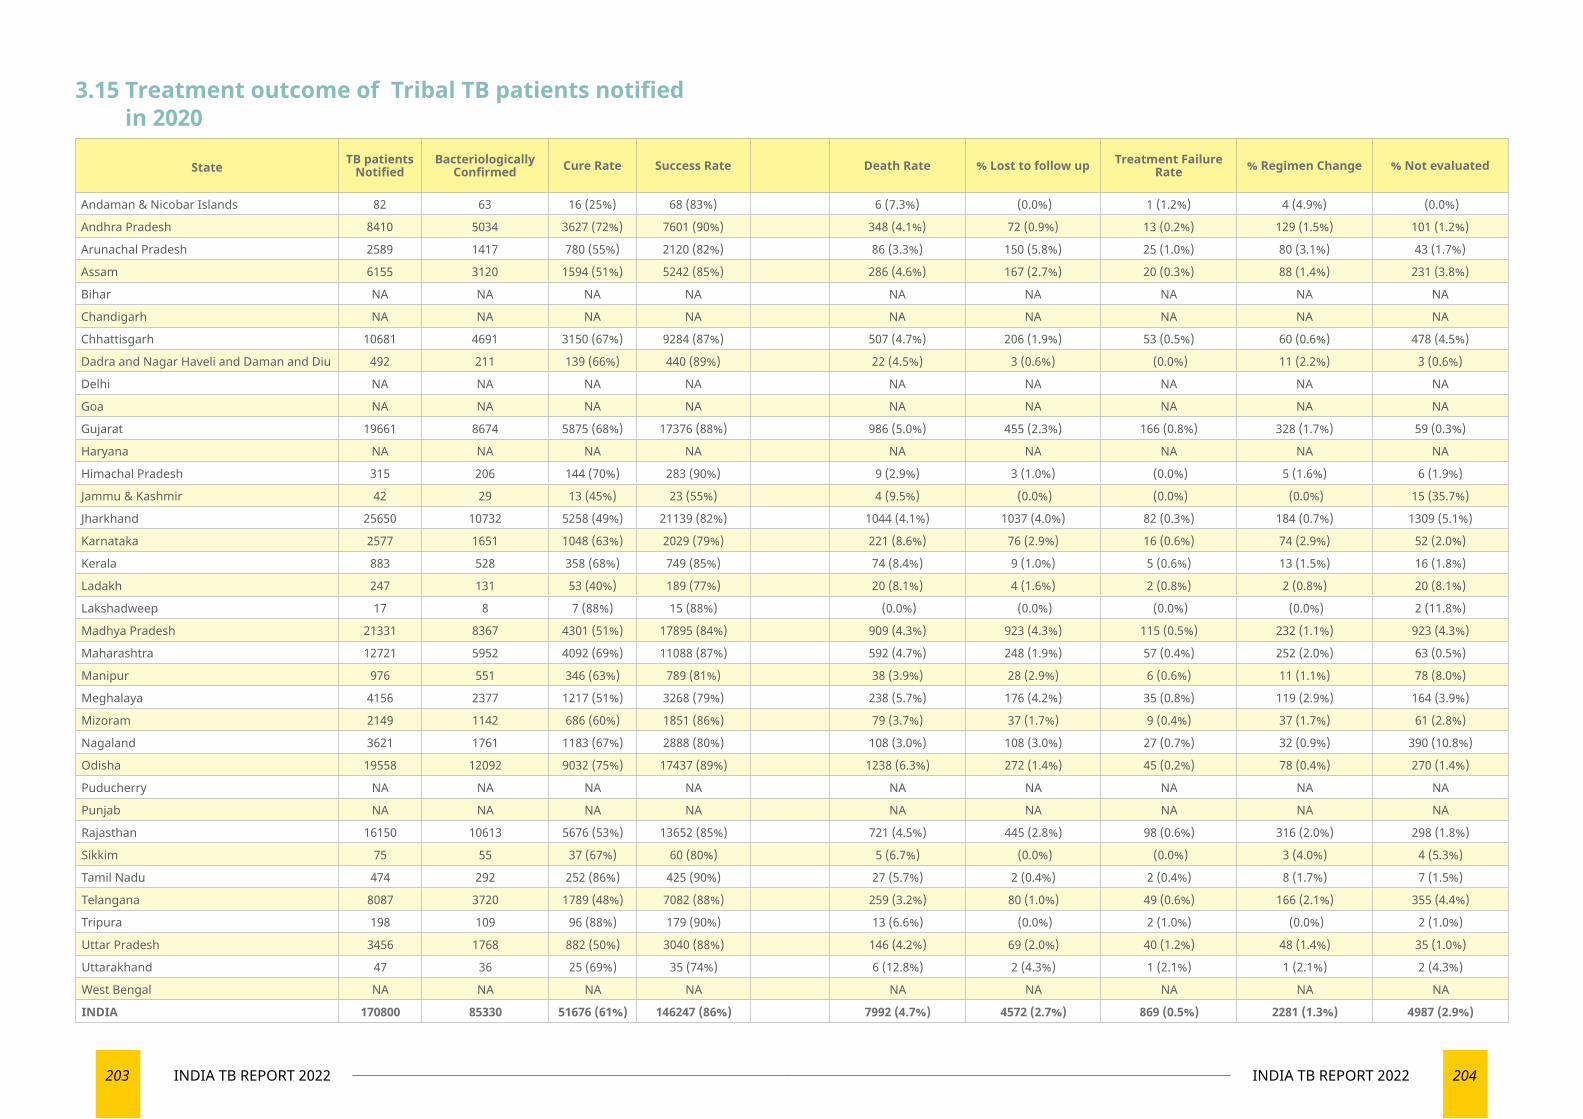
203 INDIA TB REPORT 2022 204INDIA TB REPORT 2022
3.15 Treatment outcome of Tribal TB patients notified in 2020
State TB patients Notified
Bacteriologically Confirmed Cure Rate Success Rate Death Rate % Lost to follow up Treatment Failure
Rate % Regimen Change % Not evaluated
Andaman & Nicobar Islands 82 63 16 (25%) 68 (83%) 6 (7.3%) (0.0%) 1 (1.2%) 4 (4.9%) (0.0%)
Andhra Pradesh 8410 5034 3627 (72%) 7601 (90%) 348 (4.1%) 72 (0.9%) 13 (0.2%) 129 (1.5%) 101 (1.2%)
Arunachal Pradesh 2589 1417 780 (55%) 2120 (82%) 86 (3.3%) 150 (5.8%) 25 (1.0%) 80 (3.1%) 43 (1.7%)
Assam 6155 3120 1594 (51%) 5242 (85%) 286 (4.6%) 167 (2.7%) 20 (0.3%) 88 (1.4%) 231 (3.8%)
Bihar NA NA NA NA NA NA NA NA NA
Chandigarh NA NA NA NA NA NA NA NA NA
Chhattisgarh 10681 4691 3150 (67%) 9284 (87%) 507 (4.7%) 206 (1.9%) 53 (0.5%) 60 (0.6%) 478 (4.5%)
Dadra and Nagar Haveli and Daman and Diu 492 211 139 (66%) 440 (89%) 22 (4.5%) 3 (0.6%) (0.0%) 11 (2.2%) 3 (0.6%)
Delhi NA NA NA NA NA NA NA NA NA
Goa NA NA NA NA NA NA NA NA NA
Gujarat 19661 8674 5875 (68%) 17376 (88%) 986 (5.0%) 455 (2.3%) 166 (0.8%) 328 (1.7%) 59 (0.3%)
Haryana NA NA NA NA NA NA NA NA NA
Himachal Pradesh 315 206 144 (70%) 283 (90%) 9 (2.9%) 3 (1.0%) (0.0%) 5 (1.6%) 6 (1.9%)
Jammu & Kashmir 42 29 13 (45%) 23 (55%) 4 (9.5%) (0.0%) (0.0%) (0.0%) 15 (35.7%)
Jharkhand 25650 10732 5258 (49%) 21139 (82%) 1044 (4.1%) 1037 (4.0%) 82 (0.3%) 184 (0.7%) 1309 (5.1%)
Karnataka 2577 1651 1048 (63%) 2029 (79%) 221 (8.6%) 76 (2.9%) 16 (0.6%) 74 (2.9%) 52 (2.0%)
Kerala 883 528 358 (68%) 749 (85%) 74 (8.4%) 9 (1.0%) 5 (0.6%) 13 (1.5%) 16 (1.8%)
Ladakh 247 131 53 (40%) 189 (77%) 20 (8.1%) 4 (1.6%) 2 (0.8%) 2 (0.8%) 20 (8.1%)
Lakshadweep 17 8 7 (88%) 15 (88%) (0.0%) (0.0%) (0.0%) (0.0%) 2 (11.8%)
Madhya Pradesh 21331 8367 4301 (51%) 17895 (84%) 909 (4.3%) 923 (4.3%) 115 (0.5%) 232 (1.1%) 923 (4.3%)
Maharashtra 12721 5952 4092 (69%) 11088 (87%) 592 (4.7%) 248 (1.9%) 57 (0.4%) 252 (2.0%) 63 (0.5%)
Manipur 976 551 346 (63%) 789 (81%) 38 (3.9%) 28 (2.9%) 6 (0.6%) 11 (1.1%) 78 (8.0%)
Meghalaya 4156 2377 1217 (51%) 3268 (79%) 238 (5.7%) 176 (4.2%) 35 (0.8%) 119 (2.9%) 164 (3.9%)
Mizoram 2149 1142 686 (60%) 1851 (86%) 79 (3.7%) 37 (1.7%) 9 (0.4%) 37 (1.7%) 61 (2.8%)
Nagaland 3621 1761 1183 (67%) 2888 (80%) 108 (3.0%) 108 (3.0%) 27 (0.7%) 32 (0.9%) 390 (10.8%)
Odisha 19558 12092 9032 (75%) 17437 (89%) 1238 (6.3%) 272 (1.4%) 45 (0.2%) 78 (0.4%) 270 (1.4%)
Puducherry NA NA NA NA NA NA NA NA NA
Punjab NA NA NA NA NA NA NA NA NA
Rajasthan 16150 10613 5676 (53%) 13652 (85%) 721 (4.5%) 445 (2.8%) 98 (0.6%) 316 (2.0%) 298 (1.8%)
Sikkim 75 55 37 (67%) 60 (80%) 5 (6.7%) (0.0%) (0.0%) 3 (4.0%) 4 (5.3%)
Tamil Nadu 474 292 252 (86%) 425 (90%) 27 (5.7%) 2 (0.4%) 2 (0.4%) 8 (1.7%) 7 (1.5%)
Telangana 8087 3720 1789 (48%) 7082 (88%) 259 (3.2%) 80 (1.0%) 49 (0.6%) 166 (2.1%) 355 (4.4%)
Tripura 198 109 96 (88%) 179 (90%) 13 (6.6%) (0.0%) 2 (1.0%) (0.0%) 2 (1.0%)
Uttar Pradesh 3456 1768 882 (50%) 3040 (88%) 146 (4.2%) 69 (2.0%) 40 (1.2%) 48 (1.4%) 35 (1.0%)
Uttarakhand 47 36 25 (69%) 35 (74%) 6 (12.8%) 2 (4.3%) 1 (2.1%) 1 (2.1%) 2 (4.3%)
West Bengal NA NA NA NA NA NA NA NA NA
INDIA 170800 85330 51676 (61%) 146247 (86%) 7992 (4.7%) 4572 (2.7%) 869 (0.5%) 2281 (1.3%) 4987 (2.9%)
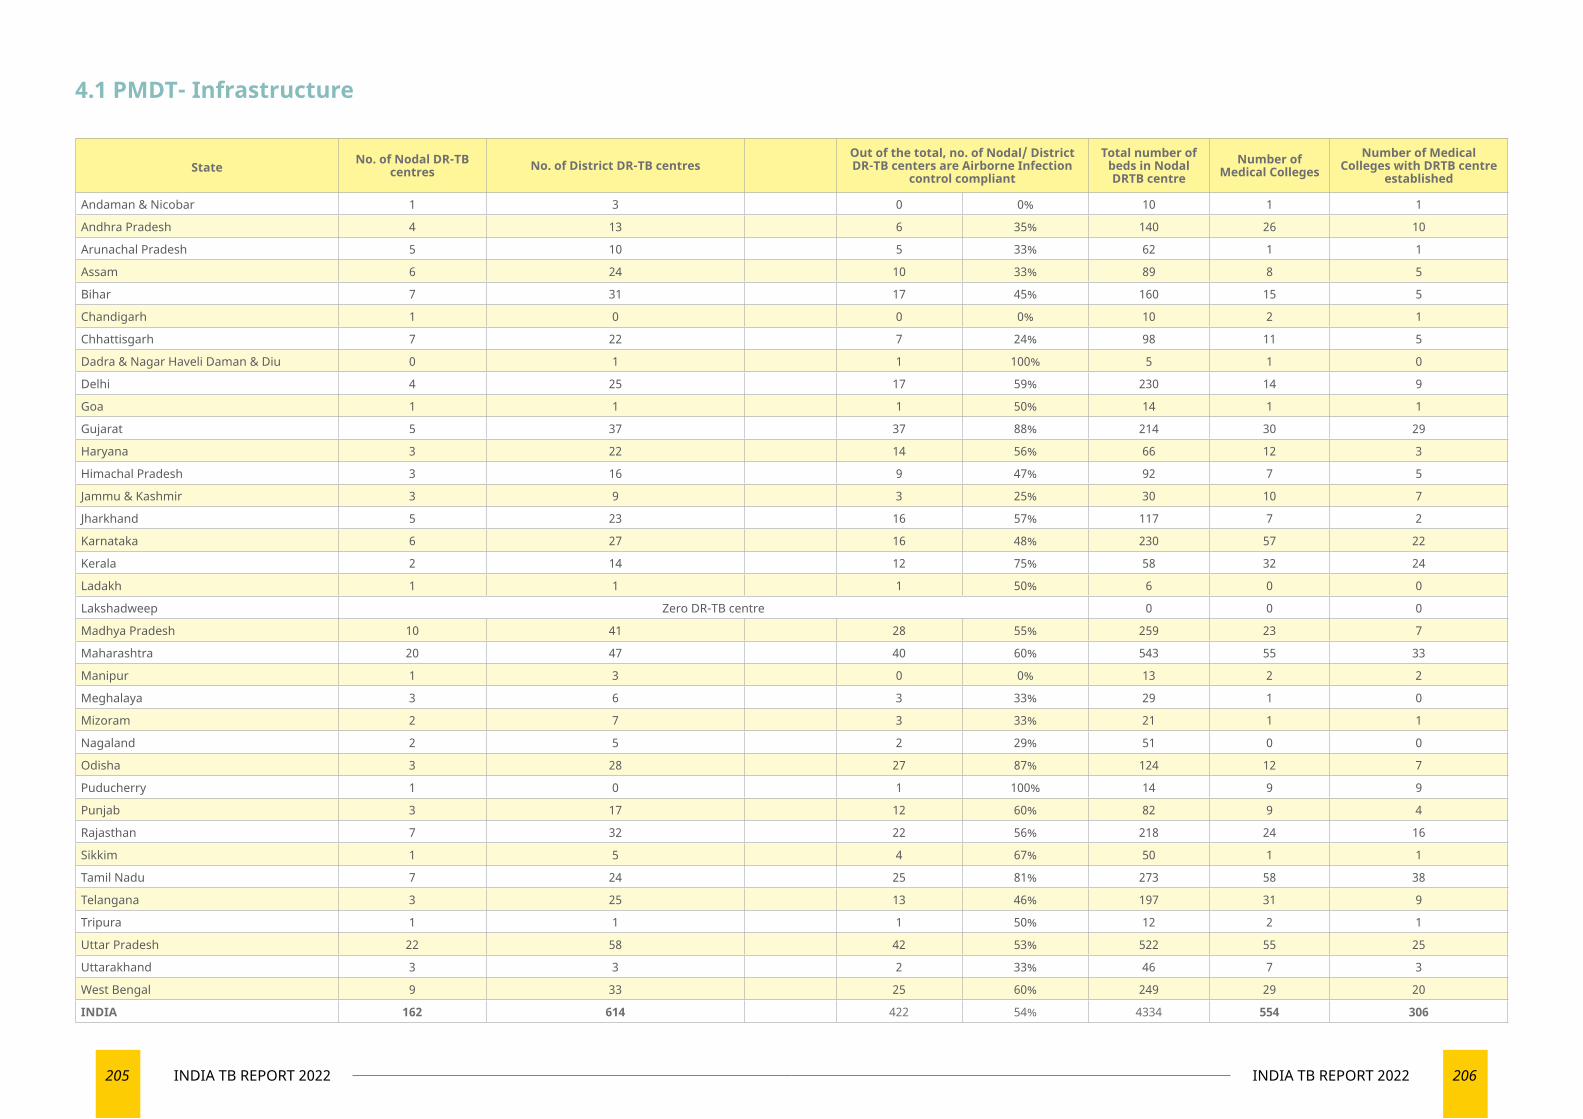
205 INDIA TB REPORT 2022 206INDIA TB REPORT 2022
State No. of Nodal DR-TB centres No. of District DR-TB centres
Out of the total, no. of Nodal/ District DR-TB centers are Airborne Infection
control compliant
Total number of beds in Nodal DRTB centre
Number of Medical Colleges
Number of Medical Colleges with DRTB centre
established
Andaman & Nicobar 1 3 0 0% 10 1 1
Andhra Pradesh 4 13 6 35% 140 26 10
Arunachal Pradesh 5 10 5 33% 62 1 1
Assam 6 24 10 33% 89 8 5
Bihar 7 31 17 45% 160 15 5
Chandigarh 1 0 0 0% 10 2 1
Chhattisgarh 7 22 7 24% 98 11 5
Dadra & Nagar Haveli Daman & Diu 0 1 1 100% 5 1 0
Delhi 4 25 17 59% 230 14 9
Goa 1 1 1 50% 14 1 1
Gujarat 5 37 37 88% 214 30 29
Haryana 3 22 14 56% 66 12 3
Himachal Pradesh 3 16 9 47% 92 7 5
Jammu & Kashmir 3 9 3 25% 30 10 7
Jharkhand 5 23 16 57% 117 7 2
Karnataka 6 27 16 48% 230 57 22
Kerala 2 14 12 75% 58 32 24
Ladakh 1 1 1 50% 6 0 0
Lakshadweep Zero DR-TB centre 0 0 0
Madhya Pradesh 10 41 28 55% 259 23 7
Maharashtra 20 47 40 60% 543 55 33
Manipur 1 3 0 0% 13 2 2
Meghalaya 3 6 3 33% 29 1 0
Mizoram 2 7 3 33% 21 1 1
Nagaland 2 5 2 29% 51 0 0
Odisha 3 28 27 87% 124 12 7
Puducherry 1 0 1 100% 14 9 9
Punjab 3 17 12 60% 82 9 4
Rajasthan 7 32 22 56% 218 24 16
Sikkim 1 5 4 67% 50 1 1
Tamil Nadu 7 24 25 81% 273 58 38
Telangana 3 25 13 46% 197 31 9
Tripura 1 1 1 50% 12 2 1
Uttar Pradesh 22 58 42 53% 522 55 25
Uttarakhand 3 3 2 33% 46 7 3
West Bengal 9 33 25 60% 249 29 20
INDIA 162 614 422 54% 4334 554 306
4.1 PMDT- Infrastructure
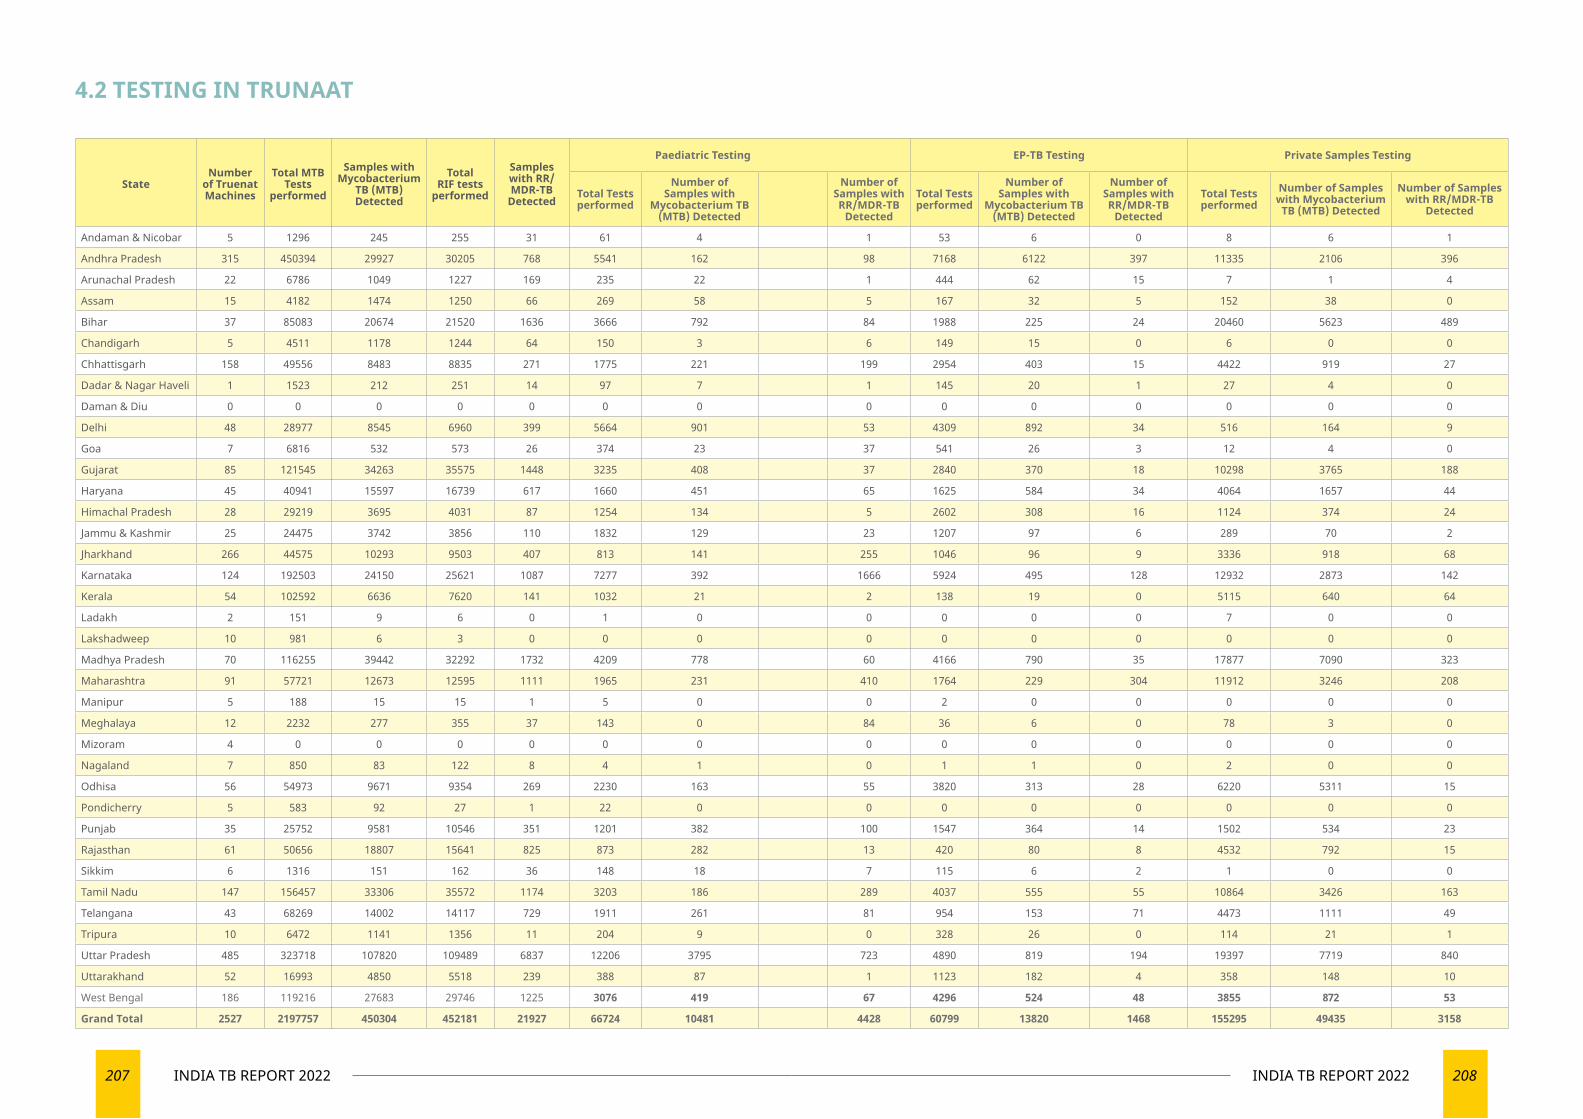
207 INDIA TB REPORT 2022 208INDIA TB REPORT 2022
4.2 TESTING IN TRUNAAT
StateNumber
of Truenat Machines
Total MTB Tests
performed
Samples with Mycobacterium
TB (MTB) Detected
Total RIF tests
performed
Samples with RR/MDR-TB
Detected
Paediatric Testing EP-TB Testing Private Samples Testing
Total Tests performed
Number of Samples with
Mycobacterium TB (MTB) Detected
Number of Samples with RR/MDR-TB
Detected
Total Tests performed
Number of Samples with
Mycobacterium TB (MTB) Detected
Number of Samples with RR/MDR-TB
Detected
Total Tests performed
Number of Samples with Mycobacterium
TB (MTB) Detected
Number of Samples with RR/MDR-TB
Detected
Andaman & Nicobar 5 1296 245 255 31 61 4 1 53 6 0 8 6 1
Andhra Pradesh 315 450394 29927 30205 768 5541 162 98 7168 6122 397 11335 2106 396
Arunachal Pradesh 22 6786 1049 1227 169 235 22 1 444 62 15 7 1 4
Assam 15 4182 1474 1250 66 269 58 5 167 32 5 152 38 0
Bihar 37 85083 20674 21520 1636 3666 792 84 1988 225 24 20460 5623 489
Chandigarh 5 4511 1178 1244 64 150 3 6 149 15 0 6 0 0
Chhattisgarh 158 49556 8483 8835 271 1775 221 199 2954 403 15 4422 919 27
Dadar & Nagar Haveli 1 1523 212 251 14 97 7 1 145 20 1 27 4 0
Daman & Diu 0 0 0 0 0 0 0 0 0 0 0 0 0 0
Delhi 48 28977 8545 6960 399 5664 901 53 4309 892 34 516 164 9
Goa 7 6816 532 573 26 374 23 37 541 26 3 12 4 0
Gujarat 85 121545 34263 35575 1448 3235 408 37 2840 370 18 10298 3765 188
Haryana 45 40941 15597 16739 617 1660 451 65 1625 584 34 4064 1657 44
Himachal Pradesh 28 29219 3695 4031 87 1254 134 5 2602 308 16 1124 374 24
Jammu & Kashmir 25 24475 3742 3856 110 1832 129 23 1207 97 6 289 70 2
Jharkhand 266 44575 10293 9503 407 813 141 255 1046 96 9 3336 918 68
Karnataka 124 192503 24150 25621 1087 7277 392 1666 5924 495 128 12932 2873 142
Kerala 54 102592 6636 7620 141 1032 21 2 138 19 0 5115 640 64
Ladakh 2 151 9 6 0 1 0 0 0 0 0 7 0 0
Lakshadweep 10 981 6 3 0 0 0 0 0 0 0 0 0 0
Madhya Pradesh 70 116255 39442 32292 1732 4209 778 60 4166 790 35 17877 7090 323
Maharashtra 91 57721 12673 12595 1111 1965 231 410 1764 229 304 11912 3246 208
Manipur 5 188 15 15 1 5 0 0 2 0 0 0 0 0
Meghalaya 12 2232 277 355 37 143 0 84 36 6 0 78 3 0
Mizoram 4 0 0 0 0 0 0 0 0 0 0 0 0 0
Nagaland 7 850 83 122 8 4 1 0 1 1 0 2 0 0
Odhisa 56 54973 9671 9354 269 2230 163 55 3820 313 28 6220 5311 15
Pondicherry 5 583 92 27 1 22 0 0 0 0 0 0 0 0
Punjab 35 25752 9581 10546 351 1201 382 100 1547 364 14 1502 534 23
Rajasthan 61 50656 18807 15641 825 873 282 13 420 80 8 4532 792 15
Sikkim 6 1316 151 162 36 148 18 7 115 6 2 1 0 0
Tamil Nadu 147 156457 33306 35572 1174 3203 186 289 4037 555 55 10864 3426 163
Telangana 43 68269 14002 14117 729 1911 261 81 954 153 71 4473 1111 49
Tripura 10 6472 1141 1356 11 204 9 0 328 26 0 114 21 1
Uttar Pradesh 485 323718 107820 109489 6837 12206 3795 723 4890 819 194 19397 7719 840
Uttarakhand 52 16993 4850 5518 239 388 87 1 1123 182 4 358 148 10
West Bengal 186 119216 27683 29746 1225 3076 419 67 4296 524 48 3855 872 53
Grand Total 2527 2197757 450304 452181 21927 66724 10481 4428 60799 13820 1468 155295 49435 3158
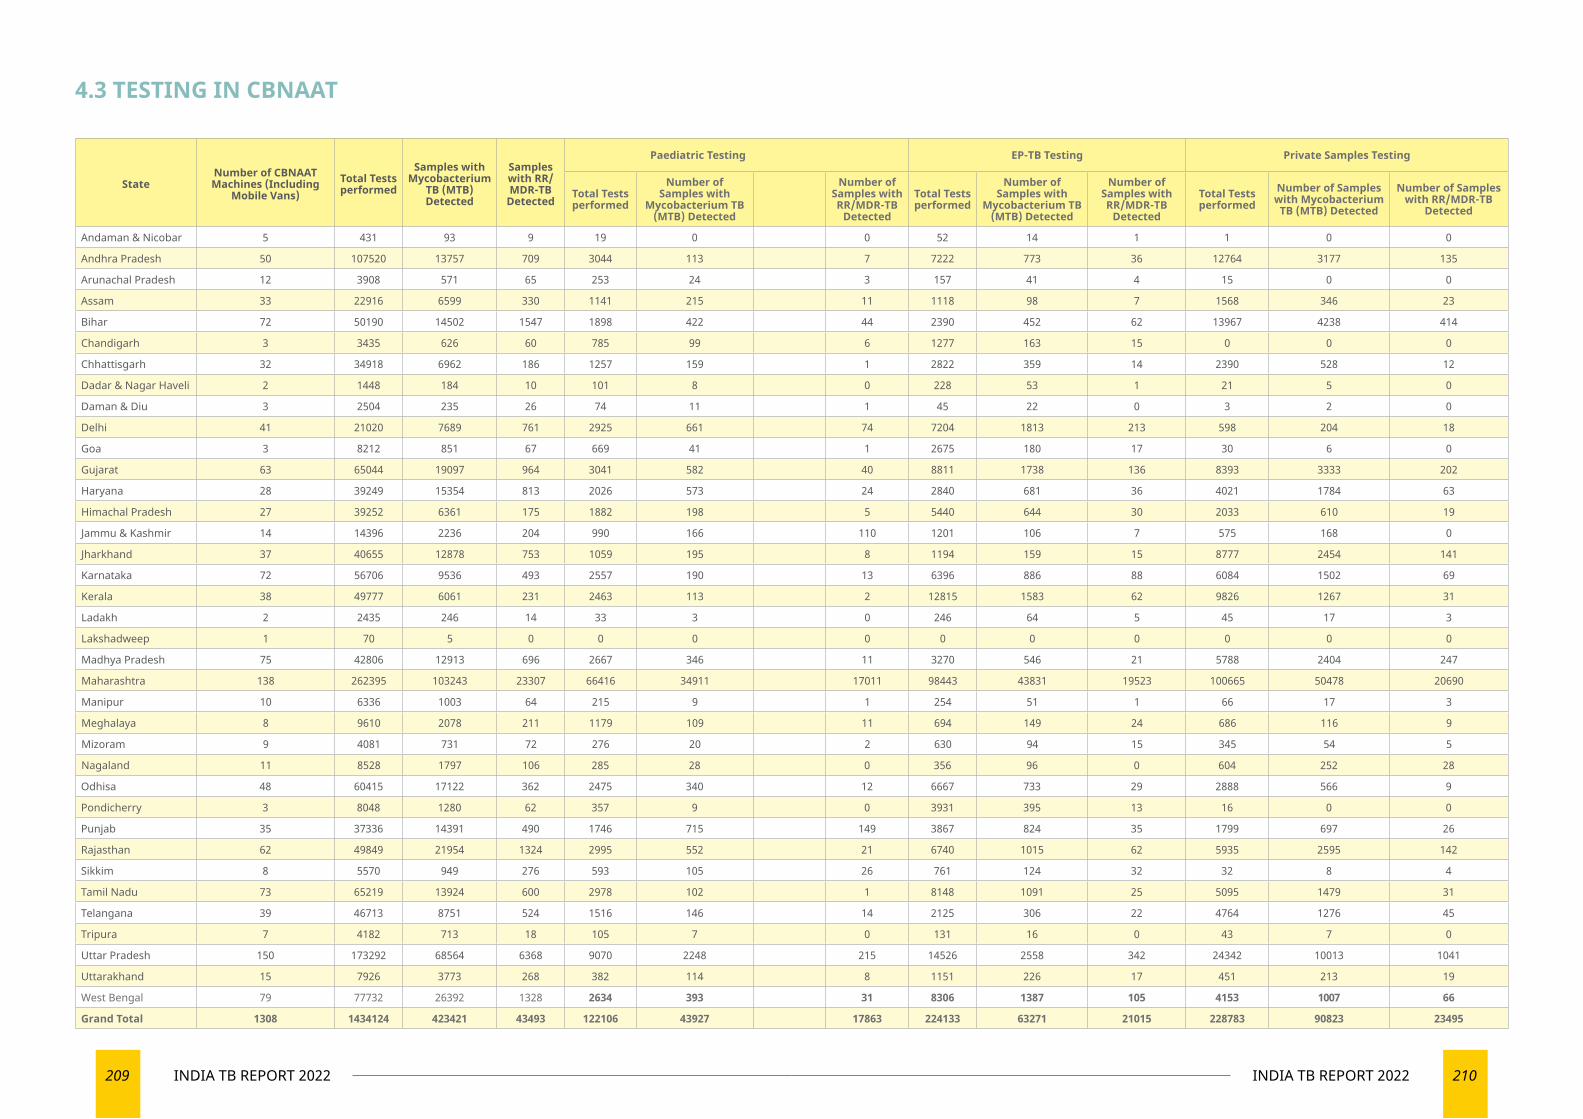
209 INDIA TB REPORT 2022 210INDIA TB REPORT 2022
4.3 TESTING IN CBNAAT
StateNumber of CBNAAT Machines (Including
Mobile Vans)Total Tests performed
Samples with Mycobacterium
TB (MTB) Detected
Samples with RR/MDR-TB
Detected
Paediatric Testing EP-TB Testing Private Samples Testing
Total Tests performed
Number of Samples with
Mycobacterium TB (MTB) Detected
Number of Samples with RR/MDR-TB
Detected
Total Tests performed
Number of Samples with
Mycobacterium TB (MTB) Detected
Number of Samples with RR/MDR-TB
Detected
Total Tests performed
Number of Samples with Mycobacterium
TB (MTB) Detected
Number of Samples with RR/MDR-TB
Detected
Andaman & Nicobar 5 431 93 9 19 0 0 52 14 1 1 0 0
Andhra Pradesh 50 107520 13757 709 3044 113 7 7222 773 36 12764 3177 135
Arunachal Pradesh 12 3908 571 65 253 24 3 157 41 4 15 0 0
Assam 33 22916 6599 330 1141 215 11 1118 98 7 1568 346 23
Bihar 72 50190 14502 1547 1898 422 44 2390 452 62 13967 4238 414
Chandigarh 3 3435 626 60 785 99 6 1277 163 15 0 0 0
Chhattisgarh 32 34918 6962 186 1257 159 1 2822 359 14 2390 528 12
Dadar & Nagar Haveli 2 1448 184 10 101 8 0 228 53 1 21 5 0
Daman & Diu 3 2504 235 26 74 11 1 45 22 0 3 2 0
Delhi 41 21020 7689 761 2925 661 74 7204 1813 213 598 204 18
Goa 3 8212 851 67 669 41 1 2675 180 17 30 6 0
Gujarat 63 65044 19097 964 3041 582 40 8811 1738 136 8393 3333 202
Haryana 28 39249 15354 813 2026 573 24 2840 681 36 4021 1784 63
Himachal Pradesh 27 39252 6361 175 1882 198 5 5440 644 30 2033 610 19
Jammu & Kashmir 14 14396 2236 204 990 166 110 1201 106 7 575 168 0
Jharkhand 37 40655 12878 753 1059 195 8 1194 159 15 8777 2454 141
Karnataka 72 56706 9536 493 2557 190 13 6396 886 88 6084 1502 69
Kerala 38 49777 6061 231 2463 113 2 12815 1583 62 9826 1267 31
Ladakh 2 2435 246 14 33 3 0 246 64 5 45 17 3
Lakshadweep 1 70 5 0 0 0 0 0 0 0 0 0 0
Madhya Pradesh 75 42806 12913 696 2667 346 11 3270 546 21 5788 2404 247
Maharashtra 138 262395 103243 23307 66416 34911 17011 98443 43831 19523 100665 50478 20690
Manipur 10 6336 1003 64 215 9 1 254 51 1 66 17 3
Meghalaya 8 9610 2078 211 1179 109 11 694 149 24 686 116 9
Mizoram 9 4081 731 72 276 20 2 630 94 15 345 54 5
Nagaland 11 8528 1797 106 285 28 0 356 96 0 604 252 28
Odhisa 48 60415 17122 362 2475 340 12 6667 733 29 2888 566 9
Pondicherry 3 8048 1280 62 357 9 0 3931 395 13 16 0 0
Punjab 35 37336 14391 490 1746 715 149 3867 824 35 1799 697 26
Rajasthan 62 49849 21954 1324 2995 552 21 6740 1015 62 5935 2595 142
Sikkim 8 5570 949 276 593 105 26 761 124 32 32 8 4
Tamil Nadu 73 65219 13924 600 2978 102 1 8148 1091 25 5095 1479 31
Telangana 39 46713 8751 524 1516 146 14 2125 306 22 4764 1276 45
Tripura 7 4182 713 18 105 7 0 131 16 0 43 7 0
Uttar Pradesh 150 173292 68564 6368 9070 2248 215 14526 2558 342 24342 10013 1041
Uttarakhand 15 7926 3773 268 382 114 8 1151 226 17 451 213 19
West Bengal 79 77732 26392 1328 2634 393 31 8306 1387 105 4153 1007 66
Grand Total 1308 1434124 423421 43493 122106 43927 17863 224133 63271 21015 228783 90823 23495
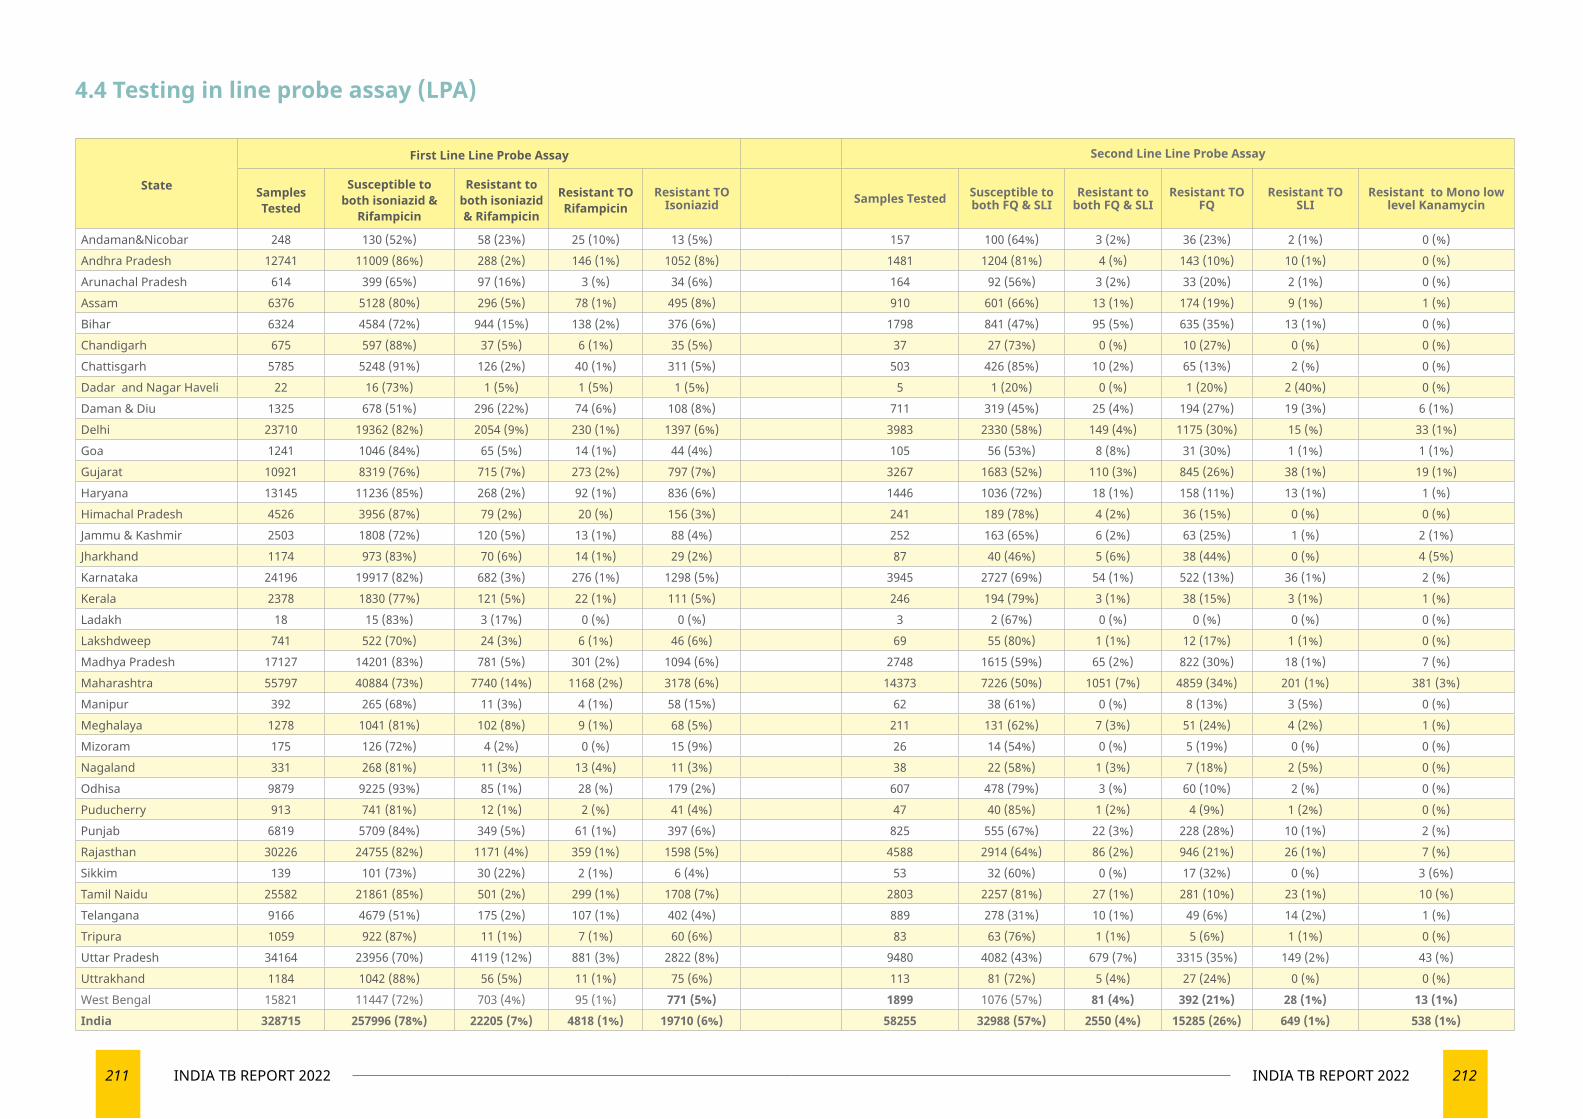
211 INDIA TB REPORT 2022 212INDIA TB REPORT 2022
State
First Line Line Probe Assay Second Line Line Probe Assay
Samples Tested
Susceptible to both isoniazid &
Rifampicin
Resistant to both isoniazid & Rifampicin
Resistant TO Rifampicin
Resistant TO Isoniazid Samples Tested Susceptible to
both FQ & SLIResistant to
both FQ & SLIResistant TO
FQResistant TO
SLIResistant to Mono low
level Kanamycin
Andaman&Nicobar 248 130 (52%) 58 (23%) 25 (10%) 13 (5%) 157 100 (64%) 3 (2%) 36 (23%) 2 (1%) 0 (%)Andhra Pradesh 12741 11009 (86%) 288 (2%) 146 (1%) 1052 (8%) 1481 1204 (81%) 4 (%) 143 (10%) 10 (1%) 0 (%)Arunachal Pradesh 614 399 (65%) 97 (16%) 3 (%) 34 (6%) 164 92 (56%) 3 (2%) 33 (20%) 2 (1%) 0 (%)Assam 6376 5128 (80%) 296 (5%) 78 (1%) 495 (8%) 910 601 (66%) 13 (1%) 174 (19%) 9 (1%) 1 (%)Bihar 6324 4584 (72%) 944 (15%) 138 (2%) 376 (6%) 1798 841 (47%) 95 (5%) 635 (35%) 13 (1%) 0 (%)Chandigarh 675 597 (88%) 37 (5%) 6 (1%) 35 (5%) 37 27 (73%) 0 (%) 10 (27%) 0 (%) 0 (%)Chattisgarh 5785 5248 (91%) 126 (2%) 40 (1%) 311 (5%) 503 426 (85%) 10 (2%) 65 (13%) 2 (%) 0 (%)Dadar and Nagar Haveli 22 16 (73%) 1 (5%) 1 (5%) 1 (5%) 5 1 (20%) 0 (%) 1 (20%) 2 (40%) 0 (%)Daman & Diu 1325 678 (51%) 296 (22%) 74 (6%) 108 (8%) 711 319 (45%) 25 (4%) 194 (27%) 19 (3%) 6 (1%)Delhi 23710 19362 (82%) 2054 (9%) 230 (1%) 1397 (6%) 3983 2330 (58%) 149 (4%) 1175 (30%) 15 (%) 33 (1%)Goa 1241 1046 (84%) 65 (5%) 14 (1%) 44 (4%) 105 56 (53%) 8 (8%) 31 (30%) 1 (1%) 1 (1%)Gujarat 10921 8319 (76%) 715 (7%) 273 (2%) 797 (7%) 3267 1683 (52%) 110 (3%) 845 (26%) 38 (1%) 19 (1%)Haryana 13145 11236 (85%) 268 (2%) 92 (1%) 836 (6%) 1446 1036 (72%) 18 (1%) 158 (11%) 13 (1%) 1 (%)Himachal Pradesh 4526 3956 (87%) 79 (2%) 20 (%) 156 (3%) 241 189 (78%) 4 (2%) 36 (15%) 0 (%) 0 (%)Jammu & Kashmir 2503 1808 (72%) 120 (5%) 13 (1%) 88 (4%) 252 163 (65%) 6 (2%) 63 (25%) 1 (%) 2 (1%)Jharkhand 1174 973 (83%) 70 (6%) 14 (1%) 29 (2%) 87 40 (46%) 5 (6%) 38 (44%) 0 (%) 4 (5%)Karnataka 24196 19917 (82%) 682 (3%) 276 (1%) 1298 (5%) 3945 2727 (69%) 54 (1%) 522 (13%) 36 (1%) 2 (%)Kerala 2378 1830 (77%) 121 (5%) 22 (1%) 111 (5%) 246 194 (79%) 3 (1%) 38 (15%) 3 (1%) 1 (%)Ladakh 18 15 (83%) 3 (17%) 0 (%) 0 (%) 3 2 (67%) 0 (%) 0 (%) 0 (%) 0 (%)Lakshdweep 741 522 (70%) 24 (3%) 6 (1%) 46 (6%) 69 55 (80%) 1 (1%) 12 (17%) 1 (1%) 0 (%)Madhya Pradesh 17127 14201 (83%) 781 (5%) 301 (2%) 1094 (6%) 2748 1615 (59%) 65 (2%) 822 (30%) 18 (1%) 7 (%)Maharashtra 55797 40884 (73%) 7740 (14%) 1168 (2%) 3178 (6%) 14373 7226 (50%) 1051 (7%) 4859 (34%) 201 (1%) 381 (3%)Manipur 392 265 (68%) 11 (3%) 4 (1%) 58 (15%) 62 38 (61%) 0 (%) 8 (13%) 3 (5%) 0 (%)Meghalaya 1278 1041 (81%) 102 (8%) 9 (1%) 68 (5%) 211 131 (62%) 7 (3%) 51 (24%) 4 (2%) 1 (%)Mizoram 175 126 (72%) 4 (2%) 0 (%) 15 (9%) 26 14 (54%) 0 (%) 5 (19%) 0 (%) 0 (%)Nagaland 331 268 (81%) 11 (3%) 13 (4%) 11 (3%) 38 22 (58%) 1 (3%) 7 (18%) 2 (5%) 0 (%)Odhisa 9879 9225 (93%) 85 (1%) 28 (%) 179 (2%) 607 478 (79%) 3 (%) 60 (10%) 2 (%) 0 (%)Puducherry 913 741 (81%) 12 (1%) 2 (%) 41 (4%) 47 40 (85%) 1 (2%) 4 (9%) 1 (2%) 0 (%)Punjab 6819 5709 (84%) 349 (5%) 61 (1%) 397 (6%) 825 555 (67%) 22 (3%) 228 (28%) 10 (1%) 2 (%)Rajasthan 30226 24755 (82%) 1171 (4%) 359 (1%) 1598 (5%) 4588 2914 (64%) 86 (2%) 946 (21%) 26 (1%) 7 (%)Sikkim 139 101 (73%) 30 (22%) 2 (1%) 6 (4%) 53 32 (60%) 0 (%) 17 (32%) 0 (%) 3 (6%)Tamil Naidu 25582 21861 (85%) 501 (2%) 299 (1%) 1708 (7%) 2803 2257 (81%) 27 (1%) 281 (10%) 23 (1%) 10 (%)Telangana 9166 4679 (51%) 175 (2%) 107 (1%) 402 (4%) 889 278 (31%) 10 (1%) 49 (6%) 14 (2%) 1 (%)Tripura 1059 922 (87%) 11 (1%) 7 (1%) 60 (6%) 83 63 (76%) 1 (1%) 5 (6%) 1 (1%) 0 (%)Uttar Pradesh 34164 23956 (70%) 4119 (12%) 881 (3%) 2822 (8%) 9480 4082 (43%) 679 (7%) 3315 (35%) 149 (2%) 43 (%)Uttrakhand 1184 1042 (88%) 56 (5%) 11 (1%) 75 (6%) 113 81 (72%) 5 (4%) 27 (24%) 0 (%) 0 (%)West Bengal 15821 11447 (72%) 703 (4%) 95 (1%) 771 (5%) 1899 1076 (57%) 81 (4%) 392 (21%) 28 (1%) 13 (1%)India 328715 257996 (78%) 22205 (7%) 4818 (1%) 19710 (6%) 58255 32988 (57%) 2550 (4%) 15285 (26%) 649 (1%) 538 (1%)
4.4 Testing in line probe assay (LPA)
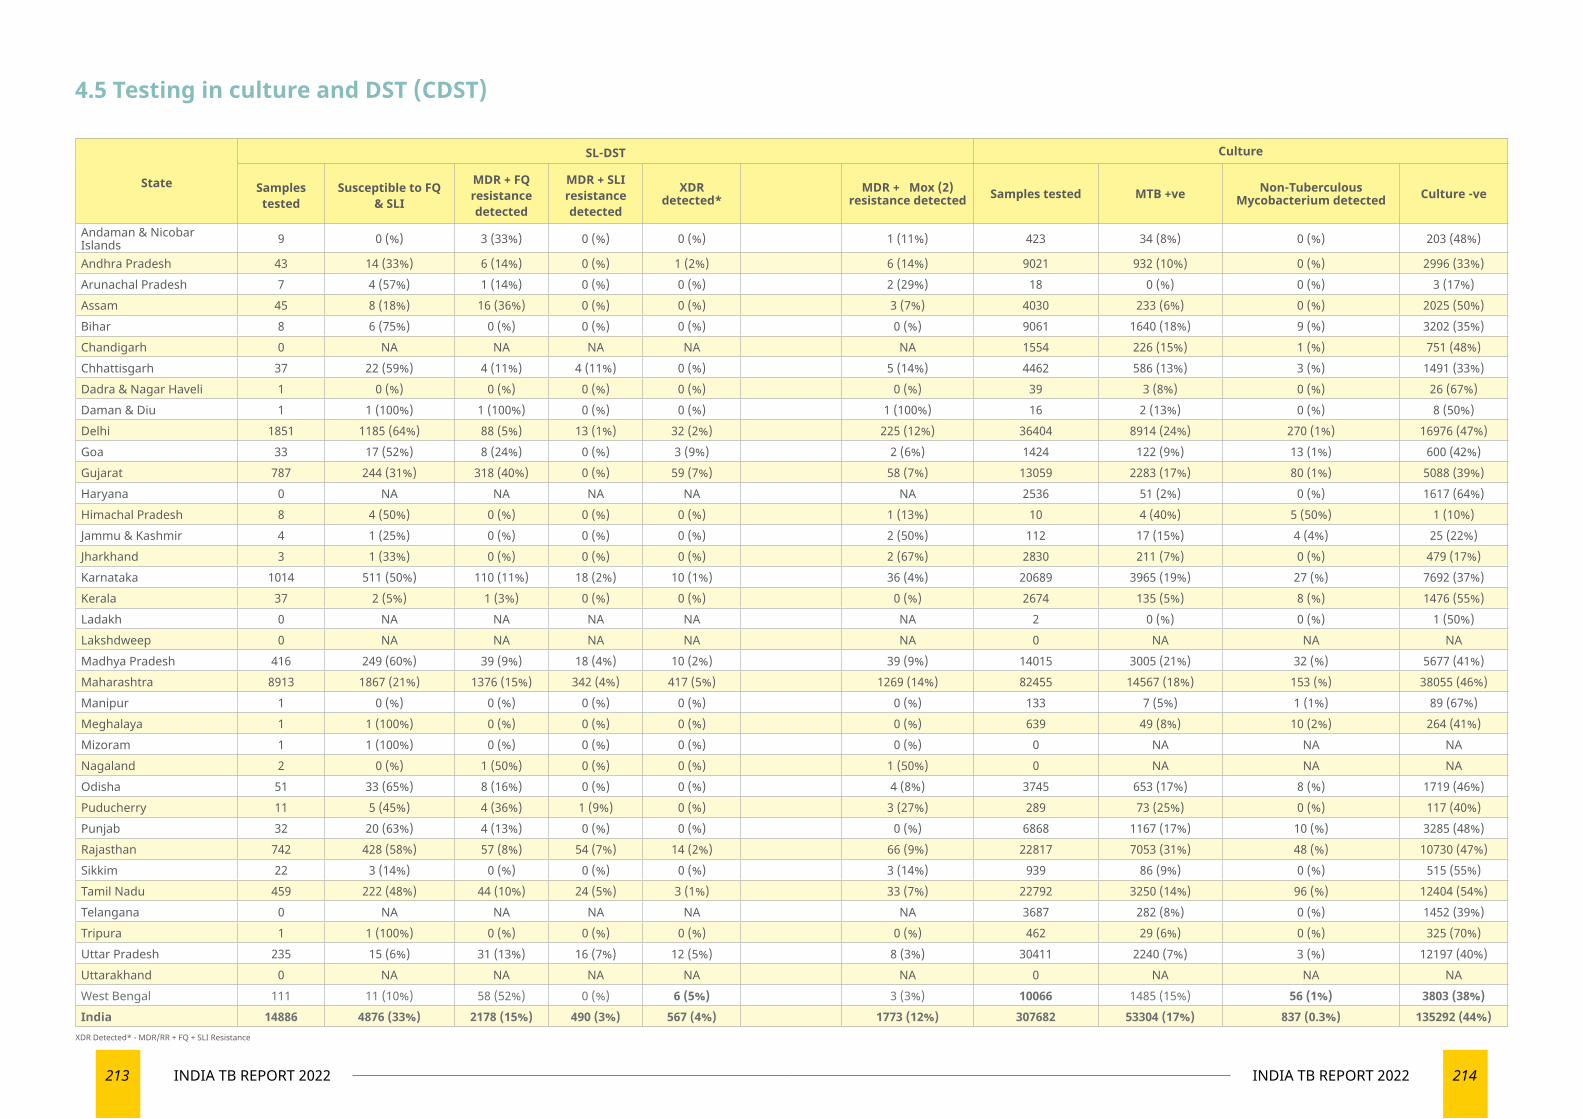
213 INDIA TB REPORT 2022 214INDIA TB REPORT 2022
State
SL-DST Culture
Samples tested
Susceptible to FQ & SLI
MDR + FQ resistance detected
MDR + SLI resistance detected
XDR detected*
MDR + Mox (2) resistance detected Samples tested MTB +ve Non-Tuberculous
Mycobacterium detected Culture -ve
Andaman & Nicobar Islands 9 0 (%) 3 (33%) 0 (%) 0 (%) 1 (11%) 423 34 (8%) 0 (%) 203 (48%)
Andhra Pradesh 43 14 (33%) 6 (14%) 0 (%) 1 (2%) 6 (14%) 9021 932 (10%) 0 (%) 2996 (33%)Arunachal Pradesh 7 4 (57%) 1 (14%) 0 (%) 0 (%) 2 (29%) 18 0 (%) 0 (%) 3 (17%)Assam 45 8 (18%) 16 (36%) 0 (%) 0 (%) 3 (7%) 4030 233 (6%) 0 (%) 2025 (50%)Bihar 8 6 (75%) 0 (%) 0 (%) 0 (%) 0 (%) 9061 1640 (18%) 9 (%) 3202 (35%)Chandigarh 0 NA NA NA NA NA 1554 226 (15%) 1 (%) 751 (48%)Chhattisgarh 37 22 (59%) 4 (11%) 4 (11%) 0 (%) 5 (14%) 4462 586 (13%) 3 (%) 1491 (33%)Dadra & Nagar Haveli 1 0 (%) 0 (%) 0 (%) 0 (%) 0 (%) 39 3 (8%) 0 (%) 26 (67%)Daman & Diu 1 1 (100%) 1 (100%) 0 (%) 0 (%) 1 (100%) 16 2 (13%) 0 (%) 8 (50%)Delhi 1851 1185 (64%) 88 (5%) 13 (1%) 32 (2%) 225 (12%) 36404 8914 (24%) 270 (1%) 16976 (47%)Goa 33 17 (52%) 8 (24%) 0 (%) 3 (9%) 2 (6%) 1424 122 (9%) 13 (1%) 600 (42%)Gujarat 787 244 (31%) 318 (40%) 0 (%) 59 (7%) 58 (7%) 13059 2283 (17%) 80 (1%) 5088 (39%)Haryana 0 NA NA NA NA NA 2536 51 (2%) 0 (%) 1617 (64%)Himachal Pradesh 8 4 (50%) 0 (%) 0 (%) 0 (%) 1 (13%) 10 4 (40%) 5 (50%) 1 (10%)Jammu & Kashmir 4 1 (25%) 0 (%) 0 (%) 0 (%) 2 (50%) 112 17 (15%) 4 (4%) 25 (22%)Jharkhand 3 1 (33%) 0 (%) 0 (%) 0 (%) 2 (67%) 2830 211 (7%) 0 (%) 479 (17%)Karnataka 1014 511 (50%) 110 (11%) 18 (2%) 10 (1%) 36 (4%) 20689 3965 (19%) 27 (%) 7692 (37%)Kerala 37 2 (5%) 1 (3%) 0 (%) 0 (%) 0 (%) 2674 135 (5%) 8 (%) 1476 (55%)Ladakh 0 NA NA NA NA NA 2 0 (%) 0 (%) 1 (50%)Lakshdweep 0 NA NA NA NA NA 0 NA NA NAMadhya Pradesh 416 249 (60%) 39 (9%) 18 (4%) 10 (2%) 39 (9%) 14015 3005 (21%) 32 (%) 5677 (41%)Maharashtra 8913 1867 (21%) 1376 (15%) 342 (4%) 417 (5%) 1269 (14%) 82455 14567 (18%) 153 (%) 38055 (46%)Manipur 1 0 (%) 0 (%) 0 (%) 0 (%) 0 (%) 133 7 (5%) 1 (1%) 89 (67%)Meghalaya 1 1 (100%) 0 (%) 0 (%) 0 (%) 0 (%) 639 49 (8%) 10 (2%) 264 (41%)Mizoram 1 1 (100%) 0 (%) 0 (%) 0 (%) 0 (%) 0 NA NA NANagaland 2 0 (%) 1 (50%) 0 (%) 0 (%) 1 (50%) 0 NA NA NAOdisha 51 33 (65%) 8 (16%) 0 (%) 0 (%) 4 (8%) 3745 653 (17%) 8 (%) 1719 (46%)Puducherry 11 5 (45%) 4 (36%) 1 (9%) 0 (%) 3 (27%) 289 73 (25%) 0 (%) 117 (40%)Punjab 32 20 (63%) 4 (13%) 0 (%) 0 (%) 0 (%) 6868 1167 (17%) 10 (%) 3285 (48%)Rajasthan 742 428 (58%) 57 (8%) 54 (7%) 14 (2%) 66 (9%) 22817 7053 (31%) 48 (%) 10730 (47%)Sikkim 22 3 (14%) 0 (%) 0 (%) 0 (%) 3 (14%) 939 86 (9%) 0 (%) 515 (55%)Tamil Nadu 459 222 (48%) 44 (10%) 24 (5%) 3 (1%) 33 (7%) 22792 3250 (14%) 96 (%) 12404 (54%)Telangana 0 NA NA NA NA NA 3687 282 (8%) 0 (%) 1452 (39%)Tripura 1 1 (100%) 0 (%) 0 (%) 0 (%) 0 (%) 462 29 (6%) 0 (%) 325 (70%)Uttar Pradesh 235 15 (6%) 31 (13%) 16 (7%) 12 (5%) 8 (3%) 30411 2240 (7%) 3 (%) 12197 (40%)Uttarakhand 0 NA NA NA NA NA 0 NA NA NAWest Bengal 111 11 (10%) 58 (52%) 0 (%) 6 (5%) 3 (3%) 10066 1485 (15%) 56 (1%) 3803 (38%)India 14886 4876 (33%) 2178 (15%) 490 (3%) 567 (4%) 1773 (12%) 307682 53304 (17%) 837 (0.3%) 135292 (44%)
4.5 Testing in culture and DST (CDST)
XDR Detected* - MDR/RR + FQ + SLI Resistance
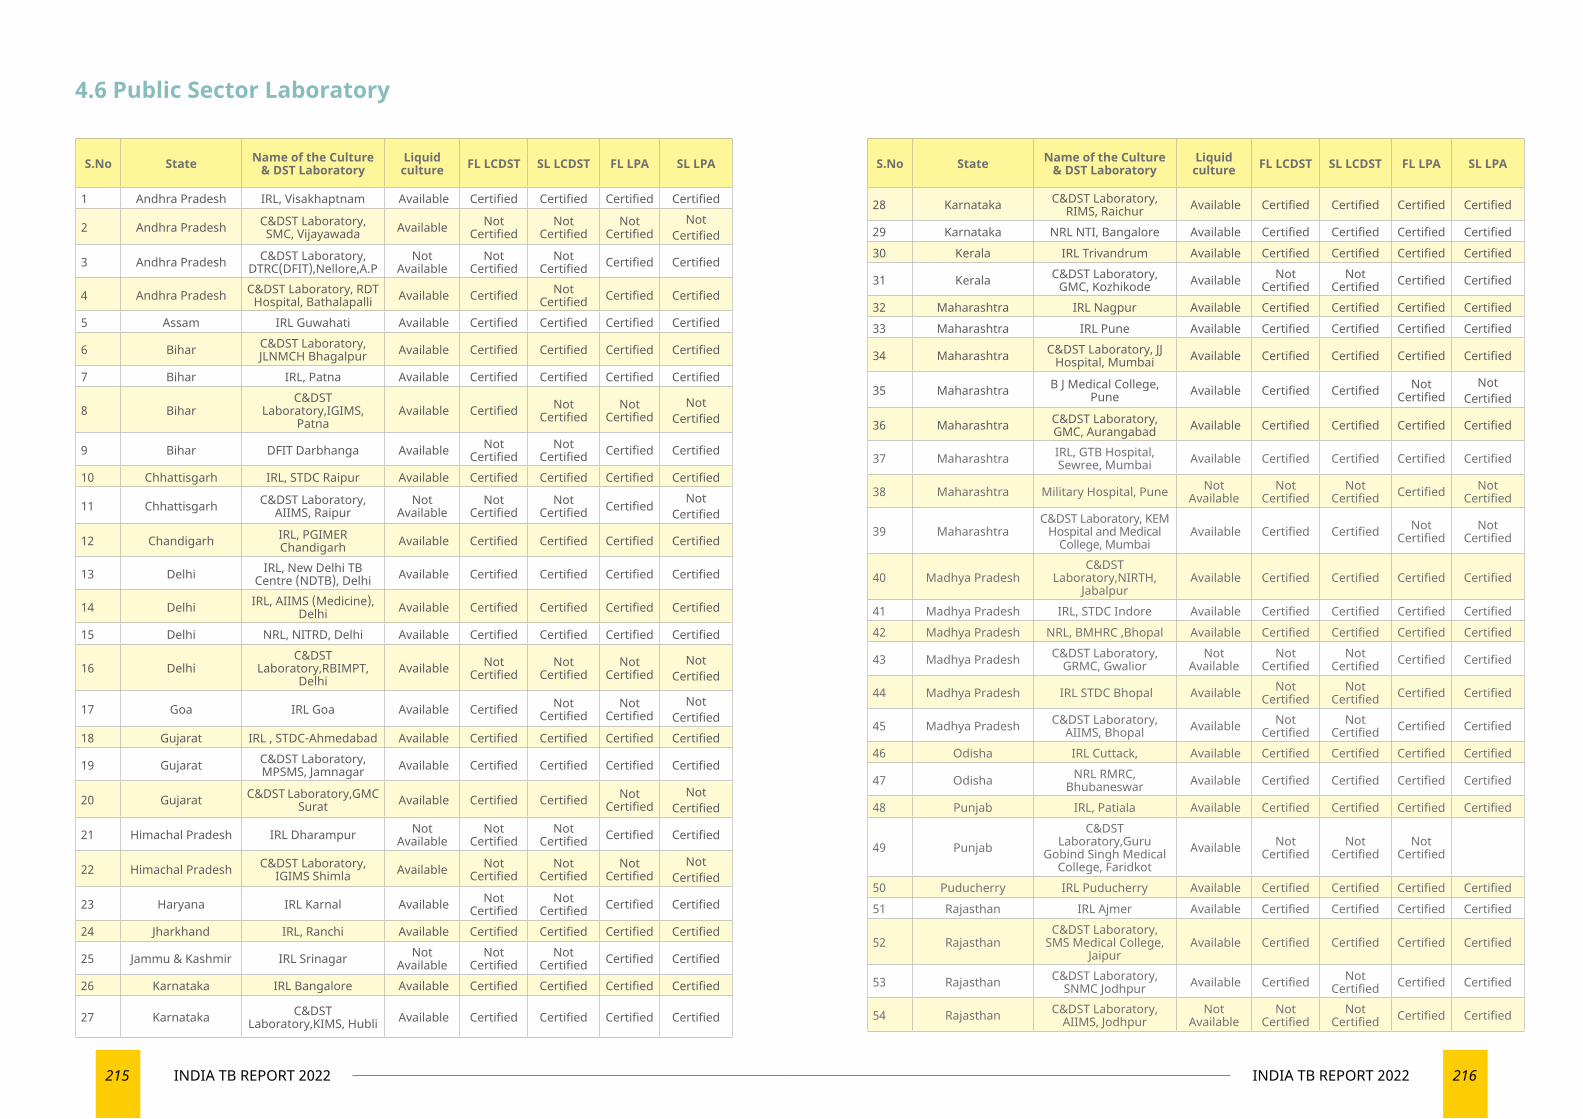
215 INDIA TB REPORT 2022 216INDIA TB REPORT 2022
4.6 Public Sector Laboratory
S.No State Name of the Culture & DST Laboratory
Liquid culture FL LCDST SL LCDST FL LPA SL LPA
1 Andhra Pradesh IRL, Visakhaptnam Available Certified Certified Certified Certified
2 Andhra Pradesh C&DST Laboratory, SMC, Vijayawada Available Not
CertifiedNot
CertifiedNot
CertifiedNot
Certified
3 Andhra Pradesh C&DST Laboratory, DTRC(DFIT),Nellore,A.P
Not Available
Not Certified
Not Certified Certified Certified
4 Andhra Pradesh C&DST Laboratory, RDT Hospital, Bathalapalli Available Certified Not
Certified Certified Certified
5 Assam IRL Guwahati Available Certified Certified Certified Certified
6 Bihar C&DST Laboratory, JLNMCH Bhagalpur Available Certified Certified Certified Certified
7 Bihar IRL, Patna Available Certified Certified Certified Certified
8 BiharC&DST
Laboratory,IGIMS, Patna
Available Certified Not Certified
Not Certified
Not Certified
9 Bihar DFIT Darbhanga Available Not Certified
Not Certified Certified Certified
10 Chhattisgarh IRL, STDC Raipur Available Certified Certified Certified Certified
11 Chhattisgarh C&DST Laboratory, AIIMS, Raipur
Not Available
Not Certified
Not Certified Certified Not
Certified
12 Chandigarh IRL, PGIMER Chandigarh Available Certified Certified Certified Certified
13 Delhi IRL, New Delhi TB Centre (NDTB), Delhi Available Certified Certified Certified Certified
14 Delhi IRL, AIIMS (Medicine), Delhi Available Certified Certified Certified Certified
15 Delhi NRL, NITRD, Delhi Available Certified Certified Certified Certified
16 DelhiC&DST
Laboratory,RBIMPT, Delhi
Available Not Certified
Not Certified
Not Certified
Not Certified
17 Goa IRL Goa Available Certified Not Certified
Not Certified
Not Certified
18 Gujarat IRL , STDC-Ahmedabad Available Certified Certified Certified Certified
19 Gujarat C&DST Laboratory, MPSMS, Jamnagar Available Certified Certified Certified Certified
20 Gujarat C&DST Laboratory,GMC Surat Available Certified Certified Not
CertifiedNot
Certified
21 Himachal Pradesh IRL Dharampur Not Available
Not Certified
Not Certified Certified Certified
22 Himachal Pradesh C&DST Laboratory, IGIMS Shimla Available Not
CertifiedNot
CertifiedNot
CertifiedNot
Certified
23 Haryana IRL Karnal Available Not Certified
Not Certified Certified Certified
24 Jharkhand IRL, Ranchi Available Certified Certified Certified Certified
25 Jammu & Kashmir IRL Srinagar Not Available
Not Certified
Not Certified Certified Certified
26 Karnataka IRL Bangalore Available Certified Certified Certified Certified
27 Karnataka C&DST Laboratory,KIMS, Hubli Available Certified Certified Certified Certified
S.No State Name of the Culture & DST Laboratory
Liquid culture FL LCDST SL LCDST FL LPA SL LPA
28 Karnataka C&DST Laboratory, RIMS, Raichur Available Certified Certified Certified Certified
29 Karnataka NRL NTI, Bangalore Available Certified Certified Certified Certified30 Kerala IRL Trivandrum Available Certified Certified Certified Certified
31 Kerala C&DST Laboratory, GMC, Kozhikode Available Not
CertifiedNot
Certified Certified Certified
32 Maharashtra IRL Nagpur Available Certified Certified Certified Certified33 Maharashtra IRL Pune Available Certified Certified Certified Certified
34 Maharashtra C&DST Laboratory, JJ Hospital, Mumbai Available Certified Certified Certified Certified
35 Maharashtra B J Medical College, Pune Available Certified Certified Not
CertifiedNot
Certified
36 Maharashtra C&DST Laboratory, GMC, Aurangabad Available Certified Certified Certified Certified
37 Maharashtra IRL, GTB Hospital, Sewree, Mumbai Available Certified Certified Certified Certified
38 Maharashtra Military Hospital, Pune Not Available
Not Certified
Not Certified Certified Not
Certified
39 MaharashtraC&DST Laboratory, KEM
Hospital and Medical College, Mumbai
Available Certified Certified Not Certified
Not Certified
40 Madhya PradeshC&DST
Laboratory,NIRTH, Jabalpur
Available Certified Certified Certified Certified
41 Madhya Pradesh IRL, STDC Indore Available Certified Certified Certified Certified42 Madhya Pradesh NRL, BMHRC ,Bhopal Available Certified Certified Certified Certified
43 Madhya Pradesh C&DST Laboratory, GRMC, Gwalior
Not Available
Not Certified
Not Certified Certified Certified
44 Madhya Pradesh IRL STDC Bhopal Available Not Certified
Not Certified Certified Certified
45 Madhya Pradesh C&DST Laboratory, AIIMS, Bhopal Available Not
CertifiedNot
Certified Certified Certified
46 Odisha IRL Cuttack, Available Certified Certified Certified Certified
47 Odisha NRL RMRC, Bhubaneswar Available Certified Certified Certified Certified
48 Punjab IRL, Patiala Available Certified Certified Certified Certified
49 PunjabC&DST
Laboratory,Guru Gobind Singh Medical
College, Faridkot Available Not
CertifiedNot
CertifiedNot
Certified
50 Puducherry IRL Puducherry Available Certified Certified Certified Certified51 Rajasthan IRL Ajmer Available Certified Certified Certified Certified
52 RajasthanC&DST Laboratory,
SMS Medical College, Jaipur
Available Certified Certified Certified Certified
53 Rajasthan C&DST Laboratory, SNMC Jodhpur Available Certified Not
Certified Certified Certified
54 Rajasthan C&DST Laboratory, AIIMS, Jodhpur
Not Available
Not Certified
Not Certified Certified Certified
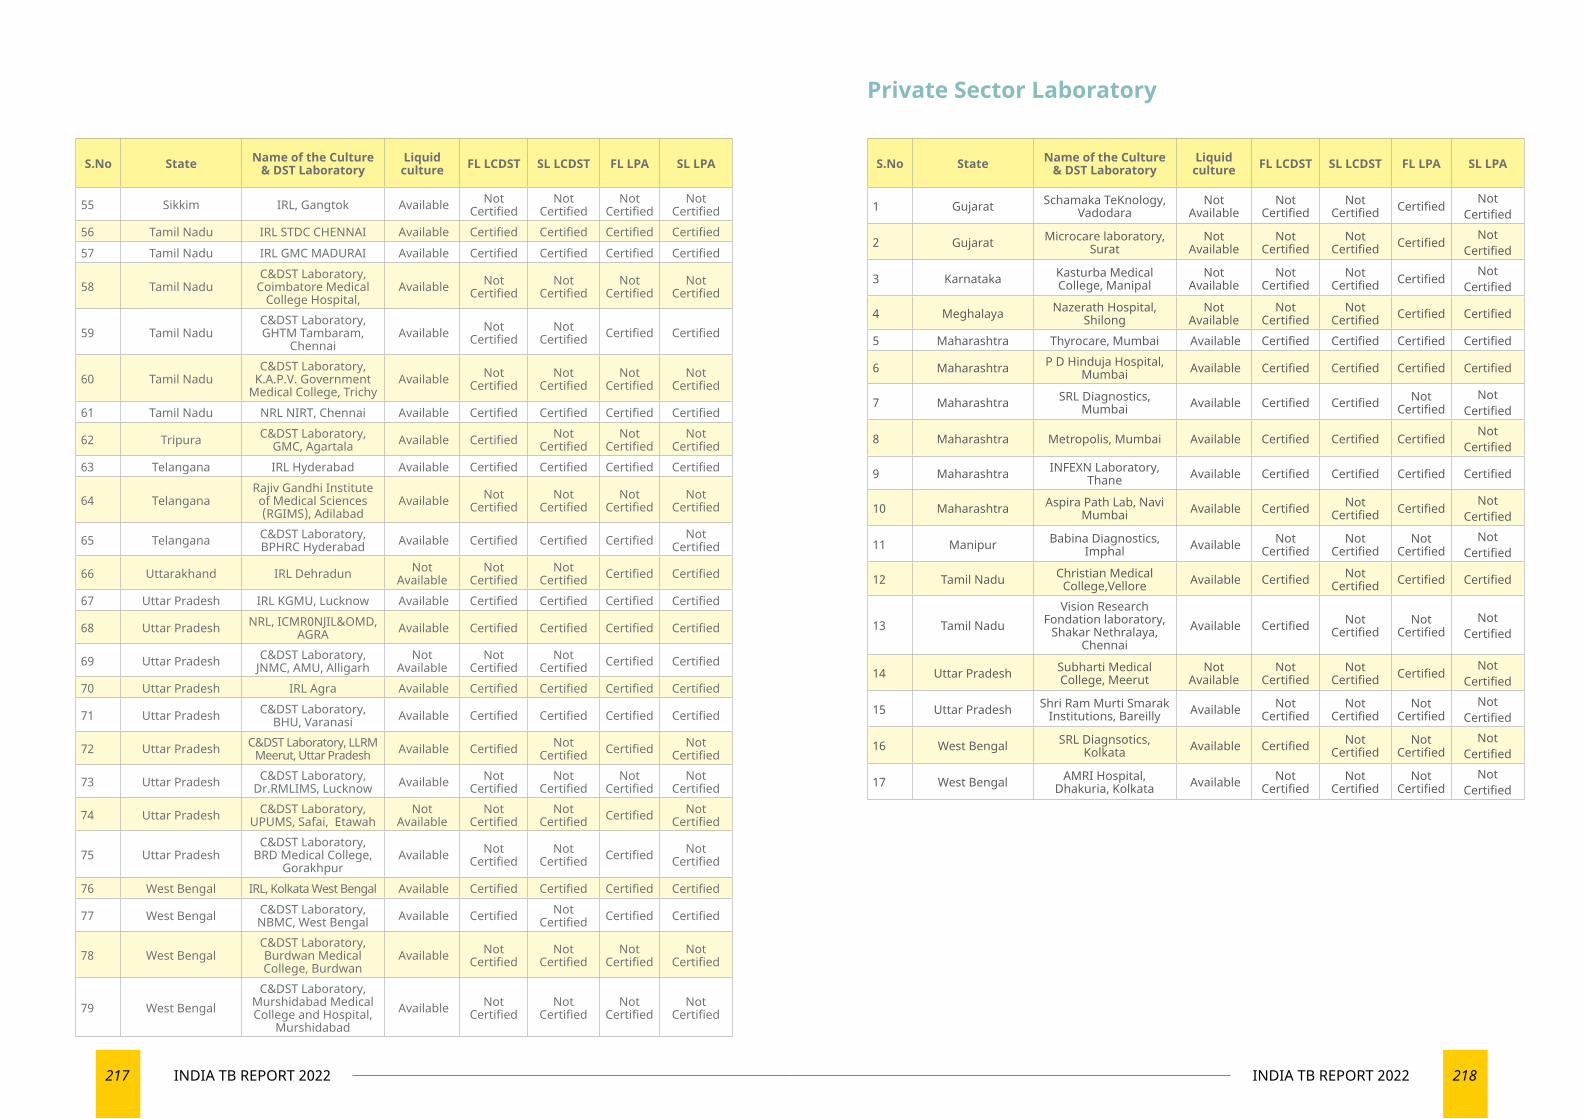
217 INDIA TB REPORT 2022 218INDIA TB REPORT 2022
S.No State Name of the Culture & DST Laboratory
Liquid culture FL LCDST SL LCDST FL LPA SL LPA
55 Sikkim IRL, Gangtok Available Not Certified
Not Certified
Not Certified
Not Certified
56 Tamil Nadu IRL STDC CHENNAI Available Certified Certified Certified Certified57 Tamil Nadu IRL GMC MADURAI Available Certified Certified Certified Certified
58 Tamil NaduC&DST Laboratory,
Coimbatore Medical College Hospital,
Available Not Certified
Not Certified
Not Certified
Not Certified
59 Tamil NaduC&DST Laboratory, GHTM Tambaram,
Chennai Available Not
CertifiedNot
Certified Certified Certified
60 Tamil NaduC&DST Laboratory,
K.A.P.V. Government Medical College, Trichy
Available Not Certified
Not Certified
Not Certified
Not Certified
61 Tamil Nadu NRL NIRT, Chennai Available Certified Certified Certified Certified
62 Tripura C&DST Laboratory, GMC, Agartala Available Certified Not
CertifiedNot
CertifiedNot
Certified63 Telangana IRL Hyderabad Available Certified Certified Certified Certified
64 TelanganaRajiv Gandhi Institute of Medical Sciences (RGIMS), Adilabad
Available Not Certified
Not Certified
Not Certified
Not Certified
65 Telangana C&DST Laboratory, BPHRC Hyderabad Available Certified Certified Certified Not
Certified
66 Uttarakhand IRL Dehradun Not Available
Not Certified
Not Certified Certified Certified
67 Uttar Pradesh IRL KGMU, Lucknow Available Certified Certified Certified Certified
68 Uttar Pradesh NRL, ICMR0NJIL&OMD, AGRA Available Certified Certified Certified Certified
69 Uttar Pradesh C&DST Laboratory, JNMC, AMU, Alligarh
Not Available
Not Certified
Not Certified Certified Certified
70 Uttar Pradesh IRL Agra Available Certified Certified Certified Certified
71 Uttar Pradesh C&DST Laboratory, BHU, Varanasi Available Certified Certified Certified Certified
72 Uttar Pradesh C&DST Laboratory, LLRM Meerut, Uttar Pradesh Available Certified Not
Certified Certified Not Certified
73 Uttar Pradesh C&DST Laboratory, Dr.RMLIMS, Lucknow Available Not
CertifiedNot
CertifiedNot
CertifiedNot
Certified
74 Uttar Pradesh C&DST Laboratory, UPUMS, Safai, Etawah
Not Available
Not Certified
Not Certified Certified Not
Certified
75 Uttar PradeshC&DST Laboratory,
BRD Medical College, Gorakhpur
Available Not Certified
Not Certified Certified Not
Certified
76 West Bengal IRL, Kolkata West Bengal Available Certified Certified Certified Certified
77 West Bengal C&DST Laboratory, NBMC, West Bengal Available Certified Not
Certified Certified Certified
78 West BengalC&DST Laboratory, Burdwan Medical College, Burdwan
Available Not Certified
Not Certified
Not Certified
Not Certified
79 West BengalC&DST Laboratory,
Murshidabad Medical College and Hospital,
Murshidabad Available Not
CertifiedNot
CertifiedNot
CertifiedNot
Certified
Private Sector Laboratory
S.No State Name of the Culture & DST Laboratory
Liquid culture FL LCDST SL LCDST FL LPA SL LPA
1 Gujarat Schamaka TeKnology, Vadodara
Not Available
Not Certified
Not Certified Certified Not
Certified
2 Gujarat Microcare laboratory, Surat
Not Available
Not Certified
Not Certified Certified Not
Certified
3 Karnataka Kasturba Medical College, Manipal
Not Available
Not Certified
Not Certified Certified Not
Certified
4 Meghalaya Nazerath Hospital, Shilong
Not Available
Not Certified
Not Certified Certified Certified
5 Maharashtra Thyrocare, Mumbai Available Certified Certified Certified Certified
6 Maharashtra P D Hinduja Hospital, Mumbai Available Certified Certified Certified Certified
7 Maharashtra SRL Diagnostics, Mumbai Available Certified Certified Not
CertifiedNot
Certified
8 Maharashtra Metropolis, Mumbai Available Certified Certified Certified Not Certified
9 Maharashtra INFEXN Laboratory, Thane Available Certified Certified Certified Certified
10 Maharashtra Aspira Path Lab, Navi Mumbai Available Certified Not
Certified Certified Not Certified
11 Manipur Babina Diagnostics, Imphal Available Not
CertifiedNot
CertifiedNot
CertifiedNot
Certified
12 Tamil Nadu Christian Medical College,Vellore Available Certified Not
Certified Certified Certified
13 Tamil NaduVision Research
Fondation laboratory, Shakar Nethralaya,
Chennai Available Certified Not
CertifiedNot
CertifiedNot
Certified
14 Uttar Pradesh Subharti Medical College, Meerut
Not Available
Not Certified
Not Certified Certified Not
Certified
15 Uttar Pradesh Shri Ram Murti Smarak Institutions, Bareilly Available Not
CertifiedNot
CertifiedNot
CertifiedNot
Certified
16 West Bengal SRL Diagnsotics, Kolkata Available Certified Not
CertifiedNot
CertifiedNot
Certified
17 West Bengal AMRI Hospital, Dhakuria, Kolkata Available Not
CertifiedNot
CertifiedNot
CertifiedNot
Certified
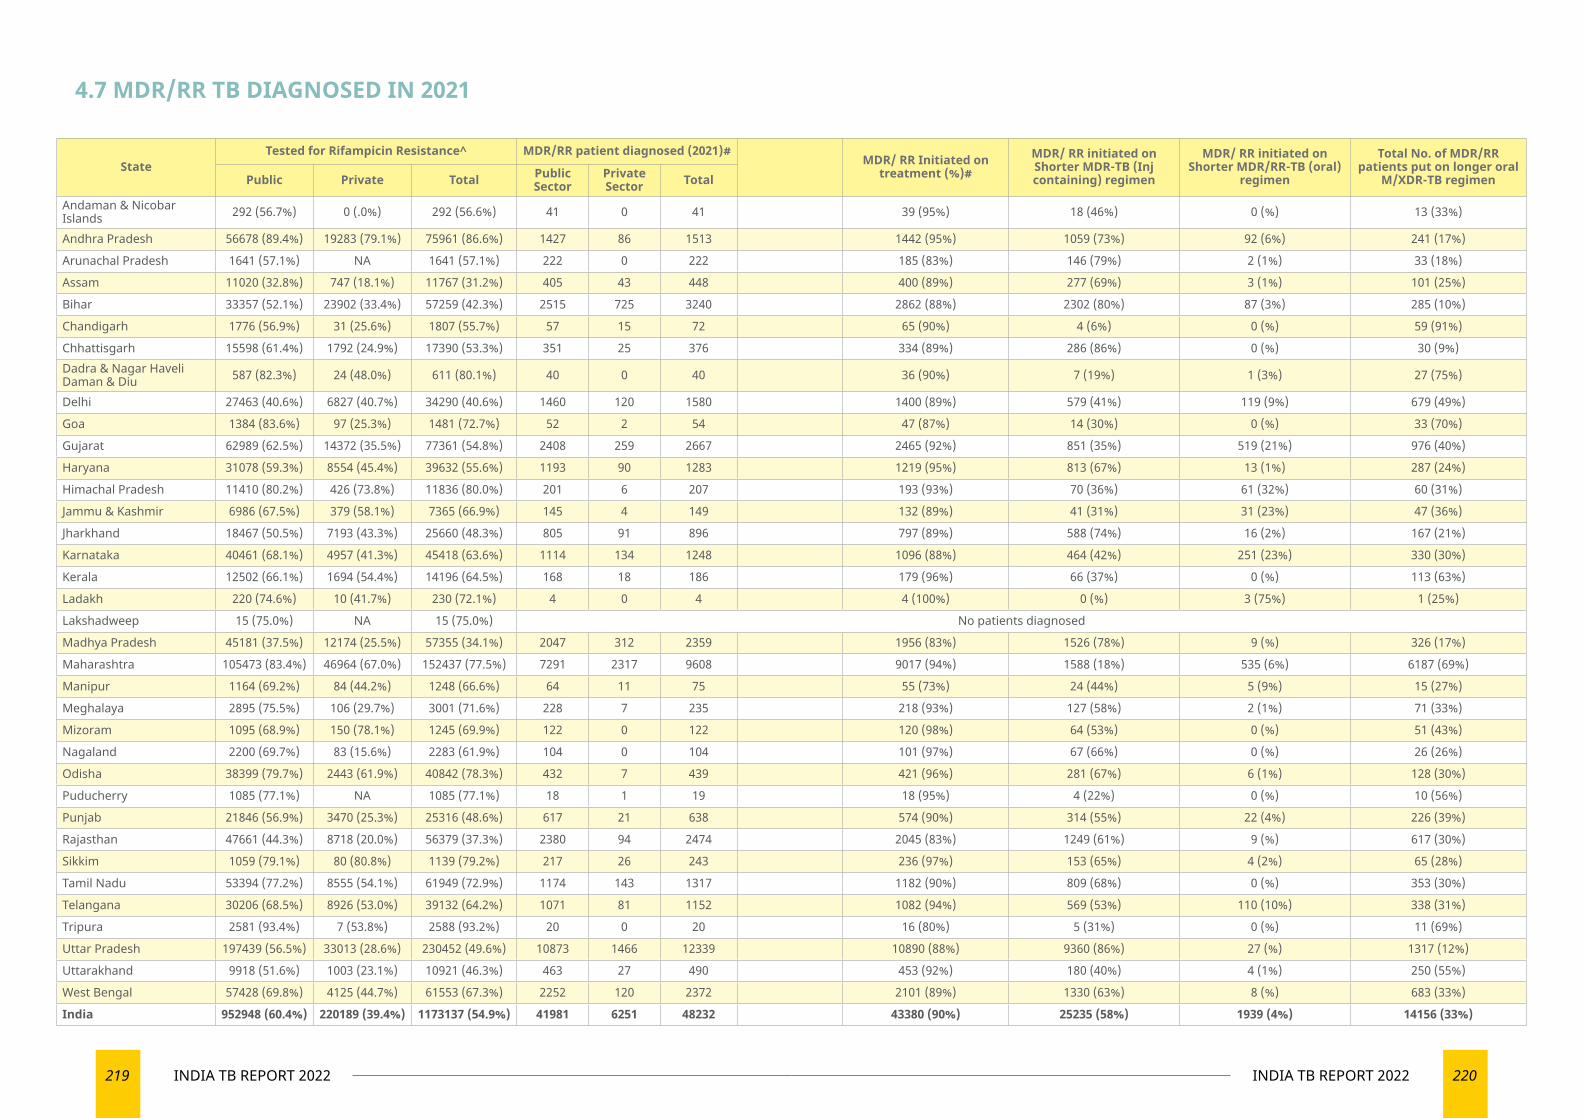
219 INDIA TB REPORT 2022 220INDIA TB REPORT 2022
4.7 MDR/RR TB DIAGNOSED IN 2021
StateTested for Rifampicin Resistance^ MDR/RR patient diagnosed (2021)#
MDR/ RR Initiated on treatment (%)#
MDR/ RR initiated on Shorter MDR-TB (Inj containing) regimen
MDR/ RR initiated on Shorter MDR/RR-TB (oral)
regimen
Total No. of MDR/RR patients put on longer oral
M/XDR-TB regimenPublic Private Total Public Sector
Private Sector Total
Andaman & Nicobar Islands 292 (56.7%) 0 (.0%) 292 (56.6%) 41 0 41 39 (95%) 18 (46%) 0 (%) 13 (33%)
Andhra Pradesh 56678 (89.4%) 19283 (79.1%) 75961 (86.6%) 1427 86 1513 1442 (95%) 1059 (73%) 92 (6%) 241 (17%)
Arunachal Pradesh 1641 (57.1%) NA 1641 (57.1%) 222 0 222 185 (83%) 146 (79%) 2 (1%) 33 (18%)
Assam 11020 (32.8%) 747 (18.1%) 11767 (31.2%) 405 43 448 400 (89%) 277 (69%) 3 (1%) 101 (25%)
Bihar 33357 (52.1%) 23902 (33.4%) 57259 (42.3%) 2515 725 3240 2862 (88%) 2302 (80%) 87 (3%) 285 (10%)
Chandigarh 1776 (56.9%) 31 (25.6%) 1807 (55.7%) 57 15 72 65 (90%) 4 (6%) 0 (%) 59 (91%)
Chhattisgarh 15598 (61.4%) 1792 (24.9%) 17390 (53.3%) 351 25 376 334 (89%) 286 (86%) 0 (%) 30 (9%)Dadra & Nagar Haveli Daman & Diu 587 (82.3%) 24 (48.0%) 611 (80.1%) 40 0 40 36 (90%) 7 (19%) 1 (3%) 27 (75%)
Delhi 27463 (40.6%) 6827 (40.7%) 34290 (40.6%) 1460 120 1580 1400 (89%) 579 (41%) 119 (9%) 679 (49%)
Goa 1384 (83.6%) 97 (25.3%) 1481 (72.7%) 52 2 54 47 (87%) 14 (30%) 0 (%) 33 (70%)
Gujarat 62989 (62.5%) 14372 (35.5%) 77361 (54.8%) 2408 259 2667 2465 (92%) 851 (35%) 519 (21%) 976 (40%)
Haryana 31078 (59.3%) 8554 (45.4%) 39632 (55.6%) 1193 90 1283 1219 (95%) 813 (67%) 13 (1%) 287 (24%)
Himachal Pradesh 11410 (80.2%) 426 (73.8%) 11836 (80.0%) 201 6 207 193 (93%) 70 (36%) 61 (32%) 60 (31%)
Jammu & Kashmir 6986 (67.5%) 379 (58.1%) 7365 (66.9%) 145 4 149 132 (89%) 41 (31%) 31 (23%) 47 (36%)
Jharkhand 18467 (50.5%) 7193 (43.3%) 25660 (48.3%) 805 91 896 797 (89%) 588 (74%) 16 (2%) 167 (21%)
Karnataka 40461 (68.1%) 4957 (41.3%) 45418 (63.6%) 1114 134 1248 1096 (88%) 464 (42%) 251 (23%) 330 (30%)
Kerala 12502 (66.1%) 1694 (54.4%) 14196 (64.5%) 168 18 186 179 (96%) 66 (37%) 0 (%) 113 (63%)
Ladakh 220 (74.6%) 10 (41.7%) 230 (72.1%) 4 0 4 4 (100%) 0 (%) 3 (75%) 1 (25%)
Lakshadweep 15 (75.0%) NA 15 (75.0%) No patients diagnosed
Madhya Pradesh 45181 (37.5%) 12174 (25.5%) 57355 (34.1%) 2047 312 2359 1956 (83%) 1526 (78%) 9 (%) 326 (17%)
Maharashtra 105473 (83.4%) 46964 (67.0%) 152437 (77.5%) 7291 2317 9608 9017 (94%) 1588 (18%) 535 (6%) 6187 (69%)
Manipur 1164 (69.2%) 84 (44.2%) 1248 (66.6%) 64 11 75 55 (73%) 24 (44%) 5 (9%) 15 (27%)
Meghalaya 2895 (75.5%) 106 (29.7%) 3001 (71.6%) 228 7 235 218 (93%) 127 (58%) 2 (1%) 71 (33%)
Mizoram 1095 (68.9%) 150 (78.1%) 1245 (69.9%) 122 0 122 120 (98%) 64 (53%) 0 (%) 51 (43%)
Nagaland 2200 (69.7%) 83 (15.6%) 2283 (61.9%) 104 0 104 101 (97%) 67 (66%) 0 (%) 26 (26%)
Odisha 38399 (79.7%) 2443 (61.9%) 40842 (78.3%) 432 7 439 421 (96%) 281 (67%) 6 (1%) 128 (30%)
Puducherry 1085 (77.1%) NA 1085 (77.1%) 18 1 19 18 (95%) 4 (22%) 0 (%) 10 (56%)
Punjab 21846 (56.9%) 3470 (25.3%) 25316 (48.6%) 617 21 638 574 (90%) 314 (55%) 22 (4%) 226 (39%)
Rajasthan 47661 (44.3%) 8718 (20.0%) 56379 (37.3%) 2380 94 2474 2045 (83%) 1249 (61%) 9 (%) 617 (30%)
Sikkim 1059 (79.1%) 80 (80.8%) 1139 (79.2%) 217 26 243 236 (97%) 153 (65%) 4 (2%) 65 (28%)
Tamil Nadu 53394 (77.2%) 8555 (54.1%) 61949 (72.9%) 1174 143 1317 1182 (90%) 809 (68%) 0 (%) 353 (30%)
Telangana 30206 (68.5%) 8926 (53.0%) 39132 (64.2%) 1071 81 1152 1082 (94%) 569 (53%) 110 (10%) 338 (31%)
Tripura 2581 (93.4%) 7 (53.8%) 2588 (93.2%) 20 0 20 16 (80%) 5 (31%) 0 (%) 11 (69%)
Uttar Pradesh 197439 (56.5%) 33013 (28.6%) 230452 (49.6%) 10873 1466 12339 10890 (88%) 9360 (86%) 27 (%) 1317 (12%)
Uttarakhand 9918 (51.6%) 1003 (23.1%) 10921 (46.3%) 463 27 490 453 (92%) 180 (40%) 4 (1%) 250 (55%)
West Bengal 57428 (69.8%) 4125 (44.7%) 61553 (67.3%) 2252 120 2372 2101 (89%) 1330 (63%) 8 (%) 683 (33%)
India 952948 (60.4%) 220189 (39.4%) 1173137 (54.9%) 41981 6251 48232 43380 (90%) 25235 (58%) 1939 (4%) 14156 (33%)
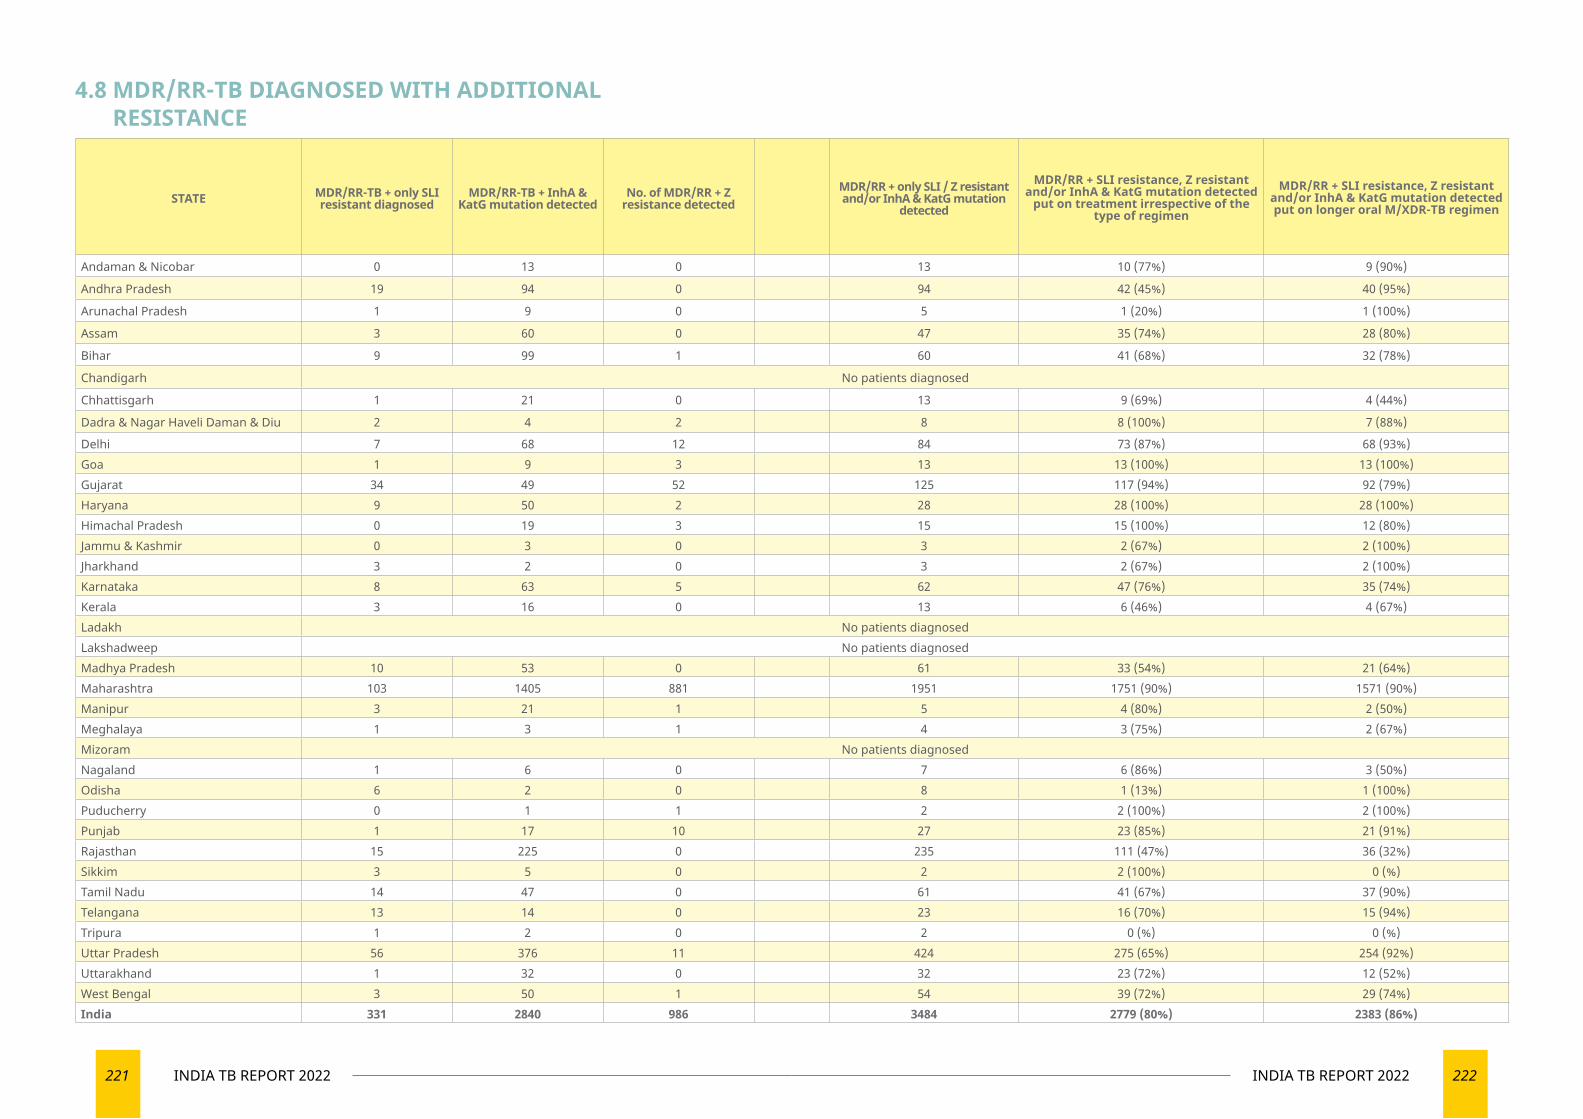
221 INDIA TB REPORT 2022 222INDIA TB REPORT 2022
STATE MDR/RR-TB + only SLI resistant diagnosed
MDR/RR-TB + InhA & KatG mutation detected
No. of MDR/RR + Z resistance detected
MDR/RR + only SLI / Z resistant and/or InhA & KatG mutation
detected
MDR/RR + SLI resistance, Z resistant and/or InhA & KatG mutation detected
put on treatment irrespective of the type of regimen
MDR/RR + SLI resistance, Z resistant and/or InhA & KatG mutation detected put on longer oral M/XDR-TB regimen
Andaman & Nicobar 0 13 0 13 10 (77%) 9 (90%)
Andhra Pradesh 19 94 0 94 42 (45%) 40 (95%)
Arunachal Pradesh 1 9 0 5 1 (20%) 1 (100%)
Assam 3 60 0 47 35 (74%) 28 (80%)
Bihar 9 99 1 60 41 (68%) 32 (78%)
Chandigarh No patients diagnosed
Chhattisgarh 1 21 0 13 9 (69%) 4 (44%)
Dadra & Nagar Haveli Daman & Diu 2 4 2 8 8 (100%) 7 (88%)
Delhi 7 68 12 84 73 (87%) 68 (93%)Goa 1 9 3 13 13 (100%) 13 (100%)Gujarat 34 49 52 125 117 (94%) 92 (79%)Haryana 9 50 2 28 28 (100%) 28 (100%)Himachal Pradesh 0 19 3 15 15 (100%) 12 (80%)Jammu & Kashmir 0 3 0 3 2 (67%) 2 (100%)Jharkhand 3 2 0 3 2 (67%) 2 (100%)Karnataka 8 63 5 62 47 (76%) 35 (74%)Kerala 3 16 0 13 6 (46%) 4 (67%)Ladakh No patients diagnosedLakshadweep No patients diagnosedMadhya Pradesh 10 53 0 61 33 (54%) 21 (64%)Maharashtra 103 1405 881 1951 1751 (90%) 1571 (90%)Manipur 3 21 1 5 4 (80%) 2 (50%)Meghalaya 1 3 1 4 3 (75%) 2 (67%)Mizoram No patients diagnosedNagaland 1 6 0 7 6 (86%) 3 (50%)Odisha 6 2 0 8 1 (13%) 1 (100%)Puducherry 0 1 1 2 2 (100%) 2 (100%)Punjab 1 17 10 27 23 (85%) 21 (91%)Rajasthan 15 225 0 235 111 (47%) 36 (32%)Sikkim 3 5 0 2 2 (100%) 0 (%)Tamil Nadu 14 47 0 61 41 (67%) 37 (90%)Telangana 13 14 0 23 16 (70%) 15 (94%)Tripura 1 2 0 2 0 (%) 0 (%)Uttar Pradesh 56 376 11 424 275 (65%) 254 (92%)Uttarakhand 1 32 0 32 23 (72%) 12 (52%)West Bengal 3 50 1 54 39 (72%) 29 (74%)India 331 2840 986 3484 2779 (80%) 2383 (86%)
4.8 MDR/RR-TB DIAGNOSED WITH ADDITIONAL RESISTANCE
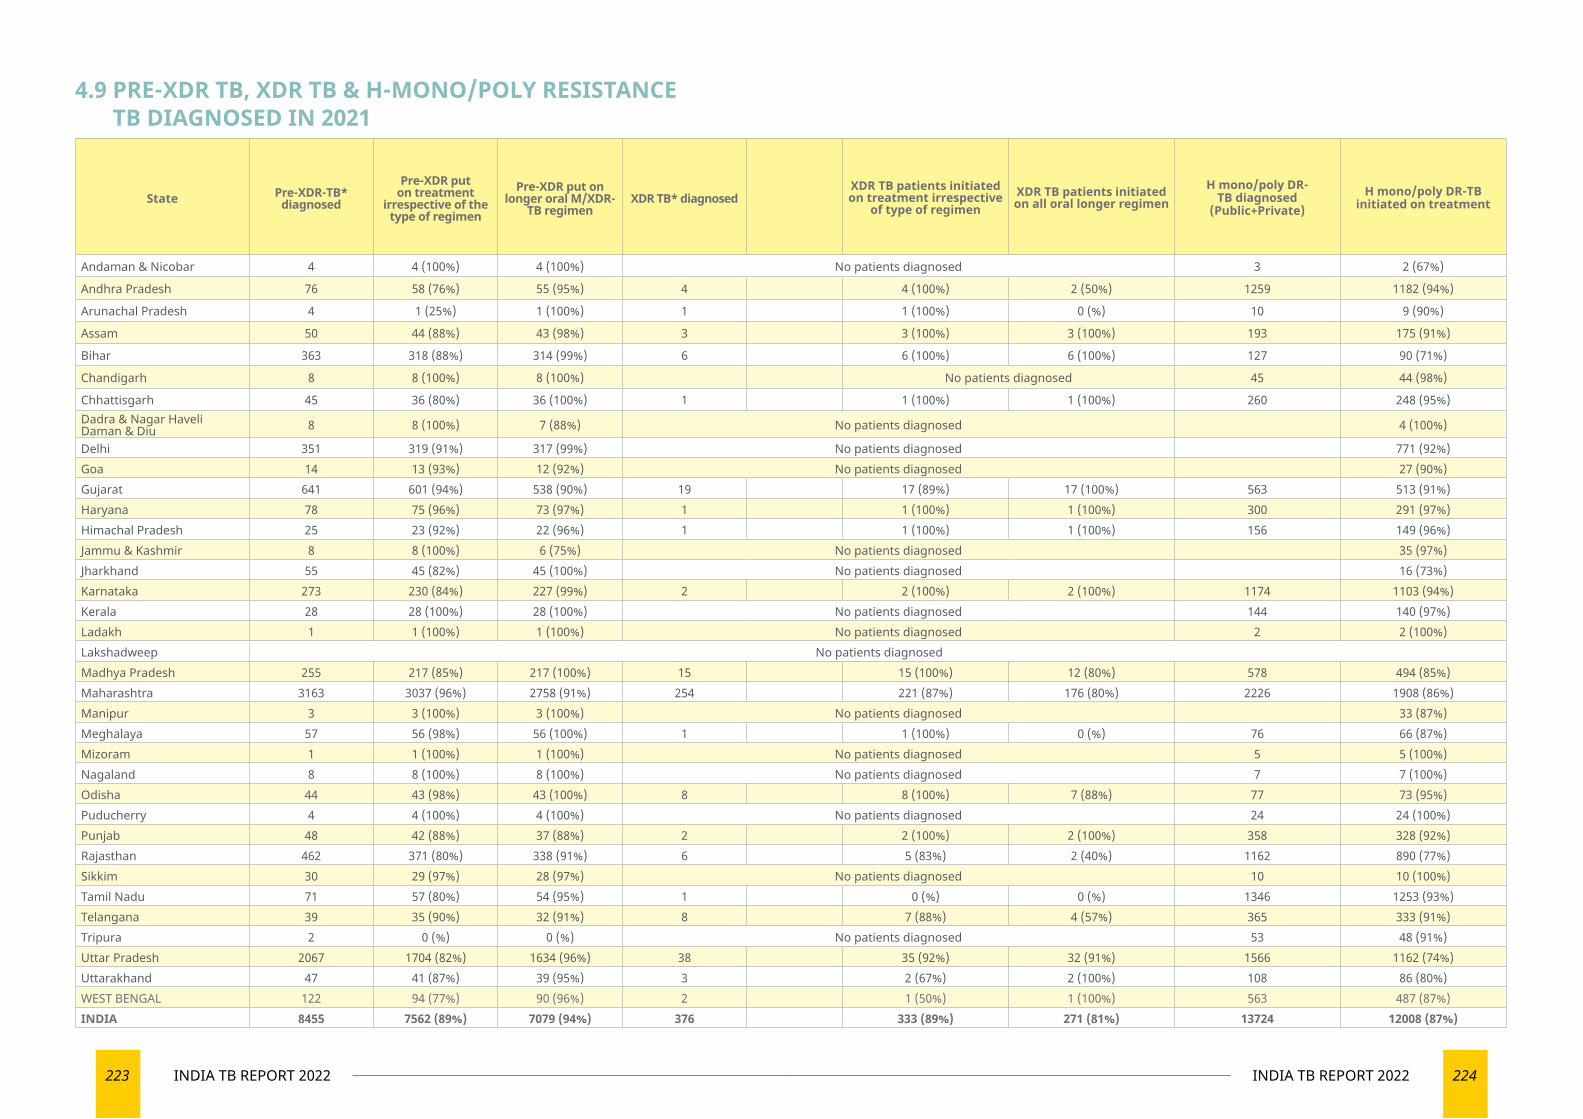
223 INDIA TB REPORT 2022 224INDIA TB REPORT 2022
State Pre-XDR-TB* diagnosed
Pre-XDR put on treatment
irrespective of the type of regimen
Pre-XDR put on longer oral M/XDR-
TB regimenXDR TB* diagnosed
XDR TB patients initiated on treatment irrespective
of type of regimenXDR TB patients initiated on all oral longer regimen
H mono/poly DR-TB diagnosed
(Public+Private)H mono/poly DR-TB
initiated on treatment
Andaman & Nicobar 4 4 (100%) 4 (100%) No patients diagnosed 3 2 (67%)
Andhra Pradesh 76 58 (76%) 55 (95%) 4 4 (100%) 2 (50%) 1259 1182 (94%)
Arunachal Pradesh 4 1 (25%) 1 (100%) 1 1 (100%) 0 (%) 10 9 (90%)
Assam 50 44 (88%) 43 (98%) 3 3 (100%) 3 (100%) 193 175 (91%)
Bihar 363 318 (88%) 314 (99%) 6 6 (100%) 6 (100%) 127 90 (71%)
Chandigarh 8 8 (100%) 8 (100%) No patients diagnosed 45 44 (98%)
Chhattisgarh 45 36 (80%) 36 (100%) 1 1 (100%) 1 (100%) 260 248 (95%)Dadra & Nagar Haveli Daman & Diu 8 8 (100%) 7 (88%) No patients diagnosed 4 (100%)
Delhi 351 319 (91%) 317 (99%) No patients diagnosed 771 (92%)Goa 14 13 (93%) 12 (92%) No patients diagnosed 27 (90%)Gujarat 641 601 (94%) 538 (90%) 19 17 (89%) 17 (100%) 563 513 (91%)Haryana 78 75 (96%) 73 (97%) 1 1 (100%) 1 (100%) 300 291 (97%)Himachal Pradesh 25 23 (92%) 22 (96%) 1 1 (100%) 1 (100%) 156 149 (96%)Jammu & Kashmir 8 8 (100%) 6 (75%) No patients diagnosed 35 (97%)Jharkhand 55 45 (82%) 45 (100%) No patients diagnosed 16 (73%)Karnataka 273 230 (84%) 227 (99%) 2 2 (100%) 2 (100%) 1174 1103 (94%)Kerala 28 28 (100%) 28 (100%) No patients diagnosed 144 140 (97%)Ladakh 1 1 (100%) 1 (100%) No patients diagnosed 2 2 (100%)Lakshadweep No patients diagnosedMadhya Pradesh 255 217 (85%) 217 (100%) 15 15 (100%) 12 (80%) 578 494 (85%)Maharashtra 3163 3037 (96%) 2758 (91%) 254 221 (87%) 176 (80%) 2226 1908 (86%)Manipur 3 3 (100%) 3 (100%) No patients diagnosed 33 (87%)Meghalaya 57 56 (98%) 56 (100%) 1 1 (100%) 0 (%) 76 66 (87%)Mizoram 1 1 (100%) 1 (100%) No patients diagnosed 5 5 (100%)Nagaland 8 8 (100%) 8 (100%) No patients diagnosed 7 7 (100%)Odisha 44 43 (98%) 43 (100%) 8 8 (100%) 7 (88%) 77 73 (95%)Puducherry 4 4 (100%) 4 (100%) No patients diagnosed 24 24 (100%)Punjab 48 42 (88%) 37 (88%) 2 2 (100%) 2 (100%) 358 328 (92%)Rajasthan 462 371 (80%) 338 (91%) 6 5 (83%) 2 (40%) 1162 890 (77%)Sikkim 30 29 (97%) 28 (97%) No patients diagnosed 10 10 (100%)Tamil Nadu 71 57 (80%) 54 (95%) 1 0 (%) 0 (%) 1346 1253 (93%)Telangana 39 35 (90%) 32 (91%) 8 7 (88%) 4 (57%) 365 333 (91%)Tripura 2 0 (%) 0 (%) No patients diagnosed 53 48 (91%)Uttar Pradesh 2067 1704 (82%) 1634 (96%) 38 35 (92%) 32 (91%) 1566 1162 (74%)Uttarakhand 47 41 (87%) 39 (95%) 3 2 (67%) 2 (100%) 108 86 (80%)WEST BENGAL 122 94 (77%) 90 (96%) 2 1 (50%) 1 (100%) 563 487 (87%)INDIA 8455 7562 (89%) 7079 (94%) 376 333 (89%) 271 (81%) 13724 12008 (87%)
4.9 PRE-XDR TB, XDR TB & H-MONO/POLY RESISTANCE TB DIAGNOSED IN 2021
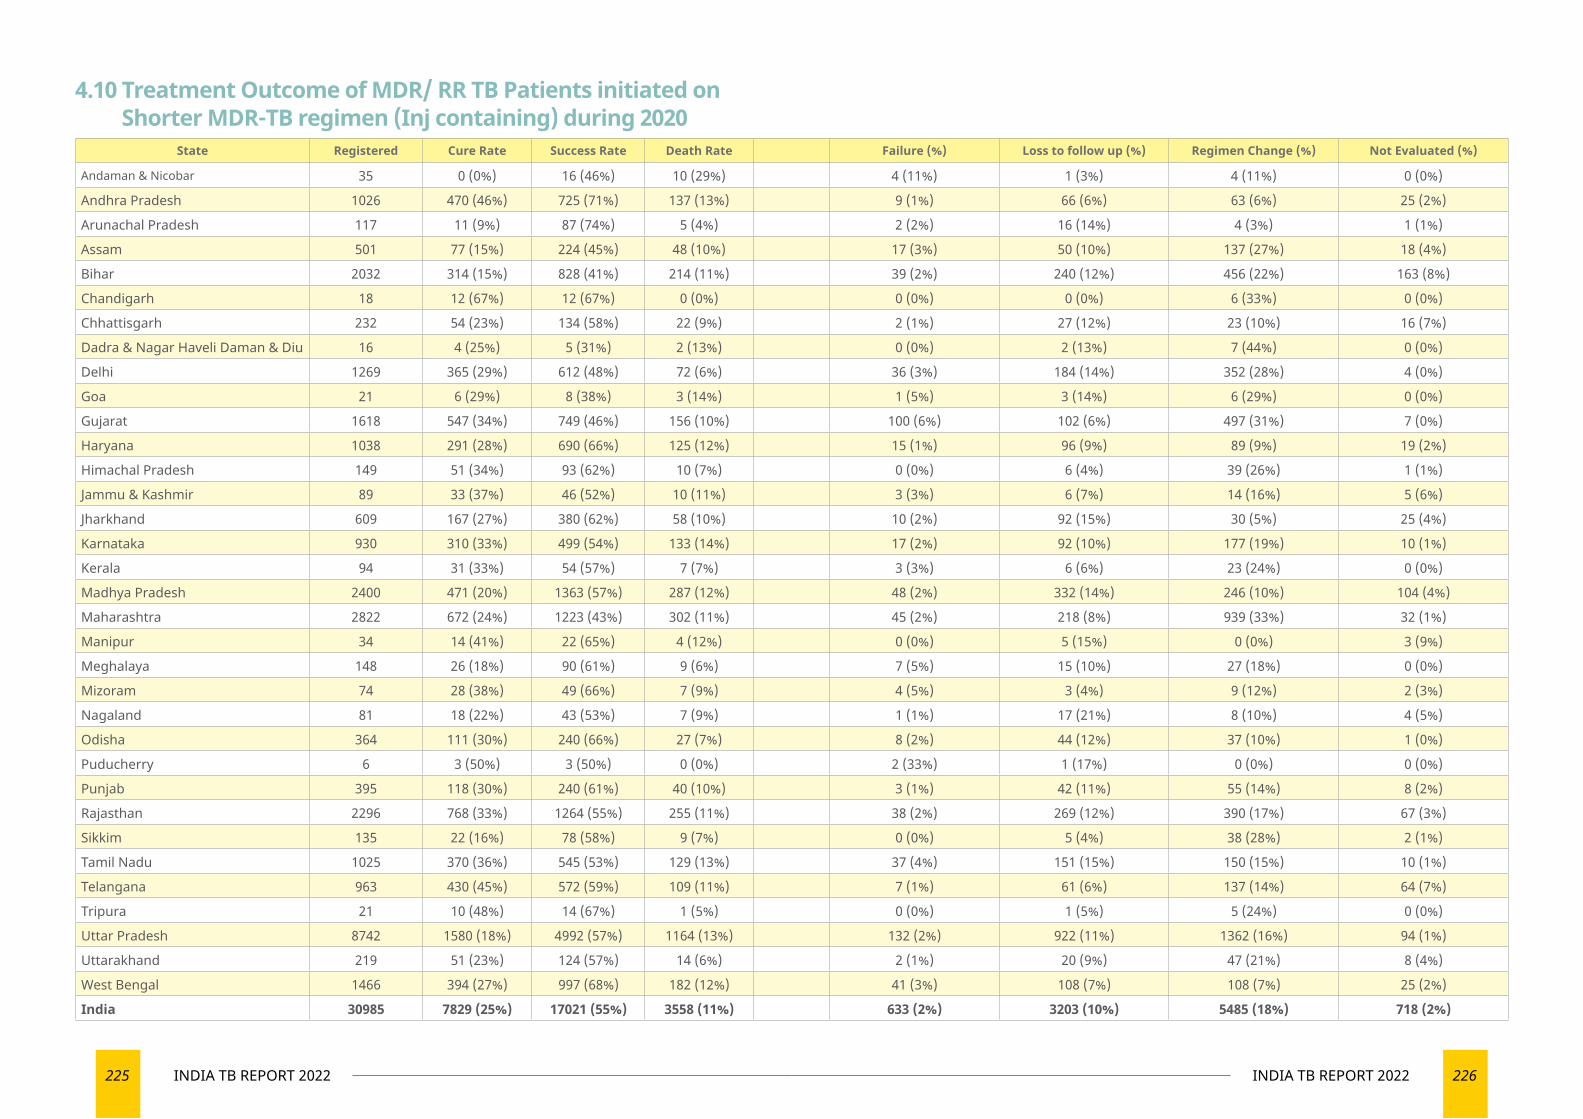
225 INDIA TB REPORT 2022 226INDIA TB REPORT 2022
State Registered Cure Rate Success Rate Death Rate Failure (%) Loss to follow up (%) Regimen Change (%) Not Evaluated (%)
Andaman & Nicobar 35 0 (0%) 16 (46%) 10 (29%) 4 (11%) 1 (3%) 4 (11%) 0 (0%)
Andhra Pradesh 1026 470 (46%) 725 (71%) 137 (13%) 9 (1%) 66 (6%) 63 (6%) 25 (2%)
Arunachal Pradesh 117 11 (9%) 87 (74%) 5 (4%) 2 (2%) 16 (14%) 4 (3%) 1 (1%)
Assam 501 77 (15%) 224 (45%) 48 (10%) 17 (3%) 50 (10%) 137 (27%) 18 (4%)
Bihar 2032 314 (15%) 828 (41%) 214 (11%) 39 (2%) 240 (12%) 456 (22%) 163 (8%)
Chandigarh 18 12 (67%) 12 (67%) 0 (0%) 0 (0%) 0 (0%) 6 (33%) 0 (0%)
Chhattisgarh 232 54 (23%) 134 (58%) 22 (9%) 2 (1%) 27 (12%) 23 (10%) 16 (7%)
Dadra & Nagar Haveli Daman & Diu 16 4 (25%) 5 (31%) 2 (13%) 0 (0%) 2 (13%) 7 (44%) 0 (0%)
Delhi 1269 365 (29%) 612 (48%) 72 (6%) 36 (3%) 184 (14%) 352 (28%) 4 (0%)
Goa 21 6 (29%) 8 (38%) 3 (14%) 1 (5%) 3 (14%) 6 (29%) 0 (0%)
Gujarat 1618 547 (34%) 749 (46%) 156 (10%) 100 (6%) 102 (6%) 497 (31%) 7 (0%)
Haryana 1038 291 (28%) 690 (66%) 125 (12%) 15 (1%) 96 (9%) 89 (9%) 19 (2%)
Himachal Pradesh 149 51 (34%) 93 (62%) 10 (7%) 0 (0%) 6 (4%) 39 (26%) 1 (1%)
Jammu & Kashmir 89 33 (37%) 46 (52%) 10 (11%) 3 (3%) 6 (7%) 14 (16%) 5 (6%)
Jharkhand 609 167 (27%) 380 (62%) 58 (10%) 10 (2%) 92 (15%) 30 (5%) 25 (4%)
Karnataka 930 310 (33%) 499 (54%) 133 (14%) 17 (2%) 92 (10%) 177 (19%) 10 (1%)
Kerala 94 31 (33%) 54 (57%) 7 (7%) 3 (3%) 6 (6%) 23 (24%) 0 (0%)
Madhya Pradesh 2400 471 (20%) 1363 (57%) 287 (12%) 48 (2%) 332 (14%) 246 (10%) 104 (4%)
Maharashtra 2822 672 (24%) 1223 (43%) 302 (11%) 45 (2%) 218 (8%) 939 (33%) 32 (1%)
Manipur 34 14 (41%) 22 (65%) 4 (12%) 0 (0%) 5 (15%) 0 (0%) 3 (9%)
Meghalaya 148 26 (18%) 90 (61%) 9 (6%) 7 (5%) 15 (10%) 27 (18%) 0 (0%)
Mizoram 74 28 (38%) 49 (66%) 7 (9%) 4 (5%) 3 (4%) 9 (12%) 2 (3%)
Nagaland 81 18 (22%) 43 (53%) 7 (9%) 1 (1%) 17 (21%) 8 (10%) 4 (5%)
Odisha 364 111 (30%) 240 (66%) 27 (7%) 8 (2%) 44 (12%) 37 (10%) 1 (0%)
Puducherry 6 3 (50%) 3 (50%) 0 (0%) 2 (33%) 1 (17%) 0 (0%) 0 (0%)
Punjab 395 118 (30%) 240 (61%) 40 (10%) 3 (1%) 42 (11%) 55 (14%) 8 (2%)
Rajasthan 2296 768 (33%) 1264 (55%) 255 (11%) 38 (2%) 269 (12%) 390 (17%) 67 (3%)
Sikkim 135 22 (16%) 78 (58%) 9 (7%) 0 (0%) 5 (4%) 38 (28%) 2 (1%)
Tamil Nadu 1025 370 (36%) 545 (53%) 129 (13%) 37 (4%) 151 (15%) 150 (15%) 10 (1%)
Telangana 963 430 (45%) 572 (59%) 109 (11%) 7 (1%) 61 (6%) 137 (14%) 64 (7%)
Tripura 21 10 (48%) 14 (67%) 1 (5%) 0 (0%) 1 (5%) 5 (24%) 0 (0%)
Uttar Pradesh 8742 1580 (18%) 4992 (57%) 1164 (13%) 132 (2%) 922 (11%) 1362 (16%) 94 (1%)
Uttarakhand 219 51 (23%) 124 (57%) 14 (6%) 2 (1%) 20 (9%) 47 (21%) 8 (4%)
West Bengal 1466 394 (27%) 997 (68%) 182 (12%) 41 (3%) 108 (7%) 108 (7%) 25 (2%)
India 30985 7829 (25%) 17021 (55%) 3558 (11%) 633 (2%) 3203 (10%) 5485 (18%) 718 (2%)
4.10 Treatment Outcome of MDR/ RR TB Patients initiated on Shorter MDR-TB regimen (Inj containing) during 2020
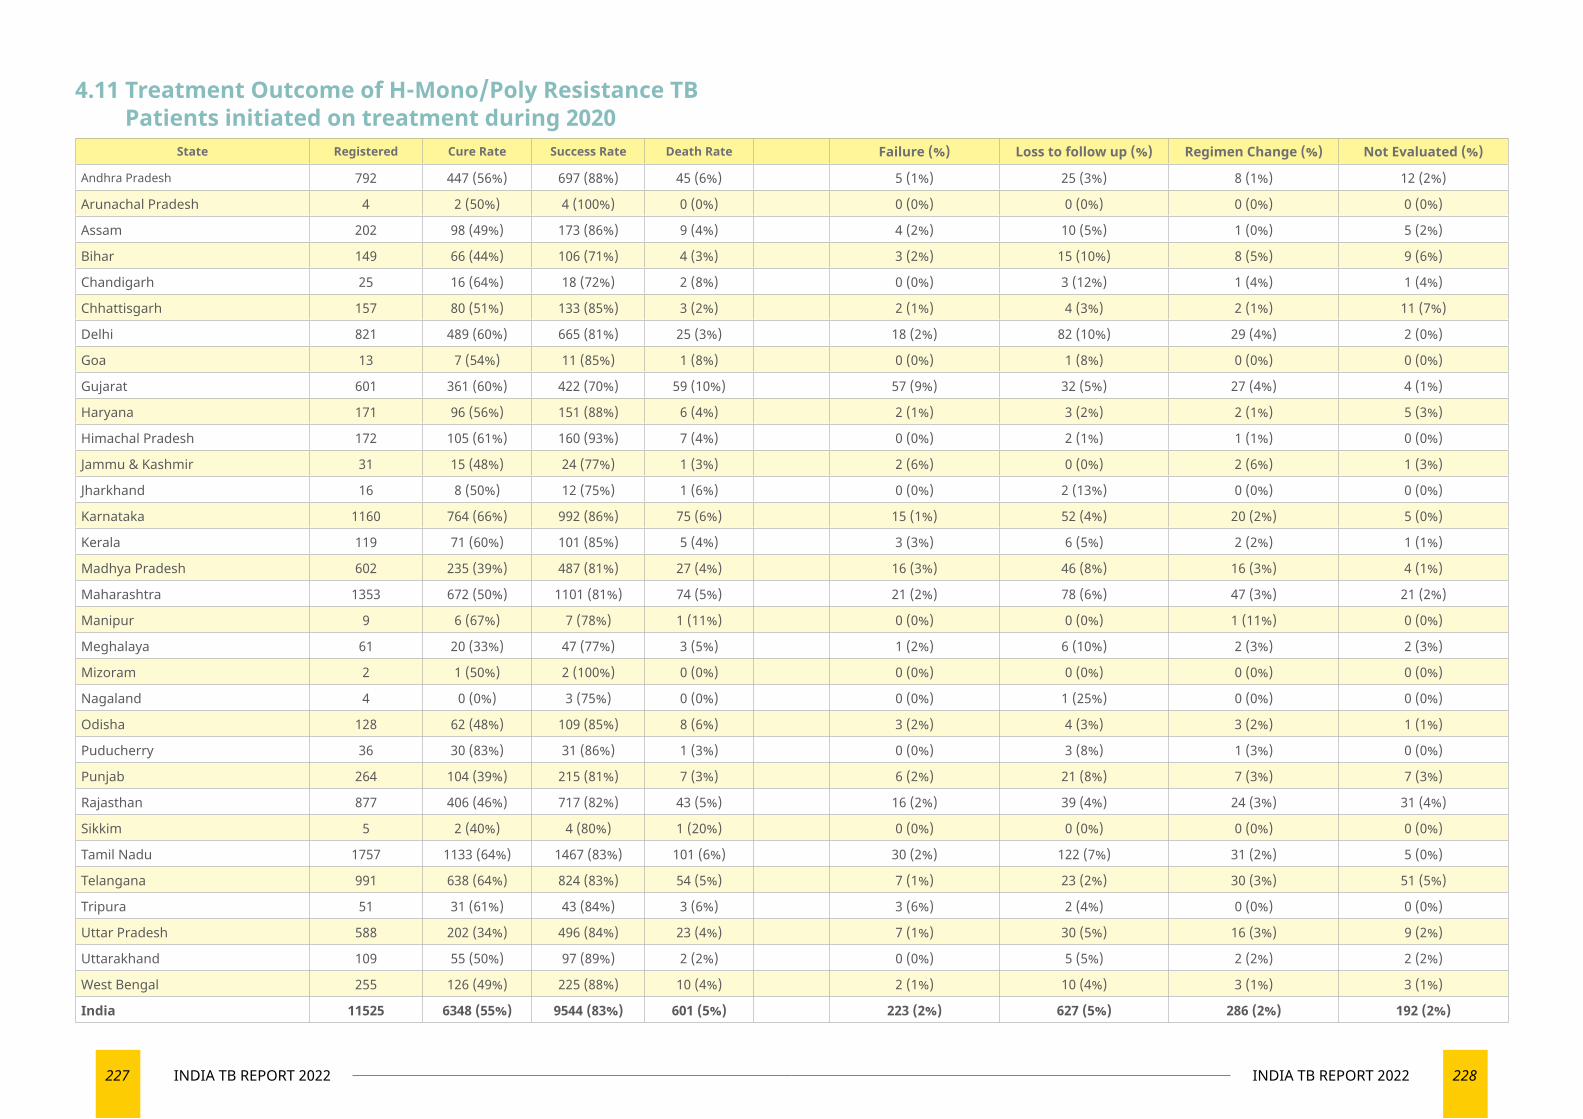
227 INDIA TB REPORT 2022 228INDIA TB REPORT 2022
State Registered Cure Rate Success Rate Death Rate Failure (%) Loss to follow up (%) Regimen Change (%) Not Evaluated (%)
Andhra Pradesh 792 447 (56%) 697 (88%) 45 (6%) 5 (1%) 25 (3%) 8 (1%) 12 (2%)
Arunachal Pradesh 4 2 (50%) 4 (100%) 0 (0%) 0 (0%) 0 (0%) 0 (0%) 0 (0%)
Assam 202 98 (49%) 173 (86%) 9 (4%) 4 (2%) 10 (5%) 1 (0%) 5 (2%)
Bihar 149 66 (44%) 106 (71%) 4 (3%) 3 (2%) 15 (10%) 8 (5%) 9 (6%)
Chandigarh 25 16 (64%) 18 (72%) 2 (8%) 0 (0%) 3 (12%) 1 (4%) 1 (4%)
Chhattisgarh 157 80 (51%) 133 (85%) 3 (2%) 2 (1%) 4 (3%) 2 (1%) 11 (7%)
Delhi 821 489 (60%) 665 (81%) 25 (3%) 18 (2%) 82 (10%) 29 (4%) 2 (0%)
Goa 13 7 (54%) 11 (85%) 1 (8%) 0 (0%) 1 (8%) 0 (0%) 0 (0%)
Gujarat 601 361 (60%) 422 (70%) 59 (10%) 57 (9%) 32 (5%) 27 (4%) 4 (1%)
Haryana 171 96 (56%) 151 (88%) 6 (4%) 2 (1%) 3 (2%) 2 (1%) 5 (3%)
Himachal Pradesh 172 105 (61%) 160 (93%) 7 (4%) 0 (0%) 2 (1%) 1 (1%) 0 (0%)
Jammu & Kashmir 31 15 (48%) 24 (77%) 1 (3%) 2 (6%) 0 (0%) 2 (6%) 1 (3%)
Jharkhand 16 8 (50%) 12 (75%) 1 (6%) 0 (0%) 2 (13%) 0 (0%) 0 (0%)
Karnataka 1160 764 (66%) 992 (86%) 75 (6%) 15 (1%) 52 (4%) 20 (2%) 5 (0%)
Kerala 119 71 (60%) 101 (85%) 5 (4%) 3 (3%) 6 (5%) 2 (2%) 1 (1%)
Madhya Pradesh 602 235 (39%) 487 (81%) 27 (4%) 16 (3%) 46 (8%) 16 (3%) 4 (1%)
Maharashtra 1353 672 (50%) 1101 (81%) 74 (5%) 21 (2%) 78 (6%) 47 (3%) 21 (2%)
Manipur 9 6 (67%) 7 (78%) 1 (11%) 0 (0%) 0 (0%) 1 (11%) 0 (0%)
Meghalaya 61 20 (33%) 47 (77%) 3 (5%) 1 (2%) 6 (10%) 2 (3%) 2 (3%)
Mizoram 2 1 (50%) 2 (100%) 0 (0%) 0 (0%) 0 (0%) 0 (0%) 0 (0%)
Nagaland 4 0 (0%) 3 (75%) 0 (0%) 0 (0%) 1 (25%) 0 (0%) 0 (0%)
Odisha 128 62 (48%) 109 (85%) 8 (6%) 3 (2%) 4 (3%) 3 (2%) 1 (1%)
Puducherry 36 30 (83%) 31 (86%) 1 (3%) 0 (0%) 3 (8%) 1 (3%) 0 (0%)
Punjab 264 104 (39%) 215 (81%) 7 (3%) 6 (2%) 21 (8%) 7 (3%) 7 (3%)
Rajasthan 877 406 (46%) 717 (82%) 43 (5%) 16 (2%) 39 (4%) 24 (3%) 31 (4%)
Sikkim 5 2 (40%) 4 (80%) 1 (20%) 0 (0%) 0 (0%) 0 (0%) 0 (0%)
Tamil Nadu 1757 1133 (64%) 1467 (83%) 101 (6%) 30 (2%) 122 (7%) 31 (2%) 5 (0%)
Telangana 991 638 (64%) 824 (83%) 54 (5%) 7 (1%) 23 (2%) 30 (3%) 51 (5%)
Tripura 51 31 (61%) 43 (84%) 3 (6%) 3 (6%) 2 (4%) 0 (0%) 0 (0%)
Uttar Pradesh 588 202 (34%) 496 (84%) 23 (4%) 7 (1%) 30 (5%) 16 (3%) 9 (2%)
Uttarakhand 109 55 (50%) 97 (89%) 2 (2%) 0 (0%) 5 (5%) 2 (2%) 2 (2%)
West Bengal 255 126 (49%) 225 (88%) 10 (4%) 2 (1%) 10 (4%) 3 (1%) 3 (1%)
India 11525 6348 (55%) 9544 (83%) 601 (5%) 223 (2%) 627 (5%) 286 (2%) 192 (2%)
4.11 Treatment Outcome of H-Mono/Poly Resistance TB Patients initiated on treatment during 2020
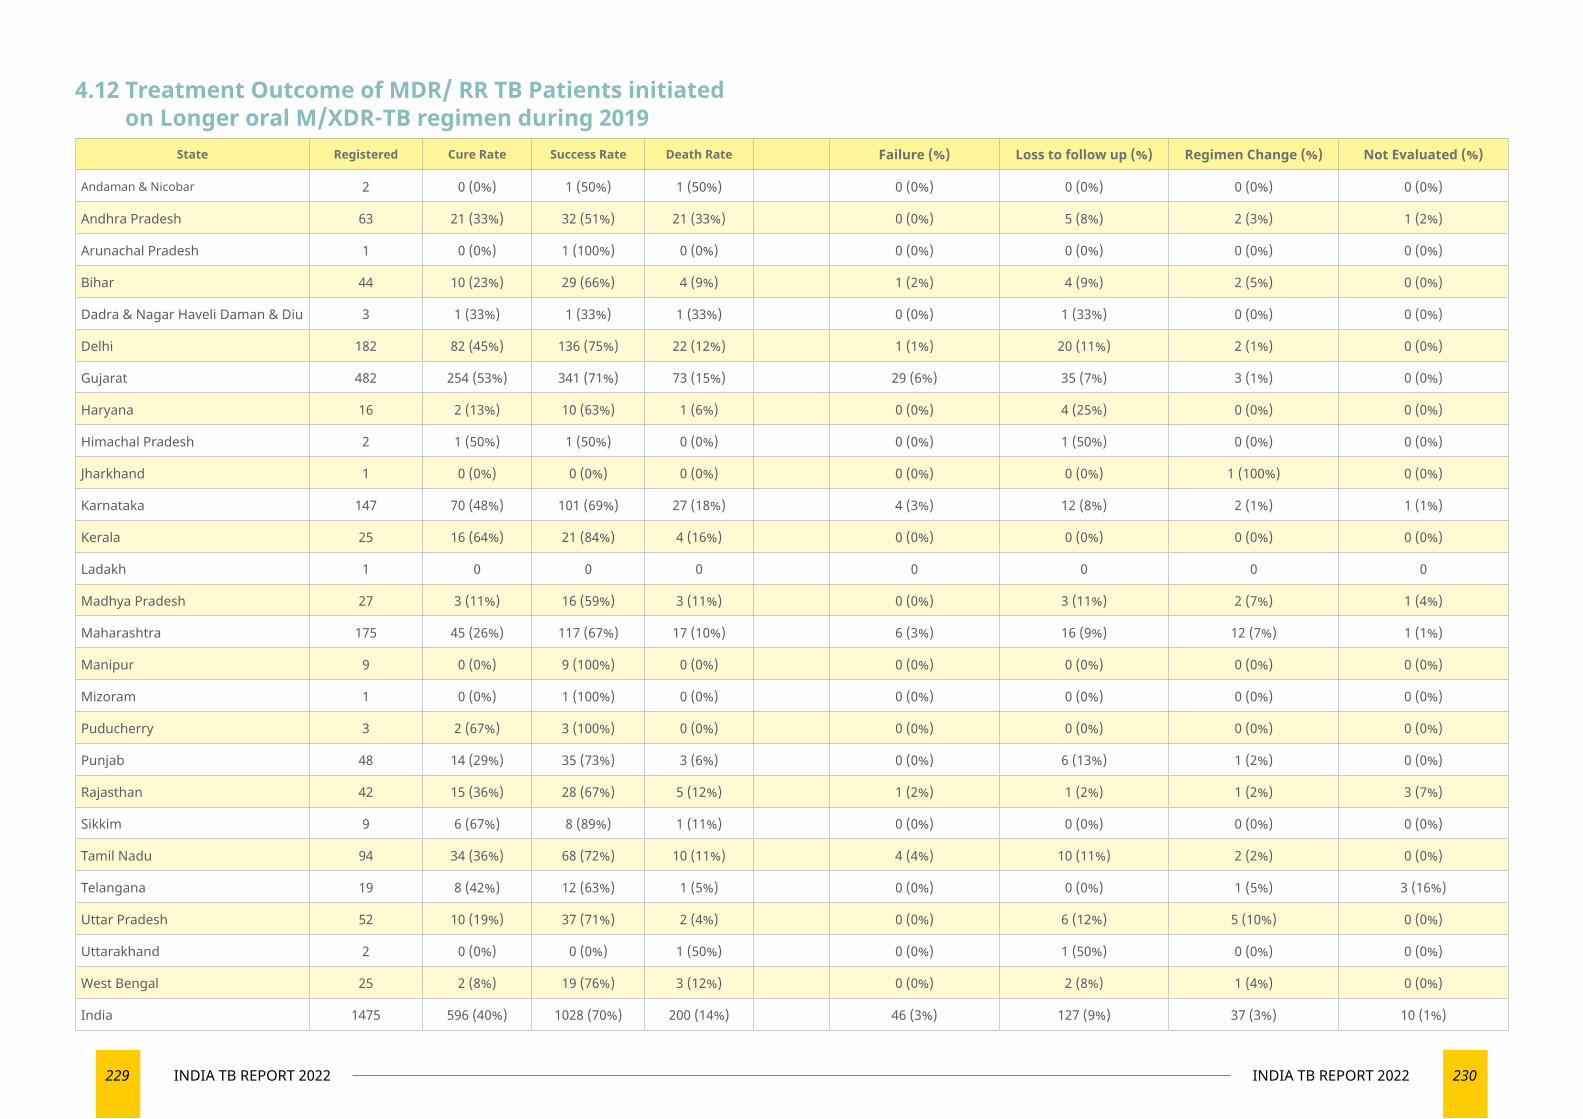
229 INDIA TB REPORT 2022 230INDIA TB REPORT 2022
State Registered Cure Rate Success Rate Death Rate Failure (%) Loss to follow up (%) Regimen Change (%) Not Evaluated (%)
Andaman & Nicobar 2 0 (0%) 1 (50%) 1 (50%) 0 (0%) 0 (0%) 0 (0%) 0 (0%)
Andhra Pradesh 63 21 (33%) 32 (51%) 21 (33%) 0 (0%) 5 (8%) 2 (3%) 1 (2%)
Arunachal Pradesh 1 0 (0%) 1 (100%) 0 (0%) 0 (0%) 0 (0%) 0 (0%) 0 (0%)
Bihar 44 10 (23%) 29 (66%) 4 (9%) 1 (2%) 4 (9%) 2 (5%) 0 (0%)
Dadra & Nagar Haveli Daman & Diu 3 1 (33%) 1 (33%) 1 (33%) 0 (0%) 1 (33%) 0 (0%) 0 (0%)
Delhi 182 82 (45%) 136 (75%) 22 (12%) 1 (1%) 20 (11%) 2 (1%) 0 (0%)
Gujarat 482 254 (53%) 341 (71%) 73 (15%) 29 (6%) 35 (7%) 3 (1%) 0 (0%)
Haryana 16 2 (13%) 10 (63%) 1 (6%) 0 (0%) 4 (25%) 0 (0%) 0 (0%)
Himachal Pradesh 2 1 (50%) 1 (50%) 0 (0%) 0 (0%) 1 (50%) 0 (0%) 0 (0%)
Jharkhand 1 0 (0%) 0 (0%) 0 (0%) 0 (0%) 0 (0%) 1 (100%) 0 (0%)
Karnataka 147 70 (48%) 101 (69%) 27 (18%) 4 (3%) 12 (8%) 2 (1%) 1 (1%)
Kerala 25 16 (64%) 21 (84%) 4 (16%) 0 (0%) 0 (0%) 0 (0%) 0 (0%)
Ladakh 1 0 0 0 0 0 0 0
Madhya Pradesh 27 3 (11%) 16 (59%) 3 (11%) 0 (0%) 3 (11%) 2 (7%) 1 (4%)
Maharashtra 175 45 (26%) 117 (67%) 17 (10%) 6 (3%) 16 (9%) 12 (7%) 1 (1%)
Manipur 9 0 (0%) 9 (100%) 0 (0%) 0 (0%) 0 (0%) 0 (0%) 0 (0%)
Mizoram 1 0 (0%) 1 (100%) 0 (0%) 0 (0%) 0 (0%) 0 (0%) 0 (0%)
Puducherry 3 2 (67%) 3 (100%) 0 (0%) 0 (0%) 0 (0%) 0 (0%) 0 (0%)
Punjab 48 14 (29%) 35 (73%) 3 (6%) 0 (0%) 6 (13%) 1 (2%) 0 (0%)
Rajasthan 42 15 (36%) 28 (67%) 5 (12%) 1 (2%) 1 (2%) 1 (2%) 3 (7%)
Sikkim 9 6 (67%) 8 (89%) 1 (11%) 0 (0%) 0 (0%) 0 (0%) 0 (0%)
Tamil Nadu 94 34 (36%) 68 (72%) 10 (11%) 4 (4%) 10 (11%) 2 (2%) 0 (0%)
Telangana 19 8 (42%) 12 (63%) 1 (5%) 0 (0%) 0 (0%) 1 (5%) 3 (16%)
Uttar Pradesh 52 10 (19%) 37 (71%) 2 (4%) 0 (0%) 6 (12%) 5 (10%) 0 (0%)
Uttarakhand 2 0 (0%) 0 (0%) 1 (50%) 0 (0%) 1 (50%) 0 (0%) 0 (0%)
West Bengal 25 2 (8%) 19 (76%) 3 (12%) 0 (0%) 2 (8%) 1 (4%) 0 (0%)
India 1475 596 (40%) 1028 (70%) 200 (14%) 46 (3%) 127 (9%) 37 (3%) 10 (1%)
4.12 Treatment Outcome of MDR/ RR TB Patients initiated on Longer oral M/XDR-TB regimen during 2019
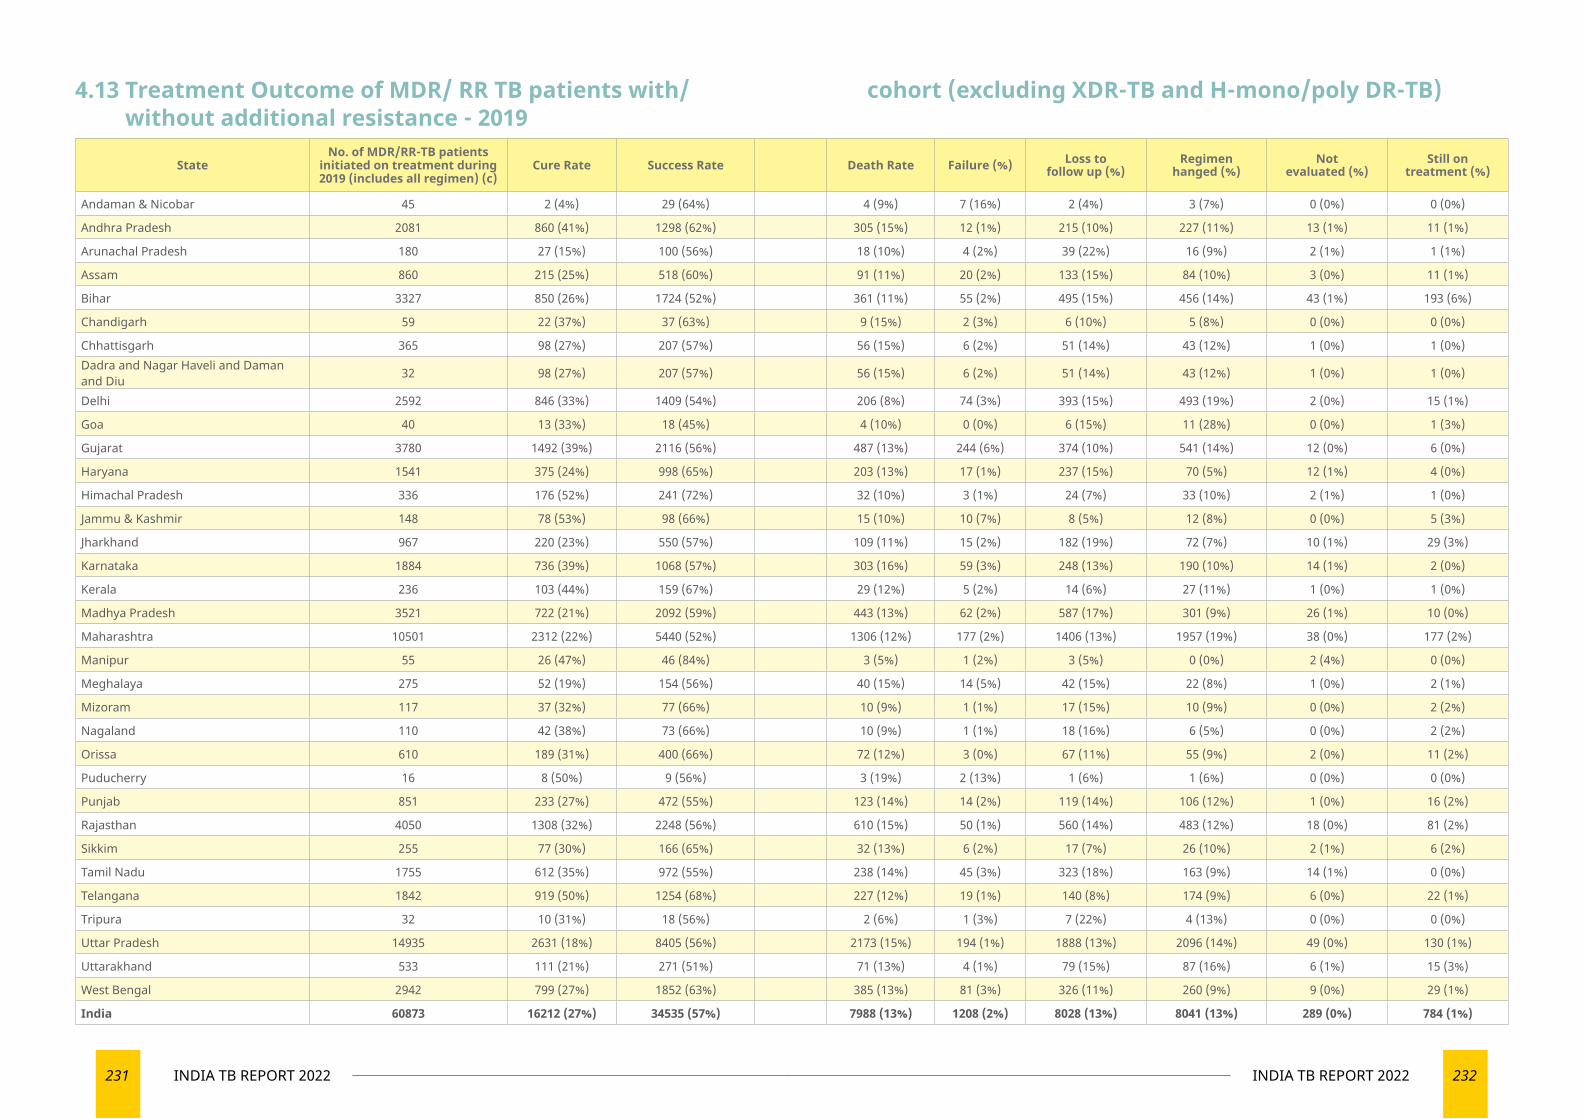
231 INDIA TB REPORT 2022 232INDIA TB REPORT 2022
StateNo. of MDR/RR-TB patients
initiated on treatment during 2019 (includes all regimen) (c)
Cure Rate Success Rate Death Rate Failure (%) Loss to follow up (%)
Regimen hanged (%)
Not evaluated (%)
Still on treatment (%)
Andaman & Nicobar 45 2 (4%) 29 (64%) 4 (9%) 7 (16%) 2 (4%) 3 (7%) 0 (0%) 0 (0%)
Andhra Pradesh 2081 860 (41%) 1298 (62%) 305 (15%) 12 (1%) 215 (10%) 227 (11%) 13 (1%) 11 (1%)
Arunachal Pradesh 180 27 (15%) 100 (56%) 18 (10%) 4 (2%) 39 (22%) 16 (9%) 2 (1%) 1 (1%)
Assam 860 215 (25%) 518 (60%) 91 (11%) 20 (2%) 133 (15%) 84 (10%) 3 (0%) 11 (1%)
Bihar 3327 850 (26%) 1724 (52%) 361 (11%) 55 (2%) 495 (15%) 456 (14%) 43 (1%) 193 (6%)
Chandigarh 59 22 (37%) 37 (63%) 9 (15%) 2 (3%) 6 (10%) 5 (8%) 0 (0%) 0 (0%)
Chhattisgarh 365 98 (27%) 207 (57%) 56 (15%) 6 (2%) 51 (14%) 43 (12%) 1 (0%) 1 (0%)Dadra and Nagar Haveli and Daman and Diu 32 98 (27%) 207 (57%) 56 (15%) 6 (2%) 51 (14%) 43 (12%) 1 (0%) 1 (0%)
Delhi 2592 846 (33%) 1409 (54%) 206 (8%) 74 (3%) 393 (15%) 493 (19%) 2 (0%) 15 (1%)
Goa 40 13 (33%) 18 (45%) 4 (10%) 0 (0%) 6 (15%) 11 (28%) 0 (0%) 1 (3%)
Gujarat 3780 1492 (39%) 2116 (56%) 487 (13%) 244 (6%) 374 (10%) 541 (14%) 12 (0%) 6 (0%)
Haryana 1541 375 (24%) 998 (65%) 203 (13%) 17 (1%) 237 (15%) 70 (5%) 12 (1%) 4 (0%)
Himachal Pradesh 336 176 (52%) 241 (72%) 32 (10%) 3 (1%) 24 (7%) 33 (10%) 2 (1%) 1 (0%)
Jammu & Kashmir 148 78 (53%) 98 (66%) 15 (10%) 10 (7%) 8 (5%) 12 (8%) 0 (0%) 5 (3%)
Jharkhand 967 220 (23%) 550 (57%) 109 (11%) 15 (2%) 182 (19%) 72 (7%) 10 (1%) 29 (3%)
Karnataka 1884 736 (39%) 1068 (57%) 303 (16%) 59 (3%) 248 (13%) 190 (10%) 14 (1%) 2 (0%)
Kerala 236 103 (44%) 159 (67%) 29 (12%) 5 (2%) 14 (6%) 27 (11%) 1 (0%) 1 (0%)
Madhya Pradesh 3521 722 (21%) 2092 (59%) 443 (13%) 62 (2%) 587 (17%) 301 (9%) 26 (1%) 10 (0%)
Maharashtra 10501 2312 (22%) 5440 (52%) 1306 (12%) 177 (2%) 1406 (13%) 1957 (19%) 38 (0%) 177 (2%)
Manipur 55 26 (47%) 46 (84%) 3 (5%) 1 (2%) 3 (5%) 0 (0%) 2 (4%) 0 (0%)
Meghalaya 275 52 (19%) 154 (56%) 40 (15%) 14 (5%) 42 (15%) 22 (8%) 1 (0%) 2 (1%)
Mizoram 117 37 (32%) 77 (66%) 10 (9%) 1 (1%) 17 (15%) 10 (9%) 0 (0%) 2 (2%)
Nagaland 110 42 (38%) 73 (66%) 10 (9%) 1 (1%) 18 (16%) 6 (5%) 0 (0%) 2 (2%)
Orissa 610 189 (31%) 400 (66%) 72 (12%) 3 (0%) 67 (11%) 55 (9%) 2 (0%) 11 (2%)
Puducherry 16 8 (50%) 9 (56%) 3 (19%) 2 (13%) 1 (6%) 1 (6%) 0 (0%) 0 (0%)
Punjab 851 233 (27%) 472 (55%) 123 (14%) 14 (2%) 119 (14%) 106 (12%) 1 (0%) 16 (2%)
Rajasthan 4050 1308 (32%) 2248 (56%) 610 (15%) 50 (1%) 560 (14%) 483 (12%) 18 (0%) 81 (2%)
Sikkim 255 77 (30%) 166 (65%) 32 (13%) 6 (2%) 17 (7%) 26 (10%) 2 (1%) 6 (2%)
Tamil Nadu 1755 612 (35%) 972 (55%) 238 (14%) 45 (3%) 323 (18%) 163 (9%) 14 (1%) 0 (0%)
Telangana 1842 919 (50%) 1254 (68%) 227 (12%) 19 (1%) 140 (8%) 174 (9%) 6 (0%) 22 (1%)
Tripura 32 10 (31%) 18 (56%) 2 (6%) 1 (3%) 7 (22%) 4 (13%) 0 (0%) 0 (0%)
Uttar Pradesh 14935 2631 (18%) 8405 (56%) 2173 (15%) 194 (1%) 1888 (13%) 2096 (14%) 49 (0%) 130 (1%)
Uttarakhand 533 111 (21%) 271 (51%) 71 (13%) 4 (1%) 79 (15%) 87 (16%) 6 (1%) 15 (3%)
West Bengal 2942 799 (27%) 1852 (63%) 385 (13%) 81 (3%) 326 (11%) 260 (9%) 9 (0%) 29 (1%)
India 60873 16212 (27%) 34535 (57%) 7988 (13%) 1208 (2%) 8028 (13%) 8041 (13%) 289 (0%) 784 (1%)
4.13 Treatment Outcome of MDR/ RR TB patients with/ without additional resistance - 2019
cohort (excluding XDR-TB and H-mono/poly DR-TB)
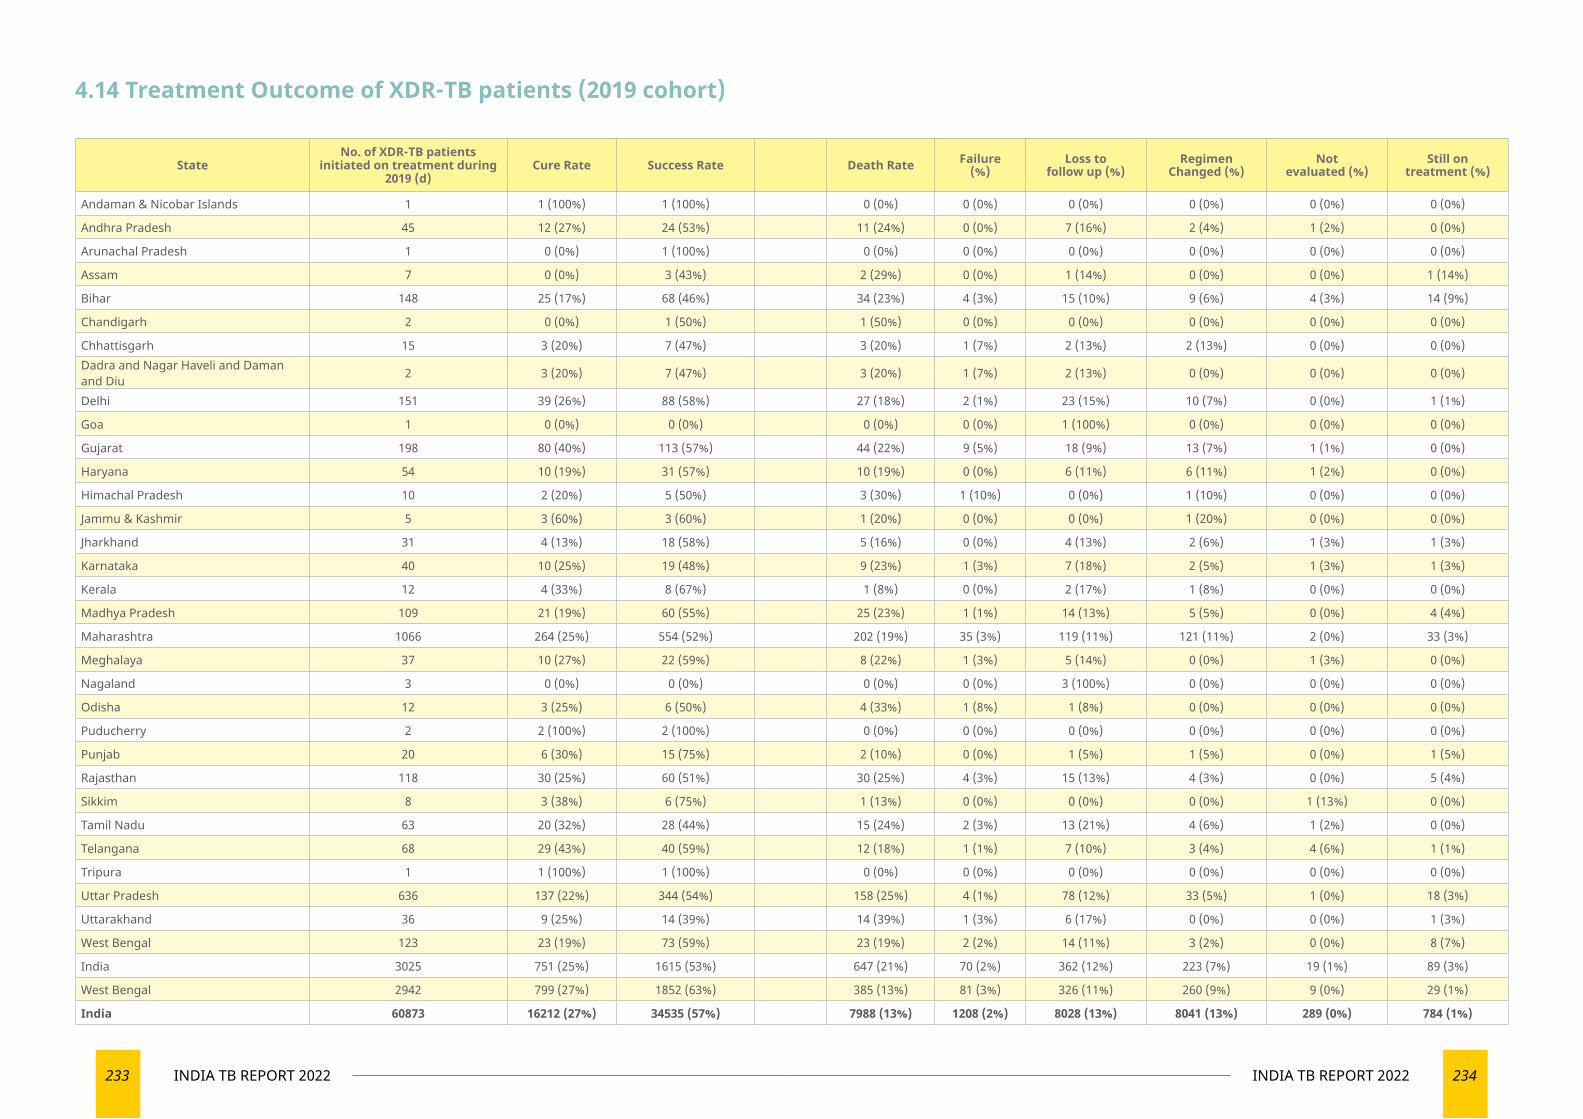
233 INDIA TB REPORT 2022 234INDIA TB REPORT 2022
4.14 Treatment Outcome of XDR-TB patients (2019 cohort)
StateNo. of XDR-TB patients
initiated on treatment during 2019 (d)
Cure Rate Success Rate Death Rate Failure (%)
Loss to follow up (%)
Regimen Changed (%)
Not evaluated (%)
Still on treatment (%)
Andaman & Nicobar Islands 1 1 (100%) 1 (100%) 0 (0%) 0 (0%) 0 (0%) 0 (0%) 0 (0%) 0 (0%)
Andhra Pradesh 45 12 (27%) 24 (53%) 11 (24%) 0 (0%) 7 (16%) 2 (4%) 1 (2%) 0 (0%)
Arunachal Pradesh 1 0 (0%) 1 (100%) 0 (0%) 0 (0%) 0 (0%) 0 (0%) 0 (0%) 0 (0%)
Assam 7 0 (0%) 3 (43%) 2 (29%) 0 (0%) 1 (14%) 0 (0%) 0 (0%) 1 (14%)
Bihar 148 25 (17%) 68 (46%) 34 (23%) 4 (3%) 15 (10%) 9 (6%) 4 (3%) 14 (9%)
Chandigarh 2 0 (0%) 1 (50%) 1 (50%) 0 (0%) 0 (0%) 0 (0%) 0 (0%) 0 (0%)
Chhattisgarh 15 3 (20%) 7 (47%) 3 (20%) 1 (7%) 2 (13%) 2 (13%) 0 (0%) 0 (0%)Dadra and Nagar Haveli and Daman and Diu 2 3 (20%) 7 (47%) 3 (20%) 1 (7%) 2 (13%) 0 (0%) 0 (0%) 0 (0%)
Delhi 151 39 (26%) 88 (58%) 27 (18%) 2 (1%) 23 (15%) 10 (7%) 0 (0%) 1 (1%)
Goa 1 0 (0%) 0 (0%) 0 (0%) 0 (0%) 1 (100%) 0 (0%) 0 (0%) 0 (0%)
Gujarat 198 80 (40%) 113 (57%) 44 (22%) 9 (5%) 18 (9%) 13 (7%) 1 (1%) 0 (0%)
Haryana 54 10 (19%) 31 (57%) 10 (19%) 0 (0%) 6 (11%) 6 (11%) 1 (2%) 0 (0%)
Himachal Pradesh 10 2 (20%) 5 (50%) 3 (30%) 1 (10%) 0 (0%) 1 (10%) 0 (0%) 0 (0%)
Jammu & Kashmir 5 3 (60%) 3 (60%) 1 (20%) 0 (0%) 0 (0%) 1 (20%) 0 (0%) 0 (0%)
Jharkhand 31 4 (13%) 18 (58%) 5 (16%) 0 (0%) 4 (13%) 2 (6%) 1 (3%) 1 (3%)
Karnataka 40 10 (25%) 19 (48%) 9 (23%) 1 (3%) 7 (18%) 2 (5%) 1 (3%) 1 (3%)
Kerala 12 4 (33%) 8 (67%) 1 (8%) 0 (0%) 2 (17%) 1 (8%) 0 (0%) 0 (0%)
Madhya Pradesh 109 21 (19%) 60 (55%) 25 (23%) 1 (1%) 14 (13%) 5 (5%) 0 (0%) 4 (4%)
Maharashtra 1066 264 (25%) 554 (52%) 202 (19%) 35 (3%) 119 (11%) 121 (11%) 2 (0%) 33 (3%)
Meghalaya 37 10 (27%) 22 (59%) 8 (22%) 1 (3%) 5 (14%) 0 (0%) 1 (3%) 0 (0%)
Nagaland 3 0 (0%) 0 (0%) 0 (0%) 0 (0%) 3 (100%) 0 (0%) 0 (0%) 0 (0%)
Odisha 12 3 (25%) 6 (50%) 4 (33%) 1 (8%) 1 (8%) 0 (0%) 0 (0%) 0 (0%)
Puducherry 2 2 (100%) 2 (100%) 0 (0%) 0 (0%) 0 (0%) 0 (0%) 0 (0%) 0 (0%)
Punjab 20 6 (30%) 15 (75%) 2 (10%) 0 (0%) 1 (5%) 1 (5%) 0 (0%) 1 (5%)
Rajasthan 118 30 (25%) 60 (51%) 30 (25%) 4 (3%) 15 (13%) 4 (3%) 0 (0%) 5 (4%)
Sikkim 8 3 (38%) 6 (75%) 1 (13%) 0 (0%) 0 (0%) 0 (0%) 1 (13%) 0 (0%)
Tamil Nadu 63 20 (32%) 28 (44%) 15 (24%) 2 (3%) 13 (21%) 4 (6%) 1 (2%) 0 (0%)
Telangana 68 29 (43%) 40 (59%) 12 (18%) 1 (1%) 7 (10%) 3 (4%) 4 (6%) 1 (1%)
Tripura 1 1 (100%) 1 (100%) 0 (0%) 0 (0%) 0 (0%) 0 (0%) 0 (0%) 0 (0%)
Uttar Pradesh 636 137 (22%) 344 (54%) 158 (25%) 4 (1%) 78 (12%) 33 (5%) 1 (0%) 18 (3%)
Uttarakhand 36 9 (25%) 14 (39%) 14 (39%) 1 (3%) 6 (17%) 0 (0%) 0 (0%) 1 (3%)
West Bengal 123 23 (19%) 73 (59%) 23 (19%) 2 (2%) 14 (11%) 3 (2%) 0 (0%) 8 (7%)
India 3025 751 (25%) 1615 (53%) 647 (21%) 70 (2%) 362 (12%) 223 (7%) 19 (1%) 89 (3%)
West Bengal 2942 799 (27%) 1852 (63%) 385 (13%) 81 (3%) 326 (11%) 260 (9%) 9 (0%) 29 (1%)
India 60873 16212 (27%) 34535 (57%) 7988 (13%) 1208 (2%) 8028 (13%) 8041 (13%) 289 (0%) 784 (1%)
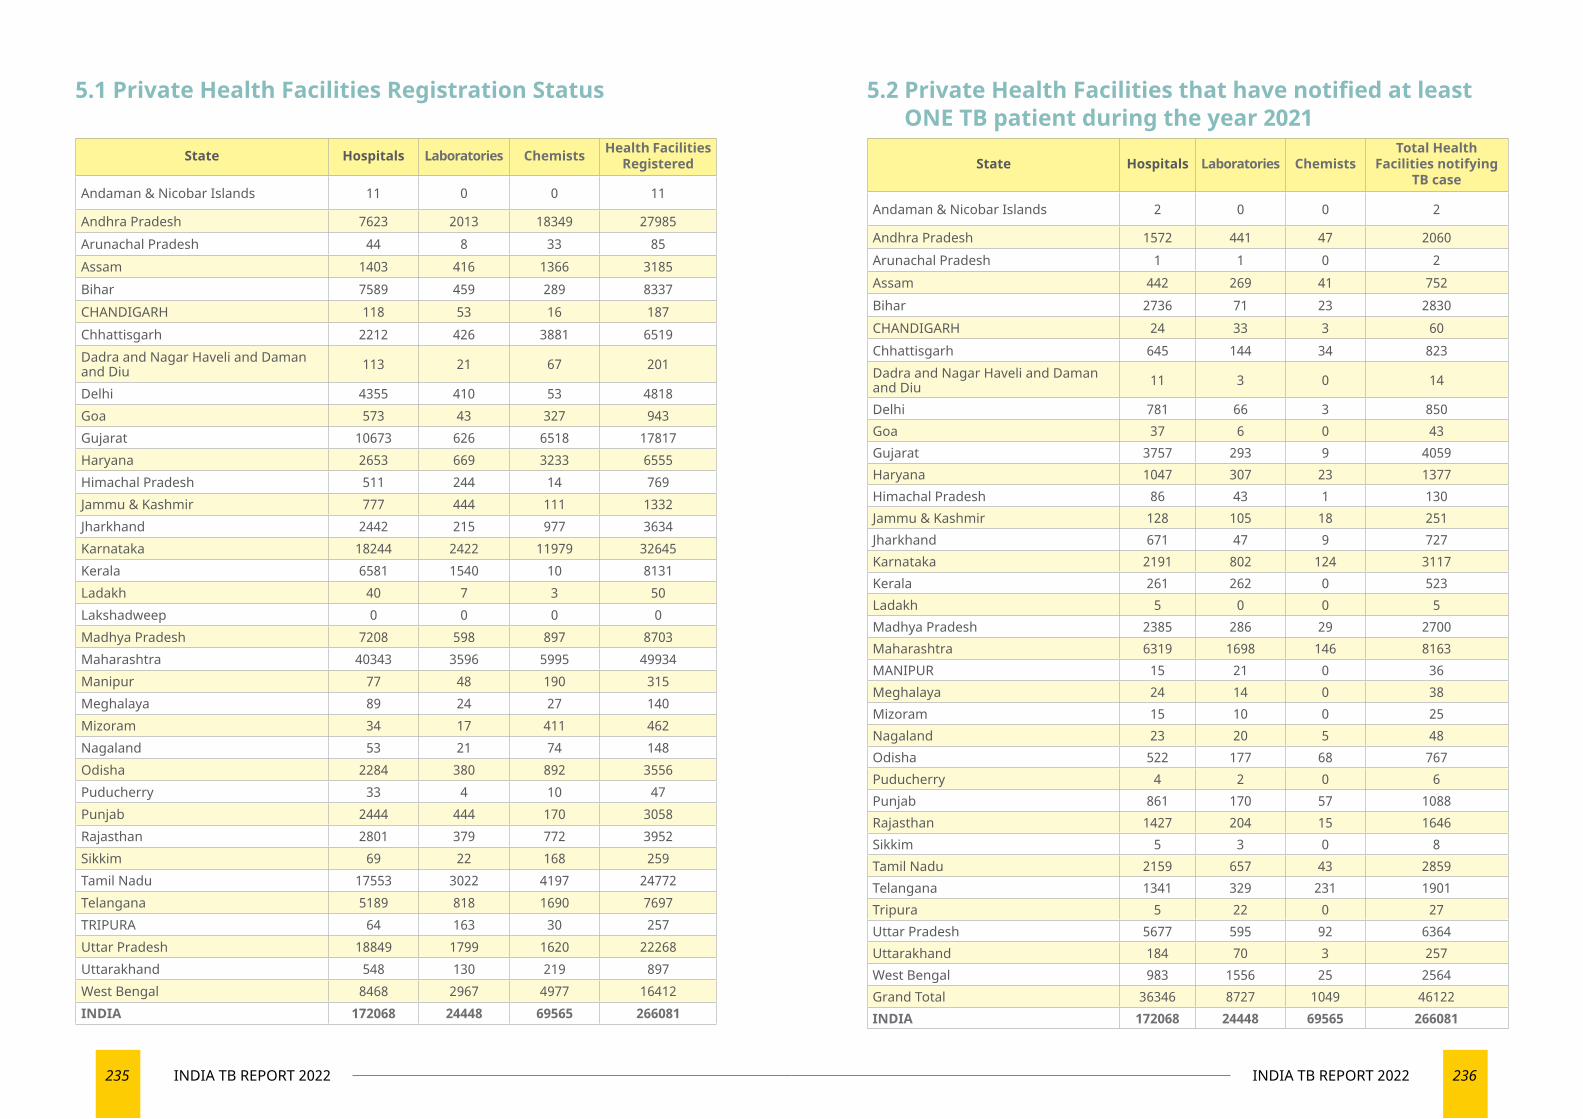
235 INDIA TB REPORT 2022 236INDIA TB REPORT 2022
State Hospitals Laboratories Chemists Health Facilities Registered
Andaman & Nicobar Islands 11 0 0 11
Andhra Pradesh 7623 2013 18349 27985Arunachal Pradesh 44 8 33 85Assam 1403 416 1366 3185Bihar 7589 459 289 8337CHANDIGARH 118 53 16 187Chhattisgarh 2212 426 3881 6519Dadra and Nagar Haveli and Daman and Diu 113 21 67 201
Delhi 4355 410 53 4818Goa 573 43 327 943Gujarat 10673 626 6518 17817Haryana 2653 669 3233 6555Himachal Pradesh 511 244 14 769Jammu & Kashmir 777 444 111 1332Jharkhand 2442 215 977 3634Karnataka 18244 2422 11979 32645Kerala 6581 1540 10 8131Ladakh 40 7 3 50Lakshadweep 0 0 0 0Madhya Pradesh 7208 598 897 8703Maharashtra 40343 3596 5995 49934Manipur 77 48 190 315Meghalaya 89 24 27 140Mizoram 34 17 411 462Nagaland 53 21 74 148Odisha 2284 380 892 3556Puducherry 33 4 10 47Punjab 2444 444 170 3058Rajasthan 2801 379 772 3952Sikkim 69 22 168 259Tamil Nadu 17553 3022 4197 24772Telangana 5189 818 1690 7697TRIPURA 64 163 30 257Uttar Pradesh 18849 1799 1620 22268Uttarakhand 548 130 219 897West Bengal 8468 2967 4977 16412INDIA 172068 24448 69565 266081
5.1 Private Health Facilities Registration Status
State Hospitals Laboratories ChemistsTotal Health
Facilities notifying TB case
Andaman & Nicobar Islands 2 0 0 2
Andhra Pradesh 1572 441 47 2060Arunachal Pradesh 1 1 0 2Assam 442 269 41 752Bihar 2736 71 23 2830CHANDIGARH 24 33 3 60Chhattisgarh 645 144 34 823Dadra and Nagar Haveli and Daman and Diu 11 3 0 14
Delhi 781 66 3 850Goa 37 6 0 43Gujarat 3757 293 9 4059Haryana 1047 307 23 1377Himachal Pradesh 86 43 1 130Jammu & Kashmir 128 105 18 251Jharkhand 671 47 9 727Karnataka 2191 802 124 3117Kerala 261 262 0 523Ladakh 5 0 0 5Madhya Pradesh 2385 286 29 2700Maharashtra 6319 1698 146 8163MANIPUR 15 21 0 36Meghalaya 24 14 0 38Mizoram 15 10 0 25Nagaland 23 20 5 48Odisha 522 177 68 767Puducherry 4 2 0 6Punjab 861 170 57 1088Rajasthan 1427 204 15 1646Sikkim 5 3 0 8Tamil Nadu 2159 657 43 2859Telangana 1341 329 231 1901Tripura 5 22 0 27Uttar Pradesh 5677 595 92 6364Uttarakhand 184 70 3 257West Bengal 983 1556 25 2564Grand Total 36346 8727 1049 46122INDIA 172068 24448 69565 266081
5.2 Private Health Facilities that have notified at least ONE TB patient during the year 2021
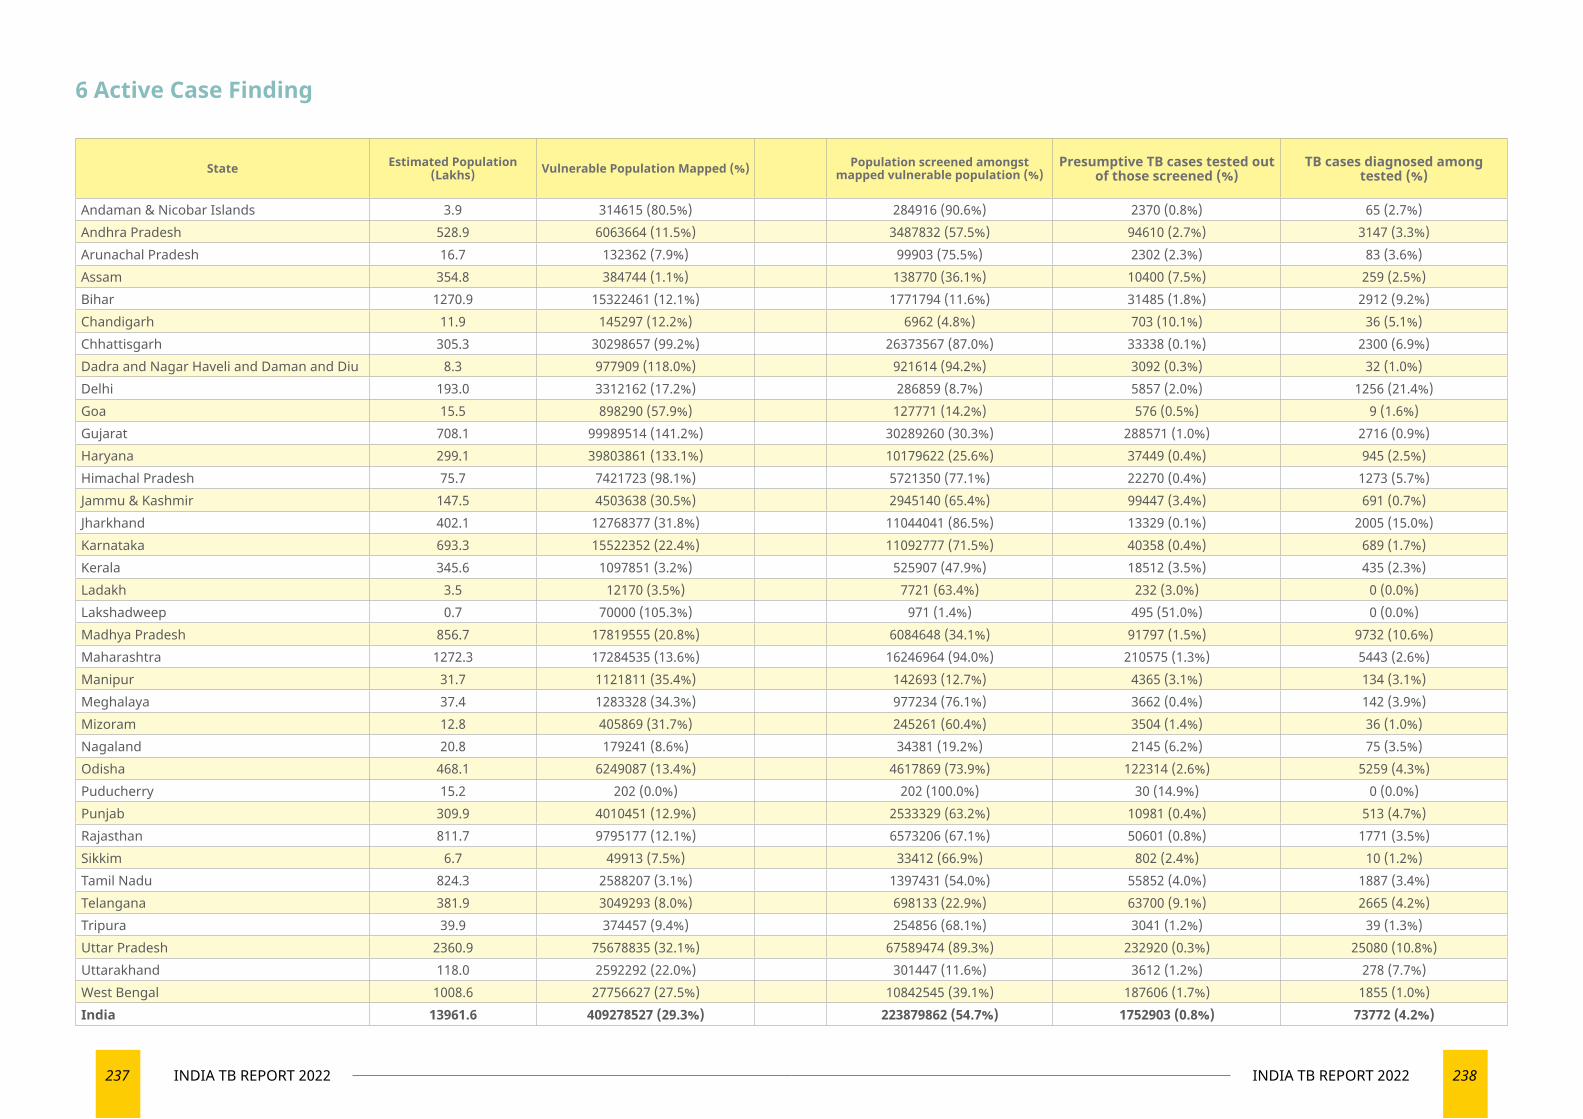
237 INDIA TB REPORT 2022 238INDIA TB REPORT 2022
State Estimated Population (Lakhs) Vulnerable Population Mapped (%) Population screened amongst
mapped vulnerable population (%)Presumptive TB cases tested out
of those screened (%)TB cases diagnosed among
tested (%)
Andaman & Nicobar Islands 3.9 314615 (80.5%) 284916 (90.6%) 2370 (0.8%) 65 (2.7%)Andhra Pradesh 528.9 6063664 (11.5%) 3487832 (57.5%) 94610 (2.7%) 3147 (3.3%)Arunachal Pradesh 16.7 132362 (7.9%) 99903 (75.5%) 2302 (2.3%) 83 (3.6%)Assam 354.8 384744 (1.1%) 138770 (36.1%) 10400 (7.5%) 259 (2.5%)Bihar 1270.9 15322461 (12.1%) 1771794 (11.6%) 31485 (1.8%) 2912 (9.2%)Chandigarh 11.9 145297 (12.2%) 6962 (4.8%) 703 (10.1%) 36 (5.1%)Chhattisgarh 305.3 30298657 (99.2%) 26373567 (87.0%) 33338 (0.1%) 2300 (6.9%)Dadra and Nagar Haveli and Daman and Diu 8.3 977909 (118.0%) 921614 (94.2%) 3092 (0.3%) 32 (1.0%)Delhi 193.0 3312162 (17.2%) 286859 (8.7%) 5857 (2.0%) 1256 (21.4%)Goa 15.5 898290 (57.9%) 127771 (14.2%) 576 (0.5%) 9 (1.6%)Gujarat 708.1 99989514 (141.2%) 30289260 (30.3%) 288571 (1.0%) 2716 (0.9%)Haryana 299.1 39803861 (133.1%) 10179622 (25.6%) 37449 (0.4%) 945 (2.5%)Himachal Pradesh 75.7 7421723 (98.1%) 5721350 (77.1%) 22270 (0.4%) 1273 (5.7%)Jammu & Kashmir 147.5 4503638 (30.5%) 2945140 (65.4%) 99447 (3.4%) 691 (0.7%)Jharkhand 402.1 12768377 (31.8%) 11044041 (86.5%) 13329 (0.1%) 2005 (15.0%)Karnataka 693.3 15522352 (22.4%) 11092777 (71.5%) 40358 (0.4%) 689 (1.7%)Kerala 345.6 1097851 (3.2%) 525907 (47.9%) 18512 (3.5%) 435 (2.3%)Ladakh 3.5 12170 (3.5%) 7721 (63.4%) 232 (3.0%) 0 (0.0%)Lakshadweep 0.7 70000 (105.3%) 971 (1.4%) 495 (51.0%) 0 (0.0%)Madhya Pradesh 856.7 17819555 (20.8%) 6084648 (34.1%) 91797 (1.5%) 9732 (10.6%)Maharashtra 1272.3 17284535 (13.6%) 16246964 (94.0%) 210575 (1.3%) 5443 (2.6%)Manipur 31.7 1121811 (35.4%) 142693 (12.7%) 4365 (3.1%) 134 (3.1%)Meghalaya 37.4 1283328 (34.3%) 977234 (76.1%) 3662 (0.4%) 142 (3.9%)Mizoram 12.8 405869 (31.7%) 245261 (60.4%) 3504 (1.4%) 36 (1.0%)Nagaland 20.8 179241 (8.6%) 34381 (19.2%) 2145 (6.2%) 75 (3.5%)Odisha 468.1 6249087 (13.4%) 4617869 (73.9%) 122314 (2.6%) 5259 (4.3%)Puducherry 15.2 202 (0.0%) 202 (100.0%) 30 (14.9%) 0 (0.0%)Punjab 309.9 4010451 (12.9%) 2533329 (63.2%) 10981 (0.4%) 513 (4.7%)Rajasthan 811.7 9795177 (12.1%) 6573206 (67.1%) 50601 (0.8%) 1771 (3.5%)Sikkim 6.7 49913 (7.5%) 33412 (66.9%) 802 (2.4%) 10 (1.2%)Tamil Nadu 824.3 2588207 (3.1%) 1397431 (54.0%) 55852 (4.0%) 1887 (3.4%)Telangana 381.9 3049293 (8.0%) 698133 (22.9%) 63700 (9.1%) 2665 (4.2%)Tripura 39.9 374457 (9.4%) 254856 (68.1%) 3041 (1.2%) 39 (1.3%)Uttar Pradesh 2360.9 75678835 (32.1%) 67589474 (89.3%) 232920 (0.3%) 25080 (10.8%)Uttarakhand 118.0 2592292 (22.0%) 301447 (11.6%) 3612 (1.2%) 278 (7.7%)West Bengal 1008.6 27756627 (27.5%) 10842545 (39.1%) 187606 (1.7%) 1855 (1.0%)India 13961.6 409278527 (29.3%) 223879862 (54.7%) 1752903 (0.8%) 73772 (4.2%)
6 Active Case Finding
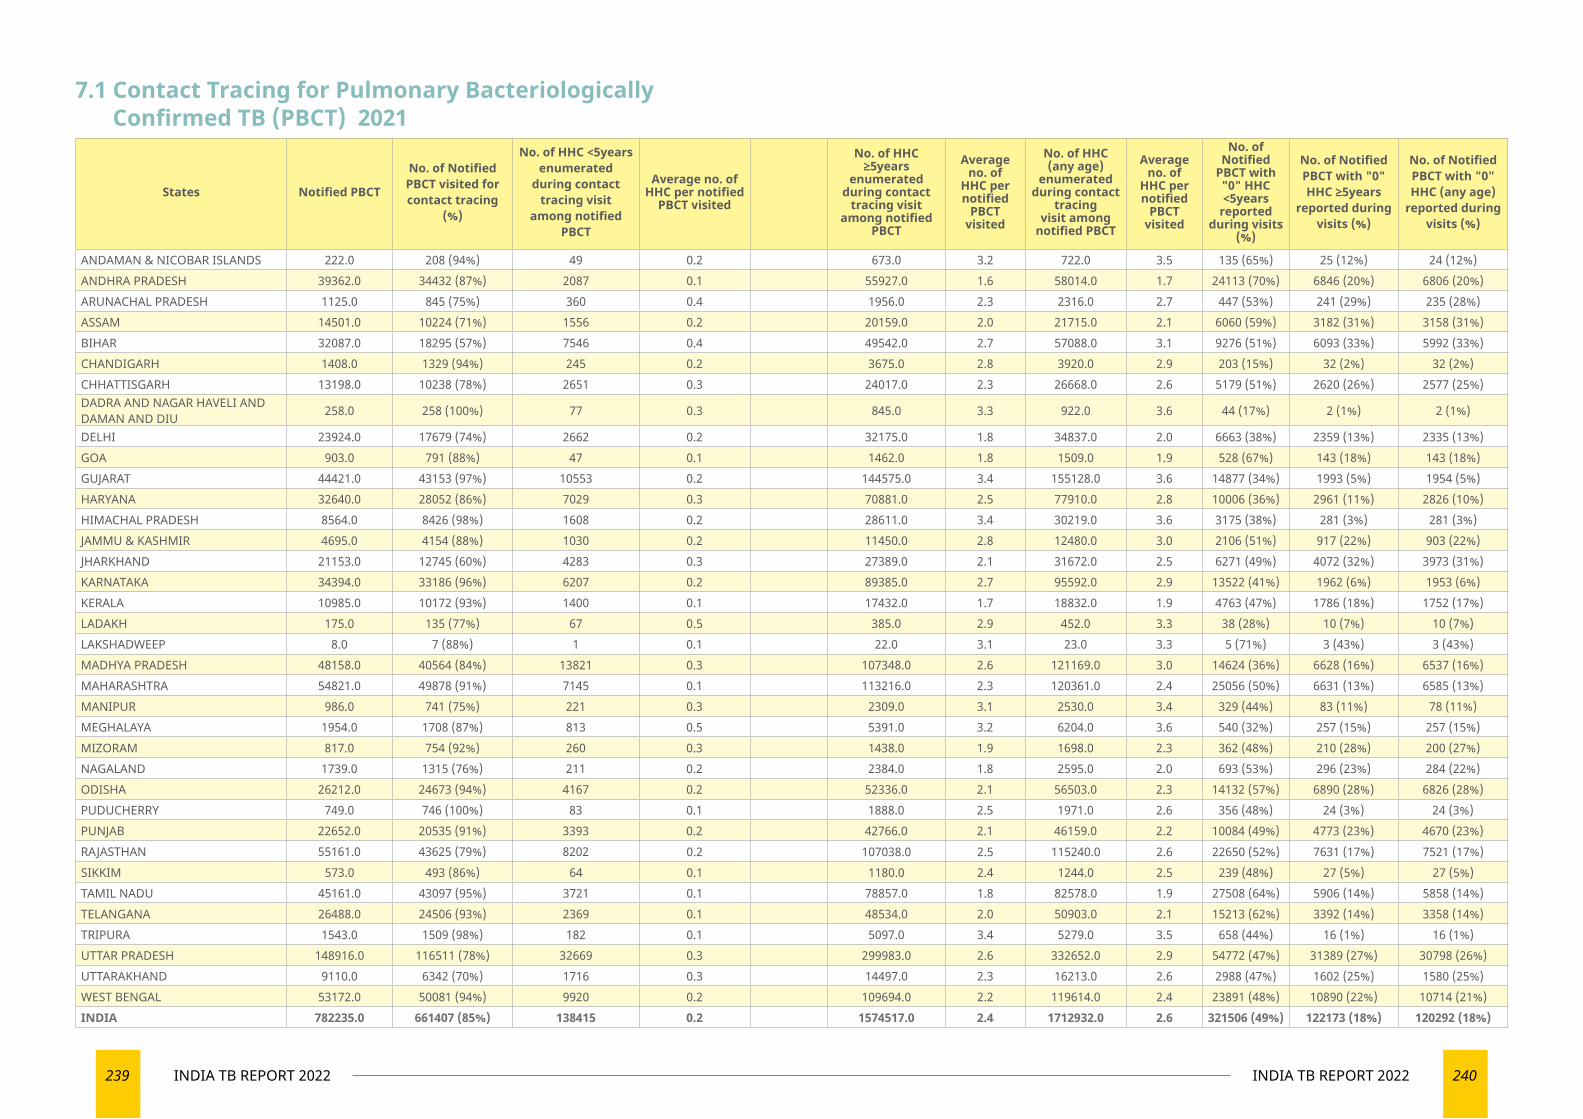
239 INDIA TB REPORT 2022 240INDIA TB REPORT 2022
7.1 Contact Tracing for Pulmonary Bacteriologically Confirmed TB (PBCT) 2021
States Notified PBCT
No. of Notified PBCT visited for contact tracing
(%)
No. of HHC <5years enumerated
during contact tracing visit
among notified PBCT
Average no. of HHC per notified
PBCT visited
No. of HHC ≥5years
enumerated during contact
tracing visit among notified
PBCT
Average no. of
HHC per notified
PBCT visited
No. of HHC (any age)
enumerated during contact
tracing visit among
notified PBCT
Average no. of
HHC per notified
PBCT visited
No. of Notified
PBCT with "0" HHC <5years
reported during visits
(%)
No. of Notified PBCT with "0" HHC ≥5years
reported during visits (%)
No. of Notified PBCT with "0" HHC (any age)
reported during visits (%)
ANDAMAN & NICOBAR ISLANDS 222.0 208 (94%) 49 0.2 673.0 3.2 722.0 3.5 135 (65%) 25 (12%) 24 (12%)ANDHRA PRADESH 39362.0 34432 (87%) 2087 0.1 55927.0 1.6 58014.0 1.7 24113 (70%) 6846 (20%) 6806 (20%)ARUNACHAL PRADESH 1125.0 845 (75%) 360 0.4 1956.0 2.3 2316.0 2.7 447 (53%) 241 (29%) 235 (28%)ASSAM 14501.0 10224 (71%) 1556 0.2 20159.0 2.0 21715.0 2.1 6060 (59%) 3182 (31%) 3158 (31%)BIHAR 32087.0 18295 (57%) 7546 0.4 49542.0 2.7 57088.0 3.1 9276 (51%) 6093 (33%) 5992 (33%)CHANDIGARH 1408.0 1329 (94%) 245 0.2 3675.0 2.8 3920.0 2.9 203 (15%) 32 (2%) 32 (2%)CHHATTISGARH 13198.0 10238 (78%) 2651 0.3 24017.0 2.3 26668.0 2.6 5179 (51%) 2620 (26%) 2577 (25%)DADRA AND NAGAR HAVELI AND DAMAN AND DIU 258.0 258 (100%) 77 0.3 845.0 3.3 922.0 3.6 44 (17%) 2 (1%) 2 (1%)
DELHI 23924.0 17679 (74%) 2662 0.2 32175.0 1.8 34837.0 2.0 6663 (38%) 2359 (13%) 2335 (13%)GOA 903.0 791 (88%) 47 0.1 1462.0 1.8 1509.0 1.9 528 (67%) 143 (18%) 143 (18%)GUJARAT 44421.0 43153 (97%) 10553 0.2 144575.0 3.4 155128.0 3.6 14877 (34%) 1993 (5%) 1954 (5%)HARYANA 32640.0 28052 (86%) 7029 0.3 70881.0 2.5 77910.0 2.8 10006 (36%) 2961 (11%) 2826 (10%)HIMACHAL PRADESH 8564.0 8426 (98%) 1608 0.2 28611.0 3.4 30219.0 3.6 3175 (38%) 281 (3%) 281 (3%)JAMMU & KASHMIR 4695.0 4154 (88%) 1030 0.2 11450.0 2.8 12480.0 3.0 2106 (51%) 917 (22%) 903 (22%)JHARKHAND 21153.0 12745 (60%) 4283 0.3 27389.0 2.1 31672.0 2.5 6271 (49%) 4072 (32%) 3973 (31%)KARNATAKA 34394.0 33186 (96%) 6207 0.2 89385.0 2.7 95592.0 2.9 13522 (41%) 1962 (6%) 1953 (6%)KERALA 10985.0 10172 (93%) 1400 0.1 17432.0 1.7 18832.0 1.9 4763 (47%) 1786 (18%) 1752 (17%)LADAKH 175.0 135 (77%) 67 0.5 385.0 2.9 452.0 3.3 38 (28%) 10 (7%) 10 (7%)LAKSHADWEEP 8.0 7 (88%) 1 0.1 22.0 3.1 23.0 3.3 5 (71%) 3 (43%) 3 (43%)MADHYA PRADESH 48158.0 40564 (84%) 13821 0.3 107348.0 2.6 121169.0 3.0 14624 (36%) 6628 (16%) 6537 (16%)MAHARASHTRA 54821.0 49878 (91%) 7145 0.1 113216.0 2.3 120361.0 2.4 25056 (50%) 6631 (13%) 6585 (13%)MANIPUR 986.0 741 (75%) 221 0.3 2309.0 3.1 2530.0 3.4 329 (44%) 83 (11%) 78 (11%)MEGHALAYA 1954.0 1708 (87%) 813 0.5 5391.0 3.2 6204.0 3.6 540 (32%) 257 (15%) 257 (15%)MIZORAM 817.0 754 (92%) 260 0.3 1438.0 1.9 1698.0 2.3 362 (48%) 210 (28%) 200 (27%)NAGALAND 1739.0 1315 (76%) 211 0.2 2384.0 1.8 2595.0 2.0 693 (53%) 296 (23%) 284 (22%)ODISHA 26212.0 24673 (94%) 4167 0.2 52336.0 2.1 56503.0 2.3 14132 (57%) 6890 (28%) 6826 (28%)PUDUCHERRY 749.0 746 (100%) 83 0.1 1888.0 2.5 1971.0 2.6 356 (48%) 24 (3%) 24 (3%)PUNJAB 22652.0 20535 (91%) 3393 0.2 42766.0 2.1 46159.0 2.2 10084 (49%) 4773 (23%) 4670 (23%)RAJASTHAN 55161.0 43625 (79%) 8202 0.2 107038.0 2.5 115240.0 2.6 22650 (52%) 7631 (17%) 7521 (17%)SIKKIM 573.0 493 (86%) 64 0.1 1180.0 2.4 1244.0 2.5 239 (48%) 27 (5%) 27 (5%)TAMIL NADU 45161.0 43097 (95%) 3721 0.1 78857.0 1.8 82578.0 1.9 27508 (64%) 5906 (14%) 5858 (14%)TELANGANA 26488.0 24506 (93%) 2369 0.1 48534.0 2.0 50903.0 2.1 15213 (62%) 3392 (14%) 3358 (14%)TRIPURA 1543.0 1509 (98%) 182 0.1 5097.0 3.4 5279.0 3.5 658 (44%) 16 (1%) 16 (1%)UTTAR PRADESH 148916.0 116511 (78%) 32669 0.3 299983.0 2.6 332652.0 2.9 54772 (47%) 31389 (27%) 30798 (26%)UTTARAKHAND 9110.0 6342 (70%) 1716 0.3 14497.0 2.3 16213.0 2.6 2988 (47%) 1602 (25%) 1580 (25%)WEST BENGAL 53172.0 50081 (94%) 9920 0.2 109694.0 2.2 119614.0 2.4 23891 (48%) 10890 (22%) 10714 (21%)INDIA 782235.0 661407 (85%) 138415 0.2 1574517.0 2.4 1712932.0 2.6 321506 (49%) 122173 (18%) 120292 (18%)
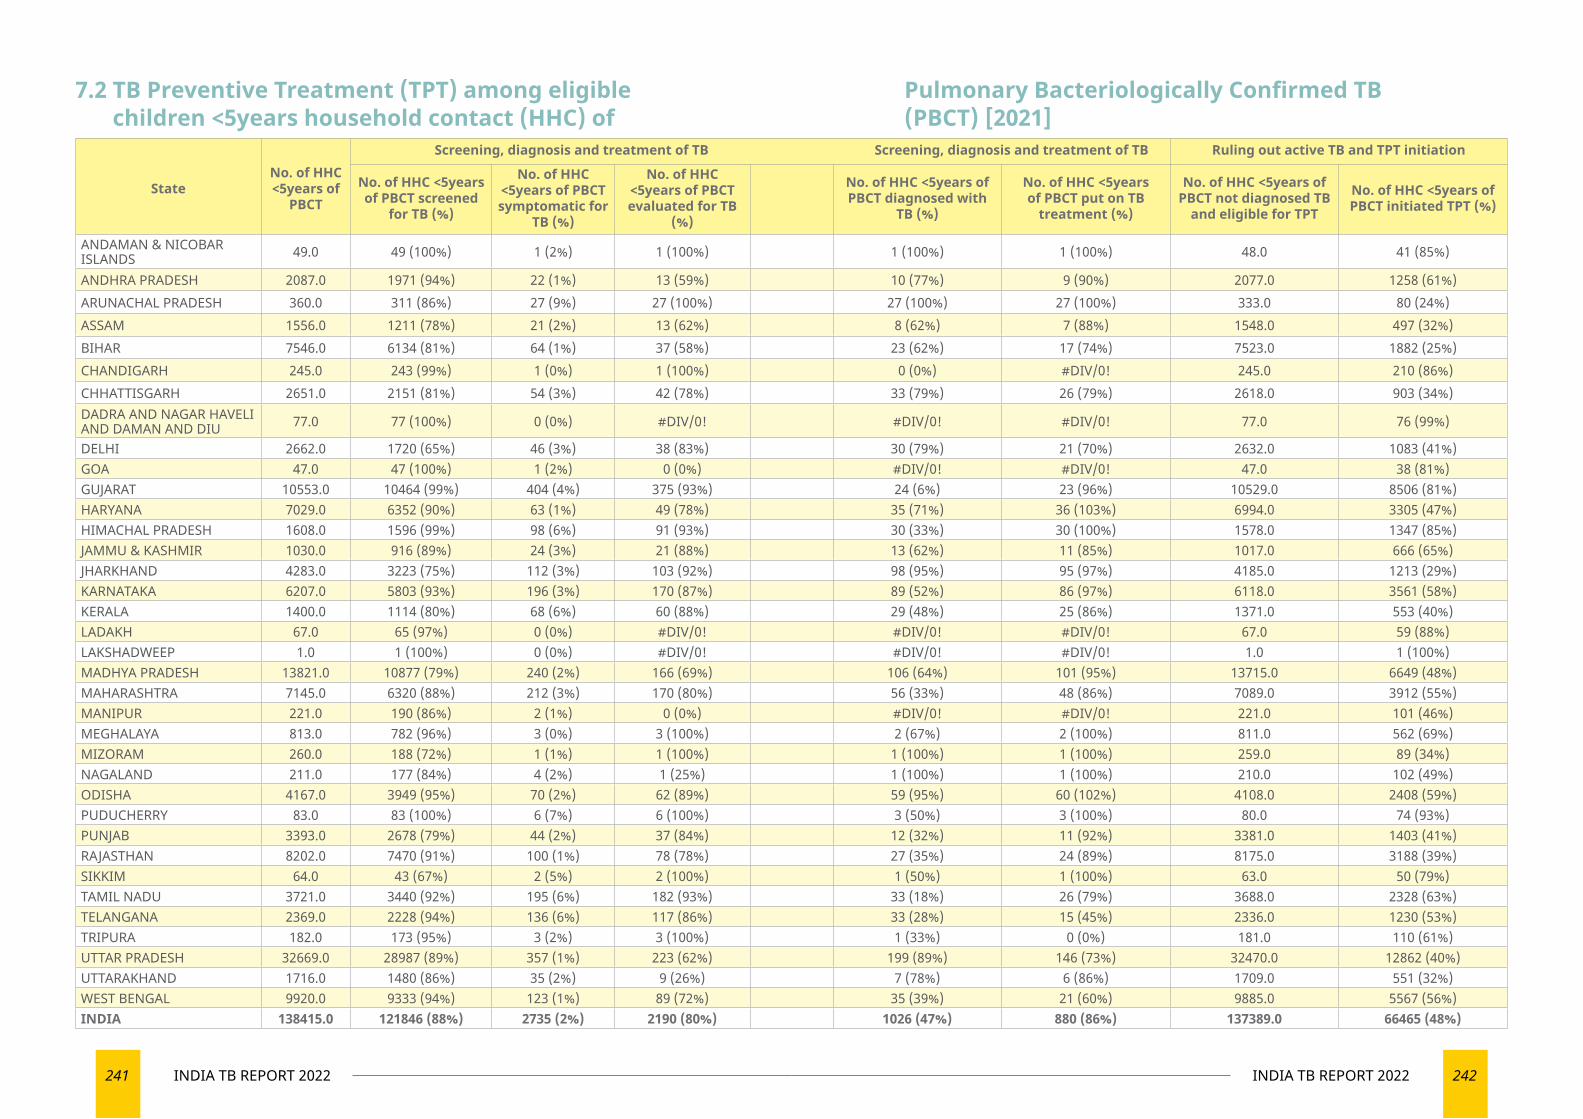
241 INDIA TB REPORT 2022 242INDIA TB REPORT 2022
StateNo. of HHC <5years of
PBCT
Screening, diagnosis and treatment of TB Screening, diagnosis and treatment of TB Ruling out active TB and TPT initiation
No. of HHC <5years of PBCT screened
for TB (%)
No. of HHC <5years of PBCT symptomatic for
TB (%)
No. of HHC <5years of PBCT evaluated for TB
(%)
No. of HHC <5years of PBCT diagnosed with
TB (%)
No. of HHC <5years of PBCT put on TB
treatment (%)
No. of HHC <5years of PBCT not diagnosed TB
and eligible for TPT
No. of HHC <5years of PBCT initiated TPT (%)
ANDAMAN & NICOBAR ISLANDS 49.0 49 (100%) 1 (2%) 1 (100%) 1 (100%) 1 (100%) 48.0 41 (85%)
ANDHRA PRADESH 2087.0 1971 (94%) 22 (1%) 13 (59%) 10 (77%) 9 (90%) 2077.0 1258 (61%)ARUNACHAL PRADESH 360.0 311 (86%) 27 (9%) 27 (100%) 27 (100%) 27 (100%) 333.0 80 (24%)ASSAM 1556.0 1211 (78%) 21 (2%) 13 (62%) 8 (62%) 7 (88%) 1548.0 497 (32%)BIHAR 7546.0 6134 (81%) 64 (1%) 37 (58%) 23 (62%) 17 (74%) 7523.0 1882 (25%)CHANDIGARH 245.0 243 (99%) 1 (0%) 1 (100%) 0 (0%) #DIV/0! 245.0 210 (86%)CHHATTISGARH 2651.0 2151 (81%) 54 (3%) 42 (78%) 33 (79%) 26 (79%) 2618.0 903 (34%)DADRA AND NAGAR HAVELI AND DAMAN AND DIU 77.0 77 (100%) 0 (0%) #DIV/0! #DIV/0! #DIV/0! 77.0 76 (99%)
DELHI 2662.0 1720 (65%) 46 (3%) 38 (83%) 30 (79%) 21 (70%) 2632.0 1083 (41%)GOA 47.0 47 (100%) 1 (2%) 0 (0%) #DIV/0! #DIV/0! 47.0 38 (81%)GUJARAT 10553.0 10464 (99%) 404 (4%) 375 (93%) 24 (6%) 23 (96%) 10529.0 8506 (81%)HARYANA 7029.0 6352 (90%) 63 (1%) 49 (78%) 35 (71%) 36 (103%) 6994.0 3305 (47%)HIMACHAL PRADESH 1608.0 1596 (99%) 98 (6%) 91 (93%) 30 (33%) 30 (100%) 1578.0 1347 (85%)JAMMU & KASHMIR 1030.0 916 (89%) 24 (3%) 21 (88%) 13 (62%) 11 (85%) 1017.0 666 (65%)JHARKHAND 4283.0 3223 (75%) 112 (3%) 103 (92%) 98 (95%) 95 (97%) 4185.0 1213 (29%)KARNATAKA 6207.0 5803 (93%) 196 (3%) 170 (87%) 89 (52%) 86 (97%) 6118.0 3561 (58%)KERALA 1400.0 1114 (80%) 68 (6%) 60 (88%) 29 (48%) 25 (86%) 1371.0 553 (40%)LADAKH 67.0 65 (97%) 0 (0%) #DIV/0! #DIV/0! #DIV/0! 67.0 59 (88%)LAKSHADWEEP 1.0 1 (100%) 0 (0%) #DIV/0! #DIV/0! #DIV/0! 1.0 1 (100%)MADHYA PRADESH 13821.0 10877 (79%) 240 (2%) 166 (69%) 106 (64%) 101 (95%) 13715.0 6649 (48%)MAHARASHTRA 7145.0 6320 (88%) 212 (3%) 170 (80%) 56 (33%) 48 (86%) 7089.0 3912 (55%)MANIPUR 221.0 190 (86%) 2 (1%) 0 (0%) #DIV/0! #DIV/0! 221.0 101 (46%)MEGHALAYA 813.0 782 (96%) 3 (0%) 3 (100%) 2 (67%) 2 (100%) 811.0 562 (69%)MIZORAM 260.0 188 (72%) 1 (1%) 1 (100%) 1 (100%) 1 (100%) 259.0 89 (34%)NAGALAND 211.0 177 (84%) 4 (2%) 1 (25%) 1 (100%) 1 (100%) 210.0 102 (49%)ODISHA 4167.0 3949 (95%) 70 (2%) 62 (89%) 59 (95%) 60 (102%) 4108.0 2408 (59%)PUDUCHERRY 83.0 83 (100%) 6 (7%) 6 (100%) 3 (50%) 3 (100%) 80.0 74 (93%)PUNJAB 3393.0 2678 (79%) 44 (2%) 37 (84%) 12 (32%) 11 (92%) 3381.0 1403 (41%)RAJASTHAN 8202.0 7470 (91%) 100 (1%) 78 (78%) 27 (35%) 24 (89%) 8175.0 3188 (39%)SIKKIM 64.0 43 (67%) 2 (5%) 2 (100%) 1 (50%) 1 (100%) 63.0 50 (79%)TAMIL NADU 3721.0 3440 (92%) 195 (6%) 182 (93%) 33 (18%) 26 (79%) 3688.0 2328 (63%)TELANGANA 2369.0 2228 (94%) 136 (6%) 117 (86%) 33 (28%) 15 (45%) 2336.0 1230 (53%)TRIPURA 182.0 173 (95%) 3 (2%) 3 (100%) 1 (33%) 0 (0%) 181.0 110 (61%)UTTAR PRADESH 32669.0 28987 (89%) 357 (1%) 223 (62%) 199 (89%) 146 (73%) 32470.0 12862 (40%)UTTARAKHAND 1716.0 1480 (86%) 35 (2%) 9 (26%) 7 (78%) 6 (86%) 1709.0 551 (32%)WEST BENGAL 9920.0 9333 (94%) 123 (1%) 89 (72%) 35 (39%) 21 (60%) 9885.0 5567 (56%)INDIA 138415.0 121846 (88%) 2735 (2%) 2190 (80%) 1026 (47%) 880 (86%) 137389.0 66465 (48%)
7.2 TB Preventive Treatment (TPT) among eligible children <5years household contact (HHC) of
Pulmonary Bacteriologically Confirmed TB (PBCT) [2021]
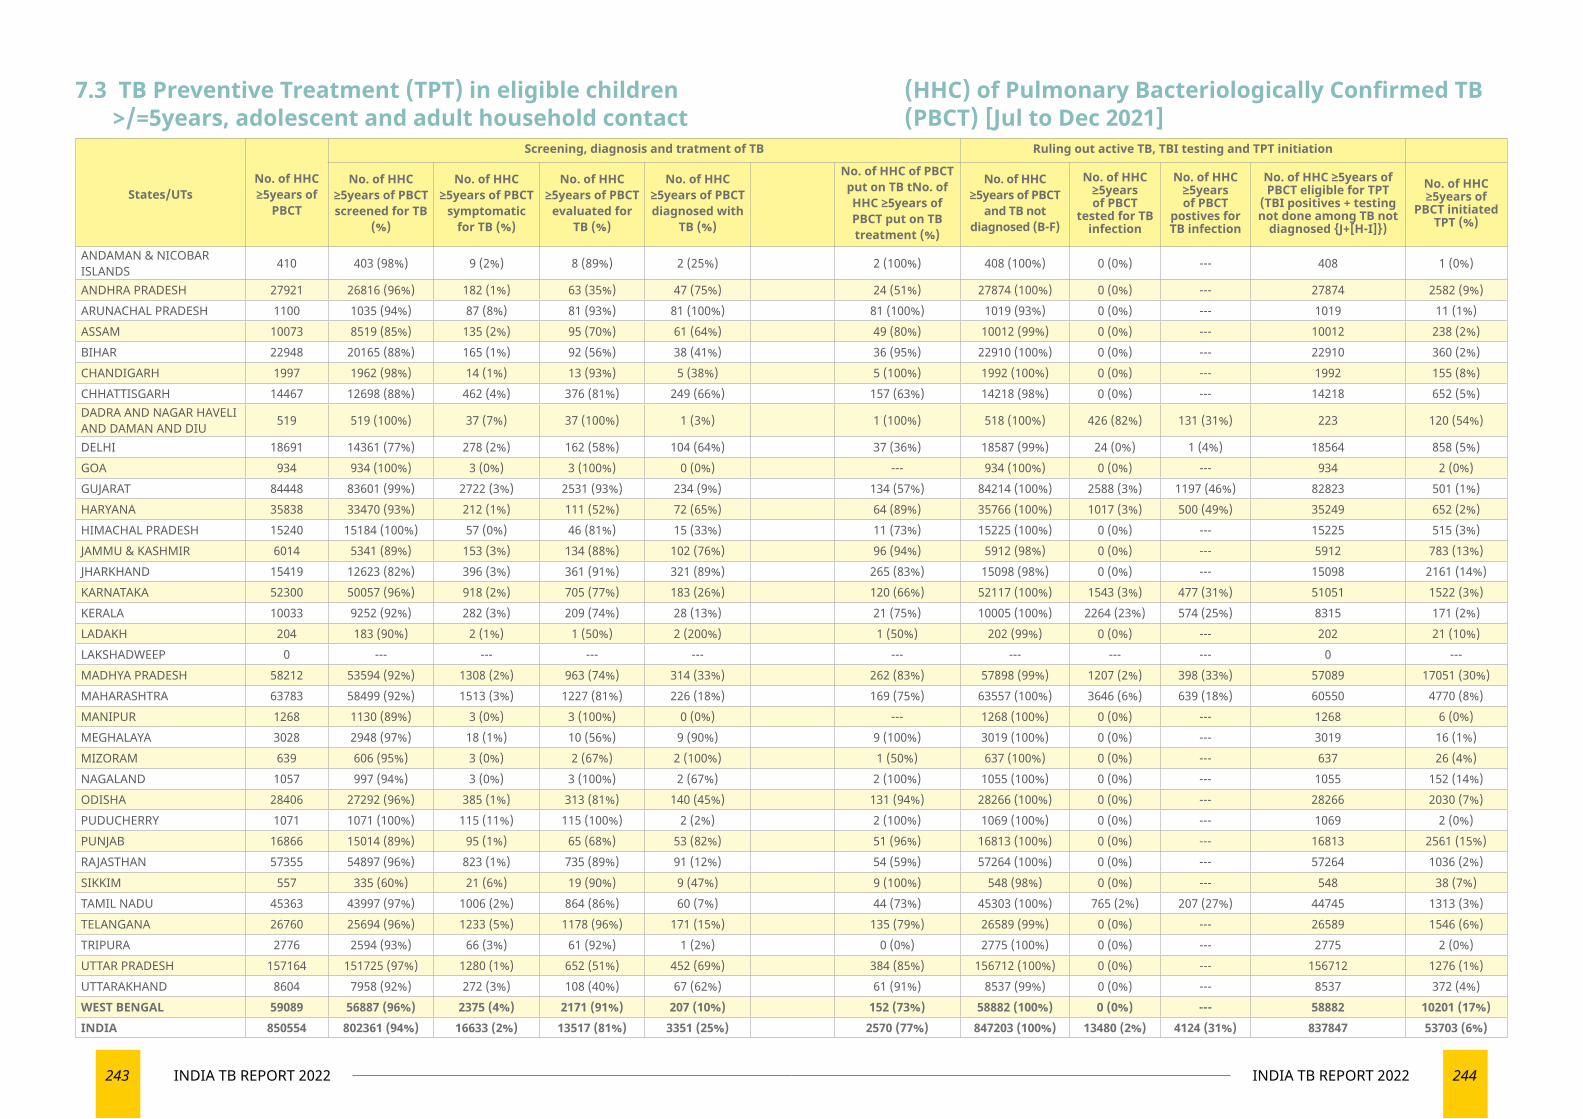
243 INDIA TB REPORT 2022 244INDIA TB REPORT 2022
States/UTsNo. of HHC ≥5years of
PBCT
Screening, diagnosis and tratment of TB Ruling out active TB, TBI testing and TPT initiation
No. of HHC ≥5years of PBCT screened for TB
(%)
No. of HHC ≥5years of PBCT
symptomatic for TB (%)
No. of HHC ≥5years of PBCT
evaluated for TB (%)
No. of HHC ≥5years of PBCT diagnosed with
TB (%)
No. of HHC of PBCT put on TB tNo. of HHC ≥5years of PBCT put on TB treatment (%)
No. of HHC ≥5years of PBCT
and TB not diagnosed (B-F)
No. of HHC ≥5years of PBCT
tested for TB infection
No. of HHC ≥5years of PBCT
postives for TB infection
No. of HHC ≥5years of PBCT eligible for TPT
(TBI positives + testing not done among TB not
diagnosed {J+[H-I]})
No. of HHC ≥5years of
PBCT initiated TPT (%)
ANDAMAN & NICOBAR ISLANDS 410 403 (98%) 9 (2%) 8 (89%) 2 (25%) 2 (100%) 408 (100%) 0 (0%) --- 408 1 (0%)
ANDHRA PRADESH 27921 26816 (96%) 182 (1%) 63 (35%) 47 (75%) 24 (51%) 27874 (100%) 0 (0%) --- 27874 2582 (9%)ARUNACHAL PRADESH 1100 1035 (94%) 87 (8%) 81 (93%) 81 (100%) 81 (100%) 1019 (93%) 0 (0%) --- 1019 11 (1%)ASSAM 10073 8519 (85%) 135 (2%) 95 (70%) 61 (64%) 49 (80%) 10012 (99%) 0 (0%) --- 10012 238 (2%)BIHAR 22948 20165 (88%) 165 (1%) 92 (56%) 38 (41%) 36 (95%) 22910 (100%) 0 (0%) --- 22910 360 (2%)CHANDIGARH 1997 1962 (98%) 14 (1%) 13 (93%) 5 (38%) 5 (100%) 1992 (100%) 0 (0%) --- 1992 155 (8%)CHHATTISGARH 14467 12698 (88%) 462 (4%) 376 (81%) 249 (66%) 157 (63%) 14218 (98%) 0 (0%) --- 14218 652 (5%)DADRA AND NAGAR HAVELI AND DAMAN AND DIU 519 519 (100%) 37 (7%) 37 (100%) 1 (3%) 1 (100%) 518 (100%) 426 (82%) 131 (31%) 223 120 (54%)
DELHI 18691 14361 (77%) 278 (2%) 162 (58%) 104 (64%) 37 (36%) 18587 (99%) 24 (0%) 1 (4%) 18564 858 (5%)GOA 934 934 (100%) 3 (0%) 3 (100%) 0 (0%) --- 934 (100%) 0 (0%) --- 934 2 (0%)GUJARAT 84448 83601 (99%) 2722 (3%) 2531 (93%) 234 (9%) 134 (57%) 84214 (100%) 2588 (3%) 1197 (46%) 82823 501 (1%)HARYANA 35838 33470 (93%) 212 (1%) 111 (52%) 72 (65%) 64 (89%) 35766 (100%) 1017 (3%) 500 (49%) 35249 652 (2%)HIMACHAL PRADESH 15240 15184 (100%) 57 (0%) 46 (81%) 15 (33%) 11 (73%) 15225 (100%) 0 (0%) --- 15225 515 (3%)JAMMU & KASHMIR 6014 5341 (89%) 153 (3%) 134 (88%) 102 (76%) 96 (94%) 5912 (98%) 0 (0%) --- 5912 783 (13%)JHARKHAND 15419 12623 (82%) 396 (3%) 361 (91%) 321 (89%) 265 (83%) 15098 (98%) 0 (0%) --- 15098 2161 (14%)KARNATAKA 52300 50057 (96%) 918 (2%) 705 (77%) 183 (26%) 120 (66%) 52117 (100%) 1543 (3%) 477 (31%) 51051 1522 (3%)KERALA 10033 9252 (92%) 282 (3%) 209 (74%) 28 (13%) 21 (75%) 10005 (100%) 2264 (23%) 574 (25%) 8315 171 (2%)LADAKH 204 183 (90%) 2 (1%) 1 (50%) 2 (200%) 1 (50%) 202 (99%) 0 (0%) --- 202 21 (10%)LAKSHADWEEP 0 --- --- --- --- --- --- --- --- 0 ---MADHYA PRADESH 58212 53594 (92%) 1308 (2%) 963 (74%) 314 (33%) 262 (83%) 57898 (99%) 1207 (2%) 398 (33%) 57089 17051 (30%)MAHARASHTRA 63783 58499 (92%) 1513 (3%) 1227 (81%) 226 (18%) 169 (75%) 63557 (100%) 3646 (6%) 639 (18%) 60550 4770 (8%)MANIPUR 1268 1130 (89%) 3 (0%) 3 (100%) 0 (0%) --- 1268 (100%) 0 (0%) --- 1268 6 (0%)MEGHALAYA 3028 2948 (97%) 18 (1%) 10 (56%) 9 (90%) 9 (100%) 3019 (100%) 0 (0%) --- 3019 16 (1%)MIZORAM 639 606 (95%) 3 (0%) 2 (67%) 2 (100%) 1 (50%) 637 (100%) 0 (0%) --- 637 26 (4%)NAGALAND 1057 997 (94%) 3 (0%) 3 (100%) 2 (67%) 2 (100%) 1055 (100%) 0 (0%) --- 1055 152 (14%)ODISHA 28406 27292 (96%) 385 (1%) 313 (81%) 140 (45%) 131 (94%) 28266 (100%) 0 (0%) --- 28266 2030 (7%)PUDUCHERRY 1071 1071 (100%) 115 (11%) 115 (100%) 2 (2%) 2 (100%) 1069 (100%) 0 (0%) --- 1069 2 (0%)PUNJAB 16866 15014 (89%) 95 (1%) 65 (68%) 53 (82%) 51 (96%) 16813 (100%) 0 (0%) --- 16813 2561 (15%)RAJASTHAN 57355 54897 (96%) 823 (1%) 735 (89%) 91 (12%) 54 (59%) 57264 (100%) 0 (0%) --- 57264 1036 (2%)SIKKIM 557 335 (60%) 21 (6%) 19 (90%) 9 (47%) 9 (100%) 548 (98%) 0 (0%) --- 548 38 (7%)TAMIL NADU 45363 43997 (97%) 1006 (2%) 864 (86%) 60 (7%) 44 (73%) 45303 (100%) 765 (2%) 207 (27%) 44745 1313 (3%)TELANGANA 26760 25694 (96%) 1233 (5%) 1178 (96%) 171 (15%) 135 (79%) 26589 (99%) 0 (0%) --- 26589 1546 (6%)TRIPURA 2776 2594 (93%) 66 (3%) 61 (92%) 1 (2%) 0 (0%) 2775 (100%) 0 (0%) --- 2775 2 (0%)UTTAR PRADESH 157164 151725 (97%) 1280 (1%) 652 (51%) 452 (69%) 384 (85%) 156712 (100%) 0 (0%) --- 156712 1276 (1%)UTTARAKHAND 8604 7958 (92%) 272 (3%) 108 (40%) 67 (62%) 61 (91%) 8537 (99%) 0 (0%) --- 8537 372 (4%)WEST BENGAL 59089 56887 (96%) 2375 (4%) 2171 (91%) 207 (10%) 152 (73%) 58882 (100%) 0 (0%) --- 58882 10201 (17%)INDIA 850554 802361 (94%) 16633 (2%) 13517 (81%) 3351 (25%) 2570 (77%) 847203 (100%) 13480 (2%) 4124 (31%) 837847 53703 (6%)
7.3 TB Preventive Treatment (TPT) in eligible children >/=5years, adolescent and adult household contact
(HHC) of Pulmonary Bacteriologically Confirmed TB (PBCT) [Jul to Dec 2021]
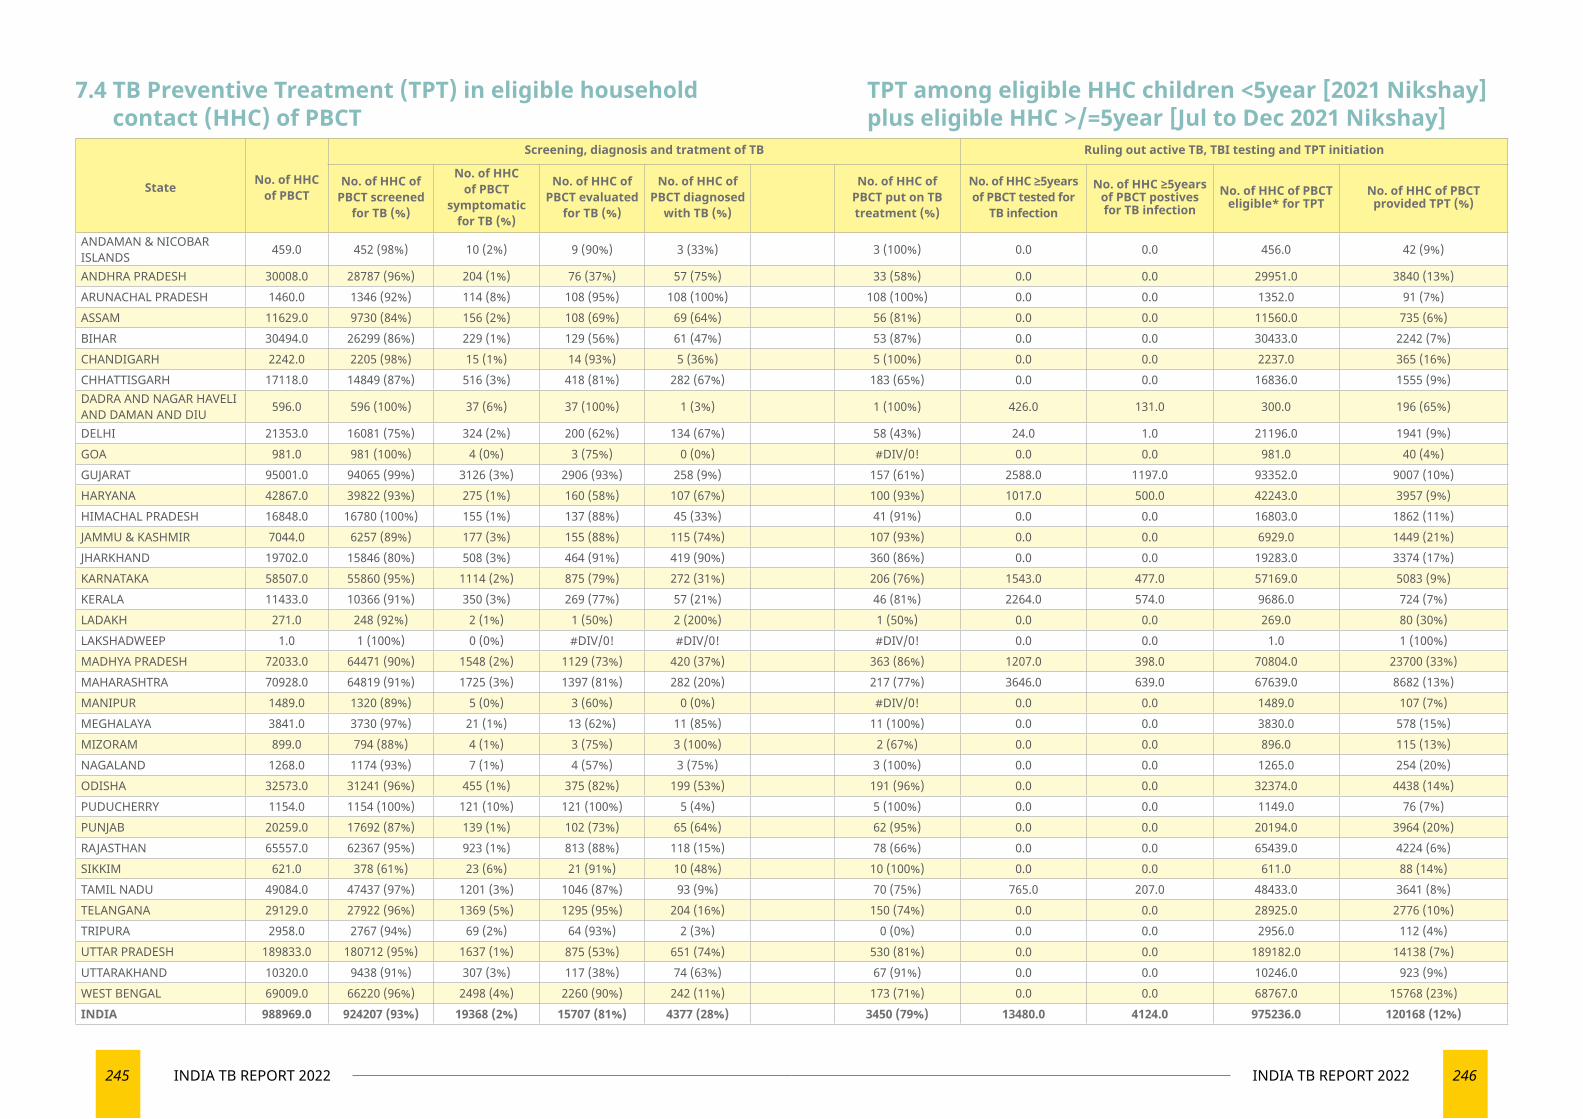
245 INDIA TB REPORT 2022 246INDIA TB REPORT 2022
7.4 TB Preventive Treatment (TPT) in eligible household contact (HHC) of PBCT
State No. of HHC of PBCT
Screening, diagnosis and tratment of TB Ruling out active TB, TBI testing and TPT initiation
No. of HHC of PBCT screened
for TB (%)
No. of HHC of PBCT
symptomatic for TB (%)
No. of HHC of PBCT evaluated
for TB (%)
No. of HHC of PBCT diagnosed
with TB (%)
No. of HHC of PBCT put on TB treatment (%)
No. of HHC ≥5years of PBCT tested for
TB infection
No. of HHC ≥5years of PBCT postives for TB infection
No. of HHC of PBCT eligible* for TPT
No. of HHC of PBCT provided TPT (%)
ANDAMAN & NICOBAR ISLANDS 459.0 452 (98%) 10 (2%) 9 (90%) 3 (33%) 3 (100%) 0.0 0.0 456.0 42 (9%)
ANDHRA PRADESH 30008.0 28787 (96%) 204 (1%) 76 (37%) 57 (75%) 33 (58%) 0.0 0.0 29951.0 3840 (13%)ARUNACHAL PRADESH 1460.0 1346 (92%) 114 (8%) 108 (95%) 108 (100%) 108 (100%) 0.0 0.0 1352.0 91 (7%)ASSAM 11629.0 9730 (84%) 156 (2%) 108 (69%) 69 (64%) 56 (81%) 0.0 0.0 11560.0 735 (6%)BIHAR 30494.0 26299 (86%) 229 (1%) 129 (56%) 61 (47%) 53 (87%) 0.0 0.0 30433.0 2242 (7%)CHANDIGARH 2242.0 2205 (98%) 15 (1%) 14 (93%) 5 (36%) 5 (100%) 0.0 0.0 2237.0 365 (16%)CHHATTISGARH 17118.0 14849 (87%) 516 (3%) 418 (81%) 282 (67%) 183 (65%) 0.0 0.0 16836.0 1555 (9%)DADRA AND NAGAR HAVELI AND DAMAN AND DIU 596.0 596 (100%) 37 (6%) 37 (100%) 1 (3%) 1 (100%) 426.0 131.0 300.0 196 (65%)
DELHI 21353.0 16081 (75%) 324 (2%) 200 (62%) 134 (67%) 58 (43%) 24.0 1.0 21196.0 1941 (9%)GOA 981.0 981 (100%) 4 (0%) 3 (75%) 0 (0%) #DIV/0! 0.0 0.0 981.0 40 (4%)GUJARAT 95001.0 94065 (99%) 3126 (3%) 2906 (93%) 258 (9%) 157 (61%) 2588.0 1197.0 93352.0 9007 (10%)HARYANA 42867.0 39822 (93%) 275 (1%) 160 (58%) 107 (67%) 100 (93%) 1017.0 500.0 42243.0 3957 (9%)HIMACHAL PRADESH 16848.0 16780 (100%) 155 (1%) 137 (88%) 45 (33%) 41 (91%) 0.0 0.0 16803.0 1862 (11%)JAMMU & KASHMIR 7044.0 6257 (89%) 177 (3%) 155 (88%) 115 (74%) 107 (93%) 0.0 0.0 6929.0 1449 (21%)JHARKHAND 19702.0 15846 (80%) 508 (3%) 464 (91%) 419 (90%) 360 (86%) 0.0 0.0 19283.0 3374 (17%)KARNATAKA 58507.0 55860 (95%) 1114 (2%) 875 (79%) 272 (31%) 206 (76%) 1543.0 477.0 57169.0 5083 (9%)KERALA 11433.0 10366 (91%) 350 (3%) 269 (77%) 57 (21%) 46 (81%) 2264.0 574.0 9686.0 724 (7%)LADAKH 271.0 248 (92%) 2 (1%) 1 (50%) 2 (200%) 1 (50%) 0.0 0.0 269.0 80 (30%)LAKSHADWEEP 1.0 1 (100%) 0 (0%) #DIV/0! #DIV/0! #DIV/0! 0.0 0.0 1.0 1 (100%)MADHYA PRADESH 72033.0 64471 (90%) 1548 (2%) 1129 (73%) 420 (37%) 363 (86%) 1207.0 398.0 70804.0 23700 (33%)MAHARASHTRA 70928.0 64819 (91%) 1725 (3%) 1397 (81%) 282 (20%) 217 (77%) 3646.0 639.0 67639.0 8682 (13%)MANIPUR 1489.0 1320 (89%) 5 (0%) 3 (60%) 0 (0%) #DIV/0! 0.0 0.0 1489.0 107 (7%)MEGHALAYA 3841.0 3730 (97%) 21 (1%) 13 (62%) 11 (85%) 11 (100%) 0.0 0.0 3830.0 578 (15%)MIZORAM 899.0 794 (88%) 4 (1%) 3 (75%) 3 (100%) 2 (67%) 0.0 0.0 896.0 115 (13%)NAGALAND 1268.0 1174 (93%) 7 (1%) 4 (57%) 3 (75%) 3 (100%) 0.0 0.0 1265.0 254 (20%)ODISHA 32573.0 31241 (96%) 455 (1%) 375 (82%) 199 (53%) 191 (96%) 0.0 0.0 32374.0 4438 (14%)PUDUCHERRY 1154.0 1154 (100%) 121 (10%) 121 (100%) 5 (4%) 5 (100%) 0.0 0.0 1149.0 76 (7%)PUNJAB 20259.0 17692 (87%) 139 (1%) 102 (73%) 65 (64%) 62 (95%) 0.0 0.0 20194.0 3964 (20%)RAJASTHAN 65557.0 62367 (95%) 923 (1%) 813 (88%) 118 (15%) 78 (66%) 0.0 0.0 65439.0 4224 (6%)SIKKIM 621.0 378 (61%) 23 (6%) 21 (91%) 10 (48%) 10 (100%) 0.0 0.0 611.0 88 (14%)TAMIL NADU 49084.0 47437 (97%) 1201 (3%) 1046 (87%) 93 (9%) 70 (75%) 765.0 207.0 48433.0 3641 (8%)TELANGANA 29129.0 27922 (96%) 1369 (5%) 1295 (95%) 204 (16%) 150 (74%) 0.0 0.0 28925.0 2776 (10%)TRIPURA 2958.0 2767 (94%) 69 (2%) 64 (93%) 2 (3%) 0 (0%) 0.0 0.0 2956.0 112 (4%)UTTAR PRADESH 189833.0 180712 (95%) 1637 (1%) 875 (53%) 651 (74%) 530 (81%) 0.0 0.0 189182.0 14138 (7%)UTTARAKHAND 10320.0 9438 (91%) 307 (3%) 117 (38%) 74 (63%) 67 (91%) 0.0 0.0 10246.0 923 (9%)WEST BENGAL 69009.0 66220 (96%) 2498 (4%) 2260 (90%) 242 (11%) 173 (71%) 0.0 0.0 68767.0 15768 (23%)INDIA 988969.0 924207 (93%) 19368 (2%) 15707 (81%) 4377 (28%) 3450 (79%) 13480.0 4124.0 975236.0 120168 (12%)
TPT among eligible HHC children <5year [2021 Nikshay] plus eligible HHC >/=5year [Jul to Dec 2021 Nikshay]
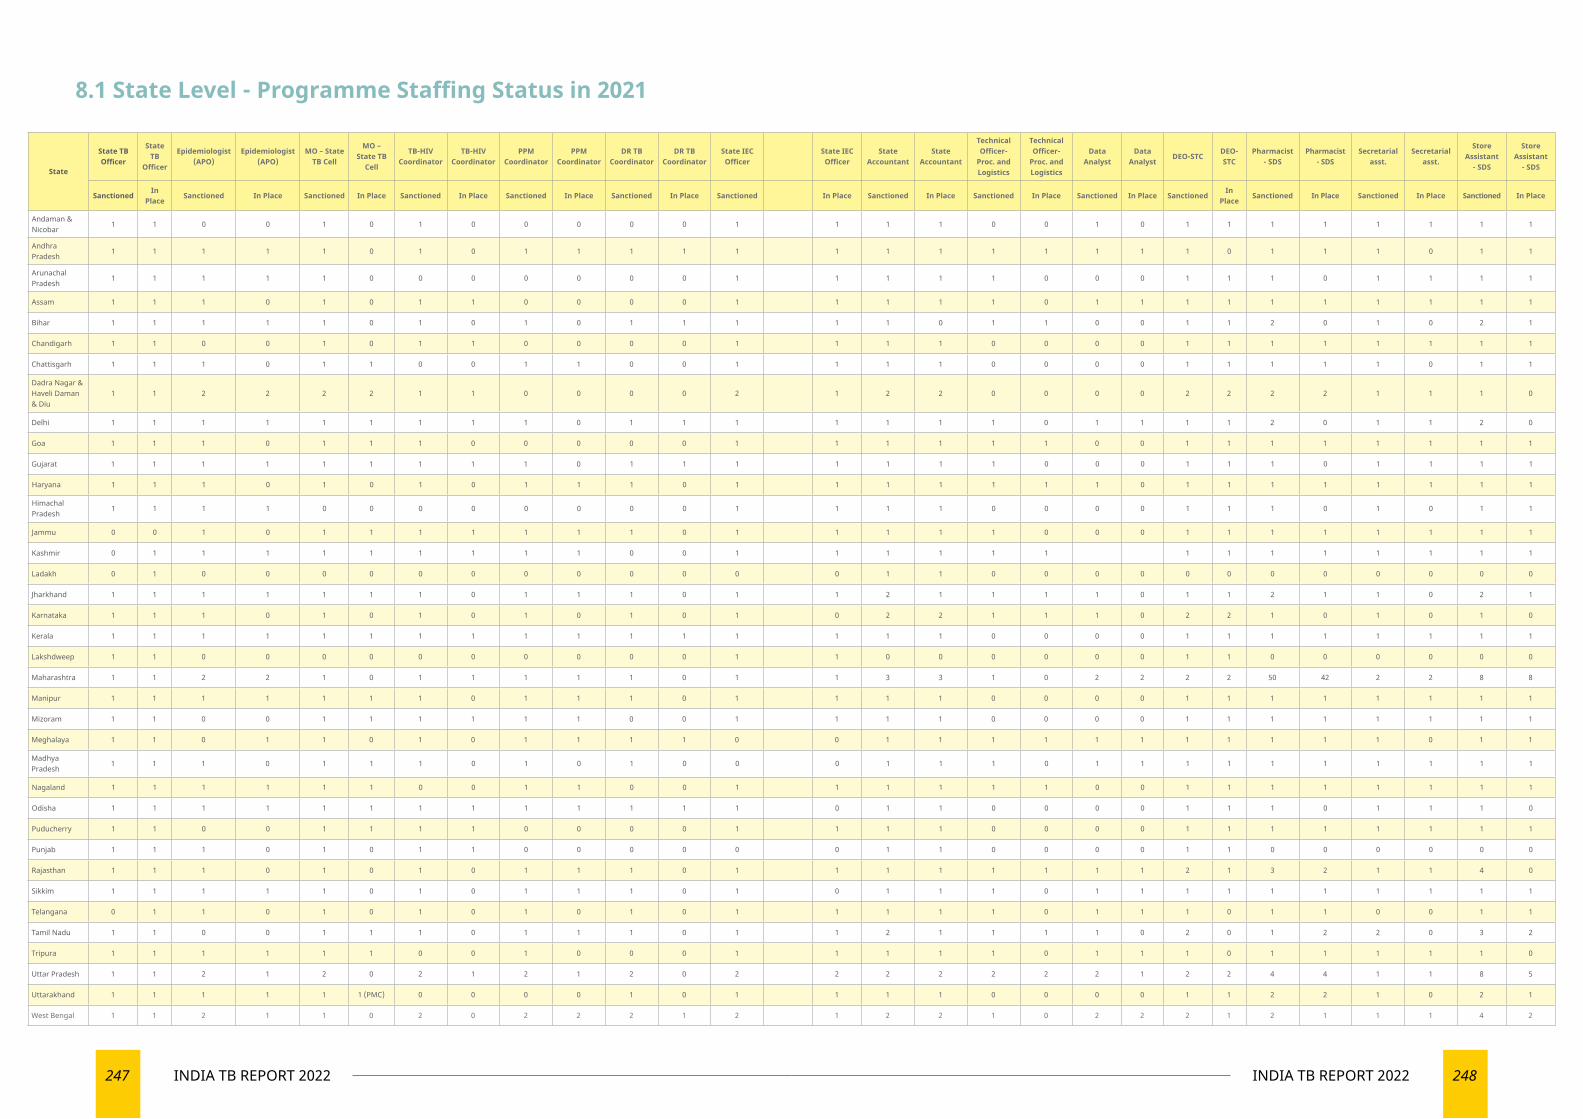
247 INDIA TB REPORT 2022 248INDIA TB REPORT 2022
State
State TB Officer
State TB
Officer
Epidemiologist (APO)
Epidemiologist (APO)
MO – State TB Cell
MO – State TB
Cell
TB-HIV Coordinator
TB-HIV Coordinator
PPM Coordinator
PPM Coordinator
DR TB Coordinator
DR TB Coordinator
State IEC Officer
State IEC Officer
State Accountant
State Accountant
Technical Officer-
Proc. and Logistics
Technical Officer-
Proc. and Logistics
Data Analyst
Data Analyst
DEO-STCDEO-STC
Pharmacist - SDS
Pharmacist - SDS
Secretarial asst.
Secretarial asst.
Store Assistant
- SDS
Store Assistant
- SDS
SanctionedIn
PlaceSanctioned In Place Sanctioned In Place Sanctioned In Place Sanctioned In Place Sanctioned In Place Sanctioned In Place Sanctioned In Place Sanctioned In Place Sanctioned In Place Sanctioned
In Place
Sanctioned In Place Sanctioned In Place Sanctioned In Place
Andaman & Nicobar
1 1 0 0 1 0 1 0 0 0 0 0 1 1 1 1 0 0 1 0 1 1 1 1 1 1 1 1
Andhra Pradesh
1 1 1 1 1 0 1 0 1 1 1 1 1 1 1 1 1 1 1 1 1 0 1 1 1 0 1 1
Arunachal Pradesh
1 1 1 1 1 0 0 0 0 0 0 0 1 1 1 1 1 0 0 0 1 1 1 0 1 1 1 1
Assam 1 1 1 0 1 0 1 1 0 0 0 0 1 1 1 1 1 0 1 1 1 1 1 1 1 1 1 1
Bihar 1 1 1 1 1 0 1 0 1 0 1 1 1 1 1 0 1 1 0 0 1 1 2 0 1 0 2 1
Chandigarh 1 1 0 0 1 0 1 1 0 0 0 0 1 1 1 1 0 0 0 0 1 1 1 1 1 1 1 1
Chattisgarh 1 1 1 0 1 1 0 0 1 1 0 0 1 1 1 1 0 0 0 0 1 1 1 1 1 0 1 1
Dadra Nagar & Haveli Daman & Diu
1 1 2 2 2 2 1 1 0 0 0 0 2 1 2 2 0 0 0 0 2 2 2 2 1 1 1 0
Delhi 1 1 1 1 1 1 1 1 1 0 1 1 1 1 1 1 1 0 1 1 1 1 2 0 1 1 2 0
Goa 1 1 1 0 1 1 1 0 0 0 0 0 1 1 1 1 1 1 0 0 1 1 1 1 1 1 1 1
Gujarat 1 1 1 1 1 1 1 1 1 0 1 1 1 1 1 1 1 0 0 0 1 1 1 0 1 1 1 1
Haryana 1 1 1 0 1 0 1 0 1 1 1 0 1 1 1 1 1 1 1 0 1 1 1 1 1 1 1 1
Himachal Pradesh
1 1 1 1 0 0 0 0 0 0 0 0 1 1 1 1 0 0 0 0 1 1 1 0 1 0 1 1
Jammu 0 0 1 0 1 1 1 1 1 1 1 0 1 1 1 1 1 0 0 0 1 1 1 1 1 1 1 1
Kashmir 0 1 1 1 1 1 1 1 1 1 0 0 1 1 1 1 1 1 1 1 1 1 1 1 1 1
Ladakh 0 1 0 0 0 0 0 0 0 0 0 0 0 0 1 1 0 0 0 0 0 0 0 0 0 0 0 0
Jharkhand 1 1 1 1 1 1 1 0 1 1 1 0 1 1 2 1 1 1 1 0 1 1 2 1 1 0 2 1
Karnataka 1 1 1 0 1 0 1 0 1 0 1 0 1 0 2 2 1 1 1 0 2 2 1 0 1 0 1 0
Kerala 1 1 1 1 1 1 1 1 1 1 1 1 1 1 1 1 0 0 0 0 1 1 1 1 1 1 1 1
Lakshdweep 1 1 0 0 0 0 0 0 0 0 0 0 1 1 0 0 0 0 0 0 1 1 0 0 0 0 0 0
Maharashtra 1 1 2 2 1 0 1 1 1 1 1 0 1 1 3 3 1 0 2 2 2 2 50 42 2 2 8 8
Manipur 1 1 1 1 1 1 1 0 1 1 1 0 1 1 1 1 0 0 0 0 1 1 1 1 1 1 1 1
Mizoram 1 1 0 0 1 1 1 1 1 1 0 0 1 1 1 1 0 0 0 0 1 1 1 1 1 1 1 1
Meghalaya 1 1 0 1 1 0 1 0 1 1 1 1 0 0 1 1 1 1 1 1 1 1 1 1 1 0 1 1
Madhya Pradesh
1 1 1 0 1 1 1 0 1 0 1 0 0 0 1 1 1 0 1 1 1 1 1 1 1 1 1 1
Nagaland 1 1 1 1 1 1 0 0 1 1 0 0 1 1 1 1 1 1 0 0 1 1 1 1 1 1 1 1
Odisha 1 1 1 1 1 1 1 1 1 1 1 1 1 0 1 1 0 0 0 0 1 1 1 0 1 1 1 0
Puducherry 1 1 0 0 1 1 1 1 0 0 0 0 1 1 1 1 0 0 0 0 1 1 1 1 1 1 1 1
Punjab 1 1 1 0 1 0 1 1 0 0 0 0 0 0 1 1 0 0 0 0 1 1 0 0 0 0 0 0
Rajasthan 1 1 1 0 1 0 1 0 1 1 1 0 1 1 1 1 1 1 1 1 2 1 3 2 1 1 4 0
Sikkim 1 1 1 1 1 0 1 0 1 1 1 0 1 0 1 1 1 0 1 1 1 1 1 1 1 1 1 1
Telangana 0 1 1 0 1 0 1 0 1 0 1 0 1 1 1 1 1 0 1 1 1 0 1 1 0 0 1 1
Tamil Nadu 1 1 0 0 1 1 1 0 1 1 1 0 1 1 2 1 1 1 1 0 2 0 1 2 2 0 3 2
Tripura 1 1 1 1 1 1 0 0 1 0 0 0 1 1 1 1 1 0 1 1 1 0 1 1 1 1 1 0
Uttar Pradesh 1 1 2 1 2 0 2 1 2 1 2 0 2 2 2 2 2 2 2 1 2 2 4 4 1 1 8 5
Uttarakhand 1 1 1 1 1 1 (PMC) 0 0 0 0 1 0 1 1 1 1 0 0 0 0 1 1 2 2 1 0 2 1
West Bengal 1 1 2 1 1 0 2 0 2 2 2 1 2 1 2 2 1 0 2 2 2 1 2 1 1 1 4 2
8.1 State Level - Programme Staffing Status in 2021
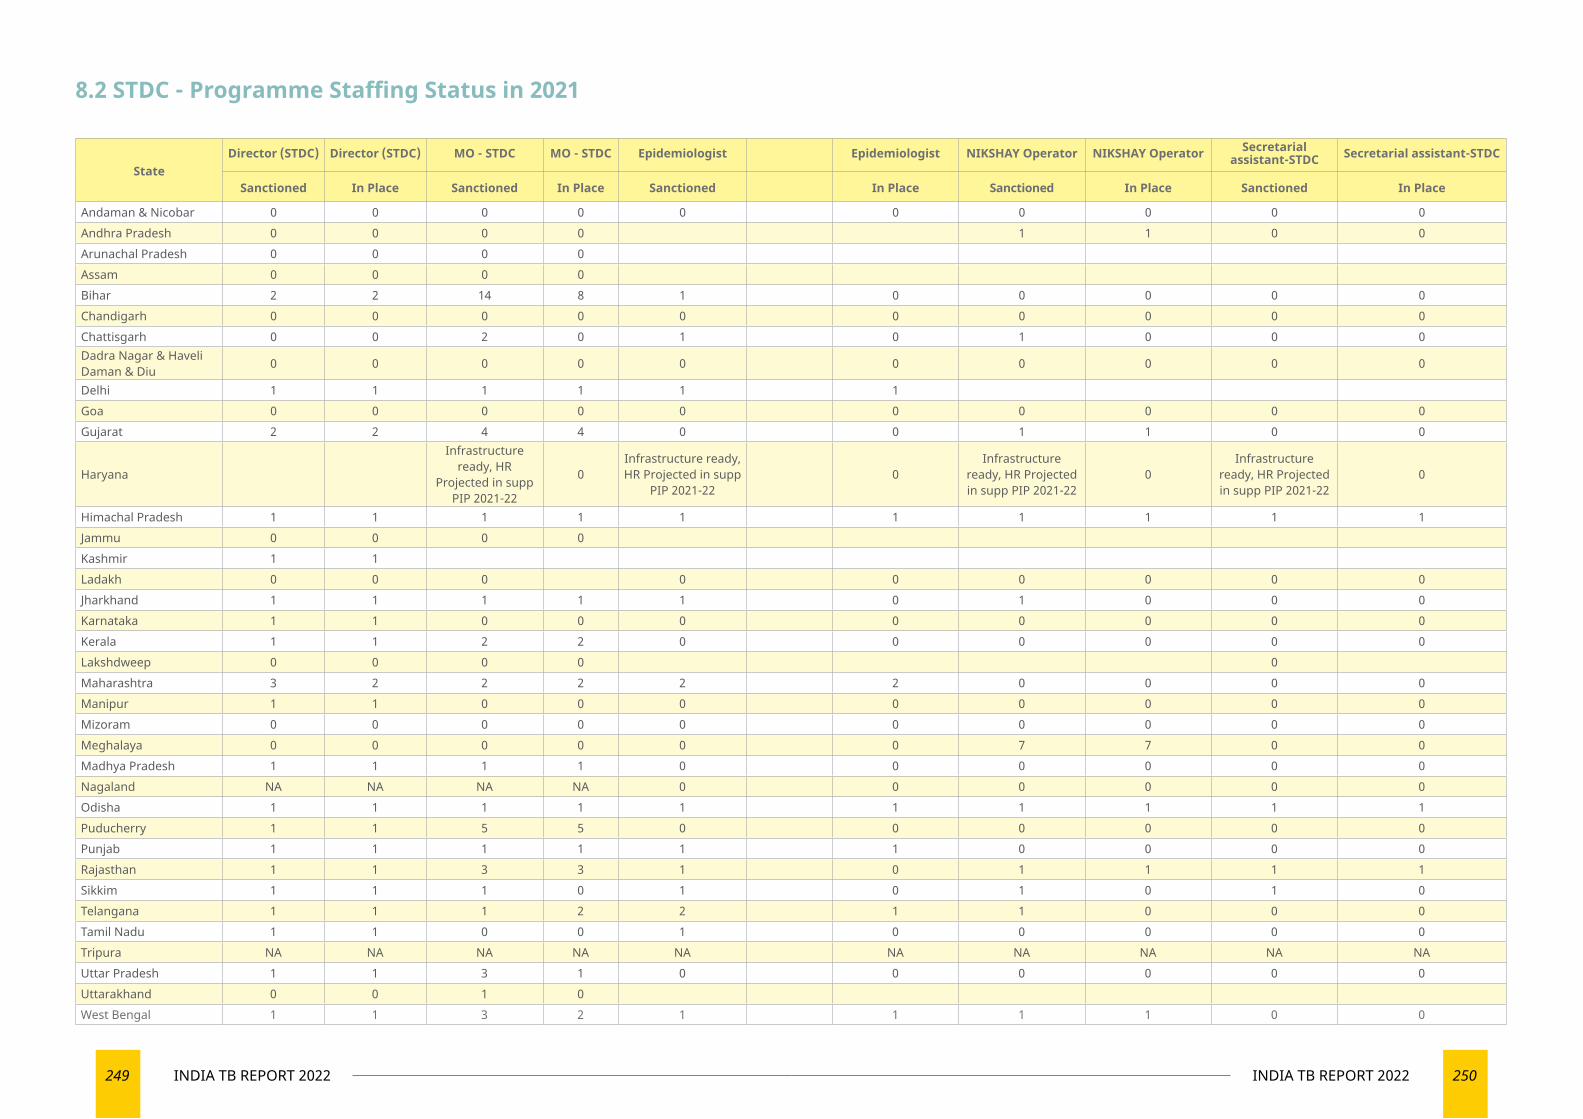
249 INDIA TB REPORT 2022 250INDIA TB REPORT 2022
StateDirector (STDC) Director (STDC) MO - STDC MO - STDC Epidemiologist Epidemiologist NIKSHAY Operator NIKSHAY Operator Secretarial
assistant-STDC Secretarial assistant-STDC
Sanctioned In Place Sanctioned In Place Sanctioned In Place Sanctioned In Place Sanctioned In Place
Andaman & Nicobar 0 0 0 0 0 0 0 0 0 0Andhra Pradesh 0 0 0 0 1 1 0 0Arunachal Pradesh 0 0 0 0Assam 0 0 0 0Bihar 2 2 14 8 1 0 0 0 0 0Chandigarh 0 0 0 0 0 0 0 0 0 0Chattisgarh 0 0 2 0 1 0 1 0 0 0Dadra Nagar & Haveli Daman & Diu 0 0 0 0 0 0 0 0 0 0
Delhi 1 1 1 1 1 1Goa 0 0 0 0 0 0 0 0 0 0Gujarat 2 2 4 4 0 0 1 1 0 0
Haryana
Infrastructure ready, HR
Projected in supp PIP 2021-22
0Infrastructure ready, HR Projected in supp
PIP 2021-220
Infrastructure ready, HR Projected in supp PIP 2021-22
0Infrastructure
ready, HR Projected in supp PIP 2021-22
0
Himachal Pradesh 1 1 1 1 1 1 1 1 1 1Jammu 0 0 0 0Kashmir 1 1Ladakh 0 0 0 0 0 0 0 0 0Jharkhand 1 1 1 1 1 0 1 0 0 0Karnataka 1 1 0 0 0 0 0 0 0 0Kerala 1 1 2 2 0 0 0 0 0 0Lakshdweep 0 0 0 0 0Maharashtra 3 2 2 2 2 2 0 0 0 0Manipur 1 1 0 0 0 0 0 0 0 0Mizoram 0 0 0 0 0 0 0 0 0 0Meghalaya 0 0 0 0 0 0 7 7 0 0Madhya Pradesh 1 1 1 1 0 0 0 0 0 0Nagaland NA NA NA NA 0 0 0 0 0 0Odisha 1 1 1 1 1 1 1 1 1 1Puducherry 1 1 5 5 0 0 0 0 0 0Punjab 1 1 1 1 1 1 0 0 0 0Rajasthan 1 1 3 3 1 0 1 1 1 1Sikkim 1 1 1 0 1 0 1 0 1 0Telangana 1 1 1 2 2 1 1 0 0 0Tamil Nadu 1 1 0 0 1 0 0 0 0 0Tripura NA NA NA NA NA NA NA NA NA NAUttar Pradesh 1 1 3 1 0 0 0 0 0 0Uttarakhand 0 0 1 0West Bengal 1 1 3 2 1 1 1 1 0 0
8.2 STDC - Programme Staffing Status in 2021
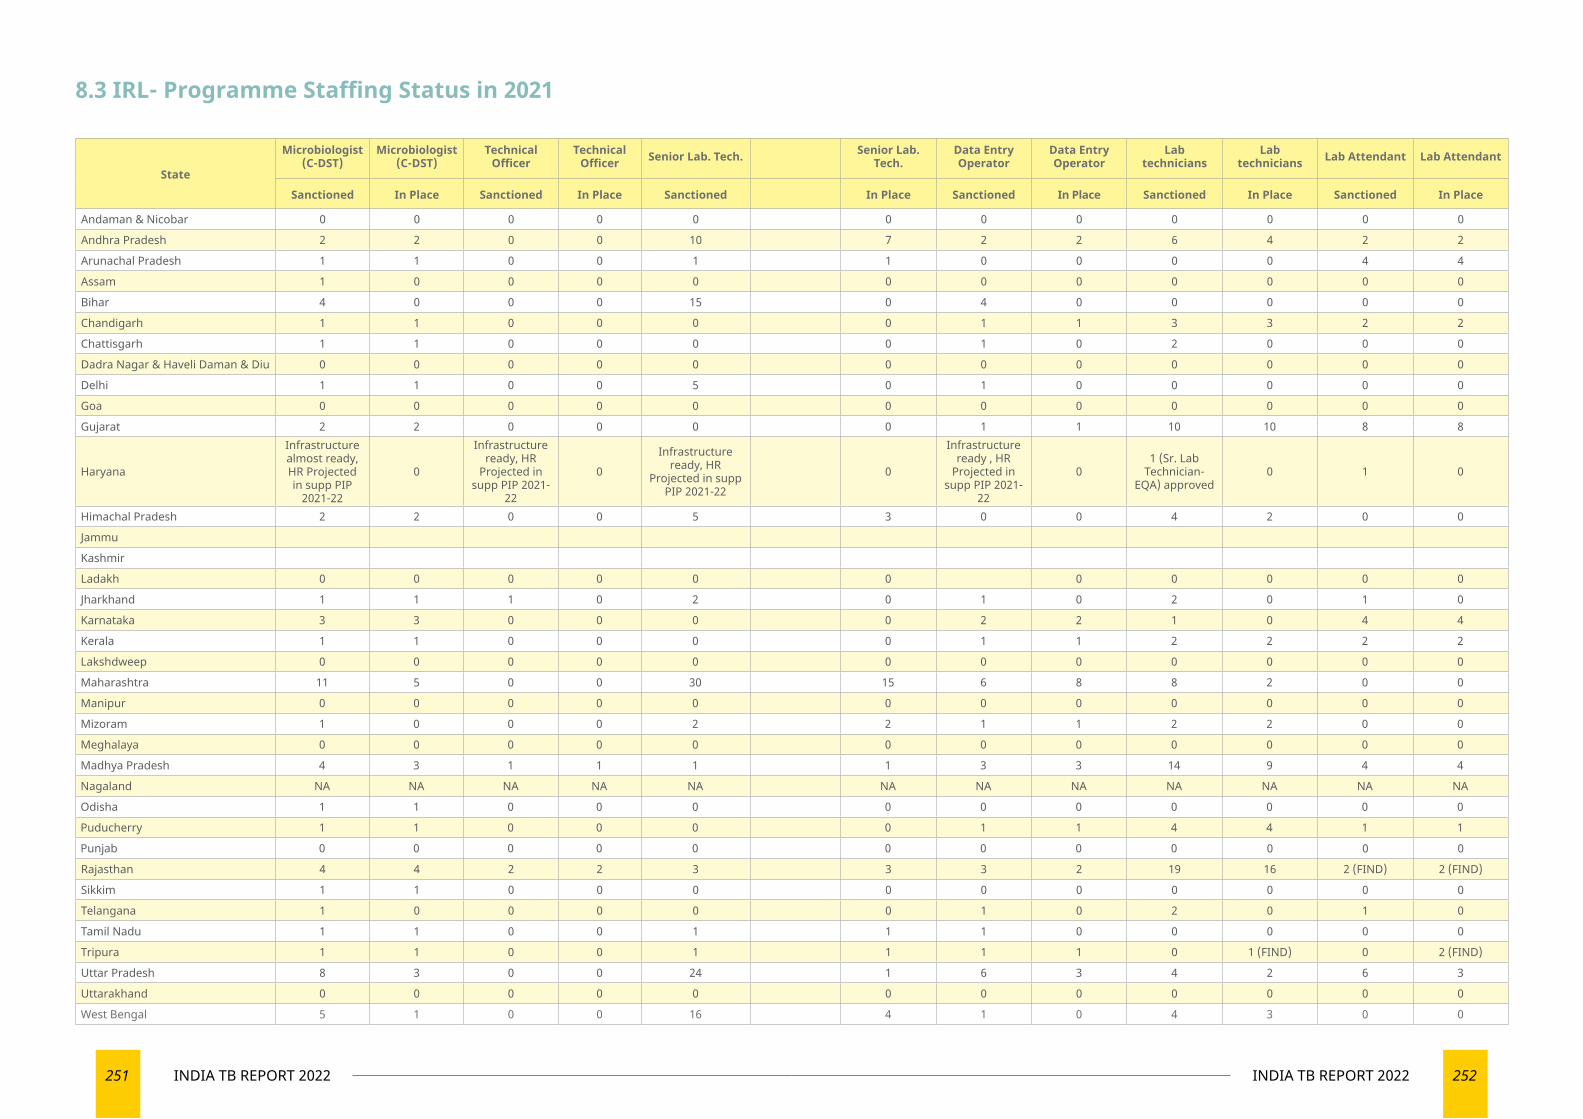
251 INDIA TB REPORT 2022 252INDIA TB REPORT 2022
8.3 IRL- Programme Staffing Status in 2021
State
Microbiologist (C-DST)
Microbiologist (C-DST)
Technical Officer
Technical Officer Senior Lab. Tech. Senior Lab.
Tech.Data Entry Operator
Data Entry Operator
Lab technicians
Lab technicians Lab Attendant Lab Attendant
Sanctioned In Place Sanctioned In Place Sanctioned In Place Sanctioned In Place Sanctioned In Place Sanctioned In Place
Andaman & Nicobar 0 0 0 0 0 0 0 0 0 0 0 0
Andhra Pradesh 2 2 0 0 10 7 2 2 6 4 2 2
Arunachal Pradesh 1 1 0 0 1 1 0 0 0 0 4 4
Assam 1 0 0 0 0 0 0 0 0 0 0 0
Bihar 4 0 0 0 15 0 4 0 0 0 0 0
Chandigarh 1 1 0 0 0 0 1 1 3 3 2 2
Chattisgarh 1 1 0 0 0 0 1 0 2 0 0 0
Dadra Nagar & Haveli Daman & Diu 0 0 0 0 0 0 0 0 0 0 0 0
Delhi 1 1 0 0 5 0 1 0 0 0 0 0
Goa 0 0 0 0 0 0 0 0 0 0 0 0
Gujarat 2 2 0 0 0 0 1 1 10 10 8 8
Haryana
Infrastructure almost ready, HR Projected in supp PIP
2021-22
0
Infrastructure ready, HR
Projected in supp PIP 2021-
22
0Infrastructure
ready, HR Projected in supp
PIP 2021-220
Infrastructure ready , HR
Projected in supp PIP 2021-
22
01 (Sr. Lab
Technician- EQA) approved
0 1 0
Himachal Pradesh 2 2 0 0 5 3 0 0 4 2 0 0
Jammu
Kashmir
Ladakh 0 0 0 0 0 0 0 0 0 0 0
Jharkhand 1 1 1 0 2 0 1 0 2 0 1 0
Karnataka 3 3 0 0 0 0 2 2 1 0 4 4
Kerala 1 1 0 0 0 0 1 1 2 2 2 2
Lakshdweep 0 0 0 0 0 0 0 0 0 0 0 0
Maharashtra 11 5 0 0 30 15 6 8 8 2 0 0
Manipur 0 0 0 0 0 0 0 0 0 0 0 0
Mizoram 1 0 0 0 2 2 1 1 2 2 0 0
Meghalaya 0 0 0 0 0 0 0 0 0 0 0 0
Madhya Pradesh 4 3 1 1 1 1 3 3 14 9 4 4
Nagaland NA NA NA NA NA NA NA NA NA NA NA NA
Odisha 1 1 0 0 0 0 0 0 0 0 0 0
Puducherry 1 1 0 0 0 0 1 1 4 4 1 1
Punjab 0 0 0 0 0 0 0 0 0 0 0 0
Rajasthan 4 4 2 2 3 3 3 2 19 16 2 (FIND) 2 (FIND)
Sikkim 1 1 0 0 0 0 0 0 0 0 0 0
Telangana 1 0 0 0 0 0 1 0 2 0 1 0
Tamil Nadu 1 1 0 0 1 1 1 0 0 0 0 0
Tripura 1 1 0 0 1 1 1 1 0 1 (FIND) 0 2 (FIND)
Uttar Pradesh 8 3 0 0 24 1 6 3 4 2 6 3
Uttarakhand 0 0 0 0 0 0 0 0 0 0 0 0
West Bengal 5 1 0 0 16 4 1 0 4 3 0 0
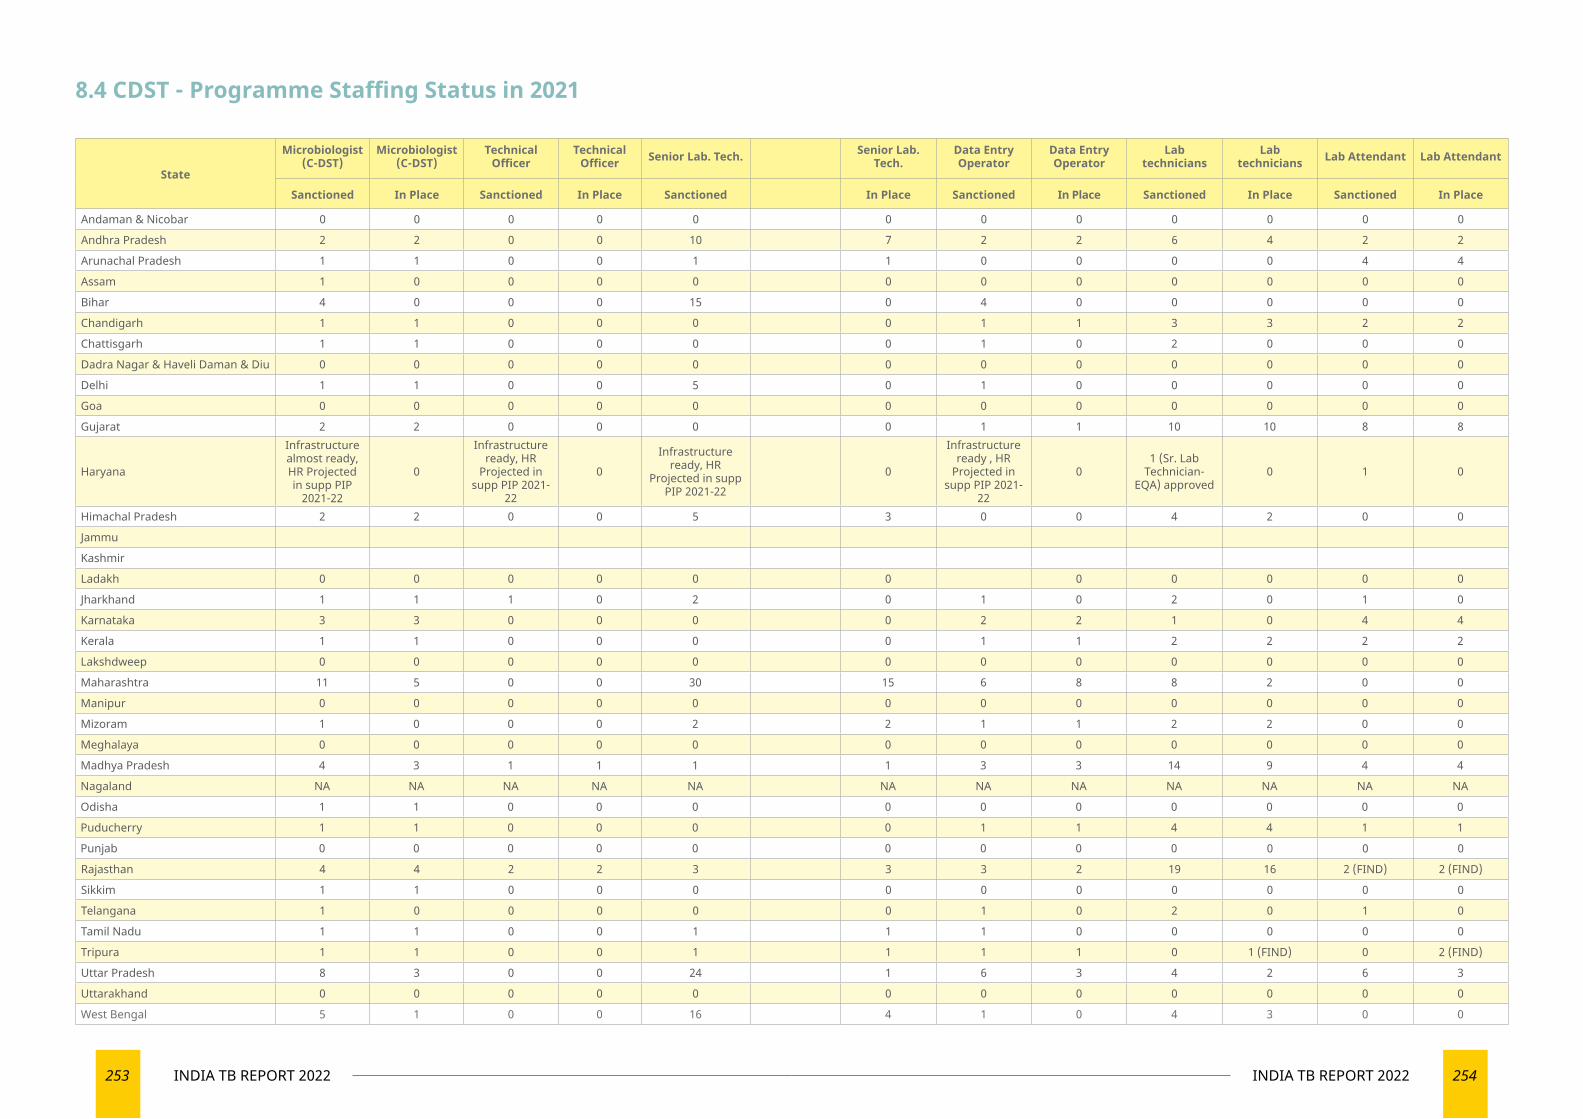
253 INDIA TB REPORT 2022 254INDIA TB REPORT 2022
8.4 CDST - Programme Staffing Status in 2021
State
Microbiologist (C-DST)
Microbiologist (C-DST)
Technical Officer
Technical Officer Senior Lab. Tech. Senior Lab.
Tech.Data Entry Operator
Data Entry Operator
Lab technicians
Lab technicians Lab Attendant Lab Attendant
Sanctioned In Place Sanctioned In Place Sanctioned In Place Sanctioned In Place Sanctioned In Place Sanctioned In Place
Andaman & Nicobar 0 0 0 0 0 0 0 0 0 0 0 0
Andhra Pradesh 2 2 0 0 10 7 2 2 6 4 2 2
Arunachal Pradesh 1 1 0 0 1 1 0 0 0 0 4 4
Assam 1 0 0 0 0 0 0 0 0 0 0 0
Bihar 4 0 0 0 15 0 4 0 0 0 0 0
Chandigarh 1 1 0 0 0 0 1 1 3 3 2 2
Chattisgarh 1 1 0 0 0 0 1 0 2 0 0 0
Dadra Nagar & Haveli Daman & Diu 0 0 0 0 0 0 0 0 0 0 0 0
Delhi 1 1 0 0 5 0 1 0 0 0 0 0
Goa 0 0 0 0 0 0 0 0 0 0 0 0
Gujarat 2 2 0 0 0 0 1 1 10 10 8 8
Haryana
Infrastructure almost ready, HR Projected in supp PIP
2021-22
0
Infrastructure ready, HR
Projected in supp PIP 2021-
22
0Infrastructure
ready, HR Projected in supp
PIP 2021-220
Infrastructure ready , HR
Projected in supp PIP 2021-
22
01 (Sr. Lab
Technician- EQA) approved
0 1 0
Himachal Pradesh 2 2 0 0 5 3 0 0 4 2 0 0
Jammu
Kashmir
Ladakh 0 0 0 0 0 0 0 0 0 0 0
Jharkhand 1 1 1 0 2 0 1 0 2 0 1 0
Karnataka 3 3 0 0 0 0 2 2 1 0 4 4
Kerala 1 1 0 0 0 0 1 1 2 2 2 2
Lakshdweep 0 0 0 0 0 0 0 0 0 0 0 0
Maharashtra 11 5 0 0 30 15 6 8 8 2 0 0
Manipur 0 0 0 0 0 0 0 0 0 0 0 0
Mizoram 1 0 0 0 2 2 1 1 2 2 0 0
Meghalaya 0 0 0 0 0 0 0 0 0 0 0 0
Madhya Pradesh 4 3 1 1 1 1 3 3 14 9 4 4
Nagaland NA NA NA NA NA NA NA NA NA NA NA NA
Odisha 1 1 0 0 0 0 0 0 0 0 0 0
Puducherry 1 1 0 0 0 0 1 1 4 4 1 1
Punjab 0 0 0 0 0 0 0 0 0 0 0 0
Rajasthan 4 4 2 2 3 3 3 2 19 16 2 (FIND) 2 (FIND)
Sikkim 1 1 0 0 0 0 0 0 0 0 0 0
Telangana 1 0 0 0 0 0 1 0 2 0 1 0
Tamil Nadu 1 1 0 0 1 1 1 0 0 0 0 0
Tripura 1 1 0 0 1 1 1 1 0 1 (FIND) 0 2 (FIND)
Uttar Pradesh 8 3 0 0 24 1 6 3 4 2 6 3
Uttarakhand 0 0 0 0 0 0 0 0 0 0 0 0
West Bengal 5 1 0 0 16 4 1 0 4 3 0 0
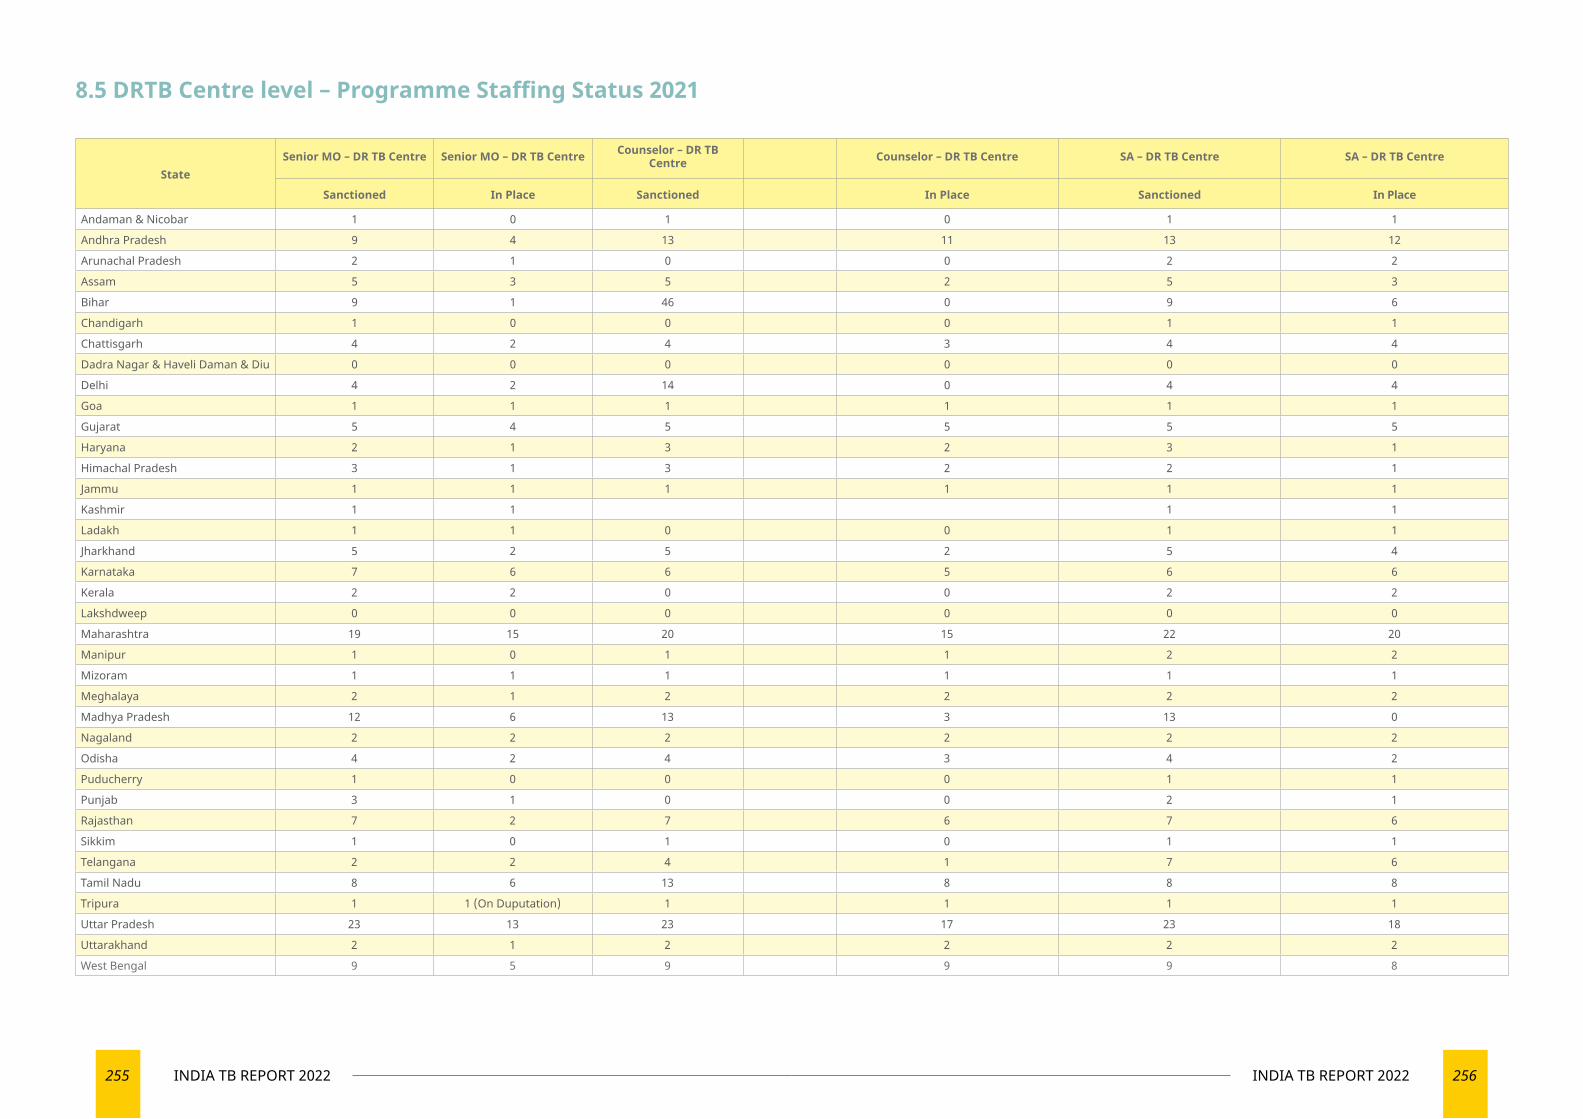
255 INDIA TB REPORT 2022 256INDIA TB REPORT 2022
8.5 DRTB Centre level – Programme Staffing Status 2021
StateSenior MO – DR TB Centre Senior MO – DR TB Centre Counselor – DR TB
Centre Counselor – DR TB Centre SA – DR TB Centre SA – DR TB Centre
Sanctioned In Place Sanctioned In Place Sanctioned In Place
Andaman & Nicobar 1 0 1 0 1 1
Andhra Pradesh 9 4 13 11 13 12
Arunachal Pradesh 2 1 0 0 2 2
Assam 5 3 5 2 5 3
Bihar 9 1 46 0 9 6
Chandigarh 1 0 0 0 1 1
Chattisgarh 4 2 4 3 4 4
Dadra Nagar & Haveli Daman & Diu 0 0 0 0 0 0
Delhi 4 2 14 0 4 4
Goa 1 1 1 1 1 1
Gujarat 5 4 5 5 5 5
Haryana 2 1 3 2 3 1
Himachal Pradesh 3 1 3 2 2 1
Jammu 1 1 1 1 1 1
Kashmir 1 1 1 1
Ladakh 1 1 0 0 1 1
Jharkhand 5 2 5 2 5 4
Karnataka 7 6 6 5 6 6
Kerala 2 2 0 0 2 2
Lakshdweep 0 0 0 0 0 0
Maharashtra 19 15 20 15 22 20
Manipur 1 0 1 1 2 2
Mizoram 1 1 1 1 1 1
Meghalaya 2 1 2 2 2 2
Madhya Pradesh 12 6 13 3 13 0
Nagaland 2 2 2 2 2 2
Odisha 4 2 4 3 4 2
Puducherry 1 0 0 0 1 1
Punjab 3 1 0 0 2 1
Rajasthan 7 2 7 6 7 6
Sikkim 1 0 1 0 1 1
Telangana 2 2 4 1 7 6
Tamil Nadu 8 6 13 8 8 8
Tripura 1 1 (On Duputation) 1 1 1 1
Uttar Pradesh 23 13 23 17 23 18
Uttarakhand 2 1 2 2 2 2
West Bengal 9 5 9 9 9 8
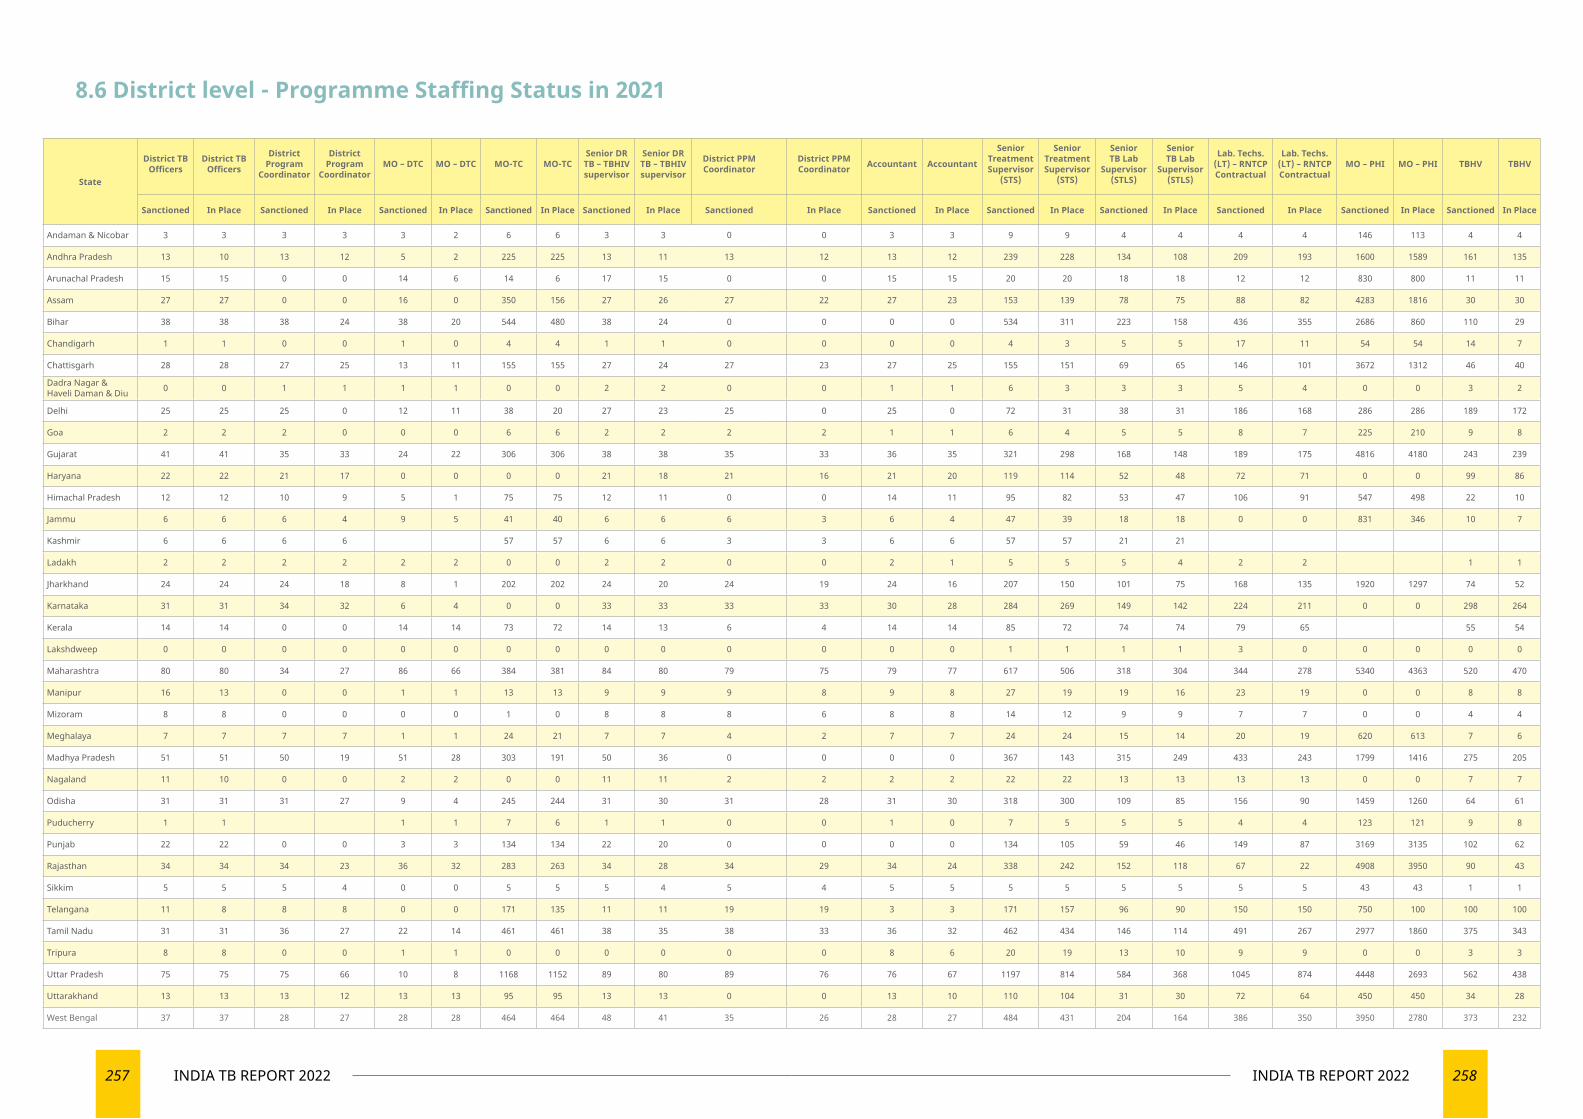
257 INDIA TB REPORT 2022 258INDIA TB REPORT 2022
State
District TB Officers
District TB Officers
District Program
Coordinator
District Program
CoordinatorMO – DTC MO – DTC MO-TC MO-TC
Senior DR TB – TBHIV supervisor
Senior DR TB – TBHIV supervisor
District PPM Coordinator
District PPM Coordinator Accountant Accountant
Senior Treatment Supervisor
(STS)
Senior Treatment Supervisor
(STS)
Senior TB Lab
Supervisor (STLS)
Senior TB Lab
Supervisor (STLS)
Lab. Techs. (LT) – RNTCP Contractual
Lab. Techs. (LT) – RNTCP Contractual
MO – PHI MO – PHI TBHV TBHV
Sanctioned In Place Sanctioned In Place Sanctioned In Place Sanctioned In Place Sanctioned In Place Sanctioned In Place Sanctioned In Place Sanctioned In Place Sanctioned In Place Sanctioned In Place Sanctioned In Place Sanctioned In Place
Andaman & Nicobar 3 3 3 3 3 2 6 6 3 3 0 0 3 3 9 9 4 4 4 4 146 113 4 4
Andhra Pradesh 13 10 13 12 5 2 225 225 13 11 13 12 13 12 239 228 134 108 209 193 1600 1589 161 135
Arunachal Pradesh 15 15 0 0 14 6 14 6 17 15 0 0 15 15 20 20 18 18 12 12 830 800 11 11
Assam 27 27 0 0 16 0 350 156 27 26 27 22 27 23 153 139 78 75 88 82 4283 1816 30 30
Bihar 38 38 38 24 38 20 544 480 38 24 0 0 0 0 534 311 223 158 436 355 2686 860 110 29
Chandigarh 1 1 0 0 1 0 4 4 1 1 0 0 0 0 4 3 5 5 17 11 54 54 14 7
Chattisgarh 28 28 27 25 13 11 155 155 27 24 27 23 27 25 155 151 69 65 146 101 3672 1312 46 40
Dadra Nagar & Haveli Daman & Diu 0 0 1 1 1 1 0 0 2 2 0 0 1 1 6 3 3 3 5 4 0 0 3 2
Delhi 25 25 25 0 12 11 38 20 27 23 25 0 25 0 72 31 38 31 186 168 286 286 189 172
Goa 2 2 2 0 0 0 6 6 2 2 2 2 1 1 6 4 5 5 8 7 225 210 9 8
Gujarat 41 41 35 33 24 22 306 306 38 38 35 33 36 35 321 298 168 148 189 175 4816 4180 243 239
Haryana 22 22 21 17 0 0 0 0 21 18 21 16 21 20 119 114 52 48 72 71 0 0 99 86
Himachal Pradesh 12 12 10 9 5 1 75 75 12 11 0 0 14 11 95 82 53 47 106 91 547 498 22 10
Jammu 6 6 6 4 9 5 41 40 6 6 6 3 6 4 47 39 18 18 0 0 831 346 10 7
Kashmir 6 6 6 6 57 57 6 6 3 3 6 6 57 57 21 21
Ladakh 2 2 2 2 2 2 0 0 2 2 0 0 2 1 5 5 5 4 2 2 1 1
Jharkhand 24 24 24 18 8 1 202 202 24 20 24 19 24 16 207 150 101 75 168 135 1920 1297 74 52
Karnataka 31 31 34 32 6 4 0 0 33 33 33 33 30 28 284 269 149 142 224 211 0 0 298 264
Kerala 14 14 0 0 14 14 73 72 14 13 6 4 14 14 85 72 74 74 79 65 55 54
Lakshdweep 0 0 0 0 0 0 0 0 0 0 0 0 0 0 1 1 1 1 3 0 0 0 0 0
Maharashtra 80 80 34 27 86 66 384 381 84 80 79 75 79 77 617 506 318 304 344 278 5340 4363 520 470
Manipur 16 13 0 0 1 1 13 13 9 9 9 8 9 8 27 19 19 16 23 19 0 0 8 8
Mizoram 8 8 0 0 0 0 1 0 8 8 8 6 8 8 14 12 9 9 7 7 0 0 4 4
Meghalaya 7 7 7 7 1 1 24 21 7 7 4 2 7 7 24 24 15 14 20 19 620 613 7 6
Madhya Pradesh 51 51 50 19 51 28 303 191 50 36 0 0 0 0 367 143 315 249 433 243 1799 1416 275 205
Nagaland 11 10 0 0 2 2 0 0 11 11 2 2 2 2 22 22 13 13 13 13 0 0 7 7
Odisha 31 31 31 27 9 4 245 244 31 30 31 28 31 30 318 300 109 85 156 90 1459 1260 64 61
Puducherry 1 1 1 1 7 6 1 1 0 0 1 0 7 5 5 5 4 4 123 121 9 8
Punjab 22 22 0 0 3 3 134 134 22 20 0 0 0 0 134 105 59 46 149 87 3169 3135 102 62
Rajasthan 34 34 34 23 36 32 283 263 34 28 34 29 34 24 338 242 152 118 67 22 4908 3950 90 43
Sikkim 5 5 5 4 0 0 5 5 5 4 5 4 5 5 5 5 5 5 5 5 43 43 1 1
Telangana 11 8 8 8 0 0 171 135 11 11 19 19 3 3 171 157 96 90 150 150 750 100 100 100
Tamil Nadu 31 31 36 27 22 14 461 461 38 35 38 33 36 32 462 434 146 114 491 267 2977 1860 375 343
Tripura 8 8 0 0 1 1 0 0 0 0 0 0 8 6 20 19 13 10 9 9 0 0 3 3
Uttar Pradesh 75 75 75 66 10 8 1168 1152 89 80 89 76 76 67 1197 814 584 368 1045 874 4448 2693 562 438
Uttarakhand 13 13 13 12 13 13 95 95 13 13 0 0 13 10 110 104 31 30 72 64 450 450 34 28
West Bengal 37 37 28 27 28 28 464 464 48 41 35 26 28 27 484 431 204 164 386 350 3950 2780 373 232
8.6 District level - Programme Staffing Status in 2021
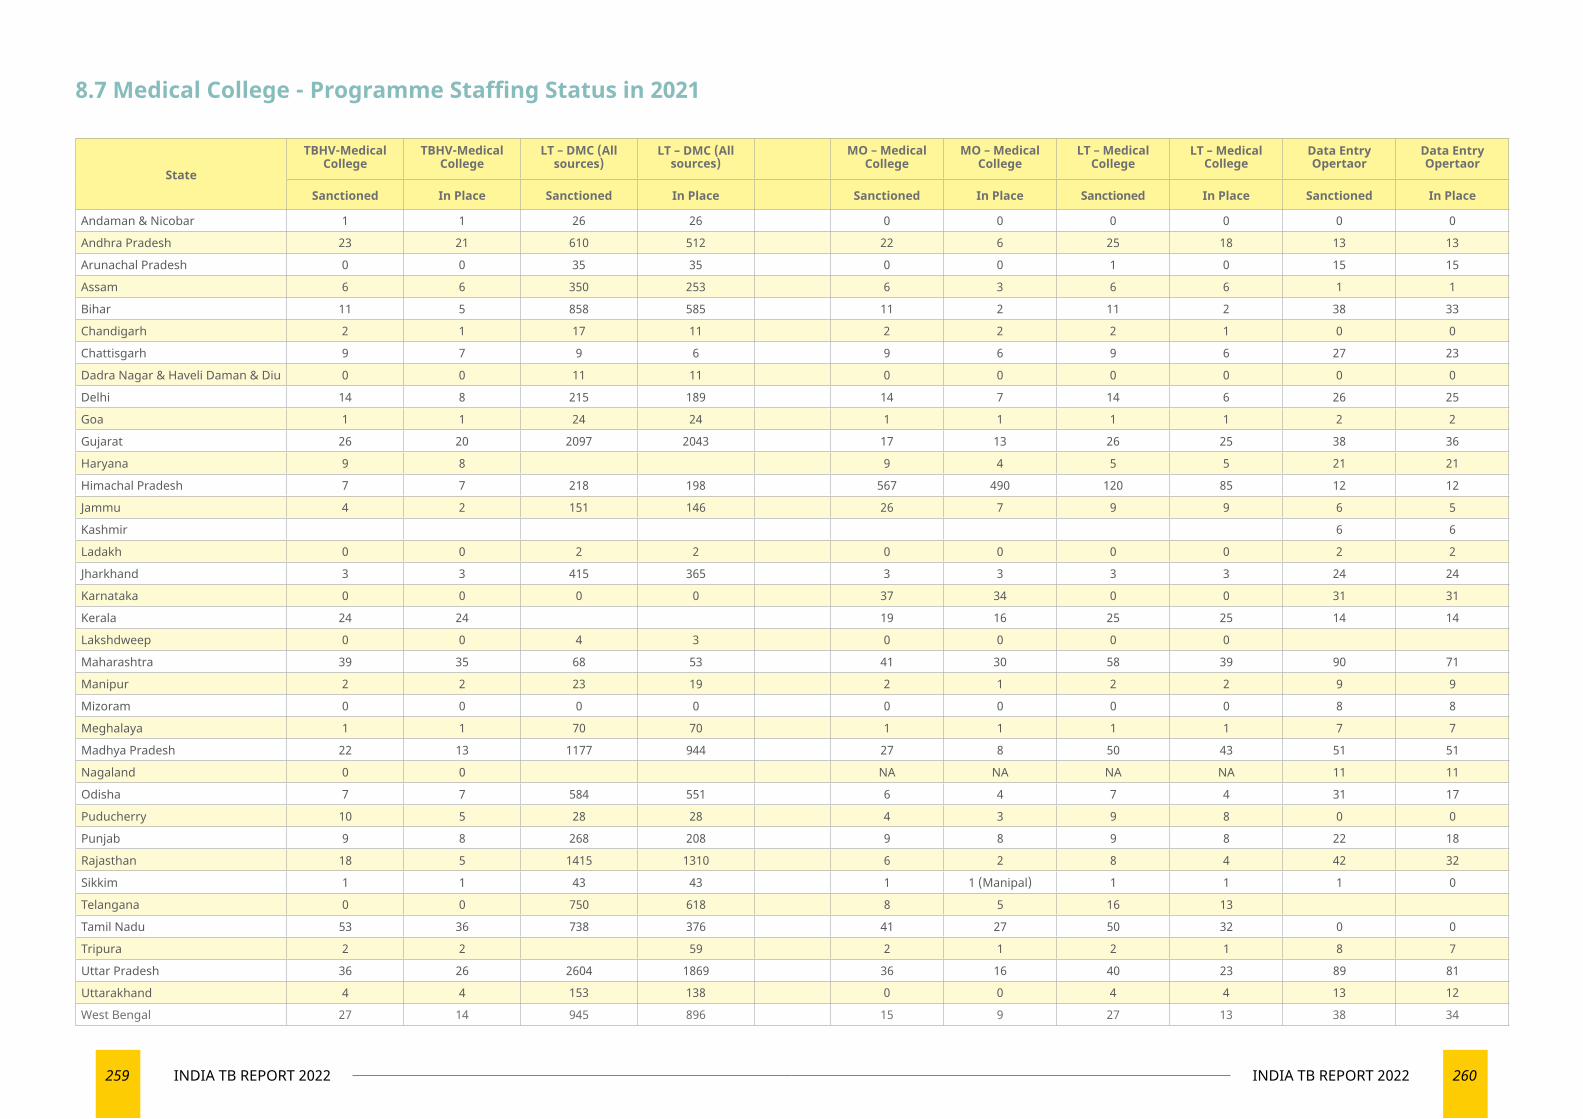
259 INDIA TB REPORT 2022 260INDIA TB REPORT 2022
8.7 Medical College - Programme Staffing Status in 2021
State
TBHV-Medical College
TBHV-Medical College
LT – DMC (All sources)
LT – DMC (All sources)
MO – Medical College
MO – Medical College
LT – Medical College
LT – Medical College
Data Entry Opertaor
Data Entry Opertaor
Sanctioned In Place Sanctioned In Place Sanctioned In Place Sanctioned In Place Sanctioned In Place
Andaman & Nicobar 1 1 26 26 0 0 0 0 0 0
Andhra Pradesh 23 21 610 512 22 6 25 18 13 13
Arunachal Pradesh 0 0 35 35 0 0 1 0 15 15
Assam 6 6 350 253 6 3 6 6 1 1
Bihar 11 5 858 585 11 2 11 2 38 33
Chandigarh 2 1 17 11 2 2 2 1 0 0
Chattisgarh 9 7 9 6 9 6 9 6 27 23
Dadra Nagar & Haveli Daman & Diu 0 0 11 11 0 0 0 0 0 0
Delhi 14 8 215 189 14 7 14 6 26 25
Goa 1 1 24 24 1 1 1 1 2 2
Gujarat 26 20 2097 2043 17 13 26 25 38 36
Haryana 9 8 9 4 5 5 21 21
Himachal Pradesh 7 7 218 198 567 490 120 85 12 12
Jammu 4 2 151 146 26 7 9 9 6 5
Kashmir 6 6
Ladakh 0 0 2 2 0 0 0 0 2 2
Jharkhand 3 3 415 365 3 3 3 3 24 24
Karnataka 0 0 0 0 37 34 0 0 31 31
Kerala 24 24 19 16 25 25 14 14
Lakshdweep 0 0 4 3 0 0 0 0
Maharashtra 39 35 68 53 41 30 58 39 90 71
Manipur 2 2 23 19 2 1 2 2 9 9
Mizoram 0 0 0 0 0 0 0 0 8 8
Meghalaya 1 1 70 70 1 1 1 1 7 7
Madhya Pradesh 22 13 1177 944 27 8 50 43 51 51
Nagaland 0 0 NA NA NA NA 11 11
Odisha 7 7 584 551 6 4 7 4 31 17
Puducherry 10 5 28 28 4 3 9 8 0 0
Punjab 9 8 268 208 9 8 9 8 22 18
Rajasthan 18 5 1415 1310 6 2 8 4 42 32
Sikkim 1 1 43 43 1 1 (Manipal) 1 1 1 0
Telangana 0 0 750 618 8 5 16 13
Tamil Nadu 53 36 738 376 41 27 50 32 0 0
Tripura 2 2 59 2 1 2 1 8 7
Uttar Pradesh 36 26 2604 1869 36 16 40 23 89 81
Uttarakhand 4 4 153 138 0 0 4 4 13 12
West Bengal 27 14 945 896 15 9 27 13 38 34
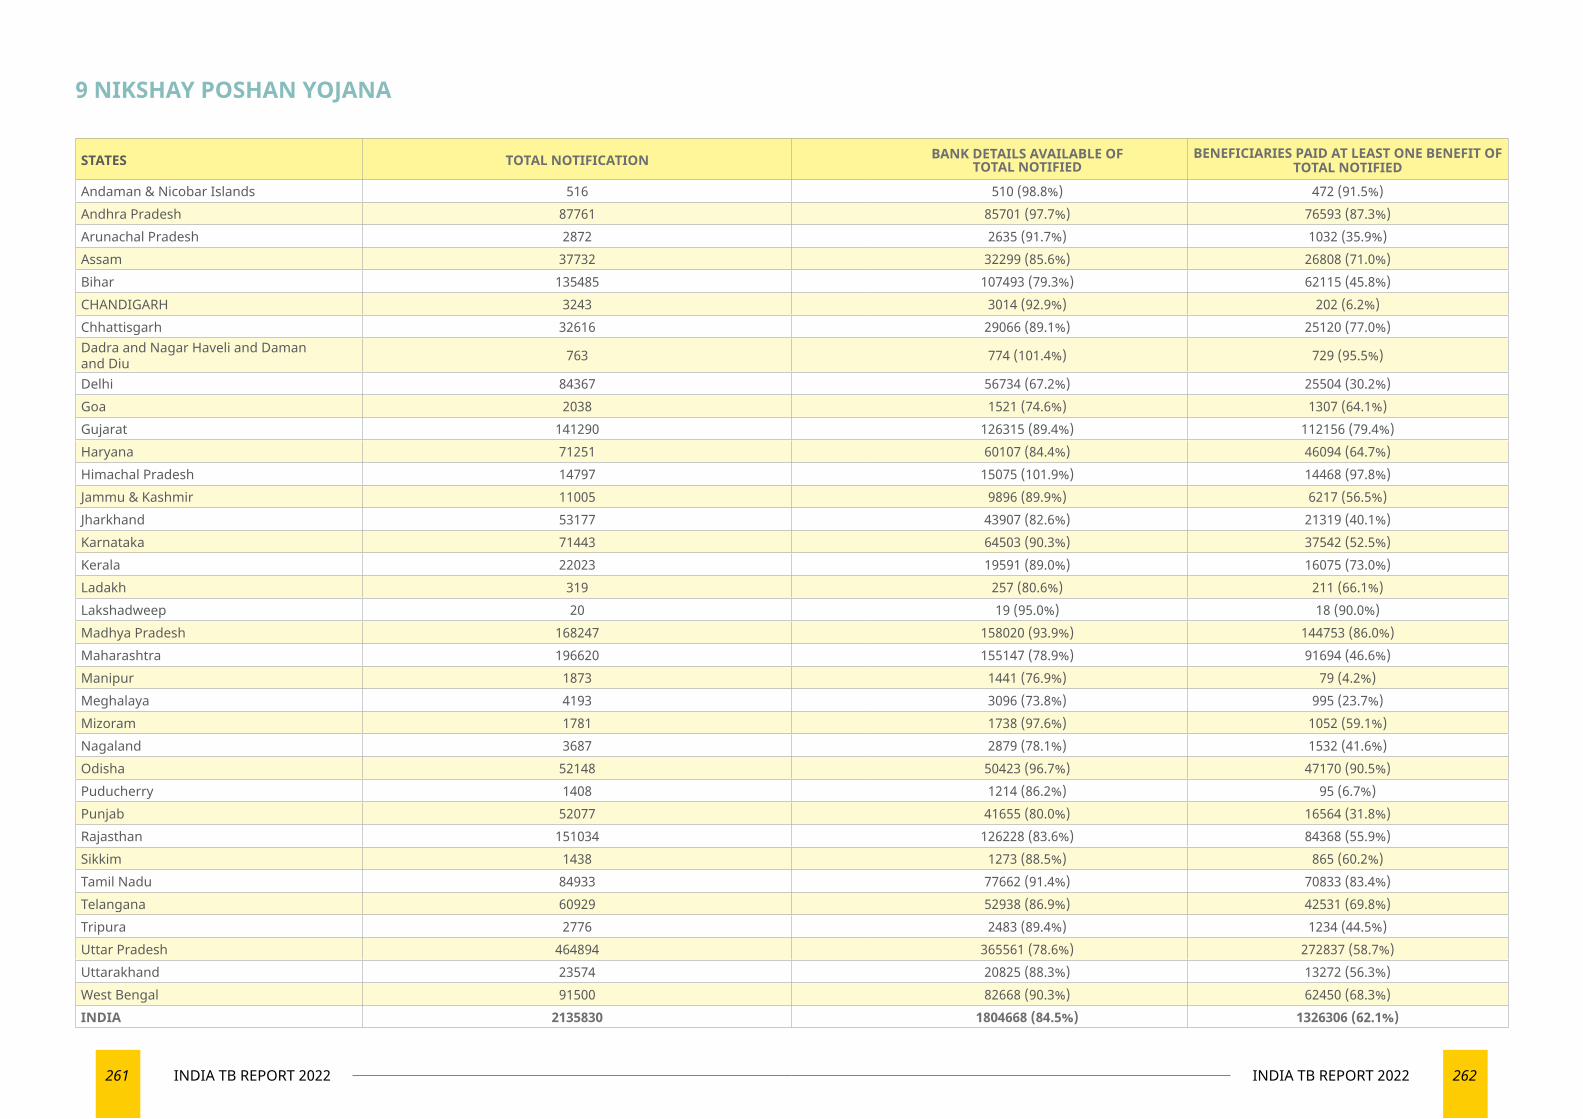
261 INDIA TB REPORT 2022 262INDIA TB REPORT 2022
STATES TOTAL NOTIFICATION BANK DETAILS AVAILABLE OF TOTAL NOTIFIED
BENEFICIARIES PAID AT LEAST ONE BENEFIT OF TOTAL NOTIFIED
Andaman & Nicobar Islands 516 510 (98.8%) 472 (91.5%)Andhra Pradesh 87761 85701 (97.7%) 76593 (87.3%)Arunachal Pradesh 2872 2635 (91.7%) 1032 (35.9%)Assam 37732 32299 (85.6%) 26808 (71.0%)Bihar 135485 107493 (79.3%) 62115 (45.8%)CHANDIGARH 3243 3014 (92.9%) 202 (6.2%)Chhattisgarh 32616 29066 (89.1%) 25120 (77.0%)Dadra and Nagar Haveli and Daman and Diu 763 774 (101.4%) 729 (95.5%)
Delhi 84367 56734 (67.2%) 25504 (30.2%)Goa 2038 1521 (74.6%) 1307 (64.1%)Gujarat 141290 126315 (89.4%) 112156 (79.4%)Haryana 71251 60107 (84.4%) 46094 (64.7%)Himachal Pradesh 14797 15075 (101.9%) 14468 (97.8%)Jammu & Kashmir 11005 9896 (89.9%) 6217 (56.5%)Jharkhand 53177 43907 (82.6%) 21319 (40.1%)Karnataka 71443 64503 (90.3%) 37542 (52.5%)Kerala 22023 19591 (89.0%) 16075 (73.0%)Ladakh 319 257 (80.6%) 211 (66.1%)Lakshadweep 20 19 (95.0%) 18 (90.0%)Madhya Pradesh 168247 158020 (93.9%) 144753 (86.0%)Maharashtra 196620 155147 (78.9%) 91694 (46.6%)Manipur 1873 1441 (76.9%) 79 (4.2%)Meghalaya 4193 3096 (73.8%) 995 (23.7%)Mizoram 1781 1738 (97.6%) 1052 (59.1%)Nagaland 3687 2879 (78.1%) 1532 (41.6%)Odisha 52148 50423 (96.7%) 47170 (90.5%)Puducherry 1408 1214 (86.2%) 95 (6.7%)Punjab 52077 41655 (80.0%) 16564 (31.8%)Rajasthan 151034 126228 (83.6%) 84368 (55.9%)Sikkim 1438 1273 (88.5%) 865 (60.2%)Tamil Nadu 84933 77662 (91.4%) 70833 (83.4%)Telangana 60929 52938 (86.9%) 42531 (69.8%)Tripura 2776 2483 (89.4%) 1234 (44.5%)Uttar Pradesh 464894 365561 (78.6%) 272837 (58.7%)Uttarakhand 23574 20825 (88.3%) 13272 (56.3%)West Bengal 91500 82668 (90.3%) 62450 (68.3%)INDIA 2135830 1804668 (84.5%) 1326306 (62.1%)
9 NIKSHAY POSHAN YOJANA
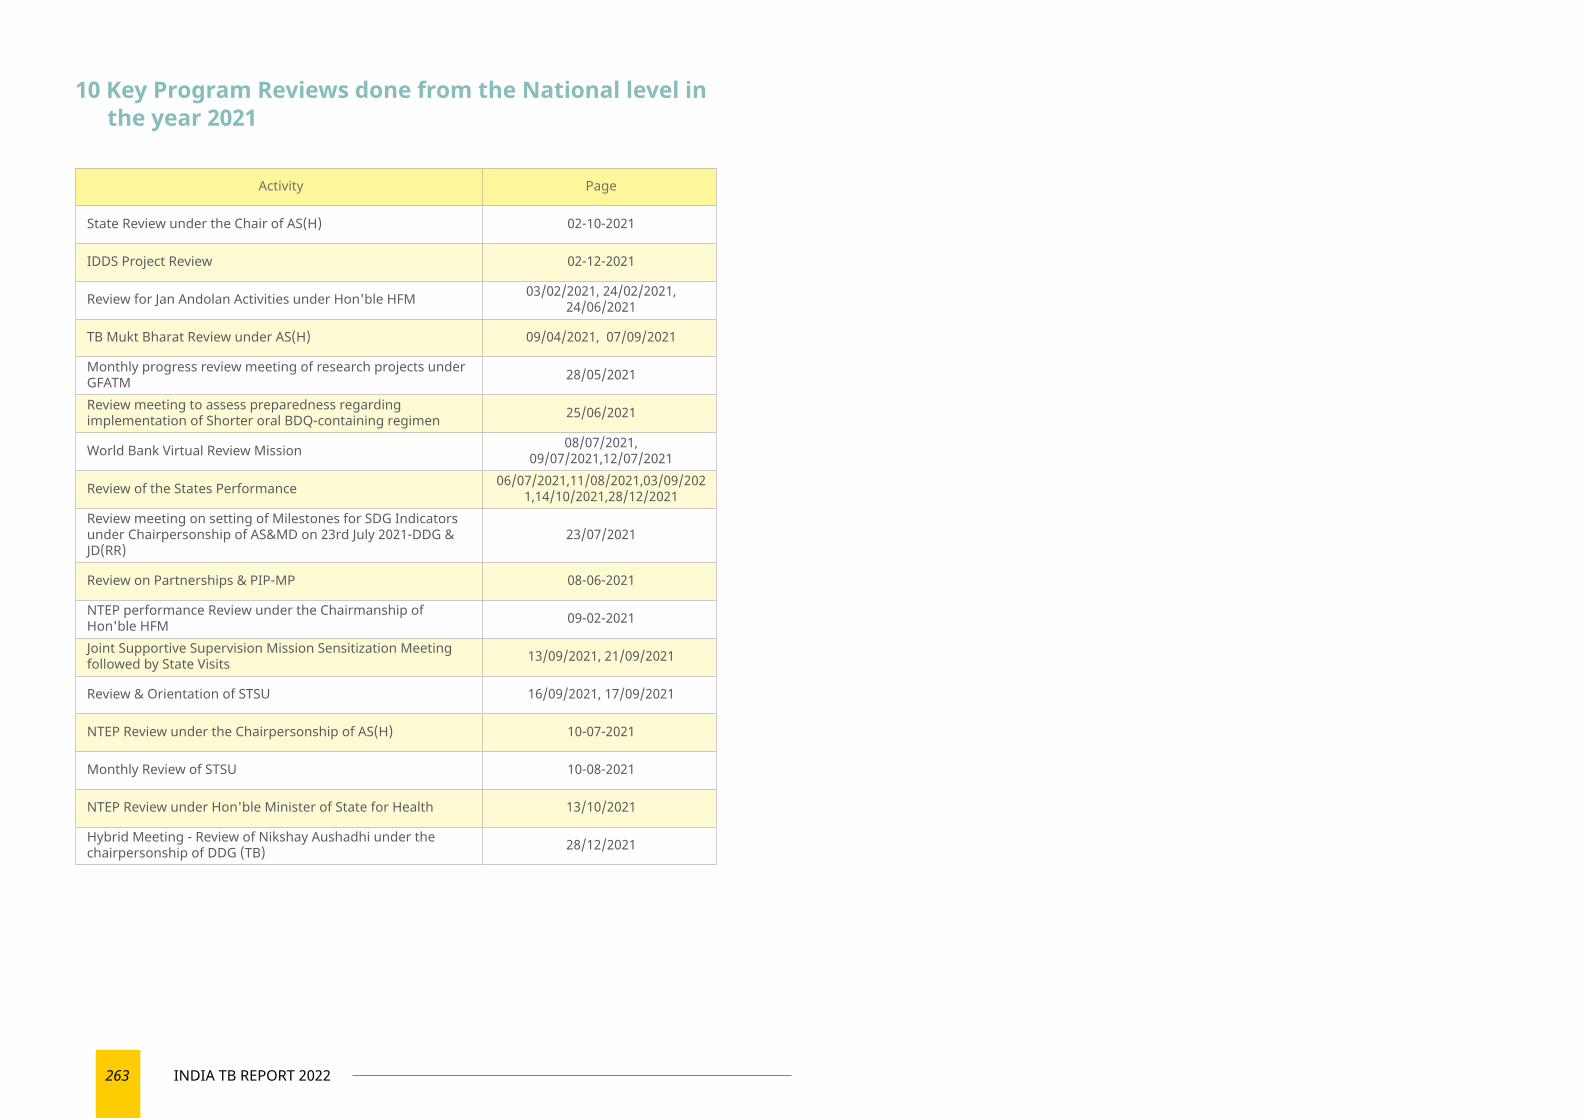
263 INDIA TB REPORT 2022
10 Key Program Reviews done from the National level in the year 2021
Activity Page
State Review under the Chair of AS(H) 02-10-2021
IDDS Project Review 02-12-2021
Review for Jan Andolan Activities under Hon'ble HFM 03/02/2021, 24/02/2021, 24/06/2021
TB Mukt Bharat Review under AS(H) 09/04/2021, 07/09/2021
Monthly progress review meeting of research projects under GFATM 28/05/2021
Review meeting to assess preparedness regarding implementation of Shorter oral BDQ-containing regimen 25/06/2021
World Bank Virtual Review Mission 08/07/2021, 09/07/2021,12/07/2021
Review of the States Performance 06/07/2021,11/08/2021,03/09/2021,14/10/2021,28/12/2021
Review meeting on setting of Milestones for SDG Indicators under Chairpersonship of AS&MD on 23rd July 2021-DDG & JD(RR)
23/07/2021
Review on Partnerships & PIP-MP 08-06-2021
NTEP performance Review under the Chairmanship of Hon'ble HFM 09-02-2021
Joint Supportive Supervision Mission Sensitization Meeting followed by State Visits 13/09/2021, 21/09/2021
Review & Orientation of STSU 16/09/2021, 17/09/2021
NTEP Review under the Chairpersonship of AS(H) 10-07-2021
Monthly Review of STSU 10-08-2021
NTEP Review under Hon'ble Minister of State for Health 13/10/2021
Hybrid Meeting - Review of Nikshay Aushadhi under the chairpersonship of DDG (TB) 28/12/2021
Ministry of Health and Family WelfareGovernment of India
INDIA TB REPORT 2022
Coming Together to End TB Altogether
TB Mukt Bharat @TbdivisionNTEPEndsTB
Central TB Division3, Sansad Marg, Janpath, New Delhi – 110001
www.tbcindia.gov.in
Related Documents