July 14, 2003 A World Bank Development Policy Review Report No. 25797-IN India Sustaining Reform, Reducing Poverty Poverty Reduction and Economic Management Sector Unit South Asia Region Public Disclosure Authorized Public Disclosure Authorized Public Disclosure Authorized Public Disclosure Authorized Public Disclosure Authorized Public Disclosure Authorized Public Disclosure Authorized Public Disclosure Authorized

Welcome message from author
This document is posted to help you gain knowledge. Please leave a comment to let me know what you think about it! Share it to your friends and learn new things together.
Transcript
July 14, 2003
A World Bank Development Policy Review
Report N
o. 25797-INIndia Sustaining R
eform, R
educing Poverty
Report No. 25797-IN
IndiaSustaining Reform, Reducing Poverty
Poverty Reduction and Economic Management Sector UnitSouth Asia Region
Pub
lic D
iscl
osur
e A
utho
rized
Pub
lic D
iscl
osur
e A
utho
rized
Pub
lic D
iscl
osur
e A
utho
rized
Pub
lic D
iscl
osur
e A
utho
rized
Pub
lic D
iscl
osur
e A
utho
rized
Pub
lic D
iscl
osur
e A
utho
rized
Pub
lic D
iscl
osur
e A
utho
rized
Pub
lic D
iscl
osur
e A
utho
rized

CURRENCY AND EQUIVALENT
ACR AD AIDS AP APDRP BE BIFR
BMC
BOP BPL CAD CAG CDS
CDW CENVAT CII CIP CMIE CPE cso css DAP DCCB DM EAIF EAS EGS EIF EPF EPS ERC EUS
FDI FC f.c. FCI FICCI
FRBM
Currency Unit = Indian Rupee US$ 1 - INR 46.28
FISCAL YEAR April 1 - March 3 1
ACRONYMS AND ABBREVIATIONS
Annual Confidential Report Anti Dumping Acquired Immune Deficiency Syndrome Andhra Pradesh Accelerated Power Development and Reform Program Budget Estimate Bureau of Industrial and Financial Restructuring
Greater Mumbai Municipal Corporation
Balance of Payments Below Poverty Line Current Account Deficit Comptroller and Auditor General Current Daily Status
Current Weekly Status Central Value Added Tax Confederation of Indian Industries Central Issue Price Center for Monitoring Indian Economy Central Public Enterprises Central Statistical Organization
Centrally Sponsored Schemes Di- Ammonia phosphate District Central Cooperative Bank District Manager Emergency Africa Infrastructure Fund Employment Assurance Scheme Employment Guarantee Scheme European Investment Fund Employee Provident Fund Employee Pension Scheme Expenditure Reform Commission Employment Unemployment Survey
Foreign Direct Investment Finance Commission Factor Cost Food Corporation of India Federation of Indian Chambers of Commerce and Industry Fiscal Responsibility and Budget Management Act
GATS GCF GDP Go1 GSDP HIV HUDCO
ICAC
ICAR ICDS IDB IDBI IDFC
IFCI IMF IMD IR IT Kwh LGED
LIC MDGs MMR MOP MoF MOIC MoRD MOU m.p. MP MRP MRTP
MSP MTRF MW NACO NAFTA
NBFC
General Agreement on Trade in Services Gross Capital Formation Gross Domestic Product Government of India Gross State Domestic Product Human Immunodeficiency Virus Housing and Urban Development Corporation Hong Kong 's Independent Commission Against Corruption Indian Council of Agricultural Research Integrated Child Development Service India Development Bond Industrial Development Bank of India Infrastructure Finance Development
Industrial Financial Corporation of India International Monetary Fund India Millennium Deposit Indian Railways Information Technology Kilowatthour Local Government Engineering Department Life Insurance Company Millennium Development Goals Maternal Mortality Rate Muriate of Potash Ministry of Finance Ministry of Industry and Commerce Ministry of Rural Development Memorandum of Understanding Market Price Madhya Pradesh Maximum Retail Price Monopolies and Restrictive Trade Practices Act Minimum Support Price Medium Term Reforms Facility Mega Watt National Aids Control Organization North American Free Trade Agreement
COmprnY
Non-bank financial corporation
NCDC National Cooperative Development Council RBI Reserve Bank of India NDDB National Dairy Development Board RCC Rural Credit Cooperative NER Net enrollment rate REC Regional Environment Center NFHS National Family Health Survey SBA Small Borrower Accounts NGO Non-Governmental Organizations SCB State Cooperative Bank NHDP National Highways Development Project SCARDB State Cooperative Agricultural and Rural
Development Bank NIPFP National Institute of Public Finance and Policy SEB State Electricity Board NPA Non-performing asset SHG Self Help Group NPL Non-performing loan SICA Sick Industries Companies Act NRI Non Resident Indian SME Small and Medium Enterprise NSS National Sample Survey SPV Special Purpose Vehicle OECD Organization for Economic Cooperation and
Development SPS Sanitary and Phytosanitary
O&M Operations & Maintenance SSA Sarva Siksha Abhiyan (Education For All) p.a. Per Annum SSI Small Scale Industry PC Planning Commission TERI Tata Energy Research Institute PF Provident Fund TFP Total Factor Productivity PAC Public Account Committee TPDS Targeted Public Distribution System PAC Public Affairs Committee T&D Transmission and Distribution PDS Public Distribution System T&V Training and visit PEGF Pre-Export Guarantee Facility UP Uttar Pradesh PLR Prime Lending Rate UPS Usual Principal Status PMGY Prime Minister’s Gramadaya Yojna (Rural
Electrification Program) UPSS Usual Principal and Subsidiary Status
PPP Public Private Partnership USO Universal Service Obligation PRG Partial Risk Guarantee UTI Unit Trust of India PROST Pension Reform Options Simulation Toolkit VAT Value Added Tax PSEDF Private Sector Energy Development Fund WPI Wholesale Price Index PWD Public Works Department WTO World Trade Organization QR Quantitative Restriction
Vice President : Praful Patel, SARVP Country Director : Michael F. Carter, SACIN Sector Director : Sadiq Ahmed, SASPR Sector Manager : Ijaz Nabi, SASPR Task Managers : Mark Baird, Consultant &
Manuela Ferro, SASPR

ACKNOWLEDGEMENTS
This report was prepared by a team led by M a r k Baird and Manuela Ferro, under the overall guidance o f Sadiq Ahmed and Michael Carter, and with advice f rom Stephen Howes and Ijaz Nabi. The peer reviewers were N i c k Stem, Shankar Acharya, Suman Bery, and Pranab Bardhan.
Ma jo r contributors to the report were Br ian Pinto and Farah Zahir on fiscal policy, Robert Beschel and Vikram Chand o n c iv i l service reform, Jeffrey Hammer on human development, Priya Basu o n the investment climate for industry and services, Dina Umali-Deininger on agriculture and rural development, Bhavna Bhatia o n the power sector, James Hanson on the financial sector, Anthony Bot t r i l l o n the extemal sector, Luis Constantino on decentralization, Esperanza Lasagabaster o n pensions, Gloria Kessler o n the environment, and Gamy Purse11 on trade policy. A background paper on fiscal management was prepared by National Inst i tu te o f Public Finance and Policy (NIPFP) in N e w Delhi. Bhaskar Naidu and Kruti Bharucha provided statistical support. Administrative support was provided by Shunalini Sarkar and Shahnaz Rana. The DPR team visited India in February 2003 and received valuable comments o n the draft report f rom the Government o f India in June 2003.


INDIA: SUSTAINING REFORM. REDUCING POVERTY
TABLE OF CONTENTS
EXECUTIVE SUMMARY ......................................................................................................................... i
PART I: ASSESSMENT OF DEVELOPMENT OUTCOMES ............................................................. 1
Overview ................................................................................................................................... 1 Poverty Outcomes and Economic Performance ........................................................................ 2
Social Outcomes ........................................................................................................................ 7
Economic and Social Outcomes: A Regional Perspective ........................................................ 8 Accelerating Development in India: Goals and Policy Agenda ................................................ 9
PART 11: POLICY AGENDA: MANAGING PUBLIC RESOURCES .............................................. 11
I1 . 1: FISCAL POLICY ............................................................................................................................ 12
Introduction ............................................................................................................................. 12
Government Debt Dynamics and External Vulnerability ....................................................... 15 Government Debt Dynamics ............................................................................................ 16 External Vulnerability ...................................................................................................... 17
Costs o f the Fiscal Stance ........................................................................................................ 18
Fiscal Reform Priorities .......................................................................................................... 21 Tax Ref0 rm ....................................................................................................................... 21 Subsidy Reduction ............................................................................................................ 21 Financial Policy ................................................................................................................ 23 Fiscal Management ........................................................................................................... 25
Government Debt Projections: Why Fiscal Adjustment? ....................................................... 26
I1 . 2: DELIVERY OF PUBLIC SERVICES .......................................................................................... 31
Introduction ............................................................................................................................. 31
Civil Service Reform ............................................................................................................... 31 Size and Structure o f the C iv i l Service ............................................................................. 31 Costs o f the Civ i l Service ................................................................................................. 32 The Return on C iv i l Service Expenditures ....................................................................... 34 Improving Public Service Delivery .................................................................................. 35
Health, Education and Social Safety Nets ............................................................................... 37 Health Strategy and Policy Priorities ................................................................................ 40 Education Strategy and Policy Priorities .......................................................................... 43 Providing Effective Social Safety Nets ............................................................................ 45
Towards the Future ................................................................................................................. 46
PART 111: POLICY AGENDA: IMPROVING THE INVESTMENT CLIMATE ............................ 47
I11 . 1: INDUSTRY AND SERVICES ...................................................................................................... 48
Performance: Achievements and Challenges .......................................................................... 48
Investment Climate: K e y Constraints and Policy Priorities .................................................... 50 Product Market Distortions ............................................................................................... 50
Infkastructure Bottlenecks ................................................................................................. 59
Estimated Impact o f a Better Investment Climate on Overall Economic Performance .......... 63
Factor Market Distortions ................................................................................................. 56
. .................................................................. 111 2: AGRICULTURE AND RURAL DEVELOPMENT 64
Agriculture and the Rural Economy ........................................................................................ 64
Foodgrain (Rice and Wheat) Policy ........................................................................................ 67
Input Policies ........................................................................................................................... 68 Fertilizer Policy ................................................................................................................ 68 Water Resources and Irrigation ........................................................................................ 69 Power Supply to Agriculture ............................................................................................ 70
Product and Factor Markets .................................................................................................... 72 Trade Policies and Regulations ........................................................................................ 72 Access to Land .................................................................................................................. 73 Access to Rural Credit ...................................................................................................... 75
Enhancing the Productivity o f Public Investments ................................................................. 76 Agricultural Research and Extension ............................................................................... 76
Rural Electrification .......................................................................................................... 78 Rural Roads ...................................................................................................................... 77
PART 1%': DEVELOPMENT PROSPECTS AND R I S K S ................................................................... 79
Outlook .................................................................................................................................... 79
Risks ........................................................................................................................................ 82 Conclusion ............................................................................................................................... 83
REFERENCES ......................................................................................................................................... 85
STATISTICAL ANNEX .......................................................................................................................... 96
Tables
Table 1: Table 2: Table 3: Table 4: Table 5: Table 6: Table 1.1 : Table 1.2: Table 1.3: Table 1.4: Table 1.5: Table 2.1 : Table 2.2: Table 2.3: Table 2.4: Table 2.5: Table 2.6: Table 2.7: Table 2.8:
Table 2.9:
Progress on Social Indicators. 1980-2000 .................................................................................. i Macroeconomic Trends over the Past T w o Decades ................................................................ ii Ratio o f Average Wages in the Public and Private Sector ...................................................... vii Absence Rates f rom Primary Facilities, 2003 .......................................................................... ix Custom Duty Rates in India and Other Developing Count ies ................................................ x i Macroeconomic Projections - Baseline and Reform Scenarios ............................................ xvii Macroeconomic Trends over the Past T w o Decades ................................................................ 3 Sectoral Shares o f GDP, 1980/81 and 2001/02 ......................................................................... 4 Unemployment Rates, India and Comparator Countries ........................................................... 6 All India Social Indicators, 1980-2000 ..................................................................................... 7 Concentration o f Poverty in India ............................................................................................. 8 General Government Fiscal Trends ......................................................................................... 12 Trends in Central Govemment Finances ................................................................................. 13 Trends in State Government Finances .................................................................................... 14 K e y Macroeconomic Aggregates ............................................................................................ 16 Sustainable and Desirable Deficits in the Tenth Plan Context ................................................ 19 Government Subsidies ............................................................................................................ 22 Fiscal Projections .................................................................................................................... 29 Ratio o f C iv i l Service Salary and Dearness Allowance to GDP for Go1 and Selected States ......................................................................................................................... 32 Ratio o f Average Wages in the Public and Private Sector for Selected Categories o f Employment ............................................................................................................................ 32
Table 2.10: Absence Rates f rom Primary Facilities in Selected States. 2003 ............................................ 39 Table 2.1 1 : Health Spending in India and Comparator Countries ............................................................. 41 Table 2.12: Education Spending in India and Comparator Countries ........................................................ 43 Table 3.1 : GDP. Industry and Services Growth Rates ............................................................................. 48 Table 3.2: Un-weighted Average Customs Duty Rates in India and other Developing Countries .......... 53 Table 3.3: Indirect Tax Rates in Selected Developing Countries ............................................................. 56 Table 3.4: GDP, Agriculture Sector Growth Rates .................................................................................. 65 Table 3.5: Recent Fertilizer Policy Reforms ............................................................................................ 69 Table 3.6: Go1 Ma jo r Domestic Policy and Trade Regulations, January 2003 ........................................ 72 Table 4.1 : Macroeconomic Projections - Baseline and Reform Scenarios .............................................. 80 Table 4.2: Elasticity o f Employment to GDP, 1993/94 - 1999/00, Selected Sectors .............................. 81
Figures ... Figure 1 : General Govt . Def ic i t and Debt Stock 1985/86 . 2002/03 ...................................................... 111
Figure 2: Government Debt/GDP Ratio Projected to 2006/07 ................................................................ vi Figure 1 . 1. Per Capita Income Trends - India and Comparator Countries ................................................. 1 Figure 1.2: Poverty and Per Capita Income Trends, 1983-1999/00 ............................................................ 2 Figure 1.3: Unemployment Rates (Current Weekly Status), 1987/88-1999/00 ........................................... 6 Figure 1.4: State-Wise Per Capita Income. 3 year average (1 998/99 - 2000/0 1) ........................................ 9 Figure 2.1: General Government Def ic i t and Debt Stock 1985/86 - 2002/03 .......................................... 12 Figure 2.2: Primary Deficits and the Implied Difference between the Real Rate o f Interest
and Growth .............................................................................................................................. 17 Figure 2.3: Gross Capital Formation in Private and Corporate Sector and the General
Government Def ic i t including Oil Pool ................................................................................. 19 Figure 2.4: Real Interest Rates (1990/91-2001/02) .................................................................................... 20 Figure 2.5: Government Debt/GDP Ratio Projected to 2006/07 ............................................................... 28
Figure 2.6: Projected General Government Fiscal Deficits ....................................................................... 28
Figure 2.8: Public Expenditures on Health (center and states, in bi l l ion rupees at 1993 prices) ............... 38
Figure 3.1 : Private Investment in Industry and Services, (annual average growth rate) ........................... 48 Figure 3.2: State-Level Industrial Growth, by State, 1990-99 ................................................................... 50 Figure 3.3: Bankruptcies as a Share o f Total Firms ................................................................................... 58 Figure 3.4: Cost o f Power .......................................................................................................................... 60 Figure 3.5: Energy Costs as Share o f Total Sales ...................................................................................... 60 Figure 3.6: Shipping and Cost Disadvantages in Textiles ......................................................................... 62
Figure 3.8: Electric Pumps Only: Irrigation Cost as a Percent o f Gross Farm Income in
Figure 3.9: Percentage Distribution o f Number o f Owned Holdings and Area Owned by Farm
Figure 2.7: Public Expenditures on Education (center and states, in bi l l ion rupees at 1993 prices) ......... 38
Figure 2.9: Prevalence o f Diseases by Income Group: All India, 1992 .................................................... 42
Figure 3.7: Gross Capital Formation in Agriculture and Al l ied Sectors, Rs.billion, 1993/94 ................... 66
Haryana ................................................................................................................................... 71
Size .......................................................................................................................................... 73
Boxes
B o x 1: B o x 2: B o x 3: B o x 1.1: B o x 1.2: B o x 1.3: B o x 2.1: B o x 2.2: B o x 2.3 B o x 3.1: B o x 3.2: B o x 4.1 :
Who are India’s Poor? ............................................................................................................... ii Urgent Need for Reforms in Power Distribution ...................................................................... v Summary o f Priority Reforms ................................................................................................ xix Who are India’s Poor? ............................................................................................................... 2 India’s Success in Information Technology(1T) ....................................................................... 5 Targets for the Tenth Plan and Beyond ................................................................................... 10 Assumptions Underlying DebtDef ic i t Projections.. ............................................................... 27
Building a Healthy Environment ............................................................................................ , 4 2 K e y Structural Reforms since 199 1 ........................................................................................ 52 Damaging the Land ................................................................................................................. 66 Summary o f Priority Reforms ................................................................................................. 84
Karnataka’s L o k Ayukta ......................................................................................................... 37
Statistical Annex
Table A l : Gross Domestic Expenditure and Product (shares based on current price data) Table A2: Gross Domestic Expenditure and Product (Rs. b i l l ion current prices) Table A3: Annual Growth Rates o f National Income and Product at Constant Prices (annual
growth rates) Table A4: Gross Domestic Product by Expenditure, National Income and Savings (Rs. b i l l ion at
1993-94 prices) Table A5: Exchange Rates and Prices Table A6: Central Government Finances Summary Table A7: Budgetary Classification o f Central Government Finances Table A8: Budgetary Classification o f State Government Finances TableA9: Budgetary Classification o f General Government Finances Table A10: Transfers Between Center and States Table A1 1: Outstanding Debt (Center and States) Table A12: Banking Survey and Interest Rates Table A13: Balance o f Payments Table A14: Exports and Imports Table A15: External Debt and Debt Service Table A16: Financial Sector Indicators

Table A17: Investment Climate Table A18: Vulnerability Indicators Table A1 9: Mil lennium Development Goals Indicators Table A20: Development Indicators - India and Comparator Countries Table A21 : Unemployment Rates: Alternative Measures


INDIA: SUSTAINING REFORM, REDUCING POVERTY
EXECUTIVE SUMMARY
Assessment o f Development Outcomes 1. India has continued to make good progress in increasing incomes and improving living standards over the past decade. After the setback associated with the 1991 balance o f payments crisis, economic growth picked up, income poverty has continued to decline, and many social indicators, in particular literacy, have continued to improve (Table 1). These developments were supported by the wide-ranging reforms launched in 1991 to open and deregulate the economy. Even though the pace o f reforms has slowed since the mid-l990s, cumulative changes so far have been substantial. More sectors have been opened to private activity, trade pol icy and the exchange rate regime have been further liberalized, and capital markets have been reformed, leading to an improved investment climate.
Table 1: Progress on Social indicators, 1980-2000
1980s 1990s 2000 Poverty Poverty incidence (%) Adjusted poverty incidence (%)
Education Overall literacy rate: 7+ years (%) Female literacy rate as a percent of male literacy rate (%) Net enrollment rate (NER): grades 1-5 (%) Female NER as a percent of male NER: grades 1-5 (%)
Health Life expectancy at birth (years) Infant mortality rate 0-4 years (per 1000 live births) Maternal mortality rate (per 100,000) Prevalence of HIV (million people)
Sanitation Access to improved water resources (%)
44.5 36.0 26.1 28.6
44 52 65 53 61 71 47 51 77 70 80 81
56 60 61 115 79 68 n.a. 424 540 n.a. 3.5 4.0
n.a. 68 78 Number of households with toilet facility (%) n.a. 30 36
2. Development progress has been steady, but uneven. I t has been uneven across indicators o f living standards, with notable progress in some areas, but litt le or n o progress in others. Maternal and under-five mortality, for instance, has hardly improved, whi le the new threat o f HIV/AIDS i s spreading quickly. And unemployment, although s t i l l l o w by international standards, has increased. Progress has also been uneven across regions. There i s evidence o f divergence in per capita incomes across states, with richer states increasing incomes faster than poorer ones. As a result, poverty has become increasingly concentrated in the country’s slower growing states (Box 1).
i
Box 1: Who are India’s Poor? Poverty i s pervasive in India. I t i s present in the country’s rapidly growing cities and vast rural areas. But it i s increasingly concentrated in the country’s lagging states and rural areas. Over ha l f o f India’s poor now live in one o f four states: Bihar, Madhya Pradesh, Orissa, and Uttar Pradesh. Over two thirds l ive in rural areas. In rural areas, the poverty incidence i s highest amongst agricultural workers, many o f whom are small-scale farmers or casual laborers. People o f scheduled castes and scheduled tribes are far more l ikely to be poor than those o f other social groups, as low- caste status and gender barriers s t i l l operate as social obstacles that block or exclude them from opportunity.
India’s poor suffer not only from lower incomes, but also from lower access to and quality o f public services, such as basic health, education, and infrastructure. The poor often lack the leverage to ensure that state institutions serve them fairly and must often pay for education and health services that others receive for free. For example, studies b y India’s Public Affairs Center indicate that the wealthy and middle classes are more l ikely to resolve their complaints at a lower cost. Corruption is often a highly regressive tax and the poor pay more o f their incomes proportionately than do the wealthy and the middle class.
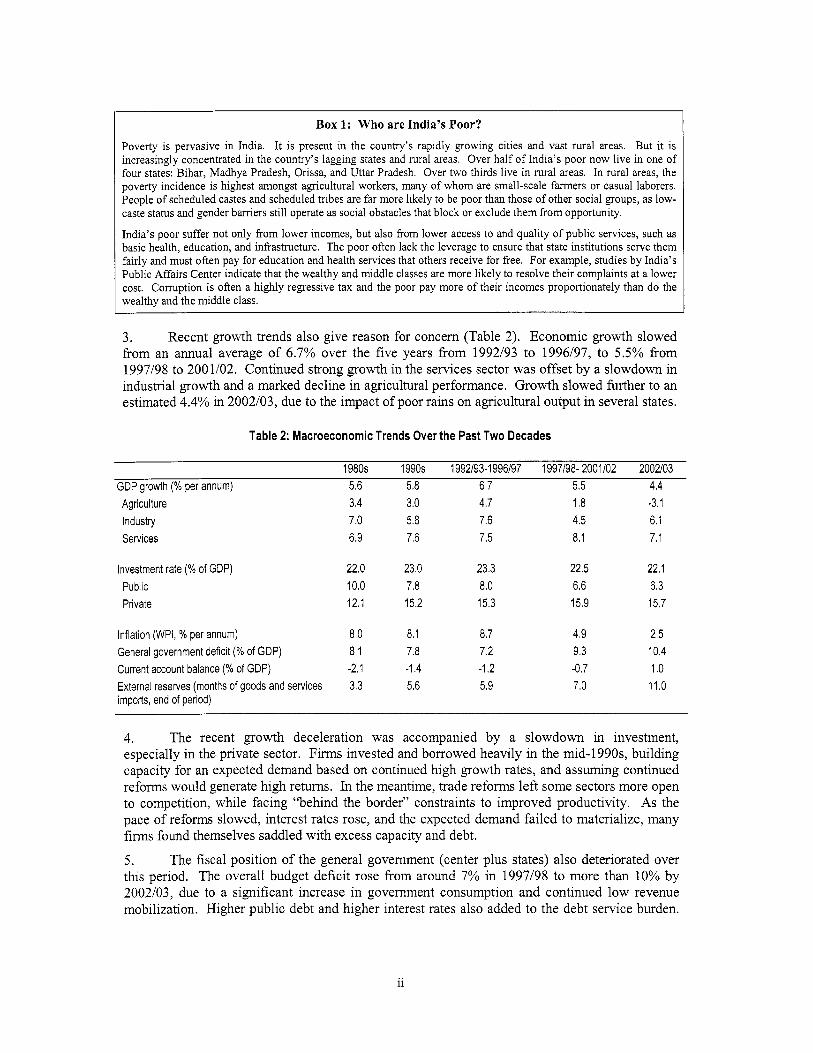
3. Recent growth trends also give reason for concern (Table 2). Economic growth slowed from an annual average o f 6.7% over the five years f rom 1992/93 to 1996/97, to 5.5% from 1997/98 to 2001/02. Continued strong growth in the services sector was offset by a slowdown in industrial growth and a marked decline in agricultural performance. Growth slowed further to an estimated 4.4% in 2002/03, due to the impact o f poor rains o n agncultural output in several states.
Table 2: Macroeconomic Trends Over the Past Two Decades
1980s 1990s 1992193-1996197 1997198- 2001102 2002103 GDP growth (% per annum) 5.6 5.8 6.7 5.5 4.4 Agriculture 3.4 3.0 4.7 1.8 -3.1 Industry 7.0 5.8 7.6 4.5 6.1 Services 6.9 7.6 7.5 8.1 7.1
Investment rate (% of GDP) Public Private
22.0 23.0 23.3 22.5 22.1 10.0 7.8 8.0 6.6 6.3 12.1 15.2 15.3 15.9 15.7
Inflation (WPI, % per annum) 8.0 8.1 8.7 4.9 2.5 General government deficit (% of GDP) 8.1 7.8 7.2 9.3 10.4 Current account balance (% of GDP) -2.1 -1.4 -1.2 -0.7 1 .o External reserves (months of goods and services 3.3 5.6 5.9 7.0 11.0 imports, end of period)
4. The recent growth deceleration was accompanied by a slowdown in investment, especially in the private sector. Firms invested and borrowed heavily in the mid-l990s, building capacity for an expected demand based on continued high growth rates, and assuming continued reforms would generate high returns. In the meantime, trade reforms lef t some sectors more open to competition, while facing “behind the border” constraints to improved productivity. As the pace o f reforms slowed, interest rates rose, and the expected demand failed to materialize, many f irms found themselves saddled with excess capacity and debt.
5. The fiscal position o f the general government (center plus states) also deteriorated over this period. The overall budget deficit rose from around 7% in 1997/98 to more than 10% by 2002/03, due to a significant increase in government consumption and continued l o w revenue mobilization. Higher public debt and higher interest rates also added to the debt service burden.
11
As a result, resources available for public investment became increasingly constrained, with adverse consequences for infrastructure development.
6. At the same time, prudent monetary policy has helped to contain inflation and strengthen the balance o f payments. Rapid growth o f IT service exports, sluggish domestic demand for imports, and higher remittances turned the current account balance into surplus. Together with modest capital inflows, this has generated a substantial increase in external reserves, which now exceed US$80 billion, equivalent to almost one year o f imports.
7. With one-third o f the world’s poor and over one b i l l ion people, India needs rapid growth to reduce poverty and create enough jobs to sustain income increases for i t s population. In i t s Tenth Five-Year Plan, the Government o f India (GoI) targets an average growth rate o f 8% per annum for 2002/03 to 2006/07. However, there are macroeconomic vulnerabilities and structural impediments that limit India’s prospects for accelerating growth and reducing poverty, as the Tenth Plan and the most recent Economic Survey recognize. India’s development pol icy challenges can be grouped into two broad areas: (a) improving the management o f public resources, by reducing budget deficits, reallocating spending to more productive investments, and enhancing the quality o f service delivery; and (b) improving the investment climate and raising productivity in industry, services, agriculture and rural development.
Policy Agenda: Managing Public Resources
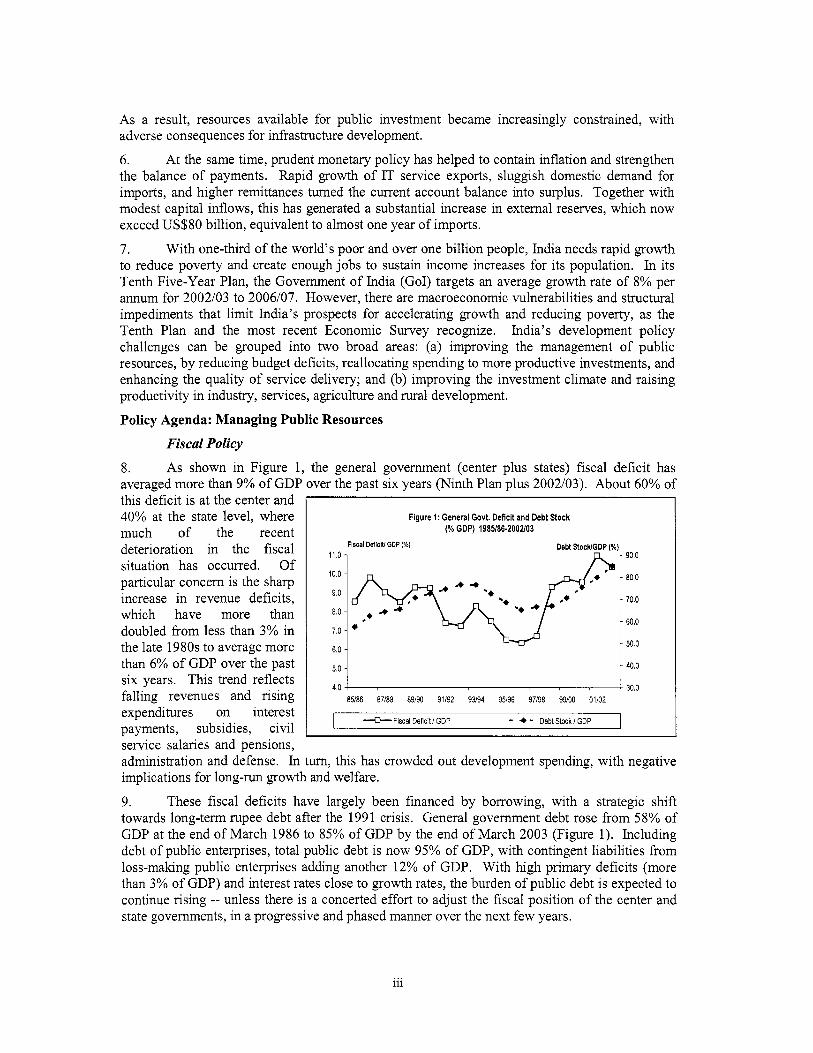
Fiscal Policy 8. As shown in Figure 1, the general government (center plus states) fiscal deficit has averaged more than 9% o f GDP over the past six years (Ninth Plan plus 2002/03). About 60% o f
11.0 -
6.0 -
this deficit i s at the center and 40% at the state level, where much o f the recent deterioration in the fiscal situation has occurred. Of particular concern i s the sharp increase in revenue deficits, which have more than doubled f rom less than 3% in the late 1980s to average more than 6% o f GDP over the past six years. This trend reflects falling revenues and rising expenditures on interest payments, subsidies, c iv i l service salaries and pensions,
- 90.0
- 80.0
- 70.0
- 60.0
- 50.0
Figure 1: General Govt. Deficit and Debt Stock (% GDP) 1985/86-2002/03
4.0 5.0 3:: 85/86 87/88 89/90 91/92 93/94 95/96 97/98 99/00 01/02
--.E)--. Fiscal Deficit / GDP - + - DebtStock/GDP
administration and defense. In turn, this has crowded out development spending, with negative implications for long-run growth and welfare.
9. These fiscal deficits have largely been financed by borrowing, with a strategic shift towards long-tenn rupee debt after the 1991 crisis. General government debt rose f rom 58% o f GDP at the end o f March 1986 to 85% o f GDP by the end o f March 2003 (Figure 1). Including debt o f public enterprises, total public debt i s now 95% o f GDP, with contingent liabilities f rom loss-malung public enterprises adding another 12% o f GDP. With high primary deficits (more than 3% o f GDP) and interest rates close to growth rates, the burden o f public debt i s expected to continue rising -- unless there i s a concerted effort to adjust the fiscal position o f the center and state governments, in a progressive and phased manner over the next few years.
... 111
10. On the surface, these fiscal indicators are worse than those faced by India in 1991 - and worse than in many other countries that actually suffered a macroeconomic crisis. However, the risk o f crisis in India today i s mitigated by the country’s strong external position. Rising external reserves, and l o w levels o f short-term external debt, give the country a very comfortable cushion to counter any speculative attack. The risk o f a speculative attack i s further reduced by a pliant financial system (which i s willing to ho ld large amounts o f domestic government debt), l imited capital account convertibility, and a flexible exchange rate. Thus India i s not vulnerable in the short term to the type o f collapse suffered by Russia or Argentina.
1 1. Even so, the Tenth Plan i s right to be concerned about the consequences over the medium term o f leaving the current fiscal situation unchecked. What has emerged in effect i s a mixture o f “loose fiscal, tight monetary” policy that has helped to keep inflation l o w and the external accounts strong. But this has been at the expense o f growth and welfare, as growing interest payments have crowded out public investment, and high real interest rates have constrained private investment. Even though interest rates have declined over the past 18 months, public debt dynamics have continued to worsen.
12. There i s a l ively debate going o n in India today as to whether the large fiscal deficit i s a serious problem or not, given the high levels o f external reserves and food stocks. Indeed, some see fiscal stimulus as desirable to counter the slowdown in private sector activity. However, arguments for fiscal stimulus are not convincing at a time when public debt levels are so high and interest rates may well start to rise f rom their current l o w levels. Furthermore, to the extent that the recent increase in external reserves has reflected capital inflows dnven by one-off events related to September 1 1, 2001, it would be r i s k y to slow fiscal reform o n a gamble that such flows will continue indefinitely. N o r would it be prudent to assume that India can simply grow out o f i t s fiscal problem. O n the contrary, analysis presented in the Tenth Plan suggests that a sizeable fiscal adjustment will be required to generate the level o f public savings, and provide space for the level o f public and private investment, needed to generate 8% growth.
13. Based on this analysis, fiscal reforms are needed in the following areas:
Tax reform. The Tenth Plan targets an increase in tax revenues f rom 8.1% o f GDP in 2001/02 to 10.3% o f GDP by 2006/07. Achieving this goal rests on several key assumptions, including a strong recovery in manufacturing sector growth (as this sector has the highest tax buoyancy) and extending the tax base to the booming services sector. The Kelkar Committee reports o n direct and indirect taxes essentially endorse the above approach, requiring that lower tax rates be complemented with the elimination o f exemptions, bringing services and agriculture into the tax net, and using information technology to improve tax administration. These reforms deserve the highest priority in view o f the substantial decline in the tax ratio during the 1990s and the positive impact higher tax effort would have on reducing primary and revenue deficits in the future.
Subsidies. Financial losses o f the power sector reached an alarming Rs.332 b i l l ion in 2001/02, or 1.4% o f GDP. Recent studies show that the poor do not benefit f rom cheap electricity, either in urban or rural areas, providing l itt le social justification for continued SEB losses. Therefore, the financial and social case for reform i s strong. Proposed reforms in power distribution are summarized in B o x 2. Similarly, food and fertilizer subsidies totaled Rs.352 b i l l ion in 2002/03, or 1.4% o f GDP. These subsidies have distorted farmer cropping and investment decisions, and thereby contributed to natural resource degradation. Proposals for reforms in these areas, and for reallocating funds to more productivity-enhancing public investments, are outlined in the section on agriculture and rural development below. Petroleum subsidies, which totaled Rs.63 b i l l ion in 2002103, or 0.3% o f GDP, are also to be phased out over the medium term.
0
0
iv

Box 2: Urgent Need for Reforms in Power Distribution
Reform o f power distribution i s essential for both fiscal sustainability and spurring growth by providing more efficient supply and quality of power services to industry, farmers and rural areas. Under the framework o f the new Electricity Act (2003), reforms are urgently needed in the following areas:
(a) Tariffs: Ensuring that tariffs on average cover costs and yeld a reasonable rate of return for the utility, and that regulatory systems have suitable mechanisms and sufficient independence to assure this over time. Achieving phased but time-bound reduction o f the cross subsidy paid by industries and services, and improving cost recovery through consumption-based tariffs charged to agriculture and residential consumers.
(b) Subsidies: Ensuring that where, for policy reasons, the government wishes to subsidize power, subsidies are clearly delineated, targeted and funded, within fiscally sustainable levels. Developing alternative mechanisms to deliver subsidies while enabling the utilities to operate on a commercial basis. Moving from present flat-rate tariffs to consumption-based tariffs for agriculture water pumping.
(c) Restructuring, commercialization and sector governance: Separating SEBs into generation, transmission and distribution businesses; and ensuring that the unbundled utilities have independent boards, financial autonomy, and skilled management with full control over operations and labor force. Reducing T&D losses, including theft, and improving operational and managerial efficiency in power distribution and supply.
(d) Distribution privatization: Accelerating privatization o f the commercially-viable segments o f the distribution business to lock in the gains from improved operational and managerial efficiencies on a sustainable basis. Targeting a broader range of potential investors and actively mitigating the perceived policy and regulatory risks.
(e) Strategies for rural areas: Developing approaches to shift from the present form of subsidy for electricity consumption to innovative models o f provision of capital subsidy for improving access in rural areas and for the poor. Facilitating new entry for timely and cost effective provision o f electricity services.
(0 Competition: Opening up electricity trading by industries with se l f generation, along with other power suppliers, by providing open access to transmission and distribution networks in a phased manner along with elimination o f cross subsidies during an agreed time frame.
0 Financial sector. Indian banks have one o f the highest ratios o f government debt to deposits in the world. Financial institutions (including insurance and provident funds) which have invested heavily in long-term government paper have been making trading profits as interest rates continued to fall, but now face r i sks f rom the possibility o f rising interest rates. Moreover, state provident funds have also invested heavily in bonds issued by special purpose vehicles and guaranteed by state governments. The growing risk that these guarantees will be called i s reflected in the widening spread o n state guaranteed bonds relative to central government securities. I t ’ s therefore encouraging to note that both the RBI and Go1 are working on establishing a clear and transparent framework for guarantees. Returns o n provident funds and small savings should also be l inked to market benchmarks.
Fiscal management. The central government needs to lead by example, by cutting i t s own revenue deficits and providing the right incentives for fiscal adjustment at the state level. Fiscal discipline at the center i s likely be reinforced (but not guaranteed) by the new Fiscal Responsibility and Budget Management Bill, which mandates the elimination o f the center’s revenue deficit by March 2008. Three states have passed similar Acts to limit their own deficits, and others are following suit. In addition, the center can help improve fiscal management at the state level by: (a) enforcing global caps o n borrowing (both on-budget borrowing and off-budget borrowing through special-purpose vehicles); (b) simplifying the borrowing regime for states by allowing them to borrow responsibly from markets within their global gaps while phasing out borrowing f rom captive sources; (c) further expanding the volume o f center-to-state transfers l inked to reforms and performance; (d) breaking down artificial distinctions between plan and non-plan expenditures; and (e) consolidating Centrally Sponsored Schemes, with greater f lexibil i ty for states to allocate the funds according to their own needs and priorities.
0
V
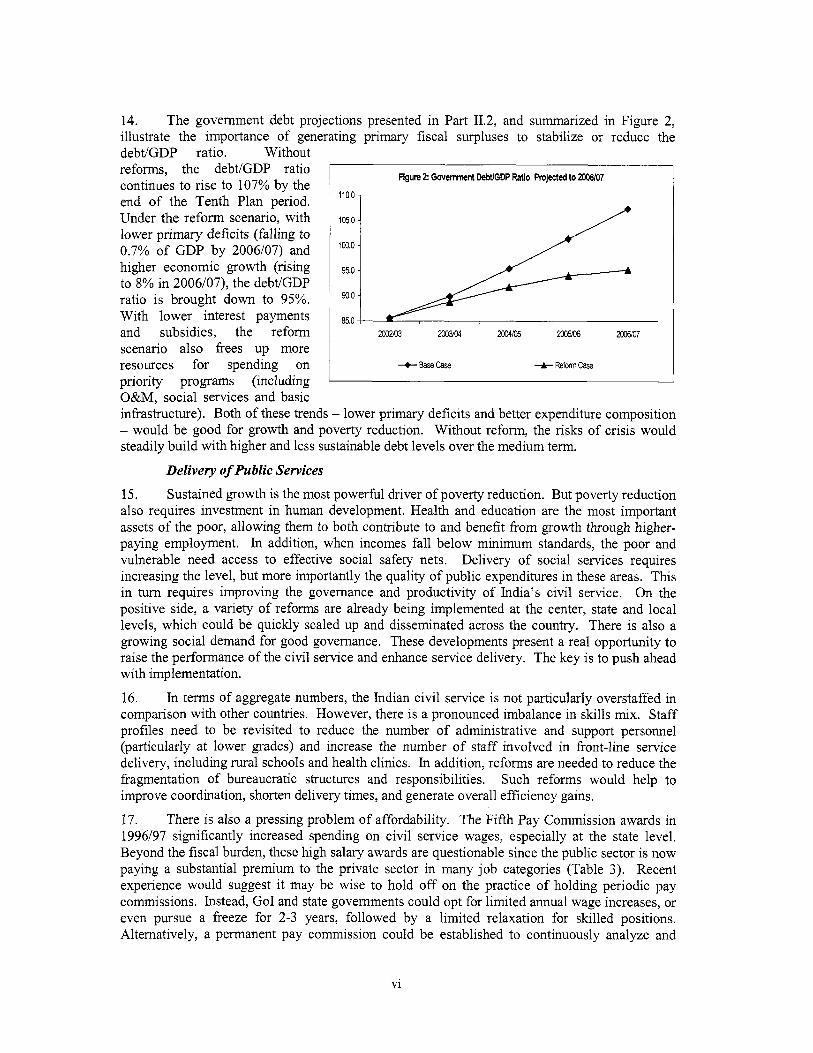
14. The government debt projections presented in Part 11.2, and summarized in Figure 2, illustrate the importance o f generating primary fiscal surpluses to stabilize or reduce the debtIGDP ratio. Without reforms, the debt/GDP ratio continues to rise to 107% by the end o f the Tenth Plan period. Under the reform scenario, with lower primary deficits (falling to 0.7% o f GDP by 2006/07) and higher economic growth (rising to 8% in 2006/07), the debt/GDP ratio i s brought down to 95%. With lower interest payments and subsidies, the reform scenario also frees up more resources for spending on priority programs (including O&M, social services and basic
Figure 2: Govemment DebtlGDP Ratio Projected to 2006107 110.0,
2002103 m3iW m105 2o05106 2036107
-+Basecase -A- Reform case
infrastructure). Bo th o f these trends - lower primary deficits and better expenditure composition - would be good for growth and poverty reduction. Without reform, the r isks o f crisis would steadily build with higher and less sustainable debt levels over the medium term.
Delivery of Public Services
15. Sustained growth i s the most powerful driver of poverty reduction. But poverty reduction also requires investment in human development. Health and education are the most important assets o f the poor, allowing them to both contribute to and benefit from growth through higher- paying employment. In addition, when incomes fal l below minimum standards, the poor and vulnerable need access to effective social safety nets. Delivery o f social services requires increasing the level, but more importantly the quality of public expenditures in these areas. T h i s in tum requires improving the governance and productivity o f India's c iv i l service. On the positive side, a variety of refoms are already being implemented at the center, state and local levels, which could be quickly scaled up and disseminated across the country. There i s also a growing social demand for good governance. These developments present a real opportunity to raise the performance o f the c iv i l service and enhance service delivery. The key i s to push ahead with implementation.
16. In terms o f aggregate numbers, the Indian c i v i l service i s not particularly overstaffed in comparison with other countries. However, there i s a pronounced imbalance in sk i l l s mix. Staff profiles need to be revisited to reduce the number o f administrative and support personnel (particularly at lower grades) and increase the number o f staff involved in front-line service delivery, including rural schools and health clinics. In addition, reforms are needed to reduce the fragmentation o f bureaucratic structures and responsibilities. Such reforms would help to improve coordination, shorten delivery times, and generate overall efficiency gains.
17. There i s also a pressing problem o f affordability. The Fifth Pay Commission awards in 1996/97 significantly increased spending o n c iv i l service wages, especially at the state level. Beyond the fiscal burden, these high salary awards are questionable since the public sector i s n o w paying a substantial premium to the private sector in many j o b categories (Table 3). Recent experience would suggest i t may be wise to ho ld off o n the practice o f holding periodic pay commissions. Instead, Go1 and state govemments could opt for l imi ted annual wage increases, or even pursue a freeze for 2-3 years, followed by a l imi ted relaxation for skilled positions. Alternatively, a permanent pay commission could be established to continuously analyze and
v i
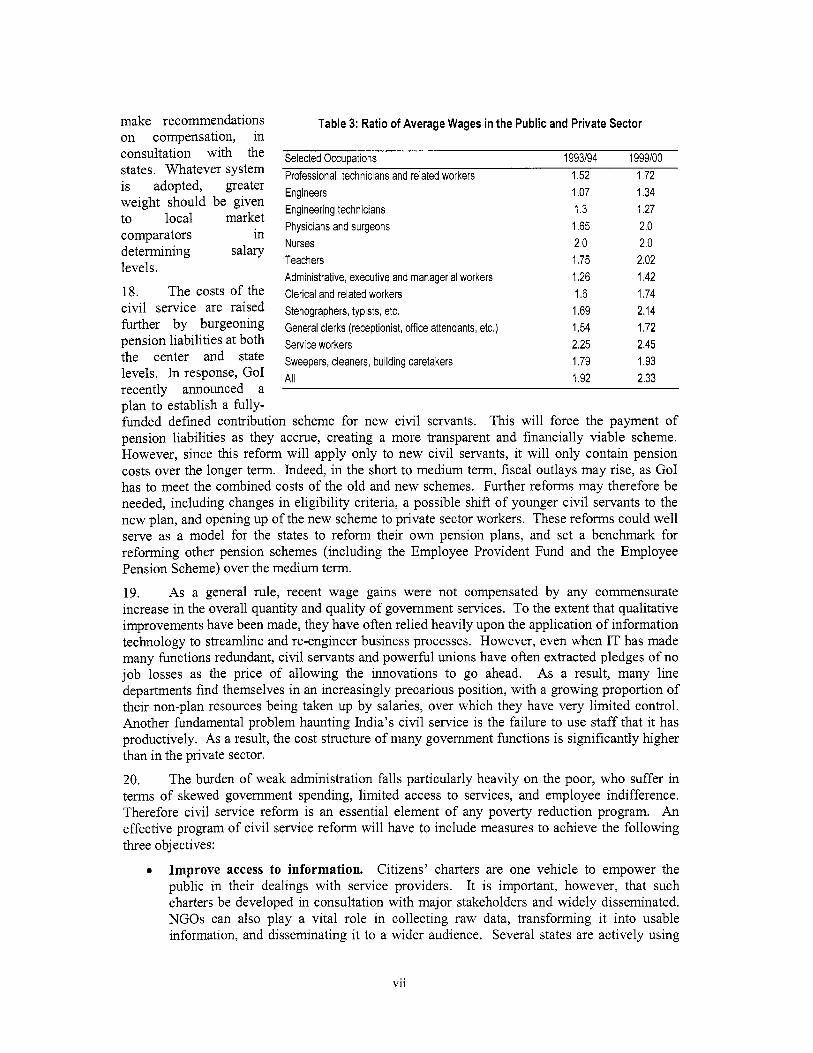
make recommendations o n compensation, in consultation with the states. Whatever system i s adopted, greater weight should be given to local market comparators in determining salary levels.
18. The costs o f the c i v i l service are raised further by burgeoning pension liabilities at both the center and state levels. In response, Go1 recently announced a plan to establish a fully-
Table 3: Ratio of Average Wages in the Public and Private Sector
Selected Occupations 1993194 1999100
Engineers 1.07 1.34
Physicians and surgeons 1.65 2.0
Professional, technicians and related workers 1.52 1.72
Engineering technicians 1.3 1.27
Nurses 2.0 2.0 Teachers 1.75 2.02 Administrative, executive and managerial workers 1.26 1.42 Clerical and related workers 1.6 1.74 Stenographers, typists, etc. 1.69 2.14 General clerks (receptionist, office attendants, etc.) 1.54 1.72 Service workers 2.25 2.45
All 1.92 2.33 Sweepers, cleaners, building caretakers 1.79 1.93
funded defined contribution scheme for new c iv i l servants. This will force the payment o f pension liabilities as they accrue, creating a more transparent and financially viable scheme. However, since this reform will apply only to new c i v i l servants, it will only contain pension costs over the longer term. Indeed, in the short to medium term, fiscal outlays may rise, as Go1 has to meet the combined costs o f the o ld and new schemes. Further reforms may therefore be needed, including changes in eligibil i ty criteria, a possible shift o f younger c i v i l servants to the new plan, and opening up o f the new scheme to private sector workers. These reforms could wel l serve as a model for the states to reform their own pension plans, and set a benchmark for reforming other pension schemes (including the Employee Provident Fund and the Employee Pension Scheme) over the medium term.
19. As a general rule, recent wage gains were not compensated by any commensurate increase in the overall quantity and quality o f government services. T o the extent that qualitative improvements have been made, they have often relied heavily upon the application o f information technology to streamline and re-engineer business processes. However, even when IT has made many functions redundant, c iv i l servants and powerful unions have often extracted pledges o f n o j o b losses as the price o f allowing the innovations to go ahead. As a result, many l i n e departments find themselves in an increasingly precarious position, with a growing proportion o f their non-plan resources being taken up by salaries, over which they have very l imi ted control. Another hndamental problem haunting India’s c i v i l service i s the failure to use staff that it has productively. As a result, the cost structure o f many government functions i s significantly higher than in the private sector.
20. The burden o f weak administration falls particularly heavily o n the poor, who suffer in terms of skewed government spending, l imi ted access to services, and employee indifference. Therefore c iv i l service reform i s an essential element o f any poverty reduction program. An effective program o f c iv i l service reform will have to include measures to achieve the fol lowing three objectives:
Improve access to information. Citizens’ charters are one vehicle to empower the public in their dealings with service providers. I t i s important, however, that such charters be developed in consultation with major stakeholders and widely disseminated. NGOs can also play a v i ta l ro le in collecting raw data, transforming it into usable information, and disseminating it to a wider audience. Several states are actively using
0
v i i
IT to improve access to information and speed up decision malung. Whi le there i s evidence that computerization by i t se l f seems to have an important effect o n reducing corruption, the most successful initiatives combine computerization with extensive business re-engineering. Finally, Go1 and a number o f states are promoting greater transparency by adopting Right to Information legislation.
Strengthen accountability. Internal audit procedures need to be strengthened, with clear sanctions for corrupt or incompetent officers. However, the key i s to strengthen “extemal” accountability to the public. The recent experience o f the L o k Ayukta (Ombudsman) in Karnataka seems to be generating good results. Independence and adequate budgets are keys to the success o f such initiatives. In addition, a comprehensive anti-corruption strategy should include: (a) a radical overhaul and simplification o f the procedures for imposing major and minor penalties; (b) expanded “whistleblower” protection; and (c) publication o f property and tax returns o f senior officials. Each state should be asked to pass the Corrupt Public Servants (Forfeiture o f Property) Act, which has already been drafted by the L a w Commission.
Reduce political interference. This topic i s a sensitive one, for the right to transfer c iv i l servants i s clearly vested within the polit ical leadership under Article 310 o f the Constitution. Yet few would disagree that this power i s often abused by both c iv i l servants and politicians. The net result in states such as Uttar Pradesh has been a reduction o f average tenure for key senior service positions to less than a year. Compounding this problem has been the relative absence o f effective transition mechanisms. Recent successful reform efforts show the value o f having an empowered and dedicated manager in place for several years. Kamataka has gone one step further and limited c iv i l service transfers, with transfer data posted o n a public website and more objective cadre management committees created to approve transfer requests.
21. Weaknesses in service delivery are o f special concern in the social sectors: education, health and social safety nets. While India has made substantial progress towards achieving better social indicators over the past two decades, the rates o f improvement have not been sufficient to achieve the targets set in the Tenth Plan or even the less ambitious Mi l len ium Development Goals (MDGs). Indeed, progress in health indicators has been slowing down precipitously.
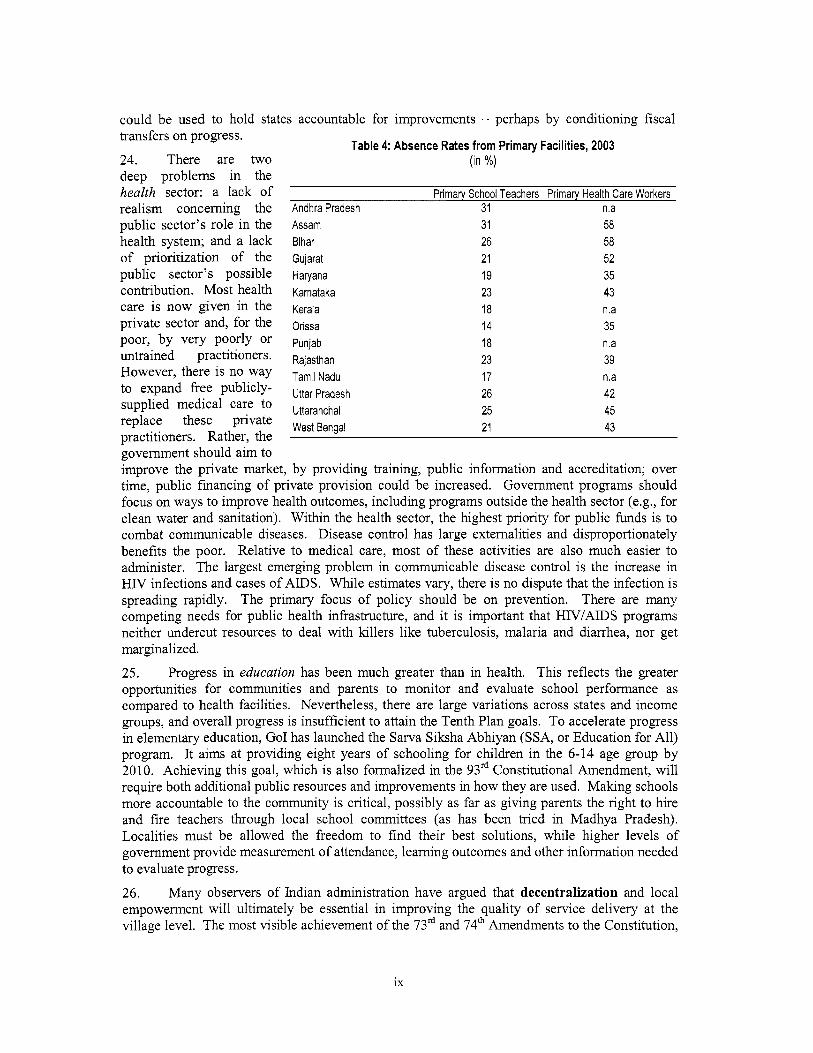
22. Public spending o n health and education in India has risen over the past decade, largely due to the sharp increase in wages awarded by the Fifth Pay Commission in 1997. International comparisons suggest that India’s spending on health and education i s in line with other countries at similar income levels (although with a more dominant role for the private sector in health, and a more skewed distribution o f public spending in education towards the secondary and tertiary levels). Whi le additional funding would help, better outcomes depend crucially on improving the quality o f services. As one indication, absentee rates for teachers and medical providers are very high in India, especially in the poorer states (Table 4). Since absentee workers are o n the payroll, i t i s not surprising that public money does not translate directly into better outcomes.
23. The root cause o f poor quality services i s that governments are not adequately focused o n social outcomes. One way to increase the focus o n outcomes i s to generate and disseminate information regarding progress in service delivery. Parents, patients and beneficiaries should know what they are entitled to and have a place to lodge complaints when they are not received. Providers and policy makers should know (and be constantly learning) about what works. One critical role o f the central govemment, when states have the primary responsibility for health and education, i s to be an independent source for measuring outcomes. Over time, such measures
0
0
viii
could be used to hold states accountable for improvements - perhaps by conditioning fiscal transfers o n progress.
24. There are two (in %) deep problems in the health sector: a lack o f realism concerning the Andhra Pradesh 31 n.a
health system; and a lack Bihar 26 58 o f prioritization of the Gujarat 21 52
Table 4: Absence Rates from Primary Facilities, 2003
Primary School Teachers Primary Health Care Workers
public sector's role in the Assam 31 58
public sector's possible Havana 19 35 contribution. Most health Karnataka 23 43
private sector and, for the Orissa 14 35
untrained practitioners. Rajastha,, 23 39
care i s n o w given in the Kerala 18 n.a
poor, by very poorly Or Punjab 18 n.a
17 n.a However, there i s n o way Tamil Nadu to expand free publicly- Uttar pradesh 26 42
25 45 supplied medical care to Uttarancha,
21 43 replace these private West practitioners. Rather, the government should a im to improve the private market, by providing training, public information and accreditation; over time, public financing o f private provision could be increased. Government programs should focus on ways to improve health outcomes, including programs outside the health sector (e.g., for clean water and sanitation). Within the health sector, the highest priority for public funds i s t o combat communicable diseases. Disease control has large externalities and disproportionately benefits the poor. Relative to medical care, most o f these activities are also much easier to administer. The largest emerging problem in communicable disease control i s the increase in HIV infections and cases o f AIDS. Whi le estimates vary, there i s n o dispute that the infection i s spreading rapidly. The primary focus o f pol icy should be on prevention. There are many competing needs for public health infrastructure, and it i s important that H IV /A IDS programs neither undercut resources to deal with ki l lers l ike tuberculosis, malaria and diarrhea, nor get marginalized.
25. Progress in education has been much greater than in health. This reflects the greater opportunities for communities and parents to monitor and evaluate school performance as compared to health facilities. Nevertheless, there are large variations across states and income groups, and overall progress i s insufficient to attain the Tenth Plan goals. T o accelerate progress in elementary education, Go1 has launched the Sarva Siksha Abhiyan (SSA, or Education for All) program. I t aims at providing eight years o f schooling for children in the 6-14 age group by 2010. Achieving this goal, which i s also formalized in the 93rd Constitutional Amendment, will require both additional public resources and improvements in how they are used. Making schools more accountable to the community i s critical, possibly as far as giving parents the right to hire and fire teachers through local school committees (as has been tried in Madhya Pradesh). Localities must be allowed the freedom to find their best solutions, while higher levels o f government provide measurement o f attendance, learning outcomes and other information needed to evaluate progress.
26. Many observers o f Indian administration have argued that decentralization and local empowerment wi l l ultimately be essential in improving the quality o f service delivery at the village level. The most visible achievement o f the 73rd and 74' Amendments to the Constitution,
ix
ratif ied in 1992, has been the high degree o f polit ical decentralization. However, progress o n fiscal and administrative aspects o f decentralization has been much more modest and hesitant. In response, India now needs to move f rom the decentralized patchwork it has created, towards an inter-governmental fkamework which leads to improved service delivery without increasing fiscal pressures. Good fiscal management would suggest reallocating public funds f rom central and state schemes into a well-designed fiscal framework for local governments, that would guarantee their autonomy and accountability, while helping them to match resource allocations with local preferences. I t would also suggest creating incentives for local governments to collect a share o f their revenues from local taxpayers (e.g., through land taxes). Flows o f funds f rom the center and state governments should be dependent on good performance and resource mobilization at the local level.
Policy Agenda: Improving the Investment Climate
Industry and Services
27. A wide range o f structural reforms stimulated industrial and services growth and investment in the early 1990s. However, momentum in the industrial sector slowed in the second ha l f o f the decade. Within the industrial sector, the slowdown in manufacturing growth has been even more marked. Despite recent s igns o f recovery, the manufacturing sector in India s t i l l accounts for only 17% o f GDP, compared to 35% in China and 25-35% in the South East Asian economies. Furthermore, n o significant increase in India’s penetration o f wor ld markets in industrial products has been observed over the past decade and foreign direct investment (as a share o f GDP) i s lower than in China and many emerging markets. As a result o f these trends, growth in manufacturing employment has averaged only about 2% per annum since the mid- 1990s, with most o f this growth in the unorganized sector. The organized manufacturing sector provides only about 7 mi l l ion jobs today. By comparison, the total labor force in India i s around 406 million, with a l i t t l e under one mi l l ion workers transitioning out o f agnculture every year.
28. Against this background, the Tenth Plan calls for higher growth in the industrial sector to create 100 mi l l ion or so new jobs over the next decade. The Plan notes that sustained industrial growth and employment will require a step up in domestic investment, particularly private investment, coupled with improved productivity. International comparisons indicate that India has intrinsic advantages, such as a large local market and skilled workforce, which should al low the country to emerge as a major hub for manufacturing and labor-intensive service industries. At the same time, recent studies o n the investment climate show that the performance o f India’s industrial and service sectors continues to be constrained by three key sets o f factors: (a) product market distortions; (b) inefficiencies in factor markets; and (c) infi-astructure bottlenecks. The success with which India can achieve the ambitious targets set in the Tenth Plan will depend crucially on progress in these areas.
29. Product market distortions. Inadequate follow-through on a number o f key reforms to create a level-playing field for investment, both domestic and foreign, coupled with slow progress in trade policy reforms continue to inhibit industrial sector performance. Ta r i f f protection in India i s s t i l l substantially higher than in most other developing countries (Table 5). The government has many wel l justif ied concerns about the policies o f other countries which restrict i t s exports, and it i s one of the most active developing countries in raising these concerns in international fora, such as the WTO. Whi le India has some bargaining leverage to gain concessions fkom other countries, it should also use the WTO process to advance domestic reforms and protect them from local pressure groups. In particular, the government should move aggressively to reduce import tariffs to a single rate (say, 10%) over the next three to four years and phase out remaining tar i f f exemptions, specific tariffs and anti-dumping duties. I t should also remove other product market distortions by: (a) eliminating the remaining preferential policies for
X
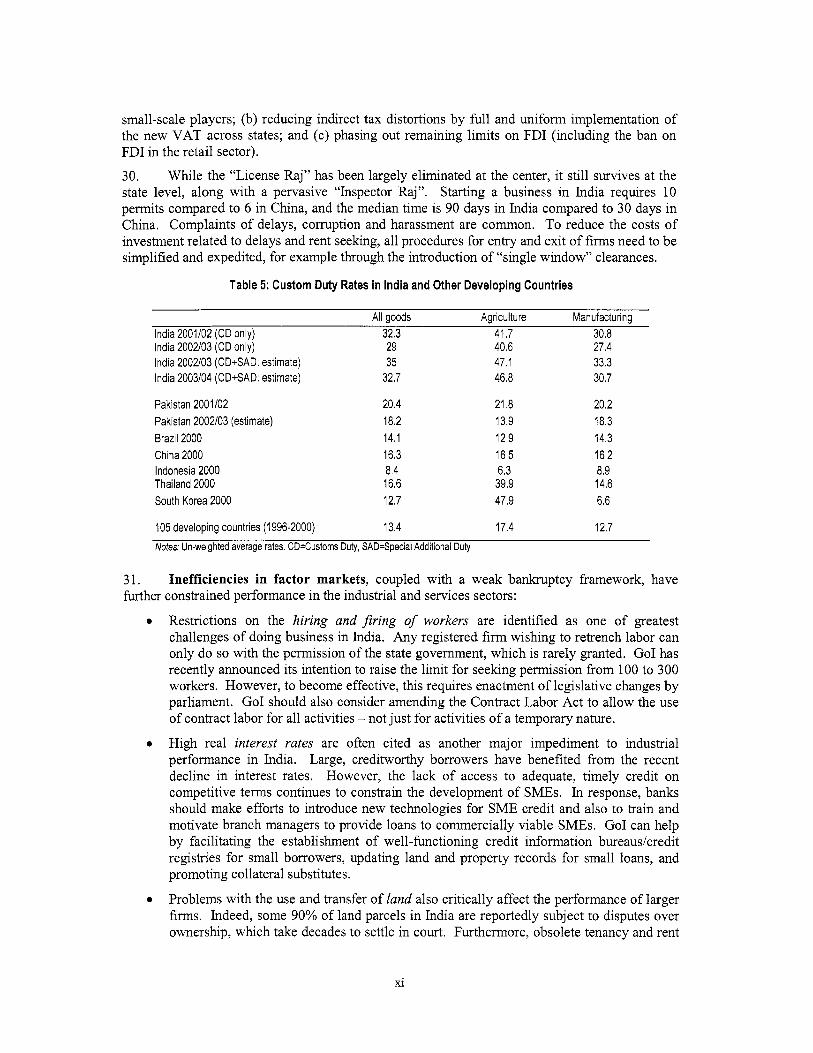
small-scale players; (b) reducing indirect tax distortions by full and uni form implementation o f the new VAT across states; and (c) phasing out remaining limits on FDI (including the ban o n FDI in the retail sector).
30. Whi le the “License Raj” has been largely eliminated at the center, i t s t i l l survives at the state level, along with a pervasive “Inspector Raj”. Starting a business in India requires 10 permits compared to 6 in China, and the median time i s 90 days in India compared to 30 days in China. Complaints o f delays, corruption and harassment are common. To reduce the costs o f investment related to delays and rent seeking, a l l procedures for entry and exit o f f i r m s need to be simplified and expedited, for example through the introduction o f “single window” clearances.
Table 5: Custom Duty Rates in India and Other Developing Countries
All goods Agriculture Manufacturing India 2001102 (CD only) 32.3 41.7 30.8 India 2002103 (CD only) 29 40.6 27.4 India 2002103 (CD+SAD: estimate) 35 47.1 33.3 India 2003104 (CDcSAD: estimate) 32.7 46.8 30.7
Pakistan 2001102 Pakistan 2002103 (estimate) Brazil 2000 China 2000 Indonesia 2000 Thailand 2000 South Korea 2000
20.4 18.2 14.1 16.3 8.4 16.6 12.7
21.8 20.2 13.9 18.3 12.9 14.3 16.5 16.2 6.3 8.9 39.9 14.6 47.9 6.6
105 developing countries (1996-2000) 13.4 17.4 12.7 Notes: Un-weighted average rates. CD=Customs Duty, SAD=Special Additional Duty
31. further constrained performance in the industrial and services sectors:
Inefficiencies in factor markets, coupled with a weak bankruptcy framework, have
Restrictions o n the hiring and $ring of workers are identified as one o f greatest challenges o f doing business in India. Any registered firm wishing to retrench labor can only do so with the permission o f the state government, which i s rarely granted. Go1 has recently announced i t s intention to raise the limit for seehng permission from 100 to 300 workers. However, to become effective, this requires enactment o f legislative changes by parliament. Go1 should also consider amending the Contract Labor A c t to allow the use o f contract labor for a l l activities - not just for activities o f a temporary nature.
High real interest rates are often cited as another major impediment to industrial performance in India. Large, creditworthy borrowers have benefited f rom the recent decline in interest rates. However, the lack o f access to adequate, timely credit on competitive terms continues to constrain the development o f SMEs. In response, banks should make efforts to introduce new technologies for S M E credit and also to train and motivate branch managers to provide loans to commercially viable SMEs. Go1 can help by facilitating the establishment o f well-functioning credit information bureaudcredit registries for small borrowers, updating land and property records for small loans, and promoting collateral substitutes.
Problems with the use and transfer o f land also critically affect the perfonnance o f larger f i rms. Indeed, some 90% o f land parcels in India are reportedly subject to disputes over ownership, which take decades to settle in court. Furthermore, obsolete tenancy and rent
0
0
0
xi
control laws keep a large part o f urban real estate o f f the market. The central government has already abolished the Urban Land Ceiling A c t which made changes in land use very diff icult. However, only a few states have repealed their corresponding Urban Land Cei l ing Acts.
Outdated bankruptcy procedures have, in the past, made industrial restructuring almost impossible. T h i s may change, once the recently enacted Amendments to the Companies A c t are put into effect. These will provide a framework for liquidating f i r m s outside the court process. However, repeal o f the Sick Industries Companies Ac t i s essential for this framework to become effective. The recently passed law on the enforcement o f creditors’ rights should also help accelerate the process o f industrial restructuring.
32. Severe infrastructure bottlenecks continue to constrain India’s industrial sector performance. Access to reliable power at reasonable costs i s a prime concern for most Indian businesses. N o t only does industry receive irregular and l o w quality power, but it i s also charged tariffs much above the cost o f supply, reducing firm-level competitiveness. As a result, a large majority o f Indian f i r m s operate their own (captive) generators, worsening utility finances. Small industries often have to go without power as they can’t afford captive generation. Power sector reforms are n o w widely accepted as fundamental t o improving industrial performance. An urgent priority i s the need to rationalize power tariffs, depoliticize the tariff-setting process, and implement a phased reduction in cross subsidies that operate against industrial consumers. Time- of-day tariffs need to be introduced for industries with peak and off-peak rates.
33. The above measures need to be accompanied by steps to improve the financial and operational performance o f the power utilities through the unbundling and commercialization o f SEBs, independent regulation and improved sector governance. Privatization should be accelerated to lock in improved operational and managerial efficiencies o n a sustainable basis. The strategy for privatizing distribution should consider focusing on the commercially viable segments o f the network, while developing alternate strategies for improving services and targeting subsidies in rural areas. The new Electricity Ac t (2003) establishes the legal framework for power sector reform and restructuring. But the key wil l be implementation. Go1 can support reforms at the state level by imposing rigorous policies o n payments to central generation and transmission utilities, and rewarding progress o n reducing SEB losses and improving governance under the Accelerated Power Development and Reform Program.
34. Speedy, reliable door-to-door transport sewices are also critical to India’s manufacturing competitiveness. India has one o f the most extensive transport systems in the world. However, the sector suffers from severe capacity and quality constraints. The Tenth Plan proposes a number o f road upgrading programs totaling 1 O,OOOkm, along with access-controlled expressways in high-volume corridors. Meeting the Tenth Plan targets will require a significant increase in funding from the private sector. In part, this can be addressed through better cost recovery f rom users. M u c h can also be gained in the short to medium term by strengthening the financial performance and accountability o f road agencies and state public works departments.
35. Indian Railways (IR) continues to be a patient who resists any bitter medicines, despite plenty o f prescriptions available. It has recently entered into operating deficits and depends o n central budget for i t s large investment program. Reforming this sector will require large-scale financial restructuring, involving the shedding (or even ring-fencing) o f i t s non-core assets or businesses. Govemment pol icy also needs to address price distortions resulting f rom the long practice o f cross subsidization f rom freight to passenger services, which causes excessively high freight tariffs, preventing IR from serving the non-bulk high-margin transport market. In the ports sector, total berth capacity i s n o longer a serious constraint. However, the l o w productivity
0
xii
o f port equipment and labor continues to cause delays in tumaround and increase costs for cargo and containers, especially in the older ports.
36. Go1 i s keen to promote greater private sector participation in the provision and funding o f infrastructure. In the long run, this requires action to address the pol icy problems that underlie investors’ concems by raising prices to cost-covering levels and establishing a sound legal and regulatory framework. In the short run, various public-private partnerships involv ing subsidies, risk-bearing and other forms o f government assistance may help attract private investment and close financing gaps. However, they can also risk simply postponing the day o f reckoning, and impose serious costs on taxpayers. Therefore, they should be seen, at best, as temporary measures and should be entered into with caution.
Agriculture and Rural Development
37. Promoting more rapid agricultural and rural growth i s a major priority for the Government o f India. Although agriculture contributes only about a quarter o f total GDP today, i t s importance in the economic, social and polit ical fabric o f India i s far greater than this number suggests. About 75% o f India’s poor l ive in rural areas and a large proportion o f the rural poor are dependent on agriculture for employment. Total factor productivity in agriculture declined between the 1980s and 1990s due to the slowdown in productivity gains f rom the earlier adoption of high-yielding varieties, the decline in public investments in the agtlculture sector, and increasing natural resource degradation due to the existing incentive framework. Loolung forward, improved agricultural performance will require: (a) rebalancing government expenditures f rom subsidies towards more productivity-enhancing public investments; and (b) removing the remaining restrictions o n domestic trade to improve the investment climate for farmers, while supporting a regulatory framework to ensure fair competition. Development o f the non-farm sector will also be essential to provide employment opportunities in rural areas, and support growth o f the agricultural sector.
38. The government’s foodgrain policy has led to mounting buffer stocks and food subsidies in recent years. In response, Go1 established a high-level committee to develop a long-term foodgrain policy with the primary goal o f maintaining self sufficiency. The committee’s proposals to remove the rice levy and al l restrictions on foodgrain trade (except in emergency conditions) will improve incentives for the private sector. However, other key proposals raise concems. In particular, the shift in the underlying principle o f the proposed pol icy f rom food security to self-sufficiency, that also ties farmers to l o w value rice and wheat production, will come at the cost of efficiency. The continued large role envisioned for the public sector in foodgrain markets will crowd out private sector participation. And the reversion back to an untargeted public distribution scheme i s l ikely to bring back the earlier problems o f subsidies being captured by non-poor families and will result in higher food subsidies.
39. Perhaps the most contentious issue in foodgrain pol icy i s the Minimum Support Price (MSP) for rice and wheat. Steady increases in the M S P in recent years have encouraged increased production, leading to larger government procurement. Strong polit ical pressure f rom states where the largest procurement takes place has stalled efforts by Go1 to contain increases in the MSP. Therefore, the committee’s proposal to limit the M S P to cover cash costs plus the retums to family labor, land and capital i s a step in the right direction. In the longer run, however, fostering competitive markets would serve as a better avenue for ensuring remunerative retums to farmers. In this scenario, the M S P should be reduced to cover cash costs only, which complemented by other schemes (e.g., TPDS, employment schemes) would serve as a safety net for farmers.
40. The government’s agricultural pol icy of the last three decades has relied o n subsidizing key inputs to promote more rapid production growth and ensure food security for i t s population.
xiii

However, there i s also broad recognition that the rapidly rising subsidy levels are fiscally unsustainable and are crowding out productivity-enhancing public investments in rural infrastructure, irrigation, and technology upgrading. Power and water subsidies, to the extent they encourage inefficient water use, are also leading to salinity, water logging, and declining groundwater tables in many areas. And fertilizer subsidies, that are largely concentrated o n urea, have distorted input use. Sectoral priorities are as follows:
Fertilizer. In 200 1/02, the government announced i t s policy to rationalize fertilizer pr ic ing and to implement the recommendations o f the Expenditure Reforms Commission for a phased program o f price increases and complete decontrol o f urea by April 2006. Since then, a number o f reform actions have been implemented. Continued commitment to the proposed timetable will lead to a significant reduction in fertilizer subsidies over the next few years.
0 Water. The government’s national water pol icy promotes the adoption o f a comprehensive and integrated approach to planning and managing water resources. I t puts priority on: (a) delivery o f good quality water services; (b) demand-driven investments in rehabilitation and maintenance o f infrastructure through greater participation o f users in managing systems; and (c) cost recovery o f at least O&M costs to ensure longer-term financial and fiscal sustainability o f operations. T o encourage full adoption o f these reforms at the state level, Go1 recently introduced an incentive program to encourage recovery o f O & M costs.
Power. The large subsidy on the price o f electricity to farmers has contributed to the severe financial crises o f SEBs. This in turn undermined the SEBs’ abil ity to undertake required investments and maintain day-to-day operations, resulting in deteriorating power services to consumers, including farmers. The incidence o f subsidies i s also heavily regressive. India should move towards a more transparent and targeted subsidy mechanism. For this to work, i t i s indispensable that there i s recovery o f at least operating costs, universal metering o f consumption, payment discipline, and improved delivery efficiency o f electricity providers.
41. Product and factor markets. While progress in economic and trade reforms has helped to improve the incentive framework for agriculture over the past decade, the sector i s s t i l l hampered by the continuing over-regulation o f domestic trading activities for major agricultural commodities. On the positive side, Go1 has temporarily l i f ted several key regulations such as storage, transport and credit control in recent years. However, the over-hang o f their possible re- introduction discourages both local and foreign investments. Moreover, whi le Go1 has l i f ted these regulations, some state governments have not l i f ted the associated state controls. This inevitably raises marketing margins, putting downward pressure on farm prices and raising costs to consumers, while reducing the competitiveness o f exports.
42. Agricultural import tariffs have increased in recent years to an un-weighted average (including the Special Additional Duty) o f about 47%, compared to an average non-agricultural import tar i f f o f about 3 1%. With a few exceptions, India i s n o longer explicit ly taxing or using licensing, export bans or quotas as i t did in the past to deliberately restrict agricultural exports and depress domestic prices. However, since 2001 it has been exporting stocks o f rice and wheat accumulated by F C I at prices far below prevailing domestic prices. It i s questionable whether these subsidized exports are in India’s long-term interests in a more open international agricultural market. India should also consider reducing i t s WTO agricultural tar i f f bindings, mostly now at 100% or more, as a way o f providing an external constraint o n domestic lobbies pressing for high tariffs.
0
0
xiv
43. Access to land. T h e distribution o f land ownership in India has become less skewed since the 1970s, with an increasing share owned by marginal to semi-medium farmers. The trend towards landlessness has also been arrested. However, regulations aimed at increasing security tenure for tenants have had unintended adverse effects, leading to large-scale self cultivation by landlords or the adoption o f wage labor contracts. Where their implementation was incomplete, they may also reduce land access and equity. There i s n o w a growing consensus, as reflected in a number o f government policy statements, about the need to revisit and re-formulate current tenancy legislations. In considering tenancy reform, i t would be critical to draw lessons f rom states who do not have tenancy restrictions. There are some states where the benefits f rom relaxing tenancy laws are l ikely to be higher than in others, due to the more advanced commercialization o f agriculture (and significant amounts o f informal leasing) and stronger polit ical commitment to reform. These states could serve as a starting point for pilots, and yield important insights for policy debate and tenancy reforms in other states.
44. The Department o f Land Resources introduced a scheme in the mid-1990s to pi lot computerization o f land records in selected districts nationwide. Some states have not only scaled up the program statewide, but also implemented the program in partnership with the private sector. These initiatives have reportedly contributed to more efficient and rapid service as we l l as reduced opportunities for corruption through increased transparency. Over the longer term, the focus will have to shift towards a more holistic approach to improving land administration systems at the state level. T o be successful, the land administration system would have to meet several other key standards o f performance, including security, costs, fairness, and sustainability . 45. Access to rural credit. India has a wide network o f rural finance institutions, but a large number o f the rural poor remain under-served or completely left out o f the formal financial system. A key factor constraining improved access to rural credit relates to inefficiencies in the formal rural finance institutions. The government should a im to improve the performance o f the regional rural banks and the rural credit cooperatives by enhancing regulatory oversight and supervision, reducing government control and ownership, and strengthening the legal framework for loan recovery and the use o f land for collateral. Other priorities for improving access to rural credit include: (a) liberalizing interest rates by removing the existing “cap” for small loans (that has the perverse effect o f rationing credit available to small rural borrowers); (b) improving credit information on rural households, by designating an agency that could take the lead in collecting and disseminating information on micro borrowers; (c) facilitating the scaling-up and sustainability o f existing low-cost micro-finance models, such as the self-help group bank linkage model and the Grameen bank replicators; and (d) removing legal and regulatory obstacles to the development o f innovations that can help reduce the costs and r i sks associated with rural finance.
46. Increased emphasis on productivity-enhancing investments will be critical to raising agricultural growth and developing the rural non-farm sector. However, t o be effective, new investments need to be matched by improvements in the quality o f public spending, particularly a greater focus on O&M, which also involves significant institutional reforms. If anything, the growth rate i s likely to slow down over time, as the deteriorating fiscal situation and the sluggish progress o n the reform agenda worsen the investment climate. Sectoral priorities are as follows:
India’s public agricultural research and extension system i s one o f the largest in the world. However, over time, the efficiency and effectiveness o f these services have been increasingly called into question. There i s a need for a more regionally-differentiated research strategy, and greater coordination between the public and private sectors. Similarly, the top-down, narrow crop-focused approach to agricultural extension has become outmoded and ineffective in meeting the needs o f farmers. In the future, the
0
xv

public extension system will need to become more demand-driven, with stronger synergies between public and private extension efforts.
Most government programs for rural roads are designed to address the immediate rural accessibility problem, without a carefully-designed pol icy and institutional framework to ensure the sustainability o f these investments. Additional funds should be allocated for rural road maintenance, with greater coordination provided by the Ministry o f Rural Development. Community participation offers significant potential for mobil izing local support for resource generation, land acquisition and tailoring o f rural road programs to local needs.
India’s rural electrification program has in the past focused o n extending the gnd supply to villages and remote areas. However, access by rural households remains l o w and power-based economic activities in the electrified villages i s minimal. Go1 plans to accelerate the rural electrification program over the coming decade. This needs to be matched by a more conducive pol icy environment, with adequate incentives for service providers and more effective targeting o f subsidies to poorer farmers and rural consumers. Decentralized generation should be encouraged, as reforms are put in place to privatize the commercially viable parts o f the sector.
0
0
Development Prospects and Risks
47. Continued progress o n poverty reduction will require both higher growth and improved delivery o f health, water, sanitation and education services. Many o f these goals are reflected in the Tenth Plan, which projects an average growth rate o f 8% per annum and rapid progress across a range o f social indicators. However, the plan period started with a deceleration o f growth to an estimated 4.4% in 2002/03. Some o f the deceleration was due to external factors, including the impact o f flooding in some areas, and drought in many others, o n agricultural output. Whi le some recovery in growth i s expected in 2003/04, as the external environment improves, this bounce back i s unlikely to be sustained - without a major push to reinvigorate the reform agenda. In the absence o f major external or domestic shocks, current policies in India are l ikely to translate into a continued growth slowdown, averaging around 5% per annum over the Tenth Plan period (Table 6).
xvi
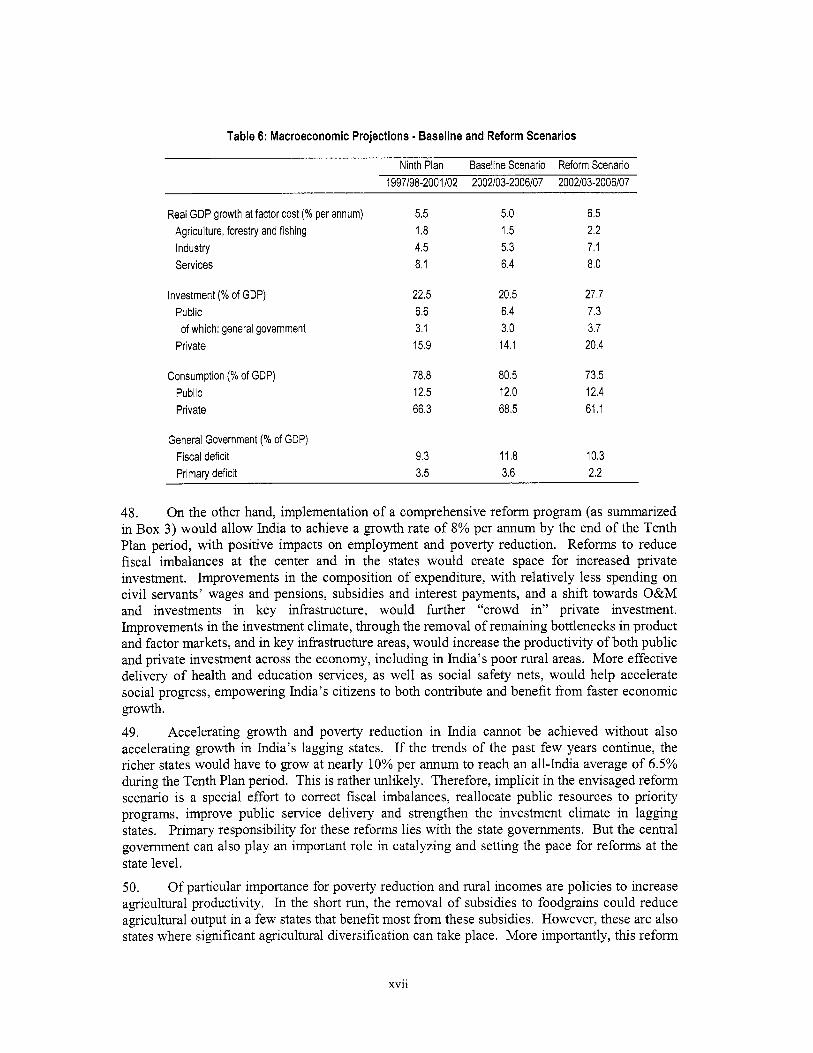
Table 6: Macroeconomic Projections - Baseline and Reform Scenarios
Ninth Plan Baseline Scenario Reform Scenario 1997198-2001102 2002103-2006107 2002103-2006107
Real GDP growth at factor cost (% per annum) Agriculture, forestry and fishing Industry Services
Investment (% of GDP) Public
Private of which: general government
Consumption (% of GDP) Public Private
General Government (% of GDP) Fiscal deficit Primary deficit
5.5 1.8 4.5 8.1
22.5 6.6 3.1 15.9
78.8 12.5 66.3
9.3 3.5
5.0 1.5 5.3 6.4
20.5 6.4 3.0 14.1
80.5 12.0 68.5
11.8 3.6
6.5 2.2 7.1 8.0
27.7 7.3 3.7 20.4
73.5 12.4 61 .I
10.3 2.2
48. On the other hand, implementation o f a comprehensive reform program (as summarized in B o x 3) would allow India to achieve a growth rate o f 8% per annum by the end o f the Tenth Plan period, with positive impacts on employment and poverty reduction. Reforms to reduce fiscal imbalances at the center and in the states would create space for increased private investment. Improvements in the composition o f expenditure, with relatively less spending o n c iv i l servants’ wages and pensions, subsidies and interest payments, and a shift towards O&M and investments in key infrastructure, would further “crowd in” private investment. Improvements in the investment climate, through the removal o f remaining bottlenecks in product and factor markets, and in key infrastructure areas, would increase the productivity o f both public and private investment across the economy, including in India’s poor rural areas. More effective delivery o f health and education services, as wel l as social safety nets, would help accelerate social progress, empowering India’s citizens to both contribute and benefit f rom faster economic growth.
49. Accelerating growth and poverty reduction in India cannot be achieved without also accelerating growth in India’s lagging states. If the trends o f the past few years continue, the richer states would have to grow at nearly 10% per annum to reach an all-India average o f 6.5% during the Tenth Plan period. This i s rather unlikely. Therefore, impl ic i t in the envisaged reform scenario i s a special effort to correct fiscal imbalances, reallocate public resources to priority programs, improve public service delivery and strengthen the investment climate in lagging states. Primary responsibility for these reforms lies with the state governments. But the central govemment can also play an important role in catalyzing and setting the pace for reforms at the state level.
50. Of particular importance for poverty reduction and rural incomes are policies to increase agricultural productivity. In the short run, the removal o f subsidies to foodgrains could reduce agricultural output in a few states that benefit most f rom these subsidies. However, these are also states where significant agricultural diversification can take place. More importantly, this reform
xvii
would free up resources for agncultural research and development and rural infrastructure. Simultaneously, faster growth in industry and continued rapid growth in services can provide jobs for the labor force released from agriculture.
5 1. India’s large fiscal imbalances pose a serious threat to sustained growth and development over the medium term. The persistence o f current fiscal trends will, at best, limit growth and j o b creation. And slower growth would, in turn, speed up the deterioration in debt dynamics. If this negative cycle continues, a full-fledged fiscal crisis cannot be ruled out over the medium term. Of course, it i s politically easy to downplay this risk, hoping that higher growth and lower interest rates will eventually solve the fiscal problem. However, experience suggests i t would be unwise to s i t back and wait for such a virtuous circle to emerge. Instead, the central and state governments will have to be pro-active in reducing the fiscal deficit, shifting expenditures into more productive areas, and removing structural impediments to higher private investment and productivity. The sooner the roadmap for these reforms i s put in place, and concrete action taken to show commitment to fo l low through, the more manageable will be the adjustment path, and the quicker the pay-off in terms o f higher growth and poverty reduction.
52. There are o f course other potential r isks to implementing an ambitious reform agenda. Domestically, Indian politics are often distracted by general or state elections, and tensions with neighboring countries. Externally, the global recovery i s expected to be slow. Whi le India i s s t i l l a relatively closed economy, and therefore somewhat protected from global trends, i t does suffer from a loss o f market share to i t s major competitors, especially China, where reforms have moved ahead much more rapidly. And the i n f l ow o f remittances into India and other countries in the region may wel l slow down, as the impact o f one-off events weakens. As a result, i t would be r i s k y to gamble on the recent strength in the balance o f payments continuing and providing a counterweight to the deteriorating fiscal situation.
53, India can be rightly proud o f i t s development record over the past two decades. I t reflects the emergence o f a much wider consensus about the importance o f opening up the Indian economy to competition. The results in terms o f more rapid growth and poverty reduction are impressive. But India has s t i l l fallen behind i t s main competitors in East Asia - and poverty remains a reality for many Indians, especially those living in the poorer states o f the Nor th and East. The government i s right to set ambitious targets for growth and social development during the Tenth Plan. The key now i s to implement the pol icy and institutional changes needed to achieve these goals. Sustained progress will n o doubt be difficult, especially in the politically- charged areas o f labor, power and agricultural reform. But it also promises high returns for poverty reduction in India.
xviii

Box 3: Summary of Priority Reforms Fiscal Policy
Progressively reduce the primary deficit at the center and in states by completing tax reforms (eliminating exemptions, bringing services into the tax net, and implementing a uniform state VAT), reducing power sector losses, and phasing out petroleum subsidies. Reduce financial sector r isks by implementing the new securitization law, linking retums on provident finds and small savings to market benchmarks, and establishing a clear framework for managing state govemment guarantees. Improve fiscal management by imposing greater fiscal discipline on state borrowing and transfers, breaking down artificial distinctions between plan and non-plan expenditures, and consolidating Centrally Sponsored Schemes. Improve the composition of public expenditures, by reducing the share spent on wages, pensions, interest payments, and agricultural subsidies, and increasing investment and O&M for priority social, infrastructure and agriculture programs.
Reduce administrative fragmentation and reform civil service pay policy and pensions. Improve the performance of the civil service and quality o f service delivery by improving public access to information, strengthening accountability, and reducing political interference. Refocus health, education and social safety net programs on outcomes. The central govemment can play an important role as an independent source for measuring progress towards agreed goals. Improve the private market for health care through training, public information and accreditation. Priorities for public funds are to provide clean water and sanitation, and to combat communicable diseases (including HIV/AIDS prevention). Support the SSA goals by providing increased public resources and improving resource use in elementary education. Schools should be more accountable to communities, with more local autonomy to find the best solutions. Develop a well-designed fiscal framework for local govemments, that would guarantee their autonomy and accountability. Flows o f funds from the center and states should be dependent on good local fiscal performance and resource mobilization.
Speed up trade reform by reducing average import tariffs and phasing out tariff exemptions, specific tariffs and anti-dumping duties. Remove other product market distortions by eliminating preferential policies for small-scale players, implementing a full and uniform VAT, and phasing out remaining FDI restrictions. Reduce inefficiencies in factor markets by easing restrictions on hiring and firing of workers, improving SME access to credit, addressing problems in the use and transfer o f land, and updating bankruptcy procedures. Ensure access to reliable power at reasonable costs by rationalizing power tariffs and improving the financial and operational performance of SEBs (Box 2). Address capacity and quality constraints in the transport sector by improving public sector performance (for roads and rail), mobilizing private sector investment (including better cost recovery for roads), phasing out price distortions (for rail), and improving the efficiency o f existing capacity (for ports).
Put in place a market-based foodgrain policy which protects the poor through targeted safety nets, while mitigating drastic supply shocks through a cost effective and well-managed price stabilization mechanism. Reduce input subsidies which are fiscally unsustainable and distorting input use. Savings should be used to fund more productive investments in agricultural research and extension, rural roads, and rural electrification. Reduce regulation o f domestic trading activities for major agricultural commodities and eliminate remaining trade policy distortions, including subsidized exports o f r ice and wheat. Improve access to land by revisiting current legislation on land tenancy, and building on successful initiatives to improve land administration. Devise market-based solutions to improve rural access to a larger range of financial services, at lower cost.
Delivery of Public Services
Investment Climate for Industry and Services
Agricultural Policy and Rural Development
xix


PART I: ASSESSMENT OF DEVELOPMENT OUTCOMES
Overview
1.1 India has continued to make progress in increasing incomes and improving living standards over the past decade. After the setback associated with the 1991 balance-of-payments crisis, economic growth picked up, income poverty has continued to decline, and many social indicators have continued to improve. These developments were supported by wide-ranging reforms launched in 1991 to open and deregulate the economy. Reforms included abolition o f a l l quantitative restrictions o n non-consumer goods, reduction in tariffs, unification o f the exchange rates, adoption o f more liberal rules for Foreign Direct Investment (FDI), and introduction o f current account convertibility. Even though the pace o f reform has slowed since the mid 1990s, cumulative changes so far have been substantial. More sectors have been opened to private activity, trade pol icy and the exchange-rate regime have been further liberalized, and capital markets have been reformed, leading to an improved investment climate.
1.2 Development progress has been steady, but uneven. I t has been uneven across indicators o f living standards, with noteworthy progress in some areas, but litt le or n o progress in others. Poverty and improving education indicators improved, particularly for females. On the other hand, maternal and under-five mortality have hardly improved. The ratio o f females to males for children under four has deteriorated, especially in richer states. And unemployment, although s t i l l l o w by international standards, has increased in rural areas and among educated youth. Progress has been uneven in urban and rural areas, with urban-rural inequality increasing in most individual states and also at the all-India level. Progress has been uneven also regionally. There i s evidence o f divergence in per capita incomes across states, with richer states increasing incomes faster than poorer ones. Because in India increases in per capita growth are strongly correlated with declines in poverty incidence, and because population growth has declined faster in richer states, poverty has become increasingly concentrated in the country's slower growing states. Aggregate outcomes at the all-India level thus mask sharp and increasing inequalities in income and social development levels across the country, with large parts o f the heavily populated north and eastern states remaining particularly poor and undeveloped. There are large disparities not only between poorer and richer states, but also between rural and urban areas, between women and men, and between castes.
1.3 Recent trends also give reason for concern. Economic growth has slowed since 1997/98. f rom an annual average o f 6.7% between 1992/93 and 1996/97 (Eighth Plan period) , to 5.5% between 1997/98 and 2001/02 (Ninth Plan period). Growth slowed further in 2002/03, to an estimated 4.4%, due to the impact o f poor rains on agricultural output. And fiscal performance deteriorated at the center and in states, with rising deficits and worsening public expenditure composition limiting the prospect for accelerating growth and poverty reduction.
1.4 With one third o f the world's poor and over one bi l l ion people, India needs rapid growth and j o b creation to reduce poverty and sustain income increases for i t s growing population.' I t
Figure 1.1: Per Capita Income Trends India and Comparator Countries
I 1200 , I
400
0 4 I 1990 2000 I g 8 O Years 1970
1 +-India +China -+-Indonesia 1 Source: World Development Indicators, 2002
starts the twenty-first century with per capita income around ha l f that o f China and Indonesia, countries that in 1970 were at comparable stages of development (Figure 1.1). In i t s Tenth Five Year Plan for
'Poverty estimated using intemationally comparable poverty estimate for the mid 199Os, based on an international poverty line of US$l per day with adjustments for purchasing power across countries (Datt and Ravallion, 2002).
1

2002103-2006/07, the Government o f India (GoI) targets an average growth rate o f 8% per annum. Accelerating poverty reduction does require setting India on a higher growth path. This chapter reviews the development outcomes o f recent years. The remainder o f the report proposes policies to accelerate development in India.
Poverty Outcomes and Economic Performance
1.5 Income poverty declined in the 1990s, broadly in l ine with earlier trends (Figure 1 .2).2 As a result, the share o f the population living below the poverty l ine declined from nearly ha l f in the early 1980s, to a l i t t l e over a quarter in 1999/00 (26% according to Go1 official estimates or 28.6% according to alternative estimate^).^ Internationally comparable poverty estimates also show a decline in the proportion o f people living o n less than US$l/day, from 46% in the early 1990s to 39% in 1999100. These findings are consistent with other data sources that show increases in real agricultural wages over the 1990s, highly correlated with poverty incidence, and in consumption expenditures in the National Sample Survey’s (NSS) 1999/00 employment unemployment survey (EUS).
Figure 1.2: Poverty and Per Capita Income Trends, 1983-1999/2000
50 i T 20
1983 19871aa 1993194 1999/00 -Poverty incidence-GO1 estimates (ieR axis) ~ - a- . Pover& incidence-adjusted estimates (iekaxis) -Per capita income (right axis)
Source: Planning Commission; Central Statistical Organization; Angus Deaton (2002, adjusted poverty estimates)
Box 1.1: Who are India’s Poor?
Poverty i s pervasive in India. I t i s present in the country’s rapidly growing cities and vast rural areas. But it i s increasingly concentrated in the country’s lagging states and rural areas. Over hal f o f India’s poor now l ive in one o f four states: Bihar, Madhya Pradesh, Orissa, and Uttar Pradesh. Over two thirds l ive in rural areas. In rural areas, poverty incidence i s highest amongst agricultural workers, many of whom are small-scale farmers or casual laborers. People o f scheduled castes and scheduled tribes are far more likely to be poor than those o f other social groups, as low-caste status and gender barriers s t i l l operate as social obstacles that block or exclude them from opportunity.
India’s poor suffer not only from lower incomes, but also from lower access to and quality o f public services, such as basic health, education, and infrastructure. The poor often lack the leverage to ensure that state institutions serve them fairly and thus lack access to public facilities or receive goods and services o f inferior quality. They must often pay for education and health services that others receive for free. For example, studies by India’s Public Affairs Center (Shekhar and Balakrishnan 1999) indicate that the wealthy and middle classes are more likely to resolve their complaints at a lower cost. Corruption is often a highly regressive tax and the poor pay more o f their incomes proportionately than do the wealthy and the middle class (World Bank 2002a).
The conventional definition o f poverty equates i t with income or expenditure levels. In India, GoI’s Planning Commission defines poverty as the level of per capita consumer expenditure sufficient to provide an average daily intake o f 2400 calories per person in rural areas and 2100 calories per person in urban areas, plus a small allocation for basic non-food items. T h i s report rel ies on income poverty estimates from the National Sample Survey’s quinquennial rounds (“thick samples” o f 1983, 1987188, 1993194, and 1999100).
Changes in the questionnaire design of the 55th Round (199912000) o f the National Sample Survey render the official poverty estimates for that year not strictly comparable to those from previous rounds. Several researchers attempted to correct for the changes in the survey methodology. Most estimates (Sundaram and Tendulkar 2002, Deaton 2002, and Ravallion and Datt 2002) point to a 5 to 10 percentage point reduction between 1993194 and 1999100. Based on the national accounts, Bhalla (2002) contends that conventional poverty measures overstate India’s poverty and understate recent progress. However, there are conceptual and measurement differences that lead to discrepancies in the per capita income growth rates implied b y CSO’s national accounts statistics and NSSO’s household level statistics.
2

1.6 Mos t o f the reduction in income poverty has been driven by economic growth, a result o f increases in average consumption per capita (Deaton and Drbze 2002). Although India’s per capita growth rates never reached East Asian levels, the acceleration o f growth in the 1980s and 1990s translated into a near doubling in per capita income over the last two decades, and a one third increase in the 1990s alone (Figure 1.2).4 Aggregate growth has reduced poverty, but the pattern o f growth was also decisive (Ravallion and Dat t 1995). Rural consumption growth reduced poverty in both rural and urban areas. Urban growth benefited the urban poor somewhat, but had n o impact on rural poverty. Economic growth has also been a key determinant for the improvement in some social indicators in particular in poor states, where the private sector provides education and health services to a large share o f the population.
1.7 Macroeconomic performance. Overall, India’s economy performed wel l in the 1980s and in particular after the reforms o f the 1990s (Table 1.1). Inflation remained l o w and external balances improved. GDP growth accelerated, fi-om only 3.5% per annum in the 1960s and 1970s, to nearly 7% per annum between 1992/93 and 1996/97.’ Growth was led by industry and services in the 1980s and by services in the 1990s (Table 1.2). Agriculture, forestry and fishing expanded slowly throughout the two decades. The structure o f the Indian economy changed considerably as a result o f these trends, with the share of agriculture declining to one fourth o f total output and the share o f services increasing to nearly half.
Table 1 .I : Macroeconomic Trends Over the Past Two Decades
1980s 1990s 1992193-1996197 1997/98- 2001102 2002103 GDP growth (% pa) 5.6 5.8 6.7 5.5 4.4
Agriculture, Forestry and Fisheries Industry Services
Investment rate (% of GDP) Private Public
3.4 3.0 4.7 1.8 -3.1 7.0 5.8 7.6 4.5 6.1 6.9 7.6 7.5 8.1 7.1
22.0 23.0 23.3 22.5 22.1 10.0 7.8 8.0 6.6 6.3 12.1 15.2 15.3 15.9 15.7
Inflation (WPI, % per annum) 8.0 8.1 8.7 4.9 2.5 General government deficit (YO of GDP) 8.1 7.8 7.2 9.3 10.4 Current account balance (% of GDP) -2.1 -1.4 -1.2 -0.7 1 .o External reserves (months of goods and services imports, end 3.3 5.6 5.9 7.0 11.0 of period) Notes: *Eighth Plan period “Ninth Plan period Source: Central Statistical Organization
1.8 Recent trends give r ise for concern. First, fiscal aggregates o f the general government (center plus states) deteriorated since 1997/98, with the overall budget deficit expanding f rom 7% to over 10% o f GDP between 1997/98 and 2002/03. This deterioration has been due to a decline in revenue mobilization, and a significant increase in government consumption, driven by higher wages and pensions o f c iv i l
Econometric analysis (Ravallion and Datt 1996 and 2002) using 23 surveys over the 1958-1991 period and private consumption per capita data from the national accounts reveal an elasticity o f -1.2, obtained by regressing the log o f the headcount poverty index against the log o f private consumption per capita.
A recent study b y the Reserve Bank of India (RBI 2002c) identified two regime shifts in India’s GDP growth series over the past two decades, which caused increases o f the trend growth rate o f GDP. The first occurred in 1981182, in the wake of an o i l shock and a severe drought. The second break occurred in 1990/91 as a result o f the structural reforms and stabilization that followed the balance o f payments crisis.
3
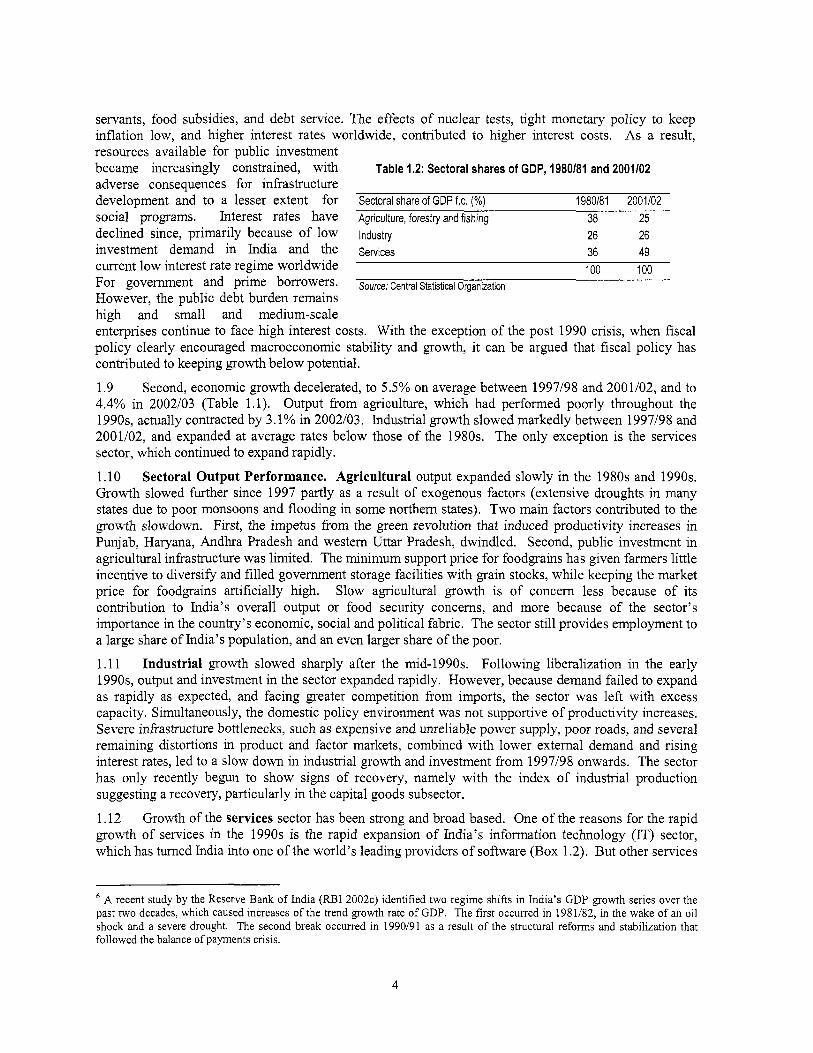
servants, food subsidies, and debt service. The effects o f nuclear tests, tight monetary pol icy to keep inflation low, and higher interest rates worldwide, contributed to higher interest costs. As a result, resources available for public investment became increasingly constrained, with Table 1.2: Sectoral shares of GDP, 1980/81 and 2001102 adverse consequences for infrastructure develoDment and to a lesser extent for Sectoral share of GDP f.c. (%) 1980181 2001102 . , social programs. Interest rates have Agriculture, forestry and fishing 38 25 declined since, primarily because of l o w Industry 26 26 investment demand in India and the Services 36 49 current l o w interest rate regime worldwide 100 100 For government and prime borrowers. However, the public debt burden remains high and small and medium-scale enterprises continue to face high interest costs. With the exception o f the post 1990 crisis, when fiscal pol icy clearly encouraged macroeconomic stability and growth, it can be argued that fiscal pol icy has contributed to keeping growth below potential.
1.9 Second, economic growth decelerated, to 5.5% on average between 1997198 and 2001102, and to 4.4% in 2002103 (Table 1.1). Output from agriculture, which had performed poorly throughout the 1990s, actually contracted by 3.1 % in 2002103. Industrial growth slowed markedly between 1997198 and 2001/02, and expanded at average rates below those o f the 1980s. The only exception i s the services sector, which continued to expand rapidly.
1.10 Sectoral Output Performance. Agricultural output expanded slowly in the 1980s and 1990s. Growth slowed further since 1997 partly as a result o f exogenous factors (extensive droughts in many states due to poor monsoons and flooding in some northern states). T w o main factors contributed to the growth slowdown. First, the impetus f rom the green revolution that induced productivity increases in Punjab, Haryana, Andhra Pradesh and western Uttar Pradesh, dwindled. Second, public investment in agricultural infrastructure was limited. The minimum support price for foodgrains has given farmers l itt le incentive to diversify and fi l led government storage facilities with grain stocks, whi le keeping the market price for foodgrains artificially high. Slow agricultural growth i s o f concern less because o f i t s contribution to India’s overall output or food security concerns, and more because o f the sector’s importance in the country’s economic, social and political fabric. The sector s t i l l provides employment to a large share o f India’s population, and an even larger share o f the poor.
1.1 1 Industrial growth slowed sharply after the mid-1990s. Fol lowing liberalization in the early 1990s, output and investment in the sector expanded rapidly. However, because demand failed to expand as rapidly as expected, and facing greater competition f rom imports, the sector was lef t with excess capacity. Simultaneously, the domestic pol icy environment was not supportive o f productivity increases. Severe infrastructure bottlenecks, such as expensive and unreliable power supply, poor roads, and several remaining distortions in product and factor markets, combined with lower external demand and rising interest rates, led to a slow down in industrial growth and investment f rom 1997/98 onwards. The sector has only recently begun to show s igns o f recovery, namely with the index o f industrial production suggesting a recovery, particularly in the capital goods subsector.
1.12 Growth o f the services sector has been strong and broad based. One o f the reasons for the rapid growth o f services in the 1990s i s the rapid expansion o f India’s information technology (IT) sector, which has turned India into one o f the world’s leading providers o f software (Box 1.2). But other services
Source: Central Statistical Organization
A recent study by the Reserve Bank o f India (RBI 2002c) identified two regime shifts in India’s GDP growth series over the past two decades, which caused increases o f the trend growth rate o f GDP. T h e first occurred in 1981/82, in the wake of an oil shock and a severe drought. T h e second break occurred in 1990191 as a result o f the structural reforms and stabilization that followed the balance of payments crisis.
4
have also expanded, namely transport, trade, and financial services. The national accounts reflect an increase in the value added o f public administration. However, if GDP estimates were corrected for the “spurious” addition to growth caused by the use o f the wage bill to estimate value added o f government services, aggregate GDP growth between 1997/98 and 1999100 would have been lower by about ha l f a percentage point annually (Acharya 2002a).
Box 1.2. India’s Success in Information Technology (IT) India has emerged as a leader among developing countries in providing cross-border IT services. Although the IT industry in India has more than three decades o f history, i t s take-off into a major software business i s a recent phenomenon, with the southem city o f Bangalore, and more recently Hyderabad, Chennai, Mumbai and Pune emerging as competitive IT hubs. Some critics assert that India’s “new economy” has l i t t l e to offer to the majority o f Indians who are not engineers, and that India’s IT sector i s essentially an export enclave. Others point out that India cannot l ive o f IT services alone. Although there is some truth to these assertions, India’s new economy, beyond making an increasing contribution to GDP and exports, also sets an example for the old. I t has grown from US$ 1 bi l l ion (or 0.3% o f GDP) in 1990/91, to US$ 9.6 bi l l ion (or 2% o f GDP) in 2001 and the share o f IT (mainly software) in total exports, has jumped from 1% in the early 199Os, to 18% in 2001. Several factors contributed to this take-off: the existence o f a skilled, English speaking workforce corning out o f India’s engineering schools and eaming lower wages than European and US counterparts, l ow dependence o f IT on physical infrastructure, and introduction o f current account convertibility and easing o f controls and regulations in the early 1990s.
IT-enabled services such as back-office operations, remote maintenance, accounting, public call centers, medical transcription, insurance claims, database, and other bulk standards processing, are also expanding rapidly in India. W h i l e at an earlier stage of development, IT-enabled services (which require an English speaking workforce and reliable telecommunications infrastructure) have the potential for broader job creation than IT itself.
1.13 Investment, which in the past had enabled phases o f acceleration and stability in periods o f slowdown (RBI, 2001), declined markedly since 1997/98, raising concerns about future growth trends.’ Public investment was clearly crowded out by expanding public consumption and debt service. Several economists (Sundarajan and Thakur 1980 and RBI 2001) agree that the slowing down o f public investment in the 1990s contributed to the slowing o f private investment, as there appears to be a crowding-in phenomenon between certain types o f public and private investments. Private investment slowed for several reasons. Fol lowing the high growth rates o f the early 1990s, f i r m s invested and borrowed heavily in the mid 199Os, building capacity for a continued expansion in domestic demand. Businesses invested based on the expectation that the pace o f regulatory and infrastructure reform and investment would remain rapid and thus contribute to higher productivity o f investment. In the meantime, trade reform lef t some sectors more open to competition, while they s t i l l faced behind the border constraints to improved productivity. As the pace o f reform slowed, interest rates rose, and the expected demand fi-om high overall growth rates failed to materialize, many f i r m s found themselves saddled with excess capacity and debt.
1.14 External sector. India’s integration into the global economy increased during the 1990s. The real depreciation of the rupee after the 1990/91 crisis promoted exports and the reduction o f import barriers allowed more foreign goods into the country. Exports o f goods and non-factor services rose from 7.5% o f GDP in 1990/91 to 10.5% in 2001/02.
1.15 The balance of payments has strengthened considerably in recent years. The performance of merchandise exports has been somewhat erratic as the stimulus fi-om the steep real depreciation o f the rupee in the early-1990s has faded, and been replaced by upward pressure o n the currency. Sluggish domestic demand growth, however, has more than offset the impact o f gradual relaxation o f import barriers, and import growth has been modest in recent years. The trade deficit, therefore, has roughly halved since 1990/00 from around US$12 b i l l ion to around US$6 b i l l ion this year. Exports o f IT services have increased sharply, and remittances have edged up. The current balance, which swung into a deficit o f 3.4% o f GDP in 1990/91 and a further deficit o f 1.7% in 1995/96, has shifted into small surplus.
’ Given the low degree of openness of India’s economy, extemal demand has played a small role in influencing the course o f business cycles.
5

1.16 Capital inflows picked up strongly in response to the reforms o f the early-1990s but have subsequently been more modest. Foreign direct investment and equity inflows have eased f rom their peaks, and borrowing from both official and private creditors has typically been more moderate. The level o f external debt has risen modestly and has fallen from almost 40% o f GDP in the early-1990s to around 23%. The combination o f an improving current balance and even modest capital inflows, however, has been enough to allow a substantial building o f reserves, which have risen from US$17 b i l l ion in 1995/96 to around to more than US$80 b i l l ion currently - equivalent to almost 12 months o f imports.
1.17 The external sector, however, continues to play a relatively modest role and India remains considerably more closed than other large Asian economies, where exports account for much larger shares o f GDP - 29% in China, 34% in Indonesia and 41% in South Korea. India’s share o f wor ld merchandise exports edged up from 0.5% in 1990 to 0.7% in 2001, but remains relatively modest for the size o f the economy. GoI’s cautious approach to opening the economy further in recent years reflects a desire to avoid a repetition o f the balance o f payments crisis o f the early-l990s, especially as fiscal imbalances re-emerge and domestic vested interests, concerned about their abil ity to compete against foreign companies, increase their resistance to further trade liberalization.
1.18 Unemployment rates in India are not high by international standards Table 1.3: Unemployment Rates, India and Comparator Countries (Table 1.3), but recent trends have
Countries Year Unemployment Rate (%) raised concern, as reflected in GoI’s 1999100 4.4 Tenth Plan. Unemployment rates based India
o n National Sample Survey (NSS) data China 1996 3.0 have been traditionally l o w in India, Indonesia 1998 5.5 regardless o f which o f the four Brazil 1998 9.0 unemployment measures CLTpSS, UPS, Pakistan 2000 5.9 CDW, and CDS) i s used.* All four Source: World Employment Report 2001 (ILO)
measures, however, show an increase in unemployment between 1993/94 and 1999/00, explained almost entirely by an increase in unemployment in rural areas (Figure 1.3 and Statistical Annex Table A21). An analysis o f disaggregated unemployment figures in the rural sector suggests that this deceleration in rural employment growth i s due to a decline in employment in agriculture, due to slow agricultural growth, combined with l o w capacity o f rural industry and services to absorb the labor released from agriculture. The share o f employment
Figure 1.3: Unemployment Rates (Current Weekly Status), 1987188.1 999100 -
io-
5 3
E 1 - 0 2
io- 2 8 1 I
7 - \ J 6 -
-0 2 - E 1, 2 0 4 =I
1987188 1993194 I999100 Year
1 -India +Urban -A- Rural 1 Source: Task Force on Employment Opportunities, Planning Commission 2002
in the organized sector remains low, and unemployment rates are high among certain population groups, such as urban educated youth, and in certain states, such as Kerala, Tamil Nadu, and West Bengal.
The NSSO provides four different measures o f unemployment, which capture different facets o f the labor market situation: Usual Principal Status ( U P S ) , Usual Principal and Subsidiary Status (UPSS), Current Weekly Status (CWS), and Current Daily Status (CDS).
6
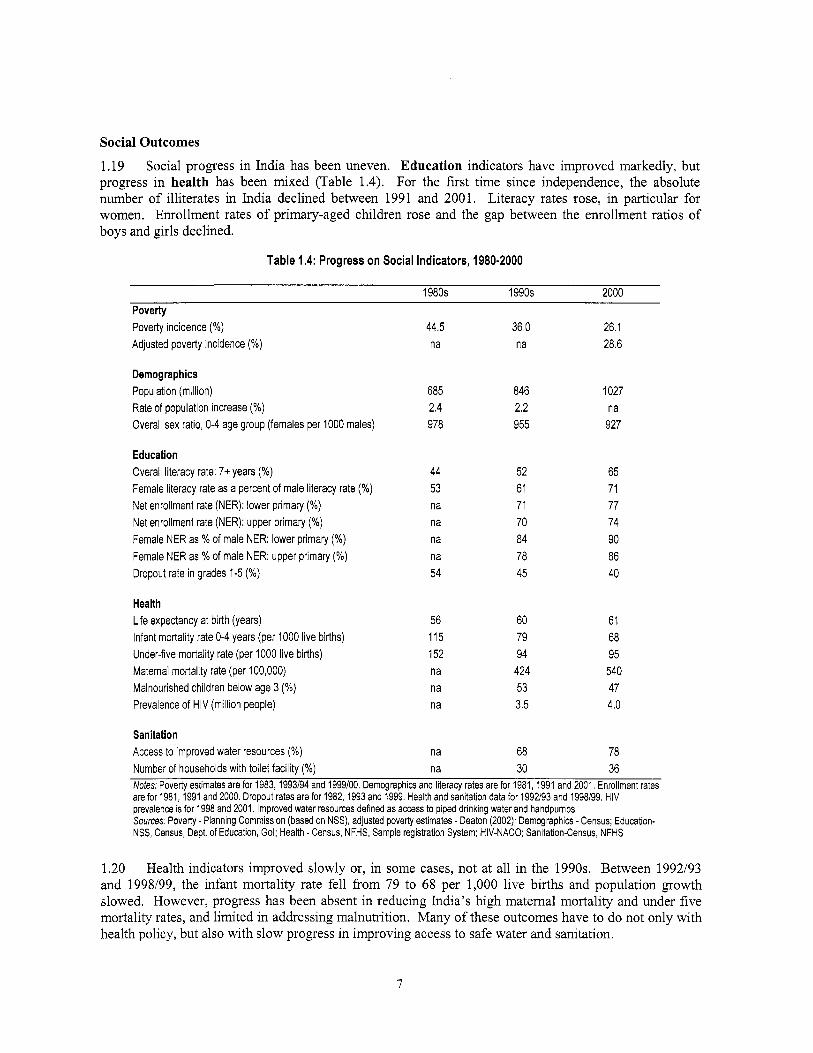
Social Outcomes
1.19 Social progress in India has been uneven. Education indicators have improved markedly, but progress in health has been mixed (Table 1.4). For the f i rs t time since independence, the absolute number o f illiterates in India declined between 1991 and 2001. Literacy rates rose, in particular for women. Enrollment rates o f primary-aged children rose and the gap between the enrollment ratios o f boys and girls declined.
Table 1.4: Progress on Social Indicators, 1980-2000
1980s 1990s 2000 Poverty Poverty incidence (%) Adjusted poverty incidence (%)
Demographics Population (million) Rate of population increase (%) Overall sex ratio, 0-4 age group (females per 1000 males)
Education Overall literacy rate: 7+ years (%) Female literacy rate as a percent of male literacy rate (%) Net enrollment rate (NER): lower primary (%) Net enrollment rate (NER): upper primary (%) Female NER as % of male NER: lower primary (%) Female NER as % of male NER: upper primary (%) Dropout rate in grades 1-5 (%)
Health Life expectancy at birth (years) Infant mortality rate 0-4 years (per 1000 live births) Under-five mortality rate (per 1000 live births) Maternal mortality rate (per 100,000) Malnourished children below age 3 (%) Prevalence of HIV (million people)
Sanitation Access to improved water resources (%) Number of households with toilet facility (%)
44.5 na
685 2.4 978
44 53 na na na na 54
56 115 152 na na na
na na
36.0 na
a46 2.2 955
52 61 71 70
78 45
a4
60 79 94
424 53 3.5
68 30
26.1 28.6
1027 na
927
65 71 77 74 90 86 40
61 68 95 540 47 4.0
78 36
Notes: Poverly estimates are for 1983,1993194 and 1999100. Demographics and literacy rates are for 1981,1991 and 2001. Enrollment rates are for 1981, 1991 and 2000. Dropout rates are for 1982, 1993 and 1999. Health and sanitation data for 1992/93 and 1998199. HIV prevalence is for 1998 and 2001. Improved water resources defined as access to piped drinking water and handpumps Sources: Poverty - Planning Commission (based on NSS), adjusted poverty estimates - Deaton (2002); Demographics - Census; Education- NSS, Census, Dept. of Education, Gol; Health - Census, NFHS, Sample registration System; HIV-NACO; Sanitation-Census, NFHS
1.20 Health indicators improved slowly or, in some cases, not at a l l in the 1990s. Between 1992/93 and 1998/99, the infant mortality rate f e l l f rom 79 to 68 per 1,000 l ive births and population growth slowed. However, progress has been absent in reducing India’s high maternal mortality and under five mortality rates, and limited in addressing malnutrition. Many o f these outcomes have to do not only with health policy, but also with slow progress in improving access to safe water and sanitation.
7

1.2 1 Other trends raise concern. An estimated four m i l l i on people in India are now infected by the H IV /A IDS and the rate o f infection i s increasing. The overall sex ratio for children under four continued to deteriorate in the 1990s.’ And although polio has disappeared from most countries, India i s one o f the seven where pol io i s endemic, and in 2002 accounted for 85% o f al l confirmed pol io cases in the wor ld (World Heath Organization 2002).
1.22 These trends are worrisome and also somewhat surprising. Worrisome, because they suggest that increased public expenditures alone will be insufficient t o improve outcomes. Public expenditures o n health and education have increased over the 1990s. Surprising because the 1990s witnessed a large increase in compensation to c iv i l servants, including education and health professionals, which could have contributed to improvements in the delivery o f basic education and health services. There i s no evidence that i t did. On the contrary, households (in particular poor households) are increasingly resorting to the private sector to provide education and health services.
Economic and Social Outcomes: A Regional Perspective 1.23 India’s good aggregate performance masks increasing divergence in per capita incomes, poverty, and other indicators o f wel l being between richer and poorer states. There i s no evidence o f convergence in per capita incomes across states, as suggested by a number o f time-series studies covering different time periods, including a 2002 analysis o f 1980-98 growth data for India’s 14 most populous states (Sachs, Bajpai and Ramiah 2002).’” ”
1.24 Although poverty declined in poorer and richer states, the extent o f progress in poverty reduction varied. In richer states the rate o f poverty reduction has been greater, while in the poorer states poverty reduction has been more limited. An important part o f the explanation i s that regional economic growth has been unbalanced, slower in the states that were poorer to start with. As noted by Deaton and Drkze (2002), the states with the poorest init ial conditions grew more slowly than the rest, resulting in an increase in regional Table 1.5: Concentration of Poverty in India inequality.12 Faster population growth in those states Wi th % of total number of poor 1983 1987188 1993/94 1999100 init ially higher incidence o f Poorer states* 70 70 71 76 poverty has led to a Richerstates** 27 28 26 22 concentration o f poverty in Others 3 2 3 3
100 100 100 100 India’s northem and eastern states 1’5)’ In 999/00, 76% o f India’s poor l ived in poorer states, or states with per capita incomes lower than the al l India average. Indeed, 54% o f the poor now l ive in four states alone: Uttar Pradesh, Bihar, Orissa, and Madhya Pradesh. Malung progress in poverty reduction in India requires, therefore, accelerating growth in India’s lagging states.
1.25 As will be discussed in Part I1 o f this report, these are also states with weaker state institutions, and where government finances are most severely stressed. Recent research by the Wor ld Bank and the Confederation o f Indian Industry suggests that a weaker investment climate in these lagging states may also be behind this slower growth, as will be discussed in more detail in Part 111.
Notes: includes AP, Assam, Bihar, Kerala, MP, Orissa, Rajasthan, UP, and W. Bengal
Source: Staff calculations, based on Planning Commission includes Gujarat, Havana, Kamataka, Maharashtra, Punjab, and Tamil Nadu
The difference i s due to female infanticide, the neglect of female children, and lately, the abortion o f female fetuses. lo See, for instance, Nair (1985), Chaudhury (1966), Majumdar and Kapoor (1980), Rao, Shand, and Kalirajan (1999), and A iyx (2001).
This i s similar to the findings for China’s provinces. Recent trends suggest that relative economic performance o f India’s poorest states i s improving, partly because they are
growing faster and partly because growth in previously fast growing states i s slowing. These trends should be interpreted with caution because: (a) recent GSDP estimates are subject to considerable revisions; and (b) establishing convergence or divergence rigorously requires a time series longer than just 4-5years.
8
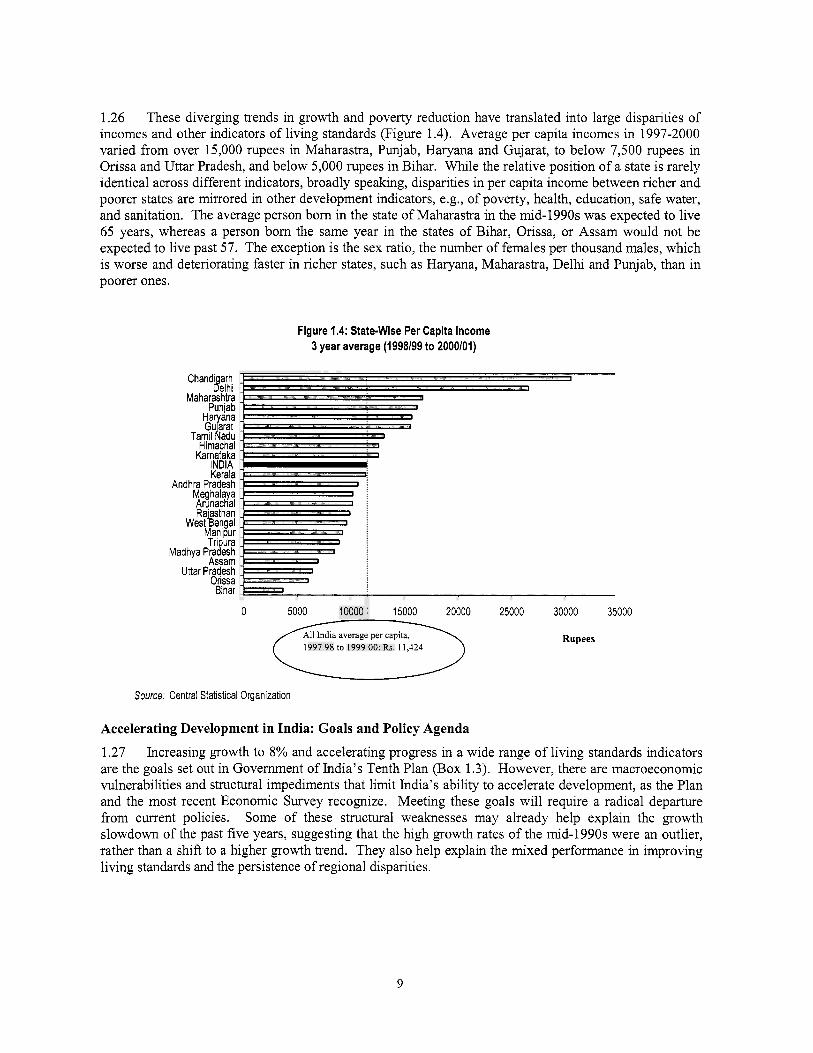
1.26 These diverging trends in growth and poverty reduction have translated into large disparities o f incomes and other indicators o f living standards (Figure 1.4). Average per capita incomes in 1997-2000 varied f rom over 15,000 rupees in Maharastra, Punjab, Haryana and Gujarat, to below 7,500 rupees in Orissa and Uttar Pradesh, and below 5,000 rupees in Bihar. W h i l e the relative position o f a state i s rarely identical across different indicators, broadly spealung, disparities in per capita income between richer and poorer states are mirrored in other development indicators, e.g., o f poverty, health, education, safe water, and sanitation. The average person born in the state o f Maharastra in the mid-1990s was expected to l ive 65 years, whereas a person born the same year in the states o f Bihar, Orissa, or Assam would not be expected to l ive past 57. The exception i s the sex ratio, the number o f females per thousand males, which i s worse and deteriorating faster in richer states, such as Haryana, Maharastra, Delh i and Punjab, than in poorer ones.
Figure 1.4: State-Wise Per Capita Income 3 year average (1998/99 to 2000101)
Chand arn Jelni
Maharasntra PunjaD
Haryana GL arar
Tam Naad h macnal
Karnataka IhDlA Kera a
Andhra Praaesn Megnalaya Arunachal Rajasinan
West Bengal Man pur Tr p,ra
Maanya Praaesn Assam
Unar Praaesn Orissa
Binar
0 5000 10000 15000 20000 25000 30000 35000
Rupees 1 9 9 7 9 8 t o 199900 Rj 11,124
Source: Central Statistical Organization
Accelerating Development in India: Goals and Policy Agenda
1.27 Increasing growth to 8% and accelerating progress in a wide range o f living standards indicators are the goals set out in Government o f India’s Tenth Plan (Box 1.3). However, there are macroeconomic vulnerabilities and structural impediments that limit India’s ability to accelerate development, as the Plan and the most recent Economic Survey recognize. Meeting these goals will require a radical departure f rom current policies. Some o f these structural weaknesses may already help explain the growth slowdown o f the past f ive years, suggesting that the high growth rates o f the mid-1990s were an outlier, rather than a shift to a higher growth trend. They also help explain the mixed performance in improving living standards and the persistence o f regional disparities.
9

Box 1.3: Targets for the Tenth Plan and Beyond
Macroeconomic Increase annual economic growth to 8% during the Tenth Plan and to 9.3% during the Eleventh Plan Double per capita consumption level in 13 years: private consumption expenditure to grow at 6.9% per annum and per capita consumption growth at 5.3% per annum in the Tenth Plan Achieve 12.4% per annum growth in exports Restore agricultural growth to 4% per annum; increase industrial growth to 8.7%, services growth to 9.3% per annum over the Tenth Plan period Reduce the Gross Fiscal Deficit o f the center and states from 10.4% o f GDP in 2001102 to 6.5% o f GDP in 2006107 Increase investment rate to 28% and savings rate to 27% o f GDP,
Reduce the poverty ratio by 5 percentage points to 21% by 2007 and by 15 percentage points to 11% by 2012
Reduce the population growth rate from 21.3% between 1991 and 2001 to 16.2% between 2001 and 201 1
Provide gainful, high-quality employment to at least the addition to the labor force Reduce the unemployment rate to 5.3% by 2006-07
Ensure all children in school by 2003; al l children to complete 5 years o f schooling by 2007 Reduce gender gaps in literacy and wage rates by at least 50% b y 2007 Increase literacy rate to 75% within the Plan period
Reduce Infant Mortality Rate from 70 to 45 per 1000 live births by 2007 and to 28 b y 2012 Reduce Matemal Mortality Rate to 2 per 1000 live births b y 2007 and 1 per 1000 l ive births by 2012 Reduce the average prevalence o f underweight children under three from 47% to 40% by 2007 Reduce severe under-nutrition in children in the 0-6 year age group by ha l f Achieve zero-level growth o f HIV1AIDS infection by 2007 Increase utilization o f public health facilities f rom 20% at present to 75% by 2010
Provide al l villages sustained access to potable drinking water within the Plan period Clean major polluted rivers by 2007 and other notified stretches by 2012
Increase forest and tree cover to 25% b y 2007 and 33% by 2012
Poverty
Demographics
Employment
Education
Health
Sanitation
Environment
Source: Go1 Tenth Five year Plan for 2002103 to 2006107
1.28 The next two parts o f this report look at the pol icy agenda to raise growth and achieve the goals of the Tenth Plan. These reforms can be grouped into two broad areas: (a) improving the management o f public resources, by reducing budget deficits, reallocating spending to more productive expenditures, and enhancing the quality o f service delivery; and (b) improving the investment climate and raising productivity in industry, services, apcu l tu re and rural development. The final part o f this report looks at the potential impact o f these reforms o n growth and poverty reduction, and the main r isks that may jeopardize realization o f these results.
10
PART 11: POLICY AGENDA - MANAGING PUBLIC RESOURCES
2.1 The public sector has always played a major role in India’s development strategy. Reforms during the 1990s reduced the role o f the state and improved the environment for private investment. However, developments in the public sector continue to have a major impact o n the prospects for economic growth and poverty reduction. In this context, the recent deterioration in the fiscal position at the center and in the states i s a cause for concem. The center and states combined are now spending almost a l l o f their revenues on interest payments, subsidies, c iv i l service salaries and pensions, administration and defense. O f particular concern are power sector losses that are placing massive stress on virtually a l l state budgets. As a result, there are limited resources for public investment, at the same time as large deficits are threatening to crowd out private investment. And even when funds are available, the delivery o f services to the poor i s constrained by weaknesses in public institutions and the regulatory fi-amework for private sector contributions.
2.2 Part 11.1 reviews the current debate around fiscal sustainability, and proposes a number o f reforms in fiscal pol icy and public resource management to steadily reduce the primary deficits at the center and state levels, and improve the composition o f public expenditure. Part 11.2 considers longer-term reforms in the c i v i l service to improve the delivery o f public services. It then looks more closely at the situation in the health and education sectors, as well as for social safety nets, and suggests possible reforms to improve the prospects o f achieving the targets set by the Tenth Plan and the Mil lennium Development Goals.

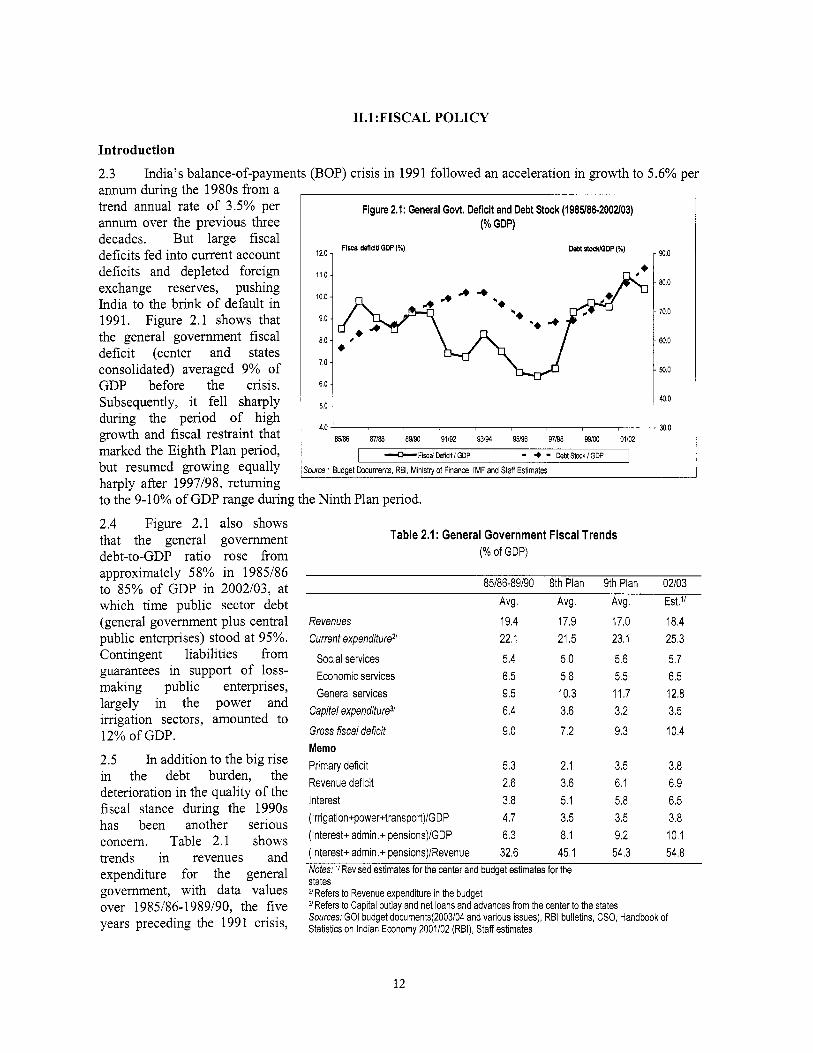
II.1:FISCAL POLICY
marked the Eighth Plan period, but resumed gowing equally
Introduction
2.3 annum during the 1980s f rom a
India’s balance-of-payments (BOP) crisis in 1991 followed an acceleration in growth to 5.6% per ,
---c)--Rscd DeficitlGDP * DebtSdxklGDP
Source : Budget b c u m n t s , RBI, Ministry of Finance, IMF and Staff Estimates
trend annual rate o f 3.5% per annum over the previous three decades. But large fiscal deficits fed into current account deficits and depleted foreign exchange reserves, pushing India to the brink o f default in 1991. Figure 2.1 shows that the general government fiscal deficit (center and states consolidated) averaged 9% o f GDP before the crisis. Subsequently, i t fe l l sharply
120
11.0
10.0
9.0
8 0
7.0
6.0
5.0
Figure 2.1: General God. Deficit and Debt Stock (1985186-2002103) (% GDP)
Fiscal deficitl GDP (Oh) Dsbt otofklGDP (Oh)
~ 4.0 during the period o f high growth and fiscal restraint that 6.5’86 87\88 89190 91/92 93194 95/96 97198 99103 01/02
90.0
80.0
70.0
60.0
50.0
40.0
30.0
2.4 Figure 2.1 also shows that the general government debt-to-GDP ratio rose from approximately 58% in 1985186 to 85% o f GDP in 2002103, at which time public sector debt (general government plus central public enterprises) stood at 95%. Contingent liabilities f rom guarantees in support o f loss- m a l n g public enterprises, largely in the power and irrigation sectors, amounted to 12% o f GDP.
2.5 In addition to the big rise in the debt burden, the deterioration in the quality o f the fiscal stance during the 1990s has been another serious concern. Table 2.1 shows trends in revenues and expenditure for the general government, with data values over 1985186-1989190, the five years preceding the 1991 crisis,
Table 2.1: General Government Fiscal Trends (% of GDP)
85186-89190 8th Plan 9th Plan 02/03
Revenues Currenf expenditurez
Social services Economic services General services
Capital expendifure3’
Avg. Avg. Avg. Est.” 19.4 17.9 17.0 18.4 22.1 21.5 23.1 25.3 5.4 5.0 5.6 5.7 6.5 5.8 5.5 6.5 9.5 10.3 11.7 12.8 6.4 3.6 3.2 3.5
Gross fiscal deficit 9.0 7.2 9.3 10.4 Memo Primary deficit 5.3 2.1 3.5 3.8 Revenue deficit 2.6 3.6 6.1 6.9 Interest 3.8 5.1 5.8 6.5 (irrigation+power+transport)/GDP 4.7 3.5 3.5 3.8 (Interest+ adinin.+ pensions)/GDP 6.3 8.1 9.2 10.1 (Interest+ adinin.+ pensions)/Revenue 32.6 45.1 54.3 54.8 Notes: ”Revised estimates for the center and budget estimates for the states ZRefers to Revenue expenditure in the budget YRefers to Capital outlay and net loans and advances from the center to the states Sources: GO1 budget documents(2003104 and various issues), RBI bulletins, CSO, Handbook of Statistics on Indian Economy 2001102 (RBI), Staff estimates
12

as a benchmark. The 1990s are divided into the period o f rapid growth, 1992193-1996197, which coincided with the Eighth Plan; and the slowdown, 1997198-2001102, which coincided with the Ninth Plan period.
2.6 Revenues fe l l considerably during the Ninth Plan period relative to the second hal f o f the 1980s. While 2002103 shows a large revenue increase, i t i s based on the budget estimate for states, which tends to be optimistic. Compared to the average for the second ha l f o f the 1980s, capital expenditure fe l l by over three percentage points o f GDP during the Ninth Plan, while the sum o f interest, administration and pensions rose by three percentage points o f GDP and a massive 22 percentage points o f revenue. Revenue deficits more than doubled with spending o n interest, administration and pensions crowding out that o n social and physical infrastructure. Even the fiscal improvement secured during the Eighth Plan period involved a large compression o f capital spending. l2
Table 2.2: Trends in Central Government Finances (% of GDP)
85186-89190 8th Plan 9th Plan 02/03 03/04
Avg , Avg. Avg. RE BE Revenues 10.4 9.2 8.9 9.7 9.3
Tax revenue (net) 7.8 6.8 6.2 6.7 6.8 Non tax revenue 2.5 2.5 2.7 3.0 2.6
Current expenditure 12.9 12.1 12.7 13.9 13.4 Interest payments 3.2 4.3 4.6 4.7 4.5 Subsidies 1.8 1.2 1.3 1.8 1.8 Salaries 0.0 1.1 1 .o 1.3 1.2 Pensions 0.4 0.4 0.7 0.6 0.6 Defense 2.5 1.6 1.7 1.7 1.6
Capital outlay 2.6 1.4 1 .I 1.2 1.5 Net lending 1.7 0.8 0.7 0.6 0.4
Gross fiscal deficit 2/ 6.9 5.1 5.6 6.1 6.1 Memo Primary deficit 3.7 0.8 1 .o 1.3 1.6 Revenue deficit 2.5 2.8 3.8 4.3 4.1 Notes: BE=Budget Estimates; RE=Revised Estimates 1’ Excludes state’s share of net small savings loans 21 Divestment receipts are treated as a financing item and not as revenues in computing the deficit Sources: Budget documents (2003-04; various issues), Staff estimates
Capital expenditure 4.3 2.2 1.8 1.8 2.0
2.7 Table 2.2 contains information on fiscal developments at the center. Revenues declined substantially during the Ninth Plan period relative to the pre-crisis benchmark, whi le interest payments, s~bsidies, ’~ c iv i l service ~ a l a r i e s ’ ~ and pensions, administration and defense literally consumed 100% o f revenues. The primary deficit more than halved based on the same comparison, whi le the revenue deficit increased substantially - which i s explicable by the displacement o f capital spending by rising interest payments. The fiscal deficit has been reduced, but the quality o f the fiscal stance has worsened.
I t was hoped the private sector w o u l d step i n to the breach and invest in infrastructure; but this has n o t happened on the desired scale except fo r telecommunications. As noted in RBI (2003a), 111-46, a b igger private ro le in infrastructure would require inst i tut ional re fo rm and “economically eff icient user charges to ensure the reasonable re tum o n investment”. l3 Exp l i c i t budgetary subsidies. l4 Excluding rai lways and posts and telecommunications.
13

According to the revised estimates (RE) for 2002/03, there has been an encouraging increase in revenues compared to the Ninth Plan average; but interest payments, the primary deficit, the revenue deficit and the gross fiscal deficit have al l increased.
2.8 Table 2.3 captures trends in revenues and expenditure at the consolidated state level. The story here mirrors that o f the center, except that the gross fiscal deficit rose significantly after fall ing during the Eighth Plan period. Revenue deficits have grown alarmingly, while capital expenditure was cut in part to accommodate growing interest payments. The share in central taxes plus grants almost fully explains the decline in revenues during the Ninth Plan period relative to the second ha l f o f the 1980s. Once again, the signs o f a deterioration in the fiscal stance are unmistakable. Interest spending has risen, capital expenditure has declined and developmental spending stagnated, even though the states have primary responsibility under the Constitution for poverty reduction and welfare o f the population.
Table 2.3: Trends in State Government Finances (%of GDP)
85186-89190 8th Plan 9th Plan 02103
Revenues Share in central taxes Grants from the center
Current expenditure Education Health and family welfare Agriculture and allied services Rural development Interest payments Administrative services Pensions Other
Capifal expenditure Capital outlay Loans and advances (net)
Gross fiscal deficit Financed by: Internal debt (net) Loans from center (net) Provident and insurance funds (net) Memo: Primary deficit Revenue deficit
Avg. 12.2 2.7 2.2 12.3 2.6 0.8 1 ,I 0.8 1.4 1.2 0.4 3.9 2.7 1.9 0.9 2.8
0.5 1.8 0.4
1.4 0.1
Avg. 11.8 2.6 2.1 12.6 2.5 0.7 0.9 0.7 1.9 1.2 0.7 4.0 1.9 1.5 0.4 2.6
0.5 1.2 0.5
0.7 0.7
Avg. 11.0 2.4 1.7 13.3 2.7 0.7 0.8 0.5 2.4 1.2 1 .o 4.0 1.9 1.5 0.4 4.2
0.7 0.9 0.6
1.8 2.3
PL
12.0 2.5 2.2 14.5 2.7 0.7 0.7 0.5 3.0 1.2 0.9 4.6 2.2 1.8 0.4 4.7
0.6 0.5 0.5
1.6 2.5
Source ;State Finances - RBI bulletin (various issues), Staff estimates
2.9 W h i l e a mechanical comparison o f the numbers for the general government, center and state? shows that most o f the increase in the general government's revenue deficit between the second ha l f o f the 1980s and the Ninth Plan period i s traceable to a big deterioration in state finances, the underlying causes
l5 N o t e that the general govemment gross f iscal and pr imary defici ts d i f fer from the sum o f the respective defici ts at the center and states because o f the nett ing out o f interest pa id by the states t o the center and net lending from the center to the states (which i s a component o f capital expenditure).
14
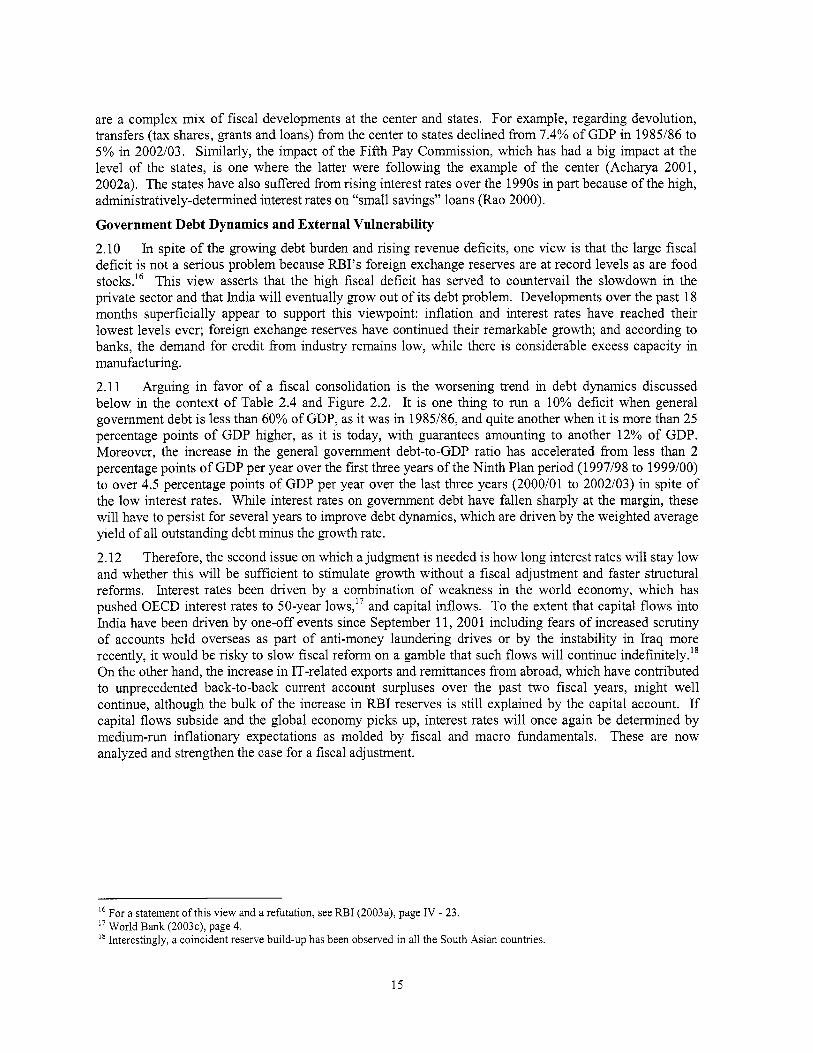
are a complex mix o f fiscal developments at the center and states. For example, regarding devolution, transfers (tax shares, grants and loans) f rom the center to states declined from 7.4% o f GDP in 1985/86 to 5% in 2002/03. Similarly, the impact o f the Fifth Pay Commission, which has had a big impact at the level o f the states, i s one where the latter were following the example o f the center (Acharya 2001, 2002a). The states have also suffered from rising interest rates over the 1990s in part because o f the high, administratively-determined interest rates on “small savings” loans (Rao 2000).
Government Debt Dynamics and External Vulnerability
2.10 In spite o f the growing debt burden and rising revenue deficits, one view i s that the large fiscal deficit i s not a serious problem because R B I ’ s foreign exchange reserves are at record levels as are food stocks.16 T h i s v iew asserts that the high fiscal deficit has served to countervail the slowdown in the private sector and that India will eventually grow out o f i t s debt problem. Developments over the past 18 months superficially appear to support this viewpoint: inflation and interest rates have reached their lowest levels ever; foreign exchange reserves have continued their remarkable growth; and according to banks, the demand for credit f rom industry remains low, while there i s considerable excess capacity in manufacturing.
2.1 1 Arguing in favor o f a fiscal consolidation i s the worsening trend in debt dynamics discussed below in the context of Table 2.4 and Figure 2.2. I t i s one thing to run a 10% deficit when general government debt i s less than 60% o f GDP, as it was in 1985/86, and quite another when it i s more than 25 percentage points o f GDP higher, as i t i s today, with guarantees amounting to another 12% o f GDP. Moreover, the increase in the general government debt-to-GDP ratio has accelerated from less than 2 percentage points o f GDP per year over the first three years o f the Ninth Plan period (1997/98 to 1999/00) to over 4.5 percentage points o f GDP per year over the last three years (2000/01 to 2002/03) in spite o f the l o w interest rates. Whi le interest rates on government debt have fallen sharply at the margin, these will have to persist for several years to improve debt dynamics, which are driven by the weighted average yield o f a l l outstanding debt minus the growth rate.
2.12 Therefore, the second issue on which a judgment i s needed i s how long interest rates will stay l o w and whether this will be sufficient to stimulate growth without a fiscal adjustment and faster structural reforms. Interest rates been driven by a combination o f weakness in the world economy, which has pushed OECD interest rates to 50-year lows,l7 and capital inflows. T o the extent that capital f lows into India have been driven by one-off events since September 11, 2001 including fears o f increased scrutiny o f accounts held overseas as part o f anti-money laundering drives or by the instability in Iraq more recently, i t would be r i s k y to slow fiscal reform o n a gamble that such flows will continue indefinitely.18 On the other hand, the increase in IT-related exports and remittances from abroad, which have contributed to unprecedented back-to-back current account surpluses over the past two fiscal years, might wel l continue, although the bulk o f the increase in RBI reserves i s s t i l l explained by the capital account. If capital flows subside and the global economy picks up, interest rates will once again be determined by medium-run inflationary expectations as molded by fiscal and macro fundamentals. These are n o w analyzed and strengthen the case for a fiscal adjustment.
l6 For a statement o f this view and a refutation, see RBI (2003a), page I V - 23. l7 World Bank (2003c), page 4. ’* Interestingly, a coincident reserve build-up has been observed in al l the South Asian countries.
15
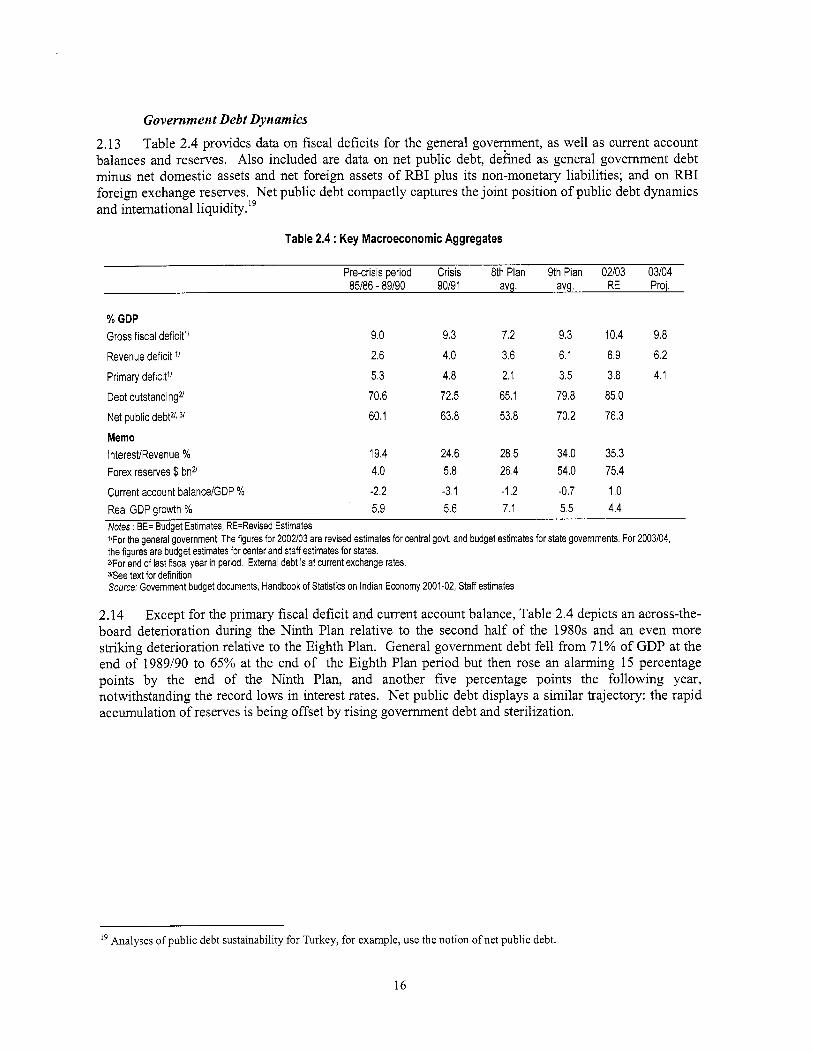
Government Debt Dynamics
2.13 Table 2.4 provides data on fiscal deficits for the general government, as well as current account balances and reserves. Also included are data o n net public debt, dehned as general government debt minus net domestic assets and net foreign assets o f RBI plus i t s non-monetary liabilities; and o n RBI foreign exchange reserves. N e t public debt compactly captures the jo int position o f public debt dynamics and international 1iq~idity.l~
Table 2.4 : Key Macroeconomic Aggregates
Precrisis period Crisis 8th Plan 9th Plan 02/03 03/04 85/86 - 89/90 90191 avg. avg. RE Proj.
% GDP Gross fiscal deficiti/ 9.0 9.3 7.2 9.3 10.4 9.8 Revenue deficit 2.6 4.0 3.6 6.1 6.9 6.2
Primary deficiti/
Debt outstandingz Net public debt2/$ 31
Memo InteresVRevenue % Forex reserves $ bn2/ Current account balancelGDP % Real GDP qrowth %
5.3 4.8 2.1 3.5 3.8 4.1 70.6 72.5 65.1 79.8 85.0 60.1 63.8 53.8 70.2 76.3
19.4 24.6 28.5 34.0 35.3 4.0 5.8 26.4 54.0 75.4 -2.2 -3.1 -1.2 -0.7 1 .o 5.9 5.6 7.1 5.5 4.4
Notes ; BE= Budget Estimates, RE=Revised Estimates "For the general government, The figures for 2002103 are revised estimates for central god. and budget estimates for state governments. For 2003104, the figures are budget estimates for center and staff estimates for states. ZFor end of last fiscal year in period. External debt is at current exchange rates. "See text for definition Source; Government budget documents, Handbook of Statistics on Indian Economy 2001-02, Staff estimates
2.14 Except for the primary fiscal deficit and current account balance, Table 2.4 depicts an across-the- board deterioration during the Ninth Plan relative to the second hal f o f the 1980s and an even more striking deterioration relative to the Eighth Plan. General government debt fe l l fi-om 71% o f GDP at the end o f 1989/90 to 65% at the end o f the Eighth Plan period but then rose an alarming 15 percentage points by the end o f the Ninth Plan, and another five percentage points the fo l lowing year, notwithstanding the record lows in interest rates. N e t public debt displays a similar trajectory: the rapid accumulation o f reserves i s being offset by rising government debt and sterilization.
Analyses o f public debt sustainability for Turkey, for example, use the notion o f net public debt.
16
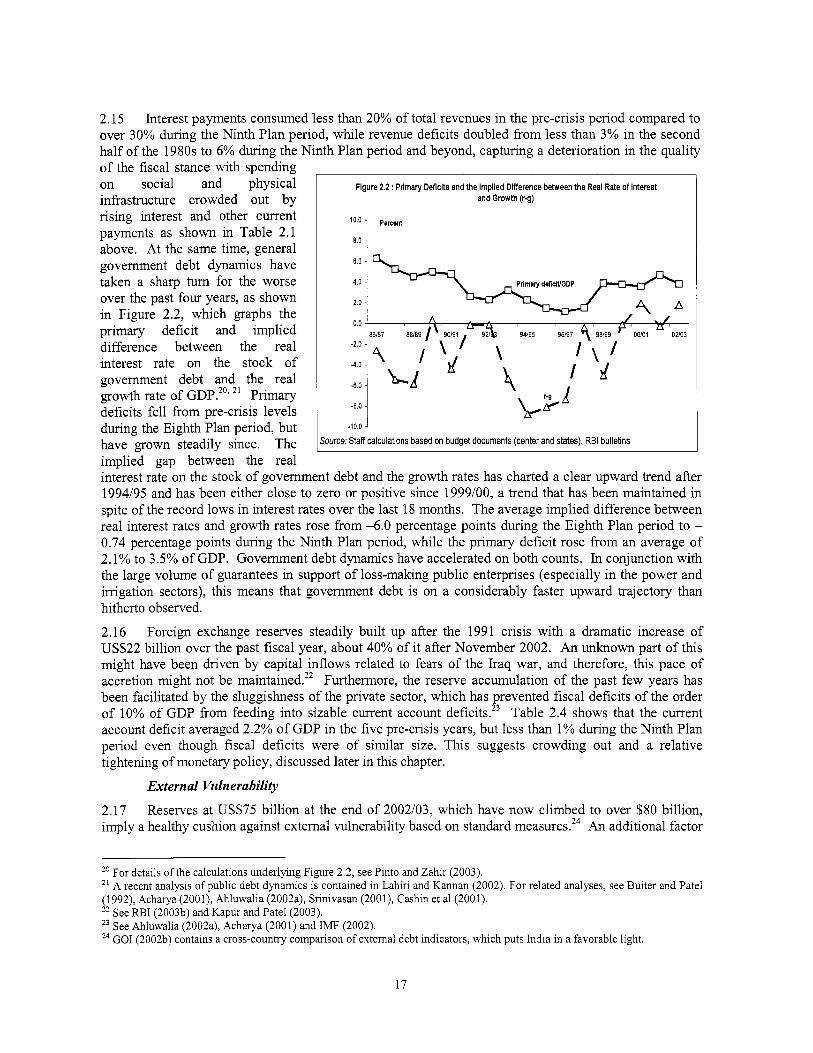
2.15 Interest payments consumed less than 20% o f total revenues in the pre-crisis period compared to over 30% during the Ninth Plan period, while revenue deficits doubled f rom less than 3% in the second half of the 1980s to 6% during the Ninth Plan period and beyond, capturing a deterioration in the quality o f the fiscal stance with spending
- -
on social and physical infrastructure crowded out by rising interest and other current payments as shown in Table 2.1 above. At the same time, general government debt dynamics have taken a sharp tum for the worse over the past four years, as shown in Figure 2.2, which graphs the primary deficit and impl ied difference between the real interest rate on the stock o f government debt and the real growth rate o f GDP.20, 21 Primary deficits f e l l f rom pre-crisis levels during the Eighth Plan period, but
Figure 2.2 : Primaly Deficits and the Implied Difference between the Real Rate of Interest and Growth (r-g)
'0.0 Percent
8.0 1 2.0 -
-8.0 -
.10.0 J
2o For details o f the calculations underlying Figure 2.2, see Pinto and Zahir (2003). 21 A recent analysis of public debt dynamics i s contained in Lahiri and Kannan (2002). For related analyses, see Buiter and Patel (1992), Acharya (2001), Ahluwalia (2002a), Srinivasan (2001), Cashin et a1 (2001). 22 See RBI (2003b) and Kapur and Patel (2003). 23 See Ahluwalia (2002a), Acharya (2001) and IMF (2002). 24 GO1 (2002b) contains a cross-country comparison o f external debt indicators, which puts India in a favorable light.
17
boosting liquidity has been the shift towards long-term rupee debt in government financing after the 1991 crisis. The average maturity o f dated securities issued more than doubled from 6.6 years in 1997/98 to 14.3 in 2001/02.25 Moreover, about 90% o f central and state government securities are held by nationalized banks, State Bank o f India, RBI and L I C and the remaining are held by Unit Trust o f India, NABARD, employees provident funds and private banks.26
2.18 Since the 1991 BOP crisis, interest rates have been liberalized, India has become more integrated into the wor ld goods and capital markets and fiscal fundamentals have deteriorated relative even to the late 1980s. IMF (2002) notes that “total public sector debt relative to GDP in India i s much greater than in Argentina and Brazil, while the ratio for Turkey recently shot up (during the crisis) to around that o f India.” And further, primary fiscal deficits are larger - in fact, the other three countries have generally run primary surpluses over the last decade.27 Cross-country comparisons are complicated by a number o f factors such as the currency composition o f debt, i t s maturity, whether or not the real exchange rate i s in equilibrium, whether privatization proceeds are included in revenues (thereby artificially boosting the primary surplus, as in Argentina);28 and the size o f contingent liabilities and potential balance sheet problems in the banlung and corporate sectors, a potent factor in the East Asian crisis o f 1997/98. Further, countries with unsustainable public debt dynamics which eventually experienced crisis, such as Russia and Argentina, simultaneously had l o w international liquidity. This combination proved intractable, even with substantial bailout packages; indeed, bailout packages could backfire in these circumstances, as they provide the means for private portfolio investors to exit and leave the country burdened with senior IF1 loans denominated in hard currency.
2.19 India’s public debt dynamics have worsened, with state government finances in a state o f crisis, significant NPAs in the financial system and a large volume o f guarantees. But reserves are high and bolstered by l imited capital account convertibility, a flexible exchange rate and the relatively long-term nature o f capital inflows, plus a pliant financial system which willingly holds long-term, rupee- denominated government paper. Hence, India i s not vulnerable to the type o f collapse suffered by Russia or Argentina. But it i s vulnerable to sub-standard growth without a fiscal adjustment.
Costs o f the Fiscal Stance 2.20 The growth target for the Tenth Plan i s 8% per year as part o f a strategy o f doubling per capita GDP by the end o f the Eleventh Plan period. In order to achieve it, chapter two o f the plan document notes that the investment rate will need to rise by four percentage points to a l itt le over to 28%, with domestic savings contributing an additional 3.5 percentage points and the rise in the current account deficit (CAD) the balance o f 0.5 percentage points. The I C O R i s assumed to fa l l f rom 4.5 to 3.6, investments to grow at 14% per annum compared to the long-run growth rate o f 6.5%, and consumption by 6.9% per annum. The chapter notes that private household savings rose over the Eighth and Ninth plans in response to the cut in tax rates and consequent rise in disposable income. This could slow down in the Tenth plan period because of the need to raise the tax/GDP ratio, and highlights the need to increase public savings from -1.7% in the base year o f the Tenth plan (2001/02) to +2.1% in i t s last year (2006/07). Unless this happens, the plan document i s quite specific that the growth target i s unlikely to be reached. I t also cautions that the C A D should not be used to slacken the public savings target, and that a safe upper limit i s 3% o f GDP.
25 RBI (2002a). 26RBI (2001b), Table 111. 27 IMF (2002), chapter 111, page 37. 28 On this specific point and how it may have put a better complexion on debt dynamics, see Mussa (2002).
18
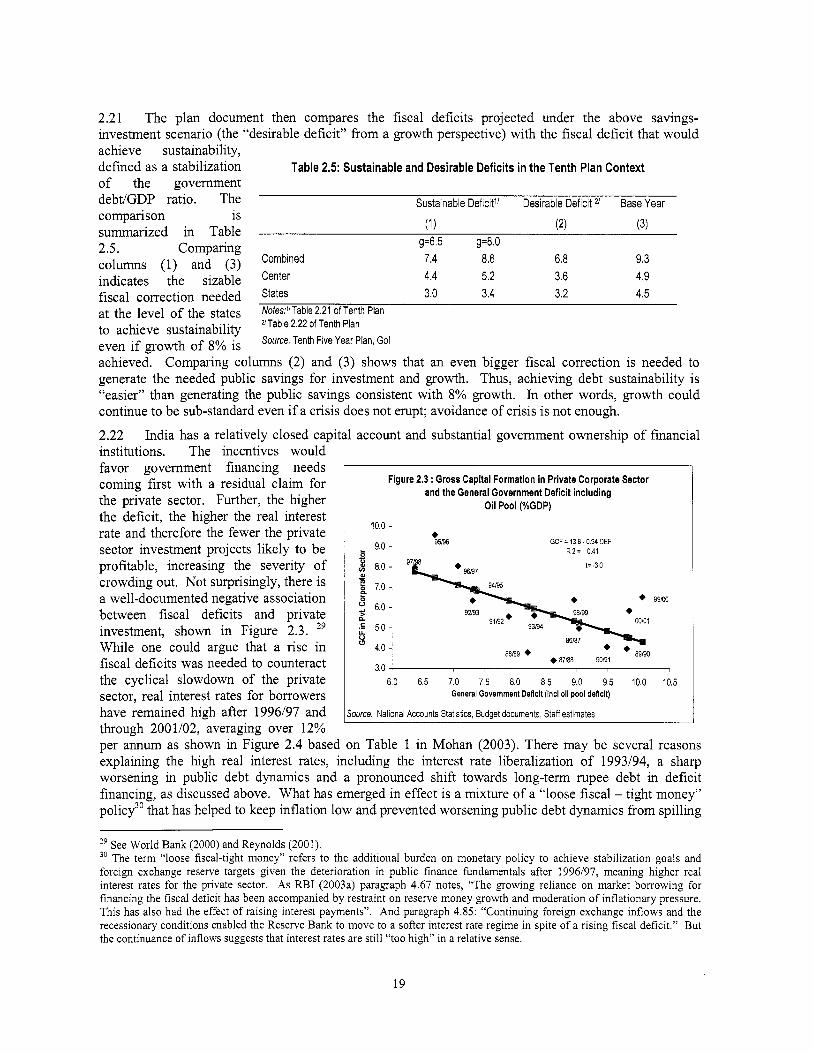
2.21 The plan document then compares the fiscal deficits projected under the above savings- investment scenario (the “desirable deficit” f rom a growth perspective) with the fiscal deficit that would achieve sustainability, defined as a stabilization o f the government debt/GDP ratio. The Sustainable Deficit” Desirable Deficit 21 Base Year comparison i s summarized in Table 2.5. columns (1) and (3) indicates the sizable Center 4.4 5.2 3.6 4.9 fiscal correction needed States 3.0 3.4 3.2 4.5
Table 2.5: Sustainable and Desirable Deficits in the Tenth Plan Context
(1) (2) (3)
Combined 7.4 8.6 6.8 9.3 Comparing g=6.5 g=a.o
at the level of the states Nofes:”Table 2.21 of Tenth Plan WTable 2.22 of Tenth Plan Source: Tenth Five Year Plan, Go1
to achieve sustainability even if growth o f 8% i s achieved. Comparing columns (2) and (3) shows that an even bigger fiscal correction i s needed to generate the needed public savings for investment and growth. Thus, achieving debt sustainability i s “easier” than generating the public savings consistent with 8% growth. In other words, growth could continue to be sub-standard even i f a crisis does not erupt; avoidance o f crisis i s not enough.
2.22 India has a relatively closed capital account and substantial govemment ownership o f financial institutions. The incentives would favor govemment financing needs coming f i rs t with a residual claim for the private sector. Further, the higher the deficit, the higher the real interest rate and therefore the fewer the private sector investment projects l ikely to be profitable, increasing the severity o f crowding out. N o t surprisingly, there i s a well-documented negative association between fiscal deficits and private investment, shown in Figure 2.3. W h i l e one could argue that a rise in fiscal deficits was needed to counteract the cyclical slowdown o f the private sector, real interest rates for borrowers have remained high after 1996197 and through 2001102, averaging over 12%
29
Figure 2.3 : Gross Capital Formation in Private Corporate Sector and the General Government Deficit including
Oil Pool (%GDP)
8.0
6.0
5.0 8
4.0
3.0
e
GCF = 13.8.0.94 DEF R 2 = 0.41
9 9 m
7
I 6.0 6.5 7.0 7.5 8.0 8.5 9.0 9.5 10.0 10.5 General Government Deficit (incl oil pool deficit)
Source: National Accounts Statistics, Budget documents, Staff estimates
per annum as shown in Figure 2.4 based o n Table 1 in Mohan (2003). There may be several reasons explaining the high real interest rates, including the interest rate liberalization o f 1993194, a sharp worsening in public debt dynamics and a pronounced shift towards long-term rupee debt in deficit financing, as discussed above. What has emerged in effect i s a mixture o f a “loose fiscal - tight money” policy3o that has helped to keep inflation l o w and prevented worsening public debt dynamics f rom spilling
29 See World Bank (2000) and Reynolds (2001). 30 T h e term “loose fiscal-tight money” refers to the additional burden on monetary policy to achieve stabilization goals and foreign exchange reserve targets given the deterioration in public finance fundamentals after 1996197, meaning higher real interest rates for the private sector. As RBI (2003a) paragraph 4.67 notes, “The growing reliance on market borrowing for financing the fiscal deficit has been accompanied by restraint on reserve money growth and moderation o f inflationary pressure. T h i s has also had the effect o f raising interest payments”. And paragraph 4.85: “Continuing foreign exchange inflows and the recessionary conditions enabled the Reserve Bank to move to a softer interest rate regime in spite o f a rising fiscal deficit.” But the continuance o f inflows suggests that interest rates are s t i l l “too high” in a relative sense.
19

reserves, as happened in the late 1980s and led to the 1991 crisis; but this has been at
interest payments have crowded out spending o n social and physical infrastructure. Even though interest rates have declined sharply over the past 18 months or so for a variety o f reasons in the external environment, public debt dynamics have continued to worsen.
2.23 In addition, there are significant micro barriers to financing the private sector, which could also act to prevent the
the expense o f growth and welfare, as rising
decline in marginal interest rates on
20
Figure 2.4: Real Interest Rates (1990191-2001102) Percent
16.0
12,0
,o,o 8,0
? . I 1
.
-4,0
Source: Speech by Rakesh Mohan, RBI Monhly Bulletin (Jan 2003)
Fiscal R e f o r m Prior i t ies 2.26 In addition to the Tenth Plan document, concerns about the fiscal situation have been expressed in key government reports and pronouncements. According to the Economic Survey, 2002-03, “Higher fiscal deficits, besides constraining growth have resulted in higher government borrowings.. .. The revenue deficit which constituted 49.4% o f the fiscal deficit in 1990/91 accounted for 70.2% o f fiscal deficit in 2001/02.. ..While the expenditure composition both for the center and states continues to reflect a preponderance o f wages, salaries, interest payments and subsidies, there has been some welcome rel ief on the interest rates in recent months. The high fiscal deficit continues to complicate the task o f conducting counter-cyclical fiscal policies and augmenting outlays o n the much needed social and physical infrastructure, and poverty alleviation programs.” During the 2003/04 Union Budget discussions, the Finance Minister informed the Rajya Sabha on March 14, 2003 that “Of our revenue, 50% i s swallowed by payment o f just interest o n (government) debt. Another 20% goes o n subsidies and 25% o n defense. What am I left with?”31 And RBI (2003a) page I V - 1, notes that “...fiscal performance during the reform period, however, was characterized by a clear divide in the mid-1990s in the attainment o f fiscal targets. There was evidence o f the successful fiscal correction during 1991/92 to 1996/97 (except for 1993/94) in terms o f a significant fa l l in the fiscal deficit and in public debt as a proportion o f GDP. Since then there has been a significant reversal o f trend. Indeed, many deficit indicators presently are even higher than the levels prevailing at the time o f the crisis in 1991. The revenue deficit has not only persisted, but has grown in size during this period. . . . . .. Several pointers indicate a reversal o f the fiscal consolidation process in the recent years. These include decline in tax to GDP ratio, downward rigidity in current expenditure, steady deterioration in public investment in productive sectors, slow progress o f PSUs restructuring and faster accumulation o f public debt.”
2.27 In v iew o f the preceding analysis, fiscal reforms are needed to ensure a phased reduction in the primary and revenue deficits o f the center and state governments, and to reallocate expenditure toward more productive uses. Following are proposals for pol icy reforms in four key areas: (a) tax reform; (b) subsidy reduction; (c) financial policy; and (d) fiscal management.
Tax Reform
2.28 The gross tax revenue o f the central government fe l l f rom 10.3% o f GDP in 1991/92 to 8.6% in 2001/02.32 The goal i s to raise taxes back to 10.3% o f GDP by the end o f the Tenth Plan. Plan projections assume a big increase in tax buoyancy f rom 0.8 during the Ninth Plan to 1.26 during the Tenth. Most o f this increased buoyancy i s expected to come f rom indirect taxes, customs duty in particular. Achieving this goal rests o n several key assumptions: (a) complete withdrawal o f import tar i f f exemptions (except on strategic imports); (b) a strong resumption o f manufacturing sector growth, as this sector has the highest tax buoyancy; and (c) extending the tax net to include the booming services sector. The states’ own tax collection i s projected to be raised f rom 5.9% o f GDP in the base year to 6.6% by the end o f the Tenth Plan. This increase crucially rests o n the implementation o f a unified VAT covering a l l goods and services.
2.29 Whi le the decline in the tax-to-GDP ratio during the 1990s i s partly due to the “costs o f reform”, which reflects the reduction in customs and excise duties to increase competition and enhance efficiency, it also reflects the costs o f incomplete reform. The shift towards direct taxes has failed to fully compensate for the reduction in indirect taxes implemented as part o f the reforms during the 1990s. As the Kelkar Committee reports33 emphasize, the lowering o f tax rates needs to be complemented with the elimination o f exemptions, the bringing into the tax net o f services and agriculture and improved information technology-based tax administration. These reforms deserve the highest priority in v iew o f the decline in the tax/GDP ratio during the 1990s and the direct positive effect this will have on reducing
3 1 Times News Network, Times o f India, New Delhi, March 14,2003. 32 Tenth Plan, Chapter 2, paragraph 2.110. 33 Report o f the Task Force on Direct Taxes, Report o f the Task Force on Indirect Taxes, MOF, December 2002.
21
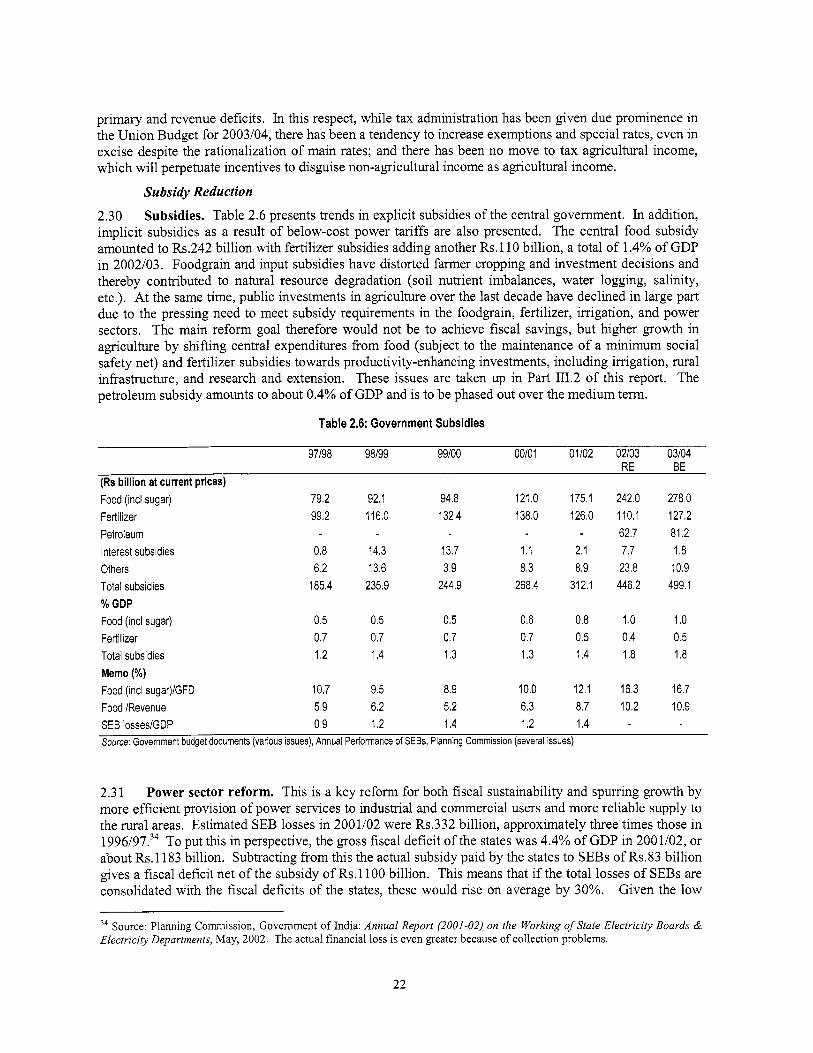
primary and revenue deficits. In this respect, while tax administration has been given due prominence in the Un ion Budget for 2003/04, there has been a tendency to increase exemptions and special rates, even in excise despite the rationalization o f main rates; and there has been n o move to tax agricultural income, which will perpetuate incentives to disguise non-agricultural income as agricultural income.
Subsidy Reduction
2.30 Subsidies. Table 2.6 presents trends in explicit subsidies o f the central government. In addition, impl ic i t subsidies as a result o f below-cost power tariffs are also presented. The central food subsidy amounted to Rs.242 b i l l ion with fertilizer subsidies adding another Rs.110 billion, a total o f 1.4% o f GDP in 2002/03. Foodgrain and input subsidies have distorted farmer cropping and investment decisions and thereby contributed to natural resource degradation (soil nutrient imbalances, water logging, salinity, etc.). At the same time, public investments in agriculture over the last decade have declined in large part due to the pressing need to meet subsidy requirements in the foodgrain, fertilizer, irrigation, and power sectors. The main reform goal therefore would not be to achieve fiscal savings, but higher growth in agriculture by shifting central expenditures f rom food (subject to the maintenance o f a minimum social safety net) and fertilizer subsidies towards productivity-enhancing investments, including imgation, rural infrastructure, and research and extension. These issues are taken up in Part I11.2 o f this report. The petroleum subsidy amounts to about 0.4% o f GDP and i s to be phased out over the medium term.
Table 2.6: Government Subsidies
97/98 98199 99/00 00101 01/02 02/03 03/04 RE BE
(Rs billion at current prices) Food (incl sugar) 79.2 92.1 94.8 121.0 175.1 242.0 278.0 Fertilizer 99.2 116.0 132.4 138.0 126.0 110.1 127.2 Petroleum 62.7 81.2 Interest subsidies 0.8 14.3 13.7 1.1 2.1 7.7 1.8 Others 6.2 13.6 3.9 8.3 8.9 23.8 10.9 Total subsidies 185.4 235.9 244.9 268.4 312.1 446.2 499.1 % GDP Food (incl sugar) 0.5 0.5 0.5 0.6 0.8 1 .o 1 .o Fertilizer 0.7 0.7 0.7 0.7 0.5 0.4 0.5 Total subsidies 1.2 1.4 1.3 1.3 1.4 1.8 1.8 Memo (%) Food (incl sugar)/GFD 10.7 9.5 8.9 10.0 12.1 16.3 16.7 Food /Revenue 5.9 6.2 5.2 6.3 8.7 10.2 10.9 SEB IosseslGDP 0.9 1.2 1.4 1.2 1.4 Source: Government budget documents (various issues), Annual Performance of SEBs, Planning Commission (several issues)
2.3 1 Power sector reform. This i s a key reform for both fiscal sustainability and spurring growth by more efficient provision o f power services to industrial and commercial users and more reliable supply to the rural areas. Estimated SEB losses in 2001/02 were Rs.332 billion, approximately three t imes those in 1996/97.34 T o put this in perspective, the gross fiscal deficit o f the states was 4.4% o f GDP in 2001/02, or about Rs.1183 billion. Subtracting f rom this the actual subsidy paid by the states to SEBs o f Rs.83 b i l l ion gives a fiscal deficit net o f the subsidy o f Rs. 1 100 bil l ion. This means that if the total losses o f SEBs are consolidated with the fiscal deficits o f the states, these would rise on average by 30%. Given the l o w
~~
34 Source: Planning Commission, Govemment o f India: Annual Report (2001-02) on the Working of State Electricity Boards & Electricity Departments, May, 2002. The actual financial loss is even greater because o f collection problems.
22
level o f the actual subsidy received, SEBs have been defaulting o n their payments to central government agencies (suppliers and lenders) to finance a part o f these losses. Bond issues by SEBs guaranteed by the state governments, which are rapidly adding to the contingent fiscal liabilities o f the states, are another source o f f i nan~ ing .~ ’ SEBs have also been “borrowing” f rom their own employees by running arrears on related pension and PF obligations. A consequence has been inabil ity to maintain SEB assets.
2.32 SEB operations also entail significant T&D losses (technical as well as commercial losses and theft) which in some states are as high as 40-50%. Owing to poor collections, outstanding receivables o f various state uti l i t ies have grown from Rs.145 b i l l ion in 1996/97 to Rs.248 bi l l ion in 1999/2000. Tariffs covered only 68% o f the cost o f supply in 2001/02. At the same time, there i s high dispersion in tariffs, with commercial and industrial users cross-subsidizing agricultural and domestic consumers and being charged rates far in excess o f the cost o f supply. As a result o f this and the poor quality o f supply, many manufacturing companies install their own generators. Moreover, recent studies show that subsidies are regressive and the poor benefit l i tt le f rom subsidized electricity, either in urban or rural areas, providing l itt le justification fo r continued subsidies to consumers. 36
2.33 The financial and social case for reform i s clear, as are the essential elements. Average tariffs need to be raised t o reflect cost o f supply; universal metering o f consumption i s required, especially for agncultural and domestic consumers; payments discipline needs to be enforced; and a targeted subsidy scheme needs to b e introduced for poor households and farmers so that the cross-subsidy burden o n industrial and commercial users can be eliminated. I t i s also accepted that there will be greater incentive to sustain reform with privatization o f the distribution business. However, polit ical will has often been found wanting especially in raising tariffs for farmers, or implementing better governance. The fundamental problems affecting the sector stem f rom the apparent unwillingness o f the state and central governments to al low the sector to function along commercial and economic lines. Go1 has recently initiated a few potentially decisive steps to give stronger incentives to states for reforming their power sectors. For these to work, privatization o f distribution, stronger action o n tariffs, governance improvement and financial restructuring are needed.
2.34 Parliament has passed a new Electricity Act, while M o F has instituted the Accelerated Power Development and Reform Program (APDRP) in support o f power reforms. Other measures include the work o f the Deepak Parekh Committee on state-specific reforms, and decisions to rate SEBs by independent rating agencies. The Ahluwalia Committee had recommended that the past-due arrears o f SEBs to central govemment agencies, which amounted to Rs.415 b i l l ion at the end o f February 2001, be compensated by bonds issued by the respective state governments, guaranteed by Go1 and carrying a tax- free interest rate o f 8.5% per annum.37 A tripartite agreement involv ing RBI, state governments and the Ministry o f Power was signed in March 2003 in this regard. Under this agreement, state governments have also agreed that in case o f default o f SEBs on payments o f bills to central agencies, RBI would deduct at source a corresponding amount due to the states. Whi le init ial s igns are encouraging, the effectiveness o f this agreement in imposing a hard budget constraint o n states, and thereby providing a stronger incentive for reform, will depend on i t s continued enforcement by GoI. APDRP i s another potentially effective step. However, for APDRP to provide incentives to states for reform, the scheme needs to clearly link assistance strictly to tangible and irreversible measures on reversing SEB losses and improving governance. Without such linkage, APDRP may weaken the resolve to reform.
Financial Policy
2.35 Since 1992/93, varying but relatively small sums o f money have been spent to assist nationalized banks, regional rural banks, UTI, IDBI and IFCI, with another 0.8% o f 2002/03 GDP identified to help UTI, I F C I and IDBI . The banks’ reported gross non-performing loans (NPLs) were 10.4% o f loans as o f
35 Credit Rating and Information Services o f India Limited (CRISIL) (2002). 36 World Bank (2001b) and (2002j). 37 Report o f the Expert Group, Settlement o f SEB Dues, May 2001.
23
March 2002; net o f provisions the figure was 5.5%; and net non-performing loans as a percent o f assets were 2.3% or about 1.5% o f GDP. Whi le some financial analysts have suggested that N P L s are substantially understated by various “evergreening” methods, a doubling o f the gross figure would put net NPLs at less than 7% o f bank assets, or about 4.5% o f GDP. Another indicator o f risk, lending for stocks, real estate, and commodities, i s less than 4% o f lending. W h i l e off-balance sheet operations are equal to nearly 60% o f the balance sheet, three-fourths are forward exchange contracts (half by the foreign banks) mostly related to exports and imports and often with RBI as the c o ~ n t e r - p a r t y . ~ ~ Whi le these numbers are l o w in comparison with East Asia and China, this has to be looked at in the context o f public sector debt that i s over 90% o f GDP in an environment o f worsening government debt dynamics.
2.36 There are two key r e f o m issues. The f i rst i s how to enhance the role o f the financial system in efficient resource allocation. The second i s how to minimize risks. The f irst topic i s closely related to the fiscal stance. So long as deficits are high, a high proportion o f bank assets will be invested in government debt. As o f March 2002, about 28% o f bank assets were invested in government debt and another 5.6% was with the RBI. Indian banks have one o f the highest ratios o f government debt to deposits in the world, similar to Lat in American countries and much higher than most East Asian comparators, even after the crisis. A fiscal adjustment would clearly help and also relieve crowding out.
2.37 In this connection, the new Securitisation and Reconstruction o f Financial Assets and Enforcement o f Security Interest A c t (2002), which allows banks to take over collateral more easily, could push debtors to pay up. Similarly, establishment o f Credit Information Bureaus should help in sharing information o n credit risk, which would lower transactions costs while also helping to control NPLs. I t would particularly help with SMEs, which at present suffer f i om very high real lending rates owing to the perception o f high risk, as noted in Mohan (2003). One topic that i s relevant at present i s interest rate risk. Financial institutions which have invested in long-term government paper have been making large trading profits as interest rates continued to fall, but now face r i sks f rom the possibility o f rising interest rates. In an attempt to counteract this, RBI has issued a directive on creating an Investment Fluctuation Reserve. Whi le banking regulation has improved, some o f this has been offset by easing regulations to encourage restructurings and lending for housing and infrastructure, which i s beset by a weak fkamework for user charges.
2.38 Insurance and provident funds are heavily invested in government debt, and will face losses as interest rates rise. Moreover, state provident funds have also invested in special purpose vehicles (SPVs) guaranteed by the state. Many o f these assets are n o w n o longer earning interest, making the performance of the state provident funds even more dependent on debt servicing by cash starved states, n o w that the guarantees are beginning to be called. The abil ity o f these provident funds to meet their obligations i s l ikely to affect public confidence in government debt issues more broadly. Finally, the administratively set returns o n the provident funds are significantly above market rates, which encourage the management to engage in r i s k y investments in the non-regulated portion o f their portfolio and, more generally, create a potential contingent l iabil i ty for the central and state governments along the lines o f UTI. Linking rates on the provident fund more closely to the market, and reducing the role o f administratively f ixed rates, would help control the continued build-up o f these problems. A similar link to rates on small savings would save interest costs for states.
2.39 Guarantees. A critical issue at the state-level pertains to contingent liabilities stemming fkom borrowings o f parastatals guaranteed by state governments. According to a recent study, such guarantees have r isen sharply after 1996, mostly in connection with borrowings by State Electricity Boards (SEBs) and special purpose vehicles (SPVs) established in connection with large irrigation project^.^' CRISIL estimates that o f the market borrowings by state-level entities guaranteed between 1995 and 2002, Rs.440 b i l l ion will be called over the next five years. Whi le this may not seem much, this estimate excludes
Measures are also needed to contain risk and manage NPAs.
38 While not a serious issue at present, this could potentially encumber RBI reserves and bears monitoring. 39 CRISIL (2002).
24
guaranteed loans f r o m banks/FIs such as NABARD, HUDCO, LIC, NCDC, REC, public sector banks and regional rural banks. Moreover, the guarantors themselves, i.e., the state governments, are already heavily indebted. N o t surprisingly, the spread o n state guaranteed bonds relative to central government securities widened from 2-2.5% in 2000 to over 4% in 2002. Another problem i s that even when state- guaranteed bonds are not being serviced, creditors do not treat this as an NPA unless the guarantee i s invoked and payment not received for two quarters after this. There i s reluctance to invoke guarantees and so defaults remain hidden, adding to the uncertainty and instability. Given the extensive l i s t o f creditors, a default will hurt the integrity and credibility o f public institutions. There i s need for a clear and transparent framework for guarantees to contain the problem. One idea i s to create a guarantee redemption fund4’, though the question i s how this will be funded given fiscal constraints. Besides, it will work only in conjunction with a correction o f the fundamental problems in power and irrigation.
Fiscal Management
2.40 There i s growing recognition that to improve fiscal policies fiscal institutions need to be strengthened. This will require changes at the central level, the state level, and in center-state fiscal relations. T h e central government needs to lead by example, by getting i t s own house in order and providing the right incentives for fiscal adjustment at the state level. At the same time, i t needs to give states sufficient flexibility to use their l imi ted resources efficiently.
2.41 The Fiscal Responsibility and Budget Management Bill (FRBM), passed by the L o k Sabha (lower house o f parliament) in early 2003, mandates elimination o f the center’s revenue deficit by March 2008. The FRBM pertains only to the central government, but three states - Karnataka, Punjab, and Tami l Nadu -- have so far passed similar Acts to limit their own deficits, and others are following suit. The proof o f the usefulness o f these pieces o f legislation will be actual progress towards their fiscal goals. A useful feature o f these Acts i s the requirement that the central and concerned state governments annually publish multi-year fiscal strategies, that is, develop time-bound road maps for restoring fiscal sustainability, and publicly monitor progress against these. This exercise has the potential o f enhancing the credibility o f India’s fiscal policy if carefully implemented.
2.42 State borrowing. While states will ultimately have to be responsible for their own fiscal adjustment, reforming the borrowing regime within which they operate (“hardening their budget constraints”) will also help induce fiscal reform. Global borrowing caps - covering both on-budget borrowing and off-budget borrowing through state-level public enterprises and special purpose vehicles the debt-servicing o f which becomes a contingent l iabil i ty o f the budget - should be introduced and enforced by GoI, using powers under Article 293 o f the Constitution (for progress to date in this regard, see the next paragraph). In return for much tighter control by Go1 over the total annual quantum o f borrowing, states could be given much greater freedom over how they arrange that borrowing. States should be allowed to borrow responsibly f rom the markets within their global cap, and borrowing f rom captive sources - small savings, negotiated loans, Go1 loans - should be phased out. If necessary, a safety-net for uncreditworthy borrowers can be provided.
2.43 Performance and reform-based transfers. The volume o f center-to-states transfers l inked to reform and performance needs to be expanded. In this regard, the creation o f the Fiscal Reforms Facil ity (FRF), as per the recommendation o f the Eleventh Finance Commission, and the APDW for the power sector are steps in the right direction. The Fiscal Reform Facil ity provides grant funding for states which reduce their revenue deficit as a ratio o f revenue receipts. Though the funding attached to the FRF i s small given i t s universal coverage (only 2% o f al l transfers to the states), i t has had a significant impact. First, it has required states to draw up “Medium Term Fiscal Restructuring Plans” (MTFRPs) which, for the first time, have placed fiscal pol icy at the state-level in a medium-term strategic framework. Second, the borrowing levels agreed o n under the MTFRPs have started to take o n the nature o f global borrowing
Legislating for fiscal prudence.
40 RBI (2003e).
25
caps, and thus have helped Go1 to start to discipline state borrowing in an environment characterized by multiple borrowing windows. (Less progress, however, has been made in preventing states circumvent central controls o n budget borrowing through use o f off-budget special purpose vehicles. Orders issued by Go1 and RBI seem to have had litt le impact in this regard.) In 2002/03, the FRF also started to provide authorization for qualifying states to borrow additional funds from the market. Multilateral agencies also provide financing to reforming states through GoI. I t would be useful for assistance to fiscal reformers to be passed o n as grants to states, rather than loans, both to increase the incentives for reform, and to help such states reduce their debt burden. Public reporting o f access by various states to reform facilities and reasons for both access and denial to access wil l help ensure transparency and consistency.
2.44 Measures to simplify expenditure management. While India’s five-year plans help provide a strategic framework for development efforts, the division o f budgetary resources into “plan” and “non- plan” i s increasingly recognized as counter-productive. I t adds complexity to the budgeting process, and also perpetuates a perception that plan spending i s always better than non-plan, and should always be increased. This militates against fiscal correction, and leads to chronic under funding o f maintenance (non-plan) relative to capital spending (plan). Unfortunately, substantial Go1 assistance i s provided for state plan spending m a h n g elimination o f the planlnon-plan distinction at the state level a complex and unpopular proposition. But Go1 could take the lead by abolishing the distinction at the central level. Go1 could also propose to states that i t s financial support to them would be delinked f rom their annual plans. Funding currently provided as plan support would be provided o n the basis o f an agreed and explicit set of criteria - which init ially could be based o n those currently in place - but could be termed “development support” rather than “plan support”. Any such move would require consensus among states to succeed. Go1 could help build this support by announcing that this move would enable funding for non-plan areas, such as maintenance.
2.45 Centrally Sponsored Schemes (CSSs) are provided by Go1 to the states, largely (though not entirely) as grants, for the achievement o f national goals such as poverty alleviation and universal enrollment. However, they have tended to proliferate, and there are n o w more than 300, leading to budgetary rigidity and poor implementation at the state level. A practical solution would be to consolidate the CSSs into a smaller number o f programs, with a minimum size, and flexibil i ty for the states to m these as per their needs and priorities. Some central ministries have already moved in this direction by adopting a cafeteria approach whereby a cluster o f CSSs are clubbed together under one umbrella scheme and the selection o f individual schemes from this cluster i s lef t to the states.
Government Debt Projections: Why Fiscal Adjustment?
2.46 The case for fiscal adjustment i s illustrated by general government debt projections to the end o f the Tenth Plan period, 2006/07, under a base-case scenario o f “no reform” versus a “reform” scenario. In both scenarios, the debt trajectory i s driven mainly by the primary (non-interest) fiscal deficit as, based o n actual developments in recent years, interest rates are unlikely to be substantially below growth rates, absent an undesirable reversion to financial repression. However, given the extraordinarily l o w interest rates because o f the weak global economy, it i s assumed that real interest rates remain below the growth rate for a year or two, depending upon the scenario (even though, as noted above, the average interest rate on government debt has been close to or above growth rates for the past four years). T w o other factors deserve emphasis: extrapolating f rom current trends, the pressure to fully absorb SEB losses into state fiscal deficits will grow, effectively raising the general government primary deficit by this amount; and it would be prudent to assume that guarantees, which amounted to 12% o f GDP in 2002/03, and which have generally been made in support o f loss-malung enterprises, will devolve at the rate o f 1% o f GDP per year over the projection horizon.41
41 Note that this assumption pertains only to the existing stock o f guarantees, and does not take account o f any new guarantees which may be issued after 2002103.
26
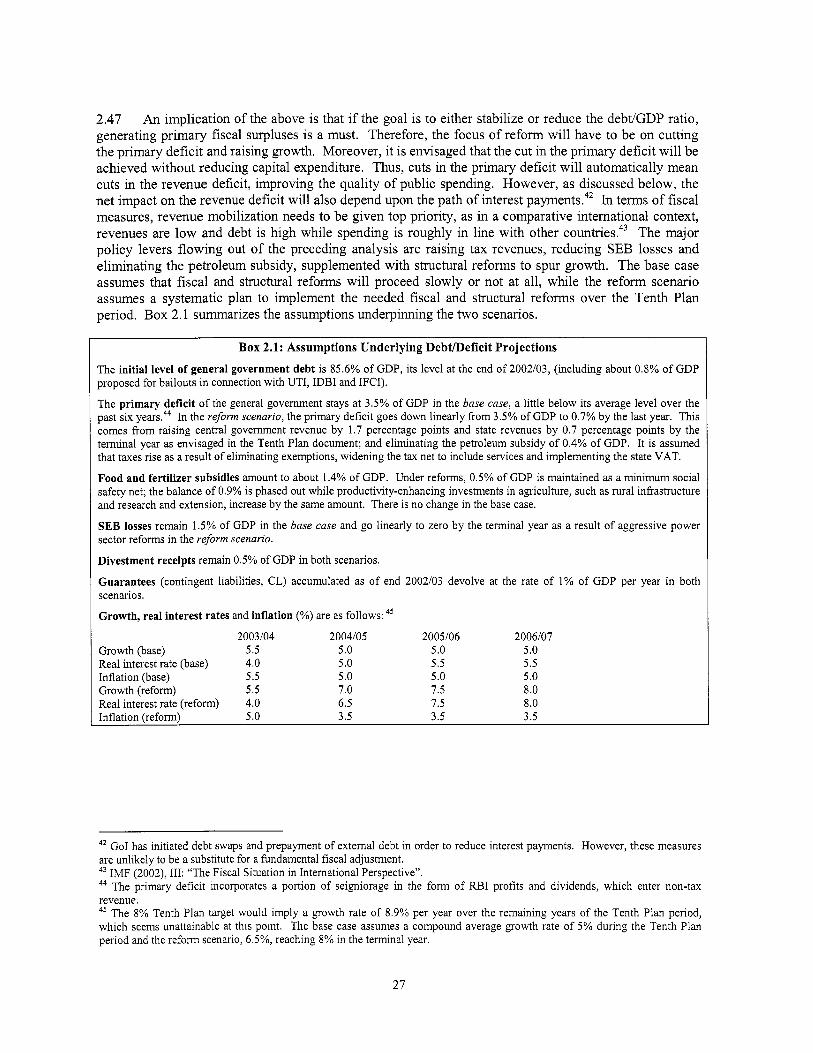
2.47 An implication o f the above i s that if the goal i s to either stabilize or reduce the debt/GDP ratio, generating pr imary fiscal surpluses i s a must. Therefore, the focus o f reform will have to be on cutting the primary deficit and raising growth. Moreover, it i s envisaged that the cut in the primary deficit will be achieved without reducing capital expenditure. Thus, cuts in the primary deficit wil l automatically mean cuts in the revenue deficit, improving the quality o f public spending. However, as discussed below, the net impact o n the revenue deficit will also depend upon the path o f interest paymen t~ .~ ’ In terms o f fiscal measures, revenue mobilization needs to be given top priority, as in a comparative international context, revenues are l o w and debt i s high while spending i s roughly in line with other countries.43 The major pol icy levers f lowing out o f the preceding analysis are raising tax revenues, reducing SEB losses and eliminating the petroleum subsidy, supplemented with structural reforms to spur growth. The base case assumes that fiscal and structural reforms will proceed slowly or not at all, while the reform scenario assumes a systematic plan to implement the needed fiscal and structural reforms over the Tenth Plan period. B o x 2.1 summarizes the assumptions underpinning the two scenarios.
Box 2.1: Assumptions Underlying DebtDeficit Projections
The initial level of general government debt i s 85.6% o f GDP, its level at the end o f 2002/03, (including about 0.8% o f GDP proposed for bailouts in connection wi th UTI, IDBI and IFCI).
The primary deficit o f the general government stays at 3.5% o f GDP in the base case, a litt le below i t s average level over the past six years.44 In the reform scenario, the primary deficit goes down linearly from 3.5% o f GDP to 0.7% b y the last year. This comes from raising central government revenue by 1.7 percentage points and state revenues by 0.7 percentage points by the terminal year as envisaged in the Tenth Plan document; and eliminating the petroleum subsidy o f 0.4% o f GDP. I t i s assumed that taxes rise as a result o f eliminating exemptions, widening the tax net to include services and implementing the state VAT.
Food and fertilizer subsidies amount to about 1.4% o f GDP. Under reforms, 0.5% o f GDP i s maintained as a minimum social safety net; the balance o f 0.9% i s phased out while productivity-enhancing investments in agriculture, such as rural infrastructure and research and extension, increase b y the same amount. There i s no change in the base case.
SEB losses remain 1.5% o f GDP in the base case and go linearly to zero b y the terminal year as a result o f aggressive power sector reforms in the reform scenario.
Divestment receipts remain 0.5% o f GDP in both scenarios.
Guarantees (contingent liabilities, CL) accumulated as o f end 2002/03 devolve at the rate o f 1% o f GDP per year in both scenarios.
Growth, real interest rates and inflation (%) are as follows: 45
Growth (base) 5.5 5.0 5.0 5.0
Inflation (base) 5.5 5.0 5.0 5 .O
2003104 2004105 2005106 2006/07
Real interest rate (base) 4.0 5.0 5.5 5.5
Growth (reform) 5.5 7.0 7.5 8.0 Real interest rate (reform) 4.0 6.5 7.5 8.0 Inflation (reform) 5.0 3.5 3.5 3.5
42 Go1 has initiated debt swaps and prepayment o f external debt in order to reduce interest payments. However, these measures are unlikely to be a substitute for a fundamental fiscal adjustment. 43 IMF (2002), 111: “The Fiscal Situation in International Perspective”. 44 The primary deficit incorporates a portion o f seigniorage in the form o f RBI profits and dividends, which enter non-tax revenue. 45 T h e 8% Tenth Plan target would imply a growth rate o f 8.9% per year over the remaining years o f the Tenth Plan period, which seems unattainable at this point. T h e base case assumes a compound average growth rate o f 5% during the Tenth Plan period and the reform scenario, 6.5%, reaching 8% in the terminal year.
27

2.48 The debt/GDP trajectory under Scenarios 1 and 2 are presented in Figure 2.5. In the base case, the general government debtlGDP ratio reaches 107% by the end o f the Tenth Plan period. In the reform scenario, it reaches 95%. These results are being driven by the general government primary deficit, SEB losses and the calling o f guarantees, and underline the need for implementing fiscal and structural reforms. The broken lines are debt/GDP excluding contingent liabilities, which would lower the debt/GDP ratio to 103% by 2006107 in the base case and 9 1 % in the reform scenario.
2.49 Figure 2.6 projects the general government fiscal deficit/GDP ratio under the two scenarios described above. For this exercise, the calling o f guarantees i s ignored in projecting debt levels and hence interest payments. Whi le SEB losses are factored into the projection o f debt levels and interest payments, they are not included in the deficits shown in Figure 2.6 for comparability with present deficit reporting practices; thus, the “true” picture especially under the base case i s l ikely to be worse than depicted in Figure 2.6 unless power sector losses are aggressively eliminated. In the base case, deficits rise steadily to 13% o f GDP, as one would expect with primary deficits at 3.5% o f GDP, debt exceeding 100% o f GDP and nominal
105.0 -
1w.o -
Figure 2.5: Government DebtlGDP Ratio Projected to Mo6107
110.0,
// j 95.0 4
850 200203 200304 xx)4105 2005106 2036107
Base case (CL-0) ...... --tBaseCase
+Reform Case -x- Reform case (a4) S m m ’ World Rank Stdf Fslirmfps
14.0
120
a 10.0 n ? ao + 5 60 m a
4.0
20
0.0
interest rates o f some 10%. Under reforms, deficits remain in the 10% o f GDP range because o f the drag exerted by the high debt stock and the impact o f rising interest rates as growth picks up; deficits will decline slowly as debt levels are brought under control.46 The only sure way to bring about a faster decline i s to achieve primary fiscal surpluses.
46 The deficit projections here, which are repeated in Table 2.7, are substantially higher than those reported in Table 2.5 based on the macroeconomic framework for the Tenth Plan. The reason i s that Table 2.5 is formulated on the basis on either achieving debt sustainability (at a minimum) or the growth target o f 8% per annum (much more difficult); in this sense, it embodies an ideal outcome. In contrast, the projections in Figure 2.5 and Table 2.7 are more in the spirit o f a probable outcome given conditions at the end o f 2002103 and the scenarios specified in Box 2.1.
28

2.50 Table 2.7 brings out the potential for a more efficient composition o f public spending under reform. Wh i le there i s not much difference in interest payments between the two scenarios (because o f the high level o f in i t ia l debt, the absence o f primary fiscal surpluses even in the reform scenario and similar levels o f nominal interest rates), the reform scenario permits a significantly higher level o f “other spending” (defined as total spending minus subsidies and interest) by the end o f the Tenth Plan period, W h i l e the increase in revenues (+2.4 percentage points o f GDP), elimination o f petroleum subsidy (0.4 percentage points) and reduction in food and fertilizer subsidies (0.9 percentage points) will act to reduce the general government revenue deficit by close to 4 percentage points o f GDP, interest payments are projected to rise by about 3 percentage points - from 6.5% o f GDP in the f irst year o f the Tenth Plan to about 9.5% o f GDP by the terminal year, 2006/07. Thus, the net reduction in the revenue deficit wil l only be about 1 percentage point o f GDP; but the quality o f spending will have vastly improved.
Table 2.7: Fiscal Projections (% of GDP)
2003104 2004105 2005106 2006107 2003104 2004105 2005106 2006107
Primarv deficit Base Case Reform Case
3.5 3.5 3.5 3.5 2.8 2.1 1.4 0.7 lnteresi payments 7.6 8.3 9.1 9.6 7.2 8.1 9.1 9.6 Fiscal deficit 11.1 11.8 12.6 13.1 10.0 10.2 10.5 10.3
Revenues 17.5 17.5 17.5 17.5 18.1 18.7 19.3 19.9 Total spending 28.6 29.3 30.1 30.6 28.1 28.9 29.8 30.2 Subsidies 1.8 1.8 1.8 1.8 1.5 1.2 0.9 0.5 Other spending 19.2 19.2 19.2 19.2 19.4 19.6 19.8 20.1
InterestlRevenue (%) 43.3 47.2 51.9 54.7 39.8 43.6 47.1 48.2 Source: World Bank Staff Estimates.
2.51 Three points emerge: (a) i t i s not going to be easy to eliminate revenue deficits by 2007/08. Further, the focus must be on raising revenues, cutting subsidies and controlling salaries, i.e., on the non- interest component o f the revenue deficit, as there i s l i tt le or n o control over interest payments. In the same vein, i t may be necessary to lay down intermediate targets by specific budgetary category in the medium-term fiscal frameworks required by the central and state-level Fiscal Responsibility Acts. (b) Even under a reform scenario, the government debt burden wil l continue to be heavy during the medium term. And (c), without reform, the debt burden and ratio o f interest payments to revenues will increase quickly and fuel inflationary expectations and eventually, higher actual inflation. Private investment will be dampened if the private sector feels i t i s going to be taxed to service the debt, leading to anemic growth.
2.52 To conclude, a program o f progressive and phased fiscal adjustment must be a cornerstone o f GoI’s attempts to spur poverty-reducing growth and avoid an unsustainable path for public debt. Even in a reform scenario, the general govemment fiscal deficit i s l ikely to remain in the 10% range over the next few years, although with primary deficits more-or-less eliminated by the end o f the Tenth Plan period, the deficit should subsequently decline as debt levels and interest payments are brought under control. The focus needs to be on tax reform and eliminating SEB losses; the re-allocation o f food and fertilizer subsidies amounting to about 1% o f GDP towards rural infi-astructure and agricultural R&E (while maintaining 0.5% o f GDP as a minimum food social safety net) will raise development spending without a negative fiscal effect.
2.53 Fortunately, India i s not facing an imminent macroeconomic crisis o f the type witnessed in Argentina or Russia, even though it i s paying a heavy price in terms o f growth and welfare for i t s current fiscal stance. On the positive side, India has the time to put in place an orderly fiscal adjustment over the
29

Tenth Plan period. At the same time, in the absence o f an impending crisis, it i s hard to develop the polit ical momentum for reform. Indeed, in some key areas, such as the power sector, there are strong polit ical and vested interests against reform. India has clearly recognized the need for fiscal adjustment in the Tenth Plan and in recent legislation. The challenge now i s for Go1 and the states to translate this commitment into an overall road map as wel l as specific policies for fiscal consolidation. The pay-off in terms o f freeing up resources for priority public programs and improving the climate for private investment will be well worth the effort.
30

II.2:DELIVERY OF PUBLIC SERVICES
Introduction 2.54 Sustained growth i s the most powerful driver o f poverty reduction. But poverty reduction also requires investment in human development. Health and education are the most important assets o f the poor, allowing them to both contribute to and benefit f rom growth through higher-paying employment. In addition, when incomes fall below minimum standards, the poor and vulnerable need access to effective safety nets. Del ivery o f social services requires increasing the level, but more importantly the quality o f public expenditures in these areas. In turn, this requires improving the governance and productivity o f India’s c i v i l service at the center, state and local levels. In many o f India’s poorest states, such as Bihar and Uttar Pradesh, the private sector delivers health and education services to a large share o f the population, including the poor. Improving service delivery will therefore require an appropriate regulatory framework for private sector contributions in the health and education sectors.
2.55 This section reviews the major challenges facing the delivery o f public services in India today. I t starts by loolung at the current size, structure, cost and contribution of the c iv i l service, and suggests a number of ways to improve the performance o f the c i v i l service and the quality o f public service delivery. Crit ically important are reforms to improve the transparency, accountability and independence o f the c iv i l service. A number o f states are already implementing innovative reforms in these areas, often with the aid of IT technology. The challenge will be to find ways to broaden these initiatives and apply them across the country, including in some o f the poorer states where the governance environment i s weak. This section then t u r n s to look more closely at the situation in the health and education sectors, as we l l as for social safety nets, focusing on the prospects for achieving the targets set by the Tenth Plan and the Mi l lennium Development Goals. I t stresses the importance o f harnessing both the public and private sectors to achieving social outcomes, with careful monitoring o f progress along the way. This section concludes with a few reflections on the decentralization agenda and the prospects for successful public sector reform in the future.
Civil Service Reform
Size and Structure of the Civil Service
2.56 In terms o f aggregate numbers, India’s c i v i l service i s not particularly overstaffed in comparison with other countries. With central government civil ian employment o f around 3.4 mill ion, estimated state employment o f around six million, and another four mi l l ion or so teachers and health workers working in government and grant-in-aid institutions, India’s c i v i l service employment i s around 1.4 per 100 o f population. Although international comparisons can be tricky, the average for Asia in the 1990s was around 2.6 employees per 100, and for the OECD countries it was 7.7 per 100.
2.57 However, while India’s c iv i l service i s not unduly large by global standards, there i s a pronounced imbalance in ski l ls mix. Around 93% o f the c iv i l service i s comprised o f Class I11 and IV employees for both Go1 and various state governments. Class I11 encompasses a number o f front-line delivery workers, but also includes a large number o f office staff (e.g., clerks, typists) whose functions are rapidly being made redundant by advances in information technology. Class I V employees function entirely in a support role (e.g., peons, sweepers, messengers, watchmen), and most could be le t go without any discernable impact upon government functioning. This over abundance in support and logistical personnel often exists alongside chronic shortages o f sh l led staff in rural schools and health clinics.
2.58 Changes in the sk i l ls mix need to be accompanied by measures to reduce administrative fragmentation. Within Go1 and in many states, the number o f ministers, ministries and departments has proliferated far beyond any rational assignment o f functions. The number o f cabinet ministers for O E C D countries has come down in recent years to an average o f 14. GO1 has 31 cabinet ministers and another 45 ministers o f state. Most Indian states have between 35-40 cabinet departments, and some states such
31

as Uttar Pradesh can have over 70. Compounding the problem are relatively weak mechanisms for policy coordination in many states, since most departments report directly through their own minister. N o r does fragmentation end with administrative structures. Budget heads are not always closely aligned with departments. The c i v i l service i s divided into dozens o f cadres, each with i t s own service and terms and conditions, whose controlling authorities are widely disbursed throughout the various departments. Rigid terms and conditions make it diff icult to transfer staff between cadres where they can be better utilized. Institutional reforms are therefore needed to reduce the current administrative fragmentation and align the structure o f the c iv i l service more closely with modem-day functions.
Costs of the Civil Service
The Fifth Pay Commission has been called “the single largest adverse shock to India’s strained 2.59 public finances in the last decade” and an act o f “fiscal profligacy”
Table 2.8: Ratio of Civil Service Salary and Dearness Allowance to GDP for Go1 and Selected States
without - parallel (in %) (Godbole 1997, Acharya 2001). As a result, the 1995196 1996197 1997198 1998199 199912000 2000101 compensation paid by Actual Actual Actual Actual Actual Actual Go1 to c iv i l servants GO1 1.3 1.2 1.6 1.5 1.5 1.4 (here defined as salaries Andhra Pradesh 4.8 4.3 5.0 4.7 5.4 5.5 and deamess allowance) Karnataka n.a n.a 4.9 4.5 4.8 4.4
between 1996197 and Rajasthan n.a 6.8 7.0 8.6 8.2 7.9 rose by around 40% Orissa 7.0 8.3 7.6 9.1 9.2 8.6
1997/98. Over the Uttar Pradesh 5.6 5.4 6.2 6.1 5.9 6.0 decade of the 199oS, Notes: GOI data on salaries is based on salaries for sanctioned strength of central govemment employees GoI’s wage bill has risen Sources: Various Budget Documents, Central Statistical Organisation by an average nominal rate o f 14.3% per annum, substantially higher than the average increase in the consumer price index (9.5% per annum) over this period. As Table 2.8 indicates, the situation in the states i s even more dire. In this sample o f states, which includes a mixture o f the richer southem states and poorer northern ones, the wage bill increased on average by nearly 1% o f state GDP between 1996/97 and 1998/99. The example o f Orissa i s extreme but not atypical. During the 1990s, Orissa’s salary and pension obligations increased 4.7 times, while revenues increased approximately threefold. By 1999/00, over 180% o f Orissa’s own source revenues were going to cover salary and pension expenses.
2.60 Table 2.9 uses National Sample Survey Data to demonstrate that wages for
Table 2.9: Ratio of Average Wages in the Public and Private Sector for Selected Categories of Employment
Occupation* 1993194 I999100 Professional, technicians and related workers 1.52 1.72 Engineers 1.07 1.34 Engineering technicians 1.3 1.27 Physicians and surgeons 1.65 2.0 Nurses 2.0 2.0 Teachers 1.75 2.02 Administrative, executive and managerial workers 1.26 1.42 Clerical and related workers 1.6 1.74 Stenographers, typists, etc. 1.69 2.14 General clerks (receptionist, office attendants, etc.) 1.54 1.72 Service workers 2.25 2.45
All 1.92 2.33 Notes:* Based on National Classification of Occupations (ILO, 1968) Source: Preliminary results based on 50th and 55th NSS rounds, from forthcoming “Wage Differentials Between the Public and Private Sectors in India”
Sweepers, cleaners, building caretakers 1.79 1.93
32
selected categories o f staff are consistently higher than they could expect to make in the private sector, with premiums ranging from 27% for engineering technicians to 145% for low-end service workers. For teachers, the premium i s around This provides further evidence that, even prior to the recent salary increases, the vast majority o f Indian c iv i l servants were already well-compensated compared to other employees - a finding that helps explain the l o w attrition rates throughout the public sector even for highly-shlled positions.
2.61 Recent experience would suggest it may be wise to ho ld o f f on the practice o f holding periodic pay commissions, which has provided impetus for significant wage increases. Instead, Go1 and state govemments could opt for l imited annual wage increases, or even pursue a freeze for 2-3 years, followed by a l imi ted relaxation for skilled positions. Altematively, as recommended by the Fifth Pay Commission, the process o f constituting commissions every ten years could be abandoned in favor o f a permanent pay commission, which could continuously analyze and make recommendations regarding appropriate compensation in consultation with the states. Whatever system i s adopted, greater emphasis needs to be given to local market comparators (particularly those involving the private sector) in determining salary levels. Efforts to rationalize the number o f cadres and review the classification o f posts would also help to improve managerial f lexibil i ty and consistency between various categories o f employees.
2.62 The costs of the c iv i l service are raised further by burgeoning pension liabilities. At the center, pension spending for c i v i l servants increased dramatically during the 1990s, with average yearly growth surpassing 20%, and has now reached 1% o f GDP. The situation i s even more diff icult at the state level. For example, in Uttar Pradesh, the ratio o f pension spending to state GDP increased from 0.4% to 1.2% during the 1990s. Pension expenditures at the central and state levels are l ikely to keep on growing at a fast pace, especially at the state level where employment more than doubled over the past 30 years. Preliminary estimates conducted in 2001 using the Wor ld Bank PROST actuarial model suggest that the present value o f central and state pension liabilities could amount to 25% of GDP.
2.63 In light o f rising pension liabilities, Go1 announced in February 2003 a plan to establish a fully- funded defined contribution (DC) scheme for new c iv i l servants, where individuals will be able to choose among a limited number o f pre-qualified private asset managers and one public asset manager. The system will be centrally administered to reduce costs. A new specialized pension regulatory agency will be created to supervise the new scheme.48 The shift to a fully-funded D C scheme will force the payment o f pension liabilities as they accrue, creating a more transparent and financially viable scheme. Critical design issues of the scheme are s t i l l to be defined, including the contribution rate, criteria for selecting private asset managers, and the structure o f the public asset manager to minimize governance problems, The implementation plan wil l also have to be carefully devised to minimize risks, and a strong and effective regulatory agency will have to be established. Since this reform wil l apply to new c iv i l servants, primarily younger workers, i t will only contain pension costs over the longer term. Indeed, in the short to medium term, fiscal outlays may rise, as Go1 has to meet the combined costs o f the old and new schemes. Better measurement of the pension liabilities o f current c iv i l servants would l ikely point to sustainability issues and the need for further reforms, including changes in eligibil i ty criteria, and a possible shift of younger c iv i l servants (on a voluntary or mandatory basis) to the new D C plan.
2.64 The proposed D C scheme for c iv i l servants constitutes the f i rst attempt to address the problems besetting the pension system in India. The reform faces the dual challenges o f establishing a sound a well- regulated funded pension system for new federal c iv i l servants and, more importantly, motivation further and deeper reforms within the rest o f India’s pension system. The new scheme will hopefully serve as a
47 Intemational comparisons of average primary teacher salaries to per capita GDP indicate a ration o f around 5 to 1 in India compared to 1.7 in a sample of 39 Asian countries between 1970 and 1990. See Nelson (1994), pp 11 1-127. 48 However i t s regulatory authorities w i l l not encompass existing pension plans - the Employee Provident Fund (EPF), the Employee Pension Scheme (EPS) and occupational plans - that w i l l remain unsupervised despite performance concems.
33
model for the states to reform their own pension plans. Some states (e.g., Tamil Nadu) are already contemplating similar changes for new entrants. Once implemented at the central level, Go1 also intends to expand the new scheme to the unorganized private sector which remains uncovered by formal pension plans. Whi le a laudable goal, i t i s likely that coverage o f the unorganized sector will expand only gradually based o n other intemational experience^.^^ T h i s raises some question as to the viabil ity o f the new scheme unless it i s able to attract a wider group o f workers, including private sector employees to participating in the EPF and EPS. At a minimum, the reform could allow new workers in the private sector to j o i n in the new scheme and allow others to opt out f rom the EPF and EPS5’ The success o f this reform could we l l set a benchmark for deeper changes in the EPF and EPS over the medium term.
The Return on Civil Service Expenditures
2.65 Whi le the odd success story may be found, as a general rule the recent wage gains were not compensated by any commensurate increase in the overall quantity or quality o f government services. In fact, the mandate o f India’s public service has been shrinkmg during this period, as governments seek to withdraw f rom direct involvement in economic production and focus more on playing a regulatory and facilitative role for private sector growth.
2.66 To the extent that qualitative improvements have been implemented, they have often relied heavily upon the application o f information technology to streamline and re-engineer business processes, such as the Bhoomi program for registering property records in Karnataka or the e-Seva “one stop shops” for over 40 government services in Andhra Pradesh. Even when in fomat ion technology has made many functions redundant, c iv i l servants and powerful unions have often extracted pledges o f n o j o b losses as the price o f allowing the innovations to go forward, thereby limiting the economy and efficiency gains to be reaped. O n e south Indian state, for example, computerized part o f i t s stamps and registration function. The result was faster client service and a reduction in turn around times by nearly half. By some estimates, as many as 48% o f the department’s staff o f approximately 3,200 were made redundant by this decision, yet they are retained on the state payroll at an estimated cost o f over US$3 mi l l ion per year.
2.67 Overall experience varies, but o n average both Go1 and the states have successfully resisted pressure towards new recruitment during much o f the 1990s and beyond. However, even the best performers are yet to embark upon a significant program o f staff reduction. As a result, many l ine departments find themselves in an increasingly precarious position, with a growing proportion o f their non-plan resources being taken up by salaries, over which they have very l imi ted control. For example, in the Andhra Pradesh Department o f Stamps and Registration, only about 16% o f non-plan resources went to non-wage funding from 1995/96 to 1999/00. Other critical departments in Andhra Pradesh, such as those looking after primary education, spent 93% o f their non-capital budget o n salaries during this period - to the detriment o f spending o n training and learning materials, maintenance, scholarships etc. Furthermore, because i t i s diff icult to shed labor or adjust personnel inputs, the burden o f any shocks that occur during the year fall disproportionately o n non-wage expenditures, malung rational planning a l l but impossible.
2.68 Another fundamental problem haunting India’s c iv i l service i s the failure to use staff that it has productively. In Uttar Pradesh, for example, the Public Works Department (PWD) has a total strength o f 77,000, including roughly 9,000 technical and 12,000 administrative staff, as wel l as 56,000 gang laborers. With 5 1 laborers for every 100 km o f road, PWD has one o f the highest manual staffing ratios in India. Furthermore, market manual wage rates are about one third o f PWD rates. As a result, the cost o f keeping this gang labor force i s substantial - in 1998/99, the actual expenditure on maintenance was
49 Inadequate coverage of the formal pension schemes also threatens to increase poverty among the elderly as informal arrangements become more strained. T h i s raises the need to better target social assistance for the elderly poor. 50 There are also concems about poor investment practices o f occupational pension schemes (in particular, self-lending to the sponsoring enterprises and related parties). Asset management under occupational pension plans could now be transferred to asset managers under the new scheme.
34

Rs. 2.8 billion, while establishment costs were Rs. 3.4 billion. As will be discussed below in the sections on health and education, rates o f absenteeism among front-line workers are often appallingly high, with few being sanctioned or dismissed f rom service in spite o f chronic violations.
2.69 The burden o f weak administration falls particularly heavily on the poor, who suffer in terms o f skewed government spending, l imi ted access to services, and employee indifference. One assessment o f spending for health and nutrition in North India, for example, revealed that out o f every Rs.100 o f expenditure, the poorest 20% o f households received about Rs. 10, whereas the richest 20% received Rs.41 .51 In rural areas, only 4% o f the poorest households had access to electricity and 25% had access to drinking water, whereas comparable figures for the richest were 28% and 66% respectively. Innovative survey research by the Public Affairs Center in Delh i and Bangalore reveal that the average slum dweller needed to make six trips to a government agency to resolve a particular problem, whereas the number o f trips among general households was four.52 The rate o f success was over four times higher for general households, averaging 27%, as opposed to only about 6% for slum dwellers.
Improving Public Service Delivery
2.70 There are many reasons for the poor quality o f public service delivery in India. Internally, administrative structures and responsibilities are highly fragmented, while human resource management places more weight o n seniority than merit. I t will obviously take time to reform these long-standing structures and systems. However, experience throughout India shows that c iv i l servants do respond to external pressure for delivery o f better services. Three key elements for success are: (a) improved public access to information; (b) strengthened accountability; and (d) independence from polit ical interference. Recent experiments in these areas, and prospects for further reforms, are discussed below.
2.71 Access to information. In order to demand better public services, citizens need to be better informed about service standards, norms and procedures, as well as have ready access to forms and other such material. Opening up access to information, short circuits the rent-seelung opportunities provided by secrecy. Citizens’ charters are one vehicle to empower the public in their dealings with service providers. I t i s important, however, that such charters be developed in consultation with major stakeholders and widely disseminated. One model charter i s that developed by the Greater Mumbai Municipal Corporation (BMC) in June 1999, with assistance from an NGO, Praja.
2.72 NGOs can also play a v i ta l role in collecting raw data, transforming it into usable information, creating data banks that other organizations can access, and disseminating relevant information to a wider audience through report cards, surveys and public hearings. In Bangalore, for example, the Public Affairs Committee (PAC) conducted a user survey o f maternity wards that led to a major restructuring o f the service by the Bangalore City Corporation. Other NGOs have concentrated on public interest litigation to prod governments into taking action to improve the performance in laggard services.
2.73 Several states are actively using information technology to improve access to information. Tamil Nadu has placed all major Government Orders o f public interest o n i t s website. A P ’ s portal contains extensive information about government departments, schemes and policies; allows citizens to contact government officials directly, f rom the Chief Minister’s office on down; and provides (initially) for l imited on-line transaction processing as well. Computerization i s also being used to reengineer business processes and speed-up decision malung.
2.74 Finally, Go1 and a number o f states are promoting greater transparency by adopting Right to Information (RTI) legislation. Maharashtra’s RTI initiative (2002), for example, provides for access to Cabinet-level documents (with certain narrow exceptions), the creation o f a public records commission to improve record keeping and cataloguing, an independent appeals process to the office o f the L o k Ayukta, penalties for non-compliance, and the creation o f a high-level council to monitor implementation. These
See World Bank (2002a), p. 110. 52 See Paul and Sekhar (1999) and Sekhar and Balakrishnan (1999).
35
initiatives will be followed closely, to see whether they can help counter well-entrenched practices and interests within the c iv i l service to limit public access to information.
2.75 Accountability. The vast majority o f staff within Go1 and the state governments are promoted on the basis o f seniority cum merit, which in practice means they will be promoted as a matter o f course regardless o f their performance as long as n o adverse remarks are entered against them. Performance evaluation i s weak, and poorly l inked to the system o f rewards and promotions. Even more problematic i s the failure to punish or weed out corrupt or incompetent officers. The process o f sanctioning malfeasance or mal-administration i s fkaught with multiple review and appeals stages, resulting in years of delay and only a minority o f cases where criminal or administrative sanctions are i m p ~ s e d . ’ ~ As a result, the average Indian c iv i l servant has l itt le to motivate him or her to better performance beyond their innate professional ethic, and faces only a minute risk o f punishment for unlawful or inappropriate behavior.
2.76 The Indian administrative structure was designed during colonial times to perform two functions: facilitate the collection o f revenue and preserve l aw and order. Govemment reporting relationships are inwardly focused and strongly hierarchical in nature, with the pivotal ro le being played by the district collector and magistrate. At the sub-district level, a l l lines o f authority f lowed upwards to the D C D M , who in tum reported to his superiors in the state capital. Whi le a host o f developmental functions have been added since independence, these basic reporting relationships have survived largely unchanged. Recently, a number o f reforms have attempted to enhance “external” accountability and customer orientation. Some, such as Madhya Pradesh, have sought to empower local communities by allowing them to recruit their own teachers through i t s Education Guarantee Scheme. Others, such as Janmabhoomi in Andhra Pradesh, have sought to regularly bring bureaucrats in contact with local villagers to listen to their concerns.
2.77 Independent audits by the Comptroller and Auditor General (CAG) are one o f the primary institutional mechanisms for accountability o f the executive. However, the C A G mainly focuses o n financial irregularities. Whi le some performance appraisals are carried out, they rarely indicate how management can be strengthened. Discussion o f CAG reports by the Public Account Committees (PAC) o f parliament and state assemblies are not open to the public and often come with a long delay, which reduces the prospects for effective fo l low up. Clearly, audit procedures should be improved. But there should also be wider use o f other accountability mechanisms. The recent experience o f the L o k Ayukta (Ombudsman) in Kamataka i s one example which seems to be generating good results and may hold valuable lessons for other states (Box 2.2). The success o f vigilance and ombudsman functions i s critically dependent upon their having sufficient independence, budget and staff resources to investigate and prosecute corruption effectively. In addition, a comprehensive anti-corruption strategy should include: (a) a radical overhaul and simplification o f the procedures for imposing major and minor penalties; (b) expanded “whistleblower” protection; and (c) publication o f property and tax retums o f senior officials. Each state should be asked to pass the Corrupt Public Servants (Forfeiture o f Property) Act, which has already been drafted by the L a w Commission.
53 In this regard, the comparison of Uttar Pradesh (UP) with Hong Kong’s Independent Commission Against Corruption (or ICAC), arguably the most effective anti-corruption agency in Asia, i s instructive. The average Hong Kong citizen i s 39 times more likely to institute a complaint; the ICAC i s over 240 times more likely to investigate a case during the year in which the complaint i s made; and a Hong Kong civil servant i s 24 times more likely to be charged with a crime than his or her counterpart in UP. Furthermore, disciplinary cases in UP can wind through the courts for as long as 20 years, and a large majority ultimately end in acquittal. (Source: World Bank staff calculations based on annual reports for the UP Vigilance Department, the UP Lok Ayukta’s Office, and the Hong Kong ICAC, 1997-99.)
36

I Box 2.2: Karnataka’s Lok Ayukta I The Kamataka L o k Ayukta i s probably the strongest o f all L o k Ayukta offices in the country. As in Madhya Pradesh, Kamataka has placed the Vigilance Department under the full control o f the independent Lok Ayukta, to strengthen his capacity for autonomous action. In addition, the Kamataka Lok Ayukta Act vests the L o k Ayukta with wide statutory powers ranging from investigating corruption to addressing citizen grievances against any public servant, including the Chief Minister. H e also has the right to initiate prosecution directly. Kamataka’s L o k Ayukta i s appointed for a fixed five-year term by the Chief Minister in consultation wi th the Speaker o f the House, the Leader o f the Opposition, and the Chief Justice. Once appointed, he can only be removed for “proven misbehavior” or “incapacity” by the Govemor after a two-thirds majority vote in both chambers o f the legislature.
The current Lok Ayukta in Kamataka has been very active in investigating corruption in health and education facilities around the state, visiting districts to hear complaints on a regular basis, unearthing large financial scams in Kamataka’s city municipal corporations, and raiding regional transport and stamps and registration offices to catch people red-handed. The growing activism o f the L o k Ayukta has forced many departments to fumish effective redress to citizens to avoid further investigation and adverse media attention. The growing credibility o f the L o k Ayukta as an effective channel for grievance redressal i s reflected in the dramatic increase in complaints in just one year f rom 303 in January 2002 to 1,026 in December 2002.
2.78 Political independence. This topic i s a sensitive one, for the right to transfer c i v i l servants i s clearly vested within the polit ical leadership under Article 3 10 o f the Indian Constitution, which maintains that c i v i l servants serve at the “pleasure” o f the ruling authorities. Yet few would disagree that this power i s often abused by both c iv i l servants and politicians -- the former in seeking prime postings, and the latter for a variety o f legitimate and occasionally illegitimate reasons. T h e net result in states such as Uttar Pradesh has been a reduction o f average tenure for key senior c iv i l service positions to less than a year. Chronic polit ical instability in states such as UP and Manipur has led to the frequent collapse o f government, which has in turn led to a new round o f transfers as the next group o f polit ical leaders has sought to reward supporters and put their “own” staff into place. Compounding this problem has been the relative absence o f effective transition mechanisms. Since most reforms in large public organizations require several years to produce results, i t i s impossible for even the most capable and well-intentioned manager to implement lasting improvements under such circumstances.
2.79 A variety o f approaches have been tried to curb the problem o f excess transfers. Karnataka, for example, has created a new system o f cadre management authorities to approve transfers for the f i rs t time in India and posted the number o f transfers o n a public website. This system has succeeded in reducing transfers below the 5% norm in most departments. The success o f these initiatives should be followed closely and extended to other states as appropriate.
Health, Education and Social Safety Nets
2.80 India has made substantial progress towards achieving better social indicators over the past two decades. Official estimates o f poverty, literacy, and net enrollment rates have been improving dramatically since the 1980s. However, the rates o f improvement have not been sufficient to achieve the targets set in the Tenth Plan or even the less ambitious Mi l lennium Development Goals. Indeed, progress in health indicators has been slowing down precipitously. Infant mortality rates o f 115 per thousand in the 1980s f e l l to 79 in 1992 (a fa l l o f over 30%) but only to 68 in 2001 (a further fa l l o f less than 15%). Furthermore, mortality o f children under f ive appears to have seen no improvement over the 1990s and might, if anything, have worsened (fkom 94 in 1992 to 95 in 2001). Education indicators have continued to improve but, even here, there are s t i l l wide disparities across states, gender and caste in completion o f primary education. For example, ill iteracy rates for men and women ages 15 to 24 have declined f rom 27 and 46 to 20 and 35% respectively -- substantial progress both in levels and in the gender differential, but s t i l l with a way to go.
2.81 Making progress on aggregate indicators o f health and education in India requires improving the health and education status o f the poor. Gaps in both mortality and educational status between the poor and non-poor are striking: the 1998-99 National Family Health Survey (NFHS) indicates differences in
37

chi ld mortality between the poorest and richest deciles o f wealth o f 100% to 400% across states with enrollment rates varying by multiples as well.54 For example, the range o f under-two mortality rates f rom the poorest 5% to the richest 5% i s f rom 19% to 4% in Tamil Nadu and from 12% to 6% in Maharashtra. Similarly, in education, the completion rates o f the poorest 20% compared to the richest 20% are 17% versus 78% in Bihar and 44% versus 95% in Kamataka. Since for the relatively wel l -of f mortality rates are quite l o w and enrollment rates near universal, improvements in the average rates needed to reach the Tenth Plan goals cannot be achieved without directly improving the health and education status o f the poor.
2.82 Plausible rates o f economic growth alone wil l be insufficient to reach the Tenth Plan goals. If real GDP were to grow at 6% per annum, India as a whole and the majority o f states will not reduce infant mortality to ha l f o f the 1990 rate nor achieve full primary enrollment by 2015. N o r can the Plan goals be achieved by simply increasing public expenditures - without complementary measures to improve the effectiveness o f public service delivery. This conclusion i s corroborated by analyses o f the National Family Health Survey that show that the presence o f public health care facilities in a village has n o effect on mortality, controlling for income, education, access to good roads and water supply.55 W h i l e the effectiveness o f public expenditure in education i s better, higher spending i s s t i l l not enough to achieve universal enrollment, let alone completion o f lower primary education.
2.83 Public expenditures o n health and education have increased over the past decade. However, because both health and education are labor intensive, the bulk o f this increase has been due to sharp increases in wages o f public service providers, following the Fifth Pay Commission recommendations in 1997. The impact o f the Commission's recommendations on spending was somewhat higher in education and health than in other sectors. In some states the wage bill has topped 90% o f the total costs. Figures 2.7 and 2.8 show the growth o f real spending in these two sectors with noticeable increases in the years immediately fo l lowing the pay decision. The increase in the wage bill following the Commission decision l ed to increases in pay rates and not to numbers o f teachers, doctors or nurses. As Table 2.7 above showed, this led to a further widening o f the gap in pay between public and private doctors and teachers (though not nurses) al l three professions now receiving twice the private pay while in public service. This spending increase was not l ikely to, and indeed did not, lead to improved health or education outcomes.
m MO
Figure 2.7: Public Expenditures on Education (center and states, in billion rupees ai 1993 prices)
cIc/ 400 -
100 4
",i 1991192 1992193 199394 1994.85 1995196 1996/97 1997198 199W9 19S3EU
Figure 2.8: Public Expenditures on Health (center and states, in billion nipees at i993 prices)
1
:j , , , ~ , , , , , 0
1991192 1992193 1993194 1994.85 1995196 1996197 1997198 199853 19S3DQ
Soum. Abusaleh ShariH, Prabir K. Ghosh, S a m K Mondal, 'Indian Public Expeoditures M Smal Seclw and Povetty Nleviabm Rqrams during the 1993s'. NCAER, Wwking Paper 163, March 2002
54 These analyses are presented in World Bank (199%) and World Bank (20021). s5 Ibid.
38

2.84 The essential weakness in the social sectors i s in the implementation o f good policies. The quality o f services needs to improve. As one indication, recent estimates o f absentee rates for teachers and
providers are presented in Table 2.10. The problem, besides being high overall, i s generally much worse in poorer states. In Bihar, for example, surprise visi ts t o schools indicated that as many as 26% o f the teachers were not present and for medical practitioners, the rates are more than Andhra Pradesh 31 n.a twice as high. Since these people are Assam 31 58 on the payroll, it should not be Bihar 26 58 surprising that public money does not Gujarat 21 52
Table 2.10: Absence Rates from Primary Facilities in Selected States, 2003
(in %)
Primary School Primary Health Care Teachers Workers
translate directly into better outcomes. Haryana 19 35 If vacancy rates (positions unfilled) are Karnataka 23 43
even more pronounced. These and Orissa 14 35
lost o n the public. Bypassing free Rajasthan 23 39
f rom the National Sample Survey o f Uttaranchal 25 45 1995 indicates that more than hal f o f WestBengal 21 43
included, the bias against poor people i s Kerala 18 n.a
other indicators o f l o w quality are not Punjab 18 n.a
public Services to Use the private Sector Tamil Nadu 17 n.a i s common, even among the poor. Data Uttar pradesh 26 42
visi ts to medical providers by people in Notes: -not available the poorest quintile in rural areas are to the private sector. Similarly, the use o f private schools i s increasing rapidly in general and to some extent among the poor. English medium schools, particularly, are seen as a means o f upward mobil ity.
2.85 The root cause o f the implementation problem i s that the government (both politicians and bureaucrats) i s not accountable for social outcomes -- the health status o f the people, learning by students -- and do not ho ld personnel providing the service accountable either. Incentives to public providers are not such that anyone feels responsible for better or worse outcomes. Components o f the problem are: (a) there are systemic reasons why the interests o f the poor are not reflected in policy decisions regarding health and education. Influential urban and wealthier constituencies, for example, don't consider reaching remote areas or handling disease problems that mostly affect the poor as high priorities. The building o f facilities carries with it polit ical benefits o f being very visible and having opening ceremonies but basic public health activities such as hygiene, education or mosquito control are not as beneficial to politicians; (b) policy makers have insufficient means o f influencing the incentives facing service providers. As in the general discussion o f c iv i l service reform mentioned above, the weakness o f administration -- in this case illustrated by the lack o f control over staff behavior -- hurts the poor and denies them basic services; (c) the influence o f parents and patients on public providers (as in monitoring and sanctioning) i s not effective enough to compensate; and (d) the intrinsic motivation o f providers, while strong, i s not sufficient to meet social objectives.
2.86 One way to make outcomes more o f a motivating factor in service delivery i s to generate and disseminate information regarding progress in services. Parents and patients should know what they are entitled to and have a place to lodge complaints when they are not received. Public officials should k n o w whether the public i s satisfied or not. Providers and pol icy makers should know (and be constantly learning) about what works. This requires outcomes to be more regularly measured and their determinants analyzed. One critical role o f the central government, when states have the primary responsibility for the delivery o f publicly-funded services, i s t o be an independent source for this
Source: World Development Report, 2004 "Making Services Work for Poor People"
39
measurement. Initially, measurement o f outcomes may just be for information and the sake o f openness. Over time, such measures could be used to ho ld states accountable for improvements - perhaps to the extent o f conditioning fiscal transfers on progress. The increase in expenditures shown in Figures 2.8 and 2.9 did not translate into better social indicators - primarily because the spending was simply an increase in payments for inputs rather than outcomes.
2.87 Centrally Sponsored Schemes could also be made more flexible, and in many cases, such as preventative health care, their functions and funding should be at least partially passed on to the states. What works in Kerala may not work in the north. Measures to ensure ownership, polit ical independence and conscientious behavior o f c iv i l service staff may be unnecessary in states with a track record o f good governance. I t i s in the experimentation that such flexibil i ty allows, that solutions to the problem o f implementation can be found. CSS should also be evaluated rigorously, based on survey data. Lessons learned will help al l states improve their programs. Hence the benefits will spread wider than the state level, warranting central government involvement.
2.88 Creating institutions and establishing the measurement and evaluation procedures that will yield more effective policies and better social outcomes will take time. The solutions will also vary by sector. The fol lowing sections look at the key problems and strategies for dealing with them in the health and education sectors, and for social safety nets, as wel l as some proposals for improving policies in the short to medium term.
Health Strategy and Policy Priorities
2.89 There are two deep problems in the health sector: a lack o f realism concerning the public sector’s role in the health system, and a lack o f prioritization o f the public sector’s possible contributions. There i s a strong tendency in the public sector (and much o f public discussion) to believe that provision in government facilities i s the whole o f the health sector. In fact, in terms o f expenditures on health, it i s only about 20% o f the total. The share i s even less in terms o f number o f v i s i t s to providers, since the public sector i s more prominent in expensive hospital care than it i s in primary care. There i s also a strong tendency in the public sector to believe that the clientele o f the public sector i s predominantly poor. In fact, the usage o f the public sector i s much greater for the relatively well-off. N o t only are most public inpatient services (over 65%) used by the richest two quintiles o f the population (compared with 19% for the poorest two quintiles), but outpatient services as wel l (though to a lesser degree - 48% for the better o f f 40% o f the population versus 31% for the poorest 40%).56 2.90 Intemational comparisons with a select number o f comparators support the observation that India’s health system i s dominated by the private sector (Table 2.11). India’s public expenditure on health reflects i t s l o w income. International comparisons over a larger range o f countries show public health expenditures to be highly correlated with income - shares o f total income going to public health spending increases with income itself . More unusually, private spending on health care i s high as a share o f income even in comparison with such countries as Thailand and Malaysia that are significantly richer. This indicates a substantial demand and willingness to pay for health care that should be kept in mind as financing options are considered.
~
56 See Ajay Mahal et a1 (2001).
40
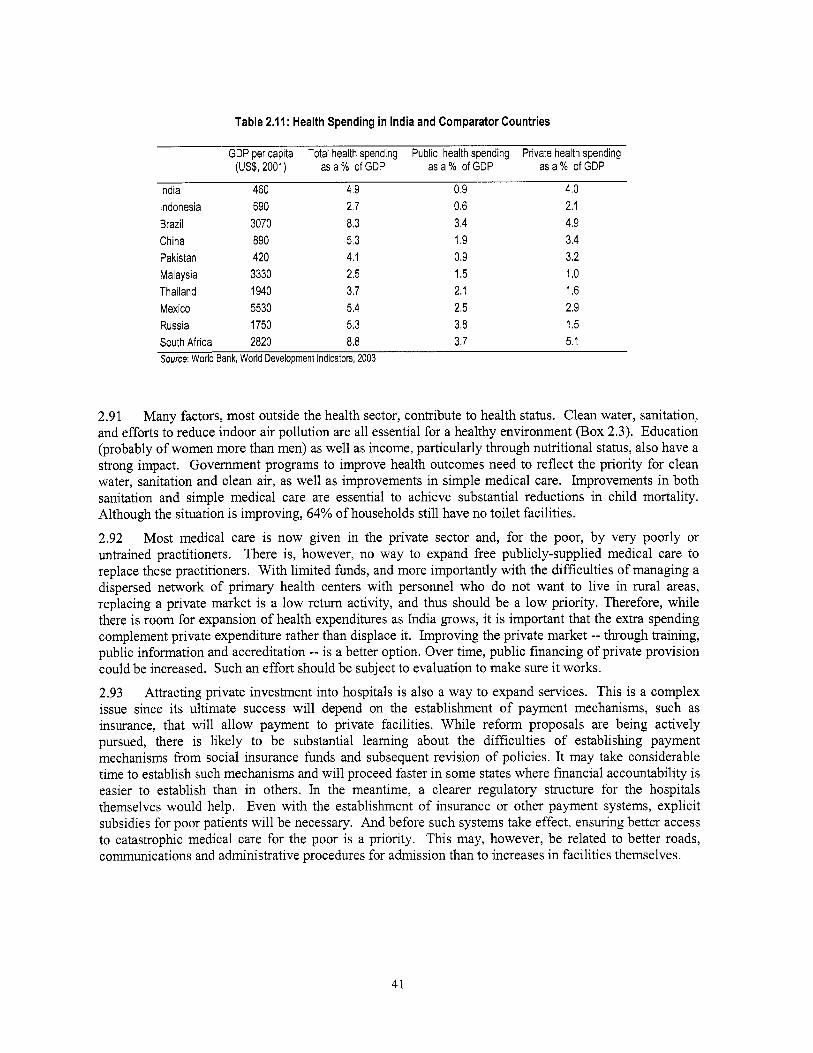
Table 2.11: Health Spending in India and Comparator Countries
GDP per capita Total health spending Public health spending Private health spending (US$, 2001) as a % of GDP as a % of GDP as a % of GDP
India 460 4.9 0.9 4.0 Indonesia 690 2.7 0.6 2.1 Brazil 3070 8.3 3.4 4.9 China 890 5.3 1.9 3.4 Pakistan 420 4.1 0.9 3.2
Thailand 1940 3.7 2.1 1.6 Mexico 5530 5.4 2.5 2.9 Russia 1750 5.3 3.8 1.5 South Africa 2820 8.8 3.7 5.1 Source: World Bank, World Development Indicators, 2003
Malaysia 3330 2.5 1.5 1 .o
2.91 Many factors, most outside the health sector, contribute to health status. Clean water, sanitation, and efforts to reduce indoor air pollution are al l essential for a healthy environment (Box 2.3). Education (probably o f women more than men) as wel l as income, particularly through nutritional status, also have a strong impact. Government programs to improve health outcomes need to reflect the priority for clean water, sanitation and clean air, as wel l as improvements in simple medical care. Improvements in both sanitation and simple medical care are essential to achieve substantial reductions in chi ld mortality. Although the situation i s improving, 64% o f households s t i l l have n o toilet facilities.
2.92 Most medical care i s now given in the private sector and, for the poor, by very poor ly or untrained practitioners. There is, however, n o way to expand free publicly-supplied medical care to replace these practitioners. With limited funds, and more importantly with the difficulties o f managing a dispersed network o f primary health centers with personnel who do not want to l ive in rural areas, replacing a private market i s a l o w retum activity, and thus should be a l o w priority. Therefore, while there i s room for expansion o f health expenditures as India grows, i t i s important that the extra spending complement private expenditure rather than displace it. Improving the private market -- through training, public information and accreditation -- i s a better option. Over time, public financing o f private provision could be increased. Such an effort should be subject to evaluation to make sure it works.
2.93 Attracting private investment into hospitals i s also a way to expand services. T h i s i s a complex issue since i t s ultimate success will depend on the establishment o f payment mechanisms, such as insurance, that will a l low payment to private facilities. Whi le reform proposals are being actively pursued, there i s l ikely to be substantial learning about the difficulties o f establishing payment mechanisms f rom social insurance funds and subsequent revision o f policies. I t may take considerable time to establish such mechanisms and will proceed faster in some states where financial accountability i s easier to establish than in others. In the meantime, a clearer regulatory structure for the hospitals themselves would help. Even with the establishment o f insurance or other payment systems, explicit subsidies for poor patients wil l be necessary. And before such systems take effect, ensuring better access to catastrophic medical care for the poor i s a priority. This may, however, be related to better roads, communications and administrative procedures for admission than to increases in facilities themselves.
41
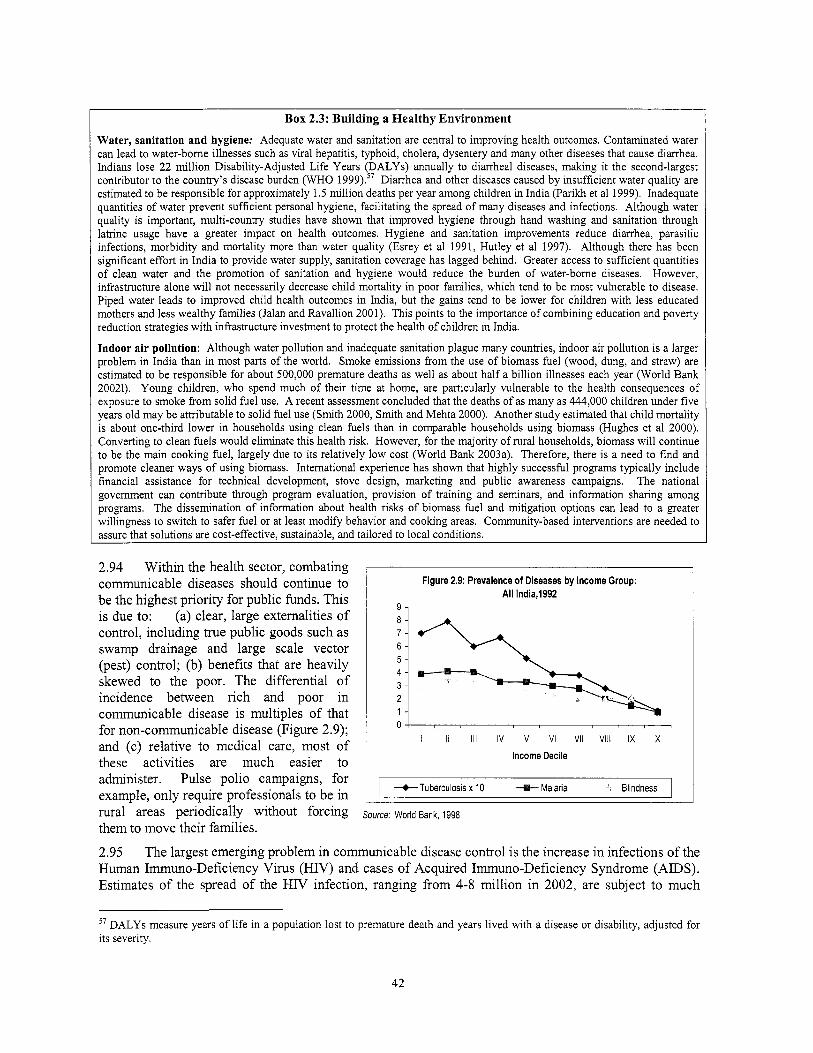
Box 2.3: Building a Healthy Environment
Water, sanitation and hygiene: Adequate water and sanitation are central to improving health outcomes. Contaminated water can lead to water-borne illnesses such as viral hepatitis, typhoid, cholera, dysentery and many other diseases that cause diarrhea. Indians lose 22 mi l l ion Disability-Adjusted L i fe Years (DALYs) annually to diarrheal diseases, making i t the second-lugest contributor to the country’s disease burden (WHO 1999).57 Diarrhea and other diseases caused by insufficient water quality are estimated to be responsible for approximately 1.5 mi l l ion deaths per year among children in India (Parikh et a1 1999). Inadequate quantities o f water prevent sufficient personal hygiene, facilitating the spread o f many diseases and infections. Although water quality is important, multi-country studies have shown that improved hygiene through hand washing and sanitation through latrine usage have a greater impact on health outcomes. Hygiene and sanitation improvements reduce diarrhea, parasitic infections, morbidity and mortality more than water quality (Esrey et a1 1991, Hutley et a1 1997). Although there has been significant effort in India to provide water supply, sanitation coverage has lagged behind. Greater access to sufficient quantities o f clean water and the promotion o f sanitation and hygiene would reduce the burden o f water-bome diseases. However, infrastructure alone will not necessarily decrease child mortality in poor families, which tend to be most vulnerable to disease. Piped water leads to improved child health outcomes in India, but the gains tend to be lower for children with less educated mothers and less wealthy families (Jalan and Ravallion 2001). This points to the importance o f combining education and poverty reduction strategies w i th infrastructure investment to protect the health o f children in India.
Indoor air pollution: Although water pollution and inadequate sanitation plague many countries, indoor air pollution is a larger problem in India than in most parts o f the world. Smoke emissions from the use o f biomass fuel (wood, dung, and straw) are estimated to be responsible for about 500,000 premature deaths as wel l as about ha l f a bi l l ion illnesses each year (World Bank 20021). Young children, who spend much o f their time at home, are particularly vulnerable to the health consequences o f exposure to smoke from solid fuel use. A recent assessment concluded that the deaths o f as many as 444,000 children under five years old may be attributable to solid fuel use (Smith 2000, Smith and Mehta 2000). Another study estimated that child mortality i s about one-third lower in households using clean fuels than in comparable households using biomass (Hughes et a1 2000). Converting to clean fuels would eliminate this health risk. However, for the majority o f rural households, biomass will continue to be the main cooking fuel, largely due to i t s relatively l ow cost (World Bank 2003a). Therefore, there i s a need to find and promote cleaner ways o f using biomass. International experience has shown that highly successful programs typically include financial assistance for technical development, stove design, marketing and public awareness campaigns. The national government can contribute through program evaluation, provision o f training and seminars, and information sharing among programs. The dissemination o f information about health risks o f biomass fuel and mitigation options can lead to a greater willingness to switch to safer fuel or at least modify behavior and cooking areas. Community-based interventions are needed to assure that solutions are cost-effective, sustainable, and tailored to local conditions.
9 - 8 - 7 - 6 - 5 - 4 - 3 - 2 - 1 -
2.94 Within the health sector, combating communicable diseases should continue to be the highest priority for public funds. This i s due to: (a) clear, large externalities o f control, including true public goods such as swamp drainage and large scale vector (pest) control; (b) benefits that are heavily skewed to the poor. The differential o f incidence between r i ch and poor in communicable disease i s multiples o f that
o + , for non-communicable disease (Figure 2.9); and (c) relative to medical care, most o f these activities are much easier to
I I / 111 IV v VI VI1 Vlll IX x Income Decile
administer. Pulse pol io campaigns, for example, only require professionals to be in rural areas periodically without forcing source: world Bank, 1998 them to move their families.
2.95 The largest emerging problem in communicable disease control i s the increase in infections o f the Human Immuno-Deficiency Virus (HIV) and cases o f Acquired Immuno-Deficiency Syndrome (ADS) . Estimates o f the spread o f the HIV infection, ranging f rom 4-8 mi l l ion in 2002, are subject to much
+Tuberculosis x 10 +Malaria Blindness
57 DALYs measure years o f l i f e in a population lost to premature death and years l ived with a disease or disability, adjusted for i t s severity.
42

dispute. But there i s n o dispute that the infection i s spreading rapidly. Some predictions are that as many as 20 to 25 mi l l ion cases wil l occur as soon as 2010 (a more than doubling o f current, approximate, estimates o f prevalence). T h e H IV /A IDS crisis presents a unique challenge for leadership in India. There are many competing needs for the public health infrastructure, and it i s important to ensure that H IV /A IDS programs neither undercut resources to deal with other h l l e rs l ike tuberculosis (TB), malaria, and diarrhea, nor get marginalized.
2.96 The main focus o f H IV /A IDS pol icy should be on prevention. Treatment i s expensive and has the possibility (as demonstrated in the US, Europe and Australia) o f undermining prevention activities by m a h n g contracting the disease less o f a catastrophe. Instead, treatment should only be used if it can complement prevention efforts as, for example, as an inducement for testing. Surveillance o f the disease should not be l imited to public ante-natal clinics and other standard locations. M u c h more attention i s needed for accurate measurement o f the incidence as wel l as research to understand the sexual (and drug use) behavior o f people if effective prevention strategies are to be designed. Finally, while the political obstacles are severe, the epidemic can only begin to be controlled if there i s a candid public discussion o f sex. People must be able to know the extent o f their risk and how to reduce this risk with safe sex. If this i s not done, the country faces a genuine disaster.
Education Strategy and Policy Priorities
2.97 Progress in education has been much greater than in health. Enrollments have responded to higher expenditure, polit ical support has been more reliable in many states, and there are several notable success stories within India. Nevertheless, there are large variations across states and the current rate o f aggregate progress in education indicators i s insufficient to attain the goals in the Tenth Plan. Of 200 mi l l ion children in the age group o f 6-14 years, 42 mi l l ion do not attend schools. There are problems relating to high drop out rates, l o w levels o f leaming achievement, and l o w participation o f girls. Coupled with these are various systemic issues l ike large-scale teacher vacancies, high teacher absenteeism, and inadequate teaching- leaming materials.
2.98 India's overall spending o n education i s not much different than that of other countries at similar income levels (Table 2.12). Expenditure composition, however, i s somewhat more skewed towards the secondary level and considerably more skewed towards higher education. Given the distinctive feature o f India, in which a very sophisticated academic tradition coexists with mass poverty, i t i s
Table 2.12: Education Spending in India and Comparator Countries
Country GDP per capita Public expenditure per student (US$, 2001) (as % of GDP per capita)
Primary Secondary Tertiary
India 460 7.2 23.1 92.5 Indonesia 690 3.2 8.7 12.2 Brazil 3070 12.5 12.6 72.8 China 890 6.1 12.1 85.8 Pakistan 420 n.a. n.a. n.a. Malaysia 3330 11.2 19.9 86.1 Thailand 1940 12.5 12.8 38.2 Mexico 5530 11.7 13.8 45.2 Russian Federation 1750 n.a. 20.5 15.8 South Africa 2820 14 17.9 61.3 Source: World Development Indicators, 2003; UNESCO Institute for Statistics
perhaps not surprising that higher education i s expensive in terms o f GDP. This does not mean, however, that higher education i s a high priority use o f public money as opposed to private.
2.99 T o accelerate progress in elementary education, the Government o f India launched in 2000/01 the Sarva Siksha Abhiyan (SSA, or Education for All) program. It aims at providing eight years o f schooling for children in the 6-14 age group by 2010. Go1 has also enacted a Constitutional Amendment (93'd) that
43

makes free and compulsory education a fundamental right for children in the 6-14 years age group. Universalizing the completion o f primary schooling, and then elementary schooling, across al l Indian states will require both additional public resources for these levels o f education and improvements in the effectiveness with which public resources are used. The central issues are:
0
0
0
2.100
H o w to ensure that al l children, particular poor children, become enrolled in primary school and are able and willing to complete an elementary education o f reasonable quality?
What can b e done to improve community-school relationships and to make the education system, including the teachers, more accountable to the communities they are intended to serve?
To what extent, and how, can the experiences o f educationally stronger states be replicated in weaker performing states to improve completion rates and levels o f learning achievement?
Education differs f rom health in that i t i s possible to rely o n communities and parents to monitor and evaluate school performance to a much greater degree than i s possible with health-facilities. Parents are in the best position to monitor what goes on in schools. They may not know the best pedagogical techniques, but they do know whether or not the teacher comes to work. And even illiterate parents can t e l l if their children are learning anything. So, effective reform will almost certainly put more power into their hands. In urban settings where there i s the possibility o f choice o f schools, increasing market power with vouchers (maybe for the poor, maybe for everyone with limits on topping up) might be experimented with, The essential feature i s to allow money to fo l low the student. And to allow schools enough autonomy to be able to compete for it.
2.101 In rural areas, where l itt le or n o real choice i s practical, increasing parent voice and influence on school operations i s a good option. Making schools more accountable to the community i s critical, possibly as far as giving parents the right to hire and fire teachers in the context o f local school committees. The most promising developments in primary education have been in Madhya Pradesh, where communities have been allowed to hire informal, less qualified, teachers at much lower wages than possible in the c i v i l service with much better performance in terms o f attendance as wel l as educational outcomes. Other states, such as Rajasthan and Uttar Pradesh have also experimented with para-teachers who, although with lower qualifications and earning a lower salary, appear to provide better services.58 States will differ in the degree and form in which they rely o n parents and communities depending o n their ability to monitor and ensure good performance from their teachers. Whi le parents in the community schools in Madhya Pradesh can dismiss and hire teachers, other states might find that ordinary complaint procedures through panchayats can work as well. In al l cases, however, the active participation o f parents i s l ikely to be a major factor in al l successful education reforms for a long time to come.
2.102 There may also be more scope for competition in education than i s ordinarily considered. Competition can be for concessions to establish a school in a village even i f there will be only one. Further, competition can be enhanced by makmg it easier for children to reach the competition. In Kerala, for example, substantial subsidies are given for transportation. Parents can shop around for better schools and the revenue o f the school depends on enrollments.
2.103 Schools need to be given enough autonomy to act on attracting teachers and students. Circumstances across India differ enormously and reaching the poorest and most remote children will require flexibil i ty and experimentation. Once again, localities must be allowed the freedom to find their best solutions and higher levels o f government can help by establishing more regular measurement o f attendance, o f learning outcomes and other information needed to evaluate progress. T h i s helps individual districts adjust their strategies and allows other districts to learn.
58 For example, a recent evaluation o f a remedial education program run by Pratham (an NGO) concluded: “Hiring remedial education teachers from the communi ty appears to be 10 times more cost effective than hiring n e w teachers”. See Duflo (2003).
44
2.104 Experience i s building on making contracts with government contingent on better performance o n tests, NGOs and possibly for-profit institutions can be given operating budgets contingent on independent measures of improvement in teaching. Whi le over-reliance o n test scores carries risks (such as “teaching to the test” and ignoring less quantifiable aspects o f education) many parents would be happy if enough teaching was taking place that test scores improved. One way or another, schools should be more accountable for better outcomes. This can be done in many ways - contracts with local governments, contracts with state departments of education, giving parents a greater say in school governance or a greater choice between schools where attracting students i s in the school’s interest. The common feature i s separation between the funder o f the school and the provider, with the latter beholden to the former.
2.105 Above primary education, there i s substantial increased demand for upper primary and secondary education, partly as a result of the success in increasing primary enrollments. In many states, secondary schools are grant-in-aid institutions (private schools paid for by public funds) and there i s concern over the quality o f education in such facilities. In many states, there are also concerns about leakages in grant- in-aid expenditures. Again, more regular evaluation o f outcomes can both improve oversight o f such contracts as well as increase public accountability o f the use o f public funds.
Providing Effective Social Safety Nets
2.106 Anti-poverty programs, or social safety nets, suffer f rom the same lack o f focus o n outcomes. The nature o f the poverty problem has changed dramatically since the establishment o f the major anti- poverty programs such as the Public Distribution System (PDS) in the early post-independence era. Then, mass poverty - at rates o f 60% or more - meant that universal programs were bound to help poor people. Now, with poverty rates below 30% and falling, there i s greater need to avoid waste o f public resources by making sure that program funds actually reach poor people. This, in turn, means more careful monitoring of programs to determine h o w much it costs to transfer a rupee to a poor person.
2.107 These costs vary widely among programs. One study compared five programs and found that i t cost f rom 1.8 rupees for each rupee ultimately received by someone below the poverty l ine through the ICDS, a nutrit ion and pre-school education program, to over 6.3 rupees through the “two rupee per h l o ” food distribution scheme of Andhra Pradesh.” The PDS cost over 5.3 rupees per rupee transferred. Included were both administrative costs associated with determining eligibil i ty and implementation as wel l as “leakage” costs o f benefits that reach people above the poverty line. Since many state programs are tied to PDS eligibil i ty conditions, i t s inabil ity to discriminate between poor and non-poor (there were fully 2.8 non-poor for each poor beneficiary) i s a matter o f great concern.
2.108 One general rule that has emerged f rom comparison o f programs i s that self-targeted programs, such as the Maharashtra Employment Guarantee Scheme (GES), do tend to reach the poorest better than those that rely on administrative discretion for eligibility. Self-targeted programs allow people to choose to participate but are designed to attract the neediest. For example, if wages in a GES are below prevailing wages, only the neediest will volunteer. These programs are cheaper both in terms o f administration, since there i s n o eligibility to check as wel l as in leakage, since only the poor will volunteer.60 The lesson, though, i s not that one existing program i s better or worse than another but that, once again, all programs should be continually re-examined in terms o f their effectiveness. Regular monitoring, measurement o f actual outcomes and re-focus o f programs i s essential.
59 Radhakrishna and Subbarao (1 997). 6o Ravallion and Datt (1995).
45

Towards the Future 2.109 Many internal and external observers o f Indian administration have argued that decentralization and local empowerment will ultimately be essential in improving the quality o f service delivery at the village level. Faced with slow and uneven progress on decentralization, the 73rd and 74* Amendments to the Constitution, ratified in 1992, imposed on states the obligation to decentralize to lower levels. The Amendments created distinct rural and urban govemments, mandated periodic elections and the establishment o f an important accountability mechanism, the Gram Sabha (village assembly), but lef t other matters o f implementation to the states. The most visible achievement o f these reforms has been the high degree o f polit ical decentralization. With the election o f over three mi l l ion local politicians, one third o f whom are women and around 20% from scheduled castes and tribals, India's decentralization has, at least nominally, opened the state to democratic participation. However, progress on fiscal and administrative aspects o f decentralization has been much more modest and hesitant. Administrative evolution has often failed to take account o f the limited capacity o f local governments, the existence o f economies o f scale for delivering services, or the potential role o f the private sector. And a serious overlap o f responsibilities between state, district, block and village governments obscures lines o f accountability to voters. For the most part, local governments s t i l l raise l itt le revenues o f their own (although the potential i s much higher) and also deliver few services. Rather, they are usually treated by state and central bureaucracies as service agents for higher level governments.
2.110 India now needs to move from the decentralized patchwork i t created towards an inter- governmental framework which leads to improved service delivery without increasing fiscal pressures. Good fiscal management would suggest reallocating public funds f rom central and state schemes into a well-designed fiscal framework for local govemments, that would guarantee their autonomy and accountability, while helping them to match resource allocations with local preferences. I t would also suggest creating incentives for local governments to collect a share o f their revenues f rom local taxpayers (e.g., through land taxes). Flows o f funds from the center and state governments should be dependent o n good performance and resource mobilization at the local level. Performance should be monitored not only by the Local Audit Fund, but also by local joumalists, c iv i l society groups and panchayat leaders from neighboring districts. This would help strengthen accountability, and ensure greater participation and empowerment o f local communities - one o f the primary objectives o f the decentralization process.
2.1 1 1 India's federal structure, common institutions and practices between states, and the ongoing program o f decentralization make it a fertile laboratory for reform. A variety o f changes are being implemented at the center, state and local levels, with varying degrees o f success, which can be quickly scaled up and disseminated across the country. India i s one o f the leaders in the information technology revolution, and states such as Andhra Pradesh and Karnataka are malung impressive gains in the application o f IT solutions to a variety o f public sector problems. For a l l o f their weaknesses, cadres such as the Indian Administrative Service remain a tremendous reservoir o f talent and capacity. Perhaps most important, a number of broader dynamics -- such as the rise o f the Indian middle class and the growth o f NGOs dedicated to issues o f good governance -- are fostering increasing social demand for good governance. Thus, while the nature o f the Indian public sector reform agenda has remained relatively fixed for a decade or more, India i tsel f i s changing in ways that make i t s realization more feasible.
46

PART 111: POLICY AGENDA: IMPROVING THE INVESTMENT CLIMATE
3.1 There i s l i tt le doubt that India’s economic performance has been aided by the structural reforms introduced over the past decade. However, i t also seems clear that higher levels o f private investment and productivity wil l b e needed to raise the growth rate to 8% per annum, as targeted in the Tenth Plan. Compared to many other countries in Asia, India’s private sector faces a relatively unfavorable investment climate. This constrains productivity and employment creation in industry and services, and reduces India’s abil ity to compete in world markets. Agricultural performance i s constrained by imbalances in public expenditure, which favor subsidies over productivity-enhancing investments, and remaining restrictions o n trade and competition. Development o f the non-farm sector will be essential to provide employment opportunities in rural areas, and support the agriculture sector.
3.2 Part 111.1 reviews recent progress in improving the business climate for industry and services, and proposes an agenda o f pol icy reforms to encourage more investment and higher productivity in the coming years. Part 111.2 covers the same ground for agriculture and rural development.

111.1: INDUSTRY AND SERVICES
the early 1990s (Box 3.1). The industrial sector grew by 7.6% per annum, and manufacturing by 9.8% per annum, in real terms from 1992193 to 1996197 (Table 3.1). Private investment in industry grew by 20.1% per annum in real terms over the same period (Figure 3.1). However, the momentum slowed in the second hal f o f the decade, with industrial growth averaging Only 4*5% per annum, manufacturing
Figure 3.1: Private Investment in Industry and Services, (annual average growth rates)
120 -
100 -
80 -
e 6 0 -
1 2o
-40 - 1991192 1992193 1993194 1994195 1995196 1996197 1997198 1998199 1999100 2000101
--O- Private investment in industy ,. D Private investment in sewices 1 Notes: Private investmentde!md as gross domestic fixed capitel formation in the private sector ~ource: Centa statistics Organization
Table 3.1: GDP, Industry and Services Growth Rates"
1992193-1 996197 1997198-2001102 2001102 2002103
GDP at factor cost 6.7 5.5 5.6 4.4
Industry Mining and Quarrying Manufacturing Electricity, Gas &water etc Construction
7.6 4.5 3.3 6.1 3.6 3.8 1 .o 4.8 9.8 3.8 3.4 6.1 5.5 5.9 4.3 5.2 3.6 7.0 3.7 7.1
Services 7.5 8.1 6.8 7.1
Trade, hotels & restaurant 9.1 7.1 8.8 n.a. Transport, storage &communication 8.1 9.6 8.5 n.a.
Financing, insurance, real estate & business 8.0 7.5 4.5 6.5
Community, social & personal services 5.1 9.1 5.6 6.4
Trade, hotels, Transport & communication 8.8 7.9 8.7 7.8
services
Notes: "Compound annual growth rate % Source: Central Statistical Organization
48
3.4 Latest (provisional) estimates based on a redefinition o f foreign direct investment (FDI), in accordance with international best practices,52 indicate that FDI in India stood at about 1.3% o f GDP in 2001/02, declining to 0.9% in 2002103, compared with 4% in China and between 2% and 3% in many emerging market countries. Unl ike in China and South East Asia, FDI in India has been oriented towards the domestic market and not towards exports. No significant increase in India’s penetration o f wor ld markets in industrial products has been observed over the past decade, with the share o f non-agricultural exports in wor ld exports o f the same commodities having increased only marginally f rom 0.5% in 1990/91 to 0.55% in 2000/01. Unl ike i t s experience with trade in goods, India in a short span o f time has achieved a prominent position in global trade in services, today accounting for 1.4% o f global exports in services. However, this growth has taken place on the back o f a narrow set o f sub-sectors, primarily software exports, which grew at an annual average rate o f 49% during the second ha l f o f the 1990s. In contrast, India’s performance in service segments such as travel and transportation services, where the underlying growth i s l inked to trade in goods, has been mediocre.
3.5 The organized industry and services sectors today account for 27 mi l l ion jobs, o f which just seven mi l l ion jobs are in manufacturing and some 17 mi l l ion are in the services sector (some 70% o f organized sector jobs are in public sector units). By comparison, the total labor force in India i s around 406 million, with a l itt le under one mi l l ion workers moving out o f agriculture every year. The organized services sector has generated some 760,000 new jobs over the past decade, while employment in organized manufacturing has remained almost unchanged, with only 350,000 new jobs having been created between 1993/94 and 1999/00. Growth in total manufacturing employment (organized and unorganized) in India has averaged only about 2% per annum during the period 1994-2000, with the unorganized sector accounting for the bulk o f this
3.6 Over the past 12 months, industry has begun to show signs o f recovery, fueled mainly by a better use o f existing capacity rather than by new investments, and by the lower interest rates that have resulted in huge windfall gains for industry. Industrial growth for 2002/03 i s estimated to be 6.1%, compared to 3.1 % for the previous year. However, as emphasized in the Tenth Five-Year Plan, much higher industrial sector growth will be required to create the targeted 100 mi l l ion or so new jobs over the next decade. This will need to be accompanied with an acceleration o f growth in labor-intensive services such as retail trade. The Plan notes that sustained growth and employment will require a step up in domestic investment, particularly private investment, coupled with improved productivity.
52 In accordance with the new and expanded definition o f FDI released by Go1 on July 2,2003, FDI i s defined to include, besides equity capital (which comprises the equity capital o f unincorporated entities, now also including the equity capital o f foreign banks’ branches in India, control premium and non-competition fees), reinvested earnings of incorporated and unincorporated entities and other capital (including short-term and long-term borrowing, trade and suppliers’ credit of more than 180 days, and financial leasing). 53 Based on the NSS figures as reported in the Report o f the Task Force on Employment Opportunities, (Go1 2001a)
49
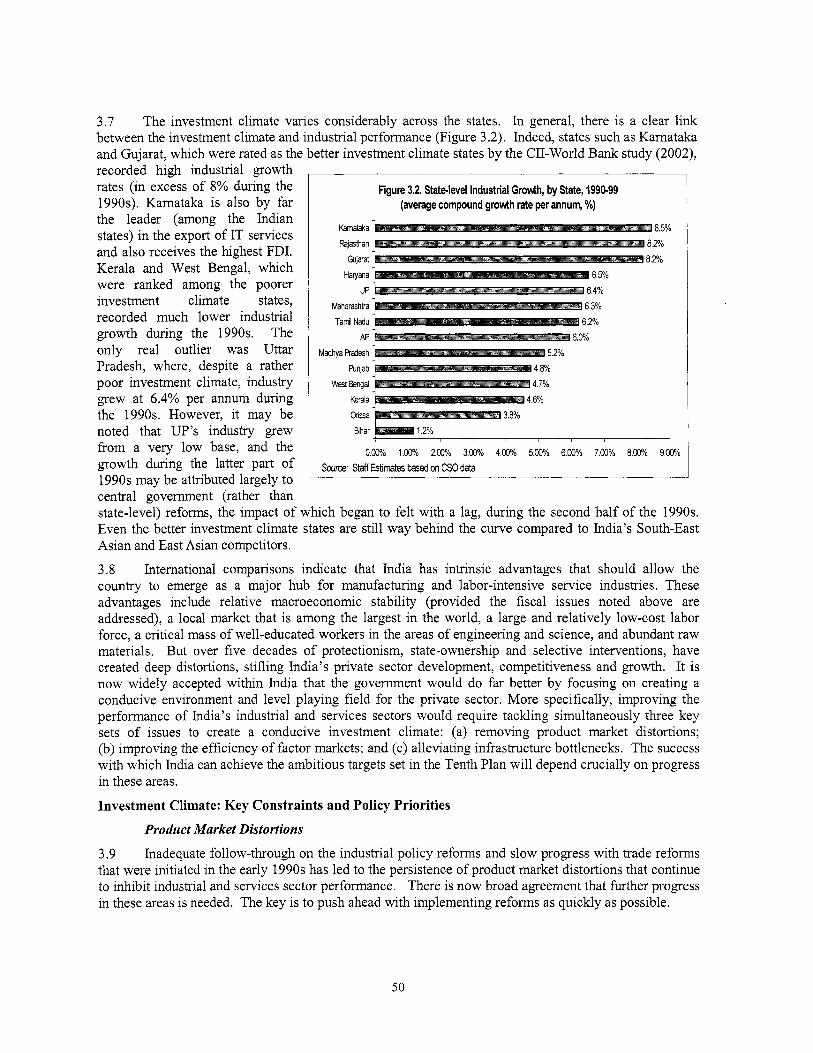
3.7 The investment climate varies considerably across the states. In general, there i s a clear link between the investment climate and industrial performance (Figure 3.2). Indeed, states such as Kamataka and Gujarat, which were rated as the better investment climate states by the CII-World Bank study (2002), recorded high industrial growth rates (in excess o f 8% during the 1990s). Kamataka i s also by far the leader (among the Indian states) in the export o f IT services and also receives the highest FDI. Kerala and West Bengal, which were ranked among the poorer investment climate states, recorded much lower industrial growth during the 1990s. The only real outlier was Uttar Pradesh, where, despite a rather poor investment climate, industry grew at 6.4% per annum during the 1990s. However, it may be noted that UP’S industry grew f rom a very l o w base, and the growth during the latter part o f 1990s may be attributed largely to central government (rather than
Figure 3.2. Statelevel Industrial Grourth, by State, 199&99 (average compound growth rate per annum, %)
Kamataka Rajasthan
Gujarat Havana
UP Maharashba Tamil Nadu
Ap
Madhya M e s h Funjab
West Bengal Kerala Crissa Bhar
O.W/o I.W/o 2.03% 3.03% 4.03% 5.00% 6.00% 7.00% 8.Wh 9.Wh Source: Staff Estimates k e d on CSO data
state-level) reforms, the impact o f which began to felt with a lag, during the second ha l f o f the 1990s. Even the better investment climate states are s t i l l way behind the curve compared to India’s South-East Asian and East Asian competitors.
3.8 International comparisons indicate that India has intrinsic advantages that should allow the country to emerge as a major hub for manufacturing and labor-intensive service industries. These advantages include relative macroeconomic stability (provided the fiscal issues noted above are addressed), a local market that i s among the largest in the world, a large and relatively low-cost labor force, a critical mass o f well-educated workers in the areas o f engineering and science, and abundant raw materials. But over five decades of protectionism, state-ownership and selective interventions, have created deep distortions, stifling India’s private sector development, competitiveness and growth. I t i s n o w widely accepted within India that the government would do far better by focusing on creating a conducive environment and level playing field for the private sector. More specifically, improving the performance o f India’s industrial and services sectors would require tackling simultaneously three key sets o f issues to create a conducive investment climate: (a) removing product market distortions; (b) improving the efficiency o f factor markets; and (c) alleviating infrastructure bottlenecks. The success with which India can achieve the ambitious targets set in the Tenth Plan will depend crucially on progress in these areas.
Investment Climate: Key Constraints and Policy Priorities
Product Market Distortions
3.9 Inadequate follow-through o n the industrial pol icy reforms and slow progress with trade reforms that were initiated in the early 1990s has l ed to the persistence o f product market distortions that continue to inhibit industrial and services sector performance. There i s n o w broad agreement that further progress in these areas i s needed. The key i s t o push ahead with implementing reforms as quickly as possible.
50
3.10 A key area where industrial pol icy reforms need to move faster relates to India’s policy o f small scale industry (SSI) reservation. At the start o f the reform program o f the 199Os, about 800 items were reserved for exclusive production in the SSI sector, which meant that investment in plant and machinery in any individual SSI unit could not exceed a specified monetary ceiling. Over the years, this l i s t has been only slightly pruned, so that, as o f June 30, 2003, a total o f 674 items remained reserved exclusively for the SSI sector, although non-SSI f i r m s can now obtain a license to produce products reserved for the SSI sector, provided they are exported. In the case o f 610 o f these reserved categories, total investment in plant and machinery for any single firm i s capped at an upper limit o f Rs.10 mi l l ion (a l itt le over US$200,000), whi le for 64 reserved items, the investment cap has been raised to Rs.50 mi l l ion (about US$1 million). This pol icy o f product reservation and investment ceilings has held back the SSI sector from achieving economies o f scale and greater efficiency, by inhibiting small f i r m s f rom investing beyond the stipulated limits, expanding their operations in the domestic market, and then moving into exports. N o w i s the time to eliminate this policy o f SSI reservation, which would unleash the potential o f India’s small-scale players, encouraging small businesses to grow and compete on wor ld markets.
3.11 Trade policy. Import licensing has been abolished. Whi le rapid progress was made in tar i f f reduction until the mid-l990s, the process has slowed since then (Box 3.1), and high import tariffs remain a key constraint t o better industrial performance and competitiveness, driving up the prices o f manufactured products, suppressing demand and providing opportunities for inefficient f i r m s to survive and for efficient f i r m s to capture rents. Many tariffs, mostly o n agricultural products and processed foods, but also on some industrial products (e.g., automobiles) are far above the new “peak” customs duty rate o f 25% introduced in the 2003/04 budget. In March 2003, including the protective effect o f the Special Additional Duty ( S A D ) , the un-weighted average protective tar i f f was about 32.7%, overall, 30.7% for industrial goods and 46.8% for agricultural products including processed foods. T h i s i s far lower than pre- reform tar i f f levels during the 1980s, but s t i l l very high by wor ld standards. In fact, comparing the un- weighted average Customs duty rates o f 105 developing countries between 1996 and 2000, India’s average tar i f f was the second highest (next to Morocco). Even without allowing for the S A D , India’s current tariffs are much higher than average tariffs in other large developing countries: e.g., more than double China’s and Brazil’s, four times Indonesia’s, and two and a ha l f times the average o f developing countries (Table 3.2). Reducing import tar i f fs i s critical to improving industrial performance. The a im for India should be to reduce import tariffs on al l imports to a single rate (say, 10%) over the next three to four years. This schedule would give domestic manufacturers the time to restructure and become competitive, and i s comparable with the rate o f tar i f f reduction in countries such as China and Brazil over the past decade (China’s import duties are expected to average 9% by 2005).
51
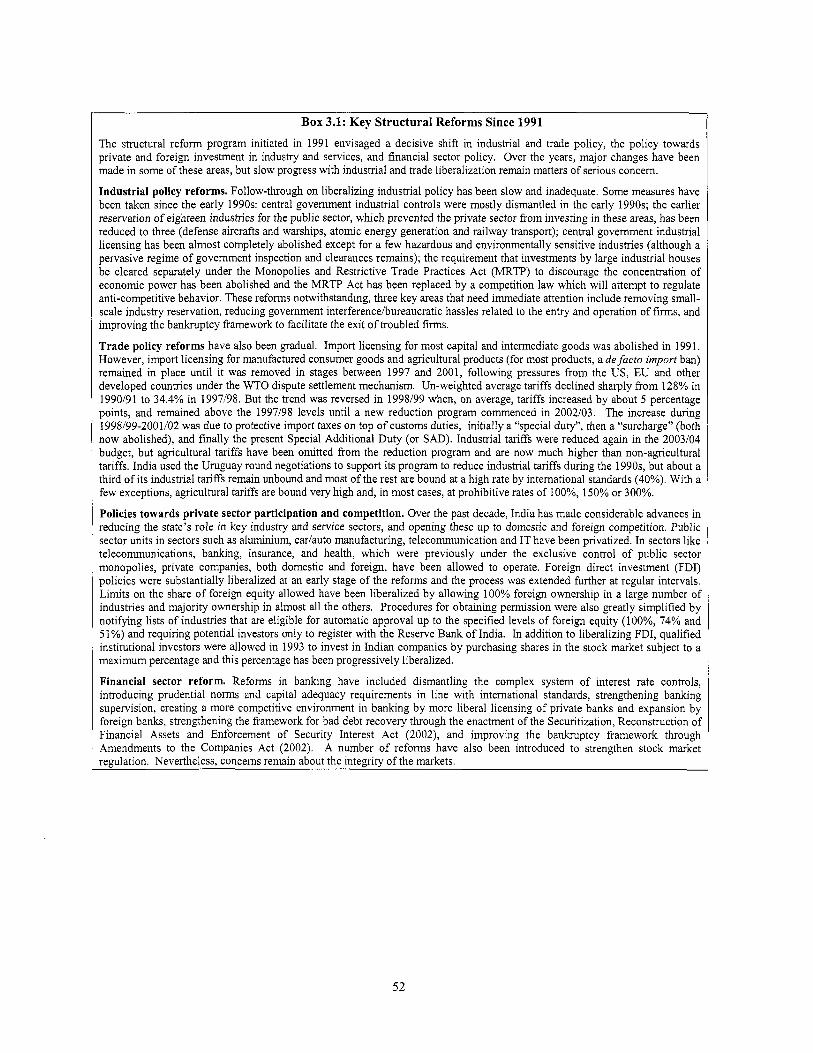
Box 3.1: Key Structural Reforms Since 1991
T h e structural reform program initiated in 1991 envisaged a decisive shift in industrial and trade policy, the policy towards private and foreign investment in industry and services, and financial sector policy. Over the years, major changes have been made in some o f these areas, but slow progress with industrial and trade liberalization remain matters o f serious concem.
Industrial policy reforms. Follow-through on liberalizing industrial policy has been slow and inadequate. Some measures have been taken since the early 1990s: central govemment industrial controls were mostly dismantled in the early 1990s; the earlier reservation o f eighteen industries for the public sector, which prevented the private sector from investing in these areas, has been reduced to three (defense aircrafts and warships, atomic energy generation and railway transport); central govemment industrial licensing has been almost completely abolished except for a few hazardous and environmentally sensitive industries (although a pervasive regime o f govemment inspection and clearances remains); the requirement that investments by large industrial houses be cleared separately under the Monopolies and Restrictive Trade Practices Act (MRTP) to discourage the concentration of economic power has been abolished and the MRTP Act has been replaced by a competition law which w i l l attempt to regulate anti-competitive behavior. These reforms notwithstanding, three key areas that need immediate attention include removing small- scale industry reservation, reducing govemment interferencehureaucratic hassles related to the entry and operation o f f i rms, and improving the bankruptcy framework to fadi tate the exit o f troubled f i rms.
Trade policy reforms have also been gradual. Import licensing for most capital and intermediate goods was abolished in 199 1. However, import licensing for manufactured consumer goods and agricultural products (for most products, a de facto import ban) remained in place until i t was removed in stages between 1997 and 2001, following pressures f rom the US, EU and other developed countries under the WTO dispute settlement mechanism. Un-weighted average tariffs declined sharply f rom 128% in 1990191 to 34.4% in 1997198. But the trend was reversed in 1998199 when, on average, tariffs increased by about 5 percentage points, and remained above the 1997198 levels until a new reduction program commenced in 2002103. The increase during I998/99-2001/02 was due to protective import taxes on top o f customs duties, init ially a “special duty”, then a “surcharge” (both now abolished), and finally the present Special Additional Duty (or S A D ) . Industrial tari f fs were reduced again in the 2003104 budget, but agricultural tariffs have been omitted from the reduction program and are now much higher than non-agricultural tariffs. India used the Uruguay round negotiations to support i t s program to reduce industrial tariffs during the 199Os, but about a third o f its industrial tariffs remain unbound and most o f the rest are bound at a high rate by intemational standards (40%). With a few exceptions, agricultural tariffs are bound very high and, in most cases, at prohibitive rates o f loo%, 150% or 300%.
Policies towards private sector participation and competition. Over the past decade, India has made considerable advances in reducing the state’s role in key industry and service sectors, and opening these up to domestic and foreign competition. Public sector units in sectors such as aluminium, car1auto manufacturing, telecommunication and IT have been privatized. In sectors like telecommunications, banking, insurance, and health, which were previously under the exclusive control o f public sector monopolies, private companies, both domestic and foreign, have been allowed to operate. Foreign direct investment (FDI) policies were substantially liberalized at an early stage o f the reforms and the process was extended further at regular intervals, L imits on the share o f foreign equity allowed have been liberalized b y allowing 100% foreign ownership in a large number of industries and majority ownership in almost all the others. Procedures for obtaining permission were also greatly simplified by notifymg l i s ts o f industries that are eligible for automatic approval up to the specified levels o f foreign equity (loo%, 74% and 5 1 %) and requiring potential investors only to register with the Reserve Bank o f India. In addition to liberalizing FDI, qualified institutional investors were allowed in 1993 to invest in Indian companies by purchasing shares in the stock market subject to a maximum percentage and this percentage has been progressively liberalized.
Financial sector reform. Reforms in banking have included dismantling the complex system o f interest rate controls, introducing prudential norms and capital adequacy requirements in line wi th intemational standards, strengthening banking supervision, creating a more competitive environment in banking b y more liberal licensing o f private banks and expansion by foreign banks, strengthening the framework for bad debt recovery through the enactment o f the Securitization, Reconstruction o f Financial Assets and Enforcement o f Security Interest Act (2002), and improving the bankruptcy framework through Amendments to the Companies Act (2002). A number o f reforms have also been introduced to strengthen stock market regulation. Nevertheless, concems remain about the intemitv o f the markets.
52
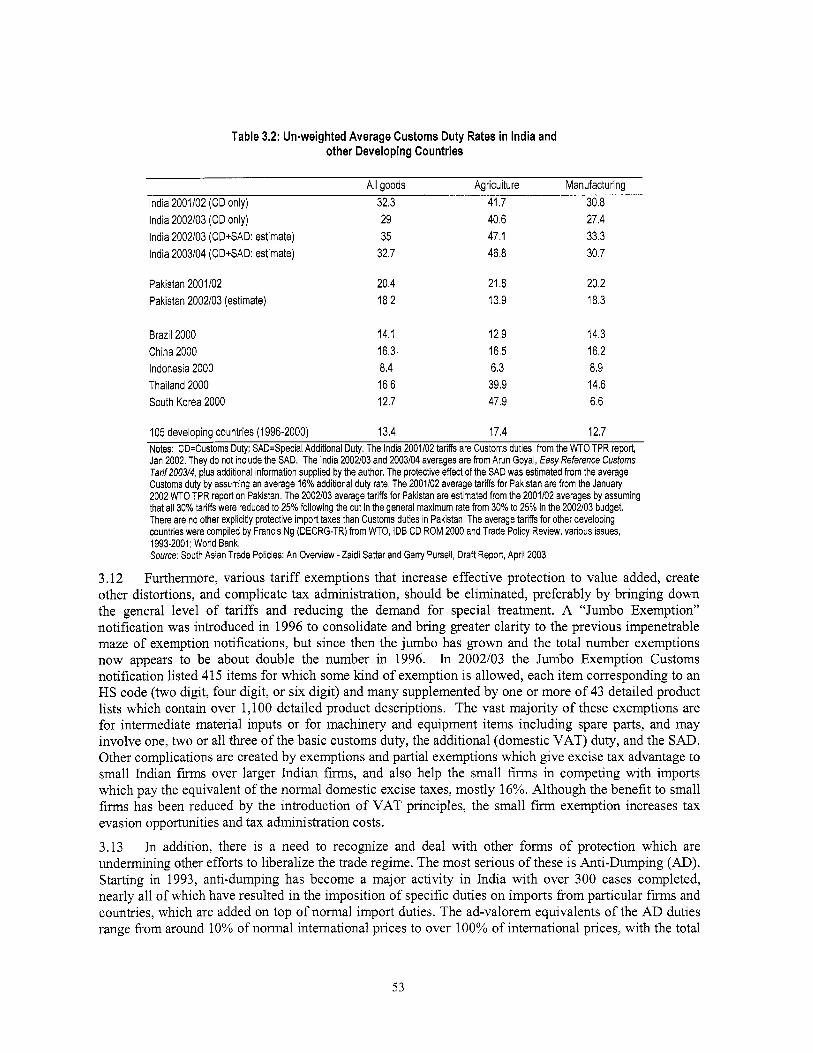
Table 3.2: Un-weighted Average Customs Duty Rates in India and other Developing Countries
All goods Agriculture Manufacturing India 2001102 (CD only) 32.3 41.7 30.8 India 2002103 (CD only) 29
India 2003104 (CDcSAD: estimate) 32.7 India 2002103 (CDcSAD: estimate) 35
Pakistan 2001102 Pakistan 2002103 (estimate)
Brazil 2000 China 2000 Indonesia 2000 Thailand 2000 South Korea 2000
40.6 27.4 47.1 33.3 46.8 30.7
20.4 21.8 20.2 18.2 13.9 18.3
14.1 16.3 8.4 16.6 12.7
12.9 14.3 16.5 16.2 6.3 8.9 39.9 14.6 47.9 6.6
105 developing countries (1996-2000) 13.4 17.4 12.7 Notes: CD=Customs Duty; SAD=Special Additional Duty. The India 2001102 tariffs are Customs duties from the WTO TPR report, Jan 2002. They do not include the SAD. The India 2002103 and 2003104 averages are from Arun Goyal, Easy Reference Customs Tarif 2003/4, plus additional information supplied by the author. The protective effect of the SAD was estimated from the average Customs duty by assuming an average 16% additional duty rate. The 2001102 average tariffs for Pakistan are from the January 2002 WTO TPR report on Pakistan. The 2002103 average tariffs for Pakistan are estimated from the 2001102 averages by assuming that all 30% tariffs were reduced to 25% following the cut in the general maximum rate from 30% to 25% in the 2002103 budget. There are no other explicitly protective import taxes than Customs duties in Pakistan. The average tariffs for other developing countries were compiled by Francis Ng (DECRG-TR) from WTO, IDB CD ROM 2000 and Trade Policy Review, various issues, 1993-2001; World Bank. Source: South Asian Trade Policies: An Overview - Zaidi Sattar and Gary Pursell, Draft Report, April 2003
3.12 Furthermore, various tar i f f exemptions that increase effective protection to value added, create other distortions, and complicate tax administration, should be eliminated, preferably by bringing down the general level o f tariffs and reducing the demand for special treatment. A “Jumbo Exemption’’ notification was introduced in 1996 to consolidate and bring greater clarity t o the previous impenetrable maze o f exemption notifications, but since then the jumbo has grown and the total number exemptions now appears to be about double the number in 1996. In 2002/03 the Jumbo Exemption Customs notification l isted 41 5 items for which some lund o f exemption i s allowed, each i tem corresponding to an HS code (two digit, four digit, or six digit) and many supplemented by one or more o f 43 detailed product l i s t s which contain over 1,100 detailed product descriptions. The vast majority o f these exemptions are for intermediate material inputs or for machinery and equipment items including spare parts, and may involve one, two or al l three o f the basic customs duty, the additional (domestic VAT) duty, and the S A D . Other complications are created by exemptions and partial exemptions which give excise tax advantage to small Indian f i r m s over larger Indian f irms, and also help the small f i r m s in competing with imports which pay the equivalent o f the normal domestic excise taxes, mostly 16%. Although the benefit to small f i rms has been reduced by the introduction o f VAT principles, the small firm exemption increases tax evasion opportunities and tax administration costs.
3.13 In addition, there i s a need to recognize and deal with other forms o f protection which are undermining other efforts to liberalize the trade regime. The most serious o f these i s Anti-Dumping (AD). Starting in 1993, anti-dumping has become a major activity in India with over 300 cases completed, nearly a l l o f which have resulted in the imposition o f specific duties o n imports f rom particular f i r m s and countries, which are added on top o f normal import duties. The ad-valorem equivalents o f the AD duties range from around 10% of normal international prices to over 100% o f international prices, with the total
53

resulting import tariffs often prohibitive. The effects o f AD go beyond the products actually subject to AD duties, since the threat o f bringing AD actions can be used by domestic f i r m s to prevent or limit competition from imports. India’s AD activity (especially following recent anti-dumping duties imposed on imports f rom f i r m s in Nepal and Bangladesh) i s influencing the other South Asian countries to also embark on anti-dumping and among other things i s complicating efforts to reduce barriers to regional trade.
3.14 As we l l as by anti-dumping, a number o f other methods are also being used to provide extra protection. These include: (a) specific tariffs, used mostly to protect textile fabric and garment producers against l o w priced import competition, the ad valorem equivalents o f which (based on export prices f rom China and Korea) can be prohibitively high, ranging from 50% to over 100%; (b) the use o f govemment mandated import monopolies (State Trading Enterprises) to control imports o f foodgrains and fertilizers; (c) the application o f the MW (Maximum Retail Price) rules to imported consumer goods which raises the effective CENVAT (1.e. excise tax) rate as a proportion o f the c i f prices o f some imports, above the equivalent rate o n domestically produced products; (d) the application o f sanitary and phytosanitary (SPS) rules and technical regulations in ways which discriminate against imports; and (e) in February 2003, a new Customs Ordinance, one purpose o f which i s to give discretionary power to the Ministry o f Finance to act quickly to increase customs duties without obtaining the parliamentary clearance that was previously required.
3.15 The govemment has been making strenuous efforts to streamline and simplify i t s export policies, especially the large number o f schemes which are used to exempt, offset or refund import duties on imported inputs used by exporter^.'^ However, many long-standing problems in the administration o f these schemes have continued, including delays and high negotiation and transactions costs for exporters. The basic underlying reason for these difficulties i s the s t i l l very high levels o f tariffs and indirect taxes which mean that fast and complete rebates or exemptions are essential for profitable exporting, but which on the other hand create large potential economic rents f rom the misuse o f the schemes, which in tum lead to large numbers o f different schemes to meet different circumstances and to complex layers o f control. The diff iculty this creates for exporters i s another major reason to substantially reduce the level o f protective tariffs and to simplify their structure.
3.16 India has many wel l justif ied concerns about the policies o f other countries which restrict i t s exports o f goods and services where it has a clear comparative advantage, and it i s one o f the most active o f the developing countries in combating these policies in various international fora, especially at the WTO. O f particular concern are agricultural protectionism in the EU, U S and other developed countries, escalated tar i f f structures in developed countries, the multi-fiber arrangement which restricts textile and garments exports, developed country regional preferential policies such as NAFTA which have diverted imports f rom India and other excluded suppliers, the misuse o f anti-dumping, sanitary and phytosanitary regulations, technical regulations as protective instruments, and the reluctance o f developed countries to allow Indians and people f rom other developing countries to provide services by temporarily moving within their borders.
3.17 However, this negotiating stance in relation to developed country restrictions has been combined with defensive positions with respect to India’s own commitments, as indicated, for example, by mostly prohibitively high agricultural tar i f f bindings, many unbound industrial tariffs, and conservative bindings under the GATS. Because of the size o f i t s economy, and even more i t s potential future size, India has some bargaining leverage in offering to trade some o f these restrictions for concessions by other countries (Mattoo and Subramanian 2003). But these potential future economic benefits should be weighed against the current and ongoing economic costs o f not taking advantage o f the opportunity offered by the WTO process to help tie in liberalizing reforms by making them more diff icult t o reverse under the pressure of
54 Current export policies are outlined in the M in i s t r y o f Commerce Report ofthe High Level Committee for the Exim Policy, 2002-07, (GoI, 2002a).
54

domestic protectionist forces. The W T O bargaining process can also help overcome domestic interests resisting trade liberalization by balancing increased import competition in the domestic market with better and more secure access to export markets. F rom this perspective, some o f the recent directions o f Indian trade policies, especially the routine use o f anti-dumping, the use o f SPS and technical regulations for protection purposes, and the subsidized exports o f rice and wheat, are emulating developed country practices about which India rightly complains, and are l ikely to undermine i t s credibility in negotiating for multilateral rules to limit their future use.
3.18 Domestic taxes. The business environment in India has greatly benefited f rom the introduction o f VAT principles and the gradual broadening and simplification o f the previously extremely complex central government indirect (excise) tax system, n o w known as CENVAT. This has been under way since the mid-1980s and has continued with major improvements in recent years (especially as regards the textile sector), despite a recent move to a basic three-tier structure (8%, 16% and 24%) rather than a system with a single basic rate. But in sharp contrast to an overwhelming majority o f developing countries (by 1998, 116 countries around the wor ld had adopted VAT or a VAT- l ike tax), India has not yet introduced a VAT. I t has been announced that sales taxes wil l be replaced by a VAT regime, originally expected to be introduced on April 1, 2003. But VAT implementation has been delayed. If fully and uniformly implemented across a l l states, the VAT should help eliminate distortions caused by the cascading effect o f sales taxes applied at each stage o f the value chain.
3.19 In the meanwhile, however, the prevailing indirect tax regime in India creates significant distortions and transactions costs, and the indirect tax rates remain quite high relative to other developing countries (Table 3.2). A recent calculation (CIVMcKinsey 2002) suggests that a lowering o f domestic sales taxes in India would significantly reduce costs in the value chain, lower consumer prices, and result in rapid growth in domestic sales volumes, without having an adverse impact o n government revenues (given the elasticity o f demand for manufactured goods and also given that reduction in rates would encourage f i r m s to move from the unorganized to the organized sector, thereby bringing them into the tax net). Another tax-related distortion worth mentioning relates to the granting o f discretionary tax holidays by various states in India. Whi le this problem has been reduced since the abolition o f sales tax concessions post-1 999, it does continue to create a fragmentation o f manufacturing capacities, resulting in high costs.
3.20 Whi le FDI policies have been significantly liberalized, FDI i s s t i l l allowed only in selected sectors (e.g., telecom, insurance, etc.) and i s s t i l l subject to limits, particularly o n full ownership by foreign players. For example, FDI i s not currently permitted in pure retailing (global retailers can only participate in India’s retail sector through wholesale trade or by operating retail outlets through local franchises). In apparel, which i s another important sector f rom the viewpoint o f j o b creation, FDI i s l imi ted to 24% o f equity. In housing construction, restrictions o n foreign ownership o f land limit the entry o f foreign builders and developers into the construction market, so that foreign players face higher r i sks when operating in India as they are unable to take land ownership as collateral for the capital they have invested. Phasing out these FDI limits would not only bring in the necessary capital into these sectors (as the local capital markets and the pockets o f the Indian players are not deep enough to provide the necessary equity commitment) and generate growth and employment, but also, as shown by several studies, the entry o f multinationals would l ikely lead to technology and s lu l l s transfers to domestic f i rms . If foreign f i r m s introduce new products and processes, domestic f i r m s would benefit f rom the accelerated diffusion o f technology. Diffusion could also occur f rom labor tumover as domestic employees move from foreign f i r m s (which typically focus more o n j o b training programs) to domestic f i rms.
55
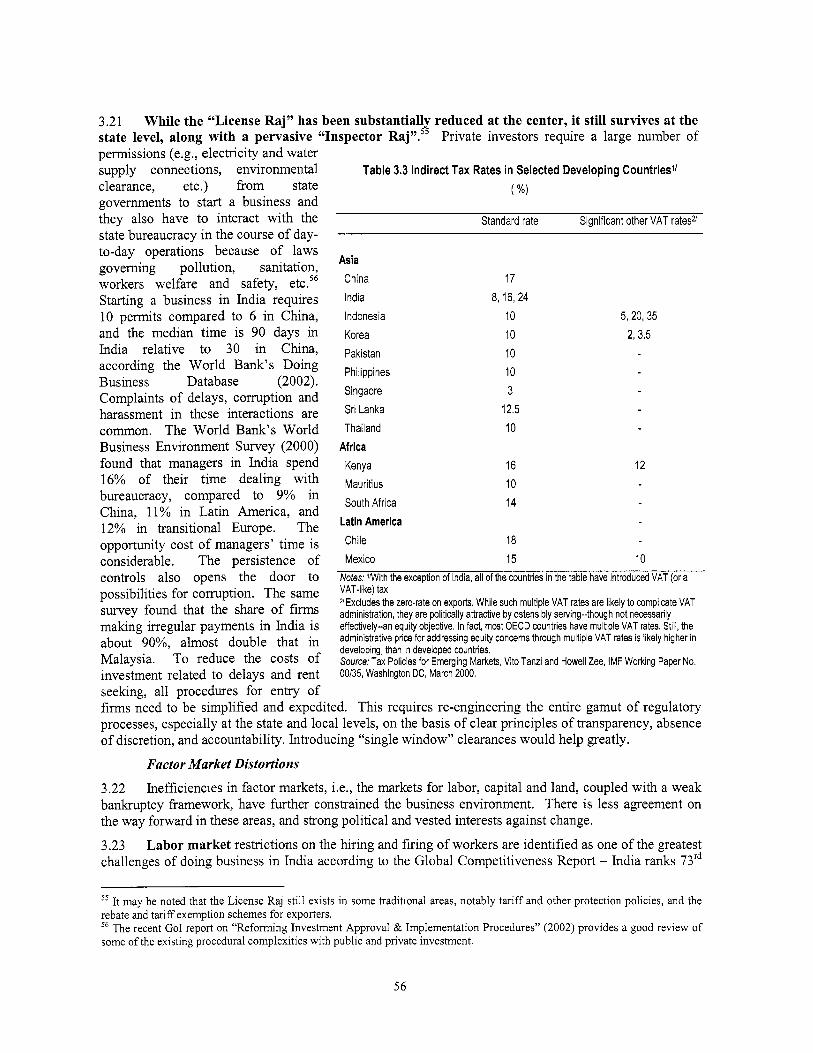
3.21 While the “License Raj” has been substantially reduced at the center, i t st i l l survives at the state level, along with a pervasive “Inspector Raj”.55 Private investors require a large number o f permissions (e.g., electricity and water supply connections, environmental clearance, etc.) f rom state governments to start a business and they also have to interact with the state bureaucracy in the course o f day- to-day operations because o f laws governing pollution, sanitation, workers welfare and safety, et^.^^ Starting a business in India requires 10 permits compared to 6 in China, and the median time i s 90 days in India relative to 30 in China, according the Wor ld Bank’s Doing
Complaints o f delays, corruption and harassment in these interactions are common. The Wor ld Bank’s Wor ld Business Environment Survey (2000) found that managers in India spend 16% o f their t ime dealing with bureaucracy, compared to 9% in China, 11% in Lat in America, and 12% in transitional Europe. The opportunity cost o f managers’ time i s considerable. The persistence o f controls also opens the door to possibilities for corruption. The same survey found that the share o f f i r m s malung irregular payments in India i s about 90%, almost double that in Malaysia. To reduce the costs of investment related to delays and rent seeking, al l procedures for entry o f
Business Database (2002).
Table 3.3 Indirect Tax Rates in Selected Developing Countries” ( 9/01
Standard rate Significant other VAT ratesu
Asia China
India
Indonesia
Korea
Pakistan Philippines
Singaore
Sri Lanka
Thailand
Africa Kenya
Mauritius
South Africa
Latin America Chile
Mexico
17 8, 16, 24
10 10 10 10 3
12.5 10
16 10 14
18 15
5, 20, 35 2, 3.5
12
10 Notes: ’With the exception of India, all of the countries in the table have introduced VAT (or a VAT-like) tax ZExcludes the zero-rate on exports. While such multiple VAT rates are likely to complicate VAT administration, they are politically attractive by ostensibly serving-though not necessarily effectively-an equity objective. In fact, most OECD countries have multiple VAT rates. Still, the administrative price for addressing equity concerns through multiple VAT rates is likely higher in developing, than in developed countries. Source: Tax Policies for Emerging Markets, Vito Tanzi and Howell Zee, IMF Working Paper No. 00135, Washington DC, March 2000.
f i rms need t o be simplified and processes, especially at the state o f discretion, and accountability.
expedited. This requires re-engineering the entire gamut o f regulatory and local levels, on the basis o f clear principles o f transparency, absence Introducing “single window” clearances would help greatly.
Factor Market Distortions
3.22 Inefficiencies in factor markets, i.e., the markets for labor, capital and land, coupled with a weak bankruptcy framework, have further constrained the business environment. There i s less agreement on the way forward in these areas, and strong polit ical and vested interests against change.
3.23 Labor market restrictions on the hiring and firing o f workers are identified as one o f the greatest challenges o f doing business in India according to the Global Competitiveness Report - India ranks 731d
55 I t may be noted that the License Raj s t i l l exists in some traditional areas, notably tariff and other protection policies, and the rebate and tariff exemption schemes for exporters. 56 The recent Go1 report on “Reforming Investment Approval & Implementation Procedures” (2002) provides a good review o f some of the existing procedural complexities with public and private investment.
56
out o f 75 countries (China ranks 23rd). Employment in India’s registered f i r m s (those with more than 100 employees) i s highly protected. Any registered firm wishing to retrench labor can only do so with the permission o f the state government which i s rarely granted. These provisions make labor rationalization very difficult, discourage the hiring o f labor in the organized sector, and are especially onerous for labor- intensive sectors. They are obviously especially burdensome for exporters who have to compete with producers in other exporting countries. And they also explain the tendency o f FDI to focus o n the domestic market rather than use India as a base for exports. A Wor ld Bank-CII Survey (2002) found that the typical Indian firm reported having 17% more workers than it desired and that the labor laws and regulations were the main reason why it could not adjust t o the preferred level. The government has recently announced i t s intention to raise the limit for seeking permission from 100 to 300 workers. However, to become effective, this requires enactment o f legislative changes by Parliament (repealing Section 5B o f the Industrial Disputes Act), and the polit ical sensitivity o f such changes are likely to make them very di f f icul t to implement. W h i l e contract labor i s not subject to these retrenchment laws, the flexibility to hire contract workers i s l imited by the Contract Labor Ac t which allows the use o f contract labor only for activities o f a temporary nature. Amendments to the Contract Labor Act, currently being considered by GoI, would allow the use o f contract labor for a l l activities - not just for activities o f a temporary nature.
3.24 Various expert committees appointed by Go1 and the Reserve Bank o f India (RBI) have emphasized that the lack o f adequate, t imely financing on competitive terms acts as the single most important constraint to SME growth and d e ~ e l o p m e n t . ~ ~ Credit volume to small-scale units has declined since 1997, with the shrinkage o f the non-bank financial sector.58 Small players in India typically cannot access any financing for start-up from commercial sources. Even after they have reached a break-even point in their operations, profitable small businesses face shortages o f w o r h n g capital, investment funds and other types o f financing, that undermine their ability to grow. Interest rate caps on small loans lead to a rationing o f the supply o f credit fi-om formal financial institutions, so that even the better performing SMEs are often forced to resort to informal sources o f finance, resulting in interest rates that are significantly above the prime lending rate (PLR). High interest costs o f Indian small businesses affect their international competitiveness; the Wor ld Bank-CII Survey found that interest costs over sales were a quarter higher for Indian f i r m s than f i r m s in South East Asia.
3.25 In large part, the problem o f SME financing may be attributed to market inefficiency. Transaction costs related to S M E lending are high as most banks use the same lending technologies for small business financing as they do for large corporations, but they do not have the necessary credit information on SMEs to assess credit risk. Also, lenders’ perception o f the default risk associated with lending to small business i s high, as these f i r m s often lack collateral that would secure loans. Problems in using land as collateral (lack o f updated landproperty records and the uncertainty surrounding ownership), the non- recognition by lenders o f other types o f collateral, diff iculty in collateral enforcement and loan recovery, and a bankruptcy framework that does not allow for the easy exit o f troubled f i rms, further dnve up the risk o f default.
3.26 T o improve the efficiency o f financial markets for SMEs, Go1 needs to remove interest rate caps on small loans; facilitate the establishment o f well-functioning credit information bureaudcredit rating agencies for small borrowers; introduce legislative changes in mortgage registration to make the process more customer friendly; update land and property records for small loans; simplify the legal framework
’’ See, for example, the Report of the Abid Hussain Committee on Small Enterprises ( 1 997), the Interim Report of the SP Gupta Study Group on Development of Small Enterprises (2000), and the Report of the SL Kapur H igh Level Credit Committee on SMEs (1998). 58 Public sector banks’ lending to small scale f i rms has declined from 2.5% o f GDP in 1997198 to 2.2% in 2001/02, with total lending rising only 30% over the period. However, private banks’ lending to the sector has grown 50% over the period, and foreign banks’ lending has more than doubled (from a small base), perhaps reflecting their ability to evaluate borrowers and earn reasonable retums in the sector.
57

for collateral enforcemendloan recovery by introducing alternate, out o f court, methods o f dispute resolution between creditors and debtors (the recently enacted L a w on Securitization, Reconstruction o f Financial Assets and Enforcement o f Security Interest, which allows for the out o f court settlement o f bad loans, should be extended to small loans); promote collateral substitutes, as wel l as the use o f peer group security in providing and pricing loans to SMEs; and strengthen the bankruptcy framework to facilitate the easy exit o f small f i rms, given their relatively high mortality rate. At the same time, banks should make efforts to introduce new technologies (e.g., credit scoring) for S M E credit and also to train and motivate branch managers to provide loans to commercially viable SMEs.
3.27 Problems with the use and transfer o f land also critically affect the performance o f larger f i rms . Indeed, some 90% o f land parcels in India are reportedly subject to disputes over ownership, which take decades to settle in court. Furthermore, obsolete tenancy and rent control laws keep a large part o f urban real estate o f f the market. The freezing o f rents at unrealistically l o w levels in Mumbai, for instance, has raised rents for new properties to phenomenal levels while keeping rents for o ld but desirable properties very low. Practices such as this hamper the growth o f domestic retail trade and the construction sector by making it very diff icult for new players to enter. A report on “India’s Growth Imperative” by the McKinsey Global Institute (2001) argues that land market distortions account for about 1.3% o f lost growth per year. The central government has already abolished the Urban Land Ceiling A c t which made changes in land use very difficult; however, only a few states have repealed their corresponding Urban Land Ceiling Acts, and this should be extended to al l states.
3.28 Outdated bankruptcy procedures and ineffective laws have, in the past, led to inefficiencies in - . -
the system, making industrial restructuring almost impossible. Recent estimates show that i t i s entirely common for proceedings to take more than two years, and over 60% o f liquidation cases before the High Courts have been in process for more than 10 years. N o t surprisingly, when loolung at the share o f f i r m s that go bankrupt, India has a much lower share (0.04%) than other emerging markets, such as Thailand (Figure 3.3).
3.29 The recently enacted Amendments to the Companies Ac t
Figure 3.3. Bankruptcies as a Share of Total Firms
Percent
4 1
U S A Hungary France Czeoh Turkey Chile Thailand India Republic
Source: World Bank-CII (2002)
(in 2002) should help improve the bankruptcy framework. The Amendment stipulates the abolition o f the Bureau o f Industrial and Financial Restructuring (BIFR), and the creation o f a new umbrella body -- the National Company L a w Tribunal (NCLT) -- that will henceforth perform the tasks o f restructuring, amalgamating and winding up companies (tasks hitherto performed by the high courts and district courts), and the revivalhehabilitation o f sick companies (a task hitherto assigned to BIFR). Under the new framework, courts will no longer have any powers in respect o f mergers and liquidationlwinding up, and this should help expedite the process o f restructuringAiquidating sick companies. However, repeal o f the Sick Industries Companies Ac t i s essential for this new bankruptcy framework to become effective. The effectiveness o f the new framework will also depend to some extent on the pace o f labor market reforms, since the successful winding up o f companies may be hampered by problems in retrenching workers. The recently passed law on the enforcement o f creditors’ rights should help the process o f industrial restructuring, unlockmg the resources tied up in non-performing enterprises for more productive use, but to help the restructuring o f small f i rms, the law needs to be extended to cover the small scale sector.
58

Infrastructure Bottlenecks
3.30 Severe shortfalls in capacity, poor quality and high costs o f key infrastructure continue to constrain Indian b u s i n e s ~ e s . ~ ~ The most important and diff icult area i s power sector reform.
3.31 Access to reliable power at reasonable costs i s a prime concern for most Indian businesses. Industry surveys have found that acute power shortfalls, unscheduled power cuts (i.e., unreliable supply), the erratic quality o f power supply (low voltage coupled with fluctuations), delays and informal payments required to obtain new connections, and very high industrial energy costs, present major constraints to Indian industry, with serious implications for overall industry performance and competitiveness. India- wide, the shortfall in 2001/02 was estimated at 7.5% for energy and 13% for peak demand, with substantial variation across states in the availability and reliability o f supply. Firms in Karnataka are reported to face, o n average, daily power cuts o f 2.4 hours, compared to 6.6 hours (mostly unscheduled cuts) faced by their counterparts in Haryana (TEN, 2000).
3.32 Unscheduled power cuts impose substantial costs on f i rms . Average industrial production losses per unit outage are reported at Rs.5 and Rs.22 for f i r m s in Karnataka and Haryana, respectively (TEN, 2000).60 Production losses due to outages are estimated at about 7.6% and 7.9% o f the production costs for high tension (larger f irms) and l o w tension (smaller f irms) industries, respectively, in Haryana, and a higher proportion o f 12.4% and 15.3% in the case o f Karnataka. Some 40% o f the industries surveyed in Andhra Pradesh report damage to equipment due to the poor quality o f power and the damage i s much more costly for industries with sensitive equipment, and where process and quality i s heavily dependent on motor speed.
3.33 N o t only does industry receive irregular and l o w quality power, but also, it i s charged tariffs much above the cost o f supply. M u c h o f this i s due to cross-subsidization o f power tariffs by state governments and widespread power theft that i s euphemistically referred to as “transmission and distribution losses”. In most states, polit ical factors have dictated that agricultural consumers pay l itt le or nothing for the power that they consume, and households, too, pay relatively l i tt le and, often connive with the electricity departments to draw much more power than what i s billed. Industry ends up paying an average tar i f f o f Rs.3.81kWh (as against an average tar i f f o f Rs.2.39ikW for a l l categories) and an average cost o f public power supply o f Rs.3.50kwh. Industrial tariffs for high tension industries in India are between 8-9 centskWh, among the highest in the world, as compared to 8 cents in Argentina, 7 cents in Bolivia, 6 cents in Brazi l and Thailand, and 3-4 cents in China. Typical rates in Western Europe are in the range o f 6-7 centslkwh.
59 T h i s section focuses on infrastructure bottlenecks that are in most critical need o f being addressed in order to improve the business environment. One sector that i s not covered i s telecommunications, mainly because considerable progress has been made with reforms and most business surveys report that Indian f irms are reasonably satisfied with the country’s telecommunications infrastructure. The challenge n o w is to improve rural telephone-density and further improve overall access rates to communication services. 6o The wide difference between the two states is because the average production cost for industries i s higher in Kamataka compared to Haryana, and firms in Haryana rely more heavily on self-generation.
59
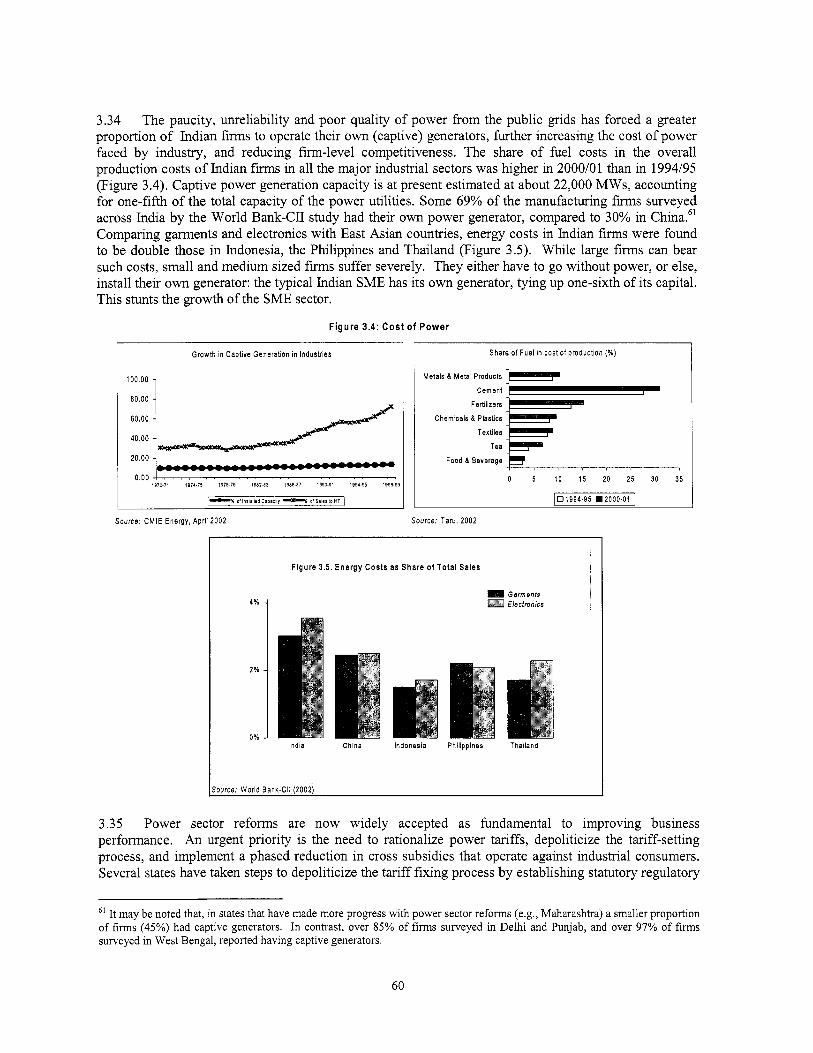
3.34 The paucity, unreliability and poor quality o f power f rom the public grids has forced a greater proportion o f Indian f i r m s to operate their own (captive) generators, further increasing the cost o f power faced by industry, and reducing firm-level competitiveness. The share o f fuel costs in the overall production costs o f Indian f i r m s in al l the major industrial sectors was higher in 2000/01 than in 1994/95 (Figure 3.4). Captive power generation capacity i s at present estimated at about 22,000 MWs, accounting for one-fifth o f the total capacity o f the power utilities. Some 69% o f the manufacturing f i r m s surveyed across India by the Wor ld Bank-CII study had their own power generator, compared to 30% in China.61 Comparing garments and electronics with East Asian countries, energy costs in Indian f i r m s were found to be double those in Indonesia, the Philippines and Thailand (Figure 3.5). While large f i r m s can bear such costs, small and medium sized f i r m s suffer severely. They either have to go without power, or else, install their own generator: the typical Indian SME has i t s own generator, tying up one-sixth o f i t s capital. This stunts the growth o f the SME sector.
Figure 3.4: Cost of Power
Growth in Captive Generation in Industries
100.00 , 80.00 -
60.00 -
40.00 -
20.00
1070.71 1814.75 1976-73 1382-83 1986-81 1390-31 1934.95 1938.11
Source: CMlE Energy, April 2002
Share of Fuel in cost of production (%)
Metals & Metal Products
Cement
Fertilizers
Chemicals 8 Plastics
Textiles
Tea
Food 8 Beverage
0 5 10 1 5 20 25 30 35
0 1 9 9 4 - 9 5 .ZOO041
Source: Taru, 2002
F i g u r e 3.5. E n e r g y Costs as Share of Total Sales
Garments Electronics
India China Indonesia Philippines Thailand
ISource World Bank-Cll (20021
3.35 Power sector reforms are n o w widely accepted as fundamental to improving business performance. An urgent priority i s the need to rationalize power tariffs, depoliticize the tariff-setting process, and implement a phased reduction in cross subsidies that operate against industrial consumers. Several states have taken steps to depoliticize the tar i f f fixing process by establishing statutory regulatory
61 I t may be noted that, in states that have made more progress with power sector reforms (e.g., Maharashtra) a smaller proportion o f f i r m s (45%) had captive generators. In contrast, over 85% o f f i r m s surveyed in Delhi and Punjab, and over 97% o f f i r m s surveyed in West Bengal, reported having captive generators.
60

authorities, and others should fo l low suit. Also, states such as Andhra Pradesh and Kamataka have introduced price incentive schemes to encourage industry to shift to the grid; in i t ia l results for Andhra Pradesh are encouraging with about 22% increase in demand during 2003, in response to the price incentives. Time-of-day tariffs need to be introduced for industries with peak and off-peak rates. T o minimize the impact o f financial losses to the power utilities, cost recovery needs to be enhanced through tariffs charged to agriculture and residential consumers. Tar i f f rationalization should be accompanied by reforms to improve the reliability and quality o f power supply through dedicated feeders for industries.
3.36 The above measures must be accompanied by steps to encourage greater private investment in the power sector, hitherto constrained by the poor credibility and financial viabil ity o f the sector. K e y reform measures required include improvements in the financial and operational performance o f the SEBs, and in distributional efficiency through commercialization and privatization. The strategy for privatizing distribution should consider focusing o n privatizing the relatively commercially viable segments o f the network and, in parallel, developing altemate strategies for improving services and targeting subsidies in rural areas. Targeting a broader range o f potential investors and actively mitigating the perceived pol icy and regulatory r isks will be key to the successful privatization o f the distribution business. Trading by industries with self generation, along with other power suppliers, should be encouraged by providing open access to the transmission and distribution networks in a phased manner along with the elimination of cross subsidies during an agreed time frame.
3.37 Since power sector reform i s primarily the responsibility o f the states, alleviating bottlenecks in this sector requires the full commitment o f state govemments. The central govemment can play a supportive role by introducing legislation to foster reforms to encourage private sector involvement. In this context, the newly passed Electricity A c t 2003 should play a positive facilitating role, through for example, i t s provisions for moving to open access, the removal o f entry barriers for new generation, delicensing o f off-grid supply in rural areas, trading for distribution licenses, antitheft, and deepening o f regulatory reforms. The new legislation effectively empowers Indian states to accelerate power sector reforms in the direction o f greater competition, better governance and private sector investment. However many implementation details remain to be decided, and the Act’s ultimate success will depend on action at the state level. As noted in Part 11.1, the central govemment has also introduces a scheme for providing financial assistance to states willing to adopt a program o f reforms in the power sector. More critical, however, are l ikely to be continuing Go1 efforts to maintain a hard budget constraint for state- level utilities, including through rigorous policies on payments to central generation and transmission utilities.
3.3 8 Ensuring speedy, reliable, door-to-door transport services i s also critical t o improving industrial performance. India has one o f the most extensive transport systems in the world. But the sector suffers f rom severe capacity and quality constraints. Whi le notable progress has been made with the implementation o f the National Highways Development Project, India currently has n o interstate expressways linkmg the major economic centers, and only 3,000 k m s o f four-lane highways, compared to China, which has built 25,000 k m s o f four to six lane, access-controlled, expressways over the last 10 years. Poor riding quality and congestion result in truck and bus speeds o n Indian highways that average 30-40 km per hour, about half the expected averages. Go1 and some states are implementing major highway upgrading programs, with the 4-laning o f 13,000 km national highways being the most notable. In addition, the Tenth Plan proposes a number o f road upgrading projects totaling 10,000 km, and recognizes the need to start investing soon in a program o f access controlled expressways to provide faster and safer transport in high-volume corridors. Meeting the Tenth Plan targets will require a significant increase in funding from the private sector, which has hitherto been limited. Although private financing o f transport infrastructure has increased considerably in recent years, i t can realistically be expected to fund only a small fraction o f sector investment. In the short to medium term, much can be gained through greater efforts to strengthen the policy, regulatory and legal framework, so as to reduce uncertainties arising from political interference and weak contract enforcement, which have inhibited
61
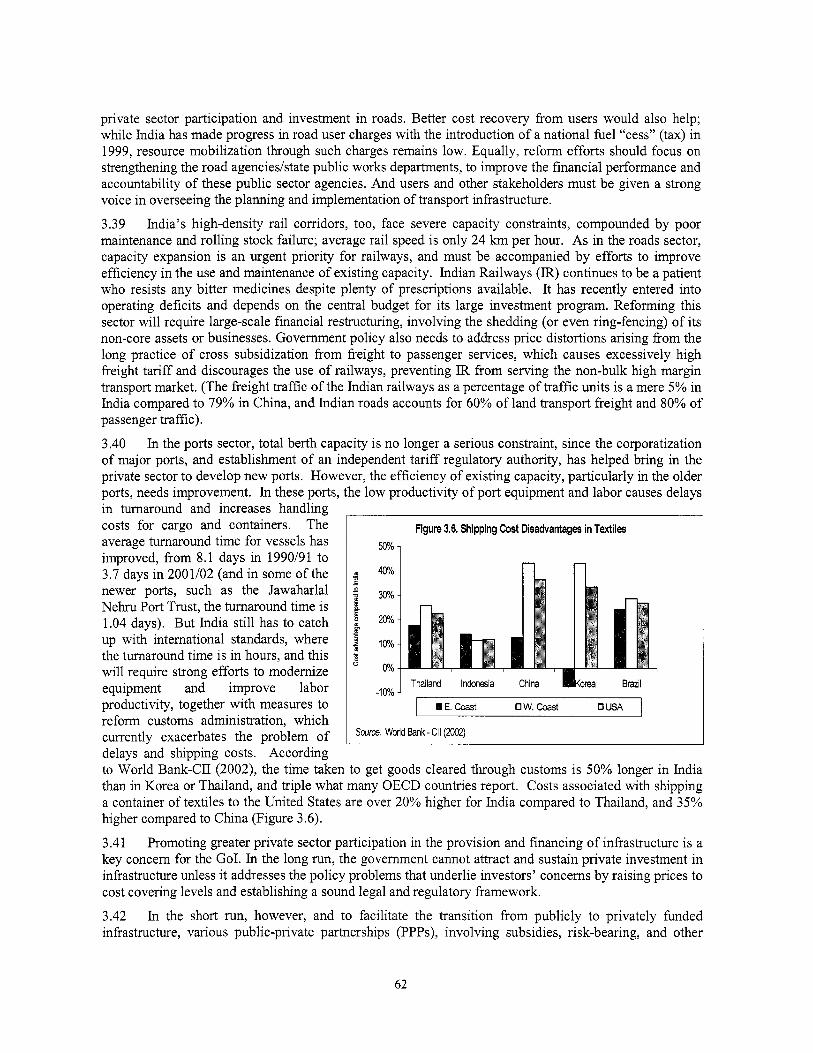
private sector participation and investment in roads. Better cost recovery f rom users would also help; while India has made progress in road user charges with the introduction o f a national fuel “cess” (tax) in 1999, resource mobilization through such charges remains low. Equally, reform efforts should focus on strengthening the road agenciedstate public works departments, to improve the financial performance and accountability o f these public sector agencies. And users and other stakeholders must be given a strong voice in overseeing the planning and implementation o f transport infrastructure.
3.39 India’s high-density ra i l corridors, too, face severe capacity constraints, compounded by poor maintenance and rol l ing stock failure; average ra i l speed i s only 24 km per hour. As in the roads sector, capacity expansion i s an urgent priority for railways, and must be accompanied by efforts to improve efficiency in the use and maintenance o f existing capacity. Indian Railways (IR) continues to be a patient who resists any bitter medicines despite plenty o f prescriptions available. I t has recently entered into operating deficits and depends on the central budget for i t s large investment program. Reforming this sector wi l l require large-scale financial restructuring, involving the shedding (or even ring-fencing) o f i t s non-core assets or businesses. Government policy also needs to address price distortions arising f rom the long practice o f cross subsidization f rom freight to passenger services, which causes excessively high freight tar i f f and discourages the use o f railways, preventing IR from serving the non-bulk high margin transport market. (The freight traffic o f the Indian railways as a percentage o f traffic un i ts i s a mere 5% in India compared to 79% in China, and Indian roads accounts for 60% o f land transport freight and 80% o f passenger traffic).
3.40 In the ports sector, total berth capacity i s n o longer a serious constraint, since the corporatization o f major ports, and establishment o f an independent tar i f f regulatory authority, has helped bring in the private sector to develop new ports. However, the efficiency o f existing capacity, particularly in the older ports, needs improvement. In these ports, the l o w productivity o f port equipment and labor causes delays in turnaround and increases handling costs for cargo and containers. The average turnaround time for vessels has improved, f rom 8.1 days in 1990/91 to 3.7 days in 2001/02 (and in some o f the newer ports, such as the Jawaharlal Nehru Port Trust, the turnaround time i s 1.04 days). But India s t i l l has to catch up with international standards, where the turnaround time i s in hours, and this wil l require strong efforts to modernize equipment and improve labor productivity, together with measures to reform customs administration, which currently exacerbates the problem o f delays and shipping costs. According
Figure 3.6. Shipping Cost Disadvantages in Textiles
m 40% n n
- 1 w o J
Ill E. Coast 0W.COaSt 0 USA
Source: World Bank- CII (2202)
to Wor ld Bank-CII (2002), the time taken to get goods cleared through customs i s 50% longer in India than in Korea or Thailand, and triple what many OECD countries report. Costs associated with shipping a container o f textiles to the United States are over 20% higher for India compared to Thailand, and 35% higher compared to China (Figure 3.6).
3.41 Promoting greater private sector participation in the provision and financing o f infrastructure i s a key concern for the GoI. In the long run, the government cannot attract and sustain private investment in infrastructure unless i t addresses the pol icy problems that underlie investors’ concerns by raising prices to cost covering levels and establishing a sound legal and regulatory framework.
3.42 In the short run, however, and to facilitate the transition f rom publ ic ly to privately funded infrastructure, various public-private partnerships (PPPs), involv ing subsidies, risk-bearing, and other
62
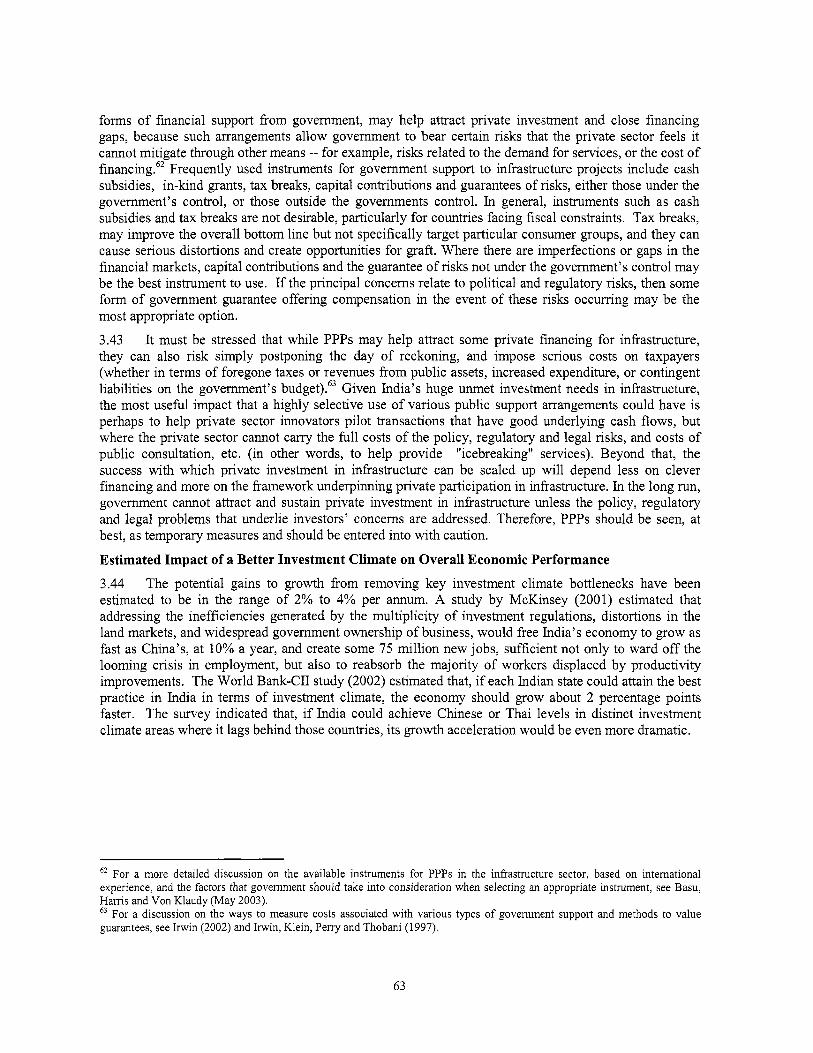
forms o f financial support f rom government, may help attract private investment and close financing gaps, because such arrangements allow government to bear certain r i sks that the private sector feels it cannot mitigate through other means -- for example, r isks related to the demand for services, or the cost o f financing.62 Frequently used instruments for government support to infrastructure projects include cash subsidies, in-kmd grants, tax breaks, capital contributions and guarantees o f risks, either those under the government’s control, or those outside the governments control. In general, instruments such as cash subsidies and tax breaks are not desirable, particularly for countries facing fiscal constraints. Tax breaks, may improve the overall bottom line but not specifically target particular consumer groups, and they can cause serious distortions and create opportunities for graft. Where there are imperfections or gaps in the financial markets, capital contributions and the guarantee o f r isks not under the government’s control may be the best instrument to use. If the principal concerns relate to polit ical and regulatory risks, then some form o f government guarantee offering compensation in the event o f these r isks occurring may be the most appropriate option.
3.43 I t must be stressed that while PPPs may help attract some private financing for infrastructure, they can also risk simply postponing the day o f reckoning, and impose serious costs on taxpayers (whether in terms o f foregone taxes or revenues f rom public assets, increased expenditure, or contingent liabilities on the government’s budget).63 Given India’s huge unmet investment needs in infrastructure, the most useful impact that a highly selective use o f various public support arrangements could have i s perhaps to help private sector innovators pi lot transactions that have good underlying cash flows, but where the private sector cannot carry the full costs o f the policy, regulatory and legal risks, and costs o f public consultation, etc. (in other words, to help provide “icebreaking” services). Beyond that, the success with which private investment in infrastructure can be scaled up wil l depend less on clever financing and more o n the framework underpinning private participation in infrastructure. In the long run, government cannot attract and sustain private investment in infrastructure unless the policy, regulatory and legal problems that underlie investors’ concerns are addressed. Therefore, PPPs should be seen, at best, as temporary measures and should be entered into with caution.
Estimated Impact of a Better Investment Climate on Overall Economic Performance
3.44 The potential gains to growth f rom removing key investment climate bottlenecks have been estimated to be in the range o f 2% to 4% per annum. A study by McKinsey (2001) estimated that addressing the inefficiencies generated by the multiplicity o f investment regulations, distortions in the land markets, and widespread government ownership o f business, would free India’s economy to grow as fast as China’s, at 10% a year, and create some 75 mi l l ion new jobs, sufficient not only to ward o f f the looming crisis in employment, but also to reabsorb the majority o f workers displaced by productivity improvements. The Wor ld Bank-CII study (2002) estimated that, if each Indian state could attain the best practice in India in terms o f investment climate, the economy should grow about 2 percentage points faster. The survey indicated that, if India could achieve Chinese or Thai levels in distinct investment climate areas where it lags behind those countries, i t s growth acceleration would be even more dramatic.
For a more detailed discussion on the available instruments for PPPs in the infrastructure sector, based on international experience, and the factors that government should take into consideration when selecting an appropriate instrument, see Basu, Harris and Von Klaudy (May 2003). 63 For a discussion on the ways to measure costs associated with various types o f government support and methods to value guarantees, see Irwin (2002) and Irwin, Klein, Perry and Thobani (1 997).
63
111.2: AGRICULTURE AND RURAL DEVELOPMENT Agriculture and the Rural Economy 3.45 The agricultural sector’s contribution to GDP has declined from about 35% in 1980/81 to 23% in 2001/02. Despite this, about 75% o f India’s poor are currently in rural areas and a large proportion o f the rural poor are dependent on agriculture for employment and as a major source o f livelihood. Analysis o f the N S S 55th round survey (1999/2000) shows that agricultural households64 comprise about 54% o f
households in rural areas. In some states, such as Rajasthan and Uttar Pradesh, apcu l tu ra l households comprise over 70% o f poor rural households. The majority o f cultivators are also small landholders. The large number o f poor agricultural households and their income vulnerability are major concerns among policy makers. These in turn have driven both agricultural policies (trade protection and private trade marketing controls) and public expenditures (investments and subsidies) in apcul ture. Improving agriculture’s performance, especially increasing foodgrain output to achieve self-sufficiency to meet i t s food security goals, has also been a major government priority.
3.46 According to the latest Census, about 235 mi l l ion people (58% o f the total labor force) were employed in the agricultural sector in India in 2001.66 Of serious concem i s the l o w productivity o f workers engaged in agriculture compared to those employed in the non-agricultural sector in most state^.^' This results f rom the large numbers o f workers tied to agriculture in almost a l l states, the slowing down o f agricultural growth, the shnkmg share o f agricultural GDP and l imi ted opportunities for employment in the rural non-farm sector. This in turn contributes to the high levels o f poverty in rural areas at the state level.
3.47 In view o f the high rates of poverty among agricultural households, the large concentration o f labor tied to apcul ture and the l o w productivity o f these workers, GoI’s National A p c u l t u r a l Policy and the Tenth Plan place high priority on raising agricultural productivity as a means to achieve more rapid agricultural growth and to reduce rural poverty. At the same time, it has also heightened government attention towards promoting the more rapid growth o f the rural non-farm sector. Promoting both agricultural and rural non-farm sector growth i s vital, because they are closely l inked due to the strong backward and forward linkages.@ Promoting rural non-farm sector growth would require improved access to basic infrastructure (roads, markets, electricity, water) and services (market information, credit, education). In opening greater employment opportunities in the rural non-farm sectors, this could create demand for agricultural labor, contributing to higher agricultural wages and incomes.
3.48 Over the last two decades, apcu l tu ra l growth rates have begun to fo l low a slowing trend, which will have dire consequences for rural areas and the rural poor in the longer t e r m if appropriate actions are not taken to reverse it. The growth slowdown can be traced to the continuing decline in productivity- enhancing investment by the government, which i s leading to the slowdown o f total factor productivity growth in the agricultural sector. Although most Go1 domestic trade restrictions were l i f ted in 2002, the possibility o f their re-imposition at any time continues to reduce private sector incentives to participate or invest in the apcul ture sector. In the future, therefore, improving agricultural performance wouldrequire
64These include households involved in cultivation and agricultural wage labor. 65 Based on the Planning Commission rural poverty line. 66 These include 128 mill ion cultivators and 107 mi l l ion agricultural laborers. In rural areas, dependence on the agricultural sector i s even greater. About 228 mi l l ion workers, or nearly three-quarters o f the rural population, were employed in the agricultural sector. 67 Average labor productivity i s measured by the sector GSDP divided by the number o f workers employed in the sector. In major states, excluding Punjab and Kerala, agricultural labor productivity on average amounts to about one quarter o f labor productivity in the non-agricultural sector. ‘* Forward linkages take the form o f the agricultural sector supplying products for downstream processing or direct consumption, agricultural surplus providing investment funds to the n o n - f m economy, and consumption b y agricultural household o f goods and services from the non-farm sector. Backward linkages take the form o f the non-farm sector stimulating growth in the agricultural sector by supplying inputs and investing in the agricultural sector (Lanjouw and Feder 2001, Haggblade et al. 2001).
64
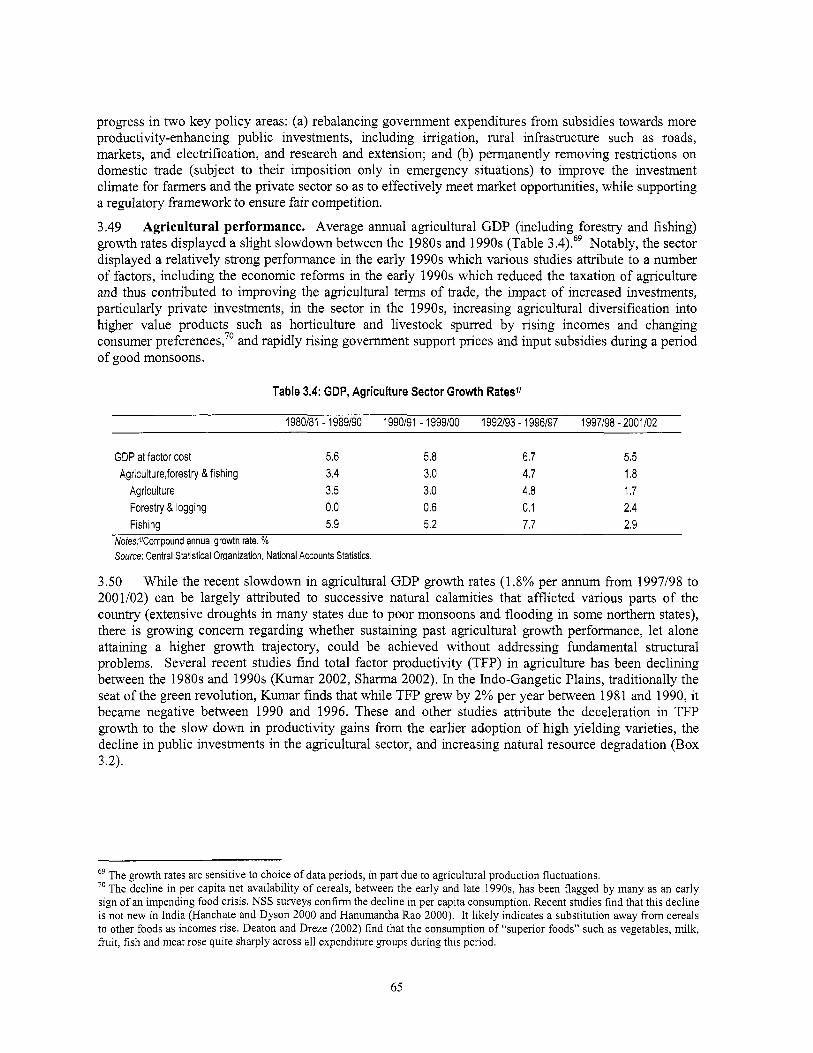
progress in two key pol icy areas: (a) rebalancing govemment expenditures f rom subsidies towards more productivity-enhancing public investments, including irrigation, rural infrastructure such as roads, markets, and electrification, and research and extension; and (b) permanently removing restrictions on domestic trade (subject to their imposition only in emergency situations) to improve the investment climate for farmers and the private sector so as to effectively meet market opportunities, while supporting a regulatory framework to ensure fair competition.
3.49 Agricultural performance. Average annual agricultural GDP (including forestry and fishing) growth rates displayed a slight slowdown between the 1980s and 1990s (Table 3.4).69 Notably, the sector displayed a relatively strong performance in the early 1990s which various studies attribute to a number o f factors, including the economic reforms in the early 1990s which reduced the taxation o f agriculture and thus contributed to improving the agricultural terms o f trade, the impact o f increased investments, particularly private investments, in the sector in the 1990s, increasing agricultural diversification into higher value products such as horticulture and livestock spurred by rising incomes and changing consumer preference^,^' and rapidly rising govemment support prices and input subsidies during a period o f good monsoons.
Table 3.4: GDP, Agriculture Sector Growth Rates”
1980181 - 1989190 1990/91 - I999100 1992/93 - 1996197 1997198 - 2001102
GDP at factor cost 5.6 5.8 6.7 5.5 Agriculture,forestry & fishing 3.4 3.0 4.7 1.8
Agriculture 3.5 3.0 4.8 1.7 Forestry & logging 0.0 0.6 0.1 2.4 Fishing 5.9 5.2 7.7 2.9
Nofes:”Compound annual growth rate. % Source: Central Statistical Organization, National Accounts Statistics.
3.50 Whi le the recent slowdown in apcu l tu ra l GDP growth rates (1.8% per annum from 1997/98 to 2001/02) can be largely attributed to successive natural calamities that afflicted various parts o f the country (extensive droughts in many states due to poor monsoons and flooding in some northem states), there i s growing concem regarding whether sustaining past agricultural growth performance, let alone attaining a higher growth trajectory, could be achieved without addressing fundamental structural problems. Several recent studies find total factor productivity (TFP) in agriculture has been declining between the 1980s and 1990s (Kumar 2002, Sharma 2002). In the Indo-Gangetic Plains, traditionally the seat o f the green revolution, Kumar finds that while TFP grew by 2% per year between 1981 and 1990, it became negative between 1990 and 1996. These and other studies attribute the deceleration in TFP growth to the slow down in productivity gains f rom the earlier adoption o f high yielding varieties, the decline in public investments in the agricultural sector, and increasing natural resource degradation (Box 3.2).
69 The growth rates are sensitive to choice of data periods, in part due to agricultural production fluctuations. ’ O The decline in per capita net availability o f cereals, between the early and late 199Os, has been flagged by many as an early s ign of an impending food crisis. NSS surveys confirm the decline in per capita consumption. Recent studies find that this decline i s not new in India (Hanchate and Dyson 2000 and Hanumantha Rao 2000). I t l ikely indicates a substitution away from cereals to other foods as incomes rise. Deaton and Dreze (2002) find that the consumption o f “superior foods” such as vegetables, milk, fruit, fish and meat rose quite sharply across all expenditure groups during this period.
65

Box 3.2: Damaging the Land As recently as 1999, the govemment estimated that nearly hal f o f the country’s 329 mi l l ion hectares o f soil could be categorized as degraded (Go1 1999). One study asserts that the majority o f Indian soil has been harmed, concluding that only 36% o f land area suffers no serious damage. They found that 5% faced l o w degradation (less than 15% yield loss), 11% was moderately degraded (15-33% yield loss), 43% was highly degraded (33-67% yield loss), and 5% was so damaged that the land became unusable. More importantly, about half o f the land under use for agriculture, forestry and pasture can be categorized as degraded. A household-level and plot-level study in Uttar Pradesh showed serious damage: waterlogging and salinization led to significant declines in paddy and wheat yields over a ten-year period (Joshi and Jha 1991). T h i s productivity loss leads to significant economic losses. A study from the mid-1990s estimated that agricultural output loss due to soil degradation amounts to about US$1.9 bi l l ion per year (Brandon and Hommann 1995). One researcher estimated that waterlogging and salinization caused annual cereal production loss amounting to about 5% o f agricultural GDP (Young 1993). Such economic losses represent short- run effects, but long-run impacts o f soil degradation in India, such as permanent damage, should also be considered. Dregne and Chou (1 992) found that human-induced water erosion led to irreversible soil productivity loss o f 20% or more in certain sections o f India.
driven by private sector investments, mainly in farm equipment, minor irrigation and
contrast, public investment systematically declined since the m i d - 1 9 8 0 ~ ; ~ ~ i ts share o f annual agricultural GCF decreasing from 44% in 1985186 to 23% in 2000101. This decline i s a major cause for concern because o f i t s potential
land improvements (Figure 3.7). By
negative impact on agricultural growth over the longer term. Gulati and Bathla (2002) estimate that a lo% decrease in public investments (including irrigation and power) leads to a 2.4% reduction per year
Figure 3.7: Gross Capital Formation in Agriculture and Allied Sectors, Rs. billion, 1993194
250 3
gj 150 z .: - loo E 50 2
4 200 d
ai
-
0
1960161 197Oii’l 1980181 I990191 2000101 --t Public -E+ Private +Total
Source: Ministry of Agriculture, Agricultural Statistics at a Glance 2002 Notes:*Quick Estimates
71 According to the Indian System o f National Accounts, the public capital formation statistics primarily comprise investments in major and medium irrigation schemes. Gulati and Bathla (2002) re-estimate public gross capital formation to include investments in power (Concept 11) and power plus investments made in agriculture and allied activities as defined under budgetary heads o f the govemment accounts (Concept 111). Under both concepts, public capital investments declined. ’* Gulati and Bathla (2002) also find that availability o f institutional credit and terms o f trade between agriculture and non- agriculture also has a positive and significant influence on private GCF.
66
etc). The bias towards subsidies also reduces resources for much-needed social investments and appropriate operations and maintenance o f critical rural infrastructure. Indian policymakers have questioned why India should reduce i t s agricultural subsidies, in view o f the large agricultural subsidies provided by developed countries such as the EU and US. These are issues that clearly need to be raised and addressed through i t s bilateral and multilateral negotiations (e.g., WTO). However, India’s reduction of agricultural subsidies i s n o longer purely an issue o f i t s fiscal costs and o f using i t s fiscal resources more efficiently. The extent to which these subsidies are eroding the core foundation for sustained agricultural growth over the longer term, due to inadvertent natural resource degradation, i s as or even more critical. The following sections elaborate further o n key sectoral issues.
Foodgrain (Rice and Wheat) Policy 3.53 GoI’s foodgrain policy rests on two major pillars: (a) to ensure farmers a reasonable income through government procurement at a minimum support price (MSP) for rice and wheat; and (b) to ensure adequate availability o f and improved access to foodgrains by consumers at reasonable prices through the distribution o f subsidized foodgrains and price stabilization through buffer stockmg operations. T o achieve this, Go1 created a public marketing system that parallels that o f the private sector. The Targeted Public Distribution System (TPDS), introduced in June 1997, aims to ensure access by the poor and other vulnerable groups to essential food commodities. The program supplies rice, wheat, and sugar nationally, and other commodities such as edible oils and coarse grains in some states, at subsided prices. The shift to the TPDS was a significant milestone in GoI’s food security strategy, as it targeted a larger share o f the foodgrain subsidy to the poor relative to the n ~ n - p o o r . ~ ~ T o support TPDS and price stabilization activities, trade restrictions on the private sector were enforced by Go1 and state governments. The Essential Commodities Act, 1955 empowers the Go1 and state govemments to enforce controls on movement, storage, exports and imports, and access to trade credit. Controls were enforced or l i fted depending on the severity o f supply shortfalls and price rises, thus eliminating private sector incentives for spatial and temporal arbitrage. In 2002, the Go1 finally lifted the licencing requirements and movement and storage restrictions o n private dealers. However, the potential for their re-imposition continues to discourage private investments in the foodgrain sector. Recognizing this, the Go1 i s considering the amendment o f the Essential Commodities Ac t to permanently remove these trade restrictions, with provisions for their enforcement only in emergency conditions. In 2003, restrictions on the use o f risk management instruments, specifically futures contracts, were also removed.
3.54 Steady increases in the minimum support price (MSP) for rice and wheat encouraged increased production, necessitating greater government procurement. However, strong polit ical pressure f rom states where the largest procurement have traditionally been made (i.e., Punjab, Haryana and Andhra Pradesh) stalled efforts by Go1 to contain increases in the MSP. Combined with the reduction in foodgrain off-take with the shift to TPDS and the downward trend in wor ld market prices, which l imi ted export possibilities, continued government procurement led to growing buffer stocks, which rose to over 60 mi l l ion metric tons in July 2002, compared to the norm o f 18 mi l l ion tons (Economic Survey 2002-03). Consequently the buffer stock component o f the food subsidy rose from 12.5% in 1997/98 to about 41.6% in 2001/02. The overhang o f burgeoning buffer stocks in turn exerted downward pressure o n open market prices, and combined with high MSPs necessitated even greater government procurement. In an effort t o reduce surplus stocks, the Go1 instituted several measures, including increasing the monthly allocations under TPDS for all households, lowering the issue price for above poverty l ine families, increased use o f foodgrains for welfare schemes and drought relief, open market sales at prices below FCI’s economic costs and subsidized exports. In the context o f high MSPs, these measures combined to raise the food subsidy bill further.
~
73 I t s predecessor, the Public Distribution System, by contrast was a general entitlement scheme, which was widely criticized for i ts failure to serve the population below the poverty line. I t was also criticized because it provided meager income and suffered from urban bias, leakage and diversion and deteriorating quality of grain supplied, and lack o f transparent procurement and delivery systems.
67

3.55 Recent analysis o f the impact o f the shift to TPDS indicates increased participation o f persons below the poverty l ine at the All India level and in most states (Deninger and Umali-Deninger, forthcoming). However, despite this improvement, many o f the poorest are s t i l l un-served. The most frequently cited reasons that households cite for not purchasing foodgrains f rom the TPDS are: “the i tem was not available in the ration shop”, “not having a ration card”, and “unsatisfactory quality.”
3.56 Recognizing the crisis created by mounting buffer stocks and food subsidies, Go1 established a high-level committee to develop proposals for a long-term foodgrain policy. The report o f the committee was released in 2002. The committee’s proposals to remove the rice levy and al l restrictions on foodgrain trade, and i t s activation only in emergency conditions, will improve incentives for the private sector. However, some o f the other proposals raise concems. The underlying principle o f the proposed pol icy towards maintaining self-sufficiency that also ties farmers to low-value rice and wheat production will come at the cost o f efficiency. The continued large public sector role envisioned in foodgrain markets will crowd out private sector participation. The proposal to set the Minimum Support Price (MSP) to cover the cash costs plus the returns to family labor, land and capital i s a positive step. In the longer term, however, fostering competitive markets would serve as a better avenue for ensuring remunerative returns to farmers. In this scenario, the M S P should be reduced to cover the cash cost only, which complemented by others schemes (e.g., employment schemes, TPDS) would serve as a safety net for farmers. Otherwise this implies that the government will continue to determine farm prices rather than the market. Finally the proposed reversion back to an untargeted public distribution scheme i s l ikely to bring back the earlier problems o f the PDS o f subsidies being captured by non-poor households and will l ikely result in an escalation o f food subsidies. Effectively targeted safety nets, such as the TPDS, would help protect the poor f rom price and income shocks, while drastic supply shocks would be mitigated by a cost-effective and well-managed price stabilization mechanism.
3.57 There i s broad based agreement in India that the existing foodgrain pol icy i s not sustainable but there i s l imited agreement on the way forward. Significant polit ical economy constraints, necessitating complex negotiations between the Go1 and states which traditionally benefited f rom large-scale procurement (i.e., Punjab, Andhra Pradesh and Havana), and the considerable inter-dependence among the various interventions (procurement, buffer stockmg and the TPDS), have compounded the complexity o f managing the reform process. Future progress will require diff icult decisions that will necessitate strong govemment commitment.
Input Policies
3.58 The government’s agricultural policy o f the last three decades has relied on subsidizing key inputs to promote more rapid agricultural production growth and ensure food security for i t s population. This policy i s recognized as a key factor in the rapid adoption o f high-yield varieties o f rice and wheat that were the cornerstones o f the green revolution in India in the 1970s and 1980s. There i s also broad recognition that the rapidly rising subsidy levels are fiscally unsustainable. Power and irrigation subsidies are a major cause o f the fiscal crises in many states, and with deteriorating state finance, are crowding out productivity-enhancing public investments such as rural infrastructure, irrigation, and technology upgrading. Power and water subsidies, to the extent that they encourage inefficient water use are also leading to salinity, water logging, and declining groundwater tables in many areas. Fertilizer subsidies, that are largely concentrated on urea, have distorted input use. These issues are elaborated below.
Fertilizer Policy 3.59 Fertilizer subsidies were introduced in the 1970s in response to the sharp rise in the prices o f o i l and feedstock o f the fertilizer industry, and have remained since then. Domestic producers o f urea are given a designated plant specific retention price, which i s essentially derived o n a cost-plus formula. The fertilizer subsidy given to the firm i s the difference between the retention price and the farm gate price o f fertilizer. Di-ammonium phosphate (DAP) production and muriate o f potash (MOP), which i s generally
68
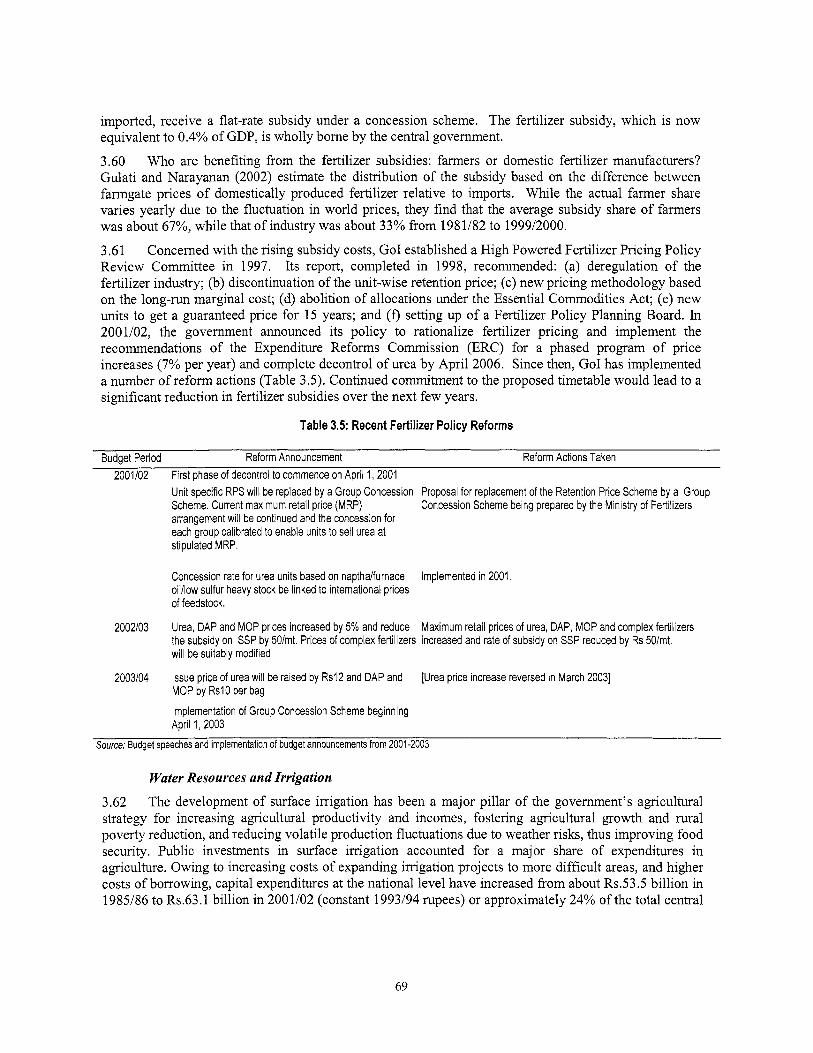
imported, receive a flat-rate subsidy under a concession scheme. The fertilizer subsidy, which i s now equivalent to 0.4% o f GDP, i s whol ly borne by the central government.
3.60 Who are benefiting f rom the fertilizer subsidies: farmers or domestic fertilizer manufacturers? Gulati and Narayanan (2002) estimate the distribution o f the subsidy based o n the difference between farmgate prices o f domestically produced fertilizer relative to imports. Whi le the actual farmer share varies yearly due to the fluctuation in world prices, they find that the average subsidy share o f farmers was about 67%, while that o f industry was about 33% from 1981/82 to 1999/2000.
3.61 Concerned with the rising subsidy costs, Go1 established a High Powered Fertilizer Pricing Policy Review Committee in 1997. I t s report, completed in 1998, recommended: (a) deregulation o f the fertilizer industry; (b) discontinuation of the unit-wise retention price; (c) new pricing methodology based on the long-run marginal cost; (d) abolition o f allocations under the Essential Commodities Act; (e) new u n i t s t o get a guaranteed price for 15 years; and (0 setting up o f a Fertilizer Policy Planning Board. In 2001/02, the government announced i t s pol icy to rationalize fertilizer pricing and implement the recommendations o f the Expenditure Reforms Commission (ERC) for a phased program o f price increases (7% per year) and complete decontrol o f urea by April 2006. Since then, Go1 has implemented a number o f reform actions (Table 3.5). Continued commitment to the proposed timetable would lead to a significant reduction in fertilizer subsidies over the next few years.
Table 3.5: Recent Fertilizer Policy Reforms
Budget Period Reform Announcement Reform Actions Taken 2001102 First phase of decontrol to commence on April 1, 2001
Unit specific RPS will be replaced by a Group Concession Proposal for replacement of the Retention Price Scheme by a Group Scheme. Current maximum retail price (MRP) arrangement will be continued and the concession for each group calibrated to enable units to sell urea at stipulated MRP.
Concession Scheme being prepared by the Ministry of Fertilizers
Concession rate for urea units based on napthalfurnace oililow sulfur heavy stock be linked to international prices of feedstock.
Urea, DAP and MOP prices increased by 5% and reduce Maximum retail prices of urea, DAP, MOP and complex fertilizers the subsidy on SSP by 501mt. Prices of complex fertilizers increased and rate of subsidy on SSP reduced by Rs 501mt. will be suitably modified
Issue price of urea will be raised by Rs12 and DAP and MOP by RslO per bag
Implementation of Group Concession Scheme beginning April 1,2003
Implemented in 2001
2002103
2003104 [Urea price increase reversed in March 20031
Source; Budget speeches and implementation of budget announcements from 2001-2003
Water Resources and Irrigation
3.62 The development o f surface irrigation has been a major pil lar o f the government’s agricultural strategy for increasing agricultural productivity and incomes, fostering agricultural growth and rural poverty reduction, and reducing volatile production fluctuations due to weather risks, thus improving food security. Public investments in surface irrigation accounted for a major share o f expenditures in agriculture. Owing to increasing costs o f expanding irrigation projects to more diff icult areas, and higher costs o f borrowing, capital expenditures at the national level have increased from about Rs.53.5 b i l l ion in 1985/86 to Rs.63.1 bi l l ion in 2001/02 (constant 1993194 rupees) or approximately 24% o f the total central
69
and state capital expenditure^.'^ These investments contributed to an All India increase in net surface irrigated area f rom 15.7 mi l l ion hectares in 1981/82 to 17.7 mi l l ion hectares in 1998/99.
3.63 Water resources management i s a state subject. A major challenge facing the water sector in al l states i s the increasing inter-sectoral competition-between agriculture, the largest consumer, and other sectors such as industry, drinking water and other users, for increasingly scarce water (surface and groundwater) resources. In some areas, drinking water supplies have reached crisis levels due to over- extraction o f groundwater. In surface irrigation (major, medium and minor), the sector i s suffering f rom a vicious circle resulting in the degeneration o f existing infrastructure adversely affecting agricultural productivity, whi le contributing to the fiscal crisis in many states.
3.64 Who benefits f rom surface irrigation and i t s associated subsidies? In general, small and marginal farmers account for the major proportion using canal irrigation. The distribution o f canal-irrigated land according to farm size, however, varies considerably by state. In 10 o f the 15 major states examined, small and marginal farmers accounted for ha l f o f the total canal irrigated area (World Bank 2003). Household level analysis o f the incidence o f canal irrigation subsidies in Rajasthan, however, finds that i t s distribution i s regressive, with a marginal farmer receiving about a tenth o f the subsidies received by a large farmer (Sur and Umali-Deininger 2003).
3.65 GoI’s national water policy (2002) aims to address the above constraints, by ensuring the long- term sustainable allocation and efficient use o f the country’s increasingly scarce water resources by promoting the adoption o f a comprehensive and integrated approach to planning and management o f water resources o n a river basin basis. It puts priority on rebalancing expenditures f rom the creation o f new assets to demand-driven investments in rehabilitation and maintenance o f infrastructure through greater participation of users in managing systems. It promotes cost recovery o f at least Operations and Maintenance (O&M) costs to ensure longer-term financial and fiscal sustainability o f operations. And it seeks to reorient water agencies towards greater attention to clients and the delivery o f good quality water services. Several states have began to adopt these reform measures in varying degrees, including Andhra Pradesh, Kamataka, Maharashtra, Rajasthan, Tami l Nadu, and Uttar Pradesh. As water i s under the purview o f state governments, the challenge in the future i s to encourage states to adopt the whole reform package.
3.66 As a start, Go1 recently introduced an incentive program to encourage cost recovery o f O&M costs under the Accelerated Benefits Program by providing central assistance for the completion o f “last mile” projects. During the Tenth plan period, Rs.95 b i l l ion have been allocated. So far, Rajasthan, Madhya Pradesh, Orissa, Maharashtra and Uttar Pradesh have availed o f these resources. In 2003, Go1 established a task force to look into the feasibility o f inter-linking rivers as a way o f transferring water f rom surplus to deficit areas.
Power Supply to Agriculture
3.67 In 1997/98, about 57% o f net irrigated area in India was irrigated using groundwater. The use o f electric pumps for groundwater irrigation has been critical for expanding irrigated area, which in turn contributed to the growth in agricultural productivity and aggregate output. I t s positive impact on agricultural productivity has been shown in various studies. Studies at the village level found that the use o f electric pumps for irrigation increased aggregate output growth by 2 percentage points (World Bank 2002i). A study on the cost of un-served energy found an estimated loss in crop production o f 3.1% o f agricultural GSDP in the state o f Haryana and 13.3% for Kamataka (Tata Energy Research Institute 2000).
74 The public sector gross capital formation statistics f rom the national accounts and the capital expenditures based on the govemment budget differ considerably. T h e irrigation capital expenditure estimates, which primarily make up the agriculture gross capital formation, exceed the reported agriculture gross capital formation figure, due to differences in definition.
70
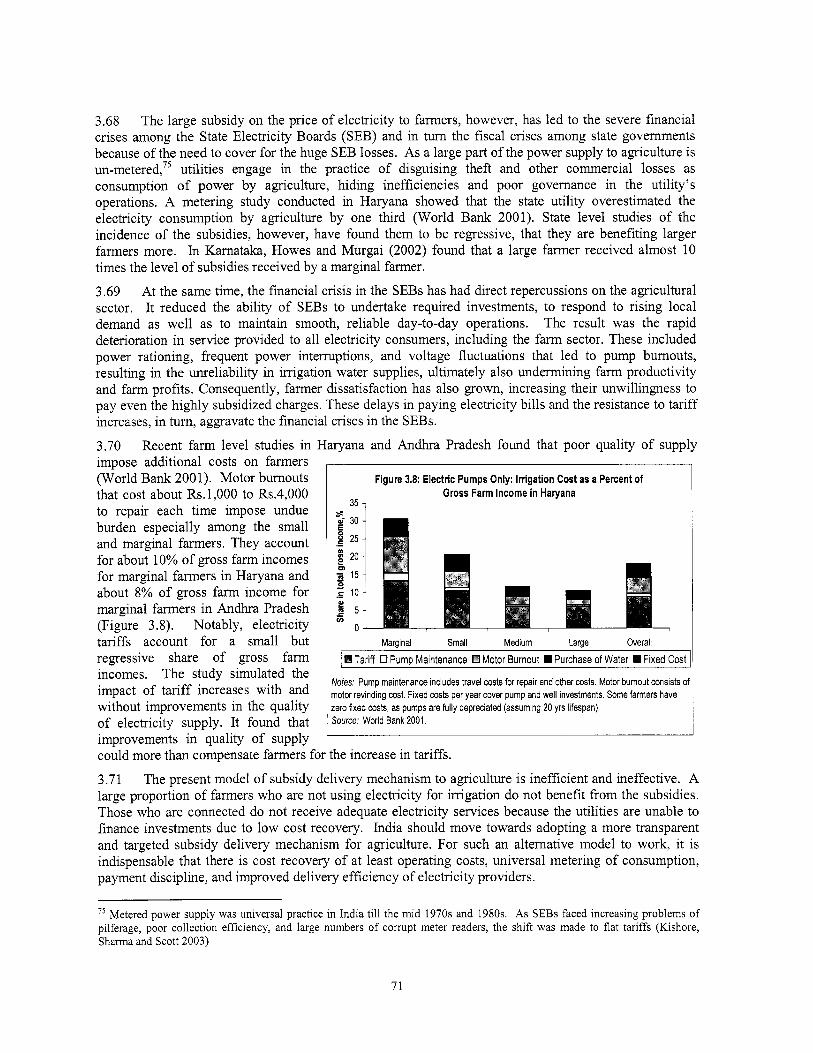
(World Bank 2001). Motor burnouts that cost about Rs.1,000 to Rs.4,000 to repair each time impose undue burden especially among the small and marginal farmers. They account for about 10% o f gross farm incomes for marginal farmers in Haryana and about 8% o f gross farm income for marginal farmers in Andhra Pradesh (Figure 3.8). Notably, electricity tariffs account for a small but regressive share o f gross farm incomes. The study simulated the impact o f tar i f f increases with and without improvements in the quality o f electricity supply. It found that improvements in quality o f supply
Figure 3.8: Electric Pumps Only: Irrigation Cost as a Percent of Gross Farm Income in Haryana
n r I 53 7
s d 30
g 25
20
1 15
s .-
U J - - .- c 10 c t 5 v)
0 Marginal Small Medium Large Overall
Nofes: Pump maintenance includes travel costs for repair and other costs. Motor bumout consists c motor revinding cost. Fixed costs per year cover pump and well investments. Some farmers have zero fixed costs, as pumps are fully depreciated (assuming 20 yrs lifespan). Source: World Bank 2001.
could more than compensate farmers for the increase in tariffs.
3.71 The present model o f subsidy delivery mechanism to agriculture i s inefficient and ineffective. A large proportion o f farmers who are not using electricity for irrigation do not benefit f rom the subsidies. Those who are connected do not receive adequate electricity services because the utilities are unable to finance investments due to l o w cost recovery. India should move towards adopting a more transparent and targeted subsidy delivery mechanism for agriculture. For such an alternative model to work, it i s indispensable that there i s cost recovery o f at least operating costs, universal metering o f consumption, payment discipline, and improved delivery efficiency o f electricity providers.
75 Metered power supply was universal practice in Ind ia til l the mid 1970s and 1980s. As SEBs faced increasing problems o f pilferage, poor collection efficiency, and large numbers o f corrupt meter readers, the shif t was made to f lat tari f fs (Kishore, Sharma and Scott 2003)
71
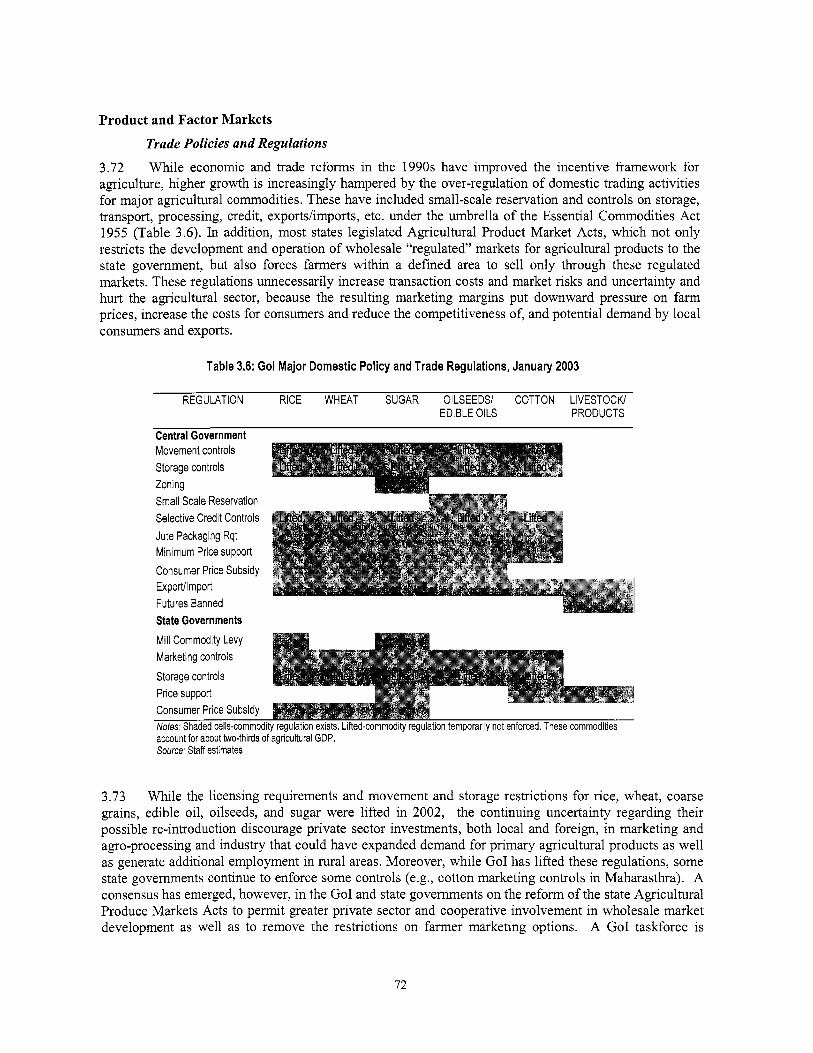
Product and Factor Markets Trade Policies and Regulations
3.72 Whi le economic and trade reforms in the 1990s have improved the incentive framework for agriculture, higher growth i s increasingly hampered by the over-regulation o f domestic trading activities for major agricultural commodities. These have included small-scale reservation and controls on storage, transport, processing, credit, exports/imports, etc. under the umbrella o f the Essential Commodities Ac t 1955 (Table 3.6). In addition, most states legislated Agricultural Product Market Acts, which not only restricts the development and operation o f wholesale “regulated” markets for agmultural products to the state government, but also forces farmers within a defined area to sell only through these regulated markets. These regulations unnecessarily increase transaction costs and market r isks and uncertainty and hurt the agricultural sector, because the resulting marketing margins put downward pressure on farm prices, increase the costs for consumers and reduce the competitiveness of, and potential demand by local consumers and exports.
Table 3.6: Go1 Major Domestic Policy and Trade Regulations, January 2003
REGULATION RICE WHEAT SUGAR OILSEEDS/ COTTON LIVESTOCW EDIBLE OILS PRODUCTS
Central Government Movement controls Storage controls Zoning Small Scale Reservation Selective Credit Controls Jute Packaging Rqt Minimum Price support Consumer Price Subsidy ExporVlmport Futures Banned State Governments Mill Commodity Levy Marketing controls Storage controls Price support Consumer Price Subsidy Notes Shaded cells-commodity requlation exists. Lifted-commodity requlation temporarilv not enforced. These commodities . - account for about two-thirds ofag&ultural GDP. Source: Staff estimates
3.73 W h i l e the licensing requirements and movement and storage restrictions for rice, wheat, coarse grains, edible oil, oilseeds, and sugar were lifted in 2002, the continuing uncertainty regarding their possible re-introduction discourage private sector investments, both local and foreign, in marketing and ago-processing and industry that could have expanded demand for primary agricultural products as wel l as generate additional employment in rural areas. Moreover, while Go1 has lifted these regulations, some state governments continue to enforce some controls (e.g., cotton marketing controls in Maharasthra). A consensus has emerged, however, in the Go1 and state governments o n the reform o f the state Agricultural Produce Markets Acts to permit greater private sector and cooperative involvement in wholesale market development as well as to remove the restrictions on farmer marketing options. A Go1 taskforce i s
72

currently drafting a model Act. So far, only Kamataka has made minor amendments to al low NDDB to set up a fruit and vegetable wholesale market and Punjab, Haryana, and Madhya Pradesh have allowed farmers under contract farming arrangements to by-pass the wholesale markets and sel l directly to the private buyer/contractor.
3.74 The reduction in manufacturing protection and exchange rate devaluations, which started in 199 1/92, substantially reduced the overall anti-agricultural bias o f the system (Blarel, Purse11 and Valdes 1999). After 1997, however, several major aspects of the extemal environment changed, which had important repercussions on India’s agricultural trade policies. The quantitative restrictions o n agricultural consumer goods imports were abolished in April 2001, at a time when world prices o f some major commodities produced by India (e.g., foodgrains, edible oils and oilseeds, cotton, and rubber) declined substantially, reinforcing local pressures for increased protection. At the same time, Indian policymakers developed a more pessimistic v iew of the prospects for wor ld agricultural trade liberalization, especially following the massive new subsidies introduced by the 2001 US Farm Bill. In response, Go1 has raised agricultural tariffs, so that they are now above the average non-apcul tural tariffs. In 2003/04 the un- weighted average rate (including the S A D tax) i s about 46.8% compared to about 30.7% for non- agricultural tariffs. But with few exceptions, India i s no longer explicitly taxing or using licensing, export bans or quotas as it did in the past to restrict agricultural exports and depress domestic prices.
3.75 Even though Indian agriculture as a whole remains internationally competitive, there are dangers for i t s efficient development, given the present direction of increasing trade protection. Experience world-wide, especially in agriculture, shows that high protection will sooner or later create high cost production, as land, labor and capital move to produce products protected by high barriers to imports, at the expense o f other products where pro-protection lobbies are less effective. Exporters and exports are typically major losers in this process, since they have to compete in wor ld markets without protection. In this perspective, i t would be in India’s interests to reduce i t s WTO agncultural tar i f f bindings to much lower levels, as a way of providing an extemal constraint on domestic lobbies pressing for high protection. As one o f the world’s largest apcu l tu ra l economies, India directly influences the world markets o f many agricultural products. If it follows open, predictable, non-interventionist trade policies i t can broaden these markets and reduce their instability, but if India intervenes excessively to protect i t s domestic market against instability in wor ld markets, i t i s large enough to further increase international instability, which in turn reinforces protection and intervention in other countries.
Access to Land
3.76 The agrarian structure in India has undergone significant structural transformation since the 1970s. The distribution o f land ownership has become less skewed (Figure 3.9).76 The trend towards landlessness also appears to have been arrested, with the percentage o f landless between 1982/83 and 1999/00 remaining at around 11%. The two critical factors driving this process have been the government’s land policies and demographic pressures (i.e., farm break-up through
Figure 3.9: Percentage Distribution of Number of Owned Holdings and Area Owned by Farm Size
60 n
Number of Holdings Number of Holdings Area Owned (71i72) Area Owned (99100) (71172) (99100)
0 Marginal 10 Small Semi-Medium
Nofes: Marginal -0.1 to less than 1 ha. Small - 1 to 2 ha. Semi-medium - 2 to 4 ha. to 10 ha. and large - 10 or more ha. Source: 1971/72 and 1992193 NSS surveys, as cited in Vyas 2002; 1990100 NSS survey- Klaus Deininger, mimeo
76 These figures do not account for land quality. T h e ceiling on land ownership varies across states and depends on the quality o f the land (e.g., dryland, irrigated land with one or two crops).
73
inheritance) though the contribution o f each o f these i s open to some debate.
3.77 Under the Constitution, state governments have the responsibility for land reform. All states completed the passing o f land reform legislations in 1972. These legislations focused on: (a) the abolition of intermediaries between the state and the cultivator; (b) the imposition o f land ownership ceilings and distribution o f surplus lands to the landless; (c) tenancy reforms to provide security o f tenure and regulate fair rent; and (d) consolidation o f holdings to prevent their further fragmentation. T h e land ceiling, the redistribution o f surplus land and the purchase o f land by tenants contributed to the changing land ownership structure in India. However, i t appeared to work more through encouraging land subdivision rather than the sale o f surplus land to the poor. Government purchases o f ceiling surplus land for re- distribution to the landless have been very l imi ted in virtually al l states. Today, because o f declining average farm sizes in al l states, there i s increased debate on the land ceiling legislation. Another area o f increasing concern i s ensuring legal recognition o f property rights o f women that have been neglected in earlier land legislations, for example, to redress gender inequalities in existing succession legislation for Hindu women as wel l as customary laws to provide inheritance o f property f rom other religious communities (Saxena 2000b) .~~
3.78 Tenancy restrictions vary by state and range f rom a total ban to almost complete freedom o f These laws, however, had unintended adverse impacts, including large-scale self-cultivation by
landlords or the adoption o f wage labor contracts. Appu (1997) estimated that tenancy legislations were associated with the eviction o f more than 100 mi l l ion tenants, which caused the rural poor to lose access to about 30% o f total operated area. Furthermore, the legislation has driven tenancy underground in most states, thereby reducing the scope for greater land access through rental markets and the tenant’s bargaining position and ability to enforce contract terms. These restrictions are also limiting the abil ity o f the increasing number o f marginal and small farmers to use their labor more productively, whether in farming by renting in land, or renting it out to take advantage o f higher-paying non-farm opportunities.
3.79 There i s a growing consensus, as reflected in a number o f recent government pol icy statements (e.g., National Agricultural Policy 2002, Tenth Five-Year Plan, Karnataka Agricultural Policy 1995) about the need to revisit and re-formulate current tenancy legislations. In considering tenancy reform, i t would be critical to draw lessons from experience in states that do not have any tenancy restrictions. More importantly, there are some states where the benefits f rom relaxing tenancy laws are l ikely to be higher than in others, due to the more advanced commercialization o f agriculture (and significant amounts of informal leasing) and stronger political commitment to reform. These states could serve as starting point for pilots and could y ie ld important insights for the pol icy debate and subsequently serve as a basis for broader implementation o f tenancy reform initiatives in other states.
3.80 In 1997/98, the Department o f Land Resources introduced a Centrally Sponsored Scheme to pi lot computerization o f land records in selected districts nationwide. I t s objective was to promote greater efficiency through faster information retrieval, transparency and cost reduction. Some states, such as Karnataka and Maharashtra, have not only scaled-up the program statewide, but have also implemented the program in partnership with the private sector. These initiatives reportedly have contributed to more efficient and rapid service as well as reduced opportunities for corruption through increased transparency. Over the longer-term, the focus would need to shift towards a more holistic approach to improving land administration systems at the state level. To be successful, the land administration system would need to meet several other key standards o f performance, including security, cost effectiveness, fairness, clarity, simplicity, and sustainability. States could draw o n considerable international experience in this area.
77 For example, in Haryana, Himachal Pradesh, Jammu and Kashmir, Punjab, Delhi and Uttar Pradesh, women can only hold limited tenancy rights on the land and on her death, the holding goes to the heirs o f the last male landowner and not to her heirs. ’’ Tenancy is totally banned in Bihar, Gujarat, Kamataka, Kerala, Manipur, Orissa, Rajasthan, Jammu and Kashmir and Uttar Pradesh, while there i s almost complete freedom o f rental in Assam, Punjab and Haryana.
74
Access to Rural Credit
3 .8 1 India has a wide network o f rural finance institutions (RFIs), but a large number o f the rural poor remain under-served or completely lef t out o f the formal financial system. There are over 30,000 commercial bank branches, over 14,000 regional rural banks (RRBs), and over 100,000 rural credit cooperatives (RCCs) in addition to several non-bank financial institutions. This translates to about 4,700 people served by each RFI outlet. However, the last available rural household survey (Reserve Bank o f India 1991) found that only about one-sixth o f rural households borrowed from formal R F I s . Non- institutional sources accounted for as high as 52-62% o f household outstanding debt. The rural non-farm sector also faces constraints to accessing finance. A recent study covering some 20 mi l l ion small-scale rural enterprises (in the unorganized sector) found that commercial banks reportedly meet merely 4% o f the credit needs o f this sector, and micro-finance sources provide another 3% o f their credit needs. Various estimates suggest that India’s rural poor rely almost entirely o n informal sources (money lenders, traders, commission agents, etc.) to meet their consumption credit needs, at annual interest rates ranging from 36% to 120% per annum.
3.82 A key factor constraining improved access to rural credit relates to inefficiencies in the formal rural finance institutions (RFIs). Several task forces/committees set up by Go1 have concluded that the weak financial health and poor performance o f a large number o f R F I s prevented them f rom performing their function o f providing credit to rural areas.” Most R R B s report losses, despite major government efforts to recapitalize and reform them. Cooperative banks in general, and RCCs in particular, are also performing poorly. This i s largely due to governance and management weaknesses, which in turn result f rom pervasive government control in response to an inappropriate legal framework and weak regulation. In addition, the existing legal/regulatory framework stifles innovation. Rural access to finance i s further constrained by the inefficiency o f rural financial markets, which i s characterized by interest rate “caps” requiring banks to price small loans within a range o f 2% above or below the prime lending rate. These caps have the perverse effect o f rationing credit to small rural borrowers, as banks prefer not to lend at a l l than lend at these rates, and small rural borrowers are forced to borrow f rom the informal sector, where money lenders charge exorbitant rates.
3.83 Bo th the govemment and R F I s can play an important role in devising market-based solutions to help the rural poor access a larger range o f financial services more easily, and o n less costly terms. Future priorities for the government should include: (a) liberalizing interest rates by removing the existing interest rate “caps” for small loans; (b) improving credit information o n rural households, by designating an agency that could take the lead in collecting and disseminating information o n micro borrowers; (c) facilitating the scaling-up and sustainability o f existing low-cost micro-finance models, such as the self-help group-bank linkage model as wel l as the Grameen bank replicators, that have been piloted in various parts o f India, particularly in the South, so as to make finance accessible to the poor; and (d) removing legal and regulatory obstacles to the development o f innovations that can help reduce the costs and risks associated with rural finance. The government should also a im to improve the performance o f the regional rural banks (RRBs) and rural credit cooperatives (RCCs) through enhancing regulatory oversight and supervision based on internationally accepted prudential norms; reducing government control and ownership, which, in the case o f RRBs, would require an amendment to the existing law, and in the case o f RCCs, would require states to adopt the recently enacted Mode l Cooperatives law; strengthening corporate governance; improving management and staff s lu l ls , particularly in the area o f credit decisions and risk assessmentlmanagement; and strengthening the legal framework to make it easier for R R B s and RCCs to recover small loans and to facilitate the use o f land as collateral.
’’ Report of the Task Force to Study the Cooperative Credit System and Suggest Measures for i t s Strengthening (Capoor et a1 1999); The Joint Committee on Revitalization Support to Cooperative Credit Structure (Purkayastha et a1 2001); Report o f the Expert Committee on Rural Credit (Vyas et a1 2001); Report o f the Working Group to Suggest Amendments in the Regional Rural Banks Act (Rao et a1 June 2002).
75

Enhancing the Productivity o f Public Investments
3.84 Increased emphasis on productivity-enhancing investments, such as agricultural research and extension, irrigation and rural infrastructure i s critical to enhancing agricultural productivity, rural non- farm sector growth and rural poverty reduction. Indeed, Fan, Hazel1 and Thorat (2000) estimate that a 10% increase in government expenditures on apcul tura l research and development, irrigation and rural roads contribute to a 2.6%, 0.4%, and 0.6% increase in total factor productivity and a 0.6%, 0.1% and 0.5% reduction in the rural poverty rate, respectively. For these sectors, however, h t u r e challenges l ie not only on the need to increase investments, but also on the immediate need to improve the quality o f public spending, particularly a greater focus on operations and maintenance, that also necessarily involves significant institutional reforms.
Agricultural Research and Extension
3.85 India’s public agricultural research and extension service i s one o f the largest in the world. Agricultural research i s primarily under the purview o f GoI. The public agricultural research system, overseen by the Indian Council o f Agricultural Research alone includes 184 institutes, centers, directorates, and special projects and programs and 29 state agricultural universities with a research staff o f over 30,000. The extension system i s primarily under the purview o f the state government, although I C A R also operates 261 Krishi Vigyan Kendras (farmer science centers) and 8 trainer training centers ( ICAR 2002). The public agricultural and extension services have played a pivotal role in promoting agricultural productivity and output growth, especially during the green revolution in the 1970s and 1980s. However, over time, their efficiency and cost effectiveness are increasingly called to question.
3.86 Agricultural research. During the Ninth Plan (1997/98-2001/02), the budget outlay for the public agricultural research system amounted to Rs 67 b i l l ion or 0.8% o f agricultural GDP. While there i s room for increasing budgetary allocations further, there i s also an urgent and immediate need to f i rst improve the effectiveness o f existing expenditures. Critical weaknesses o f the ICAR system include crop (bias towards rice and wheat, inadequate priority to post-harvest and gender-related and environmental conservation issues) and regional (inadequate emphasis to the needs o f rain-fed areas) imbalances in research priorities and resource allocations, multiplicity o f agencies at times leading to duplication, inadequacy o f collaborative multi-disciplinary research, weak interaction between researchers, extension workers, farmers and the private sector, excessive centralization o f planning and monitoring, and lack o f accountability for performance (Vaidyanathan 2002, I C A R 2002).
3.87 Private sector participation in agricultural research i s increasing in India, especially with the advent o f biotechnology and the adoption of recent key policies, including the Plant Variety Protection and Farmer’s Rights A c t (2002), National Seed Policy (2002) and National Seed Ac t (in draft) aimed at the protection o f intellectual property rights. However, private sector participation tends to focus more on higher value crops in better-endowed areas. Public sector research would need to increasingly address the problems o f poorer farmers in less-endowed regions (Hanumantha Rao 2003). Thus, what i s needed i s a more regionally differentiated research strategy. Greater consultation and coordination between the public and private sectors would also minimize duplication o f research efforts.
3.88 Agricultural extension. The agricultural extension systems at the state level, which are based o n the training and visit (T&V) system with i t s top-down, narrow crop-focused approach, has become outmoded and ineffective in meeting the changed needs o f farmers. In many states, tight fiscal constraints have led to the breakdown o f the state extension machinery (Hanumantha Rao 2003). At the same time there i s increasing participation o f the private sector in providing extension to farmers. Cooperatives, input suppliers, traders and private extension providers have also become an important source o f information for farmers. In the future, improving the effectiveness o f the public extension system would require reforms to make them more demand-driven and address the broad information and technical needs o f farmers, taking advantage of major advances in communication technologies and innovative delivery mechanisms. There i s also a need to build greater synergies between public and private extension efforts.
76

The Ministry o f Agriculture formulated a new “Policy Framework for Agricultural Extension” in 2002 whose key priorities include the adoption o f a farming systems approach through multi-agency (public and private) delivery systems, greater farmer participation (including women) in planning and implementation, increased use o f innovative information technologies, and initiatives for increased financial sustainability and cost effectiveness. The future challenge lies in promoting the adoption and implementation o f this policy at the state level.
Rural Roads
3.89 India’s rural road network faces two major problems. Firstly, about 40% o f the rural villages are not yet connected by all-weather roads to market centers or main road networks. These unconnected villages are often cut o f f from the outside wor ld for long periods during the monsoons. I t i s estimated that 20-30% of the agricultural, horticultural and forest produce get wasted due to lack o f roads to carry the produce to markets and processing centers. Secondly, much o f the rural road network i s poorly maintained, thus heavily deteriorated. Due to poor maintenance o f bridges and culverts, many existing rural roads become practically impassable during the rainy season.
3.90 Most government programs, however, suffer f rom the lack o f a carefully designed pol icy and institutional framework to ensure the sustainability o f these investments. For example, All India rural road maintenance requires about Rs.50 b i l l ion per annum, but only 20-30% i s generally available. Politicization o f investment decisions bias resource allocation towards investment, resulting in gross neglect o f maintenance and diversion o f maintenance funds to fresh construction. Consequently, this results in premature deterioration o f the road assets and a huge backlog o f maintenance. Moreover, the quality o f construction and maintenance work i s generally poor, resulting in overall l o w service l i fe o f the roads. The multiplicity o f agencies involved in roads further increases the complexity o f rural roads development and management.
3.91 The Go1 gives priority to improving the connectivity o f villages through several centrally sponsored programs. Rural roads generally received about 50% o f funding f rom various government employment generation programs. Go1 i s committed to providing all-weather roads to the remaining unconnected villages, involving upgrading or constructing about 1.1 mi l l ion lan o f rural roads at a cost o f about Rs.l.1 trill ion. In 2000, Go1 launched a national program called “Pradhan Mantr i Gram Sadak Yogna” (Prime Minister’s Rural Road Program), which aims to provide all-weather road access to al l habitations with over 1,000 people by 2003 and those with population o f over 500 by 2007.80
3.92 T o ensure greater consistency, the Ministry o f Rural Development (MoRD) should take leadership in the policy and institutional changes that are essential, as well as in financing, technology transfer, human resources development, and monitoring o f rural road development in different states. The Pradhan Mantr i Gram Sadak Yojana can be an important potential instrument for Go1 to influence state- level rural road sector reform. If the program i s properly structured and tied with pol icy reform commitment and outcomes, the program can provide a powerful incentive for change. Panchayat Raj bodies at district, b lock and village levels are expected to play an increasingly pivotal ro le in the construction and management o f rural roads. Community participation offers significant potential for mobil izing the support o f local communities in resource generation, land acquisition, and tailoring the rural road programs according to local needs.
The major source o f funding o f the program i s the Central Road Fund with revenues from an earmarked tax on diesel and gasoline. The allocation to rural roads amounted to Rs. 25 bi l l ion in 2001.
77
Rural Electrification
3.93 India's rural electrification program has in the past focused o n extending the grid supply to villages and remote areas, thereby resulting in coverage o f 85%" o f the villages and electrification o f 13 mi l l ion irrigation pumps. Access by rural households, however, remains l o w at 31% (All India household access rate 52%), and electricity-based economic activities in the electrified villages are minimal. About 77% o f the rural poor and 31% o f the urban poor remain unconnected. During the 1990s the rural electrification program slowed down, and the supply conditions in rural areas deteriorated. The pol icy o f various states has been to subsidize electricity prices for agnculture and domestic use rather than improving access to the consumers. Often the rural areas face extensive power cuts (scheduled and unscheduled), much more than what urban areas e~per ience. '~ About one tenth o f the households reported adverse impact o n their livelihood, and among the salarieclhusiness category households this was reported by one-forth o f the respondents (Tam 2001). Provision o f adequate and reliable grid supply i s increasingly becoming untenable given the financial and operational difficulties plaguing the power utilities.
3.94 The Government o f India plans to accelerate the electrification program and has set a target for coverage o f a l l the remaining 62,000 un-electrified villages by 2007 and 100% household connections by 2012. The remaining 18,000 remote villages are to be electrified by 2012 through the use o f non- conventional technologies. Funds have been made available under the Prime Minister's Gramadaya Yojna (PMGY). For strategic and implementation support, the Ministry o f Power has recently set up a high-level commission for renewable energy.
3.95 T o facilitate electricity service delivery for agriculture and rural development, a conducive policy environment will be required, including: (a) adequate incentives for the service provider, at the minimum the agriculture and residential tariffs should cover the operating costs; (b) early subsidy reform to bring subsidies to a fiscally sustainable levels and to enable more effective targeting o f poorer farmers and rural consumers; (c) encouraging cost effective technical designs o f rural networks and exploiting the scope for reducing the construction and operating cost o f rural electrification; (d) improving affordability o f connection charges through subsidized connection charges and financing o f the capital subsidy for the service provider through innovative models of subsidy provision; and (e) a supportive regulatory regime for rural supply. Decentralized generation should be incorporated into the rural energy service company model to augment power supply, provide voltage support and reduce transmission losses. These steps to reform the policy environment for rural electricity supply needs to be put in place in parallel with reforms aimed at more conventional privatization o f the commercially viable parts o f the sector.
In Ind ia village electrification i s defined as the existence o f at least one electricity connection within the revenue boundary o f a particular village. A village could j us t have a single connection to the house, o r an agriculture pump and i t wou ld be considered as electrified by the utility and planning agencies. 82 In Kerala one-fifth o f consumers surveyed in 2000 reported power cuts, 98% o f wh ich were f r o m the rura l areas. In Haryana (2000), one third rural households reported frequent power cuts, and in Andhra Pradesh (2001) 40% o f the rural households reported dissatisfaction.
78
PART IV: DEVELOPMENT PROSPECTS AND R I S K S
4.1 India’s economic growth over the past two decades has been one o f the world’s highest among large countries. In an outcome few might have expected in the late 1970s, growth jumped from an entrenched 3.5% per annum to close to 6% over the 1980s and 1990s, substantially reducing poverty. Although progress in improving other indicators o f living standards has been uneven, there has been real progress in some areas such as education. These are real achievements for India. Because around one third o f the world’s poor l ive in India, these are also achievements o f global significance.
4.2 Whi le India’s economic and social performance has been remarkable when compared to i t s own past, i t i s far behind that o f i t s main competitors in East Asia, in particular China. Poverty remains widespread, average incomes low, and social indicators poor. Moreover, a growing gulf has emerged between the richer and poorer states within the country. Accelerating development requires improving the delivery o f health, water and sanitation, and education, and setting India on a higher growth trajectory.
4.3 Many o f these goals are reflected in GoI’s Tenth Five-Year Plan for 2002/03 to 2006/07, which targets an average growth rate o f 8% per annum and rapid progress across a wide range o f living standards indicators. I f the trends o f the past decade continue, however, the goals o f the Tenth Plan (and the less ambitious Mi l len ium Development Goals) cannot be achieved. Growth has fallen in recent years, to below 6% per annum between 1997/98 and 2001/02, and below 5% in 2002/03. Loose fiscal policies and a slowdown in the pace o f structural reform have been l ikely contributors to this growth deceleration. Although a recovery may take place in 2003104, India’s current growth trajectory appears closer to 5%, than to the desired 8% per annum. And the rate o f progress in improving social indicators i s insufficient to meet GoI’s goals. A comprehensive set o f reforms, as discussed in this report and summarized in B o x 4.1, could unleash faster growth and improve delivery o f key services. The remainder o f Part lV discusses the outlook for the Indian economy under baseline and reform scenarios, and highlights the main fiscal, polit ical and external r isks for the Indian economy.
Outlook 4.4 Growth. The Tenth Plan period started with a further deceleration o f growth in fiscal year 2002103 to an estimated 4.4%, partly as a result o f external shocks or influences. Agncultural output declined by 3% due to flooding in some areas and drought in others. Industrial and services output growth remained above 6%, despite depressed global demand. The degree to which global demand affects domestic output (with the exception o f IT output and exports) remains limited, however, domestic demand and the policies that affect i t are s t i l l largely responsible for India’s output performance.
4.5 Baseline scenario. In the absence o f major external or domestic shocks, and in spite o f the expected recovery in 2003/04, the continuation o f current policies will translate into a continued growth slowdown over the Tenth Plan period (Table 4.1). Without a major reform impetus, it i s unlikely that GDP will average much more than 5% per annum between 2002/03 and 2006/07. Agricultural output i s expected to recover from the 2002/03 slump, and subsequently return to the previous trend. Industrial sector growth i s expected to remain at between 5% and 6% per annum, although the lagged effect o f the contraction in agnculture on industrial output may dampen this recovery in 2003/04. Services, the fastest growing sector over the 1990s, can be expected to continue expanding rapidly throughout the period, albeit at rates slightly lower than those o f the past five years, as large c i v i l service wage increases are unlikely to be repeated, given the existing fiscal crisis. Although growth in IT-enabled services may expand rapidly, it i s also unlikely that the IT sector will continue to expand at rates comparable to those o f previous years. The speed o f recovery in global demand wil l be important to continue fueling growth in services.
79

Table 4.1 : Macroeconomic Projections - Baseline and Reform Scenarios
Ninth Plan Baseline Scenario Reform Scenario 1 997198-200 1/02 2002103-2006107 2002103-2006107
Real GDP growth at factor cost (% per annum) 5.5 5.0 6.5 Agriculture, forestry and fishing 1.8 1.5 2.2 Industry 4.5 5.3 7.1 Services 8.1 6.4 8.0
Investment (% of GDP) Public
Private of which: general government
Consumption (% of GDP) Public Private
General Government (% of GDP) Fiscal deficit Primary deficit
22.5 20.5 27.7 6.6 6.4 7.3 3.1 3.0 3.7 15.9 14.1 20.4
78.8 80.5 73.5 12.5 12.0 12.4 66.3 68.5 61.1
9.3 11.8 10.3 3.5 3.6 2.2
Source: 1997198 to 2001102 - CSO; 2002103 to 2006107 - Staff Projections
4.6 Reform scenario. A comprehensive reform program could improve the outlook for the Indian economy considerably by providing new impetus to growth and accelerating improvements in social indicators. Although it i s unlikely that an average annual growth rate o f 8% could be achieved, i t would be possible to gradually set growth on a higher trajectory and reach 8% by the end o f the Tenth Plan period. Because o f the l o w init ial growth rate in 2002/03, this would translate into an average growth rate of 6.5% per annum over the Tenth Plan period (Table 4.1).
4.7 The reforms underpinning the above reform scenario are comprehensive, and would be expected to have an impact across the board, during and beyond the Tenth Plan period. Reforms to reduce fiscal imbalances at the center and state levels would reduce crowding out and create space for increased private investment. Improvements in the composition o f public expenditures, with a lower share spent o n c iv i l servants’ wages, pensions, and interest, and on covering power sector losses, and a higher share spent o n O&M and investments in key infrastructure, would further L‘crowd in” private investment. Improvements in the investment climate, through the removal o f bottlenecks in product and factor markets and key infrastructure would increase the productivity o f both public and private investment across the economy, including in India’s poor rural areas. An increased contribution o f FDI would contribute technology transfer and would increase output. More effective delivery o f health, education and safety nets would help accelerate progress in social indicators, empowering India’s citizens to both contribute and benefit f rom faster economic growth.
4.8 Accelerating growth and poverty reduction in India cannot be achieved without also accelerating growth in India’s lagging states. If the trends o f the past few years continue, i.e., if growth continues to be divergent across states in 2002-07 (with poorer states growing n o faster than 5% per annum or only slightly better than in 1997-2002), then richer states would have to grow at near 10% per annum o n average in 2002-07 to reach an all-India average o f 6.5% per annum. This i s a rather unlikely scenario. Thus implicit in the envisaged reform scenario i s an acceleration o f growth in India’s lagging states, without which regional divergences wil l continue to worsen. For growth to accelerate in lagging states, an
80

important part o f the reform agenda outlined and discussed in earlier parts o f this report (reduction o f fiscal imbalances and improvements in composition o f public expenditures; improvement in the investment climate; and more effective delivery o f health and education services and social-safety nets) must be implemented by state governments, in particular in poorer states. The role o f the central government in both catalyzing and setting the pace for reforms at the state level i s critical.
4.9 Of particular importance for poverty reduction and rural incomes are policies to increase productivity o f agriculture, which has declined between the 1980s and 1990s. In the short run, the removal of subsidies to foodgrains could reduce agricultural output in the few states that benefit the most from these subsidies. However, these are also states where significant agricultural diversification can take place. More importantly, this reform would release resources for other expenditures, such as research and extension, rural electrification, and rural roads. Simultaneously, faster growth in industry and continued rapid growth in services can provide jobs for the labor force released from agriculture.
4.10 Employment impact. Relative to the baseline scenario, reforms can be expected to have a positive impact o n employment. Even though the employment elasticity o f GDP i s less than one (reflecting increased productivity o f labor) and has been declining in India since the 1970s, a higher aggregate growth rate o f the economy can be expected to generate higher Selected Sectors employment levels (GOI, Task Force on Employment Opportunities, 2001).
matters. Agriculture, which employs a large share o f the labor force, can be expected to continue expanding output without increasing employment significantly, underemployment and improvements in labor productivity, and thus increasing agricultural wages. Over the 1990s, agricultural growth has had a zero elasticity o f employment, even though it has a strong positive impact on poverty reduction (Table 4.2). The estimated elasticities o f employment to GDP in services and manufacturing, on the other hand, are considerably higher. An acceleration o f growth in these sectors wi l l have a stronger impact on j ob creation.
4.1 1 Poverty impact. The continuation o f the current growth trajectory i s unlikely to make a strong dent on poverty. In the absence o f efforts to reform the agricultural sector, to improve productivity and improve development expenditures for rural growth, i t i s unlikely that agricultural growth rates will accelerate beyond the 3% per annum in subsequent years. This will have direct consequences o n the pace of poverty reduction in India over the next f ive years. Given the strong correlation between agricultural performance and wages and poverty reduction in rural areas, an unbalanced growth pattern where agriculture continues lagging behind will do l itt le to accelerate poverty reduction in India. Part o f the rapid progress in reducing poverty in China i s due to more rapid growth in agnculture, fueled by reforms in the sector. Poverty incidence can be projected to decline by less than 6 percentage points under the baseline scenario and nearly 10 percentage points under the reform scenario between 2002103 and 2006107.
4.12 External sector. Continuation o f recent trends would translate into a modest growth o f merchandise exports over the Tenth Plan period. Recovery in domestic demand, coupled with the government’s further planned reduction in import tariffs, however, could lead to some acceleration in import growth. These trends could push the current balance into deficit again. This could be reinforced by a renewed r ise in domestic interest rates as a result o f competition between public and private borrowers, which could put further upward pressure o n the rupee real effective exchange rate. Part o f any
Table 4.2: Elasticity of Employment to GDP, 1993194-1999100,
Estimated Elasticity The composition o f growth also Agriculture 0.00
Manufacturing 0.26 Construction 1 .oo Wholesale and retail trade 0.55
reflecting Transport, storage and construction 0.69 Finance, Real Estate, Insurance and Business Services 0.73 Source: Gol, Planning Commission, Report of the Task Force on Employment Opportunities, 7Ml1
81

crowding out, therefore, could be reflected in the balance o f payments. In the absence o f any major pol icy slippage, however, any renewed current deficit i s l ikely to be moderate. The Tenth Plan envisages a deficit equal to about 3-4% o f GDP by 2006-07, albeit with rather faster growth o f both exports and imports than might be likely on past trends.
4.1 3 Financing such a deficit would require a mixture o f renewed equity inflows and new borrowings from both foreign commercial banks and the bond markets. India’s attractiveness to both direct and portfolio equity investors i s l ikely to require reinvigoration o f the government’s privatization program and fresh reforms to enhance domestic industrial prospects. Foreign lenders, in turn, are l ikely to look for action to tackle the imbalances in the domestic economy, especially the fiscal deficits o f both the central government and the states. The current high level o f reserves provides a cushion against both domestic and external shocks, although a change in sentiment about the rupee as a result o f continued high fiscal deficits or nervousness about the health o f parts o f the domestic financial sector could lead to some erosion o f reserves.
Risks 4.14 Fiscal. India’s large fiscal imbalances pose a serious threat to sustained growth and development over the medium term. In the short run, the risk o f a speculative attack i s reduced by a compliant financial system, a large pool o f household savers, the l imi ted convertibility o f the current account, and a flexible exchange rate. Thus, in the absence o f a rapid increase in interest rates and weakening growth performance, India i s not vulnerable to the type o f collapse suffered by Russia or Argentina in the short term. Over the medium term, however, there are consequences o f leaving the current fiscal situation unchecked. Whi le current policies have helped reduce external vulnerabilities, they have also kept economic growth below potential, as growing interest payments have crowded out public investment, and high real interest rates have constrained private investment. Slower growth, in turn, speeds up the deterioration in debt dynamics. Even though interest rates have declined over the past 18 months, public debt dynamics have continued to worsen. As interest rates can be expected to increase from the current historical lows, the growth-interest rate ratio which has prevented the current fiscal vulnerabilities f rom translating into a full-blown macroeconomic crisis could deteriorate. The persistence o f current fiscal trends will, at best, further limit growth and job creation. If this negative cycle continues, a full-fledged fiscal crisis cannot be ruled out over the medium term.
4.15 I t i s polit ically easy to downplay this risk, hoping that higher growth and lower interest rates will eventually solve the fiscal problem. However, experience suggests i t would be unwise to s i t back and wait for such a virtuous circle to emerge. Instead, the central and state governments will have to be pro- active in reducing the fiscal deficit, shifting expenditures into more productive areas, and removing structural impediments to higher private investment and productivity. The sooner the roadmap for these reforms i s put in place, and concrete action taken to show commitment to fo l low through, the more manageable wi l l be the adjustment path, and the quicker the pay-off in terms o f higher growth and poverty reduction.
4.16 Political. Other r isks could threaten India’s development prospects. An important risk i s that the comprehensive reforms needed to accelerate development will be delayed due to the primacy o f polit ical concerns, such as general or state elections. Another i s the diversion o f pol icy makers’ attention (and public resources) to other issues, such as the tensions with neighboring countries. Political obstacles to the needed hardening o f budget constraints between the center and the states, in particular those states which yield large political power, are r isks that threatens to further deteriorate state level finances and discourage reforming states.
4.17 External. In the short run, expected developments in the external environment cannot be expected to be strong positive forces. The recovery o f the global economy i s expected to be slow. There remain weaknesses in demand in the world’s largest markets Western Europe, Japan, and Nor th America. This will slowdown growth in industry, albeit to a l imited extent because India s t i l l i s a relatively closed
82
economy, but in particular in services. A slow down in the in f low o f remittances i s also l ikely. At least part o f the increased inf low o f remittances observed in India i s l ikely to have been a one-off episode, motivated by the events o f September 11, 2001 in the U S and resulting partly f rom a “flight to safety” event. The same trends can be observed in other countries, such as Palustan and Bangladesh. This level of inflows can be expected to weaken, emphasizing India’s fiscal vulnerabilities.
Conclusion
4.18 India can be rightly proud o f i t s development record over the past two decades. I t reflects the emergence o f a much wider consensus about the importance o f opening up the Indian economy to competition. The results in terms o f more rapid growth and poverty reduction are impressive. But India has s t i l l fallen behind i t s main competitors in East Asia - and poverty remains a reality for many Indians, especially those living in the poorer states o f the Nor th and East. The government i s right to set ambitious targets for growth and social development during the Tenth Plan. The key now i s to implement the pol icy and institutional changes needed to achieve these goals. Sustained progress will n o doubt be difficult, especially in the politically-charged areas o f labor, power and agricultural re’form. But it also promises high returns for poverty reduction in India.
83
Box 4.1: Summary of Priority Reforms Fiscal Policy
Progressively reduce the primary deficit at the center and in states by completing tax reforms (eliminating exemptions, bringing services into the tax net, and implementing a uniform state VAT), reducing power sector losses, and phasing out petroleum subsidies. Reduce financial sector r isks by implementing the new securitization law, linking returns on provident funds and small savings to market benchmarks, and establishing a clear framework for managing state govemment guarantees. Improve fiscal management by imposing greater fiscal discipline on state borrowing and transfers, breaking down artificial distinctions between plan and non-plan expenditures, and consolidating Centrally Sponsored Schemes. Improve the composition of public expenditures, by reducing the share spent on wages, pensions, interest payments, and agricultural subsidies, and increasing investment and O&M for priority social, infrastructure and agriculture programs.
Delivery of Public Services Reduce administrative fragmentation and reform civil service pay policy and pensions. Improve the performance o f the civil service and quality of service delivery by improving public access to information, strengthening accountability, and reducing political interference. Refocus health, education and social safety net programs on outcomes. The central govemment can play an important role as an independent source for measuring progress towards agreed goals. Improve the private market for health care through training, public information and accreditation. Priorities for public funds are to provide clean water and sanitation, and to combat communicable diseases (including HIViAIDS prevention). Support the SSA goals by providing increased public resources and improving resource use in elementary education. Schools should be more accountable to communities, with more local autonomy to find the best solutions. Develop a well-designed fiscal framework for local govemments, that would guarantee their autonomy and accountability. Flows of funds from the center and states should be dependent on good local fiscal performance and resource mobilization.
Investment Climate for Industry and Services Speed up trade reform by reducing average import tariffs and phasing out tariff exemptions, specific tariffs and anti-dumping duties. Remove other product market distortions by eliminating preferential policies for small-scale players, implementing a full and uniform VAT, and phasing out remaining FDI restrictions. Reduce inefficiencies in factor markets by easing restrictions on hiring and firing o f workers, improving SME access to credit, addressing problems in the use and transfer of land, and updating bankruptcy procedures. Ensure access to reliable power at reasonable costs by rationalizing power tari f fs and improving the financial and operational performance of SEBs. Address capacity and quality constraints in the transport sector by improving public sector performance (for roads and rail), mobilizing private sector investment (including better cost recovery for roads), phasing out price distortions (for rail), and improving the efficiency o f existing capacity (for ports).
Agricultural Policy and Rural Development
Put in place a market-based foodgrain policy which protects the poor through targeted safety nets, while mitigating drastic supply shocks through a cost effective and well-managed price stabilization mechanism. Reduce input subsidies which are fiscally unsustainable and distorting input use. Savings should be used to fund more productive investments in agricultural research and extension, rural roads, and rural electrification. Reduce regulation o f domestic trading activities for major agricultural commodities and eliminate remaining trade policy distortions, including subsidized exports o f r ice and wheat. Improve access to land by revisiting current legislation on land tenancy, and building on successful initiatives to improve land administration. Devise market-based solutions to improve rural access to a larger range o f financial services, at lower cost.
84
References
Acharya, S. (2003). “Reform Agenda for Indian Agriculture,” mimeo.
Acharya, S. (2002a). “Macroeconomic Management in the Nineties”. Economic and Political Weekly,
Acharya, S., (2002b). “India’s Medium-Term Growth Prospects”. Economic and Political Weekly, July.
Acharya, Shankar. (2001). “India’s Macroeconomic Management in the Nineties.” N e w Delhi, ICRIER.
Acharya, S., Isher Ahluwalia, K.L. Knshna, and I l a Patnaik. (2002). Global Research Project: India Case Study, Indian Council for Research on International Economic Relations (ICRIER), N e w Delhi.
Ahluwalia, Montek S. (2002a). “India’s Vulnerability to External Crisis: An Assessment.” In Macroeconomics and Monetary Policy: Issues for a Reforming Economy. Essays in Honor of C. Rangarajan, eds. Montek Ahluwalia, S.S. Tarapore and Y.V. Reddy, OUP (forthcoming).
Ahluwalia, Montek S. (2002b). “Economic Reforms in India: A Decade o f Gradualism”, Journal of Economic Perspectives.
Aiyar, Shekhar. (2001). “Growth Theory and Convergence Across Indian States: A Panel Study”, in India at the Crossroads: Sustaining Growth and Reducing Poverty, eds., Callen, Reynolds and Towe IMF, Washington DC.
Anant, T.C.A. and N.L. Mitra. (1998). “The Role o f L a w and Legal Institutions in Asian Economic Development: The Case o f India,” Haward Institute for International Development Discussion Paper No. 662, November.
Bajpai, Nirupam and Jeffrey Sachs. (1 998). “Strengthening India’s Strategy for Economic Growth,” Economic and Political Weekly, July.
Banerjee, A. V., P. J. Gertler, and M. Ghatak. (2002). “Empowerment and Efficiency: Tenancy Reform in West Bengal.” Journal of Political Economy, 1 lO(2): pp. 239-280.
Banerjee, Abhijit and Lakshmi Iyer. (2002). “History, Institutions and Economic Performance: The Legacy o f Colonial Land Tenure Systems in India,” Paper delivered at Wor ld Bank research seminar, March, 2002. Processed.
Bardhan, P. (2002). “Disjunctures in the Indian Reform Process: Some Reflections”, Outline presented at Cornel1 University, April 19-20.
Barro, Robert and Xavier Sala-I-Martin. (2002). Economic Growth. N e w York: Mc-Graw Hill Inc.
Basu, Priya, Clive Harris and Stephan Von Klaudyu. (2003). “Public Support for Private Infrastructure
Bhalla, Surjit S. (2002). “Imagine There’s N o Country - Poverty, Inequality and Growth in the Era o f
Besley, T. and R. Burgess. (2000). “Land Reform, Poverty Reduction, and Growth: Evidence from India.”
Brandon, C., and K. Hommann.(l995). “The Cost o f Inaction: Valuing the Economy-Wide Cost o f
Buiter, Wi l lem and Urjit Patel. (1992). “Debt, Deficits and Inflation: An Application to the Public
Burgess, Robin and R. Pande. (2002). “Do Rural Banks Matter? Evidence from the Indian Social Banking
April.
Projects: Issues and Challenges ”, Wor ld Bank Policy Note, May.
Globalization,” Institute for International Economics, Washington D.C.:
Quarterly Journal of Economics, 115(2): pp. 389430 .
Environmental Degradation in India”(draft), Wor ld Bank.
Finances o f India.” Journal of Public Economics. N o . 47, pp. 171-205.
Experiment”, Draf t Version, October.
85
Cashin, P., N. Olekalns and R. Sahay. (2001). “Tax Smoothing, Financial Repression and Fiscal Def ic i ts in India.” in India at the Crossroads - Sustaining Growth and Reducing Poverty, eds. Tim Callen, Patricia Reynolds and Christopher Towe, IMF, Washington D.C.
Census of India. (198 1,1991,200 1). New Delhi, India: Office o f the Registrar General.
Center for Monitoring Indian Economy (CMIE), (2002). Agriculture, Mumbai.
Center for Monitoring Indian Economy (CMIE). (2000). Agriculture, November
Chang, Roberto and Andres Velasco. (1998). “The Asian Liquidity Crisis.’’ NBER Working Paper 6796,
Chaudhry, M.D. (1966). Regional Income Accounting in an Underdeveloped Economy: A Case Study of
Comptroller and Auditor General o f India. (2000). Report of the CAG on the Union Government for the
Confederation o f Indian Industry and McKinsey & Co. (2002) “Learning from China to Unlock India’s
Credit Rating and Information Services o f India Limited. (2002). “Mounting State Government
Dan, Gaurav and Martin Ravallion. (2002). “Is India’s Economic Growth Leaving the Poor Behind?”,
Datt, Gaurav and M. Ravallion. (1996). “How Important to India’s Poor I s the Sectoral Composition o f
Deaton, Angus. (2002). “Adjusted Indian Poverty Estimates for 1999-2000,” Paper delivered at the India
Deaton, A. and J. Dreze. (2002). “Poverty and Inequality in India, A Re-Examination,” Economic and
Deininger, K. and D. Umali-Deininger. “Targetted Public Distribution System: I s i t Reaching the Poor,”
Deshpande, R.S. (2003). “Land Issues in India,” Land Reform, Land Settlement and Cooperatives
Drkze, Jean. (2001). “Starving the poor”, The Hindu, February 26,27, New Delhi.
Dregne, H. E., and N. T. Chou. (1992). “Global Desertifications Dimensions and Costs.” ed. H.E. Dregne Degradation and restoration of arid lands.
Duflo, Esther. (2003). “Scaling up and Evaluation” draft paper prepared for the ABCDE conference in Bangalore
Dutta, B. and B. Ramaswami. (2001). “Targeting and efficiency in the public distribution system: Case o f Andhra Pradesh and Maharashtra”, Economic and Political Weekly, May 5, pp. 1524-1532.
Economic and Political Weekly. (2003). “Fertilizers: Revamping Pricing,” Editorial, March 15.
Expenditure Reform Commission. (2000). “Rationalizing Fertilizer Subsidies, Part I”, mimeo.
Esrey S., J. Potash, L. Roberts, and C. Shiff. (1991). “Effects o f Improved Water Supply and Sanitation on Ascariasis, Diarrhea, Dracunculiasis, Hookworm Infection, Schistosomiasis, and Trachoma”, WHO Bulletin 69 (5), pp. 609-62 1.
November.
India (Calcutta: Firma K. L. Mukhopadhyay).
Year Ended 1999, New Delhi: CAG.
Manufacturing Potential”, New Delhi.
Guarantees - Fiscally Unsustainable”. July.
Journal of Economic Perspectives, Vol. 16, No. 3.
Growth?” World Bank Economic Review I O ( 1): 1-25.
Workshop on Poverty Measurement, Monitoring and Evaluation, January 11 -12,2002.
Political Weekly, Septembe, pp. 3729-48.
draft mimeo.
Journal. Forthcoming.
86
Fan, S., P. Hazell, and S. Thorat. (2000). “Government Spending, Growth and Poverty in Rural India,”
Federation o f Indian Chambers o f Commerce and Industry (FICCI). (2002). “Indian Agnculture
Ferro, M., D. Rosenblatt and N. Stem. (2002). “Policies for Pro-Poor Growth in India”, draft paper
Global Competitiveness Report. (2002/03 and previous years). Wor ld Economic Forum, Oxford
Godbole, Madhav. (1 997). “Pay Revision: High Cost o f Total Surrender”, Economic and Political
Government o f India, Planning Commission (2003), Tenth Five Year Plan 2001-02 to 2006-07, New
Government o f India, Ministry o f Finance. (2003a). Budget Speech 2003-04, New Delhi: mimeo.
Government o f India, Ministry o f Finance. (2003b). Economic Survey, 2002-03, N e w Delhi.
Government o f India, Ministry o f Finance. (2003~). “Implementation o f Budget Announcements” (Budget Speech 2002-03), N e w Delhi: mimeo
Government o f India, Planning Commission (2002), Planning Commission Reports on Labour and Employment, Economica India Info-Services, Academic Foundation, N e w Delhi.
Government o f India, Planning Commission. (2002a). Annual Report o n the Working o f SEBs and Electricity Departments.
Government o f India, Planning Commission. (2002b). “Report o f the Steering Committee o n Foreign Direct Investment”, N e w Delhi, August.
Government o f India, Ministry o f Commerce. (2002). Report on “Reforming Investment Approval & Implementation Procedures”.
Government o f India, Ministry o f Commerce. (2002a). Report of the High Level Committee for EXTM Policy, 2002-07, Directorate General o f Foreign Trade, N e w Delhi.
Government o f India, Ministry o f Consumer Affairs, Food and Public Distribution. (2002). Report of the High Level Committee on Long-Term Grain Policy, New Delhi: Department o f Food and Public Distribution.
Government o f India, Prime Minister’s Economic Advisory Council. (2002). “Report o f the Prime Minister’s Economic Advisory Council,” mimeo.
Government o f India, Prime Minister’s Economic Advisory Council. (2002). “Economic Reforms: A Medium-Term Perspective”.
Government o f India. (2002a). Economic Survey ofIndia 2001-02. N e w Delhi.
Government o f India. (2002b). External Debt Status Report. August. N e w Delhi.
Government o f India, Department o f Food and Public Distribution. (2002). Report of the High Level Committee on Long Term Grain Policy, N e w Delhi: Department o f Food and Public Distribution.
Government o f India, Ministry o f Agriculture. (2002a), “Agricultural Statistics at a Glance 2002”, N e w Delhi: Directorate o f Economics and Statistics.
Government o f India, Ministry o f Agriculture. (2002b). “Policy Framework for Agricultural Extension”, N e w Delhi: Extension Divis ion , Department o f Agriculture and Cooperation.
American Journal ofAgricultura1 Economics, Vol . 82, No . 4: pp.1038-105 1.
Unbound: Mak ing Indian Agriculture Globally Competitive”, N e w Delhi.
presented at Cornell University, April 19-20.
University Press: USA.
Weekly, October.
Delhi.
87

Government o f India, Ministry of Finance. (2002). Report o f the Worlung Group to Suggest Amendments
Government o f India, Ministry of Finance. (2002a). Budget Speech 2002-03, New Delhi: mimeo.
Government o f India, Ministry of Finance. (2002b). “Implementation o f Budget Announcements”
Government o f India, Ministry o f Finance. (2002~). Economic Survey 2001-02, New Delhi.
Government o f India, Planning Commission. (2001). Report o f the Task Force on Employment.
Government o f India. (2001). Report o f the Prime Minister ’s Economic Advisory Council,
Government o f India, Planning Commission. (2001). “Approach Paper to the Tenth Five Year Plan
Government o f India, Planning Commission. (2001a). Report of the Task Force on Employment
Government o f India, Ministry of Finance. (2001) Report of the Joint Committee on Revitalization
Government o f India, Ministry o f Finance. (2001a). Budget Speech 2001-02, New Delhi: mimeo.
Government o f India, Ministry of Finance. (2001b). “Implementation o f Budget Announcements”
Government o f India, Ministry of Finance. (2001~). Economic Survey 2000-01, New Delhi: Ministry o f
Government o f India, Ministry o f Rural Development. (2001). Annual Report 2000-2001, New Delhi: Ministry o f Rural Development.
Government o f India, Ministry of Agriculture. (2000). “National Agncultural Policy”, New Delhi: Department o f Agriculture and Cooperation.
Government o f India, Ministry of Finance. (2000). Report of the Task Force to study the Cooperative Credit System and Suggest Measures for its Strengthening (chaired by Jagdish Capoor), submitted to GoI.
Government o f India, Planning Commission. (1999). Report of the S.P. Gupta Committee on Small Scale
Government o f India, Ministry o f Finance. (1999). Economic Survey 1998-99, New Delhi.
Government o f India, Ministry of Chemicals and Fertilizers. (1998). Fertilizer Pricing Policy, Report of
Government o f India, Planning Commission. (1997). Report of the Abid Hussain Committee on Small
Government o f India, Planning Commission.(2002). NK Singh Committee Report on FDI.
Goswami, Omkar and David Dollar. (2002). “Competitiveness o f Indian Manufacturing: Results from a
Govinda Rao, M. (2000). “Invisible Transfers in Indian Federalism”, Public Finance, 52 (3-4), pp. 429-
Govinda Rao, M., R.T. Shand, and K.P. Kalirajan. (1999). :Convergence o f Incomes Across Indian
in the Regional Rural Banks Act (Chaired by MVS Chalapathi Rao), June.
(Budget Speech 200 1 -02), New Delhi: mimeo.
(2002-2007)”, New Delhi.
Opportunities ”, New Delhi.
Support to Cooperative Credit Structure (chaired by Balasaheb Vikhe Patil).
(Budget Speech 2000-Ol), New Delhi: mimeo.
Finance.
Industry
the High Powered Review Committee, New Delhi.
Scale Enterprises.
Firm Level Survey”, New Delhi: January.
448.
States: A Divergent View”, Economic and Political Weekly, Vol. 34 (March 27), pp. 769-78
88

Gulati, A. and G. Pursell. (2003). “Indian Agriculture during the 1990s, Performance, Policy Environment and Incentives,” Wor ld Bank working paper.
Gulati, A. and S. Bathla. (2002). “Capital Formation in India Agriculture: Trends, Composition and Implications for Growth ”, Occasional Paper No . 24, National Bank for Agnculture and Rural Development, Mumbai.
Gulati, A. and S. Narayanan. (2002). “Demystifying Fertilizer and Power Subsidies in India”, in R. Kapila and U. Kapila (eds), Indian Agriculture in the Changing Environment, Volume 1, N e w Delhi: Academic Foundation, pp. 175-208.
Haggblade, Steven, Peter Hazell, and Thomas Reardon. (200 1). ”Strategies for Stimulating Equitable Growth o f the Rural Non-farm Economy in Developing Countries,” South Asia Rural Development Unit, draft mimeo.
Hanchate, A. and T. Dyson, (2000). “Trends in the Composition o f Food Consumption and Their Impact o n Nutrit ion and Poverty in India,” London School o f Economics, mimeo.
Hanson, J. and S. Kathuria (eds) (1999). India: A Financial Sectorfor the Twenty-First Century, Oxford University Press, N e w Delhi.
Hanson, J. (2002). “Improving Indian Banks Performance”, paper presented at the Goa Conference on Adapting India’s Financial Sector to a Globalized World, November.
Hanumantha Rao, C.H. (2003). “Reform Agenda for Agriculture,” Economic and Political Weekly, February 15.
Hanumantha Rao, C.H. (2002) “Agricultural Growth Sustainability and Poverty Alleviation”, in R. Kapila and U. Kapila (eds), Indian Agriculture in the Changing Environment, Volume 1, N e w Delhi: Academic Foundation, pp.113-130.
Hanumantha Rao, C.H. (2000). “Declining Demand for Foodgrains in Rural India: Causes and Implications,” Economic and Political Weekly, January 22.
Howes, Stephen, A. Lahir i and N Stem. (2003). “Introduction to States Forum Proceedings.” Forthcoming.
Howes, Stephen and Rinku Murgai. (2002). “Kamataka : Incidence o f agricultural power subsidies : Estimate”. Economic and Political Weekly, Vo1.38, No.16, pp.1533-1535
Hughes G., K. Lvovsky and M. Dunleavy. (2000). Environmental Health in India: Priorities in Andhra Pradesh, South Asia Environment Unit, Wor ld Bank, Washington DC.
Hut ley S., S. Morris, V. Pisana. (1997). “Prevention o f Diarrhea in Young Children in Developing Countries”, WHO Bulletin 75 (2), pp. 163-174.
International Monetary Fund. (2002). India: Selected Issues and Statistical Appendix. IMF Country Report no. 02/193.
Indian Council for Agricultural Research (ICAR). (2002), ICAR Vision 2020, N e w Delh i
Indian Council o f Agricultural Research (ICAR), (2001). ICAR Now and Ahead, N e w Delhi.
Infrastructure Development Finance Company Ltd. (2002). India Infrastructure Report, Mumbai.
Infrastructure Development Finance Company Ltd. (200 1). India Infrastructure Report, Mumbai.
Irwin, Timothy. (2002). “Deciding When to Offer Guarantees, Out-based Subsidies, or other Forms o f Fiscal Support for Private Infrastructure Services”. Mimeo, Wor ld Bank.
89
Irwin, Timothy, Michael Klein, Guillermo E. Perry and Mateen Thobani. (1997). “Dealing with Public Risk in Private Infrastructure”, World Bank.
Jalan J. and M. Ravallion. (2001). “Does Piped Water Reduce Diarrhea for Children in Rural India?” Policy Research Working Paper 2664, World Bank.
Jha, Shikha and P.V. Srinivasan, (2001). “Tahng the PDS to the poor: Directions for further reform”, Economic and Political Weekly, September 29, pp.3779-3786.
Joshi, P. K., and D. Jha. (1991). Farm-Level Effects o f Soil Degradation in Sharda Sahayak Irrigation Project. Worlung Papers on Future Growth in Indian Agriculture No. 1. New Delhi and Washington, D.C. Central Soil Salinity Research Institute, Indian Council o f Agricultural Research, and International Food Policy Research Institute.
Kalirajan, K.P. and R. T. Shand. (1997). “Sources o f Output Growth in India Agriculture”, Indian Journal of Agricultural Economics, Vol. 52, No. 4 pp. 693-706.
Kapur, Devesh and Urjit R. Patel. (2003). “Large Foreign Currency Reserves: Insurance for Domestic Weakness and External Uncertainities?” Economic and Political Weekly, Vol. XXXVIII, No. 11, March 15.
Kelkar, V.J. (2002). Report of the Task Force on Direct-Indirect Taxes, Akalank Publications, New Delhi, November.
Kishore, A., A. Sharma and C. Scott. (2003). “Power Supply to Agriculture, Reassessing Options”, Water Policy Research Highlight No. 7, IWMI-Tata Water Policy Program, Ahmedabad, India.
Kochar, Anjini. (1997). “An Empirical Investigation o f Rationing Constraints in Rural Credit Markets in India”, Journal of Development Economics, Vol. 53, pp.339-371.
Krueger, A. (ed.) (2002). Economic Policy Reforms and the Indian Economy, Oxford University Press, New Delhi.
Kumar, P., (2002). “Economic Analysis o f Total Factor Productivity o f Crop Sector in the Indo-Gangetic Plain o f India by District and Region”, Agricultural Economics Research Report No. 2002-02, National Agricultural Technology Project Irrigated Ago-Ecosystem Research, New Delhi: Indian Agricultural Research Insti tute.
Kumar, Praduman and Mark W. Rosegrant. (1994). “Productivity and Sources o f Growth for &ce in India”, Economic and Political Weekly, Vol. 29, No. 52, pp. A183-188.
Kharas, Homi J., Brian Pinto, and Sergei Ulatov. (2001). “An Analysis o f Russia’s 1998 Meltdown: Fundamentals and Market Signals,” Brookings Papers on Economic Activity, Issue 1.
Lanjouw, P. (2000). “Poverty in Kamataka: Profiles and Emerging Issues”, World Bank, mimeo.
Lanjouw, P. and G. Feder. (2001). “Rural Non-Farm Activities and Rural Development, From Experience Towards Strategy,” Rural Strategy Background Paper No. 4, Washington, D.C. Rural Development Department, World Bank.
Lahiri, Ashok and R. Kannan. (2002). “India’s Fiscal Deficits and Their Sustainability in Perspective.” In India - Fiscal Policies to Accelerate Economic Growth. World Bank.
Mahal, A., et al. (2001). “Who Benefits fkom Public Health Spending in India” World Bank, HNP Working Paper.
Majumdar, Grace and J L Kapoor. (1980). “Behavior o f inter-state income inequalities in India”, Journal ofIncome and Wealth, Vol. 4 No.1 (January), pp.1-8.
90
Mattoo, Aaditya and Arvind Subramanian. (2003). “India and the Multilateral Trading System Post-Doha: Defensive or Proactive?. Chapter 13 in Aaditya Mattoo and Robert Stem (eds. 2003), “India and the WTO”, Oxford University Press and the Wor ld Bank.
Mckinsey & CII. (2002). “Learning from China to Unlock India’s Manufacturing Potential”.
McKinsey & Company. (2001). “India: The Growth Imperative, Understanding the Barriers to Rapid
McKinsey Global Institute. (200 1). “India: The Growth Imperative”, Washington D.C.
Mohan, Rakesh. (2003). “Transforming Indian Banlung: In Search o f a Better Tomorrow.” Reserve Bank of India Bulletin.
Mussa, Michael. (2002). “Argentina and the Fund: F rom Triumph to Tragedy,” Institute for International Economics, Washington DC.
Nair, K.R.G. (1985). “A Note on Inter-State Income Differentials in India 1970-71 to 1979-80”, in Regional Structure of Growth and Development in India, Vol. 1, ed. By G.P. Misra (New Delhi: Ashish Publishing House).
Growth and Employment Creation”. N e w Delh i
National Bank for Agriculture and Rural Development (NABARD). Annual Report, various years
National Bank for Agriculture and Rural Development (NABARD). (2001). Report of the Expert Committee on Rural Credit (Chaired by V S Vyas), July.
National Bank for Agriculture and Rural Development (NABARD). (2001). Regional Rural Banks: K e y Statistics, 2001
National Bank for Agriculture and Rural Development (NABARD). Statistical Statements Relating to The Cooperative Movement in India, various years.
Nelson, Howard. (1 994). “International Comparisons o f Teachers Salaries and Conditions o f Employment”, in Developments in School Finance, National Center for Education Statistics,
New Initiatives Needed” in Kirit S. Parikh (ed.) India Development Report 1999-2000, Oxford University Press.
Paul, Samuel and Sita Sekhar. (1999). “The Second Report Card o n Bangalore’s Public Services”, Public Affairs Center, Bangalore, November.
Perry, Guillermo and Luis Serven. (2002). “The Anatomy o f a Mult ip le Crisis: Why was Argentina Special and What can we learn f rom it.” Wor ld Bank, mimeo.
Peters, D., A. Yazbeck, R. Sharma, G. Ramana, L. Pritchett and A. Wagstaff (2002). “Better Health Systems for India’s Poor. Wor ld Bank, Washington D.C.
Pinto, Br ian and Farah Zahir. (2003). India: why Fiscal Adjustment Now? Manuscript, Wor ld Bank.
Radhaknshna, R. and K. Subbarao. (1997). “India’s Public Distribution System: A National and International Perspective”, Wor ld Bank Discussion Paper.
Ravallion, Mar t in and Guarav Datt. (2002). “Growth and Poverty in India: What Have W e Learnt f rom the NSS?” India Workshop on Poverty Measurement, Monitoring and Evaluation, January 11-12, 2002.
Ravallion, Mar t in and Guarav Datt. (2001). “Why Has Economic Growth Been More Pro-Poor in Some States o f India Than Others?” International Monetary Fund Seminar Series, Number 200 1-59, July.
pp. 11 1-127.
Parikh, K., J. Parikh, and T. L. Raghu Ram. (1999). “Air and Water Quality Management:
91

Ravallion, Mar t in and Guarav Datt. (1998). “Farm Productivity and Rural Poverty in India,” Journal of Development Studies, Number 34, April.
Ravallion, Mar t in and Guarav Datt. (1997). “Why Have Some Indian States Done Better Than Others at Reducing Rural Poverty?” Economica, Number 65.
Ravallion, Mar t in and Gaurav Datt. (1995). “Is Targeting through a Work Requirement Efficient? Some Evidence for Rural India” in D. van de Walle and K. Nead (eds) Public Spending and the Poor: Theory and Evidence, Baltimore, MD: Johns Hophns University Press.
Rawal, V. (2001). “Agrarian Reform and Land Markets: A Study o f Land Transactions in T w o Villages of West Bengal, 1977-1995.” Economic Development and Cultural Change 49(3), pp. 61 1-29.
Ray, T. (1 999). “Share Tenancy as Strategic Delegation.” Journal of Development Economics 58( l), pp.
Reserve Bank o f India. (2003a). Report on Currency and Finance 2001-02, Mumbai.
Reserve Bank o f India. (2003b). “Accretion to Foreign Exchange Reserves in India”: Sources, Arbitage
Reserve Bank o f India. (2003~). Monthly Bulletin, January, Mumbai.
Reserve Bank o f India. (2003d). State Finances: A Study of Budgets of 2002-03, February, Mumbai.
Reserve Bank o f India. (2003e). Report of the Group to Assess the Fiscal Risk of State Government
Reserve Bank o f India. (2002). Annual Report 2001-02, Mumbai.
Reserve Bank o f India. (2002a). Annual Report 2001-02, Chapter XI: Public Debt Management, Mumbai.
Reserve Bank o f India. (2002b). Report on Trends and Progress of Banking in India 2001-02, Mumbai.
Reserve Bank o f India. (2002~). Report on Currency and Finance 2000-01, Mumbai.
Reserve Bank o f India. (2001). Annual Report, Mumbai.
Reserve Bank o f India. (2001a). Annual Report 2000-01, Mumbai.
Reserve Bank o f India. (2001b). Handbook of Statistics ofIndian Economy 2001, Mumbai.
Reserve Bank o f India. (2001~). Reserve Bank ofIndia Monthly Bulletin January 2002, Mumbai.
Reserve Bank o f India. (1991). Al l India Debt and Investment Survey, Reserve Bank o f India,
Reserve Bank o f India. Report on Trend and Progress of Banking in India, various years.
Sachs, Jeffrey, Nirupam Bajpai, and Ananthi Ramiah. (2002). Understanding Regional Economic Growth
Sachs, Jeffrey, Ashutosh Varshney, and Nirupam Bajpai. (1999). India in the Era of Economic Reforms,
Saxena, N.C. (2000a). “Tenancy Reforms vs Open Market Leasing-What Wou ld Serve the Poor
Saxena, N.C. (2000b). “Theme Paper on Enhancement o f Property Rights Including Land Rights of
Shariff, A., P. Ghosh and S. Mondal. (2002). “Indian Public Expenditures o n Social Sector and Poverty
45-60.
and Costs, January.
Guarantees, July, Mumbai.
in India, Worlung Paper No. 88, Center for International Development at Harvard University.
New Delhi, New York: Oxford University Press.
Better?”, Planning Commission Discussion Paper, mimeo.
Women,’’ Planning Commission Discussion Paper, mimeo.
Alleviation Programmes during the 1990s”, ODI Working Paper N o . 163, May.
92
Shekhar, S. and S. Balakrishnan. (1999). “Voices from the Capital: A Report Card on Public Service in
Singh, Nirvikar. (2002), Information Technology and India ’s Economic Development, paper presented at
Shariff, Abusaleh and Ananta C. Mallick, (1999). “Dynamics o f Food Intake and Nutrit ion by
Sharma, A. (2002). “The Agricultural Sector,” in Economic and Policy Reforms in India, N e w Delhi:
Smith K.R. (2000). “National Burden o f Disease in India f rom Indoor Air Pollution.” PNAS 97,
Smith K.R., and S. Mehta. (2000). “The Burden o f Disease f rom Indoor Air Pollution in Developing
Delhi,” Public Affairs Center, Bangalore.
the Come11 University Conference on the Indian Economy, April.
Expenditure Class in India”, Economic and Political Weekly, July 3-9.
National Council o f Applied Economic Research, pp. 185-21 3.
pp. 13286 - 13293.
Countries. Comparison o f Estimates.” Paper presented at the USATD/WHO Global Technical Consultation on the Health Impacts o f Indoor Air Pollution and Household Energy in Developing Countries.”
Srinivasan, T.N. (2002). “China and India, Growth and Poverty, 1980-2000”, June.
Srinivasan, T.N. (2001). “India’s Fiscal Situation: I s a Crisis Ahead?” Working Paper no. 92, Center for Research on Economic Development and Policy Reform, Stanford University.
Stem, N.(2002). “Public Finance and Policy for Development: Challenges for India”, NPFP Silver Jubilee Lecture, January 10,2002.
Sundaram, K. and S. Tendulkar. (2002). “Recent Debates o n Database for Measurement o f Poverty in India: Some Fresh Evidence”, paper presented at the Workshop on Poverty Measurement, Monitoring and Evaluation January1 1-12, N e w Delh i
model Applied to India and Korea”, IMF Staff Papers, 814-888.
Publishers Pvt. Ltd.
Sundararajan, V. and S. Thakur. (1980). “Public investment, Crowding Out, and Growth: A Dynamic
Taimin, B.K. (2001). “Food Security in the 21St Century, Perspective and Vision”, N e w Delhi: Konark
Tanzi, V i to and Howel l Zee. (2002). “Tax Policies for Emerging Markets”. IMF Working Paper No .
TARU Leading Edge. (2001). “Socio Economic Impact Assessment Study for Andhra Pradesh ”. TARU Leading Edge. (2000). “Socio Economic Impact Assessment Study for Haryana ”. Tata Energy Research Institute. (2002). “Cost o f Un-served Energy”. N e w Delhi, June.
Tata Energy Research Institute. (2000). “Cost o f Un-served Energy”, N e w Delhi: June.
The Economist Intelligence Unit (2002), India Country Profile 2002, United Kingdom.
Umali-Deininger, Dina L. and K.W. Deininger. (2001). “Towards Greater Food Security For India’s Poor: Balancing Government Intervention And Private Competition”, Agricultural Economics 25,
Virmani, A. (2002). A New Development Paradigm: Employment, Entitlement and Empowerment, paper presented at the Conference on “The Politics and Economics o f Liberalisation in India”, April 1 1 - 13, 2002 at the RG Institute for Contemporary Studies, N e w Delhi.
0013 5.
pp. 321-335.
93
Vaidyanathan, A. (2002). “India’s Agricultural Development Policy” in R. Kapila and U. Kapila (eds), Indian Agriculture in the Changing Environment, Volume 1, New Delhi: Academic Foundation,
Venkatasubramanian, K. (2000). “Land Reforms Remain an Unfinished Business,” Planning Commission Discussion Paper, mimeo.
Vyas, V.S. (2002). “Changing Contours o f Indian Agriculture,” in R. Kapila and U. Kapi la (eds), Indian Agriculture in the Changing Environment, Volume 1, New Delhi: Academic Foundation, pp. 4 1 - 74.
Vyas, V.S. (2002). “Agriculture The Second Round o f Reforms,” in R. Kapila and U. Kapi la (eds), Indian Agriculture in the Changing Environment, Volume 1, N e w Delhi: Academic Foundation, pp. 143- 174.
pp. 83-104.
Vyas, V.S. (2003). “Market Reforms in Indian Agriculture,” draft mimeo.
Williamson, J. and R. Zagha. (2002). “From Slow Growth to Slow Reform?”, paper presented at Stanford
Wor ld Bank. (2003). Doing Business Database.
Wor ld Bank, (2003a). “Access o f the Poor to Clean Household Fuels in India.” (draft).
Wor ld Bank. (2003b). “Strategy for Sustained Reforms in the State Power Sector”, South Asia Energy
Wor ld Bank. (2003~). “Global Development Finance ”, Wor ld Bank, Washington D.C.
Wor ld Bank. (2002a). “Poverty in India: The Challenge of Uttar Pradesh”. Poverty Reduction and
Wor ld Bank. (2002b). India: CAS Progress Report, 2002
Wor ld Bank. (2002~). Report on the Transport Sector Strategy for India, 2002
Wor ld Bank. (2002d). Report on the Financial Sector Strategy for India, M a y 2002
Wor ld Bank and CII. (2002e). “Improving India’s Investment Climate”, March.
Wor ld Bank. (2002f). “India - Fiscal Policies to Accelerate Economic Growth”, Poverty Reduction and Economic Management Unit, South Asia Region, Green Cover Report 2473IN.
World Bank. (2002g). “Micro-finance in India: Issues, Constraints, and Potential for Sustainable Growth”, Report No. 22531-IN, September.
Wor ld Bank. (2002h). “Sustainability o f Micro-finance Self Help Groups in India: Would Federating Help?” (Draft), September.
Wor ld Bank. (2002i). “Improving Rural Access to Electricity Services in India”, South Asia Energy and Infrastructure Unit, mimeo.
Wor ld Bank. (2002J). “India: Power Sector Reforms and the Poor”, South Asian Energy and Infrastructure Unit, Wor ld Bank, September.
Wor ld Bank. (2002k). “Maharashtra: Reorienting Government to Facilitate Growth and Reduce Poverty”,
Wor ld Bank, (20021). “India Household Energy, Indoor Air Pollution and Health.”, Report 261/02.
Wor ld Bank. (2002m). Concept Paper for Review of ICT Developments in South Asian Countries and
University, June 3-4,2002.
and Infrastructure Unit, draft discussion paper.
Economic Management Sector Unit, South Asia Region.
October.
Lessons from the Indian ITSewice Industly Experience, SASFP, 6 September.
94
World Bank. (2002n). “Challenges for India’s Transport Sector, Final Report, February 25,2002.
World Bank. (20020). “Development Policy Review: Rationale, Content and Process”, PRMEP, June 17.
World Bank. (2002~). “Power for India: A Strategy for Sustained Reform in the State Power Sectors”,
World Bank. (2002q). “Country Assistance Strategy Progress Report o f the World Bank Group for India”,
World Bank, (2002r). “India: Agricultural Policy Framework for Growth and Sustained Rural Poverty
World Bank. (2001). “India : Power Supply to Agriculture (Vol I-I?”, Report No. 221714” SASEI,
World Bank. (2001a) “India Improving Household Food and Nutrition Security”, Report No. 20300-IN,
World Bank. (2001 c). “India: The Challenges o f Development”, OED Country Assistance Evaluation.
World Bank. (200 1 d). “India: Country Assistance Strategy”, June.
World Bank. (2000). “India: Reducing Poverty, Accelerating Development ”, A World Bank Country
World Bank. (2000). Rural Development Report
World Bank. (2000). World Business Environment Survey.
World Bank. (1999). “India Foodgrain Marketing Policies: Reforming to Mee t Food Security Needs”,
World Bank. (1 999a). “India: Towards Rural Development and Poverty Reduction”, Washington, D.C.
World Bank. (1 999c). “Special (Infrastructure) Financing Facilities - Cross-Country Experience”.
World Bank. (1 998a). Report on Rural Credit Cooperatives (Draft).
World Bank. (1998b). India: Report on Rural Finance, (Draft).
World Bank. (1998~). “Reducing Poverty in India: Options for more Effective Public Services”. A World
World Health Organization. (2002). Polio News Eradication, Global Polio Eradication Initiative,
World Health Organization. (1 999). World Health Report 1999: Making a Difference.
Young, A. (1993). Land Degradation in South Asia: I t s severity, causes, and effects upon the people. Final report prepared for submission to the Economic and Social Council o f the United Nations (ECOSOC). Rome: Food and Agriculture Organization o f the United Nations, United Nations Development Program, and United Nations Environment Program.
draft report, October 24.
November 4.
Reduction: Recent Achievements and Challenges Ahead”, draft concept note, November 13.
Washington D.C.
Washington, D.C.
Study, Oxford University Press, New Delhi.
Report No. 18329-IN, Washington, D.C.
Bank Country Study.
Newsletter 11.17, December.
95

STATISTICAL ANNEX


Table AI . Gross Domestic Expenditure and Product (Shares based on current price data, percent)
1993-94 1994-95 1995-96 1996-97 1997.98 1998-99 1999-00 2000-01 2oO1.02
A. Shares of gross domestic expenditure at market prices
1. Final consumption a) Public Sector b) Private
a) Gross fixed capital formation i) Public sector ii) Private sector
b) Change in inventories 3. Total Absorption (1+2) 4. Resource balance
a) Exports of goods & services b) Imports of goods & services
2. Gross capital formation
5. Gross domestic product 6. Net income from abroad 7. Gross national income (54 ) 8. Net current transfers from abroad 9. Gross national disposable income ( 7 4 ) 10. National savings (9-1)
a) Public Sector b) Private Sector
B. Shares of GDP by Industrial Origin 1. Agriculture 2. Industry
Construction Gas, electricity, water Mining and quarrying Manufacturing
3. Services 4. Statistical discrepancy 5. Total value added at basic prices 6. Taxes less subsidies on products 7. GDP at market prices
78.3 11.4 66.9 21.3 21.4 8.0
13.4 -0.2 99.5
0.0 10.0 10.0
100.0 -1.4 98.6
1.9 100.5 22.2 0.6
21.6
28.2 23.9 4.7 2.2 2.3
14.6 38.9 -1 .o 90.9 9.1
100.0
76.3 10.7 65.6 23.4 21.9 8.8
13.2 1.4
99.7 -0.3 10.0 10.3
100.0 -1.3 98.7
2.5 101.2 24.9
1.7 23.2
27.5 24.5 4.6 2.4 2.2
15.3 38.5 0.0
90.5 9.5
100.0
75.3 10.8 64.5 26.5 24.4 7.7
16.7 2.2
101.8 -1.2 11.0 12.2
100.0 -1 .I 98.9 2.4
101.3 26.0 2.0
23.9
25.5 25.4 4.6 2.3 2.1
16.3 39.4 0.0
90.3 9.7
100.0
76.7 10.7 66.0 21.8 22.8 6.9
15.9 -1 .o 98.5 -1.2 10.6 11.8
100.0 -1 .o 99.0 3.2
102.3 25.6
1.7 23.9
26.5 24.9 4.6 2.2 2.0
16.1 39.5 0.0
90.9 9.1
100.0
75.8 11.3 64.5 22.6 21.7
6.4 15.3 0.9
98.4 -1.3 10.9 12.1
100.0 -0.9 99.1 2.9
102.0 26.2
1.3 24.9
25.4 24.9 5.1 2.3 2.2
15.2 41 .O 0.0
91.3 8.7
100.0
77.7 12.3 65.4 21.4 21.5 6.5
15.1 -0.1 99.1 -1.7 11.2 12.9
100.0 -0.9 99.1
2.5 101.6 23.9 -1 .o 24.9
25.4 24.3 5.3 2.5 2.0
14.5 42.0 0.0
91.8 8.2
100.0
78.6 13.0 65.6 23.7 21.8
6.2 15.6 1.9
102.3 -2.0 11.8 13.7
100.0 -0.8 99.2
2.7 101.9 23.3 -1 .o 24.4
23.9 23.5
5.4 2.2 2.1
13.8 43.6
0.0 91 .o
9.0 100.0
77.7 13.1 64.6 22.5 21.8 6.1
15.8 0.7
100.2 -0.8 13.8 14.5
100.0 -0.8 99.2
2.8 102.0 24.2 -2.3 26.5
22.7 24.2
5.5 2.2 2.2
14.3 44.2 0.0
91 .I 8.9
100.0
77.9 12.8 65.0 22.4 21.7
5.9 15.7 0.8
100.3 -0.7 13.3 13.9
100.0 -0.6 99.4 2.5
102.0 24.1 -2.5 26.6
22.8 23.6 5.5 2.2 2.0
13.9 44.8
0.0 91.2
8.8 100.0
Memo Item (Rs. billion) Gross domestic product at market prices 8592 10128 11880 13682 15225 17409 19369 21043 22960 Source: Central Statistical Organization, National Accounts Statistics.
96
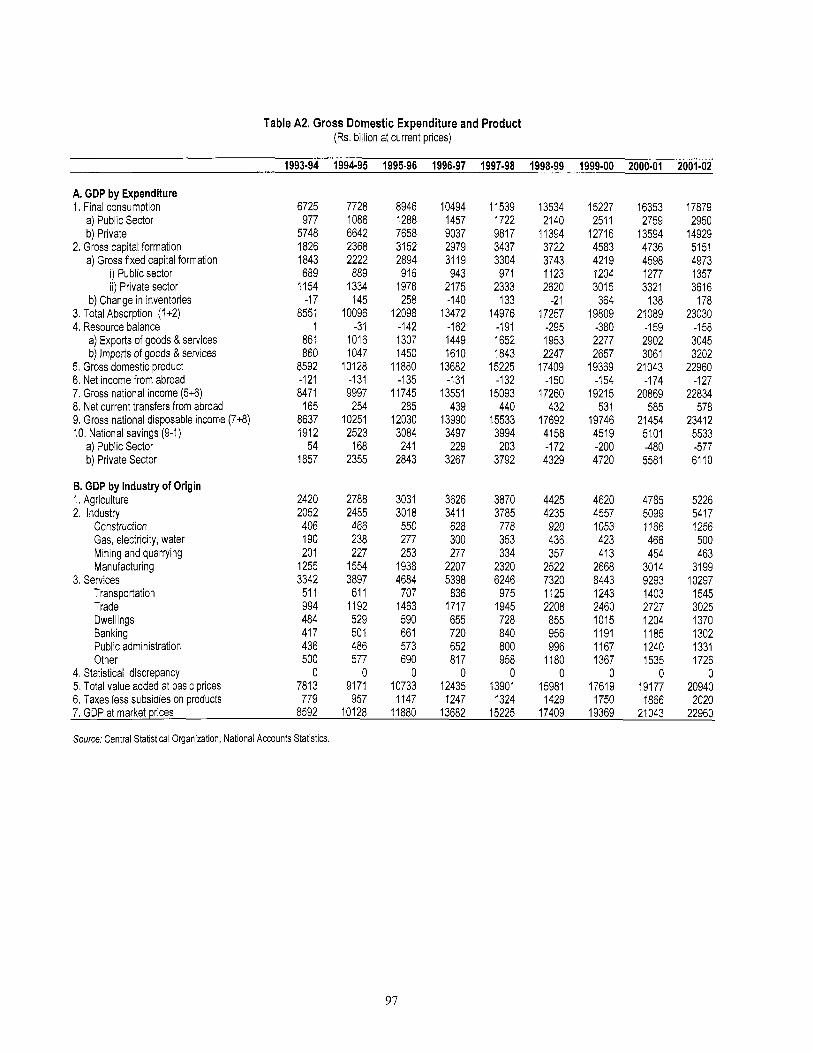
Table A2. Gross Domestic Expenditure and Product (Rs. billion at current prices)
1993-94 199495 1995.96 1996-97 1997-98 1998-99 1999-00 2000-01 2001-02
A. GDP by Expenditure 1. Final consumption
a) Public Sector b) Private
a) Gross fixed capital formation i) Public sector ii) Private sector
b) Change in inventories 3. Total Absorption (1 +2) 4. Resource balance
2. Gross capital formation
a) Exports of goods & services b) Imports of goods & services
5. Gross domestic product 6. Net income from abroad 7. Gross national income ( 5 4 ) 8. Net current transfers from abroad 9. Gross national disposable income ( 7 4 ) 10. National savings (9-1)
a) Public Sector b) Private Sector
B. GDP by Industry of Origin 1. Agriculture 2. Industry
Construction Gas, electricity, water Mining and quarrying Manufacturing
3. Services Transportation Trade Dwellings Banking Public administration Other
4. Statistical discrepancy 5. Total value added at basic prices 6. Taxes less subsidies on Droducts
6725 977
5748 1826 1843 689
1154 -1 7
8551 1
861 860
8592 -1 21 8471
165 8637 1912
54 1857
2420 2052 406 190 201
1255 3342
51 1 994 484 41 7 436 500
0 7813 779
7728 1086 6642 2368 2222 889
1334 145
10096
1016 1047
101 28 -1 31 9997
254 10251 2523
168 2355
-3 1
2788 2485 466 238 227
1554 3897
61 1 1192 529 501 486 577
0 9171 957
8946 1288 7658 3152 2894 91 6
1978 258
12098
1307 1450
11880
11745 285
12030 3084 241
2843
-1 42
-1 35
3031 3018 550 277 253
1938 4684
707 1463 590 661 573 690
0 10733 1147
10494 1457 9037 2979 3119 943
2175 -140
13472 -162 1449 1610
13682 -131
13551 439
13990 3497 229
3267
3626 341 1 628 300 277
2207 5398
836 1717 655 720 652 81 7
0 12435 1247
11 539 1722 9817 3437 3304 971
2333 133
14976 -191 1652 1843
15225
15093 440
15533 3994 203
3792
-1 32
3870 3785
778 353 334
2320 6246
975 1945 728 840 800 958
0 13901 1324
13534 2140
1 1394 3722 3743 1123 2620
-2 1 17257
-295 1953 2247
17409
17260 432
17692 4158
4329
-1 50
-1 72
4425 4235 920 436 357
2522 7320 1125 2208 855 956 996
1180 0
15981 1429
15227 251 1
12716 4583 421 9 1204 3015
364 19809
2277 2657
19369
19215 531
19746 451 9 -200 4720
-380
-1 54
4620 4557 1053 423 41 3
2668 8443 1243 2460 1015 1191 1167 1367
0 17619 1750
16353 2759
13594 4736 4598 1277 3321
138 21089
-1 59 2902 3061
21043
20869 585
21454 5101 4 8 0 5581
-1 74
4785 5099 1166 466 454
3014 9293 1403 2727 1204 1185 1240 1535
0 19177 1866
17879 2950
14929 5151 4973 1357 3616
178 23030
3045 3202
22960
22834 578
23412 5533 -577 61 10
-1 58
-1 27
5226 5417 1256 500 463
3199 10297
1545 3025 1370 1302 1331 1726
0 20940 2020
7. GDP at market prices 8592 10128 11880 13682 15225 17409 19369 21043 22960
Source; Central Statistical Organization, National Accounts Statistics.
97

Table A3. National Income and Product at constant prices (annual growth rates, in percent)
1994-95 1995-96 1996-97 1997-98 1998-99 1999.00 2000-01 2001-02
A. GDP by Expenditure and Income
1, Final consumption a) Public Sector b) Private
2. Gross capital formation Gross fixed capital formation
i) Public sector ii) Private sector
3. Total Absorption 4. Exports of goods & services 5. Imports of goods & services 6. Capacity to Import 7. Gross Domestic Income at market prices 8. Gross national income 9. Gross national disposable income 10. Gross national savings
B. GDP by Industrial origin 1, Agriculture 2. Industry
Construction Gas, electricity, water Mining and quarrying Manufacturing
3. Services 4, Total value added at basic prices
4.2 1.2 4.6
12.8 11.8 18.0 8.1 6.0
13.1 22.7 18.9 8.0 7.4 8.1
21.8
5.0 10.2 5.5 9.4 9.3
12.0 7.1 7.3
6.5 8.0 6.2
19.3 19.3 -6.5 36.1
9.4 31.4 28.0 19.0 6.4 7.8 7.7
11.4
-0.9 11.6 6.2 6.8 5.9
14.9 10.5 7.3
3.8 11.1 2.6 2.2 2.1
-2.8 4.1 3.4
-2.3 13.2 12.8 6.3 4.5 4.2 5.6
-2.4 4.3
10.2 7.9 9.8 1.5 9.8 4.8
7.4 12.9 6.4 8.6 8.7 9.4 8.4 7.7
13.9 20.8 17.2 6.4 5.9 5.5 0.5
6.2 3.7 6.2 7.0 2.8 2.7 8.4 6.5
7.1 13.2 6.0 8.6 8.6 4.9
10.0 7.5
18.0 7.0 5.5 5.5 7.2 7.5 8.5
0.3 4.8 8.0 5.2 3.3 4.0
10.1 6.1
2.3 0.6 2.6 9.4 4.7
10.9 2.4 4.0
23.4 6.5
17.8 3.0 3.9 3.9 8.7
-0.4 6.6 6.9 5.0 2.4 7.3 5.6 4.4
6.1 7.2 5.9 3.0 3.0 3.0 3.0 5.3 6.0 3.5 3.8 5.1 5.8 5.5 4.0
5.7 3.3 3.7 4.3 1 .o 3.4 6.8 5.6
5. GDP at market prices 7.5 7.6 . . . 4.5 6.0 7.1 3.9 5.5 Notes: ' I Exports deflated by import price index. Source: Central Statistical Organization, National Accounts Statistics.
7.4 4.5 7.9 1.6 1.5
-5.9 4.8 6.0 6.3
-2.5 -2.7 6.3 7.7 8.5
11.6
9.6 7.1 2.1 5.4 0.5 9.7 7.2 7.8 7 4
98

Table A4. Gross Domestic Product by Expenditure, National Income and Savings (Rs. billion at 1993-94 prices)
1993-94 1994.95 1995-96 1996-97 1997-98 1998.99 1999.00 2000-01 2001-02 A. GDP by Expenditure and Income 1. Final consumption
a) Public Sector b) Private
a) Gross fixed capital formation 2. Gross capital formation
i) Public sector ii) Private sector
b) Change in inventories 3. Total Absorption (1 +2) 4. Resource balance
a) Exports of goods & services b) Imports of goods & services
5. Gross domestic product 6. Trading gains or losses 7. Gross domestic income ( 5 4 ) 8. Net income from abroad 9. Gross national income ( 7 4 ) 10. Net current transfers from abroad 11, Gross national disposable income (9+10) 12. Gross national savings (11-1) Memo Item: Capacity to import
B. GDP by Industrial origin 1, Agriculture 2. Industry
Construction Gas, electricity, water Mining and quarrying Manufacturing
3. Services Transportation Trade Dwellings Banking Public administration Other
4. Statistical discrepancy 5. Total value added at basic prices 6. Taxes less subsidies on DrOdUCtS
6725 977
5748 1826 1843 689
1154 141
8551 1
861 860
8592 0
8592 -1 21 8471
165 8637 1912
861
2420 2052 406 190 20 1
1255 3342 51 1 994 484 41 7 436 500
0 7813 779
7004 989
6015 2061 2061 81 3
1248 378
9065 -82 974
1055 9233
50 9284 -132 9101
232 9333 2329
1024
2541 2261 428 208 220
1405 3579 562
1100 499 452 442 525
0 8380 853
7458 1069 6389 2458 2458
759 1698 252
9916 -7 1
1280 1351 9939
-61 9878 -126 9813
238 10052 2594
1219
251 9 2524 455 222 233
1614 3953 623
1259 527 501 472 571
0 8996
944
8012 1116 6896 2496 2495 715
1780 189
10509 43
1361 1318
10674
10499 -1 07
10567 339
10906 2894
1185
-175
2761 2702 465 234 234
1770 4238
674 1355
550 550 49 1 61 7
0 9701 974
8313 1240 7073 2551 2548 695
1853 343
10864 -1 63 1329 1492
11152 8
11161 -1 06
11 046 322
11 368 3056
1337
2694 281 8 51 2 252 257
1797 4654
730 1458 580 648 562 676
0 10166
987
8924 1400 7524 2772 2769 760
2009 140
11 696
1514 1803
11820 53
1 1874 -1 20
11700 293
11994 3069
1567
-290
2861 2923 544 270 264
1846 5043 789
1569 613 705 622 744
0 10827
993
9561 1584 7977 301 0 3008 798
221 0 493
12571 -1 44 1786 1930
12664
12532 -116
12548 345
12892 3332
1654
-1 32
2870 3064 587 284 273
1920 5551 876
1682 659 800 704 829
0 11484
1179
9780 1593 81 86 3294 3148
885 2264 304
13074 149
2204 2054
13163
12907
13039 362
13401 3621
1948
-256
-1 24
2859 3266
628 298 279
2061 5862 983
1751 71 9 790 722 897
0 11 987
1177
10378 1709 8669 3394 3244
91 1 2333
150 13772
21 0 2336 21 25
13881 -315
13566 -84
13798 345
14143 3765
2021
3021 3375 652 31 1 282
2131 6259 1066 1906 761 81 6 743 966
0 12654
1227 7. GDP at market prices ( 5 4 ) 8592 9233 9939 10674 11152 11820 12664 13163 13881 Source: Central Statistical Organization, National Accounts Statistics.
99
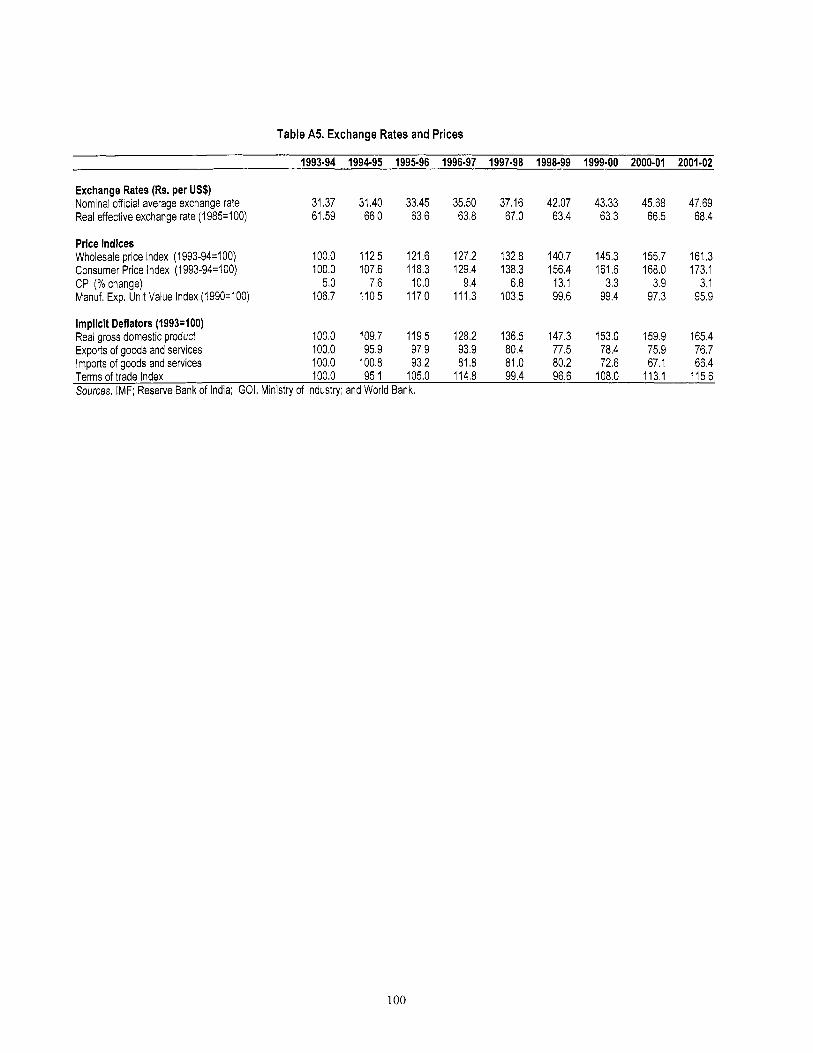
Table A5. Exchange Rates and Prices
1993.94 199495 1995-96 1996-97 1997.98 1998-99 1999.00 2000-01 200142
Exchange Rates (Rs. per US$) Nominal official average exchange rate 31.37 31.40 33.45 35.50 37.16 42.07 43.33 45.68 47.69 Real effective exchange rate (1985=100) 61.59 66.0 63.6 63.8 67.0 63.4 63.3 66.5 68.4
Price Indices Wholesale price index (1993-94=100) 100.0 112.5 121.6 127.2 132.8 140.7 145.3 155.7 161.3 Consumer Price Index (1993-94400) 100.0 107.6 118.3 129.4 138.3 156.4 161.6 168.0 173.1 CPI (YO change) 5.0 7.6 10.0 9.4 6.8 13.1 3.3 3.9 3.1 Manuf. Exp. Unit Value Index (1990=100) 106.7 110.5 117.0 111.3 103.5 99.6 99.4 97.3 95.9
Implicit Deflators (1993=100) Real gross domestic product 100.0 109.7 119.5 128.2 136.5 147.3 153.0 159.9 165.4 Exports of goods and services 100.0 95.9 97.9 93.9 80.4 77.5 78.4 75.9 76.7 Imports of goods and services 100.0 100.8 93.2 81.8 81.0 80.2 72.6 67.1 66.4 Terms of trade Index 100.0 95.1 105.0 114.8 99.4 96.6 108.0 113.1 115.6 Sources: IMF; Reserve Bank of India; GOI, Ministry of Industry; and World Bank.
100
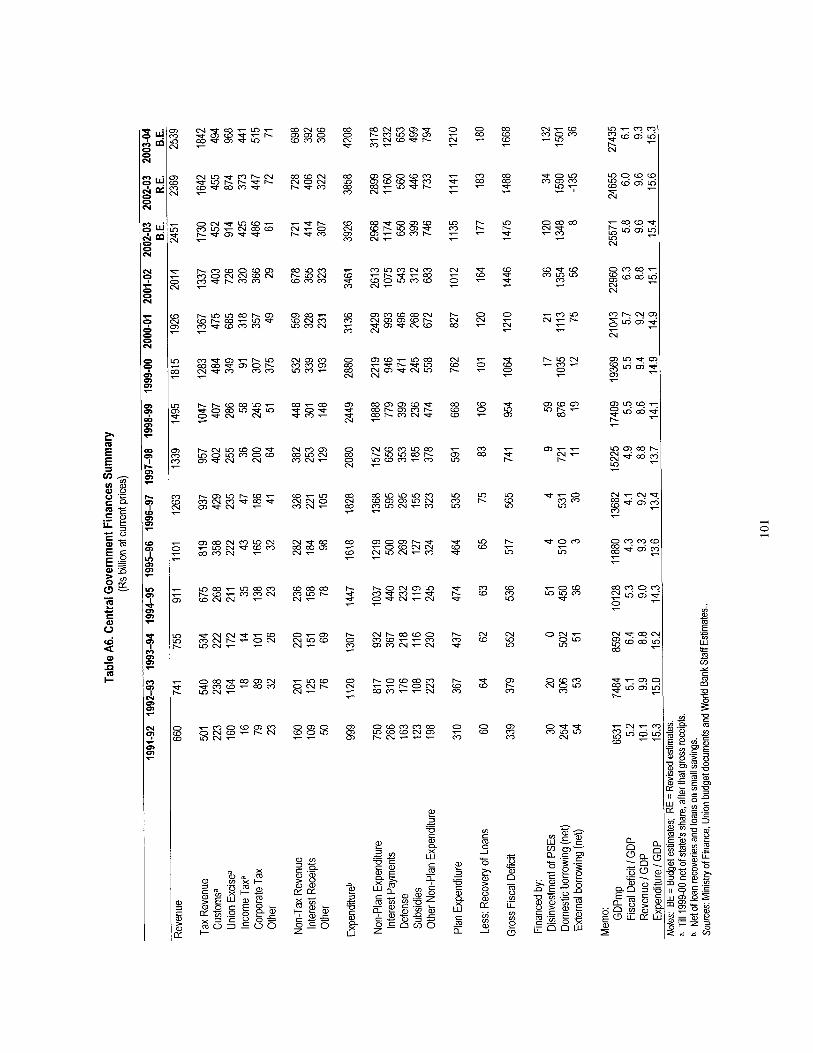
w w w m m r - N -
0.-m w m w N.-
- - m w ohlr-
o m 0 W O L D 7.-
r- d
f r - o n l m L o m 9 m - w O d N - h l .-
W m m - o w m m m d
O N - - o m m
o w 0 w o m m
O b d m m m hl
N m m r- 0
2
m r- 0
r - o w w m --r.ohl wm.-.-N
m m m
v ) c m 0 1
.n 2 3 a c 25 s

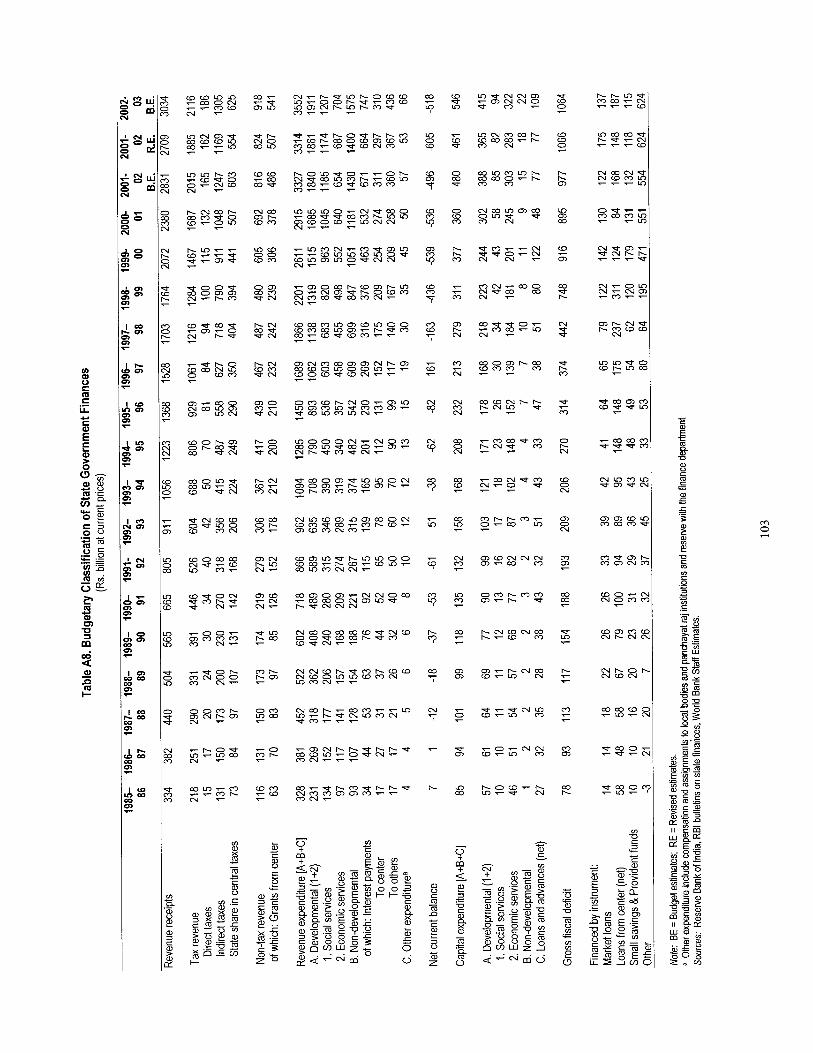
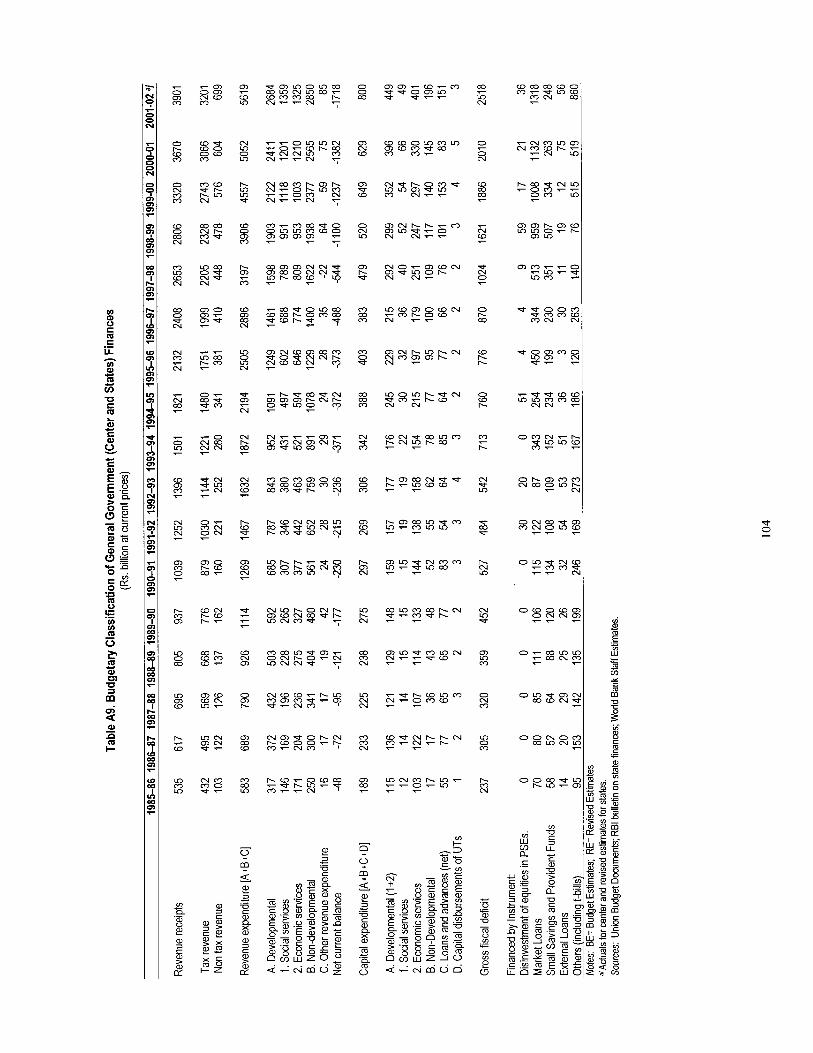

J
h R

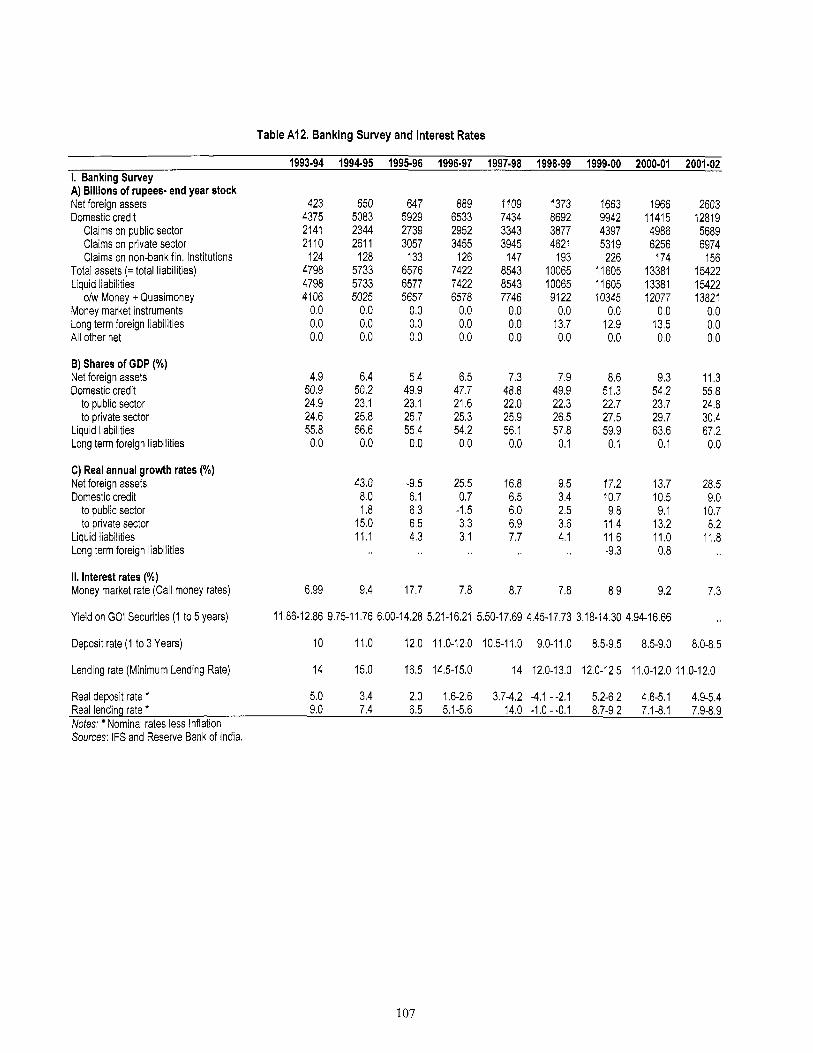
Table A12. Banking Survey and Interest Rates
1993-94 1994.95 1995.96 1996-97 1997.98 1998.99 1999-00 2000-01 200142 1. Banking Survey A) Billions of rupees- end year stock Net foreign assets Domestic credit
Claims on public sector Claims on private sector Claims on non-bank fin. Institutions
Total assets (= total liabilities) Liquid liabilities
olw Money + Quasimoney Money market instruments Long term foreign liabilities All other net
B) Shares of GDP (%) Net foreign assets Domestic credit
to public sector to private sector
Liquid liabilities Long term foreign liabilities
C) Real annual growth rates (%) Net foreign assets Domestic credit
to public sector to private sector
Liquid liabilities Long term foreign liabilities
II. Interest rates (%) Money market rate (Call money rates)
Yield on GO1 Securities (1 to 5 years)
Deposit rate (1 to 3 Years)
Lending rate (Minimum Lending Rate)
Real deposit rate *
423 4375 2141 2110
124 4798 4798 4106
0.0 0.0 0.0
4.9 50.9 24.9 24.6 55.8 0.0
6.99
650 5083 2344 261 1
128 5733 5733 5025
0.0 0.0 0.0
6.4 50.2 23.1 25.8 56.6 0.0
43.0 8.0 1.8
15.0 11.1
9.4
647 5929 2739 3057
133 6576 6577 5657
0.0 0.0 0.0
5.4 49.9 23.1 25.7 55.4 0.0
-9.5 6.1 6.3 6.5 4.3
17.7
889 6533 2952 3455
126 7422 7422 6578
0.0 0.0 0.0
6.5 47.7 21 6 25.3 54.2 0.0
25.5 0.7
-1.5 3.3 3.1
7.8
1109 7434 3343 3945
147 8543 8543 7746
0.0 0.0 0.0
7.3 48.8 22.0 25.9 56.1
0.0
16.8 6.5 6.0 6.9 7.7
8.7
1373 8692 3877 4621
193 10065 10065 91 22
0.0 13.7 0.0
7.9 49.9 22.3 26.5 57.8
0.1
9.5 3.4 2.5 3.6 4.1
7.8
1663 9942 4397 531 9
226 11 605 1 1605 10345
0.0 12.9 0.0
8.6 51.3 22.7 27.5 59.9
0.1
17.2 10.7 9.8
11.4 11.6 -9.3
8.9
1966 11415 4986 6256
174 13381 13381 12077
0.0 13.5 0.0
9.3 54.2 23.7 29.7 63.6
0.1
13.7 10.5 9.1
13.2 11.0 0.8
9.2
11.86-12.86 9.75-1 1.76 6.00-14.28 5.21-16.21 5.50-17.69 4.45-17.73 3.18-14.30 4.94-16.66
10 11.0 12.0 11.0-12.0 10.5-11.0 9.0-11.0 8.5-9.5 8.5-9.0
2603 12819 5689 6974
156 15422 15422 13821
0.0 0.0 0.0
11.3 55.8 24.8 30.4 67.2 0.0
28.5 9.0
10.7 8.2
11.8
7.3
8.0-8,5
14 15.0 16.5 14.5-15.0 14 12.0-13.0 12.0-12.5 11.0-12.0 11.0-12.0
5.0 3.4 2.0 1.6-2.6 3.74.2 4.1--2.1 5.2-6.2 4.6-5.1 4.9-5.4 Real lending rate * 9.0 7.4 6.5 5.1-5.6 14.0 -1.0 --0.1 8.7-9.2 7.1-8.1 7.9-8.9 Notes: Nominal rates less Inflation Sources: IFS and Reserve Bank of India.
107

Table A I 3. Balance of Payments (US$ Millions)
1993-94 1994-95 1995-96 1996-97 1997-98 1998-99 1999-00 2000.01 2001-02 ~
Current Account Exports of goods & services
Exports of goods Exports of services
Imports of goods & services Imports of goods, f.0.b. Imports of services
Net trade in goods & services
Income receipts Income payments Net income from abroad
Private current transfer receipts Private current transfer payments Net private current transfers
Current Account Balance Capital & Financial Account Net official capital grants
Net total private investment inflows Net direct investment inflows Net portfolio investment inflows
External Assistance, net Commercial Borrowings, net Rupee Debt Service NRI Deposits, net Other Capital
Reserves, net change (negative sign indicates increase) Other Series Foreign Exchange reserves (end of period, incl.
Reserves (as months of imports of goods and services)
gold)
27947 22683 5264
31468 26739 4729
-3521
395 3665
-3270
5287 22
5265
-1 526
368
4235 668
3567
1901 607
-1 053 1205 2800
-8724
19254
7.3
32990 39657 41607 45109 47484 53251 63764 26855 32311 34133 35680 34298 37542 44894 6135 7346 7474 9429 13186 15709 18870
41437 51213 55696 59297 58565 67028 75656 35904 43670 48948 51187 47544 55383 59264 5533 7543 6748 8110 11021 11645 16392
-8447 -11556 -14089 -14188 -11081 -13777 -11892
886 1429 1073 1561 1935 1931 2366 4317 4634 4380 5082 5479 5490 6187
-3431 -3205 -3307 -3521 -3544 -3559 -3821
8112 8539 12435 11875 10341 12290 12873 19 33 68 45 61 34 75
8093 8506 12367 11830 10280 12256 12798
-3785 -6255 -5029 -5879 -4345 -5080 -2915
416 345 410 379 307 382 336
4807 4805 6153 5390 2412 5191 5102 983 2057 2841 3562 2473 2165 2342
3824 2748 3312 1828 -61 3026 2760
1526 883 1109 907 820 901 427 1030 1275 2848 3999 4362 313 4011
172 1103 3350 1125 960 1540 2317 -983 -952 -727 -767 -802 -711 -617
2604 -2425 -1321 -643 508 3866 -2805
-4644 2936 -5818 -3893 -3829 -6142 -5830
25186 21687 26423 29367 32490 38036 42281
7.3 5.1 5.7 5.9 6.7 6.8 6.7
65201 44915 20286
73705 57618 16087
-8504
2749 5403
-2654
12192 67
12125
967
384
5925 3905 2020
1204 -1 147
-51 9 2754 21 89
-1 1757
541 06
8.8
GDP (b/'liions of US$) 273.9 322.6 355.2 385.4 409.7 413.8 447.0 460.6 481.4 Source: Reserve Bank of India.
108


Table A14. Exports and Imports (US$ million)
1993-94 1994-95 1995-96 1996-97 1997-98 1998-99 1999.00 2000-01 2001-02 A. EXPORTS AI . Exports (fob, US$) Total Primary Commodities
Oil Meals Marine Products Ores and Minerals Other Primary commodities
Gems and Jewellery Readymade Garments Other Manufactures
Manufactures
Total A.2 Exports (constant prices- 1993-94) Total Primary Commodities
Oil Meals Marine Products Ores and Minerals Other Primary commodities
Manufactures Gems and Jewellery Readymade Garments Other Manufactures
Total 6. IMPORTS B.l Imports (cif, US$) Food Consumer Goods POL and Other Energy Intermediate Goods
Stones Pearls, Precious and Semi-precious
Organic and Inorganic Chemicals Other intermediate goods
Capital Goods Total 6.2 Imports (constant prices, 1993-94) Food Consumer Goods POL and Other Energy Intermediate Goods
Stones Pearls, Precious and Semi-Precious
Organic and Inorganic Chemicals Other intermediate goods
Capital Goods Total C. INDEXES (1993=100) C1. Volume Indices Merchandise Exports Merchandise Imports C2. Price Indices Merchandise export price index Merchandise import price index
4916 74 1 814 888
2473 16657 3996 2586
10075 22683
491 6 741 814 888
2473 16657 3996 2586
10075 22683
327 3032 5754 7951 2635
1371 3946 6243
23306
327 3032 5754 7951 2635
1371 3946 6243
23306
100.0 100.0
100.0 100.0
5214 573
1126 988
2527 20404 4500 3282
12622 26855
4907 579 935
1136 2258
20388 4339 2978
13071 25769
1144 4249 5928 9696 1630
2137 5929 7638
28654
858 3603 5775 421 2 1493
1898 821
14413 28861
113.7 124.1
104.2 99.3
7257 702
1011 1175 4369
23747 5275 3676
14797 3231 1
7868 687 922
1386 4874
23207 5283 3285
14639 33739
970 5819 7526
12031 2106
2566 7359
10330 36675
64 1 4606 6832
12073 1550
2319 8204
12286 36438
149.2 156.4
95.8 100.7
8035 985
1129 1172 4749
2461 3 4753 3753
16107 34133
7694 770
1033 1181 471 1
27003 5622 4562
16819 36290
1214 5115
10036 12845 2925
2661 7260 9922
39132
1002 3812 7614
13196 2337
2784 8075
10584 36208
159.9 155.5
94.1 108.1
7687 6928 924 462
1207 1038 1061 893 4495 4535
26547 25792 5346 5929 3876 4365
17325 15497 35680 34298
6676 7904 685 633
1030 994 1043 910 3918 5367
23891 21907 5700 6452 5711 6415
12481 9040 34007 35638
1483 2524 5143 4307 8164 6399
16898 19094 3342 3760
2956 2684 10600 12650 9796 10064
41485 42389
1276 2085 4171 3551 7793 8504
18108 22794 2875 3656
2881 5986 12352 13152 8438 8635
39786 45568
149.9 155.0 170.8 195.7
104.9 96.2 104.3 93.0
6524 378
1183 91 6
4048 29714 7502 4765
17447 37542
7171 490
1141 1070 4469
23988 7898 7090 9000
4071 1
2417 461 8
12611 21059 5436
2866 12757 8966
49671
1768 41 33 9533
24873 5518
7480 11875 9559
49865
179.0 214.2
92.2 99.6
71 26 448
1396 1155 4127
34391 7384 5578
21429 44894
7877 453
1231 1104 5090
38427 8857 8146
21 424 49681
1443 3722
15650 20780 4808
2444 13528 8941
50536
2078 3215 9207
25326 4161
541 9 15745 9598
49424
221.7 212.1
90.4 102.3
7065 474
1218 1214 41 59
33241 7306 5004
20930 44915
8546 493
1288 1094 5671
41061 8116 8637
24308 52391
2044 4209
14000 21 51 9 4622
2771 14126 9315
51087
1542 4202 9978
24709 4600
2773 17337 11091 51 523
274.7 210.0
86 99
Merchandise Terms of Trade 100.0 105.0 95.1 87.0 100.6 103.5 92.6 88.4 86 Source: Reserve Bank of India.
110
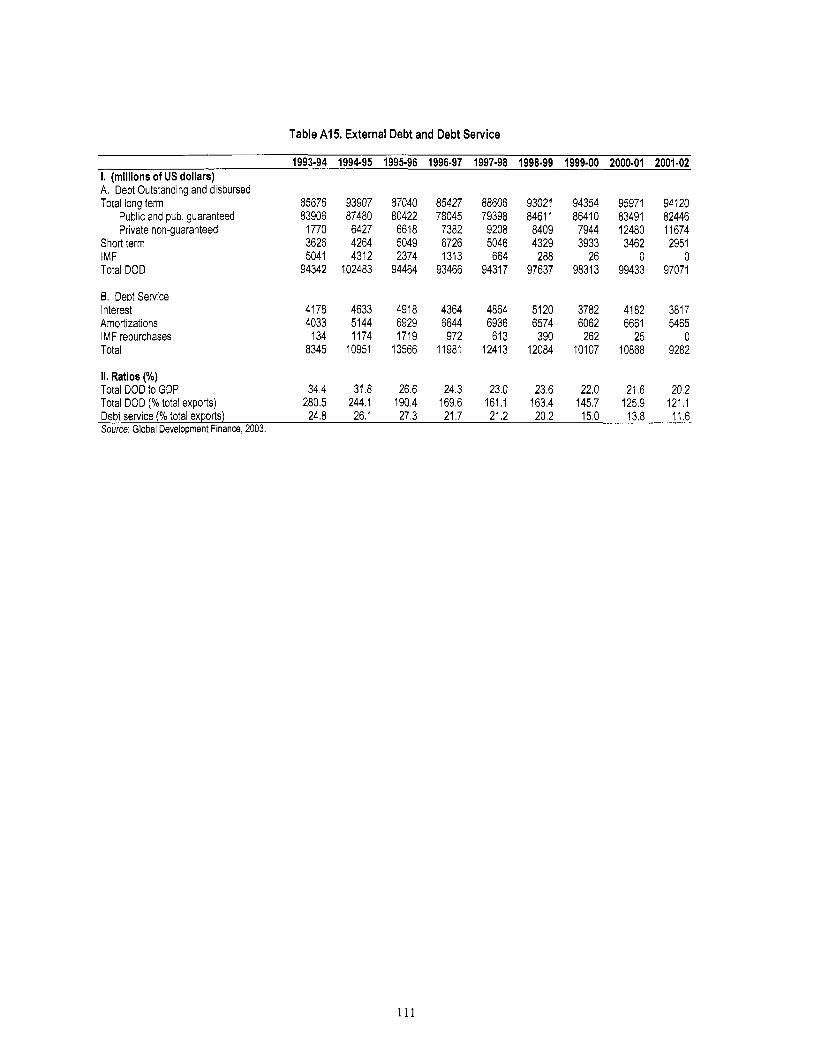
Table A15 External Debt and Debt Service
1. (millions of US dollars) A. Debt Outstanding and disbursed Total long term
Public and pub. guaranteed Private non-guaranteed
Short term IMF Total DOD
6. Debt Service Interest Amortizations IMF repurchases Total
1993-94 1994-95 1995-96 1996-97 1997.98 1998.99 1999.00 2000-01 2001-02
85676 93907 87040 85427 88606 93021 94354 95971 94120 83906 87480 80422 78045 79398 84611 86410 83491 82446
1770 6427 6618 7382 9208 8409 7944 12480 11674 3626 4264 5049 6726 5046 4329 3933 3462 2951 5041 4312 2374 1313 664 288 26 0 0
94342 102483 94464 93466 94317 97637 98313 99433 97071
4178 4633 4918 4364 4864 5120 3782 4182 3817 4033 5144 6929 6644 6936 6574 6062 6661 5465
134 1174 1719 972 613 390 262 25 0 8345 10951 13566 11981 12413 12084 10107 10868 9282
II. Ratios (%) Total DOD to GDP 34.4 31.8 26.6 24.3 23.0 23.6 22.0 21.6 20.2 Total DOD (%total exports) 280.5 244.1 190.4 169.6 161.1 163.4 145.7 125.9 121.1 Debt service (% total exports) 24.8 26.1 27.3 21.7 21.2 20.2 15.0 13.8 11.6 Source: Global Development Finance, 2003.
111
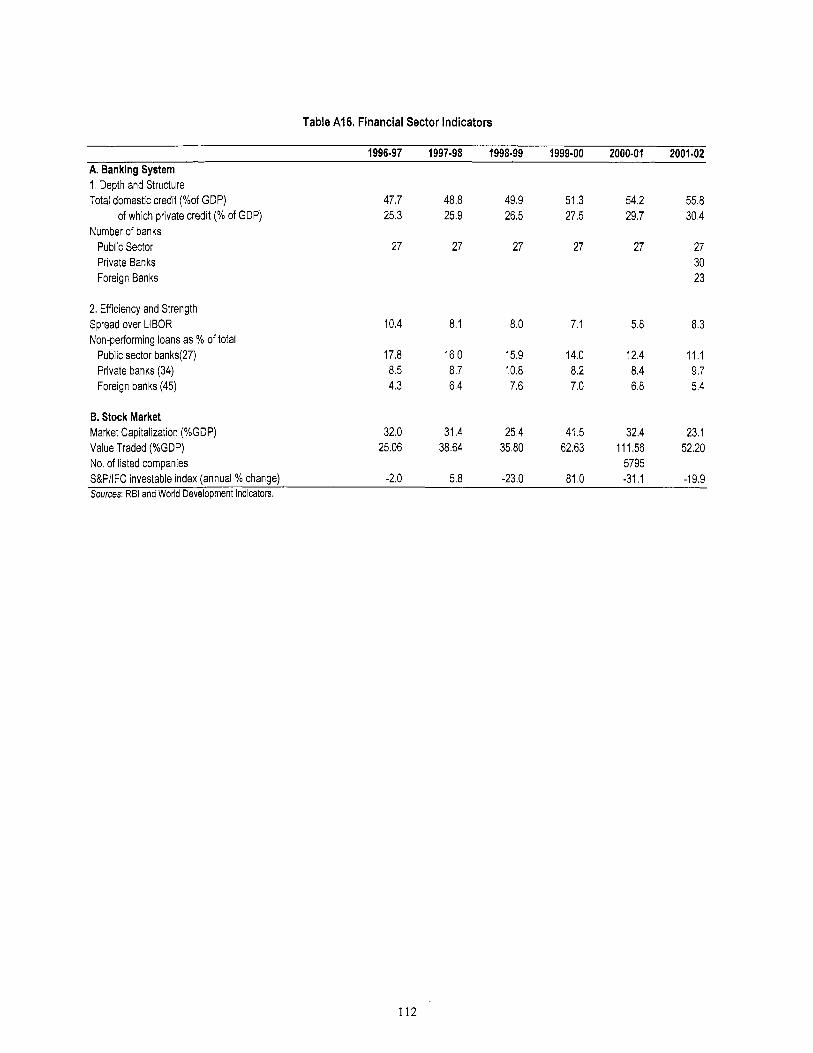
Table A16. Financial Sector Indicators
1996-97 1997-98 1998-99 1999-00 2000-01 2001-02 A. Banking System 1. Depth and Structure Total domestic credit (%of GDP)
Number of banks Public Sector Private Banks Foreign Banks
of which private credit (% of GDP)
2. Efficiency and Strength Spread over LIBOR Non-performing loans as % of total
Public sector banks(27) Private banks (34) Foreign banks (45)
47.7 48.8 49.9 51.3 54.2 55.8 25.3 25.9 26.5 27.5 29.7 30.4
27 27 27 27 27 27 30 23
10.4 8.1 8.0 7.1 5.8 8.3
17.8 16.0 15.9 14.0 12.4 11.1 8.5 8.7 10.8 8.2 8.4 9.7 4.3 6.4 7.6 7.0 6.8 5.4
B. Stock Market Market Capitalization (%GDP) 32.0 31.4 25.4 41.5 32.4 23.1 Value Traded (%GDP) 25.06 38.64 35.80 62.63 111.56 52.20 No. of listed companies 5795 S&P/IFC investable index (annual % change) -2.0 5.8 -23.0 81 .O -31 .I -1 9.9 Sources: RBI and World Development Indicators.
112
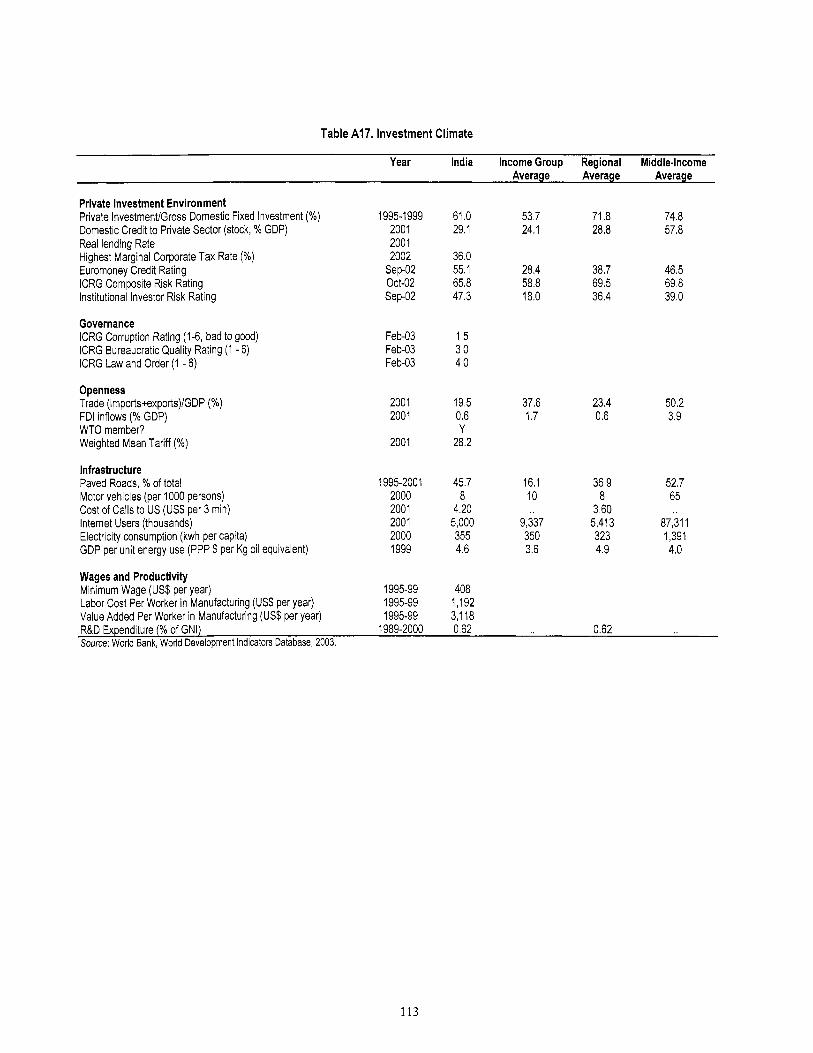
Table A17. Investment Climate
Year India Income Group Regional Middle-Income Average Average Average
Private Investment Environment Private InvestmentlGross Domestic Fixed Investment (%) Domestic Credit to Private Sector (stock, % GDP) Real lending Rate Highest Marginal Corporate Tax Rate (%) Euromoney Credit Rating ICRG Composite Risk Rating Institutional Investor Risk Rating
Governance ICRG Corruption Rating (1-6, bad to good) ICRG Bureaucratic Quality Rating (1 - 6) ICRG Law and Order (1 - 6)
Openness Trade (imports+exports)/GDP (%) FDI inflows (% GDP) WTO member? Weighted Mean Tariff (%)
Infrastructure Paved Roads, % of total Motor vehicles (per 1000 persons) Cost of Calls to US (US$ per 3 min) Internet Users (thousands) Electricity consumption (kwh per capita) GDP per unit energy use (PPP $ per Kg oil equivalent)
Wages and Productivity Minimum Wage (US$ per year) Labor Cost Per Worker in Manufacturing (US$ per year) Value Added Per Worker in Manufacturing (US$ per year)
1995-1999 2001 2001 2002
Sep-02 Oct-02 Sep-02
Feb-03 Feb-03 Feb-03
2001 2001
2001
1995-2001 2000 2001 2001 2000 1999
1995-99 1995-99 1995-99
61 .O 53.7 29.1 24.1
36.0 55.1 28.4 65.8 58.8 47.3 18.0
1.5 3.0 4.0
19.5 37.6 0.6 1.7 Y
28.2
45.7 16.1 8 10
4.20 5,000 9,337 355 350 4.6 3.6
408 1,192 3,118
71.8 74.8 28.8 57.8
38.7 46.5 69.5 69.8 36.4 39.0
23.4 0.6
50.2 3.9
36.9 52.7 8 65
3.60 5,413 87,311 323 1,391 4.9 4.0
R&D Expenditure (% of GNI) 1989-2000 0.62 0.62 Source: World Bank, World Development Indicators Database, 2003.
113
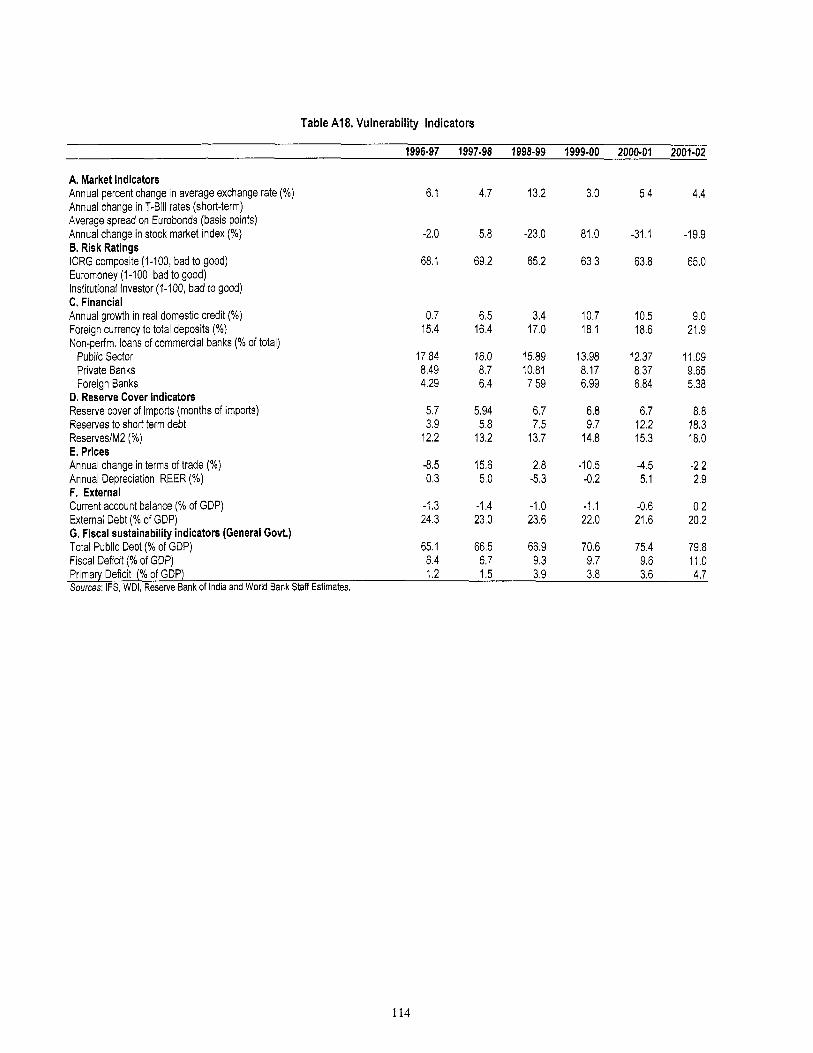
Table A I 8. Vulnerability Indicators
1996-97 1997-98 1998-99 1999-00 2000-01 2001-02
A. Market Indicators Annual percent change in average exchange rate (%) Annual change in T-Bill rates (short-term) Average spread on Eurobonds (basis points) Annual change in stock market index (%) B. Risk Ratings ICRG composite (1-100, bad to good) Euromoney (1-100, bad to good) Institutional Investor (1-100, bad to good) C. Financial Annual growth in real domestic credit (%) Foreign currency to total deposits (%) Non-perfm. loans of commercial banks (% of total)
Public Sector Private Banks Foreign Banks
D. Reserve Cover Indicators Reserve cover of imports (months of imports) Reserves to short term debt ReserveslM2 (%) E. Prices Annual change in terms of trade (%) Annual Depreciation REER (%) F. External Current account balance (% of GDP) External Debt (% of GDP) G. Fiscal sustainability indicators (General Govt.) Total Public Debt (% of GDP) Fiscal Deficit (% of GDP)
6.1
-2.0
68.1
0.7 15.4
17.84 8.49 4.29
5.7 3.9
12.2
-8.5 0.3
-1.3 24.3
65.1 6.4
4.7
5.8
69.2
6.5 16.4
16.0 8.7 6.4
5.94 5.8
13.2
15.6 5.0
-1.4 23.0
66.5 6.7
13.2
-23.0
65.2
3.4 17.0
15.89 10.81 7.59
6.7 7.5
13.7
2.8 -5.3
-1 .o 23.6
66.9 9.3
3.0
81 .O
63.3
10.7 18.1
13.98 8.17 6.99
6.8 9.7
14.8
-10.5 -0.2
-1.1 22.0
70.6 9.7 3.8
5.4
-31 .I
63.8
10.5 18.6
12.37 8.37 6.84
6.7 12.2 15.3
-4.5 5.1
-0.6 21 6
75.4 9.6
4.4
-1 9.9
65.0
9.0 21.9
11.09 9.65 5.38
8.8 18.3 18.0
-2.2 2.9
0.2 20.2
79.8 11.0 4.7 Primary Deficit (% of GDP) 1.2 1.5 3.9 3.6
Sources: IFS, WDI, Reselve Bank of India and World Bank Staff Estimates.
114

Table A19. Millennium Development Goals Indicators
1990 1994 1999 2001
1. Eradicate extreme poverty and hunger 2015 target halve 1990 $1 a day poverty and malnutrition rates Population below $1 a day (%) 44 Poverty gap at $1 a day (%) 12 Poverty rate (%) 36 Percentage share of income or consumption held by poorest 20% Prevalence of child malnutrition (% of children under age 5) 64 53 Population below minimum level of dietary energy consumption (%) 25
2. Achieve universal primary education 2015 target net enrollment to 100 Net primary enrollment ratio (% of relevant age group) Percentage of cohort reaching grade 5 (%) Youth literacy rate (% ages 15-24)
3. Promote gender equality 2005 target education ratio to 100 Ratio of girls to boys in primary and secondary education (%) Ratio of young literate females to males (% ages 15-24) Share of women employed in the nonagricultural sector (%) Proportion of seats held by women in national parliament (%)
51 55
64 68
68 70 74 78
8
4. Reduce child mortality 2015 target reduce 1990 under 5 mortality by two-thirds Under 5 mortality rate (per 1,000) Infant mortality rate (per 1,000 live births) Immunization, measles (% of children under 12 months)
94 79 35
5. Improve maternal health 2015 target reduce 1990 maternal mortality by three- fourths Maternal mortality ratio (per 100,000 live births) Births attended by skilled health staff (% of total)
424 34
6. Combat HIVIAIDS, malaria and other diseases 2015 target halt, and begin to reverse, AIDS, etc. Prevalence of HIV, female (% ages 15-24) Contraceptive prevalence rate (% of women ages 1549) Number of children orphaned by HlVlAlDS Incidence of tuberculosis (per 100,000 people) Tuberculosis cases detected under DOTS (%)
40.6
467
7. Ensure environmental sustainability 2015 target various (see notes) Forest area (% of total land area) Nationally protected areas (% of total land area) GDP per unit of energy use (PPP $ per kg oil equivalent) C02 emissions (metric tons per capita) Access to an improved water source (% of population) Access to improved sanitation (% of population) Number of households with toilet facility (%) Access to secure tenure (% of population)
21.4 4.8
3.3 4 0.8 1
68 21
30
8. Develop a Global Partnership for Development 2015 target = various (see notes) 10.1
Fixed line and mobile telephones (per 1,000 people) 5.9 13 Youth unemployment rate (% of total labor force ages 15-29)
Personal computers (per 1,000 people) 0.3 1.3 Note: In some cases the data are for earlier or later years than those stated
8 47 23
77 ' 60
72
75 81
48
95 68 42
540 42
0.6 48.2
544 6
4.8 4.7 1 ,I 78
36
26.5 3.3
28.6
73
81
21.6
31
12.1 32 4.5
Source: World Development Indicators database, April 2003; National Family Health Survey (NFHS); National Sample Survey (NSS); Planning Commission, Govemment of India
115
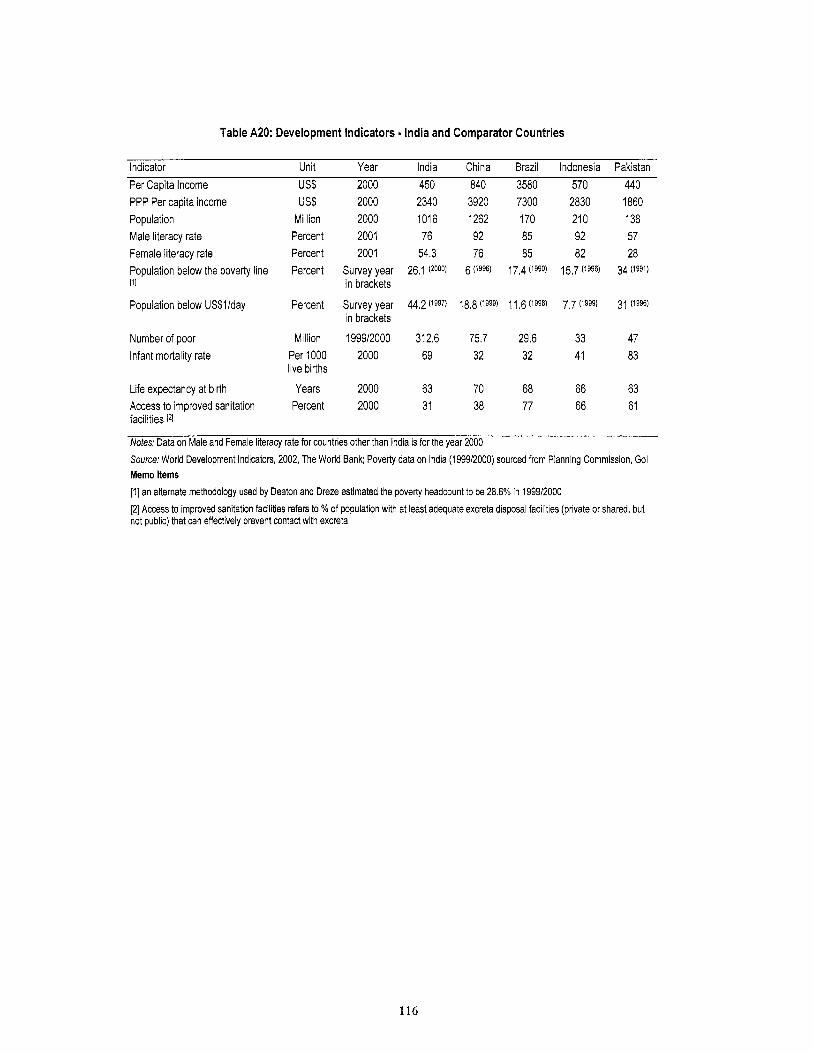
Table A20: Development Indicators - India and Comparator Countries
Indicator Unit Year India China Brazil Indonesia Pakistan Per Capita Income US$ 2000 450 840 3580 570 440 PPP Per capita income Population Male literacy rate Female literacy rate Population below the poverty line [I1
Population below US$l/day
Number of poor Infant mortality rate
Life expectancy at birth Access to improved sanitation facilities I21
US$ Million Percent Percent Percent
Percent
Million Per 1000 live births
Years Percent
2000 2000 2001 2001
Survey year in brackets
Survey year in brackets I99912000
2000
2000 2000
2340 1016 76
54.3 26.1 (2000)
44.2 (1997)
312.6 69
63 31
3920 7300 1262 170 92 85 76 85
6 (1996) 17.4 (1990)
75.7 29.6 32 32
70 68 38 77
1860 138 57 28
34 (1991)
31 (1996)
47 83
63 61
Notes: Data on Male and Female literacy rate for countries other than India is for the year 2000 Source: World Development Indicators, 2002, The World Bank; Poverty data on India (199912000) sourced from Planning Commission, Go1 Memo Items [ I ] an alternate methodology used by Deaton and Dreze estimated the poverty headcount to be 28.6% in 199912000 [2] Access to improved sanitation facilities refers to % of population with at least adequate excreta disposal facilities (private orshared, but not public) that can effectively prevent contact with excreta
116
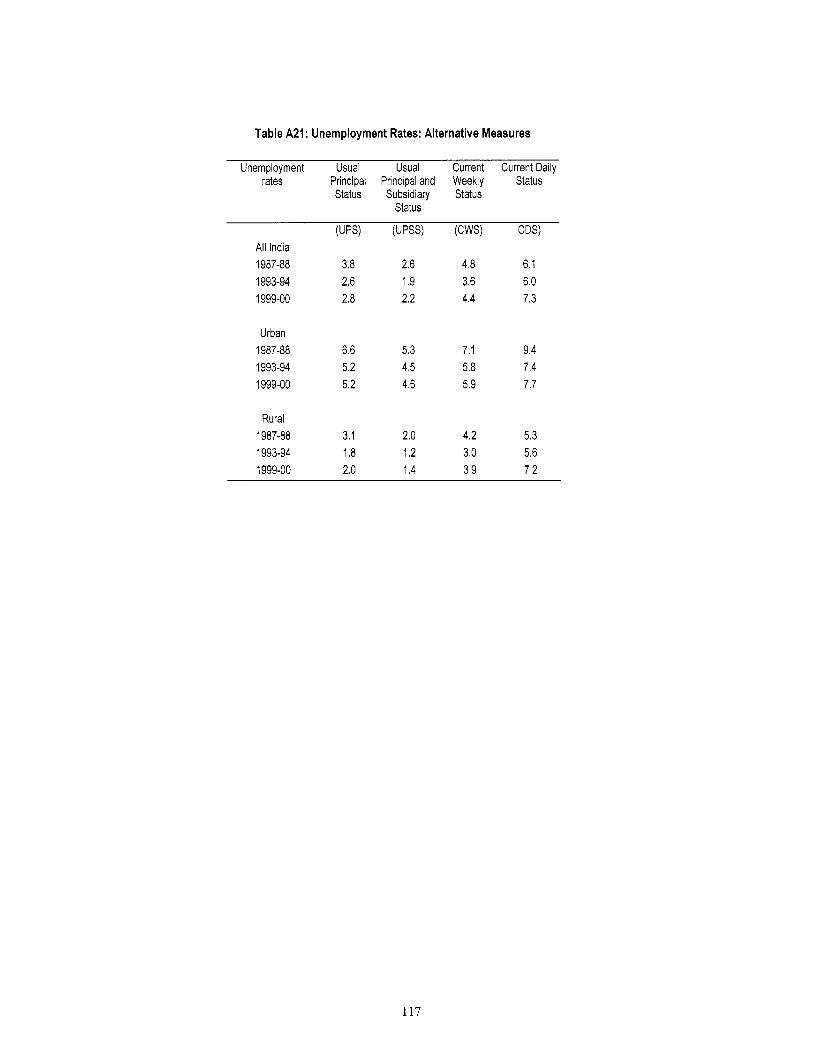
Table A21 : Unemployment Rates: Alternative Measures
Unemployment Usual Usual Current Current Daily rates Principal Principal and Weekly Status
Status Subsidiary Status Status
(UPS) (UPSS) (CWS) CDS) All India 1987-88 3.8 2.6 4.8 6.1 1993-94 2.6 1.9 3.6 6.0 1999-00 2.8 2.2 4.4 7.3
Urban 1987-88 6.6 5.3 7.1 9.4 1993-94 5.2 4.5 5.8 7.4 1999-00 5.2 4.6 5.9 7.7
Rural 1987-88 3.1 2.0 4.2 5.3 1993-94 1.8 1.2 3.0 5.6 1999-00 2.0 1.4 3.9 7.2
117


Related Documents