Four Years after the Base-Year Revision: Taking Stock of the Debate Surrounding India’s National Income Estimates R Nagaraj IGIDR Amey Sapre NIPFP Rajeswari Sengupta IGIDR India Policy Forum July 8–10, 2019 NCAER | National Council of Applied Economic Research 11 IP Estate, New Delhi 110002 Tel: +91-11-23379861–63, www.ncaer.org NCAER | Quality . Relevance . Impact

Welcome message from author
This document is posted to help you gain knowledge. Please leave a comment to let me know what you think about it! Share it to your friends and learn new things together.
Transcript
Four Years after the Base-Year Revision: Taking Stock of the Debate Surrounding India’s National Income
Estimates
R Nagaraj IGIDR
Amey Sapre NIPFP
Rajeswari Sengupta IGIDR
India Policy Forum July 8–10, 2019
NCAER | National Council of Applied Economic Research
11 IP Estate, New Delhi 110002 Tel: +91-11-23379861–63, www.ncaer.org
NCAER | Quality . Relevance . Impact

The findings, interpretations, and conclusions expressed are those of the authors and do not necessarily reflect the views of the Governing Body or Management of NCAER.
Four Years after the Base-Year Revision: Taking Stock of the Debate Surrounding India’s National Income
Estimates*
R Nagaraj IGIDR
Amey Sapre NIPFP
Rajeswari Sengupta IGIDR
India Policy Forum July 8–10, 2019
__________________________________________________________________________ * Preliminary draft as of July 5, 2019. Please do not circulate beyond the NCAER India Policy Forum 2019, for which this paper has been prepared.We are thankful to Pramod Sinha for discussion and [email protected]; [email protected]; [email protected]
Abstract
In 2015, with the release of the 2011-12 base-year GDP series the Central Statistical Office (CSO) substantially revised the way GDP is calculated in India. According to the new series, India is the fastest growing large economy in the world. Other trusted measures of the state of the economy convey a discordant picture. This discrepancy has led to an active debate over the last few years. Numerous studies by academic scholars have identified, analysed and documented the problems with the kind of data used in the new series as well as with the specific methodologies applied. The criticisms have cast persistent doubts on the new GDP series and have dented the credibility of India's National Accounts Statistics. The debate seems at an impasse. In this study we provide a comprehensive summary of the issues surrounding the new GDP series as highlighted by the academic experts and outline recommendations about a possible way forward to resolve India's GDP data crisis.
JEL Classification: E01, E11 Keywords: GDP measurement, National Accounts Statistics, Central Statistical Office, National Income, Manufacturing, Gross Value Added, Base year revision

1
1 Introduction
Gross Domestic Product or GDP is one of the most important macroeconomic
indicators of the level of economic activity in the country.1 It drives economic policies,
is a crucial input in the fiscal calculations of the government, affects investor
confidence and conveys a comprehensive picture about the health of the economy to
the rest of the world. In India, while policy outcomes and performance of the
economy are debated extensively using GDP growth numbers, evaluation of the
quality of data and assessment of soundness of the methodology used for making the
GDP estimates, does not get as much attention. The last few years have been an
exception in this regard. In January 2015, the Central Statistical Office (CSO) released
the 2011-12 base year series of the National Accounts Statistics (NAS) to replace the
earlier 2004-05 series.2 Since then, issues in the measurement of GDP have been at
the centre–stage of academic and policy debates.
The 2011-12 series apart from changing the base year of the NAS, also
introduced several methodological changes in GDP computation. These changes were
done primarily to align the methods with the most recent international guidelines of
the UN System of National Accounts, 2008 (see SNA 2008). New data sources
particularly for the private corporate sector (which includes organized
manufacturing as well as service sector enterprises) were also introduced. As a result
of these changes, the growth rates at the aggregate level as well as for some sectors
changed significantly under the 2011-12 series as compared to the 2004-05 series,
particularly for the years for which data were available in both the series.
1 GDP, or gross value added (GVA), is a measure of goods and services produced in an economy in a year, net
of intermediate inputs. Broadly-speaking, it is a statistical construct based on innumerable estimations of value addition
taking place in an economy. GDP is estimated following the UN System of National Accounts (UNSNA) – a global
template, revised periodically to account for evolving economic activities.
2 GDP is re-based regularly to account for changing production structure, relative prices and better recording
of economic activities. Crucially, the re-basing also allows for introducing newer methodologies and improved
databases. Such changes often expand the absolute GDP size because we are able to more accurately capture output.
However, annual growth rates usually do not vary too much with re-basing of GDP – implying that the underlying pace
of economic expansion has remained the same.
2
In a paper presented at the India Policy Forum 2016, Nagaraj and Srinivasan
(henceforth NS, 2016) highlighted some of the core issues in the measurement of the
2011-12 series. They summarised the arguments made in studies published after the
release of the NAS in 2015. According to NS (2016), while a base year revision
usually leads to a marginal rise in the absolute size of the economy owing to better
representation, it does not cause a big change in the annual growth rates of GDP
estimates. However the latest base year revision significantly changed growth rates.
It resulted in 2.3 percentage point shrinkage of the absolute size of GDP in the base
year (2011-12), and raised aggregate GDP growth rates in the subsequent years.
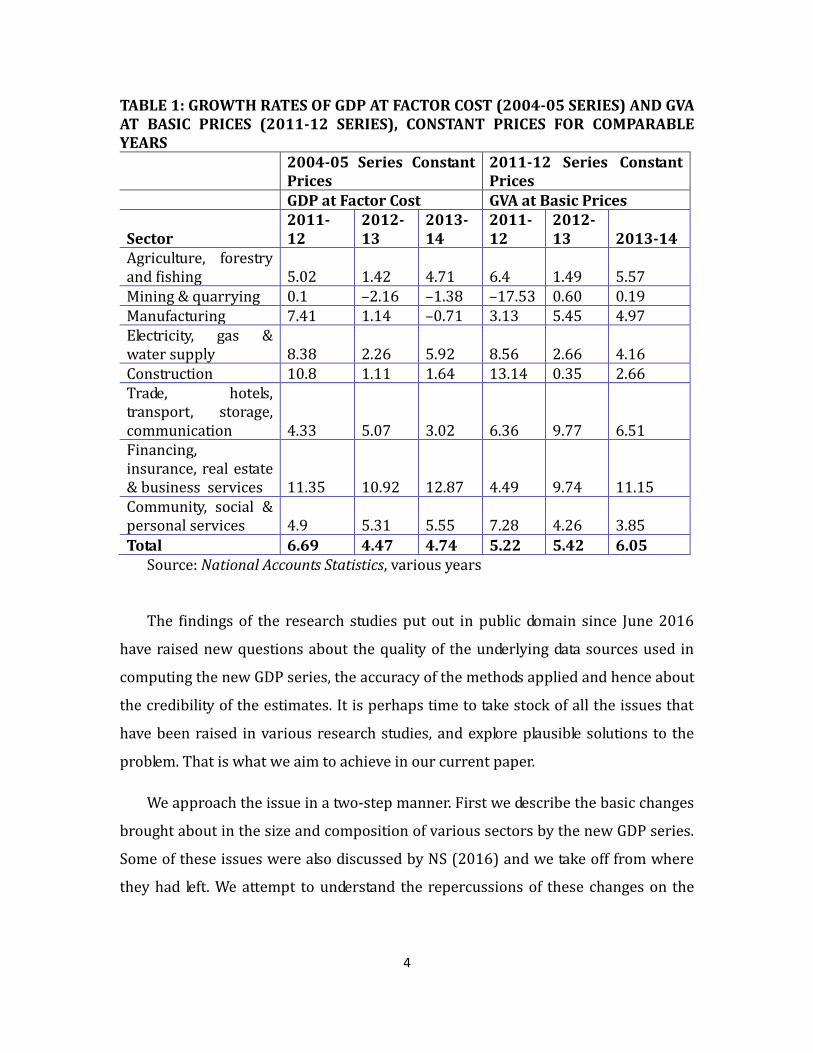
Changes in growth rates are presented in Table 1 for the overlapping set of
years before the 2004-05 series was discontinued. For instance, the changes in the
manufacturing sector led to a revision in growth rates from 1.14% to 5.45% in 2012-
13 and from –0.71% to 4.9% in 2013-14. Similarly, growth rates for the trade, hotels
and transport sector were significantly revised from 3.02% to 6.51% for 2013-14 as
compared to the 2004-05 series. The revision also altered the institutional
composition of India’s GDP. In particular, the size of the private corporate sector
(PCS) was enlarged while the unorganised/informal/household sector got
contracted, with public sector’s share remaining the same.
The methodological changes responsible for these comprehensive revisions
have since then been questioned by a number of academic experts and continue to
capture the attention of mainstream media, both domestic and international. Over the
last four years, a large number of analytical studies have identified and analysed
specific problems in the data and methodology used in the 2011-12 GDP series, over
and above those highlighted by NS (2016). The common question in these studies
has been about the extent to which the revised growth rates paint a true picture of
the economy as opposed to being an outcome of problems in the underlying
methodology and data used for estimation.
In addition, new controversies related to the 2011-12 series have cropped up
in recent times such as (i) release of two contradictory back series that paint
3
diametrically opposite pictures of the historical performance of the economy, (ii)
release of first revised estimates for 2016-17 which showed a staggering 8.2%
growth rate in the year of demonetisation when more than 80% of the cash in the
economy was removed from circulation overnight dealing a severe blow to the
unorganised segment of the population and (iii) release of an NSS service sector
survey report (74th round) in May 2019, that showed several gaps in the sample of
firms used for GDP estimation by the CSO.
Despite growing scepticism and the wide range of questions raised by the
academic community following the release of the new series, the CSO has defended
the series (see for instance CSO, 2015f and CSO, 2018) citing reasons such as
adoption of international best practices, improvements in methods of estimation, and
wider coverage of the economy through new datasets.
4
TABLE 1: GROWTH RATES OF GDP AT FACTOR COST (2004-05 SERIES) AND GVA AT BASIC PRICES (2011-12 SERIES), CONSTANT PRICES FOR COMPARABLE YEARS
2004-05 Series Constant Prices
2011-12 Series Constant Prices
GDP at Factor Cost GVA at Basic Prices
Sector 2011-12
2012-13
2013-14
2011-12
2012-13 2013-14
Agriculture, forestry and fishing 5.02 1.42 4.71 6.4 1.49 5.57 Mining & quarrying 0.1 –2.16 –1.38 –17.53 0.60 0.19 Manufacturing 7.41 1.14 –0.71 3.13 5.45 4.97 Electricity, gas & water supply 8.38 2.26 5.92 8.56 2.66 4.16 Construction 10.8 1.11 1.64 13.14 0.35 2.66 Trade, hotels, transport, storage, communication 4.33 5.07 3.02 6.36 9.77 6.51 Financing, insurance, real estate & business services 11.35 10.92 12.87 4.49 9.74 11.15 Community, social & personal services 4.9 5.31 5.55 7.28 4.26 3.85
Total 6.69 4.47 4.74 5.22 5.42 6.05 Source: National Accounts Statistics, various years
The findings of the research studies put out in public domain since June 2016
have raised new questions about the quality of the underlying data sources used in
computing the new GDP series, the accuracy of the methods applied and hence about
the credibility of the estimates. It is perhaps time to take stock of all the issues that
have been raised in various research studies, and explore plausible solutions to the
problem. That is what we aim to achieve in our current paper.
We approach the issue in a two-step manner. First we describe the basic changes
brought about in the size and composition of various sectors by the new GDP series.
Some of these issues were also discussed by NS (2016) and we take off from where
they had left. We attempt to understand the repercussions of these changes on the
5
sectoral as well as aggregate GDP growth rates. We conclude that majority of the
changes affect the estimates for the Private Corporate Sector (PCS).3
Next, we undertake an examination of the changes in data and methodology used
to compute the PCS estimates and discuss the problems therein. Most of these
problems seem to stem from the usage of the MCA21 database. In particular, there are
three main issues all of which are related to the way sampling is done by the CSO for
estimating the output of the PCS: (i) which companies are included in the sample? (ii)
how to deal with companies that are outside the sample but form a part of the larger
universe of companies? (iii) how to deal with companies that cannot be sampled but
are included in PCS? It appears that there are problems in each of these aspects of
sampling and we present a detailed discussion of these issues. In addition we also
analyse the problems in GDP growth estimation arising from deflator related issues,
problems in the regional accounts and issues with the release of two contradictory
back series.
We base our analysis largely on the findings of academic experts who have
written extensively on these problems. We also take stock of the findings of different
committee reports that have dealt with various issues regarding GDP estimation. Our
goal here is to present a comprehensive summary of major issues in the new NAS in
order to provide deeper insights into the GDP debate, assess the severity of the
problem at hand and discuss a way forward.
The rest of the paper is organised as follows. In section 2 we discuss the changes
in the shares of various sectors and in the institutional composition of GDP under the
new series. In section 3 we present a detailed analysis of the problems affecting the
estimates of the Private Corporate Sector. In section 4 we discuss issues related to
the deflators. In sections 5 and 6 we talk about the issues with the estimation of the
regional accounts and issues with the release of the two back series, respectively.
3 The PCS includes companies (both financial and non-financial) from the manufacturing and services sectors.
6
Finally in section 7 we summarise the main points and provide recommendations for
the way forward.
2. Size, structure and evaluation of the economy, as seen through NAS
The new NAS has brought about many changes that have altered our image (or
understanding) of the structure of the economy. Below we describe some of the
prominent changes with regard to the institutional and sectoral composition of GDP.
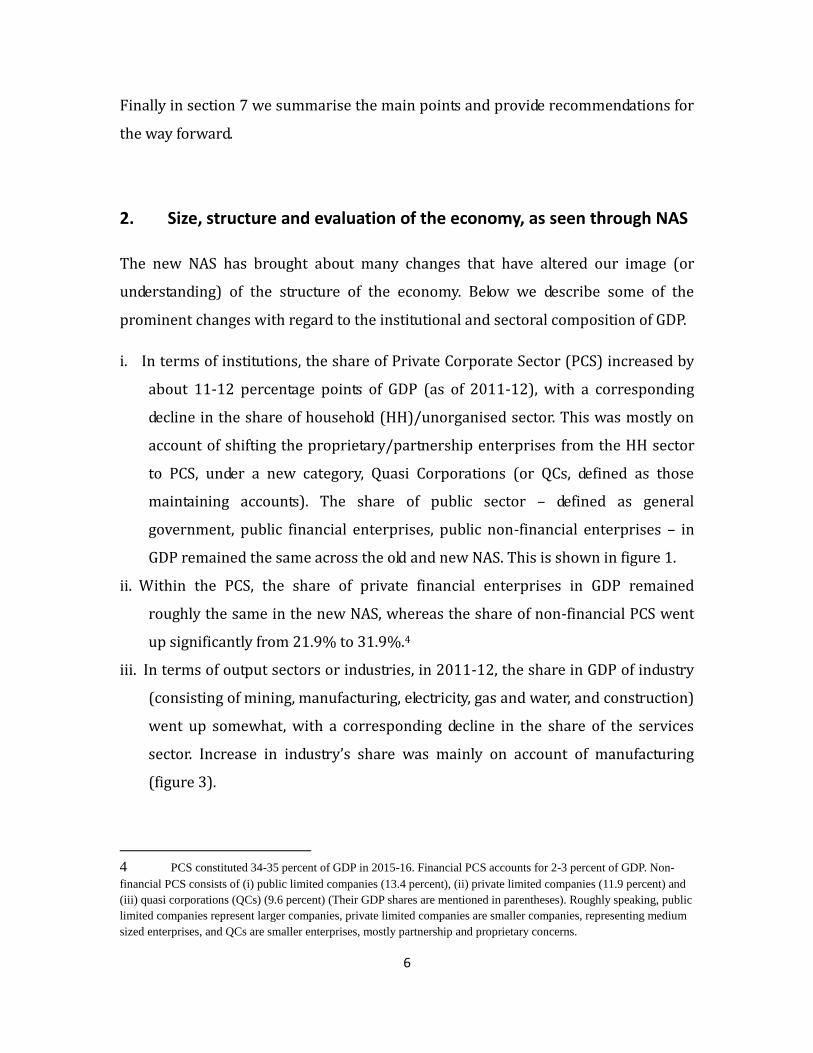
i. In terms of institutions, the share of Private Corporate Sector (PCS) increased by
about 11-12 percentage points of GDP (as of 2011-12), with a corresponding
decline in the share of household (HH)/unorganised sector. This was mostly on
account of shifting the proprietary/partnership enterprises from the HH sector
to PCS, under a new category, Quasi Corporations (or QCs, defined as those
maintaining accounts). The share of public sector – defined as general
government, public financial enterprises, public non-financial enterprises – in
GDP remained the same across the old and new NAS. This is shown in figure 1.
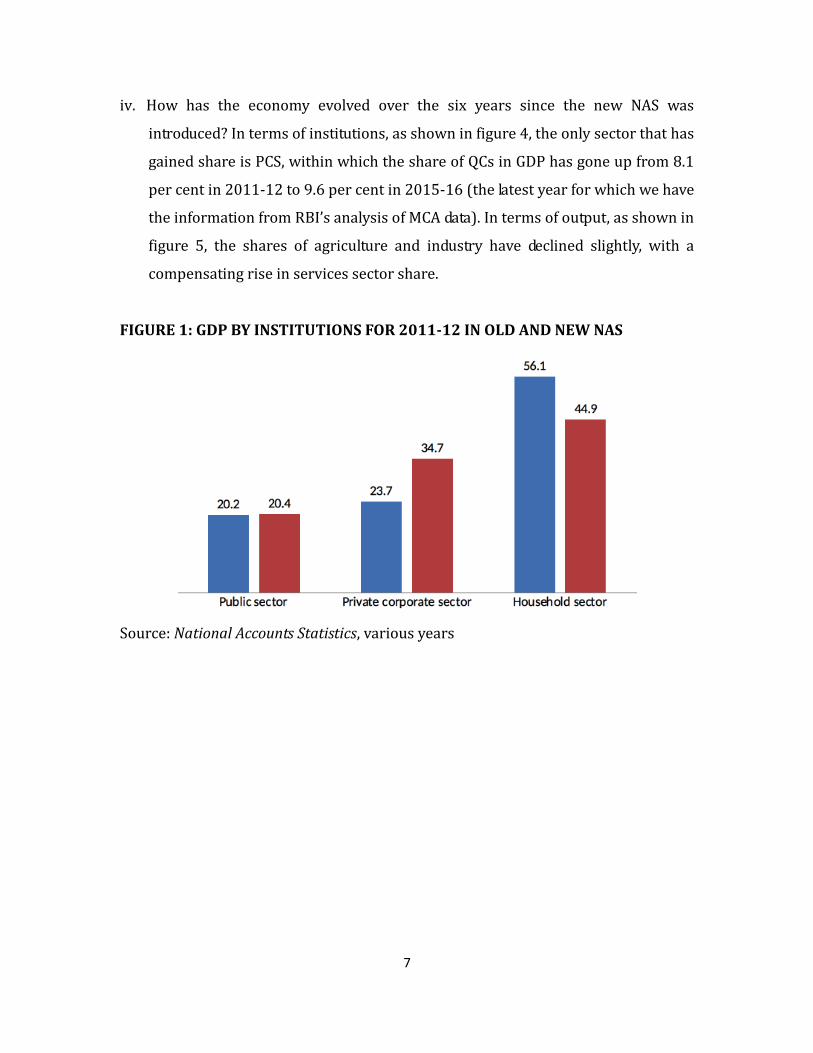
ii. Within the PCS, the share of private financial enterprises in GDP remained
roughly the same in the new NAS, whereas the share of non-financial PCS went
up significantly from 21.9% to 31.9%.4
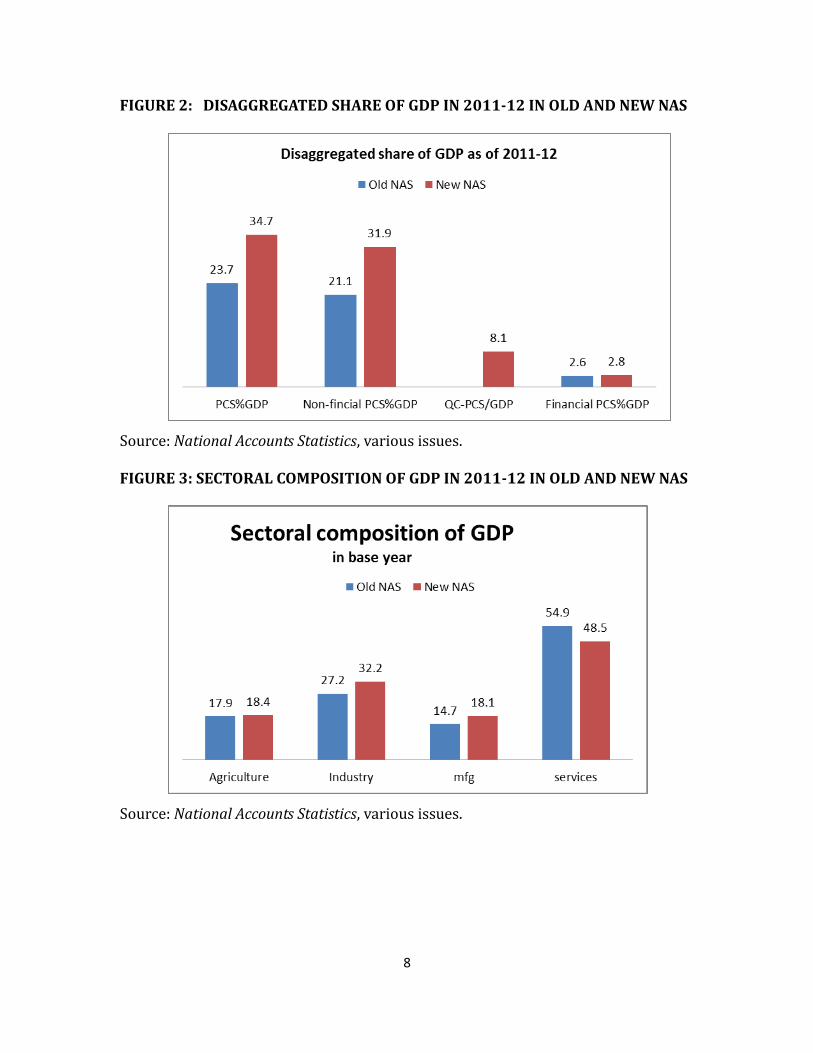
iii. In terms of output sectors or industries, in 2011-12, the share in GDP of industry
(consisting of mining, manufacturing, electricity, gas and water, and construction)
went up somewhat, with a corresponding decline in the share of the services
sector. Increase in industry’s share was mainly on account of manufacturing
(figure 3).
4 PCS constituted 34-35 percent of GDP in 2015-16. Financial PCS accounts for 2-3 percent of GDP. Non-
financial PCS consists of (i) public limited companies (13.4 percent), (ii) private limited companies (11.9 percent) and
(iii) quasi corporations (QCs) (9.6 percent) (Their GDP shares are mentioned in parentheses). Roughly speaking, public
limited companies represent larger companies, private limited companies are smaller companies, representing medium
sized enterprises, and QCs are smaller enterprises, mostly partnership and proprietary concerns.
7
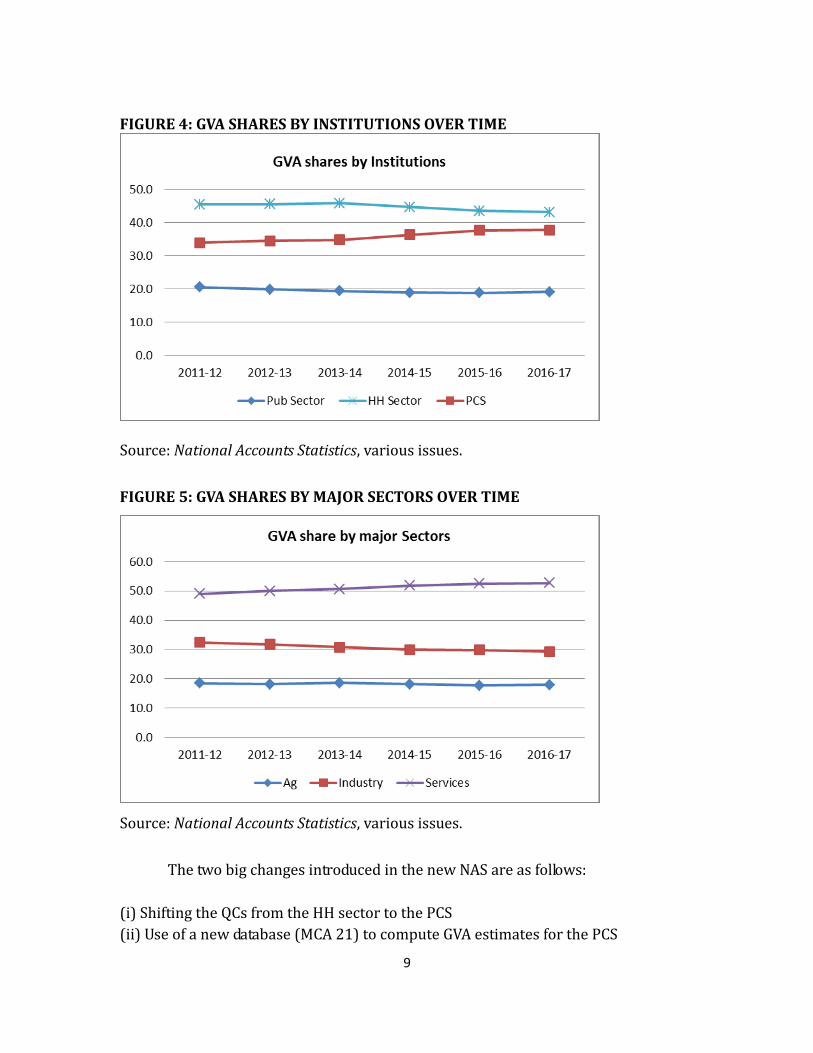
iv. How has the economy evolved over the six years since the new NAS was
introduced? In terms of institutions, as shown in figure 4, the only sector that has
gained share is PCS, within which the share of QCs in GDP has gone up from 8.1
per cent in 2011-12 to 9.6 per cent in 2015-16 (the latest year for which we have
the information from RBI’s analysis of MCA data). In terms of output, as shown in
figure 5, the shares of agriculture and industry have declined slightly, with a
compensating rise in services sector share.
FIGURE 1: GDP BY INSTITUTIONS FOR 2011-12 IN OLD AND NEW NAS
Source: National Accounts Statistics, various years
8
FIGURE 2: DISAGGREGATED SHARE OF GDP IN 2011-12 IN OLD AND NEW NAS
Source: National Accounts Statistics, various issues. FIGURE 3: SECTORAL COMPOSITION OF GDP IN 2011-12 IN OLD AND NEW NAS
Source: National Accounts Statistics, various issues.
9
FIGURE 4: GVA SHARES BY INSTITUTIONS OVER TIME
Source: National Accounts Statistics, various issues.
FIGURE 5: GVA SHARES BY MAJOR SECTORS OVER TIME
Source: National Accounts Statistics, various issues.
The two big changes introduced in the new NAS are as follows:
(i) Shifting the QCs from the HH sector to the PCS
(ii) Use of a new database (MCA 21) to compute GVA estimates for the PCS
10
If the changes in the shares of sectors and institutions in the aggregate output
in the new NAS are an outcome of a mere reshuffling of economic activities, then
these should not affect aggregate growth rates. For example, the shifting of QCs to
PCS should not increase the aggregate GDP growth rates, given that QCs were already
accounted for in the old NAS as part of the HH sector. Yet as we see from Table 1, in
the overlapping years for which data on both the old and new NAS are available, the
aggregate GDP growth rates were revised upwards in the new series. In terms of
coverage, no new sector was captured by the new NAS either which could have
potentially explained the increase in growth rates.
The very fact that the new series reported significantly higher growth rates at
the aggregate level for the overlapping years, points to the possibility that the
changes in methodology and data played a role. Since there has been no substantial
change in the methodology used to measure GVA of the Public sector and the
Household sector, it maybe concluded that the increase in the growth rate of
aggregate GDP is mainly due to changes in the PCS, primarily non-financial PCS since
financial PCS constitutes a small fraction of overall GDP (see footnote 3).
As shown above, PCS consists of non-financial companies, financial
companies and QCs. Net of QCs and financial companies, the size of the PCS in the
new GDP series is higher by 2.9 percentage of GDP. This can be attributed to the
changes in methodology and introduction of the MCA21 database. The main question
here is: Is it a case of more comprehensive capture of the contribution of PCS, or does
it represent an over-estimation?
A number of academic experts have identified and documented multiple
problems with the MCA21 database which under some scenarios might lead to
overestimation of the growth rate of the PCS and of the aggregate GDP growth rate,
given the high share of PCS in overall GDP. Moreover given the infirmities in the
estimation of output of QCs under the new NAS, shifting these entities to the PCS
could have potentially contributed to boosting the level and growth rate of PCS GVA
and hence aggregate GDP. We discuss these problems in detail in the next section.
11
3. Issues with estimates of the Private Corporate Sector (PCS)
The private corporate sector especially the manufacturing sector continues to be at
the heart of the GDP measurement debate. Since NS (2016), a number of new issues
concerning the PCS have come up in public debates and these have been chronicled
by several academic scholars over the last few years. The bulk of the problem in
estimation seems to stem from the shift to the MCA 21 database from the Annual
Survey of Industries (ASI) database. In what follows we discuss three major issues
with regard to the PCS estimates that have surfaced after the introduction of the
MCA21 database. These issues are primarily related to the manner in which sampling
is done by the CSO for the PCS-GVA estimation.
i. What companies are included in the sample?
ii. What method is used to account for companies not in the sample but in the
larger universe of all companies?
iii. What about the companies that cannot be sampled but are included in PCS?
Below we discuss these issues in detail. In addition, we also analyse the validity of
the rationale behind the shift from ASI to MCA21 database, issues of misclassification
of companies in the PCS and the problems associated with the shift from an
`establishment' to an `enterprise' approach.
3.1 Sample of companies used for estimation
Companies (belonging to PCS i.e. manufacturing as well as services sector
companies) file their financial returns in the MCA 21 database but not all companies
file in every year. The set of companies that files returns at least once in three years is
called an `active' set5. This is regarded by the CSO as the `universe' of companies for
estimating the GVA of PCS. Within the `active' set, only a fraction of the companies file
returns in any given year. For the GVA estimation of any given year, the CSO first 5 We do not know the exact definition of 'active' companies in the MCA database. When the MCA passes on
the `active' list to the CSO, as per the official documents, the latter considers this `active' set to consist of companies
that have filed returns at least once in the last three years. This may not necessarily be the case and there does not seem
to be any verification process in place to ensure that this definition indeed correctly identifies the `active' companies
given to CSO by the MCA. This itself introduces a layer of uncertainty about the universe of companies that is being
considered for the estimation of GVA.
12
considers those companies that have filed their returns in that specific year. This is
the `filing' set which constitutes the sample for that year6. They then use a blow-up
factor to estimate the GVA of the non-filing, active companies.
Tables 4A and 4B show the numbers of registered, active and filing companies
for the years for which data is available. The first big question with regard to
sampling is whether the sample of companies considered by the CSO are working
companies. It would be problematic if the `filing' set consisted of say shell companies
that engage in fictitious transactions for the purpose of evading laws and falsely
report their returns. The GVA estimates computed on the basis of the returns of
these companies are likely to be erroneous. In this context there are two key issues
that are worth looking into and we discuss them sequentially.
3.1.1 Doubts about the universe and sample of companies
In 2016-17, the NSSO (National Sample Survey Office) in its 74th round conducted a
survey of services sector enterprises, on its way to launch an annual survey of
services (on the line of Annual Survey of Industries). With the release of the NSSO’s
technical report on the services sector survey (hereafter, NSS report) in May 2019,
new questions arose regarding the quality and reliability of MCA 21 database, in
particular about the soundness of the sample of companies used by the CSO for its
estimation. Official press notes of May 10, 2019 (issued by MOF), and May 30, 2019
(issued by MOSPI) have sought to dismiss the doubts, claiming that the MCA database
is in fine order for GDP estimation but if anything these have raised further doubts
about the sample of companies.
One of the three list frames (or, universes of enterprises) used for the NSS
survey was the list of `active' companies – companies that are said to have filed their
6 The 'filing' companies which constitute the sample set used by the CSO for GVA estimation, vary from year to year
because they self-select to file returns. As shown in table 4b, the absolute number of `filing' companies changes every
year and so does the ratio of `filing' and `active companies. This implies that the sample used by the CSO for GVA
estimation changes every year. This raises doubts about the comparability of the sectoral GVA estimates over multiple
years and the statistical soundness and stability of the estimates obtained.
13
statutory returns at least once during previous three years – obtained from the CSO
(called the MCA frame). After due verification of a sample of about 35,000 non-
financial companies, the non-response to the survey was found to be as high as 45.5
per cent. 21.3 per cent of the sampled companies were found to be misclassified, and
24.2 per cent of the companies refused to provide information, or were found closed,
or were non-traceable. Considering the severity of non-response, NSSO abandoned its
project of bringing out two-volumes of survey results, and instead settled for a
modest technical report. NSSO cautioned data users that “The estimates from the
sample are therefore, not likely to be robust over the domains” (NSSO, 2019: 16).
Arguing that the non-responding companies could be
shell/fake/dubious/non-existent companies that do not produce goods and services
on a regular basis, but perhaps serve as conduits to hide profits or circumvent
regulations, critics contended that such companies represent non-working
companies. MOSPI defended their GDP estimation procedure (May 30 press note)
saying that every year MCA has been weeding out an increasingly larger number of
companies that are not operating, implying that `active' companies in MCA’s register
represent genuinely working companies. Further, the missing/fake/shell companies
are outside the set of `active' companies, and hence the database and methodology
used by the CSO are correct. MOSPI's May 30 press release also said the following:
“...from the 35,456 companies included in the NSS 74th Round, around 34,834 (86.5%) companies had filed their returns in the MCA database and only 622 were untraceable in MCA. In the context of GVA estimation in respect of private corporate sector (PCS), out of the 4,235 units categorised as not traceable at the given address in the 74th Round, around 3,154 units had actually filed returns on-line on the MCA portal..........For the purposes of National Accounts Estimates, the returns actually filed by the corporates under MCA is duly taken into account and the scaling up factor for the Paid-Up-Capital for the non-response is low.”
MOSPI is therefore implying that the above record of filing of returns holds for
the PCS as a whole too. This would imply that say out of about 10.9 lakh `active'
companies (as of 2015-16), majority are filing returns. Non-filing companies form a
small fraction of `active' companies whose output is estimated by blowing-up the
14
parameters prepared for majority of the companies. Hence MOSPI claims that the
GDP estimates and its growth rates are valid.
Shortcomings of MOPSI’s contention:
The May 30 press note classifies MCA database into (i) active companies, and (ii)
others. An `active' company is taken to mean a working company as it files its
financial return once at least in 3 years. So, by definition, `others' are non-working
companies, whose status, as per the press release, could be `amalgamated',
`converted', `unclassified', `under process', `under liquidation', `dissolved', 'dormant'
etc. There are several problems with MOSPI's claims.
First, contrary to the May 30 press release, the NSS report clearly states that
its sample is drawn from the list of active companies obtained from the CSO. To quote
it, “From the MCA frame active private non-financial companies of 2013-14, as
available from National Accounts Division (NAD) was taken into consideration.” (P. 3)
(emphasis added). Hence all the non-responding/untraceable companies in the
sample must also be `active' companies. It means that the active list includes non-
working or `others' as well, and hence CSO’s list of `active' companies is not
watertight, as claimed.
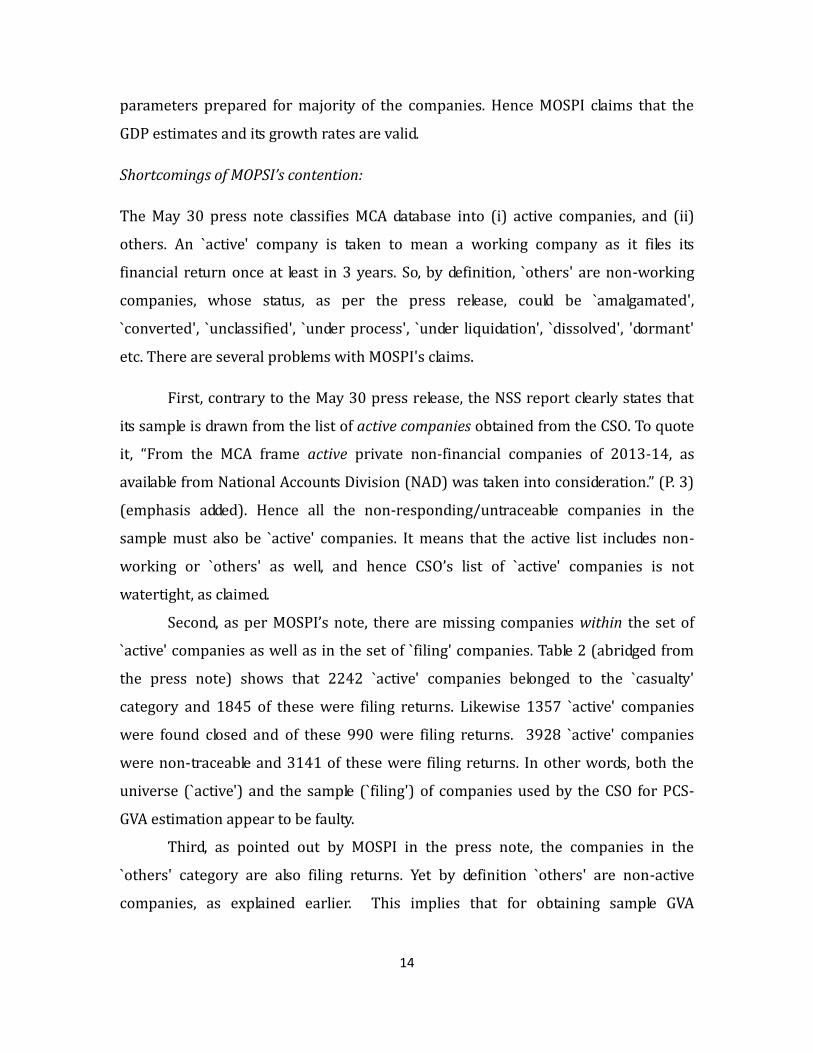
Second, as per MOSPI’s note, there are missing companies within the set of
`active' companies as well as in the set of `filing' companies. Table 2 (abridged from
the press note) shows that 2242 `active' companies belonged to the `casualty'
category and 1845 of these were filing returns. Likewise 1357 `active' companies
were found closed and of these 990 were filing returns. 3928 `active' companies
were non-traceable and 3141 of these were filing returns. In other words, both the
universe (`active') and the sample (`filing') of companies used by the CSO for PCS-
GVA estimation appear to be faulty.
Third, as pointed out by MOSPI in the press note, the companies in the
`others' category are also filing returns. Yet by definition `others' are non-active
companies, as explained earlier. This implies that for obtaining sample GVA
15
estimates (even before blowing-up for the universe of `active' companies) the CSO is
using financial data of non-active companies, which is theoretically incorrect.
Fourth, Mospi's (May 30) press release claimed, “In the last few years, nearly
6.3 lakh entities have been de-registered”. However we do not know the distribution
of such companies between (i) `filing' companies, (ii) `active' companies and (iii)
`others'. There is no a priori reason to believe that the act of de-registering
companies would remove the unresponsive companies (as highlighted by the NSSO
report) from the sample.
TABLE 2: STATUS OF COMPANIES IN NSS 74TH ROUND SURVEY
Category Number of companies in NSS survey
In MCA in 2016-17, Active companies Active companies Companies filing
returns Surveyed 19317 (54.5) 18818 (55.5) 17612 (57.6) Casualty (i.e. refused information)
2428 (6.9) 2242 (6.6) 1845 (6.0)
Closed during survey
1579 (4.5) 1357 (4.0) 990 (3.2)
Out of coverage i.e. misclassified
7573 (21.4) 7291 (21.5) 6755 (22.0)
Non-traceable units at the address provided
4235 (12.0) 3928 (11.6) 3141 (10.3)
Total 35456 33912 30583 Note: Figures in brackets refer to percentage of column total.
Source: NSSO’s Technical Report of Services Sector Enterprises in India, 2019
Generalising from the NSS services sector survey results, we now present a
fuller picture of the shortcomings of the MCA database for the entire PCS, with the
help of table 3 and a Venn diagram given in figure 6, using the MCA data for 2015-16.
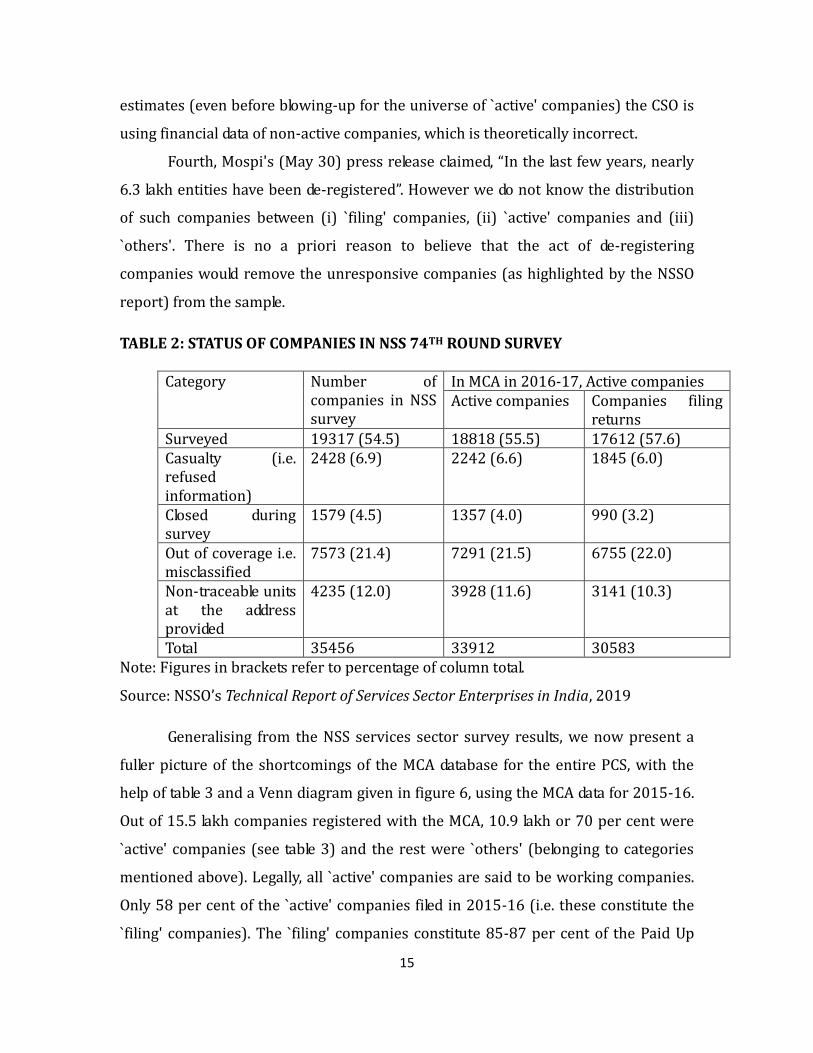
Out of 15.5 lakh companies registered with the MCA, 10.9 lakh or 70 per cent were
`active' companies (see table 3) and the rest were `others' (belonging to categories
mentioned above). Legally, all `active' companies are said to be working companies.
Only 58 per cent of the `active' companies filed in 2015-16 (i.e. these constitute the
`filing' companies). The `filing' companies constitute 85-87 per cent of the Paid Up
16
Capital (PUC) of `active' companies, and hence MOSPI claims that GDP estimates for
the PCS are reliable.
TABLE 3: DETAILS OF MCA DATABASE FOR 2015-16
Number of registered companies 15.5 lakh
Number of active companies 10.9 lakh
Number of companies filing returns 6.3 lakh
Ratio of active to registered companies 70.1%
Ratio of filing to active companies 58.3%
Ratio of filing to registered companies 40.7%
Source: Press Information Bureau (2019) However, as described above, the sets of 'active' as well as 'filing' companies
i.e. the universe as well as the sample of companies appear defective. While the
boundaries of various categories of companies in the MCA database are claimed to be
watertight, as shown in figure 6 below, there seems to be a grey area consisting of
shell/fake/dubious/non-existent companies (shaded portion in the diagram) whose
contours and quantitative dimensions are unknown.
Given that the sample of companies used by the CSO for GVA estimation
appears to contain shell companies that engage in fictitious transactions, the sectoral
as well as aggregate growth estimates obtained from such a sample are likely to be
biased upwards.
3.1.2 Filing vs. working companies
As reported by the CSO (2015b, 2015d) close to 5 lakh `active' companies were a part
of the sample used for estimation in the NAS for the initial years of the 2011-12
series. Over the last few years, the number of `active' companies has increased more
than 11 lakh (See MCA, 2019 for details) while the number of `filing' companies has
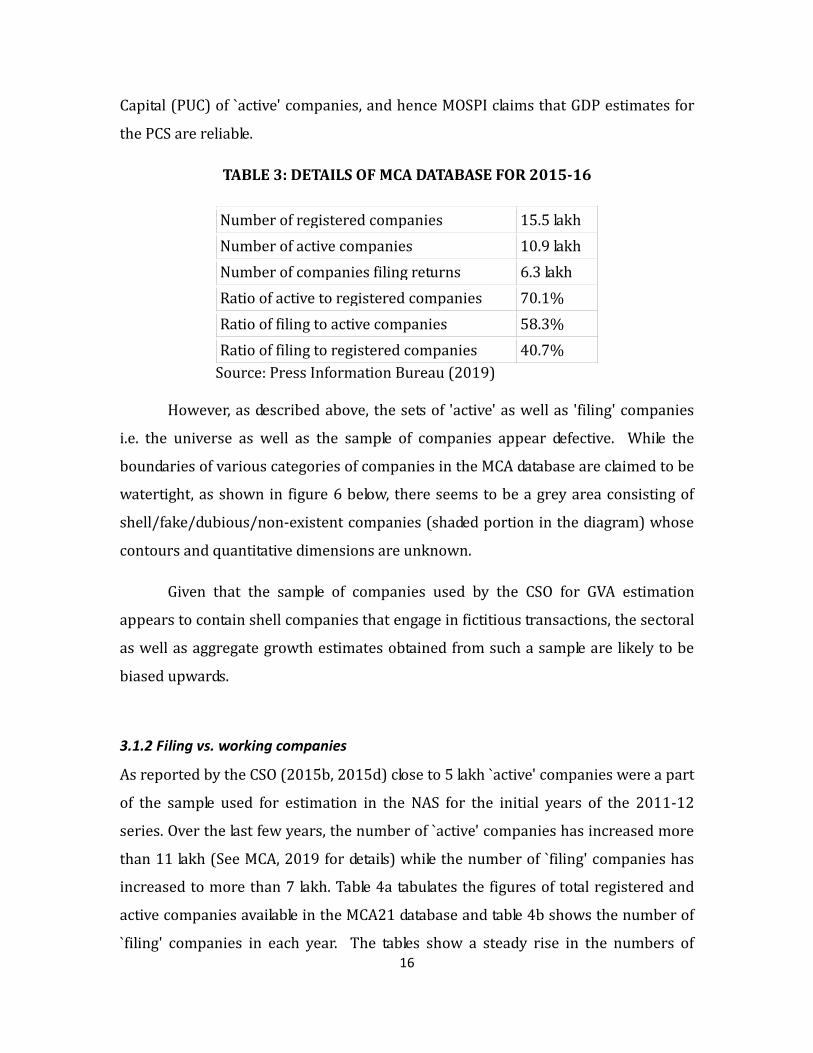
increased to more than 7 lakh. Table 4a tabulates the figures of total registered and
active companies available in the MCA21 database and table 4b shows the number of
`filing' companies in each year. The tables show a steady rise in the numbers of
17
`active' companies and those filing returns. The reality however may be different as
gleaned from various official documents.
TABLE 4A: DETAILS OF THE MCA 21 DATABASE: NUMBER OF REGISTERED AND ACTIVE COMPANIES
Year
Total Registered Companies (in lakhs)
Active Companies (in lakhs)
% Active of Total Registered Companies
2013 (Oct) 13.45 9.06 67.37 2014 (Apr) 13.95 9.51 68.20 2015 (Apr) 14.65 10.26 70.04 2016 (Apr) 15.47 10.85 70.14 2017 (Apr) 16.50 13.15 79.73 2018 (Apr) 17.59 11.76 66.82 2019 (Jan) 18.50 11.34 61.27
Source: Monthly Information Bulletin, Ministry of Corporate Affairs. TABLE 4B: NUMBER OF ACTIVE AND FILING COMPANIES IN THE MCA21 DATABASE
Year
Active companies (in lakhs)
Number of companies that filed returns (in lakhs)
% Filed of Active
2012-13 8.8 5.6 63.64 2013-14 9.5 6.1 64.21 2014-15 10.1 6.0 59.41 2015-16 10.8 6.3 58.33 2016-17 11.6 7.1 61.21
Source: Press Information Bureau (2019)
It appears that the CSO uses a set of 'common' companies instead of the
entire `filing' set, for preparing the sample estimates. Common companies are those
that have data on returns for the previous year and the current year. This set has
remained stable at around 3 lakh companies, a figure just around one-half of the
companies touted to be the number of companies filing returns. Murthy (2018)
mentioned,
18
“Accounts of about 5.5 lakh companies (covering both the manufacturing,
mining and services sectors) have been analysed and incorporated in the estimation
of national accounts series for the above mentioned sectors whereas there are some
11 lakh active companies. The estimates based on the available data were blown up to
cover all companies using the active population and ratio of Paid-up capital for them.
A common company growth based on over three lakh companies was used when the
data on the whole complement of 5.5 lakh companies were not available.”
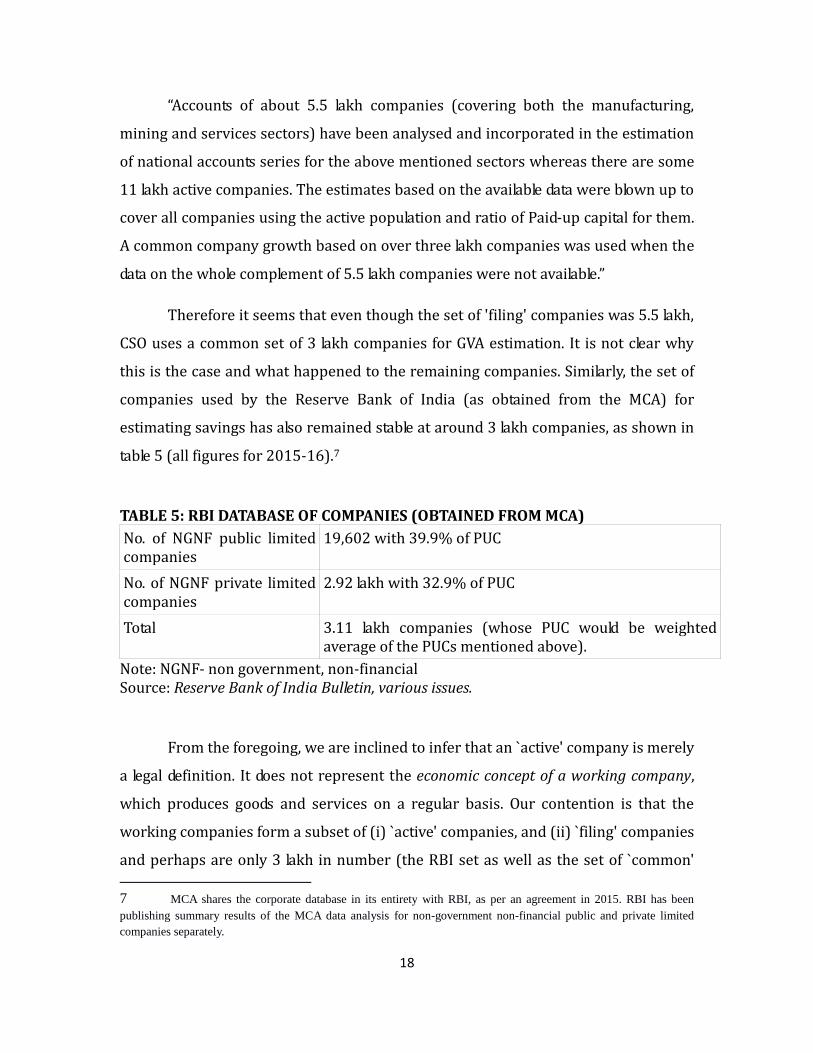
Therefore it seems that even though the set of 'filing' companies was 5.5 lakh,
CSO uses a common set of 3 lakh companies for GVA estimation. It is not clear why
this is the case and what happened to the remaining companies. Similarly, the set of
companies used by the Reserve Bank of India (as obtained from the MCA) for
estimating savings has also remained stable at around 3 lakh companies, as shown in
table 5 (all figures for 2015-16).7
TABLE 5: RBI DATABASE OF COMPANIES (OBTAINED FROM MCA)
No. of NGNF public limited companies
19,602 with 39.9% of PUC
No. of NGNF private limited companies
2.92 lakh with 32.9% of PUC
Total 3.11 lakh companies (whose PUC would be weighted average of the PUCs mentioned above).
Note: NGNF- non government, non-financial Source: Reserve Bank of India Bulletin, various issues.
From the foregoing, we are inclined to infer that an `active' company is merely
a legal definition. It does not represent the economic concept of a working company,
which produces goods and services on a regular basis. Our contention is that the
working companies form a subset of (i) `active' companies, and (ii) `filing' companies
and perhaps are only 3 lakh in number (the RBI set as well as the set of `common'
7 MCA shares the corporate database in its entirety with RBI, as per an agreement in 2015. RBI has been
publishing summary results of the MCA data analysis for non-government non-financial public and private limited
companies separately.
19
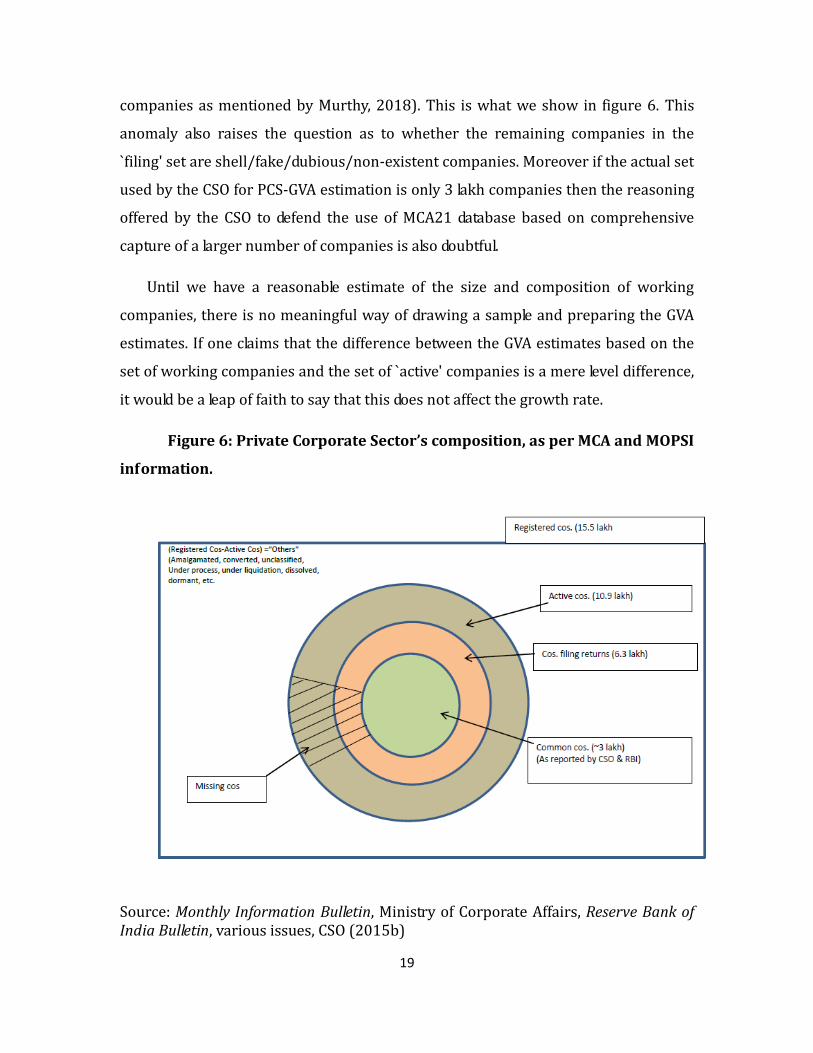
companies as mentioned by Murthy, 2018). This is what we show in figure 6. This
anomaly also raises the question as to whether the remaining companies in the
`filing' set are shell/fake/dubious/non-existent companies. Moreover if the actual set
used by the CSO for PCS-GVA estimation is only 3 lakh companies then the reasoning
offered by the CSO to defend the use of MCA21 database based on comprehensive
capture of a larger number of companies is also doubtful.
Until we have a reasonable estimate of the size and composition of working
companies, there is no meaningful way of drawing a sample and preparing the GVA
estimates. If one claims that the difference between the GVA estimates based on the
set of working companies and the set of `active' companies is a mere level difference,
it would be a leap of faith to say that this does not affect the growth rate.
Figure 6: Private Corporate Sector’s composition, as per MCA and MOPSI
information.
Source: Monthly Information Bulletin, Ministry of Corporate Affairs, Reserve Bank of India Bulletin, various issues, CSO (2015b)
20
3.2 Accounting for companies not in the sample
Under the old NAS, GDP of PCS was not estimated directly. It used to be derived
indirectly, as a residual. The saving and investment of the PCS were estimated by the
RBI using the balance sheet of selected companies. RBI sample consisted of about
4,500 large public limited companies and a smaller number of private limited
companies. For public limited companies, PUC of the selected large companies was
said to be around 45 per-cent of the total PUC of public limited companies (as
provided to RBI by MCA). Likewise for the private limited companies. The estimates
of the selected companies were blown-up to cover the entire universe of companies.
Separate blow-up factors were used for public and private limited companies.
There was a concern that RBI's blowing up procedure was problematic
because the size and composition of PCS had changed substantially during the last
three decades. To overcome the problem, National Statistical Commission headed by C
Rangarajan recommended conducting of a census of working companies. This was
not taken up. Instead MCA's e-filing initiative was seen as a solution to the problem of
obtaining the universe of working companies.
Under the new NAS, the CSO does not have data on the returns of the
companies that are part of the universe but not of the sample i.e. the non-filing,
active companies. So they use a blow-up methodology to calculate the GVA of these
companies. The estimates for the non-filing companies are obtained by blowing-up
the estimates of the filing companies. The blow-up factor used by the CSO (also called
the Paid-Up Capital or PUC factor) is computed as the reciprocal of the ratio of PUC of
`filing` companies to the PUC of all `active` companies (CSO, 2015a, 2015d).8
This implies that if there are problems in the 'non-filing, active' set of
companies, then the estimates obtained after blowing-up may not convey the true
picture of the sectoral growth and hence of the aggregate growth. Depending on the
8 Paid up Capital of a company is the amount for which shares are issued to shareholders. According to the Companies
Act, 2013 (section 64) paid-up share capital is such aggregate amount of money credited as paid-up as is equivalent to
the amount received as paid-up in respect of shares issued and also includes any amount credited as paid-up in respect
of shares of the company.The reliance on PUC is because in absence of information on actual production, a physical
indicator is required that is closely related to production (or production capacity).
21
nature of the problems there could be overestimation of the growth rates. Several
studies have pointed out problems with this blowing-up methodology. Here we
discuss the two main problems.
3.2.1 Lack of correspondence between PUC and GVA
The use of PUC in computing the blow-up factor is based on the assumption that GVA
and PUC have a one-to-one correspondence and that one can directly infer about a
company’s value addition by analysing its PUC.
Sapre and Sinha (2016) replicated the process of blow-up of GVA for a
comparable sample of firms (from the CMIE Prowess database) that qualify for filing
in the XBRL format in the MCA21. They find that GVA and PUC have little or no
correspondence, especially in cases where GVA is negative (i.e. a loss making
company). PUC of a company is by definition always positive. This means that it is
possible that using a PUC based blow-up factor, estimates are scaled up for
companies that are in reality loss-making companies with negative GVA. This would
lead to an overestimation (see Box 1 for details).9
Application of the blow-up methodology requires a detailed analysis of GVA
and PUC of registered companies in the MCA21 database. In response to this
problem, NSC (2018) recommends:
‘Cross-validation study on data on corporate bodies with single manufacturing unit available from the two sources - MCA and the ASI. Additionally, a study of plants covered in ASI data belonging to non-reporting but active companies in the MCA list should be undertaken. In the same vain, the ratio of GVA to PUC should be compared between companies that submit their return by the specified due date and those that submit return after the due date. A related research that may be undertaken using ASI and MCA data is to identify plant covered in ASI data which belong to active but not reporting manufacturing companies in the MCA list. The ratio of GVA to invested capital for such plants should be studied in comparison with plants that belong to companies in the MCA list which are active and reporting.’ [III 6.5 NSC (2018)]
9 Manna (2017) corroborates this finding by highlighting that a common blow-up factor for all companies would be
inappropriate and separate blow-up factors ought to be computed for different size classes of PUC. Both Sapre and
Sinha (2016) and Manna (2017) have argued in favour of exploring alternatives other than PUC for blow-up of GVA.
Manna (2017) proposed the use of Gross Fixed Assets and Sapre and Sinha (2016) explored the possibility of using
industry wise growth rates for scaling up of GVA of non-filing companies.
22
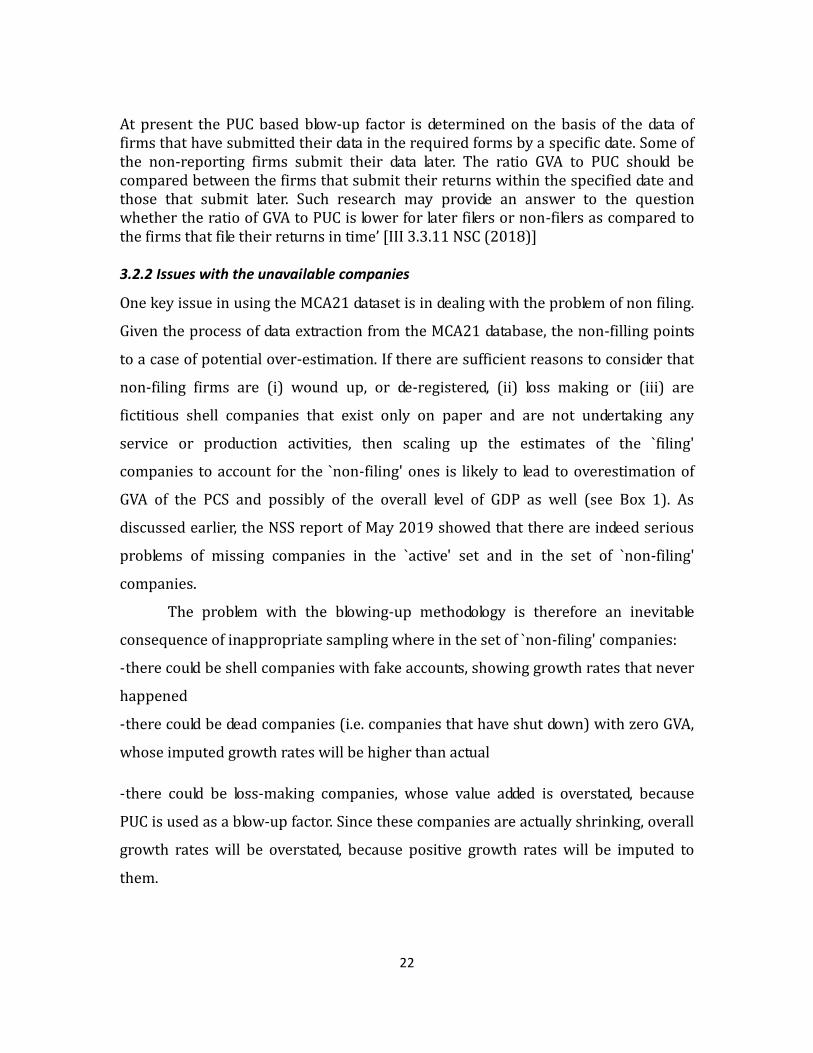
At present the PUC based blow-up factor is determined on the basis of the data of firms that have submitted their data in the required forms by a specific date. Some of the non-reporting firms submit their data later. The ratio GVA to PUC should be compared between the firms that submit their returns within the specified date and those that submit later. Such research may provide an answer to the question whether the ratio of GVA to PUC is lower for later filers or non-filers as compared to the firms that file their returns in time’ [III 3.3.11 NSC (2018)] 3.2.2 Issues with the unavailable companies
One key issue in using the MCA21 dataset is in dealing with the problem of non filing.
Given the process of data extraction from the MCA21 database, the non-filling points
to a case of potential over-estimation. If there are sufficient reasons to consider that
non-filing firms are (i) wound up, or de-registered, (ii) loss making or (iii) are
fictitious shell companies that exist only on paper and are not undertaking any
service or production activities, then scaling up the estimates of the `filing'
companies to account for the `non-filing' ones is likely to lead to overestimation of
GVA of the PCS and possibly of the overall level of GDP as well (see Box 1). As
discussed earlier, the NSS report of May 2019 showed that there are indeed serious
problems of missing companies in the `active' set and in the set of `non-filing'
companies.
The problem with the blowing-up methodology is therefore an inevitable
consequence of inappropriate sampling where in the set of `non-filing' companies:
-there could be shell companies with fake accounts, showing growth rates that never
happened
-there could be dead companies (i.e. companies that have shut down) with zero GVA,
whose imputed growth rates will be higher than actual
-there could be loss-making companies, whose value added is overstated, because
PUC is used as a blow-up factor. Since these companies are actually shrinking, overall
growth rates will be overstated, because positive growth rates will be imputed to
them.
23
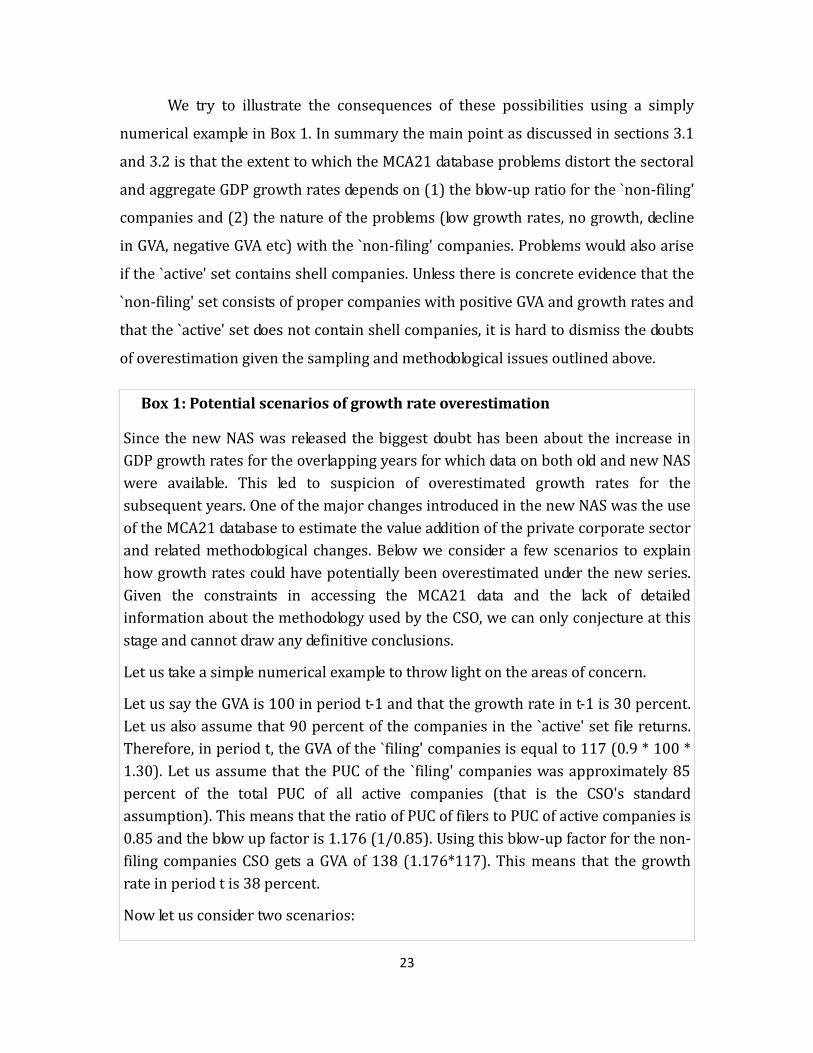
We try to illustrate the consequences of these possibilities using a simply
numerical example in Box 1. In summary the main point as discussed in sections 3.1
and 3.2 is that the extent to which the MCA21 database problems distort the sectoral
and aggregate GDP growth rates depends on (1) the blow-up ratio for the `non-filing'
companies and (2) the nature of the problems (low growth rates, no growth, decline
in GVA, negative GVA etc) with the `non-filing' companies. Problems would also arise
if the `active' set contains shell companies. Unless there is concrete evidence that the
`non-filing' set consists of proper companies with positive GVA and growth rates and
that the `active' set does not contain shell companies, it is hard to dismiss the doubts
of overestimation given the sampling and methodological issues outlined above.
Box 1: Potential scenarios of growth rate overestimation
Since the new NAS was released the biggest doubt has been about the increase in
GDP growth rates for the overlapping years for which data on both old and new NAS
were available. This led to suspicion of overestimated growth rates for the
subsequent years. One of the major changes introduced in the new NAS was the use
of the MCA21 database to estimate the value addition of the private corporate sector
and related methodological changes. Below we consider a few scenarios to explain
how growth rates could have potentially been overestimated under the new series.
Given the constraints in accessing the MCA21 data and the lack of detailed
information about the methodology used by the CSO, we can only conjecture at this
stage and cannot draw any definitive conclusions.
Let us take a simple numerical example to throw light on the areas of concern.
Let us say the GVA is 100 in period t-1 and that the growth rate in t-1 is 30 percent.
Let us also assume that 90 percent of the companies in the `active' set file returns.
Therefore, in period t, the GVA of the `filing' companies is equal to 117 (0.9 * 100 *
1.30). Let us assume that the PUC of the `filing' companies was approximately 85
percent of the total PUC of all active companies (that is the CSO's standard
assumption). This means that the ratio of PUC of filers to PUC of active companies is
0.85 and the blow up factor is 1.176 (1/0.85). Using this blow-up factor for the non-
filing companies CSO gets a GVA of 138 (1.176*117). This means that the growth
rate in period t is 38 percent.
Now let us consider two scenarios:
24
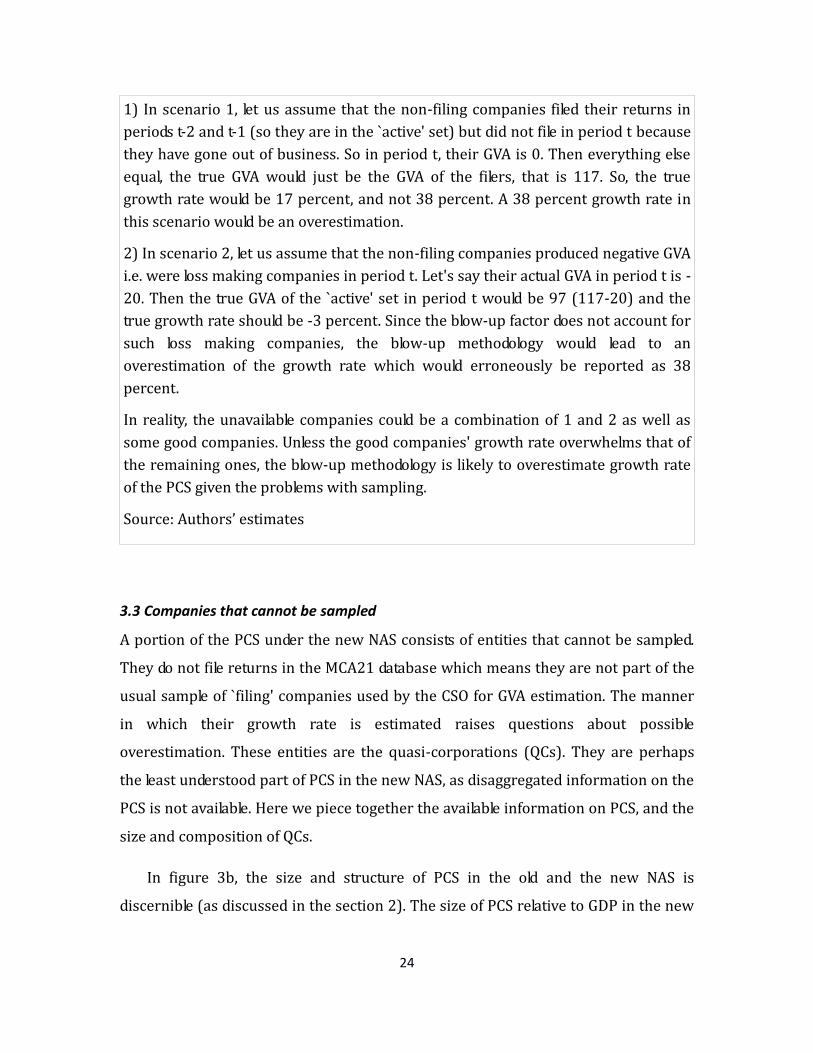
1) In scenario 1, let us assume that the non-filing companies filed their returns in
periods t-2 and t-1 (so they are in the `active' set) but did not file in period t because
they have gone out of business. So in period t, their GVA is 0. Then everything else
equal, the true GVA would just be the GVA of the filers, that is 117. So, the true
growth rate would be 17 percent, and not 38 percent. A 38 percent growth rate in
this scenario would be an overestimation.
2) In scenario 2, let us assume that the non-filing companies produced negative GVA
i.e. were loss making companies in period t. Let's say their actual GVA in period t is -
20. Then the true GVA of the `active' set in period t would be 97 (117-20) and the
true growth rate should be -3 percent. Since the blow-up factor does not account for
such loss making companies, the blow-up methodology would lead to an
overestimation of the growth rate which would erroneously be reported as 38
percent.
In reality, the unavailable companies could be a combination of 1 and 2 as well as
some good companies. Unless the good companies' growth rate overwhelms that of
the remaining ones, the blow-up methodology is likely to overestimate growth rate
of the PCS given the problems with sampling.
Source: Authors’ estimates
3.3 Companies that cannot be sampled
A portion of the PCS under the new NAS consists of entities that cannot be sampled.
They do not file returns in the MCA21 database which means they are not part of the
usual sample of `filing' companies used by the CSO for GVA estimation. The manner
in which their growth rate is estimated raises questions about possible
overestimation. These entities are the quasi-corporations (QCs). They are perhaps
the least understood part of PCS in the new NAS, as disaggregated information on the
PCS is not available. Here we piece together the available information on PCS, and the
size and composition of QCs.
In figure 3b, the size and structure of PCS in the old and the new NAS is
discernible (as discussed in the section 2). The size of PCS relative to GDP in the new
25
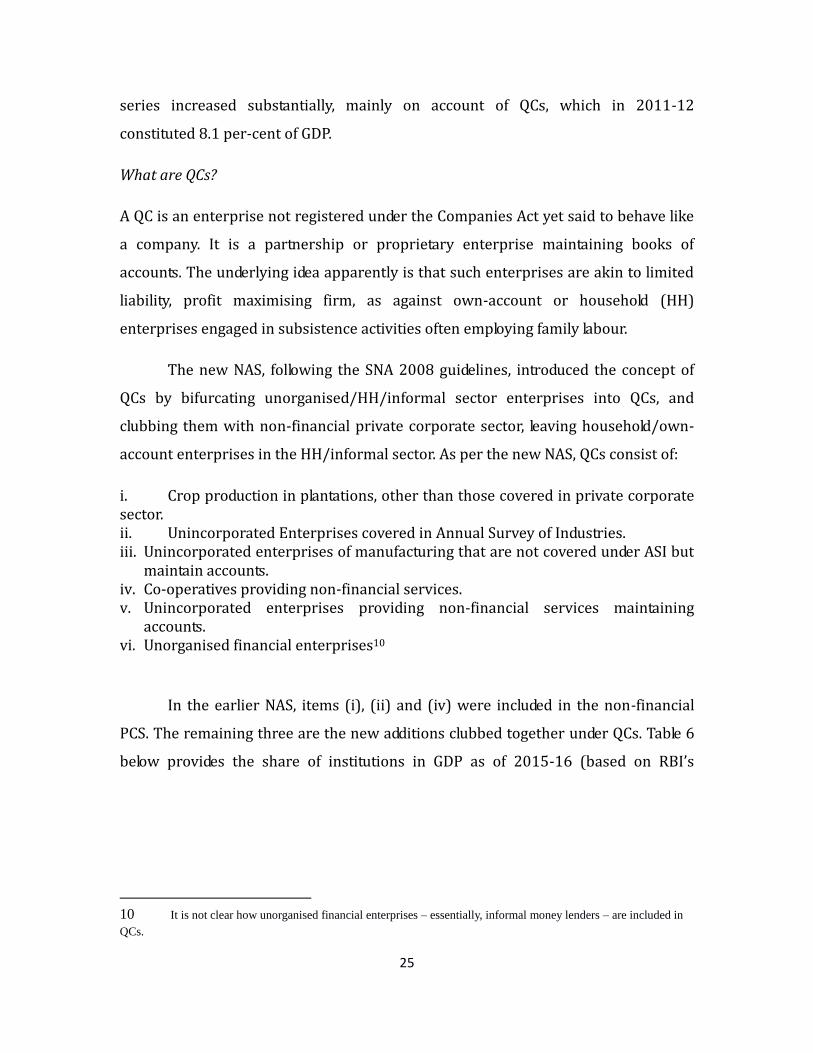
series increased substantially, mainly on account of QCs, which in 2011-12
constituted 8.1 per-cent of GDP.
What are QCs?
A QC is an enterprise not registered under the Companies Act yet said to behave like
a company. It is a partnership or proprietary enterprise maintaining books of
accounts. The underlying idea apparently is that such enterprises are akin to limited
liability, profit maximising firm, as against own-account or household (HH)
enterprises engaged in subsistence activities often employing family labour.
The new NAS, following the SNA 2008 guidelines, introduced the concept of
QCs by bifurcating unorganised/HH/informal sector enterprises into QCs, and
clubbing them with non-financial private corporate sector, leaving household/own-
account enterprises in the HH/informal sector. As per the new NAS, QCs consist of:
i. Crop production in plantations, other than those covered in private corporate sector. ii. Unincorporated Enterprises covered in Annual Survey of Industries. iii. Unincorporated enterprises of manufacturing that are not covered under ASI but
maintain accounts. iv. Co-operatives providing non-financial services. v. Unincorporated enterprises providing non-financial services maintaining
accounts. vi. Unorganised financial enterprises10
In the earlier NAS, items (i), (ii) and (iv) were included in the non-financial
PCS. The remaining three are the new additions clubbed together under QCs. Table 6
below provides the share of institutions in GDP as of 2015-16 (based on RBI’s
10 It is not clear how unorganised financial enterprises – essentially, informal money lenders – are included in
QCs.
26
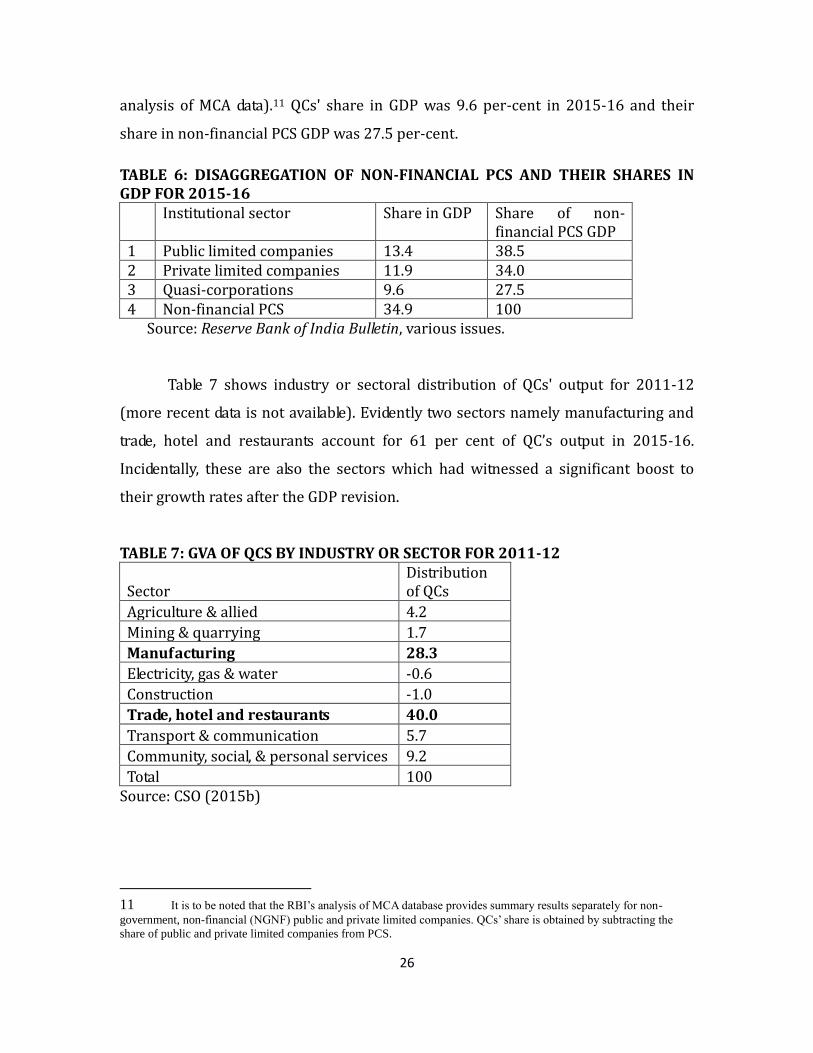
analysis of MCA data).11 QCs' share in GDP was 9.6 per-cent in 2015-16 and their
share in non-financial PCS GDP was 27.5 per-cent.
TABLE 6: DISAGGREGATION OF NON-FINANCIAL PCS AND THEIR SHARES IN GDP FOR 2015-16
Institutional sector Share in GDP Share of non-financial PCS GDP
1 Public limited companies 13.4 38.5 2 Private limited companies 11.9 34.0 3 Quasi-corporations 9.6 27.5 4 Non-financial PCS 34.9 100
Source: Reserve Bank of India Bulletin, various issues.
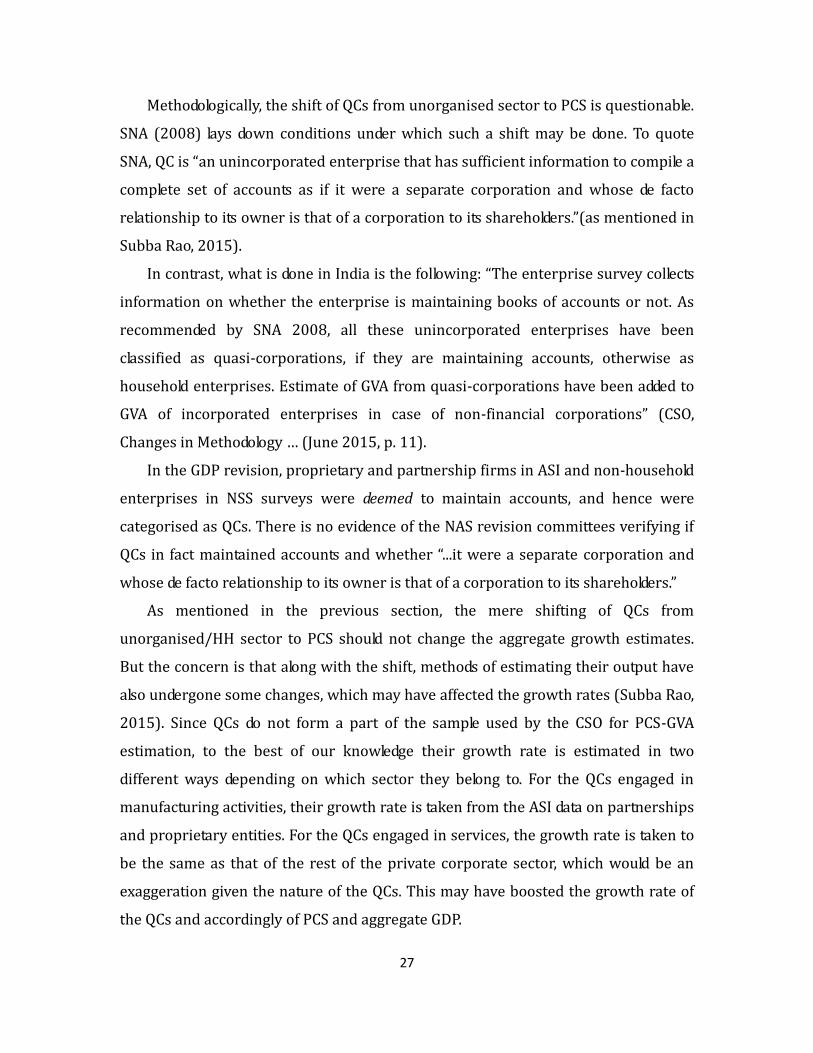
Table 7 shows industry or sectoral distribution of QCs' output for 2011-12
(more recent data is not available). Evidently two sectors namely manufacturing and
trade, hotel and restaurants account for 61 per cent of QC’s output in 2015-16.
Incidentally, these are also the sectors which had witnessed a significant boost to
their growth rates after the GDP revision.
TABLE 7: GVA OF QCS BY INDUSTRY OR SECTOR FOR 2011-12
Sector Distribution of QCs
Agriculture & allied 4.2
Mining & quarrying 1.7
Manufacturing 28.3
Electricity, gas & water -0.6
Construction -1.0
Trade, hotel and restaurants 40.0
Transport & communication 5.7
Community, social, & personal services 9.2
Total 100 Source: CSO (2015b)
11 It is to be noted that the RBI’s analysis of MCA database provides summary results separately for non-
government, non-financial (NGNF) public and private limited companies. QCs’ share is obtained by subtracting the
share of public and private limited companies from PCS.
27
Methodologically, the shift of QCs from unorganised sector to PCS is questionable.
SNA (2008) lays down conditions under which such a shift may be done. To quote
SNA, QC is “an unincorporated enterprise that has sufficient information to compile a
complete set of accounts as if it were a separate corporation and whose de facto
relationship to its owner is that of a corporation to its shareholders.”(as mentioned in
Subba Rao, 2015).
In contrast, what is done in India is the following: “The enterprise survey collects
information on whether the enterprise is maintaining books of accounts or not. As
recommended by SNA 2008, all these unincorporated enterprises have been
classified as quasi-corporations, if they are maintaining accounts, otherwise as
household enterprises. Estimate of GVA from quasi-corporations have been added to
GVA of incorporated enterprises in case of non-financial corporations” (CSO,
Changes in Methodology … (June 2015, p. 11).
In the GDP revision, proprietary and partnership firms in ASI and non-household
enterprises in NSS surveys were deemed to maintain accounts, and hence were
categorised as QCs. There is no evidence of the NAS revision committees verifying if
QCs in fact maintained accounts and whether “...it were a separate corporation and
whose de facto relationship to its owner is that of a corporation to its shareholders.”
As mentioned in the previous section, the mere shifting of QCs from
unorganised/HH sector to PCS should not change the aggregate growth estimates.
But the concern is that along with the shift, methods of estimating their output have
also undergone some changes, which may have affected the growth rates (Subba Rao,
2015). Since QCs do not form a part of the sample used by the CSO for PCS-GVA
estimation, to the best of our knowledge their growth rate is estimated in two
different ways depending on which sector they belong to. For the QCs engaged in
manufacturing activities, their growth rate is taken from the ASI data on partnerships
and proprietary entities. For the QCs engaged in services, the growth rate is taken to
be the same as that of the rest of the private corporate sector, which would be an
exaggeration given the nature of the QCs. This may have boosted the growth rate of
the QCs and accordingly of PCS and aggregate GDP.
28
The issue really is whether the QCs are growing at the rate of other companies in
the PCS. For most periods, we do not have enough information to assess this. They
may be more dynamic, since they are smaller or they may be stagnant in which case
their growth would be overestimated. It is possible some are the former, some the
latter. We have no idea what the aggregate situation is for the QCs. It is possible
however, that post-demonetisation and post-GST these companies are growing much
more slowly than the big companies in PCS. In that case the maintained assumption
will lead to an overestimation of growth.
3.4 Comparability of MCA21 with ASI based estimates
The discussion in sections 3.1-3.3 shows that there are myriad problems with the
MCA21 database used by the CSO to compile the estimates for PCS under the new
NAS. Both the universe and the sample of companies used for the estimation of GVA
seem to be riddled with holes and given the manner in which blowing up of estimates
is undertaken, there is ample room for overestimation of sectoral and aggregate
growth rates.
As mentioned earlier, under the old NAS, for much of the non-government and
non-agricultural activities, data used to be collected for the factory sector from the
Annual Survey of Industries (ASI). In addition various unorganised sector surveys by
the NSS were establishment based surveys. However, there has been a concern that
ASI was increasingly missing out value addition taking place outside of factory
premises, in sites such as service centres, R&D labs, company headquarters etc.
Hence a view prevailed that the ASI was underestimating the output growth in the
manufacturing sector, given its specific approach to data collection.
The replacement of ASI with MCA21 database for manufacturing sector was
predicated on the foregoing views. The problems with the MCA database that have
been uncovered over the past few years by various academic experts raised the
following question: Is it really true that the ASI captured value addition taking place
only inside the registered premises, ignoring the related or auxiliary activities?
Dholakia, Nagaraj and Pandya (2018) examined the question by closely looking at (i)
29
ASI schedule, (ii) its field investigators manual (which provides detailed instructions to
investigators on how to post the information in the questionnaire), and discussions
with the concerned officials responsible for the data collection.
The investigation revealed that the ASI in fact gathers information on all
activities of a factory, and the data gathered are apportioned to different factories of
an enterprise as per standardised procedures. The argument that a shift to
enterprise approach increased capture of value addition is not entirely correct. In
light of this research, the premises of the change over from an establishment
approach to an enterprise approach for GDP estimation and hence the use of MCA
database itself appears questionable and unwarranted.
In the face of all the criticisms, the CSO has continued to defend the use of the
MCA 21 database. In 2015, after the release of the new series, the then Chief
Statistician of India, T. C. Anant claimed that the use of the new database for the PCS
captures the production that was left out in the earlier ASI series. To quote him,
“There is a large invisible corporate segment, which we were not adequately
describing in the earlier series. We were partially describing it in manufacturing
through the ASI. So, there is recognition that there is a need to get better
information on this segment as a large part of government policies are aimed at
this segment. The 5,000 listed companies are typically not the principal focus of
promotional policies.” (Sidhartha and Gupta, 2015).
While the MCA database may have technically increased the coverage of
companies, it is worth noting that more data need not necessarily mean better data,
as has been analysed in the previous sections.
3.5 Other problems with the MCA21 database
3.5.1 Shift from Establishment to Enterprise approach
The 2011-12 series makes a conceptual shift by capturing value addition at an
`enterprise` level instead of at an `establishment` level. In economic terms the
distinction between the two can be understood as the difference between a factory
30
(or a plant) and a firm (or an enterprise). The former is a technical unit of
production, and the latter is an organisational unit of production. Various authors
(Nagaraj, 2015a, 2015b, 2015c; Raja Kumar, 2015; Nagaraj and Srinivasan, 2016;
Sapre and Sinha, 2016) have looked into several aspects of the estimation process in
detail. In the new series the GDP of the private corporate sector is estimated using
the financial statements of enterprises as a whole as opposed to the earlier method
of using industrial output of factory establishments. This shift leads to a direct
comparison with the ASI based estimates.
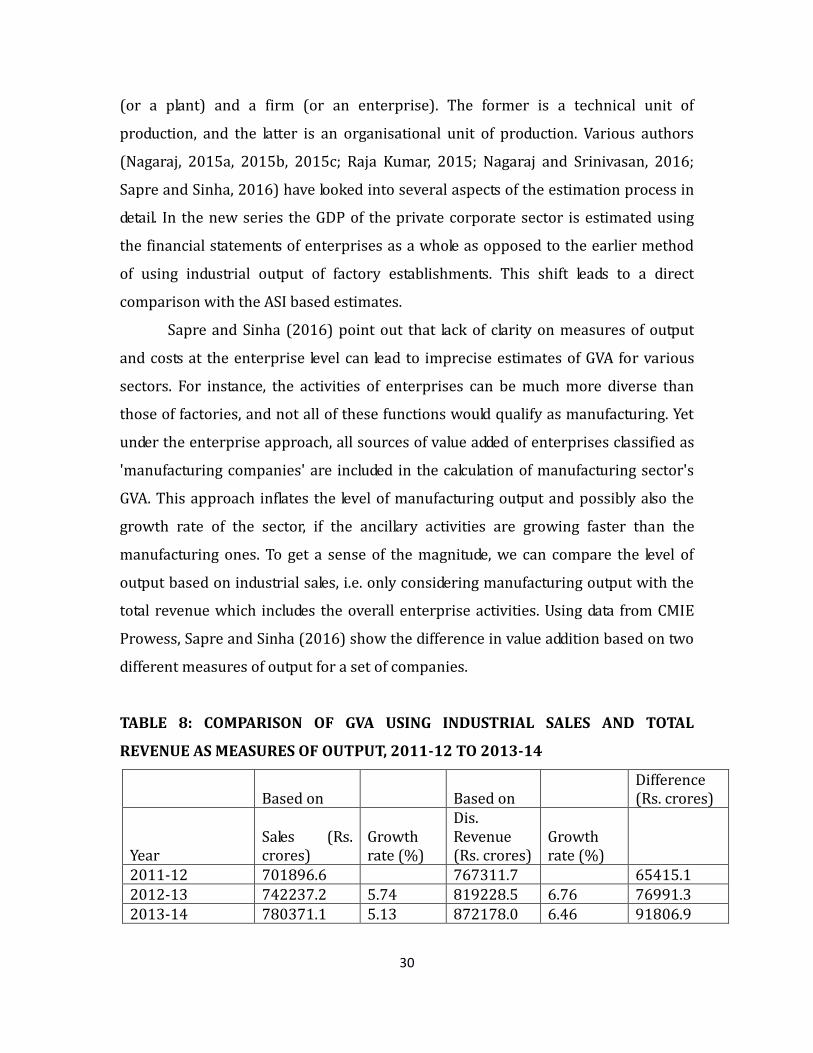
Sapre and Sinha (2016) point out that lack of clarity on measures of output
and costs at the enterprise level can lead to imprecise estimates of GVA for various
sectors. For instance, the activities of enterprises can be much more diverse than
those of factories, and not all of these functions would qualify as manufacturing. Yet
under the enterprise approach, all sources of value added of enterprises classified as
'manufacturing companies' are included in the calculation of manufacturing sector's
GVA. This approach inflates the level of manufacturing output and possibly also the
growth rate of the sector, if the ancillary activities are growing faster than the
manufacturing ones. To get a sense of the magnitude, we can compare the level of
output based on industrial sales, i.e. only considering manufacturing output with the
total revenue which includes the overall enterprise activities. Using data from CMIE
Prowess, Sapre and Sinha (2016) show the difference in value addition based on two
different measures of output for a set of companies.
TABLE 8: COMPARISON OF GVA USING INDUSTRIAL SALES AND TOTAL
REVENUE AS MEASURES OF OUTPUT, 2011-12 TO 2013-14
Based on Based on Difference (Rs. crores)
Year Sales (Rs. crores)
Growth rate (%)
Dis. Revenue (Rs. crores)
Growth rate (%)
2011-12 701896.6 767311.7 65415.1 2012-13 742237.2 5.74 819228.5 6.76 76991.3 2013-14 780371.1 5.13 872178.0 6.46 91806.9
31
Source: Sapre and Sinha (2016). Dis. Revenue are fields of disaggregated revenue adding up to total revenue of the company
As can be seen from table 8, in comparison to industrial sales, total revenue
shows a considerable increase in the level estimates of GVA. Total revenue fields
include revenues from ancillary and related manufacturing activities and other non-
operating revenues such as treasury operations, etc. The change in the measure of
output possibly explains the large upward revisions in levels and on average it
corresponds to a 1 per-cent increase in growth rate for the manufacturing sector.
In comparison to the establishment based estimation, the enterprise
approach has also complicated the process of GVA estimation to some extent.
Conventionally, subtracting cost of production (of manufactured items) and taxes
from the value of output gives an estimate of value addition. However, with
diversified activities under one roof in case of an enterprise, identifying costs of
manufacturing activities from financial statements poses serious challenges (see
Sapre and Sinha, 2016 for details on the process of GVA estimation). Lack of proper
identification of cost components can lead to imprecise GVA estimates.
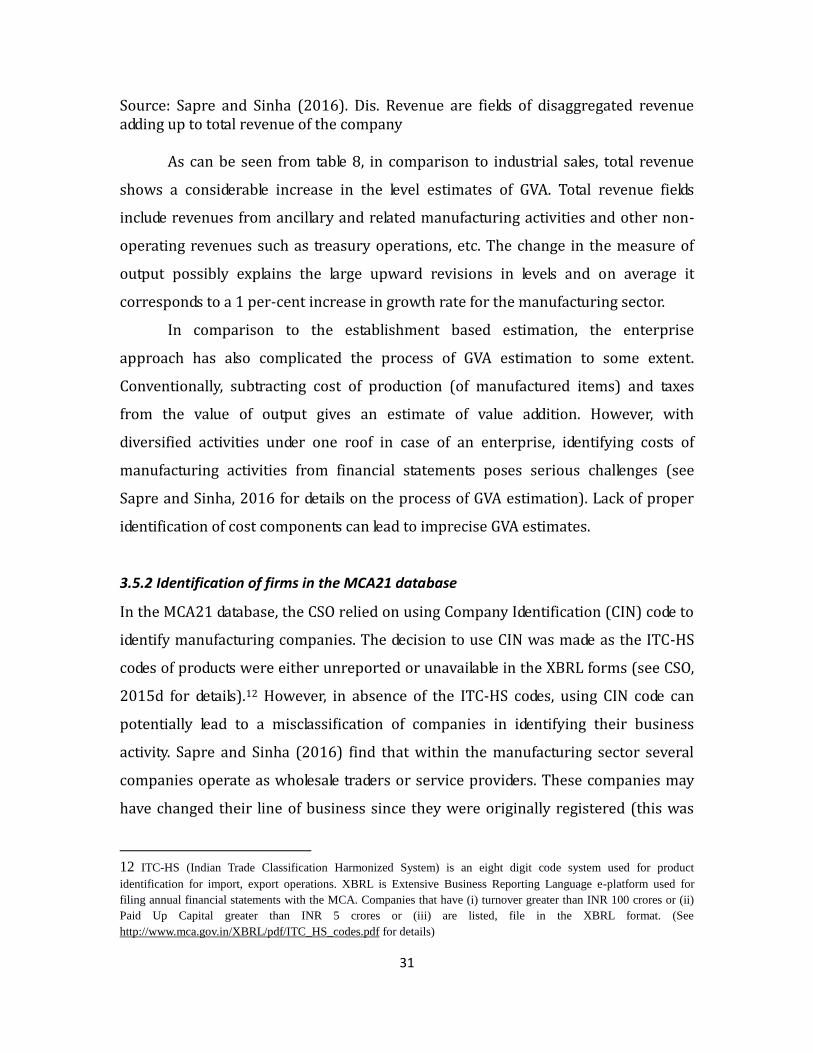
3.5.2 Identification of firms in the MCA21 database
In the MCA21 database, the CSO relied on using Company Identification (CIN) code to
identify manufacturing companies. The decision to use CIN was made as the ITC-HS
codes of products were either unreported or unavailable in the XBRL forms (see CSO,
2015d for details).12 However, in absence of the ITC-HS codes, using CIN code can
potentially lead to a misclassification of companies in identifying their business
activity. Sapre and Sinha (2016) find that within the manufacturing sector several
companies operate as wholesale traders or service providers. These companies may
have changed their line of business since they were originally registered (this was
12 ITC-HS (Indian Trade Classification Harmonized System) is an eight digit code system used for product
identification for import, export operations. XBRL is Extensive Business Reporting Language e-platform used for
filing annual financial statements with the MCA. Companies that have (i) turnover greater than INR 100 crores or (ii)
Paid Up Capital greater than INR 5 crores or (iii) are listed, file in the XBRL format. (See
http://www.mca.gov.in/XBRL/pdf/ITC_HS_codes.pdf for details)
32
reported in the NSS survey of services as discussed earlier). These changes do not
get reflected in the Company Identification (CIN) code assigned to the companies.
Such misclassification of companies will distort the manufacturing estimates,
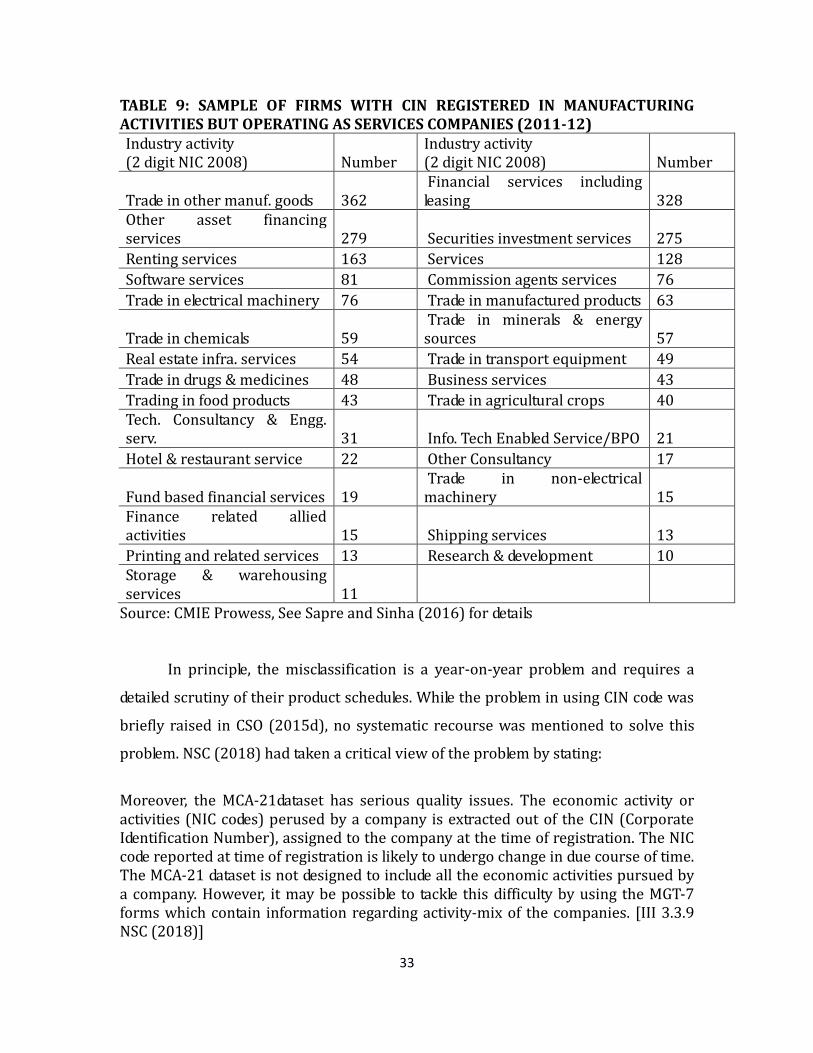
although not the overall GVA. The paper and Table 9 shows an illustration on how
firms registered in manufacturing can be in other activities.
Companies may change their primary activity over time as part of their usual
business strategy and even repeatedly. Hence, lack of a proper identification system
poses serious challenges for classification and estimation of value addition at the
sectoral level. Sapre and Sinha (2016) and Pandey et. al (2019) show the extent of
misclassification that can arise in absence of a system of identification and
classification and present an illustrative exercise on the frequency of changes in
economic activity. They contend that it is of crucial importance to build and use the
history of economic activity of companies so as to correctly classify companies into
respective sectors based on their primary economic activity. As an illustrative case,
table 9 shows a sample of companies with economic activity different from their CIN
based activity.
33
TABLE 9: SAMPLE OF FIRMS WITH CIN REGISTERED IN MANUFACTURING ACTIVITIES BUT OPERATING AS SERVICES COMPANIES (2011-12) Industry activity (2 digit NIC 2008) Number
Industry activity (2 digit NIC 2008) Number
Trade in other manuf. goods 362 Financial services including leasing 328
Other asset financing services 279 Securities investment services 275
Renting services 163 Services 128
Software services 81 Commission agents services 76
Trade in electrical machinery 76 Trade in manufactured products 63
Trade in chemicals 59 Trade in minerals & energy sources 57
Real estate infra. services 54 Trade in transport equipment 49
Trade in drugs & medicines 48 Business services 43
Trading in food products 43 Trade in agricultural crops 40 Tech. Consultancy & Engg. serv. 31 Info. Tech Enabled Service/BPO 21
Hotel & restaurant service 22 Other Consultancy 17
Fund based financial services 19 Trade in non-electrical machinery 15
Finance related allied activities 15 Shipping services 13
Printing and related services 13 Research & development 10 Storage & warehousing services 11
Source: CMIE Prowess, See Sapre and Sinha (2016) for details
In principle, the misclassification is a year-on-year problem and requires a
detailed scrutiny of their product schedules. While the problem in using CIN code was
briefly raised in CSO (2015d), no systematic recourse was mentioned to solve this
problem. NSC (2018) had taken a critical view of the problem by stating:
Moreover, the MCA-21dataset has serious quality issues. The economic activity or activities (NIC codes) perused by a company is extracted out of the CIN (Corporate Identification Number), assigned to the company at the time of registration. The NIC code reported at time of registration is likely to undergo change in due course of time. The MCA-21 dataset is not designed to include all the economic activities pursued by a company. However, it may be possible to tackle this difficulty by using the MGT-7 forms which contain information regarding activity-mix of the companies. [III 3.3.9 NSC (2018)]
34
The extent of distortion in GVA estimates due to misclassification cannot be
assumed to be negligible. There are two main concerns: (i) misclassification
introduces spurious volatility in levels and growth rates and such volatility does not
represent actual movements, and (ii) it distorts the GVA-to-Output (GVA/GVO) ratio
which is significantly different for manufacturing and services. Identification of
economic activity remains amongst the finer aspects of measurement and accuracy
of macroeconomic aggregates. The case of the manufacturing or services sector is no
different and deciphering information from a large dataset like the MCA21 is a
challenging task.
4. Deflator related issues
The issues discussed in the previous section pertain to nominal GDP estimation.
When it comes to real GDP growth rate estimation under the new NAS, a major issue
is related to the kind of deflators that are being used to convert the nominal values to
real estimates. There are two main issues in this regard and we discuss them below.
4.1 Single vs. double deflation
To get to the heart of the problem, one needs to understand how the GDP figures or
almost equivalently, Gross Value Added (GVA) figures are calculated. In the broadest
terms, the procedure followed by the CSO is the same as that all over the world. It
obtains data on the nominal values of output produced in various sectors of the
economy from the financial accounts of firms. Then, it deflates these figures by price
indices to arrive at estimates of real GDP. CSO’s methodology differs from what is
followed in other countries in two specific areas: the deflating procedure it follows
and the price indices it uses.
In terms of the deflating procedure, the standard international practice,
followed by nearly every major country with the exception of China and India, is to
use a methodology called ‘double deflation’. Under this procedure, the output price is
deflated by an output deflator, while raw material prices are deflated by a raw material
deflator. Then the real input value is subtracted from the real output value to obtain
35
real GVA estimates. The CSO's methodology is different in that it first computes the
nominal GVA, and then deflates this number using a single deflator to obtain the real
GVA. The main problem with this approach is that if input prices move in tandem
with output prices, there is no problem and both methodologies will give similar
results. But if the two price series diverge- as they did in India for the first few years
after the release of the new GDP series- single deflation can overstate growth by a big
margin.13
The reason is not difficult to see. If the price of inputs falls sharply, profits will
increase, and nominal value added will go up. Since real GDP is supposed to be
measured at `constant prices', this increase needs to be deflated away. Double
deflation will do this easily. But single deflation will not work. In fact, if a commodity-
weighted deflator like the Wholesale Price Index (WPI) is used, as is the case under
the current methodology, nominal growth will be inflated, on the grounds that prices
are actually falling. In this case, real growth will be seriously overestimated. As the
gap between input and output inflation starts to close, the problem will diminish. But
that could also send a misleading signal, because it might seem that growth is
slowing, when only the measurement bias is disappearing. This can be best
explained using a numerical example as given in Box 2.
13 For more details about how lack of a double deflation practice may have overstated real GDP growth under
the new series, see article: https://www.livemint.com/Opinion/58qihTaOIRd3rPyf1eK09L/Real-GDP-is-growing-at-5-
not-71.html
36
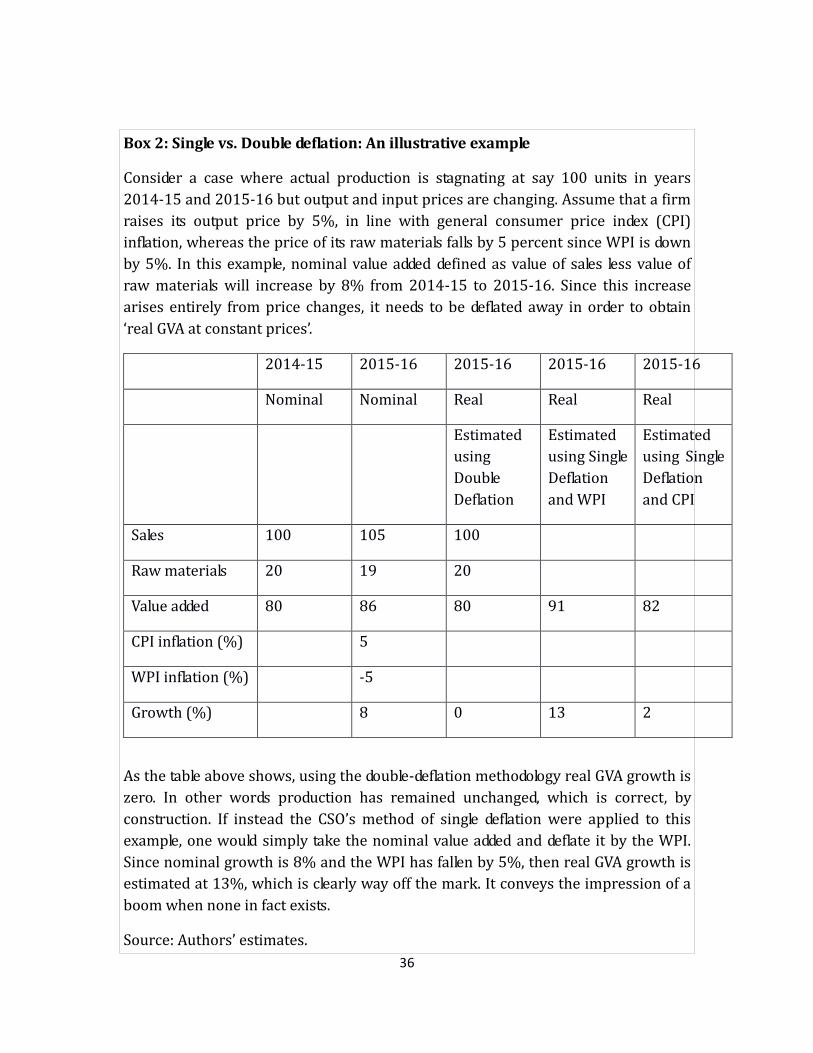
Box 2: Single vs. Double deflation: An illustrative example
Consider a case where actual production is stagnating at say 100 units in years
2014-15 and 2015-16 but output and input prices are changing. Assume that a firm
raises its output price by 5%, in line with general consumer price index (CPI)
inflation, whereas the price of its raw materials falls by 5 percent since WPI is down
by 5%. In this example, nominal value added defined as value of sales less value of
raw materials will increase by 8% from 2014-15 to 2015-16. Since this increase
arises entirely from price changes, it needs to be deflated away in order to obtain
‘real GVA at constant prices’.
2014-15 2015-16 2015-16 2015-16 2015-16
Nominal Nominal Real Real Real
Estimated
using
Double
Deflation
Estimated
using Single
Deflation
and WPI
Estimated
using Single
Deflation
and CPI
Sales 100 105 100
Raw materials 20 19 20
Value added 80 86 80 91 82
CPI inflation (%) 5
WPI inflation (%) -5
Growth (%) 8 0 13 2
As the table above shows, using the double-deflation methodology real GVA growth is
zero. In other words production has remained unchanged, which is correct, by
construction. If instead the CSO’s method of single deflation were applied to this
example, one would simply take the nominal value added and deflate it by the WPI.
Since nominal growth is 8% and the WPI has fallen by 5%, then real GVA growth is
estimated at 13%, which is clearly way off the mark. It conveys the impression of a
boom when none in fact exists.
Source: Authors’ estimates.
37
Globally, major developed countries have moved to a double deflator method,
particularly for the manufacturing sector. In India, the issue of deflator regained
importance in the 2011-12 series for two reasons. First, while under the old NAS real
growth rate was calculated largely using volume based measures, under the new NAS
it is calculated using value based measures. As a result the deflating procedure has
become more critical than before.
The introduction of the MCA21 database has however led to new challenges in
construction of a double deflator method in case of the manufacturing sector. It is a
database of financial statements (such as Profit/Loss statements and Balance Sheets)
that does not provide information on input or output prices at a commodity level.
These are necessary ingredients for constructing a double deflator that can deflate
values of inputs and outputs separately. In most countries, nominal production is
deflated by the producer price index (PPI). India lacks a PPI, so the CSO uses the WPI
instead. To ensure that the GDP numbers accurately reflect developments in the
economy, the CSO needs to develop proper PPIs, and then employ them using the
double deflation methodology.
4.2 WPI vs. CPI as deflator
It will take some time to develop PPIs, and even longer to calibrate double deflation for
each sector. There is however an interim solution that can be much more easily
applied. The other problem with CSO's deflation procedure is that the WPI suffers
from several drawbacks. For one, it does not measure the price of services, and
services constitute the bulk - around two-thirds - of India’s economy. Instead, the
WPI is heavily weighted towards commodities, especially oil. So when oil prices fall,
the WPI falls, and this leads to measured deflation in the services sectors (notably
finance and trade) even if service costs could actually be rising. As a result, growth in
services could be overstated by a large margin.
One interim solution to this problem, till the time a proper PPI is developed
and data on input prices are collected is to start using the Consumer Price Index (CPI)
series for the whole of the services sector, instead of the WPI. The change to CPI
38
makes even more sense in the services sector, because the CPI has extensive
information on price movements in the various services sub-sectors.
Using the CPI would not solve the problems caused by single deflation as that
can only be resolved through the introduction of double deflation methodology,
especially for the manufacturing sector, but it would nonetheless help as shown in
the table in Box 1. The main reason is that the CPI at least has the correct sign for the
deflator. It is increasing when the deflator needs to increase, rather than falling like
the WPI. The result, of course, is not perfect. Using the CPI to deflate the nominal
value added leads to an estimated real GVA growth of 2% in our example, when the
correct answer is zero. But this is much closer to the reality than the 13% real
growth rate obtained by using WPI as the deflator.
The better ‘fit’ of the CPI is not just an accident of the particular example
chosen. It is perfectly general because when commodity prices (such as oil prices)
fall, GVA tends to increase, at least in commodity importers such as India. (In this
case, one should think of GVA as firm profits, which will go up when input prices fall.)
Since this increase needs to be deflated away to arrive at a real GVA estimate at
constant prices, one needs an index that will increase when commodity prices fall,
rather than decrease, as the WPI tends to do. The CPI will also tend to decrease, but
by much less than the WPI, since commodities constitute a much smaller share of the
consumer basket.14
5. Issues in compiling Regional Accounts (Gross State Domestic Product)
The 2011-12 GDP series has led to new challenges for compiling state level GDP
estimates. After the introduction of the MCA21 database, estimates of the organised
manufacturing and services sectors are available only at the all-India level. This
constraint is because the consolidated financial statements of enterprises are not
available as per geographical regions, plant locations and products. As a result, state
14 As shown in Sengupta (2016; : https://www.livemint.com/Opinion/58qihTaOIRd3rPyf1eK09L/Real-GDP-is-
growing-at-5-not-71.html), for the year 2015-16 official statistics showed that nominal growth was 8%, and real growth
was 9% in the manufacturing sector. If the correct deflator was actually around 3%, in line with CPI manufacturing
inflation, then real growth was only around 5%.
39
level GDP for the organized manufacturing and services sectors is driven largely by
allocation rather than by actual estimation done in each state. Relying on an allocation
method (example using ASI shares of value added poses serious measurement issues
as such estimates may not entirely reflect ground realities.
For instance, Manna (2018) shows the bias arising out allocating state wise GVA
based on shares of each compilation category in total GVA available from ASI. Instead,
Manna (2018) argues that a more appropriate allocation method would be to use the
shares of respective compilation category in total GVA of private companies as per
ASI. The issue with such an allocation method is that both the MCA21 and ASI frame
have different coverage of units and GVA thus leading to mismatches in growth rates.
The problem has also been acknowledged by the Committee of Real Sector Statistics
when it stated that:
The most important gap in MCA-21data relates to the information at the regional (State) level. For the companies operating in more than one State, there is no way of ascertaining the distribution of GVA of such a company over its States of operation. In absence of details of a company’s state-wise activities, the national-level GVA estimates are allocated to States in proportion to State-level GVA estimates obtained from ASI for manufacturing activities. [III 3.3.7 NSC (2018)]
Adding another dimension to the problem, Dholakia and Pandya (2018) in the
context of the unorganized services argued that the ELI method does not take into
account variations in productivity at the state level. They argue that that labour
productivity in sectors such as trade, and freight transport services would be
necessarily different across states and ignoring such differences can lead to
imprecise estimates. In the old Labor Input (LI) method although category wise
labour productivity was not explicitly considered, inter-state variation was taken into
account as output per worker varied across states. Thus, on theoretical grounds, the
new ELI method cannot be assumed to be superior as compared to the simple
Labour Input method.
The revised GDP methodology has affected state domestic product estimation,
with a sharp rise in ‘apportionments’ and ‘projections’ and a decline in the share of
estimates based on state-level primary data, as demonstrated by Dholakia and Pandya
40
(2017) for Gujarat. This amounts to a regression in the quality of estimation of SDP
series. It has happened at a time when a greater share of fiscal resources is being
managed by the states. In response to the problems in compiling the regional
accounts, NSC (2018) clearly outlined that the major issue with regional accounts
apart from existing problems was due to the data gap in MCA21. To quote:
The most important gap in MCA-21data relates to the information at the regional (State) level. For the companies operating in more than one State, there is no way of ascertaining the distribution of GVA of such a company over its States of operation. In absence of details of a company’s state-wise activities, the national-level GVA estimates are allocated to States in proportion to (i) State-level GVA estimates obtained from ASI for manufacturing activities, (ii) The indicators for allocating services sector estimates have been mentioned in para IV.2.4.3 above. [IV. 3.3.6 NSC (2018)]
Given the complexity of the problem at the regional level, lack of credible SDP
estimates could adversely affect states’ ability for resource planning and budgeting.
The recommendations of the NSC (2018) for resolving these issues would require a
series of policy and regulatory efforts so as to rely less on voluntary compliance by
companies and more on data validation and scrutiny checks.
6. Issues with the 2011-12 Back Series of GDP
While data and methodology problems remained unresolved, new controversies
related to the 2011-12 series also cropped up in the last one year. Since its release,
the 2011-12 NAS did not have a ‘back casted series’, i.e. estimates at 2011-12 prices
beginning from 1950-51. The release of back series of any new base year series is a
routine exercise. Given the substantial changes in data sources and methods of
estimation in the 2011-12 NAS series which introduced inconsistencies with the
sources and methods used in the older series, compiling a back series was a major
challenge.
However in 2018, two separate sets of back series based on two different
approaches were released, one official and another unofficial, for varying time
lengths, leading to an inconclusive debate on the historic growth performance of the
41
economy. First, the Committee on Real Sector Statistics presented its own estimates
from 1994-95 till 2013-14 (henceforth NSC back series). Subsequently the CSO
released the official version of the back series for only seven years from 2004-05 till
2011-12 (henceforth CSO back series).15 These two series showed diametrically
opposite growth trends (CSO, 2018; NSC, 2018). This is clearly demonstrated in
figures 7 and 8.
The CSO back series showed lower annual growth rates for all the years from
2005-06 to 2011-12. For the seven year period, most of which was so far considered
to be an economic boom period for India, CSO back series reported an average
annual growth rate of 6.9 percent as opposed to the 8.2 percent growth rate
reported in the 2004-05 base year series.
The significant downward revision of growth rates and also the diametrically
opposite picture painted by the CSO back series compared to the NSC back series,
raised suspicion about the veracity of the estimates. This was especially because, as
mentioned earlier, by most popular accounts, these seven years recorded
unprecedented economic growth, an export boom, a credit boom, and an investment
boom when India was hailed as one of the fastest growing economies in the world.
The CSO back series changed this piece of Indian economic history.
In addition to changes in the aggregate growth rates, the CSO back series also
changed the overall composition of GDP in the following ways:
i. Reduction in the share of the services sector for this seven year period ii. A rise in the shares of primary and secondary sectors (corporate
manufacturing in particular) iii. A reduction in the size of unorganised/informal sector and expansion of the size of the private corporate sector FIGURE 7: COMPARISON OF THE NSC AND THE CSO BACK SERIES GROWTH RATES
15 See NSC (2018) and CSO (2018a) for details and documentation
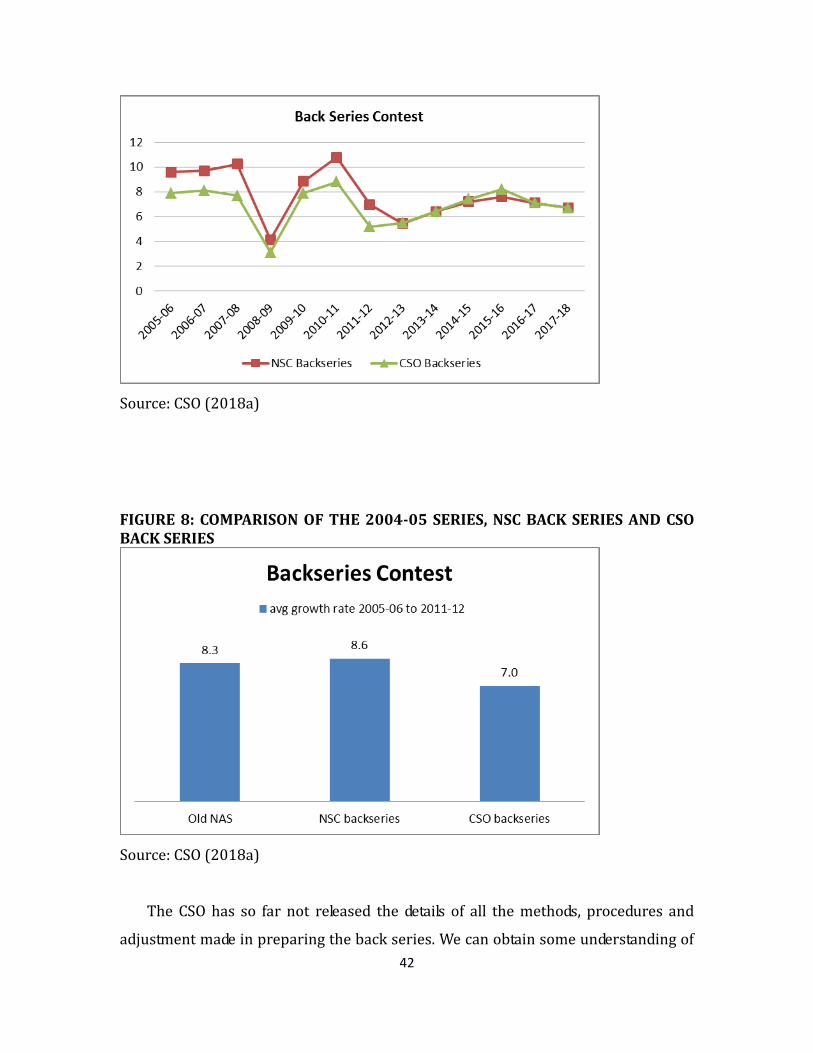
42
Source: CSO (2018a)
FIGURE 8: COMPARISON OF THE 2004-05 SERIES, NSC BACK SERIES AND CSO BACK SERIES
Source: CSO (2018a)
The CSO has so far not released the details of all the methods, procedures and
adjustment made in preparing the back series. We can obtain some understanding of
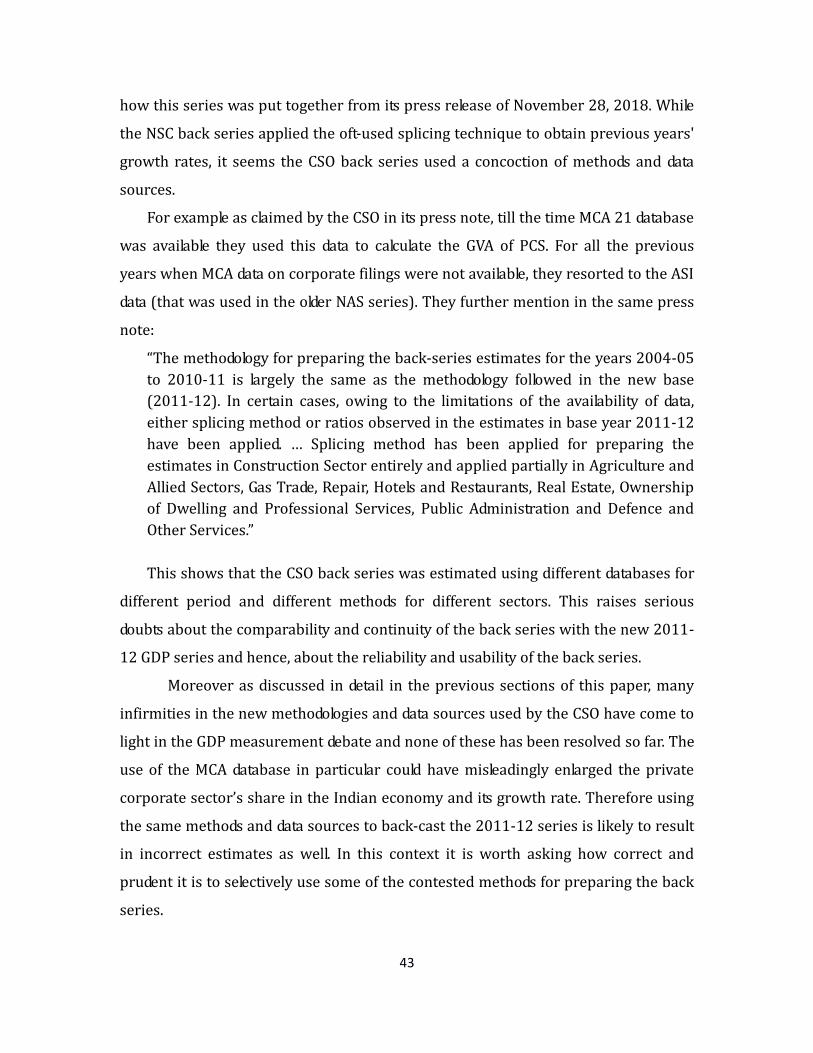
43
how this series was put together from its press release of November 28, 2018. While
the NSC back series applied the oft-used splicing technique to obtain previous years'
growth rates, it seems the CSO back series used a concoction of methods and data
sources.
For example as claimed by the CSO in its press note, till the time MCA 21 database
was available they used this data to calculate the GVA of PCS. For all the previous
years when MCA data on corporate filings were not available, they resorted to the ASI
data (that was used in the older NAS series). They further mention in the same press
note:
“The methodology for preparing the back-series estimates for the years 2004-05
to 2010-11 is largely the same as the methodology followed in the new base
(2011-12). In certain cases, owing to the limitations of the availability of data,
either splicing method or ratios observed in the estimates in base year 2011-12
have been applied. … Splicing method has been applied for preparing the
estimates in Construction Sector entirely and applied partially in Agriculture and
Allied Sectors, Gas Trade, Repair, Hotels and Restaurants, Real Estate, Ownership
of Dwelling and Professional Services, Public Administration and Defence and
Other Services.”
This shows that the CSO back series was estimated using different databases for
different period and different methods for different sectors. This raises serious
doubts about the comparability and continuity of the back series with the new 2011-
12 GDP series and hence, about the reliability and usability of the back series.
Moreover as discussed in detail in the previous sections of this paper, many
infirmities in the new methodologies and data sources used by the CSO have come to
light in the GDP measurement debate and none of these has been resolved so far. The
use of the MCA database in particular could have misleadingly enlarged the private
corporate sector’s share in the Indian economy and its growth rate. Therefore using
the same methods and data sources to back-cast the 2011-12 series is likely to result
in incorrect estimates as well. In this context it is worth asking how correct and
prudent it is to selectively use some of the contested methods for preparing the back
series.
44
7. Conclusion and way forward:
In 2015, the CSO introduced a new series of National Accounts Statistics with 2011-
12 as the base year, replacing the earlier 2004-05 base year series – a routine matter
for statistical authorities of most countries. The re-basing was carried out to account
for the economy’s structural changes, and in relative prices, always following the
global template of UN System of National Accounts (UNSNA), the latest one being the
2008 edition. It is also an occasion for statistical authorities to introduce newer
databases and better methodologies to improve the data quality.
Typically, as seen in the past, re-basing leads to a slight enlargement of the
absolute GDP size, as output that was previously left out or inadequately captured
gets recorded after the revision. This does not usually lead to changes in the growth
rates, implying that the underlying trend remains the same. The latest NAS revision
however defied these usual patterns, and reported a slight contraction of the GDP
size in the base year, as well as a faster growth rate in the subsequent years. As the
growth trends in the new series did not square with related macroeconomic
aggregates, widespread scepticism emerged questioning the veracity of the new GDP
series. Statistical authority responded saying that the newer estimates are sound
because they have used the latest UN guidelines, larger databases and improved
methodologies but this failed to carry conviction.
In their IPF paper, Nagaraj and Srinivasan (2016) unpacked the issues and
recorded the state of affairs as they were till mid-2016. Since then, fresh research and
data releases have uncovered newer problems thereby strengthening the earlier
doubts about the new GDP’s veracity and reliability. This has made it imperative to
assess the issues, which is the objective of our present paper. Given that much of the
newer research and questions are centred on the private corporate sector output
estimates, our paper has paid most attention to this aspect of the revision.
A major change in GDP estimation in the new series was the use of regulatory
filings of financial returns (in the MCA database) to estimate output of the private
corporate sector, replacing the production accounts obtained under the Annual
45
Survey of Industries (ASI) for manufacturing firms (which account for nearly one-
half of the overall corporate sector output). This change was predicated on the view
that the production accounts did not capture output outside the factory premises
given its approach to data collection. The enterprise approach used company balance
sheet is considered a solution to this problem. Research undertaken to closely
examine the ASI data revealed that the assumption for the shift in the approach is
factually incorrect, thereby undercutting the very basis of the innovation introduced
in the new NAS. Since manufacturing sector growth rate has been persistently higher
in the new series compared to picture painted by other macroeconomic indicators,
there are apprehensions that the change in approach to data collection may be at the
source of the problem.
While the universe of registered companies may have increased substantially,
the state of `active' and `filing' companies in the database has serious implications for
GVA estimation. The structure of the private corporate sector is such that a small
number of large companies contribute a large share to GVA. Limited information
from the MCA database suggests that a large number of small companies are
unavailable for estimation on an annual basis. Their estimates are obtained through a
blowing-up procedure whose details have not been released by the CSO. GVA
estimates can be imprecise especially when the sample size, its fraction and the
universe of working companies is indeterminate.
A recent official data release gave credence to the above suspicion. In 2016-17,
NSSO conducted a survey of non-government and non-financial services sector
enterprises, on its way to lunch a full-fledged series of annual survey of services, on
the lines of ASI. One of the list-frames (that is, the universe) for drawing the sample,
expectedly, was the MCA’s list of `active' (that is, deemed working) companies – a
part of the universe of companies CSO uses for estimating private corporate sector
GDP. After due verification, when NSSO launched the survey, it failed to get response
from up to 45 per cent of the sampled companies. Admittedly, some of the non-
responses could be due to misclassification (which in principle could be rectified). But
46
the fact that 24 per cent of the sample companies were non-traceable/failed to
respond suggest that the universe of ‘active’ companies used for private corporate
sector GDP estimation is unreliable and riddled with holes. This raises doubts about
the magnitude and reliability of output estimates (prepared using the same list
frame) accounting for over 1/3rd of the economy's GDP.
Regional Accounts are an integral part of the system of national accounts. The
NAS revision process has apparently paid scant attention to the implications of
methodological and database changes for the estimation of state domestic product
estimates. The problem arises because the newer databases used – such as the
corporate filings in MCA database mentioned above – are not geared for producing
state-level (let alone at the district level) output estimates. As a result, the state level
estimates are mostly apportionments of the national estimates, grossly distorting the
statistical picture of underlying economic reality. With increasing economic
decentralisation, distorted state income accounts end up affecting the distribution of
resources and probably even aggravating inter-regional inequalities.
After denying for three years that GDP back-series could not be prepared due
to the substantial methodological changes in the latest GDP revision, in 2018, the
statistical establishment, in quick succession, came out with two back-series with
diametrically opposite trends. While the series by a committee of the National
Statistical Commission boosted the growth rates for the last decade (2004-05 to
2011-12), CSO’s officially accepted series, reversed the trends, drastically lowering
the growth trends of the previous. The conflicting trends and lack of transparency in
the methodology used (especially) in the official back-series, confounded data users,
and also further dented the credibility of the statistical establishment.
Recommendations
If the foregoing analysis is sound and substantial, then they cast a serious doubt
on the new GDP series. In response, many private and international financial firms
have apparently resorted to their own devices to find proxies for GDP. Some are
apparently using World Bank’s night lights data as a measure of economic activity, or
47
high frequency industry and sector specific data – all of which are at best second best
solutions.
Going forward, we consider two sets of recommendations, one short run or
intermediate remedies, and the second a longer term and lasting solution. Since the
MCA database and the methodologies are the heart of problem, authorities should
immediately release the data in suitable form for independent verification of the
official GDP estimates. As corporate filing is a statutory requirement, the data should
in principle be easily accessible in public domain. However, considering its sheer size
and complexity the database needs to be made public in a suitable format via public
institutions. MCA could set up data labs in leading research institutions and
universities, similar to the Census Commission’s initiative, to encourage policy-
oriented research on the corporate sector. More specifically and immediately,
MCA/CSO can release the following data from 2011-12 onwards,
Yearly information on the sample size, sample fraction and the size of universe
of `active’ companies and their PUCs.
A break-up of financial and non-financial companies, by various categories.
List of companies filing returns with information on selected variables, which
could help data users to independently verify the data quality.
MCA and CSO should also create a suitable institutionalised forum for regular and
sustained interaction with data users to address the numerous issues that have come
up in the course of the GDP measurement debate.
For a lasting solution – reiterating Nagaraj and Srinivasan’s 2016
recommendation – a statistical audit and a credible expert committee need to be set
up to invite the best expertise available globally to review the GDP revision process.
Some of the core issues that the expert body may examine are the following:
1. Appropriateness of replacing the establishment approach to data collection
with enterprise approach for the non-farm sector, given the present level of
India’s development and quality and reliability of the available statistical bases.
48
2. Shifting of Quasi corporations (QCs) from household/unorganised sector to
private corporate sector, and its many ramifications for macroeconomic
aggregates, and policy.
3. Critically examine the incompleteness and unreliability of the MCA database,
given limited state capacity to enforce laws governing private enterprises.
There is an urgent need for a thorough investigation to ascertain its suitability
for estimating domestic output for an emerging market economy like India.
The objective of the audit/committee would be to investigate in detail the
problems in the sources and methods of the new NAS and help come up with the best
alternative estimates, preferably before the next base-year revision is conducted.
Otherwise we may end up perpetuating the defects in the current base-year series
and India's GDP will continue to be marred in controversy.
49
References
CSO (2015a) Report of the Sundaram Committee on Unorganised Manufacturing and Services Compilation of National Accounts Statistics with Base-Year 2011-12, Ministry of Statistics and Programme Implementation, April 13, 2015, February 27, 2015 CSO (2015b) Changes in Methodology and Data Sources in the New Series of National Accounts, Base Year 2011-12, New Delhi Central Statistical Office CSO (2015c) Data Users’ Conference on New Series of National Accounts with Base Year 2011-12, New Delhi, National Accounts Division, Ministry of Statistics and Programme Implementation, April 13, 2015. CSO (2015d) Final Report of the Sub-Committee on Private Corporate Sector including PPPs, National Accounts Division, Ministry of Statistics and Programme Implementation, Government of India, New Delhi. CSO (2015e) Report of the Sub-Committee on System of Indian National Accounts, National Accounts Division, Ministry of Statistics and Programme Implementation, Government of India, New Delhi CSO (2015f) No room for doubts on new GDP numbers, Economic and Political Weekly, Vol. 50, Issue 16, April, 2015 CSO (2018) Proceedings of Awareness Workshop on Challenges and Issues of Official Statistics for Senior ISS Officers during 18th - 19th May, 2018, Bengaluru, Part I and II, National Statistical Systems Training Academy, Ministry of Statistics and Programme Implementation, Government of India, New Delhi CSO (2018a) Back-series estimation Base 2011-12 Methodology Document, Ministry of Statistics and Programme Implementation, Government of India, New Delhi. Dholakia, Ravindra H, R Nagaraj, and Manish B Pandya (2018) Manufacturing Output in New GDP Series: Some Methodological Issues, Economic and Political Weekly, Vol. 53, No. 35, September 1 Dholakia, Ravindra, and Manish B. Pandya (2017) Critique of Recent Revisions with base Year Change for Estimation of State Income in India, Journal of Indian School of Political Economy, Vol. 29, No. 1-2, Jan-June
Manna, G C (2017) An Investigation into Some Contentious Issues of GDP Estimation, Journal of Indian School of Political Economy, Vol. 29, No. 1-2, Jan-June Manna, G C (2018) A Study on the Likely Magnitude of Bias in the Estimates of Gross State Domestic Product for the Private Corporate Segment of Manufacturing Sector as
50
per the New Methodology, Indian School of Political Economy Conference Proceedings, January, 2018, Pune Ministry of Finance (2019) GDP Estimation: A clarification, Press Information Bureau, 10th May, 2019 Nagaraj, R and T N Srinivasan (2017) Measuring India’s GDP growth: Unpacking the Analytics and Data Issues behind a Controversy that Refuses to Go Away, India Policy Forum (NCAER), Vol. 13, July 2017 Nagaraj, R (2017) Quarterly GDP Estimation, Economic and Political Weekly, Vol. 52, Issue No. 10, 11 Mar, 2017 National Statistical Commission (NSC) (2018) Report of the Committee on Real Sector Statistics, National Statistical Commission, New Delhi, May, 2018 National Statistical Commission (NSC) (2018a) Report of the Committee on Financial Sector Statistics, National Statistical Commission, New Delhi, May, 2018 Pandey, Radhika, Amey Sapre and Pramod Sinha (2019) What do we know about changing economic activity of firms?, National Institute of Public Finance and Policy Working Paper, No. 249, January, 2019 Ramana Murthy, S.V. (2018) Base change 2011-12 and implications on GSVA, Journal of Indian School of Political Economy, Vol (30), No 3&4, July-Dec 2018. Sapre, Amey and Pramod Sinha (2016) Some areas of concern about Indian Manufacturing Sector GDP estimation, National Institute of Public Finance and Policy (NIPFP) Working Paper, No. 172/2016 Sapre, Amey and Pramod Sinha (2017) Some Unsettled Questions about Indian Manufacturing GDP Estimation, Journal of Indian School of Political Economy, Vol. 29, No. 1, 2017 Shetty, SL and J Dennis Rajakumar (2017) Critique of Recent Revisions with Base Year Change for Estimation of State Income in India, Journal of Indian School of Political Economy, Vol. 29, No. 1, 2017 Sidhartha and Gupta, S. (2015) There Is More Acceptance, Credibility of New GDP Data: Chief Statistician, Times of India, 2 June. Subba Rao, KGK (2018) Discrepancies between Flow-of-Funds and National Accounts Statistics, Economic and Political Weekly, Vol. 53, No. 15, April Subba Rao, KGK (2018) Regional Accounts: A perspective, Journal of Income and Wealth, Vol. 40, Issue 1, 2018.
Related Documents