India Pilot Study Report: District: Rajnandgaon Block: Dongargaon Village: Amlidih Nalini Juneja Reshmi Chakraborty, Nupur Behl, Rujuta Deshmukh and Harish Chandra Behera December 2007 WORK IN PROGRESS CREATE research teams are producing a range of interim research products. These include fieldwork reports, pilot studies, background reviews, research instruments, and draft papers. These vary in focus, depth, and quality and have not been peer reviewed. Some will become CREATE publications after quality assurance, and others will remain as project documents. The Work in Progress products are collected together in one area of the website (http://www.create-rpc.org/publications/index.shtml ). They are also linked to other website pockets as appropriate. Author details are provided with this document for any follow up correspondence. National University of Educational Planning and Administration Consortium for Research on Educational Access, Transitions and Equity

Welcome message from author
This document is posted to help you gain knowledge. Please leave a comment to let me know what you think about it! Share it to your friends and learn new things together.
Transcript
India Pilot Study Report: District: Rajnandgaon
Block: Dongargaon Village: Amlidih
Nalini Juneja Reshmi Chakraborty, Nupur Behl,
Rujuta Deshmukh and Harish Chandra Behera
December 2007
WORK IN PROGRESS CREATE research teams are producing a range of interim research products. These include fieldwork reports, pilot studies, background reviews, research instruments, and draft papers. These vary in focus, depth, and quality and have not been peer reviewed. Some will become CREATE publications after quality assurance, and others will remain as project documents. The Work in Progress products are collected together in one area of the website (http://www.create-rpc.org/publications/index.shtml). They are also linked to other website pockets as appropriate. Author details are provided with this document for any follow up correspondence.
National University of Educational Planning and Administration
Consortium for Research on Educational Access, Transitions and Equity
The Consortium for Educational Access, Transitions and Equity (CREATE) is a Research Programme Consortium supported by the UK Department for International Development (DFID). Its purpose is to undertake research designed to improve access to basic education in developing countries. It seeks to achieve this through generating new knowledge and encouraging its application through effective communication and dissemination to national and international development agencies, national governments, education and development professionals, non-government organisations and other interested stakeholders. Access to basic education lies at the heart of development. Lack of educational access, and securely acquired knowledge and skill, is both a part of the definition of poverty, and a means for its diminution. Sustained access to meaningful learning that has value is critical to long term improvements in productivity, the reduction of inter-generational cycles of poverty, demographic transition, preventive health care, the empowerment of women, and reductions in inequality.
The CREATE partners CREATE is developing its research collaboratively with partners in Sub-Saharan Africa and South Asia. The lead partner of CREATE is the Centre for International Education at the University of Sussex. The partners are:
The Centre for International Education, University of Sussex: Professor Keith M Lewin (Director) The Institute of Education and Development, BRAC University, Dhaka, Bangladesh: Dr Manzoor Ahmed The National University of Educational Planning and Administration, Delhi, India: Professor R Govinda
The Education Policy Unit, University of the Witwatersrand, South Africa: Dr Shireen Motala The Universities of Education at Winneba and Cape Coast, Ghana: Professor Jerome Djangmah
The Institute of Education, University of London: Professor Angela W Little
Disclaimer The research on which this paper is based was commissioned by the Consortium for Research on Educational Access, Transitions and Equity (CREATE http://www.create-rpc.org). CREATE is funded by the UK Department for International Development (DFID) for the benefit of developing countries and is coordinated from the Centre for International Education, University of Sussex. The views expressed are those of the author(s) and not necessarily those of DFID, NUEPA, or the CREATE Team. Copyright © CREATE 2007
Addresses for correspondence: CREATE, Centre for International Education, Sussex School of Education, University of Sussex, Falmer, Brighton BN1 9QQ, United Kingdom Tel: + 44 (0) 1273 678464 Website: http://www.create-rpc.orgEmail [email protected]
National University of Educational Planning and Administration 17-B, Sri Aurobindo Marg New Delhi-110016 Email: [email protected]
i
Contents
List of Tables .................................................................................................................................. ii List of Figures ................................................................................................................................ iv 1. Introduction................................................................................................................................. 1
1.1 Purpose of the Survey ........................................................................................................... 1 1.2 General Design...................................................................................................................... 1 1.3 Methodology ......................................................................................................................... 1 1.4 Tools...................................................................................................................................... 1
1.4.1 Household Questionnaire ............................................................................................... 2 1.4.2 School Profile and School Baseline................................................................................ 2 1.4.3 Teachers Questionnaire .................................................................................................. 2 1.4.4 Head Teacher Questionnaire .......................................................................................... 2 1.4.5 Child Tracking Instruments ............................................................................................ 2 1.4.6 Competency Test ............................................................................................................ 4 1.4.7 Administration and Scoring............................................................................................ 5
1.5 Data Collection...................................................................................................................... 5 1.5.1 Households ..................................................................................................................... 5 1.5.2 Schools ........................................................................................................................... 5 1.5.3 Tracking Children........................................................................................................... 5
1.6 Data Tabulation and Analyses............................................................................................... 6 1.6.1 Data Management........................................................................................................... 6
2. Findings from the Pilot Survey: Village and Households .......................................................... 8 2.1 Village Profile ....................................................................................................................... 8 2.2 Socio- Economic Characteristics of Households .................................................................. 8 2.3 Survey Households, Population and Children....................................................................... 8 2.4 Child Population.................................................................................................................... 8 2.5 Family Structure.................................................................................................................. 10 2.6 Caste Profile ........................................................................................................................ 11 2.7 Languages Spoken............................................................................................................... 12 2.8 Type of Dwellings............................................................................................................... 12 2.9 Land Holdings ..................................................................................................................... 12 2.10 Asset Ownership ............................................................................................................... 13 2.11 Income............................................................................................................................... 14 2.12 Migration........................................................................................................................... 15 2.13 Drinking Water.................................................................................................................. 16 2.14 Toilet Facilities.................................................................................................................. 16 2.15 Electricity .......................................................................................................................... 17
3. Findings Regarding Children 3-18 years of Age ...................................................................... 18 3.1 Profile of Children............................................................................................................... 18 3.2 Profile of the Parents ........................................................................................................... 20
3.2.1 Literacy......................................................................................................................... 20 3.2.2 Local Residence............................................................................................................ 21
3.3 Age-Grade Enrolment ......................................................................................................... 21 3.3.1 Age at Admission to Class I ......................................................................................... 23
3.4 Schools Attended................................................................................................................. 23 3.5 Regularity of Attendance .................................................................................................... 24 3.6 Distance to School............................................................................................................... 24 3.7 Mode of Commuting ........................................................................................................... 25 3.8 Time Taken to Reach School .............................................................................................. 25
ii
3.9 Facilities Provided by the School........................................................................................ 26 3.10 Schedule of Payments to Schools...................................................................................... 26 3.11 Extra Tuition ..................................................................................................................... 27 3.12 Parent-Teacher Meetings................................................................................................... 27 3.13 Most Recent Parent-Teacher Meeting............................................................................... 27 3.14 Health Issues ..................................................................................................................... 28 3.15 Support for Education in the Home................................................................................... 29 3.16 The Importance of Education............................................................................................ 29 3.17 Parents’ Aspirations for Their Children ............................................................................ 30 3.18 Drop Out............................................................................................................................ 31
4. The Government Primary School, Amlidih .............................................................................. 33 4.1 Introduction ......................................................................................................................... 33 4.2 Enrolment Status of the School........................................................................................... 35 4.3 Age-Grade Relationships .................................................................................................... 35 4.4 Grade Repetition ................................................................................................................. 37 4.5 Enrolment ............................................................................................................................ 37 4.7 The School’s Teachers ........................................................................................................ 38
4.7.1 Personal Backgrounds .................................................................................................. 38 4.7.2 Educational Background............................................................................................... 39
4.8 Teaching, Learning and Attendance.................................................................................... 39 4.8.1 Multi-Grade Teaching .................................................................................................. 39 4.8.2 Employment as a Teacher............................................................................................. 39
4.9 School Management............................................................................................................ 40 4.10 Community Relations........................................................................................................ 40 4.11 School Learning Facilities................................................................................................. 40 4.12 Student Health Management ............................................................................................. 40 4.13 Resources .......................................................................................................................... 40 4.14 Teachers Comments on Access and Meaningful Access .................................................. 40
5. Mapping Children from Households into the School Register ................................................. 41 5.1 Numerical Competency Test............................................................................................... 42 5.2 Child Tracking Instrument .................................................................................................. 44
6. Discussion of Findings and Suggestions for Thematic Research ............................................. 46 6.1 Zone 1: Access to Grade 1 .................................................................................................. 46 6.2 Zone 2: Drop Out ................................................................................................................ 46 6.3 Zone 3: At Risk of Drop Out............................................................................................... 46 6.4 Zone 4: Transition to Upper Primary .................................................................................. 48
7. Technical Annex ....................................................................................................................... 49 7.1 Instruments Used in Data Collection .................................................................................. 49 7.2 Log Book............................................................................................................................. 49
7.2.1 Analysis Plan ................................................................................................................ 49 7.2.2 Sample Analysis Plan for Village Amlidih, Household Questionnaire........................ 50 7.2.3 Codes for Open-ended Questions ................................................................................. 50 7.2.4 Code Sheet for the Household Questionnaire............................................................... 51
7.3 Data Entry Format in Excel and SPSS ................................................................................ 62 Annex 1 School and Class Distribution of School-Going Children, Amlidih.............................. 63 Annex 2 Age-Grade Enrolment for 2006-2007; Government Primary School, Amlidih............. 64
List of Tables
Table 1 Survey Households, Population and Children ................................................................... 8
iii
Table 2 Number of Children in the Age Group (Age and Sex Wise)............................................. 9 Table 3 Sex Ratio in Rural Areas of Rajnandgaon District, Dongargaon Block, and Amlidih Village........................................................................................................................................... 10 Table 4 Sex Ratio in Urban Areas of Rajnandgaon District and Dongargaon Block................... 10 Table 5 Family Type..................................................................................................................... 10 Table 6 Family Size ...................................................................................................................... 11 Table 7 Caste Profile of the Village.............................................................................................. 11 Table 8 Type of Houses in the Village ......................................................................................... 12 Table 9 Ownership of Land .......................................................................................................... 12 Table 10 Size of Land Holdings ................................................................................................... 13 Table 11 Furniture......................................................................................................................... 13 Table 12 Communication Devices................................................................................................ 13 Table 13 Means of Transportation................................................................................................ 14 Table 14 Education Assets............................................................................................................ 14 Table 15 Income Level of Households ......................................................................................... 14 Table 16 Household Income Level ............................................................................................... 14 Table 17 Migration ....................................................................................................................... 15 Table 18 Type of Work Attained by Out-Migrants ...................................................................... 15 Table 19 Percentage Share of Households with Migrating Members .......................................... 15 Table 20 Source of Drinking Water.............................................................................................. 16 Table 21 Distance to Water Source .............................................................................................. 16 Table 22 Availability of Toilet Facilities...................................................................................... 16 Table 23 Supply of Electricity to the Households ........................................................................ 17 Table 24 Number of Children by Age .......................................................................................... 19 Table 25 Distribution of Girls and Boys in the Village ................................................................ 19 Table 26 Educational Status of Parents ........................................................................................ 20 Table 27 Local Residence of Parents............................................................................................ 21 Table 28 Age-Grade Data According to Household..................................................................... 22 Table 29 Age of Children in Relation to Anganwari / Pre School and School Status.................. 23 Table 30 Age at the Time of Admission to Class I....................................................................... 23 Table 31 Number of Days Children Were Reported Absent in the Previous Week..................... 24 Table 32 Distance Travelled to School......................................................................................... 24 Table 33 Transportation to School................................................................................................ 25 Table 34 Time Taken to Reach School......................................................................................... 25 Table 35 Difficulty faced by Children in Reaching School.......................................................... 26 Table 36 Resources Provided by Schools..................................................................................... 26 Table 37 Schedule of Payments to the School.............................................................................. 27 Table 38 Child going to Extra Classes/ Tuition Classes............................................................... 27 Table 39 Parent-Teacher Meetings ............................................................................................... 27 Table 40 Most Recent Meeting of Parent with Teacher ............................................................... 28 Table 41 Health Problems faced by the Children in the Past Month............................................ 28 Table 42 Visits by Health Workers in the Last Year .................................................................... 29 Table 43 Help with Homework..................................................................................................... 29 Table 44 Amount Borrowed by Parents for Completion of Education ........................................ 29 Table 45 Importance of Education................................................................................................ 30 Table 46 Parents’ Aspirations....................................................................................................... 31 Table 47 Last Class Attended Before Dropping Out .................................................................... 31 Table 48 Children’s Occupations After Dropping Out................................................................. 32 Table 49 Classwise Enrolment (2007-2008), Amlidih Government Primary School .................. 35 Table 50 Age-Grade Enrolment (2006-2007), Amlidih Government Primary School ................ 36
iv
Table 51 Grade Repetition ............................................................................................................ 37 Table 52 Enrolment in Class I and Class V .................................................................................. 37 Table 53 Enrolment and Tracking ................................................................................................ 41 Table 54 Mean, Median and Modal scores on the Numerical Competency Test ......................... 42 Table 55 Age and School Attendance Status of Tracked Children .............................................. 45
List of Figures
Figure 1 Percentage of Boys and Girls in the 3-15 Years Age Group............................................ 9 Figure 2 Families with Children Between 3-18 Years.................................................................. 18 Figure 3 Graphic Representation of Village Children by Age ..................................................... 19 Figure 4 Education of Parents....................................................................................................... 21 Figure 5. Enrolment Trends in Class I over the last 5 Years ........................................................ 38 Figure 6 Numerical Competency of Class V Children, Government Primary School, Amlidih.. 43 Figure 7 Total Numerical Competency of Class V Children, Government Primary School, Amlidih ......................................................................................................................................... 43 Figure 8. Levels of Numerical Competencies for Class V, Village Amlidih ............................... 44
v
Acronyms
BRC Block Resource Centre
CRC Cluster Resource Centre
CTC Child Tracking Card
HH Household
HTQ Head Teacher Questionnaire
OBC Other Backward Classes
PTA Parent Teacher Association
SC Scheduled Caste
SSA Sarva Shiksha Abhiyan
ST Scheduled Tribe
TQ Teacher Questionnaire
VEC Village Education Committee
Vernacular Terms
Kachcha Ghar House made of mud, or thatch
Semi Kachcha Ghar House wherein either walls or roof is made of concrete
Pakka Ghar House with walls and roof made of concrete.
1
1. Introduction
1.1 Purpose of the Survey
The main purpose of this pilot study was to test the instruments that were designed to study educational access, transitions and equity of children aged 3-15 years in communities and schools, in the field sites of the CREATE India study. The pilot study was conducted in a village named Amlidih, located in Dongargaon block, of Rajnandgaon district in the state of Chhattisgarh, India. The village Amlidih is fairly compact, with houses in fairly close proximity to each other. Although clusters of houses are differentiated into ‘wards’, they share the same primary school. One ward of the village was across the road, and at a distance from the rest of the village. The children from this ward are closer to the primary school of the next village, Ari. There was no other school or EGS school catering to one part of the village, nor was the ward across the road inhabited by persons from castes other than those residing in the main village.
1.2 General Design
A census survey was conducted of all the households (HH) in the above village. In addition, information about the primary and middle school serving that village, the heads of the schools, teachers, and pupils was also collected using instruments designed for the purpose. Data gathering tools, based on generic instruments (designed in a workshop of the CREATE consortium partners at the University of Sussex in March 2007) were designed for households, schools, and teachers. The questionnaire was translated into Hindi, to facilitate ease of administration in the field. Methods were also devised and tested for tracking children of elementary school age. A mathematics test was constructed to assess learning levels of children in grade 5.
1.3 Methodology
The pilot study was carried out in four stages. In the first stage of the pilot study, a survey was conducted of all the households in the village except for those without children aged 3-15 years. In the second stage, data was collected from the schools. In the third stage, the research team went back to the households to collect data from selected children. In the fourth stage, a competency test was carried out in three schools of Amlidih, Ari and Konari villages. This report provides detailed accounts of the first three stages.
1.4 Tools
The following instruments were tested in the pilot study in Amlidih:
• Household Questionnaire • School Profile and School Baseline • Teachers Questionnaire • Head Teacher Questionnaire • Child Tracking Instruments • Child Tracking Card (CTC) • Light Tracking Card/Class Pictures (LTC) • Competency Test

2
A brief description of each of these instruments is presented below.
1.4.1 Household Questionnaire
Information was collected on socio-economic variables such as caste, religion, occupation, land ownership and size of land, income, sources of income, expenditure, migration status, household assets etc. The household information also included the literacy and the schooling status of the members of the household. Since the focus of the study was to map all children (aged 3-15 years) in respect of their school attendance status - (i) enrolled and attending, (ii) never enrolled, or (iii) enrolled and dropped out, data was gathered on the class and the type of school they were currently enrolled in, attendance, repetition and participation in the school and expenditure on schooling. Questions also related to whether they were ever enrolled, or whether they had enrolled and dropped out, if so how long ago, and what they are doing now. Questions were also asked regarding health and disability of the children and expectations and aspirations from education.
1.4.2 School Profile and School Baseline
Data collected on the school included information about the location, infrastructure, personnel and timings, etc. (School Profile) and statistical data on schools such as enrolment trends, repeaters, drop outs, teachers, incentives, schemes, etc. (School Baseline Questionnaire).
1.4.3 Teachers Questionnaire
The Teacher Questionnaire (TQ) was designed for administration to teachers in order to understand their background, place of residence, their educational qualifications, etc. The questionnaire investigated participation and involvement of the teachers in teaching and other administrative activities. It also sought to understand teachers’ explanations for phenomena such as underage and late enrolment of children, dropout, repetition, etc.
1.4.4 Head Teacher Questionnaire
The Head Teacher Questionnaire (HTQ) collected information on administrative duties and responsibilities of the head teacher, the facilities available in the school, the school funds and their utilization; various school bodies such as the PTA, VEC, etc. The HTQ also sought to understand the head teachers’ explanations for phenomena such as late enrolment, underage and overage children, dropout, repetition, transition and access.
1.4.5 Child Tracking Instruments
i) Child Tracking Card (CTC) The Child Tracking Card (CTC) was actually a small booklet designed for the collection of information on a small sample of children on a bi-annual basis. This included information on their school status, their likes and dislikes in terms of the subjects, teachers, involvement in the household activities, involvement in other economic activities etc. The Child Tracking Card is planned to be used for tracking a sample of children once every six months.
3
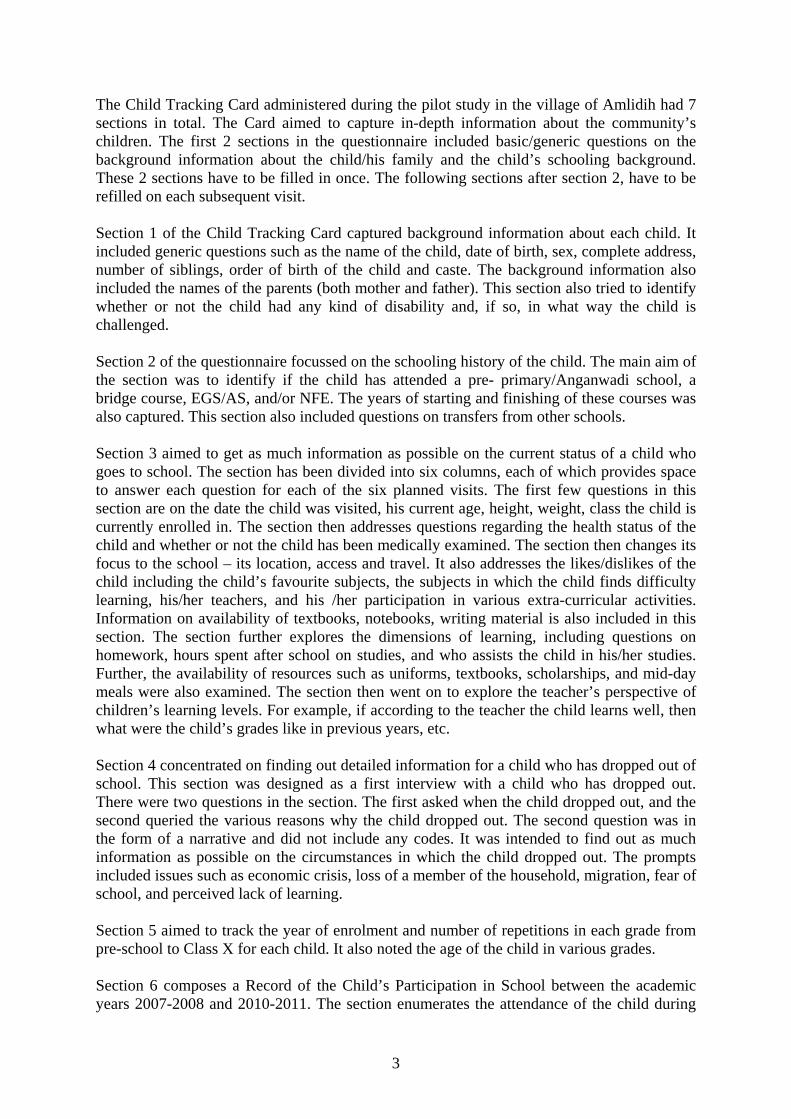
The Child Tracking Card administered during the pilot study in the village of Amlidih had 7 sections in total. The Card aimed to capture in-depth information about the community’s children. The first 2 sections in the questionnaire included basic/generic questions on the background information about the child/his family and the child’s schooling background. These 2 sections have to be filled in once. The following sections after section 2, have to be refilled on each subsequent visit. Section 1 of the Child Tracking Card captured background information about each child. It included generic questions such as the name of the child, date of birth, sex, complete address, number of siblings, order of birth of the child and caste. The background information also included the names of the parents (both mother and father). This section also tried to identify whether or not the child had any kind of disability and, if so, in what way the child is challenged. Section 2 of the questionnaire focussed on the schooling history of the child. The main aim of the section was to identify if the child has attended a pre- primary/Anganwadi school, a bridge course, EGS/AS, and/or NFE. The years of starting and finishing of these courses was also captured. This section also included questions on transfers from other schools. Section 3 aimed to get as much information as possible on the current status of a child who goes to school. The section has been divided into six columns, each of which provides space to answer each question for each of the six planned visits. The first few questions in this section are on the date the child was visited, his current age, height, weight, class the child is currently enrolled in. The section then addresses questions regarding the health status of the child and whether or not the child has been medically examined. The section then changes its focus to the school – its location, access and travel. It also addresses the likes/dislikes of the child including the child’s favourite subjects, the subjects in which the child finds difficulty learning, his/her teachers, and his /her participation in various extra-curricular activities. Information on availability of textbooks, notebooks, writing material is also included in this section. The section further explores the dimensions of learning, including questions on homework, hours spent after school on studies, and who assists the child in his/her studies. Further, the availability of resources such as uniforms, textbooks, scholarships, and mid-day meals were also examined. The section then went on to explore the teacher’s perspective of children’s learning levels. For example, if according to the teacher the child learns well, then what were the child’s grades like in previous years, etc. Section 4 concentrated on finding out detailed information for a child who has dropped out of school. This section was designed as a first interview with a child who has dropped out. There were two questions in the section. The first asked when the child dropped out, and the second queried the various reasons why the child dropped out. The second question was in the form of a narrative and did not include any codes. It was intended to find out as much information as possible on the circumstances in which the child dropped out. The prompts included issues such as economic crisis, loss of a member of the household, migration, fear of school, and perceived lack of learning. Section 5 aimed to track the year of enrolment and number of repetitions in each grade from pre-school to Class X for each child. It also noted the age of the child in various grades. Section 6 composes a Record of the Child’s Participation in School between the academic years 2007-2008 and 2010-2011. The section enumerates the attendance of the child during
4
the month of each visit and also during the week of each visit, as well as the various reasons for absenteeism. Section 7 focuses on the child who has already dropped out of school. It gathers information on what the child is doing at present, if he/she would like to attend the school, if he/she is able to attend school in their current circumstances, and if there as been any kind of contact between the parents and the school teachers/head teacher. ii) Light Tracking Card/Class Pictures (LTC) “Light tracking” of children in the classrooms was done by ascertaining the physical presence in the class of children listed in the school register. They were also asked which class they had attended last year, in order to know if they were new to the school or were repeaters. Although the school maintains attendance records of the children in the attendance registers, and these could be checked and charted, the LTC was considered to be an additional form of verification of the continued presence of the child in the school. A class photograph was taken, and children were identified on the photograph. The photograph will be used for continued tracking in the next year.
1.4.6 Competency Test
A Competency Test was prepared on the basis of a List of Competencies already available from a previous study conducted in 1991. The test items were developed corresponding to the three Levels of Competencies identified in the appendicles to the 1992 book, Quality of Primary Schooling in India: a Case Study of Madhya Pradesh by Professor R. Govinda and Professor N.V. Varghese. In this 1991 study, a set of questions were developed based on identified competencies for Classes I, III, and V. Unfortunately, the tests that were used in 1991 are no longer available. Therefore, a new set of items based on the same competencies were developed and validated in consultation with school teachers. The mathematical ability test incorporated questions on number counts and recognition of signs and symbols used in simple math. The test also included simple arithmetic skills such as summation, subtraction, multiplication and division, as well as other mathematics used in day-to-day life. These were then tried out in the pilot study on 24 children in Class V in Amlidih village. The present test developed, corresponding to the identified three competencies consisted of 64 items. The maximum score for the test was 128, and before equalisation, the bulk of the scores (41%) were obtainable from level 1 competencies, 38% from level 2, and the remaining 22% were obtainable from level 3 competency items on the test. Scoring The scoring key for each of the items in the test was as follows:
• For each correct answer, a score of 2 was assigned; • For the items where the answer was wrong but the process followed was right, a score
of 1 was assigned (i.e. half the score of the correct answer); • A score was 0 was assigned for each incorrect answer and for items for which no
response was given.
5
After scoring as per the scheme outlined above, the level-wise scores for the 24 pupils were tabulated on Excel, with separate subtotals for level 1 (L1), level 2 (L2), and level 3 (L3) respectively, as well as a total score. Frequencies were computed from the scores for the total as well as the different levels of the test.
1.4.7 Administration and Scoring
The test was administered to 24 pupils of Class V. All of the pupils on the roll in Class V were present on the day of the test. One of the 24 sheets had to be eliminated, however, leaving only 23 pupils.
1.5 Data Collection
1.5.1 Households
The survey was conducted of households which had children aged between 3-15 years. Those households which did not have children in this age group were not surveyed. There were 10 wards in the village. All the households in the village were identified using a list obtained from the village Sarpanch (elected head of the village). However, the households were not listed ward-wise, and therefore the location of each household had to be plotted onto a hand drawn map of the village. The survey team visited the households ward-wise with questionnaires carrying the names of the household to be visited. This ensured that no household was left unvisited in the village.
1.5.2 Schools
After the Household Survey, information was collected about the Government Primary School, Amlidih, which offers Classes I-V, and the Government Middle School, Ari, which caters to upper primary Classes 6-8. The School Profile Questionnaire was administered to the head of the school, and where necessary, information was collected from the school registers and from observation. The head teacher and teachers of the Government Primary School, Amlidih were interviewed using the HTQ and the TQ, respectively. A Mathematical Competency test was also administered to children of Class V.
1.5.3 Tracking Children
i) Photographs An effort was made to trace all enrolled children (according to the household data) in the school. Photographs for all children in the Government. Primary School, Amlidih were clicked. All children in the photographs were identified and were matched with the household data/ school register. On the basis of this exercise, an attempt was made to map all school-going children in Amlidih Village. Since the photographs were taken in the school, the pictures related to only school going children. The photograph may be useful in the future in checking to see which of the children continue to be part of the cohort in future years. Similarly, children who have dropped out could be identified. ii) Child Tracking Card In-depth information was collected on 25 selected children, from the Government Primary School, Amlidih (Classes I-V). The sample for tracking included all children who had dropped out (according to the household survey). Information gathered from these children included their current school-going status, their likes/dislikes in terms of subjects, teachers,
6
involvement in household activities, involvement in other economic activities, etc. Interviews with children who had dropped out focused on their reasons for dropping out, engagement in work at present, opportunities available to re-join school, and alternate opportunities available for learning. iii) Light Tracking in the Classroom All classrooms were visited to ascertain whether or not the children listed in the register were actually present in the classrooms. This process was referred to as ‘light tracking’. All children in the Government Primary School, Amlidih were lightly tracked. In the process, the class that they attended prior to the current class was also noted. iv) Photocopy of Registers The attendance register of each class was also photocopied in order to study it in more detail. The register records the child’s attendance over time.
1.6 Data Tabulation and Analyses
1.6.1 Data Management
After the pilot study, the data was entered in Excel and SPSS. A data management workshop was conducted. Before beginning the data coding and tabulation exercises, all questionnaires were checked against a serial-wise list of all households; this also indicated the ward numbers, and any case specific information (for e.g. no child in the household, vacant house, etc). All questionnaires were also checked for completeness and to ensure that no items were left unanswered. If the pages were falling apart, the questionnaires were securely tagged. An Analysis Plan was prepared for all sections and all questions in the questionnaire, and for all items it was determined whether frequencies would be calculated or if cross tabulation was also needed for verification (for instance, cross tabulation of caste with caste category - the Sahoo caste, for example, is also in the OBC list). Dummy tables were prepared for frequency counts and cross tabulations. Qualitative data such as caste categories, were coded as per the procedure given in Section 7 of this report. Data was tabulated on the computer only for the Baseline Household Questionnaire administered in the Pilot Study. Data for the other questionnaires were not tabulated due to paucity of time and more importantly, since there were only one or at the most two questionnaires filled for each of the other instruments. The competency tests were scored and then the data was tabulated. Procedures Adopted Before Entering the Data
• Each household (183) questionnaire was given a distinct code. • The code was indicative of the State/ district/ block/ village and household. • We filtered out those questionnaires which did not contain data (i.e. households
without children between 3-15 years of age). • A quality check of the data for each questionnaire was done during the process of
entering it for the first time in Excel1. • The questionnaire included both open ended and closed ended questions.
1 This helped us to discover the nature of possible discrepancy in the data and eliminate it while entering them.
7
• A list of open ended questions was made from the entire questionnaire. • The various responses to each open ended questions were tally marked. • A frequency table was made for the responses and codes were assigned for the
different responses. • Responses with highest frequency were coded 1, responses with the next highest
frequency were coded 2, etc. This method was employed for each question with descriptive (open) responses.
• Meanwhile a new code sheet was prepared for all the items of the questionnaire. This includes the codes with which we went to the field and also new codes developed based on the nature of responses.
• An analysis plan was prepared for the items to be analyzed from the household questionnaire.
• To facilitate data entry the questionnaire was divided into two major parts. The first part includes household information broadly on socio-economic status and poverty levels; cultural groups; livelihoods; sources of income; migration; and assets to facilitate learning. The second part included information on children and their parents; characteristics of household heads, caregivers, mothers; education and occupation status of parents; characteristics of school age children; health and disability status; education status of school age children; provisions from school available to the children; aspirations and expectations of heads/mothers/caregivers for children.
Procedure Adopted During and After Data Entry
• After the first stage of data entry in Excel, the data was re-entered in Excel with the fresh codes developed. According to the major parts the data is entered in two separate sheets.
• The data was entered in such a way that it is compatible with the SPSS format. • The entered data was copied to SPSS.
The quantitative data collected using the Household Questionnaire was tabulated in Excel format and then imported into SPSS 16 for statistical analysis.
8
2. Findings from the Pilot Survey: Village and Households
2.1 Village Profile
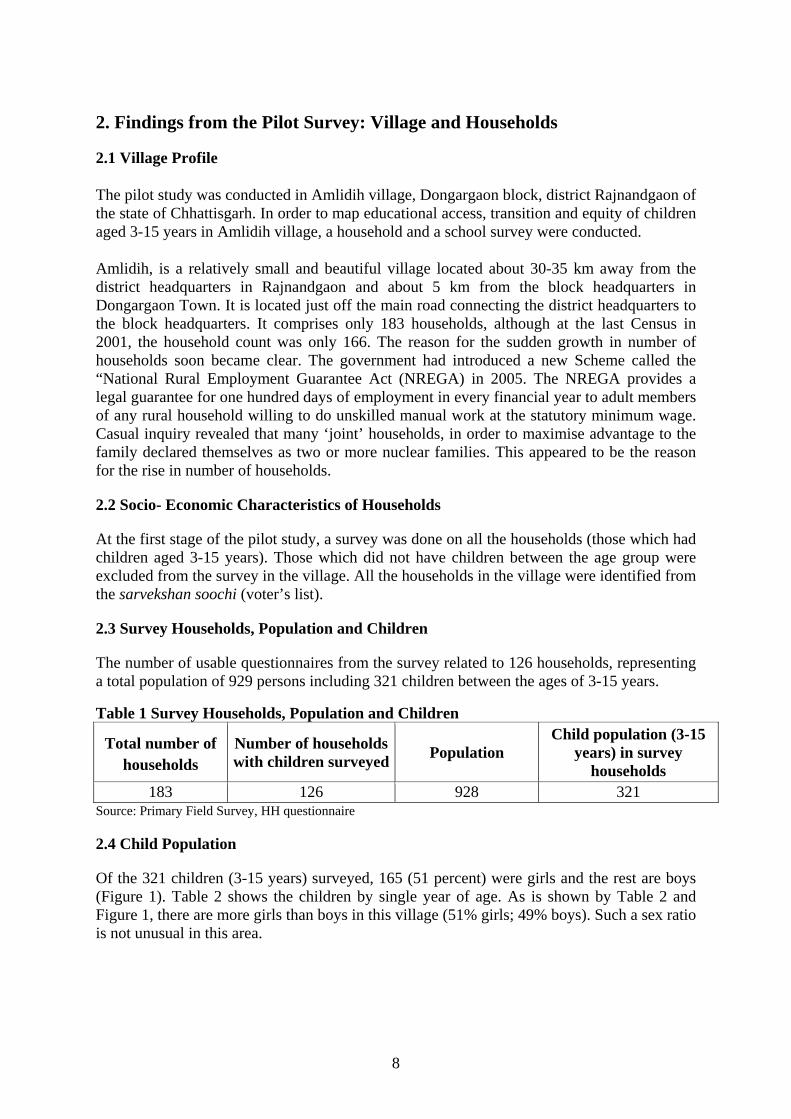
The pilot study was conducted in Amlidih village, Dongargaon block, district Rajnandgaon of the state of Chhattisgarh. In order to map educational access, transition and equity of children aged 3-15 years in Amlidih village, a household and a school survey were conducted.
Amlidih, is a relatively small and beautiful village located about 30-35 km away from the district headquarters in Rajnandgaon and about 5 km from the block headquarters in Dongargaon Town. It is located just off the main road connecting the district headquarters to the block headquarters. It comprises only 183 households, although at the last Census in 2001, the household count was only 166. The reason for the sudden growth in number of households soon became clear. The government had introduced a new Scheme called the “National Rural Employment Guarantee Act (NREGA) in 2005. The NREGA provides a legal guarantee for one hundred days of employment in every financial year to adult members of any rural household willing to do unskilled manual work at the statutory minimum wage. Casual inquiry revealed that many ‘joint’ households, in order to maximise advantage to the family declared themselves as two or more nuclear families. This appeared to be the reason for the rise in number of households.
2.2 Socio- Economic Characteristics of Households
At the first stage of the pilot study, a survey was done on all the households (those which had children aged 3-15 years). Those which did not have children between the age group were excluded from the survey in the village. All the households in the village were identified from the sarvekshan soochi (voter’s list).
2.3 Survey Households, Population and Children
The number of usable questionnaires from the survey related to 126 households, representing a total population of 929 persons including 321 children between the ages of 3-15 years. Table 1 Survey Households, Population and Children
Total number of households
Number of households with children surveyed Population
Child population (3-15 years) in survey
households 183 126 928 321
Source: Primary Field Survey, HH questionnaire
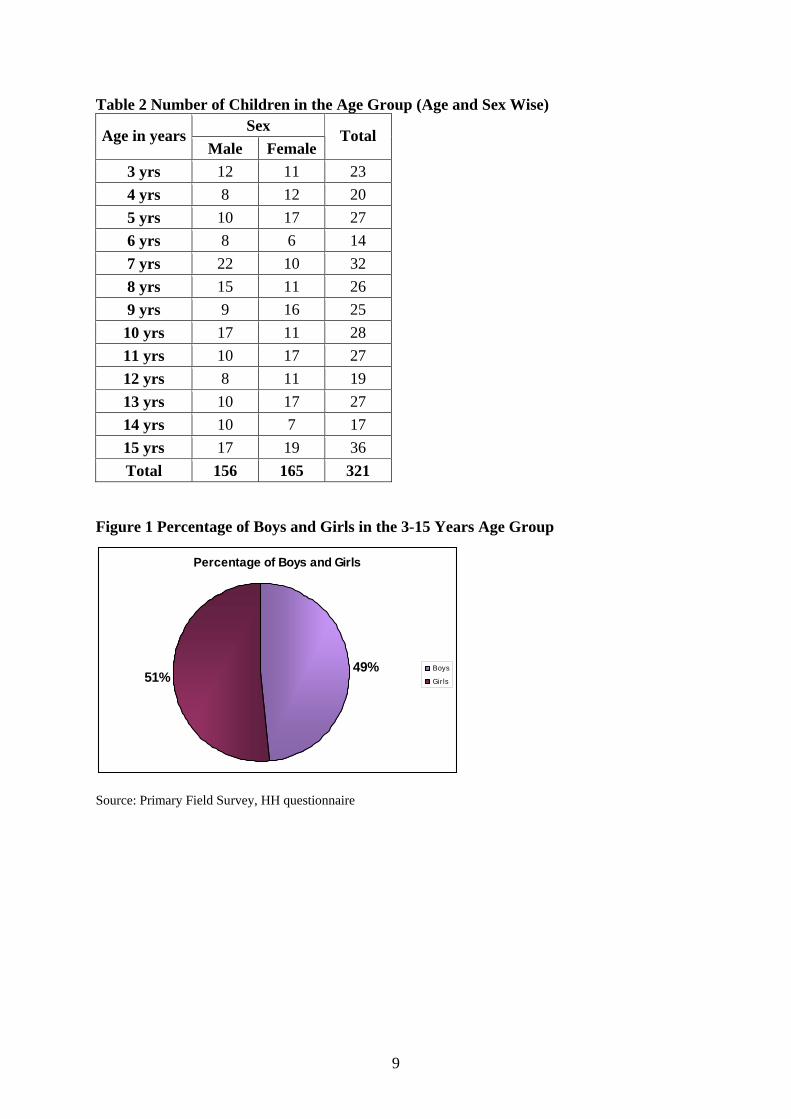
2.4 Child Population
Of the 321 children (3-15 years) surveyed, 165 (51 percent) were girls and the rest are boys (Figure 1). Table 2 shows the children by single year of age. As is shown by Table 2 and Figure 1, there are more girls than boys in this village (51% girls; 49% boys). Such a sex ratio is not unusual in this area.
9
Table 2 Number of Children in the Age Group (Age and Sex Wise)
Figure 1 Percentage of Boys and Girls in the 3-15 Years Age Group Source: Primary Field Survey, HH questionnaire
Sex Age in years Male Female
Total
3 yrs 12 11 23 4 yrs 8 12 20 5 yrs 10 17 27 6 yrs 8 6 14 7 yrs 22 10 32 8 yrs 15 11 26 9 yrs 9 16 25 10 yrs 17 11 28 11 yrs 10 17 27 12 yrs 8 11 19 13 yrs 10 17 27 14 yrs 10 7 17 15 yrs 17 19 36 Total 156 165 321
Percentage of Boys and Girls
49%51%
Boys
Gir ls

10
Table 3 Sex Ratio in Rural Areas of Rajnandgaon District, Dongargaon Block, and Amlidih Village
Male Female Total % Female
Rajnandgaon district (rural )2001 520385 535587 1055972 50.7
Dongargaon block (rural) 2001 48626 50548 99174 51.0
Amlidih village 2001 482 495 977 50.2 Amlidih village 1981 330 339 669 50.7
Source: Census of India, 2001 and 1981 Table 4 Sex Ratio in Urban Areas of Rajnandgaon District and Dongargaon Block
Male Female Total % Female
District Rajnandgaon (urban) 2001 117257 114390 231647 49.4
Dongargaon block (urban) 2001 5881 5636 11517 48.9
Source: Census of India, 2001 and 1981 Table 3 shows that in the rural areas of the district, the sex ratio is more or less equal, and if anything it favours females. Amlidih village follows the same trend as the rural areas of the district and block of which it is part. Nor is this trend new, for even according to the 1981 census, the sex ratio in the village favoured females. An equitable sex ratio / sex ratio favouring women appears to be a rural phenomenon since in the urban areas of the same district and block, as may be seen from Table 4, there are fewer females than males.
2.5 Family Structure
The total number of households in Amlidih with children in the age group of 3 to 15 years is 126. The numbers of nuclear and joint families, i.e. families including members other than a mother, a father and their children; were found to be equal among the 124 households providing this data (Table 5). Table 5 Family Type
Family Type Number of Households Percentage
Nuclear family 62 50 Joint family 62 50
Total 124 100 Source: Primary Field Survey, HH questionnaire The modal family size was found to be about 5½ members per household. About 17 households had more than 10 family members in the household (Table 6) The mean for 126 households works out to 7.4 members for these households with children. It may be remembered that household data was collected for only those households with children between 3-15 years of age. This leaves out all the households without children or without
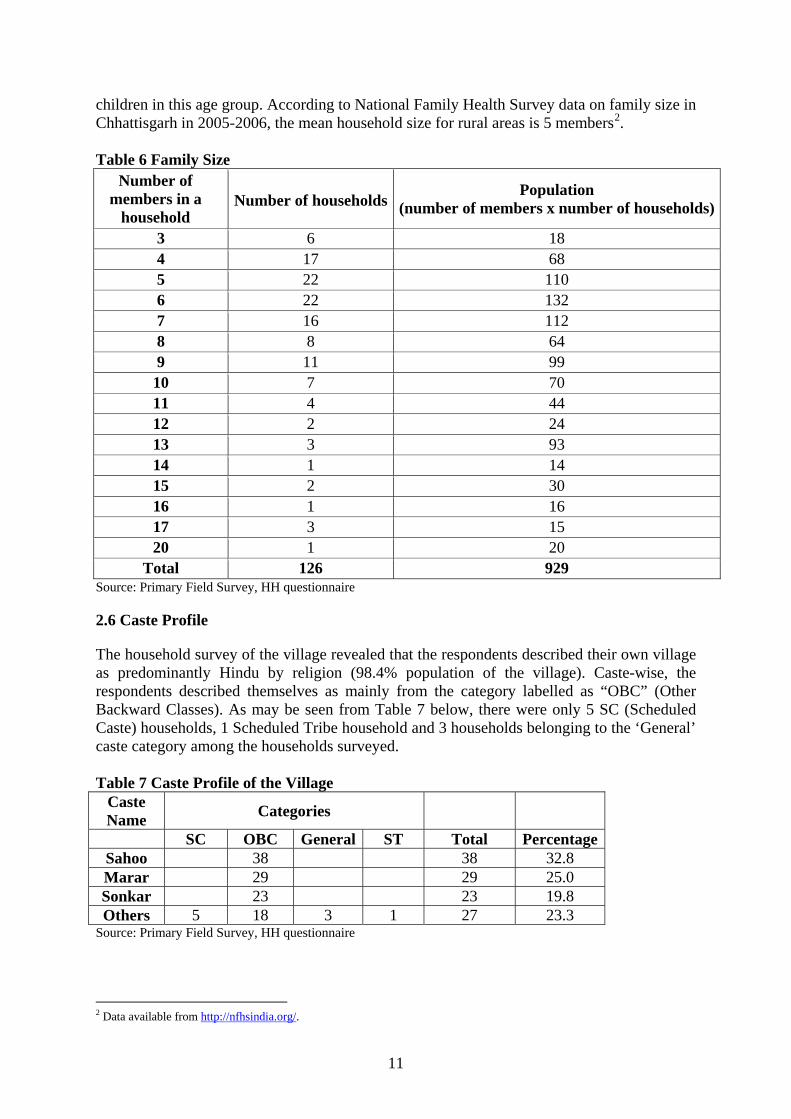
11
children in this age group. According to National Family Health Survey data on family size in Chhattisgarh in 2005-2006, the mean household size for rural areas is 5 members2. Table 6 Family Size
Number of members in a
household Number of households
Population (number of members x number of households)
3 6 18 4 17 68 5 22 110 6 22 132 7 16 112 8 8 64 9 11 99 10 7 70 11 4 44 12 2 24 13 3 93 14 1 14 15 2 30 16 1 16 17 3 15 20 1 20
Total 126 929 Source: Primary Field Survey, HH questionnaire
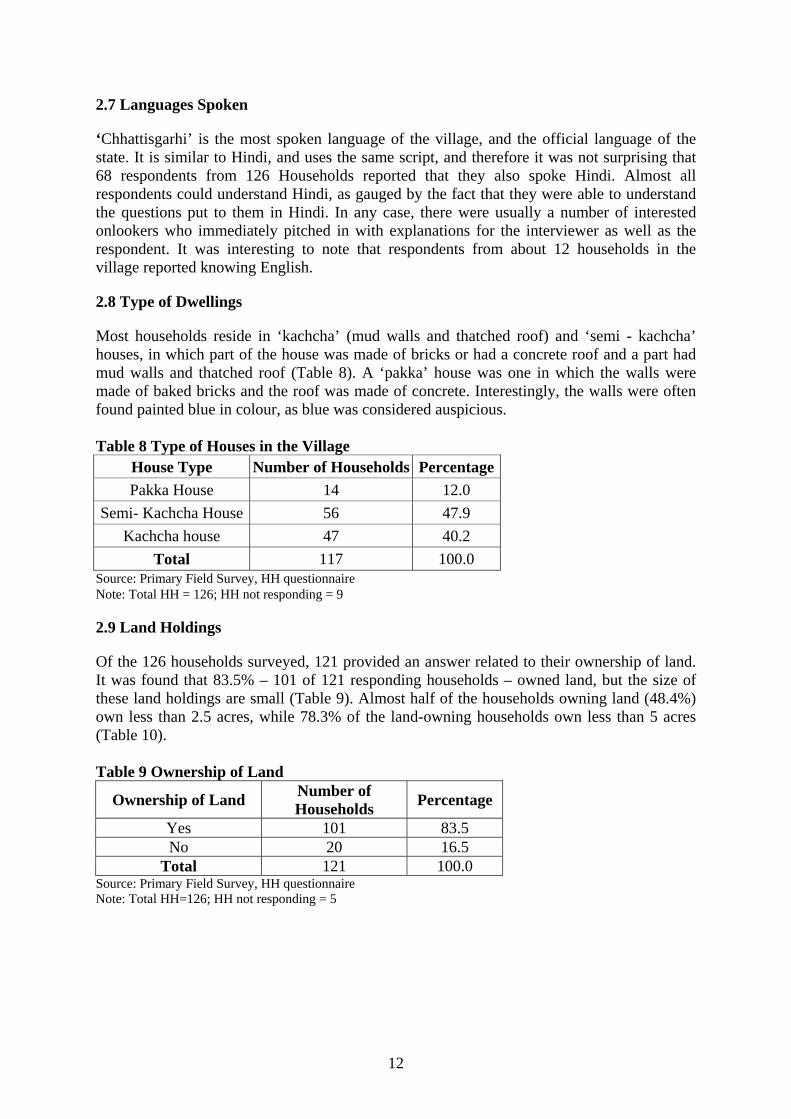
2.6 Caste Profile
The household survey of the village revealed that the respondents described their own village as predominantly Hindu by religion (98.4% population of the village). Caste-wise, the respondents described themselves as mainly from the category labelled as “OBC” (Other Backward Classes). As may be seen from Table 7 below, there were only 5 SC (Scheduled Caste) households, 1 Scheduled Tribe household and 3 households belonging to the ‘General’ caste category among the households surveyed. Table 7 Caste Profile of the Village
Caste Name Categories
SC OBC General ST Total Percentage Sahoo 38 38 32.8 Marar 29 29 25.0 Sonkar 23 23 19.8 Others 5 18 3 1 27 23.3
Source: Primary Field Survey, HH questionnaire
2 Data available from http://nfhsindia.org/.
12
2.7 Languages Spoken
‘Chhattisgarhi’ is the most spoken language of the village, and the official language of the state. It is similar to Hindi, and uses the same script, and therefore it was not surprising that 68 respondents from 126 Households reported that they also spoke Hindi. Almost all respondents could understand Hindi, as gauged by the fact that they were able to understand the questions put to them in Hindi. In any case, there were usually a number of interested onlookers who immediately pitched in with explanations for the interviewer as well as the respondent. It was interesting to note that respondents from about 12 households in the village reported knowing English.
2.8 Type of Dwellings
Most households reside in ‘kachcha’ (mud walls and thatched roof) and ‘semi - kachcha’ houses, in which part of the house was made of bricks or had a concrete roof and a part had mud walls and thatched roof (Table 8). A ‘pakka’ house was one in which the walls were made of baked bricks and the roof was made of concrete. Interestingly, the walls were often found painted blue in colour, as blue was considered auspicious. Table 8 Type of Houses in the Village
House Type Number of Households PercentagePakka House 14 12.0
Semi- Kachcha House 56 47.9 Kachcha house 47 40.2
Total 117 100.0 Source: Primary Field Survey, HH questionnaire Note: Total HH = 126; HH not responding = 9
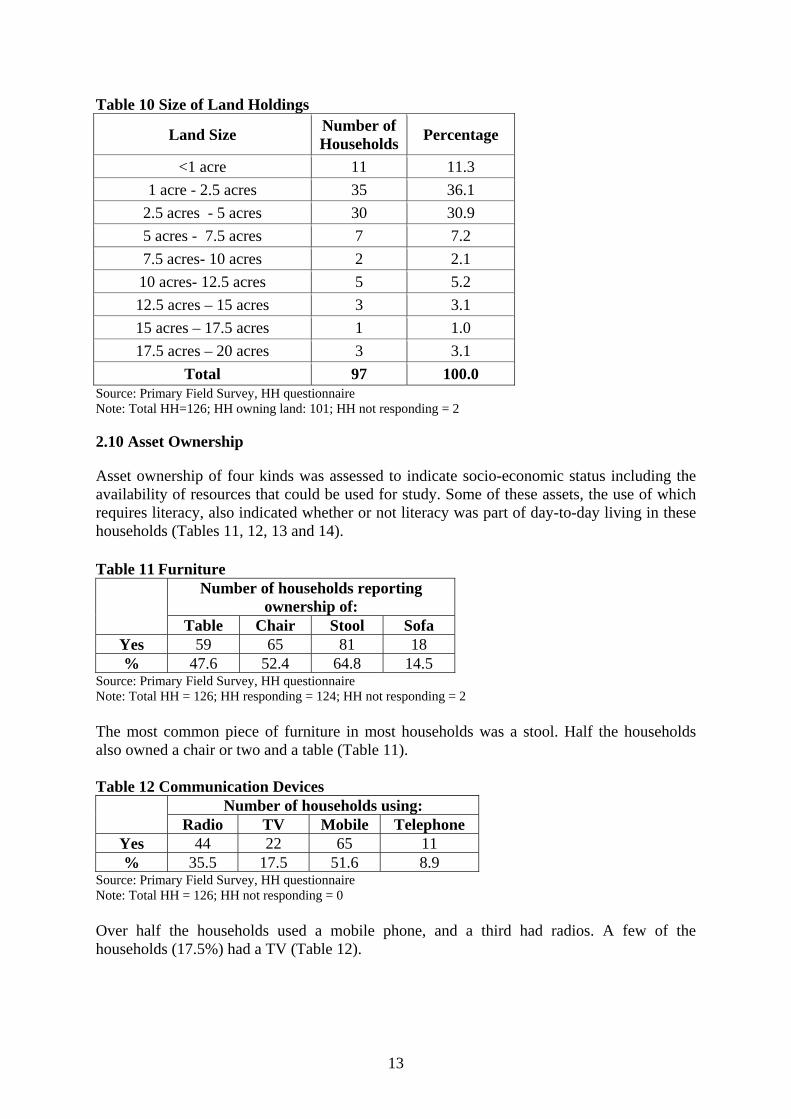
2.9 Land Holdings
Of the 126 households surveyed, 121 provided an answer related to their ownership of land. It was found that 83.5% – 101 of 121 responding households – owned land, but the size of these land holdings are small (Table 9). Almost half of the households owning land (48.4%) own less than 2.5 acres, while 78.3% of the land-owning households own less than 5 acres (Table 10). Table 9 Ownership of Land
Ownership of Land Number of Households Percentage
Yes 101 83.5 No 20 16.5
Total 121 100.0 Source: Primary Field Survey, HH questionnaire Note: Total HH=126; HH not responding = 5
13
Table 10 Size of Land Holdings
Land Size Number of Households Percentage
<1 acre 11 11.3 1 acre - 2.5 acres 35 36.1
2.5 acres - 5 acres 30 30.9 5 acres - 7.5 acres 7 7.2 7.5 acres- 10 acres 2 2.1 10 acres- 12.5 acres 5 5.2 12.5 acres – 15 acres 3 3.1 15 acres – 17.5 acres 1 1.0 17.5 acres – 20 acres 3 3.1
Total 97 100.0 Source: Primary Field Survey, HH questionnaire Note: Total HH=126; HH owning land: 101; HH not responding = 2
2.10 Asset Ownership
Asset ownership of four kinds was assessed to indicate socio-economic status including the availability of resources that could be used for study. Some of these assets, the use of which requires literacy, also indicated whether or not literacy was part of day-to-day living in these households (Tables 11, 12, 13 and 14). Table 11 Furniture
Number of households reporting ownership of:
Table Chair Stool Sofa Yes 59 65 81 18 % 47.6 52.4 64.8 14.5
Source: Primary Field Survey, HH questionnaire Note: Total HH = 126; HH responding = 124; HH not responding = 2 The most common piece of furniture in most households was a stool. Half the households also owned a chair or two and a table (Table 11). Table 12 Communication Devices
Number of households using: Radio TV Mobile Telephone Yes 44 22 65 11 % 35.5 17.5 51.6 8.9
Source: Primary Field Survey, HH questionnaire Note: Total HH = 126; HH not responding = 0 Over half the households used a mobile phone, and a third had radios. A few of the households (17.5%) had a TV (Table 12).

14
Table 13 Means of Transportation Number of households reporting ownership of:
Cycle Motorcycle Car Tractor Bullock Cart
Yes 120 25 0 8 37 % 96 19.8 0 6.3 29.4
Source: Primary Field Survey, HH questionnaire Note: Total HH = 126; HH not responding = 0 The cycle was almost universally owned by all households, and a quarter of the families owned a bullock cart. Motorcycles were relatively few (20%) and tractors were owned by eight families. Table 14 Education Assets
Number of households reading: Newspaper School Texts Magazines Other Books
Yes 19 120 22 36 % 15.2 97. 6 17.6 28.8
Source: Primary Field Survey, HH questionnaire Note: Total HH = 126; HH not responding = 1 School text books were the only reading material available in most households. About a quarter of the households had other books, and these were mostly religious texts.
2.11 Income
Household members were asked to indicate their monthly income. The monthly income of more than half (52%) of the total households is less than Rs. 2,000/- per month. Another 31% of the households earn an average income of Rs. 3,000/- to 5,000/- per month and members of only 17% of the households earn more than Rs. 5,000/- per month (Tables 15 and 16). Table 15 Income Level of Households
Monthly income of households (in Rupees) <1000 <2000 <3000 <4000 5000 5000 -
7000 7000 - 9000 >9000 Total
Number of HHs 33 31 25 8 6 9 1 10 123
% of HHs 26.8 25.2 20.3 6.5 4.8 7.3 0.8 8.1 100 Source: Primary Field Survey, HH questionnaire Note: Total HH = 126; HH not responding = 3 Table 16 Household Income Level
Monthly income of households (in Rupees) Below 2000/- 3000 - 5000/- More than 5000/- Total
Number of HHs 64 39 20 123 % of HHs 52 31 17 100
Source: Primary Field Survey, HH questionnaire Note: Total HH = 126; HH not responding = 3
15
2.12 Migration
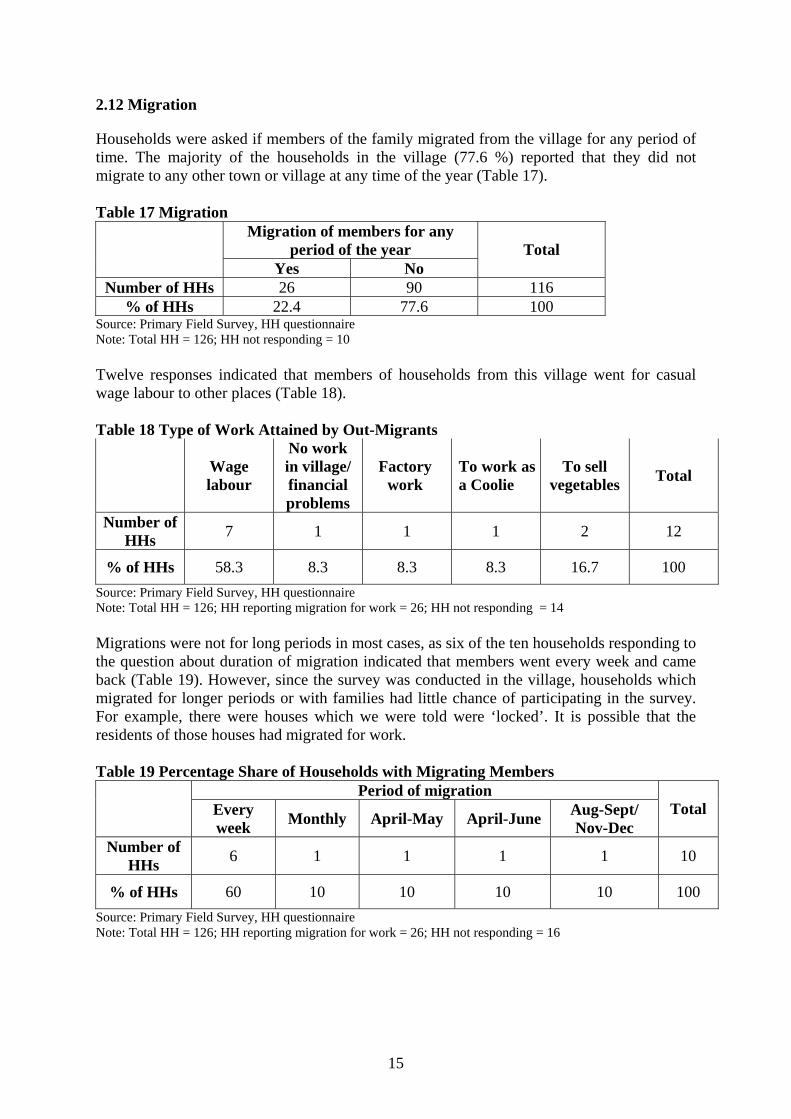
Households were asked if members of the family migrated from the village for any period of time. The majority of the households in the village (77.6 %) reported that they did not migrate to any other town or village at any time of the year (Table 17). Table 17 Migration
Migration of members for any period of the year
Yes No Total
Number of HHs 26 90 116 % of HHs 22.4 77.6 100
Source: Primary Field Survey, HH questionnaire Note: Total HH = 126; HH not responding = 10 Twelve responses indicated that members of households from this village went for casual wage labour to other places (Table 18). Table 18 Type of Work Attained by Out-Migrants
Wage labour
No work in village/ financial problems
Factory work
To work as a Coolie
To sell vegetables Total
Number of HHs 7 1 1 1 2 12
% of HHs 58.3 8.3 8.3 8.3 16.7 100 Source: Primary Field Survey, HH questionnaire Note: Total HH = 126; HH reporting migration for work = 26; HH not responding = 14 Migrations were not for long periods in most cases, as six of the ten households responding to the question about duration of migration indicated that members went every week and came back (Table 19). However, since the survey was conducted in the village, households which migrated for longer periods or with families had little chance of participating in the survey. For example, there were houses which we were told were ‘locked’. It is possible that the residents of those houses had migrated for work. Table 19 Percentage Share of Households with Migrating Members
Period of migration Every
week Monthly April-May April-June Aug-Sept/ Nov-Dec
Total
Number of HHs 6 1 1 1 1 10
% of HHs 60 10 10 10 10 100 Source: Primary Field Survey, HH questionnaire Note: Total HH = 126; HH reporting migration for work = 26; HH not responding = 16
16
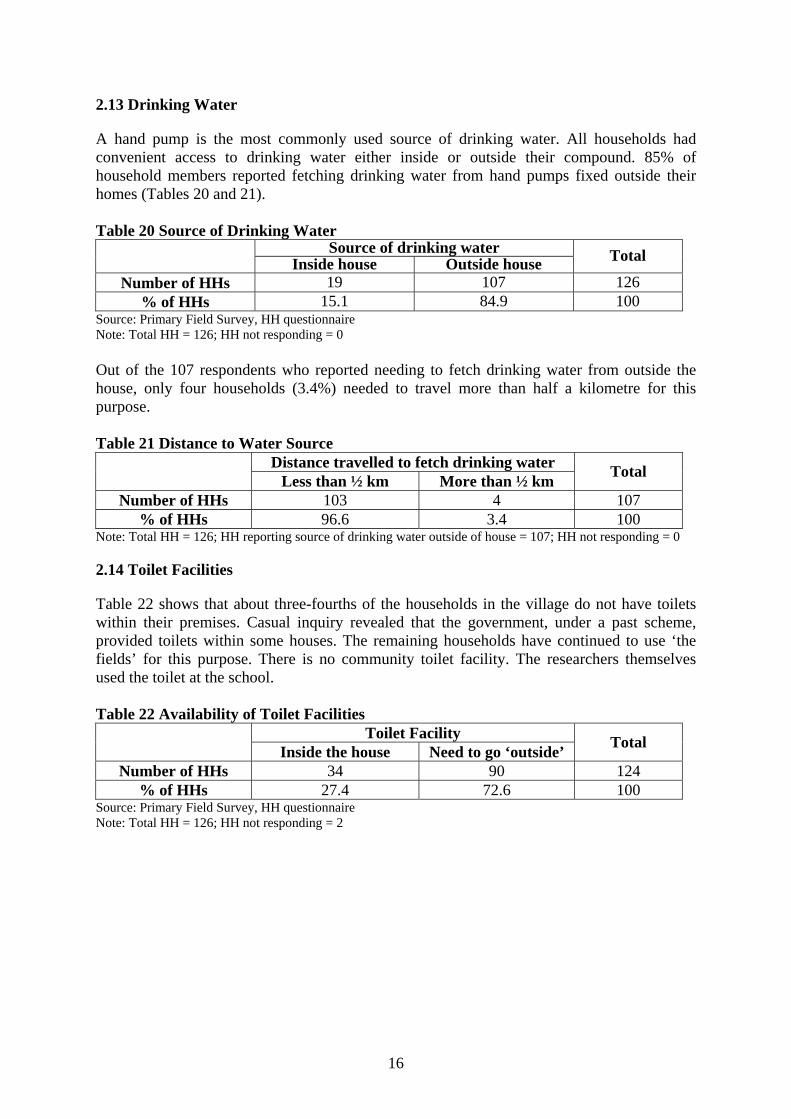
2.13 Drinking Water
A hand pump is the most commonly used source of drinking water. All households had convenient access to drinking water either inside or outside their compound. 85% of household members reported fetching drinking water from hand pumps fixed outside their homes (Tables 20 and 21). Table 20 Source of Drinking Water
Source of drinking water Inside house Outside house Total
Number of HHs 19 107 126 % of HHs 15.1 84.9 100
Source: Primary Field Survey, HH questionnaire Note: Total HH = 126; HH not responding = 0 Out of the 107 respondents who reported needing to fetch drinking water from outside the house, only four households (3.4%) needed to travel more than half a kilometre for this purpose. Table 21 Distance to Water Source
Distance travelled to fetch drinking water Less than ½ km More than ½ km Total
Number of HHs 103 4 107 % of HHs 96.6 3.4 100
Note: Total HH = 126; HH reporting source of drinking water outside of house = 107; HH not responding = 0
2.14 Toilet Facilities
Table 22 shows that about three-fourths of the households in the village do not have toilets within their premises. Casual inquiry revealed that the government, under a past scheme, provided toilets within some houses. The remaining households have continued to use ‘the fields’ for this purpose. There is no community toilet facility. The researchers themselves used the toilet at the school. Table 22 Availability of Toilet Facilities
Toilet Facility Inside the house Need to go ‘outside’ Total
Number of HHs 34 90 124 % of HHs 27.4 72.6 100
Source: Primary Field Survey, HH questionnaire Note: Total HH = 126; HH not responding = 2
17
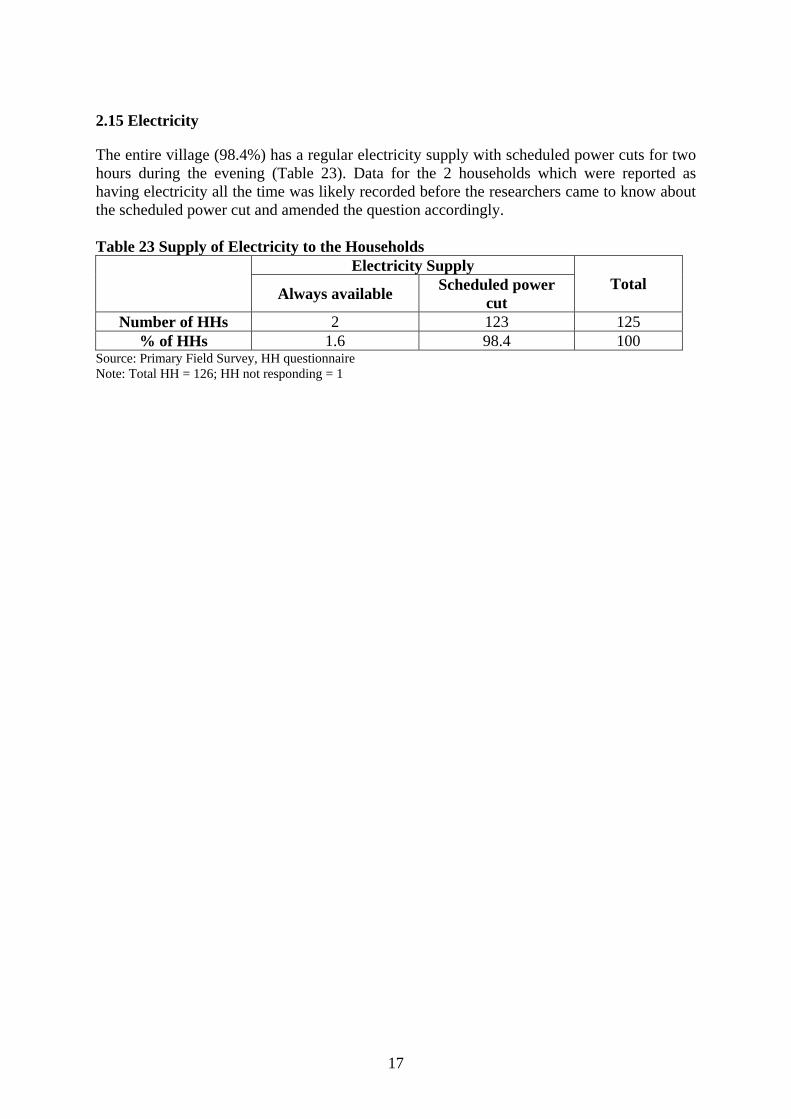
2.15 Electricity
The entire village (98.4%) has a regular electricity supply with scheduled power cuts for two hours during the evening (Table 23). Data for the 2 households which were reported as having electricity all the time was likely recorded before the researchers came to know about the scheduled power cut and amended the question accordingly. Table 23 Supply of Electricity to the Households
Electricity Supply Always available Scheduled power
cut Total
Number of HHs 2 123 125 % of HHs 1.6 98.4 100
Source: Primary Field Survey, HH questionnaire Note: Total HH = 126; HH not responding = 1
18
3. Findings Regarding Children 3-18 years of Age
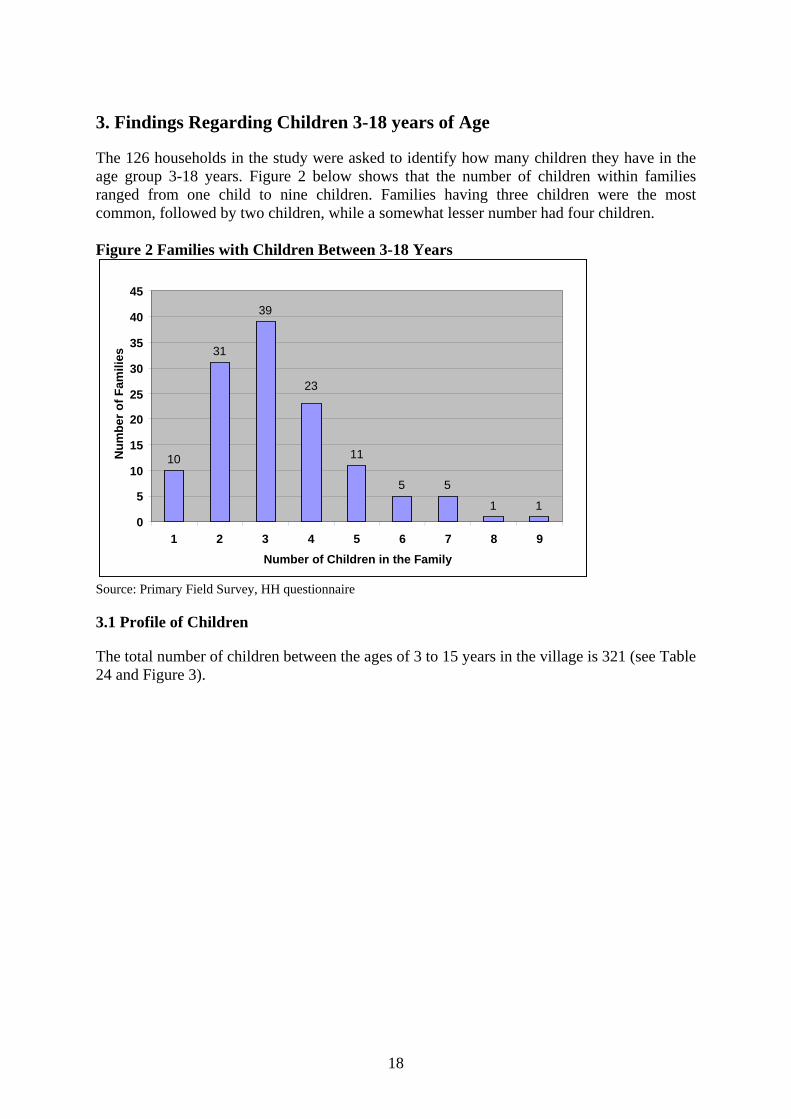
The 126 households in the study were asked to identify how many children they have in the age group 3-18 years. Figure 2 below shows that the number of children within families ranged from one child to nine children. Families having three children were the most common, followed by two children, while a somewhat lesser number had four children. Figure 2 Families with Children Between 3-18 Years
Source: Primary Field Survey, HH questionnaire
3.1 Profile of Children
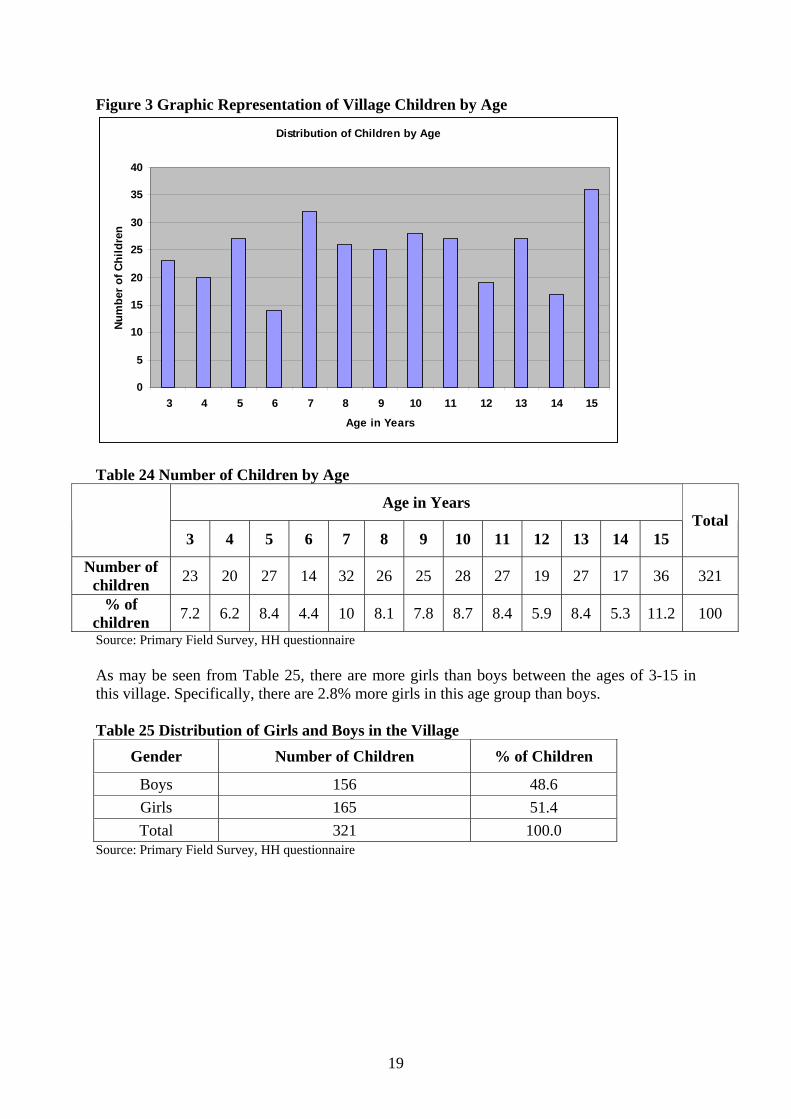
The total number of children between the ages of 3 to 15 years in the village is 321 (see Table 24 and Figure 3).
10
31
39
23
11
5 5
1 10 5
10 15 20 25 30 35 40 45
1 2 3 4 5 6 7 8 9Number of Children in the Family
Num
ber o
f Fam
ilies
19
Figure 3 Graphic Representation of Village Children by Age
Distribution of Children by Age
0
5
10
15
20
25
30
35
40
3 4 5 6 7 8 9 10 11 12 13 14 15
Age in Years
Num
ber o
f Chi
ldre
n
Table 24 Number of Children by Age
Age in Years
3 4 5 6 7 8 9 10 11 12 13 14 15 Total
Number of children 23 20 27 14 32 26 25 28 27 19 27 17 36 321
% of children 7.2 6.2 8.4 4.4 10 8.1 7.8 8.7 8.4 5.9 8.4 5.3 11.2 100 Source: Primary Field Survey, HH questionnaire As may be seen from Table 25, there are more girls than boys between the ages of 3-15 in this village. Specifically, there are 2.8% more girls in this age group than boys. Table 25 Distribution of Girls and Boys in the Village
Gender Number of Children % of Children
Boys 156 48.6 Girls 165 51.4 Total 321 100.0
Source: Primary Field Survey, HH questionnaire
20
3.2 Profile of the Parents
3.2.1 Literacy
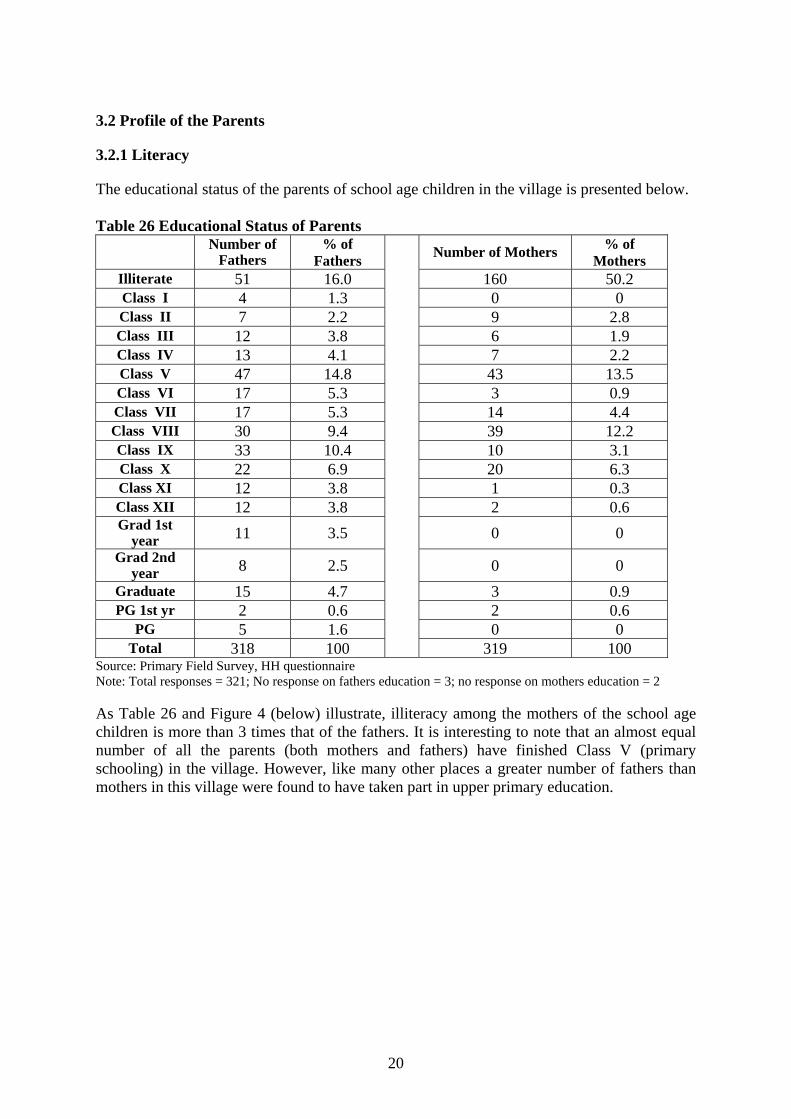
The educational status of the parents of school age children in the village is presented below. Table 26 Educational Status of Parents
Number of Fathers
% of Fathers Number of Mothers % of
Mothers Illiterate 51 16.0 160 50.2 Class I 4 1.3 0 0 Class II 7 2.2 9 2.8 Class III 12 3.8 6 1.9 Class IV 13 4.1 7 2.2 Class V 47 14.8 43 13.5 Class VI 17 5.3 3 0.9 Class VII 17 5.3 14 4.4 Class VIII 30 9.4 39 12.2 Class IX 33 10.4 10 3.1 Class X 22 6.9 20 6.3 Class XI 12 3.8 1 0.3 Class XII 12 3.8 2 0.6 Grad 1st
year 11 3.5 0 0 Grad 2nd
year 8 2.5 0 0 Graduate 15 4.7 3 0.9 PG 1st yr 2 0.6 2 0.6
PG 5 1.6 0 0 Total 318 100
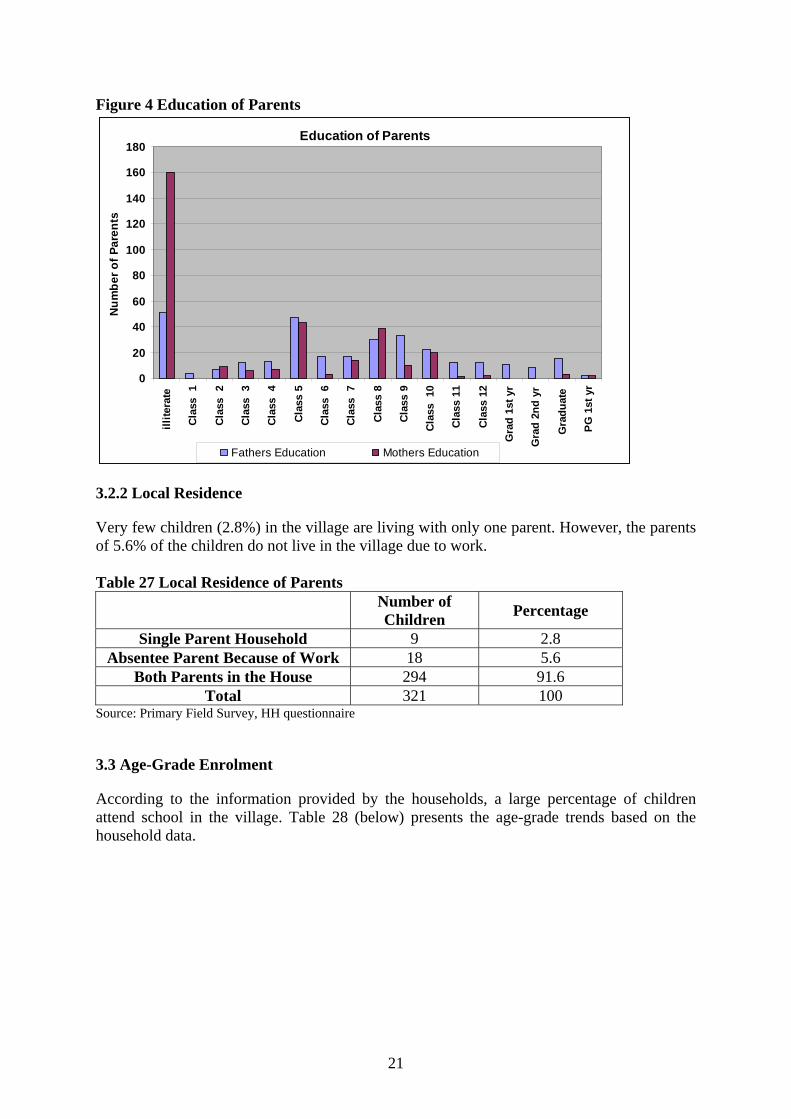
319 100 Source: Primary Field Survey, HH questionnaire Note: Total responses = 321; No response on fathers education = 3; no response on mothers education = 2 As Table 26 and Figure 4 (below) illustrate, illiteracy among the mothers of the school age children is more than 3 times that of the fathers. It is interesting to note that an almost equal number of all the parents (both mothers and fathers) have finished Class V (primary schooling) in the village. However, like many other places a greater number of fathers than mothers in this village were found to have taken part in upper primary education.
21
Figure 4 Education of Parents
Education of Parents
0
20
40
60
80
100
120
140
160
180ill
itera
te
Clas
s 1
Clas
s 2
Clas
s 3
Clas
s 4
Clas
s 5
Clas
s 6
Clas
s 7
Clas
s 8
Clas
s 9
Clas
s 1
0
Clas
s 11
Clas
s 12
Gra
d 1s
t yr
Gra
d 2n
d yr
Gra
duat
e
PG 1
st y
r
Num
ber o
f Par
ents
Fathers Education Mothers Education
3.2.2 Local Residence
Very few children (2.8%) in the village are living with only one parent. However, the parents of 5.6% of the children do not live in the village due to work. Table 27 Local Residence of Parents
Number of Children Percentage
Single Parent Household 9 2.8 Absentee Parent Because of Work 18 5.6
Both Parents in the House 294 91.6 Total 321 100
Source: Primary Field Survey, HH questionnaire
3.3 Age-Grade Enrolment
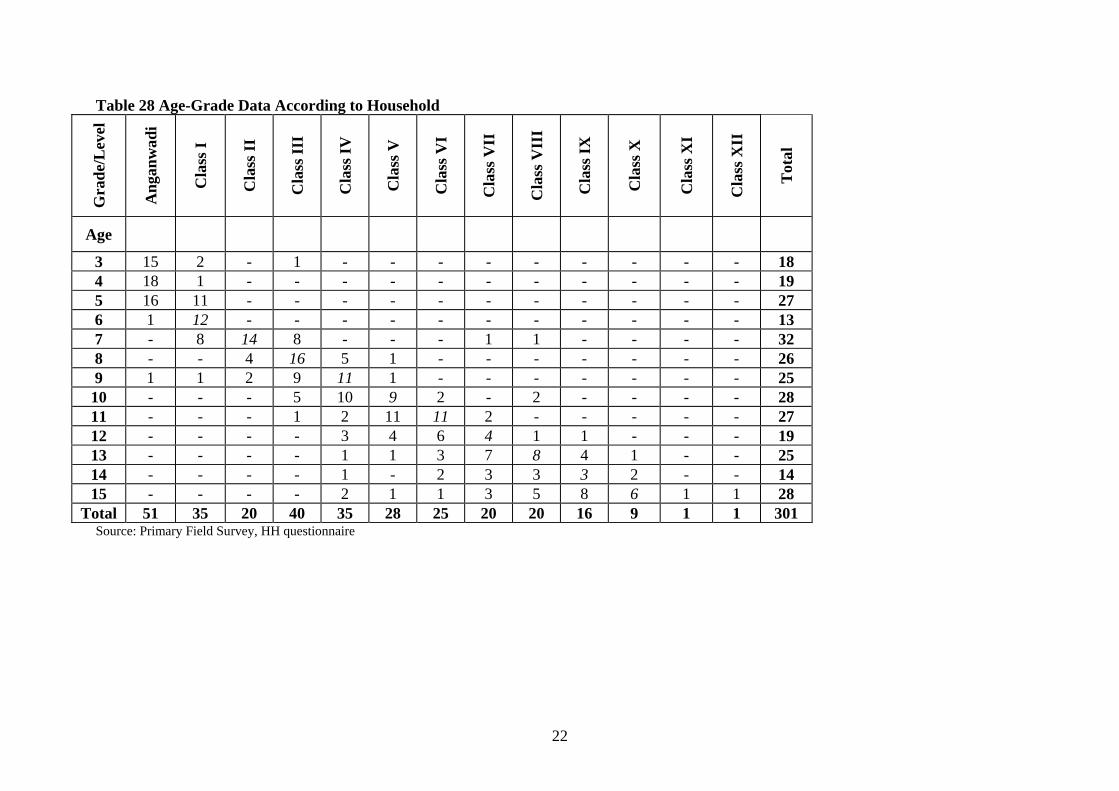
According to the information provided by the households, a large percentage of children attend school in the village. Table 28 (below) presents the age-grade trends based on the household data.
22
Table 28 Age-Grade Data According to Household G
rade
/Lev
el
Ang
anw
adi
Cla
ss I
Cla
ss II
Cla
ss II
I
Cla
ss IV
Cla
ss V
Cla
ss V
I
Cla
ss V
II
Cla
ss V
III
Cla
ss IX
Cla
ss X
Cla
ss X
I
Cla
ss X
II
Tot
al
Age
3 15 2 - 1 - - - - - - - - - 18 4 18 1 - - - - - - - - - - - 19 5 16 11 - - - - - - - - - - - 27 6 1 12 - - - - - - - - - - - 13 7 - 8 14 8 - - - 1 1 - - - - 32 8 - - 4 16 5 1 - - - - - - - 26 9 1 1 2 9 11 1 - - - - - - - 25 10 - - - 5 10 9 2 - 2 - - - - 28 11 - - - 1 2 11 11 2 - - - - - 27 12 - - - - 3 4 6 4 1 1 - - - 19 13 - - - - 1 1 3 7 8 4 1 - - 25 14 - - - - 1 - 2 3 3 3 2 - - 14 15 - - - - 2 1 1 3 5 8 6 1 1 28
Total 51 35 20 40 35 28 25 20 20 16 9 1 1 301 Source: Primary Field Survey, HH questionnaire
23
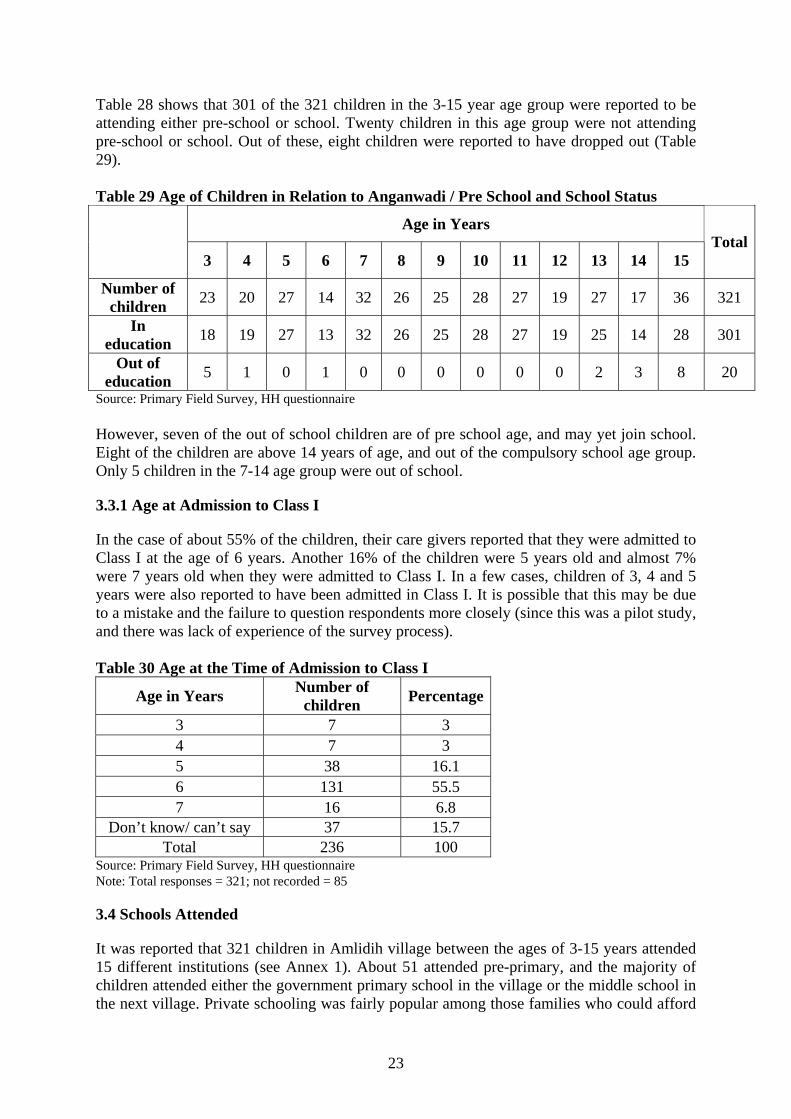
Table 28 shows that 301 of the 321 children in the 3-15 year age group were reported to be attending either pre-school or school. Twenty children in this age group were not attending pre-school or school. Out of these, eight children were reported to have dropped out (Table 29). Table 29 Age of Children in Relation to Anganwadi / Pre School and School Status
Age in Years
3 4 5 6 7 8 9 10 11 12 13 14 15 Total
Number of children 23 20 27 14 32 26 25 28 27 19 27 17 36 321
In education 18 19 27 13 32 26 25 28 27 19 25 14 28 301
Out of education 5 1 0 1 0 0 0 0 0 0 2 3 8 20
Source: Primary Field Survey, HH questionnaire However, seven of the out of school children are of pre school age, and may yet join school. Eight of the children are above 14 years of age, and out of the compulsory school age group. Only 5 children in the 7-14 age group were out of school.
3.3.1 Age at Admission to Class I
In the case of about 55% of the children, their care givers reported that they were admitted to Class I at the age of 6 years. Another 16% of the children were 5 years old and almost 7% were 7 years old when they were admitted to Class I. In a few cases, children of 3, 4 and 5 years were also reported to have been admitted in Class I. It is possible that this may be due to a mistake and the failure to question respondents more closely (since this was a pilot study, and there was lack of experience of the survey process). Table 30 Age at the Time of Admission to Class I
Age in Years Number of children Percentage
3 7 3 4 7 3 5 38 16.1 6 131 55.5 7 16 6.8
Don’t know/ can’t say 37 15.7 Total 236 100
Source: Primary Field Survey, HH questionnaire Note: Total responses = 321; not recorded = 85
3.4 Schools Attended
It was reported that 321 children in Amlidih village between the ages of 3-15 years attended 15 different institutions (see Annex 1). About 51 attended pre-primary, and the majority of children attended either the government primary school in the village or the middle school in the next village. Private schooling was fairly popular among those families who could afford
24
to pay fees. Of the six local private schools, the Saraswati Shishu Mandir catered to 21 children from the village, and also provided transport. In total, 14 children were reported to travel to school in transport provided by the school (Table 33). Twelve other children were distributed among the five other private schools.
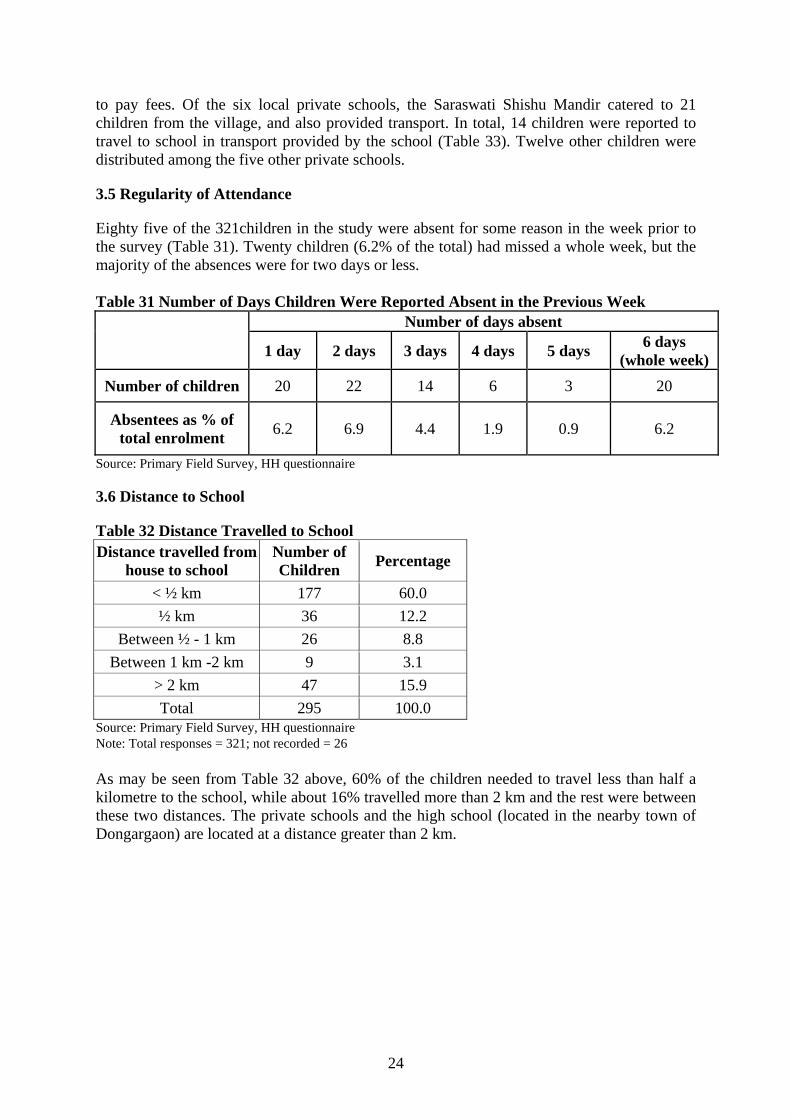
3.5 Regularity of Attendance
Eighty five of the 321children in the study were absent for some reason in the week prior to the survey (Table 31). Twenty children (6.2% of the total) had missed a whole week, but the majority of the absences were for two days or less. Table 31 Number of Days Children Were Reported Absent in the Previous Week
Number of days absent
1 day 2 days 3 days 4 days 5 days 6 days (whole week)
Number of children 20 22 14 6 3 20
Absentees as % of total enrolment 6.2 6.9 4.4 1.9 0.9 6.2
Source: Primary Field Survey, HH questionnaire
3.6 Distance to School
Table 32 Distance Travelled to School Distance travelled from
house to school Number of Children Percentage
< ½ km 177 60.0 ½ km 36 12.2
Between ½ - 1 km 26 8.8 Between 1 km -2 km 9 3.1
> 2 km 47 15.9 Total 295 100.0
Source: Primary Field Survey, HH questionnaire Note: Total responses = 321; not recorded = 26 As may be seen from Table 32 above, 60% of the children needed to travel less than half a kilometre to the school, while about 16% travelled more than 2 km and the rest were between these two distances. The private schools and the high school (located in the nearby town of Dongargaon) are located at a distance greater than 2 km.
25
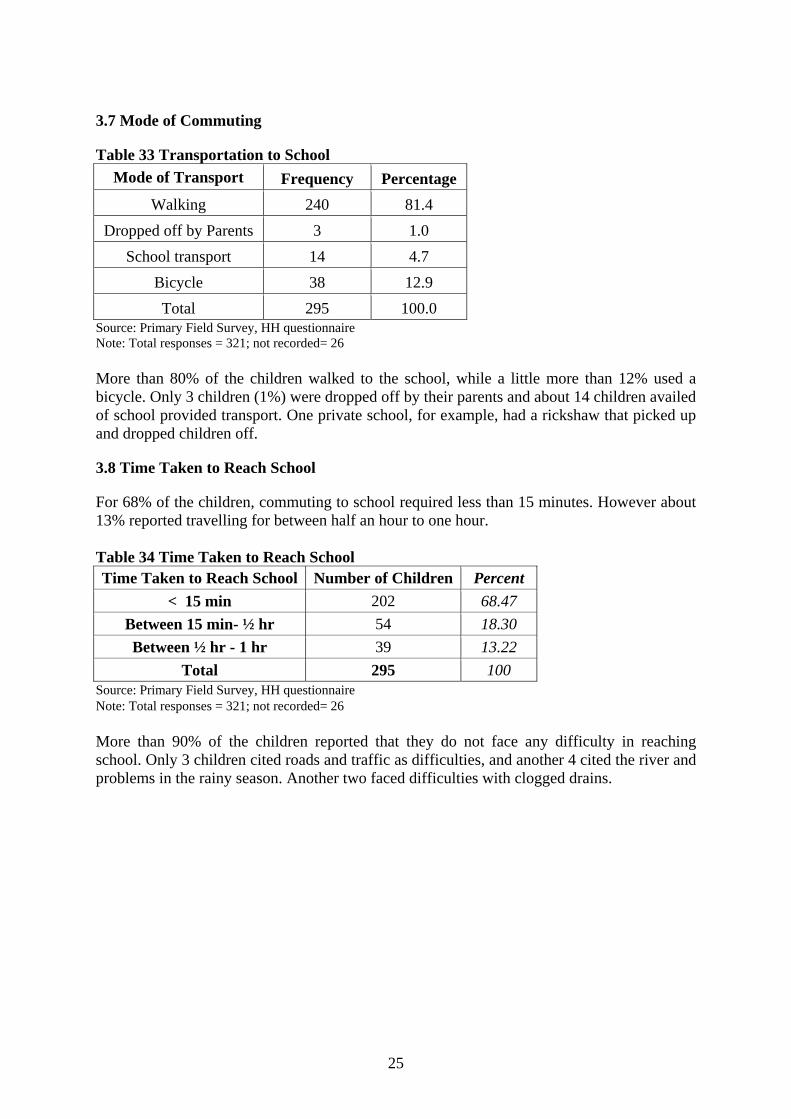
3.7 Mode of Commuting
Table 33 Transportation to School Mode of Transport Frequency Percentage
Walking 240 81.4 Dropped off by Parents 3 1.0
School transport 14 4.7 Bicycle 38 12.9 Total 295 100.0
Source: Primary Field Survey, HH questionnaire Note: Total responses = 321; not recorded= 26 More than 80% of the children walked to the school, while a little more than 12% used a bicycle. Only 3 children (1%) were dropped off by their parents and about 14 children availed of school provided transport. One private school, for example, had a rickshaw that picked up and dropped children off.
3.8 Time Taken to Reach School
For 68% of the children, commuting to school required less than 15 minutes. However about 13% reported travelling for between half an hour to one hour. Table 34 Time Taken to Reach School Time Taken to Reach School Number of Children Percent
< 15 min 202 68.47 Between 15 min- ½ hr 54 18.30 Between ½ hr - 1 hr 39 13.22
Total 295 100 Source: Primary Field Survey, HH questionnaire Note: Total responses = 321; not recorded= 26 More than 90% of the children reported that they do not face any difficulty in reaching school. Only 3 children cited roads and traffic as difficulties, and another 4 cited the river and problems in the rainy season. Another two faced difficulties with clogged drains.
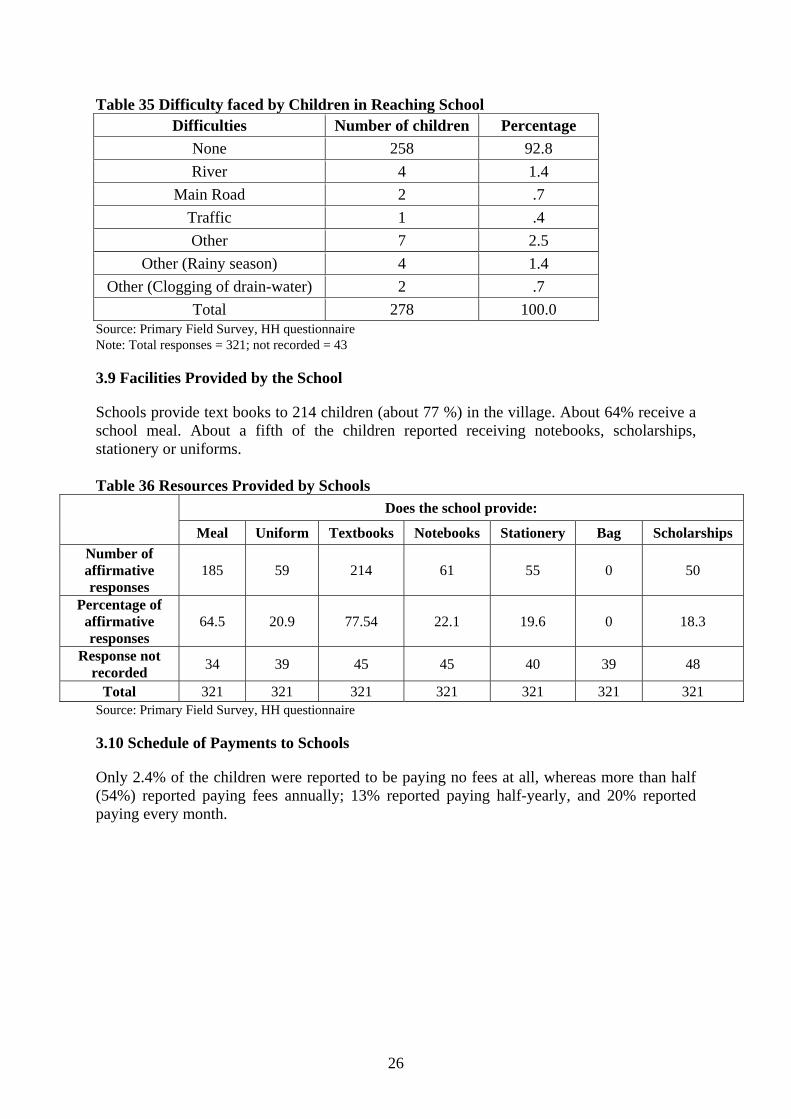
26
Table 35 Difficulty faced by Children in Reaching School Difficulties Number of children Percentage
None 258 92.8 River 4 1.4
Main Road 2 .7 Traffic 1 .4 Other 7 2.5
Other (Rainy season) 4 1.4 Other (Clogging of drain-water) 2 .7
Total 278 100.0 Source: Primary Field Survey, HH questionnaire Note: Total responses = 321; not recorded = 43
3.9 Facilities Provided by the School
Schools provide text books to 214 children (about 77 %) in the village. About 64% receive a school meal. About a fifth of the children reported receiving notebooks, scholarships, stationery or uniforms. Table 36 Resources Provided by Schools
Does the school provide:
Meal Uniform Textbooks Notebooks Stationery Bag Scholarships Number of affirmative responses
185 59 214 61 55 0 50
Percentage of affirmative responses
64.5 20.9 77.54 22.1 19.6 0 18.3
Response not recorded 34 39 45 45 40 39 48
Total 321 321 321 321 321 321 321 Source: Primary Field Survey, HH questionnaire
3.10 Schedule of Payments to Schools
Only 2.4% of the children were reported to be paying no fees at all, whereas more than half (54%) reported paying fees annually; 13% reported paying half-yearly, and 20% reported paying every month.

27
Table 37 Schedule of Payments to the School Payment of School Fees Number of Children Percentage
None 4 2.4 Once in a year 91 54.2
In the beginning of the year 12 7.1 Half-yearly 22 13.1
Every 3 months 5 3.0 Every month 34 20.2
Total 168 100.0 Source: Primary Field Survey, HH questionnaire Note: Total number of children = 321; no data available on 153 children
3.11 Extra Tuition
In this village, 98% of the children did not take private tuition, and only five children reported taking extra tuition. Table 38 Child going to Extra Classes/ Tuition Classes
Does the child attend extra classes?
Number of Children Percentage
Yes 5 1.9 No 252 98.1
Total 257 100.0 Source: Primary Field Survey, HH questionnaire Note: Total number of children = 321; data not recorded for 64 children
3.12 Parent-Teacher Meetings
When parents were asked if they had gone to meet the teacher for any reason in the current year, less than half responded in the affirmative (Table 39). Table 39 Parent-Teacher Meetings Have you met with a teacher in
the current year? Number of Responses
Percentage
Yes 123 41.1 No 176 58.9
Total 299 100.0 Source: Primary Field Survey, HH questionnaire Note: Total number of children = 321; data not recorded for 22 children
3.13 Most Recent Parent-Teacher Meeting
About a quarter of the parents reported never having met with their children’s teachers. Two thirds (66%) had met a teacher within the last month or less. About 8% of the parents reported having met a teacher 6 months ago or more. Two parents reported not remembering whether, or when, they had met a teacher (Table 40).
28
Table 40 Most Recent Meeting of Parent with Teacher
Time Period Number of Responses Percentage
Less than a month ago 67 41.1 One month ago 42 25.8 6 months ago 7 4.3 A year ago 6 3.7
Don’t remember 2 1.2 Never met them 39 23.9
Total 163 100.0 Source: Primary Field Survey, HH questionnaire Note: Total number of children = 321; data not recorded for 158 children
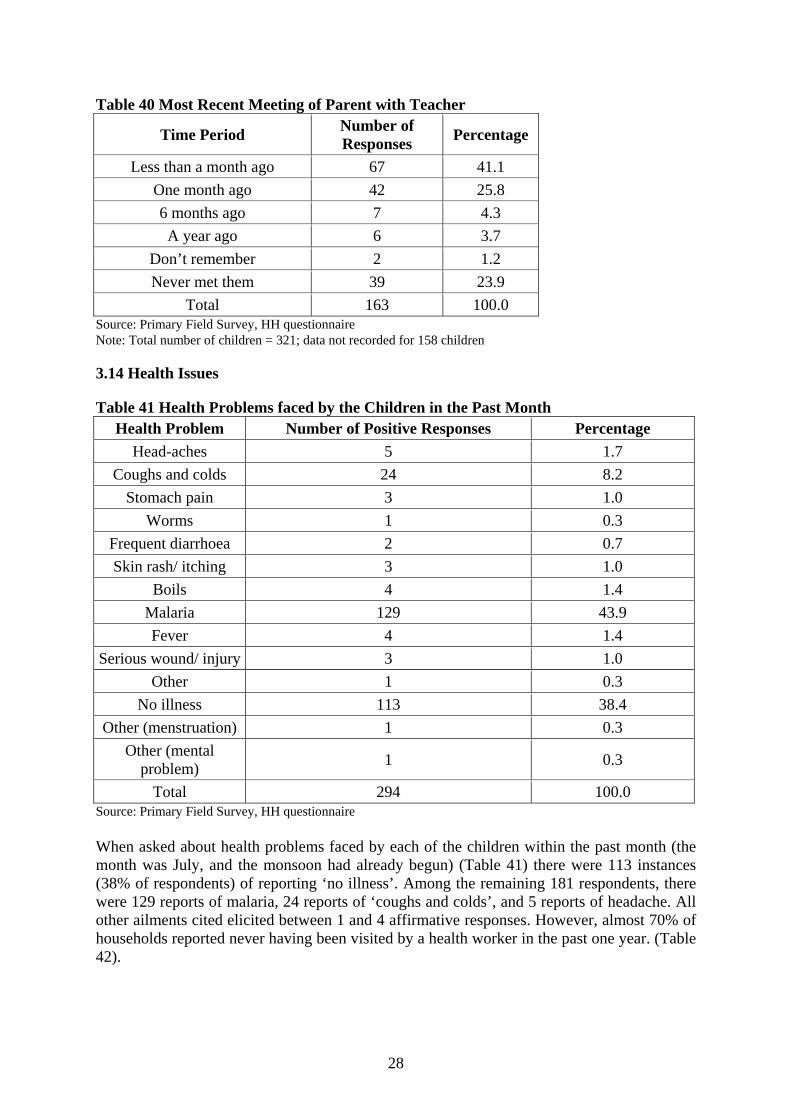
3.14 Health Issues
Table 41 Health Problems faced by the Children in the Past Month Health Problem Number of Positive Responses Percentage
Head-aches 5 1.7 Coughs and colds 24 8.2
Stomach pain 3 1.0 Worms 1 0.3
Frequent diarrhoea 2 0.7 Skin rash/ itching 3 1.0
Boils 4 1.4 Malaria 129 43.9 Fever 4 1.4
Serious wound/ injury 3 1.0 Other 1 0.3
No illness 113 38.4 Other (menstruation) 1 0.3
Other (mental problem) 1 0.3
Total 294 100.0 Source: Primary Field Survey, HH questionnaire When asked about health problems faced by each of the children within the past month (the month was July, and the monsoon had already begun) (Table 41) there were 113 instances (38% of respondents) of reporting ‘no illness’. Among the remaining 181 respondents, there were 129 reports of malaria, 24 reports of ‘coughs and colds’, and 5 reports of headache. All other ailments cited elicited between 1 and 4 affirmative responses. However, almost 70% of households reported never having been visited by a health worker in the past one year. (Table 42).
29
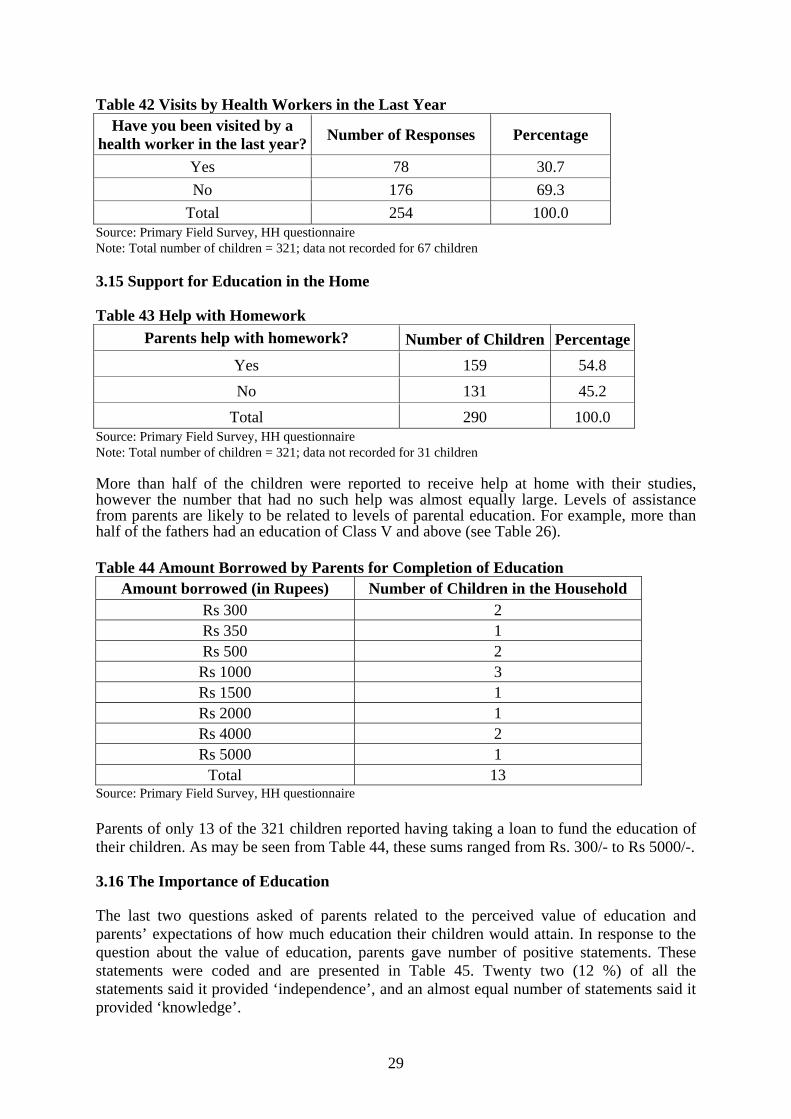
Table 42 Visits by Health Workers in the Last Year Have you been visited by a
health worker in the last year? Number of Responses Percentage
Yes 78 30.7 No 176 69.3
Total 254 100.0 Source: Primary Field Survey, HH questionnaire Note: Total number of children = 321; data not recorded for 67 children
3.15 Support for Education in the Home
Table 43 Help with Homework Parents help with homework? Number of Children Percentage
Yes 159 54.8 No 131 45.2
Total 290 100.0 Source: Primary Field Survey, HH questionnaire Note: Total number of children = 321; data not recorded for 31 children More than half of the children were reported to receive help at home with their studies, however the number that had no such help was almost equally large. Levels of assistance from parents are likely to be related to levels of parental education. For example, more than half of the fathers had an education of Class V and above (see Table 26). Table 44 Amount Borrowed by Parents for Completion of Education
Amount borrowed (in Rupees) Number of Children in the Household Rs 300 2 Rs 350 1 Rs 500 2 Rs 1000 3 Rs 1500 1 Rs 2000 1 Rs 4000 2 Rs 5000 1
Total 13 Source: Primary Field Survey, HH questionnaire Parents of only 13 of the 321 children reported having taking a loan to fund the education of their children. As may be seen from Table 44, these sums ranged from Rs. 300/- to Rs 5000/-.
3.16 The Importance of Education
The last two questions asked of parents related to the perceived value of education and parents’ expectations of how much education their children would attain. In response to the question about the value of education, parents gave number of positive statements. These statements were coded and are presented in Table 45. Twenty two (12 %) of all the statements said it provided ‘independence’, and an almost equal number of statements said it provided ‘knowledge’.
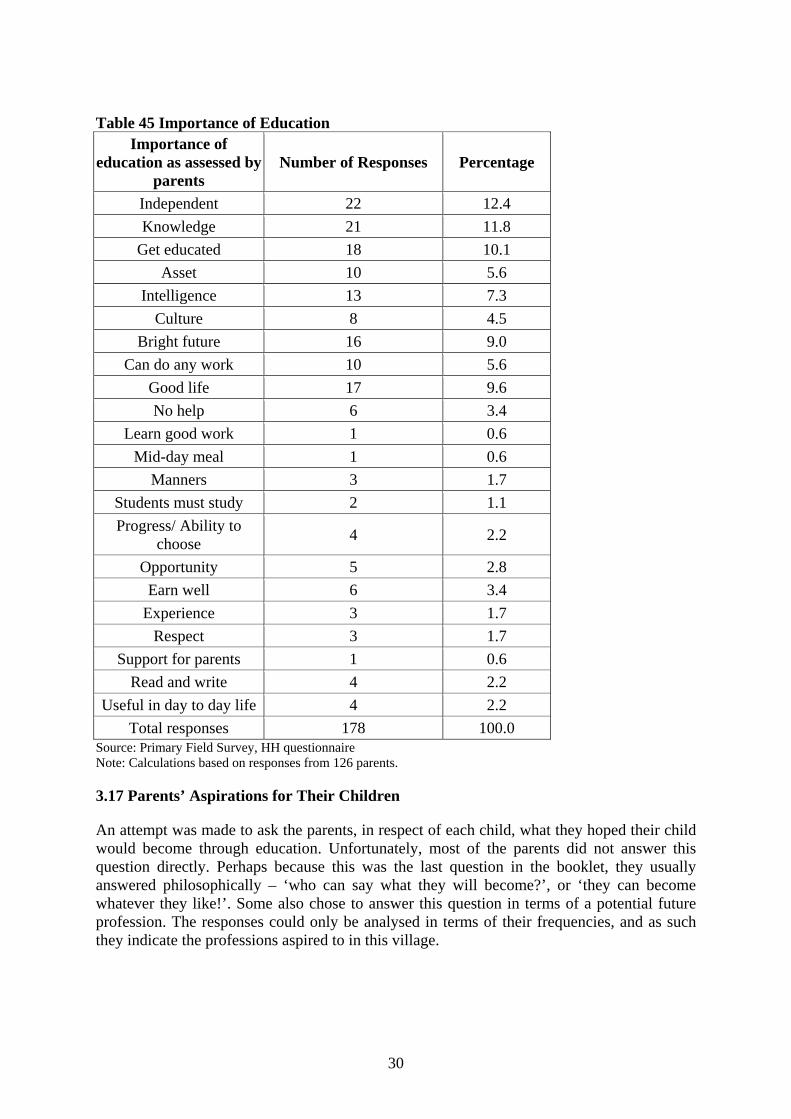
30
Table 45 Importance of Education
Importance of education as assessed by
parents Number of Responses Percentage
Independent 22 12.4 Knowledge 21 11.8
Get educated 18 10.1 Asset 10 5.6
Intelligence 13 7.3 Culture 8 4.5
Bright future 16 9.0 Can do any work 10 5.6
Good life 17 9.6 No help 6 3.4
Learn good work 1 0.6 Mid-day meal 1 0.6
Manners 3 1.7 Students must study 2 1.1 Progress/ Ability to
choose 4 2.2
Opportunity 5 2.8 Earn well 6 3.4
Experience 3 1.7 Respect 3 1.7
Support for parents 1 0.6 Read and write 4 2.2
Useful in day to day life 4 2.2 Total responses 178 100.0
Source: Primary Field Survey, HH questionnaire Note: Calculations based on responses from 126 parents.
3.17 Parents’ Aspirations for Their Children
An attempt was made to ask the parents, in respect of each child, what they hoped their child would become through education. Unfortunately, most of the parents did not answer this question directly. Perhaps because this was the last question in the booklet, they usually answered philosophically – ‘who can say what they will become?’, or ‘they can become whatever they like!’. Some also chose to answer this question in terms of a potential future profession. The responses could only be analysed in terms of their frequencies, and as such they indicate the professions aspired to in this village.
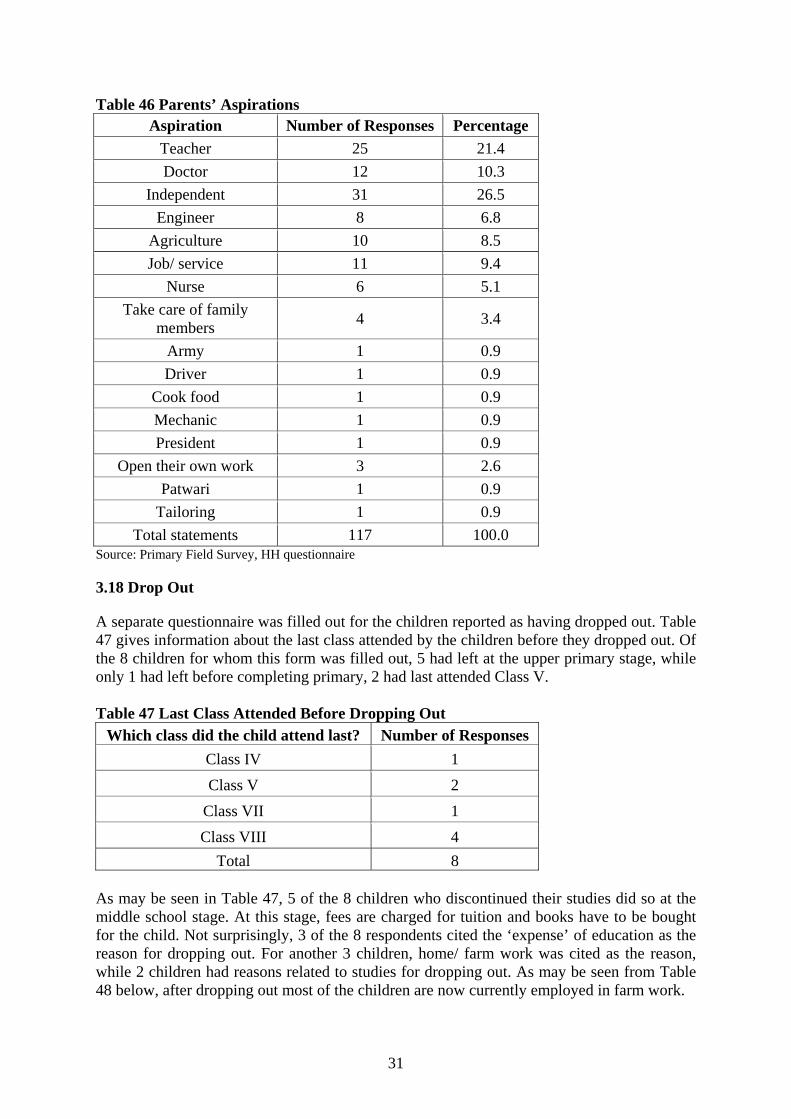
31
Table 46 Parents’ Aspirations Aspiration Number of Responses Percentage
Teacher 25 21.4 Doctor 12 10.3
Independent 31 26.5 Engineer 8 6.8
Agriculture 10 8.5 Job/ service 11 9.4
Nurse 6 5.1 Take care of family
members 4 3.4
Army 1 0.9 Driver 1 0.9
Cook food 1 0.9 Mechanic 1 0.9 President 1 0.9
Open their own work 3 2.6 Patwari 1 0.9
Tailoring 1 0.9 Total statements 117 100.0
Source: Primary Field Survey, HH questionnaire
3.18 Drop Out
A separate questionnaire was filled out for the children reported as having dropped out. Table 47 gives information about the last class attended by the children before they dropped out. Of the 8 children for whom this form was filled out, 5 had left at the upper primary stage, while only 1 had left before completing primary, 2 had last attended Class V. Table 47 Last Class Attended Before Dropping Out
Which class did the child attend last? Number of Responses Class IV 1 Class V 2
Class VII 1 Class VIII 4
Total 8 As may be seen in Table 47, 5 of the 8 children who discontinued their studies did so at the middle school stage. At this stage, fees are charged for tuition and books have to be bought for the child. Not surprisingly, 3 of the 8 respondents cited the ‘expense’ of education as the reason for dropping out. For another 3 children, home/ farm work was cited as the reason, while 2 children had reasons related to studies for dropping out. As may be seen from Table 48 below, after dropping out most of the children are now currently employed in farm work.
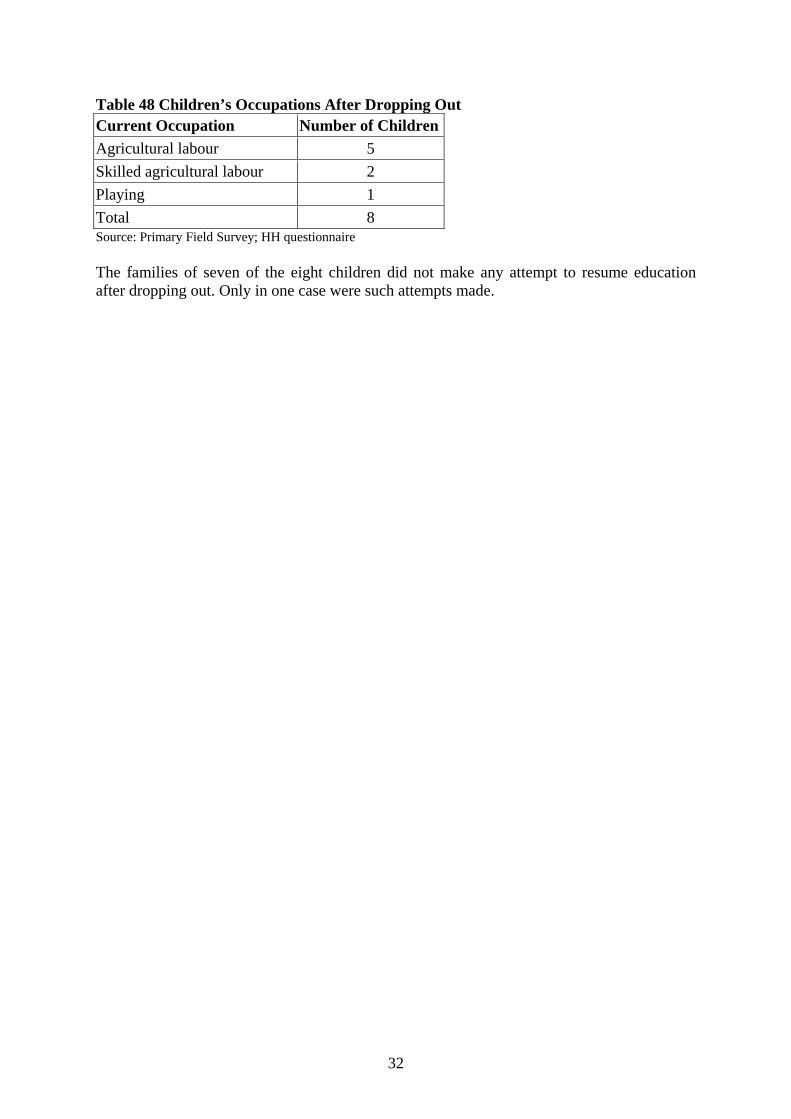
32
Table 48 Children’s Occupations After Dropping Out Current Occupation Number of ChildrenAgricultural labour 5 Skilled agricultural labour 2 Playing 1 Total 8 Source: Primary Field Survey; HH questionnaire The families of seven of the eight children did not make any attempt to resume education after dropping out. Only in one case were such attempts made.
33
4. The Government Primary School, Amlidih
4.1 Introduction
The Government Primary School, Amlidih was established in 1955 and is located just off a busy main road in Amlidih village. The school is at the entrance of the village and ensures easy access to most of the children. An Anganwadi/pre-primary school and Panchayat Ghar are located adjacent to the school compound. The school has a pucca building and it currently consists of 5 rooms; this is compared to the 2 rooms it had in 1991 (see Govinda and Varghese, 1992). It is a co-educational school offering Classes I-V. The medium of instruction is Hindi, however the majority of the children in the school come from households where Chhattisgarhi is the mother tongue. Recently, the number of teachers in the school went up from 2 (in 1991) to 3 teachers (in 2007). This includes one male teacher, who is also the head teacher, and two female teachers. The school opens at 10.30am. It starts with a morning assembly in the open space in the school compound, followed by taking the attendance of the students. The teachers and all students take an active part in the morning assembly. Senior students in the fifth grade have been assigned duties and they help the teachers in tasks such as opening and closing the school gate every day, cleaning the compound, ringing the school bell, serving the mid-day meal, and conducting morning assemblies. The school does not follow a strict time table, although frequent breaks are given to the children. In the case of the absence of any of the teachers, the other teachers take over their class(es). It is, however, interesting to note that hardly any multi grade teaching was noted in the school, even on days where there was only one teacher present. (It was not possible in this pilot study to ascertain how often teachers are absent.) In these circumstances, children continue to sit in their respective classrooms, and the teacher who is present takes turns teaching different classes. The teacher writes lessons on the blackboard, which the children then copy while the teacher attends to the next class. There is no library in the school. Classes II, III, IV and V sit in classrooms while children of Class I sit in a common room which is at the centre of the school and has a table and chairs for the teachers to sit. There is no staff room in the school. The younger children (Classes I and II) sit on mats in groups. Class III children also sit on mats, but they are organized in form of rows. The older children (Classes IV and V) sit on benches. They do not have tables. An interesting feature in the way children sit in the classrooms is that the boys and girls in the older grades (Classes III, IV and V) sit on different sides of the classroom. All children in all grades seem to have a permanent placement in the classroom, which is set at the beginning of the year. All children prefer to sit with their friends, and there is no rotation in terms of their actual position in the classroom. The teachers give homework to all the children, although they do not check the homework on a daily basis. Regular examinations are reportedly conducted in the school, but there are no written records of these. Yearly scores are available in the registers maintained by the teachers.
34
Each classroom has a blackboard, chalk, duster and a chair for the teacher. All children have textbooks, notebooks and stationary. The school provides free books to all children in the school, and uniforms are given to all girl students. The school does not have electricity or a clock. Dry grains which are used in the preparation of the mid-day meal are stored in the Class IV classroom. There have been frequent reports of the theft of these grains (rice, pulses, etc) from the school in the past. The classroom and the main gate of the school are now locked at all times. All the rooms in the school are well lit and well ventilated. There is adequate space for all children in the classrooms. There is a kitchen in the school where the mid-day meal is prepared. A lady from the village panchayat (village council) was nominated to cook the food. The food in the school is hygienic and nutritious and is served regularly. All children carry their own thalis (plates) to the school. During the lunch break, all children are made to sit in the veranda in the school compound. All children wash their hands and the thalis before the food is served. There is a hand pump in the school which is the only source of safe drinking water. The students are organized into neat rows before the food is served. The food is served by the girls of Class V. After the food is served, it is followed by a small prayer, after which the children eat. They wash their thalis after eating their food. The children who live close to the school go home at times during the break, but all children eat in the school. The school has separate toilets for boys and girls. There is also a toilet for the teachers. The school seemed to have all essential amenities. The school has recently been given a transistor radio, used by the teachers for English and Mathematics lessons in Classes I and V. Besides the recent introduction of the radio, which acts as an active mode of communication, the teaching in the school appears to be confined to rote learning. All lessons are either written down on the blackboard or are read aloud. The main problem stems from the fact that there is no teacher present at all times with the children in any of the grades. There are only three teachers in the school, out of which most of them are involved in a lot of non-teaching activities. The teachers have to maintain approximately 16 class registers and they are involved in village activities such as the gram sabha, computing the voter list for the village, organizing events like the Independence Day celebrations in the village, and helping with student health checks. The teachers are generally gentle and kind hearted. They do not appear to discriminate on the basis of sex, caste, class, or religion. The teachers seemed to be familiar with most of the children, including knowing their family background, etc. On the whole the head teacher and the teachers in the school were not dismissive about the family backgrounds of the children or the work burdens they faced. However, the teachers very regularly used a thick rod (which is also used as a ruler) on the children. Interestingly, in the absence of the teacher, children who were appointed as class monitors mimic the role of the teacher by using the blackboard, reading lessons aloud, and also using the rod. The teachers in the school, however, are not trained to handle children with different educational needs. For instance, there were two learning impaired children in the school, one girl and one boy. The researchers observed that the teachers expressed displeasure with the girl for not speaking in the school, and for remaining completely withdrawn in the classroom situation. The boy, on the other hand, did not seem to learn anything. He could not read and could barely write. He was not given any special attention by the teachers.
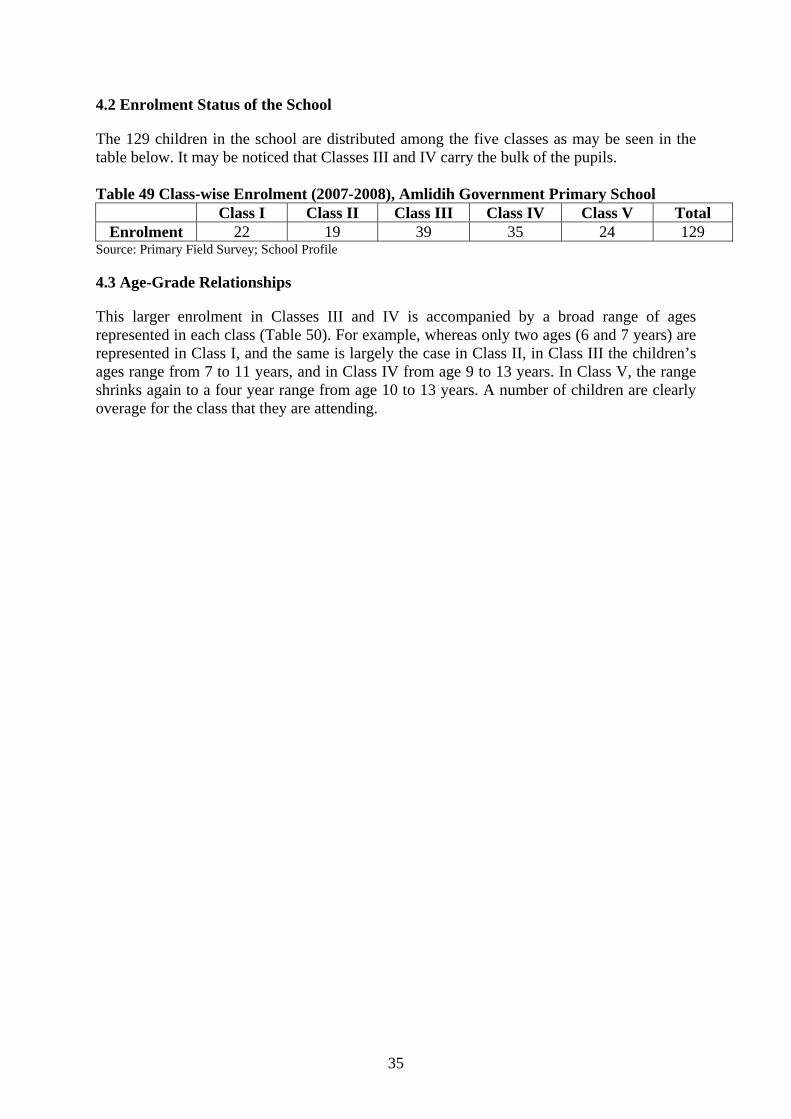
35
4.2 Enrolment Status of the School
The 129 children in the school are distributed among the five classes as may be seen in the table below. It may be noticed that Classes III and IV carry the bulk of the pupils. Table 49 Class-wise Enrolment (2007-2008), Amlidih Government Primary School
Class I Class II Class III Class IV Class V Total Enrolment 22 19 39 35 24 129
Source: Primary Field Survey; School Profile
4.3 Age-Grade Relationships
This larger enrolment in Classes III and IV is accompanied by a broad range of ages represented in each class (Table 50). For example, whereas only two ages (6 and 7 years) are represented in Class I, and the same is largely the case in Class II, in Class III the children’s ages range from 7 to 11 years, and in Class IV from age 9 to 13 years. In Class V, the range shrinks again to a four year range from age 10 to 13 years. A number of children are clearly overage for the class that they are attending.
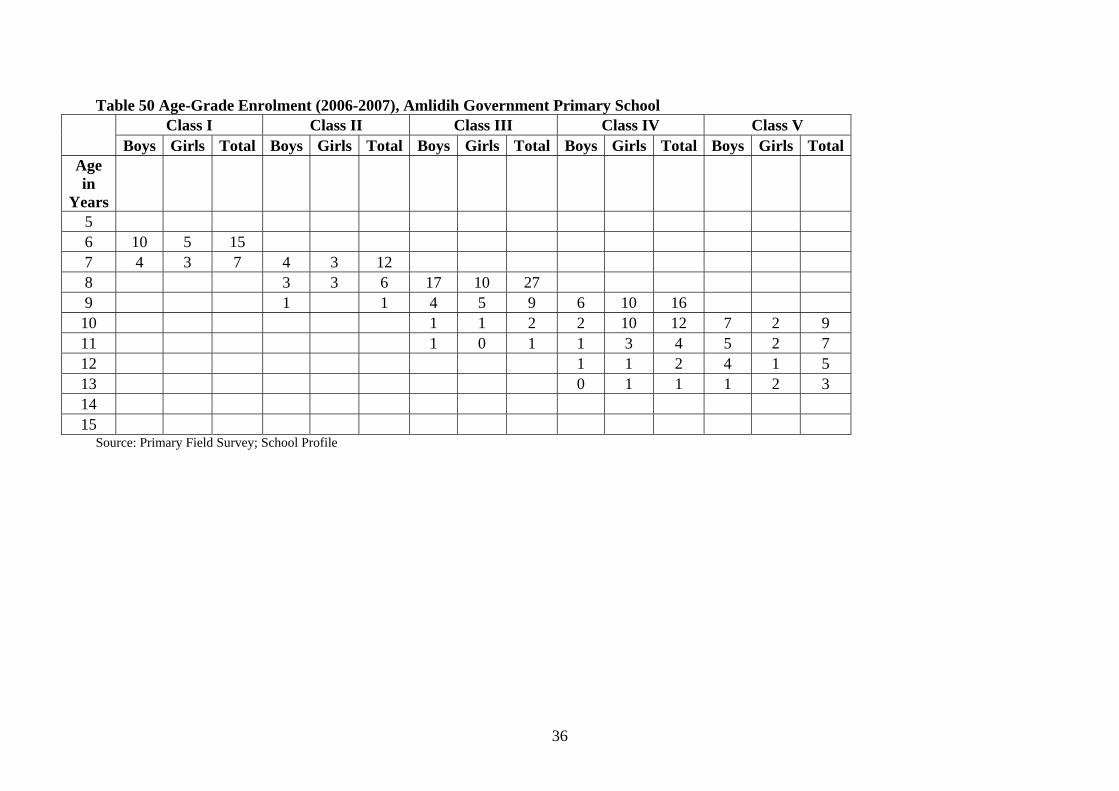
36
Table 50 Age-Grade Enrolment (2006-2007), Amlidih Government Primary School Class I Class II Class III Class IV Class V
Boys Girls Total Boys Girls Total Boys Girls Total Boys Girls Total Boys Girls TotalAge in
Years
5 6 10 5 15 7 4 3 7 4 3 12 8 3 3 6 17 10 27 9 1 1 4 5 9 6 10 16 10 1 1 2 2 10 12 7 2 9 11 1 0 1 1 3 4 5 2 7 12 1 1 2 4 1 5 13 0 1 1 1 2 3 14 15
Source: Primary Field Survey; School Profile
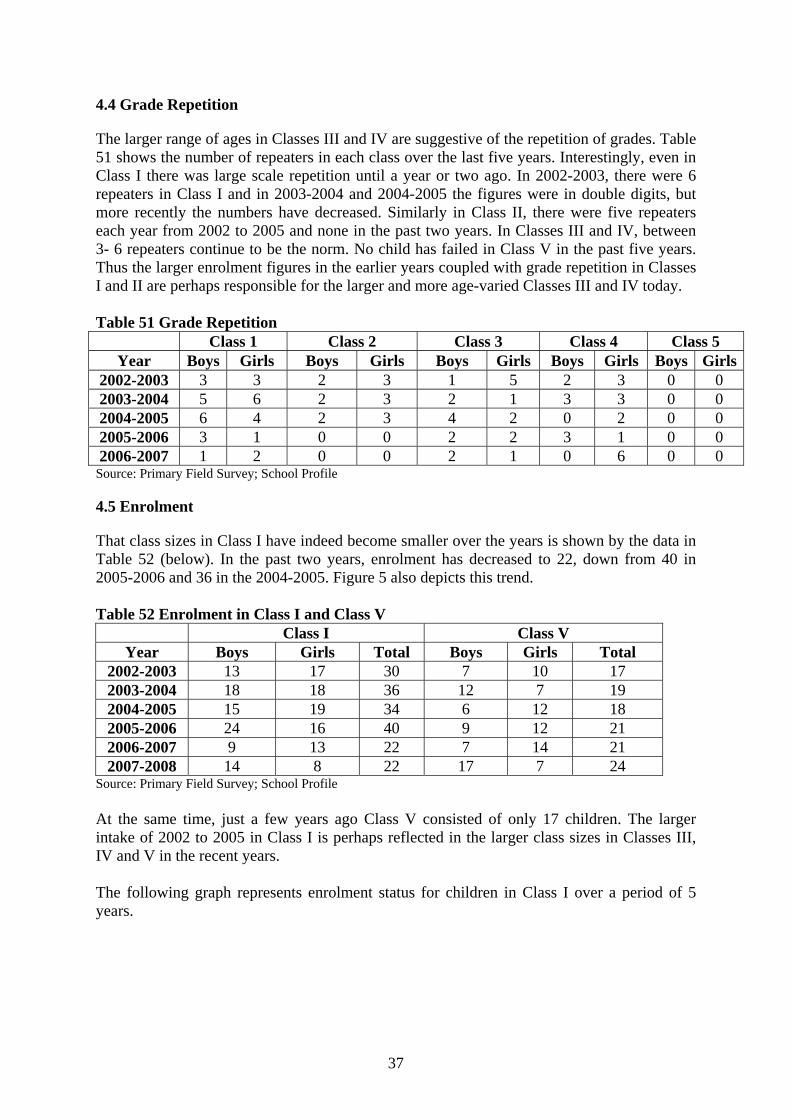
37
4.4 Grade Repetition
The larger range of ages in Classes III and IV are suggestive of the repetition of grades. Table 51 shows the number of repeaters in each class over the last five years. Interestingly, even in Class I there was large scale repetition until a year or two ago. In 2002-2003, there were 6 repeaters in Class I and in 2003-2004 and 2004-2005 the figures were in double digits, but more recently the numbers have decreased. Similarly in Class II, there were five repeaters each year from 2002 to 2005 and none in the past two years. In Classes III and IV, between 3- 6 repeaters continue to be the norm. No child has failed in Class V in the past five years. Thus the larger enrolment figures in the earlier years coupled with grade repetition in Classes I and II are perhaps responsible for the larger and more age-varied Classes III and IV today. Table 51 Grade Repetition
Source: Primary Field Survey; School Profile
4.5 Enrolment
That class sizes in Class I have indeed become smaller over the years is shown by the data in Table 52 (below). In the past two years, enrolment has decreased to 22, down from 40 in 2005-2006 and 36 in the 2004-2005. Figure 5 also depicts this trend. Table 52 Enrolment in Class I and Class V
Class I Class V Year Boys Girls Total Boys Girls Total
2002-2003 13 17 30 7 10 17 2003-2004 18 18 36 12 7 19 2004-2005 15 19 34 6 12 18 2005-2006 24 16 40 9 12 21 2006-2007 9 13 22 7 14 21 2007-2008 14 8 22 17 7 24
Source: Primary Field Survey; School Profile At the same time, just a few years ago Class V consisted of only 17 children. The larger intake of 2002 to 2005 in Class I is perhaps reflected in the larger class sizes in Classes III, IV and V in the recent years. The following graph represents enrolment status for children in Class I over a period of 5 years.
Class 1 Class 2 Class 3 Class 4 Class 5 Year Boys Girls Boys Girls Boys Girls Boys Girls Boys Girls
2002-2003 3 3 2 3 1 5 2 3 0 0 2003-2004 5 6 2 3 2 1 3 3 0 0 2004-2005 6 4 2 3 4 2 0 2 0 0 2005-2006 3 1 0 0 2 2 3 1 0 0 2006-2007 1 2 0 0 2 1 0 6 0 0
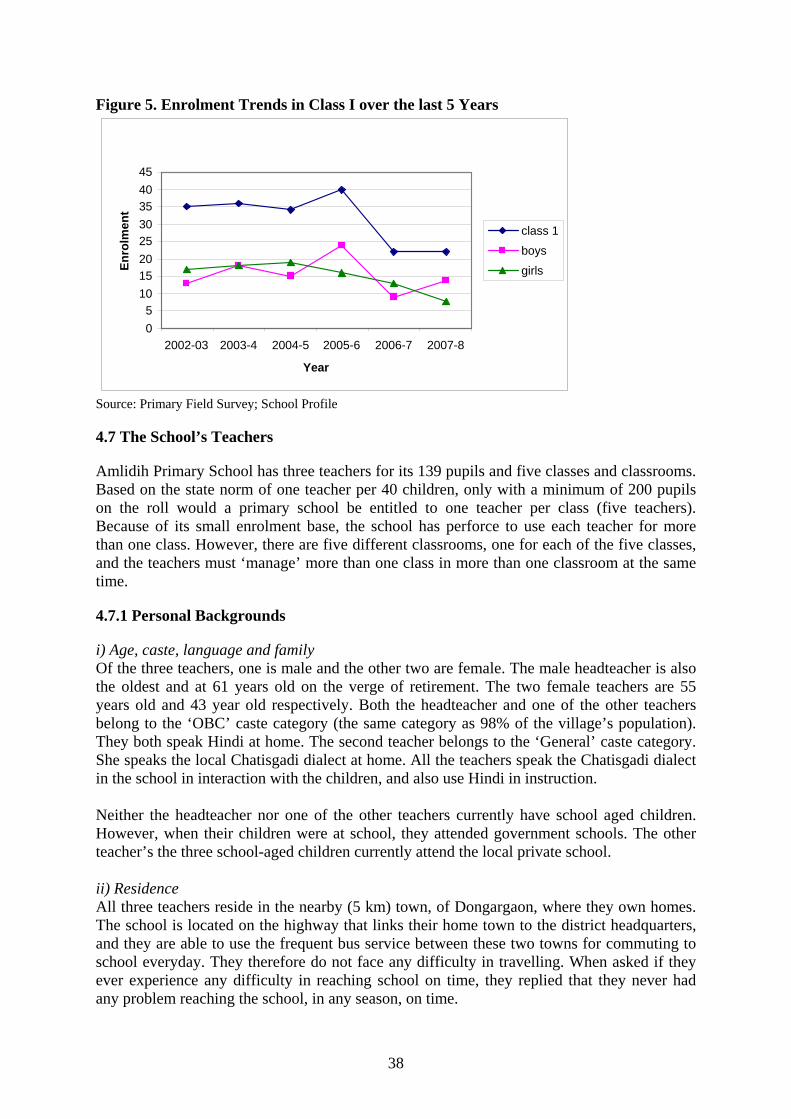
38
Figure 5. Enrolment Trends in Class I over the last 5 Years
Source: Primary Field Survey; School Profile
4.7 The School’s Teachers
Amlidih Primary School has three teachers for its 139 pupils and five classes and classrooms. Based on the state norm of one teacher per 40 children, only with a minimum of 200 pupils on the roll would a primary school be entitled to one teacher per class (five teachers). Because of its small enrolment base, the school has perforce to use each teacher for more than one class. However, there are five different classrooms, one for each of the five classes, and the teachers must ‘manage’ more than one class in more than one classroom at the same time.
4.7.1 Personal Backgrounds
i) Age, caste, language and family Of the three teachers, one is male and the other two are female. The male headteacher is also the oldest and at 61 years old on the verge of retirement. The two female teachers are 55 years old and 43 year old respectively. Both the headteacher and one of the other teachers belong to the ‘OBC’ caste category (the same category as 98% of the village’s population). They both speak Hindi at home. The second teacher belongs to the ‘General’ caste category. She speaks the local Chatisgadi dialect at home. All the teachers speak the Chatisgadi dialect in the school in interaction with the children, and also use Hindi in instruction. Neither the headteacher nor one of the other teachers currently have school aged children. However, when their children were at school, they attended government schools. The other teacher’s the three school-aged children currently attend the local private school. ii) Residence All three teachers reside in the nearby (5 km) town, of Dongargaon, where they own homes. The school is located on the highway that links their home town to the district headquarters, and they are able to use the frequent bus service between these two towns for commuting to school everyday. They therefore do not face any difficulty in travelling. When asked if they ever experience any difficulty in reaching school on time, they replied that they never had any problem reaching the school, in any season, on time.
0 5
10 15 20 25 30 35 40 45
2002-03 2003-4 2004-5 2005-6 2006-7 2007-8
Year
Enro
lmen
t
class 1
boys
girls
39
4.7.2 Educational Background
The highest educational qualification of all the teachers is Class X. All three teachers have also received professional teacher training. The headteacher completed a BTI professional qualification in 1974 and he has been teaching in the school for the last 12 years. One of the female teachers did a primary teachers’ diploma, D.Ed, in 1986, and she has been teaching in the school for the last two years. The other female teacher completed a D.Ed in 1989 and has been teaching in the school for the last 18 years. All of the teachers reported that they had undergone an in-service training during the last year. They also reported that each month they are involved in activities other than teaching for approximately three days.
4.8 Teaching, Learning and Attendance
4.8.1 Multi-Grade Teaching
In the school, Classes I and II are taught all subjects by the head teacher. On the day of the visit 18 children of the 22 children enrolled in Class I were present in his class, and the same number of children was recorded as present the day before. Classes III and IV are taught English, Hindi, Maths and Social Studies at the same time but as separate groups by one of the other teachers. On the day of the visit, 32 of the 39 children in Class III were present in her class, and the same numbers of children were present the day before. The second teacher teaches Class V English, Hindi, Maths, and Social Studies. On the day of the visit, 22 of the 24 children enrolled in Class V were present in her class, while 23 children were recorded as present the day before. All of the teachers give homework to the children daily and check the homework regularly. They give their students tests once per month, and keep records of their performance. These records are used to identify slow learners. i) Lesson plans Teachers have to complete lesson plans each week, and the school keeps records of the lesson plans. ii) Overage and Underage and Repeaters According to the teachers, there are no overage or underage children in the school. There are, however, cases of children repeating classes because of poor attendance. Since the age-wise data contradicts what the teachers say, it is possible that the teachers are interpreting the question in terms of being overage for primary school as a whole, rather than for each class. However, even that seems unlikely, since there are 22 children older than age 11 in Classes IV and V. Perhaps the teachers did not want to report anything ‘negative’. iii) Drop-Out According to the teachers, there is no drop-out in the school, although children may be absent from classes for long periods of time because they go out of station with their parents.
4.8.2 Employment as a Teacher
All the teachers are regular employees of the school and receive salaries according to a graded scale. The headteacher’s monthly total salary is Rs.14000/-. The other teachers’ monthly total salaries are Rs.10, 000/- and Rs.11, 000/-, respectively.
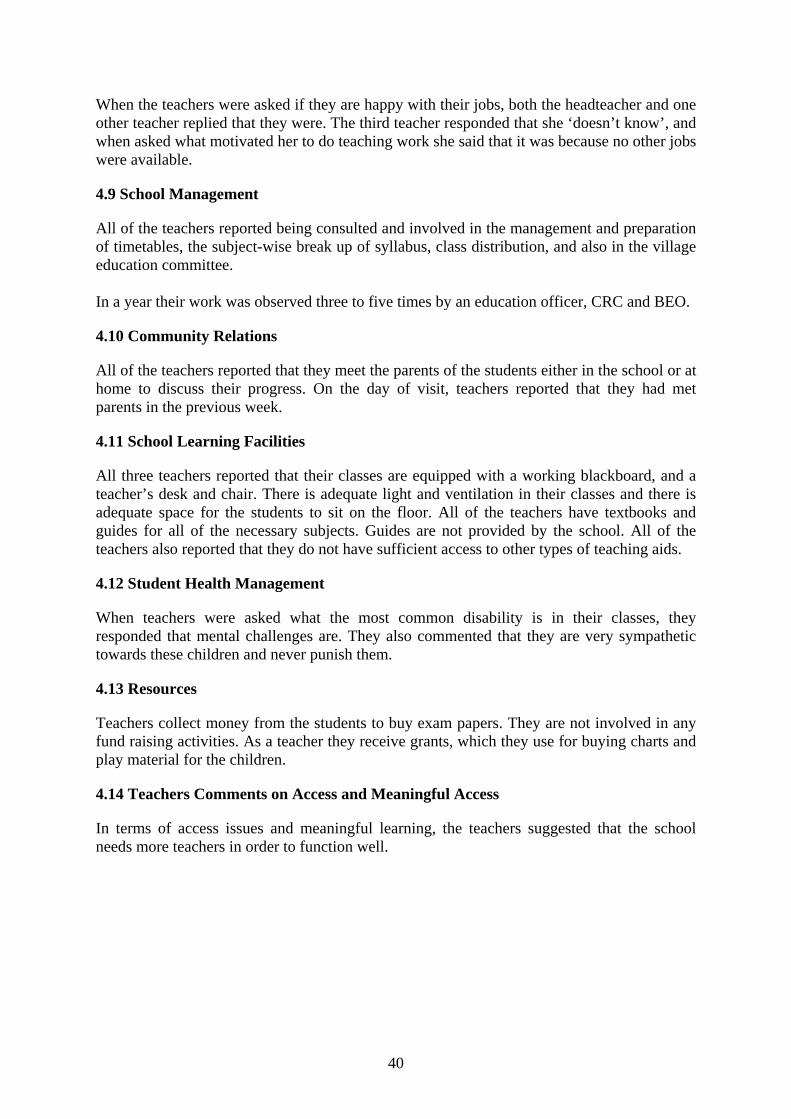
40
When the teachers were asked if they are happy with their jobs, both the headteacher and one other teacher replied that they were. The third teacher responded that she ‘doesn’t know’, and when asked what motivated her to do teaching work she said that it was because no other jobs were available.
4.9 School Management
All of the teachers reported being consulted and involved in the management and preparation of timetables, the subject-wise break up of syllabus, class distribution, and also in the village education committee. In a year their work was observed three to five times by an education officer, CRC and BEO.
4.10 Community Relations
All of the teachers reported that they meet the parents of the students either in the school or at home to discuss their progress. On the day of visit, teachers reported that they had met parents in the previous week.
4.11 School Learning Facilities
All three teachers reported that their classes are equipped with a working blackboard, and a teacher’s desk and chair. There is adequate light and ventilation in their classes and there is adequate space for the students to sit on the floor. All of the teachers have textbooks and guides for all of the necessary subjects. Guides are not provided by the school. All of the teachers also reported that they do not have sufficient access to other types of teaching aids.
4.12 Student Health Management
When teachers were asked what the most common disability is in their classes, they responded that mental challenges are. They also commented that they are very sympathetic towards these children and never punish them.
4.13 Resources
Teachers collect money from the students to buy exam papers. They are not involved in any fund raising activities. As a teacher they receive grants, which they use for buying charts and play material for the children.
4.14 Teachers Comments on Access and Meaningful Access
In terms of access issues and meaningful learning, the teachers suggested that the school needs more teachers in order to function well.
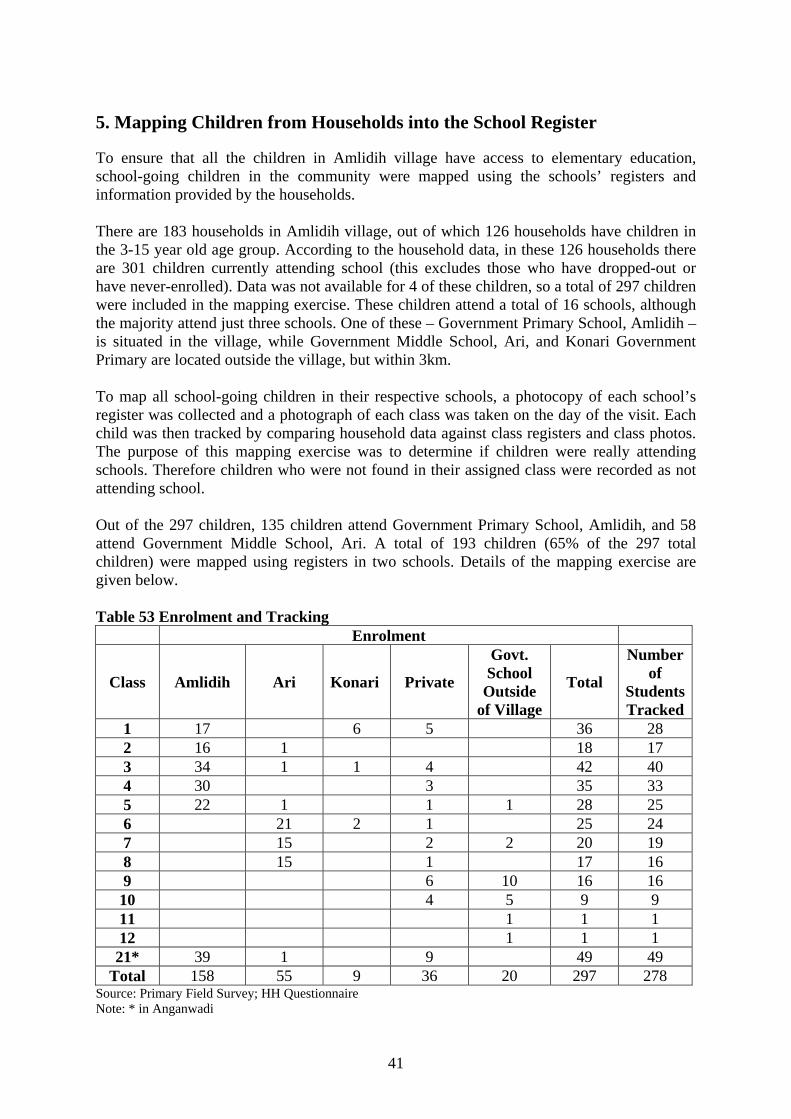
41
5. Mapping Children from Households into the School Register
To ensure that all the children in Amlidih village have access to elementary education, school-going children in the community were mapped using the schools’ registers and information provided by the households. There are 183 households in Amlidih village, out of which 126 households have children in the 3-15 year old age group. According to the household data, in these 126 households there are 301 children currently attending school (this excludes those who have dropped-out or have never-enrolled). Data was not available for 4 of these children, so a total of 297 children were included in the mapping exercise. These children attend a total of 16 schools, although the majority attend just three schools. One of these – Government Primary School, Amlidih – is situated in the village, while Government Middle School, Ari, and Konari Government Primary are located outside the village, but within 3km. To map all school-going children in their respective schools, a photocopy of each school’s register was collected and a photograph of each class was taken on the day of the visit. Each child was then tracked by comparing household data against class registers and class photos. The purpose of this mapping exercise was to determine if children were really attending schools. Therefore children who were not found in their assigned class were recorded as not attending school. Out of the 297 children, 135 children attend Government Primary School, Amlidih, and 58 attend Government Middle School, Ari. A total of 193 children (65% of the 297 total children) were mapped using registers in two schools. Details of the mapping exercise are given below. Table 53 Enrolment and Tracking
Enrolment
Class Amlidih Ari Konari Private
Govt. School
Outside of Village
Total
Number of
Students Tracked
1 17 6 5 36 28 2 16 1 18 17 3 34 1 1 4 42 40 4 30 3 35 33 5 22 1 1 1 28 25 6 21 2 1 25 24 7 15 2 2 20 19 8 15 1 17 16 9 6 10 16 16 10 4 5 9 9 11 1 1 1 12 1 1 1 21* 39 1 9 49 49
Total 158 55 9 36 20 297 278 Source: Primary Field Survey; HH Questionnaire Note: * in Anganwadi
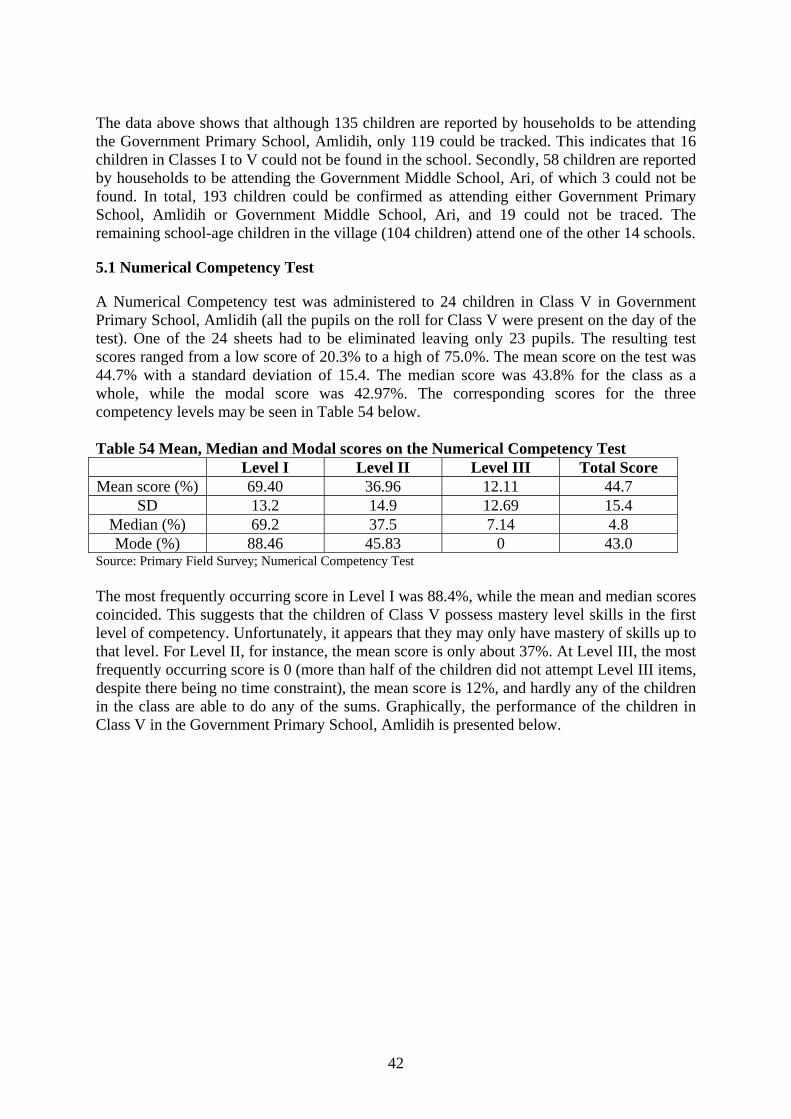
42
The data above shows that although 135 children are reported by households to be attending the Government Primary School, Amlidih, only 119 could be tracked. This indicates that 16 children in Classes I to V could not be found in the school. Secondly, 58 children are reported by households to be attending the Government Middle School, Ari, of which 3 could not be found. In total, 193 children could be confirmed as attending either Government Primary School, Amlidih or Government Middle School, Ari, and 19 could not be traced. The remaining school-age children in the village (104 children) attend one of the other 14 schools.
5.1 Numerical Competency Test
A Numerical Competency test was administered to 24 children in Class V in Government Primary School, Amlidih (all the pupils on the roll for Class V were present on the day of the test). One of the 24 sheets had to be eliminated leaving only 23 pupils. The resulting test scores ranged from a low score of 20.3% to a high of 75.0%. The mean score on the test was 44.7% with a standard deviation of 15.4. The median score was 43.8% for the class as a whole, while the modal score was 42.97%. The corresponding scores for the three competency levels may be seen in Table 54 below. Table 54 Mean, Median and Modal scores on the Numerical Competency Test
Level I Level II Level III Total Score Mean score (%) 69.40 36.96 12.11 44.7
SD 13.2 14.9 12.69 15.4 Median (%) 69.2 37.5 7.14 4.8 Mode (%) 88.46 45.83 0 43.0
Source: Primary Field Survey; Numerical Competency Test The most frequently occurring score in Level I was 88.4%, while the mean and median scores coincided. This suggests that the children of Class V possess mastery level skills in the first level of competency. Unfortunately, it appears that they may only have mastery of skills up to that level. For Level II, for instance, the mean score is only about 37%. At Level III, the most frequently occurring score is 0 (more than half of the children did not attempt Level III items, despite there being no time constraint), the mean score is 12%, and hardly any of the children in the class are able to do any of the sums. Graphically, the performance of the children in Class V in the Government Primary School, Amlidih is presented below.
43
Figure 6 Numerical Competency of Class V Children, Government Primary School, Amlidih
Source: Source: Primary Field Survey; Numerical Competency Test Figure 7 Total Numerical Competency of Class V Children, Government Primary School, Amlidih
Source: Source: Primary Field Survey; Numerical Competency Test If most of the children in Class V have a level of competency in mathematics of only Class I (the class in which competencies of level one are supposed to be acquired), Level II represents only about 31% of the average score, and Level III accounts for only about 10% on the whole, then the majority of the children are at significant risk of dropping out (CREATE Zone 3). The data was further analysed to examine where each child stands when it comes to level-wise classification. A minimum standard (cut off point) which a child is expected to score at each level was identified, the classification of which is as follows:
• L-1 for those who scored above 70% • L-2 for those who scored above 60% • L-3 for those who scored above 40% • Below L-1 for those who scored less than 70 %
0.0 10.0 20.0 30.0 40.0 50.0 60.0 70.0 80.0 90.0
100.0
1 2 3 4 5 6 7 8 9 10 11 12 13 14 15 16 17 18 19 20 21 22 23
%L1 %L2 %L3
Level 2 31%
Level 1 59%
Level 3 10%
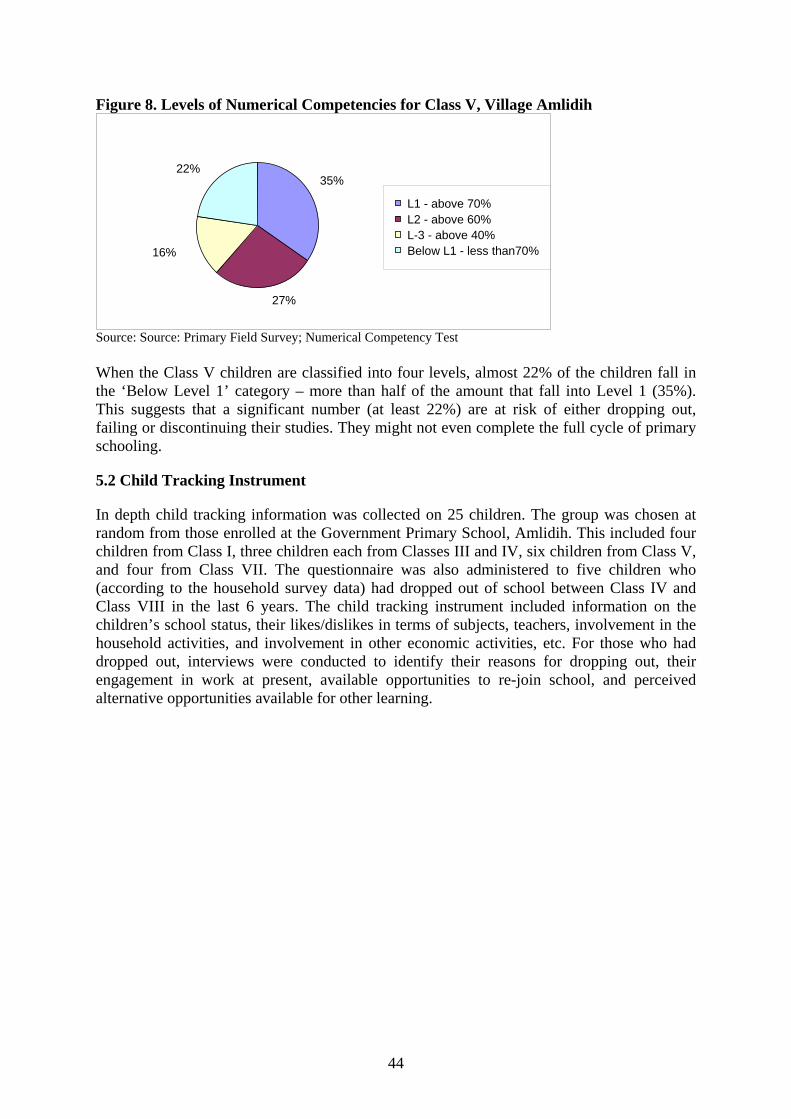
44
Figure 8. Levels of Numerical Competencies for Class V, Village Amlidih
Source: Source: Primary Field Survey; Numerical Competency Test When the Class V children are classified into four levels, almost 22% of the children fall in the ‘Below Level 1’ category – more than half of the amount that fall into Level 1 (35%). This suggests that a significant number (at least 22%) are at risk of either dropping out, failing or discontinuing their studies. They might not even complete the full cycle of primary schooling.
5.2 Child Tracking Instrument
In depth child tracking information was collected on 25 children. The group was chosen at random from those enrolled at the Government Primary School, Amlidih. This included four children from Class I, three children each from Classes III and IV, six children from Class V, and four from Class VII. The questionnaire was also administered to five children who (according to the household survey data) had dropped out of school between Class IV and Class VIII in the last 6 years. The child tracking instrument included information on the children’s school status, their likes/dislikes in terms of subjects, teachers, involvement in the household activities, and involvement in other economic activities, etc. For those who had dropped out, interviews were conducted to identify their reasons for dropping out, their engagement in work at present, available opportunities to re-join school, and perceived alternative opportunities available for other learning.
35%
27%
16%
22%
L1 - above 70%L2 - above 60%L-3 - above 40%Below L1 - less than70%
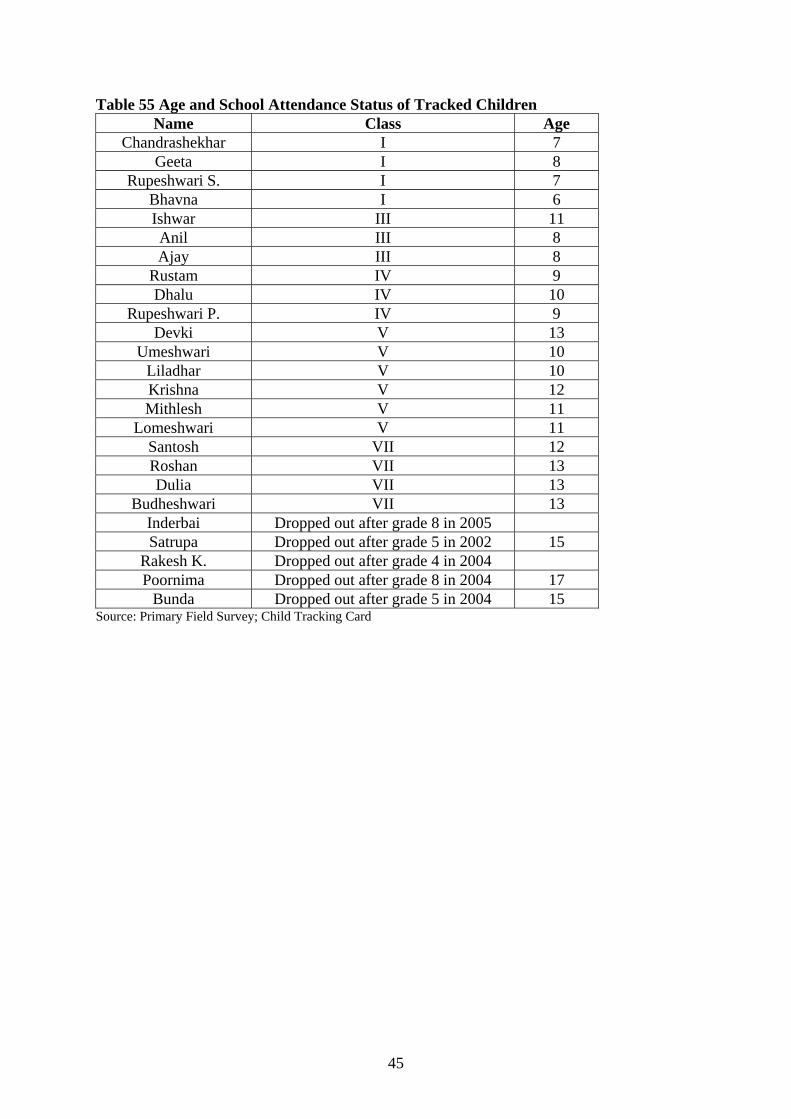
45
Table 55 Age and School Attendance Status of Tracked Children Name Class Age
Chandrashekhar I 7 Geeta I 8
Rupeshwari S. I 7 Bhavna I 6 Ishwar III 11 Anil III 8 Ajay III 8
Rustam IV 9 Dhalu IV 10
Rupeshwari P. IV 9 Devki V 13
Umeshwari V 10 Liladhar V 10 Krishna V 12 Mithlesh V 11
Lomeshwari V 11 Santosh VII 12 Roshan VII 13 Dulia VII 13
Budheshwari VII 13 Inderbai Dropped out after grade 8 in 2005 Satrupa Dropped out after grade 5 in 2002 15
Rakesh K. Dropped out after grade 4 in 2004 Poornima Dropped out after grade 8 in 2004 17
Bunda Dropped out after grade 5 in 2004 15 Source: Primary Field Survey; Child Tracking Card
46
6. Discussion of Findings and Suggestions for Thematic Research
6.1 Zone 1: Access to Grade 1
Initial entry to school does not appear to be a problem in this village. All children enrol. Moreover, this process is facilitated by the Anganwadi, which cares for the children before the age of 6. Not all children go to the Anganwadi however, despite the fact that there is no fee to attend and that a mid-day meal is provided. A survey of the village by the primary school teachers is an annual exercise mandated by the administration, and there is a ‘survey register’ maintained by the school. This register could provide some information, but since it is prepared by the teachers, the data is not likely to say anything very different from the data provided by the teachers. However, this information can provide a useful list of residents.
6.2 Zone 2: Drop Out
The household survey succeeded in identifying approximately 5 children who had dropped out of school. One of the children who was reported to have stopped coming to school during the light tracking portion of the pilot study was only 8 years old. Apparently he had not come back after the summer break. Another girl of 13 was out of school because she was not able to get a transfer certificate from her old school. The remaining children were 14 years of age or older. Four of these children were included in the group of children tracked with the CTC.
6.3 Zone 3: At Risk of Drop Out
Observation highlighted this Zone as requiring the most attention from ethnographic studies.
a) Lack of teacher attention: The school had only 3 teachers for 5 classes. One teacher taught Classes I and II, and another taught Classes III and IV, while Class V was taught by the third teacher. The process of teaching went something like this: the teacher would write something on the board, and the children would copy it. He/ she would do this alternately in each class. Studies are needed while examine the impacts of these management strategies on teaching and learning.
b) Teacher absence from school/teaching: We do not know if this was a normal
fortnight, but during the period in which the Household Survey was being conducted, the survey team observed that the school functioned normally (i.e. with 3 teachers for 5 classes) for only 3 of the 10 working days. In this period the school was officially closed on the two Sundays and on August 15 (Independence Day). Saturday is a working day, but often a second Saturday may be a holiday. There was no second Saturday in this period, and so after accounting for the official holidays there were ten working days. One or more teachers were absent on each of these ten days for reasons such as, ‘training at cluster HQ’, ‘assistance of the HM required for facilitating distribution of ID cards of the villagers’, the ‘gram sabha meeting’, ‘ill health’, ‘visit by the nurse to record height. and weight’. This does not include the days in which the presence of researchers snatched away precious teaching time. A study of time on task could reveal how such teacher ‘unavailability’ contributes to ‘silent exclusion’, and how much time a child spends in a class in which the teacher is actually present and teaching (i.e. and not filling up registers).
47
c) Serving data, not children: The Head teacher is required to spend a great deal of time on maintaining the 16 or so registers required by administration. An attempt was made to list out the various registers, but had to be given up due to the headteacher's lack of time to provide this information. The time spent on maintaining these registers, instead of teaching, should be more carefully studied – and perhaps result in an alternative being found to replace this task. Moreover, these registers are purchased from the Rs. 2000/- allotted to each school for “school improvement” by the centrally sponsored Sarva Shiksha Abhiyan (SSA) scheme. Prior to SSA funding, it was the education department that paid for these registers.
d) Copying instead of learning: Children appear to spend most of their time copying
from the board instead of receiving instruction or feedback. According to some sources we spoke to this is also the way in which exams are conducted, i.e. teachers write the answers on the board and children copy. Moreover, teachers and students can buy exam papers (published by private publishers) from any stationery shop. Apparently, teachers do not make their own tests in Classes I-IV. It seems that these test papers are made by a ‘publisher’ who prints out a large number of these papers. The teachers then collect money from the children in the name of exam fees and go and buy these papers. One of the officers spoke of his own role in ensuring that the end of year exam papers are published and sold not at the beginning of the year, but towards the end, thereby ensuring that the teacher teaches the whole course and not just the five questions that are in the question paper. A similar practice was found to be operating in another town in Madhya Pradesh. (Chhattisgarh was once part of the state of Madhya Pradesh.) This may be one lead to follow up through an ethnographic study. It certainly puts the children at risk.
e) Violence against students: Although the teachers are, by and large, kind-hearted and
gentle, it also appears to be second nature for them to pick up the thick rod (which is also used as a ruler for drawing lines in the register) to threaten the children, and sometimes even hit them. In the Household Survey, one family narrated how their daughters (now 16 years old, married and illiterate) had remained uneducated because when they were in Class II the teacher in the school had hit them on the thigh with a thick rod. The girls never went back to school. The researchers actually saw a teacher hitting children sitting on the floor. The thigh is exactly where the blow fell.
f) Role of communication media: A recent programme introduced while the
researchers were in the schools was a programme of teaching through radio. Schools have been given transistor radios and timetables for different lessons. These classes were being held during the time of the pilot study, but since the radios run on batteries, and the teachers used the radios to listen to music in their lunch break, one wonders how long the radio lessons will continue.
g) Electricity: The school itself has no electricity (and nor do the other schools in the
block), even though the village is electrified. Some children are reported to miss school and to stay home to watch TV for the whole day. When asked why the school does not ask for fans in the school since it can get swelteringly hot in a classroom of 30 children, the Head teacher asked – “how will we pay the electricity bill?”. When the same question was asked to a training group of 50 primary school teachers, the same response was given. The common assumption appears to be that they are not entitled to such comforts, and that even if they get a fan installed, they will then have
48
to pay the electricity bill. The assumption that they, from school funds will have to foot the bill must surely have a basis, and a study needs to go into the ‘system’ that gives them this belief.
6.4 Zone 4: Transition to Upper Primary
The good news about this village is that – according to the school baseline data submitted by the primary school head teacher – most of the children are able to make a successful transition to the upper primary school at Ari. Household Data is currently being examined to verify this.
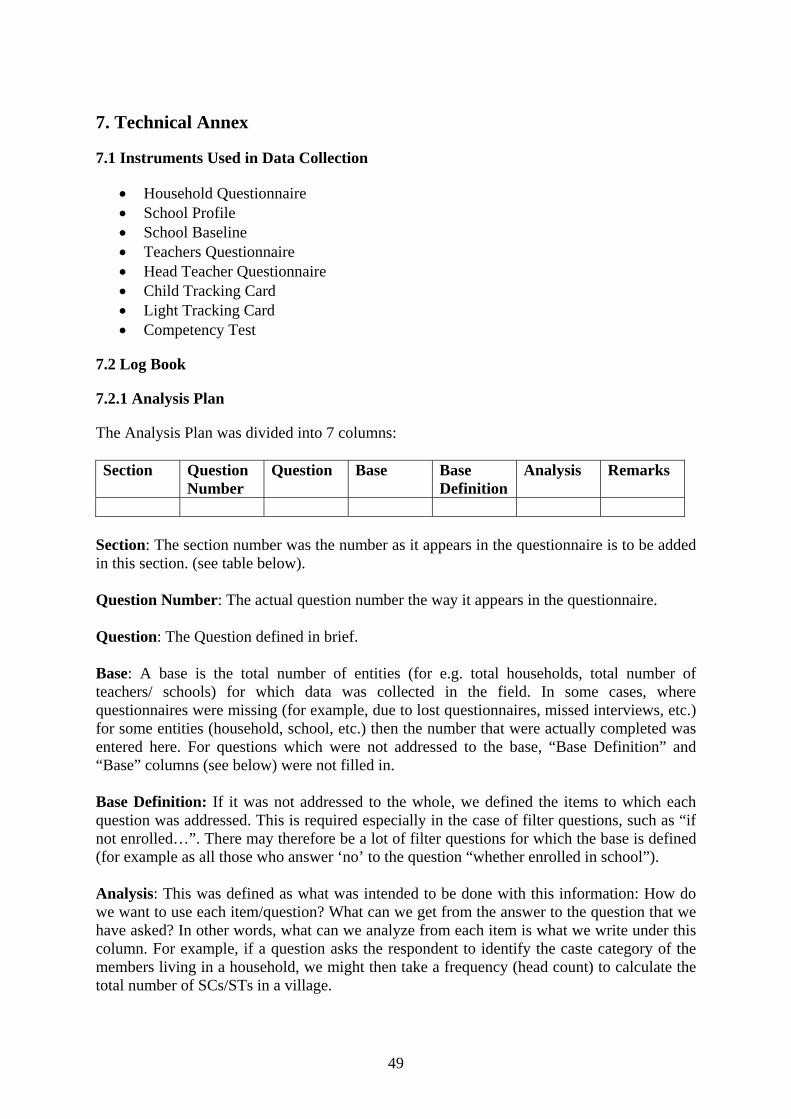
49
7. Technical Annex
7.1 Instruments Used in Data Collection
• Household Questionnaire • School Profile • School Baseline • Teachers Questionnaire • Head Teacher Questionnaire • Child Tracking Card • Light Tracking Card • Competency Test
7.2 Log Book
7.2.1 Analysis Plan
The Analysis Plan was divided into 7 columns: Section Question
Number Question Base Base
Definition Analysis Remarks
Section: The section number was the number as it appears in the questionnaire is to be added in this section. (see table below). Question Number: The actual question number the way it appears in the questionnaire. Question: The Question defined in brief. Base: A base is the total number of entities (for e.g. total households, total number of teachers/ schools) for which data was collected in the field. In some cases, where questionnaires were missing (for example, due to lost questionnaires, missed interviews, etc.) for some entities (household, school, etc.) then the number that were actually completed was entered here. For questions which were not addressed to the base, “Base Definition” and “Base” columns (see below) were not filled in. Base Definition: If it was not addressed to the whole, we defined the items to which each question was addressed. This is required especially in the case of filter questions, such as “if not enrolled…”. There may therefore be a lot of filter questions for which the base is defined (for example as all those who answer ‘no’ to the question “whether enrolled in school”). Analysis: This was defined as what was intended to be done with this information: How do we want to use each item/question? What can we get from the answer to the question that we have asked? In other words, what can we analyze from each item is what we write under this column. For example, if a question asks the respondent to identify the caste category of the members living in a household, we might then take a frequency (head count) to calculate the total number of SCs/STs in a village.
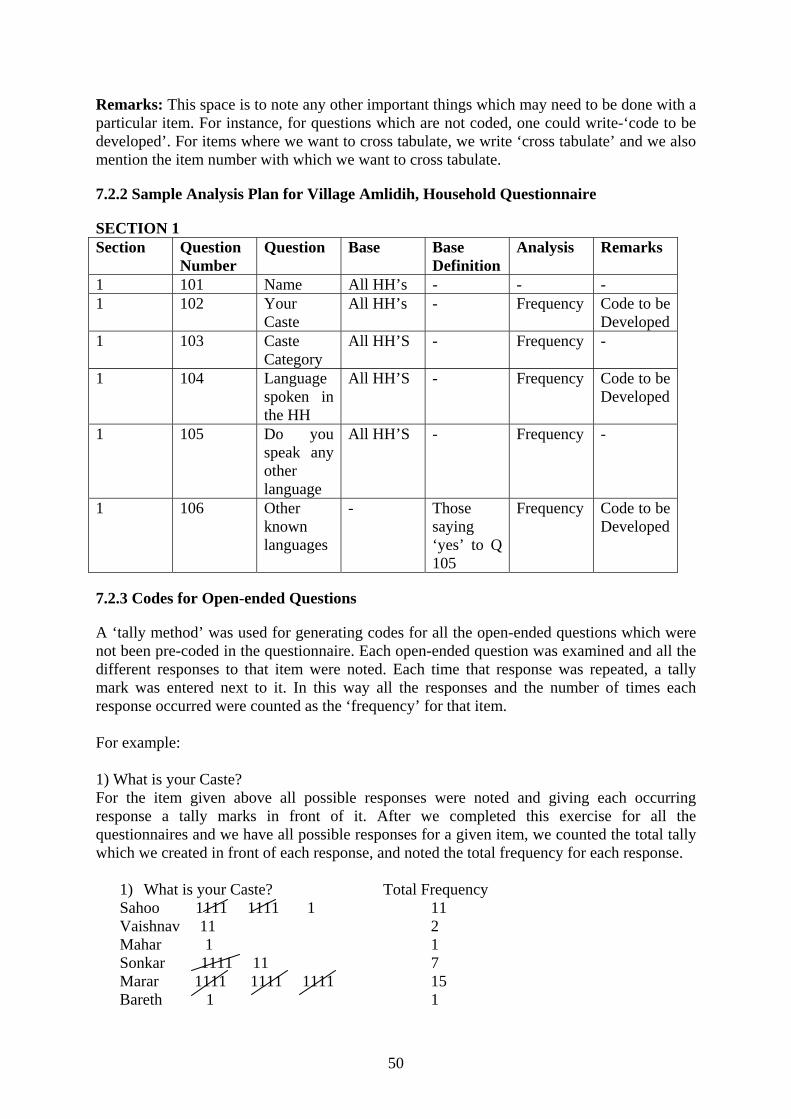
50
Remarks: This space is to note any other important things which may need to be done with a particular item. For instance, for questions which are not coded, one could write-‘code to be developed’. For items where we want to cross tabulate, we write ‘cross tabulate’ and we also mention the item number with which we want to cross tabulate.
7.2.2 Sample Analysis Plan for Village Amlidih, Household Questionnaire
SECTION 1 Section Question
Number Question Base Base
Definition Analysis Remarks
1 101 Name All HH’s - - - 1 102 Your
Caste All HH’s - Frequency Code to be
Developed1 103 Caste
Category All HH’S - Frequency -
1 104 Language spoken in the HH
All HH’S - Frequency Code to be Developed
1 105 Do you speak any other language
All HH’S - Frequency -
1 106 Other known languages
- Those saying ‘yes’ to Q 105
Frequency Code to be Developed
7.2.3 Codes for Open-ended Questions
A ‘tally method’ was used for generating codes for all the open-ended questions which were not been pre-coded in the questionnaire. Each open-ended question was examined and all the different responses to that item were noted. Each time that response was repeated, a tally mark was entered next to it. In this way all the responses and the number of times each response occurred were counted as the ‘frequency’ for that item. For example: 1) What is your Caste? For the item given above all possible responses were noted and giving each occurring response a tally marks in front of it. After we completed this exercise for all the questionnaires and we have all possible responses for a given item, we counted the total tally which we created in front of each response, and noted the total frequency for each response.
1) What is your Caste? Total Frequency Sahoo 1111 1111 1 11 Vaishnav 11 2 Mahar 1 1 Sonkar 1111 11 7 Marar 1111 1111 1111 15 Bareth 1 1
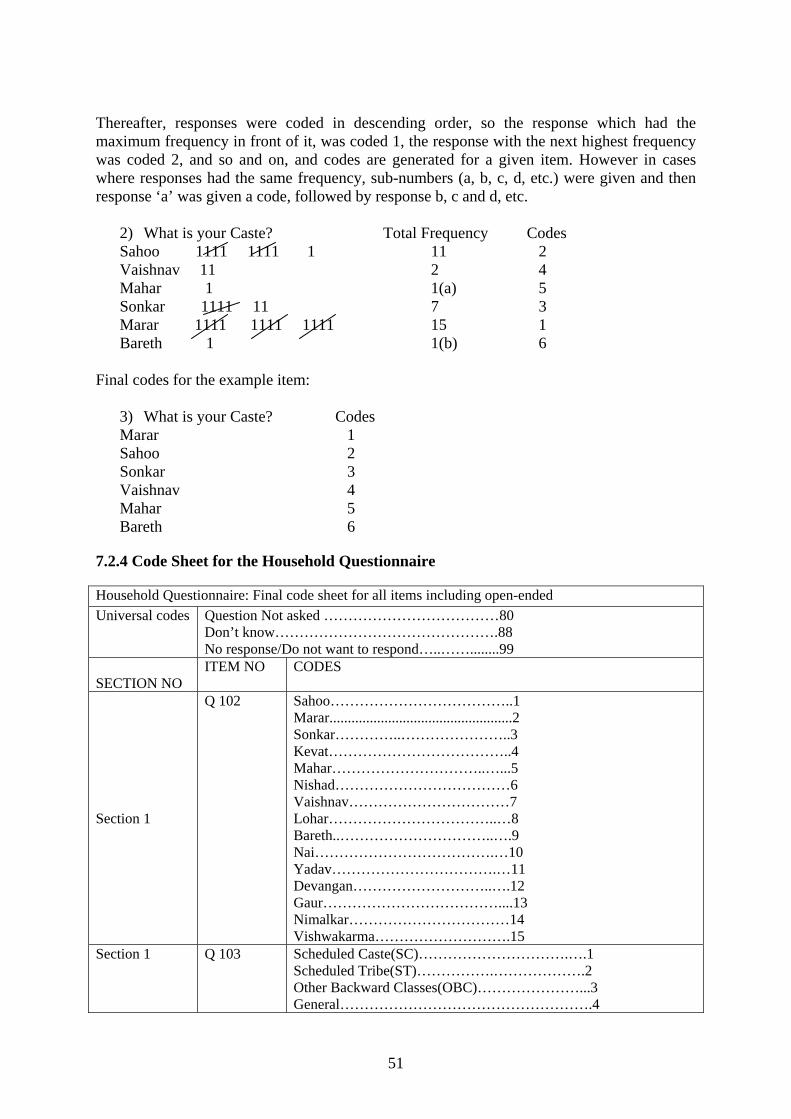
51
Thereafter, responses were coded in descending order, so the response which had the maximum frequency in front of it, was coded 1, the response with the next highest frequency was coded 2, and so and on, and codes are generated for a given item. However in cases where responses had the same frequency, sub-numbers (a, b, c, d, etc.) were given and then response ‘a’ was given a code, followed by response b, c and d, etc.
2) What is your Caste? Total Frequency Codes Sahoo 1111 1111 1 11 2 Vaishnav 11 2 4 Mahar 1 1(a) 5 Sonkar 1111 11 7 3 Marar 1111 1111 1111 15 1 Bareth 1 1(b) 6
Final codes for the example item:
3) What is your Caste? Codes Marar 1 Sahoo 2 Sonkar 3 Vaishnav 4 Mahar 5 Bareth 6
7.2.4 Code Sheet for the Household Questionnaire
Household Questionnaire: Final code sheet for all items including open-ended Universal codes Question Not asked ………………………………80
Don’t know……………………………………….88 No response/Do not want to respond…..……........99
SECTION NO
ITEM NO CODES
Section 1
Q 102 Sahoo………………………………..1 Marar..................................................2 Sonkar…………..…………………..3 Kevat………………………………..4 Mahar…………………………..…...5 Nishad………………………………6 Vaishnav……………………………7 Lohar……………………………..…8 Bareth..…………………………..….9 Nai……………………………….…10 Yadav…………………………….…11 Devangan………………………..….12 Gaur………………………………....13 Nimalkar……………………………14 Vishwakarma……………………….15
Section 1 Q 103 Scheduled Caste(SC)………………………….….1 Scheduled Tribe(ST)…………….……………….2 Other Backward Classes(OBC)…………………...3 General…………………………………………….4
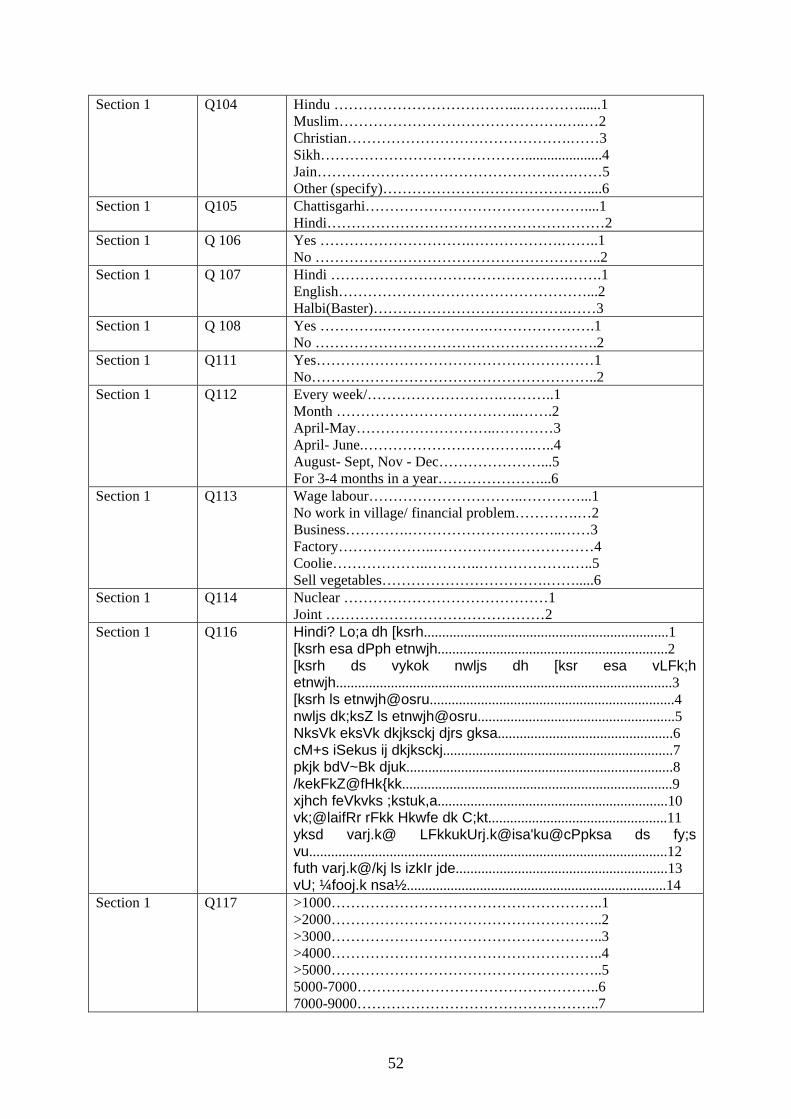
52
Section 1 Q104 Hindu ………………………………...…………......1 Muslim……………………………………….…..…2 Christian……………………………………….……3 Sikh…………………………………….....................4 Jain………………………………………….….……5 Other (specify)……………………………………....6
Section 1 Q105 Chattisgarhi………………………………………....1 Hindi…………………………………………………2
Section 1 Q 106 Yes ………………………….……………….……..1 No …………………………………………………..2
Section 1 Q 107 Hindi ………………………………………….…….1 English……………………………………………...2 Halbi(Baster)………………………………….……3
Section 1 Q 108 Yes ………….………………….………………….1 No ………………………………………………….2
Section 1 Q111 Yes…………………………………………………1 No…………………………………………………..2
Section 1 Q112 Every week/……………………….………..1 Month ………………………………..…….2 April-May………………………..…………3 April- June.……………………………..…..4 August- Sept, Nov - Dec…………………...5 For 3-4 months in a year…………………...6
Section 1 Q113 Wage labour…………………………..…………...1 No work in village/ financial problem………….…2 Business………….…………………………..……3 Factory………………..……………………………4 Coolie………………..………..……………….…..5 Sell vegetables…………………………….…….....6
Section 1 Q114 Nuclear ……………………………………1 Joint ………………………………………2
Section 1 Q116 Hindi? Lo;a dh [ksrh...................................................................1 [ksrh esa dPph etnwjh...............................................................2 [ksrh ds vykok nwljs dh [ksr esa vLFk;h etnwjh............................................................................................3 [ksrh ls etnwjh@osru...................................................................4 nwljs dk;ksZ ls etnwjh@osru......................................................5 NksVk eksVk dkjksckj djrs gksa................................................6 cM+s iSekus ij dkjksckj...............................................................7 pkjk bdV~Bk djuk.........................................................................8 /kekFkZ@fHk{kk..........................................................................9 xjhch feVkvks ;kstuk,a...............................................................10 vk;@laifRr rFkk Hkwfe dk C;kt.................................................11 yksd varj.k@ LFkkukUrj.k@isa'ku@cPpksa ds fy;s vu..................................................................................................12 futh varj.k@/kj ls izkIr jde..........................................................13 vU; ¼fooj.k nsa½.......................................................................14
Section 1 Q117 >1000………………………………………………..1 >2000………………………………………………..2 >3000………………………………………………..3 >4000………………………………………………..4 >5000………………………………………………..5 5000-7000…………………………………………..6 7000-9000…………………………………………..7
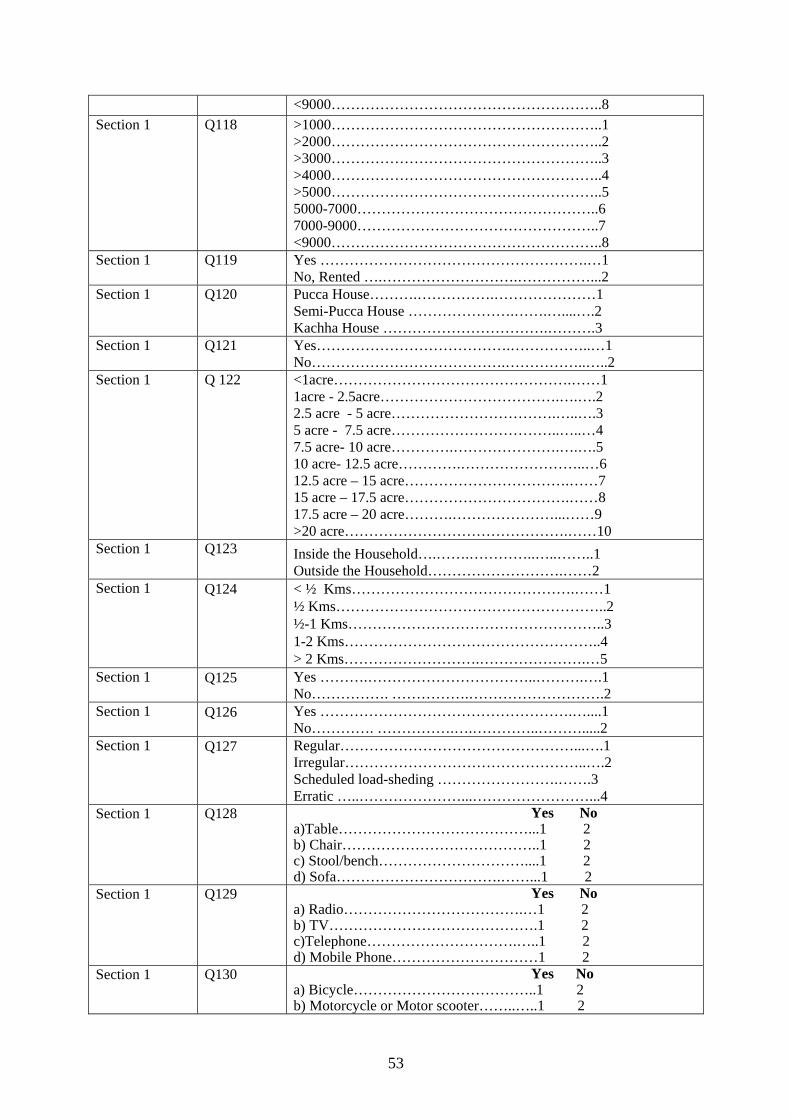
53
<9000………………………………………………..8 Section 1 Q118 >1000………………………………………………..1
>2000………………………………………………..2 >3000………………………………………………..3 >4000………………………………………………..4 >5000………………………………………………..5 5000-7000…………………………………………..6 7000-9000…………………………………………..7 <9000………………………………………………..8
Section 1 Q119 Yes ……………………………………………….…1 No, Rented ….……………………….……………...2
Section 1 Q120 Pucca House……….…………….…………………1 Semi-Pucca House ………………….…….…....….2 Kachha House …………………………….……….3
Section 1 Q121 Yes………………………………….……………..…1 No………………………………….……………..…..2
Section 1 Q 122 <1acre………………………………………….……1 1acre - 2.5acre……………………………….….….2 2.5 acre - 5 acre…………………………….…..….3 5 acre - 7.5 acre……………………………..…..…4 7.5 acre- 10 acre………….………………….….….5 10 acre- 12.5 acre………….……………………..…6 12.5 acre – 15 acre…………………………….……7 15 acre – 17.5 acre…………………………….……8 17.5 acre – 20 acre……….…………………...……9 >20 acre……………………………………….……10
Section 1 Q123 Inside the Household….…….…………..…..……..1 Outside the Household……………………….……2
Section 1 Q124 < ½ Kms……………………………………….……1 ½ Kms………………………………………………..2 ½-1 Kms……………………………………………..3 1-2 Kms……………………………………………..4 > 2 Kms……………………….………………….…5
Section 1 Q125 Yes ……….……………………………..……….….1 No……………. …………….……………………….2
Section 1 Q126 Yes …………………………………………….…....1 No…………. …………….….…………..……….....2
Section 1 Q127 Regular…………………………………………...….1 Irregular…………………………………………..….2 Scheduled load-sheding …………………….…….3 Erratic …..…………………...……………………...4
Section 1 Q128 Yes No a)Table…………………………………...1 2 b) Chair…………………………………..1 2 c) Stool/bench…………………………....1 2 d) Sofa…………………………….……...1 2
Section 1 Q129 Yes No a) Radio……………………………….…1 2 b) TV…………………………………….1 2 c)Telephone………………………….…..1 2 d) Mobile Phone…………………………1 2
Section 1 Q130 Yes No a) Bicycle………………………………..1 2 b) Motorcycle or Motor scooter……..…..1 2
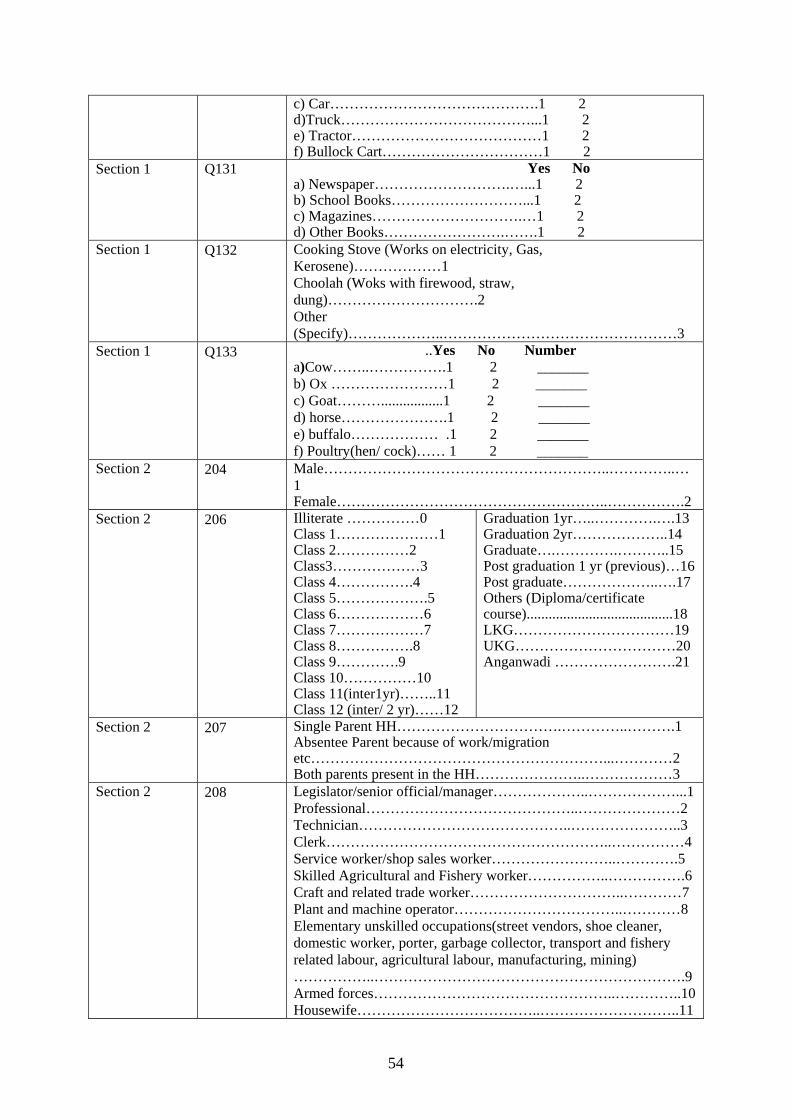
54
c) Car…………………………………….1 2 d)Truck…………………………………...1 2 e) Tractor…………………………………1 2 f) Bullock Cart……………………………1 2
Section 1 Q131 Yes No a) Newspaper……………………….…...1 2 b) School Books………………………...1 2 c) Magazines………………………….…1 2 d) Other Books…………………….…….1 2
Section 1 Q132 Cooking Stove (Works on electricity, Gas, Kerosene)………………1 Choolah (Woks with firewood, straw, dung)………………………….2 Other (Specify)………………..…………………………………………3
Section 1 Q133 ..Yes No Number a)Cow……..…………….1 2 _______ b) Ox ……………………1 2 _______ c) Goat……….................1 2 _______ d) horse………………….1 2 _______ e) buffalo……………… .1 2 _______ f) Poultry(hen/ cock)…… 1 2 _______
Section 2 204 Male…………………………………………………..…………..…1 Female………………………………………………..…………….2
Section 2 206 Illiterate ……………0 Class 1…………………1 Class 2……………2 Class3………………3 Class 4…………….4 Class 5……………….5 Class 6………………6 Class 7………………7 Class 8…………….8 Class 9………….9 Class 10……………10 Class 11(inter1yr)……..11 Class 12 (inter/ 2 yr)……12
Graduation 1yr…..………….….13 Graduation 2yr………………..14 Graduate….………….………..15 Post graduation 1 yr (previous)…16 Post graduate………………..….17 Others (Diploma/certificate course)........................................18 LKG……………………………19 UKG……………………………20 Anganwadi …………………….21
Section 2 207 Single Parent HH…………………………….…………..……….1 Absentee Parent because of work/migration etc……………………………………………………...…………2 Both parents present in the HH…………………..………………3
Section 2 208 Legislator/senior official/manager………………..………………...1 Professional……………………………………..…………………2 Technician……………………………………..…………………..3 Clerk…………………………………………………..……………4 Service worker/shop sales worker……………………..………….5 Skilled Agricultural and Fishery worker……………..…………….6 Craft and related trade worker…………………………..…………7 Plant and machine operator……………………………..…………8 Elementary unskilled occupations(street vendors, shoe cleaner, domestic worker, porter, garbage collector, transport and fishery related labour, agricultural labour, manufacturing, mining) ……………..……………………………………………………….9 Armed forces…………………………………………..…………..10 Housewife………………………………..………………………..11
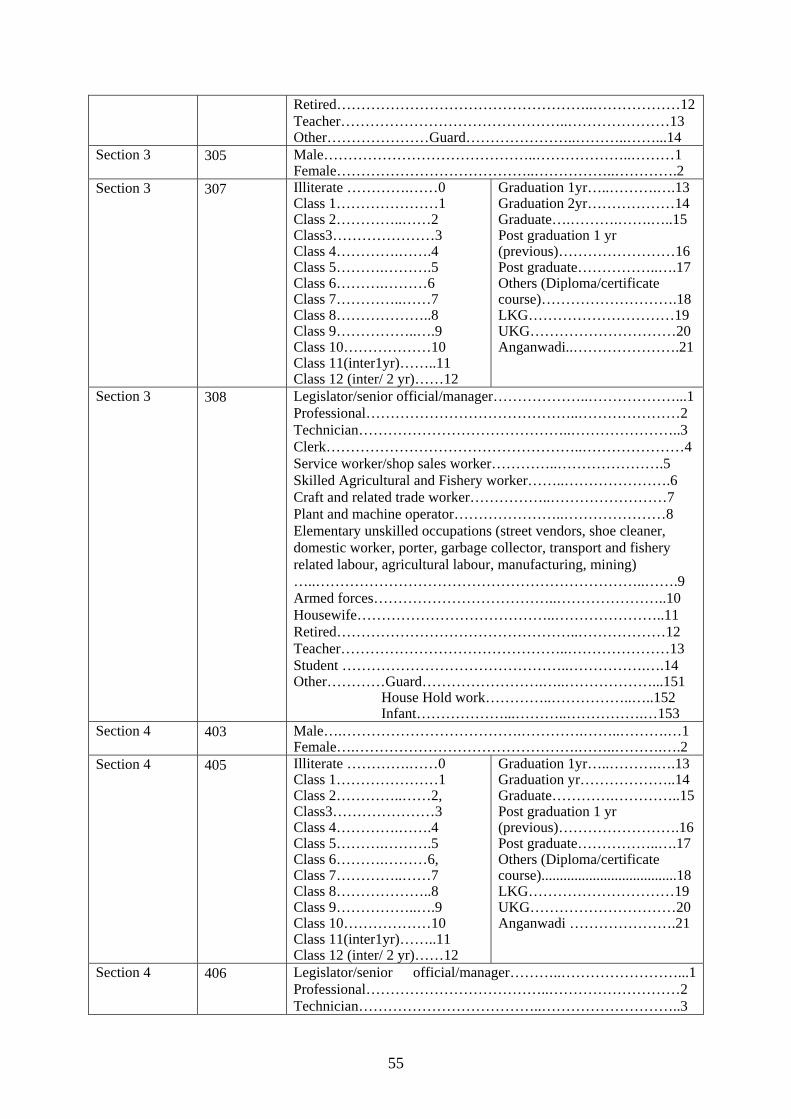
55
Retired……………………………………………..………………12 Teacher………………………………………..…………………13 Other…………………Guard…………………..………..……...14
Section 3 305 Male……………………………………..………………..………1 Female…………………………………..……………..………….2
Section 3 307 Illiterate ………….……0 Class 1…………………1 Class 2…………..……2 Class3…………………3 Class 4………….…….4 Class 5……….……….5 Class 6……….………6 Class 7…………..……7 Class 8………………..8 Class 9……………..….9 Class 10………………10 Class 11(inter1yr)……..11 Class 12 (inter/ 2 yr)……12
Graduation 1yr…..……….….13 Graduation 2yr………………14 Graduate….……….…….…..15 Post graduation 1 yr (previous)……………………16 Post graduate……………..….17 Others (Diploma/certificate course)……………………….18 LKG…………………………19 UKG…………………………20 Anganwadi..………………….21
Section 3 308 Legislator/senior official/manager………………..………………...1 Professional……………………………………..…………………2 Technician……………………………………..…………………..3 Clerk……………………………………………..…………………4 Service worker/shop sales worker…………..………………….5 Skilled Agricultural and Fishery worker……..………………….6 Craft and related trade worker……………..……………………7 Plant and machine operator…………………..…………………8 Elementary unskilled occupations (street vendors, shoe cleaner, domestic worker, porter, garbage collector, transport and fishery related labour, agricultural labour, manufacturing, mining) …..…………………………………………………………..…….9 Armed forces………………………………..…………………..10 Housewife…………………………………..…………………..11 Retired…………………………………………..………………12 Teacher………………………………………..…………………13 Student ………………………………………..…………….….14 Other…………Guard…………………….…..………………...151 House Hold work…………..……………..…..152 Infant………………...………..…………….…153
Section 4 403 Male….……………………………….………….……..……….…1 Female….……………………………………….……..……….….2
Section 4 405 Illiterate ………….……0 Class 1…………………1 Class 2…………..……2, Class3…………………3 Class 4………….…….4 Class 5……….……….5 Class 6……….………6, Class 7…………..……7 Class 8………………..8 Class 9……………..….9 Class 10………………10 Class 11(inter1yr)……..11 Class 12 (inter/ 2 yr)……12
Graduation 1yr…..……….….13 Graduation yr………………..14 Graduate………….…………..15 Post graduation 1 yr (previous)…………………….16 Post graduate……………..….17 Others (Diploma/certificate course).....................................18 LKG…………………………19 UKG…………………………20 Anganwadi ………………….21
Section 4 406 Legislator/senior official/manager………..……………………...1 Professional………………………………..………………………2 Technician………………………………..………………………..3
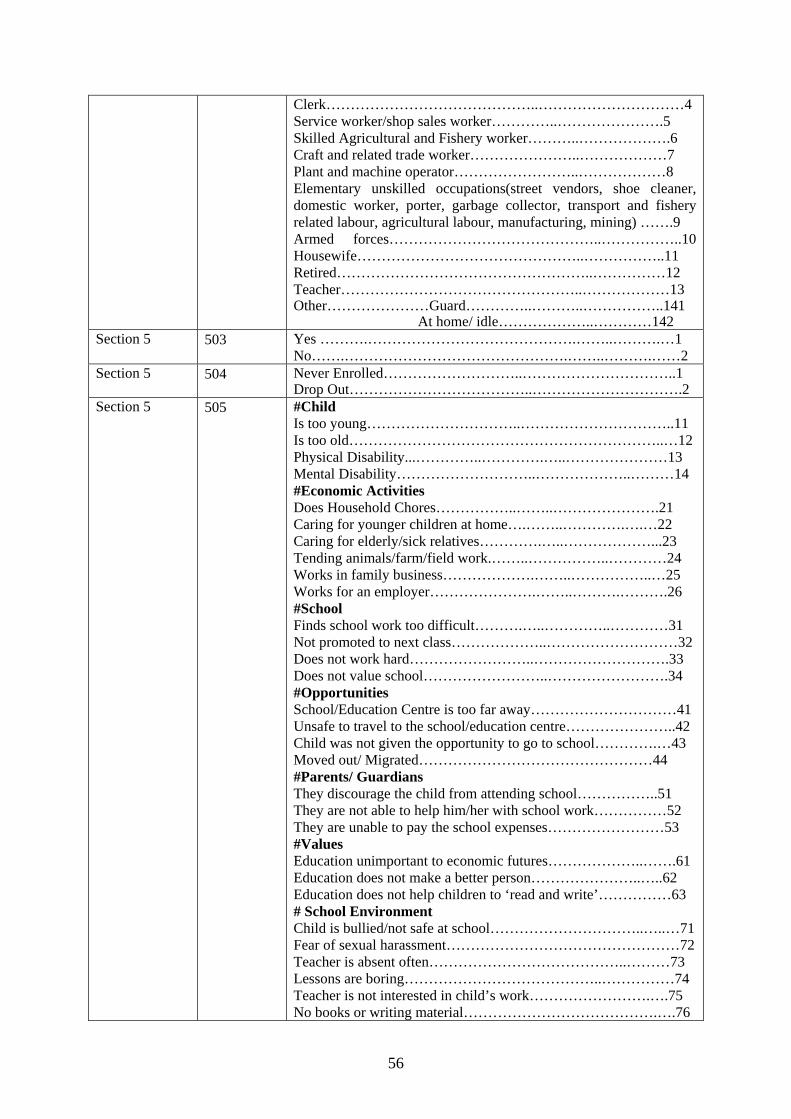
56
Clerk……………………………………..…………………………4 Service worker/shop sales worker…………..………………….5 Skilled Agricultural and Fishery worker………..……………….6 Craft and related trade worker…………………..………………7 Plant and machine operator……………………..………………8 Elementary unskilled occupations(street vendors, shoe cleaner, domestic worker, porter, garbage collector, transport and fishery related labour, agricultural labour, manufacturing, mining) …….9 Armed forces……………………………………..……………..10 Housewife………………………………………..……………..11 Retired……………………………………………..……………12 Teacher…………………………………………..………………13 Other…………………Guard…………..………..……………..141 At home/ idle………………..…………142
Section 5 503 Yes ……….…………………………………….……..……….…1 No…….……………………………………….……..……….……2
Section 5 504 Never Enrolled………………………..…………………………..1 Drop Out………………………………..………………………….2
Section 5 505 #Child Is too young…………………………..…………………………..11 Is too old………………………………………………………..…12 Physical Disability...…………..………….…..…………………13 Mental Disability………………………..………………..………14 #Economic Activities Does Household Chores……………..……..………………….21 Caring for younger children at home….……..………….….…22 Caring for elderly/sick relatives………….…..………………...23 Tending animals/farm/field work.……..……………..…………24 Works in family business……………….……..……………..…25 Works for an employer………………….……..……….……….26 #School Finds school work too difficult……….…..…………..…………31 Not promoted to next class………………..………………………32 Does not work hard……………………..……………………….33 Does not value school……………………..…………………….34 #Opportunities School/Education Centre is too far away…………………………41 Unsafe to travel to the school/education centre…………………..42 Child was not given the opportunity to go to school………….…43 Moved out/ Migrated…………………………………………44 #Parents/ Guardians They discourage the child from attending school……………..51 They are not able to help him/her with school work……………52 They are unable to pay the school expenses……………………53 #Values Education unimportant to economic futures………………..…….61 Education does not make a better person…………………..…..62 Education does not help children to ‘read and write’……………63 # School Environment Child is bullied/not safe at school…………………………..…..…71 Fear of sexual harassment…………………………………………72 Teacher is absent often…………………………………..………73 Lessons are boring…………………………………..……………74 Teacher is not interested in child’s work…………………….….75 No books or writing material………………………………….….76
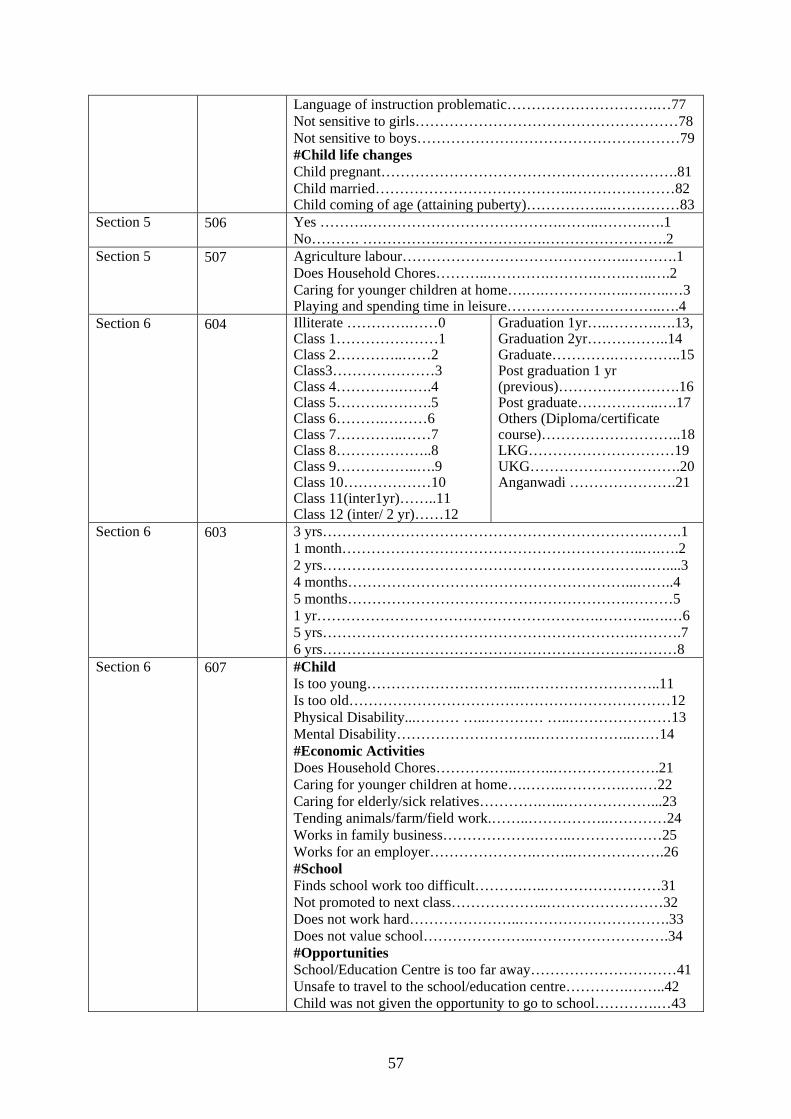
57
Language of instruction problematic………………………….…77 Not sensitive to girls………………………………………………78 Not sensitive to boys………………………………………………79 #Child life changes Child pregnant…………………………………………………….81 Child married…………………………………..…………………82 Child coming of age (attaining puberty)……………..……………83
Section 5 506 Yes ……….………………………………….……..……….….1 No………. …………….………………….…………………….2
Section 5 507 Agriculture labour………………………………………..……….1 Does Household Chores………..………….……….…….…..….2 Caring for younger children at home….….………….…..….…..…3 Playing and spending time in leisure…………………………..….4
Section 6 604 Illiterate ………….……0 Class 1…………………1 Class 2…………..……2 Class3…………………3 Class 4………….…….4 Class 5……….……….5 Class 6……….………6 Class 7…………..……7 Class 8………………..8 Class 9……………..….9 Class 10………………10 Class 11(inter1yr)……..11 Class 12 (inter/ 2 yr)……12
Graduation 1yr…..……….….13, Graduation 2yr……………..14 Graduate………….…………..15 Post graduation 1 yr (previous)…………………….16 Post graduate……………..….17 Others (Diploma/certificate course)………………………..18 LKG…………………………19 UKG………………………….20 Anganwadi ………………….21
Section 6 603 3 yrs………………………………………………………….…….1 1 month……………………………………………………..….….2 2 yrs…………………………………………………………..…....3 4 months…………………………………………………...……..4 5 months………………………………………………….………5 1 yr………………………………………………….………..….…6 5 yrs……………………………………………………….……….7 6 yrs……………………………………………………….………8
Section 6 607 #Child Is too young…………………………..………………………..11 Is too old…………………………………………………………12 Physical Disability...……… …..………… …..…………………13 Mental Disability………………………..………………..……14 #Economic Activities Does Household Chores……………..……..………………….21 Caring for younger children at home….……..………….….…22 Caring for elderly/sick relatives………….…..………………...23 Tending animals/farm/field work.……..……………..…………24 Works in family business……………….……..………….……25 Works for an employer………………….……..……………….26 #School Finds school work too difficult……….…..……………………31 Not promoted to next class………………..……………………32 Does not work hard…………………..………………………….33 Does not value school…………………..……………………….34 #Opportunities School/Education Centre is too far away…………………………41 Unsafe to travel to the school/education centre………….……..42 Child was not given the opportunity to go to school………….…43
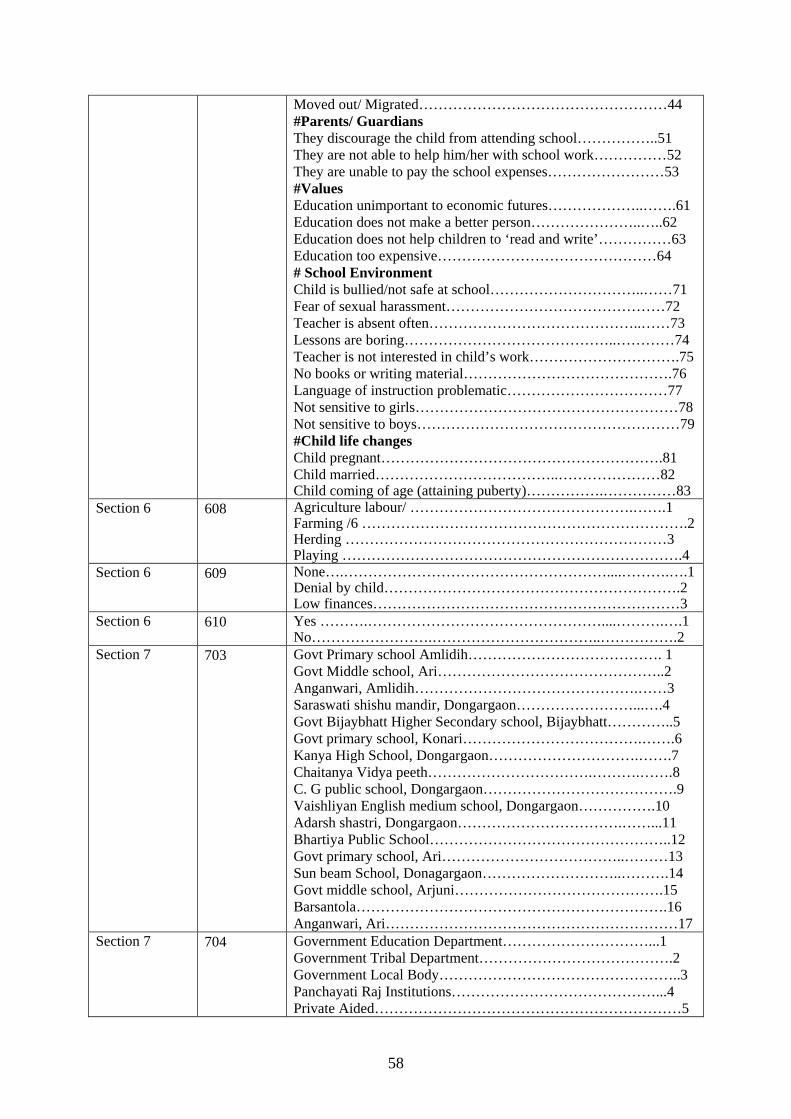
58
Moved out/ Migrated……………………………………………44 #Parents/ Guardians They discourage the child from attending school……………..51 They are not able to help him/her with school work……………52 They are unable to pay the school expenses……………………53 #Values Education unimportant to economic futures………………..…….61 Education does not make a better person…………………..…..62 Education does not help children to ‘read and write’……………63 Education too expensive………………………………………64 # School Environment Child is bullied/not safe at school…………………………..……71 Fear of sexual harassment………………………………………72 Teacher is absent often……………………………………..……73 Lessons are boring……………………………………..…………74 Teacher is not interested in child’s work………………………….75 No books or writing material…………………………………….76 Language of instruction problematic……………………………77 Not sensitive to girls………………………………………………78 Not sensitive to boys………………………………………………79 #Child life changes Child pregnant………………………………………………….81 Child married………………………………..…………………82 Child coming of age (attaining puberty)…………….……………83
Section 6 608 Agriculture labour/ ……………………………………….…….1 Farming /6 ………………………………………………………….2 Herding …………………………………………………………3 Playing …………………………………………………………….4
Section 6 609 None….………………………………………………....……….….1 Denial by child…………………………………………………….2 Low finances………………………………………………………3
Section 6 610 Yes ……….…………………………………………....……….….1 No…………………….……………………………..…………….2
Section 7 703 Govt Primary school Amlidih…………………………………. 1 Govt Middle school, Ari………………………………………..2 Anganwari, Amlidih……………………………………….……3 Saraswati shishu mandir, Dongargaon……………………...….4 Govt Bijaybhatt Higher Secondary school, Bijaybhatt…………..5 Govt primary school, Konari……………………………….…….6 Kanya High School, Dongargaon………………………….…….7 Chaitanya Vidya peeth…………………………….……….…….8 C. G public school, Dongargaon………………………………….9 Vaishliyan English medium school, Dongargaon…………….10 Adarsh shastri, Dongargaon…………………………….……...11 Bhartiya Public School…………………………………………..12 Govt primary school, Ari………………………………..………13 Sun beam School, Donagargaon………………………..……….14 Govt middle school, Arjuni…………………………………….15 Barsantola……………………………………………………….16 Anganwari, Ari……………………………………………………17
Section 7 704 Government Education Department…………………………...1 Government Tribal Department………………………………….2 Government Local Body…………………………………………..3 Panchayati Raj Institutions……………………………………...4 Private Aided………………………………………………………5
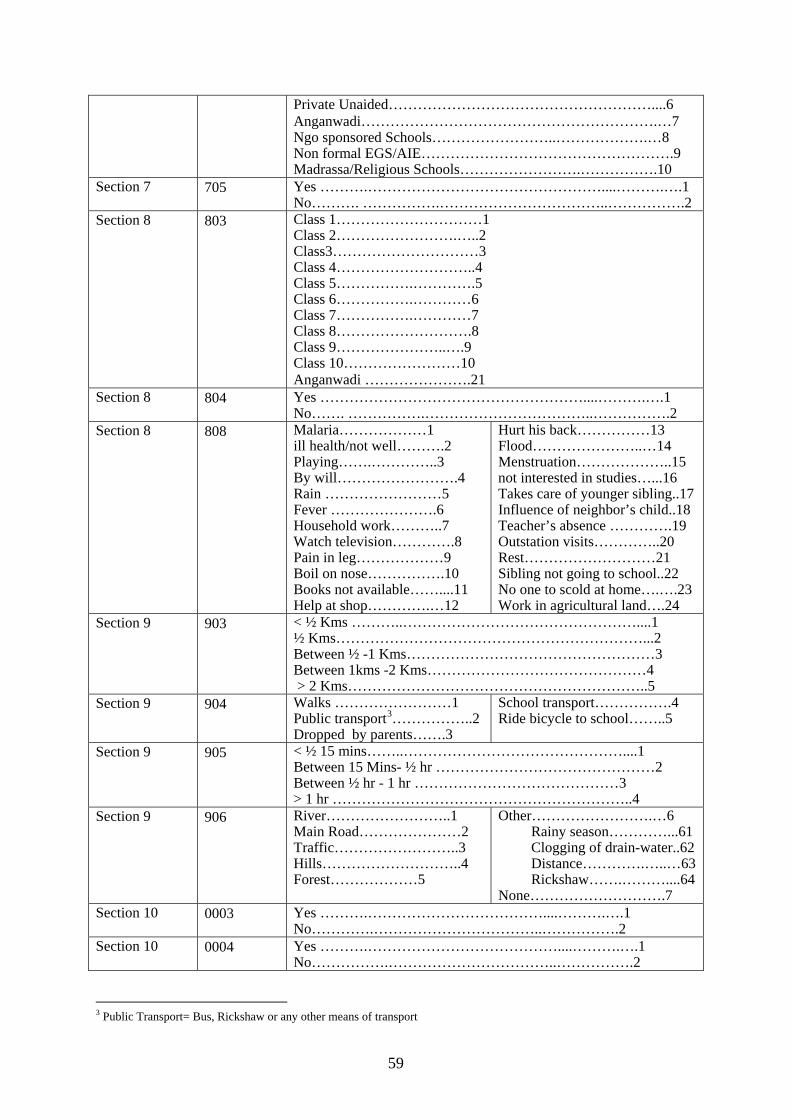
59
Private Unaided………………………………………………....6 Anganwadi…………………………………………………….…7 Ngo sponsored Schools……………………..……………….…8 Non formal EGS/AIE…………………………………………….9 Madrassa/Religious Schools…………………….…………….10
Section 7 705 Yes ……….…………………………………………....……….….1 No………. …………….……………………………..…………….2
Section 8 803 Class 1…………………………1 Class 2…………………….…..2 Class3…………………………3 Class 4………………………..4 Class 5…………….………….5 Class 6…………….…………6 Class 7…………….…………7 Class 8……………………….8 Class 9…………………..….9 Class 10……………………10 Anganwadi ………………….21
Section 8 804 Yes ………………………………………………....……….….1 No……. …………….……………………………..…………….2
Section 8 808 Malaria………………1 ill health/not well……….2 Playing…….…………..3 By will…………………….4 Rain ……………………5 Fever ………………….6 Household work………..7 Watch television………….8 Pain in leg………………9 Boil on nose…………….10 Books not available……....11 Help at shop………….…12
Hurt his back……………13 Flood…………………..…14 Menstruation………………..15 not interested in studies…...16 Takes care of younger sibling..17 Influence of neighbor’s child..18 Teacher’s absence ………….19 Outstation visits…………..20 Rest………………………21 Sibling not going to school..22 No one to scold at home….….23 Work in agricultural land….24
Section 9 903 < ½ Kms ………..…………………………………………....1 ½ Kms………………………………………………………...2 Between ½ -1 Kms……………………………………………3 Between 1kms -2 Kms………………………………………4 > 2 Kms……………………………………………………..5
Section 9 904 Walks ……………………1 Public transport3……………..2 Dropped by parents…….3
School transport…………….4 Ride bicycle to school……..5
Section 9 905 < ½ 15 mins……..………………………………………....1 Between 15 Mins- ½ hr ………………………………………2 Between ½ hr - 1 hr ……………………………………3 > 1 hr ……………………………………………………..4
Section 9 906 River……………………..1 Main Road…………………2 Traffic……………………..3 Hills………………………..4 Forest………………5
Other…………………….…6 Rainy season…………...61 Clogging of drain-water..62 Distance………….…..…63 Rickshaw…….………....64 None……………………….7
Section 10 0003 Yes ……….………………………………....……….….1 No………….……………………………..…………….2
Section 10 0004 Yes ……….…………………………………....……….….1 No…………….……………………………..…………….2
3 Public Transport= Bus, Rickshaw or any other means of transport
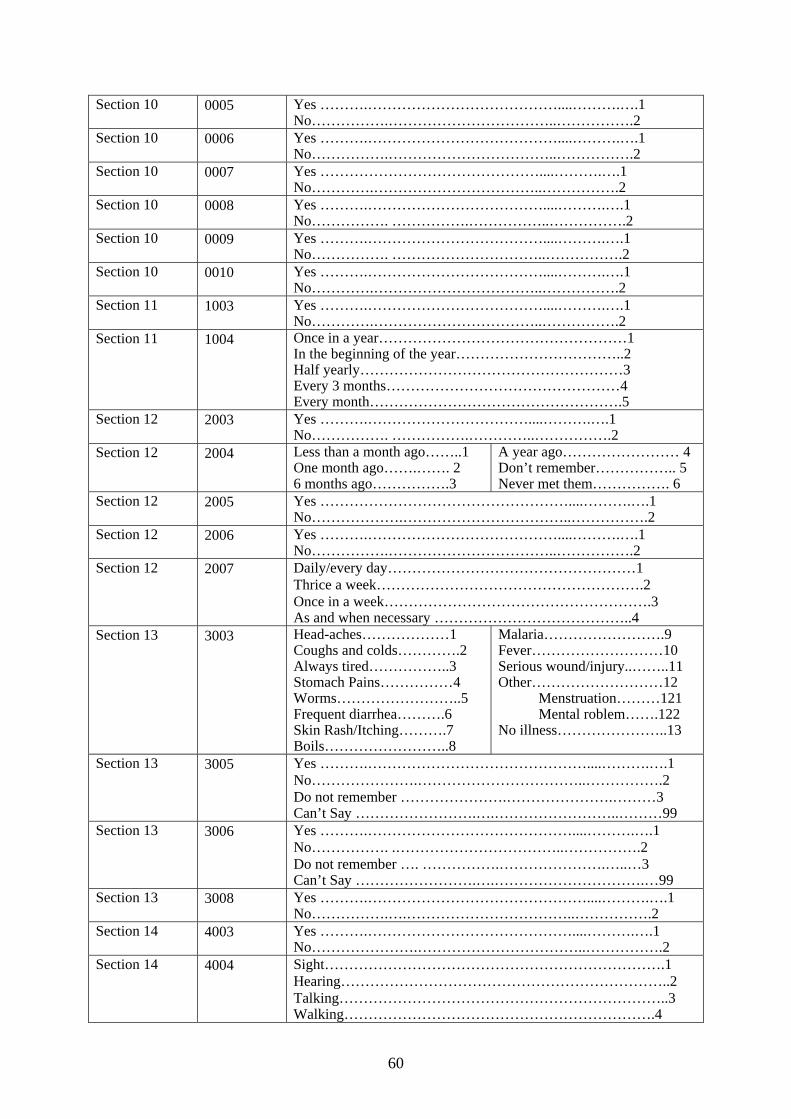
60
Section 10 0005 Yes ……….…………………………………....……….….1 No…………….……………………………..…………….2
Section 10 0006 Yes ……….…………………………………....……….….1 No…………….……………………………..…………….2
Section 10 0007 Yes ………………………………………....……….….1 No………….……………………………..…………….2
Section 10 0008 Yes ……….………………………………....……….….1 No……………. …………….……………..…………….2
Section 10 0009 Yes ……….………………………………....……….….1 No……………. …………………………..…………….2
Section 10 0010 Yes ……….………………………………....……….….1 No………….……………………………..…………….2
Section 11 1003 Yes ……….………………………………....……….….1 No………….……………………………..…………….2
Section 11 1004 Once in a year……………………………………………1 In the beginning of the year……………………………..2 Half yearly………………………………………………3 Every 3 months…………………………………………4 Every month…………………………………………….5
Section 12 2003 Yes ……….……………………………....……….….1 No……………. …………….…………..…………….2
Section 12 2004 Less than a month ago……..1 One month ago…….……. 2 6 months ago…………….3
A year ago…………………… 4 Don’t remember…………….. 5 Never met them……………. 6
Section 12 2005 Yes ……………………………………………....……….….1 No……………….……………………………..…………….2
Section 12 2006 Yes ……….…………………………………....……….….1 No…………….……………………………..…………….2
Section 12 2007 Daily/every day……………………………………………1 Thrice a week……………………………………………….2 Once in a week……………………………………………….3 As and when necessary …………………………………..4
Section 13 3003 Head-aches………………1 Coughs and colds………….2 Always tired……………..3 Stomach Pains……………4 Worms……………………..5 Frequent diarrhea……….6 Skin Rash/Itching……….7 Boils……………………..8
Malaria…………………….9 Fever………………………10 Serious wound/injury..……..11 Other………………………12 Menstruation………121
Mental roblem…….122 No illness…………………..13
Section 13 3005 Yes ……….………………………………………....……….….1 No………………….……………………………..…………….2 Do not remember ………………….………………….………3 Can’t Say …………………….….……………………..………99
Section 13 3006 Yes ……….……………………………………....……….….1 No……………. .……………………………..…………….2 Do not remember …. …………….………………….…..…3 Can’t Say …………………….….………………………….…99
Section 13 3008 Yes ……….………………………………………....……….….1 No…………….….……………………………..…………….2
Section 14 4003 Yes ……….……………………………………....……….….1 No………………….……………………………..…………….2
Section 14 4004 Sight…………………………………………………………….1 Hearing…………………………………………………………..2 Talking…………………………………………………………..3 Walking……………………………………………………….4

61
Mental disability……………………………………………….5 Section 14 4005 Yes ……….………………………………………....……….….1
No……………. ….……………………………..…………….2 Section 14 4006 No, finds it very difficult to make a social connection...................1
Usually plays alone, but responds when others make contact ….2 Plays well with others…………………………………………………3
Section 14 4007 School not willing to register………………………………..1 Difficult to register……………………………………………..2 No problem………………………………………………….3 Registered at special class/school……………………………….4
Section 14 4008 Yes ……….………………………………………....……….….1 No…………….…………….……………………..…………….2
Section 15 5003 Yes ……….………………………………………....……….….1 No………………….……………………………..…………….2
Section 15 5004 Yes ……….……………………………………....……….….1 No………………….……………………………..…………….2
Section 15 5006 Up to class 5……………….1 Up to class 8……………………2 Up to class 10……………….3 Up to 12th (Inter)………………4 College…………………………..5
Section 15 5007 Independent……………………………………………………..1 Knowledge……………………………………………………2 Get educated…………………………………………………3 Asset…………………………………………………………4 Intelligence …………………………………………………5 Culture………………………………………………………..6 Bright future………………………………………………….7 Can do any work……………………………………………….8 Good life………………………………………………………..9 No help………………………………………………………10 Learn good work……………………………………………..11 Mid-day meal…………………………………………………………..12 Help illiterates…………………………………………………..13 Manners………………………………………………………..14 Students must study…………………………………………….15 Progress/ Ability to choose……………………………………..16 Opportunity……………………………………………………..17 Cleanliness……………………………………………………18 Earn well……………………………………………………….19. Experience …………………………………………………….20 Increase understanding………………………………………….21 Respect ………………………………………………………….22 Support for parents………………………………………………23 Read and write…………………………………………………24 Useful in day to day life………………………………………..25
Section 15 5008 Teacher ………………………………………………………….1 Doctor………………………………………………………….2 Independent…………………………………………………….3 Engineer…………………………………………………………4 Agriculture………………………………………………………5 Job/ service………………………………………………………6 Nurse……………………………………………………………..7 Take care of family members……………………………………8
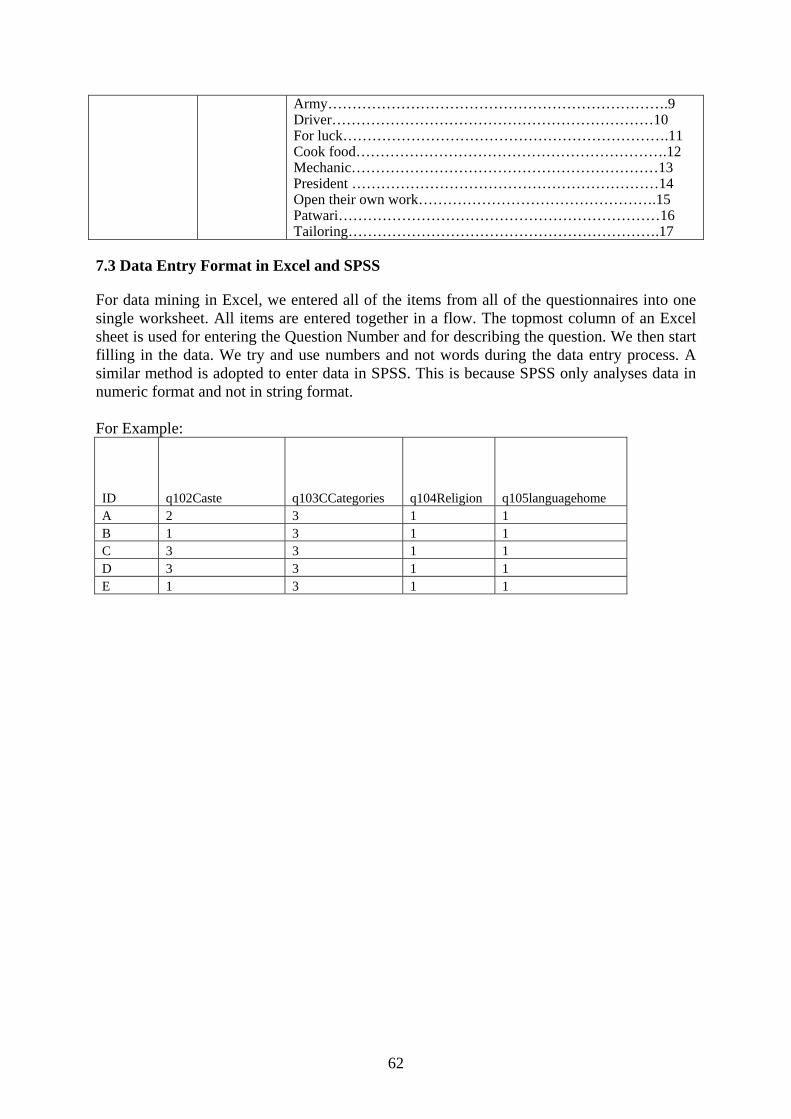
62
Army…………………………………………………………….9 Driver…………………………………………………………10 For luck………………………………………………………….11 Cook food……………………………………………………….12 Mechanic………………………………………………………13 President ………………………………………………………14 Open their own work………………………………………….15 Patwari…………………………………………………………16 Tailoring……………………………………………………….17
7.3 Data Entry Format in Excel and SPSS
For data mining in Excel, we entered all of the items from all of the questionnaires into one single worksheet. All items are entered together in a flow. The topmost column of an Excel sheet is used for entering the Question Number and for describing the question. We then start filling in the data. We try and use numbers and not words during the data entry process. A similar method is adopted to enter data in SPSS. This is because SPSS only analyses data in numeric format and not in string format. For Example:
ID q102Caste q103CCategories q104Religion q105languagehome A 2 3 1 1 B 1 3 1 1 C 3 3 1 1 D 3 3 1 1 E 1 3 1 1
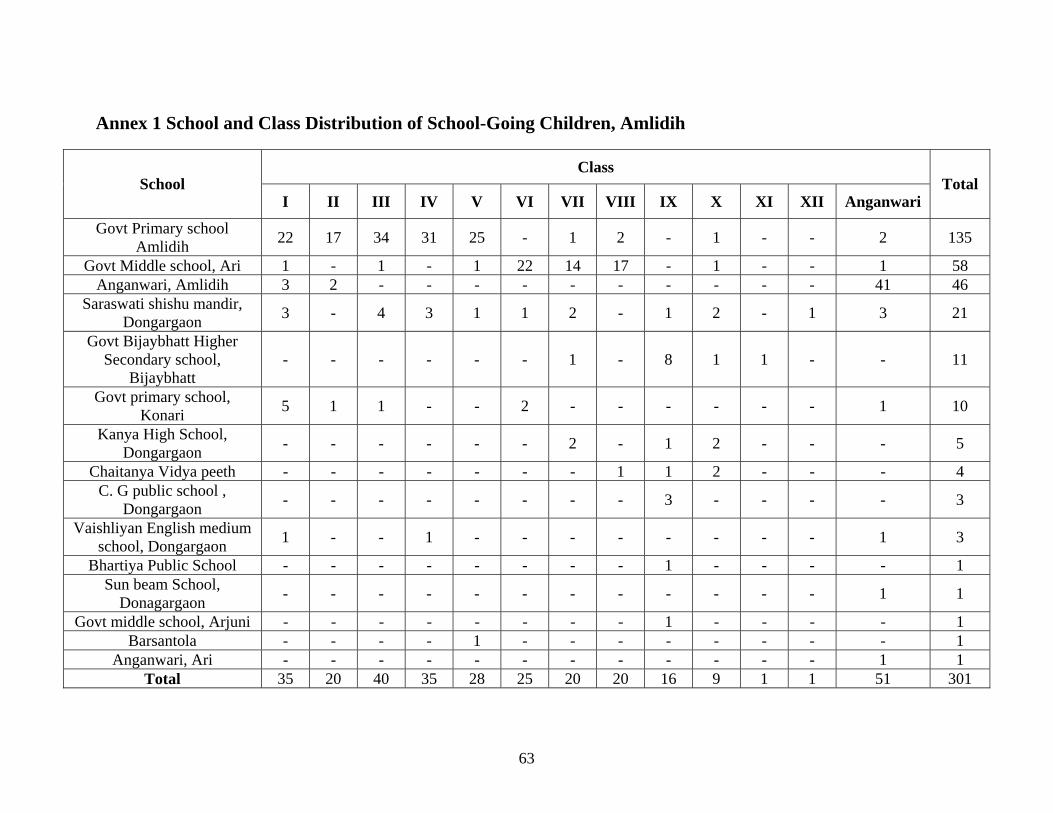
63
Annex 1 School and Class Distribution of School-Going Children, Amlidih
Class School
I II III IV V VI VII VIII IX X XI XII Anganwari Total
Govt Primary school Amlidih 22 17 34 31 25 - 1 2 - 1 - - 2 135
Govt Middle school, Ari 1 - 1 - 1 22 14 17 - 1 - - 1 58 Anganwari, Amlidih 3 2 - - - - - - - - - - 41 46
Saraswati shishu mandir, Dongargaon 3 - 4 3 1 1 2 - 1 2 - 1 3 21
Govt Bijaybhatt Higher Secondary school,
Bijaybhatt - - - - - - 1 - 8 1 1 - - 11
Govt primary school, Konari 5 1 1 - - 2 - - - - - - 1 10
Kanya High School, Dongargaon - - - - - - 2 - 1 2 - - - 5
Chaitanya Vidya peeth - - - - - - - 1 1 2 - - - 4 C. G public school ,
Dongargaon - - - - - - - - 3 - - - - 3
Vaishliyan English medium school, Dongargaon 1 - - 1 - - - - - - - - 1 3
Bhartiya Public School - - - - - - - - 1 - - - - 1 Sun beam School,
Donagargaon - - - - - - - - - - - - 1 1
Govt middle school, Arjuni - - - - - - - - 1 - - - - 1 Barsantola - - - - 1 - - - - - - - - 1
Anganwari, Ari - - - - - - - - - - - - 1 1 Total 35 20 40 35 28 25 20 20 16 9 1 1 51 301
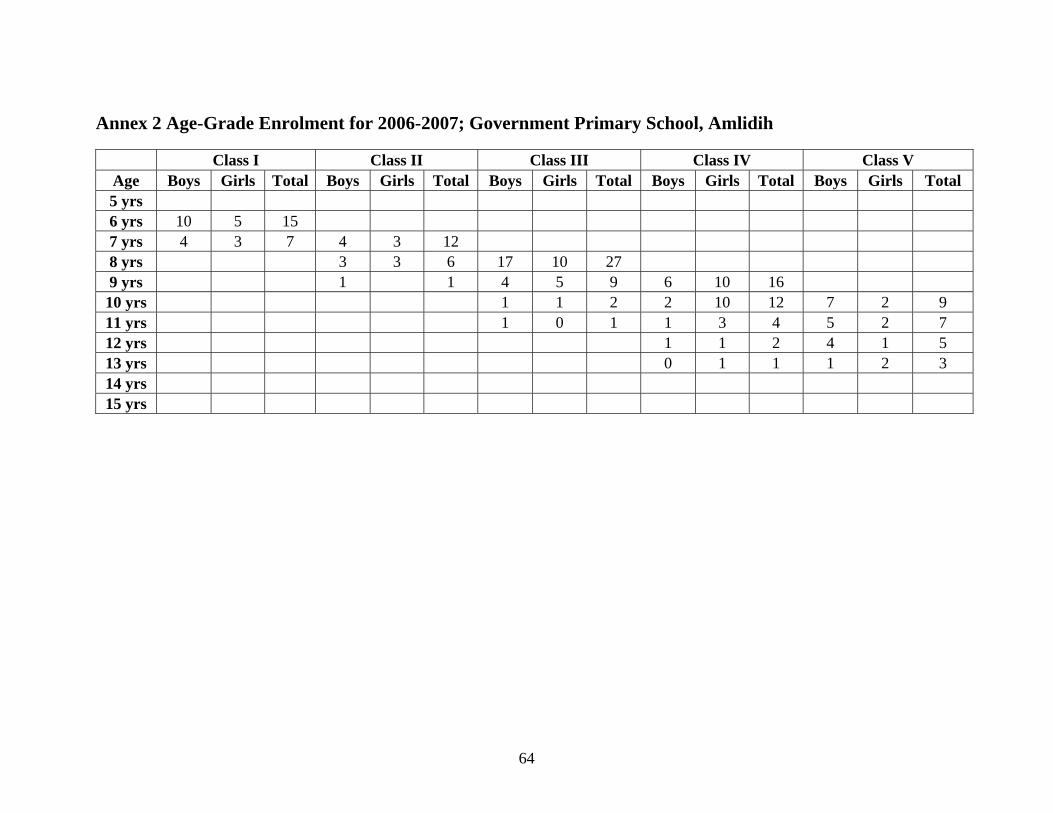
64
Annex 2 Age-Grade Enrolment for 2006-2007; Government Primary School, Amlidih
Class I Class II Class III Class IV Class V Age Boys Girls Total Boys Girls Total Boys Girls Total Boys Girls Total Boys Girls Total 5 yrs 6 yrs 10 5 15 7 yrs 4 3 7 4 3 12 8 yrs 3 3 6 17 10 27 9 yrs 1 1 4 5 9 6 10 16 10 yrs 1 1 2 2 10 12 7 2 9 11 yrs 1 0 1 1 3 4 5 2 7 12 yrs 1 1 2 4 1 5 13 yrs 0 1 1 1 2 3 14 yrs 15 yrs
Related Documents