TeamLease TM This Report is a confidential document of TeamLease Services prepared for private circulation. No part should be reproduced without acknowledgment www.teamlease.com INDIA LABOUR REPORT 2006 A Ranking of Indian States by their Labour Ecosystem (Labour Demand, Labour Supply, Labour Laws) A Report By TeamLease Services

Welcome message from author
This document is posted to help you gain knowledge. Please leave a comment to let me know what you think about it! Share it to your friends and learn new things together.
Transcript
TeamLeaseTM
This Report is a confidential document of TeamLease Services prepared for private circulation. No part should be reproduced without acknowledgment
www.teamlease.com
INDIA LABOUR REPORT
2006
A Ranking of Indian States by their
Labour Ecosystem (Labour Demand, Labour Supply, Labour Laws)
AReport
ByTeamLease Services


Coming Unemployment Explosion
! India's working population in 2020 will be equal to India's total population when reforms started in 1991
! Projecting current variables forward means 211 million unemployed in 2020; an unemployment rate of 30%
! Unemployment will largely be a youth problem; nine out of ten unemployed are likely to be in the 15-29 age bracket
Inefficient Labour Markets
! Unorganized employment grew by 31% versus Organized employment of 4% in the nineties
! Labour laws may not be affecting overall growth but are influencing where jobs are created and amplifying the substitution of labour with capital
Labour Ecosystem Index
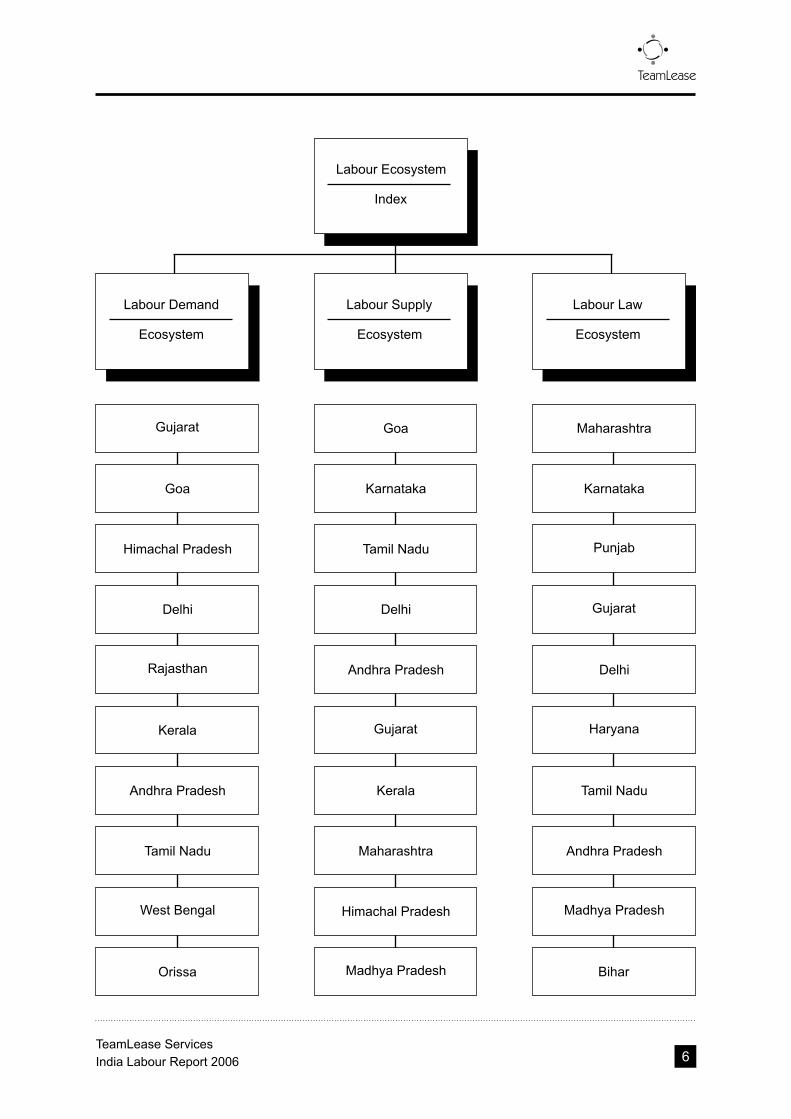
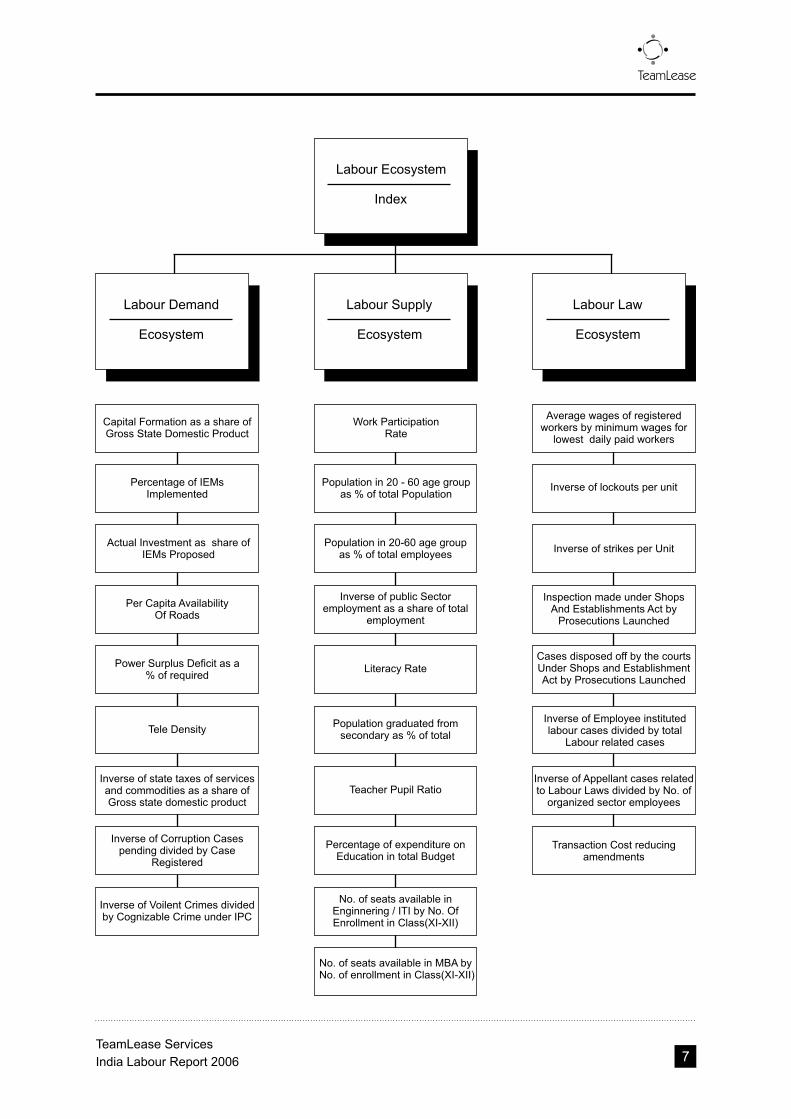
! The Index is based on three sub-indices; Labour Demand ecosystem, Labour Supply ecosystem and Labour Law ecosystem
! The Top 3 States in the Overall Labour Ecosystem are Delhi, Gujarat and Karnataka. The bottom 3 are J&K, Bihar, and UP
! The Top 3 States in the Labour Demand Ecosystem ranking are Gujarat, Goa and Himachal Pradesh. The bottom 3 are Bihar, UP and J&K
! The Top 3 States in the Labour Supply ecosystem ranking are Goa, Karnataka and Tamil Nadu. The bottom 3 are Assam, Bihar and J&K
! The Top 3 States in the Labour Law ecosystem ranking are Maharashtra, Karnataka and Punjab. The bottom 3 are West Bengal, J&K and Assam.
! A reconstruction of past indices shows that States with better overall ratings have tended to have greater growth
Way Forward
! Labour Laws have remained untouched for 20 years! There are more than 2500 Central and over 25,000 State laws! There is an urgent need for elimination, harmonization, and re-engineering! The three most urgent laws are the Industrial Disputes Act, the Contract Labour
Act and the Trade Union Act! If we cannot make progress on difficult issues, we must move on
administrative issues! A possible solution could be moving Labour laws from the Concurrent list of the
Constitution to the State list
TeamLease
Summary
3TeamLease Services
India Labour Report 2006

4
TeamLease
TeamLease Services
India Labour Report 2006

Labour Ecosystem
Ranking
Delhi
Gujarat
Karnataka
Tamil Nadu
Maharashtra
Andhra Pradesh
Goa
Punjab
Rajasthan
Himachal Pradesh
5
TeamLease
TeamLease Services
India Labour Report 2006
Labour Demand
Ecosystem
Delhi
Gujarat
Tamil Nadu
Andhra Pradesh
Goa
Rajasthan
Himachal Pradesh
Labour Supply
Delhi
Gujarat
Karnataka
Tamil Nadu
Andhra Pradesh
Goa
Himachal Pradesh
Labour Law
Delhi
Gujarat
Karnataka
Tamil Nadu
Maharashtra
Andhra Pradesh
Punjab
Labour Ecosystem
Index
Kerala
West Bengal
Orissa
Kerala
Maharashtra
Madhya Pradesh
Haryana
Madhya Pradesh
Bihar
Ecosystem Ecosystem
6
TeamLease
TeamLease Services
India Labour Report 2006
Labour Demand
Ecosystem
Labour Supply Labour Law
Labour Ecosystem
Index
Ecosystem Ecosystem
Capital Formation as a share ofGross State Domestic Product
Percentage of IEMsImplemented
Per Capita AvailabilityOf Roads
Power Surplus Deficit as a % of required
Tele Density
Inverse of state taxes of services and commodities as a share of Gross state domestic product
Inverse of Corruption Cases pending divided by Case
Registered
Inverse of Voilent Crimes divided by Cognizable Crime under IPC
Actual Investment as share of IEMs Proposed
Work Participation Rate
Population in 20 - 60 age group as % of total Population
Inverse of public Sector employment as a share of total
employment
Literacy Rate
Population graduated from secondary as % of total
No. of seats available in Enginnering / ITI by No. OfEnrollment in Class(XI-XII)
Percentage of expenditure on Education in total Budget
Population in 20-60 age group as % of total employees
Average wages of registered workers by minimum wages for
lowest daily paid workers
Inverse of lockouts per unit
Inspection made under ShopsAnd Establishments Act by
Prosecutions Launched
Cases disposed off by the courts Under Shops and Establishment Act by Prosecutions Launched
Inverse of Appellant cases related to Labour Laws divided by No. of
organized sector employees
Transaction Cost reducing amendments
Inverse of strikes per Unit
Teacher Pupil Ratio
No. of seats available in MBA byNo. of enrollment in Class(XI-XII)
Inverse of Employee instituted labour cases divided by total
Labour related cases
7
TeamLease
TeamLease Services
India Labour Report 2006

8
TeamLease
TeamLease Services
India Labour Report 2006

Preface 11
About this Report 13
Section A - The Emerging Labour Scenario
1. The Labour Force Explosion 152. The Myth of Jobless Growth 24
Section B - The Index of State Ranking
1. Introduction 312. Methodology 323. The Labour Demand Ecosystem Index 344. The Labour Supply Ecosystem Index 375. The Labour Law Ecosystem Index 406. The Labour Ecosystem Index 45
Section C - The Way Forward: Labour Market Reforms
1. The Agenda - Reducing Transaction Costs 512. The Labour Law Reform Agenda 533. The Three Critical Laws 62
Table of Contents
9
TeamLease
TeamLease Services
India Labour Report 2006
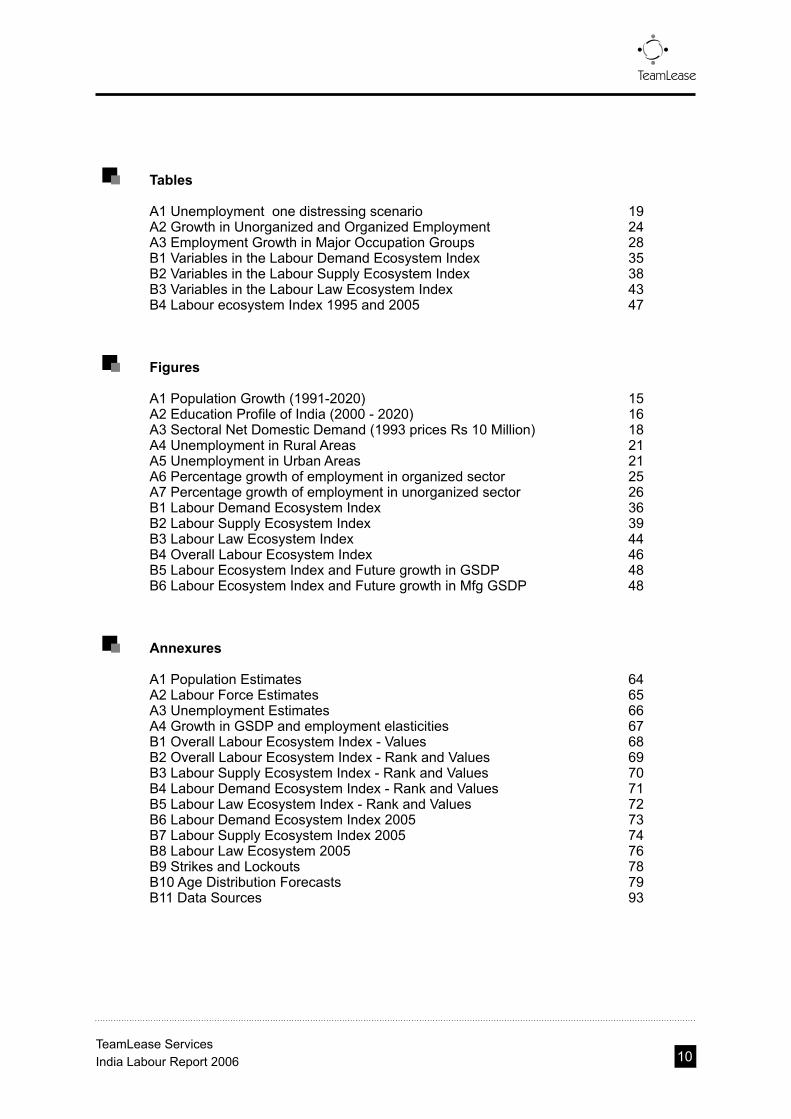
Tables
A1 Unemployment one distressing scenario 19A2 Growth in Unorganized and Organized Employment 24A3 Employment Growth in Major Occupation Groups 28B1 Variables in the Labour Demand Ecosystem Index 35B2 Variables in the Labour Supply Ecosystem Index 38B3 Variables in the Labour Law Ecosystem Index 43B4 Labour ecosystem Index 1995 and 2005 47
Figures
A1 Population Growth (1991-2020) 15A2 Education Profile of India (2000 - 2020) 16A3 Sectoral Net Domestic Demand (1993 prices Rs 10 Million) 18A4 Unemployment in Rural Areas 21A5 Unemployment in Urban Areas 21A6 Percentage growth of employment in organized sector 25A7 Percentage growth of employment in unorganized sector 26B1 Labour Demand Ecosystem Index 36B2 Labour Supply Ecosystem Index 39B3 Labour Law Ecosystem Index 44B4 Overall Labour Ecosystem Index 46B5 Labour Ecosystem Index and Future growth in GSDP 48B6 Labour Ecosystem Index and Future growth in Mfg GSDP 48
Annexures
A1 Population Estimates 64A2 Labour Force Estimates 65A3 Unemployment Estimates 66A4 Growth in GSDP and employment elasticities 67B1 Overall Labour Ecosystem Index - Values 68B2 Overall Labour Ecosystem Index - Rank and Values 69B3 Labour Supply Ecosystem Index - Rank and Values 70B4 Labour Demand Ecosystem Index - Rank and Values 71B5 Labour Law Ecosystem Index - Rank and Values 72B6 Labour Demand Ecosystem Index 2005 73B7 Labour Supply Ecosystem Index 2005 74B8 Labour Law Ecosystem 2005 76B9 Strikes and Lockouts 78B10 Age Distribution Forecasts 79B11 Data Sources 93
10
TeamLease
TeamLease Services
India Labour Report 2006
What creates jobs? Why do some states have lower unemployment? While job creation is complex and not pivoted around any one variable, it is surely not a stochastic (random) variable. States that consciously focus on labour ecosystems (demand, supply and laws) can build habitats that attract investments, create jobs and reduce poverty.
This report is first ranking of Indian states based on a labour ecosystem index constructed using three variables of labour demand, labour supply and labour laws. It also examines the current state of our labour markets and makes the case for massive job creation to avoid an unemployment explosion (30% by 2020) that is neither inevitable nor desirable.
India's tragic farmer suicides and huge farm workforce (73% of employment) represent our spectacular failure to create non-farm jobs. Creating labour demand needs investments, rule of law, infrastructure, fiscal prudence and much else. Improving labour supply needs education reform, capacity expansion, skill development for transitions, higher workforce participation, etc. But raising labour demand takes five years and improving labour supply probably needs fifteen years. Given desire and backbone, labour laws could be amended in under a year.
We argue that states are losing an important opportunity to create a visible and immediate difference in their labour ecosystems by not differentiating labour laws. The surprising lack of variation between states in key labour laws may represent a lack of competition that could change with empowerment. Like politics, labour demand and supply are local. The different opening balances, needs and aspirations of states makes photocopying central laws ineffective.
Pt. Jawaharlal Nehru's tryst with destiny speech was inspiring but India missed that appointment. But she has made a new one; what is happening in India is not once in a decade or once in a millennium but once in the lifetime of a country. But all our progress will not be worth the trip if we cannot give our youth the strength and self-esteem that comes with a job. It may be time to empower states with unfettered control over their labour ecosystems by shifting labour from the concurrent list to the state list.
This report is part of our broader campaign to increase information around the current labour regime that hinders job creation and the expansion of non-traditional employment. This bi-annual report complements our research series that includes our temping reform white paper, annual temp salary primer, and six-monthly employment outlook survey that are available for download at www.teamlease.com.
This project is a joint effort of our in-house regulatory affairs team and Indicus Analytics. But there would be no output without the team at Indicus (Siddhartha Dutta, Mridusmita Bordoloi, Preetam Mohanty, and Komal Tannan) led by Laveesh Bhandari and advised by Bibek Debroy.
We thank them for their efforts but more importantly for the knowledge; we have learnt much from them and are applying it in our campaign to put unemployment in the museum it belongs.
The Teamlease Team
Preface
11
TeamLease
TeamLease Services
India Labour Report 2006
12
TeamLease
TeamLease Services
India Labour Report 2006

To sum up, then, there will be a large number of people in 2020 in the labour force who will require a range of employment opportunities. If current trends continue, it will lead to widespread unemployment. This is a problem facing mostly the youth (and currently the children) of India, which will have substantial negative socio-economic ramifications in many unpredictable ways.
What would be a good labour environment? How can that be created? What should be the government's role? And what should be the overall directions? This report makes the case that the agenda for the future needs to be based on three aspects: Labour Demand, Labour Supply and Labour Laws.
Labour Demand: It is quite clear that in the next decade and a half the labour force will increase significantly. A do nothing approach will ensure that the bulk of this segment will be poorly educated and generally not employable in the emerging and sunrise sectors of the economy. It is also quite evident that agriculture will not be able to absorb most of this segment.
Labour Supply: As India seeks to become an active member of the world community both in economic and non-economic spheres, it is clear that the educational status of its population would need to be far higher than it is currently. This, it is now commonly accepted, will occur if (i) a range of opportunities for education are available to all, and (ii) everyone has access to quality education.
Labour Laws: The new economic paradigm that India has chosen and continued across many different governments, and across the political spectrum, is greater flexibility and choice in economic decisions for all. Within this over-arching direction, there is general agreement on:
(i) Greater role of the private sector and market forces(ii) Decentralization of governance (iii) Government's role in the economic sphere focused towards social security issues and ensuring fair competition
Clearly, any labour reform will need to be based on commonly accepted principles if they are to occur rapidly. Within the above three issues in many cases the first and the last points might create counteracting pressures. And this is perhaps the key reason why significant labour reform has not occurred in the last decade and a half. Issues of labour laws, flexibility, and ensuring security are discussed in much greater detail in later chapters.
What is evident is that even though economic activity increasingly spans national and international boundaries, the environment for employment be it employment or educational opportunities or the legal-regulatory environment that sustains it, are local issues. That is, state-level differences play a critical role in determining the structure of employment.
Part A of this report projects demographics and labour markets into the future and examines the notion of jobless growth since reforms began.
Part B is a ranking of states based on their employment, employability and labour law ecosystem. This report brings out these differences between states by way of a state level ranking that spans all the major states of the country in the last decade and a half. Over this period, either by design or default, various states have improved or become worse in ensuring a good climate for employment generation. It also links economic growth with a states past
About This Report
13
TeamLease
TeamLease Services
India Labour Report 2006

ranking on the index and shows that states that have had a better rating in the past have tended to have greater growth.
Part C focuses on the legal issues that need to be changed. The idea is not so much to ensure greater powers to employers or employees, but to ensure that unnecessarily high transactions costs that are associated with employment contracts are minimized.
Many inputs from labour law experts, academia, and industry professionals have gone into this study. Indicus would like to thank Aditya Bhattacharjea of Delhi school of economics for his guidance on the literature on labour reform and law. We would also like to acknowledge the inputs of Shubhashis Gangopadhyay, Amir Ullah Khan and Jugnu Bagga of India Development Foundation on labour laws.
14
TeamLease
TeamLease Services
India Labour Report 2006
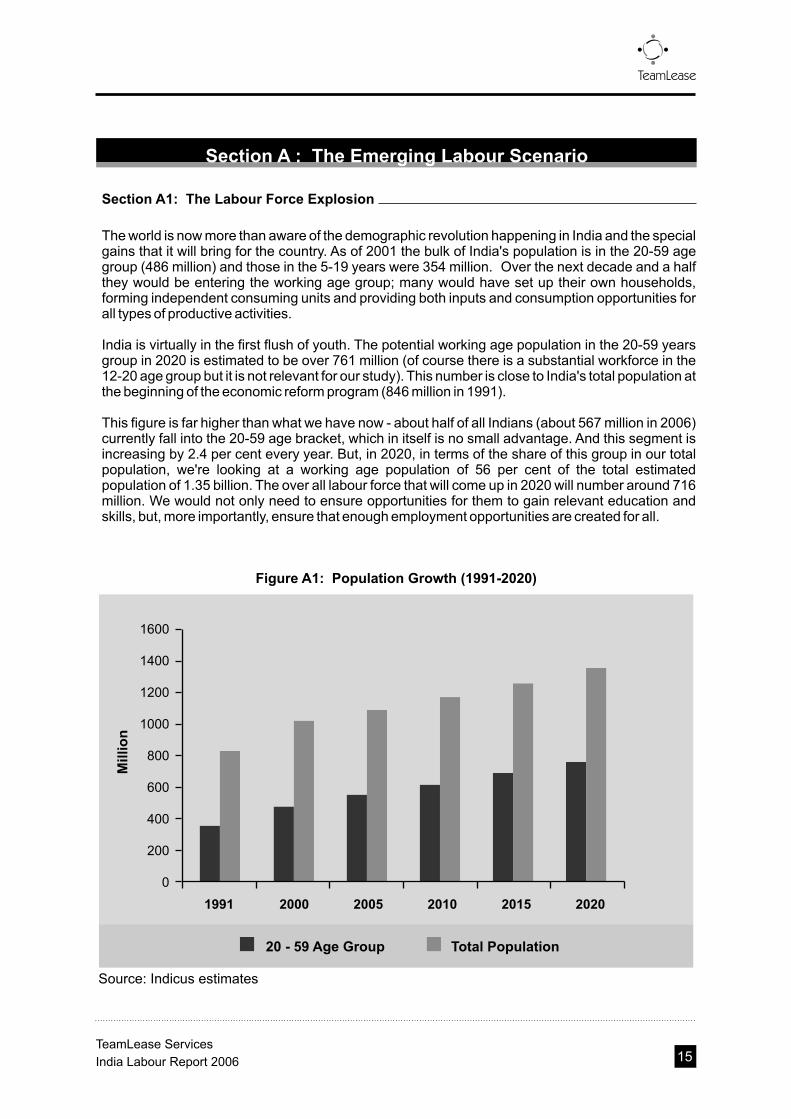
The world is now more than aware of the demographic revolution happening in India and the special gains that it will bring for the country. As of 2001 the bulk of India's population is in the 20-59 age group (486 million) and those in the 5-19 years were 354 million. Over the next decade and a half they would be entering the working age group; many would have set up their own households, forming independent consuming units and providing both inputs and consumption opportunities for all types of productive activities.
India is virtually in the first flush of youth. The potential working age population in the 20-59 years group in 2020 is estimated to be over 761 million (of course there is a substantial workforce in the 12-20 age group but it is not relevant for our study). This number is close to India's total population at the beginning of the economic reform program (846 million in 1991).
This figure is far higher than what we have now - about half of all Indians (about 567 million in 2006) currently fall into the 20-59 age bracket, which in itself is no small advantage. And this segment is increasing by 2.4 per cent every year. But, in 2020, in terms of the share of this group in our total population, we're looking at a working age population of 56 per cent of the total estimated population of 1.35 billion. The over all labour force that will come up in 2020 will number around 716 million. We would not only need to ensure opportunities for them to gain relevant education and skills, but, more importantly, ensure that enough employment opportunities are created for all.
Section A : The Emerging Labour Scenario
Section A1: The Labour Force Explosion
Figure A1: Population Growth (1991-2020)
15
TeamLease
1991 2000 2005 2010 2015 2020
0
200
400
600
800
1000
1200
1400
1600
Millio
n
20 - 59 Age Group Total Population
Source: Indicus estimates
TeamLease Services
India Labour Report 2006
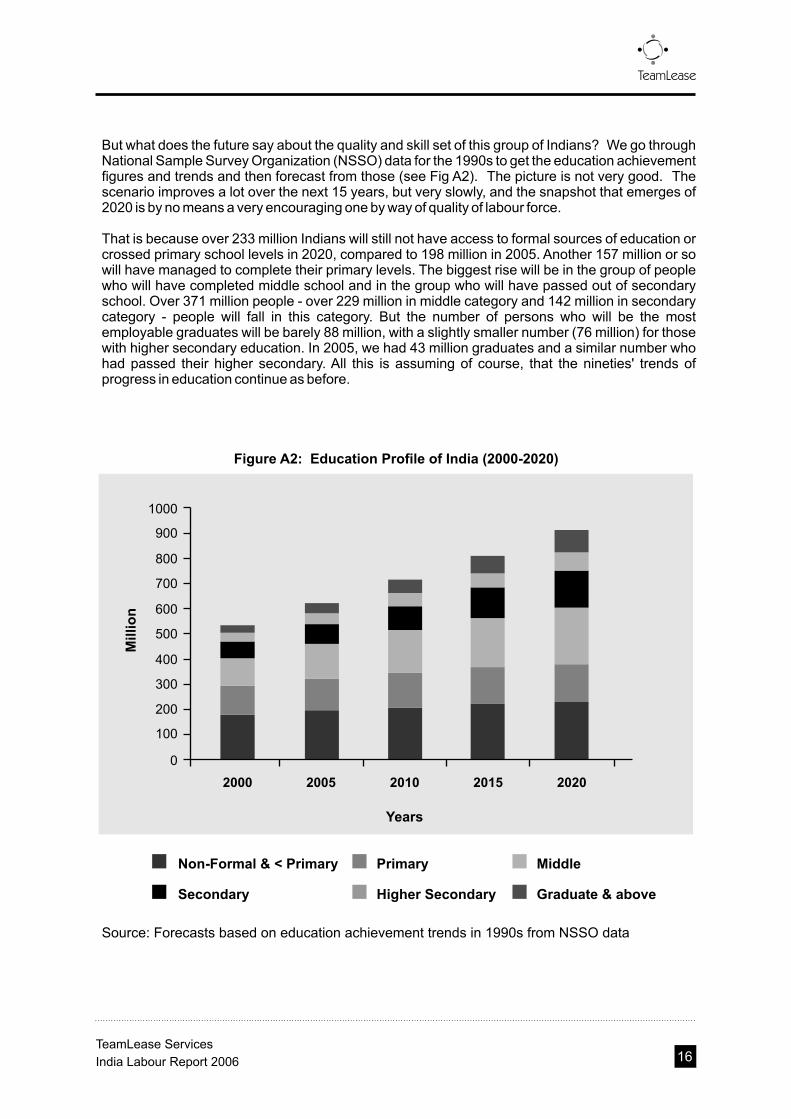
But what does the future say about the quality and skill set of this group of Indians? We go through National Sample Survey Organization (NSSO) data for the 1990s to get the education achievement figures and trends and then forecast from those (see Fig A2). The picture is not very good. The scenario improves a lot over the next 15 years, but very slowly, and the snapshot that emerges of 2020 is by no means a very encouraging one by way of quality of labour force.
That is because over 233 million Indians will still not have access to formal sources of education or crossed primary school levels in 2020, compared to 198 million in 2005. Another 157 million or so will have managed to complete their primary levels. The biggest rise will be in the group of people who will have completed middle school and in the group who will have passed out of secondary school. Over 371 million people - over 229 million in middle category and 142 million in secondary category - people will fall in this category. But the number of persons who will be the most employable graduates will be barely 88 million, with a slightly smaller number (76 million) for those with higher secondary education. In 2005, we had 43 million graduates and a similar number who had passed their higher secondary. All this is assuming of course, that the nineties' trends of progress in education continue as before.
Figure A2: Education Profile of India (2000-2020)
Non-Formal & < Primary Primary Middle
Secondary Higher Secondary Graduate & above
Source: Forecasts based on education achievement trends in 1990s from NSSO data
16
TeamLease
2000 2005 2010 2015
0
100
200
400
500
600
700
800
900
Millio
n
300
1000
2020
Years
TeamLease Services
India Labour Report 2006
We, therefore, have to look at employment opportunities offered by the Indian economy currently and 15 years later. Take the agriculture sector first. This sector is already overpopulated; three fifths of the population dependent on a sector that provides barely one fifth of the GDP. Underemployment and disguised employment is high. Most farmers are picking poor returns and even non-farm sectors are dwindling at present. To raise the return on farming and allied activities, it is important to raise productivity first, or sufficiently energize the rural economy to generate non-farm employment. Suffice to say then that with farming fast becoming increasingly less rewarding than other sectors, farming households are likely to release an increasingly large share of workers every year for non-agricultural activities.
Manufacturing comes next, but it is again a sector that has gone through a huge churn post-reforms. To remain competitive against global manufacturers', the sector has had to drop prices while becoming more cost and labour efficient. After a long period of job shedding, the Indian manufacturing sector is expanding again. Still, the job market here remains practically stagnant. This is more so in the organized sector and is discussed in later sections.
A large part of manufacturing jobs used to be generated in the public sector before the reforms. The public sector now barely employs 5-6 per cent of the total workforce, but with demands for privatization and VRS, and its overall poor performance in an increasingly competitive environment, job accretion here can be practically ruled out.
That leaves the services sector, which many see as India's great white-collar hope. Here, apart from a small share of low-paid agency jobs, education and skill will play a big role in determining employability. Of course, the unorganized services sector has great scope for self-employment and some potential for non-skilled employment. But broadly, the organized services sector companies - as in banking and finance, telecommunications or IT - will need a workforce with a respectable level of education, definitely graduates and above. But that is not where the largest increases in the labour force are going to be.
17
TeamLease
TeamLease Services
India Labour Report 2006

The sector scenario then does not offer much hope to the youth of this country. What will they do then? As we evolve more and more towards adopting western lifestyles, there will be little family or social support for such large numbers. The joint or extended family system has been breaking up for some time now. As we have seen in the case of farmers, the lack of a social and community support is also contributing to the helplessness and suicide. We hope that there will not be such a harsh fate waiting for the youth. But it is apparent that with the organized sector also not growing and hiring, most of this huge labour force of 716 million is staring at two very hard realities: Widespread unemployment and Poor employment.
There are various estimates for unemployment in India that vary depending upon the specific definition and the source data used. There is a separate point that with a significant share of the workforce employed in the rural sector, unemployment figures may not reveal much. The problem is more of under-employment. What is however more worrying is that the annual average growth in employment has slowed. This slowing down is largely because in the 1990s agriculture failed to create jobs. However, it is not agriculture's business to create jobs. The history of development is one of pulling people out of agriculture, into non-farm activities, into manufacturing and into services, not retaining them there. In that sense, India has witnessed a failed industrial revolution. If 10 million new jobs have to be created a year, manufacturing also has a role to play.
If we were to look at the recently released Census 2001 figures, we find that about 10 percent of the labour-force did not have any main or marginal economic activity but were looking for one. That is one of the higher unemployment estimates (the next highest - from NSSOs 1999 - 2000 estimates was at about 7 percent).
The more worrisome factor has to do with employment elasticities. This is quite low for India and fell in the nineties. For the un-initiated, the employment elasticity is a measure of how employment
Figure A3: Sectoral Net Domestic Product (1993 Prices Rs 10 million)
700,000600,000500,000400,000300,000200,000100,000
1950 - 51
1960 - 61
1970 - 71
1980 - 81
1990 - 91
2000 - 01
Trade, Financing, Public Administration & Other Services
Manufacturing, Construction, Electricity, Gas & Water Supply
Agriculture, Forestry & Fishing, Mining & Quarrying
Source: NCAER
18
TeamLease
TeamLease Services
India Labour Report 2006
increases with increase in the size of the economy. The latest estimates are about 0.15 for India. In other words, for every 1 percent economic growth, employment increases by about 0.15 percent. This is much lower for the agriculture sector (being close to 0, but significantly higher for the manufacturing and service sectors).
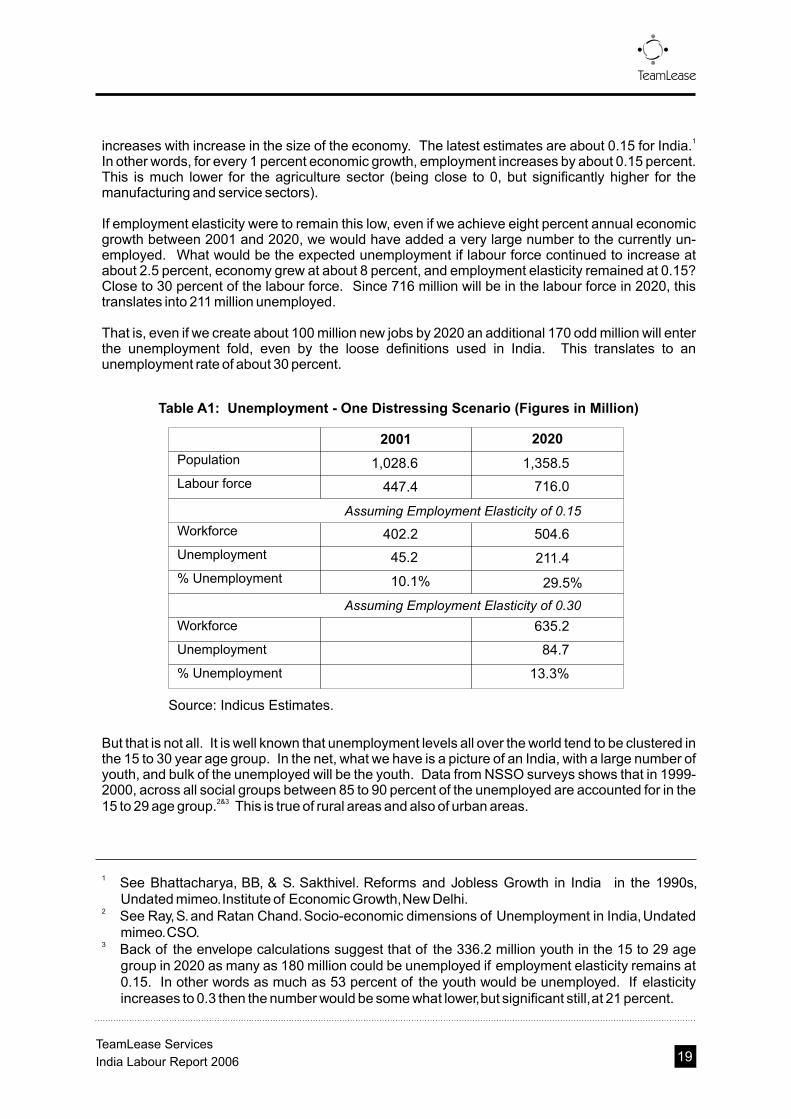
If employment elasticity were to remain this low, even if we achieve eight percent annual economic growth between 2001 and 2020, we would have added a very large number to the currently un-employed. What would be the expected unemployment if labour force continued to increase at about 2.5 percent, economy grew at about 8 percent, and employment elasticity remained at 0.15? Close to 30 percent of the labour force. Since 716 million will be in the labour force in 2020, this translates into 211 million unemployed.
That is, even if we create about 100 million new jobs by 2020 an additional 170 odd million will enter the unemployment fold, even by the loose definitions used in India. This translates to an unemployment rate of about 30 percent.
1
Table A1: Unemployment - One Distressing Scenario (Figures in Million)
But that is not all. It is well known that unemployment levels all over the world tend to be clustered in the 15 to 30 year age group. In the net, what we have is a picture of an India, with a large number of youth, and bulk of the unemployed will be the youth. Data from NSSO surveys shows that in 1999-2000, across all social groups between 85 to 90 percent of the unemployed are accounted for in the
2&315 to 29 age group. This is true of rural areas and also of urban areas.
Labour force
Workforce
Population
Unemployment
% Unemployment
Workforce
Unemployment
% Unemployment
2001
447.4
1,358.5
402.2
211.4 45.2
10.1% 29.5%
635.2
84.7
13.3%
716.0
2020
1,028.6
504.6
Assuming Employment Elasticity of 0.15
Assuming Employment Elasticity of 0.30
Source: Indicus Estimates.
19
TeamLease
TeamLease Services
India Labour Report 2006
1 See Bhattacharya, BB, & S. Sakthivel. Reforms and Jobless Growth in India in the 1990s, Undated mimeo. Institute of Economic Growth, New Delhi.
2 See Ray, S. and Ratan Chand. Socio-economic dimensions of Unemployment in India, Undated mimeo. CSO.
3 Back of the envelope calculations suggest that of the 336.2 million youth in the 15 to 29 age group in 2020 as many as 180 million could be unemployed if employment elasticity remains at 0.15. In other words as much as 53 percent of the youth would be unemployed. If elasticity increases to 0.3 then the number would be some what lower, but significant still, at 21 percent.

Box A1: What is happening to Employment Elasticity?
Between 1993-94 and 1999-2000, manufacturing hasn't done that well in creating jobs either. The average annual employment growth in manufacturing during this period was 2.58%, compared to 3.64% between 1982 to 1987-88. Between 1993-94 and 1999-2000, the overall employment elasticity was 0.15. But at 0.33, it was higher for manufacturing. Although the progressive decline in the employment elasticity of manufacturing should cause concern. For instance, this elasticity was 0.59 between 1983 and 1987-88, declining to 0.33 between 1993-94 and 1999-2000. This employment elasticity translates into jobs in the following way. Employment in manufacturing was 40.79 million in 1999-2000. If manufacturing grows at 9%, with an employment elasticity of 0.33, 1.2 million jobs are created in manufacturing a year. But if the employment elasticity is 0.59, as it was between 1983 and 1987-88, with 9% manufacturing growth, 2.2 million jobs are created a year. And if manufacturing growth increases to 12%, with an elasticity of 0.59, 2.9 million jobs are created a year in manufacturing. There is a target of creating 10 million jobs a year. However, this is for the entire economy and not all of this 10 million is expected to be created in manufacturing. But manufacturing can make its contribution. Most of the demographic dividend, in terms of new entrants into the labour force, is going to occur in central parts of India, leading eastwards. In an era of industrial licensing, manufacturing capacities could be set up in geographical areas where labour forces existed. But industrial licensing is not only impossible now, it is also undesirable. Nor will employment growth primarily happen through the public sector, and it must not be forgotten that many sick public sector units (PSUs) are precisely in these geographical regions and they will eventually be closed down. If one is to avoid tensions over a few jobs in the Railways, private sector job creation, including in manufacturing, must compensate. What should be of concern is the declining employment elasticity of manufacturing in the 1990s, compared to say, the 1980s. While labour market rigidities may be partly responsible, these haven't worsened in the 1990s. The answer therefore probably lies in restructuring consequent to competition, leading to shedding of surplus jobs, and even a sectoral change in manufacturing sectors that have shown relatively higher rates of growth in the 1990s.
20
TeamLease
TeamLease Services
India Labour Report 2006

How likely is this estimate to hold true? And will the assumption of employment elasticity of 0.15 hold in the future? That is anyone's guess. As a whole lot will change - technologies will change, the economic environment will change, regulatory and policy conditions will be different, and the elasticities will also change as a result. So perhaps the above is one unlikely possibility.
Figure A4: Unemployment in Rural Areas (Across age groups)
Figure A5: Unemployment in Urban Areas (Across age groups)
21
TeamLease
0
10
20
30
40
ST
SC
Age-Group
0-4
5-9
10
-14
15
-19
20
-24
25
-29
30
-34
35
-39
40
-44
45
-49
50
-54
55
-59
60
& a
bo
ve
% U
ne
mp
loye
d
OBC
Others
0
10
20
30
40
ST
SC
Age-Group
0-4
5-9
10
-14
15
-19
20
-24
25
-29
30
-34
35
-39
40
-44
45
-49
50
-54
55
-59
60
& a
bo
ve
% U
ne
mp
loye
d
OBC
Others
Source: NSSO, 1999-2000
TeamLease Services
India Labour Report 2006

But the worrisome factor is, if things do not change. The evidence from scores of studies appears to be that though employment growth has been occurring, it has been biased in favour of the unorganized sector, casual and temporary employment, and low wage growth for the less educated. This has been occurring through the nineties and early 2000s, when clearly greater opportunities have been brought out by, and have contributed to, economic growth.
4Again a host of studies (see Anant et. al. 2006 for a survey ) tend to point to some aspect of the legal-regulatory structure that is somehow impeding the better spread of employment opportunities. But the popular debate in India is more divided. And here the political leanings also play an important role. Those to the left of center believe that the legal-regulatory structure and its implementation is now biased against the labour force. And those to the right prefer the laws impeding creation of better opportunities arguments.
It is not the objective of this report to argue against or for any particular argument. But to draw attention to the facts as they stand today. And the facts are that unless a set of actions aimed at sustainable employment generation takes place, India could conceivably end up quite poorly.
So, to sum up the labour market scenario in 2020, we see that to gainfully employ the large number of people in the job market, we need to generate a range of additional employment opportunities, rapidly improve the skill and education base of those in the labour force, and create an environment where opportunities and capabilities are matched smoothly. Many government and political documents talk about 10 million new jobs every year. But the requirement is far higher - at about 15 million per year.
4 Anant, TCA, R Hasan, P Mohapatra, R Nagaraj, and SK Sasikumar. 2006. Labour Markets in India: Issues and Perspectives, mimeo, Asian Development Bank.
22
TeamLease
TeamLease Services
India Labour Report 2006
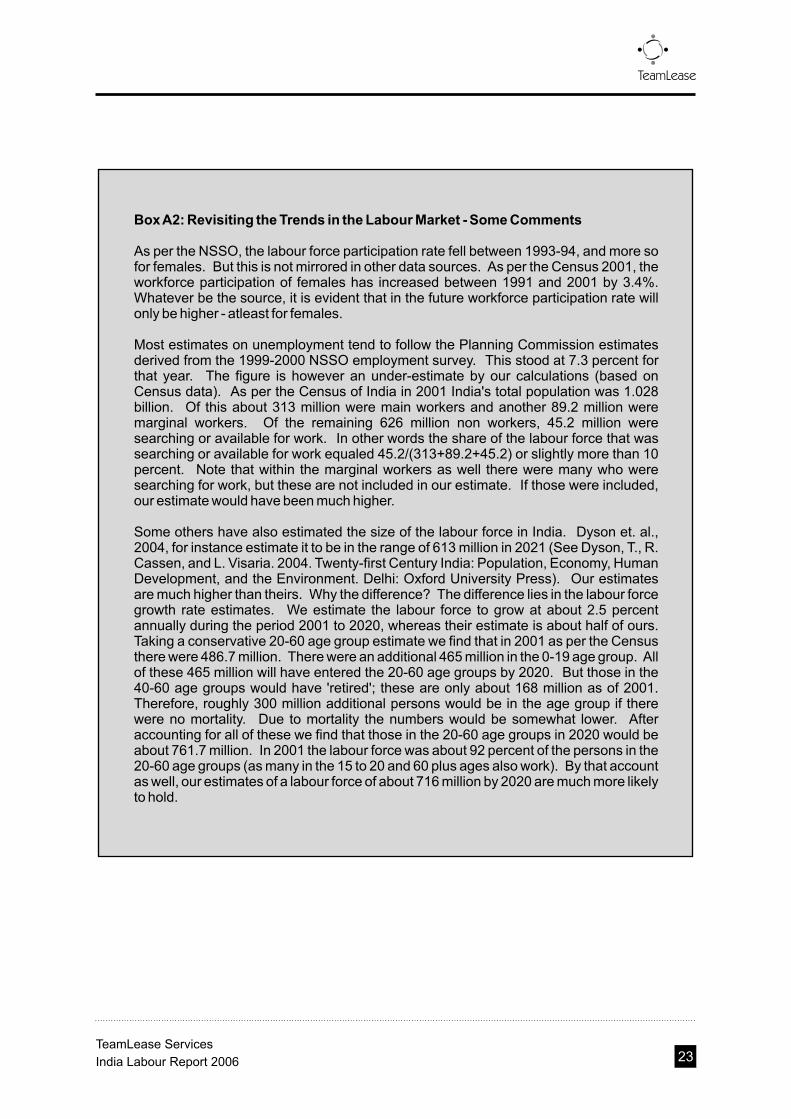
Box A2: Revisiting the Trends in the Labour Market - Some Comments
As per the NSSO, the labour force participation rate fell between 1993-94, and more so for females. But this is not mirrored in other data sources. As per the Census 2001, the workforce participation of females has increased between 1991 and 2001 by 3.4%. Whatever be the source, it is evident that in the future workforce participation rate will only be higher - atleast for females.
Most estimates on unemployment tend to follow the Planning Commission estimates derived from the 1999-2000 NSSO employment survey. This stood at 7.3 percent for that year. The figure is however an under-estimate by our calculations (based on Census data). As per the Census of India in 2001 India's total population was 1.028 billion. Of this about 313 million were main workers and another 89.2 million were marginal workers. Of the remaining 626 million non workers, 45.2 million were searching or available for work. In other words the share of the labour force that was searching or available for work equaled 45.2/(313+89.2+45.2) or slightly more than 10 percent. Note that within the marginal workers as well there were many who were searching for work, but these are not included in our estimate. If those were included, our estimate would have been much higher.
Some others have also estimated the size of the labour force in India. Dyson et. al., 2004, for instance estimate it to be in the range of 613 million in 2021 (See Dyson, T., R. Cassen, and L. Visaria. 2004. Twenty-first Century India: Population, Economy, Human Development, and the Environment. Delhi: Oxford University Press). Our estimates are much higher than theirs. Why the difference? The difference lies in the labour force growth rate estimates. We estimate the labour force to grow at about 2.5 percent annually during the period 2001 to 2020, whereas their estimate is about half of ours. Taking a conservative 20-60 age group estimate we find that in 2001 as per the Census there were 486.7 million. There were an additional 465 million in the 0-19 age group. All of these 465 million will have entered the 20-60 age groups by 2020. But those in the 40-60 age groups would have 'retired'; these are only about 168 million as of 2001. Therefore, roughly 300 million additional persons would be in the age group if there were no mortality. Due to mortality the numbers would be somewhat lower. After accounting for all of these we find that those in the 20-60 age groups in 2020 would be about 761.7 million. In 2001 the labour force was about 92 percent of the persons in the 20-60 age groups (as many in the 15 to 20 and 60 plus ages also work). By that account as well, our estimates of a labour force of about 716 million by 2020 are much more likely to hold.
23
TeamLease
TeamLease Services
India Labour Report 2006

Section A2: The Myth of Jobless Growth
Several times in the past few years it has been mentioned that India has been going through a period of jobless growth. If we look at the data on organized sector, we are tempted to believe that it is true (see Table A2). The hyped reports over astronomical salaries for highly skilled professionals are true to a large extent. But beyond the few success stories, employment in the organized sector has indeed not grown at the rate it was expected. On the contrary, the growth rate has slowed down distinctly.
In fact, except for Karnataka, which houses the tech center Bangalore and our unalloyed success story, and to a much smaller extent Punjab and Himachal Pradesh, all other states have fared disastrously in creating organized sector employment in the nineties compared to the eighties. Karnataka managed to raise its employment growth rate from 2.41 per cent (1981-91) to 2.65 per cent (1991-01), while Himachal increased it from one per cent to 1.38 per cent. Punjab, which had faced a negative job growth rate of 4.36 per cent due to political turmoil in the eighties, managed to raise the number of jobs marginally by 0.7 per cent in the next decade mainly due to the improving law and order situation.
There ends the happiness story. Job growth has crashed in Madhya Pradesh (from 2.15 per cent to a negative 3.42 per cent over the two decades), Gujarat, Orissa and Rajasthan. It has also decelerated markedly in Delhi, Haryana, Uttar Pradesh, Tamil Nadu and Andhra Pradesh. In Kerala, West Bengal, Maharashtra and Bihar in the eighties, job growth was barely sufficient to keep pace with steady population growth. Their position worsened further in the nineties. Madhya Pradesh, Uttar Pradesh and Bengal were the three worst cases of negative growth in employment - all theseStates also have population pressure and dying small industry. Thus, the amount of surplus labour or disguised unemployment in all States would boggle the mind.
As a result, out of India's 402 million (figures as of 2001) workforce, only about 7 per cent ended up working in the organized sector. These people were mostly in the public sector, and other organized sector. However, due to the pressure of reforms and disinvestment efforts, the nineties were a bad time for the public sector. Whereas public sector employment had increased by 23 per cent in the eighties, the growth slumped to only 0.43 per cent in the nineties. Total organized sector jobs similarly increased by close to 17 per cent in the eighties, but grew much slower at only four per cent or so in the next decade.
The gainer here was the unorganized sector, which improved its eighties' record of 29.62 per cent growth to 30.29 per cent in the nineties. This is as per data from the Institute of Applied Manpower Research (IAMR). Thanks to the rise in job opportunities in the unorganized sector and the shrinking in size of the organized sector, total employment increased by 28 per cent in the nineties, only a shade smaller than the eighties' growth rate of 28.42 per cent.
Table A2: Growth in Organized & Unorganized Employment
Organized Sector (in Lakhs)
Unorganized Sector (in Lakhs)
1991 2001Annualized growth rate
267 278
2874 3744
0.38%
2.68%
Source : Institute of Applied Manpower Research
24
TeamLease
TeamLease Services
India Labour Report 2006

So, what we had in the nineties was a terrible stagnation in employment opportunities, even a small deceleration, but it was definitely not a period of jobless growth. That much now can be said for sure.
Most of these new jobs, however, were generated by the unorganized sector and was not clearly visible. The sector also managed to maintain a higher rate of growth in jobs than its organized counterpart. Over the decade of nineties, the unorganized sector generated seven times that of organized sector employment. Among the states, Haryana showed the maximum increase in growth between the two decades.
Figure A6: Percent Growth Rate of Employment in Organized Sector
25
TeamLease
1981 - 91 1991 - 2001
Source: Institute of Applied Manpower Research
Pu
nja
b
We
st B
en
ga
l
Bih
ar
Ma
ha
rash
tra
Him
ach
al P
rad
esh
Ke
rala
Utta
r P
rad
esh
De
lhi
Ha
rya
na
Tam
il N
ad
u
An
dh
ra P
rad
esh
Ma
dh
ya P
rad
esh
Gu
jara
t
Ka
rna
taka
Oriss
a
Ra
jast
ha
n
4.0
3.0
2.0
1.0
0.0
-1.0
-2.0
-3.0
-4.0
-5.0
TeamLease Services
India Labour Report 2006
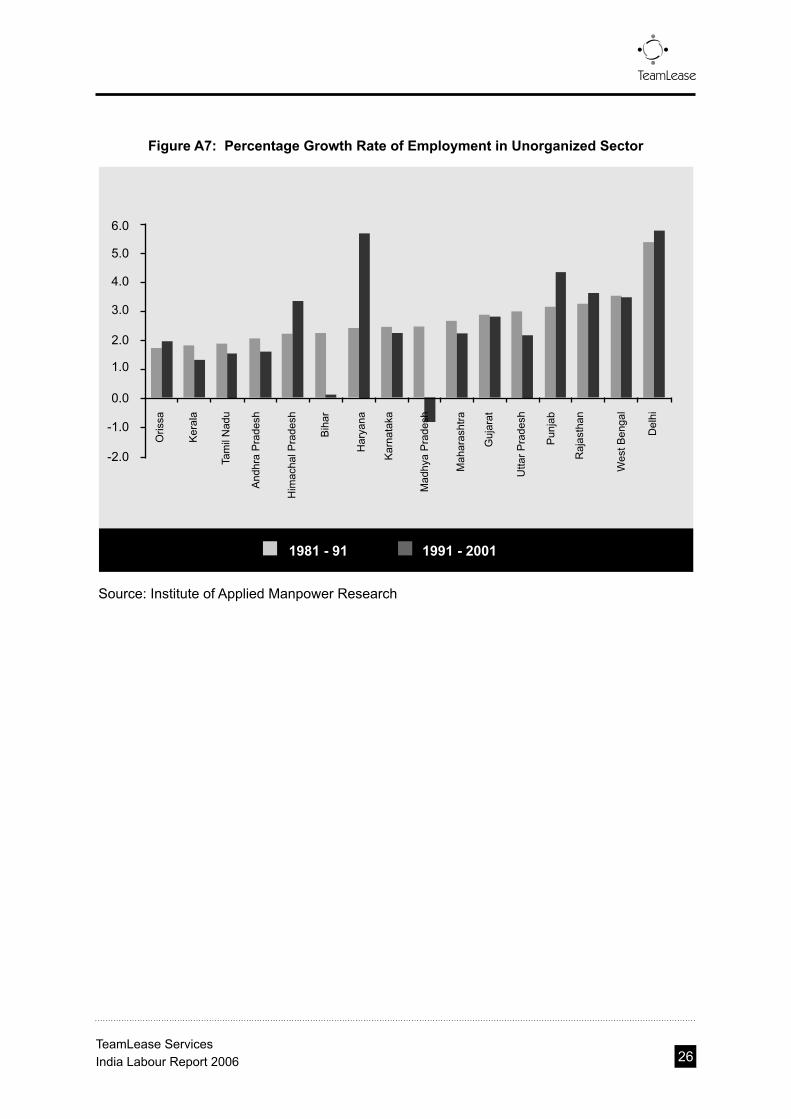
Figure A7: Percentage Growth Rate of Employment in Unorganized Sector
26
TeamLease
1981 - 91 1991 - 2001
Source: Institute of Applied Manpower Research
Pu
nja
b
We
st B
en
ga
l
Bih
ar
Ma
ha
rash
tra
Him
ach
al P
rad
esh
Ke
rala
Utta
r P
rad
esh
De
lhi
Ha
rya
na
Tam
il N
ad
u
An
dh
ra P
rad
esh
Ma
dh
ya P
rad
esh
Gu
jara
t
Ka
rna
taka
Oriss
a
Ra
jast
ha
n
4.0
3.0
2.0
1.0
0.0
-1.0
-2.0
5.0
6.0
TeamLease Services
India Labour Report 2006

Box A3: What is the unorganized Sector and why does it keep growing?
There are three different definitions of organized/unorganized, although they do overlap. First, there is the labour law kind of definition, the Factories Act of 1948 being the obvious example, although this only applies to “factories”. Registration is required if a factory employs 20 or more people and doesn't use power or if it employs 10 or more people and uses power. Registration is equated with organized and everything else is unorganized. Second, there is a definition of small-scale industry (SSI), in terms of threshold levels of investment in plant and machinery. SSI is often equated with unorganized manufacturing. Third, there is a threshold level of turnover below which, excise need not be paid. Excise exemption constitutes yet another definition of unorganized.
However, whichever definition of unorganized/organized one uses, the organized sector accounts for less than 8% of the work force. Of the total employment of about 27.2 million in the organized sector, 18.8 million (69%) is in the public sector. Public sector employment has stagnated in the 1990s. The private sector accounts for 8.4 million employment (31%) in the organized sector. This has increased a bit in the 1990s, but only from 7.6 million in 1990 to 8.4 million in 2002. These figures are of course for total private sector employment. Private sector employment in organized sector manufacturing is 4.9 million in 2002, compared to total manufacturing employment of 40.79 million. Public sector employment in organized sector manufacturing is 1.4 million in 2002. Total employment in organized sector manufacturing is thus 6.3 million, 15.4% of total manufacturing employment. This organized/total ratio may be higher for manufacturing than for overall employment, but is still fairly low.
With reforms, the dichotomy between the organized and unorganized sectors should break down. The organized sector is under the purview of labour laws, which are certainly rigid. Liberalization will involve making labour market provisions in the organized sector more flexible. However, it should also be noted that the unorganized sector is completely outside the purview of most labour laws, and this includes social security. Liberalization will also involve extending protection to labour in the unorganized sector. This is indeed the thrust of the recommendations of the Second National Commission on Labour, which submitted its report in 2002.
27
TeamLease
TeamLease Services
India Labour Report 2006

Now we look at which occupations grew the most. Table A3 gives NSSO data for 1993-94 and 1999-2000 for occupations employing more than one million workers. The six-year overall employment growth was 14 per cent. Out of this, the topmost beneficiary was in the category of working proprietors, wholesale and retail trade. That is the number of self-employed grew the highest, by over one and a half times, to 2.6 million. This was followed by manufacturers and agents the number of whom also grew by 71 per cent to 1.2 million.
With construction activity getting a boost, the number of bricklayers and other construction workers shot up close to 10 million, registering a growth of 54 per cent. All other categories had less than 50 per cent job growth in this period, their pace ranging from 44 per cent for directors and manager to 23 per cent clerical and other supervisors.
Table A3: Employment Growth in Major Occupation Groups
Note: Six year overall employment growth b/s 1993-94 & 99-00: 14%Source: NSSO 1993-94 & 1999-00; Percent Growth in employment in occupations with >1 million workers
22
41
95
24
08
50
98
26
52
94
55
85
54
84
99
30
2.6
1.2
9.9
4.5
1.0
1.5
8.6
1.5
1.8
2.5
2.2
2.7
1.9
3.7
11.3
1.9
155%
71%
54%
44%
42%
41%
40%
38%
33%
31%
30%
25%
24%
24%
23%
23%
2 DigNOC
Description Millions 6 yr.Growth
Working Proprietors, Wholesale & Retail Trade
Manufacturers, Agents’
Bricklayers & Other Construction Workers
Working Proprietors, Directors & Managers
Nursing & Other Medical & Health Technicians
Hotel & Restaurant Keepers
Transport Equipment Operators
Working Proprietors, Directors & Managers, Other Services
Cooks, Waiters, Bartenders & Related Workers
Production & Related Workers, n.e.c.
Launderers, Dry-Cleaners & Pressers
Electrical Fitters & Related Electrical & Electronic Workers
Building Caretakers, Sweepers, Cleaners etc
Labourers, n.e.c.
Clerical & Other Supervisors
Machinery Fitters, Assemblers & Instrument Makers
28
TeamLease
TeamLease Services
India Labour Report 2006

When we look at the numbers though, the largest share of employment is that of labourers. They number 11.3 million and grew at 23 per cent in the six-year period. Those with second largest share in jobs are the 9.9 million bricklayers, followed by the 8.6 million transport equipment operators. The third largest category is the 4.5 million of directors and managers. All other categories, except for machinery fitters, assemblers and instrument makers (3.7 million), employ less than 2.6 million people.
What is common among all these professions? They are mostly in the unorganized sector. The unorganized or informal sector has existed in all countries, but over a period of time, as economic growth occurs and the scale and scope of its activities grow, forces within the sector favour its formalization, or making it 'organized'. Due to some reason that is not occurring in India; at-least to the extent one would expect.
We have also seen that there is a continued growth momentum in employment opportunities. The tragedy is that this is not happening in the organized sector. More people got employed in the nineties than ever before. But they were in the unorganized segment.
Why might that be the case? The answer lies in what defines the distinction between the organized and unorganized sectors. The organized sector follows a set of laws, rules and regulations. It (in India at-least) tends to pay higher taxes, is more dependent upon explicit contracts between the various players within the sector, has better records, etc. In return for all of these, an organized sector entity benefits from better and easier access to formal credit, some government support in specific areas, is more able to obtain permissions and grants, is better able to access services of public utilities. And because of explicit contracts is also better able to access higher human capital.
An unorganized sector entity on the other hand benefits from not being answerable to many lows of the land, labour, and the scores of laws and regulations that organized sector entities need to follow. Its dependence on informal contracts and highly informal record keeping tends to get in the way of its access to formal credit, and also many public services.
In a high growth environment therefore one would expect that it would make sense for the unorganized sector entities to enter the organized or formal way of undertaking their economic activities. If that is not happening, clearly the gains from greater access are being outweighed by the greater costs due to taxation, and of course regulations and laws.
In other words, the legal-regulatory-taxation structure should not be underplayed as an important determinant of the employment structure of India. It may or may not be affecting overall growth but it is definitely impacting the way various players are being able to benefit from the opportunities that are being created.
29
TeamLease
TeamLease Services
India Labour Report 2006

Box A4: What is the tax revenue loss due to the Unorganized Sector?
The unorganized sector pays little taxes by way of either direct income or corporate taxes, or indirect taxes such as VAT etc. This is all well known, but what is not as well known is what may be the extent of the 'damage' to the exchequer due to a large un-organized sector? Take the case of manufacturing unorganized sector. In 2005 - 06 the Manufacturing sector GDP was Rs. 5,14,002 crores (advanced estimates) in current prices. About 32 percent of this is accounted for by the unregistered or unorganized manufacturing sector; that is, about Rs. 1,62,000 crores. There are no good estimates of the total direct plus indirect and state, central and local, taxes paid as a share of value added by the manufacturing sector at the central and state-levels. But even at a highly conservative 10 percent of the total value added, as much as Rs. 16.2 thousand crores revenue is not being earned.
30
TeamLease
TeamLease Services
India Labour Report 2006

As has been mentioned before, there are various factors that affect the likelihood of a state creating a good environment for employment generation. At a very basic level, opportunities for income generation should be created, that itself is a function of many different factors ranging from infrastructure, to governance, to overall investment. This is referred to as the labour demand ecosystem.
But purely creating opportunities will of course not necessarily lead to greater employment, if the proper match with the available human capital is not there. Increasingly there is a need for higher levels of education. This is obvious given the lower role that traditional agriculture is playing. With higher productivity becoming a critical aspect of competitiveness in all areas, greater usage of newer technologies, the need for a more knowledgeable, better educated and trained labour force has become more important. This is referred to as labour supply ecosystem.
However, that is not all. There are enough examples where a highly educated and skilled workforce was forced to migrate because the overall conditions did not favor a 'smooth' matching between the demand and supply of labour. The legal-regulatory regime plays an important role in this. The objective of a good legal-regulatory climate is to ensure that the costs of transacting in the labour markets be low. This is referred to as labour law ecosystem.
Note the difference of this particular view with some others. This report deliberately does not enter into the debate on whether greater powers be given to employers or employees. Nor does it venture into the 'pro-labour' vs. 'pro-employer' legal/regulatory reform debate. The point being that for economic efficiency the laws should be harmonious with each other, easy to implement, be implemented, and ensure low cost transactions in the labour market.
In other words the combination of a good economic (employment) ecosystem, employability, and legal and regulatory structure lead to a good environment for employment creation. We refer to this as the Labour Ecosystem.
Most important, as already mentioned in the past Sections - these issues, be they related to education and training, or infrastructure and governance, or for that matter the legal / regulatory structure - all are mostly determined by state-level efforts. Therefore a state - level rating of these conditions is conducted. The index that resulted from this rating is referred to as the State Labour Ecosystem Index.
The rest of this part proceeds as follows. The following section details the method, which is followed by a brief discussion of the variables included in the state level index. The section that follows links the index values in the past years with the growth that followed, making the case that a good overall employment generation conditions lead to greater growth.
Section B: The State Ranking Index
Section B1: Introduction
31
TeamLease
TeamLease Services
India Labour Report 2006
The labour ecosystem index has been calculated for 19 States of India. Ideally, all 35 States and Union Territories should have been included. However data unavailability prevented this. Efforts are currently on to expand the number of States and the next rankings are expected to include all the States of India. As a result only those States and Union Territories are included for which data were available for most of the variables used to construct the index. No imputations were made.
Further, many variables that would have found a suitable place in this index could not be included as data were not available for many States. Eventually about 40 variables were used to generate 28 ratios, covering diverse aspects of labour ecosystem index, to arrive at the composite labour ecosystem index. There were a few variables wherein data were not available for some of the 19 States. However, these variables were retained if they were at-least available for the larger States.
There are many different ways for constructing a composite index. One way to do this is to assign subjective weights to different variables. However, in order to ensure objectivity, this ranking refrains from such an exercise. No subjective weights have been used and as a result each variable is considered to be equally important.
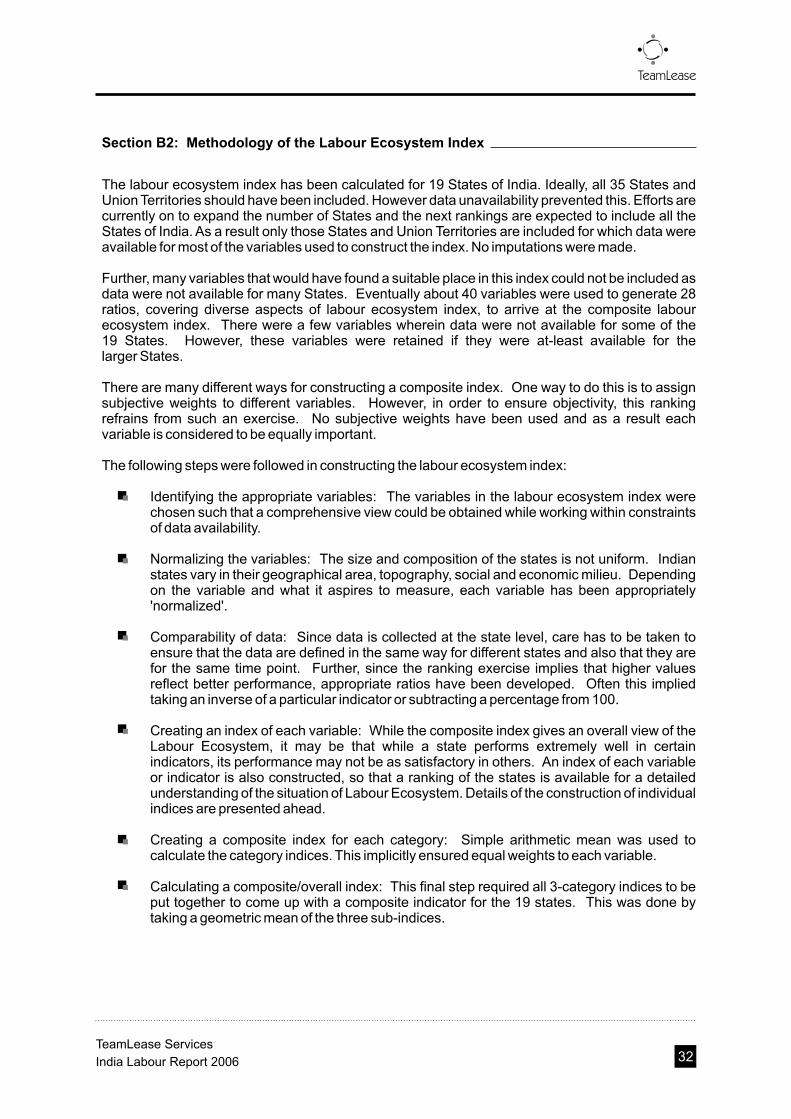
The following steps were followed in constructing the labour ecosystem index:
Identifying the appropriate variables: The variables in the labour ecosystem index were chosen such that a comprehensive view could be obtained while working within constraints of data availability.
Normalizing the variables: The size and composition of the states is not uniform. Indian states vary in their geographical area, topography, social and economic milieu. Depending on the variable and what it aspires to measure, each variable has been appropriately 'normalized'.
Comparability of data: Since data is collected at the state level, care has to be taken to ensure that the data are defined in the same way for different states and also that they are for the same time point. Further, since the ranking exercise implies that higher values reflect better performance, appropriate ratios have been developed. Often this implied taking an inverse of a particular indicator or subtracting a percentage from 100.
Creating an index of each variable: While the composite index gives an overall view of the Labour Ecosystem, it may be that while a state performs extremely well in certain indicators, its performance may not be as satisfactory in others. An index of each variable or indicator is also constructed, so that a ranking of the states is available for a detailed understanding of the situation of Labour Ecosystem. Details of the construction of individual indices are presented ahead.
Creating a composite index for each category: Simple arithmetic mean was used to calculate the category indices. This implicitly ensured equal weights to each variable.
Calculating a composite/overall index: This final step required all 3-category indices to be put together to come up with a composite indicator for the 19 states. This was done by taking a geometric mean of the three sub-indices.
Section B2: Methodology of the Labour Ecosystem Index
32
TeamLease
TeamLease Services
India Labour Report 2006
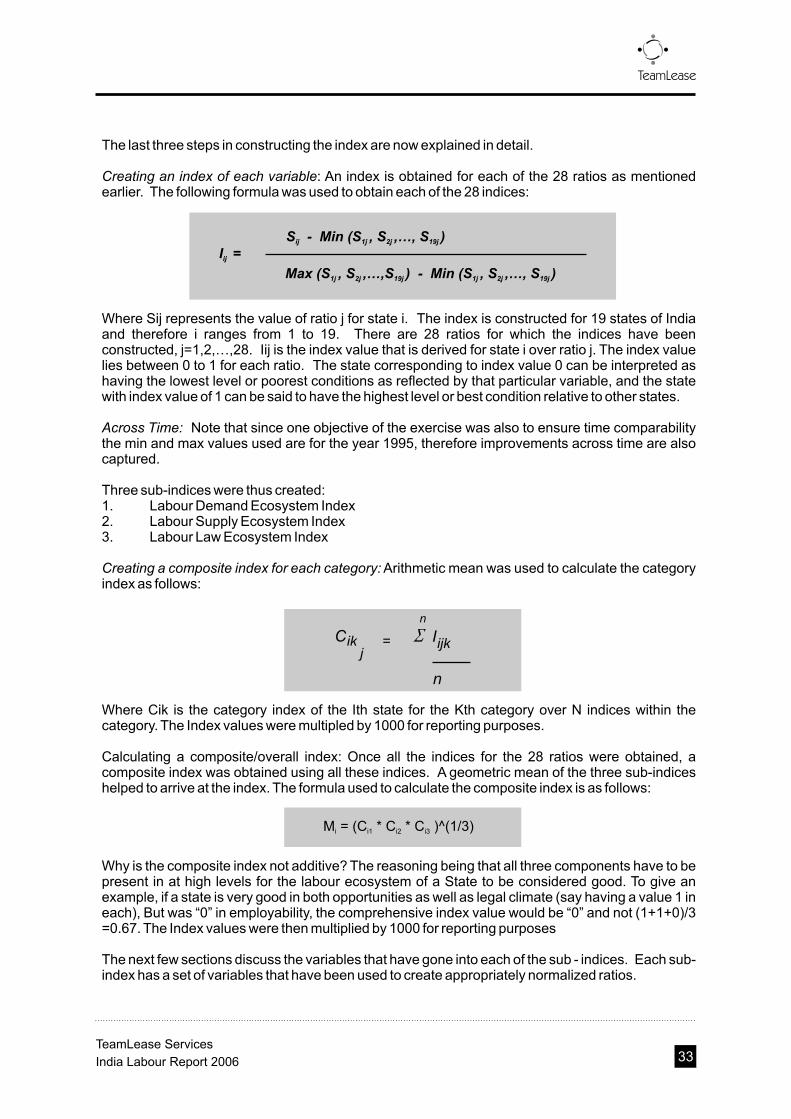
The last three steps in constructing the index are now explained in detail.
Creating an index of each variable: An index is obtained for each of the 28 ratios as mentioned earlier. The following formula was used to obtain each of the 28 indices:
I = ij
S - Min (S , S ,…, S )ij 1j 2j 19j
Max (S , S ,…,S ) - Min (S , S ,…, S )1j 2j 19j 1j 2j 19j
Where Sij represents the value of ratio j for state i. The index is constructed for 19 states of India and therefore i ranges from 1 to 19. There are 28 ratios for which the indices have been constructed, j=1,2,…,28. Iij is the index value that is derived for state i over ratio j. The index value lies between 0 to 1 for each ratio. The state corresponding to index value 0 can be interpreted as having the lowest level or poorest conditions as reflected by that particular variable, and the state with index value of 1 can be said to have the highest level or best condition relative to other states.
Across Time: Note that since one objective of the exercise was also to ensure time comparability the min and max values used are for the year 1995, therefore improvements across time are also captured.
Three sub-indices were thus created:1. Labour Demand Ecosystem Index2. Labour Supply Ecosystem Index3. Labour Law Ecosystem Index
Creating a composite index for each category: Arithmetic mean was used to calculate the category index as follows:
C ik
j= Iijk
n
n
Where Cik is the category index of the Ith state for the Kth category over N indices within the category. The Index values were multipled by 1000 for reporting purposes.
Calculating a composite/overall index: Once all the indices for the 28 ratios were obtained, a composite index was obtained using all these indices. A geometric mean of the three sub-indices helped to arrive at the index. The formula used to calculate the composite index is as follows:
Why is the composite index not additive? The reasoning being that all three components have to be present in at high levels for the labour ecosystem of a State to be considered good. To give an example, if a state is very good in both opportunities as well as legal climate (say having a value 1 in each), But was “0” in employability, the comprehensive index value would be “0” and not (1+1+0)/3 =0.67. The Index values were then multiplied by 1000 for reporting purposes
The next few sections discuss the variables that have gone into each of the sub - indices. Each sub-index has a set of variables that have been used to create appropriately normalized ratios.
M = (C * C * C )^(1/3)i i1 i2 i3
33
TeamLease
TeamLease Services
India Labour Report 2006
Investment is perhaps the most important component of ensuring that economic growth occurs and as a result greater employment opportunities are created. The intention of businesses to invest in a State if actually translated into investment also reveals the superior economic conditions in a state. Infrastructure availability in a state is captured through per capita road length (note that road density is not used as that unnecessarily 'punishes' low population density states). Power surplus and deficit and telephone penetration (including mobile phones) completes the key infrastructure variables.
States that charge a high level of taxes do create adverse conditions for greater economic activity and therefore the inverse of the state-level commodity and service taxes to GSDP ratio is included. State level action against corruption is captured as the inverse of the ratio of corruption cases pending against those registered. Crime is another important aspect that reveals the overall climate for greater economic activity. The inverse of violent crimes to total reported IPC crimes reveals one more aspect of the economic climate of the state and as a result the overall employment ecosystem.
Most of the data are from a three-year period between 1993-1995 and 2003-2005. The sources are all public and all from government sources.
We find that as of 2005, Gujarat had the best employment ecosystem closely followed by Goa and Himachal Pradesh. More than the ranks, the index values reveal that there was no significant difference among the top 5 States. Kerala, Andhra Pradesh and Tamil Nadu group for the next step. Karnataka, the only remaining southern State is far below, predominantly due to poor infrastructure as well as low investment.
The worst states as per this sub-index are expectedly Bihar and Uttar Pradesh. Jammu and Kashmir, though relatively ranked better than Uttar Pradesh, is also among the poorer performing States.
Section B3: The Labour Demand Ecosystem Index
34
TeamLease
TeamLease Services
India Labour Report 2006

Table B1: Variables in the Labour Demand Ecosystem Index
S.No Normalized Variables Variables
1
2
3
4
5
6
7
8
9
Capital Formation as a share of Gross State Domestic Product
Percentage of IEMs implemented
Actual investment as share of proposed as per IEMs
Per Capita Availability of Roads
Power Surplus / Deficit as % of Required
Tele Density
Gross State Domestic Product (at current prices) by Taxes on Commodities & Services
Inverse of Corruption cases pending investigation divided by cases registered under Prevention of Corruption & Related Acts
Inverse of Violent Crimes divided by Cognizable Crime under IPC
Capital Formation
GSDP (93-94 constant prices)
No. of Cases Implemented (IEMs)
Numbers Filed (IEMs)
Investment (Implementation of IEMs)
Numbers Filed (IEMs)
Total Length of Roads in India
Total Population
Power Supply (Surplus (+) / Deficit (-))
Tele Density
GSDP (current price)
Taxes on Commodities and Services (at Current Prices)
Corruption: Total Cases under Investigation
100+Corruption: Pending Investigation from Previous Year
Total (reported) cognizable crime under IPC
100+Total Violent Crimes
35
TeamLease
TeamLease Services
India Labour Report 2006

Figure: B1 Labour Demand Ecosystem Index
0 100 200 300 400 500 600
Gujarat
Goa
Himachal Pradesh
Delhi
Rajasthan
Kerala
Andhra Pradesh
Tamil Nadu
West Bengal
Orissa
Haryana
Punjab
Maharashtra
Karnataka
Assam
Madhya Pradesh
Uttar Pradesh
Bihar
Jammu & Kashmir
36
TeamLease
TeamLease Services
India Labour Report 2006

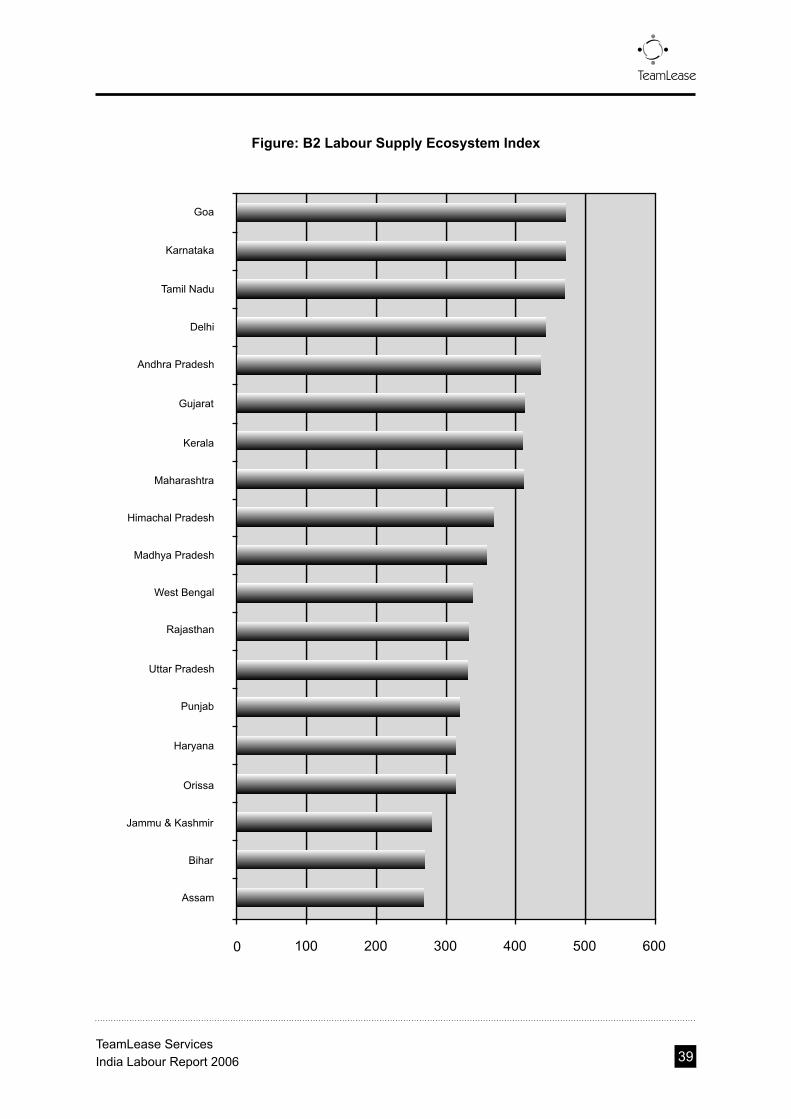
Work participation rate is one of the most used measures of employment in the state; a high value of the population in the 20-60 age group as a share of total population as well as employment also reveals that there is a large labour force to draw from. However, many states might have a high percentage in this age group but have low levels of human capital. Literacy rate captures a very basic measure of human capital in a State; the percentage of population that has graduated from secondary school is considered by most to be a better measure of human capital.
Education achievement by itself may not be an adequate measure if the quality of the education is not captured. We do so by including the teacher pupil ratio as one measure of quality of education in the State. The state-government's percentage of total budget towards education also reveals the emphasis that the state has put on education and skill formation and that is also included. However in States where public sector employment is high, a larger share of the population is drawn away from the other productive sectors, and therefore the inverse of the public sector's share of employment is included
Increasingly, it is felt that the sunrise sectors will require greater numbers of those who are highly educated. They will help attract economic activity to the state, which in turn will help the trickle down of the benefits that come from these activities. The number of seats in engineering colleges, ITI's, MBA institutes are normalized by the class XI and XII enrollment to capture the extent of professional human capital creation in the state.
Unlike in the employment ecosystem index, the employability ecosystem index has the southern and western states generally performing much better than the northern and eastern states.
Goa, Karnataka, Tamil Nadu have similar index values, followed by Delhi and Andhra. These are followed by Gujarat, Kerala and Maharashtra. The worst states are Assam, Bihar and J&K. Orissa, Punjab, Haryana and UP are somewhat better.
Overall therefore, the index finds what others have also found, that the northern and eastern states (barring Delhi and to a lesser extent Himachal) have not been investing adequately in improving the human capital in the state. Nor have they been creating greater choices by way of ensuring good quality private professional institutions.
Section B4: The Labour Supply Ecosystem Index
37
TeamLease
TeamLease Services
India Labour Report 2006
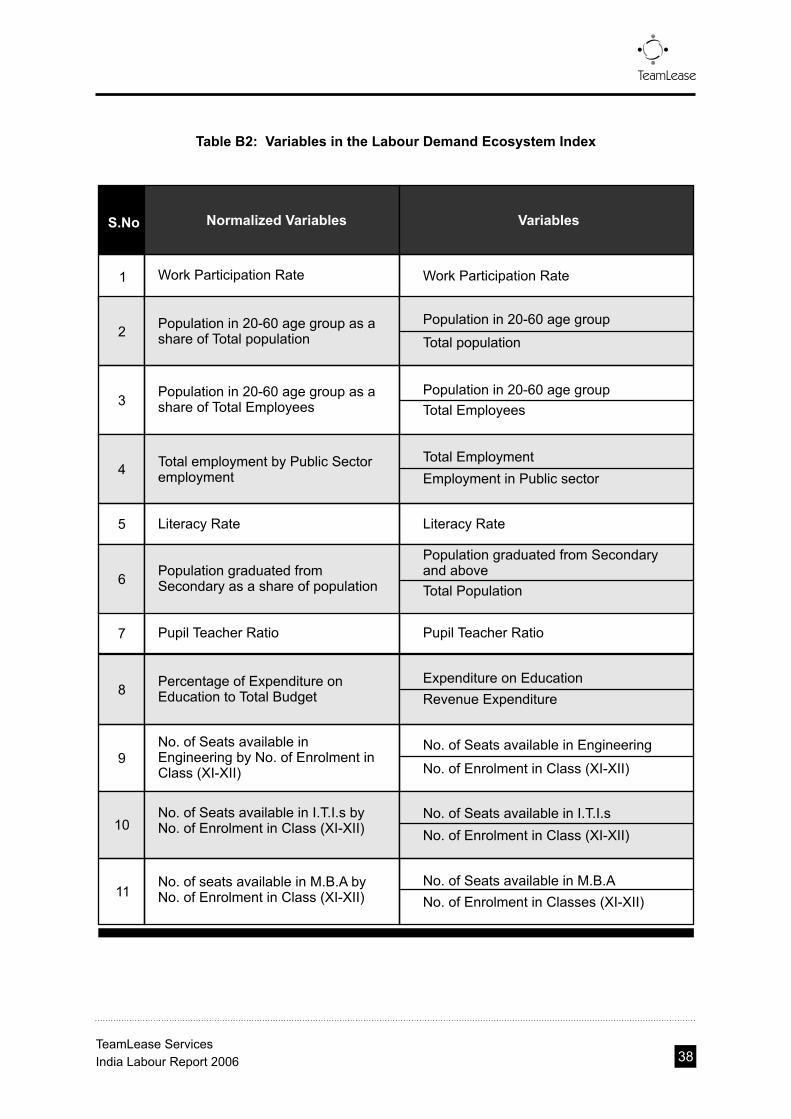
Table B2: Variables in the Labour Demand Ecosystem Index
S.No Normalized Variables Variables
1
2
3
4
5
8
9
Work Participation Rate
Population in 20-60 age group as a share of Total population
Population in 20-60 age group as a share of Total Employees
Total employment by Public Sector employment
Literacy Rate
Percentage of Expenditure on Education to Total Budget
No. of Seats available in Engineering by No. of Enrolment in Class (XI-XII)
Work Participation Rate
Population in 20-60 age group
Total population
Population in 20-60 age group
Total Employees
Total Employment
Employment in Public sector
Pupil Teacher Ratio
Expenditure on Education
Revenue Expenditure
No. of Seats available in Engineering
No. of Enrolment in Class (XI-XII)
7 Pupil Teacher Ratio
Population graduated from Secondary and above
Total Population
10No. of Seats available in I.T.I.s by No. of Enrolment in Class (XI-XII)
No. of Seats available in I.T.I.s
No. of Enrolment in Class (XI-XII)
11No. of seats available in M.B.A by No. of Enrolment in Class (XI-XII)
No. of Seats available in M.B.A
No. of Enrolment in Classes (XI-XII)
Population graduated from Secondary as a share of population
Literacy Rate
6
38
TeamLease
TeamLease Services
India Labour Report 2006
0 100 200 300 400 500 600
Gujarat
Goa
Himachal Pradesh
Delhi
Rajasthan
Kerala
Andhra Pradesh
Tamil Nadu
West Bengal
Orissa
Haryana
Punjab
Maharashtra
Karnataka
Assam
Madhya Pradesh
Uttar Pradesh
Bihar
Jammu & Kashmir
Figure: B2 Labour Supply Ecosystem Index
39
TeamLease
TeamLease Services
India Labour Report 2006
The Minimum Wages Act enables the state government to specify the minimum wage for different activities in the state. The measure 'average wages of registered workers divided by Minimum wages for lowest daily paid workers' reflects how much are average wages higher than the bare minimum specified by the state government. Lockouts and strikes reveal the failure of the legal-regulatory mechanism in synchronizing the interests of the employers and employees. Therefore the inverse of strikes per unit and lockouts per unit are included. Increasingly the service sector has become quite important and the shops and establishment act needs to be enforced adequately. The inverse of the number of prosecutions launched as a share of inspections under the shops and establishments act is included. Purely launching a prosecution however is not enough, the cases need to be disposed off by the courts fairly rapidly, and therefore case disposed as a share of prosecutions launched under the shops and establishments act is also included. Note that there is much about the shops and establishment act that needs to be changed and in many cases it imposes unnecessary constraints on both the employers and employees (see part c).
There are many labour laws and there are many avenues through which employers and employees can come to a satisfactory resolution of their differences. However, we find that there are significant state level differences. The inverse of the employee instituted cases as a share of total labour cases (as counted from the Labour Law Digest for that year) reveals that the labour law regime is not providing other avenues to the employees. More important, if overall the number of cases as a share of total organized sector employment is high, it reveals, another aspect of the failure of the labour-law regime in smooth resolution of differences.
Last, but perhaps not the least. There have been many state-level amendments to the Industrial Disputes Act since inception. Some studies have attempted to identify these amendments as pro-labour or pro-employer. We do not agree on such assignment, and consider this distinction to be flawed. Instead we assign labour laws to be either transaction cost reducing or transaction cost increasing. A transaction cost reducing amendment is one that ensures smoother and more rapid resolution of differences. Hence amendments that introduce greater number of steps in any dispute resolution would be classified as transaction cost increasing. And those that facilitate rapid resolution of differences as transaction cost reducing. The Appendix has greater details.
Each Transaction Cost (TC) reducing amendment is given a value of 1, and a TC increasing amendment is given a value of 1. Some amendments are considered to be TC neutral and are assigned a value of 0. These are then summed for each State up to the year under consideration; and the net summed value is included as another indicator in this sub-index.
Maharashtra is by far the highest in terms of a good labour law and regulation index. It is followed by Karnataka and Punjab. Gujarat and Delhi follow, though they are not highly different from each other in terms of the index values. The worst States in this respect is West Bengal, J&K, Assam, Uttar Pradesh and Kerala.
Section B5: The Labour Law Ecosystem Index
40
TeamLease
TeamLease Services
India Labour Report 2006

Box B1: Measuring Impact of State Amendments on Transaction Costs in Labour Markets
The objective is to classify (and code) state-level labour law changes as those that are more, or less, likely to reduce the time taken by the concerned parties in coming to a solution of the issue at hand. This for the purposes of this discussion is termed as Transaction Cost reducing or increasing changes.
Transaction Cost: Transaction cost in the context of labour regulations can be defined as the cost involved in terms of effort, time, money and stake arising out of the time taken in concluding a disagreement; whether through the judicial system or mutually (for instance through arbitration).
So, instead of being “anti-labour” or “pro-labour” (As in Besley and Burgess, 2004), we are indexing the state amendments according to the concept of “whether they are enabling the smooth/early disposition of disputes. For example in the Besley & Burgess the state amendment (Andhra Pradesh; 1982 Section:11A-11D) has been put under the class “-1” which it terms as “anti-labour”, but we have given it a rating of “+1” i.e. irrespective of the party involved or issues raised, it improves upon the Central Act by amalgamating the powers associated with Industrial Tribunals and Civil Court thereby reducing the transaction cost.
Similarly, in the same book the state amendment (Maharashtra1974; Section : 7) has been classified as “0”. The particular amendment reduced the minimum required qualifications of the deciding authority (judge). That is, it is in no way connected with the question of being “pro- labour” or “anti - labour”. But we have given it a rating of “+1”, because it is facilitating the judicial process by increasing the number of persons who can deliberate on the judicial proceedings in an environment where there are a large number of vacant posts.
Note that we are not making any claims on the quality of the solution/judgment, for the time being we are only concerned with the speed with which they occur. Reference: Besley, Timothy and Robin Burgess, 2004. "Can Labour Regulation Hinder Economic Performance? Evidence from India," The Quarterly Journal of Economics, MIT Press, vol. 119(1), pages 91-134
41
TeamLease
TeamLease Services
India Labour Report 2006

Box B2: Has the IDA become irrelevant?
In 1984 the Industrial Disputes Act was amended by the central government to apply to all units above 100 workers, from 300 workers before. Most states followed suit. One would have expected that it would have had some impact on industrial disputes. But the long-term trend of fall in strikes continued.
Since IDA is designed to empower the workers, one would have expected that it would have an impact on worker wages and salaries. But as Anant et. al., 2005, show, both as a share of value added and as a share of output, worker salaries in the organized sector have been falling continuously since early eighties.
While few studies have been able to identify the potential causes, we believe that it is a part of the overall pattern where a combination of high unemployment rate, easy availability of qualified workers, and greater emphasis on temporary and casual workers have made the IDA redundant, and this had already occurred by the mid eighties.
4,000
3,500
3,000
2,500
2,000
1,500
1,000
500
1961 1964 1967 1970 1973 1976 1979 1982 1985 1988 1991 1994 1997 20000
Strikes Lockouts Total
1981/82 1983/84 1985/86 1987/88 1989/90 1991/92 1993/94 1995/96 1997/980
5
10
15
20
25
30
Fall In Strikes & Lockouts - Before and after IDA amendment
Fall in Wages as share of Value Added - Before and after IDA amendment
Source : Ministry of Labour, Indian Labour Yearbook
Source : CSO, Annual Survey of Industies
( in
% )
42
TeamLease
TeamLease Services
India Labour Report 2006

Table B3: Variables in the Labour Law Ecosystem Index
S.No Normalized Variables Variables
1
2
3
4
5
6
7
8
Average wages of registered workers by Minimum wages for lowest daily paid workers.
Inverse of Lockouts per Unit
Inverse of Strikes per Unit
Inspections made under Shops & Establishment Act by Prosecutions launched
Cases disposed off by the Courts under Shops & Establishment Act by Prosecutions launched
Inverse of Employee instituted Labour cases divided by total Labour related cases
Inverse of Total Appellant Cases related to Labour laws divided by No. of Organized sector Employees
Net Transaction Cost Reduction
Minimum Wages*300
Average wages of registered workers
No. of Units
No. of Lockouts
No. of Units
No. of Strikes
Inspections made (Shops & Estab. Act)
Prosecutions Launched (Shops & Estab. Act)
Cases disposed off by the Courts (Shops & Estab. Act)
Total Employees
Total Cases (Management & Employees as Appellant)
Prosecutions Launched (Shops & Estab. Act)
Total Cases (Management & Employees as Appellant)
No. of Cases with Employees as Appellant
Net transaction cost reducing changes to the Industrial Disputes Act
43
TeamLease
TeamLease Services
India Labour Report 2006
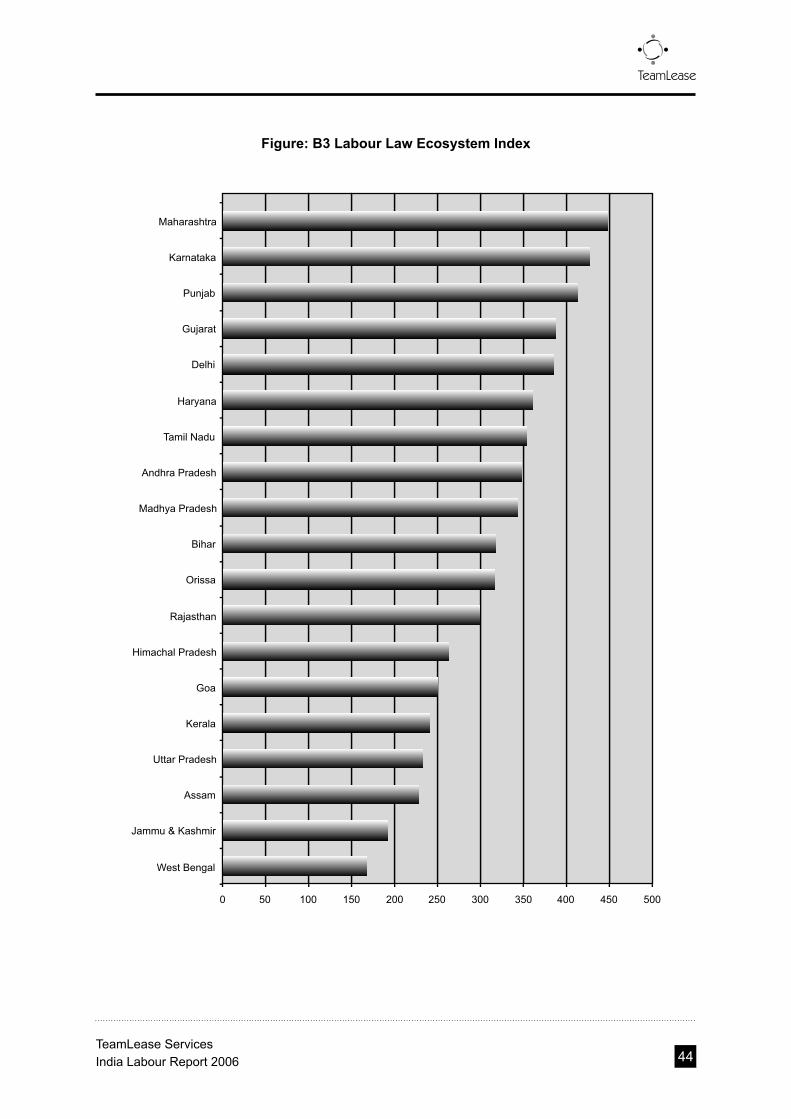
Figure: B3 Labour Law Ecosystem Index
0 50 100 150 200 250 300 350 400 450 500
West Bengal
Jammu & Kashmir
Assam
Uttar Pradesh
Kerala
Goa
Himachal Pradesh
Rajasthan
Orissa
Bihar
Madhya Pradesh
Andhra Pradesh
Tamil Nadu
Haryana
Delhi
Gujarat
Punjab
Karnataka
Maharashtra
44
TeamLease
TeamLease Services
India Labour Report 2006
The overall labour ecosystem index is calculated next. As discussed before, a state has to have relatively high levels of all three sub-indices for it to do better in the overall labour ecosystem index.
We find that States tend to be clustered in the index values. Gujarat and Delhi have the best overall performance. Karnataka, Tamil Nadu, Maharashtra and Andhra Pradesh follow next, and there is not much that separates them from each other. Goa and Punjab follow them. Himachal, Kerala and Haryana are also clustered around a similar value, followed closely by Madhya Pradesh and Orissa.
The eastern States of West Bengal and Assam are followed by Uttar Pradesh, Bihar and Jammu & Kashmir, which are all clustered at the bottom of the pile.
What is most worrisome in this is that the States that have the highest population growth and resultant high labour force growth are among the bottom-most States. It is these States where the need for greater employment generation will be the highest and it is precisely these States where the Overall Labour Ecosystem is the poorest.
The table following the graph also reveals how the ratings and rankings have changed over the decade since the mid nineties. Tamil Nadu has had a significant improvement in its ratings and as a result its rank has shot up from 7 to 4. Andhra Pradesh is the other major gainer. Among the North Indian States, both Punjab and Rajasthan have improved their ranks by four positions from 12 and 13 to 8 and 9 respectively.
Maharashtra has fallen marginally, but the greatest falls in both ratings and rankings have been Madhya Pradesh, Orissa and Goa. Of these Madhya Pradesh has had the largest reduction in its index value from 703 to 523. Uttar Pradesh has also performed quite poorly, from 297 to 170, though its position has remained unchanged at 17.
The past values of the index are found to be correlated with manufacturing sector growth as well as overall GSDP growth. Moreover, since the time period of the index and the period over which the growth rate is captured do not overlap, the index has decent predictive powers.
Section B6: The Labour Ecosystem Index
45
TeamLease
TeamLease Services
India Labour Report 2006

Figure: B4 Overall Labour Ecosystem Index
0 100 200 300 400 500 600 700 800 900
Jammu & Kashmir
Bihar
Uttar Pradesh
Assam
West Bengal
Orissa
Madhya Pradesh
Haryana
Kerala
Himachal Pradesh
Rajasthan
Punjab
Goa
Andhra Pradesh
Maharashtra
Tamil Nadu
Karnataka
Gujarat
Delhi
46
TeamLease
TeamLease Services
India Labour Report 2006

Table B4: Labour Ecosystem Index 1995 and 2005
Punjab
West Bengal
Bihar
Maharashtra
Himachal Pradesh
Kerala
Uttar Pradesh
Delhi
Haryana
Tamil Nadu
Andhra Pradesh
Madhya Pradesh
Gujurat
Karnataka
Orissa
Rajasthan
Jammu & Kashmir
Assam
Goa
1 1 967 835
3 2 829 834
2 3 937 765
7 4 614 763
4 5 808 757
8 6 608 748
5 7 712 670
12 8 520 617
13 9 507 573
14 10 409 568
9 11 602 564
11 12 537 558
6 13 703 523
10 14 560 510
15 15 379 307
16 16 360 269
17 17 297 170
19 18 177 136
18 19 190 126
StatesRank 1995
Rank 2005
Overall IndexValues 1995
Overall IndexValues 2005
47
TeamLease
TeamLease Services
India Labour Report 2006

0.20 0.25 0.30 0.35 0.40 0.45 0.50
0
2
4
6
8
10
Labour Ecosystem Values 1995
% G
row
th r
ate
b
etw
ee
n 1
99
5-
03
- 2
Figure B5: Labour Ecosystem Index and Future Growth in GSDP
Figure B6: Labour Ecosystem Index & Future Growth in Man. GSDP
0.20 0.25 0.30 0.35 0.40 0.45 0.50
0
1
2
3
4
5
6
7
8
9
10
Labour Ecosystem Values 1995
% G
row
th r
ate
b
etw
ee
n 1
99
5-
03
14
16
12
48
TeamLease
TeamLease Services
India Labour Report 2006

This section has created a Labour Ecosystem Index that has the following characteristics:
1. It is based on objective criteria2. The index can be expanded to include all States and Union Territories provided data
are available3. The criteria are measurable 4. Is based on publicly available highly credible data 5. It is politically neutral and based on commonly accepted principle of ensuring
growth as well as support for the labour6. The index is correlated with future economic growth
Moreover, the index is one way to put forth the argument that greater employment will not merely come about through greater investment, or only through greater education, or only through labour law reform. All have to play a role.
Of these, there are already significant steps underway in the education sector, but will take many years before those steps yield results. Greater opportunities have also been the focus of both the central and state governments.
However, the third component is one where little has happened in the last few years - labour law regime. More important, this is one area where changes can be made the fastest. Provided there is a consensus. But consensus is possible, as part C will show. And a possible start is by eliminating the unnecessary, harmonizing the various laws, and by greater decentralization. These issues are discussed in later sections.
Conclusion
49
TeamLease
TeamLease Services
India Labour Report 2006

TeamLease
50
TeamLease
TeamLease Services
India Labour Report 2006

Significant economic reforms have been introduced since 1991. These reforms focus on the need to step up real GDP (gross domestic product) growth rates. The question of institutional constraints to higher growth rates has often been posed. Among such institutional constraints, one should include the legal system. The legal system must provide an adequate structure of incentives and deterrents for a market-based economy to function. Globalization also requires a legal system that conforms to global norms. Measured by this yardstick, the Indian legal system falls short. Post-1991, there has been a more explicit recognition that without a legal system that conforms to global norms, market-oriented reforms will not work. Economic reforms have thus provided a trigger for reforming the legal system. However, even if there had been no economic reforms, there would have been a case for reforming the legal system.
However, the expressions law and legal system are used in different senses. At one level, law means the aggregate of legislation. That is, law means statutory law. A statute suggests something enacted by a legislative body, like Parliament or a Legislative Assembly. The Constitution of India is
5federal and Article 246 sets out three lists - areas where the Centre or the Union can legislate, areas where States can legislate and areas where both can legislate (the Concurrent List). Therefore, the corpus of Indian statutory law includes both Central and State-level legislation.
It is not easy to figure out how many statutes there are in India. "There are now nearly 2500 Central laws in force. While our focus in this study has been on the Central laws, it is worthwhile keeping in view the fact that there is not even a rough estimate available about the number of laws operating in states. In one State alone the number is stated to be of the order of 1100. There might, thus, be 25000 to 30000 laws of States." This quote is from the report of a government-appointed
6committee. The State referred to is presumably Orissa, where someone has sat down and counted that there are 1015 statutes. However, legal systems have traditionally been divided into common law and civil law frameworks, with the former based on law as interpreted by tradition and judges and the latter based on law codified in statutes. India belongs to the common law tradition. But increasingly, the difference between common law and civil law has become irrelevant, since law has become codified even in countries that followed the common law tradition. Common law often evolved through judgments made by judges in specific cases, referred to as case law. Case law is thus a subset of common law. One might think judges should interpret the law, not create it. But that's not quite the way it works and one should take cognizance of case law.
There is also a body of law known as administrative law or subordinate legislation. While the need to reduce State intervention and over-legislation in the form of statutes is reasonably well appreciated, perhaps the need to simplify administrative law is less well appreciated. Administrative law is subordinate legislation and consists of rules, regulations, orders and administrative instructions from ministries and government departments. These are non-transparent and discretionary and encourage bribery and corruption. Corruption is not distributionally neutral. The last time all administrative law was systematically collated was in 1966. Rather remarkably, the afore-
Section C : The Way Forward - Labour Market Reforms
Section C1: The Agenda - Reducing Transaction Costs
5 The Seventh Schedule.6 Report of the Commission on Review of Administrative Laws, Department of Administrative Reforms and Public Grievances, Ministry of Personnel, Public Grievances and Pensions, September 1998. This is popularly referred to as the Jain Commission.
51
TeamLease
TeamLease Services
India Labour Report 2006

7mentioned Commission on Review of Administrative Laws had the following to say , “The Commission was seriously constrained by the fact that it did not have access to a complete set of subordinate legislation in the form of rules, regulations and administrative instructions, issued under different Central Acts, by individual Ministries and Departments. It appears that the Legislative Department itself did not have such a complete compilation of rules, regulations and procedures issued by the Ministries…. Another handicap was that the Central Ministries did not have full information about the rules and regulations issued by State Governments by virtue of the authority vested in them by Central laws.”
In more general vein, transaction costs associated with obeying the law must be brought down, so that people do not have an incentive to operate in a quasi-legal or illegal framework.
7 Report of the Commission on Review of Administrative Laws, Department of Administrative Reforms and Public Grievances, Ministry of Personnel, Public Grievances and Pensions, September 1998.
52
TeamLease
TeamLease Services
India Labour Report 2006

The expression law is also used in a broad sense to cover the legal system, that is, the judicial and administrative process that oversees the resolution of disputes. Legal and judicial reform can be clubbed under a few heads, although this is not a neat water-tight compartmentalization.
First, there are old and dysfunctional laws and these must be eliminated. Second, there is a need for unification and harmonization. Third, there is a need for reducing unnecessary state intervention and over-legislation and this often occurs through administrative law. Fourth, there is the question of procedural law. If procedural law is inefficient and time
8consuming, no matter how good substantive law is, the legal system will lack credibility.
Dysfunctional Laws
With old laws, the first element of statutory law reform is to scrap dysfunctional statutes. For the 93000 to 3500 Central statutes, this identification has been done. The most visible of these
identification exercises is the Jain Commission on Review of Administrative Law, mentioned 10earlier. This Commission identified around 1300 statutes for outright repeal. Based partly on the
recommendations of this Commission, around 350 Central statutes were repealed in 2001/02. It is always easier to repeal a statute in its entirety. Part of the problem is that a statute often has dysfunctional and old sections that need repeal. The entire statute cannot be junked. Unfortunately, not much has been done to repeal old statutes at State-level. Some have been repealed in Gujarat and an exercise has been undertaken to identify old ones in Rajasthan. Ideally, all States should have permanent Law Commissions.
Rationalization and Harmonization
Statutes have been enacted at various points in time in the same area and this is a point that was made earlier. The second component of statutory law reform should therefore be one of rationalization and harmonization. In the absence of this, there is a multiplicity of definitions, conflicting case law and when one incorporates subordinate legislation or administrative law, even a plethora of inspectors. This multiplicity problem can be vividly illustrated using labour laws. Under Article 246 of the Indian Constitution, labour is in the concurrent list (item 22 on trade unions, industrial and labour disputes; item 23 on social security and social insurance, employment and unemployment; item 24 on welfare of labour including conditions of work, provident funds, employer's liability, workmen's compensation, invalidity and old age pensions and maternity benefits). There are exceptions like labour and safety in mines and oilfields and industrial disputes concerning Union employees that are in the Central list. There are minor inter-State variations in labour laws.
Section C2: The Labour Law Reform Agenda
53
TeamLease
TeamLease Services
India Labour Report 2006
8 There are an estimated 25 million cases pending in various courts and on an average, it takes anything up to twenty years for a case to be resolved. This does not make the redressal mechanism credible.
9 There is always a problem with counting statutes. For instance, if there is an amending statute, does one count this as a new act? At the Central level, a figure of between 3000 to 3500 is as good a figure as any, although after the repeal of around 350 in 2001/02, around 3000 is closer to the mark now. However, if amendments are not counted separately, one is probably talking about around 1500.
10 This only identified entire statutes for repeal. For sectional identifications on old sections, see B. Debroy, In the Dock: Absurdities of Indian Law, Konark Publishers, 2000.
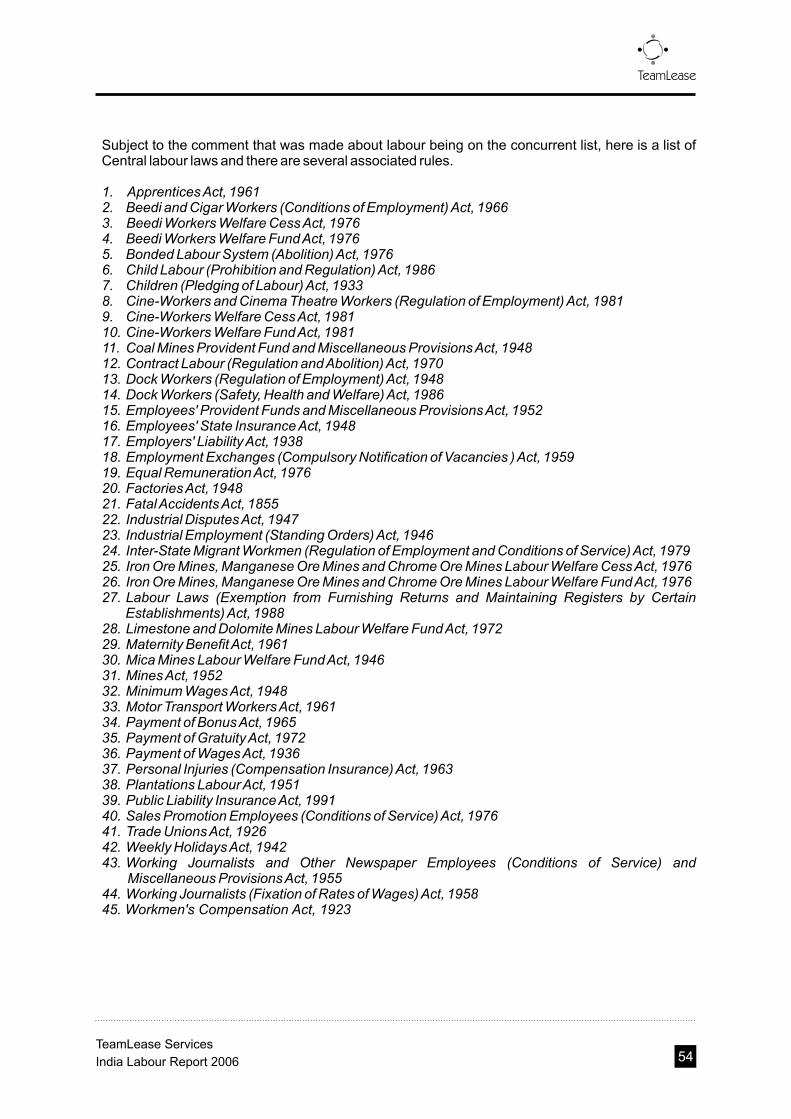
Subject to the comment that was made about labour being on the concurrent list, here is a list of Central labour laws and there are several associated rules.
1. Apprentices Act, 19612. Beedi and Cigar Workers (Conditions of Employment) Act, 19663. Beedi Workers Welfare Cess Act, 19764. Beedi Workers Welfare Fund Act, 19765. Bonded Labour System (Abolition) Act, 19766. Child Labour (Prohibition and Regulation) Act, 19867. Children (Pledging of Labour) Act, 19338. Cine-Workers and Cinema Theatre Workers (Regulation of Employment) Act, 19819. Cine-Workers Welfare Cess Act, 198110. Cine-Workers Welfare Fund Act, 198111. Coal Mines Provident Fund and Miscellaneous Provisions Act, 194812. Contract Labour (Regulation and Abolition) Act, 197013. Dock Workers (Regulation of Employment) Act, 194814. Dock Workers (Safety, Health and Welfare) Act, 198615. Employees' Provident Funds and Miscellaneous Provisions Act, 195216. Employees' State Insurance Act, 194817. Employers' Liability Act, 193818. Employment Exchanges (Compulsory Notification of Vacancies ) Act, 195919. Equal Remuneration Act, 197620. Factories Act, 194821. Fatal Accidents Act, 185522. Industrial Disputes Act, 194723. Industrial Employment (Standing Orders) Act, 194624. Inter-State Migrant Workmen (Regulation of Employment and Conditions of Service) Act, 197925. Iron Ore Mines, Manganese Ore Mines and Chrome Ore Mines Labour Welfare Cess Act, 197626. Iron Ore Mines, Manganese Ore Mines and Chrome Ore Mines Labour Welfare Fund Act, 197627. Labour Laws (Exemption from Furnishing Returns and Maintaining Registers by Certain Establishments) Act, 198828. Limestone and Dolomite Mines Labour Welfare Fund Act, 197229. Maternity Benefit Act, 196130. Mica Mines Labour Welfare Fund Act, 194631. Mines Act, 195232. Minimum Wages Act, 194833. Motor Transport Workers Act, 196134. Payment of Bonus Act, 196535. Payment of Gratuity Act, 197236. Payment of Wages Act, 193637. Personal Injuries (Compensation Insurance) Act, 196338. Plantations Labour Act, 195139. Public Liability Insurance Act, 199140. Sales Promotion Employees (Conditions of Service) Act, 197641. Trade Unions Act, 192642. Weekly Holidays Act, 194243. Working Journalists and Other Newspaper Employees (Conditions of Service) and Miscellaneous Provisions Act, 195544. Working Journalists (Fixation of Rates of Wages) Act, 195845. Workmen's Compensation Act, 1923
54
TeamLease
TeamLease Services
India Labour Report 2006

Not only is this is a list of Central labour-related statutes alone, it is a list of statutes that have something to do directly with labour. If one includes the ones that indirectly have something to do with labour, the list is longer. For example, the Boilers Act (1923), the Collection of Statistics Act (1953), the Dangerous Machines (Regulations) Act (1983) and the Emigration Act (1983) indirectly impinge on labour. Do we really need 45 and more statutes, not to speak of the rules? Apart from the Constitutional angle of the Seventh Schedule, are special statutes needed for cine-workers, dock-workers, motor transport workers, sales promotion employees, plantation labour, working journalists and workers in mines? Consider also the time span of the legislation, from the Fatal Accidents Act of 1855 to the Public Liability Insurance Act of 1991. Over a period of time, concepts and definitions have changed. So has the case law, contributing to further confusion. For example, there is lack of unanimity about definitions of wages, workman, employee, factory, industry and child labour. Case law also differs, causing further confusion. There is case law whereby the manufacture of bidis is not an industry, but the press and publication departments of Andhra and Osmania universities are factories. Reforming labour law has many dimensions and issues like reducing State intervention in industrial relations are identified with an exit policy for labour and are
11therefore controversial. But unification and harmonization is an issue on which there should be no lack of consensus.
To take a somewhat trivial example, no one can object to the Weekly Holidays Act of 1942. It simply states that every shop must remain closed on one day of the week, every employee in a shop, restaurant or theatre must be granted one day's leave per week and that a State Government can decree one additional half-day of closing. Nor should one object to "day" being defined as "a period of twenty-four hours beginning at mid-night" or "week" being defined as "a period of seven days beginning at midnight on Saturday." Or should there be objections? Here are some definitions of the word “day”. "A period of twenty-four hours beginning at mid-night" - Child Labour (Prohibition and Regulation) Act (1986); Dangerous Machines (Regulation) Act (1983); Factories Act (1948); Mines Act (1952); Plantations Labour Act (1951). "A period of twenty-four hours beginning at mid-night. Provided that where a motor transport worker's duty commences before mid-night but extends beyond midnight the following, day for him shall be deemed to be the period of twenty-four hours beginning when such duty ends, and the hours he has worked after midnight shall be counted in the previous day." - Motor Transport Workers Act (1961). Or take the definition of “week”. "Week means a period of seven days beginning at midnight on Saturday." - Beedi and Cigar Workers (Conditions of Employment) Act (1966). "Week means the period between midnight on Saturday night and midnight on the succeeding Saturday night."- Motor Transport Workers Act (1961). "Week means a period of seven days beginning at mid-night on Saturday night or such other night as may be approved in writing for a particular area by the Inspector."-Child Labour (Prohibition and Regulation) Act (1986). The discretion is granted to an Inspector. "Week means a period of seven days beginning at mid-night on Saturday night or such other night as may be approved in writing for a particular area by the Chief Inspector of Factories."-Factories Act (1948). The discretion is granted to a Chief Inspector. "Week means a period of seven days beginning at mid-night on Saturday night or such other night as may be approved in writing for a particular area by the Chief Inspector or an Inspector." - Mines Act (1952). The discretion is granted to either an Inspector or a Chief Inspector. "Week means a period of seven days beginning at midnight on Saturday night or such other night as may be fixed by the State Government in relation to plantations in any area after such consultation as may be prescribed with reference to the plantations concerned in that area." - Plantations Labour Act (1951).
11 Meaning primarily, but not exclusively, Chapter V-B of the Industrial Disputes Act
TeamLease
55TeamLease Services
India Labour Report 2006

Here are some examples of definitional variations that are quite unnecessary:
Adolescent: Between 15 and 18 under Section 2(b) of the Factories Act, but between 14 and 18 under Section 2(a) of the Minimum Wages Act.
Child: Under 14 under Section 2(ii) of the Child Labour (Prohibition and Regulation) Act, but under 15 under Section 2C of the Factories Act.
Contract Labour: Under Section 2(e) of the Beedi and Cigar Workers (Conditions of Employment) Act, "contract labour means any person engaged or employed in any premises by or through a contractor, with or without the knowledge of the employer, in any manufacturing process." But under Section 2(b) of the Contract Labour (Regulation and Abolition) Act, "a workman shall be deemed to be employed as contract labour in or in connection with the work of an establishment when he is hired in or in connection with such work by or through a contractor, with or without the knowledge of the principal employer." Note the difference between manufacturing process and any enterprise.
Employee: Under Section 2(13) of the Payment of Bonus Act, "employee means any person (other than an apprentice) employed on a salary or wage not exceeding two thousand and five hundred rupees per mensem in any industry to do any skilled or unskilled manual, supervisory, managerial, administrative, technical or clerical work of hire or reward, whether the terms of employment be express or implied." However, under Section 2(e) of the Payment of Gratuity Act, we have, "employee means any person (other than an apprentice) employed on wages in any establishment, factory, mine, oilfield, plantation, railway company or shop, to do any skilled, semi-skilled, or unskilled, manual, supervisory, technical or clerical work, whether the terms of employment be express or implied, and whether or not such person is employed in a managerial or administrative capacity, but does not include any such person who holds a post under the Central Government or a State Government and is governed by any other Act or by any rules providing for payment of gratuity."
Factory: Under Section 2(g) of the Employees' Provident Funds and Miscellaneous Provisions Act, "factory means any premises, including the precincts thereof, in any part of which a manufacturing process is being carried on or is ordinarily so carried on, whether with the aid of power or without the aid of power." However, under Section 2(m) of the Factories Act, "factory means any premises including the precincts thereof - (I) whereon ten or more workers are working, or were working on any day of the preceding twelve months, and in any part of which a manufacturing process is being carried on with the aid of power, or is ordinarily so carried on, or (ii) whereon twenty or more workers are working, or were working on any day of the preceding twelve months, and in any part of which a manufacturing process is being
production, supply or distribution of goods and services with a view to satisfy human wants
carried on without the aid of power, or is ordinarily so carried on, - but does not include a mine subject to the operation of the Mines Act, 1952, or a mobile unit belonging to the armed forces of the Union, a railway running shed or a hotel, restaurant or eating place.”
Industry: Under Section 2(I) of the Employees' Provident Fund and Miscellaneous Provisions Act, "industry means any industry specified in Schedule I, and includes any other industry added to that Schedule by notification under Section 4." However, under Section 2(j) of the Industrial Disputes Act, "industry means any systematic activity carried on by co-operation between an employer and his workmen (whether such workmen are employed by such employer directly or by or through any agency, including a contractor) for the
56
TeamLease
TeamLease Services
India Labour Report 2006

or wishes (not being wants or wishes which are merely spiritual or religious in nature), whether or not, - (I) any capital has been invested for the purpose of carrying on such activity; or (ii) such activity is carried on with a motive to make any gain or profit". Given such a comprehensive definition, the case law under the Industrial Disputes Act has held almost
12everything to be an industry. All of the following have been held to be industries - panchayat samitis, state hospitals, real estate companies, running of tube wells, primary health centers, Federation of Indian Chambers of Commerce and Industry, religious institutions, universities and research institutions.
Wages: Under Section 2(k) of the Cine-Workers and Cinema Theatre Workers (Regulation of Employment) Act, house rent allowance and dearness allowance are not included in wages. However, under Section 2(rr) of the Industrial Disputes Act, house rent allowance and dearness allowance are part of wages.
Workman: Under Section 2(I) of the Contract Labour (Regulation and Abolition) Act, "workman means any person employed in or in connection with the work of any establishment to do any skilled, semi-skilled or un-skilled manual, supervisory, technical or clerical work for hire or reward, whether the terms of employment be express or implied, but does not include any such person - (A) who is employed mainly in a managerial or administrative capacity; or (B) who, being employed in a supervisory capacity draws wages exceeding five hundred rupees per mensem or exercises, either by the nature of the duties attached to the office or by reason of the powers vested in him, functions mainly of a managerial nature; or (C) who is an out-worker, that is to say, a person to whom any articles and materials are given out by or on behalf of the principal employer to be made up, cleaned, washed, altered, ornamented, finished, repaired, adapted or otherwise processed for sale for the purposes of the trade or business of the principal employer and the process is to be carried out either in the home of the out-worker or in some other premises, not being premises under the control and management of the principal employer." Under Section 2(l) of the Factories Act, "worker means a person employed, directly or by or through any agency (including a contractor) with or without the knowledge of the principal employer, whether for remuneration or not, in any manufacturing process or in cleaning any part of the machinery or premises used for a manufacturing process, or in any other kind of work incidental to, or connected with, the manufacturing process, or the subject of the manufacturing process, but does not include any member of the armed forces of the Union."
The workman/employee distinction is a special instance of inordinate confusion. The Payment of Wages Act uses the term "employed person", the Factories Act uses the term "worker", the Minimum Wages Act uses the term "employee" and the Mines Act uses the term "employed". Presumably, all workmen are employees, but all employees are not workmen. There are some categories of employees, who because they are relatively disadvantaged, require special protection. Such "workmen" can either be defined in terms of a wage threshold or in terms of the nature of the job. But even in this, there is complete lack of harmonization. If the intention is to separate out a managerial class, that task is not accomplished.
There are several instances of legislation where provisions that can broadly be called "social security" are applied. But even in this, there is no uniformity. The Payment of Gratuity Act and the Payment of Bonus Act (optional) are applicable to establishments that employ a minimum of 10 people. The Employees' Provident Fund and Miscellaneous Provisions Act is applicable to enterprises that employ a minimum of 20 people. The Factories Act and the Employees' State Insurance Act are applicable to enterprises that employ 10 or more people with electricity or 20 or more people without electricity.
TeamLease
57TeamLease Services
India Labour Report 2006
12. Especially after the Bangalore Water Supply and Sewerage Board vs. A. Rajappa case in 1978 and an amendment to the Industrial Disputes Act in 1982.

The wage limit for entitlement to some benefits is Rs 6500 per month under the Payment of Wages Act, Rs. 7500 per month for Employees' State Insurance Act. For the Employees' Provident Fund and Miscellaneous Provisions Act, the threshold is Rs 6500 per month.
There must be one canteen for 100 motor transport workers. But there must be one canteen for 150 plantation workers and one canteen for 250 factory workers.
There is also lack of harmony in penalties for offences. The Payment of Bonus Act does not prescribe any minimum penalties. But the maximum penalty is imprisonment of six months or fine of Rs 1000. This is for any offence under the Payment of Bonus Act. For "obstructing inspectors", the Payment of Wages Act prescribes a maximum fine of Rs 1000 and a minimum of Rs 100 (there is no jail term). However, under the Plantations Labour Act, an identical offence has maximum imprisonment of three months or a maximum fine of Rs 500. No minimum penalty is prescribed. For an identical offence, the Factories Act prescribes a maximum imprisonment of six months or a maximum fine of Rs 10,000. No minimum penalty is prescribed.
All these concepts, definitions and provisions need to be unified. All social security type provisions can be unified into a single statute. Similarly, all wage type legislation can also be unified into a single statute. The National Labour Association attempted this through a Uniform Indian Labour
13Code. But this was not implemented. The report of the Second National Commission, submitted in 2002, also argues for such unification. While there can be debate about the Industrial Disputes Act, there is absolutely no reason why the unification and rationalization should not happen.
Over - legislation
However, within the labour law reform agenda, the most contentious issue is that of over-legislation and reducing State intervention. India is a country that is over-legislated and under-governed. Over-legislation is correlated with the problem of reducing unnecessary State intervention and with reforms, views on what the State should have changed. Even if one ignores industrial relations for the moment, the Factories Act is a good example of unnecessary government stipulations. Do we need the government to lay down these things?
Section 11: "(1) Every factory shall be kept clean and free from effluvia arising from any drain, privy or other nuisance, and in particular - (a) accumulations of dirt and refuse shall be removed daily by sweeping or by any other effective method from the floors and benches of workrooms, and from staircases and passages, and disposed of in a suitable manner; (b) the floor of every workroom shall be cleaned at least once in every week by washing, using disinfectant, where necessary, or by some other effective method; (c) where a floor is liable to become wet in the course of any manufacturing process, to such extent as is capable of being drained, effective means of drainage shall be provided; (d) all inside walls and partitions, all ceilings or tops of rooms and all walls, sides and tops of passages and staircases shall - (i) where they are painted otherwise than with washable water-paint or varnished, be re-painted or re-varnished at least once in every period of five years; (ia) where they are painted with washable water paint be re-painted with at least one coat of such paint at least once in every period of three years and washed at least once in every period of six months; (ii) where they are painted or varnished or where they have smooth impervious surfaces, be cleaned at least once in every period of fourteen months by such methods as may be prescribed; (iii) in any other case, be kept whitewashed, or colour washed, and the whitewashing or colourwashing shall be carried out at least once in every period of fourteen months; (dd) all doors and window frames and other wooden or metallic framework and shutters shall be kept painted or varnished and the painting or varnishing shall be carried out at least once in every period of five
13 Uniform Indian Labour Code - A Draft, National Labour Association and FES.
TeamLease
58TeamLease Services
India Labour Report 2006
years; (e) the dates on which the processes required by clause (d) are carried out shall be entered in the prescribed register.”
Section 18: "(1) In every factory effective arrangements shall be made to provide and maintain at suitable points conveniently situated for all workers employed therein a sufficient supply of wholesome drinking water. (2) All such points shall be legibly marked "drinking water" in a language understood by a majority of the workers employed in the factory, and no such point shall be situated within six metres of any washing place, urinal, latrine, spittoon, open drain carrying sullage or effluent or any other source of contamination unless a shorter distance is approved in writing by the Chief Inspector. (3) In every factory wherein more than two hundred and fifty workers are ordinarily employed, provisions shall be made for cooling drinking water during hot weather by effective means and for distribution thereof. (4) In respect of all factories or any class or description of factories the State Government may make rules for securing compliance with the provisions of such-sections (1), (2) and (3) and for the examination by prescribed authorities of the supply and distribution of drinking water in factories."
Section 19: "(1) In every factory - (a) sufficient latrine and urinal accommodation of prescribed types shall be provided conveniently situated and accessible to workers at all times while they are at the factory; (b) separate enclosed accommodation shall be provided for male and female workers; (c) such accommodation shall be adequately lighted and ventilated, and no latrine or urinal shall, unless specifically exempted in writing by the Chief Inspector, communicate with any workroom except through an intervening open space or ventilated passage; (d) all such accommodation shall be maintained in a clean and sanitary condition at all times; (e) sweepers shall be employed whose primary duty would be to keep clean latrines, urinals and washing places. (2) In every factory wherein more than two hundred and fifty workers are ordinarily employed - (a) all latrine and urinal accommodation shall be of prescribed sanitary types; (b) the floors and internal walls, up to a height of ninety centimetres, of the latrines and urinals and the sanitary blocks shall be laid in glazed tiles or otherwise finished to provide a smooth polished impervious surface; (c) without prejudice to the provisions of clauses (d) and (e) of sub-section (1), the floors, portions of the walls and blocks so laid or finished and the sanitary pans of latrines and urinals shall be thoroughly washed and cleaned at least once in every seven days with suitable detergents or disinfectants or with both. (3) The State Government may prescribe the number of latrines and urinals to be provided in any factory in proportion to the numbers of male and female workers ordinarily employed therein, and provide for such further matters in respect of sanitation in factories, including the obligation of workers in this regard, as it considers necessary in the interest of the health of the workers employed therein."
Section 20: "(1) In every factory there shall be provided a sufficient number of spittoons in convenient places and they shall be maintained in a clean and hygienic condition. (2) The State Government may make rules prescribing the type and the number of spittoons to be provided and their location in any factory and provide for such further matters relating to their maintenance in a clean and hygienic condition. (3) No person shall spit within the premises of a factory except in the spittoons provided for the purpose and a notice containing this provision and the penalty for its violation shall be prominently displayed at suitable places in the premises."
Section 43: "The State Government may, in respect of any factory or class or description of factories, make rules requiring the provision therein of suitable places for keeping clothing not worn during working hours and for the drying of wet clothing."
TeamLease
59TeamLease Services
India Labour Report 2006

Section 51: "No adult worker shall be required or allowed to work in a factory for more than forty-eight hours in any week."
These are examples from only one act. It is no one's case that welfare provisions should not exist. But are welfare provisions enacted in 1948 still relevant?
Or take the Delhi Shops and Establishments Act of 1954 and the assorted rules. This is applicable to Delhi, but mirror images exist in other States. Shops are "premises where goods are sold" and establishments are "premises wherein any trade, business or profession …is carried on. Any commercial enterprise that is not a factory (covered by the Factories Act with similar provisions) or does not belong to the category of "theatres, cinemas, restaurants, eating houses, residential hotels, clubs or other places of public amusements or entertainment" is a shop or an establishment and is covered by the 1954 statute.
Since this act was passed in 1954, we have Section 14 and Section 15. Consider Section 14 first. "No young person, or woman shall be allowed or required to work whether as an employee or otherwise in any establishment between 9 P.M. and 7 A.M. during the summer season and between 8 P.M. to 8 A.M. during the winter season." Junk the call centers and junk any idea of India exploiting the time difference advantage. These things are technically illegal. Not entirely of course. Because under Section 4 of the statute, the government can grant specific exemptions, sometimes with a stipulation that overtime wages be paid. For example, "Establishments of M/S Band Box Pvt. Ltd, Dyers and Dry Cleaners situated in the premises of Ashoka Hotel, New Delhi" have been granted such an exemption. One doesn't even know if Band Box still exists inside Ashoka Hotel. Shouldn't we simply scrap Section 14 and dispense with this system of selectively granting exemptions?
Section 15 should also be scrapped. Among other things, this states, "No shop or commercial establishment on any day, be opened earlier than such hour or closed later than such hour as may be fixed by the Government by general or special order made in this behalf." So Kamla Market must be closed on Sunday, Jor Bagh must be closed on Monday and so on. And at festival time, the government does citizens a big favour by announcing that shops will be open till 10 P.M. rather than 7 P.M. There are two related problems with this state of affairs. First, the government should have better things to do than deciding which side of Najafgarh Drain should be closed on which day of the week. Surely we can leave opening and closure decisions to the market.
Inefficient and time-consuming administrative law
The most important constraint to efficient decision-making is not statutory law, but administrative law. These rules, orders and regulations are not even published. Even when they are, the language is not citizen friendly, the Plain English movement having left India untouched. The last time such a collation of administrative law was attempted was in 1966. The labour market can be used to illustrate the difference between statutory law and administrative law. In labour markets, reduced State intervention is primarily interpreted as reduced intervention in industrial relations. Most problems relate to the Industrial Disputes Act (IDA), especially Chapter V-B. These concern layoffs, retrenchments and closures and Chapter V-B requires prior permission from the "appropriate" government before such action can take place.
Therefore, labour markets become rigid, employers adopt artificially high capital intensity and circumvent the legislation. Given the other provisions of labour legislation, the requirement of governmental permission can be dispensed with, without adversely affecting the interests of labour. This is a valid point and the IDA invariably figures when labour market reform is mentioned. However, the IDA only covers the organized labour force (7% of the labour force) and within that, only enterprises that employ more than 100 workers (2.17% of the labour force).
60
TeamLease
TeamLease Services
India Labour Report 2006

In contrast, the administrative law in labour covers many more people. 29 different inspectors can descend under 45 statutes. A system of a single inspector for all labour laws does not exist. While grave violations are ignored, minor errors become a scope for harassment. Rules under the Factories Act, framed in 1948, provide for whitewashing of factories. Distemper won't do. Earthen pots filled with water are required. Water coolers won't suffice. Red-painted buckets filled with sand are required. Fire extinguishers won't do. Nor are documentation requirements or time periods for which records have to be kept, standardized. And so on.
Such procedural problems characterize all three stages of an enterprise's operations, entry, functioning and exit, and impose transaction costs that render Indian business uncompetitive. Part of the problem with administrative decisions is that they leave a large degree of discretion, often at petty functionary levels, and thereby encourage corruption and rent-seeking.
Corruption is not distributionally neutral and has an anti-poor bias. The answer lies in removing scope for discretion and discretionary abuse. But that's part of the agenda of pending reforms, often at State-level. Such discretion kicks in at all three stages of an enterprise's life cycle - entry, functioning and exit.
But it also plagues the self-employed entrepreneur. And as Madhu Kishwar's work on street 14vendors and rickshaw pullers in Delhi demonstrates , this entrepreneur can also be a poor
entrepreneur. Thanks to administrative law, the entrepreneur is constrained to work in an illegal or 15quasi-legal environment. There has been some disciplining of government action in consumer
court cases and even through citizen's charters and right to information acts. But there is no substitute to a complete overhaul of the administrative law system and this is predominantly a State government subject. This exercise is still pending.
TeamLease
61TeamLease Services
India Labour Report 2006
14 Reported in several issues of Manushi.15 Hernando de Soto, The Other Path, 1989. Hernando de Soto's The Mystery of Capital (2001)
had an additional argument about inadequate land markets preventing the poor from being ableto use the most productive asset they possess.
The three statutes that impinge on industrial relations are
The Contract Labour (Regulation and Abolition) ActThe Trade Unions ActThe Industrial Disputes Act
The Contract Labour (Regulation and Abolition) Act was never meant to prohibit contract labour. Section 10 provided the appropriate Government the discretion of prohibiting contract labour in selected areas. In fact, in the title of the act, regulation comes before abolition. Contract labour allows flexibility and permits outsourcing. However, a few court judgments have affected this flexibility. There is an argument doing the rounds that the Contract Labour (Regulation and Abolition) Act should be scrapped. This is probably facile. If the 1970 statute is scrapped, decisions on abolition of contract labour will revert from the government to industrial tribunals. To take the Factories Act as an example, industrial tribunals are likely to conclude that since canteens are mandated under Section 46 of the Factories Act, no contract labour can be employed in canteens. It seems to be a better idea to retain the 1970 act and tighten up Section 10 so that ambiguity about continuance of contract labour is removed.
The Trade Unions Act should also be mentioned. As a minor point, child labour is not prohibited in India. It is only prohibited in hazardous processes. Yet, under Section 21 of the Trade Unions Act, those under fifteen are not allowed to be members of trade unions and under Section 21-A of the Trade Unions Act, those under eighteen are prevented from becoming office bearers. But more important are provisions of the Trade Unions Act that lead to multiplicity. Under Section 4 of the Trade Unions Act, any seven people can form and register a trade union and these seven people need not even be workers. There is no cap on office bearers being from outside either. Nor is there any test for representativeness of a trade union, through secret ballots or otherwise. The multiplicity problem impinges on collective bargaining because an agreement with one union is not necessarily binding on others. This is partly due to Section 18(1) of the Industrial Disputes Act, which states, "A settlement arrived at by agreement between the employer and workman otherwise than in the course of conciliation proceeding shall be binding on the parties to the agreement." It is not mandatory on others. Maharashtra and Gujarat are the only States where there are laws requiring recognition of trade unions by employers for purposes of collective bargaining. Following recommendations of the Second Labour Commission, the government has introduced amendments to the Trade Unions Act. The number of persons required for registration of a trade union will change from seven to 10 per cent of the labour force. Not more than one-third of office bearers (subject to a maximum of five) can be outsiders. And the holding of annual elections and auditing of accounts will be mandatory.
In the Industrial Disputes Act (IDA) and the following is a list of sections where there are problems - Section 9-A, Section 11, Section 11-A, Section 17-B, Sections 22/23 and Chapter V-B/Sections 25-K, 25-L, 25-M, 25-N and 25-0. Labour markets become artificially rigid, employers adopt artificially high capital intensity and circumvent the legislation.
The argument against Chapter V-B of IDA is indeed a valid one. Why? An employer-employee relationship ought to be in the nature of a personal contract, with an optional provision of resorting to the government in case of exploitation. However, the provisions of the Industrial Disputes Act make recourse to the Government and thus to Labour Commissioners, mandatory. Given the other provisions of labour legislation, the requirement of governmental permission can be dispensed with, without adversely affecting the interests of labour. Unless this rigidity in labour markets is removed, higher growth will not necessarily translate into greater employment.
Section C3: The Three Critical Laws
62
TeamLease
TeamLease Services
India Labour Report 2006
TeamLease Services
India Labour Report 2006
What is involved is not an exit policy for labour but for companies. Competition cannot function without free exit. The NCMP (National Common Minimum Programme) states, “The UPA rejects the idea of automatic hire and fire.” Everyone who is against reforming labour markets criticizes the government for trying to introduce hire and fire. Everyone who is in favour of reforming labour markets criticizes the government for not introducing hire and fire. The recently published Economic Freedom of the World 2004 is an example. Scores are out of 10 and the higher, the better. India gets an overall score of 6.3. But for flexibility in hiring and firing, the Indian score is
162.0. The point is that this is probably largely perceptional rather than real.
But more importantly, while a consensus on Chapter V-B is being rustled up, why not amend the other sections of IDA and implement the other labour law reforms?
If implemented, these recommendations will harmonize labour laws under five heads of industrial relations, wages, social security, safety and welfare and working conditions. While flexibility will improve in the organized labour market, there will simultaneously be better social security provisions in the unorganized one. Implementation of the latter of course remains a problem. But it is the political economy that proves to be intractable.
One answer could be to amend the Seventh Schedule of the Constitution and move labour from the Concurrent List to the State List. That way, States that wish to reform, can go ahead, without waiting for the Central government to resolve problems centered around coalition politics.
16 This is the Fraser Institute's economic freedom index, not the ones brought out by Freedom House or Heritage Foundation (in collaboration with Wall Street Journal).
63
TeamLease
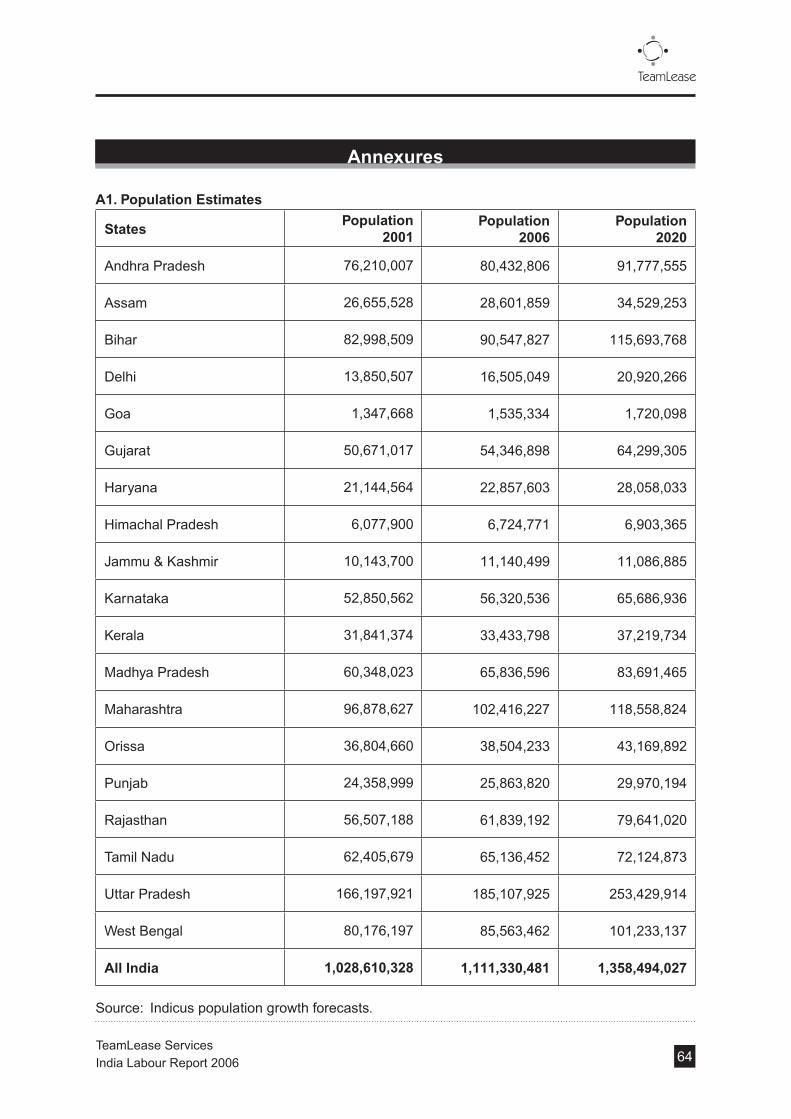
StatesPopulation
2001Population
2006Population
2020
Andhra Pradesh 76,210,007 80,432,806 91,777,555
Assam 26,655,528 28,601,859 34,529,253
Bihar 82,998,509 90,547,827 115,693,768
Delhi 13,850,507 16,505,049 20,920,266
Goa 1,347,668 1,535,334 1,720,098
Gujarat 50,671,017 54,346,898 64,299,305
Haryana 21,144,564 22,857,603 28,058,033
Himachal Pradesh 6,077,900 6,724,771 6,903,365
Jammu & Kashmir 10,143,700 11,140,499 11,086,885
Karnataka 52,850,562 56,320,536 65,686,936
Kerala 31,841,374 33,433,798 37,219,734
Madhya Pradesh 60,348,023 65,836,596 83,691,465
Maharashtra 96,878,627 102,416,227 118,558,824
Orissa 36,804,660 38,504,233 43,169,892
Punjab 24,358,999 25,863,820 29,970,194
Rajasthan 56,507,188 61,839,192 79,641,020
Tamil Nadu 62,405,679 65,136,452 72,124,873
Uttar Pradesh 166,197,921 185,107,925 253,429,914
West Bengal 80,176,197 85,563,462 101,233,137
All India 1,028,610,328 1,111,330,481 1,358,494,027
Source: Indicus population growth forecasts.
A1. Population Estimates
Annexures
64

A2: Labour Force Estimates
States Labour Force - 2001 Labour Force - 2020
Andhra Pradesh 38,102,741 56,417,221
Assam 11,412,148 19,400,971
Bihar 30,169,003 53,822,566
Delhi 5,039,401 8,983,655
Goa 654,786 909,612
Gujarat 22,771,163 34,416,807
Haryana 8,932,962 15,382,997
Himachal Pradesh 3,199,012 4,488,962
Jammu & Kashmir 4,411,475 6,210,975
Karnataka 25,038,718 37,314,000
Kerala 14,428,065 19,557,239
Madhya Pradesh 27,269,963 45,391,721
Maharashtra 43,957,491 67,376,836
Orissa 16,414,670 24,549,272
Punjab 10,215,242 15,688,885
Rajasthan 24,956,024 44,588,194
Tamil Nadu 31,779,407 42,056,781
Uttar Pradesh 59,067,525 104,231,898
West Bengal 37,774,343 58,455,932
All India 447,392,620 715,946,966
Note: Labour Force has been estimated using Census of India (main + marginal workers as well as those looking for a job for 2001; forecasts are based on a growth parameter that is based on (a) expected growth in 20-60 age group (b) increased female work participation.
65
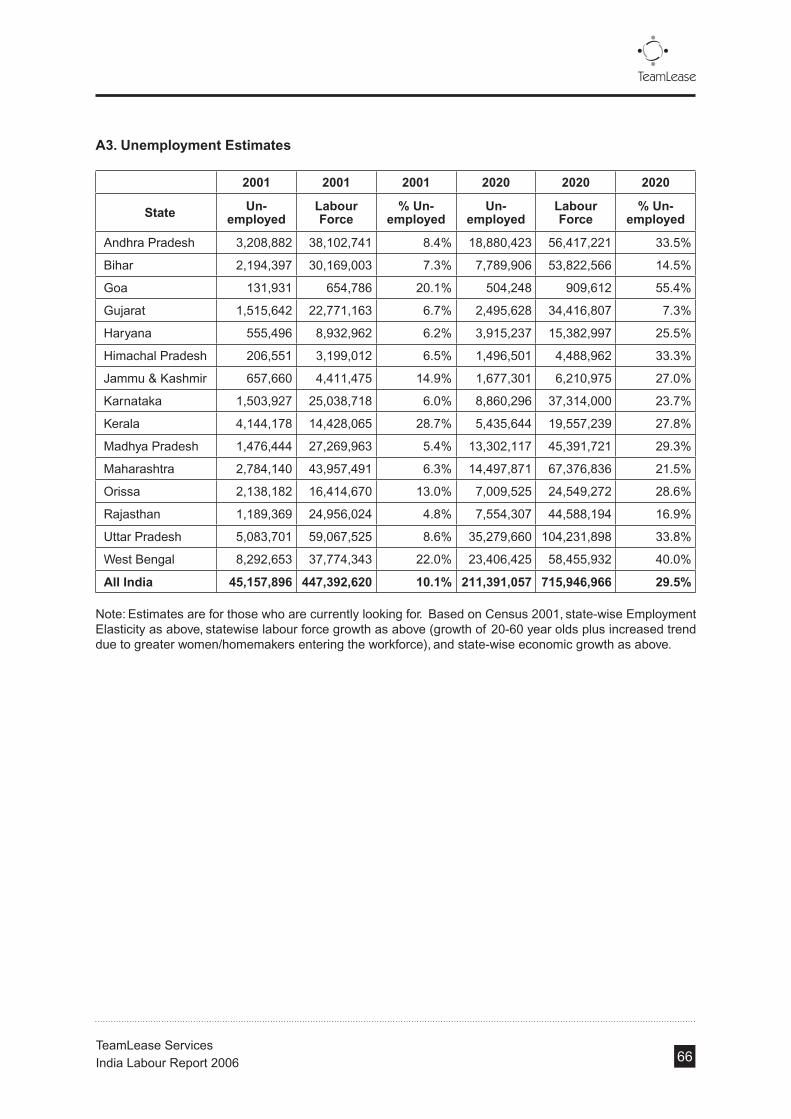
A3. Unemployment Estimates
2001 2001 2001 2020 2020 2020
State Un-employed
Labour Force
% Un-employed
Un-employed
Labour Force
% Un-employed
Andhra Pradesh 3,208,882 38,102,741 8.4% 18,880,423 56,417,221 33.5%
Bihar 2,194,397 30,169,003 7.3% 7,789,906 53,822,566 14.5%
Goa 131,931 654,786 20.1% 504,248 909,612 55.4%
Gujarat 1,515,642 22,771,163 6.7% 2,495,628 34,416,807 7.3%
Haryana 555,496 8,932,962 6.2% 3,915,237 15,382,997 25.5%
Himachal Pradesh 206,551 3,199,012 6.5% 1,496,501 4,488,962 33.3%
Jammu & Kashmir 657,660 4,411,475 14.9% 1,677,301 6,210,975 27.0%
Karnataka 1,503,927 25,038,718 6.0% 8,860,296 37,314,000 23.7%
Kerala 4,144,178 14,428,065 28.7% 5,435,644 19,557,239 27.8%
Madhya Pradesh 1,476,444 27,269,963 5.4% 13,302,117 45,391,721 29.3%
Maharashtra 2,784,140 43,957,491 6.3% 14,497,871 67,376,836 21.5%
Orissa 2,138,182 16,414,670 13.0% 7,009,525 24,549,272 28.6%
Rajasthan 1,189,369 24,956,024 4.8% 7,554,307 44,588,194 16.9%
Uttar Pradesh 5,083,701 59,067,525 8.6% 35,279,660 104,231,898 33.8%
West Bengal 8,292,653 37,774,343 22.0% 23,406,425 58,455,932 40.0%
All India 45,157,896 447,392,620 10.1% 211,391,057 715,946,966 29.5%
Note: Estimates are for those who are currently looking for. Based on Census 2001, state-wise Employment Elasticity as above, statewise labour force growth as above (growth of 20-60 year olds plus increased trend due to greater women/homemakers entering the workforce), and state-wise economic growth as above.
66
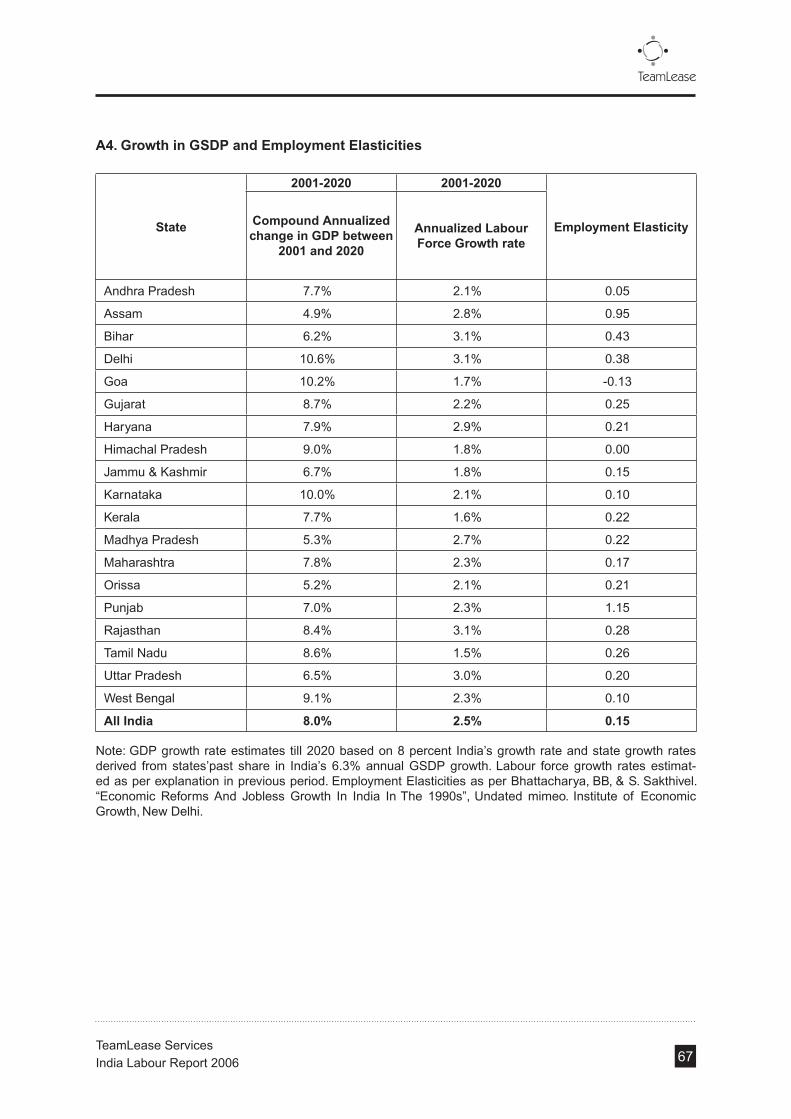
A4. Growth in GSDP and Employment Elasticities
State
2001-2020 2001-2020
Employment ElasticityCompound Annualized change in GDP between
2001 and 2020
Annualized Labour Force Growth rate
Andhra Pradesh 7.7% 2.1% 0.05
Assam 4.9% 2.8% 0.95
Bihar 6.2% 3.1% 0.43
Delhi 10.6% 3.1% 0.38
Goa 10.2% 1.7% -0.13
Gujarat 8.7% 2.2% 0.25
Haryana 7.9% 2.9% 0.21
Himachal Pradesh 9.0% 1.8% 0.00
Jammu & Kashmir 6.7% 1.8% 0.15
Karnataka 10.0% 2.1% 0.10
Kerala 7.7% 1.6% 0.22
Madhya Pradesh 5.3% 2.7% 0.22
Maharashtra 7.8% 2.3% 0.17
Orissa 5.2% 2.1% 0.21
Punjab 7.0% 2.3% 1.15
Rajasthan 8.4% 3.1% 0.28
Tamil Nadu 8.6% 1.5% 0.26
Uttar Pradesh 6.5% 3.0% 0.20
West Bengal 9.1% 2.3% 0.10
All India 8.0% 2.5% 0.15
67
Note: GDP growth rate estimates till 2020 based on 8 percent India’s growth rate and state growth rates derived from states’past share in India’s 6.3% annual GSDP growth. Labour force growth rates estimat-ed as per explanation in previous period. Employment Elasticities as per Bhattacharya, BB, & S. Sakthivel. “Economic Reforms And Jobless Growth In India In The 1990s”, Undated mimeo. Institute of Economic Growth, New Delhi.

B1. Overall Labour Ecosystem Index - Values
States Values 1991
Values 1995
Values 2001
Values 2005
Andhra Pradesh 609 608 619 748
Assam 369 360 578 269
Bihar 316 177 147 136
Delhi 968 967 786 835
Goa 1,000 712 499 670
Gujarat 842 829 756 834
Haryana 273 537 675 558
Himachal Pradesh 701 409 578 568
Jammu & Kashmir - 190 157 126
Karnataka 896 937 690 765
Kerala 894 602 670 564
Madhya Pradesh 865 703 479 523
Maharashtra 909 808 954 757
Orissa 757 560 543 510
Punjab 332 520 586 617
Rajasthan 537 507 504 573
Tamil Nadu 710 614 774 763
Uttar Pradesh 220 297 218 170
West Bengal 385 379 210 307
68

B2. Overall Labour Ecosystem Index - Rank and Values
StatesRank1995
Rank2005
Values1995
Values2005
Delhi 1 1 967 835
Gujarat 3 2 829 834
Karnataka 2 3 937 765
Tamil Nadu 7 4 614 763
Maharashtra 4 5 808 757
Andhra Pradesh 8 6 608 748
Goa 5 7 712 670
Punjab 12 8 520 617
Rajasthan 13 9 507 573
Himachal Pradesh 14 10 409 568
Kerala 9 11 602 564
Haryana 11 12 537 558
Madhya Pradesh 6 13 703 523
Orissa 10 14 560 510
West Bengal 15 15 379 307
Assam 16 16 360 269
Uttar Pradesh 17 17 297 170
Bihar 19 18 177 136
Jammu & Kashmir 18 19 190 126
69
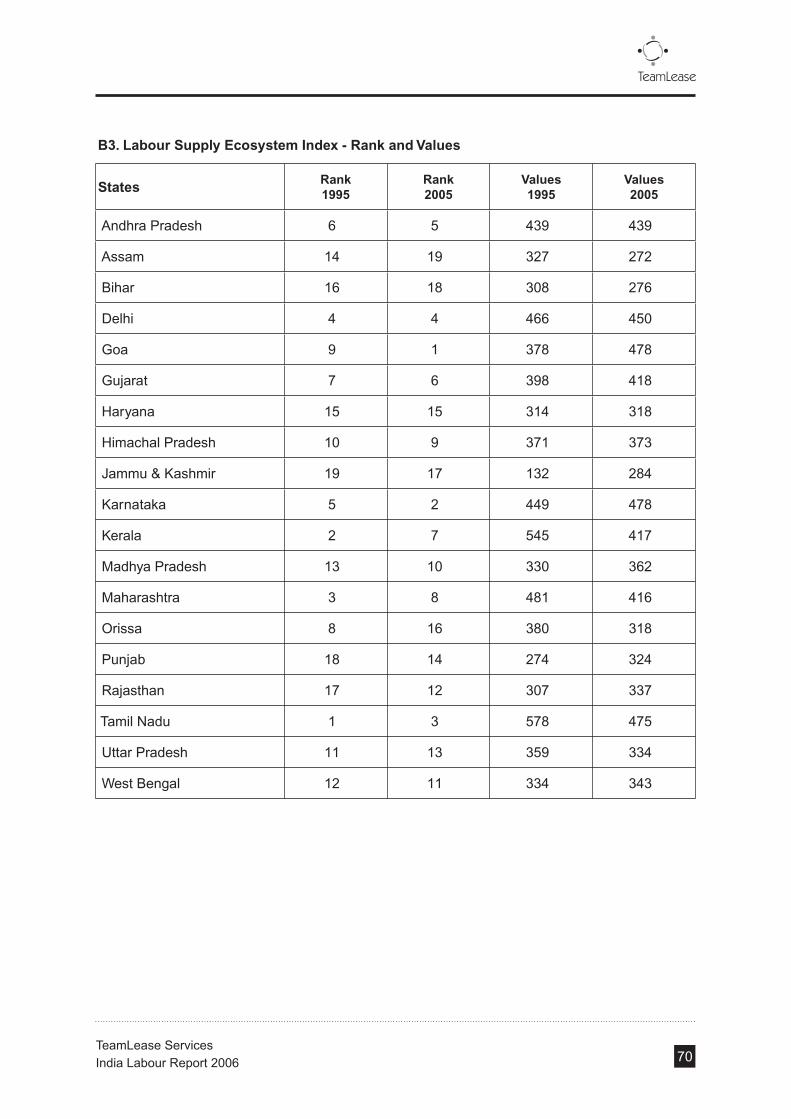
B3. Labour Supply Ecosystem Index - Rank and Values
States Rank 1995
Rank 2005
Values 1995
Values2005
Andhra Pradesh 6 5 439 439
Assam 14 19 327 272
Bihar 16 18 308 276
Delhi 4 4 466 450
Goa 9 1 378 478
Gujarat 7 6 398 418
Haryana 15 15 314 318
Himachal Pradesh 10 9 371 373
Jammu & Kashmir 19 17 132 284
Karnataka 5 2 449 478
Kerala 2 7 545 417
Madhya Pradesh 13 10 330 362
Maharashtra 3 8 481 416
Orissa 8 16 380 318
Punjab 18 14 274 324
Rajasthan 17 12 307 337
Tamil Nadu 1 3 578 475
Uttar Pradesh 11 13 359 334
West Bengal 12 11 334 343
70

B4. Labour Demand Ecosystem Index - Rank and Values
StatesRank 1995
Rank 2005
Values 1995
Values 2005
Andhra Pradesh 15 7 362 472
Assam 13 15 381 359
Bihar 19 19 164 167
Delhi 3 4 503 492
Goa 4 2 503 510
Gujarat 1 1 594 526
Haryana 10 11 438 415
Himachal Pradesh 7 3 482 498
Jammu & Kashmir 9 17 465 258
Karnataka 16 14 360 365
Kerala 5 6 493 482
Madhya Pradesh 8 16 475 353
Maharashtra 6 13 484 392
Orissa 2 10 535 423
Punjab 12 12 405 407
Rajasthan 11 5 431 490
Tamil Nadu 17 8 353 441
Uttar Pradesh 18 18 275 211
West Bengal 14 9 369 435
71

B5. Labour Law Ecosystem Index - Rank and Values
States Rank 1995
Rank 2005
Values 1995
Values 2005
Andhra Pradesh 8 8 336 348
Assam 17 17 233 229
Bihar 9 10 333 318
Delhi 2 5 463 386
Goa 6 14 352 251
Gujarat 5 4 357 387
Haryana 10 6 330 361
Himachal Pradesh 19 13 185 263
Jammu & Kashmir 12 18 287 193
Karnataka 1 2 637 427
Kerala 18 15 196 241
Madhya Pradesh 3 9 420 344
Maharashtra 7 1 348 449
Orissa 16 11 236 317
Punjab 4 3 394 413
Rajasthan 11 12 319 300
Tamil Nadu 13 7 265 354
Uttar Pradesh 15 16 246 233
West Bengal 14 19 248 168
72

B6.
Lab
ou
r D
eman
d E
cosy
stem
200
5
Sta
tes
Cap
ital
F
orm
atio
n
as a
sh
are
of
Gro
ss S
tate
D
om
esti
c P
rod
uct
% o
f IE
Ms
im-
ple
men
ted
Act
ual
in
vest
men
t as
sh
are
of
pro
po
sed
as
per
IEM
s.
Per
Cap
ita
avai
lab
ility
of
Ro
ads
Po
wer
S
urp
lus/
Defi
cit
as
%
of
Req
uir
ed
Tele
-Den
sity
Gro
ss S
tate
D
om
esti
c P
rod
uct
(at
curr
ent
pri
ces)
by
Taxe
s o
n
Co
m-
mo
dit
ies
&
Ser
vice
s
Inve
rse
of
(Co
rru
pti
on
ca
ses
pen
din
g
inve
sti-
gat
ion
)/
(Cas
es
reg
. un
der
P
reve
nti
on
of
Co
rru
pti
on
&
Rel
ated
Act
)
Inve
rse
of
Vio
len
t C
rim
es
div
ided
by
Co
gn
izab
le
Cri
me
un
der
IP
C
And
hra
Pra
desh
28
.87
11.6
18.
700.
24-0
.70
101,
378
150
1,34
1 A
ssam
12
.68
16.8
413
.45
0.31
-5.4
03
2,21
450
396
Bih
ar
22.1
26.
664.
170.
07-1
0.10
31,
871
8838
0 D
elhi
25
.91
9.43
9.69
0.16
-1.0
052
1,49
387
1,33
6 G
oa
43.7
817
.77
10.7
00.
680.
00.
1,34
318
741
Guj
arat
50
.65
14.2
616
.71
0.25
-11.
7013
1,79
414
01,
479
s H
arya
na
37.2
811
.11
22.4
60.
12-5
.70
111,
308
114
1,07
8 H
imac
hal P
rade
sh
90.5
36.
886.
160.
46-2
.10
141,
872
8291
9 J
amm
u &
Kas
hmir
35.9
02.
7412
.79
0.21
-9.2
06
1,74
993
435
Kar
nata
ka
39.3
37.
149.
560.
27-4
.20
131,
214
9799
5 K
eral
a 33
.09
14.3
48.
670.
46-1
.20
201,
119
118
993
Mad
hya
Pra
desh
29
.45
9.63
5.35
0.22
-13.
505
1,65
612
61,
239
Mah
aras
htra
38
.07
8.02
10.2
80.
25-1
2.10
111,
534
169
983
Oris
sa
26.1
65.
151.
610.
61-0
.80
41,
948
148
690
Pun
jab
23.7
810
.98
9.44
0.23
-9.0
023
1,41
714
11,
011
Raj
asth
an
30.7
813
.02
24.5
00.
21-0
.80
71,
624
119
1,15
1 T
amil
Nad
u 33
.80
8.45
7.18
0.25
-0.6
011
1,16
112
41,
516
Utta
r P
rade
sh
31.6
78.
1814
.17
0.15
-20.
104
1,74
374
472
Wes
t Ben
gal
14.2
812
.11
40.2
80.
11-1
.60
32,
884
2167
8 73
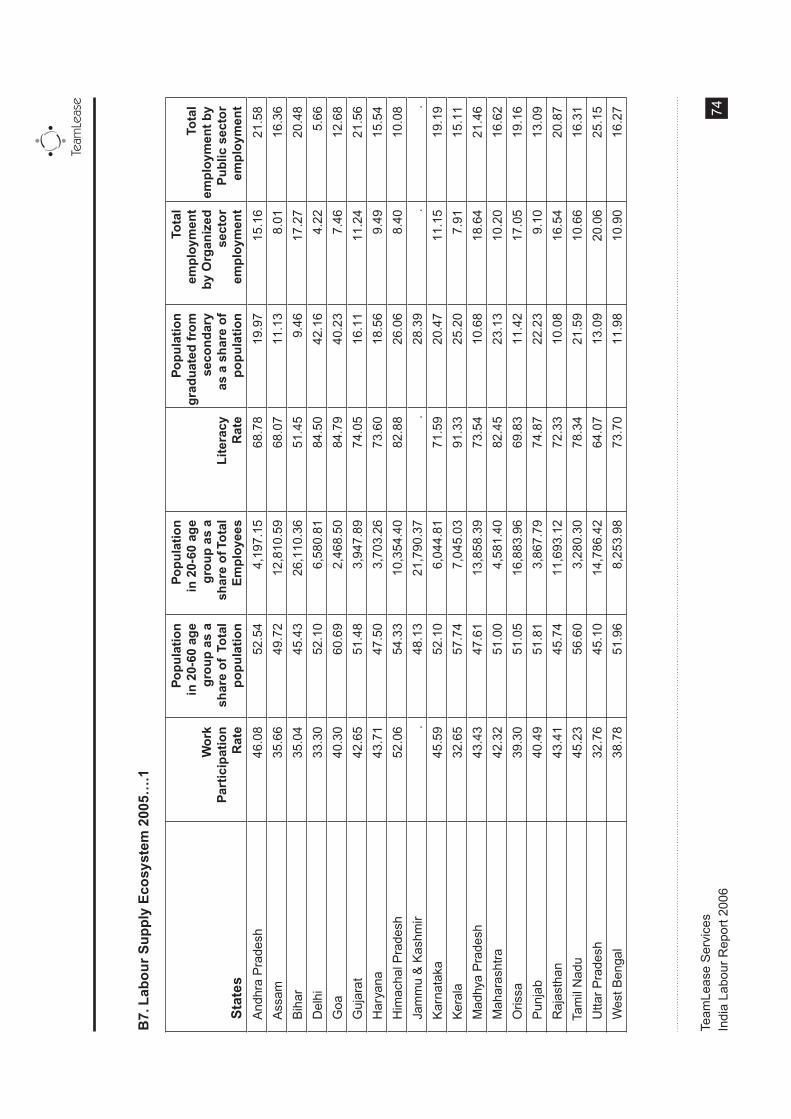
B7.
Lab
ou
r S
up
ply
Eco
syst
em 2
005…
.1
Sta
tes
Wo
rk
Par
tici
pat
ion
R
ate
Po
pu
lati
on
in
20-
60 a
ge
gro
up
as
a sh
are
of
To
tal
po
pu
lati
on
Po
pu
lati
on
in
20-
60 a
ge
gro
up
as
a sh
are
of T
ota
l E
mp
loye
es
Lit
erac
y
Rat
e
Po
pu
lati
on
g
rad
uat
ed f
rom
se
con
dar
y as
a s
har
e o
f p
op
ula
tio
n
To
tal
emp
loym
ent
by O
rgan
ized
se
cto
r em
plo
ymen
t
To
tal
emp
loym
ent
by
Pu
blic
sec
tor
emp
loym
ent
And
hra
Pra
desh
4
6.08
5
2.54
4,1
97.1
5
6
8.78
1
9.97
15
.16
21
.58
Ass
am
35.
66
49.
72
12,
810.
59
68.
07
11.
13
8.0
1
16.3
6
Bih
ar
35.
04
45.
43
26,
110.
36
51.
45
9
.46
17.2
7
20.4
8
Del
hi
33.
30
52.
10
6
,580
.81
84.
50
42.
16
4.2
2
5.6
6
Goa
4
0.30
6
0.69
2,4
68.5
0
8
4.79
4
0.23
7
.46
12
.68
Guj
arat
4
2.65
5
1.48
3,9
47.8
9
7
4.05
1
6.11
11
.24
21
.56
Har
yana
4
3.71
4
7.50
3,7
03.2
6
7
3.60
1
8.56
9
.49
15
.54
Him
acha
l Pra
desh
5
2.06
5
4.33
1
0,35
4.40
8
2.88
2
6.06
8
.40
10
.08
Jam
mu
& K
ashm
ir .
48.
13
21,
790.
37
.
2
8.39
.
.
Kar
nata
ka
45.
59
52.
10
6
,044
.81
71.
59
20.
47
11.1
5
19.1
9
Ker
ala
32.
65
57.
74
7
,045
.03
91.
33
25.
20
7.9
1
15.1
1
Mad
hya
Pra
desh
4
3.43
4
7.61
1
3,85
8.39
7
3.54
1
0.68
18
.64
21
.46
Mah
aras
htra
4
2.32
5
1.00
4,5
81.4
0
8
2.45
2
3.13
10
.20
16
.62
Oris
sa
39.
30
51.
05
16,
883.
96
69.
83
11.
42
17.0
5
19.1
6
Pun
jab
40.
49
51.
81
3
,867
.79
74.
87
22.
23
9.1
0
13.0
9
Raj
asth
an
43.
41
45.
74
11,
693.
12
72.
33
10.
08
16.5
4
20.8
7
Tam
il N
adu
45.
23
56.
60
3
,280
.30
78.
34
21.
59
10.6
6
16.3
1
Utta
r P
rade
sh
32.
76
45.
10
14,
786.
42
64.
07
13.
09
20.0
6
25.1
5
Wes
t Ben
gal
38.
78
51.
96
8
,253
.98
73.
70
11.
98
10.9
0
16.2
7 74
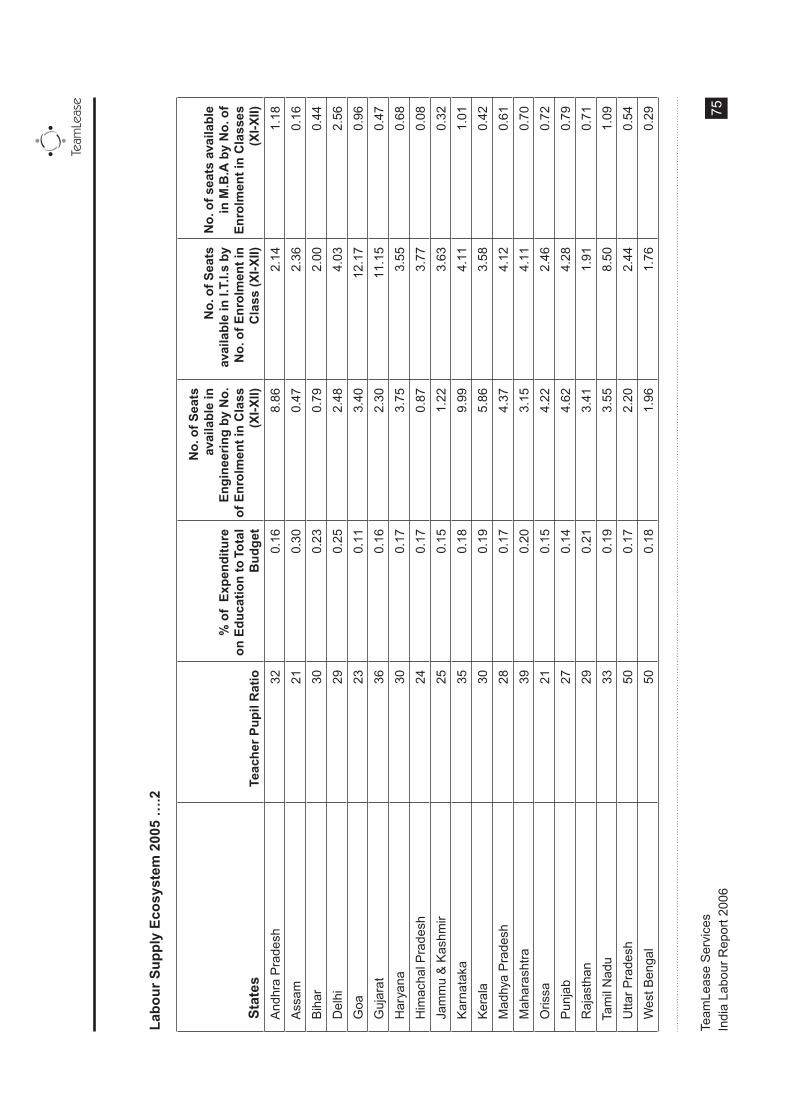
Lab
ou
r S
up
ply
Eco
syst
em 2
005
….2
Sta
tes
Tea
cher
Pu
pil
Rat
io
% o
f E
xpen
dit
ure
o
n E
du
cati
on
to
To
tal
Bu
dg
et
No
. of
Sea
ts
avai
lab
le in
E
ng
inee
rin
g b
y N
o.
of
En
rolm
ent
in C
lass
(X
I-X
II)
No
. of
Sea
ts
avai
lab
le in
I.T.
I.s b
y N
o. o
f E
nro
lmen
t in
C
lass
(X
I-X
II)
No
. of
seat
s av
aila
ble
in
M.B
.A b
y N
o. o
f E
nro
lmen
t in
Cla
sses
(X
I-X
II)
And
hra
Pra
desh
32
0.1
6
8
.86
2.1
4
1
.18
Ass
am
21
0
.30
0.4
7
2
.36
0.1
6
Bih
ar
30
0
.23
0.7
9
2
.00
0.4
4
Del
hi
29
0
.25
2.4
8
4
.03
2.5
6
Goa
23
0.1
1
3
.40
1
2.17
0
.96
Guj
arat
36
0.1
6
2
.30
1
1.15
0
.47
Har
yana
30
0.1
7
3
.75
3.5
5
0
.68
Him
acha
l Pra
desh
24
0.1
7
0
.87
3.7
7
0
.08
Jam
mu
& K
ashm
ir
25
0.1
5
1
.22
3.6
3
0
.32
Kar
nata
ka
35
0
.18
9.9
9
4
.11
1.0
1
Ker
ala
30
0
.19
5.8
6
3
.58
0.4
2
Mad
hya
Pra
desh
28
0.1
7
4
.37
4.1
2
0
.61
Mah
aras
htra
39
0.2
0
3
.15
4.1
1
0
.70
Oris
sa
21
0
.15
4.2
2
2
.46
0.7
2
Pun
jab
27
0
.14
4.6
2
4
.28
0.7
9
Raj
asth
an
29
0
.21
3.4
1
1
.91
0.7
1
Tam
il N
adu
33
0
.19
3.5
5
8
.50
1.0
9
Utta
r P
rade
sh
50
0
.17
2.2
0
2
.44
0.5
4
Wes
t Ben
gal
50
0
.18
1.9
6
1
.76
0.2
9 75
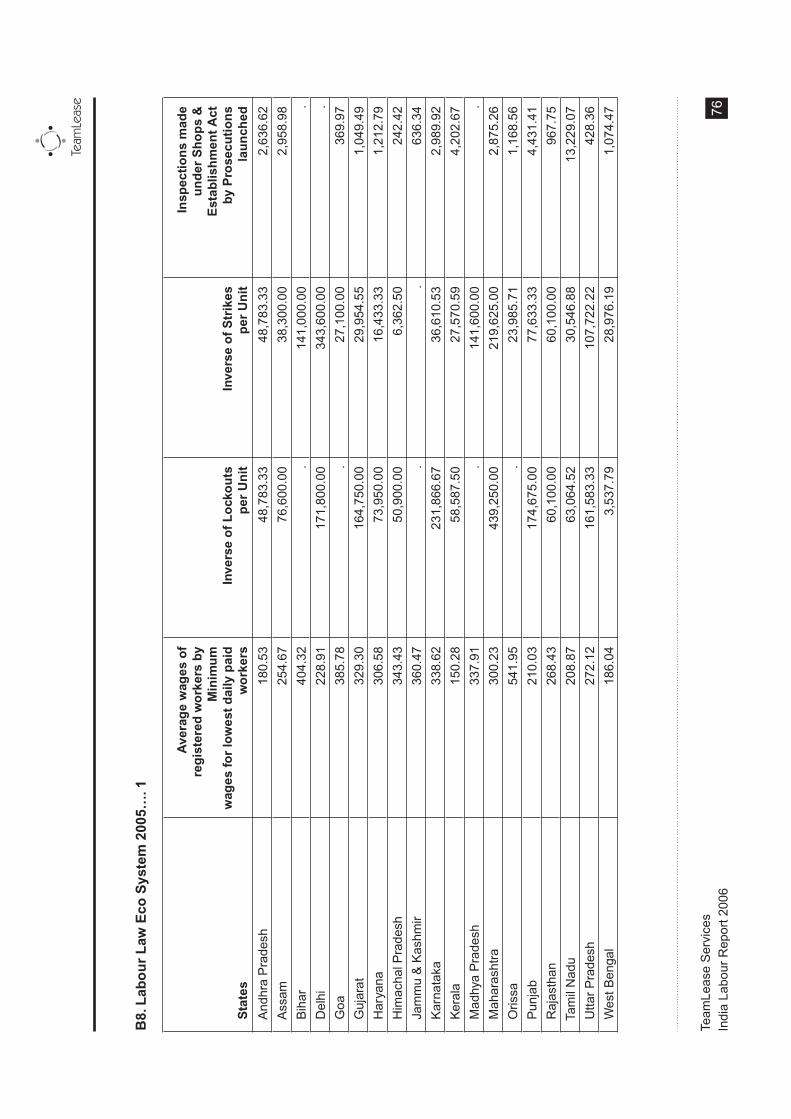
B8.
Lab
ou
r L
aw E
co S
yste
m 2
005…
. 1
Sta
tes
Ave
rag
e w
ages
of
reg
iste
red
wo
rker
s by
M
inim
um
wag
es fo
r lo
wes
t d
aily
pai
d
wo
rker
s In
vers
e o
f L
ock
ou
ts
per
Un
it
Inve
rse
of
Str
ikes
p
er U
nit
Insp
ecti
on
s m
ade
un
der
Sh
op
s &
E
stab
lish
men
t A
ct
by P
rose
cuti
on
s la
un
ched
And
hra
Pra
desh
1
80.5
3
4
8,78
3.33
4
8,78
3.33
2,6
36.6
2
Ass
am
254
.67
76,
600.
00
38,
300.
00
2
,958
.98
Bih
ar
404
.32
.
14
1,00
0.00
.
Del
hi
228
.91
171,
800.
00
343,
600.
00
.
Goa
3
85.7
8 .
27,
100.
00
369
.97
Guj
arat
3
29.3
0
16
4,75
0.00
2
9,95
4.55
1,0
49.4
9
Har
yana
3
06.5
8
7
3,95
0.00
1
6,43
3.33
1,2
12.7
9
Him
acha
l Pra
desh
3
43.4
3
5
0,90
0.00
6,3
62.5
0
2
42.4
2
Jam
mu
& K
ashm
ir
3
60.4
7 .
.
6
36.3
4
Kar
nata
ka
338
.62
231,
866.
67
36,
610.
53
2
,989
.92
Ker
ala
150
.28
58,
587.
50
27,
570.
59
4
,202
.67
Mad
hya
Pra
desh
3
37.9
1 .
141,
600.
00
.
Mah
aras
htra
3
00.2
3
43
9,25
0.00
21
9,62
5.00
2,8
75.2
6
Oris
sa
541
.95
.
2
3,98
5.71
1,1
68.5
6
Pun
jab
210
.03
174,
675.
00
77,
633.
33
4
,431
.41
Raj
asth
an
268
.43
60,
100.
00
60,
100.
00
967
.75
Tam
il N
adu
208
.87
63,
064.
52
30,
546.
88
13,
229.
07
Utta
r P
rade
sh
272
.12
161,
583.
33
107,
722.
22
428
.36
Wes
t Ben
gal
186
.04
3
,537
.79
28,
976.
19
1
,074
.47 76

Lab
ou
r L
aw E
co S
yste
m 2
005…
. 2
Sta
tes
Cas
es d
isp
ose
d O
ff b
y th
e C
ou
rts
un
der
Sh
op
s &
Est
ablis
hm
ent
Act
by
Pro
secu
tio
ns
lau
nch
ed
Inve
rse
of T
ota
l Ap
pel
lan
t C
ases
rel
ated
to
lab
ou
r la
ws
div
ided
by
No
. Of
Un
its
Inve
rse
of T
ota
l Ap
pel
lan
t C
ases
rel
ated
to
lab
ou
r la
ws
div
ided
by
No
. O
f O
rgan
ized
sec
tor
Em
plo
yees
Inve
rse
of
emp
loye
e in
stit
ute
d la
bo
ur
case
s d
ivid
ed b
y to
tal l
abo
ur
rela
ted
cas
es
And
hra
Pra
desh
7
4
17,8
48
228
1,
228,
613
Ass
am
28
4
,942
1
72
35
7,67
4
Bih
ar
.
2,4
31
141
181,
622
Del
hi
.
2,8
63
171
106,
613
Goa
4
8 .
. .
Guj
arat
131
13,5
88
211
739,
232
Har
yana
140
22,8
48
161
1,
301,
734
Him
acha
l Pra
desh
6
4
3,3
93
300
226,
820
Jam
mu
& K
ashm
ir
7
8
4,8
57
117
355,
443
Kar
nata
ka
78
8
,695
2
35
60
7,39
6
Ker
ala
86
6
,996
1
76
40
3,80
3
Mad
hya
Pra
desh
.
5
,900
1
36
42
0,37
2
Mah
aras
htra
7
5
8,6
13
159
573,
755
Oris
sa
59
3
,572
2
04
25
1,46
2
Pun
jab
3
05
22
,848
1
61
1,30
1,73
4
Raj
asth
an
1
08
6
,439
1
71
29
0,79
2
Tam
il N
adu
51
9
,009
2
01
51
8,66
2
Utta
r P
rade
sh
75
2
,592
1
45
15
6,05
5
Wes
t Ben
gal
25
8
,570
2
22
75
8,95
5 77

B9. Strikes & Lockouts
States Strikes Lockouts
Year 1991 1995 2001 2005 1991 1995 2001 2005
Andhra Pradesh 340 120 47 30 200 139 45 30
Assam 29 27 5 4 - 1 - 2
Bihar 51 11 4 2 12 13 2 -
Delhi 15 4 1 - - 2 2 -
Goa 22 9 8 2 1 - - -
Gujarat 146 105 45 44 21 16 8 8
Haryana 57 24 - 27 10 1 - 6
Himachal Pradesh - 7 13 8 1 - - 1
Jammu & Kashmir 1 - - - - - - -
Karnataka 20 18 26 19 1 11 11 3
Kerala 39 27 13 17 11 22 12 8
Madhya Pradesh 24 28 10 3 2 - - -
Maharashtra 105 89 21 8 68 23 2 4
Orissa 55 42 8 7 5 3 1 -
Punjab 46 20 12 9 2 1 5 4
Rajasthan 75 31 14 9 25 11 11 9
Tamil Nadu 154 120 98 64 25 18 27 31
Uttar Pradesh 70 33 10 9 34 28 9 6
West Bengal 18 12 23 21 108 45 167 172
78
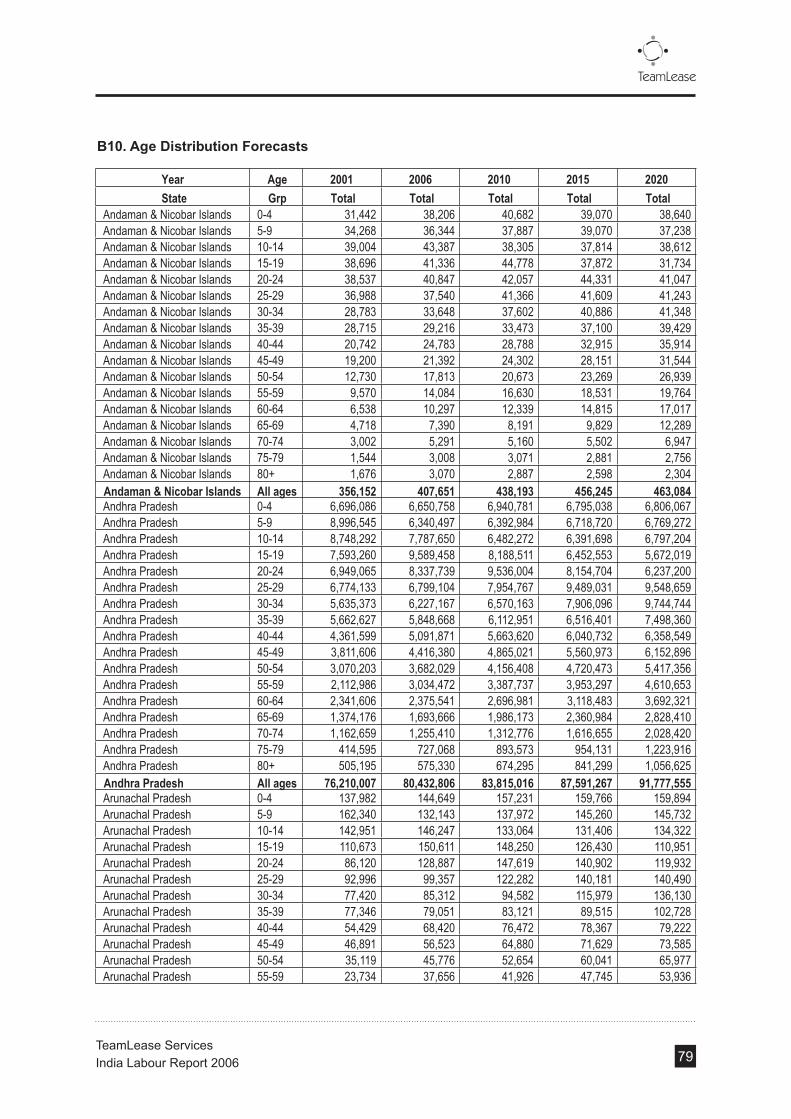
B10. Age Distribution Forecasts
Year Age 2001 2006 2010 2015 2020 State Grp Total Total Total Total Total
Andaman & Nicobar Islands 0-4 31,442 38,206 40,682 39,070 38,640 Andaman & Nicobar Islands 5-9 34,268 36,344 37,887 39,070 37,238 Andaman & Nicobar Islands 10-14 39,004 43,387 38,305 37,814 38,612 Andaman & Nicobar Islands 15-19 38,696 41,336 44,778 37,872 31,734 Andaman & Nicobar Islands 20-24 38,537 40,847 42,057 44,331 41,047 Andaman & Nicobar Islands 25-29 36,988 37,540 41,366 41,609 41,243 Andaman & Nicobar Islands 30-34 28,783 33,648 37,602 40,886 41,348 Andaman & Nicobar Islands 35-39 28,715 29,216 33,473 37,100 39,429 Andaman & Nicobar Islands 40-44 20,742 24,783 28,788 32,915 35,914 Andaman & Nicobar Islands 45-49 19,200 21,392 24,302 28,151 31,544 Andaman & Nicobar Islands 50-54 12,730 17,813 20,673 23,269 26,939 Andaman & Nicobar Islands 55-59 9,570 14,084 16,630 18,531 19,764 Andaman & Nicobar Islands 60-64 6,538 10,297 12,339 14,815 17,017 Andaman & Nicobar Islands 65-69 4,718 7,390 8,191 9,829 12,289 Andaman & Nicobar Islands 70-74 3,002 5,291 5,160 5,502 6,947 Andaman & Nicobar Islands 75-79 1,544 3,008 3,071 2,881 2,756 Andaman & Nicobar Islands 80+ 1,676 3,070 2,887 2,598 2,304 Andaman & Nicobar Islands All ages 356,152 407,651 438,193 456,245 463,084 Andhra Pradesh 0-4 6,696,086 6,650,758 6,940,781 6,795,038 6,806,067 Andhra Pradesh 5-9 8,996,545 6,340,497 6,392,984 6,718,720 6,769,272 Andhra Pradesh 10-14 8,748,292 7,787,650 6,482,272 6,391,698 6,797,204 Andhra Pradesh 15-19 7,593,260 9,589,458 8,188,511 6,452,553 5,672,019 Andhra Pradesh 20-24 6,949,065 8,337,739 9,536,004 8,154,704 6,237,200 Andhra Pradesh 25-29 6,774,133 6,799,104 7,954,767 9,489,031 9,548,659 Andhra Pradesh 30-34 5,635,373 6,227,167 6,570,163 7,906,096 9,744,744 Andhra Pradesh 35-39 5,662,627 5,848,668 6,112,951 6,516,401 7,498,360 Andhra Pradesh 40-44 4,361,599 5,091,871 5,663,620 6,040,732 6,358,549 Andhra Pradesh 45-49 3,811,606 4,416,380 4,865,021 5,560,973 6,152,896 Andhra Pradesh 50-54 3,070,203 3,682,029 4,156,408 4,720,473 5,417,356 Andhra Pradesh 55-59 2,112,986 3,034,472 3,387,737 3,953,297 4,610,653 Andhra Pradesh 60-64 2,341,606 2,375,541 2,696,981 3,118,483 3,692,321 Andhra Pradesh 65-69 1,374,176 1,693,666 1,986,173 2,360,984 2,828,410 Andhra Pradesh 70-74 1,162,659 1,255,410 1,312,776 1,616,655 2,028,420 Andhra Pradesh 75-79 414,595 727,068 893,573 954,131 1,223,916 Andhra Pradesh 80+ 505,195 575,330 674,295 841,299 1,056,625 Andhra Pradesh All ages 76,210,007 80,432,806 83,815,016 87,591,267 91,777,555 Arunachal Pradesh 0-4 137,982 144,649 157,231 159,766 159,894 Arunachal Pradesh 5-9 162,340 132,143 137,972 145,260 145,732 Arunachal Pradesh 10-14 142,951 146,247 133,064 131,406 134,322 Arunachal Pradesh 15-19 110,673 150,611 148,250 126,430 110,951 Arunachal Pradesh 20-24 86,120 128,887 147,619 140,902 119,932 Arunachal Pradesh 25-29 92,996 99,357 122,282 140,181 140,490 Arunachal Pradesh 30-34 77,420 85,312 94,582 115,979 136,130 Arunachal Pradesh 35-39 77,346 79,051 83,121 89,515 102,728 Arunachal Pradesh 40-44 54,429 68,420 76,472 78,367 79,222 Arunachal Pradesh 45-49 46,891 56,523 64,880 71,629 73,585 Arunachal Pradesh 50-54 35,119 45,776 52,654 60,041 65,977 Arunachal Pradesh 55-59 23,734 37,656 41,926 47,745 53,936
79
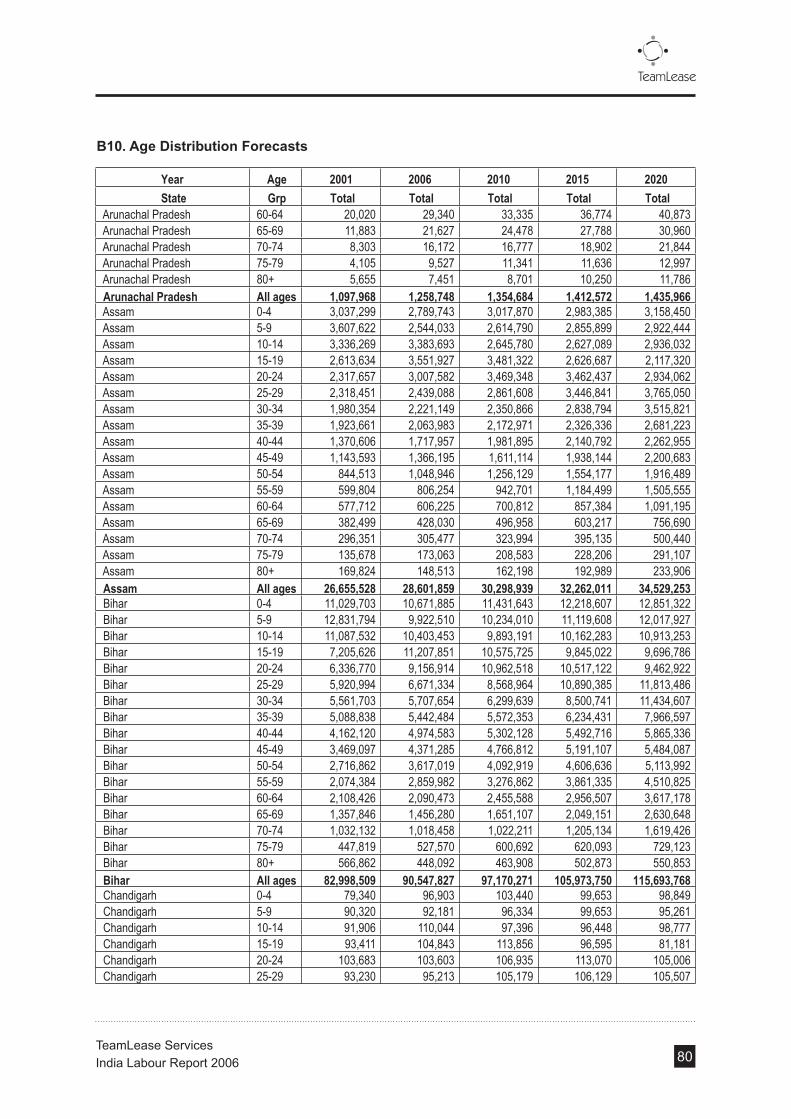
B10. Age Distribution Forecasts
Year Age 2001 2006 2010 2015 2020 State Grp Total Total Total Total Total
Arunachal Pradesh 60-64 20,020 29,340 33,335 36,774 40,873 Arunachal Pradesh 65-69 11,883 21,627 24,478 27,788 30,960 Arunachal Pradesh 70-74 8,303 16,172 16,777 18,902 21,844 Arunachal Pradesh 75-79 4,105 9,527 11,341 11,636 12,997 Arunachal Pradesh 80+ 5,655 7,451 8,701 10,250 11,786 Arunachal Pradesh All ages 1,097,968 1,258,748 1,354,684 1,412,572 1,435,966 Assam 0-4 3,037,299 2,789,743 3,017,870 2,983,385 3,158,450 Assam 5-9 3,607,622 2,544,033 2,614,790 2,855,899 2,922,444 Assam 10-14 3,336,269 3,383,693 2,645,780 2,627,089 2,936,032 Assam 15-19 2,613,634 3,551,927 3,481,322 2,626,687 2,117,320 Assam 20-24 2,317,657 3,007,582 3,469,348 3,462,437 2,934,062 Assam 25-29 2,318,451 2,439,088 2,861,608 3,446,841 3,765,050 Assam 30-34 1,980,354 2,221,149 2,350,866 2,838,794 3,515,821 Assam 35-39 1,923,661 2,063,983 2,172,971 2,326,336 2,681,223 Assam 40-44 1,370,606 1,717,957 1,981,895 2,140,792 2,262,955 Assam 45-49 1,143,593 1,366,195 1,611,114 1,938,144 2,200,683 Assam 50-54 844,513 1,048,946 1,256,129 1,554,177 1,916,489 Assam 55-59 599,804 806,254 942,701 1,184,499 1,505,555 Assam 60-64 577,712 606,225 700,812 857,384 1,091,195 Assam 65-69 382,499 428,030 496,958 603,217 756,690 Assam 70-74 296,351 305,477 323,994 395,135 500,440 Assam 75-79 135,678 173,063 208,583 228,206 291,107 Assam 80+ 169,824 148,513 162,198 192,989 233,906 Assam All ages 26,655,528 28,601,859 30,298,939 32,262,011 34,529,253 Bihar 0-4 11,029,703 10,671,885 11,431,643 12,218,607 12,851,322 Bihar 5-9 12,831,794 9,922,510 10,234,010 11,119,608 12,017,927 Bihar 10-14 11,087,532 10,403,453 9,893,191 10,162,283 10,913,253 Bihar 15-19 7,205,626 11,207,851 10,575,725 9,845,022 9,696,786 Bihar 20-24 6,336,770 9,156,914 10,962,518 10,517,122 9,462,922 Bihar 25-29 5,920,994 6,671,334 8,568,964 10,890,385 11,813,486 Bihar 30-34 5,561,703 5,707,654 6,299,639 8,500,741 11,434,607 Bihar 35-39 5,088,838 5,442,484 5,572,353 6,234,431 7,966,597 Bihar 40-44 4,162,120 4,974,583 5,302,128 5,492,716 5,865,336 Bihar 45-49 3,469,097 4,371,285 4,766,812 5,191,107 5,484,087 Bihar 50-54 2,716,862 3,617,019 4,092,919 4,606,636 5,113,992 Bihar 55-59 2,074,384 2,859,982 3,276,862 3,861,335 4,510,825 Bihar 60-64 2,108,426 2,090,473 2,455,588 2,956,507 3,617,178 Bihar 65-69 1,357,846 1,456,280 1,651,107 2,049,151 2,630,648 Bihar 70-74 1,032,132 1,018,458 1,022,211 1,205,134 1,619,426 Bihar 75-79 447,819 527,570 600,692 620,093 729,123 Bihar 80+ 566,862 448,092 463,908 502,873 550,853 Bihar All ages 82,998,509 90,547,827 97,170,271 105,973,750 115,693,768 Chandigarh 0-4 79,340 96,903 103,440 99,653 98,849 Chandigarh 5-9 90,320 92,181 96,334 99,653 95,261 Chandigarh 10-14 91,906 110,044 97,396 96,448 98,777 Chandigarh 15-19 93,411 104,843 113,856 96,595 81,181 Chandigarh 20-24 103,683 103,603 106,935 113,070 105,006 Chandigarh 25-29 93,230 95,213 105,179 106,129 105,507
80

B10. Age Distribution Forecasts
Year Age 2001 2006 2010 2015 2020 State Grp Total Total Total Total Total
Chandigarh 30-34 74,894 85,342 95,610 104,283 105,777 Chandigarh 35-39 69,630 74,101 85,109 94,628 100,866 Chandigarh 40-44 55,420 62,859 73,198 83,953 91,875 Chandigarh 45-49 47,147 54,257 61,793 71,802 80,695 Chandigarh 50-54 34,420 45,180 52,564 59,350 68,914 Chandigarh 55-59 22,259 35,722 42,283 47,266 50,561 Chandigarh 60-64 15,564 26,118 31,374 37,787 43,532 Chandigarh 65-69 11,242 18,743 20,828 25,069 31,438 Chandigarh 70-74 8,289 13,419 13,120 14,034 17,773 Chandigarh 75-79 4,666 7,628 7,809 7,348 7,049 Chandigarh 80+ 5,216 7,788 7,341 6,627 5,893 Chandigarh All ages 900,635 1,033,943 1,114,169 1,163,696 1,184,657 Chhattisgarh 0-4 2,456,265 2,216,917 2,427,273 2,453,102 2,643,028 Chhattisgarh 5-9 2,637,919 2,021,660 2,103,076 2,348,276 2,445,536 Chhattisgarh 10-14 2,608,853 2,688,910 2,128,002 2,160,136 2,456,906 Chhattisgarh 15-19 1,934,331 2,822,600 2,800,028 2,159,805 1,771,799 Chhattisgarh 20-24 1,673,744 2,390,027 2,790,397 2,847,004 2,455,258 Chhattisgarh 25-29 1,639,159 1,938,263 2,301,592 2,834,180 3,150,639 Chhattisgarh 30-34 1,544,362 1,765,074 1,890,802 2,334,211 2,942,081 Chhattisgarh 35-39 1,426,765 1,640,180 1,747,721 1,912,840 2,243,679 Chhattisgarh 40-44 1,097,624 1,365,204 1,594,039 1,760,276 1,893,668 Chhattisgarh 45-49 947,286 1,085,671 1,295,819 1,593,647 1,841,558 Chhattisgarh 50-54 749,568 833,563 1,010,305 1,277,929 1,603,741 Chhattisgarh 55-59 611,512 640,704 758,214 973,960 1,259,866 Chhattisgarh 60-64 569,694 481,747 563,663 704,987 913,125 Chhattisgarh 65-69 402,635 340,142 399,703 495,998 633,207 Chhattisgarh 70-74 275,713 242,753 260,588 324,902 418,774 Chhattisgarh 75-79 122,885 137,528 167,764 187,644 243,602 Chhattisgarh 80+ 135,488 118,018 130,456 158,686 195,735 Chhattisgarh All ages 20,833,803 22,728,959 24,369,442 26,527,584 28,894,488 Dadra & Nagar Haveli 0-4 29,435 24,580 26,951 26,016 26,082 Dadra & Nagar Haveli 5-9 25,585 22,415 23,351 24,905 24,133 Dadra & Nagar Haveli 10-14 22,775 29,813 23,628 22,909 24,245 Dadra & Nagar Haveli 15-19 19,976 31,295 31,090 22,906 17,485 Dadra & Nagar Haveli 20-24 27,045 26,499 30,983 30,194 24,229 Dadra & Nagar Haveli 25-29 25,158 21,490 25,555 30,058 31,091 Dadra & Nagar Haveli 30-34 18,014 19,570 20,994 24,755 29,033 Dadra & Nagar Haveli 35-39 14,746 18,185 19,406 20,287 22,141 Dadra & Nagar Haveli 40-44 10,356 15,137 17,699 18,669 18,687 Dadra & Nagar Haveli 45-49 8,331 12,037 14,388 16,901 18,173 Dadra & Nagar Haveli 50-54 5,685 9,242 11,218 13,553 15,826 Dadra & Nagar Haveli 55-59 4,566 7,104 8,419 10,329 12,433 Dadra & Nagar Haveli 60-64 3,704 5,341 6,259 7,477 9,011 Dadra & Nagar Haveli 65-69 2,496 3,771 4,438 5,260 6,249 Dadra & Nagar Haveli 70-74 1,428 2,691 2,893 3,446 4,133 Dadra & Nagar Haveli 75-79 579 1,525 1,863 1,990 2,404 Dadra & Nagar Haveli 80+ 611 1,309 1,448 1,683 1,932 Dadra & Nagar Haveli All ages 220,490 252,005 270,582 281,338 285,139
81

B10. Age Distribution Forecasts
Year Age 2001 2006 2010 2015 2020 State Grp Total Total Total Total Total
Daman & Diu 0-4 14,964 16,935 18,005 17,260 17,033 Daman & Diu 5-9 14,267 16,109 16,768 17,260 16,415 Daman & Diu 10-14 13,982 19,231 16,953 16,705 17,021 Daman & Diu 15-19 17,687 18,322 19,818 16,730 13,989 Daman & Diu 20-24 24,845 18,105 18,613 19,583 18,094 Daman & Diu 25-29 19,983 16,639 18,307 18,381 18,180 Daman & Diu 30-34 13,443 14,914 16,642 18,062 18,227 Daman & Diu 35-39 10,438 12,950 14,814 16,389 17,381 Daman & Diu 40-44 7,108 10,985 12,741 14,541 15,831 Daman & Diu 45-49 5,725 9,482 10,756 12,436 13,905 Daman & Diu 50-54 4,365 7,896 9,149 10,279 11,875 Daman & Diu 55-59 3,352 6,243 7,360 8,186 8,712 Daman & Diu 60-64 3,034 4,564 5,461 6,545 7,501 Daman & Diu 65-69 2,081 3,275 3,625 4,342 5,417 Daman & Diu 70-74 1,380 2,345 2,284 2,431 3,063 Daman & Diu 75-79 739 1,333 1,359 1,273 1,215 Daman & Diu 80+ 811 1,361 1,278 1,148 1,015 Daman & Diu All ages 158,204 180,689 193,932 201,549 204,133 Delhi 0-4 1,379,971 1,432,120 1,588,598 1,636,342 1,701,308 Delhi 5-9 1,554,656 1,399,773 1,464,698 1,576,881 1,612,186 Delhi 10-14 1,565,192 1,727,786 1,521,550 1,502,863 1,571,560 Delhi 15-19 1,430,166 1,895,591 1,879,772 1,550,519 1,313,542 Delhi 20-24 1,429,045 1,686,661 1,979,385 1,917,501 1,612,410 Delhi 25-29 1,361,006 1,383,744 1,706,891 2,018,006 2,077,321 Delhi 30-34 1,156,745 1,301,224 1,417,838 1,738,745 2,087,672 Delhi 35-39 1,057,647 1,247,145 1,357,600 1,442,089 1,620,926 Delhi 40-44 810,647 1,073,307 1,278,501 1,376,830 1,403,540 Delhi 45-49 624,013 880,985 1,077,296 1,289,944 1,415,607 Delhi 50-54 449,521 693,303 868,505 1,076,191 1,280,425 Delhi 55-59 311,147 557,361 672,785 853,052 1,056,096 Delhi 60-64 259,015 436,036 527,881 642,490 792,255 Delhi 65-69 192,588 316,470 392,337 482,545 584,400 Delhi 70-74 133,021 226,467 265,521 336,261 419,115 Delhi 75-79 65,197 135,613 174,329 205,619 266,666 Delhi 80+ 70,930 111,464 140,948 183,199 232,094 Delhi All ages 13,850,507 16,505,049 18,314,433 19,829,079 20,920,266 Goa 0-4 104,366 111,433 118,908 110,195 109,302 Goa 5-9 107,952 103,427 110,941 115,374 107,172 Goa 10-14 120,641 130,536 110,449 112,312 118,885 Goa 15-19 125,685 135,894 137,834 110,232 91,208 Goa 20-24 142,759 145,585 141,796 137,846 119,590 Goa 25-29 139,339 147,980 151,394 141,750 130,268 Goa 30-34 118,159 144,960 152,639 151,258 141,147 Goa 35-39 105,112 126,122 146,641 152,342 147,694 Goa 40-44 82,971 104,614 125,063 146,041 155,256 Goa 45-49 76,028 90,886 103,839 124,044 144,270 Goa 50-54 64,647 73,446 89,252 102,186 116,104 Goa 55-59 47,150 58,474 70,503 86,644 99,991
82
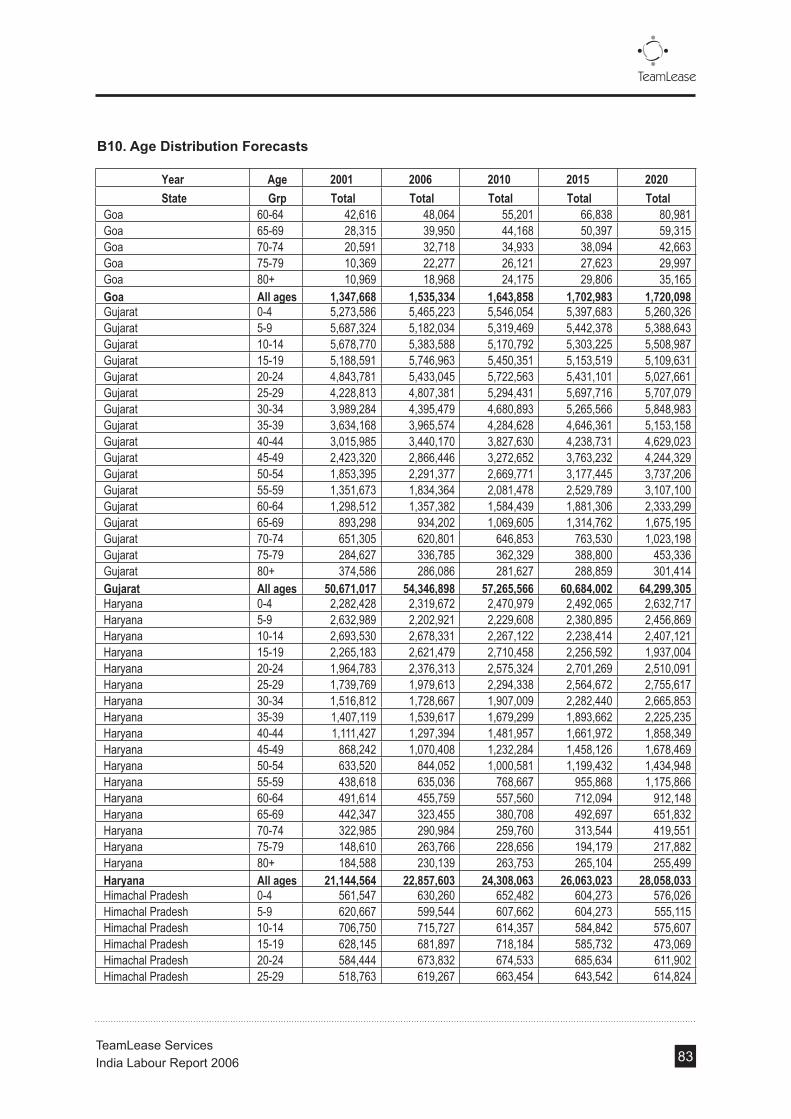
B10. Age Distribution Forecasts
Year Age 2001 2006 2010 2015 2020 State Grp Total Total Total Total Total
Goa 60-64 42,616 48,064 55,201 66,838 80,981 Goa 65-69 28,315 39,950 44,168 50,397 59,315 Goa 70-74 20,591 32,718 34,933 38,094 42,663 Goa 75-79 10,369 22,277 26,121 27,623 29,997 Goa 80+ 10,969 18,968 24,175 29,806 35,165 Goa All ages 1,347,668 1,535,334 1,643,858 1,702,983 1,720,098 Gujarat 0-4 5,273,586 5,465,223 5,546,054 5,397,683 5,260,326 Gujarat 5-9 5,687,324 5,182,034 5,319,469 5,442,378 5,388,643 Gujarat 10-14 5,678,770 5,383,588 5,170,792 5,303,225 5,508,987 Gujarat 15-19 5,188,591 5,746,963 5,450,351 5,153,519 5,109,631 Gujarat 20-24 4,843,781 5,433,045 5,722,563 5,431,101 5,027,661 Gujarat 25-29 4,228,813 4,807,381 5,294,431 5,697,716 5,707,079 Gujarat 30-34 3,989,284 4,395,479 4,680,893 5,265,566 5,848,983 Gujarat 35-39 3,634,168 3,965,574 4,284,628 4,646,361 5,153,158 Gujarat 40-44 3,015,985 3,440,170 3,827,630 4,238,731 4,629,023 Gujarat 45-49 2,423,320 2,866,446 3,272,652 3,763,232 4,244,329 Gujarat 50-54 1,853,395 2,291,377 2,669,771 3,177,445 3,737,206 Gujarat 55-59 1,351,673 1,834,364 2,081,478 2,529,789 3,107,100 Gujarat 60-64 1,298,512 1,357,382 1,584,439 1,881,306 2,333,299 Gujarat 65-69 893,298 934,202 1,069,605 1,314,762 1,675,195 Gujarat 70-74 651,305 620,801 646,853 763,530 1,023,198 Gujarat 75-79 284,627 336,785 362,329 388,800 453,336 Gujarat 80+ 374,586 286,086 281,627 288,859 301,414 Gujarat All ages 50,671,017 54,346,898 57,265,566 60,684,002 64,299,305 Haryana 0-4 2,282,428 2,319,672 2,470,979 2,492,065 2,632,717 Haryana 5-9 2,632,989 2,202,921 2,229,608 2,380,895 2,456,869 Haryana 10-14 2,693,530 2,678,331 2,267,122 2,238,414 2,407,121 Haryana 15-19 2,265,183 2,621,479 2,710,458 2,256,592 1,937,004 Haryana 20-24 1,964,783 2,376,313 2,575,324 2,701,269 2,510,091 Haryana 25-29 1,739,769 1,979,613 2,294,338 2,564,672 2,755,617 Haryana 30-34 1,516,812 1,728,667 1,907,009 2,282,440 2,665,853 Haryana 35-39 1,407,119 1,539,617 1,679,299 1,893,662 2,225,235 Haryana 40-44 1,111,427 1,297,394 1,481,957 1,661,972 1,858,349 Haryana 45-49 868,242 1,070,408 1,232,284 1,458,126 1,678,469 Haryana 50-54 633,520 844,052 1,000,581 1,199,432 1,434,948 Haryana 55-59 438,618 635,036 768,667 955,868 1,175,866 Haryana 60-64 491,614 455,759 557,560 712,094 912,148 Haryana 65-69 442,347 323,455 380,708 492,697 651,832 Haryana 70-74 322,985 290,984 259,760 313,544 419,551 Haryana 75-79 148,610 263,766 228,656 194,179 217,882 Haryana 80+ 184,588 230,139 263,753 265,104 255,499 Haryana All ages 21,144,564 22,857,603 24,308,063 26,063,023 28,058,033 Himachal Pradesh 0-4 561,547 630,260 652,482 604,273 576,026 Himachal Pradesh 5-9 620,667 599,544 607,662 604,273 555,115 Himachal Pradesh 10-14 706,750 715,727 614,357 584,842 575,607 Himachal Pradesh 15-19 628,145 681,897 718,184 585,732 473,069 Himachal Pradesh 20-24 584,444 673,832 674,533 685,634 611,902 Himachal Pradesh 25-29 518,763 619,267 663,454 643,542 614,824
83

B10. Age Distribution Forecasts
Year Age 2001 2006 2010 2015 2020 State Grp Total Total Total Total Total
Himachal Pradesh 30-34 433,725 555,068 603,092 632,351 616,395 Himachal Pradesh 35-39 412,060 481,951 536,858 573,803 587,776 Himachal Pradesh 40-44 331,472 408,835 461,724 509,075 535,385 Himachal Pradesh 45-49 303,617 352,886 389,778 435,395 470,236 Himachal Pradesh 50-54 238,823 293,850 331,568 359,883 401,584 Himachal Pradesh 55-59 188,995 232,338 266,715 286,609 294,634 Himachal Pradesh 60-64 174,553 169,869 197,904 229,130 253,677 Himachal Pradesh 65-69 129,219 121,905 131,378 152,016 183,200 Himachal Pradesh 70-74 106,966 87,277 82,759 85,100 103,568 Himachal Pradesh 75-79 57,003 49,614 49,257 44,559 41,078 Himachal Pradesh 80+ 81,152 50,652 46,308 40,185 34,341 Himachal Pradesh All ages 6,077,900 6,724,771 7,028,013 7,056,401 6,903,365 Jammu & Kashmir 0-4 967,965 1,130,578 1,174,909 1,097,302 1,040,295 Jammu & Kashmir 5-9 1,298,616 1,073,675 1,060,141 1,048,352 970,810 Jammu & Kashmir 10-14 1,366,819 1,305,384 1,077,978 985,614 951,153 Jammu & Kashmir 15-19 1,152,274 1,277,675 1,288,777 993,618 765,390 Jammu & Kashmir 20-24 893,998 1,158,184 1,224,523 1,189,418 991,841 Jammu & Kashmir 25-29 792,957 964,838 1,090,919 1,129,272 1,088,858 Jammu & Kashmir 30-34 700,294 842,530 906,751 1,005,000 1,053,388 Jammu & Kashmir 35-39 693,229 750,389 798,478 833,814 879,282 Jammu & Kashmir 40-44 541,128 632,333 704,646 731,797 734,310 Jammu & Kashmir 45-49 460,390 521,703 585,931 642,040 663,232 Jammu & Kashmir 50-54 341,845 411,380 475,759 528,132 567,007 Jammu & Kashmir 55-59 255,805 309,508 365,488 420,886 464,633 Jammu & Kashmir 60-64 244,946 222,131 265,110 313,548 360,427 Jammu & Kashmir 65-69 158,834 157,648 181,020 216,943 257,566 Jammu & Kashmir 70-74 133,425 141,822 123,512 138,059 165,782 Jammu & Kashmir 75-79 58,762 128,556 108,722 85,500 86,094 Jammu & Kashmir 80+ 82,414 112,167 125,410 116,730 100,958 Jammu & Kashmir All ages 10,143,700 11,140,499 11,558,076 11,476,025 11,086,885 Jharkhand 0-4 3,273,692 3,378,157 3,661,518 3,891,346 4,182,436 Jharkhand 5-9 3,908,928 3,086,069 3,213,031 3,538,025 3,811,984 Jharkhand 10-14 3,539,328 3,415,462 3,098,722 3,200,600 3,513,519 Jharkhand 15-19 2,502,744 3,517,375 3,452,362 3,079,408 2,902,209 Jharkhand 20-24 2,152,368 3,010,028 3,437,668 3,431,896 3,137,132 Jharkhand 25-29 2,034,162 2,320,391 2,847,645 3,414,330 3,674,879 Jharkhand 30-34 1,884,708 1,992,378 2,202,582 2,824,856 3,560,829 Jharkhand 35-39 1,772,268 1,846,161 1,935,681 2,180,281 2,687,107 Jharkhand 40-44 1,418,673 1,597,884 1,780,829 1,908,751 2,072,258 Jharkhand 45-49 1,234,472 1,320,038 1,510,881 1,744,627 1,924,791 Jharkhand 50-54 930,447 1,069,051 1,226,190 1,462,401 1,725,805 Jharkhand 55-59 713,425 879,418 976,343 1,162,905 1,410,843 Jharkhand 60-64 626,921 685,202 776,278 895,693 1,069,147 Jharkhand 65-69 399,850 505,080 570,021 676,811 809,837 Jharkhand 70-74 283,966 377,689 390,694 460,383 571,392 Jharkhand 75-79 121,735 222,503 264,100 283,403 339,975 Jharkhand 80+ 148,143 174,011 202,620 249,646 308,303 Jharkhand All ages 26,945,829 29,396,896 31,547,165 34,405,362 37,561,271
84
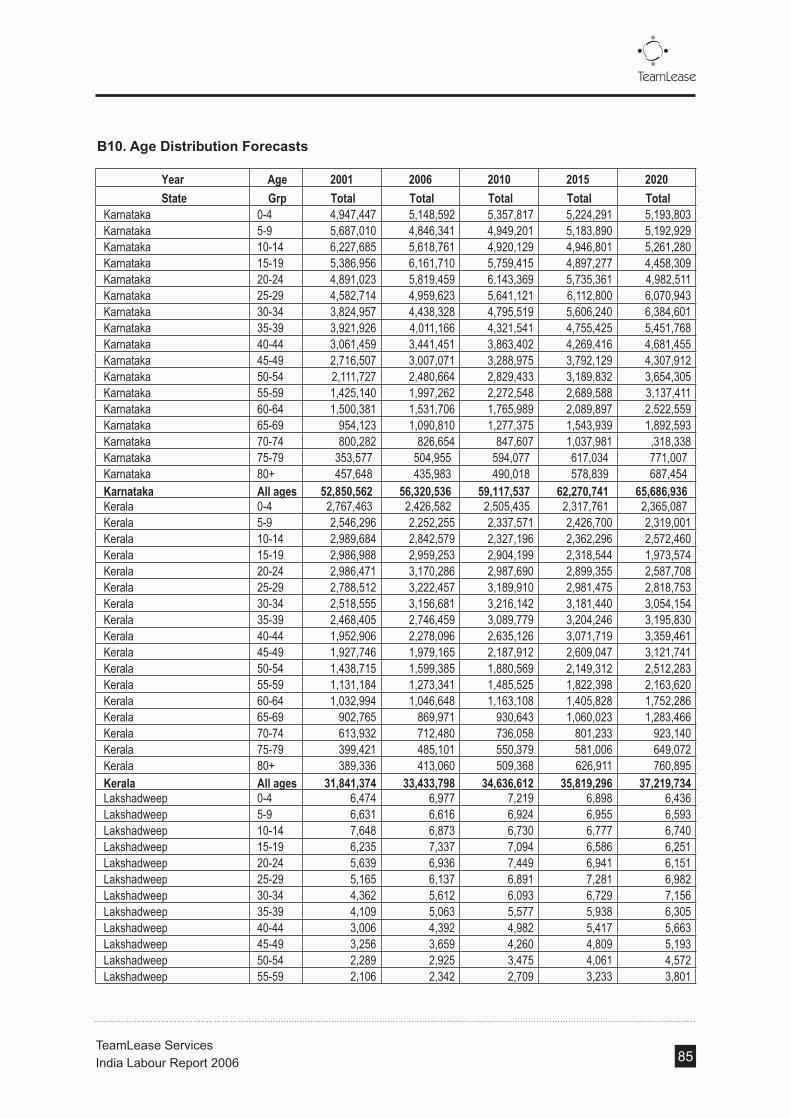
B10. Age Distribution Forecasts
Year Age 2001 2006 2010 2015 2020 State Grp Total Total Total Total Total
Karnataka 0-4 4,947,447 5,148,592 5,357,817 5,224,291 5,193,803 Karnataka 5-9 5,687,010 4,846,341 4,949,201 5,183,890 5,192,929 Karnataka 10-14 6,227,685 5,618,761 4,920,129 4,946,801 5,261,280 Karnataka 15-19 5,386,956 6,161,710 5,759,415 4,897,277 4,458,309 Karnataka 20-24 4,891,023 5,819,459 6,143,369 5,735,361 4,982,511 Karnataka 25-29 4,582,714 4,959,623 5,641,121 6,112,800 6,070,943 Karnataka 30-34 3,824,957 4,438,328 4,795,519 5,606,240 6,384,601 Karnataka 35-39 3,921,926 4,011,166 4,321,541 4,755,425 5,451,768 Karnataka 40-44 3,061,459 3,441,451 3,863,402 4,269,416 4,681,455 Karnataka 45-49 2,716,507 3,007,071 3,288,975 3,792,129 4,307,912 Karnataka 50-54 2,111,727 2,480,664 2,829,433 3,189,832 3,654,305 Karnataka 55-59 1,425,140 1,997,262 2,272,548 2,689,588 3,137,411 Karnataka 60-64 1,500,381 1,531,706 1,765,989 2,089,897 2,522,559 Karnataka 65-69 954,123 1,090,810 1,277,375 1,543,939 1,892,593 Karnataka 70-74 800,282 826,654 847,607 1,037,981 ,318,338 Karnataka 75-79 353,577 504,955 594,077 617,034 771,007 Karnataka 80+ 457,648 435,983 490,018 578,839 687,454 Karnataka All ages 52,850,562 56,320,536 59,117,537 62,270,741 65,686,936 Kerala 0-4 2,767,463 2,426,582 2,505,435 2,317,761 2,365,087 Kerala 5-9 2,546,296 2,252,255 2,337,571 2,426,700 2,319,001 Kerala 10-14 2,989,684 2,842,579 2,327,196 2,362,296 2,572,460 Kerala 15-19 2,986,988 2,959,253 2,904,199 2,318,544 1,973,574 Kerala 20-24 2,986,471 3,170,286 2,987,690 2,899,355 2,587,708 Kerala 25-29 2,788,512 3,222,457 3,189,910 2,981,475 2,818,753 Kerala 30-34 2,518,555 3,156,681 3,216,142 3,181,440 3,054,154 Kerala 35-39 2,468,405 2,746,459 3,089,779 3,204,246 3,195,830 Kerala 40-44 1,952,906 2,278,096 2,635,126 3,071,719 3,359,461 Kerala 45-49 1,927,746 1,979,165 2,187,912 2,609,047 3,121,741 Kerala 50-54 1,438,715 1,599,385 1,880,569 2,149,312 2,512,283 Kerala 55-59 1,131,184 1,273,341 1,485,525 1,822,398 2,163,620 Kerala 60-64 1,032,994 1,046,648 1,163,108 1,405,828 1,752,286 Kerala 65-69 902,765 869,971 930,643 1,060,023 1,283,466 Kerala 70-74 613,932 712,480 736,058 801,233 923,140 Kerala 75-79 399,421 485,101 550,379 581,006 649,072 Kerala 80+ 389,336 413,060 509,368 626,911 760,895 Kerala All ages 31,841,374 33,433,798 34,636,612 35,819,296 37,219,734 Lakshadweep 0-4 6,474 6,977 7,219 6,898 6,436 Lakshadweep 5-9 6,631 6,616 6,924 6,955 6,593 Lakshadweep 10-14 7,648 6,873 6,730 6,777 6,740 Lakshadweep 15-19 6,235 7,337 7,094 6,586 6,251 Lakshadweep 20-24 5,639 6,936 7,449 6,941 6,151 Lakshadweep 25-29 5,165 6,137 6,891 7,281 6,982 Lakshadweep 30-34 4,362 5,612 6,093 6,729 7,156 Lakshadweep 35-39 4,109 5,063 5,577 5,938 6,305 Lakshadweep 40-44 3,006 4,392 4,982 5,417 5,663 Lakshadweep 45-49 3,256 3,659 4,260 4,809 5,193 Lakshadweep 50-54 2,289 2,925 3,475 4,061 4,572 Lakshadweep 55-59 2,106 2,342 2,709 3,233 3,801
85

B10. Age Distribution Forecasts
Year Age 2001 2006 2010 2015 2020 State Grp Total Total Total Total Total
Lakshadweep 60-64 1,488 1,733 2,062 2,404 2,855 Lakshadweep 65-69 956 1,193 1,392 1,680 2,050 Lakshadweep 70-74 640 793 842 976 1,252 Lakshadweep 75-79 267 430 472 497 555 Lakshadweep 80+ 381 365 367 369 369 Lakshadweep All ages 60,650 69,383 74,538 77,550 78,668 Madhya Pradesh 0-4 7,388,266 7,939,697 8,466,803 9,035,325 9,556,488 Madhya Pradesh 5-9 8,136,178 7,205,020 7,512,784 8,119,662 8,653,883 Madhya Pradesh 10-14 7,789,600 7,302,393 7,136,528 7,436,204 7,985,848 Madhya Pradesh 15-19 5,705,699 7,416,266 7,321,980 7,089,383 7,132,751 Madhya Pradesh 20-24 5,181,713 6,279,910 7,233,528 7,267,030 6,949,831 Madhya Pradesh 25-29 4,676,865 5,056,292 5,960,114 7,169,585 7,809,123 Madhya Pradesh 30-34 4,359,986 4,654,241 4,865,835 5,896,992 7,312,497 Madhya Pradesh 35-39 3,937,617 4,366,361 4,551,346 4,800,411 5,507,935 Madhya Pradesh 40-44 3,024,429 3,708,765 4,194,788 4,469,572 4,663,374 Madhya Pradesh 45-49 2,443,651 3,014,226 3,482,339 4,087,816 4,555,942 Madhya Pradesh 50-54 1,895,990 2,434,453 2,781,709 3,345,638 4,026,326 Madhya Pradesh 55-59 1,515,760 2,025,936 2,209,669 2,608,291 3,188,802 Madhya Pradesh 60-64 1,576,965 1,575,497 1,765,401 1,988,310 2,350,083 Madhya Pradesh 65-69 1,105,544 1,141,187 1,274,231 1,486,735 1,760,668 Madhya Pradesh 70-74 819,142 814,135 835,687 965,464 1,199,936 Madhya Pradesh 75-79 353,696 457,872 520,827 545,280 649,896 Madhya Pradesh 80+ 436,923 444,344 472,959 524,765 586,481 Madhya Pradesh All ages 60,348,023 65,836,596 70,586,527 76,836,463 83,691,465 Maharashtra 0-4 9,544,477 8,817,952 9,207,444 9,189,653 9,769,745 Maharashtra 5-9 10,242,574 8,712,822 8,533,744 8,867,438 9,000,656 Maharashtra 10-14 11,351,278 11,010,732 9,048,963 8,575,109 8,925,709 Maharashtra 15-19 9,582,328 11,084,291 11,212,864 9,008,657 7,388,585 Maharashtra 20-24 8,867,468 10,103,186 10,915,055 11,177,769 10,069,646 Maharashtra 25-29 8,228,393 8,654,101 9,780,015 10,873,338 11,546,298 Maharashtra 30-34 7,401,742 8,037,214 8,424,302 9,733,063 11,221,504 Maharashtra 35-39 6,966,852 7,497,990 7,894,244 8,369,384 9,334,138 Maharashtra 40-44 5,552,999 6,581,920 7,276,318 7,819,345 8,273,408 Maharashtra 45-49 4,548,753 5,673,321 6,305,335 7,167,759 7,930,007 Maharashtra 50-54 3,450,542 4,651,069 5,338,667 6,142,711 7,058,229 Maharashtra 55-59 2,676,243 3,750,152 4,263,820 5,091,882 6,056,686 Maharashtra 60-64 2,734,124 2,882,385 3,292,627 3,903,727 4,780,519 Maharashtra 65-69 2,635,878 2,087,967 2,343,323 2,800,809 3,494,994 Maharashtra 70-74 1,631,321 1,447,401 1,507,775 1,758,713 2,256,975 Maharashtra 75-79 683,606 781,685 879,956 940,653 1,155,289 Maharashtra 80+ 780,049 642,038 692,747 774,600 871,605 Maharashtra All ages 96,878,627 102,416,227 106,917,200 112,194,610 118,558,824 Manipur 0-4 205,710 204,732 220,060 214,211 207,462 Manipur 5-9 243,426 195,181 202,692 211,805 206,340 Manipur 10-14 259,050 239,730 205,523 201,496 207,191 Manipur 15-19 238,475 295,195 259,620 203,414 172,894 Manipur 20-24 222,950 256,663 302,343 257,074 190,121 Manipur 25-29 194,288 209,299 252,209 299,138 291,061
86
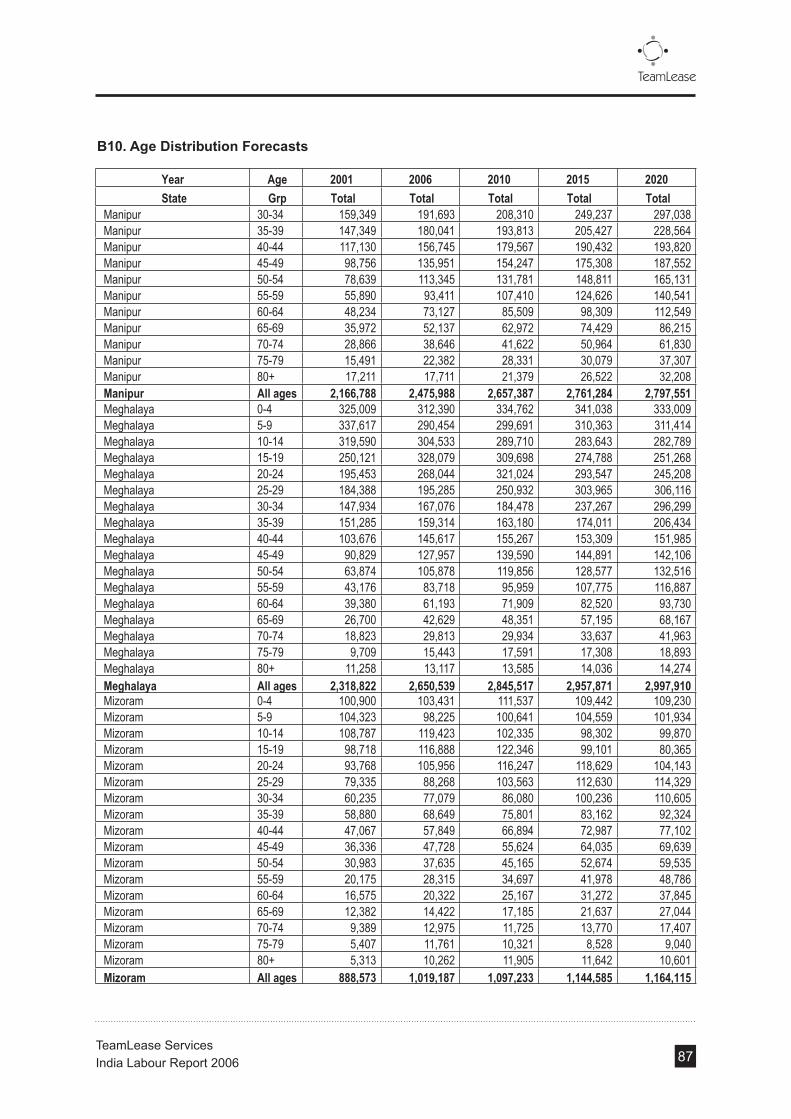
B10. Age Distribution Forecasts
Year Age 2001 2006 2010 2015 2020 State Grp Total Total Total Total Total
Manipur 30-34 159,349 191,693 208,310 249,237 297,038 Manipur 35-39 147,349 180,041 193,813 205,427 228,564 Manipur 40-44 117,130 156,745 179,567 190,432 193,820 Manipur 45-49 98,756 135,951 154,247 175,308 187,552 Manipur 50-54 78,639 113,345 131,781 148,811 165,131 Manipur 55-59 55,890 93,411 107,410 124,626 140,541 Manipur 60-64 48,234 73,127 85,509 98,309 112,549 Manipur 65-69 35,972 52,137 62,972 74,429 86,215 Manipur 70-74 28,866 38,646 41,622 50,964 61,830 Manipur 75-79 15,491 22,382 28,331 30,079 37,307 Manipur 80+ 17,211 17,711 21,379 26,522 32,208 Manipur All ages 2,166,788 2,475,988 2,657,387 2,761,284 2,797,551 Meghalaya 0-4 325,009 312,390 334,762 341,038 333,009 Meghalaya 5-9 337,617 290,454 299,691 310,363 311,414 Meghalaya 10-14 319,590 304,533 289,710 283,643 282,789 Meghalaya 15-19 250,121 328,079 309,698 274,788 251,268 Meghalaya 20-24 195,453 268,044 321,024 293,547 245,208 Meghalaya 25-29 184,388 195,285 250,932 303,965 306,116 Meghalaya 30-34 147,934 167,076 184,478 237,267 296,299 Meghalaya 35-39 151,285 159,314 163,180 174,011 206,434 Meghalaya 40-44 103,676 145,617 155,267 153,309 151,985 Meghalaya 45-49 90,829 127,957 139,590 144,891 142,106 Meghalaya 50-54 63,874 105,878 119,856 128,577 132,516 Meghalaya 55-59 43,176 83,718 95,959 107,775 116,887 Meghalaya 60-64 39,380 61,193 71,909 82,520 93,730 Meghalaya 65-69 26,700 42,629 48,351 57,195 68,167 Meghalaya 70-74 18,823 29,813 29,934 33,637 41,963 Meghalaya 75-79 9,709 15,443 17,591 17,308 18,893 Meghalaya 80+ 11,258 13,117 13,585 14,036 14,274 Meghalaya All ages 2,318,822 2,650,539 2,845,517 2,957,871 2,997,910 Mizoram 0-4 100,900 103,431 111,537 109,442 109,230 Mizoram 5-9 104,323 98,225 100,641 104,559 101,934 Mizoram 10-14 108,787 119,423 102,335 98,302 99,870 Mizoram 15-19 98,718 116,888 122,346 99,101 80,365 Mizoram 20-24 93,768 105,956 116,247 118,629 104,143 Mizoram 25-29 79,335 88,268 103,563 112,630 114,329 Mizoram 30-34 60,235 77,079 86,080 100,236 110,605 Mizoram 35-39 58,880 68,649 75,801 83,162 92,324 Mizoram 40-44 47,067 57,849 66,894 72,987 77,102 Mizoram 45-49 36,336 47,728 55,624 64,035 69,639 Mizoram 50-54 30,983 37,635 45,165 52,674 59,535 Mizoram 55-59 20,175 28,315 34,697 41,978 48,786 Mizoram 60-64 16,575 20,322 25,167 31,272 37,845 Mizoram 65-69 12,382 14,422 17,185 21,637 27,044 Mizoram 70-74 9,389 12,975 11,725 13,770 17,407 Mizoram 75-79 5,407 11,761 10,321 8,528 9,040 Mizoram 80+ 5,313 10,262 11,905 11,642 10,601 Mizoram All ages 888,573 1,019,187 1,097,233 1,144,585 1,164,115
87

B10. Age Distribution Forecasts
Year Age 2001 2006 2010 2015 2020 State Grp Total Total Total Total Total
Nagaland 0-4 188,108 225,981 257,615 249,645 248,909 Nagaland 5-9 258,145 235,869 224,422 239,400 234,280 Nagaland 10-14 283,896 277,377 246,083 222,269 231,595 Nagaland 15-19 266,740 264,042 280,701 239,028 180,468 Nagaland 20-24 210,432 235,418 262,289 273,535 258,420 Nagaland 25-29 163,833 195,887 228,987 255,405 262,314 Nagaland 30-34 123,201 172,814 191,782 222,737 253,244 Nagaland 35-39 122,516 153,016 170,142 186,200 203,844 Nagaland 40-44 95,211 128,032 148,578 164,637 173,763 Nagaland 45-49 87,472 105,121 123,123 142,915 158,925 Nagaland 50-54 60,115 82,306 99,288 117,123 132,759 Nagaland 55-59 39,829 61,574 75,778 92,680 108,827 Nagaland 60-64 31,823 44,084 54,703 68,578 83,271 Nagaland 65-69 21,007 32,574 37,324 47,185 58,916 Nagaland 70-74 14,917 30,738 26,792 30,054 37,365 Nagaland 75-79 9,149 27,024 24,792 19,692 18,510 Nagaland 80+ 13,644 21,709 26,335 27,014 24,756 Nagaland All ages 1,990,036 2,293,566 2,478,736 2,598,099 2,654,824 Orissa 0-4 3,579,693 3,371,532 3,518,932 3,466,409 3,535,680 Orissa 5-9 4,384,999 3,189,625 3,161,532 3,297,532 3,288,384 Orissa 10-14 4,263,800 4,017,417 3,279,003 3,144,433 3,298,021 Orissa 15-19 3,537,349 4,477,426 4,145,375 3,249,485 2,714,809 Orissa 20-24 3,195,582 3,936,694 4,405,460 4,109,037 3,389,335 Orissa 25-29 3,114,206 3,312,185 3,763,239 4,359,656 4,519,745 Orissa 30-34 2,765,664 3,037,035 3,195,633 3,716,111 4,414,133 Orissa 35-39 2,668,484 2,770,741 2,949,290 3,144,636 3,530,335 Orissa 40-44 2,066,120 2,370,791 2,648,895 2,886,078 3,083,148 Orissa 45-49 1,758,815 2,010,846 2,232,047 2,567,868 2,887,091 Orissa 50-54 1,346,411 1,652,734 1,856,934 2,127,302 2,469,495 Orissa 55-59 1,079,304 1,370,763 1,487,319 1,720,938 2,024,436 Orissa 60-64 1,106,005 1,075,254 1,179,899 1,316,610 1,539,528 Orissa 65-69 769,438 773,535 856,091 973,156 1,134,034 Orissa 70-74 616,396 545,516 555,594 636,216 768,179 Orissa 75-79 258,625 307,317 344,778 356,179 427,454 Orissa 80+ 293,768 284,821 307,114 342,742 384,524 Orissa All ages 36,804,660 38,504,233 39,887,134 41,414,386 43,169,892 Pondicherry 0-4 84,688 79,784 85,857 83,431 82,527 Pondicherry 5-9 83,723 77,382 80,428 83,888 81,502 Pondicherry 10-14 94,495 96,152 82,994 81,320 83,692 Pondicherry 15-19 97,770 108,145 103,410 83,264 69,597 Pondicherry 20-24 97,776 108,902 113,371 103,864 85,321 Pondicherry 25-29 96,596 102,075 111,986 113,803 105,925 Pondicherry 30-34 81,289 96,321 104,538 112,320 114,803 Pondicherry 35-39 78,484 87,344 98,216 104,695 108,783 Pondicherry 40-44 59,131 74,922 87,740 98,080 103,365 Pondicherry 45-49 50,524 66,670 74,931 87,172 97,585 Pondicherry 50-54 38,874 58,263 66,249 73,733 82,256 Pondicherry 55-59 29,912 49,462 56,713 64,118 70,416
88

B10. Age Distribution Forecasts
Year Age 2001 2006 2010 2015 2020 State Grp Total Total Total Total Total
Pondicherry 60-64 28,648 39,041 46,418 53,376 59,777 Pondicherry 65-69 20,496 28,702 34,667 41,814 48,797 Pondicherry 70-74 15,276 20,673 23,758 29,213 36,052 Pondicherry 75-79 8,441 12,197 15,593 18,206 22,361 Pondicherry 80+ 8,223 9,406 12,055 15,827 20,239 Pondicherry All ages 974,345 1,115,440 1,198,926 1,248,123 1,266,975 Punjab 0-4 2,136,976 2,424,013 2,514,013 2,431,980 2,500,754 Punjab 5-9 2,667,652 2,305,879 2,341,321 2,431,980 2,409,969 Punjab 10-14 2,842,728 2,752,723 2,367,117 2,353,777 2,498,932 Punjab 15-19 2,565,824 2,622,611 2,767,165 2,357,360 2,053,779 Punjab 20-24 2,348,203 2,591,593 2,598,977 2,759,431 2,656,506 Punjab 25-29 1,953,151 2,381,735 2,556,290 2,590,025 2,669,190 Punjab 30-34 1,776,000 2,134,819 2,323,714 2,544,986 2,676,013 Punjab 35-39 1,732,088 1,853,609 2,068,515 2,309,353 2,551,766 Punjab 40-44 1,438,977 1,572,399 1,779,023 2,048,845 2,324,314 Punjab 45-49 1,178,580 1,357,218 1,501,815 1,752,307 2,041,480 Punjab 50-54 899,077 1,130,162 1,277,531 1,448,399 1,743,432 Punjab 55-59 619,567 893,586 1,027,655 1,153,499 1,279,120 Punjab 60-64 672,239 653,324 762,526 922,165 1,101,310 Punjab 65-69 588,077 468,853 506,201 611,808 795,343 Punjab 70-74 440,082 335,670 318,871 342,498 449,630 Punjab 75-79 200,669 190,817 189,787 179,335 178,334 Punjab 80+ 299,107 194,810 178,424 161,729 149,087 Punjab All ages 24,358,999 25,863,820 27,078,947 28,399,479 29,970,194 Rajasthan 0-4 7,270,221 7,106,277 7,723,879 8,221,867 8,868,004 Rajasthan 5-9 8,109,341 6,491,842 6,777,806 7,475,348 8,082,536 Rajasthan 10-14 7,278,986 7,184,753 6,536,674 6,762,418 7,449,700 Rajasthan 15-19 5,518,298 7,399,136 7,282,668 6,506,356 6,153,542 Rajasthan 20-24 4,773,661 6,331,883 7,251,671 7,251,113 6,651,648 Rajasthan 25-29 4,218,693 4,881,166 6,007,035 7,213,999 7,791,832 Rajasthan 30-34 3,840,698 4,191,157 4,646,290 5,968,523 7,550,012 Rajasthan 35-39 3,471,528 3,883,577 4,083,270 4,606,626 5,697,462 Rajasthan 40-44 2,774,395 3,361,302 3,756,613 4,032,923 4,393,801 Rajasthan 45-49 2,281,261 2,776,827 3,187,165 3,686,151 4,081,126 Rajasthan 50-54 1,784,126 2,248,851 2,586,617 3,089,848 3,659,218 Rajasthan 55-59 1,356,217 1,849,940 2,059,570 2,457,054 2,991,405 Rajasthan 60-64 1,368,237 1,441,387 1,637,538 1,892,474 2,266,907 Rajasthan 65-69 987,902 1,062,484 1,202,444 1,430,007 1,717,095 Rajasthan 70-74 761,875 794,505 824,160 972,724 1,211,521 Rajasthan 75-79 317,546 468,057 557,111 598,791 720,848 Rajasthan 80+ 394,202 366,049 427,423 527,467 653,694 Rajasthan All ages 56,507,188 61,839,192 66,547,933 72,693,687 79,641,020 Sikkim 0-4 52,457 54,187 58,665 57,926 57,509 Sikkim 5-9 65,204 51,263 52,707 55,104 53,487 Sikkim 10-14 71,926 64,567 54,665 52,546 53,643 Sikkim 15-19 63,672 71,960 69,109 54,302 44,157 Sikkim 20-24 55,369 63,270 73,445 68,665 55,129 Sikkim 25-29 47,723 53,233 62,738 72,853 73,515
89

B10. Age Distribution Forecasts
Year Age 2001 2006 2010 2015 2020 State Grp Total Total Total Total Total
Sikkim 30-34 39,294 48,811 53,276 62,099 71,797 Sikkim 35-39 36,515 44,531 49,169 52,549 57,422 Sikkim 40-44 28,230 38,103 44,161 48,229 50,148 Sikkim 45-49 22,257 32,318 37,211 42,911 46,960 Sikkim 50-54 16,980 26,562 30,958 35,549 40,167 Sikkim 55-59 12,080 22,031 24,796 28,758 32,928 Sikkim 60-64 10,507 17,281 19,671 22,002 25,041 Sikkim 65-69 7,620 12,432 14,272 16,262 18,445 Sikkim 70-74 5,543 8,767 9,263 10,632 12,495 Sikkim 75-79 2,759 4,939 5,748 5,952 6,953 Sikkim 80+ 2,716 4,578 5,120 5,727 6,254 Sikkim All ages 540,851 618,832 664,973 692,068 702,173 Tamil Nadu 0-4 5,133,749 4,658,991 4,816,510 4,647,621 4,697,990 Tamil Nadu 5-9 5,638,844 4,518,745 4,511,957 4,673,084 4,639,625 Tamil Nadu 10-14 6,053,937 5,614,848 4,655,913 4,530,030 4,764,327 Tamil Nadu 15-19 6,226,565 6,315,176 5,801,245 4,638,298 3,961,921 Tamil Nadu 20-24 5,841,535 6,359,385 6,360,027 5,785,843 4,857,038 Tamil Nadu 25-29 5,758,652 5,960,701 6,282,335 6,339,515 6,029,998 Tamil Nadu 30-34 4,720,243 5,624,673 5,864,502 6,256,910 6,535,374 Tamil Nadu 35-39 4,953,125 5,100,480 5,509,825 5,832,158 6,192,654 Tamil Nadu 40-44 3,812,546 4,375,091 4,922,172 5,463,644 5,884,254 Tamil Nadu 45-49 3,635,864 3,893,202 4,203,595 4,856,038 5,555,215 Tamil Nadu 50-54 2,836,973 3,402,291 3,716,490 4,107,382 4,682,576 Tamil Nadu 55-59 2,248,128 2,888,324 3,181,567 3,571,754 4,008,553 Tamil Nadu 60-64 2,063,978 2,279,823 2,604,039 2,973,371 3,402,887 Tamil Nadu 65-69 1,384,442 1,676,034 1,944,809 2,329,274 2,777,874 Tamil Nadu 70-74 1,038,054 1,207,177 1,332,796 1,627,334 2,052,319 Tamil Nadu 75-79 502,011 712,257 874,763 1,014,214 1,272,954 Tamil Nadu 80+ 557,033 549,255 676,272 881,686 1,152,150 Tamil Nadu All ages 62,405,679 65,136,452 67,258,819 69,528,156 72,124,873 Tripura 0-4 294,903 302,367 325,097 316,579 306,717 Tripura 5-9 363,470 288,262 299,439 313,024 305,058 Tripura 10-14 418,797 354,054 303,621 297,788 306,317 Tripura 15-19 339,950 435,971 383,539 300,623 255,611 Tripura 20-24 274,499 379,063 446,654 379,926 281,081 Tripura 25-29 279,404 309,112 372,591 442,092 430,312 Tripura 30-34 243,508 283,109 307,738 368,343 439,149 Tripura 35-39 245,757 265,901 286,323 303,598 337,915 Tripura 40-44 171,577 231,495 265,277 281,436 286,549 Tripura 45-49 149,994 200,784 227,871 259,085 277,281 Tripura 50-54 106,423 167,398 194,681 219,926 244,134 Tripura 55-59 78,023 137,958 158,677 184,183 207,780 Tripura 60-64 72,958 108,001 126,323 145,289 166,395 Tripura 65-69 53,333 77,000 93,030 109,998 127,463 Tripura 70-74 46,529 57,075 61,489 75,320 91,411 Tripura 75-79 24,782 33,055 41,854 44,453 55,156 Tripura 80+ 35,297 26,157 31,583 39,196 47,617 Tripura All ages 3,199,203 3,656,763 3,925,787 4,080,858 4,135,972
90
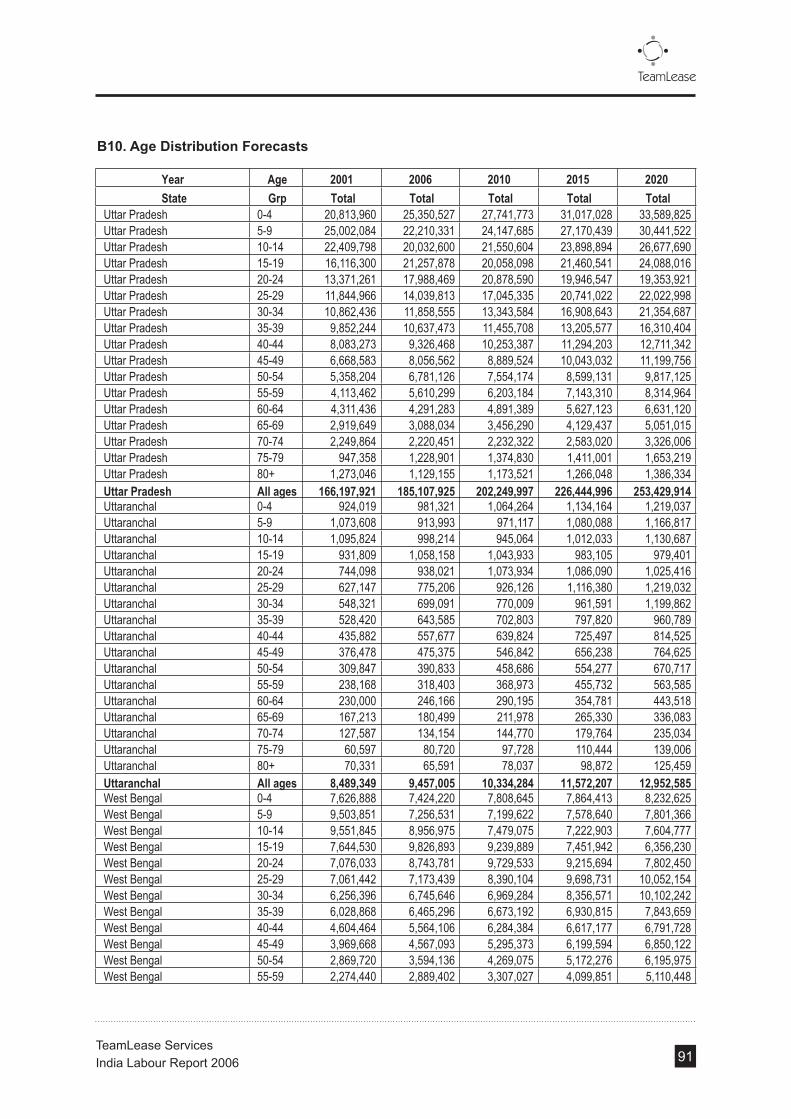
B10. Age Distribution Forecasts
Year Age 2001 2006 2010 2015 2020 State Grp Total Total Total Total Total
Uttar Pradesh 0-4 20,813,960 25,350,527 27,741,773 31,017,028 33,589,825 Uttar Pradesh 5-9 25,002,084 22,210,331 24,147,685 27,170,439 30,441,522 Uttar Pradesh 10-14 22,409,798 20,032,600 21,550,604 23,898,894 26,677,690 Uttar Pradesh 15-19 16,116,300 21,257,878 20,058,098 21,460,541 24,088,016 Uttar Pradesh 20-24 13,371,261 17,988,469 20,878,590 19,946,547 19,353,921 Uttar Pradesh 25-29 11,844,966 14,039,813 17,045,335 20,741,022 22,022,998 Uttar Pradesh 30-34 10,862,436 11,858,555 13,343,584 16,908,643 21,354,687 Uttar Pradesh 35-39 9,852,244 10,637,473 11,455,708 13,205,577 16,310,404 Uttar Pradesh 40-44 8,083,273 9,326,468 10,253,387 11,294,203 12,711,342 Uttar Pradesh 45-49 6,668,583 8,056,562 8,889,524 10,043,032 11,199,756 Uttar Pradesh 50-54 5,358,204 6,781,126 7,554,174 8,599,131 9,817,125 Uttar Pradesh 55-59 4,113,462 5,610,299 6,203,184 7,143,310 8,314,964 Uttar Pradesh 60-64 4,311,436 4,291,283 4,891,389 5,627,123 6,631,120 Uttar Pradesh 65-69 2,919,649 3,088,034 3,456,290 4,129,437 5,051,015 Uttar Pradesh 70-74 2,249,864 2,220,451 2,232,322 2,583,020 3,326,006 Uttar Pradesh 75-79 947,358 1,228,901 1,374,830 1,411,001 1,653,219 Uttar Pradesh 80+ 1,273,046 1,129,155 1,173,521 1,266,048 1,386,334 Uttar Pradesh All ages 166,197,921 185,107,925 202,249,997 226,444,996 253,429,914 Uttaranchal 0-4 924,019 981,321 1,064,264 1,134,164 1,219,037 Uttaranchal 5-9 1,073,608 913,993 971,117 1,080,088 1,166,817 Uttaranchal 10-14 1,095,824 998,214 945,064 1,012,033 1,130,687 Uttaranchal 15-19 931,809 1,058,158 1,043,933 983,105 979,401 Uttaranchal 20-24 744,098 938,021 1,073,934 1,086,090 1,025,416 Uttaranchal 25-29 627,147 775,206 926,126 1,116,380 1,219,032 Uttaranchal 30-34 548,321 699,091 770,009 961,591 1,199,862 Uttaranchal 35-39 528,420 643,585 702,803 797,820 960,789 Uttaranchal 40-44 435,882 557,677 639,824 725,497 814,525 Uttaranchal 45-49 376,478 475,375 546,842 656,238 764,625 Uttaranchal 50-54 309,847 390,833 458,686 554,277 670,717 Uttaranchal 55-59 238,168 318,403 368,973 455,732 563,585 Uttaranchal 60-64 230,000 246,166 290,195 354,781 443,518 Uttaranchal 65-69 167,213 180,499 211,978 265,330 336,083 Uttaranchal 70-74 127,587 134,154 144,770 179,764 235,034 Uttaranchal 75-79 60,597 80,720 97,728 110,444 139,006 Uttaranchal 80+ 70,331 65,591 78,037 98,872 125,459 Uttaranchal All ages 8,489,349 9,457,005 10,334,284 11,572,207 12,952,585 West Bengal 0-4 7,626,888 7,424,220 7,808,645 7,864,413 8,232,625 West Bengal 5-9 9,503,851 7,256,531 7,199,622 7,578,640 7,801,366 West Bengal 10-14 9,551,845 8,956,975 7,479,075 7,222,903 7,604,777 West Bengal 15-19 7,644,530 9,826,893 9,239,889 7,451,942 6,356,230 West Bengal 20-24 7,076,033 8,743,781 9,729,533 9,215,694 7,802,450 West Bengal 25-29 7,061,442 7,173,439 8,390,104 9,698,731 10,052,154 West Bengal 30-34 6,256,396 6,745,646 6,969,284 8,356,571 10,102,242 West Bengal 35-39 6,028,868 6,465,296 6,673,192 6,930,815 7,843,659 West Bengal 40-44 4,604,464 5,564,106 6,284,384 6,617,177 6,791,728 West Bengal 45-49 3,969,668 4,567,093 5,295,373 6,199,594 6,850,122 West Bengal 50-54 2,869,720 3,594,136 4,269,075 5,172,276 6,195,975 West Bengal 55-59 2,274,440 2,889,402 3,307,027 4,099,851 5,110,448
91

B10. Age Distribution Forecasts
Year Age 2001 2006 2010 2015 2020 State Grp Total Total Total Total Total
West Bengal 60-64 1,960,621 2,260,443 2,594,763 3,087,869 3,833,723 West Bengal 65-69 1,471,819 1,640,605 1,928,506 2,319,159 2,827,911 West Bengal 70-74 1,068,110 1,174,023 1,305,150 1,616,104 2,028,097 West Bengal 75-79 536,684 703,031 856,902 988,226 1,290,397 West Bengal 80+ 670,819 577,840 692,819 880,473 1,123,101 West Bengal All ages 80,176,197 85,563,462 90,023,343 95,300,437 101,233,137 India 0-4 110,747,479 114,057,569 121,503,652 125,950,785 132,182,614 India 5-9 128,666,768 105,921,970 109,374,006 117,704,729 123,674,033 India 10-14 125,181,947 117,763,942 106,857,489 109,063,396 117,504,475 India 15-19 100,484,408 125,601,531 120,113,463 106,336,274 100,426,845 India 20-24 90,001,577 111,380,770 124,080,924 119,559,466 106,959,961 India 25-29 83,641,374 91,917,257 106,980,216 123,409,775 128,803,812 India 30-34 74,468,241 82,740,089 88,804,810 106,274,060 127,337,208 India 35-39 70,758,819 76,106,374 80,922,841 88,042,311 101,791,916 India 40-44 55,884,785 65,861,553 73,617,327 79,949,106 86,033,368 India 45-49 47,534,286 56,027,669 62,825,325 72,281,305 80,718,316 India 50-54 36,685,171 45,943,937 52,564,982 60,937,939 70,854,943 India 55-59 27,727,784 37,294,937 42,107,706 49,862,551 59,210,466 India 60-64 27,591,066 28,652,784 32,849,425 38,547,759 46,439,587 India 65-69 19,859,345 20,712,704 23,605,824 28,287,689 34,664,828 India 70-74 14,748,146 15,051,420 15,610,048 18,486,727 23,435,038 India 75-79 6,568,708 8,795,308 10,095,408 10,731,765 13,025,449 India 80+ 8,060,424 7,500,666 8,358,385 9,696,148 11,364,927 India All ages 1,028,610,328 1,111,330,481 1,180,271,832 1,265,121,784 1,358,494,027
92

B11
. Dat
a S
ou
rces
S.No
Varia
bles
Norm
alize
d Va
riabl
esYe
arDe
fi niti
ons
Sour
ce
1Ca
pital
Form
ation
Capit
al Fo
rmati
on as
shar
e of G
ross
St
ate D
omes
tic P
rodu
ct19
91, 1
995,
2001
Thi
s is
the
ratio
of
Cap
ital
Form
atio
n as
sha
re o
f G
ross
S
tate
Dom
estic
Pro
duct
CSO
GS
DP (9
3-94
cons
tant p
rices
)19
91-92
, 199
5-96,
2001
-02, 2
003-0
4CS
O
2No
. of C
ases
Imple
mente
d (IE
Ms)
Perce
ntage
of IE
Ms im
pleme
nted
1991
-200
5IE
M
deno
tes
the
inte
ntio
n to
in
vest
. T
his
is t
he r
atio
of
tota
l ca
ses
impl
emen
ted
as a
sha
re
of to
tal c
ases
file
d.
SIA/
DIPP
, MOI
1991
-200
5Nu
mber
s File
d (IE
Ms)
SIA/
DIPP
, MOI
3Inv
estm
ent (
Imple
menta
tion o
f IEMs
)Ac
tual in
vestm
ent a
s sha
re of
pr
opos
ed as
per I
EMs
1991
-200
5Im
plem
enta
tion
Rat
e of
Indu
stria
l E
ntre
pren
eurs
M
emor
andu
m
(IE
M).
Thi
s In
dica
tor
is t
he r
atio
of
to
tal
amou
nt
inve
sted
as
a
ratio
of
tota
l am
ount
pro
pose
d fo
r in
vest
men
t thr
ough
IEM
s.
SIA/
DIPP
, MOI
1991
-200
5Va
lue of
Pro
pose
d IEM
sSI
A/DI
PP, M
OI
4To
tal Le
ngth
of Ro
ads
Per C
apita
Ava
ilabil
ity of
Roa
ds
1991
, 199
5, 20
01,20
02T
his
is t
he r
atio
of
per
km r
oad
avai
labl
e to
tot
al p
opul
atio
n of
th
e S
tate
.
Basic
Roa
d Stat
istics
, Mini
stry o
f Sh
ipping
, Roa
d Tran
sport
and H
ighwa
ysCe
nsus
of In
dia &
Esti
mates
Total
Pop
ulatio
n19
91, 1
995,2
001,2
005
5Po
wer S
upply
(Sur
plus (
+) /
Defi c
it (-))
Powe
r Sur
plus /
Defi
cit as
% of
Re
quire
d 19
91, 1
995,
2001
, 200
3T
his
is th
e ra
tio o
f pow
er s
hort
age
to th
e to
tal p
ower
dem
and.
Centr
al El
ectric
ity A
uthor
ity.
6Te
le De
nsity
Te
le De
nsity
19
91, 1
995,
2001
,2005
Num
ber
of t
elep
hone
s av
aila
ble
to p
er 1
00 p
erso
nsTR
AI
7GS
DP (c
urre
nt pr
ice)
Gros
s Stat
e Dom
estic
Pro
duct
(at c
urre
nt pr
ices)
by Ta
xes o
n Co
mmod
ities &
Ser
vices
1991
, 199
5, 20
01,20
05
Thi
s is
the
ratio
of
taxe
s co
llect
ed
by th
e st
ate
on c
omm
oditi
es a
nd
serv
ices
i.e
. sa
les
tax,
se
rvic
e ta
x, e
xcis
e ta
x, e
xcis
e, e
tc. t
o th
e G
ross
S
tate
D
omes
tic
Pro
duct
(a
t cur
rent
pric
es).
CSO
Taxe
s on C
ommo
dities
and S
ervic
es
(at C
urre
nt Pr
ices)
1991
-92, 1
995-9
6, 20
01-02
, 200
3-04
State
Fina
nce,
RBI
93

S.No
Varia
bles
Norm
alize
d Va
riabl
esYe
arDe
fi niti
ons
Sour
ce
8Co
rrupti
on: T
otal C
ases
unde
r Inv
estig
ation
Inver
se of
Cor
rupti
on ca
ses p
endin
g inv
estig
ation
divid
ed by
case
s re
gister
ed un
der P
reve
ntion
of
Corru
ption
& R
elated
Acts
19
91, 1
995,
2001
, 200
3
Thi
s is
the
ratio
of
case
s pe
ndin
g in
vest
igat
ion
from
th
e pr
evio
us
year
of
case
s re
gist
ered
und
er
prev
entio
n of
co
rrup
tion
&
rela
ted
acts
as
a sh
are
of t
otal
ca
ses
regi
ster
ed
unde
r th
e sa
me
acts
. Inv
erse
of
this
rat
io is
co
nsid
ered
.
Crim
e in I
ndia
,NCR
BCr
ime i
n Ind
ia ,N
CRB
100+
Corru
ption
: Pen
ding
Inves
tigati
on fr
om P
revio
us Ye
ar19
91, 1
995,
2001
, 200
3
9
Total
(rep
orted
) cog
nizab
le cri
me
unde
r IPC
Inver
se of
Viol
ent C
rimes
divid
ed by
Co
gniza
ble C
rime u
nder
IPC
1991
, 199
5, 20
01, 2
003
Thi
s is
the
ratio
of
viol
ent c
rimes
, in
clud
ing
mur
der,
atte
mpt
to
m
urde
r, cu
lpab
le
hom
icid
e no
t am
ount
ing
to
mur
der,
rape
, ki
dnap
ping
an
d ab
duct
ion,
ro
bber
y, rio
ts,
arso
n &
do
wry
de
aths
, to
tota
l crim
es u
nder
the
In
dian
P
enal
C
ode.
In
vers
e of
th
is r
atio
is
cons
ider
ed,
rela
ting
to h
ighe
r lab
our e
cosy
stem
inde
x to
lo
wer
in
cide
nce
of
viol
ent
crim
es.
Crim
e in I
ndia
,NCR
B19
91, 1
995,
2001
, 200
3Cr
ime i
n Ind
ia ,N
CRB
100+
Total
Viol
ent C
rimes
10W
ork P
artic
ipatio
n Rate
1991
, 199
5, 20
01, 2
005
Thi
s is
the
rat
io o
f nu
mbe
r of
w
orke
rs to
tota
l pop
ulat
ion
Cens
us of
India
& E
stima
tes
11Po
pulat
ion in
20-6
0 age
grou
pW
ork P
artic
ipatio
n Rate
Popu
lation
in 20
-60 a
ge gr
oup a
s a
shar
e of T
otal p
opula
tion
1991
, 199
5, 20
01, 2
005
Thi
s is
the
rat
io o
f po
pula
tion
in
20-6
0 ag
e-gr
oup
as a
sha
re o
f to
tal p
opul
atio
n
Cens
us of
India
& E
stima
tes19
91, 1
995,
2001
, 200
5To
tal po
pulat
ion
Cens
us of
India
& E
stima
tes
12Po
pulat
ion in
20-6
0 age
grou
p Po
pulat
ion in
20-6
0 age
grou
p as a
sh
are o
f Tota
l Emp
loyee
s19
91, 1
995,
2001
, 200
5T
his
is t
he r
atio
of
popu
latio
n in
20
-60
age-
grou
p as
a s
hare
of
tota
l em
ploy
ees
Cens
us of
India
& E
stima
tesTo
tal E
mploy
ees
1991
-92,
1995
-96,
2001
-02,
2002
-03
ASI
13To
tal E
mploy
ment
Total
emplo
ymen
t by P
ublic
secto
r em
ploym
ent
1991
, 199
5, 20
01, 2
005
Thi
s is
the
rat
io o
f em
ploy
men
t w
ith
publ
ic
sect
or
to
tota
l em
ploy
men
t. In
vers
e of
thi
s ra
tio
is c
onsi
dere
d.
Cens
us of
India
& E
stima
tesIns
titute
of Ap
plied
Man
powe
r Res
earch
.Em
ploym
ent in
Pub
lic se
ctor
1991
, 199
5, 20
01, 2
003
94

S.No
Varia
bles
Norm
alize
d Va
riabl
esYe
arDe
fi niti
ons
Sour
ce
14Lit
erac
y Rate
Liter
acy R
ate19
91, 1
995,
2001
, 200
5T
his
is t
he r
atio
of
num
ber
of
liter
ates
to to
tal p
opul
atio
nCe
nsus
of In
dia &
Esti
mates
15
Popu
lation
grad
uated
from
se
cond
ary &
abov
ePo
pulat
ion gr
adua
ted fr
om
seco
ndar
y & ab
ove a
s a sh
are o
f po
pulat
ion
1993
-94,
1995
, 199
9-20
00, 2
005
Thi
s is
th
e ra
tio
of
popu
latio
n w
ho h
ave
com
plet
ed s
econ
dary
, hi
gher
sec
onda
ry &
gra
duat
ion
&
abov
e to
tota
l pop
ulat
ion
NSS-
50th
& 55
th ro
und &
Esti
mates
Total
Pop
ulatio
n19
91, 1
995,
2001
, 200
5Ce
nsus
of In
dia &
Esti
mates
16Pu
pil Te
ache
r Rati
oPu
pil Te
ache
r Rati
o19
91-9
2,199
5-96
, 200
1-02
, 20
02-0
3N
umbe
r of
stu
dent
s pe
r te
ache
r fo
r H
ighe
r S
econ
dary
Sch
ools
Selec
ted E
duca
tiona
l Stat
istics
, Mi
nistry
of H
.R.D
17Ex
pend
iture
on E
duca
tion
Perce
ntage
of E
xpen
ditur
e on
Educ
ation
to To
tal B
udge
t19
91, 1
995,
2001
, 200
3T
his
is t
he r
atio
of
gove
rnm
ent’s
pe
rcen
tage
of
to
tal
budg
et
tow
ards
edu
catio
n.
State
Fina
nce,
RBI
Reve
nue E
xpen
ditur
e19
91, 1
995,
2001
, 200
3St
ate F
inanc
e, RB
I
18No
. of S
eats
avail
able
in En
ginee
ring
No. O
f Sea
ts av
ailab
le in
Engin
eerin
g by N
o. of
Enro
lmen
t in
Clas
s (XI
-XII)
1995
, 200
0,200
5-06
Thi
s is
the
rat
io o
f nu
mbe
r of
se
ats
avai
labl
e in
en
gine
erin
g co
llege
s by
the
cla
ss X
I an
d X
II en
rollm
ent
AICT
ENo
. of E
nrolm
ent in
Clas
s (XI
-XII)
1991
-92,
1995
-96,
2001
-02,
2002
-03
Selec
ted E
duca
tiona
l Stat
istics
, Mi
nistry
of H
.R.D
19No
. of S
eats
avail
able
in I.T
.I.sNo
. of S
eats
avail
able
in I.T
.I.s by
No
. of E
nrolm
ent in
Clas
s (XI
-XII)
1991
,1995
, 200
0,200
5-06
Thi
s is
the
rat
io o
f nu
mbe
r of
se
ats
avai
labl
e in
I.T
.I.s
by t
he
clas
s X
I and
XII
enro
llmen
t
AICT
ENo
. of E
nrolm
ent in
Clas
s (XI
-XII)
1991
-92,
1995
-96,
2001
-02,
2002
-03
Selec
ted E
duca
tiona
l Stat
istics
, Mi
nistry
of H
.R.D
20No
. of S
eats
avail
able
in M.
B.A
No. o
f sea
ts av
ailab
le in
M.B.
A by
No
. of E
nrolm
ent in
Clas
s (XI
-XII)
1995
, 200
0,200
5-06
Thi
s is
the
rat
io o
f nu
mbe
r of
se
ats
avai
labl
e in
M.B
.A
by t
he
clas
s X
I and
XII
enro
llmen
t
AICT
ENo
. of E
nrolm
ent in
Clas
ses (
XI-X
II)19
91-9
2, 19
95-9
6, 20
01-0
2, 20
02-0
3Se
lected
Edu
catio
nal S
tatist
ics,
Minis
try of
H.R
.D
21Mi
nimum
Wag
es*3
00Av
erag
e wag
es of
regis
tered
wo
rkers
by M
inimu
m wa
ges f
or
lowes
t dail
y paid
wor
kers.
1991
, 199
5, 20
01, 2
004
Year
ly
aver
age
of
regi
ster
ed
wor
kers
is
cons
ider
ed a
s a
ratio
of
min
imum
Wag
es in
the
stat
e.
Minim
um W
ages
in In
dia, M
inistr
y of
Labo
urAv
erag
e wag
es of
regis
tered
wo
rkers
1991
-92,
1995
-96,
2001
-02,
2002
-03
ASI
95
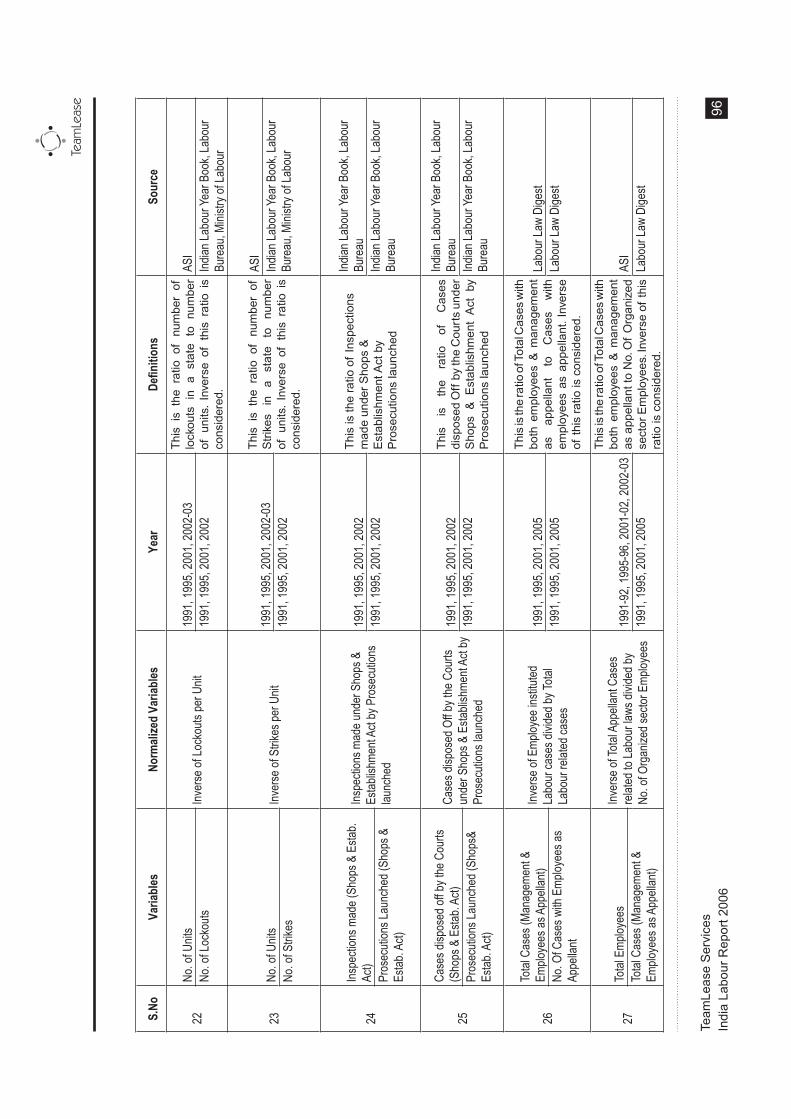
S.No
Varia
bles
Norm
alize
d Va
riabl
esYe
arDe
fi niti
ons
Sour
ce
22No
. of U
nits
Inver
se of
Lock
outs
per U
nit19
91, 1
995,
2001
, 200
2-03
Thi
s is
the
rat
io o
f nu
mbe
r of
lo
ckou
ts
in
a st
ate
to
num
ber
of u
nits
. In
vers
e of
thi
s ra
tio i
s co
nsid
ered
.
ASI
No. o
f Loc
kouts
1991
, 199
5, 20
01, 2
002
Indian
Labo
ur Ye
ar B
ook,
Labo
ur
Bure
au, M
inistr
y of L
abou
r
23No
. of U
nits
Inver
se of
Strik
es pe
r Unit
1991
, 199
5, 20
01, 2
002-
03T
his
is t
he r
atio
of
num
ber
of
Str
ikes
in
a
stat
e to
nu
mbe
r of
uni
ts.
Inve
rse
of t
his
ratio
is
cons
ider
ed.
ASI
Indian
Labo
ur Ye
ar B
ook,
Labo
ur
Bure
au, M
inistr
y of L
abou
r19
91, 1
995,
2001
, 200
2No
. of S
trikes
24Ins
pecti
ons m
ade (
Shop
s & E
stab.
Act)
Inspe
ction
s mad
e und
er S
hops
&
Estab
lishm
ent A
ct by
Pro
secu
tions
lau
nche
d
1991
, 199
5, 20
01, 2
002
Thi
s is
the
ratio
of
Insp
ectio
ns
mad
e un
der
Sho
ps &
E
stab
lishm
ent A
ct b
y P
rose
cutio
ns la
unch
ed
Indian
Labo
ur Ye
ar B
ook,
Labo
ur
Bure
au
1991
, 199
5, 20
01, 2
002
Indian
Labo
ur Ye
ar B
ook,
Labo
ur
Bure
au
Pros
ecuti
ons L
aunc
hed (
Shop
s &
Estab
. Act)
25
Case
s disp
osed
off b
y the
Cou
rts
(Sho
ps &
Esta
b. Ac
t)Ca
ses d
ispos
ed O
ff by t
he C
ourts
un
der S
hops
& E
stabli
shme
nt Ac
t by
Pros
ecuti
ons l
aunc
hed
1991
, 199
5, 20
01, 2
002
Thi
s is
th
e ra
tio
of
Cas
es
disp
osed
Off
by
the
Cou
rts
unde
r S
hops
& E
stab
lishm
ent
Act
by
Pro
secu
tions
laun
ched
Indian
Labo
ur Ye
ar B
ook,
Labo
ur
Bure
au
1991
, 199
5, 20
01, 2
002
Indian
Labo
ur Ye
ar B
ook,
Labo
ur
Bure
au
Pros
ecuti
ons L
aunc
hed (
Shop
s&
Estab
. Act)
26
Total
Cas
es (M
anag
emen
t &
Emplo
yees
as A
ppell
ant)
Inver
se of
Emp
loyee
insti
tuted
La
bour
case
s divi
ded b
y Tota
l La
bour
relat
ed ca
ses
1991
, 199
5, 20
01, 2
005
Thi
s is
the
ratio
of T
otal
Cas
es w
ith
both
em
ploy
ees
& m
anag
emen
t as
ap
pella
nt
to
Cas
es
with
em
ploy
ees
as a
ppel
lant
. Inv
erse
of
this
rat
io is
con
side
red.
Labo
ur La
w Di
gest
1991
, 199
5, 20
01, 2
005
Labo
ur La
w Di
gest
No. O
f Cas
es w
ith E
mploy
ees a
s Ap
pella
nt
27To
tal E
mploy
ees
Inver
se of
Total
App
ellan
t Cas
es
relat
ed to
Labo
ur la
ws di
vided
by
No. o
f Org
anize
d sec
tor E
mploy
ees
1991
-92,
1995
-96,
2001
-02,
2002
-03
Thi
s is
the
ratio
of T
otal
Cas
es w
ith
both
em
ploy
ees
& m
anag
emen
t as
app
ella
nt to
No.
Of
Org
aniz
ed
sect
or E
mpl
oyee
s. In
vers
e of
this
ra
tio is
con
side
red.
ASI
Total
Cas
es (M
anag
emen
t &
Emplo
yees
as A
ppell
ant)
1991
, 199
5, 20
01, 2
005
Labo
ur La
w Di
gest
96
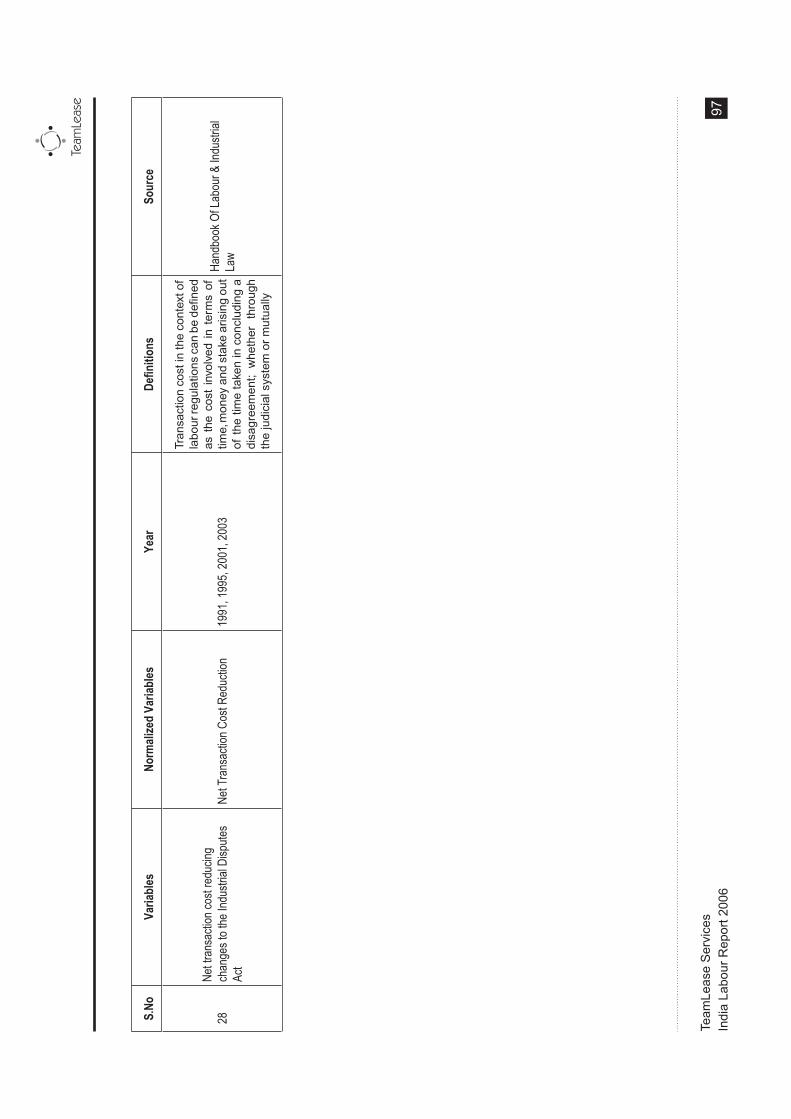
S.No
Varia
bles
Norm
alize
d Va
riabl
esYe
arDe
fi niti
ons
Sour
ce
28Ne
t tran
sacti
on co
st re
ducin
g ch
ange
s to t
he In
dustr
ial D
ispute
s Ac
tNe
t Tra
nsac
tion C
ost R
educ
tion
1991
, 199
5, 20
01, 2
003
Tran
sact
ion
cost
in th
e co
ntex
t of
labo
ur re
gula
tions
can
be
defin
ed
as t
he c
ost
invo
lved
in
term
s of
tim
e, m
oney
and
sta
ke a
risin
g ou
t of
the
time
take
n in
con
clud
ing
a di
sagr
eem
ent;
whe
ther
th
roug
h th
e ju
dici
al s
yste
m o
r m
utua
lly
Hand
book
Of L
abou
r & In
dustr
ial
Law
97
TeamLease is India's largest staffing company. It is a liquidity provider in labour markets that enables the better matching of demand and supply by connecting people, to the right company, at the right time. We currently have over 47,000 employees in over 425 locations across the country.
TeamLease has a range of temp and perm solutions for companies and individuals. Our primary services include temporary staffing, payrolling and permanent recruitment. These are supplemented by strong vertical practices for ITES, Retail, Telecom and Financial Services that understand their industries deeply and offer special solutions. Clients, associates and candidates are serviced through our network of offices, web and phone support. Our proprietary web based TeamLease Temp Network (TLnet) is hosted at www.teamlease.com. TLnet has three components; ALCS (Associate Life Cycle System), CLCS (Candidate Life Cycle System) and our Intranet.
TeamLease, as a market leader, has a responsibility and self-interest in dispelling the faulty conception of temporary staffing as precarious employment. Our research efforts include a quarterly TeamLease Employment Outlook, annual TeamLease Temp Salary Primer and the TeamLease Staffing White Paper.
TeamLease
About TeamLease
Indicus Analytics (http://www.indicus.net) is a specialized economics research firm based in New Delhi. It has been providing research inputs to institutions such as The World Bank, Harvard University, The Finance Commission, and many other national and international institutions.
Its areas of analysis include modeling, indexation, monitoring and evaluation, socio-economic surveys, and analytical studies. Indicus research covers the whole range of areas including: (i) Socio-economy and Infrastructure (ii) States Performance, Governance, Policy and Law (iii) Labour, Poverty and Demography(Iv) Macro-economy and Trade.
About Indicus
TeamLease Services
India Labour Report 2006 98


TeamLeaseStaffing Solutions
TM
Bangalore - III“Sheriff House”#85, Richmond RoadBangalore – 560025Ph: +91 - 80 - 66635101 / 5
Bangalore - II“Silver Palms”#13, Palm Grove RoadOff. Victoria RoadBangalore – 560047Ph: +91 - 80 - 66618340 / 2-5
Chennai"Vukan Towers"81, Thirumalai Pillai Road, T Nagar Chennai - 600017Ph: +91 - 44 - 43901111
Jaipur#334, IIIrd Floor,Multi-Story ComplexGanpati Plaza, M.I. RoadJaipur - 302001Ph: +91 - 141 - 3919 771 / 3
Goa#606, Unitech City Centre,M.G.Road, PanjimGoa - 403001 Ph: +91 - 832 - 3954761, 6650445
Bangalore - I“TeamLease House”#26, Palm Grove RoadOff. Victoria RoadBangalore - 560047Ph: +91 - 80 - 25575660
Ahmedabad#102, Shivam Complex, Nr Silicon Tower, Law Garden, Ellis BridgeAhmedabad - 380009Ph: +91 - 79 - 30009660 / 3
ChandigarhReliant Business Centre4th Floor, Cabin 401 & 402S.C.O. 60-62, Sector 17C Chandigarh - 160017Ph: +91 - 172 - 4618278, 4638712/3
Indore“Royal Ratan”#111, First Floor#7, M G RoadIndore - 452001 Ph: 91 - 731 - 4222299 / 499
Mumbai - II#501, 5th Floor,Chintamani Plaza BuildingChakala, Andheri Kurla RoadAndheri (East). Mumbai - 400099Ph: +91 - 22 - 40009000
HyderabadNavabharat ChambersRajbhavan Road Hyderabad - 500082Ph: +91 - 40 - 55680538 / 39
KochiBusiness Communication CentreChiramel ChambersKurisupally Road, RavipuramKochi - 682015 Ph: +91 - 484 - 4029788
Baroda#315, Race Course Tower, Near Natubhai Circle, Opp. Citi Bank, Gotri RoadBaroda - 390007 Ph: +91 - 265 - 2352031
Mumbai - I#205, Dalamal TowersNariman PointMumbai - 400021Ph: +9 1- 22 - 22856063 / 5754
LucknowA4/B4, First FloorSaran Chambers II 5 Park Road, HazratganjLucknow - 226001Ph: +91 - 522 - 4001569
Kolkata'Lords', # 503, 5th Floor# 7/1, Lord Sinha RoadKolkata - 700071Ph: +91 - 33 - 30584310 / 38
New Delhi#81/1, Ganga PlazaSri Arubindo Marg, AdchiniNew Delhi - 110017Ph: +91 - 11 - 41203000
Pune#10, Island Pearl, 2nd FloorSholapur RoadPune - 411001Ph: +91 - 20 - 26333649, 26334479
VisakhapatnamDoor No 47 - 15 - 7 / 32, Shop No – C6, 2nd Floor,Pavan Palace, DwarakanagarVisakhapatnam - 530016Ph: +91 - 891 - 3958103
www.teamlease.com
ww
w.c
orr
ido
rs-m
ult
ime
dia
.co
m
Related Documents