Page 112 find SPARK RESEARCH on (SPAK <go>) RESEARCH ANALYSTS INTERNET SECTOR UPDATE 24 June 2019 IndiaMART IPO SOUMITRA CHATTERJEE [email protected] +91 22 6176 6805 OMPRAKASH KAVADI [email protected] +91 44 4344 0096 INDIA INTERNET SECTOR IndiaMART IPO offers investors an additional play on the Indian Internet sector, which currently has only three listed players viz. Info Edge, Just Dial (Rating: REDUCE, target price: Rs. 530) and Matrimony (Not Rated). Our preferred pick remains Info Edge (Rating: BUY, target price: Rs. 2,290), as it is a verticalized player with leadership position in all its verticals except the matrimonial segment. This verticalization brings in pricing power (7.5% CAGR in recruitment segment for Info Edge and 7% CAGR for Matrimony ltd versus -1% CAGR for Just Dial during FY14-19) and improves the quality of revenue and earnings. Whilst IndiaMART pricing has improved 7% CAGR over the last 3 years and is greater than 2x of Just Dial’s pricing thereby indicating stickiness from suppliers, based on our channel checks with over 75 suppliers across the country (slide 5), the stress in the MSME sector (slide 6 and 7) could be the single biggest risk for IndiaMART’s revenue and pricing growth (deferred revenue is 85% of cash and bank balance). The recent appreciation in the stock price of Just Dial (up 56% in last 3 months) followed by the launch of IPO of IndiaMART reminds us of the 56% appreciation in the stock price of Navneet Education from December 2016 till May 2017, when IPO of SChand was launched and fully subscribed. In sectors where investible options are limited, investors tend to lean towards the best available option till the investible universe within the sector expands and the Indian Internet sector is one such sector. Thus, the appreciation in stock price of Just Dial and expected valuations of IndiaMART can pose valuation related risks for a segment, where growth headwinds in the near term are a possibility. Just Dial is the only comparable company Comparable with Just Dial and provides an additional option to play Indian Internet sector – While Info Edge (recruitment, real estate and marriage classifieds) and Matrimony (marriage classifieds) are vertical players, Just Dial and IndiaMART are horizontal players and operates in the SME classified segment with just one exception - IndiaMART operates in the B2B segment while Just Dial operates in B2C segment and are hence comparable on growth profile, margins, balance sheet, return ratios and metrics. Therefore IndiaMART offers investors an additional option to play the Indian Internet sector. IndiaMART is the largest online B2B marketplace for business products and services with approximately 60% market share of the online B2B classifieds space in India (FY17 data). IndiaMART’s growth in billings is significantly higher than that of Just Dial – The companies in the Indian internet segment enjoys a negative working capital cycle, as subscriptions are collected upfront and services are delivered over the tenure of the contract, which could be one year or even more. Thus, the cash generation (pre tax OCF as % of EBITDA) is higher than 100%. The flip side of this negative working capital argument is slowdown in revenue growth, which impacts deferred revenue growth and consequently cash generation negatively. Thus, the metric to look into is growth in billings, which is the balancing figure computed using opening and closing deferred revenue and revenue accounted in the quarter/year. IndiaMART’s growth in billings has been 36% over the last two years, which is higher than Just Dial’s 8% in FY18 and 15% in FY19. However, roughly, 40% of the billings is from services to be rendered beyond 12 months and hence consistent growth in economy and MSME segment is vital. Channel checks with suppliers – Our channel checks with 75 vendors across the 4 regions of country indicates, stress in the MSME segment as the single biggest risk, which can impact FY21 growth expectations of IndiaMART. Amongst various parameters surveyed, ~46% of vendors have seen an improvement in their sales post listing on IndiaMART while ~54% have not seen any impact on their sales post listing. Brief contours of the IPO and valuations – IndiaMART IPO opens on 24 th June 2019 and closes on 26 th June 2019 with entire 4.9mn shares being an offer for sale translating to an amount of Rs. 4.76bn at Rs. 973 per share. At market cap of Rs. 28bn, this translates to FY19 valuation of 5.6x on revenue and is comparable to Just Dial’s FY19 valuation on revenue. However, on EV basis, IndiaMART is 6% premium to revenues, 60% on EBITDA and 27% discount on OCF. As IndiaMART’s 85% of the cash balance is in the form of deferred revenues (cash collected upfront but services to be delivered over next 1 year or multiple years), investors should remove the deferred revenues from cash to make valuations comparable, as in event of any mid term cancellation of subscription, cash balance would come down and future revenue would get impacted. On a deferred revenue adjusted basis, IndiaMART is 21% and 80% premium on revenues and EBITDA to Just Dial and only 16% discount to Pre Tax OCF. -10% -5% 0% 5% 10% 15% 20% 25% Jun-18 Sep-18 Dec-18 Mar-19 Jun-19 NSE IT index Sensex Stock performance (%) 1m 3m 12m Sensex 0.6% 3.2% 11.4% CNXIT 2.2% 4.6% 18.1%

Welcome message from author
This document is posted to help you gain knowledge. Please leave a comment to let me know what you think about it! Share it to your friends and learn new things together.
Transcript

Page 112 find SPARK RESEARCH on (SPAK <go>)
RESEARCH ANALYSTS
INTERNET SECTOR UPDATE 24 June 2019
IndiaMART IPO
SOUMITRA CHATTERJEE
+91 22 6176 6805
OMPRAKASH KAVADI
+91 44 4344 0096
INDIA INTERNET SECTOR
IndiaMART IPO offers investors an additional play on the Indian Internet sector, which currently has only three listed players viz. Info Edge, Just Dial (Rating: REDUCE, target price: Rs. 530) and Matrimony (Not Rated). Our preferred pick remains Info Edge (Rating: BUY, target price: Rs. 2,290), as it is a verticalized player with leadership position in all its verticals except the matrimonial segment. This verticalization brings in pricing power (7.5% CAGR in recruitment segment for Info Edge and 7% CAGR for Matrimony ltd versus -1% CAGR for Just Dial during FY14-19) and improves the quality of revenue and earnings. Whilst IndiaMART pricing has improved 7% CAGR over the last 3 years and is greater than 2x of Just Dial’s pricing thereby indicating stickiness from suppliers, based on our channel checks with over 75 suppliers across the country (slide 5), the stress in the MSME sector (slide 6 and 7) could be the single biggest risk for IndiaMART’s revenue and pricing growth (deferred revenue is 85% of cash and bank balance). The recent appreciation in the stock price of Just Dial (up 56% in last 3 months) followed by the launch of IPO of IndiaMART reminds us of the 56% appreciation in the stock price of Navneet Education from December 2016 till May 2017, when IPO of SChand was launched and fully subscribed. In sectors where investible options are limited, investors tend to lean towards the best available option till the investible universe within the sector expands and the Indian Internet sector is one such sector. Thus, the appreciation in stock price of Just Dial and expected valuations of IndiaMART can pose valuation related risks for a segment, where growth headwinds in the near term are a possibility.
Just Dial is the only comparable company
Comparable with Just Dial and provides an additional option to play Indian Internet sector – While Info Edge (recruitment, real estate and marriage classifieds) and Matrimony (marriage classifieds) are vertical players, Just Dial and IndiaMART are horizontal players and operates in the SME classified segment with just one exception - IndiaMART operates in the B2B segment while Just Dial operates in B2C segment and are hence comparable on growth profile, margins, balance sheet, return ratios and metrics. Therefore IndiaMART offers investors an additional option to play the Indian Internet sector. IndiaMART is the largest online B2B marketplace for business products and services with approximately 60% market share of the online B2B classifieds space in India (FY17 data).
IndiaMART’s growth in billings is significantly higher than that of Just Dial – The companies in the Indian internet segment enjoys a negative working capital cycle, as subscriptions are collected upfront and services are delivered over the tenure of the contract, which could be one year or even more. Thus, the cash generation (pre tax OCF as % of EBITDA) is higher than 100%. The flip side of this negative working capital argument is slowdown in revenue growth, which impacts deferred revenue growth and consequently cash generation negatively. Thus, the metric to look into is growth in billings, which is the balancing figure computed using opening and closing deferred revenue and revenue accounted in the quarter/year. IndiaMART’s growth in billings has been 36% over the last two years, which is higher than Just Dial’s 8% in FY18 and 15% in FY19. However, roughly, 40% of the billings is from services to be rendered beyond 12 months and hence consistent growth in economy and MSME segment is vital.
Channel checks with suppliers – Our channel checks with 75 vendors across the 4 regions of country indicates, stress in the MSME segment as the single biggest risk, which can impact FY21 growth expectations of IndiaMART. Amongst various parameters surveyed, ~46% of vendors have seen an improvement in their sales post listing on IndiaMART while ~54% have not seen any impact on their sales post listing.
Brief contours of the IPO and valuations – IndiaMART IPO opens on 24th June 2019 and closes on 26th June 2019 with entire 4.9mn shares being an offer for sale translating to an amount of Rs. 4.76bn at Rs. 973 per share. At market cap of Rs. 28bn, this translates to FY19 valuation of 5.6x on revenue and is comparable to Just Dial’s FY19 valuation on revenue. However, on EV basis, IndiaMART is 6% premium to revenues, 60% on EBITDA and 27% discount on OCF. As IndiaMART’s 85% of the cash balance is in the form of deferred revenues (cash collected upfront but services to be delivered over next 1 year or multiple years), investors should remove the deferred revenues from cash to make valuations comparable, as in event of any mid term cancellation of subscription, cash balance would come down and future revenue would get impacted. On a deferred revenue adjusted basis, IndiaMART is 21% and 80% premium on revenues and EBITDA to Just Dial and only 16% discount to Pre Tax OCF.
-10%
-5%
0%
5%
10%
15%
20%
25%
Jun-1
8
Se
p-1
8
Dec-1
8
Ma
r-19
Jun-1
9
NSE IT index Sensex
Stock performance (%)
1m 3m 12m
Sensex 0.6% 3.2% 11.4%
CNXIT 2.2% 4.6% 18.1%

Page 113
India Internet: Sector Update (IndiaMART IPO)
Company Factsheet
Corporate Factsheet
Company Background
IndiaMART is the leading online marketplace for business goods and services, with ~60% market share in the online B2B classifieds space in India (FY17 data). IndiaMART had ~4.7mn suppliers and ~60mn registered buyers as of Mar 31, 2018 and had an aggregate of 553mn visits in FY18, of which, 72% has emanated from mobile traffic. Major portion of revenue is led by subscription based model, while IndiaMART also derives revenue from other avenues like advertising and providing access to leads. The paying subscription suppliers by end of FY18 stood at 108k. Of these paying suppliers, 50% subscribe to monthly packages , 15% subscribe to annual packages and the balance subscribe for other packages.
Operational Footprint
By Mar 31, 2018, IndiaMART’s online market place had a total of ~50mn listed products across 97k categories and 52 industries, of which, 75% are products and 25% are services The products and services are spread across India. Although 39% and 50% of the buyers and suppliers are respectively derived from the top 8 metro cities in
India, the market place offerings also generate traffic from Tier-II/III cities representing more than 1000 cities in total
Revenue model
IndiaMART offers basic and premium subscription models, which include a set number of RFQ credits that may be used by the suppliers. Revenue is also driven by providing access to lead management system, integrated access to third party online payment and advertising by suppliers. Major portion of revenue is driven by subscription revenue IndiaMART offers monthly, annual and multi-year subscription packages Advertising on IndiaMART desktop and mobile optimized platforms
Top Management & Board of Directors
Board of Directors Mr. Dinesh Chandra Agarwal – Promoter & Managing Director Mr. Brijesh Agarwal – Promoter & Whole-time Director Mr. Druv Prakash – Non-executive Director Mr. Rajesh Sawhney – Independent Director Ms. Elizabeth Lucy Chapman – Independent Director Mr. Vivek Narayan Gour – Independent Director Key Managerial Personnel Mr. Prateek Chandra – Chief Financial Officer Mr. Dinesh Gulati – Chief Operating Officer
Credit Rating NA
Bankers Book running lead managers : ICICI Securities Limited / Jefferies India Private Limited / Edelweiss Financial Services Limited Bankers to IndiaMART: HDFC Bank Limited / ICICI Bank Limited
Auditors S.R. Batliboi & Associates LLP
Page 114
India Internet: Sector Update (IndiaMART IPO)
IndiaMart product distribution across industries
Source: Company data, Spark Capital
8%
9%
4%
7%
4%
3%
3% 3%
3% 3%
53%
Apparel Clothing and garments
Construction and Building materials
Electronics and Electrical
FMCG, Vegetables, Fruits and Grocery
Medical, Surgical and Healthcare
Auto, spare parts and auto ancs
Travel and Tourism
IT Hardware and Software
Educational Institutes
Trade Event Organiser
Others
Packages
Silver
7 RFQ each week for Rs. 25,000 p.a.
Gold
Silver package with TrustSEAL
14 RFQ each week from Rs. 25,000
p.a. to Rs. 50,000 p.a.
Maximiser
21 RFQ each week from Rs. 25,000
p.a. to Rs. 50,000 p.a.
Platinum
Priority listing plus all benefits of Gold and Silver package
City categorization definition No. Buyers (%) Suppliers (%)
Delhi NCR, Mumbai, Kolkata, Chennai, Bangalore, Pune, Hyderabad, Ahmedabad
8 39% 50%
Population >5 lacs (excluding top 8) 69 27% 27%
Population >1 lacs <5 lacs (excluding top 77) 394 19% 13%
Remaining Cities 15% 10%
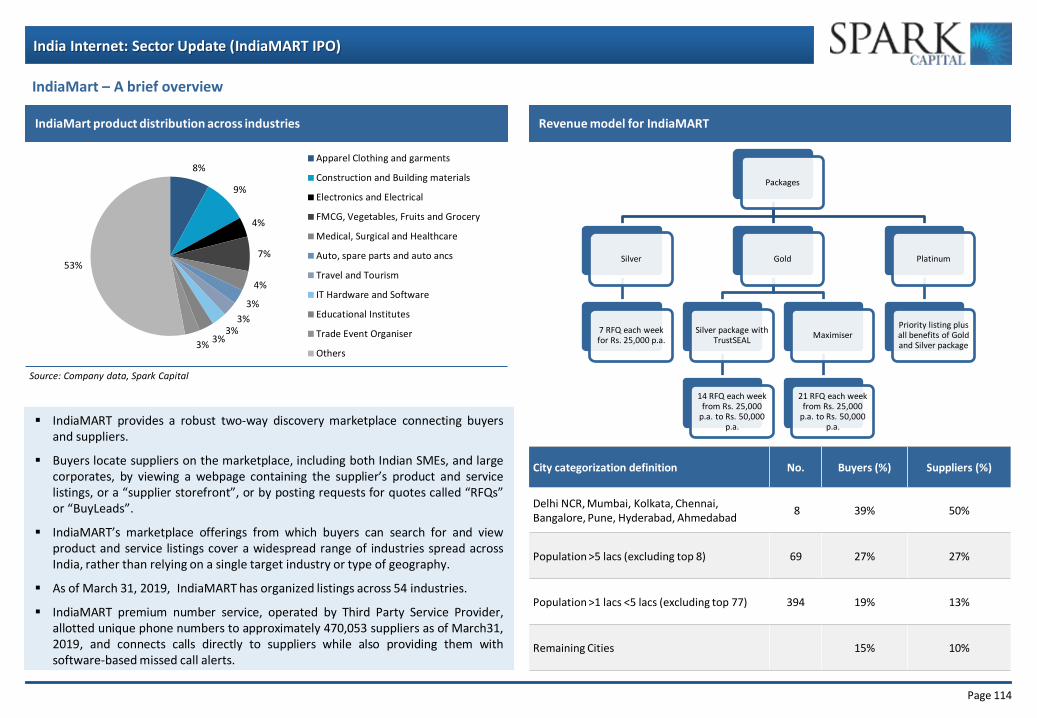
IndiaMART provides a robust two-way discovery marketplace connecting buyers and suppliers.
Buyers locate suppliers on the marketplace, including both Indian SMEs, and large corporates, by viewing a webpage containing the supplier’s product and service listings, or a “supplier storefront”, or by posting requests for quotes called “RFQs” or “BuyLeads”.
IndiaMART’s marketplace offerings from which buyers can search for and view product and service listings cover a widespread range of industries spread across India, rather than relying on a single target industry or type of geography.
As of March 31, 2019, IndiaMART has organized listings across 54 industries.
IndiaMART premium number service, operated by Third Party Service Provider, allotted unique phone numbers to approximately 470,053 suppliers as of March31, 2019, and connects calls directly to suppliers while also providing them with software-based missed call alerts.
IndiaMart – A brief overview
Revenue model for IndiaMART

Page 115
India Internet: Sector Update (IndiaMART IPO)
Particulars FY16 FY17 FY18 FY19 Aggregate visits (in mn) 262 326 553 724 Growth 24.3% 69.6% 30.9% Aggregate visits from Mobile (in mn) 155 205 397 550 Growth 32.4% 93.8% 38.6% % of visits from Mobile 59.0% 62.9% 71.8% 76.1% Business enquiries delivered to IndiaMART (in mn) 115 157 290 449 Growth 36.3% 84.9% 54.8% Daily unique buyer request (in mn) NA NA 52.6 72.5 Repeat buyers calculated on the basis of the past 90 days NA NA 52% 55% Types of industries listed in IndiaMART NA NA 52 54 Supplier Storefronts (in mn) 2.3 3.2 4.7 5.6 Growth 36.2% 49.4% 17.6% Paying subscription suppliers 72,335 96,025 1,08,347 1,29,589 Growth 32.8% 12.8% 19.6% Registered Buyers (in mn) 27 39 60 83 Growth 45.5% 51.9% 38.3% Revenue per paid supplier (Average) 33,974 37,748 40,173 41,801 Growth 11% 6% 4% India Mart Premium members NA NA 4,72,855 4,70,053 Revenues 2,458 3,178 4,105 4,973 Growth 39.6% 29.3% 29.2% 21.1% Employee Costs 1,819 2,097 1,949 2,223 Growth 52.9% 15.3% -7.1% 14.1% Other Expenses 1,894 1,625 1,690 1,890 Growth 94.5% -14.2% 4.0% 11.8% EBITDA -1,256 -544 466 860 Growth -211.7% 143.3% 185.7% 84.4% EBITDA (%) -51.1% -17.1% 11.4% 17.3% OCF -537 6 1,800 2,603 OCF as % of EBITDA 42.7% -1.1% 386.1% 302.7% Deferred Revenue (Rs Mn.) 2,361 2,932 3,920 5,860 Growth 24.2% 33.7% 49.5% Deferred Revenue as proportion of LTM Revenues 96.1% 92.3% 95.5% 117.8% Deferred Revenue as proportion of Cash and Bank 148.7% 165.7% 101.0% 85.5%
IndiaMART
Source: Company data, Spark Capital

Page 116
India Internet: Sector Update (IndiaMART IPO)
51.7% 48.3%
32.1%
67.9%
42.2%
46.0%
26.5%
35.5%
38.0%
25.0%
35.0%
40.0%
20.0% 35.0% 45.0%
42.9%
57.1%
20.7% 41.4% 37.9%
Neutral Positive Negative Sales Improved Sales flattish
Feedback on Sales
Feedback on Sales
Feedback on Sales
Feedback on Sales
Overall feedback from suppliers
Overall feedback from
suppliers
Overall feedback from suppliers
Overall feedback from
suppliers
Channel Check takeaways from suppliers on IndiaMART
Source: Spark Capital

Page 117
India Internet: Sector Update (IndiaMART IPO)
MSME credit constitutes ~23% of systemic credit, of which 10% is commercial credit to individuals and the remaining 14% is commercial credit to entities; large & mid corporate form the bulk of the systemic credit at 42%
Source: CIBIL, Spark Capital
Market share of PSU banks in the overall lending to MSMEs have been steadily coming off, from 58% in Dec’13 to 39% in Dec’18 (decline of 19% market share), with the market share losses getting distributed between Private banks & NBFCs
Source: CIBIL, Spark Capital
In MSME loans to individuals, PSU banks have largely maintained their market share at ~30% levels over 2013-2018…
Source: CIBIL, Spark Capital
… implying that market share losses of PSU banks have come entirely from the MSME lending to entities (69% in 2013 to 46% in 2018)
Source: CIBIL, Spark Capital
Agri & Retail Credit, 35%
Mid & Large Corporate,
42%
MSME Credit to Individual, 10%
MSME Credit to Entity, 14%
MSME Credit, [VALUE]
Systemic Credit breakup (%)
58% 55% 50% 48% 47% 39%
22% 23% 27% 28% 29% 33%
13% 15% 15% 17% 18% 21%
7% 7% 7% 7% 6% 7%
0%
20%
40%
60%
80%
100%
Dec'13 Dec'14 Dec'15 Dec'16 Dec'17 Dec'18
Share of Lenders in MSME Segment (%)
PSU PVT NBFC Others
34% 33% 32% 31% 34% 29%
26% 29% 29% 30% 30% 30%
29% 30% 29% 31% 29% 33%
11% 8% 11% 8% 7% 8%
0%
20%
40%
60%
80%
100%
Dec'13 Dec'14 Dec'15 Dec'16 Dec'17 Dec'18
Share of Lenders in Individual Segment (%)
PSU PVT NBFC Others
69% 67% 61% 58% 55% 46%
20% 20% 26% 27% 29% 34%
6% 7% 8% 9% 10% 13%
6% 6% 5% 6% 6% 7%
0%
20%
40%
60%
80%
100%
Dec'13 Dec'14 Dec'15 Dec'16 Dec'17 Dec'18
Share of Lenders in Entity Segment (%)
PSU PVT NBFC Others
MSME Sector

Page 118
India Internet: Sector Update (IndiaMART IPO)
Contrary to popular belief, it is the lower ticket size lending that has the least delinquencies, with micro loans (<Rs. 10mn) having GNPAs of 8.7%, while the larger ticket size Corporate (>Rs.1bn) exhibiting GNPAs of 19.0%
Private banks have the best set of customers among the MSMEs, with private bank GNPAs being the lowest at 3.5%, compared to NBFCs at 5.2% & PSU banks at 15.6%
Source: CIBIL, Spark Capital
Source: CIBIL, Spark Capital
While, MSME lending to individuals have lower delinquencies than MSME lending to entities, the GNPAs in the individuals segment has been steadily increasing over 2015-18
Source: CIBIL, Spark Capital
8.7%
10.5%
16.5%
19.0%
5.0%
7.0%
9.0%
11.0%
13.0%
15.0%
17.0%
19.0%
21.0%
Dec'15 Mar'16 Jun'16 Sep'16 Dec'16 Mar'17 Jun'17 Sep'17 Dec'17 Mar'18 Jun'18 Sep’18 Dec'18
Ticket-size wise NPA (%)
Micro (< Rs. 10mn) SME (Rs. 10mn - Rs. 250mn)
Mid-corporate (Rs. 250mn - Rs. 1bn) Large-corporate (>Rs. 1bn)
6.1% 5.8% 5.3%
6.0%
6.8%
7.7% 7.7%
8.8% 9.2%
10.7% 10.6% 10.0%
7.0% 7.5% 7.6%
8.7% 9.0% 9.0%
4.0%
5.0%
6.0%
7.0%
8.0%
9.0%
10.0%
11.0%
12.0%
Dec'13 Dec'14 Dec'15 Dec'16 Dec'17 Dec'18
NPA - segment wise (%)
Individual Entity Aggregate
3.0% 4.0% 3.9% 4.2% 4.4%
5.1% 5.0% 5.4% 5.0% 5.0% 5.0% 5.2%
3.7% 3.6% 3.6% 3.4% 4.2% 4.1% 4.0% 3.9% 3.8% 3.9% 3.9% 3.5%
10.3%
11.9% 13.0% 13.4%
14.3% 14.3% 14.5% 14.3% 14.2% 14.4% 15.2% 15.6%
0.0%
2.0%
4.0%
6.0%
8.0%
10.0%
12.0%
14.0%
16.0%
18.0%
Dec'15 Mar'16 Jun'16 Sep'16 Dec'16 Mar'17 Jun'17 Sep'17 Dec'17 Mar'18 Jun'18 Sep'18
Lender-type MSME NPA (%)
NBFC Private Banks PSU Banks
MSME Sector

Page 119
India Internet: Sector Update (IndiaMART IPO)
Info Edge (Billings in Rs. million and growth in billings)
Source: Company, Spark Capital
IndiaMART (Billings in Rs. million and growth in billings)
Source: Company, Spark Capital
Just Dial (Billings in Rs. million and growth in billings)
Source: Company, Spark Capital
Matrimony (Billings in Rs. million and growth in billings)
Source: Company, Spark Capital
7,534 8,606
9,767
11,770
14% 13%
21%
FY16 FY17 FY18 FY19
Rs.
mn
Billings Growth in Billings
3,883 4,876
6,382 6,919
7,816 8,405
9,639
26%
31%
8%
13%
8%
15%
FY13 FY14 FY15 FY16 FY17 FY18 FY19
Rs.
mn
Billings Growth in Billings
3,355 3,749
5,093
6,913
12%
36% 36%
FY16 FY17 FY18 FY19
Rs.
mn
Billings Growth in Billings
2,037 2,376
2,588 2,853
3,333 3,488
17%
9% 10%
17%
5%
FY14 FY15 FY16 FY17 FY18 FY19
Rs.
mn
Billings Growth in Billings
Billings growth trends across Internet companies

Page 120
India Internet: Sector Update (IndiaMART IPO)
27% 28%
17%
4%
9%
14%
124%
145%
121%
145% 165%
141%
19% 30%
0%
30%
21% 22%
FY14 FY15 FY16 FY17 FY18 FY19
Revenue growth (LHS) Pre Tax OCF as % of EBITDA (RHS) Deferred revenue growth (RHS)
1,355 1,618
2,102 2,113
2,743
3,330
4,054
27% 24%
26% 25% 27%
28% 30%
37% 35%
36% 31%
38%
43%
45%
FY13 FY14 FY15 FY16 FY17 FY18 FY19
Rs.
in m
illio
n
Deferred Revenues As % of cash balance (RHS) As % of LTM revenues (RHS)
Growth in actual revenue vs. deferred revenue
Deferred revenue as % of cash balance and LTM revenue
Growth in actual revenue vs. deferred revenue
Deferred revenue as % of cash balance and LTM revenue
IndiaMART vs. Just Dial
30%
40%
29% 29%
21%
61%
24% 34%
49%
-13% 43%
-1%
386%
303%
FY15 FY16 FY17 FY18 FY19
Revenue growth (LHS) Deferred revenue growth (LHS) Pre Tax OCF as % of EBITDA (RHS)
2,361 2,361 2,932
3,920
5,860
208%
149%
166%
101%
86% 83%
96% 92%
95%
118%
FY15 FY16 FY17 FY18 FY19
Rs.
in m
illio
n
Deferred Revenues As % of cash balance (RHS) As % of LTM revenues (RHS)
Source: Company data, Spark Capital

Page 121
India Internet: Sector Update (IndiaMART IPO)
Growth in total listings vs. paid listings
Revenue from paid listing
Growth in total registered suppliers vs. paying suppliers
Revenue per paid supplier
23%
28% 28%
17%
9%
16%
20%
30%
24% 27%
18%
15%
9% 7%
FY13 FY14 FY15 FY16 FY17 FY18 FY19
Growth in total listings Growth in paid listings
19,219 19,686 19,880 19,738 17,872 17,758 18,849
2% 1%
-1%
-9%
-1%
6%
FY13 FY14 FY15 FY16 FY17 FY18 FY19
INR
Revenue Per Paid Listing Growth in Revenue Per Paid Listing (RHS)
36%
49%
11%
16%
21%
16%
FY17 FY18 FY19
Growth in total registered suppliers Growth in total paying suppliers
33,974 37,748
40,173 41,801
11%
6%
4%
FY16 FY17 FY18 FY19
INR
Revenue per paid supplier Revenue per paid supplier (RHS)
IndiaMART vs. Just Dial
Source: Company data, Spark Capital

Page 122
India Internet: Sector Update (IndiaMART IPO)
Employee break-up
Sales productivity : IndiaMART vs. Just Dial (calculated after removing corporate and IT headcount)
Employee break-up
3,544 4,350 4,057 4,072
1,327 1,484 1,410 1,461
1,911 2,055 2,663 3,896
4,416 3,445 3,322 3,262
FY16 FY17 FY18 FY19
Telemarketing Feet-On-Street (Marketing)
Feet-On-Street (JDAs and Cold Calling) Corporate
60
40 43
40
54
FY17 FY18 FY19
Just Dial IndiaMART
794 488 407
1,289
1,454 1,842
532 979 1,067
424 424 520 147 173 149
FY17 FY18 FY19
Sales Services Outsourced field representative Product Development + IT Corporate
IndiaMART vs. Just Dial
Source: Company data, Spark Capital

Page 123
India Internet: Sector Update (IndiaMART IPO)
Comparative Valuation
All fig in Rs.mn Info Edge Just Dial Matrimony IndiaMART
Market Cap 2,58,892 49,430 13,600 28,000
Net Cash 19,052 13,414 2,123 6,852
Deferrred Revenue 4,744 4,054 721 5,860
Net cash after Deferred Revenue 14,308 9,360 1,402 992
Enterprise Value 2,44,584 40,070 12,198 27,008
FY21 Revenue 15,452 10,907 4,236 NA
FY21 EBITDA 5,966 2,514 844 NA
FY21 PAT 5,339 2,008 652 NA
FY21 Pre Tax OCF 7,246 2,560 991 NA
FY21 Market Cap to PAT (x) 48.5 24.6 20.9 NA
FY21 EV to EBITDA (x) 41.0 15.9 14.5 NA
FY21 EV to OCF (x) 33.8 15.7 12.3 NA
FY21 EV to Revenue (x) 15.8 3.7 2.9 NA
Last 5 years Revenue CAGR 21.4% 14.1% 11.1% 30.2%
Last 5 years Revenue CAGR - Naukri.com 16.1% NA NA NA
Last 5 years Volume CAGR 8.6% 15.1% 4.1% 18.0%
Last 5 years Pricing CAGR 7.5% -1.0% 7.0% 7.0%
Last 5 years EBITDA CAGR 19.6% 10.0% 38.4% 45.6%
Last 5 years Employee Costs CAGR 18.4% 16.8% 10.1% 19.6%
Last 5 years Other Costs CAGR 16.0% 12.8% 7.4% 29.1%
Last 5 years PAT CAGR 24.5% 11.4% 26.7% 20.6%
ROIC 19.8% 20.4% 16.9% 95.2%
Note: 1. Volume CAGR for Info Edge is only for recruitment business 2. Pricing CAGR for Info Edge is only for recruitment business 3. Matrimony FY21 estimates is from Bloomberg Consensus and 4. Volume and Pricing CAGR for IndiaMART is for last 3 years Source: Company data, Spark Capital

Page 124
India Internet: Sector Update (IndiaMART IPO)
0
20
40
60
80
100
120
140
160
180
200
Jan
-13
Mar
-13
May
-13
Jul-
13
Sep
-13
No
v-1
3
Jan
-14
Mar
-14
May
-14
Jul-
14
Sep
-14
No
v-1
4
Jan
-15
Mar
-15
May
-15
Jul-
15
Sep
-15
No
v-1
5
Jan
-16
Mar
-16
May
-16
Jul-
16
Sep
-16
No
v-1
6
Jan
-17
Mar
-17
May
-17
Jul-
17
Sep
-17
No
v-1
7
Jan
-18
Mar
-18
May
-18
Jul-
18
Sep
-18
No
v-1
8
Jan
-19
Mar
-19
May
-19
DRHP Filed by SChand
Listing of SChand
0
100
200
300
400
500
600
700
800
900
Jan
-17
Jan
-17
Feb
-17
Mar
-17
Mar
-17
Ap
r-1
7
May
-17
May
-17
Jun
-17
Jul-
17
Jul-
17
Au
g-1
7
Sep
-17
Oct
-17
Oct
-17
No
v-1
7
Dec
-17
Dec
-17
Jan
-18
Feb
-18
Feb
-18
Mar
-18
Ap
r-1
8
Ap
r-1
8
May
-18
Jun
-18
Jul-
18
Jul-
18
Au
g-1
8
Sep
-18
Sep
-18
Oct
-18
No
v-1
8
No
v-1
8
Dec
-18
Jan
-19
Jan
-19
Feb
-19
Mar
-19
Ap
r-1
9
Ap
r-1
9
May
-19
Jun
-19
DRHP Filed by IndiaMART
IndiaMART IPO launched
Share price history
Source: Bloomberg, Spark Capital
Navneet Education: The scrip saw an appreciation of 56% leading to the IPO of S Chand and Company as publishing sector had only one listed play i.e. Navneet
Just Dial: The scrip has also seen an appreciation of 56% leading to the IPO of IndiaMART as the sector had only one listed play i.e. Just Dial

Page 125
India Internet: Sector Update (IndiaMART IPO)
Abridged Financial Statements Rs. mn FY14 FY15 FY16 FY17 FY18 FY19 Profit & Loss
Revenue 1,357 1,761 2,458 3,178 4,106 5,074
Gross Profit 419 571 638 1,081 2,157 2,774
EBITDA -126 -403 -1,256 -544 467 823
Depreciation 22 30 37 46 29 41
EBIT -148 -433 -1,293 -590 438 782
Other Income 76 120 15.39 23 29 37
Net gain / loss on Financial Assets 3 5 (34) (74) (1,067) (279)
Exceptional items - - - - - -
PBT -76 -319 -1,311 -641 -600 539
Reported PAT (after minority interest) -76 -319 -1,316 -643 548 200
Adj PAT (76) (319) (1,316) (649) 538 193
EPS (Rs.) (2.6) (11.1) (45.7) (22.6) 18.7 6.7
Balance Sheet
Net Worth (621) (940) (3,271) (3,900) (3,212) 1,599
Deferred Revenue (Long Term and Short Term) - 1,463 2,361 3,255 4,244 5,860
Share Buyback obligation - - 2,195 2,461 3,729 -
Other liabilities and provisions 1,445 502 661 394 666 749
Total Networth and liabilities 824 1,025 1,946 2,209 5,427 8,208
Gross Fixed assets 195 211 130 150 171 220
Net fixed assets 64 53 100 77 75 87
Intangible Assets 2 10 8 12 8 6
Deferred Tax Asset - - - - 1,156 858
Investments 580 600 1,286 1,363 3,111 6,074
Cash and bank balances 67 103 301 407 769 777
Loans & advances and other assets 77 109 204 298 266 361
Other Long Term Assets 34 149 47 53 43 44
Total assets 824 1,025 1,946 2,209 5,427 8,208
Capital Employed (621) (940) (3,271) (3,900) (3,212) 1,599
Invested Capital (CE- cash-CWIP) (688) (1,043) (3,572) (4,307) (3,982) 821
Net Debt (647) (703) (1,587) (1,769) (3,880) (6,852)
Cash Flows
Cash flows from Operations (Pre-tax) 225 52 -537 6 1,800 2,603
Cash flows from Operations (post-tax) 223 71 -555 -6 1,791 2,551
Capex -40 28 74 27 22 51
Free cashflows 263 43 -629 -33 1,769 2,500
Free cashflows (post interest costs) 263 38 -629 -33 1,769 2,500
Cash flows from Investing -250 -10 -608 51 -1,631 -2,707
Cash flows from Financing 1 1 1,324 73 152 141
Total cash & liquid investments 647 703 1,587 1,769 3,880 6,852
IndiaMART - Financial Summary

Page 126
India Internet: Sector Update (IndiaMART IPO)
IndiaMART - Financial Summary
FY14 FY15 FY16 FY17 FY18 FY19 Key variables Total listings (mn) 12 15 16 18 22 26 Total paid ad campaigns (000') 262 331 369 435 445 501 Employee headcount 8,543 9,533 11,198 11,334 11,452 12,691 Growth ratios Revenue 29.7% 39.6% 29.3% 29.2% 23.6% EBITDA 220.1% 211.4% -56.7% -185.9% 76.3% Adj PAT 320.5% 312.6% -51.1% -185.1% -63.4% Margin ratios Gross 30.8% 32.4% 26.0% 34.0% 52.5% 54.7% EBITDA -9.3% -22.9% -51.1% -17.1% 11.4% 16.2% Adj PAT -5.6% -18.1% -53.5% -20.4% 13.1% 3.8% Performance ratios Pre-tax OCF/EBITDA -178.4% -12.9% 42.7% -1.1% 385.4% 316.2% OCF/IC (%) -32.4% -6.8% 15.5% 0.1% -45.0% 310.6% RoE (%) 12.2% 40.9% 62.5% 18.1% -15.1% -23.9% ROCE (%) 7.8% 22.4% 26.2% 9.8% -9.7% 34.3% RoCE (Pre-tax) 11.7% 40.2% 60.7% 15.8% -13.1% -101.5% RoIC (Pre-tax) 21.6% 41.6% 36.2% 13.7% -11.0% 95.2% Fixed asset turnover (x) 21.4 30.2 32.1 36.0 54.3 63.0 Total asset turnover (x) 1.6 1.9 1.7 1.5 1.1 0.7 Financial stability ratios
Net Debt to Equity (x) 1.0 0.7 0.5 0.5 1.2 (4.3)
Net Debt to EBITDA (x) 5.1 1.7 1.3 3.3 (8.3) (8.3)
Interest cover (x) N.A N.A N.A N.A N.A N.A DSO days N.A N.A N.A N.A N.A N.A Working capital days N.A N.A N.A N.A N.A N.A Valuation metrics Fully Diluted Shares (mn) 29 29 29 29 29 29 Market cap (Rs.mn) 27,998 P/E (x) -369.2 -87.8 -21.3 -43.1 52.0 145.0 P/OCF(x) 125.6 397.0 -50.4 -4,810.6 15.6 11.0 EV (Rs.mn) 27,351 27,295 28,771 29,483 28,362 27,006
EV/ EBITDA (x) (217.1) (67.7) (22.9) (54.2) 60.7 32.8
EV/ OCF(x) 122.7 387.0 (51.8) (5,066) 15.8 10.6
FCF Yield 1% 0% -2% 0% 6% 9%
Price to BV (x) (45.1) (29.8) (8.6) (7.2) (8.7) 17.5
Dividend pay-out (%) 0.0% 0.0% 0.0% 0.0% 0.0% 0.0% Dividend yield (%) 0.0% 0.0% 0.0% 0.0% 0.0% 0.0%

Page 127
Just Dial | REDUCE | Target Price of Rs. 530
Financial Summary
Abridged Financial Statements Rs. mn FY15 FY16 FY17 FY18 FY19 FY20E FY21E FY22E Profit & Loss Revenue 5,898 6,908 7,186 7,818 8,915 9,901 10,907 11,999 Gross Profit 2,810 3,134 2,777 3,402 3,944 4,160 4,401 4,825 EBITDA 1,657 1,705 1,096 1,644 2,289 2,378 2,514 2,725 Depreciation 241 311 401 364 337 389 433 476 EBIT 1,416 1,394 695 1,280 1,953 1,989 2,081 2,249 Other Income 489 585 870 659 930 699 731 766 Interest expense 0 0 0 0 1 4 4 4 Exceptional items 0 0 0 0 0 0 0 0 PBT 1,904 1,979 1,565 1,939 2,881 2,685 2,809 3,012 Reported PAT (after minority interest) 1,388 1,418 1,213 1,432 2,068 1,920 2,008 2,153 Adj PAT 1,388 1,418 1,213 1,432 2,068 1,920 2,008 2,153 EPS (Rs.) 19.8 20.1 17.5 21.0 31.0 29.5 30.9 33.1 Balance Sheet Net Worth 6,734 7,395 9,053 9,792 9,986 10,800 11,417 12,101 Deferred Tax liabilities 0 0 0 0 173 173 173 173 Total debt 0 0 0 0 28 28 28 28 Other liabilities and provisions 2,775 2,894 3,468 4,096 5,003 5,003 5,003 5,003 Total Networth and liabilities 9508 10289 12521 13888 15190 16004 16621 17304 Gross Fixed assets 1576 2329 2853 3132 3316 3716 4116 4516 Net fixed assets 922 1474 1647 1489 1262 1292 1280 1223 Goodwill 0 0 0 0 0 0 0 0 Capital Work in Progress 0 0 0 0 59 59 59 59 Investments 7722 8074 9765 11431 12911 12911 12911 12911 Cash and bank balances 422 354 561 575 404 1017 1683 2454 Loans & advances and other assets 580 580 682 609 855 855 855 855 Net working capital -136 -193 -133 -216 -301 -348 -394 -435 Total assets 9508 10289 12521 13888 15190 16004 16621 17304 Capital Employed 6,734 7,395 9,053 9,792 10,014 10,828 11,445 12,129 Invested Capital (CE- cash-CWIP) 6,312 7,041 8,492 9,217 9,550 9,752 9,702 9,615 Net Debt -8143 -8428 -10326 -12006 -13288 -13900 -14566 -15337 Cash Flows Cash flows from Operations (Pre-tax) 2,404 2,067 1,585 2,714 3,236 2,425 2,560 2,766 Cash flows from Operations (post-tax) 1,844 1,496 1,363 2,262 2,423 1,660 1,760 1,908 Capex 681 948 324 212 246 420 420 420 Free cashflows 1,164 548 1,039 2,050 2,177 1,240 1,340 1,488 Free cashflows (post interest costs) 1,164 548 1,039 2,050 2,175 1,236 1,336 1,484 Cash flows from Investing -1,585 230 -1,178 -1,370 -394 279 311 346 Cash flows from Financing -141 -1,812 5 -842 -2,200 -1,326 -1,404 -1,482 Total cash & liquid investments 8,143 8,428 10,326 12,006 13,315 13,927 14,594 15,365

Page 128
Just Dial | REDUCE | Target Price of Rs. 530
FY15 FY16 FY17 FY18 FY19 FY20E FY21E FY22E
Key variables
Total listings (mn) 15 16 18 22 26 30 35 40
Total paid ad campaigns (000') 331 369 435 445 501 539 604 669
Employee headcount 9,533 11,198 11,334 11,452 12,691 13,691 14,491 15,291
Growth ratios
Revenue 27.9% 17.1% 4.0% 8.8% 14.0% 11.1% 10.2% 10.0%
EBITDA 16.5% 2.9% -35.7% 50.0% 39.2% 3.9% 5.7% 8.4%
Adj PAT 15.1% 2.1% -14.4% 18.0% 44.4% -7.2% 4.6% 7.2%
Margin ratios
Gross 47.6% 45.4% 38.6% 43.5% 44.2% 42.0% 40.3% 40.2%
EBITDA 28.1% 24.7% 15.3% 21.0% 25.7% 24.0% 23.0% 22.7%
Adj PAT 23.5% 20.5% 16.9% 18.3% 23.2% 19.4% 18.4% 17.9%
Performance ratios
Pre-tax OCF/EBITDA 145.1% 121.2% 144.6% 165.0% 141.4% 102.0% 101.8% 101.5%
OCF/IC (%) 29.2% 21.2% 16.0% 24.5% 25.4% 17.0% 18.1% 19.8%
RoE (%) 23.0% 20.1% 14.8% 15.2% 20.9% 18.5% 18.1% 18.3%
ROCE (%) 23.0% 20.1% 14.8% 15.2% 20.9% 18.4% 18.1% 18.3%
RoCE (Pre-tax) 31.5% 28.0% 19.0% 20.6% 29.1% 25.8% 25.3% 25.6%
RoIC (Pre-tax) 22.4% 19.8% 8.2% 13.9% 20.4% 20.4% 21.4% 23.4%
Fixed asset turnover (x) 8.1 5.8 4.6 5.0 6.5 7.8 8.5 9.6
Total asset turnover (x) 0.7 0.7 0.6 0.6 0.6 0.6 0.7 0.7
Financial stability ratios
Net Debt to Equity (x) -1.2 -1.1 -1.1 -1.2 -1.3 -1.3 -1.3 -1.3
Net Debt to EBITDA (x) -4.9 -4.9 -9.4 -7.3 -5.8 -5.8 -5.8 -5.6
Interest cover (x) N.A N.A N.A N.A N.A N.A N.A N.A
DSO days N.A N.A N.A N.A N.A N.A N.A N.A
Working capital days N.A N.A N.A N.A N.A N.A N.A N.A
Valuation metrics
Fully Diluted Shares (mn) 65 65 65
Market cap (Rs.mn) 49,467 49,467 49,467
P/E (x) 38.5 37.8 43.5 36.2 24.6 25.7 24.6 22.9
P/OCF(x) 26.8 33.1 36.3 21.9 20.4 29.8 28.1 25.9
EV (Rs.mn) 41,324 41,040 39,142 37,461 36,180 35,567 34,901 34,130
EV/ EBITDA (x) 24.9 24.1 35.7 22.8 15.8 15.0 13.9 12.5
EV/ OCF(x) 22.4 27.4 28.7 16.6 14.9 21.4 19.8 17.9
FCF Yield 4.1% 4.4% 2.5% 2.7% 3.0%
Price to BV (x) 7.3 6.7 5.5 5.1 5.0 4.6 4.3 4.1
Dividend pay-out (%) 10.1% 9.9% 0.0% 0.0% 0.0% 57.6% 58.3% 57.4%
Dividend yield (%) 0.3% 0.3% 0.0% 0.0% 0.0% 2.2% 2.4% 2.5%
Financial Summary

Page 129
Info Edge | BUY | Target Price of Rs. 2,290
SOTP valuation
Business Metric Mar-21 (Rs.mn) Multiple type Multiple Value (Rs.mn) Per share % contribution
Naukri EBITDA 6,190 EV/EBITDA 26.0 1,60,951 1,320 57.7%
99Acres Sales 2,669 EV/Sales 7.0 18,686 153 6.7%
Jeevan Sathi Sales 1,062 EV/Sales 2.0 2,125 17 0.8%
Others (Shiksha, Brijj& Others) Sales 465 EV/Sales 2.0 930 8 0.3%
Cash 25,640 1.0 25,640 210 9.2%
36,028 2,08,333
Shares O/S 122
Price /share 1,709 74.6%
Investment value 580 25.4%
Infoedge consolidated value 2,290
Investment Particulars % stake Book value of
investments (Rs.mn) Discount % Value (Rs.mn) Per share
% Contribution per share
Contribution to investments
Zomato Media 26.4% 1,520 Valued at US$3.0bn 55,447 455 19.9% 78.4%
Policy Bazaar 15.6% 4,140 Valued at US$1.2bn 13,104 108 4.7% 18.5%
Applect Learning Systems 66.0% 1,360 25% 1,020 8 0.4% 1.4%
International Education Gateway 31.4% 130 25% 98 1 0.0% 0.1%
Shop Kirana 11.5% 100 25% 75 1 0.0% 0.1% Happily Unmarried 45.3% 260 25% 195 2 0.1% 0.3% Vacationlabs 26.1% 60 25% 45 0 0.0% 0.1% NoPaperForms Solutions 48.1% 340 25% 255 2 0.1% 0.4% Bluedolph 43.9% 110 25% 83 1 0.0% 0.1% Unnati 31.6% 40 25% 30 0 0.0% 0.0% Vcare 15.1% 40 25% 30 0 0.0% 0.0% Wishbook Infoservices 25.7% 40 25% 30 0 0.0% 0.0% Zippserv 45.3% 50 25% 38 0 0.0% 0.1% Gramophone 27.8% 60 25% 45 0 0.0% 0.1% Shoekonnect 28.9% 60 25% 45 0 0.0% 0.1% Printo 26.1% 250 25% 188 2 0.1% 0.3% Medcords 11.4% 30 25% 23 0 0.0% 0.0%
Sum of investments 8,590 70,748 580 100%

Page 130
Info Edge | BUY | Target Price of Rs. 2,290
Financial Summary
Abridged Financial Statements
Rs. mn FY15 FY16 FY17 FY18 FY19 FY20E FY21E FY22E
Profit & Loss
Revenue 6,116 7,235 8,021 9,155 10,983 13,159 15,452 18,106
Gross Profit 3,399 3,800 4,097 5,081 6,176 7,410 8,825 10,383
EBITDA 1,822 1,580 2,275 2,973 3,413 4,515 5,966 7,305
Depreciation 173 210 241 215 204 212 217 218
EBIT 1,649 1,370 2,034 2,758 3,210 4,303 5,750 7,087
Other Income 764 827 625 971 1,112 1,221 1,370 1,661
Interest expense 30 1 1 1 1 1 1 1
Exceptional items 0 0 0 0 0 0 0 0
PBT 2375 2196 2659 3728 4320 5523 7119 8747
Reported PAT (after minority interest) 1,931 1,416 2,044 1,824 2,817 4,143 5,339 6,560
Adj PAT 1,639 1,530 2,084 2,737 3,151 4,143 5,339 6,560
EPS (Rs.) 14.2 12.7 17.3 22.6 25.9 34.0 43.8 53.8
Balance Sheet
Net Worth 16,624 17,640 19,831 21,074 23,239 25,875 29,321 33,803
Deferred Tax liabilities 0 0 0 0 0 0 0 0
Total debt 0 0 0 0 0 0 0 0
Other liabilities and provisions 520 489 468 500 543 632 737 853
Total Networth and liabilities 17144 18129 20299 21575 23782 26508 30058 34657
Gross Fixed assets 1520 1711 1044 1127 1333 1517 1702 1886
Net fixed assets 840 922 602 529 569 542 509 476
Goodwill 0 0 0 0 0 0 0 0
Capital Work in Progress 0 0 0 0 0 0 0 0
Investments 5410 5736 7409 8263 10333 11191 11191 11191
Cash and bank balances 11981 9879 14460 14494 15320 18222 22979 28916
Loans & advances and other assets 327 1827 1258 2816 2939 2939 2939 2939
Net working capital -1414 -235 -3429 -4528 -5379 -6386 -7561 -8865
Total assets 17144 18129 20299 21575 23782 26508 30058 34657
Capital Employed 16,624 17,640 19,831 21,074 23,239 25,875 29,321 33,803
Invested Capital (CE- cash-CWIP) 10,053 13,497 13,842 14,843 16,182 15,916 14,605 13,150
Net Debt -11981 -9879 -14460 -14494 -15320 -18222 -22979 -28916
Cash Flows
Cash flows from Operations (Pre-tax) 1,847 1,912 3,167 4,327 4,305 5,611 7,246 8,725
Cash flows from Operations (post-tax) 1,390 1,091 2,283 3,067 3,136 4,230 5,466 6,539
Capex 123 298 89 139 207 184 184 184
Free cashflows 1,266 792 2,194 2,928 2,929 4,046 5,282 6,354
Free cashflows (post interest costs) 1,237 792 2,193 2,927 2,928 4,045 5,281 6,353
Cash flows from Investing -8,430 -300 -1,839 -2,042 904 179 1,185 1,477
Cash flows from Financing 7,156 -701 -419 -757 -881 -1,507 -1,894 -2,079
Total cash & liquid investments 11,981 9,879 14,460 14,494 15,320 18,222 22,979 28,916

Page 131
Info Edge | BUY | Target Price of Rs. 2,290
FY15 FY16 FY17 FY18 FY19 FY20E FY21E FY22E
Key variables
Number of resumes in Naukri (mn) 41 46 51 56 62 68 75 82
Number of paid listings in 99acres (000') 964 1,098 1,038 1,153 1,268 1,395 1,535 1,688
Number of profiles loaded in Jeevansathi (mn) 7 8 9 8 9 10 11 12
Growth ratios
Revenue 20.9% 18.3% 10.9% 14.1% 20.0% 19.8% 17.4% 17.2%
EBITDA 9.2% -13.3% 44.0% 30.7% 14.8% 32.3% 32.2% 22.4%
Adj PAT 50.2% -26.7% 44.4% -10.8% 54.5% 47.1% 28.9% 22.9%
Margin ratios
Gross 55.6% 52.5% 51.1% 55.5% 56.2% 56.3% 57.1% 57.3%
EBITDA 29.8% 21.8% 28.4% 32.5% 31.1% 34.3% 38.6% 40.3%
Adj PAT 26.8% 21.2% 26.0% 29.9% 28.7% 31.5% 34.6% 36.2%
Performance ratios
Pre-tax OCF/EBITDA 101.4% 121.0% 139.2% 145.5% 126.1% 124.3% 121.4% 119.5%
OCF/IC (%) 13.8% 8.1% 16.5% 20.7% 19.4% 26.6% 37.4% 49.7%
RoE (%) 13.5% 8.9% 11.1% 13.4% 14.2% 16.9% 19.3% 20.8%
ROCE (%) 13.7% 8.9% 11.1% 13.4% 14.2% 16.9% 19.3% 20.8%
RoCE (Pre-tax) 19.9% 12.8% 14.2% 18.2% 19.5% 22.5% 25.8% 27.7%
RoIC (Pre-tax) 16.4% 10.2% 14.7% 18.6% 19.8% 27.0% 39.4% 53.9%
Fixed asset turnover (x) 7.2 8.2 10.5 16.2 20.0 23.7 29.4 36.8
Total asset turnover (x) 0.5 0.4 0.4 0.4 0.5 0.5 0.5 0.6
Financial stability ratios
Net Debt to Equity (x) -0.7 -0.6 -0.7 -0.7 -0.7 -0.7 -0.8 -0.9
Net Debt to EBITDA (x) -6.6 -6.3 -6.4 -4.9 -4.5 -4.0 -3.9 -4.0
Interest cover (x) 47 N.A N.A N.A N.A N.A N.A N.A
DSO days 6 6 3 2 2 2 2 2
Working capital days -40 -23 -35 -39 -40 -40 -40 -40
Valuation metrics
Fully Diluted Shares (mn) 122 122 122
Market cap (Rs.mn) 2,65,126 2,65,126 2,65,126
P/E (x) 153.1 171.4 126.1 96.4 84.1 64.0 49.7 40.4
P/OCF(x) 190.6 242.8 116.0 86.4 84.5 62.6 48.5 40.5
EV (Rs.mn) 2,52,906 2,55,007 2,50,427 2,50,393 2,49,567 2,46,665 2,41,908 2,35,971
EV/ EBITDA (x) 138.8 161.4 110.1 84.2 73.1 54.6 40.5 32.3
EV/ OCF(x) 182.0 233.8 109.7 81.6 79.6 58.3 44.3 36.1
FCF Yield 1.1% 1.1% 1.5% 2.0% 2.4%
Price to BV (x) 15.9 15.0 13.4 12.6 11.4 10.2 9.0 7.8
Dividend pay-out (%) 21.1% 15.8% 29.0% 29.7% 23.2% 30.2% 29.3% 26.2%
Dividend yield (%) 0.1% 0.1% 0.2% 0.3% 0.3% 0.5% 0.6% 0.6%
Financial Summary

Page 132
BharatMatrimony
Financial Summary
Abridged Financial Statements
Rs. mn FY13 FY14 FY15 FY16 FY17 FY18E FY19
Profit & Loss
Revenue 1,886 2,054 2,414 2,548 2,928 3,354 3,484
Gross Profit 1,133 1,165 1,336 1,296 1,762 2,026 2,069
EBITDA 160 112 164 66 591 776 551
Depreciation 65 56 82 98 104 96 111
EBIT 96 55 82 -31 487 680 440
Other Income 2 19 14 6 1 1 17
Interest expense 14 8 16 30 44 15 1
Exceptional items 19 189 142 738 44 -128 0
PBT 104 - 91 - 29 - 751 438 858 595
Reported PAT (after minority interest) 104 -92 -29 -751 438 739 431
Adj PAT 123 97 112 -13 482 610 431
EPS (Rs.) 5.8 4.6 5.2 -0.6 22.4 27.6 18.9
Balance Sheet
Net Worth 70 -22 -9 -761 -311 1,676 2,069
Deferred Tax liabilities 0 0 0 0 0 0 0
Total debt 255 148 272 483 444 64 0
Other liabilities and provisions 383 475 542 1,164 898 813 863
Total Networth and liabilities 708 601 805 886 1,030 2,554 2,932
Net fixed assets 179 236 240 284 242 676 758
Goodwill 0 0 0 0 - - -
Capital Work in Progress - - - - - - -
Investments 0 0 - - - 737 1,449
Cash and bank balances 318 373 531 584 580 978 676
Loans & advances and other assets 390 202 250 351 350 304 225
Net working capital (180) (210) (216) (333) (142) (142) (176)
Total assets 708 601 805 886 1,030 2,554 2,932
Capital Employed 325 126 263 (277) 132 1,741 2,069
Invested Capital (CE- cash-CWIP) 6 (247) (268) (861) (448) 763 1,393
Net Debt -63 -225 -259 -100 -136 -1651 -2043
Cash Flows
Cash flows from Operations (Pre-tax) 131 210 235 212 513 961 NA
Cash flows from Operations (post-tax) 136 201 232 205 496 830 NA
Capex 102 123 103 99 101 539 NA
Free cashflows 34 78 130 106 395 291 NA
Free cashflows (post interest costs) 20 70 114 76 350 275 NA
Cash flows from Investing 61 146 148 6 7 1,500 NA
Cash flows from Financing -57 97 152 183 -77 844 NA
Total cash & liquid investments 318 373 531 584 580 1,715 2,043

Page 133
BharatMatrimony
Financial Summary
FY13 FY14 FY15 FY16 FY17 FY18 FY19
Growth ratios
Revenue 8.9% 17.5% 5.6% 14.9% 14.6% 3.9%
EBITDA -30.3% 46.6% -59.6% 792.4% 31.3% -29.0%
Adj PAT -20.6% 15.5% -111.6% NA 26.8% -29.4%
Margin ratios
Gross 60.1% 56.7% 55.3% 50.8% 60.2% 60.4% 59.4%
EBITDA 8.5% 5.4% 6.8% 2.6% 20.2% 23.1% 15.8%
Adj PAT 6.5% 4.7% 4.7% -0.5% 16.4% 18.2% 12.4%
Performance ratios
Pre-tax OCF/EBITDA 81.6% 187.9% 143.7% 319.5% 86.9% 123.9% NA
OCF/IC (%) 2137.6% -81.5% -86.6% -23.8% -110.7% 108.8% NA
RoE (%) 176.0% 407.5% -721.1% 3.4% -89.8% 89.4% 23.0%
ROCE (%) 30.0% 32.9% 49.5% 349.7% -673.5% 62.6% 17.4%
RoCE (Pre-tax) 30.0% 32.9% 49.5% 349.7% -673.5% 72.7% 24.0%
RoIC (Pre-tax) 1497.5% -46.0% -31.9% 5.5% -74.4% 431.4% 40.8%
Fixed asset turnover (x) 10.5 9.9 10.1 9.7 11.1 7.3 4.9
Total asset turnover (x) 2.7 3.1 3.4 3.0 3.1 1.9 1.3
Financial stability ratios
Net Debt to Equity (x) -0.9 10.3 27.8 0.1 0.4 -1.0 -1.0
Net Debt to EBITDA (x) -0.4 -2.0 -1.6 -1.5 -0.2 -2.1 -3.7
Interest cover (x) 9.7 24.5 14.8 6.9 11.2 54.2 NA
DSO days 3 3 2 3 3 4 4
Net WC days -92 -92 -77 -100 -49 -45 -51
Valuation metrics
Fully Diluted Shares (mn) 21 21 22 21 21 22 23
Market cap (Rs.mn) 12,580 12,580 12,895 12,791 12,813 13,202 13,627
P/E (x) 114.6 -981.7 26.6 21.6 31.6
P/OCF(x) 99.9 67.7 58.6 66.5 27.5 16.4 NA
EV (Rs.mn) 13,564 13,403 13,368 13,527 13,491 11,977 11,584
EV/ EBITDA (x) 84.7 120.0 81.6 204.3 22.8 15.4 21.0
EV/ OCF(x) 99.5 66.6 57.5 66.1 27.2 14.4 NA
FCF Yield 0.3% 0.6% 1.0% 0.8% 2.9% 2.1% NA
Price to BV (x) 195.5 -622.3 -1,465.3 -17.9 -43.8 8.1 6.6
Dividend pay-out (%) 5.4% 7.9%
Dividend yield (%) 0.0 0.0
Related Documents