Report No. 35772 -IN India India’s Employment Challenge: Creating Jobs, Helping Workers February 25, 2008 Poverty Reduction and Economic Management South Asia Document of the World Bank Public Disclosure Authorized Public Disclosure Authorized Public Disclosure Authorized Public Disclosure Authorized Public Disclosure Authorized Public Disclosure Authorized Public Disclosure Authorized Public Disclosure Authorized

Welcome message from author
This document is posted to help you gain knowledge. Please leave a comment to let me know what you think about it! Share it to your friends and learn new things together.
Transcript
Report No. 35772 -IN
India
India’s Employment Challenge: Creating
Jobs, Helping Workers
February 25, 2008
Poverty Reduction and Economic Management
South Asia
Document of the World Bank
Pub
lic D
iscl
osur
e A
utho
rized
Pub
lic D
iscl
osur
e A
utho
rized
Pub
lic D
iscl
osur
e A
utho
rized
Pub
lic D
iscl
osur
e A
utho
rized
Pub
lic D
iscl
osur
e A
utho
rized
Pub
lic D
iscl
osur
e A
utho
rized
Pub
lic D
iscl
osur
e A
utho
rized
Pub
lic D
iscl
osur
e A
utho
rized

2
CURRENCY EQUIVALENTS
(Exchange Rate Effective)
Currency unit = Rupees (Rs.)
Rs. 1 = US$ 0.023218
US $ 1 = Rs.44.33
FISCAL YEAR
April 1 – March 31
ABBREVIATIONS AND ACRONYMS
ASI Annual Survey of Industries JGSY Jawahar Gram Samidhi Yojana
BIRA Bombay Industrial Relations Act, 1946 JRY Jawahar Rozgar Yojana
BPL Below Poverty Line KAM Knowledge Assessment Methodology
CBMI Community based micro-insurance MFI Micro-finance Institution
CDS Current Daily Status MPCE Mean per-capita Expenditures
CII Confederation of Indian Industries MRTU Maharashtra Trade Union Act
CSS Centrally Sponsored Scheme NDME Non-directory Manufacturing Enterprise
CWS Current Weekly Status NFFWP National Food for Work Programme
DRDA District Revenue/ District Administration NGO Non-Government Organization
DGE&T Director General of Employment & Training NIC National Industry Classification
DME Directory Manufacturing Enterprise NSS National Sample Survey
DRER Domestic Real Exchange Rate NSSO National Sample Survey Organization
EAS Employment Assurance Scheme OAME Owner Operated Family Firms
EE Employment Exchange PRI Panchayati Raj Institution
FDI Foreign Direct Investment PULP Prevention of Unfair Labor Practices Act, 1971
FICCI Federation of Indian Chambers of Commerce
& Industry
REG National Rural Guarantee Act
GDP Gross Domestic Product SC / ST Scheduled Cast / Tribe
GSDP Gross State Domestic Product SEWA Self-Employed Women’s Association
GVA Gross Value Added SGRY Sampoorna Grameen Rozgar Yojana
IDA Industrial Disputes Act, 1947 SME Small & Medium Enterprises
ILO Indian Labor Organization UHIS Universal Health Insurance Scheme
IRDA Insurance Regulatory and Development
Authority
UPS Usual Principal Status
ISIC International Standard Industry Classification UPSS Usual Principal and Subsidiary Status
ITC Industrial Training Centers VET Vocational Education & Training
ITES Information Technology Enabled Services VRS Voluntary Retirement Scheme
ITI Industrial Training Institutes
Vice President: Praful C. Patel, SARVP
Country Director: Michael F. Carter, SACIN
Sector Director: Ernesto May, SASPR
Sector Manager: Ijaz Nabi, SASPR
Task Managers: Ahmad Ahsan and Ashish Narain, SASPR
3
Report Team and Acknowledgements
This Report was prepared by a team led by Ahmad Ahsan and Ashish Narain (SASPR), under the
guidance of Ijaz Nabi, Sector Manager. Sadiq Ahmed (SASPR), Michael Carter (SACIN), and
Fayez Omar (SACIA) provided overall guidance. Kapil Kapoor and Dipak Dasgupta, (SASPR)
provided helpful comments at various stages.
Other core Bank team members were: Amit Dar (SASHD), Maitreyi Das (SASES), Elena Glinskaya
(SASPR), Dipak Mazumdar (Toronto University and Consultant), Philip B. O’Keefe (SASHD),
Carmen Pages (HDNSP), Kin Bing Wu (SASHD) and Farah Zahir (SASPR). Vidya Kamath, Rita
Soni (SASPR, Program Assistants), Sergiy Biletsky (RA, Database and Analysis), M. Bontch (RA,
Data analysis and Maps) and Arpita Chakraborty (RA, Data analysis). Zhaoyang Hou provided very
helpful research assistance in updating the report with 2005-05 NSS data.
This report draws primarily on back ground papers written for this report and the planned India
Labor Conference planned for later this year. These papers were written by the team members
mentioned above and by the following economists who however are not responsible for the views in
this report: Jyotsna Jalan (CSSS), Tirthankar Roy (Gokhale Institute of Politics and Economics), K.
Ramaswamy (IGIDR), R. Srivastava (Jawaharlal Nehru University), K. Sundaram (Delhi
University), Suresh Tendulkar (Delhi University), and Jeemol Unni (GIDR).
The team thanks peer reviewers Kaushik Basu (Cornell University), William Maloney (LACVP),
and T.S. Papola (Institute for Studies in Industrial Development) for their very helpful and detailed
comments on an earlier draft of this report and participating in the Review Meeting on this report.
The team also thanks all other participants of the Review Meeting who provided helpful comments.
The team also thanks the Department of Economic Affairs, Ministry of Finance and the Ministry of
Labor, Government of India for sending their comments in 2007. Finally, the team gratefully
acknowledges comments from Dr. Sandip Sarkar, Institute for Human Development in updating this
report.
This report has been prepared alongside parallel World Bank studies on Skills Development in India:
The Vocational Education and Training System, led by Amit Dar, and on the Secondary Education
on India led by Kin Bing Wu, and the Development Policy Review Inclusive Growth and Service
delivery: Building on India’s Success led by Rinku Murgai, Lant Pritchett and Marina Wes. All four
reports have drawn a few common team members and sometimes drew on common material.

TABLE OF CONTENTS
A. Introduction ................................................................................................................................ i
B. Structural Changes in the Indian Economy & Labor Market Developments since the 1990s..iii
C. Meeting India’s Employment Challenges .......................................................... ……………..vi
D. How can Policy and Institutional Reforms Help to Meet the Employment Challenge? .......... xi
A. Introduction…. .......................................................................................................................... 1
B. Trends in Labor Supply. ............................................................................................................ 5
C. Employment. ............................................................................................................................. 9
D. Wages and Productivity ....................................... ……………………………………………16
E. Female labor force Participation ............................................................................................. 20
F. Scheduled Caste and Schedule Tribe ...................................................................................... 21
G. The Unemployment Situation ................................................................................................. 23
E. India’s Formidable Employment Challenges .......................................................................... 26
A. Size of Employment in the Informal Sector ............................................................................ 27
B. Quality of Jobs in the Informal sector ..................................................................................... 29
C. Informal Employment in Manufacturing and Tertiary Sectors ............................................... 32
D. Labor Absorption in Agricultural and The Rural Sector ......................................................... 37
E. Policies & Regulations to Support the Informal Sector Earnings & promote Formalization.. 42
A. Employment in Organized Sectors .......................................................................................... 43
B. Why Has Employment Elasticity in Formal Manufacturing Been Low? ................................ 47
C. How Has Trade Affected Employment Growth in Manufacturing? ....................................... 51
D. Dualism in the Manufacturing Sector...................................................................................... 54
E. Is Outsourcing Mitigating Dualism? ....................................................................................... 59
F. Why Has Dualism Persisted? .................................................................................................. 61
G. The Tertiary Sector .................................................................................................................. 63
A. Introduction ............................................................................................................................. 69
B. The Stylized Facts - How Significant Are Regional Differences? .......................................... 70
C. Low Migration and Urbanization Rates .................................................................................. 77
D. What is Driving the Regional Differences in Labor Market Outcomes? ................................ 80
E. Summing Up ........................................................................................................................... 90
A. The Role of Regulations in Labor Markets ............................................................................. 91
B. Labor Regulations in India and their Enforcement ................................................................. 93
C. Assessing India’s Labor Regulations .................................................................................... 104
D. The Impact of Some Key Labor Regulations in India ........................................................... 108
A. Introduction ........................................................................................................................... 128
B. Central Public Works Programs ............................................................................................ 129
ii
C. Social Insurance Schemes ..................................................................................................... 135
D. Employment Exchanges ....................................................................................................... 141
E. Vocational Education and Training ....................................................................................... 144
F. Conclusion ............................................................................................................................. 152
APPENDIX TABLES ....................................................................................................................... 152
TABLES Table 1.1: Population and Labor Force (in millions, UPSS) .................................................................................. 3
Table 1.2: Distribution of Prime Age Workers by Status 1983 to 2002 (UPS, 15-59) ......................................... 13
Table 1.3: India and the World: Educational Attainment of Adult Population Aged 25 and Over, circa 2000 .... 18
Table 1.4: Rural Workers and Female Workers Wages are Below Poverty Line Wages (in Rupees) ................. 19
Table 1.5: Rates of Underemployment by Status ................................................................................................. 23
Table 1.6: Reasons for Unemployment (UPSS) (by %) ....................................................................................... 25
Table 2.1: Ratio of Predicted Wages of Regular Salaried and Casual Labor, All India ....................................... 31
Table 2.2: Categories of Growth and Non-Growth in Unorganized Sector Industries ......................................... 33
Table 2.3: Growth Rate of Person Days, by Operation ........................................................................................ 37
Table 2.4: Impact of irrigation on agricultural production and employment ........................................................ 40
Table 3.1: Growth rate of value added and employment elasticity ...................................................................... 47
Table 3.2:The relative importance of the wage-employment trade-off and the DRER effect .............................. 49
Table 3.3: Industries Classified by Trade Orientation ......................................................................................... 51
Table 3.4: Manufacturing Sub-sectors According to Exposure to International Trade ........................................ 53
Table 3.5: Relative importance of wage-employment trade-off and DRER in employment elasticity ................ 53
Table 3.6: Change in Employment Shares by Factory Size.................................................................................. 58
Table 3.7: Contract Intensity (percent of Contract Labor) by Size of Factory in Six Industry Groups ................ 58
Table 3.8: Distribution of Manufacturing Employment ....................................................................................... 58
Table 3.9: Product Outsourcing Intensity by Employment Size of Factories: 2000-01 ....................................... 59
Table 3.10: Proportion and Distribution of Firms Subcontracting-In by Location and Industry Group, .............. 60
Table 3.11: Employment Elasticities for different Sectors and periods................................................................ 64
Table 3.12: Values of Dummies of Quantile Regressions: 55th
Round ................................................................ 68
Table 4.1: Employment and Participation Rates in Regions are Correlated Across Rounds ................................ 73
Table 4.2: Regional Convergence Beta Coefficients of Real Wage Growth regressed on Initial real wages ....... 74
Table 4.3: Growth of Population and Manufacturing Jobs by Size of Town ....................................................... 79
Table 4.4: Participation Rates for Male and Female Groups ................................................................................ 86
Table 5.1: Labor Laws and Regulations Governing Industrial Regulations ......................................................... 93
Table 5.2: Laws and Regulations on Working Conditions ................................................................................... 97
Table 5.3: Amendments in the IDA ...................................................................................................................... 99
Table 5.4: Industrial Dispute Reconciliation Bodies .......................................................................................... 104
Table 5.5: State-wise details of number of dispute cases pending in labor courts (Oct, 2000) .......................... 105
Table 6.1: Coverage rates of social insurance for organized and unorganized sector, 2004 .............................. 105
FIGURES Figure 1.1: GDP Growth and Employment in India ............................................................................................... 2
Figure 1.2: Labor Force (in Millions) ..................................................................................................................... 7
Figure 1.3: All India Worker Population Ratios and Student Population Ratios : Age Group 10-14 years ........... 8
Figure 1.4: Factors explaining changes in the probability of participating in the Labor Force .............................. 9
Figure 1.5: Worker to Population Ratios (UPSS) ................................................................................................. 10
Figure 1.6: Distribution of India’s Workforce ...................................................................................................... 11
Figure 1.7: Industry-wise Deployment of Incremental Workforce & Productivity Growth. ................................ 12

iii
Figure 1.8: Share of Workers (UPS) in Different Sectors in 1999-2000 .............................................................. 13
Figure 1.9: Wage Premiums by Educational Attainment ..................................................................................... 14
Figure 1.10: Rural Real Wages and Growth from 1983 to 1999-00 .................................................................... 16
Figure 1.11: Sources of Productivity Growth By Sectors (weighted), within and across sectors movement ...... 17
Figure 1.12: Average Real Daily Wages and Wage Growth ................................................................................ 19
Figure 1.13: Aspirations of Women (aged 26-66) currently doing Domestic Work ............................................ 21
Figure 1.14: Occupational Distribution by Caste ................................................................................................. 22
Figure 1.15: Unemployment Rate in India (CDS) ................................................................................................ 24
Figure 1.16: Education-specific Unemployment Rates 1999/2000 ...................................................................... 25
Figure 2.1: Composition of Formal and Informal Sector Employment ................................................................ 28
Figure 2.2: Relative Wages of Regular Salaried to Casual Workers .................................................................... 31
Figure 2.3: Nominal Wages in Rupees, per day, in non-Agricultural Occupations .............................................. 38
Figure 2.4: Growth of Labor Productivity and Employment Across States ......................................................... 39
Figure 3.1: Total Formal Sector Employment Levels (in Millions) and Growth ................................................. 46
Figure 3.2: Employment and Real Gross Value Added in Formal Manufacturing............................................... 47
Figure 3.3: Changes in Real Effective Exchange Rates and Domestic Real Exchange Rates .............................. 49
Figure 3.4: Growth of Manufacturing Exports ..................................................................................................... 50
Figure 3.5: Trade and Employment Share (percent) ............................................................................................. 52
Figure 3.6: The Missing Middle Manufacturing Firms – India compared to Other Countries ............................. 56
Figure 3.7: India – Distribution of Employment and Productivity by Size Groups ............................................. 57
Figure 3.8: Distribution of Employment by Firm Size in Manufacturing Sub-sectors ......................................... 57
Figure 3.9: Employment share of the tertiary sector by quintile groups, different rounds ................................... 66
Figure 3.10: Kernel Density Functions of expenditure per capita in the tertiary sector ....................................... 67
Figure 3.11: Kernel Density Functions by major sub-groups of the tertiary sector .............................................. 67
Figure 3.12: Coefficients of (Dummy) Variables from Quantile Regressions on Mean Capita Expenditures ..... 68
Figure 4.1: Log Household Real Per Capita Expenditures plotted against Log Real Weekly Earnings ...................
Figure 4.2: Map of Male Employment Rates ....................................................................................................... 71
Figure 4.3: Employment and Participation Rates for Male and Female Across Different States ......................... 72
Figure 4.4: Map of Female Employment Rates .................................................................................................... 73
Figure 4.5: Convergence of Casual Wages: Growth over 1983-2000 against real Wages in 1983 ...................... 75
Figure 4.6: Rural & Urban Casual Wage Ratio is Narrowing But Regular & Casual Wage Ratio is Increasing . 76
Figure 4.7: Economic Migration Across States and Regions, 1997-2000 ............................................................ 77
Figure 4.8: Urban Migration in Each Region ....................................................................................................... 79
Figure 4.9: India’s Urbanization Growth by Types of Cities ............................................................................... 78
Figure 4.10: Decomposing Growth by Contribution of Productivity, Employment Rate, &Dependency Ratio .. 80
Figure 4.11: Growth of Employment and Growth of Labor Productivity by Regions – ...................................... 81
Figure 4.12: Employment Levels of Males and Females and GSDP Levels ........................................................ 83
Figure 4.13: The Effect of Variations in GSDP on Male Earnings ...................................................................... 84
Figure 4.14: Participation Rates for Females, 55th
Round .................................................................................... 87
Figure 4.15: Female Participation Rates (25 years and above) and Expected Earnings for Females and Males .. 87
Figure 5.1: The Use of Contract Labor Has Increased Markedly ....................................................................... 101
Figure 5.2: Prosecutions and Convictions from Violations of the Contract Labor Act ...................................... 106
Figure 5.3: India Labor Laws compared to Selected Countries .......................................................................... 108
Figure 5.4: Firms’ Consider India’s Labor Laws to be More Binding than Most other Countries ..................... 109
Figure 5.5: Ranking of Constraints to Manufacturing Growth ........................................................................... 110
Figure 5.6: Measuring the Costs of Regulations on Employment By Sectors .................................................... 113
Figure 5.7: Measuring the Costs of Regulations on Employment and Value Added By States ......................... 114
Figure 5.8: Measuring the Costs of Regulations on the Number of Registered Factories .................................. 115
Figure 5.9: Minimum Wages and Employment.................................................................................................. 117
Figure 5.10: Clustering of Urban and Rural Casual Wages and Minimum Wages by State .............................. 118
Figure 5.11: Rural and Urban Wages ................................................................................................................. 121
Figure 6.1: SGRY Workdays per Agricultural Worker and per BPL Household, 2003/04 ................................ 131

iv
Figure 6.2: Vacancies and Placements by Employment Exchanges, 1991-2002 ............................................... 142
Figure 6.3: Secondary School Drop Out in India ............................................................................................... 144
BOXES Box 1.1: Definition of Key Labor Market Terms in India and Used in this Report ............................................... 4
Box 1.2: Labor Market Data in India ..................................................................................................................... 6
Box 1.3: International Migration from India ........................................................................................................ 15
Box 2.1: Successful Examples in the Promotion of SMEs ................................................................................... 36
Box 2.2: The Self-Employed Women’s Association (SEWA) ............................................................................. 40
Box 2.3: Horticulture Development in Maharashtra ............................................................................................ 42
Box 3.1: Determinants of Employment Elasticity ................................................................................................ 48
Box 3.2: Wage Setting In the Public Sector ......................................................................................................... 62
Box 3.3: Composition of Employment in the Tertiary Sector .............................................................................. 64
Box 4.1: Does an increase in labor productivity imply a decline in employment?............................................... 81
Box 4.2: Relating GSDP Levels and Employment – The Need to Address Endogeneity .................................... 83
Box 5.1: The Economic Case for Labor Market Regulations ............................................................................... 91
Box 5.2: Trade Unions in India ............................................................................................................................ 95
Box 5.3: Special Economic Zones and Employment ......................................................................................... 101
Box 5.4: Implementation of Core Labor Standards ............................................................................................ 102
Box 5.5: Doing Business Indices ........................................................................................................................ 107
Box 5.6: What Does Economic Theory Say About the Costs of Labor Regulations? ........................................ 111
Box 5.7: Principles to Guide Labor Market Reforms ......................................................................................... 121
Box 5.8: Amending IDA to Simplify Dispute Resolution Mechanisms ............................................................. 123
Box 5.9: Amending IDA to Increase Labor Market Flexibility .......................................................................... 124
Box 5.10: Example of Labor Market Reforms to Increase Market Flexibility in Other countries ..................... 125
Box 6.1: Major Central Rural Employment Programs in the 1990s and at Present ............................................ 130
Box 6.2: The National Rural Employment Guarantee Act ................................................................................. 133
Box 6.3: Improving Public Works’ Outcomes ................................................................................................... 139
Box 6.4: West Bengal’s Provident Fund for Unorganized Sector Workers ....................................................... 138
Box 6.5: Proposed initiatives on social security for unorganized worker........................................................... 139
Box 6.6: International experience of Vocational Education Programs ............................................................... 145
Box 6.7: Secondary Education in India .............................................................................................................. 146
Box 6.8: The Appropriate Role of the Public Sector in Training ....................................................................... 151
Box 6.9: Training for the Informal Sector – The Jua Kali Experience ............................................................... 152

SUMMARY
INDIA’S EMPLOYMENT CHALLENGE -- CREATING JOBS, HELPING WORKERS
A. Introduction
1. Although labor market outcomes in the 1990s were better than what is commonly
perceived and job growth has picked up markedly since 2000, India’s employment situation is still
a cause for concern. In the 1990s1, job growth in India decelerated but less sharply than official
estimates suggest. Seen in terms of changes over two decades – 1983-1993 and 1993-2004 – and
taking both principal and subsidiary workers into consideration, employment growth was largely flat
at 2 percent or slightly declining – from 2.1 percent (1983-1993) to 1.9 percent (1993-2004).2 But,
labor productivity and average wage growth were higher in the latter period than in the 1983-1993
decade. Then, as economic growth accelerated post-2000, employment numbers too showed an
increase. However, since 2000, there has been a deceleration in the growth of wages and earnings,
especially for workers whose earnings fall in the middle of the wage spectrum. Additionally, as the
large number of working poor (some 105 million persons or more than a quarter of all workers in
2004) indicates, many Indian workers are still trapped in jobs with low earnings.
2. Of the 413 million prime-aged persons in the Indian labor force in 2004/2005, the
overwhelming majority, about 90 percent, are employed in low productivity informal sector jobs.3
The share of formal sector and manufacturing in total employment has remained low and strikingly
unchanged over the two decades since 1983. Although the open unemployment rate, at about 2.8
percent, is low, it is chronic in nature and markedly higher among the youth (6.7 percent), in urban
areas (5 percent), in certain regions (for example, West Bengal), and among the better educated.4
Unemployment and underemployment, taken together, have increased since the year 2000 and now
apply to more than 8 percent of the labor force. These developments have evoked considerable
public concern in India, leading to the enactment of the National Rural Employment Guarantee Act
that guarantees 100 days of employment in public works to each rural household.
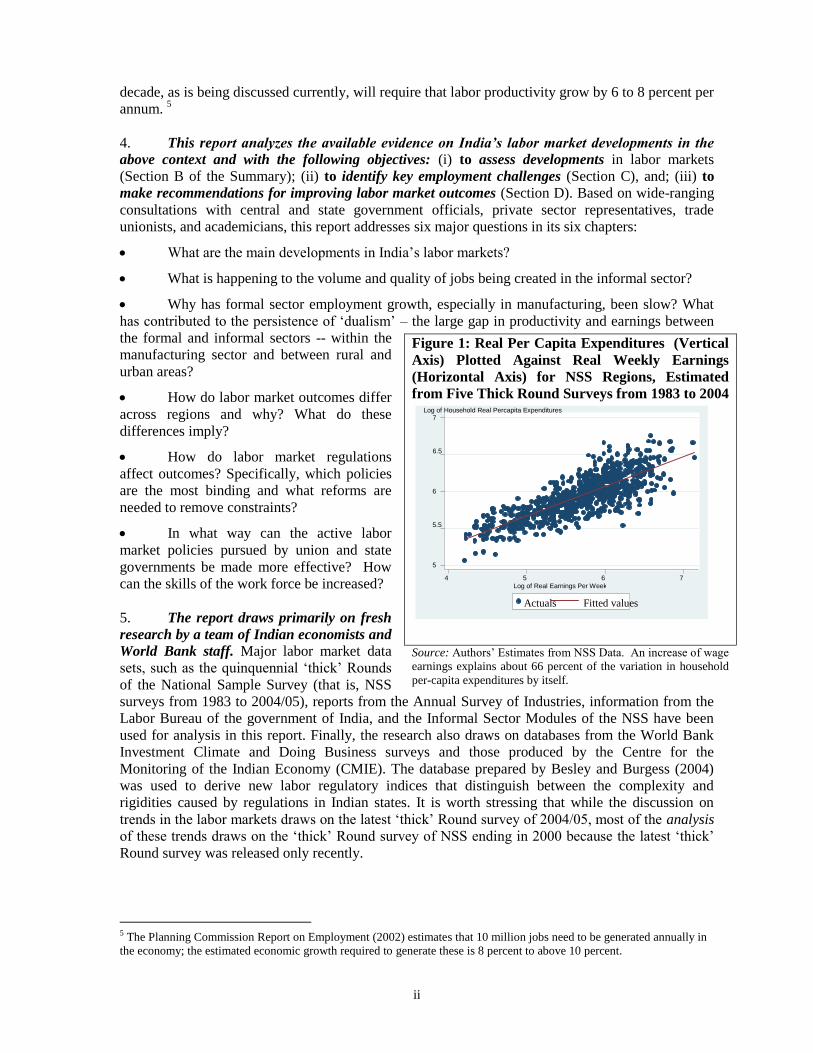
3. The concern caused by labor market outcomes in India is, thus, not misplaced. For most
Indians, especially the poor and marginalized, labor is their principal asset. The tight relationship
between wage earnings, income and household expenditures across India’s different regions (Figure
1) suggests that labor markets are the main channel through which economic growth is distributed
across regions and people. Pro-poor growth requires not only increasing the earnings of the current
105 million working poor but also creating productive jobs for the 90 million or so new entrants
expected to join the labor force over the next decade. The key challenge is to create good jobs that
increase productivity. Achieving economic growth rates of 8 to 10 percent per annum over the next
1 The 1990s refer to the period 1993-2000, that is, the period between the 50th Round National Sample Survey (NSS) and
the 55th Round NSS survey. The 1980s refers to the period 1983-1993 which corresponds to two other NSS Rounds. See
Box 1.2 in Chapter 1 for more details on data sources. 2 The data used throughout this report refers to the Usual Principal and Subsidiary Workers (UPSS) definition of
employment measures (see Box 1.1 in Chapter 1 for details), unless specifically noted otherwise. 3 See Table 1.1 in Chapter 1. 4 The 2.8 percent unemployment rate, sometimes referred to as the ‘open unemployment rate’, is long-term in nature
because it refers to persons who have been searching for or have been available for jobs for most of the year prior to the
survey. But in keeping with the international definition of ‘open unemployment rate’ – persons who while searching for a
job did not even work one hour a week – the actual unemployment rate is close to 5 percent.
ii
decade, as is being discussed currently, will require that labor productivity grow by 6 to 8 percent per
annum. 5
4. This report analyzes the available evidence on India’s labor market developments in the
above context and with the following objectives: (i) to assess developments in labor markets
(Section B of the Summary); (ii) to identify key employment challenges (Section C), and; (iii) to
make recommendations for improving labor market outcomes (Section D). Based on wide-ranging
consultations with central and state government officials, private sector representatives, trade
unionists, and academicians, this report addresses six major questions in its six chapters:
What are the main developments in India’s labor markets?
What is happening to the volume and quality of jobs being created in the informal sector?
Why has formal sector employment growth, especially in manufacturing, been slow? What
has contributed to the persistence of ‘dualism’ – the large gap in productivity and earnings between
the formal and informal sectors -- within the
manufacturing sector and between rural and
urban areas?
How do labor market outcomes differ
across regions and why? What do these
differences imply?
How do labor market regulations
affect outcomes? Specifically, which policies
are the most binding and what reforms are
needed to remove constraints?
In what way can the active labor
market policies pursued by union and state
governments be made more effective? How
can the skills of the work force be increased?
5. The report draws primarily on fresh
research by a team of Indian economists and
World Bank staff. Major labor market data
sets, such as the quinquennial ‘thick’ Rounds
of the National Sample Survey (that is, NSS
surveys from 1983 to 2004/05), reports from the Annual Survey of Industries, information from the
Labor Bureau of the government of India, and the Informal Sector Modules of the NSS have been
used for analysis in this report. Finally, the research also draws on databases from the World Bank
Investment Climate and Doing Business surveys and those produced by the Centre for the
Monitoring of the Indian Economy (CMIE). The database prepared by Besley and Burgess (2004)
was used to derive new labor regulatory indices that distinguish between the complexity and
rigidities caused by regulations in Indian states. It is worth stressing that while the discussion on
trends in the labor markets draws on the latest ‘thick’ Round survey of 2004/05, most of the analysis
of these trends draws on the ‘thick’ Round survey of NSS ending in 2000 because the latest ‘thick’
Round survey was released only recently.
5 The Planning Commission Report on Employment (2002) estimates that 10 million jobs need to be generated annually in
the economy; the estimated economic growth required to generate these is 8 percent to above 10 percent.
Figure 1: Real Per Capita Expenditures (Vertical
Axis) Plotted Against Real Weekly Earnings
(Horizontal Axis) for NSS Regions, Estimated
from Five Thick Round Surveys from 1983 to 2004
Source: Authors’ Estimates from NSS Data. An increase of wage
earnings explains about 66 percent of the variation in household
per-capita expenditures by itself.
5
5.5
6
6.5
7 Log of Household Real Percapita Expenditures
4 5 6 7 Log of Real Earnings Per Week
Actuals Fitted values

iii
6. This report elaborates on three main themes:
As noted earlier, while labor market outcomes in the 1990s were better than what is
commonly perceived and job growth has accelerated in recent years, overall outcomes still present
concerns for at least three reasons. First, a comparison of the trends in job growth over two
decades, 1983-1993/94 and 1993/94 to 2004/2005, suggests that job growth has been flat over the
long term. Second, the spurt in employment since 2000 has been accompanied by a marked
deceleration in real wage growth and even in a decline for many workers; the number of working
poor has increased in the past five years. Third, low paying, relatively unproductive, informal sector
jobs continue to dominate labor markets.
Looking ahead, India faces formidable employment challenges. The overarching challenge
is to increase the earnings of workers, especially of the 105 million who live in poverty (2004/05),
while meeting the demand for jobs by new entrants to the labor force. Given that 60 percent of
India’s population is younger than age 30, the Indian economy can enjoy a ‘demographic dividend’
of some 123 million persons who will enter the prime working age over the next decade, lowering
the dependency ratio and raising growth prospects. However, this can happen only if the economy is
capable of providing productive jobs to the 90 million or so persons in this age-group who will likely
seek work over the coming decade. This will require: (i) raising productivity and job quality in the
informal sector, including in agriculture; (ii) stimulating formal sector employment growth; and (iii)
addressing persistent regional, gender and social disparities in labor market outcomes.
Meeting these challenges will require reforms in labor market policies along two
directions. First, regulatory reforms are required to remove barriers to the growth of formal sector
jobs and labor intensive manufacturing. Current labor regulations that are intended to help workers
actually end up hurting them by constraining job growth. By imposing excessive rigidity in the
formal manufacturing labor market the regulations create disincentives for employers to create jobs.
This study estimates that the Industrial Disputes Act (IDA) has caused about 3 million less jobs to be
created in formal sector manufacturing. Second, regulatory reforms need to be complemented with
effective and active labor market policies that can help workers, especially those in the informal
sector, become more productive, obtain more protection against unemployment, and enhance skills.
7. Although economic growth in India accelerated significantly in the past two decades,
structural changes in the economy were relatively slow, especially compared to other fast-growing
Asian economies. The economic growth rate averaged about 6 percent per annum since the mid-
1980s. Growth accelerated further in the last three years and is now more than 8 percent. There was
a rapid increase in trade and, more recently, in the investment rate which increased to over 30 percent
of GDP. Economic development in India, from the early 1950s to the present, has been broadly
consistent with the experience of other countries in that the share of agriculture in GDP declined
from more than 50 percent to less than a quarter, while the shares of industry and services increased.
However, in some key respects, India’s pattern of structural change has been different from most
other developing countries. First, most of the increase in economic activity took place in services,
which now account for more than 50 percent of GDP. While the share of industry increased to
around a quarter of GDP, manufacturing’s share increased minimally and today accounts for less
than 15 percent of GDP, compared to much higher shares in other developing countries. While the
pace of transformation accelerated after 1990, when India’s largely closed and regulated economy
started liberalizing to become more open and competitive, the shares of industry and manufacturing
remained largely unchanged throughout the 1990s. Second, most of the increases in services and

iv
industry took place in relatively skill-intensive and capital-intensive sectors, and less in labor-
intensive industries.
8. The structure of employment was, until recently, surprisingly resistant to change. There
was little shift in employment away from agriculture and the sector still provides employment to
nearly half of India’s workers. The share of employment in agriculture has declined, from 65 percent
in the early 1980s to 55 percent at present, but much less so than the decline of agriculture’s share in
GDP. During the same period, the share of manufacturing employment has matched the share of
manufacturing GDP and remains at less than 15 percent of all employment. Between 1999/2000 and
2004/05, however, there were faster changes in employment, especially in rural areas, away from
agriculture to construction and trade, hotels and restaurants, and transport and communications in the
service sectors, and to some extent to manufacturing. However, contrary to expectations,
employment is still overwhelmingly dominated by small-scale, informal sector activity in all sectors,
more than a decade after the liberalization of the 1990s.
9. While overall job growth in the 1990s slowed down, the deceleration was considerably less
than official estimates. Fresh estimates, based on combining data from NSS surveys with 2001
census data, suggest that employment growth among prime-age workers may have declined from 2.1
percent in the 1983-1993 period to 1.6 percent in the 1993-2000 period, that is, a decline of about 0.5
percentage points.6 Official estimates, on the other hand, show a halving of the employment growth
rate from 2 percent to about 1 percent over the same period. An important implication of these fresh
estimates is that while the growth elasticity of employment – the response of employment growth to
GDP growth -- declined, it did not decline by nearly as much as what is implied by official estimates
of employment trends.
10. On the other hand, while job growth has picked up since 2000, the job growth rate has
remained unchanged over the past two decades. The recent acceleration in job growth for the
prime-age population, to about 2.3 percent between 1999/2000 and 2004/05, reflects both supply and
demand side factors. On one side, the numbers of working-age population have increased, leading to
an increase in the number of workers looking for jobs and a rise in self-employment. On the other
side, the job growth also reflects the acceleration in economic growth since 2003, indicated by the
growing share of construction, trade, and manufacturing jobs. Several factors suggest that it is the
growing supply of workers which is mainly driving this growth: (i) most of the job growth has been
in subsidiary (part-time) workers and in self-employment; growth of employment for ‘principal’
(full-time) workers has actually slowed down; (ii) allowing for the fact that 1999/2000, a year when
the agricultural sector contracted, may have led to an unusual drop in employment in the rural areas,
and looking at decadal changes from 1983 to 1993/94 and 1993/94 to 2004/05, employment growth
has remained flat or slowed down slightly; (iii) unemployment rates have increased; and (iv) wage
growth has decelerated markedly in recent years for almost all groups of workers.
11. Wages and productivity grew across the board in the 1990s but both slowed down post-
2000. Mean wages grew by 3.4 percent per annum, on average, between 1994 and 2000, tracking the
growth in labor productivity. However, wage growth decelerated markedly in the past five years. At
the same time, wage growth took place across all wage groups – including the most vulnerable
agricultural casual worker group. There were also indications of a convergence in real wages across
regions during the past two decades, including between rural and urban areas. Overall, in the space
of 6 years from 1994 to 2000, the number of working poor fell by 12 million to 102 million. 7 Wage
growth across individuals, however, was unequal. Most of the wage growth took place in the top two
6 This re-estimate is based on applying NSS-based worker-to-population ratios to census-based age distribution of the
population. Sundaram and Tendulkar (2005a) present these estimates in a background paper done for this report. 7 The number of working poor is the number of workers in households below the poverty line.
v
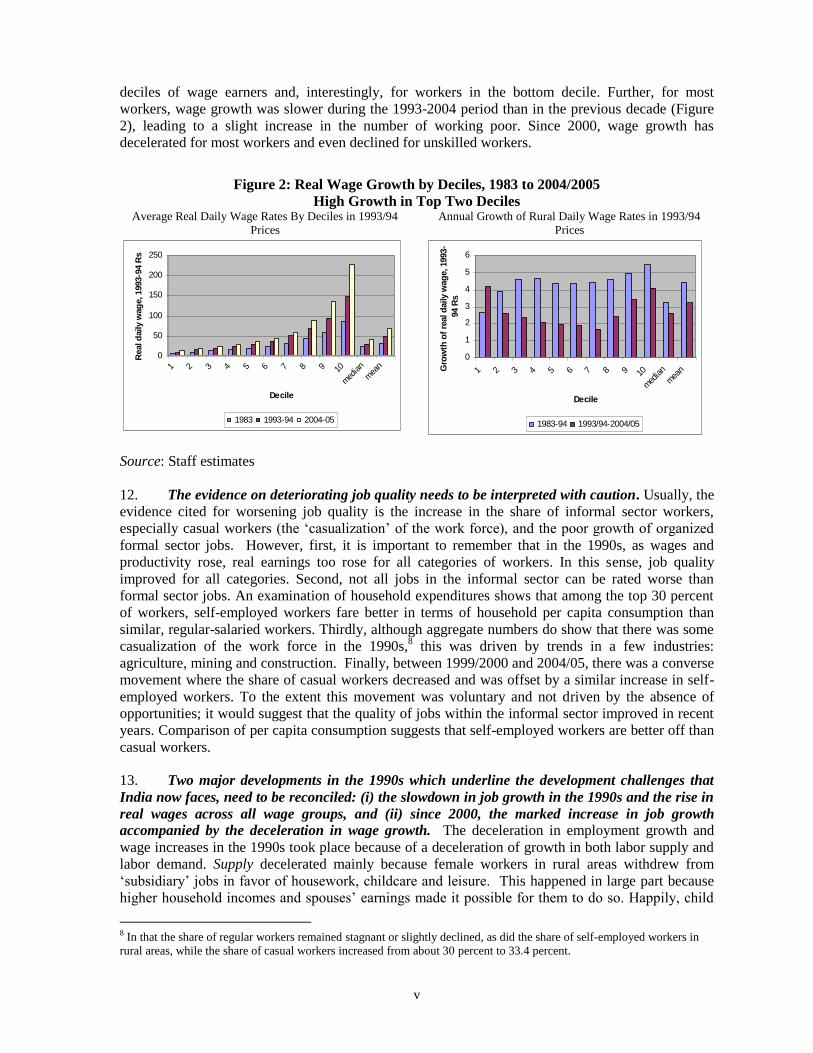
deciles of wage earners and, interestingly, for workers in the bottom decile. Further, for most
workers, wage growth was slower during the 1993-2004 period than in the previous decade (Figure
2), leading to a slight increase in the number of working poor. Since 2000, wage growth has
decelerated for most workers and even declined for unskilled workers.
Figure 2: Real Wage Growth by Deciles, 1983 to 2004/2005
High Growth in Top Two Deciles Average Real Daily Wage Rates By Deciles in 1993/94
Prices
Annual Growth of Rural Daily Wage Rates in 1993/94
Prices
0
50
100
150
200
250
1 2 3 4 5 6 7 8 9 10
med
ian
mea
n
Decile
Real d
aily w
ag
e, 1993-9
4 R
s
1983 1993-94 2004-05
0
1
2
3
4
5
6
1 2 3 4 5 6 7 8 9 10
med
ian
mea
n
Decile
Gro
wth
of
real d
aily w
ag
e, 1993-
94 R
s
1983-94 1993/94-2004/05
Source: Staff estimates
12. The evidence on deteriorating job quality needs to be interpreted with caution. Usually, the
evidence cited for worsening job quality is the increase in the share of informal sector workers,
especially casual workers (the ‘casualization’ of the work force), and the poor growth of organized
formal sector jobs. However, first, it is important to remember that in the 1990s, as wages and
productivity rose, real earnings too rose for all categories of workers. In this sense, job quality
improved for all categories. Second, not all jobs in the informal sector can be rated worse than
formal sector jobs. An examination of household expenditures shows that among the top 30 percent
of workers, self-employed workers fare better in terms of household per capita consumption than
similar, regular-salaried workers. Thirdly, although aggregate numbers do show that there was some
casualization of the work force in the 1990s,8 this was driven by trends in a few industries:
agriculture, mining and construction. Finally, between 1999/2000 and 2004/05, there was a converse
movement where the share of casual workers decreased and was offset by a similar increase in self-
employed workers. To the extent this movement was voluntary and not driven by the absence of
opportunities; it would suggest that the quality of jobs within the informal sector improved in recent
years. Comparison of per capita consumption suggests that self-employed workers are better off than
casual workers.
13. Two major developments in the 1990s which underline the development challenges that
India now faces, need to be reconciled: (i) the slowdown in job growth in the 1990s and the rise in
real wages across all wage groups, and (ii) since 2000, the marked increase in job growth
accompanied by the deceleration in wage growth. The deceleration in employment growth and
wage increases in the 1990s took place because of a deceleration of growth in both labor supply and
labor demand. Supply decelerated mainly because female workers in rural areas withdrew from
‘subsidiary’ jobs in favor of housework, childcare and leisure. This happened in large part because
higher household incomes and spouses’ earnings made it possible for them to do so. Happily, child
8 In that the share of regular workers remained stagnant or slightly declined, as did the share of self-employed workers in
rural areas, while the share of casual workers increased from about 30 percent to 33.4 percent.

vi
labor also fell significantly, though some ten million children still remained in the work force in
1999/2000.9 In addition, the youth population, both men and women, withdrew from the work force
in favor of schooling or leisure. Our analysis reveals, however, that part of the slowdown in the
supply of labor also happened because workers became discouraged and dropped out of the labor
force due to fewer employment opportunities, leading to reduced labor supply. Demand for labor
decelerated because agricultural growth fell sharply at the end of the 1990s and organized
manufacturing growth was sluggish. Agricultural employment – still accounting for 59 percent of the
labor force in that period – stagnated as growth in agricultural value-added employment decelerated
sharply in the second half of the 1990s. Employment in the formal sector was also stagnant because
while the public sector shed labor, adverse relative price changes against manufacturing, and
regulatory policies, encouraged private producers to invest in more skill-intensive techniques that
increased productivity instead of raising employment. Though the formal service sector, relatively
unfettered by labor regulations, grew rapidly, its contribution to job creation was limited by its small
share in overall employment.
14. Despite the deceleration in job growth in the 1990s, real wages grew for several reasons. First, significant deceleration in labor supply matched deceleration in job growth, offsetting any
dampening effects on wages. Second, wage growth followed productivity growth; productivity
within sectors increased and workers moved from less productive jobs to more productive jobs in the
non-farm sectors. In particular, the fast pace of growth in skill and capital-intensive services, as well
as the manufacturing sectors, increased productivity and wage growth in jobs which were already
high-earning. Third, wage growth was also faster at the high end in urban salaried jobs due to
institutional factors: firms using efficiency wages to retain skilled workers and the large increase in
public sector salaries awarded by the Fifth Pay Commission. Due to these factors, while average
wages grew robustly, median real wage growth rate was relatively anemic at less than 2 percent per
annum. These contrasting trends of deceleration in job growth and unequal wage increases highlight
the employment challenges that India faces.
15. Developments in labor market outcomes from 2000 to 2005 were almost a mirror image of
developments in the 1990s.10
Job growth in the first five years of the new century accelerated to
about 2.3 percent while real wage growth decelerated appreciably and even declined for many
workers. While regular worker jobs also increased significantly in this period, most of the job growth
took place for self-employed workers in rural areas and their share increased markedly.
Correspondingly, the share of casual workers fell. However, unemployment and underemployment
rates, taken together over the entire period of 2000-2005, increased. These developments suggest that
the acceleration in job growth may have mainly reflected a rise in the supply of labor which was
absorbed by rural, non-agricultural, self-employed occupations. Understanding these trends and their
implications require further study.
C. Meeting India’s Employment Challenges
9 It is worth stressing though that this number only reflects paid child labor or child labor used to produce goods meant to
be sold; it does not include the use of child labor for unpaid domestic work which may also be hazardous for child health. 10 See Box 1.2 in Chapter 1 for a discussion on data issues.
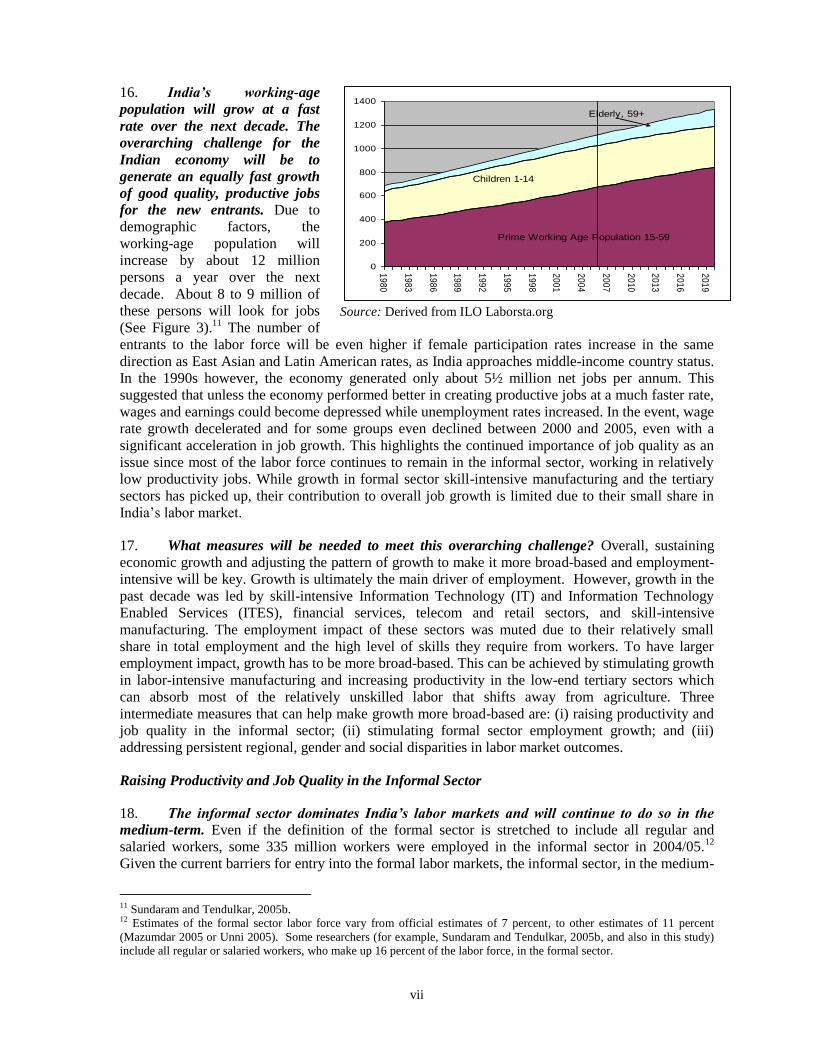
Figure 3: Over 12 Million Working-Age Persons and More Than 9
Million Workers Will Enter the Job Market Each Year in the Next
Decade
vii
16. India’s working-age
population will grow at a fast
rate over the next decade. The
overarching challenge for the
Indian economy will be to
generate an equally fast growth
of good quality, productive jobs
for the new entrants. Due to
demographic factors, the
working-age population will
increase by about 12 million
persons a year over the next
decade. About 8 to 9 million of
these persons will look for jobs
(See Figure 3).11
The number of
entrants to the labor force will be even higher if female participation rates increase in the same
direction as East Asian and Latin American rates, as India approaches middle-income country status.
In the 1990s however, the economy generated only about 5½ million net jobs per annum. This
suggested that unless the economy performed better in creating productive jobs at a much faster rate,
wages and earnings could become depressed while unemployment rates increased. In the event, wage
rate growth decelerated and for some groups even declined between 2000 and 2005, even with a
significant acceleration in job growth. This highlights the continued importance of job quality as an
issue since most of the labor force continues to remain in the informal sector, working in relatively
low productivity jobs. While growth in formal sector skill-intensive manufacturing and the tertiary
sectors has picked up, their contribution to overall job growth is limited due to their small share in
India’s labor market.
17. What measures will be needed to meet this overarching challenge? Overall, sustaining
economic growth and adjusting the pattern of growth to make it more broad-based and employment-
intensive will be key. Growth is ultimately the main driver of employment. However, growth in the
past decade was led by skill-intensive Information Technology (IT) and Information Technology
Enabled Services (ITES), financial services, telecom and retail sectors, and skill-intensive
manufacturing. The employment impact of these sectors was muted due to their relatively small
share in total employment and the high level of skills they require from workers. To have larger
employment impact, growth has to be more broad-based. This can be achieved by stimulating growth
in labor-intensive manufacturing and increasing productivity in the low-end tertiary sectors which
can absorb most of the relatively unskilled labor that shifts away from agriculture. Three
intermediate measures that can help make growth more broad-based are: (i) raising productivity and
job quality in the informal sector; (ii) stimulating formal sector employment growth; and (iii)
addressing persistent regional, gender and social disparities in labor market outcomes.
Raising Productivity and Job Quality in the Informal Sector
18. The informal sector dominates India’s labor markets and will continue to do so in the
medium-term. Even if the definition of the formal sector is stretched to include all regular and
salaried workers, some 335 million workers were employed in the informal sector in 2004/05.12
Given the current barriers for entry into the formal labor markets, the informal sector, in the medium-
11 Sundaram and Tendulkar, 2005b. 12 Estimates of the formal sector labor force vary from official estimates of 7 percent, to other estimates of 11 percent
(Mazumdar 2005 or Unni 2005). Some researchers (for example, Sundaram and Tendulkar, 2005b, and also in this study)
include all regular or salaried workers, who make up 16 percent of the labor force, in the formal sector.
0
200
400
600
800
1000
1200
1400
19
80
19
83
19
86
19
89
19
92
19
95
19
98
20
01
20
04
20
07
20
10
20
13
20
16
20
19
Prime Working Age Population 15-59
Children 1-14
Elderly, 59+
Source: Derived from ILO Laborsta.org

viii
term, will remain huge. While some informal sector workers, the self-employed in particular, are
engaged in high-productivity work, most others are employed in low productivity jobs in the
agriculture and tertiary sectors.
19. Stimulating productivity growth in informal sector manufacturing and the tertiary sectors
is necessary for enhancing job growth in the short-term. These sectors are important both in terms
of the number of workers they employ, as also because they are well placed to receive workers
moving out of agriculture. In the manufacturing sector, of a total of about 45 million workers, some
33.4 million are employed in unorganized sector firms (Unni 2005). In the late 1990s there was rapid
growth in this sector -- spurred by policy changes which dismantled small-scale reservations and
unleashed the forces of competition, and policies which enhanced investment ceilings and gave other
concessions, allowing firms to grow and upgrade their technology. Unlike formal sector
manufacturing, however, this growth in value-addition in the informal manufacturing sector was
passed on to workers in the form of higher wages and more employment. This sector is, therefore,
essential to employment-creating strategies. At the same time, it is worth stressing that average
productivity in informal manufacturing still remains only one-eighth that of formal sector firms. The
welfare consequences of having such low-productivity employment are large -- in terms of lower
output and wages, poorer working conditions, insecurity, lost tax revenues, and constraints to
financial development.13
20. Fostering productivity and employment growth in the agriculture sector should continue
to claim priority because of the large size of the sector and its continuing potential for providing
productive employment. Although, in the long term, development necessarily entails moving labor
out of agriculture and into more productive jobs in manufacturing and the services sectors, more than
half of the labor force in India currently remains in agriculture.14
Thus, employment growth in this
sector will continue to have a large impact on overall employment growth as well as on workers’
earnings through its effect on wages. In the 1990s, employment growth in this sector slumped due to
low growth, especially in the net sown area, as investments in irrigation and rural infrastructure
declined. There is considerable potential for stimulating demand for labor and productivity in
agriculture through diversification into horticulture (which has an employment elasticity of
production twice that of cereals), livestock and other high-value products, and increasing the spread
of irrigation. Irrigated farms can use 50 percent more hired labor than rain-fed farms. The further
spread of labor-intensive high-yielding varieties (HYV) of rice, especially to the north-eastern
regions where water is available but productivity is relatively low, offers potential in this respect.
Expanding sustainable irrigation under the Bharat Nirman project of the government will help this
process. Increase in agricultural activity will also likely lead to growth in off-farm employment
opportunities through second-round effects, both supply side (as more people are employed in
marketing and food processing) and demand side (as more prosperous firms demand more goods and
services). The fact that less than 2 percent of India’s fruits and vegetables are processed, compared to
about 50-80 percent in some East Asian economies, indicates the enormous employment potential in
this area.
21. Both investment and regulatory reforms are needed in the informal agriculture and non-
agriculture sectors to stimulate growth and increase incentives for firms to become formalized. At
present, regulations restrict the marketing of agricultural produce under the Agriculture Produce and
Marketing Act and the Essential Commodities Act, and the gather of forest products under the Indian
Forest Act (Saxena, 2003). Storage of produce and storage rent are restricted in some large states.
These restrictions depress both demands, for farm produce as well as farmers’ earnings. The tens of
13 Informal sector firms have less access to formal credit. 14 The last major NSS survey in 2000 suggested agriculture’s share was 59 percent. The most recent NSS survey (2004/05)
suggests a significant drop in agriculture’s share, to 53 percent.
ix
millions of forest dwellers who depend on forestry products are hindered from harvesting non-timber
forest products such as fruits, nuts, flowers, and twigs -- activities that are ecologically sustainable.
International evidence suggests that governments need to take two approaches to encourage firms to
become formal (World Bank, 2005i). First, they should recognize that expanding the formal sector
takes time. In the interim, governments can provide a supportive environment for the growth of
productivity and improvement in working conditions in the informal sector. But to support the
growth of the formal sector, it is crucial to remove disincentives for growth -- reserving sectors for
small-scale firms, regulations that raise transaction costs and costs when firms grow beyond a certain
size, and other regulatory barriers discussed above. Second, governments can gradually improve
enforcement by raising penalties for non-compliance. This approach requires cautious handling
because eliminating informality can lead to high costs in the short-term by throwing firms and
employees out of work.
Stimulating Formal Sector Employment Growth
22. Increasing formal sector employment in India is another key challenge. The share of
formal sector employment in total employment has been virtually at a standstill, even declining
slightly, more than a decade after liberalization. In the second half of the 1990s, formal
manufacturing employment growth slowed down, both because overall sectoral growth was
relatively slow and because employment elasticity fell sharply. Our analysis suggests three factors
were responsible for the latter: (i) an adverse movement of relative prices against manufacturing
producers; (ii) firms investing heavily in increasing capacity as the economy opened up in the 1990s.
When the expected manufacturing growth did not materialize, particularly in the second half of the
1990s, this had a dampening effect on employment. Trade also had an impact: while export-intensive
sub-sectors increased their share in employment growth, the share of import-competing sectors fell
slightly during this period of adjustment; and (iii) the choice made by firms to raise wages and
productivity of existing workers rather than employ more people. India stands in striking contrast to
other countries in that it has seen relatively faster growth in wages rather than employment in the
manufacturing sector. It is important to note that despite the growth in wages the current wage bill of
formal sector manufacturing firms in India is only about 8 percent of total costs.15
What explains
this? India’s generous depreciation rate of 25 percent for machinery and equipment for tax purposes,
compared to 10 percent in OECD countries, encourages firms to be capital intensive. This allowance,
combined with labor market regulations that discourage labor mobility, has dampened job growth in
labor-intensive sectors.16
23. A specific task will be to mitigate dualism (or the concentration of production and
employment in very small-scale and large-scale production) in manufacturing by accelerating
growth in the ‘missing’ mid-sized plant group in manufacturing. Compared to other countries,
Indian manufacturing is marked by the concentration of value-addition and employment in very
large-scale and very small-scale firms, leading to the problem of a ‘missing middle’. Currently, the
incentive structure in the Indian manufacturing sector favors small and micro industries, while the
dualism in the capital markets gives specific advantages to large firms if they opt for capital-
intensive techniques that result in high wage per worker and low employment per unit of output. The
mid-size firms are trapped in a disadvantaged no-man’s land. This is problematic because
international experience shows this ‘middle’ group is the most dynamic in terms of employment
generation and entrepreneurial development. By introducing more competition this group also
promotes efficient manufacturing growth.
15 Business Standard, January 4, 2006. 16 The revenue loss from accelerated depreciation allowance is estimated to be close to 0.8 percent of GDP.

x
24. The dualistic pattern of job growth in the tertiary sectors also needs to be addressed. At
one end, the main source of growth in the formal sector has been the rapidly expanding ITES and
financial sectors. But these sectors’ influence on the overall labor markets is marginal given that they
employ only 6 million workers out of a labor force of more than 400 million. More important, in
terms of employment generation, are sectors such as trade, hotels and restaurants, construction, and
community services. Evidence suggests, however, that the bulk of jobs created in these sectors are
of low productivity and, also, informal. Thus, as in manufacturing, workers are clustered at two ends
of the wage spectrum, mostly at the low end.
Addressing Regional, Gender and Social Disparities
25. The differences in earnings across individuals, regions, gender, and caste groups indicate
some specific challenges that need to be overcome to improve labor market outcomes. Increasing
wage disparity, a conspicuous development in the 1990s and in this past decade, appears to arise
from two sources. First, as mentioned earlier, the dualism in labor markets segments workers –
placing most workers in relatively low-paying, low-productivity jobs in small- or micro-size firms
and a few in better-paying high-productivity jobs in very large-sized firms. This leads to differences
in wages between the two groups, above what can be explained by observed skill differences.
Second, as India’s economy becomes more integrated with the world economy, the premium on
skills is increasing the divide between educated and uneducated workers. The number of persons
returning to school to complete secondary education is particularly high. At the same time, less than
10 percent of workers in India have completed secondary or post-secondary education. Real wage
growth among persons of managerial and executive rank – at about 10 percent per annum -- was
highest in the South Asian region for three consecutive years, indicating the scarcity of these skills.
Wage growth among the less-skilled, middle 40 percent group of workers on the other hand was a
more modest 3 percent per annum in the 1990s.
26. The large differences in labor market outcomes across India’s 32 states and 78 regions
need to be addressed by focusing on lagging regions and facilitating migration.17
The differences
can be dramatic. For instance, employment rates for males can vary from 65 percent to 83 percent,
and for females from 10 percent in Delhi or Tripura to 50 percent in Andhra Pradesh.18
Real weekly
earnings from rural work in one region were less than one-tenth the weekly earnings in another in
1999/2000. These differences are also persistent: employment outcomes were consistently poor in
the northeast, the northern states of Bihar and Uttar Pradesh, the coastal regions of Orissa and
Kerala, and the former French and Portuguese colonies of Pondicherry and Goa respectively. One
important exception to these persistent differences is real wages which show a tendency to converge
across regions and between rural and urban areas.19
This may help explain why migration and
urbanization rates across Indian states are low. This also suggests important barriers to improving
labor market outcomes – for instance, low labor mobility, both across regions and from rural to urban
areas, which has led to unusually low urbanization in India. In this respect, the contrast with China is
dramatic: whereas the urban population in China grew by about 180 million between 1989 and 2003,
in India it grew by a much smaller number of 80 million.20
27. Two proximate factors stand out as the main drivers of regional differences in labor
market outcomes: first, economic activity levels as measured by the Gross State Domestic Product
(GSDP) and, second, female participation rates. Firstly, over the long run, regions with higher
17 This refers to the 78 regions in the NSS which correspond loosely to agro-ecological areas. 18 Employment rate refers to the share of the population in the 15-59 age group that is employed. Participation Rate refers
to the share of the 15-59 working-age population that is working or unemployed, that is, looking for jobs. 19 While wages may converge, earnings – which depend on both wages and employment opportunities – may not, due to
differences in employment opportunities. 20 World Development Indicators.

xi
GSDP and higher economic growth rates show higher employment rates and earnings, and lower
unemployment rates. This challenges the widespread perception of ‘jobless’ growth. Interestingly,
GSDP levels and economic growth appear to have a more significant effect on female employment
than on male employment. A one percent increase in GSDP leads to a 0.7 percent increase in female
employment levels, a 1 percent increase in urban employment and a 0.4 percent increase in rural
employment levels.21
Economic activity also affects the quality of jobs, as measured by earnings in
rural areas. It is worth stressing though that the link between GSDP and employment opportunities is
more long-term than short-term. Over short periods, increasing labor productivity – which has driven
most of India’s economic growth – can dampen employment growth in both urban and rural areas. In
the medium-term, however, regional analysis suggests, increasing productivity does not dampen
employment growth. The second proximate factor driving regional differences, the difference in
female participation rates, has a complex relationship with income. On the one hand, increases in
household expenditures (which proxy increases in household incomes) or spouses’ earnings, lower
female participation rates. On the other hand, regions that provide greater economic opportunities for
earnings by females have markedly higher female participation rates.
28. A key task, in the above context, will be to draw more women into the ‘paid’ labor force.
The labor force participation rates for females are unusually low in India. While they declined
further in the 1990s, and then recovered after 2000, overall participant rates remained stuck at low
levels. While female participation rates in East Asia and Latin America are around 60 percent, in
India they are only around 30 percent. Contrary to international experience, the rising rate of
education among females and lower fertility rates were accompanied by declining female
participation in the work force in India (about 3 percent between 1993/94 and 1999/2000). Two
factors help explain India’s low and falling female participation rates. First, there is a positive
income effect: with increased household incomes or earnings by spouses, females working in
subsidiary jobs in rural areas quit the labor force in favor of household work, leisure or childcare.22
The second factor is the absence of employment opportunities which has hurt rural female
participation.23
Also, the high gender gap in wages, about 28 percent, cannot be explained by age,
experience or education -- it discourages female participation. Thus, increasing good economic
opportunities will be important for increasing female participation, especially in rural areas.
29. Addressing the exclusion of scheduled castes (SC) and scheduled tribes (ST) from good
quality jobs is an important challenge. Government policies to reserve jobs and use affirmative
action have been effective in providing SC/ST groups some advantage in getting rationed salaried
public sector jobs. But SC and ST workers still have a much higher probability of being employed in
relatively poor quality jobs (often as agricultural laborers) and significantly lower probability of
entering self-employed occupations (Das, 2005). Improving outcomes for this group will require that
special attention be paid to improving the skills and educational attainments of SC and ST workers
on the one hand, and promoting policies to enhance micro-credit, self-help groups and small
businesses among these groups on the other.
D. How can Policy and Institutional Reforms Help Meet the Employment Challenge?
Regulatory Reforms to Sustain Growth and Create Jobs
21 These estimates try to take into account the two-way relationship between employment and economic activity -- that is,
the two determine each another. 22 The effect of household expenditures (which proxies household incomes) and spouses’ earnings on female participation
were separately estimated and found to be significant. 23 ‘Expected earnings’ is defined as weekly earnings times the probability of finding a job.
xii
30. India enjoyed a robust rate of economic growth in the 1990s but its pattern of growth was
atypical of the experience of most developing countries. Since the mid-1990s, growth was led by
the services sector, with the share of manufacturing value-added and other jobs remaining largely
stagnant. Even within manufacturing, job growth took place mostly in the informal sector. While
there has been an upsurge in formal manufacturing growth and exports since 2004, it is marked by
the use of relatively skill-intensive labor; unskilled labor is used less intensively. This raises the
issue: can India leapfrog the labor-intensive manufacturing stage and follow the growth path of an
upper middle-income, or even rich, industrialized, developed economy which is based on skill-
intensive services and manufacturing? It is unclear whether India’s human capital and infrastructure
are adequately developed to sustain such a pattern of growth. Already, virtually all sectors of the
economy are experiencing shortage of talent. According to a McKinsey survey, the biggest concerns
of 81 percent of Indian managers are the availability of talent and high wages.24
A second issue is
that such a growth pattern will only have a muted impact on poverty because the country will be
unable to provide good jobs to the 90 percent of workers who have not completed secondary
education. This could exacerbate inequality among the ‘two Indias’ and among India’s regions by
concentrating growth in relatively better developed areas that already have a more skilled labor force
and better infrastructure.
31. Adjusting India’s pattern of growth to make it more employment intensive, without
lowering productivity, would require addressing some overall policy reform issues. First, reforms
are needed to improve the investment climate in the country and do away with factors that currently
dampen investment, productivity, growth, and job creation. The following positive measures would
help considerably: better provision of law and order, protection of property rights, corruption control,
improvements in policy and tax administration, investment in infrastructure in a sustained manner,
and increased access to finance.25
The cost of most infrastructure services is estimated to be 50-100
percent higher in India than in China and is a particularly binding constraint. Second, in agriculture,
pricing and subsidy policies that bias incentives against labor-intensive crops and cropping practices
(for example, horticulture and irrigated farm-based cereals) will need to be addressed. Third,
manufacturing and tertiary sector regulations, such as the small- and medium-enterprises (SME)
reservation policies, constrain factor mobility (of capital, land and labor) by raising barriers against
entry, exit and trade, and dampen investment and competition. However, analysis suggests that even
after accounting for the dampening effect of all these elements, reforming specific labor market
regulations and policies which currently have an anti-labor bias, and making active labor market
policies more effective, will generate growth and job creation.
32. As in all countries, labor market regulations are necessary to address important market
failures and to protect workers. However, India’s labor regulations are unusually complex. There
are currently 47 central laws and 157 state regulations that directly affect labor markets. These are
often inconsistent and, at times, overlapping. It is impossible for both firms and workers to be aware
of their rights and obligations when rules and regulations are spread over numerous national and
state level Acts. There are also other issues. One of the major pieces of legislation, the Industrial
Disputes Act (IDA), creates incentives for adjudication rather than reconciliation, and has caused an
overloading of the disputes resolution system. To illustrate, in 2001, about 533,000 labor disputes
were pending; over 28,000 had been pending for more than 10 years. Other clauses in the IDA make
retrenchment and layoffs (necessary at times because of changing market conditions) costly, and
hinder the closure of firms with more than 100 workers. This makes firms more reluctant to hire in
the first place. It also prevents firms from redeploying resources from less efficient activities and
firms to more efficient activities and firms. Finally, there is ambiguity and uncertainty surrounding
24 The Job Boom, India Today, Feb 27, 2006. 25 These were key constraints identified by firms in the last investment climate survey conducted in India by the World
Bank.
xiii
the Contract Labor Regulation and Abolition Act. Contract labor has become increasingly important
in recent years because it provides firms some flexibility to hire and fire.
33. The cost of these labor regulations is significant in terms of formal sector jobs lost.
Research for this study, which tried to measure both de jure and de facto applications of the IDA,
showed that manufacturing value-added, employment and the number of factories were all adversely
affected in states with more restrictive labor laws. Our conservative estimates, based on studying
both de jure and de facto differences in labor regulations across states, suggest that India failed to
create about 2.8 million formal manufacturing jobs because of just two clauses in the IDA per se.
Stated differently, the cost of these two clauses alone is about 45 percent of all current formal
manufacturing jobs. Although the cost (in terms of number of jobs lost) can be distributed almost
equally between the ‘Disputes’ clause and the ‘Retrenchment barriers’ clause of the IDA, the two
clauses affect different sectors in different ways. While dispute-related regulations cost more jobs in
capital-intensive industries, retrenchment-related regulations affect labor-intensive industries
adversely. The retrenchment clause is also related to job losses in more states.
34. Two overall goals can help make the reform of labor market regulations in India more
effective: One, simplifying regulations, with special emphasis on improving industrial relations,
smoothening dispute resolutions and removing ambiguity and uncertainty. Two, reducing the
rigidities in labor markets. Specifically, four main types of reforms are called for: (i) consolidating
and simplifying labor laws from the current 47 central laws to about 4 – these should cover the main
themes of dispute resolution, conditions of work and welfare, wages and benefits, and social
security; (ii) modernizing the IDA to reduce the bias towards adjudication in disputes and increasing
the flexibility for employers to hire and fire in a way that also protects workers’ rights; (iii) resolving
ambiguities concerning the Contract Labor (Regulation and Abolition) Act to introduce greater
flexibility; and (iv) improving the labor law enforcement and inspection system. The study provides
detailed recommendations towards this end. There will also be benefits from simplifying India’s
complex maze of minimum wage laws wherein states have to administer 40 or so types of minimum
wages. However, minimum wages, even in their present form, can be beneficial: while a large share
of workers still gets wages lower than the minimum wages, the minimum wage laws can create a
‘lighthouse effect’ by clustering workers’ wages around the states’ minimum wages. As the affected
workers are generally poor, and since minimum wages do not appear to affect unemployment rates,
the minimum wages may actually be increasing the earnings and welfare of poor households.
Active Labor Market Policies to Help Workers
35. Regulatory reforms will be more effective if they are complemented with programs that
help workers obtain more marketable skills and some protection against unemployment. At
present, the vast majority of workers who are in the informal sector receive neither. Major
government interventions, in the form of employment generation through public works programs and
social insurance, are limited in coverage and mostly ineffective. These programs are burdened by
problems of poor accountability, uneven implementation and high costs. However, some promising
initiatives for the protection and security of the poor and vulnerable in the labor market are under
way. These include: expanding special employment programs for poor and less-skilled workers;
widening social security and insurance programs to include informal sector workers; seeking private
sector participation in employment exchanges to make them more effective in matching employers
and workers, and; strengthening programs that increase workers’ skills and competencies.
36. The first initiative, the National Rural Employment Guarantee Act (NREG), will
potentially provide more protection to workers. The Act guarantees every rural household up to 100
days employment per year at the agricultural minimum wage set by each state, financed mostly by
the central government. Coverage is initially to be confined to 200 backward districts, with
xiv
nationwide coverage of all rural areas within five years. Analysis of the NREG to date suggests a
mixed picture of costs and benefits. First, there is significant potential for a lean season Employment
Guarantee Scheme (EGS). Simulations of a nationwide 100-day employment guarantee program
suggest that the lean season rural poverty rate can be reduced from 37 percent to around 23 percent,
or around 30 percent on a year round basis (Murgai and Ravallion, 2005). The fiscal cost would be
around 1.7 percent of GDP annually, if implemented nationally. The gains would be progressive,
with the poorest (richest) quintiles accounting for 29 (10) percent of participants, and gains from
EGS coming to 51 (7) percent of pre-EGS consumption levels. The bulk of expected participants
would be casual laborers.
37. The design and implementation of the REG Act need to be further refined to ensure that it
is effective and equitable. An area of concern is the use of state agricultural minimum wage rates as
the scheme wage rates, as the former are above market rates. This typically results in rationing
(fewer jobs made available), lowering the employment generation impact, which the experience from
the Maharashtra EGS confirms also applies to ‘guarantees’. The direct transfer impact of the REG is
significantly less than an untargeted transfer due to the opportunity costs of participation. An
untargeted transfer, using the wage portion of the REG only, would reduce poverty to around 15
percent – as against 23 percent from REG. While the comparison is imperfect – as it measures only
the transfer impact of REG and not other economic impacts – non-transfer gains from EGS would
need to be substantial to be larger than those from untargeted transfers. This point highlights the
importance of achieving significant economic returns to EGS assets and the poor to capture a
reasonable share of the gains.
38. A shortcoming of previous public works programs in India (and internationally) has been
the absence of evaluation of the economic impact of assets. While the NREG scheme benefits from
a stronger monitoring and evaluation (M&E) system than previous works schemes, in order to
expand the system of concurrent evaluation to include robust impact evaluation it will be critical to
collect good baseline data prior to the commencement of the scheme. Another significant
improvement in REG over previous works schemes is the strengthened role of local governments or
panchayats in design, implementation and monitoring. However, it will be important to develop
accountability mechanisms which avoid the bundling of functions to specific agencies (in particular
the District Rural Development Agency), which has contributed to implementation problems in
previous schemes. It also remains to be seen if the incentive and accountability structures ensure that
gram panchayats (governing councils in villages) are at the heart of REG. A key component of such
a program will be social insurance. Currently, the spending on this is low and the implementation
concentrated. Another issue is that the Act offers limited guidance on funds-flow mechanisms. If
panchayats are to be empowered it is important for them to have direct control over a portion of
scheme funds. The initial findings about the experience of the NREG in the first two years
highlighting its highly uneven implementation across different states, has only served to emphasize
the importance of strengthening the monitoring and accountability systems discussed here.
39. The second initiative is to move from employment program type safety nets towards a more
comprehensive system of social protection. Past attempts at the national level to increase coverage
in the unorganized sector, where most of the work force is concentrated, failed to achieve any
significant penetration. While expanding social security in the unorganized sector is important,
experimenting with different schemes is not without cost either. Future efforts should thus be based
on a critical evaluation of existing initiatives, some of which show promise. Two types of insurance
that stand out as somewhat more easy to expand are life insurance, for which demand in the
commercial market already appears high among unorganized sector workers, and disability
insurance, which acts in one sense as the most extreme form of curative health insurance. Past
experience suggests a cautious and gradual approach to the expansion of social insurance coverage.
Although such a strategy may not be consistent with the political desire for broad-based schemes

xv
which have high announcement value, the financial costs of a poorly-designed and rapidly expanded
program can be high, as can the cost of raising expectations and failing to meet them.
40. The third initiative, enhancing the performance of India’s largely ineffective government-
run employment exchanges (EEs), has started in some states. As of end-2004, there were 947
regular employment exchanges in India, concentrated in urban areas -- with some 5.3 million
registered job seekers, 300,000 listed vacancies, and only about 160,000 workers placed through the
exchanges.26
Apart from their placement function, exchanges are tasked with providing job
counseling, training, labor market information collection and dissemination, aptitude testing of job
seekers, and promotion of self-employment through special cells. The limited assessments that are
available suggest that in the large majority of exchanges these functions are performed poorly, often
by staff who do not have skills and knowledge of local labor markets to allow for effective service.
This performance was reflected in the sharp decline in both registered vacancies and placements
between 1991 and 2001. The placement rate at the all-India level, never more than 5 percent,
declined to almost 3 percent in the 1990s. While the overall picture is not encouraging, other states
can draw from emerging good practices in two Indian states: Gujarat and Tamil Nadu. Both have
expanded the role of IT in increasing outreach to jobseekers and employers. In particular, they are
able to offer detailed information on jobseekers which employers can sort according to their needs.
41. There is a fundamental need to reorient the National Employment Service (NES) if it is to
regain relevance in the current labor market. As some government committees have noted,27
there
is a need to focus on functions that address the most important market failures. These include: (i) the
labor market information function which has been generally neglected. Timely information on trends
in local labor markets can provide value to both employers and jobseekers; (ii) developing a service
orientation by engaging more intensively with employers and groups such as trade unions and
worker associations, to assess their needs which cannot be met by private sector providers (these
methods are already pursued by private employment agencies through interaction with the human
resource (HR) divisions of firms); (iii) considering whether some functions of the exchanges should
be discontinued altogether. For example, some exchanges operate small credit schemes for
jobseekers who want to pursue self-employment -- the results to date have been poor (for example, in
West Bengal), and; (iv) developing effective rural outreach strategies for the NES at the national and
state levels. This may not involve a physical network of more exchanges but perhaps a combination
of IT-based information services and collaboration with arms of state governments that already have
rural networks in place. Some state employment services, such as the ones in Gujarat and Tamil
Nadu, already provide good models for increasing effectiveness by expanding the role of IT in
outreach, offering detailed information on jobseekers, arranging job fairs where jobseekers and
employers engage directly, and strengthening job counseling functions which in most exchanges are
desultory. A particularly interesting initiative in Gujarat is the Rojgar Sahay Kendra which links a
group of non-government organizations (NGOs) that have knowledge of local job markets with the
EE jobseeker database, and intermediates between employers and jobseekers.
42. The fourth initiative is enhancing the skills and education of workers by reorienting the
vocational education and training (VET) system which, currently, is not serving the economy’s
needs. This is especially important in a country like India where a large part of the work force is
stuck in agriculture, without the skills to transit to more productive employment in other sectors. It is
also important, given that 8 million children drop out from secondary schools (between grades 6
26 Consolidated information on private placement agencies is not available but the Directorate General of Employment and
Training (DGE&T) estimates that at least 800 existed as of the early 2000s (for example, there are estimated to be more
than 100 in Gurgaon, Haryana, alone). India is not a signatory to the ILO Convention ‘96 on private employment agencies.
Like the EEs, these are primarily concentrated in urban areas and in the formal sector, often with specific sectoral focus. 27 The 1978 Matthew Committee and, subsequently, the Working Group on Employment of the Planning Commission,
2001.

xvi
through 12) every year. At present, the 6,800 VET schools, almost all in the public sector, enroll less
than 3 percent of students at the upper secondary level. Also, while these schools offer a total of over
100 courses in various areas -- agriculture, business and commerce, humanities, engineering and
technology, home science, and health and para-medical skills -- only 40 percent of the available seats
are utilized. Programs operated by the Industrial Training Institutes (ITIs) and Industrial Training
Centers (ITCs) to provide certificate level crafts training also meet with only limited success. A
study by the Operational Research Group in 1998 reported that only 28 percent of graduates of
vocational education were gainfully employed. A 2003 ILO study found that none of the states
covered by the study had more than 50 percent of the ITI/ITC graduates find wage employment, or
become self-employed, or even work in family businesses.28
At the same time, employers in these
states reported experiencing problems finding employees with the right skills, implying that the
graduates did not meet employers’ needs (World Bank, 2006). A survey by the Federation of Indian
Chambers of Commerce and Industry (FICCI) in late 2001 also reported that 87 percent of industry
respondents felt that VET institutions should have greater exposure to industrial practices.
43. Most significant, however, is the fact that current VET programs do not meet the training
needs of the large work force in the informal sector, arguably the group which should be its main
target. Because of its entry requirements and geographical mapping, the formal training system of
VETs is not designed to offer skills to people with little or no education, and particularly not to those
in the rural non-farm sectors.29
There are no other providers who fill this gap either. Most workers
continue to learn trades on the job, through informal apprenticeships at their place of work, from
other low-skilled crafts people. International experience suggests that employers look for young
workers who possess the basic skills taught in primary and general secondary education, and not
workers trained in narrow vocational skills. This highlights the importance of enhancing secondary
education, an area where India is still lagging.
44. Two principles should guide reforms intended to improve the employability of VET
graduates and the secondary-age cohort in general. First, international experience suggests that
there are few successful models of vocational education at the secondary school level. It is, therefore,
more advisable to focus attention on strengthening the secondary education program rather than
expanding the vocational education program. Second, as far as technical education is concerned,
VET management, curricula and instruction will need to be restructured by introducing public-
private partnerships. Reforms would also require a clear demarcation between the functions of
central and state governments, and the development of effective coordination mechanisms between
them. Significant involvement by employers in the decision-making processes of VETS is also
critical to ensure that the system is responsive to market demands. Another way to increase
incentives would be to give the institutions greater autonomy in terms of deciding on training
programs, hiring and firing of teachers, and generating revenues by selling goods and services.
Finding the right role for the public sector in training is critical. State-sponsored training may be
used to address equity issues or market failures (for example, providing training for informal sector
workers or addressing the externalities or spillover affects created due to training by firms) but may
be less needed when private capacity exists.
45. The main emphasis on improving workers’ skills will have to be in the form of expanding
secondary education. Worldwide, in response to globalization and the emergence of the knowledge
economy, the importance of secondary education is being recognized for preparing young people for
28 However, there were significant inter-state differences: in Andhra Pradesh, unemployment ranged from 33 percent for
ITI graduates to more than 70 percent for ITC graduates, while in Maharashtra it was around 23 percent and 27 percent
respectively. 29 While one of the mandates of the ITIs is to train workers for the informal sector, evidence shows this is rarely the case
(Dar, 2005).

xvii
lifelong learning. A variety of research suggests that in India also, returns to education jump at the
secondary and post-secondary levels. Yet, while government policies have helped raise the
enrolment rate for elementary schooling to 94 percent, no such increase has taken place at the
secondary level. While secondary school enrolment currently stands at 54 percent, less than 10
percent of the working-age population aged 25 and above has completed secondary and post-
secondary education. This number is low, relative to what international experience suggests should
be at India’s income level. A variety of supply and demand side interventions are needed to expand
access to secondary education.30
Improving the skills of future workers requires expanding access to
secondary education and also improving its quality. More directly relevant for employment are
curricula reforms to imbue students with more problem-solving and entrepreneurial skills of the kind
that employers seek. At the same time, it must be kept in mind that education also raises workers’
expectations; efforts to raise the educational level of the labor force must be matched with efforts to
increase the availability of the kind of jobs these workers will demand.
30 See, for instance, Wu (2005) and World Bank (2006).

CHAPTER 1: OVERVIEW AND LABOR MARKET TRENDS
Indian policy-makers have stated as their goal, the provision of “gainful and high quality
employment to at least the additions to the labor force.” In a country where the working age
population is expected to grow by about 12 million persons, or close to 2 percent, annually, till the
year 2016, this constitutes a major challenge. Further, the deceleration in job growth in the 1990s,
at a time when the economy grew at 6 percent per annum, raised concerns about India witnessing
“jobless growth”. This chapter argues that although labor market developments in the 1990s were
not as poor as is generally perceived and employment growth picked up subsequently, India still
faces formidable employment challenges. Labor supply continues to exceed labor demand and
unemployment has grown by most measures. While a significant part of the labor force continues to
shift out of low productivity jobs in the agricultural sector to better paying jobs, mainly in the
tertiary sector, the bulk of it is still employed in casual jobs. Encouragingly, labor productivity and
wages have risen and the number of working poor has declined. But, at the same time, the inequality
in earnings is more marked because wage growth has been more rapid among high wage earners.
The challenge facing India now is to provide employment to a growing, more educated and young
labor force, improve job quality in the informal sector, expand the formal sector, and address
regional disparities in labor market outcomes.
1. Indian policy makers have stated as their goal, the provision of gainful and high quality
employment to at least the additions to the labor force. This is already a major task in a country
where the working age population will increase by more than 12 million persons each year over the
next decade. Approximately 8 million people will enter the labor force annually. This number will
be even higher if India’s low female employment participation rate increases.31
In the 1990s32
,
against similar employment needs, the economy produced only about 5.3 million jobs on average
each year. This number, based on the NSS 55th Round Employment-Unemployment Survey (July
1999 to June 2000), reflected the substantial slowdown in work force growth during the 1990s
(relative to the 1980s) and caused much concern. Estimates by India’s Planning Commission show
that employment growth halved from 2 percent per annum in the 1983-1993/94 period to about 0.98
percent per annum in the 1993/94-1999/00 period. This happened despite robust economic growth,
implying a declining employment elasticity of growth (Figure 1.1). More recent data for 2004/05
suggests that while the overall employment growth rate in recent years has been almost double of
what it was in the 1990s, it is still only just managing to keep pace with labor supply (Table 1.1).
Tellingly, the unemployment rate increased from 7.2 percent in 1999/00 to 8.3 percent in 2004/05.33
31
Participation rate is the share of the population in the 15-59 age group that is working, searching for work, or is willing
to work. 32 The 1990s refer to the period from 1993 to 2000, based on the timing of the main National Sample Surveys (NSS) on
which most labor market analyses are based. 33 This is measured by the Current Daily Status (CDS) definition as per official practice. If the international definition of
Current Weekly Status (CWS) is considered, then rural unemployment rates for both males and females increased from 3 to
4.5 percent over the same period (See Box 1.1 for explanation of CDS and CWS). In urban areas on the other hand,
unemployment rates were 5.7 percent for males and 9 percent for females in 2005/06 (Economic Survey, Government of
India, 2005/06)

2
Figure 1.1: GDP Growth and Employment (UPSS) in India
0.00
1.00
2.00
3.00
4.00
5.00
6.00
7.00
8.00
9.00
10.00
1983 - 1993/94 1993/94 - 1999/00 1999/00 - 2004/05
perc
ent
GDP Grow th Employment Grow th
Source: Estimates from NSS surveys adjusted by population census.
Note: See Box 1.1 for explanation of UPSS and other labor market terms used in this report
2. India faces an employment opportunity as well as an employment challenge. The
opportunity comes from the fact that the working age population is largely young and will continue
to grow at the rate of 2 percent per annum over the next decade, even as the dependency ratio (the
ratio of dependents to workers in a household) drops significantly.34
The challenge will be to train
and educate these workers and provide them with productive jobs. This will require a significant
acceleration in job creation, compared to the 1990s, over the next decade. In turn, this will require
not just robust economic growth but a change in the pattern of growth which will need to become
more labor intensive. At the same time, growth in productivity cannot be sacrificed either. Achieving
annual economic growth rates of between 8 to 10 percent to bridge the employment gap, as is being
currently discussed, will require that labor productivity also grow by 6 to 8 percent per annum.35
3. However, simply creating more jobs will not be enough; concerns about the quality of jobs
have to be addressed. In the 1990s, relatively few jobs were created in the better paying, more
productive ‘organized sector’,36
which is the sector of choice for Indian workers, especially for the
educated. Employment in this sector grew by only 0.5 percent annually from 1994 to 2000. Most
jobs were created in the unorganized sector where employment grew by 1.1 percent annually but
where productivity is several times lower than in the organized sector. Data on labor market trends
between 2000 and 2004/05 shows that this pattern has continued; the share of regular salaried jobs in
overall jobs has remained virtually unchanged. Another issue is that within the unorganized sector,
the share of casual wage employment is above 30 percent. Casual workers are at the bottom of the
employment scale -- they get lower wages, have uncertain employment prospects with few benefits
or pension arrangements, and are beyond the reach of most laws designed to protect labor.
4. The pace of transformation of India’s economy has picked up in recent years. Economic
development in India, from the 1950s to the present, is broadly consistent with the experience of
other countries in that the share of agriculture in GDP declined from around 60 percent in 1950/51 to
less than 25 percent now. However, in some other respects, India’s pattern of structural change
varied from that of most other developing countries. First, most of the increase in economic activity
took place in services, which now account for more than 50 percent of GDP. While the share of
industry increased from 13 percent to around a quarter of GDP, manufacturing’s share increased
minimally and now accounts for less than 15 percent of GDP, much lower than in other developing
34 Planning Commission of India, 2001a, 2001b, and 2002; estimates based on Indian Labor Organization (ILO) database. 35 Planning Commission of India report, 2001b, estimates that 10 million jobs need to be generated annually in the
economy. The growth required to generate these will need to be 8 percent to above 10 percent per annum. 36 ‘Organized sector’ usually refers to the government or establishments employing more than 10 persons.
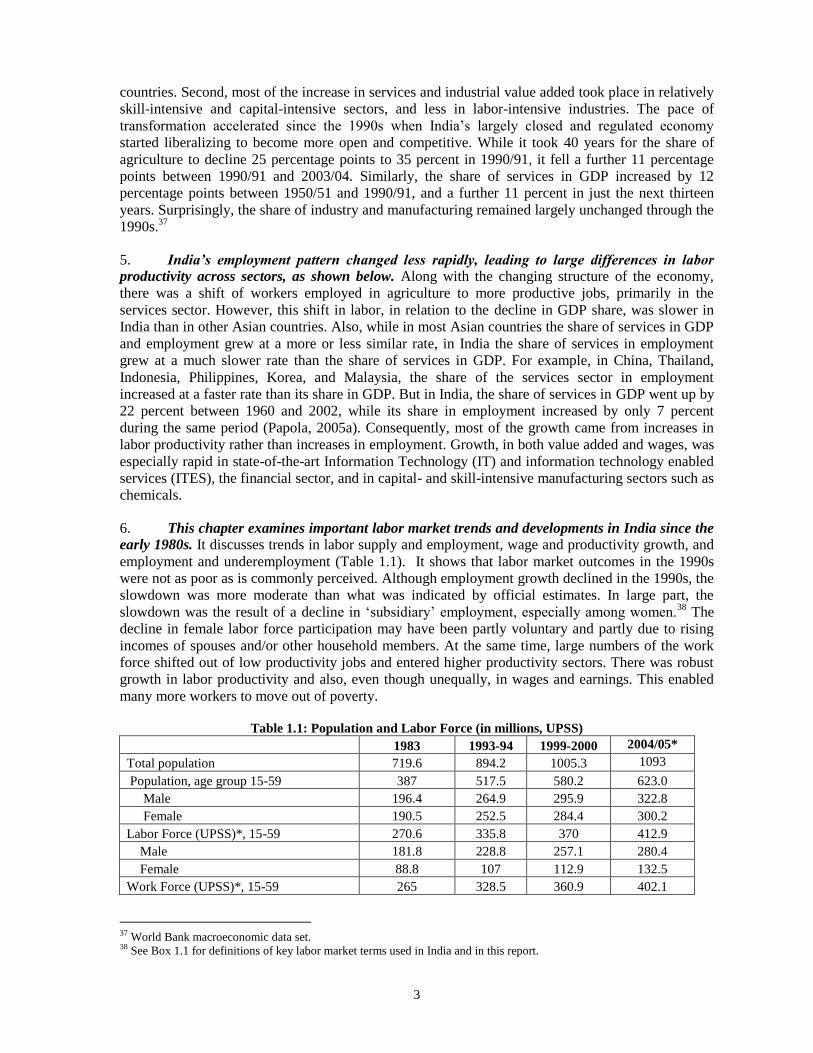
3
countries. Second, most of the increase in services and industrial value added took place in relatively
skill-intensive and capital-intensive sectors, and less in labor-intensive industries. The pace of
transformation accelerated since the 1990s when India’s largely closed and regulated economy
started liberalizing to become more open and competitive. While it took 40 years for the share of
agriculture to decline 25 percentage points to 35 percent in 1990/91, it fell a further 11 percentage
points between 1990/91 and 2003/04. Similarly, the share of services in GDP increased by 12
percentage points between 1950/51 and 1990/91, and a further 11 percent in just the next thirteen
years. Surprisingly, the share of industry and manufacturing remained largely unchanged through the
1990s.37
5. India’s employment pattern changed less rapidly, leading to large differences in labor
productivity across sectors, as shown below. Along with the changing structure of the economy,
there was a shift of workers employed in agriculture to more productive jobs, primarily in the
services sector. However, this shift in labor, in relation to the decline in GDP share, was slower in
India than in other Asian countries. Also, while in most Asian countries the share of services in GDP
and employment grew at a more or less similar rate, in India the share of services in employment
grew at a much slower rate than the share of services in GDP. For example, in China, Thailand,
Indonesia, Philippines, Korea, and Malaysia, the share of the services sector in employment
increased at a faster rate than its share in GDP. But in India, the share of services in GDP went up by
22 percent between 1960 and 2002, while its share in employment increased by only 7 percent
during the same period (Papola, 2005a). Consequently, most of the growth came from increases in
labor productivity rather than increases in employment. Growth, in both value added and wages, was
especially rapid in state-of-the-art Information Technology (IT) and information technology enabled
services (ITES), the financial sector, and in capital- and skill-intensive manufacturing sectors such as
chemicals.
6. This chapter examines important labor market trends and developments in India since the
early 1980s. It discusses trends in labor supply and employment, wage and productivity growth, and
employment and underemployment (Table 1.1). It shows that labor market outcomes in the 1990s
were not as poor as is commonly perceived. Although employment growth declined in the 1990s, the
slowdown was more moderate than what was indicated by official estimates. In large part, the
slowdown was the result of a decline in ‘subsidiary’ employment, especially among women.38
The
decline in female labor force participation may have been partly voluntary and partly due to rising
incomes of spouses and/or other household members. At the same time, large numbers of the work
force shifted out of low productivity jobs and entered higher productivity sectors. There was robust
growth in labor productivity and also, even though unequally, in wages and earnings. This enabled
many more workers to move out of poverty.
Table 1.1: Population and Labor Force (in millions, UPSS)
1983 1993-94 1999-2000 2004/05*
Total population 719.6 894.2 1005.3 1093
Population, age group 15-59 387 517.5 580.2 623.0
Male 196.4 264.9 295.9 322.8
Female 190.5 252.5 284.4 300.2
Labor Force (UPSS)*, 15-59 270.6 335.8 370 412.9
Male 181.8 228.8 257.1 280.4
Female 88.8 107 112.9 132.5
Work Force (UPSS)*, 15-59 265 328.5 360.9 402.1
37 World Bank macroeconomic data set. 38 See Box 1.1 for definitions of key labor market terms used in India and in this report.

4
Male 177.4 223.4 250.1 273.5
Female 87.7 105 110.7 128.6
Unemployment Rate Percent (CDS)* 8.4 6.0 7.3 8.3
Unemployment Rate Percent (CWS)*
- Rural Male 3.7 3 3.9 3.8
- Rural Female 4.3 3 3.7 4.2
- Urban Male 6.7 5.2 5.6 5.2
- Urban Female 7.5 8.4 7.3 9
Source: Sundaram and Tendulkar, 2005a and Bank staff estimates for 2004/05
*See Box 1.1 for definitions of UPSS, CWS and CDS. Calculations from NSS, 6/6/2007
The definition of ‘workers’ corresponds to UPSS unless otherwise specified.
Box 1.1: Definition of Key Labor Market Terms Used in India and in This Report
Labor Force: This includes all people who spent the year preceding the employment survey either engaged in
work or seeking/being available for employment. Given that the large majority of Indian workers are engaged
in casual or self-employed jobs, the NSS uses various definitions to classify the labor force, workers and the
unemployed. These include:
Principal Status Workers: A worker’s principal status is determined by the activity the worker spent most of
his time doing in the reference period (the last 365 days). Usual Principal Status (UPS) workers are those who
spent most of their time employed in their principal activity or looking for jobs.
Subsidiary Status Workers: Any activity other than the principal status constitutes a worker’s subsidiary status.
Subsidiary status laborers/workers are those who did not have a principal activity in the preceding 365 days but
spent at least some of their time employed in a subsidiary activity.
Employed Workers in Principal and Subsidiary Status (UPSS): Workers are classified as being employed in the
principal status (UPS) if they spent a majority of their time in the preceding year engaged in gainful economic
activity. Sometimes, subsidiary workers are included in this category to determine total employment on
principal and subsidiary status, that is, Usual Principal-Cum-Subsidiary Status (UPSS). This category includes
salaried workers, workers in household enterprises (including unpaid workers), and casual workers. Since
household enterprises often employ family members who are unable to find gainful employment elsewhere,
employment figures can hide substantial amounts of underemployment. Unless mentioned otherwise, most of
the analyses in this report are based on the UPSS definition of laborers and workers.
Workers in Current Weekly Activity Status (CWS): The current weekly activity status of a person is the activity
status obtained for a person during the reference period of 7 days preceding the date of survey. A person is
considered working (or employed) if he/she, while pursuing any economic activity, has worked for at least 1
hour on at least 1 day during the 7 days preceding the date of survey.
Workers in Current Daily Activity Status (CDS): The current daily activity status for a person is determined on
the basis of his/her activity status on each day of the reference week preceding the survey. A person is
considered to be employed if he/she has been employed for 4 hours on any 1 day of the week preceding the
survey.
Unemployed Workers: The unemployed category includes people who sought work but did not find it during:
the major part of the previous year (UPS), or major or minor part of the year (UPSS), or in the week preceding
the survey (CWS). Unemployment can also be defined in man-days, that is, the number of days (measured in
half days) a person was not employed in the week preceding the survey.
Regular Workers, Casual Workers and Self-employed Workers: These are defined based on the responses by
surveyed workers to the relevant NSS questions.
Prime-Age Workers: Workers in the 15-59 age group.
Labor Force: Prime-age employed and unemployed workers. This group is the unit of analysis for this report
unless mentioned otherwise.
Employment Rate: The ratio of workers to the population in the same age group. For the most part,
employment rate refers to the employment rate of the prime-age group as defined by UPSS.

5
Unemployment Rate: The ratio of prime-age unemployed workers to the labor force (that is, prime-age
employed and unemployed workers).
Source: NSS manuals; Bank staff.
7. Despite increases in wages and productivity, India faces significant employment
challenges ahead. The most important challenge is to accelerate job growth. Employment has barely
kept pace with increases in the labor force and unemployment is growing. There is some evidence,
presented later, that the absence of employment opportunities led to potential workers opting out of
the labor force. Thus, starting with a backlog of some 30 million unemployed or discouraged
workers, added to a rapidly growing labor force which has rising expectations as well as skill levels,
the demand for good jobs has grown and continues to accelerate.
B. Trends in Labor Supply
8. In 2004, the prime-age labor force (15 to 59 years) stood at about 413 million.
39 About 75
percent of the labor force lived in rural areas. Female workers constituted about 32 percent of the
total labor force. The main sources of labor market data and the issues concerning this data are
presented in Box 1.2
9. While India’s male employment participation rates are roughly comparable to those in
other countries, female employment participation rates are low and display wide regional
variations. This may reflect, in part, a preferred division of labor within the family, with women
responsible for activities inside the household and men responsible for outside work.40
For females,
participation in economic activity is often a subsidiary or occasional activity, while for males it is
usually the principal activity (Figure 1.2). Not only is the labor force participation of Indian women
low, it has been virtually stagnant since the 1980s.
10. Labor force growth decelerated in the 1990s but less so than official estimates suggest.
The Planning Commission (2001b) estimated (based on the UPSS definition) that labor force growth
declined sharply from 2.05 percent per annum between 1983 and 1993/94, to 1.03 percent per annum
between 1993/94 and 1999/00. However, other research suggests that this appearance of a sharp
slowdown may be the result of survey-based age distribution in the national sample; more reliable
distribution emerges from the Population Census. Correcting for the difference moderates the
slowdown -- from about 1.8 percent per annum to 1.4 percent (Sundaram and Tendulkar, 2005a). A
substantial amount of the slowdown in labor force growth can be attributed to the withdrawal by
subsidiary workers from the labor force (Figure 1.2). Supporting evidence for this comes from
Mazumdar and Sarkar (2004) who point out that the decline in employment participation rates in the
1990s was smaller for principal status workers and larger for subsidiary status workers – defined as
underemployed workers or workers who were not employed for most of the past year. The
subsequent period, till 2004/05, witnessed a reversal of this trend with the labor force growing by
about 2.2 percent per annum between 1999/00 and 2004/05. Much of this growth was driven again
by the growth in subsidiary workers. Thus, much of the volatility in labor force supply appears to be
driven by this category.
39 Based on UPSS definition (see Box 1.1) 40 Since household activities are not classified as economic activity, this depresses female employment participation rates.
6
Box 1.2: Labor Market Data in India
The most comprehensive data source for national labor market data is the ‘Household Employment-
Unemployment Situation Survey’ carried out by the National Sample Survey Organization (NSSO). The
NSSO first carried out this survey on an all-India basis in 1983. However, it did not repeat the exercise again
till 1987/88. From then onwards, surveys have been carried out in one of two forms: a ‘Thick’ Round every 5
years and a ‘Thin’ Annual Round. The Thick Rounds are full-fledged surveys containing information on
demographic particulars, activity status and time disposition of all household members, along with other
employment-related information. The Thin Rounds are canvassed as part of the ‘demographic and other
statistics’ block in the Consumer Expenditure Survey schedule and contain information only on demographic
attributes and employment status. Until the most recent Round, wage information was not collected.
An additional issue is that the annual Rounds are often not comparable to each other or to the quinquennial
Round due to differences in the sampling frame. This is a result of the main focus of the annual survey not
being the employment characteristics of households. Consequently, the level of non-sampling errors in the
Thin Rounds is expected to be high. The Annual Rounds also canvass much smaller numbers of households.
As a result, while sampling errors are not very large at the national level, at the individual state levels they are
significantly larger. Consequently, reliable and comprehensive labor market information is available only once
every 5 years.
Information on employment is also available from the Population Census which is carried out once every
decade on an all-India basis. The Census divides people into two main categories: workers and non-workers.
Workers are further classified as main and marginal workers. A ‘non-worker’ is someone who has not worked
at all in the year preceding the survey. A ’main worker’ is someone who has worked for the major part of the
reference period (that is, at least 183 days in the preceding year). A ‘marginal worker’ is one who worked for
some time but for less than 6 months in the preceding year. Main and marginal workers together add up to
form the work force. In theory, there should be close coincidence between the work force estimates as
calculated from the Census and by the NSS surveys. In practice, however, the differences are often significant.
The advantage of using the Census calculations is that the estimates are likely to be more reliable and are
available at a much more disaggregated level than through the NSSO. The disadvantage is the infrequency of
the exercise and the difficulty in comparing (especially in measuring unemployment) with the more frequent
NSSO data.
This report draws on some recent work that combines Census-based population weights with NSSO-collected
participation and employment rates, to revise estimates of job and labor force growth trends. However, all
other analyses are based on standard NSSO Thick Round data or ASI data (see below).
The Annual Survey of Industries (ASI) is an indispensable source of employment information on the
organized manufacturing sector. The ASI is the principal source of industrial statistics in India. This survey is
conducted annually under the statutory provisions of the Collection of Statistics Act, 1953. It covers all
factories employing 10 or more workers that use electricity, and those employing 20 or more workers that do
not use electricity. Note, however, that this survey does not cover the informal sector, and therefore, excludes
the major part of the work force. Also, the primary unit of enumeration in the survey is an enterprise. Because
of this reason, and because of the relatively limited universe for which information is collected, this data is
again not directly comparable with NSSO figures.
The Directorate General of Employment and Training (DGE&T) provides sector-wise data on sub-categories
within the ‘organized’ sector. This data is widely considered to be an underestimate (by up to 20 percent) of
formal private sector employment, including by the DGE&T itself, although the DGE&T considers the general
trend of its data to be accurate. This report refers to DGE&T data but does not use it for analyses.
In brief, Indian labor data may need improvement along the following lines: (i) producing more reliable and
frequent labor statistics at a geographically disaggregated level; (ii) increasing the frequency of collection of
labor data to annual and, for a few key data, to a quarterly basis; (ii) improving collection of data on formal
sector employment; (iii) collecting longitudinal data to support research; (iv) improving comparability across
datasets; and (v) standardizing definitions of variables.
Source: Ghose (2004); Sundaram and Tendulkar (2005 a); Bank staff
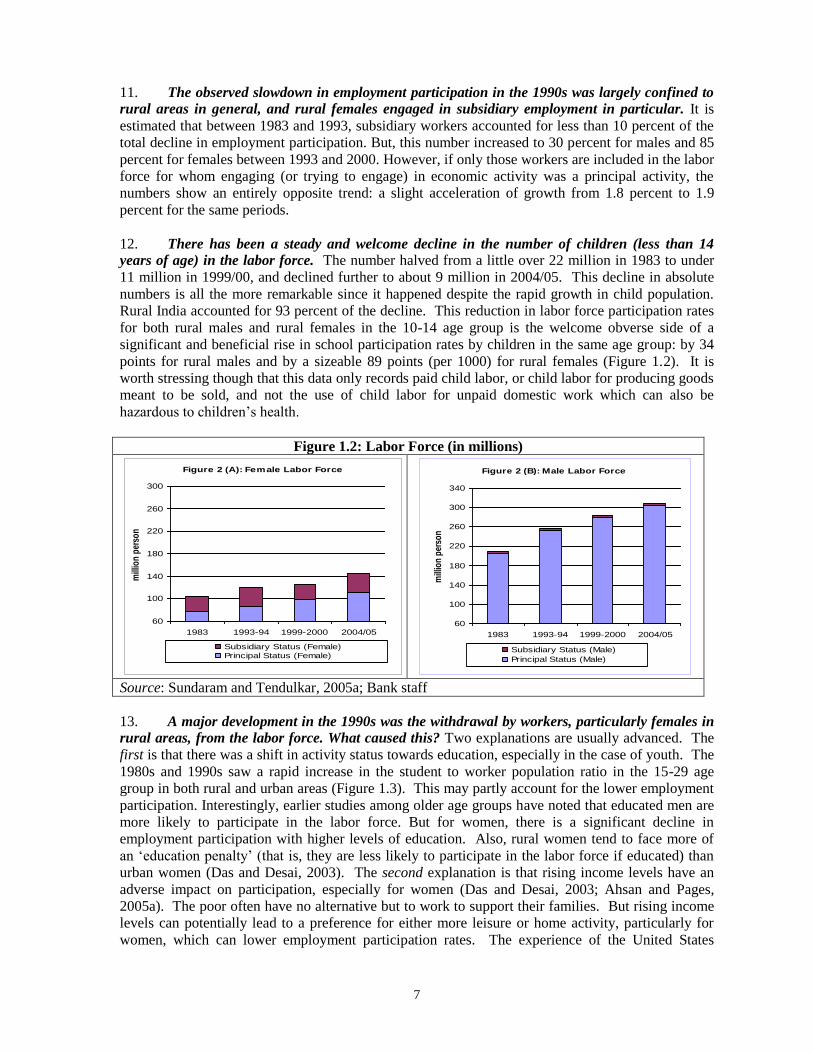
7
11. The observed slowdown in employment participation in the 1990s was largely confined to
rural areas in general, and rural females engaged in subsidiary employment in particular. It is
estimated that between 1983 and 1993, subsidiary workers accounted for less than 10 percent of the
total decline in employment participation. But, this number increased to 30 percent for males and 85
percent for females between 1993 and 2000. However, if only those workers are included in the labor
force for whom engaging (or trying to engage) in economic activity was a principal activity, the
numbers show an entirely opposite trend: a slight acceleration of growth from 1.8 percent to 1.9
percent for the same periods.
12. There has been a steady and welcome decline in the number of children (less than 14
years of age) in the labor force. The number halved from a little over 22 million in 1983 to under
11 million in 1999/00, and declined further to about 9 million in 2004/05. This decline in absolute
numbers is all the more remarkable since it happened despite the rapid growth in child population.
Rural India accounted for 93 percent of the decline. This reduction in labor force participation rates
for both rural males and rural females in the 10-14 age group is the welcome obverse side of a
significant and beneficial rise in school participation rates by children in the same age group: by 34
points for rural males and by a sizeable 89 points (per 1000) for rural females (Figure 1.2). It is
worth stressing though that this data only records paid child labor, or child labor for producing goods
meant to be sold, and not the use of child labor for unpaid domestic work which can also be
hazardous to children’s health.
Figure 1.2: Labor Force (in millions)
Figure 2 (A): Female Labor Force
60
100
140
180
220
260
300
1983 1993-94 1999-2000 2004/05
mill
ion
per
son
Subsidiary Status (Female)
Principal Status (Female)
Figure 2 (B): Male Labor Force
60
100
140
180
220
260
300
340
1983 1993-94 1999-2000 2004/05
mill
ion
per
son
Subsidiary Status (Male)
Principal Status (Male)
Source: Sundaram and Tendulkar, 2005a; Bank staff
13. A major development in the 1990s was the withdrawal by workers, particularly females in
rural areas, from the labor force. What caused this? Two explanations are usually advanced. The
first is that there was a shift in activity status towards education, especially in the case of youth. The
1980s and 1990s saw a rapid increase in the student to worker population ratio in the 15-29 age
group in both rural and urban areas (Figure 1.3). This may partly account for the lower employment
participation. Interestingly, earlier studies among older age groups have noted that educated men are
more likely to participate in the labor force. But for women, there is a significant decline in
employment participation with higher levels of education. Also, rural women tend to face more of
an ‘education penalty’ (that is, they are less likely to participate in the labor force if educated) than
urban women (Das and Desai, 2003). The second explanation is that rising income levels have an
adverse impact on participation, especially for women (Das and Desai, 2003; Ahsan and Pages,
2005a). The poor often have no alternative but to work to support their families. But rising income
levels can potentially lead to a preference for either more leisure or home activity, particularly for
women, which can lower employment participation rates. The experience of the United States

8
during the post-World War II period also shows that labor force participation of married women rose
when an increase in women’s own wages trumped the negative effect of husbands’ wages on labor
force participation (Mincer, 1962, cited in Blau, 1998). Analysis suggests that both these factors
were important in India, though the impact of education was more significant in the 1980s than in the
1990s (Figure 1.4).41
Figure 1.3: All India Worker Population Ratios and Student Population Ratios: Age Group
10-14 Years
Source: Sundaram and Tendulkar,2005b
14. Analysis suggests that another factor which lowered participation rates for principal status
workers was ‘discouragement’ caused by lack of employment opportunities. Increase in
unemployment rates lowered the probability of employment participation by both males and females.
Evidence from national surveys suggests that for females, especially in rural areas, declines in
participation on the principal status were closely related to worsening unemployment rates (Figure
1.4). Rising educational levels that led to unmet expectations of finding good jobs also played a role
in discouraging workers, though this effect was much smaller in magnitude. In India, the preferred
occupation of the educated is non-manual regular jobs in the organized sector (Planning Commission
2001a). This is true even for workers who have received only middle level education. When these
aspirations cannot be met, some young workers may become discouraged and withdraw from the
labor force. While these effects became less important in urban areas by the mid-1990s, they
continued to be significant in rural areas. However, they were countered to some extent by rising per
capita household expenditure levels. While this had little effect on male participation, it encouraged
female participation on the principal status, except at the top end of the income scale.42
15. Evidence suggests that discouragement effects are strongest on the most vulnerable
segments of the population: female workers and youth. This is consistent with the experience of
other countries which also suggests that high and persistent unemployment is accompanied by
declines in labor force participation rates, as workers become discouraged by the lack of job
opportunities and give up searching for jobs (World Bank, 2005c). In India, women are especially
41 The role of income and substitution effects, employment opportunities and earnings by workers and their spouses is
discussed at greater length in Chapter 5, ‘What Do Regional Differences in Employment Outcomes Imply?’ 42 The fact that household income affects participation on subsidiary and primary status differently for women suggests that
women’s employment participation is driven by factors other than those for men.
All India Rural Females: 10-14 years
0100
200
300
400500
600
700
1983 1993-94 1999-00
Stu
den
t P
opula
tion
Rat
io
0
50
100
150
200
250
300
Wo
rker
Popu
lation
Rat
io
Student Population Ratio Worker Population Ratio

9
vulnerable because social norms and inflexible working conditions restrict the range of jobs
considered acceptable for them. This constrains their choices in the market place and makes them
particularly vulnerable to tough employment conditions.43
Women who do not enter the labor force
work predominantly within the home.44
Over 92 percent of women doing domestic work say they do
so from compulsion, and almost one-third of this number would like to be employed -- primarily in
regular part-time jobs. There is little variation in these characteristics by educational level. Thus, a
combination, of norms that determine a woman’s place as being in the home and a lack of
appropriate employment opportunities, relegate a significant number of women out of the labor
force.
16. Slow employment growth is a major concern for Indian policymakers. In the 1990s,
despite fast economic growth, employment growth declined. Based on national surveys, the Planning
43 Occupational concentration is among the highest for female workers, especially in rural areas. This may be a
consequence of their being concentrated primarily in agriculture and allied occupations (Sundaram and Tendulkar, 2005b). 44 Within the home women undertake a range of activities that contribute to the economic welfare of the household; these
are listed in the surveys.
Figure 1.4: Factors Affecting the Probability of Participating in the Labor Force
Rural Women: 1983-1993/94
-20.00 -15.00 -10.00 -5.00 0.00 5.00
Change in average age
changes in marital status
Change in number of children per family
Change in number of elderly per family
Educational Attainment
changes in unemployment rate
change in per capita expenditures
Rural Women: 1993/94-1999/2000
-20.00 -15.00 -10.00 -5.00 0.00 5.00
Change in average age
changes in marital status
Change in number of children per family
Change in number of elderly per family
Educational Attainment
changes in unemployment rate
change in per capita expenditures
Rural Men: 1983-1993/94
-20.0 -15.0 -10.0 -5.0 0.0 5.0
Change in average age
changes in marital status
Change in number of children per family
Change in number of elderly per family
Educational Attainment
changes in unemployment rate
change in per capita expenditures
Rural Men: 1993/94-1999/2000
-20.0 -15.0 -10.0 -5.0 0.0 5.0
Change in average age
changes in marital status
Change in number of children per family
Change in number of elderly per family
Educational Attainment
changes in unemployment rate
change in per capita expenditures
Source: Narain (2006)
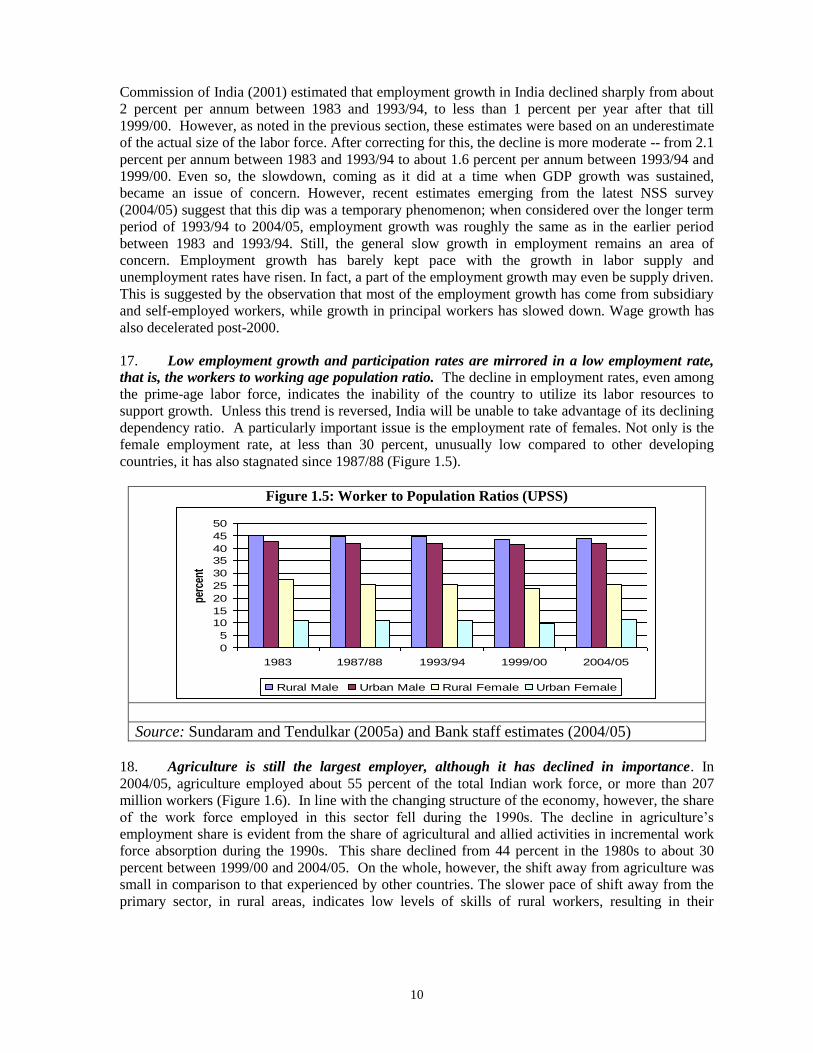
10
Commission of India (2001) estimated that employment growth in India declined sharply from about
2 percent per annum between 1983 and 1993/94, to less than 1 percent per year after that till
1999/00. However, as noted in the previous section, these estimates were based on an underestimate
of the actual size of the labor force. After correcting for this, the decline is more moderate -- from 2.1
percent per annum between 1983 and 1993/94 to about 1.6 percent per annum between 1993/94 and
1999/00. Even so, the slowdown, coming as it did at a time when GDP growth was sustained,
became an issue of concern. However, recent estimates emerging from the latest NSS survey
(2004/05) suggest that this dip was a temporary phenomenon; when considered over the longer term
period of 1993/94 to 2004/05, employment growth was roughly the same as in the earlier period
between 1983 and 1993/94. Still, the general slow growth in employment remains an area of
concern. Employment growth has barely kept pace with the growth in labor supply and
unemployment rates have risen. In fact, a part of the employment growth may even be supply driven.
This is suggested by the observation that most of the employment growth has come from subsidiary
and self-employed workers, while growth in principal workers has slowed down. Wage growth has
also decelerated post-2000.
17. Low employment growth and participation rates are mirrored in a low employment rate,
that is, the workers to working age population ratio. The decline in employment rates, even among
the prime-age labor force, indicates the inability of the country to utilize its labor resources to
support growth. Unless this trend is reversed, India will be unable to take advantage of its declining
dependency ratio. A particularly important issue is the employment rate of females. Not only is the
female employment rate, at less than 30 percent, unusually low compared to other developing
countries, it has also stagnated since 1987/88 (Figure 1.5).
Figure 1.5: Worker to Population Ratios (UPSS)
0
5
10
15
20
25
30
35
40
45
50
1983 1987/88 1993/94 1999/00 2004/05
perc
ent
Rural Male Urban Male Rural Female Urban Female
Source: Sundaram and Tendulkar (2005a) and Bank staff estimates (2004/05)
18. Agriculture is still the largest employer, although it has declined in importance. In
2004/05, agriculture employed about 55 percent of the total Indian work force, or more than 207
million workers (Figure 1.6). In line with the changing structure of the economy, however, the share
of the work force employed in this sector fell during the 1990s. The decline in agriculture’s
employment share is evident from the share of agricultural and allied activities in incremental work
force absorption during the 1990s. This share declined from 44 percent in the 1980s to about 30
percent between 1999/00 and 2004/05. On the whole, however, the shift away from agriculture was
small in comparison to that experienced by other countries. The slower pace of shift away from the
primary sector, in rural areas, indicates low levels of skills of rural workers, resulting in their
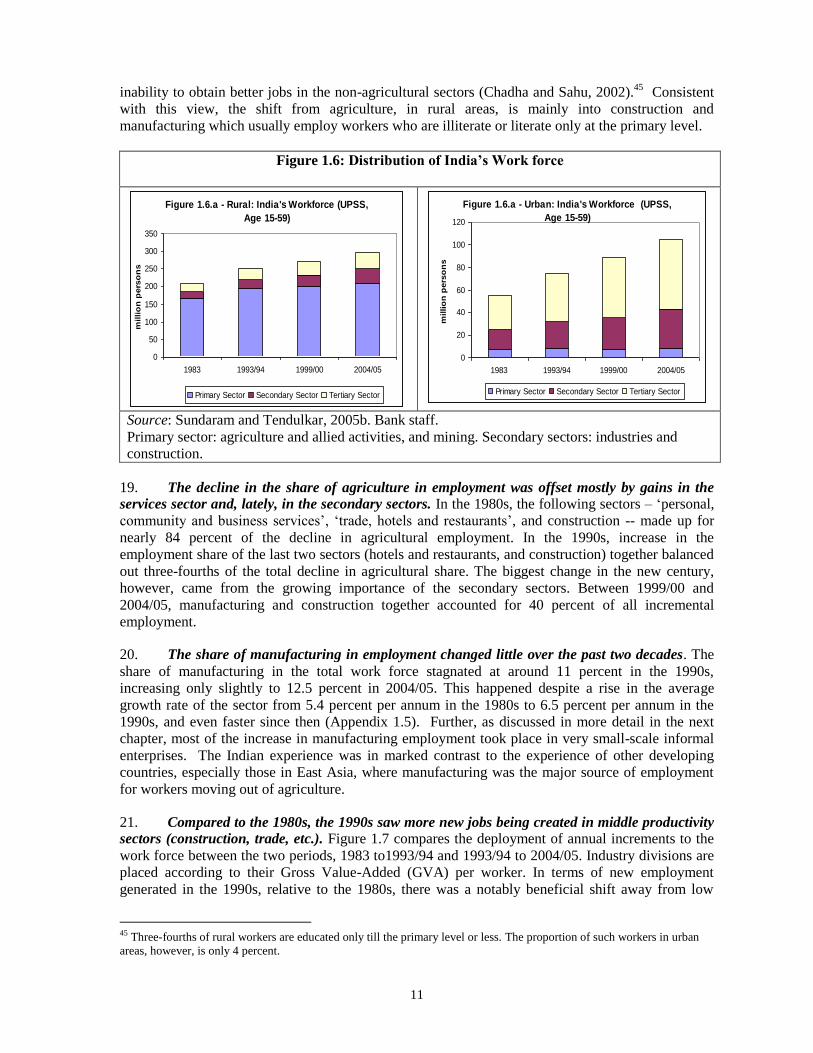
11
inability to obtain better jobs in the non-agricultural sectors (Chadha and Sahu, 2002).45
Consistent
with this view, the shift from agriculture, in rural areas, is mainly into construction and
manufacturing which usually employ workers who are illiterate or literate only at the primary level.
Figure 1.6: Distribution of India’s Work force
Figure 1.6.a - Rural: India's Workforce (UPSS,
Age 15-59)
0
50
100
150
200
250
300
350
1983 1993/94 1999/00 2004/05
millio
n p
ers
on
s
Primary Sector Secondary Sector Tertiary Sector
Figure 1.6.a - Urban: India's Workforce (UPSS,
Age 15-59)
0
20
40
60
80
100
120
1983 1993/94 1999/00 2004/05
millio
n p
ers
on
s
Primary Sector Secondary Sector Tertiary Sector
Source: Sundaram and Tendulkar, 2005b. Bank staff.
Primary sector: agriculture and allied activities, and mining. Secondary sectors: industries and
construction.
19. The decline in the share of agriculture in employment was offset mostly by gains in the
services sector and, lately, in the secondary sectors. In the 1980s, the following sectors – ‘personal,
community and business services’, ‘trade, hotels and restaurants’, and construction -- made up for
nearly 84 percent of the decline in agricultural employment. In the 1990s, increase in the
employment share of the last two sectors (hotels and restaurants, and construction) together balanced
out three-fourths of the total decline in agricultural share. The biggest change in the new century,
however, came from the growing importance of the secondary sectors. Between 1999/00 and
2004/05, manufacturing and construction together accounted for 40 percent of all incremental
employment.
20. The share of manufacturing in employment changed little over the past two decades. The
share of manufacturing in the total work force stagnated at around 11 percent in the 1990s,
increasing only slightly to 12.5 percent in 2004/05. This happened despite a rise in the average
growth rate of the sector from 5.4 percent per annum in the 1980s to 6.5 percent per annum in the
1990s, and even faster since then (Appendix 1.5). Further, as discussed in more detail in the next
chapter, most of the increase in manufacturing employment took place in very small-scale informal
enterprises. The Indian experience was in marked contrast to the experience of other developing
countries, especially those in East Asia, where manufacturing was the major source of employment
for workers moving out of agriculture.
21. Compared to the 1980s, the 1990s saw more new jobs being created in middle productivity
sectors (construction, trade, etc.). Figure 1.7 compares the deployment of annual increments to the
work force between the two periods, 1983 to1993/94 and 1993/94 to 2004/05. Industry divisions are
placed according to their Gross Value-Added (GVA) per worker. In terms of new employment
generated in the 1990s, relative to the 1980s, there was a notably beneficial shift away from low
45 Three-fourths of rural workers are educated only till the primary level or less. The proportion of such workers in urban
areas, however, is only 4 percent.

12
productivity sectors towards the middle productivity sectors such as manufacturing, construction,
trade, hotels and restaurants – where labor productivity was 2.5 to 3.5 times higher than in
agriculture. At the very top end, employment declined in high productivity sectors like mining and
quarrying, and the electricity, gas and water supply sectors. These are dominated by the public
sector and were believed to be overmanned (Planning Commission, 2001a). However, the financial
and other business services category, the highest productivity sector in the economy, did better in
terms of generating new jobs relative to the 1980s.
22. Since 1999/00, the evidence shows, productivity growth has decelerated. If the 1993/94 to
2004/05 period is disaggregated into two periods, that is, the period before 1999/00 and the period
since, it is possible to see that overall productivity growth slowed down markedly in almost all
sectors in the latter period. Productivity growth in the tertiary sector, especially, declined from 10
percent per annum to less than 4 percent per annum between the two periods. While there was a
surge in employment in the high productivity IT and ITES sectors, in terms of overall impact their
effect is likely to be small, given that these sectors employ only about 5 million workers, or about 1.5
percent of India’s labor force (see Figure 1.8 for distribution of labor force, by sectors). This
slowdown in productivity growth after 2000 has important implications for wages, as discussed
below.
23. Further, employment within the manufacturing and tertiary sectors still shows signs of
dualism, with most jobs clustered at the low productivity end and some growth taking place in high
productivity and high skill level jobs. This dualism, which continues to persist even a decade after
liberalization, reflects the continuing barriers and disincentives to entry in the formal sector,
especially in manufacturing. An important challenge will be to stimulate growth in manufacturing,
especially in the ‘missing middle’ group of plants/firms (see Chapter 3). Though not as marked as in
manufacturing, evidence indicates that job growth in the tertiary sectors also reflects dualism. At one
end is the formal sector where the main source of growth has come from the proliferating ITES
sector. But its pull on the overall labor market can only be marginal given that it employs only 1
million workers out of a labor force of more than 400 million. More important, in terms of
generating employment, are trade, hotels and restaurants, construction, and community services. But,
as evidence suggests, the bulk of jobs created in these sectors is informal and of low productivity
(see Figure 1.8). Thus, as in manufacturing, workers in the tertiary sector too are clustered at two
ends of the wage spectrum.
Figure 1.7: Industry-wise Deployment of Incremental Work force (in millions) and Productivity
Growth (by percentage)
Source: Bank staff
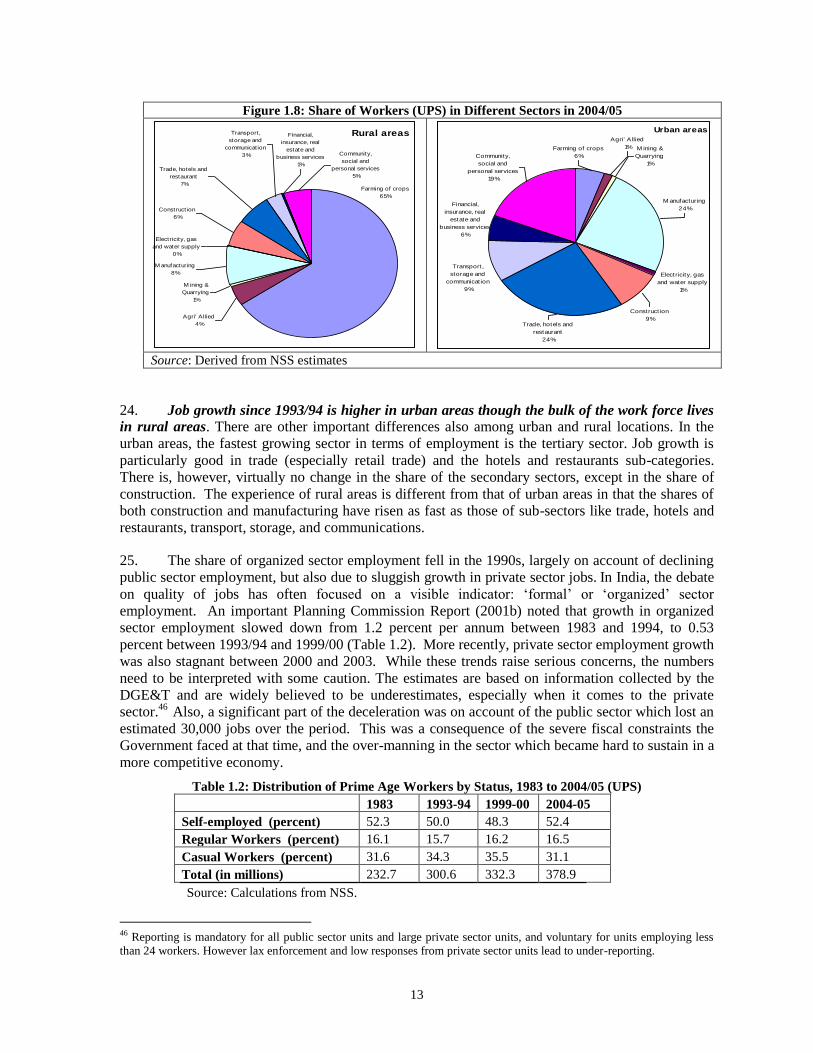
13
Figure 1.8: Share of Workers (UPS) in Different Sectors in 2004/05
Rural areas
Community,
social and
personal services
5%
Farming of crops
65%
Financial,
insurance, real
estate and
business services
1%
Transport,
storage and
communicat ion
3%
Trade, hotels and
restaurant
7%
Construct ion
6%
Electricity, gas
and water supply
0%
M anufacturing
8%
M ining &
Quarrying
1%
Agri' Allied
4%
Urban areas
Agri' Allied
1% M ining &
Quarrying
1%
M anufacturing
24%
Electricity, gas
and water supply
1%
Construct ion
9%Trade, hotels and
restaurant
24%
Transport,
storage and
communicat ion
9%
Financial,
insurance, real
estate and
business services
6%
Farming of crops
6%Community,
social and
personal services
19%
Source: Derived from NSS estimates
24. Job growth since 1993/94 is higher in urban areas though the bulk of the work force lives
in rural areas. There are other important differences also among urban and rural locations. In the
urban areas, the fastest growing sector in terms of employment is the tertiary sector. Job growth is
particularly good in trade (especially retail trade) and the hotels and restaurants sub-categories.
There is, however, virtually no change in the share of the secondary sectors, except in the share of
construction. The experience of rural areas is different from that of urban areas in that the shares of
both construction and manufacturing have risen as fast as those of sub-sectors like trade, hotels and
restaurants, transport, storage, and communications.
25. The share of organized sector employment fell in the 1990s, largely on account of declining
public sector employment, but also due to sluggish growth in private sector jobs. In India, the debate
on quality of jobs has often focused on a visible indicator: ‘formal’ or ‘organized’ sector
employment. An important Planning Commission Report (2001b) noted that growth in organized
sector employment slowed down from 1.2 percent per annum between 1983 and 1994, to 0.53
percent between 1993/94 and 1999/00 (Table 1.2). More recently, private sector employment growth
was also stagnant between 2000 and 2003. While these trends raise serious concerns, the numbers
need to be interpreted with some caution. The estimates are based on information collected by the
DGE&T and are widely believed to be underestimates, especially when it comes to the private
sector.46
Also, a significant part of the deceleration was on account of the public sector which lost an
estimated 30,000 jobs over the period. This was a consequence of the severe fiscal constraints the
Government faced at that time, and the over-manning in the sector which became hard to sustain in a
more competitive economy.
Table 1.2: Distribution of Prime Age Workers by Status, 1983 to 2004/05 (UPS)
1983 1993-94 1999-00 2004-05
Self-employed (percent) 52.3 50.0 48.3 52.4
Regular Workers (percent) 16.1 15.7 16.2 16.5
Casual Workers (percent) 31.6 34.3 35.5 31.1
Total (in millions) 232.7 300.6 332.3 378.9
Source: Calculations from NSS.
46 Reporting is mandatory for all public sector units and large private sector units, and voluntary for units employing less
than 24 workers. However lax enforcement and low responses from private sector units lead to under-reporting.

14
26. The share of
regular wage employment
has remained unchanged. Sundaram and Tendulkar
(2005b) argue that the
supply of organized sector
jobs, which are of superior
quality compared to
informal sector jobs, can be
approximated from the
number of workers
reporting themselves to be
earning regular
wages/salaries in the
national sample surveys.47
Support for this proposition
also comes from Glinskaya
and Jalan (2005) who show
that regular wage jobs are clearly better than casual wage jobs, and at least as good as self-
employment. Since the 1990s, growth in regular wage employment has been the fastest among all
employment categories. But it is still slower than it was in the 1980s (Appendix 1.6). The share of
regular wage employment has gone up marginally in recent years – an indicator of improved quality.
However, even at the start of the new century, regular wage jobs accounted for only about 16 percent
of total employment. The 1990s also saw an increase in the number of casual workers in the rural,
but not the urban, work force (in terms of share in incremental work force), but this trend
subsequently reversed itself. (See Figure 1.9).
27. The labor force became more educated in the 1990s. The average number of years of
schooling of a prime-age worker went up from 3.2 years in 1987/88 to 4.5 years in 1999/00. This
increase was, in part, thanks to the concerted efforts by the Government to increase the reach of
primary education and eradicate adult illiteracy. The number of workers with less than 5 years of
education came down steeply from 80 percent of the total labor force in 1983, to 67 percent in
2004/05. The total number of graduates in the work force also increased from 7.4 million to 23.4
million over the same period (Appendix 1.7). Most new entrants to the work force since the 1990s
have completed primary school sharply with increases in the levels of educational attainment
(Sundaram and Tendulkar, 2005b). Overall, the increase in educational levels has also possibly
contributed to an increase in the prospects and earnings of Indian labor migrating abroad (Box 1.3).
47 This is based on the observation that 88 percent of workers in non-agricultural organized enterprises reported regular
wage status in the 55th Round, the only Round where worker-reported affiliation by type of enterprise was also reported.
Also, at least 50 percent of workers with regular wage status, in every population segment (male/female and rural/urban),
were located in the organized sector.
Figure 1.9: Wage Premiums by Educational Attainment
0
0.1
0.2
0.3
0.4
0.5
0.6
0.7
0.8
0.9
1987 1993/94 1999/2000
log
rupe
es
upto primary secondary graduate
Source: Narain (2006)
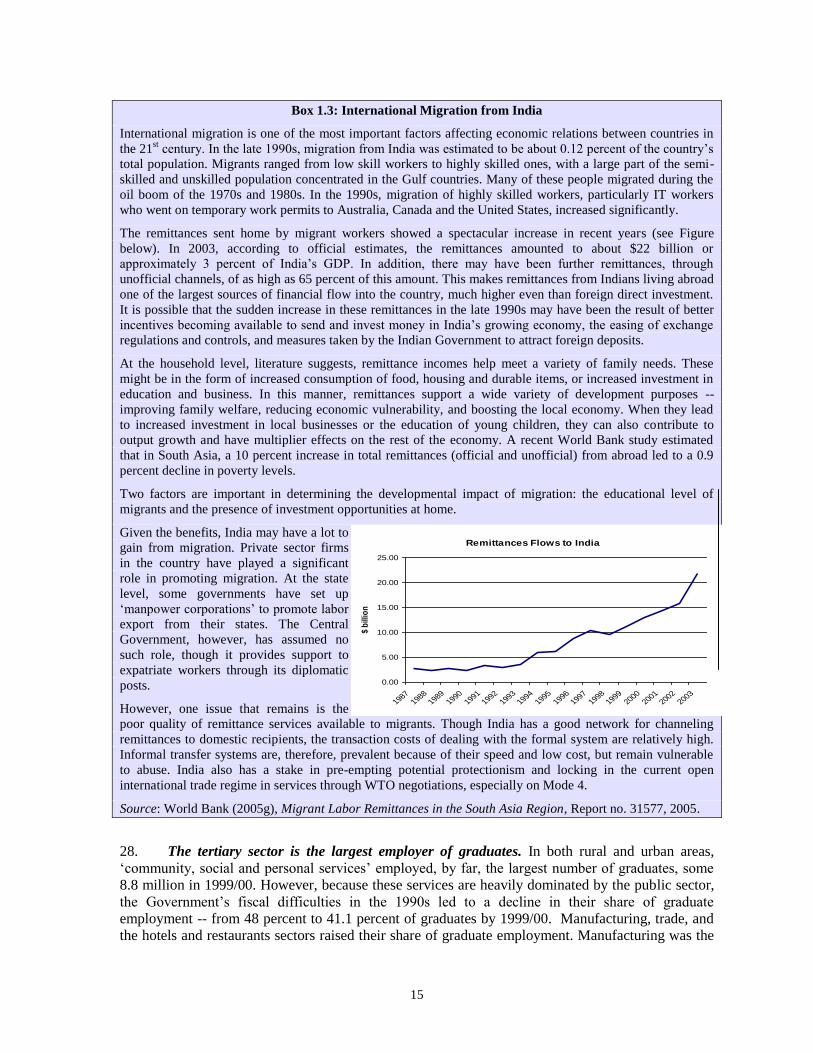
15
Remittances Flows to India
0.00
5.00
10.00
15.00
20.00
25.00
19871988
19891990
19911992
19931994
19951996
19971998
19992000
20012002
2003
$ b
illio
n
Box 1.3: International Migration from India
International migration is one of the most important factors affecting economic relations between countries in
the 21st century. In the late 1990s, migration from India was estimated to be about 0.12 percent of the country’s
total population. Migrants ranged from low skill workers to highly skilled ones, with a large part of the semi-
skilled and unskilled population concentrated in the Gulf countries. Many of these people migrated during the
oil boom of the 1970s and 1980s. In the 1990s, migration of highly skilled workers, particularly IT workers
who went on temporary work permits to Australia, Canada and the United States, increased significantly.
The remittances sent home by migrant workers showed a spectacular increase in recent years (see Figure
below). In 2003, according to official estimates, the remittances amounted to about $22 billion or
approximately 3 percent of India’s GDP. In addition, there may have been further remittances, through
unofficial channels, of as high as 65 percent of this amount. This makes remittances from Indians living abroad
one of the largest sources of financial flow into the country, much higher even than foreign direct investment.
It is possible that the sudden increase in these remittances in the late 1990s may have been the result of better
incentives becoming available to send and invest money in India’s growing economy, the easing of exchange
regulations and controls, and measures taken by the Indian Government to attract foreign deposits.
At the household level, literature suggests, remittance incomes help meet a variety of family needs. These
might be in the form of increased consumption of food, housing and durable items, or increased investment in
education and business. In this manner, remittances support a wide variety of development purposes --
improving family welfare, reducing economic vulnerability, and boosting the local economy. When they lead
to increased investment in local businesses or the education of young children, they can also contribute to
output growth and have multiplier effects on the rest of the economy. A recent World Bank study estimated
that in South Asia, a 10 percent increase in total remittances (official and unofficial) from abroad led to a 0.9
percent decline in poverty levels.
Two factors are important in determining the developmental impact of migration: the educational level of
migrants and the presence of investment opportunities at home.
Given the benefits, India may have a lot to
gain from migration. Private sector firms
in the country have played a significant
role in promoting migration. At the state
level, some governments have set up
‘manpower corporations’ to promote labor
export from their states. The Central
Government, however, has assumed no
such role, though it provides support to
expatriate workers through its diplomatic
posts.
However, one issue that remains is the
poor quality of remittance services available to migrants. Though India has a good network for channeling
remittances to domestic recipients, the transaction costs of dealing with the formal system are relatively high.
Informal transfer systems are, therefore, prevalent because of their speed and low cost, but remain vulnerable
to abuse. India also has a stake in pre-empting potential protectionism and locking in the current open
international trade regime in services through WTO negotiations, especially on Mode 4.
Source: World Bank (2005g), Migrant Labor Remittances in the South Asia Region, Report no. 31577, 2005.
28. The tertiary sector is the largest employer of graduates. In both rural and urban areas,
‘community, social and personal services’ employed, by far, the largest number of graduates, some
8.8 million in 1999/00. However, because these services are heavily dominated by the public sector,
the Government’s fiscal difficulties in the 1990s led to a decline in their share of graduate
employment -- from 48 percent to 41.1 percent of graduates by 1999/00. Manufacturing, trade, and
the hotels and restaurants sectors raised their share of graduate employment. Manufacturing was the
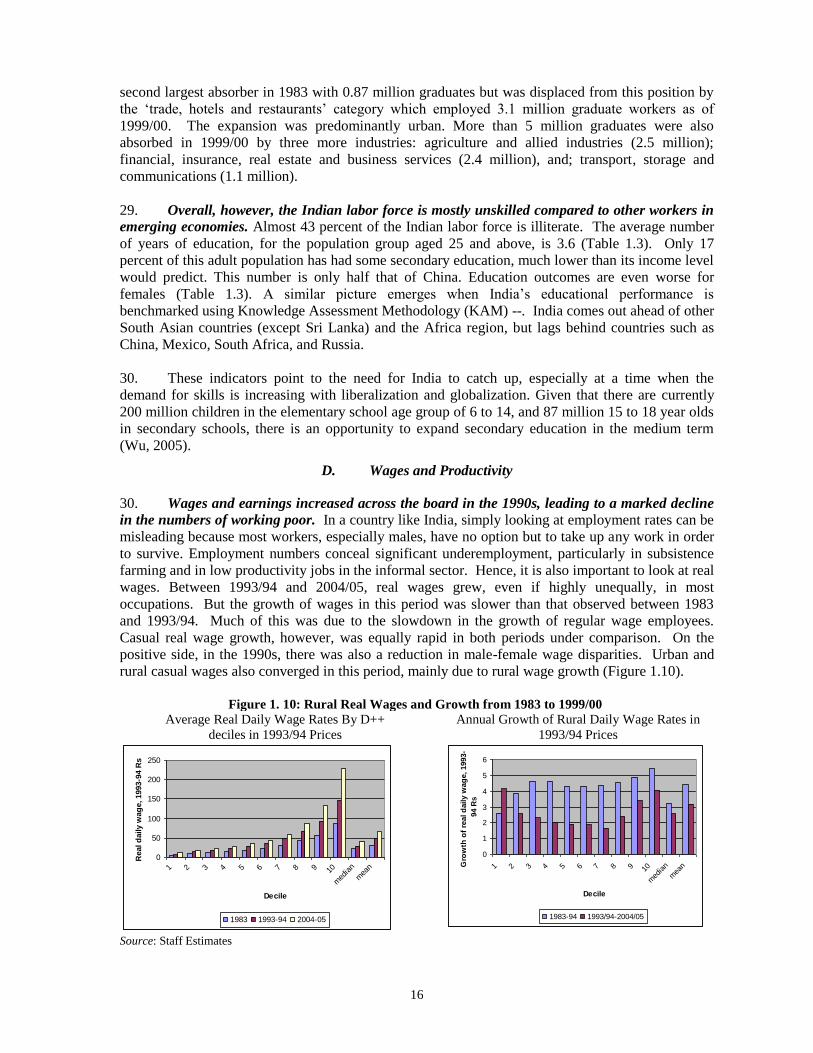
16
second largest absorber in 1983 with 0.87 million graduates but was displaced from this position by
the ‘trade, hotels and restaurants’ category which employed 3.1 million graduate workers as of
1999/00. The expansion was predominantly urban. More than 5 million graduates were also
absorbed in 1999/00 by three more industries: agriculture and allied industries (2.5 million);
financial, insurance, real estate and business services (2.4 million), and; transport, storage and
communications (1.1 million).
29. Overall, however, the Indian labor force is mostly unskilled compared to other workers in
emerging economies. Almost 43 percent of the Indian labor force is illiterate. The average number
of years of education, for the population group aged 25 and above, is 3.6 (Table 1.3). Only 17
percent of this adult population has had some secondary education, much lower than its income level
would predict. This number is only half that of China. Education outcomes are even worse for
females (Table 1.3). A similar picture emerges when India’s educational performance is
benchmarked using Knowledge Assessment Methodology (KAM) --. India comes out ahead of other
South Asian countries (except Sri Lanka) and the Africa region, but lags behind countries such as
China, Mexico, South Africa, and Russia.
30. These indicators point to the need for India to catch up, especially at a time when the
demand for skills is increasing with liberalization and globalization. Given that there are currently
200 million children in the elementary school age group of 6 to 14, and 87 million 15 to 18 year olds
in secondary schools, there is an opportunity to expand secondary education in the medium term
(Wu, 2005).
D. Wages and Productivity
30. Wages and earnings increased across the board in the 1990s, leading to a marked decline
in the numbers of working poor. In a country like India, simply looking at employment rates can be
misleading because most workers, especially males, have no option but to take up any work in order
to survive. Employment numbers conceal significant underemployment, particularly in subsistence
farming and in low productivity jobs in the informal sector. Hence, it is also important to look at real
wages. Between 1993/94 and 2004/05, real wages grew, even if highly unequally, in most
occupations. But the growth of wages in this period was slower than that observed between 1983
and 1993/94. Much of this was due to the slowdown in the growth of regular wage employees.
Casual real wage growth, however, was equally rapid in both periods under comparison. On the
positive side, in the 1990s, there was also a reduction in male-female wage disparities. Urban and
rural casual wages also converged in this period, mainly due to rural wage growth (Figure 1.10).
Figure 1. 10: Rural Real Wages and Growth from 1983 to 1999/00
Average Real Daily Wage Rates By D++
deciles in 1993/94 Prices
Annual Growth of Rural Daily Wage Rates in
1993/94 Prices
0
50
100
150
200
250
1 2 3 4 5 6 7 8 9 10
med
ian
mea
n
Decile
Real d
aily w
ag
e, 1993-9
4 R
s
1983 1993-94 2004-05
0
1
2
3
4
5
6
1 2 3 4 5 6 7 8 9 10
med
ian
mea
n
Decile
Gro
wth
of
real d
aily w
ag
e, 1993-
94 R
s
1983-94 1993/94-2004/05
Source: Staff Estimates

17
31. Rising wages led to a decline in the number of working poor in the labor force, from 115
million or 36 percent of the work force in 1993/94, to 104.4 million or 23 percent of the work force
in 2004/05 (Sundaram and Tendulkar, 2004a). However, it is important to note that wages were not
observed for all segments of the work force, particularly the self-employed who constitute more than
50 percent of the work force.
32. In the 1990s, the acceleration in wage growth tracked the acceleration in labor
productivity of about 5.4 percent per annum (1993/94 to 2004/05). Figure 1.11 shows the
productivity growth originating in each sector, weighted by the share of the labor force. Most of the
labor productivity growth in recent decades took place due to growth in trade, hotels and restaurants,
electricity, mining and quarrying, and community and personal services. The growth in the last
sector during the 1990s is likely to be a statistical artifact, reflecting as it does the relatively large
increase in public sector wages by the 5th Pay Commission.48
The small role of productivity growth
in the manufacturing sector in driving overall productivity growth is remarkable. This reflects the
large share of low productivity small-scale manufacturing in this sector, discussed in more detail in
the next chapter.
Figure 1.11: Panel A: Sources of Productivity Growth by Sectors (weighted)
Figure 1.11: Panel B: Within and Across Sectors Movement
46.6%
39.6%
13.8% 16.5%
10.0%
73.5%
0%
10%
20%
30%
40%
50%
60%
70%
80%
Within Sectors Between Sectors Interaction
1983-93 1993-04
Source: Estimated from NSS
48 The public sector accounts for close to one-third of employment in community and public services

18
33. Between 2000 and 2005, however, both wage growth and productivity growth decelerated,
markedly so in some sectors. On average, real wages actually declined in urban areas for both male
and female casual workers in this period, while wage growth in rural areas decelerated markedly
(Table 1.3). (Notably, wage growth in rural areas had seen significant acceleration over the previous
period between 1983 and 1993/94). The decline in wage growth since 2000 has mirrored the
deceleration in productivity growth in most sectors (Table 1.4). As also noticed by other observers,
productivity growth has decelerated in all sectors, and even reversed in key sectors such as
construction, and less expectedly, in finance and real estate.
Table 1.3: Annual Real Wage Growth (CAGR)
Rural Casual Non-
agricultural Male
Worker
Urban Casual
Male Worker
Rural Casual Non-
agricultural Female
Worker
Urban Casual
Female Worker
1983 to 1987/88 3.0 2.8 2.0 3.2
1987/88 to 1993/94 1.2 0.7 1.7 1.3
1993/94 to 1999/00 3.2 3.0 4.6 4.9
1999/00 to 2004/05 2.8 -0.8 2.5 -0.6
1983 to 1993/94 2.6 2.1 2.2 2.7
1993/94 to 2004/05 3.3 1.3 4.0 2.6
Source: Staff Estimates
Table 1.4: Productivity Growth (by Sectors)
1983-
1987/88
1987/88
-1993/94
1993/94
-
1999/00
1999/00-
2004/05
1983-
1993/94
1993/94-
2004/05
1. Agriculture -4.3 19.4 13.2 10.2 1.3 2.2
2. Mining & Quarrying -0.2 27.0 56.4 10.2 2.3 5.6
3. Manufacturing 15.1 29.4 42.0 8.3 3.9 4.4
4. Electricity, Gas and Water
Supply
27.8 20.1 82.5 13.7 4.2 7.6
5. Construction -31.1 38.6 -1.8 -8.6 -0.4 -1.1
6. Trade, Hotels and Restaurants 5.2 15.2 31.7 9.2 1.8 3.7
7. Transport, Storage and
Communication
19.8 11.1 22.4 9.7 1.0 3.0
8. Financial, Insurance, Real Estate
and Business Services
21.1 8.4 26.0 -
12.5
2.6 1.0
9. Community, Social and Personal
Services
21.5 3.6 54.0 33.7 2.2 7.5
Tertiary Sector (6-9) 17.3 15.7 60.5 20.8 3.0 6.8
Source: Mazumdar and Sarkar, Labor productivity based on UPS numbers (Forthcoming, 2008).
34. While real wages grew, on average, in the past two decades, the growth was highly
unequal. While wages of most income deciles increased by about 2 percent per annum between
1993/94 and 2004/05, wage growth in the top two deciles was higher at 3.4 percent and 4 percent.
Across almost all wage deciles, wage growth was higher between 1983 and 1993/94 than over the
next decade. The only exception was the bottom income decile where wages grew faster in the latter
period (Figure 1.12). Some analyses suggest that this robust growth of the lowest decile contributed
to the decline of inequality in wages among male casual workers between 1983 and 1999, mostly
through a reduction in regional differences (Dutta, 2005). Overall, however, the gap between the
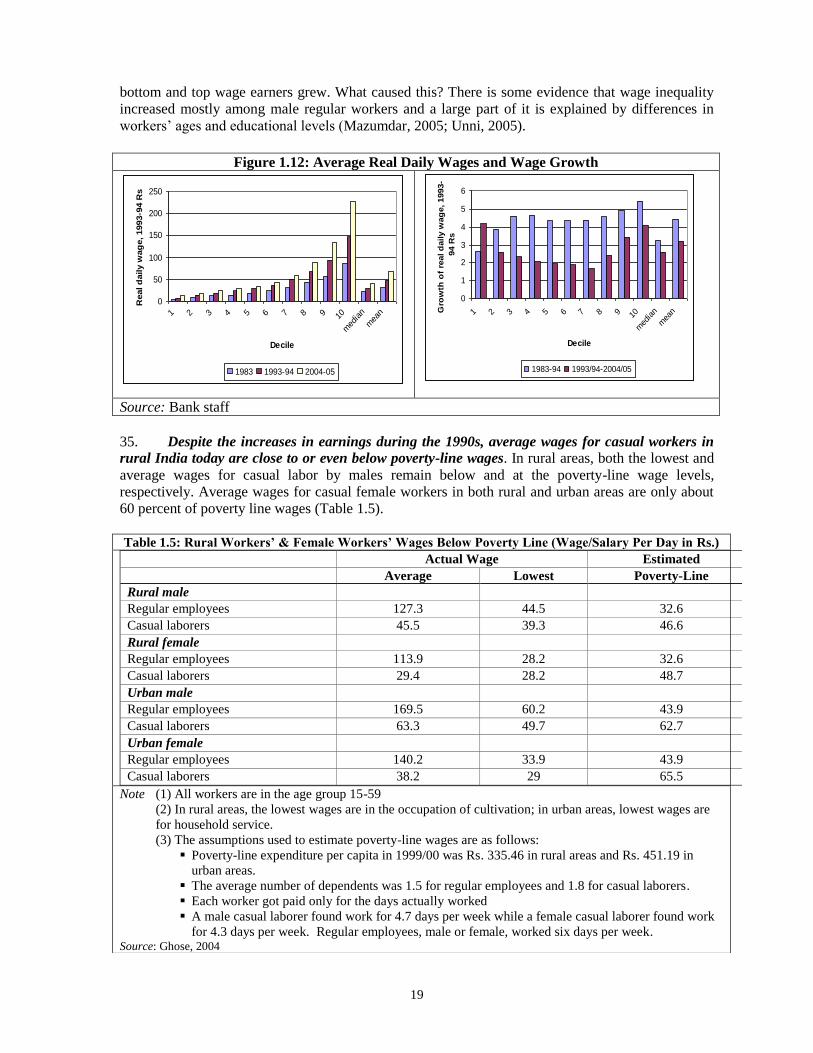
19
bottom and top wage earners grew. What caused this? There is some evidence that wage inequality
increased mostly among male regular workers and a large part of it is explained by differences in
workers’ ages and educational levels (Mazumdar, 2005; Unni, 2005).
35. Despite the increases in earnings during the 1990s, average wages for casual workers in
rural India today are close to or even below poverty-line wages. In rural areas, both the lowest and
average wages for casual labor by males remain below and at the poverty-line wage levels,
respectively. Average wages for casual female workers in both rural and urban areas are only about
60 percent of poverty line wages (Table 1.5).
Figure 1.12: Average Real Daily Wages and Wage Growth
0
50
100
150
200
250
1 2 3 4 5 6 7 8 9 10
med
ian
mea
n
Decile
Real d
aily w
ag
e, 1993-9
4 R
s
1983 1993-94 2004-05
0
1
2
3
4
5
6
1 2 3 4 5 6 7 8 9 10
med
ian
mea
n
Decile
Gro
wth
of
real d
aily w
ag
e, 1993-
94 R
s
1983-94 1993/94-2004/05
Source: Bank staff
Table 1.5: Rural Workers’ & Female Workers’ Wages Below Poverty Line (Wage/Salary Per Day in Rs.)
Actual Wage Estimated
Average Lowest Poverty-Line
Rural male
Regular employees 127.3 44.5 32.6
Casual laborers 45.5 39.3 46.6
Rural female
Regular employees 113.9 28.2 32.6
Casual laborers 29.4 28.2 48.7
Urban male
Regular employees 169.5 60.2 43.9
Casual laborers 63.3 49.7 62.7
Urban female
Regular employees 140.2 33.9 43.9
Casual laborers 38.2 29 65.5
Note (1) All workers are in the age group 15-59
(2) In rural areas, the lowest wages are in the occupation of cultivation; in urban areas, lowest wages are
for household service.
(3) The assumptions used to estimate poverty-line wages are as follows:
Poverty-line expenditure per capita in 1999/00 was Rs. 335.46 in rural areas and Rs. 451.19 in
urban areas.
The average number of dependents was 1.5 for regular employees and 1.8 for casual laborers.
Each worker got paid only for the days actually worked
A male casual laborer found work for 4.7 days per week while a female casual laborer found work
for 4.3 days per week. Regular employees, male or female, worked six days per week. Source: Ghose, 2004

20
36. Male-female wage differentials have declined but remain significant. Evidence of this
decline, in the case of rural casual labor, comes from Sundaram and Tendulkar (2005b). Yet, in most
occupations, especially manual ones, women’s wages are about one half those of men. What explains
this difference? Evidence suggests that even after accounting for regional, individual, occupational
and industry characteristics, male workers in 1999/00 earned 64 percent higher wages than female
workers (Narain, 2005). A separate exercise that decomposed the weekly wages of men and women
in casual labor for the 55th Round (1999/00) into differences attributable to individual characteristics
and other factors, found that only 27.5 percent of the difference in casual wages between male and
female workers could be explained by human capital and location attributes (Das, 2005). Such a
discriminatory labor market may induce women to stay out of the labor force, especially if other
family members are earning.
E. Female Labor Force Participation
37. Women’s participation in the labor force in India has been flat or even declining. Women’s labor force participation in South Asia is low compared to developing country standards
and India is no exception. Participation rates for women in the region range from about 16 percent in
Pakistan, 23 percent in Bangladesh, to over 78 percent in Nepal. In India, they remain stubbornly
close to 25 percent. Multivariate analyses at the household level, using NSS data from 1983-2000,
show that for both urban and rural women, demographic variables such as age, childcare
responsibilities and marital status have significant negative effects on participation. Interestingly, for
women, there is a significant decline in employment participation with higher levels of education.
Rural women tend to face a greater ‘education penalty’ than urban women, that is, the more highly
educated they are the less likely they are to work outside the home. There are also large regional
variations, with the southern and western regions associated with much higher participation by
women in the labor market.
38. Both demand side and supply side explanations have been articulated for the low labor
force participation by Indian women. The demand side argument rests on cultural mores and the
values of status and seclusion in the region which may be preventing higher status households from
allowing women to go out and work. For instance, family honor in most parts of India rests on
restricting women to the home, thus affecting their ability to work outside the house (Chen, 1995).
Basu (2006) argues that a woman’s choice also has an in-built ‘reinforcement property’ in that
whatever she does, the household’s tendency is to prefer that. Thus, cultural attitudes may tend to
reinforce themselves. The supply side argument postulates that the supply of well-paying, secure
jobs for educated women is low. Hence, educated women, who mostly belong to the higher socio-
economic strata, prefer to opt out of the labor force rather than accept low status jobs. There also
seems to be an income effect at play here: our analysis finds that the higher a husband’s income, the
lower the probability of his wife participating in the work force (see Chapter 4 for further
discussion).
39. What are the employment preferences of women? Women who do not enter the labor force
predominantly work within the home. Descriptive statistics from various Rounds of the NSS show
that over 92 percent of women doing domestic work say they do so from compulsion. Of these, over
65 percent say they do domestic work because there are no other members in their households who
will take on their duties. The responses do not vary by educational status. However, almost one-
third of the women who do only domestic work would prefer to be employed -- primarily in regular
part-time jobs (Figure 1.13). Again, there is little variation by educational levels (Das, 2005). Thus,
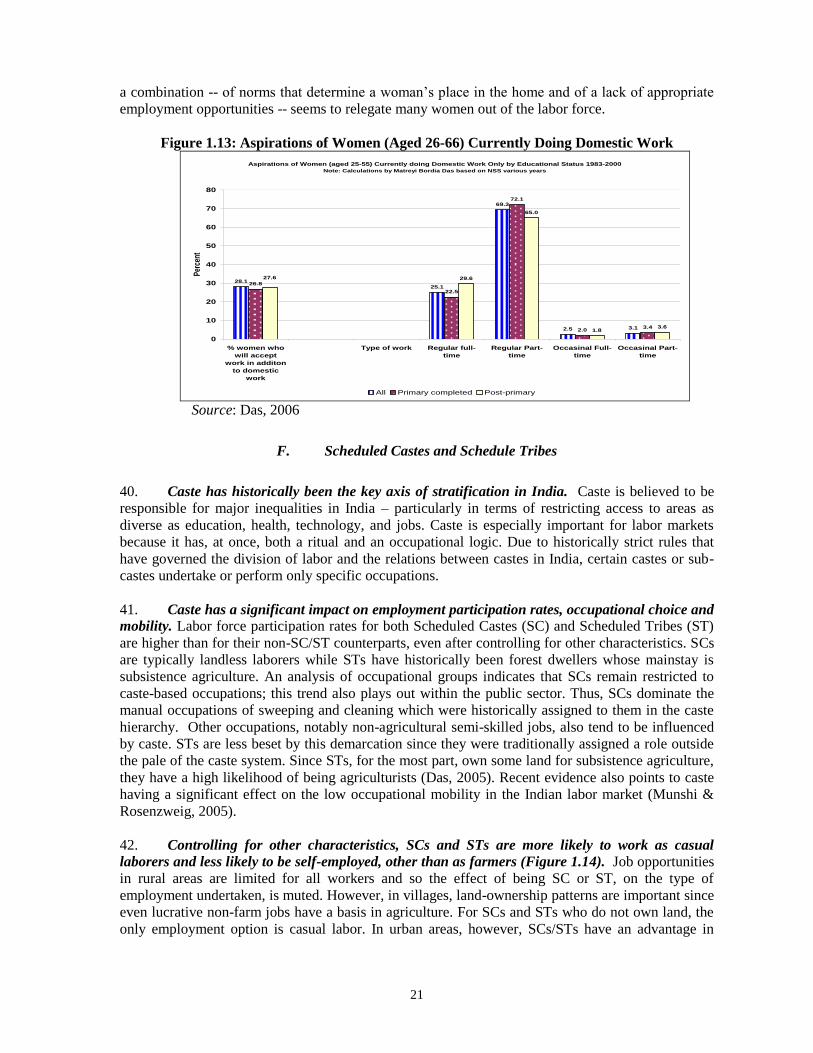
21
a combination -- of norms that determine a woman’s place in the home and of a lack of appropriate
employment opportunities -- seems to relegate many women out of the labor force.
Figure 1.13: Aspirations of Women (Aged 26-66) Currently Doing Domestic Work
Aspirations of Women (aged 25-55) Currently doing Domestic Work Only by Educational Status 1983-2000
Note: Calculations by Matreyi Bordia Das based on NSS various years
28.125.1
69.3
2.5 3.1
26.8
22.5
72.1
2.03.4
29.6
65.0
1.83.6
27.6
0
10
20
30
40
50
60
70
80
% women who
will accept
work in additon
to domestic
work
Type of work Regular full-
time
Regular Part-
time
Occasinal Full-
time
Occasinal Part-
time
Per
cent
All Primary completed Post-primary Source: Das, 2006
F. Scheduled Castes and Schedule Tribes
40. Caste has historically been the key axis of stratification in India. Caste is believed to be
responsible for major inequalities in India – particularly in terms of restricting access to areas as
diverse as education, health, technology, and jobs. Caste is especially important for labor markets
because it has, at once, both a ritual and an occupational logic. Due to historically strict rules that
have governed the division of labor and the relations between castes in India, certain castes or sub-
castes undertake or perform only specific occupations.
41. Caste has a significant impact on employment participation rates, occupational choice and
mobility. Labor force participation rates for both Scheduled Castes (SC) and Scheduled Tribes (ST)
are higher than for their non-SC/ST counterparts, even after controlling for other characteristics. SCs
are typically landless laborers while STs have historically been forest dwellers whose mainstay is
subsistence agriculture. An analysis of occupational groups indicates that SCs remain restricted to
caste-based occupations; this trend also plays out within the public sector. Thus, SCs dominate the
manual occupations of sweeping and cleaning which were historically assigned to them in the caste
hierarchy. Other occupations, notably non-agricultural semi-skilled jobs, also tend to be influenced
by caste. STs are less beset by this demarcation since they were traditionally assigned a role outside
the pale of the caste system. Since STs, for the most part, own some land for subsistence agriculture,
they have a high likelihood of being agriculturists (Das, 2005). Recent evidence also points to caste
having a significant effect on the low occupational mobility in the Indian labor market (Munshi &
Rosenzweig, 2005).
42. Controlling for other characteristics, SCs and STs are more likely to work as casual
laborers and less likely to be self-employed, other than as farmers (Figure 1.14). Job opportunities
in rural areas are limited for all workers and so the effect of being SC or ST, on the type of
employment undertaken, is muted. However, in villages, land-ownership patterns are important since
even lucrative non-farm jobs have a basis in agriculture. For SCs and STs who do not own land, the
only employment option is casual labor. In urban areas, however, SCs/STs have an advantage in

22
obtaining regular salaried jobs which are still predominantly in the public sector where the
Government’s reservation policies favor them.
Figure 1.14: Occupational Distribution by Caste
Source: Das, 2005
43. Real upward mobility for SCs/STs seems to occur once they migrate to urban areas. Regression results suggest that SCs/STs have an advantage in getting better quality employment in
urban areas. At the same time, these results need to be interpreted with caution. The fact that formal
jobs need more than just education is well-accepted. In addition, workers need access to information,
social networks, knowledge about rules and procedures, etc. Contacts and networks are important for
successful entry into the formal salaried market since the flow of information herein often lacks
transparency. Thus, educated SCs/STs who migrate to towns and have social networks, possibly
enjoy a selection bias.
44. One of the most significant affirmative action policies in India is caste-based reservations
in the public sector. These reservations exist for regular salaried work in the public sector and in
publicly-funded education. Preferential treatment for SCs/STs (and more recently for ‘Other
Backward Castes’ or OBCs) in other ways and in areas such as relaxation of the age bar, waiver of
applications fees, special coaching, and quotas in public employment and poverty alleviation
programs also have a bearing on educational attainment and labor markets. However, the impact of
reservations is a controversial issue; it is also not easy to measure.
45. Rising educational levels and the Government’s affirmative action policies have had a
positive impact on STs and on rural SC women. While SCs/STs continue to lag behind in
educational attainment, this and other disadvantages have diminished over time, particularly since
the 1990s (Desai and Kulkarni, 2005). Combined with the Government’s reservation policy, the
progress has had a positive impact on the probability of STs obtaining regular salaried jobs, a
category for which there is a dearth of candidates relative to the quotas.
46. However, where supply exceeds reservations, as in the case of SCs, they either crowd into
casual labor or, if they can afford to, stay out of the labor force altogether. The supply of educated
SC labor outstrips demand, leading to a glut of educated SC men in both urban and rural areas, and
of educated SC women in urban areas. In this case, the multiplied effects of education on caste
suggest that SC men suffer a disadvantage in obtaining regular salaried jobs if they have post-
primary education. This would appear to indicate that the reservation policies have created a system
of rationing of jobs for SCs and, since they cannot penetrate the non-reserved public sector jobs,

23
placed a cap on their access to regular jobs (Das 2005). The situation has implications for the
structure of the reservation policies which may, in fact, be penalizing educated SC men and, as
anecdotal evidence on the ’creamy layer’ of SCs suggests, fostering an elite within them.
47. In India, low open unemployment rates can often be misleading. Going by the UPS
definition, the number of unemployed persons in India steadily increased from around 7.8 million in
1983, to 12.3 million in 2004/05. This places the unemployment rate at about 2.8 percent, a number
that has shown little variation since 1983 (Appendix 1.10). The low unemployment rate is, however,
misleading on many counts. First, low unemployment rates can reflect workers stuck in low value-
added and poorly paid work. Second, according to the UPS definition, only those people are
considered unemployed who spent more than 6 months of the year looking for or being available for
work. This definition, therefore, captures only long-term unemployment. Understood this way, far
from being low, the number of unemployed at any given time is very high. Two alternative
approaches, based on CWS (which corresponds to the international definition of unemployment) and
CDS, rely on a shorter reference period and can better capture both underemployment and short-term
unemployment. According to the CWS definition, the unemployment rate in India had increased to
about 5 percent in 2004; by the CDS definition, the unemployment rate increased from 7.3 percent in
1990/2000 (Figure 1.16) to 8.3 percent in 2004/05.
48. Underemployment, rather than unemployment, presents a more accurate picture of the
employment situation in India. Combining the distinct notions of CWS and CDS, unemployment
rates suggest that underemployment can be as high as 13 percent, on average, for all workers, and 25
percent for casual laborers (Table 1.6). Underemployment rates are much higher for females than for
males.
49. Long-term open unemployment rates are particularly high among the youth, the better
educated, and in urban areas. Youth in the 15-29 age-group account for an overwhelming
proportion (over 80 percent) of unemployed on the UPS status. This may, in part, be related to
poverty. Low family incomes force people to enter the labor market at a relatively young age and
this can increase youth unemployment. At the same time, prolonged and unsuccessful job searches
by young family members may themselves contribute to poverty. Youth unemployment is also a
cause for concern because it prevents new entrants to the labor market from gaining experience and
developing labor market skills (World Bank, 2005c). In India, where formal opportunities for
acquiring skills are limited and most training happens on the shop floor, this may be even more of an
issue. (Figure 1.15)
Table 1.6: Underemployment Rates, by Status
Self-
employed
Casual
Laborers
Regular
Employees
All Employed
Persons
Male 5 21.7 0 10
Female 21.7 28.3 0 21.7
Employed Persons 11.7 25 0 13.3
Note: The estimates are based on the assumption that all workers would want to work
eight-hour days, six days a week.
Source: Ajit K. Ghose (2004)

24
Figure 1.15: Unemployment Rate in India (CDS)
0
1
2
3
4
5
6
7
8
9
1983 1987-88 1993-94 1999-00 2004-05
perc
en
t
Source: Report of the Steering Committee of Labor and Employment, Planning
Commission (2001b)
50. Unemployment rates are significantly higher for urban workers than for their rural
counterparts. This reflects both the higher capacity of urban workers to sustain unemployment and,
possibly, disguised unemployment in rural areas. It may also reflect the fact that job seekers take a
longer time job searching, especially if there is a higher probability of their being rewarded with
good jobs after the search process. Interestingly, in rural areas, unemployment rates are usually
higher among males than females; the situation is the reverse in urban areas.
51. Education of workers and unemployment are positively related. Unemployment rates in
India are lowest among illiterates; they rise progressively with education. They are now highest for
workers with graduate and above degrees (Figure 1.16). This all-India picture also holds at the state
level where, without any exception, unemployment rates among secondary and above educated
workers are much higher than among workers with middle school and below education. While
disguised employment among workers with low education level attainments may explain part of the
story, the high rates of unemployment among the educated indicate that India is underutilizing its
human capital. Surprisingly, unemployment is highest among workers holding technical diplomas.
These diplomas, by design, are meant to cater to specific, identified labor market needs. The
evidence, thus, strongly suggests a mismatch between labor market requirements and the training
provided.
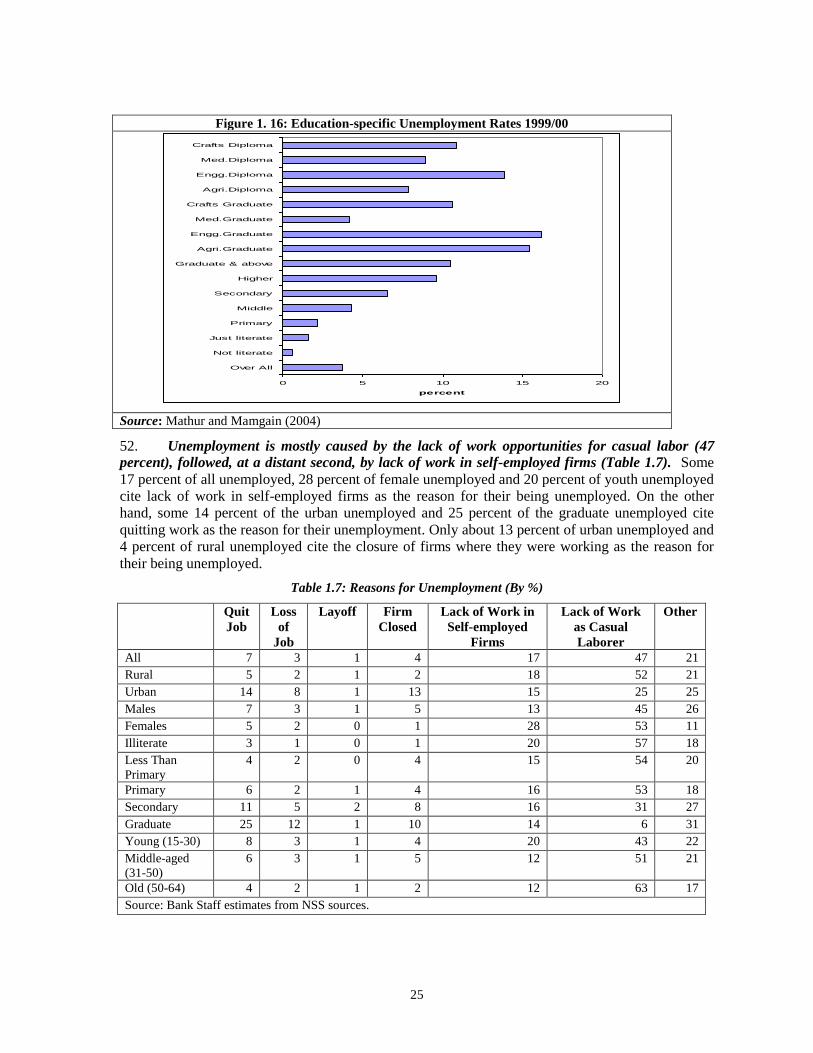
25
Figure 1. 16: Education-specific Unemployment Rates 1999/00
0 5 10 15 20
Over All
Not literate
Just literate
Primary
Middle
Secondary
Higher
Graduate & above
Agri.Graduate
Engg.Graduate
Med.Graduate
Crafts Graduate
Agri.Diploma
Engg.Diploma
Med.Diploma
Crafts Diploma
percent
Source: Mathur and Mamgain (2004)
52. Unemployment is mostly caused by the lack of work opportunities for casual labor (47
percent), followed, at a distant second, by lack of work in self-employed firms (Table 1.7). Some
17 percent of all unemployed, 28 percent of female unemployed and 20 percent of youth unemployed
cite lack of work in self-employed firms as the reason for their being unemployed. On the other
hand, some 14 percent of the urban unemployed and 25 percent of the graduate unemployed cite
quitting work as the reason for their unemployment. Only about 13 percent of urban unemployed and
4 percent of rural unemployed cite the closure of firms where they were working as the reason for
their being unemployed.
Table 1.7: Reasons for Unemployment (By %)
Quit
Job
Loss
of
Job
Layoff Firm
Closed
Lack of Work in
Self-employed
Firms
Lack of Work
as Casual
Laborer
Other
All 7 3 1 4 17 47 21
Rural 5 2 1 2 18 52 21
Urban 14 8 1 13 15 25 25
Males 7 3 1 5 13 45 26
Females 5 2 0 1 28 53 11
Illiterate 3 1 0 1 20 57 18
Less Than
Primary
4 2 0 4 15 54 20
Primary 6 2 1 4 16 53 18
Secondary 11 5 2 8 16 31 27
Graduate 25 12 1 10 14 6 31
Young (15-30) 8 3 1 4 20 43 22
Middle-aged
(31-50)
6 3 1 5 12 51 21
Old (50-64) 4 2 1 2 12 63 17
Source: Bank Staff estimates from NSS sources.

26
H. India’s Formidable Employment Challenges
52. Although labor market outcomes in the 1990s were not as poor as is generally perceived
and employment growth has accelerated in recent years, India still faces formidable challenges in
labor markets. The employment to population ratio in India was always low to start with. In
addition, unemployment, by some indicators, worsened over the 1990s and in recent years. There are
also worrying indications that tough labor market conditions may be discouraging vulnerable
segments of the population, particularly youth and women, from participating in the labor force.
Education levels are rising among the work force, increasing workers’ expectations, but employment
opportunities have not kept pace and the country’s human capital base is being underutilized. If this
more educated work force is to be better utilized, employment growth has to pick up in the more
productive formal sector, the destination of choice for these workers. An important challenge is to
improve the quality of jobs in the informal sector. In recent years, since 2000, while employment
growth has markedly accelerated, it has been accompanied by an equally marked deceleration in
wage growth. Moreover, the share of formal sector employment has remained unchanged. In short,
India needs to simultaneously accelerate the pace of job creation in the economy and improve the
quality of jobs generated as well.
CHAPTER 2: EMPLOYMENT IN THE INFORMAL SECTOR
The informal sector employs about 90 percent of the Indian labor force. Further, most of the
increase in employment in the 1990s was also absorbed by the informal tertiary and manufacturing
sectors. Although this is widely regarded to imply a decline in welfare, this chapter argues that these
developments need to be interpreted more cautiously. There is little doubt that the bulk of the
increase in informal sector employment in the tertiary sector was involuntary, in the sense that the
labor market entrants would have preferred regular, formal jobs. Compared to the formal sector,
most of the increases in informal tertiary and manufacturing employment were in low productivity
jobs. However, there was also a large shift in employment from the agricultural sector to more
productive jobs in the informal tertiary and manufacturing sectors. Within the informal sector, job
growth was robust in sub-sectors with rising productivity. These developments were reflected in the
growth of casual wages in the 1990s. Finally, the top end of self-employed jobs (also regarded as
part of the informal sector) was estimated to be as well-paying as top regular salaried jobs. The last
section of this chapter argues that the agriculture sector still has considerable potential in
generating a new round of jobs -- by expanding high yield cereal production in the relatively water
abundant Northeast, through diversifying into more labor-intensive commercial crops. Finally,
recommendations are made to improve the quality of jobs in the informal sector, to lower barriers to
entry to the formal sector, and to stimulate agricultural sector jobs.
A. Size of Employment in the Informal Sector
1. The vast majority of India’s work force is employed in what is often called the ‘informal’
sector. In India, the term ‘informal sector’ is of recent origin and has been in use only during the last
two decades. A careful analysis of this sector is essential to understanding Indian labor markets. Not
only does the informal sector provide employment to the vast majority of the country’s work force, it
will also continue absorbing most of the additions to the work force in the medium-term. Hence, a
careful evaluation of the potential of this sector, the quality of jobs that it can generate, and the
constraints to its growth, is essential. This chapter focuses on the informal sector, generally known
in India as the unorganized sector.49
After discussing the size of the sector, the chapter presents an
assessment of the quality of jobs produced in this informal sector. Subsequently, the chapter turns to
trends and prospects for informal sector employment in the manufacturing and tertiary sectors and in
agriculture.
2. In theory, the formal sector can be distinguished from the informal sector by the presence
of legal protection and formal recognition by the Government. Other criteria include: size of
establishments, capability of workers to organize themselves into unions, and the systematic manner
in which production processes are organized. In practice, however, because an exact definition is
hard to establish, the informal sector is most often defined in terms of what it is not, that is, it is not
organized sector employment. According to the Indian definition, employment in the Government or
in establishments employing more than 10 workers constitutes ‘organized’ employment. While
official estimates suggest that the informal sector could account for as much as 93 percent of total
employment, other definitions based on the NSS survey (1999/00) suggest a figure somewhere
49 Henceforth, the terms ‘unorganized’ and ‘informal’ are used interchangeably.

28
between 86 to 89 percent.50
Not only is this sector large, it is also the sector targeted by policy-
makers to absorb most of the additions to the country’s work force (Planning Commission, 2002).
3. The informal sector is large, partly because the bulk of the country’s work force is employed in
the primary sector and almost 99 percent of employment in this sector is informal. Not
surprisingly, almost half of informal sector workers are in the primary sector (Figure 2.1). However,
even in the other two sectors, informal employment accounts for the majority of employment: about
65 percent in the secondary sector and about 50 percent in the tertiary sector. By comparison, the
formal sector is small, accounting for just about 11 percent of total employment in the economy.
Most of the formal sector employment, some 69 percent, is in the public sector. The dominance of
the public sector also partly explains the large share (60 percent) of the tertiary sector in formal
employment.
Figure 2.1: Composition of Formal and Informal Sector Employment
Informal Sector Employment 2004-05
Secondary
Sector
27%
Primary
Sector
45%
Tertiary
Sector
28%
Formal Sector Employment 2004-05
Secondary
Sector
28%
Primary
Sector
11%
Tertiary
Sector
61%
Source: Estimated from NSS data
4. There is a close association between organized sector employment and regular wage
employment; this can be used to approximate trends in formal employment. Since information on
the types of establishments employing workers was not adequately collected in earlier Rounds
(before the 55th Round) of the NSS Survey, a rigorous delineation between formal and informal
sectors, using the definition of enterprises under the Factories Act, is ruled out. However, it has been
argued that of the three types of workers distinguished in the NSS of successive Rounds — regular
wage employees, casual wage workers and the self-employed — the overlap between formal sector
workers and regular wage employees is considerable (Sundaram and Tendulkar, 2005b). Trends in
this category may thus be a good proxy for examining trends in formal sector employment. To
facilitate analysis, self-employment and casual employment, the two kinds of employment that tend
to dominate in the informal sector, are used to approximate the informal sector in the rest of this
chapter.
5. Between 1983 and 2004/05, the share of regular wage employment in overall employment
50 The NSS 55th round provided information on the affiliation of workers with different types of establishments, public and
private, and the class of employment size to which they belonged. Information on UPSS workers was broken down into
‘formal’ and ‘informal’ categories on the basis of the following criteria: (i) all employees in public sector undertakings
were considered to be in the formal sector; (ii) private sector wage workers working in units that had electricity and
employed 10 or more workers, or units with no electricity but employing 20 or more workers, were considered to be in the
formal sector; and (iii) self-employed workers with higher secondary or more education were considered to be in the formal
sector.
29
remained stagnant at the aggregate level. Underlying this aggregate picture, however, was the fact
that for both urban and rural workers, there was a small decline in the share of regular wage
employment. The overall share was maintained only because of the increasing share of urban
workers in the work force, for whom regular wage employment was more significant than for rural
workers. Thus, in both urban and rural areas, informal employment became more important. Growth
in job categories was also different for different age-groups. While the proportion of older male
workers with salaried jobs increased over time, the number of young and middle-aged salaried
workers fell sharply.51
This is of some concern since regular employment is the preferred choice of
workers, especially the educated section of the work force. Encouragingly, however, young female
workers became more likely to report being regular workers, especially in urban areas.
6. Within the informal sector also, the share of self-employed and casual workers remained
largely stable over the two decades, though in the 1990s there was a decline in the proportion of
self-employed workers and a corresponding increase in the proportion of casual workers. The
decline was of the order of about 4 percentage points (Glinskaya and Jalan 2005).52
This led to
concerns about the growing ‘casualization’ of the work force, though recent data again shows a
turnaround. At the same time, the situation is worrisome because around a third of workers find
employment as casual labor, and casual jobs are often at the bottom of the pile in terms of wages and
job security.
7. The increase in the share of casual workers in the 1990s was driven by trends in a few
industries. Firstly, the trend towards casualization has been driven by trends in a few important
industries: agriculture, mining and construction. In these, the shift to casual jobs may have been
associated with increased commercialization (in agriculture and mining), and the choice of industrial
‘technology’ (in construction). If so, the welfare implications are not immediately clear. At the same
time, there were a number of ‘sunrise’ industries (for example, manufacturing and financial services)
which created good quality self-employment jobs for both men and women, in both urban and rural
areas. Apart from a few industries, most others also saw an increase in the proportion of workers
employed in regular salaried jobs.
8. The national samples also appear to suggest that there is a life-cycle pattern in
employment that could partly account for the shift from casual work to self-employment. Young
male workers (15-30 years old) in rural areas are more likely to work as casual labor and become
self-employed once older. A similar pattern exists among urban males, except that for this group the
movement in later life is somewhat more pronounced towards regular salaried employment. This
life-cycle movement is much less pronounced for females, in both urban and rural areas. If this
hypothesis is correct, the growing share of casual employment may be a reflection of a growing
young work force.
9. Apart from concern about jobless growth, the other big issue in India is the quality of jobs.
In the Indian context, regular salaried employment is the most desirable form of employment for
workers from the point of view of earnings, stability of employment, and availability of some social
security. It is followed, next, by self-employment which has variable returns but little security. At the
bottom of the pile is casual wage work which offers the lowest levels of earnings and has the least
stability. National surveys also show that though there is a wide distribution of income-levels within
51 This is not surprising given that over two-thirds of the salaried sector is public enterprises; the public sector had very
high rates of hiring in the 1980s which slowed down in the early mid-1990s. 52 This category includes own account (that is, self-employed) workers and unpaid family workers.

30
each of the major categories of employment, casual workers have jobs that are of ‘lower quality’ as
measured by household per capita consumption. This is true for all industries and in both rural and
urban areas. In the case of self-employed workers, earnings are better than those of salaried workers
in many industries (Glinskaya and Jalan, 2005).
10. An increase in the share of casual workers does not necessarily imply a deterioration in
the quality of jobs. Differences in human capital characteristics largely explain the differences
between the welfare of casual workers on the one hand and self-employed and salaried workers on
the other. Over time, the human capital stock of all workers has increased. The improved
educational composition of the work force is reflected in the somewhat sharp reduction in the
percentage of illiterate workers, slow decline in the numbers of literate and primary-level educated
workers, and the rising share of workers in the remaining three higher level education groups. This
has translated to improved welfare levels for all categories of workers.
11. One way of assessing changes in the quality of jobs is to examine how the proportion of
workers living below the poverty line (BPL) has changed in different segments of the work force. Let us consider casual employment first. The number of casual BPL households increased in the
1980s but, in absolute terms, declined in the 1990s. Thus, for this most vulnerable segment, the
1990s registered an improvement over the 1980s. For self-employed workers, average annual
increments to BPL households came down in the 1990s; so this segment too fared better compared to
the 1980s. These two segments, together, accounted for 96 percent of the incremental work force in
the 1980s and 86 percent of the incremental work force in the 1990s. The only segment that did
worse in the second period (1993-2000) compared to the 1980s was, surprisingly, the regular
wage/salaried workers, for whom the decline in increments to BPL households was much sharper in
the 1980s. This is not surprising when we consider that the major share of regular wage workers are
employed in the relatively high-paying public sector and there was, indeed, a decline in new
employment in this sub-segment in the 1990s.
12. An important, related question is: how disadvantaged are workers in the informal sector
compared to their counterparts in the formal sector? This can be gauged, in part, by focusing on the
earnings of wage earners only (Figure 2.2); individual earnings are better defined for this group
compared to self-employed workers. Using the wage earnings of regular and casual workers as a proxy
for the gap between the formal and informal sectors, evidence from the NSS surveys shows that earnings
of regular salary workers were almost 2.5 times higher than those of casual workers in 2004/05, and this
gap has grown since the 1980s. The relative wage gap varies across the industry groups in urban
areas. It is higher in the service sectors, being greatest in business and financial services, compared
to manufacturing.
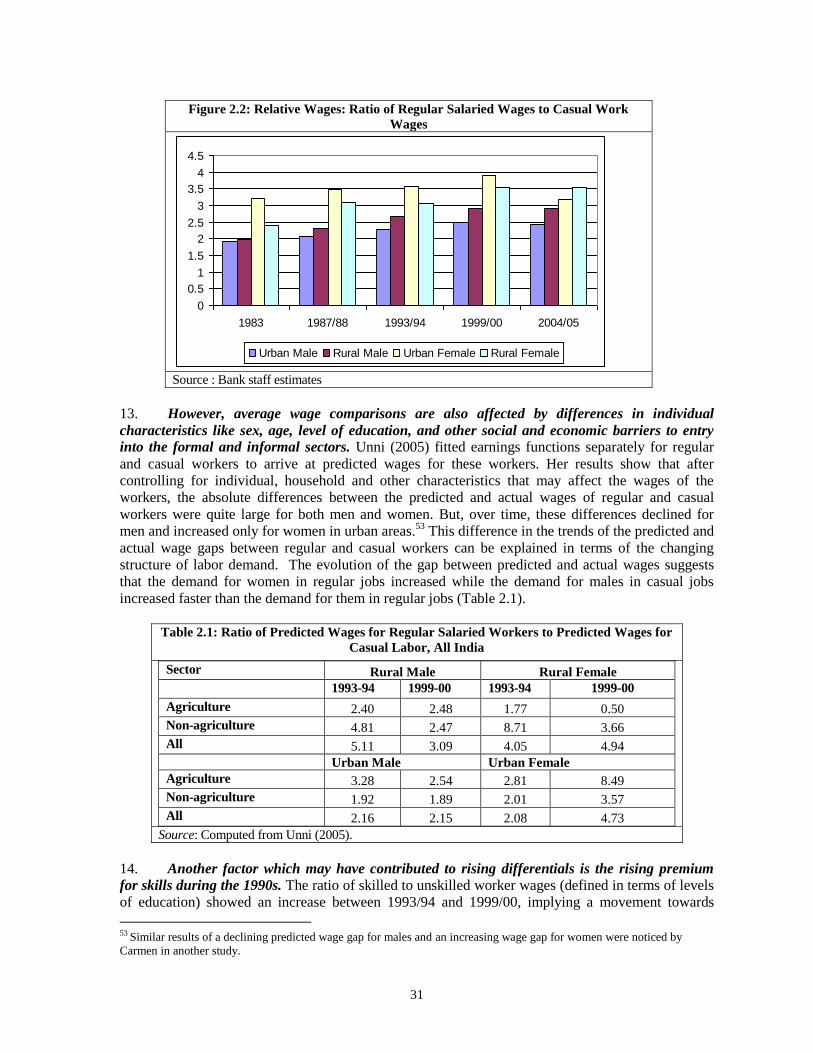
31
Figure 2.2: Relative Wages: Ratio of Regular Salaried Wages to Casual Work
Wages
0
0.5
1
1.5
2
2.5
3
3.5
4
4.5
1983 1987/88 1993/94 1999/00 2004/05
Urban Male Rural Male Urban Female Rural Female
Source : Bank staff estimates
13. However, average wage comparisons are also affected by differences in individual
characteristics like sex, age, level of education, and other social and economic barriers to entry
into the formal and informal sectors. Unni (2005) fitted earnings functions separately for regular
and casual workers to arrive at predicted wages for these workers. Her results show that after
controlling for individual, household and other characteristics that may affect the wages of the
workers, the absolute differences between the predicted and actual wages of regular and casual
workers were quite large for both men and women. But, over time, these differences declined for
men and increased only for women in urban areas.53
This difference in the trends of the predicted and
actual wage gaps between regular and casual workers can be explained in terms of the changing
structure of labor demand. The evolution of the gap between predicted and actual wages suggests
that the demand for women in regular jobs increased while the demand for males in casual jobs
increased faster than the demand for them in regular jobs (Table 2.1).
Table 2.1: Ratio of Predicted Wages for Regular Salaried Workers to Predicted Wages for
Casual Labor, All India
Sector Rural Male Rural Female
1993-94 1999-00 1993-94 1999-00
Agriculture 2.40 2.48 1.77 0.50
Non-agriculture 4.81 2.47 8.71 3.66
All 5.11 3.09 4.05 4.94
Urban Male Urban Female
Agriculture 3.28 2.54 2.81 8.49
Non-agriculture 1.92 1.89 2.01 3.57
All 2.16 2.15 2.08 4.73
Source: Computed from Unni (2005).
14. Another factor which may have contributed to rising differentials is the rising premium
for skills during the 1990s. The ratio of skilled to unskilled worker wages (defined in terms of levels
of education) showed an increase between 1993/94 and 1999/00, implying a movement towards
53 Similar results of a declining predicted wage gap for males and an increasing wage gap for women were noticed by
Carmen in another study.
32
skilled workers. This was true for all the one-digit industry groups (Unni and Rani, 2004). The
improvement in the skill premium implied an increase in the earnings gap between skilled and
unskilled workers. To the extent regular workers were more likely to be skilled and in the formal
sector, the rising skill premium also implied a rise in inequality of earnings between formal and
informal sector workers.
C. Informal Employment in the Manufacturing and Tertiary Sectors
15. In 2000/01 there were 14.8 million enterprises in the manufacturing sector, employing
45.7 million workers. Of these, only 1 percent of enterprises and 26 percent of workers were in the
organized sector.54
Two-thirds of the work force in the unorganized sector worked in own-account
enterprises, based on self-employment and, primarily, family labor. Less than 20 percent of workers
were employed in larger unorganized enterprises with 6-10 workers each. In rural areas, unorganized
employment was more strongly dominated by own-account enterprises (79 percent), while in urban
areas the picture was more balanced. Over the 1990s, the structure of unorganized manufacturing
remained more or less stable, with only a slight decline in the share of own-account enterprises.
16. While own-account enterprises had a large share in employment, they produced only 39
percent of value-added in the unorganized sector. The most productive enterprises were the
relatively larger ones employing 6-10 workers each; they produced almost the same share of value-
added as own-account enterprises, but with a work force that was a third of the size of the latter.
17. In the mid-1990s, unorganized manufacturing did better than its organized counterpart,
both in terms of wage growth and employment growth. The average, per annum, rate of growth of
wage earnings in the unorganized sector, 5.1 percent, was much higher than that of the organized
sector earnings, 1.2 percent (Unni, 2005). Similarly, while there was a virtual stagnation in
employment in the organized manufacturing sector, employment in informal manufacturing grew by
2.1 percent per annum.
18. The mid-1990s period also saw a lot of churning in unorganized manufacturing. In the
early part of the decade, a few industries in the sector saw growth in value-added, employment and
labor productivity. Unni (2006) categorizes these as Category A industries (Table 2.2). Most of the
sector saw declining value-added. However, by the mid-1990s, the unorganized manufacturing sector
found its feet and grew rapidly in terms of both value-added and employment. In this period, a large
number of industries shifted categories and grew in terms of value-added and productivity, while
generating quality employment (Category A). These included organic industries (food and paper),
chemicals (including pharmaceuticals and cosmetics), metal based industries and machinery.
Another group of industries (Category B) grew in terms of value-added but faced declining labor
productivity. This group included industries such as tobacco, wood products and wearing apparel.
Only a small, third group of industries (Category C) did not grow in terms of value-added at all. The
improvement was relatively broad-based, with most industries moving up the ladder. It is also
interesting to note that this upswing happened despite the continuing de-reservation of industries
which were earlier reserved for the small-scale sector.
54 The data on the organized sector is obtained from the Annual Survey of Industries (ASI). The ASI collect two separate sets of
data called the Census Sector, referring to a census of enterprises employing more than 100 workers each, and the Factory
Sector, referring to a sample survey of enterprises employing 10-100 workers each. We have used both sets to show the structure
of the industry but, in a later limited analysis of organized sector data, only used the Census Sector data.
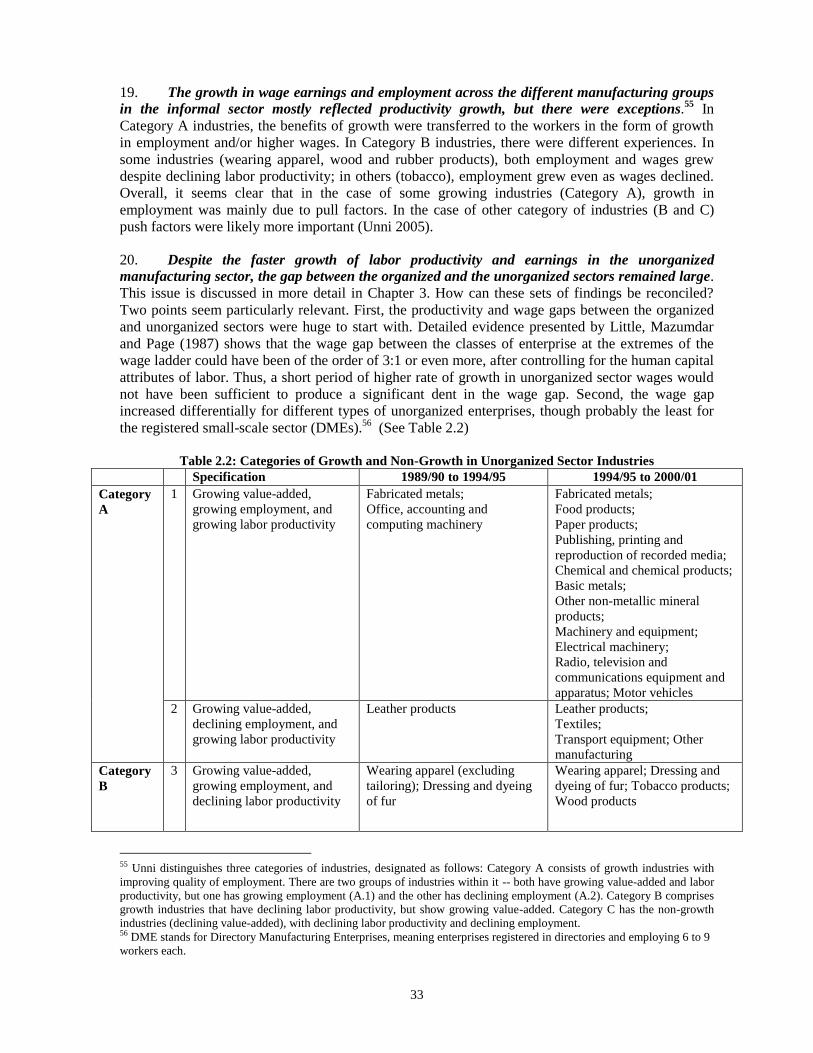
33
19. The growth in wage earnings and employment across the different manufacturing groups
in the informal sector mostly reflected productivity growth, but there were exceptions.55
In
Category A industries, the benefits of growth were transferred to the workers in the form of growth
in employment and/or higher wages. In Category B industries, there were different experiences. In
some industries (wearing apparel, wood and rubber products), both employment and wages grew
despite declining labor productivity; in others (tobacco), employment grew even as wages declined.
Overall, it seems clear that in the case of some growing industries (Category A), growth in
employment was mainly due to pull factors. In the case of other category of industries (B and C)
push factors were likely more important (Unni 2005).
20. Despite the faster growth of labor productivity and earnings in the unorganized
manufacturing sector, the gap between the organized and the unorganized sectors remained large.
This issue is discussed in more detail in Chapter 3. How can these sets of findings be reconciled?
Two points seem particularly relevant. First, the productivity and wage gaps between the organized
and unorganized sectors were huge to start with. Detailed evidence presented by Little, Mazumdar
and Page (1987) shows that the wage gap between the classes of enterprise at the extremes of the
wage ladder could have been of the order of 3:1 or even more, after controlling for the human capital
attributes of labor. Thus, a short period of higher rate of growth in unorganized sector wages would
not have been sufficient to produce a significant dent in the wage gap. Second, the wage gap
increased differentially for different types of unorganized enterprises, though probably the least for
the registered small-scale sector (DMEs).56
(See Table 2.2)
Table 2.2: Categories of Growth and Non-Growth in Unorganized Sector Industries
Specification 1989/90 to 1994/95 1994/95 to 2000/01
Category
A
1 Growing value-added,
growing employment, and
growing labor productivity
Fabricated metals;
Office, accounting and
computing machinery
Fabricated metals;
Food products;
Paper products;
Publishing, printing and
reproduction of recorded media;
Chemical and chemical products;
Basic metals;
Other non-metallic mineral
products;
Machinery and equipment;
Electrical machinery;
Radio, television and
communications equipment and
apparatus; Motor vehicles
2 Growing value-added,
declining employment, and
growing labor productivity
Leather products
Leather products;
Textiles;
Transport equipment; Other
manufacturing
Category
B
3 Growing value-added,
growing employment, and
declining labor productivity
Wearing apparel (excluding
tailoring); Dressing and dyeing
of fur
Wearing apparel; Dressing and
dyeing of fur; Tobacco products;
Wood products
55 Unni distinguishes three categories of industries, designated as follows: Category A consists of growth industries with
improving quality of employment. There are two groups of industries within it -- both have growing value-added and labor
productivity, but one has growing employment (A.1) and the other has declining employment (A.2). Category B comprises
growth industries that have declining labor productivity, but show growing value-added. Category C has the non-growth
industries (declining value-added), with declining labor productivity and declining employment. 56 DME stands for Directory Manufacturing Enterprises, meaning enterprises registered in directories and employing 6 to 9
workers each.

34
Category
C
5 Declining value-added,
growing employment, and
declining labor productivity
Food products; Basic metals
-
6 Declining value-added,
declining employment, and
growing labor productivity
Tobacco products;
Radio, television and
communications equipment and
apparatus; Transport equipment
Cotton ginning;
Medical, precision and optical
instruments; Watches and clocks
7 Declining value-added,
declining employment, and
declining labor productivity
Rubber and plastic products;
Other non-metallic mineral
products;
Paper products;
Cotton ginning;
Textiles;
Wood products;
Publishing, printing and
reproduction of recorded media;
Chemical and chemical
products;
Machinery and equipment;
Electrical machinery;
Medical, precision and optical
instruments; Watches and
clocks;
Motor vehicles; Other
manufacturing
Rubber and plastic products;
Office, accounting and
computing machinery; Leather
products
Source: Unni (2005)
21. The major player in the absorption of labor outside agriculture, since the 1990s, is not
manufacturing, but the tertiary sector. The importance of the tertiary sector in employment
generation has increased in spite of a significant negative trend in the growth of public services.
However, an important question is: is labor being absorbed at a reasonable or growing income level
in the tertiary sector or is it being pushed into it for lack of alternative opportunities? The next
chapter provides detailed analysis on this point. However, evidence suggests that there has been an
outward shift in the distribution of earnings in the tertiary sector, so that earnings at all levels have
increased. Labor absorption has also been proportionately larger in the first and fifth income
quintiles of the distribution, with relatively less absorption in the middle range. This implies an
increase in inequality in the bottom half of the distribution --- a trend more prominent in the urban
economy. Disaggregating the tertiary sector by its 1-digit components, it is seen that these effects are
mild in consumer services, but much more striking in business services and the public sector.
22. The overall evidence, thus, is that there has been a movement of labor from low productivity
agriculture to the higher productivity tertiary and manufacturing sectors where earnings are
higher and rising. This development can be broadly considered to be welfare improving and, to
some extent, voluntary. However, the non-agricultural sectors have seen a relatively higher rate of
employment growth in the informal or unorganized sector. The welfare implication of this has to be
interpreted carefully. On the one hand, the trend cannot be equated to decline in the returns from
working, since casual wages are higher in these off-farm activities and there is a reduction in the
incidence of poverty.57
But this absolute improvement in living conditions is accompanied by a
perceptible trend of increasing inequality — with the increase in differentials favoring the skilled and
57 See Maloney (2004) for evidence from Latin America on how the informal sector can be viewed as an unregulated
micro-entrepreneurial sector with voluntary participation by workers, and not as a residual from the segmented formal
sector.
35
the more educated, and also the better-off sections of the self-employed.
23. A particularly important issue is the problem of the ‘missing middle’ firm size. In
manufacturing, while there has been some redistribution of employment from the largest to smaller
size groups within the organized sector, the structure of employment on the whole displays
conspicuous ‘dualism’. There are two prominent modes or concentrations of employment, at the low
and high ends of the spectrum, and a large, persistent differential in productivity (and earnings)
between these two groups. The scenario underlines the difficulty faced by smaller firms in
graduating to become middle-size units. This is explored in more detail in the next chapter. A similar
phenomenon of the ‘missing middle’ is suggested by the data on earnings distribution presented for
the tertiary sector (see Chapter 3).
24. The persistence of dualism reduces economic welfare, from both the efficiency and equity
points of view. Dualism is a constraint on the healthy, long-run development of the economy. It
suggests a need for policies that ease constraints on the growth of small enterprises. Credit,
technology and labor regulation are critical areas which are particularly relevant here (see Box 2.1
for a discussion on successful international experiences in promoting small and medium enterprises,
or SMEs). The development of sub-contracting is one way in which the large-scale sector seeks to
rectify the problem of dualism. There is some evidence of this happening in recent years in India but
there are important concerns about the specific way in which the sub-contracting system develops in
an economy. We discuss this in more detail in the next chapter.

36
Box 2.1: Successful Examples of the Promotion of SMEs
While large firms in India may be important for setting the pace of economic and technological change in
India, the experience of the 1990s shows that most new employment will continue to be generated by small and
medium enterprises (SMEs). What does international experience tell us about how SMEs grow, and what is
their relationship with larger firms? What can be learnt from public initiatives to promote SMEs in countries
which have done so successfully?
Open, competitive sub-contracting seems to be the dominant pattern of relationship between large firms and
SMEs in India currently. Large firms are disinclined to combine the different stages of manufacture in-house,
with expensive permanent employees, and hence, source some components and services from SMEs. The
advantage of this approach is that it allows costs to be driven down to meet domestic and international
competition. The disadvantage, however, is that the jobs generated are mostly low-paid and insecure. There
are also economic costs to not investing in and upgrading labor.
Conditions in Mexico are similar to India -- 99 percent of firms are small- and medium-sized enterprises. The
Integral Quality and Modernization Program (CIMO – now renamed as PAC), established in 1988, has been
reaching small- and medium-size enterprises and assisting them with upgrading worker skills, improving
quality and raising productivity. All states and the Federal District of Mexico have at least one CIMO unit
each. Most units are housed with business associations that contribute office and support infrastructure. The
promoters organize workshops to provide training and technical assistance services, identify potential local and
regional training suppliers and consulting agents, and actively seek out enterprises to deliver assistance on a
cost-sharing basis. CIMO is expanding in two directions — assisting enterprises with specific sectoral needs
and providing an integrated package of services that includes information on technology, new production
processes, quality control techniques, marketing, and subsidized training.
Alternate examples come from countries like Italy, Germany, Japan, Denmark, and Spain where a significant
share of production takes place in SME clusters. These clusters combine the advantage of smallness with
economies of scale and scope, which big firms enjoy. They can give small firms the strength to choose between
supplying to large firms and competing with them. This can lead to rapid economic growth, good wages and
good jobs. Such flexible specialization, however, requires some degree of trust between entrepreneurs, and
between them and their workers.
Some networks of firms, including innovative and successful ones in fast-developing industries, develop based
on economic interest and personal friendship. Others develop within business associations of firms in the same
industrial sector or because they share the same place, like an industrial estate. However, in most cases,
effective networks of cooperation, capable of making SMEs competitive in national and world markets require
deliberate policies from national or local governments to encourage this kind of development.
In Italy, Germany and Denmark, this ‘push’ came from the government (a) providing collectively 'real services'
like training, consultancy and design, which single SMEs could not afford by themselves; and (b) encouraging
and supporting consortia or other local arrangements, which gave clusters of inter-dependent SMEs access to
European and world markets. In Italy, local and regional governments, working with private enterprises and
sometimes trade unions, set up institutes to provide technical services, research and development testing,
feasibility studies, and advice on management and marketing. The strategy was to develop what already existed
in the region, and then to find ways of diversifying into new fields and markets. In Germany, the state
Government promoted the setting up of a network of technology transfer centers closely linked to local
chambers of commerce. These centers are demand-driven and almost self-funded. They usually specialize in
particular industries and technologies, and often refer clients to other centers with the necessary expertise. In
Spain, the Valencian regional government established a high-profile agency named Impiva. Impiva has two
kinds of institutes: technological institutes and local business innovation centers. Some technological institutes
are designed to help a distinct industrial sector. Others aim to develop particular technologies, like
biomechanics or optics, which are used in diverse industries. Each institute is linked to an association of
entrepreneurs who elect a majority of its supervisory board and determine the services the institute will provide
for a fee. The institutes are meant to become self-financing.
Source: Holstrom, 1999; Tan et al, 2004.

37
D. Labor Absorption in the Agricultural and Rural Sectors
25. Rural employment, which accounts for a little more than three-fourth of all employment
in India, is overwhelmingly informal in nature and dominated by agriculture. In 2004/05, about 56
percent of rural workers were self-employed, while another 36 percent were casual workers.58
Further, while rural employment is diversifying into sectors such as transport, storage and
communications (3 percent of all employment in 2004/05), construction (6 percent), trade and hotels
(7 percent), and manufacturing (8 percent), agriculture and allied activities still account for 70
percent of rural employment. Generating rural, non-farm employment will require improving the
investment climate for small and medium industries, as discussed above, and addressing regulatory
barriers that constrain non-farm activity in rural areas (see below). In the medium-term, however, the
role of agriculture will remain critical, both because of its large share in employment and because
growth in agriculture will create a demand for non-agricultural goods, services and jobs.
26. Growth in agricultural employment slumped between 1993 and 2000, before regaining
some strength. Agriculture accounted for a mere 23 percent of the increase in employment over the
1993-1999/00 period, declining massively from its 44 percent share during the 1983-1993 period.
There were also important changes in the structure of employment within agriculture. Records reveal
a surprising slump in non-cultivation related employment in the 1990s, after rapid growth over the
1983-1993 period. This slump, in ‘person’ days of employment generated, affected all activities
except forestry. The decline came on the back of a fall in growth of cultivation-related employment
(Table 2.3). Whatever employment was generated came mainly from activities such as forestry and
plantation. The agricultural and allied sectors regained some strength after 2000, accounting for 30
percent of new rural employment generation between 1999/00 and 2004/05, but not to the level
witnessed in the 1980s.
Table 2.3: Growth Rate of ‘Person’ Days, by Operation
Operation Type
1983
to
1987/88
1987/88
to
1993/94
1983
to
1993/94
1993/94
to
1999/00
1983
to
1999/00
Total Cultivation 0.9 2.5 1.8 0.5 1.4
Forestry -5.8 -3.3 -4.4 2.0 -2.1
Plantation 3.0 11.3 7.7 0.4 5.0
Animal husbandry 2.2 2.8 2.5 -0.3 1.5
Fisheries -3.4 9.1 3.6 -7.9 -0.8
Agriculture other than
cultivation 3.5 7.7 5.9 -2.5 2.7
Total agriculture 1.4 3.7 2.7 -0.2 1.7
Non-agriculture 6.8 0.7 3.2 3.2 3.2
Total 2.7 2.9 2.9 0.7 2.0
Source: Srivastava (2005)
58
World Bank staff estimates
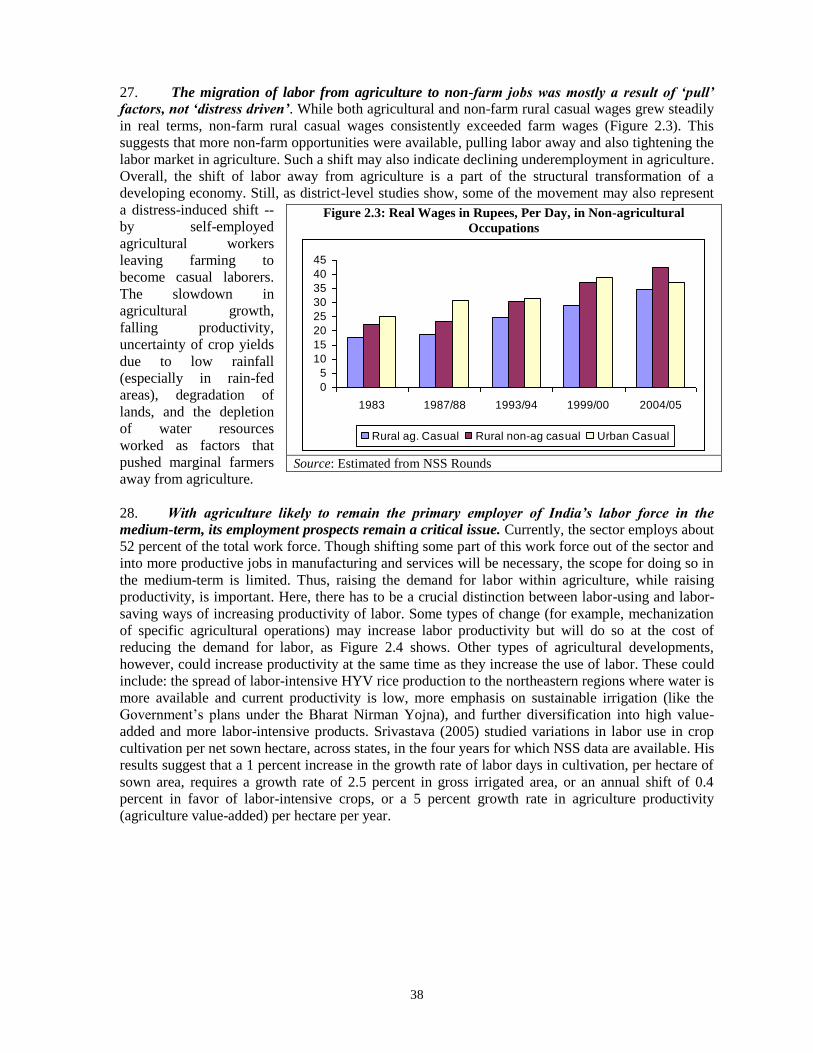
38
27. The migration of labor from agriculture to non-farm jobs was mostly a result of ‘pull’
factors, not ‘distress driven’. While both agricultural and non-farm rural casual wages grew steadily
in real terms, non-farm rural casual wages consistently exceeded farm wages (Figure 2.3). This
suggests that more non-farm opportunities were available, pulling labor away and also tightening the
labor market in agriculture. Such a shift may also indicate declining underemployment in agriculture.
Overall, the shift of labor away from agriculture is a part of the structural transformation of a
developing economy. Still, as district-level studies show, some of the movement may also represent
a distress-induced shift --
by self-employed
agricultural workers
leaving farming to
become casual laborers.
The slowdown in
agricultural growth,
falling productivity,
uncertainty of crop yields
due to low rainfall
(especially in rain-fed
areas), degradation of
lands, and the depletion
of water resources
worked as factors that
pushed marginal farmers
away from agriculture.
28. With agriculture likely to remain the primary employer of India’s labor force in the
medium-term, its employment prospects remain a critical issue. Currently, the sector employs about
52 percent of the total work force. Though shifting some part of this work force out of the sector and
into more productive jobs in manufacturing and services will be necessary, the scope for doing so in
the medium-term is limited. Thus, raising the demand for labor within agriculture, while raising
productivity, is important. Here, there has to be a crucial distinction between labor-using and labor-
saving ways of increasing productivity of labor. Some types of change (for example, mechanization
of specific agricultural operations) may increase labor productivity but will do so at the cost of
reducing the demand for labor, as Figure 2.4 shows. Other types of agricultural developments,
however, could increase productivity at the same time as they increase the use of labor. These could
include: the spread of labor-intensive HYV rice production to the northeastern regions where water is
more available and current productivity is low, more emphasis on sustainable irrigation (like the
Government’s plans under the Bharat Nirman Yojna), and further diversification into high value-
added and more labor-intensive products. Srivastava (2005) studied variations in labor use in crop
cultivation per net sown hectare, across states, in the four years for which NSS data are available. His
results suggest that a 1 percent increase in the growth rate of labor days in cultivation, per hectare of
sown area, requires a growth rate of 2.5 percent in gross irrigated area, or an annual shift of 0.4
percent in favor of labor-intensive crops, or a 5 percent growth rate in agriculture productivity
(agriculture value-added) per hectare per year.
Figure 2.3: Real Wages in Rupees, Per Day, in Non-agricultural
Occupations
0
5
10
15
20
25
30
35
40
45
1983 1987/88 1993/94 1999/00 2004/05
Rural ag. Casual Rural non-ag casual Urban Casual
Source: Estimated from NSS Rounds
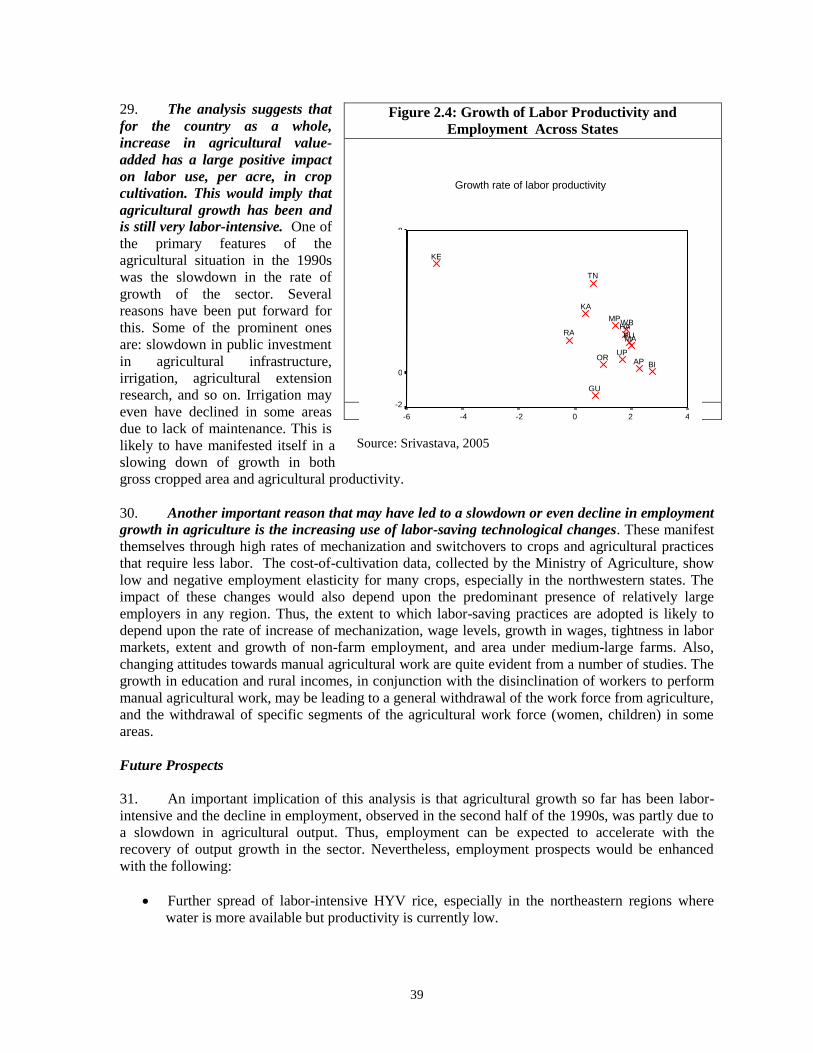
39
29. The analysis suggests that
for the country as a whole,
increase in agricultural value-
added has a large positive impact
on labor use, per acre, in crop
cultivation. This would imply that
agricultural growth has been and
is still very labor-intensive. One of
the primary features of the
agricultural situation in the 1990s
was the slowdown in the rate of
growth of the sector. Several
reasons have been put forward for
this. Some of the prominent ones
are: slowdown in public investment
in agricultural infrastructure,
irrigation, agricultural extension
research, and so on. Irrigation may
even have declined in some areas
due to lack of maintenance. This is
likely to have manifested itself in a
slowing down of growth in both
gross cropped area and agricultural productivity.
30. Another important reason that may have led to a slowdown or even decline in employment
growth in agriculture is the increasing use of labor-saving technological changes. These manifest
themselves through high rates of mechanization and switchovers to crops and agricultural practices
that require less labor. The cost-of-cultivation data, collected by the Ministry of Agriculture, show
low and negative employment elasticity for many crops, especially in the northwestern states. The
impact of these changes would also depend upon the predominant presence of relatively large
employers in any region. Thus, the extent to which labor-saving practices are adopted is likely to
depend upon the rate of increase of mechanization, wage levels, growth in wages, tightness in labor
markets, extent and growth of non-farm employment, and area under medium-large farms. Also,
changing attitudes towards manual agricultural work are quite evident from a number of studies. The
growth in education and rural incomes, in conjunction with the disinclination of workers to perform
manual agricultural work, may be leading to a general withdrawal of the work force from agriculture,
and the withdrawal of specific segments of the agricultural work force (women, children) in some
areas.
Future Prospects
31. An important implication of this analysis is that agricultural growth so far has been labor-
intensive and the decline in employment, observed in the second half of the 1990s, was partly due to
a slowdown in agricultural output. Thus, employment can be expected to accelerate with the
recovery of output growth in the sector. Nevertheless, employment prospects would be enhanced
with the following:
Further spread of labor-intensive HYV rice, especially in the northeastern regions where
water is more available but productivity is currently low.
Figure 2.4: Growth of Labor Productivity and
Employment Across States
Employment Growth
4 2 0 -2 -4 -6
Growth rate of labor productivity
8
6
4
2
0
-2
WB
UP
TN
RA PU
OR
MA
MP
KE
KA
HA
GU
BI AP
Source: Srivastava, 2005

40
More emphasis on sustainable irrigation (similar to what the Government is currently
planning under Bharat Nirman) through public and community investments in the expansion,
maintenance and rehabilitation of irrigation systems. Irrigated farms hire 50 percent more
labor than rain-fed farms (Table 2.4).
Table 2.4: Impact of Irrigation on Agricultural Production and Employment
Variable All farms Irrigated a/
Rain-fed b/
Total crop value (Rs) 44,327 50,224 29,655
Crop area (acres) 6 7 6
Total labor (man days) 173 186 140
Family labor (man days) 60 61 58
Hired labor (man days) 112 125 81
Total labor expenditures (Rs) 7,595 8,509 5,322
Value of agricultural assets (Rs) 43,620 51,267 24,596
Observations 4,161 2,968 1,193
Note: These figures for states include Assam Bihar, Madhya Pradesh, and Uttar Pradesh
(un-split states), and; Gujarat, Haryana, Himachal Pradesh, Karnataka, Kerala,
Maharashtra, Orissa, Punjab, Rajasthan, Tamil Nadu, West Bengal.
a. Irrigated: Share of irrigated area > 0.25
b. Rain-fed : Share of irrigated area <0.25
Source: Jin and others, 2005.
Diversification of agriculture: some products, such as horticulture, have almost twice the
labor intensity as cereals (see Box 2.3). While horticultural production growth is already
accelerating, policy attention will help to sustain this trend. It will be important to strengthen
links to market outlets (for example, through investments in roads, markets, electricity, and
information systems) so that farmers can produce more crops and livestock products for the
market. To help farmers cope with changing markets and production systems, investments
must be made in financial systems for managing risk (for example, futures markets, crop
insurance schemes, warehouse receipt systems, commodity exchanges, and social safety
nets).
Supporting the growth of agro-processing. Currently, only 2 percent of fruits and vegetables
are processed in India compared with 30 percent in Thailand, 70 percent in Brazil and 80
percent in Malaysia (MoCFP, ICRIER, Vyas, 2005).
Off-farm employment, such as animal husbandry, increases the incomes of rural families and
also improves the economic welfare of families that are dependant on agriculture by reducing
the pressure on farm land and exclusive agricultural activities. Thus, developments which
increase off-farm employment should be encouraged, even if they reduce employment in the
crop-producing sector. A good example of a promising initiative to promote off-farm female
employment comes from the Self-Employed Women’s Association (SEWA) movement in
India (see Box 2.2).
Box 2.2: The Self-Employed Women’s Association (SEWA)
The Self-Employed Women’s Association (SEWA) was set up in 1972 in Ahmedabad, Gujarat, as a
membership organization of poor women working in the informal sector. From its small beginning in 1972,
SEWA’s membership has grown to over 1.2 million members in 7 states in India. Recently, more than 100,000
new members have joined each year. A structure has evolved that gives SEWA great flexibility to grow and
respond to its members’ needs. Apart from their participation in the union’s formal election and governance
arrangements, members are engaged in three main ways: (a) through a union, with both urban and rural
branches, that helps members demand fair treatment and access to justice, markets and services; (b) through
cooperatives that help members produce and market goods, and build their assets; and (c) through member
41
services, which are financed partly through user charges, partly by donors, and partly by Government
departments that have been unable to provide the services for which they are responsible by law.
Cooperatives
SEWA cooperatives in rural areas help women improve the quality and designs of the handicraft and woven
items they produce for sale. In most cases, the women are already highly skilled in embroidery and weaving or
other crafts. SEWA’s task is mainly to ensure consistent quality and timely delivery. Cooperatives have also
promoted new agricultural products and techniques that add value to traditional products. For example, tree
nurseries are a new activity in areas where traditional tobacco workers are being displaced. Milk cooperatives
improve cattle breeding, as well as milking and milk handling techniques, raising the value of sales. Salt
farmers are being shown how to produce higher-value industrial salt rather than lower-value edible salt.
Cooperatives also provide their members with information on market prices for traditional and new products.
SEWA has also become directly involved in marketing what its members produce.
By far, the largest cooperative is SEWA Bank. At the end of fiscal 2003/4, deposits totaled $14.4 million in
257,000 accounts, and there were 53,000 outstanding loans totaling $3.9 million (for an average loan size of
about $73). Historically, SEWA Bank’s loan recovery rate has been about 96 percent. In 2003 and 2004, the
Bank started innovative mobile “doorstep banking” arrangements so that members would not have to interrupt
their daily livelihood activities to go to the bank. It also offers training courses in financial planning. SEWA
Bank has introduced the habit of regular saving to tens of thousands of poor women. Members pay significant
interest rates to SEWA Bank (currently over 20 percent a year, while the rate of inflation is around 5 percent),
but no longer feel powerless and exploited by moneylenders.
Member Services
SEWA concentrates its member services in four areas: health care, childcare, insurance, and housing. In
SEWA’s experience, the security of a poor woman’s livelihood is not complete without access to these four
basic goods. If a government-provided service functions well, then SEWA disseminates information on how to
use it; if a service needs improvement or reorientation, SEWA tries to influence decision-makers accordingly.
If all else fails, it provides the service on a sustainable basis.
SEWA has pioneered the provision of insurance for poor women, drawing on both the SEWA Bank and
Government insurance companies. Typically, a woman saves Rs 1,000 (about $22) and puts the money in a
fixed deposit. The annual interest pays the premium and ensures uninterrupted coverage, which includes
maternity benefits, as well as payments in the event of illness, death, and loss of property. In 2003, more than
110,000 members were covered: over 6,000 claims were paid for a total of close to $180,000 (with the average
payment being about $30). SEWA is now planning an insurance cooperative, drawing on the example of the
SEWA Bank.
Key Factors behind the Success
SEWA’s impressive record in scaling up its membership and activities over the past three decades offers useful
lessons. First, member-based organizations promote ownership and help ensure that activities are based on
members’ demands and needs. Such organizations can harness hitherto untapped energy and generate it anew
once members attain self-confidence and learn new skills. Second, an organization based on values must
emphasize them constantly. If it does so, it can maintain consistency of purpose and function very flexibly.
Values generate strong loyalty among staff and members, as well as support from the wider public, and
underpin the patience and perseverance required to change difficult policy environments. Third, a flexible style
of working encourages learning and innovation and, therefore, facilitates adaptation to changing circumstances,
including the ability to see crises as opportunities. At the same time, flexibility motivates high performance and
low turnover among staff, and makes it possible to take advantage of partnerships with external actors. Finally,
leadership skills are crucial, not only to define and uphold the vision of an organization, but also in establishing
management and behavioral practices that minimize social distance between the management cadre and the
organization’s members (or clients). Moreover, with proper attention to training and practical research, an
organization can find and develop new leaders among its members or clients, despite their poverty and lack of
formal education, and in this way ensure its continuity and growth.
Source: “Collective Action by Women Workers: The Self-Employed Women’s Association, India,” in Ending Poverty in
South Asia: Ideas that Work eds: D. Narayan and E. Glinskaya, Oxford University Press, India

42
E. Policies and Regulations to Support Informal Sector Earnings and Promote Formalization
32. Completing the agenda of market reforms by changing policies and regulations that
currently constrain trade, marketing, and large-scale production, will be crucial for raising
employment and earnings in the informal sector, including in agriculture. Regulations affect two
important rural activities in particular: marketing of agricultural produce is restricted under the
Essential Commodities Act and the gathering of forest products is restricted by the Indian Forest Act
(Saxena, 2003). At present, farmers in Punjab, Haryana, Andhra Pradesh, and Karnataka can be
prevented from selling their produce outside their states. Storage of produce is restricted in states
such as Gujarat (for pulses), Maharashtra, Kerala, Andhra Pradesh, and West Bengal. Storage rent is
regulated by the states’ cold storage regulations in West Bengal, Uttar Pradesh and Bihar. All these
restrictions serve to depress demand for farm produce, as well as farmers’ earnings. In the case of
forestry, some 100 million forest dwellers whose livelihoods depend on forestry products are
prevented from harvesting non-timber forest products like fruits, nuts, flowers, and twigs -- activities
that can be sustainably pursued. The harvesting of prosopis, its conversion into charcoal, and its
transportation for sale -- activities that can potentially provide significant off-farm employment, face
numerous restrictions in states such as Gujarat and Tamil Nadu.
33. Regulatory reforms that address these barriers will increase employment and the earnings
of the poor in the informal sector. This includes amending Acts such as the Essential Commodities
Act, phasing out levies and monopoly controls, de-reserving agro-based and food-processing
industries, de-controlling sugar and removing sugar from the list of commodities distributed through
the public distribution system (PDS), and removing restrictions on the export of agro-products.
Subsidies for food distribution and inputs (such as fertilizers), and procurement schemes such as the
Minimum Support Price (MSP) policies, currently accounting for more than 5 percent of national
GDP, can be more narrowly targeted to promote high value, labor-intensive crops. A good example
of the success of regulatory reforms is the licensing requirements for milk processing in Uttar
Pradesh – the easing of these requirements led to a doubling in milk processing capacity in four
years. Another example of a more comprehensive Government intervention is the Maharashtra
horticulture promotion program (Box 2.3).
Box 2.3: Horticulture Development in Maharashtra
The Maharashtra Horticulture Development Program, which is linked with the state’s Employment Guarantee
Scheme (EGS), aims to accelerate the expansion of horticultural production and generate additional
employment in rural areas. While food crops can provide employment of approximately 100 to 115 ‘person’
days per hectare per year, horticulture production requires up to 275 ‘person’ days per hectare per year. The
program, applied to 25 fruit crops, spices intercropped in coconut plantations, and medicinal and aromatic
plants, was open to all farmers, with a minimum required area per project. The scheme provided 100 percent
subsidies on wages and material inputs (planting materials, fertilizers and agrochemicals) to small and marginal
farmers, Scheduled Castes (SC), Scheduled Tribes (ST), and other ethnic minorities, on a declining scale – the
subsidies were phased out by the third year. All other farmers received subsidies of 100 percent on wages and
75 percent on material inputs, on a declining scale, over 3 years. Wages were given in cash while the material
inputs were supplied in kind. The ‘grant’ or subsidy averaged Rs. 7,709 ($161) per farmer beneficiary.
To support the scheme, the Government of Maharashtra implemented complementary initiatives that ensured
the supply of key inputs and services. During the first 7 years of the project, 140 Government nurseries and 24
nurseries in four agricultural universities were established to supply high-quality planting materials. Planting
material supply was further expanded by the entry of approximately 1,670 private nurseries. Pesticide residue
testing laboratories of international standards were established in Pune and Nagpur. A website ‘agri.mah.nic.in’
on agriculture-horticulture was launched by the Department of Agriculture to disseminate information about
the program. A Central Government sponsored scheme for sprinkler and drip irrigation facilitated the
expansion of horticulture and floriculture production. In view of water scarcity conditions in many areas, the
scheme aimed to increase efficiency in water use. The drip/sprinkler scheme provided subsidies equivalent to

43
75 percent of cost of equipment for all farmers and 90 percent of costs for SCs/STs, up to a limit of Rs. 32,000
per individual, the cost of which was shared between the central and state governments with a ratio of 75:25.
Public and private investments further supported the growth of the sector. The Maharashtra Government’s
investments in infrastructure, such as building the Pune-Mumbai expressway and other roads, and upgrading
airport and port facilities, reduced transportation costs and helped to increase the competitiveness of
Maharashtra’s products domestically and in the export market.
Private sector initiatives and investments also contributed. Large farmers and corporate investors in
horticulture and floriculture -- who invested in supporting marketing infrastructure such as pre-cooling
facilities, cold storage, refrigerated transport, and agro-processing -- promoted production and organized
supply from other (smaller) farmers to meet the bulk requirements for export and local demand, and provided
technical advice to meet export quality requirements. Increased private participation in input supply (fertilizers,
agrochemicals and improved seeds) increased the accessibility of key farm inputs to farmers. Commodity
marketing organizations, including Mahagrapes, Mahamangoes and the Western India Floriculture Association,
were instrumental in promoting exports of local products.
The program has been a success from both the horticulture and employment perspectives. Of the 1 million
hectare increase in area planted with fruits in the state between 1989/90 and 2000/01, 96 percent was supported
through the horticulture-linked EGS scheme. It directly created an estimated 213 million ‘person’ days of
work, or approximately 807,000 ‘person’ years (assuming 220 days of work per year) over the past decade.
Since the fruit orchards, once initiated, would normally require continuous employment to meet day-to-day
labor needs, the scheme also opened opportunities for permanent full-time employment for agricultural
laborers. In addition, the increased fruit production generated positive multiplier effects in terms of increased
labor demand arising from increased demand for inputs and marketing services (transport, storage, packaging,
processing, and trading). In the future, in view of the rapid uptake of the technologies, the challenge will be to
more exclusively target assistance to poor, small and marginal farmers who are more capital constrained.
Source: World Bank, 2005d.
34. Over the long term, however, informality can impose considerable costs on the economy;
policies will be needed to encourage the informal sector to become formal. Informality is
encouraged in an economy when firms seek to avoid the transaction costs of complying with
regulations concerning registration, licensing, tax administration and tax policies, and laws that
reduce flexibility. Firms can also have an incentive to stay informal to be more competitive vis a` vis
formal sector firms that have to comply with regulations. In the long run, however, the costs of
informality can be high for firms and for the economy. Firms may avoid official taxes but may end
up incurring higher costs from making payments to corrupt officials or private extortionists due to
their lack of legal status and bargaining power. Informal sector firms have less access to and high
costs of capital, and unreliable access to electricity and business services. By becoming formal, firms
can enjoy the benefits of property rights and contract enforcement, and access to finance,
infrastructure and tax concessions offered by governments. These conditions, in turn, translate to
lower investments and productivity growth in the economy as a whole.
35. International evidence suggests that governments need to take two approaches to
encourage firms to become formal (World Bank, 2005i). First, recognizing that formalization will
take time, the Government of India can provide a supporting environment for the growth of
productivity and improvement in working conditions in the informal sector. The key step here will be
to remove disincentives to growth -- such as, reserving sectors for small-scale firms, regulations that
raise transactions costs and costs when firms grow beyond a certain size, and other regulatory
barriers discussed above. The other prominent example of a regulation that taxes firm growth in
India is Clause VB of the Industrial Disputes Act which severely restricts the rights of firms
employing more than 100 workers to retrench labor. The costs of this Act are discussed in detail in
Chapter 5 of this study. In general, procedures can be simplified (Chen, 2006). Governments can
directly and indirectly (for example, through private sector associations) provide business services

44
and access to capital for informal sector firms to grow. Second, the Indian Government can gradually
improve enforcement by raising incentives for firms to join the formal sector and impose penalties
for non-compliance with formal sector regulations. A whole range of tax and regulatory reforms that
reduce concessions to informal sector firms, and lower taxes, social security contributions and
regulatory burdens on formal sector firms, can be employed for this purpose. In implementing the
second step to increase the penalties for non-compliance, however, the Government will need to be
careful. Eliminating informality can lead to high costs in the short term by throwing firms and
workers out of jobs. Rather, the spirit should be to encourage growth and increase the incentives for
firms to become formal, because this will enable them to gain access to services and benefits and
grow faster.

This chapter examines the trends in formal sector employment in the secondary and tertiary sectors
low in India during the last two decades? In formal manufacturing, an analysis of the elasticity of
employment to GDP shows that three factors were responsible for low employment growth in the
1990s: (i) an adverse movement of the terms of trade against producers; (ii) the adjustment of the
economy to trade liberalization in the early 1990s -- while export-intensive sub-sectors witnessed
increased employment growth, import-competing sectors saw a slowdown in employment, and; (iii)
the choice made by formal sector firms to raise wages and productivity of existing workers rather
than increase employment. The tertiary sector accounts for most of the growth in formal sector
employment in recent years in India. But, like manufacturing, employment in this sector too displays
a dualistic pattern. At one end are the main sources of growth in the formal services sector -- the
rapidly evolving information technology enabled services (ITES) and financial sectors. But the pull
of these sectors on overall labor markets is muted, given that they employ only 7 million workers out
of a labor force of more than 400 million. Instead, most jobs are being created in the trade, hotels
and restaurants, construction, and community services sectors where the bulk of the jobs are
informal and of low productivity. Thus, as in manufacturing, workers in the tertiary sector are
clustered at two ends of the wage distribution scale.
59
1. Employment growth in the formal (‘organized’) sectors in India has been disappointing in
spite of a fairly healthy rate of growth of output. Although likely an underestimate, according to
official figures, employment in the organized sector grew minimally from 26.7 million in 1991 to 28
million in 2001, and then declined to 26.4 million in 2004. Over the same period, manufacturing
employment fell from 6.3 million in 1991 to 5.7 million in 2004.60
The bulk of manufacturing jobs
today remain in the informal sector.61
As with manufacturing, employment in the formal services
sector (according to official estimates) grew minimally from 15.7 million in 1991 to 16.8 million in
2000; the most recent estimates put it at 16.7 million (Figure 3.1) out of a total prime age work force
of 412 million.
59 Organized sector workers are defined as those working in private establishments employing more than 10 workers and
those working in the public sector. The organized sector is generally referred to as the formal sector. All other workers are
considered to be in the unorganized or informal sector. In this chapter, we also consider other definitions of the formal
sector in order to analyze trends. 60 DGE&T estimates and Economic Survey, 2005-2006 61
While another source, the Annual Survey of Industries (ASI), estimates current organized manufacturing employment to
be around 11 million out of a total manufacturing work force of 46 million, the overall picture does not change significantly

46
Figure 3.1: Total Formal Sector Employment Levels (in Millions) and Growth
Formal Sector Employment (in millions) Growth Rate of Formal Sector Employment
0.0
5.0
10.0
15.0
20.0
25.0
30.01
98
1
19
91
20
00
20
03
19
81
19
91
20
00
20
03
19
81
19
91
20
00
20
03
19
81
19
91
20
00
20
03
Public Private
Agriculture Industry Services Total
-1.5
-1.0
-0.5
0.0
0.5
1.0
1.5
2.0
2.5
3.0
1976-80 1981-90 1991-2001 1991-95 1996-2001
Total Agriculture Industry
Manufacturing Services
Source: DGE&T estimates. These are considered to be underestimates, including by the DGE&T itself.
2. Low elasticity of employment and persistent dualism are the key reasons for low
employment growth in the formal manufacturing sector.62
Overall, the share of all manufacturing
jobs in total employment has remained largely unchanged. Even during the period of relatively rapid
growth between 2002 and 2005, employment elasticity of output was less than 0.3. This chapter
attempts to answer four main questions: (i) Why has employment elasticity been so low in
manufacturing? (ii) How has international trade impacted employment growth and elasticity? (iii) Is
dualism still persisting in manufacturing and, if so, why? (iv) What role is sub-contracting playing in
mitigating dualism? The last section of this chapter addresses issues related to employment growth in
the services sector.
62
Dualism refers to the concentration of employment in very low productivity jobs at one end and high
productivity jobs at the other end.

47
B. Why Has Employment Elasticity in Formal Manufacturing Been Low?
3. In fact, not only has employment elasticity been low with respect to output, it has been
fluctuating over time (Figure 3.2).
Between 1974 and the
present time, it is possible
to distinguish between
five periods, or distinct
breaks, in the value of
employment elasticity: (i)
1974-1980, when
employment elasticity
had a high positive value
of 0.99; (ii) the 1980-86
period of ‘jobless growth’
when employment
elasticity actually turned
negative (with an average
value of -0.16); (iii) the
reform period of 1986-96
which saw a recovery of
employment elasticity to
positive values
(increasing to 0.33),
although it was significantly lower than the value attained in the first period; (iv) the post-reform
period, 1996-2001, when elasticity turned substantially negative at a time when output growth also
slowed down, and; (v) the last period, since 2001, when elasticity has again turned positive, albeit to
a modest 0.28 (Table 3.1).
Table 3.1: Growth Rate of Value-added and Employment Elasticity
Period Value Added Growth Employment Elasticity
I 1974-1980 3.99 0.99
II 1980-86 6.21 -0.16
III 1986-96 10.65 0.33
IV 1996-2002 1.75 -1.42
V 2002-2005 12.54 0.28
Source: Mazumdar, 2005
4. Employment growth in manufacturing was obviously influenced by the rate of growth of
output or value-added. But, given this, what determined employment elasticity? The analysis in
this chapter suggests two main factors: (i) manufacturing producers faced adverse terms of trade for
most of this period because the prices of consumer goods used by workers increased faster than the
prices of manufactured products received by producers, and; (ii) the producers chose to use more
capital-intensive techniques of production, leading to wage growth substituting for employment
growth (this trend has also reversed since 2002). By using a model to decompose elasticity of
employment (see Box 3.1 and Appendix 3.1), three important elements that determine the value of
the employment elasticity can be identified:
Figure 3.2: Employment and Real Gross Value-added in Formal
Manufacturing- (1974/75 to 2004/05)
Employment w.r.t. GVA, 1974 to 2004
6.70
6.75
6.80
6.85
6.90
6.95
7.00
5.90 6.00 6.10 6.20 6.30 6.40 6.50 6.60 6.70 6.80 6.90 7.00
Log of GVA
Lo
g o
f E
MP
Source: Mazumdar and Sarkar, 2007.
GVA stands for Gross value-added
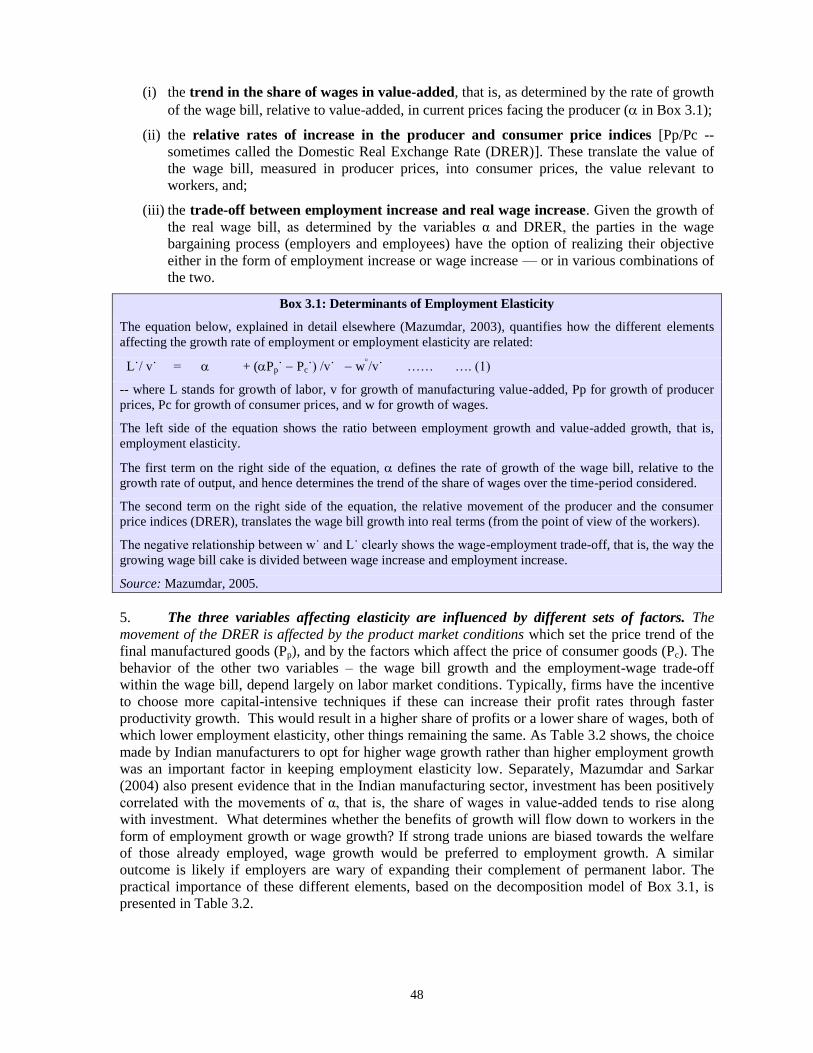
48
(i) the trend in the share of wages in value-added, that is, as determined by the rate of growth
of the wage bill, relative to value-added, in current prices facing the producer ( in Box 3.1);
(ii) the relative rates of increase in the producer and consumer price indices [Pp/Pc --
sometimes called the Domestic Real Exchange Rate (DRER)]. These translate the value of
the wage bill, measured in producer prices, into consumer prices, the value relevant to
workers, and;
(iii) the trade-off between employment increase and real wage increase. Given the growth of
the real wage bill, as determined by the variables α and DRER, the parties in the wage
bargaining process (employers and employees) have the option of realizing their objective
either in the form of employment increase or wage increase — or in various combinations of
the two.
Box 3.1: Determinants of Employment Elasticity
The equation below, explained in detail elsewhere (Mazumdar, 2003), quantifies how the different elements
affecting the growth rate of employment or employment elasticity are related:
L˙/ v˙ = + (Pp˙ Pc˙) /v˙ w/v˙ …… …. (1)
-- where L stands for growth of labor, v for growth of manufacturing value-added, Pp for growth of producer
prices, Pc for growth of consumer prices, and w for growth of wages.
The left side of the equation shows the ratio between employment growth and value-added growth, that is,
employment elasticity.
The first term on the right side of the equation, defines the rate of growth of the wage bill, relative to the
growth rate of output, and hence determines the trend of the share of wages over the time-period considered.
The second term on the right side of the equation, the relative movement of the producer and the consumer
price indices (DRER), translates the wage bill growth into real terms (from the point of view of the workers).
The negative relationship between w˙ and L˙ clearly shows the wage-employment trade-off, that is, the way the
growing wage bill cake is divided between wage increase and employment increase.
Source: Mazumdar, 2005.
5. The three variables affecting elasticity are influenced by different sets of factors. The
movement of the DRER is affected by the product market conditions which set the price trend of the
final manufactured goods (Pp), and by the factors which affect the price of consumer goods (Pc). The
behavior of the other two variables – the wage bill growth and the employment-wage trade-off
within the wage bill, depend largely on labor market conditions. Typically, firms have the incentive
to choose more capital-intensive techniques if these can increase their profit rates through faster
productivity growth. This would result in a higher share of profits or a lower share of wages, both of
which lower employment elasticity, other things remaining the same. As Table 3.2 shows, the choice
made by Indian manufacturers to opt for higher wage growth rather than higher employment growth
was an important factor in keeping employment elasticity low. Separately, Mazumdar and Sarkar
(2004) also present evidence that in the Indian manufacturing sector, investment has been positively
correlated with the movements of α, that is, the share of wages in value-added tends to rise along
with investment. What determines whether the benefits of growth will flow down to workers in the
form of employment growth or wage growth? If strong trade unions are biased towards the welfare
of those already employed, wage growth would be preferred to employment growth. A similar
outcome is likely if employers are wary of expanding their complement of permanent labor. The
practical importance of these different elements, based on the decomposition model of Box 3.1, is
presented in Table 3.2.

49
6. Because the trend in
domestic real exchange is an
important factor in determining
elasticity of employment (Table
3.2), macroeconomic management
becomes additionally important.
Table 3.2 shows that the adverse
movements of producer prices,
relative to consumer prices,
contributed significantly to making
manufacturing elasticity negative in
two periods: 1980 to 1986, and 1996 to 2002. This relative movement of prices, however, depends
not only on labor market conditions but also on overall macroeconomic factors. For instance, if real
effective exchange rates appreciate, or do not depreciate enough to maintain manufacturing
competitiveness, the domestic terms of trade can be adversely affected. As Figure 3.3 (left panel)
shows, this indeed happened in the mid-1990s: real effective exchange rates stabilized and have even
appreciated slightly since then. This was associated with an adverse movement of producer prices,
relative to consumer prices. Econometric estimates show that after controlling for time trends, there
is a robust relationship between real exchange rate appreciation and adverse movements in the
domestic real exchange rates (Figure 3.3, right panel), which in turn lowers employment elasticity.
Thus, one policy implication will be to keep real exchange rates competitive by guarding against
inflation, especially in prices of consumer goods. This, in turn, has implications for fiscal policy.
Higher deficits, government borrowing and inflation tend to appreciate real exchange rates. If the
government’s expenditure is directed disproportionately towards consumption, as was the trend in
India during the 1990s, this too would turn the domestic real exchange rate against producers and
discourage the growth of jobs. If government policy raises food prices in an artificial manner, that
will also lower manufacturing elasticity.
Figure 3.3: Changes in Real Effective Exchange Rates and Domestic Real Exchange Rates (Producer Prices to
Consumer Prices)
114.3
5114.4
114.4
5114.5
pre
ddre
r1
50 100 150 200reer
Source: Estimated from Mazumdar (2005) data and Reserve Bank of India (RBI) data on real exchange rates.
7. The other policy implication is that the wage-employment trade-off needs to be managed,
so as to not create a bias against employment. There is a cyclical pattern in the wage-employment
trade-off (as measured by the difference between the growth rates of employment and wages), which
has an important bearing on the oscillating values of employment elasticity (Table 3.2). Such a
Table 3.2:The Relative Importance of the Wage-Employment
Trade-off and the DRER Effect
Period .
L - .
w
.
pP -
.
cP
Employment
Elasticity
I 1974-1980 1.32 2.38 0.99
II 1980-1986 -4.84 -2.59 -0.16
III 1986-1996 1.71 -0.46 0.33
IV 1996-2002 -3.62 -3.85 -1.42
V 2002-2005 2.69 2.61 0.28
Source: Mazumdar and Sarkar, 2007.
0
50
100
150
200
1980 1981
1982 1983 1984 1985 1986 1987 1988 1989 1990 1991 1992 1993 1994 1995 1996 1997 1998 1999 2000 2001 2002
Producer Prices to Consumer Prices, manufacturing.
Real Effective Exchange Rates
Producer prices to consumer prices non-manufacturing
50
pattern suggests that firms treat their labor force as a ‘quasi-fixed’ factor -- a firm operates with at
least a core body of tenured workers whose size is slow to respond to changes in the current demand
for labor. Like the stock of fixed investment, the firm’s stock of ‘permanent’ workers is built up
based on its perception of expected demand. If current demand deviates from the expected demand,
the firm adjusts the labor input for the period in question by varying the number of hours worked, or
by using temporary workers, rather than adjusting the stock of labor. When manufacturing growth
accelerates in a sustained manner, as it did from 1986 to 1996 and between 2002 and 2005, it
increases expected demand and leads to employment growth overtaking wage growth.
8. An important implication here is that job security legislation (as buttressed by the state-
supported legal system) that increases the ‘fixed’ cost of hiring permanent labor, tilts the wage-
employment trade-off against employment. If the fixed cost is high, firms become cautious about
changing the complement of workers in the permanent roster and the role of expectations about
future demand becomes stronger. In this case, employment elasticity is likely to have cyclical swings
with changes in business expectations, as it happened in the case of India. As noted, the reform
period (Period III in Table 3.2) and the post-2002 period witnessed higher expectations about future
growth, leading to an increase in output and investment growth. But, while the share of wages
showed a downward trend with the increase in the investment rate, employment elasticity, while
positive, was not very high at 0.33. The employers’ perception of labor as a ‘quasi-fixed’ factor is
likely to have slowed the tilt towards employment increase. Conversely, the substantial slowdown in
industrial growth in the post-reform years (Period IV in Table 3.2), drastically reduced expectations
of future growth and led to negative employment elasticity as employers started to shed labor. A
distinct reduction in the power of labor unions in enforcing job security might also have contributed
to the large fall in employment, even as the persistent fear of the fixed cost of labor, and uncertainty
about future labor policies, encouraged labor- shedding. Thus, one policy implication is the
importance of continued labor reforms for employment expansion in manufacturing.
9. Employment reduction over the 1996-2002 period (Period IV in Table 3.2) was related to
stagnation in the value-added in manufacturing. It is obvious that while the growth rate of
manufacturing output slowed down in real terms, a more important factor was the DRER turning
against manufacturing. It is also apparent that this was partly due to the slackening of producer
prices, particularly in the domestic market. But the other major development was the increase in
consumer prices as the ‘minimum support prices’ of key agricultural commodities were increased in
the post-reform years. A turning of the terms of trade towards agriculture could be expected to
strengthen the domestic market for industrial goods. But this effect, if any, seems to have been
swamped by the direct effect of the increase in the price of wage goods, leading to higher product
wages. This leads to another important policy conclusion: the Government needs to take a broader
and more comprehensive outlook on the consequences of policies. While increase of farmers’ prices
might be desirable from some angles, its adverse effect on manufacturing, and particularly
employment in this sector, has to be recognized. Finally, the impact of another major development,
the growth of international trade, on employment, needs to be considered as well.
C. How Has Trade Affected Employment Growth in Manufacturing?
Figure 3.4: Growth of Manufacturing Exports

51
10. India underwent
significant trade
liberalization in the
1990s. Mean tariffs for
manufacturing declined
from 71 percent in the
early 1990s to 29 percent
in 2001, to about 15
percent in recent years.
The share of trade in
GDP increased from 16
percent to over 30 percent in the same period, and export growth has accelerated sharply in recent
years (Figure 3.4). Thus, a key issue is the impact that trade liberalization had on employment
growth in manufacturing, and on employment elasticity. Analysis reveals that export-oriented
industries likely experienced higher employment growth and employment elasticity. However,
overall employment growth has remained low and export patterns have not been as labor-intensive as
expected but, rather, skill-intensive and capital-intensive. We draw on two recent studies to first
show how trade impacted employment growth and elasticity, and then analyze the route through
which elasticity was impacted.
11. We examine the impact of trade on employment growth and elasticity by first classifying
industries according to their trade orientation, as presented in Table 3.3 (Ramaswamy, 2005).
Industries are classified as export-oriented, import- competing and ‘others’, based on the following
criteria: first, all the 4-digit International Standard Industrial Classification (ISIC) industries are
ranked in terms of net exports, and each industry’s export share in total manufactured exports is
estimated. Second, net exports, net exports to output, and export to output ratios for each industry are
calculated. Two industry groups are specially identified -- automobile (including the tires and tubes
industry) and food (including food, beverages and tobacco) -- for their importance in India. The
automobile sector in India has recently emerged as a global outsourcing hub for many leading
automobile manufacturers in the world and, thus, deserves to be looked at separately. The food sector
needs to be considered separately because food is an agro-product based industry. An industry is
classified as export-oriented if its net exports to output ratio is significantly positive and it figured on
the list of leading net export earners in the manufacturing sector in the year 1999. An industry is
Export of Manufactures: India
4.2
4.3
4.4
4.5
4.6
4.7
4.8
1995 1996 1997 1998 1999 2000 2001 2002 2003
Years
Log
of E
xpor
t Val
ues
Table 3.3: Industries, Classified by Trade Orientation
Category Key Industries
Export-oriented Textile Fabrics, Apparel, Footwear, Drugs & Pharmaceuticals
Import-competing Paper, Iron & Steel, Electrical & Non-electrical Machinery, Office &
Computing Machinery, TV & Communications, Watches and Plastic
Products
Food, Beverages and
Tobacco
Grain Mills, Wine, Soft Drinks, Cigarettes
Petroleum Refining
and Coal Products
Petroleum Refining Products (Naphtha, Gasoline, Diesel, etc.), Coal
& Coke Products
Auto & Tire Four-wheelers, Two-wheelers, Bicycles, Tire & Tubes, Auto
Components
Others Wood Containers, Cane, Paper, Rubber Products, Cement, Glass,
Soap & Cosmetics.
Source: Ramaswamy,2005
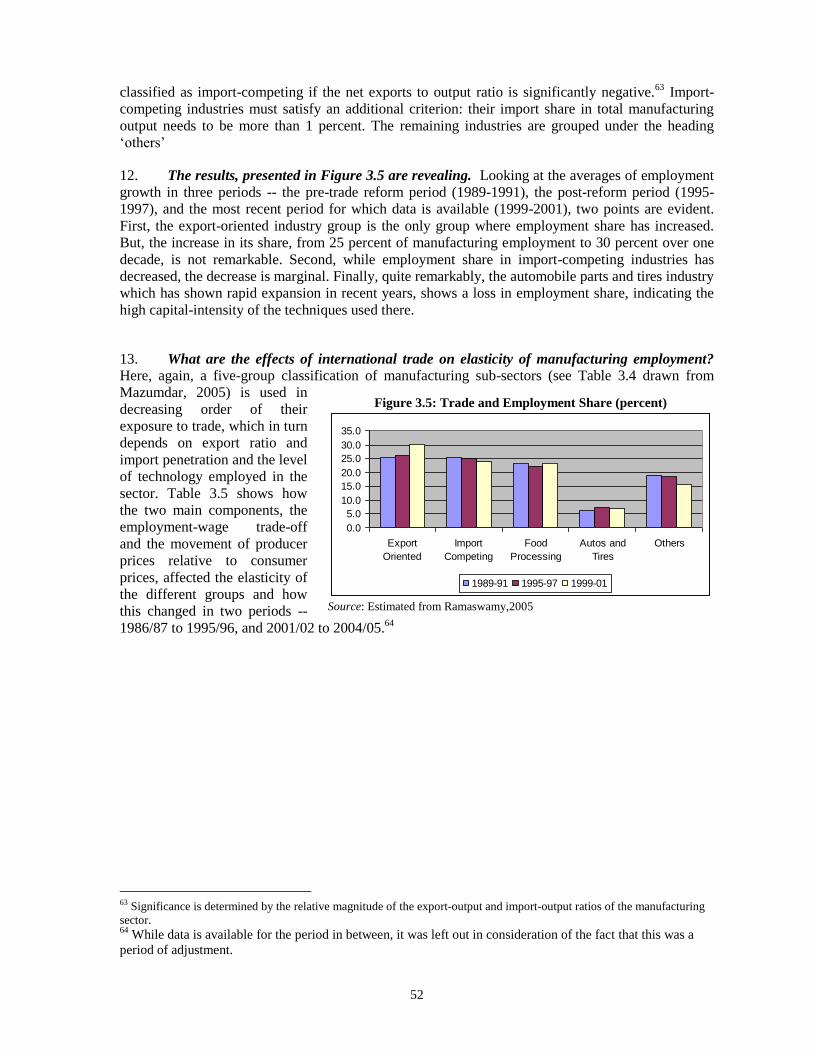
52
classified as import-competing if the net exports to output ratio is significantly negative.63
Import-
competing industries must satisfy an additional criterion: their import share in total manufacturing
output needs to be more than 1 percent. The remaining industries are grouped under the heading
‘others’
12. The results, presented in Figure 3.5 are revealing. Looking at the averages of employment
growth in three periods -- the pre-trade reform period (1989-1991), the post-reform period (1995-
1997), and the most recent period for which data is available (1999-2001), two points are evident.
First, the export-oriented industry group is the only group where employment share has increased.
But, the increase in its share, from 25 percent of manufacturing employment to 30 percent over one
decade, is not remarkable. Second, while employment share in import-competing industries has
decreased, the decrease is marginal. Finally, quite remarkably, the automobile parts and tires industry
which has shown rapid expansion in recent years, shows a loss in employment share, indicating the
high capital-intensity of the techniques used there.
13. What are the effects of international trade on elasticity of manufacturing employment? Here, again, a five-group classification of manufacturing sub-sectors (see Table 3.4 drawn from
Mazumdar, 2005) is used in
decreasing order of their
exposure to trade, which in turn
depends on export ratio and
import penetration and the level
of technology employed in the
sector. Table 3.5 shows how
the two main components, the
employment-wage trade-off
and the movement of producer
prices relative to consumer
prices, affected the elasticity of
the different groups and how
this changed in two periods --
1986/87 to 1995/96, and 2001/02 to 2004/05.64
63 Significance is determined by the relative magnitude of the export-output and import-output ratios of the manufacturing
sector. 64
While data is available for the period in between, it was left out in consideration of the fact that this was a
period of adjustment.
Figure 3.5: Trade and Employment Share (percent)
0.0
5.0
10.0
15.0
20.0
25.0
30.0
35.0
Export
Oriented
Import
Competing
Food
Processing
Autos and
Tires
Others
1989-91 1995-97 1999-01
Source: Estimated from Ramaswamy,2005

53
Table 3.5: Relative Importance of Wage-Employment Trade-off and DRER in Employment Elasticity
Sub-group L∙ − W∙ Pp∙ − Pc∙ Employment
Elasticity
L∙ − W∙ Pp∙ − Pc∙ Employment
Elasticity
1986/87 to 1995/96 1995/96 to 2001/02
High Technology/
Exposed 3.83 -1.07 0.37 -5.72 -2.36 8.05*
Medium Technology/
Exposed
6.16 -4.29 0.46 0.42 -4.55 0.13
Low Technology/
Exposed 0.51 0.84 0.40 -3.29 -6.34 -1.01
Medium Technology/
Domestic 1.38 -0.85 0.27 -3.88 -4.69 -0.98
Low Technology/
Domestic 1.30 0.21 0.43 -2.25 -1.28 -0.04
All 1.94 -0.46 0.33 -3.35 -3.85 -1.42
Note: Both output growth and employment growth are negative in this case, producing the positive elasticity.
14. The following points follow from this analysis:
Starting in the mid-1990s, elasticity of employment fell slightly in all categories,
except in the case of low technology exposed industries and medium technology
domestic industries where the elasticity increased slightly.
Sectors more exposed to trade experienced higher employment elasticity in both
periods (1986/87-1995/96 and 1995/96-2001/02). Notice that this happened even when in
some exposed sectors, producer prices fell sharply relative to consumer prices. Moreover, it
was only the medium exposed group that maintained a positive elasticity of employment (the
high exposed group had a positive elasticity only because both employment and output fell
in the second period).
Significantly, the tilt in the employment-wage trade-off towards wage growth in the
post-reform period seems to have been particularly strong in the ‘exposed’ category. This suggests that the search for competitiveness, in the wake of liberalization, induced firms
Table 3.4: Manufacturing Sub-sectors, According to Exposure to International Trade
Technology Level
plus Exposed Ratio NIC Code
Import
Penetration Export Ratio
Exposed
Ratio
Size of Sector
(percent)
High Technology/ Exposed 38 25.31 28.37 46.50 5.46
Medium Technology/
Exposed 30+35 to 37 29.50 6.05 33.76 31.77
Low Technology/ Exposed
23 to26;
28+29 2.73 15.79 18.09 23.35
Medium Technology/
Domestic 31 to 34 11.08 3.83 14.48 23.86
Low Technology/ Domestic 20, 22, 27 1.35 2.98 4.29 15.55
All 14.30 8.54 21.62 100.00
Definitions:
Import Penetration= (Value of Import)/(Value of Output - Value of Export)*100
Exposed Ratio= (Value of Export)(Value of Output)*100
Exposed Ratio= (Value of Import + Value of Export)(Value of Output)*100
Source: Mazumdar, 2005
54
in this category to opt for smaller bodies of workers with high wages. This type of labor
deployment contrasts with the alternative of a more labor-intensive solution. If so, the
expectation that liberalization was likely to increase employment by increasing the
profitability of labor-intensive products, was at least partly thwarted. Firms exposed to more
international competition may have found it important to increase product quality by raising
labor productivity. It is likely that institutional factors which raise the fixed cost of
employing labor contributed to this outcome.
Although the adverse changes in producer prices, relative to consumer prices, were
fairly widespread, the changes were relatively larger in the two ‘domestic’ sectors. This
suggests that the adverse price shift might have been more due to a slackening of the
domestic market for manufactured goods produced by these industries. This general negative
swing may also have been partly fuelled by the increase in ‘minimum support prices’ for
agricultural commodities. The need to have a general equilibrium framework for the
consequences of price policies is brought out by these results.
The updating of this analysis, with recent data covering the period 2002-2005,
suggests that employment elasticity has increased and become positive in all the groups,
except the low technology domestically oriented group. On the other hand, employment
elasticity has recovered most strongly in the low technology trade-oriented group.
15. In sum, while employment elasticity declined across the board and then increased for all
but one of the groups, it appears to have been related to the degree of exposure to trade. In the
more exposed industries, the choice of techniques that tilted towards higher wages instead of
increased employment (which is consistent with firms adjusting to raise skills and productivity of
workers) was the more important factor behind reducing elasticity in the immediate post-adjustment
period. The converse was true in the second period when manufacturing exports took off. In the more
exposed industry groups, the recent significant increase in the domestic real exchange rates has
helped to increase elasticity. In the less exposed domestic industries, the converse was important in
reducing elasticity in the 1990s. Overall, however, the elasticity of employment and employment
growth were higher in the more exposed industries.
16. The consequence of limited employment growth in the formal manufacturing sector was
that workers were absorbed either in the tertiary sector or in unorganized manufacturing. Since
the gap in labor productivity and earnings between the unorganized and the organized sectors is
large, this leads to the phenomenon of ‘dualism’ in manufacturing. There are two aspects to this
‘dualism’. The first is the productivity gap and distribution of employment between the unorganized
sector on the one hand and the organized sector, as a whole, on the other. The second is that, within
the organized sector, the distribution of employment is skewed heavily towards large firms, with
relatively small representation by small and medium enterprises. Consequently, taking organized and
unorganized manufacturing together, the distribution of employment is strongly bi-polar with two
peaks of employment, one at the low end and the other at the high end of the size spectrum, and a
wide range of size-groups with relatively smaller numbers of workers in the middle. This is the
phenomenon of the ‘missing middle’ firm size in India.
17. Underscoring the dualism in the manufacturing sector is the striking ‘missing middle’
firm size in India. A review of the size structure of manufacturing in Asian countries reveals three
major types. One is where small, medium and large firms play more or less equally important roles
and the productivity differential between the size classes is small. The second is the pattern in which
the distribution of employment by size-groups is distinctly skewed towards large firms. India belongs

55
to the third type — the ‘dualistic’ structure. In this, it shares the experience of the typical Asian
pattern which arises when modern industry is superimposed on a largely agrarian economy with a
high man-land ratio, but also having a large presence of traditional industry, albeit at a low level of
productivity (historical Japan, the Philippines, and Indonesia). Figure 3.6 shows how Indian
manufacturing employment was concentrated in the two extreme modes. While the picture presented
in Figure 3.6 refers to the 1980s when countries other than India had developed to a higher level of
GDP per capita, earlier data available for a few countries shows that India had a more marked
dualistic pattern than what these other Asian economies showed in their early stages of development.
The Indian pattern resembled that of Japan where ‘dualism’ had existed for a long time in
manufacturing, with a large concentration of employment at the low and top ends.
18. But the peculiarity of the Indian pattern is that it had an exceptionally large productivity
differential between the largest and smallest size groups — of the order of 8:1 compared to 3:1 in
the case of Japan before its era of post-War growth.65
India also contrasts dramatically with the
case of Taiwan which had a much more even distribution of employment by size classes in the
course of its manufacturing growth, and a large-small productivity differential no more than that of
Japan. Even in Korea, where distribution of employment in formal manufacturing was heavily
skewed towards large firms during the country’s early stage of development, the productivity
differential was not larger than that of Japan or Taiwan; it continued to be moderate as state policies
worked towards a redistribution of employment in the small-medium sector over the last three
decades of the 20th century.
19. Recent data shows that dualism has persisted and the concentration of the Indian labor
force in the bi-polar mode continues to the present day (Figure 3.6 Panel A). The only change,
over the period covered, seems to have been the significant reduction in the number of workers
employed in very large firms (1000 and above). The distribution is, however, still strongly bi-polar,
with the two types of employment size firms concentrated at the two extremes (those employing 6-9
people and those with 500+ employees) and accounting for 40 percent and close to 25 percent of
employment respectively. Further, over time, the productivity differentials by size-groups seem to
have changed even less than employment patterns (Figure 3.6). If anything, the extreme ‘dualism’
noticed in India, compared to other Asian countries, seems to have worsened since 1984/85, though
much of the deterioration occurred in the first half of the 1980s.
65
Broadbridge, 1966, Table 16, p.56

56
Figure 3.6: The ‘Missing Middle’ Manufacturing Firms – India Compared to Other Countries
Source: Mazumdar, 2005.
20. From a welfare point of view, the Indian pattern of manufacturing employment distribution
is least satisfactory of the several types discussed. For one thing, the absence of the ‘missing middle’
means that the bulk of the labor force is stuck in very small firms (Figure 3.7, Panel A) with low
productivity (Figure 3.7, Panel B). Second, the industrial structure offers limited opportunity for
small firms to graduate to middle-sized units. This is a serious drag on the formation of dynamic
entrepreneurship, particularly of the type oriented to searching for new technology and new markets.
Third, from an efficiency aspect, the wide difference in wages, which the dualistic structure implies,
points to a loss of output and welfare. Fourth, this pattern produces a significantly higher degree of
inequality in the distribution of earnings than a more equal size distribution of firms would.
Korea 1986
0 10 20 30 40 50
5-9
10-49
50-99
100-199
200-499
500+
Percentage distribution of employment
India 1989-90
0 10 20 30 40 50
5-9
10-49
50-99
100-199
200-499
500+
Percentage distribution of employment
Hong Kong 1982
0 10 20 30 40 50
5-9
10-49
50-99
100-199
200-499
500+
Percentage distribution of employment
Malaysia 1981
0 10 20 30 40 50
5-9
10-49
50-99
100-199
200-499
500+
Percentage distribution of employment

57
Figure 3.7: India – Distribution of Employment and Productivity by Size-Groups
Panel A: Distribution of Employment (in percent) in Manufacturing
Firms by Employment Size Groups
0
5
10
15
20
25
30
35
40
45
6-9 10-49 50-199 200-499 500+
Panel B: Index of Labor Productivity by Size of Firms
0
20
40
60
80
100
120
6-9 10-49 50-199 200-499 500+
1984-85 1994-95 2000-01
Source: Mazumdar, 2005
21. It is worth emphasizing that the persistence of dualism in India appears to cut across most
manufacturing sub-sectors. Data disaggregated by sectors show that in 14 of the 18 large (two-
digit) industry groups, the largest share of workers is found in the group of firms employing 10-99
workers (Figure 3.8). When 2000/01 figures are compared with those from 1994/95, it is seen that
there was a loss in the share of employment in the 100-199 class for as many as 13 out of 18
industries (Table 3.7).
Figure 3.8: Distribution of Employment by Firm Size in Manufacturing Sub-sectors
0%
20%
40%
60%
80%
100%
Food
Bevera
ge,
tobacco
Cotto
n
Textile
s
Oth
er T
extile
s
Jute
Textile
Pro
ducts
Wood
Paper
Leath
er
Chem
icals
Rubber
Non-M
eta
llic
Min
era
ls
Basic
Meta
ls
Meta
l
Pro
ducts
Machin
ery
Tra
nsport
Equip
ment
Mis
cella
neous
Repairs
10-99 100-199 200-499 500-999 1000-1999 above 2000
Source: Annual Survey of Industries, 2000/01, and Central Statistical Organization (CSO)

58
Table 3.6: Change in Employment Share, by Factory Size,
1994-2000: Gainers and Losers
Employment Size Class of Factories
10-99
Workers
100-
199
200-
499
500-
999
1000-
1999
Above
2000
Food 3.5 -4.7 -2.0 -5.6 2.3 5.4
Beverage & Tobacco -48.9 -3.4 -4.7 -11.5 2.4 63.0
Cotton Textiles 5.0 -6.5 -4.3 -3.1 -5.4 -1.0
Other Textiles 0.1 -1.6 7.2 -3.0 -6.7 -1.4
Jute 0.6 -0.1 -0.5 0.9 -4.4 3.3
Textile Products -11.3 -9.4 18.8 5.8 4.3 4.7
Wood -12.8 1.9 4.9 1.7 2.3 0.0
Paper 13.0 -3.4 1.5 -5.5 -4.9 -0.2
Leather -4.1 -11.7 16.7 0.9 5.3 -4.3
Chemicals -11.8 4.9 5.7 0.1 -2.5 1.5
Rubber 19.0 -8.7 0.2 -4.0 1.6 -5.8
Non-Metallic Minerals 3.0 -3.5 0.9 -0.5 3.0 -1.7
Basic Metals 5.3 -4.0 -4.3 -7.2 -0.5 3.0
Metal Products 1.9 0.2 7.4 -1.9 1.3 -6.4
Machinery 4.4 -4.5 6.7 -0.4 1.4 -9.0
Transport Equipment 7.4 1.4 1.3 2.5 0.1 -15.7
Miscellaneous -5.7 -7.3 7.8 -3.8 -6.2 15.5
Repairs 50.9 -0.2 -1.5 -5.9 -4.7 -27.4
Source: Authors' estimates based on Tables 3.1 and 3.2
22. The fall in the share of firms employing 100-199 workers, in a large number of industries,
may have been partly due to the rising practice of using contract labor. A look at disaggregated
groups of industries shows that contract intensity in export-oriented or import-competing industries
peaked in the 100-199 group (Table 3.7). This happened, probably, in response to firms searching
for more flexible ways to increase output.
Table 3.7: Contract Intensity (Percent of Contract Labor) by Size of Factory in Six Industry Groups:
2000-2001
Employment
Size-Class
Export-
Oriented
Import- Competing Food Auto & Tire Petroleum Others
0-9 3.0 2.5 5.8 1.2 3.7 4.4
10-99 10.6 11.6 21.2 8.6 10.5 22.7
100-199 18.7 18.9 17.7 16.2 19.4 18.6
200-299 14.6 15.6 21.3 18.1 36.5 14.1
300-above 7.6 16.1 38.2 6.2 15.3 19.6
All Factories NE NE NE NE NE NE
Source: Ramaswamy, 2005.
Table 3.8: Distribution of Manufacturing Employment

59
23. As noted in the beginning
of this chapter, dualism also exists
and has persisted between the
organized (also known as
‘registered’) and the unorganized
sectors. Unorganized sector firms
are those which use power and
employ less than 10 workers, the
threshold size of registered sector
firms.7 Their employment share is
very large – nearly 3/4th of the
manufacturing labor force -- and the
productivity gap between them and
organized sector firms is huge
(Table 3.8). In the early post-reform
years, when organized sector
employment share increased
marginally, the productivity gap
between unorganized and organized
sectors widened even more. In the
more recent period, between 1994
and 2001, the employment share of
the organized sector tended to fall.
24. Although the outsourcing of production from formal sector firms to informal sector firms
can mitigate dualism, this does not appear to be the experience in India. For instance, it is well
known that the Japanese system of dualism in the manufacturing sector enhanced efficiency, both in
the static and dynamic aspects, by the vital system of outsourcing (Little, Mazumdar and Page,
1987). But while there is some evidence of this happening in Indian manufacturing, a good deal of
outsourcing is in the nature of ‘capacity outsourcing’ in response to the perceived limits to grow
beyond the threshold size, and not driven by a need to increase efficiency.
25. In India, most
outsourcing takes place by
small, unregistered firms. In
the case of the food industry,
small firms procure as much
as 36 percent of their output
from other firms (Table 3.9).
This suggests that firms have
a strong incentive to not
expand beyond the size
group of 9, to avoid
becoming registered firms.
26. This issue can also be looked at from the viewpoint of the firms in the unorganized sector
which do the sub-contracted work. Using the questions canvassed in the ‘Unorganized Sector
Survey’ of 2000/01, Unni (2005) reported that 30 percent of unorganized sector firms undertook sub-
contracted work (Table 3.10). The industries in which this percentage was particularly high were:
Organized Sector Share of Employment
No. of
workers in
firms
1984/85 1994/95 2000/01
100+ workers 10.0 11.8 10.2
10-100
workers
15.0 18.4 16.3
Total
Organized
25.0 30.2 26.5
Unorganized Sector Share of Employment
DME (6-9
workers)
9.7 12.8 14.1
NDME (1-6
workers)
65.2 9.2 10.4
OAME
(family
operated)
47.9 49.0
Total
Unorganized
74.9 69.8 73.4
Total 100.0 100.0 100.0
Source: Unni (2005), NSS Unorganized Sector Survey Module.
Table 3.9: Product Outsourcing Intensity, by Employment Size of
Factories: 2000/01
Employment
Size
Export-
oriented
Import-
Competing
Auto Food Others
0-9 22.1 26.2 - 36.2 11.2
10-99 8.8 11.4 27.6 12.5 11.8
100-199 6.1 9.1 7.7 7.4 4.7
200-299 7.7 6.2 - 10.5 5.6
Above 300 6.3 3.4 4.0 8.6 4.2
Total 6.3 4.0 6.0 10.0 5.1 Source: Estimated from Ramaswamy, 2005.

60
Tobacco Products (National Industrial Classification, NIC, code 89), Textiles (NIC 56), Chemical
Products (NIC 67), and Office Accounting and Computing (NIC 64). Other key points revealed
were:
The distribution of sub-contracted firms by place of work showed that an
overwhelming number of them (81.2 percent) operated from home. Only 15 percent
operated from business premises. In the chemical industry, the percentage of home-based
firms was as high as 95 percent, suggesting that modern industry had clearly penetrated the
lowest segments of the informal sector.
Besides sub-contracted production work, unorganized sector firms were also linked
through service contracting. The Unorganized Manufacturing Sector Survey captured the
‘receipts from services provided to others, including commission charges’. From this, the
subcontracting-in of services undertaken by firms can be estimated. About 67 percent of
firms reported undertaking sub-contracted service activities, with DMEs (firms with 6-9
workers) less likely to undertake this activity compared to the NDME (firms with 1-5
workers) and OAME (owner-operated family firms) firms. Such service contracts were not
necessarily regular arrangements between two firms and were probably only indicative of
market interactions between firms.
Is the sub-contract undertaken by a firm ‘vertical’ or ‘horizontal’ sub-contracting? In
‘vertical’ sub-contracting, the firm is fully dependent upon the parent
firm/middleman/contractor to supply the raw material, design and equipment. This can be
called a form of transfer of technology between firms. In ‘horizontal’ sub-contracting, the
firm is independent and sources its raw material, design and equipment on its own.
According to Watanabe (1983), the majority of Indian firms which undertook sub-
contracting work were ‘vertical’ sub-contractors and only 1.6 percent of the 30.7 percent
firms involved in sub-contracting could be called the ‘horizontal’ types.
27. Vertical sub-contracting can facilitate the transfer of technology because the sub-contracted
firm supplies raw material, equipment and sometimes the design also. But, again, this is not the
case in India. While 88 percent of firms received raw material from contractors, only 7 percent were
supplied equipment. The designs were specified by contractors for 93 percent of firms. These
numbers were similar across different sizes of firms for both design specification and equipment
supply, but there was a slight variation with regard to the supply of raw material. A significantly
higher proportion of OAME firms received raw materials, compared to NDME and DME firms. The
vertical linkages of raw materials and design specifications were much higher in modern industries
than in traditional industries. Across industry groups, more modern industries were supplied with
equipment, compared to traditional industries.
28. Overall, these findings suggest that sub-contractors in Indian manufacturing are yet to
graduate from their ‘dependant’ status and become independent producers that seek out the
mother firms — a development that underlies the success of the Japanese model of sub-
contracting.
Table 3.10: Proportion and Distribution of Firms Subcontracting-In, by Location and Industry Group:
2000/01
Industry
Proportion of Sub-
contracting
Firms
Distribution of
Sub-contracting Firms by Location
Total At Home Outside
No Fixed
Premises Total

61
29. Dualism in manufacturing has persisted even after 15 years of liberalizing reforms. This
suggests that the factors that created dualism have not altered significantly, despite significant policy
changes. One change in the post-reform period was the virtual elimination of the reservation of
specific product lines as the excusive purview of the small-scale sector. Secondly, the liberalization
of imports of consumer goods also profoundly altered the monopoly of small-scale producers in
these markets. A third change was that efforts were made to reduce the strength of capital market
segmentation. Despite these, surprisingly, available survey data show, the size structure of industry
has hardly changed in the last 25 years.
30. The fact that there is little change in the size structure of the manufacturing industry
implies, possibly: (i) segmentation of factor markets — in labor and capital — is more important in
supporting dualism than product market segmentation which the reservation policy encouraged, and;
(ii) once the specialization by small and large firms in different segments of the product market has
been firmly established, it is difficult for firms to alter their market positions easily, especially in the
short- to medium-term.
31. There are four important reasons for the emergence and persistence of the Indian pattern
of dualistic industrial structure:
14. Cotton Gin, Cleaning & Bailing 8.3 6.9 93.1 0.0 100
15. Food Products 3.6 71.1 23.5 5.4 100
16. Tobacco Products 89.3 99.1 0.8 0.1 100
17. Textiles 55.5 89.7 10.3 0.1 100
18. Apparels 17.4 70.5 29.4 0.1 100
19. Leather Products 23.7 66.2 33.8 0.0 100
20. Wood (except Furniture) 11.3 58.9 16.3 24.8 100
21. Paper & Paper Products 42.0 80.2 19.8 0.1 100
22. Publishing, Printing 39.6 31.7 68.3 0.0 100
23. Coke, Refined Petroleum 0.3 0.0 100.0 0.0 100
24. Chemical Products 66.8 95.9 4.1 0.0 100
25. Rubber Products 42.6 59.0 40.9 0.0 100
26. Nonmetallic Mineral Products 5.6 69.4 29.6 1.0 100
27. Basic Metals 36.5 36.9 63.1 0.0 100
28. Fabricated Metal Products 22.1 39.8 59.7 0.4 100
29. Machinery and Equipment 22.0 25.2 73.9 0.9 100
30. Office Accounting & Computing 63.6 0.0 100.0 0.0 100
31. Electrical Machinery 32.0 57.0 43.0 0.0 100
32. Radio, TV, Communications 46.8 44.8 55.2 0.0 100
33. Medical, Precision, Optical 37.7 33.5 66.5 0.0 100
34. Motor Vehicles 48.1 7.3 92.7 0.0 100
35. Other Transport Equipment 42.7 22.7 77.3 0.0 100
36. Furniture & Other Manufactures 35.4 52.1 37.8 10.1 100
37. Recycling 44.2 61.0 39.0 0.0 100
Total 30.7 82.0 15.3 2.6 100
Source: Data from Unorganized Manufacturing Sector Survey, 2000/01, New Delhi, Central Statistical
Organization; Unni (2005).

62
The first is labor market segmentation which ensures that wage levels (even after
controlling for human capital attributes or skill levels of workers) increase sharply with firm
size. Even if there are some economic reasons for the prevalence of this size-wage
relationship (for example, efficiency wages could be higher in larger units due to the cost of
managing larger groups of workers), there can be no doubt that these are cemented, and
indeed augmented, by institutional factors. For example, for a long time, in many industries,
wage boards were responsible for setting wage levels. Their rulings on wage levels for
different classes of firms were based partly on the levels of labor productivity attained. This
strengthened the high productivity-high wage nexus found in larger firms. At the same time,
labor laws also impact through inducing large firms with more capital assets to invest in
labor-saving techniques, leading to higher labor productivity and wages (see Chapter 5 for
more on this). Finally, wages in the public sector, which dominates employment in the
formal sector, are set above the market rates for most workers. This is another factor that
segments the labor market in all sectors. It can also lead to unemployment as educated
workers queue up and wait for public sector jobs (See Box 3.2)
Capital market segmentation and a generous depreciation allowance make the
availability and cost of capital significantly more favorable for large firms. This group of
factors works in the same direction as labor market segmentation, in inducing firms to adopt
more capital-using and labor-saving methods. The net effect is to strengthen forces which
increase the small-large differential in labor productivity and wages.
Product market segmentation differentiates between small and large firms by the
quality of the products (even in the same general category) in which they specialize. Smaller
firms opt for low-quality, labor-intensive sub-categories of products which cater to the needs
of low-income groups. The result is a further strengthening of the factors that create the gap
in labor productivity (value-added per worker) between large and small firms.
32. Reservation policies have been largely abandoned in the post-reform years since 1997,
both by increasing the size of investment permissible to qualify as a small-scale industry, and by
‘de-reserving’ specific sectors. In any event, the impact of this policy lost its bite with the
liberalization of imports and increased competition in the market for consumer goods which were the
mainstay of the small-scale sector in manufacturing.
33. However, there still exist a number of fiscal subsidy programs and policies that discourage
firm growth. For instance, there are fiscal and credit market benefits to enterprises below a certain
size. Thus, there are built-in disincentives for enterprises to go beyond this size limit. In addition,
labor laws on wages, benefits and job security apply to units above the critical size. Enterprises
graduating out of the protected small-sector thus face extra costs, even as they are denied the benefits
of fiscal subsidies and other programs. This causes a polarization of the industrial structure even
within the same sector -- small-scale and large enterprises have increasingly occupied different
niches of the market in the same industry (Box 3.2).8
Box 3.2: Wage-setting in the Public Sector
Wages of central Government employees are revised on the recommendations of the Pay Commissions,
specially appointed at intervals of approximately ten years by the federal Government. For state Government
employees, State Pay Commissions are appointed by the respective states, which may endorse in full or
partially the recommendations of the central government’s Pay Commissions. (In the central public sector
undertakings, there are periodic wage settlements between management and workers, four years being the
typical duration of a wage agreement.) The recommendations of the Pay Commissions usually revolve around
fixing a minimum pay, determining maximum pay, neutralizing the rise in the cost of living (dearness
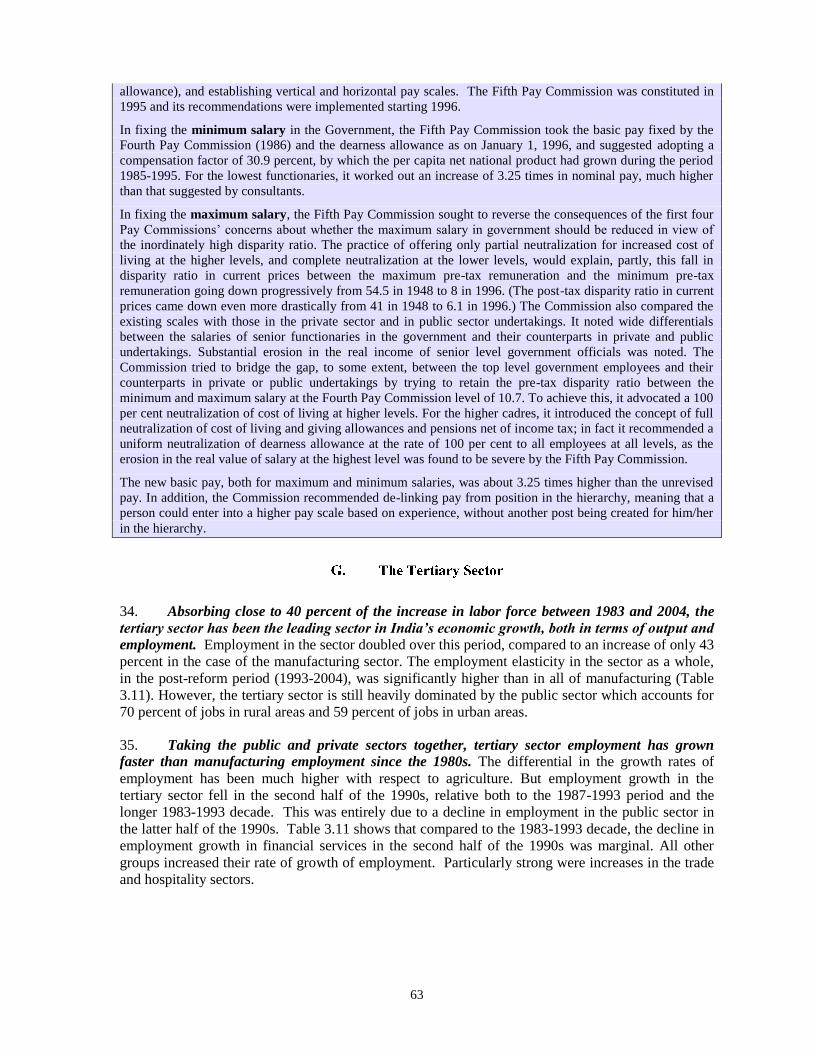
63
allowance), and establishing vertical and horizontal pay scales. The Fifth Pay Commission was constituted in
1995 and its recommendations were implemented starting 1996.
In fixing the minimum salary in the Government, the Fifth Pay Commission took the basic pay fixed by the
Fourth Pay Commission (1986) and the dearness allowance as on January 1, 1996, and suggested adopting a
compensation factor of 30.9 percent, by which the per capita net national product had grown during the period
1985-1995. For the lowest functionaries, it worked out an increase of 3.25 times in nominal pay, much higher
than that suggested by consultants.
In fixing the maximum salary, the Fifth Pay Commission sought to reverse the consequences of the first four
Pay Commissions’ concerns about whether the maximum salary in government should be reduced in view of
the inordinately high disparity ratio. The practice of offering only partial neutralization for increased cost of
living at the higher levels, and complete neutralization at the lower levels, would explain, partly, this fall in
disparity ratio in current prices between the maximum pre-tax remuneration and the minimum pre-tax
remuneration going down progressively from 54.5 in 1948 to 8 in 1996. (The post-tax disparity ratio in current
prices came down even more drastically from 41 in 1948 to 6.1 in 1996.) The Commission also compared the
existing scales with those in the private sector and in public sector undertakings. It noted wide differentials
between the salaries of senior functionaries in the government and their counterparts in private and public
undertakings. Substantial erosion in the real income of senior level government officials was noted. The
Commission tried to bridge the gap, to some extent, between the top level government employees and their
counterparts in private or public undertakings by trying to retain the pre-tax disparity ratio between the
minimum and maximum salary at the Fourth Pay Commission level of 10.7. To achieve this, it advocated a 100
per cent neutralization of cost of living at higher levels. For the higher cadres, it introduced the concept of full
neutralization of cost of living and giving allowances and pensions net of income tax; in fact it recommended a
uniform neutralization of dearness allowance at the rate of 100 per cent to all employees at all levels, as the
erosion in the real value of salary at the highest level was found to be severe by the Fifth Pay Commission.
The new basic pay, both for maximum and minimum salaries, was about 3.25 times higher than the unrevised
pay. In addition, the Commission recommended de-linking pay from position in the hierarchy, meaning that a
person could enter into a higher pay scale based on experience, without another post being created for him/her
in the hierarchy.
34. Absorbing close to 40 percent of the increase in labor force between 1983 and 2004, the
tertiary sector has been the leading sector in India’s economic growth, both in terms of output and
employment. Employment in the sector doubled over this period, compared to an increase of only 43
percent in the case of the manufacturing sector. The employment elasticity in the sector as a whole,
in the post-reform period (1993-2004), was significantly higher than in all of manufacturing (Table
3.11). However, the tertiary sector is still heavily dominated by the public sector which accounts for
70 percent of jobs in rural areas and 59 percent of jobs in urban areas.
35. Taking the public and private sectors together, tertiary sector employment has grown
faster than manufacturing employment since the 1980s. The differential in the growth rates of
employment has been much higher with respect to agriculture. But employment growth in the
tertiary sector fell in the second half of the 1990s, relative both to the 1987-1993 period and the
longer 1983-1993 decade. This was entirely due to a decline in employment in the public sector in
the latter half of the 1990s. Table 3.11 shows that compared to the 1983-1993 decade, the decline in
employment growth in financial services in the second half of the 1990s was marginal. All other
groups increased their rate of growth of employment. Particularly strong were increases in the trade
and hospitality sectors.

64
Table 3.11: Employment Elasticities for Different Sectors and Periods
Growth Rates of GDP Growth Rates of
Employment
Elasticity of Employment
NIC Industry
1993/94 -
1999/00
1983-
1993/94
1993/94
-
1999/00
1983-
1993/94
1993/94 -
1999/00
1
Agriculture &
Allied Activities 2.7 4.8 2.9 1.4 2.2 0.7 0.503 0.459 0.250
2&3
Mining,
Quarrying and
Manufacturing 5.8 6.1 5.2 4.2 3.8 -4.2 0.726 0.628
-
0.806
4
Electricity, Gas
and Water 5.2 5.2 7.3 2.0 1.4 1.9 0.382 0.262 0.262
5 Construction 7.9 7.9 6.9 3.9 3.9 -2.3 0.488 0.499 -
0.331
6
Trade, Hotels and
Restaurants 4.6 5.3 6.4 5.5 0.1 6.4 1.183 0.024 1.007
7
Transport,
Storage &
Communications 5.3 5.6 9.2 3.9 3.4 6.3 0.741 0.608 0.691
8
Financial,
Insurance, Real
Estate &
Business Services 5.8 5.6 9.4 3.5 3.5 5.4 0.608 0.629 0.570
9
Personal,
Business and
Community
Services 9.62
10.
5 8.4 5.3 4.4 5.6 0.555 0.416 0.666
6+7+8+
9
Tertiary
5.4 4.9 8.6 3.6 4.4 -1.2 0.663 0.900
-
0.137
All Sectors 6.4 6.5 8.8 3.8 3.9 3.1 0.590 0.597 0.346
Source: National Accounts for GDP and NSS for Employment (Based on UPS employment estimates)
36. It is possible to give estimates of employment in the formal and informal sub-sectors, in
tertiary activities, on the basis of some accepted criteria. Estimates for 1999/00 show that the formal
sector accounted for a quarter of tertiary employment in the rural areas, and more than a third of
employment in the urban economy. Even after the decline in public sector employment in the post-
reform period, this sector still accounts for more than half of formal tertiary employment in the urban
areas and more than 70 percent in the rural (See Box 3.3). In the absence of time-series data for the
formal and informal sectors in the tertiary sector, trends in low- and high-paid employment in the
sector have been analyzed by looking at changes in the entire distribution of earnings in this sector
over time. The issue has been examined from several angles:
Productivity differentials between sectors. The average productivity in the tertiary sector
as a whole is pulled up by the high value in the financial sub-sector, but seems to be about
the level of manufacturing (in 2000) in most sectors, except trade (where it is 20 percent
lower).
There is indeed some evidence to support the general perception that some sub-groups
like consumer services have witnessed a relatively large influx of labor, pushing down their
relative productivity to some extent, while others like business services have improved their
position due to demand factors.
Box 3.3: Composition of Employment in the Tertiary Sector
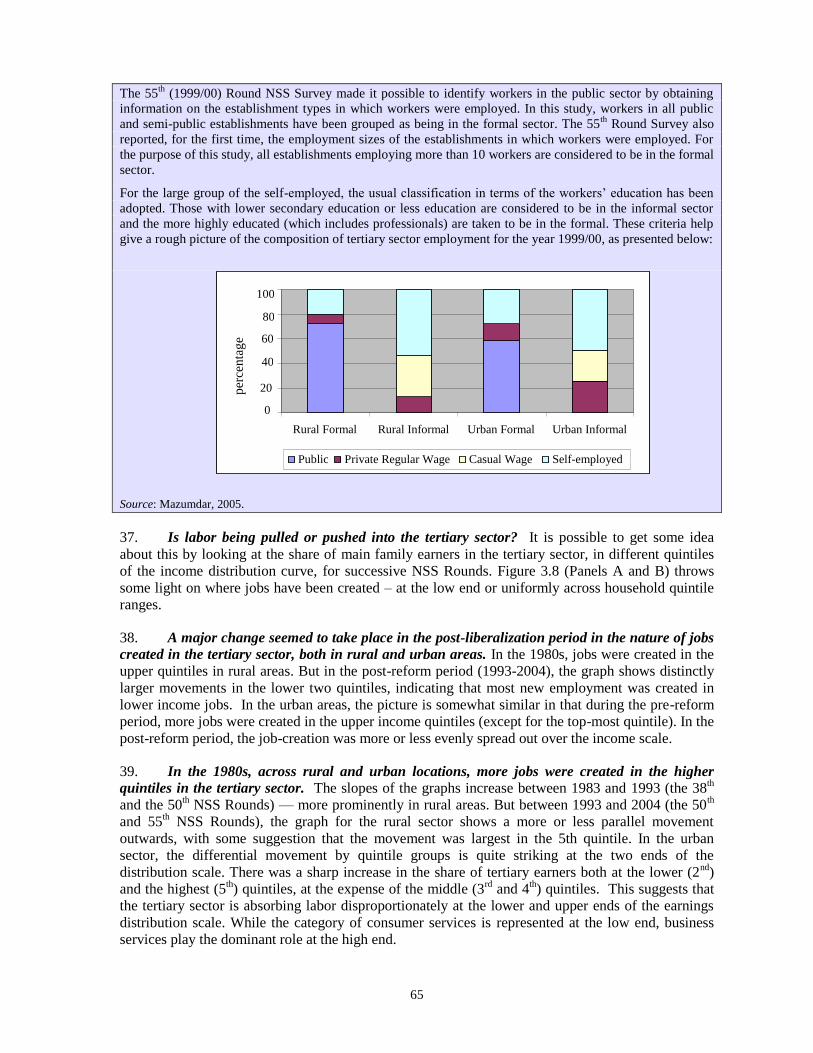
65
The 55th
(1999/00) Round NSS Survey made it possible to identify workers in the public sector by obtaining
information on the establishment types in which workers were employed. In this study, workers in all public
and semi-public establishments have been grouped as being in the formal sector. The 55th
Round Survey also
reported, for the first time, the employment sizes of the establishments in which workers were employed. For
the purpose of this study, all establishments employing more than 10 workers are considered to be in the formal
sector.
For the large group of the self-employed, the usual classification in terms of the workers’ education has been
adopted. Those with lower secondary education or less education are considered to be in the informal sector
and the more highly educated (which includes professionals) are taken to be in the formal. These criteria help
give a rough picture of the composition of tertiary sector employment for the year 1999/00, as presented below:
Source: Mazumdar, 2005.
37. Is labor being pulled or pushed into the tertiary sector? It is possible to get some idea
about this by looking at the share of main family earners in the tertiary sector, in different quintiles
of the income distribution curve, for successive NSS Rounds. Figure 3.8 (Panels A and B) throws
some light on where jobs have been created – at the low end or uniformly across household quintile
ranges.
38. A major change seemed to take place in the post-liberalization period in the nature of jobs
created in the tertiary sector, both in rural and urban areas. In the 1980s, jobs were created in the
upper quintiles in rural areas. But in the post-reform period (1993-2004), the graph shows distinctly
larger movements in the lower two quintiles, indicating that most new employment was created in
lower income jobs. In the urban areas, the picture is somewhat similar in that during the pre-reform
period, more jobs were created in the upper income quintiles (except for the top-most quintile). In the
post-reform period, the job-creation was more or less evenly spread out over the income scale.
39. In the 1980s, across rural and urban locations, more jobs were created in the higher
quintiles in the tertiary sector. The slopes of the graphs increase between 1983 and 1993 (the 38th
and the 50th NSS Rounds) — more prominently in rural areas. But between 1993 and 2004 (the 50
th
and 55th NSS Rounds), the graph for the rural sector shows a more or less parallel movement
outwards, with some suggestion that the movement was largest in the 5th quintile. In the urban
sector, the differential movement by quintile groups is quite striking at the two ends of the
distribution scale. There was a sharp increase in the share of tertiary earners both at the lower (2nd
)
and the highest (5th) quintiles, at the expense of the middle (3
rd and 4
th) quintiles. This suggests that
the tertiary sector is absorbing labor disproportionately at the lower and upper ends of the earnings
distribution scale. While the category of consumer services is represented at the low end, business
services play the dominant role at the high end.
0
20
40
60
80
100
Rural Formal Rural Informal Urban Formal Urban Informal
Public Private Regular Wage Casual Wage Self-employed
per
cen
tag
e
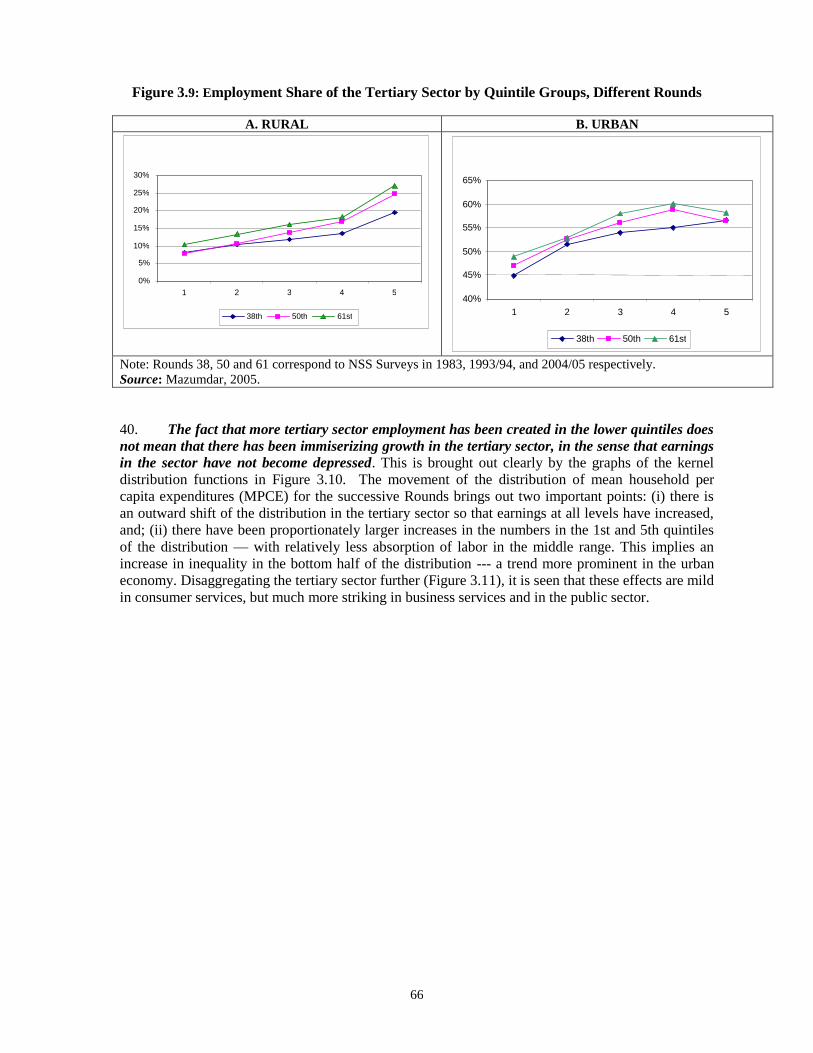
66
Figure 3.9: Employment Share of the Tertiary Sector by Quintile Groups, Different Rounds
A. RURAL B. URBAN
Note: Rounds 38, 50 and 61 correspond to NSS Surveys in 1983, 1993/94, and 2004/05 respectively.
Source: Mazumdar, 2005.
40. The fact that more tertiary sector employment has been created in the lower quintiles does
not mean that there has been immiserizing growth in the tertiary sector, in the sense that earnings
in the sector have not become depressed. This is brought out clearly by the graphs of the kernel
distribution functions in Figure 3.10. The movement of the distribution of mean household per
capita expenditures (MPCE) for the successive Rounds brings out two important points: (i) there is
an outward shift of the distribution in the tertiary sector so that earnings at all levels have increased,
and; (ii) there have been proportionately larger increases in the numbers in the 1st and 5th quintiles
of the distribution — with relatively less absorption of labor in the middle range. This implies an
increase in inequality in the bottom half of the distribution --- a trend more prominent in the urban
economy. Disaggregating the tertiary sector further (Figure 3.11), it is seen that these effects are mild
in consumer services, but much more striking in business services and in the public sector.
40%
45%
50%
55%
60%
65%
1 2 3 4 5
38th 50th 61st
0% 5%
10% 15% 20% 25% 30%
1 2 3 4 5
38th 50th 61st

67
Figure 3.10: Kernel Density Functions of Expenditure Per Capita in the Tertiary Sector,
Different Rounds: 1. Rural; 2. Urban
0
.001
.002
.003
.004
0 500 1000 1500 2000 0 500 1000 1500 2000
1 2
43rd round 50th round
55th round
kden
sity
mpc
e30_
c
x
Graphs by sector
Figure 3.11: Kernel Density Functions by Major Sub-groups of the Tertiary Sector
0
.001
.002
.003
.004
0
.001
.002
.003
.004
0 500 1000 1500 2000 0 500 1000 1500 2000
6 7
8 9
43rd round 50th round
55th round
kden
sity
mpc
e30_
c
x
Graphs by nic_1
6: Trade, Hotels and Restaurants; 7: Transport, Storage and Communication; 8: Finance, Real
Estate and Business Activities; 9: Public, Community and Personal Services
41. The finding that labor is being absorbed more in the lower and upper parts of the earnings
distribution scale raises the question: is ‘dualism’ greater in the tertiary sector? As noted earlier,
‘dualism’, in terms of the gap between low and high earners, is high in manufacturing in the Indian
economy. If the dualism is stronger in the tertiary sector, then the ‘net’ tertiary-manufacturing
differential, after controlling for other major determinants of earnings (like human capital attributes),
would be expected to increase when moving up the scale in earnings distribution. Quantile
regressions on the 55th Round of the NSS were used to estimate the net differential at the five
quintiles of the distribution.66
Dummies for the sectors (with primary as base) were used in the
regressions, along with a set of other explanatory variables. The latter included education, age, sex,
66 The quantile regression technique estimates the coefficients of the explanatory variables, not just at the mean values as in
ordinary least squares estimation, but at each of their five quintile values. Thus, the dummies of the sector coefficients
which have been used to show the ‘net’ earnings differential in the sector concerned (tertiary or secondary), with respect to
the base (primary) at five points of the expenditure (or earnings) distribution of the latter (Mazumdar, 2005).

68
and urban/rural location. The exercise was done separately for mean per capita expenditures
(MPCE) of households (in which the characteristics of the ‘main earner’ were used for the
explanatory variables) and for monthly earnings of regular wage earners. There were some
differences in the sets of explanatory variables used in each case.
42. The coefficients of the tertiary and manufacturing dummies at the different quintiles are
given in Table 3.12 and they are graphed in Figure 3.12. They show the ‘net’ difference in MPCE
with respect to the base, the agricultural sector. The differential is, all along, higher for tertiary sector
workers. The gap between the agricultural and tertiary sectors increases in the middle range and
diminishes, somewhat, only at the highest quarter of the distribution.
Table 3.12: Values of Dummies of Quantile Regressions: 55th
NSS Round
Co-efficients of Dummies
(Base= Primary) Q5 Q25 Q50 Q75 Q95
Mean Per Capita Household Expenditures
Tertiary 0.048 0.08 0.108 0.128 0.172
Secondary 0.024 0.05 0.064 0.079 0.145
Figure 3.12: Coefficients of (Dummy) Variables from Quantile Regressions on Mean Per Capita
Expenditures
Source: Mazumdar, 2006.
43. The conclusion is that dualism is quantitatively more important in the tertiary sector when
the ‘net’ earnings of the lowest quintile are compared with those of the higher quintile — except
that the difference is reduced for the highest quintile. There is, thus, some support for the popular
perception that the tertiary sector is home to a body of low-earners, more so than the secondary
sector.
0
0.05
0.1
0.15
0.2
0 1 2 3 4 5 6
Tertiary
Secondary

69
4: DO REGIONAL DIFFERENCES IN LABOR MARKET OUTCOMES
IMPLY?
44. Not only are there significant differences in labor market outcomes across India’s states
and regions, these differences have also been persistent. Employment outcomes have been
consistently poor in the northeastern states, the northern states of Uttar Pradesh and Bihar, the coastal
regions of Orissa and Kerala, and the former French and Portuguese colonies of Goa and
Pondicherry respectively. One important exception to these differences is real wages (wages adjusted
for inflation), which show a slight tendency to converge across regions and, more robustly, across
rural and urban areas. This exception helps explain why migration rates across Indian states have
been unusually low, as have urbanization rates
45. Two proximate factors stand out as the main drivers behind regional differences. First,
contrary to the widespread perception of ‘jobless’ growth, differences in economic activity
levels (that is, GSDP) and economic growth affect employment, earnings and unemployment
rates significantly. However, the GSDP and employment nexus is not robust in the short run,
indicating that regulations, which differ from state to state, play a role in affecting the labor market.
The second proximate factor is differences in female participation rates which, in turn, depend
largely on the opportunities for employment and earnings.
46. The Labor market outcomes vary significantly across India’s 32 states and 78 regions.67
The differences can be dramatic --for instance, male employment rates can vary from 65 percent to
83 percent and female participation rates from 10 percent to 53 percent.68
In 1999/00, rural weekly
earnings in one region were less than one-tenth of weekly earnings in another. Further, not only are
these differences large, they have persisted over the past two decades. In this context, some
important questions would be: What can regional differences tell us about the determinants of labor
market outcomes in India? What role do economic growth and economic activity levels play in
affecting labor market outcomes? Why do female participation rates vary so dramatically across
India’s states and regions and what light can this phenomenon throw on the decline in female
participation rates in the 1990s?
67 This refers to the 78 regions in the NSS, which correspond loosely to agro-ecological areas. 68 Employment rate refers to the share of the population in the 15-59 age group which is employed.
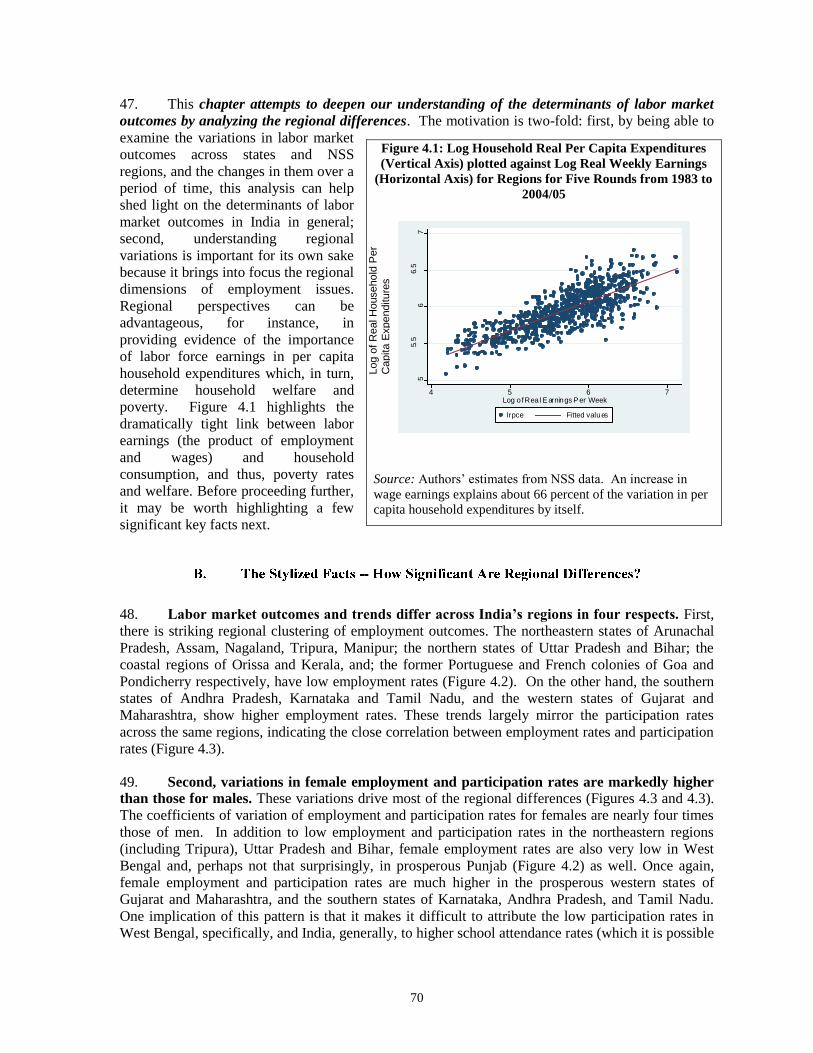
70
47. This chapter attempts to deepen our understanding of the determinants of labor market
outcomes by analyzing the regional differences. The motivation is two-fold: first, by being able to
examine the variations in labor market
outcomes across states and NSS
regions, and the changes in them over a
period of time, this analysis can help
shed light on the determinants of labor
market outcomes in India in general;
second, understanding regional
variations is important for its own sake
because it brings into focus the regional
dimensions of employment issues.
Regional perspectives can be
advantageous, for instance, in
providing evidence of the importance
of labor force earnings in per capita
household expenditures which, in turn,
determine household welfare and
poverty. Figure 4.1 highlights the
dramatically tight link between labor
earnings (the product of employment
and wages) and household
consumption, and thus, poverty rates
and welfare. Before proceeding further,
it may be worth highlighting a few
significant key facts next.
48. Labor market outcomes and trends differ across India’s regions in four respects. First,
there is striking regional clustering of employment outcomes. The northeastern states of Arunachal
Pradesh, Assam, Nagaland, Tripura, Manipur; the northern states of Uttar Pradesh and Bihar; the
coastal regions of Orissa and Kerala, and; the former Portuguese and French colonies of Goa and
Pondicherry respectively, have low employment rates (Figure 4.2). On the other hand, the southern
states of Andhra Pradesh, Karnataka and Tamil Nadu, and the western states of Gujarat and
Maharashtra, show higher employment rates. These trends largely mirror the participation rates
across the same regions, indicating the close correlation between employment rates and participation
rates (Figure 4.3).
49. Second, variations in female employment and participation rates are markedly higher
than those for males. These variations drive most of the regional differences (Figures 4.3 and 4.3).
The coefficients of variation of employment and participation rates for females are nearly four times
those of men. In addition to low employment and participation rates in the northeastern regions
(including Tripura), Uttar Pradesh and Bihar, female employment rates are also very low in West
Bengal and, perhaps not that surprisingly, in prosperous Punjab (Figure 4.2) as well. Once again,
female employment and participation rates are much higher in the prosperous western states of
Gujarat and Maharashtra, and the southern states of Karnataka, Andhra Pradesh, and Tamil Nadu.
One implication of this pattern is that it makes it difficult to attribute the low participation rates in
West Bengal, specifically, and India, generally, to higher school attendance rates (which it is possible
Figure 4.1: Log Household Real Per Capita Expenditures
(Vertical Axis) plotted against Log Real Weekly Earnings
(Horizontal Axis) for Regions for Five Rounds from 1983 to
2004/05
55.
56
6.5
7
Lo
g o
f H
ous
ehold
Real P
erc
apita E
xpend
iture
s
4 5 6 7Log o f Real E arnings P er Week
lrpce Fitted values
Source: Authors’ estimates from NSS data. An increase in
wage earnings explains about 66 percent of the variation in per
capita household expenditures by itself.
Log o
f R
eal H
ousehold
Per
Capita E
xpenditure
s

71
A n d h r a P r a d e s h
T a m i l N a d u
A r u n a c h a l
P r a d e s h
J a m m u &
K a s h m i r
U t t a r P r a d e s h
O r i s s a
A &
N I s l a n d s
M i z o r a m
N a g a l a n d
W e s t
B e n g a l
R a j a s t h a n
G u j a r a t
M a h a r a s h t r a
K a r n a t a k a
P u n j a b
K e r a l a
M a d h y a P r a d e s h
B i h a r
N o t A v a i l a b l e
0 . 6 2 - 0 . 6 5 0 . 6 5 - 0 . 6 8 0 . 6 8 - 0 . 7 1 0 . 7 1 - 0 . 7 4 0 . 7 4 - 0 . 7 7 0 . 7 7 - 0 . 8 0 . 8 - 0 . 8 3 0 . 8 3 - 0 . 8 6 0 . 8 6 - 0 . 8 9 0 . 8 9 - 0 . 9 2
N
E W
S
Male employment
sometimes to do) because school attendance rates are also high in the western and southern states.
Figure 4.2: Map of Male Employment Rates
Source: Derived from NSS data for the 55th
Round.

72
0 .2 .6 .8 1
Dadra & Nagar Haveli A & N Islands Gujarat Daman & Diu Chandigarh Andhra Pradesh Karnataka Tamil Nadu West Bengal Assam Punjab Pondicherry Madhya Pradesh Lakshdweep Orissa Rajasthan Maharashtra Kerala Goa Delhi Uttar Pradesh Jammu & Kashmir Mizoram Sikkim Haryana Meghalaya Himachal Pradesh Tripura Manipur Nagaland
Arunachal Pradesh
Employment Rate Participation rate
Figure 4.3: Employment and Participation Rates for Males and Females Across Different States
Male Female
Source: Authors’ estimates. Derived from NSS 55th Round data. Employment rate refers to the share of the population in
the 15-59 age group that is employed. Participation rate is the share of the population in the 15-59 age group that is
working or searching for work.
0 .2 .4 .6
Mizoram Meghalaya Andhra Pradesh Nagaland Himachal Pradesh Tamil Nadu Maharashtra Rajasthan Karnataka Gujarat Madhya Pradesh Dadra & Nagar Haveli Orissa Kerala Lakshdweep Daman & Diu Sikkim Manipur Pondicherry Arunachal Pradesh A & N Islands Punjab Assam Jammu & Kashmir Uttar Pradesh Haryana Goa West Bengal Bihar Chandigarh Tripura Delhi
Employment Rate Participation Rate

73
Andhra Pradesh
Tamil Nadu
Arunachal Pradesh
Jammu & Kashmir
Uttar Pradesh
Orissa
A & N Islands
Mizoram
Nagaland
West Bengal
Rajasthan
Gujarat
Maharashtra
Karnataka
Punjab
Kerala
Madhya Pradesh
Bihar
Not Available
female employment rate0.1 - 0.210.21 - 0.270.27 - 0.310.31 - 0.360.36 - 0.450.45 - 0.520.52 - 0.550.55 - 0.610.61 - 0.650.65 - 0.75
N
EW
S
Figure 4.4: Map of Female Employment Rates
Source: Staff Estimates
50. Third, regional differences are persistent. There are few signs of convergence in
employment rates or participation rates across regions. If we use the threshold of one standard
deviation from the Indian average to classify regions as being significantly different from all-India
averages, the number of regions significantly different has either stayed the same or increased in the
NSS 55th Round (male employment rates were significantly different in 34 regions out of 78 regions
in 2000) compared to the 50th Round (when 32 regions were significantly different in 1993).
Particularly noteworthy is the increasing divergence from the all-India average in rural employment
rates in the 55th Round, compared to the 50th Round. The persistence in employment indicators is
also confirmed when we see that employment and participation rates are highly correlated across
Rounds (Table 4.1). Employment and participation rates tend to show persistence across the
different Rounds, in sharp contrast to real wages which are not correlated across Rounds.
Table 4.1: Employment and Participation Rates in Regions are Correlated Across Rounds
Correlation Between One Round and Previous Round
Employment Indicators Real Wages
Employment
Rate
Participation Rate Unemployment
Rate
Urban
Urban Rural
Male Female Male Female Male Female Salaried Casual Casual
0.8266 0.8971 0.7955 0.8924 0.6485 0.5581 -.1143 -.0547 -.0819
Source: Estimated from NSS Data -- 38th
, 43rd
, 50th
and 55th Rounds.

74
51. Fourth, in contrast to employment indicators, real wages are showing signs of
convergence, even though there are still substantial differences in wage rates across regions.
Wage inequality appears to be falling, across regions, for all categories of casual wages. There was a
drop in measures of inequality -- coefficient of variation and gini coefficients -- in all three casual
wage categories – rural, agricultural and urban -- between 1993 and 2000. Although there was a
slight increase in regional inequality in salaried wages, the inequality was low to begin with.
Convergence in wages is indicated by econometric tests of convergence which show that regions that
had the lowest wage rates in 1983 had higher growth in wages in the next 17 years for which data is
available. Conversely, regions which had higher real wages in 1983, experienced lower growth rates
later on (Figure 4.5). This is also seen in the significant negative relation between growth rates of
real wages and initial wages. Table 4.2 presents the estimates which show that wages are converging.
Significantly, the convergence is least for wages in agricultural operations. Given that agricultural
productivity varies widely depending on agro-ecological conditions, a slower degree of convergence
is not unexpected.
Table 4.2: Regional Convergence -- Regions with Higher Initial Real Wages have seen
Slower Real Wage Growth
Rounds
Urban
Casual
Industry
Urban
Salaried
Industry
Rural
Casual
Industry
Rural Casual
Agriculture
Rural Casual
Agricultural
Operations
Rural
Salaried
Industry
38-50 -1.06 -0.64 -1.07 -1.21 -0.19 -0.68
50-55 -1.13 -1.24 -0.97 -0.95 -0.20 -0.92
38-55 -1.03 -1.03 -0.87 -0.99 -0.24 -0.97
Source: Ahsan and Pages, 2006. Note, all estimates are statistically significant.

75
52. Within each region, however, there are two contrasting trends. Differences between
casual wages in rural and urban areas largely disappeared in the 1990s. However, salaried and casual
wages began to diverge (Figure 4.6 shows urban casual and regular wages). Seen across the last four
Rounds, the ratio of urban to rural off-farm casual wages declined as the growth rate of rural casual
wages exceeded those of urban casual wages. While the growth rate of agricultural wages was lower
than that of off-farm casual wages, it was still higher than the growth rate of urban casual wages.
Indeed, once human capital attributes and the differences in cost-of-living are taken into account,
there is little difference between rural and urban casual wages. Further, as Figure 4.6 (bottom panel)
shows, most states replicate the pattern of narrowing urban-rural wage differences. Unlike casual
wages, urban salaried and casual wages show a divergence on average and across different regions.
As noted earlier in Chapter 3, a substantial part of this divergence cannot be accounted for by skill
and human capital differences, though these have certainly contributed. Regulatory barriers and
public sector salaries (which account for most of the salaried jobs) create market segmentation and
shore up salaried wages, as elaborated in Chapter 5.
Figure 4.5: Convergence of Casual Wages: Growth from 1983-2000 Against Real Wages in 1983. Rural
Wages in Left Panel and Urban Wages in Right Panel
.1
-.5
0.5
11.5
lrcm
rwci_
5538
2 2.5 3 3.5 4lrcmrwci38
-.5
0.5
1
lrcm
uw
ci_
5538
2 2.5 3 3.5 4lrcmuwci38
Source: Ahsan and Pages, 2006.

76
Figure 4.6: Rural and Urban Casual Wage Ratio is Narrowing but Regular and Casual Wage
Ratio is Increasing
.2
.3
Ratio of Urban-Rural Casual Real Wages by States and Rounds
Source: Estimated from NSS data.
0 .5 1 1.5 2
0 .5 1 1.5 2
0 .5 1 1.5 2
0 .5 1 1.5 2
0 .5 1 1.5 2
0 .5 1 1.5 2
38 43 50 55 38 43 50 55 38 43 50 55 38 43 50 55 38 43
Graphs by State Names
0
0.5
1
1.5
2
2.5
3
1983 1987-88 1993-93 1999-00
Urban Salaried To Casual Urban to Rural Casual

77
53. Given the significant differences in labor market conditions across different regions,
India’s unusually low economic migration rates present a puzzle. Overall, while about 1.8
percent of India’s population migrated on average each year between 1997 and 2000, only about 0.3
percent did so due to economic factors. A small number of them, 0.3 percent, did so outside of their
districts or states. In comparison, some 5.5 percent of the US population migrated across the county
or across states in a similar period.69
54. A look at the pattern of migration from and to different regions in the map of India in
Figure 4.7 confirms that migration rates are low across many regions. In three years, from 1998
to 2000, most regions showed
less than 1 percent net in- or
out-migration. Chandigarh,
Goa, Daman and Diu,
Haryana, Punjab, Delhi,
Mumbai, and the Kolkata
areas showed the maximum
inflow, exceeding 1 percent
of the total labor force in the
three years from 1998 to
2000. Overall though,
Maharashtra and Gujarat
showed in-migration of
around 0.5 percent and 0.2
percent respectively.
Northern Tamil Nadu,
Andhra Pradesh, parts of
Madhya Pradesh, and less
expectedly, Mizoram and
Nagaland, also show in-
migration. The main out-
migration regions were Bihar,
western Rajasthan, and
Jammu & Kashmir. Kerala,
Karnataka, and southern Tamil Nadu were also regions from where out-migration took place.
55. The trend of real wages converging across regions on the one hand and growing
unemployment rates in major urban areas on the other, can help explain why migration rates
have not picked up. While wage differences are high, they are converging and do not appear to
significantly affect migration. However, urban casual wages – the best proxy of spot-market wages --
are positively related to in-migration. On the other hand, unemployment rates are significantly
inversely related to net economic migration rates. In sum, low migration rates appear to be related to
low prospects for increases in earnings after migration.
56. Another issue related to labor markets is India is low urbanization rates. Even in the
larger metropolitan areas of Mumbai, Delhi, Kolkata, and Chennai which attract the highest rates of
migrants, the in-migration rates, about 1.5 percent of the population per annum, are low (Figure 4.8
69 U.S. Bureau of the Census, Geographic Mobility: March 2000 to March 2001
Figure 4.7: Economic Migration Across States and Regions, 1997-2000
Andhra Pradesh
Tamil Nadu
Arunachal Pradesh
Jammu & Kashmir
Uttar Pradesh
Orissa
A & N Islands
Mizoram
Nagaland
West Bengal
Rajasthan
Gujarat
Maharashtra
Karnataka
Punjab
Kerala
Madhya Pradesh
Bihar
Not Available
In migration, %
0 - 0.10.1 - 0.25
0.25 - 0.50.5 - 1
1 - 2.52.5 - 8
Out migration, %-8.3
-8.3 - -1-1 - -0.5
-0.5 - -0.25-0.25 - -0.1
-0.1 - 0
N
EW
S
Source: Estimated from NSS data, 55th
Round
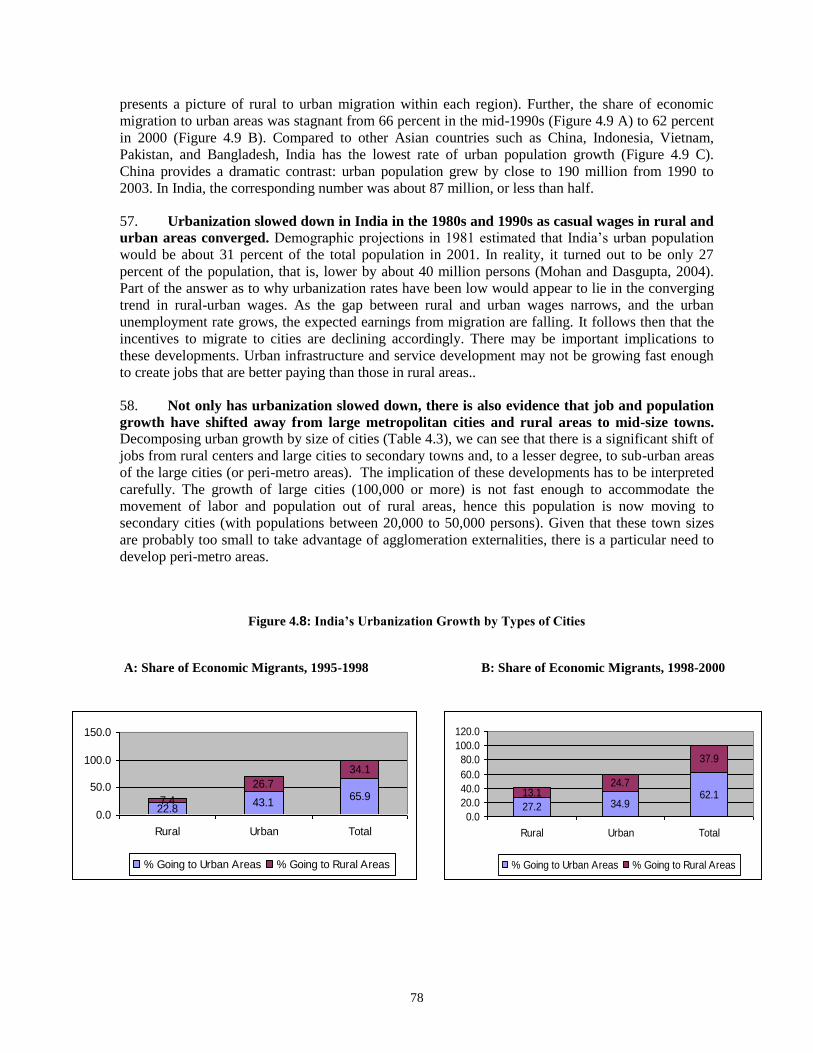
78
presents a picture of rural to urban migration within each region). Further, the share of economic
migration to urban areas was stagnant from 66 percent in the mid-1990s (Figure 4.9 A) to 62 percent
in 2000 (Figure 4.9 B). Compared to other Asian countries such as China, Indonesia, Vietnam,
Pakistan, and Bangladesh, India has the lowest rate of urban population growth (Figure 4.9 C).
China provides a dramatic contrast: urban population grew by close to 190 million from 1990 to
2003. In India, the corresponding number was about 87 million, or less than half.
57. Urbanization slowed down in India in the 1980s and 1990s as casual wages in rural and
urban areas converged. Demographic projections in 1981 estimated that India’s urban population
would be about 31 percent of the total population in 2001. In reality, it turned out to be only 27
percent of the population, that is, lower by about 40 million persons (Mohan and Dasgupta, 2004).
Part of the answer as to why urbanization rates have been low would appear to lie in the converging
trend in rural-urban wages. As the gap between rural and urban wages narrows, and the urban
unemployment rate grows, the expected earnings from migration are falling. It follows then that the
incentives to migrate to cities are declining accordingly. There may be important implications to
these developments. Urban infrastructure and service development may not be growing fast enough
to create jobs that are better paying than those in rural areas..
58. Not only has urbanization slowed down, there is also evidence that job and population
growth have shifted away from large metropolitan cities and rural areas to mid-size towns. Decomposing urban growth by size of cities (Table 4.3), we can see that there is a significant shift of
jobs from rural centers and large cities to secondary towns and, to a lesser degree, to sub-urban areas
of the large cities (or peri-metro areas). The implication of these developments has to be interpreted
carefully. The growth of large cities (100,000 or more) is not fast enough to accommodate the
movement of labor and population out of rural areas, hence this population is now moving to
secondary cities (with populations between 20,000 to 50,000 persons). Given that these town sizes
are probably too small to take advantage of agglomeration externalities, there is a particular need to
develop peri-metro areas.
Figure 4.8: India’s Urbanization Growth by Types of Cities
A: Share of Economic Migrants, 1995-1998 B: Share of Economic Migrants, 1998-2000
22.843.1
65.97.4
26.7
34.1
0.0
50.0
100.0
150.0
Rural Urban Total
% Going to Urban Areas % Going to Rural Areas
27.2 34.962.113.1
24.7
37.9
0.0
20.0
40.0
60.0
80.0
100.0
120.0
Rural Urban Total
% Going to Urban Areas % Going to Rural Areas

79
59. Two proximate factors play key roles in driving regional differences in labor market
outcomes. From the demand side, economic activity or, more specifically, differences in Gross State
Domestic Product (GSDP) levels and economic growth play a key role in the long term in explaining
differences in employment levels and earnings. From the supply side, the differences arise primarily
because of variations in female labor force participation rates across different regions, with male
participation rates remaining relatively invariant. A step deeper, differences in female participation
rates depend on employment prospects and wages, across regions, in a complex manner. If
opportunities and wages for female employment increase, female participation increases. On the
C: Growth Rate of Urbanization, 1990-2003 D: Urban Population in Millions
2
3
4
5
India
China
Bangladesh
Indonesia
Pakistan
Vietn
am
Grow th Rate
216.9311.1
447.5
301.3
498
686.5
0
200
400
600
800
India China Low Income
1990 2003
Table 4.3: Growth of Population and Manufacturing Jobs by Size of Town
District type Population, 1991 (in
millions)
Percentage share of
population
Percentage share of
manufacturing
employment in 1989
Percentage share of
manufacturing
employment in 1996
Metropolitan centers
(100,000 + persons)
40.4 5.1 15.7 13.5
Peri-metro (50,000-less than
10,000 persons)
21.7 2.7 3.9 8.3
Secondary cities (20,000-
less than 50,000 persons)
100.2 12.6 10.4 21.1
Tertiary cities (10,000-less
than 20,000 persons)
86.5 10.9 7.5 10.2
Towns and rural centers
(less than 10,000)
549.2 68.8 62.4 46.9
Source: Bank staff estimates from Census and other sources.
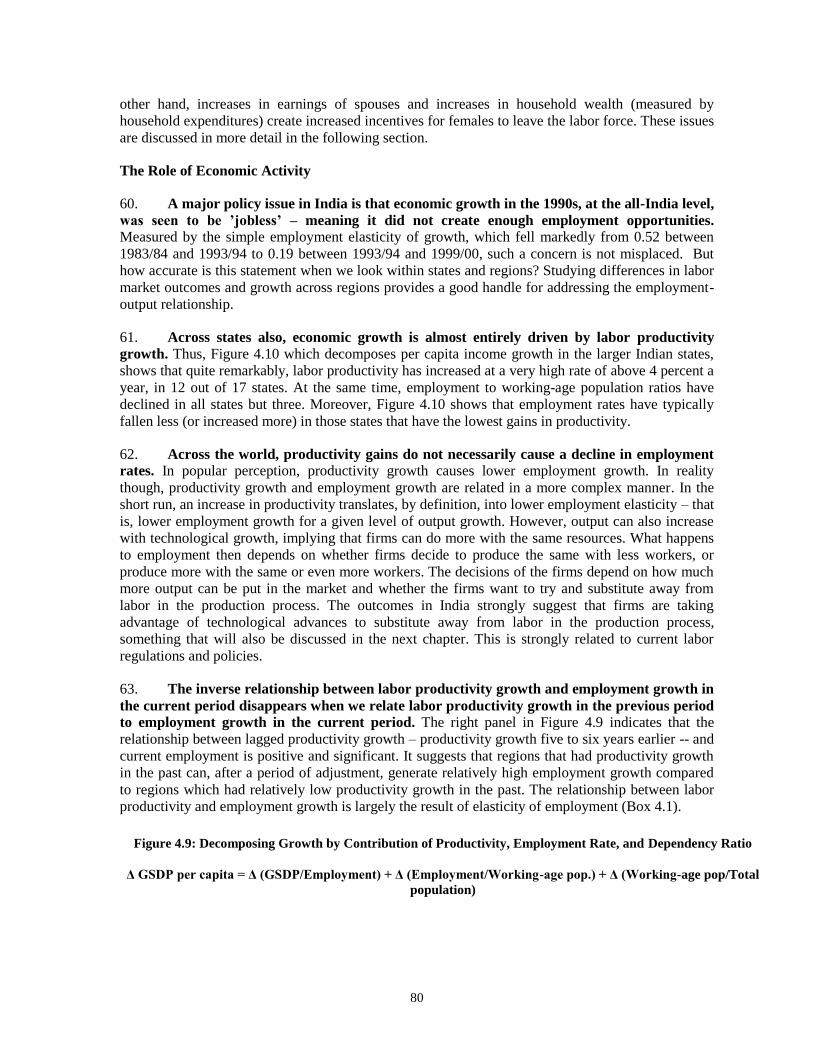
80
other hand, increases in earnings of spouses and increases in household wealth (measured by
household expenditures) create increased incentives for females to leave the labor force. These issues
are discussed in more detail in the following section.
The Role of Economic Activity
60. A major policy issue in India is that economic growth in the 1990s, at the all-India level,
was seen to be ’jobless’ – meaning it did not create enough employment opportunities. Measured by the simple employment elasticity of growth, which fell markedly from 0.52 between
1983/84 and 1993/94 to 0.19 between 1993/94 and 1999/00, such a concern is not misplaced. But
how accurate is this statement when we look within states and regions? Studying differences in labor
market outcomes and growth across regions provides a good handle for addressing the employment-
output relationship.
61. Across states also, economic growth is almost entirely driven by labor productivity
growth. Thus, Figure 4.10 which decomposes per capita income growth in the larger Indian states,
shows that quite remarkably, labor productivity has increased at a very high rate of above 4 percent a
year, in 12 out of 17 states. At the same time, employment to working-age population ratios have
declined in all states but three. Moreover, Figure 4.10 shows that employment rates have typically
fallen less (or increased more) in those states that have the lowest gains in productivity.
62. Across the world, productivity gains do not necessarily cause a decline in employment
rates. In popular perception, productivity growth causes lower employment growth. In reality
though, productivity growth and employment growth are related in a more complex manner. In the
short run, an increase in productivity translates, by definition, into lower employment elasticity – that
is, lower employment growth for a given level of output growth. However, output can also increase
with technological growth, implying that firms can do more with the same resources. What happens
to employment then depends on whether firms decide to produce the same with less workers, or
produce more with the same or even more workers. The decisions of the firms depend on how much
more output can be put in the market and whether the firms want to try and substitute away from
labor in the production process. The outcomes in India strongly suggest that firms are taking
advantage of technological advances to substitute away from labor in the production process,
something that will also be discussed in the next chapter. This is strongly related to current labor
regulations and policies.
63. The inverse relationship between labor productivity growth and employment growth in
the current period disappears when we relate labor productivity growth in the previous period
to employment growth in the current period. The right panel in Figure 4.9 indicates that the
relationship between lagged productivity growth – productivity growth five to six years earlier -- and
current employment is positive and significant. It suggests that regions that had productivity growth
in the past can, after a period of adjustment, generate relatively high employment growth compared
to regions which had relatively low productivity growth in the past. The relationship between labor
productivity and employment growth is largely the result of elasticity of employment (Box 4.1).
Figure 4.9: Decomposing Growth by Contribution of Productivity, Employment Rate, and Dependency Ratio
Δ GSDP per capita = Δ (GSDP/Employment) + Δ (Employment/Working-age pop.) + Δ (Working-age pop/Total
population)

81
Figure 4.10: Growth of Employment and Growth of Labor Productivity by Regions –
Same Period and Previous Period
Source: Bank staff estimates
Box 4.1: Does Increase in Labor Productivity Imply a Decline in Employment?
It is commonly perceived that if an economy is able to produce the same level of goods and services with less
labor, this leads to a decline in employment rates. However, this is not necessarily the case; it depends on what
is driving the labor-saving process. For example, if excessively high labor costs drive employers to substitute
0 2 4%
Himachal Pradesh
Karnataka
Gujarat
Tamil Nadu
Rajasthan
West Bengal
Kerala
Delhi
Andhra Pradesh
Maharashtra
Madhya Pradesh
Haryana
Punjab
Orissa
Uttar Pradesh
Bihar
Assam
0 2 4%
-2 0 2%
-2 0 2%
Source : Bank staff estimates
-.5
0
.5
1
1.5
Growth of UPS employment
-4 -3 -2 -1 Log of Labor Productivity in Same Period
Growth of Employment and Same Period Labor Productivity
-.5
0
.5
1
1.5
Growth of UPS employment
-4 -3 -2 -1 Log of Labor Productivity in Previous Period
Growth of Employment and Previous Period Labor Productivity
82
labor for a less expensive factor, for example capital, then this process of labor saving is associated with a
decline in employment in firms that undertake such labor substitution. If, instead, the underlying factor is an
increase in the capacity of workers to produce more with the same factors, either because workers are learning
new production techniques or because new technologies allow workers to be more productive, then there need
not be a decline in employment rates. The final outcome on employment depends on the price elasticity of the
goods produced by such workers.
For goods where large increases in production do not imply a large decline in their price, increases in the
productivity of labor will result in an expansion of employment. This is because while fewer workers are
needed to produce the same goods, more goods can now be produced at lower costs. Instead, if the gains in
productivity occur in sectors where an increase in production leads to a sharp decline in prices, firms will be
reluctant to increase the production of goods and will consequently need fewer workers. Notice, however, that
even when some employment losses are likely to occur in this case, they need not be long-lasting. This is
because increases in productivity lead to lower prices which, in turn, boost the ability of workers to consume
other goods, in turn boosting the demand for workers to produce such goods. A successful and smooth process
is such in which workers who lose jobs in one sector as a result of productivity growth, can be quickly re-
employed in another thriving sector. Clearly, for this smooth process to take place: (i) cost reductions brought
on by increases in productivity need to be passed on to consumers; (ii) workers need to have sufficient skills so
they can quickly adapt to working in other sectors, and; (iii) some form of income-protection needs to be in
place to protect the incomes of workers while they search for other jobs.
64. The lack of short-run correlation between economic activity and employment levels is
highlighted again when state GSDP levels are related to employment levels, separately for
women and men and for rural and urban areas, controlling for regional fixed effects. This study
looked at changes across the levels of states’ GSDPs, changes in GSDP across time, and took care to
account for the fact that employment also determines GSDP levels (see Box 4.2). In doing so, the
effects that other economic variables such as availability of credit, roads, power, and irrigation have
in determining GSDP were also considered. Then, changes in GSDP caused by changes in these
variables were linked to employment. The results of this exercise, provided in Appendix 4.1, suggest
a lack of correlation between GSDP and any of the employment variables, when regional fixed
effects are included and only the time variations around the state means are considered. The results
are substantially different if the fixed effects are not included.
65. In the long run, however, there is an important relationship between employment and
growth. The results, without regional fixed effects, indicate that across states, levels of GSDP have a
significant impact on employment levels of males in urban areas. A 1 percent increase in GSDP
leads to, on average, a 0.4 percent increase in male employment levels. The effect is much weaker,
though still significant, in rural areas where the elasticity is 0.2 percent compared to urban areas,
where the elasticity is 0.8 percent (see Appendix 4.1). Figure 4.12 shows the average increases in
male (left panel) and female employment (measured in logs) against the increase in the log of the
state GSDP. It is evident from the left panel, from the fitted quadratic curve, that the increase in
GSDP leads to an increase in the employment of males but at a declining rate: that is, elasticity falls
as GSDP levels increase.
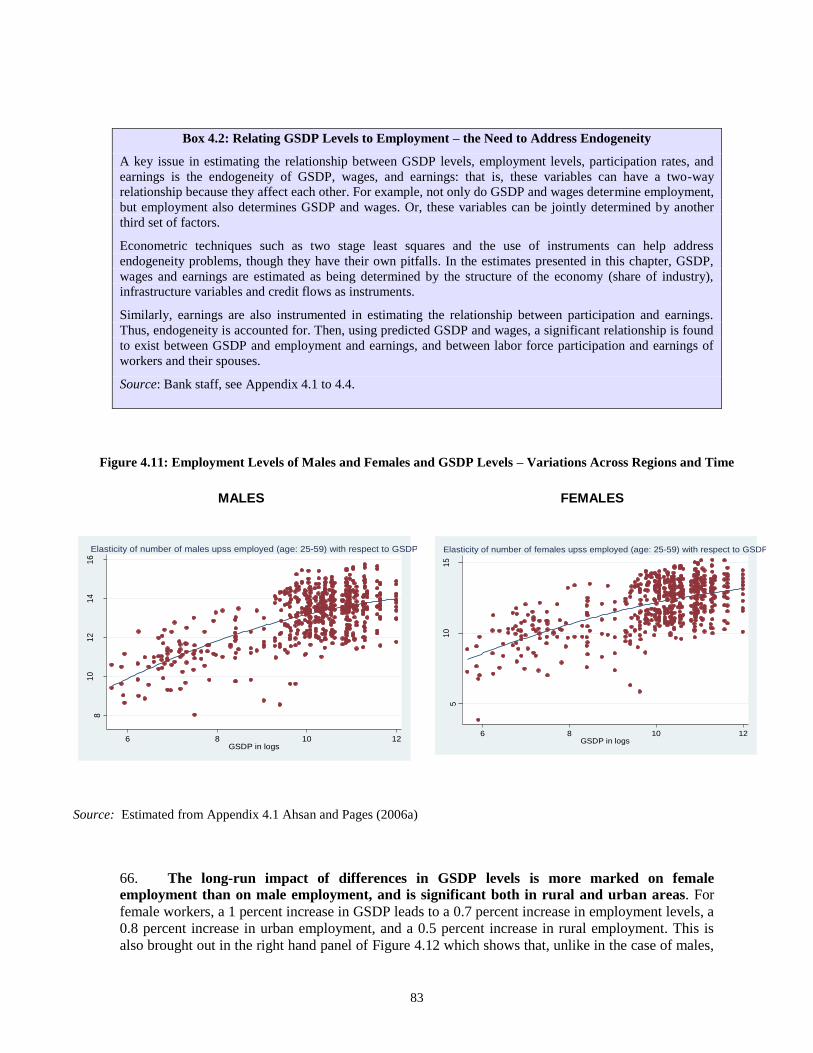
83
Box 4.2: Relating GSDP Levels to Employment – the Need to Address Endogeneity
A key issue in estimating the relationship between GSDP levels, employment levels, participation rates, and
earnings is the endogeneity of GSDP, wages, and earnings: that is, these variables can have a two-way
relationship because they affect each other. For example, not only do GSDP and wages determine employment,
but employment also determines GSDP and wages. Or, these variables can be jointly determined by another
third set of factors.
Econometric techniques such as two stage least squares and the use of instruments can help address
endogeneity problems, though they have their own pitfalls. In the estimates presented in this chapter, GSDP,
wages and earnings are estimated as being determined by the structure of the economy (share of industry),
infrastructure variables and credit flows as instruments.
Similarly, earnings are also instrumented in estimating the relationship between participation and earnings.
Thus, endogeneity is accounted for. Then, using predicted GSDP and wages, a significant relationship is found
to exist between GSDP and employment and earnings, and between labor force participation and earnings of
workers and their spouses.
Source: Bank staff, see Appendix 4.1 to 4.4.
66. The long-run impact of differences in GSDP levels is more marked on female
employment than on male employment, and is significant both in rural and urban areas. For
female workers, a 1 percent increase in GSDP leads to a 0.7 percent increase in employment levels, a
0.8 percent increase in urban employment, and a 0.5 percent increase in rural employment. This is
also brought out in the right hand panel of Figure 4.12 which shows that, unlike in the case of males,
Figure 4.11: Employment Levels of Males and Females and GSDP Levels – Variations Across Regions and Time
MALES FEMALES
81
01
21
41
6
Nu
mb
er
of up
ss e
mplo
yed
ma
les(
age
: 25
-59
)in
logs
6 8 10 12GSDP in logs
Elasticity of number of males upss employed (age: 25-59) with respect to GSDP
51
01
5
Nu
mb
er
of up
ss e
mplo
yed
fem
ale
s(a
ge: 2
5-5
9)i
n log
s
6 8 10 12GSDP in logs
Elasticity of number of females upss employed (age: 25-59) with respect to GSDP
Source: Estimated from Appendix 4.1 Ahsan and Pages (2006a)
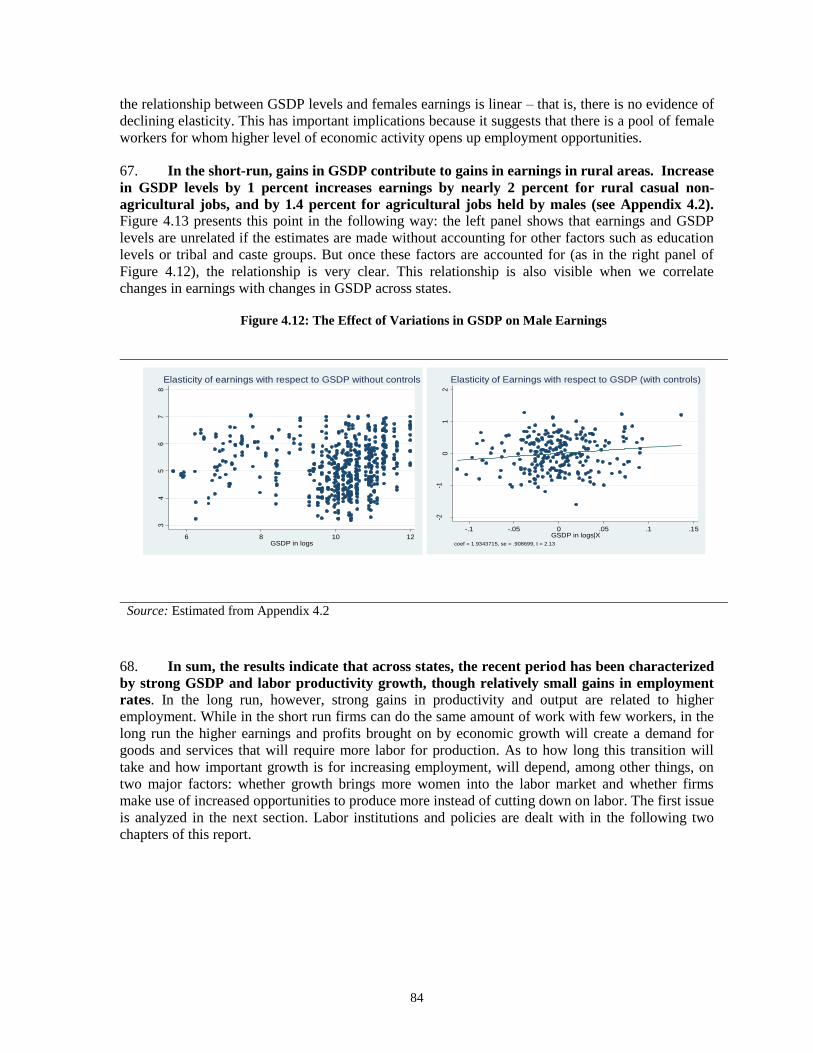
84
the relationship between GSDP levels and females earnings is linear – that is, there is no evidence of
declining elasticity. This has important implications because it suggests that there is a pool of female
workers for whom higher level of economic activity opens up employment opportunities.
67. In the short-run, gains in GSDP contribute to gains in earnings in rural areas. Increase
in GSDP levels by 1 percent increases earnings by nearly 2 percent for rural casual non-
agricultural jobs, and by 1.4 percent for agricultural jobs held by males (see Appendix 4.2). Figure 4.13 presents this point in the following way: the left panel shows that earnings and GSDP
levels are unrelated if the estimates are made without accounting for other factors such as education
levels or tribal and caste groups. But once these factors are accounted for (as in the right panel of
Figure 4.12), the relationship is very clear. This relationship is also visible when we correlate
changes in earnings with changes in GSDP across states.
Figure 4.12: The Effect of Variations in GSDP on Male Earnings
-2-1
01
2
Ma
le C
asu
al n
on
-Agri
cultu
re E
arn
ings
in lo
gs|
X
-.1 -.05 0 .05 .1 .15GSDP in logs|X
coef = 1.9343715, se = .908699, t = 2.13
Elasticity of Earnings with respect to GSDP (with controls)
34
56
78
Ma
le C
asu
al n
on
-Agri
cultu
re E
arn
ings
in lo
gs
6 8 10 12GSDP in logs
Elasticity of earnings with respect to GSDP without controls
Source: Estimated from Appendix 4.2
68. In sum, the results indicate that across states, the recent period has been characterized
by strong GSDP and labor productivity growth, though relatively small gains in employment
rates. In the long run, however, strong gains in productivity and output are related to higher
employment. While in the short run firms can do the same amount of work with few workers, in the
long run the higher earnings and profits brought on by economic growth will create a demand for
goods and services that will require more labor for production. As to how long this transition will
take and how important growth is for increasing employment, will depend, among other things, on
two major factors: whether growth brings more women into the labor market and whether firms
make use of increased opportunities to produce more instead of cutting down on labor. The first issue
is analyzed in the next section. Labor institutions and policies are dealt with in the following two
chapters of this report.
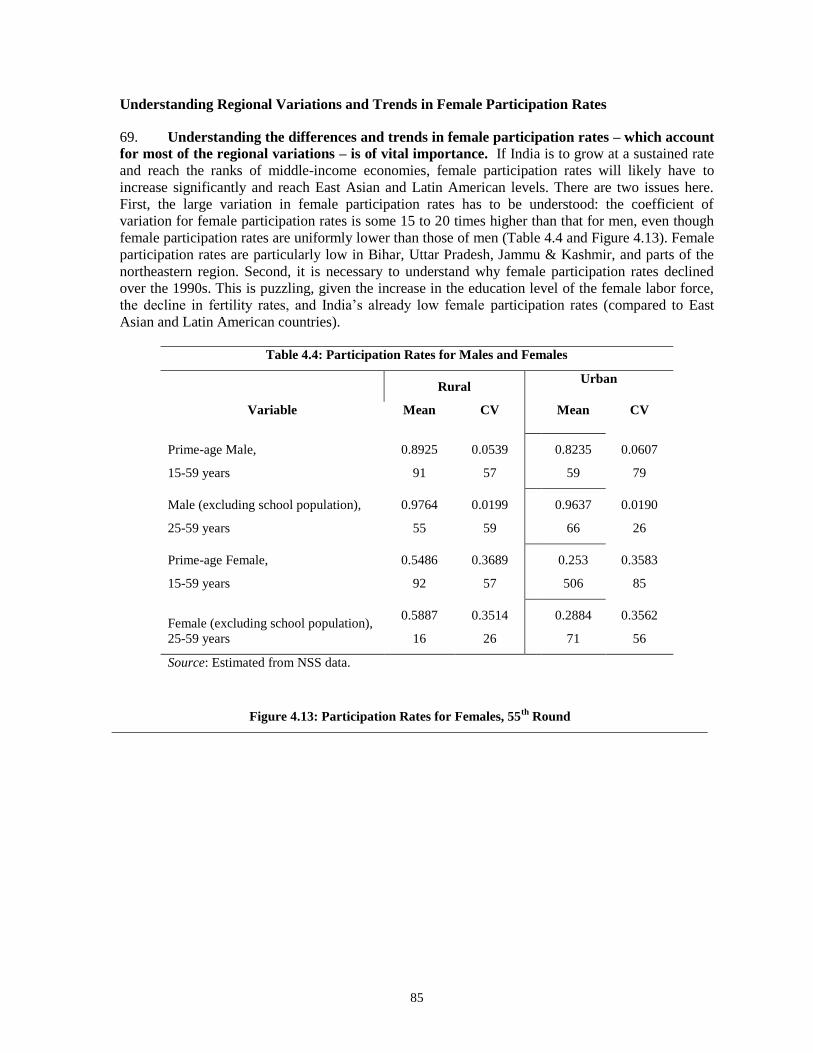
85
Understanding Regional Variations and Trends in Female Participation Rates
69. Understanding the differences and trends in female participation rates – which account
for most of the regional variations – is of vital importance. If India is to grow at a sustained rate
and reach the ranks of middle-income economies, female participation rates will likely have to
increase significantly and reach East Asian and Latin American levels. There are two issues here.
First, the large variation in female participation rates has to be understood: the coefficient of
variation for female participation rates is some 15 to 20 times higher than that for men, even though
female participation rates are uniformly lower than those of men (Table 4.4 and Figure 4.13). Female
participation rates are particularly low in Bihar, Uttar Pradesh, Jammu & Kashmir, and parts of the
northeastern region. Second, it is necessary to understand why female participation rates declined
over the 1990s. This is puzzling, given the increase in the education level of the female labor force,
the decline in fertility rates, and India’s already low female participation rates (compared to East
Asian and Latin American countries).
Table 4.4: Participation Rates for Males and Females
Rural
Urban
Variable Mean CV Mean CV
Prime-age Male,
15-59 years
0.8925
91
0.0539
57
0.8235
59
0.0607
79
Male (excluding school population),
25-59 years
0.9764
55
0.0199
59
0.9637
66
0.0190
26
Prime-age Female,
15-59 years
0.5486
92
0.3689
57
0.253
506
0.3583
85
Female (excluding school population),
25-59 years
0.5887
16
0.3514
26
0.2884
71
0.3562
56
Source: Estimated from NSS data.
Figure 4.13: Participation Rates for Females, 55th
Round

86
70. Two factors have been identified to account for the decline in female participation rates
(Sundaram and Tendulkar, 2005b; Vaidyanathan, 2003; Mazumdar, 2005):
First, the rise in secondary and high school attendance by females – that is, members of the
age-group 15-25 have opted for education over work.
Second, the effect of higher incomes – as wage rates (for male spouses) increase, women
workers drop out of the labor force to spend more time on housework or on leisure.
Further, decisions to marry, which often take place between the ages of 15 and 25, may also lead to
women dropping out of the labor force.
71. A careful look at the evidence (see Chapter 1), though, suggests that education can only
partly explain the decline in participation. Of greater importance is the decline in the participation
rate of prime-age females in part-time or ‘subsidiary’ occupations, and an increase in the time they
spend on housework or leisure. A better understanding of the reasons for the low participation rate of
females is thus important.
72. Specifically, it is crucial to ascertain whether women are withdrawing from the labor
force voluntarily, because the incomes of households are increasing (the ‘income effect’), or
whether they are doing so for lack of opportunity: jobs and good earnings (the ‘substitution
effect’). The ‘income effect’ refers to the effect of the rise in household incomes which can take
place due to increased earnings by spouses or from other sources; female labor can then opt out of
the labor force to do housework or enjoy leisure. The ‘substitution effect’ refers to the better
Andhra Pradesh
Tamil Nadu
Arunachal Pradesh
Jammu & Kashmir
Uttar Pradesh
Orissa
A & N Islands
Mizoram
Nagaland
West Bengal
Rajasthan
Gujarat
Maharashtra
Karnataka
Punjab
Kerala
Madhya Pradesh
Bihar
Himachal Pradesh
Goa
Not Available
Female Participation0.11 - 0.230.23 - 0.30.3 - 0.370.37 - 0.430.43 - 0.50.5 - 0.540.54 - 0.560.56 - 0.610.61 - 0.660.66 - 0.76
N
EW
S
Source: Authors’ estimates. Participation rates measured as a share of the 15 to 59 age-group, working or
seeking work.
87
incentives women have to work -- the availability of good jobs and higher earnings. Which of these
effects is at play and, if both are at play, which is dominant? If the ‘substitution effect’ is dominant
then the scope for including more women in the labor force increases, if they can be provided with
greater opportunities for employment.
73. Two approaches have been used to answer these questions in this report. The first
approach estimates the determinants of participation rates for females aged 25 years or older, by
testing the relationship of both female wages and spouses’ wages with participation rates, to capture
‘substitution’ and ‘income effects’ respectively. A positive relationship between female wages and
female participation rates would highlight the presence of ‘substitution effects’. A negative
relationship between spouses’ wages/household expenditures and female participation rates would
point to ‘income effects’. In order to filter out any possible role played by decisions to go to school
or decisions to marry, only females in the age group 25 or older are considered here. Unemployment
rates are included to measure opportunities (specifically, the absence thereof) in the labor market.
Finally, household per capita expenditures (equations 7 through 9 in Appendix 4.4a) are used instead
of spouses’ wages, after taking into account female wages. The results, presented in Appendix 4.4a,
are clear:
Urban unemployment and overall high unemployment rates for females appear to discourage
participation. Thus, low urban unemployment rates are partly explained by lack of
opportunities.
Higher wages encourage female participation in rural casual work – again stressing that
opportunities are important.
Men’s wages appear to have little impact on female participation rates, indicating the
weakness of the ‘income effect’ in this model.
74. Hence, in this first approach, it is the lack of opportunities that is highlighted as
explaining low levels of female participation.
75. In the second approach, ’expected earnings’ are used as a composite measure of labor
market conditions: the prospects for employment and earning an average market wage. Variables are constructed to represent female and male expected earnings by multiplying wages with
the probability of employment. Female ‘expected earnings’ represent ‘substitution effects’ and also
capture the employment opportunities available to women. Men’s ‘expected earnings’ represent
‘income effects’. In sum, the higher the ‘expected earnings’ for females, the greater the incentives
for females to participate in the labor force; the greater the ‘expected earnings’ for males, the greater
the scope for females to drop out of the labor force, leading to a decline in participation rates. The
effects are quite clear and consistent: female ‘expected earnings’ in rural areas robustly increase
participation. Figure 4.14 presents the key results with the detailed results presented in Appendix
4.4.
Figure 4.14: Female Participation Rates (25 years and above) and Expected Earnings for Females and Males

88
76. The results are clear and similar to the first approach: the left hand panel in Figure
4.15 shows that an increase in the ‘expected earnings’ for females has a significant impact on
increasing female participation, across regions, after taking other variables (education, caste,
etc.) into account. The right hand panel shows that increasing ‘expected earnings’ for male casual
workers in rural areas, and salaried workers in urban areas, reduces female participation after a
certain point. However, the effect is weaker and does not hold for work in urban areas – that is,
higher ‘expected earnings’ from casual urban work do not lead to lower participation rates. It is only
higher ‘expected earnings’ from urban salaried work that lower the participation rate of urban
women.
77. How can female participation be increased? From the analysis of household level
factors, some policy conclusions seem to emerge. As expected, earnings are important. Firstly,
unexplained wage differentials among males and females have to be reduced. This requires
enforcement of equal pay for equal work (as mandated in the Constitution), especially in the casual
labor market; it also requires galvanizing the legal system to respond to complaints about the
infraction of this law. Policy makers also need to take a fresh look at minimum wages and whether
the lower wages set for women may actually be harming women in the labor force. Secondly, it is
likely that low quality of education and lack of technical skills are hampering women’s entry, at full
potential, into the new services sector. Thus, it may be necessary to focus on higher education and
technical education for women. Thirdly, since the majority of women are employed in agriculture or
agriculture-based occupations, policy also needs to address issues that would enhance women’s
productivity in the agricultural sector. Fourthly, almost 30 percent of Indian women would like to
enter the labor force, but as part-time workers. Thus, flexible work hours and part-time work also
need to be promoted by policy in regular salaried jobs. The possibility of more efficient, well-
regulated child care arrangements would also likely encourage the entry of women into the labor
force.
Source: Bank staff estimates.
-1
-.5
0
.5
1
Female Participation Rates in logs|X
-.4 -.2 0 .2 .4 Expected Earnings for Females in logs|X
coef = .92576571, se = .14429932, t = 6.42
Elasticity of Female Participation Rates with Respect to Expected Earnings for Females
-1
-.5
0
.5 Male Casual Agriculture Earnings in logs|X
-.4 -.2 0 .2 .4 Expected Earnings for Males in logs|X|X
coef = -.68487742, se = .10729855, t = -6.38
Elasticity of Female Participation Rates with Respect to Expected Earnings for Males
89
78. Regional differences in labor market outcomes are striking in India and have persisted
over the last two decades. The exception is real wages which show signs of converging across
regions and across rural and urban areas. The latter fact, combined with unemployment in states,
may help explain why economic migration rates and urbanization rates are unusually low in India.
Some policy implications can be drawn:
79. Foremost among these is the fact that economic growth and activity levels have been
important in causing good labor market outcomes, though in a somewhat nuanced way. When
regional differences are taken into account, growth has not been ‘jobless’. In the short run though,
growth has had a muted effect on employment. Increasing labor productivity, which leads to growth,
is associated with lower employment growth as an immediate effect. But in the medium-term,
increasing productivity does not adversely affect employment growth. Over the longer term, the
relationship between growth and employment is clearer. States with higher levels of GSDP are also
states which have created more urban employment and rural earnings in the case of males. Given that
male unemployment rates are negligible in rural areas, this result is understandable. The effect of
differences in GSDP levels is more striking for female employment, which is low in India on
average. Higher GSDP levels lead to higher female employment in rural and urban areas.
80. This analysis also reveals that increasing employment opportunities for females will
help to arrest the decline in female participation rates. Although there is some evidence of
‘income effects’ that lead females to drop out of the labor force, economic opportunities are the
strongest factor affecting female participation.
81. The analysis in this chapter also highlights the importance of urbanization and
domestic migration. The narrowing of the wage gap between rural and urban areas, in each region,
and higher unemployment rates have lowered urbanization rates. Conversely, impediments to
urbanization lower the growth of employment and higher wages. At present, slow urban
development is also slowing down manufacturing growth – with about half of new manufacturing
jobs being created in rural areas. A complementary approach would be to facilitate economic
migration, both to regions that are more dynamic and also to urban areas. Policies that can mitigate
obstacles to domestic migration, through better safety nets and insurance for migrants, will also
improve labor market outcomes by allowing workers to work in areas where there are more
opportunities and higher returns.
82. Given that poor employment outcomes are persistently clustered in the northern,
northeastern and some coastal regions, a regional focus on growth and employment is called
for. Investment in infrastructure – power, road, irrigation, and credit facilities -- which are
found to affect GSDP positively, can lead to higher employment prospects. Related to this is the
need to improve the investment climate in these regions – a key aspect of which is labor market
related regulatory reforms. Also, it is important to enhance the effectiveness of active labor market
policies. In the next two chapters, we turn to regulatory reforms and active labor market policies that
can improve India’s labor market outcomes.

90
CHAPTER 5: LABOR REGULATIONS IN INDIA: HELPING OR HURTING
WORKERS?
A growing body of evidence suggests that labor regulations in India are unusually complex and
costly. Research conducted for this chapter suggests that some current regulations hurt workers
by preventing good jobs from being created -- especially in the manufacturing and formal
sectors. These regulations discourage manufacturing sector growth, encourage informality and
deepen dualism (division or extreme disparities, especially between formal and informal sectors).
They also foster inequality between a very small segment of workers in the organized sector and
the vast majority, about 90 percent of workers, in the informal sector, as well as between regions.
Indeed, manufacturing firms employing more than 100 workers identified labor to be as big a
constraint to their growth as the availability of power (electricity). Reforming labor markets
should involve the following: simplifying regulations; reforming the dispute resolution processes
in the Industrial Disputes Act (IDA) to reduce transaction costs; and ensuring that workers in
both formal and informal sectors are protected and get adequate compensation by introducing
broader and more effective employment programs and social insurance (this topic is discussed in
the next chapter). The aim should be to protect workers, not jobs.
1. Well-functioning labor markets will be key to achieving equitable growth in India.
First, growth prospects will depend not only on the economy’s ability to provide employment
opportunities to the 80 million new entrants to the labor force over the coming decade, but also to
employ them in good, productive jobs. Second, the impact of growth on reducing poverty and
promoting equity will depend on the extent to which labor markets help create employment
opportunities, with good wages for the majority of people whose main source of earnings is their
labor. It is evident from the previous chapter that labor market earnings in India’s regions are
closely correlated to household expenditures and welfare. But how well labor markets perform in
meeting the goals of growth and equity will depend, in turn, on the quality of labor regulations in
India -- the theme of this chapter.
2. How well labor markets function will depend on the regulations that govern them.
Regulations influence labor market performance in several ways. First, by affecting the efficiency
and flexibility with which workers can be allocated among various jobs, regulations affect the
productivity and wages of workers and the profitability of firms. Second, by changing the costs of
adjusting production, regulations can influence the ability and incentives of firms and labor
markets to create jobs. Third, by providing protection against sudden and arbitrary job losses and
poor working conditions, regulations can enhance the welfare and productivity of workers.
Fourth, by determining the processes by which wages are set, regulations affect the earnings of
labor (from the point of view of workers) and hence labor supply, and the cost of labor (from the
point of view of employers) and hence labor demand. Fifth, by affecting industrial relations
between workers and employers, regulations can help or hinder profit and employment prospects.
It is worth stressing here that although regulations have costs attached to them, there are strong

91
economic arguments for most countries in the world having regulations and for the existence of
international labor conventions (See Box 5.1).
Box 5.1: The Economic Case for Labor Market Regulations
The economic case for labor market regulations arises from the need to correct labor market failures, that
is, situations where the free market does not lead to outcomes that maximize social welfare. Specifically,
labor market regulations and policies address:
Asymmetry in market power between employer and employee that can lead not only to inadequate
protection of workers, unsafe working conditions and low wages, but also to inefficient economic
outcomes.
Information failures – lack of knowledge on the part of workers about existing opportunities, and
lack of information among firms about workers and credit market failures. These failures may lead
to lack of opportunities for workers, and high costs to firms. In both cases, output and employment
will be less than the potential.
Insurance market failures -- around the world, information asymmetries prevent the emergence of
private unemployment insurance markets. Labor regulations (by means of severance payments and
other mechanisms) and labor policy (through unemployment insurance) address such failures by
protecting the incomes of workers in the event of their losing their jobs.
Spillovers from labor markets that affect other markets and society in general -- for instance,
unemployment lowers incomes for all, not just the unemployed. Unemployment can also strain the
social fabric, creating political instability and adversely affecting social interests.
Misalignment of private and social incentives -- for instance, by improving poor working conditions
or stopping child labor. These may be costly for firms and employers but are beneficial for
employees and society as a whole.
3. In India, 45 central laws and 170 state statutes deal directly with labor market issues.
These laws – a few dating back to the 19th century -- regulate minimum wages, hours of work,
benefits, safety, security, conditions of employment, dismissal, trade unions, and other aspects of
industrial relations. As is widely recognized now, these numerous laws have created an unusual
complexity in labor markets through overlapping and sometimes contradictory mandates, and
inconsistencies in basic definitions of commonly used concepts and terms, such as, factory,
worker, workmen, employees and employer. These complexities have been further compounded
by a long trail of judicial decisions that have interpreted these laws, sometimes in an inconsistent
manner.
4. This chapter surveys the main labor laws and regulations and assesses their impact on
labor markets and job creation, in general. It concludes that current labor regulations lead to
several unintended and adverse consequences: (i) ambiguity and uncertainty in the interpretation
of labor laws; (ii) high administrative and judicial costs in enforcement; (iii) large output and
employment costs; (iv) inequality resulting from dualism between the formal and informal
sectors; and (v) regional differences and disparities in labor market outcomes.
5. There are two overall effects. First, evidence presented in this chapter shows that these
regulations constrain the growth of jobs, especially in the formal and manufacturing sectors. They
also promote informality and dualism which, in turn, lead to inefficiencies as labor and other
resources are not allocated efficiently. Second, in trying to protect about 26 million jobs in the
formal sector, these laws fail to protect the employment conditions of the remaining 390 million
workers in the informal sector. For instance, despite the average 40 or so minimum wages that are
92
in force in the typical Indian state, large segments of the labor force receive below minimum
wages. Finally, these regulations have not been helpful to the cause of industrial peace. In 2004,
482 major cases of work-stoppage cost industry 15 million man-days. The ratio of workers
involved in major work-stoppages (strikes and lockouts) to total factory workers, was in the range
8 to 10 percent between 1995 and 2001. In China, by comparison, the ratio was consistently near
zero.
6. Two kinds of laws have had particularly pernicious effects on the growth of
manufacturing and formal sector jobs in India: laws concerning dispute resolution mechanisms
and laws restricting retrenchment and layoffs of workers (including those arising from closures of
firms). Both these aspects have had a significant adverse effect on job creation – the severity of
the impact depending on the labor intensity of the industry. On average, it is estimated that
current regulations could have cost India almost 40 percent of existing formal sector
manufacturing jobs. This chapter also provides evidence that although the Contract Labor
(Control and Abolition) Act introduced a certain measure of flexibility in manufacturing labor
markets, ambiguity surrounding the status of this law lends to uncertainty regarding its use and a
large variation in its application across different states.
7. As a consequence, labor laws have actually reduced the welfare of workers as a whole.
Labor regulations have not increased the share of income going to workers (labor share). Instead,
a constant labor share has meant that any gains in wages and working conditions have quickly
translated into lower job creation. With a growing labor supply, the scarcity of formal sector jobs
has fueled income insecurity -- the loss of a formal sector job is associated with a very low
probability of re-employment in a similar type of job. Better regulations would enable more job
creation and higher income gains for workers.
8. This chapter provides recommendations for regulation reform with a view to balancing
the need to provide income security and good working conditions to formal sector workers with
the need for providing more jobs, good jobs, and preferably formal sector jobs to the vast
majority of workers in the informal sector. Chapter 6 discusses active labor market policies that
can provide employment protection and better benefits to informal sector workers.
B. Labor Regulations in India and Their Enforcement
9. Labor market regulations were first introduced in India in 1880 when the Factories
Act was legislated. Driven in part by the English textiles manufacturers’ concerns about
“evening’ the competition between the growing Indian textiles industry and its competition in
England, and in part by a nationalist desire to protect the interests of Indian labor, regulations,
from early on, placed more emphasis on employment protection and less on the efficiency of
labor markets and on dispute settlement (Pages and Roy, 2005). Historically, the principle of
‘employment protection’ was subsumed under the principle of ‘social justice’: Employment
security was enhanced in the formal sector not only by a whole range of new laws but also by
cases where judges referred to ‘social justice’ to interpret laws. Removing or changing laws
became politically difficult, with the result that demand for new laws led to a proliferation of
laws.
10. While most labor regulations are the concurrent responsibility of the central
government and the state governments, the implementation of regulations is almost wholly the
responsibility of state governments. The Constitution’s Article 246 divides legislative powers
for promulgating labor laws between the Center and the states. But most labor laws are listed on

93
the concurrent list, List III, where both Parliament and state legislatures have the powers to make
laws. Only the economic activities enumerated under List I of the Seventh Schedule lie in the
exclusive purview of the central government and Parliament. Prominent among these central laws
are the regulations on labor and safety in mines and oilfields, ports and insurance, and
telecommunications. The important labor regulatory issues lie in the concurrent list shared by the
Center and states – ‘trade unions, industrial and labor disputes’ (Item 22 on this list); ‘social
security and social insurance, employment and unemployment’ (Item 23); and ‘welfare of labor,
including conditions of work, provident funds, employers’ liability, workmen’s benefits,
compensation, invalidity and old age pensions, and maternity benefits’ (Item 24). However, the
implementation machinery for enforcing these concurrent list laws rests almost exclusively with
the state governments.
11. Although many in number, Indian labor laws cover four main areas: industrial
relations, working conditions, wages, and social security and welfare (see Table 5.1). The rest of
this section discusses these four laws.
Industrial Relations
12. Industrial relations between employers and employees are covered by several Acts, of
which the two most important are: (i) The Trade Unions Act, 1926, which specifies the
conditions that a trade union needs to satisfy in order to be recognized under the Act; and (ii) the
Industrial Disputes Act (IDA), 1947. Of minor importance are three other Acts: the Bombay
Industrial Relations Act (BIRA), 1946; the Administrative Tribunals Act, 1985; and the
Maharashtra Recognition of Trade Unions and Prevention of Unfair Labor Practices Act, 1971.
The objectives of these Acts and their coverage are presented in Table 5.1.
Table 5.1: Labor Laws and Regulations Governing Industrial Regulations
Laws and
Regulations
Aim Coverage
Industrial
Disputes Act,
1947
Provides procedures and institutions for settling disputes.
Sets out conditions for recruitment, discharge and
dismissal of workers.
Existing industry in all of
India. Chapter Vb of the Act
applies to establishments
that employ 100 or more
workers
Trade Unions
Act, 1926
Provides legal and corporate status to registered trade
unions and provides immunity to office-holders of these
unions from civil and criminal liability
All India
Bombay
Industrial
Relations Act
(BIRA), 1946
Specifies the nature of collective bargaining in the textile
industry of Maharashtra, cooperative banks and the
Bombay Electric Supply and Transport Undertaking of
Maharashtra. These industries are not subject to the IDA,
except in cases of retrenchment, closure and dismissal
State of Maharashtra
Source: Pagés and Roy, 2006.
13. The IDA is probably the most important law governing the Indian labor market. The
IDA specifies a multi-tier conciliation-cum-adjudication system, created and maintained by the
state governments. Although the system is invariant in principle, its working changes from state
to state. The lowest and most immediate tier consists of Conciliation Officers and Boards
appointed by the government. This tier was in place even before the IDA was enacted. The
Conciliation Officer either settles the dispute or sends a ‘failure report’ to the government. The
emphasis in the Act, however, is less on encouraging conciliation, and more on adjudication. The
dispute then goes to the Labor Court and, further, to an Industrial Tribunal. The Labor Courts

94
deal with disputes that affect workers. The Industrial Tribunals, apart from working as appellate
bodies, deal with cases that affect all workers in an industry. Therefore, cases dealing with wages
usually go to Tribunals. In rarer cases, disputes go to National Tribunals, which are centrally
administered bodies empowered to deal with cases of potentially national significance. There is
some uncertainty about the status of Labor Court orders. Although the government can in
principle suspend orders, in practice this option is not used often.
14. In addition to setting up adjudication systems, the IDA imposes significant restrictions
on employers regarding retrenchment and exit of workers. Units employing more than 100
workers require authorization from the government (Chapter Vb) for retrenchment and layoffs of
employees. In practice, such authorization is rarely granted. Retrenched workers also receive
priority in case of new recruitment. Closure of units (firms) also requires prior authorization as
per Clause 25-0. All establishments that are going to close are required to provide one month
advance notice and severance pay equivalent to fifteen days of work, per year of completed
service, to workers who have completed more than one year of service at the firm.
15. The provisions of the Trade Union Act, largely unchanged since their enactment,
facilitate trade union activities. Any seven or more ‘workmen’ can apply for registration as a
union; the ‘workmen’ need not work for the same employer. In 1926, the year when the Act was
legislated, the implicit idea behind allowing outside members into unions was that trade unions
were not organizations of workers but organizations for workers. This notion was widely held
among nationalistic circles in the late-interwar period and it influenced early labor legislation
(See Box 5.2 for a discussion on trade unions in India).
16. The coverage of the Trade Union Act has gradually extended beyond industry. Through
the application of case laws, workers in government undertakings and religious trusts who made
goods and services for sale were brought under the Act. Civil servants ‘engaged in the tasks of the
sovereign and regal aspects of the Government’ were excluded from the purview of the Act
(Tamil Nadu Non-Gazetted Government Officers’ Union, Madras v. Registrar of Trade Unions,
Madras, 1962-63). It was also clarified that ‘industry’ would have the same meaning in the Trade
Union Act as it does in the IDA, that is, ‘any business, trade, undertaking, manufacture, or calling
of employers’ (Section 2j of IDA) or, essentially, any commercial organization. Thus, even
though the IDA explicitly excludes hospitals, educational institutions, universities, charitable
institutions and welfare organizations, clubs, cooperatives, and research institutes, these have
come to be covered by the Act because of court rulings over the years.
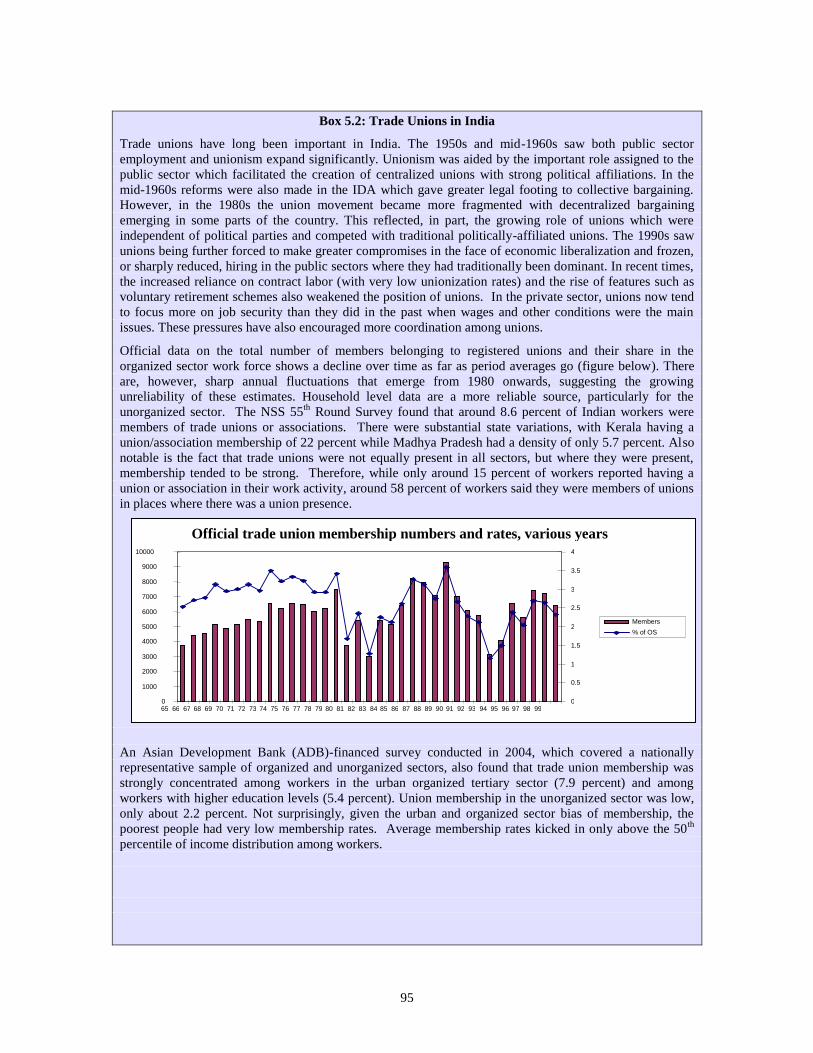
95
Box 5.2: Trade Unions in India
Trade unions have long been important in India. The 1950s and mid-1960s saw both public sector
employment and unionism expand significantly. Unionism was aided by the important role assigned to the
public sector which facilitated the creation of centralized unions with strong political affiliations. In the
mid-1960s reforms were also made in the IDA which gave greater legal footing to collective bargaining.
However, in the 1980s the union movement became more fragmented with decentralized bargaining
emerging in some parts of the country. This reflected, in part, the growing role of unions which were
independent of political parties and competed with traditional politically-affiliated unions. The 1990s saw
unions being further forced to make greater compromises in the face of economic liberalization and frozen,
or sharply reduced, hiring in the public sectors where they had traditionally been dominant. In recent times,
the increased reliance on contract labor (with very low unionization rates) and the rise of features such as
voluntary retirement schemes also weakened the position of unions. In the private sector, unions now tend
to focus more on job security than they did in the past when wages and other conditions were the main
issues. These pressures have also encouraged more coordination among unions.
Official data on the total number of members belonging to registered unions and their share in the
organized sector work force shows a decline over time as far as period averages go (figure below). There
are, however, sharp annual fluctuations that emerge from 1980 onwards, suggesting the growing
unreliability of these estimates. Household level data are a more reliable source, particularly for the
unorganized sector. The NSS 55th
Round Survey found that around 8.6 percent of Indian workers were
members of trade unions or associations. There were substantial state variations, with Kerala having a
union/association membership of 22 percent while Madhya Pradesh had a density of only 5.7 percent. Also
notable is the fact that trade unions were not equally present in all sectors, but where they were present,
membership tended to be strong. Therefore, while only around 15 percent of workers reported having a
union or association in their work activity, around 58 percent of workers said they were members of unions
in places where there was a union presence.
An Asian Development Bank (ADB)-financed survey conducted in 2004, which covered a nationally
representative sample of organized and unorganized sectors, also found that trade union membership was
strongly concentrated among workers in the urban organized tertiary sector (7.9 percent) and among
workers with higher education levels (5.4 percent). Union membership in the unorganized sector was low,
only about 2.2 percent. Not surprisingly, given the urban and organized sector bias of membership, the
poorest people had very low membership rates. Average membership rates kicked in only above the 50th
percentile of income distribution among workers.
Official trade union membership numbers and rates, various years
0 1000 2000 3000 4000 5000 6000 7000 8000 9000
10000
65 66 67 68 69 70 71 72 73 74 75 76 77 78 79 80 81 82 83 84 85 86 87 88 89 90 91 92 93 94 95 96 97 98 99 0
0.5
1
1.5
2
2.5
3
3.5
4
Members % of OS

96
Box 5.2 (continued): Trade Unions in India
Though overall membership is small, unions can potentially play an important role in settling disputes
through conciliation and arbitration. The Second National Commission on Labor made a number of
recommendations to improve the effectiveness of conciliation. The reasons why arbitration has failed to
catch on in a significant way to date are also well understood (See Hazra, in Debroy, 2005). Apart from the
supply side issue of there being too few qualified arbitrators, the absence of a legal framework for
determining a representative union (except in a few states) in a firm is problematic. Overall, there is a lack
of adequate grievance-redressal options within firms and beyond that would promote more rapid settlement
of disputes.
Some measures which could help unions remain relevant in the new environment are:
Strengthening the legal framework for collective bargaining, which could have benefits for both
employers and workers, provided there is scope for bargaining to remain decentralized and at the
firm level where preferred.1 A key element of this would be to create provisions for the recognition
of unions in the workplace to represent workers’ interests in bargaining. A second issue would be to
clarify the legal status of collective agreements. These have no direct legal force in Indian law,
except insofar as they are formally endorsed as the outcome of conciliation proceedings.
Addressing factors that undermine the link between trade union representatives and workers (see
Hazra, op. cit., and Nath, in Debroy). With the exception of a few states such as Rajasthan and
Maharashtra, there is no provision for trade union recognition in the bargaining and dispute
settlement processes. This results in fragmentation among worker representatives and lack of clarity
about whom employers should negotiate with (union formation requires only 7 workers, with no
lower limit on the share of enterprise work force in a particular union). There is also a lack of
internally democratic procedures in trades unions. Under the Trade Unions Act, 1926, office bearers
of unions are not required to be elected by secret ballot of members, a procedure common in most
countries. Similarly, there is no requirement of approval from the membership for initiating activities
such as strikes, amending the rules of the union or maintaining a political fund. A further dimension
to this is the lack of requirement for union representatives to come from the enterprise work force.
All these features increase the risks of unions pursuing agendas which go beyond the interests of the
workers they represent. They also undermine the accountability of union management, which in turn
reduces the appeal of union membership for workers.
In order for unions to become more appealing to unorganized sector workers, it is necessary that
unions strongly emphasize service provision for their members. While all unions are committed to
expanding their memberships in the unorganized sector, this has largely failed to happen to date,
particularly in rural areas. In this respect, the experience of NGOs, such as the Self Employed
Women’s Association (SEWA) which are transforming into unions, provides lessons. The
membership of these unions is being driven by a demand for services (for example, social security
schemes) which the unions can provide or facilitate. Particularly for unorganized sector workers, it is
likely to be the appeal of different services which the union can provide or intermediate that will
facilitate expansion in membership.
Source: O’Keefe (2006)
Working Conditions
17. Working conditions are governed principally by: (i) the Factories Act, 1948; (ii) the
Industrial Employment (Standing Orders) Act, 1946, which specifies the form of the employment
1Note that Indian employers are not obliged to bargain collectively. The question of whether it is desirable for them to
do so, is not addressed here. However, facilitating bargaining where both parties are agreeable would be desirable,
whatever the position on obligation of bargain in good faith.

97
contract; and (iii) the Contract Labor (Regulation and Abolition) Act, 1970. Of minor importance
is the Apprentices Act, 1961. Table 5.2 presents the objectives and coverage of these regulations.
Table 5.2: Laws and Regulations on Working Conditions
Laws and Regulations Aim Coverage
The Factories Act, 1948
Governs the health, safety and
welfare of workers in factories and
plantations that use power and
employ 10 workers or more. The Act
requires all units to file annual
returns about their activities.
Extends to the whole of India and
includes service sector units
employing intellectual labor.
The Industrial Employment
(Standing Orders) Act,
1946, specifies the form of
the employment contract.
Requires employers with industrial
units employing 100 or more workers
(excluding managers and
supervisors) to specify working
conditions in line with ‘model
standing orders’.
All India. This is a central act but
the states are empowered to change
some of its provisions. Many states
apply the Act to units below the
specified size, even shops and
establishments.
The Contract Labor
(Regulation and Abolition)
Act, 1970.
Gradual abolition of casual labor
hiring and, where permitted, to
regulate the working conditions of
casual labor.
All India.
18. The Factories Act governs the health, safety and welfare of workers in factories and
plantations that use power and employ ten workers or more (20 workers or more if firms do not
use power). However, Section 85 of the Act empowers state governments to extend the
provisions of the Act to smaller factories. In several states, small-scale and seasonal factories
such as rice and oil mills and textile power-looms have been brought under the Act by the use of
this provision. The Act, which requires all units to file annual returns about their activities,
extends to the whole of India and includes service sector units employing intellectual labor.
Separate acts cover mines and railways workers. In 1987, a major amendment incorporated
elements of occupational health and safety into the Factories Act.
19. The Industrial Employment (Standing Orders) Act, 1946, requires employers with
industrial units that employ 100 or more workers (excluding managers and supervisors) to
ensure that working conditions conform to ‘model standing orders’. Like the Factories Act,
this is a central act but the states are empowered to change some of its provisions. Many states
apply the Act to units below the specified size and even to shops and establishments. The ‘model
standing orders’ distinguish between ‘permanent’ and various types of casual workers, and set out
rules regarding leave, disciplinary action, layoffs and retrenchment, and other minor issues.
20. The Contract Labor (Regulation and Abolition) Act, 1971, another key law in
industrial relations today, is a major source of regulatory ambiguity. Initially created with the
objective of gradually abolishing casual labor hiring, this law is now being used extensively – in
many but not all states -- as the primary recourse by employers and state governments to increase
labor market flexibility within the existing legal regime. Notably, the original purpose of the Act
was quite the opposite.

98
Wages
21. The principal laws relating to wages are: (i) the Payment of Wages Act, 1937; and (ii)
the Minimum Wages Act, 1948. Of lesser importance are the Payment of Bonus Act, 1965, and
the Equal Remuneration Act, 1976. The Payment of Wages Act, 1937, is again a central act, the
enforcement of which is a state responsibility, except in mines, railways, oilfields, ports, and air
transport which lie in the ‘central sphere’. The Act specifies the standard wage period (a month or
less), payment day, permissible deductions, mode of payment, and inspections. It applies to
workers below a certain salary range. The Minimum Wages Act, 1948, is a central act, the
enforcement of which is a state responsibility, except in mines, railways, oilfields, ports, and air
transport. This Act specifies minimum wages (and is also empowered to specify the length of the
working day) in ‘scheduled’ employment (that is, those jobs explicitly identified in a schedule).
The statutory minimum wage is set based on proposals by central and state advisory boards.
Social Security and Insurance
22. Coverage of workers by formal social security and insurance programs is extremely
limited and covers less than 10 percent of India’s labor force. The principal laws here are: (i)
the Workmen’s Compensation Act, 1923, which specifies compensation that employers need to
pay on account of injury by accident at the worksite or because of occupational diseases. An
important provision of the Act is the liability of the principal employer in case of contract labor
employment; (ii) the Employees State Insurance Act, 1948, extends to workers who earn less than
a certain salary limit in factories covered under the Factories Act and commercial establishments
employing 20 or more persons. It requires contributions from both employers and employees for
insurance covering sickness, maternity, death, and disablement; and (iii) the Employees Provident
Funds Act, 1952, applies primarily to factories and specifies deposit-linked provident funds or
pension schemes.
Reform of Labor Laws
23. There has been little legal or de jure liberalization in labor regulations in India despite
demand from industry and recommendations by several government commissions. Even the
cautiously worded recommendations of the National Labor Commission (2002) exceeded the
limits on changes placed by the national trade unions. As a result, Indian labor regulations,
formulated during a period when India was largely a closed economy unexposed to international
competition and when the arrival of information technology had not speeded up business
processes enormously, have remained largely unchanged for the past 50 years. 2
24. Some liberalization has taken place in recent years. Overall, the IDA has been revised
the maximum number of times, but these revisions have more often been aimed at making laws
more stringent rather than liberal (Table 5.3). The Trade Unions (Amendment) Act, 2001 (Act
No. 31 of 2001) was aimed at reducing the multiplicity of unions, limiting the number of
‘outsiders’ in the executives of trade unions, and prohibiting professional politicians from
becoming members of the executives of trade unions. More recently, in March 2005, the Union
Cabinet decided to amend the Factories Act, 1948, to allow women workers to do night-shifts.
This was done in view of the fact that there is already a large and growing number of female
workers in the information technology industry and in export-oriented manufacturing units.
2 There have been a number of state amendments to the IDA; most often the laws were changed with the objective of
increasing protection of workers.
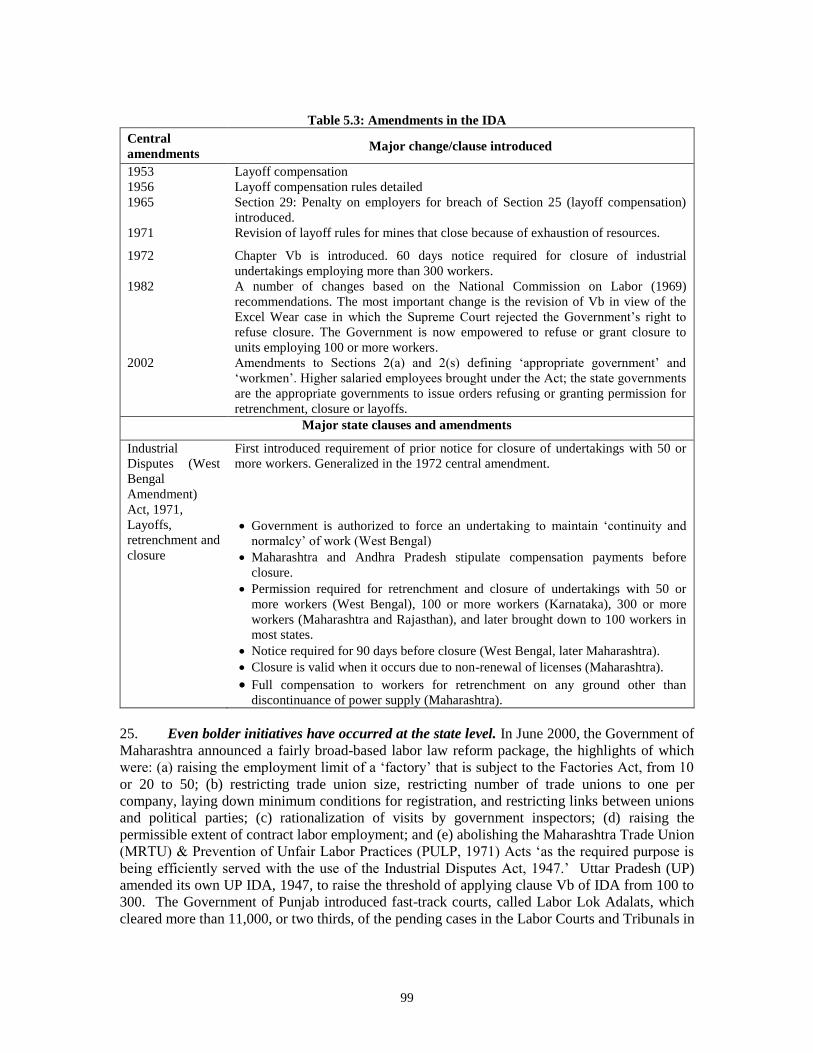
99
Table 5.3: Amendments in the IDA
Central
amendments Major change/clause introduced
1953 Layoff compensation
1956 Layoff compensation rules detailed
1965 Section 29: Penalty on employers for breach of Section 25 (layoff compensation)
introduced.
1971 Revision of layoff rules for mines that close because of exhaustion of resources.
1972 Chapter Vb is introduced. 60 days notice required for closure of industrial
undertakings employing more than 300 workers.
1982 A number of changes based on the National Commission on Labor (1969)
recommendations. The most important change is the revision of Vb in view of the
Excel Wear case in which the Supreme Court rejected the Government’s right to
refuse closure. The Government is now empowered to refuse or grant closure to
units employing 100 or more workers.
2002 Amendments to Sections 2(a) and 2(s) defining ‘appropriate government’ and
‘workmen’. Higher salaried employees brought under the Act; the state governments
are the appropriate governments to issue orders refusing or granting permission for
retrenchment, closure or layoffs.
Major state clauses and amendments
Industrial
Disputes (West
Bengal
Amendment)
Act, 1971,
First introduced requirement of prior notice for closure of undertakings with 50 or
more workers. Generalized in the 1972 central amendment.
Layoffs,
retrenchment and
closure
Government is authorized to force an undertaking to maintain ‘continuity and
normalcy’ of work (West Bengal)
Maharashtra and Andhra Pradesh stipulate compensation payments before
closure.
Permission required for retrenchment and closure of undertakings with 50 or
more workers (West Bengal), 100 or more workers (Karnataka), 300 or more
workers (Maharashtra and Rajasthan), and later brought down to 100 workers in
most states.
Notice required for 90 days before closure (West Bengal, later Maharashtra).
Closure is valid when it occurs due to non-renewal of licenses (Maharashtra).
Full compensation to workers for retrenchment on any ground other than
discontinuance of power supply (Maharashtra).
25. Even bolder initiatives have occurred at the state level. In June 2000, the Government of
Maharashtra announced a fairly broad-based labor law reform package, the highlights of which
were: (a) raising the employment limit of a ‘factory’ that is subject to the Factories Act, from 10
or 20 to 50; (b) restricting trade union size, restricting number of trade unions to one per
company, laying down minimum conditions for registration, and restricting links between unions
and political parties; (c) rationalization of visits by government inspectors; (d) raising the
permissible extent of contract labor employment; and (e) abolishing the Maharashtra Trade Union
(MRTU) & Prevention of Unfair Labor Practices (PULP, 1971) Acts ‘as the required purpose is
being efficiently served with the use of the Industrial Disputes Act, 1947.’ Uttar Pradesh (UP)
amended its own UP IDA, 1947, to raise the threshold of applying clause Vb of IDA from 100 to
300. The Government of Punjab introduced fast-track courts, called Labor Lok Adalats, which
cleared more than 11,000, or two thirds, of the pending cases in the Labor Courts and Tribunals in
100
three rounds of hearings since 2000. The Andhra Pradesh Government announced its intention to
introduce liberalized labor laws for designated Special Economic Zones (SEZs). 3
26. Special Economic Zones (SEZs) are another possible means to introduce labor policy
reforms. For example, In China, financial, legal, labor and other policy reforms were introduced
and tested first within the SEZs before being extended to the rest of the economy. Internationally,
export processing and other zones are witnessing increasing share of trade flows and are
employing a growing number of workers. In 1986, there were 176 zones across 47 countries; by
2003, the number had increased to over 3,000 across 116 countries. Export Processing zones have
a long history in India dating back to 1965. In 2000, the government replaced the old EPZ regime
by a new scheme of “Special Economic Zones” (SEZs) with several lucrative incentives/benefits
that were not available in the earlier scheme. In 2005, it enacted the SEZ Act and the SEZ Rules
were notified in February 2006. (See Box 5.3) The commerce ministry’s web site described the
SEZs as “designated duty free enclaves to be treated as foreign territory for trade operations and
duties and tariffs.” The most important change of the new law is that it offers a highly attractive
fiscal incentive package consisting of (i) exemption from custom duties, central excise duties,
service tax, central sales taxes and securities transaction tax to both the developers and the units;
(ii) tax holidays for 15 years (currently the units enjoy a seven year tax holiday), i e, 100 per cent
tax exemption for 5 years, 50 per cent for the next five years, and 50 per cent of the ploughed
back export profits for the next five years; and (iii) 100 per cent income tax exemption for 10
years in a block period of 15 years for SEZ developers. States have the right to determine which
labor laws.
Box 5.3: Special Economic Zones and Employment
There is a variety of reasons why countries have gone for economic zones. These include export promotion,
attraction of foreign investment, development of depressed regions and policy reform experimentation. In
China, financial, legal, labor and other policy reforms were introduced and tested first within the SEZs
before being extended to the rest of the economy. The main rationale for the Shannon Free Zone in Ireland,
in contrast, was to establish a ‘growth pole’ in the economically distressed southern part of the country.
India has not remained immune to these developments. In 2005, it enacted the SEZ Act and the SEZ Rules
were notified in February 2006. The commerce ministry’s web site described the SEZs as “designated duty
free enclaves to be treated as foreign territory for trade operations and duties and tariffs.” The most
important change of the new law is that it offers a highly attractive fiscal incentive package. There has been
a tremendous rush to set up SEZs since the Act came into effect in February 2006. The Ministry of
Commerce claims that these zones are expected to attract investment of about US$20 billion, including FDI
of US$ 5 billion and create additional 500,000 direct jobs.
The supporters of the SEZ Act claim that promotion of SEZs is an attempt to deal with infrastructural
deficiencies, procedural complexities, bureaucratic hassles and barriers raised by monetary, trade, fiscal,
taxation, tariff and labor policies. Under the given socio-economic and political institutions, the
establishment of industrial enclaves (SEZs/EPZs) is seen as an important strategic tool for expediting the
process of industrialization. These claims notwithstanding, the policy has come under heavy criticism.
Dissenters contend that the policy would be misused for real estate development rather than for generating
exports. Concerns have also been expressed on the displacement of farmers by land acquisition, loss of
fertile agricultural, forests or coastal land, a huge revenue loss to the exchequer and adverse consequences
of uneven growth. Many contend that the SEZ Act was framed without giving sufficient attention to the
ancillary issues, such as for massive land acquisition.
International evidence suggests that the role of SEZs in employment generation is often relatively marginal.
In most countries SEZs are not a major source of employment and they account for less than 1% of the
3 (Business Standard online, May 24, 2005): “In the race for new investments, the state is expected to go all
out in modifying the labor laws”, the online report of Business Standard said.

101
global workforce. Their role in employment generation in India too has been muted: compared to the 30
million jobs created in 15 special economic zones in China, India EPZs have created less than 100,000 jobs
in India (see Table 1).
Table 1: India’s export processing zones have not been as effective in generating employment as zones
in other countries in the region.
No. of
zones
Total empl.
(2000-03)
Investment
(US$ million)
Bangladesh 6 2,138,341 750
China 15 30,000,000 43560
India 8 95,000 NA
Malaysia 14 322,000 NA
Pakistan 22 410540 815
Philippines 34 820960 387
Sri Lanka 12 461,000 2627
Source: RIS (2006)
The SEZ Act may also entail significant revenue losses, and also set the stage for tax exemptions in other
sectors. The MOF has estimated that SEZs will lead to a revenue loss, on account of direct and indirect
taxes of around 0.4%-0.6% of GDP a year. Estimates by NIPFP suggest similar numbers. Moreover, the
SEZ Act may well set the stage for further tax exemptions in other sectors. Importantly, the inclusion of IT
in the SEZ Act has contributed to reigniting the debate on extending the tax holiday in the IT sector beyond
2009. At the same time, international experience shows that tax incentives by themselves will not attract
investment. This is supported by both econometric studies, and surveys of investors, which are generally in
agreement that investors do not consider tax incentives as a determining factor in their location decisions.
Enforcement of These Laws and De Facto Reforms
27. Although de jure reforms have been limited, de facto there has been perceptible
liberalization. At the state level, where the implementation takes place, de facto labor regulations
appear to have undergone a fair amount of liberalization (Roy, 2003). Signs of weakening law
enforcement are appearing in ineffective and corrupt inspections and an increasing recourse to
contract labor. A shift in the stand of the judiciary may also be contributing to a more flexible
application of the law. The incidence of voluntary retirement and contractual employment has
increased. Firm-level bargaining has increased too, suggesting some decline in the penetration of
national trade unions which usually lead the resistance to legal reforms.
Figure 5.1: The Use of Contract Labor Has Increased
Markedly
(Percentage of Contract Labor in Total Manufacturing
Labor Force)
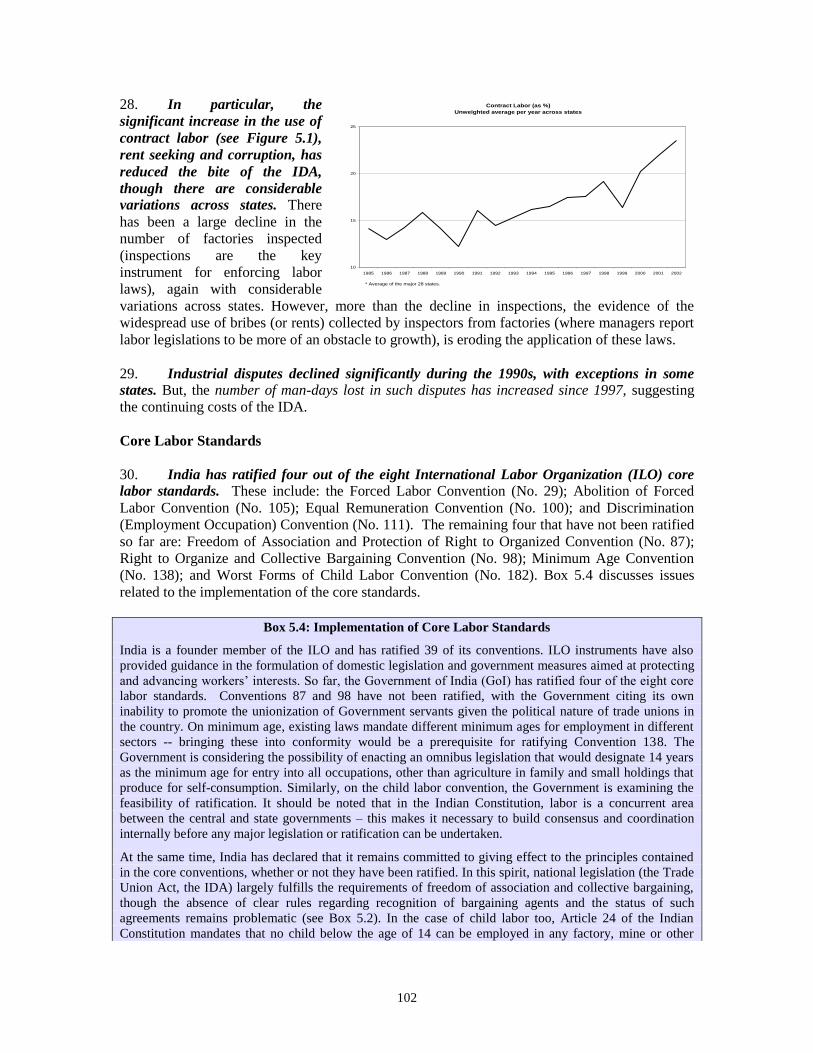
102
28. In particular, the
significant increase in the use of
contract labor (see Figure 5.1),
rent seeking and corruption, has
reduced the bite of the IDA,
though there are considerable
variations across states. There
has been a large decline in the
number of factories inspected
(inspections are the key
instrument for enforcing labor
laws), again with considerable
variations across states. However, more than the decline in inspections, the evidence of the
widespread use of bribes (or rents) collected by inspectors from factories (where managers report
labor legislations to be more of an obstacle to growth), is eroding the application of these laws.
29. Industrial disputes declined significantly during the 1990s, with exceptions in some
states. But, the number of man-days lost in such disputes has increased since 1997, suggesting
the continuing costs of the IDA.
Core Labor Standards
30. India has ratified four out of the eight International Labor Organization (ILO) core
labor standards. These include: the Forced Labor Convention (No. 29); Abolition of Forced
Labor Convention (No. 105); Equal Remuneration Convention (No. 100); and Discrimination
(Employment Occupation) Convention (No. 111). The remaining four that have not been ratified
so far are: Freedom of Association and Protection of Right to Organized Convention (No. 87);
Right to Organize and Collective Bargaining Convention (No. 98); Minimum Age Convention
(No. 138); and Worst Forms of Child Labor Convention (No. 182). Box 5.4 discusses issues
related to the implementation of the core standards.
Box 5.4: Implementation of Core Labor Standards
India is a founder member of the ILO and has ratified 39 of its conventions. ILO instruments have also
provided guidance in the formulation of domestic legislation and government measures aimed at protecting
and advancing workers’ interests. So far, the Government of India (GoI) has ratified four of the eight core
labor standards. Conventions 87 and 98 have not been ratified, with the Government citing its own
inability to promote the unionization of Government servants given the political nature of trade unions in
the country. On minimum age, existing laws mandate different minimum ages for employment in different
sectors -- bringing these into conformity would be a prerequisite for ratifying Convention 138. The
Government is considering the possibility of enacting an omnibus legislation that would designate 14 years
as the minimum age for entry into all occupations, other than agriculture in family and small holdings that
produce for self-consumption. Similarly, on the child labor convention, the Government is examining the
feasibility of ratification. It should be noted that in the Indian Constitution, labor is a concurrent area
between the central and state governments – this makes it necessary to build consensus and coordination
internally before any major legislation or ratification can be undertaken.
At the same time, India has declared that it remains committed to giving effect to the principles contained
in the core conventions, whether or not they have been ratified. In this spirit, national legislation (the Trade
Union Act, the IDA) largely fulfills the requirements of freedom of association and collective bargaining,
though the absence of clear rules regarding recognition of bargaining agents and the status of such
agreements remains problematic (see Box 5.2). In the case of child labor too, Article 24 of the Indian
Constitution mandates that no child below the age of 14 can be employed in any factory, mine or other
Contract Labor (as %)
Unweighted average per year across states
10
15
20
25
1985 1986 1987 1988 1989 1990 1991 1992 1993 1994 1995 1996 1997 1998 1999 2000 2001 2002
* Average of the major 28 states.
103
hazardous job. The Factories Act, 1948, also prohibits the employment of children below the age of 14. In
addition, in 1986, the government passed the Child Labor (Prohibition and Regulation) Act which further
listed occupations and processes where children cannot be employed. These include activities like
slaughterhouses, carpet-weaving, wool-cleaning, cloth-printing, and dyeing and weaving, which were not
covered in the previous Acts. These actions by the Government underscore the legislative intent to
progressively eliminate child labor in India. The Government also recognizes that significant progress in
this regard cannot be made without tackling the socio-economic milieus which force children to work. It
has formulated a National Child Labor Policy to design a specific program of action in this regard. There is
also a Central Advisory Board which reviews progress and recommends further action. Besides, the
Government also runs programs, directly and through voluntary organizations, to rehabilitate child workers.
The Government has also redoubled efforts to put children in schools by improving access and providing
free mid-day meals in schools. In addition, there are many state level initiatives, such as the Andhra
Pradesh Integrated Action Plan to Eliminate Child Labor. This is innovative in that it defines child labor
not as ‘working kids’, but more broadly, as children out of school, thus getting around the vexed issue of
what types/extent of child work actually constitute a harmful situation. Despite these efforts, child labor
remains a significant issue. According to NSS surveys, slightly fewer than 11 million children remained in
India’s work force in 1999/2000, mostly in rural areas, employed in agricultural activities.
C. Assessing India’s Labor Regulations
Some Key Issues
31. Notwithstanding some liberalization and the easing of enforcement in recent years,
there is increasing awareness, supported by research, that Indian labor laws are stiflingly
complex and restrict growth of the manufacturing and formal sectors in particular. Work done
by several national commissions and Government-appointed working groups, business and trade
groups, firm-level surveys, and recent research on labor issues in India, all point to this direction.
For instance, the report of the Second National Commission for Labor criticized labor laws as
being “ad hoc, complicated, mutually inconsistent, if not contradictory, lacking in uniformity of
definitions and riddled with clauses that have become outdated and anachronistic4 Further, a
growing body of research, discussed below, shows how labor regulations complicate dispute
resolution and restrict retrenchment and layoffs of workers in manufacturing, effectively
constraining the growth of the manufacturing sector and manufacturing jobs. The existence of
these laws helps explain, partly, why the Indian manufacturing sector is so small relative to that
of many other countries.
32. Overall, there are three main issues. First, there are too many laws. Some 47 Acts
directly regulate working conditions, wages and benefits, industrial relations, social security, and
insurance. States have as many as 40 minimum wages, corresponding to different types of
workers. This multiplicity of laws – several of them overlapping and sometimes inconsistent in
their definitions -- leads to ambiguities in interpretation. This, in turn, not only creates difficulties
in enforcement but also provides opportunities for discretionary behavior, rent-seeking and
corruption. Specifically, it creates conditions for the ‘Inspector Raj’ to operate and extract rents
(bribes) from industry. It has a particularly pernicious effect on small- and medium-scale
industries for which these costs are disproportionately high. Further, the numerous laws, by cross-
referencing one other, often extend the mandate of labor laws to organizations far different from
manufacturing enterprises5
4Planning Commission Report, 2001b.
5For instance, Section 2i of the IDA states: “Industry means any systematic activity carried on by cooperation between
an employer and his workmen (whether such workmen are employed by such employer directly or through any agency,
including a contractor) for the production, supply or distribution of goods with a view to satisfy human wants…whether

104
33. Second, clauses in Chapters Va and Vb of the IDA impose inordinately high
administrative costs on retrenching or laying-off workers and on closing firms. These
administrative costs are among the highest in the world6 For instance, Section 25-0, which makes
it mandatory for employers to refer cases of retrenchment due to firm closure to state
governments, has been in the eye of a legal storm for nearly 50 years on account of the barriers it
creates for failed firms to close their operations. Chapters Vb and Clause 25-0 make labor,
effectively, a fixed factor. They create disincentives for employers to hire more labor on a
permanent basis, and encourage the use of contract labor or casual labor. This law also creates
incentives for employers to choose more capital intensive techniques and increase wages instead
of employment.
34. Section 9A of the IDA also restricts the flexibility of firms to quickly adjust to changing
market conditions. It requires employers to provide three weeks written notice for changes in (a)
shift work; (b) grade classification; (c) technology that may affect labor demand; and (d)
occupation, process or department. The worker then has the right to dispute such changes, leading
to the costs of dispute resolution.
35. Third, the design of labor dispute settlement processes in the IDA creates incentives to
adjudicate disputes rather than reconcile them. The IDA makes provisions for dispute
settlement in three stages: (i) negotiation; (ii) mediation; and (iii) adjudication -- involving six
tiers of officers (Table 5.4). The first stage involves voluntary communication between the
disputants. The Act provides for Works Committees
to be constituted for the purpose of mediating. These
bodies are internal to firms. However, if a
significant number of outsiders are represented in
the union, then conciliation marginalizes the unions
and other outside political actors. It is then in the
unions’ interests to sabotage conciliation. Second,
and more important, the majority of cases of dispute
concern discharge, dismissal and retrenchment. The
legal provisions of the IDA are so protective of
workers that they expect to gain more from the
courtroom than from conciliation efforts. As a result, the number of pending court cases
concerning labor disputes is huge (around 533,000 at the end of the 1990s).
36. Numerous, and often conflicting, court decisions on labor disputes have increased
uncertainty about the interpretation of labor laws. This has raised transaction costs, created
large rents (bribery) in enforcing these laws, and lowered investors’ confidence (Debroy, 2005;
Pagés and Roy, 2006). Enforcing the IDA has also become more unwieldy and complex with the
state governments and courts intervening more in enterprise-level disputes and raising the costs
and rents to regulators. This has resulted in excessively long waiting times for resolving labor
disputes. Labor termination disputes that should, in principle, take no longer than 3 months to
decide, in practice sometimes take as long as ten years with, at times, 2000 pages of reported
or not -- (i) any capital has been invested for the purpose of carrying on such an activity; or (ii) such activity is carried
on with a motive to make any gain or profit…” Consequently, all activities can be defined as industrial and under the
purview of the IDA. In practice also, organizations as different as panchayat samitis, hospitals, real estate companies,
operators of tubewells, religious institutions, etc., have been considered to be industries, making, in principle, laws
applicable to industries also applicable to these institutions. 6Doing Business in 2006 (World Bank)
Table 5.4: Industrial Dispute
Reconciliation Bodies
Works Committees,
Conciliation Officers,
Board of Conciliation,
Courts of Inquiry,
Labor Courts,
Industrial Tribunals, and
A National Industrial Tribunal
Source: Debroy (2005).

105
materials being submitted for review7 Disputes referred to High Courts can lie pending for as
long as 10 years as well (Table 5.5).
37. An important consequence of these costs imposed by the IDA is that firms are
encouraged to remain small and thus, outside the purview of the law. Interviews suggest that
medium- and small-scale firms are threatened by permanent loss of business and clientele due to
prolonged disputes. A recent McKinsey report on India’s textile industry pointed out that Indian
manufacturers often set up multiple small plants instead of a single big one in order to take
advantage of easier labor laws. As a result, Indian clothing plants typically have 10 to 20 percent
of the capacity of Chinese plants and work at lower levels of efficiency. 8
38. The uncertainty surrounding some of the labor laws also leads to high transaction
costs, a most prominent example of which comes from the Contract Labor Act. The most
important example of this is the large number of prosecutions and cases concerning the Contract
Labor (Regulations and Abolition) Act. While the contract labor act provision has been
interpreted by firms and many states as a means of introducing flexibility in the labor market,
leading to a marked increase in the use of contract labor in many states, the provisions of the law
contain considerable ambiguity regarding the legality of using contract labor. Section 10 of the
Act prevents firms from outsourcing most core functions, or hiring workers on temporary
contracts for more than 120 days (anyone so employed can demand permanent employment from
the company). The prohibition of contract workers in ‘core’ areas follows from a Supreme Court
judgment (Standard Vacuum Refinery Company v their workmen, 1960) which prohibited
temporary labor in tasks that were (a) perennial; (b) necessary for the work of the factory; (c)
sufficient to employ a considerable number of whole-time workmen; and (d) were being done in
most concerns by regular workmen.
7Amir Ullah Khan (2005), ‘Regulating Labor Markets,’ page 90, in B. Debroy ed., Reforming Labor Laws in India.
8Business Standard, February 19, 2005.
Table 5.5: State-wise Details of Number of Dispute Cases Pending in Labor Courts
(Oct, 2000)
Major States No. of Cases Pending
No. of Cases Pending for
More Than 10 years
Assam 189 138
Bihar 5,200 566
Delhi 28,837 2,342
Gujarat 133,916 8,616
Kerala 3,450 63
Karnataka 17,457 2,924
Maharashtra 142,345 11,508
Madhya Pradesh 89,341 0
Punjab 14,784 110
Rajasthan 20,066 775
Tamil Nadu 21,713 150
Uttar Pradesh 22,539 10,303
West Bengal 2,225 283
Total (All States and
Union
Territories) 533,038 28,864
Source: Ministry of Labor

106
39. These detailed rules on the use of contract labor are backed up by strong discretionary
enforcement powers vested in Government bodies. A Central Advisory Board and a State
Advisory Board, consisting of the Labor Commissioners and nominees of the Governments, have
the discretion to determine whether the work involving contract labor is of a perennial nature and
justifies the use of casual, in
place of permanent, work force.
On the advice of such Boards,
state governments can issue
orders prohibiting contract
labor and/or its absorption in
the core work force. A series of
government notifications has
extended the scope of this
prohibition to individual
industries and fields of service.
From 2001 to 2002, there were
close to 4000 prosecutions and
over 2000 convictions arising
from the use of contract labor,
which affected nearly half a
million workers (Figure 5.2).
40. The uncertainty surrounding the use of contract labor even extends to the new ITES (Information Technology Enabled Services) firms which use many contract laborers in non-core
services. These firms face the prospect of standing in violation of the Contract Labor Act or being
compelled to add contract workers to their regular work force9
9Interview with IT firm in Bangalore, February 2005.
Figure 5.2: Prosecutions and Convictions from Violations
of the Contract Labor (Control and Abolition) Act
0
1,000
2,000
3,000
4,000
5,000
6,000
7,000
No. of Inspections No. of Prosecutions No. of Convictions No. of Contract
Laborers Covered
(000)
1995-96 2001-02
Source: Ministry of Labor

107
International Comparisons with Indian Labor Regulations
41. India comes across as
one of the most restrictive
countries in the world in terms
of regulations governing
retrenchment and layoffs. These
comparisons are based on the
Doing Business indicators, a
publicly available database based
on a detailed study of
employment laws across the
world. 10
Besides providing other
information, this data
summarizes information on legal
provisions related to hiring, hours
of work and retrenchment of
workers. These provisions are
assigned scores which increase
progressively as labor laws are revealed to be more pro-worker (see Box 5.5).
42. According to these measures, Indian labor laws are atypically restrictive in those
provisions that refer to worker retrenchment and, within this group, those that effectively deny
firms authorization to retrench. On the other hand, neither do provisions related to hours of
work, nor those related to the hiring of workers, appear to especially favor workers or restrict
employers, relative to the rest of the world. Furthermore, retrenched workers in India receive
fairly low compensation compared to those in other developing countries.
43. Indian laws regarding the use of alternative contracts are more restrictive than those in
other large developing economies, but are in line with international standards. India is assigned
a score of 33 in the restrictions on hiring index, slightly above the international median of 31 and
below the international average of 35 (Figure 5.3). Yet, when comparing India to a sample of
countries -- of either large developing economies or countries in the south and east Asia regions --
it is seen that hiring rules tend to be more restrictive in India than in other countries in the group,
with the exception of Brazil, Indonesia, Pakistan, Thailand, and Vietnam.
10
See http://rru.worldbank.org/DoingBusiness
Box 5.5: Doing Business Indices
A first index (restrictions on hiring) measures how difficult it is
for employers to offer non-standard contracts, that is, they have to
hire workers using modalities other than open-ended, permanent
contracts. A higher score indicates higher difficulty in hiring
through alternative contracts.
A second index (restrictions on hours of work) measures legal
provisions pertaining to hours of work. It compares countries in
aspects related to overtime, restrictions on night work, and length
of the work-day and work-week. Countries where employers face
more restrictions on hours of work are given a higher score.
A third index (restrictions on retrenchment) measures legal and
administrative constraints on dismissals. Finally, the rigidity of
employment index provides a summary index of the rigidity of
labor laws.

108
44. Thus, while Indian labor laws exert little restriction on hours of work, they impose
high administrative costs on dismissal. India scores 20 on the restrictions on hours of work
index, well below the international median score of 60 and the international average of 50. Indian
scores are also much lower than the mean of the group of comparators, with the exception of
Malaysia and Nepal which have similarly unrestricted laws on hours of work. However, Indian
labor laws impose high administrative constraints on dismissals relative to most countries in the
world. On a scale of 1 to 100, India scores 90 on the restrictions on dismissals index, well above
the international median of 40 and the international average of 37.4. Indian firms also experience
much higher bureaucratic restrictions on dismissals than firms in the sample of comparator
countries.
D. The Impact of Some Key Labor Regulations in India
45. How important are labor regulations in the eyes of employers? The information on this
is available from a survey of 1900 firms that were asked about the various constraints to growth
that they face, including those from labor regulations. The results of this combined Confederation
of Indian Industries (CII) and World Bank Investment Climate survey can be used to assess, first,
how constraining labor regulations are relative to other factors. Second, how do responses
regarding labor regulations and other constraints in India compare with those from other
countries? Figure 5.4 shows the average response to labor laws (as an obstacle question) across
all countries for which the survey is available. All surveys were conducted in the period starting
at the end of the 1990s and continuing into the early 2000s. It is interesting that India (along with
Kenya, Indonesia, Poland, and Brazil) is one of the countries where employers perceive labor
regulations to be a big obstacle. Somewhat surprisingly, Chinese employers rate China’s labor
regulations to be at least as binding as the ones in India, while objective measures of labor
regulations, such as the ones presented in the World Bank Doing Business Report, classify India
as a country with more stringent regulations than China.
Figure 5.3: India Labor Laws Compared to Selected Countries
0
20
40
60
80
100
120
Difficu
lty o
f
Hir
ing
In
de
x
Rig
idity o
f
Ho
urs
In
de
x
Difficu
lty o
f
Fir
ing
In
de
x
Rig
idity o
f
Em
plo
ym
en
t
Ind
ex
Hir
ing
co
st
(% o
f sa
lary
)
Fir
ing
co
sts
(we
eks o
f
wa
ge
s)
India China Turkey Bangladesh United States

109
Figure 5.4:Firms Consider India’s Labor Laws to be More Binding than Those of Most Other
Countries
Average ICA score on perceptions of labor regulations
0
0.5
1
1.5
2
2.5
Uzb
ekist
an
Eritre
a
Kazakh
stan
Azerb
aijan
Armenia
Ethio
pia
Russ
ian F
ederatio
n
Tajikista
n
Georg
ia
Kyrgyz
Republic
Nicara
gua
Cro
atia
Mold
ova
Bulgaria
Slove
nia
Ecuador
Mace
donia, F
YR
Albania
Ukr
aine
Cam
bodia
Uganda
Estonia
Hungary
Cze
ch R
epublic
Rom
ania
Lithuania
Latvia
Bosnia
and H
erzegovin
a
Mala
ysia
Slova
k Republic
Turkey
Belaru
s
Serbia
and M
ontenegro
Hondura
s
Algeria
Pakist
an
Bangladesh
Tanzania
Zambia
Guate
mala
Philippin
esIn
dia
Chin
a
Kenya
Indonesi
a
Poland
Brazil
0=no obstacle to 3=major or very severe obstacle Source: Estimated from Investment Climate Survey of 2002. Ahsan and Pagés, 2005b.
46. Importantly, the perception of constraints posed by labor regulations varies greatly
according to firm size. Overall, given that Indian firms score labor regulations to be a minor to
moderate obstacle (that is, a score between 1 and 2), it may appear that labor problems are not
very significant in comparison to other obstacles. However, when perceptions of labor constraints
by firms are broken down by firm-size, labor regulations are highly significant for the larger firms
for which most regulations apply.
47. Large firms consider labor issues to be as big a constraint as electricity. Infrastructure
and, in particular, unreliable and insufficient supply of power have been identified as a major
constraint for the future growth of India. For instance, Krueger and Chinoy (2002, p 31) note that:
“By the end of the decade, the growth of the 1990s had already pushed infrastructure utilization
well above the optimum. It is then noticeable that the data from the 2002 Investment Climate
Survey show that firms with more than 100 workers consider labor regulation to be as important a
constraint to their growth as electricity shortages”. 11
(Figure 5.5).
11
Although most firms rank labor regulations as 99.5 compared to 100 for power, statistically there is no difference
between the two scores.
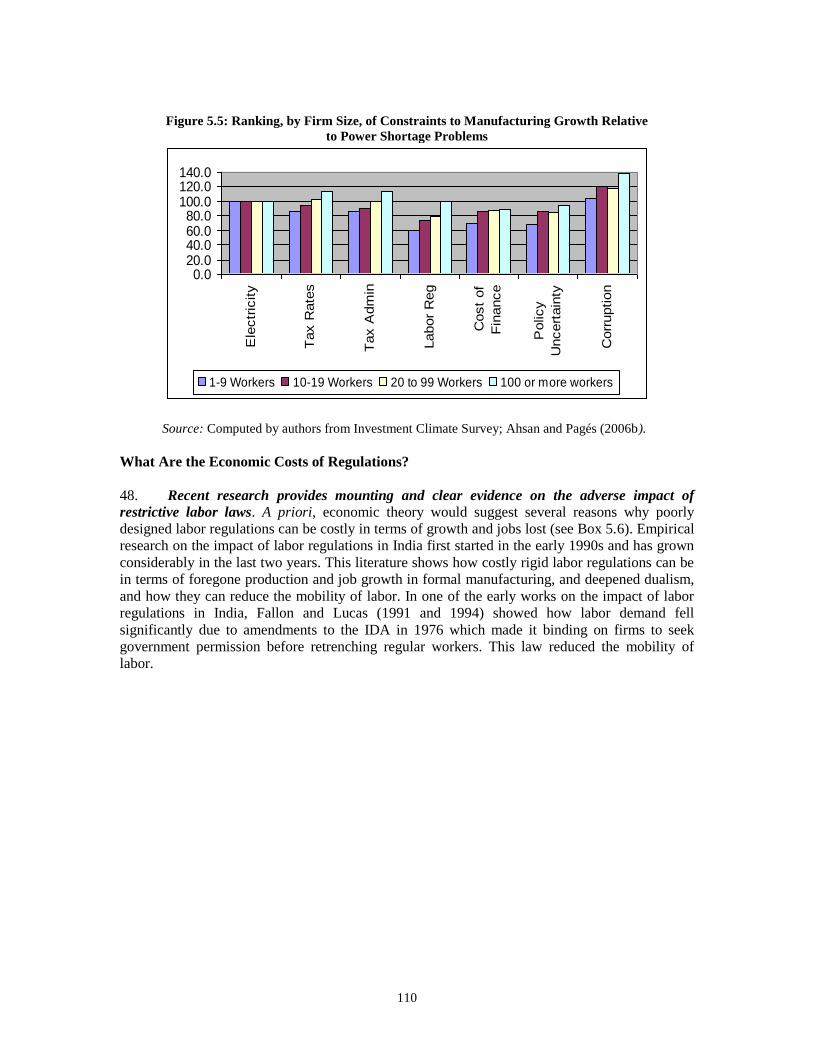
110
What Are the Economic Costs of Regulations?
48. Recent research provides mounting and clear evidence on the adverse impact of
restrictive labor laws. A priori, economic theory would suggest several reasons why poorly
designed labor regulations can be costly in terms of growth and jobs lost (see Box 5.6). Empirical
research on the impact of labor regulations in India first started in the early 1990s and has grown
considerably in the last two years. This literature shows how costly rigid labor regulations can be
in terms of foregone production and job growth in formal manufacturing, and deepened dualism,
and how they can reduce the mobility of labor. In one of the early works on the impact of labor
regulations in India, Fallon and Lucas (1991 and 1994) showed how labor demand fell
significantly due to amendments to the IDA in 1976 which made it binding on firms to seek
government permission before retrenching regular workers. This law reduced the mobility of
labor.
Figure 5.5: Ranking, by Firm Size, of Constraints to Manufacturing Growth Relative
to Power Shortage Problems
0.020.040.060.080.0
100.0120.0140.0
Ele
ctr
icity
Tax R
ate
s
Tax A
dm
in
Labor
Reg
Cost
of
Fin
ance
Policy
Uncert
ain
ty
Corr
uption
1-9 Workers 10-19 Workers 20 to 99 Workers 100 or more workers
Source: Computed by authors from Investment Climate Survey; Ahsan and Pagés (2006b).

111
Box 5.6: What Does Economic Theory Say About the Costs of Labor Regulations?12
Higher adjustment costs: By restricting changes in the use of labor, a key factor in production, regulations
hinder firms from adjusting output and labor in response to changes in demand and market conditions.
Consequently, firms may be unable to produce at the most efficient scale of production.
Higher labor costs and wage stickiness: Protecting jobs of existing workers and deterring recruitment of
new workers, creates a wage premium for formal sector workers over casual workers that is unaccounted
for by skills, experience or other human capital attributes. Further, regulations restricting labor
retrenchment or layoffs can also result in wage rigidity in the formal sector, creating unemployment.
Higher transaction costs and rents: When administrative and judicial procedures dominate recruitment,
retrenchment and industrial relations, transaction costs increase for both firms and workers. This is because
instead of simple and transparent financial compensatory mechanisms being used, the use of administrative
or legal procedures can result in rent-seeking or bribe taking by inspectors.
Reduced incentives to invest. Excessively protective labor laws reduce the returns to capital, leading to
reduced investment and capital accumulation.
Uncertainty. Complicated regulations that are enforced mostly through administrative rules create
uncertainty for investors. This leads, in turn, to lower investments (because investments are costly to
reverse), lower hiring of regular and permanent workers, and reduced training of workers.
Slower growth of jobs and employment in the formal sector: The sum total of effects leads to slower
growth of production and jobs in the sectors affected by the laws.
Lower productivity. By hindering the movement of labor from less productive to more productive jobs,
regulations can lower overall economic and labor productivity, adversely impacting wages and growth.
Off-setting factors: Simple, transparent regulations that rely more on financial compensatory mechanisms
can lead to increased welfare of workers, more harmonious industrial relations, and less uncertainty for
investors and workers – leading to overall better outcomes than when markets are entirely unregulated.
49. Recent research, focusing on differences in labor laws among Indian states, shows
how states that increased the stringency of the IDA experienced a decline in formal sector
manufacturing value-added and employment (Besley and Burgess, 2004). Building further on
this work Hasan, Mitra and Ramaswamy (2003) find that states with more stringent labor
regulations (as measured in Besley and Burgess, 2004) have lower demand elasticities and these
elasticities are less affected by trade reforms. A recent work (Lall and Mengistae, 2005) that
analyzed plant level data in 40 of India’s major cities using a measure for the enforcement of
laws, suggested that an inadequate investment climate (principally inadequate power supply and
the rigidity of labor laws) results in lower productivity at the plant level and lower manufacturing
development in the states most affected by these laws.
50. Recent research for this study, which tries to measure both de jure and de facto
applications of the IDA, has also shown how manufacturing value-added, employment and the
number of factories are all adversely affected in states with more restrictive labor laws. This
research assesses the impact of state amendments to the IDA on output, employment, wages,
labor share, and number of factories in the manufacturing sector of such states, during the period
1959-1997. Some states made amendments to reduce the costs of labor disputes while other states
12
See Basu (2006) for a theoretical exposition of how India’s labor market regulations, especially the provisions of the
IDA, can harm labor market outcomes.

112
passed amendments that made labor disputes more costly.13
As mentioned above, state
amendments that increased the cost of labor disputes or retrenchment, above the cost stipulated
by the central Act, resulted in declines in registered manufacturing employment and output in that
state, relative to the states that did not implement such changes. There is some evidence that the
use of contract labor across different states in the 1990s may have helped to reduce adjustment
costs for firms, but did not do away with all the effects of regulations. Figures 5.6 through 5.8
present the results of research that measure the costs of IDA regulations that (i) make labor
disputes costly; and (ii) raise retrenchment costs through the Vb clause. The main results are the
following:
Overall, India loses out on 2.8 million jobs in the formal manufacturing sector due to the IDA
per se, which is, about 45 percent of the 6.4 millions jobs that currently exist in the formal
manufacturing sector.
The costs, in terms of jobs lost, are caused almost equally by the disputes related sections of
the IDA and the retrenchment barriers clauses in the IDA.
However, the disputes-related regulations cost more jobs in capital-intensive industries (top
panel of Figure 5.6), while retrenchment-related regulations cost more jobs in labor-intensive
industries (bottom panel of Figure 5.6).
Retrenchment-related regulations affect jobs in more states (top panel in Figure 5.7) than
disputes-related regulations. This is due, in part, to the fact that some states have
implemented laws that reduce the costs of labor disputes, resulting in employment gains. But
no states have implemented laws that reduce the costs of retrenchments.
West Bengal and Maharashtra pay, by far, the biggest costs in terms of jobs lost – accounting
for more than half of gross job losses.
States such as West Bengal, Maharashtra, Gujarat, and Rajasthan pay the costs in terms of
thousands of factories that do not exist because of the IDA regulations. This is because these
states have more stringent labor regulations relative to the rest of states.
13 For example, in 1988, Tamil Nadu introduced an amendment that increased the power of Conciliation Officers in
terms of enforcing attendance, compelling the production of documents and issuing commissions for the examination
of witnesses. Examples of laws that reduce the costs of disputes are: (i) eliminating the need for the parties to refer
labor disputes to the government prior to referring them to a tribunal; and (ii) granting the government the power to
transfer any industrial dispute pending before a tribunal to any other tribunal constituted by the state government for
adjudication.
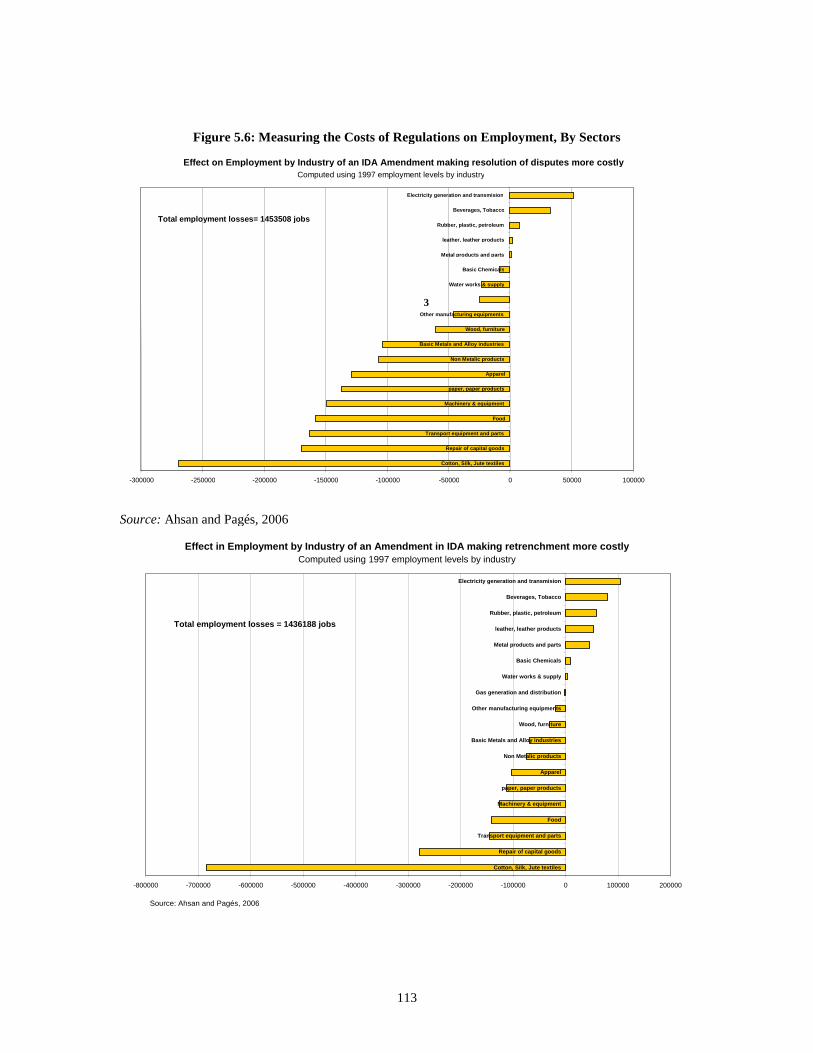
113
Figure 5.6: Measuring the Costs of Regulations on Employment, By Sectors
Source: Ahsan and Pagés, 2006
Effect in Employment by Industry of an Amendment in IDA making retrenchment more costly
Computed using 1997 employment levels by industry
-800000 -700000 -600000 -500000 -400000 -300000 -200000 -100000 0 100000 200000
Cotton, Silk, Jute textiles
Repair of capital goods
Transport equipment and parts
Food
Machinery & equipment
paper, paper products
Apparel
Non Metalic products
Basic Metals and Alloy industries
Wood, furniture
Other manufacturing equipments
Gas generation and distribution
Water works & supply
Basic Chemicals
Metal products and parts
leather, leather products
Rubber, plastic, petroleum
Beverages, Tobacco
Electricity generation and transmision
Source: Ahsan and Pagés, 2006
Total employment losses = 1436188 jobs
Effect on Employment by Industry of an IDA Amendment making resolution of disputes more costly Computed using 1997 employment levels by industry
-300000 -250000 -200000 -150000 -100000 -50000 0 50000 100000 Cotton, Silk, Jute textiles
Repair of capital goods Transport equipment and parts
Food Machinery & equipment
paper, paper products Apparel
Non Metalic products Basic Metals and Alloy industries
Wood, furniture Other manufacturing equipments 3
Water works & supply Basic Chemicals
Metal products and parts leather, leather products
Rubber, plastic, petroleum Beverages, Tobacco
Electricity generation and transmision
Total employment losses= 1453508 jobs

114
Figure 5.7: Measuring the Costs of Regulations on Employment and Value-Added, by State
Effect of State Labor Reforms on Organized Manufacturing Value Added, by State ( Values in Rs Lakhs of 1997)
-600000 -500000 -400000 -300000 -200000 -100000 0 100000 200000
West Bengal Maharashtra
Gujarat Rajasthan
Orissa Assam
Bihar Haryana
Jammu & Kashmir Punjab
Uttar Pradesh Madhya Pradesh
Karnataka
Kerala Andhra Pradesh
Tamil Nadu
IDA amendments on Hiring and Firing Laws IDA Amendments on Disputes Laws Source: Ahsan and Pagés (2006)
Effect of State Labor Reforms on Organized Manufacturing Employment, by State
-700000 -600000 -500000 -400000 -300000 -200000 -100000 0 100000 200000
West Bengal
Maharashtra Gujarat
Rajasthan Orissa Assam
Bihar Haryana
Jammu & Kashmir Punjab
Uttar Pradesh Madhya Pradesh
Karnataka Kerala
Andhra Pradesh Tamil Nadu
IDA amendments on Hiring and Firing Laws IDA amendments on Disputes Laws
Source: Ahsan and Pagés (2006)
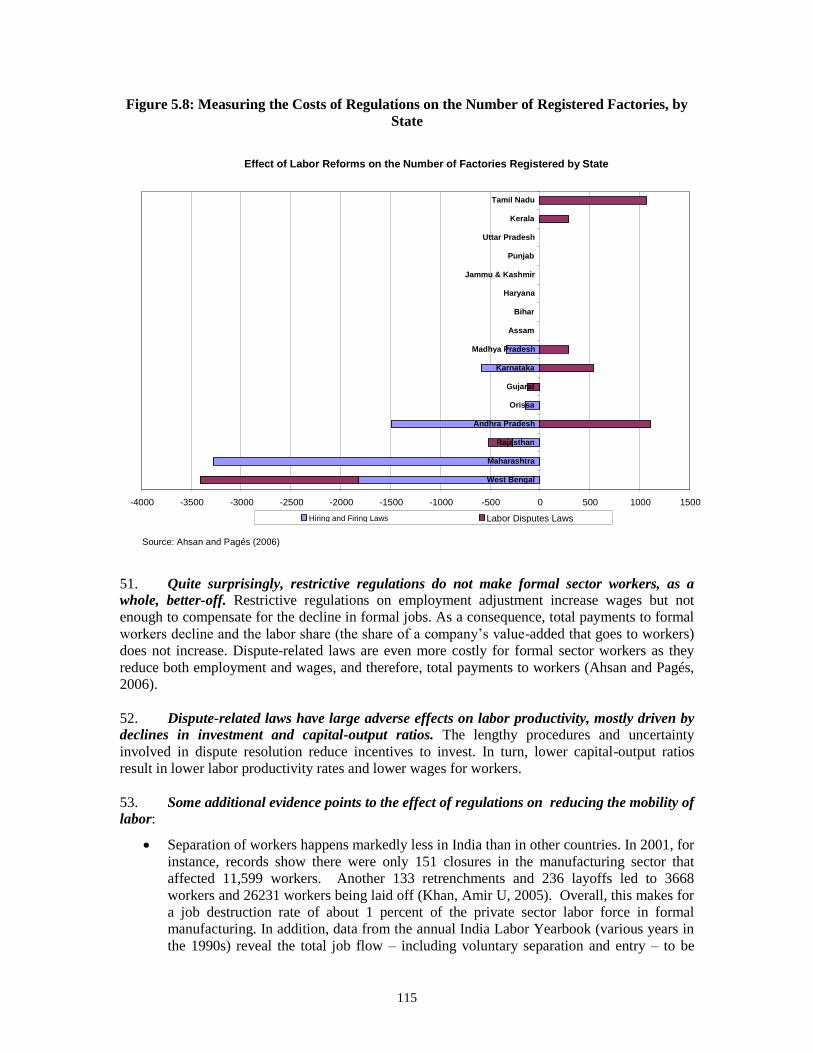
115
Figure 5.8: Measuring the Costs of Regulations on the Number of Registered Factories, by
State
51. Quite surprisingly, restrictive regulations do not make formal sector workers, as a
whole, better-off. Restrictive regulations on employment adjustment increase wages but not
enough to compensate for the decline in formal jobs. As a consequence, total payments to formal
workers decline and the labor share (the share of a company’s value-added that goes to workers)
does not increase. Dispute-related laws are even more costly for formal sector workers as they
reduce both employment and wages, and therefore, total payments to workers (Ahsan and Pagés,
2006).
52. Dispute-related laws have large adverse effects on labor productivity, mostly driven by
declines in investment and capital-output ratios. The lengthy procedures and uncertainty
involved in dispute resolution reduce incentives to invest. In turn, lower capital-output ratios
result in lower labor productivity rates and lower wages for workers.
53. Some additional evidence points to the effect of regulations on reducing the mobility of
labor:
Separation of workers happens markedly less in India than in other countries. In 2001, for
instance, records show there were only 151 closures in the manufacturing sector that
affected 11,599 workers. Another 133 retrenchments and 236 layoffs led to 3668
workers and 26231 workers being laid off (Khan, Amir U, 2005). Overall, this makes for
a job destruction rate of about 1 percent of the private sector labor force in formal
manufacturing. In addition, data from the annual India Labor Yearbook (various years in
the 1990s) reveal the total job flow – including voluntary separation and entry – to be
Effect of Labor Reforms on the Number of Factories Registered by State
-4000 -3500 -3000 -2500 -2000 -1500 -1000 -500 0 500 1000 1500
West Bengal
Maharashtra
Rajasthan
Andhra Pradesh
Orissa
Gujarat
Karnataka
Madhya Pradesh
Assam
Bihar
Haryana
Jammu & Kashmir
Punjab
Uttar Pradesh
Kerala
Tamil Nadu
Hiring and Firing Laws Labor Disputes Laws
Source: Ahsan and Pagés (2006)
116
around 14 percent in the 1990s. In comparison, gross worker flows for the formal sector
in OECD countries can range from 60 percent in Germany to about 80 percent in the US.
Middle income countries, such as Mexico and Brazil, have gross worker flows of 65
percent and 80 percent respectively.
Firm level surveys reveal that ‘labor hoarding’ can be as much as 17 percent, that is,
firms may have as many as 17 percent more workers than their desired number of labor
force.
To avoid disputes, firms are willing to pay two to six times the legally mandated
compensation for retrenching or laying-off workers. Instead of the mandated two weeks
of wages for each year of service, firms often offer up to four to six weeks of wages as
compensation.
54. Restrictive regulations and labor laws also contribute to inequality by perpetuating
dualism between the formal and informal sectors. With the exception of chapter Vb in the IDA,
most regulations, including labor regulations, become binding in manufacturing firms which have
more than 10 workers (if power or electricity is used) or 20 workers (if no power is used)
registered under the Factories Act. The impact of this is seen starkly on the overwhelming share
of workers (about 75 percent) in firms or plant sizes of below 10 workers – the bulk of
employment in firms that remain unregistered. In contrast, less than 20 percent of workers in a
sample of fast-growing East Asian countries work in such small firms. More generally, as seen in
Chapter 3, Indian manufacturing sector firms continue to show a highly bi-modal size structure:
the bulk of the firms are low-productivity small enterprises at one end and on the other, upper
end, are relatively large firms with high productivity.
55. Recent data suggests that dualistic trends are persistent in the manufacturing and
tertiary sectors. In manufacturing, for instance, only 2 percent of firms belong to the formal
organized sector (that is, firms that employ more than 10 workers each). But the share of
employees working in these firms has declined to 25 percent of all manufacturing sector
employment (Unni, 2006). Thus, on the one side are the more productive, relatively better paid,
salaried, formal sector workers (14 percent of the Indian labor force) who enjoy the ‘insider
benefits’ of being protected by employment protection legislation, and on the other side are the
vast majority of informal or unorganized sector workers who work for much lower wages and
have little or no social protection. This is evident from the persistent real wage premium of about
28 percent that exists for salaried workers over casual workers, even when they have similar
human capital characteristics.
56. The dualism in India’s manufacturing sector spills over to the tertiary sector through
two channels. First, by discouraging growth of the formal manufacturing sector, in particular, and
the manufacturing sector in general, regulations push a large number of workers towards low-end
tertiary sector employment. Second, regulations can also directly impinge on the services sector
through the broader application of laws such as the IDA, something that was not originally
intended. For instance, clauses in the Shops and Establishment Act sometimes overlap with those
of the IDA and some court decisions have extended the reach of the IDA to cover tertiary sector
activities.
57. Contrary to the adverse impact of some clauses of the IDA, preliminary analysis
suggests that minimum wages for unskilled workers can be welfare-enhancing in India. Minimum wages may be supporting the wages of less skilled workers, without apparent costs to
employment. However, minimum wage regimes need to be streamlined. With individual states
having as many as 40 or more minimum wages in place, set by both central and state
governments, minimum wage regulations in India are also as complex as other labor laws. Within

117
the agricultural sector alone, there are minimum wages for ploughing, weeding, sowing,
transplanting, harvesting, winnowing, threshing, picking, and herding. In the construction
industry, the central government has set eight minimum wages which are differentiated by the
thickness of around an inch of the stones meant to be broken. There are also floor minimum
wages for unskilled workers which have been set by the state governments.
58. One result of this complexity is that minimum wages laws are not well-enforced. A
large share of workers, some 40 percent of agricultural workers and 21 percent of urban casual
workers (see left panel of Figure 5.9), get wages below the lowest minimum wage (typically the
one set for unskilled casual workers). These figures likely underestimate the lack of compliance
since, in most states, minimum wages are considerably below the average wages of casual
agricultural and urban workers (right hand side panel in Figure 5.9).
Figure 5.9: Minimum Wages and Employment
Panel A: Share of workers getting wages below
the state minimum wage for unskilled workers
Panel B: Minimum wages as a percentage of average
wages in NSS regions.
40.8
16.5
21.7
40.6
15.7
21.6
Rural
Agriculture
Rural Non-
agriculture
Urban
Casual
1993-94 1999-00
62.9 61.276.9 78.0
59.357.7
0.0
20.0
40.0
60.0
80.0
Rural Non-
farm wages
Agricultural
Wages
Urban Casual
Wages
1993-94
1999-00
Source: Wage data from NSS. Minimum wage data from Indiastat.com
59. The data suggests the strong effect minimum wages have on supporting wages for
unskilled casual workers in urban and rural areas. In most states, casual wages tend to be
concentrated around the minimum wage for unskilled workers (Figure 5.10). The data also shows
that casual wages for agricultural and urban workers, as well as minimum wages, moved in the
same direction over the period between 1993-1994 and 1999-2000. This is the case even after
controlling for state fixed effects which take into account other factors that determine the level of
minimum wages.
60. On average, minimum wages did not seem to ration jobs in the 1990s. A separate
exercise shows that unemployment (UPS) and underemployment (CDS) rates in the different
states do not appear to be related to minimum wages.14
Such results are consistent with our
finding that real wages do not affect casual employment levels or employment rates. A
preliminary conclusion of this analysis is that minimum wages for unskilled workers can be
welfare-enhancing as they raise wages for unskilled poor workers without increasing
unemployment significantly. Such a conclusion is only tentative in that it needs to be supported
by further analysis. However, it points to an under-researched area of major policy importance as
it can imply that a streamlined regime of minimum wages can be welfare-enhancing for those in
more need.
14
This accounted for other omitted factors. See chapter 1 for definition of these terms.

118
05
01
00
15
0
kd
en
sity R
ura
l_W
ag
e, a
rea
=4
44
0/k
de
nsity U
rba
n_
Wa
ge
, a
rea
=3
05
6
100 300 500Min.wage=25.96x
Rural Urban
Daily Wage
Note: excluding 1% of highest earners within +/-4 standard deviations
Andhra Pradesh
05
01
00
15
02
00
kd
en
sity R
ura
l_W
ag
e, a
rea
=4
71
0/k
de
nsity U
rba
n_
Wa
ge
, a
rea
=1
34
7
100 300 500 700Min.wage=27.3x
Rural Urban
Daily Wage
Note: excluding 1% of highest earners within +/-4 standard deviations
Bihar
05
01
00
15
0
kd
en
sity R
ura
l_W
ag
e, a
rea
=3
59
1/k
de
nsity U
rba
n_
Wa
ge
, a
rea
=2
37
1
100 300 500 658Min.wage=39x
Rural Urban
Daily Wage
Note: excluding 1% of highest earners within +/-4 standard deviations
Madhya Pradesh
0
20
40
60
kd
en
sity R
ura
l_W
ag
e, a
rea
=2
33
3/k
de
nsity U
rba
n_
Wa
ge
, a
rea
=2
32
1
200 300 400 500 600 700Min.wage=50x
Rural Urban
Daily Wage
Note: excluding 1% of highest earners within +/-4 standard deviations
Gujarat
Figure 5.10: Clustering of Urban and Rural Casual Wages and Minimum Wages, by State
Kernel Distribution of Urban and Rural Casual Wages
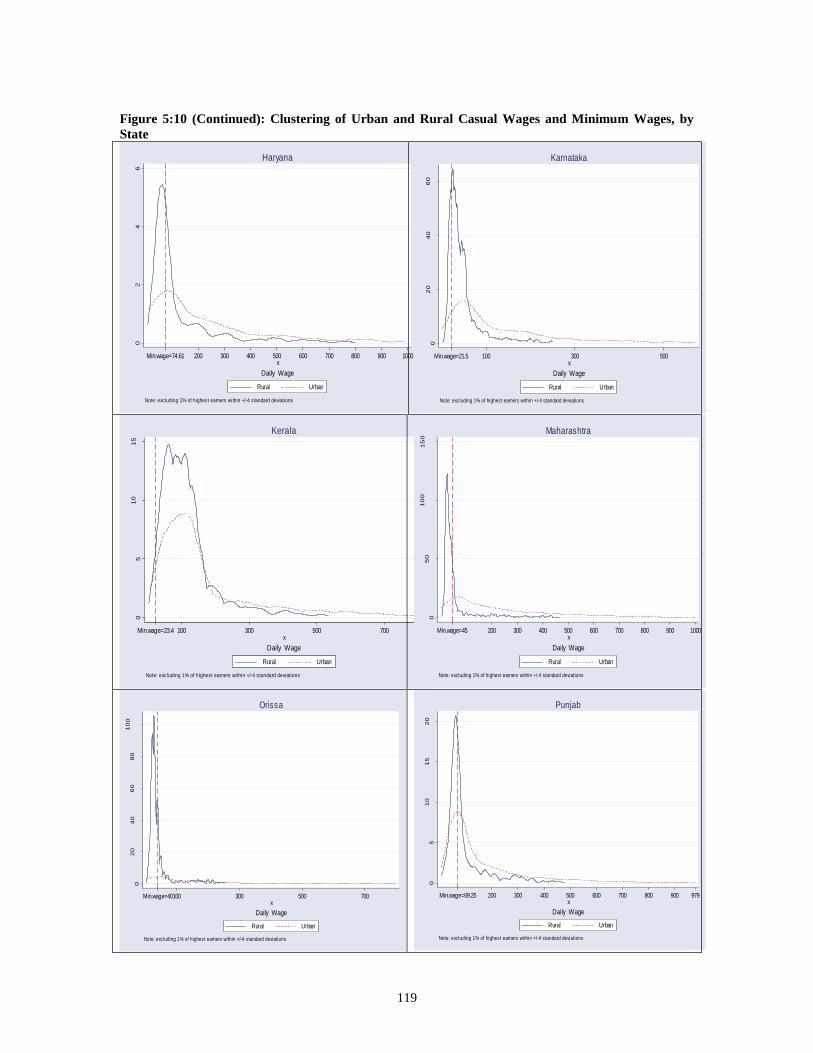
119
Figure 5:10 (Continued): Clustering of Urban and Rural Casual Wages and Minimum Wages, by
State
0
24
6
kd
en
sity R
ura
l_W
ag
e, a
rea
=5
19
/kd
en
sity U
rba
n_
Wa
ge
, a
rea
=5
12
200 300 400 500 600 700 800 900 1000Min.wage=74.61x
Rural Urban
Daily Wage
Note: excluding 1% of highest earners within +/-4 standard deviations
Haryana
02
04
06
0
kd
en
sity R
ura
l_W
ag
e, a
rea
=2
52
5/k
de
nsity U
rba
n_
Wa
ge
, a
rea
=2
16
7
100 300 500Min.wage=21.5x
Rural Urban
Daily Wage
Note: excluding 1% of highest earners within +/-4 standard deviations
Karnataka
05
10
15
kd
en
sity R
ura
l_W
ag
e, a
rea
=2
04
4/k
de
nsity U
rba
n_
Wa
ge
, a
rea
=1
66
9
100 300 500 700 804Min.wage=23.4x
Rural Urban
Daily Wage
Note: excluding 1% of highest earners within +/-4 standard deviations
Kerala
0
50
10
01
50
kd
en
sity R
ura
l_W
ag
e, a
rea
=3
86
5/k
de
nsity U
rba
n_
Wa
ge
, a
rea
=4
78
7
200 300 400 500 600 700 800 900 1000Min.wage=45x
Rural Urban
Daily Wage
Note: excluding 1% of highest earners within +/-4 standard deviations
Maharashtra
02
04
06
08
01
00
kd
en
sity R
ura
l_W
ag
e, a
rea
=2
59
4/k
de
nsity U
rba
n_
Wa
ge
, a
rea
=7
81
100 300 500 700Min.wage=40x
Rural Urban
Daily Wage
Note: excluding 1% of highest earners within +/-4 standard deviations
Orissa
05
10
15
20
kd
en
sity R
ura
l_W
ag
e, a
rea
=1
22
3/k
de
nsity U
rba
n_
Wa
ge
, a
rea
=1
34
3
200 300 400 500 600 700 800 900 979Min.wage=69.25x
Rural Urban
Daily Wage
Note: excluding 1% of highest earners within +/-4 standard deviations
Punjab

120
Figure 5:10 (Continued): Clustering of Urban and Rural Casual Wages and Minimum Wages, by
State
05
10
15
20
25
kd
en
sity R
ura
l_W
ag
e, a
rea
=1
32
6/k
de
nsity U
rba
n_
Wa
ge
, a
rea
=1
38
6
200 300 400 500 570Min.wage=50.36x
Rural Urban
Daily Wage
Note: excluding 1% of highest earners within +/-4 standard deviations
Rajasthan
02
04
06
08
0
kd
en
sity R
ura
l_W
ag
e, a
rea
=3
97
2/k
de
nsity U
rba
n_
Wa
ge
, a
rea
=3
63
5
200 300 400 500 600 700 800Min.wage=32.69x
Rural Urban
Daily Wage
Note: excluding 1% of highest earners within +/-4 standard deviations
Tamil Nadu
02
04
06
08
0
kd
en
sity R
ura
l_W
ag
e, a
rea
=3
52
9/k
de
nsity U
rba
n_
Wa
ge
, a
rea
=2
65
3
100 300 500Min.wage=40x
Rural Urban
Daily Wage
Note: excluding 1% of highest earners within +/-4 standard deviations
Uttar Pradesh
0
20
40
60
80
kd
en
sity R
ura
l_W
ag
e, a
re
a=
29
75
/kd
en
sity U
rb
an
_W
ag
e, a
re
a=
24
45
200 300 400 500 600 666Min.wage=58.9x
Rural Urban
Daily Wage
Note: excluding 1% of highest earners within +/-4 standard deviations
West Bengal
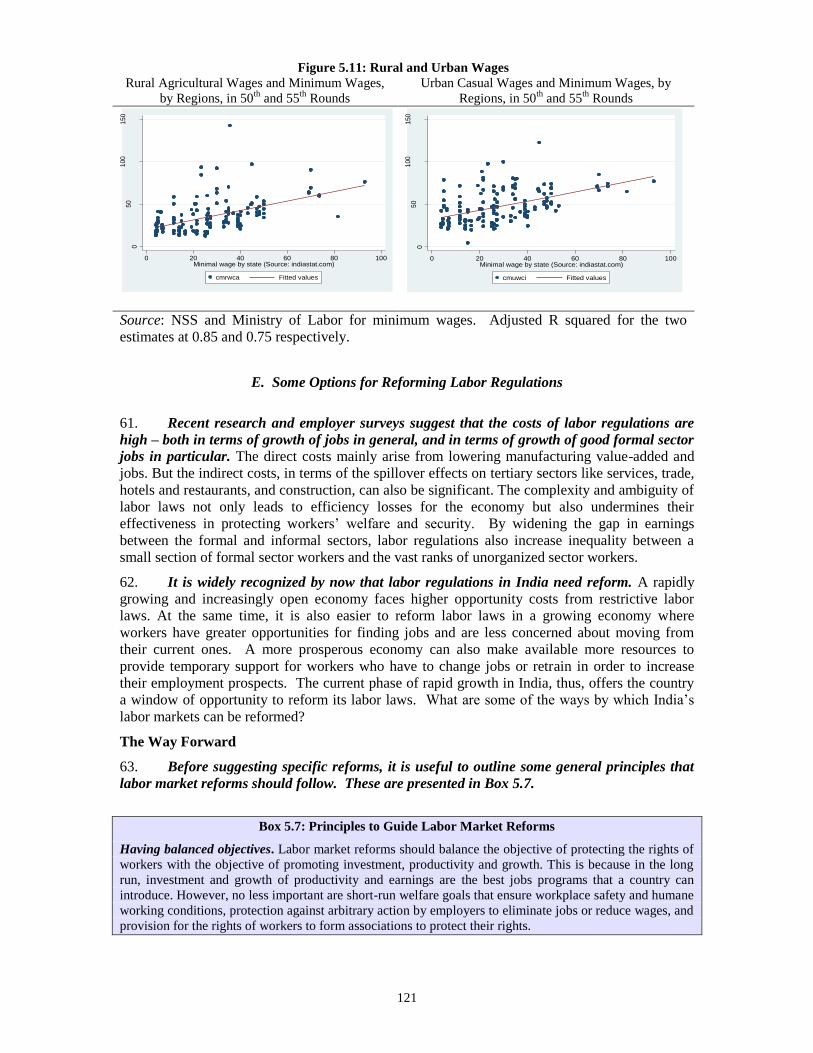
121
E. Some Options for Reforming Labor Regulations
61. Recent research and employer surveys suggest that the costs of labor regulations are
high – both in terms of growth of jobs in general, and in terms of growth of good formal sector
jobs in particular. The direct costs mainly arise from lowering manufacturing value-added and
jobs. But the indirect costs, in terms of the spillover effects on tertiary sectors like services, trade,
hotels and restaurants, and construction, can also be significant. The complexity and ambiguity of
labor laws not only leads to efficiency losses for the economy but also undermines their
effectiveness in protecting workers’ welfare and security. By widening the gap in earnings
between the formal and informal sectors, labor regulations also increase inequality between a
small section of formal sector workers and the vast ranks of unorganized sector workers.
62. It is widely recognized by now that labor regulations in India need reform. A rapidly
growing and increasingly open economy faces higher opportunity costs from restrictive labor
laws. At the same time, it is also easier to reform labor laws in a growing economy where
workers have greater opportunities for finding jobs and are less concerned about moving from
their current ones. A more prosperous economy can also make available more resources to
provide temporary support for workers who have to change jobs or retrain in order to increase
their employment prospects. The current phase of rapid growth in India, thus, offers the country
a window of opportunity to reform its labor laws. What are some of the ways by which India’s
labor markets can be reformed?
The Way Forward
63. Before suggesting specific reforms, it is useful to outline some general principles that
labor market reforms should follow. These are presented in Box 5.7.
Box 5.7: Principles to Guide Labor Market Reforms
Having balanced objectives. Labor market reforms should balance the objective of protecting the rights of
workers with the objective of promoting investment, productivity and growth. This is because in the long
run, investment and growth of productivity and earnings are the best jobs programs that a country can
introduce. However, no less important are short-run welfare goals that ensure workplace safety and humane
working conditions, protection against arbitrary action by employers to eliminate jobs or reduce wages, and
provision for the rights of workers to form associations to protect their rights.
Figure 5.11: Rural and Urban Wages
Rural Agricultural Wages and Minimum Wages,
by Regions, in 50th
and 55th
Rounds
Urban Casual Wages and Minimum Wages, by
Regions, in 50th
and 55th
Rounds
05
01
00
150
0 20 40 60 80 100Minimal wage by state (Source: indiastat.com)
cmrwca Fitted values
05
01
00
150
0 20 40 60 80 100Minimal wage by state (Source: indiastat.com)
cmuwci Fitted values
Source: NSS and Ministry of Labor for minimum wages. Adjusted R squared for the two
estimates at 0.85 and 0.75 respectively.
122
Basing policy reforms on well-identified market and policy failures. Given political and capacity
constraints, reforms are costly and should only be based on good research that identifies exactly the market
and policy failures that regulations need to address.
Objectives and instruments should be well-distinguished. For instance, it should be clear that labor market
flexibility is not an end in itself but rather a means to create more jobs and better outcomes.
Reform legislation should be flexible so that unforeseen and undesired consequences can be easily
mitigated. The clearer the distinction between objectives and instruments for reforms, the more effective
reforms can be.
Identifying the winners and losers from the reforms, and providing compensation as needed. Even when
reforms have clear net gains, they can still hurt some groups of workers and employers. The challenge for
the Government is to organize assistance to compensate the losers.
(From Pagés and Saavedra, 2002).
64. In the case of India, the preceding analysis suggests labor market reforms should
address four priority areas:
(i) streamlining and simplifying labor laws;
(ii) reducing market rigidities by modernizing the IDA;
(iii) resolving ambiguities concerning the Contract Labor (Regulation and Abolition) Act;
and
(iv) improving enforcement of laws to make them more effective, while reducing
transaction costs and rents for firms.
Before discussing the specific reforms that can be carried out in each area, it is worth laying out
some guiding principles that reforms could follow.
Rationalizing and Consolidating Labor Laws
65. Rationalize and consolidate labor laws. Perhaps the greatest consensus between
Government, labor and industry is in the case of this reform. The existence of 55 central labor
laws and more than 100 state laws is causing extraordinary confusion and complexity. It is
impossible for either firms or workers to be aware of their rights and obligations when rules and
regulations are spread over so many national and state level Acts. The current 47 centrally
enacted labor laws can be consolidated into four Acts centered on industrial disputes, wages and
benefits, conditions of employment, and social security (Table 5.6).
Table 5.6: Suggestions for Consolidating Labor Laws
Current Laws Possible Consolidation Into New Law
Industrial Employment (Standing Orders) Act,
Industrial Disputes Act,
Trade Unions Act.
Terms and Conditions of Employment And
Disputes Mechanism
Factories Act,
Maternity Benefits Act,
Workmen’s Compensation Act,
Contract Labor (Regulation) Act.
Conditions of Work and Welfare
Minimum Wages Act,
Payment of Wages Act,
Bonus Act.
Wages and Benefits
Employees Provident Funds Act,
Employees State Insurance Act,
Social Security

123
Payment of Gratuity Act.
Source: Federation of Indian Chambers of Commerce (FICCI)
66. Alongside consolidation of laws, key concepts such as workmen, industry and factory –
the meanings of which are ambiguous and variable among Acts -- should be clarified and
harmonized. Concepts should be broad and comprehensive and give room to very few exceptions
and ambiguities. If the objective is to provide a minimum set of rights and obligations, it is
unclear why employers and workers in certain sectors or industries (say hospitals or educational
institutions) should be exempted from or devoid of such obligations and rights respectively. As
stated by Debroy (2005), while there may be debates on the nature of regulations, “unification
and harmonization is an issue on which there should be no lack of consensus”. Harmonization
and consolidation are also two of the recommendations submitted by the Second National
Commission on Labor (2NCL)
Modernizing the IDA
67. Next to simplifying and consolidating labor laws, which can take some time,
modernizing the IDA is a priority. IDA reforms should focus on two main areas. First, the
disputes resolution mechanism should be simplified to reduce time and resources consumed in
disputes (see Box 5.8).
Box 5.8: Amending the IDA to Simplify Dispute Resolution Mechanisms
Allowing only rights-based disputes should be adjudicated. By distinguishing between ‘rights
disputes’ (those disputes that are based on a legal right) -- and ’interest disputes’ (disputes which are not
based on any existing rights), transaction costs can be lowered by limiting dispute cases. Disagreements
belonging to the ‘interest disputes’ category should be solved by means of collective bargaining or, if that
fails, conciliation and arbitration mechanisms (Nath, 2005).
Strengthening grievance-handling mechanisms at the enterprise level. While Section 9C,
introduced by the Amendment Act of 1982, created a grievance-redressal mechanism at the enterprise
level, it has not been enforced, with employers and employees often failing to recognize it. Accordingly,
Section 9C could be enforced better after suitable procedural amendments. The aim should be to provide
greater authority and incentives to Conciliation Officers to resolve disputes at their level or at the
Conciliation Board level.
Providing Conciliation Officers with the powers currently awarded to the Conciliation Board. Conciliation should be made a compulsory step to adjudication in industrial dispute cases. Appropriate
training and incentives can be given to officers to enable them to resist pressures from interested groups
(Hazra, 2005).
Reintroducing the Labor Appellate Tribunals which were abolished in 1954. This will reduce the
work of higher judiciary, that is, High Courts and the Supreme Court, which consumes considerable time
and cost.
Addressing the shortage of well-trained presiding officers in labor courts and tribunals (Hazra,
2005).
Fixing the limit of filing disputes to, say, one year after occurrence of disputes (by amending
Section 10 of the IDA). The aim should be to reduce the burden on the courts and discourage the filing of
non-genuine claims.
Making industrial dispute decisions enforceable within 30 days after they have been
communicated in writing to all parties, as in civil court cases. At present, Section 17 of the IDA makes
laws enforceable 30 days after publication of the decision; this can often delay implementation.

124
68. The second major reform of the IDA should aim at protecting workers rather than
protecting jobs. Change, transformation and upgradation are the engines of economic growth. In
order to foster growth while ensuring the livelihoods of workers, governments are turning to
mechanisms that protect the incomes of the workers rather than their jobs. This, in turn, implies
that current provisions aimed at ensuring job security have to be transformed into mechanisms
that protect the incomes and welfare of those workers who are adversely affected by
technological change or market fluctuations. Some specific measures are suggested in Box 5.9.
Box 5.9: Amending the IDA to Increase Labor Market Flexibility
Eliminating the requirement for firms employing 100 or more workers to seek prior permission
from governments for layoffs would be the first best solution. Such arbitrary thresholds only create
strong disincentives for firms to grow above the thresholds. This, in turn, prevents firms from enjoying
economies of scale at a time when India’s manufacturing trade is increasing. The threshold for all
industrial establishments, plantations and mines, employing 100 workers or more, having to seek prior
permission from the appropriate government before layoffs, retrenchment, or closure, should be
increased to at least 500 workers. Anything less than this reduces incentives for firms to grow and, in
the process, create jobs. It should be noted that investment climate data suggest that increasing the
threshold from 100 to 300 will not be effective in solving the problem but will involve similar political
costs.
Waiving the condition of prior government permission for retrenchment under Section 25N, if
workers accept compensation higher than that prescribed by the IDA.
Removing the requirement for prior government permission for layoffs (Section 25M) and
replacing it with Section 25C.
Eliminating Section 25G which requires that employers should start retrenchment by laying off
the last person hired. In the current, fast-changing work environment, this Section penalizes firms
that seek to hire and maintain workers with the latest up-to-date skills, relative to firms that rely on
experience. This creates disincentives because it secures the jobs of older and more experienced
workers, even if they don’t perform in their jobs.
Eliminating the requirement of notice for change of service (Sections 9A and 9B of IDA) under
which employers cannot change the terms and conditions of service without 21 days notice. This
can be replaced with a requirement of notice for a smaller period.
Increasing compensation for retrenchment and firm closure. The current compensation
contemplated in the IDA is well below the standards of developing countries. Although it is in line
with compensations prevalent in developed countries, workers in industrial countries have access to
other forms of unemployment insurance. A compensation equivalent to one month’s salary per year of
work, with an upper maximum of 8-12 months pay, would be in line with international standards.70
Building funds for a rainy day would allow the very meager compensation that workers now
receive in case of closure (Section 25FFF) to be increased to the same level as compensations
awarded for retrenchment. To make this possible, firms that default on their contributions should be
penalized for breaching the law. A slightly different alternative, already in effect in some Latin
American countries (Colombia, Peru, Ecuador, and somewhat differently in Brazil), is to create
individual accounts for each worker in which firms deposit a certain percentage of the worker’s wage
every month. The funds accumulated in the individual accounts are available to the worker in case the
worker is retrenched, laid-off or quits, or in case of firm closure.71
70 It should be noted that a level of compensation of 45 days and 60 days of compensation per year of service, in case of
restructuring sick industries and profit-making companies respectively, is above the norm in both developing and
developed countries. 71 For more information on the operation of these schemes see Heckman and Pages (2004), Inter-American
Development Bank (2004), Kugler (2004, 2005), Saavedra and Torero (2004) and Paes de Barros and Corseuil (2004)

125
Making job search assistance and training available to workers affected by retrenchment. The
most successful income-support mechanism for a worker who loses his or her job is to find a similar or
better job as fast as possible. Labor policy should assist workers to this end.
69. In addition to amending the IDA, India may also consider other broader measures to
undertake labor market reforms. Malaysia, perhaps, offers one of the more extreme models of
introducing labor market flexibility by allowing specific contracts to be freely negotiated between
workers and firms. The lead article of the 1995 Employment Act in Malaysia states: “Every
employee must be given a written contract of employment which states the terms and conditions
of employment, including the notice period required to terminate it.” This is an example of a legal
system that gives freedom to employers, workers and unions to enter into mutually satisfying
contracts. By allowing unions to advise workers on contracts, the interests of the workers are also
protected. The role of the state is limited to providing a legal framework that respects and
enforces these contracts. Examples of reforms in other countries are provided in Box 5.10.
Box 5.10: Example of Labor Market Reforms in Other Countries that Increased Market Flexibility
Slovakia Main Reforms
Pre-reform: No part-time contracts; term contracts could not be extended; limit of
150 hours of overtime a year; approval by union for firing a worker; retraining
before dismissal; union approval for flexible work-time; and approval by union for
group dismissals.
Now: Part-time contracts for students, women and retirees; extension of term
contracts possible; limit of 400 hours of overtime, with worker consent; no
approval for shifting hours in a 4 month period; no notification/retraining
requirement; and notification for group dismissals.
Colombia 1990
Reduction in severance payments (from one month of last salary for each year
worked, to a monthly contribution equivalent to one month of yearly salary
into a severance account).
Wider definition of fair dismissals (extended to include noncompliance with
company regulations/instructions). Also employees with less than 10 years of
service cannot sue company for unfair dismissal.
Extended use of temporary contracts (permitted to be used for periods of less
than one year; can be renewed up to three times)
Faster process for mass dismissals (reduction in advance notice requirement).
2002
Employers permitted to hire workers by the hour.
Severance payments for employees with 10 years of service reduced to 45 days
pay for first year, and 20 days pay for each year thereafter.
Thailand Labor Protection Act enforced in August 1998. Covers working hours, wages,
severance pay, child labor, holidays/leave, female workers, and so forth. Key
changes introduced were:
Employee Welfare Fund created to assist employees who become
unemployed or face other problems. Contributions made by employer,
employees, government, and income from penalties.
Severance pay enhanced. Workers fired because of no fault of their own
are entitled to severance pay depending on their tenure of employment.
This payment was enhanced for those with more than six years of service.
Provision for special severance pay in case firm relocates.

126
Reducing Uncertainty by Making Contract Labor Law Clearer
70. Reducing regulatory uncertainties surrounding the use of contract labor is another
priority. Currently, the Contract Labor (Regulation and Abolition) Act (CLA) is designed to
prohibit and discourage the use of contract labor, thereby introducing considerable uncertainty in
the working of this increasingly important contractual arrangement. There is a need to formalize
contract labor. The main instrument for implementing this would come from restricting the
application of Section 10, Chapter 3 of the Contract Labor (Regulation and Abolition) Act, 1970,
under which, currently:
“(1) Notwithstanding anything contained in the Act, the appropriate Government may, after
consultation with the Central or a State Board, prohibit by notification in the National Gazette,
employment of contract labor in any process, operation or other work in any establishment.”
Although the appropriate government is required to consider whether the ‘contracted’ work is
incidental for the industry, trade or business, or whether it is ‘perennial’ to the operation, the
government makes the final decision regarding this. This is leading to uncertainty even among
firms in the ITES sectors. The way to resolve this may lie in clearly identifying certain
specialized and supporting occupations that ‘naturally’ tend to use contractual work for a variety
of industries. Such a list could include: cleaning; security, maintenance, housekeeping, laundry,
loading, information technology, support services for ports, airports, hospitals, and export-
oriented units in SEZs. A second issue is that contract law prohibitions are being applied to
establishments as small as those employing 20 or more workmen. Raising the threshold over
which the Contract Labor (Abolition and Regulation) Act applies would be another way to
introduce flexibility.
Improving Enforcement
71. At present, labor laws are not very effective in providing protection, security and
benefits to workers, due to weaknesses in the enforcement machinery. Not only do regulations
raise transaction and adjustment costs for firms, they also provide scope for rent seeking and
corruption. Hence, a key area of reforms would be strengthening labor inspections and labor law
enforcement. The aim of the reforms should be that firms should not have to devote too much
valuable time in dealing with inspections, and inspectors should not be able to use their inordinate
powers to extract unofficial payments. With this objective in mind, the following reforms can be
considered:
72. First, the system of multiple inspections under different laws may be replaced with an
optional ‘self-certification’ system, the enforcement of which can be selectively (risk-based) or
randomly enforced through inspections and audits. The self-selection system can be given force
by requiring legal affidavits, laying the responsibility on the CEO, and specifying a few crucial
laws that are amenable under this. Alongside, the current system of multiple registers and records
may be replaced with one register for each broad area covering muster rolls, accidents, and
wages. The process of filing many returns can be reduced drastically by switching over to a
system of single filing.
73. For those firms that do not opt for ‘self-certification’ systems, the inspection regime
can be reformed on the following lines:
127
Inspections should be targeted and publicly pre-announced. Firms to be inspected should
be selected based on formal complaints raised by workers’ representatives. For firms
where no complaints are raised, inspections should be targeted based on an assessment of
which firms are more likely to evade the law. The list of firms to be inspected every
month should be posted on an official, public list, in advance, and an inspection order
should be signed by the labor commissioner to be valid. Priority should be assigned to
firms where workers have raised a complaint. Firms that engage in irregular payments to
inspectors or those that do not report irregular behavior on the part of inspectors should
be made liable. Inspections for the numerous labor acts should be merged in a
consolidated inspection that covers all labor acts.
Inspections should focus on technical assistance and not just sanctions. This, in turn,
requires that inspectors be appropriately trained to be able to perform. On this issue, the
ILO recommends that the inspectorate not be funded from revenues generated from fines,
as this inhibits the educational/promotional role of the inspectors. Some initiatives, such
as employer-generated implementation plans (EGIPs), have produced good results in
other countries. Employers can tailor implementation plans and policies to suit their
needs. They report to the inspectorate on progress against self-defined benchmarks in
their annual plans for improving working conditions. Compliance is more likely since
employers and often, as recommended, workers, ‘own’ the strategy. Other useful
strategies are providing special educational components and information provision to
small and medium firms.
Other important measures are: (i) building a culture of compliance through mass media
campaigns and education in business schools; and (ii) professionalizing inspections by
providing adequate training and compensation.
74. In conclusion, reforming labor market regulations which hinder the creation of jobs is one
of two key approaches for addressing India’s employment challenge. The other part will be to
help workers by providing more protection against unemployment and uncertainty, and giving
them the skills that are in demand by employers. Increasing the effectiveness of active labor
market policies will help to achieve these goals. The next chapter takes up this issue.
128
CHAPTER 6: INCREASING THE EFFECTIVENESS OF ACTIVE LABOR MARKET
POLICIES
Increasing labor market flexibility will be most effective in creating good jobs if it is
complemented with policies that help workers obtain social protection, skills and help in finding
good jobs. Increasing social protection for workers in the informal sector who are mostly not
covered by these policies, and for workers affected by regulatory reforms, should be a priority.
Presently, the major Government intervention in this regard is employment generation through
public works programs. However, despite their progressive incidence, the employment and
income effects of public works programs have been limited historically. The programs have been
beset by problems of poor accountability, uneven implementation and design issues. The
Government’s commitment to a major expansion of public works through the national Rural
Employment Guarantee (NREG) Act has considerable potential to provide protection and reduce
poverty through employment but only if its many design innovations can be delivered in practice.
More broadly, India is also poised to move from its current reliance on safety net programs to a
more comprehensive system of social protection which promotes risk management among
unorganized sector workers to reduce their vulnerability. But serious administrative challenges
and high transaction costs have to be overcome first. Social insurance coverage should be
expanded in a phased manner which takes account of constraints and adjusts programs in the
light of initial experience. The Government has also made substantial efforts to establish a
vocational training system to fill the skills gaps in the economy. This system, however, suffers
from a lack of proper targeting and an overly bureaucratic approach which stresses delivery over
quality. In order to make it more relevant, the system needs to be made more flexible and
responsive to market needs. There is also a need to reassess where public interventions are most
needed and the forms these interventions should take.
A. Introduction
1. The close correlation between labor earnings and poverty in India has created a
demand for active labor market policies. These are especially necessary to improve conditions
for vulnerable groups such as the poor, the young, and women, particularly in rural areas where
employment tends to be seasonal. There is also a strong equity rationale for such policies since
one of the major factors driving both chronic and transient poverty in India is the uninsured risk
faced by households from loss of work due to unemployment, poor health or injury.72
In turn,
such uninsured risks and associated credit and insurance market failures may be contributing to
workers remaining in low productivity employment in the unorganized sector and making poverty
more persistent.2
In the current situation, where there is a need to reform labor regulations, there
is an additional rationale for such policies. Public interventions to provide social security and
72 See World Bank (2002) and Duflo (2004) regarding health shocks, and Pal and Palacios (2005) regarding old age
security. 2 See World Development Report (WDR) 2006, and Munshi and Rosenzweig (2005) for empirical evidence of credit
and insurance market failures leading to limited mobility in rural areas.

129
employment support to workers, some of whom may face increased risk of unemployment due to
reforms, may be necessary to build up acceptance of such reforms.
2. Public works programs have a long history, dating back to the colonial period, starting
with famine relief works. Since the late 1970s, they have been an increasingly important
component of the Indian safety net, with a succession of centrally sponsored and state specific
workfare programs. Most schemes operate largely in rural areas where they perform a social
assistance function and provide, possibly, an insurance-like element. It is difficult to form a
comprehensive picture of public works programs across India because there is a multiplicity of
schemes. There have also been frequent changes in the names and guidelines of these programs
though, in practice, this has not implied any fundamental change in approach. The 1990s saw two
major policy shifts though. The first was an increase in the role of the panchayati raj (local
government) Institutions (PRIs). The second was a shift from scheme-based commitments to
providing work in rural areas through a legislatively-backed 100-day employment guarantee, the
newly launched national NREG Act.
3. After the decline in real spending that started in the mid-1990s, India appears to
have now entered a new phase of expansion in public works spending. This is being driven, in
large measure, by a shift towards greater Central financing. Though the rate of expansion is
unlikely to be sustained, reversal is also unlikely, given legal commitments. This puts the country
at an interesting stage in the evolution of social protection spending. While public works
programs provide some form of social protection in rural areas, urban areas remain mostly
outside the reach of these programs. At the same time, there is considerable scope for increasing
social insurance coverage in urban areas as well. Another thing of note is that the increased
commitments to NREG, combined with existing significant spending on other social protection
programs, will raise social welfare spending (as a share of GDP) to a level which international
evidence suggests is about as high as countries reach. This, together with democracy and the
opening of the economy, suggests that future expansions in social protection spending are likely
to come through the expansion of social insurance rather than through social assistance.
4. Given the high rate of informality of Indian labor markets and the low levels of
income, coverage by social insurance is predictably very low and concentrated in the organized
sector. At the same time, the public sector and the non-government and private sectors are all
making efforts to expand social insurance coverage. The Government of India (GoI) has, in
recent years, increased its efforts to expand social security among unorganized sector workers. It
has tabled a bill before the Parliament on social security in this sector, its most ambitious effort to
date.
5. This Chapter concentrates on the major active labor market programs of the
Government. These can be broadly grouped under (i) public works programs; (ii) social insurance
for workers; (iii) employment exchanges; and (iv) training workers to increase their
employability. It discusses the labor market impacts and shortcomings of these policies and
makes recommendations.
B. Central Public Works Programs
6. In terms of spending, public works, confined largely to rural areas, are the most
important element of the Government’s active intervention in labor markets. Box 6.1 lists the
major rural works schemes run by the Central Government from the late 1980s to date. Nominal
spending on these increased rapidly during the 1980s but was broadly stable by the mid-1990s.
130
This means that as economic growth picked up, expenditure on the schemes, both as a share of
GDP and total Central Government spending, fell. At its lowest level, the share of expenditure on
these schemes in 2002/03 was a third of what it was in the early 1990s -- about 3.5 percent of
Central spending. This trend has reversed in recent years and if the NREG is rolled out as rapidly
as is anticipated, the spending share can be expected to further increase sharply.
Box 6.1: Major Central Rural Employment Programs in the 1990s and at Present
Jawahar Rozgar Yojana (JRY), from 1989 to 1999, was a Central scheme (CSS) targeted at below
poverty line (BPL) households in rural areas, with preference given to scheduled castes/scheduled
tribes (SCs/STs) and women. The financing for this program was split 80:20 between the Center and
states respectively, and the wages to materials ratio was 60:40. The District Rural Employment
Agencies (DRDAs) and zila parishads (ZPs) were the main implementing agencies through line
departments and gram panchayats (GPs).
Employment Assurance Scheme (EAS), from 1993 to 2001, was a CSS that initially focused on 261
districts and gradually expanded to provide nationwide rural coverage by 1997. The EAS committed to
provide 100 days of lean season employment, per year, for up to two adults per rural family. It was
financed on the basis of an 80:20 Centre and state split. As with JRY, the wages to materials ratio was
60:40 and the DRDAs and ZPs were the main implementing agencies through line departments and
GPs.
In 1999, the JRY was restructured into the Jawahar Gram Samidhi Yojana (JGSY), with the main
difference being that the creation of demand-driven community infrastructure moved from being a
secondary objective to the primary objective, and rural employment generation, conversely, became
the secondary objective.
In 2001, the EAS and JGSY were merged into the Sampoorna Grameen Rozgar Yojana (SGRY) which
has a target of providing 100 days employment, per year, per rural household. Financing is split 75:25
between the Centre and the states respectively and PRIs have, in principle, been given an increased
role in its implementation.
In late 2004, the National Food for Work Program (NFFWP) was introduced in 150 backward districts
with a massive increase in funding to Rs 5400 crore in the 2005-2006 budget.
The National Rural Employment Guarantee Act (NREG) was passed in August 2005 and commenced
implementation in February 2006. It initially covered 200 backward districts (now covers 330) with
commitment to national rural coverage within 5 years of launch. This is the first legislated national
rural employment program and it commits to 100 days guaranteed employment, per rural household,
annually. The funding split is 90:10 between the Centre and states respectively, and PRIs are the
primary implementing agencies. The program is self-targeting, designed to encourage the participation
of the target population and deter participation by others.
Source: O’Keefe, 2005.
7. Public works programs can potentially improve labor market outcomes in several ways.
Other than the direct benefits (cash or kind) to participating households, they may also have a
positive spillover impact on overall wages which could be felt by non-participating households.
There may also be indirect benefits from the assets created under the scheme. Depending on their
scale and comprehensiveness, such programs may also perform an insurance function by acting as
an effective minimum wage. Other potential effects stem from the skills development of workfare
participants, either directly through work provided or indirectly through training provided to
workfare participants (though this has not been emphasized in Indian programs to date).73
Such
programs could also impact gender and other social and economic relations, for example, through
73 For summaries of international experience, see Subbarao (2003); Devereux (2002); Ravallion (1991).
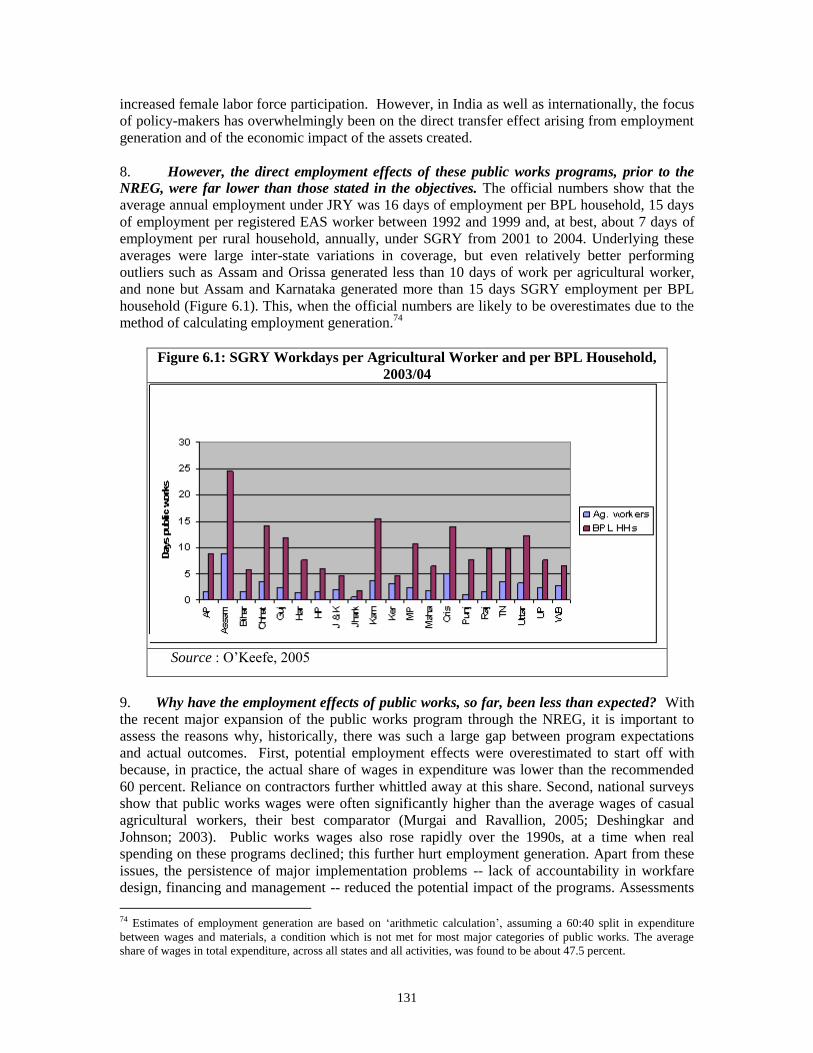
131
increased female labor force participation. However, in India as well as internationally, the focus
of policy-makers has overwhelmingly been on the direct transfer effect arising from employment
generation and of the economic impact of the assets created.
8. However, the direct employment effects of these public works programs, prior to the
NREG, were far lower than those stated in the objectives. The official numbers show that the
average annual employment under JRY was 16 days of employment per BPL household, 15 days
of employment per registered EAS worker between 1992 and 1999 and, at best, about 7 days of
employment per rural household, annually, under SGRY from 2001 to 2004. Underlying these
averages were large inter-state variations in coverage, but even relatively better performing
outliers such as Assam and Orissa generated less than 10 days of work per agricultural worker,
and none but Assam and Karnataka generated more than 15 days SGRY employment per BPL
household (Figure 6.1). This, when the official numbers are likely to be overestimates due to the
method of calculating employment generation.74
Figure 6.1: SGRY Workdays per Agricultural Worker and per BPL Household,
2003/04
Source : O’Keefe, 2005
9. Why have the employment effects of public works, so far, been less than expected? With
the recent major expansion of the public works program through the NREG, it is important to
assess the reasons why, historically, there was such a large gap between program expectations
and actual outcomes. First, potential employment effects were overestimated to start off with
because, in practice, the actual share of wages in expenditure was lower than the recommended
60 percent. Reliance on contractors further whittled away at this share. Second, national surveys
show that public works wages were often significantly higher than the average wages of casual
agricultural workers, their best comparator (Murgai and Ravallion, 2005; Deshingkar and
Johnson; 2003). Public works wages also rose rapidly over the 1990s, at a time when real
spending on these programs declined; this further hurt employment generation. Apart from these
issues, the persistence of major implementation problems -- lack of accountability in workfare
design, financing and management -- reduced the potential impact of the programs. Assessments
74 Estimates of employment generation are based on ‘arithmetic calculation’, assuming a 60:40 split in expenditure
between wages and materials, a condition which is not met for most major categories of public works. The average
share of wages in total expenditure, across all states and all activities, was found to be about 47.5 percent.

132
by the Government and others point to significant leakages, in part due to poor monitoring and
evaluation of programs, both administrative and through mechanisms such as social audits, and
the lack of reliable records (in particular, of muster rolls of funds).5
10. Do public works programs provide some insurance to the target population? Even if
employment generation through workfare programs is small, they can still play an important
safety net role if they reach the people who need them the most, at the time when they need them
the most. This should be one of the most important objectives of well-designed schemes. The
evidence in India suggests that where the coverage is good, workfare programs do play a positive
insurance function. Most of the evidence comes from the state of Maharashtra which has been
running an employment guarantee scheme (EGS) for some time. A 1980s study from
Maharashtra found that income variability among landless agricultural households, in villages
where EGS was available, was half the level of villages where it was not (Walker 1990). Farmer
studies in Maharashtra also found that there was greater adoption of higher-risk higher-return
agricultural practices (Devereux 2002) in the state, though what percentage of these can be
attributed to the EGS is open to debate.
11. Most public programs (other than JRY) are aimed primarily at the poor and are mildly
progressive in their incidence. The main targeting mechanisms for most schemes have been the
wage rates and work requirements under the programs. The programs appear to be mildly
progressive. For example, in 1999/00 57 percent of beneficiaries of employment generation
programs lived in households with monthly per capita incomes equal to or less than Rs. 400,
compared to an overall population share of 45 percent (O’Keefe 2005). Interestingly, programs
explicitly targeted at poor households appear to achieve no better outcomes than self-targeting,
even when the wages paid by these programs are above market wages. This is consistent with
findings on targeting performance from other developing countries; it suggests that the choice of
method is less important than effective implementation. Evidence suggests that poor households
may benefit relatively more from increased public works and be hurt relatively more by cuts in
works spending (Lanjouw and Ravallion 1999).
12. The timing of public works programs has often not matched the timing of the need for
such programs. There have been consistent difficulties in matching peak periods of public works
provision with periods of lowest market demand. In Maharashtra, public works employment
drops sharply during the monsoon when market-based work is least likely to be available. This is
also consistent with the findings in Rajasthan and Orissa where public works are typically carried
out January-March when the opportunity costs of labor are high. Part of the problem is that
certain work cannot be executed during the lean season due to the monsoons. Public expenditure
management practices, which concentrate disbursements for works in the final quarter of the
fiscal year, make the problem more acute.
13. Historically, the insurance effects of Central public work programs have also been low
due to their patchy geographical and household coverage. Despite commitments to full rural
coverage, the share of villages covered by employment schemes is far less than complete. The
assessment of EAS for 1993-1997 found that only 53 percent of villages had any EAS works,
with the numbers for some states being much lower. Analysis from the 2002 NSS village data
also confirmed that partial spatial coverage had continued, with only 48.5 percent of villages
(56.4 percent of population) reporting any public employment programs in 2001. Coverage is
also not consistent. Strikingly, the proportion of villages covered in all the four assessment years
5 See, for example, Comptroller and Auditor General (CAG) Reports (1997 and 2000); Planning Commission Reports
(1997 and 2000).

133
from 1993 to 1997 was only 5.4 percent. This is consistent with anecdotal reports of rotation of
public works between different areas/villages. Thus, in terms of local availability, public works,
to date, have been a rather unreliable source of employment in most of India.
14. Evidence suggests that public works prior to the NREG did not help ease gender
differences in participation. Female labor force participation in SGRY appears to have been
lower than general rural female participation rates. The all-India share of SGRY female
participants was only 12 percent, which is similar to the Comptroller and Auditor General’s
(CAG) report findings on JRY and EAS of only around 16 percent female beneficiaries (the
target share was 30 percent). In states such as Uttar Pradesh, Bihar and Punjab, female
participation in public works was less than 2 percent. Clearly, an important range of issues will
need to be addressed to make the new NREG more effective (see Box 6.2).
Box 6.2: The National Rural Employment Guarantee (NREG) Act
The NREG is the GoI’s most ambitious public works initiative. Financed almost wholly by the Central
Government, it guarantees every rural household up to 100 days employment, per year, at the agricultural
minimum wage. Coverage was initially confined to 200 backward districts, and expanded to 330 districts in
2007, with nationwide rural coverage planned within 5 years of launch (from February, 2006).75
Analysis
to date suggests a mixed picture of costs and benefits. First, there is significant potential for a lean season
NREG. Simulations of a nationwide 100 day employment guarantee suggest (Murgai and Ravallion, 2005):
• The lean season rural poverty rate can be reduced from 37 percent to around 23 percent, or to around
30 percent on a year round basis.
• The annual fiscal cost will be around 1.7 percent of GDP, if implemented nationally at a wage rate of
around Rs. 60 per day at current prices.
• Gains should be progressive, with the poorest 20 percent of the rural population accounting for 29
percent of participants. For them the gains from the EGS, direct and indirect, would be 51 percent of
their pre-EGS consumption levels. The bulk of participants are expected to be casual laborers.
There are, however, issues about scheme design that influence effectiveness, efficiency and equity:
• Using the state agricultural minimum wage rates as the scheme wage rates is likely to be problematic.
If scheme rates are above market rates this typically results in ‘rationing’ (that is, the demand for
scheme jobs is greater than available jobs so they have to be ‘rationed’ according to some criteria).
The experience from the Maharashtra EGS confirms that this ‘rationing’ could also apply to
‘guarantees’.
• Participating in the NREG, for many, implies giving up work that they are already doing and also the
income from this. The additional income they get from the NREG, therefore, is lower than what they
would receive if they did not change their current employment and the wage portion of the NREG was
simply distributed to everyone on a pro-rata basis. Using this option would reduce poverty to around
15 percent – as against 23 percent from NREG. While the comparison is imperfect – as it measures
only the transfer impact of NREG and not the other economic impacts – it implies that the non-transfer
gains from NREG would need to be substantial for it to be better than an untargeted transfer. The point
highlights the importance of achieving significant economic returns from the NREG assets and for the
poor to capture a reasonable share of the gains.
• A significant improvement in the NREG over previous works schemes is the strengthened role of
panchayats in design, implementation and monitoring. However, it will be important to develop
accountability mechanisms which avoid the bundling or concentration of functions with specific actors
(in particular DRDAs) which has contributed to implementation problems in previous schemes. It
remains to be seen if the incentive and accountability structure ensures that GPs are at the heart of
NREG implementation. In addition, the Act offers limited guidance on funds flow mechanisms. If GPs
75 See Papola (2005) for a positive view on the feasibility of rolling out the NREG in its full dimension.

134
are to be empowered, it will be important for them to have direct control over a portion of scheme
funds.
• The scheme benefits from a stronger monitoring and evaluation (M&E) system than previous works
schemes, including funds earmarked for this purpose. In order to expand the system of concurrent
evaluation to include robust impact evaluation, it will be critical to collect regular surveys for
evaluation purposes.
Source: O’Keefe (2005).
15. Overall, it is too early to make conclusions about the effects of the NREG on
parameters such as poverty, labor markets and the local economies. Nonetheless, relative to
previous public works schemes, there are a number of design features in the NREG which are
very sensible, and in many states there has been greater political and institutional commitment to
trying to “make the scheme work”. Administrative data show that the NREG generated
significant demand from rural households in its first 18 months of implementation, with 66
million rural workers issued with job cards and around 20 million people provided with work.
This is a major achievement in program coverage relative to prior public works schemes. That
said, the summary of initial implementation experience suggests that implementation is highly
variable across (and even within) states, and that there remain major challenges in
implementation.
16. While the NREG has the potential to reduce poverty through workfare, ongoing
improvements in implementation will be needed to realize this potential and justify its costs. Initial field-based studies of NREG implementation suggest that it will take some time to
consolidate the good practices reflected in the implementation to be included in program design.76
These includes: operationalizing the anticipated roles of communities in a meaningful way;
making the “guarantee” stronger through provision of unemployment allowance where necessary;
continuing to work on the difficult issue of mobilizing demand for work from the poor; increasing
transparency in implementation to reduce corruption, and; staffing and equipping administrative
support systems.
17. Public works, set to become an expanded component of the social safety net in India,
are one of the easiest instruments for providing social protection in rural areas. They
combine elements of social assistance and insurance and possibly have a productivity enhancing
impact through asset creation. However, the experience so far suggests that the delivery of works
will need to undergo major improvements if their potential effects are to be realized in a manner
that justifies their significant fiscal costs (see Box 6.3). Their opportunity costs, in terms of
foregone spending on a range of alternate public services including education, health and
nutrition interventions, will be high. It is also important to realize the limitations of these
programs. Firstly, they are not likely to be major drivers of rural employment and productivity
growth, and should not be viewed as such. Rather, they can – if better implemented – be a useful
tool at the margin for poverty alleviation and for providing some level of insurance to the poor.
Even here, such programs can, at best, be only one risk management strategy for poor
households. Such households will continue to rely on informal sources of support and look
towards different types of public interventions for additional risk protection. It is in this context
that the other major public intervention -- providing social security to unorganized sector workers
-- becomes important.
76
CBGA (Chattisgarh, MP, AP and Jharkhand); IHD (Bihar); CDA (Gujarat), all 2006.

135
C. Social Insurance Schemes
18. International evidence suggests that as countries become richer, social insurance
usually accounts for an increasingly higher share of GDP. In this context, India is at an
interesting threshold in the evolution of social protection; international experience suggests that it
is likely to start moving away from reliance on public safety net programs towards greater
provision of social insurance. At the same time, country experience also shows that major
coverage expansions typically do not come from voluntary social insurance systems. More
formalized labor markets, where mandated participation can be enforced, are associated with
higher coverage rates of social insurance. In India, however, the bulk of the work force is
employed in the unorganized sector; this will be a challenge in expanding coverage.
19. Given the high rate of informality of Indian labor markets and the general low level of
income, coverage by social insurance is predictably low and concentrated very heavily in the
organized sector. Even within the organized sector, coverage is concentrated in the public sector.
Table 6.1 provides coverage estimates of different social insurance types for the organized and
unorganized sectors in 2004. It should be noted that apart from life insurance, contributory
initiatives for other types of social insurance, in both public and commercial sectors, have
achieved minimal coverage in the unorganized sector. The singular exception of life insurance
may give an indication, from the demand side, on where attention should be focused in terms of
sequencing expansion of public intervention.
Table 6.1: Coverage Rates of Social Insurance for Organized and Unorganized Sectors, 2004
Org. Sector Coverage Unorg. Sector Coverage
Public schemes:
Employees’ Provident Fund 25.1 percent 0.18 percent
Employees Pension Scheme 12.2 percent 0.02 percent
Government Pension Scheme 48.7 percent 0.24 percent
Government Provident Fund 54.0 percent 0.21 percent
Contributory Provident Fund 4.0 percent 0.02 percent
Any Formal Pension Coverage Around 95 percent Less than 1 percent
Commercial Schemes
Life Insurance (endowment) 54 percent 23 percent
Personal Accident Insurance 3.6 percent 1.2 percent
Private Health Insurance 2.0 percent 0.5 percent
Non-life General Insurance 2.8 percent 1.4 percent
Source: O’Keefe (2005)
20. Most of the employed in the unorganized sector, especially the poor, face an array of
uninsured risks that renders them highly vulnerable to shocks. Presently, the effect of public
safety nets is limited and the poor rely on family, jaati (caste) and other informal support
networks to tide over shocks. The risk-sharing functions these networks perform are, however, far
from perfect. It is more effective in the case of individual shocks rather than those which affect
the group as a whole, and for small and intermediate rather than catastrophic shocks. The role that
such informal institutions play also declines with increased labor mobility. Migration and
marriage outside the community, for example, often trigger loss of access to support systems.
21. It is evident from surveys that uninsured shocks impact the welfare of households. This
is particularly the case with health shocks, especially for the poor.77
Data indicate that at least 24
77 See Peters et al (2002); Duflo (2005), and World Bank report “Social Protection for a Changing India (forthcoming)

136
percent of Indians who are hospitalized fall into poverty as a result (Peters et al., op. cit.). There
are also concerns that credit market failures lead to coping mechanisms, which may turn transient
poverty into long-term and even inter-generational poverty. This may happen, for example, if
transient poverty induces the withdrawal of children from school or pushes people into debt
bondage. Evidence from countries such as Indonesia shows that the benefits of social insurance in
poor countries may come less from their direct contribution to consumption smoothing and more
from their help in reducing destructive coping strategies (Chetty and Looney, 2005; Gertler and
Gruber, 1997) The vulnerability of households to shocks also has a wider economic effect --
credit and insurance market failures may be important factors in limiting the ability of rural
workers to seek more productive employment opportunities, both outside traditional occupations
and away from home.
22. The public sector (Central and state governments), non-government sector and private
sector are all involved in efforts to expand social insurance to unorganized sector workers,
most of whom have little or no coverage. Various approaches are being tried with differing
degrees of success in terms of reaching scale, achieving financial viability and providing financial
protection. Each approach has potential advantages and drawbacks, some inherent to the
intervention (for example, viability in the face of co-variate and/or catastrophic idiosyncratic
shocks for genuine community-based initiatives) and others a product of specific design and/or
implementation features. The main initiatives discussed in this section are: (i) welfare and
provident funds for unorganized sector workers at both Central and state levels, both occupation-
specific and generalized for the sector; (ii) national schemes for unorganized sector workers
outside the welfare fund model; and (iii) non-governmental organization (NGO) and community-
based initiatives, which range from coverage of specific insurance types (most often health) to
somewhat more bundled social insurance packages.
Welfare Funds
23. Welfare funds are traditionally occupation-specific and provide a range of benefits for
members. The earliest fund dates back to 1946, though welfare funds have proliferated since the
late 1970s. It is difficult to obtain a comprehensive picture of such funds due to their typically
decentralized nature, both geographical and occupational, and attention here is restricted mainly
to documented funds. Most discussions about welfare funds have been centered around the Kerala
funds (of which there were more than 20 in the year 2000) and the Central Government funds (of
which there are 5 with direct Central financing, and 1 under a Central act but which is
implemented and financed at the state level). However, in terms of total coverage, welfare funds
in other states -- initially the southern and western states but spreading, in recent years, to the
north and east of the country – have had an increasing share of participating workers since the
1990s. The membership, contribution structure and benefits provided, in a sample of these funds,
are presented in Appendix 6.1.
24. The financing of welfare funds follows two basic models. Some are financed through
either a proper cess or excise duty. This is the mode for all Central Government welfare funds.
The more common mode though (for 24 out of 30 documented funds) is financing through
contributions (See Box 6.2). Contributions may be either tripartite -- between Government,
employers and workers, or bipartite -- between employers and employees. In cases where the
Government contributes, the dominant method is direct contribution. Contribution rates exhibit
dramatic variations -- from very low amounts to rates more akin to formal sector contribution
rates (see Appendix 6.1). Management of the funds is either tripartite or rests solely with the
Government, for roughly equal proportions of documented funds.
137
25. Welfare funds may have a potential as vehicles for expanding social insurance to some
segments of the unorganized sector, if some key design and implementation challenges can be
met. They are most likely to work in segments which are amenable to a cess, and/or those
segments where there is a strong presence of intermediary organizations which can share the
transaction intensity inherent in a wide-membership/low-contribution scheme. They are, however,
less likely to succeed where employers feel reluctant to allow a formal registration process for
workers, given the potential costs associated with quasi-formality. Other issues and challenges
that can constrain their use are inherent in the nature of these funds:
These funds are often small and, as a result, administrative costs are high: between 25-54
percent of fund value.9 The high administrative costs and the inherent concentration in
the risk pool suggest a weak capacity to absorb significant shocks which affect the entire
sector. In theory, these challenges can be surmounted through group insurance with larger
and diversified commercial insurers, but in practice it is unclear as to what extent this
avenue has been exploited to date.
Welfare funds typically cover entitlements ranging from education and housing support
to benefits such as medical cover and pensions, so that their pure social insurance focus is
diluted.
An initial examination suggests little correlation between contribution rates and benefits.
The scope of benefits provided in many funds may therefore lead to inadequate financial
protection for any specific type of benefit. For the pensions portions of schemes, the large
majority are defined-benefit programs, with benefits typically expressed in nominal
rupees and hence subject to deterioration in real value.
Similarly, for the more insurance-like benefits, there appears to be no actuarial basis for
determining contributions. This raises concerns about their long-term viability.
26. The emerging experience of the West Bengal Provident Fund for unorganized sector
workers presents a promising case of a fund which appears to have got around a number of
these design issues by relying on a defined contribution (rather than defined benefit) approach
to pension payments (see Box 6.3). While not a welfare fund per se, it is a most interesting
model of a contributory approach which is likely to avoid the financial viability problems of
welfare funds, and may provide lessons for future reforms throughout the country.
9 It is important to note though that administrative costs in the beedi (a type of low-cost Indian cigarette) workers’ fund
have been historically much more reasonable, with data for 1993-2000 indicating an average administrative share of 6-
7 percent.

138
Box 6.3: West Bengal’s Provident Fund for Unorganized Sector Workers
Since 2001, West Bengal has operated a Provident Fund for workers in the unorganized sector, not
including agricultural workers. By mid-2005, enrolment was almost 640,000, with a further 60,000
membership applications pending. Membership is open to wage and self-employed workers in designated
industries/activities (which are expanding over time), whose family income is no more than Rs 3,500 per
month (though the means test appears to be rather informal). The key feature of the Fund is that it is a
defined contribution scheme. Members contribute Rs 20 per month, with a matching contribution from the
state Government. Interest accrues in the account at a rate designated by the Government (the Employee
Provident Fund Organization rate is being used to date). Accrued principal and interest are paid to the
worker at age 55, or at death, or when there is no account activity for 6 months.
Rapid expansion has been driven by a highly decentralized distribution network and governance structure,
with support from trade unions and political parties in mobilizing awareness and interest. Collection agents
are typically public workers who are incentivized with a Re 1 payment for each enrollee. The state
government covers the administration costs of the Fund. While the West Bengal experience shows great
promise, particularly given its defined contribution basis, it remains to be seen whether the promotion and
distribution success it has achieved is replicable in states with less stable political institutions.
Source: International Labor Organization (ILO), 2004.
Other Government Initiatives
27. The Central Government has, in recent years, increased its efforts to expand social
security to unorganized sector workers through non-welfare fund mechanisms (Report of the
Planning Commission (2002), headed by S. P. Gupta). It launched the Krishi Shramik Samajik
Suraksha Yojana scheme in 50 selected districts in 2001. This scheme closed in February 2004.
It was operated through the Life Insurance Corporation of India and covered life, survivor and
pension insurance for agricultural workers. Another major initiative was the Universal Health
Insurance Scheme (UHIS), launched in 2003 and targeted at poor households. In 2004, the
Government introduced a social insurance scheme for unorganized sector workers (excluding
agricultural workers), with the intention of targeting 2.5 million workers in 50 pilot districts
nationwide. It provides for old age, medical and accident insurance. Membership in both
schemes is voluntary. Both are funded by contributions primarily from the Government and
partly from the covered parties. Unfortunately, these schemes have had negligible penetration.
28. A recent initiative, that uses a different approach, is linking participation in anti-
poverty programs with social insurance. This can be seen in the social insurance component of
the SGSY credit scheme targeted at BPL individuals and self-help groups. This approach has the
advantage of providing effective mandatory coverage for a sub-group of the poor, though the
extent of its financial sustainability is less clear.
29. A final and important element of public sector attempts to expand insurance cover for
the unorganized sector is crop insurance. Although this is not addressed in any detail here,
research on different efforts is rather negative on the effectiveness of major public schemes to
date.10
Despite repeated major initiatives to expand subsidized crop insurance, penetration has
been relatively low, estimated at around 12 percent of farmers nationally in 2002. Several
concerns recur in assessments, including lack of actuarial viability, low awareness of schemes
among some categories of farmers, partial coverage of crop types, and complex administration.
10
See Ramaswami, Ravi and Chopra (2004) regarding the Comprehensive Crop Insurance Scheme and the National
Agricultural Insurance Scheme. See also Kalavakonda and Mahul (2005) regarding Karnataka.
139
30. Though the coverage of previous initiatives here is by no means comprehensive, some
preliminary conclusions may be drawn. First, the frequent rollover of central insurance schemes
is problematic; especially when trust in the whole notion of insurance is low and information
dissemination is weak. This ‘start-stop’ approach is likely to discourage future participation.
Second, there have also been design problems which have limited their usefulness. Most of these
schemes take up health insurance first. While the need for this is clearly high, this is one of the
most challenging areas of social insurance even in developed countries. Starting coverage with
life insurance may be more feasible. Third, as with welfare funds, it is not apparent that the
contributions for various schemes are based on an informed assessment of claims information
from existing insurance products. Lastly, most Central schemes, to date, have failed to address the
fundamental issue of high transaction costs and the need for establishing decentralized
distribution networks. The Government is seeking to take these lessons into account in its new
initiative for social security for unorganized workers, which it has recently submitted to
Parliament for consideration (Box 6.4).
Box 6.4: The Government’s Recent Initiatives on Social Security for Unorganized Sector Workers
In 2006 and 2007, the Government of India (GoI) did considerable work to develop proposals for
expanding social security to the unorganized sector, with a strong focus on health, life and disability
insurance, together with benefits for old age. This came from the strong commitment in the GoI’s
Common Minimum Program for improving social insurance in this sector. A first proposal was made by
the National Commission on Enterprises in the Unorganized Sector (NCEUS) in 2006 and, building on this,
the GoI in mid-2007 submitted a draft Bill on the subject to the Parliament.
The Bill provides for several types of social insurance, with particular emphasis on BPL workers and their
families. In contrast to some of the earlier approaches for reform in this area, the GoI’s proposals place
more emphasis on the intermediary and other implementation arrangements necessary to make different
insurance schemes functional for the target population. They also give the states a stronger role in defining
the specific institutional arrangements of schemes. Finally, the proposed phased expansion of programs
takes into account fiscal realities. These features increase the chances of a scheme being implemented.
At the same time, there will be a need for a massive implementation agenda to make the draft Bill
workable, including strong outreach efforts, building capacity of states and partner intermediaries such as
Micro-finance institutions, NGOs and others to help workers access programs, and working with insurers
and health providers to put in place workable systems for service provision and claims processing. There
will also be a need for coordination by the Center to develop the elements of common platforms such as
beneficiary identification systems.
NGO and Community-based Social Insurance Initiatives
31. Given the very low coverage rates achieved, to date, by the Central Government
initiatives outlined above, community-based micro-insurance (CBMI) initiatives assume
greater significance as a potential channel for the expansion of social security in the
unorganized sector. Estimates of the scale of social insurance provision by NGOs and other
community-based actors (for example, MFIs and health facilities) vary from a coverage figure of
around 3 million to around 5 million. Most of the schemes are small though the largest have
achieved significant memberships. The Yeshasvini scheme in Karnataka, for example, had
enrolled 2 million farmers in 2004/05 after only one year of operation.
32. The primary focus of most schemes has been health insurance, though some schemes
also cover associated costs such as loss of income and life and accident insurance. Most work
on a voluntary participation basis. In terms of financing, all CBMI schemes require contributions.
However, there is a range -- both of the level of contribution required and the extent to which it is
140
subsidized. In the best cases, contributions cover the bulk of medical claims under the schemes
and administration are covered by donor support. At the other end of the spectrum, contributions
are covered for many of the members by the NGOs’/funders’ own resources. An additional
innovation in some schemes is the provision for deposit of a lump sum by the participant, from
which the interest generated covers the annual premium. Although community/NGO involvement
controls administrative costs, most schemes rely on external subsidies. The subsidies may come
from the Government, the NGOs or donors, cooperatives, or other sources. This is very typical of
rural health insurance initiatives in developing countries, virtually none of which cover services
from contributions alone (O ‘Keefe, 2003).
33. There are a few basic models of community-based social insurance.11
The first is the
insurer-agent model, where the NGO/MFI or other founders act as intermediaries between
members and the insurers. This model has been relied on by large organizations such as Self
Employed Women’s Association (SEWA) and Buldhana, and much smaller ones such as
Navsarjan in Gujarat and Bharatiya Agro Industries Foundation (BAIF) in Maharashtra (Acharya
and Ranson, 2005). The second model is where the founding organization itself acts as the direct
insurer but is not the provider of the insured services. This applies both to some NGO schemes
(Yeshasvini in Karnataka and Dhan in Tamil Nadu) and more occupationally-based programs (for
example, Tribhuvandas Foundation).12
The last model is one where the founding organization is
both the direct insurer as well as the main provider of the insured services. Examples include
Action for Community Organization, Rehabilitation and Development (ACCORD) in Tamil
Nadu, Kasturba Hospital Scheme in Maharashtra, and Students’ Health Home in West Bengal. Of
these, the insurer-agent model appears to have the most potential for broadening coverage. It
appears to combine the benefits of large-scale pooling of risks (both within the membership group
when group insurance is purchased, and beyond through the risk pool of the end-insurer) and the
cost-reducing benefits of an intermediary organization close to the client. At the same time, the
Yeshasvini experience cautions against being very prescriptive on a preferred model.
34. The experience to date is mixed, with serious questions remaining on the capacity to go
to scale, given the reliance on subsidies from funding institutions and donors. In addition,
community-based initiatives to date have focused primarily on health insurance and not yet
addressed other types of social insurance, particularly that related to old age. There are also legal
issues with respect to CBMIs as the Insurance Regulatory and Development Authority (IRDA)
Act does not provide for such schemes as part of the broader insurance market. Recent IRDA
guidelines aim to address this issue though.
The Way Forward
35. While the case for public intervention in providing social insurance for unorganized
sector workers in India is clear, it is by no means axiomatic that more is better. Badly designed
schemes can have negative impacts on the poor (for example, they contribute to health cost
escalation which harms the uninsured and dilutes impact even for the insured). It is important for
public policy to be framed with realistic expectations of the scope and timeframe for coverage
and expansion, and by taking into account India’s income levels, high degree of labor market
informality, current informal support mechanisms, and their likely impact on demand,
administrative and institutional capacities, demographics, and other factors.
11
Devadasan et al., op. cit., gives a useful typology and overview, noting around 20 community-based health insurance
schemes. See also Ahuja and Narang, 2005. 12
See Kuruvilla et al, 2005 for a detailed discussion of Yeshasvini, and also ILO.2005.
141
36. Evidence suggests that inadequate design of many public and quasi-public initiatives,
combined with high ambitions, has failed to take into account these constraints in the past. Future
initiatives should be based on a serious analysis of previous public, welfare fund and CBMI
initiatives, to understand the factors driving more and less successful schemes. The experience,
to date, suggests serious skepticism about overly-defined top-down schemes. It would seem
sensible to place more explicit emphasis on group-based insurance for schemes where a public
subsidy is involved.
37. What might be some elements of a strategy for gradual expansion of social insurance
coverage in the unorganized sector? The experience of middle-income countries in expansion
suggests that achieving wide-scale coverage at India’s current income levels and degree of labor
market informality is very challenging (See Palacios, forthcoming). Some portions of the
unorganized sector (for example, urban workers with a strong organizational structure, members
of cooperatives) can more feasibly be included in social insurance in the short- to medium-term
than others. This points to the critical role that intermediary organizations need to play between
the Government/insurers and the unorganized worker population if schemes are to be both
effective and affordable. Being aware of the ’low hanging fruit’ is important in developing a
sequenced and more focused expansion strategy. Similarly, based on prior experience and
insurance principles, policies should focus on exploring what appear to be the easier wins in
terms of specific types of social insurance that are less subject to moral hazards and
administrative problems. Two types of insurance that stand out as somewhat more easy to expand
are life insurance (for which demand in the commercial market already appears high among
unorganized sector workers) and disability insurance, which acts in one sense as the most extreme
form of ex post health insurance. These points suggest a cautious and gradual approach to
expansion of social insurance coverage. Such a strategy may not be consistent with the political
desire for broad-based schemes with high announcement value. However, it is a strategy which
lessens the risks of doing harm and also extends coverage sustainably and as rapidly as feasible.
D. Employment Exchanges13
38. Employment exchanges were established under the Employment Exchanges (Compulsory
Notification of Vacancies) Act of 1959 which made it compulsory for public establishments and
private sector establishments engaged in non-agricultural activities, employing 25 workers or
more, to send notices about specified types of vacancies to the nearest employment exchanges.
The administration of employment exchanges rests with state and union territory (UT)
governments.78
As of end-2004, there were 947 regular employment exchanges in India,
concentrated in urban areas. There are different types of employment exchanges. Most
employment exchanges cater to all types of job seekers but some (totaling an additional 76 in
2001, with a further 82 bureaus for universities) specialize in particular types of jobs. The special
exchanges include those for colliery workers, exchanges for professionals and executives only,
and special employment exchanges for the physically handicapped.
39. The main function of exchanges is to register and place job seekers. The officer in
charge of an exchange meets individual job seekers at the time of registration where evidence of
educational levels, and medical certificates in the case of special exchanges for the handicapped,
is collected. Vocational guidance is provided at the time of registration. Persons interested in
13
This note draws extensively on ILO (2003), and Mitra and Sambamoorthi (2006). 78 In practice, enforcement of the Employment Exchanges Act has been limited, with only few private establishments
reporting their vacancies to the exchanges.
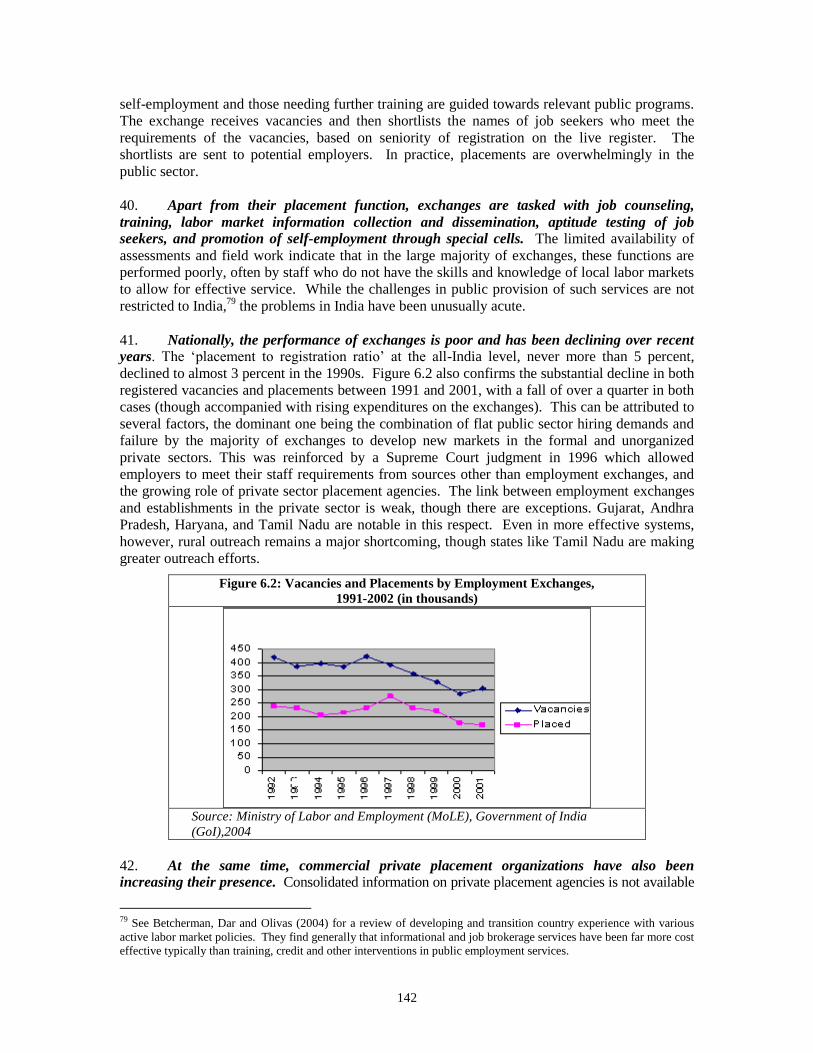
142
self-employment and those needing further training are guided towards relevant public programs.
The exchange receives vacancies and then shortlists the names of job seekers who meet the
requirements of the vacancies, based on seniority of registration on the live register. The
shortlists are sent to potential employers. In practice, placements are overwhelmingly in the
public sector.
40. Apart from their placement function, exchanges are tasked with job counseling,
training, labor market information collection and dissemination, aptitude testing of job
seekers, and promotion of self-employment through special cells. The limited availability of
assessments and field work indicate that in the large majority of exchanges, these functions are
performed poorly, often by staff who do not have the skills and knowledge of local labor markets
to allow for effective service. While the challenges in public provision of such services are not
restricted to India,79
the problems in India have been unusually acute.
41. Nationally, the performance of exchanges is poor and has been declining over recent
years. The ‘placement to registration ratio’ at the all-India level, never more than 5 percent,
declined to almost 3 percent in the 1990s. Figure 6.2 also confirms the substantial decline in both
registered vacancies and placements between 1991 and 2001, with a fall of over a quarter in both
cases (though accompanied with rising expenditures on the exchanges). This can be attributed to
several factors, the dominant one being the combination of flat public sector hiring demands and
failure by the majority of exchanges to develop new markets in the formal and unorganized
private sectors. This was reinforced by a Supreme Court judgment in 1996 which allowed
employers to meet their staff requirements from sources other than employment exchanges, and
the growing role of private sector placement agencies. The link between employment exchanges
and establishments in the private sector is weak, though there are exceptions. Gujarat, Andhra
Pradesh, Haryana, and Tamil Nadu are notable in this respect. Even in more effective systems,
however, rural outreach remains a major shortcoming, though states like Tamil Nadu are making
greater outreach efforts.
Figure 6.2: Vacancies and Placements by Employment Exchanges,
1991-2002 (in thousands)
Source: Ministry of Labor and Employment (MoLE), Government of India
(GoI),2004
42. At the same time, commercial private placement organizations have also been
increasing their presence. Consolidated information on private placement agencies is not available
79 See Betcherman, Dar and Olivas (2004) for a review of developing and transition country experience with various
active labor market policies. They find generally that informational and job brokerage services have been far more cost
effective typically than training, credit and other interventions in public employment services.

143
but the Directorate General of Employment and Training (DGE&T) estimates that at least 800
existed as of the early 2000s (for example, it is estimated that there are more than 100 private
placement agencies in Gurgaon, Haryana alone).80
Like the Government-run employment
exchanges, these focus primarily on urban areas and the formal sector, often with specific sectoral
focus. Fees are charged either to the job seekers who are placed or to the employer upon placement.
Even less is known about organizations in the unorganized sector that intermediate between
employers and more casual laborers, though there are concerns in industries like construction that
business practices are often less than ethical.
43. There is a fundamental need to reorient the National Employment Service if it is to
regain relevance in the current labor market. The problems are well-understood by the
Government, having first been reviewed by the 1978 Matthew Committee and subsequently by a
Working Group on Employment of the Planning Commission in 2001. The increasing role of the
private sector in providing employment placement services points to the need for focusing public
intervention where it is most needed to address market failures. It may also be useful to
discontinue some functions of the exchanges altogether. For example, some exchanges have been
operating small credit schemes for job seekers looking to pursue self-employment. Results, to
date, have been poor. Given the range of public and private credit channels available in India, the
more logical function for exchanges in this regard would be to provide information – pointing
entrepreneurial job seekers in the direction of existing credit facilities rather than the exchange
itself being the provider. Similarly, best practices suggest that training should not be provided by
the employment exchanges themselves. Instead, exchanges should focus on referring workers to
the appropriate public or private training providers.
44. Exchanges could play a more important role if they develop a greater service
orientation and fill gaps unlikely to be met by the private sector. Both official and ILO analyses
point towards some key areas where reinvigorated employment exchanges might focus. They
include: developing a service orientation by more active engagement with trade associations,
workers associations and employers, including those in the unorganized sector, and; assessing
needs which cannot be met by private sector providers. In many countries, employment
exchanges are moving in the direction of establishing partnerships with private placement
agencies. The exchanges serve as the contact points from where workers get linked and referred
to networks of services. The partnerships work best when the government sets the appropriate
regulatory framework and oversight mechanisms. In general, this requires intensive use of
information technology.
45. Another important function for employment exchanges can be providing timely and
more localized labor market information. This function has been generally neglected till now.
Timely information on trends in local labor markets is a product which can provide value addition
for both employers and job seekers. This will require innovation in information gathering in local
labor markets, ranging from regular (at least annual, and preferably more regular) and quick
assessments of labor market developments in both urban and rural areas to analyzing
emerging/declining labor demands and skills gaps. This will, in turn, require linking with a
broader range of partners, including public and private sector training providers, other
departments of government that are engaged with productive sectors of the economy, local
employer organizations in the formal and unorganized sectors, and labor researchers. Given the
current skill base of employment exchanges, it may be necessary in many states to explore the
contracting out of surveys and other investigations. At the national and state levels, another
important role could be developing much more effective rural outreach strategies.
80 India is not a signatory to the ILO Convention of 1996 on private employment agencies.

144
46. The future role of employment exchanges could draw from emerging good practices in
two Indian states: Gujarat and Tamil Nadu. Both have expanded the role of Information
Technology (IT) in increasing outreach to job seekers and employers. In particular, they are able
to offer detailed information on job seekers which employers can sort through according to their
needs. This addresses a fundamental weakness in the typical exchange system where the
exchange itself proposes job seekers to prospective employers, largely on the basis of the
seniority on the job seeker roll and not on the suitability for the specific vacancy. Both have also
been active in arranging job fairs where job seekers and employers engage directly. These
practices have proven more effective than regular procedures. For example, Gujarat placed over
50,000 job seekers with employers in 2003-2004 alone (that is, around one-sixth of total national
placements in 2001) through 32 Industrial Recruitment Rallies. Both states have also attempted
to strengthen vocational guidance functions which, in most exchanges, remain desultory. This has
included job seeker groups, initiatives like ‘career corners’, and greater availability of resource
material on specific sectors and job openings. A particularly interesting initiative in Gujarat has
been the Rojgar Sahay Kendra that linked a group of NGOs, which had knowledge of local job
opportunities, with the job seeker database and intermediated between employers and appropriate
job seekers.
Figure 6.3: Secondary School Drop Out Rates in India

145
47. Another
element of the
Government’s active
labor market policies
has been providing
support to the
vocational education
and training (VET)
system in the
country. Not only
does providing skills
training to workers
enhance the
efficiency and
flexibility of the labor
market and reduce
skills bottlenecks, skilled workers are also more easily absorbed into the economy and their job
mobility is improved. This is especially important in a country like India where a large part of the
work force remains stuck in agriculture and does not possess the skills to transit to more
productive employment in other sectors. Further, close to 5 million school children drop out of
school between Grades 6 to10 (Figure 6.3); another 3 million drop out between Grades 10 and 12.
For these student groups, access to secondary education and VET can potentially facilitate an
effective school to work transition and improve their employment prospects and lifetime
earnings.
48. The vocational education stream is quite small, enrolling less than 3 percent of
students at the upper secondary level. Currently, vocational skills are provided either within the
schooling system in Grades 11 or 12 (vocational education) or through separate institutions for
students who leave school after completing Grade10 (vocational training). Aimed at students
who want to enter the labor market, 6,800 schools, almost all in the public sector, currently
provide vocational education. These schools offer a total of over 100 courses in various areas --
agriculture, business and commerce, humanities, engineering and technology, home science and
health, and para-medical skills, etc.
49. The vocational education program has, however, not met with much success to date.
This stream has not been very popular; just about 40 percent of the available student capacity in
the schools is filled. Even students who opt for vocational education appear to be more intent on
entering higher education than in entering the labor market. Employers too, international
experience suggests, look for young workers with the basic skills taught in primary and general
secondary education, and not for workers trained in narrow vocational skills. In India, there have
been very thorough evaluations of the performance of vocational education. However, a study by
the Operational Research Group in 1998 reported that only 28 percent of graduates of vocational
education were, in fact, gainfully employed. (See Box 6.5).
Box 6.5: International Experience of Vocational Education Programs
The international experience of vocational education points to a few key things.
Vocational subjects are desirable on general education grounds, as part of a well-rounded education
intended for everyone, but they should not detract from efforts to improve the quality of core subjects. No
study has shown that vocational courses offered as a minor part of a student’s total curriculum give an
advantage in finding work (let alone self-employment) within the first few years after leaving school. This
Source: Wu (2005).

146
is particularly so when the labor market conditions for youth are severely depressed. Vocational subjects
may foster an interest in the types of work for which the subjects are broadly intended, and the skills
learned may have private uses. However, tracer studies have found that they have no positive impact on
access to work after students leave school and no strong effect on access to further relevant technical
training.
Providing vocational education is costly. Most variants are more costly per student class period than
general education subjects, primarily because of smaller classes and the greater cost of facilities, equipment
and consumables. Unless a course can be taught to a full class of students (few can), operating costs will be
more than twice that of non-laboratory academic subjects.
Enrollment in some types of vocational courses is often strongly gender- biased. Many skills taught are
culturally identified with one gender only -- for example, domestic science and secretarial skills with girls,
industrial arts skills with boys, etc.
Vocational education is hard to implement well. It requires specially trained instructors, preferably
with work experience in the types of skills taught. Teachers with these qualifications are hard to recruit and
retain. Time spent on vocational skills training can detract from the teaching of basic academic skills which
are badly in need of improvement and also essential for labor market purposes.
Source: Johanson and van Adams (2004)
50. It is more appropriate for the Government to focus its efforts on strengthening
secondary education. India’s enrolment ratio for secondary education is lower than what its
country income level would predict. Access by gender and social groups, by rural and urban
locations, and by expenditure quintiles, also remains more unequal for the secondary school age
group relative to the elementary school age group. This is worrisome because the positive effects
of secondary education on health, gender equality and poverty alleviation are even stronger than
those of primary education (Wu, 2005). Through its impact on delayed marriage, reduced
fertility and safer birth practices, secondary education of girls can also lead to significantly
reduced maternal and child mortality, and slower population growth, both of which are important
Government goals. In achieving the goal of expanding secondary education, the Government
faces two challenges. One, creating opportunities for all to attend secondary education and
securing that everyone takes advantage of the opportunities created. Two, the even greater
challenge of improving student learning. This entails strengthening existing institutions;
implementing reforms in curriculums, textbooks, examinations, and teacher training, and;
improving accountability and monitoring, and evaluation of outcomes (Wu, 2005). (Box 6.6)
Box 6.6: Secondary Education in India
In India, the average number of years of schooling among people over the age of 25 is just over 4 years. 44
percent have never even been to school. In this respect, India lags behind most East Asian countries. Over
the past decade, thanks to the Government’s drive to universalize elementary education, access to schooling
for children aged 6 to 14 rose rapidly. The enrolment rate in elementary schools for this age group has
reached 94 percent. No such rapid increase has, however, taken place at the secondary level where the
enrolment rate still stands at only 38 percent. This is low, relative to what international experience suggests
it should be at India’s income level. At the same time, improving the skills of future workers requires
expanding secondary education and improving the quality of both elementary and secondary education.
Worldwide, in response to globalization and the emergence of the knowledge economy, the role of
secondary education is now changing to prepare young people for lifelong learning, and the boundaries
between general and vocational education are rapidly blurring.
Both demand-side and supply-side factors have contributed to India’s poor educational outcomes. Demand-
side constraints include the inability of poor households to bear the direct and opportunity costs of
schooling, a parental bias against girls’ secondary education, and poor quality of education and high
dropout rates in elementary schools which limit the number of students ready for secondary education.
Policies to improve the efficiency and quality of elementary education, information campaigns to change
147
parental attitudes towards schooling and delayed marriages, and financial assistance targeted at
disadvantaged students, have the potential to raise the demand for secondary education.
The limiting factors on the supply side include distances from homes to schools and the reluctance of
teachers (particularly of mathematics, science and English teachers) to serve in rural areas and urban slums.
Correcting the imbalances in supply requires: improving policies regarding teacher recruitment,
deployment, transfer and evaluation; more effective utilization of private school capacities for expansion;
the use of vouchers to encourage private schools to serve disadvantaged students, and; building government
schools in under-served and remote communities.
However, beyond enrolment, quality is also an issue. A 2005 World Bank survey of secondary schools in
Rajasthan and Orissa administered separate mathematics tests, drawn from a sample of published test items
in mathematics from the Third International Mathematics and Science Study (TIMSS), to a sample of 9th
and 11th graders in order to benchmark Indian student performance with some international measures. The
Rajasthan and Orissa mean scores for many items were below the international mean of the same items.
What is the reason behind this? A comparison of the curricula in mathematics and science prescribed by
India’s Central Board of Secondary Education and the respective state education boards, with the Geneva-
based International Baccalaureate and Britain’s International General Certificate of Secondary Education
(IGCSE), found that the coverage was similar but the emphasis of both systems was very different. India’s
school system remains oriented towards examination and rote memorization at the expense of conceptual
understanding and application. This weakness in foundation in elementary education also contributes to
low achievements at the secondary level. Improving quality requires strengthening the basic skills and
promoting deeper understanding in order to enable students to tackle new materials and devise solutions.
India developed a progressive national curriculum framework in 2005 which aims to prepare children and
youth with higher order thinking and flexible skills. However, syllabi, examinations, textbooks, teacher
education, and in-service training have yet to be revised to align with the new framework. Since every state
has its own system and standards, setting national standards regarding the basic skills students need to
master in each subject and in each grade, would be helpful in raising standards for all and facilitating labor
mobility.
Source: Wu (2005)
51 Another Government intervention is the running of certificate level crafts institutes.
Programs are operated by the Industrial Training Institutes (ITIs) and Industrial Training Centers
(ITCs). These are open to 5 million or so students a year who leave school after completing
Grade 10. About 80 percent of the students take admission in engineering courses, and the
remaining in non-engineering courses. In addition, there are about 150,000 apprentices employed
in various industries. Students who complete crafts training are certified when they pass an All
India Trades Test, conducted under the aegis of the National Council for Vocational Training
(NCVT) but administered by the states. Individual states also administer tests for state-approved
trades that are not affiliated with the NCVT.
52. The crafts certificate courses have, however, only met with limited success. A
comprehensive study of vocational training programs was conducted by the ILO in 2002/03. The
study found that employment of ITI/ITC graduates in the organized sector was very low. In none
of the states did more than 50 percent of the graduates find wage employment, or become self-
employed, or even work in a family business. There were significant inter-state differences: in
Andhra Pradesh, unemployment ranged from 33 percent for ITI graduates to more than 70
percent for ITC graduates, while in Maharashtra it was around 23 and 27 percent respectively. At
the same time, employers in the same states reported experiencing problems finding employees
with the right skills, implying that graduates did not meet employers’ needs. A survey by the
Federation of Indian Chambers of Commerce and Industry (FICCI) in late 2001 also reported that
close to 60 percent of industry respondents felt that these institutions were not geared to meet the
challenges of the global economy, and over 43 percent felt that academic institutions were not
148
aligned to the needs of industry. 87 percent felt that institutions should have greater exposure to
industrial practices.
53. The poor outcomes may reflect the many constraints the public vocational training
system faces. Management of the system is shared between Central and state authorities. While,
on paper, the functions of each are clearly specified, there is little coordination between them,
leading to poor accountability and duplication of efforts. Furthermore, a preoccupation with
providing and financing training has resulted in the Government neglecting a key role – providing
information about the availability and effectiveness of training programs. There are few
incentives to institutes to improve their performance and little industry inputs in defining training
policies and developing courses. This is now changing, and industry associations and individual
employers are showing considerable interest in involving themselves in developing and managing
ITIs.
54. A bigger failing of the system is that the current programs are quite inadequate to meet
the training needs of the large work force in rural areas, arguably the group which should
have been its main target. The formal training system, because of its entry requirements and
geographical mapping, is not designed to offer skills to low-educated people, and particularly not
to those in the rural non-farm sectors.81
But, there are also no other providers to fill this gap.
Most workers continue to learn trades on the job and through informal apprenticeships at their
places of work from other low-skilled crafts people. These apprenticeships are based on
traditional technologies and ideas from previous generations. The quality of training is thus only
as good as the skills of the master and his/her willingness and ability to pass them on. The
theoretical aspect of learning is weak or absent; only the simplest skills are learnt, resulting in low
quality products. However, re-orienting public training institutions to meet the needs of rural
workers would not seem to be the solution. Public institutions would find it difficult to make the
changes to serve both the formal and informal sectors with the same skills and experience.
Innovative solutions are, thus, needed (see Box 6.8).
55. In-service training in India is also much lower, on average, than international levels,
though there are wide variations among states. Provision of in-service training is another area
which has not received much attention by policy-makers. No more than 17 percent of
manufacturing establishments in India provide in-service formal training. This is less than half the
average for Europe, East Asia and Latin America. On average, Indian firms are less likely to
train than even firms in Bangladesh (27 percent) and Sri Lanka (38 percent). Within India, too,
there is a wide variation in the incidence of formal in-service training among the states. Only 11
percent of firms provide training in West Bengal, Punjab and Uttar Pradesh, compared to 27
percent in Andhra Pradesh and Karnataka. From the point of view of coverage, only about 7
percent of employees receive training in a given year. The proportion of workers in India
receiving in-service training is especially low among micro and small firms, where fewer than 4
percent of employees receive training. In medium and large firms, the figures are around 17
percent for managers and professionals, and about 11 percent for less-skilled groups. These
estimates again appear low compared to countries in South Asia or East Asia. For example, the
level of employees receiving in-service training in Sri Lanka is twice as high. Generally, the
incidence of in-service training in states with good ‘investment climates’ and those receiving
more FDI was strikingly higher (21 and 25 percent respectively) than in the other states (10
percent and 8 percent respectively).82
81 While one of the mandates of ITIs is to train workers in the informal sector, evidence shows this is rarely the case
(Dar 2005). 82 A World Bank study (2004b) categorized 12 Indian states according to their investment climates.

149
56. There are distinct differences between industry sectors and firms of different kinds in
their propensity to offer formal in-service training. A survey of 1,827 industries in India
showed that industries where training levels were below average included textiles, garments,
leather products, food processing, automobile parts, and metal products. Industries where training
levels were above average, included chemicals, pharmaceuticals, machine tools, electrical white
goods, electronic products, and software. The second list can be considered to be more
technologically sophisticated than the first one of low-training industries. Firms that have no
R&D capacity and are not involved in export have a poor track record of providing in-service
training. The incidence of formal in-service training also rises with firm size, from 6 percent for
micro enterprises to 56 percent for large enterprises. This is a common finding in all countries for
which data are available, and probably reflects size-related differences with respect to access to
finance, scale economies in the provision of training, education levels of workers, managerial
capabilities, and use of new technologies.
57. Indian employers do not appear to rate the skills of their work force as an especially
important constraint. This may explain why, for all types of Indian firms, the employers’ pay
policies reward formal pre-employment education and training but not the later acquisition of
skills. Information from an Investment Climate Study done by the World Bank (2004) also
indicated that in-service training actually had very little, if any, impact on wages. At the same
time, external training appeared to have a positive and statistically significant effect on
productivity, especially for firms that either exported or conducted R&D, indicating the
importance of such training.
58. Strengthening the in-house training capabilities of Indian firms should thus be a
priority for policy-makers. Public institutions have typically focused on pre-employment training
in basic skills and may have little capacity to provide, on demand, the kinds of tailored training
programs that firms want and private providers can deliver. Given the limited capacity of public
institutions, private providers – firms themselves, industry associations, buyers and equipment
suppliers, and private training institutes -- are important for expanding the resources available for
work force skills development. International experience suggests that there are three market
failures that constrain training, particularly among small firms: (a) the high cost of training; (b)
lack of adequate information; and (c) high turnover of skilled workers. The first failure can be
addressed by financial sector reforms that improve access to funding for all kinds of investments,
including training. The appropriate policy response to the second failure would be to disseminate
widely the evidence of the productivity benefits of training, best practices in training know-how,
and information about the availability, offerings and costs of services from different public and
private sector training providers. The problem of high turnover (or ‘poaching’ of skilled workers
by other employers) requires collective action. In this respect, the Human Resource Development
Fund of Malaysia is an example that has successfully increased training among firms.
59. Consideration could be given to employer-targeted training policies to remedy the
under-investment in in-service training. Programs used elsewhere include: (a) training levy
rebate schemes where firms are partially reimbursed for approved training out of payroll levies;
(b) levy exemption schemes where employers are exempt from levy payments, provided they
spend a given percentage of their payrolls on training; and (c) tax incentives for approved
training, paid out of general revenues.
60. Going forward, rather than only expanding vocational education, policymakers should
focus on strengthening general secondary education and reforming the vocational education
system, including promoting private sector participation in VET. Such reforms would include
improving the management of the system. This would require creating a clear demarcation
between the functions of various levels of government and developing an effective coordination

150
mechanism between them. Significant involvement of employers in the decision-making process
of these bodies would also be critical to ensure that the system is responsive to market demands.
Another way to incentivize the system would be to give institutions greater autonomy in terms of
deciding on training programs, hiring and firing of teachers, and generating revenues by selling
goods and services.
61. Finding the right role for the public sector in training is critical. State provided training
can be used to address market failures (for example, externalities from training, in general) and
equity issues (for example, provision of training for the informal sector) but may be less needed
in an environment where private capacity exists (Box 6.7 presents the general principles for the
role of the public sector in training). As a rule, unplanned public provisions should not crowd out
private supply. It is also not necessary that the Government intervene solely through providing
training. Indeed, it may have a more important role to play in things that the non-government
sector cannot do, such as, developing policies and standards, preparing teaching materials,
training instructors, and even contracting training to the private sector. A key function could be
the providing information on the nature and quality of training and facilitating regular and
independent evaluations of the impact of these training programs. The GoI is keen to undertake
reforms to move towards a system where it plays a key role in policy development, standards
setting, financing, and monitoring and evaluation, while engendering greater competitiveness and
accountability among institutions. A key ingredient of the reform agenda is to move the private
sector into a lead role at all levels of decision making – from policy-making at the Central and
state levels to managing institutions through Institutional Management Committees (IMCs) which
are led by employers. The Ministry of Labor and Employment (MoLE) is working closely with
the private sector to transfer this vision into reality. In terms of public investment, the GoI aims to
upgrade 500 public sector ITIs, out of a total of 1,863 institutions (there are 3,500 additional ITIs
that are fully private), between 2005 and 2010. It has already used its own funds to upgrade 100
ITIs and is in the process of selecting another 100 for upgrading.
151
62. In the informal sector, instead of delivering training, the Government can act as
facilitator by creating an environment that is supportive of non-public providers of training. In
India, as in many other countries, non-government providers are much more active in providing
training in the informal sector. Non-public providers pick up innovative training approaches
much more quickly and need less support. Instead of delivering training itself, the Government
can focus on creating an environment to support non-public providers through: (i) supporting
curriculum development, training of trainers, and development of competency-based skills
testing; (ii) stimulating investment through tax incentives or financial support so as to increase the
capacity and quality of training; and (iii) revising apprenticeship Acts that are outdated and
contain regulations which hamper enterprise-based training. One successful approach in this
regard is Kenya’s Jua Kali project (see Box 6.8).
Box 6.7: The Appropriate Role for the Public Sector in Training
There has always been an extensive debate regarding the appropriate role of the Government in providing
and financing training. While the debate is by no means resolved, international experience points towards
some guiding principles in this regard:
No government today can afford to provide and finance all the skills needed by a modern economy.
Finding the appropriate balance between government and non-government provision and financing of
skills is essential. The highest priority for a government in this context is to formulate the right
policies which facilitate skills development and encourage both the public and private sectors to pursue
their comparative advantages in a market context. The balance in the partnership may vary from
country to country, given the economic context, and will need to be informed by analysis of this
context.
Some rather clear roles for government emerge where ensuring equity of access to training is
concerned, and where markets fail to provide the right signals to guide training decisions. Encouraging
the cost recovery of training can improve the efficiency with which training resources are used but
reduce access to training for those without a capacity to pay. The state has a clear role in promoting
equity in access and can use its financing in a targeted fashion to achieve this goal in state-sponsored
and non-government sources of skills training. Where markets fail to send the right signals to guide
training decisions, governments can also justify financing interventions. The presence of social
benefits to training that are not captured in increased earnings for the trainees or higher profits for the
enterprises, will lead to lower levels of private investment in skills development than those needed
from a social perspective. Targeting public financing at those who will invest in these skills can
improve the performance of the market.
State-sponsored provision of training can also be used to address equity and market failures, but it is
not a necessary condition in an environment where non-government capacity for skills development
exists. Determining the role of the public sector in the provision of training therefore requires carefully
assessing what the non-government sector is willing to do and whether, with appropriate incentives, it
can be encouraged to fill training gaps.
There are many things the non-government sector does not or cannot do. These include overall policy
development and guidance, standards setting, the provision of information about the benefits and
locations of training, preparing teaching materials, training instructors, and running standardized
examinations of graduates. Here, the state’s role is clear and positive.
Source: Johanson and van Adams, 2004.
152
Box 6.8: Training for the Informal Sector – The Jua Kali Experience
The Jua Kali (informal sector) project in Kenya, funded by the International Development Association
(IDA), is aimed at providing skills and technology up-gradation to about 25,000 informal sector
manufacturing workers; increasing the access of informal sector entrepreneurs to services, and; improving
the policy and institutional environment by removing restrictive laws and policies.
A key feature of the project is a voucher program intended to introduce consumer choice, enabling informal
sector operators to purchase the training they want, wherever they want. Intermediaries — allocation
agencies — are selected by competitive tender to market, allocate and redeem vouchers in a decentralized
way throughout Kenya. Allocation agencies receive a fee equal to 3 percent of the value of vouchers issued.
Vouchers can be used for any kind of training from any registered training provider.
Over the course of the project, about 700 training providers have become pre-qualified to provide training.
By early 2001, some 18,000 training vouchers had been issued. The impact of the project, evaluated
through two tracer studies, has been highly positive for the beneficiaries. Employment among the graduates
has increased by 50 percent compared with employment before training, and the income of enterprises has
also increased by 50 percent. According to anecdotal evidence, some participants who received vouchers
for basic training have paid the full costs of more advanced training.
One unexpected outcome of the voucher training program is the emergence of a new kind of training
provider — the skilled master craftsperson. The strong preference of Jua Kali workers for appropriate,
accessible training by master crafts persons was revealed in the first phase of the project: 85 percent of all
vouchers went to pay for the services of master crafts persons and only 15 percent went to private and
public training institutions.
Some important lessons include: (a) the use of a voucher mechanism enabled the project to stimulate
demand for training, technology and management and marketing consultation among micro and small
enterprises. A supply response was generated and a training market established to address the needs of
micro enterprises; (b) an unexpected impact of the voucher training program was the emergence of skilled
craftsmen as the leading providers of training. Entrepreneurs preferred the training services of master crafts
persons in the informal sector to training in formal institutions. The training by master crafts persons was
usually well adapted to entrepreneurs’ needs for short, practical training. These training providers were
previously invisible to agencies that wished to pay for training directly; and (c) the implementation
experience underscored the importance of appropriate management arrangements — a project for the
private sector is best managed by the private sector, with the government at best playing a facilitating role.
Source: Johanson and van Adams, 2004.
F. Conclusion
63. The GoI already has in place a range of active market policies to help improve labor
market outcomes. It has also committed to a major expansion of two important components of
this program: public works and social insurance. This significant expansion is in line with the
Government’s objective of protecting vulnerable sections of the work force, and also with the
country’s rising income levels. Improvements in the social protection system are also a
prerequisite if the GoI is to undertake any reform of labor regulations.
64. Prior experience, however, suggests that significant changes and improvements are
required to make such programs more effective. In public works programs, poor implementation
remains an issue. For these to be more effective, program designs need to be improved and
reinforced through the development of better monitoring and evaluation mechanisms. Similarly,
previous experience on social insurance provision suggests a cautious and gradual approach to
expansion which may not be consistent with the political desire for broad-based schemes with
high ‘announcement value’. The vocational training system in India suffers from a lack of proper

153
targeting and an overly bureaucratic approach which stresses delivery over quality. If this is to be
made more relevant, the system needs to become more flexible and responsive to market needs.
There is also a need to reassess where public interventions are most needed, and the form these
interventions should take.
65. These policies involve substantial fiscal expenditure and may come at the cost of other
possible welfare-enhancing interventions. Experimentation is also not without cost. Thus, it is
essential to fully learn the lessons from previous experiences and incorporate them going forward.
While such policies have considerable potential, moving from the big picture of policy initiatives
to the ’nuts and bolts’ of effective implementation will remain the biggest challenge in realizing
the full labor market potential of the policies and the benefits they may hold for the poor.
154
REFERENCES
Acharya, A., and K. Ranson. (2005), ‘Health Care Financing for the Poor: Community-based Health
Insurance Schemes in Gujarat’, Economic and Political Weekly, 40 (38) pp. 4141-4150
Ahsan, A. and Carmen Pages (2005 a), “What Can We Learn for Regional Differences in Labor Market
Outcomes?” Paper written for India Labor Conference and Draft World Bank Report, India’s Employment
Challenge: Creating Jobs, Helping Workers, forthcoming, World Bank.
Ahsan, A. and Carmen Pages (2005b): “Helping or Hurting Workers?: Assessing the Effects of De Jure
and De Facto Labor Regulation in India” Paper written for India Labor Conference and Draft World Bank
Report, India’s Employment Challenge: Creating Jobs, Helping Workers, forthcoming, World Bank
Anant, T.C.A., (2005). “Labor Market Reforms in India’s Employment Challenge: A Review” in B.
Debroy and P.D. Kaushik (ed.) Reforming The Labor Market, Academic Foundation, New Delhi.
Barro, Robert, and Jong-wha Lee. 2000. “International Data on Educational Attainment Updates and
Implications.” National Bureau of Economic Research (NBER) Working Paper Series No. 7911.
Basu, Kaushik (2006), “Labor Laws and Labor Welfare in the Context of the Indian Experience”, in Alain
de Janvry and R. Kanbur (ed), Poverty, Inequality and Development, Essays in Honor of Erik Thorbecke,
Springer, 2006.
Basu, Kaushik (2006), “Gender and Say: A Model of Household Behavior with Endogenours Balance of
Power,” Economic Journal, April 2006.
Basu, Priya, ed. (2005). “India’s Financial Sector – Recent Reforms, Future Challenges”. Macmillan, India,
New Delhi 2005.
Besley, Timothy & Robin Burgess (2004). "Can Labor Regulation Hinder Economic Performance?
Evidence from India," The Quarterly Journal of Economics, MIT Press, vol. 119 (1), pages 91-134,
February
Besley, Timothy, Robin Burgess and Berta Esteve-Volart (2005). “Growth and Poverty in India,”
Department of Economics, London School of Economics, London.
Betcherman, G., Olivas K. and A. Dar (2004). “Impacts of active labor market programs: new evidence
from evaluations with particular attention to developing and transition countries,” Social Protection
Discussion paper Series No. SP 0402, World Bank
Bhattacharya, B. B. and S. Sakthivel, (2004). “Economic Reforms and Jobless Growth in India”. Working
Paper Series No. E/245/2004. Institute of Economic Growth.
Blau, Francine, D. (1998): “Labor force dynamics of older married couples,” JOURNAL OF LABOR
ECONOMICS (U.S.); 16:595-629, July 1998
Broadbridge, Seymour (1966). Industrial Dualism in Japan. Aldina Publishing Co., Chicago.
155
Chadha, G. K., and P. P. Sahu, (2002): “Post-Reform Setbacks in Rural Employment: Issues that Need
Further Scrutiny”. Economic and Political Weekly, May 25, pp 1998-2026.
Chen, Martha (1995). “A Matter of Survival: Women’s Right to Employment in India and Bangladesh” in
Martha Nussbaum and Jonathan Glover (eds) Women, Culture and Development. Oxford: Clarendon Press.
Chetty, R and A. Looney (2005), “Consumption Smoothing and the Welfare Consequences of Social
Insurance in Developing Countries”, NBER Working Paper 11709, Cambridge, Massachusetts
CII, (October 2003). “Industrial Policies of Northern Region States: A Comparative Study”.
Dar, Amit (2005): “Making the TVET Programmes More Effective in India”, Paper written for India Labor
Conference and Draft World Bank Report, India’s Employment Challenge: Creating Jobs, Helping
Workers, forthcoming
Das, Maitreyi, (2005): “Addressing Social Exclusion in Labor Market Outcomes”, Paper written for India
Labor Conference and World Bank Report, India’s Employment Challenge: Creating Jobs, Helping
Workers, forthcoming, World Bank
Das, Maitreyi and S. Desai (2003): “Why are educated women less likely to be employed in India? testing
competing hypotheses”, Washington, D.C.: Social Protection, World Bank, Discussion Paper 0313.
Debroy, Bibek (2005). “Issues in Labor Law Reform” in B. Debroy and P.D. Kaushik (ed.) Reforming The
Labor Market, Academic Foundation, New Delhi.
Deichmann, U. and S.V. Lall, S.J. Redding, A.J. Venables, (2005). “Industrial Location in Developing
Countries” Third draft, London School of Economics and CEPR.
Deshingkar, P., and Johnson, C. 2003: “State Transfers to the Poor and Back: The Case of FFW
Programme in Andhra Pradesh”, ODI Working Paper 222.
Dev, S. Mahendra (2002). “Pro-Poor Growth in India’s Employment Challenge: What do we know about
the Employment Effects of Growth 1980-2000?” Working Paper 161, Centre for Economic and Social
Studies, Hyderabad.
Dutta P.V. (2005) “Accounting for Wage Inequality in India 1983-99”, Indian Journal of Labor Economics,
Vol. 48 (2)
E. Duflo, A. Banerjee and A. Deaton (2004). “Health Care Delivery in Rural Rajasthan.” Economic and
Political Weekly, February 2004, (2-28-04) pp.944-949
FICCI – AIOE, (2005). “Report of Core Group on Restructuring Labor Policy” in B. Debroy and P.D.
Kaushik (ed.) Reforming The Labor Market, Academic Foundation, New Delhi.
Foster, D. Andrew and Mark P. Rosenzweig, (2004). “Agricultural Productivity Growth, Rural Economic
Diversity and Economic Reforms: India 1970-2000” Economic Development and Cultural Change.
Gertler, Paul J. and Gruber, Jonathan. "Insuring Consumption Against Illness" (May 1997). NBER
Working Paper No. W6035.
Ghose, Ajit K., (2004). “The Employment Challenge in India,” Economic and Political Weekly, November
27 2004

156
Ghosh, Jayati (2004). “Macroeconomic Reforms and a Labor Policy Framework for India”. Employment
Strategy Papers, ILO.
Glinkskaya, E. and Jyotsna Jalan, Centre for Studies in the Social Sciences, Kolkata; (2005) “Quality of
Informal Jobs in India” Paper written for India Labor Conference and Draft World Bank Report, India’s
Employment Challenge: Creating Jobs, Helping Workers, forthcoming, World Bank
Glinskaya, F. and Michael Lokshin, (2004), “Wage Differentials between Public and Private Sectors in
India”, World Bank, mimeo.
Hasan, Rana Devashish Mitra and K. V. Ramaswamy (2003). “Trade reforms, labor regulations and labor-
demand elasticities: empirical evidence from India” /NATIONAL BUREAU OF ECONOMIC
RESEARCH. WORKING PAPER SERIES (U.S.); No. 9879:1-[53], July 2003
Hazra, Arnab K., (2005). “Labor Laws and Industrial Relations” in B. Debroy and P. D. Kaushik (ed.)
Reforming The Labor Market, Academic Foundation, New Delhi.
Holstrom, M. (1999). “Employment in Smaller Indian Firms: Choices Under Liberalization,” Economic
and Political Weekly, September 25, 1999
Jin, Songqin, Klaus Deininger and Dina Umali-Deininger (forthcoming) “Does the farm-size productivity
relationship change over time? Evidence from India.” World Bank Policy Research Working Paper,
forthcoming.
Jin and others, 2005.
Johanson, R. and A. V. Adams (2004). “Skills Development in Sub-Saharan Africa,” World Bank
Publication.
Kalavakonda, V and O. Mahul (2005). “Crop Insurance in Karnataka”. World Bank Policy Research
working Paper No. 3654, World Bank.
Kar, Sabyasachi and S. Sakthivel. “Regional Divergence in India During the Era of Liberalisation: A
Sectoral Decomposition”,
Khan, Amir Ullah, (2005). “Regulating Labor Markets” in B. Debroy and P. D. Kaushik (ed.) Reforming
The Labor Market, Academic Foundation, New Delhi.
Kijima, Yoko and Peter Lanjouw, (2004). “Agricultural Wages, Non-Farm Employment and Poverty in
Rural India”, World Bank, Mimeo, Sept. 2004
Kijima, Yoko and Peter Lanjouw. “Agricultural Wages, Non-Farm Employment and Poverty in Rural
India”. Foundation for the Advanced Studies in International Development, Tokyo and DECRG, The
World Bank.
Kingdon, Geeta, and Jeemol Unni. (2001). “Education and Women’s Labor Market Outcomes in India.”
Education Economics 9 (2).
Kocchar, Kalpana, Ustav Kumar, Raghuram Rajan, Arvind Subramanian, and Ioannis Tokatlidis (2005).
“India’s Pattern of Development: What Happened, What Follows”, mimeo
Krueger, Anne O. “Economic Policy Reforms and the Indian Economy”
Lall, Somik V. and Taye Mengistae (2005): “The Impact of Labor Market Regulations on Firm Level
Productivity and Manufacturing Growth”, World Bank, processed.
157
Lall, Somik V. and Taye Mengistae (2005): “Business environment, clustering, and industry location:
evidence from Indian cities”, Policy Research Working Paper; No. 3675
Lall, V. Somik and Taye Mengistae (2005). “The impact of business environment and economic geography
on plant level productivity: an analysis of Indian industry”. Development Research Group, The World
Bank.
Lanjouw, P., and Ravallion, M. 1999. “Benefit Incidence, Public Spending Reforms, and the Timing of
Program Capture”, World Bank Economic Review. 13 (2): 257-274.
Little, Ian, D., D. Mazumdar, and J. Page (1987), Small Manufacturing Enterprises – A Comparative
Analysis of India and Other Economies, Oxford.
Maloney, William F. (2004),, “Informality Revisited”, World Development, Elsevier, Vol 32. No. 7
Mathur A., and Rajendra P. Mamgain (2004). “Human Capital Stocks: Their Level of Utilization and
Economic Development in India”, The Indian Journal of Labor Economics, Vol 47 (4), Oct-Dec 2004
Mazumdar, Dipak and Sandip Sarkar (2004).
Mazumdar, Dipak University of Toronto, Canada, and Visiting Professor, IHD, New Delhi (2005): “Trends
and Employment and Earnings in the Formal Sector of India, Background Paper”, Draft World Bank
Report, India’s Employment Challenge: Creating Jobs, Helping Workers, forthcoming
Mazumdar, Dipak (2003) Chapter 7 in Reducing Poverty in Asia, edited by Christopher M. Edmonds,
Asian Development Bank and Edward Elgar, UK.
(MoCFP, ICRIERVyas, 2005).
Mohan, R. and S. Dasgupta (2004). “21st Century : Asia Becomes Urban”, Economic and Political Weekly,
Vol 40 (3) January 15, 2005.
Munshi, Kaivan and Mark P. Rosenzweig (2005). “Why is Mobility in India so Low? Social Insurance,
Inequality, and Growth” CID Working Paper No. 121.
Murgai, R., and Martin Ravallion, (2005). “Employment Guarantee in Rural India; What Would it Cost and
How Much Would it Reduce Poverty?” Economic and Political Weekly, July 20, 2005
Narain, A, (2006). “Wage Trends and Determinants” - Paper written for India Labor Conference and Draft
World Bank Report, India’s Employment Challenge: Creating Jobs, Helping Workers, forthcoming, World
Bank
Collective Action by Women Workers: The Self-Employed Women’s Association, India” in Ending
Poverty in South Asia: Ideas that Work eds: D Narayan and E Glinskaya, Oxford University Press, India
Nath, Surendra, (2005). “Labor Policy and Economic Reforms in India” in B. Debroy and P. D. Kaushik
(ed.) Reforming The Labor Market, Academic Foundation, New Delhi.
National Sample Survey Organization, 2000. “Employment and Unemployment in India-1999-2000; Key
Results of 55th Round”. Report No. 455 (55/10/1)
Pages, C. and Tirthankar Roy. “Labor Market Institutions and Regulations in India”, Background Paper
(2006), Draft World Bank Report, India’s Employment Challenge: Creating Jobs, Helping Workers,
forthcoming, World Bank
158
Palmer-Jones, Richard and Kunal Sen. “What has luck got to do with it? A Regional Analysis of Poverty
and Agricultural Growth in Rural India” School of Development Studies, University of East Anglia,
Norwich, NR4 7TJ, U.K.
Papola, T.S. (2005), “A Universal Programme Is Feasible”, Economic and Political Weekly, Mumbai,
February 12, 2005
Papola, T.S. (2005a), “Emerging Structure of Indian Economy: Implications of growing Inter-Sectoral
Imbalances”, Presidential Address, the 88th
Conference of the Indian Economic Association,
Vishakhapatnam, 27-29 December, 2005
Philip O'Keefe, World Bank: Increasing the Effectiveness of Active Labor Market Programs in India. Paper
written for India Labor Conference and Draft World Bank Report, India’s Employment Challenge:
Creating Jobs, Helping Workers, forthcoming
Planning Commission, (2001a). Report of the Task Force On Employment Opportunities, in Planning
Commission Reports on Labor and Employment, Academic Foundation, Delhi 2002.
Planning Commission, (2001b). Report of The Steering Committee of Labor and Employment for the 10th
Five Year Plan, in Planning Commission Reports on Labor and Employment, Academic Foundation, Delhi
2002.
Planning Commission Reports, (2002). Report of the Special Group on “Targeting Ten Million
Employment Opportunities Per Year over the Tenth Plan Period” in Planning Commission Reports on
Labor and Employment, Academic Foundation, Delhi 2002.
Ramaswamy, K.V. IGIDR, Mumbai: Employment in Indian Manufacturing and New Services: Impact of
Trade and Outsourcing, Paper written for India Labor Conference and Draft World Bank Report, India’s
Employment Challenge: Creating Jobs, Helping Workers, forthcoming
Ratnam. C.S. Venkata.. (2000). “Competitive Labor Policies and Labor Laws in Indian States”, The Indian
Journal of Labor Economics, Vol.43, No. 4, 2000
Sachs, Jeffrey D., Nirupam Bajpai and Ananthi Ramiah (2002). “Understanding Regional Economic
Growth in India.” CID Working Paper No. 88
Srivastava, Ravi S. JNU, Delhi (2005), “Trends in Rural Employment India with Special Reference to
Agricultural Sector” Paper written for India Labor Conference and Draft World Bank Report, India’s
Employment Challenge: Creating Jobs, Helping Workers, forthcoming
Saxena, N. C. (2003). “The Rural Non-Farm Economy in India – Some Policy Issues,” Draft Discussion
Paper For the Rural Non-Farm Economy Project, Natural Resource Institute, University of Greenwich
Sundaram, K. and Suresh D. Tendulkar (2005a) “Recent Trends in Labor Supply and Employment in
India’s Employment Challenge: Some Fresh Results” Paper written for India Labor Conference and Draft
World Bank Report, India’s Employment Challenge: Creating Jobs, Helping Workers, forthcoming
Sundaram, K. and Suresh D. Tendulkar (2005b) “Changing Structure of Indian Workforce, Quality of
Employment and Real Earnings”* Paper written for India Labor Conference and Draft World Bank
Report, India’s Employment Challenge: Creating Jobs, Helping Workers, forthcoming
Sundaram, K. and Suresh D. Tendulkar (2004): “Poor in the Indian Labor Force: Scenario in the 1990s”,
Economic and Political Weekly, Vol. 39, No.48, November 27, 2004.

159
Sundaram, K. (2001). “Employment and Poverty in 1990s: Further Results from NSS 55th
Round
Employment-Unemployment Survey 1999-2000,” Economic and Political Weekly, August 11, 2001
Tan, H., G. Lopez-Acevedo, M. Sanchez, and M. Tinajero (2004). “Evaluating SME Programs in Mexico
Using Panel Firm Data”. World Bank Institute, Washington, DC.
Tendulkar. Suresh D. (2003). “Organized Labor Market in India’s Employment Challenge: Pre and Post
Reform.” Mimeo, Delhi School of Economics.
Unni, Jeemol and Uma Rani, 2004, ‘Technical Change and Workforce in India: Skill Biased Growth’, The
Indian Journal of Labour Economics, 47(4): 683-692.
Unni J. (2005) : “Employment Trends and Determinants in the Informal Sector”, Paper written for India
Labor Conference and Draft World Bank Report, India’s Employment Challenge: Creating Jobs, Helping
Workers, forthcoming.
US Bureau of the Census (2001), Geographic Mobility: March 2000 to March 2001
Vaidyanathan, A., 2001. “Employment in India 1977-78 to 1999-00: Characteristics and Trends”. Journal
of Indian School of Political Economy. April-June 2001.
Walker, T.S, and Ryan, J.G. (1990): Village and Household Economies in India’s Semi-Arid Tropics,
Johns Hopkins University Press, Baltimore.
Watanabe, S., edited, (1983), Technology, Marketing and Industrialization: Linkages Between and Small
Enterprise, Delhi: Macmillan.
World Bank (2004a), India: Investment Climate Assessment 2004 – Improving Manufacturing
Competitiveness.
World Bank (2004b), India: Scaling-up Access to Finance for India’s Rural Poor. Rep. No. 30740-IN,
2004.
World Bank (2004c), Labor Markets in South Asia: Issues and Challenges, World Bank.
World Bank (2005a), Building Capacities for Public-Private Partnerships, South Asia Region.
World Bank (2005b), Economic Growth in the 1990s: Learning from a Decade of Reform. Washington DC.
World Bank (2005c), Economic Enhancing Job Opportunities; Eastern Europe and the Former Soviet
Union. Washington DC.
World Bank (2005d), India: Re-energizing the Agricultural Sector to Sustain Growth and Reduce Poverty.
Agriculture and Rural Development Unit, South Asia Region, Oxford University Press, New Delhi.
World Bank (2005e), India- Urban Finance and Governance Review. South Asia Energy and Infrastructure
Unit.
World Bank (2005f), India’s Water Economy: Bracing for a Turbulent Future. South Asia Region, New
Delhi.
World Bank (2005g), Migrant Labor Remittances in the South Asia Region, Report no. 31577
World Bank (2005h). Pro-poor Growth in the 1990s: Lessons and Insights from Fourteen Countries

160
World Bank (2005i), The Informality Trap”, Private Sector Development, View Point Note Number 301,
the World Bank
Wu, Kin Bing (2005): Increasing the Employability of Secondary Educated Workers in India. Paper written
for India Labor Conference and Draft World Bank Report, India’s Employment Challenge: Creating Jobs,
Helping Workers, forthcoming

161
Appendix 1.1
Panel A: Number of Persons in Labor Force (in thousands) and Rates of Growth of Labor Force (percent per annum)
Population
Segment
UPS SS UPSS UPS SS UPSS UPS SS UPSS UPS SS UPSS UPS UPSS UPS UPSS UPS UPSS
Rural Males 154676 4244 158920 185113 3991 189104 200800 2582 203382 214112 3535 217647 1.73 1.67 1.36 1.22 1.47 1.42
Rural Females 66986 23956 90942 73089 28853 101942 82010 23925 105435 90077 30303 120380 0.83 1.09 1.94 0.56 2.11 1.68
Rural Persons 221662 28200 249862 258202 32844 291046 282810 26007 308817 304189 33839 338027 1.46 1.46 1.52 0.99 1.65 1.51
Urban Males 49632 768 50400 66582 628 67210 80051 493 80544 90602 759 91361 2.84 2.78 3.12 3.06 3.13 3.12
Urban Females 10330 2340 12670 14199 3546 17745 16658 2819 19477 21191 4314 25505 3.08 3.26 2.7 1.56 4.09 3.69
Urban persons 59962 3108 63070 80781 4174 84955 96709 3312 100021 111793 5073 116866 2.88 2.88 3.04 2.76 3.30 3.24
Males 204308 5012 209320 251695 4619 256314 280851 3075 283926 304714 4294 309008 2.01 1.95 1.84 1.72 1.93 1.89
Females 77316 26296 103612 87288 32399 119687 98668 26244 124912 111267 34617 145885 1.16 1.38 2.06 0.71 2.46 2.00
Persons 281624 31308 312932 338983 37018 376001 379519 29319 408838 415982 38911 454893 1.78 1.76 1.9 1.41 2.07 1.92
1993/94-
1999/00
2004-2005 1993/94-
2004/05
1983 1993-94 1999-2000 1983-
1993/94
Panel B: Average Annual Increments to Labor Force (in thousands)

162
Population
Segments
UPS SS UPSS UPS SS UPSS UPS SS UPSS
Rural Males 2899 -24 2875 2615 -235 2380 2636 -41 2595
Rural Females 581 466 1047 1487 -905 582 1544 132 1676
Rural Persons 3480 442 3922 4101 -1140 2562 4181 90 4271
Urban Males 1614 -13 1601 2245 -23 2222 2184 12 2196
Urban Females 369 114 483 410 -121 289 636 70 705
Urban Persons 1983 101 2084 2655 -144 2511 2819 82 2901
Total Males 4513 -37 4476 4859 -257 4602 4820 -30 4790
Total Females 950 581 1531 1897 -1026 871 2180 202 2382
Total Persons 5463 544 6007 6756 -1283 5473 7000 172 7172
1983-1993/94 1993/94-1999/00 1993/94-2004/05

163
Appendix 1.2
Estimates of Children (0-14 years of age) in Labor Force on Usual Principal and Usual Principal plus Subsidiary Status: All-India, 1983-1999/00
(in thousands)
Population
Segment
UPS SS UPSS UPS SS UPSS UPS SS UPSS UPS SS UPSS UPS UPSS UPS UPSS UPS UPSS
Rural Males 9091 1733 10824 5120 1177 6297 4277 507 4784 2995 745 3740 -5.32 -5.03 -2.95 -4.48 -5.22 -5.08
Rural Females 6477 2609 9086 4378 1496 5874 3480 988 4468 2406 1170 3576 -3.66 -4.07 -3.75 -4.46 -5.81 -4.84
Rural Persons 15568 4342 19910 9498 2673 12171 7757 1495 9252 5401 1915 7316 -4.6 -4.58 -3.32 -4.47 -5.49 -4.96
Urban Males 1226 233 1459 938 121 1059 865 48 913 961 79 1040 -2.52 -3.01 -1.34 -2.44 0.24 -0.18
Urban Females 612 170 782 501 161 662 455 125 580 456 180 636 -1.89 -1.57 -1.59 -2.18 -0.94 -0.40
Urban persons 1838 403 2241 1439 282 1721 1320 173 1493 1417 260 1676 -2.3 -2.48 -1.43 -2.34 -0.16 -0.26
Males 10317 1966 12283 6058 1298 7356 5142 555 5697 3956 824 4780 -4.94 -4.77 -2.7 -4.17 -4.17 -4.22
Females 7089 2779 9868 4879 1657 6536 3935 1113 5048 2862 1350 4212 -3.5 -3.85 -3.52 -4.21 -5.20 -4.30
Persons 17406 4745 22151 10937 2955 13892 9077 1668 10745 6817 2175 8992 -4.33 -4.35 -3.06 -4.19 -4.62 -4.26
2004-2005
Persons in Labor Force
1993/94-
2004/05
Labor Force Growth Rate Percent Per Annum
1983 1993-94 1999-2000 1983-1993/94 1993/94-
1999/00
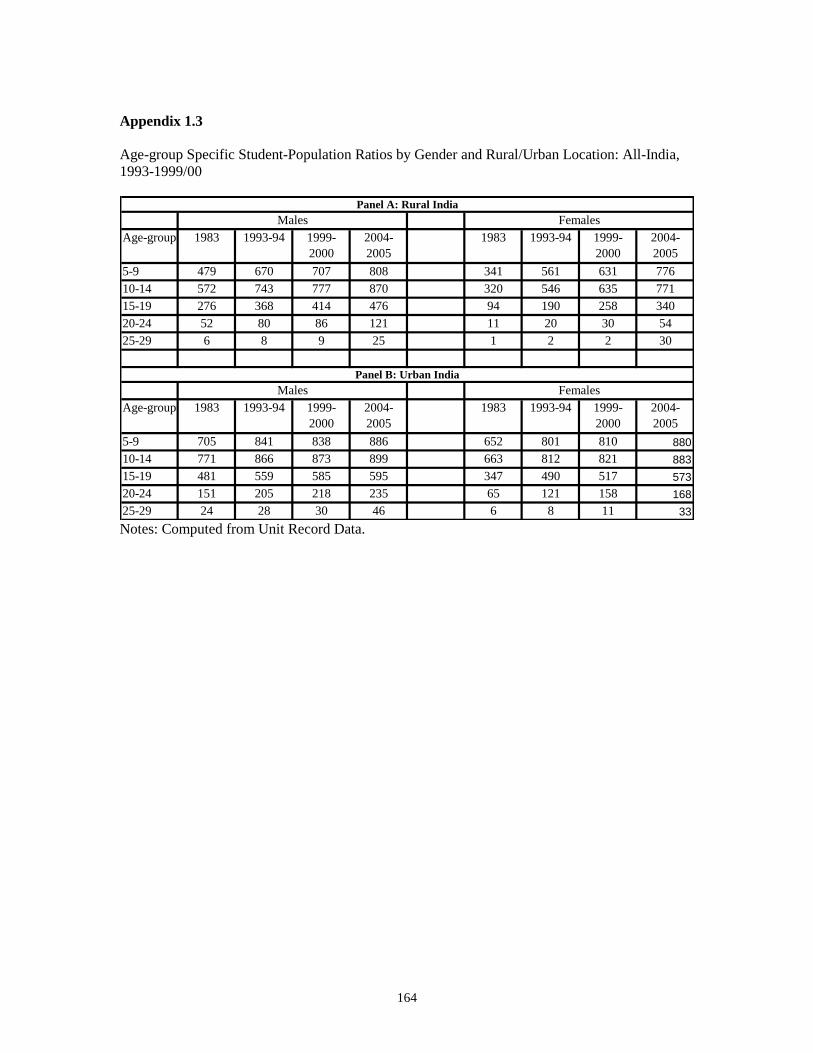
164
Appendix 1.3
Age-group Specific Student-Population Ratios by Gender and Rural/Urban Location: All-India,
1993-1999/00
Age-group 1983 1993-94 1999-
2000
2004-
2005
1983 1993-94 1999-
2000
2004-
2005
5-9 479 670 707 808 341 561 631 776
10-14 572 743 777 870 320 546 635 771
15-19 276 368 414 476 94 190 258 340
20-24 52 80 86 121 11 20 30 54
25-29 6 8 9 25 1 2 2 30
Age-group 1983 1993-94 1999-
2000
2004-
2005
1983 1993-94 1999-
2000
2004-
2005
5-9 705 841 838 886 652 801 810 880
10-14 771 866 873 899 663 812 821 883
15-19 481 559 585 595 347 490 517 573
20-24 151 205 218 235 65 121 158 168
25-29 24 28 30 46 6 8 11 33
Males
Panel A: Rural India
Females
Males
Panel B: Urban India
Females
Notes: Computed from Unit Record Data.
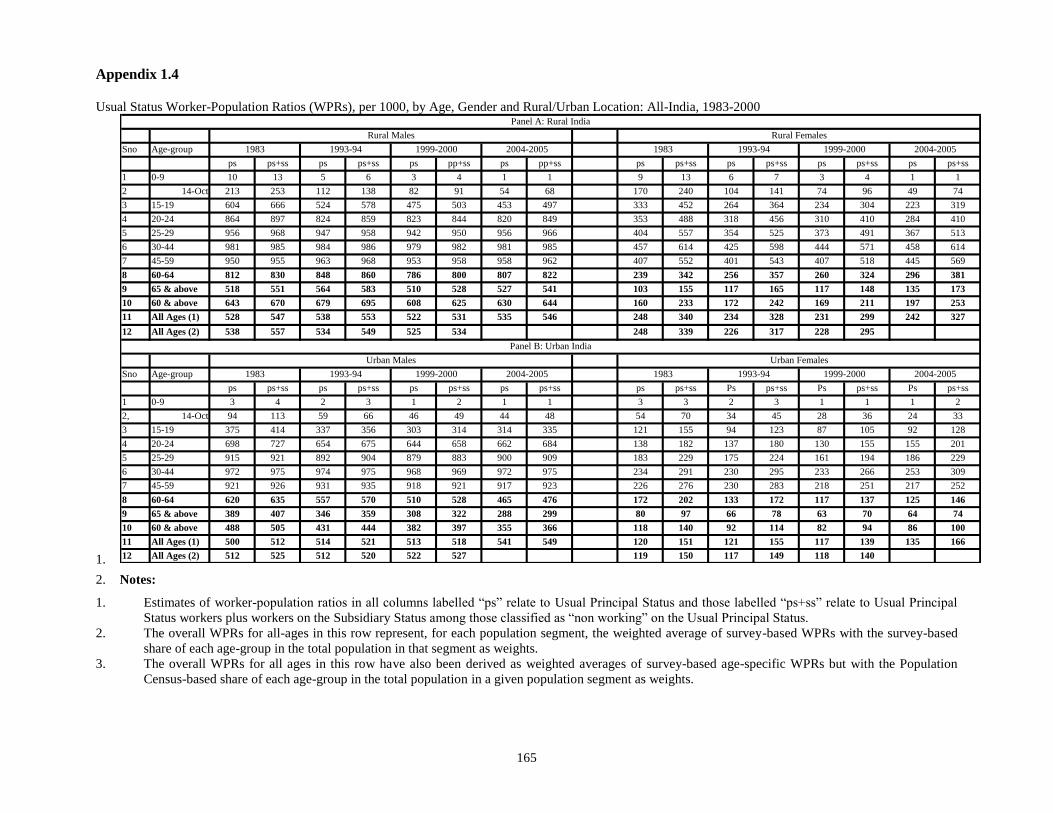
165
Appendix 1.4
Usual Status Worker-Population Ratios (WPRs), per 1000, by Age, Gender and Rural/Urban Location: All-India, 1983-2000
1.
Sno Age-group
ps ps+ss ps ps+ss ps pp+ss ps pp+ss ps ps+ss ps ps+ss ps ps+ss ps ps+ss
1 0-9 10 13 5 6 3 4 1 1 9 13 6 7 3 4 1 1
2 14-Oct 213 253 112 138 82 91 54 68 170 240 104 141 74 96 49 74
3 15-19 604 666 524 578 475 503 453 497 333 452 264 364 234 304 223 319
4 20-24 864 897 824 859 823 844 820 849 353 488 318 456 310 410 284 410
5 25-29 956 968 947 958 942 950 956 966 404 557 354 525 373 491 367 513
6 30-44 981 985 984 986 979 982 981 985 457 614 425 598 444 571 458 614
7 45-59 950 955 963 968 953 958 958 962 407 552 401 543 407 518 445 569
8 60-64 812 830 848 860 786 800 807 822 239 342 256 357 260 324 296 381
9 65 & above 518 551 564 583 510 528 527 541 103 155 117 165 117 148 135 173
10 60 & above 643 670 679 695 608 625 630 644 160 233 172 242 169 211 197 253
11 All Ages (1) 528 547 538 553 522 531 535 546 248 340 234 328 231 299 242 327
12 All Ages (2) 538 557 534 549 525 534 248 339 226 317 228 295
Sno Age-group
ps ps+ss ps ps+ss ps ps+ss ps ps+ss ps ps+ss Ps ps+ss Ps ps+ss Ps ps+ss
1 0-9 3 4 2 3 1 2 1 1 3 3 2 3 1 1 1 2
2, 14-Oct 94 113 59 66 46 49 44 48 54 70 34 45 28 36 24 33
3 15-19 375 414 337 356 303 314 314 335 121 155 94 123 87 105 92 128
4 20-24 698 727 654 675 644 658 662 684 138 182 137 180 130 155 155 201
5 25-29 915 921 892 904 879 883 900 909 183 229 175 224 161 194 186 229
6 30-44 972 975 974 975 968 969 972 975 234 291 230 295 233 266 253 309
7 45-59 921 926 931 935 918 921 917 923 226 276 230 283 218 251 217 252
8 60-64 620 635 557 570 510 528 465 476 172 202 133 172 117 137 125 146
9 65 & above 389 407 346 359 308 322 288 299 80 97 66 78 63 70 64 74
10 60 & above 488 505 431 444 382 397 355 366 118 140 92 114 82 94 86 100
11 All Ages (1) 500 512 514 521 513 518 541 549 120 151 121 155 117 139 135 166
12 All Ages (2) 512 525 512 520 522 527 119 150 117 149 118 140
Rural Males
2004-2005
Urban Males
2004-2005
2004-2005
Rural Females
Panel B: Urban India
Urban Females
1983 1993-94 1999-2000 1983 1993-94 1999-2000
1983 1993-94 1999-2000 1983 1993-94 1999-20002004-2005
Panel A: Rural India
2. Notes:
1. Estimates of worker-population ratios in all columns labelled “ps” relate to Usual Principal Status and those labelled “ps+ss” relate to Usual Principal
Status workers plus workers on the Subsidiary Status among those classified as “non working” on the Usual Principal Status.
2. The overall WPRs for all-ages in this row represent, for each population segment, the weighted average of survey-based WPRs with the survey-based
share of each age-group in the total population in that segment as weights.
3. The overall WPRs for all ages in this row have also been derived as weighted averages of survey-based age-specific WPRs but with the Population
Census-based share of each age-group in the total population in a given population segment as weights.
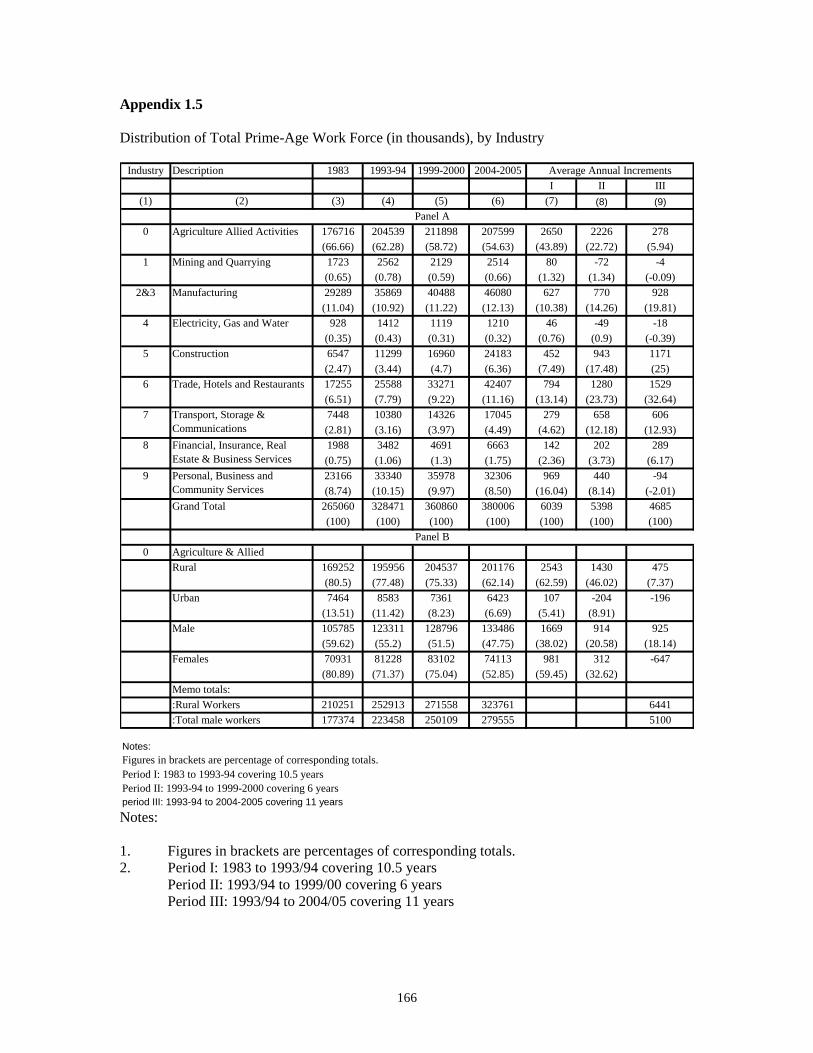
166
Appendix 1.5
Distribution of Total Prime-Age Work Force (in thousands), by Industry
Industry
Division
Description 1983 1993-94 1999-2000 2004-2005
I II III
(1) (2) (3) (4) (5) (6) (7) (8) (9)
176716 204539 211898 207599 2650 2226 278
(66.66) (62.28) (58.72) (54.63) (43.89) (22.72) (5.94)
1723 2562 2129 2514 80 -72 -4
(0.65) (0.78) (0.59) (0.66) (1.32) (1.34) (-0.09)
29289 35869 40488 46080 627 770 928
(11.04) (10.92) (11.22) (12.13) (10.38) (14.26) (19.81)
928 1412 1119 1210 46 -49 -18
(0.35) (0.43) (0.31) (0.32) (0.76) (0.9) (-0.39)
6547 11299 16960 24183 452 943 1171
(2.47) (3.44) (4.7) (6.36) (7.49) (17.48) (25)
17255 25588 33271 42407 794 1280 1529
(6.51) (7.79) (9.22) (11.16) (13.14) (23.73) (32.64)
7448 10380 14326 17045 279 658 606
(2.81) (3.16) (3.97) (4.49) (4.62) (12.18) (12.93)
1988 3482 4691 6663 142 202 289
(0.75) (1.06) (1.3) (1.75) (2.36) (3.73) (6.17)
23166 33340 35978 32306 969 440 -94
(8.74) (10.15) (9.97) (8.50) (16.04) (8.14) (-2.01)
265060 328471 360860 380006 6039 5398 4685
(100) (100) (100) (100) (100) (100) (100)
0 Agriculture & Allied
Activities: 169252 195956 204537 201176 2543 1430 475
(80.5) (77.48) (75.33) (62.14) (62.59) (46.02) (7.37)
7464 8583 7361 6423 107 -204 -196
(13.51) (11.42) (8.23) (6.69) (5.41) (8.91)
105785 123311 128796 133486 1669 914 925
(59.62) (55.2) (51.5) (47.75) (38.02) (20.58) (18.14)
70931 81228 83102 74113 981 312 -647
(80.89) (71.37) (75.04) (52.85) (59.45) (32.62)
Memo totals:
:Rural Workers 210251 252913 271558 323761 6441
:Total male workers 177374 223458 250109 279555 5100
Notes:
Figures in brackets are percentage of corresponding totals.
Period I: 1983 to 1993-94 covering 10.5 years
Period II: 1993-94 to 1999-2000 covering 6 years
period III: 1993-94 to 2004-2005 covering 11 years
Females
Urban
Male
Grand Total
Rural
Panel B
8 Financial, Insurance, Real
Estate & Business Services
9 Personal, Business and
Community Services
6 Trade, Hotels and Restaurants
7 Transport, Storage &
Communications
4 Electricity, Gas and Water
5 Construction
1 Mining and Quarrying
2&3 Manufacturing
Panel A
0 Agriculture Allied Activities
Average Annual Increments
Notes:
1. Figures in brackets are percentages of corresponding totals.
2. Period I: 1983 to 1993/94 covering 10.5 years
Period II: 1993/94 to 1999/00 covering 6 years
Period III: 1993/94 to 2004/05 covering 11 years
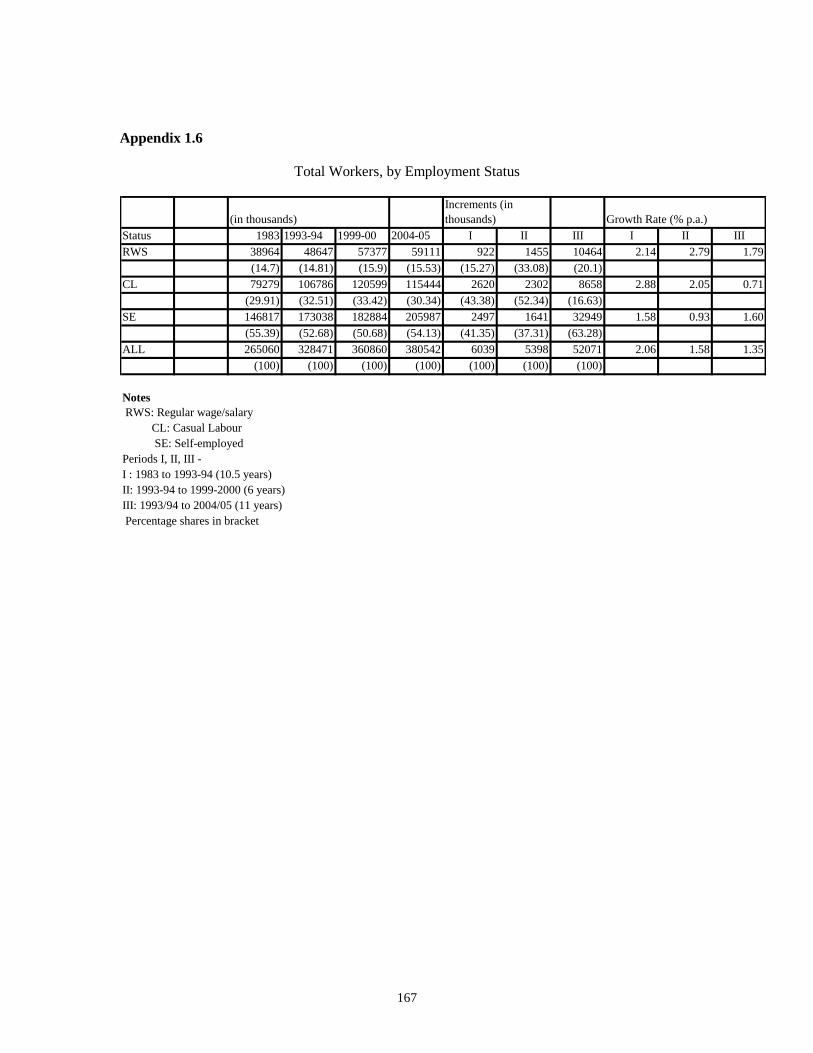
167
Appendix 1.6
Total Workers, by Employment Status
Status 1983 1993-94 1999-00 2004-05 I II III I II III
RWS 38964 48647 57377 59111 922 1455 10464 2.14 2.79 1.79
(14.7) (14.81) (15.9) (15.53) (15.27) (33.08) (20.1)
CL 79279 106786 120599 115444 2620 2302 8658 2.88 2.05 0.71
(29.91) (32.51) (33.42) (30.34) (43.38) (52.34) (16.63)
SE 146817 173038 182884 205987 2497 1641 32949 1.58 0.93 1.60
(55.39) (52.68) (50.68) (54.13) (41.35) (37.31) (63.28)
ALL 265060 328471 360860 380542 6039 5398 52071 2.06 1.58 1.35
(100) (100) (100) (100) (100) (100) (100)
Notes
Periods I, II, III -
I : 1983 to 1993-94 (10.5 years)
II: 1993-94 to 1999-2000 (6 years)
III: 1993/94 to 2004/05 (11 years)
Percentage shares in bracket
CL: Casual Labour
SE: Self-employed
(in thousands)
Increments (in
thousands) Growth Rate (% p.a.)
RWS: Regular wage/salary

168
Appendix 1.7
Educational Composition of the Indian Work Force (in thousands)
1983 1993-94 1999-
2000
2004-2005 I II III 1983 1993-94 1999-
2000
2004-2005
1 2 3 4 5 6 7 8 9 10 11 12 13
149043 156812 154448 146745 740 -394 -915
(56.23) (47.73) (42.8) (40.56) (12.22) (-7.30) (-30.24)
63137 78800 82060 95346 1492 543 1504
(23.82) (23.99) (22.74) (26.36) (24.71) (10.06) (49.7)
25923 39646 52144 61522 1307 2083 1989
(9.78) (12.07) (14.45) (17) (21.64) (38.59) (65.71)
19588 37906 50773 58149 1744 2145 1840
(7.39) (11.54) (14.07) (16.07) (28.88) (39.74) (60.81)
7369 15307 21435 23410 756 1021 737
(2.78) (4.66) (5.94) (6.47) (12.52) (18.91) (24.34)
265060 328471 360860 361762 6039 5398 3026
(100) (100) (100) (100) (100) (100) (100)
82.91
6 Total 66.92 68.03 65.01
86.46
69.31
5 Graduate &
above
89.06 87.3
79.59
4 Middle upto
Graduate
91.18 89.31 83.40
85.23
88.47
3 Primary upto
Middle
90.25 87.03
46.08
2 Literate upto
Primary
83.16 79.77 73.53
50.49
78.27
1 Illiterate 51.7 50.3
SNo. Education
Category
Share of Male Workers in each education
category All Workers Avg. Annual Additions
Notes: Figures in brackets are percentages of totals
I: Period from 1983 to 1993/94
II: Period from 1993/94 to 1999/00
III: Period from 1993/94 to 2004/05

169
Appendix 1.8: Average Annual Increment to Adult (15-59 years of age) Work Force by
Gender, Rural/Urban Location and Poverty Status: All-India, 1983-1993/94
and 1993-94/00
Panel A: Rural India
1983-1994 1993/94-1999/00
Category Rural
Males
Rural
Females
Rural
Persons
Rural
Males
Rural
Females
Rural
Persons
Self-employed
All Households 1220 497 1717 521 96 617
APL Households 1655 864 2519 1017 420 1437
RWS Workers
All Households 69 27 96 325 103 428
APL Households 271 52 323 344 102 446
Casual Laborers
All Households 1558 695 2253 1563 469 2032
APL Households 1224 375 1799 1688 750 2438
All Workers
All Households 2847 1219 4066 2409 668 3077
APL Households 3150 1491 4641 3049 1272 4321
Panel B: Urban India
1983-1994 1993/94-1999/00
Category Urban
Males Urban
Females
Urban
Persons
Urban
Males
Urban
Females
Urban
Persons
Self-employed
All Households 664 179 843 792 123 915
APL Households 465 90 555 739 53 792
RWS Workers
All Households 586 163 749 773 220 993
APL Households 497 135 632 789 234 1023
Casual Laborers
All Households 294 89 383 437 (-) 38 399
APL Households 100 19 119 343 17 360
All Workers
All Households 1544 431 1975 2002 305 2307
APL Households 1062 244 1306 1871 368 2239

170
Appendix 1.8 (Contd)
Panel C: All Areas (Rural + Urban)
1983-1994 1993/94-1999/00
Category Males Females Persons Males Females Persons
Self-employed
All Households 1884 676 2560 1313 219 1532
APL Households 2120 954 3074 1756 537 2293
RWS Workers
All Households 655 190 845 1098 323 1421
APL Households 768 187 955 1133 336 1469
Casual Laborers
All Households 1852 784 2636 2004 431 2431
APL Households 1324 594 1918 2031 767 2798
All Workers
All Households 4391 1650 6041 4411 973 5084
APL Households 4212 1735 5947 4920 1640 6560
Note:
APL Households are Above Poverty Line Households
RWS Workers are ‘regular wage salaried’ workers

171
Appendix 1.9
Rural Average Daily Earnings of Adult (15-59 years of age) Male and Female Casual Wage Laborers: All India (in Rupees at 1993/94 prices)
Males Females
S.No. Operation
Codes
1983 1993/94 1999/00 I II 1983 1993/94 1999/00 I II
1 1-6 16.08 21.06 25.10 2.60 2.97 11.09 15.08 18.23 2.97 3.21
2 7-11 18.75 24.88 30.02 2.73 3.18 11.05 16.48 20.03 3.88 3.30
3 1-11 16.42 21.87 25.85 2.77 2.83 11.09 15.31 18.44 3.12 3.15
4 13-14 22.84 30.42 35.43 2.77 2.57 11.54 17.32 23.84 3.94 5.47
5 1-11,13-
14
16.64 22.37 26.82 2.86 3.07 11.12 15.37 18.64 3.13 3.27
6 12 23.27 30.07 38.71 2.47 4.30 11.63 17.93 24.05 4.21 5.02
7 14 24.48 30.98 35.64 2.27 2.36 12.13 17.62 24.07 3.62 5.34
8 12-14 23.22 30.14 37.69 2.52 3.80 11.63 17.80 23.98 4.14 5.09
9 All Ag 16.39 21.96 26.03 2.83 2.87 11.05 15.26 18.25 3.12 3.03
10 All Non-
ag
23.78 30.46 38.32 2.39 3.90 11.66 17.91 23.88 4.17 4.91
11 All
Activities
18.01 23.91 29.26 2.74 3.42 11.14 15.57 18.78 3.24 3.17
12 Public
Works
19.51 24.65 31.47 2.25 4.15 11.92 18.54 25.91 4.30 5.74
Notes: 1. Operation Codes:
1-6: Manual work in cultivation
7-11: Manual work in other agricultural work
7-11: Manual work in agriculture
13-14: Non-manual work in agriculture
1-11 and 13-14: Casual work in agriculture
12: Manual work in non-agriculture
14: Non-manual work in non-agriculture
12-14: Casual work in non-agriculture
2. Column (6), (7), (11), and (12) Growth Rate (percent per annum), for Period I: 1983 to 1993/94 (10.5 years) and Period II: 1993/94 to
1999/00 (6 years)

172
Appendix 1.10
Population
Segments
UPS UPSS UPS UPSS UPS UPSS UPS UPSS
3260 2225 3647 2709 4275 3556 4430 3345
(21) (14) (20) (14) (21) (17) (20) (15)
940 593 1040 816 1228 1096 2923 2218
(14) (7) (14) (8) (15) (10) (30) (17)
4200 2818 4687 3525 5503 4652 7353 5562
(19) (11) (18) (12) (19) (15) (23) (15)
2888 2541 3061 2752 3878 3650 3290 2879
(58) (50) (46) (41) (48) (45) (35) (30)
733 632 1224 1165 1192 1128 1669 1512
(71) (50) (86) (66) (72) (58) (75) (57)
3621 3173 4285 3917 5070 4778 4958 4391
(60) (50) (53) (46) (52) (48) (43) (36)
6148 4756 6708 5461 8153 7206 7719 6224
(30) (23) (27) (21) (29) (25) (24) (19)
1673 1225 2264 1981 2420 2224 4592 3729
(22) (12) (26) (17) (25) (18) (39) (24)
7821 5991 8972 7442 10573 9430 12312 9953
(28) (19) (26) (20) (28) (23) (28) (21)
Population
Segments
UPS UPSS UPS UPSS UPS UPSS UPS UPSS
2776 1851 3291 2463 3724 3157 3852 3002
(49) (31) (48) (35) (51) (43) (49) (37)
690 498 869 724 1057 978 2251 1852
(28) (15) (32) (19) (37) (26) (75) (44)
3363 2349 4160 3187 4781 4135 6103 4855
(41) (25) (44) (29) (47) (37) (56) (40)
2442 2161 2678 2415 3311 3118 2794 2484
(122) (106) (108) (96) (115) (107) (85) (74)
637 557 1065 1015 969 925 1313 1191
(156) (112) (193) (149) (168) (138) (170) (126)
3079 2718 3743 3430 4280 4043 4107 3675
(128) (107) (123) (107) (124) (113) (101) (86)
5115 4012 5969 4878 7035 6275 6646 5486
(66) (151) (64) (51) (69) (61) (60) (48)
1327 1055 1934 1739 2026 1903 3564 3043
(46) (27) (60) (39) (59) (440) (94) (59)
6442 5067 7903 6617 9061 8178 10210 8529
(61) (43) (63) (47) (67) (56) (69) (52)
Total Persons
1999-2000 2004-2005
1999-2000 2004-2005
Urban Females
Urban Persons
Total Males
Total Females
Rural Males
Rural Females
Rural Persons
Urban Males
Total Persons
Panel B: Youth (15-29)
Persons unemployed on UPS & UPSS
1983 1993-94
Urban Females
Urban Persons
Total Males
Total Females
Rural Males
Rural Females
Rural Persons
Urban Males
Panel A: Persons (All Ages) Unemployed on UPS and UPSS
Persons unemployed on UPS & UPSS (000)
1983 1993-94
173
Notes: Figures within brackets relate to unemployment rates defined as number of persons unemployed
expressed per 1000 persons in the labor force.
Appendix 2.1
Sundaram-Tendulkar on the statistics on employment in the organized sector
Attempts have been made recently to explore the connection between the NSS-based
RWS (regular wage salaried) workers and employment in the organised high productivity units.
The most commonly used data source for organised employment is the number of employees on
regular payrolls, as on March 31 each year, reported by the Directorate General of Employment
and Training (DGE&T) and published in the annual Economic Surveys of the Ministry of
Finance. DGE&T collects this information under the Employment Exchanges (Notification of
Vacancies) Act. Under this legislation, the reporting is mandatory for all public sector units,
irrespective of size, as also for large private sector establishments with 25 or more employees. It
is voluntary for private sector units with 10-24 employees. The data are known to suffer from
under-reporting because of the voluntary nature of reporting from small units and lax
enforcement of mandatory requirements from large units. The NSS 55th Round collected, for the
first time, worker-reported information on the types of enterprises where workers were employed.
This was confined only to workers engaged in non-agricultural activities. Three types of
enterprises provide a reasonable approximation to organised sector employment: (i) public sector,
(ii) semi-public, and (iii) other (including cooperative society, private limited company and other
units under the Annual Survey of Industries). A special tabulation of the self-reported affiliation
of workers by type of enterprise, carried out by the Central Statistical Organization (GOI-CSO,
2004), brought out two results of interest in the present context. One, the aggregate employment
in (i) to (iii) was 31.85 million, compared to 26.54 million as reported on 31st March 2000 by
DGE&T, thus providing some support to the apprehension of under-reporting in DGE&T data.
Two, the shortfall was almost entirely in organised services where the NSS-based estimate was
16.8 million compared with 11.5 million in DGE&T. Sundaram (2004) reported an alternative
tabulation of the 55th Round data, in which he focused on activity-status categorisation. He
reported two findings that are relevant. One, close to 88 percent of the workers in organised non-
agricultural enterprises reported RWS status. Second, in every population segment (rural/urban x
male/female), at least 50 percent of the workers with RWS status were located in the organised
segment, with this proportion being as high as 57 percent for rural RWS female workers. These
results suggest that RWS status would provide a good approximation of organised high-
productivity employment and possibly be a good alternative source of information on
employment in the sector so that it would not be necessary to rely solely on DGE&T data. Why
can’t data on worker-reported affiliation by type of enterprise in non-agricultural activities be
used directly as a measure of employment in the organised sector? One reason is that this
information is available so far only for the 55th Round and not for earlier periods. It was not
collected in the earlier quinquennial Rounds. Secondly, self-reported affiliation by type of
enterprise is yet to stabilise itself in the NSS reporting system. Consequently, data from the two
exercises cited above may only be used to provide support to the suggestion of approximating
organised sector employment by the number of RWS workers.

174
Appendix 2.2
Percentage of Employment in Formal and Informal Sectors, by Industrial Categories,
1999/00.
Column Percentages Row Percentages
INDUSRTY FORMAL INFORMAL TOTAL FFOORRMMAALL IINNFFOORRMMAALL TTOOTTAALL
Primary 5.79 67.31 60.53 1.05 98.95 100
Secondary 28.31 14.14 15.71 19.88 80.12 100
Tertiary 65.90 18.54 23.77 30.67 69.43 100
TOTAL 100 100 100 11.03 88.91 100

175
Appendix 2.3
Relative Wages of Regular Salaried and Casual Laborers, All India, 1983-2000
Urban Male Urban Female
Industry 1983 1987/88 1993/94 1999/00 1983 1987/88 1993/94 1999/00
Agriculture(0) 1.47 2.11 2.02 3.10 1.95 2.50 2.83 2.00
Mining & Quarrying(1) 1.88 2.65 3.20 3.37 2.80 2.71 2.84 2.69
Manufacture (Organic) 1.79 1.65 1.67 1.62 1.63 1.58 1.87 1.49
Manufacture(Inorganic)
1.89 2.54 2.41 2.43 5.57 3.73 3.62 2.43
Electricity, Gas, Water
(4) 2.65 2.97 2.56 3.35 - 4.16 3.86 -
Construction(5) 1.83 2.01 1.88 1.92 2.35 2.32 1.54 2.78
Trade and Hotels(6) 1.49 1.46 1.51 1.74 2.37 2.14 2.02 2.75
Transport(7) 2.11 2.34 2.14 2.50 2.71 3.12 3.86 3.80
Business, Financial
Services(8) 3.41 3.55 4.37 3.96 5.50 2.89 3.35 5.54
Social, Personal
Services(9) 2.73 2.71 3.11 3.92 3.29 3.87 3.27 5.80
Non-agriculture 2.11 2.35 2.34 2.71 3.27 3.61 3.22 3.94
All (0-9) 2.18 2.46 2.41 2.68 3.28 3.88 3.37 3.67
Rural Male Rural Female
Agriculture 1.04 1.30 1.27 1.73 1.95 1.43 1.51 1.73
Non-agriculture 1.89 2.22 2.21 2.42 2.29 2.85 2.32 3.89
All 2.04 2.41 2.52 2.80 2.20 2.80 2.28 3.88 Note: Figures refer to regular wage earnings per worker/casual wage earnings per worker.
Source: National Sample Survey Organisation, Employment and Unemployment Surveys, various issues.
Computed from Unni (2006), Table 8.

176
Appendix 2.4
Skilled-Unskilled Workers, by Level of Education and Skill Premium (W), All, Regular, and Casual.
1993/94 and 1999/00
ALL WORKERS
B. Industry
SKILLED/UNSKILLED
WH/WL
1993/94 1999/00 1993/94 1999/00
Agriculture, Forestry & Fishing 0.03 0.04 1.56 1.72
Mining & Quarrying 0.19 0.20 2.27 2.33
Manufacturing 0.36 0.48 2.38 2.42
Electricity, Gas & Water 1.00 1.42 1.67 1.55
Construction 0.08 0.11 2.20 1.69
Trade 0.46 0.59 1.79 1.79
Hotels & Restaurants 0.17 0.28 1.62 1.94
Transport, Storage &
Communications 0.43 0.57 1.85 1.94
Finance & Real Estate - - 2.87 2.41
Services 1.45 1.58 2.41 2.61
Total 0.22 0.25 3.50 3.37
Regular Workers
Agriculture, Forestry & Fishing 0.08 0.16 2.92 2.37
Mining & Quarrying 0.53 0.61 1.30 1.33
Manufacturing 0.64 0.78 1.94 2.20
Electricity, Gas & Water 1.14 1.52 1.56 1.48
Construction 0.59 0.58 2.26 1.94
Trade 0.63 0.84 1.74 1.73
Hotels & Restaurants 0.22 0.40 1.57 1.94
Transport, Storage &
Communications 0.67 0.91 1.57 1.66
Finance & Real Estate - - 2.54 2.24
Services 1.93 2.25 2.07 2.13
Total 0.99 1.17 2.10 2.16
Casual Workers

177
Agriculture, Forestry & Fishing 0.02 0.04 1.22 1.28
Mining & Quarrying 0.02 0.05 0.96 1.19
Manufacturing 0.09 0.13 1.20 1.25
Electricity, Gas & Water 0.21 0.58 0.99 1.22
Construction 0.05 0.09 1.12 1.19
Trade 0.15 0.21 1.10 1.16
Hotels & Restaurants - - 0.93 1.29
Transport, Storage &
Communications 0.09 0.13 1.06 1.09
Finance & Real Estate - - 1.22 0.94
Services 0.07 0.08 1.27 3.09
Total 0.03 0.06 1.25 1.37 Note: Skilled workers are those who completed education of secondary school and above.
WH – wages of skilled workers; WL _- wages of unskilled workers.
Source: Unni (2006), Table 13.
Computed from the National Sample Survey Organisation, Employment and Unemployment Survey, 1993/94
(50th Round) and 1999/00 (55th Round). Obtained from Compact Discs, New Delhi.

178
APPENDIX 2.5
Model 1: Estimating the Determinants of Labor Use in Cultivation by 2SLS Instrumental Variable
Regression with Time Dummies
Dependent: Labor Days in Cultivation Per Hectare of Net Sown Area
Coef. t –value p-value
Area under labor intensive crops (%) 7.03 7.93 0.00
Tractors per hectare -1.69 -1.96 0.56
Total non-farm workers (%) -5.97 -3.45 0.00
D for Year 1987/88 26.12 0.66 0.51
D for Year 1993/94 74.29 1.83 0.07
D for Year 1999/00 116.06 2.64 0.01
Constant 311.76 4.85 0.00
(p >F =0.000) R2=0.63 R 2
=0.59 Df=49
Endogenous Variable: Area under Labour Intensive Crops (%)
Model 2
Dependent: Growth of Labor Days in Cultivation Per Hectare of Net Sown Area
Coef. t –value p-value
Growth in gross irrigated area 0.40 1.92 0.069
Growth of rural non-farm workers -0.59 -2.60 0.016
Annual % change in area of labor intensive crops 2.57 3.80 0.001
Growth of NSDP in agriculture per 1000 hectares 0.18 1.80 0.085
D for Period 1994/00 -1.01 -1.65 0.113
Constant 1.10 1.12 0.276
(p >F =0.000) R2=0.49 R 2
=0.38 Df=22

179
APPENDIX TABLES
Appendix 3.1
Distribution of Employment in the Tertiary Sector: Formal and Informal (percentages as
indicated)
RURAL
Category FORMAL IINNFFOORRMMAALL
Males Females Total MMaalleess FFeemmaalleess TToottaall
Public 69.7 86.3 71.9 ---- ---- ----
Private Regular Wage 7.8 8.1 7.9 1122..66 1122..22 1122..66
Casual Wage -- -- -- 3344..11 2299..55 3333..55
Self-Employed 22.5 5.6 20.2 5533..33 5588..44 5533..99
TOTAL 100.0 100.0 100.0 110000..00 110000..00 110000..00
% of All Tertiary 21.3 3.4 24.6 6655..55 99..99 7755..44
URBAN
Category FORMAL IINNFFOORRMMAALL
Males Females Total MMaalleess FFeemmaalleess TToottaall
Public 57.1 67.4 58.7 ---- ---- ----
Private Regular Wage 12.5 19.7 13.6 2244..66 3311..00 2255..66
Casual Wage -- -- -- 2244..55 2277..99 2255..00
Self-Employed 30.4 12.9 27.7 5500..99 4411..11 4499..44
TOTAL 100.0 100.0 100.0 110000..00 110000..00 110000..00
% of All Tertiary 31.7 5.8 37.5 5533..11 99..55 6622..55
Appendix 3.2
Labor Productivity, by Broad Sectors 1983-2000 [ Based on UPS estimates of employment]
Labor Productivity (UPS) Labor Productivity Index(UPS)
NIC 55th
50th
43rd 38th
55th 50th 43rd 38th
0 13,349 11,752 10,116 10,223 100 100 100 100
1 129,579 73,754 64,802 62,920 971 628 641 615
2&3 46,999 34,444 27,547 24,801 352 293 272 243
4 239,870 139,433 111,410 93,247 1,797 1,186 1,101 912
5 34,406 34,492 25,551 37,543 258 294 253 367
6 42,838 36,593 32,298 31,866 321 311 319 312
7 60,537 48,310 42,871 38,468 453 411 424 376
8 303,895 259,820 184,626 171,029 2,276 2,211 1,825 1,673
9 47,729 27,137 26,387 22,588 358 231 261 221
6+7+8+9 61,216 44,144 37,985 33,950 459 376 375 332
Source: NSS and National Accounts
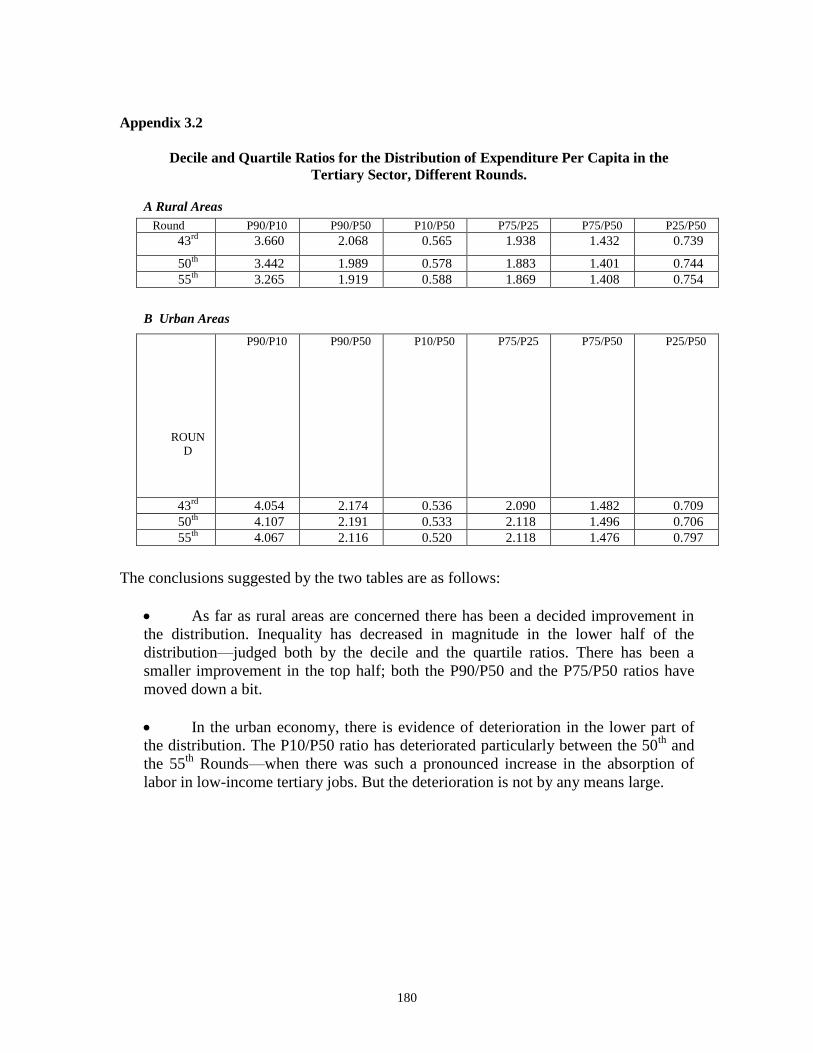
180
Appendix 3.2
Decile and Quartile Ratios for the Distribution of Expenditure Per Capita in the
Tertiary Sector, Different Rounds.
A Rural Areas
Round P90/P10 P90/P50 P10/P50 P75/P25 P75/P50 P25/P50
43rd
3.660 2.068 0.565 1.938 1.432 0.739
50th 3.442 1.989 0.578 1.883 1.401 0.744
55th 3.265 1.919 0.588 1.869 1.408 0.754
B Urban Areas
ROUN
D
P90/P10 P90/P50 P10/P50 P75/P25 P75/P50 P25/P50
43rd
4.054 2.174 0.536 2.090 1.482 0.709
50th 4.107 2.191 0.533 2.118 1.496 0.706
55th 4.067 2.116 0.520 2.118 1.476 0.797
The conclusions suggested by the two tables are as follows:
As far as rural areas are concerned there has been a decided improvement in
the distribution. Inequality has decreased in magnitude in the lower half of the
distribution—judged both by the decile and the quartile ratios. There has been a
smaller improvement in the top half; both the P90/P50 and the P75/P50 ratios have
moved down a bit.
In the urban economy, there is evidence of deterioration in the lower part of
the distribution. The P10/P50 ratio has deteriorated particularly between the 50th
and
the 55th
Rounds—when there was such a pronounced increase in the absorption of
labor in low-income tertiary jobs. But the deterioration is not by any means large.

181
Appendix 4.1: Instrumental Variable Estimates of the Effect of GSDP on Employment Levels for Male and Female Workers
1 2 3 4 5 6 7 8 9 10 11 12Male
Rural
Male
Urban Male All
Male
Rural
Male
Urban Male All
female
Rural
female
Urban female All
female
Rural
female
Urban female All
0.21 0.817 0.423 -0.155 0.452 -0.453 0.515 0.77 0.677 1.089 0.188 2.115
[1.73]+ [4.73]** [4.99]** [0.22] [1.05] [0.26] [4.41]** [3.63]** [4.02]** [1.20] [0.14] [1.28]
0.146 0.242 -0.223 0.968
[0.31] [0.52] [0.26] [0.67]
-8.368 -3.835 -0.493 0.145
[2.90]** [2.15]* [0.54] [0.08]
0.287 1.249 0.014 -0.723
[0.83] [2.11]* [0.03] [0.89]
5 -2.201 0.48 1.544
[1.22] [0.90] [0.39] [0.91]
0.054 1.095 0.422 0.142 -0.105 -0.179 -0.052 -0.775 0.176 -0.123 -0.19 -0.554
[0.30] [2.17]* [1.25] [1.51] [0.60] [0.55] [0.39] [1.15] [0.43] [0.86] [0.62] [1.23]
-0.03 2.913 1.213 0.295 0.112 0.1 -0.225 -1.933 0.456 -0.386 -0.013 -1.287
[0.14] [2.74]** [1.67]+ [1.76]+ [0.24] [0.09] [1.20] [1.25] [0.45] [0.95] [0.01] [1.02]
-0.229 4.954 2.023 0.326 0.038 -0.052 -0.648 -4.137 0.368 -0.929 -0.407 -2.502
[0.72] [2.65]** [1.59] [1.13] [0.05] [0.03] [2.31]* [1.40] [0.22] [1.35] [0.24] [1.17]
-1.262 -1.262 -2.063 -2.063
[24.02]** [24.02]** [39.42]** [26.90]**
11.311 38.175 24.39 16.653 10.058 15.326 7.554 -15.334 11.713 1.822 7.397 -12.847
[5.53]** [3.21]** [2.91]** [3.26]** [1.44] [0.77] [5.20]** [1.05] [1.48] [0.20] [0.46] [0.62]
247 277 492 270 253 492 235 253 462 233 251 462
Test for Validity of Instruments
0.29779 0.20501 0.22334 0.73552 0.1719 0.40246 0.50153 0.49159 0.18463 0.47135 0.40425 0.8337
lgsdp 0.341 0.2407 0.3395 0.9971 0.9968 0.9965 0.2838 0.4053 0.3121 0.9959 0.9968 0.9959
Urban Salaried Wage, Male 0.761 0.7736 0.8426 0.8553
Rural Casual Wage, Male 0.3231 0.3201 0.5754 0.5792
Urban Salaried Wage,female 0.4177 0.4916 0.5315 0.6218
Rural Casual Wage, female 0.1864 0.1931 0.3726 0.3723
Share of Industry in GSDP x x x x x x x x x x
Road density x x x x x x x x x x x x
Percentage of villages electrified x x x x x x x x x x x
Industrial Credit Rs. Per Capita x x x x x x x x x x
Agricultural Credit Rs. Per Capita x x x x x x x x x x x x
Notes:
1, Absolute value of z statistics in brackets. Robust z is reported where heteroskedasticity exists.
2. + significant at 10%; * significant at 5%; ** significant at 1%
3. x - excluded instruments used in the specification.
without State Dummies with State Dummies without State Dummies with State Dummies
1st stage
Centered R2 for
Instrumented
Variables
Excluded
Instruments
Overidentification Test of all instruments (P-val=)
GSDP
Rural Casual Wage Male
Urban Salaried Wage Male
Rural Casual Wage Female
Urban Salaried Wage Female
1987-88 Dummy
1993-94 dummy
1999-00 Dummy
Urban Dummy
Constant
Observations
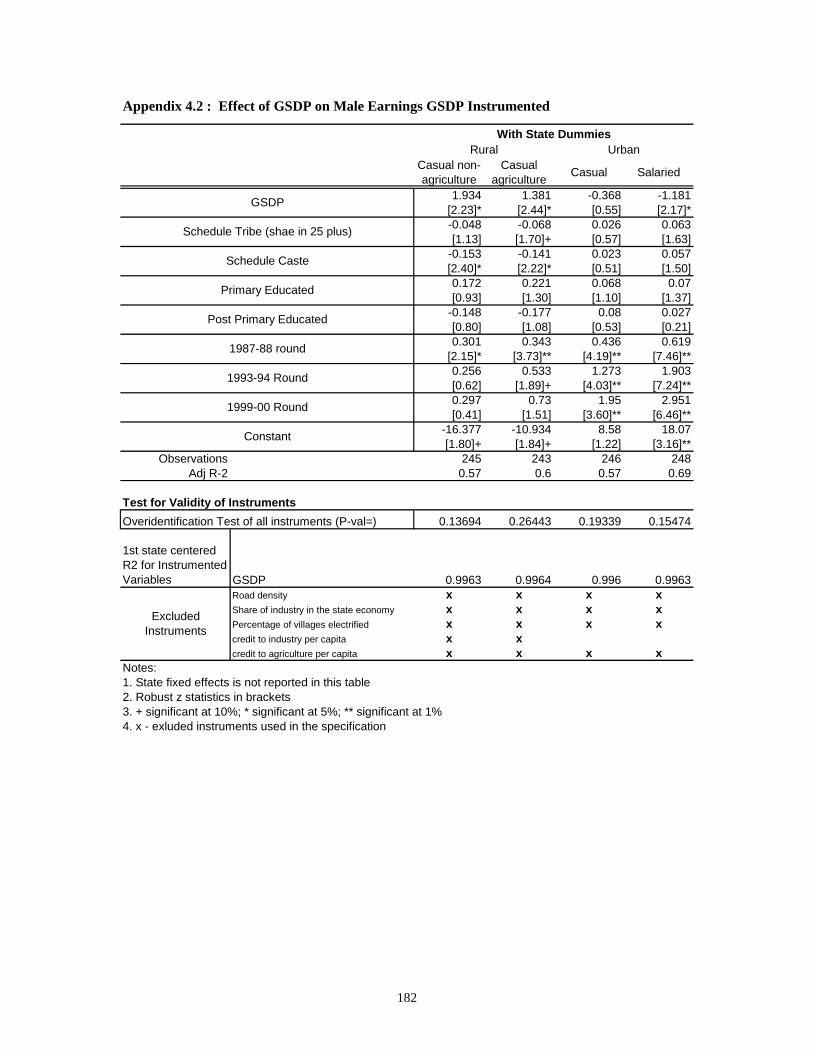
182
Appendix 4.2 : Effect of GSDP on Male Earnings GSDP Instrumented
Casual non-
agriculture
Casual
agricultureCasual Salaried
1.934 1.381 -0.368 -1.181
[2.23]* [2.44]* [0.55] [2.17]*
-0.048 -0.068 0.026 0.063
[1.13] [1.70]+ [0.57] [1.63]
-0.153 -0.141 0.023 0.057
[2.40]* [2.22]* [0.51] [1.50]
0.172 0.221 0.068 0.07
[0.93] [1.30] [1.10] [1.37]
-0.148 -0.177 0.08 0.027
[0.80] [1.08] [0.53] [0.21]
0.301 0.343 0.436 0.619
[2.15]* [3.73]** [4.19]** [7.46]**
0.256 0.533 1.273 1.903
[0.62] [1.89]+ [4.03]** [7.24]**
0.297 0.73 1.95 2.951
[0.41] [1.51] [3.60]** [6.46]**
-16.377 -10.934 8.58 18.07
[1.80]+ [1.84]+ [1.22] [3.16]**
Observations 245 243 246 248
Adj R-2 0.57 0.6 0.57 0.69
Test for Validity of Instruments
0.13694 0.26443 0.19339 0.15474
1st state centered
R2 for Instrumented
Variables GSDP 0.9963 0.9964 0.996 0.9963
Road density x x x x
Share of industry in the state economy x x x x
Percentage of villages electrified x x x x
credit to industry per capita x x
credit to agriculture per capita x x x x
Notes:
1. State fixed effects is not reported in this table
2. Robust z statistics in brackets
3. + significant at 10%; * significant at 5%; ** significant at 1%
4. x - exluded instruments used in the specification
Overidentification Test of all instruments (P-val=)
Excluded
Instruments
GSDP
Schedule Tribe (shae in 25 plus)
Schedule Caste
Primary Educated
Post Primary Educated
1987-88 round
1993-94 Round
1999-00 Round
Constant
With State Dummies
Rural Urban
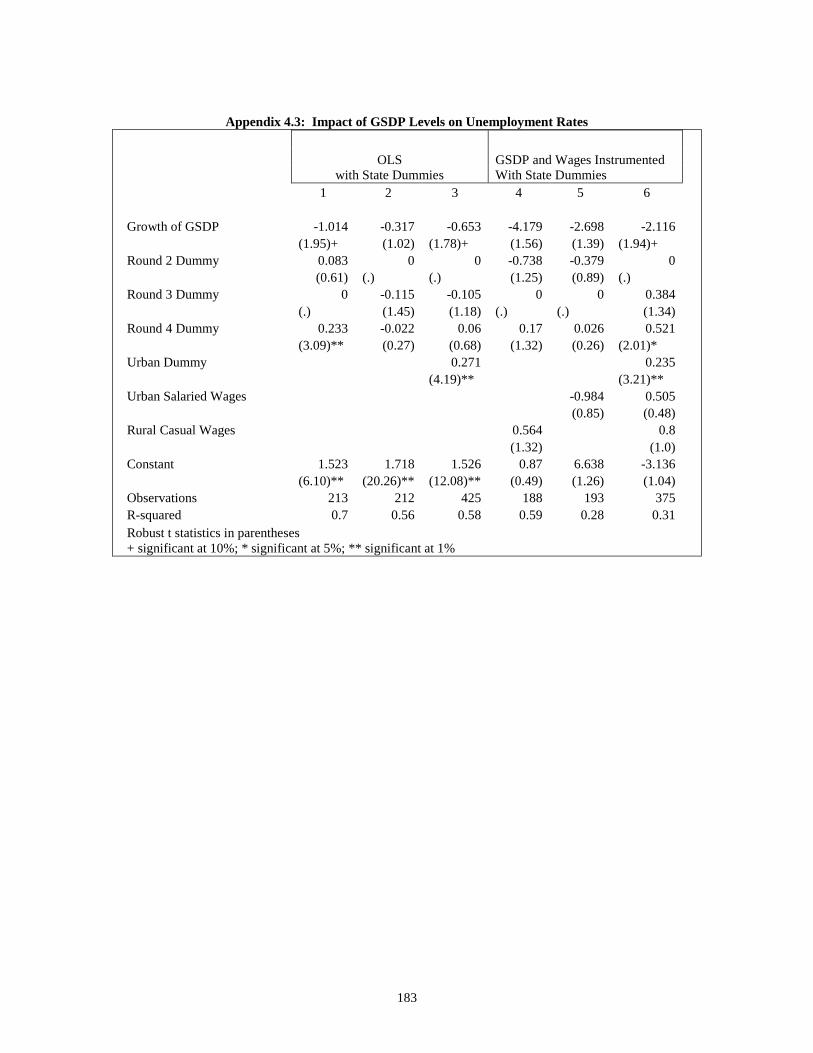
183
Appendix 4.3: Impact of GSDP Levels on Unemployment Rates
OLS
with State Dummies
GSDP and Wages Instrumented
With State Dummies
1 2 3 4 5 6
Growth of GSDP -1.014 -0.317 -0.653 -4.179 -2.698 -2.116
(1.95)+ (1.02) (1.78)+ (1.56) (1.39) (1.94)+
Round 2 Dummy 0.083 0 0 -0.738 -0.379 0
(0.61) (.) (.) (1.25) (0.89) (.)
Round 3 Dummy 0 -0.115 -0.105 0 0 0.384
(.) (1.45) (1.18) (.) (.) (1.34)
Round 4 Dummy 0.233 -0.022 0.06 0.17 0.026 0.521
(3.09)** (0.27) (0.68) (1.32) (0.26) (2.01)*
Urban Dummy 0.271 0.235
(4.19)** (3.21)**
Urban Salaried Wages -0.984 0.505
(0.85) (0.48)
Rural Casual Wages 0.564 0.8
(1.32) (1.0)
Constant 1.523 1.718 1.526 0.87 6.638 -3.136
(6.10)** (20.26)** (12.08)** (0.49) (1.26) (1.04)
Observations 213 212 425 188 193 375
R-squared 0.7 0.56 0.58 0.59 0.28 0.31
Robust t statistics in parentheses
+ significant at 10%; * significant at 5%; ** significant at 1%

184
1 2 3 4 5 6 7 8 9
Rural Urban All Rural Urban All Rural Urban All
-0.098 0.001 -0.05 -0.778 0.092 -0.338 -0.475 -0.235 -0.325
[3.68]** [0.05] [2.74]** [2.70]** [0.22] [3.91]** [2.72]** [0.40] [1.45]
-1.812 3.381 1.685
[0.93] [0.47] [0.52]
0.133 0.119 0.734 1.491 1.547 1.359
[2.20]* [3.35]** [1.06] [2.59]** [1.69]+ [1.50]
-0.019 -2.069 0.155 2.855 -1.596
[0.29] [0.94] [0.19] [0.53] [0.68]
-0.114 -0.126 5.651
[1.10] [1.44] [0.97]
0.211
[1.92]+
-0.187 -0.051 0.046 -0.617
[2.01]* [0.79] [0.10] [1.57]
-0.169 -0.071 -4.35 -1.412
[0.77] [0.40] [0.98] [1.91]+
-0.573 -0.182 -0.71
[10.85]** [1.18] [0.57]
0.217 0.016 0.097 0.624 0.199 0.405 0.889 -2.226 -0.229
[2.16]* [0.20] [1.40] [2.16]* [0.49] [2.42]* [1.29] [0.49] [0.24]
-0.012 0.162 0.105 -0.486 -0.026 0.144 1.072 -4.339 -1.636
[0.11] [1.70]+ [1.28] [1.44] [0.05] [0.77] [0.67] [0.48] [0.63]
-0.032 0.122 0.066 -0.724 -0.112 0.152 1.217 -6.719 -2.494
[0.26] [0.89] [0.56] [1.48] [0.13] [0.56] [0.57] [0.50] [0.70]
-0.946 -0.87 -0.316 -6.757 0.668 1.034 2.006 -27.422 -9.869
[2.48]* [1.14] [0.48] [2.55]* [0.12] [0.53] [0.26] [0.53] [1.03]
heteroskedasticity test (P-val=) 0.0981 0.8393 0.0459 0.9498 1 0.9828 0.999 1 0.9995
R-squared 0.14 0.04 0.45
Observations 177 210 371 159 170 322 161 177 324
Test for Validity of Instruments
0.81588 0.88074 0.15068 0.543 0.84699 0.39977
Rate of Unemployment 0.1884 0.1247 0.4474 0.3931 0.236 0.4387
Rural (non-agr) Casual Wages, Female 0.2989 0.3332 0.292 0.2699
Urban Salaried Wages, Female 0.6647
Urban casual Wages, Female 0.4212 0.3408 0.2027 0.267
Real Household Per Capita Expenditure 0.4962 0.5121 0.5342
Share of Industry in GSDP x x x x x x
Share of sch tribe25-59: female x x x x x x
Share of sch caste 25-59: female x x x x x
Share of prmiary educated female 25-59 x x x x
Share of secondary educated female 25-59 x x x
Industrial Credit Rs. Per Capita x
Agricultural Credit Rs. Per Capita x x x x x
Gini - real daily wage x x
count no_salaried_15-59 x
Notes:
1. t statistics in brackets. Robust t is reported where heteroskedasticity exists.
2. + significant at 10%; * significant at 5%; ** significant at 1%
3. x - excluded instruments used in the specification
1999-00 Round
1st state centered Partial R2 for
Instrumented Variables
Excluded Instruments
OLS
Urban Casual Wages, Female
Urban Salaried Wages, Female
Urban Casual Wages, Male
Female Wages and
Unemployment Rate
Instrumented
Rate of Unemployment
Real Household per Capita
Expenditure
Rural(non-agr) Casual Wages, Female
Appendix 4.4A: Estimates of Determinants of Female Participation Rates: Female and Male Wages, Household
Earnings and Unemployment Rates
Overidentification Test of all instruments (P-val=)
Household Per Capita
Expenditures, Unemployment
Instrumented
Dependent variable:Female
Participation Rates
Rural Casual Wages, Male
Urban Salaried Wages, Maqle
Constant
Urban Dummy
1987-88 round
1993-94 Round
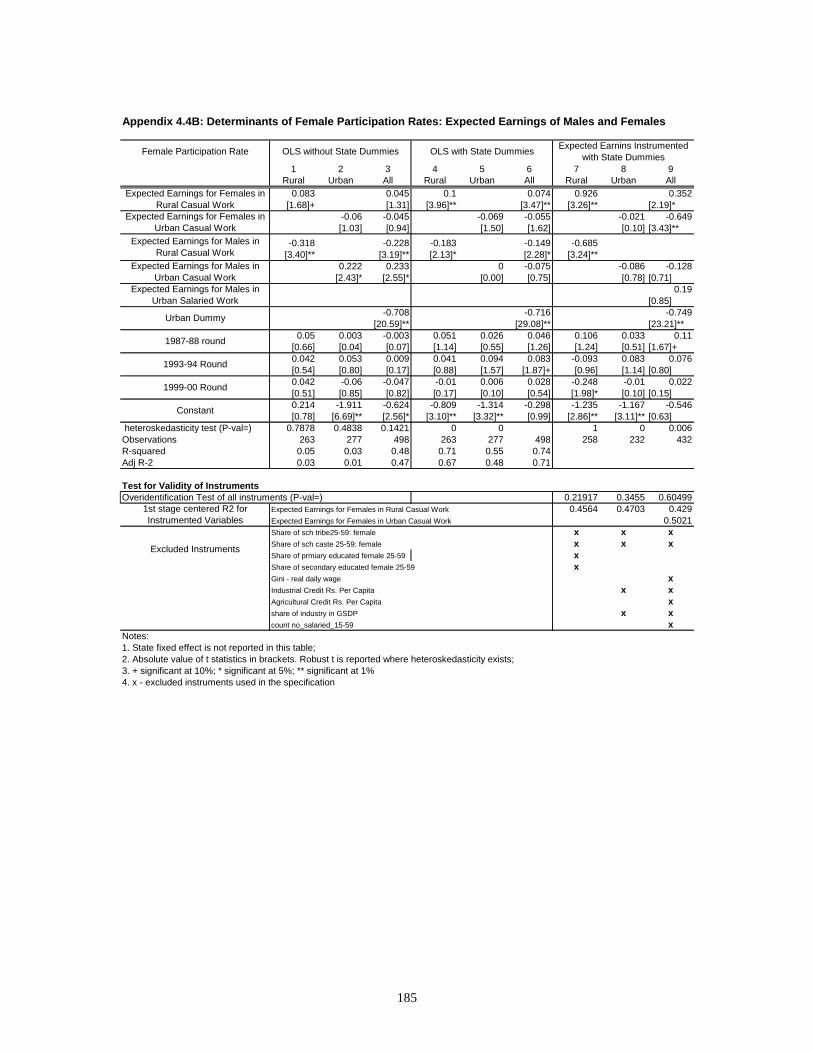
185
Appendix 4.4B: Determinants of Female Participation Rates: Expected Earnings of Males and Females
1 2 3 4 5 6 7 8 9
Rural Urban All Rural Urban All Rural Urban All
0.083 0.045 0.1 0.074 0.926 0.352
[1.68]+ [1.31] [3.96]** [3.47]** [3.26]** [2.19]*
-0.06 -0.045 -0.069 -0.055 -0.021 -0.649
[1.03] [0.94] [1.50] [1.62] [0.10] [3.43]**
-0.318 -0.228 -0.183 -0.149 -0.685
[3.40]** [3.19]** [2.13]* [2.28]* [3.24]**
0.222 0.233 0 -0.075 -0.086 -0.128
[2.43]* [2.55]* [0.00] [0.75] [0.78] [0.71]
0.19
[0.85]
-0.708 -0.716 -0.749
[20.59]** [29.08]** [23.21]**
0.05 0.003 -0.003 0.051 0.026 0.046 0.106 0.033 0.11
[0.66] [0.04] [0.07] [1.14] [0.55] [1.26] [1.24] [0.51] [1.67]+
0.042 0.053 0.009 0.041 0.094 0.083 -0.093 0.083 0.076
[0.54] [0.80] [0.17] [0.88] [1.57] [1.87]+ [0.96] [1.14] [0.80]
0.042 -0.06 -0.047 -0.01 0.006 0.028 -0.248 -0.01 0.022
[0.51] [0.85] [0.82] [0.17] [0.10] [0.54] [1.98]* [0.10] [0.15]
0.214 -1.911 -0.624 -0.809 -1.314 -0.298 -1.235 -1.167 -0.546
[0.78] [6.69]** [2.56]* [3.10]** [3.32]** [0.99] [2.86]** [3.11]** [0.63]
heteroskedasticity test (P-val=) 0.7878 0.4838 0.1421 0 0 1 0 0.006
Observations 263 277 498 263 277 498 258 232 432
R-squared 0.05 0.03 0.48 0.71 0.55 0.74
Adj R-2 0.03 0.01 0.47 0.67 0.48 0.71
Test for Validity of Instruments
Overidentification Test of all instruments (P-val=) 0.21917 0.3455 0.60499
Expected Earnings for Females in Rural Casual Work 0.4564 0.4703 0.429
Expected Earnings for Females in Urban Casual Work 0.5021
Share of sch tribe25-59: female x x x
Share of sch caste 25-59: female x x x
Share of prmiary educated female 25-59 x
Share of secondary educated female 25-59 x
Gini - real daily wage x
Industrial Credit Rs. Per Capita x x
Agricultural Credit Rs. Per Capita x
share of industry in GSDP x x
count no_salaried_15-59 x
Notes:
1. State fixed effect is not reported in this table;
2. Absolute value of t statistics in brackets. Robust t is reported where heteroskedasticity exists;
3. + significant at 10%; * significant at 5%; ** significant at 1%
4. x - excluded instruments used in the specification
Constant
Expected Earnings for Females in
Urban Casual Work
Expected Earnings for Males in
Rural Casual Work
Expected Earnings for Males in
Urban Casual Work
Expected Earnings for Males in
Urban Salaried Work
Urban Dummy
Expected Earnins Instrumented
with State DummiesFemale Participation Rate
1st stage centered R2 for
Instrumented Variables
Excluded Instruments
OLS without State Dummies OLS with State Dummies
1987-88 round
1993-94 Round
1999-00 Round
Expected Earnings for Females in
Rural Casual Work

186
Appendix 4.5: Effect of GSDP on Unemployment Rates for Males and Females
OLS Instrumental
Variables
Rural Urban All Rural Urban All
1 2 3 4 5 6
GSDP -1.036 -0.966 -1.01 -2.028 -1.225 -1.26
(2.58)* (3.00)** (3.61)** (-1.45) (1.85)+ (-1.42)
Rural Casual Wage 0.051 0.116 0.896 1.002
(0.48) (1.49) (1.99)+ (1.42)
Urban Salaried Wages -0.042 -0.129 -0.663 0.08
(-0.46) (-1.28) (-0.87) (0.08)
Round 2 Dummy 0.169 0.172 0.164 -0.582 0 0
(1.42) (2.16)* (2.17)* (-1.05) (.) (.)
Round 3 Dummy 0.224 0.334 0.301 0 0.217 0.379
(0.99) (1.95)+ (2.07)* (.) (0.9) (0.99)
Round 4 Dummy 0.863 0.784 0.829 0.917 0.718 0.955
(2.46)* (2.72)** (3.43)** (1.79)+ (1.56) (1.47)
Urban Dummy 0.263 0.236
(4.51)** (3.26)**
Constant 12.094 11.871 12.1 20.37 17.435 10.968
(2.85)** (3.53)** (4.14)** (1.39) (1.87)+ (1.05)
Number of Observations 280 285 556 188 193 375
R Square 0.68 0.56 0.58 0.57 0.46 0.37
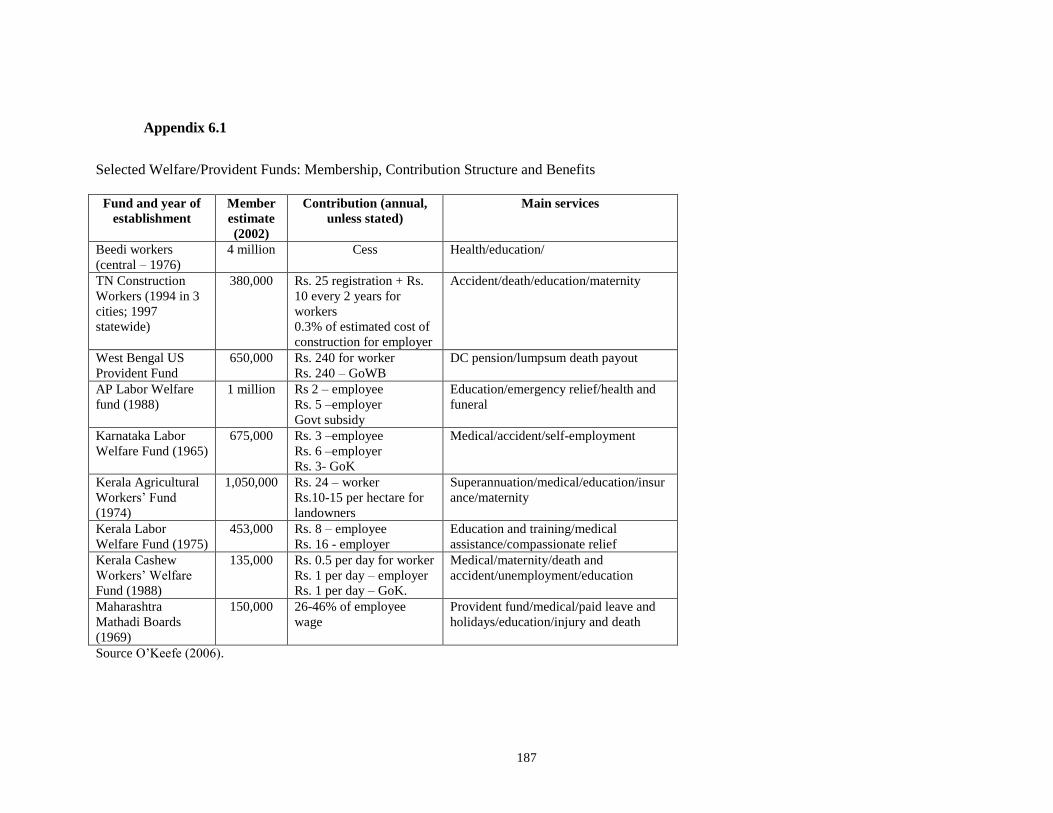
187
Appendix 6.1
Selected Welfare/Provident Funds: Membership, Contribution Structure and Benefits
Fund and year of
establishment
Member
estimate
(2002)
Contribution (annual,
unless stated)
Main services
Beedi workers
(central – 1976)
4 million Cess Health/education/
TN Construction
Workers (1994 in 3
cities; 1997
statewide)
380,000 Rs. 25 registration + Rs.
10 every 2 years for
workers
0.3% of estimated cost of
construction for employer
Accident/death/education/maternity
West Bengal US
Provident Fund
650,000 Rs. 240 for worker
Rs. 240 – GoWB
DC pension/lumpsum death payout
AP Labor Welfare
fund (1988)
1 million Rs 2 – employee
Rs. 5 –employer
Govt subsidy
Education/emergency relief/health and
funeral
Karnataka Labor
Welfare Fund (1965)
675,000 Rs. 3 –employee
Rs. 6 –employer
Rs. 3- GoK
Medical/accident/self-employment
Kerala Agricultural
Workers’ Fund
(1974)
1,050,000 Rs. 24 – worker
Rs.10-15 per hectare for
landowners
Superannuation/medical/education/insur
ance/maternity
Kerala Labor
Welfare Fund (1975)
453,000 Rs. 8 – employee
Rs. 16 - employer
Education and training/medical
assistance/compassionate relief
Kerala Cashew
Workers’ Welfare
Fund (1988)
135,000 Rs. 0.5 per day for worker
Rs. 1 per day – employer
Rs. 1 per day – GoK.
Medical/maternity/death and
accident/unemployment/education
Maharashtra
Mathadi Boards
(1969)
150,000 26-46% of employee
wage
Provident fund/medical/paid leave and
holidays/education/injury and death
Source O’Keefe (2006).

188
Appendix 6.2
Coverage Rates in Selected Voluntary Rural Health Insurance Schemes
Coverage rate among
eligible population
(late 1990s)
Target eligible population
Health card (Thailand) 25% Non-poor villagers
Rural voluntary HI
(Vietnam)
9%, but higher among
school children and
very low among adults.
(i) school children; (ii) households below poverty
line; (iii) self-employed (around 75% of
population)
Dana sehat schemes
(Indonesia)
13% Primarily rural population
ORT (Philippines) 11% Local community
Grameen (Bangladesh) 66% Poor banking with Grameen
National HI - Category
II (Korea)
100% Urban and rural self-employed, including farmers
Source: O’Keefe (2006)
WB22968 C:\Documents and Settings\wb22968\My Documents\IndiaLES\1st India Labor & Emp Study Feb 16\Appendix tables Mar 28.doc
Related Documents


![IN THE EMPLOYMENT COURT CHRISTCHURCH CRC 32/11€¦ · IN THE EMPLOYMENT COURT CHRISTCHURCH [2012] NZEmpC 137 CRC 32/11 IN THE MATTER OF a challenge to a determination of the Employment](https://static.cupdf.com/doc/110x72/5edf730dad6a402d666acbbb/in-the-employment-court-christchurch-crc-3211-in-the-employment-court-christchurch.jpg)