December 2013 N Mohan India Footwear Update December 2013

Welcome message from author
This document is posted to help you gain knowledge. Please leave a comment to let me know what you think about it! Share it to your friends and learn new things together.
Transcript

December 2013 N Mohan
!India Footwear Update!
December 2013
Contents!1. Overview of Indian Economy
2. Status of Indian Footwear & Leather Industry
3. History of The Tata Group & Tata International
4. Tata International: Current Business Update
5. Appendix
Indian Economy!Overview"
Overview!!
01
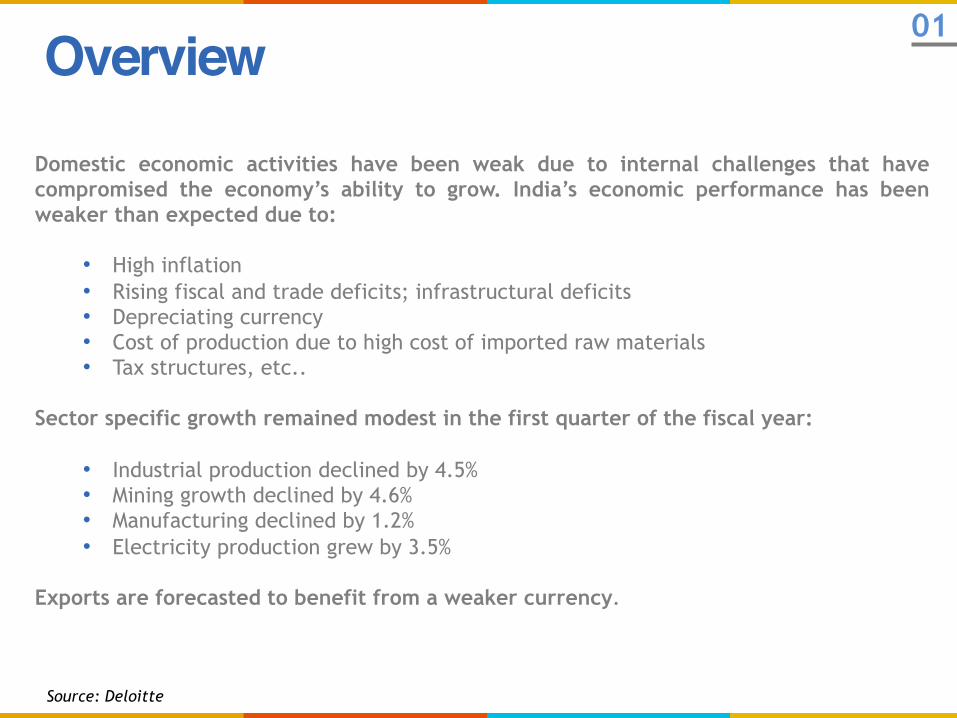
Domestic economic activities have been weak due to internal challenges that have compromised the economy’s ability to grow. India’s economic performance has been weaker than expected due to:
• High inflation • Rising fiscal and trade deficits; infrastructural deficits • Depreciating currency • Cost of production due to high cost of imported raw materials • Tax structures, etc..
Sector specific growth remained modest in the first quarter of the fiscal year:
• Industrial production declined by 4.5% • Mining growth declined by 4.6% • Manufacturing declined by 1.2% • Electricity production grew by 3.5%
Exports are forecasted to benefit from a weaker currency.
Source: Deloitte

Brazil (BRL/US$)
China (CNY/US$)
India (INR/US$)
Japan (JPY/US$)
Russia (RUB/US$)
.0
10.0
20.0
30.0
40.0
50.0
60.0
70.0
80.0
90.0
100.0
110.0
2013 2014 f 2015 f 2016 f 2017 f 2018 f 2019 f 2020 f 2021 f 2022 f 2023 f
Curr
ency
vs.
US$
Exchange Rates 10 year Forecasts: Currencies vs. US dollar
Source: Business Monitor International - forecasts
02
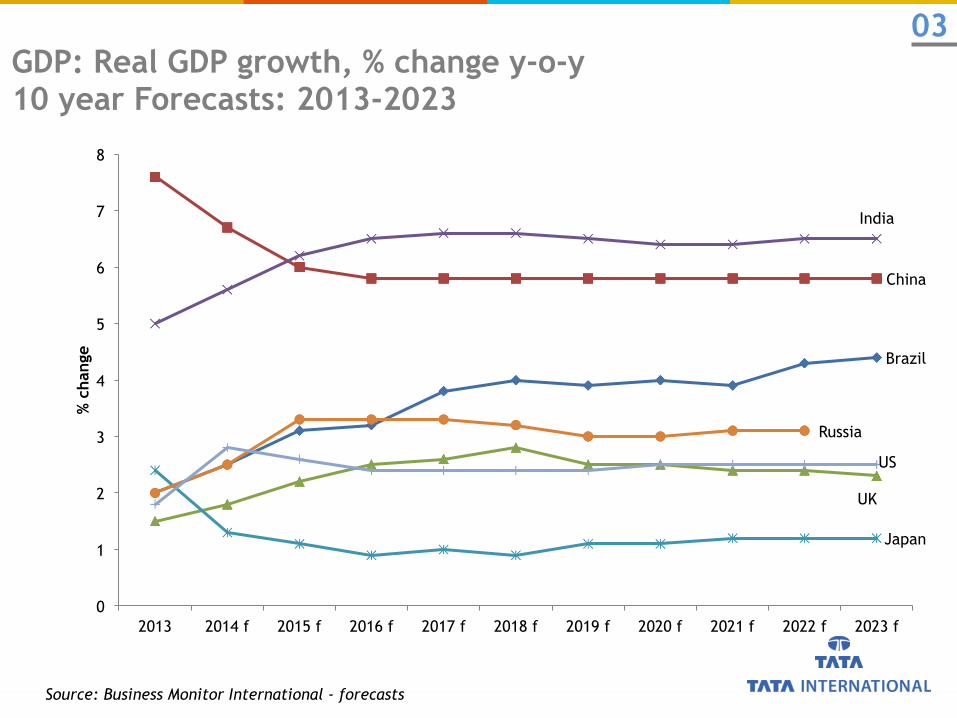
GDP: Real GDP growth, % change y-o-y 10 year Forecasts: 2013-2023
Brazil
China
UK
India
Japan
Russia
US
0
1
2
3
4
5
6
7
8
2013 2014 f 2015 f 2016 f 2017 f 2018 f 2019 f 2020 f 2021 f 2022 f 2023 f
% c
hang
e
Source: Business Monitor International - forecasts
03
Status Update:!Indian Leather "& "Footwear Industry"!

Indian Footwear Market Overview!!2nd largest global producer of footwear after China;
3rd largest market, worth US$ 3.94 billion
13% of global footwear production of 16 billion pairs
India produces 2065 million pairs of different categories
Leather footwear - 909 million pairs
Leather shoe uppers - 100 million pairs
Non-leather footwear - 1056 million pairs
India exports about 115 million pairs
95% of production goes to meet India’s domestic demand
Source: Business Monitor International – forecasts
1.10 million are engaged in the footwear manufacturing industry
04

CHENNAI RANIPET AMBUR
JALANDHAR KARNAL
LUDHIANA FARIDABAD SONEPAT
AGRA DELHI
KANPUR
MUMBAI PUNE
KOLKATA
CACICUT ERNAKULAM
Source: Council for Leather Exports; Government of India
05 India Leather Hubs
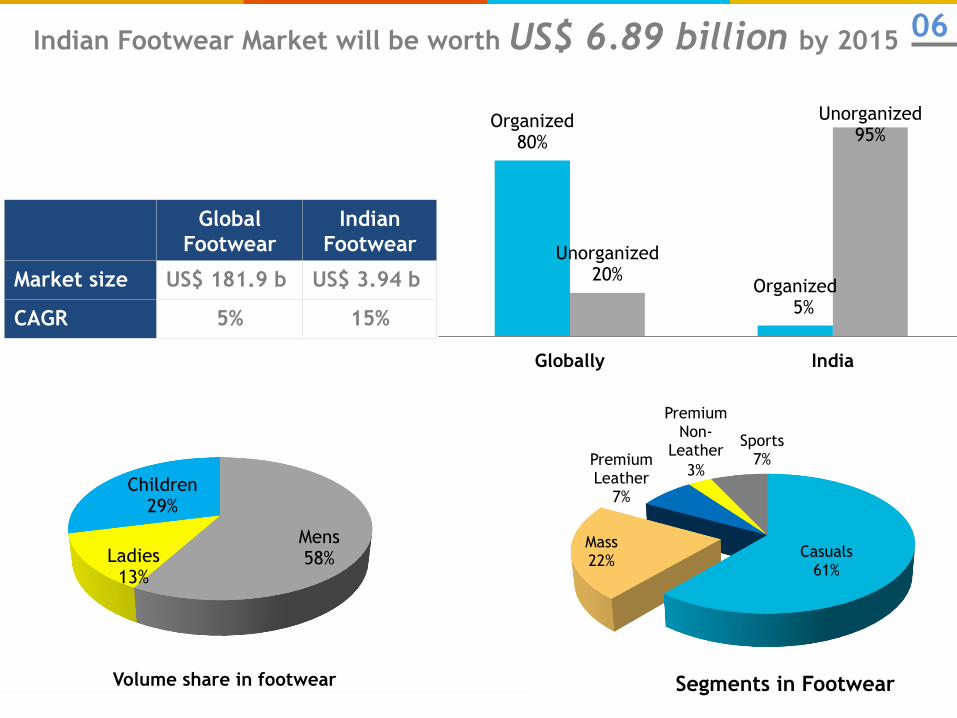
Indian Footwear Market will be worth US$ 6.89 billion by 2015
Organized 80%
Organized 5%
Unorganized 20%
Unorganized 95%
Globally India
Global Footwear
Indian Footwear
Market size US$ 181.9 b US$ 3.94 b
CAGR 5% 15%
Mens 58% Ladies
13%
Children 29%
Volume share in footwear
Casuals 61%
Mass 22%
Premium Leather
7%
Premium Non-
Leather 3%
Sports 7%
Segments in Footwear
06
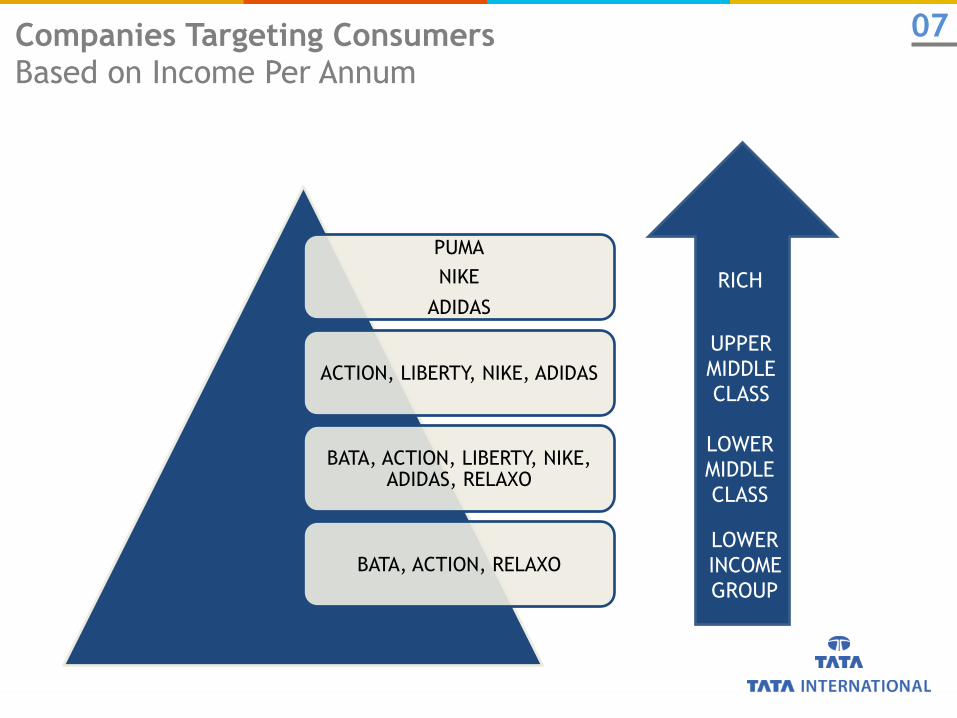
PUMA NIKE
ADIDAS
ACTION, LIBERTY, NIKE, ADIDAS
BATA, ACTION, LIBERTY, NIKE, ADIDAS, RELAXO
BATA, ACTION, RELAXO
Companies Targeting Consumers Based on Income Per Annum
RICH
UPPER MIDDLE CLASS
LOWER MIDDLE CLASS
LOWER INCOME GROUP
07
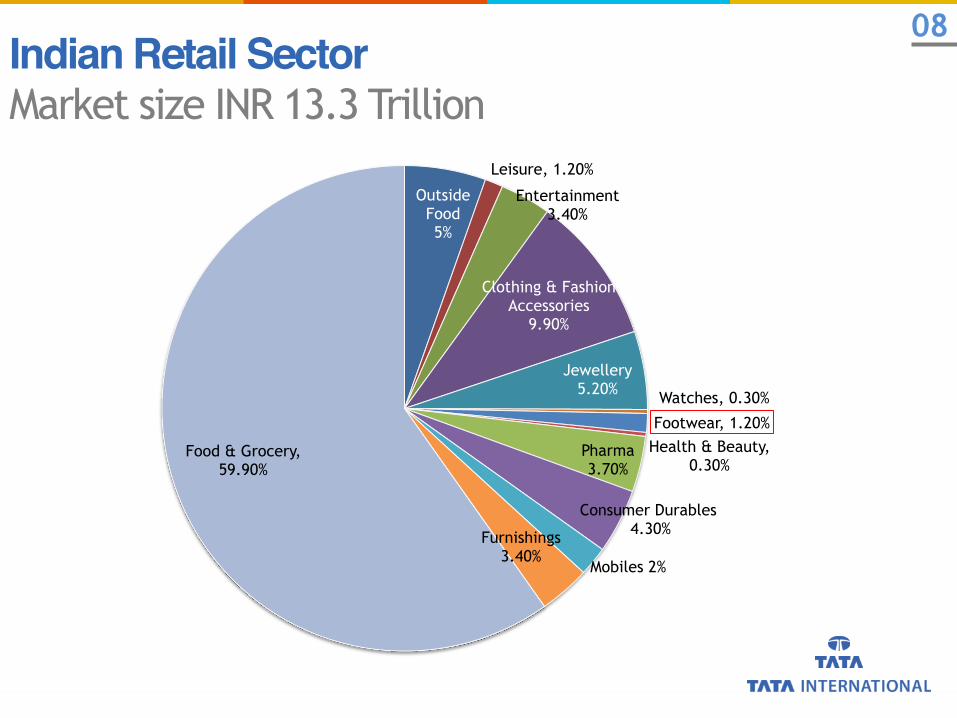
Outside Food 5%
Leisure, 1.20%
Entertainment 3.40%
Clothing & Fashion Accessories
9.90%
Jewellery 5.20% Watches, 0.30%
Footwear, 1.20% Health & Beauty,
0.30% Pharma 3.70%
Consumer Durables 4.30%
Mobiles 2%
Furnishings 3.40%
Food & Grocery, 59.90%
Indian Retail Sector!Market size INR 13.3 Trillion
08
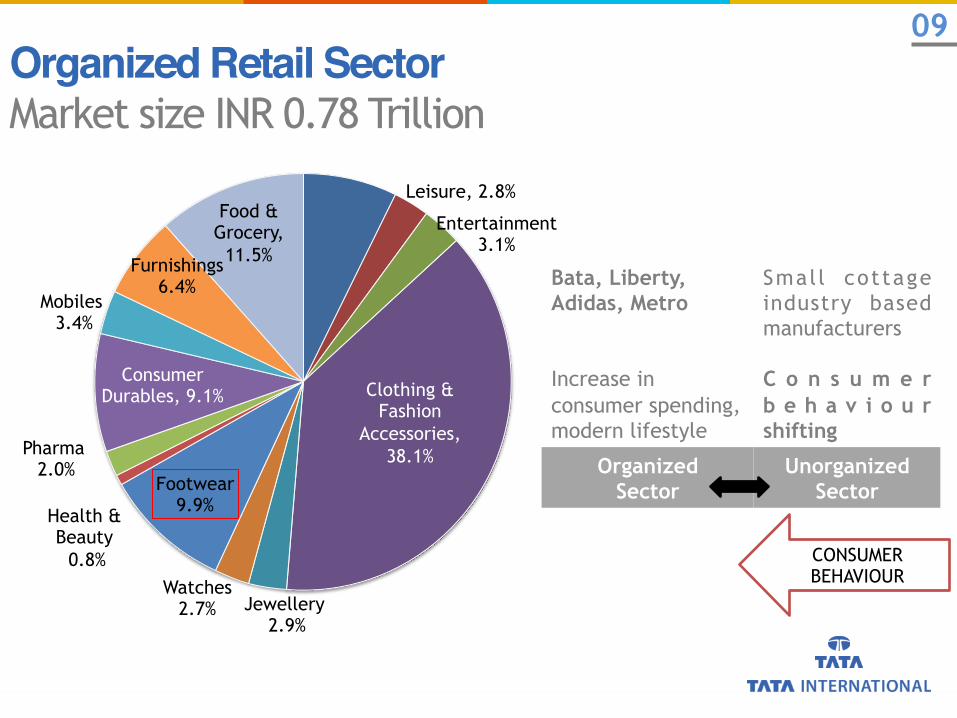
Out-of-Home Food, 7.3%
Leisure, 2.8%
Entertainment 3.1%
Clothing & Fashion
Accessories, 38.1%
Jewellery 2.9%
Watches 2.7%
Footwear 9.9% Health &
Beauty 0.8%
Pharma 2.0%
Consumer Durables, 9.1%
Mobiles 3.4%
Furnishings 6.4%
Food & Grocery,
11.5%
Organized Retail Sector!Market size INR 0.78 Trillion
Bata, Liberty, Adidas, Metro Increase in consumer spending, modern lifestyle
Smal l cottage industry based manufacturers C o n s u m e r b e h a v i o u r shifting
Organized Sector
Unorganized Sector
CONSUMER BEHAVIOUR
09
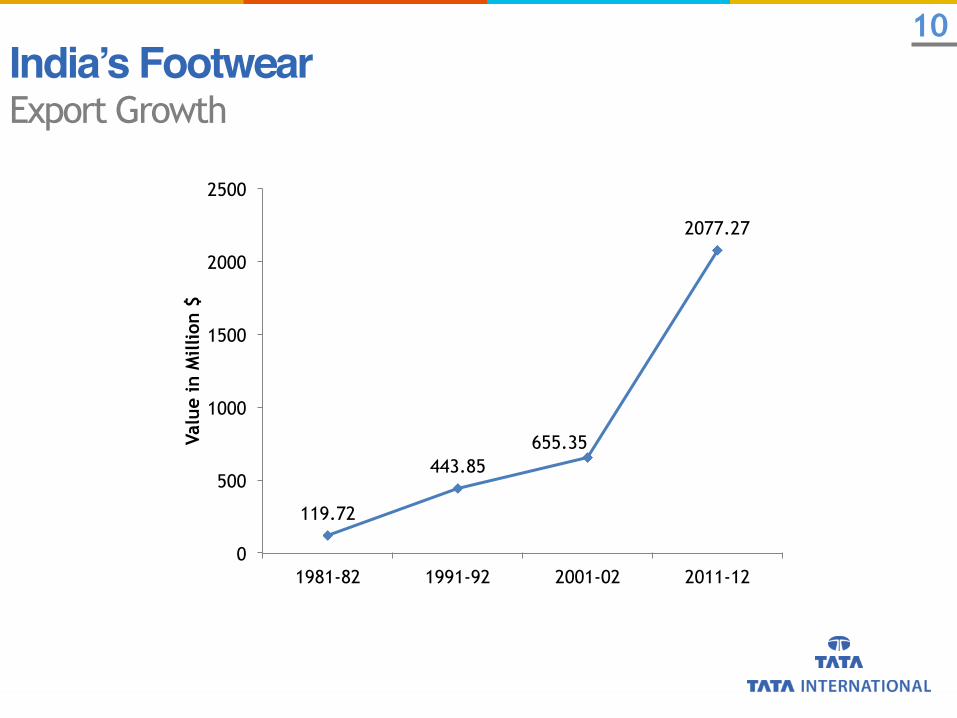
India’s Footwear!Export Growth
119.72
443.85 655.35
2077.27
0
500
1000
1500
2000
2500
1981-82 1991-92 2001-02 2011-12
Valu
e in
Mill
ion
$
10

CONSUMPTION PRODUCTION SOURCING
• Increasing disposable income and number of middleclass households
• Growing fashion consciousness
• Increasing number of working women
• Increasing penetra8on in Tier II and Tier III ci8es
• Online availability
• Low-‐cost produc8on • Abundance of raw
material • Skilled manpower • Government ini8a8ves
boos8ng the industry • High export poten8al
• Major supplier of medium and low priced footwear.
• Several footwear majors source parts of their produc8on and purchase from India.
• Global brands such as Florsheim, Bush, Gabor, Clarks, Reebok, Deichmann, Elefanten, Salamander, etc.. are manufactured under license in India.
India Footwear !Growth Drivers
11
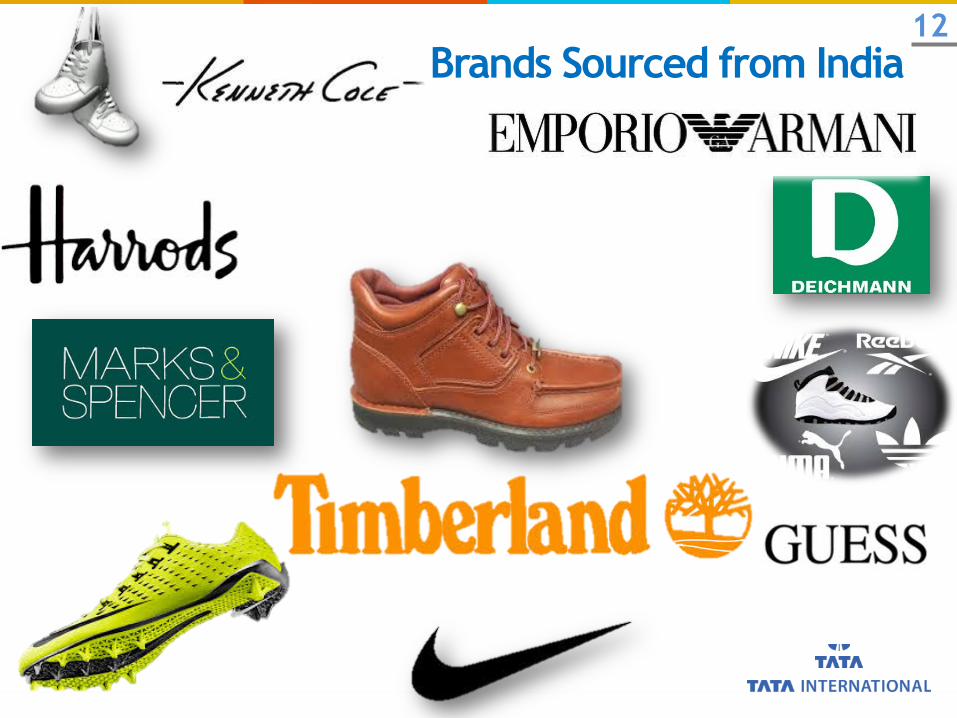
Brands Sourced from India 12
Tata Group !&!Tata International Ltd.!!
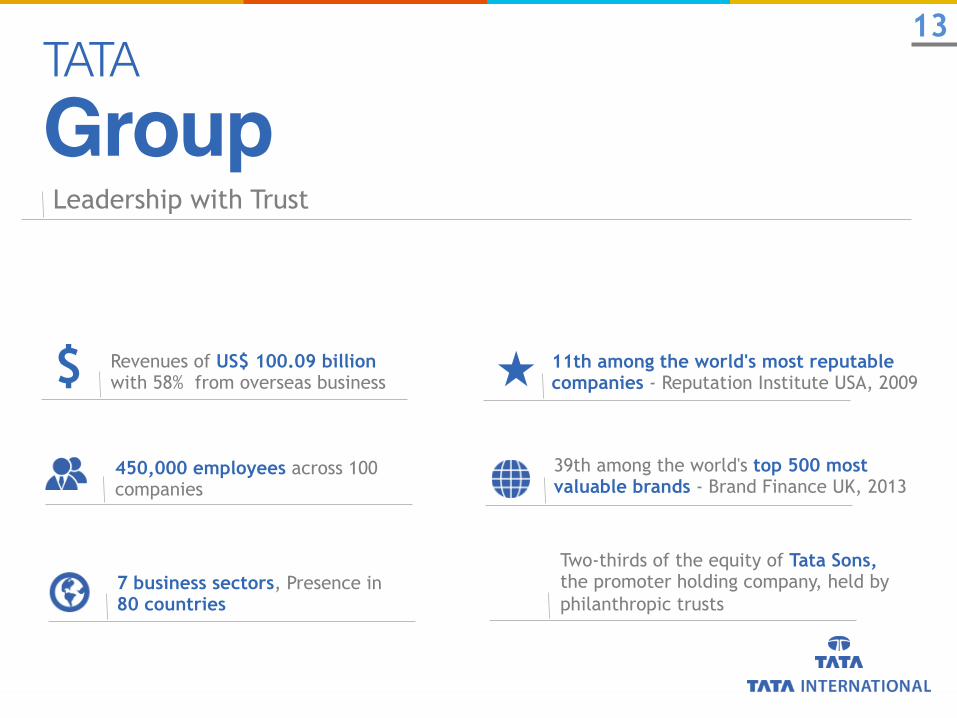
TATA Group!
13
Leadership with Trust
11th among the world's most reputable companies - Reputation Institute USA, 2009
39th among the world's top 500 most valuable brands - Brand Finance UK, 2013
Revenues of US$ 100.09 billion with 58% from overseas business
450,000 employees across 100 companies
7 business sectors, Presence in 80 countries
Two-thirds of the equity of Tata Sons, the promoter holding company, held by philanthropic trusts
$
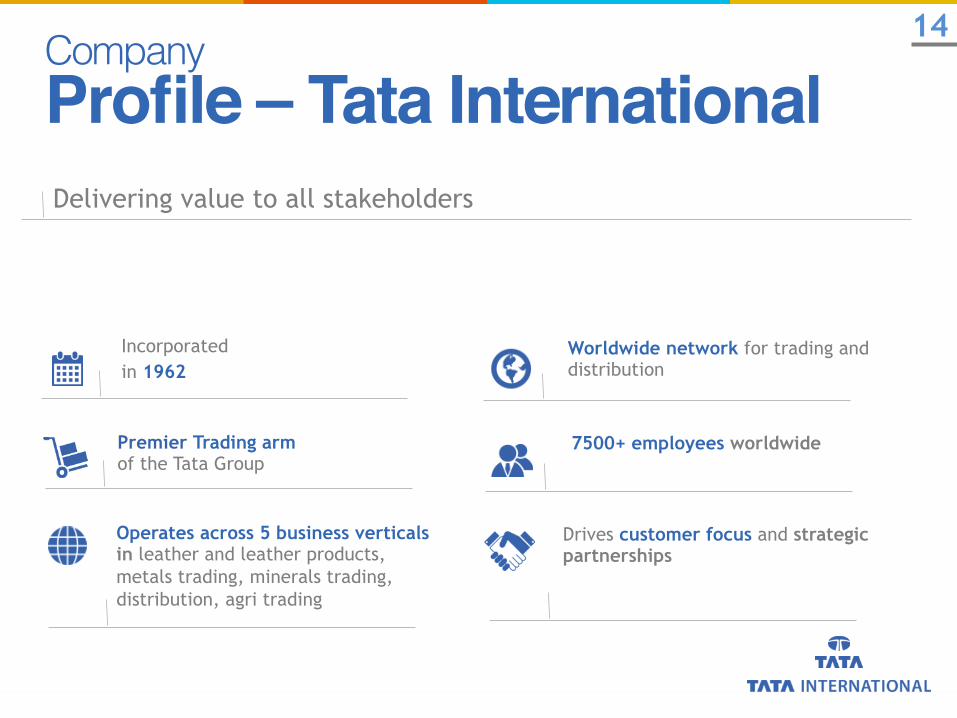
Incorporated in 1962
Premier Trading arm of the Tata Group
Operates across 5 business verticals in leather and leather products, metals trading, minerals trading, distribution, agri trading
Worldwide network for trading and distribution
7500+ employees worldwide
Company Profile – Tata International!
14
Drives customer focus and strategic partnerships
Delivering value to all stakeholders

Subsidiaries Hong Kong, UAE, Singapore, Brazil, Cambodia, South Africa, Kenya, Uganda, Zambia, Ghana, Nigeria, Senegal, Mozambique, Tanzania, Malawi, Zimbabwe, Côte D' Ivories, Namibia, Mauritius Madagascar
Offices India, China, UK, Thailand, Myanmar, Portugal, Switzerland, Ethiopia, Vietnam, Poland, USA, Japan, South Korea, Italy, Netherlands, Indonesia, Spain, Russia, Taiwan
39+ Countries Emerging markets focused
Global Presence!
15
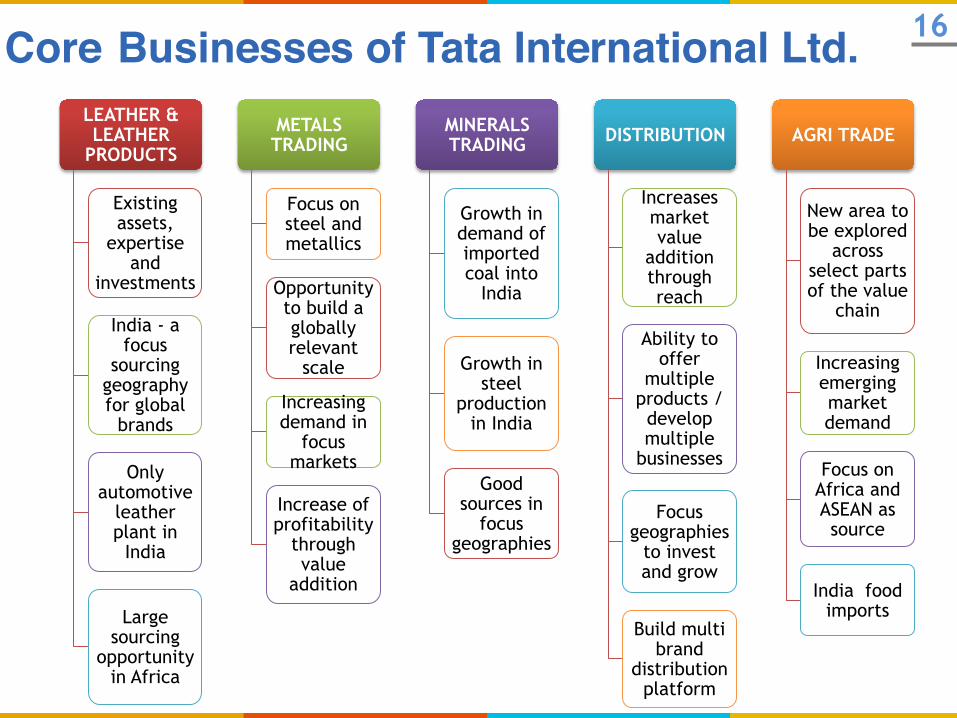
LEATHER & LEATHER
PRODUCTS
Existing assets,
expertise and
investments
India - a focus
sourcing geography for global
brands
Only automotive
leather plant in
India
Large sourcing
opportunity in Africa
METALS TRADING
Focus on steel and metallics
Opportunity to build a globally relevant
scale
Increasing demand in
focus markets
Increase of profitability
through value
addition
MINERALS TRADING
Growth in demand of imported coal into
India
Growth in steel
production in India
Good sources in
focus geographies
DISTRIBUTION
Increases market value
addition through reach
Ability to offer
multiple products / develop multiple
businesses
Focus geographies
to invest and grow
Build multi brand
distribution platform
AGRI TRADE
New area to be explored
across select parts of the value
chain
Increasing emerging market demand
Focus on Africa and ASEAN as source
India food imports
Core Businesses of Tata International Ltd. ! 16
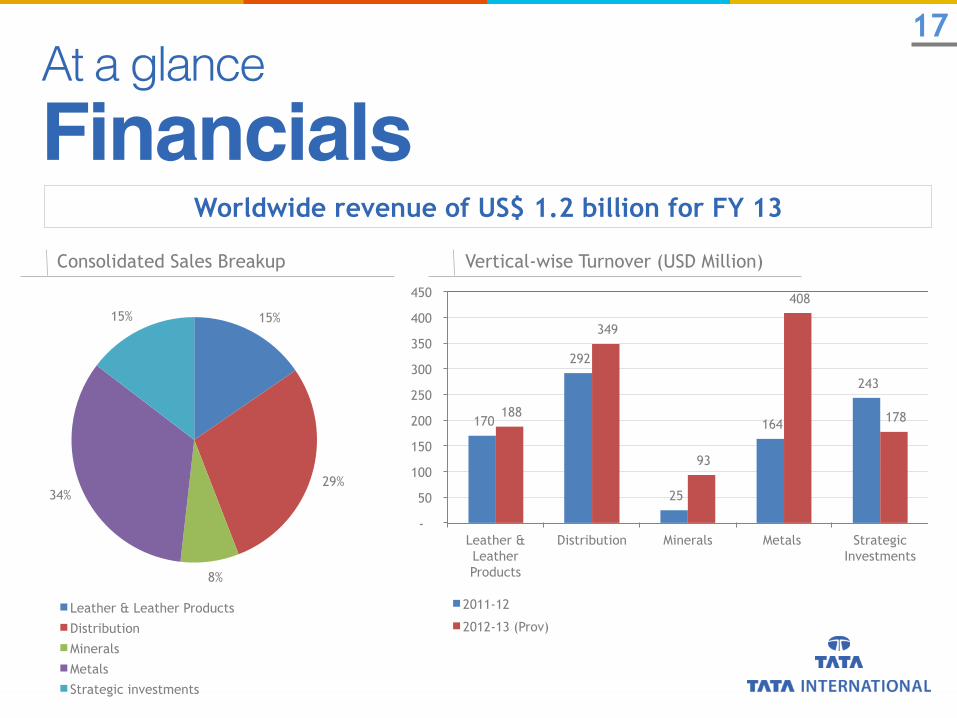
At a glance Financials!
15%
29%
8%
34%
15%
Leather & Leather Products
Distribution
Minerals
Metals
Strategic investments
170
292
25
164
243
188
349
93
408
178
-
50
100
150
200
250
300
350
400
450
Leather & Leather Products
Distribution Minerals Metals Strategic Investments
2011-12
2012-13 (Prov)
17
Consolidated Sales Breakup Vertical-wise Turnover (USD Million)
Worldwide revenue of US$ 1.2 billion for FY 13
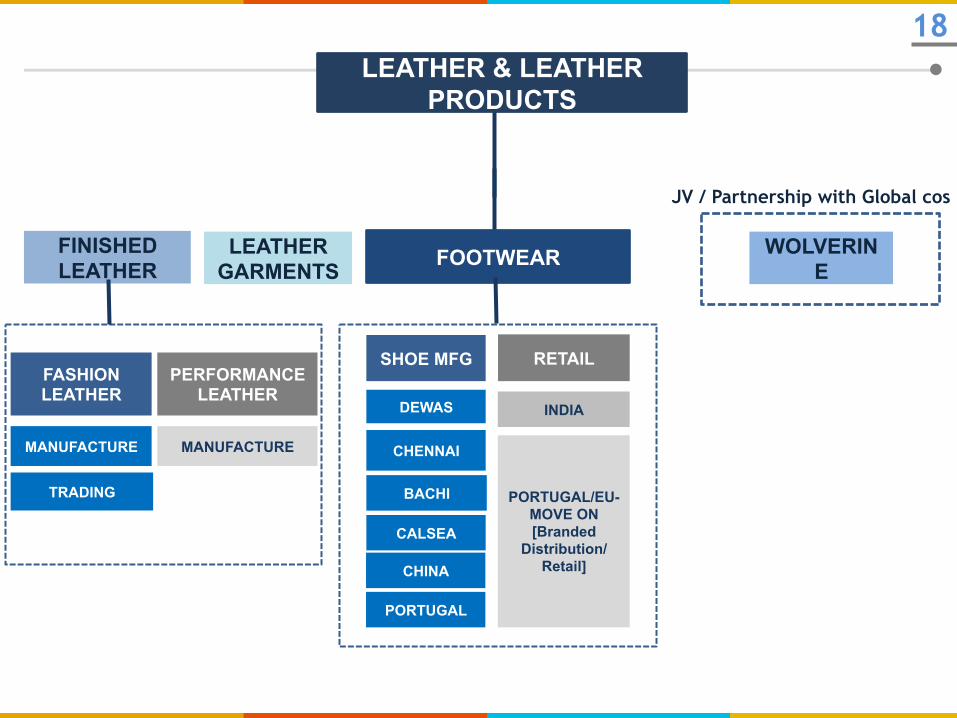
LEATHER & LEATHER PRODUCTS
FOOTWEAR FINISHED LEATHER
LEATHER GARMENTS
WOLVERINE
FASHION LEATHER
TRADING
SHOE MFG RETAIL
DEWAS
CHENNAI
BACHI
CALSEA
INDIA
PORTUGAL/EU-MOVE ON [Branded
Distribution/ Retail]
JV / Partnership with Global cos
MANUFACTURE
PERFORMANCE LEATHER
MANUFACTURE
CHINA
PORTUGAL
18

TATA INTERNATIONAL LTD. !Footwear Business Updates
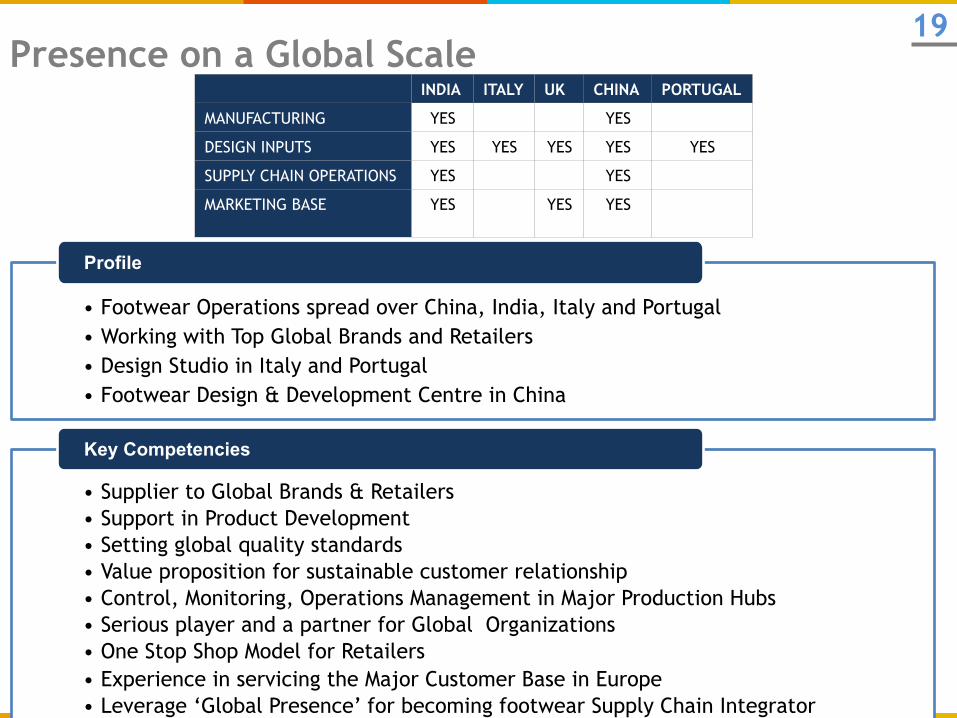
• Footwear Operations spread over China, India, Italy and Portugal • Working with Top Global Brands and Retailers • Design Studio in Italy and Portugal • Footwear Design & Development Centre in China
Profile
• Supplier to Global Brands & Retailers • Support in Product Development • Setting global quality standards • Value proposition for sustainable customer relationship • Control, Monitoring, Operations Management in Major Production Hubs • Serious player and a partner for Global Organizations • One Stop Shop Model for Retailers • Experience in servicing the Major Customer Base in Europe • Leverage ‘Global Presence’ for becoming footwear Supply Chain Integrator
Key Competencies
Presence on a Global Scale 19
INDIA ITALY UK CHINA PORTUGAL
MANUFACTURING YES YES
DESIGN INPUTS YES YES YES YES YES
SUPPLY CHAIN OPERATIONS YES YES
MARKETING BASE YES YES YES
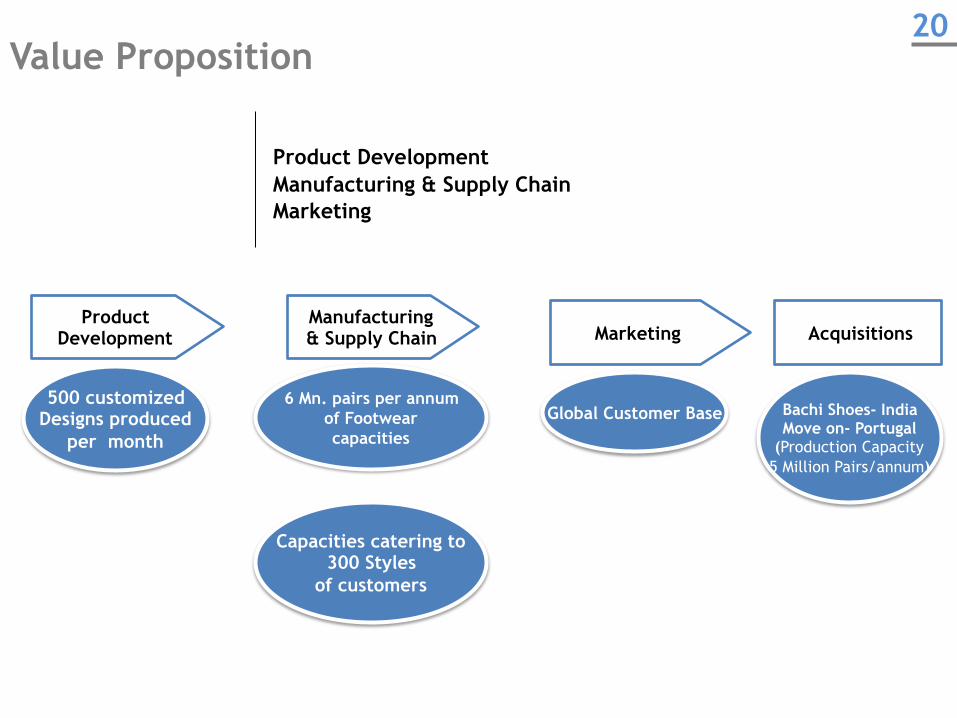
Product Development Manufacturing & Supply Chain Marketing
6 Mn. pairs per annum of Footwear capacities
Capacities catering to 300 Styles
of customers
Global Customer Base
Product Development
Manufacturing & Supply Chain Marketing Acquisitions
Bachi Shoes- India Move on- Portugal
(Production Capacity 5 Million Pairs/annum)
500 customized Designs produced
per month
Value Proposition 20

TIL Footwear Business India 21
STYLES LADIES FOOTWEAR MEN’S FOOTWEAR
DEWAS FOOTWEAR PLANT 1.2 MILLION PAIRS PER ANNUM
• LADIES BOOTS • BALLERINA AND • MEN’S DRESS/CITY
SHOES
• BATA EUROPE • NEXT UK • ALDO CANADA
THROUGH FENILI • RSH AUSTRALIA
• GEBRA-ALDI STORES • BUGGATI
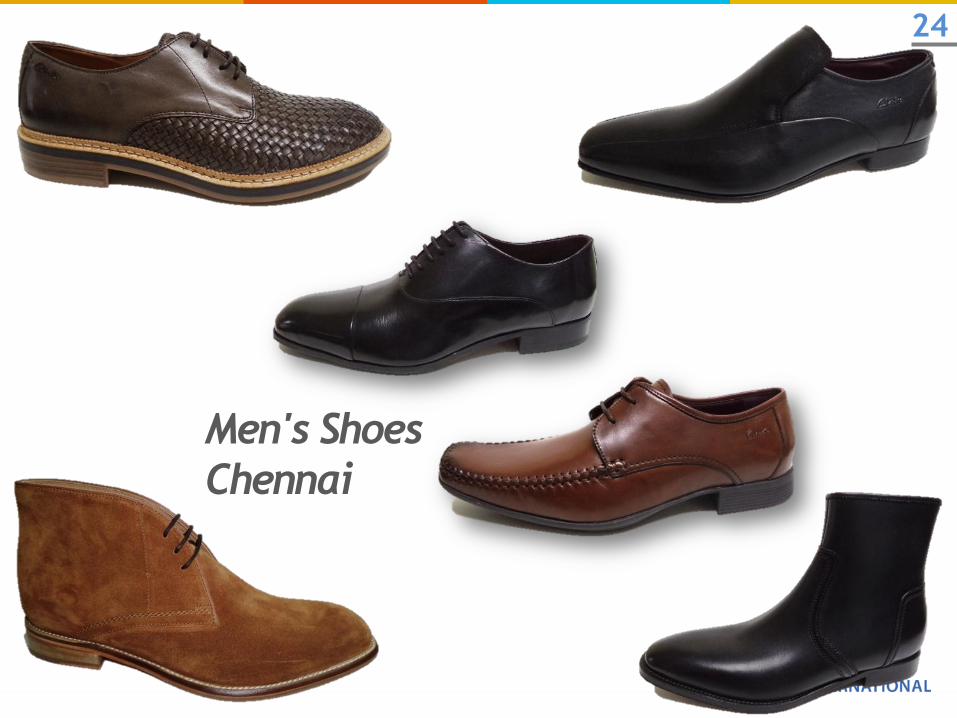
CHENNAI FOOTWEAR UNITS 1.3 MILLION PAIRS PER ANNUM
• HIGH END MEN’S ELEGANT SHOES
• MEN’S DRESS & MEN’S SMART CASUALS
• MARKS & SPENCER • ZARA • MASSIMO DUTTI • CLARKS • WOLVERINE • FLORSHEIM • LLOYD • SALAMANDER
CALSEA RANIPET 1 MILLION PAIRS PER ANNUM
• LADIES COMFORT SHOES
• SANDALS ON STITCH & TURN CONSTRUCTION
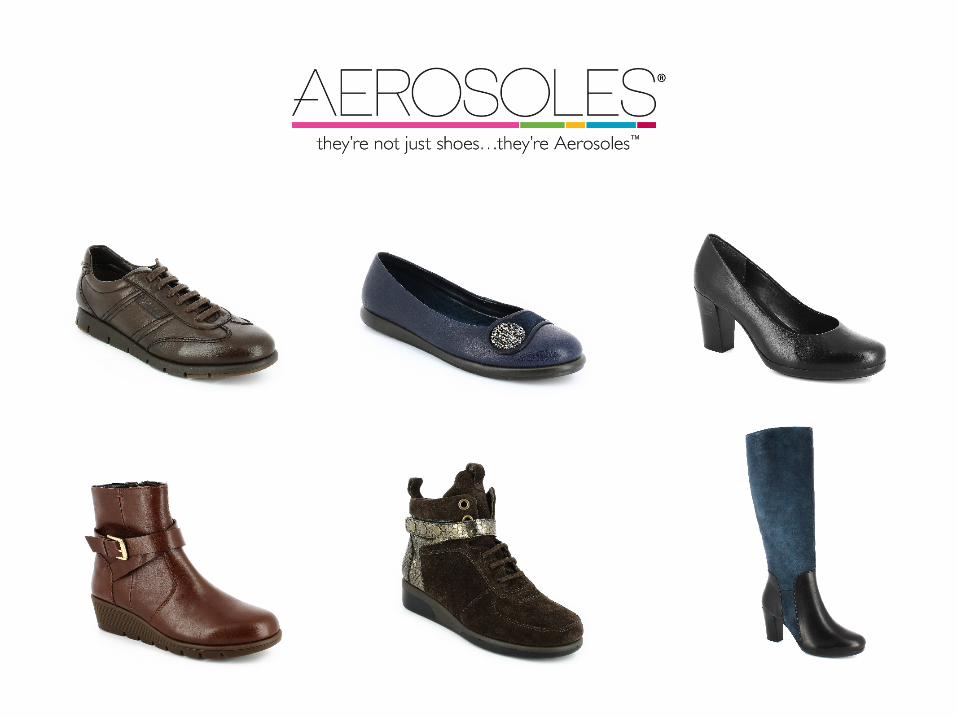
• MARKS & SPENCER • MOVE-ON • AEROSOLES
BACHI SHOES 2.4 MILLION PAIRS PER ANNUM
• CHILDREN SHOES • STARTRITE • STONES & BONES • DEICHMANN • LEGERO

Children Shoes Bachi
22

Ladies Shoes Dewas
23
Men's Shoes Chennai
24
Men's Shoes Chennai
24
Tata International Ltd.!Finished Leather !

TIL Finished Leather Spread Global Customer Base
Our product basket Our global customer base
Market spread – Germany, Italy, France, Spain, Portugal
Market spread – China, Taiwan, Vietnam, Korea, Australia, India
Market spread – US
USA Far East Europe
CUSTOMER BASE
25
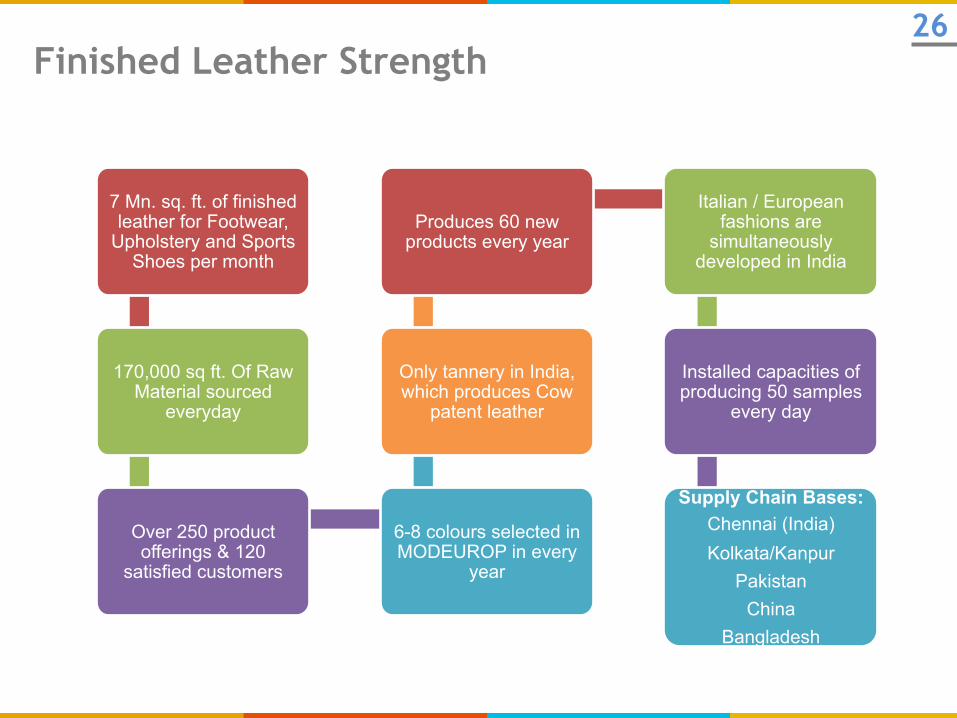
Finished Leather Strength
7 Mn. sq. ft. of finished leather for Footwear,
Upholstery and Sports Shoes per month
170,000 sq ft. Of Raw Material sourced
everyday
Over 250 product offerings & 120
satisfied customers
6-8 colours selected in MODEUROP in every
year
Only tannery in India, which produces Cow
patent leather
Produces 60 new products every year
Italian / European fashions are
simultaneously developed in India
Installed capacities of producing 50 samples
every day
Supply Chain Bases: Chennai (India) Kolkata/Kanpur
Pakistan China
Bangladesh
26
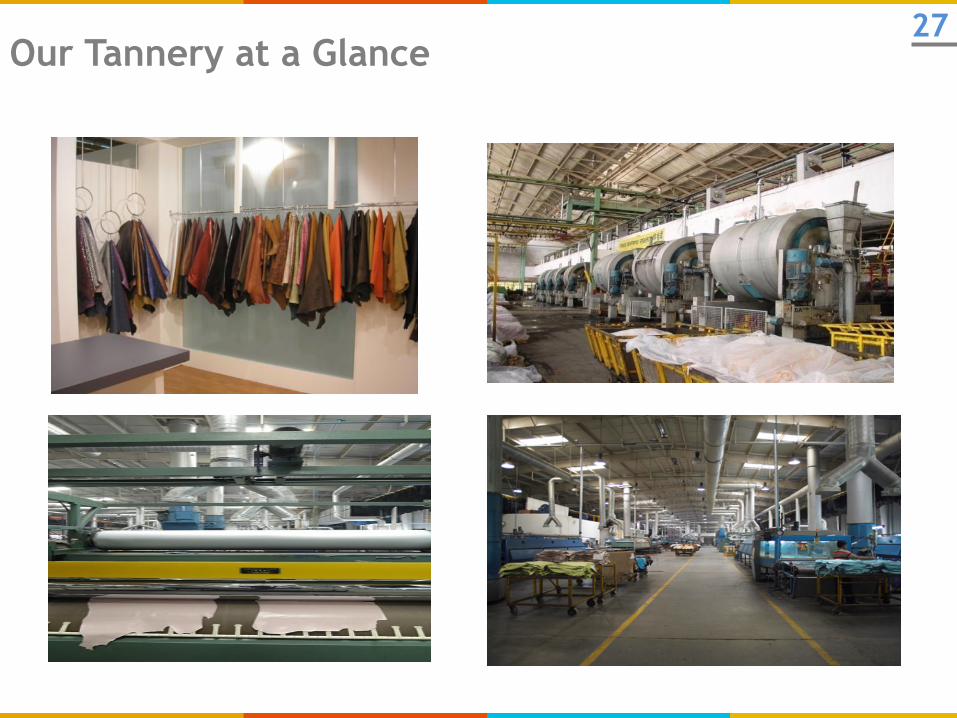
Our Tannery at a Glance 27
Tata USA!!
Our new Focus Market
Concentrate on a few ‘key customers’ and build
gradually on ‘economies of scale’
Open for ‘strategic partnerships’
Facilitate ‘tie ups’ with Key Manufacturers in India
Good reactions to our products & service
Full time ‘representative' in the USA – Jack Guze
28
Encouraging indications
Plans to start work with 2 customers next year
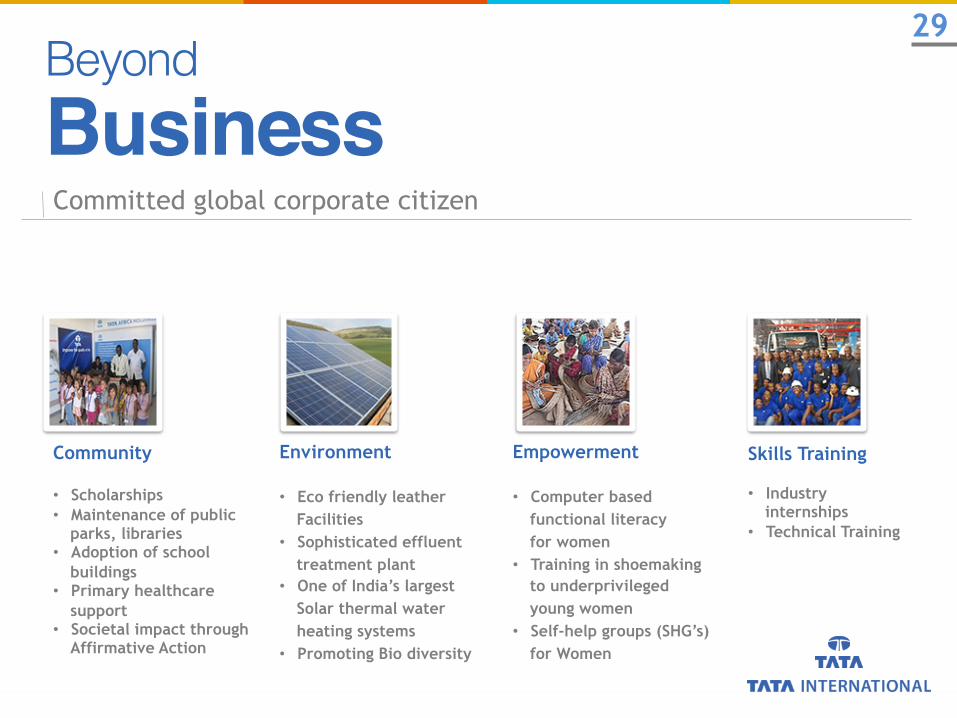
Committed global corporate citizen
Beyond Business!
29
Community • Scholarships • Maintenance of public
parks, libraries • Adoption of school
buildings • Primary healthcare
support • Societal impact through
Affirmative Action
Environment • Eco friendly leather
Facilities • Sophisticated effluent
treatment plant • One of India’s largest
Solar thermal water heating systems
• Promoting Bio diversity
Skills Training • Industry
internships • Technical Training
Empowerment • Computer based
functional literacy for women
• Training in shoemaking to underprivileged young women
• Self-help groups (SHG’s) for Women

Corporate Social Responsibility Initiatives Environment & Quality
ECO FRIENDLY LEATHER • In house eco friendly leather manufacturing process has been
developed which is chrome free BIO- METHANATION PLANT
• Implemented in house developed patented technology for gainful utilization of solid waste
ECO LABELING OF FINISHED LEATHER • Eco Labeling of our finished leather has been Awarded by Bureau of
Indian Standards (BIS) • Implemented to make our leather free from banned items like PCP,
formaldehyde, Azo dyes to meet the eco criteria
30

Corporate Social Responsibility Initiatives Environment & Quality
ETP TREATMENT BY NEW PROCESS • Process has been developed at pilot level for reducing chemical,
manpower & energy cost as well as sludge reduction.
SUBSTITUTION BY CHEAPER CHEMICALS • Expensive & hazardous chemicals have been replaced with cheaper &
environment friendly chemicals. • Chemicals from Waste Recycling
UP-GRADATION OF TECHNOLOGY • Adopted Reverse Osmosis technology for further improving the effluent
treated water. • Daily 200 M3 water as good as drinking water is supplied to boiler house.
31
Tata Business Excellence Model (TBEM) Firmly committed to adoption and alignment of all processes in line with the Tata Business Excellence Model modeled after the Malcolm Baldridge Quality Award
Ensuring sustained value creation
32
Awards & Certifications Recipient of prestigious national and international awards and certifications for quality, sustainability projects and business performance. SA 8000, ISO 9001 and ISO 14000 certifications for plants and processes
Business Excellence!

Appendix!!
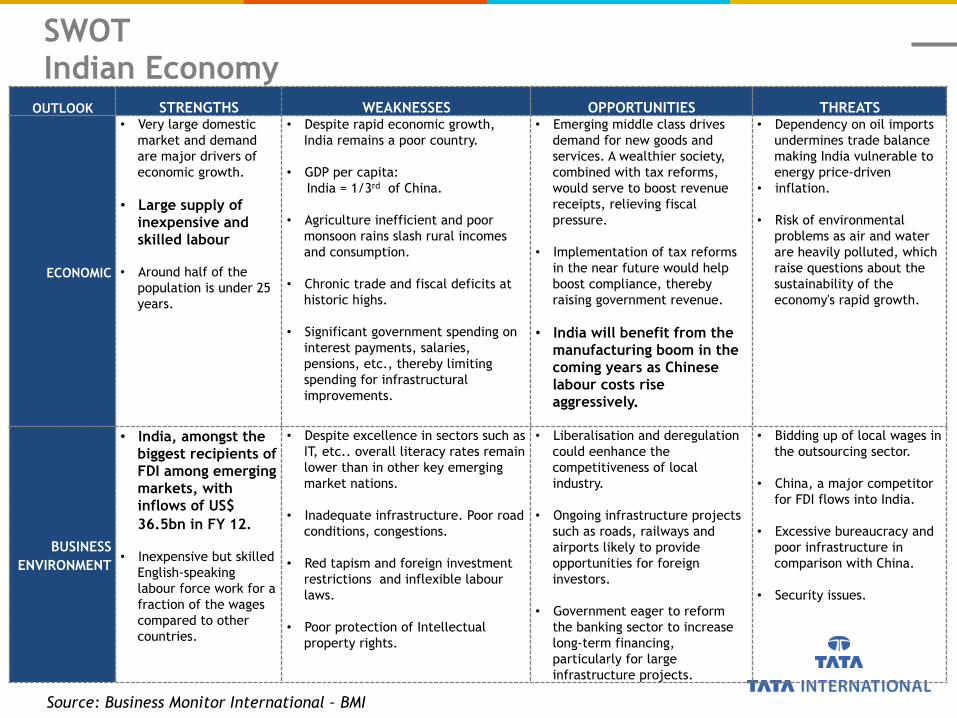
OUTLOOK STRENGTHS WEAKNESSES OPPORTUNITIES THREATS
ECONOMIC
• Very large domestic market and demand are major drivers of economic growth.
• Large supply of
inexpensive and skilled labour
• Around half of the
population is under 25 years.
• Despite rapid economic growth, India remains a poor country.
• GDP per capita: India = 1/3rd of China.
• Agriculture inefficient and poor monsoon rains slash rural incomes and consumption.
• Chronic trade and fiscal deficits at historic highs.
• Significant government spending on interest payments, salaries, pensions, etc., thereby limiting spending for infrastructural improvements.
• Emerging middle class drives demand for new goods and services. A wealthier society, combined with tax reforms, would serve to boost revenue receipts, relieving fiscal pressure.
• Implementation of tax reforms in the near future would help boost compliance, thereby raising government revenue.
• India will benefit from the manufacturing boom in the coming years as Chinese labour costs rise aggressively.
• Dependency on oil imports undermines trade balance making India vulnerable to energy price-driven
• inflation.
• Risk of environmental problems as air and water are heavily polluted, which raise questions about the sustainability of the economy's rapid growth.
BUSINESS ENVIRONMENT
• India, amongst the biggest recipients of FDI among emerging markets, with inflows of US$ 36.5bn in FY 12.
• Inexpensive but skilled English-speaking labour force work for a fraction of the wages compared to other countries.
• Despite excellence in sectors such as IT, etc.. overall literacy rates remain lower than in other key emerging market nations.
• Inadequate infrastructure. Poor road conditions, congestions.
• Red tapism and foreign investment restrictions and inflexible labour laws.
• Poor protection of Intellectual property rights.
• Liberalisation and deregulation could eenhance the competitiveness of local industry.
• Ongoing infrastructure projects such as roads, railways and airports likely to provide opportunities for foreign investors.
• Government eager to reform the banking sector to increase long-term financing, particularly for large infrastructure projects.
• Bidding up of local wages in the outsourcing sector.
• China, a major competitor for FDI flows into India.
• Excessive bureaucracy and poor infrastructure in comparison with China.
• Security issues.
SWOT Indian Economy
Source: Business Monitor International – BMI

Long Term Political Rating
.0
10.0
20.0
30.0
40.0
50.0
60.0
70.0
80.0
90.0
100.0
Brazil China United Kingdom
India Japan Russia United States
.0
10.0
20.0
30.0
40.0
50.0
60.0
70.0
80.0
90.0
Brazil China United Kingdom
India Japan Russia United States
Long Term Economic Rating
.0
10.0
20.0
30.0
40.0
50.0
60.0
70.0
80.0
Brazil China United Kingdom
India Japan Russia United States
Business Environment Rating
BMI Ratings (2013)
Source: Business Monitor International – BMI calculations
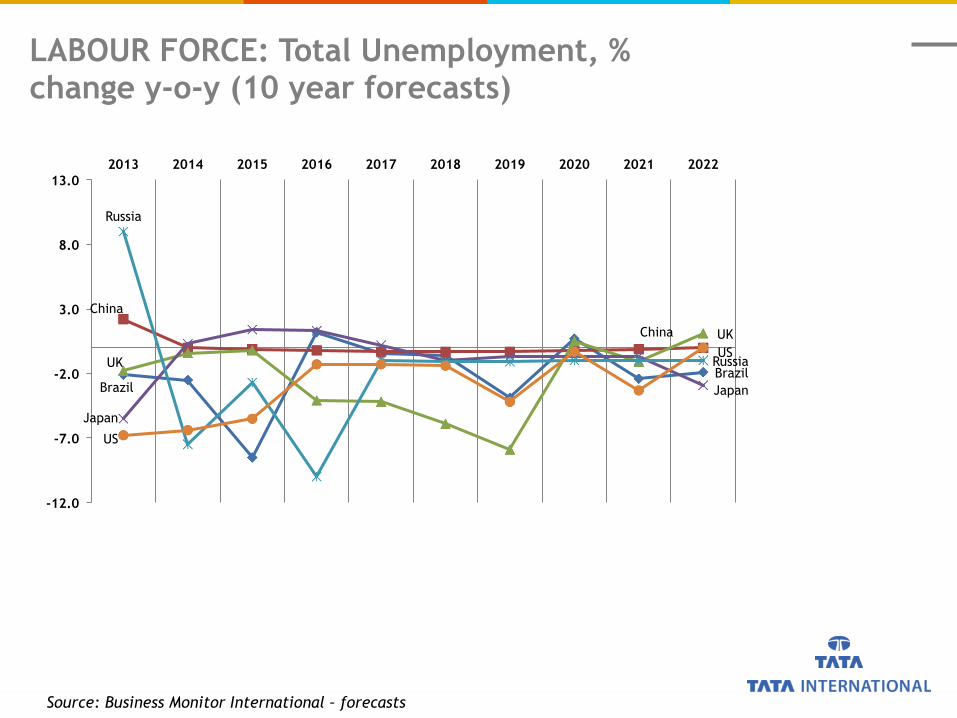
Brazil Brazil
China
China
UK
UK
Japan
Japan
Russia
Russia
US
US
-12.0
-7.0
-2.0
3.0
8.0
13.0 2013 2014 2015 2016 2017 2018 2019 2020 2021 2022
LABOUR FORCE: Total Unemployment, % change y-o-y (10 year forecasts)
Source: Business Monitor International – forecasts
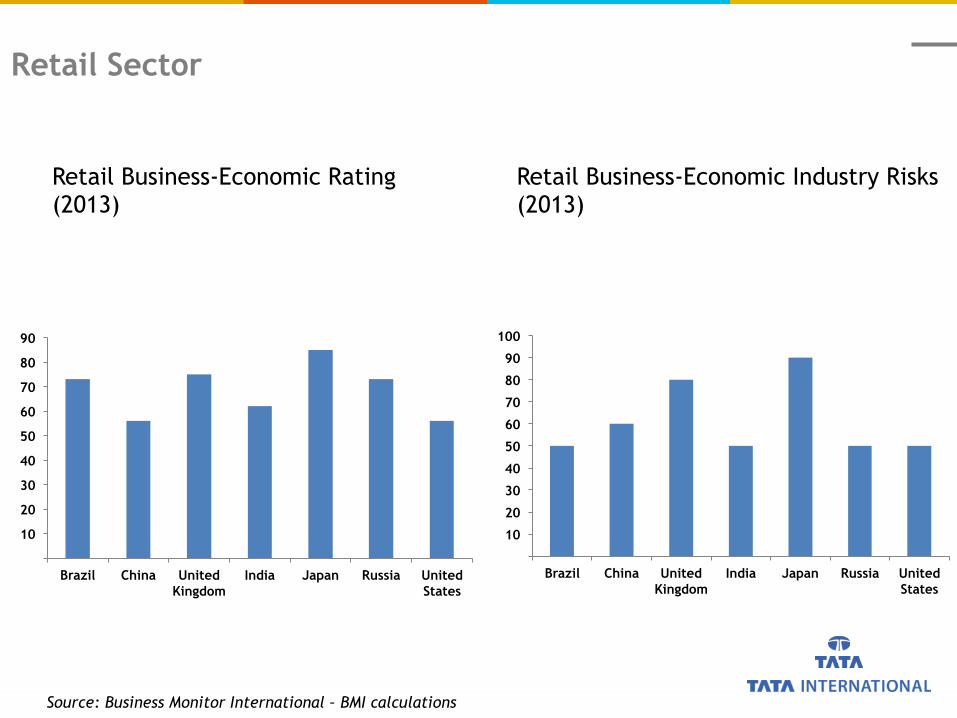
10
20
30
40
50
60
70
80
90
Brazil China United Kingdom
India Japan Russia United States
Retail Business-Economic Rating (2013)
10
20
30
40
50
60
70
80
90
100
Brazil China United Kingdom
India Japan Russia United States
Retail Business-Economic Industry Risks (2013)
Retail Sector
Source: Business Monitor International – BMI calculations

Quarterly data Q1 FY 13
Q4 FY 13
Q1 FY 14
Monthly average of Q2 FY 14
GDP, % y-o-y 5.4 4.8 4.4 Downside risk
Real private consumption expenditure, % y-o-y
4.3 3.8 1.6 Downside risk
Total fixed investment, % y-o-y -2.2 3.4 -1.2 No deterioration expected
Industrial production, % y-o-y -3.8 3.7 -4.5 2.1
CPI- inflation , % y-o-y 9.9 11 9.6 11.8
Trade balance, , % y-0-y -10.3 -9.6 -11.5 No deterioration expected
Quarterly data Q1 FY 14
Q4 FY 14
Q1 FY 15
Monthly average of Q2 FY 14
10 year yield % 8.7 7.9 7.5 8.4
INR / USD 49.9 54.1 56.7 63.3
Equity index, , % y-o-y -10 10.1 15.3 8.1
Fiscal Year data FY11 FY12 FY13 FY14
Fiscal deficit, % GDP -4.8 -5.7 -4.8 Downside risk
Current account deficit, % GDP -2.8 -4.2 -4.8 No deterioration expected
Source: RBI Bulletin, Press Information Bureau, Government of India; Bloomberg
Summary – Economic & Future Outlook
High risk
Medium risk
Low risk
Related Documents