INDIA 1.0 INTRODUCTION 1.1 BRIEF HISTORY During the Bronze Age civilization, that is when the Indian history started with the birth of the Indus Valley Civilization which is now Pakistan, parts of India, Afghanistan and Iran. One of the greatest emperors known in Indian history was Ashoka; he expanded the country and was the one who spread Buddhism across Asia after embracing it. In the 17 th century, the British came to India and settled. It got its independence in august 1947 and its first prime minister was Jawaharlal Nehru. India is the 7 th largest country in the world by area and is the 2 nd most populous with 1.27 billion. It’s considered as nearly industrialized country; however it does face some issues like poverty, corruption and terrorism. 1.1.1 Economic history The Indian economy in a pre-colonial period, that is before the British came to colonize them, it was based on agriculture, domesticated animals, trade with other cities and even a maritime

Welcome message from author
This document is posted to help you gain knowledge. Please leave a comment to let me know what you think about it! Share it to your friends and learn new things together.
Transcript
INDIA1.0 INTRODUCTION
1.1 BRIEF HISTORY
During the Bronze Age civilization, that is when the Indian
history started with the birth of the Indus Valley Civilization
which is now Pakistan, parts of India, Afghanistan and Iran. One
of the greatest emperors known in Indian history was Ashoka; he
expanded the country and was the one who spread Buddhism across
Asia after embracing it. In the 17th century, the British came to
India and settled. It got its independence in august 1947 and its
first prime minister was Jawaharlal Nehru.
India is the 7th largest country in the world by area and is the
2nd most populous with 1.27 billion. It’s considered as nearly
industrialized country; however it does face some issues like
poverty, corruption and terrorism.
1.1.1 Economic history
The Indian economy in a pre-colonial period, that is before the
British came to colonize them, it was based on agriculture,
domesticated animals, trade with other cities and even a maritime
trade was carried out between the south India and south East
Asia. Their main exports were cotton textiles, raw silk, rice and
wheat; where as their imports was pearls, wood, and dried fruits.
In the 18th century, India was the centre of trade and industry,
but later it was destroyed by the British who came to establish
machines to make cloth and replace the ones made by Indians due
to the boost of the industrial revolution in Europe.
After the British have settled, changes were being made on
taxation and agricultural policies so as to promote trade and
agriculture and this resulted in the decrease of the production
of food crops and famine. However, a beneficial thing is that,
with the British, railways and telegraphs were developed so as to
ease the trade. At the end of the colonization, India was one of
the countries in the world with the poorest economy, because the
population had grown fast and there was not enough food to feed
them and the industrial development slow down.
India got their independence in 1947, the new government that was
on power, looked at improving their economy through protecting
their domestic market on highly emphasizing on import
substitution industrialization and a good central planning; and
for trade and foreign investment policies were made liberal.
Other reforms were seen on agriculture, where there was an
increase on fertilizers, improvement on irrigation facilities and
the use of different variety of seeds which later increased crop
productivity.
As years went by, the Indian economy was doing well, not until
their major trading partner that is the Soviet Union collapsed
and the Gulf War which affected their economy and the decrease in
oil prices led to balance of payment crisis. In 1991, they asked
for a bailout loan from the IMF of $ 1.8 million which in return
demanded some reforms. Reforms were done as demanded, where the
Indian economy was liberalized, approval of foreign investment in
different sectors and the reduction of tariffs.
1.1.2 Indian Economic Progress
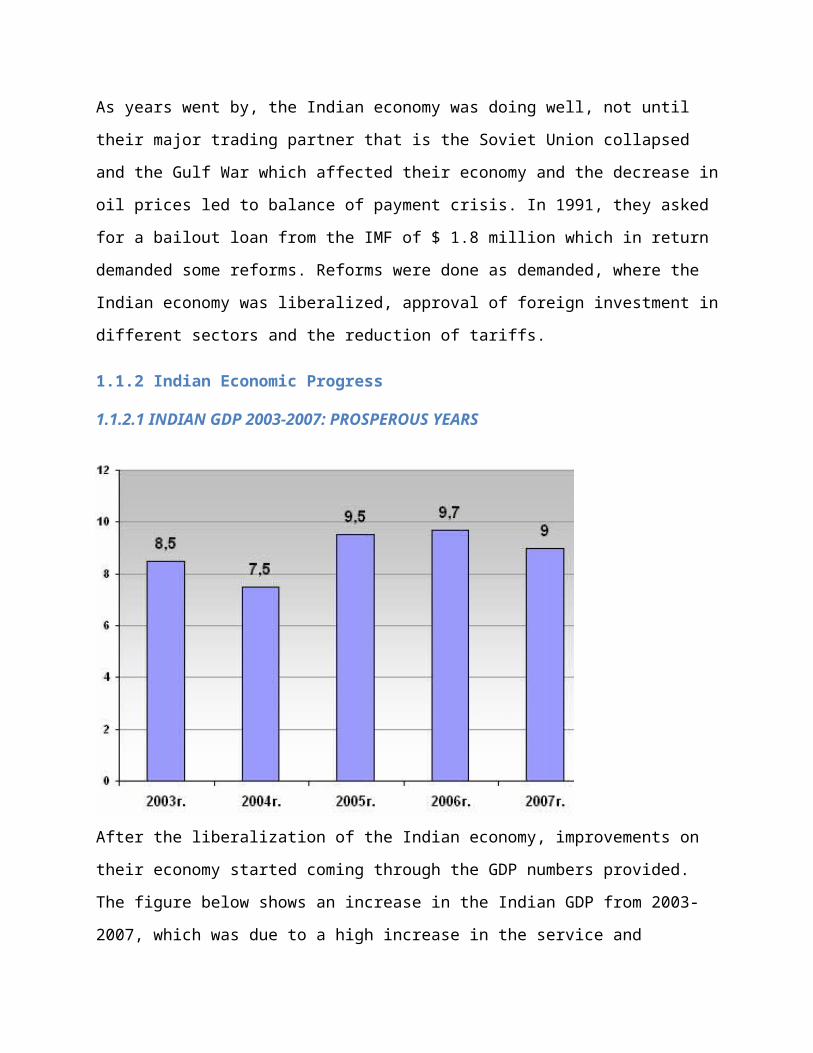
1.1.2.1 INDIAN GDP 2003-2007: PROSPEROUS YEARS
After the liberalization of the Indian economy, improvements on
their economy started coming through the GDP numbers provided.
The figure below shows an increase in the Indian GDP from 2003-
2007, which was due to a high increase in the service and
manufacturing industry. Reforms in banking services and a high
demand in education and healthcare increased the service sector,
compared to china that was led by the manufacturing industry.
(Grapfs are needed?)
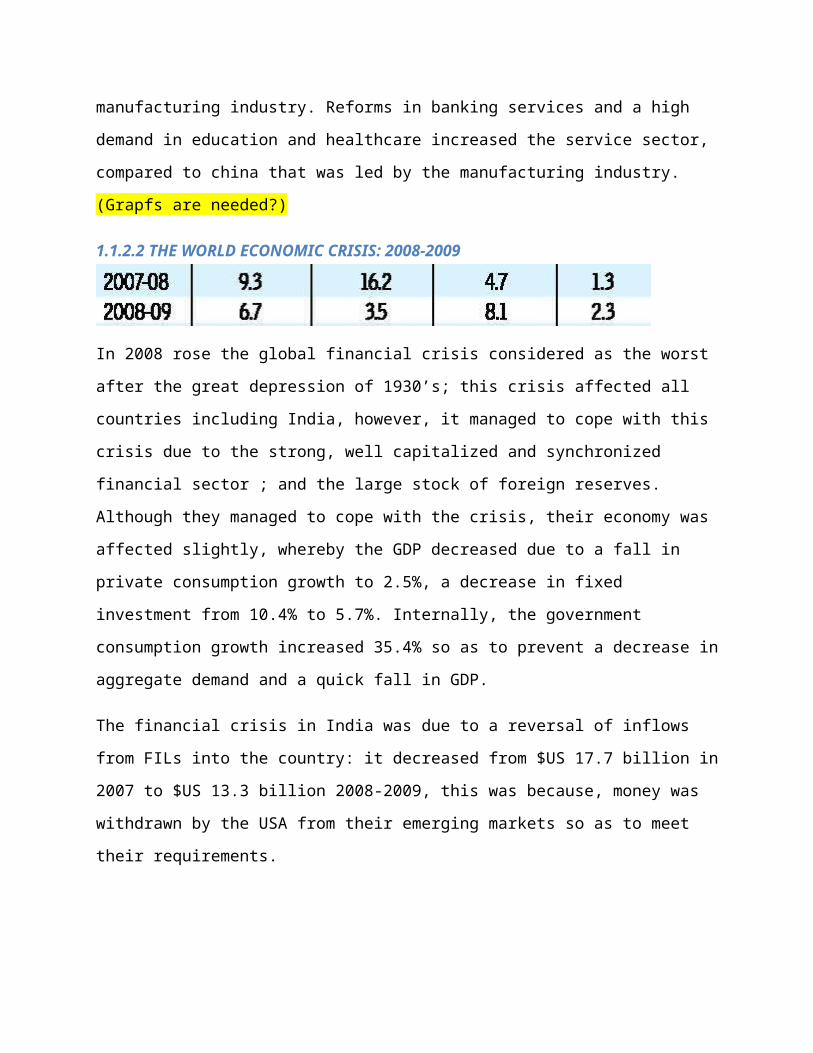
1.1.2.2 THE WORLD ECONOMIC CRISIS: 2008-2009
In 2008 rose the global financial crisis considered as the worst
after the great depression of 1930’s; this crisis affected all
countries including India, however, it managed to cope with this
crisis due to the strong, well capitalized and synchronized
financial sector ; and the large stock of foreign reserves.
Although they managed to cope with the crisis, their economy was
affected slightly, whereby the GDP decreased due to a fall in
private consumption growth to 2.5%, a decrease in fixed
investment from 10.4% to 5.7%. Internally, the government
consumption growth increased 35.4% so as to prevent a decrease in
aggregate demand and a quick fall in GDP.
The financial crisis in India was due to a reversal of inflows
from FILs into the country: it decreased from $US 17.7 billion in
2007 to $US 13.3 billion 2008-2009, this was because, money was
withdrawn by the USA from their emerging markets so as to meet
their requirements.
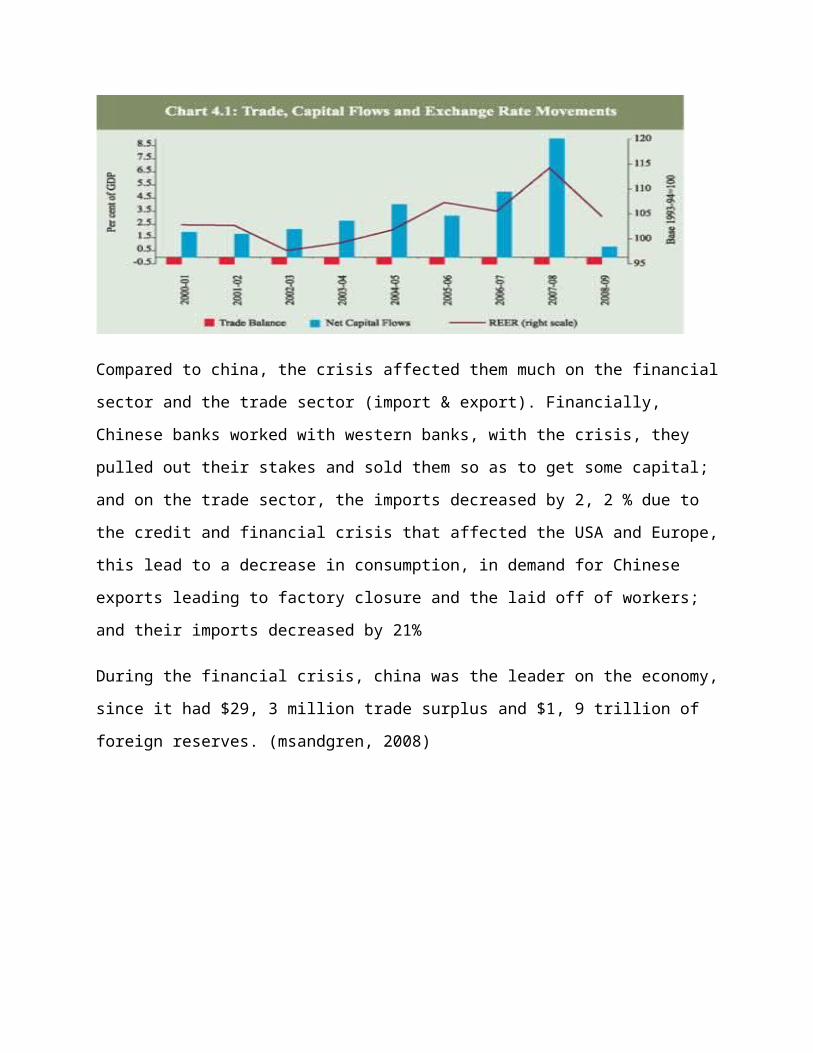
Compared to china, the crisis affected them much on the financial
sector and the trade sector (import & export). Financially,
Chinese banks worked with western banks, with the crisis, they
pulled out their stakes and sold them so as to get some capital;
and on the trade sector, the imports decreased by 2, 2 % due to
the credit and financial crisis that affected the USA and Europe,
this lead to a decrease in consumption, in demand for Chinese
exports leading to factory closure and the laid off of workers;
and their imports decreased by 21%
During the financial crisis, china was the leader on the economy,
since it had $29, 3 million trade surplus and $1, 9 trillion of
foreign reserves. (msandgren, 2008)
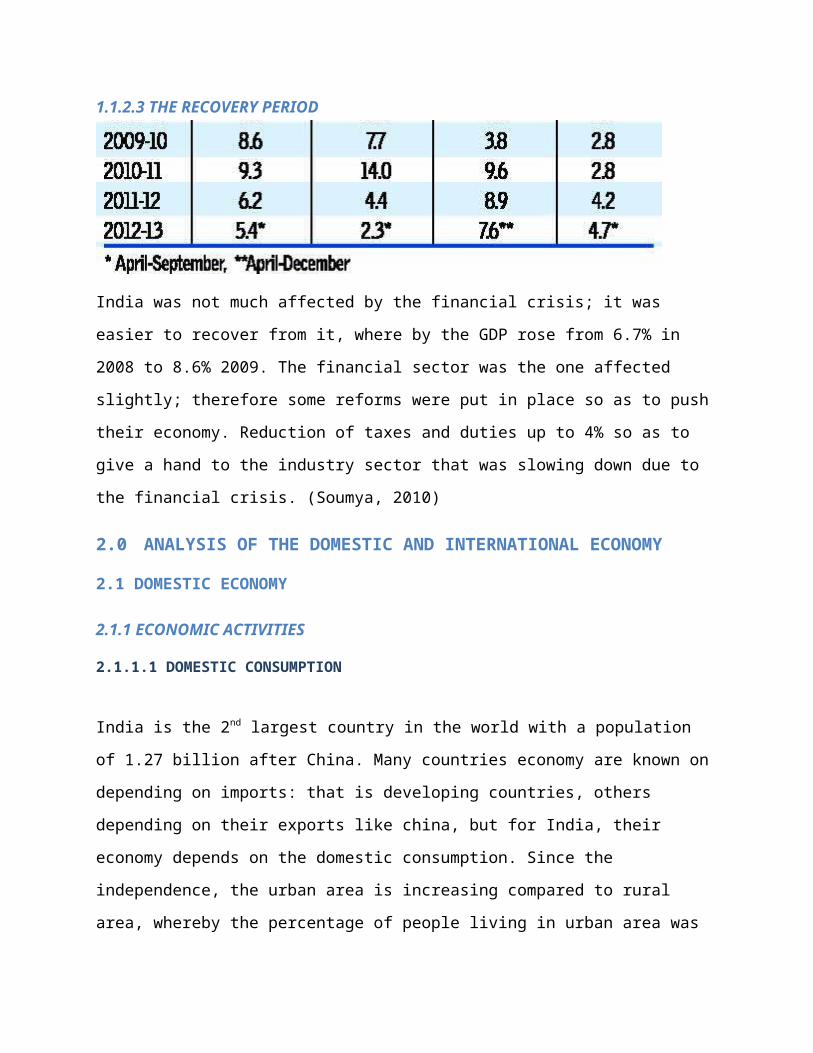
1.1.2.3 THE RECOVERY PERIOD
India was not much affected by the financial crisis; it was
easier to recover from it, where by the GDP rose from 6.7% in
2008 to 8.6% 2009. The financial sector was the one affected
slightly; therefore some reforms were put in place so as to push
their economy. Reduction of taxes and duties up to 4% so as to
give a hand to the industry sector that was slowing down due to
the financial crisis. (Soumya, 2010)
2.0 ANALYSIS OF THE DOMESTIC AND INTERNATIONAL ECONOMY
2.1 DOMESTIC ECONOMY
2.1.1 ECONOMIC ACTIVITIES
2.1.1.1 DOMESTIC CONSUMPTION
India is the 2nd largest country in the world with a population
of 1.27 billion after China. Many countries economy are known on
depending on imports: that is developing countries, others
depending on their exports like china, but for India, their
economy depends on the domestic consumption. Since the
independence, the urban area is increasing compared to rural
area, whereby the percentage of people living in urban area was
27.81% in 2000 and now its 31.16% and those living in rural area
were 72.19% and now its 68.84%. (Standard, 2011)
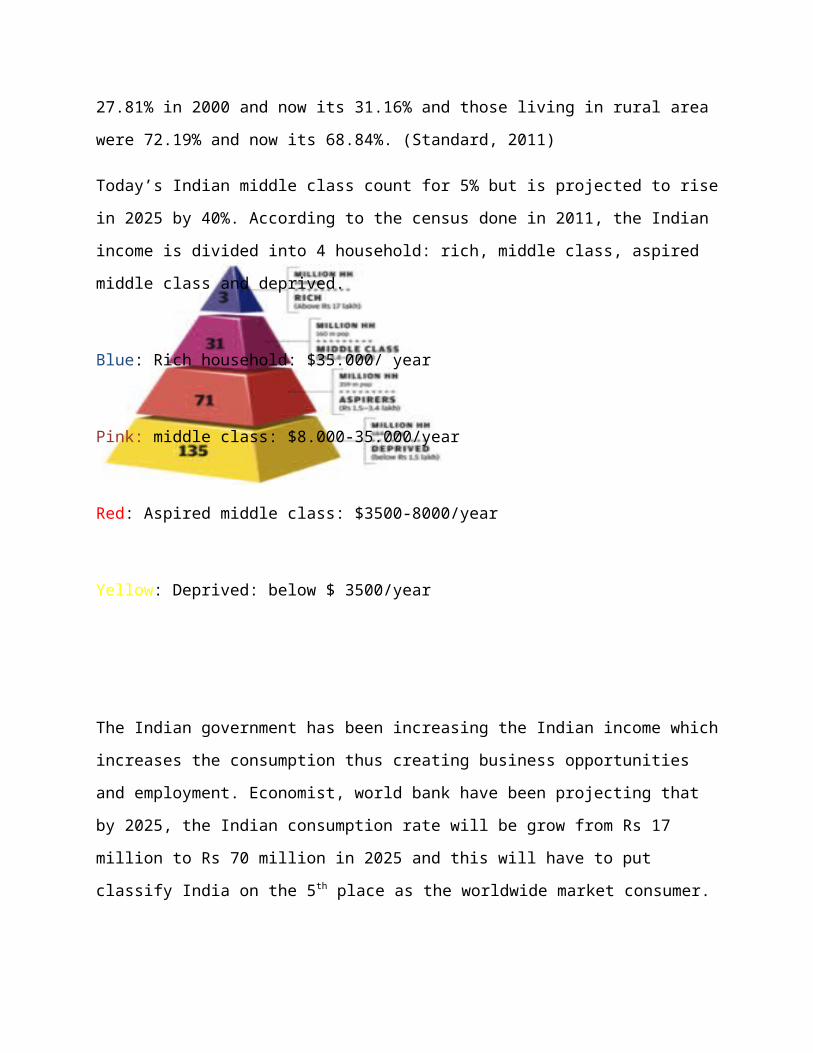
Today’s Indian middle class count for 5% but is projected to rise
in 2025 by 40%. According to the census done in 2011, the Indian
income is divided into 4 household: rich, middle class, aspired
middle class and deprived.
Blue: Rich household: $35.000/ year
Pink: middle class: $8.000-35.000/year
Red: Aspired middle class: $3500-8000/year
Yellow: Deprived: below $ 3500/year
The Indian government has been increasing the Indian income which
increases the consumption thus creating business opportunities
and employment. Economist, world bank have been projecting that
by 2025, the Indian consumption rate will be grow from Rs 17
million to Rs 70 million in 2025 and this will have to put
classify India on the 5th place as the worldwide market consumer.
This sudden increase in consumption is due to a high rise of
income; an increase in the population; and last but not least a
decrease in savings. With an increase in income (Rs200.000-
Rs1.000.000), it will increase the middle class. The current
saving rate of India is 28% where as in 2025, it will be 22%.
(Standard, 2007) However, compared to other countries like China,
Japan; the saving rate of India is low and it may have an impact
on their economy precisely the investment if they continue
depending on the consumption.
2.1.1.2 FOREIGN DIRECT INVESTMENTA. INFLOWS
Commonly known as a direct investment interested in production in
a specific country by a private individual or another country,
either to buy a company in that specific country or invest in the
existing activities (Moran, 2011). Since India has liberalized
their economy, it has implemented different initiatives so as to
attract FDI and boost its economy.
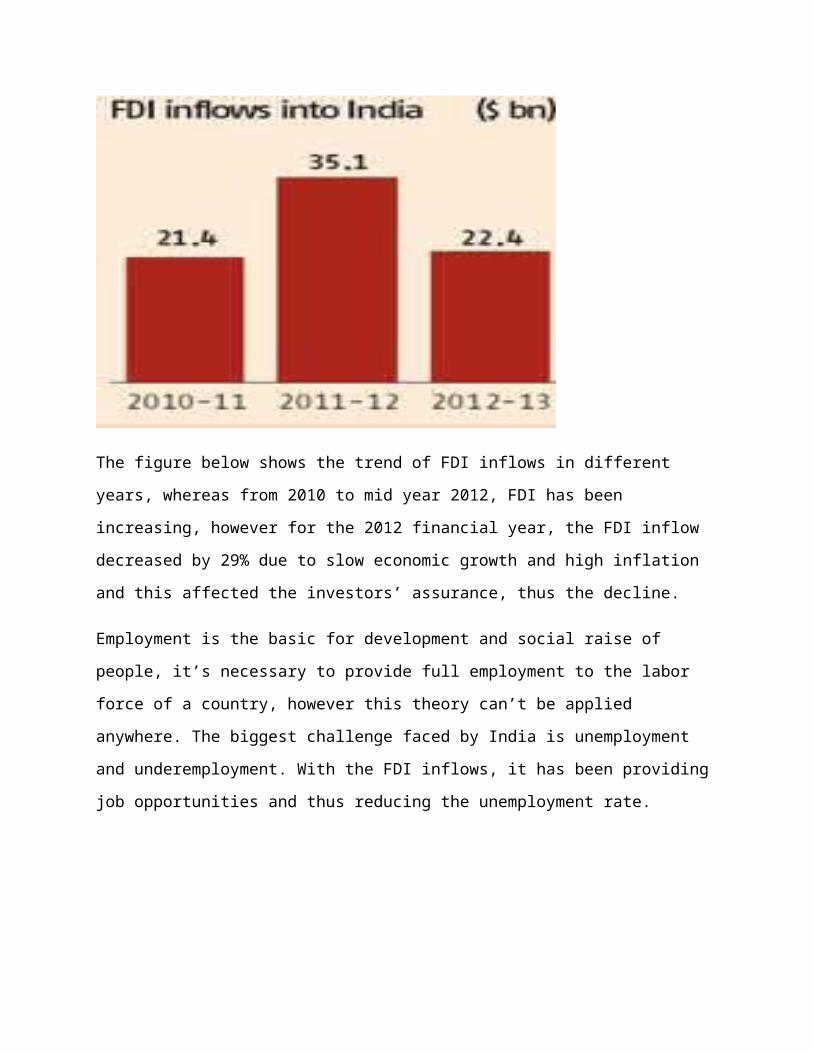
The figure below shows the trend of FDI inflows in different
years, whereas from 2010 to mid year 2012, FDI has been
increasing, however for the 2012 financial year, the FDI inflow
decreased by 29% due to slow economic growth and high inflation
and this affected the investors’ assurance, thus the decline.
Employment is the basic for development and social raise of
people, it’s necessary to provide full employment to the labor
force of a country, however this theory can’t be applied
anywhere. The biggest challenge faced by India is unemployment
and underemployment. With the FDI inflows, it has been providing
job opportunities and thus reducing the unemployment rate.
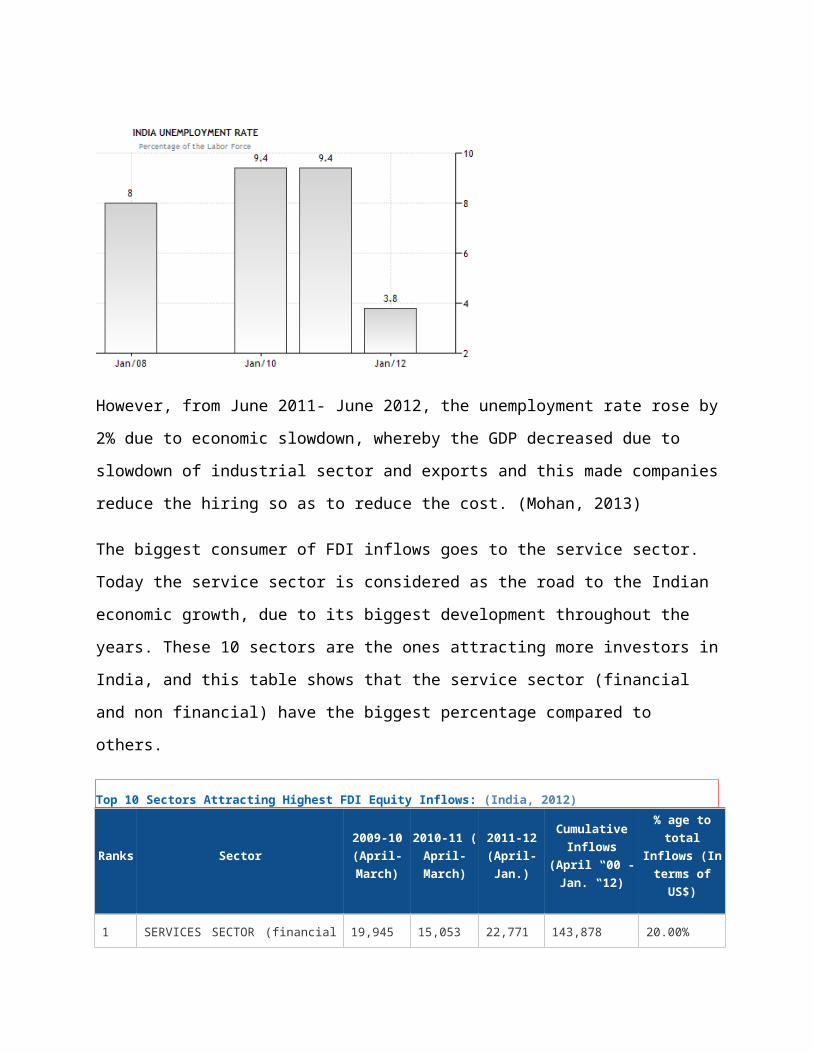
However, from June 2011- June 2012, the unemployment rate rose by
2% due to economic slowdown, whereby the GDP decreased due to
slowdown of industrial sector and exports and this made companies
reduce the hiring so as to reduce the cost. (Mohan, 2013)
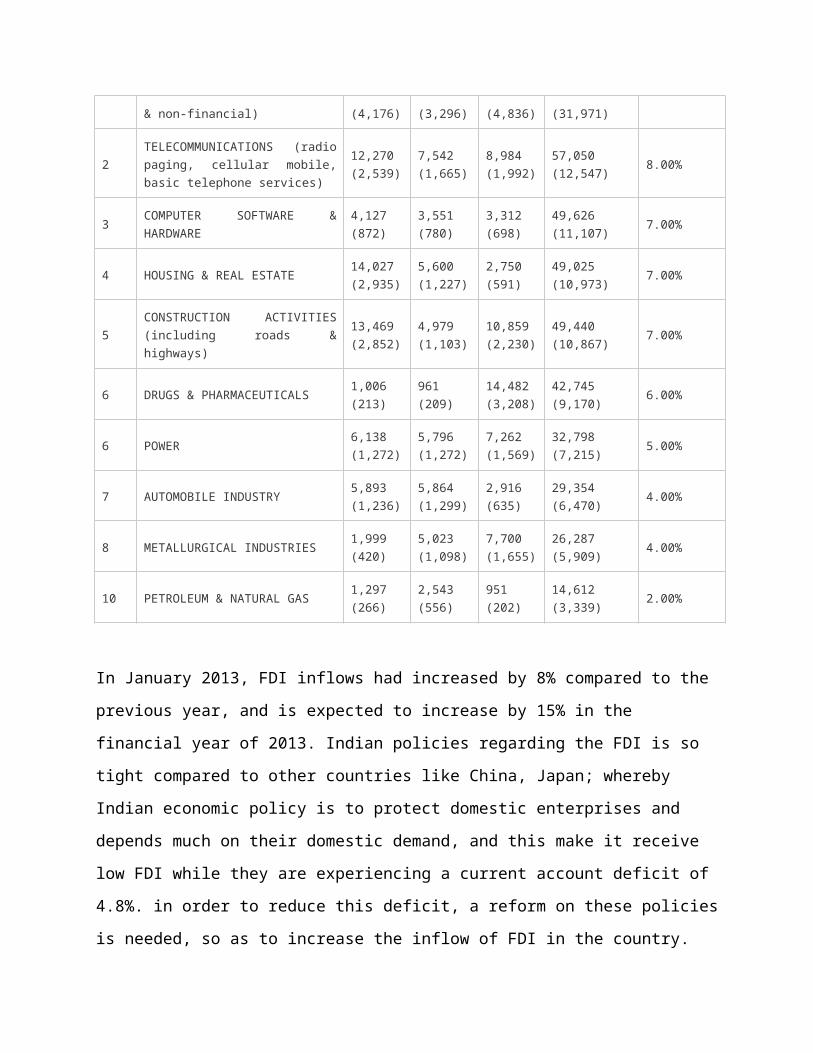
The biggest consumer of FDI inflows goes to the service sector.
Today the service sector is considered as the road to the Indian
economic growth, due to its biggest development throughout the
years. These 10 sectors are the ones attracting more investors in
India, and this table shows that the service sector (financial
and non financial) have the biggest percentage compared to
others.
Top 10 Sectors Attracting Highest FDI Equity Inflows: (India, 2012)
Ranks Sector2009-10(April-March)
2010-11 (April-March)
2011-12(April-Jan.)
CumulativeInflows
(April ‟00 -Jan. ‟12)
% age tototal
Inflows (Interms of
US$)
1 SERVICES SECTOR (financial 19,945 15,053 22,771 143,878 20.00%
& non-financial) (4,176) (3,296) (4,836) (31,971)
2TELECOMMUNICATIONS (radiopaging, cellular mobile,basic telephone services)
12,270(2,539)
7,542(1,665)
8,984(1,992)
57,050(12,547) 8.00%
3 COMPUTER SOFTWARE &HARDWARE
4,127(872)
3,551(780)
3,312(698)
49,626(11,107) 7.00%
4 HOUSING & REAL ESTATE 14,027(2,935)
5,600(1,227)
2,750(591)
49,025(10,973) 7.00%
5CONSTRUCTION ACTIVITIES(including roads &highways)
13,469(2,852)
4,979(1,103)
10,859(2,230)
49,440(10,867) 7.00%
6 DRUGS & PHARMACEUTICALS 1,006(213)
961(209)
14,482(3,208)
42,745(9,170) 6.00%
6 POWER 6,138(1,272)
5,796(1,272)
7,262(1,569)
32,798(7,215) 5.00%
7 AUTOMOBILE INDUSTRY 5,893(1,236)
5,864(1,299)
2,916(635)
29,354(6,470) 4.00%
8 METALLURGICAL INDUSTRIES 1,999(420)
5,023(1,098)
7,700(1,655)
26,287(5,909) 4.00%
10 PETROLEUM & NATURAL GAS 1,297(266)
2,543(556)
951(202)
14,612(3,339) 2.00%
In January 2013, FDI inflows had increased by 8% compared to the
previous year, and is expected to increase by 15% in the
financial year of 2013. Indian policies regarding the FDI is so
tight compared to other countries like China, Japan; whereby
Indian economic policy is to protect domestic enterprises and
depends much on their domestic demand, and this make it receive
low FDI while they are experiencing a current account deficit of
4.8%. in order to reduce this deficit, a reform on these policies
is needed, so as to increase the inflow of FDI in the country.
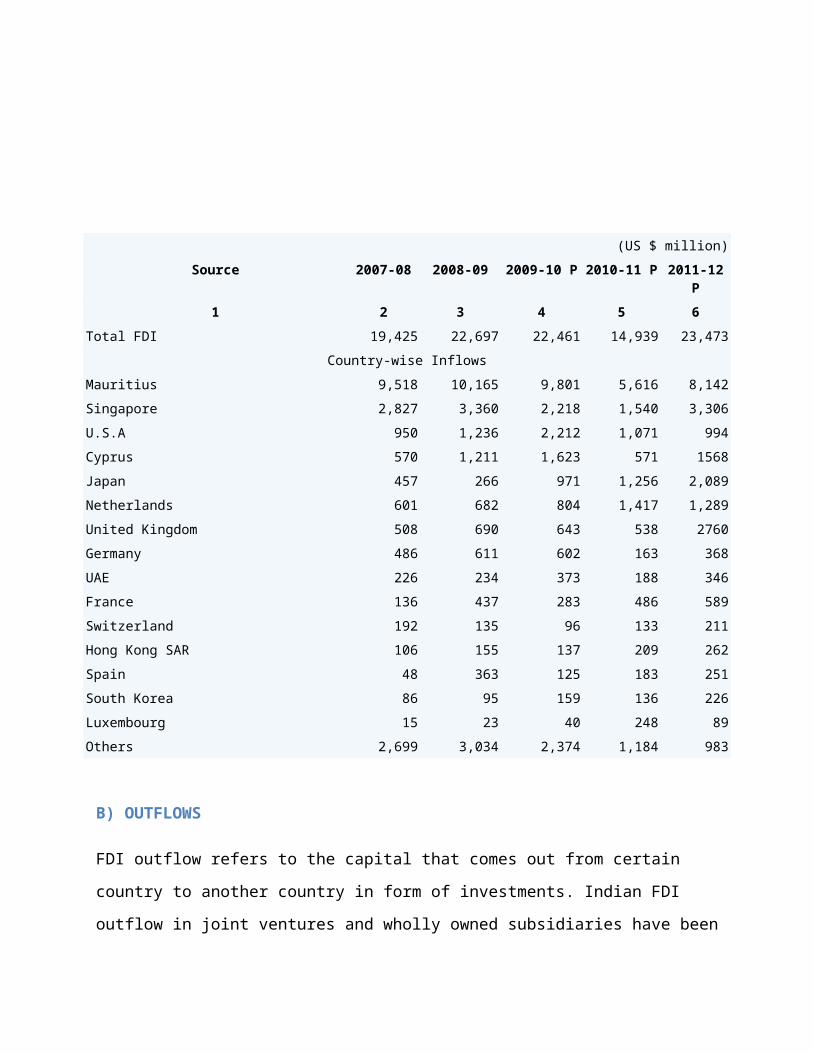
(US $ million)Source 2007-08 2008-09 2009-10 P 2010-11 P 2011-12
P1 2 3 4 5 6
Total FDI 19,425 22,697 22,461 14,939 23,473Country-wise Inflows
Mauritius 9,518 10,165 9,801 5,616 8,142Singapore 2,827 3,360 2,218 1,540 3,306U.S.A 950 1,236 2,212 1,071 994Cyprus 570 1,211 1,623 571 1568Japan 457 266 971 1,256 2,089Netherlands 601 682 804 1,417 1,289United Kingdom 508 690 643 538 2760Germany 486 611 602 163 368UAE 226 234 373 188 346France 136 437 283 486 589Switzerland 192 135 96 133 211Hong Kong SAR 106 155 137 209 262Spain 48 363 125 183 251South Korea 86 95 159 136 226Luxembourg 15 23 40 248 89Others 2,699 3,034 2,374 1,184 983
B) OUTFLOWS
FDI outflow refers to the capital that comes out from certain
country to another country in form of investments. Indian FDI
outflow in joint ventures and wholly owned subsidiaries have been
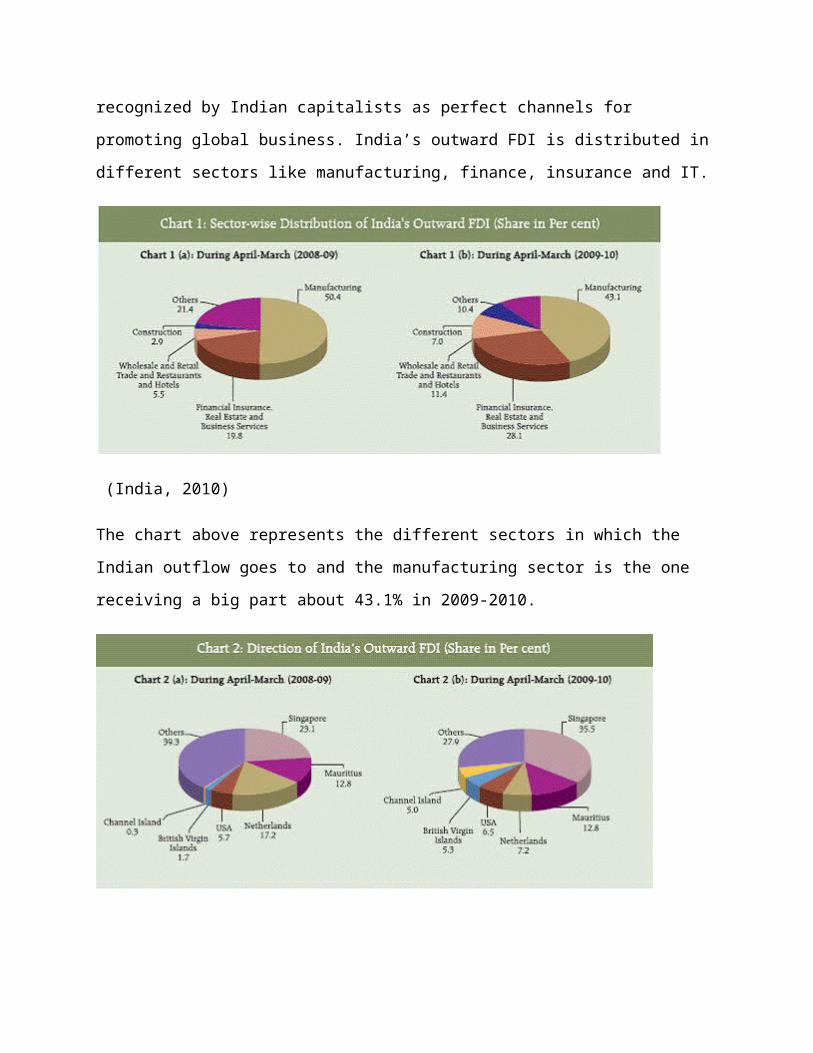
recognized by Indian capitalists as perfect channels for
promoting global business. India’s outward FDI is distributed in
different sectors like manufacturing, finance, insurance and IT.
(India, 2010)
The chart above represents the different sectors in which the
Indian outflow goes to and the manufacturing sector is the one
receiving a big part about 43.1% in 2009-2010.
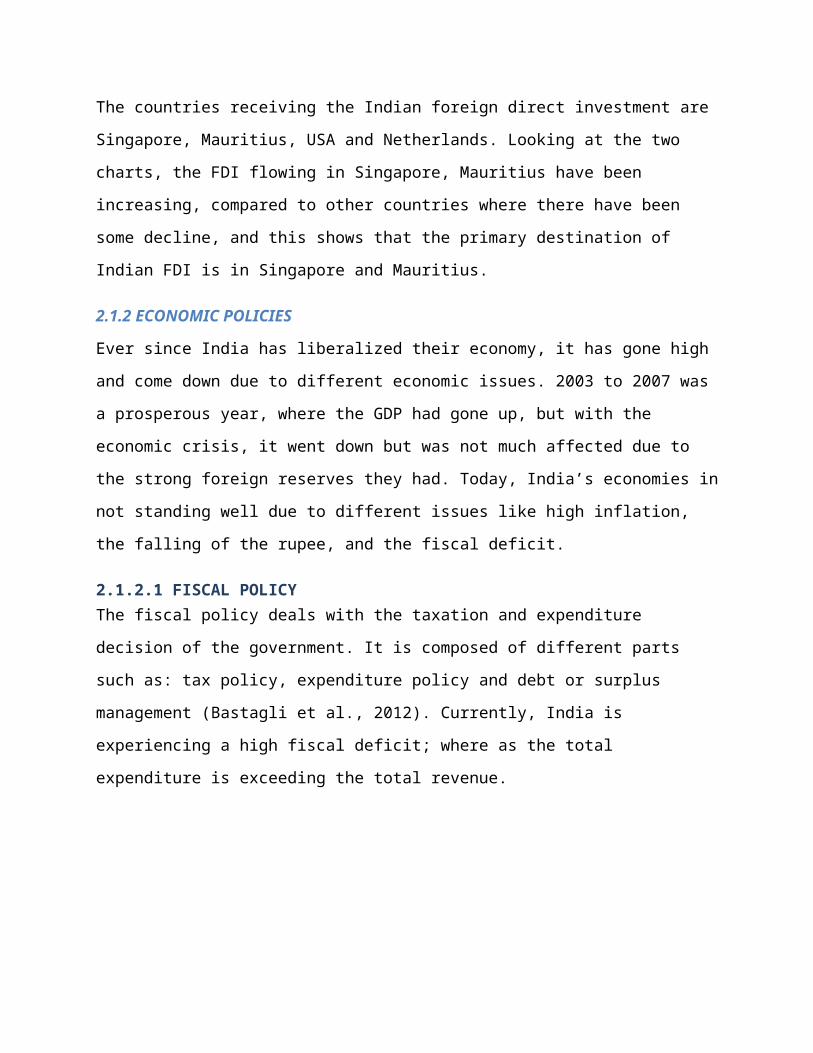
The countries receiving the Indian foreign direct investment are
Singapore, Mauritius, USA and Netherlands. Looking at the two
charts, the FDI flowing in Singapore, Mauritius have been
increasing, compared to other countries where there have been
some decline, and this shows that the primary destination of
Indian FDI is in Singapore and Mauritius.
2.1.2 ECONOMIC POLICIES
Ever since India has liberalized their economy, it has gone high
and come down due to different economic issues. 2003 to 2007 was
a prosperous year, where the GDP had gone up, but with the
economic crisis, it went down but was not much affected due to
the strong foreign reserves they had. Today, India’s economies in
not standing well due to different issues like high inflation,
the falling of the rupee, and the fiscal deficit.
2.1.2.1 FISCAL POLICYThe fiscal policy deals with the taxation and expenditure
decision of the government. It is composed of different parts
such as: tax policy, expenditure policy and debt or surplus
management (Bastagli et al., 2012). Currently, India is
experiencing a high fiscal deficit; where as the total
expenditure is exceeding the total revenue.
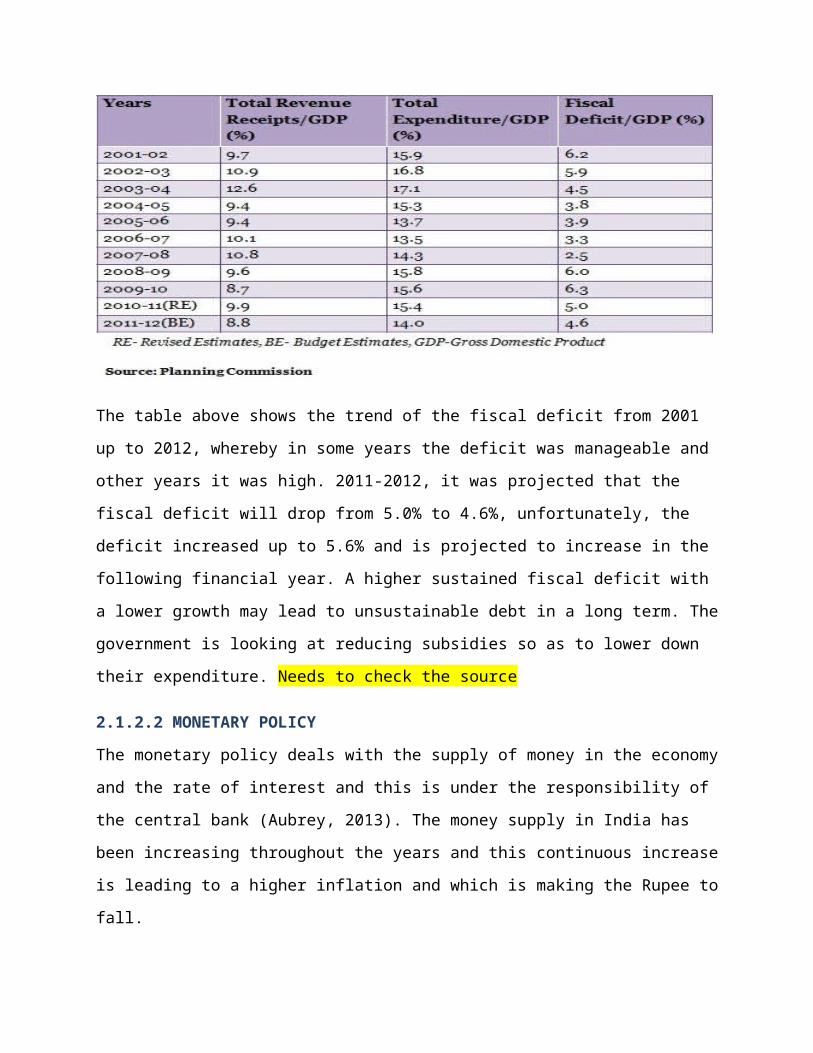
The table above shows the trend of the fiscal deficit from 2001
up to 2012, whereby in some years the deficit was manageable and
other years it was high. 2011-2012, it was projected that the
fiscal deficit will drop from 5.0% to 4.6%, unfortunately, the
deficit increased up to 5.6% and is projected to increase in the
following financial year. A higher sustained fiscal deficit with
a lower growth may lead to unsustainable debt in a long term. The
government is looking at reducing subsidies so as to lower down
their expenditure. Needs to check the source
2.1.2.2 MONETARY POLICY
The monetary policy deals with the supply of money in the economy
and the rate of interest and this is under the responsibility of
the central bank (Aubrey, 2013). The money supply in India has
been increasing throughout the years and this continuous increase
is leading to a higher inflation and which is making the Rupee to
fall.
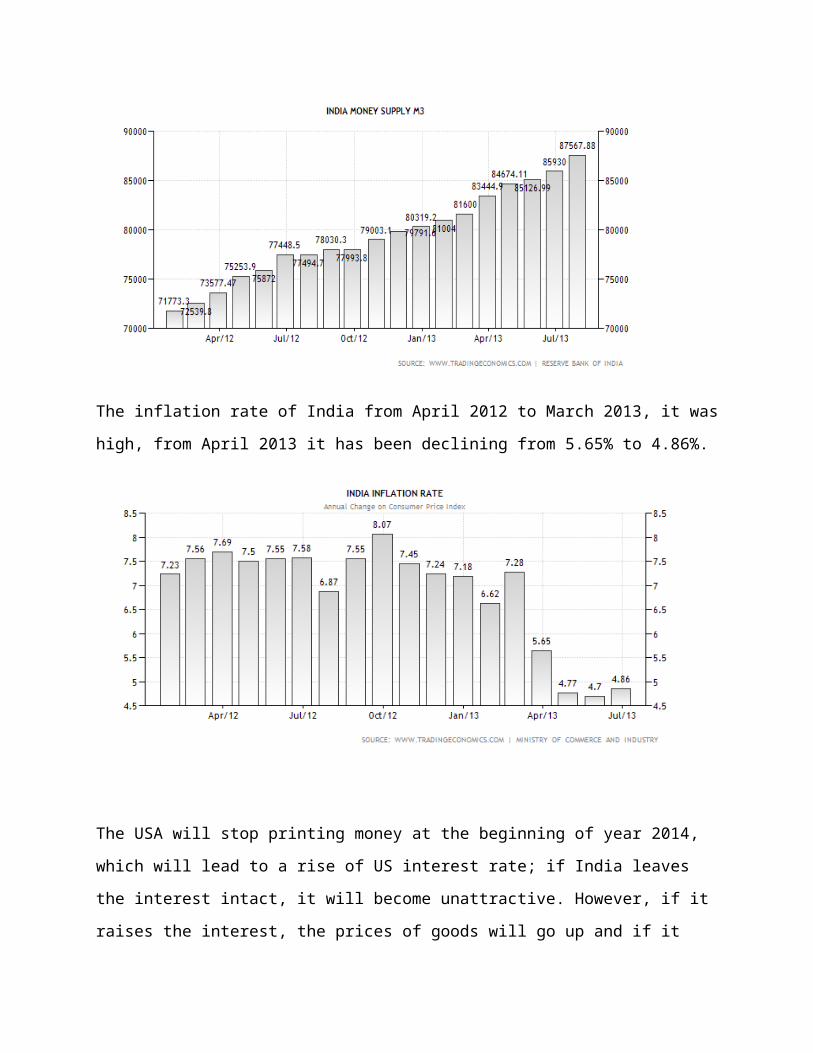
The inflation rate of India from April 2012 to March 2013, it was
high, from April 2013 it has been declining from 5.65% to 4.86%.
The USA will stop printing money at the beginning of year 2014,
which will lead to a rise of US interest rate; if India leaves
the interest intact, it will become unattractive. However, if it
raises the interest, the prices of goods will go up and if it
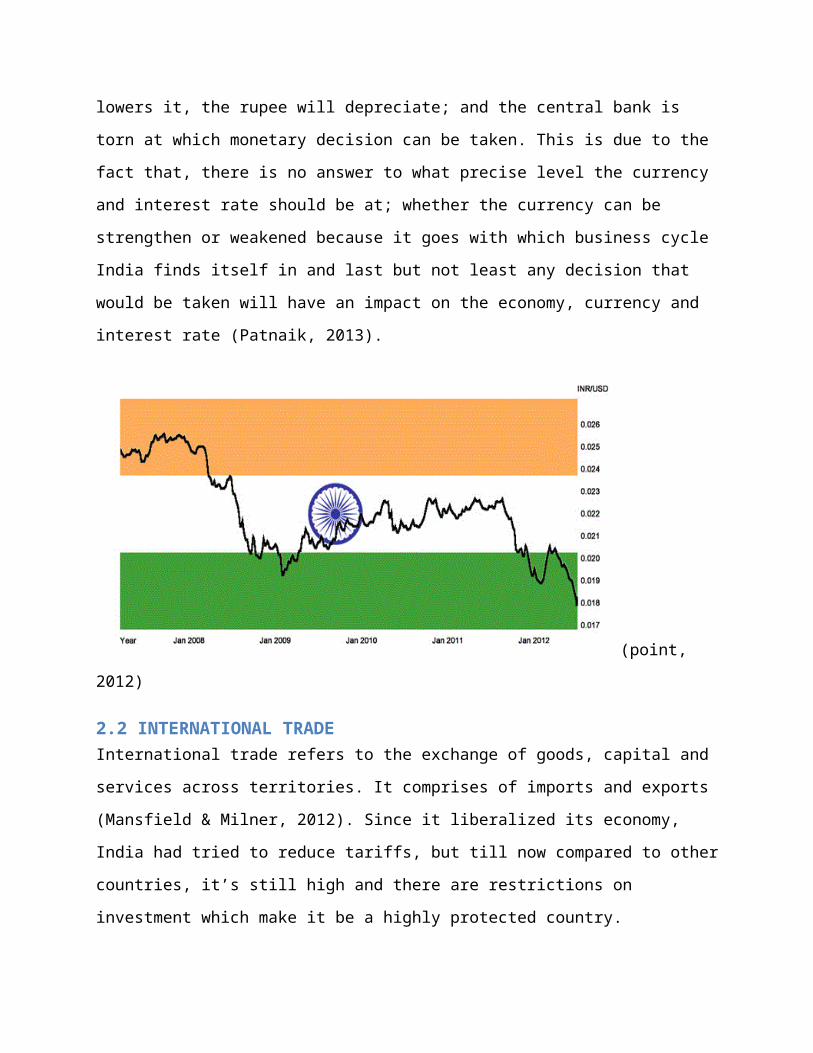
lowers it, the rupee will depreciate; and the central bank is
torn at which monetary decision can be taken. This is due to the
fact that, there is no answer to what precise level the currency
and interest rate should be at; whether the currency can be
strengthen or weakened because it goes with which business cycle
India finds itself in and last but not least any decision that
would be taken will have an impact on the economy, currency and
interest rate (Patnaik, 2013).
(point, 2012)
2.2 INTERNATIONAL TRADEInternational trade refers to the exchange of goods, capital and
services across territories. It comprises of imports and exports
(Mansfield & Milner, 2012). Since it liberalized its economy,
India had tried to reduce tariffs, but till now compared to other
countries, it’s still high and there are restrictions on
investment which make it be a highly protected country.
2.2.1 TRADE POLICY
1950’s, Indian trade policy was based on regulation and controls,
where tariffs and non-tariffs barriers were high, and at that
time India had a closed economy. After it liberalized their
economy, reforms were made on the trade policy: India was looking
at doubling their share of global merchandise trade and develop
the rural and semi urban areas, not forgetting reducing tariffs,
so as to encourage imports, and exports.
This new trade policy had an impact on the economic growth, where
it developed highly and this was seen on the GDP from 2004-2009,
and it also boosted the exports, where it helped India to
diversify in different sectors so as to competitive on the global
market (Ramakrishna, 2011).
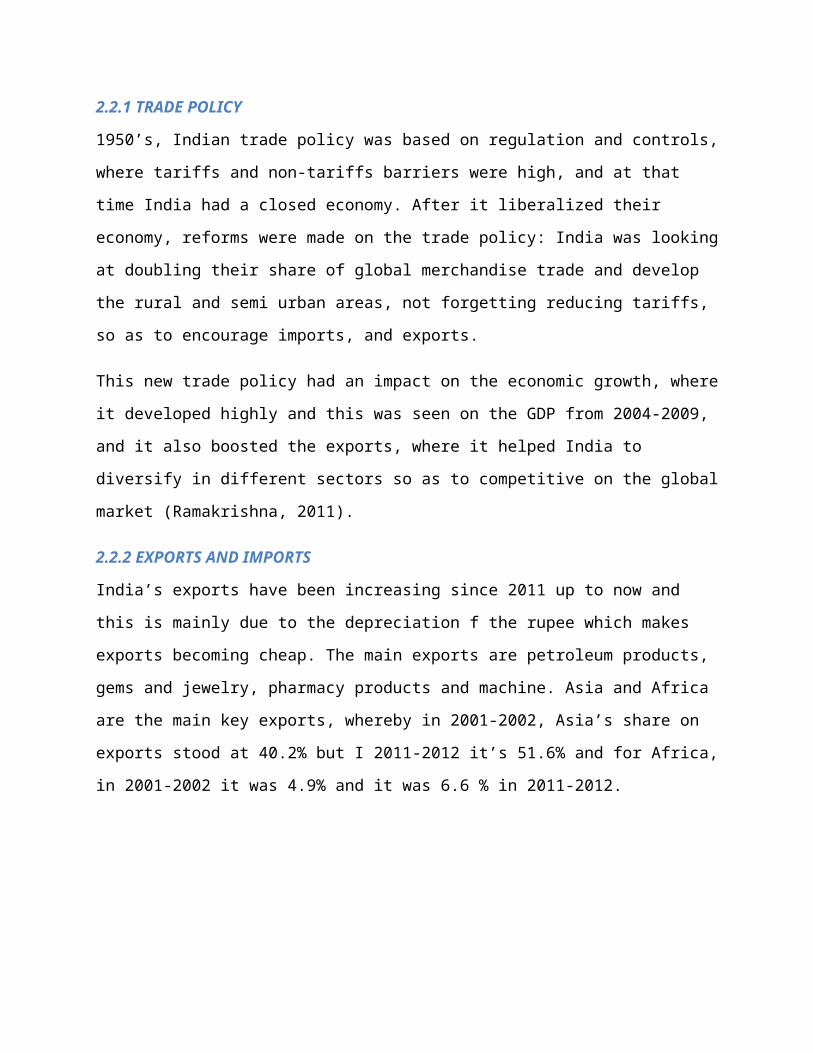
2.2.2 EXPORTS AND IMPORTS
India’s exports have been increasing since 2011 up to now and
this is mainly due to the depreciation f the rupee which makes
exports becoming cheap. The main exports are petroleum products,
gems and jewelry, pharmacy products and machine. Asia and Africa
are the main key exports, whereby in 2001-2002, Asia’s share on
exports stood at 40.2% but I 2011-2012 it’s 51.6% and for Africa,
in 2001-2002 it was 4.9% and it was 6.6 % in 2011-2012.
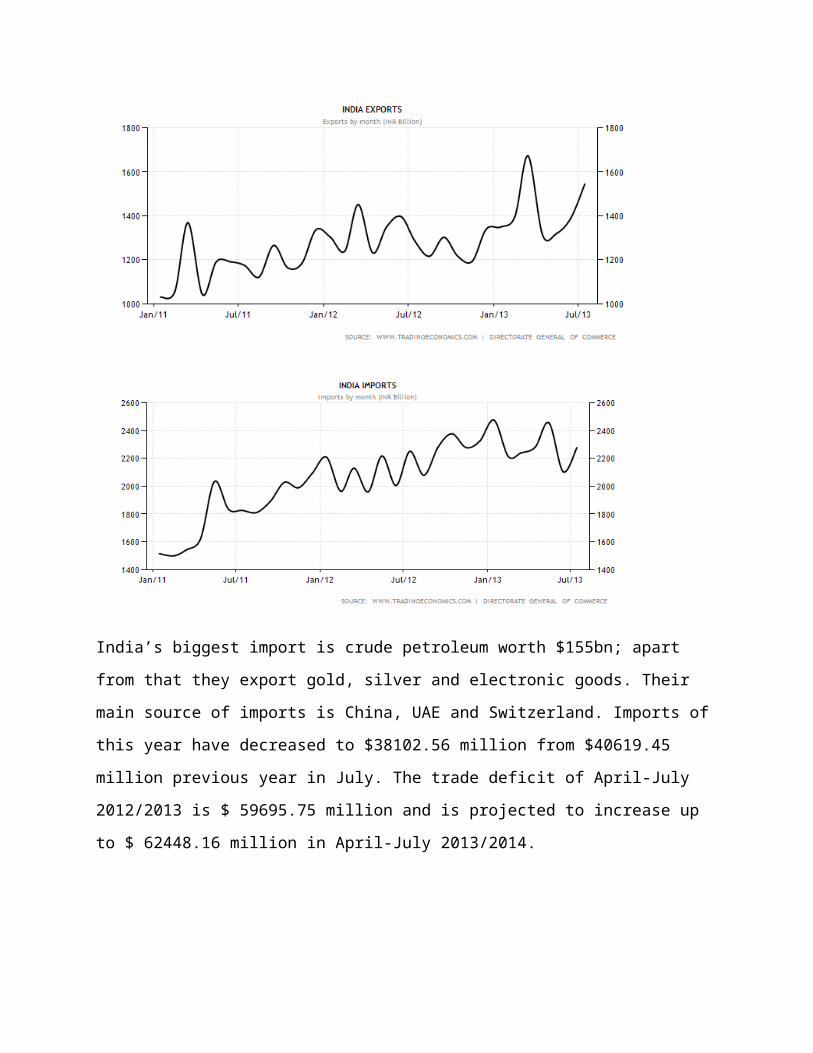
India’s biggest import is crude petroleum worth $155bn; apart
from that they export gold, silver and electronic goods. Their
main source of imports is China, UAE and Switzerland. Imports of
this year have decreased to $38102.56 million from $40619.45
million previous year in July. The trade deficit of April-July
2012/2013 is $ 59695.75 million and is projected to increase up
to $ 62448.16 million in April-July 2013/2014.
Related Documents


![Aintree twitter ppt [autosaved] [autosaved]](https://static.cupdf.com/doc/110x72/55d7693dbb61ebc6238b466d/aintree-twitter-ppt-autosaved-autosaved.jpg)


![Presentation3 [Autosaved] [Autosaved]](https://static.cupdf.com/doc/110x72/577d2e691a28ab4e1eaef4b4/presentation3-autosaved-autosaved.jpg)


![20357358-Cadbury-Marketing-Mix-focuses-on-cadbury-india-ltd [Autosaved]](https://static.cupdf.com/doc/110x72/551d84494a795970108b478b/20357358-cadbury-marketing-mix-focuses-on-cadbury-india-ltd-autosaved.jpg)
![Udara Sekeliling Kita [Autosaved] [Autosaved]](https://static.cupdf.com/doc/110x72/5572026e4979599169a37d85/udara-sekeliling-kita-autosaved-autosaved.jpg)