Enhancing Bilatera Investment and Collab Services: India and E Union Project Coordinat Arpita Mukherje Contributing Autho Divya Satija Ramneet Goswam Smita Miglani Tanu M. Goyal Submitted to Konrad Adenauer Stiftun November 2012 INDIAN COUNCIL FOR RESEARCH ON INTERNATION Core 6-A, 4 th Floor, India Habitat Centre al Trade, boration in European tor ee ors mi ng (KAS) 2 NAL ECONOMIC RELATIONS e, Lodi Road, New Delhi 110 003

Welcome message from author
This document is posted to help you gain knowledge. Please leave a comment to let me know what you think about it! Share it to your friends and learn new things together.
Transcript
Enhancing Bilateral Trade, Investment and Collaboration in
Services: India and European Union
Project CoordinatorArpita Mukherjee
Contributing Authors
Divya Satija Ramneet Goswami
Smita Miglani Tanu M. Goyal
Submitted to Konrad Adenauer Stiftung (KAS)
November 2012
INDIAN COUNCIL FOR RESEARCH ON INTERNATIONAL ECONOM IC RELATIONSCore 6-A, 4th Floor, India Habitat Centre, Lodi Road, New Delhi 110 003
Enhancing Bilateral Trade, Investment and Collaboration in
Services: India and European
Project Coordinator Arpita Mukherjee
Contributing Authors
Ramneet Goswami
Adenauer Stiftung (KAS) November 2012
INDIAN COUNCIL FOR RESEARCH ON INTERNATIONAL ECONOM IC RELATIONS Floor, India Habitat Centre, Lodi Road, New Delhi 110 003

Draft not for citation and quotation
2
Contents
Introduction .............................................................................................................................. 4
Chapter 1: Services Sector in India and the European Union (EU) ......................................... 7
Chapter 2: India-EU: Trade and Investments in Services ...................................................... 26
Chapter 3: Trade, Investment and Collaboration between India and the EU - Logistics
Services ................................................................................................................ 59
Chapter 4: Energy services ..................................................................................................... 85
Chapter 5: Strengthening Trade and Investment Ties between India and the EU - The Case
of IT/ITeS Sector ................................................................................................ 118
Chapter 6: Evolving Retail Sector in India and the EU - Opportunities and Challenges ..... 157
Chapter 7: India-EU Multilateral and Bilateral Engagements and the Way Forward .......... 187
APPENDICES ...................................................................................................................... 199

Draft not for citation and quotation
3
Draft not for citation and quotation
4
Introduction
The services sector forms the backbone of social and economic development of a country. It has emerged as the largest and fastest-growing sectors in the world economy, contributing significantly to the global output and employment. In India and in the European Union (EU), services sector is the largest contributor to the gross domestic product (GDP). In 2009, services contributed about 54.9 per cent and 72.8 per cent to India and the EU’s GDP, respectively.1 It is also one of the largest employers, employing about 23 per cent and 70 per cent of workforce in India2 and the EU, respectively. Since 1990s, the EU member countries and India have autonomously liberalised the services sector. Both are global players of trade in services and their trade in services is increasing. In 2009, services accounted for around 30 per cent and 25 per cent, respectively, of the total trade of India and the EU. In 2009, the EU was the largest exporter of services among the WTO member countries, accounting for around 46 per cent of world’s total exports of services. India, on the other hand, had the 12th position with a share of 2.6 per cent.3 India and the EU have trade complementarities in services. India has a large pool of young, educated and English-speaking work force who can offer services at globally competitive rates while the EU is facing a shortage of skilled work force as the population of the EU member countries is ageing. The EU companies are facing a saturated market within their home countries, whereas the Indian market is growing. India has shown high growth in information technology, medical services, business services whereas the EU is a leader in professional services such as accounting and legal services, financial services, postal and courier services and telecommunication services.4 The EU companies can explore investment opportunities in sectors such as energy, telecommunications and transport in India. The EU’s ‘Global Europe: Competing in the World’ 5 strategy report also emphasised on need to focus on emerging economies like India. Bilateral trade in services between India and the EU has grown impressively - from $6.7 billion in 2003 to $22.7 billion in 2009. The EU is India’s largest trading partners in services and accounts for around 13 per cent of India’s services trade. Although India is among the top 15 trading partners of the EU, its share among EU’s trading partners in services is less than 2 per cent.6 However, this share is increasing. The EU is a major source of foreign investments in India. Between April 2008 and June 2011, cumulative FDI inflows from the EU were $20 billion, with services accounting for 35 per cent. Indian investment in the EU has also shown an upward trend. In 2000, Indian investments in the EU was $0.14 billion in 2000 and in 2009, it increased to $1.21 billion. The EU is an important supplier of technical know-how to India. India’s relation with European Union (EU) dates back to 1962 when India was among first set of countries to set up diplomatic relations with the European Economic Community 1IMF (2010) 2 The figure is for organized employment. The sector is highly unorganized and it is difficult to get the information on it. 3 WTO (2010) 4 European Commission (2006) 5 http://trade.ec.europa.eu/doclib/docs/2006/october/tradoc_130376.pdf 6WTO (2011)
Draft not for citation and quotation
5
(EEC). This relationship deepened but was primarily confined to economic cooperation, trade and development issues. The India-EU relationship took a new turn in the Lisbon Summit of June 2000 and in this and the following two summits, the focus was on building a “Strategic Partnership”. So far, the two economies had nine summits alternatively in India and in EU member states. In the 5th Summit at Hague in November 2004 the relationship was upgraded from an economic one into a Strategic Partnership. India was the sixth country (after the United States (US), Russia, China, Japan and Canada) to have a strategic partnership with the EU. In the 6th Summit in September 2005, a High Level Trade Group (HLTG) was established to explore ways and means to deepen and widen the bilateral trade and investment relationship. This HLTG recommended a Broad-based Trade and Investment Agreement (BTIA) in the 7th Summit in Helsinki. In June 2007, the EU and India began negotiations on BTIA in Brussels, Belgium that will cover goods, services, investment, government procurement, sustainable development and labour standards, among others, to strengthen bilateral trade relations. The BTIA negotiation began in June 2007 and is likely to be signed in a year’s timeframe. There are several other inter-governmental initiatives for enhancing trade, investment and economic cooperation between the two economies. India and the EU have signed a Horizontal Civil Aviation Agreement in 2008. India has Bilateral Investment Protection Agreement, Double Taxation Avoidance Agreements and cultural agreements with a number of EU member countries. There are a number of studies on India-EU relations. Most of them focus on the India-EU strategic relationships [see Baroowa, (2007) and Sachdeva (2009)]. Studies by Centre for the Analysis of Regional Integration at Sussex (CARIS) and Consumer Unity & Trust Society (CUTS), (2007), and ECORYS, CUTS and Centre for Trade and Development (Centad) (2009) have analysed the trade potential of the proposed India-EU FTA. The focus of these studies is trade in goods. Though there are a few studies on trade in services, they are sector-specific and mainly cover financial services [see Stichele and Singh, (2009)]. To our knowledge, there is no holistic study on India-EU Bilateral trade in services. This study aims to fill that lacuna. The focus of this study is to enhance bilateral trade and investments in services between India and the EU. Given this background, the objective of the study is to examine the trade potential, investment and collaborations in services between India and the EU, give an overview of trade of services and global competitiveness of India and the EU, analyse the pattern of bilateral trade flows in services between India and the EU, identify the areas of future cooperation and collaboration and trade and investment barriers faced by the EU companies in India and Indian companies in the EU and finally, make recommendations to remove these barriers through the India-EU negotiations and reforms. The study is divided in seven chapters. Chapter 1 presents the overview of services sector in India and in the EU. Chapter 2 gives the trends and patterns of trade and investment between India and the EU. The next few chapters focus on some of the selected services sectors of importance to India and the EU. Chapter 3 gives a comprehensive analysis of the logistics sector, Chapter 4 discusses energy services, Chapter 5 focuses on the information technology (IT), IT enabled services (ITeS), and Chapter 6 gives an overview of the retail sector. Each sector study provides a comprehensive analysis of the services sector. They give a brief overview of the sector, bilateral trade flows between India and the EU in the sector, barriers faced by Indian and the EU companies in the sector, areas of future collaboration and suggest

Draft not for citation and quotation
6
reforms and make policy recommendations. The last and final chapter discusses India and the EU’s bilateral and multilateral negotiations and strategies and discusses the way forward with reference to the India-EU BTIA.
Draft not for citation and quotation
7
Chapter 1: Services Sector in India and the European Union (EU)
Ramneet Goswami
Introduction The services sector is the major contributor to the gross domestic product (GDP) and economic growth of India and the European Union (EU) Member States. The European economy is described as a “service economy”, while in India, the services sector is regarded as the “mainstay of the economy”.7 In the EU, the economic growth has led to a shift from agriculture to industries/manufacturing and then to services. In India, on the other hand, there has been a shift directly from agriculture to the services sector. In this respect, India consider as an outlier among South Asian countries and other emerging markets.8 In both economies, services sector started to grow in the mid-1980s but growth accelerated in the 1990s. Reforms in the services were a part of the overall reform process in India and the EU. Liberalisation of services sector, economic development and technological advancement are some of the main factors of the growth of services sector in India and the EU.9
The services sector contributes a significant share in employment in both economies. While in the EU, the services sector is largest employer, in India, it is the second largest employer after agriculture. The reason behind this is that in India the rise in employment in services sector has not been commensurate with the rise in its share in GDP.10 Nevertheless, over the years, the percentage of people employed in agriculture in India is declining and employment in services sector is increasing.
India and the EU have similarities in governance structure. Both have quasi-federal institutional structure. India has 28 states and the EU has 27 Member States. Services sector is jointly governed by the centre (central government in India and European Commission in the EU); and state (state government in India, and individual Member States in the EU).
This chapter presents an overview of services sector in India and the EU. The structure of the chapter is as follows. The next section discusses the governance structure and the following section gives the differences in definition of ‘services” in India and the EU. The third section presents a macro-overview of Indian and the European economy, focusing on the contribution of services sector to the GDP and employment. It also gives the future growth projections of services. The fourth section focuses on the liberalisation of services sector in both economies. The fifth section describes the current acts and regulations which impact the services sector of India and the EU and the last section draws the conclusion.
7 European Commission (2009) and Planning Commission (2008). 8 Ansari (1995). 9 Ansari (1995), Bhattacharya and Mitra (1990), Banga and Goldar (2004), Banga (2005), Chanda (2002), Gordon and Gupta (2003), Hansda (2001), Jain and Ninan (2010); and Kemekliene and Watt (2010). 10 Bhattacharyya and Mitra (1990) and Kochhar et. al. (2006).
Draft not for citation and quotation
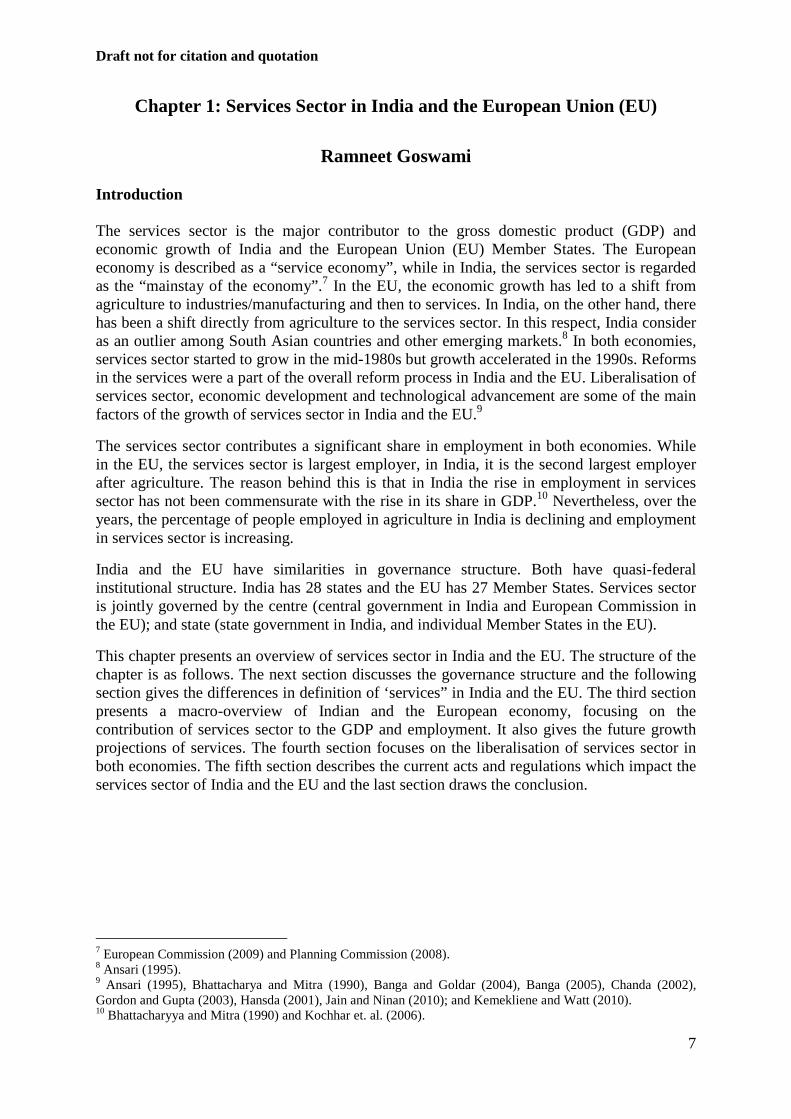
1.1 Governance Structure in India and the EU India has a quasi-federal governance structure and accordsome services sectors are under the jurisdiction of the Central government (Union List), some are under the state governments (State List) and the remaining are under the joint administration of central and state governmencentral level, multiple ministries and government departments regulates the different services sector. For instance, in India, energy is being regulated by Ministry of Power, Ministry of Coal, Ministry of Oil and Natural Gas and Ministry of New and Renewable Energy at the Centre. On the other hand, there are no nodal ministry for some sectors like construction and retail. Professional bodies regulate professions such as doctors, architects and accountants.
Figure 1.1: Services Sector under Different Jurisdictions according to the Constitution
Source: Extracted by author from Mukherjee (2012). Like India, the EU has a quasiis under both the Union and the individual Member States. At the EU level, there are five types of governing institutionsUnion; (3) European Council; (4) European Parliament; and (5) European Court of Justice (see Figure 1.2). The European Commission is the main executive authority of the EU which has legislative as well as administrative powers. The European Commission comprises of 27 Commissioners - one from each Member State policy areas such as foreign affairs, education and transport. The main role of the European Commission is to propose (to Parliament and the Council); implement and enforce EU laws (jointly with the Court of Justice); and to represent the EU at internCouncil of the European Union represents the individual Member States and its role adoption of European laws and concluding/finalising international agreements between the EU and other foreign countries or international oan official EU institution under the Treaty of Lisbon in 2009. The main function of the
11 Kelemen (2006).
•Telecommunications,postal,banking), nationalhighways,
UNION LIST
•Health and relatedservices,agriculture, huntingand
STATE LIST
•Professional serviceskeeping, taxation,architectural,and landscapearchitectural,midwives, nurses, etc.),
CONCURRENT LIST
Draft not for citation and quotation
1.1 Governance Structure in India and the EU
federal governance structure and according to the Constitution of India, some services sectors are under the jurisdiction of the Central government (Union List), some are under the state governments (State List) and the remaining are under the joint administration of central and state governments (Concurrent List) (see Figure 1.1.) At the central level, multiple ministries and government departments regulates the different services sector. For instance, in India, energy is being regulated by Ministry of Power, Ministry of
nd Natural Gas and Ministry of New and Renewable Energy at the Centre. On the other hand, there are no nodal ministry for some sectors like construction and retail. Professional bodies regulate professions such as doctors, architects and accountants.
ure 1.1: Services Sector under Different Jurisdictions according to the Constitution
of India
Extracted by author from Mukherjee (2012).
Like India, the EU has a quasi-federal institutional structure11 and the governance of services the Union and the individual Member States. At the EU level, there are five
types of governing institutions– (1) European Commission; (2) Council of the European Union; (3) European Council; (4) European Parliament; and (5) European Court of Justice
Figure 1.2). The European Commission is the main executive authority of the EU which has legislative as well as administrative powers. The European Commission comprises of 27
one from each Member State - each of whom is responsible for specpolicy areas such as foreign affairs, education and transport. The main role of the European Commission is to propose (to Parliament and the Council); implement and enforce EU laws (jointly with the Court of Justice); and to represent the EU at international negotiations. Council of the European Union represents the individual Member States and its role adoption of European laws and concluding/finalising international agreements between the EU and other foreign countries or international organisations. The European Council became an official EU institution under the Treaty of Lisbon in 2009. The main function of the
postal,broadcasting, financial services(includinghighways,mining services
services, real estate services, retail, servicesandforestry
services (legal, accounting, auditingarchitectural,engineering, integrated engineering,urban
architectural,medical and dental services andservice), education, printing and publishing, electricity
8
ing to the Constitution of India, some services sectors are under the jurisdiction of the Central government (Union List), some are under the state governments (State List) and the remaining are under the joint
ts (Concurrent List) (see Figure 1.1.) At the central level, multiple ministries and government departments regulates the different services sector. For instance, in India, energy is being regulated by Ministry of Power, Ministry of
nd Natural Gas and Ministry of New and Renewable Energy at the Centre. On the other hand, there are no nodal ministry for some sectors like construction and retail. Professional bodies regulate professions such as doctors, architects and accountants.
ure 1.1: Services Sector under Different Jurisdictions according to the Constitution
and the governance of services the Union and the individual Member States. At the EU level, there are five
(1) European Commission; (2) Council of the European Union; (3) European Council; (4) European Parliament; and (5) European Court of Justice
Figure 1.2). The European Commission is the main executive authority of the EU which has legislative as well as administrative powers. The European Commission comprises of 27
each of whom is responsible for specific policy areas such as foreign affairs, education and transport. The main role of the European Commission is to propose (to Parliament and the Council); implement and enforce EU laws
ational negotiations. The Council of the European Union represents the individual Member States and its role includes adoption of European laws and concluding/finalising international agreements between the
rganisations. The European Council became an official EU institution under the Treaty of Lisbon in 2009. The main function of the
(including insurance and
incidental to
and book-urbanplanning
service provided by
Draft not for citation and quotation
9
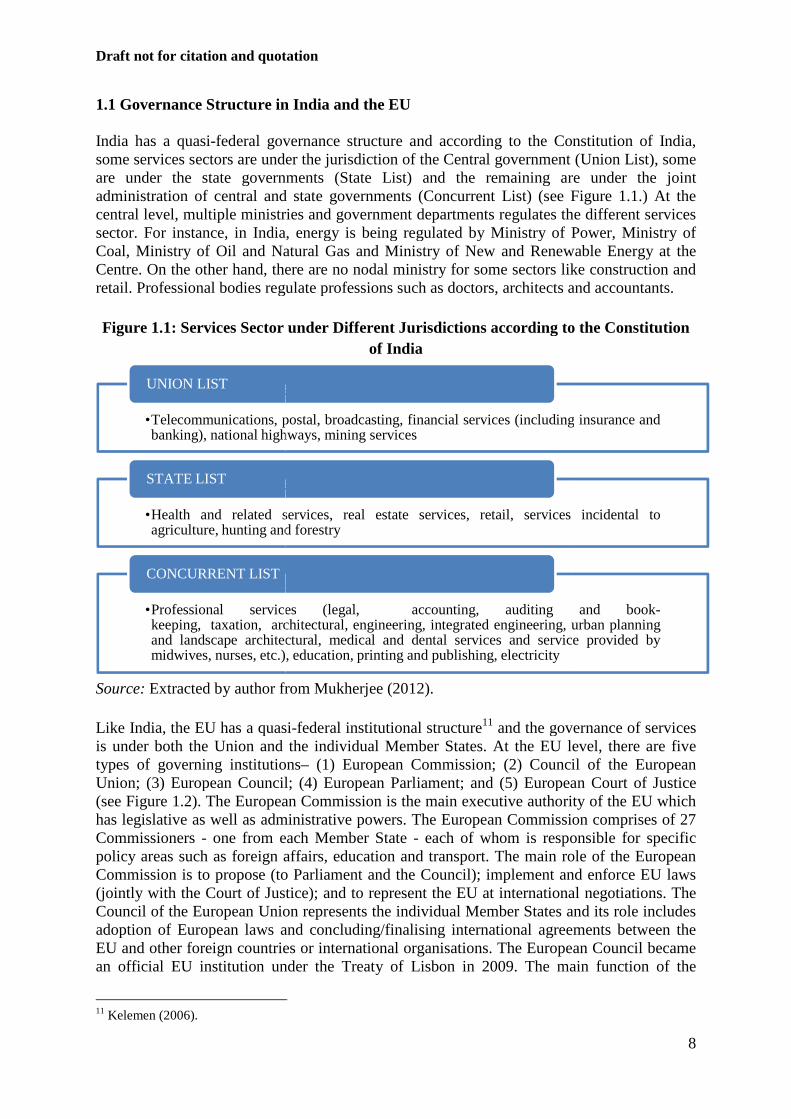
European Council is to set up EU’s policy and resolve issues between different Member States. The European Parliament was established in 1979. It has three main roles: (1) passing European laws (jointly with the Council); (2) exercising democratic supervision over other EU institutions; and (3) adopting or rejecting the EU budget (jointly with the Council). The European Court of Justice ensures that EU legislations are interpreted and applied uniformly in all EU Member States. It also settles legal disputes between EU Member States, EU institutions, businesses and individuals.12 Figure 1.2: Regulatory or Governance Structure in the EU Source: Extracted by author from Figure: EU Institutions, Demuro (2008). In the EU, legislations or regulations are adopted in the form of the EU laws. Every Member State is obliged to implement these laws or legislation in their national law.13 The EU laws can be in the form of:
(a) Regulations: These are the most direct form of EU law that becomes immediately enforceable as law in all Member States simultaneously. Regulations14 override all national laws of Member States dealing with the same subject matter.
(b) Directives: These lay down certain guidelines or end results that must be achieved by every Member State within a given time frame. National authorities have to adapt their laws to meet these goals, but are free to decide how to do so. Generally, Directives are used to bring different national laws into line with each other, and are particularly common in matters affecting the operation of the single market. Directives may concern one or more Member States, or all of them.
(c) Decisions: Decision is a legal instrument, which is addressed to an individual Member State. These are generally passed either by the Council of the European
12 http://europa.eu/about-eu/institutions-bodies/index_en.htm (last accessed on August 16, 2012). 13 http://ec.europa.eu/eu_law/introduction/treaty_en.htm (last accessed on August 17, 2012). 14 For example, REACH (EC 1907/2006) which deals with the Registration, Evaluation, Authorisation and Restriction of Chemical substances.
European Commission
The Council of European Union
European Council
European Court of Justice
European Parliament
EU Institutions
Decision
Guidance
Draft not for citation and quotation
10
Union (sometimes jointly with the European Parliament) or by the European Commission.15
Every individual Member States have freedom to enact acts and regulations related to the services sector. Work permits and visas are under the purview of individual Member States. Due to the state level policy implementations, regulations can vary significantly across Member States. The speed of implementation of liberalisation Directives vary markedly across Member States and the extent of market integration varies across different services sectors. For instance, as of date, while telecommunications and energy have been subjected to full open market competition, postal services remain relatively regulated.16 The Directive on electricity, came into force in February 1999, but five years later DG Energy and Transport (2004) found full competition only in the United Kingdom (UK), Sweden, Finland, Norway and Denmark.17 Similar to the EU, there are differences in implementation of regulation in services across different Indian states. Thus, services markets and regulations in both India and EU is not integrated and this needs to be kept in mind while examining the services sector of the two economies. It is also important to note that services sector is not homogenous and it covers a wide range of activities from the most sophisticated information technology (IT) to simple services provided by informal sector workers. The next sub-section discusses coverage of different services sector in India and the EU. 1.2 Classification of ‘Services’ in India and the EU Services Sector can be classified either by using the country’s own definition or by using the United Nations Central Product Classification (UNCPC). The UNCPC is used as a basis for international negotiations such as the World Trade Organization’s (WTO) General Agreement on Trade in Services (GATS) negotiations. In India the classification of ‘services sector’ is provided by the the National Industrial Classification (NIC) and at present, the NIC 2008 classification is used. In the EU, the classification of ‘services sector’ is based on European Classification of Economic Activities (NACE) classification. At present, NACE revision 2 is used in the EU. Broadly, there are similarities in classification and coverage of services in India and the EU (for details, see Table 1A.1 in Appendix 1A). However, for some services such as wholesale and retail trade and education, EU’s coverage is broader than that of India’s. ‘Construction’ is not included as a services sector under both classifications. In India, disaggregated data for many services is not available. Even where data is available, it suffer from deficiencies related to definition, method of collection, suitability for pricing, and construction of indices, etc.18 In the past few years, different government departments such as Central Statistical Organisation (CSO), National Sample Survey Organisation (NSSO) under the Ministry of Statistics and Programme Implementation (MOSPI); and the Reserve Bank of India (RBI) have been trying to collect and collate data at the disaggregated
15 http://ec.europa.eu/eu_law/introduction/what_decision_en.htm (last accessed on August 17, 2012). 16 Raza et al. (2004). 17 Keune et. al (2008). 18 CSO (2012).
Draft not for citation and quotation
11
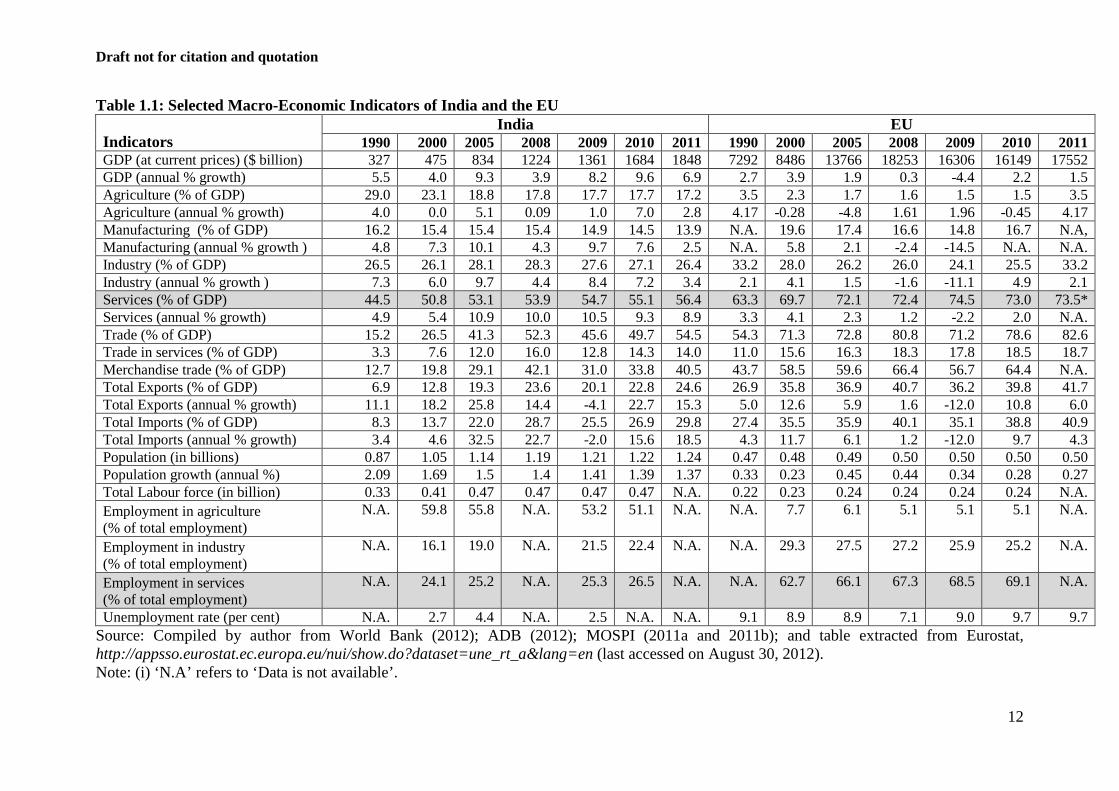
level. However, since many services such as retail and construction are largely in the non-corporate sector (the informal or unorganised sector), there is misreporting and underreporting of data. In the EU, sector specific data on different services sector is provided by Eurostat. The data is available under ‘Structural business statistics (SBS)’19 according to the NACE classification. The SBS does not cover education and health sector. Thus, it suffers from the lack of comprehensive coverage. Nevertheless, since most of the services sectors in EU are in the corporate sector unlike India and since the compilation of data is uniform across all EU Member States, it is expected that there are lesser chances of mismatching or misreporting of data. The next section presents the overview of the services sector in India and EU. 1.3 Overview of Services Sector in India and the EU In 2011, the EU was the largest economy in the world with a GDP of $17.5 trillion whereas India had the 11th rank with a GDP of $1.9 trillion.20 Among EU Member States, Germany was ranked as fourth largest economy with a share of 5.1 per cent of the world’s GDP, followed by France (5th, 4 per cent), the UK (7th, 3.5 per cent) and Italy (8th, 3.2 per cent).21 Although, in the volume, the EU’s GDP is almost 9 times larger than India’s GDP; India’s GDP is growing at a higher rate compared to the EU. In 2011, India’s GDP grew at the rate of 7 per cent compared to 1.5 per cent growth in EU’s GDP. India has a larger labour force compared to the EU - 0.47 billion labourers in India and 0.24 billion in the EU in 2010 (see Table 1.1).
19 The data is available at the link http://epp.eurostat.ec.europa.eu/portal/page/portal/european_business/data/database (last accessed on August 29, 2012). 20 IMF (2012). 21 Compiled and calculated by author from IMF (2012).
Draft not for citation and quotation
12
Table 1.1: Selected Macro-Economic Indicators of India and the EU
Indicators India EU
1990 2000 2005 2008 2009 2010 2011 1990 2000 2005 2008 2009 2010 2011 GDP (at current prices) ($ billion) 327 475 834 1224 1361 1684 1848 7292 8486 13766 18253 16306 16149 17552 GDP (annual % growth) 5.5 4.0 9.3 3.9 8.2 9.6 6.9 2.7 3.9 1.9 0.3 -4.4 2.2 1.5 Agriculture (% of GDP) 29.0 23.1 18.8 17.8 17.7 17.7 17.2 3.5 2.3 1.7 1.6 1.5 1.5 3.5 Agriculture (annual % growth) 4.0 0.0 5.1 0.09 1.0 7.0 2.8 4.17 -0.28 -4.8 1.61 1.96 -0.45 4.17 Manufacturing (% of GDP) 16.2 15.4 15.4 15.4 14.9 14.5 13.9 N.A. 19.6 17.4 16.6 14.8 16.7 N.A, Manufacturing (annual % growth ) 4.8 7.3 10.1 4.3 9.7 7.6 2.5 N.A. 5.8 2.1 -2.4 -14.5 N.A. N.A. Industry (% of GDP) 26.5 26.1 28.1 28.3 27.6 27.1 26.4 33.2 28.0 26.2 26.0 24.1 25.5 33.2 Industry (annual % growth ) 7.3 6.0 9.7 4.4 8.4 7.2 3.4 2.1 4.1 1.5 -1.6 -11.1 4.9 2.1 Services (% of GDP) 44.5 50.8 53.1 53.9 54.7 55.1 56.4 63.3 69.7 72.1 72.4 74.5 73.0 73.5* Services (annual % growth) 4.9 5.4 10.9 10.0 10.5 9.3 8.9 3.3 4.1 2.3 1.2 -2.2 2.0 N.A. Trade (% of GDP) 15.2 26.5 41.3 52.3 45.6 49.7 54.5 54.3 71.3 72.8 80.8 71.2 78.6 82.6 Trade in services (% of GDP) 3.3 7.6 12.0 16.0 12.8 14.3 14.0 11.0 15.6 16.3 18.3 17.8 18.5 18.7 Merchandise trade (% of GDP) 12.7 19.8 29.1 42.1 31.0 33.8 40.5 43.7 58.5 59.6 66.4 56.7 64.4 N.A. Total Exports (% of GDP) 6.9 12.8 19.3 23.6 20.1 22.8 24.6 26.9 35.8 36.9 40.7 36.2 39.8 41.7 Total Exports (annual % growth) 11.1 18.2 25.8 14.4 -4.1 22.7 15.3 5.0 12.6 5.9 1.6 -12.0 10.8 6.0 Total Imports (% of GDP) 8.3 13.7 22.0 28.7 25.5 26.9 29.8 27.4 35.5 35.9 40.1 35.1 38.8 40.9 Total Imports (annual % growth) 3.4 4.6 32.5 22.7 -2.0 15.6 18.5 4.3 11.7 6.1 1.2 -12.0 9.7 4.3 Population (in billions) 0.87 1.05 1.14 1.19 1.21 1.22 1.24 0.47 0.48 0.49 0.50 0.50 0.50 0.50 Population growth (annual %) 2.09 1.69 1.5 1.4 1.41 1.39 1.37 0.33 0.23 0.45 0.44 0.34 0.28 0.27 Total Labour force (in billion) 0.33 0.41 0.47 0.47 0.47 0.47 N.A. 0.22 0.23 0.24 0.24 0.24 0.24 N.A. Employment in agriculture (% of total employment)
N.A.
59.8
55.8 N.A.
53.2 51.1
N.A.
N.A.
7.7
6.1 5.1 5.1
5.1
N.A.
Employment in industry (% of total employment)
N.A.
16.1
19.0 N.A.
21.5 22.4
N.A.
N.A.
29.3
27.5 27.2 25.9
25.2
N.A.
Employment in services (% of total employment)
N.A.
24.1
25.2 N.A. 25.3 26.5
N.A.
N.A.
62.7
66.1 67.3 68.5
69.1
N.A.
Unemployment rate (per cent) N.A. 2.7 4.4 N.A. 2.5 N.A. N.A. 9.1 8.9 8.9 7.1 9.0 9.7 9.7 Source: Compiled by author from World Bank (2012); ADB (2012); MOSPI (2011a and 2011b); and table extracted from Eurostat, http://appsso.eurostat.ec.europa.eu/nui/show.do?dataset=une_rt_a&lang=en (last accessed on August 30, 2012). Note: (i) ‘N.A’ refers to ‘Data is not available’.
Draft not for citation and quotation
13
1.3.1 Contribution of Services Sector to GDP of India and the EU
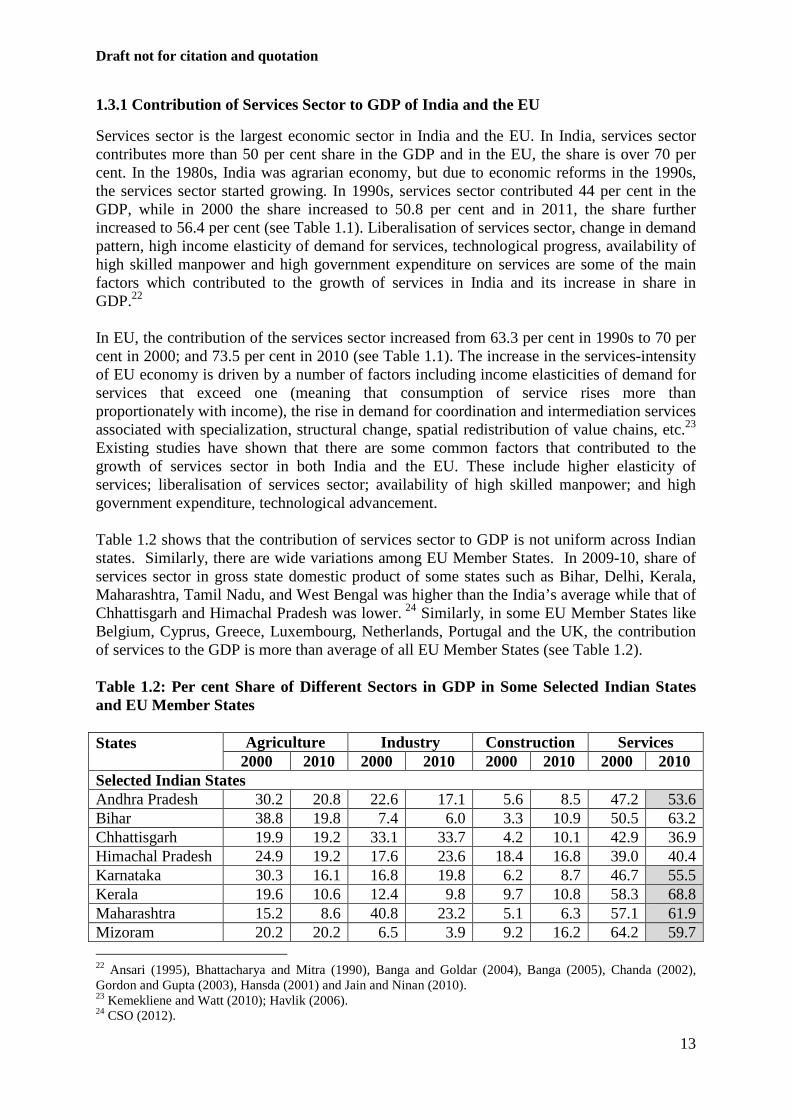
Services sector is the largest economic sector in India and the EU. In India, services sector contributes more than 50 per cent share in the GDP and in the EU, the share is over 70 per cent. In the 1980s, India was agrarian economy, but due to economic reforms in the 1990s, the services sector started growing. In 1990s, services sector contributed 44 per cent in the GDP, while in 2000 the share increased to 50.8 per cent and in 2011, the share further increased to 56.4 per cent (see Table 1.1). Liberalisation of services sector, change in demand pattern, high income elasticity of demand for services, technological progress, availability of high skilled manpower and high government expenditure on services are some of the main factors which contributed to the growth of services in India and its increase in share in GDP.22 In EU, the contribution of the services sector increased from 63.3 per cent in 1990s to 70 per cent in 2000; and 73.5 per cent in 2010 (see Table 1.1). The increase in the services-intensity of EU economy is driven by a number of factors including income elasticities of demand for services that exceed one (meaning that consumption of service rises more than proportionately with income), the rise in demand for coordination and intermediation services associated with specialization, structural change, spatial redistribution of value chains, etc.23 Existing studies have shown that there are some common factors that contributed to the growth of services sector in both India and the EU. These include higher elasticity of services; liberalisation of services sector; availability of high skilled manpower; and high government expenditure, technological advancement. Table 1.2 shows that the contribution of services sector to GDP is not uniform across Indian states. Similarly, there are wide variations among EU Member States. In 2009-10, share of services sector in gross state domestic product of some states such as Bihar, Delhi, Kerala, Maharashtra, Tamil Nadu, and West Bengal was higher than the India’s average while that of Chhattisgarh and Himachal Pradesh was lower. 24 Similarly, in some EU Member States like Belgium, Cyprus, Greece, Luxembourg, Netherlands, Portugal and the UK, the contribution of services to the GDP is more than average of all EU Member States (see Table 1.2). Table 1.2: Per cent Share of Different Sectors in GDP in Some Selected Indian States and EU Member States States
Agriculture Industry Construction Services 2000 2010 2000 2010 2000 2010 2000 2010
Selected Indian States Andhra Pradesh 30.2 20.8 22.6 17.1 5.6 8.5 47.2 53.6 Bihar 38.8 19.8 7.4 6.0 3.3 10.9 50.5 63.2 Chhattisgarh 19.9 19.2 33.1 33.7 4.2 10.1 42.9 36.9 Himachal Pradesh 24.9 19.2 17.6 23.6 18.4 16.8 39.0 40.4 Karnataka 30.3 16.1 16.8 19.8 6.2 8.7 46.7 55.5 Kerala 19.6 10.6 12.4 9.8 9.7 10.8 58.3 68.8 Maharashtra 15.2 8.6 40.8 23.2 5.1 6.3 57.1 61.9 Mizoram 20.2 20.2 6.5 3.9 9.2 16.2 64.2 59.7 22 Ansari (1995), Bhattacharya and Mitra (1990), Banga and Goldar (2004), Banga (2005), Chanda (2002), Gordon and Gupta (2003), Hansda (2001) and Jain and Ninan (2010). 23 Kemekliene and Watt (2010); Havlik (2006). 24 CSO (2012).
Draft not for citation and quotation
14
States
Agriculture Industry Construction Services 2000 2010 2000 2010 2000 2010 2000 2010
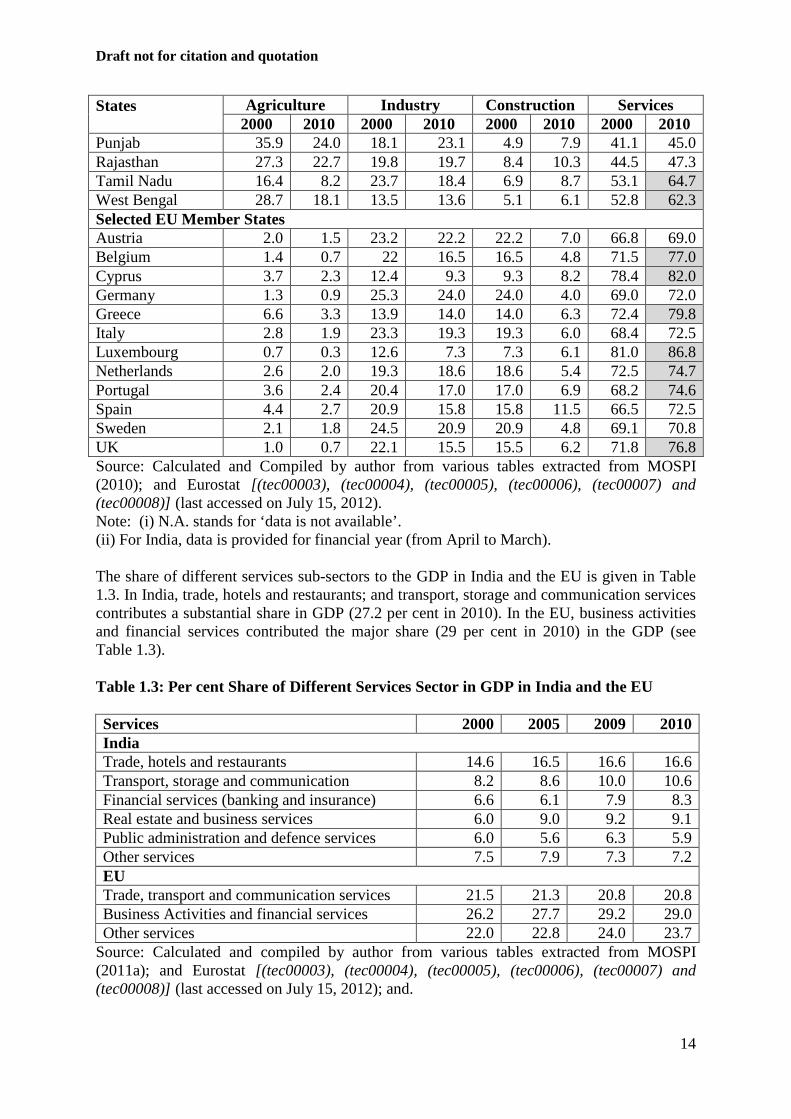
Punjab 35.9 24.0 18.1 23.1 4.9 7.9 41.1 45.0 Rajasthan 27.3 22.7 19.8 19.7 8.4 10.3 44.5 47.3 Tamil Nadu 16.4 8.2 23.7 18.4 6.9 8.7 53.1 64.7 West Bengal 28.7 18.1 13.5 13.6 5.1 6.1 52.8 62.3 Selected EU Member States Austria 2.0 1.5 23.2 22.2 22.2 7.0 66.8 69.0 Belgium 1.4 0.7 22 16.5 16.5 4.8 71.5 77.0 Cyprus 3.7 2.3 12.4 9.3 9.3 8.2 78.4 82.0 Germany 1.3 0.9 25.3 24.0 24.0 4.0 69.0 72.0 Greece 6.6 3.3 13.9 14.0 14.0 6.3 72.4 79.8 Italy 2.8 1.9 23.3 19.3 19.3 6.0 68.4 72.5 Luxembourg 0.7 0.3 12.6 7.3 7.3 6.1 81.0 86.8 Netherlands 2.6 2.0 19.3 18.6 18.6 5.4 72.5 74.7 Portugal 3.6 2.4 20.4 17.0 17.0 6.9 68.2 74.6 Spain 4.4 2.7 20.9 15.8 15.8 11.5 66.5 72.5 Sweden 2.1 1.8 24.5 20.9 20.9 4.8 69.1 70.8 UK 1.0 0.7 22.1 15.5 15.5 6.2 71.8 76.8 Source: Calculated and Compiled by author from various tables extracted from MOSPI (2010); and Eurostat [(tec00003), (tec00004), (tec00005), (tec00006), (tec00007) and (tec00008)] (last accessed on July 15, 2012). Note: (i) N.A. stands for ‘data is not available’. (ii) For India, data is provided for financial year (from April to March). The share of different services sub-sectors to the GDP in India and the EU is given in Table 1.3. In India, trade, hotels and restaurants; and transport, storage and communication services contributes a substantial share in GDP (27.2 per cent in 2010). In the EU, business activities and financial services contributed the major share (29 per cent in 2010) in the GDP (see Table 1.3). Table 1.3: Per cent Share of Different Services Sector in GDP in India and the EU Services 2000 2005 2009 2010 India Trade, hotels and restaurants 14.6 16.5 16.6 16.6 Transport, storage and communication 8.2 8.6 10.0 10.6 Financial services (banking and insurance) 6.6 6.1 7.9 8.3 Real estate and business services 6.0 9.0 9.2 9.1 Public administration and defence services 6.0 5.6 6.3 5.9 Other services 7.5 7.9 7.3 7.2 EU Trade, transport and communication services 21.5 21.3 20.8 20.8 Business Activities and financial services 26.2 27.7 29.2 29.0 Other services 22.0 22.8 24.0 23.7
Source: Calculated and compiled by author from various tables extracted from MOSPI (2011a); and Eurostat [(tec00003), (tec00004), (tec00005), (tec00006), (tec00007) and (tec00008)] (last accessed on July 15, 2012); and.
Draft not for citation and quotation
15
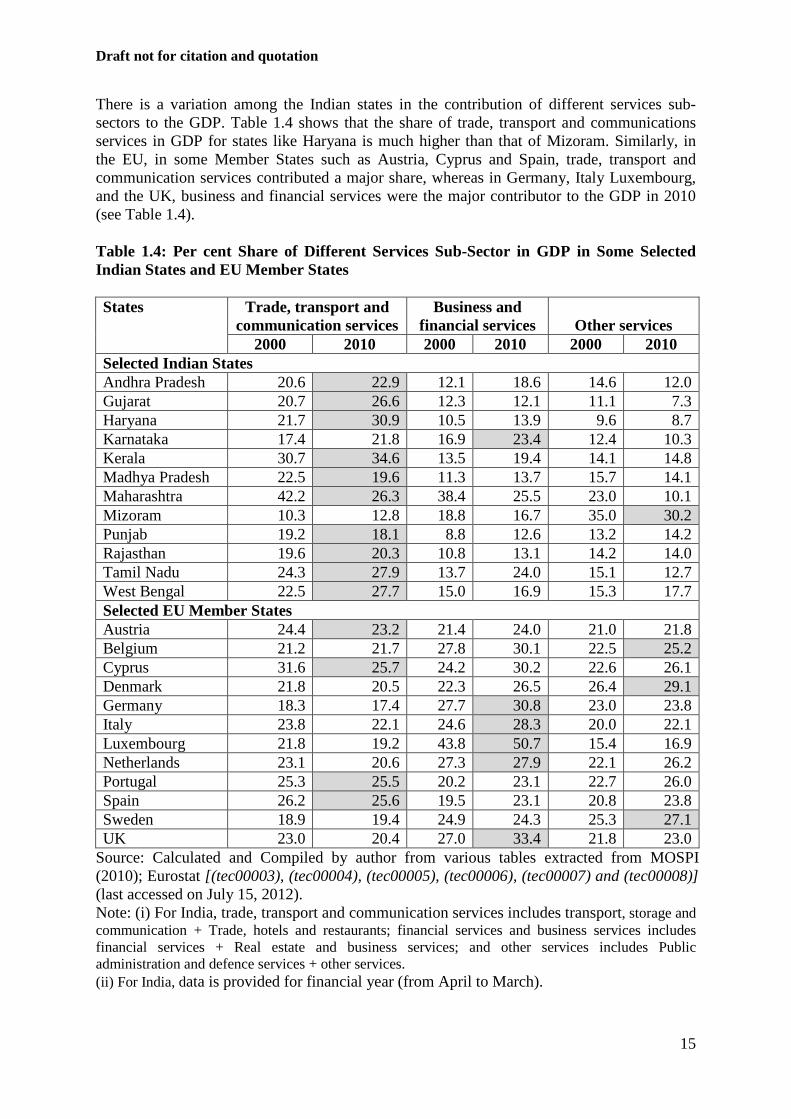
There is a variation among the Indian states in the contribution of different services sub-sectors to the GDP. Table 1.4 shows that the share of trade, transport and communications services in GDP for states like Haryana is much higher than that of Mizoram. Similarly, in the EU, in some Member States such as Austria, Cyprus and Spain, trade, transport and communication services contributed a major share, whereas in Germany, Italy Luxembourg, and the UK, business and financial services were the major contributor to the GDP in 2010 (see Table 1.4). Table 1.4: Per cent Share of Different Services Sub-Sector in GDP in Some Selected Indian States and EU Member States States Trade, transport and
communication services Business and
financial services Other services 2000 2010 2000 2010 2000 2010
Selected Indian States Andhra Pradesh 20.6 22.9 12.1 18.6 14.6 12.0 Gujarat 20.7 26.6 12.3 12.1 11.1 7.3 Haryana 21.7 30.9 10.5 13.9 9.6 8.7 Karnataka 17.4 21.8 16.9 23.4 12.4 10.3 Kerala 30.7 34.6 13.5 19.4 14.1 14.8 Madhya Pradesh 22.5 19.6 11.3 13.7 15.7 14.1 Maharashtra 42.2 26.3 38.4 25.5 23.0 10.1 Mizoram 10.3 12.8 18.8 16.7 35.0 30.2 Punjab 19.2 18.1 8.8 12.6 13.2 14.2 Rajasthan 19.6 20.3 10.8 13.1 14.2 14.0 Tamil Nadu 24.3 27.9 13.7 24.0 15.1 12.7 West Bengal 22.5 27.7 15.0 16.9 15.3 17.7 Selected EU Member States Austria 24.4 23.2 21.4 24.0 21.0 21.8 Belgium 21.2 21.7 27.8 30.1 22.5 25.2 Cyprus 31.6 25.7 24.2 30.2 22.6 26.1 Denmark 21.8 20.5 22.3 26.5 26.4 29.1 Germany 18.3 17.4 27.7 30.8 23.0 23.8 Italy 23.8 22.1 24.6 28.3 20.0 22.1 Luxembourg 21.8 19.2 43.8 50.7 15.4 16.9 Netherlands 23.1 20.6 27.3 27.9 22.1 26.2 Portugal 25.3 25.5 20.2 23.1 22.7 26.0 Spain 26.2 25.6 19.5 23.1 20.8 23.8 Sweden 18.9 19.4 24.9 24.3 25.3 27.1 UK 23.0 20.4 27.0 33.4 21.8 23.0
Source: Calculated and Compiled by author from various tables extracted from MOSPI (2010); Eurostat [(tec00003), (tec00004), (tec00005), (tec00006), (tec00007) and (tec00008)] (last accessed on July 15, 2012). Note: (i) For India, trade, transport and communication services includes transport, storage and communication + Trade, hotels and restaurants; financial services and business services includes financial services + Real estate and business services; and other services includes Public administration and defence services + other services. (ii) For India, data is provided for financial year (from April to March).
Draft not for citation and quotation
16
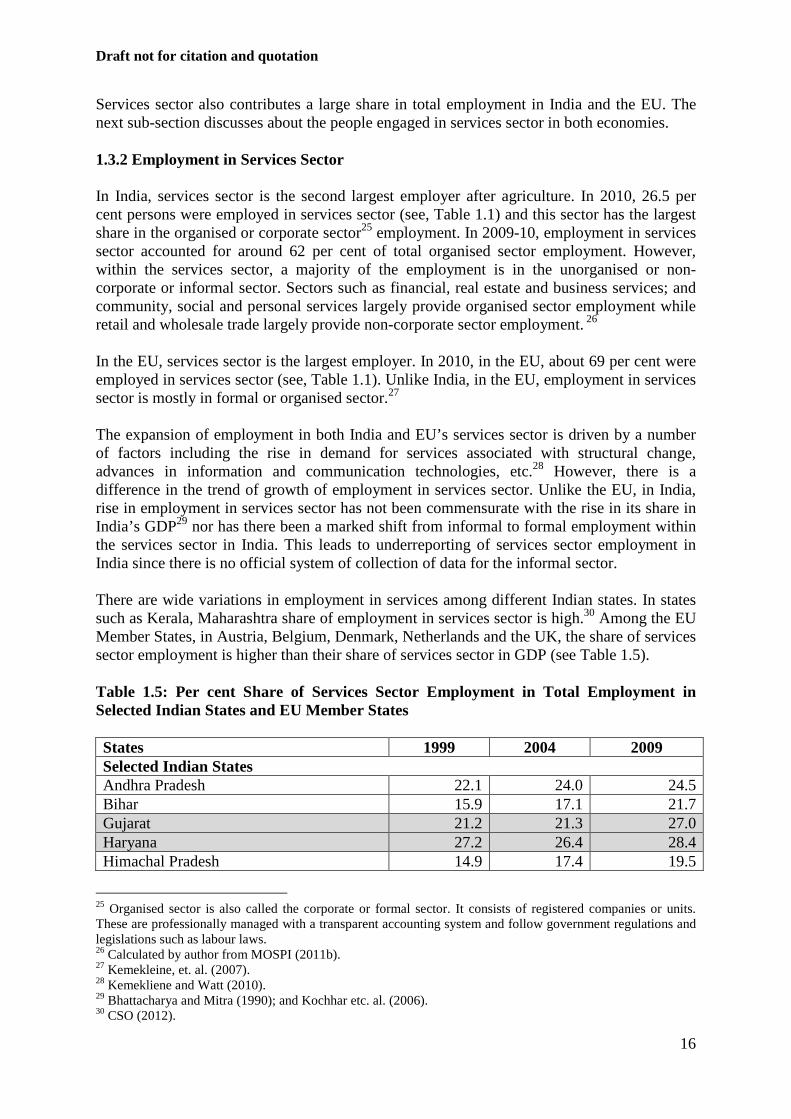
Services sector also contributes a large share in total employment in India and the EU. The next sub-section discusses about the people engaged in services sector in both economies. 1.3.2 Employment in Services Sector In India, services sector is the second largest employer after agriculture. In 2010, 26.5 per cent persons were employed in services sector (see, Table 1.1) and this sector has the largest share in the organised or corporate sector25 employment. In 2009-10, employment in services sector accounted for around 62 per cent of total organised sector employment. However, within the services sector, a majority of the employment is in the unorganised or non-corporate or informal sector. Sectors such as financial, real estate and business services; and community, social and personal services largely provide organised sector employment while retail and wholesale trade largely provide non-corporate sector employment. 26 In the EU, services sector is the largest employer. In 2010, in the EU, about 69 per cent were employed in services sector (see, Table 1.1). Unlike India, in the EU, employment in services sector is mostly in formal or organised sector.27 The expansion of employment in both India and EU’s services sector is driven by a number of factors including the rise in demand for services associated with structural change, advances in information and communication technologies, etc.28 However, there is a difference in the trend of growth of employment in services sector. Unlike the EU, in India, rise in employment in services sector has not been commensurate with the rise in its share in India’s GDP29 nor has there been a marked shift from informal to formal employment within the services sector in India. This leads to underreporting of services sector employment in India since there is no official system of collection of data for the informal sector. There are wide variations in employment in services among different Indian states. In states such as Kerala, Maharashtra share of employment in services sector is high.30 Among the EU Member States, in Austria, Belgium, Denmark, Netherlands and the UK, the share of services sector employment is higher than their share of services sector in GDP (see Table 1.5). Table 1.5: Per cent Share of Services Sector Employment in Total Employment in Selected Indian States and EU Member States States 1999 2004 2009 Selected Indian States Andhra Pradesh 22.1 24.0 24.5 Bihar 15.9 17.1 21.7 Gujarat 21.2 21.3 27.0 Haryana 27.2 26.4 28.4 Himachal Pradesh 14.9 17.4 19.5
25 Organised sector is also called the corporate or formal sector. It consists of registered companies or units. These are professionally managed with a transparent accounting system and follow government regulations and legislations such as labour laws. 26 Calculated by author from MOSPI (2011b). 27 Kemekleine, et. al. (2007). 28 Kemekliene and Watt (2010). 29 Bhattacharya and Mitra (1990); and Kochhar etc. al. (2006). 30 CSO (2012).
Draft not for citation and quotation
17
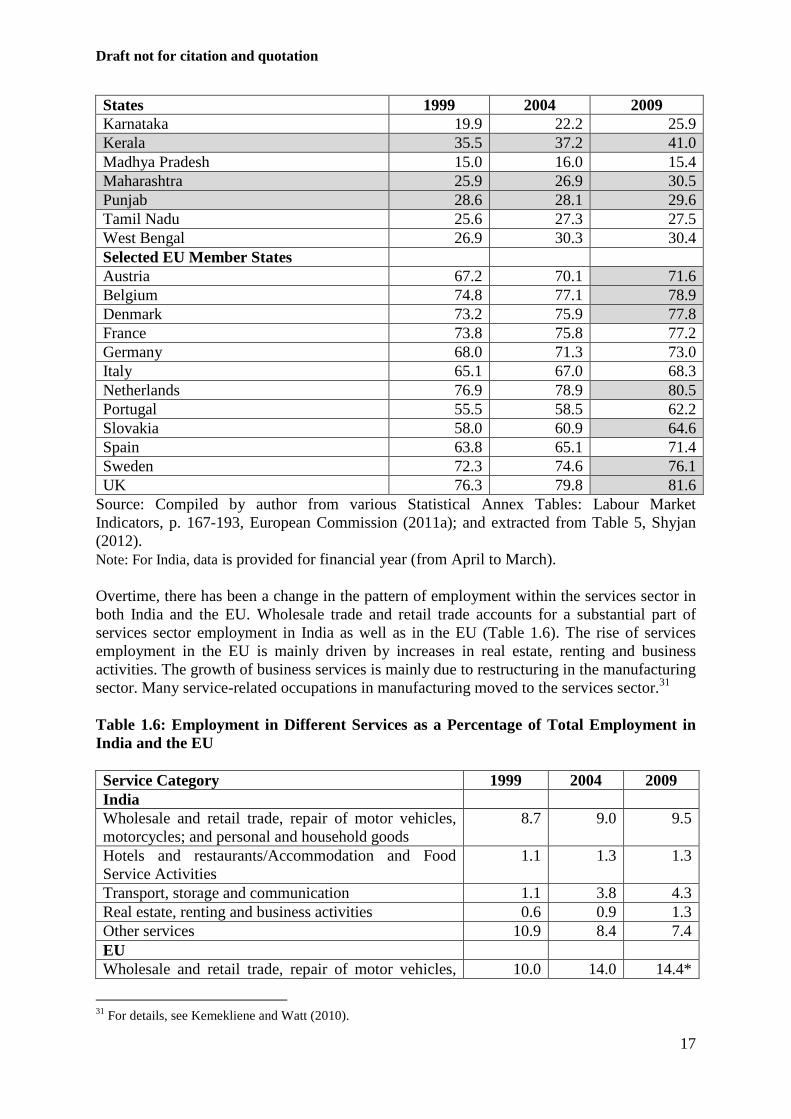
States 1999 2004 2009 Karnataka 19.9 22.2 25.9 Kerala 35.5 37.2 41.0 Madhya Pradesh 15.0 16.0 15.4 Maharashtra 25.9 26.9 30.5 Punjab 28.6 28.1 29.6 Tamil Nadu 25.6 27.3 27.5 West Bengal 26.9 30.3 30.4 Selected EU Member States Austria 67.2 70.1 71.6 Belgium 74.8 77.1 78.9 Denmark 73.2 75.9 77.8 France 73.8 75.8 77.2 Germany 68.0 71.3 73.0 Italy 65.1 67.0 68.3 Netherlands 76.9 78.9 80.5 Portugal 55.5 58.5 62.2 Slovakia 58.0 60.9 64.6 Spain 63.8 65.1 71.4 Sweden 72.3 74.6 76.1 UK 76.3 79.8 81.6
Source: Compiled by author from various Statistical Annex Tables: Labour Market Indicators, p. 167-193, European Commission (2011a); and extracted from Table 5, Shyjan (2012). Note: For India, data is provided for financial year (from April to March). Overtime, there has been a change in the pattern of employment within the services sector in both India and the EU. Wholesale trade and retail trade accounts for a substantial part of services sector employment in India as well as in the EU (Table 1.6). The rise of services employment in the EU is mainly driven by increases in real estate, renting and business activities. The growth of business services is mainly due to restructuring in the manufacturing sector. Many service-related occupations in manufacturing moved to the services sector.31 Table 1.6: Employment in Different Services as a Percentage of Total Employment in India and the EU Service Category 1999 2004 2009 India Wholesale and retail trade, repair of motor vehicles, motorcycles; and personal and household goods
8.7
9.0
9.5
Hotels and restaurants/Accommodation and Food Service Activities
1.1
1.3
1.3
Transport, storage and communication 1.1 3.8 4.3 Real estate, renting and business activities 0.6 0.9 1.3 Other services 10.9 8.4 7.4 EU Wholesale and retail trade, repair of motor vehicles, 10.0 14.0 14.4*
31 For details, see Kemekliene and Watt (2010).
Draft not for citation and quotation
18
Service Category 1999 2004 2009 motorcycles; and personal and household goods Hotels and restaurants/Accommodation and Food Service Activities
3.5
4.0
4.2*
Transportation and storage; and communication 4.8 5.5 5.4* Real estate, renting activities; and professional, scientific and technical activities/business activities
8.3
10.7
12.3*
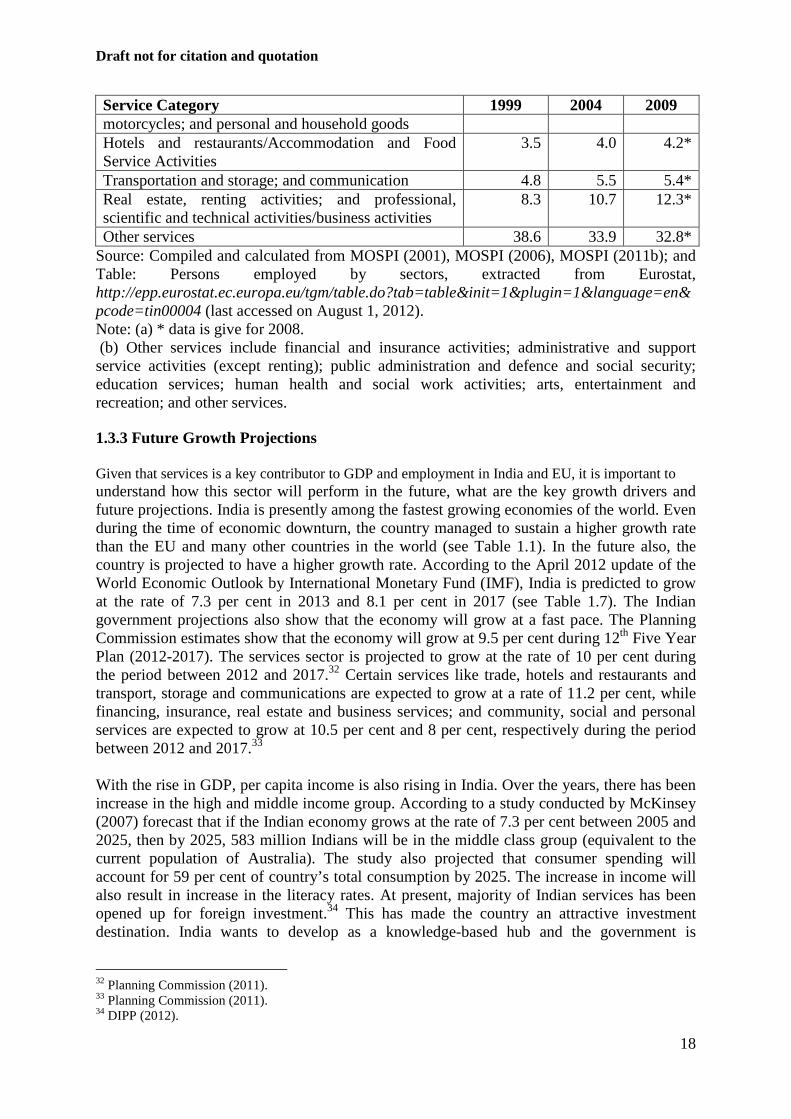
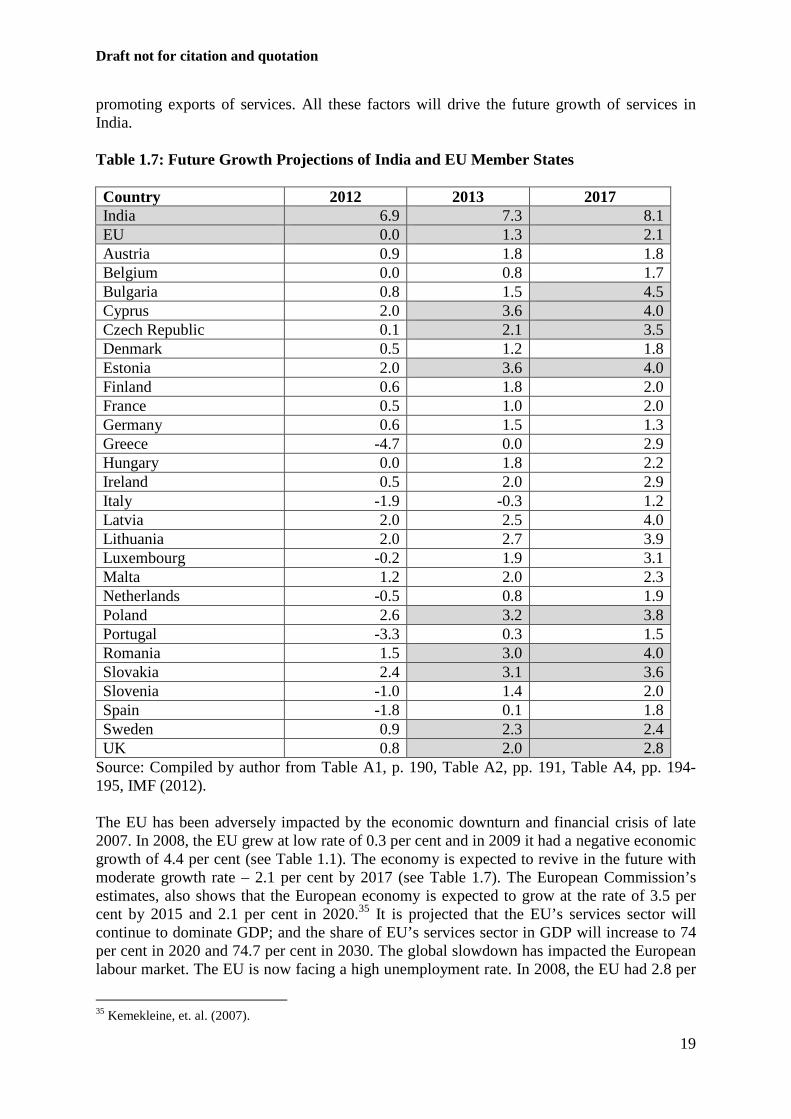
Other services 38.6 33.9 32.8* Source: Compiled and calculated from MOSPI (2001), MOSPI (2006), MOSPI (2011b); and Table: Persons employed by sectors, extracted from Eurostat, http://epp.eurostat.ec.europa.eu/tgm/table.do?tab=table&init=1&plugin=1&language=en&pcode=tin00004 (last accessed on August 1, 2012). Note: (a) * data is give for 2008. (b) Other services include financial and insurance activities; administrative and support service activities (except renting); public administration and defence and social security; education services; human health and social work activities; arts, entertainment and recreation; and other services. 1.3.3 Future Growth Projections Given that services is a key contributor to GDP and employment in India and EU, it is important to understand how this sector will perform in the future, what are the key growth drivers and future projections. India is presently among the fastest growing economies of the world. Even during the time of economic downturn, the country managed to sustain a higher growth rate than the EU and many other countries in the world (see Table 1.1). In the future also, the country is projected to have a higher growth rate. According to the April 2012 update of the World Economic Outlook by International Monetary Fund (IMF), India is predicted to grow at the rate of 7.3 per cent in 2013 and 8.1 per cent in 2017 (see Table 1.7). The Indian government projections also show that the economy will grow at a fast pace. The Planning Commission estimates show that the economy will grow at 9.5 per cent during 12th Five Year Plan (2012-2017). The services sector is projected to grow at the rate of 10 per cent during the period between 2012 and 2017.32 Certain services like trade, hotels and restaurants and transport, storage and communications are expected to grow at a rate of 11.2 per cent, while financing, insurance, real estate and business services; and community, social and personal services are expected to grow at 10.5 per cent and 8 per cent, respectively during the period between 2012 and 2017.33 With the rise in GDP, per capita income is also rising in India. Over the years, there has been increase in the high and middle income group. According to a study conducted by McKinsey (2007) forecast that if the Indian economy grows at the rate of 7.3 per cent between 2005 and 2025, then by 2025, 583 million Indians will be in the middle class group (equivalent to the current population of Australia). The study also projected that consumer spending will account for 59 per cent of country’s total consumption by 2025. The increase in income will also result in increase in the literacy rates. At present, majority of Indian services has been opened up for foreign investment.34 This has made the country an attractive investment destination. India wants to develop as a knowledge-based hub and the government is
32 Planning Commission (2011). 33 Planning Commission (2011). 34 DIPP (2012).
Draft not for citation and quotation
19
promoting exports of services. All these factors will drive the future growth of services in India. Table 1.7: Future Growth Projections of India and EU Member States Country 2012 2013 2017 India 6.9 7.3 8.1 EU 0.0 1.3 2.1 Austria 0.9 1.8 1.8 Belgium 0.0 0.8 1.7 Bulgaria 0.8 1.5 4.5 Cyprus 2.0 3.6 4.0 Czech Republic 0.1 2.1 3.5 Denmark 0.5 1.2 1.8 Estonia 2.0 3.6 4.0 Finland 0.6 1.8 2.0 France 0.5 1.0 2.0 Germany 0.6 1.5 1.3 Greece -4.7 0.0 2.9 Hungary 0.0 1.8 2.2 Ireland 0.5 2.0 2.9 Italy -1.9 -0.3 1.2 Latvia 2.0 2.5 4.0 Lithuania 2.0 2.7 3.9 Luxembourg -0.2 1.9 3.1 Malta 1.2 2.0 2.3 Netherlands -0.5 0.8 1.9 Poland 2.6 3.2 3.8 Portugal -3.3 0.3 1.5 Romania 1.5 3.0 4.0 Slovakia 2.4 3.1 3.6 Slovenia -1.0 1.4 2.0 Spain -1.8 0.1 1.8 Sweden 0.9 2.3 2.4 UK 0.8 2.0 2.8
Source: Compiled by author from Table A1, p. 190, Table A2, pp. 191, Table A4, pp. 194-195, IMF (2012). The EU has been adversely impacted by the economic downturn and financial crisis of late 2007. In 2008, the EU grew at low rate of 0.3 per cent and in 2009 it had a negative economic growth of 4.4 per cent (see Table 1.1). The economy is expected to revive in the future with moderate growth rate – 2.1 per cent by 2017 (see Table 1.7). The European Commission’s estimates, also shows that the European economy is expected to grow at the rate of 3.5 per cent by 2015 and 2.1 per cent in 2020.35 It is projected that the EU’s services sector will continue to dominate GDP; and the share of EU’s services sector in GDP will increase to 74 per cent in 2020 and 74.7 per cent in 2030. The global slowdown has impacted the European labour market. The EU is now facing a high unemployment rate. In 2008, the EU had 2.8 per
35 Kemekleine, et. al. (2007).
Draft not for citation and quotation
20
cent of unemployment rate which increased to 9 per cent in 2009 and 9.7 per cent in 2010 (see Table 1.1).36 The future GDP growth will differ across EU Member State (see Table 1.7). While some Member States such as Cyprus, Estonia and Romania are predicted to grow at the rate of 4 to 4.5 per cent, other Member States such as Czech Republic, Poland, Slovakia, Sweden and the UK are predicted a growth rate ranging from 2 per cent to 4 per cent by 2017 (see Table 1.7). 1.4 Services Sector Liberalisation and Future Regulations In India and the EU, reforms in services started in the 1980s but gained momentum in the 1990s. In both economies the reform process is still on-going. The main elements of the reforms in India which impacted the services sector were delicensing, dismantling of public monopoly in sectors like air transport, telecommunications, and financial services, opening up of various services sectors (including banking, insurance, telecommunications, broadcasting, transport, health and education) for foreign investments and streamlining of the approval procedures. Except for a few services sectors such as multi-brand retail, legal, postal, banking, insurance and railways where there are full or partial FDI restrictions, almost all the other services sectors have been opened up for foreign investment in a phased manner. Public-private partnerships have been encouraged in several sectors, especially infrastructure services, to improve efficiency, productivity, quality of services and global competitiveness. India does not have a comprehensive policy or regulation for the services sector. Different services sectors are regulated by sector specific laws and regulations. For instance, energy is being regulated by Coal Mines (Nationalization) Act, 1973; Petroleum and Natural Gas Regulatory Board (PNGRB) Act, 2006; and Electricity Act, 2003, among others. Apart from these sector-specific regulations, the services sector is also impacted by other regulations such as the Company Act (1956) which lays down conditions for establishing a company. The EU, on the other side, started liberalisation and privatisation in 1980s. In Central and Eastern Europe, the formal state-socialist countries turned to capitalism at the end of the 1980s, resulting in the rapid liberalisation and privatisation of state-owned enterprises. In Western Europe, the UK under the Prime Minister Margaret Thatcher introduced economic liberalisation and privatisation between the end of the 1970s and the early 1990s. Other Western European countries followed this trend to a varying degree.37 Like India, the EU’s services sector market is not integrated. However, unlike India, the EU has a comprehensive services sector policy to integrate the services market. The main aim of the ‘Directive on Services (2006/123/EC)’ is to harmonise or create a single market for the services sector across EU Member States. Apart from this, there are sector-specific Directives for sectors like telecommunications and broadcasting, transport, electricity and gas and postal services. Directives relating to movement of people such as the Blue Card Directive (2009/50/EC) and Single Permit Directive (2011/98/EU) affect the services sector in EU and impact the abilities of third country nationals to provide services in the EU Member States. The details on the some important EU Directives relating to the services sector are given in Appendix 1B.
36Figure for 2008 is extracted from http://appsso.eurostat.ec.europa.eu/nui/show.do?dataset=une_rt_a&lang=en (last accessed on August 30, 2012). 37 Keune et. al (2008).
Draft not for citation and quotation
21
Since the services sector is evolving, the Indian government is in process of implementing different reforms in services sector to facilitate its growth and attract foreign and private investments. These include (a) liberalising the FDI restrictions in sectors such as retail insurance and air transport (b) setting up of regulatory framework and independent regulators in sectors such as coal, railways and postal services which are presently public monopolies but may be privatised in the future (c) implementing new regulations in new services such as direct selling, express delivery services, and cloud computing that have not been covered under existing regulation (d) amending outdated regulations in sectors like postal services. The Indian government is also in the process of introducing many new bills such as the Companies Bill, 2009 and Direct Taxes Code Bill, 2010; which will impact the services sector. As in the case of India, the EU is also in the process of implementing future regulations which are likely to affect the services sector. In 2010 the EU came up with a ten year growth strategy – “Europe 2020 Strategy” which focused employment; research and innovation; education; poverty reduction; and climate/energy and this have implications on the services sector. The strategy also introduced ‘Seven flagship initiatives’ which includes initiatives like broadband access to all by 2013 and enhancing international attractiveness of Europe’s universities. It recommended that the full implementation of the ‘Services Directive (2006/123/EC)’ and stated that if implemented it could increase trade in commercial services by 45 per cent and FDI by 25 per cent, bringing an increase of between 0.5 per cent and 1.5 per cent increase in GDP.38 The EU is in the process of implementing new regulations as well as amending various Directives such as the Services Directive (2006/123/EC). In May 2012, European Commission has made a proposal on ‘measures to improve the implementation of the Services Directive (2006/123/EC)’.39 This is listed in Table 1C.1 in Appendix 1C. In May 2010, the European Commission has put a proposal on “Conditions of entry and residence of third-country nationals in the framework of intra-corporate transferees such as manager, specialist and graduate trainee”.40 In the proposal, the European Commission defined the concept of ‘intra-corporate transferee” on the basis of EU’s commitment under the GATS and bilateral trade agreements. The proposal also laid emphasised on the introduction of the transparent and fast-track entry procedure of a short time (about 30 days) to process the applications; and a single application for a work and residence permit. The European Commission recommended that economic needs tests or labour market test41 should be removed. The proposed Directive would help EU companies to have a better and faster access to global talent to meet the skill shortage of managers, specialists and graduate trainees. It would also help in creating new employment opportunities.42 It is expected that the proposed Directive could complement the ‘EU Blue Card Directive ((2009/50/EC)’; and ‘Single Permit Directive (2011/98/EU)’. In December 2011, the European Commission proposed to amend the ‘Directive 2005/36/EC on the recognition of professional qualifications and Regulation on administrative cooperation through the Internal Market
38 European Commission (2010a) 39 European Commission (2012a). 40 European Commission (2010b). 41 Economic needs test or labour market test is a test which tries to establish whether there is an economic need or labour market need for a particular supply of a service in a specific mode of supply. A service supplier is allowed to supply the service if the competent authority or regulatory body decided whether there is an economic need for such a supply. 42 http://europa.eu/rapid/pressReleasesAction.do?reference=MEMO/10/324&type=HTML (last accessed on August 24, 2012).
Draft not for citation and quotation
22
Information System’43 to facilitate easier labour mobility of architects, nurses, midwives, etc. It also proposed to introduce European professional card; systematic screening and mutual evaluation exercise for all regulated professions in the Member States. The EU has sector-specific action plans for services sectors such as Financial Services Action Plan44; European Retail Action Plan45; Transport Action Plan46; and Flightpath 2050: Europe’s Vision for Aviation47. The above discussion shows that both India and the EU have taken various measures to reform the services sector and the reform process is on-going. While the EU has a long term vision or strategy to reform the services sector, India, till date, does not have a comprehensive long term service sector strategy. 1.5 Conclusion Services is a major driving force behind the growth Indian and the European economy. It contributes a significant share to the GDP and employment of the two economies. Services sector will continue to drive the economic growth of India and EU in the future. The nature of the services sector shows certain differences between India and the EU. While, in EU, bulk of the services is in the corporate sector generating organised sector employment, in India a large part of services is in the unorganised or non-corporate sector. India and the EU have regulatory similarities. Both have quasi-federal governance structure. Services sector is governed by the central and state governments in case of India, and union and member state in the case of the EU. Although, the EU is a single market for goods, services market is not completely harmonized. In case of both India and the EU, much of the services sector policies are determined respectively at the state and Member State level which makes it difficult for a service provider to have a harmonised operation. This chapter shows that although both India and the EU have taken various measures to reform the services sector there are differences in their approach towards reforms. India tends to have sector-specific reforms while the EU tries to implement comprehensive services sector reform and long-term strategies. Since the EU is a union of countries, it may seem difficult for the EU to harmonise its services market. However, this chapter shows that it has successfully achieved some key targets through clearly defined policy initiatives and deadlines. Inspite of being more affected by the global slowdown than India, reforms in the services sector in the EU seems to move at a faster pace than India. While reforms in India tend to focus on removal of market access barriers (such as the removal of restrictions on foreign investments); reforms in the EU focus on market integration, efficient service deliveries and regulatory certainties. Some of the recent EU Directives also seeks to address the barriers faced by third country service providers. In future, market integration together with removal of barriers for third country service provider make the EU an even more attractive services market for third country service providers, including Indian service providers who are exploring global 43 European Commission (2011b). 44For details, see http://europa.eu/legislation_summaries/internal_market/single_market_services/financial_services_general_framework/l24210_en.htm (last accessed on August 24, 2012). 45 For details, see http://ec.europa.eu/internal_market/retail/index_en.htm#maincontentSec1 (last accessed on August 24, 2012). 46 For details, see http://ec.europa.eu/transport/its/road/action_plan/action_plan_en.htm (last accessed on August 24, 2012). 47 For details, see http://ec.europa.eu/transport/air/doc/flightpath2050.pdf (last accessed on August 24, 2012).
Draft not for citation and quotation
23
markets. However, this will also depend upon the future economic growth and other macro-economic indicators in the EU, and its ability to recover from the present economic slowdown.
References Asian Development Bank (ADB (2012), “Key Indicators for Asia and the Pacific 2012”, 43rd
Edition, August, Asian Development Bank, Manila, http://www.adb.org/publications/key-indicators-asia-and-pacific-2012
Ansari, M.I. (1995), “ Explaining the Service Sector Growth: An Empirical Study of India, Pakistan, and Sri Lanka” , Journal of Asian Economics, Vol. 6, No. 2, pp. 233-246.
Banga, Rashmi (2005), “ Critical Issues in India’s Service-led Growth” , ICRIER Working Paper No. 171, October, 2005.
Banga, Rashmi and Bishwanath Goldar (2004), “Contribution of Services to Output Growth and Productivity in Indian Manufacturing: Pre and Post Reforms” , ICRIER Working Paper No. 139, July 2004.
Bhattacharya, B.B. and Arup Mitra (1990), “ Excess Growth of Tertiary Sector in Indian Economy: Issues and Implications” , Economic and Political Weekly, Vol. 25, No. 44 (Nov. 3, 1990), pp. 2445-2450.
Chanda, Rupa (2002), “ Globalization of Services: India’s Opportunities and Constraints”, Oxford University Press, New Delhi.
Central Statistical Organisation (CSO) (2012), ‘Economic Survey of India - 2011-12’ Central Statistical Organisation, Ministry of Statistics and Programme Implementation, Government of India, http://exim.indiamart.com/economic-survey/
Demuro, Gianmario (2008), Presentation on “European Union: Regulation and Governance”, presented at John Marshall Law School, http://giurisprudenza.unica.it/dlf/home/portali/unigiurisprudenza/UserFiles/File/Utenti/g.demuro/dispense/EU_governance.pdf
Department of Industrial Policy and Promotion (DIPP) (2012), “Consolidated FDI Policy (Effective from April 10, 2012)”, Circular 1 of 2012, April, Ministry of Commerce and Industry, Government of India, http://dipp.nic.in/English/Policies/FDI_Circular_01_2012.pdf
European Commission (2008), “NACE Rev. 2: Statistical Classification of Economic Activities in the European Community”, ISSN 1977-0375, Luxembourg, http://epp.eurostat.ec.europa.eu/cache/ITY_OFFPUB/KS-RA-07-015/EN/KS-RA-07-015-EN.PDF
European Commission (2009), “Challenges for EU Support to innovation in Services”, Commission Staff Working Document, SEC (2009), 1195, September, Luxembourg.
European Commission (2010a), “Communication from the Commission – Europe 2020: A strategy for smart, sustainable and inclusive growth”, COM(2010) 2020 final, March, Brussels, http://eur-lex.europa.eu/LexUriServ/LexUriServ.do?uri=COM:2010:2020:FIN:EN:PDF
European Commission (2010b), “Proposal for a Directive on Conditions of Entry and Residence of Third-country Nationals in the Framework of an Intra-Corporate Transfer”, COM(2010) 378 final, March, Brussels, http://ec.europa.eu/commission_2010-2014/malmstrom/archive/proposal_directive_intra_corporate_transferees.pdf
European Commission (2011a), “Employment in Europe 2010”, Luxembourg.
Draft not for citation and quotation
24
European Commission (2011b), “Proposal for a Directive of the European Parliament and of the Council amending Directive 2005/36/EC on the recognition of professional qualifications and Regulation on administrative cooperation through the Internal Market Information System, COM(2011) 883 Final, December 19, Brussels, http://ec.europa.eu/internal_market/qualifications/docs/policy_developments/modernising/COM2011_883_en.pdf
European Commission (2012a), “Communication from the Commission to the European Parliament, the Council, the European Economic and Social Committee and the Committee of the Regions on the Implementation of the Services Directive, A partnership for new growth in services 2012-2015”, COM(2012) 261 Final, June 8, Brussels, http://ec.europa.eu/internal_market/services/docs/services-dir/implementation/report/COM_2012_261_en.pdf
European Commission (2012b), “Detailed information on the Implementation of Directive 2006/123/EC on Services in the Internal Market”, Commission Staff Working Document, SWD(2012), 148 Final, June 8, Brussels.
Gordon, Jim and Poonam Gupta (2003), “Understanding India’s Services Revolution”, Paper prepared for the IMF-NCAER Conference, “A Tale of Two Giants: India’s and China’s Experience with Reform”, November 14-16, 2003, New Delhi.
Hansda, S. K. (2001), “ Sustainability of Services-led Growth: An Input-Output Analysis of Indian Economy” , RBI Occasional Working Paper, Vol. 22, No. 1, 2 and 3.
Havlik, Peter (2006), “Economic restructuring in the new EU Member States and selected Newly Independent States: Effects on Growth, Employment and Productivity, February, Vienna Institute for International Economic Studies, Austria http://indeunis.wiiw.ac.at/index.php?action=content&id=publications
International Monetary Fund (IMF) (2012), “World Economic Outlook Database” April, http://www.imf.org/external/pubs/ft/weo/2012/01/weodata/index.aspx
Jain, Sunil and T.N. Ninan (2010), “ Servicing India’s GDP Growth” , in Acharya, Shankar and Rakesh Mohan (ed.), “India’s Economy: Performance and Challenges - Essays in Honour of Montek Singh Ahluwalia”, Oxford University Press, pp. 328-365.
Kemekleine, Gintare, Connolly, Heather, Keune, Maarten and Watt, Andrew (2007), “Services Employment in the Europe: Now and in the Future”, European Trade Union Institute (ETUI) and Research, Education and Health and Safety (REHS), Brussels.
Kemekliene, Gintare and Andrew Watt (2010), “GATS and the EU” Impacts on Labour Markets and Regulatory Capacity”, Report 116, European Trade Union Institute (ETUI), Brussels.
Keune, Maarten, Leschke, Janine and Andrew Watt, (2008), “Chapter 1: Introduction, Liberalisation and the Labour Market”, in Privatisation and Liberalisation of Public Services in the EU, edited by Maarten Keune, Janine Leschke and Andrew Watt, ETUI, Brussels.
Kelemen, Daniel R. (2006), “Comment: Shaming the shameless? The Constitutionalization of the European Union, Issue 13 No. 8, Journal of European Policy, pp. 1302-1307, December.
Kochhar, Kalpana, Kumar, Utsav, Rajan, Raghuram, Subramanian, Arvind and Tokatlidis, Ioannis (2006), “India's Pattern of Development: What Happened, What Follows?,” Vol. 53(5), pp. 981-1019, Journal of Monetary Economics, Elsevier, July.
McKinsey (2007), “The Bird of Gold: The Rise of India’s Consumer Market”, Mckinsey Global Institute, http://www.mckinsey.com/mgi/reports/pdfs/india_consumer_market/MGI_india_consumer_full_report.pdf
Draft not for citation and quotation
25
Ministry of Statistics and Programme Implementation (MOSPI) (2001), “Employment and Unemployment situation among Social Groups in India”, Report No. 468(55/10/7), NSS 55th Round (July 1999-June 2000), Government of India, September, http://mospi.gov.in/national_data_bank/pdf/469_final.pdf
MOSPI (2006), “Employment and Unemployment situation among Social Groups in India (2004-05)”, Report No. 516(61/10/2), NSS 61st Round (July 2004-June 2005), Government of India, October, http://mospi.gov.in/national_data_bank/pdf/516_final.pdf
MOSPI (2008), “National Industrial Classification (All Economic Activities)”, Government of India, http://mospi.nic.in/Mospi_New/upload/nic_2008_17apr09.pdf
MOSPI (2010), “State Domestic Product Series 1999-2000’ September, Government of India, http://mospi.nic.in/mospi_new/upload/statewise_sdp1999_2000_9sep10.pdf.
MOSPI (2011a), “Summary of Macro Economic Aggregates at constant prices (1999-2000); prices from 1950-51 to 2009-10”, Government of India.
MOSPI (2011b), “Employment and Unemployment Situation in India (2009-10), Report No. NSS 537 (66/10/1), 66th Round (July 2009 - June 2010), Government of India, November, http://www.indiaenvironmentportal.org.in/files/file/NSS_Report_employment%20and%20unemployment.pdf
Monteagudo, Josefa, Rutkowski Aleksander, and Dimitri Lorenzani (2012), “The Economic Impact of the Services Directive: A first Assessment following Implementation”, Economic Papers 456, June, Directorate General for Economic and Financial Affairs, European Commission, Brussels, Belgium.
Mukherjee, Arpita (2012), “Developing the Services Sector as an Engine for Inclusive Growth in Asia”, paper presented at the ADB-PIIE Workshop on Developing the Services Sector as an Engine for Inclusive Growth in Asia, organised by Asian Development Bank and Peterson Institute for International Economics, May 29-30, Washington DC, US.
Planning Commission (2008), Report of the High Level Group on Services Sector”, Government of India, March.
Planning Commission (2011), “Faster, Sustainable and More Inclusive Growth: An Approach Paper to the Twelfth Five Year Plan”, Government of India, Planning Commission, October, http://planningcommission.nic.in/plans/planrel/12appdrft/appraoch_12plan.pdf
Raza, W., V. Wedl and S. Angelo (2004), “Liberalisation of Public Services: Benefits – A Conceptual and Legal Introduction”, AK Wien, Vienna.
Shyjan, D (2012), “Service Sector Employment in Kerala: A disaggregated analysis across Social Groups”, Trivandrum, http://www.cds.edu/admin/homeFiles/Shyjan1.pdf
World Bank (2012), ‘World Development Indicators 2012’, Washington DC, http://data.worldbank.org/data-catalog/world-development-indicators/wdi-2012
World Trade Organization (WTO) (2011), “Trade Policy Review – The EU”, Document WT/TPR/S/248, Report by the Secretariat, June 1, Geneva.
Draft not for citation and quotation
26
Chapter 2: India-EU: Trade and Investments in Services
Ramneet Goswami
Advancement in technology, greater mobility of people, cheaper transmission and communication cost has led to increase in trade across borders. The easing of the regulatory framework in conjunction with liberal policies adopted by countries across the globe has made the world a local market place. International trade in goods as well as services has largely benefited from this trend. In 2011, merchandise trade valued at $18.2 trillion compared to $5.17 trillion in 1995 and $6.4 trillion in 2001. Similarly, value of services trade increased from $1.3 trillion in 1995 to $1.5 trillion in 2001 and $ 4.2 trillion in 2011.48 With the globalisation and liberalisation, services sector has not only made waves in the domestic economy, but has also managed to make its presence felt in the external trade of every country in the world. India and the EU are now among the top ten exporters and importers of services among the WTO countries. Today, services trade contributes a significant share in GDP and total trade of both economies. The process of liberalisation and economic integration of the EU and the process of economic liberalisation in India not only led to increase in foreign investments but also bilateral investments between the two economies. Services is the major key component of their bilateral investments. Enhancing economic ties is a key part of India and EU’s relationship. Both India and EU markets complement each other. The need for infrastructure investment in India complements the core competence of EU companies in sectors like energy and transportation. India’s competence is low cost skilled workforce complements EU’s competence in technology. This Chapter presents an overview of trade and investment between India and EU. The chapter briefly explains India and the EU’s global trade in services, bilateral trade between India and the EU, and their export competitiveness of services. Liberalisation of services resulted in increase in bilateral investments between two economies. Therefore, the chapter also discusses about the global and bilateral investments between India and the EU. In the last section, the chapter discusses barriers to trade in both economies.
48 WTO (2012).
Draft not for citation and quotation
27
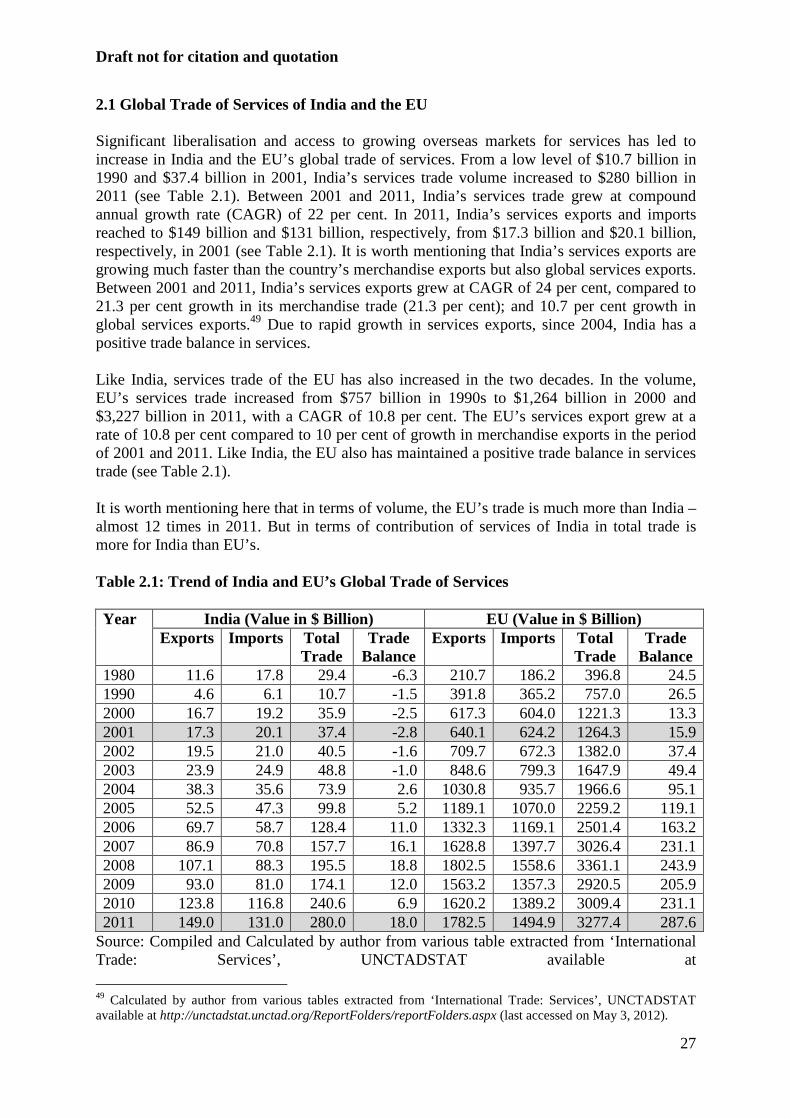
2.1 Global Trade of Services of India and the EU Significant liberalisation and access to growing overseas markets for services has led to increase in India and the EU’s global trade of services. From a low level of $10.7 billion in 1990 and $37.4 billion in 2001, India’s services trade volume increased to $280 billion in 2011 (see Table 2.1). Between 2001 and 2011, India’s services trade grew at compound annual growth rate (CAGR) of 22 per cent. In 2011, India’s services exports and imports reached to $149 billion and $131 billion, respectively, from $17.3 billion and $20.1 billion, respectively, in 2001 (see Table 2.1). It is worth mentioning that India’s services exports are growing much faster than the country’s merchandise exports but also global services exports. Between 2001 and 2011, India’s services exports grew at CAGR of 24 per cent, compared to 21.3 per cent growth in its merchandise trade (21.3 per cent); and 10.7 per cent growth in global services exports.49 Due to rapid growth in services exports, since 2004, India has a positive trade balance in services. Like India, services trade of the EU has also increased in the two decades. In the volume, EU’s services trade increased from $757 billion in 1990s to $1,264 billion in 2000 and $3,227 billion in 2011, with a CAGR of 10.8 per cent. The EU’s services export grew at a rate of 10.8 per cent compared to 10 per cent of growth in merchandise exports in the period of 2001 and 2011. Like India, the EU also has maintained a positive trade balance in services trade (see Table 2.1). It is worth mentioning here that in terms of volume, the EU’s trade is much more than India – almost 12 times in 2011. But in terms of contribution of services of India in total trade is more for India than EU’s. Table 2.1: Trend of India and EU’s Global Trade of Services Year India (Value in $ Billion) EU (Value in $ Billion)
Exports Imports Total Trade
Trade Balance
Exports Imports Total Trade
Trade Balance
1980 11.6 17.8 29.4 -6.3 210.7 186.2 396.8 24.5 1990 4.6 6.1 10.7 -1.5 391.8 365.2 757.0 26.5 2000 16.7 19.2 35.9 -2.5 617.3 604.0 1221.3 13.3 2001 17.3 20.1 37.4 -2.8 640.1 624.2 1264.3 15.9 2002 19.5 21.0 40.5 -1.6 709.7 672.3 1382.0 37.4 2003 23.9 24.9 48.8 -1.0 848.6 799.3 1647.9 49.4 2004 38.3 35.6 73.9 2.6 1030.8 935.7 1966.6 95.1 2005 52.5 47.3 99.8 5.2 1189.1 1070.0 2259.2 119.1 2006 69.7 58.7 128.4 11.0 1332.3 1169.1 2501.4 163.2 2007 86.9 70.8 157.7 16.1 1628.8 1397.7 3026.4 231.1 2008 107.1 88.3 195.5 18.8 1802.5 1558.6 3361.1 243.9 2009 93.0 81.0 174.1 12.0 1563.2 1357.3 2920.5 205.9 2010 123.8 116.8 240.6 6.9 1620.2 1389.2 3009.4 231.1 2011 149.0 131.0 280.0 18.0 1782.5 1494.9 3277.4 287.6
Source: Compiled and Calculated by author from various table extracted from ‘International Trade: Services’, UNCTADSTAT available at
49 Calculated by author from various tables extracted from ‘International Trade: Services’, UNCTADSTAT available at http://unctadstat.unctad.org/ReportFolders/reportFolders.aspx (last accessed on May 3, 2012).
Draft not for citation and quotation
28
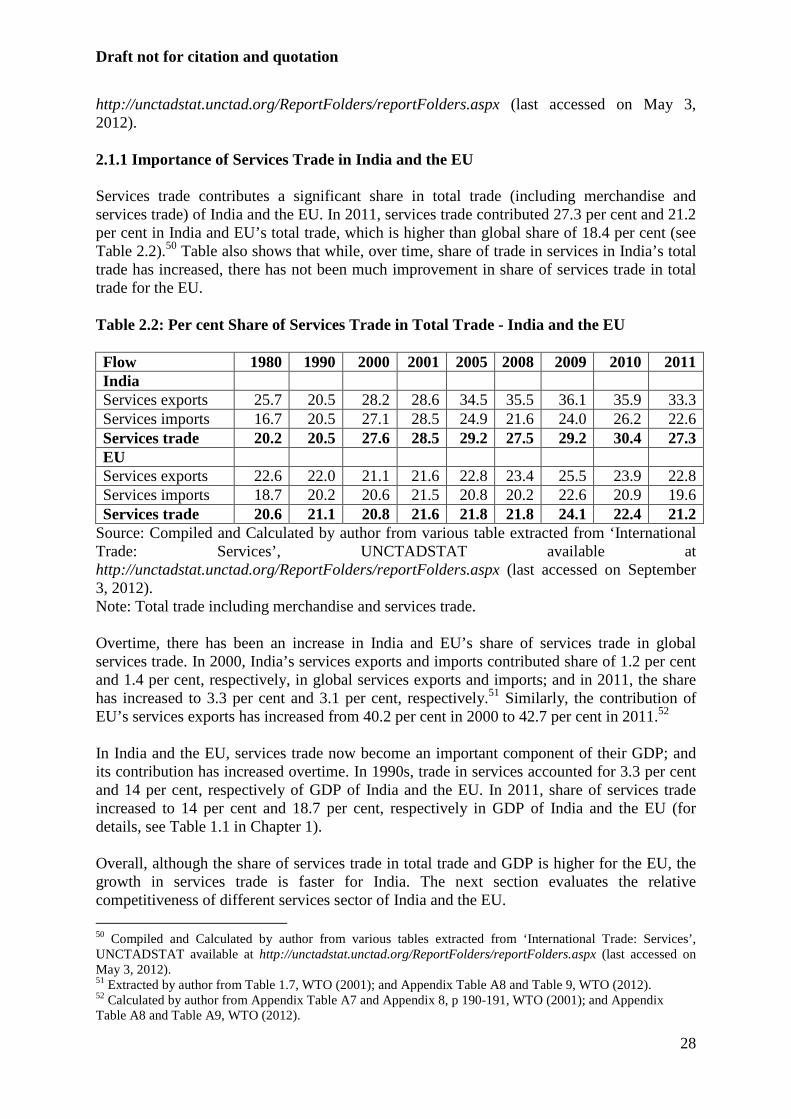
http://unctadstat.unctad.org/ReportFolders/reportFolders.aspx (last accessed on May 3, 2012). 2.1.1 Importance of Services Trade in India and the EU Services trade contributes a significant share in total trade (including merchandise and services trade) of India and the EU. In 2011, services trade contributed 27.3 per cent and 21.2 per cent in India and EU’s total trade, which is higher than global share of 18.4 per cent (see Table 2.2).50 Table also shows that while, over time, share of trade in services in India’s total trade has increased, there has not been much improvement in share of services trade in total trade for the EU. Table 2.2: Per cent Share of Services Trade in Total Trade - India and the EU Flow 1980 1990 2000 2001 2005 2008 2009 2010 2011 India Services exports 25.7 20.5 28.2 28.6 34.5 35.5 36.1 35.9 33.3 Services imports 16.7 20.5 27.1 28.5 24.9 21.6 24.0 26.2 22.6 Services trade 20.2 20.5 27.6 28.5 29.2 27.5 29.2 30.4 27.3 EU Services exports 22.6 22.0 21.1 21.6 22.8 23.4 25.5 23.9 22.8 Services imports 18.7 20.2 20.6 21.5 20.8 20.2 22.6 20.9 19.6 Services trade 20.6 21.1 20.8 21.6 21.8 21.8 24.1 22.4 21.2
Source: Compiled and Calculated by author from various table extracted from ‘International Trade: Services’, UNCTADSTAT available at http://unctadstat.unctad.org/ReportFolders/reportFolders.aspx (last accessed on September 3, 2012). Note: Total trade including merchandise and services trade. Overtime, there has been an increase in India and EU’s share of services trade in global services trade. In 2000, India’s services exports and imports contributed share of 1.2 per cent and 1.4 per cent, respectively, in global services exports and imports; and in 2011, the share has increased to 3.3 per cent and 3.1 per cent, respectively.51 Similarly, the contribution of EU’s services exports has increased from 40.2 per cent in 2000 to 42.7 per cent in 2011.52 In India and the EU, services trade now become an important component of their GDP; and its contribution has increased overtime. In 1990s, trade in services accounted for 3.3 per cent and 14 per cent, respectively of GDP of India and the EU. In 2011, share of services trade increased to 14 per cent and 18.7 per cent, respectively in GDP of India and the EU (for details, see Table 1.1 in Chapter 1). Overall, although the share of services trade in total trade and GDP is higher for the EU, the growth in services trade is faster for India. The next section evaluates the relative competitiveness of different services sector of India and the EU. 50 Compiled and Calculated by author from various tables extracted from ‘International Trade: Services’, UNCTADSTAT available at http://unctadstat.unctad.org/ReportFolders/reportFolders.aspx (last accessed on May 3, 2012). 51 Extracted by author from Table 1.7, WTO (2001); and Appendix Table A8 and Table 9, WTO (2012). 52 Calculated by author from Appendix Table A7 and Appendix 8, p 190-191, WTO (2001); and Appendix Table A8 and Table A9, WTO (2012).
Draft not for citation and quotation
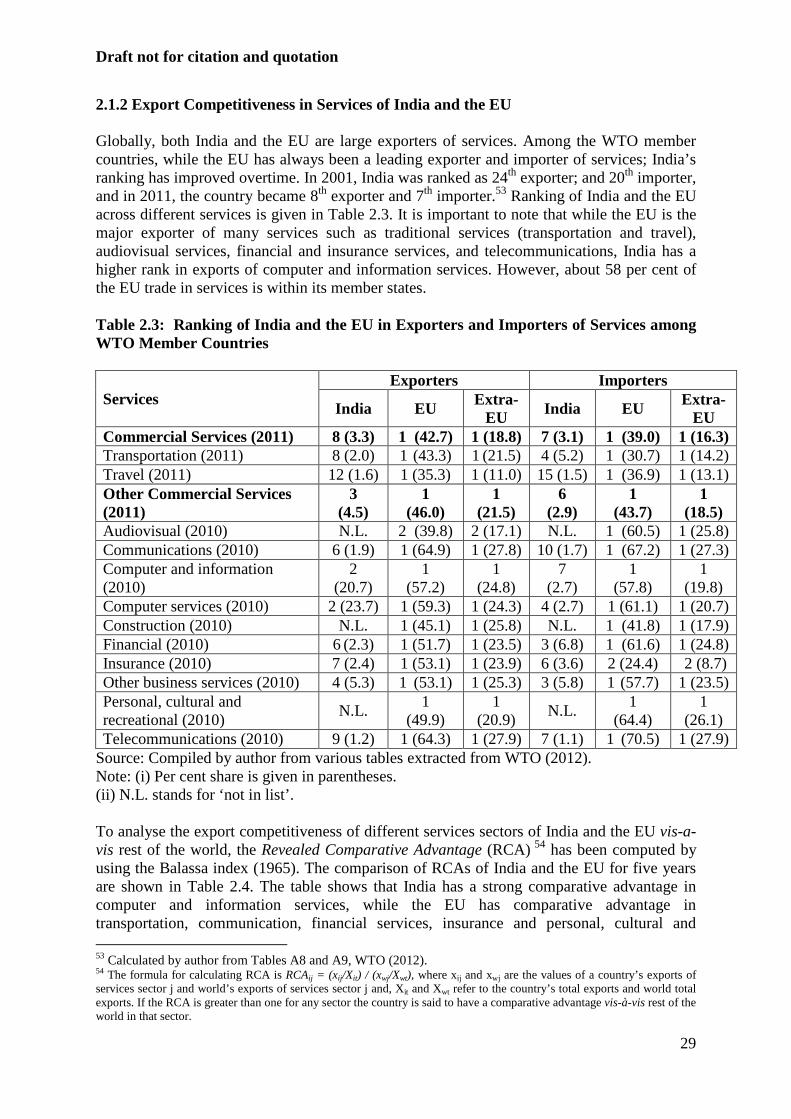
29
2.1.2 Export Competitiveness in Services of India and the EU Globally, both India and the EU are large exporters of services. Among the WTO member countries, while the EU has always been a leading exporter and importer of services; India’s ranking has improved overtime. In 2001, India was ranked as 24th exporter; and 20th importer, and in 2011, the country became 8th exporter and 7th importer.53 Ranking of India and the EU across different services is given in Table 2.3. It is important to note that while the EU is the major exporter of many services such as traditional services (transportation and travel), audiovisual services, financial and insurance services, and telecommunications, India has a higher rank in exports of computer and information services. However, about 58 per cent of the EU trade in services is within its member states. Table 2.3: Ranking of India and the EU in Exporters and Importers of Services among WTO Member Countries
Services Exporters Importers
India EU Extra-
EU India EU Extra-
EU Commercial Services (2011) 8 (3.3) 1 (42.7) 1 (18.8) 7 (3.1) 1 (39.0) 1 (16.3) Transportation (2011) 8 (2.0) 1 (43.3) 1 (21.5) 4 (5.2) 1 (30.7) 1 (14.2) Travel (2011) 12 (1.6) 1 (35.3) 1 (11.0) 15 (1.5) 1 (36.9) 1 (13.1) Other Commercial Services (2011)
3 (4.5)
1 (46.0)
1 (21.5)
6 (2.9)
1 (43.7)
1 (18.5)
Audiovisual (2010) N.L. 2 (39.8) 2 (17.1) N.L. 1 (60.5) 1 (25.8) Communications (2010) 6 (1.9) 1 (64.9) 1 (27.8) 10 (1.7) 1 (67.2) 1 (27.3) Computer and information (2010)
2 (20.7)
1 (57.2)
1 (24.8)
7 (2.7)
1
(57.8) 1
(19.8) Computer services (2010) 2 (23.7) 1 (59.3) 1 (24.3) 4 (2.7) 1 (61.1) 1 (20.7) Construction (2010) N.L. 1 (45.1) 1 (25.8) N.L. 1 (41.8) 1 (17.9) Financial (2010) 6 (2.3) 1 (51.7) 1 (23.5) 3 (6.8) 1 (61.6) 1 (24.8) Insurance (2010) 7 (2.4) 1 (53.1) 1 (23.9) 6 (3.6) 2 (24.4) 2 (8.7) Other business services (2010) 4 (5.3) 1 (53.1) 1 (25.3) 3 (5.8) 1 (57.7) 1 (23.5) Personal, cultural and recreational (2010)
N.L. 1
(49.9) 1
(20.9) N.L.
1
(64.4) 1
(26.1) Telecommunications (2010) 9 (1.2) 1 (64.3) 1 (27.9) 7 (1.1) 1 (70.5) 1 (27.9)
Source: Compiled by author from various tables extracted from WTO (2012). Note: (i) Per cent share is given in parentheses. (ii) N.L. stands for ‘not in list’. To analyse the export competitiveness of different services sectors of India and the EU vis-a-vis rest of the world, the Revealed Comparative Advantage (RCA) 54 has been computed by using the Balassa index (1965). The comparison of RCAs of India and the EU for five years are shown in Table 2.4. The table shows that India has a strong comparative advantage in computer and information services, while the EU has comparative advantage in transportation, communication, financial services, insurance and personal, cultural and 53 Calculated by author from Tables A8 and A9, WTO (2012). 54 The formula for calculating RCA is RCAij = (xij/Xit) / (xwj/Xwt), where xij and xwj are the values of a country’s exports of services sector j and world’s exports of services sector j and, Xit and Xwt refer to the country’s total exports and world total exports. If the RCA is greater than one for any sector the country is said to have a comparative advantage vis-à-vis rest of the world in that sector.
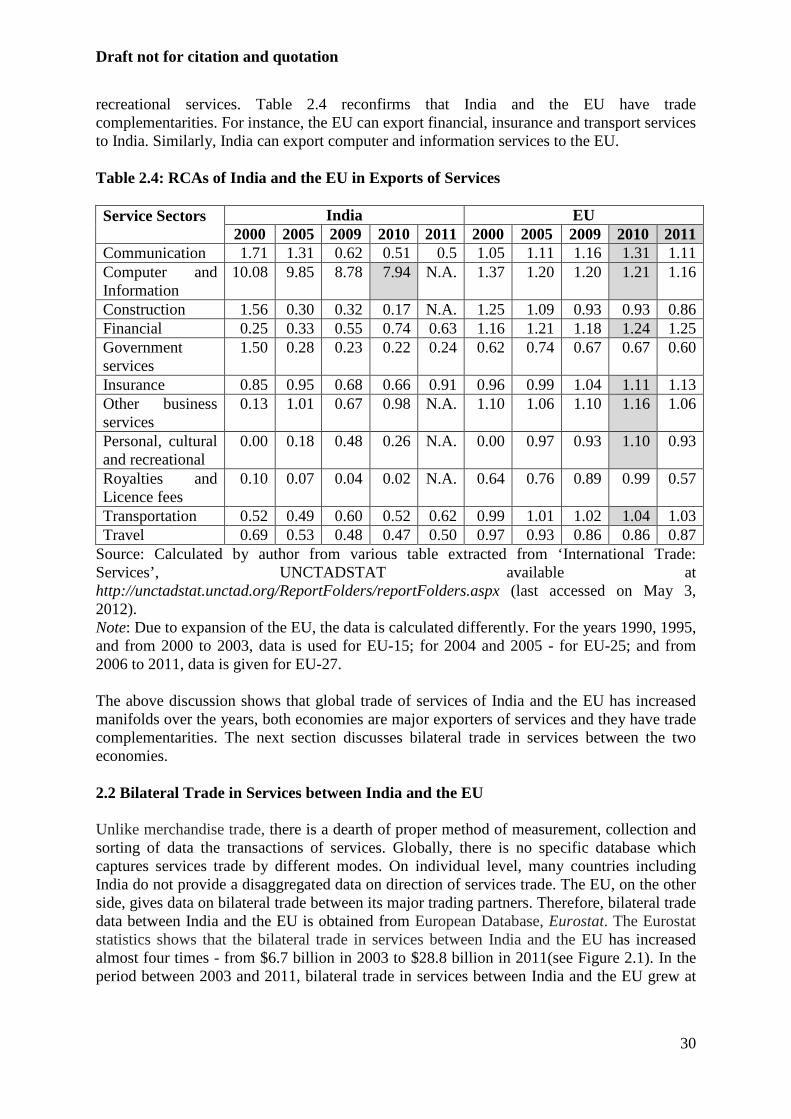
Draft not for citation and quotation
30
recreational services. Table 2.4 reconfirms that India and the EU have trade complementarities. For instance, the EU can export financial, insurance and transport services to India. Similarly, India can export computer and information services to the EU. Table 2.4: RCAs of India and the EU in Exports of Services Service Sectors
India EU 2000 2005 2009 2010 2011 2000 2005 2009 2010 2011
Communication 1.71 1.31 0.62 0.51 0.5 1.05 1.11 1.16 1.31 1.11 Computer and Information
10.08 9.85 8.78 7.94 N.A. 1.37 1.20 1.20 1.21 1.16
Construction 1.56 0.30 0.32 0.17 N.A. 1.25 1.09 0.93 0.93 0.86 Financial 0.25 0.33 0.55 0.74 0.63 1.16 1.21 1.18 1.24 1.25 Government services
1.50 0.28 0.23 0.22 0.24 0.62 0.74 0.67 0.67 0.60
Insurance 0.85 0.95 0.68 0.66 0.91 0.96 0.99 1.04 1.11 1.13 Other business services
0.13 1.01 0.67 0.98 N.A. 1.10 1.06 1.10 1.16 1.06
Personal, cultural and recreational
0.00 0.18 0.48 0.26 N.A. 0.00 0.97 0.93 1.10 0.93
Royalties and Licence fees
0.10 0.07 0.04 0.02 N.A. 0.64 0.76 0.89 0.99 0.57
Transportation 0.52 0.49 0.60 0.52 0.62 0.99 1.01 1.02 1.04 1.03 Travel 0.69 0.53 0.48 0.47 0.50 0.97 0.93 0.86 0.86 0.87
Source: Calculated by author from various table extracted from ‘International Trade: Services’, UNCTADSTAT available at http://unctadstat.unctad.org/ReportFolders/reportFolders.aspx (last accessed on May 3, 2012). Note: Due to expansion of the EU, the data is calculated differently. For the years 1990, 1995, and from 2000 to 2003, data is used for EU-15; for 2004 and 2005 - for EU-25; and from 2006 to 2011, data is given for EU-27. The above discussion shows that global trade of services of India and the EU has increased manifolds over the years, both economies are major exporters of services and they have trade complementarities. The next section discusses bilateral trade in services between the two economies. 2.2 Bilateral Trade in Services between India and the EU Unlike merchandise trade, there is a dearth of proper method of measurement, collection and sorting of data the transactions of services. Globally, there is no specific database which captures services trade by different modes. On individual level, many countries including India do not provide a disaggregated data on direction of services trade. The EU, on the other side, gives data on bilateral trade between its major trading partners. Therefore, bilateral trade data between India and the EU is obtained from European Database, Eurostat. The Eurostat statistics shows that the bilateral trade in services between India and the EU has increased almost four times - from $6.7 billion in 2003 to $28.8 billion in 2011(see Figure 2.1). In the period between 2003 and 2011, bilateral trade in services between India and the EU grew at
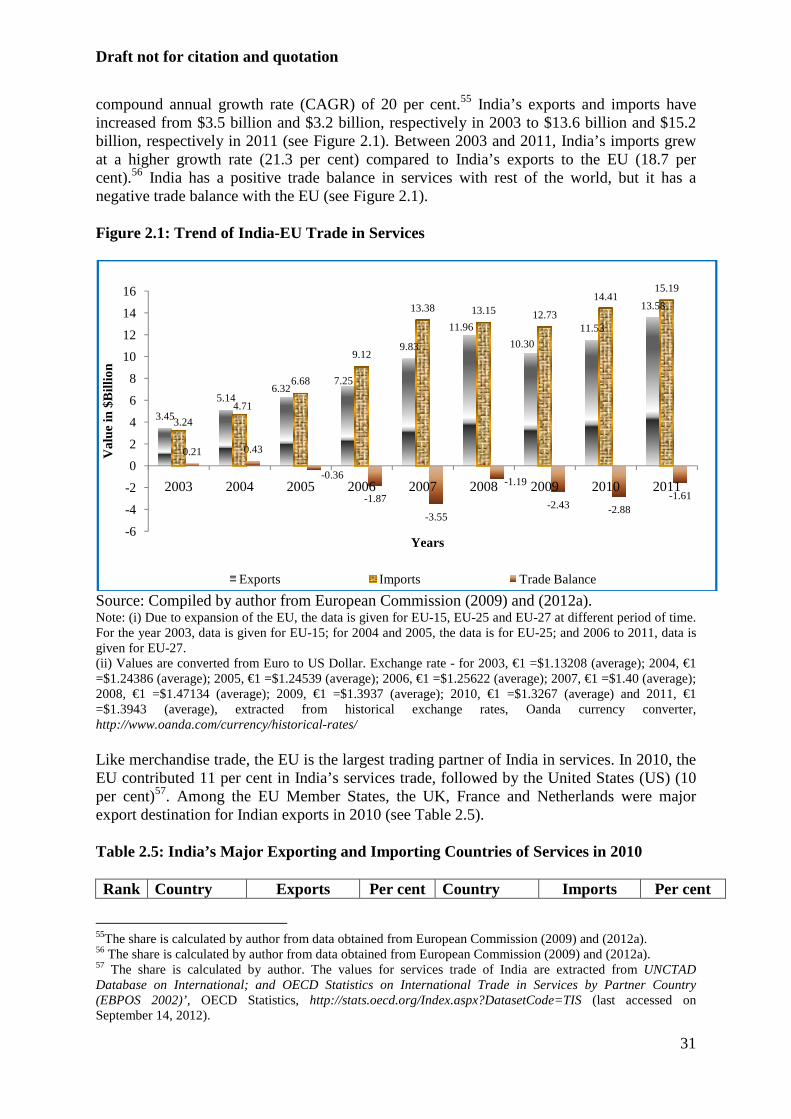
Draft not for citation and quotation
31
compound annual growth rate (CAGR) of 20 per cent.55 India’s exports and imports have increased from $3.5 billion and $3.2 billion, respectively in 2003 to $13.6 billion and $15.2 billion, respectively in 2011 (see Figure 2.1). Between 2003 and 2011, India’s imports grew at a higher growth rate (21.3 per cent) compared to India’s exports to the EU (18.7 per cent).56 India has a positive trade balance in services with rest of the world, but it has a negative trade balance with the EU (see Figure 2.1). Figure 2.1: Trend of India-EU Trade in Services
Source: Compiled by author from European Commission (2009) and (2012a). Note: (i) Due to expansion of the EU, the data is given for EU-15, EU-25 and EU-27 at different period of time. For the year 2003, data is given for EU-15; for 2004 and 2005, the data is for EU-25; and 2006 to 2011, data is given for EU-27. (ii) Values are converted from Euro to US Dollar. Exchange rate - for 2003, €1 =$1.13208 (average); 2004, €1 =$1.24386 (average); 2005, €1 =$1.24539 (average); 2006, €1 =$1.25622 (average); 2007, €1 =$1.40 (average); 2008, €1 =$1.47134 (average); 2009, €1 =$1.3937 (average); 2010, €1 =$1.3267 (average) and 2011, €1 =$1.3943 (average), extracted from historical exchange rates, Oanda currency converter, http://www.oanda.com/currency/historical-rates/ Like merchandise trade, the EU is the largest trading partner of India in services. In 2010, the EU contributed 11 per cent in India’s services trade, followed by the United States (US) (10 per cent)57. Among the EU Member States, the UK, France and Netherlands were major export destination for Indian exports in 2010 (see Table 2.5). Table 2.5: India’s Major Exporting and Importing Co untries of Services in 2010 Rank Country Exports Per cent Country Imports Per cent
55The share is calculated by author from data obtained from European Commission (2009) and (2012a). 56 The share is calculated by author from data obtained from European Commission (2009) and (2012a). 57 The share is calculated by author. The values for services trade of India are extracted from UNCTAD Database on International; and OECD Statistics on International Trade in Services by Partner Country (EBPOS 2002)’, OECD Statistics, http://stats.oecd.org/Index.aspx?DatasetCode=TIS (last accessed on September 14, 2012).
3.45
5.146.32
7.25
9.83
11.96
10.30
11.53
13.58
3.24
4.71
6.68
9.12
13.38 13.15 12.73
14.4115.19
0.21 0.43
-0.36
-1.87
-3.55
-1.19
-2.43 -2.88-1.61
-6
-4
-2
0
2
4
6
8
10
12
14
16
2003 2004 2005 2006 2007 2008 2009 2010 2011
Val
ue in
$B
illio
n
Years
Exports Imports Trade Balance
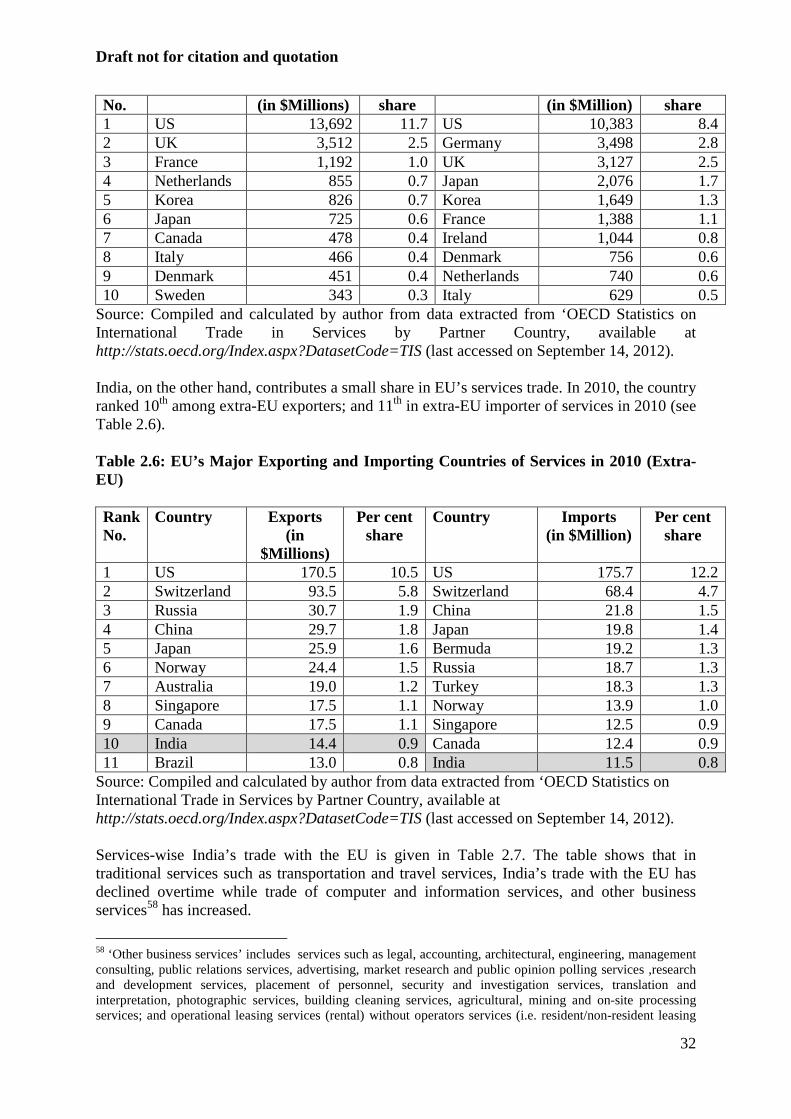
Draft not for citation and quotation
32
No. (in $Millions) share (in $Million) share 1 US 13,692 11.7 US 10,383 8.4 2 UK 3,512 2.5 Germany 3,498 2.8 3 France 1,192 1.0 UK 3,127 2.5 4 Netherlands 855 0.7 Japan 2,076 1.7 5 Korea 826 0.7 Korea 1,649 1.3 6 Japan 725 0.6 France 1,388 1.1 7 Canada 478 0.4 Ireland 1,044 0.8 8 Italy 466 0.4 Denmark 756 0.6 9 Denmark 451 0.4 Netherlands 740 0.6 10 Sweden 343 0.3 Italy 629 0.5
Source: Compiled and calculated by author from data extracted from ‘OECD Statistics on International Trade in Services by Partner Country, available at http://stats.oecd.org/Index.aspx?DatasetCode=TIS (last accessed on September 14, 2012). India, on the other hand, contributes a small share in EU’s services trade. In 2010, the country ranked 10th among extra-EU exporters; and 11th in extra-EU importer of services in 2010 (see Table 2.6). Table 2.6: EU’s Major Exporting and Importing Count ries of Services in 2010 (Extra-EU) Rank No.
Country Exports (in
$Millions)
Per cent share
Country Imports (in $Million)
Per cent share
1 US 170.5 10.5 US 175.7 12.2 2 Switzerland 93.5 5.8 Switzerland 68.4 4.7 3 Russia 30.7 1.9 China 21.8 1.5 4 China 29.7 1.8 Japan 19.8 1.4 5 Japan 25.9 1.6 Bermuda 19.2 1.3 6 Norway 24.4 1.5 Russia 18.7 1.3 7 Australia 19.0 1.2 Turkey 18.3 1.3 8 Singapore 17.5 1.1 Norway 13.9 1.0 9 Canada 17.5 1.1 Singapore 12.5 0.9 10 India 14.4 0.9 Canada 12.4 0.9 11 Brazil 13.0 0.8 India 11.5 0.8
Source: Compiled and calculated by author from data extracted from ‘OECD Statistics on International Trade in Services by Partner Country, available at http://stats.oecd.org/Index.aspx?DatasetCode=TIS (last accessed on September 14, 2012). Services-wise India’s trade with the EU is given in Table 2.7. The table shows that in traditional services such as transportation and travel services, India’s trade with the EU has declined overtime while trade of computer and information services, and other business services58 has increased.
58 ‘Other business services’ includes services such as legal, accounting, architectural, engineering, management consulting, public relations services, advertising, market research and public opinion polling services ,research and development services, placement of personnel, security and investigation services, translation and interpretation, photographic services, building cleaning services, agricultural, mining and on-site processing services; and operational leasing services (rental) without operators services (i.e. resident/non-resident leasing
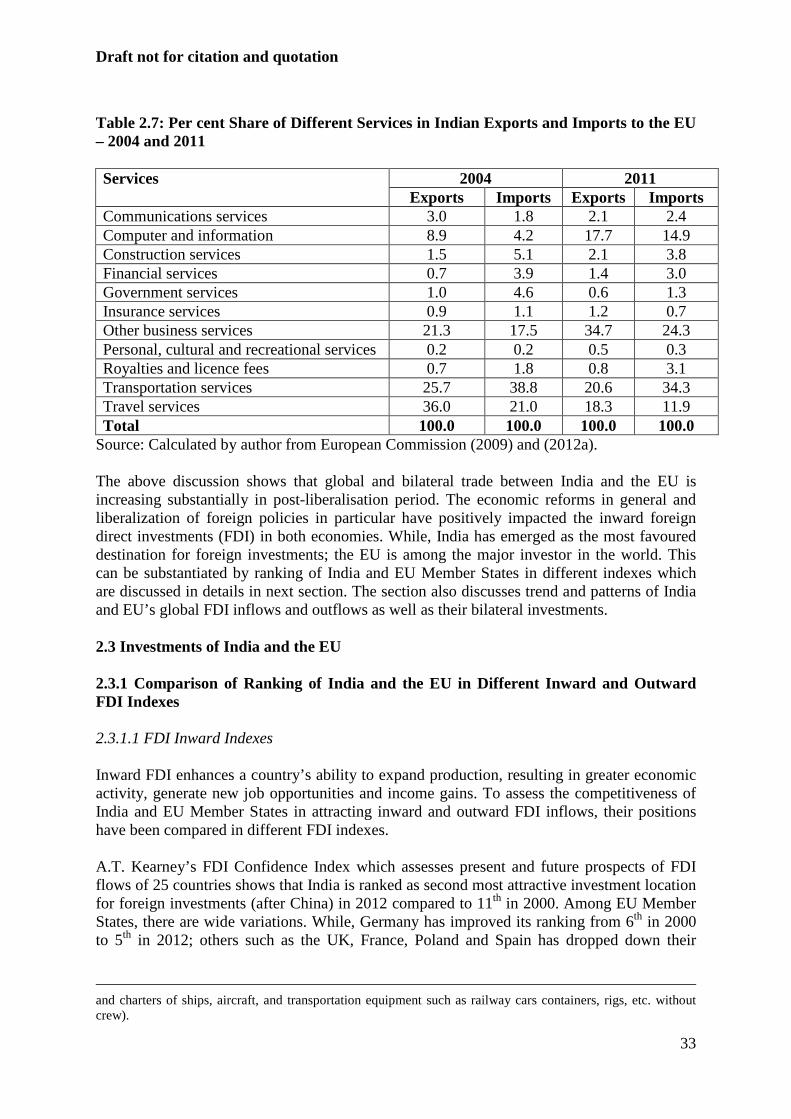
Draft not for citation and quotation
33
Table 2.7: Per cent Share of Different Services in Indian Exports and Imports to the EU – 2004 and 2011 Services 2004 2011
Exports Imports Exports Imports Communications services 3.0 1.8 2.1 2.4 Computer and information 8.9 4.2 17.7 14.9 Construction services 1.5 5.1 2.1 3.8 Financial services 0.7 3.9 1.4 3.0 Government services 1.0 4.6 0.6 1.3 Insurance services 0.9 1.1 1.2 0.7 Other business services 21.3 17.5 34.7 24.3 Personal, cultural and recreational services 0.2 0.2 0.5 0.3 Royalties and licence fees 0.7 1.8 0.8 3.1 Transportation services 25.7 38.8 20.6 34.3 Travel services 36.0 21.0 18.3 11.9 Total 100.0 100.0 100.0 100.0
Source: Calculated by author from European Commission (2009) and (2012a). The above discussion shows that global and bilateral trade between India and the EU is increasing substantially in post-liberalisation period. The economic reforms in general and liberalization of foreign policies in particular have positively impacted the inward foreign direct investments (FDI) in both economies. While, India has emerged as the most favoured destination for foreign investments; the EU is among the major investor in the world. This can be substantiated by ranking of India and EU Member States in different indexes which are discussed in details in next section. The section also discusses trend and patterns of India and EU’s global FDI inflows and outflows as well as their bilateral investments. 2.3 Investments of India and the EU 2.3.1 Comparison of Ranking of India and the EU in Different Inward and Outward FDI Indexes 2.3.1.1 FDI Inward Indexes Inward FDI enhances a country’s ability to expand production, resulting in greater economic activity, generate new job opportunities and income gains. To assess the competitiveness of India and EU Member States in attracting inward and outward FDI inflows, their positions have been compared in different FDI indexes. A.T. Kearney’s FDI Confidence Index which assesses present and future prospects of FDI flows of 25 countries shows that India is ranked as second most attractive investment location for foreign investments (after China) in 2012 compared to 11th in 2000. Among EU Member States, there are wide variations. While, Germany has improved its ranking from 6th in 2000 to 5th in 2012; others such as the UK, France, Poland and Spain has dropped down their
and charters of ships, aircraft, and transportation equipment such as railway cars containers, rigs, etc. without crew).
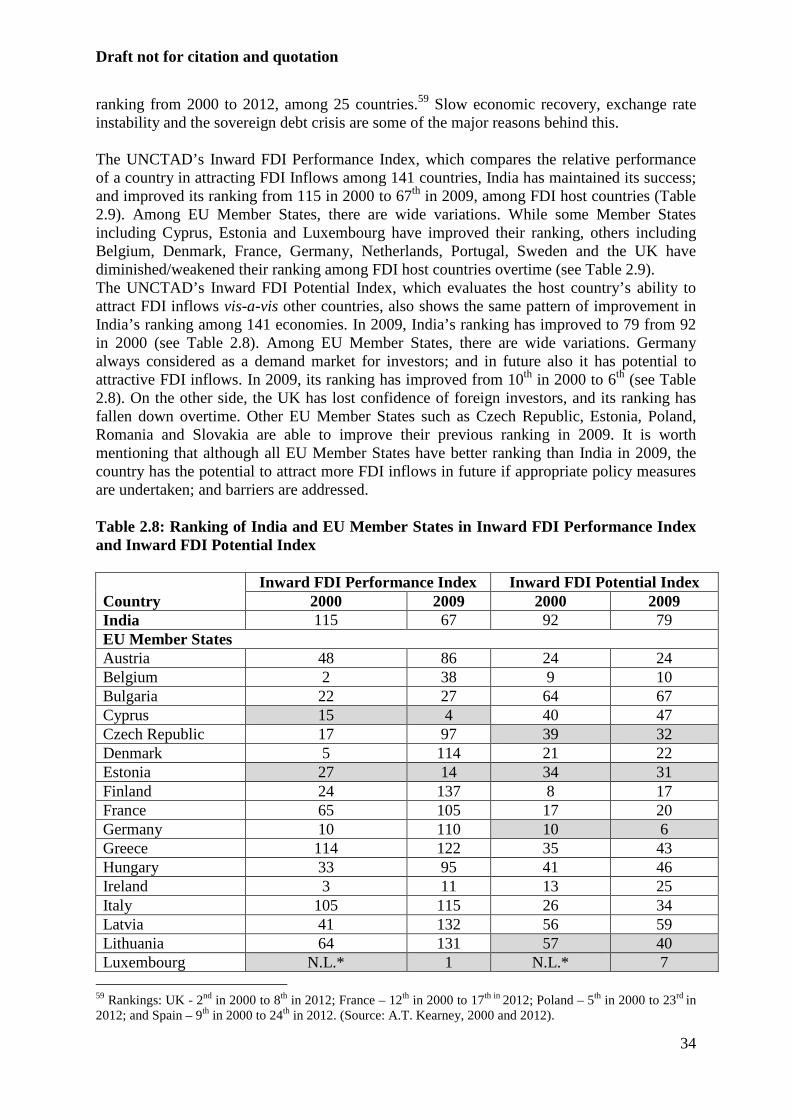
Draft not for citation and quotation
34
ranking from 2000 to 2012, among 25 countries.59 Slow economic recovery, exchange rate instability and the sovereign debt crisis are some of the major reasons behind this. The UNCTAD’s Inward FDI Performance Index, which compares the relative performance of a country in attracting FDI Inflows among 141 countries, India has maintained its success; and improved its ranking from 115 in 2000 to 67th in 2009, among FDI host countries (Table 2.9). Among EU Member States, there are wide variations. While some Member States including Cyprus, Estonia and Luxembourg have improved their ranking, others including Belgium, Denmark, France, Germany, Netherlands, Portugal, Sweden and the UK have diminished/weakened their ranking among FDI host countries overtime (see Table 2.9). The UNCTAD’s Inward FDI Potential Index, which evaluates the host country’s ability to attract FDI inflows vis-a-vis other countries, also shows the same pattern of improvement in India’s ranking among 141 economies. In 2009, India’s ranking has improved to 79 from 92 in 2000 (see Table 2.8). Among EU Member States, there are wide variations. Germany always considered as a demand market for investors; and in future also it has potential to attractive FDI inflows. In 2009, its ranking has improved from 10th in 2000 to 6th (see Table 2.8). On the other side, the UK has lost confidence of foreign investors, and its ranking has fallen down overtime. Other EU Member States such as Czech Republic, Estonia, Poland, Romania and Slovakia are able to improve their previous ranking in 2009. It is worth mentioning that although all EU Member States have better ranking than India in 2009, the country has the potential to attract more FDI inflows in future if appropriate policy measures are undertaken; and barriers are addressed. Table 2.8: Ranking of India and EU Member States in Inward FDI Performance Index and Inward FDI Potential Index
Country Inward FDI Performance Index Inward FDI Potential I ndex
2000 2009 2000 2009 India 115 67 92 79 EU Member States Austria 48 86 24 24 Belgium 2 38 9 10 Bulgaria 22 27 64 67 Cyprus 15 4 40 47 Czech Republic 17 97 39 32 Denmark 5 114 21 22 Estonia 27 14 34 31 Finland 24 137 8 17 France 65 105 17 20 Germany 10 110 10 6 Greece 114 122 35 43 Hungary 33 95 41 46 Ireland 3 11 13 25 Italy 105 115 26 34 Latvia 41 132 56 59 Lithuania 64 131 57 40 Luxembourg N.L.* 1 N.L.* 7
59 Rankings: UK - 2nd in 2000 to 8th in 2012; France – 12th in 2000 to 17th in 2012; Poland – 5th in 2000 to 23rd in 2012; and Spain – 9th in 2000 to 24th in 2012. (Source: A.T. Kearney, 2000 and 2012).
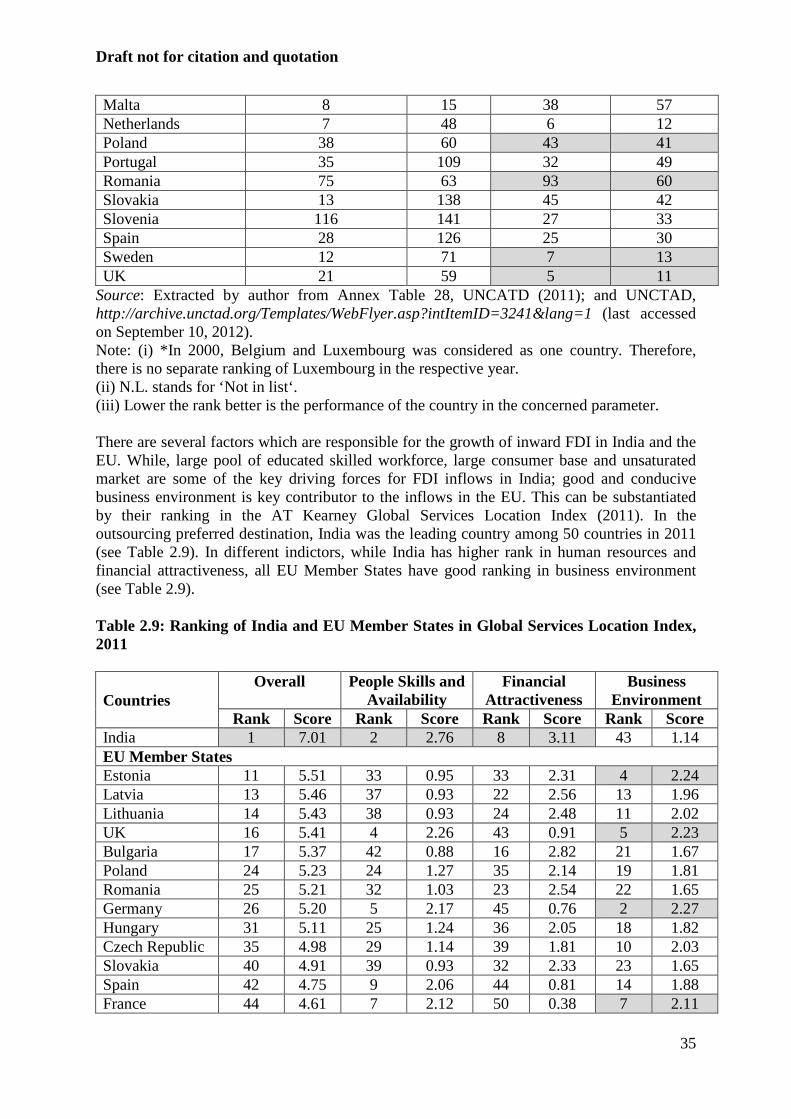
Draft not for citation and quotation
35
Malta 8 15 38 57 Netherlands 7 48 6 12 Poland 38 60 43 41 Portugal 35 109 32 49 Romania 75 63 93 60 Slovakia 13 138 45 42 Slovenia 116 141 27 33 Spain 28 126 25 30 Sweden 12 71 7 13 UK 21 59 5 11
Source: Extracted by author from Annex Table 28, UNCATD (2011); and UNCTAD, http://archive.unctad.org/Templates/WebFlyer.asp?intItemID=3241&lang=1 (last accessed on September 10, 2012). Note: (i) *In 2000, Belgium and Luxembourg was considered as one country. Therefore, there is no separate ranking of Luxembourg in the respective year. (ii) N.L. stands for ‘Not in list‘. (iii) Lower the rank better is the performance of the country in the concerned parameter. There are several factors which are responsible for the growth of inward FDI in India and the EU. While, large pool of educated skilled workforce, large consumer base and unsaturated market are some of the key driving forces for FDI inflows in India; good and conducive business environment is key contributor to the inflows in the EU. This can be substantiated by their ranking in the AT Kearney Global Services Location Index (2011). In the outsourcing preferred destination, India was the leading country among 50 countries in 2011 (see Table 2.9). In different indictors, while India has higher rank in human resources and financial attractiveness, all EU Member States have good ranking in business environment (see Table 2.9). Table 2.9: Ranking of India and EU Member States in Global Services Location Index, 2011
Countries
Overall
People Skills and Availability
Financial Attractiveness
Business Environment
Rank Score Rank Score Rank Score Rank Score India 1 7.01 2 2.76 8 3.11 43 1.14 EU Member States Estonia 11 5.51 33 0.95 33 2.31 4 2.24 Latvia 13 5.46 37 0.93 22 2.56 13 1.96 Lithuania 14 5.43 38 0.93 24 2.48 11 2.02 UK 16 5.41 4 2.26 43 0.91 5 2.23 Bulgaria 17 5.37 42 0.88 16 2.82 21 1.67 Poland 24 5.23 24 1.27 35 2.14 19 1.81 Romania 25 5.21 32 1.03 23 2.54 22 1.65 Germany 26 5.20 5 2.17 45 0.76 2 2.27 Hungary 31 5.11 25 1.24 36 2.05 18 1.82 Czech Republic 35 4.98 29 1.14 39 1.81 10 2.03 Slovakia 40 4.91 39 0.93 32 2.33 23 1.65 Spain 42 4.75 9 2.06 44 0.81 14 1.88 France 44 4.61 7 2.12 50 0.38 7 2.11
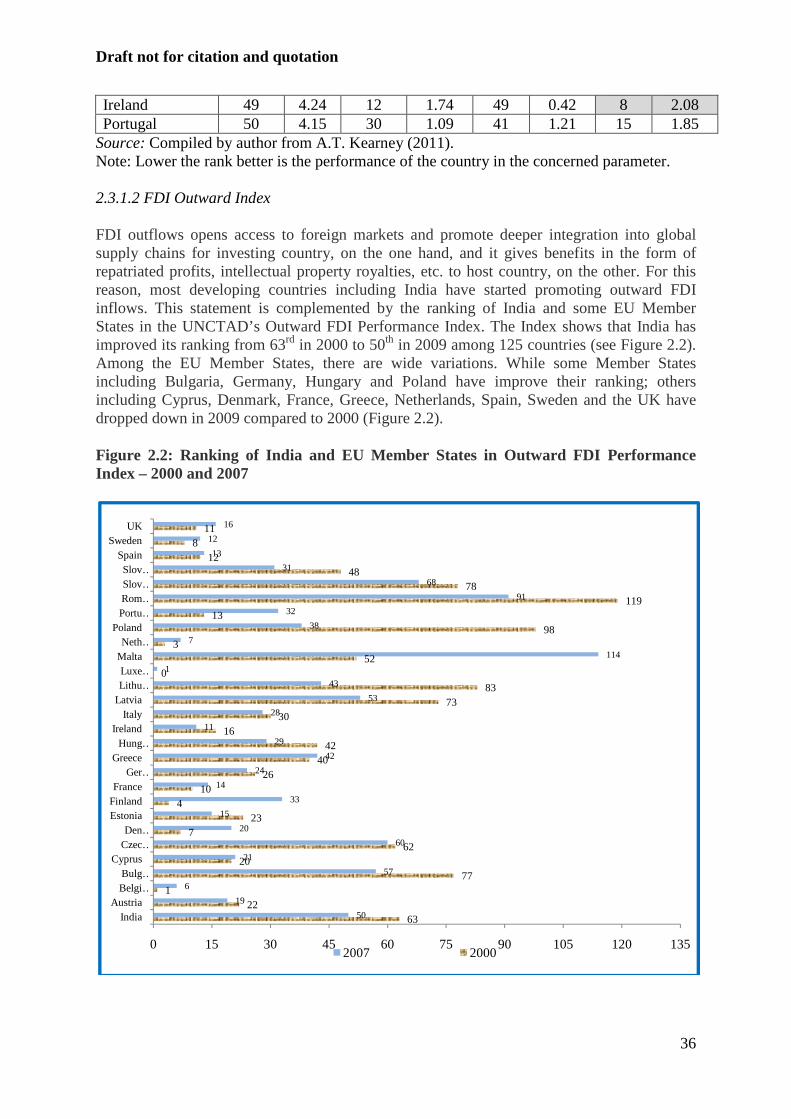
Draft not for citation and quotation
36
Ireland 49 4.24 12 1.74 49 0.42 8 2.08 Portugal 50 4.15 30 1.09 41 1.21 15 1.85
Source: Compiled by author from A.T. Kearney (2011). Note: Lower the rank better is the performance of the country in the concerned parameter. 2.3.1.2 FDI Outward Index FDI outflows opens access to foreign markets and promote deeper integration into global supply chains for investing country, on the one hand, and it gives benefits in the form of repatriated profits, intellectual property royalties, etc. to host country, on the other. For this reason, most developing countries including India have started promoting outward FDI inflows. This statement is complemented by the ranking of India and some EU Member States in the UNCTAD’s Outward FDI Performance Index. The Index shows that India has improved its ranking from 63rd in 2000 to 50th in 2009 among 125 countries (see Figure 2.2). Among the EU Member States, there are wide variations. While some Member States including Bulgaria, Germany, Hungary and Poland have improve their ranking; others including Cyprus, Denmark, France, Greece, Netherlands, Spain, Sweden and the UK have dropped down in 2009 compared to 2000 (Figure 2.2). Figure 2.2: Ranking of India and EU Member States in Outward FDI Performance Index – 2000 and 2007
6322
177
2062
723
410
2640
4216
3073
830
523
9813
11978
4812
811
50
19
6
57
21
60
20
15
33
14
24
42
29
11
28
53
43
1
114
7
38
32
91
68
31
13
12
16
0 15 30 45 60 75 90 105 120 135
IndiaAustria
Belgi…Bulg…
CyprusCzec…Den…
EstoniaFinlandFrance
Ger…Greece
Hung…Ireland
ItalyLatviaLithu…Luxe…
MaltaNeth…
PolandPortu…Rom…Slov…Slov…
SpainSweden
UK
2007 2000
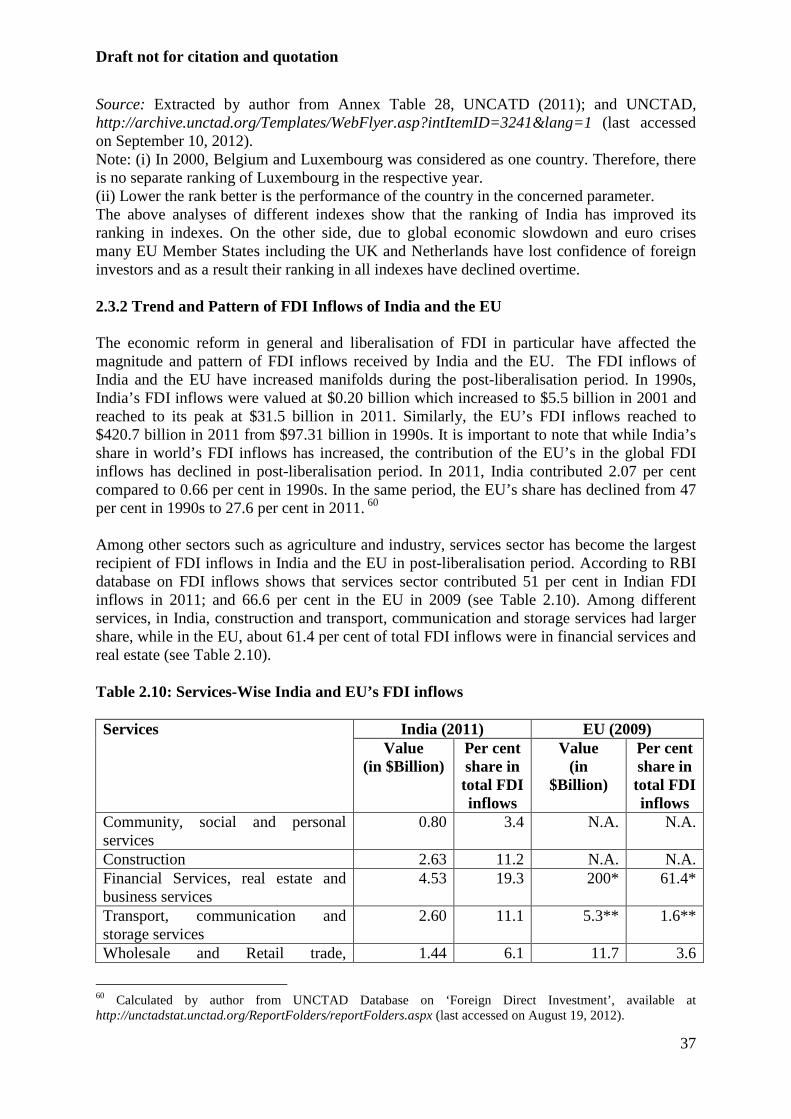
Draft not for citation and quotation
37
Source: Extracted by author from Annex Table 28, UNCATD (2011); and UNCTAD, http://archive.unctad.org/Templates/WebFlyer.asp?intItemID=3241&lang=1 (last accessed on September 10, 2012). Note: (i) In 2000, Belgium and Luxembourg was considered as one country. Therefore, there is no separate ranking of Luxembourg in the respective year. (ii) Lower the rank better is the performance of the country in the concerned parameter. The above analyses of different indexes show that the ranking of India has improved its ranking in indexes. On the other side, due to global economic slowdown and euro crises many EU Member States including the UK and Netherlands have lost confidence of foreign investors and as a result their ranking in all indexes have declined overtime. 2.3.2 Trend and Pattern of FDI Inflows of India and the EU The economic reform in general and liberalisation of FDI in particular have affected the magnitude and pattern of FDI inflows received by India and the EU. The FDI inflows of India and the EU have increased manifolds during the post-liberalisation period. In 1990s, India’s FDI inflows were valued at $0.20 billion which increased to $5.5 billion in 2001 and reached to its peak at $31.5 billion in 2011. Similarly, the EU’s FDI inflows reached to $420.7 billion in 2011 from $97.31 billion in 1990s. It is important to note that while India’s share in world’s FDI inflows has increased, the contribution of the EU’s in the global FDI inflows has declined in post-liberalisation period. In 2011, India contributed 2.07 per cent compared to 0.66 per cent in 1990s. In the same period, the EU’s share has declined from 47 per cent in 1990s to 27.6 per cent in 2011. 60 Among other sectors such as agriculture and industry, services sector has become the largest recipient of FDI inflows in India and the EU in post-liberalisation period. According to RBI database on FDI inflows shows that services sector contributed 51 per cent in Indian FDI inflows in 2011; and 66.6 per cent in the EU in 2009 (see Table 2.10). Among different services, in India, construction and transport, communication and storage services had larger share, while in the EU, about 61.4 per cent of total FDI inflows were in financial services and real estate (see Table 2.10). Table 2.10: Services-Wise India and EU’s FDI inflows Services India (2011) EU (2009)
Value (in $Billion)
Per cent share in total FDI inflows
Value (in
$Billion)
Per cent share in total FDI inflows
Community, social and personal services
0.80 3.4 N.A. N.A.
Construction 2.63 11.2 N.A. N.A. Financial Services, real estate and business services
4.53 19.3 200* 61.4*
Transport, communication and storage services
2.60 11.1 5.3** 1.6**
Wholesale and Retail trade, 1.44 6.1 11.7 3.6
60 Calculated by author from UNCTAD Database on ‘Foreign Direct Investment’, available at http://unctadstat.unctad.org/ReportFolders/reportFolders.aspx (last accessed on August 19, 2012).
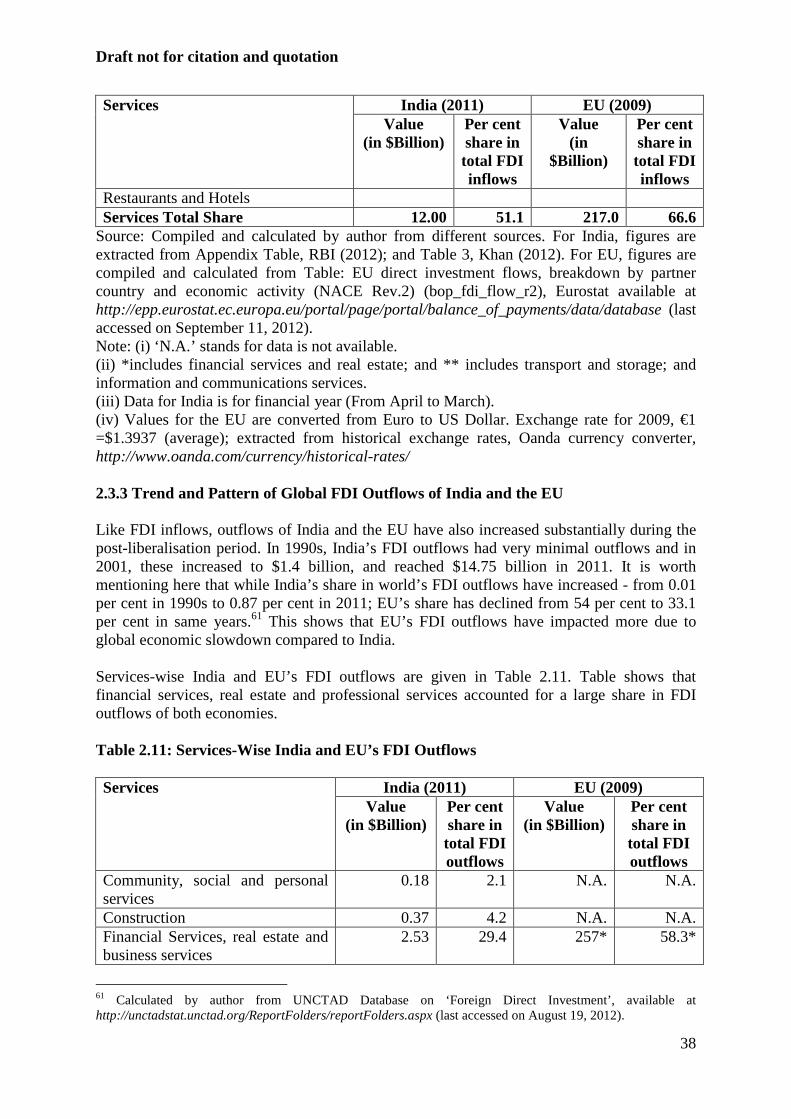
Draft not for citation and quotation
38
Services India (2011) EU (2009) Value
(in $Billion) Per cent share in total FDI inflows
Value (in
$Billion)
Per cent share in total FDI inflows
Restaurants and Hotels Services Total Share 12.00 51.1 217.0 66.6
Source: Compiled and calculated by author from different sources. For India, figures are extracted from Appendix Table, RBI (2012); and Table 3, Khan (2012). For EU, figures are compiled and calculated from Table: EU direct investment flows, breakdown by partner country and economic activity (NACE Rev.2) (bop_fdi_flow_r2), Eurostat available at http://epp.eurostat.ec.europa.eu/portal/page/portal/balance_of_payments/data/database (last accessed on September 11, 2012). Note: (i) ‘N.A.’ stands for data is not available. (ii) *includes financial services and real estate; and ** includes transport and storage; and information and communications services. (iii) Data for India is for financial year (From April to March). (iv) Values for the EU are converted from Euro to US Dollar. Exchange rate for 2009, €1 =$1.3937 (average); extracted from historical exchange rates, Oanda currency converter, http://www.oanda.com/currency/historical-rates/ 2.3.3 Trend and Pattern of Global FDI Outflows of India and the EU Like FDI inflows, outflows of India and the EU have also increased substantially during the post-liberalisation period. In 1990s, India’s FDI outflows had very minimal outflows and in 2001, these increased to $1.4 billion, and reached $14.75 billion in 2011. It is worth mentioning here that while India’s share in world’s FDI outflows have increased - from 0.01 per cent in 1990s to 0.87 per cent in 2011; EU’s share has declined from 54 per cent to 33.1 per cent in same years.61 This shows that EU’s FDI outflows have impacted more due to global economic slowdown compared to India. Services-wise India and EU’s FDI outflows are given in Table 2.11. Table shows that financial services, real estate and professional services accounted for a large share in FDI outflows of both economies. Table 2.11: Services-Wise India and EU’s FDI Outflows Services India (2011) EU (2009)
Value (in $Billion)
Per cent share in total FDI outflows
Value (in $Billion)
Per cent share in total FDI outflows
Community, social and personal services
0.18 2.1 N.A. N.A.
Construction 0.37 4.2 N.A. N.A. Financial Services, real estate and business services
2.53 29.4 257* 58.3*
61 Calculated by author from UNCTAD Database on ‘Foreign Direct Investment’, available at http://unctadstat.unctad.org/ReportFolders/reportFolders.aspx (last accessed on August 19, 2012).
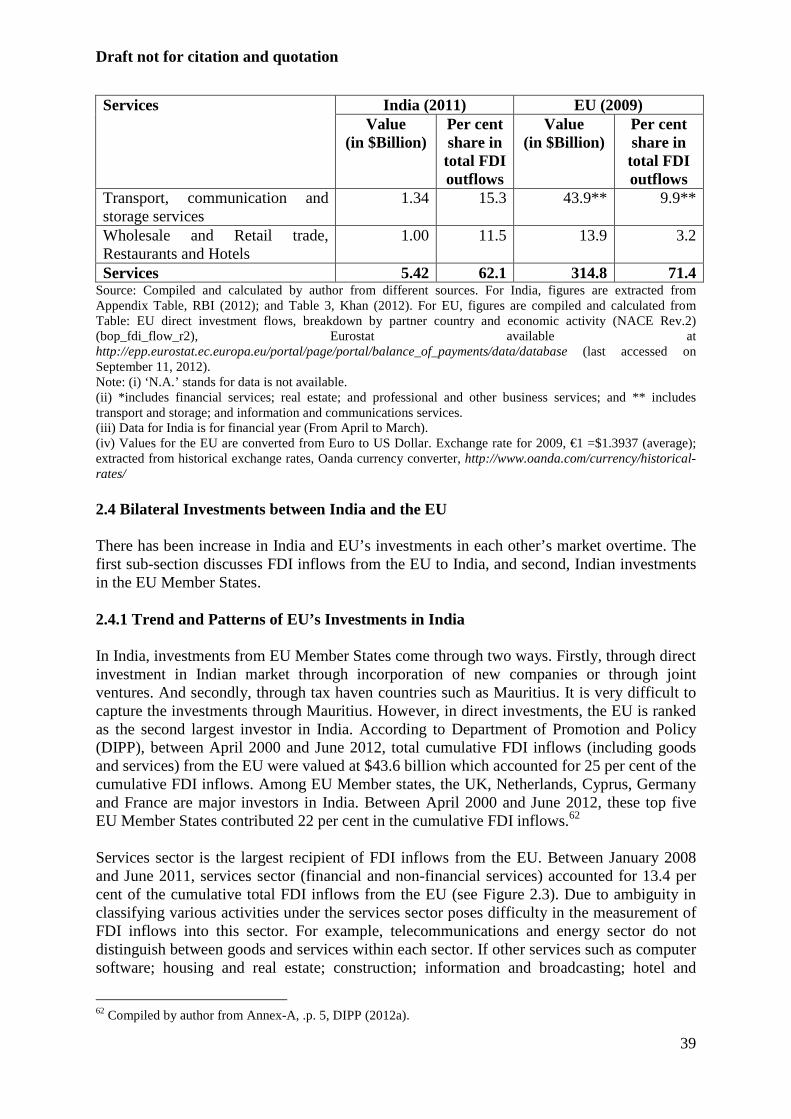
Draft not for citation and quotation
39
Services India (2011) EU (2009) Value
(in $Billion) Per cent share in total FDI outflows
Value (in $Billion)
Per cent share in total FDI outflows
Transport, communication and storage services
1.34 15.3 43.9** 9.9**
Wholesale and Retail trade, Restaurants and Hotels
1.00 11.5 13.9 3.2
Services 5.42 62.1 314.8 71.4 Source: Compiled and calculated by author from different sources. For India, figures are extracted from Appendix Table, RBI (2012); and Table 3, Khan (2012). For EU, figures are compiled and calculated from Table: EU direct investment flows, breakdown by partner country and economic activity (NACE Rev.2) (bop_fdi_flow_r2), Eurostat available at http://epp.eurostat.ec.europa.eu/portal/page/portal/balance_of_payments/data/database (last accessed on September 11, 2012). Note: (i) ‘N.A.’ stands for data is not available. (ii) *includes financial services; real estate; and professional and other business services; and ** includes transport and storage; and information and communications services. (iii) Data for India is for financial year (From April to March). (iv) Values for the EU are converted from Euro to US Dollar. Exchange rate for 2009, €1 =$1.3937 (average); extracted from historical exchange rates, Oanda currency converter, http://www.oanda.com/currency/historical-rates/ 2.4 Bilateral Investments between India and the EU There has been increase in India and EU’s investments in each other’s market overtime. The first sub-section discusses FDI inflows from the EU to India, and second, Indian investments in the EU Member States. 2.4.1 Trend and Patterns of EU’s Investments in India In India, investments from EU Member States come through two ways. Firstly, through direct investment in Indian market through incorporation of new companies or through joint ventures. And secondly, through tax haven countries such as Mauritius. It is very difficult to capture the investments through Mauritius. However, in direct investments, the EU is ranked as the second largest investor in India. According to Department of Promotion and Policy (DIPP), between April 2000 and June 2012, total cumulative FDI inflows (including goods and services) from the EU were valued at $43.6 billion which accounted for 25 per cent of the cumulative FDI inflows. Among EU Member states, the UK, Netherlands, Cyprus, Germany and France are major investors in India. Between April 2000 and June 2012, these top five EU Member States contributed 22 per cent in the cumulative FDI inflows.62 Services sector is the largest recipient of FDI inflows from the EU. Between January 2008 and June 2011, services sector (financial and non-financial services) accounted for 13.4 per cent of the cumulative total FDI inflows from the EU (see Figure 2.3). Due to ambiguity in classifying various activities under the services sector poses difficulty in the measurement of FDI inflows into this sector. For example, telecommunications and energy sector do not distinguish between goods and services within each sector. If other services such as computer software; housing and real estate; construction; information and broadcasting; hotel and
62 Compiled by author from Annex-A, .p. 5, DIPP (2012a).
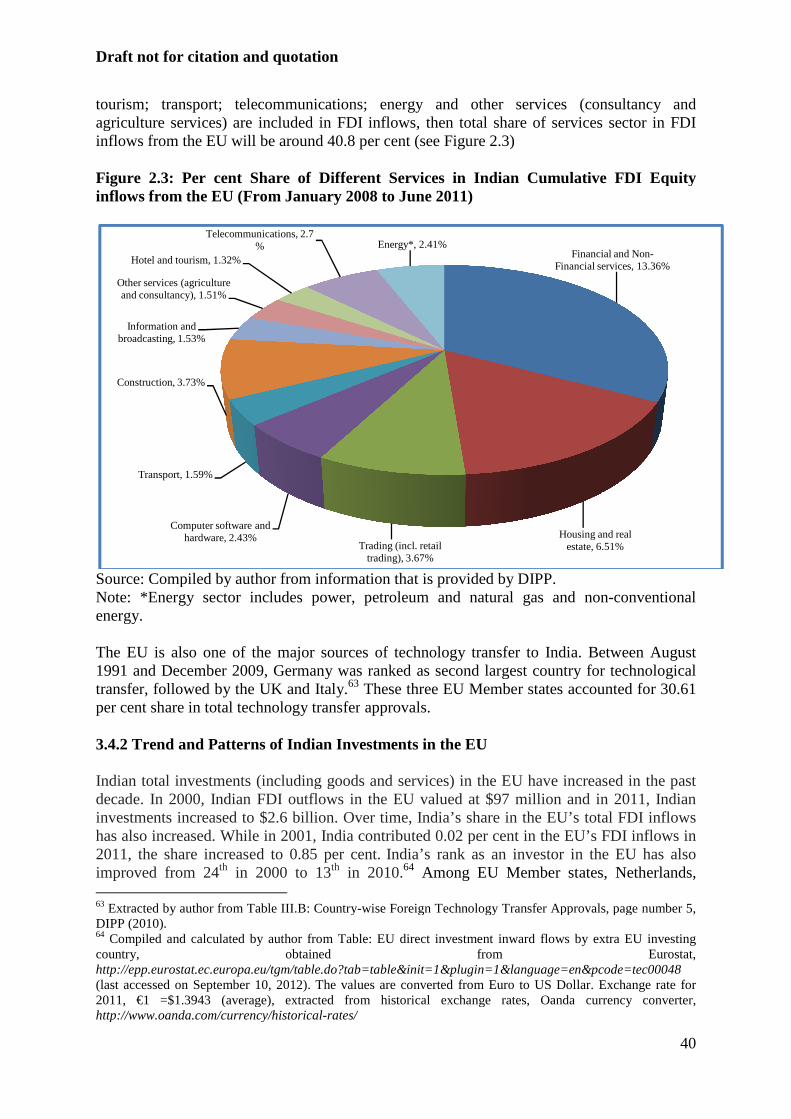
Draft not for cit ation and quotation
tourism; transport; telecommunications; energy agriculture services) are included in FDI inflows, then total share of services sector in FDI inflows from the EU will be around Figure 2.3: Per cent Share of Different Services in Indian Cumulative FDI Equity inflows from the EU (From January 2008 to June 2011
Source: Compiled by author from iNote: *Energy sector includes power, petroleum and natural gas and nonenergy. The EU is also one of the major sources of technology transfer to India. Between August 1991 and December 2009, Germany was ranked as transfer, followed by the UK and Italy.per cent share in total technology transfer 3.4.2 Trend and Patterns of Indian total investments (including goods and services)decade. In 2000, Indian FDI outflows in the EU valued at $investments increased to $2.6 has also increased. While in 2002011, the share increased to 0.improved from 24th in 2000 to 13 63 Extracted by author from Table III.B: CountryDIPP (2010). 64 Compiled and calculated by author from Table: country, obtained from Eurostat, http://epp.eurostat.ec.europa.eu/tgm/table.do?tab=table&init=1&plugin=1&language=en&pcode=tec00048(last accessed on September 10, 2012). The values are converted from Euro to US Dollar. Exchange rate for 2011, €1 =$1.3943 (average), extracted from historical exchange rates, Oanda currenhttp://www.oanda.com/currency/historical
Computer software and hardware, 2.43%
Transport, 1.59%
Construction, 3.73%
Information and broadcasting, 1.53%
Other services (agriculture and consultancy), 1.51%
Hotel and tourism, 1.32%
Telecommunications, 2.7%
ation and quotation
; transport; telecommunications; energy and other services (are included in FDI inflows, then total share of services sector in FDI will be around 40.8 per cent (see Figure 2.3)
: Per cent Share of Different Services in Indian Cumulative FDI Equity inflows from the EU (From January 2008 to June 2011)
Compiled by author from information that is provided by DIPP. includes power, petroleum and natural gas and non
The EU is also one of the major sources of technology transfer to India. Between August 1991 and December 2009, Germany was ranked as second largest country for technological
followed by the UK and Italy.63 These three EU Member states accounted for 30.61 technology transfer approvals.
Trend and Patterns of Indian Investments in the EU
(including goods and services) in the EU have increased. In 2000, Indian FDI outflows in the EU valued at $97 million and in 2011, Indian
$2.6 billion. Over time, India’s share in the EU’s total FDI inflows has also increased. While in 2001, India contributed 0.02 per cent in the EU’s FDI inflows in
, the share increased to 0.85 per cent. India’s rank as an investor in the EU has also in 2000 to 13th in 2010.64 Among EU Member states, Netherlands,
III.B: Country-wise Foreign Technology Transfer Approvals, page number 5,
Compiled and calculated by author from Table: EU direct investment inward flows by extra EU investing obtained from Eurostat,
/tgm/table.do?tab=table&init=1&plugin=1&language=en&pcode=tec00048(last accessed on September 10, 2012). The values are converted from Euro to US Dollar. Exchange rate for
=$1.3943 (average), extracted from historical exchange rates, Oanda currenhttp://www.oanda.com/currency/historical-rates/
Financial and NonFinancial services, 13.36%
Housing and real estate, 6.51%Trading (incl. retail
trading), 3.67%
Telecommunications, 2.7Energy*, 2.41%
40
other services (consultancy and are included in FDI inflows, then total share of services sector in FDI
: Per cent Share of Different Services in Indian Cumulative FDI Equity
includes power, petroleum and natural gas and non-conventional
The EU is also one of the major sources of technology transfer to India. Between August second largest country for technological
These three EU Member states accounted for 30.61
increased in the past illion and in 2011, Indian
billion. Over time, India’s share in the EU’s total FDI inflows contributed 0.02 per cent in the EU’s FDI inflows in
India’s rank as an investor in the EU has also EU Member states, Netherlands,
wise Foreign Technology Transfer Approvals, page number 5,
EU direct investment inward flows by extra EU investing obtained from Eurostat,
/tgm/table.do?tab=table&init=1&plugin=1&language=en&pcode=tec00048 (last accessed on September 10, 2012). The values are converted from Euro to US Dollar. Exchange rate for
=$1.3943 (average), extracted from historical exchange rates, Oanda currency converter,
Financial and Non-Financial services, 13.36%
Housing and real estate, 6.51%
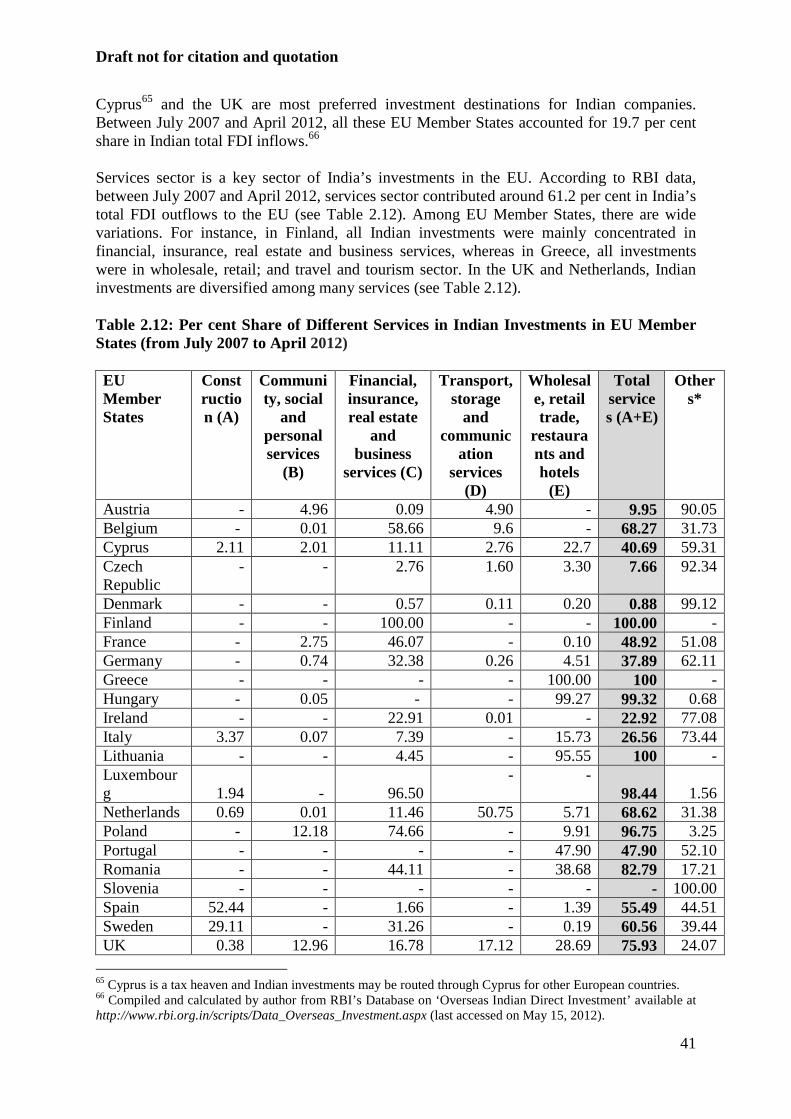
Draft not for citation and quotation
41
Cyprus65 and the UK are most preferred investment destinations for Indian companies. Between July 2007 and April 2012, all these EU Member States accounted for 19.7 per cent share in Indian total FDI inflows.66 Services sector is a key sector of India’s investments in the EU. According to RBI data, between July 2007 and April 2012, services sector contributed around 61.2 per cent in India’s total FDI outflows to the EU (see Table 2.12). Among EU Member States, there are wide variations. For instance, in Finland, all Indian investments were mainly concentrated in financial, insurance, real estate and business services, whereas in Greece, all investments were in wholesale, retail; and travel and tourism sector. In the UK and Netherlands, Indian investments are diversified among many services (see Table 2.12). Table 2.12: Per cent Share of Different Services in Indian Investments in EU Member States (from July 2007 to April 2012) EU Member States
Construction (A)
Community, social
and personal services
(B)
Financial, insurance, real estate
and business
services (C)
Transport, storage
and communic
ation services
(D)
Wholesale, retail trade,
restaurants and hotels
(E)
Total services (A+E)
Others*
Austria - 4.96 0.09 4.90 - 9.95 90.05 Belgium - 0.01 58.66 9.6 - 68.27 31.73 Cyprus 2.11 2.01 11.11 2.76 22.7 40.69 59.31 Czech Republic
- - 2.76
1.60
3.30
7.66
92.34
Denmark - - 0.57 0.11 0.20 0.88 99.12 Finland - - 100.00 - - 100.00 - France - 2.75 46.07 - 0.10 48.92 51.08 Germany - 0.74 32.38 0.26 4.51 37.89 62.11 Greece - - - - 100.00 100 - Hungary - 0.05 - - 99.27 99.32 0.68 Ireland - - 22.91 0.01 - 22.92 77.08 Italy 3.37 0.07 7.39 - 15.73 26.56 73.44 Lithuania - - 4.45 - 95.55 100 - Luxembourg 1.94 - 96.50
- - 98.44 1.56
Netherlands 0.69 0.01 11.46 50.75 5.71 68.62 31.38 Poland - 12.18 74.66 - 9.91 96.75 3.25 Portugal - - - - 47.90 47.90 52.10 Romania - - 44.11 - 38.68 82.79 17.21 Slovenia - - - - - - 100.00 Spain 52.44 - 1.66 - 1.39 55.49 44.51 Sweden 29.11 - 31.26 - 0.19 60.56 39.44 UK 0.38 12.96 16.78 17.12 28.69 75.93 24.07
65 Cyprus is a tax heaven and Indian investments may be routed through Cyprus for other European countries. 66 Compiled and calculated by author from RBI’s Database on ‘Overseas Indian Direct Investment’ available at http://www.rbi.org.in/scripts/Data_Overseas_Investment.aspx (last accessed on May 15, 2012).
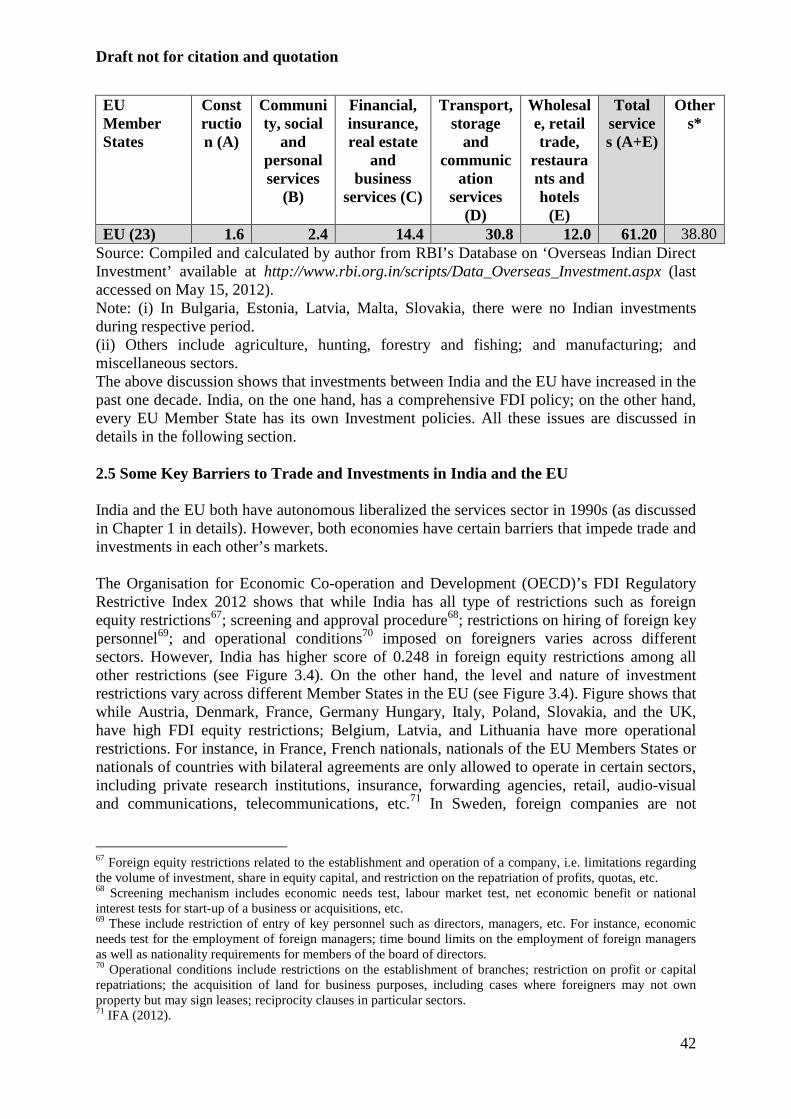
Draft not for citation and quotation
42
EU Member States
Construction (A)
Community, social
and personal services
(B)
Financial, insurance, real estate
and business
services (C)
Transport, storage
and communic
ation services
(D)
Wholesale, retail trade,
restaurants and hotels
(E)
Total services (A+E)
Others*
EU (23) 1.6 2.4 14.4 30.8 12.0 61.20 38.80 Source: Compiled and calculated by author from RBI’s Database on ‘Overseas Indian Direct Investment’ available at http://www.rbi.org.in/scripts/Data_Overseas_Investment.aspx (last accessed on May 15, 2012). Note: (i) In Bulgaria, Estonia, Latvia, Malta, Slovakia, there were no Indian investments during respective period. (ii) Others include agriculture, hunting, forestry and fishing; and manufacturing; and miscellaneous sectors. The above discussion shows that investments between India and the EU have increased in the past one decade. India, on the one hand, has a comprehensive FDI policy; on the other hand, every EU Member State has its own Investment policies. All these issues are discussed in details in the following section. 2.5 Some Key Barriers to Trade and Investments in India and the EU India and the EU both have autonomous liberalized the services sector in 1990s (as discussed in Chapter 1 in details). However, both economies have certain barriers that impede trade and investments in each other’s markets. The Organisation for Economic Co-operation and Development (OECD)’s FDI Regulatory Restrictive Index 2012 shows that while India has all type of restrictions such as foreign equity restrictions67; screening and approval procedure68; restrictions on hiring of foreign key personnel69; and operational conditions70 imposed on foreigners varies across different sectors. However, India has higher score of 0.248 in foreign equity restrictions among all other restrictions (see Figure 3.4). On the other hand, the level and nature of investment restrictions vary across different Member States in the EU (see Figure 3.4). Figure shows that while Austria, Denmark, France, Germany Hungary, Italy, Poland, Slovakia, and the UK, have high FDI equity restrictions; Belgium, Latvia, and Lithuania have more operational restrictions. For instance, in France, French nationals, nationals of the EU Members States or nationals of countries with bilateral agreements are only allowed to operate in certain sectors, including private research institutions, insurance, forwarding agencies, retail, audio-visual and communications, telecommunications, etc.71 In Sweden, foreign companies are not
67 Foreign equity restrictions related to the establishment and operation of a company, i.e. limitations regarding the volume of investment, share in equity capital, and restriction on the repatriation of profits, quotas, etc. 68 Screening mechanism includes economic needs test, labour market test, net economic benefit or national interest tests for start-up of a business or acquisitions, etc. 69 These include restriction of entry of key personnel such as directors, managers, etc. For instance, economic needs test for the employment of foreign managers; time bound limits on the employment of foreign managers as well as nationality requirements for members of the board of directors. 70 Operational conditions include restrictions on the establishment of branches; restriction on profit or capital repatriations; the acquisition of land for business purposes, including cases where foreigners may not own property but may sign leases; reciprocity clauses in particular sectors. 71 IFA (2012).
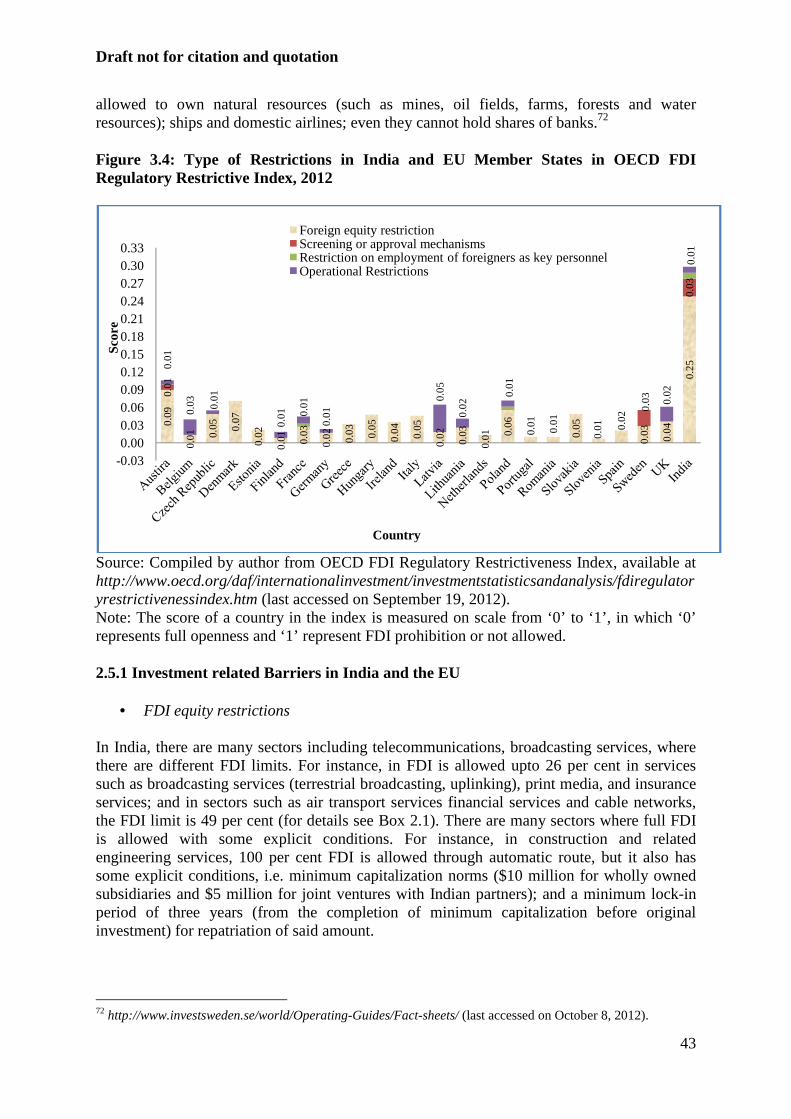
Draft not for citation and quotation
43
allowed to own natural resources (such as mines, oil fields, farms, forests and water resources); ships and domestic airlines; even they cannot hold shares of banks.72 Figure 3.4: Type of Restrictions in India and EU Member States in OECD FDI Regulatory Restrictive Index, 2012
Source: Compiled by author from OECD FDI Regulatory Restrictiveness Index, available at http://www.oecd.org/daf/internationalinvestment/investmentstatisticsandanalysis/fdiregulatoryrestrictivenessindex.htm (last accessed on September 19, 2012). Note: The score of a country in the index is measured on scale from ‘0’ to ‘1’, in which ‘0’ represents full openness and ‘1’ represent FDI prohibition or not allowed. 2.5.1 Investment related Barriers in India and the EU
• FDI equity restrictions
In India, there are many sectors including telecommunications, broadcasting services, where there are different FDI limits. For instance, in FDI is allowed upto 26 per cent in services such as broadcasting services (terrestrial broadcasting, uplinking), print media, and insurance services; and in sectors such as air transport services financial services and cable networks, the FDI limit is 49 per cent (for details see Box 2.1). There are many sectors where full FDI is allowed with some explicit conditions. For instance, in construction and related engineering services, 100 per cent FDI is allowed through automatic route, but it also has some explicit conditions, i.e. minimum capitalization norms ($10 million for wholly owned subsidiaries and $5 million for joint ventures with Indian partners); and a minimum lock-in period of three years (from the completion of minimum capitalization before original investment) for repatriation of said amount.
72 http://www.investsweden.se/world/Operating-Guides/Fact-sheets/ (last accessed on October 8, 2012).
0.0
9
0.0
1 0.0
5
0.0
7
0.0
2
0.0
1
0.0
3
0.0
2
0.0
3
0.0
5
0.0
4
0.0
5
0.0
2
0.0
3
0.0
1 0.0
6
0.0
1
0.0
1
0.0
5
0.0
1
0.0
2
0.0
3
0.0
4
0.2
5
0.0
1
0.0
3
0.0
3
0.0
1
0.0
3
0.0
1
0.0
1 0.0
1
0.0
1
0.0
5
0.0
2 0.0
1
0.0
2
0.0
1
-0.030.000.030.060.090.120.150.180.210.240.270.300.33
Sco
re
Country
Foreign equity restrictionScreening or approval mechanismsRestriction on employment of foreigners as key personnelOperational Restrictions
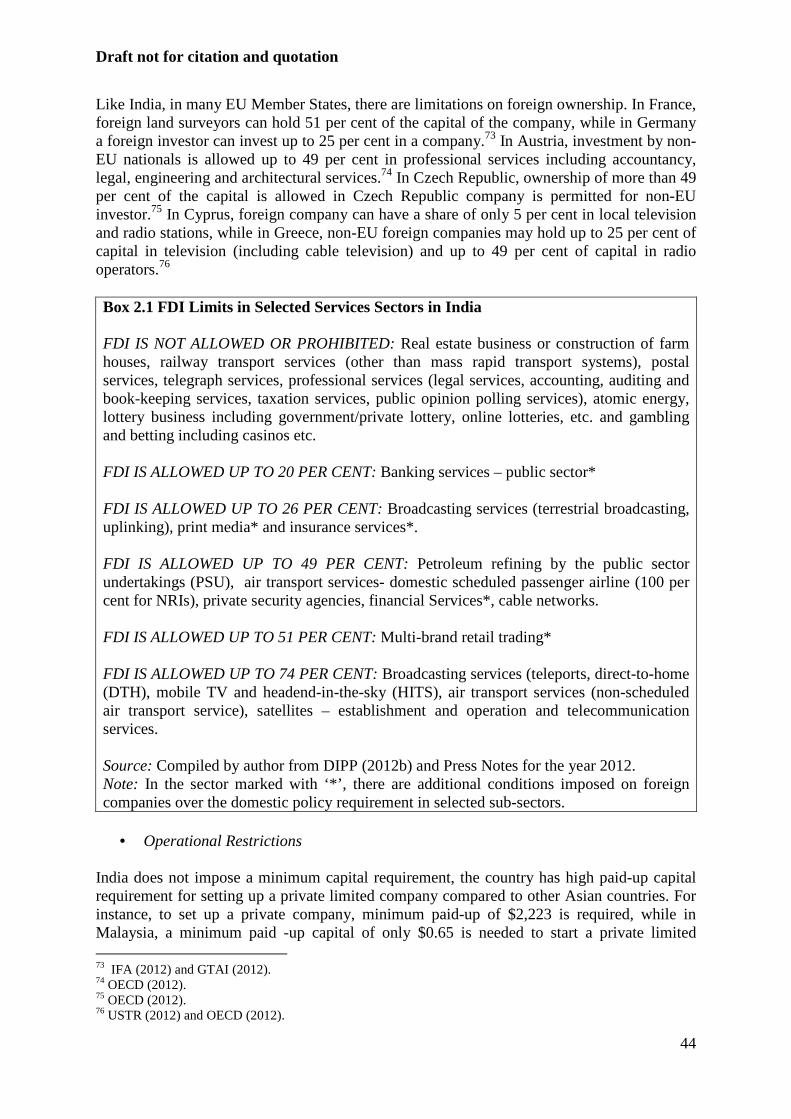
Draft not for citation and quotation
44
Like India, in many EU Member States, there are limitations on foreign ownership. In France, foreign land surveyors can hold 51 per cent of the capital of the company, while in Germany a foreign investor can invest up to 25 per cent in a company.73 In Austria, investment by non-EU nationals is allowed up to 49 per cent in professional services including accountancy, legal, engineering and architectural services.74 In Czech Republic, ownership of more than 49 per cent of the capital is allowed in Czech Republic company is permitted for non-EU investor.75 In Cyprus, foreign company can have a share of only 5 per cent in local television and radio stations, while in Greece, non-EU foreign companies may hold up to 25 per cent of capital in television (including cable television) and up to 49 per cent of capital in radio operators.76
Box 2.1 FDI Limits in Selected Services Sectors in India FDI IS NOT ALLOWED OR PROHIBITED: Real estate business or construction of farm houses, railway transport services (other than mass rapid transport systems), postal services, telegraph services, professional services (legal services, accounting, auditing and book-keeping services, taxation services, public opinion polling services), atomic energy, lottery business including government/private lottery, online lotteries, etc. and gambling and betting including casinos etc. FDI IS ALLOWED UP TO 20 PER CENT: Banking services – public sector* FDI IS ALLOWED UP TO 26 PER CENT: Broadcasting services (terrestrial broadcasting, uplinking), print media* and insurance services*. FDI IS ALLOWED UP TO 49 PER CENT: Petroleum refining by the public sector undertakings (PSU), air transport services- domestic scheduled passenger airline (100 per cent for NRIs), private security agencies, financial Services*, cable networks. FDI IS ALLOWED UP TO 51 PER CENT: Multi-brand retail trading* FDI IS ALLOWED UP TO 74 PER CENT: Broadcasting services (teleports, direct-to-home (DTH), mobile TV and headend-in-the-sky (HITS), air transport services (non-scheduled air transport service), satellites – establishment and operation and telecommunication services. Source: Compiled by author from DIPP (2012b) and Press Notes for the year 2012. Note: In the sector marked with ‘*’, there are additional conditions imposed on foreign companies over the domestic policy requirement in selected sub-sectors.
• Operational Restrictions
India does not impose a minimum capital requirement, the country has high paid-up capital requirement for setting up a private limited company compared to other Asian countries. For instance, to set up a private company, minimum paid-up of $2,223 is required, while in Malaysia, a minimum paid -up capital of only $0.65 is needed to start a private limited 73 IFA (2012) and GTAI (2012). 74 OECD (2012). 75 OECD (2012). 76 USTR (2012) and OECD (2012).
Draft not for citation and quotation
45
company.77 In some sectors, there is a requirement of a national. For instance, to get a permit for scheduled airlines, a foreign company should have Indian Chairman and at least two-thirds of the Directors from India.78 In the EU, a company is treated differently based on its mode of operation. A foreign company is treated as an EU company only if it is a wholly-owned subsidiary. Many Member States have minimum initial capital requirement for setting up a foreign subsidiary. For instance, in Germany, minimum capital of $32,825 (€25,000) is required for establishing a Germany Limited Liability Company (GmbH) and up to $64,770 (€50,000) for German Stock Corporations (AG).79 Similarly in Poland, there is a requirement of initial capital of $1,490 (€1,150) for a limited liability company; and $29,794 (€23,000) for a joint stock company.80 In Spain, a minimum share capital of $77,724 (€60,000) is required for incorporated a subsidiary in the form of corporation; and $3,886 (€3,000) for a limited liability company.81
In many EU Member States, there are restrictions on board of directors. In Sweden, a joint stock company (AB), 50 per cent of the members of the board of directors must be legally resident in the EES area. The company president must also be legally resident in the EES-area. Similarly in the UK, a private limited company must have at least one natural person in board and all directs must be aged at least 16 years. In Germany, a German limited liability company which has more than 500 employees, one third of the supervisory board members have to be employees and in company where there are 2000 employees, half of the supervisory board members have to be employees.82
• High cost of operation and poor financial environment
India has higher cost of operation in the world. In World’s Ease of Doing Business Index, which reflects institutional and business environment of a country, India was ranked as 132, among 183 economies, in 2012 (see Table 2.13). In starting a business indicator, India was ranked at 132. Starting a business in India takes 29 days, compared 2 days in Australia; 3 days in Singapore; 6 days in Malaysia; 7 days in Korea; 10 days in China; and 23 days in Japan. Costs associated with a starting a business in India are also high, at 47 per cent of income per capita, compared to 2.5 per cent in China; 14.6 per cent in Korea, and 16.4 per cent in Malaysia. Among EU Member States, there are wide variations. In Austria, Poland and Greece, it is very difficult to start a business and they have various conditions and procedures to register a property which can be substantiated by their lower ranking in Ease of Doing Business Index as shown in Table 2.13.
77 Ernst and Young (2011); and http://www.guidemesingapore.com/research-reports/malaysia/company-setup-singapore-vs-malaysia (last accessed on September 21, 2012). 78 DIPP (2012c). 79 GTAI (2012). Values are converted from Euro to US Dollar. Exchange rate is €1= $1.2954(average), obtained from http://www.oanda.com/currency/historical-rates/ (last accessed on October 8, 2012). 80PAIZ (2012). Values are converted from Euro to US Dollar. Exchange rate is €1= $1.2954 (average), obtained from http://www.oanda.com/currency/historical-rates/ (last accessed on October 8, 2012). 81 INTERES (2012). Values are converted from Euro to US Dollar. Exchange rate is €1= $1.2954(average), obtained from http://www.oanda.com/currency/historical-rates/ (last accessed on October 8, 2012). 82 FICCI and Grant Thornton (2010) and European Commission (2012b).
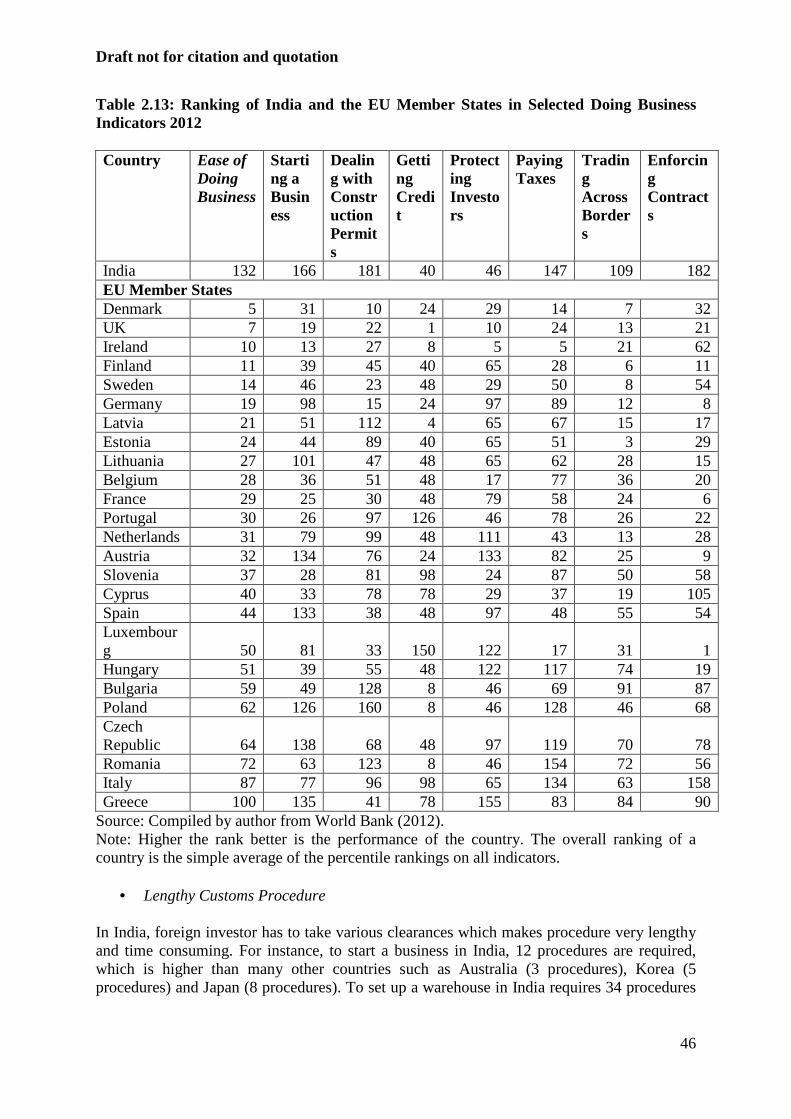
Draft not for citation and quotation
46
Table 2.13: Ranking of India and the EU Member States in Selected Doing Business Indicators 2012 Country Ease of
Doing Business
Starting a Business
Dealing with Construction Permits
Getting Credit
Protecting Investors
Paying Taxes
Trading Across Borders
Enforcing Contracts
India 132 166 181 40 46 147 109 182 EU Member States Denmark 5 31 10 24 29 14 7 32 UK 7 19 22 1 10 24 13 21 Ireland 10 13 27 8 5 5 21 62 Finland 11 39 45 40 65 28 6 11 Sweden 14 46 23 48 29 50 8 54 Germany 19 98 15 24 97 89 12 8 Latvia 21 51 112 4 65 67 15 17 Estonia 24 44 89 40 65 51 3 29 Lithuania 27 101 47 48 65 62 28 15 Belgium 28 36 51 48 17 77 36 20 France 29 25 30 48 79 58 24 6 Portugal 30 26 97 126 46 78 26 22 Netherlands 31 79 99 48 111 43 13 28 Austria 32 134 76 24 133 82 25 9 Slovenia 37 28 81 98 24 87 50 58 Cyprus 40 33 78 78 29 37 19 105 Spain 44 133 38 48 97 48 55 54 Luxembourg 50 81 33 150 122 17 31 1 Hungary 51 39 55 48 122 117 74 19 Bulgaria 59 49 128 8 46 69 91 87 Poland 62 126 160 8 46 128 46 68 Czech Republic 64 138 68 48 97 119 70 78 Romania 72 63 123 8 46 154 72 56 Italy 87 77 96 98 65 134 63 158 Greece 100 135 41 78 155 83 84 90
Source: Compiled by author from World Bank (2012). Note: Higher the rank better is the performance of the country. The overall ranking of a country is the simple average of the percentile rankings on all indicators.
• Lengthy Customs Procedure In India, foreign investor has to take various clearances which makes procedure very lengthy and time consuming. For instance, to start a business in India, 12 procedures are required, which is higher than many other countries such as Australia (3 procedures), Korea (5 procedures) and Japan (8 procedures). To set up a warehouse in India requires 34 procedures
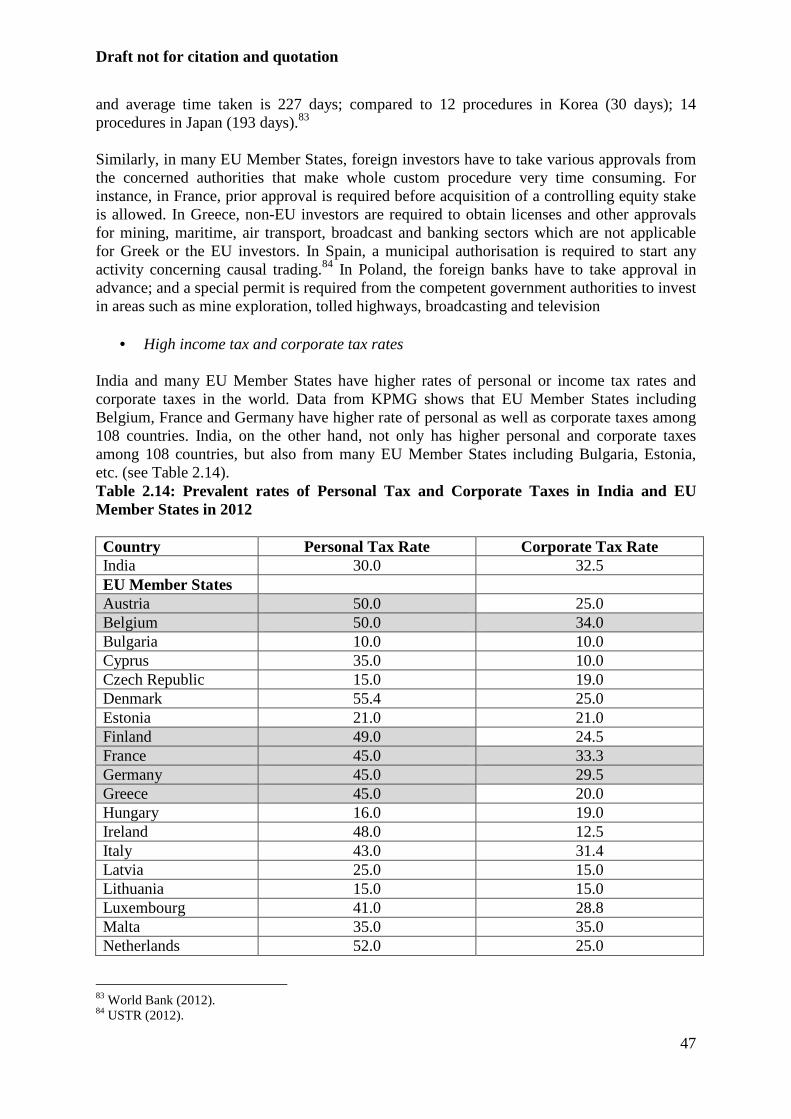
Draft not for citation and quotation
47
and average time taken is 227 days; compared to 12 procedures in Korea (30 days); 14 procedures in Japan (193 days).83 Similarly, in many EU Member States, foreign investors have to take various approvals from the concerned authorities that make whole custom procedure very time consuming. For instance, in France, prior approval is required before acquisition of a controlling equity stake is allowed. In Greece, non-EU investors are required to obtain licenses and other approvals for mining, maritime, air transport, broadcast and banking sectors which are not applicable for Greek or the EU investors. In Spain, a municipal authorisation is required to start any activity concerning causal trading.84 In Poland, the foreign banks have to take approval in advance; and a special permit is required from the competent government authorities to invest in areas such as mine exploration, tolled highways, broadcasting and television
• High income tax and corporate tax rates India and many EU Member States have higher rates of personal or income tax rates and corporate taxes in the world. Data from KPMG shows that EU Member States including Belgium, France and Germany have higher rate of personal as well as corporate taxes among 108 countries. India, on the other hand, not only has higher personal and corporate taxes among 108 countries, but also from many EU Member States including Bulgaria, Estonia, etc. (see Table 2.14). Table 2.14: Prevalent rates of Personal Tax and Corporate Taxes in India and EU Member States in 2012 Country Personal Tax Rate Corporate Tax Rate India 30.0 32.5 EU Member States Austria 50.0 25.0 Belgium 50.0 34.0 Bulgaria 10.0 10.0 Cyprus 35.0 10.0 Czech Republic 15.0 19.0 Denmark 55.4 25.0 Estonia 21.0 21.0 Finland 49.0 24.5 France 45.0 33.3 Germany 45.0 29.5 Greece 45.0 20.0 Hungary 16.0 19.0 Ireland 48.0 12.5 Italy 43.0 31.4 Latvia 25.0 15.0 Lithuania 15.0 15.0 Luxembourg 41.0 28.8 Malta 35.0 35.0 Netherlands 52.0 25.0
83 World Bank (2012). 84 USTR (2012).
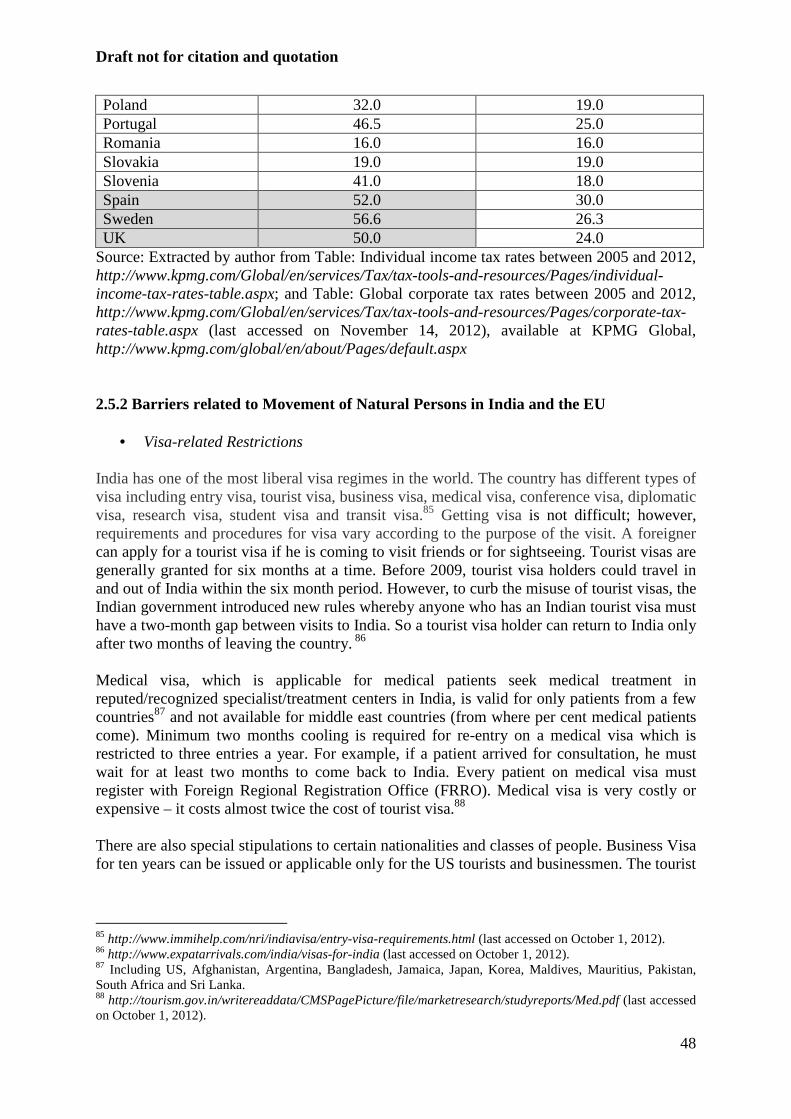
Draft not for citation and quotation
48
Poland 32.0 19.0 Portugal 46.5 25.0 Romania 16.0 16.0 Slovakia 19.0 19.0 Slovenia 41.0 18.0 Spain 52.0 30.0 Sweden 56.6 26.3 UK 50.0 24.0
Source: Extracted by author from Table: Individual income tax rates between 2005 and 2012, http://www.kpmg.com/Global/en/services/Tax/tax-tools-and-resources/Pages/individual-income-tax-rates-table.aspx; and Table: Global corporate tax rates between 2005 and 2012, http://www.kpmg.com/Global/en/services/Tax/tax-tools-and-resources/Pages/corporate-tax-rates-table.aspx (last accessed on November 14, 2012), available at KPMG Global, http://www.kpmg.com/global/en/about/Pages/default.aspx 2.5.2 Barriers related to Movement of Natural Persons in India and the EU
• Visa-related Restrictions India has one of the most liberal visa regimes in the world. The country has different types of visa including entry visa, tourist visa, business visa, medical visa, conference visa, diplomatic visa, research visa, student visa and transit visa.85 Getting visa is not difficult; however, requirements and procedures for visa vary according to the purpose of the visit. A foreigner can apply for a tourist visa if he is coming to visit friends or for sightseeing. Tourist visas are generally granted for six months at a time. Before 2009, tourist visa holders could travel in and out of India within the six month period. However, to curb the misuse of tourist visas, the Indian government introduced new rules whereby anyone who has an Indian tourist visa must have a two-month gap between visits to India. So a tourist visa holder can return to India only after two months of leaving the country. 86
Medical visa, which is applicable for medical patients seek medical treatment in reputed/recognized specialist/treatment centers in India, is valid for only patients from a few countries87 and not available for middle east countries (from where per cent medical patients come). Minimum two months cooling is required for re-entry on a medical visa which is restricted to three entries a year. For example, if a patient arrived for consultation, he must wait for at least two months to come back to India. Every patient on medical visa must register with Foreign Regional Registration Office (FRRO). Medical visa is very costly or expensive – it costs almost twice the cost of tourist visa.88 There are also special stipulations to certain nationalities and classes of people. Business Visa for ten years can be issued or applicable only for the US tourists and businessmen. The tourist
85 http://www.immihelp.com/nri/indiavisa/entry-visa-requirements.html (last accessed on October 1, 2012). 86 http://www.expatarrivals.com/india/visas-for-india (last accessed on October 1, 2012). 87 Including US, Afghanistan, Argentina, Bangladesh, Jamaica, Japan, Korea, Maldives, Mauritius, Pakistan, South Africa and Sri Lanka. 88 http://tourism.gov.in/writereaddata/CMSPagePicture/file/marketresearch/studyreports/Med.pdf (last accessed on October 1, 2012).
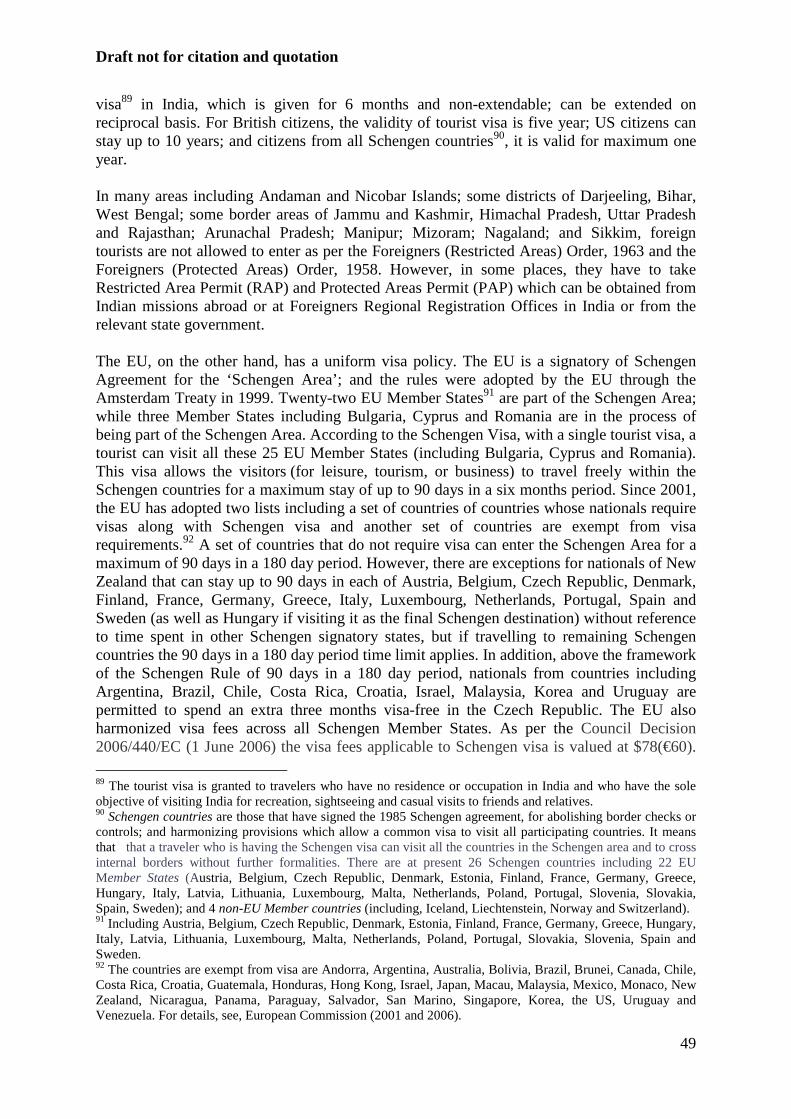
Draft not for citation and quotation
49
visa89 in India, which is given for 6 months and non-extendable; can be extended on reciprocal basis. For British citizens, the validity of tourist visa is five year; US citizens can stay up to 10 years; and citizens from all Schengen countries90, it is valid for maximum one year. In many areas including Andaman and Nicobar Islands; some districts of Darjeeling, Bihar, West Bengal; some border areas of Jammu and Kashmir, Himachal Pradesh, Uttar Pradesh and Rajasthan; Arunachal Pradesh; Manipur; Mizoram; Nagaland; and Sikkim, foreign tourists are not allowed to enter as per the Foreigners (Restricted Areas) Order, 1963 and the Foreigners (Protected Areas) Order, 1958. However, in some places, they have to take Restricted Area Permit (RAP) and Protected Areas Permit (PAP) which can be obtained from Indian missions abroad or at Foreigners Regional Registration Offices in India or from the relevant state government. The EU, on the other hand, has a uniform visa policy. The EU is a signatory of Schengen Agreement for the ‘Schengen Area’; and the rules were adopted by the EU through the Amsterdam Treaty in 1999. Twenty-two EU Member States91 are part of the Schengen Area; while three Member States including Bulgaria, Cyprus and Romania are in the process of being part of the Schengen Area. According to the Schengen Visa, with a single tourist visa, a tourist can visit all these 25 EU Member States (including Bulgaria, Cyprus and Romania). This visa allows the visitors (for leisure, tourism, or business) to travel freely within the Schengen countries for a maximum stay of up to 90 days in a six months period. Since 2001, the EU has adopted two lists including a set of countries of countries whose nationals require visas along with Schengen visa and another set of countries are exempt from visa requirements.92 A set of countries that do not require visa can enter the Schengen Area for a maximum of 90 days in a 180 day period. However, there are exceptions for nationals of New Zealand that can stay up to 90 days in each of Austria, Belgium, Czech Republic, Denmark, Finland, France, Germany, Greece, Italy, Luxembourg, Netherlands, Portugal, Spain and Sweden (as well as Hungary if visiting it as the final Schengen destination) without reference to time spent in other Schengen signatory states, but if travelling to remaining Schengen countries the 90 days in a 180 day period time limit applies. In addition, above the framework of the Schengen Rule of 90 days in a 180 day period, nationals from countries including Argentina, Brazil, Chile, Costa Rica, Croatia, Israel, Malaysia, Korea and Uruguay are permitted to spend an extra three months visa-free in the Czech Republic. The EU also harmonized visa fees across all Schengen Member States. As per the Council Decision 2006/440/EC (1 June 2006) the visa fees applicable to Schengen visa is valued at $78(€60).
89 The tourist visa is granted to travelers who have no residence or occupation in India and who have the sole objective of visiting India for recreation, sightseeing and casual visits to friends and relatives. 90 Schengen countries are those that have signed the 1985 Schengen agreement, for abolishing border checks or controls; and harmonizing provisions which allow a common visa to visit all participating countries. It means that that a traveler who is having the Schengen visa can visit all the countries in the Schengen area and to cross internal borders without further formalities. There are at present 26 Schengen countries including 22 EU Member States (Austria, Belgium, Czech Republic, Denmark, Estonia, Finland, France, Germany, Greece, Hungary, Italy, Latvia, Lithuania, Luxembourg, Malta, Netherlands, Poland, Portugal, Slovenia, Slovakia, Spain, Sweden); and 4 non-EU Member countries (including, Iceland, Liechtenstein, Norway and Switzerland). 91 Including Austria, Belgium, Czech Republic, Denmark, Estonia, Finland, France, Germany, Greece, Hungary, Italy, Latvia, Lithuania, Luxembourg, Malta, Netherlands, Poland, Portugal, Slovakia, Slovenia, Spain and Sweden. 92 The countries are exempt from visa are Andorra, Argentina, Australia, Bolivia, Brazil, Brunei, Canada, Chile, Costa Rica, Croatia, Guatemala, Honduras, Hong Kong, Israel, Japan, Macau, Malaysia, Mexico, Monaco, New Zealand, Nicaragua, Panama, Paraguay, Salvador, San Marino, Singapore, Korea, the US, Uruguay and Venezuela. For details, see, European Commission (2001 and 2006).
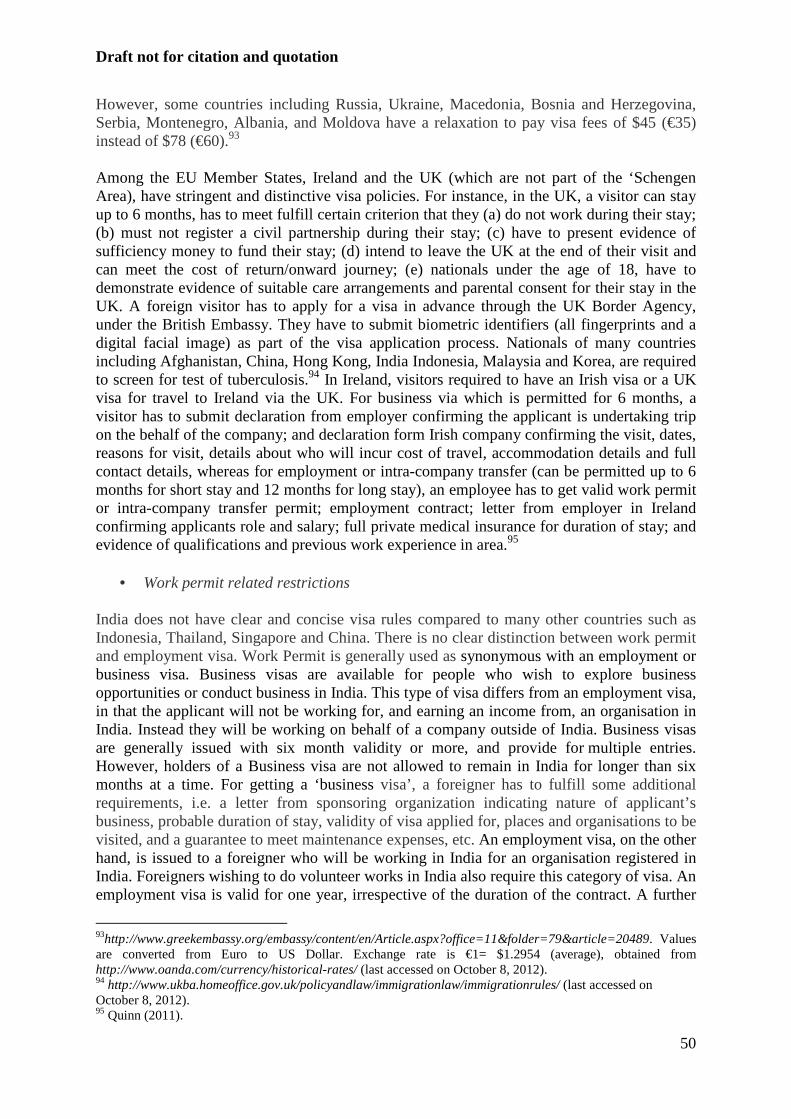
Draft not for citation and quotation
50
However, some countries including Russia, Ukraine, Macedonia, Bosnia and Herzegovina, Serbia, Montenegro, Albania, and Moldova have a relaxation to pay visa fees of $45 (€35) instead of $78 (€60).93 Among the EU Member States, Ireland and the UK (which are not part of the ‘Schengen Area), have stringent and distinctive visa policies. For instance, in the UK, a visitor can stay up to 6 months, has to meet fulfill certain criterion that they (a) do not work during their stay; (b) must not register a civil partnership during their stay; (c) have to present evidence of sufficiency money to fund their stay; (d) intend to leave the UK at the end of their visit and can meet the cost of return/onward journey; (e) nationals under the age of 18, have to demonstrate evidence of suitable care arrangements and parental consent for their stay in the UK. A foreign visitor has to apply for a visa in advance through the UK Border Agency, under the British Embassy. They have to submit biometric identifiers (all fingerprints and a digital facial image) as part of the visa application process. Nationals of many countries including Afghanistan, China, Hong Kong, India Indonesia, Malaysia and Korea, are required to screen for test of tuberculosis.94 In Ireland, visitors required to have an Irish visa or a UK visa for travel to Ireland via the UK. For business via which is permitted for 6 months, a visitor has to submit declaration from employer confirming the applicant is undertaking trip on the behalf of the company; and declaration form Irish company confirming the visit, dates, reasons for visit, details about who will incur cost of travel, accommodation details and full contact details, whereas for employment or intra-company transfer (can be permitted up to 6 months for short stay and 12 months for long stay), an employee has to get valid work permit or intra-company transfer permit; employment contract; letter from employer in Ireland confirming applicants role and salary; full private medical insurance for duration of stay; and evidence of qualifications and previous work experience in area.95
• Work permit related restrictions India does not have clear and concise visa rules compared to many other countries such as Indonesia, Thailand, Singapore and China. There is no clear distinction between work permit and employment visa. Work Permit is generally used as synonymous with an employment or business visa. Business visas are available for people who wish to explore business opportunities or conduct business in India. This type of visa differs from an employment visa, in that the applicant will not be working for, and earning an income from, an organisation in India. Instead they will be working on behalf of a company outside of India. Business visas are generally issued with six month validity or more, and provide for multiple entries. However, holders of a Business visa are not allowed to remain in India for longer than six months at a time. For getting a ‘business visa’, a foreigner has to fulfill some additional requirements, i.e. a letter from sponsoring organization indicating nature of applicant’s business, probable duration of stay, validity of visa applied for, places and organisations to be visited, and a guarantee to meet maintenance expenses, etc. An employment visa, on the other hand, is issued to a foreigner who will be working in India for an organisation registered in India. Foreigners wishing to do volunteer works in India also require this category of visa. An employment visa is valid for one year, irrespective of the duration of the contract. A further
93http://www.greekembassy.org/embassy/content/en/Article.aspx?office=11&folder=79&article=20489. Values are converted from Euro to US Dollar. Exchange rate is €1= $1.2954 (average), obtained from http://www.oanda.com/currency/historical-rates/ (last accessed on October 8, 2012). 94 http://www.ukba.homeoffice.gov.uk/policyandlaw/immigrationlaw/immigrationrules/ (last accessed on October 8, 2012). 95 Quinn (2011).

Draft not for citation and quotation
51
extension of up to five years can be obtained from the Ministry of Home Affairs or the Foreign Regional Registration Office in the concerned state in India, but this is generally granted only after a person worked in India for a period of between three and five years. Apart from the proof of employment with a company/organisation in India, such as a contract that states the terms and conditions of appointment; a foreigner should have a minimum salary96 of $25,000 per annum (except for ethnic cooks, non-English language teachers, translators, and staff working for the embassies and high commissions in India). This minimum salary threshold of $25,000 per annum imposed on foreign nationals is act as a major barrier in India. Companies that require foreign nationals with language skills often face problems when it comes to the interpretation of the fine print. Similarly, some Indian IT companies are also facing the minimum salary threshold as a barrier because foreign language skills are not available in India and they have to hire foreign professionals for the same work.97 In many EU Member States, foreign nationals need a work permit as well as a residence permit. For instance, in Germany, foreign national who intend to work in Germany need a work permit in addition to a residence permit. However, there are exceptions. Certain persons, including members of management board of corporations and employees on short-term foreign assignment for special construction jobs are exempt from the requirement of work permit. In Ireland, there is a salary threshold limit of €30,000 applicable for all work permits.98
• Difficulty in Getting Visa and work permit The other most important barrier faced by the foreign service providers is to get visa for India. Sometimes foreign service providers have to inform about their trip four weeks in advance to the Indian embassy and the total timeframe is for the work permit and other formalities is approximately 6 months. Visa process in India is very cumbersome and time consuming. The documentation and certification process within the country is very long, which delays the visa or work permit application process. Generally, it takes 55-60 days to get a visa. At present, India has a ‘Visa on Arrival’ Facility for eleven countries (Finland, Japan, Luxembourg, New Zealand, Singapore, Cambodia, Vietnam, Philippines, Laos, Myanmar and Thailand), compared to other Asian countries including Indonesia which grants the facility to 52 countries (including India). However, foreign tourists are facing lots of hurdles in getting the visa on arrival on Indian airports. Getting long term business visa and renewing residency permits is also one of the major barriers in many EU Member States. In the UK, it is very difficult to get long-term visa and mainly depend on the approval of the UK Boarder Agency. Those who stay longer face fines and deportations. A high visa fee and other transit charges is also one of the barriers faced by third country nationals in the EU. In the UK, the cost of visitor’s visa for a single stay or multiple stays of up to 6 months is $126 (₤78); and a multiple-entry visa valid for 2 years, 5
96 Including salary and allowances paid in cash. 97 http://economictimes.indiatimes.com/articleshow/12135034.cms (last accessed on October 1, 2012). 98 http://www.citizensinformation.ie/en/employment/migrant_workers/employment_permits/work_permits.html (last accessed on October 8, 2012).
Draft not for citation and quotation
52
years and 10 years costs $437 (₤270), $803 (₤496) and $1,159 (₤716), respectively.99 In Ireland, a single entry visa costs $77 (€60), while a multiple entry visa costs $130 (€100).100
• Non-recognition or Non-Accreditation of Foreign Degrees In India, non-recognition of foreign qualifications is one of the most important barriers related to entry of foreign professionals in India. For instance, medical degrees from foreign universities (i.e. US or UK) are not accepted by the Medical Council of India, and therefore, health professionals from foreign countries are not permitted to practice in India, except for research and development and charity purpose. Similarly, the Institute of Chartered Accountants of India does not recognize qualifications of foreign accountants. Qualifications of foreign professionals are not accredited in many EU Member States. Foreign professionals required to clear certain tests (including language tests). In UK, foreign doctors need to pass a test conducted by the Professional and Linguistic Assessment Board (PLAB) to get a limited registration; and after one year of supervised training, they can get fully registered. In Ireland, the limited registration can last up to 7 years.101 In France, a non-French speaking professional needs to have a minimum level (B2) in French. In several EU Member States, it is mandatory for foreign professionals to apply registration at different levels of government. In Austria, foreign architects has to register with the Body of Architects, while in Germany, registration and licensing of professions are required at different levels of government and each state has its own requirements for registration and licensing process.
• Restrictions related to entry of selected category of Professionals In many sectors, foreign professional are allowed to come in India with some restrictions. For instance, in legal services, a national of another country may be admitted as an advocate in India if there is reciprocal treatment for Indian legal professionals in the other country. Foreign lawyers neither appointed as partners nor can sign legal documents and represent clients in the court. They can only be appointed as consultants or employees of an Indian law firm. Sometimes, finding work in India and search for a job after entering the country also a barrier for foreign professionals. The salaries offered to foreign professionals on a local contract are less than desirable; and are generally a 25 per cent of salary of professionals earns in western countries.102 Many EU Member States only allow highly skilled workers and give special treatment to them. For instance, in the UK, higher level workers such as directors, senior executives, and intra-company transferees are getting visas more easily than permits for personnel such as systems analysts, construction engineers and designers, etc.103 In Germany, highly qualified employees including scientists with extraordinary qualifications; high-level teachers and
99 Values are converted from British Pound to US Dollar. Exchange rate is ₤1= 1.6184 (average), obtained from http://www.oanda.com/currency/historical-rates/ (last accessed on October 8, 2012). 100 For details, see GTAI (2012). Values are converted from Euro to US Dollar. Exchange rate is €1= $1.2954 (average), obtained from http://www.oanda.com/currency/historical-rates/ (last accessed on October 8, 2012). 101 OECD (2007). 102http://www.expatinfodesk.com/expat-guide/deciding-on-the-right-country/top-expatriate-destinations/india/ (last accessed on October 1, 2012). 103http://www.ukba.homeoffice.gov.uk/policyandlaw/immigrationlaw/immigrationrules/part2/ (last accessed on October 8, 2012).
Draft not for citation and quotation
53
professors or high-level researchers; and specialists and management level employees with experience with an annual salary of at least $77,724 (€60,000) can be granted work and residence permits of indefinite duration.104
• Residency and Nationality requirements
In India, in order to practice as an advocate in India, the person must be an Indian national. Similarly, in many Member States, residency and nationality requirements are also impedes entry of third-country professionals. For example, in Malta and Sweden, patent agents must be residents. In Bulgaria, lawyers can only exercise their activity as sole practitioners, in a partnership or through a law firm composed of lawyers. It can be substantiated with the data shown in Figure 2.3 that in professional services such as legal, accounting and audit, architectural and engineering services, Austria, Finland and Latvia and the UK have more operational restrictions such as EU nationality requirements compared to other Member States. 2.5.3 Regulatory and other barriers in India and the EU
• Multiplicity of Regulatory Bodies As India has the quasi-federal governance structure, many services sectors such as education, health, etc. are under the purview of state governments or are jointly regulated by the central and state governments. There are different ministries and governmental departments at both levels – central and state, are regulating a sector. For instance, Ministry of Environment and Forests is the nodal agency for environmental legislations. However, several states also enacted their own legislation besides the major ones enacted by the central Ministry. The State Pollution Control Board established in each state, is responsible for implementing these legislations as well as issuing rules and regulations prescribing the standards for a clean environment. Similarly, there are varied state-specific regulations for the design and construction of healthcare infrastructure.105 Each EU member state has its own regulation relating to investment which leads to multiple regulations at different Member States. Like India, there are multiple of regulatory authorities in every EU Member State. For instance, at the EU level, all laws are passed by the European Parliament, however, every Member State has a right to implement these regulations on their preference.
• Outdated and Indifferent Regulations In India, regulations have not taken that into account partly because the sectors themselves are not integrated. This has been the case of sectors like transport where there is a lack of regulations which enable a service provider to provide integrated door-to-door services. Moreover, some of the regulations are highly outdated. For instance, the postal sector is governed by the India Post Office Act, 1898. There is lack of prescribed standards and common accreditation process across India. This adversely affects services such as construction and education.
104 For details, see GTAI (2012). Values are converted from Euro to US Dollar. Exchange rate is €1= $1.2954 (average), obtained from http://www.oanda.com/currency/historical-rates/ (last accessed on October 8, 2012). 105 World Bank (2004).
Draft not for citation and quotation
54
In the EU, terms and conditions of employment and a substantial degree of labour legislation is determined on a national basis rather than at EU level. Every EU Member States has its own Employment law. There are variations in labour legislation and the extent to which an employer is responsible for the social welfare of employees, among all Member States. For instance, in Germany, employers are obliged to pay the minimum wage to registered temps for 100 per cent of the minimum working week (37 and a half hour). In Sweden, employers are obliged to pay 75-80 per cent of the number of hours constituting a working week (exact percentage dependent on a range of additional factors) at minimum wage level. In many Member States it is difficult to terminate the employment of a long-term temporary employee. In Sweden, a company cannot terminate a temporary employee who has worked for a minimum 6 months. Even if no suitable work is available or the employee has a negative attitude towards work, the company has to pay a salary to him.106
• Non-transparent public procurement process:
While the EU is a signatory to the WTO Agreement on Government Procurement (GPA), India is still has observer status. Both economies have non-transparent government procurement process. In India, private companies working for the railways have to procure materials from vendors selected by the railways. Price preferences are given to PSUs in sectors like energy services. In many services, especially infrastructure services like telecommunications and power, after privatisation it is often difficult for the private sector to enter and operate due to lack of third party access, transparent procedures for sharing of scare resources, etc.
The EU, on the other hand, which adopted a revised Utilities Directive (2004/17), covering various sectors such as transportation, energy, and postal services under public procurement; has different requirements for these sectors. For instance, competitive bidding procedures, however less than 50 percent EU content requirement applies to certain sectors including water (production, transport, and distribution of drinking water); energy (gas and heat); urban transport (urban railway, automated systems, tramway, bus, trolley bus, and cable); and postal services, that are not covered by an international or reciprocal bilateral agreement. Many EU Member States imposes various additional requirements for bidding public contracts. For instance, in Greece, company wanted to bid for public tenders, (a) must submit documentation from competent authorities indicating that they have paid taxes, have not been in bankruptcy, and have paid in full their social security obligations for their employees; (b) all managing directors and board members of companies that want to participate in procurements must submit certifications from competent authorities that they have not engaged in fraud, money laundering, criminal activity, or similar activities. The public procurement process in many EU Member States such as Bulgaria, Hungary, Italy, Lithuania and Slovenia, etc. are non-transparent and generally favours EU companies. In many EU Member States, there are numerous delays in awarding a contract due to cumbersome and time consuming process. For instance, in Ireland, there is a lengthy process for budgetary decisions which causes delays not only in awarding a contract but also finalizing contracts and commencing work. Successful bidders have also found that tender documentation does not accurately describe the conditions under which contracts are to be performed.107
106 European Commission (2001). 107 USTR (2012).
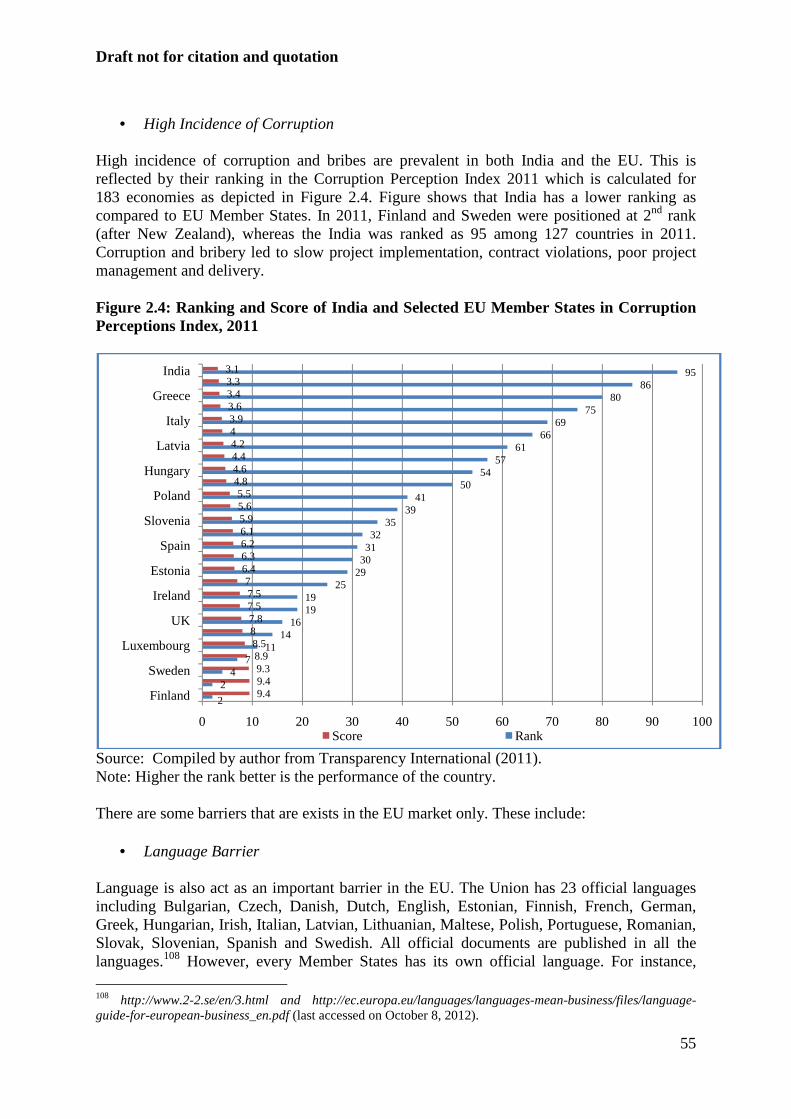
Draft not for citation and quotation
55
• High Incidence of Corruption
High incidence of corruption and bribes are prevalent in both India and the EU. This is reflected by their ranking in the Corruption Perception Index 2011 which is calculated for 183 economies as depicted in Figure 2.4. Figure shows that India has a lower ranking as compared to EU Member States. In 2011, Finland and Sweden were positioned at 2nd rank (after New Zealand), whereas the India was ranked as 95 among 127 countries in 2011. Corruption and bribery led to slow project implementation, contract violations, poor project management and delivery. Figure 2.4: Ranking and Score of India and Selected EU Member States in Corruption Perceptions Index, 2011
Source: Compiled by author from Transparency International (2011). Note: Higher the rank better is the performance of the country. There are some barriers that are exists in the EU market only. These include:
• Language Barrier Language is also act as an important barrier in the EU. The Union has 23 official languages including Bulgarian, Czech, Danish, Dutch, English, Estonian, Finnish, French, German, Greek, Hungarian, Irish, Italian, Latvian, Lithuanian, Maltese, Polish, Portuguese, Romanian, Slovak, Slovenian, Spanish and Swedish. All official documents are published in all the languages.108 However, every Member States has its own official language. For instance, 108 http://www.2-2.se/en/3.html and http://ec.europa.eu/languages/languages-mean-business/files/language-guide-for-european-business_en.pdf (last accessed on October 8, 2012).
2
24
711
1416
1919
2529303132
3539
4150
5457
6166
6975
8086
95
9.49.49.38.98.587.87.57.57
6.46.36.26.15.95.65.5
4.84.64.44.243.93.63.43.33.1
0 10 20 30 40 50 60 70 80 90 100
Finland
Sweden
Luxembourg
UK
Ireland
Estonia
Spain
Slovenia
Poland
Hungary
Latvia
Italy
Greece
India
Score Rank
Draft not for citation and quotation
56
Greek is the official language of Greece and all official documents are in Greek. Therefore, foreign company has to employ a legal national legal expert for interpretation of all laws and regulations. It creates risks and uncertainties. In addition, hiring of legal experts and translators is very expensive. The process of translation adds to the complexity and duration of different procedures in the Union.
• Market needs test Many EU Member States have imposed economic needs tests (ENT) or labour market tests whereby a firm employing a foreign worker has to prove that local employee is not available for that specific job. For instance, in Austria, the entry of foreign researcher is subject to market needs tests.109 In Ireland, work permits are granted only on the basis of market needs test.110
• Mandatory Contribution to security funds In the EU, it is mandatory for every employee (even temporary employee) and the employer to contribute to security contribution system. There are wide variations in social security contributory rates across different Member States. While in Austria, the employee and employer have to contribute 18 per cent and 21.5 per cent, respectively, the social security system, in Spain the contributory rates are 23.6 per cent and 28.3 per cent, respectively.111 The non-harmonisation of pensions and taxation across EU acts as a barrier to integrated pan-European employment market. In every Member States, an employee of the same company has to open a separate pension fund. The above discussion concludes that although, India and the EU have a large number of barriers to trade of services, both are major players of services in the world. Both economies have some trade complementarities. While India is a major exporter of computer services, the EU is an exporter of transportation and financial services. While India has a cheap and talented labour force, the EU has expertise in technology. Both India and the EU are exploring each other’s market and are successful in investing in some sectors. For instance, the EU is a major investor in energy and logistics in India, while India proves itself successful in Information Technology (IT) and IT enabled services (ITeS) in the EU. In this light, the next chapter discusses about logistics services sector in India and the EU. References A.T. Kearney (2000), ‘FDI Confidence Index 2000’, Volume 3, Issue 1, January, Global
Business Policy Council, http://www.managementplace.com/fr/atk/fdi.pdf A.T. Kearney (2009), ‘The Shifting Geography of Offshoring’, A.T. Kearney Global Services
Location Index, 2009”, A.T. Kearney (2011), ‘Offshoring Opportunities Amid Economic Turbulence’, A.T. Kearney
Global Services Location Index, 2011”,
109 OECD (2009). 110 http://www.citizensinformation.ie/en/employment/migrant_workers/employment_permits/work_permits.html (last accessed on October 8, 2012). 111 Extracted by author from different tables obtained from http://ec.europa.eu/taxation_customs/taxation/gen_info/economic_analysis/tax_structures/article_6047_en.htm (last accessed on October 8, 2012).

Draft not for citation and quotation
57
A.T. Kearney (2012), ‘Cautious Investors Feed a Tentative Recovery’, AT Kearney Foreign Direct Investment Confidence Index 2012,
Chanda, Rupa (2002), “ Globalization of Services: India’s Opportunities and Constraints”, Oxford University Press, New Delhi.
Department of Industrial Policy and Promotion (DIPP) (2010), ‘Fact Sheet on Foreign Direct Investment – from August 1991 to February 2010’, February, Ministry of Commerce and Industry, Government of India.
DIPP (2012a), ‘Fact Sheet on Foreign Direct Investment - from April 2000 to June 2012’, June, Ministry of Commerce and Industry, Government of India.
DIPP (2012b), ‘Consolidated FDI Policy (Effective from April 10, 2012), April, Ministry of Commerce and Industry, Government of India.
DIPP (2012c), ‘Review on the Policy on FDI in the Civil Aviation Sector’, Press Note No. 6 (2012 Series), September 20, Ministry of Commerce and Industry, Government of India.
Ernst & Young (2011), ‘Doing Business in India – 2011’, India, http://www.ey.com/Publication/vwLUAssets/Doing_business_in_India_2011/$FILE/Doing_business_in_India_2011.pdf
European Commission (2001), ‘Council Regulation (EC) No. 539/2001 listing the third countries whose nationals must be in the possession of visa when crossing the external borders and those whole nationals are exempt from that requirement’, March 15, Brussels.
European Commission (2006), ‘Council Regulation (EC) No. 1932/2006 on Amending Regulation (EC) No. 539/2001 listing the third countries whose nationals must be in the possession of visa when crossing the external borders and those whole nationals are exempt from that requirement’, December 21, Brussels.
European Commission (2009), ‘European Union – International Trade in Services, Analytical Aspects’, Data 2003-2007, Eurostat Statistical Books, 2009 Edition, ISSN 1725-4477, Luxembourg, http://epp.eurostat.ec.europa.eu/cache/ITY_OFFPUB/KS-EB-09-001/EN/KS-EB-09-001-EN.PDF
European Commission (2012a), ‘EU 27 Trade in Goods with India increased by 20 per cent in the first ten months of 2011’, Eurostat News Release 22/2012, 9 February, Brussels, http://epp.eurostat.ec.europa.eu/cache/ITY_PUBLIC/6-09022012-AP/EN/6-09022012-AP-EN.PDF
European Commission (2012b), ‘Detailed Information on the Implementation of Directive 2006/123/EC on Services in the Internal Market’, SWD (2012) 148 Final, June, Brussels, http://ec.europa.eu/internal_market/services/docs/services-dir/implementation/report/SWD_2012_148_en.pdf
FICCI and Grant Thornton (2010), ‘Investing in the European Union – A Comprehensive Guide for Mid-market Companies’, Federation of Indian Chamber of Commerce and Industry, India.
GTAI (2012), ‘Investment Guide to Germany 2012’, German Trade and Invest, Federal Government of Germany, http://www.gtai.de/GTAI/Content/EN/Invest/_SharedDocs/Downloads/GTAI/Brochures/Germany/investment-guide-to-germany-2012.pdf
IFA (2012), ‘Doing Business in France 2012 Edition, Invest in France Agency, France, http://www.invest-in-france.org/Medias/Publications/862/doing-business-version-anglaise-2012.PDF
INTERES (2012), ‘Invest in Spain’, available at http://www.investinspain.org/guidetobusiness/index_en.htm
Draft not for citation and quotation
58
Khan, Harun R (2002), ‘Outward Indian FDI – Recent Trends & Emerging Issues’, speech delivered at the Bombay Chamber of Commerce and Industry, Mumbai, March 2, 2012.
Organisation for Economic Co-operation and Development (OECD) (2007), ‘Immigrant Health Workers in OECD Countries in the Broader Context of Highly Qualified Skilled Migration’, Paris, http://www.oecd.org/els/internationalmigrationpoliciesanddata/41515701.pdf
OECD (2009), ‘Living and Working in Austria’, Austria, http://www.oead.at/fileadmin/oead_zentrale/willkommen_in_oe/Recht/Eures_leben_eng.pdf.
OECD (2012), ‘National Treatment for Foreign Controlled Enterprises (including adhere country exceptions to National Treatment), Paris, http://www.oecd.org/investment/investmentpolicy/nationaltreatmentinstrument%20english.pdf
PAIZ (2012), ‘Poland Open for Business’, Polish Information and Foreign Investment Agency, Polish Government, http://www.paiz.gov.pl/files/?id_plik=18179
Quinn, Emma (2011), ‘Visa Policy as Migration Channel: Ireland’, November, European Migration Network, Ireland.
Reserve Bank of India (RBI) (2012), ‘Annual Report 2011-2012’, August, http://rbi.org.in/scripts/AnnualReportPublications.aspx
Singh Vijay Vir, and Siddhartha Mitra (2010), “Regulatory Management and Reform in India”, Background Paper for OECD, Organisation for Economic Co-oepration and Development, France, http://www.oecd.org/gov/regulatorypolicy/44925979.pdf
Transparency International (2011), “Corruption Perception Index 2011”, http://cpi.transparency.org/cpi2011/results/#CountryResults
United Nations Conference on Trade and Development (UNCTAD) (2011), “World Investment Report 2011: Non-Equity Modes of International Production and Development”, Geneva,
United Nations Trade Representative (USTR) (2012), “2012 National Trade Estimate Report on Foreign Trade Barriers”, March, Washington DC.
World Bank (2004), ‘Sustaining India’s Services Revolution: Access to Foreign Markets, Domestic Reform and International Negotiations’, Washington DC.
World Bank (2012), “Doing Business 2012 - Doing Business in a More Transparent World”, October, http://www.doingbusiness.org/reports/global-reports/doing-business-2012
WTO (2001), ‘International Trade Statistics 2001’, Geneva. WTO (2012), ‘International Trade Statistics 2011’, Geneva.
Draft not for citation and quotation
59
Chapter 3: Trade, Investment and Collaboration between India and the EU - Logistics Services
Smita Miglani
Introduction
Logistics involves a wide set of activities dedicated to transformation and distribution of goods, from raw material sourcing to final market distribution and related information flows between ‘point of origin’ and ‘point of end use’. It covers various forms of freight transportation such as roads, railways, air, and maritime; consolidation of cargo and other such services as storage and warehousing, courier and express delivery, border clearance and payment. On an average, logistics costs account for 7-8 percent of final cost of a finished product in developed countries but much higher (usually more than 10 percent) in developing countries.112
Various studies have shown that logistics infrastructure has a positive impact on economic growth in an economy (Liu, 2009; Yuan and Kuang, 2010; Na, 2010). On the other hand, economic growth itself creates a need for logistics infrastructure (Yang, 2010; Yang and Zheng, 2011). Efficiency in logistics and trade facilitation systems is also seen to enhance industrial activity (Yu, 2007) and competitiveness (Navickas et al., 2011). For all these reasons, logistics has been an important part of the growth process and modernization of present day developed economies such as the US and EU, as it is for emerging economies such as India and China.
This chapter focuses on trade and collaboration in logistics between India and the EU. In terms of their nature and level of advancement, the logistics markets of these two economies are quite different. EU is a world leader in provision of logistics services and has a well-organized and evolved infrastructure base which has become saturated over the years. On the other hand, the Indian logistics sector is underdeveloped and fragmented but growing at a fast pace. In addition to being interesting case studies in themselves, the trade complementarities and opportunities for joint collaboration between India and the EU are also worth exploring.
Logistics is an important area for negotiations at bilateral and multilateral agreements for India and the EU. The EC has been a demandeur in the WTO’s General Agreement on Trade in Services (GATS) negotiations and its bilateral trade-investment agreements to liberalize the sector.113 India is a target market, which over the years has become liberal in its FDI regime and has shown interest in further opening up the sector. It is expected that the proposed India-EU BTIA will increase trade and investment flows between the two economies manifold in the coming years and hence increase the demand/need for efficient logistics. In this backdrop, this chapter looks beyond the BTIA and analyzes broad possibilities of India-EU collaboration in logistics. It also examines barriers to enhancing trade, investment and collaboration and suggests policy measures for India and the EU.
112 For instance, logistics cost as a percentage of GDP is about 13 percent for India, 18 percent for China and 17 percent for Thailand. 113 WTO, 2005a.
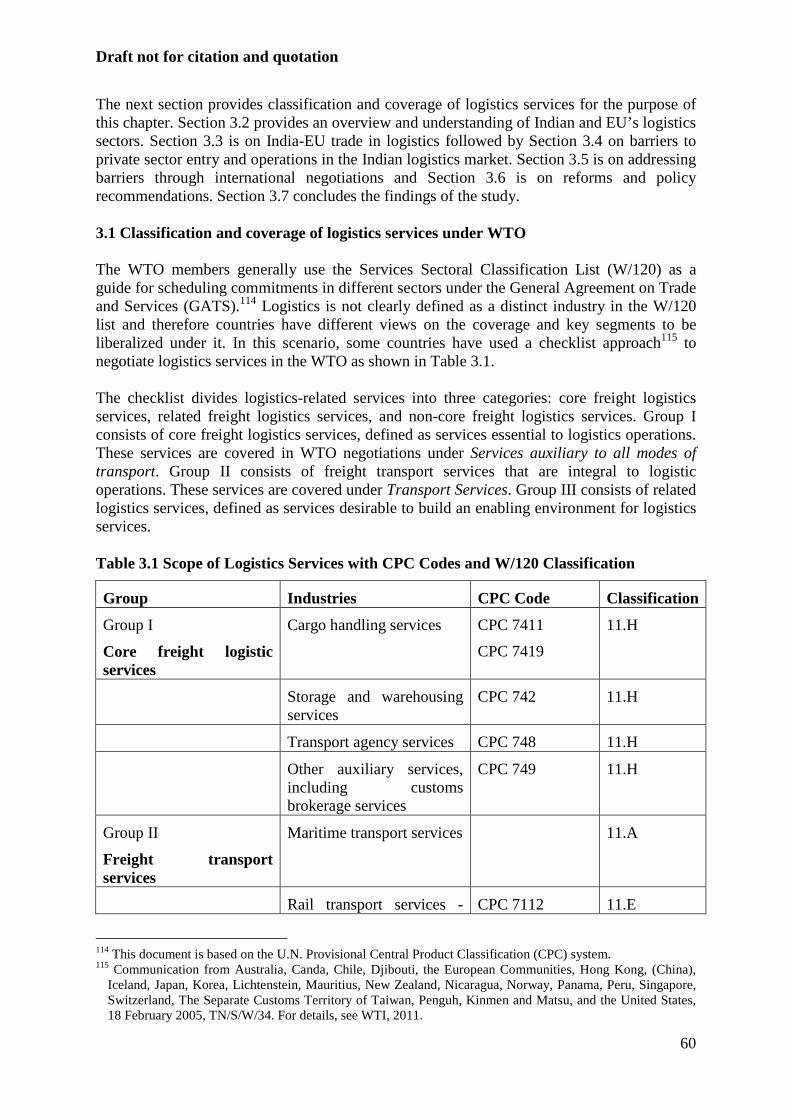
Draft not for citation and quotation
60
The next section provides classification and coverage of logistics services for the purpose of this chapter. Section 3.2 provides an overview and understanding of Indian and EU’s logistics sectors. Section 3.3 is on India-EU trade in logistics followed by Section 3.4 on barriers to private sector entry and operations in the Indian logistics market. Section 3.5 is on addressing barriers through international negotiations and Section 3.6 is on reforms and policy recommendations. Section 3.7 concludes the findings of the study. 3.1 Classification and coverage of logistics services under WTO The WTO members generally use the Services Sectoral Classification List (W/120) as a guide for scheduling commitments in different sectors under the General Agreement on Trade and Services (GATS).114 Logistics is not clearly defined as a distinct industry in the W/120 list and therefore countries have different views on the coverage and key segments to be liberalized under it. In this scenario, some countries have used a checklist approach115 to negotiate logistics services in the WTO as shown in Table 3.1. The checklist divides logistics-related services into three categories: core freight logistics services, related freight logistics services, and non-core freight logistics services. Group I consists of core freight logistics services, defined as services essential to logistics operations. These services are covered in WTO negotiations under Services auxiliary to all modes of transport. Group II consists of freight transport services that are integral to logistic operations. These services are covered under Transport Services. Group III consists of related logistics services, defined as services desirable to build an enabling environment for logistics services. Table 3.1 Scope of Logistics Services with CPC Codes and W/120 Classification
Group Industries CPC Code Classification
Group I
Core freight logistic services
Cargo handling services CPC 7411
CPC 7419
11.H
Storage and warehousing services
CPC 742 11.H
Transport agency services CPC 748 11.H
Other auxiliary services, including customs brokerage services
CPC 749 11.H
Group II
Freight transport services
Maritime transport services 11.A
Rail transport services - CPC 7112 11.E
114 This document is based on the U.N. Provisional Central Product Classification (CPC) system. 115 Communication from Australia, Canda, Chile, Djibouti, the European Communities, Hong Kong, (China),
Iceland, Japan, Korea, Lichtenstein, Mauritius, New Zealand, Nicaragua, Norway, Panama, Peru, Singapore, Switzerland, The Separate Customs Territory of Taiwan, Penguh, Kinmen and Matsu, and the United States, 18 February 2005, TN/S/W/34. For details, see WTI, 2011.
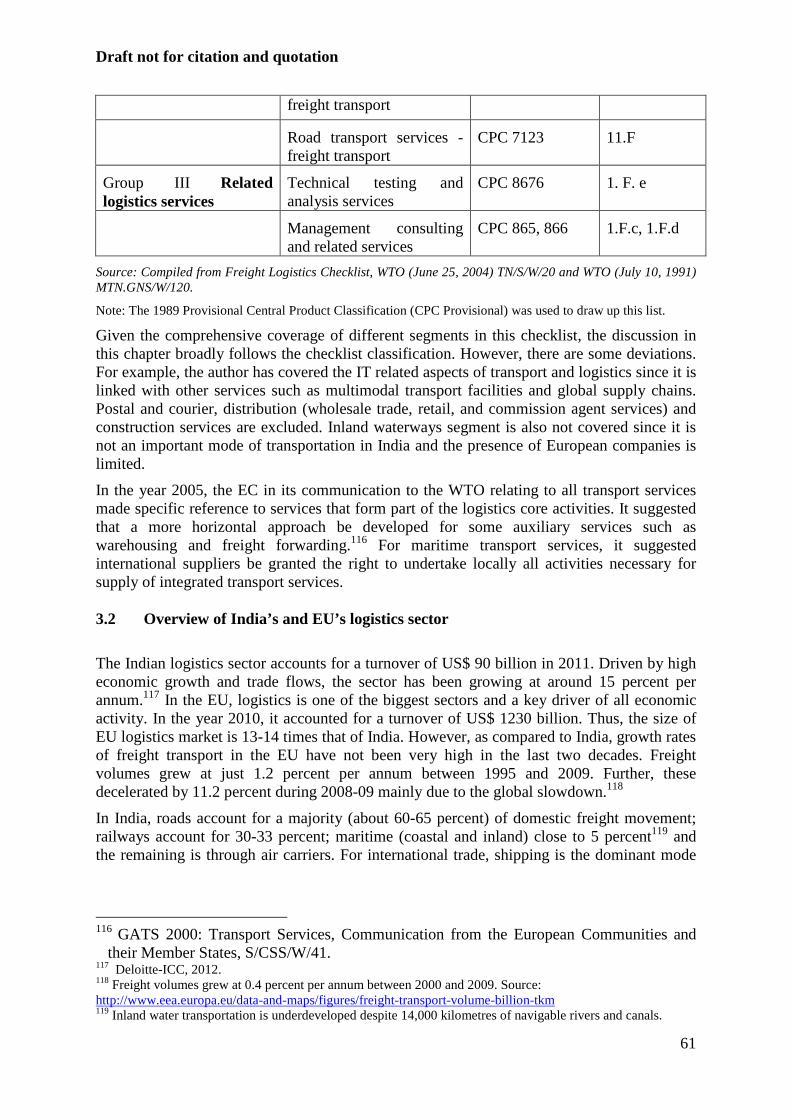
Draft not for citation and quotation
61
freight transport
Road transport services - freight transport
CPC 7123 11.F
Group III Related logistics services
Technical testing and analysis services
CPC 8676 1. F. e
Management consulting and related services
CPC 865, 866 1.F.c, 1.F.d
Source: Compiled from Freight Logistics Checklist, WTO (June 25, 2004) TN/S/W/20 and WTO (July 10, 1991) MTN.GNS/W/120.
Note: The 1989 Provisional Central Product Classification (CPC Provisional) was used to draw up this list.
Given the comprehensive coverage of different segments in this checklist, the discussion in this chapter broadly follows the checklist classification. However, there are some deviations. For example, the author has covered the IT related aspects of transport and logistics since it is linked with other services such as multimodal transport facilities and global supply chains. Postal and courier, distribution (wholesale trade, retail, and commission agent services) and construction services are excluded. Inland waterways segment is also not covered since it is not an important mode of transportation in India and the presence of European companies is limited.
In the year 2005, the EC in its communication to the WTO relating to all transport services made specific reference to services that form part of the logistics core activities. It suggested that a more horizontal approach be developed for some auxiliary services such as warehousing and freight forwarding.116 For maritime transport services, it suggested international suppliers be granted the right to undertake locally all activities necessary for supply of integrated transport services. 3.2 Overview of India’s and EU’s logistics sector
The Indian logistics sector accounts for a turnover of US$ 90 billion in 2011. Driven by high economic growth and trade flows, the sector has been growing at around 15 percent per annum.117 In the EU, logistics is one of the biggest sectors and a key driver of all economic activity. In the year 2010, it accounted for a turnover of US$ 1230 billion. Thus, the size of EU logistics market is 13-14 times that of India. However, as compared to India, growth rates of freight transport in the EU have not been very high in the last two decades. Freight volumes grew at just 1.2 percent per annum between 1995 and 2009. Further, these decelerated by 11.2 percent during 2008-09 mainly due to the global slowdown.118
In India, roads account for a majority (about 60-65 percent) of domestic freight movement; railways account for 30-33 percent; maritime (coastal and inland) close to 5 percent119 and the remaining is through air carriers. For international trade, shipping is the dominant mode
116 GATS 2000: Transport Services, Communication from the European Communities and
their Member States, S/CSS/W/41. 117 Deloitte-ICC, 2012. 118 Freight volumes grew at 0.4 percent per annum between 2000 and 2009. Source: http://www.eea.europa.eu/data-and-maps/figures/freight-transport-volume-billion-tkm 119 Inland water transportation is underdeveloped despite 14,000 kilometres of navigable rivers and canals.
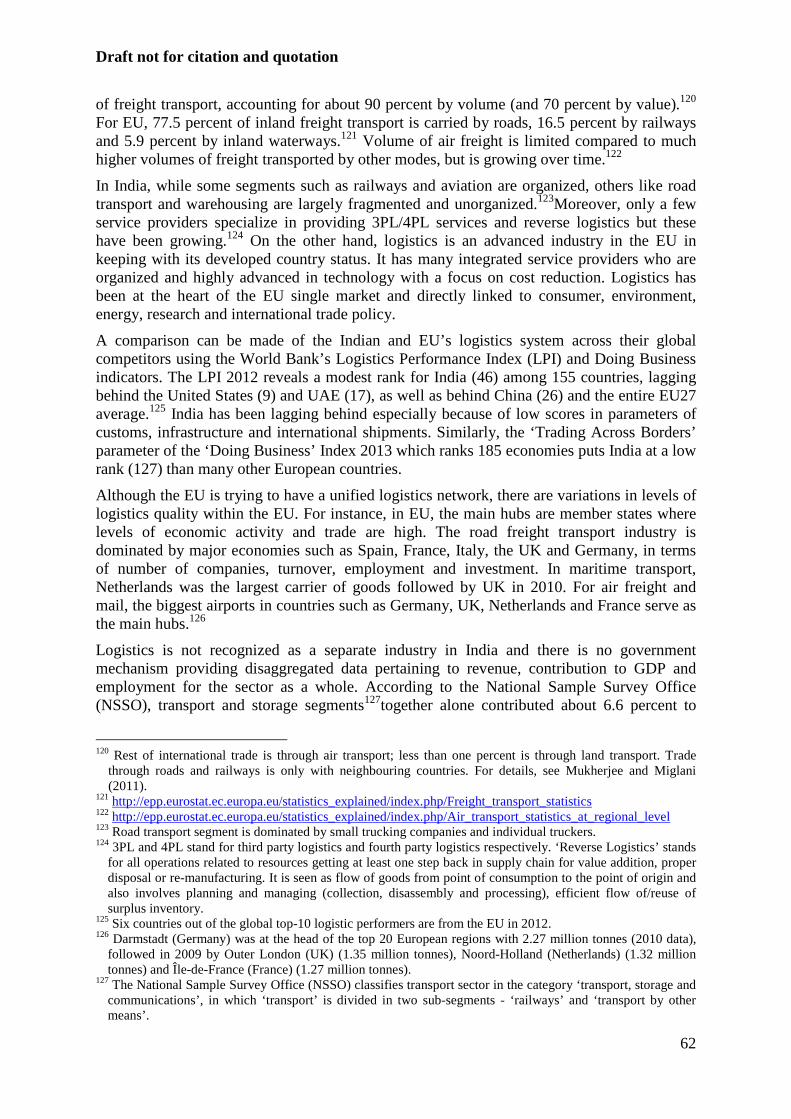
Draft not for citation and quotation
62
of freight transport, accounting for about 90 percent by volume (and 70 percent by value).120 For EU, 77.5 percent of inland freight transport is carried by roads, 16.5 percent by railways and 5.9 percent by inland waterways.121 Volume of air freight is limited compared to much higher volumes of freight transported by other modes, but is growing over time.122
In India, while some segments such as railways and aviation are organized, others like road transport and warehousing are largely fragmented and unorganized.123Moreover, only a few service providers specialize in providing 3PL/4PL services and reverse logistics but these have been growing.124 On the other hand, logistics is an advanced industry in the EU in keeping with its developed country status. It has many integrated service providers who are organized and highly advanced in technology with a focus on cost reduction. Logistics has been at the heart of the EU single market and directly linked to consumer, environment, energy, research and international trade policy.
A comparison can be made of the Indian and EU’s logistics system across their global competitors using the World Bank’s Logistics Performance Index (LPI) and Doing Business indicators. The LPI 2012 reveals a modest rank for India (46) among 155 countries, lagging behind the United States (9) and UAE (17), as well as behind China (26) and the entire EU27 average.125 India has been lagging behind especially because of low scores in parameters of customs, infrastructure and international shipments. Similarly, the ‘Trading Across Borders’ parameter of the ‘Doing Business’ Index 2013 which ranks 185 economies puts India at a low rank (127) than many other European countries.
Although the EU is trying to have a unified logistics network, there are variations in levels of logistics quality within the EU. For instance, in EU, the main hubs are member states where levels of economic activity and trade are high. The road freight transport industry is dominated by major economies such as Spain, France, Italy, the UK and Germany, in terms of number of companies, turnover, employment and investment. In maritime transport, Netherlands was the largest carrier of goods followed by UK in 2010. For air freight and mail, the biggest airports in countries such as Germany, UK, Netherlands and France serve as the main hubs.126
Logistics is not recognized as a separate industry in India and there is no government mechanism providing disaggregated data pertaining to revenue, contribution to GDP and employment for the sector as a whole. According to the National Sample Survey Office (NSSO), transport and storage segments127together alone contributed about 6.6 percent to
120 Rest of international trade is through air transport; less than one percent is through land transport. Trade
through roads and railways is only with neighbouring countries. For details, see Mukherjee and Miglani (2011).
121 http://epp.eurostat.ec.europa.eu/statistics_explained/index.php/Freight_transport_statistics 122 http://epp.eurostat.ec.europa.eu/statistics_explained/index.php/Air_transport_statistics_at_regional_level 123 Road transport segment is dominated by small trucking companies and individual truckers. 124 3PL and 4PL stand for third party logistics and fourth party logistics respectively. ‘Reverse Logistics’ stands
for all operations related to resources getting at least one step back in supply chain for value addition, proper disposal or re-manufacturing. It is seen as flow of goods from point of consumption to the point of origin and also involves planning and managing (collection, disassembly and processing), efficient flow of/reuse of surplus inventory.
125 Six countries out of the global top-10 logistic performers are from the EU in 2012. 126 Darmstadt (Germany) was at the head of the top 20 European regions with 2.27 million tonnes (2010 data),
followed in 2009 by Outer London (UK) (1.35 million tonnes), Noord-Holland (Netherlands) (1.32 million tonnes) and Île-de-France (France) (1.27 million tonnes).
127 The National Sample Survey Office (NSSO) classifies transport sector in the category ‘transport, storage and communications’, in which ‘transport’ is divided in two sub-segments - ‘railways’ and ‘transport by other means’.
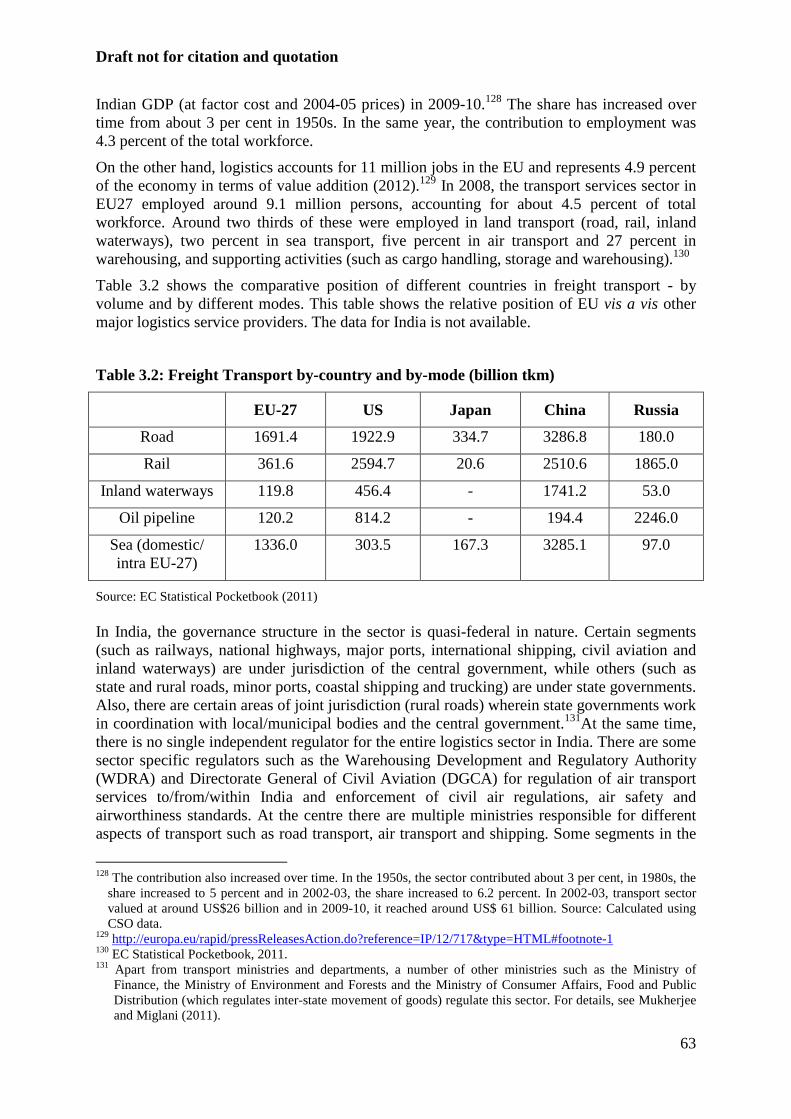
Draft not for citation and quotation
63
Indian GDP (at factor cost and 2004-05 prices) in 2009-10.128 The share has increased over time from about 3 per cent in 1950s. In the same year, the contribution to employment was 4.3 percent of the total workforce.
On the other hand, logistics accounts for 11 million jobs in the EU and represents 4.9 percent of the economy in terms of value addition (2012).129 In 2008, the transport services sector in EU27 employed around 9.1 million persons, accounting for about 4.5 percent of total workforce. Around two thirds of these were employed in land transport (road, rail, inland waterways), two percent in sea transport, five percent in air transport and 27 percent in warehousing, and supporting activities (such as cargo handling, storage and warehousing).130
Table 3.2 shows the comparative position of different countries in freight transport - by volume and by different modes. This table shows the relative position of EU vis a vis other major logistics service providers. The data for India is not available.
Table 3.2: Freight Transport by-country and by-mode (billion tkm)
EU-27 US Japan China Russia
Road 1691.4 1922.9 334.7 3286.8 180.0
Rail 361.6 2594.7 20.6 2510.6 1865.0
Inland waterways 119.8 456.4 - 1741.2 53.0
Oil pipeline 120.2 814.2 - 194.4 2246.0
Sea (domestic/ intra EU-27)
1336.0 303.5 167.3 3285.1 97.0
Source: EC Statistical Pocketbook (2011) In India, the governance structure in the sector is quasi-federal in nature. Certain segments (such as railways, national highways, major ports, international shipping, civil aviation and inland waterways) are under jurisdiction of the central government, while others (such as state and rural roads, minor ports, coastal shipping and trucking) are under state governments. Also, there are certain areas of joint jurisdiction (rural roads) wherein state governments work in coordination with local/municipal bodies and the central government.131At the same time, there is no single independent regulator for the entire logistics sector in India. There are some sector specific regulators such as the Warehousing Development and Regulatory Authority (WDRA) and Directorate General of Civil Aviation (DGCA) for regulation of air transport services to/from/within India and enforcement of civil air regulations, air safety and airworthiness standards. At the centre there are multiple ministries responsible for different aspects of transport such as road transport, air transport and shipping. Some segments in the
128 The contribution also increased over time. In the 1950s, the sector contributed about 3 per cent, in 1980s, the
share increased to 5 percent and in 2002-03, the share increased to 6.2 percent. In 2002-03, transport sector valued at around US$26 billion and in 2009-10, it reached around US$ 61 billion. Source: Calculated using CSO data.
129 http://europa.eu/rapid/pressReleasesAction.do?reference=IP/12/717&type=HTML#footnote-1 130 EC Statistical Pocketbook, 2011. 131 Apart from transport ministries and departments, a number of other ministries such as the Ministry of
Finance, the Ministry of Environment and Forests and the Ministry of Consumer Affairs, Food and Public Distribution (which regulates inter-state movement of goods) regulate this sector. For details, see Mukherjee and Miglani (2011).
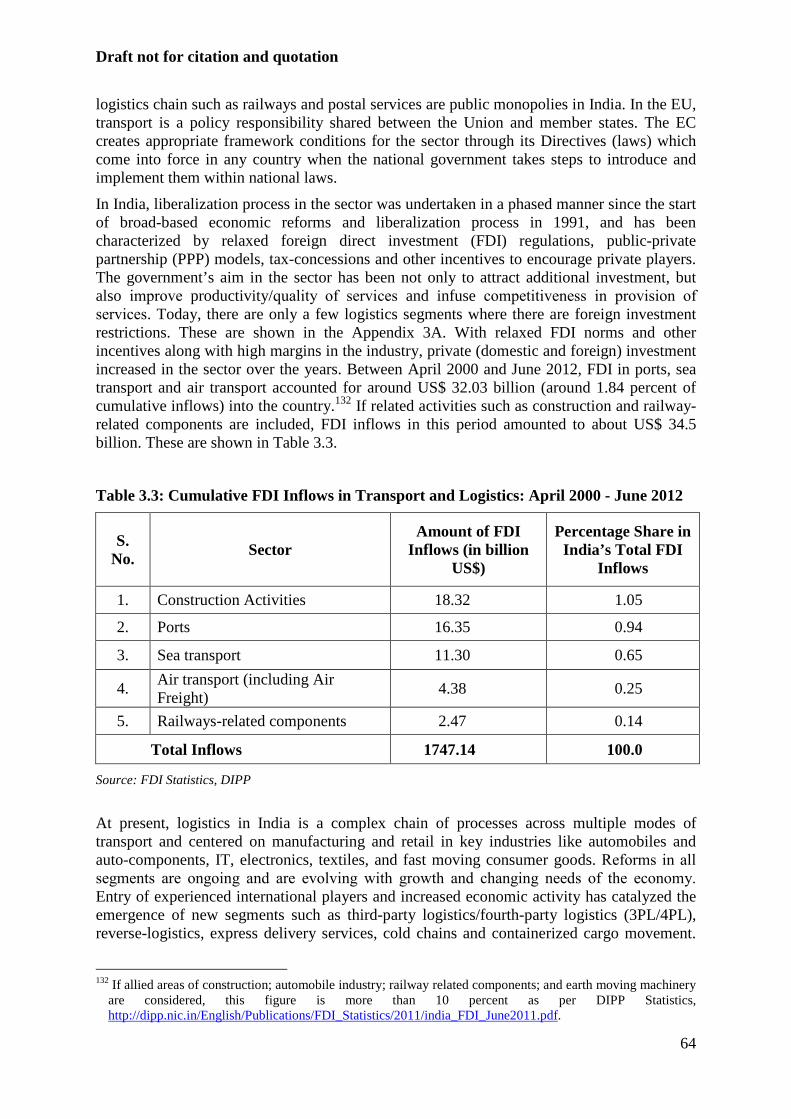
Draft not for citation and quotation
64
logistics chain such as railways and postal services are public monopolies in India. In the EU, transport is a policy responsibility shared between the Union and member states. The EC creates appropriate framework conditions for the sector through its Directives (laws) which come into force in any country when the national government takes steps to introduce and implement them within national laws.
In India, liberalization process in the sector was undertaken in a phased manner since the start of broad-based economic reforms and liberalization process in 1991, and has been characterized by relaxed foreign direct investment (FDI) regulations, public-private partnership (PPP) models, tax-concessions and other incentives to encourage private players. The government’s aim in the sector has been not only to attract additional investment, but also improve productivity/quality of services and infuse competitiveness in provision of services. Today, there are only a few logistics segments where there are foreign investment restrictions. These are shown in the Appendix 3A. With relaxed FDI norms and other incentives along with high margins in the industry, private (domestic and foreign) investment increased in the sector over the years. Between April 2000 and June 2012, FDI in ports, sea transport and air transport accounted for around US$ 32.03 billion (around 1.84 percent of cumulative inflows) into the country.132 If related activities such as construction and railway-related components are included, FDI inflows in this period amounted to about US$ 34.5 billion. These are shown in Table 3.3.
Table 3.3: Cumulative FDI Inflows in Transport and Logistics: April 2000 - June 2012
S. No.
Sector Amount of FDI
Inflows (in billion US$)
Percentage Share in India’s Total FDI
Inflows
1. Construction Activities 18.32 1.05
2. Ports 16.35 0.94
3. Sea transport 11.30 0.65
4. Air transport (including Air Freight)
4.38 0.25
5. Railways-related components 2.47 0.14
Total Inflows 1747.14 100.0
Source: FDI Statistics, DIPP
At present, logistics in India is a complex chain of processes across multiple modes of transport and centered on manufacturing and retail in key industries like automobiles and auto-components, IT, electronics, textiles, and fast moving consumer goods. Reforms in all segments are ongoing and are evolving with growth and changing needs of the economy. Entry of experienced international players and increased economic activity has catalyzed the emergence of new segments such as third-party logistics/fourth-party logistics (3PL/4PL), reverse-logistics, express delivery services, cold chains and containerized cargo movement.
132 If allied areas of construction; automobile industry; railway related components; and earth moving machinery
are considered, this figure is more than 10 percent as per DIPP Statistics, http://dipp.nic.in/English/Publications/FDI_Statistics/2011/india_FDI_June2011.pdf.
Draft not for citation and quotation
65
Use of IT is embedded in almost all stages of supply process and is reducing the need for multiple agents. With growing trends in outsourcing of logistics services, companies are also now developing end-to-end cargo management capabilities to establish asset ownership in parts of cargo value chain. All these are likely to promote towards development of an integrated logistics value chain in coming years.
Liberalisation of trade and freight transport movements in EU began with the Treaty of Rome and formation of the European Economic Community (1958). This provided for establishment of a common transport policy for removing obstacles to free competition between transport operators from different member states. However, despite treaty obligations, progress in integrating transport across the European Community was slow until the late 1980s as member states retained their national control over transport. Rapid change happened with the inclusion of transport in the ‘Single European Act’ of 1986, as part of plans to complete the single market as it became easier for foreign transport providers to work across member state borders.133
The Commission produced its first White Paper in 1992 on the future development of the common transport policy and its liberalization. This objective was achieved until 2001, except in the rail sector. Three Directives (2001/12/EC, 2001/13/EB, and 2001/14/EB) on the development of railway transport market and market liberalisation came into force on 15 March 2001. The second major policy document - the White Paper on European Transport policy was also produced by the EC in this year. It identified about 60 measures to be taken to enable the completion of integrated market areas of competition, linking up all modes of transport, eliminating barriers, attracting private investors, protecting users of transportation, and managing the globalisation of transport. In general, the White Paper established the conditions in which transport market activities could be done as easily on a Community basis as they could on a national basis. The hope was that by removing obstacles and barriers such as lack of fiscal and social harmonisation which led to distortions of competition, the fragmentation of the market could be resolved. Thus the focus is now on rebalancing all modes of transport and reducing environmental impact of transportation. The Green Paper of the EU (2006) continued to develop the EU Transport policy, building upon the existing EU policies and initiatives from the Lisbon Strategy. It also tries to find the right balance between the economic, social and environmental dimensions of sustainable development. It aims to launch a debate about a sustainable Maritime Policy for the EU as part of the EU integrated market to facilitate the trade traffic.
With globalization and EU enlargement, domestic and foreign trade volumes increased in the region. This has created the need for creating an intermodal transport system across member states.134A series of Directives and measures were adopted to promote inter-modality in transport, sustainability in freight movement to establish reliable, cheaper efficient and environment friendly networks in the region. These have been summarized in Table A.1 of Appendix 3A. As a result of operating in an increasingly complex and vast supply chain networks, several EU logistics companies became experienced in the field and expanded operations across the globe. Today, several leading and technologically advanced companies in logistics sector world-wide are of the EU origin. Some top players are Deustche Post DHL and DB Schenker AG (Germany) in diversified services, Maersk A/S (Denmark) and CMA-CGM (France) in sea freight services. As for the inward and outward FDI from the EU, the transportation and storage sector accounted for US$ 40,853 million and US$ 64, 915 million respectively at end-2009.
133 Full liberalisation of international road freight was completed by the year 1998. 134 Intermodal transport is most efficient on longer journeys, in comparison with road freight.
Draft not for citation and quotation
66
Regarding future growth potential in India, some industry associations and private consultancy organisations have tried to estimate the figures. Estimates vary but all studies show a double digit growth for the industry by 2030. An estimate by the National Skill Development Corporation (2009)135 shows that demand for human resource in transportation, logistics, and warehousing sectors of India will increase from 7.3 million in 2008 to about 25 million workers by the year 2022.136 This will specifically include higher demand for warehouse managers, truck drivers and coastal seafarers among others. The accelerated growth of the industry, along with promising new trends for future has made India a large untapped market. The Government also now places high importance of logistics sector as a support system for increasing trade flows and economic growth in future.137 Private sector investments are being encouraged in many segments to generate new revenue sources as well as improve service efficiencies and delivery standards. Public investments have also increased over the years and continue to be substantial despite the recent economic recession.138 The industry itself has already invested heavily in new intermodal infrastructure extending the use of intermodal transport significantly in the current times. The Government is making efforts in removing obstacles to growth such as poor infrastructure, regulatory and other barriers at the same time.139
Growth rates of the European logistics market are considered to range around 5 percent,140 which is lower than that of India. In the EU, the focus of logistics policy for future is on developing sustainable and eco-friendly systems in the economy. However, there are certain areas of concerns in the EU. As put forward in the Eurostat Yearbook 2011, ‘strains on transport infrastructure (congestion and delays), coupled with constraints over technical standards, interoperability and governance issues may slow down developments within the sector’.141 Costs incurred through congestion,142 labour shortages and dependency on fossil fuels are also increasing in the region. Identification of obstacles to efficient provision of logistics services is an on-going process and efforts to combat worsening network congestion are recognized as crucial to decrease costs and environmental damage in the EU.
3.3 Bilateral trade flows between India and the EU Both EU and India are among the top exporters and importers of transportation services in the world. In the year 2011, EU27 ranked first in world’s exports of transportation services accounting for about 43.3 percent share (approximately US$ 372.5 billion), while India’s rank was 8th, with a share of 2 percent (approximately US$17.5 billion). The EU27 ranked on top accounting for 30.7 percent share (approximately US$ 338.3 billion) of world’s total
135 Human resource requirement and skill requirements in transportation, logistics and warehousing and
packaging sector (2022) (accessed on March 2, 2012). 136 http://www.nsdcindia.org/pdf/transportation-logistics.pdf 137 See Planning Commission, 2009 and; Planning Commission, 2011. 138 http://www.mckinsey.com/locations/india/mckinseyonindia/pdf/building_india_transofrming_the_nations_logistics_infrastructure.pdf 139 For details of the recent initiatives in the sector, see Union Budget 2012 of the Government of India. http://indiabudget.nic.in/index.asp 140 http://www.pwc.com/en_GX/gx/transportation-logistics/tl2030/emerging-markets/pdf/tl2030_vol3_final.pdf According to Deloitte, 2009, the Indian logistics market is projected to reach about US$ 120 billion by 2015.
Frost & Sullivan project it to reach around this level in 2014, with a CAGR of 9.9 percent between 2009 and 2014.
141 Eurostat Yearbook, 2011. 142 Congestion costs Europe about one percent of GDP every year.
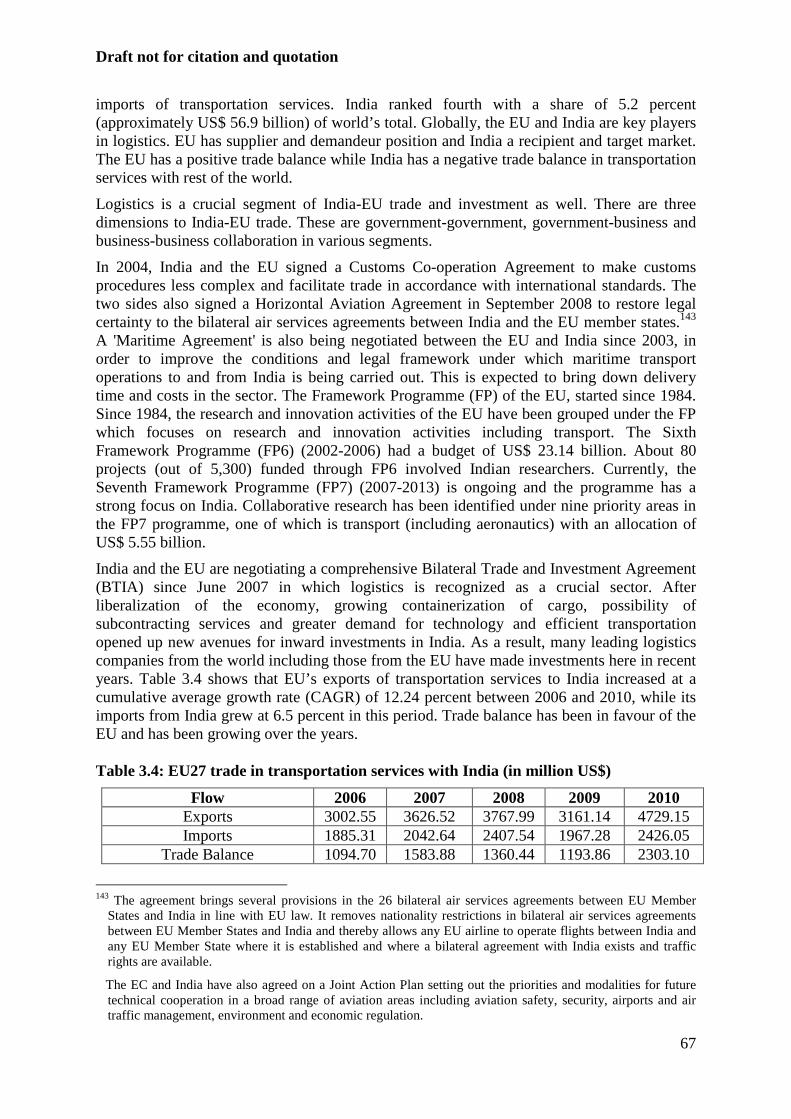
Draft not for citation and quotation
67
imports of transportation services. India ranked fourth with a share of 5.2 percent (approximately US$ 56.9 billion) of world’s total. Globally, the EU and India are key players in logistics. EU has supplier and demandeur position and India a recipient and target market. The EU has a positive trade balance while India has a negative trade balance in transportation services with rest of the world.
Logistics is a crucial segment of India-EU trade and investment as well. There are three dimensions to India-EU trade. These are government-government, government-business and business-business collaboration in various segments.
In 2004, India and the EU signed a Customs Co-operation Agreement to make customs procedures less complex and facilitate trade in accordance with international standards. The two sides also signed a Horizontal Aviation Agreement in September 2008 to restore legal certainty to the bilateral air services agreements between India and the EU member states.143 A 'Maritime Agreement' is also being negotiated between the EU and India since 2003, in order to improve the conditions and legal framework under which maritime transport operations to and from India is being carried out. This is expected to bring down delivery time and costs in the sector. The Framework Programme (FP) of the EU, started since 1984. Since 1984, the research and innovation activities of the EU have been grouped under the FP which focuses on research and innovation activities including transport. The Sixth Framework Programme (FP6) (2002-2006) had a budget of US$ 23.14 billion. About 80 projects (out of 5,300) funded through FP6 involved Indian researchers. Currently, the Seventh Framework Programme (FP7) (2007-2013) is ongoing and the programme has a strong focus on India. Collaborative research has been identified under nine priority areas in the FP7 programme, one of which is transport (including aeronautics) with an allocation of US$ 5.55 billion.
India and the EU are negotiating a comprehensive Bilateral Trade and Investment Agreement (BTIA) since June 2007 in which logistics is recognized as a crucial sector. After liberalization of the economy, growing containerization of cargo, possibility of subcontracting services and greater demand for technology and efficient transportation opened up new avenues for inward investments in India. As a result, many leading logistics companies from the world including those from the EU have made investments here in recent years. Table 3.4 shows that EU’s exports of transportation services to India increased at a cumulative average growth rate (CAGR) of 12.24 percent between 2006 and 2010, while its imports from India grew at 6.5 percent in this period. Trade balance has been in favour of the EU and has been growing over the years. Table 3.4: EU27 trade in transportation services with India (in million US$)
Flow 2006 2007 2008 2009 2010 Exports 3002.55 3626.52 3767.99 3161.14 4729.15 Imports 1885.31 2042.64 2407.54 1967.28 2426.05
Trade Balance 1094.70 1583.88 1360.44 1193.86 2303.10
143 The agreement brings several provisions in the 26 bilateral air services agreements between EU Member
States and India in line with EU law. It removes nationality restrictions in bilateral air services agreements between EU Member States and India and thereby allows any EU airline to operate flights between India and any EU Member State where it is established and where a bilateral agreement with India exists and traffic rights are available.
The EC and India have also agreed on a Joint Action Plan setting out the priorities and modalities for future technical cooperation in a broad range of aviation areas including aviation safety, security, airports and air traffic management, environment and economic regulation.
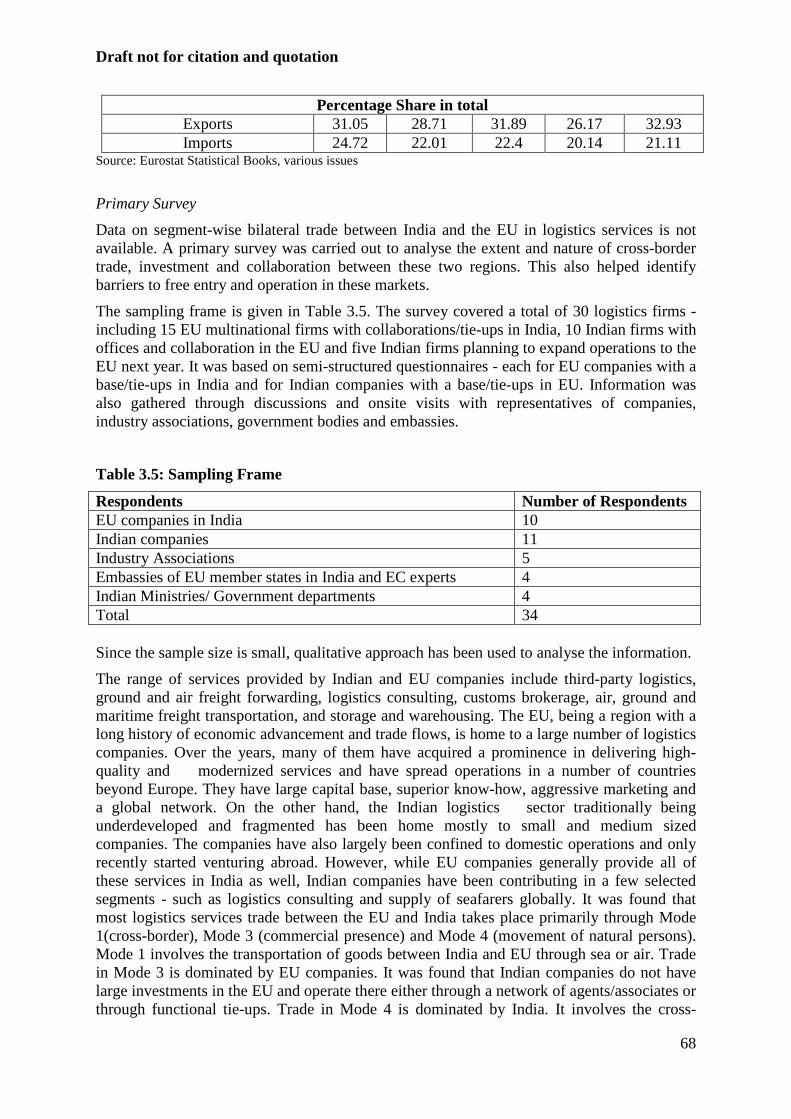
Draft not for citation and quotation
68
Percentage Share in total Exports 31.05 28.71 31.89 26.17 32.93 Imports 24.72 22.01 22.4 20.14 21.11
Source: Eurostat Statistical Books, various issues
Primary Survey
Data on segment-wise bilateral trade between India and the EU in logistics services is not available. A primary survey was carried out to analyse the extent and nature of cross-border trade, investment and collaboration between these two regions. This also helped identify barriers to free entry and operation in these markets.
The sampling frame is given in Table 3.5. The survey covered a total of 30 logistics firms - including 15 EU multinational firms with collaborations/tie-ups in India, 10 Indian firms with offices and collaboration in the EU and five Indian firms planning to expand operations to the EU next year. It was based on semi-structured questionnaires - each for EU companies with a base/tie-ups in India and for Indian companies with a base/tie-ups in EU. Information was also gathered through discussions and onsite visits with representatives of companies, industry associations, government bodies and embassies.
Table 3.5: Sampling Frame
Respondents Number of Respondents EU companies in India 10 Indian companies 11 Industry Associations 5 Embassies of EU member states in India and EC experts 4 Indian Ministries/ Government departments 4 Total 34 Since the sample size is small, qualitative approach has been used to analyse the information.
The range of services provided by Indian and EU companies include third-party logistics, ground and air freight forwarding, logistics consulting, customs brokerage, air, ground and maritime freight transportation, and storage and warehousing. The EU, being a region with a long history of economic advancement and trade flows, is home to a large number of logistics companies. Over the years, many of them have acquired a prominence in delivering high-quality and modernized services and have spread operations in a number of countries beyond Europe. They have large capital base, superior know-how, aggressive marketing and a global network. On the other hand, the Indian logistics sector traditionally being underdeveloped and fragmented has been home mostly to small and medium sized companies. The companies have also largely been confined to domestic operations and only recently started venturing abroad. However, while EU companies generally provide all of these services in India as well, Indian companies have been contributing in a few selected segments - such as logistics consulting and supply of seafarers globally. It was found that most logistics services trade between the EU and India takes place primarily through Mode 1(cross-border), Mode 3 (commercial presence) and Mode 4 (movement of natural persons). Mode 1 involves the transportation of goods between India and EU through sea or air. Trade in Mode 3 is dominated by EU companies. It was found that Indian companies do not have large investments in the EU and operate there either through a network of agents/associates or through functional tie-ups. Trade in Mode 4 is dominated by India. It involves the cross-
Draft not for citation and quotation
69
country temporary movement of professionals (consultants, managers, technicians, engineers, etc.) to provide logistics and transport services. Trade also takes place through Mode 2 (consumption abroad) where services providers from EU and India use each other’s port and airport facilities.
The size of investments by EU companies in India is substantial and many of them have offices across India. Most of them are multinationals and provide integrated and door-to-door services including outsourcing and third-party logistics services. The survey found that they generally enter through joint ventures in order to gain local market knowledge, and get assistance from their local partners in acquiring and setting up offices and establishing operations. Other common modes of entry are consortium and representative offices. Some companies such as the DHL Express took the acquisition route. However, about 75 percent of EU companies set up wholly-owned subsidiaries after initial entry.
EU companies view India, along with China among their top business destinations.144 The reasons include – the underdeveloped nature of logistics market and the high growth potential it offers to company-specific issues such as establishment of infrastructure such as warehouses for the already established companies.
In comparison, Indian companies’ investment in the EU is not significant. The survey revealed that they enter the EU primarily to meet existing customer requirements. Two observations in this context were noteworthy. One, the Indian companies still possess limited knowledge about the EU markets and two, due to their smaller size and underdeveloped specialities, they prefer not to make large investments but have small tie-ups involving minimum commitment and costs.145 Indian companies stated that they saw substantive market potential in the emerging European markets of the Eastern Europe.
As of now India’s share in the EU logistics market is very less (less than one percent). Indian companies stated that less than five percent of their revenues were from operations in the EU markets. On the other hand, EU’s share in the Indian logistics industry is significant. In fact, EU firms such as DHL and Maersk Line dominate and are counted among the top ranking players in the Indian supply chain industry.146
The strengths of Indian companies is in their local knowledge, experience with procedures and handling government, flexibility, strong customer base and lower costs of operation. Their weaknesses are small financial base, lack of competitiveness on a global scale and problems in meeting international service standards. In contrast, the strengths of EU companies are in their large capital base, wide global network and access to latest technologies.147Their weaknesses are lack of local market knowledge and not being able to get through procedures in India. These are summarized in Table 3.6 below.
Table 3.6: Strengths and Weaknesses of Indian and EU companies in India
Indian Companies EU Companies
144 Many EU companies started operations in China before entering the Indian market and felt that China has a distinct advantage over India due to better infrastructure facilities. 145 These associates in the EU contact the supplier (client), pick up the cargo, select a particular airline/ocean carrier, and complete the customs duty. 146 DHL has a 60 percent market share in India and Maersk Lines, with P&O, accounts for nearly 30 percent share of all incoming and outgoing containers in the country. 147 All EU firms also have investments offices and networks in other developing country markets such as China, Malaysia, Thailand, Korea, the Middle East etc.
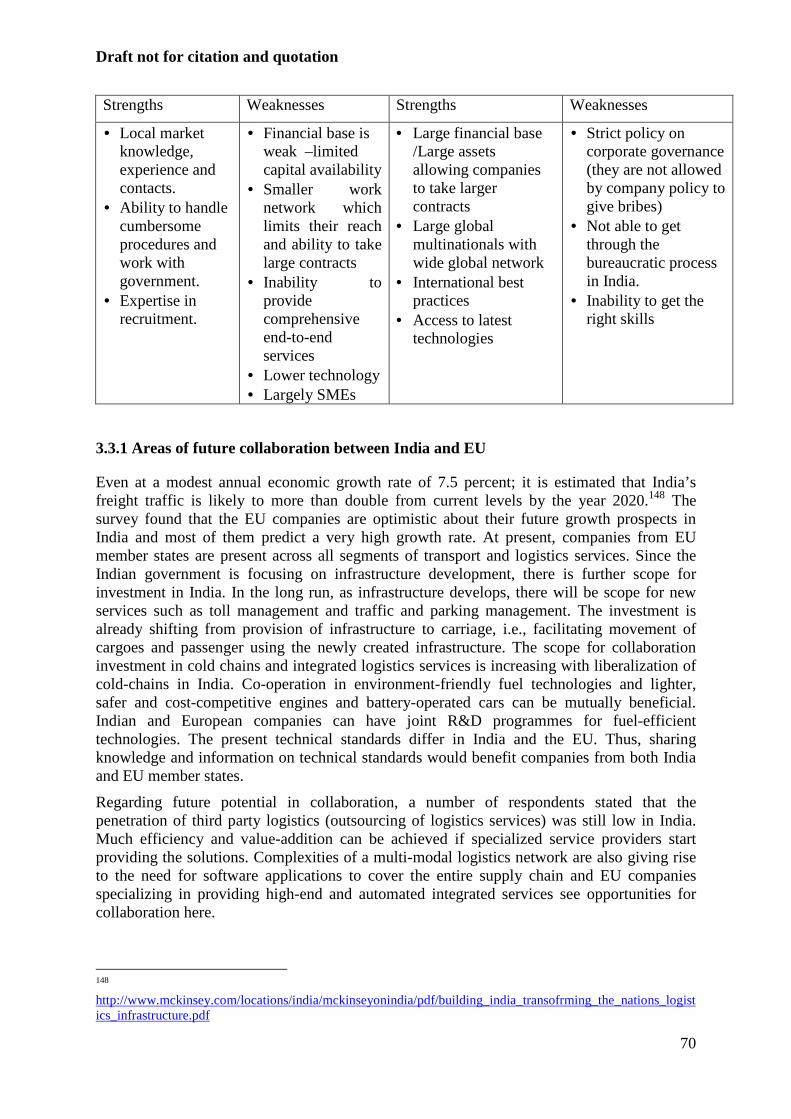
Draft not for citation and quotation
70
Strengths Weaknesses Strengths Weaknesses
• Local market knowledge, experience and contacts.
• Ability to handle cumbersome procedures and work with government.
• Expertise in recruitment.
• Financial base is weak –limited capital availability
• Smaller work network which limits their reach and ability to take large contracts
• Inability to provide comprehensive end-to-end services
• Lower technology • Largely SMEs
• Large financial base /Large assets allowing companies to take larger contracts
• Large global multinationals with wide global network
• International best practices
• Access to latest technologies
• Strict policy on corporate governance (they are not allowed by company policy to give bribes)
• Not able to get through the bureaucratic process in India.
• Inability to get the right skills
3.3.1 Areas of future collaboration between India and EU
Even at a modest annual economic growth rate of 7.5 percent; it is estimated that India’s freight traffic is likely to more than double from current levels by the year 2020.148 The survey found that the EU companies are optimistic about their future growth prospects in India and most of them predict a very high growth rate. At present, companies from EU member states are present across all segments of transport and logistics services. Since the Indian government is focusing on infrastructure development, there is further scope for investment in India. In the long run, as infrastructure develops, there will be scope for new services such as toll management and traffic and parking management. The investment is already shifting from provision of infrastructure to carriage, i.e., facilitating movement of cargoes and passenger using the newly created infrastructure. The scope for collaboration investment in cold chains and integrated logistics services is increasing with liberalization of cold-chains in India. Co-operation in environment-friendly fuel technologies and lighter, safer and cost-competitive engines and battery-operated cars can be mutually beneficial. Indian and European companies can have joint R&D programmes for fuel-efficient technologies. The present technical standards differ in India and the EU. Thus, sharing knowledge and information on technical standards would benefit companies from both India and EU member states.
Regarding future potential in collaboration, a number of respondents stated that the penetration of third party logistics (outsourcing of logistics services) was still low in India. Much efficiency and value-addition can be achieved if specialized service providers start providing the solutions. Complexities of a multi-modal logistics network are also giving rise to the need for software applications to cover the entire supply chain and EU companies specializing in providing high-end and automated integrated services see opportunities for collaboration here.
148 http://www.mckinsey.com/locations/india/mckinseyonindia/pdf/building_india_transofrming_the_nations_logistics_infrastructure.pdf
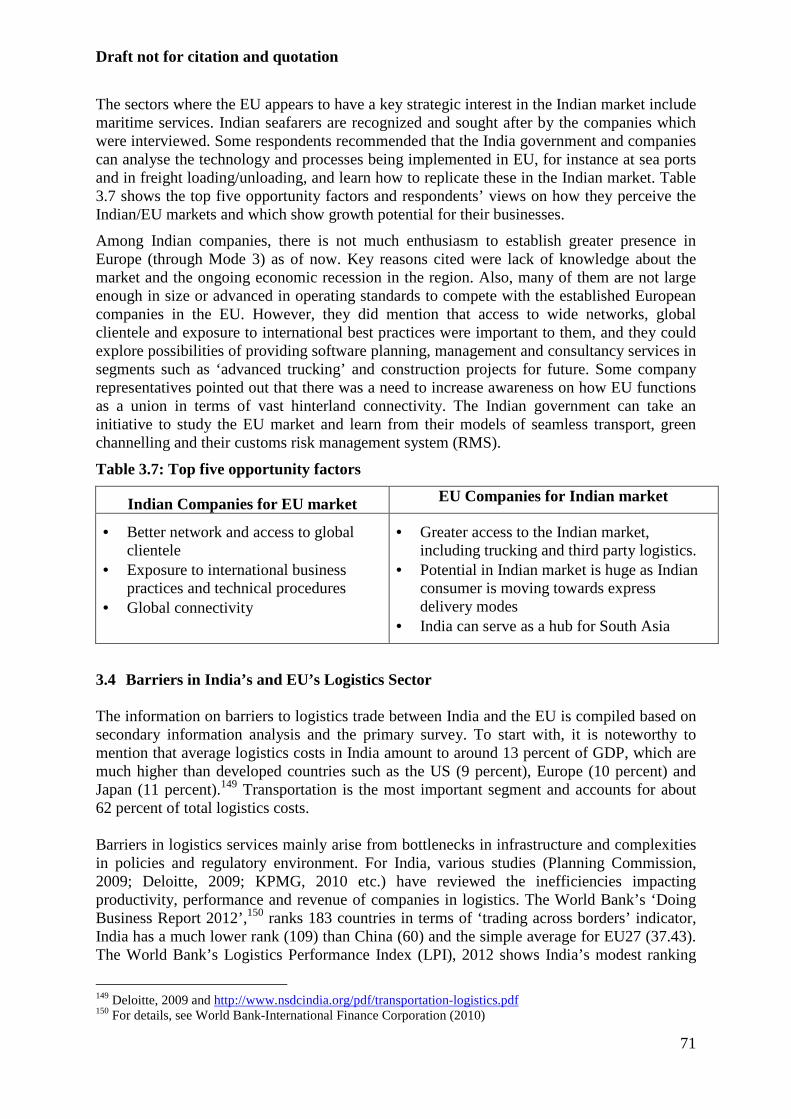
Draft not for citation and quotation
71
The sectors where the EU appears to have a key strategic interest in the Indian market include maritime services. Indian seafarers are recognized and sought after by the companies which were interviewed. Some respondents recommended that the India government and companies can analyse the technology and processes being implemented in EU, for instance at sea ports and in freight loading/unloading, and learn how to replicate these in the Indian market. Table 3.7 shows the top five opportunity factors and respondents’ views on how they perceive the Indian/EU markets and which show growth potential for their businesses.
Among Indian companies, there is not much enthusiasm to establish greater presence in Europe (through Mode 3) as of now. Key reasons cited were lack of knowledge about the market and the ongoing economic recession in the region. Also, many of them are not large enough in size or advanced in operating standards to compete with the established European companies in the EU. However, they did mention that access to wide networks, global clientele and exposure to international best practices were important to them, and they could explore possibilities of providing software planning, management and consultancy services in segments such as ‘advanced trucking’ and construction projects for future. Some company representatives pointed out that there was a need to increase awareness on how EU functions as a union in terms of vast hinterland connectivity. The Indian government can take an initiative to study the EU market and learn from their models of seamless transport, green channelling and their customs risk management system (RMS).
Table 3.7: Top five opportunity factors
Indian Companies for EU market EU Companies for Indian market
• Better network and access to global clientele
• Exposure to international business practices and technical procedures
• Global connectivity
• Greater access to the Indian market, including trucking and third party logistics.
• Potential in Indian market is huge as Indian consumer is moving towards express delivery modes
• India can serve as a hub for South Asia
3.4 Barriers in India’s and EU’s Logistics Sector The information on barriers to logistics trade between India and the EU is compiled based on secondary information analysis and the primary survey. To start with, it is noteworthy to mention that average logistics costs in India amount to around 13 percent of GDP, which are much higher than developed countries such as the US (9 percent), Europe (10 percent) and Japan (11 percent).149 Transportation is the most important segment and accounts for about 62 percent of total logistics costs. Barriers in logistics services mainly arise from bottlenecks in infrastructure and complexities in policies and regulatory environment. For India, various studies (Planning Commission, 2009; Deloitte, 2009; KPMG, 2010 etc.) have reviewed the inefficiencies impacting productivity, performance and revenue of companies in logistics. The World Bank’s ‘Doing Business Report 2012’,150 ranks 183 countries in terms of ‘trading across borders’ indicator, India has a much lower rank (109) than China (60) and the simple average for EU27 (37.43). The World Bank’s Logistics Performance Index (LPI), 2012 shows India’s modest ranking
149 Deloitte, 2009 and http://www.nsdcindia.org/pdf/transportation-logistics.pdf 150 For details, see World Bank-International Finance Corporation (2010)
Draft not for citation and quotation
72
(47) - reflecting its weaknesses in selected parameters including customs, infrastructure, international shipments, logistics competence, tracking and tracing, and timeliness. Overall, the EU is much ahead of India in many parameters such as infrastructure and customs, and has made great strides in establishing a liberalized and efficient market in logistics. However, its transport sector continues to present various legal barriers to market entry. Administrative, technical and regulatory barriers also exist.151
The trade barriers between India and the EU are listed in terms of specific problems as well as Mode 3 (commercial presence) and Mode 4 (movement of natural persons). European Union Infrastructural bottlenecks • The availability and quality of infrastructure varies between member states and is
particularly low on the eastern part of Europe (Bulgaria, Greece, Poland, Romania and Slovenia), where renovation and upgrading of an otherwise extensive railway infrastructure is a challenge. Quality of port infrastructure is low in Bulgaria, Italy, Poland, Romania and Slovak Republic. For air transport infrastructure, Bulgaria, Lithuania, Poland, Romania and Slovak Republic fare low. For inland waterways, significant bottlenecks need to be removed in Bulgaria and Hungary, which could improve efficiencies in the entire EU transport network.
• There is good provision of infrastructure in Belgium, the Netherlands and Luxembourg,
Germany and the UK, but these states suffer from a high level of road congestion, calling for better exploitation of transport modes, deployment of intelligent transport systems and adequate pricing for use of infrastructure.152 These are also lacking in eastern member states such as Hungary, Cyprus and Malta.
Inter-state variations • The EU transport policy-making has its disadvantages. First, the structure of the
implementation authorities vary from country to country which leads to delays in impact of policies. Although the EU has shared responsibilities with the member-states in terms of transport policy instruments, the implementation mechanism can be vague. There are also differences in national regulations and standards among member states.
• There are huge disparities in the regional freight vehicle equipment rates. The highest freight vehicle equipment rates were in Greece, Spain and Austria, along with Cyprus and Finland while low rates are in the Norwegian regions.153
151 The EU transport policy has developed progressively towards an integrated policymaking mechanism. Since the first White Paper appeared in 1992, the general trend has been to facilitating the movements of goods and services within the single market. This process was based not only on dismantling internal barriers but also on integrating national markets. In due course this development led to separation of the maritime policy as an integrated policy. 152 Like India, in the EU too, the pace of deployment of smart mobility systems such as intelligent transport systems for road, the air traffic management system SESAR and the European rail traffic management system was slow. 153 http://epp.eurostat.ec.europa.eu/statistics_explained/index.php/Transport_statistics_at_regional_level
Draft not for citation and quotation
73
Complex regulatory environment • Companies pointed out that the accounting standards and fiscal disclosure requirements in
the EU are very strict and complex. Currently, Indian companies are not prepared to follow their accounting and disclosure standards as it is costly to follow them in terms of training of manpower and investment in software.154
• The regulatory burden has been high in states such as Greece, France, Hungary, Italy as well as emerging economies such as Slovenia and the Slovak Republic in the road freight sector in terms of increasing burden of taxation, charges and duties which poses constraints to entry of new players.
• In the maritime sector, some Indian companies pointed out the cumbersome regulations in advance declaration of cargo at EU ports, making the procedures of loading cargo a hassle.
Incomplete liberalization
• Administrative, technical and regulatory barriers limit free market access of private operators and competition in rail transport. In many cases, the incumbents still own or operate services or facilities (such as marshalling yards), hampering free competition by private operators. Rail liberalization is delayed in Lithuania, Greece, Latvia, Luxembourg, Spain and Ireland. There is also incomplete separation of infrastructure management from operations.155
Discriminatory Policies
• The Indian companies opposed the EU’s proposal to levy carbon emissions taxes under its
emission trading scheme (ETS) on ships in July 2012 respectively.156The EU proposed to regulate emissions arising from all ocean-going ships which touch their boundaries or ports by including their emissions in the EU-ETS.
• Prospective non-EU investors in Greece’s maritime and air transport sectors are required
to obtain licenses and other approvals that are not required of Greek or other EU investors.
• The EU Utilities Directive (2004/17), covering purchases in the transportation sector requires open, competitive bidding procedures, but discriminates against bids with less than 50 percent EU content that are not covered by an international or reciprocal bilateral agreement. The EU content requirement applies to foreign suppliers of goods and services.
Barriers in government procurement – lack of transparency and corruption157 • There are problems such as lack of transparency and corruption in the government
procurement markets of some EU member states such as Italy where a lack of transparency creates obstacles for firms bidding on public procurement. Corruption also
154 For details, see Beke, 2010. 155 Cefic, 2012. 156 http://www.livemint.com/2012/07/23231420/After-aviation-India-to-oppos.html 157 These have been largely compiled from US Trade Representative Barriers (2012) since presence of Indian companies in public procurement project is limited.
Draft not for citation and quotation
74
exists at the local level. In 2010, the Italian press reported on alleged corruption involving the abuse of emergency procurement laws. In Lithuania and Bulgaria too, the public procurement process is not very transparent. In some cases, tenders are narrowly defined and appear tailored to a specific company. In Slovenia and Portugal, there are short time frames for bid preparation, lack of clarity in tendering documentation, and opacity in bid evaluation process. There are preferences for EU, especially local firms. In addition bid documents in local language create problems for Indian companies.
Mode 4 related barriers
• An examination of the schedules of commitments in EU’s Revised Offer (2005) in the WTO shows that most member states (such as UK, Germany, France, Denmark, Greece etc.) made no binding commitments with respect to movement of natural persons to supply services in many logistics segments such as cargo handling services, storage and warehouse services and maritime services. This is true of both the market access and national treatment commitments. In addition, the horizontal commitments of the EC Schedule impose conditions are stringent and these may not easily be met by persons from developing countries such as India. These include residency requirements, specific educational degrees or technical qualifications and membership of specific associations.158 Such access can be useful for drivers, and other persons such as warehouse operators and managers.
India
Infrastructure bottlenecks • In India, with the increasing economic activities, there have emerged significant demand-
supply gaps in transport services in road, waterways and airline networks.
First, domestic freight movement is heavily skewed in favor of the road sector. Nearly 60 percent of cargo is moved by roads as compared to about 37 percent in the US and 22 percent in China. Moreover, the national highways which constitute only about 2 percent of road network have to carry nearly 40 percent of freight load of the country causing congestion problems. Underdeveloped infrastructure in shipping and aviation and the Indian Railways’ policy of cross-subsidizing passenger by freight transport among others, have led to the road sector being over-burdened over the years. Inadequate road network coverage and poor road quality at many stretches hamper logistics operations in the country. They also suffer from issues of access and evacuation of traffic.
In railways, there is a problem of freight congestion in most high density corridors. The route network of Indian Railways has expanded very slowly in the past. In 1947, Indian Railways had 53,996 of route kms of track network and today the length is just over 64,000 kms.
In sea transport, lack of facilities at ports such as Paradip and Mangalore allow the entry of only small vessels. There are problems such as lack of deep water routes, insufficient dredging and berthing capabilities which make it possible to handle just about 5,500 TEUs in one ship whereas ports in China and Europe facilitate around 13,000 TEUs per ship. This causes the companies to use smaller ships which increases costs to end users. Congestion problem at major ports causes a backlog in clearance process. Ships may have
158 For details on EU’s commitments in the WTO, see Chapter 7.
Draft not for citation and quotation
75
to wait for upto four days for offloading cargo. Clearance of cargo containers takes about seven days which creates complications and delays for shipping lines and customers. Coastal shipping is characterized by inadequate port and land side infrastructure (such as inadequate depth at ports) which hampers large scale use for freight movement. Lack of hinterland connectivity is also reported.
Airport infrastructure is also weak in terms of handling cargo. An integrated system of handling cargo at terminals is also lacking often causing chaos in the clearance process. Round the clock custom facilities at air cargo are also missing at many ports. One company pointed out that in Singapore, for instance, in the automobile industry, Roll in and Roll out (RoRo) take about eight cars per minute while in India, it is three cars per ten minutes.
There is a lack of adequate number of cold storage facilities and warehouses in the country. Moreover, according to Deloitte-ICC (2012), 80-85 percent of warehouses are traditional with sizes of less than 10,000 square feet. Many of these are not equipped with cemented roofs, efficient security systems, racking facilities and consistent electricity supply. Their owners are private sector players with limited capital for investment.159 Land availability at affordable rates in many cities such as Delhi and Mumbai is also a cause of concern.
Lack of chain control
• Chain control is also lacking and integrated service provision, outsourcing or 3PL/4PL logistics are still underdeveloped. Large multimodal logistics parks with facilities for consolidation of large land parcels, integrated logistics and value addition have also not been
developed yet because of lack of recognition and funding by the state governments. Government procurement market
• There are problems in the public procurement markets related to lack of competition and transparency. In India, procurements are carried out through three channels of tender invitation. Open Tender Enquiry (OTE), limited tender enquiry (LTE) and Single tender enquiry (STE). LTE is recommended in cases of procurement where pool of vendors has been established. STE is recommended under only exceptional circumstances such as national calamities or other emergencies. The choice between these can significantly impact participation level in the tender. Organizations often (unknowingly or purposely) fail to utilize the OTE and tend to depend on LTE. A CVC Report on public procurement points out, “in the process of neglecting OTE ,the competition is restricted which in turn results in cartel formation, higher rates and favouritism to select firms”. According to Malhotra (2012), there are numerous cases where the prescribed rules and guidelines are not followed and available channel of OTEs are ignored. There are also bureaucratic hassles and complex procedures.
Technology related barriers
159 The large warehousing owners are mainly government agencies such as the Central Warehousing Corporation (CWC) and State Warehousing Corporations (SWCs) whose focus area is mainly the storage of food grains.
Draft not for citation and quotation
76
• The logistics sector is hampered by low rates of technology adoption and automation in areas such as vehicle tracking and warehouse management. In the rail segment, most terminals (goods shed) used for loading/unloading of freight are antiquated due to lack of investment over the years.
An Intelligent Transport System which includes high tech logistics technology and tracking systems is the need of the hour. Use of automatic transit network for freight corridors is also unexploited. Like the EU, India also needs to focus on alternative fuel technologies to reduce air pollution and dependency on traditional fuels.
Lack of standardisation in equipment is another problem in the industry. Most of the ports/airports lack testing facilities for key products such as textiles. There is also lack of officers to coordinate the testing process. Laboratories are located far away from the ports such as those in Mumbai which acts as a barrier to fast clearance of goods.
Lack of coordination in infrastructure planning
• Numerous industry players stated that there is little coordination amongst the various agencies of the government in creation of infrastructure. For instance, according to Deloitte-ICC (2012), if creation of additional port capacity for container handling is being planned little thought is given to evacuation logistics. When main network roads are developed the links remain of poor quality. Integration of facilities is needed to reduce the high transaction costs prevalent in the economy.
Fragmentation
• There is high level of fragmentation in the industry. This is especially true of the trucking segment wherein nearly 70 percent of the owners own between one-five trucks. Intense competition among operators has led to many problems - such as low margins and limited capacity of operators to invest in trucks, tacking and safety equipment. This has also led to a trend of overloading and inefficiencies in the segment.
• Fragmentation is also a problem in the warehousing industry partly because of a complicated tax regime involving payment of multiple state and central taxes in the country by owners. Currently, owing to multiple and differential state-level taxes, companies in India have set up multiple warehouses, often one per state (to minimize intra-state movements and associated taxation), servicing various parts of the country. This is highly inefficient and leads to higher unit and inventory carrying costs.
Inter-state variations in laws
• There are also variations in implementation of laws across states in India. For instance, one of the companies stated that the registration of the Multiple Trailer Single Horse under which a trailer and the engine can be registered separately is allowed in certain states such as Maharashtra but not in others such as Delhi and Haryana. This hampers efficient use of engines and trailers. The varying rules and regulations also impede the process, with bribes being common to get the cargo moving faster.
Skill related barriers
• Various segments of the Indian logistics sector are hampered by lack of skilled workforce, lengthy procedures, and bureaucratic hurdles particularly at the sea
Draft not for citation and quotation
77
ports.160These include technology skills and driving skills including safety procedures, industry understanding and multi-operational skills (such as maintaining of delivery records, negotiating and handling of queries) in a demanding market like India.161Also, in ports such as Paradip and Mangalore, there are insufficient number of tug operators, berthing staff and pilots.
Customs Procedures • The USTR (2012) reports that there are concerns regarding India’s customs valuation
criteria to import transactions. India’s valuation procedures allow its customs officials to reject the declared transaction value of an import when a sale is deemed to involve a lower price compared to the ordinary competitive price. India’s customs valuation methodologies do not reflect actual transaction values and raise the cost of exporting to India beyond applied tariff rates. Also, India does not assess the basic customs duty, additional duty, and special additional duty separately on the customs value of a given imported product. The additional duty is assessed on the sum of the actual (or transaction) value and the basic customs duty, while the special additional duty is assessed on the sum of the actual (or transaction) value, the basic customs duty, and the additional duty. This can result in importers paying higher duties than they should be liable for on the basis of actual value of their imported product.
• India’s customs officials generally require extensive documentation. Despite automation of trade procedures, there are complications due to India’s complex tariff structure and multiple exemptions, which may vary according to product, user, or intended use. Physical inspections by customs, multiple documentation requirements and bribes cause unnecessary processing delays and hassles for traders. Motor vehicles may be imported through only three specific ports and only from the country of manufacture.
• Companies pointed out that risk management system being followed at ports by the custom authorities was weak and inefficient. The authorities often indulge in random sample checking without checking the past records and credibility of the shipping companies. This delays the clearance procedures.
Constraints in inter-state movement of goods
• Trucks in India have to pass through multiple check points in their journey and have to stop at state borders, for payment of toll taxes, for inspections, octroi etc. An estimate of the time taken at check points shows that in a journey of 2150 kilometers between Kolkata and Mumbai a truck had to stop for as much as 32 hours at various checkpoints on 26 locations.162
160These are sometimes on account of multi-layered administration systems and multiple regulations. Over 20 government bodies govern this sector through more than 40 Acts, resulting in high administration and compliance costs. Presence of a large number of ministries results and lack of coordination among them has resulted in a fragmented approach and delayed development of the sector. 161This problem is related to fragmented nature of the sector. The supply chain has many sub-segments and there are different stakeholders, operators and size of operations. Most companies handling these operations are small or medium-sized. 162 Deloitte-ICC, 2012
Draft not for citation and quotation
78
• There are state level taxes such as sales tax, excise and octroi toll which are to be paid at the entry of every state border. A lot of time that gets wasted while paying these different taxes at different locations.
High tariff rates
• Indian Railways follows a policy of subsidizing passenger tariff by freight tariff. This has resulted in sharply rising railway freight rates over the years, one of the highest in the world. Deloitte-ICC (2012) states that the rail freight rates in India are nearly four times of that in USA.163
Other problems
• Ports in India suffer from high turnaround times for ships. The JNPT has more than two times the turnaround time of Colombo and Singapore ports because of congestion on berths and slow evacuation of cargo which are unloaded at the berths.164
• Companies complained about higher charges are to be paid by terminal handling agencies to port authorities for handling more number of ships which acted as a disincentive for expanding operations and added on to their costs of operation. This was also leading to shifting of cargo from Tariff Authority for Major Ports (TAMP) regulated ports to other ports and a conscious slowing down of clearing process by port authorities.
Cargo traffic handled at Indian ports is still modest. For instance, in the year 2010-11, the highest volume of cargo traffic handled by any port in India was about 82 million tonnes (Kandla). All major ports of together handled about 569.91 million tonnes, while in the same year the Rotterdam port in Europe handled about 430 million tonnes of traffic.
• Pilferage at ports (both air and sea), mainly at the customs level, is a common problem, which has become a part of business to the point that most companies plan for such cases.
• The companies stated that the Authorised Economic Operator (AEO) norms in India under which a certification is given to logistics companies making them liable for benefits at customs were not made clear in the policy. Logistics companies have taken this certification but they cannot claim the benefits as there is no clarity.
Mode 3 and Mode 4 related barriers • There is cabotage restriction on movement of foreign registered ships which prohibits
them to move cargo from one Indian port to another Indian port. This wastes a lot of time and adds to the costs of companies. For instance, it was mentioned by one of the companies in the survey that the Vallarpadam Port in Cochin (Kerala) was initially supposed to be a hub in southern India but due to the cabotage movement restriction; this port has been utilized only to an extent of 15-20 percent.
163 Movement of freight traffic is frequently subordinated to passenger traffic on the railway network. This results in a freight train taking as much as 6-8 days for a journey of 2000 kilometers. Also there are delays in transit time for freight trains on many routes. 164 For details, see CRISIL, 2012.
Draft not for citation and quotation
79
• In its WTO Revised offer of 2005, India only offered to allow the entry of natural persons to technical and managerial personnel.165 Moreover, in specific category of services related to logistics such as services related to management consulting, technical testing and analysis services, and air transport services, India did not offer to take commitments.166
3.5 Addressing barriers through international negotiations
In the WTO’s Doha Round of Negotiations and in its bilateral trade agreements, the EC has been a demandeur to liberalise various segments of the logistics sector in emerging economies. It had also made significant commitments in its WTO Revised Offer in the year 2005. In comparison, India did not make substantial commitments in its WTO Revised Offer in the same year. However, India’s FDI regime is currently far more liberal and it is in a position to undertake greater commitments in almost all segments of logistics. These can be offered under the ongoing negotiations for a proposed BTIA between India and the EU.
The sectors where the EU appears to have a key strategic interest in the Indian market include cargo reservation, inland transport and cabotage. However, there seems to be limited scope for further liberalization in this as both India and the EC have imposed a cabotage condition and post 9/11 coastal areas of India are sensitive. In India there is no clear policy on development on inland transport and this makes it difficult to take international commitments.
Overall, since Indian and the EU maritime sectors are considerably open and there are no major FDI restrictions, they can bind the existing regime. Greater harmonization of port policies across EU Member States, centralized and harmonized recognition procedure for Indian seafarers, and cooperation in port management and training are issues that can be raised in the BTIA.
At present, India and the EU are negotiating a bilateral maritime agreement. During the survey, it was found that entering into a maritime agreement with a regional block like EC has certain advantages. The basic focus of the agreement is on enhancing market access, right to establishment and non discriminatory access to auxiliary services. Non-discriminatory access to port facilities in both EU member states and India will be mutually beneficial. India and EC in their respective revised offers submitted to the WTO in the Doha Round have made additional commitments in non-discriminatory access to port facilities. Similar commitments should be made under the India-EU BTIA. Companies operating in the EU are treated as EU companies if they have a wholly-owned subsidiary. The EC-China agreement allows shipping companies from the two trading partners to establish different forms of operations including joint ventures, branches, and representative offices. Since in India there is no restriction in form of operations, Indian companies would benefit if such restrictions are removed in the EU. Additionally, calling for increasing transparency and covering visa work permit facilitation, removal of barriers to foreign exchange, profit repatriation and cooperation in areas like safety, security, combating terrorism and training can benefit both Indian and EU companies.
From the EU, India should request full commitments for Mode 3 in segments such as engineering and integrated engineering services; technical testing and analysis services (Cyprus, Czech Republic, Malta, Poland, Slovak Republic and Sweden); and services
165 However these are less complex than those in the EU’s Revised Offer and also appear with much less frequency. 166 For details on India’s commitments in the WTO, see Chapter 7.
Draft not for citation and quotation
80
incidental to energy distribution. In road freight, India can offer full market access and national treatment commitments in Mode 3 since foreign service suppliers are already now providing these services in India. In rail freight, Mode 3 could be encouraged for certain segments such as warehousing and dedicated freight corridors where FDI is already permitted. India can also offer binding commitments in warehousing in exchange for commitments in other areas of export interest. Commitments in Mode 1 in road freight to gain from the new form of trade in transport management software systems can also be sought. It can also seek assistance and cooperation from the EU in developing its Dedicated Railway Freight Corridors (DFCs). In services auxiliary to all modes of transport, India can ask EU for binding commitments in Modes 1 and 3. India can offer to bind the existing regime (India has autonomously opened up all the sub-sectors under services auxiliary to all modes of transport) and also offer commitments in Mode 1 and Mode 2 in maritime auxiliary services in exchange for reciprocal commitments from the EU.
As out-sourcing logistics functions increasingly becomes common, companies in Europe are likely to seek innovative and cost-effective solutions to their IT needs in the sector. This will open opportunities for Indian companies to provide logistics and related services in Europe. Since India has substantial offensive interests in Mode 1 and Mode 4 for IT-enabled logistics services, India can ask for greater commitments in these categories in exchange for Mode 3 commitments in freight logistics from the EU.
Mode 4 in road freight is kept unbound by all EU members. The EU divided Mode 4 into three major categories: intra-corporate transfers (managers, specialist and graduate trainees), business visitors, and contractual service suppliers (employees of juridical persons, independent professionals). Contractual service suppliers (CSS) can offer their services in management consultancy. The definitions of intra-corporate transfers are narrow and restrict the activities that can be undertaken by foreign professionals, especially managers. This issue can be raised by India and addressed in the BTIA. Companies pointed out that the BTIA was a positive step but there needs to greater coordination between the government and the industry to resolve specific issues. The BTIA should look into deeper aspects of domestic regulation such as national carriers not being allowed to create artificial monopoly (for instance, in inland transport of freight through sea). Environment related regulations and the issue of carbon emission mitigation can be addressed through a balanced mix of taxation and emission trading scheme.
3.6 Reforms and Policy Recommendations
There are many problems in the logistics sector which cannot be addressed in the BTIA, but require domestic reform measures in both India and EU to improvise on efficiency levels and further attract investments and trade volumes.
The most common recommendation made during the primary survey of companies was for infrastructure development in all segments of logistics in India. For instance, for freight transport, the freight forwarders stated that airport infrastructure should be further improved to allow enough clearance facilities to make sure that goods get cleared on time. For sea connectivity, development of minor ports and expansion of existing capacities of major ports are required. To develop a balanced modal logistics infrastructure, there is a need to develop a National Integrated Logistics Policy. This would entail developing long-distance corridors, medium-distance connectors and last mile interfaces as opposed to supporting diffused geographic development. A shift from a road-focused network to a balanced modal network that leverages rail and waterways to transport heavy throughput over long distances is
Draft not for citation and quotation
81
required. To ensure non-stop movement of carriers by road at the state borders, computerized networking between the state tax authorities is needed.167
State level taxes are a big issue for the logistics companies. Delays caused by these tax payments is a concern as freight forwarders are supposed to meet the delivery timelines, but due to delays at the state borders it is tough to maintain delivery standards. Kerala and West Bengal are the most problematic states for tax payments/documentation. It was found that a speedy and full implementation of the GST would help in streamlining the tax payment system in the country and bring down the cost of domestic transport. However, the respondents also stated that for the logistics industry to benefit from GST there is a need to develop a well connected network between various state authorities. A lack of coordination between state authorities on various issues such as approvals for land acquisition and environmental clearances among others, often cause a lot of unnecessary delays and financial losses.
Other areas where reforms are required pertain to administration and governance issues - improving system efficiency by streamlining customs and approval processes, transparency and greater coordination in government procedures, and labour reforms among others. The entire documentation process at ports and airports can be made smoother with introduction of a single processing window/ single levy system. The red tape involved in local transport, especially trucking is a deterrent for foreign investors as well.168 Coordination among various agencies for infrastructure planning is also required to reduce transaction costs and operational bottlenecks.
Another recommendation was regarding the non-existent port community system in India. It is an electronic platform or an association of key stakeholders that connects the multiple systems operated by a variety of organisations that make up a seaport or airport community - members from port authorities, shipping companies, customs, and municipal authorities. It is shared in the sense that it is set up, organised and used by firms in the port community. These communities are existent in the EU.169 If such communities are formed in India, they would help in streamlining processes in and around ports and form the foundation or backbone of a Single Window system.
When asked about reforms in the EU, the respondents stated that they did not possess in-depth knowledge about the entire EU market and were still exploring the same. However, they stated that the EC is still working towards creating a fully integrated transport network in the region. Many Member States would benefit from lowering barriers to market entry and reducing regulatory burdens in transport markets. This is especially true in case of Germany, France, Italy, Spain, and Austria - which are large and/or transit countries. Such efforts are likely to have a positive impact on the EU as a whole.
Transport infrastructure presents different issues for different Member States. While for some the main issue is to upgrade and maintain existing infrastructure, others need to develop or expand networks. However, most Member States face problems of financing investment in transport infrastructure, exacerbated by tight budget constraints resulting from the financial crisis, and of creating a network that integrates and connects the different transport modes.
167 Some respondents mentioned that poor infrastructure opened up possibilities for corruption by officers as well. 168 Companies’ expansion plans are into smaller cities and towns (Ludhiana being one), and also into warehousing and distribution, which is directly affected by the local transport industry. 169 PCSs have a long tradition in Europe. The first to be established in ports in Germany, France and UK began to operate in late 1970s or early 1980s. Countries such as the Netherlands and Spain started their PCSs in the 1990s or at the turn of the century.
Draft not for citation and quotation
82
Another common challenge is creating conditions of fair competition between various transport operators in a market that is not distorted by state aid or other measures to control the market. For instance, in maritime transport, ports have no obligation to keep separate accounts of economic activities that are subject to inter- and intra-port competition and their regulatory/public activities within the port. In rail, separation of infrastructure managers and service operators is required for fair competition and efficient exploitation of infrastructure.
3.7 Conclusion
This study analyzed the opportunities, prospects and constraints for trade, investment and collaboration in the logistics sector between India and the EU.
Based on secondary information and a primary survey, it was found that the Indian and EU companies have complementarities and there are a number of areas where they can further collaborate to benefit from each other’s expertise. Huge investments are likely to be made in the Indian logistics sector over the next decade offering opportunities for private sector participation. There is scope for increased collaboration in maritime auxiliary services, port and warehouse management (especially cold storage), 3PL/4PL, clean-fuel technology transfers. There is scope to benefit from the technological and R&D capabilities of EU companies and even enter into PPP arrangements in skill training of workforce. India can also learn from the experience of EU in creating a single market for transport and its advanced regulations in logistics in the process of creating a competitive business environment.
However, there are also various barriers between India and EU, which need to be removed to enhance efficiency and India-EU trade in the sector. For instance, both India and the EU suffer from congestion in transport infrastructure such as roads. Each mode of transport also has its own particular areas for urgent reform but there are also some reform requirements common across all modes such as capacity addition, manpower training, and on another level developing a common window system and simplifying bureaucratic procedures. While the EU has started development of an inter-modal freight transport system, multimodal transportation in India still has a long way to go. The EU needs to ensure a more harmonized logistics market and fair competition, and India needs to remove procedural bottlenecks and develop an integrated transport policy.
Recommendations have also been made for negotiations in the India-EU BTIA. Although India has not made any commitments in the GATS for logistics services, such as road freight, cargo-holding, storage and warehousing, and transport agency services, it has autonomously opened up most sub-sectors and FDI up to 100 percent is allowed through the automatic route. India can offer to bind these commitments with reciprocal commitments from the EU and also ask for harmonized recognition procedures for professionals through Mode 4 in road freight and maritime sectors.
References
Beke, ‘The Practical Experience of Adapting to the International Accounting Standards’. Review 110 of International Comparative Management, Volume 11, Issue 1, March 2010.
Cefic, ‘The European Chemical Industry’s Priorities in Industrial Policy’, 10 October 2012.
CII-KPMG, ‘Skill gaps in the Indian Logistics Sector: A White Paper’. CII-KPMG. September 2007.
CRISIL, ‘CRISIL Customised Research Bulletin’. February 2012.
Draft not for citation and quotation
83
Colliers International, ‘Logic of Logistics’, July 2009.
Deloitte, ‘Logistics and infrastructure Exploring opportunities’, 2009.
Deloitte, ‘Developing supply chain excellence: Optimizing inbound and outbound logistics’. April 2010.
Deloitte-ICC, ‘Logistics Sector: Present situation and way forward’, January 2012.
European Commission EC Statistical Pocketbook, ‘EU Transport in figures’, ISBN 978-92-79-21694-7, 2011.
Eurostat, ‘European Union international trade in services Analytical aspects Data 2003-2007’, Euro Stat ISSN 1725-4477. 2009.
KPMG, ‘Logistics in India’, Part 1-3. KPMG Business and Industry Issue. November 2010.
KPMG-CII, ‘Competitiveness through Efficient Logistics’, 2009. http://www.kpmg.de/docs/India_Competitiveness_through_Efficient_Logistics2009.pdf
Leunig, T., Minns, C. and Weinhold, D., ‘International trade, express logistics and globalization: Part and parcel of the solution to current economic problems’. DHL-LSE White Paper. September 2009.
Liu, Shuang, ‘A Research on the Relationship of Logistics Industry Development and Economic Growth of China’, International Business Research, July 2009.
Malhotra, D., ‘Study on Government Procurement: Study for Evidence Based Competition Advocacy’, January 2012.
Mckinsey & Company Infrastructure Practice, ‘Building India: Transforming the nation’s logistics infrastructure’. July 2010.
Mukherjee and Miglani, European Business and Technology Centre (EBTC), Research Report on ‘Non-Tariff Barriers in the Transport and Logistics Sectors: India’. August 2010.
Mukherjee and Miglani, ‘Logistics Sector in India: Opportunities and Constraints for EU Business’, Journal of Indo-European Business Studies, Reutlingen, Germany ISSN: 2192-7332. November 2011.
Mukherjee Arpita, Parthapratim Pal, Subrata Mitra, Ramneet Goswami and Souvik Dutta, ‘Facilitating Trade and Global Competitiveness: Express Delivery Services in India’. Oxford University Press. January 2012.
Navickas, Valentinas, Leila Sujeta and Sergej Vojtovich, ‘Logistics Systems as a Factor of Country’s Competitiveness’. Economics and Management, ISSN 1822-6515, p. 231-37. 2011.
Planning Commission. ‘Report of the Working Group on Logistics’, Government of India. May 2009.
Planning Commission (2011), ‘Report of Working Group on Warehousing Development And Regulation for the Twelfth Plan Period (2012-17)’, October 2011.
USTR, Office of the United States Trade Representative, ‘2012 National Trade Estimate Report on Foreign Trade Barriers’. 2012.
World Bank - International Finance Corporation, ‘Doing Business’, Washington. 2011
Draft not for citation and quotation
84
WTI, ‘Trade facilitation, logistics services and preferential trade agreements (PTAs): The case of the CARIFORUM EPA’, MILE 11 Thesis by Time Kaeser. 2011.
WTO. Services Sectoral Classification List MTN.GNS/W/120. July 10, 1991.
WTO. ‘Freight Logistics Checklist’ TN/S/W/20. June 25, 2004.
WTOa, http://trade.ec.europa.eu/doclib/docs/2008/september/tradoc_140506.pdf, TN/S/W/34, 18 February 2005.
WTOb. ‘EC’s Conditional Revised Offer’, TN/S/O/EEC/Rev.1, June 29, 2005.
WTOc. ‘India’s Revised Offer’, TN/S/O/IND/Rev.1, August 24, 2005.
WTO, ‘International Trade Statistics 2012’, Retrieved 26 November, 2012. http://www.wto.org/english/res_e/statis_e/its2012_e/its12_trade_category_e.htm
WTO, ‘Note by the Secretariat on Logistics Services’, S/C/W/317. 10 June 2010. Yang, Wang and Luqian Wang, ‘The Economic Growth Effect of Logistics Industry FDI
Analysis’, Business and Economics, p. 377-81, December 2010.
Yuan, Huaiyu and Jianmin Kuang, ‘The Relationship between Regional Logistics and Economic Growth Based on Panel Data’, Logistics Policy and Strategy, p. 618-23, 2010.
Websites and other reports http://dipp.nic.in/ http://epp.eurostat.ec.europa.eu/ http://www.frost.com/ http://www.thehindubusinessline.com/industry-and-economy/logistics/article2373408.ece http://www.mckinsey.com/locations/india/mckinseyonindia/pdf/building_india_transofrming_the_nations_logistics_infrastructure.pdf http://www.nsdcindia.org/pdf/transportation-logistics.pdf
Draft not for citation and quotation
85
Chapter 4: Energy services
Smita Miglani
Introduction Energy plays a vital and pervasive role in all of the economies in the present world. It is seen as a strong determinant of quality of living and an important driver of economic development170 and international trade. This is all the more true for large economies of the world such as the European Union (EU) and India.
The energy market broadly comprises of four main players: energy consumers, producers or generators, equipment suppliers and service suppliers. It is often difficult to distinguish between energy goods and services when companies are often vertically integrated and perform all energy-related activities, namely production, transmission and distribution simultaneously. In such a scenario, the products which can be easily stored - such as oil and solid fuels, are considered as goods, while value added to energy goods produced is classified under ‘energy services’. Energy services thus include all services related to energy production, distribution and transmission such as geological mapping of exploration and production (E&P) sites, drilling, technical testing, marketing, transportation, distribution, energy efficiency, maintenance, consulting services, construction, auditing, network maintenance, and metering and billing among others. These can be rendered across all segments of energy - primary (fossil fuel) and secondary (i.e. electricity) - and across renewable and non-renewable energy.171 Electricity, however, has characteristics of both goods and services.172
Enhancing energy production and attaining high efficiency standards have emerged as key areas of concern for both India and the EU in recent years. Over 80 per cent of their energy consumption is based on fossil fuels; and they both are net importers of these resources. The use of both renewable and non-renewable energy is increasing in these regions and competition is seen as one of the ways of promoting efficiencies in the sector. For all these reasons, energy services are a crucial part of both India and the EU in their international trade engagements.
This chapter analyzes the nature and potential of energy services sectors in India and the EU; prospects for enhancing mutual trade and investment; and key constraints to the same. The assessment is based on an in-depth research of the sector and discussions with stakeholders. It then analyzes negotiating strategies that would further India-EU collaboration in the sector. The structure of this chapter is as follows: Section two discusses the classification and coverage of energy services under the GATS. Section three and four respectively provide an overview of India’s and EU’s energy sectors, emphasizing on the liberalization process. Section five outlines the trade and collaboration activity in energy services between India and the EU and the domestic and external barriers to these. Section six analyzes whether and how
170 In fact, energy availability and consumption have become so important that ‘energy consumed per capita’ is one of the key indicators of modernization and progress of a country. Provision of energy services in an adequate, affordable and reliable way is considered essential for economic welfare, eradication of poverty, infrastructure development, growth of health services, commerce, communication and other economic activities. 171 For details, see Mukherjee and Goswami, 2009. 172 Electricity may be considered as a good in the sense that it is manufactured through the process of materially transforming fuels into electrons, and a service in the sense that it cannot be stored and must be produced and consumed simultaneously.
Draft not for citation and quotation
86
the recognized barriers in India-EU can be addressed through bilateral negotiations and reform measures. The last section draws out the main conclusions.
4.1 Classification and coverage of energy services under GATS Energy services were not negotiated as a separate sector during the Uruguay Round of World Trade Organization (WTO) negotiations (1986-94). During that Round, it was decided that production of primary and secondary energy should be covered under the General Agreement on Tariffs and Trade (GATT), and transmission and distribution of energy services should be subject to GATS rules.173 WTO member countries drew up the ‘WTO Services Sectoral Classification List’ (MTN.GNS/W/120) based on the United Nations Provisional Central Product Classifications (UNCPC) for the purpose of negotiations. This list (known as ‘W/120’) covered over 150 sub-sectors in 12 broad sectoral categories. However, ‘energy services’ was not covered as a separate comprehensive category in the W/120 and the majority of global energy services are not covered by specific commitments under GATS. Important energy services (transport, distribution, construction, consulting, engineering, etc.) are covered by the respective horizontal categories, while some energy-related services are listed as separate sub-sectors.174 Under each broad category, there is a corresponding CPC number for energy services. For instance, CPC 632 relates to non-food retailing services under which CPC 63297 covers retail sales of fuel oil, bottled gas, coal and wood. After the Uruguay Round, the coverage of energy services in the UNCPC has undergone changes in line with developments in this sector. For instance, in CPC Version 1.0, new services such as electricity distribution services (69110) and gas distribution services through mains (69120) have been included.
Thus, energy services do not constitute a separate economic sector, but cut across several other service sectors such as construction and environmental services. Complexities of classification under the GATS mean that India needs to take a cautious stand during its negotiations and scheduling of commitments at the international level, especially since the sector is continually evolving. From the beginning of the Doha Round, a number of WTO members including the EU raised concerns about the inadequate classification and provided alternative classifications. The EC (European Commission) Communication (S/CSS/W/60) of March 23, 2001 focuses on a number of sectors/sub-sectors in which the EC would like WTO members to undertake commitments, and highlights its own interest in liberalizing trade in energy services. Nuclear materials are excluded from EC’s bilateral negotiations since they are sensitive. The EC recognizes the need for regulating this sector to achieve public policy goals, and emphasizes establishment of a transparent, objective and pro-competitive regulatory framework.
For the purpose of analysis in this paper, we are using the W/120 classification as per the GATS framework as shown in Table 4.1.
Table 4.1: Coverage of Energy services W/120 CPC No. Description
173 The General Agreement on Trade in Services (GATS), which came into force in January 1995, established
rules and disciplines governing trade in services. 174 For instance, services incidental to mining and services incidental to energy distribution are classified under ‘Other Business Services’, and pipeline transportation is covered under ‘Transport Services’. One of the reasons for the poor coverage of energy services in the W/120 is that the UNCPC, from which it is drawn, does not list energy services as a separate category.
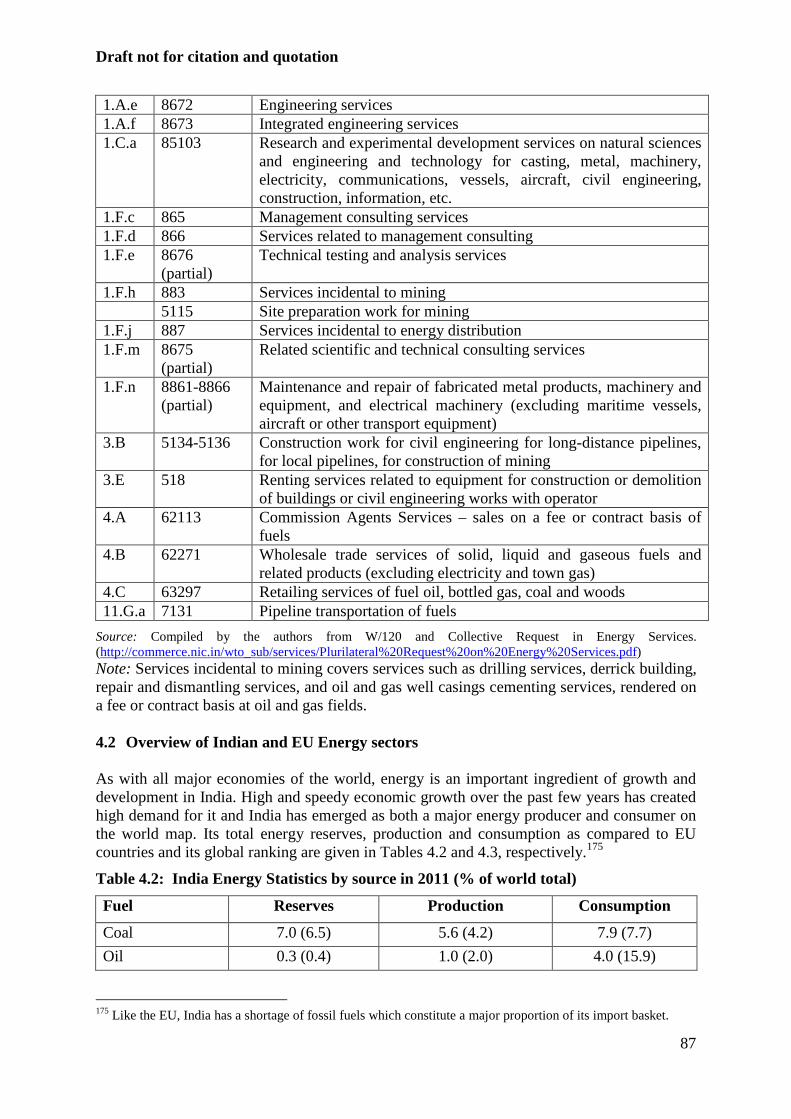
Draft not for citation and quotation
87
1.A.e 8672 Engineering services 1.A.f 8673 Integrated engineering services 1.C.a 85103 Research and experimental development services on natural sciences
and engineering and technology for casting, metal, machinery, electricity, communications, vessels, aircraft, civil engineering, construction, information, etc.
1.F.c 865 Management consulting services 1.F.d 866 Services related to management consulting 1.F.e 8676
(partial) Technical testing and analysis services
1.F.h 883 Services incidental to mining 5115 Site preparation work for mining 1.F.j 887 Services incidental to energy distribution 1.F.m 8675
(partial) Related scientific and technical consulting services
1.F.n 8861-8866 (partial)
Maintenance and repair of fabricated metal products, machinery and equipment, and electrical machinery (excluding maritime vessels, aircraft or other transport equipment)
3.B 5134-5136 Construction work for civil engineering for long-distance pipelines, for local pipelines, for construction of mining
3.E 518 Renting services related to equipment for construction or demolition of buildings or civil engineering works with operator
4.A 62113 Commission Agents Services – sales on a fee or contract basis of fuels
4.B 62271 Wholesale trade services of solid, liquid and gaseous fuels and related products (excluding electricity and town gas)
4.C 63297 Retailing services of fuel oil, bottled gas, coal and woods 11.G.a 7131 Pipeline transportation of fuels
Source: Compiled by the authors from W/120 and Collective Request in Energy Services. (http://commerce.nic.in/wto_sub/services/Plurilateral%20Request%20on%20Energy%20Services.pdf) Note: Services incidental to mining covers services such as drilling services, derrick building, repair and dismantling services, and oil and gas well casings cementing services, rendered on a fee or contract basis at oil and gas fields. 4.2 Overview of Indian and EU Energy sectors As with all major economies of the world, energy is an important ingredient of growth and development in India. High and speedy economic growth over the past few years has created high demand for it and India has emerged as both a major energy producer and consumer on the world map. Its total energy reserves, production and consumption as compared to EU countries and its global ranking are given in Tables 4.2 and 4.3, respectively.175
Table 4.2: India Energy Statistics by source in 2011 (% of world total)
Fuel Reserves Production Consumption
Coal 7.0 (6.5) 5.6 (4.2) 7.9 (7.7)
Oil 0.3 (0.4) 1.0 (2.0) 4.0 (15.9)
175 Like the EU, India has a shortage of fossil fuels which constitute a major proportion of its import basket.
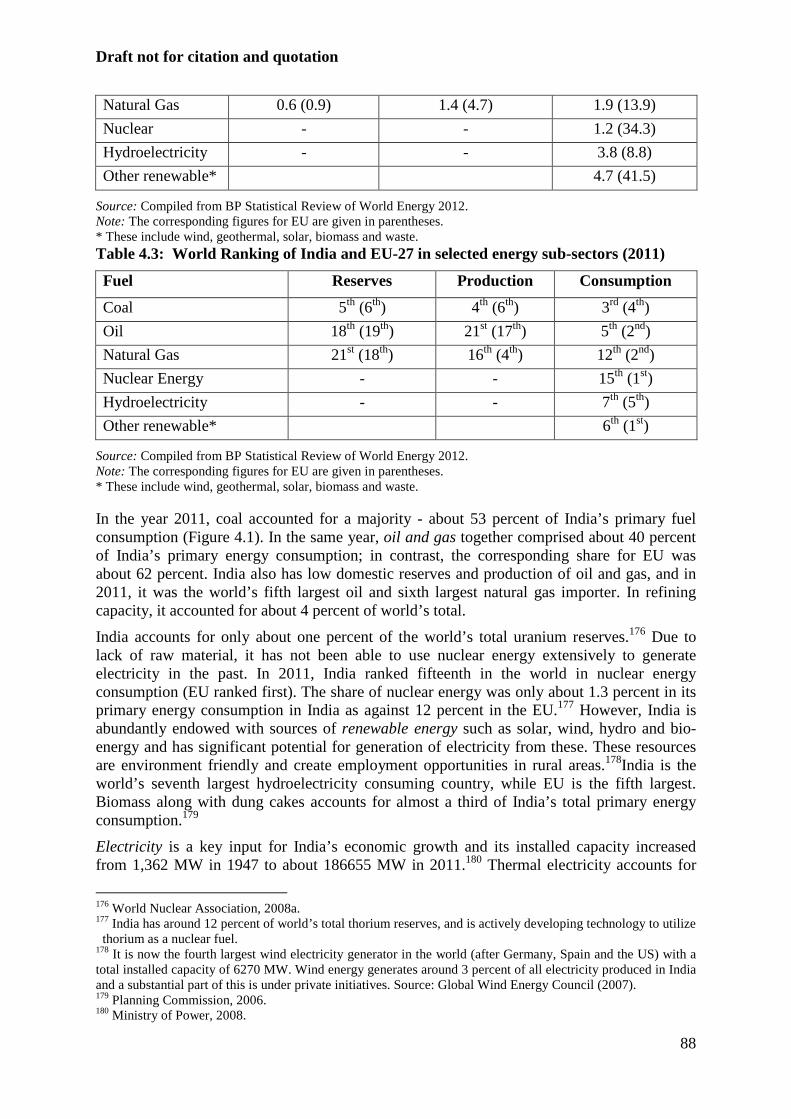
Draft not for citation and quotation
88
Natural Gas 0.6 (0.9) 1.4 (4.7) 1.9 (13.9)
Nuclear - - 1.2 (34.3)
Hydroelectricity - - 3.8 (8.8)
Other renewable* 4.7 (41.5)
Source: Compiled from BP Statistical Review of World Energy 2012. Note: The corresponding figures for EU are given in parentheses. * These include wind, geothermal, solar, biomass and waste. Table 4.3: World Ranking of India and EU-27 in selected energy sub-sectors (2011)
Fuel Reserves Production Consumption
Coal 5th (6th) 4th (6th) 3rd (4th)
Oil 18th (19th) 21st (17th) 5th (2nd)
Natural Gas 21st (18th) 16th (4th) 12th (2nd)
Nuclear Energy - - 15th (1st)
Hydroelectricity - - 7th (5th)
Other renewable* 6th (1st)
Source: Compiled from BP Statistical Review of World Energy 2012. Note: The corresponding figures for EU are given in parentheses. * These include wind, geothermal, solar, biomass and waste. In the year 2011, coal accounted for a majority - about 53 percent of India’s primary fuel consumption (Figure 4.1). In the same year, oil and gas together comprised about 40 percent of India’s primary energy consumption; in contrast, the corresponding share for EU was about 62 percent. India also has low domestic reserves and production of oil and gas, and in 2011, it was the world’s fifth largest oil and sixth largest natural gas importer. In refining capacity, it accounted for about 4 percent of world’s total.
India accounts for only about one percent of the world’s total uranium reserves.176 Due to lack of raw material, it has not been able to use nuclear energy extensively to generate electricity in the past. In 2011, India ranked fifteenth in the world in nuclear energy consumption (EU ranked first). The share of nuclear energy was only about 1.3 percent in its primary energy consumption in India as against 12 percent in the EU.177 However, India is abundantly endowed with sources of renewable energy such as solar, wind, hydro and bio-energy and has significant potential for generation of electricity from these. These resources are environment friendly and create employment opportunities in rural areas.178India is the world’s seventh largest hydroelectricity consuming country, while EU is the fifth largest. Biomass along with dung cakes accounts for almost a third of India’s total primary energy consumption.179
Electricity is a key input for India’s economic growth and its installed capacity increased from 1,362 MW in 1947 to about 186655 MW in 2011.180 Thermal electricity accounts for
176 World Nuclear Association, 2008a. 177 India has around 12 percent of world’s total thorium reserves, and is actively developing technology to utilize thorium as a nuclear fuel. 178 It is now the fourth largest wind electricity generator in the world (after Germany, Spain and the US) with a total installed capacity of 6270 MW. Wind energy generates around 3 percent of all electricity produced in India and a substantial part of this is under private initiatives. Source: Global Wind Energy Council (2007). 179 Planning Commission, 2006. 180 Ministry of Power, 2008.
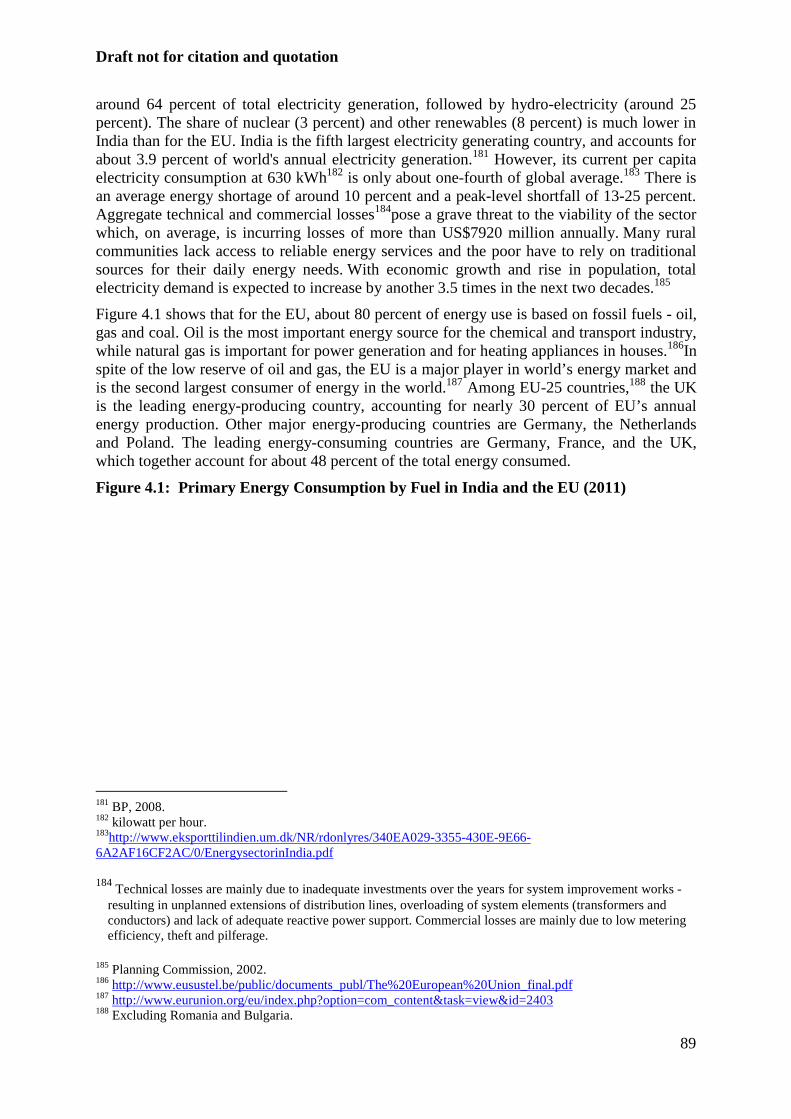
Draft not for citation and quotation
89
around 64 percent of total electricity generation, followed by hydro-electricity (around 25 percent). The share of nuclear (3 percent) and other renewables (8 percent) is much lower in India than for the EU. India is the fifth largest electricity generating country, and accounts for about 3.9 percent of world's annual electricity generation.181 However, its current per capita electricity consumption at 630 kWh182 is only about one-fourth of global average.183 There is an average energy shortage of around 10 percent and a peak-level shortfall of 13-25 percent. Aggregate technical and commercial losses184pose a grave threat to the viability of the sector which, on average, is incurring losses of more than US$7920 million annually. Many rural communities lack access to reliable energy services and the poor have to rely on traditional sources for their daily energy needs. With economic growth and rise in population, total electricity demand is expected to increase by another 3.5 times in the next two decades.185
Figure 4.1 shows that for the EU, about 80 percent of energy use is based on fossil fuels - oil, gas and coal. Oil is the most important energy source for the chemical and transport industry, while natural gas is important for power generation and for heating appliances in houses.186In spite of the low reserve of oil and gas, the EU is a major player in world’s energy market and is the second largest consumer of energy in the world.187 Among EU-25 countries,188 the UK is the leading energy-producing country, accounting for nearly 30 percent of EU’s annual energy production. Other major energy-producing countries are Germany, the Netherlands and Poland. The leading energy-consuming countries are Germany, France, and the UK, which together account for about 48 percent of the total energy consumed.
Figure 4.1: Primary Energy Consumption by Fuel in India and the EU (2011)
181 BP, 2008. 182 kilowatt per hour. 183http://www.eksporttilindien.um.dk/NR/rdonlyres/340EA029-3355-430E-9E66-6A2AF16CF2AC/0/EnergysectorinIndia.pdf
184 Technical losses are mainly due to inadequate investments over the years for system improvement works - resulting in unplanned extensions of distribution lines, overloading of system elements (transformers and conductors) and lack of adequate reactive power support. Commercial losses are mainly due to low metering efficiency, theft and pilferage.
185 Planning Commission, 2002. 186 http://www.eusustel.be/public/documents_publ/The%20European%20Union_final.pdf 187 http://www.eurunion.org/eu/index.php?option=com_content&task=view&id=2403 188 Excluding Romania and Bulgaria.
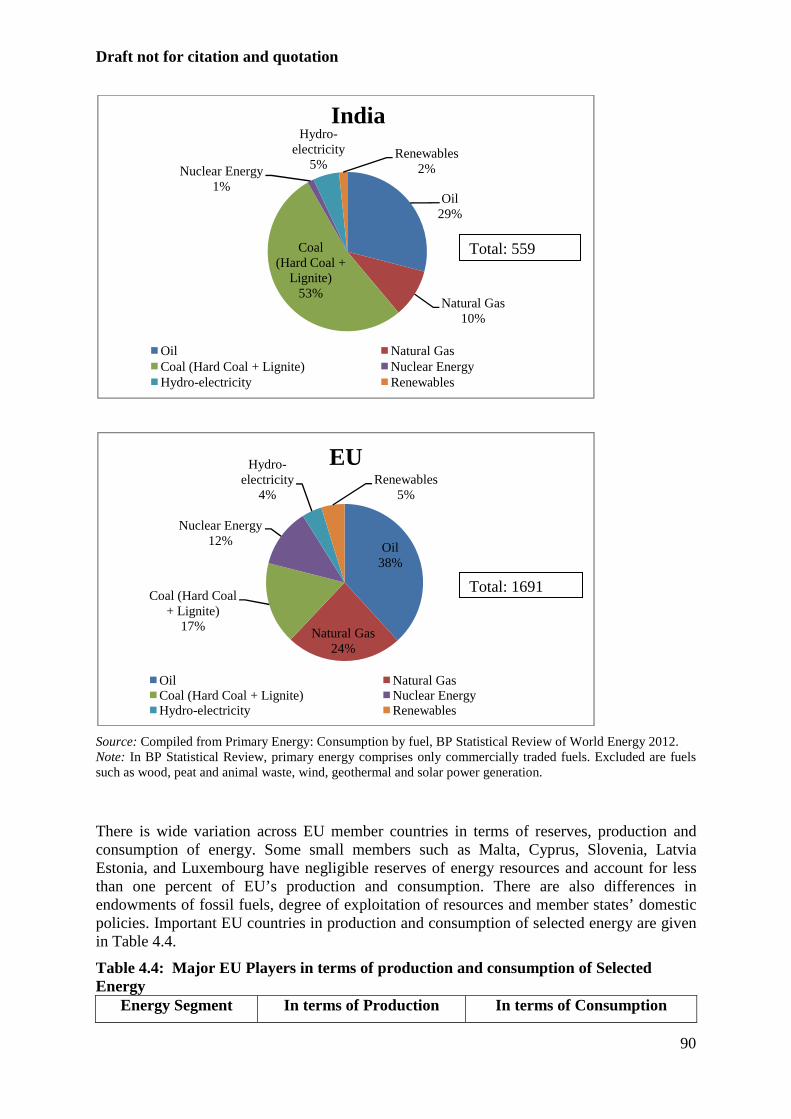
Draft not for citation and quotation
90
Source: Compiled from Primary Energy: Consumption by fuel, BP Statistical Review of World Energy 2012. Note: In BP Statistical Review, primary energy comprises only commercially traded fuels. Excluded are fuels such as wood, peat and animal waste, wind, geothermal and solar power generation.
There is wide variation across EU member countries in terms of reserves, production and consumption of energy. Some small members such as Malta, Cyprus, Slovenia, Latvia Estonia, and Luxembourg have negligible reserves of energy resources and account for less than one percent of EU’s production and consumption. There are also differences in endowments of fossil fuels, degree of exploitation of resources and member states’ domestic policies. Important EU countries in production and consumption of selected energy are given in Table 4.4.
Table 4.4: Major EU Players in terms of production and consumption of Selected Energy
Energy Segment In terms of Production In terms of Consumption
Oil29%
Natural Gas10%
Coal (Hard Coal +
Lignite)53%
Nuclear Energy1%
Hydro-electricity
5%Renewables
2%
India
Oil Natural GasCoal (Hard Coal + Lignite) Nuclear EnergyHydro-electricity Renewables
Oil38%
Natural Gas24%
Coal (Hard Coal + Lignite)
17%
Nuclear Energy12%
Hydro-electricity
4%Renewables
5%
EU
Oil Natural GasCoal (Hard Coal + Lignite) Nuclear EnergyHydro-electricity Renewables
Total: 1691
Total: 559
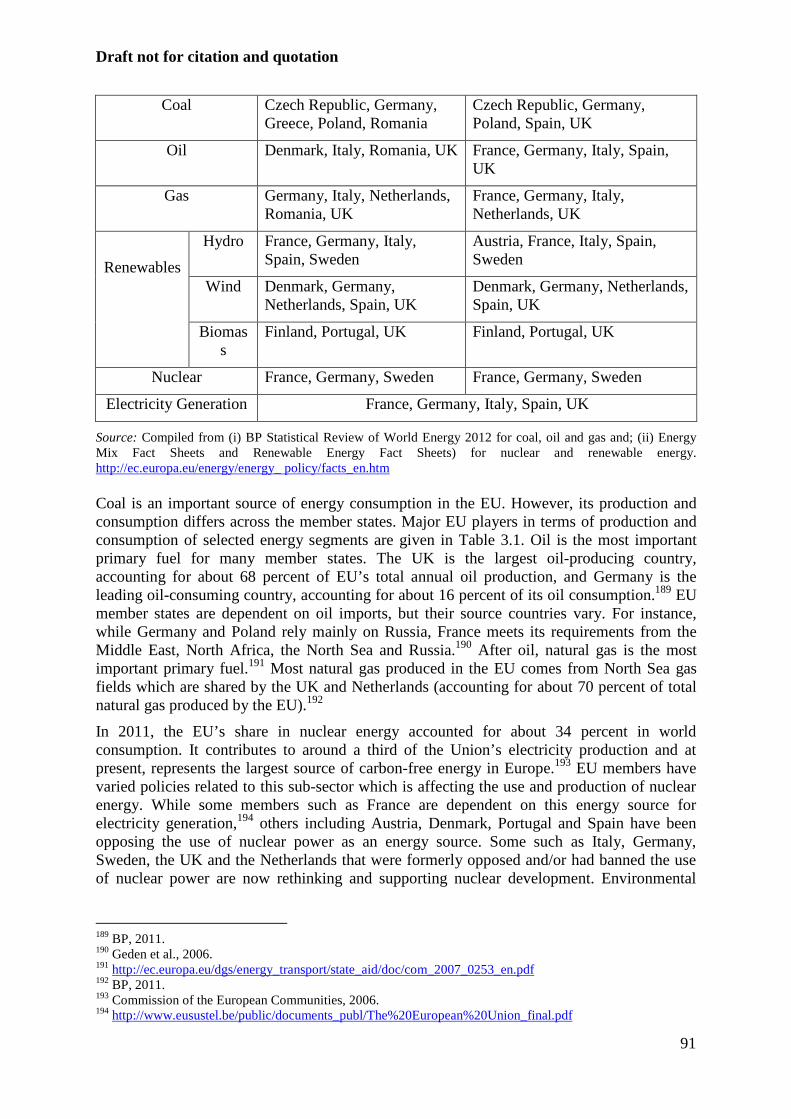
Draft not for citation and quotation
91
Coal Czech Republic, Germany, Greece, Poland, Romania
Czech Republic, Germany, Poland, Spain, UK
Oil Denmark, Italy, Romania, UK France, Germany, Italy, Spain, UK
Gas Germany, Italy, Netherlands, Romania, UK
France, Germany, Italy, Netherlands, UK
Renewables
Hydro France, Germany, Italy, Spain, Sweden
Austria, France, Italy, Spain, Sweden
Wind Denmark, Germany, Netherlands, Spain, UK
Denmark, Germany, Netherlands, Spain, UK
Biomass
Finland, Portugal, UK Finland, Portugal, UK
Nuclear France, Germany, Sweden France, Germany, Sweden
Electricity Generation France, Germany, Italy, Spain, UK
Source: Compiled from (i) BP Statistical Review of World Energy 2012 for coal, oil and gas and; (ii) Energy Mix Fact Sheets and Renewable Energy Fact Sheets) for nuclear and renewable energy. http://ec.europa.eu/energy/energy_ policy/facts_en.htm Coal is an important source of energy consumption in the EU. However, its production and consumption differs across the member states. Major EU players in terms of production and consumption of selected energy segments are given in Table 3.1. Oil is the most important primary fuel for many member states. The UK is the largest oil-producing country, accounting for about 68 percent of EU’s total annual oil production, and Germany is the leading oil-consuming country, accounting for about 16 percent of its oil consumption.189 EU member states are dependent on oil imports, but their source countries vary. For instance, while Germany and Poland rely mainly on Russia, France meets its requirements from the Middle East, North Africa, the North Sea and Russia.190 After oil, natural gas is the most important primary fuel.191 Most natural gas produced in the EU comes from North Sea gas fields which are shared by the UK and Netherlands (accounting for about 70 percent of total natural gas produced by the EU).192
In 2011, the EU’s share in nuclear energy accounted for about 34 percent in world consumption. It contributes to around a third of the Union’s electricity production and at present, represents the largest source of carbon-free energy in Europe.193 EU members have varied policies related to this sub-sector which is affecting the use and production of nuclear energy. While some members such as France are dependent on this energy source for electricity generation,194 others including Austria, Denmark, Portugal and Spain have been opposing the use of nuclear power as an energy source. Some such as Italy, Germany, Sweden, the UK and the Netherlands that were formerly opposed and/or had banned the use of nuclear power are now rethinking and supporting nuclear development. Environmental
189 BP, 2011. 190 Geden et al., 2006. 191 http://ec.europa.eu/dgs/energy_transport/state_aid/doc/com_2007_0253_en.pdf 192 BP, 2011. 193 Commission of the European Communities, 2006. 194 http://www.eusustel.be/public/documents_publ/The%20European%20Union_final.pdf
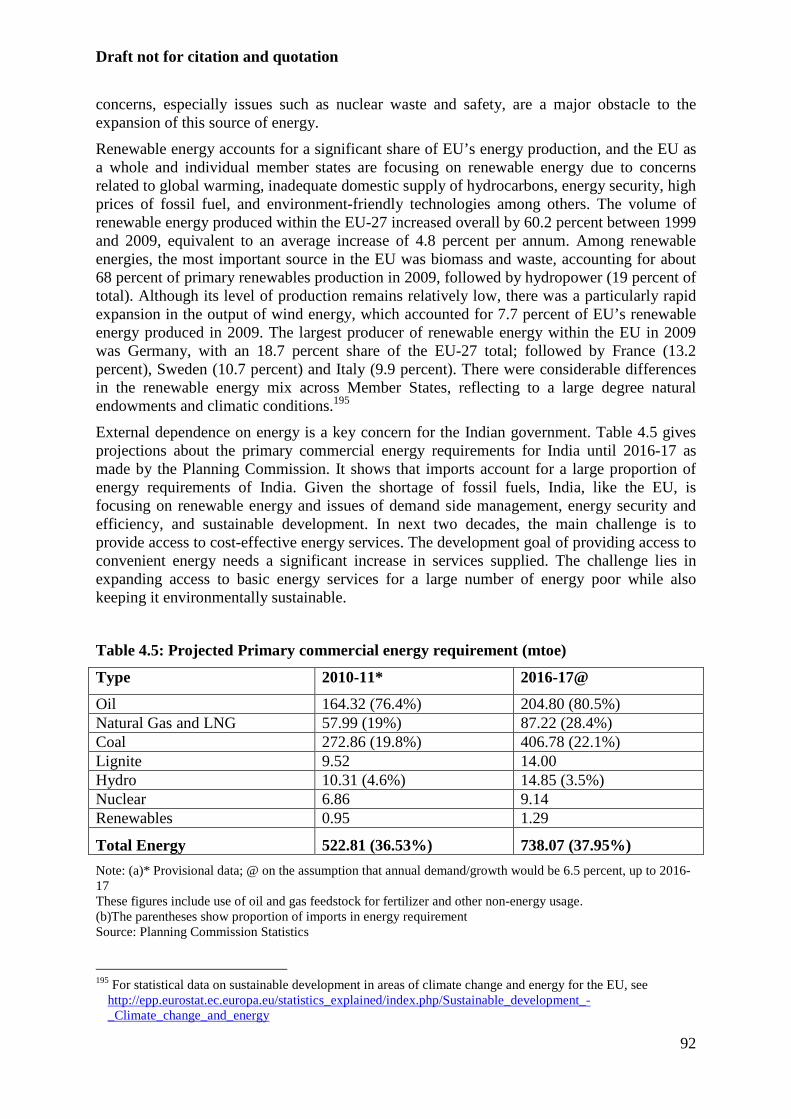
Draft not for citation and quotation
92
concerns, especially issues such as nuclear waste and safety, are a major obstacle to the expansion of this source of energy.
Renewable energy accounts for a significant share of EU’s energy production, and the EU as a whole and individual member states are focusing on renewable energy due to concerns related to global warming, inadequate domestic supply of hydrocarbons, energy security, high prices of fossil fuel, and environment-friendly technologies among others. The volume of renewable energy produced within the EU-27 increased overall by 60.2 percent between 1999 and 2009, equivalent to an average increase of 4.8 percent per annum. Among renewable energies, the most important source in the EU was biomass and waste, accounting for about 68 percent of primary renewables production in 2009, followed by hydropower (19 percent of total). Although its level of production remains relatively low, there was a particularly rapid expansion in the output of wind energy, which accounted for 7.7 percent of EU’s renewable energy produced in 2009. The largest producer of renewable energy within the EU in 2009 was Germany, with an 18.7 percent share of the EU-27 total; followed by France (13.2 percent), Sweden (10.7 percent) and Italy (9.9 percent). There were considerable differences in the renewable energy mix across Member States, reflecting to a large degree natural endowments and climatic conditions.195
External dependence on energy is a key concern for the Indian government. Table 4.5 gives projections about the primary commercial energy requirements for India until 2016-17 as made by the Planning Commission. It shows that imports account for a large proportion of energy requirements of India. Given the shortage of fossil fuels, India, like the EU, is focusing on renewable energy and issues of demand side management, energy security and efficiency, and sustainable development. In next two decades, the main challenge is to provide access to cost-effective energy services. The development goal of providing access to convenient energy needs a significant increase in services supplied. The challenge lies in expanding access to basic energy services for a large number of energy poor while also keeping it environmentally sustainable.
Table 4.5: Projected Primary commercial energy requirement (mtoe)
Type 2010-11* 2016-17@
Oil 164.32 (76.4%) 204.80 (80.5%) Natural Gas and LNG 57.99 (19%) 87.22 (28.4%) Coal 272.86 (19.8%) 406.78 (22.1%) Lignite 9.52 14.00 Hydro 10.31 (4.6%) 14.85 (3.5%) Nuclear 6.86 9.14 Renewables 0.95 1.29
Total Energy 522.81 (36.53%) 738.07 (37.95%)
Note: (a)* Provisional data; @ on the assumption that annual demand/growth would be 6.5 percent, up to 2016-17 These figures include use of oil and gas feedstock for fertilizer and other non-energy usage. (b)The parentheses show proportion of imports in energy requirement Source: Planning Commission Statistics
195 For statistical data on sustainable development in areas of climate change and energy for the EU, see
http://epp.eurostat.ec.europa.eu/statistics_explained/index.php/Sustainable_development_-_Climate_change_and_energy
Draft not for citation and quotation
93
Like India, given the gap between demand and supply of energy, the EU too is a net importer of energy and in the last five years and on an average it imported about 50 percent of its energy needs. The domestic resources of the EU (especially in oil and gas) are limited. Coal is mainly available in central and eastern European countries such as Poland, Germany and Czech Republic.196Energy imports represent six percent of total imports; forty-five percent of oil imports are from the Middle East and 40 percent of natural gas is imported from Russia.197 Energy demand has been rising every year by about 1-2 percent.198 However, energy intensity199 in the Union is falling. It fell by 1.6 percent per annum between 1990 and 2009.200
The EU depends on imports for more than 50 percent of its energy needs and is susceptible to energy price fluctuations in the global market. The external dependence on energy is an important issue in political debate and energy security and it plays a crucial role in EU’s international engagements.201The EU leads the world in energy demand management and in development of low-carbon technologies. Although it is already the world’s most energy-efficient regions, it has the potential to go much further. This is recognized by the EC. The 2005 EC Green Paper on Energy Efficiency202 stated that up to 20 percent of EU’s energy use could be saved between 2005 and 2020 by improving efficiency. From time to time, the EC identifies bottlenecks that prevent use of cost-effective technologies such as lack of appropriate incentives, information and financing mechanisms. Measures to overcome these bottlenecks are proposed at all levels - EU, national, regional and local.
For India, data from the 66th Round of the National Sample Survey Organisation, Government of India conducted during July 2009 - June 2010 reveals that energy sector employed about eight lakh people.203 In terms of contribution to the domestic product, NSSO statistics are compiled for selected sub-sectors. Hence, it is difficult to give an exact estimate for the entire energy sector. However, in 2009-10, mining and quarrying; and electricity, gas and water supply together contributed about US$ 38,145 million to GDP (about 4.3 percent share) at 2004-05 prices. As regards the EU, in 2007, the total number of employees in energy sector was 1.6 million.204 Though an exact estimate for the entire energy sector is not available, the electricity sector alone was worth around 5 percent of EU GDP in the year 2008.205
The governance structure in the sector reflects India’s quasi-federal setup. Different ministries of the central government, namely, the Ministry of Coal, Ministry of Petroleum
196 BP, 2008. 197 http://europa.eu/scadplus/leg/en/lvb/l27037.htm 198 EC, 2006. 199 The energy intensity of an economy is a measure of the amount of energy needed to produce one unit of
economic output. A reduction in energy intensity means that less energy is need to produce the same output and is thus related to energy efficiency. The indicator presented here is calculated as the ratio of gross inland energy consumption (in tonnes of oil equivalent) to GDP (in constant 1995 euro).
200 http://forum.eionet.europa.eu/nrc-energy/library/ener17_final/download/1/ENER17_final.doc 201 Directorate General for Energy and Transport, 2004. 202 EC, 2005. 203 As per the four digit classification under the NIC 2004, the sub-sectors included in this figure are mining of
coal and lignite; extraction of peat; extraction of crude petroleum and natural gas; service activities incidental to oil and gas extraction, excluding surveying; and electricity, gas, steam and hot water supply.
204 As per the National Income Accounts Statistics from CSO, the combined share of electricity, gas and water supply in total employment was 1.1 percent and remained unchanged between 1999-2000 and 2009-10. 205 By the end of 2010, the EU renewable energy industry employed over 1.1 million people. Source: EC, 2012 and EC, 2011.
Draft not for citation and quotation
94
and Natural Gas, Ministry of New and Renewable Energy, Ministry of Power and Department of Atomic Energy play a crucial role in policy formulation. Under them there are various public sector undertakings, technical and research institutions, organizations and agencies (either under the purview of nodal ministries or autonomous) and state-level nodal agencies (to formulate and implement policies at the state levels). The Planning Commission coordinates and integrates energy policy proposals of relevant government agencies as a comprehensive energy policy into the five-year plan, which is then implemented by different government agencies. The Parliamentary Committee on Energy and Energy Policy Division of the Planning Commission are involved in policy-making. In the EU, energy is a policy responsibility shared between the EU and member states.
The EC creates appropriate framework conditions for the sector through its directives (laws) which come into force in any country when the national government takes steps to introduce and implement them within national laws.
4.2.1 Market Structure and Liberalization of energy sector in India Over the years, the energy sector of India has undergone substantial changes. In the past, due to its public good characteristics, energy-related services were mostly supplied by state-owned monopolies and involvement of the private sector was limited. However, since the 1990s, the sector has undergone substantial reforms and liberalization, as also in case of EU, and now private players have an important role in the development of this sector. Privatization has led to emergence of global players in energy services and enhanced global trade in the sector.
Coal, a sector of prime importance for the economy (for thermal power generation) was nationalized in the post-independence period. In the 1990s, private players were allowed in captive mining for electricity generation, coal washing and other industrial end uses. The deregulation of coal prices began in 1996 and the Colliery Control Order in 2000 fully deregulated the coal pricing regime under which the government PSU, Coal India Limited (CIL) was allowed to fix the prices in relation to market prices and revise them from time to time. India’s total coal production is falling short of demand and there is a paucity of funds with the nationalized sector for investment and expansion. Various recommendations have been made to encourage private participation and improve productivity and efficiency.206 Development of appropriate technology and reforms in the sector has been emphasized from time to time to increase competition. These include the amendment of the Coal Mine Nationalisation Act to allow specialized private sector owned mining companies to enter the sector, allow coal to be traded on real-time, electronic exchanges to discover its present and future prices as well as monitor sales and set up a coal sector regulator.
The oil and gas sectors were also nationalized in the post-independence period. Post-nationalization production showed an upward trend but started to decline in the 1980s. At the same time, there was a steady increase in consumption demand for oil and gas. This created the need to expedite exploration efforts, develop and manage newer reserves and, a series of measures followed which encouraged private/foreign players to participate in the sector. In the eighties, the government started to offer different sedimentary basins to foreign oil companies for E&P. To generate additional investment and upgrade technology, in 1997 the 206 For instance, the Shankar Committee Report of the Expert Committee on Road Map for Coal Sector Reforms (Part I, December 2005 and Part II, October 2007) and the Ashok Chawla Committee on Allocation of Natural Resources (May 2011).
Draft not for citation and quotation
95
government introduced the New Exploration Licensing Policy (NELP). Under this policy, off-shore and on-shore exploration blocks were offered to private/foreign companies. Interested parties could bid directly without the mandatory participation of National Oil Companies (NOCs) and carried interest207 of the government/NOCs.208 Till now, nine rounds of the NELP have been completed. Various other incentives, such as seven years of income tax holiday from commencement of commercial production and abolition of customs duties on import of equipment for exploration operations, were given to encourage investment. EU companies such as Cairn Energy, British Gas, British Petroleum and Premier Oil (UK), ENI (Italy) and Geopetrol (France) have been awarded blocks in the past.209
India started focusing on renewable energy after the oil shocks of the 1970s. The early programs were initiated with a target-oriented supply-push approach and were driven by direct subsidies from the government. In the 1990s, there were changes in regulatory structure and policy and there was a shift from financial to fiscal incentives and renewable energy programs focused on commercialization and greater involvement of the private sector. By the end of 1990s, more than 80 percent of energy from renewables was generated by private sector.210 At present, foreign investment and technology transfer is encouraged through various policy initiatives. In recent past, the government has been giving greater importance to development of India’s huge hydro potential211to meet its ever-increasing power demands.
Indian electricity sector is covered under the concurrent list and is administered both by the central and state governments. The Constitution has, however, given supremacy to the central legislation. The transmission network across the country has been demarcated by the central government into five separate regions forming regional grids. The sector was brought under government control after independence and post-1990s it was progressively liberalized. To expand generation capacity, the central government opened electricity generation for foreign/private investment and encouraged the establishment of Independent Power Producers (IPP) projects to attract additional capital in the sector. Concessions such as 100 percent ownership, long-term purchase agreements and assured profits were also offered. In June 2003, the Electricity Act was enacted212which provided a framework for a more competitive, transparent and commercially driven power sector. It recognized power trading as a distinct activity, provided open access213 to the transmission and distribution network, allowed third-party sales, and introduced the concept of trading bulk electricity.
FDI up to 100 percent has been allowed in generation, transmission, distribution and electricity trading subject to the provisions of this Act. Private entities were permitted to establish, operate and maintain generating power plants and enter into long-term power purchase agreements with the SEBs. Provisions of 100 percent FDI along with fiscal
207 Carried interest was exercised by the NOCs only after commercial discovery. In pre-NELP rounds, NOCs
had the right to take up to 40 percent share in all offered blocks (mandatory 10 percent in the beginning and 30 percent after commercial discovery).
208 Government companies were required to compete to obtain oil blocks instead of being given to them on a nomination basis as had been the practice. 209 http://petroleum.nic.in/speeches/08-01-2008.doc 210 Guru, 2002. 211 It has been estimated that about 69 percent of India’s total hydro potential remains untapped to date. 212 With its coming into force, the Indian Electricity Act, 1910, Electricity (Supply) Act, 1948 and Electricity
Regulatory Commissions Act, 1998 were repealed. 213 The Electricity Act, 2003 aims to create a competitive electricity market in India through open access. As a
first step in the process, a generating company is permitted to sell a portion of the power it generates to any distribution licensee in the country. In the second stage, the generating company will be able to sell power directly to bulk consumers, bypassing the distribution company.
Draft not for citation and quotation
96
incentives such as zero customs duty on import of capital goods for mega power projects and an income tax holiday for generating plants for 10 years will make India an attractive destination for foreign investors. The per capita electricity consumption in India has been increasing. FDI norms are continually being relaxed and up to 100 per cent FDI is allowed in most segments now. Table 5A.1 in Appendix 5A gives an overview of the FDI regulations in the energy sector.
Overall, reforms in the electricity sector have restructured the vertically-integrated market structure to a competitive one. Market efficiency has improved; mobility and the number of players have increased. Regulations have contributed to the creation of a competitive market place, which in future will bring open market in the electricity sector.214
4.2.2 Market Structure and Liberalization of energy sector in the EU
Like India, the energy markets of EU member countries also underwent rapid changes over the past two decades. These changes are not in isolation but in line with the worldwide trend towards liberalization, restructuring and privatization. Before the 1980s, energy generation, grid expansion and selling were undertaken predominantly by public-owned vertically-integrated monopolies or oligopolies that were granted exclusive rights. They mainly catered to the domestic market in a non-competitive environment and government intervention was limited to subsidies, price setting and volume limits. This resulted in monopoly profits and monopoly-induced inefficiencies. The liberalization process began in the 1990s. Given the scarcity of fossil fuels, increasing demand pressures, and need to increase supply efficiency, the liberalization process focused on improving efficiency, transparency in a market where private and public generators and retailers compete on a regulated and unbundled system of energy infrastructure. It was envisaged that exposing large parts of the energy supply chain to competitive pressures would reduce prices and thus benefit users in the long term.
Much liberalization process across member states has been due to initiatives undertaken at the EU level. These pertain to common characteristics such as unbundling, independent regulators, public service provisions and security of supply in each member state.215
Given that the EU is a net importer of energy, this sector has been accorded central importance in the supranational and national policy framework. All energy policy decision-makers at the EU level (Commission, Parliament and Council), have emphasized that energy policy must form part of the general aims of the Community’s economic policy based on market integration, deregulation, limited public intervention (to safeguard the public interest and welfare), sustainable development, consumer protection and economic and social cohesion. However, beyond those general aims, energy policy must pursue particular aims in the energy sector that reconcile competitiveness, security of supply and protection of environment.”216
Overall, the reforms were pursued at two parallel levels. First, under the EU Electricity and Gas Directives, member countries were required to take at least a minimum number of steps by certain key dates towards liberalization of their national markets. Second, the EC promoted efforts to improve interfaces between national markets by improving cross-border trading rules, and expanding cross-border transmission links. The aim of these policies was to enable companies to compete with national incumbents - competitive pressure being such that 214 Table 5B.3 in Appendix 5B gives the regulators and some key regulations/programmes in the Indian energy sector. 215 http://www.euractiv.com 216 http://www.europarl.europa.eu/factsheets/4_12_0_en.htm
Draft not for citation and quotation
97
operators are able to realize productivity gains and/or decrease margins via economies of scale. Realizing the need for efficient and flexible functioning of renewable markets, important directives in these segments were initiated since 2001.
A series of Directives were passed to set up a policy framework and a time-frame for member states to work towards creating a competitive internal market to enable efficient use of scarce resources. The European Directives (approved by the EC in the second half of 1990s) designed a common framework for energy markets built on certain objectives and principles. Member states were allowed some flexibility in implementing the intended outcomes and they could develop their own plans in line with these Directives. Some of these (such as the electricity and gas Directives) directly impact the functioning and outcomes of EU energy markets, while others such as those on internal services market integration or recognition of professional qualifications indirectly influence the energy sector.217
Market integration and liberalization in the coal sector began in the 1950s as it was seen as a necessary component of an open market for steel. The opening up of the gas sector followed the liberalization of the coal and oil sectors. Like India, restructuring of electricity and gas markets across EU member states began in the early 1990s. The extent of liberalization varied across countries and the 1990s saw the governments of many EU member states reducing their shares in prominent petroleum companies. British Petroleum (UK), ENI (Italy), Repsol (Spain), Total (France), ELF (France) and Mazeikiu Naftu (Lithuania) underwent a transition from being state-owned to becoming publicly listed companies.218
The liberalization process can be analyzed in two phases. In the first phase, the EC made efforts to ensure competitive market conditions in the distribution of the gas and electricity sectors. Council Directive 90/377/EEC (June 1990) was adopted to improve transparency in gas and electricity prices charged to industrial end-users (amended by Commission Directive 93/87/EEC of October 1993). The importance of establishing an efficient internal energy market in the EU was recognized in Council Directive 91/296/EEC (May 1991) on transit of natural gas through grids which aimed at making trade between different EU members more efficient. Greater integration of the market and efficient and transparent energy practices were encouraged by Directive 94/22/EC on conditions for granting and using authorizations for prospection, exploration and production of hydrocarbons.219This Directive complemented the Directive 90/531/EEC on procurement procedures of entities operating in water, energy, transport and telecommunications sectors (repealed and replaced by Directive 93/38/EEC, which was further repealed and replaced by Directive 2004/17/EC). The second phase of EU's deregulation program introduced more comprehensive regulatory measures to establish common rules for an internal energy market. Directive 98/30/EC (June 1998) laid down a set of common rules and procedures on the organization and functioning of the national gas sector. The Directive of 1998 (98/30/EC) was replaced by Directive 2003/55/EC for gas, which came into operation at the same time as Directive 2003/54/EC for electricity. Both directives were concerned with common rules for internal markets of natural gas and electricity. The Gas Directive 2003/55/EC sought to achieve full opening of the gas markets while maintaining high standards of public service and a universal-service obligation. A two-
217 Some major directives in the sector have been summarized in Table 5B.1 under Appendix 5B. 218 A company which is owned by the public through shares listed on a stock exchange and traded on the open
market (widely acceptable to all investors/consumers). It can raise capital through sale of stocks and convertible bonds.
219 All the member states (except Luxembourg and Finland, which are exempt from transposition because they do not have any potential hydrocarbon resources) have transposed Directive 94/22/EC into national law (http://europa.eu/scadplus/leg/en/lvb/l27007.htm)
Draft not for citation and quotation
98
phase timetable was laid for fully opening the gas markets - Phase I which came into force on July 1, 2004 opened the non-residential market, while Phase II which came into effect on July 1, 2007 aimed to fully open the market.
The Directives were adhered to by member states according to their individual country situations and levels of political autonomy. The UK was one of the early countries to liberalize. Italy, the Netherlands, Austria, Belgium, the Czech Republic, Denmark, Germany, Ireland, and Spain also opened their gas markets to competition for all consumers and households before July 1, 2007. France, Bulgaria, Hungary, Poland, Romania, Slovakia, Slovenia, Lithuania, Luxembourg, Sweden and Estonia did so on July 1 2007, while Finland, Latvia, Greece and Portugal were granted derogations220 on gas market opening.221It was believed that the internal market would give smaller companies easier access to the energy market and ensure sufficient investments in power plants and transmission networks which will, in turn, reduce interruptions in supplies.222
On its part, the EC is continuously trying to further liberalize the market by ensuring the implementation and enforcement of market opening directives and by taking steps to break the vertically integrated players. On September 19, 2007 the EC adopted a third package of legislative proposals to further its energy policy objectives.223Under this, the EC proposed two options to EU member states to complete liberalization of the gas and electricity sectors. The first option was legal disintegration of supply and production activities from network operations (‘ownership unbundling’). The second option was to allow energy supply firms to maintain ownership of their transmission assets but leave their management to an Independent System Operator (ISO) for taking investment and commercial decisions.224 The EC stated that 'ownership unbundling' was the preferred option. This will ensure non-discriminatory access to energy grids by smaller firms wishing to compete in markets dominated by vertically-integrated energy companies (such as EdF in France and E.ON Ruhrgas AG in Germany). Subsequently, however, France, Germany, Austria, Bulgaria, Greece, Luxembourg, Latvia and Slovak Republic opposed the EC’s proposals and outlined a 'third option' (regulated unbundling) for liberalization. This states that fair competition can be achieved without full ownership unbundling or the ISO option and national regulatory authorities could request Transmission System Operators to legally invest in grid and infrastructure upgrades (if safeguards for the independence, management and investment decisions of TSOs are taken into consideration).225
Effective regulation is perceived to be necessary in ensuring fair competition practices after privatization at the EC level. Under the provisions of the Gas Directives, regulators now hold a minimum set of powers in every member state. At the EU level, the European Regulators’
220 Derogation is a provision in an EU legislative measure which allows for all or part of the legal measure to be
applied differently, or not at all, to individuals, groups or organizations. 221 Europa Press Release, 2007b. 222Europa Press Release, 2007b. 223 It was mentioned that shortcomings in the gas and electricity markets included lack of adequate rules on
transparency and access to market information and that vertically integrated incumbent companies effectively remain dominant in their national markets, leading member states to implement regulated prices. For details, see http://europa.eu/rapid/pressReleasesAction.do?reference=SPEECH/07/562&format=HTML&aged=1&language=EN&guiLanguage=en
224 Proposal for a Regulation of the European Parliament and of the Council establishing an Agency for the Cooperation of Energy Regulators.
http://eur-lex.europa.eu/LexUriServ/LexUriServ.do?uri=CELEX: 52007PC0530:EN:NOT 225 http://renewenergy.wordpress.com/2008/02/03/eight-eu-states-oppose-unbundling-table-third-way/
Draft not for citation and quotation
99
Group for Electricity and Gas (ERGEG) was set up in 2003 as an ‘Advisory Group’ of independent national regulatory bodies to assist the EC in consolidating the internal market for electricity and gas. Development of the Trans-European Energy network (TEN-E) was considered as a prerequisite for internal market integration, diversification of energy supplies and sustainable development.226In 2003, the EC227 also emphasized the importance of increased interconnection for reduction of inter-country price differences and associated benefits to customers. In the year 2009, with the adoption of Directive 2009/72/EC and Directive 2009/73/EC, new rules were introduced on unbundling for transmission system operators and distribution system operators.
The structure of EU's energy industry has undergone a considerable change today. Deregulation and privatization increased competition in international market, expanding companies’ efforts in exploration and exploitation of oil fields both inside and outside the EU. It also led to a number of mergers and acquisitions in this sector.228 Harmonization of the EU internal market is still in progress and the extent to which the Directives have been implemented in member countries varies. There is still a varying degree of legal and ownership unbundling within the EU. There is absence of a coherent approach meaning that the pan-EU playing field for energy giants is competitive but not completely level. Moreover, there is also an issue of trade-off between the internal market, climate policy and securities of supplies policy. The development of grid infrastructure is at the same time an enabler for creating the internal market is also pending.
The EU has also adopted a framework for energy end-use efficiency and energy services. This includes an indicative energy savings target for member states, obligations on national public authorities for energy savings and energy efficient procurement and measures to promote energy efficiency and energy services. The European Energy End-Use Efficiency and Energy Services Directive (2006/32/EC), also known as the Energy Services Directive (repealing Council Directive 93/76/EEC) was passed to establish frameworks (institutional, financial and legal) to eliminate market barriers and imperfections which prevent efficient end use of energy. This directive requires member states to achieve a nine percent reduction in final energy use by 2016 and applies to distribution and retail sale of energy, the delivery of measures to improve end-use energy efficiency.229The EU's European Energy Service Initiative (EESI) promotes development and implementation of innovative projects in energy service contracting and contributes to establishing efficient energy service markets in Europe.230 The ESCO business is fast evolving in the region as they have become very important to implementation of EU’s vision for energy efficient buildings. A significant push is underway in EU to make new buildings and major renovation “nearly zero energy” by 2021.
226 The Trans-European Energy network (TEN-E) is part of the Trans European Networks (TENs) program
(including transport, energy and telecommunications) which aims to provide high-quality infrastructure-supporting links between EU member states and with other European countries. It is due to be completed by 2020.
227 Commission of the European Communities (2003). 228 http://www.eurofound.europa.eu/eiro/2004/05/feature/pl0405104f.htm 229 It requires the Government to place an obligation on energy suppliers, to provide and promote fuel efficiency improvement measures and/or fuel efficiency audits to their customers, but also allows the Government to adopt either a mandatory or voluntary approach. 230 At the local and regional levels, the EESI supports development and consulting by national online advice centres, training for local authorities, enterprises and disseminators and provision of advice for implementation and further development of ESC in pilot projects.
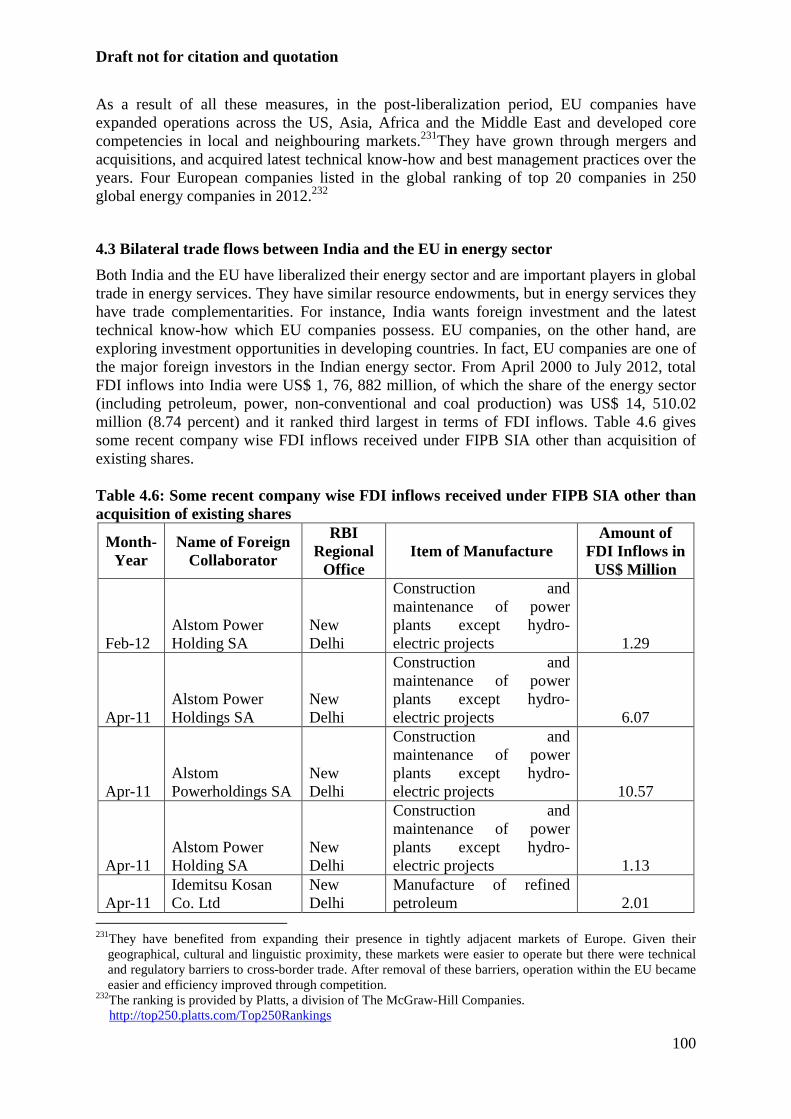
Draft not for citation and quotation
100
As a result of all these measures, in the post-liberalization period, EU companies have expanded operations across the US, Asia, Africa and the Middle East and developed core competencies in local and neighbouring markets.231They have grown through mergers and acquisitions, and acquired latest technical know-how and best management practices over the years. Four European companies listed in the global ranking of top 20 companies in 250 global energy companies in 2012.232
4.3 Bilateral trade flows between India and the EU in energy sector
Both India and the EU have liberalized their energy sector and are important players in global trade in energy services. They have similar resource endowments, but in energy services they have trade complementarities. For instance, India wants foreign investment and the latest technical know-how which EU companies possess. EU companies, on the other hand, are exploring investment opportunities in developing countries. In fact, EU companies are one of the major foreign investors in the Indian energy sector. From April 2000 to July 2012, total FDI inflows into India were US$ 1, 76, 882 million, of which the share of the energy sector (including petroleum, power, non-conventional and coal production) was US$ 14, 510.02 million (8.74 percent) and it ranked third largest in terms of FDI inflows. Table 4.6 gives some recent company wise FDI inflows received under FIPB SIA other than acquisition of existing shares. Table 4.6: Some recent company wise FDI inflows received under FIPB SIA other than acquisition of existing shares
Month- Year
Name of Foreign Collaborator
RBI Regional
Office Item of Manufacture
Amount of FDI Inflows in US$ Million
Feb-12 Alstom Power Holding SA
New Delhi
Construction and maintenance of power plants except hydro- electric projects 1.29
Apr-11 Alstom Power Holdings SA
New Delhi
Construction and maintenance of power plants except hydro- electric projects 6.07
Apr-11 Alstom Powerholdings SA
New Delhi
Construction and maintenance of power plants except hydro- electric projects 10.57
Apr-11 Alstom Power Holding SA
New Delhi
Construction and maintenance of power plants except hydro- electric projects 1.13
Apr-11 Idemitsu Kosan Co. Ltd
New Delhi
Manufacture of refined petroleum 2.01
231They have benefited from expanding their presence in tightly adjacent markets of Europe. Given their
geographical, cultural and linguistic proximity, these markets were easier to operate but there were technical and regulatory barriers to cross-border trade. After removal of these barriers, operation within the EU became easier and efficiency improved through competition.
232The ranking is provided by Platts, a division of The McGraw-Hill Companies. http://top250.platts.com/Top250Rankings
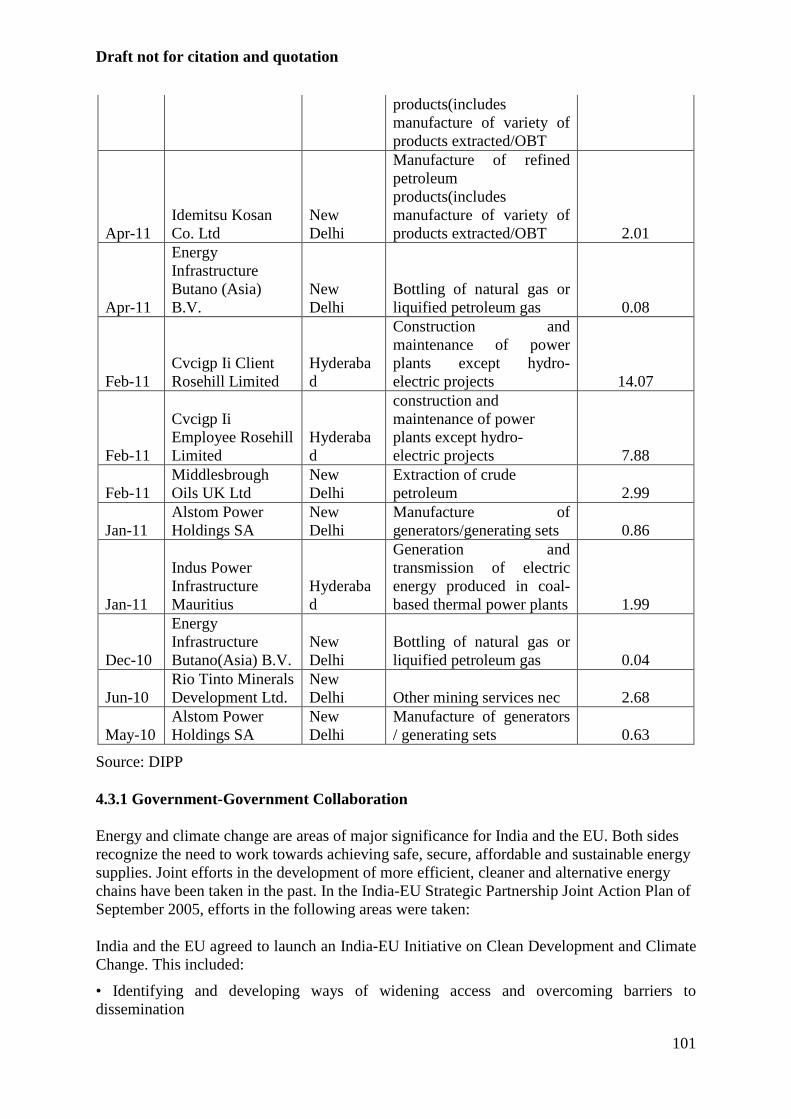
Draft not for citation and quotation
101
products(includes manufacture of variety of products extracted/OBT
Apr-11 Idemitsu Kosan Co. Ltd
New Delhi
Manufacture of refined petroleum products(includes manufacture of variety of products extracted/OBT 2.01
Apr-11
Energy Infrastructure Butano (Asia) B.V.
New Delhi
Bottling of natural gas or liquified petroleum gas 0.08
Feb-11 Cvcigp Ii Client Rosehill Limited
Hyderabad
Construction and maintenance of power plants except hydro-electric projects 14.07
Feb-11
Cvcigp Ii Employee Rosehill Limited
Hyderabad
construction and maintenance of power plants except hydro-electric projects 7.88
Feb-11 Middlesbrough Oils UK Ltd
New Delhi
Extraction of crude petroleum 2.99
Jan-11 Alstom Power Holdings SA
New Delhi
Manufacture of generators/generating sets 0.86
Jan-11
Indus Power Infrastructure Mauritius
Hyderabad
Generation and transmission of electric energy produced in coal-based thermal power plants 1.99
Dec-10
Energy Infrastructure Butano(Asia) B.V.
New Delhi
Bottling of natural gas or liquified petroleum gas 0.04
Jun-10 Rio Tinto Minerals Development Ltd.
New Delhi Other mining services nec 2.68
May-10 Alstom Power Holdings SA
New Delhi
Manufacture of generators / generating sets 0.63
Source: DIPP
4.3.1 Government-Government Collaboration
Energy and climate change are areas of major significance for India and the EU. Both sides recognize the need to work towards achieving safe, secure, affordable and sustainable energy supplies. Joint efforts in the development of more efficient, cleaner and alternative energy chains have been taken in the past. In the India-EU Strategic Partnership Joint Action Plan of September 2005, efforts in the following areas were taken:
India and the EU agreed to launch an India-EU Initiative on Clean Development and Climate Change. This included:
• Identifying and developing ways of widening access and overcoming barriers to dissemination
Draft not for citation and quotation
102
of such technologies in India and the EU; • Increasing funding and promoting public-private partnerships for R&D of cleaner technologies; • Promote adaptive research and development to suit the resource endowment of both parties; • Reduce price gap between ‘clean’ and ‘less efficient’ technologies via economies of scale; It was decided that India and the EU would take steps to encourage and promote sustainable patterns of consumption and production to lessen the adverse impacts of climate change. India and the EU also agreed to strengthen the implementation of the CDM to promote cooperation between India and the EU and encourage companies to engage in such projects. They also agreed to cooperate on improving adaptation to climate change and integrate adaptation concerns into sustainable development strategies. Both sides agreed to cooperate to enhance the scientific, technical and institutional capacity to predict climate change and its socio-economic impacts. Energy is of major significance for both India and the EU. Both sides recognize the need to work towards achieving safe, secure, affordable and sustainable energy supplies. Joint efforts in the development of more efficient, cleaner and alternative energy chains have been taken in the past.
Efforts have been made at the government level to promote India-EU trade in energy services. Apart from the Joint Working Groups in the coal sector, at the 5th India-EU Summit in Hague, energy sector was recognized as a key area for cooperation. An India-EU Energy Panel was set up in the year 2005 as a formal instrument of cooperation in the energy sector to coordinate joint efforts and matters of mutual interest. The Energy Panel decided to set up Working Groups in the following areas:
• Energy efficiency and renewable energies; • Coal and clean coal conversion technologies; • Fusion energy including India's membership in high-tech civilian thermonuclear project (ITER).
Both sides agree to cooperate closely in the areas of promoting energy efficiency and energy conservation; development of affordable clean energy technologies; identifying new technologies in new, renewable, conventional/non-conventional energy sources; oil and gas. This was with a view to promoting security of supplies and stability in prices; technology and expertise in exchange of energy between different grid systems and development of energy markets; development of hydrogen and fuel cells; and methane recovery and use.
There is significant scope for collaboration in R&D in this sector. Since 1984, the research and innovation activities of the EU have been grouped under the Framework Program (FP), which allows researchers from a third country to participate in EU research projects funded by the EC. Under the Seventh Euratom Framework Program (2007-2013), fusion energy research, nuclear fission and radiation protection have an allocation of €2.8 billion. In 2001, the EU and India signed a Science and Technology (S&T) Agreement; the two economies and agreed to strengthen cooperation in areas such as new and renewable energy.233
Primary Survey There are hardly any studies on India-EU bilateral trade in energy. Moreover, disaggregated data on bilateral trade in energy services is not available. To fill this lacuna and understand the trade and investment patterns and identify the trade barriers, a survey was conducted. A
233 India and France signed the Indo-France Nuclear Cooperation Agreement on civil nuclear cooperation in the year 2008. With this agreement, India and France could also cooperate in other areas such as nuclear safety, radiation and environment protection and nuclear fuel cycle management.
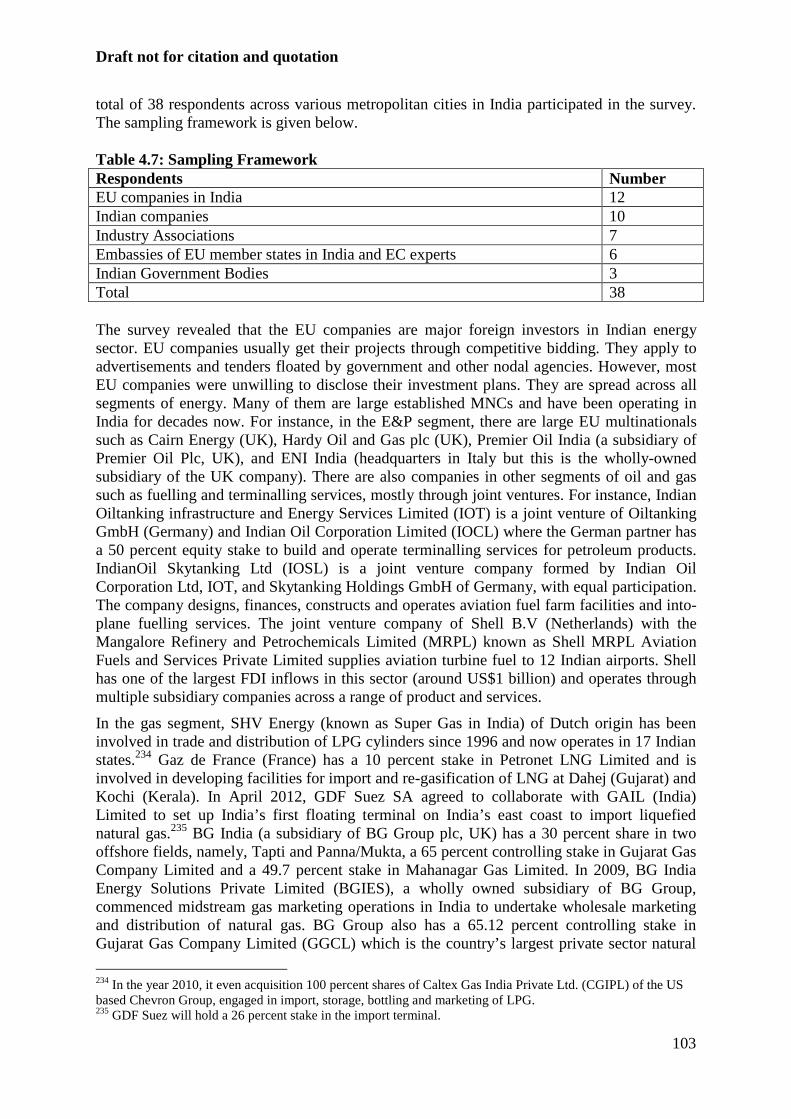
Draft not for citation and quotation
103
total of 38 respondents across various metropolitan cities in India participated in the survey. The sampling framework is given below. Table 4.7: Sampling Framework Respondents Number EU companies in India 12 Indian companies 10 Industry Associations 7 Embassies of EU member states in India and EC experts 6 Indian Government Bodies 3 Total 38 The survey revealed that the EU companies are major foreign investors in Indian energy sector. EU companies usually get their projects through competitive bidding. They apply to advertisements and tenders floated by government and other nodal agencies. However, most EU companies were unwilling to disclose their investment plans. They are spread across all segments of energy. Many of them are large established MNCs and have been operating in India for decades now. For instance, in the E&P segment, there are large EU multinationals such as Cairn Energy (UK), Hardy Oil and Gas plc (UK), Premier Oil India (a subsidiary of Premier Oil Plc, UK), and ENI India (headquarters in Italy but this is the wholly-owned subsidiary of the UK company). There are also companies in other segments of oil and gas such as fuelling and terminalling services, mostly through joint ventures. For instance, Indian Oiltanking infrastructure and Energy Services Limited (IOT) is a joint venture of Oiltanking GmbH (Germany) and Indian Oil Corporation Limited (IOCL) where the German partner has a 50 percent equity stake to build and operate terminalling services for petroleum products. IndianOil Skytanking Ltd (IOSL) is a joint venture company formed by Indian Oil Corporation Ltd, IOT, and Skytanking Holdings GmbH of Germany, with equal participation. The company designs, finances, constructs and operates aviation fuel farm facilities and into-plane fuelling services. The joint venture company of Shell B.V (Netherlands) with the Mangalore Refinery and Petrochemicals Limited (MRPL) known as Shell MRPL Aviation Fuels and Services Private Limited supplies aviation turbine fuel to 12 Indian airports. Shell has one of the largest FDI inflows in this sector (around US$1 billion) and operates through multiple subsidiary companies across a range of product and services.
In the gas segment, SHV Energy (known as Super Gas in India) of Dutch origin has been involved in trade and distribution of LPG cylinders since 1996 and now operates in 17 Indian states.234 Gaz de France (France) has a 10 percent stake in Petronet LNG Limited and is involved in developing facilities for import and re-gasification of LNG at Dahej (Gujarat) and Kochi (Kerala). In April 2012, GDF Suez SA agreed to collaborate with GAIL (India) Limited to set up India’s first floating terminal on India’s east coast to import liquefied natural gas.235 BG India (a subsidiary of BG Group plc, UK) has a 30 percent share in two offshore fields, namely, Tapti and Panna/Mukta, a 65 percent controlling stake in Gujarat Gas Company Limited and a 49.7 percent stake in Mahanagar Gas Limited. In 2009, BG India Energy Solutions Private Limited (BGIES), a wholly owned subsidiary of BG Group, commenced midstream gas marketing operations in India to undertake wholesale marketing and distribution of natural gas. BG Group also has a 65.12 percent controlling stake in Gujarat Gas Company Limited (GGCL) which is the country’s largest private sector natural
234 In the year 2010, it even acquisition 100 percent shares of Caltex Gas India Private Ltd. (CGIPL) of the US based Chevron Group, engaged in import, storage, bottling and marketing of LPG. 235 GDF Suez will hold a 26 percent stake in the import terminal.
Draft not for citation and quotation
104
gas distribution company in sales volume. Elf Gas India Limited (a subsidiary of Total) imports LPG and operates its storage facility at Mangalore. A case in point is the French major Alstom which has a well established electricity transmission business in India. The Group’s India subsidiary, Alstom T&D India, currently around 7 percent (US$792 million) to its overall grid business sales revenue and expects to expand this further in coming years. India is the single largest market for the group and they see more business in the country than China.236
There are also many EU consultancy companies that either provide consultancy services to the government, companies, and international organizations in India or have partnered with Indian companies. For instance, Wardell Armstrong (UK) has provided modern coal technologies to companies in India. Rock Mechanics Technology (UK), a leading supplier of rock mechanics consultancy and geotechnical services, has undertaken projects in India where it has provided services related to roof control management systems and stress measurement services in coal mines. IT Power India Private Limited (UK) offers consultancy services in renewable technology and management solutions. Wartsila India Limited (Finland) provides solutions for captive power plants. Its areas of expertise are electrical and automation services, engine and propulsion services. Some energy-related consultancies are closely linked to environment consultancies and have opened up or plan to open R&D/ technology centers in India. One such example is Shell Technology India Private Limited in Bangalore which delivers advanced technical studies and services for Shell activities in India and abroad. Some Indian software companies also have collaboration with EU companies; for instance, Infosys has teamed up with Alstom Power Services (France) to set up an R&D center in Bangalore to provide engineering solutions.
Some companies have also diversified their range of operations beyond their traditional work areas in India. For instance, Électricité de France (EdF) provides consultancy services to Indian firms and the government, rather than power generation, which is their core expertise. Subsidiaries of EU companies in India are exploring opportunities to export to the EU. For instance, Vestas RRB India Limited, a subsidiary of Vestas Wind System (Denmark), imports raw materials from the EU and is exploring possibilities of exporting there. EU companies hiring in India All EU companies hire their workforce locally. These are mostly skilled workers, but sometimes technical personnel are sent from the parent company in the EU to train Indian personnel. Likewise, Indians are also sent aboard to acquire training. The number of employees and condition of employment varies depending on the requirements. Some large companies such as Enercon India Limited (Germany) and Alstom Transmission and Distribution (T&D) India which conduct the business of installing wind energy converters have employed more than 3500 people in India. Others such as Fugro (Survey) India Private Limited (Netherlands) has 180 engineers and scientists, and IT Power India Limited has around 30 employees (mostly engineers). ENI (Italy) has 20 direct employees and employs up to 600 people through contractors during exploration operations. Companies have hired European experts (reservoir engineers, geophysics specialists, petroleum engineers and geologists, among others) for specialized services. Most of them are employed on a contract basis for a period ranging from one to three years. 236 http://www.thehindubusinessline.com/companies/india-stronger-base-than-china-says-alstom-grid-chief/article3874738.ece
Draft not for citation and quotation
105
Indian operations in the EU Only a few Indian companies were found to have operations in the EU. For example, Suzlon Energy Limited, one of the world’s top players in alternative energy with a global market share of 6 percent, has a presence in over 40 locations around the world including Denmark, Italy, Portugal and Greece. It offers total wind power solutions including consultancy, manufacturing, operations and maintenance support services. Suzlon has a large clientele in Europe in countries such as Italy, Portugal, Spain and Romania and has benefited from collaborating with EU companies and hires locally in the EU-27. Lanco Solar International Limited, an integrated solar value chain developer/service provider and a subsidiary of Lanco Infratech, has operations and experts based in six European countries (with headquarters in London). Acquisitions of local firms by Indian companies have helped them with local market knowledge and in hiring local skills. For instance, Essar Energy acquired Stanlow refinery in the UK in July 2011. Among consultancy companies, Engineers India Limited (EIL) has an office in London which provides third-party inspection services and procurement services for equipment manufacturing locations in Europe. Tata Consultancy Services (TCS), which has IT operations in a number of EU countries, provides consultancy services to Scotia Gas Networks (UK). NTPC also provides services such as conducting feasibility studies, engineering, planning and training in coal, oil and gas fired power plants in the EU, including France and Sweden. Only a few Indian companies currently export services to the EU. However, many of them have some form of collaboration with EU companies either in India or in third-country markets and found the collaborations fruitful. For instance, Hindustan Petroleum Corporation Limited (HPCL) has a 50-50 joint venture (known as South Asia LPG Corporation Private Limited or SALPG) with Total Fina Elf (France) to build an underground storage facility for LPG at Visakhapatnam and a joint venture with Colas SA (France) known as Hindustan Colas (HINCOL). It also has long-term licence agreements with EU companies such as M/S Axens (France) for a DHDS unit and M/s Porner (Austria) for a bitumen blowing unit. RPG Transmission Limited has collaboration with Rolls Royce Power Engineering Plc (UK) in the power transmission segment. Oil India Limited (OIL) has signed production-sharing contracts with Polish Oil and Gas Co. (POGC) and Geoenpro Petroleum for E&P in the oil and gas sector. It has also partnered with Spanish oil and gas company, Repsol S.A for E&P in two oil blocks in Venezuela. The project involves exploitation of extra heavy crude, setting up of up-grader and marketing of products. ONGC has signed MoUs with ENI (Italy) for joint operatorship in the upstream oil and gas sector in India and abroad, and with Shell (Netherlands) for technical collaboration in surface coal gasification. Bharat Petroleum Corporation Limited (BPCL) has a joint venture with Encore for oil well drilling operations in the North Sea; the skilled workforce was supplied by Encore for seismic studies in drilling and exploration. Gujarat State Petroleum Corporation Limited (GSPC) has collaborated with Fugro Robertson Limited (Netherlands) and Schlumberger Oilfield Services (France) for seismic survey and weather forecasting. Most collaboration is done on a project-to-project basis, mainly due to the nature of energy business.
The reasons for limited presence of Indian companies in the EU include the enormous opportunities they see domestically or other countries of South Asia and Africa, the saturated EU market and need for huge investments, the similar resource endowment, barriers to entry and operation in the EU and the fact that they have not explored the market as part of their international business plans.
Draft not for citation and quotation
106
It was pointed out that EU companies are technologically advanced and have a strong R&D teams, managerial expertise and financial base. Their weaknesses however are high processing and manpower costs which are the strengths of Indian companies. This way, they Indian and European companies have trade complementarities. Respondents also pointed out that the BTIA negotiations have been going on since 2007, but companies have continued to collaborate before that period. The PSUs have benefitted from collaboration with EU companies and said that the Indian government should facilitate such collaborations in the domestic market and encourage PSUs to form consortia with EU companies in third-country markets. 4.3.2 Areas of future collaboration Survey participants agreed that energy should be a key chapter covered in the BTIA and that it should focus on renewables, energy-efficient technologies to reduce carbon emissions, technological assistance and technology transfers, human resource management, training, IT related to this sector, project management and R&D.
Companies pointed out that the Indian market offers huge potential. EU companies are world leaders in E&P and renewables, and collaborations in these segments are likely to benefit Indian companies, both in India as well as other third-country markets. About 30 percent of the population has no access to grid-connected electricity, and this segment needs expansion and new investment. In the coal sector, India and the EU can collaborate in clean coal technologies, liquefaction of coal (countries such as the UK and Germany have experience in this area), development of UCG (underground coal gasification) and CBM (coal-bed methane), underground mining technologies, and R&D.
In the oil and gas segment, potential for collaboration exists in deep water E&P technology, gas hydrates exploitation, IOR/EOR and oil processing technologies, geophysical and geological data development etc. India has a resource crunch of geoscientists, petroleum engineers, drillers, etc. and training by EU companies has been beneficial in the past and can be explored further.237 Collaboration can also be in technology transfers in lubricants segment, underwater pipelines, and refinery maintenance (where Indian companies have an edge).
Companies pointed out that there is huge scope for investing in the renewable energy services, especially the solar segment. EU companies such as Enercon India Limited (Germany), Conergy Renewable Energy Limited (Germany), Sun Technics Energy Systems (Germany), Bosch Rexroth Limited (Germany), the Juwi Group (Germany), Abakus Solar AG (Germany) and Mita-Teknik (Denmark) are present. These companies have set up small teams, seeking to explore opportunities in off-grid, micro-grid and roof-top applications to serve their clients. Most companies have set up small teams, seeking to explore opportunities in off-grid, micro-grid and roof-top applications to serve the larger private consumer market.
In the renewable energy segment, collaboration in rural electrification is likely to benefit India. So far, this segment has largely focused on wind and solar energy, but there is also scope for collaboration in biofuels (such as bagasse-based plants) and hydro electricity. EU member states such as Germany, the UK and Denmark possess technologies such as installing offshore wind turbines in the sea which are useful for Indian companies.
237 Some top oil and gas companies which have entered into collaborations with Indian companies mentioned that they benefit from access to geological data and knowledge about prospective exploration sites and local market.
Draft not for citation and quotation
107
When asked about their plans for expanding operations and investments in each other’s markets, many EU companies disclosed their plans of expanding operations in India. The reasons included the unsaturated market, availability of a high-skilled workforce, and workers’ flexibility in adopting new technologies. They also pointed out that Indian entrepreneurs have local market knowledge and understand local governance systems, making collaborations useful.238 Indian companies, on the other hand, except for certain segments such as renewables, did not show much interest in expanding their operations in EU. They stated that as the EU internal market for services in general and energy in particular becomes more integrated, operational hurdles are likely to reduce. However, as of now the ongoing crisis had their businesses prospects in the EU and they find opportunities African countries, Middle East, South Asia, and even North America.
4.4 Barriers in the energy sector European Union • Barriers related to Government Procurement239 In 2004, the EU adopted a revised Utilities Directive (2004/17), covering purchases in the energy (gas and heat) and some other services sectors. This directive requires open, competitive bidding procedures, but discriminates against bids with less than 50 percent EU content not covered by an international or reciprocal bilateral agreement. This requirement applies to foreign suppliers of goods and services.
In the government procurement markets of Ireland and Lithuania, lengthy procedures for budgetary decisions delay procurements, and unsuccessful suppliers often have difficulty obtaining information regarding the basis for a tender award. There are also complaints about significant delays in finalizing contracts and commencing work. There are transparency problems in public procurement process in Bulgaria, Italy, Hungary, Slovenia and Lithuania.
There is a strong pro-EU bias in government contract awards in Austria. Although Austria’s power utilities are majority government - owned, under an EC ruling (2008/585/EC), they are exempted from having to issue public tenders for power generation projects. In Portugal, there are complaints of the Portuguese government favoring EU firms. In Spain, companies in the energy efficiency sector have reported being shut out of tenders for public projects due to bid design that favored Spanish companies.
In Slovenia, other complaints include short time frames for bid preparation, lack of clarity in tendering documentation, and opacity in bid evaluation process. One specific complaint involves the quasi-judicial National Revision Commission (NRC), which reviews all disputed public procurement cases favouring the EU, and especially Slovenian firms under its “national interest” standard.
In Greece, prospective non-EU investors in mining sector are required to obtain licenses and other approvals that are not required of Greek or other EU investors. For example, non-EU investors need special approval from the Greek cabinet for exploitation of mines. Greek authorities consider local content and export performance criteria when evaluating
238 They rated states like Gujarat and Rajasthan as favourable states for EU companies due to single window clearance and better governance in these states. 239 USTR, 2012.
Draft not for citation and quotation
108
applications for tax and investment incentives, although these are not prerequisites for approving investments. • Regulatory constraints – discriminatory policies and complex regime In Italy, the government in May 2011 announced a new incentive scheme for photovoltaic solar energy production that reduced previous, guaranteed feed-in tariff rates and included a new bonus of 10 percent above the normal incentive rate for projects with at least 60 percent EU content. this discriminates against some foreign investors. In some states such as Romania and Spain, there is uncertainty and a lack of predictability in the legal and regulatory systems which pose an impediment to foreign investments. In Romania, tax laws change frequently, and many companies experience long delays in receiving VAT refunds to which they are legally entitled. Deadlines for processing and payment of refunds as stipulated by law are often not respected. There are also transparency issues with legal decrees or regulations. • Incomplete liberalization Energy market liberalization in the EU has been difficult and is likely to remain so. While some countries, notably the UK, have created fully competitive markets within their own borders, other countries have concentrated on developing “national champions” to compete in an expected Europe-wide energy marketplace. For instance, in the Italian energy sector the government took liberalisation reform and established an Independent Regulatory Agency (IRA) but did not accord sufficient capacity to the competition authority, Autorità. The conflict of interest resulting from thirty percent public stake in ENI and ENEL has kept liberalisation process incomplete, and created conflict of interest within a state that is both shareholder and regulator.
The level of liberalisation of European electricity markets remains low while large incumbents, high market concentration, subsidies to fossil fuels and nuclear energy and regulated prices are common. Subsidies in some markets enable them to lower their costs and therefore place non-subsidising firms at a comparative disadvantage.240
• Fiscal Regime and fiscal disclosure requirements:
Some companies pointed out that the accounting standards and fiscal disclosure requirements in the EU are very strict and complex. Currently, Indian companies are not prepared to follow their accounting and disclosure standards as it is costly to follow them in terms of training of manpower and investment in software.241
India • Monopoly-induced inefficiencies
Despite liberalization, the sector continues to be dominated by the public sector or PSUs and faces monopoly-induced inefficiencies. Price preference and subsidies (on LPG and kerosene) are given to PSUs which results in a non-competitive business environment. Within the PSUs, there is lack of corporate governance, the decision-making process is
240 For details, see EWEA, 2012 and Buchan, 2012. 241 For details, see Beke, 2010.
Draft not for citation and quotation
109
long and cumbersome, and many of them, in spite of being overstaffed, do not have the required skills.
• Multiple governance bodies
Multiplicity of ministries has resulted in multiple regulations. As different sub-segments of energy are under different ministries, they are often regulated separately rather than in an integrated manner. Moreover, many sub-sectors such as mining are regulated by central and state governments. All of these create conflicts of interest, delays in decision making and result in requirements of multiple clearances. For example, in the oil and gas sector, companies require more than 70 clearances for exploration and over 20 clearances for marketing. Since the sector is highly regulated, there are bureaucratic delays in getting approvals. For example, it takes 4-5 months for getting installation certificate for solar projects in India. It takes a long time to initiate regulatory reforms. For instance, it took four years to ratify the PNGRB Act, 2006. The Coal Mines Nationalisation (Amendment) Bill, 2000 is still pending with the Parliament. Lack of coordination between planning and implementing agencies, lack of a comprehensive energy policy and weak corporate governance are also major barriers in the sector.
• Tax related problems
There is no uniformity in different levies such as custom duties, excise duties, third-party sale, wheeling242 charges and buy-back of power across different states. For example, 30 percent VAT is imposed on high speed diesel in Maharashtra compared to 8 percent in Punjab. Lack of uniformity in taxes has resulted in variation of petroleum products prices in states. The proposed solution for this indifferent taxation system is the GST.
• Distortionary pricing regime
Prices of crude oil, natural gas and petroleum products at retail level are not market-linked in India. This results in lack of level playing field for private companies. Certain users such as fertilizer producers also receive state subsidy.
• Resource and infrastructure-related bottlenecks
Uncertainty of coal supplies: There are problems and uncertainities related to securing coal supplies by independent power producers (IPPs). Coal India Limited, the state-owned coal producer, has agreed to enter into fuel-supply agreements (FSAs) with 48 new projects, albeit with a very low penalty (0.01 percent) for non-supply. Many private sector IPPs, hard-pressed for domestic coal, have signed FSAs with this low penalty clause.
High cost of borrowing in India: Most private sector projects tend to source the debt portion of their funds in overseas markets because of the substantially higher nominal interest rates in India. Financial institutions are more willing to fund projects that are backed by state guarantees. Aggressive bidding has made funding more challenging as margins have become thin or non-existent. With low tariff rates, much higher borrowing
242Transfer of electricity between utility companies, especially through networks of one company on behalf of
others.
Draft not for citation and quotation
110
costs create risks for developers. Renewable energy companies find themselves competing with the coal or other conventional energy sectors while borrowing from Indian banks.
• Other problems Local content requirement: There is a local content requirement of 30 percent under the National Solar Mission. It is a deterrent to the companies which want to set up a wholly owned subsidiary in India.
Skill-related problems: Although India has an abundance of high-skilled manpower, there is a shortage of specific skills, especially specialists and engineers. Therefore, Indian companies often depend on foreign geologists and other specialists.
Some private companies mentioned their apprehension on Indian Government’s plan to implement an overall 21 percent duty on electricity equipment imports in July 2012, as an additional factor that increased cost of electricity generation.
4.5 Addressing barriers through international negotiations Maintaining a high rate of economic growth, reducing external dependence for fuel supplies and attaining energy efficiency are key concerns for both India and the EU. With liberalization, energy services have become a key component of India’s trade in services and FDI inflows.
India progressively liberalized this sector in the early 1990s and, at present, there are only a few market access barriers. In the revised offer submitted by India to the WTO in August 2005, there was substantial improvement in commitments in terms of sectoral coverage and modes of delivery in various segments. The regulatory regime is continually evolving and the sector is undergoing reforms. However, India still lacks the standing of a global player and needs foreign investment, technical know-how and best management practices.
The EU had started liberalizing the energy market at the same time as India but is now an important global player and investor. The survey found that collaborations with EU companies will not only make the domestic industry globally competitive but also enable Indian companies to enhance their know-how and establish a presence in third-country markets.
The EU market is yet to be fully harmonized and Indian and other foreign companies are facing various barriers in member states, many of which are regulatory in nature. Although the EU’s revised offer shows various restrictions, the EU is the coordinator of plurilateral requests in energy and it seems that it has an offensive interest. On the other hand, India seems to have a defensive position in the WTO.
An analysis of India’s revised offer shows that since the sector has been unilaterally liberalized, it would not be difficult for India to accede to the EU’s demands in most sub-sectors. In the revised offer India has already offered to bind the unilateral regime for engineering services (CPC 8672), integrated engineering services (CPC 8673), R&D services on natural science and engineering (CPC 85013), management consulting services (CPC 86509), services related to management consulting (CPC 86601), technical testing and analysis services (CPC 8676 partial), services incidental to energy distribution (CPC 887), construction work for civil engineering for long-distance pipelines, local pipelines and mining (CPC 5134-5136) and renting services related to equipment for construction or demolition of buildings or civil engineering works with operator (CPC 518). Although no
Draft not for citation and quotation
111
commitments were made in sub-sectors such as services incidental to mining and site preparation work for mining, related scientific and technical consulting services, these sub-sectors are unilaterally open otherwise. It may be difficult for India to undertake commitments in Mode 1 in pipeline transportation services due to security concerns and sensitivity issues. Also, the EU’s commitment in this sub-sector is limited. India can bargain for greater market access and removal of discriminatory barriers especially in Modes 4 and 1 with the EU.
Indian companies pointed out that they need foreign technology and finance in sub-sectors such as services incidental to mining and the government may consider scheduling it subject to existing regulations. In scientific and technical consultancy, India with a strong knowledge base can be an R&D center for EU companies.
In the BTIA, requests in this sector overlap with other sectors such as environment, construction and R&D. Due to the cross-cutting nature of energy services and absence of a clear definition, it is important for India to carefully undertake commitments in this sector so that they are synchronized with commitments in other sectors. The EU may want to link the sector with sustainable development, climate change issues, etc.
Mode 4 is an important mode of trade in this sub-sector. Indian professionals are facing various market access barriers related to national treatment and domestic regulations in EU member states as highlighted before. EU members have scheduled hardly any sector-specific Mode 4 commitments and the horizontal offers are restricted to business visitors and intra-corporate transferees. India has the potential to offer consultancy services in energy sector. These are largely offered on a project-by-project basis and often do not require physical presence. India should ask the EU to undertake commitments in CSS and IP delinked from commercial presence in sub-sectors in which India has an export interest. It should also push for removal of residency requirements that the service provider should be a natural person. In order to enhance the EU’s attractiveness and foster careers in R&D. on October 12, 2005 the Council adopted Directive 05/71/EC on Scientific Visas,243prescribing specific procedures for admitting third-country nationals for the purposes of scientific research.244Different EU member states are offering flexibilities to scientific researchers from a third country subject to certain conditions. During the negotiations, India should push for greater market access for Indian scientists. It is difficult for India to sign a mutual recognition agreement (MRA) with the EU in professions such as engineering, since the domestic EU market for this profession is yet to be harmonized.
India has a comparative advantage in providing consultancy services. Mode 1 in the revised offer of the EU is full of restrictions and the levels of commitments differ across the 27 member states. For instance, Portugal and Italy kept Mode 1 unbound for engineering services and integrated engineering services. Countries such as Austria and Hungary have kept Mode 1 unbound for R&D services, while new members such as the Czech Republic, Cyprus and the Slovak Republic have kept Mode 1 unbound across many sub-sectors such as technical testing and analysis services and advisory and consulting service related to mining. India should push for removal of such barriers in the BTIA.
The EU’s commitments in sub-sectors such as R&D for natural science, technical testing and analysis services, and related scientific and technical consulting services are extremely
243 Scientific visas are fast-track visa and work permit arrangements for third-country researchers, aimed at
easing researchers’ legal and administrative procedures and requirements with respect to travel and residence. Details in http://www.eu-delegation.org.eg/en/Scientific%20Visa.pdf and http://ec.europa.eu/research/researchers ineurope/documents/media_fact_sheet_scientvisa_en.pdf
244 This Directive provides a common definition of researchers.
Draft not for citation and quotation
112
limited. India should push for broadening the coverage of commitments. In the EU, different modes of entry such as wholly-owned subsidiary and branches are treated differently; the company is treated as an EU company if it is a wholly-owned subsidiary. Since energy services are often delivered on a project-by-project basis, establishing a presence in the EU is expensive and companies often need to evaluate the market through other modes such as branches and representative offices, India should push for removal of barriers to specific modes of entry. Apart from these, Indian companies face other barriers in the EU. Some of these such as real estate restrictions, restrictions on import of machineries, and local content requirements which have been imposed by EU member countries to reduce influx from countries such as China can be discussed bilaterally. Stakeholders pointed out that an MRA in technical standards of equipment in the electricity sector will facilitate trade.
4.6 Reforms and Policy Recommendations Several estimates have focused on India’s ever-growing energy needs. For instance, the 2006 Planning Commission245 estimates show that energy utilization is likely to more than double between 2005 and 2030. There is thus an urgent requirement for investments in this sector. Such massive investments cannot be made by the public sector alone and there is need for more private sector participation. There is need for reforms to improve the efficiency, productivity, technology, and skill availability and overall competitiveness of the sector.
One of the main objectives of the government is to reduce vulnerability to price and supply shocks, lower the demand-supply gap, and attain energy security in the long run. Reforms are needed to ensure a competitive investment environment, protect consumer interests and ensure access to the poor and needy. These will enable India to benefit from its various international agreements.
One common problem across all segments is the monopolistic/oligopolistic structure in which the government protects the interests of PSUs either by controlling prices or providing subsidies (such as oil bonds). This has led to monopoly-induced inefficiencies, price distortions, a non-competitive operating environment and lack of level playing field for private investors. The PSUs should be given more autonomy, encouraged to run as corporate entities and made responsible for their profits and losses. There is need for tariff reforms and phasing out subsidies so that they do not distort investment. Subsidies should be given on a need-basis, should be directed to fuel-efficient technologies and an upper limit should be set to reduce wastage.
The regulatory regime in the electricity sector is still evolving. Regulatory uncertainty creates an uncertain business environment for sectors like energy where there is need for long-term investments. India needs to learn from the EU in setting up the regulatory framework. There is a need for a regulator in the coal segment. Multiple taxes and variation in taxes across states distort relative prices of fuels and investments across states.
There is an urgent need to formulate an integrated energy policy at the center which will link the separate policies of the different ministries (such as coal, power, petroleum and natural gas) so that there is efficient allocation of resources, a proper mix of energy, and fairness, transparency and harmony in the operation. There is a need for greater coordination between the Ministry of Environment and Forest, State Pollution Control Boards, etc. in allocating new projects so that delays and uncertainty related to environmental concerns are minimized and the approval process is streamlined. In renewables, the involvement of local
245 Planning Commission, 2006.
Draft not for citation and quotation
113
administrative bodies like panchayats is crucial. Private sector can be encouraged to invest in R&D through various fiscal incentives. The Ministry of Science and Technology should work closely with different ministries/departments in energy sector to access EU funding under the FP7 program.
While many PSUs are overstaffed, there is still a dearth of skilled professionals such as petroleum engineers, geologists and geophysics specialists. There is an urgent need for public-private investment in higher education and training institutes that cater to requirements of the energy sector. The higher education system has to be at par with international standards. India cannot sign mutual recognition agreements with important trading partners unless international educational standards are in place in the country.
In the coal segment, an estimated 66 billion tonnes of coal reserves are below a depth of 300 meters and exploration at that depth is expensive and needs modern technology. There is an urgent need for domestic investment and import of technologies to facilitate deep mining. India also needs to import efficient technologies such as in-situ coal gasification and liquefaction technology. Regulation facilitating private participation should be enacted. Delays in enacting the Coal Mines (Nationalisation) Amendment Bill, 2000 and amending the Land Acquisition Act (1984) is restricting private investment. Forest areas where mining exploration should not take place should be clearly identified as this will save time and resources for pre-exploration studies. There is a need to set up an independent regulatory body for coal mining (upstream exploration, and exploitation and allotment of coal blocks to interested parties) and pricing. This body can regulate ensure transparency in bidding and allocation processes, monitor trading margins, resolve safety and environment issues, and help facilitate healthy competition in the sector.
In oil and natural gas sub-sector, there is a need for increased transparency in the NELP bidding procedures. The service tax on risk exploration investment should be made conditional on actual oil discoveries in the field. This will encourage private investment. Oil and gas prices should be market-driven. There should be price competition at the refinery gate and at the retail level. This will reduce inter-fuel distortions and indirectly support the development of renewable energy sources, as they will help to uncover the true cost of power generation in the country. All price subsidies should be on a need-basis (for example, families below the poverty line). There is a need for technological upgrading especially in the E&P segment. The private sector needs fiscal and other support from the government to import the latest cost-effective technologies and equipment. In the past, collaborations with foreign companies have largely been asset-based rather than technology-based; the focus should be diverted to the best international technology. Currently, India’s product handling infrastructure - ports, tankages, pipeline, storage and other distribution assets - has a limited export orientation. Refining hubs are centered on major ports in many advanced countries but, in India, ports face severe capacity shortages. The downstream logistics are primarily designed to deliver products from refineries to domestic demand centers and little infrastructure has been built to transport refined products back to ports. Investment in infrastructure is a pre-requisite to sustain India’s exports. Open access to all transmission networks is needed for development of gas networks. For gas blocks given on bidding basis, the process for discovering prices needs to be clearly laid out.
Renewable energy is environment-friendly and can help reduce India’s dependence on fossil fuel imports. India is rich in sources of renewable energy and the government is encouraging private participation. The heavily subsidized nature of electricity and lack of finance with state governments to meet high costs of renewable electricity are restricting the use of renewable energy. The fiscal cost of switching to renewable is high due to cross-subsidy
Draft not for citation and quotation
114
charges, wheeling and transmission charges, etc. Regulatory certainty on tariffs and conditions of power procurement are crucial to attract private investment. Poor infrastructure such as insufficient capacity of transmission network and lack of grid presence and connectivity in remote areas needs attention. Technology access and availability of wind sites is important for development of wind energy. The potential of small hydro-power projects is estimated at about 15,000 MW and the country ranks fifth in the world in terms of exploitable hydro potential. These projects have potential to provide energy in remote and hilly areas (through decentralized off-grid applications) and have positive impacts on employment. They are also relatively free of problems concerning environmental impacts and rehabilitation of the displaced population. However, only about 21 percent of it has been developed so far.246 Untapped potential lies in the north and north-east states of India. There are difficulties in land acquisition, rehabilitation, environment- and forest-related issues, inter-state issues, and long gestation periods. There is a need for investment in basic infrastructure such as roads to facilitate access. Such investments can be made through private-public partnership. Alternative rehabilitations sites will have to be identified and the government should work with industry to provide training to local people which will increase employment and, therefore, reduce the backlash. The maintenance of data on topographical and physiographical conditions of potential sites will minimize risks. India has the potential for developing as an equipment manufacturing hub for wind turbines, solar PV, and equipment for SHP projects. There is a need for standardization of equipment, procedures and guidelines, and marketing so that India can become an export hub. Biogas plants, oil seed plantations and large solar water heaters (with special employment opportunities for local women) have the potential to generate employment. Establishment of community-based initiatives, such as cooperative societies and venture capital funds for penetration of these fuels in target segments of remote agricultural villages where people currently use diesel-operated shallow water rotary pumps, can bring advantages of efficiency/cost gains and growth impetus for the economy.
Power sector reforms in India should focus on improving the financial viability of state utilities, reducing aggregate technical and commercial losses of state transmission and distribution utilities and improving reliability. Improving the financial health of SEBs is, therefore, a priority. Time-consuming and complex bureaucratic procedures should also be addressed to increase private participation. The cost of power in India is higher than in countries such as the US, France, the UK and South Africa. Efficiency enhancement at the power generation stage and creation of a competitive environment in the market will help reduce costs. Constraints related to transmission linkages for open access and network limitations should be addressed. In the transmission segment, there is a need to expedite the bidding process for transmission projects at the central level, establish a national grid (with simultaneous strengthening of intra-state transmission networks), and link hydro and pit head plants with load centers. Comprehensive transmission planning should also include a proper policy for emission-sensitive technologies, and use of ultra high voltage in transmission of power, and ensure that there is no cascading of transmission costs especially when it involves access through multiple grids. Aggregate technical and commercial losses need to be reduced and lack of connectivity between load dispatchers and from captive power plants (CPPs) to the grid needs to be addressed. Effective use of information technology can play a major role in improving the quality of supply and moving towards an intelligent grid system. GIS and air-insulated sub-stations; remote management of electrical plants; and monitoring of quality of power, such as web interface using GPRS technology and in-built sensor networks should be encouraged. Other reforms include investment in renovation and modernization of existing
246 Government of India, Economic Survey 2007-08.
Draft not for citation and quotation
115
distribution networks, cross-country grid, reduction of T&D losses through energy audit/metering, conservation and demand-side management. The regulator should also look into constraints such as low voltage, over drawing of electricity from the grid by states, inadequate maintenance and poor repair service. There are also problems with competitive bidding process including delays in issuance of environment and forest clearance, and reluctance of certain state governments in notifying distribution of open access regulations. A review of these issues is essential to further facilitate investment of the private sector in the power sector.
4.7 Conclusion
India and the EU have similar energy resource endowments but have trade complementarities in energy services. In order to tackle its increasing energy demand, international fuel supply volatility and global warming concerns, India needs to ensure energy security for itself. For this, it needs foreign investment, the latest technical know-how and experience of best practices in management in areas such as coal, E&P and renewable energy which EU companies possess. EU companies, on the other hand, are financially strong and are exploring investment opportunities in the unsaturated energy markets of developing countries like India.
Mode 3 is an important mode of trade in the sector and EU companies have emerged as major foreign investors in India. Currently, only a few Indian energy companies have operations in the EU due to the latter’s saturated markets, untapped opportunities in domestic and other international markets and barriers to trade in the EU. High market concentration has been a major cause for worry as it adversely impacts trade through both Modes 1 and 3. Some Indian companies have world-class expertise in some sub-sectors such as petroleum refining and wind-power generation. With specialization catching up, these companies have shown interest in exploring the possibilities of investing in EU markets in the near future.
EU is a major proponent of multilateral liberalization of energy services. Although its energy sector has undergone significant liberalization in the past two decades, the EU market is yet to be harmonized. Indian and other foreign companies are facing various barriers in the EU region, many of which are regulatory in nature. EU member states are at various levels of liberalization and barriers to market entry are more prominent in the East Europe. Moreover, most energy services trade remains intra-EU and the study has highlighted various market access and discriminatory barriers for Indian players which need to be addressed during the negotiations. In Modes 1 and 3, there is significant scope for removal of barriers.
Indian companies pointed out that since a major part of the sector is unilaterally liberalized and EU companies already operate in India, they do not anticipate any major threats. The BTIA should facilitate know-how exchanges and business-to-business collaboration; and enhance opportunities for SME collaboration and investment by EU financial intermediaries in India. Indian companies can gain from the experience of EU companies in unbundling, privatization, and restructuring, and learn from their global best practices. India’s medium to long-term goal of establishing a national grid can benefit from the TEN-E program of the EU. Their experience in opening up the energy market and encouraging competition and efficiency can be re-utilized through collaboration and technology transfers for India and third-country markets.
References Beke, ‘The Practical Experience of Adapting to the International Accounting Standards’.
Review 110 of International Comparative Management, Volume 11, Issue 1, March 2010.
Draft not for citation and quotation
116
BP, ‘BP Statistical Review of World Energy 2008’, June 2008. BP, ‘BP Statistical Review of World Energy 2012’, June 2012. Buchan, D., ‘How to create a single European electricity market – and subsidise renewables’.
Centre for European Reform Policy Brief. 2012. Commission of the European Communities, ‘Proposal for a Directive of the European
Parliament and of the Council concerning measures to safeguard security of electricity supply and infrastructure investment’. COM (2003) 740 final, 2003/0301 COD.
Commission of the European Communities, ‘Green Paper: A European Strategy for Sustainable, Competitive and Secure Energy’ COM (2006) 105 final.
DGH, ‘Hydrocarbon Exploration and Production Activities 2010-11’. 2010-11 Directorate General for Energy and Transport, European Energy and Transport Scenarios on
Key Drivers, European Commission. September 2004. EC, ‘Doing More with Less: Green Paper on energy efficiency’. 2005. EC, Special Eurobarometer 258 on ‘Energy Issues’. November 2006. EC, ‘Background on energy in Europe: Information prepared for the European Council’. 4
February 2011. EC, ‘Commission Staff Working Document, Executive Summary of the Impact Assessment.
Renewable Energy: A Major Player in the European Energy Market’. SWD (2012) 163 final. 2012.
Europa Press Release, 2007b, ‘Towards a European Energy Consumers’ Charter: protecting the consumers' right to choose’, MEMO/07/278, July 5, 2007, Brussels.
European Commission, ‘Energy Issues: March-April 2006’. November. EWEA, ‘Creating the Internal Energy Market in Europe: A report by the European Wind
Energy Association’. September 2012. Geden, O., C. Marcelis, and A. Maurer, Perspectives for the European Union’s External
Energy Policy: Discourse, Ideas and Interests in Germany, the UK, Poland and France, Working Paper FG 1, 2006/1. German Institute for International and Security Affairs, Berlin. December 2006.
Global Wind Energy Council, Global Wind Report - 2007, Belgium. May 2008 Government of India, Economic Survey 2007-08. Guru, S., Renewable Energy Sources in India: Is it Viable? Working Paper, Julian Simon
Centre for Policy Research, Liberty Institute, New Delhi. 2002. Ministry of Petroleum and Natural Gas, Basic Statistics on Petroleum and Natural Gas,
Government of India. 2008 Ministry of Power, Annual Report 2007-08, Government of India. 2008. Mukherjee, A. and R. Goswami, ‘Trade in Energy Services: GATS and India’, ICRIER
Working Paper No. 231, New Delhi. January 2009.
Planning Commission, India Vision - 2020, Government of India. 2002. Planning Commission, Integrated Energy Policy - Report of the Expert Committee,
Government of India. August 2006. Rangoni, Bernardo, Fourth Annual Conference on competition and regulation in network
industries residence palace, Brussels, Belgium, explaining the incomplete liberalization reform of the Italian Energy Markets. November 2011.
Reddy and Nathan, ‘Energy in the development strategy of Indian households - the missing half’. IGIDR WP-2012-003. 2012.
USTR, Office of the United States Trade Representative, ‘2012 National Trade Estimate Report on Foreign Trade Barriers’. 2012.
World Nuclear Association, 2008a, ‘Supply of Uranium’, Information Papers, June 2008.
Draft not for citation and quotation
117
World Nuclear Association, 2009a, ‘Thorium’, Information Papers, February 2009. WTO, Services Sectoral Classification List (MTN.GNS/W/120), 10 July 1991. WTO, Energy Services - Background Note by the Secretariat, S/C/W/52. September 9, 1998. WTO, ‘Communication from the European Communities and their Member States’. March
23, 2001. WTO, ‘EC - Conditional Initial Offer, and (August 01, 2004), Revised Offer’. April 29, 2003.
Websites http://commerce.nic.in/wto_sub/services/Plurilateral%20Request%20on%20Energy%20Services.pdf http://dipp.nic.in/ http://ec.europa.eu/dgs/energy_transport/state_aid/doc/com_2007_0253_en.pdf http://ec.europa.eu/energy/efficiency/doc/2005_06_green_paper_book_en.pdf http://ec.europa.eu/energy/energy_ policy/facts_en.htm
http://ec.europa.eu/energy/green-paper-energy/doc/2006_03_08_gp_document_en.pdf http://europa.eu/rapid/pressReleasesAction.do?reference=MEMO/07/278&format=HTML&aged=0&language=EN&guiLanguage=en http://epp.eurostat.ec.europa.eu/statistics_explained/index.php/Renewable_energy_statistics http://eur-lex.europa.eu/LexUriServ/LexUriServ.do?uri=CELEX: 52007PC0530:EN:NOT http://europa.eu/rapid/pressReleasesAction.do?reference=MEMO/05/492&type=HTML&age
d=0&language=EN &guiLanguage=en http://europa.eu/scadplus/leg/en/lvb/l27007.htm http://europa.eu/scadplus/leg/en/lvb/l27037.htm http://gail.nic.in/gailnewsite/businesses/gastransmission.html http://petroleum.nic.in/speeches/08-01-2008.doc http://planningcommission.nic.in/ http://renewenergy.wordpress.com/2008/02/03/eight-eu-states-oppose-unbundling-table-third-way/ http://themes.eea.europa.eu/Sectors_and_activities/energy/indicators/EN17,2007.04 http://www.bp.com http://www.eia.doe.gov/emeu/pgem/ch4c.html http://www.eia.gov/cabs/india/Full.html http://www.euractiv.com http://www.eurofound.europa.eu/eiro/2004/05/feature/pl0405104f.htm http://www.europarl.europa.eu/factsheets/4_12_0_en.htm http://www.eurunion.org/eu/index.php?option=com_content&task=view&id=2403 http://www.eusustel.be/public/documents_publ/The%20European%20Union_final.pdf http://www.gwec.net/ http://www.pppinindia.com/sector-power.php http://www.unece.org/press/pr1996/96ene3.htm
Draft not for citation and quotation
118
Chapter 5: Strengthening Trade and Investment Ties between India and the EU - The Case of IT/ITeS Sector
Divya Satija
Introduction Over the past few decades, international offshoring of production and services has grown considerably. It took off in the late 1990s with technological development, globalisation, changes in business models and liberalisation of domestic markets. Despite the global slowdown, the global sourcing market (including IT and business process outsourcing (BPO)) grew from around $106 billion to $118 billion between 2010 and 2011 and IT/ITeS revenues in India are projected to grow by around 12-15 per cent by 2013.247 Today, growth in the Information Technology/Information Technology enabled Services (IT/ITeS) sector provides great business advantage (Lacity and Willcocks 2001, 2008).248 Multinational companies from developed countries have been outsourcing back office operations such as payroll and core operations such as financial analysis to skilled, but low cost suppliers in other countries such as India (Wunsch-Vincent, 2004). In return host countries have benefitted in terms of higher employment opportunities, skill and technological upgradation, greater capital inflows and trade flows, among others (Ghibutiu and Dumitriu, 2008). India is a key player in the global IT/ITeS trade and host to many global IT/ITeS firms. Over the years, the nature of services offered by Indian IT/ITeS companies has changed as they have matured. Earlier India was a preferred destination for setting up captive units and for body shopping, but as Indian large firms and small and medium enterprises (SMEs) are innovating new service offerings, clients are demanding more diversified and complex services. In fact various Indian companies are striving to strengthen their on-site delivery models to expand from being mere offshoring companies. Since IT services are cross cutting and impart efficiency, their usage across different sectors and verticals have been increasing. While mature verticals such as banking and financial services and manufacturing, continue to drive the sourcing market, emerging verticals such as healthcare, communication and media have recorded growth of over 6 per cent in 2011.249 There has been an increase in diversification of delivery locations due to evolving buyer requirements and to mitigate risks associated with labour markets and currency fluctuations. Evolution of the global communications network, falling prices of high-tech equipment, economic and competitive pressures to reduce costs and improve productivity and trade liberalisation, among others are some of the contributing factors to enhancing India’s IT/ITeS trade (Wunsch-Vincent, (2004) and Abramovsky and Griffith, (2006)).250 India along with the European Union (EU), United States (US), Philippines, Brazil and China, rank amongst the major exporters and importers of computer information and services in the world. While clients from the US and the EU (particularly the United Kingdom (UK)) continue to dominate the sector, majority of the IT/ITeS offshoring has been going to India 247 NASSCOM (2012). 248 Ruohonen, 2009 249 ibid. 250 Jona-Lasinio, 2010
Draft not for citation and quotation
119
and the trend is expected to continue (Palugod and Palugod, 2011). In 2008, India accounted for 55 per cent of IT offshoring and about 35 per cent of BPO services outsourced globally (NASSCOM-Everest India BPO Study, 2008).251 Among India’s major export destinations of computer software and services, the US, with a share of 55 per cent, topped the charts in 2009-10. It was followed by the EU countries particularly the UK, Netherlands and Hungary with a total share of 22.87 per cent.252 Over the past two decades, India has emerged as an attractive investment destination particularly a leading IT services off-shoring destination. According to the AT Kearney’s Global Services Location Index (2011), India ranked first among the leading sourcing hubs followed by China, Malaysia, Thailand and Indonesia.253 The global slowdown adversely affected the investment attractiveness quotient in the EU and ranking for majority of member states plummeted. However, ranking of key customer markets for IT/ITeS such as the UK (16th), Germany (26th) and France (44th) revived in 2011. India’s skilled and cheap manpower offers complementarities to the EU, which is facing shortage of labour due to a huge ageing population (EU ICT Task Force report, 2006). Due to its low labour costs and availability of huge human resources with technical and language skills, India has been a major offshoring destination over more than a decade (Ghibutiu and Dumitriu, 2008). The EU has a comparative advantage in technology and research and development (R&D), which is beneficial for India. Although Northern European countries such as Nordic countries are small in size they have good information and communication technology (ICT) network readiness and thus they are competitive on the global scale (Dutta 2008)254. These mutual complementarities have accentuated cross-border movement of Indian IT/ITeS professionals to the EU market and presence of Indian and EU companies in each other’s territories has increased (Chanda, 2009). This has contributed greatly to the growing bilateral trade in this sector across Modes 1, 3 and 4 of the General Agreement of Trade in Services (GATS).255 Against this backdrop it is important to identify what can be India’s offering to the EU in the ongoing Bilateral Trade and Investment Agreement (BTIA) negotiations and its expectations from the EU. Globally there is substantial empirical evidence and literature on IT offshoring, mapping India’s growth, but studies on identifying trade complementarities between India and the EU so as to aximise the benefits of the BTIA are limited. To fill the lacuna, this primary survey based study will analyze the pattern of bilateral trade and investment flows in IT/ITeS sector between India and the EU and identify areas of future cooperation and collaboration between the two economies and barriers faced by the EU companies in India and Indian companies in the EU. The study will also provide recommendations for the negotiating strategy particularly in this sector.
The layout of the paper is as follows: Section 5.1 will briefly define the sector and outline its coverage in India and the EU. Section 5.2 will highlight the recent trends and developments
251 Palugod and Palugod, 2011 252 Electronics and Computer Software Promotion Council, India, Statistical Year Book, 2009-2010 253 This index included 50 countries which were evaluated on 43 measurements across three major categories – financial attractiveness, people skills and availability and business environment. http://www.atkearney.com/index.php/Publications/offshoring-opportunities-amid-economic-turbulence-the-at-kearney-global-services-location-index-gsli-2011.html 254 Ruohonen, 2009 255 According to the GATS classification, the modes of supply can be defined as, Mode 1 – Cross-border trade, Mode 2- Consumption abroad and Mode 3- Commercial presence.
Draft not for citation and quotation
120
in the IT/ITeS sector in India and the EU. Section 5.3 will provide an overview of the regulations affecting this sector across the two economies. Section 5.4 will provide bilateral trade trends between the two economies. Section 5.5 will analyse the key survey findings. Section 5.6 and 5.7 will highlight the barriers and recommend the reforms required in the two economies.
5.1.Definition and Coverage of the sector
Globally there is no universal definition of the IT/ITeS sector. As discussed in Chapter 2, the IT/ITeS sector like any other services sector can be classified either on the basis of the country’s own definition or the United Nations Provisional Central Product Classification (UNCPC). According to Services Sectoral Classification (MTN.GNS/W/120) the IT/ITeS sector is broadly categorised under computer and related services, which includes a) consultancy services related to the installation of computer hardware, b) software implementation services, c) data processing services and d) database services and maintenance and repair services256. This classification is used during the World Trade Organisation (WTO) negotiations. To classify IT/ITeS sector in India, the National Industrial Classification (NIC) 2008 is used and in the EU the information and communication technology (ICT) sector is covered under the NACE Version 2 (for details see Appendix 5A, Chapter 2). There are no differences across the two classifications and both countries classify these services under computer programming, consultancy and related activities and data processing, hosting and related activities. Among other sources, in India, majority of disaggregated data on the IT/ITeS sector is collected by the National Association of Software and Services Companies (NASSCOM) and the Electronics and Computer Software Export Promotion Council (ESC) on a regular basis. Even official sources use these data. However, there are some discrepancies related to definition, method of data collection and construction of indices, across different sources in India. The Eurostat provides disaggregated data for the ICT sector of the EU on a regular interval. The recent trends and developments across the two economies in the next section use these data sources.
5.2.Recent Trends and Developments The IT/ITeS sector is one of the fastest growing services sectors in India. The total revenue of this sector has increased from $8 billion in 2000-01 to $88 billion in 2011.257 According to an estimate258, the IT/ITeS sector is expected to generate total revenue of $225 billion by 2020. It is a major contributor to the GDP, increasing from less than 2 per cent in 2000-01 to 7.1 per cent in 2011-12.259 Though the ICT services sector in the EU has been growing and value addition in the ICT services sector was around $675.42260, its contribution to the gross
256 Due to the evolving nature of the services sector, the CPC has been revised frequently and the current CPC 1.1 provides a relatively more comprehensive schedule. According to the CPC Version 1.1, IT/BPO services are broadly covered under CPC 83 (Other Professional, Business and Technical services), CPC 84, (Telecommunication services; information retrieval and supply services) and CPC 85 (Support services). (The classification is given in Appendix 5A.1). 257 NASSCOM (2012). 258 DIT (2009). 259 NASSCOM (2012). 260 Exchange rate: 1Є = $1.4715, period average for the time period January 01, 2008 to December, 31, 2008, last retrieved August 04, 2012, http://www.oanda.com/currency/historical-rates/
Draft not for citation and quotation
121
domestic product (GDP) is lower than India’s. It contributed 3.7 per cent of EU’s GDP in 2008.261 The evolution of the sector is interesting and technology driven. The emergence of internet services is changing the landscape of this sector across the globe. It is leading to higher use of IT services across sectors and establishing greater interconnectivities between them. It has been reducing requirements of physical movement of professionals and time taken to complete tasks, hence global trade ties are strengthening. The growing need has been facilitating innovations. As a result, R&D expenditure in the IT/ITeS sector across both economies has increased. According to NASSCOM, 2012, in India, engineering and research and development (ER&D) expenditure grew by 2.2 per cent in 2011. India is emerging as a leading ER&D offshoring destination. The ER&D exports from India are estimated to reach $10 billion by 2012. Majority of the exports are directed towards North America and Europe. Though adversely impacted by the global slowdown262, R&D spending in the EU ICT services revived and increased by 2.2 per cent in 2009. Business R&D in ICT industry accounted for 1.7 per cent of the GDP in 2009.263 The IT/ITeS sector in India matured from being service providers to becoming strategic partners to their customers, thereby enabling the customers to expand their operations across different geographies. The domestic market is evolving from existing captive dominated market structure to third party transformational outsourcing relationships. It yields hybrid IT services converging between telecommunications, computer technology and software and more content-oriented industries such as broadcasting and publishing. As a result, the use of IT services is predominant across majority of the sectors. For instance, there has been an increase in IT adoption by the Indian government so as to deliver efficient government services. In addition, sectors such as banking, financial services and insurance, telecommunications, manufacturing, retail, healthcare, travel and transportation, construction and utilities, media, publishing and entertainment and education have increased IT adoption. The ICT industry in the EU has also evolved since the emergence of the internet in the late 1980s and early 1990s. Similar to India there has been convergence across different services such as telecommunications and broadcasting (see Veugelers, 2012). The IT/ITeS sector is skill intensive. The sector has a huge potential for employment generation and skill development. Given the inter-linkages across countries, IT professionals benefit from percolation of technical know-how. In particular Indian workers have benefitted greatly from the IT sector revolution. Abundant pool of cheap and skilled labour has facilitated the emergence of India as a major outsourcing hub. Huge ageing population and constrained supply of labour in various developed countries have contributed to this greatly. As a result, employment generation in this sector is higher in India compared to the EU. The IT/ITeS sector in India employed around 40,000 people in the late 1990s that increased continuously to an estimated figure of 2.0 million in 2008.264 This increased to 2.77 million in 2012.265 In comparison, the ICT services sector in the EU employed 0.22 million people in 2008.266
261 JRC European Commission Report, 2011 262 For details see 2011 Report on R&D in ICT in the European Union 263 Digital Agenda Scoreboard 2012 264 NASSCOM (2008) 265 NASSCOM (2012). 266 JRC European Commission Report, 2011
Draft not for citation and quotation
122
According to the AT Kearney’s Global Services Location Index (2011), in terms of industry activity, India once again topped the chart measuring across three indicators including BPO services, voice services and information technology outsourcing services. In terms of people skills and availability scores, India ranks second with the highest score for size and availability of labour force and education. On the contrary EU member states such as the UK (0.55), France (0.53), Germany (0.31) and Spain (0.40) recorded low scores for size and availability of labour force.267 Availability of skilled workers along with a large unsaturated market and government support in the form of export promotion schemes and incentives had a positive impact on the foreign direct investment (FDI) flows in this sector in India. Between April 2000 and December 2011, cumulative FDI inflows in computer services sector (including hardware and software) $9.4 billion268, which accounted for about 6.9 per cent of the total cumulative FDI inflows.269 The global slowdown and the euro crisis among other factors had a negative effect on FDI inflows. As a result, FDI in this sector exhibits a fluctuating trend during the period 2006-07 to 2010-11 and it declined particularly after the global slowdown. In the EU, FDI inflows in the information and communication services sector were 4.58 per cent of the total FDI inflows in the services sector in 2008.270 The UK among all member states is a prominent destination for both inbound and outbound FDI in this sector. Factors such as UK’s conducive business environment and well developed infrastructure, its position as Europe’s largest e-commerce market and English speaking resource base, makes it an attractive investment destination (Chanda, 2009). Indian companies such as HCL Technologies Limited, Infosys, Tata Consultancy Services (TCS), Birlasoft UK Ltd. and Wipro among others have operations in the UK. Various EU companies such as Siemens, Deutsche Bank, ABN-Amro, Daimler Chrysler, Philips, and Bosch have operations in India. In India, while there were few large enterprises and SMEs in this sector catering to the domestic market, new players both domestic and foreign emerged after the economic liberalisation of the 1990s. What is common across India and the EU is that the sector is dominated largely by SMEs. Various entrepreneurs have invested in start-ups providing specialized services as it involves low initial investment costs while promising high returns. The Indian IT/ITeS sector consists of over 5,000 enterprises offering services across different verticals, majority of which are SMEs. However, large scale companies such as TCS, Wipro and Infosys are some key players in the sector with global presence especially in the US and the EU. A number of global captive centres and foreign companies have invested in India. In the EU, SMEs represented 99.4 per cent of the enterprises, and accounted for 69 per cent of the employment and 58 per cent of the total turnover in 2006 for computer services and related activities (NACE 72) (FWC Sector Competitiveness Studies, 2009). However, the size of EU software companies is, in most cases, considerably smaller than that of their US or Japanese counterparts.
267 This index included 50 countries which were evaluated on 43 measurements across three major categories – financial attractiveness, people skills and availability and business environment. http://www.atkearney.com/index.php/Publications/offshoring-opportunities-amid-economic-turbulence-the-at-kearney-global-services-location-index-gsli-2011.html 268 The Exchange rate: Rs.1 = $0.0192 (average for March 14, 2012 – April 12, 2012). 269 Authors’ compilation from DIPP factsheets 2010 and 2011 270 Calculated from Eurostat, Balance of Payment Statistics.
Draft not for citation and quotation
123
Another thing that is common across both economies is clustering of IT firms around few selected regions. In India, the IT/ITeS sector is largely concentrated in few states and some cities within those states. Initially, the sector developed in cities such as Mumbai (Maharashtra) and Bangalore (Karnataka) mainly after the establishment of a company called Texas Instruments271 in mid 1980s. Delhi and the suburban regions of Noida and Gurgaon also known as the National Capital Region (NCR) developed as popular IT/ITeS locations simultaneously with other cities such as Chennai (Tamil Nadu) and Hyderabad (Andhra Pradesh). These regions have witnessed an upsurge of multinational corporations such as Capgemini and Accenture, among others. Availability of high-speed data communication links and built-up space provided in software technology parks and the availability of high-skilled manpower are some key factors behind this trend (Kumar and Joseph, 2005). With increase in cost in tier I cities companies started to relocate to tier II and III cities and preferences for them cities is growing. In the EU, majority of the ICT services sector turnover is generated in the EU15272 with Spain, Italy, France, Germany, and the UK accounting for approximately 70 per cent of the total turnover. In terms of employment generation, the sector is somewhat concentrated in and around large cities and high tech countries covering the South of the UK, the Benelux, Denmark and Stockholm and the French region of Ile-de-France, the Western Region of Germany and the North of Italy. There are also important clusters in Madrid, Ireland, and Finland, and emerging outsourcing destinations in Northern Ireland, Romania, Bulgaria, the Czech Republic, and Poland. Various American, Chinese, and Indian ICT services multinationals have been establishing R&D, software development, and services units in the EU10273 and the EU15 countries. According to the AT Kearney Index (2011), tier II cities are emerging as attractive destinations of investment. Ranking of member states such as Poland (24th), Estonia (11th), Latvia (13th) and Lithuania (14th), among others has improved considerably. The next section discusses the governance structure and regulations affecting IT/ITeS sector.
5.3.Governance Structure and Regulations India and the EU have a quasi federal governance structure. In India, policies and regulations are formulated at the Central government level and implemented at the state level and in the EU, the ICT sector is governed by different EU Directives which are formulated by the European Commission (EC) and the European Parliament but implemented at the member state level. The Indian government adopted a pro-liberalisation stance towards the IT/ITeS sector, after the 1991 reforms to act as a facilitator for foreign investment. The sector has been considerably liberalised with abolishment of public sector reservations and relaxation of industrial licensing norms and allowing 100 per cent FDI in the sector through automatic route. To promote establishment of export oriented units in India, the government announced
271 Texas Instruments India Ltd started off by setting up a research facility in Bangalore in August 1985 and became the first global technology company to establish its presence in India. 272 The number of member countries in the European Union prior to the accession of ten candidate countries on 1 May 2004. The EU15 of Austria, Belgium, Denmark, Finland, France, Germany, Greece, Ireland, Italy, Luxembourg, Netherlands, Portugal, Spain, Sweden, United Kingdom. 273 Nations that joined the EU in 2004: Czech Republic, Cyprus, Estonia, Hungary, Latvia, Lithuania, Malta, Poland, Slovak Republic, Slovenia). Nations that joined in 2007: Bulgaria, Rumania
Draft not for citation and quotation
124
few schemes such as the special economic zone (SEZ) and export oriented unit (EIU) scheme under which units enjoy 100 per cent tax exemption on profits from exports. In addition, for startups focussed on technology and innovation, a weighted deduction of 150 per cent of expenditure incurred on in-house R&D is also available under the Income Tax Act, 1961. In the EU too there are hardly any market access restrictions to investment in IT/ITeS services. Both economies have offered to liberalise investments in services in their respective WTO Revised Offers (for details see274). India offered to allow 100 per cent FDI under the automatic route in data processing, software development and computer consultancy services, software supply services, business and management consultancy services, market research services, technical testing and analysis services. The Indian government regulations do not distinguish between domestic and foreign players. In the EU there are some distinctions between EU and non-EU companies based on their modes of operation. In terms of regulations, the Indian IT/ITeS sector is governed and regulated at the Centre by the Department of Information Technology (DIT), under the Ministry of Communications and Information Technology. The sector is primarily regulated under two acts, the Information Technology (Amendment) Act, 2008, an amended version of the Information Technology Act, 2000 and the Semiconductor Integrated Circuits Layout Design Act, 2000. Other acts such as the Copyright Act, 1957 and its various amendments govern the Intellectual Property Rights (IPR) of computer software. Since the sector is highly integrated, policies of other government departments such as Department of Telecommunications (DoT), the Telecom Regulatory Authority of India (TRAI), Ministry of Finance (Taxation, Special Economic Zones etc.) impact this sector. The services market in the EU is not harmonised. However, various Directives are implemented to regulate the ICT sector. The Services Directive (discussed in Chapter 2) aims to integrate the services market. This Directive only regulates computer programming and consultancy services, and excludes other services under the ICT services sector.275 Some regulations affecting the IT/ITeS trade are discussed in details below:
5.3.1. Data Protection regulations in India and the EU One of the key issues relating to IT/ITeS services and trade flows in this sector is data security. Data protection in India is governed under the Information Technology (Amendment) Act, 2008, which is the key Act regulating the IT/ITeS sector. This Act provides legal recognition for the transactions carried out by means of electronic data interchange and other means of electronic communication, commonly referred to as ‘Electronic Commerce’, which involve the use of alternatives to paper based methods of communication and storage of information. This Act does have some deficiencies. To overcome them, and to address the latest developments in the sector, the Act was amended last year. In April 2011, the Ministry of Communications and Information Technology, Government of India, notified the Information
274 EU’s Revised Offer; Communication from the European Communities and its Member States, Conditional Revised Offer, TN/S/O/EEC/Rev.1, 29 June 2005, http://www.esf.be/pdfs/GATS%20Revised%20Offers/EU%20revised%20GATS%20offer.pdf India’s Revised Offer: India Revised Offer, TN/S/O/IND/Rev.1, 24 August 2005, http://commerce.nic.in/trade/revised_offer1.pdf 275 For details see Section 1 on Definition and Coverage of the Sector.
Draft not for citation and quotation
125
Technology (Reasonable security practices and procedures and sensitive personal data or information) Rules, 2011.
Few prominent changes to the Act include introduction of digital signature, allowing public-private partnership in e-governance delivery of services, etc. To address concerns about the “Data Protection and Privacy”, and to bring the Indian regulatory regime in line with the global regulations more stringent provisions have been provided for data protection in the new Rules. Some of them are listed below: (a) Sensitive personal data or information to be handled with reasonable security practices
and procedures, (b) Gradation of severity of computer related offences, committed dishonestly or fraudulently
and punishment thereof ; and (c) Introduction of additional section for breach of confidentiality with intent to cause injury
to a subscriber. Regulations governing data security are very crucial across the EU. To provide a regulatory framework to guarantee secure and free exchange of data across the national borders of EU member states, the EU Directive on the protection of individuals with regard to the processing of personal data and on the free movement of such data or “Data Protection Directive” (95/46/EC) was formulated It restricts transfer of personal data to locations outside of the EU unless the importing country ensures adequate data protection under domestic regulations or international commitments. The Directive establishes strict guidelines for processing personal information based on the guidelines on the protection of privacy and trans-border flows of personal data adopted by the OECD.276 It is an overarching Directive and has been complemented by new legal instruments that are Directives on data protection specific to different sectors. One such directive is the Data Protection Directive in the electronics communication sector – Privacy and Electronics Communication Directive – 2002/58/EC. This Directive principally concerns with the processing of personal data relating to the delivery of communications services. It is important to note that each member state drafted its own privacy regulation to meet the requirements of the Data Protection Directive. Hence, each member state has different regulations under the same Directive. Some additional Directives that govern the data privacy in the ICT services sector are given below:
• Directive 2000/31/EC on certain legal aspects of information society services, in particular electronic commerce, in the Internal Market or “Directive on Electronic Commerce”;
276 It requires companies processing the data to appoint a data controller who must register with government authorities. The data controller must notify the government authorities before processing any data. This notification includes informing the individual of the purpose of the processing, providing a description of the data subject and of the recipients to whom the data might be disclosed, proposed transfers to third countries, and a description to ensure that basic security requirements have been met. It also requires a government authority to oversee data processing activities. Individual EU member countries are required to establish an independent public authority, namely, Data Protection Commissions, to supervise the protection of personal data by investigating and monitoring data processing activities and intervening in these activities where required.
Draft not for citation and quotation
126
• Directive 2002/20/EC on the authorisation of electronic communications networks and services or “Authorisation Directive”;
• Directive 2002/58/EC concerning the processing of personal data and the protection of privacy in the electronic communications sector or “Directive on Privacy and Electronic Communications”
• Directive on legal protection of designs (98/71/EC) and Directive on the enforcement of intellectual property rights (2004/48/EC) and the Directive on harmonising certain aspects of copyright and related rights in the information society or the Copyright Directive, (2001/29/EC) govern protection of intellectual property rights.
It is important to note that data protection regulations play a key role in outsourcing of services, contracting of foreign firms and employment creation in this sector. Therefore they have an overarching impact on trade, investment and collaboration which are discussed later in this chapter. 5.3.2. Labour Mobility and Labour Market Regulations As discussed, the IT/ITeS sector is highly labour-intensive. Hence, cross country labour mobility is crucial to enhance trade in this sector. In the EU, work permits and visas are under the purview of individual member states which restrict mobility of foreign workers. Unlike the EU, movement of foreign nationals from one state to another is not restricted in India. Hence as a market the EU is relatively more restrictive than India. In India, foreign nationals in IT/ITeS sector are treated as professionals and a work permit is granted based on valid working contract and an income of $25,000 and above. Once a visa for stay of over 180 days is granted, the foreign national can enter India and has to register at the Foreigner’s Regional Registration Office (FRRO) within 14 days of entry into India. Each state has their FRROs and hence an expat can register in the state where he will be working.277 A foreign national employed in India by an Indian company has to be paid in local currency by the employer. In addition, on September 30, 2009, the Reserve Bank of India issued a notification which stipulates that a foreign citizen who is resident in India and employed with an Indian company, can remit his entire salary received in India in Indian rupees, to any foreign currency account in a bank outside India as long as such foreign citizen pays income tax on his entire salary accrued in India. A professional in India has to abide by the labour market regulations, although there were some relaxations for the IT/ITeS sector. The Industrial Employment (Standing Orders) Act, 1946 formulated by the Labour and Employment Department under the Ministry of Labour and Employment is one of the main Acts that protect the interests of labour in India. However, IT/ITeS sector was largely exempted from this Act. This measure was initiated to grant companies flexibility to hire and fire employees. However, given that the sector is highly human-capital intensive, employing millions of people, the government recently felt that there is need to protect the interest of labour. As result, the Labour and Employment Department rejected the exemption limit to the Act in the year 2012. The IT/ITeS sector will now be regulated under the purview of the Act which requires employers to define and inform workers the terms and conditions of employment on their premises. This can lead to greater interference by workers and strikes and other disturbances by trade unions. It is likely to hurt this services industry which unlike the manufacturing sector heavily relies on contractual labour.
277 http://www.realestatemumbai.com/Expatriates/FRRO-Foreigners-Regional-Registration-Office.aspx
Draft not for citation and quotation
127
At the state level some states such as West Bengal and Karnataka have implemented state-specific labour regulations.278 to facilitate the growth of IT/ITES sector. For example, in West Bengal IT/ITeS companies are treated as public utilities and are exempted from strikes. There are certain exemptions which allow employees to work 24X7 and 365 days a year. According to an amendment of the Karnataka Shops and Commercial Establishments Act, 1961 in 2002, women IT workers are allowed to work during night shifts. Regulating labour mobility in the EU is a member state specific subject and each member state imposes different conditions on labour movement. This restricts movement of non-EU professionals/nationals. Over the years some measures have been taken at the EU level to facilitate intra-EU mobility, some of which has implications for foreign nationals.
1. Non-EU nationals entering the EU for a short term for business purposes can avail a Schengen Visa (SV). With the SV, nationals can stay and work in the selected EU member states279 for upto 90 days. Nationals can visit other member states and other countries in Europe in the Schengen territory that are signatories of the Schengen Accord with this short term business visa.
2. The “Blue Card Directive”, (2009/50/EC)280, of the EU allows a high skilled third country national to enter, re-enter and reside -for more than three months-in the territory of a member state of the EU. The objective of the Directive is to meet the growing shortage of high skilled labour in the EU. The EU Blue Card once granted to a non-EU national with a job offer, authorises uniform entry and residence, in an EU member state. It provides access to the EU labour market and residence rights. The EU Blue Card holders enjoy equal treatment with nationals of the member state issuing it as regards working conditions, social security, pensions, etc. After 18 months of legal residence in the first Member State, Blue Card holders and their family members may move to another member state for the purpose of highly qualified employment. They will, however, need to obtain the approval of the relevant authority in the second member state. The EU Blue Card will be valid from one to four years, with the possibility of renewal. A Blue Card may also be issued or renewed for shorter periods in order to cover the work contract duration plus three months. The EU Blue Card will be issued by the relevant authorities of the participating member states. The decision on an EU Blue Card application is taken within 90 days of the application being lodged.
3. The EU “Single Permit Directive”, (2011/98/EU) seeks to establish a simplified and harmonised procedure for non-EU nationals in order to obtain a work and residence permit in the EU member states. It defines a common set of rights awarded to migrants in order to address the gaps between third-country workers and EU citizens.
278 For details on Labor Laws for IT/ITeS companies in Kolkata, see Appendix 5B. 279 Signatories to the Schengen Accord include Austria, Belgium, Czech Republic, Denmark, Estonia, Finland, France, Germany, Greece, Hungary, Iceland, Italy, Latvia, Lithuania, Luxembourg, Malta, Netherlands, Norway, Poland, Portugal, Slovakia, Slovenia, Spain, Sweden, and Switzerland. 280 The EU Blue Card is the authorisation entitling its holders to reside and work in the territory of an EU Member State. It is not a substitute for a visa, but those who have applied for the EU Blue Card and have received a positive response will be granted every facility to obtain the requisite visas. The Blue Card Directive (2009/50/EC) was adopted by the EU Council on 25 May 2009 and came into force on 19 June 2009. The Directive determines in detail the common criteria for applicants of the EU Blue Card. It also requires that Member States transpose its provisions into their national legislation by 19 June 2011.
Draft not for citation and quotation
128
It necessitates a single application procedure when non-EU nationals apply for work or stay in a member state. The Directive applies to two main categories of non-EU nationals. The first category covers non-EU nationals who apply to reside in a member state to work, to whom the single application procedure is applicable. The second group includes those who have already been admitted to a member state for the purpose of work or purposes other than work and who are allowed to work, such as family members of migrant workers, students and scientific researchers.
Since the EU labour mobility legislations are not harmonised there are certain member state specific legislations that affect labour mobility. Some of these are summarized below: Table 1: Selected Member State specific Labour Movement Regulations Regulation France • No regulations on workers from EU-8 countries
• For Bulgaria and Romania: French employers can use a simplified procedure for introducing foreign labour for 61 occupations from 7 major fields of activity. For these occupations, foreign labour departments will not use the job situation in France as an objection
Ireland • No special limitations on workers from EU-8 (since 2004) • Restrictions on workers from Bulgaria and Romania • Bulgarian and Romanian Job Seekers will continue to
require a work permit. However, any of these citizens who were in Ireland on 1 Jan. 2007 for a period of 12 months or more and holding a valid work permit for that time will no longer have any restrictions and will, along with their spouses, have unrestricted access to the labour market and state employment services
Italy • Since 27 July 2006 no restrictions concerning the free movement of workers from EU-8 are in force, thus giving full effect to the free entry of all nationals from the new member states to the
• Italian job market. Restrictions on workers from Bulgaria and Romania.
• There is a transitional arrangement for a period of one year prior to allowing citizens of Romania and Bulgaria to have full access to paid employment (except self-employment). The transitional arrangement has opened the following sectors: agriculture and hotel and tourism, domestic work and care services, construction, engineering, managerial and highly skilled work, and seasonal work. Since 27 July 2006 no restrictions concerning the free movement of workers from EU-8 are in force, thus giving full effect to the free entry of all nationals from the new member states to the Italian job market.
• Restrictions on workers from Bulgaria and Romania. Any employer who wishes to hire a Romanian or Bulgarian worker for one of the above sectors must comply with the
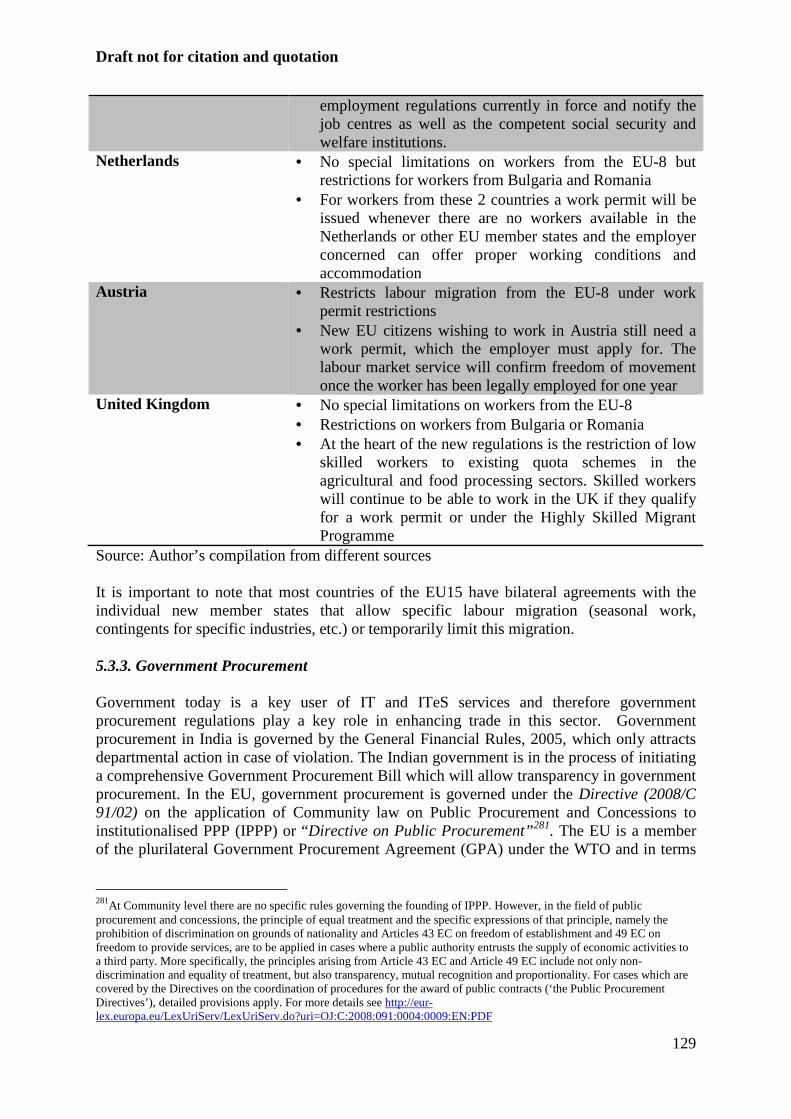
Draft not for citation and quotation
129
employment regulations currently in force and notify the job centres as well as the competent social security and welfare institutions.
Netherlands • No special limitations on workers from the EU-8 but restrictions for workers from Bulgaria and Romania
• For workers from these 2 countries a work permit will be issued whenever there are no workers available in the Netherlands or other EU member states and the employer concerned can offer proper working conditions and accommodation
Austria • Restricts labour migration from the EU-8 under work permit restrictions
• New EU citizens wishing to work in Austria still need a work permit, which the employer must apply for. The labour market service will confirm freedom of movement once the worker has been legally employed for one year
United Kingdom • No special limitations on workers from the EU-8 • Restrictions on workers from Bulgaria or Romania • At the heart of the new regulations is the restriction of low
skilled workers to existing quota schemes in the agricultural and food processing sectors. Skilled workers will continue to be able to work in the UK if they qualify for a work permit or under the Highly Skilled Migrant Programme
Source: Author’s compilation from different sources It is important to note that most countries of the EU15 have bilateral agreements with the individual new member states that allow specific labour migration (seasonal work, contingents for specific industries, etc.) or temporarily limit this migration. 5.3.3. Government Procurement Government today is a key user of IT and ITeS services and therefore government procurement regulations play a key role in enhancing trade in this sector. Government procurement in India is governed by the General Financial Rules, 2005, which only attracts departmental action in case of violation. The Indian government is in the process of initiating a comprehensive Government Procurement Bill which will allow transparency in government procurement. In the EU, government procurement is governed under the Directive (2008/C 91/02) on the application of Community law on Public Procurement and Concessions to institutionalised PPP (IPPP) or “Directive on Public Procurement”281. The EU is a member of the plurilateral Government Procurement Agreement (GPA) under the WTO and in terms
281At Community level there are no specific rules governing the founding of IPPP. However, in the field of public procurement and concessions, the principle of equal treatment and the specific expressions of that principle, namely the prohibition of discrimination on grounds of nationality and Articles 43 EC on freedom of establishment and 49 EC on freedom to provide services, are to be applied in cases where a public authority entrusts the supply of economic activities to a third party. More specifically, the principles arising from Article 43 EC and Article 49 EC include not only non-discrimination and equality of treatment, but also transparency, mutual recognition and proportionality. For cases which are covered by the Directives on the coordination of procedures for the award of public contracts (‘the Public Procurement Directives’), detailed provisions apply. For more details see http://eur-lex.europa.eu/LexUriServ/LexUriServ.do?uri=OJ:C:2008:091:0004:0009:EN:PDF

Draft not for citation and quotation
130
of regulations has a more robust domestic regulation compared to India. India has an observer status in the GPA. Given the sector overview and the regulatory framework, the next section provides a snapshot of India-EU bilateral trade in this sector.
5.4.Global and Bilateral Trade In India trade data on IT/ITeS sector is provided by different sources such as NASSCOM, Reserve Bank of India (RBI) and United Nations Conference on Trade and Development (UNCTAD). There is slight heterogeneity in the data recorded by different sources. Nevertheless, all sources confirm that since 2005, computer and information services accounts for the highest share in India’s total services exports. According to an RBI estimate, total software services exports (computer services and ITeS/BPO services exports) of India during 2009-10 was estimated at $38.7 billion, of which computer services exports accounted for nearly 69 per cent.282 The UNCTAD estimate indicates that in 2010, computer and information services exports at $56.7 billion accounted for 46 per cent of India’s total services exports.283 On an average, large Indian companies like TCS and Infosys have been exporting computer software services to over 145 countries every year. Table 2 shows the exports of some Indian companies and foreign wholly -owned subsidiaries. Table 2: Company-wise Exports of Computer Software Services in 2009-10 Company Total Exports (US$ Million) Tata Consultancy Services Ltd. 5119.94 Infosys BPO Ltd. 4456.37 Wipro Ltd. 3516.23 Cognizant Technology Solutions India Pvt. Ltd. 3284.36 HCL technologies 2129.85 IBM India Pvt. Ltd. 1357.93 Accenture Services Pvt. Ltd. 940.98 Tech Mahindra Ltd. 905.78 Mphasis Ltd. 816.61 Patni Computer Systems Ltd. 624.61 Source: Compiled from Statistical Year Book, 2009-10’, Electronics and Computer Software Export Promotion Council In India the export market is more robust than the domestic market for IT/ITeS sector. Between 2006 and 2012 revenue from exports and the domestic market grew by 65 per cent and 59 per cent respectively (see Figure 1).
282 RBI Press Release, June 2011. 283 Calculated by author by using data obtained from UNCTAD Database on ‘International Trade -Services’, http://unctadstat.unctad.org/ReportFolders/reportFolders.aspx (last accessed on March 2, 2012).
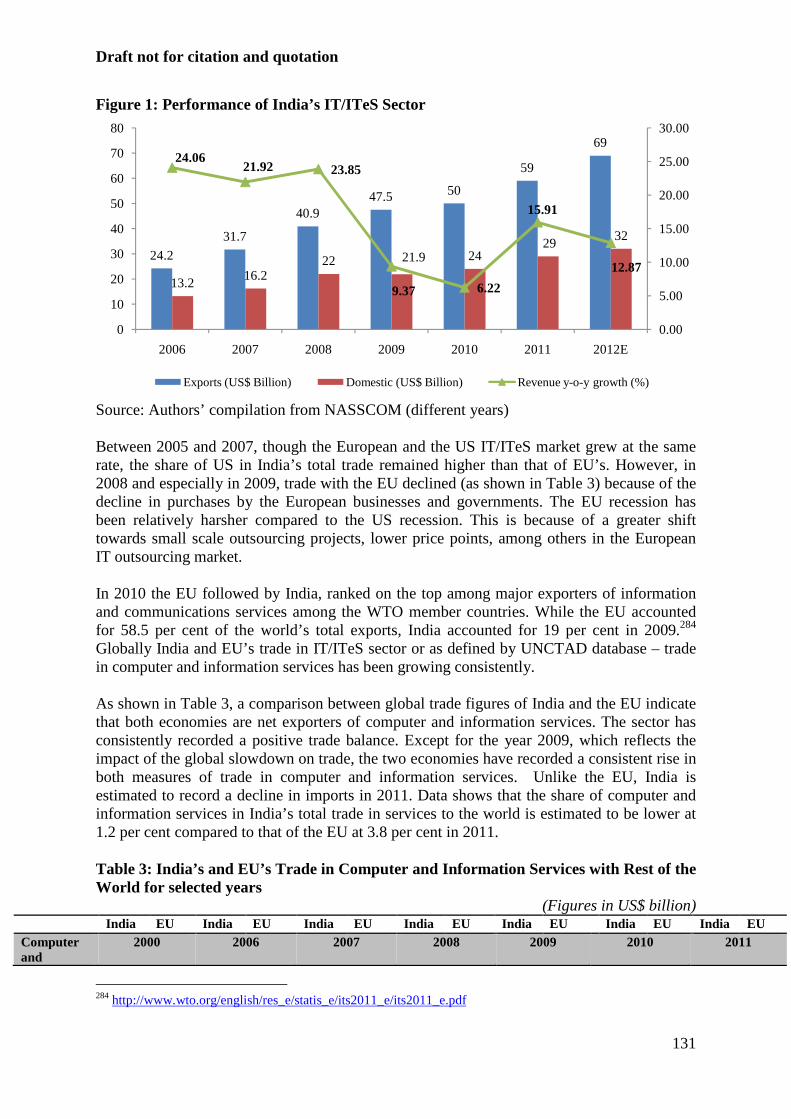
Draft not for citation and quotation
131
Figure 1: Performance of India’s IT/ITeS Sector
Source: Authors’ compilation from NASSCOM (different years) Between 2005 and 2007, though the European and the US IT/ITeS market grew at the same rate, the share of US in India’s total trade remained higher than that of EU’s. However, in 2008 and especially in 2009, trade with the EU declined (as shown in Table 3) because of the decline in purchases by the European businesses and governments. The EU recession has been relatively harsher compared to the US recession. This is because of a greater shift towards small scale outsourcing projects, lower price points, among others in the European IT outsourcing market. In 2010 the EU followed by India, ranked on the top among major exporters of information and communications services among the WTO member countries. While the EU accounted for 58.5 per cent of the world’s total exports, India accounted for 19 per cent in 2009.284 Globally India and EU’s trade in IT/ITeS sector or as defined by UNCTAD database – trade in computer and information services has been growing consistently. As shown in Table 3, a comparison between global trade figures of India and the EU indicate that both economies are net exporters of computer and information services. The sector has consistently recorded a positive trade balance. Except for the year 2009, which reflects the impact of the global slowdown on trade, the two economies have recorded a consistent rise in both measures of trade in computer and information services. Unlike the EU, India is estimated to record a decline in imports in 2011. Data shows that the share of computer and information services in India’s total trade in services to the world is estimated to be lower at 1.2 per cent compared to that of the EU at 3.8 per cent in 2011. Table 3: India’s and EU’s Trade in Computer and Information Services with Rest of the World for selected years
(Figures in US$ billion) India EU India EU India EU India EU India EU Indi a EU India EU Computer and
2000 2006 2007 2008 2009 2010 2011
284 http://www.wto.org/english/res_e/statis_e/its2011_e/its2011_e.pdf
24.2
31.7
40.947.5 50
59
69
13.216.2
22 21.9 2429
32
24.0621.92 23.85
9.37 6.22
15.91
12.87
0.00
5.00
10.00
15.00
20.00
25.00
30.00
0
10
20
30
40
50
60
70
80
2006 2007 2008 2009 2010 2011 2012E
Exports (US$ Billion) Domestic (US$ Billion) Revenue y-o-y growth (%)
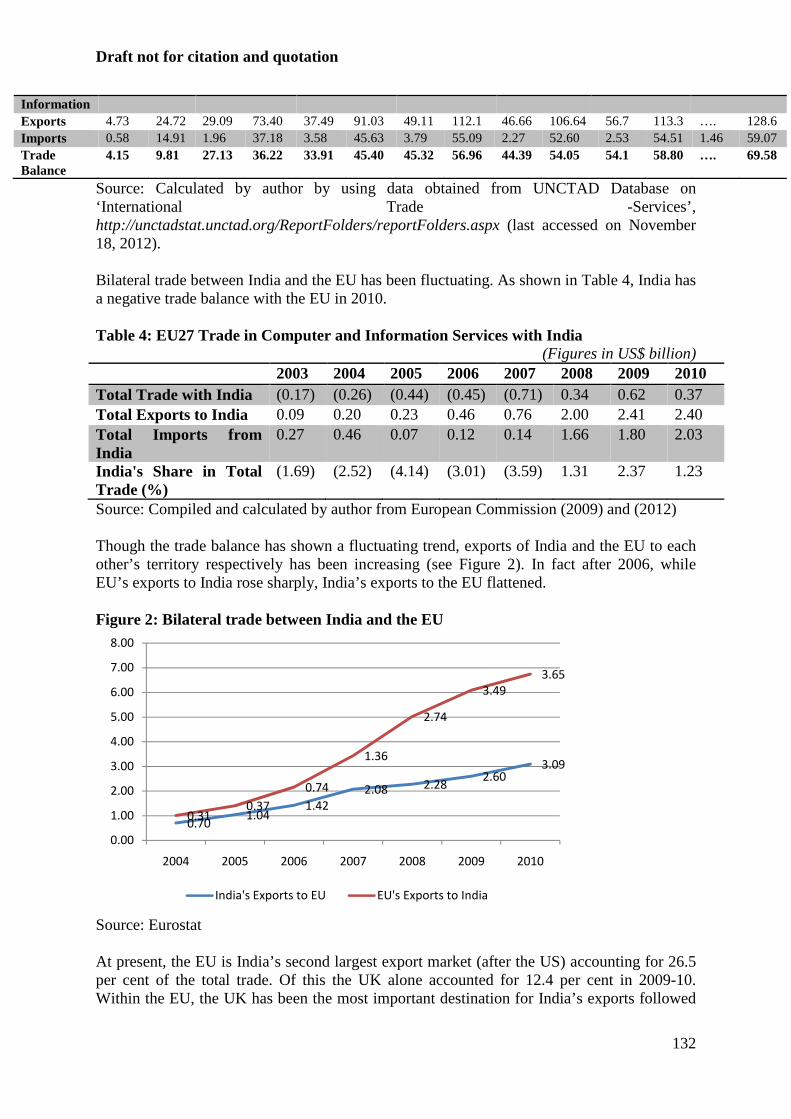
Draft not for citation and quotation
132
Information Exports 4.73 24.72 29.09 73.40 37.49 91.03 49.11 112.1 46.66 106.64 56.7 113.3 …. 128.6 Imports 0.58 14.91 1.96 37.18 3.58 45.63 3.79 55.09 2.27 52.60 2.53 54.51 1.46 59.07 Trade Balance
4.15 9.81 27.13 36.22 33.91 45.40 45.32 56.96 44.39 54.05 54.1 58.80 …. 69.58
Source: Calculated by author by using data obtained from UNCTAD Database on ‘International Trade -Services’, http://unctadstat.unctad.org/ReportFolders/reportFolders.aspx (last accessed on November 18, 2012). Bilateral trade between India and the EU has been fluctuating. As shown in Table 4, India has a negative trade balance with the EU in 2010. Table 4: EU27 Trade in Computer and Information Services with India
(Figures in US$ billion) 2003 2004 2005 2006 2007 2008 2009 2010 Total Trade with India (0.17) (0.26) (0.44) (0.45) (0.71) 0.34 0.62 0.37 Total Exports to India 0.09 0.20 0.23 0.46 0.76 2.00 2.41 2.40 Total Imports from India
0.27 0.46 0.07 0.12 0.14 1.66 1.80 2.03
India's Share in Total Trade (%)
(1.69) (2.52) (4.14) (3.01) (3.59) 1.31 2.37 1.23
Source: Compiled and calculated by author from European Commission (2009) and (2012) Though the trade balance has shown a fluctuating trend, exports of India and the EU to each other’s territory respectively has been increasing (see Figure 2). In fact after 2006, while EU’s exports to India rose sharply, India’s exports to the EU flattened. Figure 2: Bilateral trade between India and the EU
Source: Eurostat At present, the EU is India’s second largest export market (after the US) accounting for 26.5 per cent of the total trade. Of this the UK alone accounted for 12.4 per cent in 2009-10. Within the EU, the UK has been the most important destination for India’s exports followed
0.701.04
1.42
2.08 2.282.60
3.09
0.310.37
0.74
1.36
2.74
3.49
3.65
0.00
1.00
2.00
3.00
4.00
5.00
6.00
7.00
8.00
2004 2005 2006 2007 2008 2009 2010
India's Exports to EU EU's Exports to India
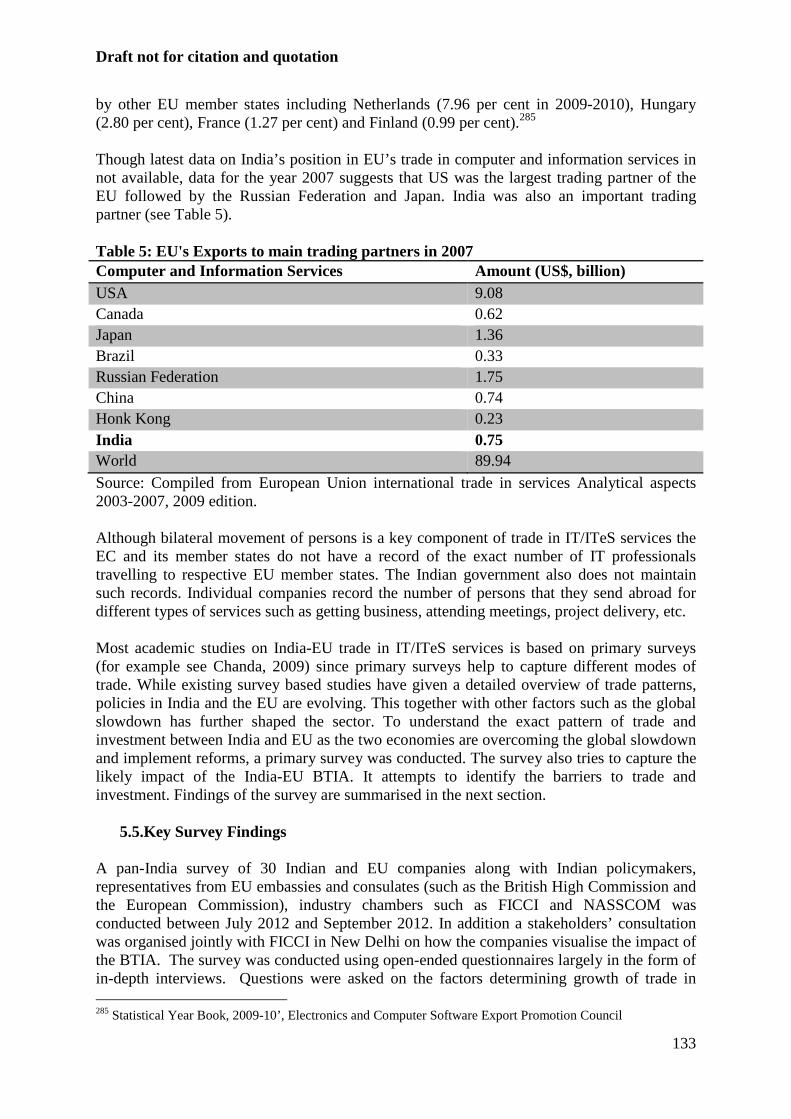
Draft not for citation and quotation
133
by other EU member states including Netherlands (7.96 per cent in 2009-2010), Hungary (2.80 per cent), France (1.27 per cent) and Finland (0.99 per cent).285 Though latest data on India’s position in EU’s trade in computer and information services in not available, data for the year 2007 suggests that US was the largest trading partner of the EU followed by the Russian Federation and Japan. India was also an important trading partner (see Table 5). Table 5: EU's Exports to main trading partners in 2007 Computer and Information Services Amount (US$, billion) USA 9.08 Canada 0.62 Japan 1.36 Brazil 0.33 Russian Federation 1.75 China 0.74 Honk Kong 0.23 India 0.75 World 89.94 Source: Compiled from European Union international trade in services Analytical aspects 2003-2007, 2009 edition. Although bilateral movement of persons is a key component of trade in IT/ITeS services the EC and its member states do not have a record of the exact number of IT professionals travelling to respective EU member states. The Indian government also does not maintain such records. Individual companies record the number of persons that they send abroad for different types of services such as getting business, attending meetings, project delivery, etc. Most academic studies on India-EU trade in IT/ITeS services is based on primary surveys (for example see Chanda, 2009) since primary surveys help to capture different modes of trade. While existing survey based studies have given a detailed overview of trade patterns, policies in India and the EU are evolving. This together with other factors such as the global slowdown has further shaped the sector. To understand the exact pattern of trade and investment between India and EU as the two economies are overcoming the global slowdown and implement reforms, a primary survey was conducted. The survey also tries to capture the likely impact of the India-EU BTIA. It attempts to identify the barriers to trade and investment. Findings of the survey are summarised in the next section.
5.5.Key Survey Findings A pan-India survey of 30 Indian and EU companies along with Indian policymakers, representatives from EU embassies and consulates (such as the British High Commission and the European Commission), industry chambers such as FICCI and NASSCOM was conducted between July 2012 and September 2012. In addition a stakeholders’ consultation was organised jointly with FICCI in New Delhi on how the companies visualise the impact of the BTIA. The survey was conducted using open-ended questionnaires largely in the form of in-depth interviews. Questions were asked on the factors determining growth of trade in 285 Statistical Year Book, 2009-10’, Electronics and Computer Software Export Promotion Council
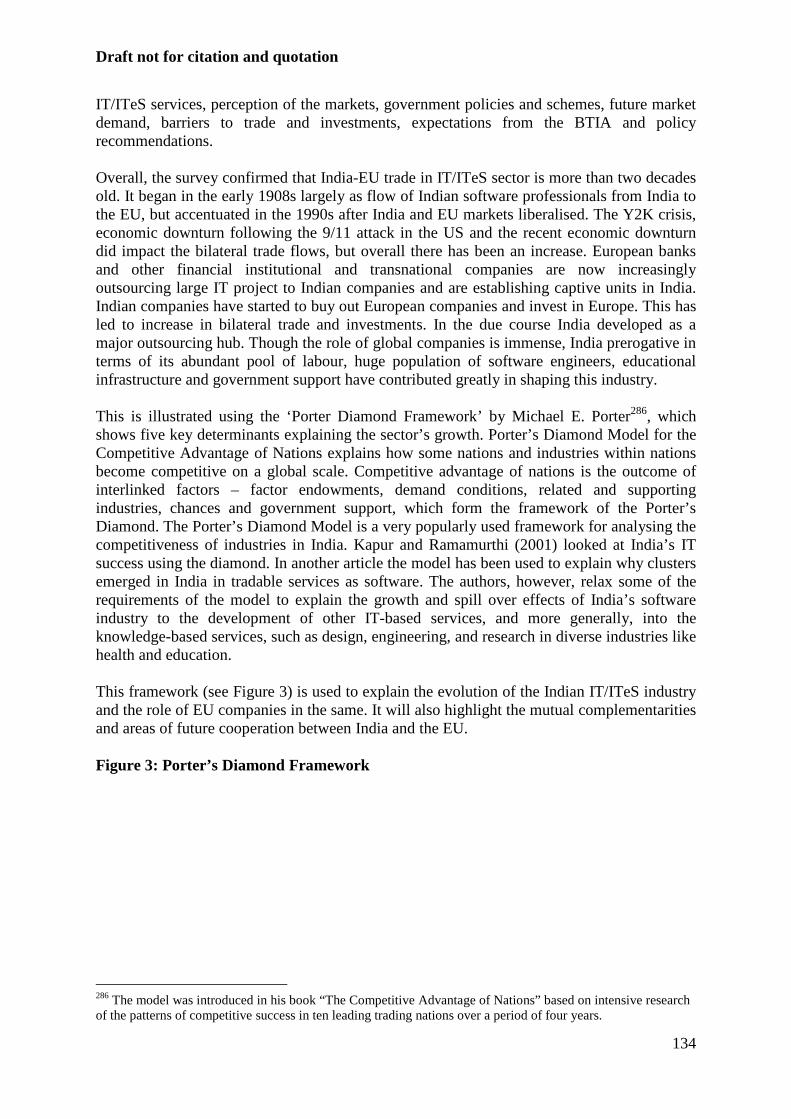
Draft not for citation and quotation
134
IT/ITeS services, perception of the markets, government policies and schemes, future market demand, barriers to trade and investments, expectations from the BTIA and policy recommendations. Overall, the survey confirmed that India-EU trade in IT/ITeS sector is more than two decades old. It began in the early 1908s largely as flow of Indian software professionals from India to the EU, but accentuated in the 1990s after India and EU markets liberalised. The Y2K crisis, economic downturn following the 9/11 attack in the US and the recent economic downturn did impact the bilateral trade flows, but overall there has been an increase. European banks and other financial institutional and transnational companies are now increasingly outsourcing large IT project to Indian companies and are establishing captive units in India. Indian companies have started to buy out European companies and invest in Europe. This has led to increase in bilateral trade and investments. In the due course India developed as a major outsourcing hub. Though the role of global companies is immense, India prerogative in terms of its abundant pool of labour, huge population of software engineers, educational infrastructure and government support have contributed greatly in shaping this industry. This is illustrated using the ‘Porter Diamond Framework’ by Michael E. Porter286, which shows five key determinants explaining the sector’s growth. Porter’s Diamond Model for the Competitive Advantage of Nations explains how some nations and industries within nations become competitive on a global scale. Competitive advantage of nations is the outcome of interlinked factors – factor endowments, demand conditions, related and supporting industries, chances and government support, which form the framework of the Porter’s Diamond. The Porter’s Diamond Model is a very popularly used framework for analysing the competitiveness of industries in India. Kapur and Ramamurthi (2001) looked at India’s IT success using the diamond. In another article the model has been used to explain why clusters emerged in India in tradable services as software. The authors, however, relax some of the requirements of the model to explain the growth and spill over effects of India’s software industry to the development of other IT-based services, and more generally, into the knowledge-based services, such as design, engineering, and research in diverse industries like health and education. This framework (see Figure 3) is used to explain the evolution of the Indian IT/ITeS industry and the role of EU companies in the same. It will also highlight the mutual complementarities and areas of future cooperation between India and the EU. Figure 3: Porter’s Diamond Framework
286 The model was introduced in his book “The Competitive Advantage of Nations” based on intensive research of the patterns of competitive success in ten leading trading nations over a period of four years.
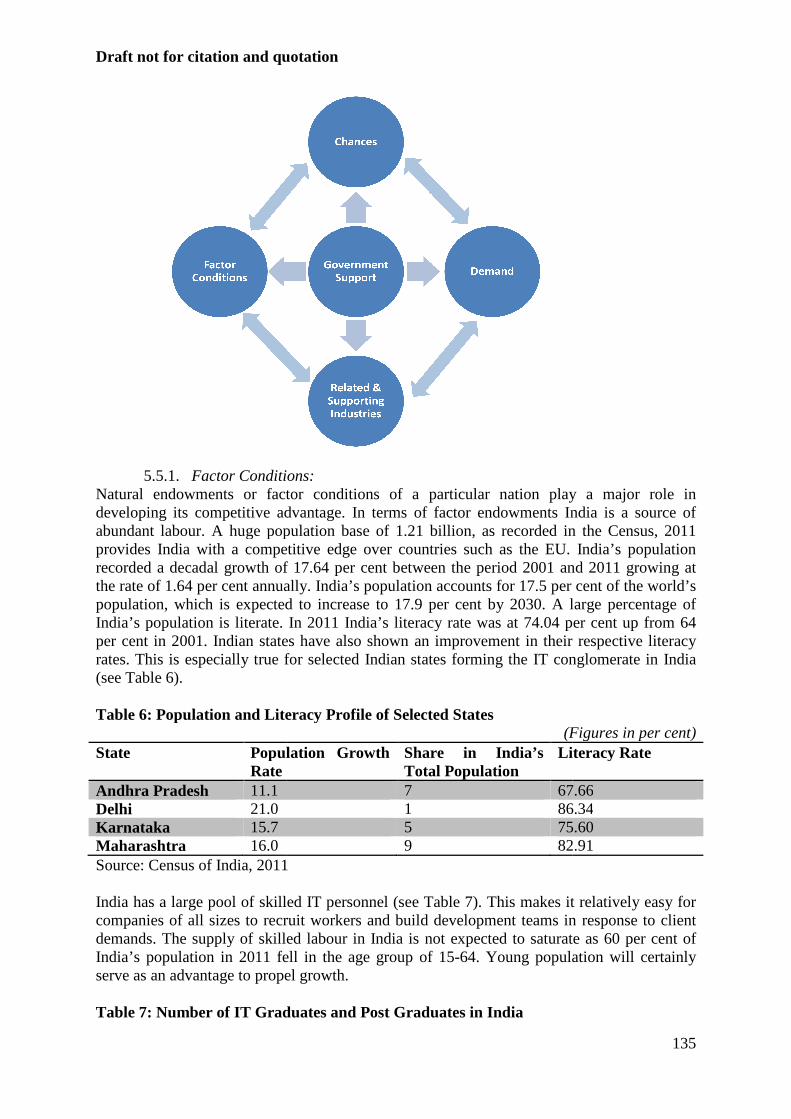
Draft not for cit ation and quotation
5.5.1. Factor Conditions:
Natural endowments or factor conditions of a particular nation play a major role in developing its competitive advantage. In terms of factor endowments India is a source of abundant labour. A huge population base of 1.21 billion, as recorded in the Census, 2011 provides India with a competitive edge over countries such as the EU. India’s population recorded a decadal growth of 17.64 per cent between the period 2001 and 2011 growing at the rate of 1.64 per cent annually. India’s population accounts for 17.5 per cent of the world’s population, which is expected to increase to 17.9 per cent by 2030. A large percentage of India’s population is literate. In 2011 India’s literacy rate was at 74.04 per cper cent in 2001. Indian states have also shown an improvement in their respective literacy rates. This is especially true for selected Indian states forming the IT conglomerate in India (see Table 6). Table 6: Population and Literacy P
State Population Growth Rate
Andhra Pradesh 11.1 Delhi 21.0 Karnataka 15.7 Maharashtra 16.0 Source: Census of India, 2011 India has a large pool of skilled IT personnel (see Table 7). This makes it relatively easy for companies of all sizes to recruit workers and build development teams in response to client demands. The supply of skilled labour in India is not expectedIndia’s population in 2011 fell in the age group of 15serve as an advantage to propel growth. Table 7: Number of IT Graduates and Post Graduates in India
ation and quotation
Factor Conditions: Natural endowments or factor conditions of a particular nation play a major role in developing its competitive advantage. In terms of factor endowments India is a source of
ge population base of 1.21 billion, as recorded in the Census, 2011 provides India with a competitive edge over countries such as the EU. India’s population recorded a decadal growth of 17.64 per cent between the period 2001 and 2011 growing at
1.64 per cent annually. India’s population accounts for 17.5 per cent of the world’s population, which is expected to increase to 17.9 per cent by 2030. A large percentage of India’s population is literate. In 2011 India’s literacy rate was at 74.04 per cper cent in 2001. Indian states have also shown an improvement in their respective literacy rates. This is especially true for selected Indian states forming the IT conglomerate in India
Table 6: Population and Literacy Profile of Selected States (Figures in per cent)
Population Growth Rate
Share in India’s Total Population
Literacy Rate
7 67.66 1 86.34 5 75.60 9 82.91
2011
India has a large pool of skilled IT personnel (see Table 7). This makes it relatively easy for companies of all sizes to recruit workers and build development teams in response to client demands. The supply of skilled labour in India is not expected to saturate as 60 per cent of India’s population in 2011 fell in the age group of 15-64. Young population will certainly serve as an advantage to propel growth.
Table 7: Number of IT Graduates and Post Graduates in India
135
Natural endowments or factor conditions of a particular nation play a major role in developing its competitive advantage. In terms of factor endowments India is a source of
ge population base of 1.21 billion, as recorded in the Census, 2011 provides India with a competitive edge over countries such as the EU. India’s population recorded a decadal growth of 17.64 per cent between the period 2001 and 2011 growing at
1.64 per cent annually. India’s population accounts for 17.5 per cent of the world’s population, which is expected to increase to 17.9 per cent by 2030. A large percentage of India’s population is literate. In 2011 India’s literacy rate was at 74.04 per cent up from 64 per cent in 2001. Indian states have also shown an improvement in their respective literacy rates. This is especially true for selected Indian states forming the IT conglomerate in India
(Figures in per cent) Literacy Rate
67.66 86.34 75.60 82.91
India has a large pool of skilled IT personnel (see Table 7). This makes it relatively easy for companies of all sizes to recruit workers and build development teams in response to client
to saturate as 60 per cent of 64. Young population will certainly
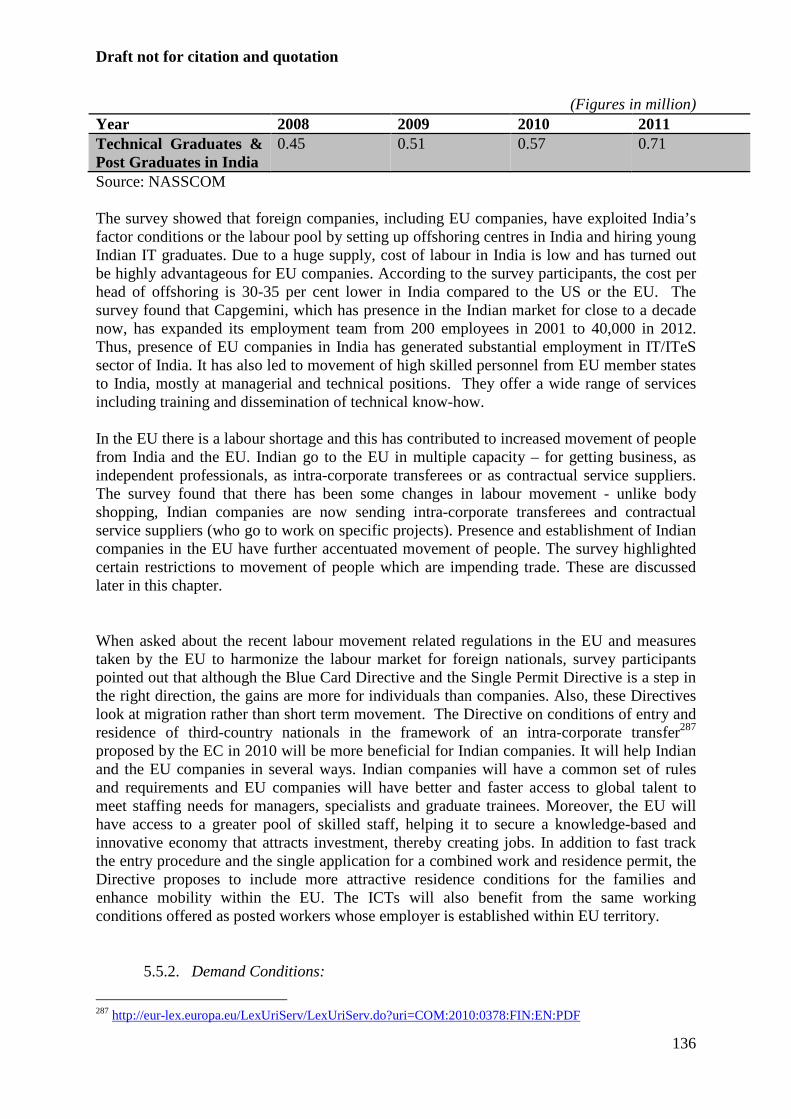
Draft not for citation and quotation
136
(Figures in million) Year 2008 2009 2010 2011 Technical Graduates & Post Graduates in India
0.45 0.51 0.57 0.71
Source: NASSCOM The survey showed that foreign companies, including EU companies, have exploited India’s factor conditions or the labour pool by setting up offshoring centres in India and hiring young Indian IT graduates. Due to a huge supply, cost of labour in India is low and has turned out be highly advantageous for EU companies. According to the survey participants, the cost per head of offshoring is 30-35 per cent lower in India compared to the US or the EU. The survey found that Capgemini, which has presence in the Indian market for close to a decade now, has expanded its employment team from 200 employees in 2001 to 40,000 in 2012. Thus, presence of EU companies in India has generated substantial employment in IT/ITeS sector of India. It has also led to movement of high skilled personnel from EU member states to India, mostly at managerial and technical positions. They offer a wide range of services including training and dissemination of technical know-how. In the EU there is a labour shortage and this has contributed to increased movement of people from India and the EU. Indian go to the EU in multiple capacity – for getting business, as independent professionals, as intra-corporate transferees or as contractual service suppliers. The survey found that there has been some changes in labour movement - unlike body shopping, Indian companies are now sending intra-corporate transferees and contractual service suppliers (who go to work on specific projects). Presence and establishment of Indian companies in the EU have further accentuated movement of people. The survey highlighted certain restrictions to movement of people which are impending trade. These are discussed later in this chapter.
When asked about the recent labour movement related regulations in the EU and measures taken by the EU to harmonize the labour market for foreign nationals, survey participants pointed out that although the Blue Card Directive and the Single Permit Directive is a step in the right direction, the gains are more for individuals than companies. Also, these Directives look at migration rather than short term movement. The Directive on conditions of entry and residence of third-country nationals in the framework of an intra-corporate transfer287 proposed by the EC in 2010 will be more beneficial for Indian companies. It will help Indian and the EU companies in several ways. Indian companies will have a common set of rules and requirements and EU companies will have better and faster access to global talent to meet staffing needs for managers, specialists and graduate trainees. Moreover, the EU will have access to a greater pool of skilled staff, helping it to secure a knowledge-based and innovative economy that attracts investment, thereby creating jobs. In addition to fast track the entry procedure and the single application for a combined work and residence permit, the Directive proposes to include more attractive residence conditions for the families and enhance mobility within the EU. The ICTs will also benefit from the same working conditions offered as posted workers whose employer is established within EU territory.
5.5.2. Demand Conditions:
287 http://eur-lex.europa.eu/LexUriServ/LexUriServ.do?uri=COM:2010:0378:FIN:EN:PDF
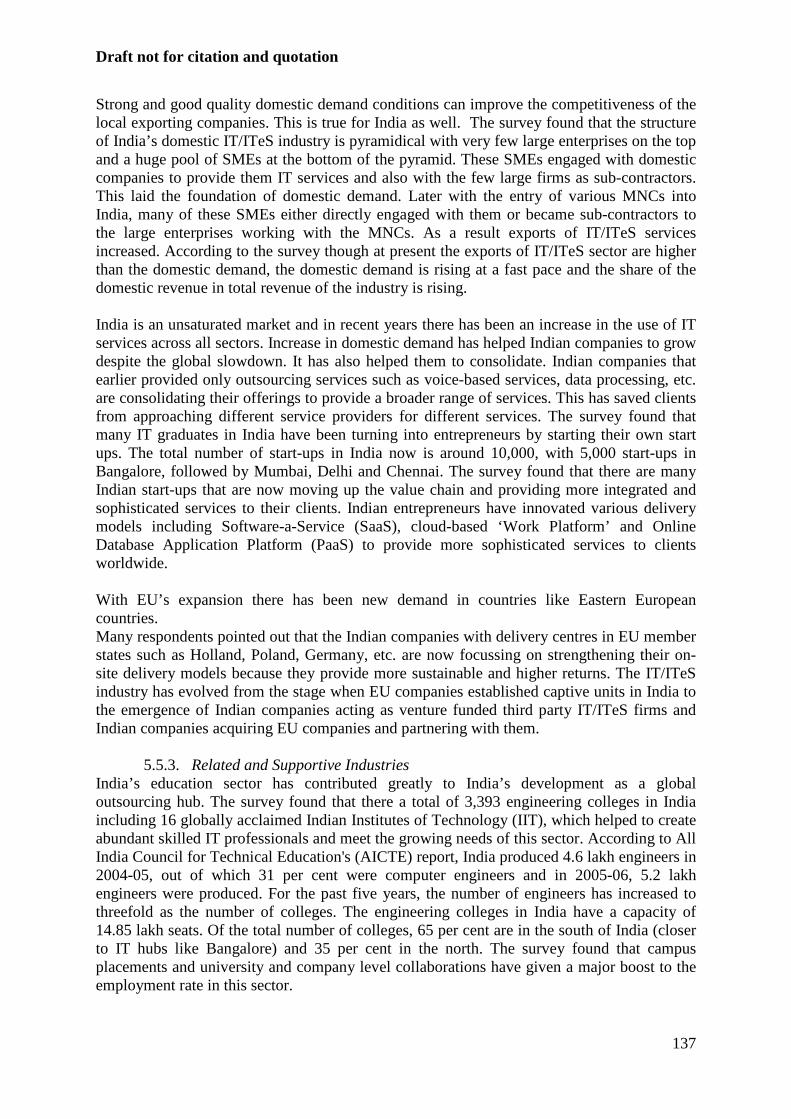
Draft not for citation and quotation
137
Strong and good quality domestic demand conditions can improve the competitiveness of the local exporting companies. This is true for India as well. The survey found that the structure of India’s domestic IT/ITeS industry is pyramidical with very few large enterprises on the top and a huge pool of SMEs at the bottom of the pyramid. These SMEs engaged with domestic companies to provide them IT services and also with the few large firms as sub-contractors. This laid the foundation of domestic demand. Later with the entry of various MNCs into India, many of these SMEs either directly engaged with them or became sub-contractors to the large enterprises working with the MNCs. As a result exports of IT/ITeS services increased. According to the survey though at present the exports of IT/ITeS sector are higher than the domestic demand, the domestic demand is rising at a fast pace and the share of the domestic revenue in total revenue of the industry is rising. India is an unsaturated market and in recent years there has been an increase in the use of IT services across all sectors. Increase in domestic demand has helped Indian companies to grow despite the global slowdown. It has also helped them to consolidate. Indian companies that earlier provided only outsourcing services such as voice-based services, data processing, etc. are consolidating their offerings to provide a broader range of services. This has saved clients from approaching different service providers for different services. The survey found that many IT graduates in India have been turning into entrepreneurs by starting their own start ups. The total number of start-ups in India now is around 10,000, with 5,000 start-ups in Bangalore, followed by Mumbai, Delhi and Chennai. The survey found that there are many Indian start-ups that are now moving up the value chain and providing more integrated and sophisticated services to their clients. Indian entrepreneurs have innovated various delivery models including Software-a-Service (SaaS), cloud-based ‘Work Platform’ and Online Database Application Platform (PaaS) to provide more sophisticated services to clients worldwide. With EU’s expansion there has been new demand in countries like Eastern European countries. Many respondents pointed out that the Indian companies with delivery centres in EU member states such as Holland, Poland, Germany, etc. are now focussing on strengthening their on-site delivery models because they provide more sustainable and higher returns. The IT/ITeS industry has evolved from the stage when EU companies established captive units in India to the emergence of Indian companies acting as venture funded third party IT/ITeS firms and Indian companies acquiring EU companies and partnering with them.
5.5.3. Related and Supportive Industries India’s education sector has contributed greatly to India’s development as a global outsourcing hub. The survey found that there a total of 3,393 engineering colleges in India including 16 globally acclaimed Indian Institutes of Technology (IIT), which helped to create abundant skilled IT professionals and meet the growing needs of this sector. According to All India Council for Technical Education's (AICTE) report, India produced 4.6 lakh engineers in 2004-05, out of which 31 per cent were computer engineers and in 2005-06, 5.2 lakh engineers were produced. For the past five years, the number of engineers has increased to threefold as the number of colleges. The engineering colleges in India have a capacity of 14.85 lakh seats. Of the total number of colleges, 65 per cent are in the south of India (closer to IT hubs like Bangalore) and 35 per cent in the north. The survey found that campus placements and university and company level collaborations have given a major boost to the employment rate in this sector.
Draft not for citation and quotation
138
Newer centres of engineering excellence in cities such as Indore, Jodhpur, Jaipur and Bhopal are emerging with the government adding new IITs and National Institutes of Technology (NIT) to the existing list in tier-II cities and the birth of more private institutes. As a result hiring from tier II and III cities is increasing. The survey found that even industry associations such as the NASSCOM have engaged in various education initiatives for skill creation. For instance, NASSCOM has developed the NASSCOM Assessment of Competence (NAC) to assess and certify talented IT professionals. There is a strong interaction between industries, industry association and education institute in developing skills for IT/ITeS sector. On-the-job training offered by both Indian and European companies have enhanced the skill level in India. Some Indian IT training institutes such as National Institute of Information Technology (NIIT) have globalised and have offices in EU member states such as the UK, Belgium, Netherlands, Germany and Spain. The Indian government is encouraging foreign investments in education sector and to this effect a number of bills including the implementation of the Foreign Educational Institutions Bill, 2010 is being mulled over. Once the Bill is passed, the sector will benefit greatly since it will encourage EU-India university and campus level collaborations that can enhance skill level across both economies. In fact few Indian students surveyed pointed out that they have greatly benefitted from the UK-India Education and Research Initiative (UKIERI), which provides them exposure to global best standards and greater employment opportunities. Survey participants argued that the fast growth of the telecommunications sector has supported the growth of the IT/ITeS sector in India. Technologies such as broadband, video conferencing, instant messaging and internet telephony has reduced time and enabled India to develop as an outsourcing hub. The survey also highlighted the growing role of EU-India collaborative research programmes initiated under the Euro-India Research Centre (EIRC) in the growth of the IT/ITeS sector. The EIRC helps Indian organisations access and benefit from EU funding in R&D. It provides a permanent platform for co-operation between India and the EU that promotes co-operation at research level. In India, the National Contact Point (NCP) is the entity that supports the scientific and business communities in accessing European funds for R&D. In addition, the Framework Programmes for research and technological development of the EU, coordinated by the EIRC has entered into phase 7 (the programmes is called FP7) and India has been strongly participating in these programmes. Over 140 Indian research organisations have been selected to fund around 90 EU projects under the FP7. The objective of joint collaborative research is to enhance innovations and research and technological development in this sector which will benefit IT/ITeS trade across the two economies. Under this programme scientists and researchers from non-EU countries can get work permit and permission to stay for long term of more than three months and short term of less than three months under the Scientific visa package.288
5.5.4. Chances
288 For details see Directive on a specific procedure for admitting third-country nationals for the purposes of scientific research http://eur-lex.europa.eu/LexUriServ/LexUriServ.do?uri=CELEX:32005L0071:EN:NOT
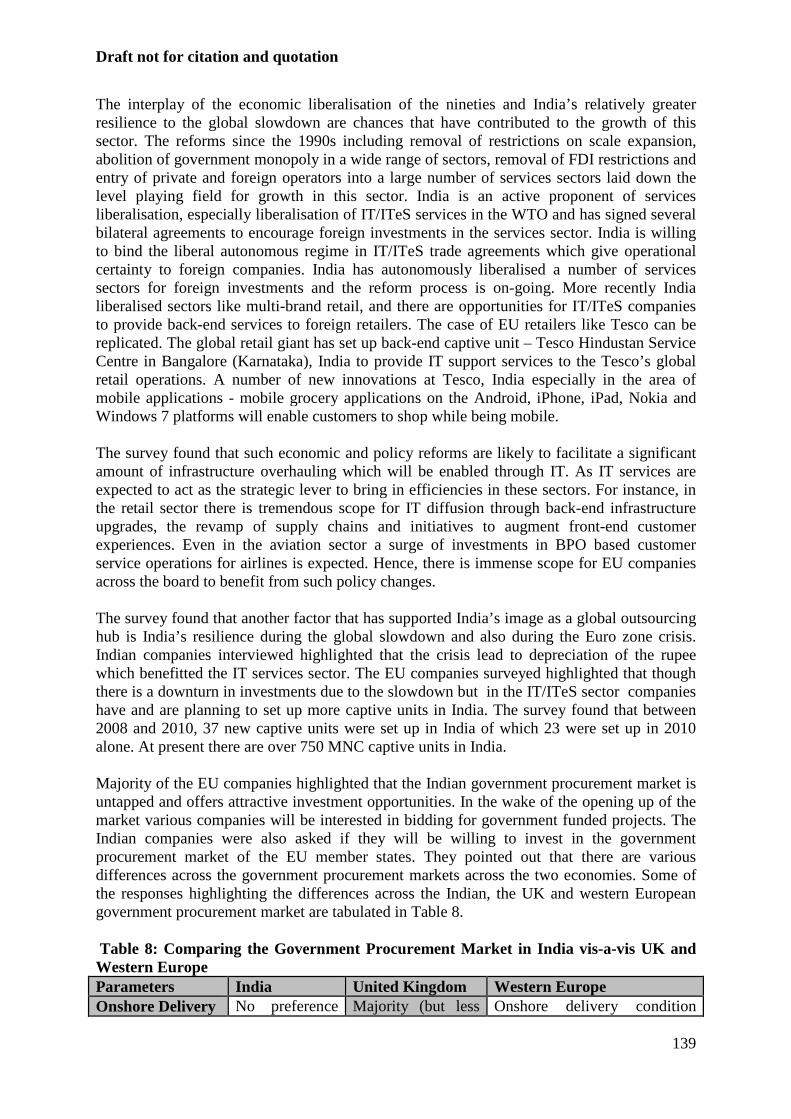
Draft not for citation and quotation
139
The interplay of the economic liberalisation of the nineties and India’s relatively greater resilience to the global slowdown are chances that have contributed to the growth of this sector. The reforms since the 1990s including removal of restrictions on scale expansion, abolition of government monopoly in a wide range of sectors, removal of FDI restrictions and entry of private and foreign operators into a large number of services sectors laid down the level playing field for growth in this sector. India is an active proponent of services liberalisation, especially liberalisation of IT/ITeS services in the WTO and has signed several bilateral agreements to encourage foreign investments in the services sector. India is willing to bind the liberal autonomous regime in IT/ITeS trade agreements which give operational certainty to foreign companies. India has autonomously liberalised a number of services sectors for foreign investments and the reform process is on-going. More recently India liberalised sectors like multi-brand retail, and there are opportunities for IT/ITeS companies to provide back-end services to foreign retailers. The case of EU retailers like Tesco can be replicated. The global retail giant has set up back-end captive unit – Tesco Hindustan Service Centre in Bangalore (Karnataka), India to provide IT support services to the Tesco’s global retail operations. A number of new innovations at Tesco, India especially in the area of mobile applications - mobile grocery applications on the Android, iPhone, iPad, Nokia and Windows 7 platforms will enable customers to shop while being mobile. The survey found that such economic and policy reforms are likely to facilitate a significant amount of infrastructure overhauling which will be enabled through IT. As IT services are expected to act as the strategic lever to bring in efficiencies in these sectors. For instance, in the retail sector there is tremendous scope for IT diffusion through back-end infrastructure upgrades, the revamp of supply chains and initiatives to augment front-end customer experiences. Even in the aviation sector a surge of investments in BPO based customer service operations for airlines is expected. Hence, there is immense scope for EU companies across the board to benefit from such policy changes. The survey found that another factor that has supported India’s image as a global outsourcing hub is India’s resilience during the global slowdown and also during the Euro zone crisis. Indian companies interviewed highlighted that the crisis lead to depreciation of the rupee which benefitted the IT services sector. The EU companies surveyed highlighted that though there is a downturn in investments due to the slowdown but in the IT/ITeS sector companies have and are planning to set up more captive units in India. The survey found that between 2008 and 2010, 37 new captive units were set up in India of which 23 were set up in 2010 alone. At present there are over 750 MNC captive units in India. Majority of the EU companies highlighted that the Indian government procurement market is untapped and offers attractive investment opportunities. In the wake of the opening up of the market various companies will be interested in bidding for government funded projects. The Indian companies were also asked if they will be willing to invest in the government procurement market of the EU member states. They pointed out that there are various differences across the government procurement markets across the two economies. Some of the responses highlighting the differences across the Indian, the UK and western European government procurement market are tabulated in Table 8. Table 8: Comparing the Government Procurement Market in India vis-a-vis UK and Western Europe Parameters India United Kingdom Western Europe Onshore Delivery No preference Majority (but less Onshore delivery condition
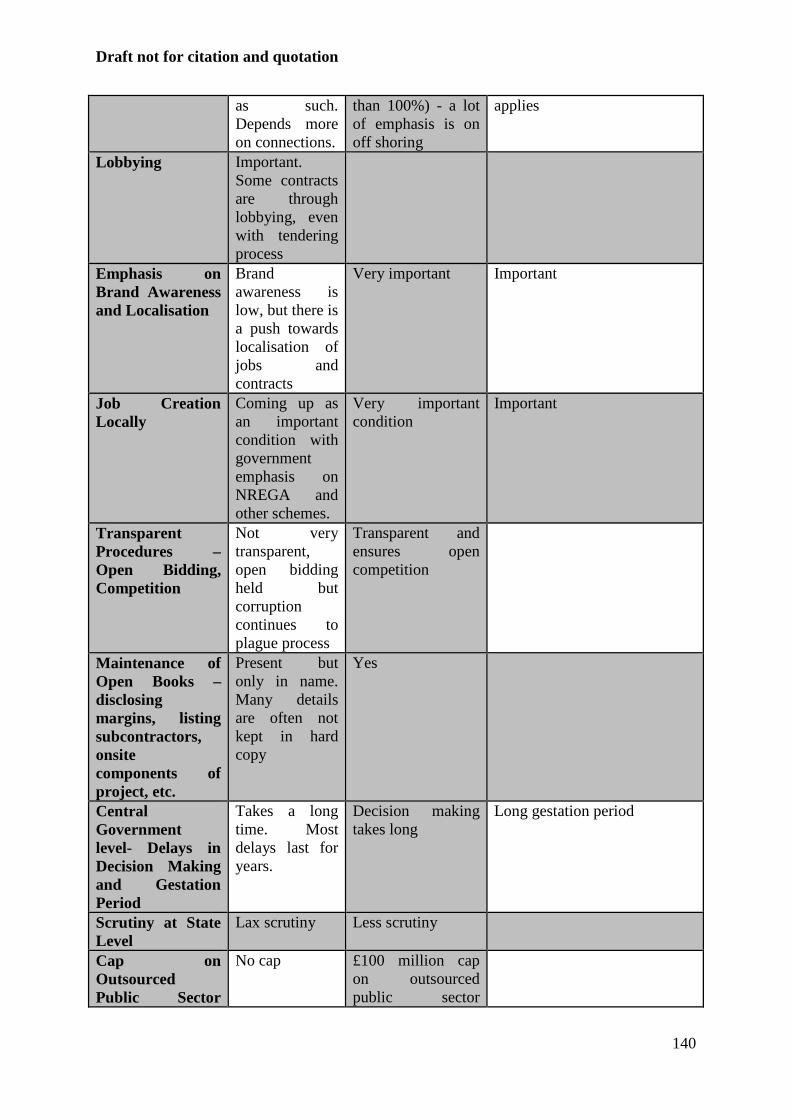
Draft not for citation and quotation
140
as such. Depends more on connections.
than 100%) - a lot of emphasis is on off shoring
applies
Lobbying Important. Some contracts are through lobbying, even with tendering process
Emphasis on Brand Awareness and Localisation
Brand awareness is low, but there is a push towards localisation of jobs and contracts
Very important Important
Job Creation Locally
Coming up as an important condition with government emphasis on NREGA and other schemes.
Very important condition
Important
Transparent Procedures – Open Bidding, Competition
Not very transparent, open bidding held but corruption continues to plague process
Transparent and ensures open competition
Maintenance of Open Books – disclosing margins, listing subcontractors, onsite components of project, etc.
Present but only in name. Many details are often not kept in hard copy
Yes
Central Government level- Delays in Decision Making and Gestation Period
Takes a long time. Most delays last for years.
Decision making takes long
Long gestation period
Scrutiny at State Level
Lax scrutiny Less scrutiny
Cap on Outsourced Public Sector
No cap £100 million cap on outsourced public sector
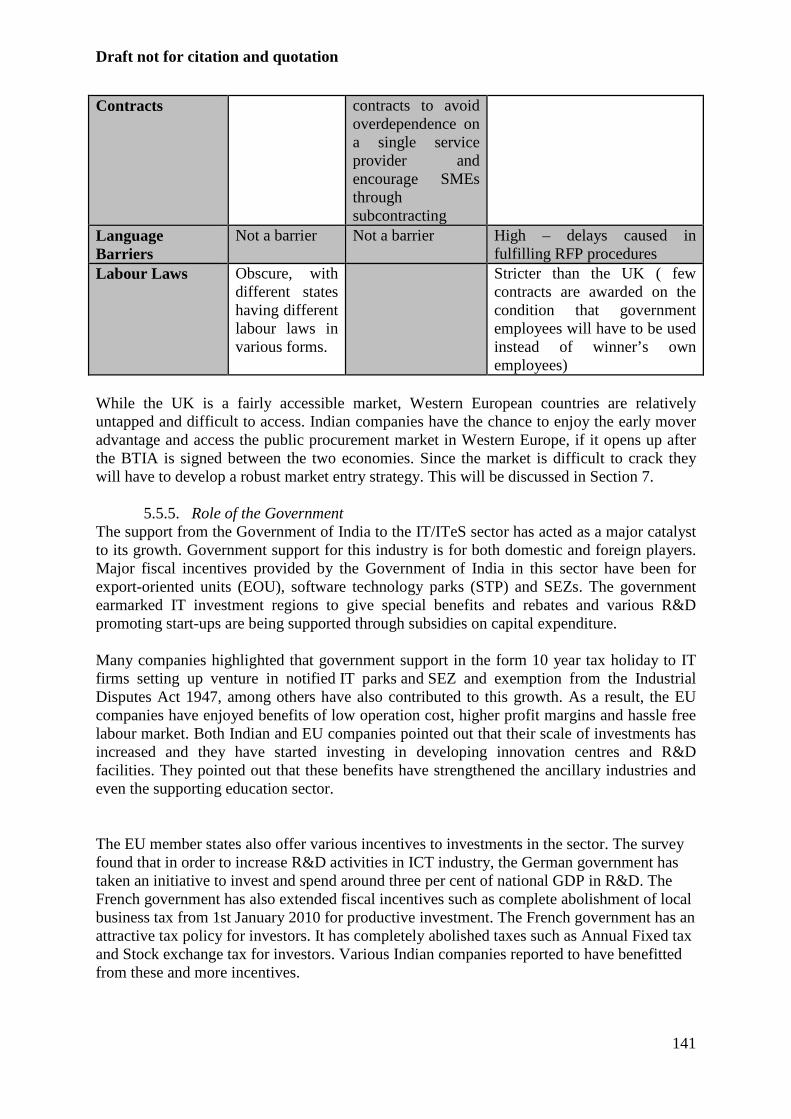
Draft not for citation and quotation
141
Contracts contracts to avoid overdependence on a single service provider and encourage SMEs through subcontracting
Language Barriers
Not a barrier Not a barrier High – delays caused in fulfilling RFP procedures
Labour Laws Obscure, with different states having different labour laws in various forms.
Stricter than the UK ( few contracts are awarded on the condition that government employees will have to be used instead of winner’s own employees)
While the UK is a fairly accessible market, Western European countries are relatively untapped and difficult to access. Indian companies have the chance to enjoy the early mover advantage and access the public procurement market in Western Europe, if it opens up after the BTIA is signed between the two economies. Since the market is difficult to crack they will have to develop a robust market entry strategy. This will be discussed in Section 7.
5.5.5. Role of the Government The support from the Government of India to the IT/ITeS sector has acted as a major catalyst to its growth. Government support for this industry is for both domestic and foreign players. Major fiscal incentives provided by the Government of India in this sector have been for export-oriented units (EOU), software technology parks (STP) and SEZs. The government earmarked IT investment regions to give special benefits and rebates and various R&D promoting start-ups are being supported through subsidies on capital expenditure. Many companies highlighted that government support in the form 10 year tax holiday to IT firms setting up venture in notified IT parks and SEZ and exemption from the Industrial Disputes Act 1947, among others have also contributed to this growth. As a result, the EU companies have enjoyed benefits of low operation cost, higher profit margins and hassle free labour market. Both Indian and EU companies pointed out that their scale of investments has increased and they have started investing in developing innovation centres and R&D facilities. They pointed out that these benefits have strengthened the ancillary industries and even the supporting education sector.
The EU member states also offer various incentives to investments in the sector. The survey found that in order to increase R&D activities in ICT industry, the German government has taken an initiative to invest and spend around three per cent of national GDP in R&D. The French government has also extended fiscal incentives such as complete abolishment of local business tax from 1st January 2010 for productive investment. The French government has an attractive tax policy for investors. It has completely abolished taxes such as Annual Fixed tax and Stock exchange tax for investors. Various Indian companies reported to have benefitted from these and more incentives.
Draft not for citation and quotation
142
The survey found that on the one hand Indian companies face problems because the EU Data Protection Directive is very restrictive; on the other hand, EU companies complain that they feel data sharing is not secure in India. To overcome this, Indian government has further amended the existing IT Information Technology (Amendment) Act, 2008 in the year 2011. Indian companies expect that after this amendment, India will be accorded the Safe Harbor Nation status by the EU and doing business will become easier. The EU companies expressed interest regarding open access to the Indian government procurement market. The survey found out that there are various barriers faced by both Indian and EU companies. These are summarised in the next section along with barriers identified during secondary research.
5.6.Barriers This section discusses the barriers faced by Indian companies in the EU and EU companies in India. The barriers are more market specific than company specific. For instance, both Indian and EU companies refer to certain common barriers in each others markets. Thus, addressing them will not only enhance trade but will also enable the domestic sector to grow. There are some issues related to the bilateral negotiations. There is limited data and secondary information on trade. For instance, both India and the EU do not collect data on bilateral movement of IT professionals on a regular basis. In the absence of the data it is difficult to estimate the volume of temporary movements of service providers. This is especially crucial for the ongoing negotiations since India and the EU are negotiating the number of service providers who can be given liberal entry to the EU market under the trade agreement. In the absence of data on total flow of movement of IT professionals, the basis of ascertaining the number of professionals permitted to enter the EU is contentious. Another issue which came up in the context of the ongoing India-EU bilateral negotiations is the difficulty of ensuring a comprehensive coverage of the sector. The nature of IT services is complex as these services are cross-sectoral in nature and have been evolving overtime. Despite several modifications to the UNCPC, some BPO services such as payroll or customer care service and web-enabled technical support services for electronic equipment do not have a corresponding entry in the W/120. In addition some services such as advertising services, placement and supply services of personnel, translation and interpretation services, among others are related to BPO services. These are classified under CPC 87 of the UNCPC. However, broadly CPC 84 of the UNCPC corresponds to IT/BPO services. Hence, in order to make commitments in BPO services, India and the EU need to make commitments in both CPC 84 and 87 at two digit level. Unless there is comprehensive sector coverage, certain sectors may not be liberalised under the bilateral agreement.
5.6.1. Barriers in India With the growing importance of the Indian IT/ITeS sector in the global market, demand for IT products and services is rising at a considerable rate. While the demand seems robust, it is important that the supply side constraints are appropriately dealt with. Some of the main concerns are summarised below: Underdeveloped Infrastructure Survey participants argued that inadequate infrastructure facilities such as availability of uninterrupted power supply, lack of well constructed roads, airports and mass transportation connectivity and traffic congestions, among others is escalating the operational costs of
Draft not for citation and quotation
143
IT/ITeS companies in India. Companies have to invest in upgrading infrastructure facilities such as setting up in house captive electricity generation units. In fact, arbitrary government policies like closure of the Bangalore airport in early 2012 for maintenance also raised operating costs and caused delays. Concentration of IT sector in few states has lead to overcrowding and saturation of infrastructure facilities. Rising real estate costs is another cause for concerns. Due to poor supporting infrastructure, rate of IT adoption is low in rural areas and in sectors like agriculture. The lack of adequate support infrastructure facilities has already generated regional heterogeneities in terms of the IT industry spread thereby depriving many states of the spill over benefits. Since majority of the prospective states are near saturation, foreign players will now look at India’s competitors such as Vietnam and Philippines to expand their operations. In fact, within the EU, member states such as Romania will in future offer competition to India where even Indian companies are trying to relocate. Inadequate Supply of Skilled Manpower Although India has abundant manpower, there are problems such as shortage of qualified and trained manpower, high attrition rate and rising salaries. Approximately 5,000 people are needed every year to meet the demand generated in the IT/ITeS sector, but the total production from educational and training institutes is only a third of this figure.289 Skill level and employability of the existing pool is diminishing (Prasad and Sathish, 2010). Industry experts have witnessed this new trend over the past four-five years. Time taken to train students from well-acclaimed institutes like the Indian Institute of Technology (IIT) is same as that required to train non-IITians. Approximately 300 regional engineering colleges/private colleges that exist in India are insufficient and the level of skill imparted in these institutes is also below the required global standards.290 This is leading to a supply-side crunch and companies are offering high salaries to retain existing personnel and attract the new ones. Job hopping due to attractive salaries is increasing costs of hiring and training employees frequently. According to a Hewitt report, salaries in the IT/ITeS sector are expected to increase at an average rate of 11 per cent in 2012.291 While the urban human capital resource is getting saturated, human capital in the rural areas is not appropriately skilled and has limited access to education and training institutes. Rise in labour cost and unavailability of adequate skill will reduce India’s competitiveness in the global market and drive various companies to other investment destinations. Regulatory Bottlenecks The IT/ITeS sector is affected by different government regulations at centre, state and local level. Regulatory uncertainties in allied sectors like the 2G and 3G licensing in telecommunications has created operational uncertainties. During the survey many Indian and EU companies pointed out that uncertainty related to government incentives such as the discontinuation of the exemption granted to the IT/ITeS sector from adhering to the Industrial Employment (Standing Orders) Act, 1946 will adversely affect the sector. While this will ensure protection of the labour pool engaged in this sector, it will cause a hike in the companies’ operating cost. Social security schemes and minimum wage requirements will be some of the mandatory clauses that the companies will have to comply with.
289 ‘Statistical Year Book, 2009-10’, Electronics and Computer Software Export Promotion Council 290http://articles.economictimes.indiatimes.com/2011-10-05/news/30246922_1_iit-students-indian-institutes-coaching-classes 291http://articles.economictimes.indiatimes.com/2012-02-21/news/31083113_1_aon-hewitt-highest-hike-cent-respondents
Draft not for citation and quotation
144
Information security is also a major problem. The existing acts - Information Technology (Amendment) Act, 2008 and the Copyright Act, 1957 are weak. The amendment to the Copyright Act is long due and the enforcement mechanism needs to be strengthened. Delays in litigation and lack of provisions for piracy cases have been pointed out by many respondents as key issues. Survey participants argued that the General Financial Rules, 2005 that govern government procurement in India are weak. These rules do not create any rights in favor of the public in general, and the potential suppliers, in particular. Nor do they provide for a fair and effective mechanism for dispute resolution, thus virtually denying any recourse against unfair and arbitrary decisions of the procuring entities. A robust Government Procurement Act is required if the government is planning to allow access to the Indian procurement market to EU companies. Delays in the implementation of the Land Acquisition Bill, 2012 are discouraging investments in India. Once implemented the cost of land is expected to increase by 80 per cent.292 During the survey various IT/ITeS companies located in the SEZs pointed out that their tax liability and thus costs have increased with the introduction of the Minimum Alteration Tax of 18.5 per cent with effect from April 2012. The industry views this move to discourage investments in SEZs which are attracted on the commitments of investments with tax exemption. Lack of R&D Initiatives Majority of the growth in the IT/ITeS sector is accounted for by software and BPO services. India predominantly exports low-technology products. This is because of lack of adequate R&D facilities and initiatives. India’s total R&D investment is only 0.8 per cent of GDP which is very low compared to countries such as China (1.6 per cent) and Japan (3.5 per cent)293. Even though India is emerging as a hub for outsourcing and IT software services, investments in R&D, particularly by the private sector is still low and based largely on the outsourcing market. There are few R&D institutions in India, but they lack resources and industry support. As a result, the IT/ITeS sector is highly dependent on exports, which makes it extremely volatile. The sector is heavily dependent on foreign technology due to limited domestic innovations. This leads to higher operation cost. To combat this R&D facilities in India have to be scaled up because new inventions are making global markets highly competitive. For instance, software robots and humanoids invented at the UK-based Blue Prism Ltd. automate and deliver IT projects at a cost that is less than one-fourth of the billing rates of engineers from TCS and Infosys.294 This is likely to displace job opportunities for Indian IT professionals. Weak Hardware Sector vis-à-vis Software Sector In India both in terms of exports and the domestic market, software ousts the hardware sector. Though increased government initiatives have driven up FDI inflows and domestic demand in the hardware sector, but India just has a comparative advantage in consumer electronics, for other segments India is dependent on imports. In the case of the IT/ITeS sector, for both finished and intermediate components Indian manufacturers rely on foreign partners such as Unisys for TUL, ICL for ICIM, Sun and other technical collaborators for WIPRO Infotech, Hewlett-Packard for HCL-HP, etc. Since both hardware and software industries complement each other it is important that the Indian hardware industry is developed in order to reduce
292 http://www.livemint.com/Opinion/dJ2QhROOhQCdbOb1FObe0N/Views--A-problem-with-the-Land-Acquisition-Bill.html 293 Battelle, 2012, “Global R&D Funding Forecast” 294 http://epaper.livemint.com/epaper/viewer.aspx
Draft not for citation and quotation
145
dependence on external sources and develop India as complete hub for IT software and hardware services and products. This will attract higher investments in India which are at present routed to countries like Taiwan, Philippines, China and Thailand, among others. Others Other barriers such as trade union demonstrations and labour unrest/strikes, exchange rate fluctuations, changes in the domestic tax regime including retrospective taxes and uncertainties over direct tax code and the single goods and services tax (GST), among others adversely affect the operations of foreign players.
5.6.2. Barriers in the EU At present both India and the EU have strong trade ties in the IT/ITeS sector and continue to have interest in each others’ economies. However, EU’s trade policies are somewhat restrictive and certain broad issue hinder free trade in services between India and the EU. The EU lacks a single market for trade in services and this is the foundation from which majority of the barriers discussed below originate.
5.6.2.1. Barriers to labour mobility • Work Permit and Visas In the EU visa and work permit regulations are not harmonised and they vary across member states. The survey participants pointed out that even for temporary stay and business visits, separate visas for entering into different states outside of the Schengen region are required. While the Schengen visa permits multiple entries into states that are signatories of the accord, visa is granted only for a short period. Moreover, the service providers have to first enter the country which gives the visa. According to the survey different countries have different immigration and entry rules and regulations. This inhibits movement across the member states for Indian companies which have multiple offices in the EU. For instance, TCS employees from India find it difficult to visit Volkswagen plants spread across different member states due to the member state specific visa requirements. It is important to understand that movement of people is requirement based. For instance, at the beginning of a project, Indian professionals need business visa for short term visits to understand the project. At times a small team may be required in the client country to facilitate the implementation and to monitor the project which is a long process. Indian professionals need work permits and multiple entries visa for this purpose. However, the visa and work permit regimes of different member states do not take into account such specific requirements of the IT /ITeS sector. The member state specific regulations and delays in visa issuance make the process time consuming and cumbersome and cause operational difficulties both for Indian companies and their clients. Some survey participants pointed out that it is more difficult to obtain visas, work permits and resident’s permits for some EU countries than from the US. This finding is in confirmation with other survey based studies (see Upadhya C., 2006).
In an attempt to harmonise the EU labour market the Blue Card Directive was introduced in 2009. However, this Directive has limitations as each member state will maintain the right to determine the number of immigrant workers that can be admitted into the domestic labour market through the Blue Card. In addition, while few member states such as Austria, Cyprus and Greece have not yet transposed the provisions of the EU Blue Card into their respective national legislations, others such as the UK and Netherlands are not in favour of the policy. The argument is that their existing labour mobility legislations are strong and open enough to ensure high-skill labour migration and hence
Draft not for citation and quotation
146
want to retain the right to screen employees of foreign origin entering their territory. As a result, the EU Blue Card is restrictive in nature and Indian companies sending their employees to EU member states and moving them across member states will still have to meet cumbersome legislative requirements. Nevertheless Indian companies sending employees to the EU member states for short term stay will still have to face lengthy and cumbersome procedural requirements. For instance, there is variability in the issuance time of visas that can vary from one week to four weeks. Across the member states, visa processing can vary from one week to six months. In fact, there is no provision for long-term multiple-entry business visa issuance. In addition, there are various restrictive conditions on entry of dependants and visa extensions and renewals.
The EU “Single Permit Directive”, (2011/98/EU) also has some limitations. It does not cover long term residents, seasonal workers or intra-corporate transferees and posted workers. In this case if the ICT Directive is not implemented soon, the Indian IT professionals will continue to face problems during entry and inter member state movement in the EU. • Economic Needs Tests and other labor Market Regulations In the EU’s revised offer, the services market has been liberalised, but there are still certain restrictions that inhibit movement of professionals between India and the EU. For all member states the EC has made the economic needs test (ENT) or labour market test295 mandatory for non EU nationals applying for jobs in the EU. There are rigid labour market restrictions in countries like Germany on hiring and firing of workers, working hours, unemployment compensations etc. In some countries there are minimum wage requirements. • Changes in Immigration Policies Of late, especially after the economic slowdown, there are sudden and sporadic changes in immigration policy without prior notice. For instance, since April 2012 the UK government discontinued the Tier I Post Study Work Visa for Indian students and there are restrictions on Tier II visa in the form of a cap on the number of visas issued to Indian nationals and an increase in the salary limit of professionals eligible to get a visa for five years
• Restrictive Mode 4 Commitments in Trade Agreements In the WTO Revised Offers and in their respective bilateral trade agreements, India’s Mode 4 offers and commitments seems to be more liberal for each category of services providers than that of the EU’s. For instance, according to the EU’s Revised Offer in the Doha Round a Business Visitor (BV)296 is only permitted to stay up to 90 days, Contractual Service Supplier (CSS)297 and Independent Professionals (IP)298 can stay up to six months in the EU in a year. On the other hand, in its Revised Offer India has offered business visitor to stay for 180 days and this has also been scheduled in India’s
295 ENT requirement is that a firm employing a foreign worker has to prove that local employee is not available for that specific job. 296 A person who visits another country specifically for business negotiations; and/or for preparatory work for establishing presence for short duration. 297 Employee of a company who is transferred from an office in the country of origin to an office of the same company in another country. 298 A person of a country who enters another country to perform a service on contract basis is called self-employed person.
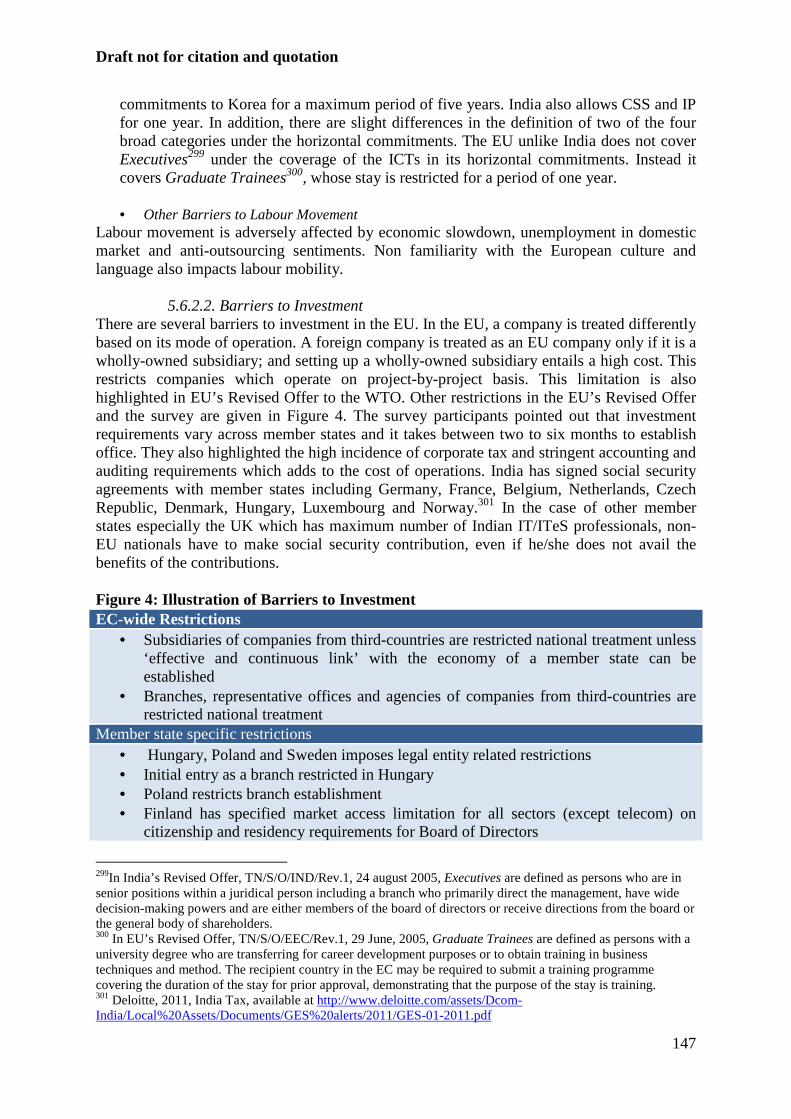
Draft not for citation and quotation
147
commitments to Korea for a maximum period of five years. India also allows CSS and IP for one year. In addition, there are slight differences in the definition of two of the four broad categories under the horizontal commitments. The EU unlike India does not cover Executives299 under the coverage of the ICTs in its horizontal commitments. Instead it covers Graduate Trainees300, whose stay is restricted for a period of one year.
• Other Barriers to Labour Movement
Labour movement is adversely affected by economic slowdown, unemployment in domestic market and anti-outsourcing sentiments. Non familiarity with the European culture and language also impacts labour mobility.
5.6.2.2. Barriers to Investment There are several barriers to investment in the EU. In the EU, a company is treated differently based on its mode of operation. A foreign company is treated as an EU company only if it is a wholly-owned subsidiary; and setting up a wholly-owned subsidiary entails a high cost. This restricts companies which operate on project-by-project basis. This limitation is also highlighted in EU’s Revised Offer to the WTO. Other restrictions in the EU’s Revised Offer and the survey are given in Figure 4. The survey participants pointed out that investment requirements vary across member states and it takes between two to six months to establish office. They also highlighted the high incidence of corporate tax and stringent accounting and auditing requirements which adds to the cost of operations. India has signed social security agreements with member states including Germany, France, Belgium, Netherlands, Czech Republic, Denmark, Hungary, Luxembourg and Norway.301 In the case of other member states especially the UK which has maximum number of Indian IT/ITeS professionals, non-EU nationals have to make social security contribution, even if he/she does not avail the benefits of the contributions. Figure 4: Illustration of Barriers to Investment EC-wide Restrictions
• Subsidiaries of companies from third-countries are restricted national treatment unless ‘effective and continuous link’ with the economy of a member state can be established
• Branches, representative offices and agencies of companies from third-countries are restricted national treatment
Member state specific restrictions • Hungary, Poland and Sweden imposes legal entity related restrictions • Initial entry as a branch restricted in Hungary • Poland restricts branch establishment • Finland has specified market access limitation for all sectors (except telecom) on
citizenship and residency requirements for Board of Directors
299In India’s Revised Offer, TN/S/O/IND/Rev.1, 24 august 2005, Executives are defined as persons who are in senior positions within a juridical person including a branch who primarily direct the management, have wide decision-making powers and are either members of the board of directors or receive directions from the board or the general body of shareholders. 300 In EU’s Revised Offer, TN/S/O/EEC/Rev.1, 29 June, 2005, Graduate Trainees are defined as persons with a university degree who are transferring for career development purposes or to obtain training in business techniques and method. The recipient country in the EC may be required to submit a training programme covering the duration of the stay for prior approval, demonstrating that the purpose of the stay is training. 301 Deloitte, 2011, India Tax, available at http://www.deloitte.com/assets/Dcom-India/Local%20Assets/Documents/GES%20alerts/2011/GES-01-2011.pdf
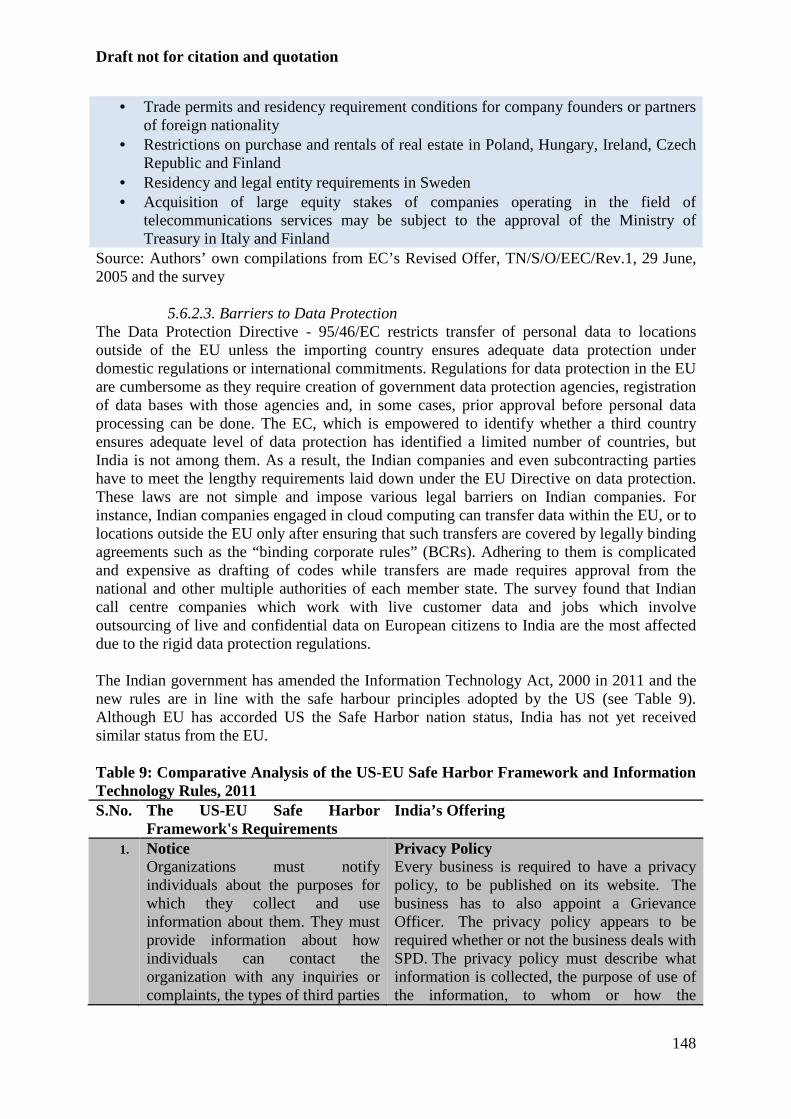
Draft not for citation and quotation
148
• Trade permits and residency requirement conditions for company founders or partners of foreign nationality
• Restrictions on purchase and rentals of real estate in Poland, Hungary, Ireland, Czech Republic and Finland
• Residency and legal entity requirements in Sweden • Acquisition of large equity stakes of companies operating in the field of
telecommunications services may be subject to the approval of the Ministry of Treasury in Italy and Finland
Source: Authors’ own compilations from EC’s Revised Offer, TN/S/O/EEC/Rev.1, 29 June, 2005 and the survey
5.6.2.3. Barriers to Data Protection The Data Protection Directive - 95/46/EC restricts transfer of personal data to locations outside of the EU unless the importing country ensures adequate data protection under domestic regulations or international commitments. Regulations for data protection in the EU are cumbersome as they require creation of government data protection agencies, registration of data bases with those agencies and, in some cases, prior approval before personal data processing can be done. The EC, which is empowered to identify whether a third country ensures adequate level of data protection has identified a limited number of countries, but India is not among them. As a result, the Indian companies and even subcontracting parties have to meet the lengthy requirements laid down under the EU Directive on data protection. These laws are not simple and impose various legal barriers on Indian companies. For instance, Indian companies engaged in cloud computing can transfer data within the EU, or to locations outside the EU only after ensuring that such transfers are covered by legally binding agreements such as the “binding corporate rules” (BCRs). Adhering to them is complicated and expensive as drafting of codes while transfers are made requires approval from the national and other multiple authorities of each member state. The survey found that Indian call centre companies which work with live customer data and jobs which involve outsourcing of live and confidential data on European citizens to India are the most affected due to the rigid data protection regulations. The Indian government has amended the Information Technology Act, 2000 in 2011 and the new rules are in line with the safe harbour principles adopted by the US (see Table 9). Although EU has accorded US the Safe Harbor nation status, India has not yet received similar status from the EU. Table 9: Comparative Analysis of the US-EU Safe Harbor Framework and Information Technology Rules, 2011 S.No. The US-EU Safe Harbor
Framework's Requirements India’s Offering
1. Notice Organizations must notify individuals about the purposes for which they collect and use information about them. They must provide information about how individuals can contact the organization with any inquiries or complaints, the types of third parties
Privacy Policy Every business is required to have a privacy policy, to be published on its website. The business has to also appoint a Grievance Officer. The privacy policy appears to be required whether or not the business deals with SPD. The privacy policy must describe what information is collected, the purpose of use of the information, to whom or how the
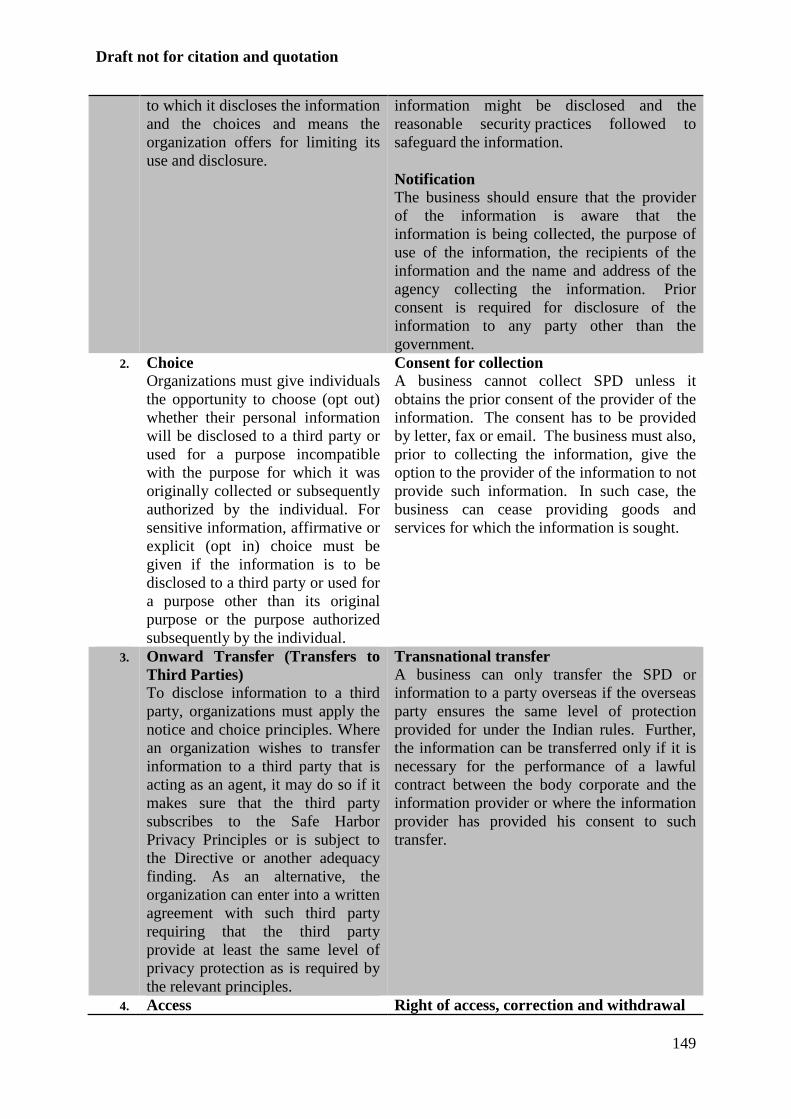
Draft not for citation and quotation
149
to which it discloses the information and the choices and means the organization offers for limiting its use and disclosure.
information might be disclosed and the reasonable security practices followed to safeguard the information. Notification The business should ensure that the provider of the information is aware that the information is being collected, the purpose of use of the information, the recipients of the information and the name and address of the agency collecting the information. Prior consent is required for disclosure of the information to any party other than the government.
2. Choice Organizations must give individuals the opportunity to choose (opt out) whether their personal information will be disclosed to a third party or used for a purpose incompatible with the purpose for which it was originally collected or subsequently authorized by the individual. For sensitive information, affirmative or explicit (opt in) choice must be given if the information is to be disclosed to a third party or used for a purpose other than its original purpose or the purpose authorized subsequently by the individual.
Consent for collection A business cannot collect SPD unless it obtains the prior consent of the provider of the information. The consent has to be provided by letter, fax or email. The business must also, prior to collecting the information, give the option to the provider of the information to not provide such information. In such case, the business can cease providing goods and services for which the information is sought.
3. Onward Transfer (Transfers to Third Parties) To disclose information to a third party, organizations must apply the notice and choice principles. Where an organization wishes to transfer information to a third party that is acting as an agent, it may do so if it makes sure that the third party subscribes to the Safe Harbor Privacy Principles or is subject to the Directive or another adequacy finding. As an alternative, the organization can enter into a written agreement with such third party requiring that the third party provide at least the same level of privacy protection as is required by the relevant principles.
Transnational transfer A business can only transfer the SPD or information to a party overseas if the overseas party ensures the same level of protection provided for under the Indian rules. Further, the information can be transferred only if it is necessary for the performance of a lawful contract between the body corporate and the information provider or where the information provider has provided his consent to such transfer.
4. Access Right of access, correction and withdrawal
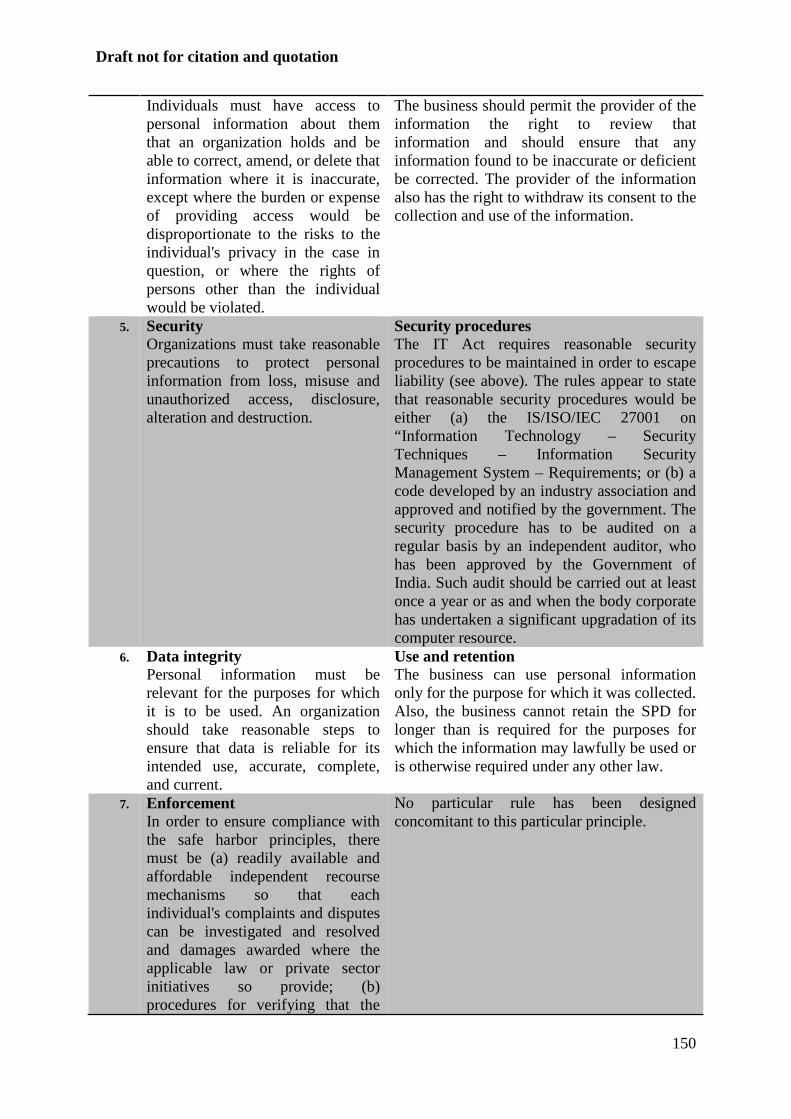
Draft not for citation and quotation
150
Individuals must have access to personal information about them that an organization holds and be able to correct, amend, or delete that information where it is inaccurate, except where the burden or expense of providing access would be disproportionate to the risks to the individual's privacy in the case in question, or where the rights of persons other than the individual would be violated.
The business should permit the provider of the information the right to review that information and should ensure that any information found to be inaccurate or deficient be corrected. The provider of the information also has the right to withdraw its consent to the collection and use of the information.
5. Security Organizations must take reasonable precautions to protect personal information from loss, misuse and unauthorized access, disclosure, alteration and destruction.
Security procedures The IT Act requires reasonable security procedures to be maintained in order to escape liability (see above). The rules appear to state that reasonable security procedures would be either (a) the IS/ISO/IEC 27001 on “Information Technology – Security Techniques – Information Security Management System – Requirements; or (b) a code developed by an industry association and approved and notified by the government. The security procedure has to be audited on a regular basis by an independent auditor, who has been approved by the Government of India. Such audit should be carried out at least once a year or as and when the body corporate has undertaken a significant upgradation of its computer resource.
6. Data integrity Personal information must be relevant for the purposes for which it is to be used. An organization should take reasonable steps to ensure that data is reliable for its intended use, accurate, complete, and current.
Use and retention The business can use personal information only for the purpose for which it was collected. Also, the business cannot retain the SPD for longer than is required for the purposes for which the information may lawfully be used or is otherwise required under any other law.
7. Enforcement In order to ensure compliance with the safe harbor principles, there must be (a) readily available and affordable independent recourse mechanisms so that each individual's complaints and disputes can be investigated and resolved and damages awarded where the applicable law or private sector initiatives so provide; (b) procedures for verifying that the
No particular rule has been designed concomitant to this particular principle.
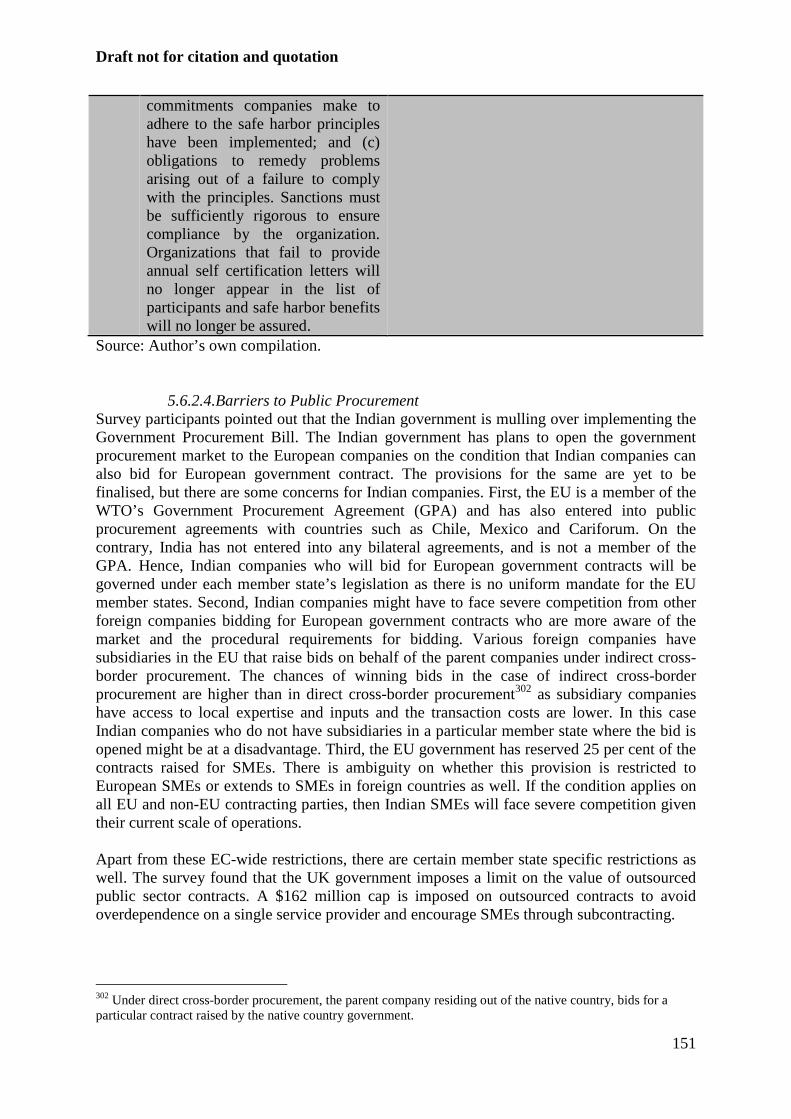
Draft not for citation and quotation
151
commitments companies make to adhere to the safe harbor principles have been implemented; and (c) obligations to remedy problems arising out of a failure to comply with the principles. Sanctions must be sufficiently rigorous to ensure compliance by the organization. Organizations that fail to provide annual self certification letters will no longer appear in the list of participants and safe harbor benefits will no longer be assured.
Source: Author’s own compilation.
5.6.2.4.Barriers to Public Procurement Survey participants pointed out that the Indian government is mulling over implementing the Government Procurement Bill. The Indian government has plans to open the government procurement market to the European companies on the condition that Indian companies can also bid for European government contract. The provisions for the same are yet to be finalised, but there are some concerns for Indian companies. First, the EU is a member of the WTO’s Government Procurement Agreement (GPA) and has also entered into public procurement agreements with countries such as Chile, Mexico and Cariforum. On the contrary, India has not entered into any bilateral agreements, and is not a member of the GPA. Hence, Indian companies who will bid for European government contracts will be governed under each member state’s legislation as there is no uniform mandate for the EU member states. Second, Indian companies might have to face severe competition from other foreign companies bidding for European government contracts who are more aware of the market and the procedural requirements for bidding. Various foreign companies have subsidiaries in the EU that raise bids on behalf of the parent companies under indirect cross-border procurement. The chances of winning bids in the case of indirect cross-border procurement are higher than in direct cross-border procurement302 as subsidiary companies have access to local expertise and inputs and the transaction costs are lower. In this case Indian companies who do not have subsidiaries in a particular member state where the bid is opened might be at a disadvantage. Third, the EU government has reserved 25 per cent of the contracts raised for SMEs. There is ambiguity on whether this provision is restricted to European SMEs or extends to SMEs in foreign countries as well. If the condition applies on all EU and non-EU contracting parties, then Indian SMEs will face severe competition given their current scale of operations. Apart from these EC-wide restrictions, there are certain member state specific restrictions as well. The survey found that the UK government imposes a limit on the value of outsourced public sector contracts. A $162 million cap is imposed on outsourced contracts to avoid overdependence on a single service provider and encourage SMEs through subcontracting.
302 Under direct cross-border procurement, the parent company residing out of the native country, bids for a particular contract raised by the native country government.
Draft not for citation and quotation
152
According to the US Trade Policy Review303 lack of transparency in awarding contracts is common across member states such as Bulgaria, Germany, Greece, Hungary and Ireland. Governments of these and other member states such as Portugal and Austria tend to favour the EU firms. Foreign companies are more successful when they bid as part of a consortia or joint venture with EU firms. Other problems include lengthy and cumbersome procedures and legal formalities, budgetary decision delays, lack of clarity in tendering documentation and opacity in bid evaluation.
5.6.2.5. Others High barriers to entry in Western Europe such as onsite delivery conditions, strict labour laws such as compulsory hiring of EU nationals irrespective of the skill disparity and multilingual requirements are other barriers that make the market more restrictive for Indian companies.
5.7. Reforms required The paper confirms the existence of mutual trade and investment complementarities between India and the EU. The governments of both economies are also working in this direction by negotiating the BTIA. For this it is important the both economies iniate some domestic policy related, regulatory and company level reforms. These are summarised below:
5.7.1. Domestic Policy related reforms
India 1. The Indian government needs to formulate policies focussing on developing regional
homogeneity across Indian states. Skilled labour and supportive infrastructure are the key requirements for a robust IT/ITeS sector. To avoid overcrowding in few cities and saturation of infrastructure focus should be on developing tier II and III cities. Establishment of IT parks specifically for global and Indian companies will reduce inter-state migration and increase employment opportunities in tier II and III cities. This needs to be complemented with higher investments in providing better road connectivity, power supply, optical fibre infrastructure, and other infrastructure support.
2. Indian government needs to invest in enhancing education standards and skill level in tier II and III cities. Focus should be on strengthening grass root level education along with university level collaborations with Indian and foreign universities so that a highly skilled pool of IT professionals can be created. Branches of well acclaimed Indian educational institutes of tier I cities should be set up in tier II and III cities. Government should encourage government and university level collaborations with foreign universities especially from the EU. This will expose Indian students to global standards and increase their employability. Government should also set employment standards in collaboration with IT companies. The IT companies can outline the necessary skills required in the IT/ITeS sector, which should be adopted in the course and curriculum of education institutes. Higher focus on in-house R&D facilities in educational institutes and in IT companies will automatically increase the skill level of the students and professionals.
303 2012 National Trade Estimate Report on Foreign Trade Barriers, available at http://www.ustr.gov/about-us/press-office/reports-and-publications/2012-1
Draft not for citation and quotation
153
3. The Indian government should adopt a robust data collection tool to track migration of IT professionals between India and the EU. This is important especially at a time when the two countries are negotiating on the permissible limit on number of Indian professionals entering the EU.
4. Government needs to increase investments in developing R&D facilities in India. Programmes similar to FP7 can be initiated by the Indian government. Greater collaborations with and attractive benefits can be offered to international institutes to encourage innovations. R&D facilities should focus on inventing hardware technology in order to support India’s hardware industry. This will foster domestic demand and supply. EU
1. The EC can remove limit on student visa for one year and allow Indian students to work in the EU for atleast one year after completion of education. The students can then be assessed by the employer as to whether they should be granted a work permit for extended stay or not. This will provide the EU member states access to high skilled IT professionals.
2. The EC needs to formularise a method of category-wise data collection on number of Indian professionals entering the EU each year and the salaries offered to them. On the basis of this data limits on permissible number of professionals allowed to enter the EU.
3. The EC needs to harmonise labour market policies across all member states in order to ease movement of Indian IT professionals across member states. This should atleast be allowed for ICT and business visitors as they need to make temporary visits to different member states.
4. The EC should accord India a Safe Harbour Nation status. This will enhance trade and investment between the two economies.
5. The EC should adopt a liberal policy towards India while opening up the EU procurement market to Indian companies. Since Indian companies will be at a disadvantage compared to companies from the GPA signatories, they can be initially offered some incentives such as the $162 million cp on outsourced contracts and SME reservation can be phased out for initial five years.
5.7.2. Regulatory reforms
India
1. Indian government needs to expedite the implementation of the Government Procurement Bill, Foreign Educational Institutions Bill, 2010 and the Land Acquisition Bill in order to streamline regulations related to government procurement and land acquisition respectively. New acts regulating labour markets and tax rates applicable for SEZ units have to be formularised so that investors soon get a clear picture. Additional benefits should be given to SEZ units with high employment and low attrition rates to compensate for the rise in operation costs resulting from these regulatory changes. This can retain investments and attract new investors in this sector.
2. Government needs to modify the Information Technology Rules, 2011 to include an ‘Enforcement’ clause so as to ensure accountability. An independent authority clearly defining the procedures and penalties in case of failure to compliance should be
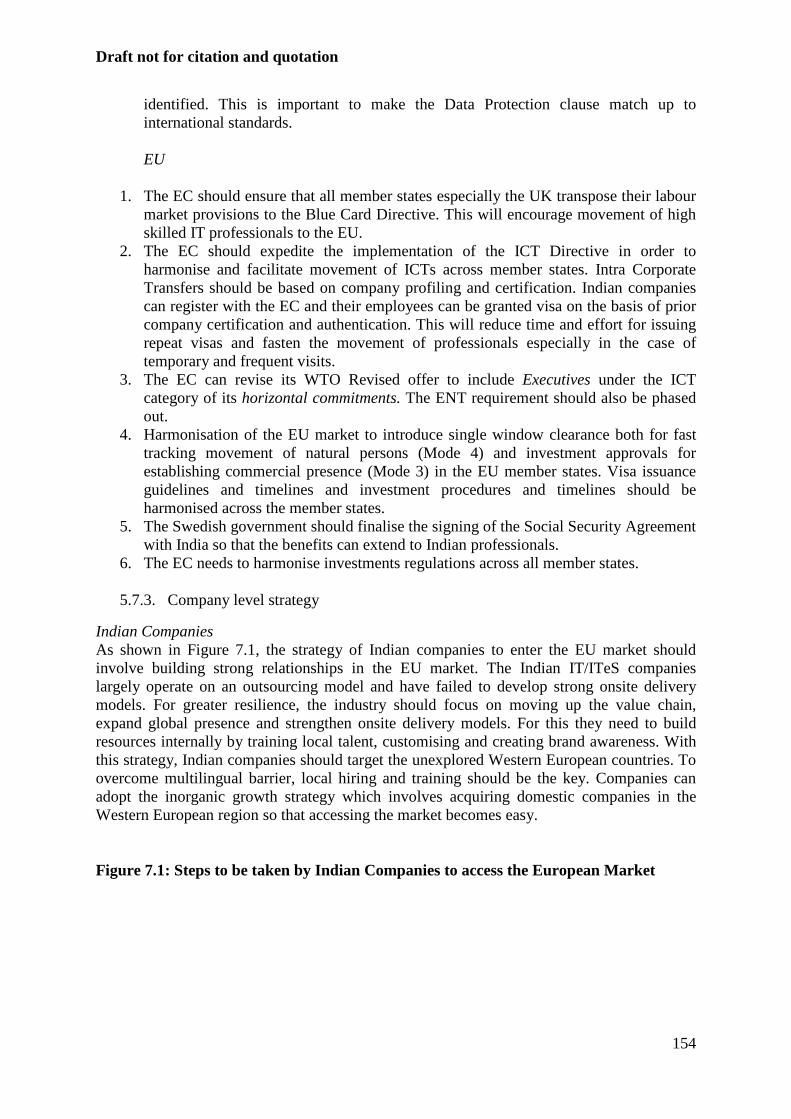
Draft not for citation and quotation
154
identified. This is important to make the Data Protection clause match up to international standards. EU
1. The EC should ensure that all member states especially the UK transpose their labour market provisions to the Blue Card Directive. This will encourage movement of high skilled IT professionals to the EU.
2. The EC should expedite the implementation of the ICT Directive in order to harmonise and facilitate movement of ICTs across member states. Intra Corporate Transfers should be based on company profiling and certification. Indian companies can register with the EC and their employees can be granted visa on the basis of prior company certification and authentication. This will reduce time and effort for issuing repeat visas and fasten the movement of professionals especially in the case of temporary and frequent visits.
3. The EC can revise its WTO Revised offer to include Executives under the ICT category of its horizontal commitments. The ENT requirement should also be phased out.
4. Harmonisation of the EU market to introduce single window clearance both for fast tracking movement of natural persons (Mode 4) and investment approvals for establishing commercial presence (Mode 3) in the EU member states. Visa issuance guidelines and timelines and investment procedures and timelines should be harmonised across the member states.
5. The Swedish government should finalise the signing of the Social Security Agreement with India so that the benefits can extend to Indian professionals.
6. The EC needs to harmonise investments regulations across all member states.
5.7.3. Company level strategy
Indian Companies As shown in Figure 7.1, the strategy of Indian companies to enter the EU market should involve building strong relationships in the EU market. The Indian IT/ITeS companies largely operate on an outsourcing model and have failed to develop strong onsite delivery models. For greater resilience, the industry should focus on moving up the value chain, expand global presence and strengthen onsite delivery models. For this they need to build resources internally by training local talent, customising and creating brand awareness. With this strategy, Indian companies should target the unexplored Western European countries. To overcome multilingual barrier, local hiring and training should be the key. Companies can adopt the inorganic growth strategy which involves acquiring domestic companies in the Western European region so that accessing the market becomes easy.
Figure 7.1: Steps to be taken by Indian Companies to access the European Market
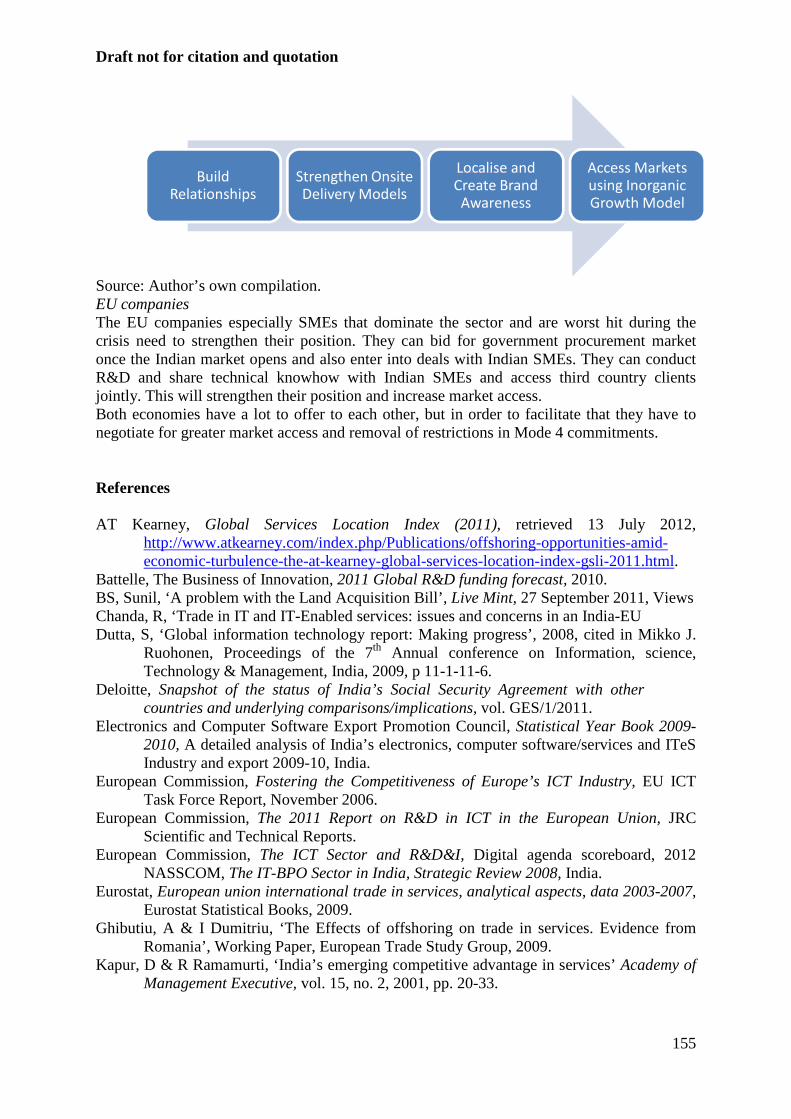
Draft not for citation and quotation
155
Source: Author’s own compilation. EU companies The EU companies especially SMEs that dominate the sector and are worst hit during the crisis need to strengthen their position. They can bid for government procurement market once the Indian market opens and also enter into deals with Indian SMEs. They can conduct R&D and share technical knowhow with Indian SMEs and access third country clients jointly. This will strengthen their position and increase market access. Both economies have a lot to offer to each other, but in order to facilitate that they have to negotiate for greater market access and removal of restrictions in Mode 4 commitments.
References AT Kearney, Global Services Location Index (2011), retrieved 13 July 2012,
http://www.atkearney.com/index.php/Publications/offshoring-opportunities-amid-economic-turbulence-the-at-kearney-global-services-location-index-gsli-2011.html.
Battelle, The Business of Innovation, 2011 Global R&D funding forecast, 2010. BS, Sunil, ‘A problem with the Land Acquisition Bill’, Live Mint, 27 September 2011, Views Chanda, R, ‘Trade in IT and IT-Enabled services: issues and concerns in an India-EU Dutta, S, ‘Global information technology report: Making progress’, 2008, cited in Mikko J.
Ruohonen, Proceedings of the 7th Annual conference on Information, science, Technology & Management, India, 2009, p 11-1-11-6.
Deloitte, Snapshot of the status of India’s Social Security Agreement with other countries and underlying comparisons/implications, vol. GES/1/2011.
Electronics and Computer Software Export Promotion Council, Statistical Year Book 2009-2010, A detailed analysis of India’s electronics, computer software/services and ITeS Industry and export 2009-10, India.
European Commission, Fostering the Competitiveness of Europe’s ICT Industry, EU ICT Task Force Report, November 2006.
European Commission, The 2011 Report on R&D in ICT in the European Union, JRC Scientific and Technical Reports.
European Commission, The ICT Sector and R&D&I, Digital agenda scoreboard, 2012 NASSCOM, The IT-BPO Sector in India, Strategic Review 2008, India.
Eurostat, European union international trade in services, analytical aspects, data 2003-2007, Eurostat Statistical Books, 2009.
Ghibutiu, A & I Dumitriu, ‘The Effects of offshoring on trade in services. Evidence from Romania’, Working Paper, European Trade Study Group, 2009.
Kapur, D & R Ramamurti, ‘India’s emerging competitive advantage in services’ Academy of Management Executive, vol. 15, no. 2, 2001, pp. 20-33.
Build
Relationships
Strengthen Onsite
Delivery Models
Localise and
Create Brand
Awareness
Access Markets
using Inorganic
Growth Model
Draft not for citation and quotation
156
Kumar, N & KJ Joseph, ‘Export of software and business process outsourcing from developed countries: lessons from the Indian experience’, ‘Asia-Pacific Trade and Investment Review’, vol. 1, no. 1, 2005, pp. 91-110.
Lacity, MC & LP Willcocks, ‘Global information technology outsourcing’, Wiley, Chichester, UK, 2001, cited in Mikko J. Ruohonen, Proceedings of the 7th Annual conference on Information, science, Technology & Management, India, 2009, p 11-1-11-6.
Laura, A & R Griffith, ‘Outsourcing and offshoring of business services: How important is ICT?’, ‘Journal of the European Economic Association’, vol. 4, no. 2-3, 2006, pp. 594-601.
Ministry of Commerce, DIPP Factsheet April 2000 to January 2012, Department of Industrial Policy and Promotion, Government of India, 2012.
Ministry of Communications & Information Technology, Information Technology, Annual Report 2010-11, Department of Technology, Government of India.
Ministry of Home Affairs, Provisional population totals paper 1 and 2 of 2011 India series 1 and paper 2, Census of India, Government of India, 2011.
NASSCOM, The IT-BPO Sector in India, Strategic Review 2012, India. NASSCOM-Everest Research Institute NASSCOM-Everest India BPO Study, 2008, cited in
Palugod, N & A Palugod, ‘Global trends in offshoring and outsourcing’, ‘International Journal of Business and Social Science’, vol. 2, no. 16, 2011, pp. 13-19.
Palugod, N & A Palugod, ‘Global trends in offshoring and outsourcing’, ‘International Journal of Business and Social Science’, vol. 2, no. 16, 2011, pp. 13-19.
PTI, ‘India Inc may give up to 20% pay hike to staff in 2012: Hewitt’, The Economic Times, 21 February 2012.
Reserve Bank of India ’Press Release, June, 2011’, retrieved on June 12 2012, http://rbidocs.rbi.org.in/rdocs/PressRelease/PDFs/IEPR1794B0611.pdf.
Sengupta, D, ‘NR Narayana Murthi’s comment stirs up debate among academicians’, The Economic Times, 05 October 2011, ET Bureau.
Shukla, T, ‘Indian carriers scramble for foreign tie-ups’ Live Mint, 27 November 2012, Front page.
trade and investment agreement’, ICRIER report, India, 2009. Turlea, G, et. al., ‘The 2011 report on R&D in ICT in the European Union’, European
Commission, Joint Research Centre, 2011. Upadhya, C, ‘The Global Indian Software Labour Force IT Professionals in Europe’, Indo-
Dutch Programme on Alternatives in Development, Working paper series 2006, no. 1, Veugelers, R, ‘New ICT sectors: platforms for European growth?’, Bruegel Policy
Contribution, no. 2012/4, Bruegel, Brussels, August, 2012. WTO, EU Revised Offer, Communications form the European Communities and its Member
States, conditional revised offer, TN/S/O/EEC/Rev.1, 2005, retrieved on 29 October 2012, http://www.esf.be/pdfs/GATS%20Revised%20Offers/EU%20revised%20GATS%20offer.pdf.
WTO, India Revised Offer, ‘India Revised Offer’, TN/S/O/IND/Rev.1, 2005, retrieved on 29 October 2012, http://commerce.nic.in/trade/revised_offer1.pdf.
Wunsch-Vincent, S, WTO, E-commerce, and Information Technologies, edited by J McIntosh, General Counsel, G8 Summit Planning Organization.
Draft not for citation and quotation
157
Chapter 6: Evolving Retail Sector in India and the EU - Opportunities and Challenges
Tanu M. Goyal Introduction Retail is defined as all activities involved in selling of goods or services directly to final consumers for their personal, non-business use via shops, markets, door-to-door selling, mail order or over the internet, where the buyer intends to consume the product through personal, family or household dues.304 This sector is labour intensive and globally it offers huge employment possibilities at low skill level. In 2010, global retail market was valued at $14.5 trillion305, exhibiting a year-on-year growth of 10.9 per cent.306 The global retail industry is expected to expand at a five-year compound annual growth rate (CAGR) of 8.5 per cent reaching $21.8 trillion in 2015.307 Since the global slowdown in 2008, emerging markets particularly in Asia and Latin America are considered high-growth markets by investors in retail sector. India, Brazil, Chile and China are the most attractive destinations for global retailers.308 According to the A.T. Kearney Global Retail Development Index (2012), the Indian retail market was ranked the fifth most attractive destination among developing markets in 2012. India’s rank has fallen over the last few years. In 2011, it was ranked the fourth most attractive destination for global retailers and between 2007 and 2009, India was ranked the topmost destination for global retailers. However, India’s rank is still higher compared to other emerging European markets. In India, retail sector is the largest private sector and second largest employer after agriculture. In the last two decades, the sector has grown at a double-digit rate. The Indian retail market is valued at $435 billion in 2011 and is expected to grow to $535 billion by 2013.309 Modern/corporate retail has been growing at the rate of 30 percent over the past decade and its share is expected to increase to $53.5 billion in 2013 with a share of 10 percent of the retail market.310 As the growth of modern/corporate sector is faster than the traditional/non-corporate sector, it is likely that in future the sector will lead to better quality jobs and secure employment. The European Union (EU) is the largest retail market in the world. Retail sector contributes around 4.2 per cent to the total value added in the EU and employs around 17.4 million people.311 Europe has one of the largest numbers of foreign retailers. Among EU members, in 2012, the UK has the largest number of foreign retailers followed by Spain (4th), France (6th), Germany (6th) and Italy (9th), among others. India was ranked 35th and China was ranked fifth
304 Mukherjee and Patel (2005). 305 All Dollar values are in United States (US) Dollar. 306 Alpen Capital (2011). 307 Alpen Capital (2011). 308 A.T. Kearney (2012). 309 A.T. Kearney (2011). 310 AT Kearney (2010). 311 For details, see http://ec.europa.eu/internal_market/retail/index_en.htm (last accessed on August 27th, 2012).
Draft not for citation and quotation
158
by the same index.312 European retailers are also expanding their presence to other markets, particularly in developing countries in Asia, Middle East and Latin America. There is a lot of interest among the EU retailers in the Indian retail market. India and the EU have complementarities in the retail sector. While Indian retail market is growing and has enormous investment potential, the EU retail market is saturated. Moreover, since the EU market is facing a slowdown, EU retailers are diversifying their investments and targeting new markets. A number of EU retailers are investing in the Indian retail sector, due to the large consumer base and emergent demand in the country. Around 50 per cent of foreign investment in the Indian retail sector is from the EU. The economic reforms of the nineties propelled the entry of large corporate in Indian retail sector and this led to the growth of modern/corporate retail. A number of Indian corporate have invested in this sector and after the single-brand retail liberalisation, they are keen to collaborate with the EU retailers. Lately, a few Indian companies have also made investments in the EU market and others are exploring the possibilities of investment. The EU retailers have technical knowledge, efficient supply-chain network, skilled workforce, which facilitate the operations of Indian retailers in the EU market. In spite of the trade and investment potential, both India and the EU have restrictive foreign direct investment policies in the retail sector. While India largely has market access restrictions in the form of conditions imposed on foreign retailers, the EU impose regulatory barriers, which can be difficult for foreign investors to meet. The two countries are already negotiating the sector under the WTO and the on-going India-EU BTIA. In plurilateral negotiations of the WTO, which began after the Hong Kong Ministerial Conference (December 2005), India is a recipient of request in distribution services and the EU is a demandeur.313 The EU has particularly requested for Mode 3 liberalisation. In the India-EU BTIA too, the EU is a demandeur. In recent months, India has liberalised the retail policy and this has an implication on India’s ability to undertake commitments. Given this background, this Chapter gives an overview of the retail sector in India and in the EU and discusses how the two countries can enhance bilateral trade and investment in the retail sector through the India-EU BTIA. This Chapter is divided in six sections. Section 6.1 gives the classification and coverage of retail sector in India and the EU. Section 6.2 presents the latest trends and developments in the Indian and the EU retail sector highlighting the size, contribution and composition of the sector. Section 6.3 presents the prevailing domestic as well as FDI foreign direct investment (FDI) related regulations in India and the EU. Since it is difficult to get disaggregated data on retail sector, the next few sections are based on a primary survey. Section 6.4 discusses the presence of Indian and the EU retailers in each other markets, giving the mode of entry, amount of investments and the nature of operations. Section 6.5 highlights the barriers faced by the EU retailers in India and by Indian retailers in the EU. The last and final section discusses the opportunities for foreign retailers in India and the way forward.
312 http://www.cbre.eu/emea_en/services/retail_leisure/how_global_is_the_business_of_retail (last accessed on November 15th, 2012) 313 For details see http://commerce.nic.in/trade/Plurilateral%20Requests%20in%20Distribution%20services.pdf (last accessed on August 27, 2012)
Draft not for citation and quotation
159
6.1 Classification of the Retail Sector Global definition of retailing is given by the United Nations Central Product Classification (UNCPC), which lays down the classification of different services. These classifications generally are used as a base for international negotiations such as the ‘WTO's General Agreement on Trade in Services’ (GATS). India and EU follows the UNCPC Provisional Classification or the WTO’s W/120 classification in international negotiations. The UNCPC Provisional Classification covers retail under Section 6 (trade services; hotel and restaurant services) Division 63 (retail trade services; repair service of personal and household goods) and comprise of food and non-food retailing services.314 Since service sectors are evolving, the UNCPC has also undergone changes/modifications. In the latest UNCPC Version 2, retail sector falls under Section 6 (distributive trade services; accommodation, food and beverage serving services; transport services; and electricity, gas and water distribution services), Division 62 (retail trade services) comprising of non-specialised store retail trade services, specialised store retail trade services, mail order or Internet retail trade services, other non-store retail trade services and retail trade services on a fee or contract basis.315 The new coverage of retail provides a comprehensive coverage of both store and non-store formats, which was not there in the earlier definition. In India, the National Industrial Classification (NIC) and in the EU the statistical classification of economic activities in the European Community (NACE) define retail trade in the same way. As per the 2008 NIC, and NACE Revision 2, wholesale and retail trade and repair of motor vehicles and motorcycles sector, referred to as distributive trades is given in Section G Within this, Division 47 covers all retail trade other than retailing of motor vehicles and motorcycles. This include – retail sale in non-specialised stores, retail sale of food, beverages and tobacco in specialised stores, retail sale of automotive fuel in specialised stores, retail sale of information and communication equipment in specialised stores, retail sale of other household equipment in specialised stores, retail sale of cultural and recreation goods in specialised stores, retail sale of other goods in specialised stores, retail sale via stalls and markets and retail trade not in stores, stalls or markets.316 In India, the Department of Industrial Policy and Promotion (DIPP) under the Ministry of Commerce and Industries issues the FDI policy, which covers each service sector in India. However, while stating the policy the DIPP does not follow the national industrial classification for defining the sector. As a result, the definition and coverage of the sector in the FDI policy is not clear. While the data for retail trade is available for the EU-27 countries, in India, disaggregated data for retail trade is not available. The Central Statistical Organisation clubs retail with wholesale trade and restaurants and it is difficult to get disaggregated data for retail sector. This problem does not arise in the case of the EU. The next section presents the available data showing trends and developments in retail sector in India and the EU.
314 For details see http://unstats.un.org/unsd/cr/registry/regcst.asp?Cl=25 (last accessed on August 27, 2012) 315 For details see http://unstats.un.org/unsd/cr/registry/regcst.asp?cl=9&lg=1 (last accessed on August 27, 2012) 316 For details see http://epp.eurostat.ec.europa.eu/cache/ITY_OFFPUB/KS-RA-07-015/EN/KS-RA-07-015-EN.PDF and http://mospi.nic.in/mospi_new/upload/nic_2008_17apr09.pdf (last accessed on August 27th, 2012)
Draft not for citation and quotation
160
6.2. Trends and Developments in the Retail Sector Globally, the retail market growth has slowed down over the past few years. This is primarily due to uncertain economic environment in the West, leading to a slowdown in consumer spending in the United States (US) and Europe. The year-on-year growth rate of retail sales declined from 11.5 per cent in 2007 to -2.5 per cent in 2009. The growth rate recovered to 10.9 per cent in 2010; however, it remained below the pre-crisis level.317 One of the factors responsible for this recovery is strong consumption demand from emerging markets that compensated for a decline in the demand from developed markets. Foreign retailers continue to explore possibilities in new and emerging markets in Asia Pacific, Africa and South America, due to the high growth in these markets.318 In Europe, the Euro crisis led to credit tightening and the government is cutting spending and raising taxes, leading to an overall decline in spending. As a result, a number of European retailers are expanding their presence to emerging markets in order to increase their sales revenue. The Deloitte (2012) study shows that European retailers are most globally active and they have reduced their dependence on their home markets. Nearly 40 per cent of their sales were generated by their operations outside their home countries. In the past five years, retailers like Carrefour (France), Tesco (UK) and Metro Group (Germany) saw their revenues in developing countries grow 2.5 times faster than revenues in their home market.319 Developing country markets like Brazil, Russia, India and China are attracting a large number of global retailers due to their large and growing consumer base. This is particularly true for the Indian market. In 2010, India attracted the largest number of new retailers among emerging and mature markets.320
6.2.1.Retail Sector in India
Retail sector in India is characterised by the presence of a large number of small family-owned stores, which are low-investment, low-profit outlets, which survived on family labour, known as traditional/non-corporate retailers. There are small but growing number of modern/corporate retailers. In India, modern retail formats started developing only after the liberalisation in 1991. At present, it is one of the fastest growing segments of retail and has a lot of untapped potential for foreign retailers. In 2009-10, the share of retail sector was around 12 per cent of the GDP.321 The share of retail in private consumption rose to 53.3 per cent in 2009-10 from 52.9 per cent in 2006-07.322 The total retail market is valued at $428 billion in 2009-10 of which only $28 billion or 6.5 per cent of the total market comprise of modern/corporate retailers.323 The share of the modern retail market in the GDP is 2.1 per
317 Alpen Capital (2011). 318 Deloitte (2012). 319 A.T. Kearney (2012) 320 CBRE (2011). 321 Author’s calculations from National Sample Survey Organisation (NSSO). There is no official source of data for the retail sector. The NSSO has clubbed retail under ‘trade, hotels and restaurants’. In 2009-10, the share of trade related services in GDP was close to 15 per cent. This includes wholesale and retail trade, repair of motor vehicles, motorcycles and personal and household goods. The share of retail is derived from the share of retail in employment. 322 Images (2011) 323 Modern retail is defined as a type of retailing which has a corporate management. Generally, these retail chains (unlike the one-shop family-owned traditional outlets) are professionally managed with a transparent accounting system, centralised quality control and sourcing. They are also known as organised retailer.
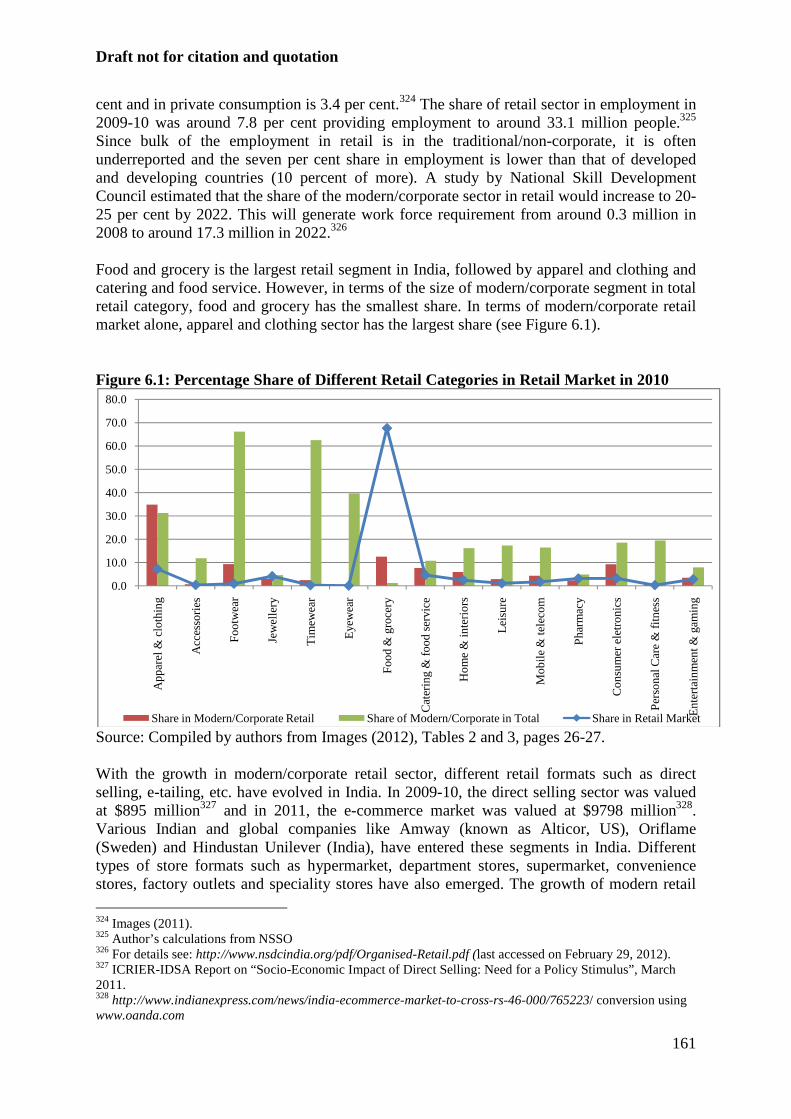
Draft not for citation and quotation
161
cent and in private consumption is 3.4 per cent.324 The share of retail sector in employment in 2009-10 was around 7.8 per cent providing employment to around 33.1 million people.325 Since bulk of the employment in retail is in the traditional/non-corporate, it is often underreported and the seven per cent share in employment is lower than that of developed and developing countries (10 percent of more). A study by National Skill Development Council estimated that the share of the modern/corporate sector in retail would increase to 20-25 per cent by 2022. This will generate work force requirement from around 0.3 million in 2008 to around 17.3 million in 2022.326 Food and grocery is the largest retail segment in India, followed by apparel and clothing and catering and food service. However, in terms of the size of modern/corporate segment in total retail category, food and grocery has the smallest share. In terms of modern/corporate retail market alone, apparel and clothing sector has the largest share (see Figure 6.1). Figure 6.1: Percentage Share of Different Retail Categories in Retail Market in 2010
Source: Compiled by authors from Images (2012), Tables 2 and 3, pages 26-27. With the growth in modern/corporate retail sector, different retail formats such as direct selling, e-tailing, etc. have evolved in India. In 2009-10, the direct selling sector was valued at $895 million327 and in 2011, the e-commerce market was valued at $9798 million328. Various Indian and global companies like Amway (known as Alticor, US), Oriflame (Sweden) and Hindustan Unilever (India), have entered these segments in India. Different types of store formats such as hypermarket, department stores, supermarket, convenience stores, factory outlets and speciality stores have also emerged. The growth of modern retail
324 Images (2011). 325 Author’s calculations from NSSO 326 For details see: http://www.nsdcindia.org/pdf/Organised-Retail.pdf (last accessed on February 29, 2012). 327 ICRIER-IDSA Report on “Socio-Economic Impact of Direct Selling: Need for a Policy Stimulus”, March 2011. 328 http://www.indianexpress.com/news/india-ecommerce-market-to-cross-rs-46-000/765223/ conversion using www.oanda.com
0.0
10.0
20.0
30.0
40.0
50.0
60.0
70.0
80.0
Ap
par
el &
clo
thin
g
Acc
esso
ries
Fo
otw
ear
Jew
elle
ry
Tim
ewea
r
Eye
wea
r
Fo
od
& g
roce
ry
Cat
erin
g &
foo
d s
ervi
ce
Ho
me
& in
terio
rs
Leis
ure
Mo
bile
& t
elec
om
Ph
arm
acy
Co
nsu
mer
ele
tro
nic
s
Per
son
al C
are
& fi
tnes
s
En
tert
ain
men
t & g
amin
g
Share in Modern/Corporate Retail Share of Modern/Corporate in Total Share in Retail Market
Draft not for citation and quotation
162
has led to the development of retail infrastructure. From the number of shopping malls increased from three in 1999 to 280 in 2007 and is expected to increase at a compound annual growth rate of more than 18.9 percent between 2007 and 2015.329 A study by FICCI330, found that in 2006 India’s total warehousing capacity was only 81 million tonnes, and an additional capacity of 35 million tonnes would be required by the end of 2012 to support the growth of the retail sector. The share of revenue of IT/BPO industry from retail has increased from 4 percent in 2001-02 to 9 per cent in 2009-10.331 Thus, the growth of modern retail is also propelling the growth of other services sector. Modern retail initially started in India and in large/metro cities. It is now penetrating into smaller cities where the growth rate is faster than large cities. Given that the rural sector accounts for nearly 55 per cent of the retail market and has around 720 million consumers, many modern retailers are venturing into rural markets. These retailers not only offer products but also services focusing on the specific requirements of the rural population. For instance, Hariyali Bazaars set up by DCM Sriram for agri-products provides retail banking, credit and other financial services such as insurance. Since food and grocery retailers need to set up supply chains, their rural retail outlets often act as a medium for both sourcing and supplying products. It is estimated that 500 rural towns have the potential to become rural hubs where modern/corporate retailers can set up their base and then cater to around 100 villages each.332 The large consumer base and growing Indian market has attracted a number of foreign retailers to the Indian retail sector. It was only during 2008-09, when the western markets were facing a slowdown, there was a huge surge of investments in India, in the retail sector. The FDI in retail reached its peak in December 2010, when it touched a value of $229.1 million. Thereafter, there has been a sharp decline in investments, and in June 2012, FDI in retail was valued at $42.70 million with a share of 0.02 per cent in total FDI into India.333
6.2.2 Retail Market in the EU
Retail trade sector was the largest sectors within the EU-27’s non-financial business economy in terms of numbers of enterprises and persons employed and the second largest in terms of turnover and value added. Like India, in the EU retail sector is clubbed under wholesale and retail trade; repair of motor vehicles and motorcycles. Retail accounts for a substantial part of the segment. In 2009, retail trade accounted for 30 per cent of wholesale and retail trade; repair of motor vehicles and motorcycles.334 The turnover of EU-27’s retail trade sector was valued at $3437.7 billion (€2466.6 billion)335, from which $602.1 billion (€432.0 billion)336 of value added was generated, equivalent to 11.2 per cent and 7.7 per cent respectively, of the totals for the non-financial business economy. There were 3.6 million retail trade enterprises
329 Images (2009). 330 FICCI and Ernst & Young Report “Winning with Intelligent Supply Chains”, 2007. 331 NASSCOM Strategic Review 2010 332 Images (2009) and interviews conducted by ICRIER researchers for the Italian Trade Commission Project in 2010. 333 Author’s compilation from Department of Industrial Policy and Promotion (DIPP), FDI Factsheet, various issues http://dipp.nic.in/English/Publications/FDI_Statistics/FDI_Statistics.aspx (last accessed on August 28th, 2012) 334 Author’s calculation from Eurostat database 335 Conversion done using the average exchange rate of US dollar for Euros for the calendar year 2009 (1€=$1.3937) using www.oanda.com (last accessed on August 30th, 2012) 336 Conversion done using the average exchange rate of US dollar for Euros for the calendar year 2009 (1€=$1.3937) using www.oanda.com (last accessed on August 30th, 2012)
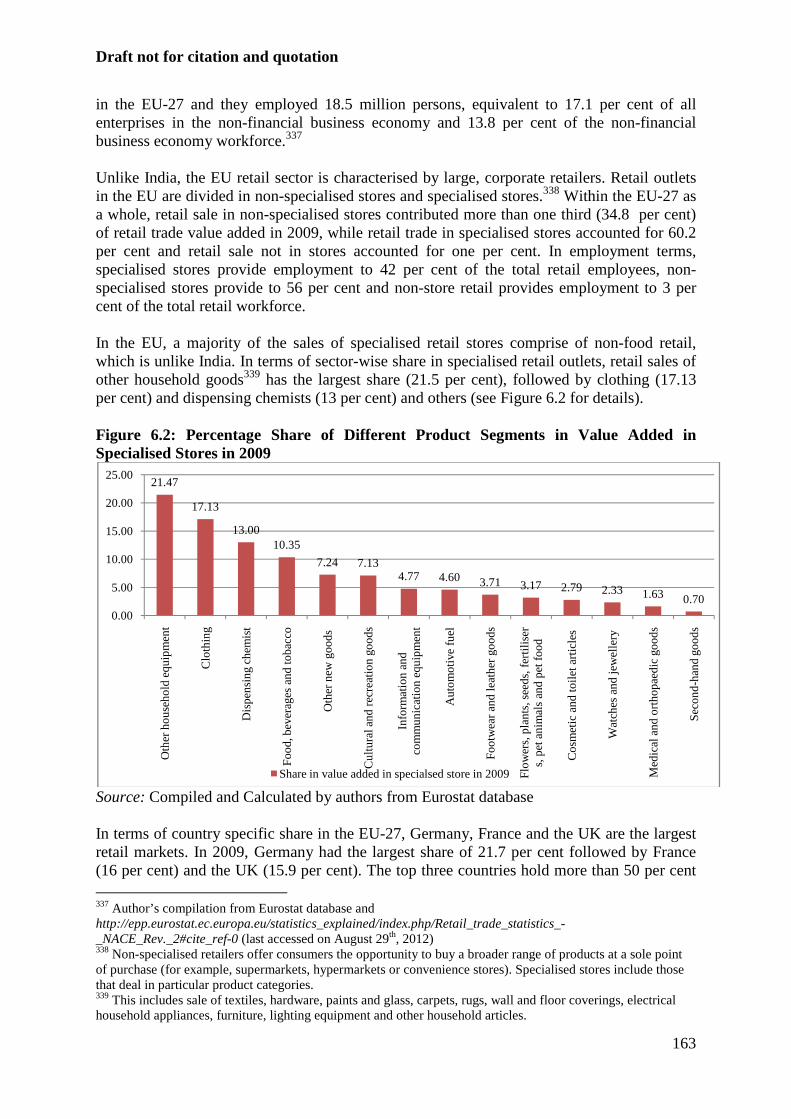
Draft not for citation and quotation
163
in the EU-27 and they employed 18.5 million persons, equivalent to 17.1 per cent of all enterprises in the non-financial business economy and 13.8 per cent of the non-financial business economy workforce.337 Unlike India, the EU retail sector is characterised by large, corporate retailers. Retail outlets in the EU are divided in non-specialised stores and specialised stores.338 Within the EU-27 as a whole, retail sale in non-specialised stores contributed more than one third (34.8 per cent) of retail trade value added in 2009, while retail trade in specialised stores accounted for 60.2 per cent and retail sale not in stores accounted for one per cent. In employment terms, specialised stores provide employment to 42 per cent of the total retail employees, non-specialised stores provide to 56 per cent and non-store retail provides employment to 3 per cent of the total retail workforce. In the EU, a majority of the sales of specialised retail stores comprise of non-food retail, which is unlike India. In terms of sector-wise share in specialised retail outlets, retail sales of other household goods339 has the largest share (21.5 per cent), followed by clothing (17.13 per cent) and dispensing chemists (13 per cent) and others (see Figure 6.2 for details). Figure 6.2: Percentage Share of Different Product Segments in Value Added in Specialised Stores in 2009
Source: Compiled and Calculated by authors from Eurostat database In terms of country specific share in the EU-27, Germany, France and the UK are the largest retail markets. In 2009, Germany had the largest share of 21.7 per cent followed by France (16 per cent) and the UK (15.9 per cent). The top three countries hold more than 50 per cent 337 Author’s compilation from Eurostat database and http://epp.eurostat.ec.europa.eu/statistics_explained/index.php/Retail_trade_statistics_-_NACE_Rev._2#cite_ref-0 (last accessed on August 29th, 2012) 338 Non-specialised retailers offer consumers the opportunity to buy a broader range of products at a sole point of purchase (for example, supermarkets, hypermarkets or convenience stores). Specialised stores include those that deal in particular product categories. 339 This includes sale of textiles, hardware, paints and glass, carpets, rugs, wall and floor coverings, electrical household appliances, furniture, lighting equipment and other household articles.
21.47
17.13
13.0010.35
7.24 7.134.77 4.60 3.71 3.17 2.79 2.33 1.63 0.70
0.00
5.00
10.00
15.00
20.00
25.00
Oth
er h
ou
seh
old
eq
uip
men
t
Clo
thin
g
Dis
pen
sin
g ch
emis
t
Fo
od
, bev
erag
es a
nd
tob
acco
Oth
er n
ew g
oo
ds
Cu
ltura
l an
d r
ecre
atio
n g
oo
ds
Info
rmat
ion
an
d
com
mu
nic
atio
n e
qu
ipm
ent
Au
tom
otiv
e fu
el
Fo
otw
ear
and
leat
her
go
od
s
Flo
wer
s, p
lan
ts, s
eed
s, fe
rtili
ser
s, p
et a
nim
als
and
pet
foo
d
Co
smet
ic a
nd
toile
t art
icle
s
Wat
ches
an
d je
wel
lery
Med
ical
an
d o
rth
op
aed
ic g
oo
ds
Sec
on
d-han
d g
oo
ds
Share in value added in specialsed store in 2009
Draft not for citation and quotation
164
share in value added in the EU-27 retail market.340 These three countries also accounted for the largest retail turnover in 2009 (for details see Table 6.1). In terms of number of enterprises, in 2009, Italy had the highest number (651,024) of retail enterprises followed by Spain (497,992) and France (378,768). Compared to this, in India, there are around 12 million traditional/non-corporate retail outlets and a few hundred modern/corporate retail outlets.341 Table 6.1: Country Specific Size and Share of Different Parameters in Retail Trade Parameter/Region Enterprises in Retail
sector Turnover Value added at
factor cost Number Share in
the EU (%)
Value (in million dollars)
Share in the EU
(%)
Value (in million dollars)
Share in the
EU (%) Austria 40,061 1.13 73989.9 2.2 14456.4 2.4 Belgium 74,260 2.09 110519.3 3.2 17638.8 2.9 Bulgaria 104,850 2.95 13964.6 0.4 1551.6 0.3 Croatia 23,499 17342.9 2698.3 Cyprus 11,325 0.32 7564.6 0.2 1274.0 0.2 Czech Republic 128,448 3.61 46639.5 1.4 6038.5 1.0 Denmark 21,786 0.61 57278.7 1.7 10112.5 1.7 Estonia 4,484 0.13 6068.4 0.2 638.6 0.1 Finland 22,840 0.64 48267.5 1.4 8002.1 1.3 France 378,768 10.65 562367.0 16.4 96537.6 16.0 Germany (including former GDR from 1991)
329,409 9.27 641803.7 18.7 130666.3 21.7
Hungary 88,971 2.50 34024.0 1.0 3337.2 0.6 Ireland 21,933 0.62 47553.2 1.4 9178.5 1.5 Italy 651,024 18.31 393699.5 11.5 57646.8 9.6 Latvia 13,566 0.38 7472.2 0.2 917.8 0.2 Lithuania 34,327 0.97 10343.3 0.3 1001.5 0.2 Luxembourg 3,066 0.09 18993.6 0.6 1584.2 0.3 Netherlands 77,879 2.19 145182.0 4.2 28167.7 4.7 Norway 27,006 0.76 62929.7 1.8 10836.2 1.8 Poland 319,039 8.97 120913.5 3.5 15806.4 2.6 Portugal 153,301 4.31 63777.1 1.9 9337.8 1.6 Romania 121,311 3.41 35669.9 1.0 4052.9 0.7 Slovakia 9,764 0.27 13574.1 0.4 2059.7 0.3 Slovenia 6,897 0.19 14704.0 0.4 1879.4 0.3 Spain 497,992 14.01 305943.8 8.9 60513.9 10.1
340 Author’s calculations from Eurostat 341 http://csis.org/files/publication/sam_137.pdf and http://www.indiastudychannel.com/attachments/Resources/35680-311746-list%20of%20retail%20company%20in%20india.txt (last accessed on September 12th, 2012)
Draft not for citation and quotation
165
Sweden 58,487 1.65 78592.0 2.3 13488.5 2.2 Switzerland 18,832 0.53 104972.5 3.1 25521.3 4.2 Turkey 745,507 169542.5 13973.5 United Kingdom 187,946 5.29 494219.5 14.4 95495.5 15.9 European Union (27 countries)
3,555,397 3437745.0 602096.6
Source: Extracted by authors from Eurostat database. Conversion done using the average exchange rate of US dollar for Euros for the calendar year 2009 (1€=$1.3937) using www.oanda.com (last accessed on August 30th, 2012) European retailers are one of the most global retailers in world (Deloitte 2012). Some of the top EU retailers in the world market are from France, Germany and the UK. These include non-specialised retailers like Carrefour S.A. (France, global rank 2nd), Tesco PLC (UK, global rank 3rd), Metro AG (Germany, global rank 4th), Schwarz Unternehmens Treuhand KG (Germany, global rank 6th) and Aldi Einkauf GmbH & Co. oHG (Germany, global rank 10th). IKEA, which is a Sweden based speciality retailer was ranked 30th by the same index. The next section discusses the retail regulations applicable in India and the EU. 6.3 Retail Regulations in India and the EU Globally, retail is a highly regulated sector. However, with liberalisation, most countries now allow foreign investment in retail. The process of liberalisation in emerging markets started in the nineties with China opening its retail sector in 1992, Brazil, Mexico and Argentina in 1994 and Indonesia in 1998.342 Many countries have opened up the retail sector in a phased manner, but some impose conditions like foreign equity cap, local partnership conditions and minimum paid-up capital requirements, among others. Apart from imposing conditions on foreign investments, some countries have imposed several regulations such as zoning regulations, economic needs test and labour market tests and local sourcing conditions, among others.343 While the emerging markets mostly resort to FDI restrictions in retail, developed countries impose stringent regulations to regulate retail operations.
6.3.1 Retail Regulations in India According to the Indian Constitution, retail sector is under the jurisdiction of the state governments. At the centre, the Department of Consumer Affairs regulates internal trade while the Department of Industrial Policy and Promotion (DIPP), under the Ministry of Commerce and industry, regulates FDI. Different central government ministries/departments such as Ministry of Agriculture and the Ministry of Textiles regulate specific products, which has an impact on the retailing of these products. The Shops and Establishment Act, under the purview of the state governments, lays down the conditions for establishing and operating retail outlets including shop opening and closing timings. The state governments also regulate sourcing (through Acts like Agricultural Produce Marketing Committee (APMC) Act)344 and
342 Mukherjee and Patel (2005) 343 For details see Goyal and Mukherjee (2012) 344 As per the Model APMC Act, 2003, APMC Act is defined as “An Act to provide for improved regulation in marketing of agricultural produce, development of efficient marketing system, promotion of agri-processing and agricultural export and the establishment and proper administration of markets for agricultural produce in
Draft not for citation and quotation
166
entry and movement of goods within state boundaries. Zoning is under the purview of local municipal bodies. Regulations relating to sourcing, packaging, distribution, etc., are applicable to retail. The Competition Act, 2002, and its amendments regulate anticompetitive practices involved in retail sale of products. From the perspective of consumers, one of the most important acts is the Consumers Protection Act, 1986, and the Consumer Protection (Amendment) Act, 2002, which became effective from March 2003. This Act protects consumers of both goods and services from unfair or restrictive trade practices. The number of regulations and extent of restrictions vary across different Indian states and even cities depending upon the type of retail formats and the commodities traded. On an average, a corporate retailer has to obtain around 30 licenses and clearances. This can increase to around 45 for segments like food and grocery retailing.345 After the severe balance of payments and currency crisis in 1991, the Indian government allowed foreign investments in a large number of sectors, excluding the retail sector. In 1997, the government imposed a ban on FDI in retail. Subsequently the policy has been relaxed and FDI is allowed through other routes of product distribution such as wholesale cash and carry (100% FDI is allowed since 2006), franchising and distribution agreement and test marketing346, among others. If a foreign company has wholly owned subsidiary in manufacturing it is allowed to retail products. However, each of these entry routes has certain drawbacks. For instance, most low-priced, multi-brand retailers like Wal-Mart and Tesco have entered through the wholesale cash-and-carry route, which does not allow these companies to make direct sales to consumers. Therefore, they cannot reap the benefits of the large and growing Indian consumer market. Moreover, wholesale cash and carry is a ‘volume’ business347 and may not be suitable for specialised and luxury products which are generally purchased in small quantities. Entry routes like franchising, licensing and distribution arrangement do not allow foreign retailers to have a share in profits in India. In addition, foreign luxury brands do not like to give away their brand ownership to a number of distributors as it can act as a deterrent to the global brand name. Setting-up a manufacturing facility requires investment, long-term commitment and is only economically viable if there is enough demand for the product. In India, setting-up of manufacturing is not easy – companies have to adhere to the labour laws and they often face infrastructural bottlenecks (such as power shortage). Therefore, most retailers prefer to source from contract manufacturers. For the purpose of FDI policy, the Indian government has divided the retail sector in single-brand and multi-brand retail trading. In 2006, the government first allowed 51 % FDI in single brand retail subject to certain conditions. The policy was liberalised to allow 100% FDI in single brand retail in January 2012 and further liberalised in September 2012. In 2012, the Indian government liberalised both the single-brand and multi-brand retail policy of India. India’s FDI regime in the retail sector is given in Table 6.2 below.
States.” As per the APMC Act, in each state of India all agricultural products are required to be sold only in government - regulated markets. 345 Joseph and Soundararajan (2009). 346 Test Marketing is a limited introduction of a product or service to test public reaction for a full market strategy. In India, the DIPP has permitted test marketing of such items for which a company has approval for manufacture, provided such test marketing facility will be for a period of two years, and investment in setting up manufacturing facility commences simultaneously with test marketing. 347 The route permits on business-to-business operations where goods are sold in bulk.
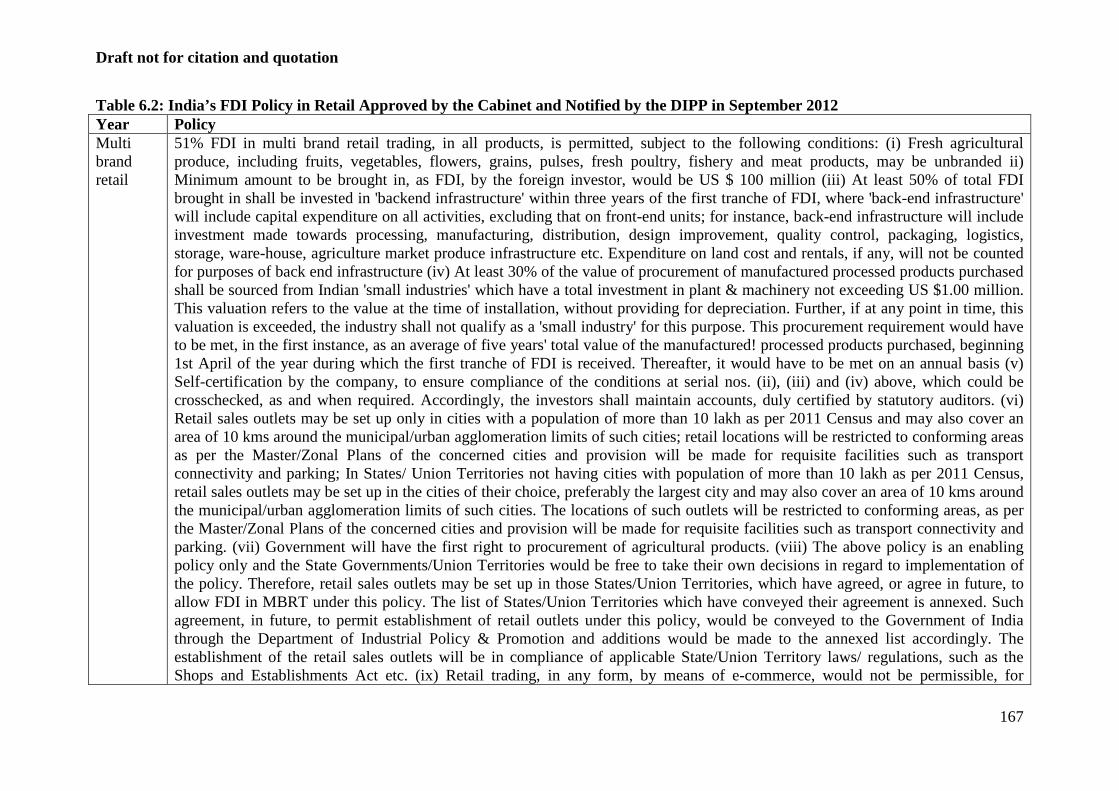
Draft not for citation and quotation
167
Table 6.2: India’s FDI Policy in Retail Approved by the Cabinet and Notified by the DIPP in September 2012 Year Policy Multi brand retail
51% FDI in multi brand retail trading, in all products, is permitted, subject to the following conditions: (i) Fresh agricultural produce, including fruits, vegetables, flowers, grains, pulses, fresh poultry, fishery and meat products, may be unbranded ii) Minimum amount to be brought in, as FDI, by the foreign investor, would be US $ 100 million (iii) At least 50% of total FDI brought in shall be invested in 'backend infrastructure' within three years of the first tranche of FDI, where 'back-end infrastructure' will include capital expenditure on all activities, excluding that on front-end units; for instance, back-end infrastructure will include investment made towards processing, manufacturing, distribution, design improvement, quality control, packaging, logistics, storage, ware-house, agriculture market produce infrastructure etc. Expenditure on land cost and rentals, if any, will not be counted for purposes of back end infrastructure (iv) At least 30% of the value of procurement of manufactured processed products purchased shall be sourced from Indian 'small industries' which have a total investment in plant & machinery not exceeding US $1.00 million. This valuation refers to the value at the time of installation, without providing for depreciation. Further, if at any point in time, this valuation is exceeded, the industry shall not qualify as a 'small industry' for this purpose. This procurement requirement would have to be met, in the first instance, as an average of five years' total value of the manufactured! processed products purchased, beginning 1st April of the year during which the first tranche of FDI is received. Thereafter, it would have to be met on an annual basis (v) Self-certification by the company, to ensure compliance of the conditions at serial nos. (ii), (iii) and (iv) above, which could be crosschecked, as and when required. Accordingly, the investors shall maintain accounts, duly certified by statutory auditors. (vi) Retail sales outlets may be set up only in cities with a population of more than 10 lakh as per 2011 Census and may also cover an area of 10 kms around the municipal/urban agglomeration limits of such cities; retail locations will be restricted to conforming areas as per the Master/Zonal Plans of the concerned cities and provision will be made for requisite facilities such as transport connectivity and parking; In States/ Union Territories not having cities with population of more than 10 lakh as per 2011 Census, retail sales outlets may be set up in the cities of their choice, preferably the largest city and may also cover an area of 10 kms around the municipal/urban agglomeration limits of such cities. The locations of such outlets will be restricted to conforming areas, as per the Master/Zonal Plans of the concerned cities and provision will be made for requisite facilities such as transport connectivity and parking. (vii) Government will have the first right to procurement of agricultural products. (viii) The above policy is an enabling policy only and the State Governments/Union Territories would be free to take their own decisions in regard to implementation of the policy. Therefore, retail sales outlets may be set up in those States/Union Territories, which have agreed, or agree in future, to allow FDI in MBRT under this policy. The list of States/Union Territories which have conveyed their agreement is annexed. Such agreement, in future, to permit establishment of retail outlets under this policy, would be conveyed to the Government of India through the Department of Industrial Policy & Promotion and additions would be made to the annexed list accordingly. The establishment of the retail sales outlets will be in compliance of applicable State/Union Territory laws/ regulations, such as the Shops and Establishments Act etc. (ix) Retail trading, in any form, by means of e-commerce, would not be permissible, for
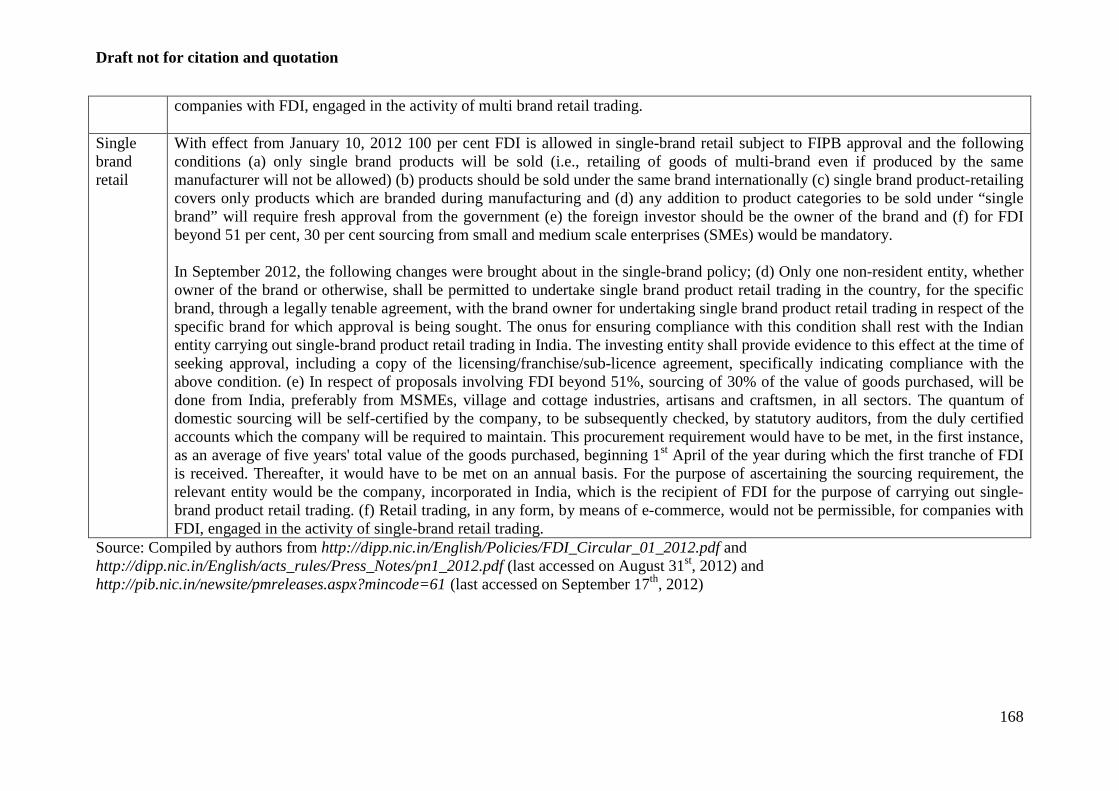
Draft not for citation and quotation
168
companies with FDI, engaged in the activity of multi brand retail trading.
Single brand retail
With effect from January 10, 2012 100 per cent FDI is allowed in single-brand retail subject to FIPB approval and the following conditions (a) only single brand products will be sold (i.e., retailing of goods of multi-brand even if produced by the same manufacturer will not be allowed) (b) products should be sold under the same brand internationally (c) single brand product-retailing covers only products which are branded during manufacturing and (d) any addition to product categories to be sold under “single brand” will require fresh approval from the government (e) the foreign investor should be the owner of the brand and (f) for FDI beyond 51 per cent, 30 per cent sourcing from small and medium scale enterprises (SMEs) would be mandatory. In September 2012, the following changes were brought about in the single-brand policy; (d) Only one non-resident entity, whether owner of the brand or otherwise, shall be permitted to undertake single brand product retail trading in the country, for the specific brand, through a legally tenable agreement, with the brand owner for undertaking single brand product retail trading in respect of the specific brand for which approval is being sought. The onus for ensuring compliance with this condition shall rest with the Indian entity carrying out single-brand product retail trading in India. The investing entity shall provide evidence to this effect at the time of seeking approval, including a copy of the licensing/franchise/sub-licence agreement, specifically indicating compliance with the above condition. (e) In respect of proposals involving FDI beyond 51%, sourcing of 30% of the value of goods purchased, will be done from India, preferably from MSMEs, village and cottage industries, artisans and craftsmen, in all sectors. The quantum of domestic sourcing will be self-certified by the company, to be subsequently checked, by statutory auditors, from the duly certified accounts which the company will be required to maintain. This procurement requirement would have to be met, in the first instance, as an average of five years' total value of the goods purchased, beginning 1st April of the year during which the first tranche of FDI is received. Thereafter, it would have to be met on an annual basis. For the purpose of ascertaining the sourcing requirement, the relevant entity would be the company, incorporated in India, which is the recipient of FDI for the purpose of carrying out single-brand product retail trading. (f) Retail trading, in any form, by means of e-commerce, would not be permissible, for companies with FDI, engaged in the activity of single-brand retail trading.
Source: Compiled by authors from http://dipp.nic.in/English/Policies/FDI_Circular_01_2012.pdf and http://dipp.nic.in/English/acts_rules/Press_Notes/pn1_2012.pdf (last accessed on August 31st, 2012) and http://pib.nic.in/newsite/pmreleases.aspx?mincode=61 (last accessed on September 17th, 2012)
Draft not for citation and quotation
169
Since, there were FDI restrictions in the past, India has adopted a restrictive approach in the retail sector in its international negotiations like the WTO and free trade agreements. In the Uruguay Round (1986-94) of WTO negotiations, India did not undertake commitments in distribution services. In the Doha Round, India offered to undertake commitments in commission agent’s services and wholesale trade services for some products. India’s commitments in distribution services vary across different bilateral trade agreements. For instance, in the India-Singapore CECA, India (August, 2005) undertook commitments in franchising services along with wholesale trading and commission agents’ services. In the India-Japan CEPA (August 2011), India allowed 51 per cent FDI in single-brand retail, based on the autonomous regime at that time. Thus, India shows some willingness to bind the autonomous regime in trade agreements, but does not offer to undertake forward-looking commitments in this sector. Since India’s major trading partners including the EU have a strong interest in this sector, it is likely that the sector will witness more liberalisation in India’s multilateral and bilateral trade agreements, especially the India-EU BTIA.
6.3.2 Regulations in the EU
In the EU, there is no retail-specific Directive/regulation applicable to the EU Member States. The Services Directive 2006/123/EC on services in the internal market is applicable to the retail sector and it lays down the general provisions governing the retail sector. The Directive establishes a general legal framework, which benefits a wide variety of services, including retail, taking in account the distinctive features of each type of activity or profession and its system of regulation.348 It establishes general provisions for facilitating freedom of establishment for service providers and the free movement of services, while maintaining a high quality of services (for details see Chapter 1). In order to ensure freedom of establishment for providers, the Services Directive has conditions governing authorisation and has prohibited certain requirements. Some of these have important implication for the retail sector. The Directive states that Member States shall not make access to or exercise of service activity subject to authorisation scheme. For instance, authorisation required by local authorities for establishing operations or selling certain products.349 Prohibited requirement include discriminatory requirements based directly or indirectly on nationality of the service provider, prohibition on having an establishment in more than one Member State and case-by-case application on economic test, among others.350 For instance, EU Member State cannot impose restrictions on opening retail outlets or branches in more than one Member State. The Directive also has provisions to ensure free movement of services. These include Articles on freedom to provide services and related derogations and the rights of recipients of services. The article on freedom to provide services gives the service provider the right to provide services in a Member State other than the one in which they are established. The Member States cannot impose requirement on the access to or exercise of services in their territory. As regards the rights of recipient of services, Member States cannot impose requirements on a recipient that restrict the use of a service supplied by a provider established
348 For details see Service directive 2006/123/EC accessible at http://eur-lex.europa.eu/LexUriServ/LexUriServ.do?uri=OJ:L:2006:376:0036:0068:EN:PDF (last accessed on August 23rd, 2012) 349 For details, see Article 9 of the Services Directive. 350 For details, see Article 14 of the Services Directive.
Draft not for citation and quotation
170
in another Member State. The Member States cannot discriminate against a recipient based on his nationality or place of residence. The Directive lays down the conditions applicable to an EU service provider and not to a foreigner. The treatment of foreign service provider depends on the mode of entry of the foreign company in the EU market. In case a foreign company enters through a joint venture or as a wholly owned subsidiary by making direct investment, it is treated as an EU company. In that case, the company enjoys the same privileges as received by any other EU company and comes under the purview of the Services Directive. A representative office, a branch, or distributive offices of foreign companies are not treated as an EU company and therefore, they do not fall under the provisions of the Services Directive. Such offices have to follow individual country’s regulations governing the sector. The European Commission has a vision to have a more efficient and fair retail services in the EU internal market by 2020. In order to achieve this, the commission encourages the Member States to adhere to the provisions under the Services Directive 2006/123/EC. The Commission is now in the process of devising a Retail Action Plan for the EU market aiming to integrate the EU retail market.351 There are several regulations applicable to foreign retailers in the EU market. These include economic need test, zoning regulations, restrictions on the size of retail outlet and restrictions on sale of certain commodities. EU Member States have amended some of their regulations to make them compliant to the EU Services Directive, while there are some other regulations that are not compliant with the Service Directive. Table 6A.1 in Appendix 6A lists some regulations specific to the retail sector have been amended by the EU Member States to meet the provisions in the Services Directives. The Table also lists regulations applicable to foreign retailers that are still present in the Member States and are not compliant with the Services Directive. Apart from the Services Directive, EU Directives on consumer protection, employment of people and e-commerce activities are also applicable to the EU retailers. In the EU, there are several Directives on consumer protection. The EU is in the forefront with respect to consumer protection. In 2011, the EC issued Directive 2011/83/EU on consumer rights amending the four Directives that aimed at high level of consumer protection by proper functioning of internal markets.352 The Directive is still under consultation. The Directive merged four existing consumer protection directives namely - 85/577/EEC on contracts negotiated away from business premises; Directive 93/13/EEC on unfair terms in consumer contracts; Directive 97/7/EC on distance contracts and Directive 99/44/EC on consumer sales and guarantees - into a single horizontal instrument. The aim was to regulate common aspects relating to consumer protection systematically, simplifying and updating the existing rules, removing inconsistencies and closing gaps in the four Directives.353 Directive 98/6/EC of the European Parliament on consumer protection in the indication of the prices of products offered to consumers. Apart from this, Directive 2005/29/EC concerning unfair
351 For details see http://ec.europa.eu/internal_market/retail/index_en.htm#maincontentSec1 (last accessed on September 13th, 2012) 352 For detail see http://eur-lex.europa.eu/LexUriServ/LexUriServ.do?uri=OJ:L:2011:304:0064:0088:EN:PDF (last accessed on August 24th, 2012) 353 For detail see http://eur-lex.europa.eu/LexUriServ/LexUriServ.do?uri=COM:2008:0614:FIN:EN:PDF (last accessed on August 24th, 2012)
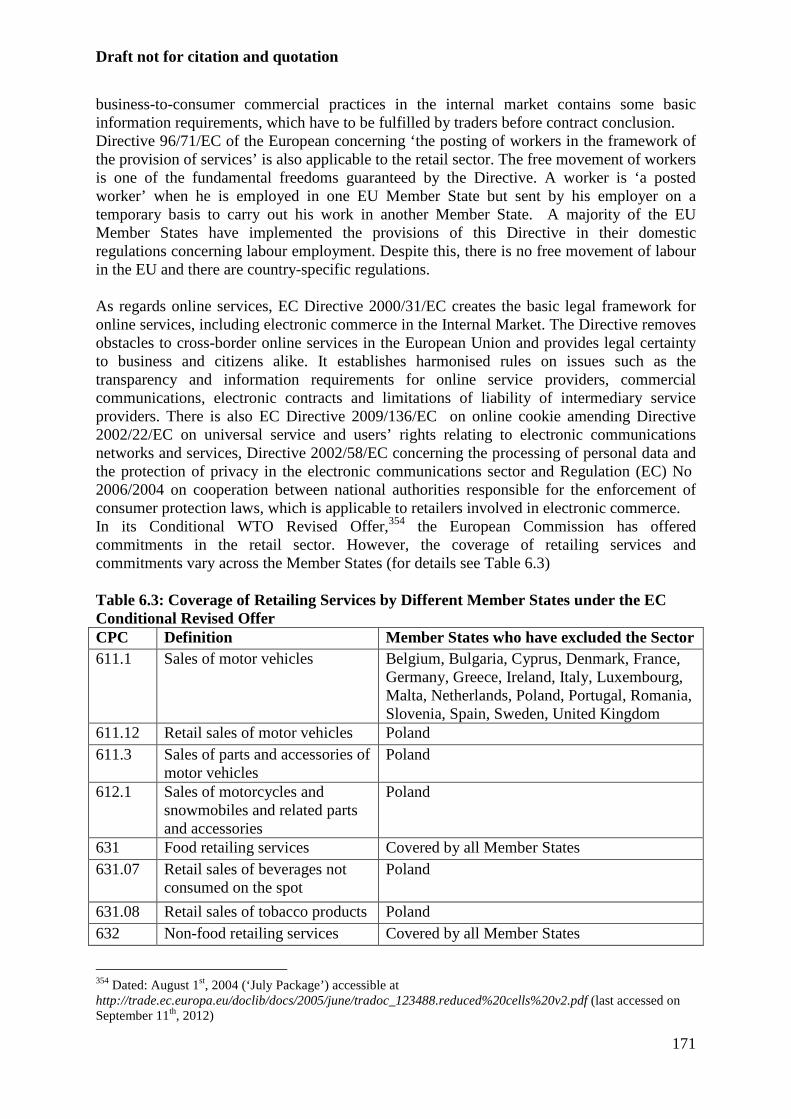
Draft not for citation and quotation
171
business-to-consumer commercial practices in the internal market contains some basic information requirements, which have to be fulfilled by traders before contract conclusion. Directive 96/71/EC of the European concerning ‘the posting of workers in the framework of the provision of services’ is also applicable to the retail sector. The free movement of workers is one of the fundamental freedoms guaranteed by the Directive. A worker is ‘a posted worker’ when he is employed in one EU Member State but sent by his employer on a temporary basis to carry out his work in another Member State. A majority of the EU Member States have implemented the provisions of this Directive in their domestic regulations concerning labour employment. Despite this, there is no free movement of labour in the EU and there are country-specific regulations. As regards online services, EC Directive 2000/31/EC creates the basic legal framework for online services, including electronic commerce in the Internal Market. The Directive removes obstacles to cross-border online services in the European Union and provides legal certainty to business and citizens alike. It establishes harmonised rules on issues such as the transparency and information requirements for online service providers, commercial communications, electronic contracts and limitations of liability of intermediary service providers. There is also EC Directive 2009/136/EC on online cookie amending Directive 2002/22/EC on universal service and users’ rights relating to electronic communications networks and services, Directive 2002/58/EC concerning the processing of personal data and the protection of privacy in the electronic communications sector and Regulation (EC) No 2006/2004 on cooperation between national authorities responsible for the enforcement of consumer protection laws, which is applicable to retailers involved in electronic commerce. In its Conditional WTO Revised Offer,354 the European Commission has offered commitments in the retail sector. However, the coverage of retailing services and commitments vary across the Member States (for details see Table 6.3) Table 6.3: Coverage of Retailing Services by Different Member States under the EC Conditional Revised Offer CPC Definition Member States who have excluded the Sector 611.1 Sales of motor vehicles Belgium, Bulgaria, Cyprus, Denmark, France,
Germany, Greece, Ireland, Italy, Luxembourg, Malta, Netherlands, Poland, Portugal, Romania, Slovenia, Spain, Sweden, United Kingdom
611.12 Retail sales of motor vehicles Poland 611.3 Sales of parts and accessories of
motor vehicles Poland
612.1 Sales of motorcycles and snowmobiles and related parts and accessories
Poland
631 Food retailing services Covered by all Member States 631.07 Retail sales of beverages not
consumed on the spot Poland
631.08 Retail sales of tobacco products Poland 632 Non-food retailing services Covered by all Member States
354 Dated: August 1st, 2004 (‘July Package’) accessible at http://trade.ec.europa.eu/doclib/docs/2005/june/tradoc_123488.reduced%20cells%20v2.pdf (last accessed on September 11th, 2012)
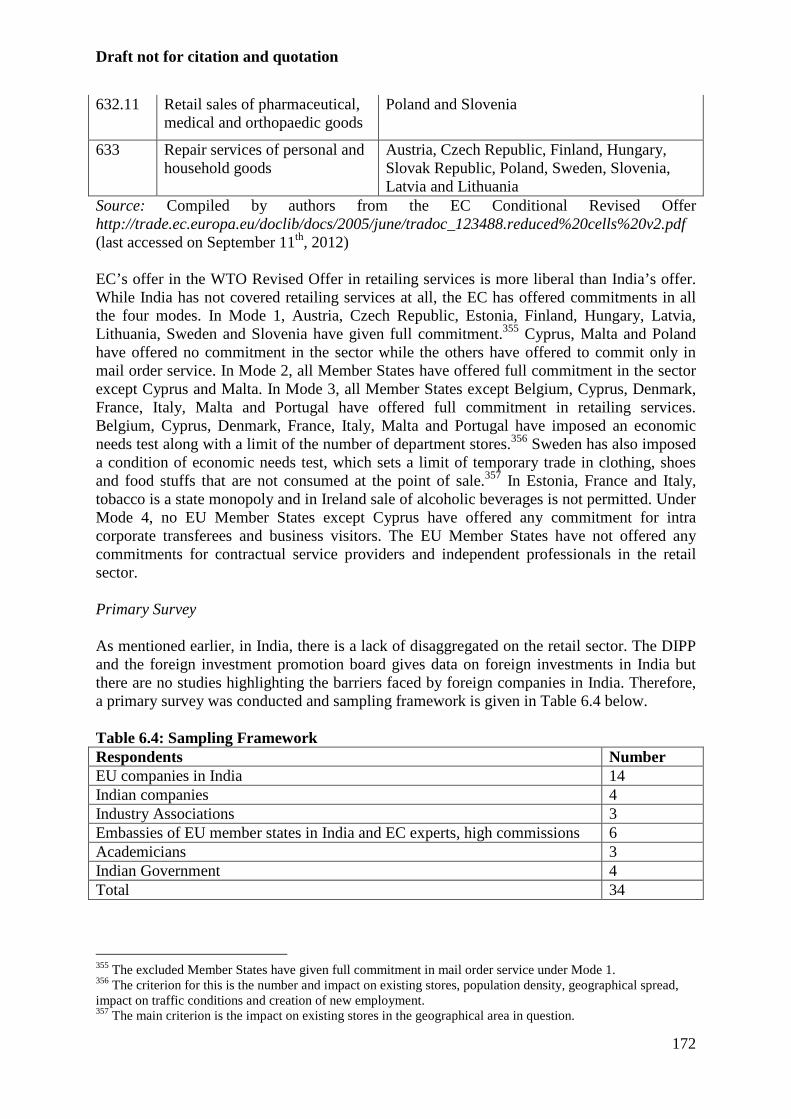
Draft not for citation and quotation
172
632.11 Retail sales of pharmaceutical, medical and orthopaedic goods
Poland and Slovenia
633 Repair services of personal and household goods
Austria, Czech Republic, Finland, Hungary, Slovak Republic, Poland, Sweden, Slovenia, Latvia and Lithuania
Source: Compiled by authors from the EC Conditional Revised Offer http://trade.ec.europa.eu/doclib/docs/2005/june/tradoc_123488.reduced%20cells%20v2.pdf (last accessed on September 11th, 2012) EC’s offer in the WTO Revised Offer in retailing services is more liberal than India’s offer. While India has not covered retailing services at all, the EC has offered commitments in all the four modes. In Mode 1, Austria, Czech Republic, Estonia, Finland, Hungary, Latvia, Lithuania, Sweden and Slovenia have given full commitment.355 Cyprus, Malta and Poland have offered no commitment in the sector while the others have offered to commit only in mail order service. In Mode 2, all Member States have offered full commitment in the sector except Cyprus and Malta. In Mode 3, all Member States except Belgium, Cyprus, Denmark, France, Italy, Malta and Portugal have offered full commitment in retailing services. Belgium, Cyprus, Denmark, France, Italy, Malta and Portugal have imposed an economic needs test along with a limit of the number of department stores.356 Sweden has also imposed a condition of economic needs test, which sets a limit of temporary trade in clothing, shoes and food stuffs that are not consumed at the point of sale.357 In Estonia, France and Italy, tobacco is a state monopoly and in Ireland sale of alcoholic beverages is not permitted. Under Mode 4, no EU Member States except Cyprus have offered any commitment for intra corporate transferees and business visitors. The EU Member States have not offered any commitments for contractual service providers and independent professionals in the retail sector. Primary Survey As mentioned earlier, in India, there is a lack of disaggregated on the retail sector. The DIPP and the foreign investment promotion board gives data on foreign investments in India but there are no studies highlighting the barriers faced by foreign companies in India. Therefore, a primary survey was conducted and sampling framework is given in Table 6.4 below. Table 6.4: Sampling Framework Respondents Number EU companies in India 14 Indian companies 4 Industry Associations 3 Embassies of EU member states in India and EC experts, high commissions 6 Academicians 3 Indian Government 4 Total 34
355 The excluded Member States have given full commitment in mail order service under Mode 1. 356 The criterion for this is the number and impact on existing stores, population density, geographical spread, impact on traffic conditions and creation of new employment. 357 The main criterion is the impact on existing stores in the geographical area in question.
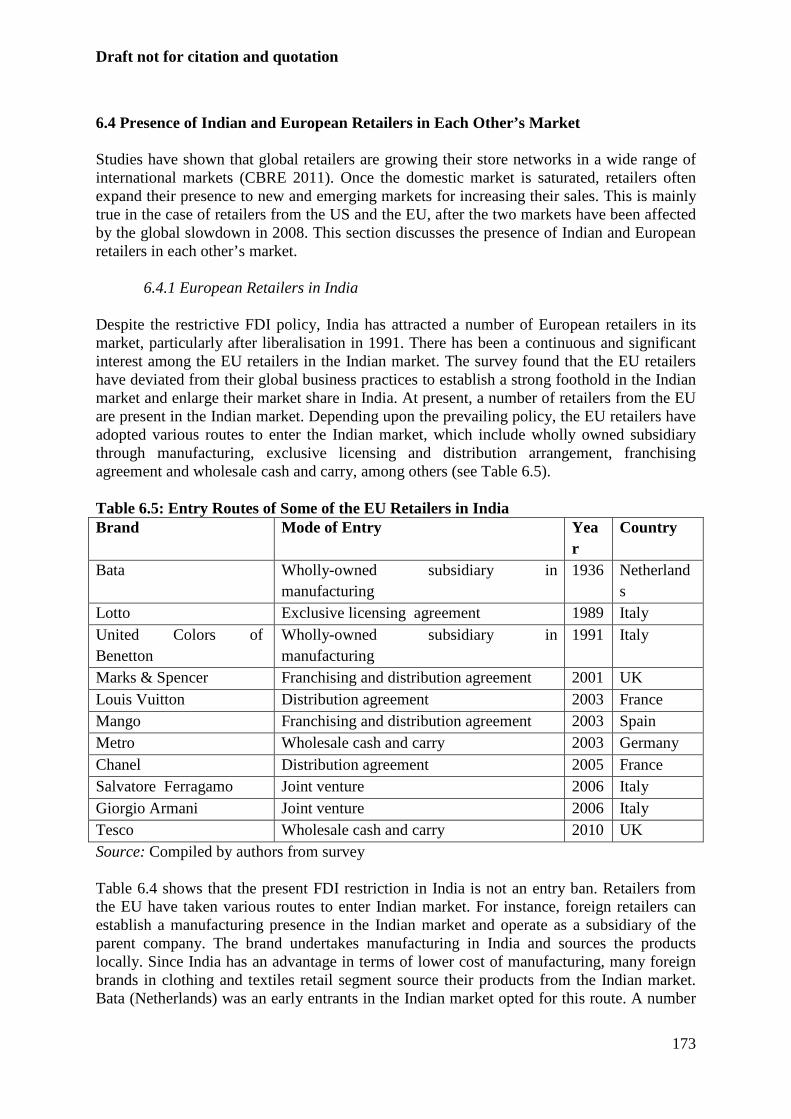
Draft not for citation and quotation
173
6.4 Presence of Indian and European Retailers in Each Other’s Market Studies have shown that global retailers are growing their store networks in a wide range of international markets (CBRE 2011). Once the domestic market is saturated, retailers often expand their presence to new and emerging markets for increasing their sales. This is mainly true in the case of retailers from the US and the EU, after the two markets have been affected by the global slowdown in 2008. This section discusses the presence of Indian and European retailers in each other’s market.
6.4.1 European Retailers in India Despite the restrictive FDI policy, India has attracted a number of European retailers in its market, particularly after liberalisation in 1991. There has been a continuous and significant interest among the EU retailers in the Indian market. The survey found that the EU retailers have deviated from their global business practices to establish a strong foothold in the Indian market and enlarge their market share in India. At present, a number of retailers from the EU are present in the Indian market. Depending upon the prevailing policy, the EU retailers have adopted various routes to enter the Indian market, which include wholly owned subsidiary through manufacturing, exclusive licensing and distribution arrangement, franchising agreement and wholesale cash and carry, among others (see Table 6.5). Table 6.5: Entry Routes of Some of the EU Retailers in India Brand Mode of Entry Yea
r Country
Bata Wholly-owned subsidiary in manufacturing
1936 Netherlands
Lotto Exclusive licensing agreement 1989 Italy United Colors of Benetton
Wholly-owned subsidiary in manufacturing
1991 Italy
Marks & Spencer Franchising and distribution agreement 2001 UK Louis Vuitton Distribution agreement 2003 France Mango Franchising and distribution agreement 2003 Spain Metro Wholesale cash and carry 2003 Germany Chanel Distribution agreement 2005 France Salvatore Ferragamo Joint venture 2006 Italy Giorgio Armani Joint venture 2006 Italy Tesco Wholesale cash and carry 2010 UK Source: Compiled by authors from survey Table 6.4 shows that the present FDI restriction in India is not an entry ban. Retailers from the EU have taken various routes to enter Indian market. For instance, foreign retailers can establish a manufacturing presence in the Indian market and operate as a subsidiary of the parent company. The brand undertakes manufacturing in India and sources the products locally. Since India has an advantage in terms of lower cost of manufacturing, many foreign brands in clothing and textiles retail segment source their products from the Indian market. Bata (Netherlands) was an early entrants in the Indian market opted for this route. A number
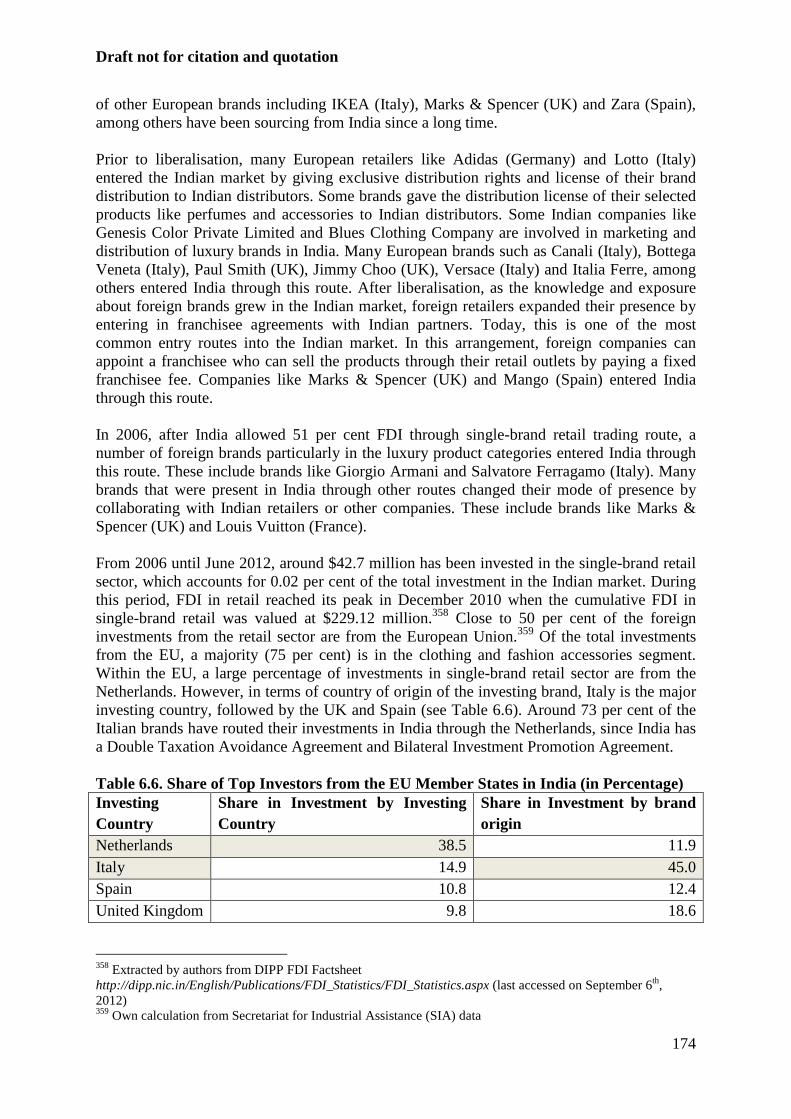
Draft not for citation and quotation
174
of other European brands including IKEA (Italy), Marks & Spencer (UK) and Zara (Spain), among others have been sourcing from India since a long time. Prior to liberalisation, many European retailers like Adidas (Germany) and Lotto (Italy) entered the Indian market by giving exclusive distribution rights and license of their brand distribution to Indian distributors. Some brands gave the distribution license of their selected products like perfumes and accessories to Indian distributors. Some Indian companies like Genesis Color Private Limited and Blues Clothing Company are involved in marketing and distribution of luxury brands in India. Many European brands such as Canali (Italy), Bottega Veneta (Italy), Paul Smith (UK), Jimmy Choo (UK), Versace (Italy) and Italia Ferre, among others entered India through this route. After liberalisation, as the knowledge and exposure about foreign brands grew in the Indian market, foreign retailers expanded their presence by entering in franchisee agreements with Indian partners. Today, this is one of the most common entry routes into the Indian market. In this arrangement, foreign companies can appoint a franchisee who can sell the products through their retail outlets by paying a fixed franchisee fee. Companies like Marks & Spencer (UK) and Mango (Spain) entered India through this route. In 2006, after India allowed 51 per cent FDI through single-brand retail trading route, a number of foreign brands particularly in the luxury product categories entered India through this route. These include brands like Giorgio Armani and Salvatore Ferragamo (Italy). Many brands that were present in India through other routes changed their mode of presence by collaborating with Indian retailers or other companies. These include brands like Marks & Spencer (UK) and Louis Vuitton (France). From 2006 until June 2012, around $42.7 million has been invested in the single-brand retail sector, which accounts for 0.02 per cent of the total investment in the Indian market. During this period, FDI in retail reached its peak in December 2010 when the cumulative FDI in single-brand retail was valued at $229.12 million.358 Close to 50 per cent of the foreign investments from the retail sector are from the European Union.359 Of the total investments from the EU, a majority (75 per cent) is in the clothing and fashion accessories segment. Within the EU, a large percentage of investments in single-brand retail sector are from the Netherlands. However, in terms of country of origin of the investing brand, Italy is the major investing country, followed by the UK and Spain (see Table 6.6). Around 73 per cent of the Italian brands have routed their investments in India through the Netherlands, since India has a Double Taxation Avoidance Agreement and Bilateral Investment Promotion Agreement. Table 6.6. Share of Top Investors from the EU Member States in India (in Percentage) Investing Country
Share in Investment by Investing Country
Share in Investment by brand origin
Netherlands 38.5 11.9 Italy 14.9 45.0 Spain 10.8 12.4 United Kingdom 9.8 18.6
358 Extracted by authors from DIPP FDI Factsheet http://dipp.nic.in/English/Publications/FDI_Statistics/FDI_Statistics.aspx (last accessed on September 6th, 2012) 359 Own calculation from Secretariat for Industrial Assistance (SIA) data
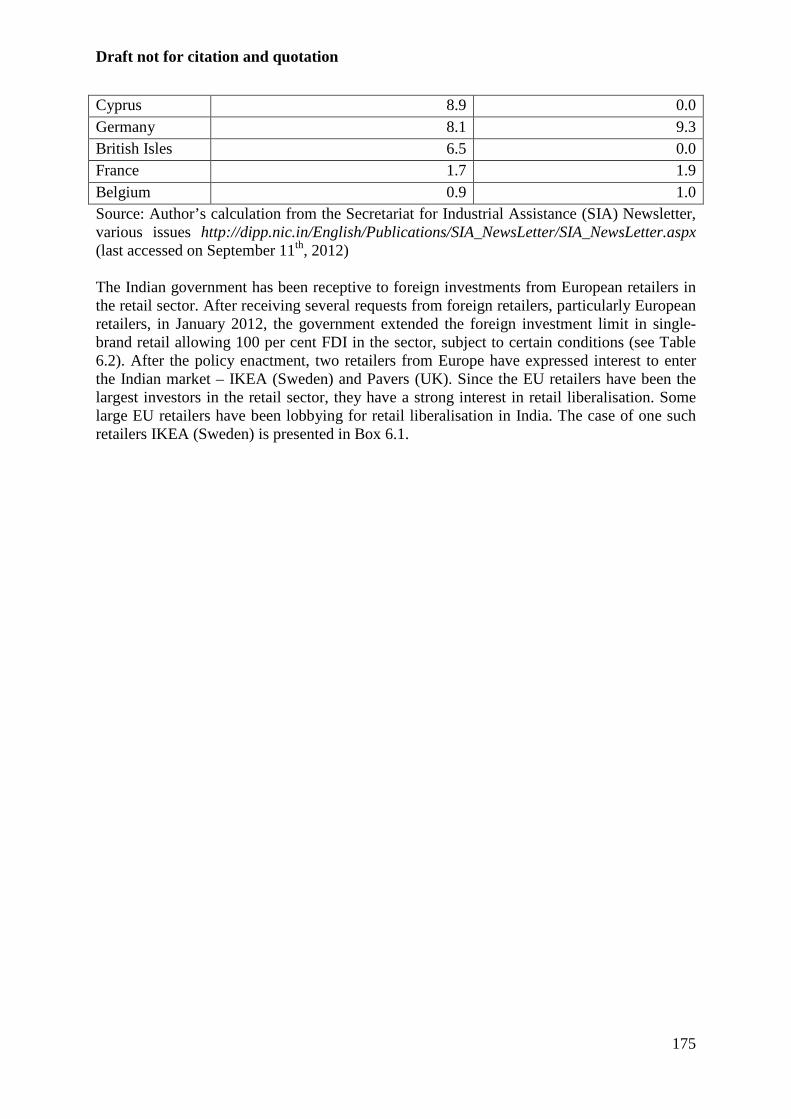
Draft not for citation and quotation
175
Cyprus 8.9 0.0 Germany 8.1 9.3 British Isles 6.5 0.0 France 1.7 1.9 Belgium 0.9 1.0 Source: Author’s calculation from the Secretariat for Industrial Assistance (SIA) Newsletter, various issues http://dipp.nic.in/English/Publications/SIA_NewsLetter/SIA_NewsLetter.aspx (last accessed on September 11th, 2012) The Indian government has been receptive to foreign investments from European retailers in the retail sector. After receiving several requests from foreign retailers, particularly European retailers, in January 2012, the government extended the foreign investment limit in single-brand retail allowing 100 per cent FDI in the sector, subject to certain conditions (see Table 6.2). After the policy enactment, two retailers from Europe have expressed interest to enter the Indian market – IKEA (Sweden) and Pavers (UK). Since the EU retailers have been the largest investors in the retail sector, they have a strong interest in retail liberalisation. Some large EU retailers have been lobbying for retail liberalisation in India. The case of one such retailers IKEA (Sweden) is presented in Box 6.1.
Draft not for citation and quotation
176
Box 6.1: IKEA in India: A Tryst with the Policy IKEA is a privately held, international home products company that designs and sells ready-to-assemble furniture such as beds, chairs, desks, appliances and home accessories. The company is the world's largest furniture retailer. It was founded in Sweden in 1943 and Inter IKEA Systems B.V. was established in 1983 in the Netherlands, when it started to develop the IKEA retail system. IKEA has around 12,000 products including upholstered furniture, bathroom articles, kitchenware, fabrics, lighting, children’s items, food items, wall decoration, pictures and frames, among others. Each of the product range has separate names under which these are sold. In 2012, IKEA had 338 stores in 40 countries providing employment to 154,000 workers. In the same year, the company had a sales turnover of Euro 27.5 Billion. IKEA is expanding its presence in Asia and has recently opened a story in Bangkok. The company has plans to establish presence in the $18.5 billion Indian home decor and furniture market, which is expected to grow by 10-12 per cent per annum. After 100 per cent FDI was permitted in the single brand retail segment in India in January 2012, IKEA proposed to invest Rs. 10,500 crores (€1.5 billion) to set-up 25 stores. However, the company had reservations about mandatory sourcing from Indian micro small and medium enterprises (MSMEs). Based on the company’s recommendations along with the recommendations of other foreign retailers, the Indian government tweaked the sourcing norms in India. As per the latest policy, foreign retailers have to undertake 30% sourcing from India and diluted the previous condition of sourcing 30 per cent of requirements "mandatorily" from Indian MSMEs by stating that sourcing should be done "preferably from MSMEs". The policy received a positive response from the company and IKEA re-submitted its application to the Foreign Investment Promotion Board (FIPB) in India seeking approval to sell 30 product lines in India. Since the proposed investment was more than Rs. 1200 crores, the company required an approval from the Cabinet Committee on Economic Affairs (CCEA). IKEA received an approval from the Indian government to sell its core furniture products. Based on the decision, 18 of the 30 product categories for which IKEA had sought approval were rejected by the government. The logic being that since it is under single-brand retail category, the company cannot be allowed to sell sub-brands. As a result, categories including home and office use products, solutions, fittings, furnishings including stationery, textile products including apparels and fabrics, consumer electronics, cleaning products, leather products, storage and sorting products and accessories, children’s products, safety-related products, travel-related products, cosmetics, recycling solutions and products, lifestyle products, decorative products, gift articles, food and beverages to be served at the IKEA restaurants and beach products and accessories were not given approval. Besides the other restrictions, FIPB has also recommended that no activities falling within the purview of non-banking financial companies activities will be conducted by the applicant. This implies that IKEA cannot offer any finance scheme to its customers. While the company still has to take a final call, IKEA’s entry plans in India is a case with several stumbling blocks.
Draft not for citation and quotation
177
Since multi-brand retail trading is prohibited in the Indian market, EU retailers like Metro (Germany) and Tesco (UK) in this segment have entered through the wholesale cash and carry route. It permits foreign retailers to undertake business-to-business (B2B) operations but does not permit direct sales to customers. Therefore, the present policy restricts the ability of a foreign retailer to enter through their most preferred route. Moreover, each of these entry routes has certain drawbacks, which are discussed later in this chapter. Companies like Tesco also have Global Captive Centre in India, by the name of Tesco Hindustan Service Centre (HSC). It provides key business services for Tesco operations globally. A lot of research and development (R&D) activities and innovation happen in this centre in Bangalore, India. It is the only development centre of Tesco. Apart from this, there are partnerships between Indian designers and European retailers for designing products for Indian and other markets. For instance, the Indian designer, Manish Arora, has design collaborations with the watch brand, Swatch (Switzerland), and jewellery brand, Swarovski (UK), that have established a presence in India. Such collaborations help foreign brands customise their products for the Indian market. The survey found that European brands have customised their products to cater to tastes of Indian consumers. Some of the brands have modified their product designs while others have altered their pricing strategy in the Indian market. This reflects continued and lasting interest of European retailers in the Indian market.
6.4.2 Indian Retailers in the EU
Compared to a widespread presence of the EU retailers in India, very few Indian companies/retailers are present in the EU market. These include retailers and distributors like Fabindia Overseas Private Limited (textiles and clothing), Gitanjali Group (jewellery and watches), Hidesign (leather accessories), Tata Global Beverages (food and grocery), Raymond (textiles and clothing) and Haldiram’s (ready-to-eat food and out of home catering). Some Indian retailers are present through stand-alone outlets in Europe while others have entered in mergers and acquisitions. Fabindia Overseas private limited, an Indian textile retailer, has an outlet in Rome (Italy). The company also acquired 62.5 per cent stake in the UK based women-wear retailer EAST in 2011. India’s Gitanjali Group, which is world’s largest jewellery retailer, has a strong foothold in the European market. The company has acquired Italy’s DIT Group’s brands namely Stefan Hafner, Porrati, Nouvelle Bague of Florence and Io Si. Hidesign, which is a leather goods manufacturer and retailer, has stores in Belgium, Germany, Ireland and the UK. The company has collaborated with Louis Vuitton (France) and some of the products are designed by Italian designers. Tata Global Beverages Limited, an Indian multinational non-alcoholic beverages company is a subsidiary of the Tata Group. In 1992, the company entered in a joint venture Britain's Tetley Tea Company and later in 2000, acquired it. The company also has a subsidiary in Czech Republic. The company retails its products in almost all European countries. Indian textile manufacturer and retailer Raymond has joint ventures with Belgian and Italian textiles and clothing manufacturers. In August 2006, the company entered into a 50:50 Joint Venture with UCO NV (Belgium) to engage in the business of manufacturing and marketing of denim fabrics. It also has a joint venture with Cotonificio Honegger S.P.A., (Italy) that produces shirts and fabrics, which are retailed in Europe. Haldiram’s, which is an Indian ready-to-eat food retailer and out of home catering chain, has outlets in the UK, Finland, Sweden, Italy, the
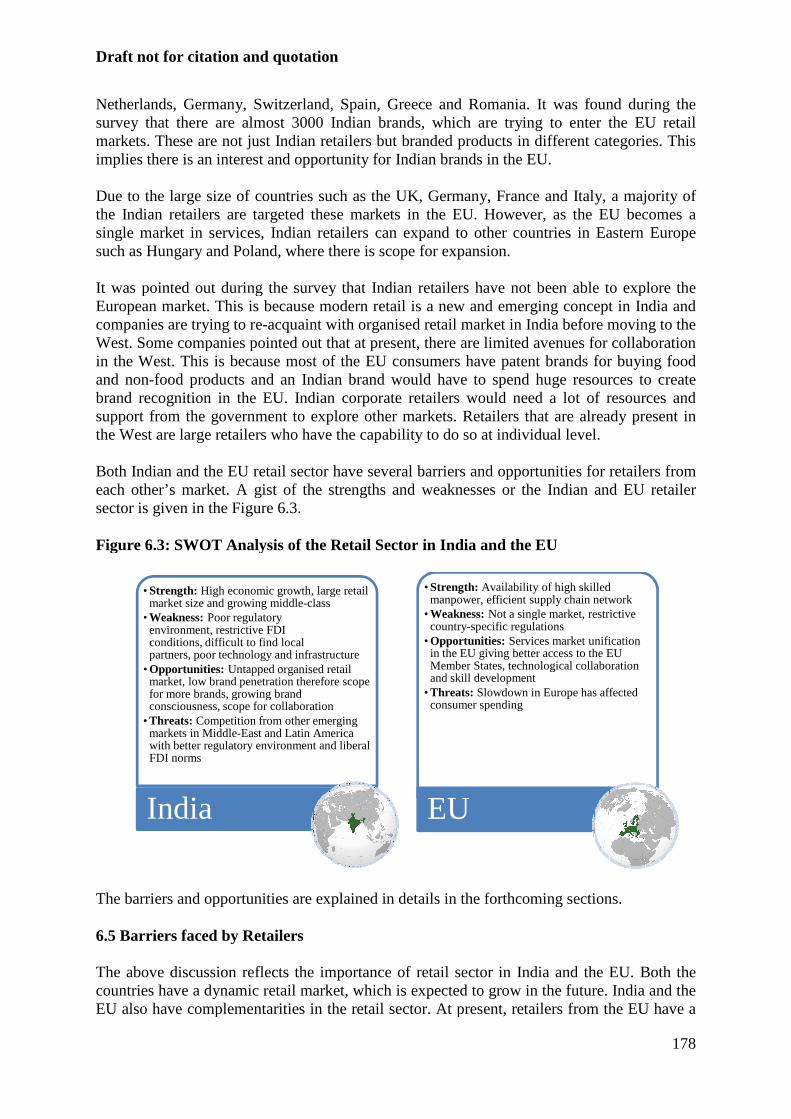
Draft not for cit ation and quotation
Netherlands, Germany, Switzerland, Spain, Greece and Romania. It was found during the survey that there are almost 3000 Indian brands, which are trying to enter the EU retail markets. These are not just Indian retailers but branded products in different categories. This implies there is an interest and opportunity for Indian brands in the EU. Due to the large size of countries such as the UK, Germany, France and Italy, a majority of the Indian retailers are targeted these markets in the EU. However, as the EU becomes a single market in services, Indian retailers can expand to other countries in Eastern Europe such as Hungary and Poland, where there is scope for expansion. It was pointed out during the survey that Indian retailers have not been able to explore the European market. This is because modern retail is a new and emerging concept in India and companies are trying to re-acquaint with organised retail market in IndiaWest. Some companies pointed out that at present, there are limited avenues for collaboration in the West. This is because most of the EU consumers have patent brands for buying food and non-food products and an Indian brand would havbrand recognition in the EU. Indian corporate retailers would need a lot of resources and support from the government to explore other markets. Retailers that are already present in the West are large retailers who have Both Indian and the EU retail sector have several barriers and opportunities for retailers from each other’s market. A gist of the strengths and weaknesses or the Indian and EU retailer sector is given in the Figure 6.3. Figure 6.3: SWOT Analysis of the Retail Sector in India and the EU
The barriers and opportunities are explained in details in the forthcoming sections. 6.5 Barriers faced by Retailers The above discussion reflects the importance of retacountries have a dynamic retail market, which is expected to grow in the future. India and the EU also have complementarities in the retail sector. At present, retailers from the EU have a
• Strength: High economic growth, large retail market size and growing middle
• Weakness: Poor regulatory environment, restrictive FDI conditions, difficult to find local partners, poor technology and infrastructure
• Opportunities: Untapped organisedmarket, low brand penetration therefore scope for more brands, growing brand consciousness, scope for collaboration
• Threats: Competition from other emerging markets in Middle-East and Latin America with better regulatory environment and liberal FDI norms
India
ation and quotation
Netherlands, Germany, Switzerland, Spain, Greece and Romania. It was found during the survey that there are almost 3000 Indian brands, which are trying to enter the EU retail
ust Indian retailers but branded products in different categories. This implies there is an interest and opportunity for Indian brands in the EU.
Due to the large size of countries such as the UK, Germany, France and Italy, a majority of lers are targeted these markets in the EU. However, as the EU becomes a
single market in services, Indian retailers can expand to other countries in Eastern Europe such as Hungary and Poland, where there is scope for expansion.
It was pointed out during the survey that Indian retailers have not been able to explore the European market. This is because modern retail is a new and emerging concept in India and
acquaint with organised retail market in India before moving to the West. Some companies pointed out that at present, there are limited avenues for collaboration in the West. This is because most of the EU consumers have patent brands for buying food
food products and an Indian brand would have to spend huge resources to create brand recognition in the EU. Indian corporate retailers would need a lot of resources and support from the government to explore other markets. Retailers that are already present in the West are large retailers who have the capability to do so at individual level.
Both Indian and the EU retail sector have several barriers and opportunities for retailers from each other’s market. A gist of the strengths and weaknesses or the Indian and EU retailer
Figure 6.3.
Figure 6.3: SWOT Analysis of the Retail Sector in India and the EU
The barriers and opportunities are explained in details in the forthcoming sections.
6.5 Barriers faced by Retailers
The above discussion reflects the importance of retail sector in India and the EU. Both the countries have a dynamic retail market, which is expected to grow in the future. India and the EU also have complementarities in the retail sector. At present, retailers from the EU have a
High economic growth, large retail market size and growing middle-class
environment, restrictive FDI conditions, difficult to find local partners, poor technology and infrastructure
organisedretail market, low brand penetration therefore scope for more brands, growing brand consciousness, scope for collaboration
Competition from other emerging East and Latin America
with better regulatory environment and liberal
• Strength: Availability of high skilled manpower, efficient supply chain network
• Weakness:Not a single market, restrictive country-specific regulations
• Opportunities: Services market unification in the EU giving better access to the EU Member States, technological collaboration and skill development
• Threats: Slowdown in Europe has affected consumer spending
EU
178
Netherlands, Germany, Switzerland, Spain, Greece and Romania. It was found during the survey that there are almost 3000 Indian brands, which are trying to enter the EU retail
ust Indian retailers but branded products in different categories. This
Due to the large size of countries such as the UK, Germany, France and Italy, a majority of lers are targeted these markets in the EU. However, as the EU becomes a
single market in services, Indian retailers can expand to other countries in Eastern Europe
It was pointed out during the survey that Indian retailers have not been able to explore the European market. This is because modern retail is a new and emerging concept in India and
before moving to the West. Some companies pointed out that at present, there are limited avenues for collaboration in the West. This is because most of the EU consumers have patent brands for buying food
e to spend huge resources to create brand recognition in the EU. Indian corporate retailers would need a lot of resources and support from the government to explore other markets. Retailers that are already present in
the capability to do so at individual level.
Both Indian and the EU retail sector have several barriers and opportunities for retailers from each other’s market. A gist of the strengths and weaknesses or the Indian and EU retailer
The barriers and opportunities are explained in details in the forthcoming sections.
il sector in India and the EU. Both the countries have a dynamic retail market, which is expected to grow in the future. India and the EU also have complementarities in the retail sector. At present, retailers from the EU have a
Availability of high skilled manpower, efficient supply chain network
Not a single market, restrictive
Services market unification in the EU giving better access to the EU Member States, technological collaboration
Slowdown in Europe has affected
Draft not for citation and quotation
179
vast presence in the Indian market, however, compared to the size and the potential of the Indian retail sector, there is a scope for further penetration. The survey found that India is lagging behind China particularly in luxury retail business. On an average, there are around 50 such brands in China while in India these are around 15-20. Indian companies that have established presence in the local market, are expanding operations and entering foreign markets, particularly the EU markets. However, there are several barriers to entry and operations in both India and the EU. In India, a majority of the problems faced by the EU retailers is largely related to the FDI policy in the retail sector. For a long time, one of the biggest impediments in the Indian retail sector was the prohibition on FDI in multi-brand retail sector. With recent liberalisation of multi-brand retail sector, there has been easing of retail policy. However, the government has imposed certain conditions on foreign retailers that are likely to be restrictive (for details see Table 6.2). The survey revealed certain concerns of foreign retailers planning to establish presence in the Indian market. Some of these are discussed below. European retailers in India pointed out that there are several problems with local sourcing. The conditions seem to be based on the conjecture that all multi-brand foreign retailers are food and grocery low-cost volume retailers. High-end specialised multi-brand foreign retailers will face the same barriers in sourcing from small and medium enterprises as has been faced by the single-brand foreign retailers. The first is related to quality of product. The single-brand policy enacted earlier this year failed to attract major FDI inflows due to the restrictive sourcing conditions.Globally, luxury brands have strict quality standards. Most of these brand names are considered as a mark for quality assurance and the products are therefore manufactured under close supervision. It is extremely difficult to ensure quality and product consistency if sourced from the small-scale sector. Some of the luxury retailers pointed out that undertaking domestic manufacturing may jeopardize the global brand name in the long run. Retailers like IKEA that is already sourcing 75 per cent of their textiles (carpets) from India, pointed out that the company follows strict social and environmental standards for manufacturing their products, which is difficult to replicate in India. It may not be financially possible for the small entrepreneurs to have the right technology due to the cost of the technology. Moreover, there are various foreign manufactures cum global retailers (like IKEA) that have been sourcing from SMEs since many years, but these SMEs have now evolved to operate on a much larger scale thereby breaching the SME stance. One of the oldest operations of Tesco in India is local sourcing. Tesco has $0.5 Billion worth of direct sourcing from India and its indirect sourcing by the means of imports is much larger. India is one of biggest sourcing hubs for textiles and apparel. Interestingly, hard lines such as playground equipments like cycles, stationery products like paper and food items like fruits are increasingly being sourced from all over India. The multi-brand policy also states that at least 50% of total FDI inflow will have to be invested in 'backend infrastructure' within a period of three years. The first issue is related to the definition or quantification of backend investment. In case a company has to invest 50% of every dollar invested in the country in backend infrastructure, it is not very realistic. The back-end cost is around 8-9% of the total investment. However, if it is $50 million in back-end infrastructure, then that can be considered in the long run. Investments in back-end operations is difficult for various retailers who are just dealing with front end retailing that is they are procuring products from different sources and selling the products. This condition will create repulsion amongst many foreign retailers who have plans
Draft not for citation and quotation
180
to just open retail stores and not set up manufacturing facilities or invest in infrastructure and supply chain. While all retailers need an efficient supply chain they do not necessarily invest in it. Often they use third party logistics (3PL) service providers. Back-end investments also vary from country to country. In more mature markets, a company has to make higher back-end investments. However, in other new markets, the company operates through the third party logistics service providers. Moreover, the requirement for back-end investment varies across product categories. For instance, a luxury product retailer or a sports goods or furniture retailer do not have a similar back-end investment requirement as a food and grocery retailer. Further, the policy is unclear as to whether land cost and rental for warehousing and cold chains will be considered as back-end or not since, it states that warehousing is back-end but land cost and rentals are not. It is also not clear about the cases where warehouses are connected to the hypermarket. In addition, these conditions are difficult to monitor and therefore are likely to create operational uncertainty. There are differences across states in terms of the implementation of the policy across states. As a result, states will have to take some hard business decisions, especially since consumers are mobile across states. For example, within the National Capital Region, if governments in Delhi and Haryana allow FDI in multi-brand retail while UP does not, how is it going to affect the retail growth in towns Noida and Ghaziabad? Some of the survey participants also pointed out that the states have the right to impose state-specific conditions, which can be more rigid. If this is true, then it will make the investment non-viable and affect the expansion plans of foreign retailers. Foreign retailers who would want to operate in states that do not allow FDI in multi-brand retail may have to operate through a franchise partner. Different modes of operations may lead to operational inefficiencies and ambiguities for a company. This condition may adversely affect the positive impact of other policies like the goods and service tax (GST). A majority of the multi-brand retailers follow hub and spoke model for distribution. At present, the hubs are chosen based on the tax advantage in a particular state and not on logistics benefits. The GST would ideally ensure that such inefficiencies are corrected. However, since some states have not opted out of multi-brand retail liberalisation, this may not be possible. Since it is a state level policy, retailers cannot operate in Gujarat or Karnataka even if they are logistically more efficient than Maharashtra and Andhra Pradesh. So it becomes difficult to have an efficiently located distribution centre. Foreign e-commerce companies are at a clear disadvantage with this policy. While the single-brand and multi-brand retailers are not allowed to sell their products online to consumers, foreign e-tailing companies are completely prohibited to undertake online retail operations in India. The e-retailing segment in India has exhibited a double-digit growth and has a potential to create one million jobs in the country.360 However, despite the potential, the future of foreign e-retailing companies is not very clear in India. In addition, e retailing is an important source of revenue earnings for a number of multi-brand retailers. A prohibition on e retailing will adversely affect their sales potential in India. Another problem associated with the retail policy is finding the right joint venture partner. In India, very few large corporate retailers have the financial ability to collaborate with foreign brands. Some companies like Marks & Spencer came with a smaller joint venture partner that led to lesser visibility and smaller retail space for the brand. The company later changed their partner to Reliance, which is a larger player. Foreign retailers are dependent on their Indian
360 Technopak (2012).
Draft not for citation and quotation
181
partner for highlighting their operations in India. Therefore, the companies have to make the right choice of partner in the country. Apart from investment related issues, foreign retailed also pointed out barriers related to movement of people. One of the problems pointed out by foreign retailers was regarding issue and renewal of work permit. Indian authorities are inefficient in granting work permit to overseas employees and in most cases, work permit is issued for a short term (3 months). Due to this, employees have to visit the authorities very often. The participants also pointed out that there are bureaucratic hassles involved in renewing or applying for work permit. Apart from these Mode 3 and Mode 4 barriers faced by foreign retailers in India, there are several other barriers. Some of these are listed below. 1. Inadequate Infrastructure: It was pointed out during the survey that the present facilities
at the airport are inadequate and the retail sector is underdeveloped. There is a need for modernisation of the airports in India, particularly to handle luxury products. A lot of detailed paper work and documentation is required for obtaining clearances and Indian airports and custom clearance departments lacks a centralised system of product clearance. In India, there is also a dearth of third party logistics service providers. In some states, integrated supply network and 3PL services are completely missing. This adversely affects expansion plans of retailers. As a result, companies have limited choice and this affects expansion plans of companies. Warehouses and cold storage facilities in India are insufficient and poorly equipped, which creates problems for retailers, particularly in food and grocery segment. Some respondents pointed out that in India, warehousing facilities are not fit to house luxury products. It was also pointed out during the survey that there is limited organised retail space available in India, which restricts expansion plans of modern retailers. While there are a number of mall coming up in India, there are very few high streets where brands are position themselves. It was pointed out during the survey that 75 per cent of the malls in India have failed due to poor mall management. This is largely because the mall spaces in India are not organised properly and therefore, most of the malls are not occupied in the country. There has to be right zoning regulation in the cities to have designated space for retailers.
2. Regulatory Issues and Policy Uncertainty: In India, there are several regulatory issues
faced by foreign retailers. The survey participants pointed out that retail sector is heavily regulated and foreign retailers have to take 40-50 licenses to set-up retail operations in India. Moreover, a lot of time is taken by the investment promotion board and other authorities to grant approval. Some retailers pointed out that implementation of rules are a problem. For instance, IKEA pointed out that factory workers work for more than one manufacturing unit and as a result, they divide their time between the two manufacturing units, which adverse effect their efficiency and production. It was also pointed out during the survey that in India the process of reform is slow and most of the reforms such as the goods and services tax (GST) are long pending. Some foreign companies pointed out that they do not have confidence in the Indian policy regime as the government easily rolls back its policies. Referring to the November 2011 multi-brand policy proposal, some of
Draft not for citation and quotation
182
the respondents pointed out that in India most of the foreign companies have adopted a ‘wait and watch’ strategy in India as they were waiting for the multi-brand policy to be enacted, which took nearly ten months to get cabinet clearance.
3. High Incidence of Corruption: It was pointed out during the survey that high incidence of
corruption is another major regulatory issue faced by foreign retailers. In order to obtain approval, lot of informal payments are to be made. Importers and distributors of foreign brands in India pointed out that during custom clearance and sample testing also, informal payments and bribes are extorted. This not only escalates the cost incurred by the company but also the time involved in getting approval for setting a brand office. One of the survey participant also pointed out that pilferage is a major issue faced by companies while importing products from the EU. It was pointed out during the survey that when products are sent for testing or even when they are sent for custom clearance, sometimes these goods stolen.
4. Inadequate Skills: Lack of skilled personnel, particularly to operate and staff organised retail stores, is a major barrier faced by foreign retailers. In India, very few individuals consider retail outlet management is a respectable position, compared to other managerial positions. At the shop floor level, most employees lack soft-skills and they have a relaxed attitude. There is also a high attrition rates at the shop floor level. It was also pointed out that there is lack of adequate skills at other levels. One of the garment retailers pointed out that in India custom officers are not well trained. While sample testing, rather than sending the whole product for testing, they cut a part from the garment and send it to the laboratory. This causes a loss to the retailers, particularly those selling luxury products.
5. High Cost of Setting Operations: There are several reasons for high costs of setting operation in India. In India, the rentals at high streets are very high. As a result, a large proportion of the earning are spend on fixed costs of operation that adversely affect revenue of the company. In addition, custom duties are very high in India, compared to other countries like China. A majority of the EU companies in India pointed out that they have to pay 30-40 per cent duty on the maximum retail price (MRP) of the product. Companies that operate in luxury product categories have to pay much higher taxes since the MRP of their products is very high. Since most international brands harmonised product prices across all countries of operation, it reduces their margin in India. It was also pointed out during the survey that in India, routine sampling at customs warehouses in India cost a lot compared to other countries. This is due to lack of adequate facilities and shortage of skills among custom staff.
As there are very few Indian companies in the EU, a majority of the barriers faced by Indian companies in the EU market are pertaining to stringent regulatory norms on foreign retailers that vary across different countries in the region.
1. Economic Needs Test (ENT): An ENT implies that the need for a particular service or service provider should be determined on an economic basis. The economic basis
Draft not for citation and quotation
183
typically involves circumstances of demand and supply (Krajewski 2003). The EU Member States including the Netherlands, Greece, Malta, Austria and Romania impose an economic needs test on foreign retailers. There is no clear definition of an economic needs test as per the GATS, as a result, there is no defined reason for imposing the economic needs test in the EU. This acts as a major entry barrier in the EU market.
2. Product-specific Regulations: In the UK, Austria, Bulgaria and Hungary, among others have authorisation requirements for some product categories such as alcohol, tobacco, gems stones, metals, veterinary products and motor vehicles, among others. This restricts the operations of Indian retailers in the EU market. Retailers have to apply for licenses and take clearances from multiple authorities. This varies across the EU Member States, making it difficult to retailers to set-up operations.
3. Labour Market Test: The EU Member States have stringent Mode 4 conditions, compared to India. In countries like France, there are labour market tests for hiring labourers. In addition, managerial positions can only be offered to French nationals. As a result, there is a restriction on hiring Indians to manage retail outlets in the country.
4. Differences across Member States: Unlike the case of goods, the EU market is still not a single market for services, which has certain implications on the retail sector as well. Indian companies interested in entering the EU market have to abide by Member State specific policies in case they want to expand their presence in the EU market. There are several regulations pertaining to market access and operations. There are also differences in languages, culture and preferences across Europe, which makes it difficult for Indian retailers to establish pan-EU operations.
5. Restrictions on Ownership of Real Estate: A number of EU Member States such as Hungary, Latvia, Italy, Poland, Malta and Greece, among others, does not permit foreigners to own real estate. As a result, foreign retailers cannot acquire property for setting up retail operations in the EU.
6.6 Opportunities and the Way Forward The above discussion shows that both India and the EU retail markets are large and growing. Retail sector has significant employment potential in both the markets. India and the EU retail markets are different – while the Indian market is largely unorganised in nature, and there is a huge potential for modern retail penetration, the EU retail market is largely saturated. There are not many large Indian corporate in the retail sector and there is a need for FDI to bring efficiency in distribution network in India. The EU can offer efficient supply management technology to India while India can offer an access to the large and growing consumer market. Whilst India is undertaking domestic market reforms and is liberalising the retail sector, the EU is experiencing a slowdown in growth and is therefore eyeing emerging markets for investments. Despite these complementarities, the presence of the EU retailers in
Draft not for citation and quotation
184
India is low, compared to their presence in other emerging markets like China. The presence of Indian retailers in the EU is negligible. Over the last one year, India has experienced a decline in the retail FDI and the EU saw a fall in the number of European Companies in top retailers in the world market. While this is partly due to the slowdown in the Western markets, some of it is also attributed to the regulatory issues and other barriers that exist in these markets. The foremost barrier is related to the FDI policy in retail. Due to the problems with the retail FDI policy, a number of foreign retailers are not opting for direct investment route. As a result, while foreign brands continue to get access to the Indian market through other routes, India is missing foreign direct investments. Over the past few years, one of the biggest concerns of foreign retailers was the restrictive FDI policy in India. Since the government has already initiated FDI related reforms, there is a need for evaluating the conditions imposed on foreign retailers and make them more realistic. The conditions have to be clear to avoid operational uncertainties. The survey found that some brands are already sourcing certain products from the Indian markets and will continue to do even when they get access to the Indian retail market. Therefore, the sourcing condition needs to be carefully designed to include the products in which India has a manufacturing advantage and the skill and capability to produce. A number of brands source from farmers and small producers in the food and grocery segment. However, these people do not own any plant and machinery. Therefore, by the current definition they may not qualify under the SME classification. In addition, no supplier discloses the investments in plant and machinery. It is an investment made over a period. There are several modifications in the entire process. The investment is made, capacity is generated, there is depreciation, etc. The conditions imposed on foreign retailers are designed with the view that all multi-brand retailers are food and grocery retailers. Some of these conditions may not actually be applicable to multi-brand retailers in categories like sports goods or electronic. The conditions imposed on foreign retailers should be realistic and should be targeted to support the industry. In case sourcing conditions are imposed, the government has to compliment the policy by reducing barriers to trade in goods. Import duties on products like textiles should be removed or reduced as has been the case in competing nations like Bangladesh and China. This will make Indian goods cost competitive in the global markets and foreign retailers will source from India not only for Indian market but also for third country markets. There is a need for right zoning regulations particularly for location of malls in India. At present, there is no Act or Regulation that lays down the zoning law in the country. Residential and commercial zones are decided based on a predefined master plan prepared by the Municipal Corporation of that state. The zoning regulation should be irrespective of the FDI policy and should be applicable to all retailers. Foreign retailers complaint about high rentals while Indian real estate developers point out that malls are unoccupied. This is because of lack of proper real estate and mall planning in the country As the retail sector is modernising, there is a need to train retail sector employees so that they can get absorbed in the modern retail sector. The survey found that European retailers organise mandatory training programmes for their employees, which is beneficial for the growth and development of retail sector employees. Large EU retailers can collaborate with
Draft not for citation and quotation
185
management institutes in India for designing retail courses. There can be collaborations between associations such as the Retailers Association of India to impart training to both modern and traditional retailers and employees of the retail outlets. There should be training programs for employees to learn to use technology such as bar coding, scanning and online product location system, among others. There is a huge technological advantage exists in Europe, which can be transferred to the Indian market. In that sense, both India and the EU can gain from each other’s market. The EU gets an access to the large Indian retail market while India can access better technology and receive training from the EU. The study found that there is an interest among Indian brands to enter the EU market. However, the presence of Indian retailers in the EU is low. While the brands are entering the markets through other channels like distribution agreement, Indian retailers have not been able to explore the EU market. This is primarily due to limited financial capacity of a majority of Indian retailers. There is a need for government support in terms of easier access to funds. In the EU, there are a number of restrictions on movement of people, which is a major barrier for Indian retailers planning to set-up operations in the EU market. In addition, there are country-specific regulations imposed on foreign retailers, which restrict operations in the EU Member States. Since India has undertaken substantial reforms in FDI policy, there is a case for securing liberal commitments in the retail sector and pushing for streamlining the regulations applicable to foreign retailers across the EU Member States. While the EU should aim to get binding commitments as per the existing autonomous regime, India should push for a single market in services in the EU. India may also ask for a more liberal commitment under Mode 4 against liberal commitments that it can now offer under Mode 3. References A.T. Kearney (2012), “Global Retail Expansion: Keeps On Moving”, A.T. Kearney Global
Retail Development Index – 2012, http://www.atkearney.com/images/global/pdf/Global_Retail_Expansion_Keeps_On_Moving.pdf (last accessed on August 27th, 2012)
Alpen Capital (2011), “GCC Retail Industry”, Alpen Capital, November 2011 http://www.alpencapital.com/downloads/GCC%20Retail%20Industry%20Report%202011_1%20November%202011.pdf (last accessed on August 27th, 2012)
AT Kearney (2011), “Retail Global Expansion: A Portfolio of Opportunities”, A.T. Kearney Global Retail Development Index – 2011, http://www.atkearney.com/documents/10192/3903b4b7-265c-484e-932c-50169e5aa2f3 (last accessed on October 1, 2012)
CBRE (2011), HowGlobal is the Business of Retail, CBRichard Ellis,Global Research and Consulting, available at: www.cbre.hr/hr_en/homepage_content/hr_homepage_title/EMEA_FPR_HOW_GLOBAL_2011_EXECUTIVE_SUMMARY.pdf (accessed April 24).
Deloitte (2012), “Switching Channels: Global Powers of Retailing 2012”, Deloitte Global Services Limited, London, January 2012 http://www.deloitte.com/assets/Dcom-Global/Local%20Assets/Documents/Consumer%20Business/dtt_CBT_GPRetailing2012.pdf (last accessed on August 28th, 2012)
Goyal, T.M. and Arpita Mukherjee (2012), “FDI in Sensitive Sectors: The Case of the Retail Sector in India”, in “Trade, Foreign Direct Investment and Economic Growth:

Draft not for citation and quotation
186
Exploring Challenges and Opportunities Post-Global Financial Crisis”, edited by Dr. Shahid Ahmed, Routledge Taylor & Francis Books India Pvt. Ltd., New Delhi.
Images (2009), ‘India Retail Report 2009’, Images F&R Research, New Delhi. Images (2011), ‘India Retail Report 2011’, Images Multimedia Pvt. Ltd., New Delhi. Krajewski Markus (2003), "National Regulation and Trade Liberalization in Services: The
Legal Impact of the General Agreement on Trade in Services (GATS) on National Regulatory Autonomy", Kluwer Law International, 2003
Mukherjee, Arpita and Nitisha Patel (2005), ‘FDI in Retail Sector in India’, New Delhi: Academic Foundation. Technopak (2012), “Foreign Direct Investment in Retail: An Objective Assessment of FDI’s
Impact on the Indian Retail Sector and the Indian Economy”, White Paper Published by Technopak, October, 2012
Draft not for citation and quotation
187
Chapter 7: India-EU Multilateral and Bilateral Enga gements and the Way Forward
Ramneet Goswami and Tanu M. Goyal
Over the years, economic engagement between India and EU has grown. India and EU member states have signed a number of trade and investment promotion agreements such as the Bilateral Investment Protection Agreement, Double Taxation Avoidance Agreement, etc. India and EU are founding member of the WTO and are major proponent of services liberalisation under the WTO. The two economies are negotiating the India-EU Broadbased Trade and Investment Agreement, which is likely to be signed soon. This agreement aims to remove barriers to trade and investment. The both economies are major proponent of liberalising trade in services in the WTO and through FTAs. Therefore, the following section discusses India and the EU’s negotiating positions in the WTO as well as bilateral trade agreements. 7.1 Multilateral Engagements of India and the EU India and the EU are founding member of the WTO and are actively participating in the on-going Doha Round of WTO negotiations. The two economies have submitted their Revised Offer in 2005.361 Both economies are proponent of multilateral liberalisation of trade in services. However, their negotiating positions have changed over the years. During the first round of WTO negotiations – the Uruguay Round, the EU had 15 Member states and EU (15) showed interest to liberalise certain services such as transport services but had a defensive position362 in services such as audiovisual services. In certain sectors like energy and telecommunications the autonomous liberalisation process had began in individual Member states and hence the EU Member states were not in a position to undertake commitments. Due to this, there were limited commitments. By 2000, many EU Member states underwent autonomous liberalisation and since the beginning of the Doha Round, the EU has been a major proponent of services liberalisation. The domestic markets in some of the major EU Member states such as France, Germany and the UK are getting saturated, and multinational companies from EU Member states are now exploring investment opportunities in emerging markets. It is also worth noting that unlike goods, the EU internal market for services is not fully integrated. The EU is trying to integrate the services market across different Member states through various Directives (as discussed in Chapter 2). This is complex since the EU has expanded to 27 member states and the interest of these Member states and their levels of development and regulatory reforms vary. The regulatory regime in some of the new Member states is evolving. The EU’s WTO Revised Offer (WTO Document No. TN/S/O/EEC/Rev.1)
shows that some Member States such as the Germany, Netherlands, Luxembourg, Spain, Sweden and the UK are more open to undertaking commitments in services while others such as Cyprus, Czech Republic, Hungary and Malta have imposed restrictions in sectors like
361 India submitted Initial Offer (WTO Document No. TN/S/O/IND) on January 12, 2004; and Revised Offer (WTO Document No. TN/S/O/IND/Rev.1) on August 24, 2005. The EU submitted Initial Offer (WTO Document No. TN/S/O/EEC) in June 10, 2003; and Revised Offer (WTO Document No. TN/S/O/EEC/Rev.1) on June 29, 2005 362 Defensive position in a particular sector means that the country is not willing to undertake commitments because the sector is politically sensitive or it is not yet liberalised or the regulations are evolving.
Draft not for citation and quotation
188
construction and related services, distribution services, etc. In the WTO Revised Offer, there have been substantial improvements over its Uruguay Round of commitments. In computer and related services (CPC 84), all EU Member States have given full commitment in all Modes (1, 2 and 3). In the Uruguay Round, Malta have not made any commitment or kept ‘Unbound’ in all Modes in this service. In legal services, engineering services and integrated engineering services, urban planning and landscape architectural services, all Member States have given full commitment in Mode 2. In the Uruguay Round, Cyprus and Malta have not made any commitment in Mode 2 or kept ‘Unbound’ in these services. In the Uruguay Round, India, along with other developing countries like Brazil, protested against the inclusion of services into the multilateral trading system. India started on an ambitious reform programme from 1990s but the autonomous liberalisation was not reflected in its WTO commitments at the end of the Uruguay Round. As opposed to this position, India is a major proponent of services liberalisation in the Doha Round. India’s WTO Revised Offer was regarded as one of the best Revised Offers submitted to the WTO. Due to the availability of high skilled professionals at competitive prices, India has created a niche for itself as an exporter of knowledge-based services such as software, IT-enabled services (ITeS) and health. India has both export and import interest in liberalisation of trade in services and this is reflected in its negotiating position in its WTO Revised Offer (WTO Document No. TN/S/O/IND/Rev.1). Compared to its Initial Offer, India offered to take commitments in a number of new sectors such as professional services (architectural services, engineering services, medical and dental services); distribution services; and air transport services. The country also improved its commitments in sectors such as computer and related services and telecommunications services in the WTO Revised Offer (WTO Document No. TN/S/O/IND/Rev.1). Although, both India and the EU are proponents of liberalising trade in services in the Doha Round, their interest varies across different type of services and modes of services delivery.363 For instance, India wants liberalisation commitments in knowledge-based services such as computer-related services in Modes 1 and 4. In Mode 1, India wants full liberalisation in a broad range of sectors which will enable Indian IT and business process outsourcing (BPO) companies to provide services to their clients. In Mode 4, India wants commitments from its trading partners for high skilled professionals in four categories namely business visitors (BV)364, intra-corporate transferees (ICT)365, independent professionals (IP)366 and contractual service suppliers (CSS)367. India wants commitments in Modes 1 and 4 to be delinked from the requirement to establish a commercial presence or an office in a foreign country. The EU, on the other hand, is a major proponent of liberalising 363 Under GATS services are traded through four different modes. Mode 1: “Cross-border supply of services” refers to the delivery of services across countries such as the cross-country movement of passengers, electronic delivery of information. Mode 2: “Consumption abroad” refers to the physical movement of the consumer of the service to the location where the service is provided and consumed. Mode 3: “Commercial presence” refers to the establishment of foreign affiliates and subsidiaries of foreign service companies, joint ventures, partnerships, representative offices and branches. It is analogous to FDI in services. Mode 4: “Presence of natural persons” refers to natural persons who are themselves service suppliers, as well as natural persons who are employees of service suppliers, temporarily present in the other member’s market to provide services. 364 A person who visit another country specifically for a) business negotiations and/or (b) for preparatory work for establishing presence for short duration. 365 Employee of a company who transferred from originating country’s office to office of the same company in another country. 366Employee of a foreign company who enter in another country temporarily in order to perform a service pursuant to a contract. 367 A self-employed person who entered another country to perform a service on contract basis.
Draft not for citation and quotation
189
Mode 3 or FDI in major markets such as India and in sectors such as telecommunications, financial services, transport and energy services. Its interest lies not only in securing the autonomously liberalised regime but also regulatory certainties. The EU has a holistic approach to securing commitments. For instance, instead of negotiating transport services, the EU prefers to negotiate logistics services, which along with transport include liberalisation of other allied services such as warehousing, transport-related consultancies and postal and courier services.368 Both India and the EU have certain sensitivities. For instance, India has so far expressed its unwillingness to undertake liberalisation commitments in sectors like retail, insurance and legal services where there are FDI restrictions while the EU has not taken commitments in sectors like audiovisual. There are various reasons for this. In certain sectors such as postal and courier services, in India the regulatory regime is evolving; retail is politically sensitive in India while the EU has not offered to take commitments in audiovisual services to protect and promote the local culture. The interest of the two economies across different services sector is also reflected in their bilateral and plurilateral requests and offers369 in the Doha Round of the WTO. During the bilateral request-offer process, the EU had made request to India to liberalise sectors such as financial, telecommunications, energy, tourism and travel related services, distribution services and transport services. India, on the other hand, made request to the EU in sectors such as professional services (accountancy, architectural engineering and integrated engineering), construction and related engineering services, health and audio-visual services. India and the EU have made requests to each other in the plurilateral negotiations. Table 7.1 lists the different services sectors and modes in which India and the EU have been demandeur and recipients of plurilateral requests. Table 3.20 shows that within each services sector, the interest of India and EU are different. Only in computer related services, both India and the EU have similar interest. In areas where they have strong trade interest, they have been the co-ordinator of the demanding group. The table also shows that while the EU has a strong interest in liberalising infrastructure services such as telecommunications and energy, India is interested in liberalising Modes 1 and 4.
368 Mukherjee and Goswami (2011). 369 GATS negotiations are based on request-offer process where a country makes a bilateral request to its trading partners, who after taking into account the requests from all countries, make an offer. The offers are multilateral, that is, all WTO members, whether the country has made a request or not, benefits from it. In the plurilateral request-offer process which began after the Hong Kong Ministerial , a group of countries – the demanders – make request to another group – the” target” countries.
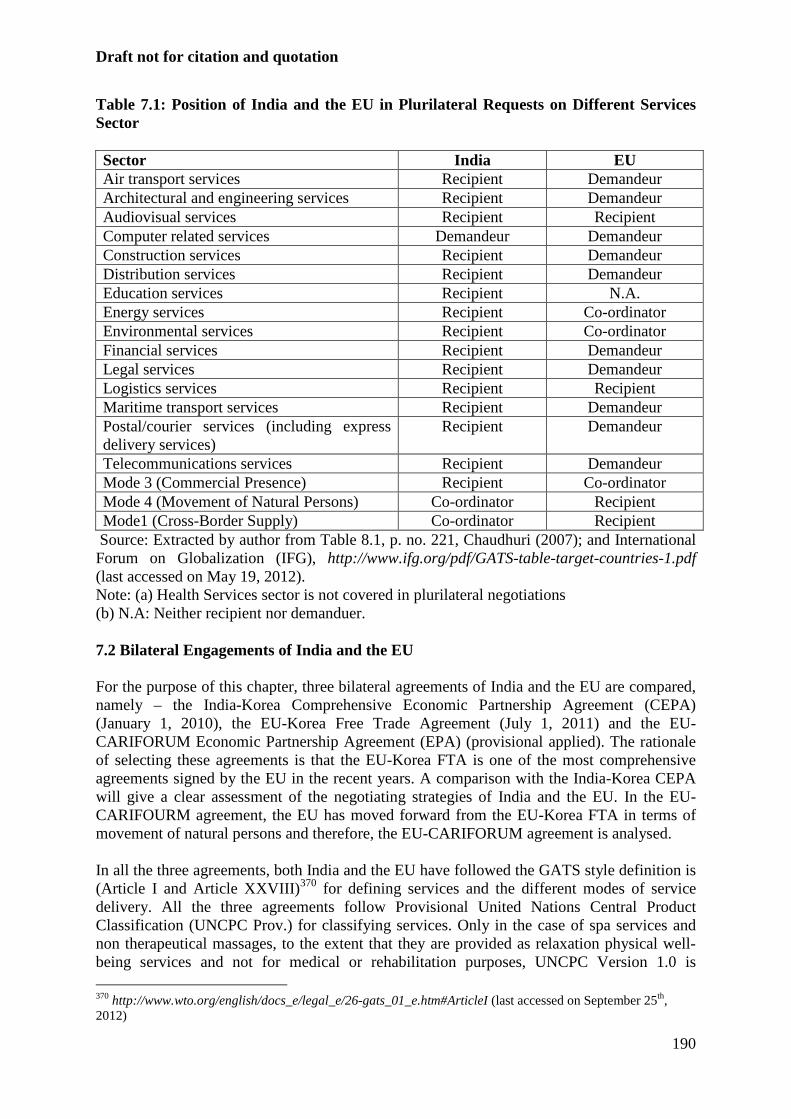
Draft not for citation and quotation
190
Table 7.1: Position of India and the EU in Plurilateral Requests on Different Services Sector Sector India EU Air transport services Recipient Demandeur Architectural and engineering services Recipient Demandeur Audiovisual services Recipient Recipient Computer related services Demandeur Demandeur Construction services Recipient Demandeur Distribution services Recipient Demandeur Education services Recipient N.A. Energy services Recipient Co-ordinator Environmental services Recipient Co-ordinator Financial services Recipient Demandeur Legal services Recipient Demandeur Logistics services Recipient Recipient Maritime transport services Recipient Demandeur Postal/courier services (including express delivery services)
Recipient Demandeur
Telecommunications services Recipient Demandeur Mode 3 (Commercial Presence) Recipient Co-ordinator Mode 4 (Movement of Natural Persons) Co-ordinator Recipient Mode1 (Cross-Border Supply) Co-ordinator Recipient
Source: Extracted by author from Table 8.1, p. no. 221, Chaudhuri (2007); and International Forum on Globalization (IFG), http://www.ifg.org/pdf/GATS-table-target-countries-1.pdf (last accessed on May 19, 2012). Note: (a) Health Services sector is not covered in plurilateral negotiations (b) N.A: Neither recipient nor demanduer. 7.2 Bilateral Engagements of India and the EU For the purpose of this chapter, three bilateral agreements of India and the EU are compared, namely – the India-Korea Comprehensive Economic Partnership Agreement (CEPA) (January 1, 2010), the EU-Korea Free Trade Agreement (July 1, 2011) and the EU-CARIFORUM Economic Partnership Agreement (EPA) (provisional applied). The rationale of selecting these agreements is that the EU-Korea FTA is one of the most comprehensive agreements signed by the EU in the recent years. A comparison with the India-Korea CEPA will give a clear assessment of the negotiating strategies of India and the EU. In the EU-CARIFOURM agreement, the EU has moved forward from the EU-Korea FTA in terms of movement of natural persons and therefore, the EU-CARIFORUM agreement is analysed. In all the three agreements, both India and the EU have followed the GATS style definition is (Article I and Article XXVIII)370 for defining services and the different modes of service delivery. All the three agreements follow Provisional United Nations Central Product Classification (UNCPC Prov.) for classifying services. Only in the case of spa services and non therapeutical massages, to the extent that they are provided as relaxation physical well-being services and not for medical or rehabilitation purposes, UNCPC Version 1.0 is 370 http://www.wto.org/english/docs_e/legal_e/26-gats_01_e.htm#ArticleI (last accessed on September 25th, 2012)
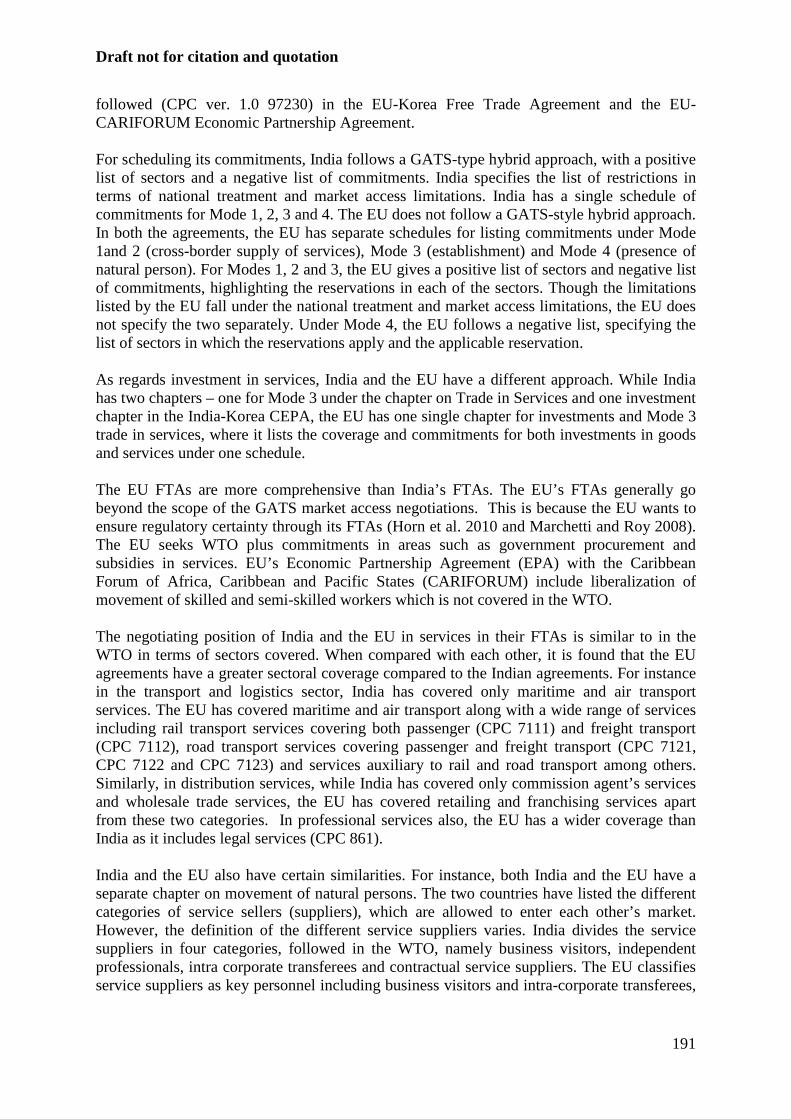
Draft not for citation and quotation
191
followed (CPC ver. 1.0 97230) in the EU-Korea Free Trade Agreement and the EU-CARIFORUM Economic Partnership Agreement. For scheduling its commitments, India follows a GATS-type hybrid approach, with a positive list of sectors and a negative list of commitments. India specifies the list of restrictions in terms of national treatment and market access limitations. India has a single schedule of commitments for Mode 1, 2, 3 and 4. The EU does not follow a GATS-style hybrid approach. In both the agreements, the EU has separate schedules for listing commitments under Mode 1and 2 (cross-border supply of services), Mode 3 (establishment) and Mode 4 (presence of natural person). For Modes 1, 2 and 3, the EU gives a positive list of sectors and negative list of commitments, highlighting the reservations in each of the sectors. Though the limitations listed by the EU fall under the national treatment and market access limitations, the EU does not specify the two separately. Under Mode 4, the EU follows a negative list, specifying the list of sectors in which the reservations apply and the applicable reservation. As regards investment in services, India and the EU have a different approach. While India has two chapters – one for Mode 3 under the chapter on Trade in Services and one investment chapter in the India-Korea CEPA, the EU has one single chapter for investments and Mode 3 trade in services, where it lists the coverage and commitments for both investments in goods and services under one schedule. The EU FTAs are more comprehensive than India’s FTAs. The EU’s FTAs generally go beyond the scope of the GATS market access negotiations. This is because the EU wants to ensure regulatory certainty through its FTAs (Horn et al. 2010 and Marchetti and Roy 2008). The EU seeks WTO plus commitments in areas such as government procurement and subsidies in services. EU’s Economic Partnership Agreement (EPA) with the Caribbean Forum of Africa, Caribbean and Pacific States (CARIFORUM) include liberalization of movement of skilled and semi-skilled workers which is not covered in the WTO. The negotiating position of India and the EU in services in their FTAs is similar to in the WTO in terms of sectors covered. When compared with each other, it is found that the EU agreements have a greater sectoral coverage compared to the Indian agreements. For instance in the transport and logistics sector, India has covered only maritime and air transport services. The EU has covered maritime and air transport along with a wide range of services including rail transport services covering both passenger (CPC 7111) and freight transport (CPC 7112), road transport services covering passenger and freight transport (CPC 7121, CPC 7122 and CPC 7123) and services auxiliary to rail and road transport among others. Similarly, in distribution services, while India has covered only commission agent’s services and wholesale trade services, the EU has covered retailing and franchising services apart from these two categories. In professional services also, the EU has a wider coverage than India as it includes legal services (CPC 861). India and the EU also have certain similarities. For instance, both India and the EU have a separate chapter on movement of natural persons. The two countries have listed the different categories of service sellers (suppliers), which are allowed to enter each other’s market. However, the definition of the different service suppliers varies. India divides the service suppliers in four categories, followed in the WTO, namely business visitors, independent professionals, intra corporate transferees and contractual service suppliers. The EU classifies service suppliers as key personnel including business visitors and intra-corporate transferees,
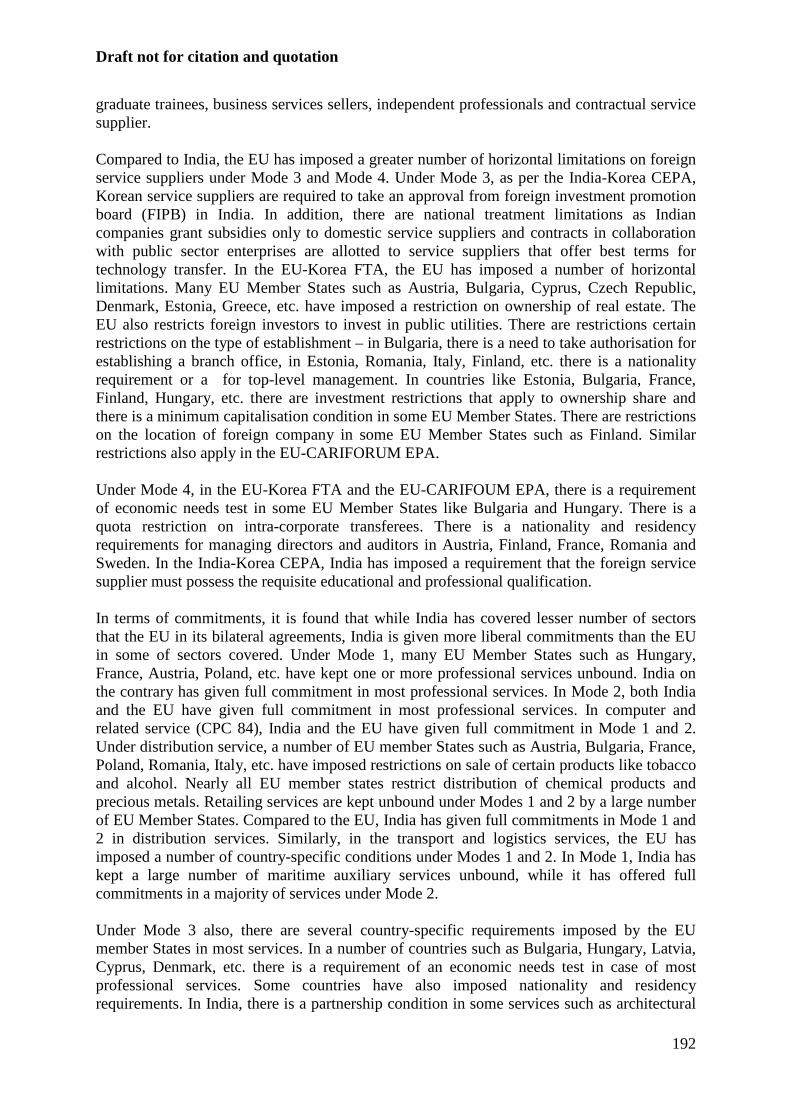
Draft not for citation and quotation
192
graduate trainees, business services sellers, independent professionals and contractual service supplier. Compared to India, the EU has imposed a greater number of horizontal limitations on foreign service suppliers under Mode 3 and Mode 4. Under Mode 3, as per the India-Korea CEPA, Korean service suppliers are required to take an approval from foreign investment promotion board (FIPB) in India. In addition, there are national treatment limitations as Indian companies grant subsidies only to domestic service suppliers and contracts in collaboration with public sector enterprises are allotted to service suppliers that offer best terms for technology transfer. In the EU-Korea FTA, the EU has imposed a number of horizontal limitations. Many EU Member States such as Austria, Bulgaria, Cyprus, Czech Republic, Denmark, Estonia, Greece, etc. have imposed a restriction on ownership of real estate. The EU also restricts foreign investors to invest in public utilities. There are restrictions certain restrictions on the type of establishment – in Bulgaria, there is a need to take authorisation for establishing a branch office, in Estonia, Romania, Italy, Finland, etc. there is a nationality requirement or a for top-level management. In countries like Estonia, Bulgaria, France, Finland, Hungary, etc. there are investment restrictions that apply to ownership share and there is a minimum capitalisation condition in some EU Member States. There are restrictions on the location of foreign company in some EU Member States such as Finland. Similar restrictions also apply in the EU-CARIFORUM EPA. Under Mode 4, in the EU-Korea FTA and the EU-CARIFOUM EPA, there is a requirement of economic needs test in some EU Member States like Bulgaria and Hungary. There is a quota restriction on intra-corporate transferees. There is a nationality and residency requirements for managing directors and auditors in Austria, Finland, France, Romania and Sweden. In the India-Korea CEPA, India has imposed a requirement that the foreign service supplier must possess the requisite educational and professional qualification. In terms of commitments, it is found that while India has covered lesser number of sectors that the EU in its bilateral agreements, India is given more liberal commitments than the EU in some of sectors covered. Under Mode 1, many EU Member States such as Hungary, France, Austria, Poland, etc. have kept one or more professional services unbound. India on the contrary has given full commitment in most professional services. In Mode 2, both India and the EU have given full commitment in most professional services. In computer and related service (CPC 84), India and the EU have given full commitment in Mode 1 and 2. Under distribution service, a number of EU member States such as Austria, Bulgaria, France, Poland, Romania, Italy, etc. have imposed restrictions on sale of certain products like tobacco and alcohol. Nearly all EU member states restrict distribution of chemical products and precious metals. Retailing services are kept unbound under Modes 1 and 2 by a large number of EU Member States. Compared to the EU, India has given full commitments in Mode 1 and 2 in distribution services. Similarly, in the transport and logistics services, the EU has imposed a number of country-specific conditions under Modes 1 and 2. In Mode 1, India has kept a large number of maritime auxiliary services unbound, while it has offered full commitments in a majority of services under Mode 2. Under Mode 3 also, there are several country-specific requirements imposed by the EU member States in most services. In a number of countries such as Bulgaria, Hungary, Latvia, Cyprus, Denmark, etc. there is a requirement of an economic needs test in case of most professional services. Some countries have also imposed nationality and residency requirements. In India, there is a partnership condition in some services such as architectural
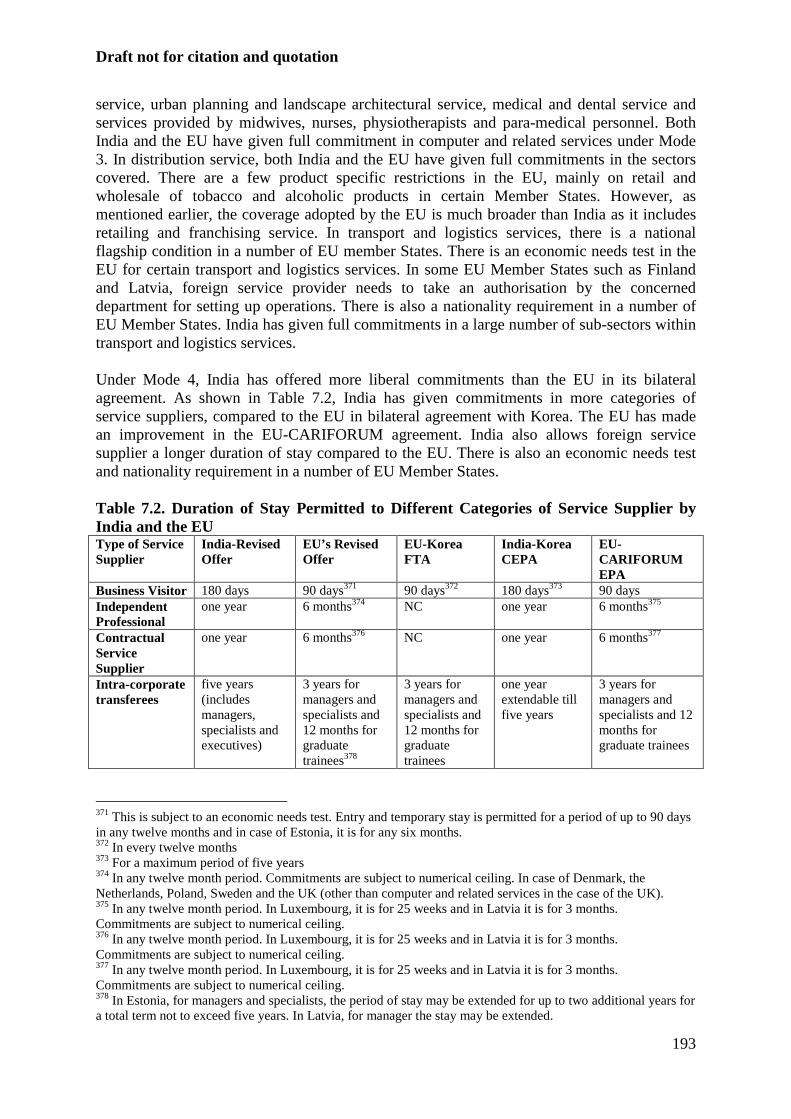
Draft not for citation and quotation
193
service, urban planning and landscape architectural service, medical and dental service and services provided by midwives, nurses, physiotherapists and para-medical personnel. Both India and the EU have given full commitment in computer and related services under Mode 3. In distribution service, both India and the EU have given full commitments in the sectors covered. There are a few product specific restrictions in the EU, mainly on retail and wholesale of tobacco and alcoholic products in certain Member States. However, as mentioned earlier, the coverage adopted by the EU is much broader than India as it includes retailing and franchising service. In transport and logistics services, there is a national flagship condition in a number of EU member States. There is an economic needs test in the EU for certain transport and logistics services. In some EU Member States such as Finland and Latvia, foreign service provider needs to take an authorisation by the concerned department for setting up operations. There is also a nationality requirement in a number of EU Member States. India has given full commitments in a large number of sub-sectors within transport and logistics services. Under Mode 4, India has offered more liberal commitments than the EU in its bilateral agreement. As shown in Table 7.2, India has given commitments in more categories of service suppliers, compared to the EU in bilateral agreement with Korea. The EU has made an improvement in the EU-CARIFORUM agreement. India also allows foreign service supplier a longer duration of stay compared to the EU. There is also an economic needs test and nationality requirement in a number of EU Member States. Table 7.2. Duration of Stay Permitted to Different Categories of Service Supplier by India and the EU Type of Service Supplier
India-Revised Offer
EU’s Revised Offer
EU-Korea FTA
India-Korea CEPA
EU-CARIFORUM EPA
Business Visitor 180 days 90 days371 90 days372 180 days373 90 days Independent Professional
one year 6 months374 NC one year 6 months375
Contractual Service Supplier
one year 6 months376 NC one year 6 months377
Intra-corporate transferees
five years (includes managers, specialists and executives)
3 years for managers and specialists and 12 months for graduate trainees378
3 years for managers and specialists and 12 months for graduate trainees
one year extendable till five years
3 years for managers and specialists and 12 months for graduate trainees
371 This is subject to an economic needs test. Entry and temporary stay is permitted for a period of up to 90 days in any twelve months and in case of Estonia, it is for any six months. 372 In every twelve months 373 For a maximum period of five years 374 In any twelve month period. Commitments are subject to numerical ceiling. In case of Denmark, the Netherlands, Poland, Sweden and the UK (other than computer and related services in the case of the UK). 375 In any twelve month period. In Luxembourg, it is for 25 weeks and in Latvia it is for 3 months. Commitments are subject to numerical ceiling. 376 In any twelve month period. In Luxembourg, it is for 25 weeks and in Latvia it is for 3 months. Commitments are subject to numerical ceiling. 377 In any twelve month period. In Luxembourg, it is for 25 weeks and in Latvia it is for 3 months. Commitments are subject to numerical ceiling. 378 In Estonia, for managers and specialists, the period of stay may be extended for up to two additional years for a total term not to exceed five years. In Latvia, for manager the stay may be extended.
Draft not for citation and quotation
194
Source: Compiled by the authors from India and EU’s bilateral agreements accessible at: http://commerce.nic.in/ and http://ec.europa.eu/trade/creating-opportunities/bilateral-relations/agreements/ (last accessed on October 3, 2012) To summarise, it is found that while the EU covers a larger number of sectors than India in its bilateral agreements, there are several Member State-specific exception. The horizontal conditions imposed by the EU in the EU-Korea FTA and the EU-CARIFORUM EPA are more restrictive than the conditions imposed by India in the India-Korea CEPA under Mode 3 and 4. In Modes 1 and 2, considering that India has covered a lesser number of sub-sectors in each of the sectors, India has given more liberal commitments compared to the EU in professional services and distribution services while the EU has given more liberal commitments in transport and logistics services. Under Mode 3, India has given more liberal commitments in professional services while the EU has given more liberal commitments in distribution service. In transport and logistics service, EU has adopted a much wider coverage compared to India, therefore, even though there are several Member State-specific restrictions imposed by the EU, it is difficult to say whether India has a better offer in the transport and logistics sector. Under Mode 4, India has given more liberal commitments than the EU. In computer and related services, both India and the EU have offered full commitment across all modes of trade in service. 7.3 Bilateral Cooperation and other Engagements between India and the EU India and the EU have signed a number of bilateral agreements. The first agreement, ‘Commercial Co-operation Agreement’ was signed in 1974. This is a comprehensive agreement covering a wide range of areas such as trade, economic co-operation, environment, agriculture, services, tourism, stands and intellectual property rights, among others. In 2001, India and the EU had signed a Science and Technology Agreement, which was renewed in 2007. The agreement covers sustainable development and also includes a legal framework to safeguard intellectual property rights. Under this agreement, researchers from India and the EU Member States can access each other’s research programmes. To promote co-operation in information technology and communications sector, India and the EU signed a Joint Vision Statement in 2001. The statement provides a framework for exchange of views on regulatory practices, mutual cooperation in regulatory and industry initiatives and specific issues/projects of bilateral interest. In 2003, the EU and India had signed a Customs Co-operation Agreement, which entails co-operation between the parties with the objective of making customs procedures less complex and facilitating trade in matters pertaining to customs in accordance with international standards. It also sets up mechanisms of mutual administrative assistance for exchanging information and carrying out inquiries, with a view to counter fraud against respective customs legislation. India and 26 individual EU Member States (except Estonia) have bilateral air services agreement.379 In 2008, the two economies signed a Horizontal Aviation Agreement, which represents a very significant step forward in strengthening EU’s relation with India. The agreement is expected to restore legal certainty to these bilateral air services agreements and bring these agreements in conformity with the EU law. The agreement will cover many new
379 http://dgca.nic.in/bilateral/Bilateral%20-download.pdf (last accessed on May 15, 2012).
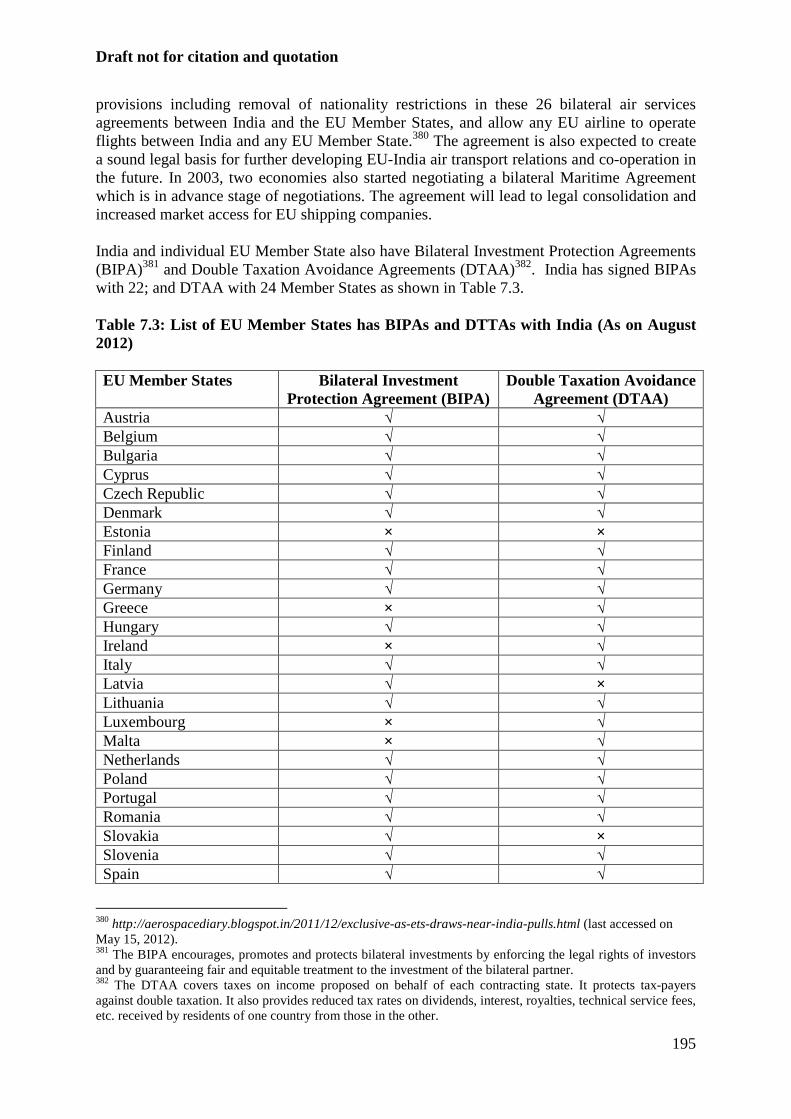
Draft not for citation and quotation
195
provisions including removal of nationality restrictions in these 26 bilateral air services agreements between India and the EU Member States, and allow any EU airline to operate flights between India and any EU Member State.380 The agreement is also expected to create a sound legal basis for further developing EU-India air transport relations and co-operation in the future. In 2003, two economies also started negotiating a bilateral Maritime Agreement which is in advance stage of negotiations. The agreement will lead to legal consolidation and increased market access for EU shipping companies. India and individual EU Member State also have Bilateral Investment Protection Agreements (BIPA)381 and Double Taxation Avoidance Agreements (DTAA)382. India has signed BIPAs with 22; and DTAA with 24 Member States as shown in Table 7.3. Table 7.3: List of EU Member States has BIPAs and DTTAs with India (As on August 2012) EU Member States Bilateral Investment
Protection Agreement (BIPA) Double Taxation Avoidance
Agreement (DTAA) Austria √ √ Belgium √ √ Bulgaria √ √ Cyprus √ √ Czech Republic √ √ Denmark √ √ Estonia × × Finland √ √ France √ √ Germany √ √ Greece × √ Hungary √ √ Ireland × √ Italy √ √ Latvia √ × Lithuania √ √ Luxembourg × √ Malta × √ Netherlands √ √ Poland √ √ Portugal √ √ Romania √ √ Slovakia √ × Slovenia √ √ Spain √ √
380 http://aerospacediary.blogspot.in/2011/12/exclusive-as-ets-draws-near-india-pulls.html (last accessed on May 15, 2012). 381 The BIPA encourages, promotes and protects bilateral investments by enforcing the legal rights of investors and by guaranteeing fair and equitable treatment to the investment of the bilateral partner. 382 The DTAA covers taxes on income proposed on behalf of each contracting state. It protects tax-payers against double taxation. It also provides reduced tax rates on dividends, interest, royalties, technical service fees, etc. received by residents of one country from those in the other.
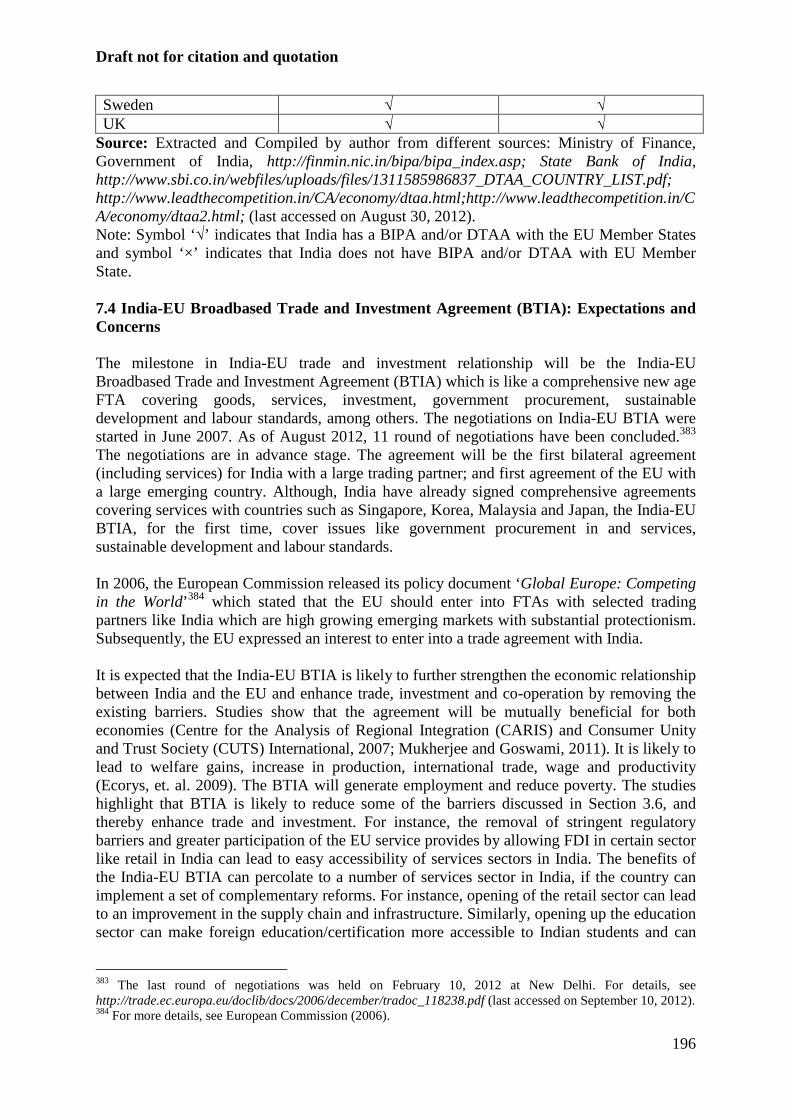
Draft not for citation and quotation
196
Sweden √ √ UK √ √
Source: Extracted and Compiled by author from different sources: Ministry of Finance, Government of India, http://finmin.nic.in/bipa/bipa_index.asp; State Bank of India, http://www.sbi.co.in/webfiles/uploads/files/1311585986837_DTAA_COUNTRY_LIST.pdf; http://www.leadthecompetition.in/CA/economy/dtaa.html;http://www.leadthecompetition.in/CA/economy/dtaa2.html; (last accessed on August 30, 2012). Note: Symbol ‘√’ indicates that India has a BIPA and/or DTAA with the EU Member States and symbol ‘×’ indicates that India does not have BIPA and/or DTAA with EU Member State. 7.4 India-EU Broadbased Trade and Investment Agreement (BTIA): Expectations and Concerns The milestone in India-EU trade and investment relationship will be the India-EU Broadbased Trade and Investment Agreement (BTIA) which is like a comprehensive new age FTA covering goods, services, investment, government procurement, sustainable development and labour standards, among others. The negotiations on India-EU BTIA were started in June 2007. As of August 2012, 11 round of negotiations have been concluded.383 The negotiations are in advance stage. The agreement will be the first bilateral agreement (including services) for India with a large trading partner; and first agreement of the EU with a large emerging country. Although, India have already signed comprehensive agreements covering services with countries such as Singapore, Korea, Malaysia and Japan, the India-EU BTIA, for the first time, cover issues like government procurement in and services, sustainable development and labour standards. In 2006, the European Commission released its policy document ‘Global Europe: Competing in the World’ 384 which stated that the EU should enter into FTAs with selected trading partners like India which are high growing emerging markets with substantial protectionism. Subsequently, the EU expressed an interest to enter into a trade agreement with India. It is expected that the India-EU BTIA is likely to further strengthen the economic relationship between India and the EU and enhance trade, investment and co-operation by removing the existing barriers. Studies show that the agreement will be mutually beneficial for both economies (Centre for the Analysis of Regional Integration (CARIS) and Consumer Unity and Trust Society (CUTS) International, 2007; Mukherjee and Goswami, 2011). It is likely to lead to welfare gains, increase in production, international trade, wage and productivity (Ecorys, et. al. 2009). The BTIA will generate employment and reduce poverty. The studies highlight that BTIA is likely to reduce some of the barriers discussed in Section 3.6, and thereby enhance trade and investment. For instance, the removal of stringent regulatory barriers and greater participation of the EU service provides by allowing FDI in certain sector like retail in India can lead to easy accessibility of services sectors in India. The benefits of the India-EU BTIA can percolate to a number of services sector in India, if the country can implement a set of complementary reforms. For instance, opening of the retail sector can lead to an improvement in the supply chain and infrastructure. Similarly, opening up the education sector can make foreign education/certification more accessible to Indian students and can
383 The last round of negotiations was held on February 10, 2012 at New Delhi. For details, see http://trade.ec.europa.eu/doclib/docs/2006/december/tradoc_118238.pdf (last accessed on September 10, 2012). 384 For more details, see European Commission (2006).
Draft not for citation and quotation
197
improve quality, efficiency and accountability in the educational institutes (CARIS and CUTS, 2007). Competition among a large number of service providers can help to improve efficiency of these sectors and also generate employment. There are several concerns for India in the India-EU BTIA. The core concern of India is how to address government procurement, labour standards, sustainable development and climate change, which are likely to be covered in the BTIA. The EU has covered all these areas in its FTAs with other countries, however, their scope varies. Once India agree to sign an agreement on government procurement, labour standards, etc., with the EU, it is very difficult for India to deny these to other FTA partners. India needs to be careful about the scope and coverage of the agreement (Mukherjee and Goswami, 2011). The regulatory regime in India is evolving. A study on the EU Preferential Trade Agreements (PTAs) shows that the EU often uses the PTAs to transfer its own regulatory regimes to its trading partners.385 Therefore, it is important for trading partners to have a sound regulatory framework in place before negotiating such agreements. In addition, the EU tends to place its demands on its trading partners across different chapters of the trade agreements. For instance, transport may be covered in services chapter, investment chapter and trade facilitation chapter, among others. Therefore, Indian policymakers have to carefully match their commitments across different chapters of the BTIA so that there are synergies across chapters and in the offers and demands. In services, the EU has already scheduled the existing market access liberalization in the WTO Revised Offer (WTO Document No. TN/S/O/EEC/Rev.1) and there is a limited scope for improving over it. The adverse effect of the global slowdown is more on the EU as compared to India. Prior to the slowdown, the EU was a major proponent of financial sector liberalisation but post-slowdown, EU banks like Royal Bank of Scotland have been nationalised. While in the early stages of negotiations, the EU had expressed interest to liberalise movement of people, unemployment and job losses after the recession has made this a sensitive sector. Both India and the EU have their sensitive areas. For instance, retail is sensitive area for India, while audiovisual is sensitive for the EU. In the current circumstances, it may not be possible for both India and the EU to go beyond their autonomous liberalisation (Mukherjee and Goswami, 2011). Overall, the India-EU BTIA is likely to be mutually beneficial for both economies. In the India-EU BTIA, while India is likely to gain free market access for professionals such as architecture, engineers, etc, the EU will able to invest in Indian sectors such as retail (multi-brand); legal; and accountancy services, some of which have undergone reforms. The India-EU BTIA will facilitate joint ventures, enhance the global competitiveness of both economies and increase investment inflows. The India-EU BTIA is also expected to provide opportunities to India and the EU to secure the autonomous liberalisation in each other’s markets. References Burange, L. G., Chaddha Sheetal J and Poonam Kapoor (2009), ‘India’s Trade in Services’,
Working Paper UDE 31/3/2009, JULY, Department of Economics, University of Mumbai, Mumbai, www.mu.ac.in/arts/social_science/eco/pdfs/depart/dwp55.pdf
385 Horn H et. al (2010) and Marchetti and Roy (2008).
Draft not for citation and quotation
198
Chanda, Rupa (2002), “ Globalization of Services: India’s Opportunities and Constraints”, Oxford University Press, New Delhi.
Chaudhuri, Sumanta (2007), “Chapter 8: Plurilateral Negotiations in Services”, p.no. 213-234, in book ‘India’s Liberalisation Experience: Hostage to the WTO” edited by Suparna Karmakar, Rajiv Kumar and Bibek Debroy, Sage Publications, New Delhi.
De, Prabir (2010), ‘Barriers to Trade in Services’, Paper presented at the ARTNeT workshop on Gravity Modelling, 23-27 August, Bogor, Indonesia, http://www.unescap.org/tid/artnet/mtg/reformservice_bp5.pdf
ECORYS, CUTS and Centre for Trade and Development (Centad) (2009), ‘Trade Sustainability Impact Assessment for the FTA between the EU and Republic of India’, TRADE/07/C1/C01 – Lot 1, Study Commissioned by DG Trade, 18 May, Brussels.
Horn Henrik, Petris C. Mavroidis and Andre Sapir (2010), ‘Beyond the WTO? An Anatomy of EU and US Preferential Trade Agreements’, The World Economy, 33, 1565-1588.
Khan, Harun R (2012), ‘Outward Indian FDI – Recent Trends & Emerging Issues’, address delivered by Shri. Harun R Khan, Deputy Governor, Reserve Bank of India, Bombay Chamber of Commerce and Industry, March 3, Mumbai http://rbi.org.in/scripts/BS_SpeechesView.aspx?Id=674
Kumar Gulshan and Neerja Dhingra (2011), ‘Impact of Liberalization on FDI Structure in India’, International Journal of Economics and Research, 2(2), 80-94.
Marchetti Juan A. and Martin Roy (eds.) (2008), ‘Services Liberalisation in the WTO and in PTAs’, in Opening Markets for Trade in Services – Countries and Sectors in Bilateral and WTO Negotiations, 61-112, Cambridge University Press, UK.
Mukherjee, Arpita (2008), ‘Services Liberalisation in PTAs and the WTO: the Experiences of India and Singapore’, in Marchetti Juan A. and Martin Roy (eds.), Opening Markets for Trade in Services – Countries and Sectors in Bilateral and WTO Negotiations, 600-632, Cambridge University Press, UK.
Mukherjee, Arpita and Ramneet Goswami (2011), ‘India-EU BTIA: Implications for Services Sector’, Journal of Indo-European Business Studies, 1(1), 2-22.
Sharma, Shefali (2009), ‘The EU-India FTA: Critical Considerations in a Time of Crisis’, Centad Working Paper No. 11, March, Centre for Trade and Development.
Whalley, John (2008), ‘Recent Regional Agreements: Why So Many, Why So Much Variance in Form, Why Coming So Fast, and Where Are They Headed?’, The World Economy, 31, 517-532.
World Bank (2012a), ‘World Development Indicators 2012, http://data.worldbank.org/news/world-development-indicators-2012-now-available
World Bank (2012b), “Doing Business 2012 - Doing Business in a More Transparent World”, October, http://www.doingbusiness.org/reports/global-reports/doing-business-2012
World Trade Organization (WTO) (1991), ‘Services Sectoral Classification List’, Note by the Secretariat, MTN.GNS/W/120, 10 July, Geneva.
WTO (2005a), ‘India – Revised Offer’, Document TN/S/O/IND/Rev.1’, Special Session, Council for Trade in Services, 24 August, Geneva.
WTO (2005b), ‘Communication from the European Communities and their Member States – Conditional Revised Offer’, Document TN/S/O/EEC/Rev.1, Special Session, Council for Trade in Services, 29 June, Geneva.
WTO (2010), ‘International Trade Statistics 2010’, Geneva. WTO (2011), ‘International Trade Statistics 2011’, Geneva. WTO (2012), “Trade Growth to slow down in 2012 after strong deceleration in 2011”, WTO
Press/658, April 12, Geneva, http://www.wto.org/english/news_e/pres12_e/pr658_e.htm

Draft not for citation and quotation
199
APPENDICES
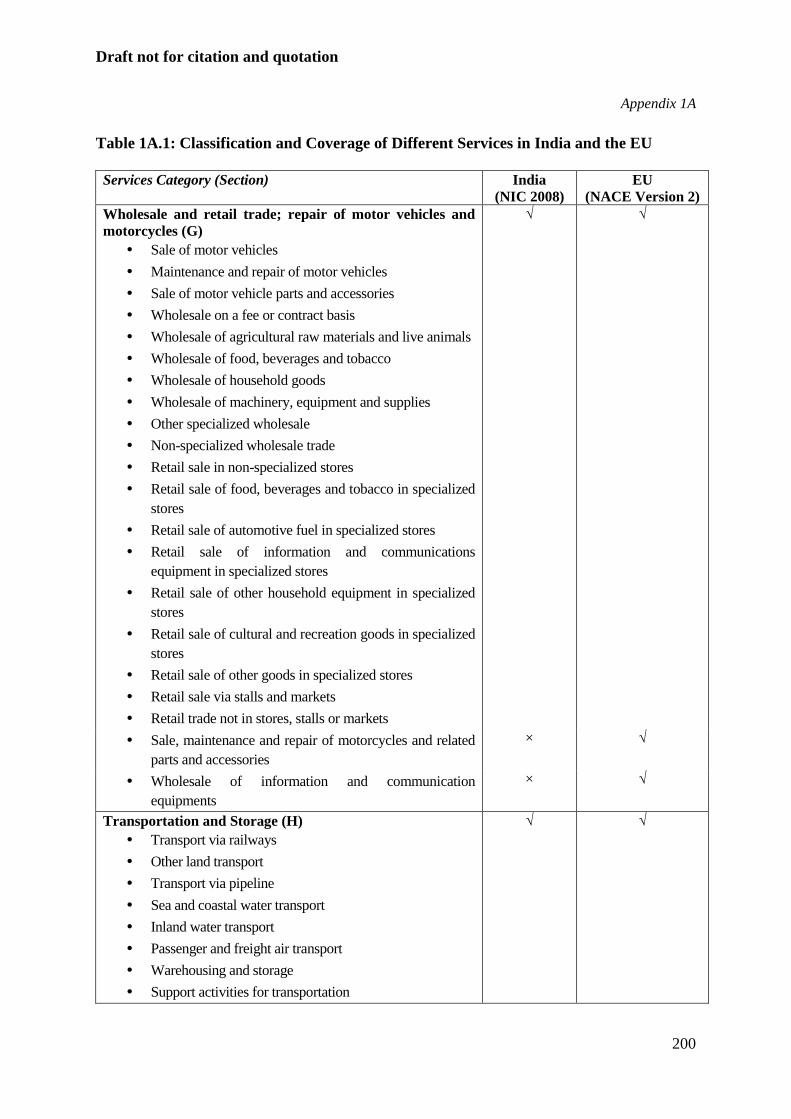
Draft not for citation and quotation
200
Appendix 1A
Table 1A.1: Classification and Coverage of Different Services in India and the EU Services Category (Section) India
(NIC 2008) EU
(NACE Version 2) Wholesale and retail trade; repair of motor vehicles and motorcycles (G)
• Sale of motor vehicles • Maintenance and repair of motor vehicles • Sale of motor vehicle parts and accessories • Wholesale on a fee or contract basis • Wholesale of agricultural raw materials and live animals • Wholesale of food, beverages and tobacco • Wholesale of household goods • Wholesale of machinery, equipment and supplies • Other specialized wholesale • Non-specialized wholesale trade • Retail sale in non-specialized stores • Retail sale of food, beverages and tobacco in specialized
stores • Retail sale of automotive fuel in specialized stores • Retail sale of information and communications
equipment in specialized stores • Retail sale of other household equipment in specialized
stores • Retail sale of cultural and recreation goods in specialized
stores • Retail sale of other goods in specialized stores • Retail sale via stalls and markets • Retail trade not in stores, stalls or markets
√ √
• Sale, maintenance and repair of motorcycles and related parts and accessories
× √
• Wholesale of information and communication equipments
× √
Transportation and Storage (H) • Transport via railways • Other land transport • Transport via pipeline • Sea and coastal water transport • Inland water transport • Passenger and freight air transport • Warehousing and storage • Support activities for transportation
√ √
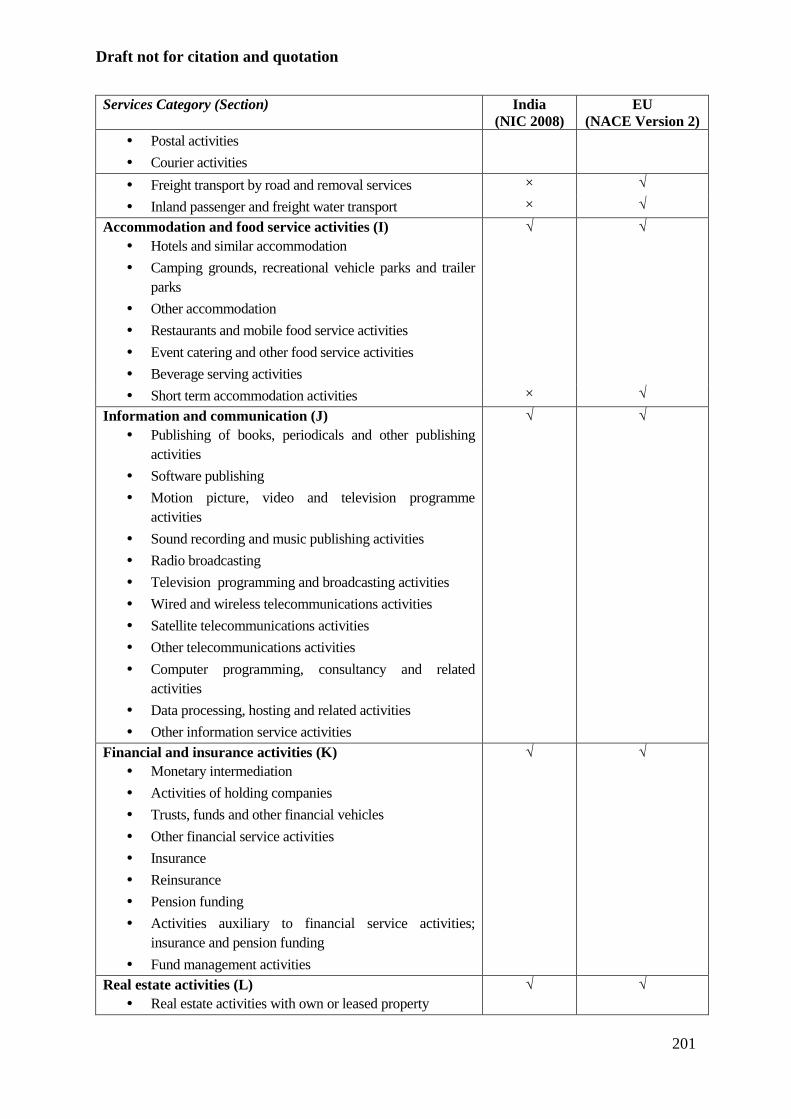
Draft not for citation and quotation
201
Services Category (Section) India (NIC 2008)
EU (NACE Version 2)
• Postal activities • Courier activities
• Freight transport by road and removal services × √
• Inland passenger and freight water transport × √
Accommodation and food service activities (I) • Hotels and similar accommodation • Camping grounds, recreational vehicle parks and trailer
parks • Other accommodation • Restaurants and mobile food service activities • Event catering and other food service activities • Beverage serving activities
√ √
• Short term accommodation activities × √
Information and communication (J) • Publishing of books, periodicals and other publishing
activities • Software publishing • Motion picture, video and television programme
activities • Sound recording and music publishing activities • Radio broadcasting • Television programming and broadcasting activities • Wired and wireless telecommunications activities • Satellite telecommunications activities • Other telecommunications activities • Computer programming, consultancy and related
activities • Data processing, hosting and related activities • Other information service activities
√ √
Financial and insurance activities (K) • Monetary intermediation • Activities of holding companies • Trusts, funds and other financial vehicles • Other financial service activities • Insurance • Reinsurance • Pension funding • Activities auxiliary to financial service activities;
insurance and pension funding • Fund management activities
√ √
Real estate activities (L) • Real estate activities with own or leased property
√ √
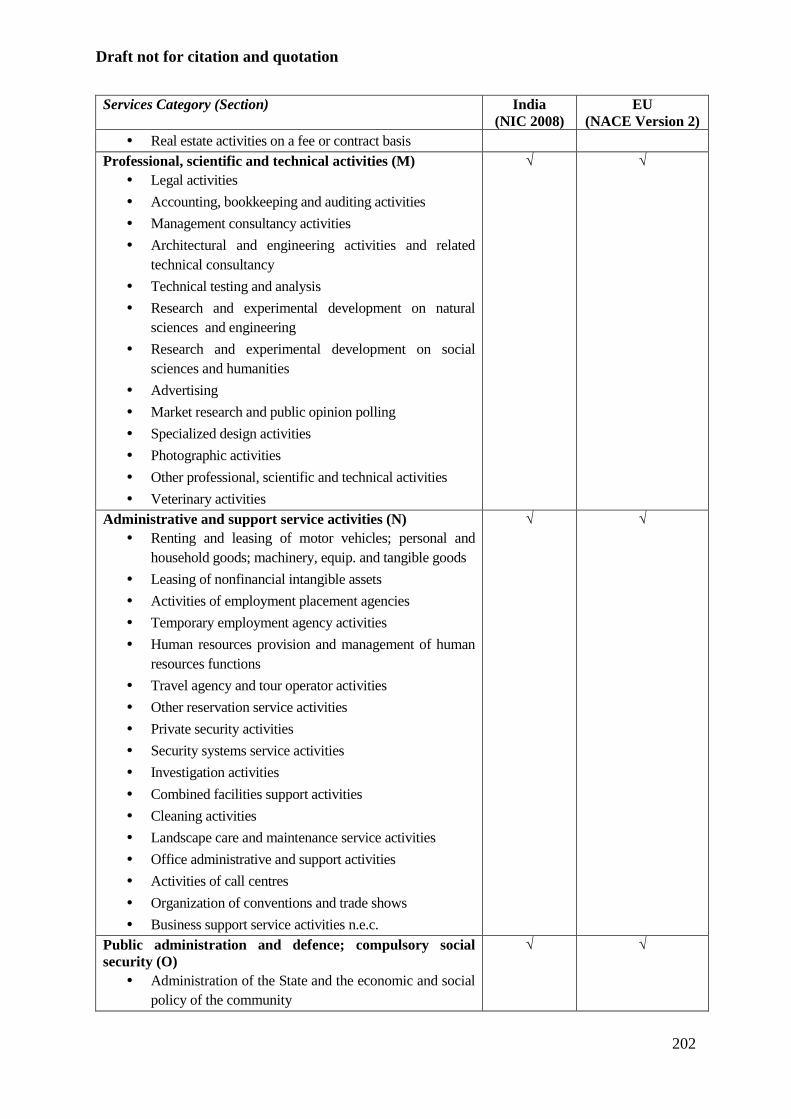
Draft not for citation and quotation
202
Services Category (Section) India (NIC 2008)
EU (NACE Version 2)
• Real estate activities on a fee or contract basis Professional, scientific and technical activities (M)
• Legal activities • Accounting, bookkeeping and auditing activities • Management consultancy activities • Architectural and engineering activities and related
technical consultancy • Technical testing and analysis • Research and experimental development on natural
sciences and engineering • Research and experimental development on social
sciences and humanities • Advertising • Market research and public opinion polling • Specialized design activities • Photographic activities • Other professional, scientific and technical activities • Veterinary activities
√ √
Administrative and support service activities (N) • Renting and leasing of motor vehicles; personal and
household goods; machinery, equip. and tangible goods • Leasing of nonfinancial intangible assets • Activities of employment placement agencies • Temporary employment agency activities • Human resources provision and management of human
resources functions • Travel agency and tour operator activities • Other reservation service activities • Private security activities • Security systems service activities • Investigation activities • Combined facilities support activities • Cleaning activities • Landscape care and maintenance service activities • Office administrative and support activities • Activities of call centres • Organization of conventions and trade shows • Business support service activities n.e.c.
√ √
Public administration and defence; compulsory social security (O)
• Administration of the State and the economic and social policy of the community
√ √
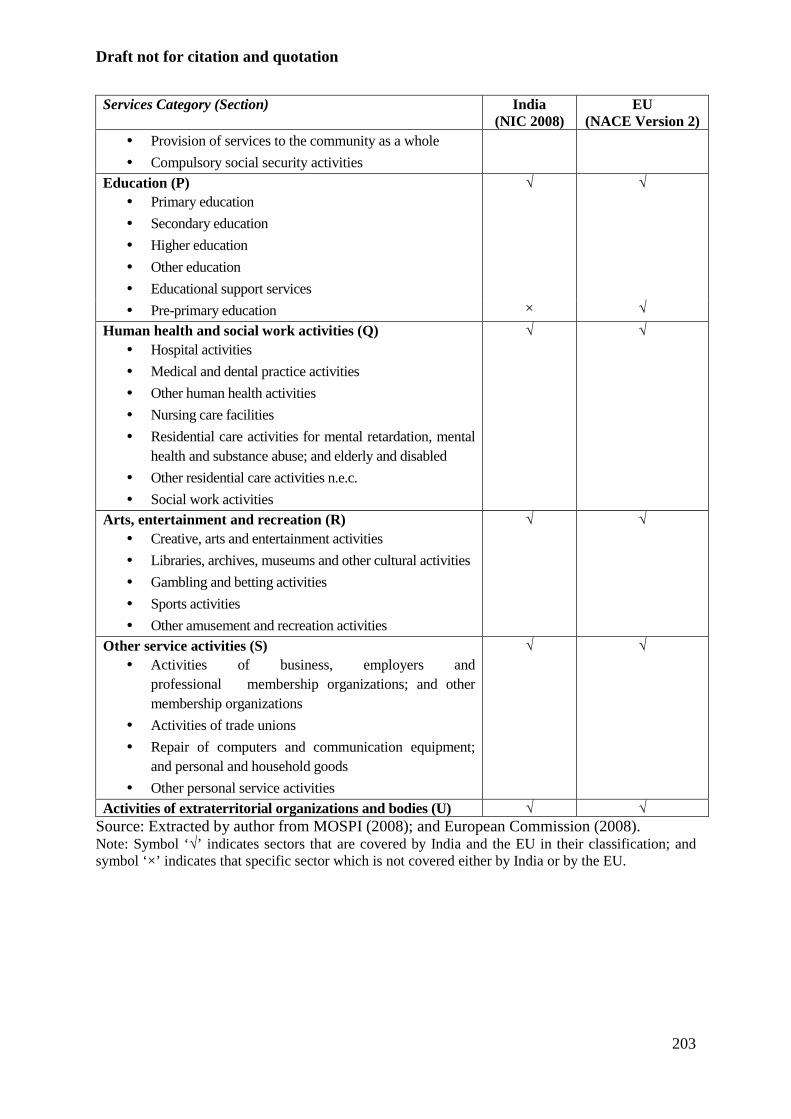
Draft not for citation and quotation
203
Services Category (Section) India (NIC 2008)
EU (NACE Version 2)
• Provision of services to the community as a whole • Compulsory social security activities
Education (P) • Primary education • Secondary education • Higher education • Other education • Educational support services
√ √
• Pre-primary education × √
Human health and social work activities (Q) • Hospital activities • Medical and dental practice activities • Other human health activities • Nursing care facilities • Residential care activities for mental retardation, mental
health and substance abuse; and elderly and disabled • Other residential care activities n.e.c. • Social work activities
√ √
Arts, entertainment and recreation (R) • Creative, arts and entertainment activities • Libraries, archives, museums and other cultural activities • Gambling and betting activities • Sports activities • Other amusement and recreation activities
√ √
Other service activities (S) • Activities of business, employers and
professional membership organizations; and other membership organizations
• Activities of trade unions • Repair of computers and communication equipment;
and personal and household goods • Other personal service activities
√ √
Activities of extraterritorial organizations and bodies (U) √ √ Source: Extracted by author from MOSPI (2008); and European Commission (2008). Note: Symbol ‘√’ indicates sectors that are covered by India and the EU in their classification; and symbol ‘×’ indicates that specific sector which is not covered either by India or by the EU.
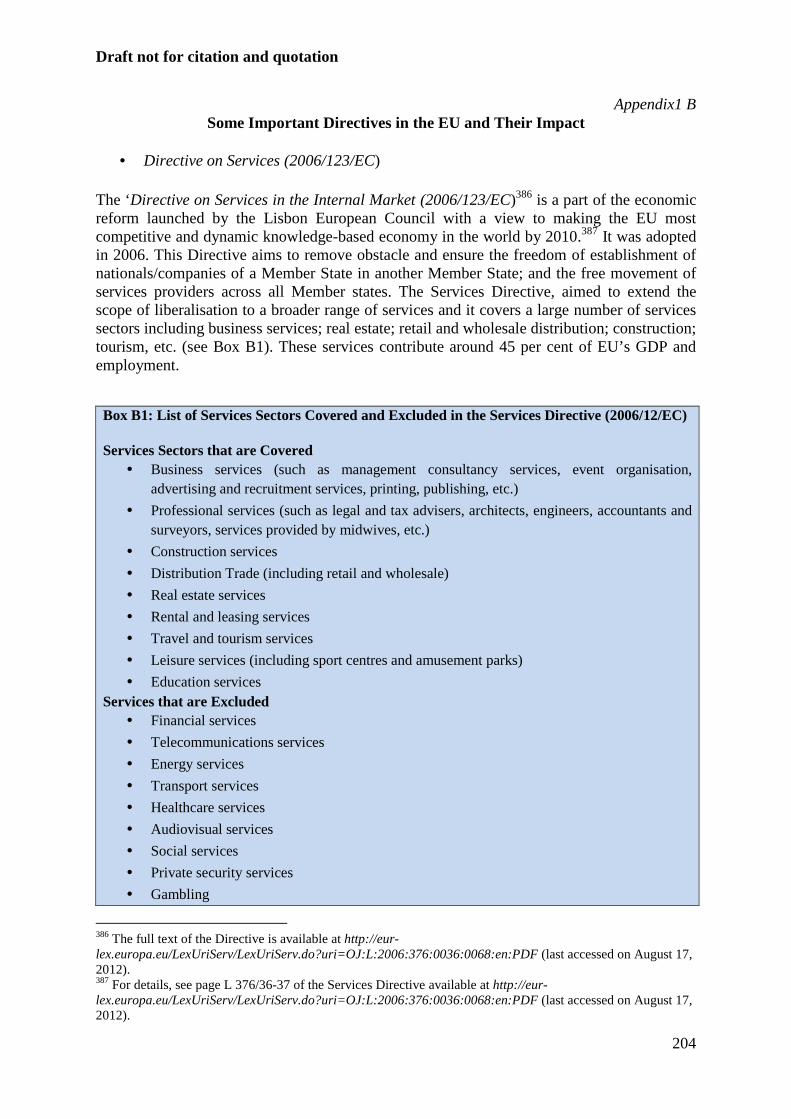
Draft not for citation and quotation
204
Appendix1 B Some Important Directives in the EU and Their Impact
• Directive on Services (2006/123/EC)
The ‘Directive on Services in the Internal Market (2006/123/EC)386 is a part of the economic reform launched by the Lisbon European Council with a view to making the EU most competitive and dynamic knowledge-based economy in the world by 2010.387 It was adopted in 2006. This Directive aims to remove obstacle and ensure the freedom of establishment of nationals/companies of a Member State in another Member State; and the free movement of services providers across all Member states. The Services Directive, aimed to extend the scope of liberalisation to a broader range of services and it covers a large number of services sectors including business services; real estate; retail and wholesale distribution; construction; tourism, etc. (see Box B1). These services contribute around 45 per cent of EU’s GDP and employment.
Box B1: List of Services Sectors Covered and Excluded in the Services Directive (2006/12/EC) Services Sectors that are Covered
• Business services (such as management consultancy services, event organisation, advertising and recruitment services, printing, publishing, etc.)
• Professional services (such as legal and tax advisers, architects, engineers, accountants and surveyors, services provided by midwives, etc.)
• Construction services • Distribution Trade (including retail and wholesale) • Real estate services • Rental and leasing services • Travel and tourism services • Leisure services (including sport centres and amusement parks) • Education services
Services that are Excluded • Financial services • Telecommunications services • Energy services • Transport services • Healthcare services • Audiovisual services • Social services • Private security services • Gambling
386 The full text of the Directive is available at http://eur-lex.europa.eu/LexUriServ/LexUriServ.do?uri=OJ:L:2006:376:0036:0068:en:PDF (last accessed on August 17, 2012). 387 For details, see page L 376/36-37 of the Services Directive available at http://eur-lex.europa.eu/LexUriServ/LexUriServ.do?uri=OJ:L:2006:376:0036:0068:en:PDF (last accessed on August 17, 2012).
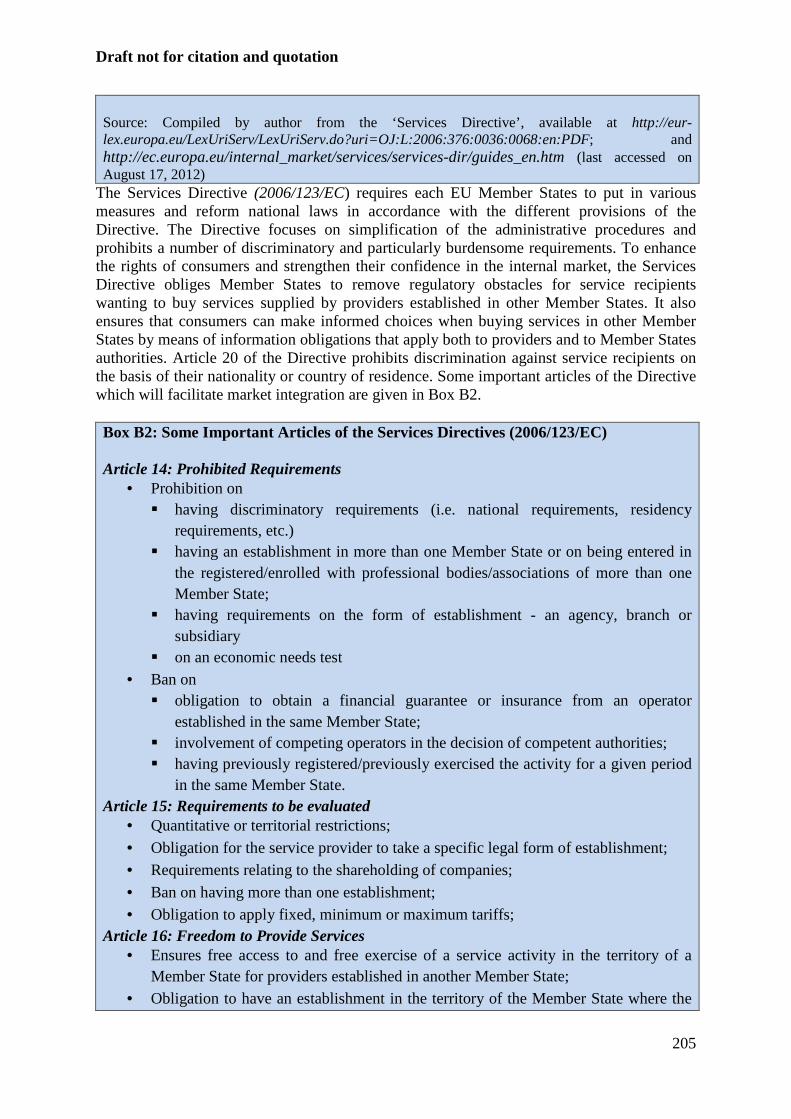
Draft not for citation and quotation
205
Source: Compiled by author from the ‘Services Directive’, available at http://eur-lex.europa.eu/LexUriServ/LexUriServ.do?uri=OJ:L:2006:376:0036:0068:en:PDF; and http://ec.europa.eu/internal_market/services/services-dir/guides_en.htm (last accessed on August 17, 2012)
The Services Directive (2006/123/EC) requires each EU Member States to put in various measures and reform national laws in accordance with the different provisions of the Directive. The Directive focuses on simplification of the administrative procedures and prohibits a number of discriminatory and particularly burdensome requirements. To enhance the rights of consumers and strengthen their confidence in the internal market, the Services Directive obliges Member States to remove regulatory obstacles for service recipients wanting to buy services supplied by providers established in other Member States. It also ensures that consumers can make informed choices when buying services in other Member States by means of information obligations that apply both to providers and to Member States authorities. Article 20 of the Directive prohibits discrimination against service recipients on the basis of their nationality or country of residence. Some important articles of the Directive which will facilitate market integration are given in Box B2. Box B2: Some Important Articles of the Services Directives (2006/123/EC) Article 14: Prohibited Requirements
• Prohibition on � having discriminatory requirements (i.e. national requirements, residency
requirements, etc.) � having an establishment in more than one Member State or on being entered in
the registered/enrolled with professional bodies/associations of more than one Member State;
� having requirements on the form of establishment - an agency, branch or subsidiary
� on an economic needs test • Ban on
� obligation to obtain a financial guarantee or insurance from an operator established in the same Member State;
� involvement of competing operators in the decision of competent authorities; � having previously registered/previously exercised the activity for a given period
in the same Member State. Article 15: Requirements to be evaluated
• Quantitative or territorial restrictions;
• Obligation for the service provider to take a specific legal form of establishment; • Requirements relating to the shareholding of companies;
• Ban on having more than one establishment; • Obligation to apply fixed, minimum or maximum tariffs;
Article 16: Freedom to Provide Services • Ensures free access to and free exercise of a service activity in the territory of a
Member State for providers established in another Member State; • Obligation to have an establishment in the territory of the Member State where the
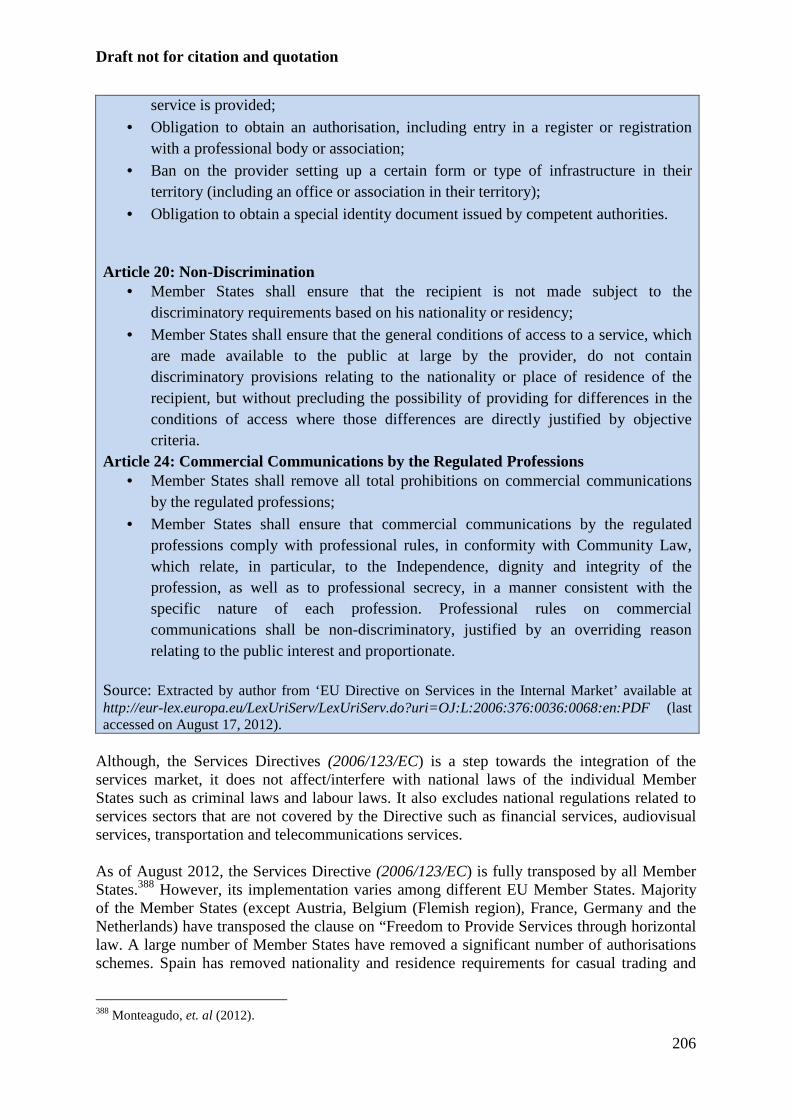
Draft not for citation and quotation
206
service is provided; • Obligation to obtain an authorisation, including entry in a register or registration
with a professional body or association; • Ban on the provider setting up a certain form or type of infrastructure in their
territory (including an office or association in their territory);
• Obligation to obtain a special identity document issued by competent authorities. Article 20: Non-Discrimination
• Member States shall ensure that the recipient is not made subject to the discriminatory requirements based on his nationality or residency;
• Member States shall ensure that the general conditions of access to a service, which are made available to the public at large by the provider, do not contain discriminatory provisions relating to the nationality or place of residence of the recipient, but without precluding the possibility of providing for differences in the conditions of access where those differences are directly justified by objective criteria.
Article 24: Commercial Communications by the Regulated Professions • Member States shall remove all total prohibitions on commercial communications
by the regulated professions; • Member States shall ensure that commercial communications by the regulated
professions comply with professional rules, in conformity with Community Law, which relate, in particular, to the Independence, dignity and integrity of the profession, as well as to professional secrecy, in a manner consistent with the specific nature of each profession. Professional rules on commercial communications shall be non-discriminatory, justified by an overriding reason relating to the public interest and proportionate.
Source: Extracted by author from ‘EU Directive on Services in the Internal Market’ available at http://eur-lex.europa.eu/LexUriServ/LexUriServ.do?uri=OJ:L:2006:376:0036:0068:en:PDF (last accessed on August 17, 2012).
Although, the Services Directives (2006/123/EC) is a step towards the integration of the services market, it does not affect/interfere with national laws of the individual Member States such as criminal laws and labour laws. It also excludes national regulations related to services sectors that are not covered by the Directive such as financial services, audiovisual services, transportation and telecommunications services. As of August 2012, the Services Directive (2006/123/EC) is fully transposed by all Member States.388 However, its implementation varies among different EU Member States. Majority of the Member States (except Austria, Belgium (Flemish region), France, Germany and the Netherlands) have transposed the clause on “Freedom to Provide Services through horizontal law. A large number of Member States have removed a significant number of authorisations schemes. Spain has removed nationality and residence requirements for casual trading and
388 Monteagudo, et. al (2012).
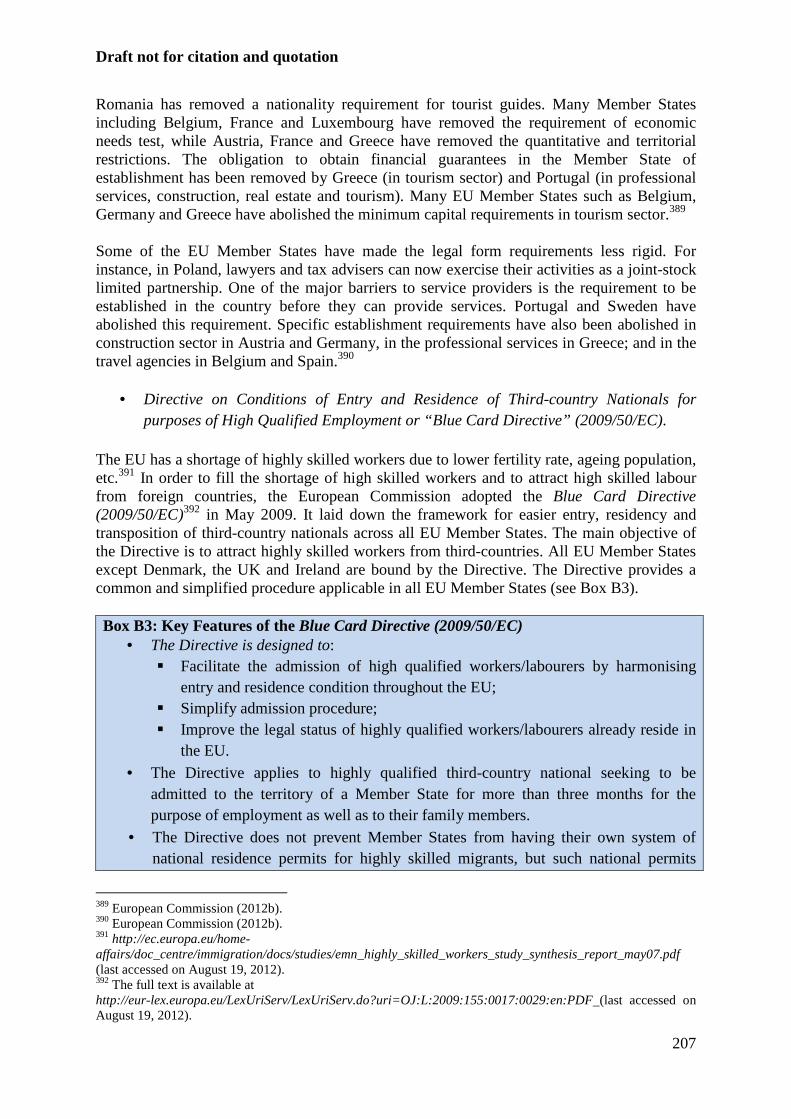
Draft not for citation and quotation
207
Romania has removed a nationality requirement for tourist guides. Many Member States including Belgium, France and Luxembourg have removed the requirement of economic needs test, while Austria, France and Greece have removed the quantitative and territorial restrictions. The obligation to obtain financial guarantees in the Member State of establishment has been removed by Greece (in tourism sector) and Portugal (in professional services, construction, real estate and tourism). Many EU Member States such as Belgium, Germany and Greece have abolished the minimum capital requirements in tourism sector.389 Some of the EU Member States have made the legal form requirements less rigid. For instance, in Poland, lawyers and tax advisers can now exercise their activities as a joint-stock limited partnership. One of the major barriers to service providers is the requirement to be established in the country before they can provide services. Portugal and Sweden have abolished this requirement. Specific establishment requirements have also been abolished in construction sector in Austria and Germany, in the professional services in Greece; and in the travel agencies in Belgium and Spain.390
• Directive on Conditions of Entry and Residence of Third-country Nationals for purposes of High Qualified Employment or “Blue Card Directive” (2009/50/EC).
The EU has a shortage of highly skilled workers due to lower fertility rate, ageing population, etc.391 In order to fill the shortage of high skilled workers and to attract high skilled labour from foreign countries, the European Commission adopted the Blue Card Directive (2009/50/EC)392 in May 2009. It laid down the framework for easier entry, residency and transposition of third-country nationals across all EU Member States. The main objective of the Directive is to attract highly skilled workers from third-countries. All EU Member States except Denmark, the UK and Ireland are bound by the Directive. The Directive provides a common and simplified procedure applicable in all EU Member States (see Box B3). Box B3: Key Features of the Blue Card Directive (2009/50/EC)
• The Directive is designed to: � Facilitate the admission of high qualified workers/labourers by harmonising
entry and residence condition throughout the EU; � Simplify admission procedure; � Improve the legal status of highly qualified workers/labourers already reside in
the EU. • The Directive applies to highly qualified third-country national seeking to be
admitted to the territory of a Member State for more than three months for the purpose of employment as well as to their family members.
• The Directive does not prevent Member States from having their own system of national residence permits for highly skilled migrants, but such national permits
389 European Commission (2012b). 390 European Commission (2012b). 391 http://ec.europa.eu/home-affairs/doc_centre/immigration/docs/studies/emn_highly_skilled_workers_study_synthesis_report_may07.pdf (last accessed on August 19, 2012). 392 The full text is available at http://eur-lex.europa.eu/LexUriServ/LexUriServ.do?uri=OJ:L:2009:155:0017:0029:en:PDF (last accessed on August 19, 2012).
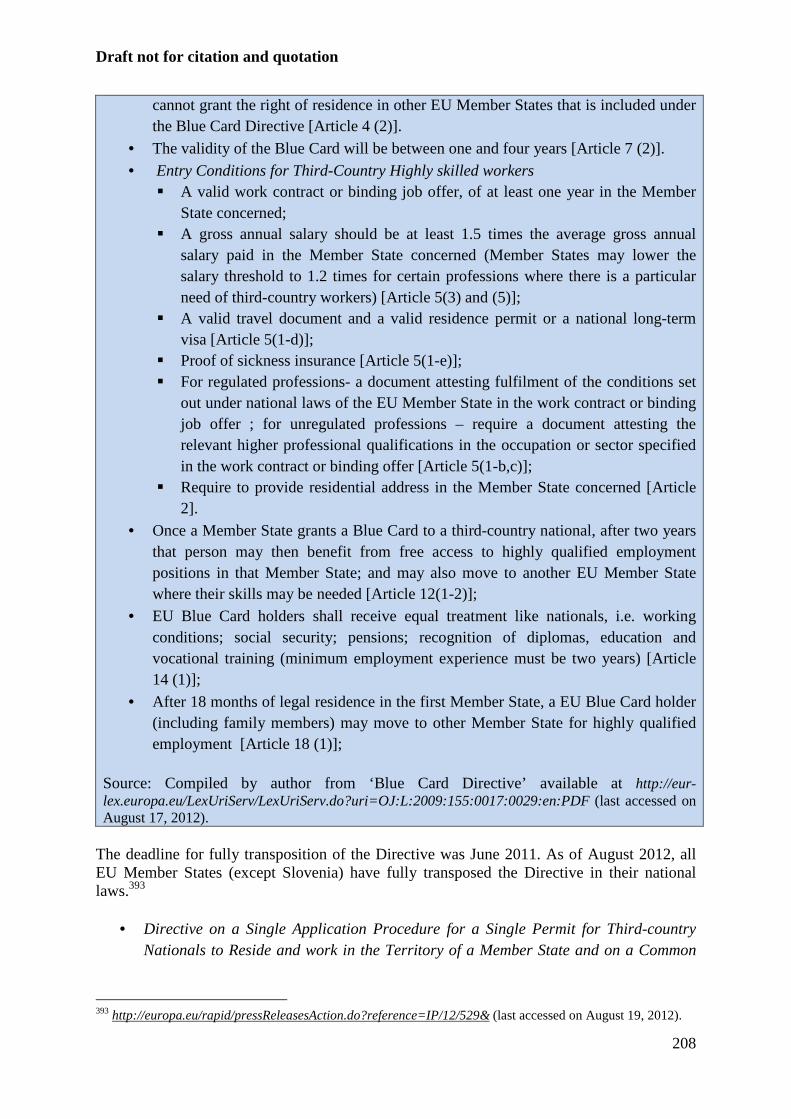
Draft not for citation and quotation
208
cannot grant the right of residence in other EU Member States that is included under the Blue Card Directive [Article 4 (2)].
• The validity of the Blue Card will be between one and four years [Article 7 (2)]. • Entry Conditions for Third-Country Highly skilled workers
� A valid work contract or binding job offer, of at least one year in the Member State concerned;
� A gross annual salary should be at least 1.5 times the average gross annual salary paid in the Member State concerned (Member States may lower the salary threshold to 1.2 times for certain professions where there is a particular need of third-country workers) [Article 5(3) and (5)];
� A valid travel document and a valid residence permit or a national long-term visa [Article 5(1-d)];
� Proof of sickness insurance [Article 5(1-e)]; � For regulated professions- a document attesting fulfilment of the conditions set
out under national laws of the EU Member State in the work contract or binding job offer ; for unregulated professions – require a document attesting the relevant higher professional qualifications in the occupation or sector specified in the work contract or binding offer [Article 5(1-b,c)];
� Require to provide residential address in the Member State concerned [Article 2].
• Once a Member State grants a Blue Card to a third-country national, after two years that person may then benefit from free access to highly qualified employment positions in that Member State; and may also move to another EU Member State where their skills may be needed [Article 12(1-2)];
• EU Blue Card holders shall receive equal treatment like nationals, i.e. working conditions; social security; pensions; recognition of diplomas, education and vocational training (minimum employment experience must be two years) [Article 14 (1)];
• After 18 months of legal residence in the first Member State, a EU Blue Card holder (including family members) may move to other Member State for highly qualified employment [Article 18 (1)];
Source: Compiled by author from ‘Blue Card Directive’ available at http://eur-lex.europa.eu/LexUriServ/LexUriServ.do?uri=OJ:L:2009:155:0017:0029:en:PDF (last accessed on August 17, 2012).
The deadline for fully transposition of the Directive was June 2011. As of August 2012, all EU Member States (except Slovenia) have fully transposed the Directive in their national laws.393
• Directive on a Single Application Procedure for a Single Permit for Third-country Nationals to Reside and work in the Territory of a Member State and on a Common
393 http://europa.eu/rapid/pressReleasesAction.do?reference=IP/12/529& (last accessed on August 19, 2012).
Draft not for citation and quotation
209
Set of Rights for Third-country Workers Legally Residing in a Member State or Single Permit Directive (2011/98/EU).
In order to free entry of third country nationals, the EU has adopted the ‘Single Permit Directive (2011/98/EU) in December 2011. This Directive seeks to establish a simplified and harmonised procedure for a non-EU migrant or third-country national to obtain a work and residence permit in an EU Member State. It also defines a common set of rights such as working conditions, recognition of educational and professional qualifications; taxation; vocational training; and access to social security, including unemployment benefits and the transfer of acquired pensions awarded to third-country workers/migrants. One key feature of the Directive is to have a single permit covering both residence and work permits. The Directive excludes posted workers and intra-corporate transferees. This is an important step in facilitating free intra-EU mobility along with equal treatment as given to the EU nationals. As of August 2012, the EU Member States are in the process of implementing this Directive.394
394 http://www.epc.eu/documents/uploads/pub_1398_eu_single_permit_directive.pdf (last accessed on August 29, 2012).
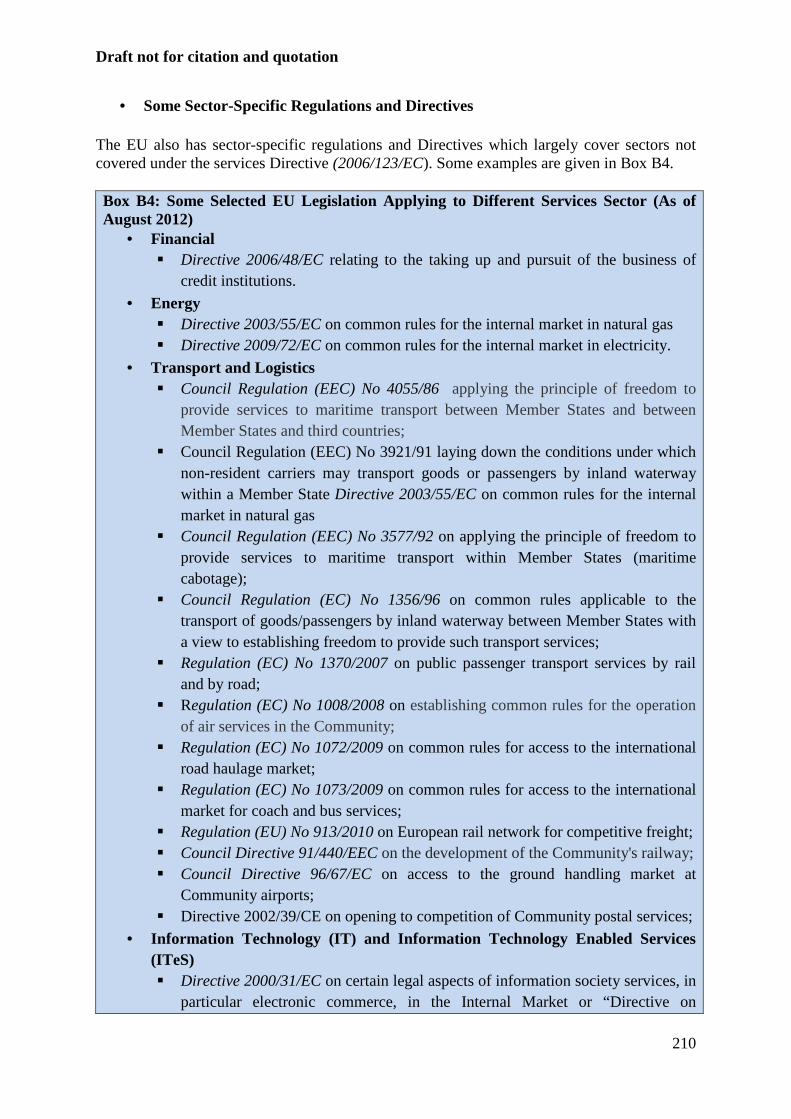
Draft not for citation and quotation
210
• Some Sector-Specific Regulations and Directives The EU also has sector-specific regulations and Directives which largely cover sectors not covered under the services Directive (2006/123/EC). Some examples are given in Box B4. Box B4: Some Selected EU Legislation Applying to Different Services Sector (As of August 2012)
• Financial � Directive 2006/48/EC relating to the taking up and pursuit of the business of
credit institutions.
• Energy � Directive 2003/55/EC on common rules for the internal market in natural gas � Directive 2009/72/EC on common rules for the internal market in electricity.
• Transport and Logistics � Council Regulation (EEC) No 4055/86 applying the principle of freedom to
provide services to maritime transport between Member States and between Member States and third countries;
� Council Regulation (EEC) No 3921/91 laying down the conditions under which non-resident carriers may transport goods or passengers by inland waterway within a Member State Directive 2003/55/EC on common rules for the internal market in natural gas
� Council Regulation (EEC) No 3577/92 on applying the principle of freedom to provide services to maritime transport within Member States (maritime cabotage);
� Council Regulation (EC) No 1356/96 on common rules applicable to the transport of goods/passengers by inland waterway between Member States with a view to establishing freedom to provide such transport services;
� Regulation (EC) No 1370/2007 on public passenger transport services by rail and by road;
� Regulation (EC) No 1008/2008 on establishing common rules for the operation of air services in the Community;
� Regulation (EC) No 1072/2009 on common rules for access to the international road haulage market;
� Regulation (EC) No 1073/2009 on common rules for access to the international market for coach and bus services;
� Regulation (EU) No 913/2010 on European rail network for competitive freight; � Council Directive 91/440/EEC on the development of the Community's railway; � Council Directive 96/67/EC on access to the ground handling market at
Community airports; � Directive 2002/39/CE on opening to competition of Community postal services;
• Information Technology (IT) and Information Technology Enabled Services (ITeS) � Directive 2000/31/EC on certain legal aspects of information society services, in
particular electronic commerce, in the Internal Market or “Directive on
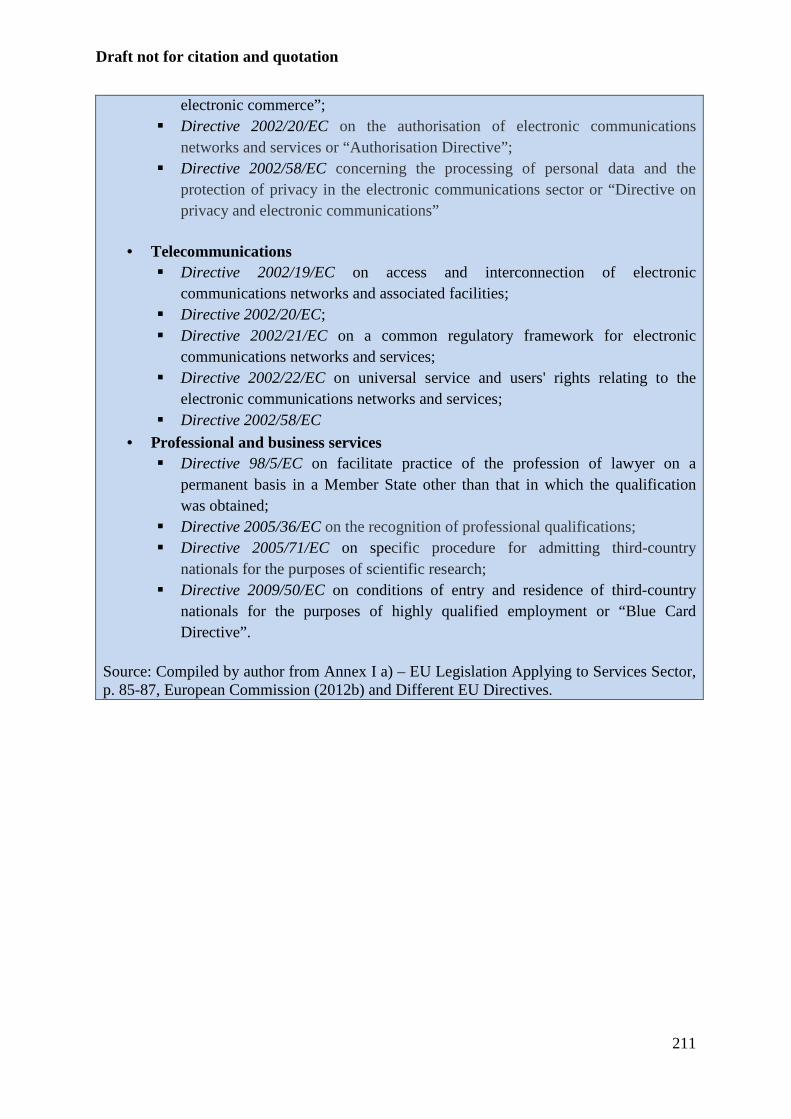
Draft not for citation and quotation
211
electronic commerce”; � Directive 2002/20/EC on the authorisation of electronic communications
networks and services or “Authorisation Directive”; � Directive 2002/58/EC concerning the processing of personal data and the
protection of privacy in the electronic communications sector or “Directive on privacy and electronic communications”
• Telecommunications
� Directive 2002/19/EC on access and interconnection of electronic communications networks and associated facilities;
� Directive 2002/20/EC; � Directive 2002/21/EC on a common regulatory framework for electronic
communications networks and services; � Directive 2002/22/EC on universal service and users' rights relating to the
electronic communications networks and services; � Directive 2002/58/EC
• Professional and business services � Directive 98/5/EC on facilitate practice of the profession of lawyer on a
permanent basis in a Member State other than that in which the qualification was obtained;
� Directive 2005/36/EC on the recognition of professional qualifications; � Directive 2005/71/EC on specific procedure for admitting third-country
nationals for the purposes of scientific research; � Directive 2009/50/EC on conditions of entry and residence of third-country
nationals for the purposes of highly qualified employment or “Blue Card Directive”.
Source: Compiled by author from Annex I a) – EU Legislation Applying to Services Sector, p. 85-87, European Commission (2012b) and Different EU Directives.
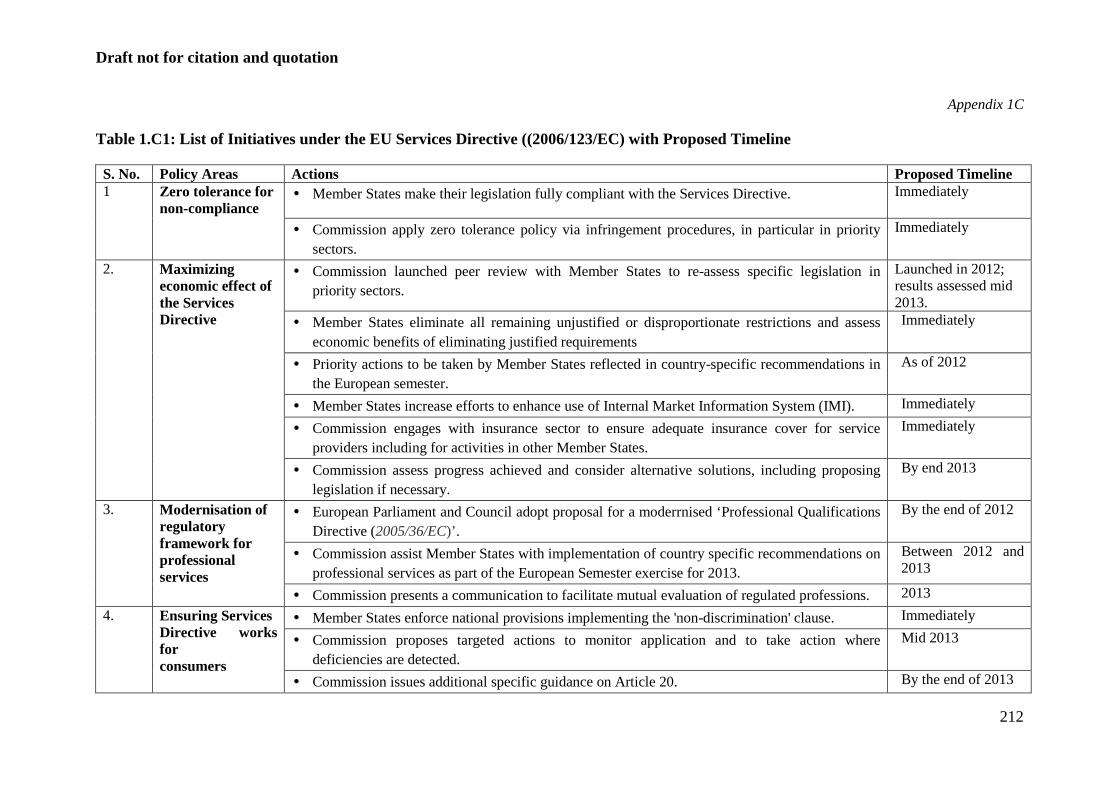
Draft not for citation and quotation
212
Appendix 1C Table 1.C1: List of Initiatives under the EU Services Directive ((2006/123/EC) with Proposed Timeline S. No. Policy Areas Actions Proposed Timeline 1 Zero tolerance for
non-compliance • Member States make their legislation fully compliant with the Services Directive. Immediately
• Commission apply zero tolerance policy via infringement procedures, in particular in priority
sectors. Immediately
2. Maximizing economic effect of the Services Directive
• Commission launched peer review with Member States to re-assess specific legislation in priority sectors.
Launched in 2012; results assessed mid 2013.
• Member States eliminate all remaining unjustified or disproportionate restrictions and assess economic benefits of eliminating justified requirements
Immediately
• Priority actions to be taken by Member States reflected in country-specific recommendations in the European semester.
As of 2012
• Member States increase efforts to enhance use of Internal Market Information System (IMI). Immediately
• Commission engages with insurance sector to ensure adequate insurance cover for service providers including for activities in other Member States.
Immediately
• Commission assess progress achieved and consider alternative solutions, including proposing legislation if necessary.
By end 2013
3. Modernisation of regulatory framework for professional services
• European Parliament and Council adopt proposal for a moderrnised ‘Professional Qualifications Directive (2005/36/EC)’ .
By the end of 2012
• Commission assist Member States with implementation of country specific recommendations on professional services as part of the European Semester exercise for 2013.
Between 2012 and 2013
• Commission presents a communication to facilitate mutual evaluation of regulated professions. 2013
4. Ensuring Services Directive works for consumers
• Member States enforce national provisions implementing the 'non-discrimination' clause. Immediately
• Commission proposes targeted actions to monitor application and to take action where deficiencies are detected.
Mid 2013
• Commission issues additional specific guidance on Article 20. By the end of 2013
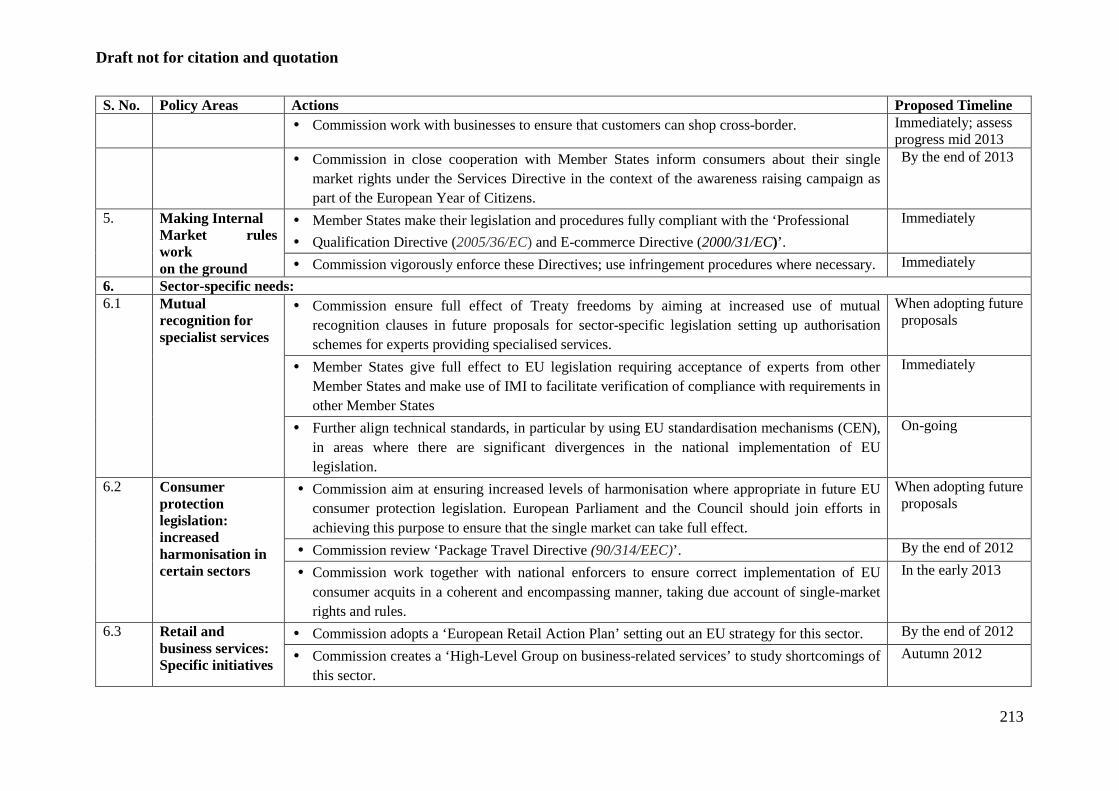
Draft not for citation and quotation
213
S. No. Policy Areas Actions Proposed Timeline • Commission work with businesses to ensure that customers can shop cross-border. Immediately; assess
progress mid 2013 • Commission in close cooperation with Member States inform consumers about their single
market rights under the Services Directive in the context of the awareness raising campaign as part of the European Year of Citizens.
By the end of 2013
5. Making Internal Market rules work on the ground
• Member States make their legislation and procedures fully compliant with the ‘Professional • Qualification Directive (2005/36/EC) and E-commerce Directive (2000/31/EC)’.
Immediately
• Commission vigorously enforce these Directives; use infringement procedures where necessary. Immediately
6. Sector-specific needs: 6.1 Mutual
recognition for specialist services
• Commission ensure full effect of Treaty freedoms by aiming at increased use of mutual recognition clauses in future proposals for sector-specific legislation setting up authorisation schemes for experts providing specialised services.
When adopting future proposals
• Member States give full effect to EU legislation requiring acceptance of experts from other Member States and make use of IMI to facilitate verification of compliance with requirements in other Member States
Immediately
• Further align technical standards, in particular by using EU standardisation mechanisms (CEN), in areas where there are significant divergences in the national implementation of EU legislation.
On-going
6.2 Consumer protection legislation: increased harmonisation in certain sectors
• Commission aim at ensuring increased levels of harmonisation where appropriate in future EU consumer protection legislation. European Parliament and the Council should join efforts in achieving this purpose to ensure that the single market can take full effect.
When adopting future proposals
• Commission review ‘Package Travel Directive (90/314/EEC)’. By the end of 2012
• Commission work together with national enforcers to ensure correct implementation of EU consumer acquits in a coherent and encompassing manner, taking due account of single-market rights and rules.
In the early 2013
6.3 Retail and business services: Specific initiatives
• Commission adopts a ‘European Retail Action Plan’ setting out an EU strategy for this sector. By the end of 2012
• Commission creates a ‘High-Level Group on business-related services’ to study shortcomings of this sector.
Autumn 2012
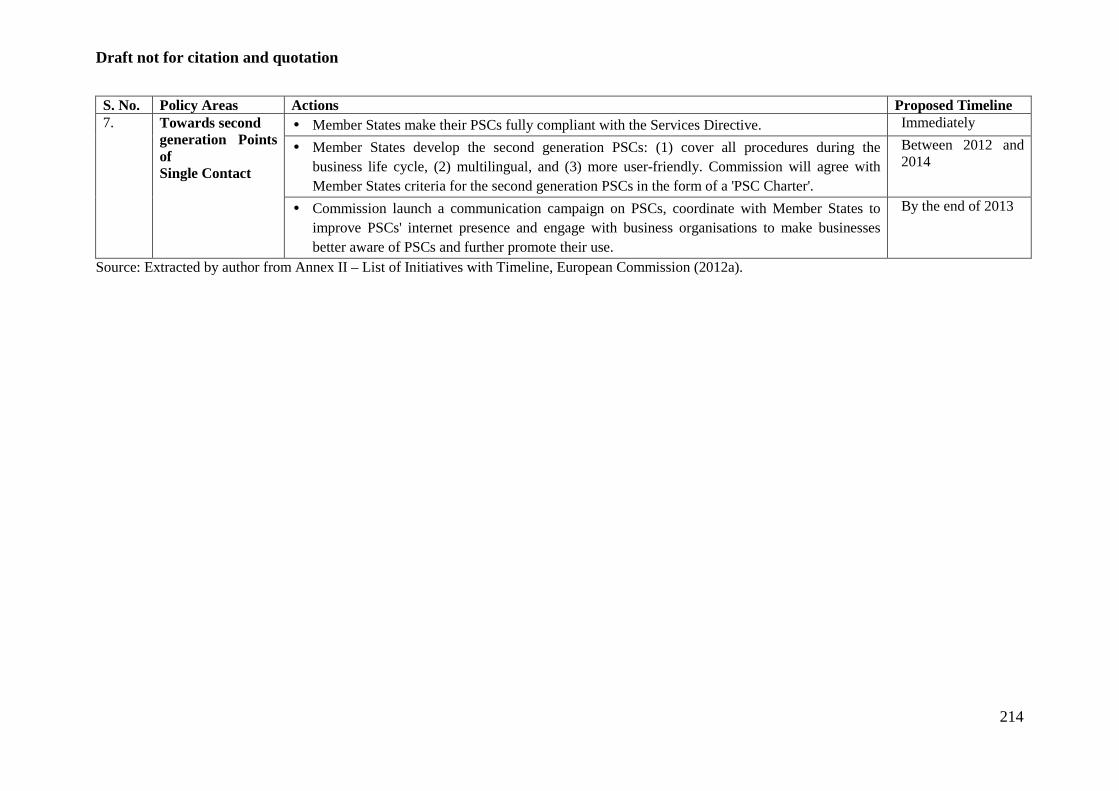
Draft not for citation and quotation
214
S. No. Policy Areas Actions Proposed Timeline 7. Towards second
generation Points of Single Contact
• Member States make their PSCs fully compliant with the Services Directive. Immediately
• Member States develop the second generation PSCs: (1) cover all procedures during the business life cycle, (2) multilingual, and (3) more user-friendly. Commission will agree with Member States criteria for the second generation PSCs in the form of a 'PSC Charter'.
Between 2012 and 2014
• Commission launch a communication campaign on PSCs, coordinate with Member States to improve PSCs' internet presence and engage with business organisations to make businesses better aware of PSCs and further promote their use.
By the end of 2013
Source: Extracted by author from Annex II – List of Initiatives with Timeline, European Commission (2012a).
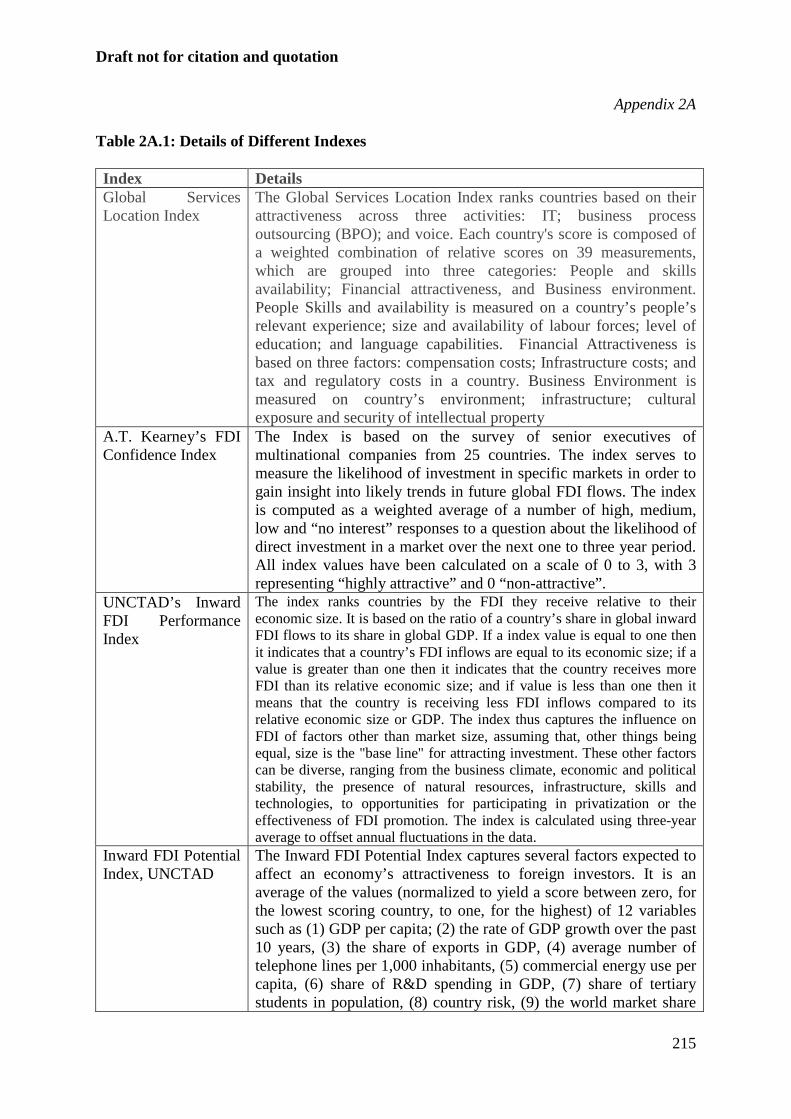
Draft not for citation and quotation
215
Appendix 2A Table 2A.1: Details of Different Indexes Index Details Global Services Location Index
The Global Services Location Index ranks countries based on their attractiveness across three activities: IT; business process outsourcing (BPO); and voice. Each country's score is composed of a weighted combination of relative scores on 39 measurements, which are grouped into three categories: People and skills availability; Financial attractiveness, and Business environment. People Skills and availability is measured on a country’s people’s relevant experience; size and availability of labour forces; level of education; and language capabilities. Financial Attractiveness is based on three factors: compensation costs; Infrastructure costs; and tax and regulatory costs in a country. Business Environment is measured on country’s environment; infrastructure; cultural exposure and security of intellectual property
A.T. Kearney’s FDI Confidence Index
The Index is based on the survey of senior executives of multinational companies from 25 countries. The index serves to measure the likelihood of investment in specific markets in order to gain insight into likely trends in future global FDI flows. The index is computed as a weighted average of a number of high, medium, low and “no interest” responses to a question about the likelihood of direct investment in a market over the next one to three year period. All index values have been calculated on a scale of 0 to 3, with 3 representing “highly attractive” and 0 “non-attractive”.
UNCTAD’s Inward FDI Performance Index
The index ranks countries by the FDI they receive relative to their economic size. It is based on the ratio of a country’s share in global inward FDI flows to its share in global GDP. If a index value is equal to one then it indicates that a country’s FDI inflows are equal to its economic size; if a value is greater than one then it indicates that the country receives more FDI than its relative economic size; and if value is less than one then it means that the country is receiving less FDI inflows compared to its relative economic size or GDP. The index thus captures the influence on FDI of factors other than market size, assuming that, other things being equal, size is the "base line" for attracting investment. These other factors can be diverse, ranging from the business climate, economic and political stability, the presence of natural resources, infrastructure, skills and technologies, to opportunities for participating in privatization or the effectiveness of FDI promotion. The index is calculated using three-year average to offset annual fluctuations in the data.
Inward FDI Potential Index, UNCTAD
The Inward FDI Potential Index captures several factors expected to affect an economy’s attractiveness to foreign investors. It is an average of the values (normalized to yield a score between zero, for the lowest scoring country, to one, for the highest) of 12 variables such as (1) GDP per capita; (2) the rate of GDP growth over the past 10 years, (3) the share of exports in GDP, (4) average number of telephone lines per 1,000 inhabitants, (5) commercial energy use per capita, (6) share of R&D spending in GDP, (7) share of tertiary students in population, (8) country risk, (9) the world market share
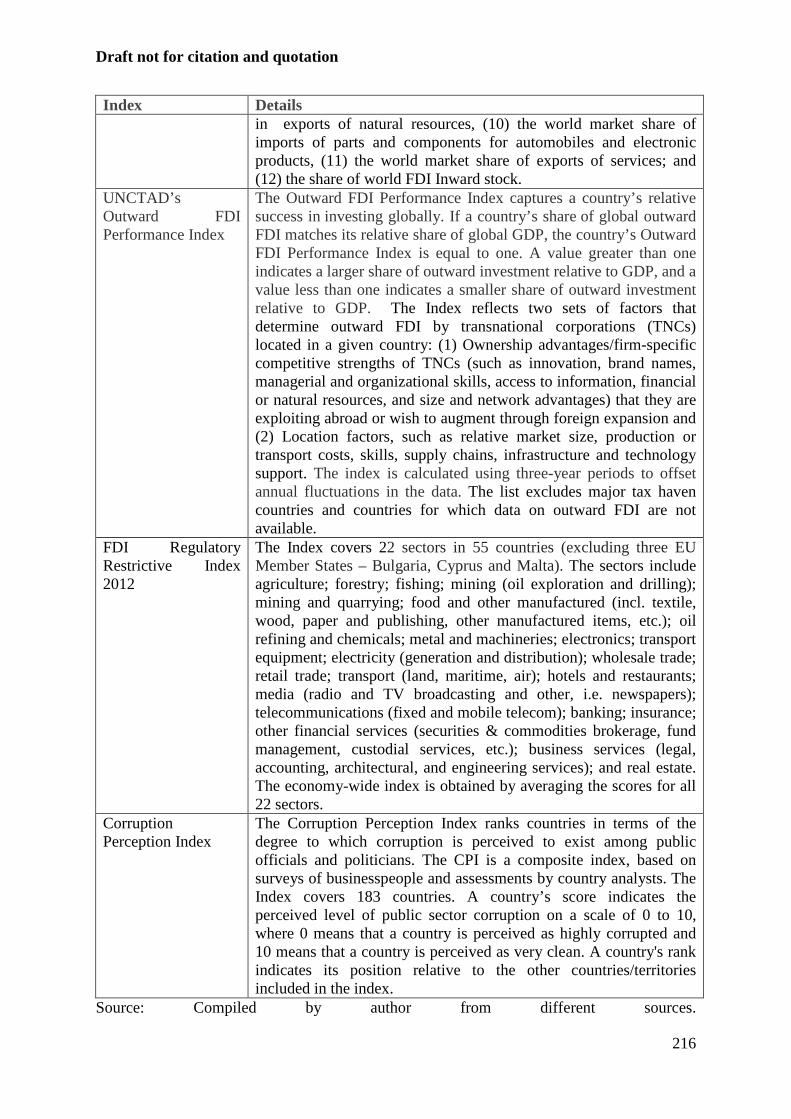
Draft not for citation and quotation
216
Index Details in exports of natural resources, (10) the world market share of imports of parts and components for automobiles and electronic products, (11) the world market share of exports of services; and (12) the share of world FDI Inward stock.
UNCTAD’s Outward FDI Performance Index
The Outward FDI Performance Index captures a country’s relative success in investing globally. If a country’s share of global outward FDI matches its relative share of global GDP, the country’s Outward FDI Performance Index is equal to one. A value greater than one indicates a larger share of outward investment relative to GDP, and a value less than one indicates a smaller share of outward investment relative to GDP. The Index reflects two sets of factors that determine outward FDI by transnational corporations (TNCs) located in a given country: (1) Ownership advantages/firm-specific competitive strengths of TNCs (such as innovation, brand names, managerial and organizational skills, access to information, financial or natural resources, and size and network advantages) that they are exploiting abroad or wish to augment through foreign expansion and (2) Location factors, such as relative market size, production or transport costs, skills, supply chains, infrastructure and technology support. The index is calculated using three-year periods to offset annual fluctuations in the data. The list excludes major tax haven countries and countries for which data on outward FDI are not available.
FDI Regulatory Restrictive Index 2012
The Index covers 22 sectors in 55 countries (excluding three EU Member States – Bulgaria, Cyprus and Malta). The sectors include agriculture; forestry; fishing; mining (oil exploration and drilling); mining and quarrying; food and other manufactured (incl. textile, wood, paper and publishing, other manufactured items, etc.); oil refining and chemicals; metal and machineries; electronics; transport equipment; electricity (generation and distribution); wholesale trade; retail trade; transport (land, maritime, air); hotels and restaurants; media (radio and TV broadcasting and other, i.e. newspapers); telecommunications (fixed and mobile telecom); banking; insurance; other financial services (securities & commodities brokerage, fund management, custodial services, etc.); business services (legal, accounting, architectural, and engineering services); and real estate. The economy-wide index is obtained by averaging the scores for all 22 sectors.
Corruption Perception Index
The Corruption Perception Index ranks countries in terms of the degree to which corruption is perceived to exist among public officials and politicians. The CPI is a composite index, based on surveys of businesspeople and assessments by country analysts. The Index covers 183 countries. A country’s score indicates the perceived level of public sector corruption on a scale of 0 to 10, where 0 means that a country is perceived as highly corrupted and 10 means that a country is perceived as very clean. A country's rank indicates its position relative to the other countries/territories included in the index.
Source: Compiled by author from different sources.
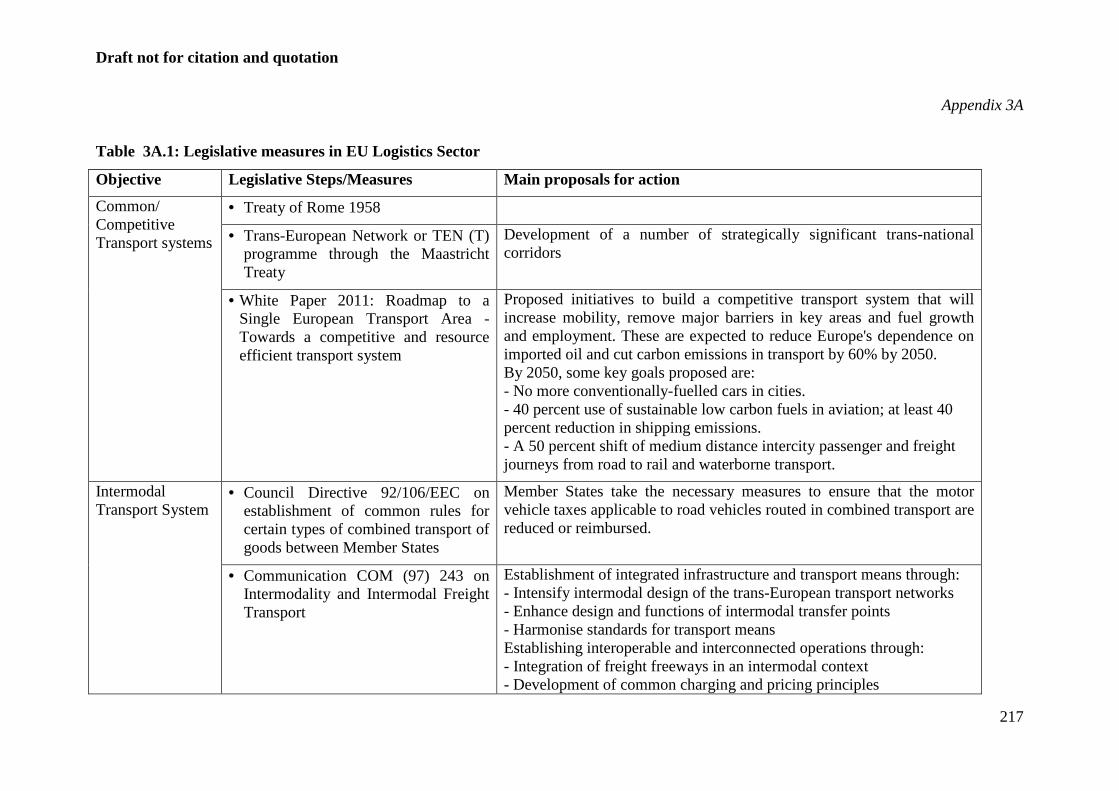
Draft not for citation and quotation
217
Appendix 3A
Table 3A.1: Legislative measures in EU Logistics Sector
Objective Legislative Steps/Measures Main proposals for action
Common/ Competitive Transport systems
• Treaty of Rome 1958
• Trans-European Network or TEN (T) programme through the Maastricht Treaty
Development of a number of strategically significant trans-national corridors
• White Paper 2011: Roadmap to a Single European Transport Area - Towards a competitive and resource efficient transport system
Proposed initiatives to build a competitive transport system that will increase mobility, remove major barriers in key areas and fuel growth and employment. These are expected to reduce Europe's dependence on imported oil and cut carbon emissions in transport by 60% by 2050. By 2050, some key goals proposed are: - No more conventionally-fuelled cars in cities. - 40 percent use of sustainable low carbon fuels in aviation; at least 40 percent reduction in shipping emissions. - A 50 percent shift of medium distance intercity passenger and freight journeys from road to rail and waterborne transport.
Intermodal Transport System
• Council Directive 92/106/EEC on establishment of common rules for certain types of combined transport of goods between Member States
Member States take the necessary measures to ensure that the motor vehicle taxes applicable to road vehicles routed in combined transport are reduced or reimbursed.
• Communication COM (97) 243 on Intermodality and Intermodal Freight Transport
Establishment of integrated infrastructure and transport means through: - Intensify intermodal design of the trans-European transport networks - Enhance design and functions of intermodal transfer points - Harmonise standards for transport means Establishing interoperable and interconnected operations through: - Integration of freight freeways in an intermodal context - Development of common charging and pricing principles
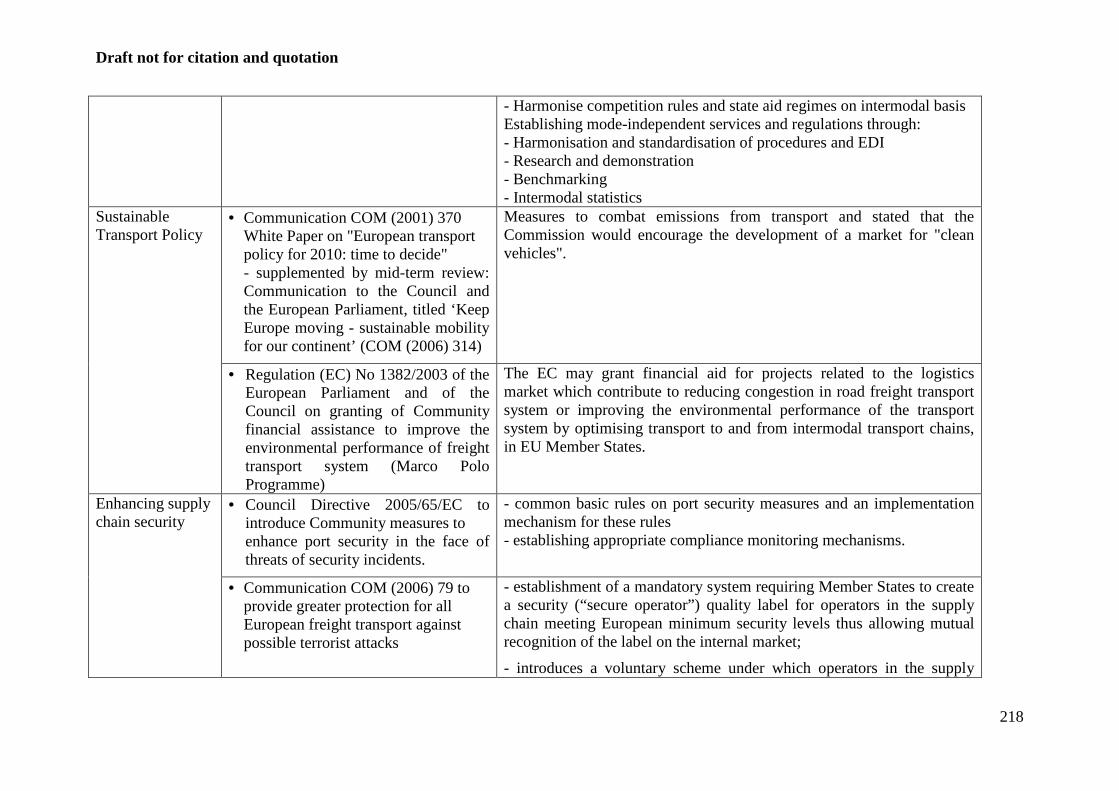
Draft not for citation and quotation
218
- Harmonise competition rules and state aid regimes on intermodal basis Establishing mode-independent services and regulations through: - Harmonisation and standardisation of procedures and EDI - Research and demonstration - Benchmarking - Intermodal statistics
Sustainable Transport Policy
• Communication COM (2001) 370 White Paper on "European transport policy for 2010: time to decide" - supplemented by mid-term review: Communication to the Council and the European Parliament, titled ‘Keep Europe moving - sustainable mobility for our continent’ (COM (2006) 314)
Measures to combat emissions from transport and stated that the Commission would encourage the development of a market for "clean vehicles".
• Regulation (EC) No 1382/2003 of the European Parliament and of the Council on granting of Community financial assistance to improve the environmental performance of freight transport system (Marco Polo Programme)
The EC may grant financial aid for projects related to the logistics market which contribute to reducing congestion in road freight transport system or improving the environmental performance of the transport system by optimising transport to and from intermodal transport chains, in EU Member States.
Enhancing supply chain security
• Council Directive 2005/65/EC to introduce Community measures to enhance port security in the face of threats of security incidents.
- common basic rules on port security measures and an implementation mechanism for these rules - establishing appropriate compliance monitoring mechanisms.
• Communication COM (2006) 79 to provide greater protection for all European freight transport against possible terrorist attacks
- establishment of a mandatory system requiring Member States to create a security (“secure operator”) quality label for operators in the supply chain meeting European minimum security levels thus allowing mutual recognition of the label on the internal market;
- introduces a voluntary scheme under which operators in the supply
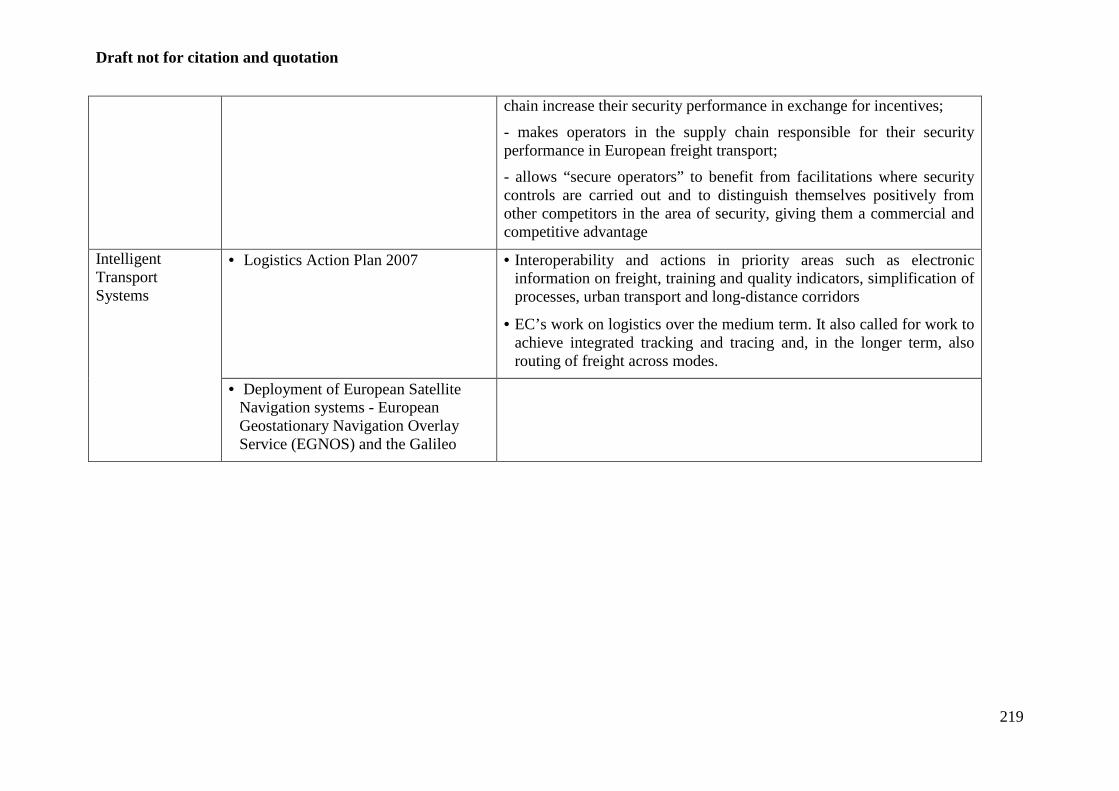
Draft not for citation and quotation
219
chain increase their security performance in exchange for incentives;
- makes operators in the supply chain responsible for their security performance in European freight transport;
- allows “secure operators” to benefit from facilitations where security controls are carried out and to distinguish themselves positively from other competitors in the area of security, giving them a commercial and competitive advantage
Intelligent Transport Systems
• Logistics Action Plan 2007 • Interoperability and actions in priority areas such as electronic information on freight, training and quality indicators, simplification of processes, urban transport and long-distance corridors
• EC’s work on logistics over the medium term. It also called for work to achieve integrated tracking and tracing and, in the longer term, also routing of freight across modes.
• Deployment of European Satellite Navigation systems - European Geostationary Navigation Overlay Service (EGNOS) and the Galileo
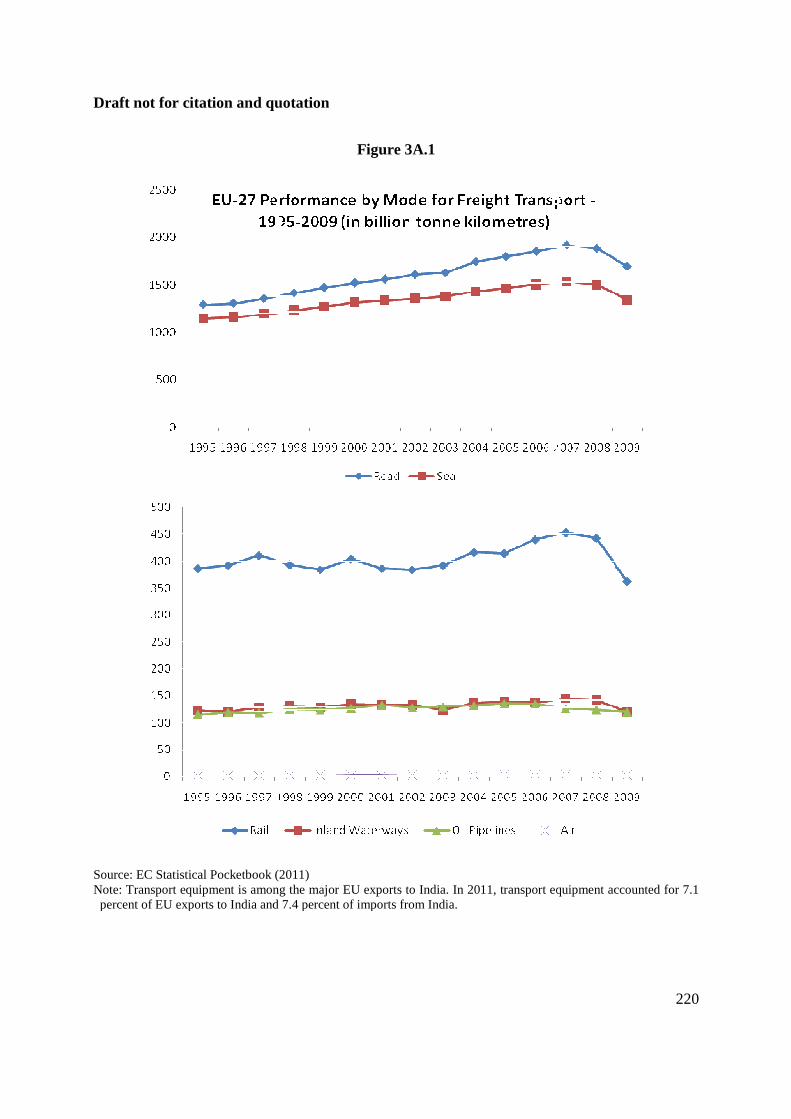
Draft not for cit ation and quotation
Source: EC Statistical Pocketbook (2011)Note: Transport equipment is among the major EU percent of EU exports to India and 7.4 percent of imports from India.
ation and quotation
Figure 3A.1
Source: EC Statistical Pocketbook (2011) Transport equipment is among the major EU exports to India. In 2011, transport equipment accounted for 7.1
percent of EU exports to India and 7.4 percent of imports from India.
220
exports to India. In 2011, transport equipment accounted for 7.1
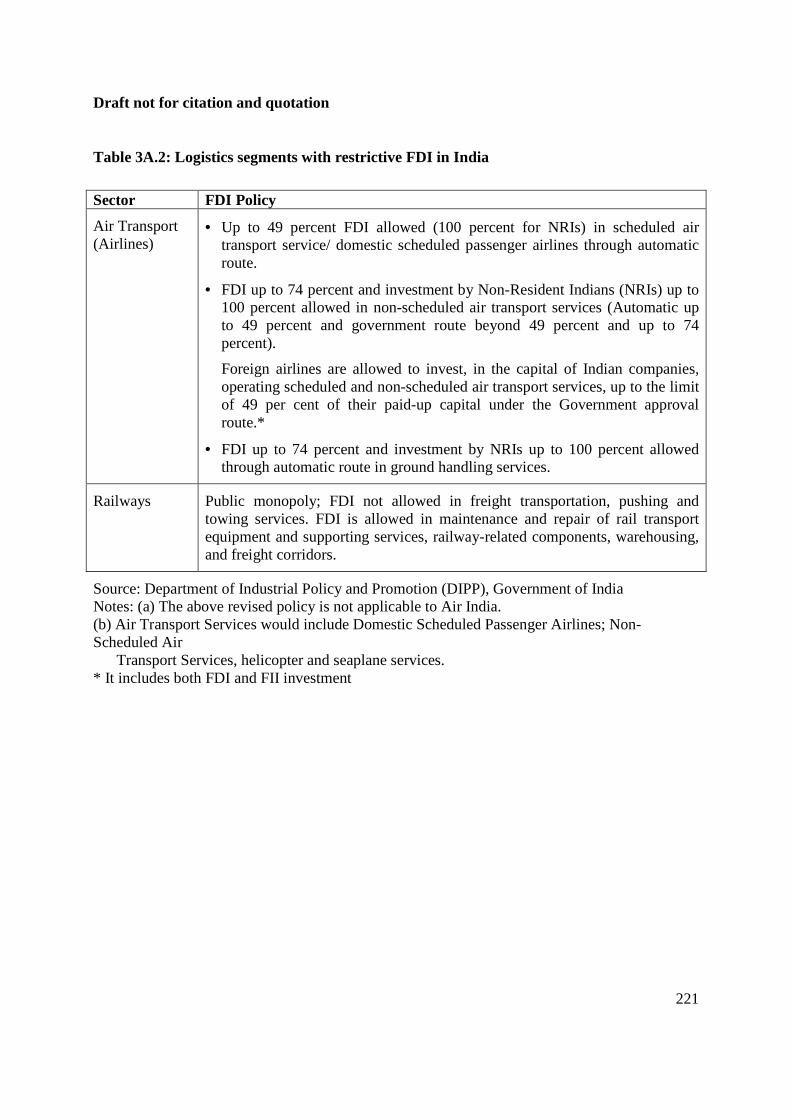
Draft not for citation and quotation
221
Table 3A.2: Logistics segments with restrictive FDI in India
Sector FDI Policy
Air Transport (Airlines)
• Up to 49 percent FDI allowed (100 percent for NRIs) in scheduled air transport service/ domestic scheduled passenger airlines through automatic route.
• FDI up to 74 percent and investment by Non-Resident Indians (NRIs) up to 100 percent allowed in non-scheduled air transport services (Automatic up to 49 percent and government route beyond 49 percent and up to 74 percent).
Foreign airlines are allowed to invest, in the capital of Indian companies, operating scheduled and non-scheduled air transport services, up to the limit of 49 per cent of their paid-up capital under the Government approval route.*
• FDI up to 74 percent and investment by NRIs up to 100 percent allowed through automatic route in ground handling services.
Railways Public monopoly; FDI not allowed in freight transportation, pushing and towing services. FDI is allowed in maintenance and repair of rail transport equipment and supporting services, railway-related components, warehousing, and freight corridors.
Source: Department of Industrial Policy and Promotion (DIPP), Government of India Notes: (a) The above revised policy is not applicable to Air India. (b) Air Transport Services would include Domestic Scheduled Passenger Airlines; Non-Scheduled Air Transport Services, helicopter and seaplane services. * It includes both FDI and FII investment
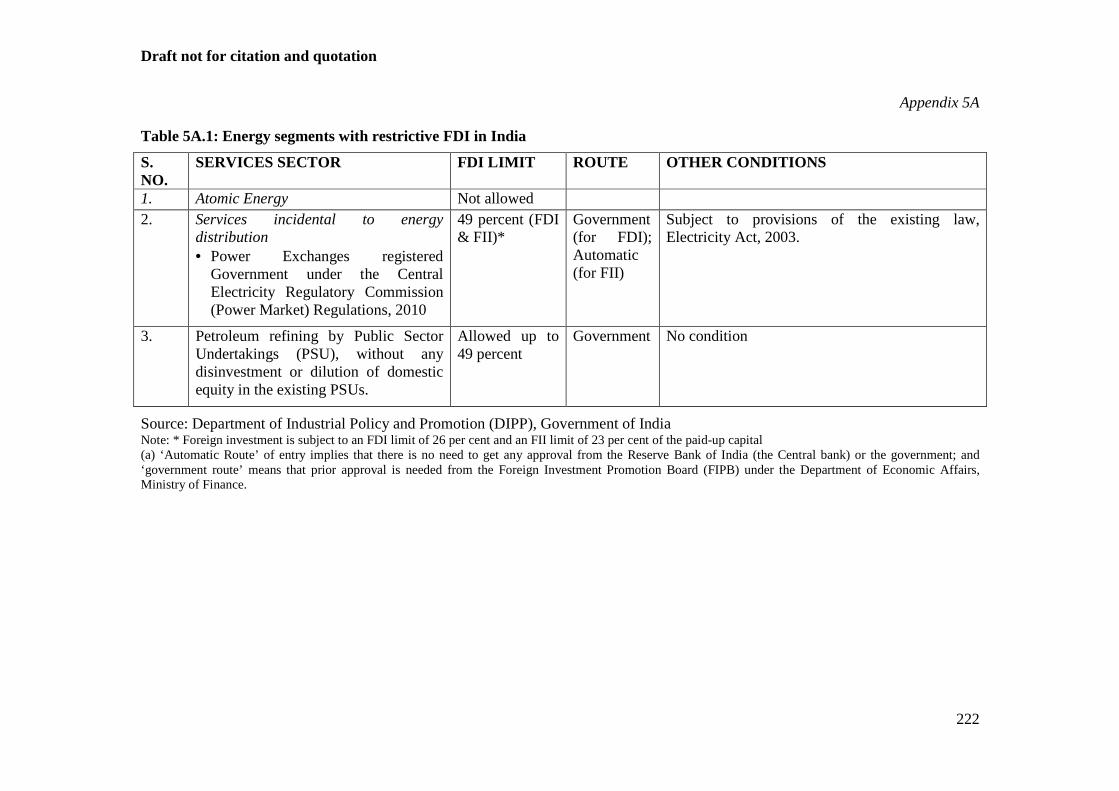
Draft not for citation and quotation
222
Appendix 5A
Table 5A.1: Energy segments with restrictive FDI in India
S. NO.
SERVICES SECTOR FDI LIMIT ROUTE OTHER CONDITIONS
1. Atomic Energy Not allowed 2. Services incidental to energy
distribution • Power Exchanges registered
Government under the Central Electricity Regulatory Commission (Power Market) Regulations, 2010
49 percent (FDI & FII)*
Government (for FDI); Automatic (for FII)
Subject to provisions of the existing law, Electricity Act, 2003.
3. Petroleum refining by Public Sector Undertakings (PSU), without any disinvestment or dilution of domestic equity in the existing PSUs.
Allowed up to 49 percent
Government No condition
Source: Department of Industrial Policy and Promotion (DIPP), Government of India Note: * Foreign investment is subject to an FDI limit of 26 per cent and an FII limit of 23 per cent of the paid-up capital (a) ‘Automatic Route’ of entry implies that there is no need to get any approval from the Reserve Bank of India (the Central bank) or the government; and ‘government route’ means that prior approval is needed from the Foreign Investment Promotion Board (FIPB) under the Department of Economic Affairs, Ministry of Finance.
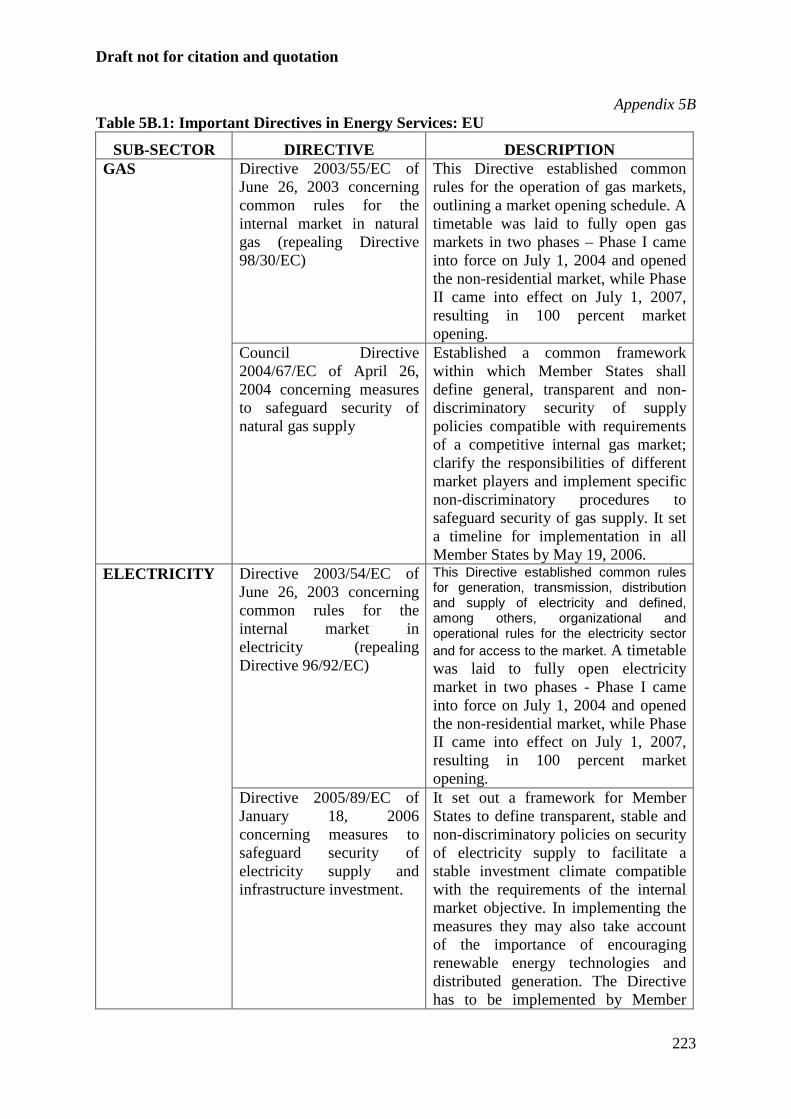
Draft not for citation and quotation
223
Appendix 5B Table 5B.1: Important Directives in Energy Services: EU
SUB-SECTOR DIRECTIVE DESCRIPTION GAS Directive 2003/55/EC of
June 26, 2003 concerning common rules for the internal market in natural gas (repealing Directive 98/30/EC)
This Directive established common rules for the operation of gas markets, outlining a market opening schedule. A timetable was laid to fully open gas markets in two phases – Phase I came into force on July 1, 2004 and opened the non-residential market, while Phase II came into effect on July 1, 2007, resulting in 100 percent market opening.
Council Directive 2004/67/EC of April 26, 2004 concerning measures to safeguard security of natural gas supply
Established a common framework within which Member States shall define general, transparent and non-discriminatory security of supply policies compatible with requirements of a competitive internal gas market; clarify the responsibilities of different market players and implement specific non-discriminatory procedures to safeguard security of gas supply. It set a timeline for implementation in all Member States by May 19, 2006.
ELECTRICITY Directive 2003/54/EC of June 26, 2003 concerning common rules for the internal market in electricity (repealing Directive 96/92/EC)
This Directive established common rules for generation, transmission, distribution and supply of electricity and defined, among others, organizational and operational rules for the electricity sector and for access to the market. A timetable was laid to fully open electricity market in two phases - Phase I came into force on July 1, 2004 and opened the non-residential market, while Phase II came into effect on July 1, 2007, resulting in 100 percent market opening.
Directive 2005/89/EC of January 18, 2006 concerning measures to safeguard security of electricity supply and infrastructure investment.
It set out a framework for Member States to define transparent, stable and non-discriminatory policies on security of electricity supply to facilitate a stable investment climate compatible with the requirements of the internal market objective. In implementing the measures they may also take account of the importance of encouraging renewable energy technologies and distributed generation. The Directive has to be implemented by Member
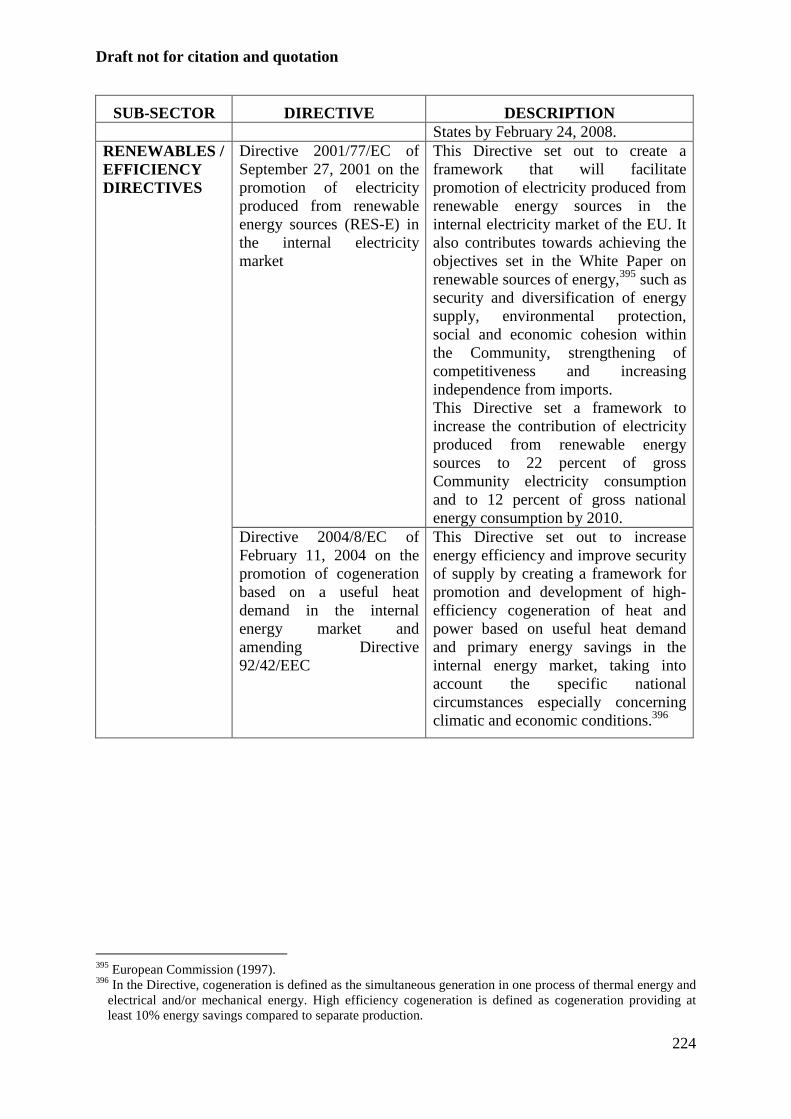
Draft not for citation and quotation
224
SUB-SECTOR DIRECTIVE DESCRIPTION States by February 24, 2008.
RENEWABLES / EFFICIENCY DIRECTIVES
Directive 2001/77/EC of September 27, 2001 on the promotion of electricity produced from renewable energy sources (RES-E) in the internal electricity market
This Directive set out to create a framework that will facilitate promotion of electricity produced from renewable energy sources in the internal electricity market of the EU. It also contributes towards achieving the objectives set in the White Paper on renewable sources of energy,395 such as security and diversification of energy supply, environmental protection, social and economic cohesion within the Community, strengthening of competitiveness and increasing independence from imports. This Directive set a framework to increase the contribution of electricity produced from renewable energy sources to 22 percent of gross Community electricity consumption and to 12 percent of gross national energy consumption by 2010.
Directive 2004/8/EC of February 11, 2004 on the promotion of cogeneration based on a useful heat demand in the internal energy market and amending Directive 92/42/EEC
This Directive set out to increase energy efficiency and improve security of supply by creating a framework for promotion and development of high-efficiency cogeneration of heat and power based on useful heat demand and primary energy savings in the internal energy market, taking into account the specific national circumstances especially concerning climatic and economic conditions.396
395 European Commission (1997). 396 In the Directive, cogeneration is defined as the simultaneous generation in one process of thermal energy and
electrical and/or mechanical energy. High efficiency cogeneration is defined as cogeneration providing at least 10% energy savings compared to separate production.
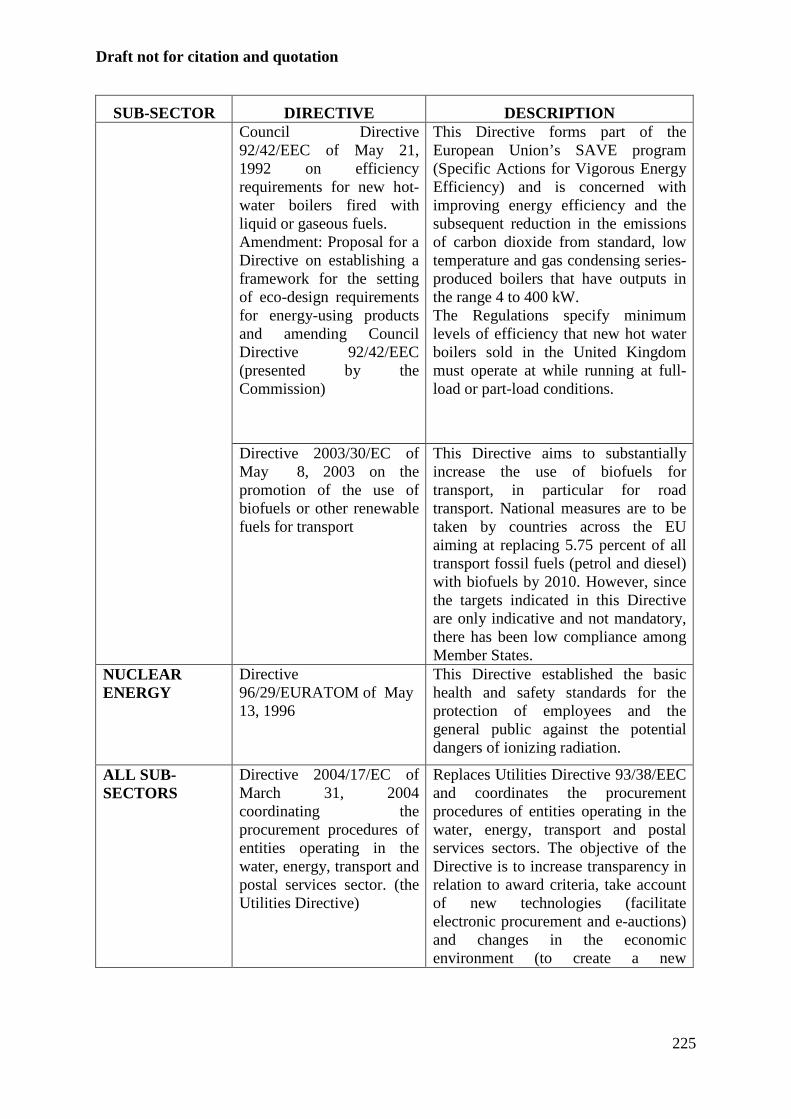
Draft not for citation and quotation
225
SUB-SECTOR DIRECTIVE DESCRIPTION Council Directive 92/42/EEC of May 21, 1992 on efficiency requirements for new hot-water boilers fired with liquid or gaseous fuels. Amendment: Proposal for a Directive on establishing a framework for the setting of eco-design requirements for energy-using products and amending Council Directive 92/42/EEC (presented by the Commission)
This Directive forms part of the European Union’s SAVE program (Specific Actions for Vigorous Energy Efficiency) and is concerned with improving energy efficiency and the subsequent reduction in the emissions of carbon dioxide from standard, low temperature and gas condensing series-produced boilers that have outputs in the range 4 to 400 kW. The Regulations specify minimum levels of efficiency that new hot water boilers sold in the United Kingdom must operate at while running at full-load or part-load conditions.
Directive 2003/30/EC of May 8, 2003 on the promotion of the use of biofuels or other renewable fuels for transport
This Directive aims to substantially increase the use of biofuels for transport, in particular for road transport. National measures are to be taken by countries across the EU aiming at replacing 5.75 percent of all transport fossil fuels (petrol and diesel) with biofuels by 2010. However, since the targets indicated in this Directive are only indicative and not mandatory, there has been low compliance among Member States.
NUCLEAR ENERGY
Directive 96/29/EURATOM of May 13, 1996
This Directive established the basic health and safety standards for the protection of employees and the general public against the potential dangers of ionizing radiation.
ALL SUB-SECTORS
Directive 2004/17/EC of March 31, 2004 coordinating the procurement procedures of entities operating in the water, energy, transport and postal services sector. (the Utilities Directive)
Replaces Utilities Directive 93/38/EEC and coordinates the procurement procedures of entities operating in the water, energy, transport and postal services sectors. The objective of the Directive is to increase transparency in relation to award criteria, take account of new technologies (facilitate electronic procurement and e-auctions) and changes in the economic environment (to create a new
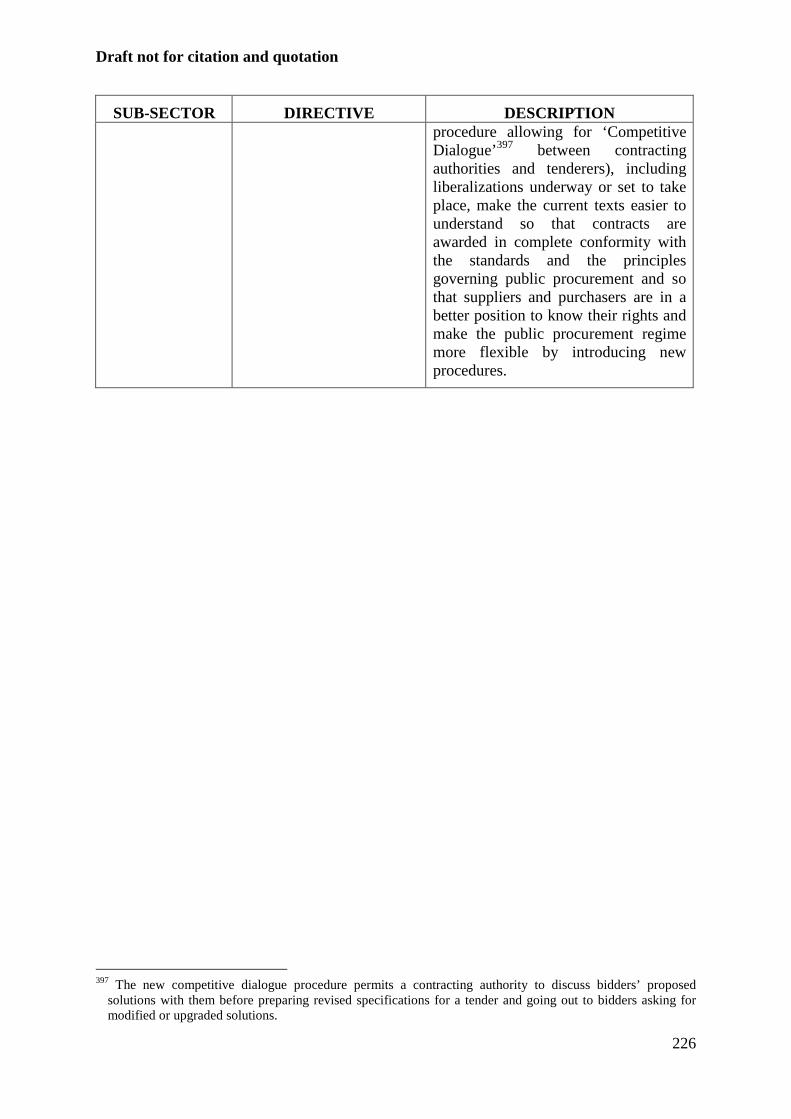
Draft not for citation and quotation
226
SUB-SECTOR DIRECTIVE DESCRIPTION procedure allowing for ‘Competitive Dialogue’397 between contracting authorities and tenderers), including liberalizations underway or set to take place, make the current texts easier to understand so that contracts are awarded in complete conformity with the standards and the principles governing public procurement and so that suppliers and purchasers are in a better position to know their rights and make the public procurement regime more flexible by introducing new procedures.
397 The new competitive dialogue procedure permits a contracting authority to discuss bidders’ proposed
solutions with them before preparing revised specifications for a tender and going out to bidders asking for modified or upgraded solutions.
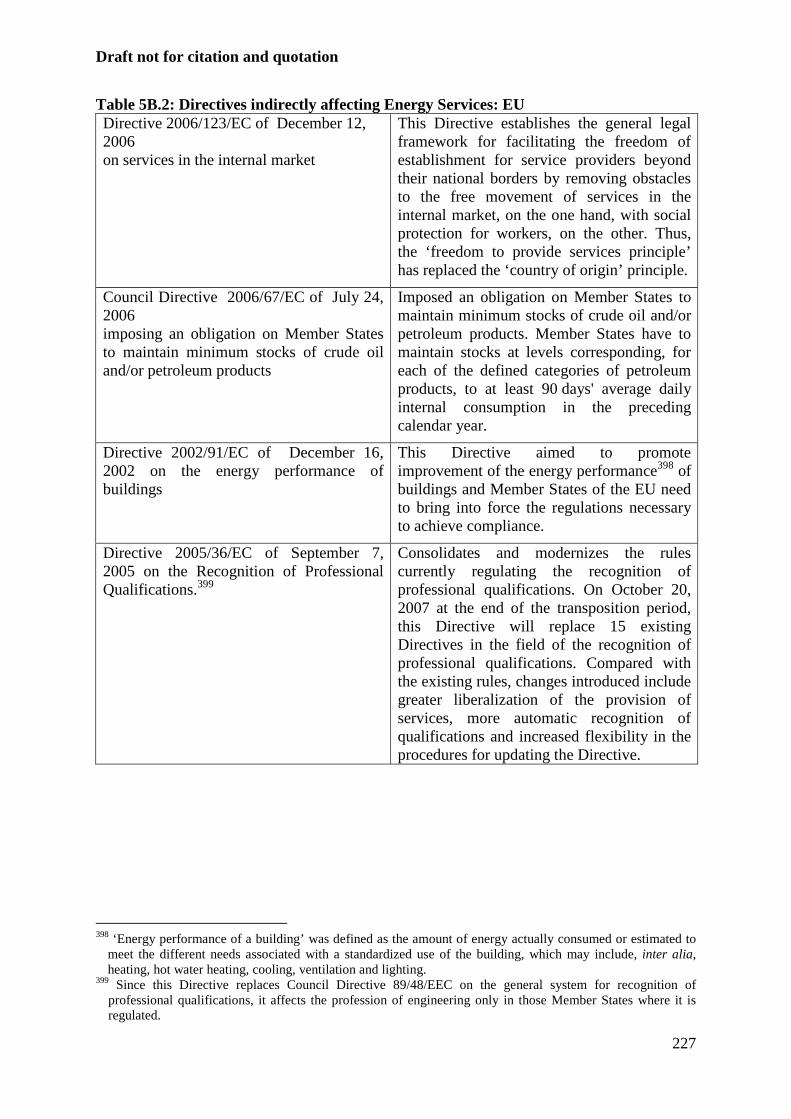
Draft not for citation and quotation
227
Table 5B.2: Directives indirectly affecting Energy Services: EU Directive 2006/123/EC of December 12, 2006 on services in the internal market
This Directive establishes the general legal framework for facilitating the freedom of establishment for service providers beyond their national borders by removing obstacles to the free movement of services in the internal market, on the one hand, with social protection for workers, on the other. Thus, the ‘freedom to provide services principle’ has replaced the ‘country of origin’ principle.
Council Directive 2006/67/EC of July 24, 2006 imposing an obligation on Member States to maintain minimum stocks of crude oil and/or petroleum products
Imposed an obligation on Member States to maintain minimum stocks of crude oil and/or petroleum products. Member States have to maintain stocks at levels corresponding, for each of the defined categories of petroleum products, to at least 90 days' average daily internal consumption in the preceding calendar year.
Directive 2002/91/EC of December 16, 2002 on the energy performance of buildings
This Directive aimed to promote improvement of the energy performance398 of buildings and Member States of the EU need to bring into force the regulations necessary to achieve compliance.
Directive 2005/36/EC of September 7, 2005 on the Recognition of Professional Qualifications.399
Consolidates and modernizes the rules currently regulating the recognition of professional qualifications. On October 20, 2007 at the end of the transposition period, this Directive will replace 15 existing Directives in the field of the recognition of professional qualifications. Compared with the existing rules, changes introduced include greater liberalization of the provision of services, more automatic recognition of qualifications and increased flexibility in the procedures for updating the Directive.
398 ‘Energy performance of a building’ was defined as the amount of energy actually consumed or estimated to
meet the different needs associated with a standardized use of the building, which may include, inter alia, heating, hot water heating, cooling, ventilation and lighting.
399 Since this Directive replaces Council Directive 89/48/EEC on the general system for recognition of professional qualifications, it affects the profession of engineering only in those Member States where it is regulated.
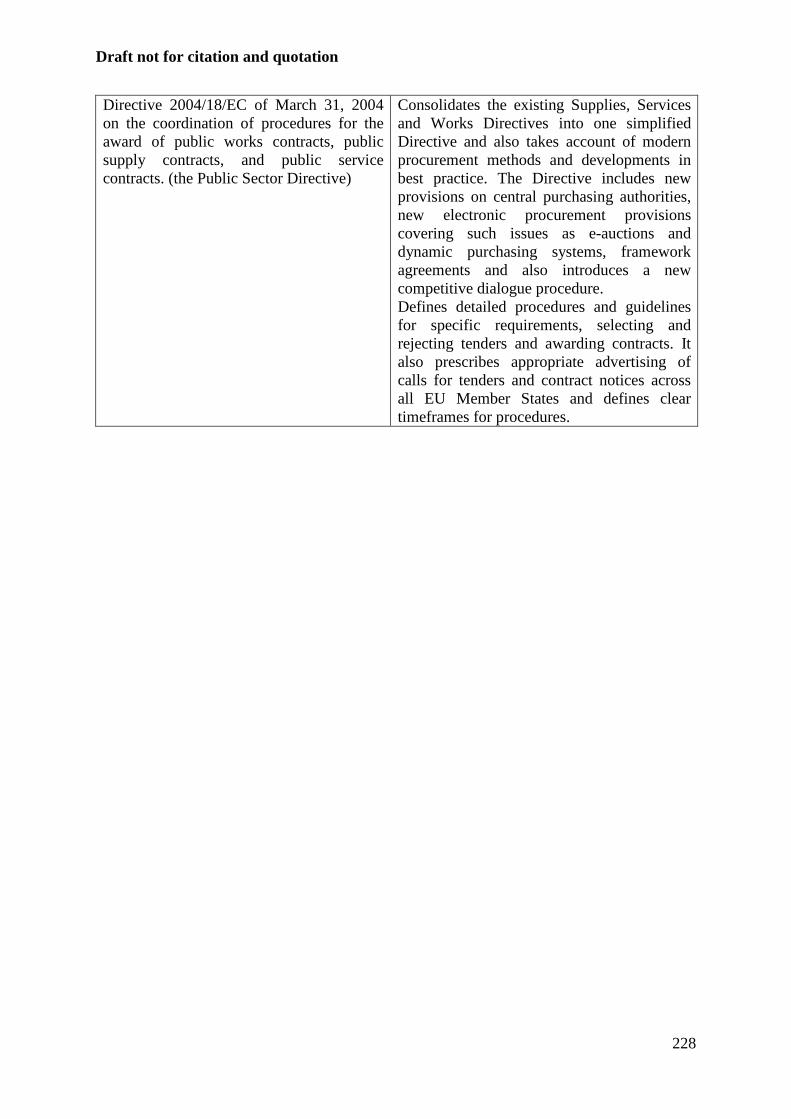
Draft not for citation and quotation
228
Directive 2004/18/EC of March 31, 2004 on the coordination of procedures for the award of public works contracts, public supply contracts, and public service contracts. (the Public Sector Directive)
Consolidates the existing Supplies, Services and Works Directives into one simplified Directive and also takes account of modern procurement methods and developments in best practice. The Directive includes new provisions on central purchasing authorities, new electronic procurement provisions covering such issues as e-auctions and dynamic purchasing systems, framework agreements and also introduces a new competitive dialogue procedure. Defines detailed procedures and guidelines for specific requirements, selecting and rejecting tenders and awarding contracts. It also prescribes appropriate advertising of calls for tenders and contract notices across all EU Member States and defines clear timeframes for procedures.
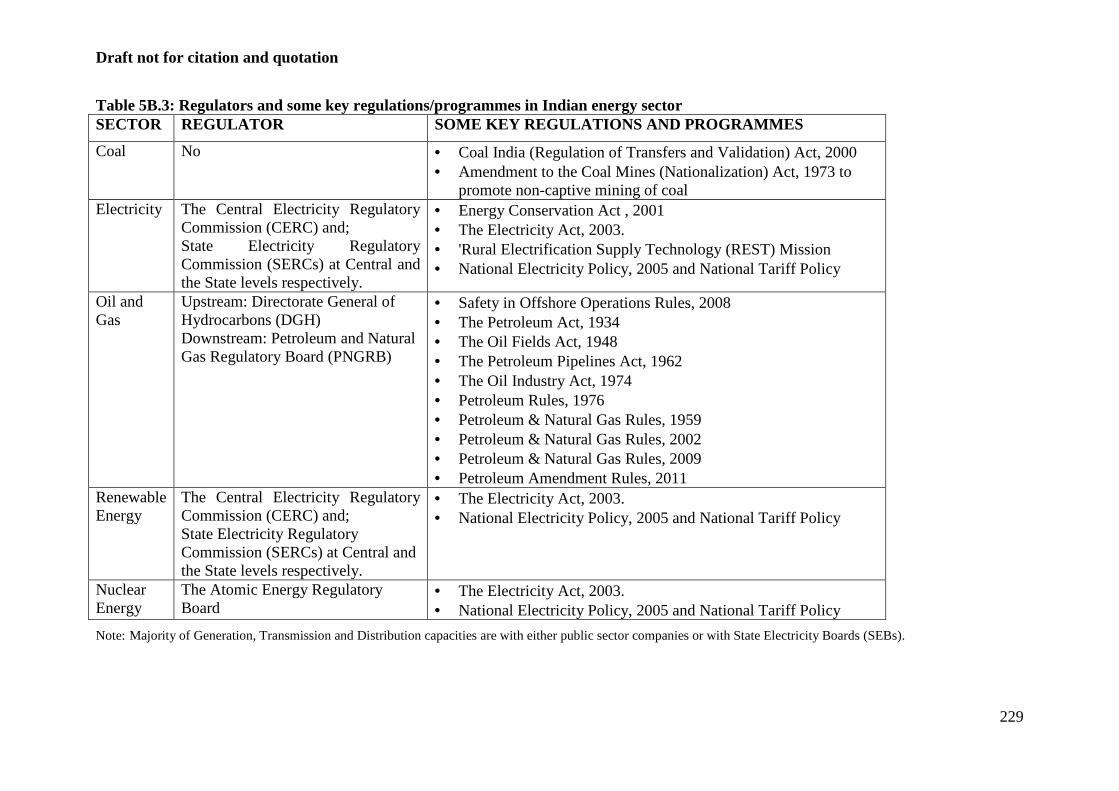
Draft not for citation and quotation
229
Table 5B.3: Regulators and some key regulations/programmes in Indian energy sector SECTOR REGULATOR SOME KEY REGULATIONS AND PROGRAMME S
Coal No • Coal India (Regulation of Transfers and Validation) Act, 2000 • Amendment to the Coal Mines (Nationalization) Act, 1973 to
promote non-captive mining of coal Electricity The Central Electricity Regulatory
Commission (CERC) and; State Electricity Regulatory Commission (SERCs) at Central and the State levels respectively.
• Energy Conservation Act , 2001 • The Electricity Act, 2003. • 'Rural Electrification Supply Technology (REST) Mission • National Electricity Policy, 2005 and National Tariff Policy
Oil and Gas
Upstream: Directorate General of Hydrocarbons (DGH) Downstream: Petroleum and Natural Gas Regulatory Board (PNGRB)
• Safety in Offshore Operations Rules, 2008 • The Petroleum Act, 1934 • The Oil Fields Act, 1948 • The Petroleum Pipelines Act, 1962 • The Oil Industry Act, 1974 • Petroleum Rules, 1976 • Petroleum & Natural Gas Rules, 1959 • Petroleum & Natural Gas Rules, 2002 • Petroleum & Natural Gas Rules, 2009 • Petroleum Amendment Rules, 2011
Renewable Energy
The Central Electricity Regulatory Commission (CERC) and; State Electricity Regulatory Commission (SERCs) at Central and the State levels respectively.
• The Electricity Act, 2003. • National Electricity Policy, 2005 and National Tariff Policy
Nuclear Energy
The Atomic Energy Regulatory Board
• The Electricity Act, 2003. • National Electricity Policy, 2005 and National Tariff Policy
Note: Majority of Generation, Transmission and Distribution capacities are with either public sector companies or with State Electricity Boards (SEBs).
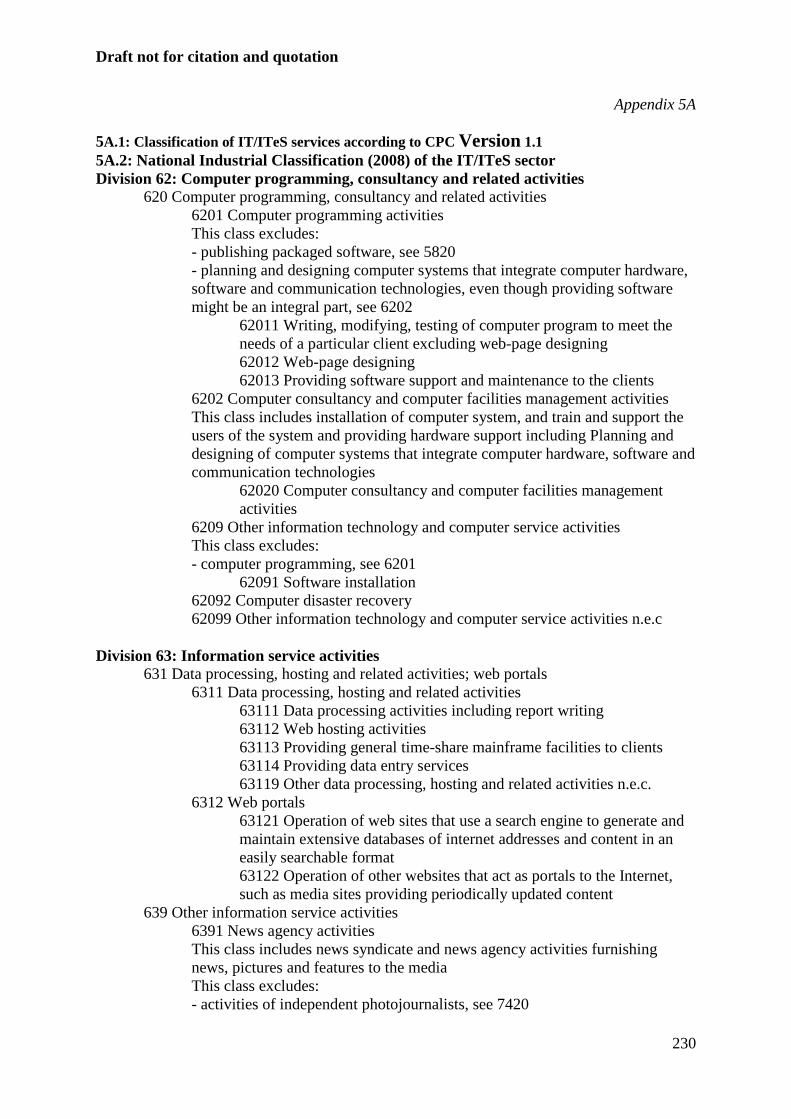
Draft not for citation and quotation
230
Appendix 5A
5A.1: Classification of IT/ITeS services according to CPC Version 1.1 5A.2: National Industrial Classification (2008) of the IT/ITeS sector Division 62: Computer programming, consultancy and related activities
620 Computer programming, consultancy and related activities 6201 Computer programming activities This class excludes: - publishing packaged software, see 5820 - planning and designing computer systems that integrate computer hardware, software and communication technologies, even though providing software might be an integral part, see 6202
62011 Writing, modifying, testing of computer program to meet the needs of a particular client excluding web-page designing 62012 Web-page designing 62013 Providing software support and maintenance to the clients
6202 Computer consultancy and computer facilities management activities This class includes installation of computer system, and train and support the users of the system and providing hardware support including Planning and designing of computer systems that integrate computer hardware, software and communication technologies
62020 Computer consultancy and computer facilities management activities
6209 Other information technology and computer service activities This class excludes: - computer programming, see 6201
62091 Software installation 62092 Computer disaster recovery 62099 Other information technology and computer service activities n.e.c
Division 63: Information service activities
631 Data processing, hosting and related activities; web portals 6311 Data processing, hosting and related activities
63111 Data processing activities including report writing 63112 Web hosting activities 63113 Providing general time-share mainframe facilities to clients 63114 Providing data entry services 63119 Other data processing, hosting and related activities n.e.c.
6312 Web portals 63121 Operation of web sites that use a search engine to generate and maintain extensive databases of internet addresses and content in an easily searchable format 63122 Operation of other websites that act as portals to the Internet, such as media sites providing periodically updated content
639 Other information service activities 6391 News agency activities This class includes news syndicate and news agency activities furnishing news, pictures and features to the media This class excludes: - activities of independent photojournalists, see 7420
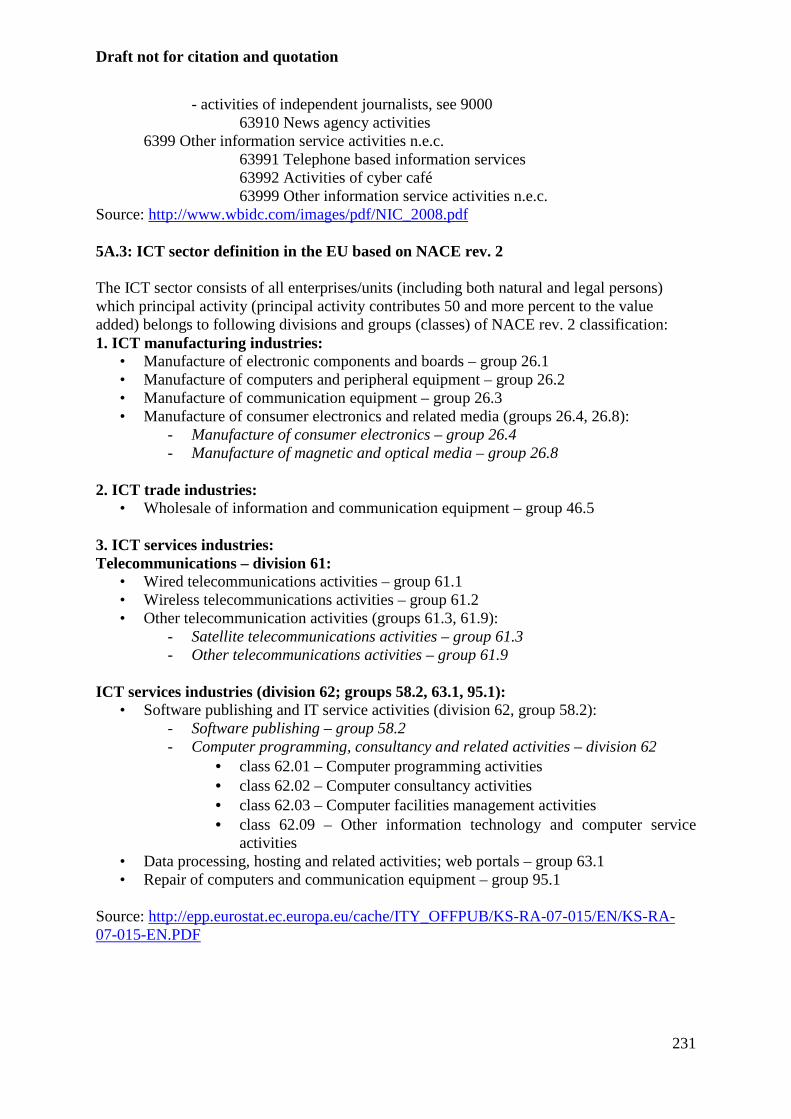
Draft not for citation and quotation
231
- activities of independent journalists, see 9000 63910 News agency activities
6399 Other information service activities n.e.c. 63991 Telephone based information services 63992 Activities of cyber café 63999 Other information service activities n.e.c.
Source: http://www.wbidc.com/images/pdf/NIC_2008.pdf 5A.3: ICT sector definition in the EU based on NACE rev. 2 The ICT sector consists of all enterprises/units (including both natural and legal persons) which principal activity (principal activity contributes 50 and more percent to the value added) belongs to following divisions and groups (classes) of NACE rev. 2 classification: 1. ICT manufacturing industries:
• Manufacture of electronic components and boards – group 26.1 • Manufacture of computers and peripheral equipment – group 26.2 • Manufacture of communication equipment – group 26.3 • Manufacture of consumer electronics and related media (groups 26.4, 26.8):
- Manufacture of consumer electronics – group 26.4 - Manufacture of magnetic and optical media – group 26.8
2. ICT trade industries:
• Wholesale of information and communication equipment – group 46.5 3. ICT services industries: Telecommunications – division 61:
• Wired telecommunications activities – group 61.1 • Wireless telecommunications activities – group 61.2 • Other telecommunication activities (groups 61.3, 61.9):
- Satellite telecommunications activities – group 61.3 - Other telecommunications activities – group 61.9
ICT services industries (division 62; groups 58.2, 63.1, 95.1):
• Software publishing and IT service activities (division 62, group 58.2): - Software publishing – group 58.2 - Computer programming, consultancy and related activities – division 62
• class 62.01 – Computer programming activities • class 62.02 – Computer consultancy activities • class 62.03 – Computer facilities management activities • class 62.09 – Other information technology and computer service
activities • Data processing, hosting and related activities; web portals – group 63.1 • Repair of computers and communication equipment – group 95.1
Source: http://epp.eurostat.ec.europa.eu/cache/ITY_OFFPUB/KS-RA-07-015/EN/KS-RA-07-015-EN.PDF
Draft not for citation and quotation
232
Appendix 5B Labour Laws for IT/ITeS Companies in West Bengal West Bengal offers the simplest labour laws as compared to other states. The state believes that Entrepreneurs will take almost important to safeguard the interests of their employee, and has not instituted any stringent requirement like many other states in India.
Some of highlights are as follows:
a. All IT/ITeS companies are granted the status of ‘Public Utility Service’ providers under the Industrial Disputes Act, 1947. The majority of employees in IT/ITeS organisations are outside the purview of the ‘blue-collared worker’ class. However, in view of the Government’s understanding of 24x365 operations of the IT/ITeS sector, the Government has decided to classify the IT/ITeS sector as ‘Public Utility Service’
b. All IT/ITeS units are deemed ‘establishment’ under the purview of the West Bengal Shops and Commercial Establishments Act, 1963.
c. Given the round-the-clock nature of work that is part of the IT/ITeS industry, the Government grants it permission to work on a 24x7x365 model. These units are also exempt from the following provisions of the West Bengal Shops and Commercial Establishment Act, 1963.
i. Closing an establishment and granting of a weekly holiday under Section 5 (1) of the Act, provided that every individual has at least one day off every week and a compulsory day off in lieu of working on bank holidays. This would enable the ITES companies to run their operations on all seven days of the week.
ii. Opening and closing hours under Section 7 (1) of the Act. This would enable the IT/ITES industry to run a three-shift operation.
iii. Working hours’ stipulation under Section 7 (2) of the Act. This will enable ‘flexitime’ operations for its employees.
iv. Enabled to engage female employees between 8 pm and 6 am, under Section 10 (b) of the Act subject to (i) Special arrangements being made for protection of female employees during these hours; (ii) Female employees being employed jointly or in a minimum group of 10 female employees; (iii) Arrangement of a separate rest room for female employees; (iv) A minimum of 50 people to be employed during these hours (including female employees).
d. Under section 13 of the West Bengal Shops and Commercial Establishment Act, 1963 the IT/ITES companies will now have an option of giving compensatory day off to an employee if the quantum of work exceeds 48 hours a week.
e. Under the Employment Exchange Compulsory Notification of Vacancies Act, 1959, IT/ITES companies will be required to send a consolidated report every quarter on the vacancies to the concerned employment exchange. The exchange, will, however sponsor names only when specifically requested to do so by the company.
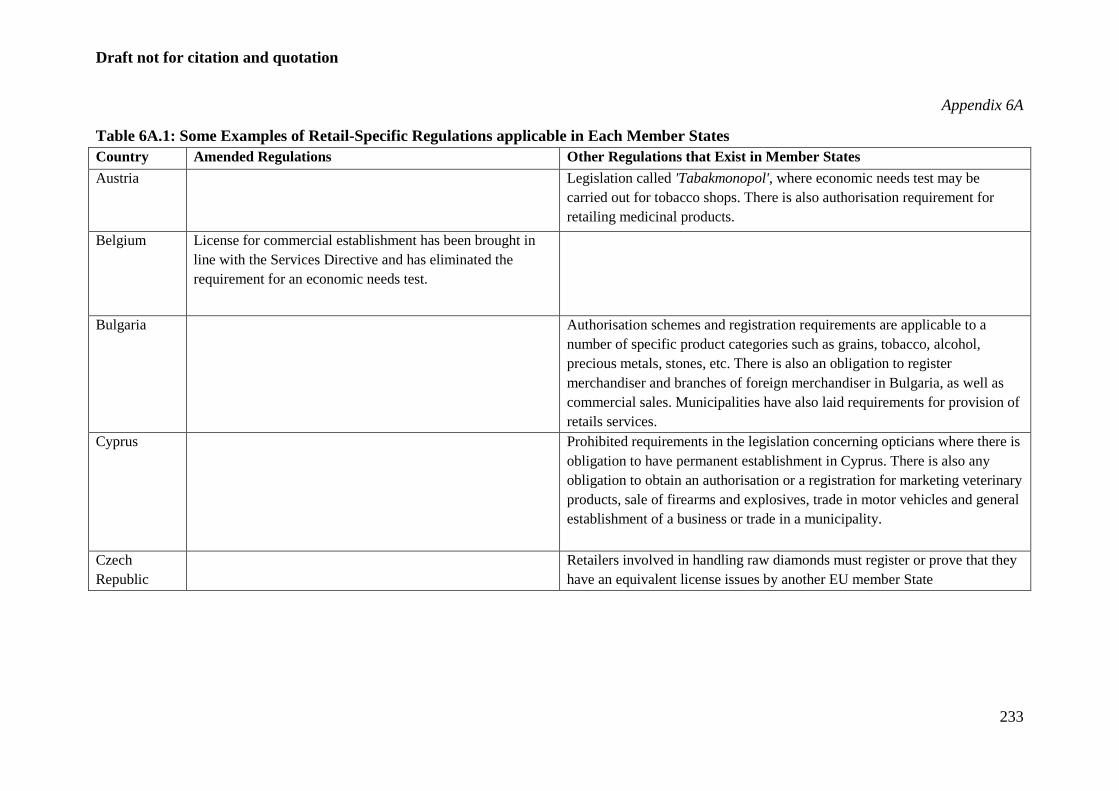
Draft not for citation and quotation
233
Appendix 6A
Table 6A.1: Some Examples of Retail-Specific Regulations applicable in Each Member States Country Amended Regulations Other Regulations that Exist in Member States
Austria Legislation called 'Tabakmonopol', where economic needs test may be carried out for tobacco shops. There is also authorisation requirement for retailing medicinal products.
Belgium License for commercial establishment has been brought in line with the Services Directive and has eliminated the requirement for an economic needs test.
Bulgaria Authorisation schemes and registration requirements are applicable to a number of specific product categories such as grains, tobacco, alcohol, precious metals, stones, etc. There is also an obligation to register merchandiser and branches of foreign merchandiser in Bulgaria, as well as commercial sales. Municipalities have also laid requirements for provision of retails services.
Cyprus Prohibited requirements in the legislation concerning opticians where there is obligation to have permanent establishment in Cyprus. There is also any obligation to obtain an authorisation or a registration for marketing veterinary products, sale of firearms and explosives, trade in motor vehicles and general establishment of a business or trade in a municipality.
Czech Republic
Retailers involved in handling raw diamonds must register or prove that they have an equivalent license issues by another EU member State
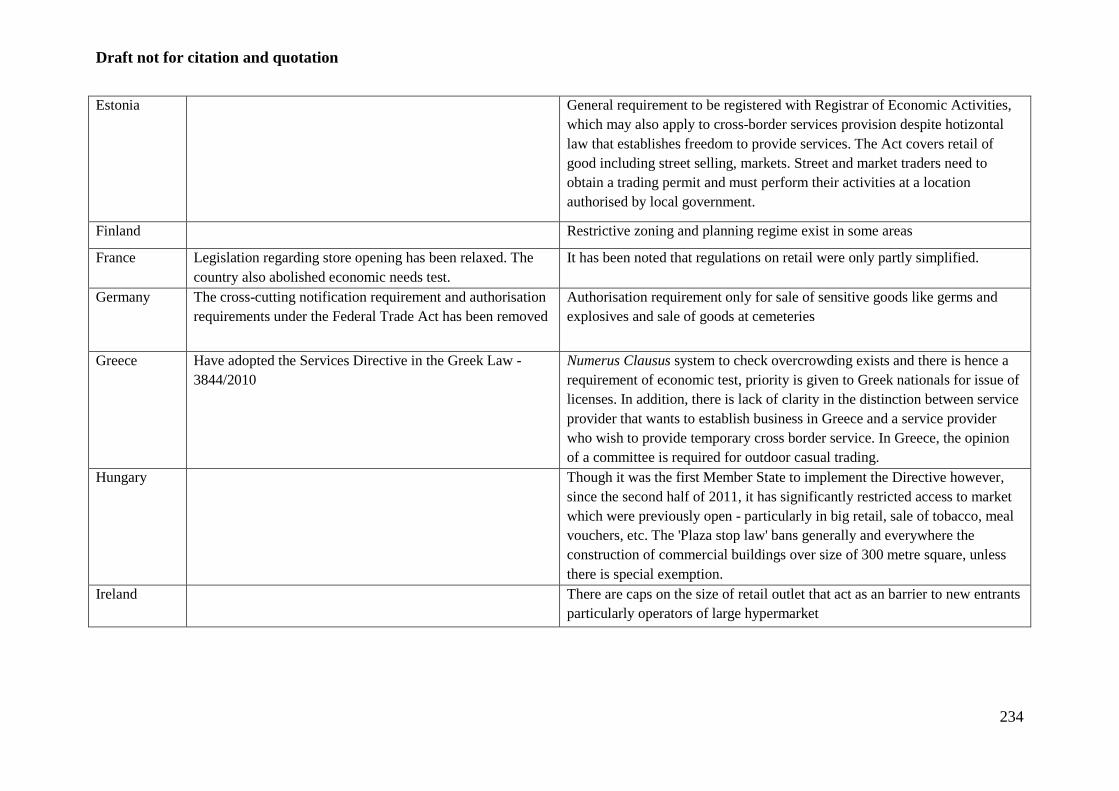
Draft not for citation and quotation
234
Estonia General requirement to be registered with Registrar of Economic Activities, which may also apply to cross-border services provision despite hotizontal law that establishes freedom to provide services. The Act covers retail of good including street selling, markets. Street and market traders need to obtain a trading permit and must perform their activities at a location authorised by local government.
Finland Restrictive zoning and planning regime exist in some areas
France Legislation regarding store opening has been relaxed. The country also abolished economic needs test.
It has been noted that regulations on retail were only partly simplified.
Germany The cross-cutting notification requirement and authorisation requirements under the Federal Trade Act has been removed
Authorisation requirement only for sale of sensitive goods like germs and explosives and sale of goods at cemeteries
Greece Have adopted the Services Directive in the Greek Law - 3844/2010
Numerus Clausus system to check overcrowding exists and there is hence a requirement of economic test, priority is given to Greek nationals for issue of licenses. In addition, there is lack of clarity in the distinction between service provider that wants to establish business in Greece and a service provider who wish to provide temporary cross border service. In Greece, the opinion of a committee is required for outdoor casual trading.
Hungary Though it was the first Member State to implement the Directive however, since the second half of 2011, it has significantly restricted access to market which were previously open - particularly in big retail, sale of tobacco, meal vouchers, etc. The 'Plaza stop law' bans generally and everywhere the construction of commercial buildings over size of 300 metre square, unless there is special exemption.
Ireland There are caps on the size of retail outlet that act as an barrier to new entrants particularly operators of large hypermarket
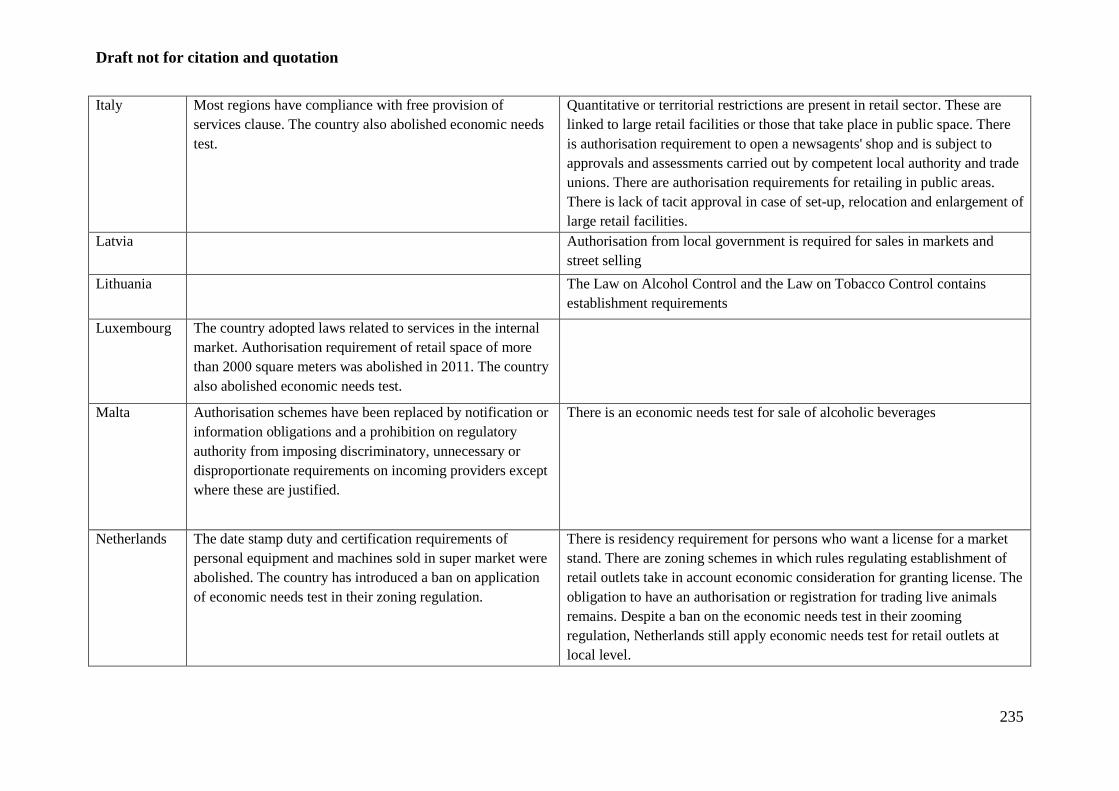
Draft not for citation and quotation
235
Italy Most regions have compliance with free provision of services clause. The country also abolished economic needs test.
Quantitative or territorial restrictions are present in retail sector. These are linked to large retail facilities or those that take place in public space. There is authorisation requirement to open a newsagents' shop and is subject to approvals and assessments carried out by competent local authority and trade unions. There are authorisation requirements for retailing in public areas. There is lack of tacit approval in case of set-up, relocation and enlargement of large retail facilities.
Latvia Authorisation from local government is required for sales in markets and street selling
Lithuania The Law on Alcohol Control and the Law on Tobacco Control contains establishment requirements
Luxembourg The country adopted laws related to services in the internal market. Authorisation requirement of retail space of more than 2000 square meters was abolished in 2011. The country also abolished economic needs test.
Malta Authorisation schemes have been replaced by notification or information obligations and a prohibition on regulatory authority from imposing discriminatory, unnecessary or disproportionate requirements on incoming providers except where these are justified.
There is an economic needs test for sale of alcoholic beverages
Netherlands The date stamp duty and certification requirements of personal equipment and machines sold in super market were abolished. The country has introduced a ban on application of economic needs test in their zoning regulation.
There is residency requirement for persons who want a license for a market stand. There are zoning schemes in which rules regulating establishment of retail outlets take in account economic consideration for granting license. The obligation to have an authorisation or registration for trading live animals remains. Despite a ban on the economic needs test in their zooming regulation, Netherlands still apply economic needs test for retail outlets at local level.
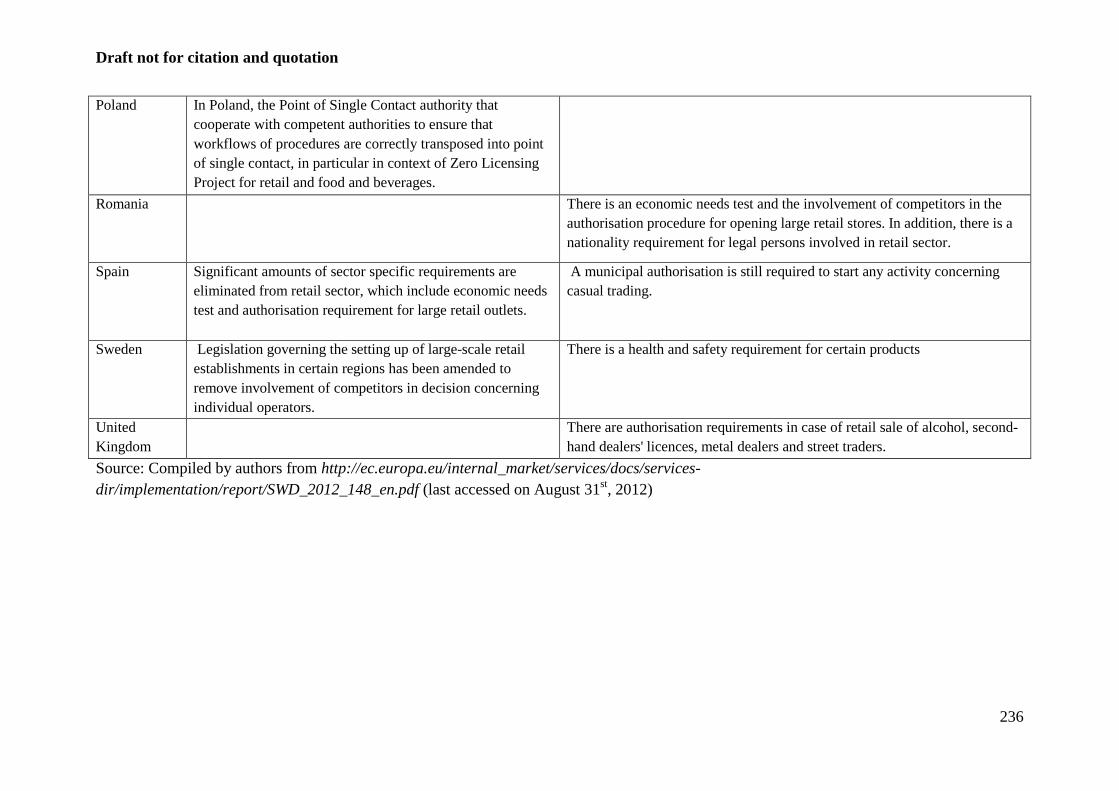
Draft not for citation and quotation
236
Poland In Poland, the Point of Single Contact authority that cooperate with competent authorities to ensure that workflows of procedures are correctly transposed into point of single contact, in particular in context of Zero Licensing Project for retail and food and beverages.
Romania There is an economic needs test and the involvement of competitors in the authorisation procedure for opening large retail stores. In addition, there is a nationality requirement for legal persons involved in retail sector.
Spain Significant amounts of sector specific requirements are eliminated from retail sector, which include economic needs test and authorisation requirement for large retail outlets.
A municipal authorisation is still required to start any activity concerning casual trading.
Sweden Legislation governing the setting up of large-scale retail establishments in certain regions has been amended to remove involvement of competitors in decision concerning individual operators.
There is a health and safety requirement for certain products
United Kingdom
There are authorisation requirements in case of retail sale of alcohol, second-hand dealers' licences, metal dealers and street traders.
Source: Compiled by authors from http://ec.europa.eu/internal_market/services/docs/services-dir/implementation/report/SWD_2012_148_en.pdf (last accessed on August 31st, 2012)

Draft not for citation and quotation
237
Related Documents


